UNITED STATES
SECURITIES AND EXCHANGE COMMISSION
Washington, D.C. 20549
FORM N-CSR
CERTIFIED SHAREHOLDER REPORT OF REGISTERED MANAGEMENT INVESTMENT COMPANIES
Investment Company Act file number 811- 01136
| Guggenheim Funds Trust |
| (Exact name of registrant as specified in charter) |
702 King Farm Boulevard, Suite 200
Rockville, Maryland 20850 |
| (Address of principal executive offices) (Zip code) |
Amy J. Lee
Guggenheim Funds Trust
702 King Farm Boulevard, Suite 200
Rockville, Maryland 20850 |
| (Name and address of agent for service) |
Registrant's telephone number, including area code: 1-301-296-5100
Date of fiscal year end:September 30
Date of reporting period:October 1, 2019 - March 31, 2020
Form N-CSR is to be used by management investment companies to file reports with the Commission not later than 10 days after the transmission to stockholders of any report that is required to be transmitted to stockholders under Rule 30e-1 under the Investment Company Act of 1940 (17 CFR 270.30e-1). The Commission may use the information provided on Form N-CSR in its regulatory, disclosure review, inspection, and policymaking roles.
A registrant is required to disclose the information specified by Form N-CSR, and the Commission will make this information public. A registrant is not required to respond to the collection of information contained in Form N-CSR unless the Form displays a currently valid Office of Management and Budget (“OMB”) control number. Please direct comments concerning the accuracy of the information collection burden estimate and any suggestions for reducing the burden to Secretary, Securities and Exchange Commission, 450 Fifth Street, NW, Washington, DC 20549-0609. The OMB has reviewed this collection of information under the clearance requirements of 44 U.S.C. §3507.
| Item 1. | Reports to Stockholders. |
The registrant’s semi-annual report transmitted to shareholders pursuant to Rule 30e-1 under the Investment Company Act of 1940, as amended (the “Investment Company Act”), is as follows:
3.31.2020
Guggenheim Funds Semi-Annual Report
Guggenheim Funds Trust-Equity |
Guggenheim Alpha Opportunity Fund | | |
Guggenheim Large Cap Value Fund | | |
Guggenheim Market Neutral Real Estate Fund | | |
Guggenheim Risk Managed Real Estate Fund | | |
Guggenheim Small Cap Value Fund | | |
Guggenheim StylePlus—Large Core Fund | | |
Guggenheim StylePlus—Mid Growth Fund | | |
Guggenheim World Equity Income Fund | | |
Beginning on January 1, 2021, paper copies of the Fund’s annual and semi-annual shareholder reports may no longer be sent by mail, unless you specifically request paper copies of the reports from a Fund or from your financial intermediary. Instead, the reports will be made available on a website, and you will be notified by mail each time a report is posted and provided with a website link to access the report.
If you already elected to receive shareholder reports electronically, you will not be affected by this change and you need not take any action.
At any time, you may elect to receive reports and other communications from a Fund electronically by calling 800.820.0888, going to GuggenheimInvestments.com/myaccount, or by contacting your financial intermediary.
You may elect to receive all future shareholder reports in paper free of charge. If you hold shares of a Fund directly, you can inform the Fund that you wish to receive paper copies of reports by calling 800.820.0888. If you hold shares of a Fund through a financial intermediary, please contact the financial intermediary to make this election. Your election to receive reports in paper will apply to all Guggenheim Funds in which you are invested and may apply to all funds held with your financial intermediary.
GuggenheimInvestments.com | SBE-SEMI-0320x0920 |

| | |
DEAR SHAREHOLDER | 2 |
ECONOMIC AND MARKET OVERVIEW | 5 |
ABOUT SHAREHOLDERS’ FUND EXPENSES | 7 |
ALPHA OPPORTUNITY FUND | 10 |
LARGE CAP VALUE FUND | 28 |
MARKET NEUTRAL REAL ESTATE FUND | 37 |
RISK MANAGED REAL ESTATE FUND | 47 |
SMALL CAP VALUE FUND | 60 |
STYLEPLUS—LARGE CORE FUND | 69 |
STYLEPLUS—MID GROWTH FUND | 81 |
WORLD EQUITY INCOME FUND | 93 |
NOTES TO FINANCIAL STATEMENTS | 104 |
OTHER INFORMATION | 119 |
INFORMATION ON BOARD OF TRUSTEES AND OFFICERS | 120 |
GUGGENHEIM INVESTMENTS PRIVACY NOTICE | 125 |
| | THE GUGGENHEIM FUNDS SEMI-ANNUAL REPORT | 1 |
Dear Shareholder:
The six-month period ended March 31, 2020, concluded on a somber note. Even though markets performed well for most of the period, the emergence of a novel and highly contagious form of coronavirus in the last weeks of the period adversely impacted global commercial activity and contributed to significant volatility in certain markets, unseen since the great recession of 2008.
As it spread beyond Asia to virtually every country in the world, many governments and businesses instituted quarantines and closures, which has resulted in significant disruption in manufacturing, supply chains, consumer demand and economic activity. The U.S. Federal Reserve responded quickly to provide liquidity in order to ensure that the U.S. markets continued to function efficiently. The fiscal policy included a spending bill worth over $2 trillion to assist consumers, states, small businesses and certain industries. While these actions helped stabilize the market, volatile conditions continued into April.
As discussed in this shareholder report, these events have affected performance of many of our funds (the “Fund” or “Funds”). We encourage you to read the Economic and Market Overview section of the report, which follows this letter.
Security Investors, LLC and Guggenheim Partners Investment Management, LLC (“GPIM”) (together, “Investment Advisers”), serve as the investment advisers to the Funds. The Investment Advisers are affiliates of Guggenheim Partners, LLC (“Guggenheim”), a global, diversified financial services firm. Guggenheim Funds Distributors, LLC serves as the distributor to the Funds and is also an affiliate of Guggenheim.
Together, we are committed to the safety and prosperity of our clients, our employees, and our shareholders. The resources of the firm are being made fully available not only to support our clients, but also to support our employees and their families.
Please practice the appropriate prudence for the protection not only of your health and that of your friends and loved ones but also for our neighbors and communities. Thank you for the trust you place in us.
Sincerely,
Guggenheim Partners Investment Management, LLC
Security Investors, LLC
April 30, 2020
Read a prospectus and summary prospectus (if available) carefully before investing. It contains the investment objectives, risks, charges, expenses and other information, which should be considered carefully before investing. Obtain a prospectus and summary prospectus (if available) at guggenheiminvestments.com or call 800.820.0888.
This material is not intended as a recommendation or as investment advice of any kind, including in connection with rollovers, transfers, and distributions. Such material is not provided in a fiduciary capacity, may not be relied upon for or in connection with the making of investment decisions, and does not constitute a solicitation of an offer to buy or sell securities. All content has been provided for informational or educational purposes only and is not intended to be and should not be construed as legal or tax advice and/or a legal opinion. Always consult a financial, tax and/or legal professional regarding your specific situation.
The global ongoing crisis caused by the outbreak of COVID-19 is causing materially reduced consumer demand and economic output, disrupting supply chains, resulting in market closures, travel restrictions and quarantines, and adversely impacting local and global economies. Investors should be aware that in light of the current uncertainty, volatility and distress in economies, financial markets, and labor and health conditions all over the world, the Funds’ investments and a shareholder’s investment in a Fund are subject to sudden and substantial losses, increased volatility and other adverse events. Firms through which investors invest with the Funds, the Funds, their service providers, the markets in which they invest and market intermediaries are also impacted by quarantines and similar measures intended to contain the ongoing pandemic, which can obstruct their functioning and subject them to heightened operational risks.
Alpha Opportunity Fund is subject to a number of risks and is not suitable for all investors. ● Investments in securities and derivatives, in general, are subject to market risks that may cause their prices to fluctuate over time. An investment in the Fund may lose money. There can be no guarantee the Fund will achieve it investment objective. ●The Fund’s use of derivatives such as futures, options and swap agreements may expose the Fund to additional risks that it would not be subject to if it invested directly in the securities underlying those derivatives. ● Certain of the derivative instruments, such as swaps and structured notes, are also subject to the risks of counterparty default and adverse tax treatment. ●The more the Fund invests in leveraged instruments, the more the leverage will magnify any gains or losses on those investments. ● The Fund’s use of short selling involves increased risk and costs, including paying more for a security than it received from its sale and the risk of unlimited losses. ●In certain circumstances the Fund may be subject to liquidity risk and it may be difficult for the Fund to purchase and sell particular investments within a reasonable time at a fair price. ●In certain circumstances, it may be difficult for the Fund to purchase and sell particular investments within a reasonable time at a fair price. ●The Fund’s fixed income investments will change in value in response to interest rate changes and other factors. ● See the prospectus for more information on these and additional risks.
2 | THE GUGGENHEIM FUNDS SEMI-ANNUAL REPORT | |
Large Cap Value Fund may not be suitable for all investors. ● An investment in the Fund will fluctuate and is subject to investment risks, which means an investor could lose money. ● The intrinsic value of the underlying stocks may never be realized, or the stock may decline in value. The Fund is subject to risk that large-capitalization stocks may underperform other segments of the equity market or the equity markets as a whole.
Market Neutral Real Estate Fund may not be suitable for all investors. ● Investing involves risk, including the possible loss of principal. ● There are no assurances that any fund will achieve its objective and/or strategy. ● The Fund’s investments in real estate securities subject the Fund to the same risks as direct investments in real estate, which is particularly sensitive to economic downturns. ● The Fund’s use of derivatives such as futures, options, and swap agreements may expose the Fund to additional risks that it would not be subject to if it invested directly in the securities underlying those derivatives. ● When market conditions are deemed appropriate, the Fund will leverage to the full extent permitted by its investment policies and restrictions and applicable law. Leveraging will exaggerate the effect on net asset value of any increase or decrease in the market value of the Fund’s portfolio. ● The more the Fund invests in leveraged instruments, the more the leverage will magnify any gains or losses on those investments. ● The Fund’s use of short selling involves increased risk and costs. The Fund risks paying more for a security than it received from its sale. ● The Fund’s investments in other investment vehicles subject the Fund to those risks and expenses affecting the investment vehicle. ● The Fund’s investments in foreign securities carry additional risks when compared to U.S. securities, due to the impact of diplomatic, political, or economic developments in the country in question (investments in emerging markets securities are generally subject to an even greater level of risk). ● The Fund may invest in derivative instruments, which may be more volatile and less liquid, increasing the risk of loss when compared to traditional securities. Certain of the derivative instruments are also subject to the risks of counterparty default and adverse tax treatment. ● Investing in sector funds is more volatile than investing in broadly diversified funds, as there is a greater risk due to the concentration of the funds’ holdings in issuers of the same or similar offerings. ● This Fund is considered non-diversified and can invest a greater portion of its assets in securities of individual issuers than a diversified fund. As a result, changes in the market value of a single security could cause greater fluctuations in the value of fund shares than would occur in a more diversified fund. ● Short selling involves increased risks and costs. You risk paying more for a security than you received from its sale. This strategy may not be suitable for all investors. ● The Fund is subject to active trading risks that may increase volatility and impact its ability to achieve its investment objective. ● You may have a gain or loss when you sell your shares. ● It is important to note that the Fund is not guaranteed by the U.S. government. ● Please read the prospectus for more detailed information regarding these and other risks.
Risk Managed Real Estate Fund may not be suitable for all investors. ● Investments in securities in general are subject to market risks that may cause their prices to fluctuate over time ● Investing involves risk, including the possible loss of principal. ● There are no assurances that any fund will achieve its objective and/or strategy. ● The Fund’s investments in real estate securities subject the Fund to the same risks as direct investments in real estate, which is particularly sensitive to economic downturns. ● The Fund’s use of derivatives such as futures, options and swap agreements may expose the Fund to additional risks that it would not be subject to if it invested directly in the securities underlying those derivatives. ● When market conditions are deemed appropriate, the Fund will leverage to the full extent permitted by its investment policies and restrictions and applicable law. Leveraging will exaggerate the effect on net asset value of any increase or decrease in the market value of the Fund’s portfolio. ● The more the Fund invests in leveraged instruments, the more the leverage will magnify any gains or losses on those investments. ● The Fund’s use of short selling involves increased risk and costs. The Fund risks paying more for a security than it received from its sale. ● The Fund’s investments in other investment vehicles subject the Fund to those risks and expenses affecting the investment vehicle. ● The Fund’s investments in foreign securities carry additional risks when compared to U.S. securities, due to the impact of diplomatic, political or economic developments in the country in question (investments in emerging markets securities are generally subject to an even greater level of risk). ● The Fund may invest in derivative instruments, which may be more volatile and less liquid, increasing the risk of loss when compared to traditional securities. Certain of the derivative instruments are also subject to the risks of counterparty default and adverse tax treatment. ● Investing in sector funds is more volatile than investing in broadly diversified funds, as there is a greater risk due to the concentration of the funds’ holdings in issuers of the same or similar offerings. ● This Fund is considered non-diversified and can invest a greater portion of its assets in securities of individual issuers than a diversified fund. As a result, changes in the market value of a single security could cause greater fluctuations in the value of fund shares than would occur in a more diversified fund. ● Short selling involves increased risks and costs. You risk paying more for a security than you received from its sale. This strategy may not be suitable for all investors. ● The Fund is subject to active trading risks that may increase volatility and impact its ability to achieve its investment objective. ● You may have a gain or loss when you sell you shares. ● It is important to note that the Fund is not guaranteed by the U.S. government. ● Please read the prospectus for more detailed information regarding these and other risks.
Small Cap Value Fund may not be suitable for all investors. ● An investment in the Fund will fluctuate and is subject to investment risks, which means investors could lose money. ● The intrinsic value of the underlying stocks may never be realized, or the stock may decline in value. ● Investing in securities of small-capitalization companies may involve a greater risk of loss and more abrupt fluctuations in market price than investments in larger-capitalization companies.
StylePlus—Large Core Fund may not be suitable for all investors. ● Investments in large capitalization stocks may underperform other segments of the equity market or the equity market as a whole. ● Growth stocks may be more volatile than other stocks because they are more sensitive to investor perceptions regarding the growth potential of the issuing companies. Value stocks are subject to the risk that the intrinsic value of the stock may never be realized by the market or that the price goes down.● The Fund may invest in derivative instruments, which may be more volatile and less liquid, increasing the risk of loss when compared to traditional securities. Certain of the derivative instruments are also subject to the risks of counterparty default and adverse tax treatment. ● The Fund’s use of leverage, through borrowings or instruments such as derivatives, may cause the Fund to be more volatile than if it had not been leveraged. ● The Fund’s investments in other investment vehicles subject the Fund to those risks and expenses affecting the investment vehicle. ● The Fund may invest in foreign securities which carry additional risks when compared to U.S. securities, due to the impact of diplomatic, political or economic developments in the country in question (investments in emerging markets securities are generally subject to an even greater level of risk). ● The Fund may invest in fixed income securities whose market value will change in response to interest rate changes and market conditions among other factors. In general, bond prices rise when interest rates fall and vice versa. ● The Fund’s exposure to high yield securities may subject the Fund to greater volatility. ● The Fund may invest in bank loans and asset-backed securities, including mortgage backed, which involve special types of risks. ● The Fund may invest in restricted securities which may involve financial and liquidity risk. ● You may have a gain or loss when you sell your shares. ● It is important to note that the Fund is not guaranteed by the U.S. government. ● Please read the prospectus for more detailed information regarding these and other risks.
StylePlus—Mid Growth Fund may not be suitable for all investors. ● Investments in mid-sized company securities may present additional risks such as less predictable earnings, higher volatility and less liquidity than larger, more established companies. ● Growth stocks may be more volatile than other stocks because they are more sensitive to investor perceptions regarding the growth potential of the issuing companies. ● The Fund may invest in derivative instruments, which may be more volatile and less liquid, increasing the risk of loss when compared to traditional securities. Certain of the derivative instruments are also subject to the risks of counterparty default and adverse tax treatment. ● The Fund’s use of leverage, through borrowings or instruments such as derivatives, may cause the Fund to be more volatile than if it had not been leveraged. ● The Fund’s investments in other investment vehicles subject the Fund to those risks and expenses affecting the investment vehicle. ● The Fund may invest in foreign securities which carry additional risks when compared to U.S. securities, due to the impact of diplomatic, political or economic developments in the
| | THE GUGGENHEIM FUNDS SEMI-ANNUAL REPORT | 3 |
country in question (investments in emerging markets securities are generally subject to an even greater level of risk). ● The Fund may invest in fixed income securities whose market value will change in response to interest rate changes and market conditions, among other factors. In general, bond prices rise when interest rates fall and vice versa. ● The Fund’s exposure to high yield securities may subject the Fund to greater volatility. ● The Fund may invest in bank loans and asset-backed securities, including mortgage backed, which involve special types of risks. ● The Fund may invest in restricted securities which may involve financial and liquidity risk. ● You may have a gain or loss when you sell your shares. ● It is important to note that the Fund is not guaranteed by the U.S. government. ● Please read the prospectus for more detailed information regarding these and other risks.
World Equity Income Fund may not be suitable for all investors. ●Investments in securities in general are subject to market risks that may cause their prices to fluctuate over time. ●The Fund’s investments in foreign securities carry additional risks when compared to U.S. securities, due to the impact of diplomatic, political or economic developments in the country in question (investments in emerging markets are generally subject to an even greater level of risk). Additionally, the Fund’s exposure to foreign currencies subjects the Fund to the risk that those currencies will decline in value relative to the U.S. Dollar. ● The Fund’s investments in derivatives may pose risks in addition to those associated with investing directly in securities or other investments, including illiquidity of the derivatives, imperfect correlations with underlying investments or the Fund’s other portfolio holdings, lack of availability and counterparty risk. ●The Fund’s use of leverage, through instruments such as derivatives, may cause the Fund to be more volatile than if it had not been leveraged. ●The Fund’s investments in other investment vehicles subject the Fund to those risks and expenses affecting the investment vehicle. ●The Fund may have significant exposure to securities in a particular capitalization range e.g., large-, mid- or small-cap securities. As a result, the Fund may be subject to the risk that the pre-denominate capitalization range may underperform other segments of the equity market or the equity market as a whole. ● Please read the prospectus for more detailed information regarding these and other risks.
4 | THE GUGGENHEIM FUNDS SEMI-ANNUAL REPORT | |
ECONOMIC AND MARKET OVERVIEW (Unaudited) | March 31, 2020 |
The six-month period ended March 31, 2020, was a wild ride for markets. While the U.S. economy was generally in good shape in 2019, recessionary fears rose throughout the year, prompting the U.S. Federal Reserve (the “Fed”) to announce a rate cut on July 31, the first since 2008, amid growing downside risks to policymakers’ baseline growth and inflation forecasts. Key among those risks were slowing global growth, the threat of additional U.S.-China tariffs, and the possible ramifications surrounding Brexit. The Fed subsequently cut rates twice more in 2019, which caused markets to rally toward the end of the year and into early 2020. Stocks reached new highs and credit spreads tightened to historic levels. Since then, the global outbreak of the coronavirus, COVID-19, has been at the center of everything. As of this writing, COVID-19 has spread to 210 countries, resulted in over 2.5 million cases, and caused over 170,000 deaths. Thus far, the U.S. makes up more than 30% of global cases, and 25% of global deaths. States have required the labor force to work from home if possible, individuals to practice social distancing, and non-essential businesses to shut down.
Closures, quarantines, and social distancing efforts have impacted the travel, hospitality, restaurants, and retail industries, with activity down 100% in some areas of the country. Further exacerbating the decline in output will be reduced business investment, which was already stalling due to falling profits, trade conflicts, and political uncertainty. The coronavirus shock and collapse in oil prices will likely further depress capital expenditures.
In response to the crisis, the Federal Open Market Committee cut rates by a further 125 basis points in the first quarter of 2020 and passed a series of stimulus programs. Among these were the Primary and Secondary Market Corporate Credit Facilities, which are lending programs primarily targeting investment-grade corporate bond issuers, implemented in concert with the U.S. Treasury. It was only after the announcement of this program that corporate credit found some relief from the selloff, but we expect this relief may be temporary.
With an alphabet soup of monetary programs targeting relief from the coronavirus impact, fiscal policy has also stepped up to the plate with a spending bill worth over $2 trillion that aims to assist consumers, states, small businesses, and certain industries. There is no question that these programs will help ease the economic fallout from virus containment measures, but even $2 trillion may be too small given the magnitude of the economic shock that we are facing. Additionally, it is far from clear that fiscal measures are an adequate solution to the issue at hand: the physical impediment to consumer spending. Fiscal and monetary policy can do their part, but ultimately it is public health policy that will likely be the greatest determinant of the economic outlook.
For the six months ended March 31, 2020, the Standard & Poor’s 500® (“S&P 500”) Index* returned -12.31%. The decline, while significant, represents something of a recovery in stocks. The S&P 500 peaked at 3,386.15 on February 19, 2020, before plummeting 33.9% to a low of 2,237.40 on March 23, 2020, then recovering some lost ground by the end of the month.
The consensus estimate for S&P 500 earnings per share in 2020 is still around $150. Our research shows S&P 500 earnings per share could fall below $100. Similarly, economists have no way to calibrate how bad the economic data could be based on history. The March U.S. non-farm payrolls report was evidence of this, as it showed a decline in payrolls of 700,000 jobs versus survey expectations of a decline of only 100,000 jobs. We currently expect that second quarter U.S. real gross domestic product (“GDP”) quarter-over-quarter growth could fall by 40% annualized and the unemployment rate could rise to at least 20%. Beyond that, the severity of the crisis depends on containment of the virus and the effectiveness of social distancing measures put in place, but expectations for a quick and sustained V-shaped recovery appear overly optimistic.
For the six months ended March 31, 2020, the MSCI Europe-Australasia-Far East (“EAFE”) Index* returned -16.37%. The return of the MSCI Emerging Markets Index* was -14.45%.
In the bond market, the Bloomberg Barclays U.S. Aggregate Bond Index* posted a 3.33% return for the six-month period, while the Bloomberg Barclays U.S. Corporate High Yield Index* returned -10.40%. The return of the ICE Bank of America (“BofA”) Merrill Lynch 3-Month U.S. Treasury Bill Index* was 1.04% for the six-month period.
The opinions and forecasts expressed may not actually come to pass. This information is subject to change at any time, based on market and other conditions, and should not be construed as a recommendation of any specific security or strategy.
| | THE GUGGENHEIM FUNDS SEMI-ANNUAL REPORT | 5 |
ECONOMIC AND MARKET OVERVIEW (Unaudited)(concluded) | March 31, 2020 |
*Index Definitions:
The following indices are referenced throughout this report. Indices are unmanaged and not available for direct investment. Index performance does not reflect transaction costs, fees, or expenses.
Bloomberg Barclays U.S. Aggregate Bond Index is a broad-based flagship benchmark that measures the investment grade, U.S. dollar-denominated, fixed-rate taxable bond market, including U.S. Treasuries, government-related and corporate securities, mortgage-backed securities or “MBS” (agency fixed-rate and hybrid adjustable-rate mortgage, or “ARM”, pass-throughs), asset-backed securities (“ABS”), and commercial mortgage-backed securities (“CMBS”) (agency and non-agency).
Bloomberg Barclays U.S. Corporate High Yield Index measures the U.S. dollar-denominated, high yield, fixed-rate corporate bond market. Securities are classified as high yield if the middle rating of Moody’s, Fitch, and S&P is Ba1/BB +/BB + or below.
FTSE NAREIT Equity REITs Total Return Index (“FNRE”) is one of the FTSE NAREIT US Real Estate Index Series that contains all Equity REITs not designated as Timber REITs or Infrastructure REITs. FTSE NAREIT US Real Estate Index Series is designed to present investors with a comprehensive family of REIT performance indexes that spans the commercial real estate space across the US economy. The index series provides investors with exposure to all investment and property sectors. In addition, the more narrowly focused property sector and sub-sector indexes provide the facility to concentrate commercial real estate exposure in more selected markets. The National Association of Real Estate Investment Trusts (NAREIT) is the trade association for REITs and publicly traded real estate companies with an interest in the US property and investment markets.
ICE BofA Merrill Lynch 3-Month U.S. Treasury Bill Index is an unmanaged market index of U.S. Treasury securities maturing in 90 days that assumes reinvestment of all income.
Morningstar Long/Short Equity Category Average is the average return of funds Morningstar places in a given category based on their portfolio statistics and compositions over the past three years. Long-short portfolios hold sizeable stakes in both long and short positions in equities, exchange traded funds, and related derivatives. Some funds that fall into this category will shift their exposure to long and short positions depending on their macro outlook or the opportunities they uncover through bottom-up research. At least 75% of the assets are in equity securities or derivatives, and funds in the category will typically have beta values to relevant benchmarks of between 0.3 and 0.8 over a three-year period.
MSCI EAFE Index is a free float-adjusted market capitalization index that is designed to measure the equity market performance of developed markets, excluding the U.S. & Canada.
MSCI Emerging Markets Index is a free float-adjusted market capitalization weighted index that is designed to measure equity market performance in the global emerging markets.
MSCI World Index (Net) is calculated with net dividends reinvested. It is a free float-adjusted market capitalization weighted index that is designed to measure the equity market performance of developed markets.
Russell 1000® Value Index is a measure of the performance for the large-cap value segment of the U.S. equity universe. It includes those Russell 1000 companies with lower price-to-book ratios and lower expected growth values.
Russell 2000® Value Index measures the performance of the small-cap value segment of the U.S. equity universe. It includes those Russell 2000 companies with lower price-to-book ratios and lower forecasted growth values.
Russell Midcap Growth® Index measures the performance of the mid-cap growth segment of the U.S. equity universe. It includes those Russell Midcap Index companies with higher price-to-book ratios and higher forecasted growth values.
S&P 500® is a broad-based index, the performance of which is based on the performance of 500 widely held common stocks chosen for market size, liquidity, and industry group representation.
6 | THE GUGGENHEIM FUNDS SEMI-ANNUAL REPORT | |
ABOUT SHAREHOLDERS’ FUND EXPENSES (Unaudited) | |
All mutual funds have operating expenses, and it is important for our shareholders to understand the impact of costs on their investments. Shareholders of a fund incur two types of costs: (i) transaction costs, including sales charges (loads) on purchase payments, reinvested dividends, other distributions, and exchange fees, and (ii) ongoing costs, including management fees, administrative services, and shareholder reports, among others. These ongoing costs, or operating expenses, are deducted from a fund’s gross income and reduce the investment return of the fund.
A fund’s expenses are expressed as a percentage of its average net assets, which is known as the expense ratio. The following examples are intended to help investors understand the ongoing costs (in dollars) of investing in a fund and to compare these costs with the ongoing costs of investing in other mutual funds.
The examples are based on an investment of $1,000 made at the beginning of the period and held for the entire six-month period beginning September 30, 2019 and ending March 31, 2020.
The following tables illustrate the Funds’ costs in two ways:
Table 1. Based on actual Fund return: This section helps investors estimate the actual expenses paid over the period. The “Ending Account Value” shown is derived from the Fund’s actual return, and the fifth column shows the dollar amount that would have been paid by an investor who started with $1,000 in the Fund. Investors may use the information here, together with the amount invested, to estimate the expenses paid over the period. Simply divide the Fund’s account value by $1,000 (for example, an $8,600 account value divided by $1,000 = 8.6), then multiply the result by the number provided under the heading “Expenses Paid During Period.”
Table 2. Based on hypothetical 5% return: This section is intended to help investors compare a fund’s cost with those of other mutual funds. The table provides information about hypothetical account values and hypothetical expenses based on the Fund’s actual expense ratio and an assumed rate of return of 5% per year before expenses, which is not the Fund’s actual return. The hypothetical account values and expenses may not be used to estimate the actual ending account balance or expenses paid during the period. The example is useful in making comparisons because the U.S. Securities and Exchange Commission (the “SEC”) requires all mutual funds to calculate expenses based on the 5% return. Investors can assess a fund’s costs by comparing this hypothetical example with the hypothetical examples that appear in shareholder reports of other funds.
The calculations illustrated above assume no shares were bought or sold during the period. Actual costs may have been higher or lower, depending on the amount of investment and the timing of any purchases or redemptions.
Please note that the expenses shown in the table are meant to highlight your ongoing costs only and do not reflect any transactional costs, such as sales charges (loads) on purchase payments, and contingent deferred sales charges (“CDSC”) on redemptions, if any. Therefore, the second table is useful in comparing ongoing costs only, and will not help you determine the relative total costs of owning different funds. In addition, if these transactional costs were included, your costs would have been higher.
More information about the Funds’ expenses, including annual expense ratios for periods up to five years (subject to the Fund’s inception date), can be found in the Financial Highlights section of this report. For additional information on operating expenses and other shareholder costs, please refer to the appropriate Fund prospectus.
| | THE GUGGENHEIM FUNDS SEMI-ANNUAL REPORT | 7 |
ABOUT SHAREHOLDERS’ FUND EXPENSES (Unaudited)(continued) | |
| Expense
Ratio1 | Fund
Return | Beginning
Account Value
September 30, 2019 | Ending
Account Value
March 31, 2020 | Expenses
Paid During
Period2 |
Table 1. Based on actual Fund return3 | | | | | |
Alpha Opportunity Fund | | | | | |
A-Class | 1.66% | (7.13%) | $ 1,000.00 | $ 928.70 | $ 8.00 |
C-Class | 2.51% | (7.59%) | 1,000.00 | 924.10 | 12.07 |
P-Class | 1.58% | (7.16%) | 1,000.00 | 928.40 | 7.62 |
Institutional Class | 1.31% | (7.05%) | 1,000.00 | 929.50 | 6.32 |
Large Cap Value Fund | | | | | |
A-Class | 1.15% | (21.31%) | 1,000.00 | 786.90 | 5.14 |
C-Class | 1.90% | (21.62%) | 1,000.00 | 783.80 | 8.47 |
P-Class | 1.15% | (21.31%) | 1,000.00 | 786.90 | 5.14 |
Institutional Class | 0.90% | (21.24%) | 1,000.00 | 787.60 | 4.02 |
Market Neutral Real Estate Fund | | | | | |
A-Class | 1.66% | 11.55% | 1,000.00 | 1,115.50 | 8.78 |
C-Class | 2.41% | 11.16% | 1,000.00 | 1,111.60 | 12.72 |
P-Class | 1.66% | 11.55% | 1,000.00 | 1,115.50 | 8.78 |
Institutional Class | 1.41% | 11.68% | 1,000.00 | 1,116.80 | 7.46 |
Risk Managed Real Estate Fund | | | | | |
A-Class | 1.88% | (13.65%) | 1,000.00 | 863.50 | 8.76 |
C-Class | 2.82% | (13.99%) | 1,000.00 | 860.10 | 13.11 |
P-Class | 1.78% | (13.69%) | 1,000.00 | 863.10 | 8.29 |
Institutional Class | 1.63% | (13.53%) | 1,000.00 | 864.70 | 7.60 |
Small Cap Value Fund | | | | | |
A-Class | 1.31% | (27.80%) | 1,000.00 | 722.00 | 5.64 |
C-Class | 2.06% | (28.09%) | 1,000.00 | 719.10 | 8.85 |
P-Class | 1.31% | (27.68%) | 1,000.00 | 723.20 | 5.64 |
Institutional Class | 1.05% | (27.71%) | 1,000.00 | 722.90 | 4.52 |
StylePlus—Large Core Fund | | | | | |
A-Class | 1.36% | (14.95%) | 1,000.00 | 850.50 | 6.29 |
C-Class | 2.34% | (15.40%) | 1,000.00 | 846.00 | 10.80 |
P-Class | 1.53% | (15.00%) | 1,000.00 | 850.00 | 7.08 |
Institutional Class | 1.13% | (14.83%) | 1,000.00 | 851.70 | 5.23 |
StylePlus—Mid Growth Fund | | | | | |
A-Class | 1.48% | (17.89%) | 1,000.00 | 821.10 | 6.74 |
C-Class | 2.34% | (18.25%) | 1,000.00 | 817.50 | 10.63 |
P-Class | 1.58% | (17.93%) | 1,000.00 | 820.70 | 7.19 |
Institutional Class | 1.33% | (17.82%) | 1,000.00 | 821.80 | 6.06 |
World Equity Income Fund | | | | | |
A-Class | 1.22% | (18.61%) | 1,000.00 | 813.90 | 5.53 |
C-Class | 1.97% | (18.90%) | 1,000.00 | 811.00 | 8.92 |
P-Class | 1.22% | (18.63%) | 1,000.00 | 813.70 | 5.53 |
Institutional Class | 0.97% | (18.51%) | 1,000.00 | 814.90 | 4.40 |
8 | THE GUGGENHEIM FUNDS SEMI-ANNUAL REPORT | |
ABOUT SHAREHOLDERS’ FUND EXPENSES (Unaudited)(concluded) | |
| Expense
Ratio1 | Fund
Return | Beginning
Account Value
September 30, 2019 | Ending
Account Value
March 31, 2020 | Expenses
Paid During
Period2 |
Table 2. Based on hypothetical 5% return (before expenses) | | | | |
Alpha Opportunity Fund | | | | | |
A-Class | 1.66% | 5.00% | $ 1,000.00 | $ 1,016.70 | $ 8.37 |
C-Class | 2.51% | 5.00% | 1,000.00 | 1,012.45 | 12.63 |
P-Class | 1.58% | 5.00% | 1,000.00 | 1,017.10 | 7.97 |
Institutional Class | 1.31% | 5.00% | 1,000.00 | 1,018.45 | 6.61 |
Large Cap Value Fund | | | | | |
A-Class | 1.15% | 5.00% | 1,000.00 | 1,019.25 | 5.81 |
C-Class | 1.90% | 5.00% | 1,000.00 | 1,015.50 | 9.57 |
P-Class | 1.15% | 5.00% | 1,000.00 | 1,019.25 | 5.81 |
Institutional Class | 0.90% | 5.00% | 1,000.00 | 1,020.50 | 4.55 |
Market Neutral Real Estate Fund | | | | | |
A-Class | 1.66% | 5.00% | 1,000.00 | 1,016.70 | 8.37 |
C-Class | 2.41% | 5.00% | 1,000.00 | 1,012.95 | 12.13 |
P-Class | 1.66% | 5.00% | 1,000.00 | 1,016.70 | 8.37 |
Institutional Class | 1.41% | 5.00% | 1,000.00 | 1,017.95 | 7.11 |
Risk Managed Real Estate Fund | | | | | |
A-Class | 1.88% | 5.00% | 1,000.00 | 1,015.60 | 9.47 |
C-Class | 2.82% | 5.00% | 1,000.00 | 1,010.90 | 14.18 |
P-Class | 1.78% | 5.00% | 1,000.00 | 1,016.10 | 8.97 |
Institutional Class | 1.63% | 5.00% | 1,000.00 | 1,016.85 | 8.22 |
Small Cap Value Fund | | | | | |
A-Class | 1.31% | 5.00% | 1,000.00 | 1,018.45 | 6.61 |
C-Class | 2.06% | 5.00% | 1,000.00 | 1,014.70 | 10.38 |
P-Class | 1.31% | 5.00% | 1,000.00 | 1,018.45 | 6.61 |
Institutional Class | 1.05% | 5.00% | 1,000.00 | 1,019.75 | 5.30 |
StylePlus—Large Core Fund | | | | | |
A-Class | 1.36% | 5.00% | 1,000.00 | 1,018.20 | 6.86 |
C-Class | 2.34% | 5.00% | 1,000.00 | 1,013.30 | 11.78 |
P-Class | 1.53% | 5.00% | 1,000.00 | 1,017.35 | 7.72 |
Institutional Class | 1.13% | 5.00% | 1,000.00 | 1,019.35 | 5.71 |
StylePlus—Mid Growth Fund | | | | | |
A-Class | 1.48% | 5.00% | 1,000.00 | 1,017.60 | 7.47 |
C-Class | 2.34% | 5.00% | 1,000.00 | 1,013.30 | 11.78 |
P-Class | 1.58% | 5.00% | 1,000.00 | 1,017.10 | 7.97 |
Institutional Class | 1.33% | 5.00% | 1,000.00 | 1,018.35 | 6.71 |
World Equity Income Fund | | | | | |
A-Class | 1.22% | 5.00% | 1,000.00 | 1,018.90 | 6.16 |
C-Class | 1.97% | 5.00% | 1,000.00 | 1,015.15 | 9.92 |
P-Class | 1.22% | 5.00% | 1,000.00 | 1,018.90 | 6.16 |
Institutional Class | 0.97% | 5.00% | 1,000.00 | 1,020.15 | 4.90 |
1 | This ratio represents annualized net expenses, which may include short dividend and interest expense. Excluding these expenses, the operating expense ratio for the Market Neutral Real Estate Fund would be 1.65%, 2.40%, 1.65% and 1.40% and Risk Managed Real Estate Fund would be 1.27%, 2.05%, 1.30% and 0.99% for the A-Class, C-Class, P-Class and Institutional Class, respectively. Excludes expenses of the underlying funds in which the Funds invest, if any. |
2 | Expenses are equal to the Fund’s annualized expense ratio, net of any applicable fee waivers, multiplied by the average account value over the period, multiplied by 183/366 (to reflect the one-half year period). |
3 | Actual cumulative return at net asset value for the period September 30, 2019 to March 31, 2020. |
| | THE GUGGENHEIM FUNDS SEMI-ANNUAL REPORT | 9 |
PERFORMANCE REPORT AND FUND PROFILE (Unaudited) | March 31, 2020 |
ALPHA OPPORTUNITY FUND
OBJECTIVE: Seeks long-term growth of capital.
Holdings Diversification (Market Exposure as % of Net Assets)
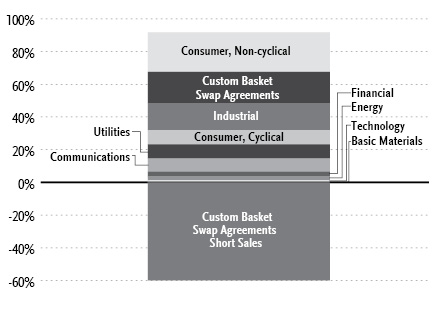
“Holdings Diversification (Market Exposure as % of Net Assets)” excludes any temporary cash investments.
Inception Dates: |
A-Class | July 7, 2003 |
C-Class | July 7, 2003 |
P-Class | May 1, 2015 |
Institutional Class | November 7, 2008 |
Ten Largest Holdings (% of Total Net Assets) |
McKesson Corp. | 1.1% |
Omnicom Group, Inc. | 1.0% |
Verizon Communications, Inc. | 1.0% |
Kimberly-Clark Corp. | 1.0% |
Merck & Company, Inc. | 0.9% |
Amgen, Inc. | 0.9% |
Johnson & Johnson | 0.9% |
Pfizer, Inc. | 0.9% |
Procter & Gamble Co. | 0.9% |
FedEx Corp. | 0.9% |
Top Ten Total | 9.5% |
| | |
“Ten Largest Holdings” excludes any temporary cash or derivative investments. |
10 | THE GUGGENHEIM FUNDS SEMI-ANNUAL REPORT | |
PERFORMANCE REPORT AND FUND PROFILE (Unaudited)(concluded) | March 31, 2020 |
Average Annual Returns*
Periods Ended March 31, 2020
| 6 Month† | 1 Year | 5 Year | 10 Year |
A-Class Shares | (7.13%) | (10.57%) | (1.27%) | 6.22% |
A-Class Shares with sales charge‡ | (11.55%) | (14.81%) | (2.23%) | 5.58% |
C-Class Shares | (7.59%) | (11.33%) | (2.05%) | 5.39% |
C-Class Shares with CDSC§ | (8.51%) | (12.22%) | (2.05%) | 5.39% |
Institutional Class Shares | (7.05%) | (10.30%) | (0.84%) | 6.63% |
Morningstar Long/Short Equity Category Average | (10.52%) | (9.60%) | (0.62%) | 2.70% |
S&P 500 Index | (12.31%) | (6.98%) | 6.73% | 10.53% |
S&P 500 Index-Blended** | 1.04% | 2.25% | 4.81% | 9.52% |
ICE BofA Merrill Lynch 3-Month U.S. Treasury Bill Index | 1.04% | 2.25% | 1.19% | 0.64% |
| | 6 Month† | 1 Year | Since
Inception
(05/01/15) |
P-Class Shares | | (7.16%) | (10.58%) | (1.68%) |
Morningstar Long/Short Equity Category Average | | (10.52%) | (9.60%) | (0.76%) |
S&P 500 Index | | (12.31%) | (6.98%) | 6.40% |
S&P 500 Index-Blended** | | 1.04% | 2.25% | 4.46% |
ICE BofA Merrill Lynch 3-Month U.S. Treasury Bill Index | | 1.04% | 2.25% | 1.21% |
* | The performance data above represents past performance that is not predictive of future results. The investment return and principal value of an investment in the Fund will fluctuate so that an investor’s shares, when redeemed, may be worth more or less than their original cost. Returns are historical and include changes in principal and reinvested dividends and capital gains and do not reflect the effect of taxes. The ICE BofA Merrill Lynch 3-Month U.S. Treasury Bill Index, S&P 500 Index, and the Morningstar Long/Short Equity Category Average are unmanaged indices and, unlike the Fund, have no management fees or operating expenses to reduce their reported returns. |
** | Effective March 13, 2017, the Fund changed its principal investment strategy. As a result of the investment strategy change, the Fund’s new benchmark is the ICE BofA Merrill Lynch 3-Month U.S. Treasury Bill Index. The Fund’s performance was previously compared to the S&P 500 Index. The S&P 500 Index-Blended uses performance data for the S&P 500 Index from 03/31/10 to 03/12/17, and the ICE BofA Merrill Lynch 3-Month U.S. Treasury Bill index from 03/13/17 to 03/31/20. |
† | 6 month returns are not annualized. |
‡ | Effective February 22, 2011, the maximum sales charge decreased from 5.75% to 4.75%. A 5.75% maximum sales charge is used in the calculation of the Average Annual Returns based on subscriptions made prior to February 22, 2011, and a 4.75% maximum sales charge will be used to calculate performance for periods based on subscriptions made on or after February 22, 2011. |
§ | Fund returns include a CDSC of 1% if redeemed within 12 months of purchase. |
| | THE GUGGENHEIM FUNDS SEMI-ANNUAL REPORT | 11 |
SCHEDULE OF INVESTMENTS (Unaudited) | March 31, 2020 |
ALPHA OPPORTUNITY FUND | |
| | Shares | | | Value | |
COMMON STOCKS† - 72.8% |
| | | | | | | | | |
Consumer, Non-cyclical - 24.2% |
McKesson Corp. | | | 2,859 | | | $ | 386,708 | |
Kimberly-Clark Corp. | | | 2,673 | | | | 341,796 | |
Merck & Company, Inc. | | | 4,359 | | | | 335,381 | |
Amgen, Inc. | | | 1,637 | | | | 331,869 | |
Johnson & Johnson | | | 2,505 | | | | 328,481 | |
Pfizer, Inc. | | | 9,821 | | | | 320,557 | |
Procter & Gamble Co. | | | 2,911 | | | | 320,210 | |
Molson Coors Beverage Co. — Class B | | | 7,788 | | | | 303,810 | |
JM Smucker Co. | | | 2,630 | | | | 291,930 | |
Eli Lilly & Co. | | | 1,973 | | | | 273,695 | |
Medtronic plc | | | 3,027 | | | | 272,975 | |
Sysco Corp. | | | 5,464 | | | | 249,322 | |
Post Holdings, Inc.* | | | 2,969 | | | | 246,338 | |
Kellogg Co. | | | 4,106 | | | | 246,319 | |
Gilead Sciences, Inc. | | | 3,281 | | | | 245,288 | |
General Mills, Inc. | | | 4,268 | | | | 225,222 | |
Abbott Laboratories | | | 2,748 | | | | 216,845 | |
Cardinal Health, Inc. | | | 4,481 | | | | 214,819 | |
CVS Health Corp. | | | 3,444 | | | | 204,333 | |
Hologic, Inc.* | | | 5,461 | | | | 191,681 | |
Philip Morris International, Inc. | | | 2,279 | | | | 166,276 | |
Becton Dickinson and Co. | | | 721 | | | | 165,664 | |
Coca-Cola Co. | | | 3,711 | | | | 164,212 | |
TreeHouse Foods, Inc.* | | | 3,523 | | | | 155,540 | |
Jazz Pharmaceuticals plc* | | | 1,558 | | | | 155,395 | |
John B Sanfilippo & Son, Inc. | | | 1,725 | | | | 154,215 | |
United Therapeutics Corp.* | | | 1,605 | | | | 152,194 | |
Ingredion, Inc. | | | 1,815 | | | | 137,033 | |
Herbalife Nutrition Ltd.* | | | 4,599 | | | | 134,107 | |
Edwards Lifesciences Corp.* | | | 704 | | | | 132,789 | |
STERIS plc | | | 910 | | | | 127,373 | |
Integer Holdings Corp.* | | | 1,921 | | | | 120,754 | |
PepsiCo, Inc. | | | 1,003 | | | | 120,460 | |
Mondelez International, Inc. — Class A | | | 2,164 | | | | 108,373 | |
Archer-Daniels-Midland Co. | | | 2,990 | | | | 105,188 | |
BioMarin Pharmaceutical, Inc.* | | | 1,205 | | | | 101,822 | |
Alexion Pharmaceuticals, Inc.* | | | 1,115 | | | | 100,116 | |
Innoviva, Inc.* | | | 8,441 | | | | 99,266 | |
Halozyme Therapeutics, Inc.* | | | 5,229 | | | | 94,070 | |
Macquarie Infrastructure Corp. | | | 3,638 | | | | 91,859 | |
Conagra Brands, Inc. | | | 3,021 | | | | 88,636 | |
Cal-Maine Foods, Inc. | | | 1,972 | | | | 86,729 | |
Illumina, Inc.* | | | 273 | | | | 74,562 | |
Baxter International, Inc. | | | 881 | | | | 71,528 | |
Thermo Fisher Scientific, Inc. | | | 239 | | | | 67,780 | |
Laboratory Corporation of America Holdings* | | | 530 | | | | 66,987 | |
Total Consumer, Non-cyclical | | | | | | | 8,590,507 | |
| | | | | | | | | |
Industrial - 16.6% |
FedEx Corp. | | | 2,611 | | | | 316,610 | |
Honeywell International, Inc. | | | 2,015 | | | | 269,587 | |
CH Robinson Worldwide, Inc. | | | 4,044 | | | | 267,713 | |
Crane Co. | | | 4,833 | | | | 237,687 | |
Landstar System, Inc. | | | 2,390 | | | | 229,105 | |
Norfolk Southern Corp. | | | 1,558 | | | | 227,468 | |
Lincoln Electric Holdings, Inc. | | | 3,258 | | | | 224,802 | |
Caterpillar, Inc. | | | 1,894 | | | | 219,780 | |
Eaton Corporation plc | | | 2,807 | | | | 218,076 | |
Werner Enterprises, Inc. | | | 6,003 | | | | 217,669 | |
CSX Corp. | | | 3,390 | | | | 194,247 | |
Gentex Corp. | | | 8,193 | | | | 181,557 | |
Mettler-Toledo International, Inc.* | | | 256 | | | | 176,770 | |
Regal Beloit Corp. | | | 2,784 | | | | 175,253 | |
Kansas City Southern | | | 1,319 | | | | 167,751 | |
Waters Corp.* | | | 915 | | | | 166,576 | |
Emerson Electric Co. | | | 3,253 | | | | 155,005 | |
Illinois Tool Works, Inc. | | | 1,068 | | | | 151,784 | |
Masco Corp. | | | 4,238 | | | | 146,508 | |
Rockwell Automation, Inc. | | | 946 | | | | 142,761 | |
Union Pacific Corp. | | | 1,000 | | | | 141,040 | |
Echo Global Logistics, Inc.* | | | 7,336 | | | | 125,299 | |
Heartland Express, Inc. | | | 6,530 | | | | 121,262 | |
Marten Transport Ltd. | | | 5,902 | | | | 121,109 | |
J.B. Hunt Transport Services, Inc. | | | 1,288 | | | | 118,792 | |
Kennametal, Inc. | | | 5,535 | | | | 103,062 | |
Garmin Ltd. | | | 1,326 | | | | 99,397 | |
Schneider National, Inc. — Class B | | | 5,089 | | | | 98,421 | |
Textron, Inc. | | | 3,611 | | | | 96,305 | |
Old Dominion Freight Line, Inc. | | | 693 | | | | 90,963 | |
Albany International Corp. — Class A | | | 1,810 | | | | 85,667 | |
AGCO Corp. | | | 1,795 | | | | 84,814 | |
Westrock Co. | | | 2,986 | | | | 84,384 | |
Knight-Swift Transportation Holdings, Inc. | | | 2,522 | | | | 82,722 | |
Oshkosh Corp. | | | 1,258 | | | | 80,927 | |
Arconic, Inc. | | | 4,775 | | | | 76,687 | |
Terex Corp. | | | 4,939 | | | | 70,924 | |
MasTec, Inc.* | | | 1,910 | | | | 62,514 | |
Vishay Intertechnology, Inc. | | | 4,171 | | | | 60,104 | |
Total Industrial | | | | | | | 5,891,102 | |
| | | | | | | | | |
Consumer, Cyclical - 8.7% |
Southwest Airlines Co. | | | 5,287 | | | | 188,270 | |
Starbucks Corp. | | | 2,649 | | | | 174,145 | |
Toll Brothers, Inc. | | | 8,509 | | | | 163,798 | |
Allison Transmission Holdings, Inc. | | | 4,923 | | | | 160,539 | |
DR Horton, Inc. | | | 4,418 | | | | 150,212 | |
Cummins, Inc. | | | 1,099 | | | | 148,717 | |
General Motors Co. | | | 7,072 | | | | 146,956 | |
Home Depot, Inc. | | | 741 | | | | 138,352 | |
Gentherm, Inc.* | | | 4,370 | | | | 137,218 | |
Whirlpool Corp. | | | 1,583 | | | | 135,821 | |
Autoliv, Inc. | | | 2,900 | | | | 133,429 | |
Brunswick Corp. | | | 3,764 | | | | 133,133 | |
Lear Corp. | | | 1,596 | | | | 129,675 | |
MSC Industrial Direct Company, Inc. — Class A | | | 1,778 | | | | 97,737 | |
PulteGroup, Inc. | | | 3,948 | | | | 88,119 | |
Wyndham Destinations, Inc. | | | 3,880 | | | | 84,196 | |
Aptiv plc | | | 1,668 | | | | 82,133 | |
BorgWarner, Inc. | | | 3,360 | | | | 81,883 | |
12 | THE GUGGENHEIM FUNDS SEMI-ANNUAL REPORT | SEE NOTES TO FINANCIAL STATEMENTS. |
SCHEDULE OF INVESTMENTS (Unaudited)(continued) | March 31, 2020 |
ALPHA OPPORTUNITY FUND | |
| | Shares | | | Value | |
Extended Stay America, Inc. | | | 10,759 | | | $ | 78,648 | |
Lowe’s Companies, Inc. | | | 894 | | | | 76,929 | |
Lennar Corp. — Class A | | | 2,009 | | | | 76,744 | |
Carnival Corp. | | | 5,491 | | | | 72,316 | |
Polaris, Inc. | | | 1,331 | | | | 64,088 | |
VF Corp. | | | 1,126 | | | | 60,894 | |
Mohawk Industries, Inc.* | | | 704 | | | | 53,673 | |
SkyWest, Inc. | | | 1,801 | | | | 47,168 | |
Allegiant Travel Co. — Class A | | | 557 | | | | 45,562 | |
Hilton Worldwide Holdings, Inc. | | | 648 | | | | 44,220 | |
JetBlue Airways Corp.* | | | 3,605 | | | | 32,265 | |
Las Vegas Sands Corp. | | | 698 | | | | 29,644 | |
Delta Air Lines, Inc. | | | 1,009 | | | | 28,787 | |
Total Consumer, Cyclical | | | | | | | 3,085,271 | |
| | | | | | | | | |
Utilities - 8.6% |
Public Service Enterprise Group, Inc. | | | 6,177 | | | | 277,409 | |
FirstEnergy Corp. | | | 6,893 | | | | 276,203 | |
NRG Energy, Inc. | | | 9,685 | | | | 264,013 | |
PPL Corp. | | | 10,132 | | | | 250,058 | |
Exelon Corp. | | | 6,593 | | | | 242,688 | |
AES Corp. | �� | | 17,743 | | | | 241,305 | |
National Fuel Gas Co. | | | 5,797 | | | | 216,170 | |
Southern Co. | | | 3,680 | | | | 199,235 | |
Vistra Energy Corp. | | | 12,339 | | | | 196,930 | |
Portland General Electric Co. | | | 3,713 | | | | 178,001 | |
Pinnacle West Capital Corp. | | | 1,984 | | | | 150,367 | |
ALLETE, Inc. | | | 2,369 | | | | 143,751 | |
Evergy, Inc. | | | 2,493 | | | | 137,240 | |
OGE Energy Corp. | | | 3,121 | | | | 95,908 | |
Entergy Corp. | | | 873 | | | | 82,036 | |
NiSource, Inc. | | | 2,832 | | | | 70,715 | |
Avista Corp. | | | 1,083 | | | | 46,017 | |
Total Utilities | | | | | | | 3,068,046 | |
| | | | | | | | | |
Communications - 8.0% |
Omnicom Group, Inc. | | | 6,716 | | | | 368,708 | |
Verizon Communications, Inc. | | | 6,614 | | | | 355,370 | |
Facebook, Inc. — Class A* | | | 1,553 | | | | 259,040 | |
AT&T, Inc. | | | 8,652 | | | | 252,206 | |
Alphabet, Inc. — Class C* | | | 202 | | | | 234,888 | |
Discovery, Inc. — Class A* | | | 7,809 | | | | 151,807 | |
News Corp. — Class A | | | 16,605 | | | | 149,030 | |
AMC Networks, Inc. — Class A* | | | 5,524 | | | | 134,288 | |
Booking Holdings, Inc.* | | | 99 | | | | 133,187 | |
GCI Liberty, Inc. — Class A* | | | 2,311 | | | | 131,658 | |
Charter Communications, Inc. — Class A* | | | 293 | | | | 127,839 | |
Altice USA, Inc. — Class A* | | | 5,171 | | | | 115,262 | |
eBay, Inc. | | | 3,833 | | | | 115,220 | |
Yelp, Inc. — Class A* | | | 5,708 | | | | 102,915 | |
Cisco Systems, Inc. | | | 1,910 | | | | 75,082 | |
Scholastic Corp. | | | 2,701 | | | | 68,848 | |
Comcast Corp. — Class A | | | 1,984 | | | | 68,210 | |
Total Communications | | | | | | | 2,843,558 | |
| | | | | | | | | |
Financial - 3.0% |
Lexington Realty Trust REIT | | | 27,939 | | | | 277,434 | |
Weingarten Realty Investors REIT | | | 10,058 | | | | 145,137 | |
Sunstone Hotel Investors, Inc. REIT | | | 14,233 | | | | 123,970 | |
Brixmor Property Group, Inc. REIT | | | 10,554 | | | | 100,263 | |
Summit Hotel Properties, Inc. REIT | | | 22,900 | | | | 96,638 | |
Kennedy-Wilson Holdings, Inc. | | | 6,772 | | | | 90,880 | |
Travelers Companies, Inc. | | | 883 | | | | 87,726 | |
Berkshire Hathaway, Inc. — Class B* | | | 387 | | | | 70,755 | |
Northern Trust Corp. | | | 831 | | | | 62,707 | |
Total Financial | | | | | | | 1,055,510 | |
| | | | | | | | | |
Energy - 2.3% |
Exxon Mobil Corp. | | | 4,849 | | | | 184,117 | |
Chevron Corp. | | | 1,941 | | | | 140,645 | |
Kinder Morgan, Inc. | | | 7,151 | | | | 99,542 | |
HollyFrontier Corp. | | | 3,528 | | | | 86,471 | |
Valero Energy Corp. | | | 1,900 | | | | 86,184 | |
Delek US Holdings, Inc. | | | 4,502 | | | | 70,951 | |
CVR Energy, Inc. | | | 3,864 | | | | 63,872 | |
Phillips 66 | | | 904 | | | | 48,500 | |
Devon Energy Corp. | | | 5,729 | | | | 39,587 | |
Total Energy | | | | | | | 819,869 | |
| | | | | | | | | |
Technology - 1.0% |
Activision Blizzard, Inc. | | | 3,680 | | | | 218,887 | |
Oracle Corp. | | | 1,663 | | | | 80,373 | |
Teradata Corp.* | | | 3,370 | | | | 69,051 | |
Total Technology | | | | | | | 368,311 | |
| | | | | | | | | |
Basic Materials - 0.4% |
International Paper Co. | | | 2,379 | | | | 74,058 | |
Domtar Corp. | | | 2,790 | | | | 60,376 | |
Total Basic Materials | | | | | | | 134,434 | |
| | | | | | | | | |
Total Common Stocks | | | | |
(Cost $33,258,852) | | | | | | | 25,856,608 | |
| | | | | | | | | |
MONEY MARKET FUND† - 17.0% |
Goldman Sachs Financial Square Treasury Instruments Fund — Institutional Shares, 0.52%1 | | | 6,060,134 | | | | 6,060,134 | |
Total Money Market Fund | | | | |
(Cost $6,060,134) | | | | | | | 6,060,134 | |
| | | | | | | | | |
Total Investments - 89.8% | | | | |
(Cost $39,318,986) | | $ | 31,916,742 | |
Other Assets & Liabilities, net - 10.2% | | | 3,644,619 | |
Total Net Assets - 100.0% | | $ | 35,561,361 | |
SEE NOTES TO FINANCIAL STATEMENTS. | THE GUGGENHEIM FUNDS SEMI-ANNUAL REPORT | 13 |
SCHEDULE OF INVESTMENTS (Unaudited)(continued) | March 31, 2020 |
ALPHA OPPORTUNITY FUND | |
Custom Basket Swap Agreements |
Counterparty | Reference Obligation | Financing Rate
Pay (Receive) | Payment
Frequency | | Maturity Date | | | Notional
Amount | | | Value and
Unrealized
Appreciation
(Depreciation) | |
OTC Custom Basket Swap Agreements †† |
Morgan Stanley Capital Services LLC | MS Equity Custom Basket | 0.50% (Federal Funds Rate + 0.40%) | At Maturity | | | 02/01/24 | | | $ | 3,390,941 | | | $ | (849,592 | ) |
Goldman Sachs International | GS Equity Custom Basket | 0.54% (Federal Funds Rate + 0.45%) | At Maturity | | | 05/06/24 | | | | 3,390,935 | | | | (865,147 | ) |
| | | | | | | | | | $ | 6,781,876 | | | $ | (1,714,739 | ) |
OTC Custom Basket Swap Agreements Sold Short †† |
Morgan Stanley Capital Services LLC | MS Equity Custom Basket | (0.20)% (Federal Funds Rate - 0.30%) | At Maturity | | | 02/01/24 | | | $ | 10,631,674 | | | $ | 1,527,871 | |
Goldman Sachs International | GS Equity Custom Basket | (0.11)% (Federal Funds Rate - 0.20%) | At Maturity | | | 05/06/24 | | | | 10,631,646 | | | | 1,639,054 | |
| | | | | | | | | | $ | 21,263,320 | | | $ | 3,166,925 | |
| | Shares | | | Percentage
Notional
Amount | | | Value and
Unrealized
Appreciation
(Depreciation) | |
MS EQUITY LONG CUSTOM BASKET | | | | | | | | |
Utilities | | | | | | | | | | | | |
FirstEnergy Corp. | | | 989 | | | | 1.18 | % | | $ | 1,527 | |
Portland General Electric Co. | | | 371 | | | | 0.53 | % | | | 60 | |
Southern Co. | | | 528 | | | | 0.85 | % | | | (66 | ) |
Avista Corp. | | | 155 | | | | 0.20 | % | | | (500 | ) |
NiSource, Inc. | | | 406 | | | | 0.30 | % | | | (609 | ) |
Entergy Corp. | | | 125 | | | | 0.35 | % | | | (2,965 | ) |
OGE Energy Corp. | | | 447 | | | | 0.41 | % | | | (5,786 | ) |
AES Corp. | | | 2,546 | | | | 1.02 | % | | | (6,037 | ) |
ALLETE, Inc. | | | 340 | | | | 0.61 | % | | | (6,826 | ) |
Exelon Corp. | | | 946 | | | | 1.03 | % | | | (7,371 | ) |
PPL Corp. | | | 1,453 | | | | 1.06 | % | | | (9,281 | ) |
National Fuel Gas Co. | | | 831 | | | | 0.91 | % | | | (9,876 | ) |
Public Service Enterprise Group, Inc. | | | 886 | | | | 1.17 | % | | | (11,895 | ) |
NRG Energy, Inc. | | | 1,389 | | | | 1.12 | % | | | (14,155 | ) |
Vistra Energy Corp. | | | 1,770 | | | | 0.83 | % | | | (17,317 | ) |
Total Utilities | | | | | | | | | | | (91,097 | ) |
| | | | | | | | | | | | | |
Communications | | | | | | | | | | | | |
Alphabet, Inc. — Class C | | | 59 | | | | 2.02 | % | | | (476 | ) |
Verizon Communications, Inc. | | | 949 | | | | 1.50 | % | | | (1,247 | ) |
Cisco Systems, Inc. | | | 274 | | | | 0.32 | % | | | (2,178 | ) |
Facebook, Inc. — Class A | | | 108 | | | | 0.53 | % | | | (2,528 | ) |
eBay, Inc. | | | 550 | | | | 0.49 | % | | | (2,758 | ) |
Charter Communications, Inc. — Class A | | | 42 | | | | 0.54 | % | | | (3,005 | ) |
Comcast Corp. — Class A | | | 284 | | | | 0.29 | % | | | (3,108 | ) |
Scholastic Corp. | | | 387 | | | | 0.29 | % | | | (4,567 | ) |
Altice USA, Inc. — Class A | | | 742 | | | | 0.49 | % | | | (4,900 | ) |
GCI Liberty, Inc. — Class A | | | 331 | | | | 0.56 | % | | | (5,554 | ) |
News Corp. — Class A | | | 2,382 | | | | 0.63 | % | | | (8,282 | ) |
Booking Holdings, Inc. | | | 14 | | | | 0.56 | % | | | (8,495 | ) |
Discovery, Inc. — Class A | | | 1,120 | | | | 0.64 | % | | | (9,435 | ) |
AT&T, Inc. | | | 1,241 | | | | 1.07 | % | | | (9,814 | ) |
AMC Networks, Inc. — Class A | | | 792 | | | | 0.57 | % | | | (12,241 | ) |
Yelp, Inc. — Class A | | | 819 | | | | 0.44 | % | | | (13,448 | ) |
Omnicom Group, Inc. | | | 1,007 | | | | 1.63 | % | | | (17,143 | ) |
Total Communications | | | | | | | | | | | (109,179 | ) |
| | | | | | | | | | | | | |
Consumer, Non-cyclical | | | | | | | | | | | | |
McKesson Corp. | | | 410 | | | | 1.64 | % | | | 8,017 | |
Cardinal Health, Inc. | | | 643 | | | | 0.91 | % | | | 3,373 | |
CVS Health Corp. | | | 494 | | | | 0.86 | % | | | 3,092 | |
Eli Lilly & Co. | | | 79 | | | | 0.32 | % | | | 2,539 | |
United Therapeutics Corp. | | | 230 | | | | 0.64 | % | | | 1,575 | |
General Mills, Inc. | | | 609 | | | | 0.95 | % | | | 1,456 | |
Kellogg Co. | | | 513 | | | | 0.91 | % | | | 1,196 | |
Amgen, Inc. | | | 234 | | | | 1.40 | % | | | 887 | |
Baxter International, Inc. | | | 220 | | | | 0.53 | % | | | 565 | |
John B Sanfilippo & Son, Inc. | | | 247 | | | | 0.65 | % | | | 45 | |
Merck & Company, Inc. | | | 625 | | | | 1.42 | % | | | (196 | ) |
Thermo Fisher Scientific, Inc. | | | 59 | | | | 0.49 | % | | | (546 | ) |
Johnson & Johnson | | | 359 | | | | 1.39 | % | | | (706 | ) |
STERIS plc | | | 130 | | | | 0.54 | % | | | (822 | ) |
BioMarin Pharmaceutical, Inc. | | | 172 | | | | 0.43 | % | | | (904 | ) |
Philip Morris International, Inc. | | | 327 | | | | 0.70 | % | | | (918 | ) |
Halozyme Therapeutics, Inc. | | | 750 | | | | 0.40 | % | | | (951 | ) |
Medtronic plc | | | 434 | | | | 1.15 | % | | | (1,023 | ) |
Abbott Laboratories | | | 394 | | | | 0.92 | % | | | (1,113 | ) |
14 | THE GUGGENHEIM FUNDS SEMI-ANNUAL REPORT | SEE NOTES TO FINANCIAL STATEMENTS. |
SCHEDULE OF INVESTMENTS (Unaudited)(continued) | March 31, 2020 |
ALPHA OPPORTUNITY FUND | |
| | Shares | | | Percentage
Notional
Amount | | | Value and
Unrealized
Appreciation
(Depreciation) | |
TreeHouse Foods, Inc. | | | 505 | | | | 0.66 | % | | $ | (1,214 | ) |
Becton Dickinson and Co. | | | 103 | | | | 0.70 | % | | | (1,269 | ) |
Conagra Brands, Inc. | | | 433 | | | | 0.37 | % | | | (1,306 | ) |
Mondelez International, Inc. — Class A | | | 310 | | | | 0.46 | % | | | (1,323 | ) |
Innoviva, Inc. | | | 1,211 | | | | 0.42 | % | | | (1,369 | ) |
PepsiCo, Inc. | | | 144 | | | | 0.51 | % | | | (1,411 | ) |
Alexion Pharmaceuticals, Inc. | | | 160 | | | | 0.42 | % | | | (2,008 | ) |
Illumina, Inc. | | | 39 | | | | 0.31 | % | | | (2,389 | ) |
Ingredion, Inc. | | | 260 | | | | 0.58 | % | | | (3,126 | ) |
Archer-Daniels-Midland Co. | | | 429 | | | | 0.45 | % | | | (3,221 | ) |
Edwards Lifesciences Corp. | | | 101 | | | | 0.56 | % | | | (4,578 | ) |
Integer Holdings Corp. | | | 275 | | | | 0.51 | % | | | (4,645 | ) |
Procter & Gamble Co. | | | 417 | | | | 1.35 | % | | | (4,657 | ) |
Sysco Corp. | | | 1,089 | | | | 1.47 | % | | | (5,299 | ) |
Coca-Cola Co. | | | 532 | | | | 0.69 | % | | | (5,847 | ) |
Pfizer, Inc. | | | 1,409 | | | | 1.36 | % | | | (6,125 | ) |
Jazz Pharmaceuticals plc | | | 223 | | | | 0.66 | % | | | (6,472 | ) |
Herbalife Nutrition Ltd. | | | 659 | | | | 0.57 | % | | | (6,809 | ) |
Macquarie Infrastructure Corp. | | | 522 | | | | 0.39 | % | | | (6,970 | ) |
Hologic, Inc. | | | 783 | | | | 0.81 | % | | | (7,636 | ) |
Post Holdings, Inc. | | | 426 | | | | 1.04 | % | | | (8,923 | ) |
Molson Coors Beverage Co. — Class B | | | 1,117 | | | | 1.29 | % | | | (15,564 | ) |
Total Consumer, Non-cyclical | | | | | | | | | | | (86,595 | ) |
| | | | | | | | | | | | | |
Financial | | | | | | | | | | | | |
Lexington Realty Trust | | | 4,009 | | | | 1.17 | % | | | (1,659 | ) |
Sunstone Hotel Investors, Inc. | | | 2,372 | | | | 0.61 | % | | | (3,144 | ) |
Northern Trust Corp. | | | 119 | | | | 0.26 | % | | | (3,876 | ) |
Travelers Companies, Inc. | | | 126 | | | | 0.37 | % | | | (4,428 | ) |
Kennedy-Wilson Holdings, Inc. | | | 971 | | | | 0.38 | % | | | (8,840 | ) |
Summit Hotel Properties, Inc. | | | 5,725 | | | | 0.71 | % | | | (9,544 | ) |
Brixmor Property Group, Inc. | | | 1,514 | | | | 0.42 | % | | | (15,792 | ) |
Weingarten Realty Investors | | | 1,443 | | | | 0.61 | % | | | (20,571 | ) |
Total Financial | | | | | | | | | | | (67,854 | ) |
| | | | | | | | | | | | | |
Industrial | | | | | | | | | | | | |
Old Dominion Freight Line, Inc. | | | 99 | | | | 0.38 | % | | | 3,546 | |
Marten Transport Ltd. | | | 847 | | | | 0.51 | % | | | 3,130 | |
Werner Enterprises, Inc. | | | 861 | | | | 0.92 | % | | | 2,637 | |
Westrock Co. | | | 1,343 | | | | 1.12 | % | | | 1,978 | |
Mettler-Toledo International, Inc. | | | 36 | | | | 0.73 | % | | | 714 | |
Knight-Swift Transportation Holdings, Inc. | | | 361 | | | | 0.35 | % | | | 513 | |
Heartland Express, Inc. | | | 937 | | | | 0.51 | % | | | (503 | ) |
Caterpillar, Inc. | | | 271 | | | | 0.93 | % | | | (1,061 | ) |
Schneider National, Inc. — Class B | | | 1,014 | | | | 0.58 | % | | | (1,291 | ) |
Oshkosh Corp. | | | 180 | | | | 0.34 | % | | | (1,438 | ) |
Garmin Ltd. | | | 190 | | | | 0.42 | % | | | (1,541 | ) |
Union Pacific Corp. | | | 143 | | | | 0.59 | % | | | (1,573 | ) |
Vishay Intertechnology, Inc. | | | 598 | | | | 0.25 | % | | | (2,225 | ) |
Regal Beloit Corp. | | | 399 | | | | 0.74 | % | | | (2,621 | ) |
Landstar System, Inc. | | | 343 | | | | 0.97 | % | | | (2,953 | ) |
Echo Global Logistics, Inc. | | | 1,052 | | | | 0.53 | % | | | (4,034 | ) |
J.B. Hunt Transport Services, Inc. | | | 184 | | | | 0.50 | % | | | (4,399 | ) |
CSX Corp. | | | 486 | | | | 0.82 | % | | | (4,919 | ) |
Gentex Corp. | | | 1,175 | | | | 0.77 | % | | | (5,028 | ) |
Illinois Tool Works, Inc. | | | 153 | | | | 0.64 | % | | | (5,702 | ) |
Waters Corp. | | | 131 | | | | 0.70 | % | | | (5,789 | ) |
Norfolk Southern Corp. | | | 223 | | | | 0.96 | % | | | (5,840 | ) |
Lincoln Electric Holdings, Inc. | | | 467 | | | | 0.95 | % | | | (6,379 | ) |
CH Robinson Worldwide, Inc. | | | 580 | | | | 1.13 | % | | | (6,657 | ) |
Eaton Corporation plc | | | 402 | | | | 0.92 | % | | | (7,081 | ) |
AGCO Corp. | | | 257 | | | | 0.36 | % | | | (7,362 | ) |
Rockwell Automation, Inc. | | | 135 | | | | 0.60 | % | | | (7,592 | ) |
Albany International Corp. — Class A | | | 259 | | | | 0.36 | % | | | (7,601 | ) |
Masco Corp. | | | 608 | | | | 0.62 | % | | | (7,818 | ) |
MasTec, Inc. | | | 274 | | | | 0.26 | % | | | (8,159 | ) |
FedEx Corp. | | | 288 | | | | 1.03 | % | | | (9,245 | ) |
Arconic, Inc. | | | 685 | | | | 0.32 | % | | | (9,432 | ) |
Textron, Inc. | | | 518 | | | | 0.41 | % | | | (9,550 | ) |
Honeywell International, Inc. | | | 289 | | | | 1.14 | % | | | (9,563 | ) |
Terex Corp. | | | 708 | | | | 0.30 | % | | | (10,245 | ) |
Kennametal, Inc. | | | 794 | | | | 0.44 | % | | | (12,053 | ) |
Crane Co. | | | 693 | | | | 1.01 | % | | | (12,714 | ) |
Emerson Electric Co. | | | 466 | | | | 0.65 | % | | | (13,961 | ) |
Total Industrial | | | | | | | | | | | (183,811 | ) |
| | | | | | | | | | | | | |
Consumer, Cyclical | | | | | | | | | | | | |
Home Depot, Inc. | | | 106 | | | | 0.58 | % | | | (4,050 | ) |
Lowe’s Companies, Inc. | | | 128 | | | | 0.32 | % | | | (4,637 | ) |
MSC Industrial Direct Company, Inc. — Class A | | | 255 | | | | 0.41 | % | | | (5,074 | ) |
Starbucks Corp. | | | 225 | | | | 0.44 | % | | | (5,179 | ) |
Gentherm, Inc. | | | 627 | | | | 0.58 | % | | | (5,297 | ) |
Mohawk Industries, Inc. | | | 101 | | | | 0.23 | % | | | (5,497 | ) |
Lennar Corp. — Class A | | | 288 | | | | 0.32 | % | | | (5,775 | ) |
SEE NOTES TO FINANCIAL STATEMENTS. | THE GUGGENHEIM FUNDS SEMI-ANNUAL REPORT | 15 |
SCHEDULE OF INVESTMENTS (Unaudited)(continued) | March 31, 2020 |
ALPHA OPPORTUNITY FUND | |
| | Shares | | | Percentage
Notional
Amount | | | Value and
Unrealized
Appreciation
(Depreciation) | |
Cummins, Inc. | | | 157 | | | | 0.63 | % | | $ | (5,785 | ) |
VF Corp. | | | 161 | | | | 0.26 | % | | | (6,705 | ) |
DR Horton, Inc. | | | 410 | | | | 0.41 | % | | | (7,056 | ) |
PulteGroup, Inc. | | | 566 | | | | 0.37 | % | | | (7,833 | ) |
Allison Transmission Holdings, Inc. | | | 706 | | | | 0.68 | % | | | (8,641 | ) |
Polaris, Inc. | | | 191 | | | | 0.27 | % | | | (9,843 | ) |
Toll Brothers, Inc. | | | 605 | | | | 0.34 | % | | | (9,979 | ) |
Extended Stay America, Inc. | | | 1,543 | | | | 0.33 | % | | | (11,104 | ) |
Autoliv, Inc. | | | 416 | | | | 0.56 | % | | | (12,098 | ) |
Brunswick Corp. | | | 540 | | | | 0.56 | % | | | (12,339 | ) |
General Motors Co. | | | 1,014 | | | | 0.62 | % | | | (14,332 | ) |
Whirlpool Corp. | | | 227 | | | | 0.57 | % | | | (14,612 | ) |
Wyndham Destinations, Inc. | | | 556 | | | | 0.36 | % | | | (16,051 | ) |
Carnival Corp. | | | 788 | | | | 0.31 | % | | | (22,546 | ) |
Total Consumer, Cyclical | | | | | | | | | | | (194,433 | ) |
| | | | | | | | | | | | | |
Energy | | | | | | | | | | | | |
Kinder Morgan, Inc. | | | 1,026 | | | | 0.42 | % | | | (4,569 | ) |
Phillips 66 | | | 129 | | | | 0.20 | % | | | (5,627 | ) |
Valero Energy Corp. | | | 272 | | | | 0.36 | % | | | (10,607 | ) |
Delek US Holdings, Inc. | | | 646 | | | | 0.30 | % | | | (11,035 | ) |
Devon Energy Corp. | | | 822 | | | | 0.17 | % | | | (12,366 | ) |
HollyFrontier Corp. | | | 506 | | | | 0.37 | % | | | (12,503 | ) |
Chevron Corp. | | | 278 | | | | 0.59 | % | | | (13,670 | ) |
CVR Energy, Inc. | | | 554 | | | | 0.27 | % | | | (14,761 | ) |
Exxon Mobil Corp. | | | 695 | | | | 0.78 | % | | | (21,122 | ) |
Total Energy | | | | | | | | | | | (106,260 | ) |
| | | | | | | | | | | | | |
Basic Materials | | | | | | | | | | | | |
International Paper Co. | | | 341 | | | | 0.31 | % | | | (4,423 | ) |
Domtar Corp. | | | 400 | | | | 0.26 | % | | | (5,390 | ) |
Total Basic Materials | | | | | | | | | | | (9,813 | ) |
| | | | | | | | | | | | | |
Technology | | | | | | | | | | | | |
Activision Blizzard, Inc. | | | 528 | | | | 0.93 | % | | | 3,686 | |
Oracle Corp. | | | 238 | | | | 0.34 | % | | | (1,066 | ) |
Teradata Corp. | | | 483 | | | | 0.29 | % | | | (3,170 | ) |
Total Technology | | | | | | | | | | | (550 | ) |
Total MS Equity Long Custom Basket | | | | | | $ | (849,592 | ) |
| | | | | | | | | |
MS EQUITY SHORT CUSTOM BASKET | | | | | | | | |
Utilities | | | | | | | | | | | | |
Dominion Energy, Inc. | | | 2,811 | | | | (1.90 | )% | | $ | 25,090 | |
American States Water Co. | | | 1,394 | | | | (1.07 | )% | | | 14,282 | |
WEC Energy Group, Inc. | | | 1,201 | | | | (1.00 | )% | | | 11,931 | |
American Water Works Company, Inc. | | | 1,182 | | | | (1.33 | )% | | | 11,561 | |
Eversource Energy | | | 916 | | | | (0.67 | )% | | | 10,458 | |
Sempra Energy | | | 262 | | | | (0.28 | )% | | | 8,874 | |
MGE Energy, Inc. | | | 757 | | | | (0.47 | )% | | | 8,152 | |
California Water Service Group | | | 1,943 | | | | (0.92 | )% | | | 5,236 | |
Alliant Energy Corp. | | | 713 | | | | (0.32 | )% | | | 3,471 | |
Atmos Energy Corp. | | | 523 | | | | (0.49 | )% | | | 2,238 | |
NextEra Energy, Inc. | | | 424 | | | | (0.96 | )% | | | (673 | ) |
Total Utilities | | | | | | | | | | | 100,620 | |
| | | | | | | | | | | | | |
Technology | | | | | | | | | | | | |
Autodesk, Inc. | | | 689 | | | | (1.01 | )% | | | 22,852 | |
Broadcom, Inc. | | | 340 | | | | (0.76 | )% | | | 19,676 | |
Twilio, Inc. — Class A | | | 787 | | | | (0.66 | )% | | | 17,991 | |
Paychex, Inc. | | | 635 | | | | (0.38 | )% | | | 14,416 | |
Workday, Inc. — Class A | | | 167 | | | | (0.20 | )% | | | 14,191 | |
salesforce.com, Inc. | | | 1,082 | | | | (1.47 | )% | | | 13,908 | |
HubSpot, Inc. | | | 448 | | | | (0.56 | )% | | | 12,716 | |
ServiceNow, Inc. | | | 235 | | | | (0.63 | )% | | | 8,444 | |
Elastic N.V. | | | 739 | | | | (0.39 | )% | | | 7,364 | |
Leidos Holdings, Inc. | | | 716 | | | | (0.62 | )% | | | 6,864 | |
Alteryx, Inc. — Class A | | | 553 | | | | (0.50 | )% | | | 6,520 | |
CACI International, Inc. — Class A | | | 500 | | | | (0.99 | )% | | | 6,294 | |
Workiva, Inc. | | | 1,234 | | | | (0.38 | )% | | | 5,642 | |
Coupa Software, Inc. | | | 275 | | | | (0.36 | )% | | | 5,160 | |
EPAM Systems, Inc. | | | 510 | | | | (0.89 | )% | | | 4,844 | |
MongoDB, Inc. | | | 307 | | | | (0.39 | )% | | | 4,435 | |
Tyler Technologies, Inc. | | | 136 | | | | (0.38 | )% | | | 3,533 | |
Fair Isaac Corp. | | | 76 | | | | (0.22 | )% | | | 3,246 | |
Smartsheet, Inc. — Class A | | | 1,164 | | | | (0.45 | )% | | | 2,584 | |
Black Knight, Inc. | | | 1,842 | | | | (1.01 | )% | | | 1,812 | |
Paycom Software, Inc. | | | 106 | | | | (0.20 | )% | | | 1,782 | |
Veeva Systems, Inc. — Class A | | | 164 | | | | (0.24 | )% | | | 65 | |
ANSYS, Inc. | | | 113 | | | | (0.25 | )% | | | (666 | ) |
Appfolio, Inc. — Class A | | | 197 | | | | (0.21 | )% | | | (1,994 | ) |
Monolithic Power Systems, Inc. | | | 167 | | | | (0.26 | )% | | | (5,352 | ) |
Splunk, Inc. | | | 601 | | | | (0.71 | )% | | | (5,384 | ) |
Five9, Inc. | | | 605 | | | | (0.44 | )% | | | (11,164 | ) |
RingCentral, Inc. — Class A | | | 160 | | | | (0.32 | )% | | | (14,042 | ) |
Total Technology | | | | | | | | | | | 145,737 | |
| | | | | | | | | | | | | |
Financial | | | | | | | | | | | | |
Realty Income Corp. | | | 2,888 | | | | (1.35 | )% | | | 68,491 | |
People’s United Financial, Inc. | | | 11,677 | | | | (1.21 | )% | | | 65,347 | |
Cousins Properties, Inc. | | | 4,827 | | | | (1.33 | )% | | | 53,527 | |
Essential Properties Realty Trust, Inc. | | | 3,713 | | | | (0.46 | )% | | | 49,777 | |
WP Carey, Inc. | | | 1,374 | | | | (0.75 | )% | | | 45,787 | |
First Republic Bank | | | 1,777 | | | | (1.38 | )% | | | 43,956 | |
BOK Financial Corp. | | | 1,123 | | | | (0.45 | )% | | | 42,297 | |
Cadence BanCorp | | | 3,590 | | | | (0.22 | )% | | | 40,986 | |
UDR, Inc. | | | 3,262 | | | | (1.12 | )% | | | 36,504 | |
16 | THE GUGGENHEIM FUNDS SEMI-ANNUAL REPORT | SEE NOTES TO FINANCIAL STATEMENTS. |
SCHEDULE OF INVESTMENTS (Unaudited)(continued) | March 31, 2020 |
ALPHA OPPORTUNITY FUND | |
| | Shares | | | Percentage
Notional
Amount | | | Value and
Unrealized
Appreciation
(Depreciation) | |
Western Alliance Bancorporation | | | 1,139 | | | | (0.33 | )% | | $ | 30,808 | |
Ameris Bancorp | | | 1,621 | | | | (0.36 | )% | | | 30,526 | |
Atlantic Union Bankshares Corp. | | | 1,844 | | | | (0.38 | )% | | | 26,585 | |
Old National Bancorp | | | 7,248 | | | | (0.90 | )% | | | 25,930 | |
First Midwest Bancorp, Inc. | | | 2,678 | | | | (0.33 | )% | | | 25,495 | |
Global Net Lease, Inc. | | | 3,477 | | | | (0.44 | )% | | | 25,006 | |
Alexandria Real Estate Equities, Inc. | | | 1,270 | | | | (1.64 | )% | | | 21,890 | |
Americold Realty Trust | | | 5,815 | | | | (1.86 | )% | | | 21,118 | |
CareTrust REIT, Inc. | | | 3,729 | | | | (0.52 | )% | | | 20,413 | |
Glacier Bancorp, Inc. | | | 2,079 | | | | (0.66 | )% | | | 17,040 | |
Northwest Bancshares, Inc. | | | 3,146 | | | | (0.34 | )% | | | 16,804 | |
Valley National Bancorp | | | 5,454 | | | | (0.38 | )% | | | 16,353 | |
Washington Real Estate Investment Trust | | | 4,133 | | | | (0.93 | )% | | | 14,806 | |
CME Group, Inc. — Class A | | | 418 | | | | (0.68 | )% | | | 13,662 | |
CenterState Bank Corp. | | | 1,980 | | | | (0.32 | )% | | | 13,415 | |
Agree Realty Corp. | | | 2,543 | | | | (1.48 | )% | | | 11,826 | |
UMB Financial Corp. | | | 720 | | | | (0.31 | )% | | | 11,459 | |
Arthur J Gallagher & Co. | | | 2,259 | | | | (1.73 | )% | | | 11,294 | |
Medical Properties Trust, Inc. | | | 2,387 | | | | (0.39 | )% | | | 9,178 | |
Healthcare Realty Trust, Inc. | | | 1,957 | | | | (0.51 | )% | | | 8,076 | |
Brown & Brown, Inc. | | | 4,756 | | | | (1.62 | )% | | | 7,730 | |
EastGroup Properties, Inc. | | | 990 | | | | (0.97 | )% | | | 7,691 | |
National Storage Affiliates Trust | | | 1,879 | | | | (0.52 | )% | | | 7,579 | |
Columbia Financial, Inc. | | | 4,004 | | | | (0.54 | )% | | | 3,007 | |
American Tower Corp. — Class A | | | 357 | | | | (0.73 | )% | | | 1,907 | |
Progressive Corp. | | | 970 | | | | (0.67 | )% | | | (152 | ) |
Sun Communities, Inc. | | | 1,214 | | | | (1.43 | )% | | | (8,097 | ) |
QTS Realty Trust, Inc. — Class A | | | 2,475 | | | | (1.35 | )% | | | (11,764 | ) |
Crown Castle International Corp. | | | 970 | | | | (1.32 | )% | | | (17,052 | ) |
RLI Corp. | | | 2,204 | | | | (1.82 | )% | | | (23,066 | ) |
Easterly Government Properties, Inc. | | | 10,934 | | | | (2.53 | )% | | | (24,994 | ) |
Rexford Industrial Realty, Inc. | | | 5,566 | | | | (2.15 | )% | | | (26,010 | ) |
Equinix, Inc. | | | 177 | | | | (1.04 | )% | | | (30,279 | ) |
Terreno Realty Corp. | | | 4,047 | | | | (1.97 | )% | | | (44,885 | ) |
SBA Communications Corp. | | | 778 | | | | (1.98 | )% | | | (49,173 | ) |
Total Financial | | | | | | | | | | | 610,798 | |
| | | | | | | | | | | | | |
Industrial | | | | | | | | | | | | |
TransDigm Group, Inc. | | | 602 | | | | (1.81 | )% | | | 77,380 | |
Waste Management, Inc. | | | 1,781 | | | | (1.55 | )% | | | 42,386 | |
HEICO Corp. | | | 479 | | | | (0.34 | )% | | | 29,659 | |
Materion Corp. | | | 1,162 | | | | (0.38 | )% | | | 28,940 | |
Tetra Tech, Inc. | | | 1,272 | | | | (0.84 | )% | | | 21,406 | |
Roper Technologies, Inc. | | | 292 | | | | (0.86 | )% | | | 18,111 | |
Casella Waste Systems, Inc. — Class A | | | 2,204 | | | | (0.81 | )% | | | 18,086 | |
Sonoco Products Co. | | | 1,462 | | | | (0.64 | )% | | | 13,823 | |
Republic Services, Inc. — Class A | | | 763 | | | | (0.54 | )% | | | 12,175 | |
Ball Corp. | | | 2,136 | | | | (1.30 | )% | | | 10,713 | |
Exponent, Inc. | | | 1,852 | | | | (1.25 | )% | | | 2,637 | |
Total Industrial | | | | | | | | | | | 275,316 | |
| | | | | | | | | | | | | |
Basic Materials | | | | | | | | | | | | |
Kaiser Aluminum Corp. | | | 997 | | | | (0.65 | )% | | | 36,277 | |
PPG Industries, Inc. | | | 1,089 | | | | (0.86 | )% | | | 32,277 | |
Compass Minerals International, Inc. | | | 1,804 | | | | (0.65 | )% | | | 29,667 | |
RPM International, Inc. | | | 2,601 | | | | (1.46 | )% | | | 29,060 | |
Linde plc | | | 726 | | | | (1.18 | )% | | | 22,274 | |
Sherwin-Williams Co. | | | 188 | | | | (0.81 | )% | | | 18,834 | |
Southern Copper Corp. | | | 1,234 | | | | (0.33 | )% | | | 17,331 | |
Newmont Corp. | | | 4,377 | | | | (1.86 | )% | | | 4,494 | |
Balchem Corp. | | | 1,937 | | | | (1.80 | )% | | | (11,989 | ) |
Total Basic Materials | | | | | | | | | | | 178,225 | |
| | | | | | | | | | | | | |
Consumer, Cyclical | | | | | | | | | | | | |
Copart, Inc. | | | 2,434 | | | | (1.57 | )% | | | 64,685 | |
| | | | | | | | | | | | | |
Consumer, Non-cyclical | | | | | | | | | | | | |
Equifax, Inc. | | | 1,414 | | | | (1.59 | )% | | | 40,221 | |
Gartner, Inc. | | | 530 | | | | (0.50 | )% | | | 31,122 | |
PayPal Holdings, Inc. | | | 1,435 | | | | (1.29 | )% | | | 15,771 | |
Verisk Analytics, Inc. — Class A | | | 629 | | | | (0.82 | )% | | | 8,786 | |
CoStar Group, Inc. | | | 190 | | | | (1.05 | )% | | | 8,287 | |
Rollins, Inc. | | | 3,960 | | | | (1.35 | )% | | | 3,907 | |
ResMed, Inc. | | | 164 | | | | (0.23 | )% | | | (2,886 | ) |
Avalara, Inc. | | | 1,134 | | | | (0.80 | )% | | | (3,888 | ) |
MarketAxess Holdings, Inc. | | | 177 | | | | (0.55 | )% | | | (11,166 | ) |
Total Consumer, Non-cyclical | | | | | | | | | | | 90,154 | |
| | | | | | | | | | | | | |
Communications | | | | | | | | | | | | |
8x8, Inc. | | | 4,461 | | | | (0.58 | )% | | | 28,929 | |
Q2 Holdings, Inc. | | | 1,126 | | | | (0.63 | )% | | | 18,473 | |
Proofpoint, Inc. | | | 798 | | | | (0.77 | )% | | | 12,310 | |
Trade Desk, Inc. — Class A | | | 86 | | | | (0.16 | )% | | | 2,877 | |
Okta, Inc. | | | 437 | | | | (0.50 | )% | | | (253 | ) |
Total Communications | | | | | | | | | | | 62,336 | |
Total MS Equity Short Custom Basket | | | | | | $ | 1,527,871 | |
SEE NOTES TO FINANCIAL STATEMENTS. | THE GUGGENHEIM FUNDS SEMI-ANNUAL REPORT | 17 |
SCHEDULE OF INVESTMENTS (Unaudited)(continued) | March 31, 2020 |
ALPHA OPPORTUNITY FUND | |
| | Shares | | | Percentage
Notional
Amount | | | Value and
Unrealized
Appreciation
(Depreciation) | |
GS EQUITY LONG CUSTOM BASKET | | | | | | | | |
Industrial | | | | | | | | | | | | |
Werner Enterprises, Inc. | | | 861 | | | | 0.93 | % | | $ | 5,837 | |
Old Dominion Freight Line, Inc. | | | 99 | | | | 0.39 | % | | | 3,705 | |
Marten Transport Ltd. | | | 847 | | | | 0.52 | % | | | 2,228 | |
Westrock Co. | | | 1,343 | | | | 1.13 | % | | | 2,025 | |
Schneider National, Inc. — Class B | | | 1,014 | | | | 0.59 | % | | | 1,399 | |
Knight-Swift Transportation Holdings, Inc. | | | 361 | | | | 0.35 | % | | | 628 | |
Mettler-Toledo International, Inc. | | | 36 | | | | 0.73 | % | | | 560 | |
Heartland Express, Inc. | | | 937 | | | | 0.51 | % | | | (150 | ) |
Vishay Intertechnology, Inc. | | | 598 | | | | 0.25 | % | | | (861 | ) |
Caterpillar, Inc. | | | 271 | | | | 0.93 | % | | | (1,427 | ) |
Garmin Ltd. | | | 190 | | | | 0.42 | % | | | (1,623 | ) |
Union Pacific Corp. | | | 143 | | | | 0.59 | % | | | (1,757 | ) |
Landstar System, Inc. | | | 343 | | | | 0.97 | % | | | (1,986 | ) |
Oshkosh Corp. | | | 180 | | | | 0.34 | % | | | (2,227 | ) |
Regal Beloit Corp. | | | 399 | | | | 0.74 | % | | | (2,806 | ) |
Waters Corp. | | | 131 | | | | 0.70 | % | | | (3,385 | ) |
Echo Global Logistics, Inc. | | | 1,052 | | | | 0.53 | % | | | (3,503 | ) |
J.B. Hunt Transport Services, Inc. | | | 184 | | | | 0.50 | % | | | (4,443 | ) |
Gentex Corp. | | | 1,175 | | | | 0.77 | % | | | (4,981 | ) |
Illinois Tool Works, Inc. | | | 153 | | | | 0.64 | % | | | (5,722 | ) |
Norfolk Southern Corp. | | | 223 | | | | 0.96 | % | | | (6,548 | ) |
Lincoln Electric Holdings, Inc. | | | 467 | | | | 0.95 | % | | | (6,549 | ) |
CH Robinson Worldwide, Inc. | | | 580 | | | | 1.13 | % | | | (6,687 | ) |
Eaton Corporation plc | | | 402 | | | | 0.92 | % | | | (7,032 | ) |
AGCO Corp. | | | 257 | | | | 0.36 | % | | | (7,351 | ) |
CSX Corp. | | | 486 | | | | 0.82 | % | | | (7,499 | ) |
Rockwell Automation, Inc. | | | 135 | | | | 0.60 | % | | | (7,588 | ) |
Albany International Corp. — Class A | | | 259 | | | | 0.36 | % | | | (7,614 | ) |
Masco Corp. | | | 608 | | | | 0.62 | % | | | (7,814 | ) |
MasTec, Inc. | | | 274 | | | | 0.26 | % | | | (8,136 | ) |
FedEx Corp. | | | 288 | | | | 1.03 | % | | | (9,237 | ) |
Arconic, Inc. | | | 685 | | | | 0.32 | % | | | (9,425 | ) |
Textron, Inc. | | | 518 | | | | 0.41 | % | | | (9,598 | ) |
Honeywell International, Inc. | | | 289 | | | | 1.14 | % | | | (9,718 | ) |
Terex Corp. | | | 708 | | | | 0.30 | % | | | (10,255 | ) |
Kennametal, Inc. | | | 794 | | | | 0.44 | % | | | (11,124 | ) |
Crane Co. | | | 693 | | | | 1.01 | % | | | (12,727 | ) |
Emerson Electric Co. | | | 466 | | | | 0.65 | % | | | (14,011 | ) |
Total Industrial | | | | | | | | | | | (177,402 | ) |
| | | | | | | | | | | | | |
Communications | | | | | | | | | | | | |
Alphabet, Inc. — Class C | | | 59 | | | | 2.02 | % | | | (501 | ) |
Cisco Systems, Inc. | | | 274 | | | | 0.32 | % | | | (2,187 | ) |
Facebook, Inc. — Class A | | | 108 | | | | 0.53 | % | | | (2,565 | ) |
eBay, Inc. | | | 550 | | | | 0.49 | % | | | (2,769 | ) |
Scholastic Corp. | | | 387 | | | | 0.29 | % | | | (2,918 | ) |
Verizon Communications, Inc. | | | 949 | | | | 1.50 | % | | | (2,942 | ) |
Charter Communications, Inc. — Class A | | | 42 | | | | 0.54 | % | | | (2,982 | ) |
Comcast Corp. — Class A | | | 284 | | | | 0.29 | % | | | (3,138 | ) |
Altice USA, Inc. — Class A | | | 742 | | | | 0.49 | % | | | (4,857 | ) |
GCI Liberty, Inc. — Class A | | | 331 | | | | 0.56 | % | | | (5,563 | ) |
News Corp. — Class A | | | 2,382 | | | | 0.63 | % | | | (7,405 | ) |
Booking Holdings, Inc. | | | 14 | | | | 0.56 | % | | | (8,438 | ) |
AT&T, Inc. | | | 1,241 | | | | 1.07 | % | | | (9,908 | ) |
Discovery, Inc. — Class A | | | 1,120 | | | | 0.64 | % | | | (10,693 | ) |
AMC Networks, Inc. — Class A | | | 792 | | | | 0.57 | % | | | (12,282 | ) |
Yelp, Inc. — Class A | | | 819 | | | | 0.44 | % | | | (13,309 | ) |
Omnicom Group, Inc. | | | 1,007 | | | | 1.63 | % | | | (18,786 | ) |
Total Communications | | | | | | | | | | | (111,243 | ) |
| | | | | | | | | | | | | |
Consumer, Cyclical | | | | | | | | | | | | |
Home Depot, Inc. | | | 106 | | | | 0.58 | % | | | (4,091 | ) |
Lowe’s Companies, Inc. | | | 128 | | | | 0.32 | % | | | (4,617 | ) |
MSC Industrial Direct Company, Inc. — Class A | | | 255 | | | | 0.41 | % | | | (5,113 | ) |
Starbucks Corp. | | | 225 | | | | 0.44 | % | | | (5,194 | ) |
Gentherm, Inc. | | | 627 | | | | 0.58 | % | | | (5,348 | ) |
Mohawk Industries, Inc. | | | 101 | | | | 0.23 | % | | | (5,475 | ) |
Lennar Corp. — Class A | | | 288 | | | | 0.32 | % | | | (5,788 | ) |
Cummins, Inc. | | | 157 | | | | 0.63 | % | | | (5,952 | ) |
VF Corp. | | | 161 | | | | 0.26 | % | | | (6,728 | ) |
DR Horton, Inc. | | | 410 | | | | 0.41 | % | | | (7,171 | ) |
PulteGroup, Inc. | | | 566 | | | | 0.37 | % | | | (7,851 | ) |
Allison Transmission Holdings, Inc. | | | 706 | | | | 0.68 | % | | | (8,006 | ) |
Polaris, Inc. | | | 191 | | | | 0.27 | % | | | (9,835 | ) |
Toll Brothers, Inc. | | | 605 | | | | 0.34 | % | | | (10,459 | ) |
Extended Stay America, Inc. | | | 1,543 | | | | 0.33 | % | | | (11,090 | ) |
Autoliv, Inc. | | | 416 | | | | 0.56 | % | | | (12,240 | ) |
Brunswick Corp. | | | 540 | | | | 0.56 | % | | | (12,324 | ) |
General Motors Co. | | | 1,014 | | | | 0.62 | % | | | (14,456 | ) |
Whirlpool Corp. | | | 227 | | | | 0.57 | % | | | (14,650 | ) |
Wyndham Destinations, Inc. | | | 556 | | | | 0.36 | % | | | (16,047 | ) |
Carnival Corp. | | | 788 | | | | 0.31 | % | | | (22,606 | ) |
Total Consumer, Cyclical | | | | | | | | | | | (195,041 | ) |
| | | | | | | | | | | | | |
Energy | | | | | | | | | | | | |
Phillips 66 | | | 129 | | | | 0.20 | % | | | (4,007 | ) |
18 | THE GUGGENHEIM FUNDS SEMI-ANNUAL REPORT | SEE NOTES TO FINANCIAL STATEMENTS. |
SCHEDULE OF INVESTMENTS (Unaudited)(continued) | March 31, 2020 |
ALPHA OPPORTUNITY FUND | |
| | Shares | | | Percentage
Notional
Amount | | | Value and
Unrealized
Appreciation
(Depreciation) | |
Kinder Morgan, Inc. | | | 1,026 | | | | 0.42 | % | | $ | (6,906 | ) |
HollyFrontier Corp. | | | 506 | | | | 0.37 | % | | | (8,101 | ) |
Valero Energy Corp. | | | 272 | | | | 0.36 | % | | | (8,432 | ) |
Delek US Holdings, Inc. | | | 646 | | | | 0.30 | % | | | (12,154 | ) |
Devon Energy Corp. | | | 822 | | | | 0.17 | % | | | (12,241 | ) |
Chevron Corp. | | | 278 | | | | 0.59 | % | | | (13,541 | ) |
CVR Energy, Inc. | | | 554 | | | | 0.27 | % | | | (14,808 | ) |
Exxon Mobil Corp. | | | 695 | | | | 0.78 | % | | | (21,179 | ) |
Total Energy | | | | | | | | | | | (101,369 | ) |
| | | | | | | | | | | | | |
Consumer, Non-cyclical | | | | | | | | | | | | |
Cardinal Health, Inc. | | | 643 | | | | 0.91 | % | | | 3,410 | |
CVS Health Corp. | | | 494 | | | | 0.86 | % | | | 2,648 | |
Eli Lilly & Co. | | | 79 | | | | 0.32 | % | | | 2,499 | |
Amgen, Inc. | | | 234 | | | | 1.40 | % | | | 2,306 | |
United Therapeutics Corp. | | | 230 | | | | 0.64 | % | | | 1,455 | |
McKesson Corp. | | | 410 | | | | 1.64 | % | | | 1,091 | |
Kellogg Co. | | | 513 | | | | 0.91 | % | | | 955 | |
Baxter International, Inc. | | | 220 | | | | 0.53 | % | | | 779 | |
General Mills, Inc. | | | 610 | | | | 0.95 | % | | | 244 | |
John B Sanfilippo & Son, Inc. | | | 247 | | | | 0.65 | % | | | 50 | |
Thermo Fisher Scientific, Inc. | | | 59 | | | | 0.49 | % | | | (529 | ) |
Becton Dickinson and Co. | | | 103 | | | | 0.70 | % | | | (747 | ) |
STERIS plc | | | 130 | | | | 0.54 | % | | | (854 | ) |
BioMarin Pharmaceutical, Inc. | | | 172 | | | | 0.43 | % | | | (869 | ) |
Halozyme Therapeutics, Inc. | | | 750 | | | | 0.40 | % | | | (944 | ) |
Johnson & Johnson | | | 359 | | | | 1.39 | % | | | (967 | ) |
Abbott Laboratories | | | 394 | | | | 0.92 | % | | | (1,155 | ) |
TreeHouse Foods, Inc. | | | 505 | | | | 0.66 | % | | | (1,224 | ) |
Ingredion, Inc. | | | 260 | | | | 0.58 | % | | | (1,230 | ) |
Conagra Brands, Inc. | | | 433 | | | | 0.37 | % | | | (1,248 | ) |
Mondelez International, Inc. — Class A | | | 310 | | | | 0.46 | % | | | (1,330 | ) |
Innoviva, Inc. | | | 1,211 | | | | 0.42 | % | | | (1,598 | ) |
Philip Morris International, Inc. | | | 327 | | | | 0.70 | % | | | (1,694 | ) |
PepsiCo, Inc. | | | 144 | | | | 0.51 | % | | | (1,886 | ) |
Alexion Pharmaceuticals, Inc. | | | 160 | | | | 0.42 | % | | | (2,020 | ) |
Illumina, Inc. | | | 39 | | | | 0.31 | % | | | (2,412 | ) |
Archer-Daniels-Midland Co. | | | 429 | | | | 0.45 | % | | | (3,257 | ) |
Integer Holdings Corp. | | | 275 | | | | 0.51 | % | | | (3,681 | ) |
Merck & Company, Inc. | | | 625 | | | | 1.42 | % | | | (3,775 | ) |
Medtronic plc | | | 434 | | | | 1.15 | % | | | (3,794 | ) |
Edwards Lifesciences Corp. | | | 101 | | | | 0.56 | % | | | (4,562 | ) |
Procter & Gamble Co. | | | 417 | | | | 1.35 | % | | | (4,592 | ) |
Coca-Cola Co. | | | 532 | | | | 0.69 | % | | | (5,905 | ) |
Jazz Pharmaceuticals plc | | | 223 | | | | 0.66 | % | | | (6,385 | ) |
Macquarie Infrastructure Corp. | | | 522 | | | | 0.39 | % | | | (7,110 | ) |
Pfizer, Inc. | | | 1,409 | | | | 1.36 | % | | | (7,201 | ) |
Post Holdings, Inc. | | | 426 | | | | 1.04 | % | | | (8,852 | ) |
Herbalife Nutrition Ltd. | | | 659 | | | | 0.57 | % | | | (9,388 | ) |
Sysco Corp. | | | 1,088 | | | | 1.46 | % | | | (9,545 | ) |
Hologic, Inc. | | | 783 | | | | 0.81 | % | | | (9,785 | ) |
Molson Coors Beverage Co. — Class B | | | 1,117 | | | | 1.29 | % | | | (15,549 | ) |
Total Consumer, Non-cyclical | | | | | | | | | | | (108,651 | ) |
| | | | | | | | | | | | | |
Utilities | | | | | | | | | | | | |
Southern Co. | | | 528 | | | | 0.84 | % | | | (337 | ) |
NiSource, Inc. | | | 406 | | | | 0.30 | % | | | (575 | ) |
Avista Corp. | | | 155 | | | | 0.19 | % | | | (602 | ) |
Portland General Electric Co. | | | 371 | | | | 0.52 | % | | | (2,293 | ) |
FirstEnergy Corp. | | | 989 | | | | 1.17 | % | | | (2,651 | ) |
Entergy Corp. | | | 125 | | | | 0.35 | % | | | (2,949 | ) |
OGE Energy Corp. | | | 447 | | | | 0.41 | % | | | (5,772 | ) |
AES Corp. | | | 2,546 | | | | 1.02 | % | | | (5,781 | ) |
ALLETE, Inc. | | | 340 | | | | 0.61 | % | | | (6,844 | ) |
Exelon Corp. | | | 946 | | | | 1.03 | % | | | (7,283 | ) |
National Fuel Gas Co. | | | 831 | | | | 0.91 | % | | | (8,478 | ) |
PPL Corp. | | | 1,453 | | | | 1.06 | % | | | (8,589 | ) |
Public Service Enterprise Group, Inc. | | | 886 | | | | 1.17 | % | | | (11,918 | ) |
Vistra Energy Corp. | | | 1,770 | | | | 0.83 | % | | | (13,396 | ) |
NRG Energy, Inc. | | | 1,389 | | | | 1.12 | % | | | (14,282 | ) |
Total Utilities | | | | | | | | | | | (91,750 | ) |
| | | | | | | | | | | | | |
Financial | | | | | | | | | | | | |
Lexington Realty Trust | | | 4,009 | | | | 1.17 | % | | | (1,746 | ) |
Sunstone Hotel Investors, Inc. | | | 2,372 | | | | 0.61 | % | | | (3,673 | ) |
Northern Trust Corp. | | | 119 | | | | 0.26 | % | | | (3,888 | ) |
Travelers Companies, Inc. | | | 126 | | | | 0.37 | % | | | (4,422 | ) |
Kennedy-Wilson Holdings, Inc. | | | 971 | | | | 0.38 | % | | | (8,830 | ) |
Summit Hotel Properties, Inc. | | | 5,722 | | | | 0.71 | % | | | (10,097 | ) |
Brixmor Property Group, Inc. | | | 1,514 | | | | 0.42 | % | | | (15,872 | ) |
Weingarten Realty Investors | | | 1,443 | | | | 0.61 | % | | | (20,575 | ) |
Total Financial | | | | | | | | | | | (69,103 | ) |
| | | | | | | | | | | | | |
Technology | | | | | | | | | | | | |
Activision Blizzard, Inc. | | | 528 | | | | 0.93 | % | | | 3,593 | |
Oracle Corp. | | | 238 | | | | 0.34 | % | | | (1,299 | ) |
Teradata Corp. | | | 483 | | | | 0.29 | % | | | (3,078 | ) |
Total Technology | | | | | | | | | | | (784 | ) |
| | | | | | | | | | | | | |
Basic Materials | | | | | | | | | | | | |
International Paper Co. | | | 341 | | | | 0.31 | % | | | (4,417 | ) |
SEE NOTES TO FINANCIAL STATEMENTS. | THE GUGGENHEIM FUNDS SEMI-ANNUAL REPORT | 19 |
SCHEDULE OF INVESTMENTS (Unaudited)(continued) | March 31, 2020 |
ALPHA OPPORTUNITY FUND | |
| | Shares | | | Percentage
Notional
Amount | | | Value and
Unrealized
Appreciation
(Depreciation) | |
Domtar Corp. | | | 400 | | | | 0.26 | % | | $ | (5,387 | ) |
Total Basic Materials | | | | | | | | | | | (9,804 | ) |
Total GS Equity Long Custom Basket | | | | | | $ | (865,147 | ) |
| | | | | | | | | |
GS EQUITY SHORT CUSTOM BASKET | | | | | | | | |
Financial | | | | | | | | | | | | |
Realty Income Corp. | | | 2,888 | | | | (1.34 | )% | | $ | 64,605 | |
People’s United Financial, Inc. | | | 11,677 | | | | (1.21 | )% | | | 61,435 | |
Cousins Properties, Inc. | | | 4,827 | | | | (1.33 | )% | | | 53,442 | |
Essential Properties Realty Trust, Inc. | | | 3,713 | | | | (0.46 | )% | | | 49,652 | |
WP Carey, Inc. | | | 1,374 | | | | (0.75 | )% | | | 45,091 | |
First Republic Bank | | | 1,777 | | | | (1.38 | )% | | | 42,340 | |
Cadence BanCorp | | | 3,590 | | | | (0.22 | )% | | | 40,958 | |
BOK Financial Corp. | | | 1,123 | | | | (0.45 | )% | | | 39,939 | |
UDR, Inc. | | | 3,262 | | | | (1.12 | )% | | | 36,513 | |
Western Alliance Bancorporation | | | 1,139 | | | | (0.33 | )% | | | 30,801 | |
Ameris Bancorp | | | 1,621 | | | | (0.36 | )% | | | 30,618 | |
Old National Bancorp | | | 7,248 | | | | (0.90 | )% | | | 27,111 | |
Atlantic Union Bankshares Corp. | | | 1,844 | | | | (0.38 | )% | | | 26,907 | |
First Midwest Bancorp, Inc. | | | 2,678 | | | | (0.33 | )% | | | 25,501 | |
Global Net Lease, Inc. | | | 3,477 | | | | (0.44 | )% | | | 24,952 | |
Alexandria Real Estate Equities, Inc. | | | 1,270 | | | | (1.64 | )% | | | 22,153 | |
CareTrust REIT, Inc. | | | 3,729 | | | | (0.52 | )% | | | 20,254 | |
Valley National Bancorp | | | 5,454 | | | | (0.38 | )% | | | 17,091 | |
Northwest Bancshares, Inc. | | | 3,146 | | | | (0.34 | )% | | | 16,745 | |
Washington Real Estate Investment Trust | | | 4,133 | | | | (0.93 | )% | | | 14,939 | |
Glacier Bancorp, Inc. | | | 2,079 | | | | (0.66 | )% | | | 13,995 | |
CME Group, Inc. — Class A | | | 418 | | | | (0.68 | )% | | | 13,785 | |
CenterState Bank Corp. | | | 1,980 | | | | (0.32 | )% | | | 13,547 | |
Arthur J Gallagher & Co. | | | 2,259 | | | | (1.73 | )% | | | 11,884 | |
Agree Realty Corp. | | | 2,543 | | | | (1.48 | )% | | | 11,545 | |
UMB Financial Corp. | | | 720 | | | | (0.31 | )% | | | 11,515 | |
EastGroup Properties, Inc. | | | 990 | | | | (0.97 | )% | | | 10,251 | |
Medical Properties Trust, Inc. | | | 2,387 | | | | (0.39 | )% | | | 9,125 | |
Healthcare Realty Trust, Inc. | | | 1,956 | | | | (0.51 | )% | | | 8,641 | |
National Storage Affiliates Trust | | | 1,879 | | | | (0.52 | )% | | | 8,229 | |
Brown & Brown, Inc. | | | 4,756 | | | | (1.62 | )% | | | 7,723 | |
Sun Communities, Inc. | | | 1,214 | | | | (1.43 | )% | | | 4,589 | |
Columbia Financial, Inc. | | | 4,004 | | | | (0.54 | )% | | | 2,128 | |
American Tower Corp. — Class A | | | 357 | | | | (0.73 | )% | | | 1,977 | |
RLI Corp. | | | 2,204 | | | | (1.82 | )% | | | 851 | |
Progressive Corp. | | | 970 | | | | (0.67 | )% | | | (49 | ) |
Rexford Industrial Realty, Inc. | | | 5,566 | | | | (2.15 | )% | | | (5,610 | ) |
Crown Castle International Corp. | | | 970 | | | | (1.32 | )% | | | (8,202 | ) |
QTS Realty Trust, Inc. — Class A | | | 2,475 | | | | (1.35 | )% | | | (11,824 | ) |
Terreno Realty Corp. | | | 4,047 | | | | (1.97 | )% | | | (18,797 | ) |
Equinix, Inc. | | | 177 | | | | (1.04 | )% | | | (21,298 | ) |
Americold Realty Trust | | | 5,815 | | | | (1.86 | )% | | | (23,561 | ) |
Easterly Government Properties, Inc. | | | 10,934 | | | | (2.53 | )% | | | (25,332 | ) |
SBA Communications Corp. | | | 778 | | | | (1.98 | )% | | | (36,150 | ) |
Total Financial | | | | | | | | | | | 670,009 | |
| | | | | | | | | | | | | |
Technology | | | | | | | | | | | | |
Autodesk, Inc. | | | 689 | | | | (1.01 | )% | | | 22,868 | |
Broadcom, Inc. | | | 340 | | | | (0.76 | )% | | | 20,047 | |
Twilio, Inc. — Class A | | | 787 | | | | (0.66 | )% | | | 18,383 | |
HubSpot, Inc. | | | 448 | | | | (0.56 | )% | | | 15,480 | |
Elastic N.V. | | | 739 | | | | (0.39 | )% | | | 15,370 | |
Workday, Inc. — Class A | | | 167 | | | | (0.20 | )% | | | 14,489 | |
Paychex, Inc. | | | 635 | | | | (0.38 | )% | | | 14,450 | |
salesforce.com, Inc. | | | 1,082 | | | | (1.47 | )% | | | 9,065 | |
ServiceNow, Inc. | | | 235 | | | | (0.63 | )% | | | 8,450 | |
Alteryx, Inc. — Class A | | | 553 | | | | (0.50 | )% | | | 7,779 | |
Leidos Holdings, Inc. | | | 716 | | | | (0.62 | )% | | | 6,844 | |
CACI International, Inc. — Class A | | | 500 | | | | (0.99 | )% | | | 6,546 | |
MongoDB, Inc. | | | 307 | | | | (0.39 | )% | | | 5,858 | |
Workiva, Inc. | | | 1,234 | | | | (0.38 | )% | | | 5,514 | |
Coupa Software, Inc. | | | 275 | | | | (0.36 | )% | | | 5,163 | |
EPAM Systems, Inc. | | | 510 | | | | (0.89 | )% | | | 4,611 | |
Paycom Software, Inc. | | | 106 | | | | (0.20 | )% | | | 3,669 | |
Tyler Technologies, Inc. | | | 136 | | | | (0.38 | )% | | | 3,543 | |
Fair Isaac Corp. | | | 76 | | | | (0.22 | )% | | | 3,264 | |
Smartsheet, Inc. ��� Class A | | | 1,164 | | | | (0.45 | )% | | | 2,620 | |
Veeva Systems, Inc. — Class A | | | 164 | | | | (0.24 | )% | | | 2,456 | |
Black Knight, Inc. | | | 1,842 | | | | (1.01 | )% | | | 2,099 | |
ANSYS, Inc. | | | 113 | | | | (0.25 | )% | | | (528 | ) |
Appfolio, Inc. — Class A | | | 197 | | | | (0.21 | )% | | | (2,043 | ) |
Splunk, Inc. | | | 601 | | | | (0.71 | )% | | | (4,453 | ) |
Monolithic Power Systems, Inc. | | | 167 | | | | (0.26 | )% | | | (6,060 | ) |
Five9, Inc. | | | 605 | | | | (0.44 | )% | | | (10,810 | ) |
RingCentral, Inc. — Class A | | | 160 | | | | (0.32 | )% | | | (13,470 | ) |
Total Technology | | | | | | | | | | | 161,204 | |
| | | | | | | | | | | | | |
Utilities | | | | | | | | | | | | |
Dominion Energy, Inc. | | | 2,811 | | | | (1.91 | )% | | | 18,801 | |
American States Water Co. | | | 1,394 | | | | (1.07 | )% | | | 14,281 | |
20 | THE GUGGENHEIM FUNDS SEMI-ANNUAL REPORT | SEE NOTES TO FINANCIAL STATEMENTS. |
SCHEDULE OF INVESTMENTS (Unaudited)(continued) | March 31, 2020 |
ALPHA OPPORTUNITY FUND | |
| | Shares | | | Percentage
Notional
Amount | | | Value and
Unrealized
Appreciation
(Depreciation) | |
WEC Energy Group, Inc. | | | 1,201 | | | | (1.00 | )% | | $ | 11,893 | |
American Water Works Company, Inc. | | | 1,182 | | | | (1.33 | )% | | | 11,630 | |
Eversource Energy | | | 916 | | | | (0.67 | )% | | | 10,578 | |
Sempra Energy | | | 262 | | | | (0.28 | )% | | | 8,743 | |
MGE Energy, Inc. | | | 757 | | | | (0.47 | )% | | | 8,111 | |
California Water Service Group | | | 1,943 | | | | (0.92 | )% | | | 5,445 | |
Alliant Energy Corp. | | | 713 | | | | (0.32 | )% | | | 3,297 | |
Atmos Energy Corp. | | | 523 | | | | (0.49 | )% | | | 2,087 | |
NextEra Energy, Inc. | | | 424 | | | | (0.96 | )% | | | (652 | ) |
Total Utilities | | | | | | | | | | | 94,214 | |
| | | | | | | | | | | | | |
Consumer, Non-cyclical | | | | | | | | | | | | |
Equifax, Inc. | | | 1,414 | | | | (1.59 | )% | | | 40,245 | |
Gartner, Inc. | | | 530 | | | | (0.50 | )% | | | 31,081 | |
PayPal Holdings, Inc. | | | 1,435 | | | | (1.29 | )% | | | 16,995 | |
Verisk Analytics, Inc. — Class A | | | 629 | | | | (0.82 | )% | | | 8,852 | |
CoStar Group, Inc. | | | 190 | | | | (1.05 | )% | | | 8,111 | |
Rollins, Inc. | | | 3,960 | | | | (1.35 | )% | | | 3,994 | |
Avalara, Inc. | | | 1,134 | | | | (0.80 | )% | | | 1,682 | |
MarketAxess Holdings, Inc. | | | 177 | | | | (0.55 | )% | | | 1,552 | |
ResMed, Inc. | | | 164 | | | | (0.23 | )% | | | (2,820 | ) |
Total Consumer, Non-cyclical | | | | | | | | | | | 109,692 | |
| | | | | | | | | | | | | |
Basic Materials | | | | | | | | | | | | |
PPG Industries, Inc. | | | 1,089 | | | | (0.86 | )% | | | 36,210 | |
Compass Minerals International, Inc. | | | 1,804 | | | | (0.65 | )% | | | 33,016 | |
Kaiser Aluminum Corp. | | | 997 | | | | (0.65 | )% | | | 29,303 | |
RPM International, Inc. | | | 2,601 | | | | (1.46 | )% | | | 25,251 | |
Linde plc | | | 726 | | | | (1.18 | )% | | | 22,731 | |
Sherwin-Williams Co. | | | 188 | | | | (0.81 | )% | | | 19,419 | |
Southern Copper Corp. | | | 1,234 | | | | (0.33 | )% | | | 17,368 | |
Newmont Corp. | | | 4,377 | | | | (1.86 | )% | | | 4,403 | |
Balchem Corp. | | | 1,937 | | | | (1.80 | )% | | | (4,770 | ) |
Total Basic Materials | | | | | | | | | | | 182,931 | |
| | | | | | | | | | | | | |
Communications | | | | | | | | | | | | |
8x8, Inc. | | | 4,461 | | | | (0.58 | )% | | | 28,827 | |
Q2 Holdings, Inc. | | | 1,126 | | | | (0.63 | )% | | | 21,629 | |
Proofpoint, Inc. | | | 798 | | | | (0.77 | )% | | | 12,022 | |
Trade Desk, Inc. — Class A | | | 86 | | | | (0.16 | )% | | | 3,888 | |
Okta, Inc. | | | 437 | | | | (0.50 | )% | | | 2,349 | |
Total Communications | | | | | | | | | | | 68,715 | |
| | | | | | | | | | | | | |
Industrial | | | | | | | | | | | | |
TransDigm Group, Inc. | | | 602 | | | | (1.81 | )% | | | 81,073 | |
Waste Management, Inc. | | | 1,781 | | | | (1.55 | )% | | | 42,223 | |
Materion Corp. | | | 1,162 | | | | (0.38 | )% | | | 35,069 | |
HEICO Corp. | | | 479 | | | | (0.34 | )% | | | 30,722 | |
Tetra Tech, Inc. | | | 1,272 | | | | (0.84 | )% | | | 21,292 | |
Roper Technologies, Inc. | | | 292 | | | | (0.86 | )% | | | 18,712 | |
Casella Waste Systems, Inc. — Class A | | | 2,204 | | | | (0.81 | )% | | | 17,980 | |
Sonoco Products Co. | | | 1,462 | | | | (0.64 | )% | | | 14,071 | |
Republic Services, Inc. — Class A | | | 763 | | | | (0.54 | )% | | | 12,111 | |
Ball Corp. | | | 2,136 | | | | (1.30 | )% | | | 11,454 | |
Exponent, Inc. | | | 1,852 | | | | (1.25 | )% | | | 2,757 | |
Total Industrial | | | | | | | | | | | 287,464 | |
| | | | | | | | | | | | | |
Consumer, Cyclical | | | | | | | | | | | | |
Copart, Inc. | | | 2,434 | | | | (1.57 | )% | | | 64,825 | |
Total GS Equity Short Custom Basket | | | | | | $ | 1,639,054 | |
* | Non-income producing security. |
† | Value determined based on Level 1 inputs — See Note 4. |
†† | Value determined based on Level 2 inputs — See Note 4. |
1 | Rate indicated is the 7-day yield as of March 31, 2020. |
| | GS — Goldman Sachs International |
| | MS — Morgan Stanley Capital Services LLC |
| | plc — Public Limited Company |
| | REIT — Real Estate Investment Trust |
| | |
| | See Sector Classification in Other Information section. |
SEE NOTES TO FINANCIAL STATEMENTS. | THE GUGGENHEIM FUNDS SEMI-ANNUAL REPORT | 21 |
SCHEDULE OF INVESTMENTS (Unaudited)(concluded) | March 31, 2020 |
ALPHA OPPORTUNITY FUND | |
The following table summarizes the inputs used to value the Fund’s investments at March 31, 2020 (See Note 4 in the Notes to Financial Statements):
Investments in Securities (Assets) | | Level 1
Quoted
Prices | | | Level 2
Significant
Observable
Inputs | | | Level 3
Significant
Unobservable
Inputs | | | Total | |
Common Stocks | | $ | 25,856,608 | | | $ | — | | | $ | — | | | $ | 25,856,608 | |
Money Market Fund | | | 6,060,134 | | | | — | | | | — | | | | 6,060,134 | |
Equity Custom Basket Swap Agreements** | | | — | | | | 3,166,925 | | | | — | | | | 3,166,925 | |
Total Assets | | $ | 31,916,742 | | | $ | 3,166,925 | | | $ | — | | | $ | 35,083,667 | |
Investments in Securities (Liabilities) | | Level 1
Quoted
Prices | | | Level 2
Significant
Observable
Inputs | | | Level 3
Significant
Unobservable
Inputs | | | Total | |
Equity Custom Basket Swap Agreements** | | $ | — | | | $ | 1,714,739 | | | $ | — | | | $ | 1,714,739 | |
** | This derivative is reported as unrealized appreciation/depreciation at period end. |
22 | THE GUGGENHEIM FUNDS SEMI-ANNUAL REPORT | SEE NOTES TO FINANCIAL STATEMENTS. |
STATEMENT OF ASSETS AND LIABILITIES (Unaudited) |
March 31, 2020 |
Assets: |
Investments, at value (cost $39,318,986) | | $ | 31,916,742 | |
Cash | | | 1,543,262 | |
Unrealized appreciation on OTC swap agreements | | | 3,166,925 | |
Prepaid expenses | | | 43,601 | |
Receivables: |
Swap settlement | | | 2,460,096 | |
Securities sold | | | 166,903 | |
Dividends | | | 59,892 | |
Interest | | | 2,588 | |
Total assets | | | 39,360,009 | |
| | | | | |
Liabilities: |
Segregated cash due to broker | | | 1,756,000 | |
Unrealized depreciation on OTC swap agreements | | | 1,714,739 | |
Payable for: |
Securities purchased | | | 170,000 | |
Fund shares redeemed | | | 42,828 | |
Management fees | | | 30,258 | |
Transfer agent/maintenance fees | | | 11,443 | |
Fund accounting/administration fees | | | 1,693 | |
Trustees’ fees* | | | 1,455 | |
Distribution and service fees | | | 1,403 | |
Due to Investment Adviser | | | 15 | |
Miscellaneous | | | 68,814 | |
Total liabilities | | | 3,798,648 | |
Net assets | | $ | 35,561,361 | |
| | | | | |
Net assets consist of: |
Paid in capital | | $ | 67,604,173 | |
Total distributable earnings (loss) | | | (32,042,812 | ) |
Net assets | | $ | 35,561,361 | |
| | | | | |
A-Class: |
Net assets | | $ | 3,633,295 | |
Capital shares outstanding | | | 226,674 | |
Net asset value per share | | $ | 16.03 | |
Maximum offering price per share (Net asset value divided by 95.25%) | | $ | 16.83 | |
| | | | | |
C-Class: |
Net assets | | $ | 407,599 | |
Capital shares outstanding | | | 29,087 | |
Net asset value per share | | $ | 14.01 | |
| | | | | |
P-Class: |
Net assets | | $ | 1,574,857 | |
Capital shares outstanding | | | 97,299 | |
Net asset value per share | | $ | 16.19 | |
| | | | | |
Institutional Class: |
Net assets | | $ | 29,945,610 | |
Capital shares outstanding | | | 1,281,940 | |
Net asset value per share | | $ | 23.36 | |
STATEMENT OF OPERATIONS (Unaudited) |
Six-Month Period Ended March 31, 2020 |
Investment Income: |
Dividends | | $ | 950,828 | |
Interest | | | 24,861 | |
Total investment income | | | 975,689 | |
| | | | | |
Expenses: |
Management fees | | | 358,235 | |
Distribution and service fees: |
A-Class | | | 7,783 | |
C-Class | | | 2,671 | |
P-Class | | | 2,292 | |
Transfer agent/maintenance fees: |
A-Class | | | 4,022 | |
C-Class | | | 1,108 | |
P-Class | | | 415 | |
Institutional Class | | | 13,541 | |
Registration fees | | | 37,523 | |
Fund accounting/administration fees | | | 30,768 | |
Professional fees | | | 25,829 | |
Custodian fees | | | 15,472 | |
Trustees’ fees* | | | 10,213 | |
Line of credit fees | | | 1,181 | |
Interest expense | | | 39 | |
Miscellaneous | | | 28,969 | |
Recoupment of previously waived fees: |
A-Class | | | 791 | |
C-Class | | | 38 | |
P-Class | | | 116 | |
Institutional Class | | | 378 | |
Total expenses | | | 541,384 | |
Less: |
Expenses reimbursed by Adviser: |
A-Class | | | (552 | ) |
C-Class | | | (512 | ) |
P-Class | | | (5 | ) |
Institutional Class | | | (91 | ) |
Expenses waived by Adviser | | | (601 | ) |
Earnings credits applied | | | (44 | ) |
Total waived/reimbursed expenses | | | (1,805 | ) |
Net expenses | | | 539,579 | |
Net investment income | | | 436,110 | |
| | | | | |
Net Realized and Unrealized Gain (Loss): |
Net realized gain (loss) on: |
Investments | | | (1,785,743 | ) |
Swap agreements | | | 155,999 | |
Net realized loss | | | (1,629,744 | ) |
Net change in unrealized appreciation (depreciation) on: |
Investments | | | (9,238,590 | ) |
Swap agreements | | | 3,719,853 | |
Net change in unrealized appreciation (depreciation) | | | (5,518,737 | ) |
Net realized and unrealized loss | | | (7,148,481 | ) |
Net decrease in net assets resulting from operations | | $ | (6,712,371 | ) |
* | Relates to Trustees not deemed “interested persons” within the meaning of Section 2(a)(19) of the 1940 Act. |
SEE NOTES TO FINANCIAL STATEMENTS. | THE GUGGENHEIM FUNDS SEMI-ANNUAL REPORT | 23 |
STATEMENTS OF CHANGES IN NET ASSETS |
| | Six-Month
Period Ended
March 31,
2020
(Unaudited) | | | Year Ended
September 30,
2019 | |
Increase (Decrease) in Net Assets from Operations: | | | | | | | | |
Net investment income | | $ | 436,110 | | | $ | 1,179,140 | |
Net realized loss on investments | | | (1,629,744 | ) | | | (17,459,178 | ) |
Net change in unrealized appreciation (depreciation) on investments | | | (5,518,737 | ) | | | 4,603,420 | |
Net decrease in net assets resulting from operations | | | (6,712,371 | ) | | | (11,676,618 | ) |
| | | | | | | | | |
Distributions to shareholders: | | | | | | | | |
A-Class | | | (62,477 | ) | | | (116,145 | ) |
P-Class | | | (14,549 | ) | | | (27,471 | ) |
Institutional Class | | | (785,413 | ) | | | (1,999,721 | ) |
Total distributions to shareholders | | | (862,439 | ) | | | (2,143,337 | ) |
| | | | | | | | | |
Capital share transactions: | | | | | | | | |
Proceeds from sale of shares | | | | | | | | |
A-Class | | | 200,275 | | | | 431,143 | |
C-Class | | | 3,000 | | | | 21,885 | |
P-Class | | | 313,527 | | | | 128,195 | |
Institutional Class | | | 417,732 | | | | 3,348,033 | |
Distributions reinvested | | | | | | | | |
A-Class | | | 60,267 | | | | 110,113 | |
P-Class | | | 14,549 | | | | 27,471 | |
Institutional Class | | | 776,126 | | | | 1,978,134 | |
Cost of shares redeemed | | | | | | | | |
A-Class | | | (3,486,959 | ) | | | (3,558,021 | ) |
C-Class | | | (262,009 | ) | | | (272,683 | ) |
P-Class | | | (503,847 | ) | | | (2,462,538 | ) |
Institutional Class | | | (43,646,952 | ) | | | (94,580,128 | ) |
Net decrease from capital share transactions | | | (46,114,291 | ) | | | (94,828,396 | ) |
Net decrease in net assets | | | (53,689,101 | ) | | | (108,648,351 | ) |
| | | | | | | | | |
Net assets: | | | | | | | | |
Beginning of period | | | 89,250,462 | | | | 197,898,813 | |
End of period | | $ | 35,561,361 | | | $ | 89,250,462 | |
| | | | | | | | | |
Capital share activity: | | | | | | | | |
Shares sold | | | | | | | | |
A-Class | | | 11,637 | | | | 23,614 | |
C-Class | | | 202 | | | | 1,365 | |
P-Class | | | 18,033 | | | | 6,923 | |
Institutional Class | | | 17,123 | | | | 130,493 | |
Shares issued from reinvestment of distributions | | | | | | | | |
A-Class | | | 3,442 | | | | 6,100 | |
P-Class | | | 823 | | | | 1,511 | |
Institutional Class | | | 30,436 | | | | 75,530 | |
Shares redeemed | | | | | | | | |
A-Class | | | (208,855 | ) | | | (196,272 | ) |
C-Class | | | (17,448 | ) | | | (17,408 | ) |
P-Class | | | (30,062 | ) | | | (135,289 | ) |
Institutional Class | | | (1,892,496 | ) | | | (3,599,302 | ) |
Net decrease in shares | | | (2,067,165 | ) | | | (3,702,735 | ) |
24 | THE GUGGENHEIM FUNDS SEMI-ANNUAL REPORT | SEE NOTES TO FINANCIAL STATEMENTS. |
This table is presented to show selected data for a share outstanding throughout each period and to assist shareholders in evaluating a Fund’s performance for the periods presented.
A-Class | | Period Ended
March 31,
2020a | | | Year Ended
September 30,
2019 | | | Year Ended
September 30,
2018 | | | Year Ended
September 30,
2017 | | | Year Ended
September 30,
2016 | | | Year Ended
September 30,
2015 | |
Per Share Data |
Net asset value, beginning of period | | $ | 17.42 | | | $ | 19.15 | | | $ | 21.10 | | | $ | 19.08 | | | $ | 18.39 | | | $ | 18.01 | |
Income (loss) from investment operations: |
Net investment income (loss)b | | | .07 | | | | .12 | | | | .10 | | | | .31 | | | | (.19 | ) | | | (.35 | ) |
Net gain (loss) on investments (realized and unrealized) | | | (1.30 | ) | | | (1.64 | ) | | | (.60 | ) | | | 1.72 | | | | .88 | | | | .73 | |
Total from investment operations | | | (1.23 | ) | | | (1.52 | ) | | | (.50 | ) | | | 2.03 | | | | .69 | | | | .38 | |
Less distributions from: |
Net investment income | | | (.16 | ) | | | (.21 | ) | | | — | | | | — | | | | — | | | | (— | )c |
Net realized gains | | | — | | | | — | | | | (1.45 | ) | | | (.01 | ) | | | — | | | | — | |
Total distributions | | | (.16 | ) | | | (.21 | ) | | | (1.45 | ) | | | (.01 | ) | | | — | | | | (— | )c |
Net asset value, end of period | | $ | 16.03 | | | $ | 17.42 | | | $ | 19.15 | | | $ | 21.10 | | | $ | 19.08 | | | $ | 18.39 | |
|
Total Returnd | | | (7.13 | %) | | | (7.97 | %) | | | (2.90 | %) | | | 10.70 | % | | | 3.70 | % | | | 2.13 | % |
Ratios/Supplemental Data |
Net assets, end of period (in thousands) | | $ | 3,633 | | | $ | 7,326 | | | $ | 11,243 | | | $ | 15,011 | | | $ | 16,041 | | | $ | 11,485 | |
Ratios to average net assets: |
Net investment income (loss) | | | 0.77 | % | | | 0.64 | % | | | 0.51 | % | | | 1.49 | % | | | (1.02 | %) | | | (1.88 | %) |
Total expenses | | | 1.68 | % | | | 1.65 | % | | | 1.54 | % | | | 2.21 | % | | | 2.69 | % | | | 3.92 | % |
Net expensese,f,g | | | 1.66 | % | | | 1.64 | % | | | 1.54 | % | | | 2.17 | % | | | 2.69 | % | | | 2.94 | % |
Portfolio turnover rate | | | 99 | % | | | 126 | % | | | 255 | % | | | 92 | % | | | 235 | % | | | 124 | % |
C-Class | | Period Ended
March 31,
2020a | | | Year Ended
September 30,
2019 | | | Year Ended
September 30,
2018 | | | Year Ended
September 30,
2017 | | | Year Ended
September 30,
2016 | | | Year Ended
September 30,
2015 | |
Per Share Data |
Net asset value, beginning of period | | $ | 15.16 | | | $ | 16.61 | | | $ | 18.62 | | | $ | 16.96 | | | $ | 16.47 | | | $ | 16.25 | |
Income (loss) from investment operations: |
Net investment income (loss)b | | | (— | )h | | | (.03 | ) | | | (.05 | ) | | | .09 | | | | (.29 | ) | | | (.44 | ) |
Net gain (loss) on investments (realized and unrealized) | | | (1.15 | ) | | | (1.42 | ) | | | (.51 | ) | | | 1.58 | | | | .78 | | | | .66 | |
Total from investment operations | | | (1.15 | ) | | | (1.45 | ) | | | (.56 | ) | | | 1.67 | | | | .49 | | | | .22 | |
Less distributions from: |
Net investment income | | | — | | | | — | | | | — | | | | — | | | | — | | | | (— | )c |
Net realized gains | | | — | | | | — | | | | (1.45 | ) | | | (.01 | ) | | | — | | | | — | |
Total distributions | | | — | | | | — | | | | (1.45 | ) | | | (.01 | ) | | | — | | | | (— | )c |
Net asset value, end of period | | $ | 14.01 | | | $ | 15.16 | | | $ | 16.61 | | | $ | 18.62 | | | $ | 16.96 | | | $ | 16.47 | |
|
Total Returnd | | | (7.59 | %) | | | (8.73 | %) | | | (3.65 | %) | | | 9.91 | % | | | 2.91 | % | | | 1.38 | % |
Ratios/Supplemental Data |
Net assets, end of period (in thousands) | | $ | 408 | | | $ | 702 | | | $ | 1,036 | | | $ | 2,508 | | | $ | 1,550 | | | $ | 1,203 | |
Ratios to average net assets: |
Net investment income (loss) | | | (0.02 | %) | | | (0.20 | %) | | | (0.31 | %) | | | 0.47 | % | | | (1.72 | %) | | | (2.64 | %) |
Total expenses | | | 2.71 | % | | | 2.55 | % | | | 2.34 | % | | | 2.94 | % | | | 3.91 | % | | | 4.81 | % |
Net expensese,f,g | | | 2.51 | % | | | 2.48 | % | | | 2.31 | % | | | 2.88 | % | | | 3.46 | % | | | 3.68 | % |
Portfolio turnover rate | | | 99 | % | | | 126 | % | | | 255 | % | | | 92 | % | | | 235 | % | | | 124 | % |
SEE NOTES TO FINANCIAL STATEMENTS. | THE GUGGENHEIM FUNDS SEMI-ANNUAL REPORT | 25 |
FINANCIAL HIGHLIGHTS (continued) |
This table is presented to show selected data for a share outstanding throughout each period and to assist shareholders in evaluating a Fund’s performance for the periods presented.
P-Class | | Period Ended
March 31,
2020a | | | Year Ended
September 30,
2019 | | | Year Ended
September 30,
2018 | | | Year Ended
September 30,
2017 | | | Year Ended
September 30,
2016 | | | Period Ended
September 30,
2015i | |
Per Share Data |
Net asset value, beginning of period | | $ | 17.56 | | | $ | 19.23 | | | $ | 21.19 | | | $ | 19.11 | | | $ | 18.39 | | | $ | 19.11 | |
Income (loss) from investment operations: |
Net investment income (loss)b | | | .08 | | | | .11 | | | | .10 | | | | (.06 | ) | | | (.12 | ) | | | (.13 | ) |
Net gain (loss) on investments (realized and unrealized) | | | (1.32 | ) | | | (1.64 | ) | | | (.61 | ) | | | 2.15 | | | | .84 | | | | (.59 | ) |
Total from investment operations | | | (1.24 | ) | | | (1.53 | ) | | | (.51 | ) | | | 2.09 | | | | .72 | | | | (.72 | ) |
Less distributions from: |
Net investment income | | | (.13 | ) | | | (.14 | ) | | | — | | | | — | | | | — | | | | — | |
Net realized gains | | | — | | | | — | | | | (1.45 | ) | | | (.01 | ) | | | — | | | | — | |
Total distributions | | | (.13 | ) | | | (.14 | ) | | | (1.45 | ) | | | (.01 | ) | | | — | | | | — | |
Net asset value, end of period | | $ | 16.19 | | | $ | 17.56 | | | $ | 19.23 | | | $ | 21.19 | | | $ | 19.11 | | | $ | 18.39 | |
|
Total Return | | | (7.16 | %) | | | (7.99 | %) | | | (2.93 | %) | | | 11.00 | % | | | 3.86 | % | | | (3.77 | %) |
Ratios/Supplemental Data |
Net assets, end of period (in thousands) | | $ | 1,575 | | | $ | 1,905 | | | $ | 4,525 | | | $ | 7,720 | | | $ | 4,453 | | | $ | 134 | |
Ratios to average net assets: |
Net investment income (loss) | | | 0.88 | % | | | 0.59 | % | | | 0.47 | % | | | (0.31 | %) | | | (0.65 | %) | | | (1.77 | %) |
Total expenses | | | 1.58 | % | | | 1.67 | % | | | 1.58 | % | | | 1.75 | % | | | 2.44 | % | | | 3.31 | % |
Net expensese,f,g | | | 1.58 | % | | | 1.66 | % | | | 1.57 | % | | | 1.72 | % | | | 2.44 | % | | | 2.87 | % |
Portfolio turnover rate | | | 99 | % | | | 126 | % | | | 255 | % | | | 92 | % | | | 235 | % | | | 124 | % |
26 | THE GUGGENHEIM FUNDS SEMI-ANNUAL REPORT | SEE NOTES TO FINANCIAL STATEMENTS. |
FINANCIAL HIGHLIGHTS (concluded) |
This table is presented to show selected data for a share outstanding throughout each period and to assist shareholders in evaluating a Fund’s performance for the periods presented.
Institutional Class | | Period Ended
March 31,
2020a | | | Year Ended
September 30,
2019 | | | Year Ended
September 30,
2018 | | | Year Ended
September 30,
2017 | | | Year Ended
September 30,
2016 | | | Year Ended
September 30,
2015 | |
Per Share Data |
Net asset value, beginning of period | | $ | 25.37 | | | $ | 27.77 | | | $ | 29.86 | | | $ | 26.82 | | | $ | 25.73 | | | $ | 25.13 | |
Income (loss) from investment operations: |
Net investment income (loss)b | | | .14 | | | | .28 | | | | .27 | | | | .12 | | | | (.13 | ) | | | (.40 | ) |
Net gain (loss) on investments (realized and unrealized) | | | (1.90 | ) | | | (2.37 | ) | | | (.91 | ) | | | 2.93 | | | | 1.22 | | | | 1.00 | |
Total from investment operations | | | (1.76 | ) | | | (2.09 | ) | | | (.64 | ) | | | 3.05 | | | | 1.09 | | | | .60 | |
Less distributions from: |
Net investment income | | | (.25 | ) | | | (.31 | ) | | | — | | | | — | | | | — | | | | (— | )c |
Net realized gains | | | — | | | | — | | | | (1.45 | ) | | | (.01 | ) | | | — | | | | — | |
Total distributions | | | (.25 | ) | | | (.31 | ) | | | (1.45 | ) | | | (.01 | ) | | | — | | | | (— | )c |
Net asset value, end of period | | $ | 23.36 | | | $ | 25.37 | | | $ | 27.77 | | | $ | 29.86 | | | $ | 26.82 | | | $ | 25.73 | |
|
Total Return | | | (7.05 | %) | | | (7.57 | %) | | | (2.50 | %) | | | 11.42 | % | | | 4.20 | % | | | 2.41 | % |
Ratios/Supplemental Data |
Net assets, end of period (in thousands) | | $ | 29,946 | | | $ | 79,318 | | | $ | 181,095 | | | $ | 196,180 | | | $ | 56,550 | | | $ | 50,304 | |
Ratios to average net assets: |
Net investment income (loss) | | | 1.14 | % | | | 1.05 | % | | | 0.94 | % | | | 0.40 | % | | | (0.49 | %) | | | (1.55 | %) |
Total expenses | | | 1.32 | % | | | 1.22 | % | | | 1.12 | % | | | 1.38 | % | | | 2.23 | % | | | 2.80 | % |
Net expensese,f,g | | | 1.31 | % | | | 1.21 | % | | | 1.12 | % | | | 1.37 | % | | | 2.23 | % | | | 2.80 | % |
Portfolio turnover rate | | | 99 | % | | | 126 | % | | | 255 | % | | | 92 | % | | | 235 | % | | | 124 | % |
a | Unaudited figures for the period ended March 31, 2020. Percentage amounts for the period, except total return and portfolio turnover rate, have been annualized. |
b | Net investment income (loss) per share was computed using average shares outstanding throughout the period. |
c | Distributions from net investment income are less than $0.01 per share. |
d | Total return does not reflect the impact of any applicable sales charges. |
e | Net expense information reflects the expense ratios after expense waivers and reimbursements, as applicable. |
f | The portion of the ratios of net expenses to average net assets attributable to recoupments of prior fee reductions or expense reimbursements for the periods presented was as follows: |
| | | 03/31/20a | 09/30/19 | 09/30/18 | 09/30/17 |
| | A-Class | 0.03% | 0.09% | 0.02% | 0.32% |
| | C-Class | 0.01% | 0.04% | 0.07% | 0.64% |
| | P-Class | 0.01% | 0.03% | 0.04% | — |
| | Institutional Class | 0.00%* | 0.00%* | — | 0.01% |
g | Net expenses may include expenses that are excluded from the expense limitation agreement. Excluding these expenses, the net expense ratios for the periods would be: |
| | | 03/31/20a | 09/30/19 | 09/30/18 | 09/30/17 | 09/30/16 | 09/30/15 |
| | A-Class | 1.66% | 1.64% | 1.52% | 2.00% | 2.11% | 2.11% |
| | C-Class | 2.51% | 2.48% | 2.30% | 2.71% | 2.86% | 2.86% |
| | P-Class | 1.58% | 1.66% | 1.56% | 1.68% | 1.87% | 2.10% |
| | Institutional Class | 1.31% | 1.21% | 1.11% | 1.28% | 1.63% | 1.86% |
h | Net investment income (loss) is less than $0.01 per share. |
i | Since commencement of operations: May 1, 2015. Percentage amounts for the period, except total return and portfolio turnover rate, have been annualized. |
SEE NOTES TO FINANCIAL STATEMENTS. | THE GUGGENHEIM FUNDS SEMI-ANNUAL REPORT | 27 |
PERFORMANCE REPORT AND FUND PROFILE (Unaudited) | March 31, 2020 |
LARGE CAP VALUE FUND
OBJECTIVE: Seeks long-term growth of capital.
Holdings Diversification (Market Exposure as % of Net Assets)
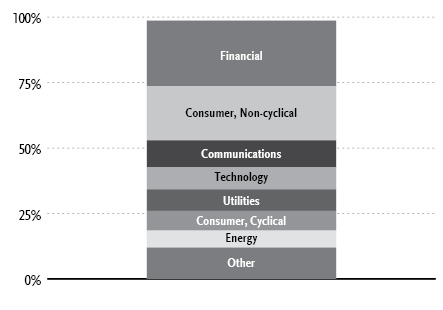
“Holdings Diversification (Market Exposure as % of Net Assets)” excludes any temporary cash investments.
Inception Dates: |
A-Class | August 7, 1944 |
C-Class | January 29, 1999 |
P-Class | May 1, 2015 |
Institutional Class | June 7, 2013 |
Ten Largest Holdings (% of Total Net Assets) |
Verizon Communications, Inc. | 3.4% |
Bank of America Corp. | 3.2% |
Pfizer, Inc. | 2.5% |
Johnson & Johnson | 2.4% |
Berkshire Hathaway, Inc. — Class B | 2.2% |
Intel Corp. | 2.2% |
JPMorgan Chase & Co. | 2.2% |
Citigroup, Inc. | 2.1% |
iShares Russell 1000 Value ETF | 2.0% |
Micron Technology, Inc. | 1.9% |
Top Ten Total | 24.1% |
| | |
“Ten Largest Holdings” excludes any temporary cash investments. |
28 | THE GUGGENHEIM FUNDS SEMI-ANNUAL REPORT | |
PERFORMANCE REPORT AND FUND PROFILE (Unaudited)(concluded) | March 31, 2020 |
Average Annual Returns*
Periods Ended March 31, 2020
| 6 Month† | 1 Year | 5 Year | 10 Year |
A-Class Shares | (21.31%) | (21.17%) | 0.78% | 5.70% |
A-Class Shares with sales charge‡ | (25.05%) | (24.92%) | (0.20%) | 5.07% |
C-Class Shares | (21.62%) | (21.76%) | 0.02% | 4.91% |
C-Class Shares with CDSC§ | (22.35%) | (22.49%) | 0.02% | 4.91% |
Russell 1000 Value Index | (21.30%) | (17.17%) | 1.90% | 7.67% |
| 6 Month† | 1 Year | 5 Year | Since
Inception
(06/07/13) |
Institutional Class Shares | (21.24%) | (21.00%) | 1.01% | 3.84% |
Russell 1000 Value Index | (21.30%) | (17.17%) | 1.90% | 4.96% |
| | 6 Month† | 1 Year | Since
Inception
(05/01/15) |
P-Class Shares | | (21.31%) | (21.16%) | 0.54% |
Russell 1000 Value Index | | (21.30%) | (17.17%) | 1.56% |
* | The performance data above represents past performance that is not predictive of future results. The investment return and principal value of an investment in the Fund will fluctuate so that an investor’s shares, when redeemed, may be worth more or less than their original cost. Returns are historical and include changes in principal and reinvested dividends and capital gains and do not reflect the effect of taxes. The Russell 1000 Value Index is an unmanaged index and, unlike the Fund, has no management fees or operating expenses to reduce its reported return. |
† | 6 month returns are not annualized. |
‡ | Effective February 22, 2011, the maximum sales charge decreased from 5.75% to 4.75%. A 5.75% maximum sales charge is used in the calculation of the Average Annual Returns based on subscriptions made prior to February 22, 2011, and a 4.75% maximum sales charge will be used to calculate performance for periods based on subscriptions made on or after February 22, 2011. |
§ | Fund returns include a CDSC of 1% if redeemed within 12 months of purchase. |
| | THE GUGGENHEIM FUNDS SEMI-ANNUAL REPORT | 29 |
SCHEDULE OF INVESTMENTS (Unaudited) | March 31, 2020 |
LARGE CAP VALUE FUND | |
| | Shares | | | Value | |
COMMON STOCKS† - 96.7% |
| | | | | | | | | |
Financial - 25.1% |
Bank of America Corp. | | | 44,166 | | | $ | 937,644 | |
Berkshire Hathaway, Inc. — Class B* | | | 3,622 | | | | 662,210 | |
JPMorgan Chase & Co. | | | 7,261 | | | | 653,708 | |
Citigroup, Inc. | | | 14,590 | | | | 614,531 | |
Wells Fargo & Co. | | | 14,451 | | | | 414,744 | |
Equity Commonwealth REIT | | | 12,941 | | | | 410,359 | |
Allstate Corp. | | | 4,373 | | | | 401,135 | |
Truist Financial Corp. | | | 9,277 | | | | 286,103 | |
Voya Financial, Inc. | | | 6,263 | | | | 253,965 | |
MetLife, Inc. | | | 8,188 | | | | 250,307 | |
Loews Corp. | | | 6,861 | | | | 238,969 | |
Prudential Financial, Inc. | | | 4,561 | | | | 237,811 | |
Morgan Stanley | | | 6,884 | | | | 234,056 | |
Hartford Financial Services Group, Inc. | | | 6,387 | | | | 225,078 | |
Principal Financial Group, Inc. | | | 7,113 | | | | 222,921 | |
Medical Properties Trust, Inc. REIT | | | 12,519 | | | | 216,454 | |
Charles Schwab Corp. | | | 4,929 | | | | 165,713 | |
Zions Bancorp North America | | | 6,177 | | | | 165,296 | |
Mastercard, Inc. — Class A | | | 590 | | | | 142,520 | |
Regions Financial Corp. | | | 13,851 | | | | 124,243 | |
Old Republic International Corp. | | | 8,083 | | | | 123,266 | |
KeyCorp | | | 11,415 | | | | 118,374 | |
Jones Lang LaSalle, Inc. | | | 1,031 | | | | 104,111 | |
Howard Hughes Corp.* | | | 1,768 | | | | 89,319 | |
American International Group, Inc. | | | 3,425 | | | | 83,056 | |
Park Hotels & Resorts, Inc. REIT | | | 5,862 | | | | 46,368 | |
Total Financial | | | | | | | 7,422,261 | |
| | | | | | | | | |
Consumer, Non-cyclical - 20.7% |
Pfizer, Inc. | | | 22,239 | | | | 725,881 | |
Johnson & Johnson | | | 5,417 | | | | 710,331 | |
Humana, Inc. | | | 1,305 | | | | 409,796 | |
McKesson Corp. | | | 2,847 | | | | 385,085 | |
Tyson Foods, Inc. — Class A | | | 6,508 | | | | 376,618 | |
HCA Healthcare, Inc. | | | 3,831 | | | | 344,215 | |
Archer-Daniels-Midland Co. | | | 9,668 | | | | 340,120 | |
Alexion Pharmaceuticals, Inc.* | | | 3,691 | | | | 331,415 | |
Quest Diagnostics, Inc. | | | 4,036 | | | | 324,091 | |
Merck & Company, Inc. | | | 4,153 | | | | 319,532 | |
Encompass Health Corp. | | | 4,795 | | | | 307,024 | |
Amgen, Inc. | | | 1,290 | | | | 261,522 | |
United Therapeutics Corp.* | | | 2,663 | | | | 252,519 | |
Zimmer Biomet Holdings, Inc. | | | 2,334 | | | | 235,921 | |
Medtronic plc | | | 2,255 | | | | 203,356 | |
Procter & Gamble Co. | | | 1,807 | | | | 198,770 | |
Bunge Ltd. | | | 4,752 | | | | 194,975 | |
Ingredion, Inc. | | | 2,407 | | | | 181,728 | |
Total Consumer, Non-cyclical | | | | | | | 6,102,899 | |
| | | | | | | | | |
Communications - 10.2% |
Verizon Communications, Inc. | | | 18,861 | | | | 1,013,402 | |
Comcast Corp. — Class A | | | 15,566 | | | | 535,159 | |
NortonLifeLock, Inc. | | | 20,571 | | | | 384,883 | |
Cisco Systems, Inc. | | | 8,535 | | | | 335,511 | |
F5 Networks, Inc.* | | | 1,505 | | | | 160,478 | |
Juniper Networks, Inc. | | | 7,968 | | | | 152,507 | |
Walt Disney Co. | | | 1,553 | | | | 150,020 | |
T-Mobile US, Inc.* | | | 1,723 | | | | 144,560 | |
AT&T, Inc. | | | 4,430 | | | | 129,134 | |
Total Communications | | | | | | | 3,005,654 | |
| | | | | | | | | |
Technology - 8.5% |
Intel Corp. | | | 12,205 | | | | 660,535 | |
Micron Technology, Inc.* | | | 13,488 | | | | 567,305 | |
Skyworks Solutions, Inc. | | | 3,635 | | | | 324,896 | |
Apple, Inc. | | | 1,245 | | | | 316,591 | |
International Business Machines Corp. | | | 1,886 | | | | 209,214 | |
Qorvo, Inc.* | | | 2,524 | | | | 203,510 | |
Amdocs Ltd. | | | 3,090 | | | | 169,857 | |
Change Healthcare, Inc.* | | | 5,647 | | | | 56,414 | |
Total Technology | | | | | | | 2,508,322 | |
| | | | | | | | | |
Utilities - 8.2% |
Exelon Corp. | | | 14,863 | | | | 547,107 | |
Public Service Enterprise Group, Inc. | | | 9,621 | | | | 432,079 | |
Duke Energy Corp. | | | 4,229 | | | | 342,042 | |
Edison International | | | 5,535 | | | | 303,263 | |
NiSource, Inc. | | | 9,482 | | | | 236,766 | |
Pinnacle West Capital Corp. | | | 2,813 | | | | 213,197 | |
AES Corp. | | | 13,709 | | | | 186,442 | |
PPL Corp. | | | 6,433 | | | | 158,766 | |
Total Utilities | | | | | | | 2,419,662 | |
| | | | | | | | | |
Consumer, Cyclical - 7.6% |
Walmart, Inc. | | | 4,843 | | | | 550,262 | |
Home Depot, Inc. | | | 1,740 | | | | 324,875 | |
Southwest Airlines Co. | | | 8,994 | | | | 320,276 | |
PACCAR, Inc. | | | 3,852 | | | | 235,473 | |
LKQ Corp.* | | | 10,067 | | | | 206,474 | |
Lear Corp. | | | 2,283 | | | | 185,494 | |
DR Horton, Inc. | | | 4,253 | | | | 144,602 | |
Walgreens Boots Alliance, Inc. | | | 2,473 | | | | 113,140 | |
PVH Corp. | | | 2,624 | | | | 98,767 | |
Carnival Corp. | | | 4,693 | | | | 61,807 | |
Macy’s, Inc. | | | 3,434 | | | | 16,861 | |
Total Consumer, Cyclical | | | | | | | 2,258,031 | |
| | | | | | | | | |
Energy - 6.5% |
Chevron Corp. | | | 7,246 | | | | 525,045 | |
ConocoPhillips | | | 14,810 | | | | 456,148 | |
Cabot Oil & Gas Corp. — Class A | | | 23,279 | | | | 400,166 | |
Exxon Mobil Corp. | | | 4,752 | | | | 180,433 | |
Marathon Oil Corp. | | | 30,406 | | | | 100,036 | |
Marathon Petroleum Corp. | | | 4,000 | | | | 94,480 | |
Parsley Energy, Inc. — Class A | | | 15,065 | | | | 86,323 | |
Range Resources Corp. | | | 29,532 | | | | 67,333 | |
Antero Resources Corp.* | | | 14,782 | | | | 10,538 | |
Total Energy | | | | | | | 1,920,502 | |
| | | | | | | | | |
30 | THE GUGGENHEIM FUNDS SEMI-ANNUAL REPORT | SEE NOTES TO FINANCIAL STATEMENTS. |
SCHEDULE OF INVESTMENTS (Unaudited)(concluded) | March 31, 2020 |
LARGE CAP VALUE FUND | |
| | Shares | | | Value | |
Industrial - 5.5% |
Eaton Corporation plc | | | 3,793 | | | $ | 294,678 | |
Knight-Swift Transportation Holdings, Inc. | | | 8,631 | | | | 283,097 | |
FedEx Corp. | | | 2,073 | | | | 251,372 | |
Owens Corning | | | 4,679 | | | | 181,592 | |
Valmont Industries, Inc. | | | 1,692 | | | | 179,318 | |
Lockheed Martin Corp. | | | 468 | | | | 158,629 | |
General Electric Co. | | | 18,189 | | | | 144,421 | |
Johnson Controls International plc | | | 4,712 | | | | 127,035 | |
Total Industrial | | | | | | | 1,620,142 | |
| | | | | | | | | |
Basic Materials - 4.4% |
Nucor Corp. | | | 7,729 | | | | 278,398 | |
Huntsman Corp. | | | 15,889 | | | | 229,278 | |
Freeport-McMoRan, Inc. | | | 32,853 | | | | 221,758 | |
Olin Corp. | | | 16,867 | | | | 196,838 | |
Reliance Steel & Aluminum Co. | | | 2,083 | | | | 182,450 | |
DuPont de Nemours, Inc. | | | 3,262 | | | | 111,234 | |
Dow, Inc. | | | 2,357 | | | | 68,919 | |
Total Basic Materials | | | | | | | 1,288,875 | |
| | | | | | | | | |
Total Common Stocks | | | | |
(Cost $33,853,605) | | | | | | | 28,546,348 | |
EXCHANGE-TRADED FUNDS† - 2.0% |
iShares Russell 1000 Value ETF | | | 5,953 | | | | 590,419 | |
Total Exchange-Traded Funds | | | | |
(Cost $764,193) | | | | | | | 590,419 | |
| | | | | | | | | |
MONEY MARKET FUND† - 1.5% |
Dreyfus Treasury Securities Cash Management Fund — Institutional Shares, 0.51%1 | | | 454,063 | | | | 454,063 | |
Total Money Market Fund | | | | |
(Cost $454,063) | | | | | | | 454,063 | |
| | | | | | | | | |
Total Investments - 100.2% | | | | |
(Cost $35,071,861) | | $ | 29,590,830 | |
Other Assets & Liabilities, net - (0.2)% | | | (72,184 | ) |
Total Net Assets - 100.0% | | $ | 29,518,646 | |
* | Non-income producing security. |
† | Value determined based on Level 1 inputs — See Note 4. |
1 | Rate indicated is the 7-day yield as of March 31, 2020. |
| | plc — Public Limited Company |
| | REIT— Real Estate Investment Trust |
| | |
| | See Sector Classification in Other Information section. |
The following table summarizes the inputs used to value the Fund’s investments at March 31, 2020 (See Note 4 in the Notes to Financial Statements):
Investments in Securities (Assets) | | Level 1
Quoted
Prices | | | Level 2
Significant
Observable
Inputs | | | Level 3
Significant
Unobservable
Inputs | | | Total | |
Common Stocks | | $ | 28,546,348 | | | $ | — | | | $ | — | | | $ | 28,546,348 | |
Exchange-Traded Funds | | | 590,419 | | | | — | | | | — | | | | 590,419 | |
Money Market Fund | | | 454,063 | | | | — | | | | — | | | | 454,063 | |
Total Assets | | $ | 29,590,830 | | | $ | — | | | $ | — | | | $ | 29,590,830 | |
SEE NOTES TO FINANCIAL STATEMENTS. | THE GUGGENHEIM FUNDS SEMI-ANNUAL REPORT | 31 |
STATEMENT OF ASSETS AND LIABILITIES (Unaudited) |
March 31, 2020 |
Assets: |
Investments, at value (cost $35,071,861) | | $ | 29,590,830 | |
Prepaid expenses | | | 31,922 | |
Receivables: |
Dividends | | | 44,410 | |
Interest | | | 413 | |
Fund shares sold | | | 9 | |
Total assets | | | 29,667,584 | |
| | | | | |
Liabilities: |
Payable for: |
Fund shares redeemed | | | 96,532 | |
Professional fees | | | 13,667 | |
Printing fees | | | 11,962 | |
Distribution and service fees | | | 6,774 | |
Management fees | | | 6,664 | |
Transfer agent/maintenance fees | | | 6,109 | |
Fund accounting/administration fees | | | 1,378 | |
Trustees’ fees* | | | 694 | |
Due to Investment Adviser | | | 42 | |
Miscellaneous | | | 5,116 | |
Total liabilities | | | 148,938 | |
Net assets | | $ | 29,518,646 | |
| | | | | |
Net assets consist of: |
Paid in capital | | $ | 30,891,084 | |
Total distributable earnings (loss) | | | (1,372,438 | ) |
Net assets | | $ | 29,518,646 | |
| | | | | |
A-Class: |
Net assets | | $ | 27,978,383 | |
Capital shares outstanding | | | 879,560 | |
Net asset value per share | | $ | 31.81 | |
Maximum offering price per share (Net asset value divided by 95.25%) | | $ | 33.40 | |
| | | | | |
C-Class: |
Net assets | | $ | 893,716 | |
Capital shares outstanding | | | 30,710 | |
Net asset value per share | | $ | 29.10 | |
| | | | | |
P-Class: |
Net assets | | $ | 160,656 | |
Capital shares outstanding | | | 5,066 | |
Net asset value per share | | $ | 31.71 | |
| | | | | |
Institutional Class: |
Net assets | | $ | 485,891 | |
Capital shares outstanding | | | 15,483 | |
Net asset value per share | | $ | 31.38 | |
STATEMENT OF OPERATIONS (Unaudited) |
Six-Month Period Ended March 31, 2020 |
Investment Income: |
Dividends | | $ | 1,081,506 | |
Interest | | | 4,752 | |
Total investment income | | | 1,086,258 | |
| | | | | |
Expenses: |
Management fees | | | 168,601 | |
Distribution and service fees: |
A-Class | | | 61,884 | |
C-Class | | | 7,280 | |
P-Class | | | 211 | |
Transfer agent/maintenance fees: |
A-Class | | | 19,753 | |
C-Class | | | 2,422 | |
P-Class | | | 308 | |
Institutional Class | | | 1,308 | |
Registration fees | | | 36,988 | |
Fund accounting/administration fees | | | 20,117 | |
Professional fees | | | 19,541 | |
Trustees’ fees* | | | 9,289 | |
Custodian fees | | | 2,809 | |
Line of credit fees | | | 680 | |
Miscellaneous | | | 22,262 | |
Recoupment of previously waived fees: |
A-Class | | | 39 | |
C-Class | | | 3 | |
Total expenses | | | 373,495 | |
Less: |
Expenses reimbursed by Adviser: |
A-Class | | | (19,657 | ) |
C-Class | | | (2,413 | ) |
P-Class | | | (307 | ) |
Institutional Class | | | (1,307 | ) |
Expenses waived by Adviser | | | (46,486 | ) |
Total waived/reimbursed expenses | | | (70,170 | ) |
Net expenses | | | 303,325 | |
Net investment income | | | 782,933 | |
| | | | | |
Net Realized and Unrealized Gain (Loss): |
Net realized gain (loss) on: |
Investments | | | 3,360,824 | |
Net realized gain | | | 3,360,824 | |
Net change in unrealized appreciation (depreciation) on: |
Investments | | | (11,052,502 | ) |
Net change in unrealized appreciation (depreciation) | | | (11,052,502 | ) |
Net realized and unrealized loss | | | (7,691,678 | ) |
Net decrease in net assets resulting from operations | | $ | (6,908,745 | ) |
* | Relates to Trustees not deemed “interested persons” within the meaning of Section 2(a)(19) of the 1940 Act. |
32 | THE GUGGENHEIM FUNDS SEMI-ANNUAL REPORT | SEE NOTES TO FINANCIAL STATEMENTS. |
STATEMENTS OF CHANGES IN NET ASSETS |
| | Six-Month
Period Ended
March 31,
2020
(Unaudited) | | | Year Ended
September 30,
2019 | |
Increase (Decrease) in Net Assets from Operations: | | | | | | | | |
Net investment income | | $ | 782,933 | | | $ | 851,296 | |
Net realized gain on investments | | | 3,360,824 | | | | 3,806,953 | |
Net change in unrealized appreciation (depreciation) on investments | | | (11,052,502 | ) | | | (6,975,646 | ) |
Net decrease in net assets resulting from operations | | | (6,908,745 | ) | | | (2,317,397 | ) |
| | | | | | | | | |
Distributions to shareholders: | | | | | | | | |
A-Class | | | (4,000,303 | ) | | | (3,032,549 | ) |
C-Class | | | (91,548 | ) | | | (126,553 | ) |
P-Class | | | (12,859 | ) | | | (8,136 | ) |
Institutional Class | | | (62,549 | ) | | | (281,733 | ) |
Total distributions to shareholders | | | (4,167,259 | ) | | | (3,448,971 | ) |
| | | | | | | | | |
Capital share transactions: | | | | | | | | |
Proceeds from sale of shares | | | | | | | | |
A-Class | | | 1,814,438 | | | | 6,686,468 | |
C-Class | | | 469,506 | | | | 506,809 | |
P-Class | | | 51,063 | | | | 45,579 | |
Institutional Class | | | 22,915 | | | | 323,966 | |
Distributions reinvested | | | | | | | | |
A-Class | | | 3,948,727 | | | | 2,987,616 | |
C-Class | | | 89,872 | | | | 125,361 | |
P-Class | | | 12,859 | | | | 8,136 | |
Institutional Class | | | 62,549 | | | | 281,712 | |
Cost of shares redeemed | | | | | | | | |
A-Class | | | (20,580,653 | ) | | | (7,766,149 | ) |
C-Class | | | (811,478 | ) | | | (1,482,917 | ) |
P-Class | | | (8,214 | ) | | | (33,283 | ) |
Institutional Class | | | (211,531 | ) | | | (5,275,661 | ) |
Net decrease from capital share transactions | | | (15,139,947 | ) | | | (3,592,363 | ) |
Net decrease in net assets | | | (26,215,951 | ) | | | (9,358,731 | ) |
| | | | | | | | | |
Net assets: | | | | | | | | |
Beginning of period | | | 55,734,597 | | | | 65,093,328 | |
End of period | | $ | 29,518,646 | | | $ | 55,734,597 | |
| | | | | | | | | |
Capital share activity: | | | | | | | | |
Shares sold | | | | | | | | |
A-Class | | | 42,602 | | | | 150,959 | |
C-Class | | | 11,553 | | | | 13,082 | |
P-Class | | | 1,389 | | | | 1,073 | |
Institutional Class | | | 714 | | | | 7,458 | |
Shares issued from reinvestment of distributions | | | | | | | | |
A-Class | | | 90,195 | | | | 77,180 | |
C-Class | | | 2,239 | | | | 3,526 | |
P-Class | | | 295 | | | | 211 | |
Institutional Class | | | 1,449 | | | | 7,373 | |
Shares redeemed | | | | | | | | |
A-Class | | | (475,573 | ) | | | (178,286 | ) |
C-Class | | | (21,634 | ) | | | (37,828 | ) |
P-Class | | | (188 | ) | | | (783 | ) |
Institutional Class | | | (5,210 | ) | | | (121,202 | ) |
Net decrease in shares | | | (352,169 | ) | | | (77,237 | ) |
SEE NOTES TO FINANCIAL STATEMENTS. | THE GUGGENHEIM FUNDS SEMI-ANNUAL REPORT | 33 |
This table is presented to show selected data for a share outstanding throughout each period and to assist shareholders in evaluating a Fund’s performance for the periods presented.
A-Class | | Period Ended
March 31,
2020a | | | Year Ended
September 30,
2019 | | | Year Ended
September 30,
2018 | | | Year Ended
September 30,
2017 | | | Year Ended
September 30,
2016 | | | Year Ended
September 30,
2015 | |
Per Share Data |
Net asset value, beginning of period | | $ | 43.56 | | | $ | 48.08 | | | $ | 46.96 | | | $ | 41.78 | | | $ | 39.11 | | | $ | 43.80 | |
Income (loss) from investment operations: |
Net investment income (loss)b | | | .65 | | | | .62 | | | | .48 | | | | .37 | | | | .58 | | | | .36 | |
Net gain (loss) on investments (realized and unrealized) | | | (9.01 | ) | | | (2.66 | ) | | | 4.46 | | | | 6.80 | | | | 5.23 | | | | (3.36 | ) |
Total from investment operations | | | (8.36 | ) | | | (2.04 | ) | | | 4.94 | | | | 7.17 | | | | 5.81 | | | | (3.00 | ) |
Less distributions from: |
Net investment income | | | (.70 | ) | | | (.36 | ) | | | (.51 | ) | | | (.58 | ) | | | (.37 | ) | | | (.35 | ) |
Net realized gains | | | (2.69 | ) | | | (2.12 | ) | | | (3.31 | ) | | | (1.41 | ) | | | (2.77 | ) | | | (1.34 | ) |
Total distributions | | | (3.39 | ) | | | (2.48 | ) | | | (3.82 | ) | | | (1.99 | ) | | | (3.14 | ) | | | (1.69 | ) |
Net asset value, end of period | | $ | 31.81 | | | $ | 43.56 | | | $ | 48.08 | | | $ | 46.96 | | | $ | 41.78 | | | $ | 39.11 | |
|
Total Returnc | | | (21.31 | %) | | | (3.59 | %) | | | 10.82 | % | | | 17.68 | % | | | 15.69 | % | | | (7.19 | %) |
Ratios/Supplemental Data |
Net assets, end of period (in thousands) | | $ | 27,978 | | | $ | 53,248 | | | $ | 56,369 | | | $ | 60,157 | | | $ | 55,325 | | | $ | 45,318 | |
Ratios to average net assets: |
Net investment income (loss) | | | 3.03 | % | | | 1.42 | % | | | 1.03 | % | | | 0.83 | % | | | 1.48 | % | | | 0.85 | % |
Total expensesd | | | 1.41 | % | | | 1.31 | % | | | 1.31 | % | | | 1.30 | % | | | 1.34 | % | | | 1.35 | % |
Net expensese,f,g | | | 1.15 | % | | | 1.15 | % | | | 1.15 | % | | | 1.17 | % | | | 1.17 | % | | | 1.16 | % |
Portfolio turnover rate | | | 13 | % | | | 37 | % | | | 24 | % | | | 40 | % | | | 56 | % | | | 60 | % |
C-Class | | Period Ended
March 31,
2020a | | | Year Ended
September 30,
2019 | | | Year Ended
September 30,
2018 | | | Year Ended
September 30,
2017 | | | Year Ended
September 30,
2016 | | | Year Ended
September 30,
2015 | |
Per Share Data |
Net asset value, beginning of period | | $ | 39.77 | | | $ | 44.03 | | | $ | 43.29 | | | $ | 38.68 | | | $ | 36.38 | | | $ | 40.91 | |
Income (loss) from investment operations: |
Net investment income (loss)b | | | .47 | | | | .26 | | | | .12 | | | | .03 | | | | .27 | | | | .04 | |
Net gain (loss) on investments (realized and unrealized) | | | (8.28 | ) | | | (2.40 | ) | | | 4.09 | | | | 6.28 | | | | 4.87 | | | | (3.13 | ) |
Total from investment operations | | | (7.81 | ) | | | (2.14 | ) | | | 4.21 | | | | 6.31 | | | | 5.14 | | | | (3.09 | ) |
Less distributions from: |
Net investment income | | | (.17 | ) | | | — | | | | (.16 | ) | | | (.29 | ) | | | (.07 | ) | | | (.10 | ) |
Net realized gains | | | (2.69 | ) | | | (2.12 | ) | | | (3.31 | ) | | | (1.41 | ) | | | (2.77 | ) | | | (1.34 | ) |
Total distributions | | | (2.86 | ) | | | (2.12 | ) | | | (3.47 | ) | | | (1.70 | ) | | | (2.84 | ) | | | (1.44 | ) |
Net asset value, end of period | | $ | 29.10 | | | $ | 39.77 | | | $ | 44.03 | | | $ | 43.29 | | | $ | 38.68 | | | $ | 36.38 | |
|
Total Returnc | | | (21.62 | %) | | | (4.28 | %) | | | 9.97 | % | | | 16.74 | % | | | 14.87 | % | | | (7.89 | %) |
Ratios/Supplemental Data |
Net assets, end of period (in thousands) | | $ | 894 | | | $ | 1,533 | | | $ | 2,632 | | | $ | 3,461 | | | $ | 3,075 | | | $ | 3,345 | |
Ratios to average net assets: |
Net investment income (loss) | | | 2.41 | % | | | 0.66 | % | | | 0.28 | % | | | 0.08 | % | | | 0.75 | % | | | 0.10 | % |
Total expensesd | | | 2.41 | % | | | 2.18 | % | | | 2.10 | % | | | 2.09 | % | | | 2.18 | % | | | 2.16 | % |
Net expensese,f,g | | | 1.90 | % | | | 1.90 | % | | | 1.90 | % | | | 1.92 | % | | | 1.92 | % | | | 1.91 | % |
Portfolio turnover rate | | | 13 | % | | | 37 | % | | | 24 | % | | | 40 | % | | | 56 | % | | | 60 | % |
34 | THE GUGGENHEIM FUNDS SEMI-ANNUAL REPORT | SEE NOTES TO FINANCIAL STATEMENTS. |
FINANCIAL HIGHLIGHTS (continued) |
This table is presented to show selected data for a share outstanding throughout each period and to assist shareholders in evaluating a Fund’s performance for the periods presented.
P-Class | | Period Ended
March 31,
2020a | | | Year Ended
September 30,
2019 | | | Year Ended
September 30,
2018 | | | Year Ended
September 30,
2017 | | | Year Ended
September 30,
2016 | | | Period Ended
September 30,
2015h | |
Per Share Data |
Net asset value, beginning of period | | $ | 43.46 | | | $ | 48.00 | | | $ | 46.91 | | | $ | 41.74 | | | $ | 39.13 | | | $ | 43.64 | |
Income (loss) from investment operations: |
Net investment income (loss)b | | | .63 | | | | .61 | | | | .49 | | | | .37 | | | | 1.40 | | | | .22 | |
Net gain (loss) on investments (realized and unrealized) | | | (8.97 | ) | | | (2.64 | ) | | | 4.44 | | | | 6.78 | | | | 4.44 | | | | (4.73 | ) |
Total from investment operations | | | (8.34 | ) | | | (2.03 | ) | | | 4.93 | | | | 7.15 | | | | 5.84 | | | | (4.51 | ) |
Less distributions from: |
Net investment income | | | (.72 | ) | | | (.39 | ) | | | (.53 | ) | | | (.57 | ) | | | (.46 | ) | | | — | |
Net realized gains | | | (2.69 | ) | | | (2.12 | ) | | | (3.31 | ) | | | (1.41 | ) | | | (2.77 | ) | | | — | |
Total distributions | | | (3.41 | ) | | | (2.51 | ) | | | (3.84 | ) | | | (1.98 | ) | | | (3.23 | ) | | | — | |
Net asset value, end of period | | $ | 31.71 | | | $ | 43.46 | | | $ | 48.00 | | | $ | 46.91 | | | $ | 41.74 | | | $ | 39.13 | |
|
Total Return | | | (21.31 | %) | | | (3.58 | %) | | | 10.80 | % | | | 17.63 | % | | | 15.83 | % | | | (10.38 | %) |
Ratios/Supplemental Data |
Net assets, end of period (in thousands) | | $ | 161 | | | $ | 155 | | | $ | 147 | | | $ | 158 | | | $ | 123 | | | $ | 9 | |
Ratios to average net assets: |
Net investment income (loss) | | | 3.00 | % | | | 1.41 | % | | | 1.03 | % | | | 0.83 | % | | | 3.61 | % | | | 1.21 | % |
Total expensesd | | | 1.70 | % | | | 1.60 | % | | | 1.59 | % | | | 1.69 | % | | | 1.41 | % | | | 3.29 | % |
Net expensese,f,g | | | 1.15 | % | | | 1.15 | % | | | 1.15 | % | | | 1.17 | % | | | 1.17 | % | | | 1.16 | % |
Portfolio turnover rate | | | 13 | % | | | 37 | % | | | 24 | % | | | 40 | % | | | 56 | % | | | 60 | % |
SEE NOTES TO FINANCIAL STATEMENTS. | THE GUGGENHEIM FUNDS SEMI-ANNUAL REPORT | 35 |
FINANCIAL HIGHLIGHTS (concluded) |
This table is presented to show selected data for a share outstanding throughout each period and to assist shareholders in evaluating a Fund’s performance for the periods presented.
Institutional Class | | Period Ended
March 31,
2020a | | | Year Ended
September 30,
2019 | | | Year Ended
September 30,
2018 | | | Year Ended
September 30,
2017 | | | Year Ended
September 30,
2016 | | | Year Ended
September 30,
2015 | |
Per Share Data |
Net asset value, beginning of period | | $ | 43.08 | | | $ | 47.60 | | | $ | 46.56 | | | $ | 41.84 | | | $ | 39.17 | | | $ | 43.87 | |
Income (loss) from investment operations: |
Net investment income (loss)b | | | .67 | | | | .71 | | | | .64 | | | | .51 | | | | .83 | | | | .47 | |
Net gain (loss) on investments (realized and unrealized) | | | (8.86 | ) | | | (2.63 | ) | | | 4.35 | | | | 6.72 | | | | 5.10 | | | | (3.37 | ) |
Total from investment operations | | | (8.19 | ) | | | (1.92 | ) | | | 4.99 | | | | 7.23 | | | | 5.93 | | | | (2.90 | ) |
Less distributions from: |
Net investment income | | | (.82 | ) | | | (.48 | ) | | | (.64 | ) | | | (1.10 | ) | | | (.49 | ) | | | (.46 | ) |
Net realized gains | | | (2.69 | ) | | | (2.12 | ) | | | (3.31 | ) | | | (1.41 | ) | | | (2.77 | ) | | | (1.34 | ) |
Total distributions | | | (3.51 | ) | | | (2.60 | ) | | | (3.95 | ) | | | (2.51 | ) | | | (3.26 | ) | | | (1.80 | ) |
Net asset value, end of period | | $ | 31.38 | | | $ | 43.08 | | | $ | 47.60 | | | $ | 46.56 | | | $ | 41.84 | | | $ | 39.17 | |
|
Total Return | | | (21.24 | %) | | | (3.33 | %) | | | 11.04 | % | | | 17.96 | % | | | 15.98 | % | | | (6.97 | %) |
Ratios/Supplemental Data |
Net assets, end of period (in thousands) | | $ | 486 | | | $ | 798 | | | $ | 5,946 | | | $ | 1,681 | | | $ | 40 | | | $ | 2,544 | |
Ratios to average net assets: |
Net investment income (loss) | | | 3.17 | % | | | 1.65 | % | | | 1.39 | % | | | 1.13 | % | | | 2.13 | % | | | 1.09 | % |
Total expensesd | | | 1.43 | % | | | 1.14 | % | | | 1.00 | % | | | 1.07 | % | | | 1.04 | % | | | 0.98 | % |
Net expensese,f,g | | | 0.90 | % | | | 0.90 | % | | | 0.90 | % | | | 0.92 | % | | | 0.92 | % | | | 0.91 | % |
Portfolio turnover rate | | | 13 | % | | | 37 | % | | | 24 | % | | | 40 | % | | | 56 | % | | | 60 | % |
a | Unaudited figures for the period ended March 31, 2020. Percentage amounts for the period, except total return and portfolio turnover rate, have been annualized. |
b | Net investment income (loss) per share was computed using average shares outstanding throughout the period. |
c | Total return does not reflect the impact of any applicable sales charges. |
d | Does not include expenses of the underlying funds in which the Fund invests. |
e | Net expense information reflects the expense ratios after expense waivers and reimbursements, as applicable. |
f | The portion of the ratios of net expenses to average net assets attributable to recoupments of prior fee reductions or expense reimbursements for the periods presented was as follows: |
| | | 03/31/20a | 09/30/19 | 09/30/18 | 09/30/17 |
| | A-Class | 0.00%* | 0.00%* | 0.00%* | 0.01% |
| | C-Class | 0.00%* | — | 0.00%* | 0.01% |
| | P-Class | — | — | — | 0.00%* |
| | Institutional Class | — | — | — | 0.02% |
g | Net expenses may include expenses that are excluded from the expense limitation agreement. Excluding these expenses, the net expense ratios for the periods would be: |
| | | 03/31/20a | 09/30/19 | 09/30/18 | 09/30/17 | 09/30/16 | 09/30/15 |
| | A-Class | 1.15% | 1.15% | 1.15% | 1.15% | 1.15% | 1.15% |
| | C-Class | 1.90% | 1.90% | 1.90% | 1.90% | 1.90% | 1.90% |
| | P-Class | 1.15% | 1.15% | 1.15% | 1.15% | 1.15% | 1.15% |
| | Institutional Class | 0.90% | 0.90% | 0.90% | 0.90% | 0.90% | 0.90% |
h | Since commencement of operations: May 1, 2015. Percentage amounts for the period, except total return and portfolio turnover rate, have been annualized. |
36 | THE GUGGENHEIM FUNDS SEMI-ANNUAL REPORT | SEE NOTES TO FINANCIAL STATEMENTS. |
PERFORMANCE REPORT AND FUND PROFILE (Unaudited) | March 31, 2020 |
MARKET NEUTRAL REAL ESTATE FUND
OBJECTIVE: Seeks to provide capital appreciation, while limiting exposure to general stock market risk.
Holdings Diversification (Market Exposure as % of Net Assets)
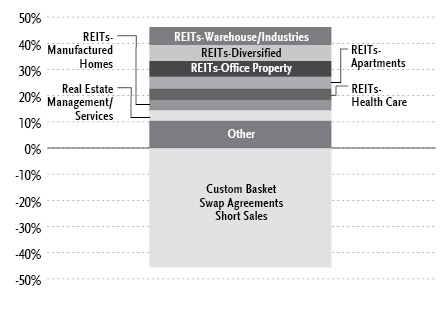
“Holdings Diversification (Market Exposure as % of Net Assets)” excludes any temporary cash investments.
Inception Dates: |
A-Class | February 26, 2016 |
C-Class | February 26, 2016 |
P-Class | February 26, 2016 |
Institutional Class | February 26, 2016 |
Ten Largest Holdings (% of Total Net Assets) |
Safehold, Inc. | 4.0% |
American Homes 4 Rent — Class A | 2.6% |
Healthpeak Properties, Inc. | 2.4% |
Alexandria Real Estate Equities, Inc. | 2.3% |
MGM Growth Properties LLC — Class A | 2.2% |
Equinix, Inc. | 2.2% |
Sun Communities, Inc. | 2.0% |
Equity LifeStyle Properties, Inc. | 2.0% |
Corporate Office Properties Trust | 2.0% |
Americold Realty Trust | 2.0% |
Top Ten Total | 23.7% |
| | |
“Ten Largest Holdings” excludes any temporary cash or derivative investments. |
| | THE GUGGENHEIM FUNDS SEMI-ANNUAL REPORT | 37 |
PERFORMANCE REPORT AND FUND PROFILE (Unaudited)(concluded) | March 31, 2020 |
Average Annual Returns*
Periods Ended March 31, 2020
| 6 Month† | 1 Year | Since
Inception
(02/26/16) |
A-Class Shares | 11.55% | 15.89% | 6.22% |
A-Class Shares with sales charge‡ | 6.27% | 10.40% | 4.96% |
C-Class Shares | 11.16% | 15.05% | 5.41% |
C-Class Shares with CDSC§ | 10.16% | 14.05% | 5.41% |
P-Class Shares | 11.55% | 15.90% | 6.12% |
Institutional Class Shares | 11.68% | 16.15% | 6.42% |
ICE BofA Merrill Lynch 3-Month U.S. Treasury Bill Index | 1.04% | 2.25% | 1.44% |
* | The performance data above represents past performance that is not predictive of future results. The investment return and principal value of an investment in the Fund will fluctuate so that an investor’s shares, when redeemed, may be worth more or less than their original cost. Returns are historical and include changes in principal and reinvested dividends and capital gains and do not reflect the effect of taxes. The ICE BofA Merrill Lynch 3-Month U.S. Treasury Bill Index is an unmanaged index and, unlike the Fund, has no management fees or operating expenses to reduce its reported return. |
† | 6 month returns are not annualized. |
‡ | Fund returns are calculated using the maximum sales charge of 4.75%. |
§ | Fund returns include a CDSC of 1% if redeemed within 12 months of purchase. |
38 | THE GUGGENHEIM FUNDS SEMI-ANNUAL REPORT | |
SCHEDULE OF INVESTMENTS (Unaudited) | March 31, 2020 |
MARKET NEUTRAL REAL ESTATE FUND | |
| | Shares | | | Value | |
COMMON STOCKS† - 46.1% |
| | | | | | | | | |
REITs - 42.2% |
REITs-Warehouse/Industries - 6.9% |
Americold Realty Trust | | | 17,065 | | | $ | 580,893 | |
Innovative Industrial Properties, Inc. | | | 5,758 | | | | 437,205 | |
Terreno Realty Corp. | | | 7,432 | | | | 384,606 | |
Rexford Industrial Realty, Inc. | | | 8,997 | | | | 368,967 | |
CyrusOne, Inc. | | | 4,121 | | | | 254,472 | |
Total REITs-Warehouse/Industries | | | | | | | 2,026,143 | |
| | | | | | | | | |
REITs-Diversified - 6.1% |
Equinix, Inc. | | | 1,035 | | | | 646,430 | |
SBA Communications Corp. | | | 1,802 | | | | 486,486 | |
CoreSite Realty Corp. | | | 2,960 | | | | 343,064 | |
American Tower Corp. — Class A | | | 1,474 | | | | 320,963 | |
Total REITs-Diversified | | | | | | | 1,796,943 | |
| | | | | | | | | |
REITs-Office Property - 5.9% |
Alexandria Real Estate Equities, Inc. | | | 4,887 | | | | 669,812 | |
Corporate Office Properties Trust | | | 26,836 | | | | 593,881 | |
Highwoods Properties, Inc. | | | 13,845 | | | | 490,390 | |
Total REITs-Office Property | | | | | | | 1,754,083 | |
| | | | | | | | | |
REITs-Apartments - 4.5% |
American Homes 4 Rent — Class A | | | 33,217 | | | | 770,634 | |
Invitation Homes, Inc. | | | 26,031 | | | | 556,282 | |
Total REITs-Apartments | | | | | | | 1,326,916 | |
| | | | | | | | | |
REITs-Health Care - 4.4% |
Healthpeak Properties, Inc. | | | 30,283 | | | | 722,250 | |
Sabra Health Care REIT, Inc. | | | 26,394 | | | | 288,222 | |
Ventas, Inc. | | | 10,495 | | | | 281,266 | |
Total REITs-Health Care | | | | | | | 1,291,738 | |
| | | | | | | | | |
REITs-Manufactured Homes - 4.0% |
Sun Communities, Inc. | | | 4,782 | | | | 597,033 | |
Equity LifeStyle Properties, Inc. | | | 10,377 | | | | 596,470 | |
Total REITs-Manufactured Homes | | | | | | | 1,193,503 | |
| | | | | | | | | |
REITs-Hotels - 2.9% |
MGM Growth Properties LLC — Class A | | | 27,633 | | | | 654,073 | |
Ryman Hospitality Properties, Inc. | | | 5,256 | | | | 188,428 | |
Total REITs-Hotels | | | | | | | 842,501 | |
| | | | | | | | | |
REITs-Shopping Centers - 2.5% |
Acadia Realty Trust | | | 23,734 | | | | 294,064 | |
Regency Centers Corp. | | | 6,074 | | | | 233,424 | |
Federal Realty Investment Trust | | | 2,893 | | | | 215,847 | |
Total REITs-Shopping Centers | | | | | | | 743,335 | |
| | | | | | | | | |
REITs-Single Tenant - 2.5% |
Agree Realty Corp. | | | 6,776 | | | | 419,434 | |
Spirit Realty Capital, Inc. | | | 12,075 | | | | 315,761 | |
Total REITs-Single Tenant | | | | | | | 735,195 | |
| | | | | | | | | |
REITs-Mortgage - 1.7% |
Capstead Mortgage Corp. | | | 120,805 | | | | 507,381 | |
| | | | | | | | | |
REITs-Storage - 0.8% |
Iron Mountain, Inc. | | | 10,197 | | | | 242,689 | |
Total REITs | | | | | | | 12,460,427 | |
| | | | | | | | | |
Real Estate - 3.9% |
Real Estate Management/Services - 3.9% |
Safehold, Inc. | | | 18,529 | | | | 1,171,588 | |
| | | | | | | | | |
Total Common Stocks | | | | |
(Cost $13,277,009) | | | | | | | 13,632,015 | |
| | | | | | | | | |
MONEY MARKET FUND† - 46.5% |
Goldman Sachs Financial Square Treasury Instruments Fund — Institutional Shares, 0.52%1 | | | 13,734,763 | | | | 13,734,763 | |
Total Money Market Fund | | | | |
(Cost $13,734,763) | | | | | | | 13,734,763 | |
| | | | | | | | | |
Total Investments - 92.6% | | | | |
(Cost $27,011,772) | | $ | 27,366,778 | |
Other Assets & Liabilities, net - 7.4% | | | 2,180,074 | |
Total Net Assets - 100.0% | | $ | 29,546,852 | |
Custom Basket Swap Agreements |
Counterparty | Reference Obligation | Financing Rate
Pay (Receive) | Payment
Frequency | | Maturity Date | | | Notional
Amount | | | Value and
Unrealized
Appreciation | |
OTC Custom Basket Swap Agreements Sold Short †† |
Morgan Stanley Capital Services LLC | MS Equity Custom Basket | (0.25)% (Federal Funds Rate - 0.35%) | At Maturity | | | 07/22/24 | | | $ | 6,759,198 | | | $ | 827,218 | |
Goldman Sachs International | GS Equity Custom Basket | (0.18)% (Federal Funds Rate - 0.27%) | At Maturity | | | 05/06/24 | | | | 6,703,648 | | | | 842,170 | |
| | | | | | | | | | $ | 13,462,846 | | | $ | 1,669,388 | |
SEE NOTES TO FINANCIAL STATEMENTS. | THE GUGGENHEIM FUNDS SEMI-ANNUAL REPORT | 39 |
SCHEDULE OF INVESTMENTS (Unaudited)(continued) | March 31, 2020 |
MARKET NEUTRAL REAL ESTATE FUND | |
| | Shares | | | Percentage
Notional
Amount | | | Value and
Unrealized
Appreciation
(Depreciation) | |
MS EQUITY SHORT CUSTOM BASKET | | | | | | | | |
Financial | | | | | | | | | | | | |
Service Properties Trust | | | 11,705 | | | | (0.94 | )% | | $ | 102,965 | |
Washington Prime Group, Inc. | | | 55,189 | | | | (0.66 | )% | | | 81,910 | |
Kimco Realty Corp. | | | 17,902 | | | | (2.56 | )% | | | 79,055 | |
Brixmor Property Group, Inc. | | | 15,669 | | | | (2.20 | )% | | | 76,428 | |
Investors Real Estate Trust | | | 7,189 | | | | (5.85 | )% | | | 60,117 | |
Diversified Healthcare Trust | | | 42,876 | | | | (2.30 | )% | | | 57,670 | |
CBRE Group, Inc. — Class A | | | 5,400 | | | | (3.01 | )% | | | 51,794 | |
VEREIT, Inc. | | | 43,709 | | | | (3.16 | )% | | | 41,687 | |
Jones Lang LaSalle, Inc. | | | 1,952 | | | | (2.92 | )% | | | 40,166 | |
DiamondRock Hospitality Co. | | | 41,381 | | | | (3.11 | )% | | | 38,550 | |
Global Net Lease, Inc. | | | 23,440 | | | | (4.64 | )% | | | 36,683 | |
Brandywine Realty Trust | | | 26,589 | | | | (4.14 | )% | | | 31,103 | |
Cushman & Wakefield plc | | | 11,933 | | | | (2.07 | )% | | | 27,915 | |
Washington Real Estate Investment Trust | | | 10,591 | | | | (3.74 | )% | | | 8,426 | |
PS Business Parks, Inc. | | | 1,513 | | | | (3.03 | )% | | | 7,068 | |
Industrial Logistics Properties Trust | | | 9,728 | | | | (2.52 | )% | | | 1,463 | |
Piedmont Office Realty Trust, Inc. — Class A | | | 21,144 | | | | (5.52 | )% | | | (3,274 | ) |
PotlatchDeltic Corp. | | | 4,555 | | | | (2.12 | )% | | | (5,454 | ) |
Saul Centers, Inc. | | | 4,351 | | | | (2.11 | )% | | | (5,869 | ) |
Healthcare Trust of America, Inc. — Class A | | | 6,321 | | | | (2.27 | )% | | | (8,900 | ) |
Healthcare Realty Trust, Inc. | | | 5,419 | | | | (2.24 | )% | | | (8,908 | ) |
Office Properties Income Trust | | | 12,866 | | | | (5.19 | )% | | | (9,179 | ) |
Rayonier, Inc. | | | 6,270 | | | | (2.18 | )% | | | (9,560 | ) |
Mack-Cali Realty Corp. | | | 14,066 | | | | (3.17 | )% | | | (10,925 | ) |
Monmouth Real Estate Investment Corp. | | | 27,351 | | | | (4.88 | )% | | | (12,308 | ) |
Apollo Commercial Real Estate Finance, Inc. | | | 24,169 | | | | (2.65 | )% | | | (27,925 | ) |
Total Financial | | | | | | | | | | | 640,698 | |
| | | | | | | | | | | | | |
Exchange-Traded Funds | | | | | | | | | | | | |
Vanguard Real Estate ETF | | | 18,639 | | | | (19.26 | )% | | | 144,870 | |
| | | | | | | | | | | | | |
Consumer, Cyclical | | | | | | | | | | | | |
Marriott International, Inc. — Class A | | | 1,406 | | | | (1.56 | )% | | | 41,650 | |
Total MS Equity Short Custom Basket | | | | | | $ | 827,218 | |
| | | | | | | | | |
GS EQUITY SHORT CUSTOM BASKET | | | | | | | | |
Financial | | | | | | | | | | | | |
Service Properties Trust | | | 11,705 | | | | (0.94 | )% | | | 102,447 | |
Washington Prime Group, Inc. | | | 55,189 | | | | (0.66 | )% | | | 82,135 | |
Kimco Realty Corp. | | | 17,902 | | | | (2.58 | )% | | | 80,019 | |
Brixmor Property Group, Inc. | | | 15,669 | | | | (2.22 | )% | | | 76,262 | |
Investors Real Estate Trust | | | 6,179 | | | | (5.07 | )% | | | 60,176 | |
Diversified Healthcare Trust | | | 42,876 | | | | (2.32 | )% | | | 58,740 | |
CBRE Group, Inc. — Class A | | | 5,400 | | | | (3.04 | )% | | | 51,818 | |
VEREIT, Inc. | | | 43,709 | | | | (3.19 | )% | | | 44,790 | |
Jones Lang LaSalle, Inc. | | | 1,952 | | | | (2.94 | )% | | | 40,145 | |
DiamondRock Hospitality Co. | | | 41,381 | | | | (3.14 | )% | | | 38,189 | |
Global Net Lease, Inc. | | | 23,440 | | | | (4.67 | )% | | | 36,760 | |
Brandywine Realty Trust | | | 26,589 | | | | (4.17 | )% | | | 31,540 | |
Cushman & Wakefield plc | | | 11,933 | | | | (2.09 | )% | | | 28,259 | |
Washington Real Estate Investment Trust | | | 10,591 | | | | (3.77 | )% | | | 9,955 | |
PS Business Parks, Inc. | | | 1,513 | | | | (3.06 | )% | | | 5,845 | |
Industrial Logistics Properties Trust | | | 9,728 | | | | (2.55 | )% | | | 1,412 | |
Piedmont Office Realty Trust, Inc. — Class A | | | 21,144 | | | | (5.57 | )% | | | 1,256 | |
Saul Centers, Inc. | | | 4,351 | | | | (2.12 | )% | | | (5,313 | ) |
PotlatchDeltic Corp. | | | 4,555 | | | | (2.13 | )% | | | (5,600 | ) |
Office Properties Income Trust | | | 12,866 | | | | (5.23 | )% | | | (8,447 | ) |
Healthcare Trust of America, Inc. — Class A | | | 6,321 | | | | (2.29 | )% | | | (8,871 | ) |
Healthcare Realty Trust, Inc. | | | 5,419 | | | | (2.26 | )% | | | (8,895 | ) |
Rayonier, Inc. | | | 6,270 | | | | (2.20 | )% | | | (9,736 | ) |
Mack-Cali Realty Corp. | | | 14,066 | | | | (3.20 | )% | | | (10,980 | ) |
Monmouth Real Estate Investment Corp. | | | 27,351 | | | | (4.92 | )% | | | (12,063 | ) |
Apollo Commercial Real Estate Finance, Inc. | | | 24,169 | | | | (2.68 | )% | | | (22,252 | ) |
Total Financial | | | | | | | | | | | 657,591 | |
| | | | | | | | | | | | | |
Consumer, Cyclical | | | | | | | | | | | | |
Marriott International, Inc. — Class A | | | 1,406 | | | | (1.57 | )% | | | 41,216 | |
| | | | | | | | | | | | | |
Exchange-Traded Funds | | | | | | | | | | | | |
Vanguard Real Estate ETF | | | 18,639 | | | | (19.42 | )% | | | 143,363 | |
Total GS Equity Short Custom Basket | | | | | | $ | 842,170 | |
40 | THE GUGGENHEIM FUNDS SEMI-ANNUAL REPORT | SEE NOTES TO FINANCIAL STATEMENTS. |
SCHEDULE OF INVESTMENTS (Unaudited)(concluded) | March 31, 2020 |
MARKET NEUTRAL REAL ESTATE FUND | |
† | Value determined based on Level 1 inputs — See Note 4. |
†† | Value determined based on Level 2 inputs — See Note 4. |
1 | Rate indicated is the 7-day yield as of March 31, 2020. |
| | GS — Goldman Sachs International |
| | MS — Morgan Stanley Capital Services LLC |
| | REIT — Real Estate Investment Trust |
| | |
| | See Sector Classification in Other Information section. |
The following table summarizes the inputs used to value the Fund’s investments at March 31, 2020 (See Note 4 in the Notes to Financial Statements):
Investments in Securities (Assets) | | Level 1
Quoted
Prices | | | Level 2
Significant
Observable
Inputs | | | Level 3
Significant
Unobservable
Inputs | | | Total | |
Common Stocks | | $ | 13,632,015 | | | $ | — | | | $ | — | | | $ | 13,632,015 | |
Money Market Fund | | | 13,734,763 | | | | — | | | | — | | | | 13,734,763 | |
Equity Custom Basket Swap Agreements** | | | — | | | | 1,669,388 | | | | — | | | | 1,669,388 | |
Total Assets | | $ | 27,366,778 | | | $ | 1,669,388 | | | $ | — | | | $ | 29,036,166 | |
** | This derivative is reported as unrealized appreciation/depreciation at period end. |
SEE NOTES TO FINANCIAL STATEMENTS. | THE GUGGENHEIM FUNDS SEMI-ANNUAL REPORT | 41 |
MARKET NEUTRAL REAL ESTATE FUND | |
STATEMENT OF ASSETS AND LIABILITIES (Unaudited) |
March 31, 2020 |
Assets: |
Investments, at value (cost $27,011,772) | | $ | 27,366,778 | |
Unrealized appreciation on OTC swap agreements | | | 1,669,388 | |
Prepaid expenses | | | 48,459 | |
Receivables: |
Securities sold | | | 1,662,102 | |
Fund shares sold | | | 792,035 | |
Swap settlement | | | 425,923 | |
Dividends | | | 108,611 | |
Interest | | | 3,479 | |
Total assets | | | 32,076,775 | |
| | | | | |
Liabilities: |
Segregated cash due to broker | | | 1,750,000 | |
Payable for: |
Securities purchased | | | 712,162 | |
Fund shares redeemed | | | 33,306 | |
Management fees | | | 5,072 | |
Transfer agent/maintenance fees | | | 4,530 | |
Distribution and service fees | | | 1,353 | |
Trustees’ fees* | | | 572 | |
Due to Investment Adviser | | | 62 | |
Miscellaneous | | | 22,866 | |
Total liabilities | | | 2,529,923 | |
Net assets | | $ | 29,546,852 | |
| | | | | |
Net assets consist of: |
Paid in capital | | $ | 27,598,217 | |
Total distributable earnings (loss) | | | 1,948,635 | |
Net assets | | $ | 29,546,852 | |
| | | | | |
A-Class: |
Net assets | | $ | 7,561,082 | |
Capital shares outstanding | | | 261,839 | |
Net asset value per share | | $ | 28.88 | |
Maximum offering price per share (Net asset value divided by 95.25%) | | $ | 30.32 | |
| | | | | |
C-Class: |
Net assets | | $ | 349,125 | |
Capital shares outstanding | | | 12,477 | |
Net asset value per share | | $ | 27.98 | |
| | | | | |
P-Class: |
Net assets | | $ | 1,617,921 | |
Capital shares outstanding | | | 57,983 | |
Net asset value per share | | $ | 27.90 | |
| | | | | |
Institutional Class: |
Net assets | | $ | 20,018,724 | |
Capital shares outstanding | | | 700,415 | |
Net asset value per share | | $ | 28.58 | |
STATEMENT OF OPERATIONS (Unaudited) |
Six-Month Period Ended March 31, 2020 |
Investment Income: |
Dividends | | $ | 145,240 | |
Interest | | | 14,438 | |
Total investment income | | | 159,678 | |
| | | | | |
Expenses: |
Management fees | | | 59,680 | |
Distribution and service fees: |
A-Class | | | 4,623 | |
C-Class | | | 808 | |
P-Class | | | 497 | |
Transfer agent/maintenance fees: |
A-Class | | | 8,172 | |
C-Class | | | 263 | |
P-Class | | | 591 | |
Institutional Class | | | 5,851 | |
Registration fees | | | 32,301 | |
Professional fees | | | 23,847 | |
Fund accounting/administration fees | | | 12,529 | |
Trustees’ fees* | | | 8,646 | |
Custodian fees | | | 4,080 | |
Line of credit fees | | | 102 | |
Interest expense | | | 99 | |
Miscellaneous | | | 10,328 | |
Recoupment of previously waived fees: |
A-Class | | | 15 | |
C-Class | | | 1 | |
P-Class | | | 2 | |
Institutional Class | | | 44 | |
Total expenses | | | 172,479 | |
Less: |
Expenses reimbursed by Adviser: |
A-Class | | | (16,998 | ) |
C-Class | | | (620 | ) |
P-Class | | | (1,426 | ) |
Institutional Class | | | (20,038 | ) |
Expenses waived by Adviser | | | (51,184 | ) |
Earnings credits applied | | | (29 | ) |
Total waived/reimbursed expenses | | | (90,295 | ) |
Net expenses | | | 82,184 | |
Net investment income | | | 77,494 | |
| | | | | |
Net Realized and Unrealized Gain (Loss): |
Net realized gain (loss) on: |
Investments | | | (64,265 | ) |
Swap agreements | | | 160,735 | |
Net realized gain | | | 96,470 | |
Net change in unrealized appreciation (depreciation) on: |
Investments | | | (634,781 | ) |
Swap agreements | | | 1,939,521 | |
Net change in unrealized appreciation (depreciation) | | | 1,304,740 | |
Net realized and unrealized gain | | | 1,401,210 | |
Net increase in net assets resulting from operations | | $ | 1,478,704 | |
* | Relates to Trustees not deemed “interested persons” within the meaning of Section 2(a)(19) of the 1940 Act. |
42 | THE GUGGENHEIM FUNDS SEMI-ANNUAL REPORT | SEE NOTES TO FINANCIAL STATEMENTS. |
MARKET NEUTRAL REAL ESTATE FUND | |
STATEMENTS OF CHANGES IN NET ASSETS |
| | Six-Month
Period Ended
March 31,
2020
(Unaudited) | | | Year Ended
September 30,
2019 | |
Increase (Decrease) in Net Assets from Operations: | | | | | | | | |
Net investment income | | $ | 77,494 | | | $ | 89,942 | |
Net realized gain on investments | | | 96,470 | | | | 87,157 | |
Net change in unrealized appreciation (depreciation) on investments | | | 1,304,740 | | | | 467,696 | |
Net increase in net assets resulting from operations | | | 1,478,704 | | | | 644,795 | |
| | | | | | | | | |
Distributions to shareholders: | | | | | | | | |
A-Class | | | (137,474 | ) | | | (23,934 | ) |
C-Class | | | (4,629 | ) | | | (1,887 | ) |
P-Class | | | (13,269 | ) | | | (8,952 | ) |
Institutional Class | | | (232,932 | ) | | | (123,892 | ) |
Total distributions to shareholders | | | (388,304 | ) | | | (158,665 | ) |
| | | | | | | | | |
Capital share transactions: | | | | | | | | |
Proceeds from sale of shares | | | | | | | | |
A-Class | | | 4,823,330 | | | | 444,400 | |
C-Class | | | 195,959 | | | | 7,500 | |
P-Class | | | 1,297,364 | | | | 93,822 | |
Institutional Class | | | 13,657,457 | | | | 7,504 | |
Distributions reinvested | | | | | | | | |
A-Class | | | 133,439 | | | | 23,478 | |
C-Class | | | 4,629 | | | | 1,887 | |
P-Class | | | 13,147 | | | | 8,952 | |
Institutional Class | | | 232,932 | | | | 123,892 | |
Cost of shares redeemed | | | | | | | | |
A-Class | | | (472,442 | ) | | | (359,944 | ) |
C-Class | | | (4,005 | ) | | | (16,459 | ) |
P-Class | | | (66,765 | ) | | | (268,362 | ) |
Institutional Class | | | (71,068 | ) | | | (27,812 | ) |
Net increase from capital share transactions | | | 19,743,977 | | | | 38,858 | |
Net increase in net assets | | | 20,834,377 | | | | 524,988 | |
| | | | | | | | | |
Net assets: | | | | | | | | |
Beginning of period | | | 8,712,475 | | | | 8,187,487 | |
End of period | | $ | 29,546,852 | | | $ | 8,712,475 | |
| | | | | | | | | |
Capital share activity: | | | | | | | | |
Shares sold | | | | | | | | |
A-Class | | | 170,940 | | | | 17,134 | |
C-Class | | | 7,256 | | | | 292 | |
P-Class | | | 47,334 | | | | 3,568 | |
Institutional Class | | | 488,917 | | | | 289 | |
Shares issued from reinvestment of distributions | | | | | | | | |
A-Class | | | 5,172 | | | | 922 | |
C-Class | | | 185 | | | | 76 | |
P-Class | | | 527 | | | | 363 | |
Institutional Class | | | 9,127 | | | | 4,912 | |
Shares redeemed | | | | | | | | |
A-Class | | | (16,918 | ) | | | (14,079 | ) |
C-Class | | | (143 | ) | | | (640 | ) |
P-Class | | | (2,599 | ) | | | (10,616 | ) |
Institutional Class | | | (2,521 | ) | | | (1,078 | ) |
Net increase in shares | | | 707,277 | | | | 1,143 | |
SEE NOTES TO FINANCIAL STATEMENTS. | THE GUGGENHEIM FUNDS SEMI-ANNUAL REPORT | 43 |
MARKET NEUTRAL REAL ESTATE FUND | |
This table is presented to show selected data for a share outstanding throughout each period and to assist shareholders in evaluating a Fund’s performance for the periods presented.
A-Class | | Period Ended
March 31,
2020a | | | Year Ended
September 30,
2019 | | | Year Ended
September 30,
2018 | | | Year Ended
September 30,
2017 | | | Period Ended
September 30,
2016b | |
Per Share Data |
Net asset value, beginning of period | | $ | 26.95 | | | $ | 25.16 | | | $ | 26.47 | | | $ | 24.45 | | | $ | 25.00 | |
Income (loss) from investment operations: |
Net investment income (loss)c | | | .12 | | | | .25 | | | | .50 | | | | .08 | | | | .24 | |
Net gain (loss) on investments (realized and unrealized) | | | 2.86 | | | | 1.78 | | | | (.41 | ) | | | 1.94 | | | | (.79 | ) |
Total from investment operations | | | 2.98 | | | | 2.03 | | | | .09 | | | | 2.02 | | | | (.55 | ) |
Less distributions from: |
Net investment income | | | (.25 | ) | | | (.01 | ) | | | — | | | | — | | | | — | |
Net realized gains | | | (.80 | ) | | | (.23 | ) | | | (1.40 | ) | | | — | | | | — | |
Total distributions | | | (1.05 | ) | | | (.24 | ) | | | (1.40 | ) | | | — | | | | — | |
Net asset value, end of period | | $ | 28.88 | | | $ | 26.95 | | | $ | 25.16 | | | $ | 26.47 | | | $ | 24.45 | |
|
Total Returnd | | | 11.55 | % | | | 8.12 | % | | | 0.13 | % | | | 8.38 | % | | | (2.20 | %) |
Ratios/Supplemental Data |
Net assets, end of period (in thousands) | | $ | 7,561 | | | $ | 2,766 | | | $ | 2,482 | | | $ | 109 | | | $ | 100 | |
Ratios to average net assets: |
Net investment income (loss) | | | 0.92 | % | | | 0.96 | % | | | 2.00 | % | | | 0.31 | % | | | 1.66 | % |
Total expenses | | | 3.56 | % | | | 3.99 | % | | | 5.01 | % | | | 4.88 | % | | | 3.74 | % |
Net expensese,f,g | | | 1.66 | % | | | 1.62 | % | | | 1.65 | % | | | 1.65 | % | | | 1.64 | % |
Portfolio turnover rate | | | 198 | % | | | 180 | % | | | 216 | % | | | 145 | % | | | 135 | % |
C-Class | | Period Ended
March 31,
2020a | | | Year Ended
September 30,
2019 | | | Year Ended
September 30,
2018 | | | Year Ended
September 30,
2017 | | | Period Ended
September 30,
2016b | |
Per Share Data |
Net asset value, beginning of period | | $ | 26.07 | | | $ | 24.67 | | | $ | 26.16 | | | $ | 24.35 | | | $ | 25.00 | |
Income (loss) from investment operations: |
Net investment income (loss)c | | | .03 | | | | .05 | | | | .12 | | | | (.11 | ) | | | .12 | |
Net gain (loss) on investments (realized and unrealized) | | | 2.76 | | | | 1.70 | | | | (.21 | ) | | | 1.92 | | | | (.77 | ) |
Total from investment operations | | | 2.79 | | | | 1.75 | | | | (.09 | ) | | | 1.81 | | | | (.65 | ) |
Less distributions from: |
Net investment income | | | (.08 | ) | | | (.12 | ) | | | — | | | | — | | | | — | |
Net realized gains | | | (.80 | ) | | | (.23 | ) | | | (1.40 | ) | | | — | | | | — | |
Total distributions | | | (.88 | ) | | | (.35 | ) | | | (1.40 | ) | | | — | | | | — | |
Net asset value, end of period | | $ | 27.98 | | | $ | 26.07 | | | $ | 24.67 | | | $ | 26.16 | | | $ | 24.35 | |
|
Total Returnd | | | 11.16 | % | | | 7.15 | % | | | (0.59 | %) | | | 7.56 | % | | | (2.60 | %) |
Ratios/Supplemental Data |
Net assets, end of period (in thousands) | | $ | 349 | | | $ | 135 | | | $ | 134 | | | $ | 143 | | | $ | 97 | |
Ratios to average net assets: |
Net investment income (loss) | | | 0.24 | % | | | 0.18 | % | | | 0.47 | % | | | (0.52 | %) | | | 0.93 | % |
Total expenses | | | 4.14 | % | | | 4.66 | % | | | 5.72 | % | | | 5.70 | % | | | 4.47 | % |
Net expensese,f,g | | | 2.41 | % | | | 2.40 | % | | | 2.38 | % | | | 2.40 | % | | | 2.38 | % |
Portfolio turnover rate | | | 198 | % | | | 180 | % | | | 216 | % | | | 145 | % | | | 135 | % |
44 | THE GUGGENHEIM FUNDS SEMI-ANNUAL REPORT | SEE NOTES TO FINANCIAL STATEMENTS. |
MARKET NEUTRAL REAL ESTATE FUND | |
FINANCIAL HIGHLIGHTS (continued) |
This table is presented to show selected data for a share outstanding throughout each period and to assist shareholders in evaluating a Fund’s performance for the periods presented.
P-Class | | Period Ended
March 31,
2020a | | | Year Ended
September 30,
2019 | | | Year Ended
September 30,
2018 | | | Year Ended
September 30,
2017 | | | Period Ended
September 30,
2016b | |
Per Share Data |
Net asset value, beginning of period | | $ | 26.10 | | | $ | 25.14 | | | $ | 26.48 | | | $ | 24.45 | | | $ | 25.00 | |
Income (loss) from investment operations: |
Net investment income (loss)c | | | .26 | | | | .20 | | | | .33 | | | | .16 | | | | .26 | |
Net gain (loss) on investments (realized and unrealized) | | | 2.61 | | | | 1.71 | | | | (.27 | ) | | | 1.87 | | | | (.81 | ) |
Total from investment operations | | | 2.87 | | | | 1.91 | | | | .06 | | | | 2.03 | | | | (.55 | ) |
Less distributions from: |
Net investment income | | | (.27 | ) | | | (.72 | ) | | | — | | | | — | | | | — | |
Net realized gains | | | (.80 | ) | | | (.23 | ) | | | (1.40 | ) | | | — | | | | — | |
Total distributions | | | (1.07 | ) | | | (.95 | ) | | | (1.40 | ) | | | — | | | | — | |
Net asset value, end of period | | $ | 27.90 | | | $ | 26.10 | | | $ | 25.14 | | | $ | 26.48 | | | $ | 24.45 | |
|
Total Return | | | 11.55 | % | | | 7.80 | % | | | 0.09 | % | | | 8.34 | % | | | (2.20 | %) |
Ratios/Supplemental Data |
Net assets, end of period (in thousands) | | $ | 1,618 | | | $ | 332 | | | $ | 488 | | | $ | 324 | | | $ | 124 | |
Ratios to average net assets: |
Net investment income (loss) | | | 1.99 | % | | | 0.77 | % | | | 1.26 | % | | | 0.52 | % | | | 1.64 | % |
Total expenses | | | 3.28 | % | | | 4.05 | % | | | 4.93 | % | | | 5.18 | % | | | 3.65 | % |
Net expensese,f,g | | | 1.66 | % | | | 1.65 | % | | | 1.65 | % | | | 1.65 | % | | | 1.66 | % |
Portfolio turnover rate | | | 198 | % | | | 180 | % | | | 216 | % | | | 145 | % | | | 135 | % |
SEE NOTES TO FINANCIAL STATEMENTS. | THE GUGGENHEIM FUNDS SEMI-ANNUAL REPORT | 45 |
MARKET NEUTRAL REAL ESTATE FUND | |
FINANCIAL HIGHLIGHTS (concluded) |
This table is presented to show selected data for a share outstanding throughout each period and to assist shareholders in evaluating a Fund’s performance for the periods presented.
Institutional Class | | Period Ended
March 31,
2020a | | | Year Ended
September 30,
2019 | | | Year Ended
September 30,
2018 | | | Year Ended
September 30,
2017 | | | Period Ended
September 30,
2016b | |
Per Share Data |
Net asset value, beginning of period | | $ | 26.74 | | | $ | 25.32 | | | $ | 26.57 | | | $ | 24.49 | | | $ | 25.00 | |
Income (loss) from investment operations: |
Net investment income (loss)c | | | .23 | | | | .31 | | | | .36 | | | | .14 | | | | .28 | |
Net gain (loss) on investments (realized and unrealized) | | | 2.75 | | | | 1.73 | | | | (.21 | ) | | | 1.94 | | | | (.79 | ) |
Total from investment operations | | | 2.98 | | | | 2.04 | | | | .15 | | | | 2.08 | | | | (.51 | ) |
Less distributions from: |
Net investment income | | | (.34 | ) | | | (.39 | ) | | | — | | | | — | | | | — | |
Net realized gains | | | (.80 | ) | | | (.23 | ) | | | (1.40 | ) | | | — | | | | — | |
Total distributions | | | (1.14 | ) | | | (.62 | ) | | | (1.40 | ) | | | — | | | | — | |
Net asset value, end of period | | $ | 28.58 | | | $ | 26.74 | | | $ | 25.32 | | | $ | 26.57 | | | $ | 24.49 | |
|
Total Return | | | 11.68 | % | | | 8.19 | % | | | 0.36 | % | | | 8.62 | % | | | (2.04 | %) |
Ratios/Supplemental Data |
Net assets, end of period (in thousands) | | $ | 20,019 | | | $ | 5,479 | | | $ | 5,083 | | | $ | 4,995 | | | $ | 4,604 | |
Ratios to average net assets: |
Net investment income (loss) | | | 1.71 | % | | | 1.18 | % | | | 1.39 | % | | | 0.55 | % | | | 1.92 | % |
Total expenses | | | 2.93 | % | | | 3.57 | % | | | 4.59 | % | | | 4.52 | % | | | 3.41 | % |
Net expensese,f,g | | | 1.41 | % | | | 1.40 | % | | | 1.40 | % | | | 1.40 | % | | | 1.39 | % |
Portfolio turnover rate | | | 198 | % | | | 180 | % | | | 216 | % | | | 145 | % | | | 135 | % |
a | Unaudited figures for the period ended March 31, 2020. Percentage amounts for the period, except total return and portfolio turnover rate, have been annualized. |
b | Since commencement of operations: February 26, 2016. Percentage amounts for the period, except total return and portfolio turnover rate, have been annualized. |
c | Net investment income (loss) per share was computed using average shares outstanding throughout the period. |
d | Total return does not reflect the impact of any applicable sales charges. |
e | Net expense information reflects the expense ratios after expense waivers and reimbursements, as applicable. |
f | The portion of the ratios of net expenses to average net assets attributable to recoupments of prior fee reductions or expense reimbursements for the periods presented was as follows: |
| | | 03/31/20a | 09/30/19 | 09/30/18 | 09/30/17 |
| | A-Class | 0.00%* | 0.00%* | — | 0.22% |
| | C-Class | 0.00%* | 0.02% | — | 0.22% |
| | P-Class | 0.00%* | 0.01% | — | 0.16% |
| | Institutional Class | 0.00%* | 0.03% | — | 0.18% |
g | Net expenses may include expenses that are excluded from the expense limitation agreement. Excluding these expenses, the net expense ratios for the periods would be: |
| | | 03/31/20a | 09/30/19 | 09/30/18 | 09/30/17 | 09/30/16 |
| | A-Class | 1.65% | 1.62% | 1.65% | 1.63% | 1.63% |
| | C-Class | 2.40% | 2.40% | 2.37% | 2.37% | 2.37% |
| | P-Class | 1.65% | 1.65% | 1.65% | 1.63% | 1.65% |
| | Institutional Class | 1.40% | 1.40% | 1.40% | 1.38% | 1.38% |
46 | THE GUGGENHEIM FUNDS SEMI-ANNUAL REPORT | SEE NOTES TO FINANCIAL STATEMENTS. |
PERFORMANCE REPORT AND FUND PROFILE (Unaudited) | March 31, 2020 |
RISK MANAGED REAL ESTATE FUND
OBJECTIVE: Seeks to provide total return, comprised of capital appreciation and current income.
Holdings Diversification (Market Exposure as % of Net Assets)

“Holdings Diversification (Market Exposure as % of Net Assets)” excludes any temporary cash investments.
Inception Dates: |
A-Class | March 28, 2014 |
C-Class | March 28, 2014 |
P-Class | May 1, 2015 |
Institutional Class | March 28, 2014 |
Ten Largest Holdings (% of Total Net Assets) |
Prologis, Inc. | 7.3% |
Equinix, Inc. | 7.2% |
Digital Realty Trust, Inc. | 5.4% |
Safehold, Inc. | 3.9% |
Welltower, Inc. | 3.0% |
Alexandria Real Estate Equities, Inc. | 2.9% |
Public Storage | 2.6% |
Healthpeak Properties, Inc. | 2.6% |
Equity Residential | 2.6% |
Sun Communities, Inc. | 2.5% |
Top Ten Total | 40.0% |
| | |
“Ten Largest Holdings” excludes any temporary cash or derivative investments. |
| | THE GUGGENHEIM FUNDS SEMI-ANNUAL REPORT | 47 |
PERFORMANCE REPORT AND FUND PROFILE (Unaudited)(concluded) | March 31, 2020 |
Average Annual Returns*
Periods Ended March 31, 2020
| 6 Month† | 1 Year | 5 Year | Since
Inception
(03/28/14) |
A-Class Shares | (13.65%) | (4.76%) | 4.29% | 8.08% |
A-Class Shares with sales charge‡ | (17.75%) | (9.28%) | 3.28% | 7.21% |
C-Class Shares | (13.99%) | (5.51%) | 3.50% | 7.27% |
C-Class Shares with CDSC§ | (14.81%) | (6.41%) | 3.50% | 7.27% |
Institutional Class Shares | (13.53%) | (4.48%) | 4.59% | 8.39% |
FTSE NAREIT Equity REITs Total Return Index | (27.86%) | (21.26%) | (0.35%) | 3.47% |
| | 6 Month† | 1 Year | Since
Inception
(05/01/15) |
P-Class Shares | | (13.69%) | (4.79%) | 5.11% |
FTSE NAREIT Equity REITs Total Return Index | | (27.86%) | (21.26%) | 0.63% |
* | The performance data above represents past performance that is not predictive of future results. The investment return and principal value of an investment in the Fund will fluctuate so that an investor’s shares, when redeemed, may be worth more or less than their original cost. Returns are historical and include changes in principal and reinvested dividends and capital gains and do not reflect the effect of taxes. The FTSE NAREIT Equity REITs Total Return Index is an unmanaged index and, unlike the Fund, has no management fees or operating expenses to reduce its reported return. |
† | 6 month returns are not annualized. |
‡ | Fund returns are calculated using the maximum sales charge of 4.75%. |
§ | Fund returns include a CDSC of 1% if redeemed within 12 months of purchase. |
48 | THE GUGGENHEIM FUNDS SEMI-ANNUAL REPORT | |
SCHEDULE OF INVESTMENTS (Unaudited) | March 31, 2020 |
RISK MANAGED REAL ESTATE FUND | |
| | Shares | | | Value | |
COMMON STOCKS† - 89.3% |
| | | | | | | | | |
REITs - 85.4% |
REITs-Diversified - 18.8% |
Equinix, Inc.1 | | | 24,225 | | | $ | 15,130,208 | |
Digital Realty Trust, Inc.1 | | | 80,979 | | | | 11,248,783 | |
VICI Properties, Inc. | | | 164,535 | | | | 2,737,862 | |
SBA Communications Corp. | | | 9,291 | | | | 2,508,291 | |
WP Carey, Inc. | | | 42,900 | | | | 2,491,632 | |
American Tower Corp. — Class A | | | 10,891 | | | | 2,371,515 | |
CoreSite Realty Corp.1 | | | 14,109 | | | | 1,635,233 | |
Gaming and Leisure Properties, Inc. | | | 42,525 | | | | 1,178,368 | |
Total REITs-Diversified | | | | | | | 39,301,892 | |
| | | | | | | | | |
REITs-Warehouse/Industries - 16.3% |
Prologis, Inc.2 | | | 189,847 | | | | 15,258,003 | |
Rexford Industrial Realty, Inc. | | | 92,052 | | | | 3,775,053 | |
Terreno Realty Corp.1 | | | 72,639 | | | | 3,759,068 | |
Americold Realty Trust | | | 88,291 | | | | 3,005,426 | |
EastGroup Properties, Inc. | | | 23,476 | | | | 2,452,773 | |
Innovative Industrial Properties, Inc. | | | 30,383 | | | | 2,306,981 | |
CyrusOne, Inc. | | | 36,382 | | | | 2,246,589 | |
QTS Realty Trust, Inc. — Class A | | | 23,317 | | | | 1,352,619 | |
Total REITs-Warehouse/Industries | | | | | | | 34,156,512 | |
| | | | | | | | | |
REITs-Apartments - 13.2% |
Equity Residential | | | 86,766 | | | | 5,354,330 | |
AvalonBay Communities, Inc. | | | 32,936 | | | | 4,847,191 | |
Invitation Homes, Inc.1 | | | 204,347 | | | | 4,366,895 | |
Essex Property Trust, Inc. | | | 16,855 | | | | 3,712,145 | |
American Homes 4 Rent — Class A1 | | | 119,915 | | | | 2,782,028 | |
Mid-America Apartment Communities, Inc. | | | 25,199 | | | | 2,596,253 | |
UDR, Inc. | | | 62,388 | | | | 2,279,658 | |
Camden Property Trust | | | 21,601 | | | | 1,711,663 | |
Total REITs-Apartments | | | | | | | 27,650,163 | |
| | | | | | | | | |
REITs-Health Care - 9.2% |
Welltower, Inc. | | | 136,013 | | | | 6,226,675 | |
Healthpeak Properties, Inc.1 | | | 225,884 | | | | 5,387,333 | |
Ventas, Inc. | | | 111,593 | | | | 2,990,692 | |
Sabra Health Care REIT, Inc. | | | 123,036 | | | | 1,343,553 | |
Healthcare Trust of America, Inc. — Class A1 | | | 54,153 | | | | 1,314,835 | |
CareTrust REIT, Inc. | | | 67,799 | | | | 1,002,747 | |
Healthcare Realty Trust, Inc. | | | 34,796 | | | | 971,852 | |
Total REITs-Health Care | | | | | | | 19,237,687 | |
| | | | | | | | | |
REITs-Office Property - 8.9% |
Alexandria Real Estate Equities, Inc.1 | | | 44,537 | | | | 6,104,241 | |
Highwoods Properties, Inc. | | | 83,633 | | | | 2,962,281 | |
Corporate Office Properties Trust | | | 125,984 | | | | 2,788,026 | |
Boston Properties, Inc.2 | | | 26,443 | | | | 2,438,838 | |
Kilroy Realty Corp. | | | 25,284 | | | | 1,610,591 | |
Cousins Properties, Inc. | | | 49,471 | | | | 1,448,016 | |
Douglas Emmett, Inc.1 | | | 39,291 | | | | 1,198,769 | |
Total REITs-Office Property | | | | | | | 18,550,762 | |
| | | | | | | | | |
REITs-Storage - 6.3% |
Public Storage | | | 27,699 | | | | 5,501,298 | |
Extra Space Storage, Inc. | | | 44,266 | | | | 4,238,912 | |
Iron Mountain, Inc. | | | 77,002 | | | | 1,832,648 | |
National Storage Affiliates Trust | | | 29,687 | | | | 878,735 | |
CubeSmart | | | 26,754 | | | | 716,740 | |
Total REITs-Storage | | | | | | | 13,168,333 | |
| | | | | | | | | |
REITs-Manufactured Homes - 4.8% |
Sun Communities, Inc. | | | 42,584 | | | | 5,316,612 | |
Equity LifeStyle Properties, Inc. | | | 85,408 | | | | 4,909,252 | |
Total REITs-Manufactured Homes | | | | | | | 10,225,864 | |
| | | | | | | | | |
REITs-Single Tenant - 3.1% |
Realty Income Corp.1 | | | 62,023 | | | | 3,092,467 | |
Agree Realty Corp. | | | 25,948 | | | | 1,606,181 | |
Spirit Realty Capital, Inc. | | | 52,733 | | | | 1,378,968 | |
National Retail Properties, Inc. | | | 14,341 | | | | 461,637 | |
Total REITs-Single Tenant | | | | | | | 6,539,253 | |
| | | | | | | | | |
REITs-Shopping Centers - 1.8% |
Regency Centers Corp. | | | 48,677 | | | | 1,870,657 | |
Federal Realty Investment Trust1 | | | 23,104 | | | | 1,723,790 | |
Acadia Realty Trust | | | 15,004 | | | | 185,900 | |
Total REITs-Shopping Centers | | | | | | | 3,780,347 | |
| | | | | | | | | |
REITs-Hotels - 1.6% |
MGM Growth Properties LLC — Class A | | | 64,785 | | | | 1,533,461 | |
Apple Hospitality REIT, Inc. | | | 88,513 | | | | 811,664 | |
Xenia Hotels & Resorts, Inc. | | | 61,508 | | | | 633,532 | |
Host Hotels & Resorts, Inc. | | | 28,241 | | | | 311,781 | |
Ryman Hospitality Properties, Inc. | | | 3,423 | | | | 122,715 | |
Total REITs-Hotels | | | | | | | 3,413,153 | |
| | | | | | | | | |
REITs-Regional Malls - 1.2% |
Simon Property Group, Inc. | | | 45,039 | | | | 2,470,840 | |
| | | | | | | | | |
REITs-Mortgage - 0.2% |
Capstead Mortgage Corp. | | | 78,207 | | | | 328,469 | |
Total REITs | | | | | | | 178,823,275 | |
| | | | | | | | | |
Real Estate - 3.9% |
Real Estate Management/Services - 3.9% |
Safehold, Inc. | | | 128,685 | | | | 8,136,752 | |
| | | | | | | | | |
Total Common Stocks | | | | |
(Cost $207,432,780) | | | | | | | 186,960,027 | |
| | | | | | | | | |
MONEY MARKET FUND† - 3.2% |
Dreyfus Treasury Securities Cash Management Fund — Institutional Shares, 0.51%3 | | | 6,651,900 | | | | 6,651,900 | |
Total Money Market Fund | | | | |
(Cost $6,651,900) | | | | | | | 6,651,900 | |
| | | | | | | | | |
Total Investments - 92.5% | | | | |
(Cost $214,084,680) | | $ | 193,611,927 | |
| | | | | | | | | |
SEE NOTES TO FINANCIAL STATEMENTS. | THE GUGGENHEIM FUNDS SEMI-ANNUAL REPORT | 49 |
SCHEDULE OF INVESTMENTS (Unaudited)(continued) | March 31, 2020 |
RISK MANAGED REAL ESTATE FUND | |
| | Shares | | | Value | |
COMMON STOCKS SOLD SHORT† - (3.7)% |
Lodging - (0.1)% |
Hotels & Motels - (0.1)% |
Marriott International, Inc. — Class A | | | 1,861 | | | $ | (139,221 | ) |
| | | | | | | | | |
Real Estate - (0.3)% |
Real Estate Management/Services - (0.3)% |
Cushman & Wakefield plc* | | | 15,370 | | | | (180,444 | ) |
Jones Lang LaSalle, Inc. | | | 2,531 | | | | (255,580 | ) |
CBRE Group, Inc. — Class A* | | | 6,897 | | | | (260,086 | ) |
Total Real Estate Management/Services | | | | | | | (696,110 | ) |
| | | | | | | | | |
Total Real Estate | | | | | | | (696,110 | ) |
| | | | | | | | | |
REITs - (3.3)% |
REITs-Regional Malls - (0.0)% |
Washington Prime Group, Inc. | | | 70,125 | | | | (56,458 | ) |
| | | | | | | | | |
REITs-Mortgage - (0.1)% |
Apollo Commercial Real Estate Finance, Inc. | | | 32,207 | | | | (238,976 | ) |
| | | | | | | | | |
REITs-Hotels - (0.2)% |
Service Properties Trust | | | 15,009 | | | | (81,049 | ) |
DiamondRock Hospitality Co. | | | 52,427 | | | | (266,329 | ) |
Total REITs-Hotels | | | | | | | (347,378 | ) |
| | | | | | | | | |
REITs-Apartments - (0.2)% |
Investors Real Estate Trust | | | 8,017 | | | | (440,935 | ) |
| | | | | | | | | |
REITs-Shopping Centers - (0.3)% |
Saul Centers, Inc. | | | 5,563 | | | | (182,133 | ) |
Brixmor Property Group, Inc. | | | 20,130 | | | | (191,235 | ) |
Kimco Realty Corp. | | | 22,691 | | | | (219,422 | ) |
Total REITs-Shopping Centers | | | | | | | (592,790 | ) |
| | | | | | | | | |
REITs-Health Care - (0.3)% |
Diversified Healthcare Trust | | | 53,061 | | | | (192,611 | ) |
Healthcare Realty Trust, Inc. | | | 7,143 | | | | (199,504 | ) |
Healthcare Trust of America, Inc. — Class A1 | | | 8,288 | | | | (201,233 | ) |
Total REITs-Health Care | | | | | | | (593,348 | ) |
| | | | | | | | | |
REITs-Warehouse/Industries - (0.3)% |
Industrial Logistics Properties Trust | | | 12,648 | | | | (221,846 | ) |
Monmouth Real Estate Investment Corp. | | | 35,367 | | | | (426,172 | ) |
Total REITs-Warehouse/Industries | | | | | | | (648,018 | ) |
| | | | | | | | | |
REITs-Office Property - (0.8)% |
VEREIT, Inc. | | | 55,704 | | | | (272,392 | ) |
Mack-Cali Realty Corp. | | | 18,260 | | | | (278,100 | ) |
Brandywine Realty Trust | | | 34,408 | | | | (361,972 | ) |
Office Properties Income Trust | | | 16,352 | | | | (445,592 | ) |
Piedmont Office Realty Trust, Inc. — Class A | | | 27,181 | | | | (480,016 | ) |
Total REITs-Office Property | | | | | | | (1,838,072 | ) |
| | | | | | | | | |
REITs-Diversified - (1.1)% |
PotlatchDeltic Corp. | | | 5,935 | | | | (186,300 | ) |
Rayonier, Inc. | | | 8,077 | | | | (190,213 | ) |
PS Business Parks, Inc. | | | 1,929 | | | | (261,418 | ) |
Washington Real Estate Investment Trust | | | 13,895 | | | | (331,674 | ) |
Global Net Lease, Inc. | | | 29,873 | | | | (399,402 | ) |
Digital Realty Trust, Inc.1 | | | 6,722 | | | | (933,753 | ) |
Total REITs-Diversified | | | | | | | (2,302,760 | ) |
| | | | | | | | | |
Total REITs | | | | | | | (7,058,735 | ) |
| | | | | | | | | |
Total Common Stocks Sold Short | | | | |
(Proceeds $8,684,616) | | | | | | | (7,894,066 | ) |
| | | | | | | | | |
EXCHANGE-TRADED FUNDS SOLD SHORT† - (0.8)% |
Vanguard Real Estate ETF | | | 23,953 | | | | (1,673,117 | ) |
Total Exchange-Traded Funds Sold Short | | | | |
(Proceeds $1,662,128) | | | | | | | (1,673,117 | ) |
| | | | | | | | | |
Total Securities Sold Short - (4.5)% | | | | |
(Proceeds $10,346,744) | | | | | | $ | (9,567,183 | ) |
Other Assets & Liabilities, net - 12.0% | | | 25,181,401 | |
Total Net Assets - 100.0% | | $ | 209,226,145 | |
Custom Basket Swap Agreements |
Counterparty | Reference Obligation | Financing Rate
Pay (Receive) | Payment
Frequency | | Maturity Date | | | Notional
Amount | | | Value and
Unrealized
Appreciation
(Depreciation) | |
OTC Custom Basket Swap Agreements †† |
Morgan Stanley Capital Services LLC | MS Equity Custom Basket | 0.50% (Federal Funds Rate + 0.40%) | At Maturity | | | 06/12/24 | | | $ | 15,937,921 | | | $ | (1,665,982 | ) |
Goldman Sachs International | GS Equity Custom Basket | 0.54% (Federal Funds Rate + 0.45%) | At Maturity | | | 05/06/24 | | | | 15,929,772 | | | | (1,723,772 | ) |
| | | | | | | | | | $ | 31,867,693 | | | $ | (3,389,754 | ) |
50 | THE GUGGENHEIM FUNDS SEMI-ANNUAL REPORT | SEE NOTES TO FINANCIAL STATEMENTS. |
SCHEDULE OF INVESTMENTS (Unaudited)(continued) | March 31, 2020 |
RISK MANAGED REAL ESTATE FUND | |
Counterparty | Reference Obligation | Financing Rate
Pay (Receive) | Payment
Frequency | | Maturity Date | | | Notional
Amount | | | Value and
Unrealized
Appreciation
(Depreciation) | |
OTC Custom Basket Swap Agreements Sold Short †† |
Morgan Stanley Capital Services LLC | MS Equity Custom Basket | (0.26)% (Federal Funds Rate - 0.36%) | At Maturity | | | 06/12/24 | | | $ | 15,818,599 | | | $ | 6,466,938 | |
Goldman Sachs International | GS Equity Custom Basket | (0.19)% (Federal Funds Rate - 0.28%) | At Maturity | | | 05/06/24 | | | | 15,672,298 | | | | 6,486,629 | |
| | | | | | | | | | $ | 31,490,897 | | | $ | 12,953,567 | |
| | Shares | | | Percentage
Notional
Amount | | | Value and
Unrealized
Appreciation
(Depreciation) | |
MS EQUITY LONG CUSTOM BASKET | | | | | | | | |
Financial | | | | | | | | | | | | |
Safehold, Inc. | | | 20,204 | | | | 8.02 | % | | $ | 697,169 | |
Equinix, Inc. | | | 1,168 | | | | 4.58 | % | | | 141,211 | |
Capstead Mortgage Corp. | | | 134,025 | | | | 3.53 | % | | | 96,235 | |
Terreno Realty Corp. | | | 8,480 | | | | 2.75 | % | | | 37,142 | |
Americold Realty Trust | | | 19,065 | | | | 4.07 | % | | | 18,778 | |
SBA Communications Corp. | | | 2,040 | | | | 3.46 | % | | | 15,747 | |
CoreSite Realty Corp. | | | 3,326 | | | | 2.42 | % | | | 11,677 | |
Rexford Industrial Realty, Inc. | | | 10,451 | | | | 2.69 | % | | | 11,183 | |
Acadia Realty Trust | | | 26,608 | | | | 2.07 | % | | | 6,663 | |
CyrusOne, Inc. | | | 4,873 | | | | 1.89 | % | | | 3,423 | |
Sabra Health Care REIT, Inc. | | | 29,703 | | | | 2.04 | % | | | (3,250 | ) |
Agree Realty Corp. | | | 7,606 | | | | 2.95 | % | | | (7,567 | ) |
Ventas, Inc. | | | 11,817 | | | | 1.99 | % | | | (20,883 | ) |
American Tower Corp. — Class A | | | 1,656 | | | | 2.26 | % | | | (22,965 | ) |
Innovative Industrial Properties, Inc. | | | 8,085 | | | | 3.85 | % | | | (28,246 | ) |
Sun Communities, Inc. | | | 5,732 | | | | 4.49 | % | | | (49,468 | ) |
Equity LifeStyle Properties, Inc. | | | 12,537 | | | | 4.52 | % | | | (68,919 | ) |
Iron Mountain, Inc. | | | 11,587 | | | | 1.73 | % | | | (91,747 | ) |
Alexandria Real Estate Equities, Inc. | | | 5,473 | | | | 4.71 | % | | | (110,226 | ) |
Highwoods Properties, Inc. | | | 16,751 | | | | 3.72 | % | | | (124,034 | ) |
Corporate Office Properties Trust | | | 32,991 | | | | 4.58 | % | | | (158,214 | ) |
American Homes 4 Rent — Class A | | | 37,466 | | | | 5.45 | % | | | (178,037 | ) |
Invitation Homes, Inc. | | | 29,164 | | | | 3.91 | % | | | (178,454 | ) |
Regency Centers Corp. | | | 7,269 | | | | 1.75 | % | | | (207,256 | ) |
Federal Realty Investment Trust | | | 3,656 | | | | 1.71 | % | | | (210,970 | ) |
MGM Growth Properties LLC — Class A | | | 30,735 | | | | 4.56 | % | | | (232,103 | ) |
Healthpeak Properties, Inc. | | | 36,343 | | | | 5.44 | % | | | (283,886 | ) |
Spirit Realty Capital, Inc. | | | 16,935 | | | | 2.78 | % | | | (329,745 | ) |
Ryman Hospitality Properties, Inc. | | | 9,238 | | | | 2.08 | % | | | (399,240 | ) |
Total Financial | | | | | | | | | | | (1,665,982 | ) |
Total MS Equity Long Custom Basket | | | | | | $ | (1,665,982 | ) |
| | | | | | | | | |
MS EQUITY SHORT CUSTOM BASKET | | | | | | | | |
Financial | | | | | | | | | | | | |
Service Properties Trust | | | 43,756 | | | | (1.49 | )% | | $ | 719,827 | |
Kimco Realty Corp. | | | 44,296 | | | | (2.71 | )% | | | 446,541 | |
Washington Prime Group, Inc. | | | 141,221 | | | | (0.72 | )% | | | 434,253 | |
Brixmor Property Group, Inc. | | | 38,820 | | | | (2.33 | )% | | | 426,448 | |
Diversified Healthcare Trust | | | 95,029 | | | | (2.18 | )% | | | 413,387 | |
CBRE Group, Inc. — Class A | | | 13,134 | | | | (3.13 | )% | | | 332,236 | |
Brandywine Realty Trust | | | 60,602 | | | | (4.03 | )% | | | 323,308 | |
VEREIT, Inc. | | | 97,475 | | | | (3.01 | )% | | | 297,226 | |
Jones Lang LaSalle, Inc. | | | 4,991 | | | | (3.19 | )% | | | 294,435 | |
Global Net Lease, Inc. | | | 52,273 | | | | (4.42 | )% | | | 243,605 | |
DiamondRock Hospitality Co. | | | 93,310 | | | | (3.00 | )% | | | 234,574 | |
Cushman & Wakefield plc | | | 37,351 | | | | (2.77 | )% | | | 215,839 | |
Investors Real Estate Trust | | | 15,987 | | | | (5.56 | )% | | | 198,866 | |
Office Properties Income Trust | | | 31,411 | | | | (5.41 | )% | | | 184,949 | |
PS Business Parks, Inc. | | | 3,666 | | | | (3.14 | )% | | | 175,076 | |
Piedmont Office Realty Trust, Inc. — Class A | | | 50,874 | | | | (5.68 | )% | | | 155,231 | |
Monmouth Real Estate Investment Corp. | | | 60,537 | | | | (4.61 | )% | | | 131,980 | |
Industrial Logistics Properties Trust | | | 22,198 | | | | (2.46 | )% | | | 95,940 | |
Washington Real Estate Investment Trust | | | 24,697 | | | | (3.73 | )% | | | 94,731 | |
PotlatchDeltic Corp. | | | 10,271 | | | | (2.04 | )% | | | (12,299 | ) |
Saul Centers, Inc. | | | 9,756 | | | | (2.02 | )% | | | (13,160 | ) |
Rayonier, Inc. | | | 14,137 | | | | (2.10 | )% | | | (21,555 | ) |
Healthcare Trust of America, Inc. — Class A | | | 14,244 | | | | (2.19 | )% | | | (21,959 | ) |
SEE NOTES TO FINANCIAL STATEMENTS. | THE GUGGENHEIM FUNDS SEMI-ANNUAL REPORT | 51 |
SCHEDULE OF INVESTMENTS (Unaudited)(continued) | March 31, 2020 |
RISK MANAGED REAL ESTATE FUND | |
| | Shares | | | Percentage
Notional
Amount | | | Value and
Unrealized
Appreciation
(Depreciation) | |
Healthcare Realty Trust, Inc. | | | 12,133 | | | | (2.14 | )% | | $ | (22,702 | ) |
Mack-Cali Realty Corp. | | | 31,717 | | | | (3.05 | )% | | | (24,635 | ) |
Apollo Commercial Real Estate Finance, Inc. | | | 54,749 | | | | (2.57 | )% | | | (73,448 | ) |
Total Financial | | | | | | | | | | | 5,228,694 | |
| | | | | | | | | | | | | |
Exchange-Traded Funds | | | | | | | | | | | | |
Vanguard Real Estate ETF | | | 41,804 | | | | (18.46 | )% | | | 987,920 | |
| | | | | | | | | | | | | |
Consumer, Cyclical | | | | | | | | | | | | |
Marriott International, Inc. — Class A | | | 3,931 | | | | (1.86 | )% | | | 250,324 | |
Total MS Equity Short Custom Basket | | | | | | $ | 6,466,938 | |
| | | | | | | | | |
GS EQUITY LONG CUSTOM BASKET | | | | | | | | |
Financial | | | | | | | | | | | | |
Safehold, Inc. | | | 20,075 | | | | 7.97 | % | | $ | 692,786 | |
Equinix, Inc. | | | 1,168 | | | | 4.58 | % | | | 140,622 | |
Capstead Mortgage Corp. | | | 134,025 | | | | 3.53 | % | | | 92,017 | |
Terreno Realty Corp. | | | 8,480 | | | | 2.76 | % | | | 39,686 | |
Rexford Industrial Realty, Inc. | | | 10,451 | | | | 2.69 | % | | | 15,886 | |
SBA Communications Corp. | | | 2,040 | | | | 3.46 | % | | | 15,885 | |
CoreSite Realty Corp. | | | 3,326 | | | | 2.42 | % | | | 11,731 | |
Acadia Realty Trust | | | 26,608 | | | | 2.07 | % | | | 7,038 | |
CyrusOne, Inc. | | | 4,873 | | | | 1.89 | % | | | 3,609 | |
Sabra Health Care REIT, Inc. | | | 29,703 | | | | 2.04 | % | | | (3,580 | ) |
Agree Realty Corp. | | | 7,606 | | | | 2.96 | % | | | (11,290 | ) |
Innovative Industrial Properties, Inc. | | | 8,085 | | | | 3.85 | % | | | (18,254 | ) |
Ventas, Inc. | | | 11,817 | | | | 1.99 | % | | | (21,559 | ) |
American Tower Corp. — Class A | | | 1,656 | | | | 2.26 | % | | | (22,745 | ) |
Americold Realty Trust | | | 19,065 | | | | 4.07 | % | | | (39,907 | ) |
Sun Communities, Inc. | | | 5,732 | | | | 4.49 | % | | | (48,026 | ) |
Equity LifeStyle Properties, Inc. | | | 12,537 | | | | 4.52 | % | | | (66,377 | ) |
Iron Mountain, Inc. | | | 11,587 | | | | 1.73 | % | | | (91,662 | ) |
Alexandria Real Estate Equities, Inc. | | | 5,473 | | | | 4.71 | % | | | (110,216 | ) |
Highwoods Properties, Inc. | | | 16,751 | | | | 3.73 | % | | | (124,683 | ) |
Corporate Office Properties Trust | | | 32,991 | | | | 4.58 | % | | | (167,089 | ) |
Invitation Homes, Inc. | | | 29,164 | | | | 3.91 | % | | | (177,674 | ) |
American Homes 4 Rent — Class A | | | 37,466 | | | | 5.46 | % | | | (179,169 | ) |
Regency Centers Corp. | | | 7,269 | | | | 1.75 | % | | | (207,811 | ) |
Federal Realty Investment Trust | | | 3,656 | | | | 1.71 | % | | | (210,692 | ) |
MGM Growth Properties LLC — Class A | | | 30,735 | | | | 4.57 | % | | | (231,602 | ) |
Healthpeak Properties, Inc. | | | 36,343 | | | | 5.44 | % | | | (282,012 | ) |
Spirit Realty Capital, Inc. | | | 16,935 | | | | 2.78 | % | | | (329,342 | ) |
Ryman Hospitality Properties, Inc. | | | 9,238 | | | | 2.08 | % | | | (399,342 | ) |
Total Financial | | | | | | | | | | | (1,723,772 | ) |
Total GS Equity Long Custom Basket | | | | | | $ | (1,723,772 | ) |
| | | | | | | | | |
GS EQUITY SHORT CUSTOM BASKET | | | | | | | | |
Financial | | | | | | | | | | | | |
Service Properties Trust | | | 43,756 | | | | (1.52 | )% | | $ | 723,876 | |
Kimco Realty Corp. | | | 44,296 | | | | (2.73 | )% | | | 446,299 | |
Washington Prime Group, Inc. | | | 141,221 | | | | (0.73 | )% | | | 435,429 | |
Brixmor Property Group, Inc. | | | 38,820 | | | | (2.35 | )% | | | 426,240 | |
Diversified Healthcare Trust | | | 95,029 | | | | (2.20 | )% | | | 414,415 | |
CBRE Group, Inc. — Class A | | | 13,134 | | | | (3.16 | )% | | | 332,694 | |
Brandywine Realty Trust | | | 60,602 | | | | (4.07 | )% | | | 324,304 | |
Jones Lang LaSalle, Inc. | | | 4,991 | | | | (3.22 | )% | | | 294,371 | |
VEREIT, Inc. | | | 97,475 | | | | (3.04 | )% | | | 293,393 | |
Global Net Lease, Inc. | | | 52,273 | | | | (4.46 | )% | | | 243,386 | |
DiamondRock Hospitality Co. | | | 93,310 | | | | (3.02 | )% | | | 233,032 | |
Cushman & Wakefield plc | | | 37,351 | | | | (2.80 | )% | | | 218,097 | |
Investors Real Estate Trust | | | 13,327 | | | | (4.68 | )% | | | 198,305 | |
Office Properties Income Trust | | | 31,411 | | | | (5.46 | )% | | | 185,033 | |
PS Business Parks, Inc. | | | 3,666 | | | | (3.17 | )% | | | 174,931 | |
Piedmont Office Realty Trust, Inc. — Class A | | | 50,874 | | | | (5.73 | )% | | | 155,449 | |
Monmouth Real Estate Investment Corp. | | | 60,537 | | | | (4.65 | )% | | | 132,003 | |
Industrial Logistics Properties Trust | | | 22,198 | | | | (2.48 | )% | | | 96,201 | |
Washington Real Estate Investment Trust | | | 24,697 | | | | (3.76 | )% | | | 95,344 | |
Saul Centers, Inc. | | | 9,756 | | | | (2.04 | )% | | | (11,914 | ) |
PotlatchDeltic Corp. | | | 10,271 | | | | (2.06 | )% | | | (12,628 | ) |
Healthcare Trust of America, Inc. — Class A | | | 14,244 | | | | (2.21 | )% | | | (21,939 | ) |
Rayonier, Inc. | | | 14,137 | | | | (2.12 | )% | | | (21,952 | ) |
Healthcare Realty Trust, Inc. | | | 12,133 | | | | (2.16 | )% | | | (22,626 | ) |
Mack-Cali Realty Corp. | | | 31,717 | | | | (3.08 | )% | | | (24,758 | ) |
Apollo Commercial Real Estate Finance, Inc. | | | 54,749 | | | | (2.59 | )% | | | (59,766 | ) |
Total Financial | | | | | | | | | | | 5,247,219 | |
| | | | | | | | | | | | | |
Exchange-Traded Funds | | | | | | | | | | | | |
Vanguard Real Estate ETF | | | 41,804 | | | | (18.63 | )% | | | 989,242 | |
| | | | | | | | | | | | | |
52 | THE GUGGENHEIM FUNDS SEMI-ANNUAL REPORT | SEE NOTES TO FINANCIAL STATEMENTS. |
SCHEDULE OF INVESTMENTS (Unaudited)(concluded) | March 31, 2020 |
RISK MANAGED REAL ESTATE FUND | |
| | | Shares | | | Percentage
Notional
Amount | | | Value and
Unrealized
Appreciation | |
| Consumer, Cyclical | | | | | | | | | | | | |
| Marriott International, Inc. — Class A | | | 3,931 | | | | (1.88 | )% | | $ | 250,168 | |
| Total GS Equity Short Custom Basket | | | | | | | | | | $ | 6,486,629 | |
* | Non-income producing security. |
† | Value determined based on Level 1 inputs — See Note 4. |
†† | Value determined based on Level 2 inputs — See Note 4. |
1 | All or a portion of this security is pledged as custom basket swap collateral at March 31, 2020. |
2 | All or a portion of this security is pledged as short security collateral at March 31, 2020. |
3 | Rate indicated is the 7-day yield as of March 31, 2020. |
| | GS — Goldman Sachs International |
| | MS — Morgan Stanley Capital Services LLC |
| | plc — Public Limited Company |
| | REIT — Real Estate Investment Trust |
| | |
| | See Sector Classification in Other Information section. |
The following table summarizes the inputs used to value the Fund’s investments at March 31, 2020 (See Note 4 in the Notes to Financial Statements):
Investments in Securities (Assets) | | Level 1
Quoted
Prices | | | Level 2
Significant
Observable
Inputs | | | Level 3
Significant
Unobservable
Inputs | | | Total | |
Common Stocks | | $ | 186,960,027 | | | $ | — | | | $ | — | | | $ | 186,960,027 | |
Money Market Fund | | | 6,651,900 | | | | — | | | | — | | | | 6,651,900 | |
Equity Custom Basket Swap Agreements** | | | — | | | | 12,953,567 | | | | — | | | | 12,953,567 | |
Total Assets | | $ | 193,611,927 | | | $ | 12,953,567 | | | $ | — | | | $ | 206,565,494 | |
Investments in Securities (Liabilities) | | Level 1
Quoted
Prices | | | Level 2
Significant
Observable
Inputs | | | Level 3
Significant
Unobservable
Inputs | | | Total | |
Common Stocks Sold Short | | $ | 7,894,066 | | | $ | — | | | $ | — | | | $ | 7,894,066 | |
Exchange-Traded Funds Sold Short | | | 1,673,117 | | | | — | | | | — | | | | 1,673,117 | |
Equity Custom Basket Swap Agreements** | | | — | | | | 3,389,754 | | | | — | | | | 3,389,754 | |
Total Liabilities | | $ | 9,567,183 | | | $ | 3,389,754 | | | $ | — | | | $ | 12,956,937 | |
** | This derivative is reported as unrealized appreciation/depreciation at period end. |
SEE NOTES TO FINANCIAL STATEMENTS. | THE GUGGENHEIM FUNDS SEMI-ANNUAL REPORT | 53 |
RISK MANAGED REAL ESTATE FUND | |
STATEMENT OF ASSETS AND LIABILITIES (Unaudited) |
March 31, 2020 |
Assets: |
Investments, at value (cost $214,084,680) | | $ | 193,611,927 | |
Cash | | | 9,640,161 | |
Unrealized appreciation on OTC swap agreements | | | 12,953,567 | |
Prepaid expenses | | | 52,065 | |
Receivables: |
Securities sold | | | 18,868,273 | |
Swap settlement | | | 1,696,507 | |
Dividends | | | 966,221 | |
Fund shares sold | | | 379,573 | |
Interest | | | 7,109 | |
Other assets | | | 5,761 | |
Total assets | | | 238,181,164 | |
| | | | | |
Liabilities: |
Securities sold short, at value (proceeds $10,346,744) | | | 9,567,183 | |
Segregated cash due to broker | | | 5,080,000 | |
Unrealized depreciation on OTC swap agreements | | | 3,389,754 | |
Payable for: |
Securities purchased | | | 10,041,160 | |
Fund shares redeemed | | | 534,369 | |
Distributions to shareholders | | | 155,549 | |
Management fees | | | 124,447 | |
Fund accounting/administration fees | | | 10,507 | |
Distribution and service fees | | | 7,733 | |
Transfer agent/maintenance fees | | | 3,093 | |
Trustees’ fees* | | | 319 | |
Due to Investment Adviser | | | 137 | |
Miscellaneous | | | 40,768 | |
Total liabilities | | | 28,955,019 | |
Net assets | | $ | 209,226,145 | |
| | | | | |
Net assets consist of: |
Paid in capital | | $ | 214,943,877 | |
Total distributable earnings (loss) | | | (5,717,732 | ) |
Net assets | | $ | 209,226,145 | |
| | | | | |
A-Class: |
Net assets | | $ | 14,064,358 | |
Capital shares outstanding | | | 502,534 | |
Net asset value per share | | $ | 27.99 | |
Maximum offering price per share (Net asset value divided by 95.25%) | | $ | 29.39 | |
| | | | | |
C-Class: |
Net assets | | $ | 2,530,471 | |
Capital shares outstanding | | | 91,068 | |
Net asset value per share | | $ | 27.79 | |
| | | | | |
P-Class: |
Net assets | | $ | 12,645,816 | |
Capital shares outstanding | | | 449,585 | |
Net asset value per share | | $ | 28.13 | |
| | | | | |
Institutional Class: |
Net assets | | $ | 179,985,500 | |
Capital shares outstanding | | | 6,353,342 | |
Net asset value per share | | $ | 28.33 | |
* | Relates to Trustees not deemed “interested persons” within the meaning of Section 2(a)(19) of the 1940 Act. |
54 | THE GUGGENHEIM FUNDS SEMI-ANNUAL REPORT | SEE NOTES TO FINANCIAL STATEMENTS. |
RISK MANAGED REAL ESTATE FUND | |
STATEMENT OF OPERATIONS (Unaudited) |
Six-Month Period Ended March 31, 2020 |
Investment Income: |
Dividends | | $ | 3,129,777 | |
Interest | | | 310,837 | |
Total investment income | | | 3,440,614 | |
| | | | | |
Expenses: |
Management fees | | | 888,538 | |
Distribution and service fees: |
A-Class | | | 20,718 | |
C-Class | | | 11,371 | |
P-Class | | | 24,639 | |
Transfer agent/maintenance fees: |
A-Class | | | 3,606 | |
C-Class | | | 1,206 | |
P-Class | | | 13,322 | |
Institutional Class | | | 37,816 | |
Short sale dividend expense | | | 663,741 | |
Fund accounting/administration fees | | | 91,320 | |
Prime broker interest expense | | | 78,195 | |
Professional fees | | | 29,932 | |
Custodian fees | | | 15,309 | |
Trustees’ fees* | | | 10,836 | |
Line of credit fees | | | 2,970 | |
Miscellaneous | | | 78,404 | |
Recoupment of previously waived fees: |
A-Class | | | 3,387 | |
C-Class | | | 386 | |
P-Class | | | 3,961 | |
Institutional Class | | | 13,852 | |
Total expenses | | | 1,993,509 | |
Less: |
Expenses reimbursed by Adviser: |
A-Class | | | (161 | ) |
C-Class | | | (349 | ) |
P-Class | | | (6,190 | ) |
Institutional Class | | | (2,596 | ) |
Expenses waived by Adviser | | | (3 | ) |
Earnings credits applied | | | (216 | ) |
Total waived/reimbursed expenses | | | (9,515 | ) |
Net expenses | | | 1,983,994 | |
Net investment income | | | 1,456,620 | |
| | | | | |
Net Realized and Unrealized Gain (Loss): |
Net realized gain (loss) on: |
Investments | | $ | 2,368,596 | |
Investments sold short | | | 9,809,272 | |
Swap agreements | | | 1,012,571 | |
Net realized gain | | | 13,190,439 | |
Net change in unrealized appreciation (depreciation) on: |
Investments | | | (57,955,129 | ) |
Investments sold short | | | 1,682,221 | |
Swap agreements | | | 7,181,365 | |
Net change in unrealized appreciation (depreciation) | | | (49,091,543 | ) |
Net realized and unrealized loss | | | (35,901,104 | ) |
Net decrease in net assets resulting from operations | | $ | (34,444,484 | ) |
* | Relates to Trustees not deemed “interested persons” within the meaning of Section 2(a)(19) of the 1940 Act. |
SEE NOTES TO FINANCIAL STATEMENTS. | THE GUGGENHEIM FUNDS SEMI-ANNUAL REPORT | 55 |
RISK MANAGED REAL ESTATE FUND | |
STATEMENTS OF CHANGES IN NET ASSETS |
| | Six-Month
Period Ended
March 31,
2020
(Unaudited) | | | Year Ended
September 30,
2019 | |
Increase (Decrease) in Net Assets from Operations: | | | | | | | | |
Net investment income | | $ | 1,456,620 | | | $ | 2,657,853 | |
Net realized gain on investments | | | 13,190,439 | | | | 6,416,174 | |
Net change in unrealized appreciation (depreciation) on investments | | | (49,091,543 | ) | | | 29,709,757 | |
Net increase (decrease) in net assets resulting from operations | | | (34,444,484 | ) | | | 38,783,784 | |
| | | | | | | | | |
Distributions to shareholders: | | | | | | | | |
A-Class | | | (826,871 | ) | | | (375,063 | ) |
C-Class | | | (103,733 | ) | | | (14,377 | ) |
P-Class | | | (779,653 | ) | | | (241,067 | ) |
Institutional Class | | | (9,956,609 | ) | | | (4,902,443 | ) |
Total distributions to shareholders | | | (11,666,866 | ) | | | (5,532,950 | ) |
| | | | | | | | | |
Capital share transactions: | | | | | | | | |
Proceeds from sale of shares | | | | | | | | |
A-Class | | | 2,505,642 | | | | 3,123,032 | |
C-Class | | | 1,694,368 | | | | 1,198,445 | |
P-Class | | | 9,339,626 | | | | 39,953,878 | |
Institutional Class | | | 42,028,049 | | | | 34,036,778 | |
Distributions reinvested | | | | | | | | |
A-Class | | | 816,639 | | | | 371,479 | |
C-Class | | | 95,849 | | | | 14,097 | |
P-Class | | | 779,653 | | | | 241,067 | |
Institutional Class | | | 8,383,005 | | | | 4,045,330 | |
Cost of shares redeemed | | | | | | | | |
A-Class | | | (2,840,899 | ) | | | (2,964,330 | ) |
C-Class | | | (440,723 | ) | | | (485,605 | ) |
P-Class | | | (28,126,864 | ) | | | (12,160,967 | ) |
Institutional Class | | | (31,494,891 | ) | | | (21,126,545 | ) |
Net increase from capital share transactions | | | 2,739,454 | | | | 46,246,659 | |
Net increase (decrease) in net assets | | | (43,371,896 | ) | | | 79,497,493 | |
| | | | | | | | | |
Net assets: | | | | | | | | |
Beginning of period | | | 252,598,041 | | | | 173,100,548 | |
End of period | | $ | 209,226,145 | | | $ | 252,598,041 | |
| | | | | | | | | |
Capital share activity: | | | | | | | | |
Shares sold | | | | | | | | |
A-Class | | | 75,594 | | | | 98,823 | |
C-Class | | | 51,614 | | | | 37,099 | |
P-Class | | | 279,209 | | | | 1,196,492 | |
Institutional Class | | | 1,277,856 | | | | 1,068,850 | |
Shares issued from reinvestment of distributions | | | | | | | | |
A-Class | | | 25,635 | | | | 12,517 | |
C-Class | | | 3,027 | | | | 477 | |
P-Class | | | 24,333 | | | | 7,585 | |
Institutional Class | | | 260,764 | | | | 133,928 | |
Shares redeemed | | | | | | | | |
A-Class | | | (87,731 | ) | | | (98,269 | ) |
C-Class | | | (14,384 | ) | | | (16,917 | ) |
P-Class | | | (842,253 | ) | | | (360,765 | ) |
Institutional Class | | | (988,595 | ) | | | (669,153 | ) |
Net increase in shares | | | 65,069 | | | | 1,410,667 | |
56 | THE GUGGENHEIM FUNDS SEMI-ANNUAL REPORT | SEE NOTES TO FINANCIAL STATEMENTS. |
RISK MANAGED REAL ESTATE FUND | |
This table is presented to show selected data for a share outstanding throughout each period and to assist shareholders in evaluating a Fund’s performance for the periods presented.
A-Class | | Period Ended
March 31,
2020a | | | Year Ended
September 30,
2019 | | | Year Ended
September 30,
2018 | | | Year Ended
September 30,
2017 | | | Year Ended
September 30,
2016 | | | Year Ended
September 30,
2015 | |
Per Share Data |
Net asset value, beginning of period | | $ | 34.11 | | | $ | 28.93 | | | $ | 29.70 | | | $ | 28.87 | | | $ | 29.77 | | | $ | 26.99 | |
Income (loss) from investment operations: |
Net investment income (loss)b | | | .17 | | | | .34 | | | | .41 | | | | .03 | | | | .19 | | | | (.21 | ) |
Net gain (loss) on investments (realized and unrealized) | | | (4.62 | ) | | | 5.65 | | | | .38 | | | | 2.08 | | | | 3.84 | | | | 3.18 | |
Total from investment operations | | | (4.45 | ) | | | 5.99 | | | | .79 | | | | 2.11 | | | | 4.03 | | | | 2.97 | |
Less distributions from: |
Net investment income | | | (.38 | ) | | | (.55 | ) | | | (.52 | ) | | | (.57 | ) | | | (1.12 | ) | | | (.05 | ) |
Net realized gains | | | (1.29 | ) | | | (.26 | ) | | | (1.04 | ) | | | (.71 | ) | | | (3.81 | ) | | | (.14 | ) |
Total distributions | | | (1.67 | ) | | | (.81 | ) | | | (1.56 | ) | | | (1.28 | ) | | | (4.93 | ) | | | (.19 | ) |
Net asset value, end of period | | $ | 27.99 | | | $ | 34.11 | | | $ | 28.93 | | | $ | 29.70 | | | $ | 28.87 | | | $ | 29.77 | |
|
Total Returnc | | | (13.65 | %) | | | 21.12 | % | | | 2.70 | % | | | 7.54 | % | | | 14.88 | % | | | 10.97 | % |
Ratios/Supplemental Data |
Net assets, end of period (in thousands) | | $ | 14,064 | | | $ | 16,682 | | | $ | 13,772 | | | $ | 2,196 | | | $ | 743 | | | $ | 366 | |
Ratios to average net assets: |
Net investment income (loss) | | | 1.01 | % | | | 1.09 | % | | | 1.42 | % | | | 0.09 | % | | | 0.66 | % | | | (0.67 | %) |
Total expensesd | | | 1.88 | % | | | 1.89 | % | | | 1.78 | % | | | 1.45 | % | | | 1.93 | % | | | 3.41 | % |
Net expensese,f,g | | | 1.88 | % | | | 1.88 | % | | | 1.76 | % | | | 1.33 | % | | | 1.78 | % | | | 3.04 | % |
Portfolio turnover rate | | | 117 | % | | | 122 | % | | | 107 | % | | | 85 | % | | | 133 | % | | | 214 | % |
C-Class | | Period Ended
March 31,
2020a | | | Year Ended
September 30,
2019 | | | Year Ended
September 30,
2018 | | | Year Ended
September 30,
2017 | | | Year Ended
September 30,
2016 | | | Year Ended
September 30,
2015 | |
Per Share Data |
Net asset value, beginning of period | | $ | 33.88 | | | $ | 28.75 | | | $ | 29.54 | | | $ | 28.77 | | | $ | 29.56 | | | $ | 26.95 | |
Income (loss) from investment operations: |
Net investment income (loss)b | | | .05 | | | | .11 | | | | .15 | | | | (.19 | ) | | | .02 | | | | (.43 | ) |
Net gain (loss) on investments (realized and unrealized) | | | (4.59 | ) | | | 5.60 | | | | .42 | | | | 2.06 | | | | 3.77 | | | | 3.18 | |
Total from investment operations | | | (4.54 | ) | | | 5.71 | | | | .57 | | | | 1.87 | | | | 3.79 | | | | 2.75 | |
Less distributions from: |
Net investment income | | | (.26 | ) | | | (.32 | ) | | | (.32 | ) | | | (.39 | ) | | | (.77 | ) | | | — | |
Net realized gains | | | (1.29 | ) | | | (.26 | ) | | | (1.04 | ) | | | (.71 | ) | | | (3.81 | ) | | | (.14 | ) |
Total distributions | | | (1.55 | ) | | | (.58 | ) | | | (1.36 | ) | | | (1.10 | ) | | | (4.58 | ) | | | (.14 | ) |
Net asset value, end of period | | $ | 27.79 | | | $ | 33.88 | | | $ | 28.75 | | | $ | 29.54 | | | $ | 28.77 | | | $ | 29.56 | |
|
Total Returnc | | | (13.99 | %) | | | 20.23 | % | | | 1.93 | % | | | 6.71 | % | | | 14.00 | % | | | 10.20 | % |
Ratios/Supplemental Data |
Net assets, end of period (in thousands) | | $ | 2,530 | | | $ | 1,721 | | | $ | 867 | | | $ | 725 | | | $ | 518 | | | $ | 95 | |
Ratios to average net assets: |
Net investment income (loss) | | | 0.30 | % | | | 0.35 | % | | | 0.53 | % | | | (0.66 | %) | | | 0.08 | % | | | (1.42 | %) |
Total expensesd | | | 2.85 | % | | | 2.73 | % | | | 2.71 | % | | | 2.27 | % | | | 3.32 | % | | | 5.76 | % |
Net expensese,f,g | | | 2.82 | % | | | 2.65 | % | | | 2.53 | % | | | 2.08 | % | | | 2.53 | % | | | 3.76 | % |
Portfolio turnover rate | | | 117 | % | | | 122 | % | | | 107 | % | | | 85 | % | | | 133 | % | | | 214 | % |
SEE NOTES TO FINANCIAL STATEMENTS. | THE GUGGENHEIM FUNDS SEMI-ANNUAL REPORT | 57 |
RISK MANAGED REAL ESTATE FUND | |
FINANCIAL HIGHLIGHTS (continued) |
This table is presented to show selected data for a share outstanding throughout each period and to assist shareholders in evaluating a Fund’s performance for the periods presented.
P-Class | | Period Ended
March 31,
2020a | | | Year Ended
September 30,
2019 | | | Year Ended
September 30,
2018 | | | Year Ended
September 30,
2017 | | | Year Ended
September 30,
2016 | | | Period Ended
September 30,
2015h | |
Per Share Data |
Net asset value, beginning of period | | $ | 34.30 | | | $ | 29.09 | | | $ | 29.85 | | | $ | 29.01 | | | $ | 29.77 | | | $ | 30.89 | |
Income (loss) from investment operations: |
Net investment income (loss)b | | | .13 | | | | .60 | | | | .37 | | | | .13 | | | | .16 | | | | .04 | |
Net gain (loss) on investments (realized and unrealized) | | | (4.62 | ) | | | 5.42 | | | | .43 | | | | 1.98 | | | | 3.88 | | | | (1.16 | ) |
Total from investment operations | | | (4.49 | ) | | | 6.02 | | | | .80 | | | | 2.11 | | | | 4.04 | | | | (1.12 | ) |
Less distributions from: |
Net investment income | | | (.39 | ) | | | (.55 | ) | | | (.52 | ) | | | (.56 | ) | | | (.99 | ) | | | — | |
Net realized gains | | | (1.29 | ) | | | (.26 | ) | | | (1.04 | ) | | | (.71 | ) | | | (3.81 | ) | | | — | |
Total distributions | | | (1.68 | ) | | | (.81 | ) | | | (1.56 | ) | | | (1.27 | ) | | | (4.80 | ) | | | — | |
Net asset value, end of period | | $ | 28.13 | | | $ | 34.30 | | | $ | 29.09 | | | $ | 29.85 | | | $ | 29.01 | | | $ | 29.77 | |
|
Total Return | | | (13.69 | %) | | | 21.12 | % | | | 2.68 | % | | | 7.53 | % | | | 14.87 | % | | | (3.63 | %) |
Ratios/Supplemental Data |
Net assets, end of period (in thousands) | | $ | 12,646 | | | $ | 33,894 | | | $ | 4,217 | | | $ | 2,564 | | | $ | 82 | | | $ | 30 | |
Ratios to average net assets: |
Net investment income (loss) | | | 0.75 | % | | | 1.87 | % | | | 1.29 | % | | | 0.42 | % | | | 0.56 | % | | | 0.30 | % |
Total expensesd | | | 1.85 | % | | | 1.93 | % | | | 1.88 | % | | | 1.51 | % | | | 1.88 | % | | | 4.04 | %i |
Net expensese,f,g | | | 1.78 | % | | | 1.89 | % | | | 1.78 | % | | | 1.30 | % | | | 1.78 | % | | | 2.94 | % |
Portfolio turnover rate | | | 117 | % | | | 122 | % | | | 107 | % | | | 85 | % | | | 133 | % | | | 214 | % |
58 | THE GUGGENHEIM FUNDS SEMI-ANNUAL REPORT | SEE NOTES TO FINANCIAL STATEMENTS. |
RISK MANAGED REAL ESTATE FUND | |
FINANCIAL HIGHLIGHTS (concluded) |
This table is presented to show selected data for a share outstanding throughout each period and to assist shareholders in evaluating a Fund’s performance for the periods presented.
Institutional Class | | Period Ended
March 31,
2020a | | | Year Ended
September 30,
2019 | | | Year Ended
September 30,
2018 | | | Year Ended
September 30,
2017 | | | Year Ended
September 30,
2016 | | | Year Ended
September 30,
2015 | |
Per Share Data |
Net asset value, beginning of period | | $ | 34.51 | | | $ | 29.27 | | | $ | 30.04 | | | $ | 29.18 | | | $ | 29.90 | | | $ | 27.00 | |
Income (loss) from investment operations: |
Net investment income (loss)b | | | .22 | | | | .43 | | | | .46 | | | | .11 | | | | .26 | | | | (.11 | ) |
Net gain (loss) on investments (realized and unrealized) | | | (4.68 | ) | | | 5.71 | | | | .43 | | | | 2.10 | | | | 3.89 | | | | 3.18 | |
Total from investment operations | | | (4.46 | ) | | | 6.14 | | | | .89 | | | | 2.21 | | | | 4.15 | | | | 3.07 | |
Less distributions from: |
Net investment income | | | (.43 | ) | | | (.64 | ) | | | (.62 | ) | | | (.64 | ) | | | (1.06 | ) | | | (.03 | ) |
Net realized gains | | | (1.29 | ) | | | (.26 | ) | | | (1.04 | ) | | | (.71 | ) | | | (3.81 | ) | | | (.14 | ) |
Total distributions | | | (1.72 | ) | | | (.90 | ) | | | (1.66 | ) | | | (1.35 | ) | | | (4.87 | ) | | | (.17 | ) |
Net asset value, end of period | | $ | 28.33 | | | $ | 34.51 | | | $ | 29.27 | | | $ | 30.04 | | | $ | 29.18 | | | $ | 29.90 | |
|
Total Return | | | (13.53 | %) | | | 21.46 | % | | | 2.98 | % | | | 7.87 | % | | | 15.20 | % | | | 11.36 | % |
Ratios/Supplemental Data |
Net assets, end of period (in thousands) | | $ | 179,986 | | | $ | 200,301 | | | $ | 154,245 | | | $ | 123,037 | | | $ | 111,823 | | | $ | 105,882 | |
Ratios to average net assets: |
Net investment income (loss) | | | 1.31 | % | | | 1.38 | % | | | 1.56 | % | | | 0.38 | % | | | 0.91 | % | | | (0.35 | %) |
Total expensesd | | | 1.64 | % | | | 1.61 | % | | | 1.51 | % | | | 1.02 | % | | | 1.50 | % | | | 2.70 | % |
Net expensese,f,g | | | 1.63 | % | | | 1.60 | % | | | 1.50 | % | | | 1.01 | % | | | 1.50 | % | | | 2.70 | % |
Portfolio turnover rate | | | 117 | % | | | 122 | % | | | 107 | % | | | 85 | % | | | 133 | % | | | 214 | % |
a | Unaudited figures for the period ended March 31, 2020. Percentage amounts for the period, except total return and portfolio turnover rate, have been annualized. |
b | Net investment income (loss) per share was computed using average shares outstanding throughout the period. |
c | Total return does not reflect the impact of any applicable sales charges. |
d | Does not include expenses of the underlying funds in which the Fund invests. |
e | Net expense information reflects the expense ratios after expense waivers and reimbursements, as applicable. |
f | The portion of the ratios of net expenses to average net assets attributable to recoupments of prior fee reductions or expense reimbursements for the periods presented was as follows: |
| | | 03/31/20a | 09/30/19 | 09/30/18 | 09/30/17 |
| | A-Class | 0.04% | 0.03% | 0.03% | 0.02% |
| | C-Class | 0.03% | 0.01% | 0.01% | 0.00%* |
| | P-Class | 0.04% | 0.02% | 0.01% | 0.00%* |
| | Institutional Class | 0.01% | 0.01% | 0.02% | — |
g | Net expenses may include expenses that are excluded from the expense limitation agreement. Excluding these expenses, the net expense ratios for the periods would be: |
| | | 03/31/20a | 09/30/19 | 09/30/18 | 09/30/17 | 09/30/16 | 09/30/15 |
| | A-Class | 1.27% | 1.27% | 1.29% | 1.30% | 1.29% | 1.30% |
| | C-Class | 2.05% | 2.05% | 2.05% | 2.04% | 2.03% | 2.05% |
| | P-Class | 1.30% | 1.30% | 1.30% | 1.29% | 1.28% | 1.30% |
| | Institutional Class | 0.99% | 1.00% | 1.03% | 0.97% | 1.00% | 0.99% |
h | Since commencement of operations: May 1, 2015. Percentage amounts for the period, except total return and portfolio turnover rate, have been annualized. |
i | Due to limited length of Fund operations, ratios for this period are not indicative of future performance. |
SEE NOTES TO FINANCIAL STATEMENTS. | THE GUGGENHEIM FUNDS SEMI-ANNUAL REPORT | 59 |
PERFORMANCE REPORT AND FUND PROFILE (Unaudited) | March 31, 2020 |
SMALL CAP VALUE FUND
OBJECTIVE: Seeks long-term capital appreciation.
Holdings Diversification (Market Exposure as % of Net Assets)
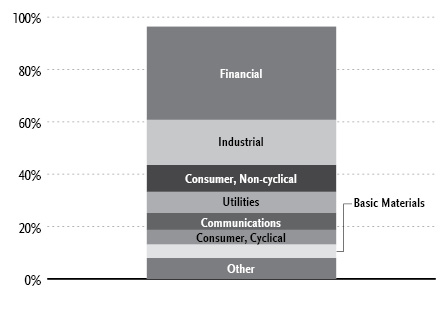
“Holdings Diversification (Market Exposure as % of Net Assets)” excludes any temporary cash investments.
Inception Dates: |
A-Class | July 11, 2008 |
C-Class | July 11, 2008 |
P-Class | May 1, 2015 |
Institutional Class | July 11, 2008 |
Ten Largest Holdings (% of Total Net Assets) |
Equity Commonwealth | 2.7% |
Portland General Electric Co. | 2.4% |
MDU Resources Group, Inc. | 2.3% |
Physicians Realty Trust | 1.9% |
Central Garden & Pet Co. — Class A | 1.9% |
Encompass Health Corp. | 1.9% |
Black Hills Corp. | 1.9% |
Lexington Realty Trust | 1.8% |
Federal Agricultural Mortgage Corp. — Class C | 1.7% |
Avista Corp. | 1.6% |
Top Ten Total | 20.1% |
| | |
“Ten Largest Holdings” excludes any temporary cash investments. |
60 | THE GUGGENHEIM FUNDS SEMI-ANNUAL REPORT | |
PERFORMANCE REPORT AND FUND PROFILE (Unaudited)(concluded) | March 31, 2020 |
Average Annual Returns*
Periods Ended March 31, 2020
| 6 Month† | 1 Year | 5 Year | 10 Year |
A-Class Shares | (27.80%) | (25.54%) | (3.25%) | 4.03% |
A-Class Shares with sales charge‡ | (31.22%) | (29.07%) | (4.19%) | 3.41% |
C-Class Shares | (28.09%) | (26.14%) | (3.99%) | 3.24% |
C-Class Shares with CDSC§ | (28.79%) | (26.86%) | (3.99%) | 3.24% |
Institutional Class Shares | (27.71%) | (25.40%) | (3.02%) | 4.27% |
Russell 2000 Value Index | (30.20%) | (29.64%) | (2.42%) | 4.79% |
| | 6 Month† | 1 Year | Since
Inception
(05/01/15) |
P-Class Shares | | (27.68%) | (25.50%) | (3.02%) |
Russell 2000 Value Index | | (30.20%) | (29.64%) | (2.10%) |
* | The performance data above represents past performance that is not predictive of future results. The investment return and principal value of an investment in the Fund will fluctuate so that an investor’s shares, when redeemed, may be worth more or less than their original cost. Returns are historical and include changes in principal and reinvested dividends and capital gains and do not reflect the effect of taxes. The Russell 2000 Value Index is an unmanaged index and, unlike the Fund, has no management fees or operating expenses to reduce its reported return. |
† | 6 month returns are not annualized. |
‡ | Effective February 22, 2011, the maximum sales charge decreased from 5.75% to 4.75%. A 5.75% maximum sales charge is used in the calculation of the Average Annual Returns based on subscriptions made prior to February 22, 2011, and a 4.75% maximum sales charge will be used to calculate performance for periods based on subscriptions made on or after February 22, 2011. |
§ | Fund returns include a CDSC of 1% if redeemed within 12 months of purchase. |
| | THE GUGGENHEIM FUNDS SEMI-ANNUAL REPORT | 61 |
SCHEDULE OF INVESTMENTS (Unaudited) | March 31, 2020 |
SMALL CAP VALUE FUND | |
| | Shares | | | Value | |
COMMON STOCKS† - 96.4% |
| | | | | | | | | |
Financial - 35.6% |
Equity Commonwealth REIT | | | 3,930 | | | $ | 124,620 | |
Physicians Realty Trust REIT | | | 6,281 | | | | 87,557 | |
Lexington Realty Trust REIT | | | 8,172 | | | | 81,148 | |
Federal Agricultural Mortgage Corp. — Class C | | | 1,404 | | | | 78,104 | |
Pinnacle Financial Partners, Inc. | | | 1,877 | | | | 70,463 | |
Axis Capital Holdings Ltd. | | | 1,793 | | | | 69,299 | |
Umpqua Holdings Corp. | | | 6,275 | | | | 68,397 | |
Radian Group, Inc. | | | 4,691 | | | | 60,748 | |
WSFS Financial Corp. | | | 2,339 | | | | 58,288 | |
Investors Bancorp, Inc. | | | 7,289 | | | | 58,239 | |
Cousins Properties, Inc. REIT | | | 1,978 | | | | 57,896 | |
Simmons First National Corp. — Class A | | | 2,938 | | | | 54,059 | |
CNO Financial Group, Inc. | | | 4,045 | | | | 50,118 | |
Heritage Insurance Holdings, Inc. | | | 4,606 | | | | 49,330 | |
Cathay General Bancorp | | | 2,146 | | | | 49,251 | |
First Horizon National Corp. | | | 5,837 | | | | 47,046 | |
Hilltop Holdings, Inc. | | | 2,806 | | | | 42,427 | |
Prosperity Bancshares, Inc. | | | 874 | | | | 42,171 | |
Piedmont Office Realty Trust, Inc. — Class A REIT | | | 2,297 | | | | 40,565 | |
Hanmi Financial Corp. | | | 3,541 | | | | 38,420 | |
First Midwest Bancorp, Inc. | | | 2,717 | | | | 35,959 | |
Howard Hughes Corp.* | | | 612 | | | | 30,918 | |
Kennedy-Wilson Holdings, Inc. | | | 2,301 | | | | 30,879 | |
Berkshire Hills Bancorp, Inc. | | | 2,052 | | | | 30,493 | |
Sunstone Hotel Investors, Inc. REIT | | | 3,446 | | | | 30,015 | |
IBERIABANK Corp. | | | 768 | | | | 27,771 | |
Hancock Whitney Corp. | | | 1,406 | | | | 27,445 | |
Stifel Financial Corp. | | | 656 | | | | 27,080 | |
Flagstar Bancorp, Inc. | | | 1,277 | | | | 25,323 | |
American National Insurance Co. | | | 300 | | | | 24,714 | |
Heartland Financial USA, Inc. | | | 764 | | | | 23,073 | |
RMR Group, Inc. — Class A | | | 797 | | | | 21,495 | |
Redwood Trust, Inc. REIT | | | 4,233 | | | | 21,419 | |
PennyMac Mortgage Investment Trust REIT | | | 1,922 | | | | 20,412 | |
MGIC Investment Corp. | | | 2,513 | | | | 15,958 | |
Independent Bank Group, Inc. | | | 658 | | | | 15,581 | |
Total Financial | | | | | | | 1,636,681 | |
| | | | | | | | | |
Industrial - 17.3% |
MDU Resources Group, Inc. | | | 4,912 | | | | 105,608 | |
Knight-Swift Transportation Holdings, Inc. | | | 2,136 | | | | 70,061 | |
Graphic Packaging Holding Co. | | | 5,282 | | | | 64,440 | |
Sanmina Corp.* | | | 2,233 | | | | 60,917 | |
Valmont Industries, Inc. | | | 545 | | | | 57,759 | |
GATX Corp. | | | 917 | | | | 57,367 | |
Plexus Corp.* | | | 834 | | | | 45,503 | |
Advanced Energy Industries, Inc.* | | | 845 | | | | 40,974 | |
Rexnord Corp. | | | 1,594 | | | | 36,136 | |
Owens Corning | | | 843 | | | | 32,717 | |
Dycom Industries, Inc.* | | | 1,259 | | | | 32,293 | |
Crane Co. | | | 656 | | | | 32,262 | |
PGT Innovations, Inc.* | | | 3,246 | | | | 27,234 | |
Park Aerospace Corp. | | | 2,051 | | | | 25,843 | |
Vishay Intertechnology, Inc. | | | 1,642 | | | | 23,661 | |
Kirby Corp.* | | | 532 | | | | 23,126 | |
EnerSys | | | 453 | | | | 22,432 | |
Kennametal, Inc. | | | 1,077 | | | | 20,054 | |
Encore Wire Corp. | | | 431 | | | | 18,098 | |
Total Industrial | | | | | | | 796,485 | |
| | | | | | | | | |
Consumer, Non-cyclical - 10.3% |
Central Garden & Pet Co. — Class A* | | | 3,424 | | | | 87,552 | |
Encompass Health Corp. | | | 1,366 | | | | 87,465 | |
Ingredion, Inc. | | | 834 | | | | 62,967 | |
TreeHouse Foods, Inc.* | | | 1,199 | | | | 52,936 | |
Andersons, Inc. | | | 2,376 | | | | 44,550 | |
Emergent BioSolutions, Inc.* | | | 699 | | | | 40,444 | |
Eagle Pharmaceuticals, Inc.* | | | 859 | | | | 39,514 | |
Perdoceo Education Corp.* | | | 2,215 | | | | 23,900 | |
MGP Ingredients, Inc. | | | 841 | | | | 22,614 | |
Adtalem Global Education, Inc.* | | | 487 | | | | 13,047 | |
Total Consumer, Non-cyclical | | | | | | | 474,989 | |
| | | | | | | | | |
Utilities - 8.1% |
Portland General Electric Co. | | | 2,259 | | | | 108,296 | |
Black Hills Corp. | | | 1,334 | | | | 85,416 | |
Avista Corp. | | | 1,751 | | | | 74,400 | |
Southwest Gas Holdings, Inc. | | | 856 | | | | 59,544 | |
ALLETE, Inc. | | | 710 | | | | 43,083 | |
Total Utilities | | | | | | | 370,739 | |
| | | | | | | | | |
Communications - 6.4% |
Infinera Corp.* | | | 13,618 | | | | 72,175 | |
Viavi Solutions, Inc.* | | | 5,482 | | | | 61,453 | |
Ciena Corp.* | | | 1,268 | | | | 50,479 | |
Scholastic Corp. | | | 1,293 | | | | 32,959 | |
Gray Television, Inc.* | | | 2,644 | | | | 28,397 | |
InterDigital, Inc. | | | 533 | | | | 23,788 | |
Tribune Publishing Co. | | | 1,946 | | | | 15,782 | |
Entercom Communications Corp. — Class A | | | 5,002 | | | | 8,553 | |
Total Communications | | | | | | | 293,586 | |
| | | | | | | | | |
Consumer, Cyclical - 5.6% |
UniFirst Corp. | | | 412 | | | | 62,249 | |
MDC Holdings, Inc. | | | 1,488 | | | | 34,522 | |
Hawaiian Holdings, Inc. | | | 3,153 | | | | 32,917 | |
Abercrombie & Fitch Co. — Class A | | | 3,302 | | | | 30,015 | |
BMC Stock Holdings, Inc.* | | | 1,336 | | | | 23,687 | |
Methode Electronics, Inc. | | | 655 | | | | 17,312 | |
MasterCraft Boat Holdings, Inc.* | | | 2,319 | | | | 16,929 | |
Wabash National Corp. | | | 2,262 | | | | 16,332 | |
La-Z-Boy, Inc. | | | 500 | | | | 10,275 | |
Caleres, Inc. | | | 1,578 | | | | 8,206 | |
Tenneco, Inc. — Class A* | | | 1,556 | | | | 5,601 | |
Total Consumer, Cyclical | | | | | | | 258,045 | |
| | | | | | | | | |
62 | THE GUGGENHEIM FUNDS SEMI-ANNUAL REPORT | SEE NOTES TO FINANCIAL STATEMENTS. |
SCHEDULE OF INVESTMENTS (Unaudited)(concluded) | March 31, 2020 |
SMALL CAP VALUE FUND | |
| | Shares | | | Value | |
Basic Materials - 5.2% |
Ashland Global Holdings, Inc. | | | 1,048 | | | $ | 52,473 | |
Huntsman Corp. | | | 3,528 | | | | 50,909 | |
Olin Corp. | | | 3,643 | | | | 42,514 | |
Reliance Steel & Aluminum Co. | | | 412 | | | | 36,087 | |
Commercial Metals Co. | | | 2,201 | | | | 34,754 | |
Verso Corp. — Class A* | | | 2,106 | | | | 23,756 | |
Total Basic Materials | | | | | | | 240,493 | |
| | | | | | | | | |
Technology - 4.6% |
MACOM Technology Solutions Holdings, Inc.* | | | 3,636 | | | | 68,829 | |
Lumentum Holdings, Inc.* | | | 589 | | | | 43,409 | |
CSG Systems International, Inc. | | | 642 | | | | 26,868 | |
Onto Innovation, Inc.* | | | 887 | | | | 26,317 | |
Axcelis Technologies, Inc.* | | | 1,202 | | | | 22,009 | |
Evolent Health, Inc. — Class A* | | | 3,877 | | | | 21,052 | |
Total Technology | | | | | | | 208,484 | |
| | | | | | | | | |
Energy - 3.3% |
Parsley Energy, Inc. — Class A | | | 9,262 | | | | 53,071 | |
Range Resources Corp. | | | 13,806 | | | | 31,477 | |
Delek US Holdings, Inc. | | | 1,747 | | | | 27,533 | |
CNX Resources Corp.* | | | 5,066 | | | | 26,951 | |
Oil States International, Inc.* | | | 3,362 | | | | 6,825 | |
Antero Resources Corp.* | | | 5,521 | | | | 3,936 | |
Total Energy | | | | | | | 149,793 | |
| | | | | | | | | |
Total Common Stocks | | | | |
(Cost $5,998,916) | | | | | | | 4,429,295 | |
| | | | | | | | | |
CONVERTIBLE PREFERRED STOCKS††† - 0.0% |
Industrial - 0.0% |
Thermoenergy Corp.*,1,2 | | | 6,250 | | | | 2 | |
Total Convertible Preferred Stocks | | | | |
(Cost $5,968) | | | | | | | 2 | |
| | | | | | | | | |
RIGHTS† - 0.1% |
Basic Materials - 0.1% | | | | | | | | |
Pan American Silver Corp.* | | | 17,705 | | | | 6,020 | |
Total Rights | | | | |
(Cost $—) | | | | | | | 6,020 | |
| | | | | | | | | |
MONEY MARKET FUND† - 3.1% |
Dreyfus Treasury Securities Cash Management Fund — Institutional Shares, 0.51%3 | | | 144,439 | | | | 144,439 | |
Total Money Market Fund | | | | |
(Cost $144,439) | | | | | | | 144,439 | |
| | | | | | | | | |
Total Investments - 99.6% | | | | |
(Cost $6,149,323) | | $ | 4,579,756 | |
Other Assets & Liabilities, net - 0.4% | | | 17,609 | |
Total Net Assets - 100.0% | | $ | 4,597,365 | |
* | Non-income producing security. |
† | Value determined based on Level 1 inputs — See Note 4. |
††† | Value determined based on Level 3 inputs — See Note 4. |
1 | Security was fair valued by the Valuation Committee at March 31, 2020. The total market value of fair valued securities amounts to $2, (cost $5,968) or less than 0.1% of total net assets. |
2 | PIPE (Private Investment in Public Equity) — Stock issued by a company in the secondary market as a means of raising capital more quickly and less expensively than through registration of a secondary public offering. |
3 | Rate indicated is the 7-day yield as of March 31, 2020. |
| | REIT — Real Estate Investment Trust |
| | |
| | See Sector Classification in Other Information section. |
The following table summarizes the inputs used to value the Fund’s investments at March 31, 2020 (See Note 4 in the Notes to Financial Statements):
Investments in Securities (Assets) | | Level 1
Quoted
Prices | | | Level 2
Significant
Observable
Inputs | | | Level 3
Significant
Unobservable
Inputs | | | Total | |
Common Stocks | | $ | 4,429,295 | | | $ | — | | | $ | — | | | $ | 4,429,295 | |
Convertible Preferred Stocks | | | — | | | | — | | | | 2 | | | | 2 | |
Rights | | | 6,020 | | | | — | | | | — | | | | 6,020 | |
Money Market Fund | | | 144,439 | | | | — | | | | — | | | | 144,439 | |
Total Assets | | $ | 4,579,754 | | | $ | — | | | $ | 2 | | | $ | 4,579,756 | |
SEE NOTES TO FINANCIAL STATEMENTS. | THE GUGGENHEIM FUNDS SEMI-ANNUAL REPORT | 63 |
STATEMENT OF ASSETS AND LIABILITIES (Unaudited) |
March 31, 2020 |
Assets: |
Investments, at value (cost $6,149,323) | | $ | 4,579,756 | |
Prepaid expenses | | | 24,060 | |
Receivables: |
Dividends | | | 13,334 | |
Investment Adviser | | | 10,263 | |
Fund shares sold | | | 1,826 | |
Interest | | | 242 | |
Total assets | | | 4,629,481 | |
| | | | | |
Liabilities: |
Payable for: |
Professional fees | | | 12,593 | |
Printing fees | | | 6,843 | |
Transfer agent/maintenance fees | | | 5,496 | |
Custodian fees | | | 2,052 | |
Distribution and service fees | | | 1,460 | |
Trustees’ fees* | | | 501 | |
Fund shares redeemed | | | 303 | |
Miscellaneous | | | 2,868 | |
Total liabilities | | | 32,116 | |
Net assets | | $ | 4,597,365 | |
| | | | | |
Net assets consist of: |
Paid in capital | | $ | 7,055,768 | |
Total distributable earnings (loss) | | | (2,458,403 | ) |
Net assets | | $ | 4,597,365 | |
| | | | | |
A-Class: |
Net assets | | $ | 3,183,449 | |
Capital shares outstanding | | | 354,115 | |
Net asset value per share | | $ | 8.99 | |
Maximum offering price per share (Net asset value divided by 95.25%) | | $ | 9.44 | |
| | | | | |
C-Class: |
Net assets | | $ | 851,190 | |
Capital shares outstanding | | | 103,243 | |
Net asset value per share | | $ | 8.24 | |
| | | | | |
P-Class: |
Net assets | | $ | 44,130 | |
Capital shares outstanding | | | 4,847 | |
Net asset value per share | | $ | 9.10 | |
| | | | | |
Institutional Class: |
Net assets | | $ | 518,596 | |
Capital shares outstanding | | | 64,236 | |
Net asset value per share | | $ | 8.07 | |
STATEMENT OF OPERATIONS (Unaudited) |
Six-Month Period Ended March 31, 2020 |
Investment Income: |
Dividends | | $ | 121,882 | |
Interest | | | 2,196 | |
Total investment income | | | 124,078 | |
| | | | | |
Expenses: |
Management fees | | | 50,089 | |
Distribution and service fees: |
A-Class | | | 10,811 | |
C-Class | | | 7,270 | |
P-Class | | | 52 | |
Transfer agent/maintenance fees: |
A-Class | | | 9,498 | |
C-Class | | | 3,292 | |
P-Class | | | 132 | |
Institutional Class | | | 4,121 | |
Registration fees | | | 35,467 | |
Professional fees | | | 17,895 | |
Fund accounting/administration fees | | | 12,525 | |
Trustees’ fees* | | | 8,743 | |
Custodian fees | | | 4,306 | |
Line of credit fees | | | 182 | |
Miscellaneous | | | 16,196 | |
Total expenses | | | 180,579 | |
Less: |
Expenses reimbursed by Adviser: |
A-Class | | | (24,879 | ) |
C-Class | | | (6,190 | ) |
P-Class | | | (225 | ) |
Institutional Class | | | (10,638 | ) |
Expenses waived by Adviser | | | (50,054 | ) |
Earnings credits applied | | | (15 | ) |
Total waived/reimbursed expenses | | | (92,001 | ) |
Net expenses | | | 88,578 | |
Net investment income | | | 35,500 | |
| | | | | |
Net Realized and Unrealized Gain (Loss): |
Net realized gain (loss) on: |
Investments | | | (566,553 | ) |
Net realized loss | | | (566,553 | ) |
Net change in unrealized appreciation (depreciation) on: |
Investments | | | (1,621,500 | ) |
Net change in unrealized appreciation (depreciation) | | | (1,621,500 | ) |
Net realized and unrealized loss | | | (2,188,053 | ) |
Net decrease in net assets resulting from operations | | $ | (2,152,553 | ) |
* | Relates to Trustees not deemed “interested persons” within the meaning of Section 2(a)(19) of the 1940 Act. |
64 | THE GUGGENHEIM FUNDS SEMI-ANNUAL REPORT | SEE NOTES TO FINANCIAL STATEMENTS. |
STATEMENTS OF CHANGES IN NET ASSETS |
| | Six-Month
Period Ended
March 31,
2020
(Unaudited) | | | Year Ended
September 30,
2019 | |
Increase (Decrease) in Net Assets from Operations: | | | | | | | | |
Net investment income | | $ | 35,500 | | | $ | 113,084 | |
Net realized gain (loss) on investments | | | (566,553 | ) | | | 701,576 | |
Net change in unrealized appreciation (depreciation) on investments | | | (1,621,500 | ) | | | (2,007,250 | ) |
Net decrease in net assets resulting from operations | | | (2,152,553 | ) | | | (1,192,590 | ) |
| | | | | | | | | |
Distributions to shareholders: | | | | | | | | |
A-Class | | | (326,187 | ) | | | (1,117,845 | ) |
C-Class | | | (40,256 | ) | | | (254,536 | ) |
P-Class | | | (1,606 | ) | | | (1,542 | ) |
Institutional Class | | | (136,363 | ) | | | (414,600 | ) |
Total distributions to shareholders | | | (504,412 | ) | | | (1,788,523 | ) |
| | | | | | | | | |
Capital share transactions: | | | | | | | | |
Proceeds from sale of shares | | | | | | | | |
A-Class | | | 465,702 | | | | 1,804,179 | |
C-Class | | | 66,300 | | | | 51,146 | |
P-Class | | | 31,592 | | | | 31,429 | |
Institutional Class | | | 690,176 | | | | 940,499 | |
Distributions reinvested | | | | | | | | |
A-Class | | | 322,155 | | | | 1,099,437 | |
C-Class | | | 39,691 | | | | 249,807 | |
P-Class | | | 1,606 | | | | 1,542 | |
Institutional Class | | | 136,363 | | | | 414,577 | |
Cost of shares redeemed | | | | | | | | |
A-Class | | | (6,077,412 | ) | | | (3,220,818 | ) |
C-Class | | | (460,359 | ) | | | (1,129,663 | ) |
P-Class | | | (32,473 | ) | | | (76 | ) |
Institutional Class | | | (2,463,208 | ) | | | (1,355,229 | ) |
Net decrease from capital share transactions | | | (7,279,867 | ) | | | (1,113,170 | ) |
Net decrease in net assets | | | (9,936,832 | ) | | | (4,094,283 | ) |
| | | | | | | | | |
Net assets: | | | | | | | | |
Beginning of period | | | 14,534,197 | | | | 18,628,480 | |
End of period | | $ | 4,597,365 | | | $ | 14,534,197 | |
| | | | | | | | | |
Capital share activity: | | | | | | | | |
Shares sold | | | | | | | | |
A-Class | | | 38,944 | | | | 143,478 | |
C-Class | | | 5,632 | | | | 4,333 | |
P-Class | | | 3,591 | | | | 2,490 | |
Institutional Class | | | 68,376 | | | | 80,364 | |
Shares issued from reinvestment of distributions | | | | | | | | |
A-Class | | | 23,970 | | | | 98,164 | |
C-Class | | | 3,214 | | | | 24,277 | |
P-Class | | | 118 | | | | 136 | |
Institutional Class | | | 11,307 | | | | 41,088 | |
Shares redeemed | | | | | | | | |
A-Class | | | (467,335 | ) | | | (249,860 | ) |
C-Class | | | (41,216 | ) | | | (94,752 | ) |
P-Class | | | (2,459 | ) | | | (6 | ) |
Institutional Class | | | (286,348 | ) | | | (117,331 | ) |
Net decrease in shares | | | (642,206 | ) | | | (67,619 | ) |
SEE NOTES TO FINANCIAL STATEMENTS. | THE GUGGENHEIM FUNDS SEMI-ANNUAL REPORT | 65 |
This table is presented to show selected data for a share outstanding throughout each period and to assist shareholders in evaluating a Fund’s performance for the periods presented.
A-Class | | Period Ended
March 31,
2020a | | | Year Ended
September 30,
2019 | | | Year Ended
September 30,
2018 | | | Year Ended
September 30,
2017 | | | Year Ended
September 30,
2016 | | | Year Ended
September 30,
2015 | |
Per Share Data |
Net asset value, beginning of period | | $ | 12.86 | | | $ | 15.56 | | | $ | 15.74 | | | $ | 13.61 | | | $ | 12.78 | | | $ | 16.82 | |
Income (loss) from investment operations: |
Net investment income (loss)b | | | .04 | | | | .10 | | | | .04 | | | | .02 | | | | .01 | | | | .02 | |
Net gain (loss) on investments (realized and unrealized) | | | (3.47 | ) | | | (1.28 | ) | | | .91 | | | | 2.20 | | | | 1.81 | | | | (.60 | ) |
Total from investment operations | | | (3.43 | ) | | | (1.18 | ) | | | .95 | | | | 2.22 | | | | 1.82 | | | | (.58 | ) |
Less distributions from: |
Net investment income | | | (.18 | ) | | | (.19 | ) | | | (.15 | ) | | | (.09 | ) | | | — | | | | (.09 | ) |
Net realized gains | | | (.26 | ) | | | (1.33 | ) | | | (.98 | ) | | | — | | | | (.99 | ) | | | (3.37 | ) |
Total distributions | | | (.44 | ) | | | (1.52 | ) | | | (1.13 | ) | | | (.09 | ) | | | (.99 | ) | | | (3.46 | ) |
Net asset value, end of period | | $ | 8.99 | | | $ | 12.86 | | | $ | 15.56 | | | $ | 15.74 | | | $ | 13.61 | | | $ | 12.78 | |
|
Total Returnc | | | (27.80 | %) | | | (6.14 | %) | | | 6.32 | % | | | 16.41 | % | | | 14.81 | % | | | (5.23 | %) |
Ratios/Supplemental Data |
Net assets, end of period (in thousands) | | $ | 3,183 | | | $ | 9,751 | | | $ | 11,931 | | | $ | 11,943 | | | $ | 13,283 | | | $ | 12,866 | |
Ratios to average net assets: |
Net investment income (loss) | | | 0.54 | % | | | 0.75 | % | | | 0.29 | % | | | 0.15 | % | | | 0.12 | % | | | 0.13 | % |
Total expensesd | | | 2.63 | % | | | 2.27 | % | | | 2.09 | % | | | 1.87 | % | | | 2.29 | % | | | 1.99 | % |
Net expensese,f,g | | | 1.31 | % | | | 1.30 | % | | | 1.30 | % | | | 1.32 | % | | | 1.32 | % | | | 1.32 | % |
Portfolio turnover rate | | | 20 | % | | | 78 | % | | | 18 | % | | | 48 | % | | | 64 | % | | | 62 | % |
C-Class | | Period Ended
March 31,
2020a | | | Year Ended
September 30,
2019 | | | Year Ended
September 30,
2018 | | | Year Ended
September 30,
2017 | | | Year Ended
September 30,
2016 | | | Year Ended
September 30,
2015 | |
Per Share Data |
Net asset value, beginning of period | | $ | 11.75 | | | $ | 14.30 | | | $ | 14.51 | | | $ | 12.57 | | | $ | 11.95 | | | $ | 15.96 | |
Income (loss) from investment operations: |
Net investment income (loss)b | | | (.01 | ) | | | — | h | | | (.07 | ) | | | (.08 | ) | | | (.08 | ) | | | (.09 | ) |
Net gain (loss) on investments (realized and unrealized) | | | (3.19 | ) | | | (1.18 | ) | | | .84 | | | | 2.02 | | | | 1.69 | | | | (.55 | ) |
Total from investment operations | | | (3.20 | ) | | | (1.18 | ) | | | .77 | | | | 1.94 | | | | 1.61 | | | | (.64 | ) |
Less distributions from: |
Net investment income | | | (.05 | ) | | | (.04 | ) | | | — | | | | — | | | | — | | | | — | |
Net realized gains | | | (.26 | ) | | | (1.33 | ) | | | (.98 | ) | | | — | | | | (.99 | ) | | | (3.37 | ) |
Total distributions | | | (.31 | ) | | | (1.37 | ) | | | (.98 | ) | | | — | | | | (.99 | ) | | | (3.37 | ) |
Net asset value, end of period | | $ | 8.24 | | | $ | 11.75 | | | $ | 14.30 | | | $ | 14.51 | | | $ | 12.57 | | | $ | 11.95 | |
|
Total Returnc | | | (28.09 | %) | | | (6.89 | %) | | | 5.57 | % | | | 15.53 | % | | | 14.02 | % | | | (5.97 | %) |
Ratios/Supplemental Data |
Net assets, end of period (in thousands) | | $ | 851 | | | $ | 1,593 | | | $ | 2,884 | | | $ | 4,281 | | | $ | 4,762 | | | $ | 5,173 | |
Ratios to average net assets: |
Net investment income (loss) | | | (0.09 | %) | | | 0.01 | % | | | (0.50 | %) | | | (0.60 | %) | | | (0.64 | %) | | | (0.65 | %) |
Total expensesd | | | 3.66 | % | | | 3.09 | % | | | 2.94 | % | | | 2.71 | % | | | 3.04 | % | | | 2.72 | % |
Net expensese,f,g | | | 2.06 | % | | | 2.05 | % | | | 2.05 | % | | | 2.07 | % | | | 2.07 | % | | | 2.08 | % |
Portfolio turnover rate | | | 20 | % | | | 78 | % | | | 18 | % | | | 48 | % | | | 64 | % | | | 62 | % |
66 | THE GUGGENHEIM FUNDS SEMI-ANNUAL REPORT | SEE NOTES TO FINANCIAL STATEMENTS. |
FINANCIAL HIGHLIGHTS (continued) |
This table is presented to show selected data for a share outstanding throughout each period and to assist shareholders in evaluating a Fund’s performance for the periods presented.
P-Class | | Period Ended
March 31,
2020a | | | Year Ended
September 30,
2019 | | | Year Ended
September 30,
2018 | | | Year Ended
September 30,
2017 | | | Year Ended
September 30,
2016 | | | Period Ended
September 30,
2015i | |
Per Share Data |
Net asset value, beginning of period | | $ | 13.01 | | | $ | 15.73 | | | $ | 15.76 | | | $ | 13.60 | | | $ | 12.77 | | | $ | 14.33 | |
Income (loss) from investment operations: |
Net investment income (loss)b | | | .05 | | | | .09 | | | | .05 | | | | .01 | | | | .02 | | | | .04 | |
Net gain (loss) on investments (realized and unrealized) | | | (3.51 | ) | | | (1.29 | ) | | | .90 | | | | 2.22 | | | | 1.80 | | | | (1.60 | ) |
Total from investment operations | | | (3.46 | ) | | | (1.20 | ) | | | .95 | | | | 2.23 | | | | 1.82 | | | | (1.56 | ) |
Less distributions from: |
Net investment income | | | (.19 | ) | | | (.19 | ) | | | — | | | | (.07 | ) | | | — | | | | — | |
Net realized gains | | | (.26 | ) | | | (1.33 | ) | | | (.98 | ) | | | — | | | | (.99 | ) | | | — | |
Total distributions | | | (.45 | ) | | | (1.52 | ) | | | (.98 | ) | | | (.07 | ) | | | (.99 | ) | | | — | |
Net asset value, end of period | | $ | 9.10 | | | $ | 13.01 | | | $ | 15.73 | | | $ | 15.76 | | | $ | 13.60 | | | $ | 12.77 | |
|
Total Return | | | (27.68 | %) | | | (6.18 | %) | | | 6.30 | % | | | 16.35 | % | | | 14.88 | % | | | (10.82 | %) |
Ratios/Supplemental Data |
Net assets, end of period (in thousands) | | $ | 44 | | | $ | 47 | | | $ | 15 | | | $ | 14 | | | $ | 11 | | | $ | 9 | |
Ratios to average net assets: |
Net investment income (loss) | | | 0.73 | % | | | 0.72 | % | | | 0.30 | % | | | 0.09 | % | | | 0.13 | % | | | 0.60 | % |
Total expenses | | | 3.14 | % | | | 2.73 | % | | | 2.79 | % | | | 3.60 | % | | | 2.50 | % | | | 4.04 | % |
Net expensese,f,g | | | 1.31 | % | | | 1.28 | % | | | 1.30 | % | | | 1.32 | % | | | 1.32 | % | | | 1.31 | % |
Portfolio turnover rate | | | 20 | % | | | 78 | % | | | 18 | % | | | 48 | % | | | 64 | % | | | 62 | % |
SEE NOTES TO FINANCIAL STATEMENTS. | THE GUGGENHEIM FUNDS SEMI-ANNUAL REPORT | 67 |
FINANCIAL HIGHLIGHTS (concluded) |
This table is presented to show selected data for a share outstanding throughout each period and to assist shareholders in evaluating a Fund’s performance for the periods presented.
Institutional Class | | Period Ended
March 31,
2020a | | | Year Ended
September 30,
2019 | | | Year Ended
September 30,
2018 | | | Year Ended
September 30,
2017 | | | Year Ended
September 30,
2016 | | | Year Ended
September 30,
2015 | |
Per Share Data |
Net asset value, beginning of period | | $ | 11.60 | | | $ | 14.24 | | | $ | 14.50 | | | $ | 12.54 | | | $ | 11.82 | | | $ | 17.04 | |
Income (loss) from investment operations: |
Net investment income (loss)b | | | .04 | | | | .12 | | | | .07 | | | | .04 | | | | .04 | | | | .05 | |
Net gain (loss) on investments (realized and unrealized) | | | (3.10 | ) | | | (1.20 | ) | | | .84 | | | | 2.04 | | | | 1.67 | | | | (.49 | ) |
Total from investment operations | | | (3.06 | ) | | | (1.08 | ) | | | .91 | | | | 2.08 | | | | 1.71 | | | | (.44 | ) |
Less distributions from: |
Net investment income | | | (.21 | ) | | | (.23 | ) | | | (.19 | ) | | | (.12 | ) | | | — | | | | (1.41 | ) |
Net realized gains | | | (.26 | ) | | | (1.33 | ) | | | (.98 | ) | | | — | | | | (.99 | ) | | | (3.37 | ) |
Total distributions | | | (.47 | ) | | | (1.56 | ) | | | (1.17 | ) | | | (.12 | ) | | | (.99 | ) | | | (4.78 | ) |
Net asset value, end of period | | $ | 8.07 | | | $ | 11.60 | | | $ | 14.24 | | | $ | 14.50 | | | $ | 12.54 | | | $ | 11.82 | |
|
Total Return | | | (27.71 | %) | | | (5.96 | %) | | | 6.64 | % | | | 16.65 | % | | | 15.18 | % | | | (5.01 | %) |
Ratios/Supplemental Data |
Net assets, end of period (in thousands) | | $ | 519 | | | $ | 3,143 | | | $ | 3,798 | | | $ | 4,790 | | | $ | 281 | | | $ | 459 | |
Ratios to average net assets: |
Net investment income (loss) | | | 0.78 | % | | | 0.99 | % | | | 0.50 | % | | | 0.30 | % | | | 0.30 | % | | | 0.33 | % |
Total expensesd | | | 2.47 | % | | | 2.09 | % | | | 1.91 | % | | | 1.56 | % | | | 2.09 | % | | | 1.70 | % |
Net expensese,f,g | | | 1.05 | % | | | 1.05 | % | | | 1.05 | % | | | 1.07 | % | | | 1.07 | % | | | 1.07 | % |
Portfolio turnover rate | | | 20 | % | | | 78 | % | | | 18 | % | | | 48 | % | | | 64 | % | | | 62 | % |
a | Unaudited figures for the period ended March 31, 2020. Percentage amounts for the period, except total return and portfolio turnover rate, have been annualized. |
b | Net investment income (loss) per share was computed using average shares outstanding throughout the period. |
c | Total return does not reflect the impact of any applicable sales charges. |
d | Does not include expenses of the underlying funds in which the Fund invests. |
e | Net expense information reflects the expense ratios after expense waivers and reimbursements, as applicable. |
f | The portion of the ratios of net expenses to average net assets attributable to recoupments of prior fee reductions or expense reimbursements for the periods presented was as follows: |
| | | 03/31/20a | 09/30/19 | 09/30/18 | 09/30/17 |
| | A-Class | — | — | — | 0.00%* |
| | C-Class | — | — | — | 0.01% |
| | P-Class | — | — | — | 0.74% |
| | Institutional Class | — | — | — | 0.00%* |
g | Net expenses may include expenses that are excluded from the expense limitation agreement. Excluding these expenses, the net expense ratios for the periods would be: |
| | | 03/31/20a | 09/30/19 | 09/30/18 | 09/30/17 | 09/30/16 | 09/30/15 |
| | A-Class | 1.30% | 1.30% | 1.30% | 1.30% | 1.30% | 1.30% |
| | C-Class | 2.05% | 2.05% | 2.05% | 2.05% | 2.05% | 2.05% |
| | P-Class | 1.30% | 1.28% | 1.30% | 1.30% | 1.30% | 1.30% |
| | Institutional Class | 1.05% | 1.05% | 1.05% | 1.05% | 1.05% | 1.05% |
h | Net investment income is less than $0.01 per share. |
i | Since commencement of operations: May 1, 2015. Percentage amounts for the period, except total return and portfolio turnover rate, have been annualized. |
68 | THE GUGGENHEIM FUNDS SEMI-ANNUAL REPORT | SEE NOTES TO FINANCIAL STATEMENTS. |
PERFORMANCE REPORT AND FUND PROFILE (Unaudited) | March 31, 2020 |
STYLEPLUS—LARGE CORE FUND
OBJECTIVE: Seeks long-term growth of capital.
Holdings Diversification (Market Exposure as % of Net Assets)
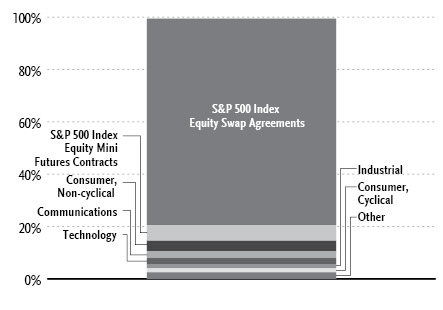
“Holdings Diversification (Market Exposure as % of Net Assets)” excludes any temporary cash investments, investments in Guggenheim Strategy Funds Trust mutual funds, or investments in Guggenheim Ultra Short Duration Fund.
Inception Dates: |
A-Class | September 10, 1962 |
C-Class | January 29, 1999 |
P-Class | May 1, 2015 |
Institutional Class | March 1, 2012 |
Ten Largest Holdings (% of Total Net Assets) |
Guggenheim Strategy Fund II | 33.3% |
Guggenheim Strategy Fund III | 33.3% |
Guggenheim Ultra Short Duration Fund — Institutional Class | 11.1% |
SPDR S&P 500 ETF Trust | 1.1% |
Microsoft Corp. | 0.7% |
Apple, Inc. | 0.6% |
Alphabet, Inc. — Class C | 0.6% |
Amazon.com, Inc. | 0.4% |
Johnson & Johnson | 0.3% |
Facebook, Inc. — Class A | 0.3% |
Top Ten Total | 81.7% |
| | |
“Ten Largest Holdings” excludes any temporary cash or derivative investments. |
| | THE GUGGENHEIM FUNDS SEMI-ANNUAL REPORT | 69 |
PERFORMANCE REPORT AND FUND PROFILE (Unaudited)(concluded) | March 31, 2020 |
Average Annual Returns*
Periods Ended March 31, 2020
| 6 Month† | 1 Year | 5 Year | 10 Year |
A-Class Shares | (14.95%) | (10.62%) | 5.30% | 8.43% |
A-Class Shares with sales charge‡ | (18.98%) | (14.86%) | 4.28% | 7.78% |
C-Class Shares | (15.40%) | (11.48%) | 4.35% | 7.45% |
C-Class Shares with CDSC§ | (16.23%) | (12.35%) | 4.35% | 7.45% |
S&P 500 Index | (12.31%) | (6.98%) | 6.73% | 10.53% |
| | 6 Month† | 1 Year | Since
Inception
(05/01/15) |
P-Class Shares | | (15.00%) | (10.72%) | 4.78% |
S&P 500 Index | | (12.31%) | (6.98%) | 6.40% |
| 6 Month† | 1 Year | 5 Year | Since
Inception
(03/01/12) |
Institutional Class Shares | (14.83%) | (10.42%) | 5.67% | 8.91% |
S&P 500 Index | (12.31%) | (6.98%) | 6.73% | 10.40% |
* | The performance data above represents past performance that is not predictive of future results. The investment return and principal value of an investment in the Fund will fluctuate so that an investor’s shares, when redeemed, may be worth more or less than their original cost. Returns are historical and include changes in principal and reinvested dividends and capital gains and do not reflect the effect of taxes. The S&P 500 Index is an unmanaged index and, unlike the Fund, has no management fees or operating expenses to reduce its reported return. |
† | 6 month returns are not annualized. |
‡ | Effective February 22, 2011, the maximum sales charge decreased from 5.75% to 4.75%. A 5.75% maximum sales charge is used in the calculation of the Average Annual Returns based on subscriptions made prior to February 22, 2011, and a 4.75% maximum sales charge will be used to calculate performance for periods based on subscriptions made on or after February 22, 2011. |
§ | Fund returns include a CDSC of 1% if redeemed within 12 months of purchase. |
70 | THE GUGGENHEIM FUNDS SEMI-ANNUAL REPORT | |
SCHEDULE OF INVESTMENTS (Unaudited) | March 31, 2020 |
STYLEPLUS—LARGE CORE FUND | |
| | Shares | | | Value | |
COMMON STOCKS† - 13.4% |
| | | | | | | | | |
Consumer, Non-cyclical - 4.0% |
Johnson & Johnson | | | 3,932 | | | $ | 515,603 | |
Procter & Gamble Co. | | | 3,751 | | | | 412,610 | |
Merck & Company, Inc. | | | 4,627 | | | | 356,001 | |
Pfizer, Inc. | | | 10,727 | | | | 350,129 | |
Medtronic plc | | | 3,427 | | | | 309,047 | |
Eli Lilly & Co. | | | 2,033 | | | | 282,018 | |
Philip Morris International, Inc. | | | 3,811 | | | | 278,051 | |
Amgen, Inc. | | | 1,334 | | | | 270,442 | |
McKesson Corp. | | | 1,745 | | | | 236,029 | |
Gilead Sciences, Inc. | | | 3,123 | | | | 233,475 | |
Kimberly-Clark Corp. | | | 1,791 | | | | 229,015 | |
Regeneron Pharmaceuticals, Inc.* | | | 381 | | | | 186,039 | |
Molson Coors Beverage Co. — Class B | | | 4,660 | | | | 181,787 | |
Abbott Laboratories | | | 2,217 | | | | 174,943 | |
Sysco Corp. | | | 3,796 | | | | 173,211 | |
General Mills, Inc. | | | 3,076 | | | | 162,321 | |
Baxter International, Inc. | | | 1,703 | | | | 138,267 | |
Becton Dickinson and Co. | | | 595 | | | | 136,713 | |
Bristol-Myers Squibb Co. | | | 2,447 | | | | 136,396 | |
Thermo Fisher Scientific, Inc. | | | 475 | | | | 134,710 | |
AbbVie, Inc. | | | 1,488 | | | | 113,371 | |
Alexion Pharmaceuticals, Inc.* | | | 1,242 | | | | 111,519 | |
UnitedHealth Group, Inc. | | | 439 | | | | 109,478 | |
Anthem, Inc. | | | 478 | | | | 108,525 | |
Kellogg Co. | | | 1,726 | | | | 103,543 | |
Edwards Lifesciences Corp.* | | | 526 | | | | 99,214 | |
Archer-Daniels-Midland Co. | | | 2,601 | | | | 91,503 | |
Kraft Heinz Co. | | | 3,670 | | | | 90,796 | |
JM Smucker Co. | | | 812 | | | | 90,132 | |
Cardinal Health, Inc. | | | 1,790 | | | | 85,813 | |
Laboratory Corporation of America Holdings* | | | 639 | | | | 80,763 | |
Illumina, Inc.* | | | 284 | | | | 77,566 | |
CVS Health Corp. | | | 1,168 | | | | 69,297 | |
Humana, Inc. | | | 205 | | | | 64,374 | |
Tyson Foods, Inc. — Class A | | | 997 | | | | 57,696 | |
Coca-Cola Co. | | | 842 | | | | 37,258 | |
Cigna Corp. | | | 164 | | | | 29,057 | |
PepsiCo, Inc. | | | 200 | | | | 24,020 | |
PayPal Holdings, Inc.* | | | 248 | | | | 23,744 | |
Danaher Corp. | | | 171 | | | | 23,668 | |
Total Consumer, Non-cyclical | | | | | | | 6,388,144 | |
| | | | | | | | | |
Communications - 2.6% |
Alphabet, Inc. — Class C* | | | 767 | | | | 891,875 | |
Amazon.com, Inc.* | | | 352 | | | | 686,301 | |
Facebook, Inc. — Class A* | | | 2,835 | | | | 472,878 | |
Verizon Communications, Inc. | | | 7,126 | | | | 382,880 | |
Cisco Systems, Inc. | | | 8,620 | | | | 338,852 | |
AT&T, Inc. | | | 11,377 | | | | 331,639 | |
Omnicom Group, Inc. | | | 3,470 | | | | 190,503 | |
Charter Communications, Inc. — Class A* | | | 371 | | | | 161,871 | |
Booking Holdings, Inc.* | | | 109 | | | | 146,640 | |
eBay, Inc. | | | 4,859 | | | | 146,062 | |
Juniper Networks, Inc. | | | 6,127 | | | | 117,271 | |
Walt Disney Co. | | | 1,087 | | | | 105,004 | |
Discovery, Inc. — Class A* | | | 5,172 | | | | 100,544 | |
Comcast Corp. — Class A | | | 2,797 | | | | 96,161 | |
Total Communications | | | | | | | 4,168,481 | |
| | | | | | | | | |
Technology - 2.3% |
Microsoft Corp. | | | 7,023 | | | | 1,107,597 | |
Apple, Inc. | | | 3,861 | | | | 981,814 | |
Intel Corp. | | | 6,993 | | | | 378,461 | |
Oracle Corp. | | | 5,428 | | | | 262,335 | |
Activision Blizzard, Inc. | | | 2,617 | | | | 155,659 | |
Cerner Corp. | | | 2,219 | | | | 139,775 | |
QUALCOMM, Inc. | | | 1,636 | | | | 110,676 | |
Seagate Technology plc | | | 2,188 | | | | 106,775 | |
NVIDIA Corp. | | | 344 | | | | 90,678 | |
NetApp, Inc. | | | 2,051 | | | | 85,506 | |
Fidelity National Information Services, Inc. | | | 684 | | | | 83,202 | |
Micron Technology, Inc.* | | | 1,689 | | | | 71,039 | |
Adobe, Inc.* | | | 175 | | | | 55,692 | |
International Business Machines Corp. | | | 223 | | | | 24,737 | |
Applied Materials, Inc. | | | 528 | | | | 24,193 | |
salesforce.com, Inc.* | | | 149 | | | | 21,453 | |
Total Technology | | | | | | | 3,699,592 | |
| | | | | | | | | |
Industrial - 1.6% |
Eaton Corporation plc | | | 3,010 | | | | 233,847 | |
Caterpillar, Inc. | | | 1,894 | | | | 219,780 | |
Union Pacific Corp. | | | 1,457 | | | | 205,495 | |
J.B. Hunt Transport Services, Inc. | | | 1,950 | | | | 179,849 | |
Honeywell International, Inc. | | | 1,329 | | | | 177,807 | |
CSX Corp. | | | 3,076 | | | | 176,255 | |
Norfolk Southern Corp. | | | 1,129 | | | | 164,834 | |
FedEx Corp. | | | 1,350 | | | | 163,701 | |
CH Robinson Worldwide, Inc. | | | 1,905 | | | | 126,111 | |
Kansas City Southern | | | 991 | | | | 126,035 | |
General Electric Co. | | | 15,026 | | | | 119,307 | |
Garmin Ltd. | | | 1,535 | | | | 115,064 | |
Old Dominion Freight Line, Inc. | | | 830 | | | | 108,880 | |
United Parcel Service, Inc. — Class B | | | 1,062 | | | | 99,212 | |
Emerson Electric Co. | | | 1,906 | | | | 90,821 | |
Waters Corp.* | | | 386 | | | | 70,271 | |
Textron, Inc. | | | 2,633 | | | | 70,222 | |
Lockheed Martin Corp. | | | 193 | | | | 65,417 | |
3M Co. | | | 461 | | | | 62,931 | |
Arconic, Inc. | | | 3,099 | | | | 49,770 | |
Total Industrial | | | | | | | 2,625,609 | |
| | | | | | | | | |
Consumer, Cyclical - 1.5% |
Home Depot, Inc. | | | 1,733 | | | | 323,569 | |
Cummins, Inc. | | | 1,280 | | | | 173,210 | |
Walmart, Inc. | | | 1,470 | | | | 167,021 | |
Walgreens Boots Alliance, Inc. | | | 3,077 | | | | 140,773 | |
Whirlpool Corp. | | | 1,604 | | | | 137,623 | |
PACCAR, Inc. | | | 2,201 | | | | 134,547 | |
Southwest Airlines Co. | | | 3,549 | | | | 126,380 | |
BorgWarner, Inc. | | | 4,969 | | | | 121,095 | |
SEE NOTES TO FINANCIAL STATEMENTS. | THE GUGGENHEIM FUNDS SEMI-ANNUAL REPORT | 71 |
SCHEDULE OF INVESTMENTS (Unaudited)(continued) | March 31, 2020 |
STYLEPLUS—LARGE CORE FUND | |
| | Shares | | | Value | |
General Motors Co. | | | 5,610 | | | $ | 116,576 | |
Aptiv plc | | | 2,171 | | | | 106,900 | |
Starbucks Corp. | | | 1,572 | | | | 103,343 | |
Best Buy Company, Inc. | | | 1,605 | | | | 91,485 | |
Lennar Corp. — Class A | | | 2,162 | | | | 82,589 | |
DR Horton, Inc. | | | 2,259 | | | | 76,806 | |
Lowe’s Companies, Inc. | | | 859 | | | | 73,917 | |
Carnival Corp. | | | 5,149 | | | | 67,812 | |
United Airlines Holdings, Inc.* | | | 2,098 | | | | 66,192 | |
PulteGroup, Inc. | | | 2,951 | | | | 65,866 | |
Delta Air Lines, Inc. | | | 2,069 | | | | 59,028 | |
NVR, Inc.* | | | 20 | | | | 51,382 | |
Alaska Air Group, Inc. | | | 1,772 | | | | 50,449 | |
Hanesbrands, Inc. | | | 6,273 | | | | 49,368 | |
McDonald’s Corp. | | | 225 | | | | 37,204 | |
Las Vegas Sands Corp. | | | 709 | | | | 30,111 | |
NIKE, Inc. — Class B | | | 335 | | | | 27,718 | |
Total Consumer, Cyclical | | | | | | | 2,480,964 | |
| | | | | | | | | |
Financial - 0.8% |
Berkshire Hathaway, Inc. — Class B* | | | 1,625 | | | | 297,099 | |
JPMorgan Chase & Co. | | | 2,342 | | | | 210,850 | |
Visa, Inc. — Class A | | | 1,207 | | | | 194,472 | |
Northern Trust Corp. | | | 1,740 | | | | 131,300 | |
Bank of America Corp. | | | 5,652 | | | | 119,992 | |
Mastercard, Inc. — Class A | | | 330 | | | | 79,715 | |
Travelers Companies, Inc. | | | 612 | | | | 60,802 | |
Morgan Stanley | | | 1,648 | | | | 56,032 | |
MetLife, Inc. | | | 1,606 | | | | 49,095 | |
Citigroup, Inc. | | | 1,060 | | | | 44,647 | |
Synchrony Financial | | | 2,611 | | | | 42,011 | |
U.S. Bancorp | | | 726 | | | | 25,011 | |
Wells Fargo & Co. | | | 817 | | | | 23,448 | |
Total Financial | | | | | | | 1,334,474 | |
| | | | | | | | | |
Energy - 0.5% |
Exxon Mobil Corp. | | | 4,748 | | | | 180,282 | |
Chevron Corp. | | | 2,062 | | | | 149,413 | |
ConocoPhillips | | | 4,535 | | | | 139,678 | |
EOG Resources, Inc. | | | 2,381 | | | | 85,525 | |
Devon Energy Corp. | | | 9,319 | | | | 64,394 | |
HollyFrontier Corp. | | | 1,873 | | | | 45,907 | |
Marathon Oil Corp. | | | 12,528 | | | | 41,217 | |
Valero Energy Corp. | | | 622 | | | | 28,214 | |
Halliburton Co. | | | 3,670 | | | | 25,140 | |
Total Energy | | | | | | | 759,770 | |
| | | | | | | | | |
Utilities - 0.1% |
Exelon Corp. | | | 1,756 | | | | 64,638 | |
PPL Corp. | | | 2,329 | | | | 57,480 | |
AES Corp. | | | 3,938 | | | | 53,557 | |
NextEra Energy, Inc. | | | 116 | | | | 27,912 | |
Total Utilities | | | | | | | 203,587 | |
| | | | | | | | | |
Basic Materials - 0.0% |
Linde plc | | | 282 | | | | 48,786 | |
| | | | | | | | | |
Total Common Stocks | | | | |
(Cost $25,210,102) | | | | | | | 21,709,407 | |
| | | | | | | | | |
EXCHANGE-TRADED FUNDS† - 1.1% |
SPDR S&P 500 ETF Trust | | | 7,200 | | | | 1,855,800 | |
Total Exchange-Traded Funds | | | | |
(Cost $1,659,851) | | | | | | | 1,855,800 | |
| | | | | | | | | |
MUTUAL FUNDS† - 77.7% |
Guggenheim Strategy Fund II1 | | | 2,250,329 | | | | 54,120,411 | |
Guggenheim Strategy Fund III1 | | | 2,245,571 | | | | 54,050,903 | |
Guggenheim Ultra Short Duration Fund — Institutional Class1 | | | 1,838,970 | | | | 17,966,735 | |
Total Mutual Funds | | | | |
(Cost $130,010,452) | | | | | | | 126,138,049 | |
| | | | | | | | | |
MONEY MARKET FUND† - 6.2% |
Dreyfus Treasury Securities Cash Management Fund — Institutional Shares, 0.51%2 | | | 10,137,877 | | | | 10,137,877 | |
Total Money Market Fund | | | | |
(Cost $10,137,877) | | | | | | | 10,137,877 | |
| | | | | | | | | |
Total Investments - 98.4% | | | | |
(Cost $167,018,282) | | $ | 159,841,133 | |
Other Assets & Liabilities, net - 1.6% | | | 2,565,452 | |
Total Net Assets - 100.0% | | $ | 162,406,585 | |
72 | THE GUGGENHEIM FUNDS SEMI-ANNUAL REPORT | SEE NOTES TO FINANCIAL STATEMENTS. |
SCHEDULE OF INVESTMENTS (Unaudited)(continued) | March 31, 2020 |
STYLEPLUS—LARGE CORE FUND | |
Futures Contracts |
Description | | Number of
Contracts | | | Expiration
Date | | | Notional
Amount | | | Value and
Unrealized
Appreciation** | |
Equity Futures Contracts Purchased† |
S&P 500 Index Mini Futures Contracts | | | 74 | | | | Jun 2020 | | | $ | 9,518,250 | | | $ | 568,392 | |
Total Return Swap Agreements |
Counterparty | Index | Financing Rate Pay | Payment
Frequency | | Maturity Date | | | Units | | | Notional
Amount | | | Value and
Unrealized
Depreciation | |
OTC Equity Index Swap Agreements†† |
Citibank N.A., New York | S&P 500 Index Total Return | 2.28% (3 Month USD LIBOR + 0.19%) | At Maturity | | | 10/30/20 | | | | 24,372 | | | $ | 128,409,244 | | | $ | (18,032,112 | ) |
* | Non-income producing security. |
** | Includes cumulative appreciation (depreciation). Variation margin is reported within the Statement of Assets and Liabilities. |
† | Value determined based on Level 1 inputs — See Note 4. |
†† | Value determined based on Level 2 inputs — See Note 4. |
1 | Affiliated issuer. |
2 | Rate indicated is the 7-day yield as of March 31, 2020. |
| | LIBOR — London Interbank Offered Rate |
| | plc — Public Limited Company |
| | |
| | See Sector Classification in Other Information section. |
The following table summarizes the inputs used to value the Fund’s investments at March 31, 2020 (See Note 4 in the Notes to Financial Statements):
Investments in Securities (Assets) | | Level 1
Quoted
Prices | | | Level 2
Significant
Observable
Inputs | | | Level 3
Significant
Unobservable
Inputs | | | Total | |
Common Stocks | | $ | 21,709,407 | | | $ | — | | | $ | — | | | $ | 21,709,407 | |
Exchange-Traded Funds | | | 1,855,800 | | | | — | | | | — | | | | 1,855,800 | |
Mutual Funds | | | 126,138,049 | | | | — | | | | — | | | | 126,138,049 | |
Money Market Fund | | | 10,137,877 | | | | — | | | | — | | | | 10,137,877 | |
Equity Futures Contracts** | | | 568,392 | | | | — | | | | — | | | | 568,392 | |
Total Assets | | $ | 160,409,525 | | | $ | — | | | $ | — | | | $ | 160,409,525 | |
Investments in Securities (Liabilities) | | Level 1
Quoted
Prices | | | Level 2
Significant
Observable
Inputs | | | Level 3
Significant
Unobservable
Inputs | | | Total | |
Equity Index Swap Agreements** | | $ | — | | | $ | 18,032,112 | | | $ | — | | | $ | 18,032,112 | |
** | This derivative is reported as unrealized appreciation/depreciation at period end. |
SEE NOTES TO FINANCIAL STATEMENTS. | THE GUGGENHEIM FUNDS SEMI-ANNUAL REPORT | 73 |
SCHEDULE OF INVESTMENTS (Unaudited)(concluded) | March 31, 2020 |
STYLEPLUS—LARGE CORE FUND | |
Affiliated Transactions
Investments representing 5% or more of the outstanding voting shares of a company, or control of or by, or common control under Guggenheim Investments (“GI”), result in that company being considered an affiliated issuer, as defined in the 1940 Act.
The Fund may invest in certain of the underlying series of Guggenheim Strategy Funds Trust, including Guggenheim Strategy Fund II and Guggenheim Strategy Fund III, (collectively, the “Short Term Investment Vehicles”), each of which are open-end management investment companies managed by GI. The Short Term Investment Vehicles, which launched on March 11, 2014, are offered as short term investment options only to mutual funds, trusts, and other accounts managed by GI and/or its affiliates, and are not available to the public. The Short Term Investment Vehicles pay no investment management fees. The Short Term Investment Vehicles’ annual report on Form N-CSR dated September 30, 2019, is available publicly or upon request. This information is available from the EDGAR database on the SEC’s website at https://www.sec.gov/Archives/edgar/data/1601445/000089180419000405/gug78512-ncsr.htm.
Transactions during the period ended March 31, 2020, in which the company is an affiliated issuer, were as follows:
Security Name | | Value
09/30/19 | | | Additions | | | Reductions | | | Realized
Gain (Loss) | | | Change in
Unrealized
Appreciation
(Depreciation) | | | Value
03/31/20 | | | Shares
03/31/20 | | | Investment
Income | |
Mutual Funds | | | | | | | | | | | | | | | | | | | | | | | | | | | | | | | | |
Guggenheim Strategy Fund II | | $ | 60,780,681 | | | $ | 832,231 | | | $ | (5,712,423 | ) | | $ | (46,795 | ) | | $ | (1,733,283 | ) | | $ | 54,120,411 | | | | 2,250,329 | | | $ | 832,231 | |
Guggenheim Strategy Fund III | | | 68,129,466 | | | | 937,072 | | | | (13,219,459 | ) | | | (206,849 | ) | | | (1,589,327 | ) | | | 54,050,903 | | | | 2,245,571 | | | | 937,071 | |
Guggenheim Ultra Short Duration Fund — Institutional Class | | | 22,398,499 | | | | 21,578,461 | | | | (26,004,996 | ) | | | 50,782 | | | | (56,011 | ) | | | 17,966,735 | | | | 1,838,970 | | | | 243,480 | |
| | | $ | 151,308,646 | | | $ | 23,347,764 | | | $ | (44,936,878 | ) | | $ | (202,862 | ) | | $ | (3,378,621 | ) | | $ | 126,138,049 | | | | | | | $ | 2,012,782 | |
74 | THE GUGGENHEIM FUNDS SEMI-ANNUAL REPORT | SEE NOTES TO FINANCIAL STATEMENTS. |
STYLEPLUS—LARGE CORE FUND | |
STATEMENT OF ASSETS AND LIABILITIES (Unaudited) |
March 31, 2020 |
Assets: |
Investments in unaffiliated issuers, at value (cost $37,007,830) | | $ | 33,703,084 | |
Investments in affiliated issuers, at value (cost $130,010,452) | | | 126,138,049 | |
Segregated cash with broker | | | 18,302,000 | |
Prepaid expenses | | | 43,883 | |
Receivables: |
Securities sold | | | 4,328,953 | |
Dividends | | | 284,354 | |
Fund shares sold | | | 5,077 | |
Interest | | | 2,219 | |
Total assets | | | 182,807,619 | |
| | | | | |
Liabilities: |
Unrealized depreciation on OTC swap agreements | | | 18,032,112 | |
Payable for: |
Swap settlement | | | 1,689,492 | |
Securities purchased | | | 239,363 | |
Variation margin on futures contracts | | | 130,271 | |
Management fees | | | 100,977 | |
Fund shares redeemed | | | 65,028 | |
Distribution and service fees | | | 34,189 | |
Transfer agent/maintenance fees | | | 13,514 | |
Fund accounting/administration fees | | | 8,018 | |
Trustees’ fees* | | | 1,177 | |
Miscellaneous | | | 86,893 | |
Total liabilities | | | 20,401,034 | |
Net assets | | $ | 162,406,585 | |
| | | | | |
Net assets consist of: |
Paid in capital | | $ | 189,978,043 | |
Total distributable earnings (loss) | | | (27,571,458 | ) |
Net assets | | $ | 162,406,585 | |
| | | | | |
A-Class: |
Net assets | | $ | 157,789,621 | |
Capital shares outstanding | | | 9,204,255 | |
Net asset value per share | | $ | 17.14 | |
Maximum offering price per share (Net asset value divided by 95.25%) | | $ | 17.99 | |
| | | | | |
C-Class: |
Net assets | | $ | 737,539 | |
Capital shares outstanding | | | 62,122 | |
Net asset value per share | | $ | 11.87 | |
| | | | | |
P-Class: |
Net assets | | $ | 171,818 | |
Capital shares outstanding | | | 10,157 | |
Net asset value per share | | $ | 16.92 | |
| | | | | |
Institutional Class: |
Net assets | | $ | 3,707,607 | |
Capital shares outstanding | | | 218,255 | |
Net asset value per share | | $ | 16.99 | |
* | Relates to Trustees not deemed “interested persons” within the meaning of Section 2(a)(19) of the 1940 Act. |
SEE NOTES TO FINANCIAL STATEMENTS. | THE GUGGENHEIM FUNDS SEMI-ANNUAL REPORT | 75 |
STYLEPLUS—LARGE CORE FUND | |
STATEMENT OF OPERATIONS (Unaudited) |
Six-Month Period Ended March 31, 2020 |
Investment Income: |
Dividends from securities of unaffiliated issuers | | $ | 502,241 | |
Dividends from securities of affiliated issuers | | | 2,012,782 | |
Interest | | | 81,319 | |
Total investment income | | | 2,596,342 | |
| | | | | |
Expenses: |
Management fees | | | 764,563 | |
Distribution and service fees: |
A-Class | | | 248,844 | |
C-Class | | | 4,594 | |
P-Class | | | 296 | |
Transfer agent/maintenance fees: |
A-Class | | | 82,876 | |
C-Class | | | 1,478 | |
P-Class | | | 303 | |
Institutional Class | | | 1,880 | |
Fund accounting/administration fees | | | 78,548 | |
Prime broker interest expense | | | 76,304 | |
Professional fees | | | 27,633 | |
Tax expense | | | 19,892 | |
Trustees’ fees* | | | 10,892 | |
Custodian fees | | | 9,671 | |
Line of credit fees | | | 2,439 | |
Miscellaneous | | | 82,155 | |
Total expenses | | | 1,412,368 | |
Less: |
Expenses waived by Adviser | | | (29,869 | ) |
Earnings credits applied | | | (1,681 | ) |
Total waived expenses | | | (31,550 | ) |
Net expenses | | | 1,380,818 | |
Net investment income | | | 1,215,524 | |
| | | | | |
Net Realized and Unrealized Gain (Loss): |
Net realized gain (loss) on: |
Investments in unaffiliated issuers | | $ | (1,236,004 | ) |
Investments in affiliated issuers | | | (202,862 | ) |
Swap agreements | | | (830,951 | ) |
Futures contracts | | | (1,667,401 | ) |
Net realized loss | | | (3,937,218 | ) |
Net change in unrealized appreciation (depreciation) on: |
Investments in unaffiliated issuers | | | (4,846,474 | ) |
Investments in affiliated issuers | | | (3,378,621 | ) |
Swap agreements | | | (18,032,112 | ) |
Futures contracts | | | 607,607 | |
Net change in unrealized appreciation (depreciation) | | | (25,649,600 | ) |
Net realized and unrealized loss | | | (29,586,818 | ) |
Net decrease in net assets resulting from operations | | $ | (28,371,294 | ) |
* | Relates to Trustees not deemed “interested persons” within the meaning of Section 2(a)(19) of the 1940 Act. |
76 | THE GUGGENHEIM FUNDS SEMI-ANNUAL REPORT | SEE NOTES TO FINANCIAL STATEMENTS. |
STYLEPLUS—LARGE CORE FUND | |
STATEMENTS OF CHANGES IN NET ASSETS |
| | Six-Month
Period Ended
March 31,
2020
(Unaudited) | | | Year Ended
September 30,
2019 | |
Increase (Decrease) in Net Assets from Operations: | | | | | | | | |
Net investment income | | $ | 1,215,524 | | | $ | 2,971,431 | |
Net realized gain (loss) on investments | | | (3,937,218 | ) | | | 1,486,957 | |
Net change in unrealized appreciation (depreciation) on investments | | | (25,649,600 | ) | | | (3,474,377 | ) |
Net increase (decrease) in net assets resulting from operations | | | (28,371,294 | ) | | | 984,011 | |
| | | | | | | | | |
Distributions to shareholders: | | | | | | | | |
A-Class | | | (3,244,843 | ) | | | (33,235,169 | ) |
C-Class | | | (12,363 | ) | | | (243,784 | ) |
P-Class | | | (3,753 | ) | | | (57,515 | ) |
Institutional Class | | | (66,049 | ) | | | (818,298 | ) |
Total distributions to shareholders | | | (3,327,008 | ) | | | (34,354,766 | ) |
| | | | | | | | | |
Capital share transactions: | | | | | | | | |
Proceeds from sale of shares | | | | | | | | |
A-Class | | | 2,476,629 | | | | 8,230,249 | |
C-Class | | | 97,784 | | | | 282,941 | |
P-Class | | | 7,287 | | | | 68,423 | |
Institutional Class | | | 1,314,584 | | | | 1,679,246 | |
Distributions reinvested | | | | | | | | |
A-Class | | | 3,042,509 | | | | 31,501,637 | |
C-Class | | | 11,771 | | | | 241,526 | |
P-Class | | | 3,753 | | | | 57,515 | |
Institutional Class | | | 59,852 | | | | 755,670 | |
Cost of shares redeemed | | | | | | | | |
A-Class | | | (13,481,801 | ) | | | (28,897,196 | ) |
C-Class | | | (196,919 | ) | | | (515,190 | ) |
P-Class | | | (38,755 | ) | | | (141,618 | ) |
Institutional Class | | | (709,141 | ) | | | (4,457,139 | ) |
Net increase (decrease) from capital share transactions | | | (7,412,447 | ) | | | 8,806,064 | |
Net decrease in net assets | | | (39,110,749 | ) | | | (24,564,691 | ) |
| | | | | | | | | |
Net assets: | | | | | | | | |
Beginning of period | | | 201,517,334 | | | | 226,082,025 | |
End of period | | $ | 162,406,585 | | | $ | 201,517,334 | |
| | | | | | | | | |
Capital share activity: | | | | | | | | |
Shares sold | | | | | | | | |
A-Class | | | 110,933 | | | | 418,821 | |
C-Class | | | 6,674 | | | | 19,388 | |
P-Class | | | 332 | | | | 3,096 | |
Institutional Class | | | 66,813 | | | | 79,717 | |
Shares issued from reinvestment of distributions | | | | | | | | |
A-Class | | | 139,629 | | | | 1,858,504 | |
C-Class | | | 777 | | | | 20,382 | |
P-Class | | | 174 | | | | 3,435 | |
Institutional Class | | | 2,773 | | | | 45,011 | |
Shares redeemed | | | | | | | | |
A-Class | | | (646,116 | ) | | | (1,462,254 | ) |
C-Class | | | (13,725 | ) | | | (38,707 | ) |
P-Class | | | (2,006 | ) | | | (7,893 | ) |
Institutional Class | | | (35,774 | ) | | | (217,211 | ) |
Net increase (decrease) in shares | | | (369,516 | ) | | | 722,289 | |
SEE NOTES TO FINANCIAL STATEMENTS. | THE GUGGENHEIM FUNDS SEMI-ANNUAL REPORT | 77 |
STYLEPLUS—LARGE CORE FUND | |
This table is presented to show selected data for a share outstanding throughout each period and to assist shareholders in evaluating a Fund’s performance for the periods presented.
A-Class | | Period Ended
March 31,
2020a | | | Year Ended
September 30,
2019 | | | Year Ended
September 30,
2018 | | | Year Ended
September 30,
2017 | | | Year Ended
September 30,
2016 | | | Year Ended
September 30,
2015 | |
Per Share Data |
Net asset value, beginning of period | | $ | 20.48 | | | $ | 24.78 | | | $ | 25.23 | | | $ | 21.86 | | | $ | 21.14 | | | $ | 24.53 | |
Income (loss) from investment operations: |
Net investment income (loss)b | | | .13 | | | | .30 | | | | .30 | | | | .24 | | | | .16 | | | | .11 | |
Net gain (loss) on investments (realized and unrealized) | | | (3.13 | ) | | | (.72 | ) | | | 3.52 | | | | 3.72 | | | | 3.04 | | | | (.12 | ) |
Total from investment operations | | | (3.00 | ) | | | (.42 | ) | | | 3.82 | | | | 3.96 | | | | 3.20 | | | | (.01 | ) |
Less distributions from: |
Net investment income | | | (.31 | ) | | | (.30 | ) | | | (.24 | ) | | | (.16 | ) | | | (.13 | ) | | | (.22 | ) |
Net realized gains | | | (.03 | ) | | | (3.58 | ) | | | (4.03 | ) | | | (.43 | ) | | | (2.35 | ) | | | (3.16 | ) |
Total distributions | | | (.34 | ) | | | (3.88 | ) | | | (4.27 | ) | | | (.59 | ) | | | (2.48 | ) | | | (3.38 | ) |
Net asset value, end of period | | $ | 17.14 | | | $ | 20.48 | | | $ | 24.78 | | | $ | 25.23 | | | $ | 21.86 | | | $ | 21.14 | |
|
Total Returnc | | | (14.95 | %) | | | 1.50 | % | | | 16.60 | % | | | 18.58 | % | | | 16.13 | % | | | (0.84 | %) |
Ratios/Supplemental Data |
Net assets, end of period (in thousands) | | $ | 157,790 | | | $ | 196,563 | | | $ | 217,697 | | | $ | 206,033 | | | $ | 188,979 | | | $ | 177,748 | |
Ratios to average net assets: |
Net investment income (loss) | | | 1.19 | % | | | 1.48 | % | | | 1.27 | % | | | 1.03 | % | | | 0.79 | % | | | 0.48 | % |
Total expensesd | | | 1.38 | % | | | 1.31 | % | | | 1.34 | % | | | 1.38 | % | | | 1.33 | % | | | 1.32 | % |
Net expensese | | | 1.36 | % | | | 1.28 | % | | | 1.31 | % | | | 1.34 | % | | | 1.31 | % | | | 1.32 | % |
Portfolio turnover rate | | | 35 | % | | | 51 | % | | | 46 | % | | | 30 | % | | | 50 | % | | | 65 | % |
C-Class | | Period Ended
March 31,
2020a | | | Year Ended
September 30,
2019 | | | Year Ended
September 30,
2018 | | | Year Ended
September 30,
2017 | | | Year Ended
September 30,
2016 | | | Year Ended
September 30,
2015 | |
Per Share Data |
Net asset value, beginning of period | | $ | 14.22 | | | $ | 18.41 | | | $ | 19.74 | | | $ | 17.22 | | | $ | 17.17 | | | $ | 20.55 | |
Income (loss) from investment operations: |
Net investment income (loss)b | | | .02 | | | | .08 | | | | .06 | | | | .03 | | | | (.02 | ) | | | (.08 | ) |
Net gain (loss) on investments (realized and unrealized) | | | (2.17 | ) | | | (.69 | ) | | | 2.69 | | | | 2.92 | | | | 2.42 | | | | (.06 | ) |
Total from investment operations | | | (2.15 | ) | | | (.61 | ) | | | 2.75 | | | | 2.95 | | | | 2.40 | | | | (.14 | ) |
Less distributions from: |
Net investment income | | | (.17 | ) | | | — | | | | (.05 | ) | | | — | | | | — | | | | (.08 | ) |
Net realized gains | | | (.03 | ) | | | (3.58 | ) | | | (4.03 | ) | | | (.43 | ) | | | (2.35 | ) | | | (3.16 | ) |
Total distributions | | | (.20 | ) | | | (3.58 | ) | | | (4.08 | ) | | | (.43 | ) | | | (2.35 | ) | | | (3.24 | ) |
Net asset value, end of period | | $ | 11.87 | | | $ | 14.22 | | | $ | 18.41 | | | $ | 19.74 | | | $ | 17.22 | | | $ | 17.17 | |
|
Total Returnc | | | (15.40 | %) | | | 0.60 | % | | | 15.56 | % | | | 17.59 | % | | | 15.00 | % | | | (1.72 | %) |
Ratios/Supplemental Data |
Net assets, end of period (in thousands) | | $ | 738 | | | $ | 973 | | | $ | 1,239 | | | $ | 2,376 | | | $ | 2,650 | | | $ | 2,767 | |
Ratios to average net assets: |
Net investment income (loss) | | | 0.21 | % | | | 0.58 | % | | | 0.33 | % | | | 0.19 | % | | | (0.14 | %) | | | (0.44 | %) |
Total expensesd | | | 2.37 | % | | | 2.23 | % | | | 2.24 | % | | | 2.23 | % | | | 2.27 | % | | | 2.25 | % |
Net expensese | | | 2.34 | % | | | 2.19 | % | | | 2.21 | % | | | 2.20 | % | | | 2.25 | % | | | 2.25 | % |
Portfolio turnover rate | | | 35 | % | | | 51 | % | | | 46 | % | | | 30 | % | | | 50 | % | | | 65 | % |
78 | THE GUGGENHEIM FUNDS SEMI-ANNUAL REPORT | SEE NOTES TO FINANCIAL STATEMENTS. |
STYLEPLUS—LARGE CORE FUND | |
FINANCIAL HIGHLIGHTS (continued) |
This table is presented to show selected data for a share outstanding throughout each period and to assist shareholders in evaluating a Fund’s performance for the periods presented.
P-Class | | Period Ended
March 31,
2020a | | | Year Ended
September 30,
2019 | | | Year Ended
September 30,
2018 | | | Year Ended
September 30,
2017 | | | Year Ended
September 30,
2016 | | | Period Ended
September 30,
2015f | |
Per Share Data |
Net asset value, beginning of period | | $ | 20.21 | | | $ | 24.49 | | | $ | 25.03 | | | $ | 21.75 | | | $ | 21.11 | | | $ | 23.12 | |
Income (loss) from investment operations: |
Net investment income (loss)b | | | .11 | | | | .29 | | | | .26 | | | | .22 | | | | .21 | | | | .03 | |
Net gain (loss) on investments (realized and unrealized) | | | (3.07 | ) | | | (.73 | ) | | | 3.45 | | | | 3.68 | | | | 2.97 | | | | (2.04 | ) |
Total from investment operations | | | (2.96 | ) | | | (.44 | ) | | | 3.71 | | | | 3.90 | | | | 3.18 | | | | (2.01 | ) |
Less distributions from: |
Net investment income | | | (.30 | ) | | | (.26 | ) | | | (.22 | ) | | | (.19 | ) | | | (.19 | ) | | | — | |
Net realized gains | | | (.03 | ) | | | (3.58 | ) | | | (4.03 | ) | | | (.43 | ) | | | (2.35 | ) | | | — | |
Total distributions | | | (.33 | ) | | | (3.84 | ) | | | (4.25 | ) | | | (.62 | ) | | | (2.54 | ) | | | — | |
Net asset value, end of period | | $ | 16.92 | | | $ | 20.21 | | | $ | 24.49 | | | $ | 25.03 | | | $ | 21.75 | | | $ | 21.11 | |
|
Total Return | | | (15.00 | %) | | | 1.47 | % | | | 16.23 | % | | | 18.43 | % | | | 16.08 | % | | | (8.69 | %) |
Ratios/Supplemental Data |
Net assets, end of period (in thousands) | | $ | 172 | | | $ | 236 | | | $ | 319 | | | $ | 508 | | | $ | 405 | | | $ | 14 | |
Ratios to average net assets: |
Net investment income (loss) | | | 1.02 | % | | | 1.45 | % | | | 1.06 | % | | | 0.93 | % | | | 1.02 | % | | | 0.31 | % |
Total expensesd | | | 1.56 | % | | | 1.36 | % | | | 1.56 | % | | | 1.47 | % | | | 1.22 | % | | | 1.38 | % |
Net expensese | | | 1.53 | % | | | 1.33 | % | | | 1.53 | % | | | 1.44 | % | | | 1.19 | % | | | 1.38 | % |
Portfolio turnover rate | | | 35 | % | | | 51 | % | | | 46 | % | | | 30 | % | | | 50 | % | | | 65 | % |
SEE NOTES TO FINANCIAL STATEMENTS. | THE GUGGENHEIM FUNDS SEMI-ANNUAL REPORT | 79 |
STYLEPLUS—LARGE CORE FUND | |
FINANCIAL HIGHLIGHTS (concluded) |
This table is presented to show selected data for a share outstanding throughout each period and to assist shareholders in evaluating a Fund’s performance for the periods presented.
Institutional Class | | Period Ended
March 31,
2020a | | | Year Ended
September 30,
2019 | | | Year Ended
September 30,
2018 | | | Year Ended
September 30,
2017 | | | Year Ended
September 30,
2016 | | | Year Ended
September 30,
2015 | |
Per Share Data |
Net asset value, beginning of period | | $ | 20.31 | | | $ | 24.65 | | | $ | 25.13 | | | $ | 21.78 | | | $ | 21.00 | | | $ | 24.42 | |
Income (loss) from investment operations: |
Net investment income (loss)b | | | .15 | | | | .35 | | | | .37 | | | | .32 | | | | .24 | | | | .12 | |
Net gain (loss) on investments (realized and unrealized) | | | (3.08 | ) | | | (.75 | ) | | | 3.51 | | | | 3.69 | | | | 3.10 | | | | (.10 | ) |
Total from investment operations | | | (2.93 | ) | | | (.40 | ) | | | 3.88 | | | | 4.01 | | | | 3.34 | | | | .02 | |
Less distributions from: |
Net investment income | | | (.36 | ) | | | (.36 | ) | | | (.33 | ) | | | (.23 | ) | | | (.21 | ) | | | (.28 | ) |
Net realized gains | | | (.03 | ) | | | (3.58 | ) | | | (4.03 | ) | | | (.43 | ) | | | (2.35 | ) | | | (3.16 | ) |
Total distributions | | | (.39 | ) | | | (3.94 | ) | | | (4.36 | ) | | | (.66 | ) | | | (2.56 | ) | | | (3.44 | ) |
Net asset value, end of period | | $ | 16.99 | | | $ | 20.31 | | | $ | 24.65 | | | $ | 25.13 | | | $ | 21.78 | | | $ | 21.00 | |
|
Total Return | | | (14.83 | %) | | | 1.74 | % | | | 16.96 | % | | | 18.96 | % | | | 17.00 | % | | | (0.75 | %) |
Ratios/Supplemental Data |
Net assets, end of period (in thousands) | | $ | 3,708 | | | $ | 3,747 | | | $ | 6,826 | | | $ | 5,631 | | | $ | 4,247 | | | $ | 303 | |
Ratios to average net assets: |
Net investment income (loss) | | | 1.41 | % | | | 1.73 | % | | | 1.57 | % | | | 1.35 | % | | | 1.11 | % | | | 0.52 | % |
Total expensesd | | | 1.16 | % | | | 1.09 | % | | | 1.06 | % | | | 1.05 | % | | | 0.99 | % | | | 1.25 | % |
Net expensese | | | 1.13 | % | | | 1.06 | % | | | 1.03 | % | | | 1.01 | % | | | 0.97 | % | | | 1.25 | % |
Portfolio turnover rate | | | 35 | % | | | 51 | % | | | 46 | % | | | 30 | % | | | 50 | % | | | 65 | % |
a | Unaudited figures for the period ended March 31, 2020. Percentage amounts for the period, except total return and portfolio turnover rate, have been annualized. |
b | Net investment income (loss) per share was computed using average shares outstanding throughout the period. |
c | Total return does not reflect the impact of any applicable sales charges. |
d | Does not include expenses of the underlying funds in which the Fund invests. |
e | Net expense information reflects the expense ratios after expense waivers and reimbursements, as applicable. |
f | Since commencement of operations: May 1, 2015. Percentage amounts for the period, except total return and portfolio turnover rate, have been annualized. |
80 | THE GUGGENHEIM FUNDS SEMI-ANNUAL REPORT | SEE NOTES TO FINANCIAL STATEMENTS. |
PERFORMANCE REPORT AND FUND PROFILE (Unaudited) | March 31, 2020 |
STYLEPLUS—MID GROWTH FUND
OBJECTIVE: Seeks long-term growth of capital.
Holdings Diversification (Market Exposure as % of Net Assets)

“Holdings Diversification (Market Exposure as % of Net Assets)” excludes any temporary cash investments, investments in Guggenheim Strategy Funds Trust mutual funds, or investments in Guggenheim Ultra Short Duration Fund.
Inception Dates: |
A-Class | September 17, 1969 |
C-Class | January 29, 1999 |
P-Class | May 1, 2015 |
Institutional Class | March 1, 2012 |
Ten Largest Holdings (% of Total Net Assets) |
Guggenheim Strategy Fund II | 33.1% |
Guggenheim Strategy Fund III | 33.1% |
Guggenheim Ultra Short Duration Fund — Institutional Class | 11.9% |
iShares S&P MidCap 400 Growth Index Fund | 1.1% |
Gentex Corp. | 0.2% |
Domino’s Pizza, Inc. | 0.2% |
Teradyne, Inc. | 0.2% |
Hill-Rom Holdings, Inc. | 0.2% |
Carlisle Companies, Inc. | 0.2% |
Trimble, Inc. | 0.2% |
Top Ten Total | 80.4% |
| | |
“Ten Largest Holdings” excludes any temporary cash or derivative investments. |
| | THE GUGGENHEIM FUNDS SEMI-ANNUAL REPORT | 81 |
PERFORMANCE REPORT AND FUND PROFILE (Unaudited)(concluded) | March 31, 2020 |
Average Annual Returns*
Periods Ended March 31, 2020
| 6 Month† | 1 Year | 5 Year | 10 Year |
A-Class Shares | (17.89%) | (14.91%) | 3.41% | 8.58% |
A-Class Shares with sales charge‡ | (21.80%) | (18.96%) | 2.41% | 7.94% |
C-Class Shares | (18.25%) | (15.65%) | 2.53% | 7.66% |
C-Class Shares with CDSC§ | (19.05%) | (16.47%) | 2.53% | 7.66% |
Russell Midcap Growth Index | (13.50%) | (9.45%) | 5.61% | 10.89% |
| | 6 Month† | 1 Year | Since
Inception
(05/01/15) |
P-Class Shares | | (17.93%) | (15.00%) | 3.23% |
Russell Midcap Growth Index | | (13.50%) | (9.45%) | 5.63% |
| 6 Month† | 1 Year | 5 Year | Since
Inception
(03/01/12) |
Institutional Class Shares | (17.82%) | (14.81%) | 3.54% | 7.93% |
Russell Midcap Growth Index | (13.50%) | (9.45%) | 5.61% | 9.96% |
* | The performance data above represents past performance that is not predictive of future results. The investment return and principal value of an investment in the Fund will fluctuate so that an investor’s shares, when redeemed, may be worth more or less than their original cost. Returns are historical and include changes in principal and reinvested dividends and capital gains and do not reflect the effect of taxes. The Russell Midcap Growth Index is an unmanaged index and, unlike the Fund, has no management fees or operating expenses to reduce its reported return. |
† | 6 month returns are not annualized. |
‡ | Effective February 22, 2011, the maximum sales charge decreased from 5.75% to 4.5%. A 5.75% maximum sales charge is used in the calculation of the Average Annual Returns based on subscriptions made prior to February 22, 2011, and a 4.75% maximum sales charge will be used to calculate performance for periods based on subscriptions made on or after February 22, 2011. |
§ | Fund returns include a CDSC of 1% if redeemed within 12 months of purchase. |
82 | THE GUGGENHEIM FUNDS SEMI-ANNUAL REPORT | |
SCHEDULE OF INVESTMENTS (Unaudited) | March 31, 2020 |
STYLEPLUS—MID GROWTH FUND | |
| | Shares | | | Value | |
COMMON STOCKS† - 13.6% |
| | | | | | | | | |
Industrial - 4.2% |
Gentex Corp. | | | 7,295 | | | $ | 161,657 | |
Carlisle Companies, Inc. | | | 1,047 | | | | 131,168 | |
Trimble, Inc.* | | | 3,939 | | | | 125,378 | |
Lincoln Electric Holdings, Inc. | | | 1,771 | | | | 122,199 | |
Knight-Swift Transportation Holdings, Inc. | | | 3,572 | | | | 117,161 | |
ITT, Inc. | | | 2,262 | | | | 102,604 | |
Hubbell, Inc. | | | 879 | | | | 100,857 | |
Oshkosh Corp. | | | 1,559 | | | | 100,290 | |
National Instruments Corp. | | | 2,900 | | | | 95,932 | |
Landstar System, Inc. | | | 982 | | | | 94,134 | |
Timken Co. | | | 2,694 | | | | 87,124 | |
Kansas City Southern | | | 666 | | | | 84,702 | |
AGCO Corp. | | | 1,791 | | | | 84,625 | |
Old Dominion Freight Line, Inc. | | | 597 | | | | 78,362 | |
Owens Corning | | | 1,900 | | | | 73,739 | |
Expeditors International of Washington, Inc. | | | 1,083 | | | | 72,258 | |
MasTec, Inc.* | | | 1,922 | | | | 62,907 | |
Werner Enterprises, Inc. | | | 1,734 | | | | 62,875 | |
Emerson Electric Co. | | | 1,254 | | | | 59,753 | |
Masco Corp. | | | 1,692 | | | | 58,492 | |
Cognex Corp. | | | 1,382 | | | | 58,348 | |
Nordson Corp. | | | 431 | | | | 58,215 | |
J.B. Hunt Transport Services, Inc. | | | 620 | | | | 57,183 | |
Teledyne Technologies, Inc.* | | | 187 | | | | 55,589 | |
Littelfuse, Inc. | | | 398 | | | | 53,101 | |
Universal Display Corp. | | | 398 | | | | 52,449 | |
Curtiss-Wright Corp. | | | 532 | | | | 49,162 | |
Woodward, Inc. | | | 821 | | | | 48,800 | |
Arconic, Inc. | | | 2,924 | | | | 46,959 | |
Mettler-Toledo International, Inc.* | | | 67 | | | | 46,264 | |
Garmin Ltd. | | | 616 | | | | 46,175 | |
Jabil, Inc. | | | 1,743 | | | | 42,843 | |
Rockwell Automation, Inc. | | | 278 | | | | 41,953 | |
PerkinElmer, Inc. | | | 547 | | | | 41,178 | |
Kirby Corp.* | | | 910 | | | | 39,558 | |
TE Connectivity Ltd. | | | 608 | | | | 38,292 | |
Waters Corp.* | | | 209 | | | | 38,049 | |
EMCOR Group, Inc. | | | 584 | | | | 35,811 | |
Moog, Inc. — Class A | | | 539 | | | | 27,236 | |
Graco, Inc. | | | 209 | | | | 10,185 | |
Trex Company, Inc.* | | | 119 | | | | 9,537 | |
Coherent, Inc.* | | | 87 | | | | 9,258 | |
Tetra Tech, Inc. | | | 127 | | | | 8,969 | |
Total Industrial | | | | | | | 2,791,331 | |
| | | | | | | | | |
Consumer, Non-cyclical - 3.7% |
Hill-Rom Holdings, Inc. | | | 1,324 | | | | 133,194 | |
Service Corporation International | | | 3,080 | | | | 120,459 | |
West Pharmaceutical Services, Inc. | | | 743 | | | | 113,122 | |
Post Holdings, Inc.* | | | 1,291 | | | | 107,114 | |
Masimo Corp.* | | | 595 | | | | 105,386 | |
Bio-Techne Corp. | | | 512 | | | | 97,086 | |
PRA Health Sciences, Inc.* | | | 1,122 | | | | 93,171 | |
Exelixis, Inc.* | | | 5,171 | | | | 89,044 | |
Hologic, Inc.* | | | 2,392 | | | | 83,959 | |
Integra LifeSciences Holdings Corp.* | | | 1,821 | | | | 81,344 | |
Haemonetics Corp.* | | | 793 | | | | 79,030 | |
Catalent, Inc.* | | | 1,431 | | | | 74,340 | |
Bio-Rad Laboratories, Inc. — Class A* | | | 212 | | | | 74,319 | |
STERIS plc | | | 493 | | | | 69,005 | |
ICU Medical, Inc.* | | | 335 | | | | 67,593 | |
Baxter International, Inc. | | | 796 | | | | 64,627 | |
Alexion Pharmaceuticals, Inc.* | | | 694 | | | | 62,314 | |
Kimberly-Clark Corp. | | | 473 | | | | 60,483 | |
Encompass Health Corp. | | | 941 | | | | 60,252 | |
Penumbra, Inc.* | | | 349 | | | | 56,304 | |
Charles River Laboratories International, Inc.* | | | 441 | | | | 55,659 | |
Molson Coors Beverage Co. — Class B | | | 1,353 | | | | 52,781 | |
Globus Medical, Inc. — Class A* | | | 1,224 | | | | 52,057 | |
Regeneron Pharmaceuticals, Inc.* | | | 104 | | | | 50,782 | |
NuVasive, Inc.* | | | 987 | | | | 50,002 | |
Helen of Troy Ltd.* | | | 339 | | | | 48,826 | |
HealthEquity, Inc.* | | | 913 | | | | 46,188 | |
Syneos Health, Inc.* | | | 1,015 | | | | 40,011 | |
Edwards Lifesciences Corp.* | | | 211 | | | | 39,799 | |
WEX, Inc.* | | | 376 | | | | 39,311 | |
Deluxe Corp. | | | 1,496 | | | | 38,791 | |
LivaNova plc* | | | 829 | | | | 37,512 | |
Incyte Corp.* | | | 481 | | | | 35,224 | |
Arrowhead Pharmaceuticals, Inc.* | | | 1,057 | | | | 30,410 | |
MEDNAX, Inc.* | | | 2,540 | | | | 29,566 | |
Aaron’s, Inc. | | | 1,232 | | | | 28,065 | |
Varian Medical Systems, Inc.* | | | 234 | | | | 24,023 | |
Laboratory Corporation of America Holdings* | | | 186 | | | | 23,509 | |
Brink’s Co. | | | 301 | | | | 15,667 | |
Sabre Corp. | | | 2,515 | | | | 14,914 | |
Total Consumer, Non-cyclical | | | | | | | 2,445,243 | |
| | | | | | | | | |
Consumer, Cyclical - 2.2% |
Domino’s Pizza, Inc. | | | 480 | | | | 155,554 | |
Pool Corp. | | | 582 | | | | 114,520 | |
Brunswick Corp. | | | 2,521 | | | | 89,168 | |
PACCAR, Inc. | | | 1,128 | | | | 68,955 | |
Deckers Outdoor Corp.* | | | 512 | | | | 68,608 | |
Dunkin’ Brands Group, Inc. | | | 1,268 | | | | 67,331 | |
Cummins, Inc. | | | 491 | | | | 66,442 | |
Polaris, Inc. | | | 1,354 | | | | 65,195 | |
Wyndham Hotels & Resorts, Inc. | | | 1,998 | | | | 62,957 | |
Wyndham Destinations, Inc. | | | 2,600 | | | | 56,420 | |
Tempur Sealy International, Inc.* | | | 1,195 | | | | 52,233 | |
Casey’s General Stores, Inc. | | | 390 | | | | 51,671 | |
Toll Brothers, Inc. | | | 2,665 | | | | 51,302 | |
PulteGroup, Inc. | | | 1,982 | | | | 44,238 | |
Marriott Vacations Worldwide Corp. | | | 761 | | | | 42,296 | |
DR Horton, Inc. | | | 1,101 | | | | 37,434 | |
Five Below, Inc.* | | | 510 | | | | 35,894 | |
Skechers U.S.A., Inc. — Class A* | | | 1,461 | | | | 34,684 | |
Visteon Corp.* | | | 661 | | | | 31,715 | |
SEE NOTES TO FINANCIAL STATEMENTS. | THE GUGGENHEIM FUNDS SEMI-ANNUAL REPORT | 83 |
SCHEDULE OF INVESTMENTS (Unaudited)(continued) | March 31, 2020 |
STYLEPLUS—MID GROWTH FUND | |
| | Shares | | | Value | |
Williams-Sonoma, Inc. | | | 695 | | | $ | 29,551 | |
Jack in the Box, Inc. | | | 739 | | | | 25,902 | |
Choice Hotels International, Inc. | | | 380 | | | | 23,275 | |
KB Home | | | 1,270 | | | | 22,987 | |
Hilton Worldwide Holdings, Inc. | | | 295 | | | | 20,131 | |
VF Corp. | | | 364 | | | | 19,685 | |
RH* | | | 194 | | | | 19,491 | |
Six Flags Entertainment Corp. | | | 1,390 | | | | 17,431 | |
Scientific Games Corp. — Class A* | | | 1,659 | | | | 16,092 | |
Toro Co. | | | 232 | | | | 15,101 | |
Eldorado Resorts, Inc.* | | | 937 | | | | 13,493 | |
Scotts Miracle-Gro Co. — Class A | | | 106 | | | | 10,854 | |
Total Consumer, Cyclical | | | | | | | 1,430,610 | |
| | | | | | | | | |
Technology - 1.5% |
Teradyne, Inc. | | | 2,507 | | | | 135,804 | |
Fair Isaac Corp.* | | | 271 | | | | 83,384 | |
Tyler Technologies, Inc.* | | | 263 | | | | 77,995 | |
Cerner Corp. | | | 1,176 | | | | 74,076 | |
Teradata Corp.* | | | 2,468 | | | | 50,569 | |
Citrix Systems, Inc. | | | 347 | | | | 49,118 | |
Seagate Technology plc | | | 969 | | | | 47,287 | |
Lumentum Holdings, Inc.* | | | 632 | | | | 46,578 | |
Silicon Laboratories, Inc.* | | | 545 | | | | 46,549 | |
NetApp, Inc. | | | 1,058 | | | | 44,108 | |
Perspecta, Inc. | | | 2,391 | | | | 43,612 | |
Synaptics, Inc.* | | | 744 | | | | 43,055 | |
CDK Global, Inc. | | | 1,241 | | | | 40,767 | |
MKS Instruments, Inc. | | | 474 | | | | 38,607 | |
Maxim Integrated Products, Inc. | | | 712 | | | | 34,610 | |
Skyworks Solutions, Inc. | | | 315 | | | | 28,155 | |
CACI International, Inc. — Class A* | | | 93 | | | | 19,637 | |
Manhattan Associates, Inc.* | | | 298 | | | | 14,846 | |
Cabot Microelectronics Corp. | | | 96 | | | | 10,958 | |
PTC, Inc.* | | | 174 | | | | 10,651 | |
j2 Global, Inc.* | | | 134 | | | | 10,030 | |
Blackbaud, Inc. | | | 176 | | | | 9,777 | |
ACI Worldwide, Inc.* | | | 400 | | | | 9,660 | |
Monolithic Power Systems, Inc. | | | 57 | | | | 9,545 | |
Total Technology | | | | | | | 979,378 | |
| | | | | | | | | |
Communications - 0.8% |
Cable One, Inc. | | | 53 | | | | 87,133 | |
New York Times Co. — Class A | | | 2,330 | | | | 71,554 | |
FactSet Research Systems, Inc. | | | 273 | | | | 71,166 | |
Ciena Corp.* | | | 1,764 | | | | 70,225 | |
Yelp, Inc. — Class A* | | | 3,360 | | | | 60,581 | |
Viavi Solutions, Inc.* | | | 4,571 | | | | 51,241 | |
Etsy, Inc.* | | | 1,202 | | | | 46,205 | |
eBay, Inc. | | | 1,478 | | | | 44,428 | |
Omnicom Group, Inc. | | | 377 | | | | 20,697 | |
Total Communications | | | | | | | 523,230 | |
| | | | | | | | | |
Financial - 0.8% |
RenaissanceRe Holdings Ltd. | | | 292 | | | | 43,602 | |
SEI Investments Co. | | | 921 | | | | 42,679 | |
Western Union Co. | | | 1,987 | | | | 36,024 | |
Brown & Brown, Inc. | | | 922 | | | | 33,395 | |
Cousins Properties, Inc. REIT | | | 1,004 | | | | 29,387 | |
Camden Property Trust REIT | | | 366 | | | | 29,002 | |
CyrusOne, Inc. REIT | | | 463 | | | | 28,590 | |
Kilroy Realty Corp. REIT | | | 436 | | | | 27,773 | |
Commerce Bancshares, Inc. | | | 532 | | | | 26,786 | |
Douglas Emmett, Inc. REIT | | | 856 | | | | 26,117 | |
Omega Healthcare Investors, Inc. REIT | | | 941 | | | | 24,974 | |
National Retail Properties, Inc. REIT | | | 746 | | | | 24,014 | |
Healthcare Realty Trust, Inc. REIT | | | 736 | | | | 20,557 | |
Jones Lang LaSalle, Inc. | | | 203 | | | | 20,499 | |
American Campus Communities, Inc. REIT | | | 601 | | | | 16,678 | |
Highwoods Properties, Inc. REIT | | | 451 | | | | 15,974 | |
Weingarten Realty Investors REIT | | | 1,031 | | | | 14,877 | |
Brixmor Property Group, Inc. REIT | | | 1,542 | | | | 14,649 | |
EastGroup Properties, Inc. REIT | | | 96 | | | | 10,030 | |
Alleghany Corp. | | | 18 | | | | 9,942 | |
PS Business Parks, Inc. REIT | | | 73 | | | | 9,893 | |
Total Financial | | | | | | | 505,442 | |
| | | | | | | | | |
Energy - 0.3% |
Murphy USA, Inc.* | | | 578 | | | | 48,760 | |
SolarEdge Technologies, Inc.* | | | 435 | | | | 35,618 | |
Cabot Oil & Gas Corp. — Class A | | | 1,835 | | | | 31,544 | |
EOG Resources, Inc. | | | 841 | | | | 30,209 | |
WPX Energy, Inc.* | | | 6,036 | | | | 18,410 | |
Cimarex Energy Co. | | | 920 | | | | 15,484 | |
Murphy Oil Corp. | | | 2,395 | | | | 14,681 | |
Devon Energy Corp. | | | 1,449 | | | | 10,012 | |
Marathon Oil Corp. | | | 2,697 | | | | 8,873 | |
Matador Resources Co.* | | | 3,157 | | | | 7,829 | |
Total Energy | | | | | | | 221,420 | |
| | | | | | | | | |
Basic Materials - 0.1% |
Reliance Steel & Aluminum Co. | | | 305 | | | | 26,715 | |
RPM International, Inc. | | | 273 | | | | 16,244 | |
Royal Gold, Inc. | | | 106 | | | | 9,297 | |
Total Basic Materials | | | | | | | 52,256 | |
| | | | | | | | | |
Utilities - 0.0% |
Essential Utilities, Inc. | | | 986 | | | | 40,130 | |
| | | | | | | | | |
Total Common Stocks | | | | |
(Cost $11,678,446) | | | | | | | 8,989,040 | |
| | | | | | | | | |
EXCHANGE-TRADED FUNDS† - 1.1% |
iShares S&P MidCap 400 Growth Index Fund | | | 4,000 | | | | 713,840 | |
Total Exchange-Traded Funds | | | | |
(Cost $704,380) | | | | | | | 713,840 | |
| | | | | | | | | |
84 | THE GUGGENHEIM FUNDS SEMI-ANNUAL REPORT | SEE NOTES TO FINANCIAL STATEMENTS. |
SCHEDULE OF INVESTMENTS (Unaudited)(continued) | March 31, 2020 |
STYLEPLUS—MID GROWTH FUND | |
| | Shares | | | Value | |
MUTUAL FUNDS† - 78.1% |
Guggenheim Strategy Fund II1 | | | 906,682 | | | $ | 21,805,691 | |
Guggenheim Strategy Fund III1 | | | 904,474 | | | | 21,770,683 | |
Guggenheim Ultra Short Duration Fund — Institutional Class1 | | | 805,345 | | | | 7,868,222 | |
Total Mutual Funds | | | | |
(Cost $52,930,206) | | | | | | | 51,444,596 | |
| | | | | | | | | |
MONEY MARKET FUND† - 8.4% |
Dreyfus Treasury Securities Cash Management Fund — Institutional Shares, 0.51%2 | | | 5,500,662 | | | | 5,500,662 | |
Total Money Market Fund | | | | |
(Cost $5,500,662) | | | | | | | 5,500,662 | |
| | | | | | | | | |
Total Investments - 101.2% | | | | |
(Cost $70,813,694) | | $ | 66,648,138 | |
Other Assets & Liabilities, net - (1.2)% | | | (772,835 | ) |
Total Net Assets - 100.0% | | $ | 65,875,303 | |
Futures Contracts |
Description | | Number of
Contracts | | | Expiration
Date | | | Notional
Amount | | | Value and
Unrealized
Appreciation** | |
Equity Futures Contracts Purchased† |
S&P MidCap 400 Index Mini Futures Contracts | | | 12 | | | | Jun 2020 | | | $ | 1,728,000 | | | $ | 183,495 | |
NASDAQ-100 Index Mini Futures Contracts | | | 3 | | | | Jun 2020 | | | | 467,850 | | | | 38,753 | |
S&P 500 Index Mini Futures Contracts | | | 4 | | | | Jun 2020 | | | | 514,500 | | | | 38,074 | |
| | | | | | | | | | | $ | 2,710,350 | | | $ | 260,322 | |
Total Return Swap Agreements |
Counterparty | Index | Financing
Rate Pay | Payment
Frequency | | Maturity Date | | | Units | | | Notional
Amount | | | Value and
Unrealized
Depreciation | |
OTC Equity Index Swap Agreements†† |
Wells Fargo Bank, N.A. | Russell MidCap Growth Index Total Return | 2.01% (3 Month USD LIBOR + 0.10%) | At Maturity | | | 11/03/20 | | | | 18,161 | | | $ | 53,088,598 | | | $ | (8,289,607 | ) |
* | Non-income producing security. |
** | Includes cumulative appreciation (depreciation). Variation margin is reported within the Statement of Assets and Liabilities. |
† | Value determined based on Level 1 inputs — See Note 4. |
†† | Value determined based on Level 2 inputs — See Note 4. |
1 | Affiliated issuer. |
2 | Rate indicated is the 7-day yield as of March 31, 2020. |
| | LIBOR — London Interbank Offered Rate |
| | plc — Public Limited Company |
| | REIT — Real Estate Investment Trust |
| | |
| | See Sector Classification in Other Information section. |
SEE NOTES TO FINANCIAL STATEMENTS. | THE GUGGENHEIM FUNDS SEMI-ANNUAL REPORT | 85 |
SCHEDULE OF INVESTMENTS (Unaudited)(concluded) | March 31, 2020 |
STYLEPLUS—MID GROWTH FUND | |
The following table summarizes the inputs used to value the Fund’s investments at March 31, 2020 (See Note 4 in the Notes to Financial Statements):
Investments in Securities (Assets) | | Level 1
Quoted
Prices | | | Level 2
Significant
Observable
Inputs | | | Level 3
Significant
Unobservable
Inputs | | | Total | |
Common Stocks | | $ | 8,989,040 | | | $ | — | | | $ | — | | | $ | 8,989,040 | |
Exchange-Traded Funds | | | 713,840 | | | | — | | | | — | | | | 713,840 | |
Mutual Funds | | | 51,444,596 | | | | — | | | | — | | | | 51,444,596 | |
Money Market Fund | | | 5,500,662 | | | | — | | | | — | | | | 5,500,662 | |
Equity Futures Contracts** | | | 260,322 | | | | — | | | | — | | | | 260,322 | |
Total Assets | | $ | 66,908,460 | | | $ | — | | | $ | — | | | $ | 66,908,460 | |
Investments in Securities (Liabilities) | | Level 1
Quoted
Prices | | | Level 2
Significant
Observable
Inputs | | | Level 3
Significant
Unobservable
Inputs | | | Total | |
Equity Index Swap Agreements** | | $ | — | | | $ | 8,289,607 | | | $ | — | | | $ | 8,289,607 | |
** | This derivative is reported as unrealized appreciation/depreciation at period end. |
Affiliated Transactions
Investments representing 5% or more of the outstanding voting shares of a company, or control of or by, or common control under Guggenheim Investments (“GI”), result in that company being considered an affiliated issuer, as defined in the 1940 Act.
The Fund may invest in certain of the underlying series of Guggenheim Strategy Funds Trust, including Guggenheim Strategy Fund II and Guggenheim Strategy Fund III, (collectively, the “Short Term Investment Vehicles”), each of which are open-end management investment companies managed by GI. The Short Term Investment Vehicles, which launched on March 11, 2014, are offered as short term investment options only to mutual funds, trusts, and other accounts managed by GI and/or its affiliates, and are not available to the public. The Short Term Investment Vehicles pay no investment management fees. The Short Term Investment Vehicles’ annual report on Form N-CSR dated September 30, 2019, is available publicly or upon request. This information is available from the EDGAR database on the SEC’s website at https://www.sec.gov/Archives/edgar/data/1601445/000089180419000405/gug78512-ncsr.htm.
Transactions during the period ended March 31, 2020, in which the company is an affiliated issuer, were as follows:
Security Name | | Value
09/30/19 | | | Additions | | | Reductions | | | Realized
Gain (Loss) | | | Change in
Unrealized
Appreciation
(Depreciation) | | | Value
03/31/20 | | | Shares
03/31/20 | | | Investment
Income | |
Mutual Funds | | | | | | | | | | | | | | | | | | | | | | | | | | | | | | | | |
Guggenheim Strategy Fund II | | $ | 29,609,705 | | | $ | 400,734 | | | $ | (7,439,833 | ) | | $ | (79,340 | ) | | $ | (685,575 | ) | | $ | 21,805,691 | | | | 906,682 | | | $ | 400,734 | |
Guggenheim Strategy Fund III | | | 27,841,081 | | | | 382,940 | | | | (5,713,891 | ) | | | (102,836 | ) | | | (636,611 | ) | | | 21,770,683 | | | | 904,474 | | | | 382,940 | |
Guggenheim Ultra Short Duration Fund — Institutional Class | | | 8,411,350 | | | | 11,260,148 | | | | (11,867,978 | ) | | | 23,361 | | | | 41,341 | | | | 7,868,222 | | | | 805,345 | | | | 80,187 | |
| | | $ | 65,862,136 | | | $ | 12,043,822 | | | $ | (25,021,702 | ) | | $ | (158,815 | ) | | $ | (1,280,845 | ) | | $ | 51,444,596 | | | | | | | $ | 863,861 | |
86 | THE GUGGENHEIM FUNDS SEMI-ANNUAL REPORT | SEE NOTES TO FINANCIAL STATEMENTS. |
STYLEPLUS—MID GROWTH FUND | |
STATEMENT OF ASSETS AND LIABILITIES (Unaudited) |
March 31, 2020 |
Assets: |
Investments in unaffiliated issuers, at value (cost $17,883,488) | | $ | 15,203,542 | |
Investments in affiliated issuers, at value (cost $52,930,206) | | | 51,444,596 | |
Cash | | | 83,795 | |
Segregated cash with broker | | | 8,157,000 | |
Prepaid expenses | | | 36,400 | |
Receivables: |
Dividends | | | 109,903 | |
Securities sold | | | 14,449 | |
Fund shares sold | | | 5,590 | |
Interest | | | 2,009 | |
Total assets | | | 75,057,284 | |
| | | | | |
Liabilities: |
Unrealized depreciation on OTC swap agreements | | | 8,289,607 | |
Payable for: |
Swap settlement | | | 651,111 | |
Securities purchased | | | 100,110 | |
Management fees | | | 42,278 | |
Variation margin on futures contracts | | | 27,255 | |
Distribution and service fees | | | 15,226 | |
Fund shares redeemed | | | 9,364 | |
Transfer agent/maintenance fees | | | 8,090 | |
Fund accounting/administration fees | | | 3,333 | |
Trustees’ fees* | | | 919 | |
Miscellaneous | | | 34,688 | |
Total liabilities | | | 9,181,981 | |
Net assets | | $ | 65,875,303 | |
| | | | | |
Net assets consist of: |
Paid in capital | | $ | 80,319,592 | |
Total distributable earnings (loss) | | | (14,444,289 | ) |
Net assets | | $ | 65,875,303 | |
| | | | | |
A-Class: |
Net assets | | $ | 63,580,232 | |
Capital shares outstanding | | | 1,996,601 | |
Net asset value per share | | $ | 31.84 | |
Maximum offering price per share (Net asset value divided by 95.25%) | | $ | 33.43 | |
| | | | | |
C-Class: |
Net assets | | $ | 1,194,333 | |
Capital shares outstanding | | | 58,398 | |
Net asset value per share | | $ | 20.45 | |
| | | | | |
P-Class: |
Net assets | | $ | 75,265 | |
Capital shares outstanding | | | 2,390 | |
Net asset value per share | | $ | 31.49 | |
| | | | | |
Institutional Class: |
Net assets | | $ | 1,025,473 | |
Capital shares outstanding | | | 32,235 | |
Net asset value per share | | $ | 31.81 | |
* | Relates to Trustees not deemed “interested persons” within the meaning of Section 2(a)(19) of the 1940 Act. |
SEE NOTES TO FINANCIAL STATEMENTS. | THE GUGGENHEIM FUNDS SEMI-ANNUAL REPORT | 87 |
STYLEPLUS—MID GROWTH FUND | |
STATEMENT OF OPERATIONS (Unaudited) |
Six-Month Period Ended March 31, 2020 |
Investment Income: |
Dividends from securities of unaffiliated issuers | | $ | 123,005 | |
Dividends from securities of affiliated issuers | | | 863,861 | |
Interest | | | 25,285 | |
Total investment income | | | 1,012,151 | |
| | | | | |
Expenses: |
Management fees | | | 321,730 | |
Distribution and service fees: |
A-Class | | | 103,591 | |
C-Class | | | 8,508 | |
P-Class | | | 130 | |
Transfer agent/maintenance fees: |
A-Class | | | 46,791 | |
C-Class | | | 1,872 | |
P-Class | | | 111 | |
Institutional Class | | | 1,148 | |
Registration fees | | | 39,640 | |
Fund accounting/administration fees | | | 33,054 | |
Professional fees | | | 21,523 | |
Prime broker interest expense | | | 18,892 | |
Custodian fees | | | 9,604 | |
Trustees’ fees* | | | 9,560 | |
Tax expense | | | 8,118 | |
Line of credit fees | | | 1,040 | |
Miscellaneous | | | 27,032 | |
Total expenses | | | 652,344 | |
Less: |
Expenses waived by Adviser | | | (9,841 | ) |
Earnings credits applied | | | (432 | ) |
Total waived expenses | | | (10,273 | ) |
Net expenses | | | 642,071 | |
Net investment income | | | 370,080 | |
| | | | | |
Net Realized and Unrealized Gain (Loss): |
Net realized gain (loss) on: |
Investments in unaffiliated issuers | | $ | (1,084,141 | ) |
Investments in affiliated issuers | | | (158,815 | ) |
Swap agreements | | | (199,017 | ) |
Futures contracts | | | (1,122,570 | ) |
Net realized loss | | | (2,564,543 | ) |
Net change in unrealized appreciation (depreciation) on: |
Investments in unaffiliated issuers | | | (3,283,859 | ) |
Investments in affiliated issuers | | | (1,280,845 | ) |
Swap agreements | | | (8,289,607 | ) |
Futures contracts | | | 275,389 | |
Net change in unrealized appreciation (depreciation) | | | (12,578,922 | ) |
Net realized and unrealized loss | | | (15,143,465 | ) |
Net decrease in net assets resulting from operations | | $ | (14,773,385 | ) |
* | Relates to Trustees not deemed “interested persons” within the meaning of Section 2(a)(19) of the 1940 Act. |
88 | THE GUGGENHEIM FUNDS SEMI-ANNUAL REPORT | SEE NOTES TO FINANCIAL STATEMENTS. |
STYLEPLUS—MID GROWTH FUND | |
STATEMENTS OF CHANGES IN NET ASSETS |
| | Six-Month
Period Ended
March 31,
2020
(Unaudited) | | | Year Ended
September 30,
2019 | |
Increase (Decrease) in Net Assets from Operations: | | | | | | | | |
Net investment income | | $ | 370,080 | | | $ | 948,570 | |
Net realized gain (loss) on investments | | | (2,564,543 | ) | | | 1,250,158 | |
Net change in unrealized appreciation (depreciation) on investments | | | (12,578,922 | ) | | | (283,287 | ) |
Net increase (decrease) in net assets resulting from operations | | | (14,773,385 | ) | | | 1,915,441 | |
| | | | | | | | | |
Distributions to shareholders: | | | | | | | | |
A-Class | | | (1,858,324 | ) | | | (15,751,937 | ) |
C-Class | | | (39,450 | ) | | | (404,113 | ) |
P-Class | | | (2,046 | ) | | | (21,229 | ) |
Institutional Class | | | (23,966 | ) | | | (165,670 | ) |
Total distributions to shareholders | | | (1,923,786 | ) | | | (16,342,949 | ) |
| | | | | | | | | |
Capital share transactions: | | | | | | | | |
Proceeds from sale of shares | | | | | | | | |
A-Class | | | 1,249,300 | | | | 7,824,230 | |
C-Class | | | 915,313 | | | | 481,877 | |
P-Class | | | 25,481 | | | | 13,250 | |
Institutional Class | | | 559,486 | | | | 740,878 | |
Distributions reinvested | | | | | | | | |
A-Class | | | 1,767,121 | | | | 15,152,789 | |
C-Class | | | 31,434 | | | | 399,145 | |
P-Class | | | 2,046 | | | | 21,229 | |
Institutional Class | | | 23,138 | | | | 158,129 | |
Cost of shares redeemed | | | | | | | | |
A-Class | | | (6,608,299 | ) | | | (13,619,860 | ) |
C-Class | | | (898,317 | ) | | | (670,235 | ) |
P-Class | | | (27,608 | ) | | | (44,190 | ) |
Institutional Class | | | (240,543 | ) | | | (613,555 | ) |
Net increase (decrease) from capital share transactions | | | (3,201,448 | ) | | | 9,843,687 | |
Net decrease in net assets | | | (19,898,619 | ) | | | (4,583,821 | ) |
| | | | | | | | | |
Net assets: | | | | | | | | |
Beginning of period | | | 85,773,922 | | | | 90,357,743 | |
End of period | | $ | 65,875,303 | | | $ | 85,773,922 | |
| | | | | | | | | |
Capital share activity: | | | | | | | | |
Shares sold | | | | | | | | |
A-Class | | | 29,785 | | | | 204,461 | |
C-Class | | | 32,729 | | | | 20,362 | |
P-Class | | | 656 | | | | 343 | |
Institutional Class | | | 13,416 | | | | 18,602 | |
Shares issued from reinvestment of distributions | | | | | | | | |
A-Class | | | 42,510 | | | | 481,032 | |
C-Class | | | 1,175 | | | | 19,433 | |
P-Class | | | 50 | | | | 681 | |
Institutional Class | | | 557 | | | | 5,020 | |
Shares redeemed | | | | | | | | |
A-Class | | | (170,468 | ) | | | (351,396 | ) |
C-Class | | | (41,079 | ) | | | (25,905 | ) |
P-Class | | | (679 | ) | | | (1,197 | ) |
Institutional Class | | | (6,249 | ) | | | (16,682 | ) |
Net increase (decrease) in shares | | | (97,597 | ) | | | 354,754 | |
SEE NOTES TO FINANCIAL STATEMENTS. | THE GUGGENHEIM FUNDS SEMI-ANNUAL REPORT | 89 |
STYLEPLUS—MID GROWTH FUND | |
This table is presented to show selected data for a share outstanding throughout each period and to assist shareholders in evaluating a Fund’s performance for the periods presented.
A-Class | | Period Ended
March 31,
2020a | | | Year Ended
September 30,
2019 | | | Year Ended
September 30,
2018 | | | Year Ended
September 30,
2017 | | | Year Ended
September 30,
2016 | | | Year Ended
September 30,
2015 | |
Per Share Data |
Net asset value, beginning of period | | $ | 39.64 | | | $ | 49.70 | | | $ | 47.34 | | | $ | 40.52 | | | $ | 41.49 | | | $ | 45.82 | |
Income (loss) from investment operations: |
Net investment income (loss)b | | | .18 | | | | .45 | | | | .41 | | | | .34 | | | | .19 | | | | .07 | |
Net gain (loss) on investments (realized and unrealized) | | | (7.07 | ) | | | (1.58 | ) | | | 7.70 | | | | 6.72 | | | | 4.25 | | | | .63 | |
Total from investment operations | | | (6.89 | ) | | | (1.13 | ) | | | 8.11 | | | | 7.06 | | | | 4.44 | | | | .70 | |
Less distributions from: |
Net investment income | | | (.45 | ) | | | (.41 | ) | | | (.24 | ) | | | (.24 | ) | | | (.05 | ) | | | — | |
Net realized gains | | | (.46 | ) | | | (8.52 | ) | | | (5.51 | ) | | | — | | | | (5.36 | ) | | | (5.03 | ) |
Total distributions | | | (.91 | ) | | | (8.93 | ) | | | (5.75 | ) | | | (.24 | ) | | | (5.41 | ) | | | (5.03 | ) |
Net asset value, end of period | | $ | 31.84 | | | $ | 39.64 | | | $ | 49.70 | | | $ | 47.34 | | | $ | 40.52 | | | $ | 41.49 | |
|
Total Returnc | | | (17.89 | %) | | | 2.34 | % | | | 18.51 | % | | | 17.54 | % | | | 11.55 | % | | | 1.04 | % |
Ratios/Supplemental Data |
Net assets, end of period (in thousands) | | $ | 63,580 | | | $ | 83,027 | | | $ | 87,509 | | | $ | 77,049 | | | $ | 72,179 | | | $ | 73,178 | |
Ratios to average net assets: |
Net investment income (loss) | | | 0.88 | % | | | 1.13 | % | | | 0.87 | % | | | 0.78 | % | | | 0.48 | % | | | 0.16 | % |
Total expensesd | | | 1.51 | % | | | 1.44 | % | | | 1.55 | % | | | 1.45 | % | | | 1.45 | % | | | 1.47 | % |
Net expensese | | | 1.48 | % | | | 1.41 | % | | | 1.52 | % | | | 1.42 | % | | | 1.43 | % | | | 1.47 | % |
Portfolio turnover rate | | | 42 | % | | | 73 | % | | | 52 | % | | | 43 | % | | | 61 | % | | | 75 | % |
C-Class | | Period Ended
March 31,
2020a | | | Year Ended
September 30,
2019 | | | Year Ended
September 30,
2018 | | | Year Ended
September 30,
2017 | | | Year Ended
September 30,
2016 | | | Year Ended
September 30,
2015 | |
Per Share Data |
Net asset value, beginning of period | | $ | 25.66 | | | $ | 35.78 | | | $ | 35.64 | | | $ | 30.58 | | | $ | 32.78 | | | $ | 37.48 | |
Income (loss) from investment operations: |
Net investment income (loss)b | | | (— | )f | | | .08 | | | | .02 | | | | (.03 | ) | | | (.12 | ) | | | (.25 | ) |
Net gain (loss) on investments (realized and unrealized) | | | (4.52 | ) | | | (1.68 | ) | | | 5.63 | | | | 5.09 | | | | 3.28 | | | | .58 | |
Total from investment operations | | | (4.52 | ) | | | (1.60 | ) | | | 5.65 | | | | 5.06 | | | | 3.16 | | | | .33 | |
Less distributions from: |
Net investment income | | | (.23 | ) | | | — | | | | — | | | | — | | | | — | | | | — | |
Net realized gains | | | (.46 | ) | | | (8.52 | ) | | | (5.51 | ) | | | — | | | | (5.36 | ) | | | (5.03 | ) |
Total distributions | | | (.69 | ) | | | (8.52 | ) | | | (5.51 | ) | | | — | | | | (5.36 | ) | | | (5.03 | ) |
Net asset value, end of period | | $ | 20.45 | | | $ | 25.66 | | | $ | 35.78 | | | $ | 35.64 | | | $ | 30.58 | | | $ | 32.78 | |
|
Total Returnc | | | (18.25 | %) | | | 1.46 | % | | | 17.51 | % | | | 16.55 | % | | | 10.55 | % | | | 0.20 | % |
Ratios/Supplemental Data |
Net assets, end of period (in thousands) | | $ | 1,194 | | | $ | 1,683 | | | $ | 1,849 | | | $ | 3,984 | | | $ | 3,760 | | | $ | 4,762 | |
Ratios to average net assets: |
Net investment income (loss) | | | (0.02 | %) | | | 0.30 | % | | | 0.05 | % | | | (0.08 | %) | | | (0.42 | %) | | | (0.68 | %) |
Total expensesd | | | 2.36 | % | | | 2.27 | % | | | 2.33 | % | | | 2.31 | % | | | 2.34 | % | | | 2.31 | % |
Net expensese | | | 2.34 | % | | | 2.24 | % | | | 2.30 | % | | | 2.27 | % | | | 2.32 | % | | | 2.31 | % |
Portfolio turnover rate | | | 42 | % | | | 73 | % | | | 52 | % | | | 43 | % | | | 61 | % | | | 75 | % |
90 | THE GUGGENHEIM FUNDS SEMI-ANNUAL REPORT | SEE NOTES TO FINANCIAL STATEMENTS. |
STYLEPLUS—MID GROWTH FUND | |
FINANCIAL HIGHLIGHTS (continued) |
This table is presented to show selected data for a share outstanding throughout each period and to assist shareholders in evaluating a Fund’s performance for the periods presented.
P-Class | | Period Ended
March 31,
2020a | | | Year Ended
September 30,
2019 | | | Year Ended
September 30,
2018 | | | Year Ended
September 30,
2017 | | | Year Ended
September 30,
2016 | | | Period Ended
September 30,
2015g | |
Per Share Data |
Net asset value, beginning of period | | $ | 39.17 | | | $ | 49.12 | | | $ | 46.83 | | | $ | 40.27 | | | $ | 41.48 | | | $ | 45.96 | |
Income (loss) from investment operations: |
Net investment income (loss)b | | | .15 | | | | .41 | | | | .32 | | | | .24 | | | | .26 | | | | — | f |
Net gain (loss) on investments (realized and unrealized) | | | (6.97 | ) | | | (1.58 | ) | | | 7.61 | | | | 6.65 | | | | 4.09 | | | | (4.48 | ) |
Total from investment operations | | | (6.82 | ) | | | (1.17 | ) | | | 7.93 | | | | 6.89 | | | | 4.35 | | | | (4.48 | ) |
Less distributions from: |
Net investment income | | | (.40 | ) | | | (.26 | ) | | | (.13 | ) | | | (.33 | ) | | | (.20 | ) | | | — | |
Net realized gains | | | (.46 | ) | | | (8.52 | ) | | | (5.51 | ) | | | — | | | | (5.36 | ) | | | — | |
Total distributions | | | (.86 | ) | | | (8.78 | ) | | | (5.64 | ) | | | (.33 | ) | | | (5.56 | ) | | | — | |
Net asset value, end of period | | $ | 31.49 | | | $ | 39.17 | | | $ | 49.12 | | | $ | 46.83 | | | $ | 40.27 | | | $ | 41.48 | |
|
Total Return | | | (17.93 | %) | | | 2.22 | % | | | 18.26 | % | | | 17.27 | % | | | 11.36 | % | | | (9.75 | %) |
Ratios/Supplemental Data |
Net assets, end of period (in thousands) | | $ | 75 | | | $ | 93 | | | $ | 125 | | | $ | 121 | | | $ | 102 | | | $ | 11 | |
Ratios to average net assets: |
Net investment income (loss) | | | 0.75 | % | | | 1.04 | % | | | 0.67 | % | | | 0.55 | % | | | 0.69 | % | | | — | |
Total expensesd | | | 1.61 | % | | | 1.55 | % | | | 1.68 | % | | | 1.66 | % | | | 1.39 | % | | | 1.49 | % |
Net expensese | | | 1.58 | % | | | 1.51 | % | | | 1.64 | % | | | 1.63 | % | | | 1.35 | % | | | 1.49 | % |
Portfolio turnover rate | | | 42 | % | | | 73 | % | | | 52 | % | | | 43 | % | | | 61 | % | | | 75 | % |
SEE NOTES TO FINANCIAL STATEMENTS. | THE GUGGENHEIM FUNDS SEMI-ANNUAL REPORT | 91 |
STYLEPLUS—MID GROWTH FUND | |
FINANCIAL HIGHLIGHTS (concluded) |
This table is presented to show selected data for a share outstanding throughout each period and to assist shareholders in evaluating a Fund’s performance for the periods presented.
Institutional Class | | Period Ended
March 31,
2020a | | | Year Ended
September 30,
2019 | | | Year Ended
September 30,
2018 | | | Year Ended
September 30,
2017 | | | Year Ended
September 30,
2016 | | | Year Ended
September 30,
2015 | |
Per Share Data |
Net asset value, beginning of period | | $ | 39.64 | | | $ | 49.80 | | | $ | 47.48 | | | $ | 40.59 | | | $ | 41.64 | | | $ | 45.96 | |
Income (loss) from investment operations: |
Net investment income (loss)b | | | .20 | | | | .51 | | | | .53 | | | | .42 | | | | .19 | | | | .11 | |
Net gain (loss) on investments (realized and unrealized) | | | (7.04 | ) | | | (1.63 | ) | | | 7.71 | | | | 6.78 | | | | 4.25 | | | | .60 | |
Total from investment operations | | | (6.84 | ) | | | (1.12 | ) | | | 8.24 | | | | 7.20 | | | | 4.44 | | | | .71 | |
Less distributions from: |
Net investment income | | | (.53 | ) | | | (.52 | ) | | | (.41 | ) | | | (.31 | ) | | | (.13 | ) | | | — | |
Net realized gains | | | (.46 | ) | | | (8.52 | ) | | | (5.51 | ) | | | — | | | | (5.36 | ) | | | (5.03 | ) |
Total distributions | | | (.99 | ) | | | (9.04 | ) | | | (5.92 | ) | | | (.31 | ) | | | (5.49 | ) | | | (5.03 | ) |
Net asset value, end of period | | $ | 31.81 | | | $ | 39.64 | | | $ | 49.80 | | | $ | 47.48 | | | $ | 40.59 | | | $ | 41.64 | |
|
Total Return | | | (17.82 | %) | | | 2.42 | % | | | 18.77 | % | | | 17.88 | % | | | 11.50 | % | | | 1.08 | % |
Ratios/Supplemental Data |
Net assets, end of period (in thousands) | | $ | 1,025 | | | $ | 972 | | | $ | 875 | | | $ | 1,743 | | | $ | 113 | | | $ | 54 | |
Ratios to average net assets: |
Net investment income (loss) | | | 0.99 | % | | | 1.28 | % | | | 1.11 | % | | | 0.95 | % | | | 0.48 | % | | | 0.23 | % |
Total expensesd | | | 1.36 | % | | | 1.31 | % | | | 1.26 | % | | | 1.26 | % | | | 1.46 | % | | | 1.41 | % |
Net expensese | | | 1.33 | % | | | 1.28 | % | | | 1.23 | % | | | 1.22 | % | | | 1.44 | % | | | 1.41 | % |
Portfolio turnover rate | | | 42 | % | | | 73 | % | | | 52 | % | | | 43 | % | | | 61 | % | | | 75 | % |
a | Unaudited figures for the period ended March 31, 2020. Percentage amounts for the period, except total return and portfolio turnover rate, have been annualized. |
b | Net investment income (loss) per share was computed using average shares outstanding throughout the period. |
c | Total return does not reflect the impact of any applicable sales charges. |
d | Does not include expenses of the underlying funds in which the Fund invests. |
e | Net expense information reflects the expense ratios after expense waivers and reimbursements, as applicable. |
f | Net investment income is less than $0.01 per share. |
g | Since commencement of operations: May 1, 2015. Percentage amounts for the period, except total return and portfolio turnover rate, have been annualized. |
92 | THE GUGGENHEIM FUNDS SEMI-ANNUAL REPORT | SEE NOTES TO FINANCIAL STATEMENTS. |
PERFORMANCE REPORT AND FUND PROFILE (Unaudited) | March 31, 2020 |
WORLD EQUITY INCOME FUND
OBJECTIVE: Seeks to provide total return, comprised of capital appreciation and income.
Holdings Diversification (Market Exposure as % of Net Assets)
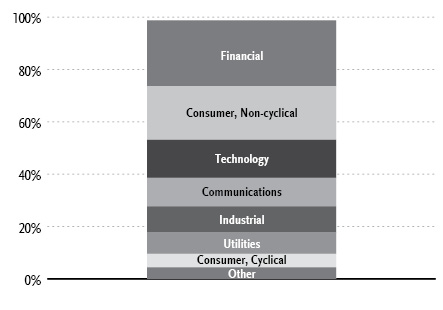
“Holdings Diversification (Market Exposure as % of Net Assets)” excludes any temporary cash investments.
COUNTRY DIVERSIFICATION
Country | | % of Long-Term
Investments | |
United States | | | 56.3 | % |
Canada | | | 6.1 | % |
Japan | | | 5.9 | % |
Australia | | | 4.7 | % |
Switzerland | | | 4.6 | % |
Finland | | | 4.1 | % |
Ireland | | | 3.1 | % |
Other | | | 15.2 | % |
Total Long-Term Investments | | | 100.0 | % |
Inception Dates: |
A-Class | October 1, 1993 |
C-Class | January 29, 1999 |
P-Class | May 1, 2015 |
Institutional Class | May 2, 2011 |
Ten Largest Holdings (% of Total Net Assets) |
Microsoft Corp. | 3.3% |
Apple, Inc. | 2.5% |
Amazon.com, Inc. | 1.6% |
Home Depot, Inc. | 1.6% |
Verizon Communications, Inc. | 1.5% |
Roche Holding AG | 1.5% |
Alphabet, Inc. — Class C | 1.3% |
Mastercard, Inc. — Class A | 1.2% |
PepsiCo, Inc. | 1.1% |
Accenture plc — Class A | 1.1% |
Top Ten Total | 16.7% |
| | |
“Ten Largest Holdings” excludes any temporary cash or derivative investments. |
| | THE GUGGENHEIM FUNDS SEMI-ANNUAL REPORT | 93 |
PERFORMANCE REPORT AND FUND PROFILE (Unaudited)(concluded) | March 31, 2020 |
Average Annual Returns*
Periods Ended March 31, 2020
| 6 Month† | 1 Year | 5 Year | 10 Year |
A-Class Shares | (18.61%) | (15.51%) | 0.72% | 3.53% |
A-Class Shares with sales charge‡ | (22.47%) | (19.51%) | (0.26%) | 2.91% |
C-Class Shares | (18.90%) | (16.15%) | (0.03%) | 2.76% |
C-Class Shares with CDSC§ | (19.70%) | (16.97%) | (0.03%) | 2.76% |
MSCI World Index | (14.30%) | (10.39%) | 3.25% | 6.57% |
| | 6 Month† | 1 Year | Since
Inception
(05/01/15) |
P-Class Shares | | (18.63%) | (15.51%) | 0.54% |
MSCI World Index | | (14.30%) | (10.39%) | 2.71% |
| 6 Month† | 1 Year | 5 Year | Since
Inception
(05/02/11) |
Institutional Class Shares | (18.51%) | (15.28%) | 1.00% | 2.29% |
MSCI World Index | (14.30%) | (10.39%) | 3.25% | 5.37% |
* | The performance data above represents past performance that is not predictive of future results. The investment return and principal value of an investment in the Fund will fluctuate so that an investor’s shares, when redeemed, may be worth more or less than their original cost. Returns are historical and include changes in principal and reinvested dividends and capital gains and do not reflect the effect of taxes. The MSCI World Index is an unmanaged index and, unlike the Fund, has no management fees or operating expenses to reduce its reported return. |
† | 6 month returns are not annualized. |
‡ | Effective February 22, 2011, the maximum sales charge decreased from 5.75% to 4.75%. A 5.75% maximum sales charge is used in the calculation of the Average Annual Returns based on subscriptions made prior to February 22, 2011, and a 4.75% maximum sales charge will be used to calculate performance for periods based on subscriptions made on or after February 22, 2011. |
§ | Fund returns include a CDSC of 1% if redeemed within 12 months of purchase. |
94 | THE GUGGENHEIM FUNDS SEMI-ANNUAL REPORT | |
SCHEDULE OF INVESTMENTS (Unaudited) | March 31, 2020 |
WORLD EQUITY INCOME FUND | |
| | Shares | | | Value | |
COMMON STOCKS† - 97.6% |
| | | | | | | | | |
Financial - 25.1% |
Mastercard, Inc. — Class A | | | 1,782 | | | $ | 430,460 | |
Zurich Insurance Group AG†† | | | 1,073 | | | | 377,062 | |
Intercontinental Exchange, Inc. | | | 4,030 | | | | 325,423 | |
Extra Space Storage, Inc. REIT | | | 3,076 | | | | 294,558 | |
Australia & New Zealand Banking Group Ltd.†† | | | 26,851 | | | | 281,572 | |
Sampo Oyj — Class A†† | | | 9,260 | | | | 266,993 | |
Commonwealth Bank of Australia†† | | | 6,892 | | | | 260,012 | |
Marsh & McLennan Companies, Inc. | | | 2,987 | | | | 258,256 | |
Medical Properties Trust, Inc. REIT | | | 14,928 | | | | 258,105 | |
Nordea Bank Abp*,†† | | | 44,303 | | | | 249,241 | |
Aviva plc†† | | | 75,190 | | | | 247,356 | |
Westpac Banking Corp.†† | | | 23,998 | | | | 246,456 | |
Cboe Global Markets, Inc. | | | 2,700 | | | | 240,975 | |
Swiss Life Holding AG†† | | | 715 | | | | 240,057 | |
Mizuho Financial Group, Inc.†† | | | 207,300 | | | | 237,853 | |
Covivio REIT†† | | | 3,788 | | | | 212,620 | |
Chubb Ltd. | | | 1,860 | | | | 207,743 | |
Public Storage REIT | | | 1,008 | | | | 200,199 | |
Tryg A/S†† | | | 8,200 | | | | 199,629 | |
Annaly Capital Management, Inc. REIT | | | 37,415 | | | | 189,694 | |
Aflac, Inc. | | | 5,232 | | | | 179,144 | |
Alexandria Real Estate Equities, Inc. REIT | | | 1,300 | | | | 178,178 | |
SmartCentres Real Estate Investment Trust | | | 13,222 | | | | 177,075 | |
Sun Hung Kai Properties Ltd.†† | | | 13,521 | | | | 176,785 | |
Assicurazioni Generali SpA†† | | | 12,948 | | | | 175,282 | |
VEREIT, Inc. | | | 35,500 | | | | 173,595 | |
RioCan Real Estate Investment Trust | | | 14,920 | | | | 171,074 | |
Invesco Ltd. | | | 17,300 | | | | 157,084 | |
Bank of Nova Scotia | | | 3,800 | | | | 155,240 | |
Visa, Inc. — Class A | | | 907 | | | | 146,136 | |
Prudential Financial, Inc. | | | 2,790 | | | | 145,471 | |
Western Union Co. | | | 8,000 | | | | 145,040 | |
First Capital Real Estate Investment Trust | | | 14,308 | | | | 138,629 | |
ASX Ltd.†† | | | 2,861 | | | | 134,285 | |
Royal Bank of Canada | | | 2,100 | | | | 130,127 | |
Scentre Group REIT†† | | | 130,800 | | | | 125,272 | |
National Bank of Canada | | | 3,000 | | | | 115,990 | |
Japan Retail Fund Investment Corp. REIT†† | | | 100 | | | | 113,688 | |
Power Corporation of Canada | | | 7,000 | | | | 112,656 | |
American Financial Group, Inc. | | | 1,502 | | | | 105,260 | |
American Express Co. | | | 1,216 | | | | 104,102 | |
United Urban Investment Corp. REIT†† | | | 100 | | | | 100,055 | |
Hong Kong Exchanges & Clearing Ltd.†† | | | 3,100 | | | | 92,880 | |
H&R Real Estate Investment Trust | | | 14,308 | | | | 90,826 | |
Ally Financial, Inc. | | | 6,231 | | | | 89,913 | |
JPMorgan Chase & Co. | | | 945 | | | | 85,078 | |
IGM Financial, Inc. | | | 5,000 | | | | 82,992 | |
Macquarie Group Ltd.†† | | | 1,502 | | | | 79,986 | |
Reinsurance Group of America, Inc. — Class A | | | 930 | | | | 78,250 | |
Swedbank AB — Class A*,†† | | | 6,314 | | | | 69,644 | |
CME Group, Inc. — Class A | | | 400 | | | | 69,164 | |
Japan Post Bank Company Ltd.†† | | | 7,400 | | | | 68,346 | |
Suncorp Group Ltd.†† | | | 11,446 | | | | 63,557 | |
Total Financial | | | | | | | 9,255,068 | |
| | | | | | | | | |
Consumer, Non-cyclical - 20.6% |
Roche Holding AG†† | | | 1,668 | | | | 536,822 | |
PepsiCo, Inc. | | | 3,505 | | | | 420,950 | |
Medtronic plc | | | 4,601 | | | | 414,918 | |
AbbVie, Inc. | | | 5,200 | | | | 396,188 | |
Coloplast A/S — Class B†† | | | 2,531 | | | | 367,141 | |
Zoetis, Inc. | | | 2,903 | | | | 341,654 | |
Stryker Corp. | | | 2,045 | | | | 340,472 | |
S&P Global, Inc. | | | 1,310 | | | | 321,016 | |
Amgen, Inc. | | | 1,508 | | | | 305,717 | |
Japan Tobacco, Inc.†† | | | 16,300 | | | | 301,524 | |
Kimberly-Clark Corp. | | | 2,191 | | | | 280,163 | |
Merck & Company, Inc. | | | 3,600 | | | | 276,984 | |
McCormick & Company, Inc. | | | 1,800 | | | | 254,178 | |
Colgate-Palmolive Co. | | | 3,782 | | | | 250,974 | |
HCA Healthcare, Inc. | | | 2,718 | | | | 244,212 | |
Orion Oyj — Class B*,†† | | | 5,961 | | | | 242,457 | |
Sonic Healthcare Ltd.†† | | | 15,738 | | | | 236,518 | |
Kellogg Co. | | | 3,756 | | | | 225,322 | |
Bunge Ltd. | | | 5,007 | | | | 205,437 | |
Pfizer, Inc. | | | 6,209 | | | | 202,662 | |
Procter & Gamble Co. | | | 1,703 | | | | 187,330 | |
Kraft Heinz Co. | | | 6,100 | | | | 150,914 | |
Quest Diagnostics, Inc. | | | 1,877 | | | | 150,723 | |
Constellation Brands, Inc. — Class A | | | 946 | | | | 135,619 | |
Johnson & Johnson | | | 1,000 | | | | 131,130 | |
Abbott Laboratories | | | 1,400 | | | | 110,474 | |
Gilead Sciences, Inc. | | | 1,300 | | | | 97,188 | |
Sonova Holding AG†† | | | 516 | | | | 92,037 | |
Novo Nordisk A/S — Class B†† | | | 1,430 | | | | 85,412 | |
ResMed, Inc. | | | 500 | | | | 73,645 | |
Sabre Corp. | | | 12,000 | | | | 71,160 | |
STERIS plc | | | 500 | | | | 69,985 | |
Booz Allen Hamilton Holding Corp. | | | 900 | | | | 61,776 | |
Total Consumer, Non-cyclical | | | | | | | 7,582,702 | |
| | | | | | | | | |
Technology - 14.5% |
Microsoft Corp. | | | 7,642 | | | | 1,205,220 | |
Apple, Inc. | | | 3,684 | | | | 936,804 | |
Accenture plc — Class A | | | 2,575 | | | | 420,395 | |
Broadcom, Inc. | | | 1,625 | | | | 385,288 | |
Fidelity National Information Services, Inc. | | | 3,000 | | | | 364,920 | |
Texas Instruments, Inc. | | | 3,498 | | | | 349,555 | |
Canon, Inc.†† | | | 13,600 | | | | 295,568 | |
salesforce.com, Inc.* | | | 1,900 | | | | 273,562 | |
Guidewire Software, Inc.* | | | 2,800 | | | | 222,068 | |
Seagate Technology plc | | | 4,223 | | | | 206,082 | |
International Business Machines Corp. | | | 1,643 | | | | 182,258 | |
Maxim Integrated Products, Inc. | | | 3,600 | | | | 174,996 | |
ASM Pacific Technology Ltd.†† | | | 12,100 | | | | 112,202 | |
Adobe, Inc.* | | | 300 | | | | 95,472 | |
Broadridge Financial Solutions, Inc. | | | 1,000 | | | | 94,830 | |
Total Technology | | | | | | | 5,319,220 | |
SEE NOTES TO FINANCIAL STATEMENTS. | THE GUGGENHEIM FUNDS SEMI-ANNUAL REPORT | 95 |
SCHEDULE OF INVESTMENTS (Unaudited)(continued) | March 31, 2020 |
WORLD EQUITY INCOME FUND | |
| | Shares | | | Value | |
Communications - 10.9% |
Amazon.com, Inc.* | | | 301 | | | $ | 586,866 | |
Verizon Communications, Inc. | | | 10,576 | | | | 568,248 | |
Alphabet, Inc. — Class C* | | | 424 | | | | 493,031 | |
NTT DOCOMO, Inc.†† | | | 13,100 | | | | 409,716 | |
Nippon Telegraph & Telephone Corp.†† | | | 15,000 | | | | 358,783 | |
AT&T, Inc. | | | 10,265 | | | | 299,225 | |
Facebook, Inc. — Class A* | | | 1,750 | | | | 291,900 | |
HKT Trust & HKT Ltd.†† | | | 175,748 | | | | 239,041 | |
Elisa Oyj†† | | | 3,654 | | | | 225,413 | |
Juniper Networks, Inc. | | | 8,000 | | | | 153,120 | |
TELUS Corp. | | | 9,448 | | | | 149,434 | |
CenturyLink, Inc. | | | 15,300 | | | | 144,738 | |
Motorola Solutions, Inc. | | | 700 | | | | 93,044 | |
Total Communications | | | | | | | 4,012,559 | |
| | | | | | | | | |
Industrial - 10.0% |
3M Co. | | | 2,647 | | | | 361,342 | |
Waste Connections, Inc. | | | 4,044 | | | | 313,410 | |
Kone Oyj — Class B†† | | | 5,365 | | | | 300,279 | |
Amcor plc | | | 34,857 | | | | 283,039 | |
Waste Management, Inc. | | | 2,846 | | | | 263,426 | |
Republic Services, Inc. — Class A | | | 3,464 | | | | 260,008 | |
United Parcel Service, Inc. — Class B | | | 2,546 | | | | 237,847 | |
Illinois Tool Works, Inc. | | | 1,621 | | | | 230,377 | |
Geberit AG†† | | | 515 | | | | 225,728 | |
Westrock Co. | | | 7,869 | | | | 222,378 | |
Techtronic Industries Company Ltd.†† | | | 33,051 | | | | 209,884 | |
Packaging Corporation of America | | | 2,319 | | | | 201,358 | |
Lennox International, Inc. | | | 1,058 | | | | 192,334 | |
FedEx Corp. | | | 1,389 | | | | 168,430 | |
Eaton Corporation plc | | | 1,735 | | | | 134,792 | |
Honeywell International, Inc. | | | 572 | | | | 76,528 | |
Total Industrial | | | | | | | 3,681,160 | |
| | | | | | | | | |
Utilities - 8.2% |
Orsted A/S††,1 | | | 3,060 | | | | 299,631 | |
Snam SpA†† | | | 65,446 | | | | 298,943 | |
Fortis, Inc. | | | 7,154 | | | | 275,987 | |
FirstEnergy Corp. | | | 5,930 | | | | 237,615 | |
SSE plc†† | | | 14,308 | | | | 230,053 | |
Terna Rete Elettrica Nazionale SpA†† | | | 36,056 | | | | 226,519 | |
Fortum Oyj | | | 15,023 | | | | 221,487 | |
Exelon Corp. | | | 5,723 | | | | 210,664 | |
Enel SpA†† | | | 29,665 | | | | 204,512 | |
National Grid plc†† | | | 17,400 | | | | 203,484 | |
Canadian Utilities Ltd. — Class A | | | 6,438 | | | | 153,953 | |
Algonquin Power & Utilities Corp. | | | 11,374 | | | | 153,215 | |
Centrica plc | | | 260,900 | | | | 123,492 | |
AGL Energy Ltd.†† | | | 11,293 | | | | 118,174 | |
NextEra Energy, Inc. | | | 303 | | | | 72,908 | |
Total Utilities | | | | | | | 3,030,637 | |
| | | | | | | | | |
Consumer, Cyclical - 5.1% |
Home Depot, Inc. | | | 3,081 | | | | 575,254 | |
Sands China Ltd.†† | | | 71,540 | | | | 260,286 | |
Sumitomo Corp.†† | | | 22,100 | | | | 252,057 | |
Persimmon plc†† | | | 10,369 | | | | 245,286 | |
Vail Resorts, Inc. | | | 1,430 | | | | 211,225 | |
Yue Yuen Industrial Holdings Ltd.†† | | | 112,500 | | | | 171,922 | |
Harvey Norman Holdings Ltd.†† | | | 87,206 | | | | 160,109 | |
Total Consumer, Cyclical | | | | | | | 1,876,139 | |
| | | | | | | | | |
Basic Materials - 1.3% |
International Paper Co. | | | 9,130 | | | | 284,217 | |
LyondellBasell Industries N.V. — Class A | | | 4,006 | | | | 198,818 | |
Total Basic Materials | | | | | | | 483,035 | |
| | | | | | | | | |
Energy - 1.2% |
Chevron Corp. | | | 2,677 | | | | 193,975 | |
Exxon Mobil Corp. | | | 4,984 | | | | 189,243 | |
Targa Resources Corp. | | | 7,692 | | | | 53,152 | |
Total Energy | | | | | | | 436,370 | |
| | | | | | | | | |
Diversified - 0.7% |
CK Hutchison Holdings Ltd.†† | | | 37,201 | | | | 247,966 | |
| | | | | | | | | |
Total Common Stocks | | | | |
(Cost $41,169,460) | | | | | | | 35,924,856 | |
| | | | | | | | | |
EXCHANGE-TRADED FUNDS† - 1.2% |
SPDR S&P 500 ETF Trust | | | 915 | | | | 235,841 | |
iShares MSCI EAFE ETF | | | 4,389 | | | | 234,636 | |
Total Exchange-Traded Funds | | | | |
(Cost $426,673) | | | | | | | 470,477 | |
| | | | | | | | | |
MONEY MARKET FUND† - 0.3% |
Goldman Sachs Financial Square Treasury Instruments Fund Institutional Shares, 0.52%2 | | | 96,903 | | | | 96,903 | |
Total Money Market Fund | | | | |
(Cost $96,903) | | | | | | | 96,903 | |
| | | | | | | | | |
Total Investments - 99.1% | | | | |
(Cost $41,693,036) | | $ | 36,492,236 | |
Other Assets & Liabilities, net - 0.9% | | | 318,985 | |
Total Net Assets - 100.0% | | $ | 36,811,221 | |
96 | THE GUGGENHEIM FUNDS SEMI-ANNUAL REPORT | SEE NOTES TO FINANCIAL STATEMENTS. |
SCHEDULE OF INVESTMENTS (Unaudited)(concluded) | March 31, 2020 |
WORLD EQUITY INCOME FUND | |
Futures Contracts |
Description | | Number of
Contracts | | | Expiration
Date | | | Notional
Amount | | | Value and
Unrealized
Appreciation
(Depreciation)** | |
Currency Futures Contracts Sold Short† |
Australian Dollar Futures Contracts | | | 26 | | | | Jun 2020 | | | $ | 1,599,780 | | | $ | 83,489 | |
Canadian Dollar Futures Contracts | | | 25 | | | | Jun 2020 | | | | 1,777,750 | | | | 23,084 | |
British Pound Futures Contracts | | | 5 | | | | Jun 2020 | | | | 388,969 | | | | (12,575 | ) |
| | | | | | | | | | | $ | 3,766,499 | | | $ | 93,998 | |
* | Non-income producing security. |
** | Includes cumulative appreciation (depreciation). Variation margin is reported within the Statement of Assets and Liabilities. |
† | Value determined based on Level 1 inputs, unless otherwise noted — See Note 4. |
†† | Value determined based on Level 2 inputs — See Note 4. |
1 | Security is a 144A or Section 4(a)(2) security. These securities have been determined to be liquid under guidelines established by the Board of Trustees. The total market value of 144A or Section 4(a)(2) securities is $299,631 (cost $327,547), or 0.8% of total net assets. |
2 | Rate indicated is the 7-day yield as of March 31, 2020. |
| | plc — Public Limited Company |
| | REIT — Real Estate Investment Trust |
| | |
| | See Sector Classification in Other Information section. |
The following table summarizes the inputs used to value the Fund’s investments at March 31, 2020 (See Note 4 in the Notes to Financial Statements):
Investments in Securities (Assets) | | Level 1
Quoted
Prices | | | Level 2
Significant
Observable
Inputs | | | Level 3
Significant
Unobservable
Inputs | | | Total | |
Common Stocks | | $ | 24,748,758 | | | $ | 11,176,098 | | | $ | — | | | $ | 35,924,856 | |
Exchange-Traded Funds | | | 470,477 | | | | — | | | | — | | | | 470,477 | |
Money Market Fund | | | 96,903 | | | | — | | | | — | | | �� | 96,903 | |
Currency Futures Contracts** | | | 106,573 | | | | — | | | | — | | | | 106,573 | |
Total Assets | | $ | 25,422,711 | | | $ | 11,176,098 | | | $ | — | | | $ | 36,598,809 | |
Investments in Securities (Liabilities) | | Level 1
Quoted
Prices | | | Level 2
Significant
Observable
Inputs | | | Level 3
Significant
Unobservable
Inputs | | | Total | |
Currency Futures Contracts** | | $ | 12,575 | | | $ | — | | | $ | — | | | $ | 12,575 | |
** | This derivative is reported as unrealized appreciation/depreciation at period end. |
SEE NOTES TO FINANCIAL STATEMENTS. | THE GUGGENHEIM FUNDS SEMI-ANNUAL REPORT | 97 |
STATEMENT OF ASSETS AND LIABILITIES (Unaudited) |
March 31, 2020 |
Assets: |
Investments, at value (cost $41,693,036) | | $ | 36,492,236 | |
Foreign currency, at value (cost $2,252) | | | 2,267 | |
Cash | | | 19,723 | |
Segregated cash with broker | | | 99,050 | |
Prepaid expenses | | | 29,759 | |
Receivables: |
Foreign tax reclaims | | | 144,971 | |
Dividends | | | 85,628 | |
Securities sold | | | 78,979 | |
Fund shares sold | | | 431 | |
Interest | | | 143 | |
Total assets | | | 36,953,187 | |
| | | | | |
Liabilities: |
Payable for: |
Printing fees | | | 31,130 | |
Fund shares redeemed | | | 18,835 | |
Professional fees | | | 18,383 | |
Transfer agent/maintenance fees | | | 18,031 | |
Variation margin on futures contracts | | | 11,709 | |
Pricing fees | | | 11,303 | |
Distribution and service fees | | | 9,006 | |
Custodian fees | | | 7,835 | |
Management fees | | | 6,697 | |
Distributions to shareholders | | | 2,959 | |
Fund accounting/administration fees | | | 1,647 | |
Trustees’ fees* | | | 1,191 | |
Due to Investment Adviser | | | 4 | |
Miscellaneous | | | 3,236 | |
Total liabilities | | | 141,966 | |
Net assets | | $ | 36,811,221 | |
| | | | | |
Net assets consist of: |
Paid in capital | | $ | 40,438,503 | |
Total distributable earnings (loss) | | | (3,627,282 | ) |
Net assets | | $ | 36,811,221 | |
| | | | | |
A-Class: |
Net assets | | $ | 31,814,069 | |
Capital shares outstanding | | | 2,597,492 | |
Net asset value per share | | $ | 12.25 | |
Maximum offering price per share (Net asset value divided by 95.25%) | | $ | 12.86 | |
| | | | | |
C-Class: |
Net assets | | $ | 2,556,996 | |
Capital shares outstanding | | | 243,803 | |
Net asset value per share | | $ | 10.49 | |
| | | | | |
P-Class: |
Net assets | | $ | 72,462 | |
Capital shares outstanding | | | 5,865 | |
Net asset value per share | | $ | 12.35 | |
| | | | | |
Institutional Class: |
Net assets | | $ | 2,367,694 | |
Capital shares outstanding | | | 194,542 | |
Net asset value per share | | $ | 12.17 | |
* | Relates to Trustees not deemed “interested persons” within the meaning of Section 2(a)(19) of the 1940 Act. |
98 | THE GUGGENHEIM FUNDS SEMI-ANNUAL REPORT | SEE NOTES TO FINANCIAL STATEMENTS. |
STATEMENT OF OPERATIONS (Unaudited) |
Six-Month Period Ended March 31, 2020 |
Investment Income: |
Dividends (net of foreign withholding tax of $43,857) | | $ | 810,724 | |
Interest | | | 4,006 | |
Total investment income | | | 814,730 | |
| | | | | |
Expenses: |
Management fees | | | 222,090 | |
Distribution and service fees: |
A-Class | | | 70,613 | |
C-Class | | | 16,772 | |
P-Class | | | 153 | |
Transfer agent/maintenance fees: |
A-Class | | | 16,115 | |
C-Class | | | 4,175 | |
P-Class | | | 89 | |
Institutional Class | | | 8,037 | |
Registration fees | | | 39,020 | |
Fund accounting/administration fees | | | 24,501 | |
Professional fees | | | 23,573 | |
Custodian fees | | | 12,598 | |
Trustees’ fees* | | | 9,546 | |
Line of credit fees | | | 832 | |
Miscellaneous | | | 31,621 | |
Recoupment of previously waived fees: |
C-Class | | | 4 | |
Total expenses | | | 479,739 | |
Less: |
Expenses reimbursed by Adviser: |
A-Class | | | (15,990 | ) |
C-Class | | | (4,151 | ) |
P-Class | | | (89 | ) |
Institutional Class | | | (8,037 | ) |
Expenses waived by Adviser | | | (55,637 | ) |
Total waived/reimbursed expenses | | | (83,904 | ) |
Net expenses | | | 395,835 | |
Net investment income | | | 418,895 | |
| | | | | |
Net Realized and Unrealized Gain (Loss): |
Net realized gain (loss) on: |
Investments | | $ | 1,719,761 | |
Futures contracts | | | 42,699 | |
Foreign currency transactions | | | (16,397 | ) |
Net realized gain | | | 1,746,063 | |
Net change in unrealized appreciation (depreciation) on: |
Investments | | | (9,285,104 | ) |
Futures contracts | | | 83,605 | |
Foreign currency translations | | | 4,662 | |
Net change in unrealized appreciation (depreciation) | | | (9,196,837 | ) |
Net realized and unrealized loss | | | (7,450,774 | ) |
Net decrease in net assets resulting from operations | | $ | (7,031,879 | ) |
* | Relates to Trustees not deemed “interested persons” within the meaning of Section 2(a)(19) of the 1940 Act. |
SEE NOTES TO FINANCIAL STATEMENTS. | THE GUGGENHEIM FUNDS SEMI-ANNUAL REPORT | 99 |
STATEMENTS OF CHANGES IN NET ASSETS |
| | Six-Month
Period Ended
March 31,
2020
(Unaudited) | | | Year Ended
September 30,
2019 | |
Increase (Decrease) in Net Assets from Operations: | | | | | | | | |
Net investment income | | $ | 418,895 | | | $ | 1,885,043 | |
Net realized gain on investments | | | 1,746,063 | | | | 191,090 | |
Net change in unrealized appreciation (depreciation) on investments | | | (9,196,837 | ) | | | (2,587,548 | ) |
Net decrease in net assets resulting from operations | | | (7,031,879 | ) | | | (511,415 | ) |
| | | | | | | | | |
Distributions to shareholders: | | | | | | | | |
A-Class | | | (677,453 | ) | | | (2,009,452 | ) |
C-Class | | | (30,896 | ) | | | (99,688 | ) |
P-Class | | | (1,459 | ) | | | (4,761 | ) |
Institutional Class | | | (46,918 | ) | | | (531,121 | ) |
Total distributions to shareholders | | | (756,726 | ) | | | (2,645,022 | ) |
| | | | | | | | | |
Capital share transactions: | | | | | | | | |
Proceeds from sale of shares | | | | | | | | |
A-Class | | | 1,106,757 | | | | 3,128,968 | |
C-Class | | | 251,334 | | | | 91,755 | |
P-Class | | | 15,439 | | | | 21,480 | |
Institutional Class | | | 617,140 | | | | 1,671,048 | |
Distributions reinvested | | | | | | | | |
A-Class | | | 671,299 | | | | 1,991,397 | |
C-Class | | | 30,046 | | | | 95,462 | |
P-Class | | | 1,459 | | | | 4,761 | |
Institutional Class | | | 46,655 | | | | 530,037 | |
Cost of shares redeemed | | | | | | | | |
A-Class | | | (24,153,219 | ) | | | (9,831,792 | ) |
C-Class | | | (445,129 | ) | | | (863,102 | ) |
P-Class | | | (56,731 | ) | | | (82,954 | ) |
Institutional Class | | | (1,076,521 | ) | | | (17,688,013 | ) |
Net decrease from capital share transactions | | | (22,991,471 | ) | | | (20,930,953 | ) |
Net decrease in net assets | | | (30,780,076 | ) | | | (24,087,390 | ) |
| | | | | | | | | |
Net assets: | | | | | | | | |
Beginning of period | | | 67,591,297 | | | | 91,678,687 | |
End of period | | $ | 36,811,221 | | | $ | 67,591,297 | |
| | | | | | | | | |
Capital share activity: | | | | | | | | |
Shares sold | | | | | | | | |
A-Class | | | 71,048 | | | | 210,190 | |
C-Class | | | 18,991 | | | | 7,204 | |
P-Class | | | 950 | | | | 1,447 | |
Institutional Class | | | 42,065 | | | | 114,575 | |
Shares issued from reinvestment of distributions | | | | | | | | |
A-Class | | | 45,493 | | | | 138,399 | |
C-Class | | | 2,353 | | | | 7,831 | |
P-Class | | | 98 | | | | 329 | |
Institutional Class | | | 3,233 | | | | 37,301 | |
Shares redeemed | | | | | | | | |
A-Class | | | (1,493,572 | ) | | | (664,558 | ) |
C-Class | | | (35,275 | ) | | | (68,969 | ) |
P-Class | | | (3,567 | ) | | | (5,642 | ) |
Institutional Class | | | (78,835 | ) | | | (1,170,759 | ) |
Net decrease in shares | | | (1,427,018 | ) | | | (1,392,652 | ) |
100 | THE GUGGENHEIM FUNDS SEMI-ANNUAL REPORT | SEE NOTES TO FINANCIAL STATEMENTS. |
This table is presented to show selected data for a share outstanding throughout each period and to assist shareholders in evaluating a Fund’s performance for the periods presented.
A-Class | | Period Ended
March 31,
2020a | | | Year Ended
September 30,
2019 | | | Year Ended
September 30,
2018 | | | Year Ended
September 30,
2017 | | | Year Ended
September 30,
2016 | | | Year Ended
September 30,
2015 | |
Per Share Data |
Net asset value, beginning of period | | $ | 15.26 | | | $ | 15.77 | | | $ | 14.84 | | | $ | 13.54 | | | $ | 12.28 | | | $ | 13.51 | |
Income (loss) from investment operations: |
Net investment income (loss)b | | | .10 | | | | .35 | | | | .23 | | | | .31 | | | | .31 | | | | .29 | |
Net gain (loss) on investments (realized and unrealized) | | | (2.91 | ) | | | (.36 | ) | | | .95 | | | | 1.34 | | | | 1.26 | | | | (1.18 | ) |
Total from investment operations | | | (2.81 | ) | | | (.01 | ) | | | 1.18 | | | | 1.65 | | | | 1.57 | | | | (.89 | ) |
Less distributions from: |
Net investment income | | | (.16 | ) | | | (.37 | ) | | | (.25 | ) | | | (.35 | ) | | | (.31 | ) | | | (.34 | ) |
Net realized gains | | | (.04 | ) | | | (.13 | ) | | | — | | | | — | | | | — | | | | — | |
Total distributions | | | (.20 | ) | | | (.50 | ) | | | (.25 | ) | | | (.35 | ) | | | (.31 | ) | | | (.34 | ) |
Net asset value, end of period | | $ | 12.25 | | | $ | 15.26 | | | $ | 15.77 | | | $ | 14.84 | | | $ | 13.54 | | | $ | 12.28 | |
|
Total Returnc | | | (18.61 | %) | | | 0.14 | % | | | 8.01 | % | | | 12.31 | % | | | 12.85 | % | | | (6.70 | %) |
Ratios/Supplemental Data |
Net assets, end of period (in thousands) | | $ | 31,814 | | | $ | 60,639 | | | $ | 67,679 | | | $ | 80,598 | | | $ | 80,575 | | | $ | 73,568 | |
Ratios to average net assets: |
Net investment income (loss) | | | 1.34 | % | | | 2.39 | % | | | 1.48 | % | | | 2.23 | % | | | 2.36 | % | | | 2.21 | % |
Total expensesd | | | 1.45 | % | | | 1.37 | % | | | 1.37 | % | | | 1.34 | % | | | 1.48 | % | | | 1.48 | % |
Net expensese,f,g | | | 1.22 | % | | | 1.22 | % | | | 1.22 | % | | | 1.24 | % | | | 1.48 | % | | | 1.43 | % |
Portfolio turnover rate | | | 112 | % | | | 127 | % | | | 125 | % | | | 94 | % | | | 51 | % | | | 131 | % |
C-Class | | Period Ended
March 31,
2020a | | | Year Ended
September 30,
2019 | | | Year Ended
September 30,
2018 | | | Year Ended
September 30,
2017 | | | Year Ended
September 30,
2016 | | | Year Ended
September 30,
2015 | |
Per Share Data |
Net asset value, beginning of period | | $ | 13.06 | | | $ | 13.53 | | | $ | 12.72 | | | $ | 11.63 | | | $ | 10.55 | | | $ | 11.61 | |
Income (loss) from investment operations: |
Net investment income (loss)b | | | .05 | | | | .21 | | | | .09 | | | | .19 | | | | .18 | | | | .17 | |
Net gain (loss) on investments (realized and unrealized) | | | (2.50 | ) | | | (.33 | ) | | | .83 | | | | 1.13 | | | | 1.09 | | | | (1.02 | ) |
Total from investment operations | | | (2.45 | ) | | | (.12 | ) | | | .92 | | | | 1.32 | | | | 1.27 | | | | (.85 | ) |
Less distributions from: |
Net investment income | | | (.08 | ) | | | (.22 | ) | | | (.11 | ) | | | (.23 | ) | | | (.19 | ) | | | (.21 | ) |
Net realized gains | | | (.04 | ) | | | (.13 | ) | | | — | | | | — | | | | — | | | | — | |
Total distributions | | | (.12 | ) | | | (.35 | ) | | | (.11 | ) | | | (.23 | ) | | | (.19 | ) | | | (.21 | ) |
Net asset value, end of period | | $ | 10.49 | | | $ | 13.06 | | | $ | 13.53 | | | $ | 12.72 | | | $ | 11.63 | | | $ | 10.55 | |
|
Total Returnc | | | (18.90 | %) | | | (0.69 | %) | | | 7.27 | % | | | 11.46 | % | | | 12.05 | % | | | (7.40 | %) |
Ratios/Supplemental Data |
Net assets, end of period (in thousands) | | $ | 2,557 | | | $ | 3,366 | | | $ | 4,215 | | | $ | 6,449 | | | $ | 5,455 | | | $ | 5,936 | |
Ratios to average net assets: |
Net investment income (loss) | | | 0.69 | % | | | 1.64 | % | | | 0.71 | % | | | 1.53 | % | | | 1.59 | % | | | 1.50 | % |
Total expensesd | | | 2.40 | % | | | 2.28 | % | | | 2.18 | % | | | 2.19 | % | | | 2.35 | % | | | 2.28 | % |
Net expensese,f,g | | | 1.97 | % | | | 1.97 | % | | | 1.97 | % | | | 1.99 | % | | | 2.23 | % | | | 2.23 | % |
Portfolio turnover rate | | | 112 | % | | | 127 | % | | | 125 | % | | | 94 | % | | | 51 | % | | | 131 | % |
SEE NOTES TO FINANCIAL STATEMENTS. | THE GUGGENHEIM FUNDS SEMI-ANNUAL REPORT | 101 |
FINANCIAL HIGHLIGHTS (continued) |
This table is presented to show selected data for a share outstanding throughout each period and to assist shareholders in evaluating a Fund’s performance for the periods presented.
P-Class | | Period Ended
March 31,
2020a | | | Year Ended
September 30,
2019 | | | Year Ended
September 30,
2018 | | | Year Ended
September 30,
2017 | | | Year Ended
September 30,
2016 | | | Period Ended
September 30,
2015h | |
Per Share Data |
Net asset value, beginning of period | | $ | 15.38 | | | $ | 15.92 | | | $ | 15.08 | | | $ | 13.73 | | | $ | 12.33 | | | $ | 13.62 | |
Income (loss) from investment operations: |
Net investment income (loss)b | | | .10 | | | | .36 | | | | .24 | | | | .33 | | | | .33 | | | | .12 | |
Net gain (loss) on investments (realized and unrealized) | | | (2.94 | ) | | | (.39 | ) | | | .95 | | | | 1.35 | | | | 1.35 | | | | (1.29 | ) |
Total from investment operations | | | (2.84 | ) | | | (.03 | ) | | | 1.19 | | | | 1.68 | | | | 1.68 | | | | (1.17 | ) |
Less distributions from: |
Net investment income | | | (.15 | ) | | | (.38 | ) | | | (.35 | ) | | | (.33 | ) | | | (.28 | ) | | | (.12 | ) |
Net realized gains | | | (.04 | ) | | | (.13 | ) | | | — | | | | — | | | | — | | | | — | |
Total distributions | | | (.19 | ) | | | (.51 | ) | | | (.35 | ) | | | (.33 | ) | | | (.28 | ) | | | (.12 | ) |
Net asset value, end of period | | $ | 12.35 | | | $ | 15.38 | | | $ | 15.92 | | | $ | 15.08 | | | $ | 13.73 | | | $ | 12.33 | |
|
Total Return | | | (18.63 | %) | | | 0.06 | % | | | 7.99 | % | | | 12.32 | % | | | 13.73 | % | | | (8.64 | %) |
Ratios/Supplemental Data |
Net assets, end of period (in thousands) | | $ | 72 | | | $ | 129 | | | $ | 195 | | | $ | 355 | | | $ | 133 | | | $ | 9 | |
Ratios to average net assets: |
Net investment income (loss) | | | 1.33 | % | | | 2.38 | % | | | 1.50 | % | | | 2.28 | % | | | 2.58 | % | | | 2.14 | % |
Total expensesd | | | 1.55 | % | | | 1.44 | % | | | 1.40 | % | | | 1.76 | % | | | 1.33 | % | | | 3.54 | % |
Net expensese,f,g | | | 1.22 | % | | | 1.22 | % | | | 1.22 | % | | | 1.24 | % | | | 1.33 | % | | | 1.48 | % |
Portfolio turnover rate | | | 112 | % | | | 127 | % | | | 125 | % | | | 94 | % | | | 51 | % | | | 131 | % |
102 | THE GUGGENHEIM FUNDS SEMI-ANNUAL REPORT | SEE NOTES TO FINANCIAL STATEMENTS. |
FINANCIAL HIGHLIGHTS (concluded) |
This table is presented to show selected data for a share outstanding throughout each period and to assist shareholders in evaluating a Fund’s performance for the periods presented.
Institutional Class | | Period Ended
March 31,
2020a | | | Year Ended
September 30,
2019 | | | Year Ended
September 30,
2018 | | | Year Ended
September 30,
2017 | | | Year Ended
September 30,
2016 | | | Year Ended
September 30,
2015 | |
Per Share Data |
Net asset value, beginning of period | | $ | 15.16 | | | $ | 15.71 | | | $ | 14.74 | | | $ | 13.44 | | | $ | 12.23 | | | $ | 13.45 | |
Income (loss) from investment operations: |
Net investment income (loss)b | | | .13 | | | | .39 | | | | .29 | | | | .35 | | | | .31 | | | | .36 | |
Net gain (loss) on investments (realized and unrealized) | | | (2.91 | ) | | | (.37 | ) | | | .93 | | | | 1.33 | | | | 1.28 | | | | (1.21 | ) |
Total from investment operations | | | (2.78 | ) | | | .02 | | | | 1.22 | | | | 1.68 | | | | 1.59 | | | | (.85 | ) |
Less distributions from: |
Net investment income | | | (.17 | ) | | | (.44 | ) | | | (.25 | ) | | | (.38 | ) | | | (.38 | ) | | | (.37 | ) |
Net realized gains | | | (.04 | ) | | | (.13 | ) | | | — | | | | — | | | | — | | | | — | |
Total distributions | | | (.21 | ) | | | (.57 | ) | | | (.25 | ) | | | (.38 | ) | | | (.38 | ) | | | (.37 | ) |
Net asset value, end of period | | $ | 12.17 | | | $ | 15.16 | | | $ | 15.71 | | | $ | 14.74 | | | $ | 13.44 | | | $ | 12.23 | |
|
Total Return | | | (18.51 | %) | | | 0.40 | % | | | 8.34 | % | | | 12.61 | % | | | 13.11 | % | | | (6.42 | %) |
Ratios/Supplemental Data |
Net assets, end of period (in thousands) | | $ | 2,368 | | | $ | 3,458 | | | $ | 19,589 | | | $ | 3,734 | | | $ | 2,824 | | | $ | 4,541 | |
Ratios to average net assets: |
Net investment income (loss) | | | 1.68 | % | | | 2.67 | % | | | 1.85 | % | | | 2.50 | % | | | 2.42 | % | | | 2.70 | % |
Total expensesd | | | 1.61 | % | | | 1.17 | % | | | 1.02 | % | | | 1.09 | % | | | 1.30 | % | | | 1.23 | % |
Net expensese,f,g | | | 0.97 | % | | | 0.97 | % | | | 0.97 | % | | | 0.98 | % | | | 1.22 | % | | | 1.23 | % |
Portfolio turnover rate | | | 112 | % | | | 127 | % | | | 125 | % | | | 94 | % | | | 51 | % | | | 131 | % |
a | Unaudited figures for the period ended March 31, 2020. Percentage amounts for the period, except total return and portfolio turnover rate, have been annualized. |
b | Net investment income (loss) per share was computed using average shares outstanding throughout the period. |
c | Total return does not reflect the impact of any applicable sales charges. |
d | Does not include expenses of the underlying funds in which the Fund invests. |
e | Net expense information reflects the expense ratios after expense waivers and reimbursements, as applicable. |
f | The portion of the ratios of net expenses to average net assets attributable to recoupments of prior fee reductions or expense reimbursements for the periods presented was as follows: |
| | | 03/31/20a | 09/30/19 | 09/30/18 | 09/30/17 |
| | A-Class | — | 0.00%* | 0.00%* | 0.01% |
| | C-Class | 0.00%* | — | 0.00%* | 0.01% |
| | P-Class | — | — | — | — |
| | Institutional Class | — | — | 0.02% | 0.03% |
g | Net expenses may include expenses that are excluded from the expense limitation agreement. Excluding these expenses, the net expense ratios for the periods would be: |
| | | 03/31/20a | 09/30/19 | 09/30/18 | 09/30/17 | 09/30/16 | 09/30/15 |
| | A-Class | 1.22% | 1.22% | 1.22% | 1.22% | 1.46% | 1.46% |
| | C-Class | 1.97% | 1.97% | 1.97% | 1.97% | 2.21% | 2.21% |
| | P-Class | 1.22% | 1.22% | 1.22% | 1.22% | 1.32% | 1.46% |
| | Institutional Class | 0.97% | 0.97% | 0.97% | 0.96% | 1.21% | 1.21% |
h | Since commencement of operations: May 1, 2015. Percentage amounts for the period, except total return and portfolio turnover rate, have been annualized. |
SEE NOTES TO FINANCIAL STATEMENTS. | THE GUGGENHEIM FUNDS SEMI-ANNUAL REPORT | 103 |
NOTES TO FINANCIAL STATEMENTS (Unaudited) |
Note 1 – Organization and Significant Accounting Policies
Organization
Guggenheim Funds Trust (the “Trust”), a Delaware statutory trust, is registered with the SEC under the Investment Company Act of 1940 (“1940 Act”), as an open-ended investment company of the series type. Each series, in effect, is representing a separate fund (each, a “Fund”). The Trust is authorized to issue an unlimited number of no par value shares. The Trust accounts for the assets of each Fund separately.
The Trust offers a combination of five separate classes of shares: A-Class shares, C-Class shares, P-Class shares, R6-Class shares and Institutional Class shares. Sales of shares of each Class are made without a front-end sales charge at the net asset value per share (“NAV”), with the exception of A-Class shares. A-Class shares are sold at the NAV, plus the applicable front-end sales charge. The sales charge varies depending on the amount purchased. A-Class share purchases of $1 million or more are exempt from the front-end sales charge but have a 1% contingent deferred sales charge (“CDSC”), if shares are redeemed within 12 months of purchase. C-Class shares have a 1% CDSC if shares are redeemed within 12 months of purchase. C-Class shares automatically convert to A-Class shares on or about the 10th day of the month following the 10-year anniversary of the purchase of the C-Class shares. This conversion will be executed without any sales charge, fee or other charge. After the conversion is completed, the shares will be subject to all features and expenses of A-Class shares. Institutional Class shares are offered primarily for direct investment by institutions such as pension and profit sharing plans, endowments, foundations and corporations. Institutional Class shares require a minimum initial investment of $2 million and a minimum account balance of $1 million. R6-Class shares are offered primarily through qualified retirement and benefit plans. R6-Class shares are also offered through certain other plans and platforms sponsored by financial intermediaries. Certain institutional investors and others deemed appropriate by Guggenheim Investments (“GI”) may also be eligible to purchase R6-Class shares subject to a $2 million minimum initial investment. At March 31, 2020, the Trust consisted of nineteen funds.
This report covers the following funds (collectively, the “Funds”):
Fund Name | Investment
Company Type |
Alpha Opportunity Fund | Diversified |
Large Cap Value Fund | Diversified |
Market Neutral Real Estate Fund | Non-diversified |
Risk Managed Real Estate Fund | Diversified |
Small Cap Value Fund | Diversified |
StylePlus—Large Core Fund | Diversified |
StylePlus—Mid Growth Fund | Diversified |
World Equity Income Fund | Diversified |
At March 31, 2020, A-Class, C-Class, P-Class and Institutional Class shares have been issued by the Funds.
Security Investors, LLC and Guggenheim Partners Investment Management, LLC (“GPIM”), which operate under the name Guggenheim Investments, provides advisory services. Guggenheim Funds Distributors, LLC (“GFD”) acts as principal underwriter for the Trust. GI and GFD are affiliated entities.
Significant Accounting Policies
The Funds operate as investment companies and, accordingly, follow the investment company accounting and reporting guidance of the Financial Accounting Standards Board (“FASB”) Accounting Standards Codification Topic 946 Financial Services – Investment Companies.
The following significant accounting policies are in conformity with U.S. generally accepted accounting principles (“U.S. GAAP”) and are consistently followed by the Trust. This requires management to make estimates and assumptions that affect the reported amount of assets and liabilities, contingent assets and liabilities at the date of the financial statements, and the reported amounts of revenues and expenses during the reporting period. Actual results could differ from these estimates. All time references are based on Eastern Time.
The NAV of each Class of a fund is calculated by dividing the market value of a fund’s securities and other assets, less all liabilities, attributable to the Class by the number of outstanding shares of the Class.
(a) Valuation of Investments
The Board of Trustees of the Funds (the “Board”) has adopted policies and procedures for the valuation of the Funds’ investments (the “Valuation Procedures”). Pursuant to the Valuation Procedures, the Board has delegated to a valuation committee, consisting of representatives from Guggenheim’s investment management, fund administration, legal and compliance departments (the “Valuation Committee”), the day-to-day responsibility for implementing the Valuation Procedures, including, under most circumstances, the responsibility for determining the fair value of the Funds’ securities and/or other assets.
Valuations of the Funds’ securities and other assets are supplied primarily by pricing services appointed pursuant to the processes set forth in the Valuation Procedures. The Valuation Committee convenes monthly, or more frequently as needed, to review the valuation of all assets which have been fair valued for reasonableness. The Funds’ officers, through the Valuation Committee and consistent with the monitoring and review
104 | THE GUGGENHEIM FUNDS SEMI-ANNUAL REPORT | |
NOTES TO FINANCIAL STATEMENTS (Unaudited)(continued) |
responsibilities set forth in the Valuation Procedures, regularly review procedures used and valuations provided by the pricing services.
If the pricing service cannot or does not provide a valuation for a particular investment or such valuation is deemed unreliable, such investment is fair valued by the Valuation Committee.
Equity securities listed or traded on a recognized U.S. securities exchange or the National Association of Securities Dealers Automated Quotations (“NASDAQ”) National Market System shall generally be valued on the basis of the last sale price on the primary U.S. exchange or market on which the security is listed or traded; provided, however, that securities listed on NASDAQ will be valued at the NASDAQ Official Closing Price, which may not necessarily represent the last sale price. If there is no sale on the valuation date, exchange-traded U.S. equity securities will be valued on the basis of the last bid price.
Generally, trading in foreign securities markets is substantially completed each day at various times prior to the close of the New York Stock Exchange (“NYSE”). The values of foreign securities are determined as of the close of such foreign markets or the close of the NYSE, if earlier. All investments quoted in foreign currencies are valued in U.S. dollars on the basis of the foreign currency exchange rates prevailing at the close of U.S. business at 4:00 p.m. Investments in foreign securities may involve risks not present in domestic investments. The Valuation Committee will determine the current value of such foreign securities by taking into consideration certain factors which may include those discussed above, as well as the following factors, among others: the value of the securities traded on other foreign markets, ADR trading, closed-end fund trading, foreign currency exchange activity, and the trading prices of financial products that are tied to foreign securities. In addition, under the Valuation Procedures, the Valuation Committee and GI are authorized to use prices and other information supplied by a third party pricing vendor in valuing foreign securities.
Open-end investment companies are valued at their NAV as of the close of business, on the valuation date. Exchange-traded funds are valued at the last quoted sale price.
The value of futures contracts is accounted for using the unrealized appreciation or depreciation on the contracts that is determined by marking the contracts to their current realized settlement prices. Financial futures contracts are valued at the 4:00 p.m. price on the valuation date. In the event that the exchange for a specific futures contract closes earlier than 4:00 p.m., the futures contract is valued at the official settlement price of the exchange. However, the underlying securities from which the futures contract value is derived are monitored until 4:00 p.m. to determine if fair valuation would provide a more accurate valuation.
The values of swap agreements entered into by a fund are accounted for using the unrealized appreciation or depreciation on the agreements that are determined by marking the agreements to the last quoted value of the index or the underlying position that the swaps pertain to at the close of the NYSE.
Investments for which market quotations are not readily available are fair-valued as determined in good faith by GI subject to review and approval by the Valuation Committee, pursuant to methods established or ratified by the Board. Valuations in accordance with these methods are intended to reflect each security’s (or asset’s or liability’s) “fair value”. Each such determination is based on a consideration of all relevant factors, which are likely to vary from one pricing context to another. Examples of such factors may include, but are not limited to market prices; sale prices; broker quotes; and models which derive prices based on inputs such as prices of securities with comparable maturities and characteristics, or based on inputs such as anticipated cash flows or collateral, spread over U.S. Treasury securities, and other information analysis. In connection with futures contracts and other derivative investments, such factors may include obtaining information as to how (a) these contracts and other derivative investments trade in the futures or other derivative markets, respectively, and (b) the securities underlying these contracts and other derivative investments trade in the cash market.
(b) Short Sales
When a Fund engages in a short sale of a security, an amount equal to the proceeds is reflected as an asset and an equivalent liability. The amount of the liability is subsequently marked-to-market to reflect the market value of the short sale. The Fund maintains a segregated account of cash and/or securities as collateral for short sales.
Fees, if any, paid to brokers to borrow securities in connection with short sales are recorded as interest expense. In addition, the Fund must pay out the dividend rate of the equity or coupon rate of the obligation to the lender and record this as an expense. Short dividend or interest expense is a cost associated with the investment objective of short sales transactions, rather than an operational cost associated with the day-to-day management of any mutual fund. The Fund may also receive rebate income from the broker resulting from the investment of the proceeds from securities sold short.
(c) Futures Contracts
Upon entering into a futures contract, a Fund deposits and maintains as collateral such initial margin as required by the exchange on which the transaction is affected. Pursuant to the contract, the Fund agrees to receive from or pay to the broker an amount of cash equal to the daily fluctuation in value of the contract. Such receipts or payments are known as variation
| | THE GUGGENHEIM FUNDS SEMI-ANNUAL REPORT | 105 |
NOTES TO FINANCIAL STATEMENTS (Unaudited)(continued) |
margin and are recorded by the Fund as unrealized appreciation or depreciation. When the contract is closed, the Fund records a realized gain or loss equal to the difference between the value of the contract at the time it was opened and the value at the time it was closed.
(d) Swap Agreements
Swap agreements are marked-to-market daily and the change, if any, is recorded as unrealized appreciation or depreciation. Payments received or made as a result of an agreement or termination of an agreement are recognized as realized gains or losses.
(e) Currency Translations
The accounting records of the Funds are maintained in U.S. dollars. All assets and liabilities initially expressed in foreign currencies are converted into U.S. dollars at prevailing exchange rates. Purchases and sales of investment securities, dividend and interest income, and certain expenses are translated at the rates of exchange prevailing on the respective dates of such transactions. Changes in the relationship of these foreign currencies to the U.S. dollar can significantly affect the value of the investments and earnings of the Funds. Foreign investments may also subject the Funds to foreign government exchange restrictions, expropriation, taxation, or other political, social or economic developments, all of which could affect the market and/or credit risk of the investments.
The Funds do not isolate that portion of the results of operations resulting from changes in the foreign exchange rates on investments from the fluctuations arising from changes in the market prices of securities held. Such fluctuations are included with the net realized gain or loss and unrealized appreciation or depreciation on investments.
Reported net realized foreign exchange gains and losses arise from sales of foreign currencies and currency gains or losses realized between the trade and settlement dates on investment transactions. Net unrealized appreciation and depreciation arise from changes in the fair values of assets and liabilities other than investments in securities at the fiscal period end, resulting from changes in exchange rates.
(f) Foreign Taxes
The Funds may be subject to foreign taxes (a portion of which may be reclaimable) on income, stock dividends, capital gains on investments or certain foreign currency transactions. All foreign taxes are recorded in accordance with the applicable foreign tax regulations and rates that exist in the foreign jurisdictions in which the Funds invest. These foreign taxes, if any, are paid by the Funds and reflected in their Statements of Operations as follows: foreign taxes withheld at source are presented as a reduction of income and foreign taxes on capital gains from sales of investments are included with the net realized gain (loss) on investments. Foreign taxes payable or deferred as of March 31, 2020, if any, are disclosed in the Funds’ Statements of Assets and Liabilities.
(g) Security Transactions
Security transactions are recorded on the trade date for financial reporting purposes. Realized gains and losses from securities transactions are recorded using the identified cost basis. Proceeds from lawsuits related to investment holdings are recorded as a reduction to cost if the securities are still held and as realized gains if no longer held in the respective Fund. Dividend income is recorded on the ex-dividend date, net of applicable taxes withheld by foreign countries, if any. Taxable non-cash dividends are recorded as dividend income. Interest income, including amortization of premiums and accretion of discounts, is accrued on a daily basis. Amendment fees are earned as compensation for evaluating and accepting changes to the original loan agreement and are recognized when received. Dividend income from Real Estate Investment Trusts (“REITs”) is recorded based on the income included in the distributions received from the REIT investments using published REIT classifications, including some management estimates when actual amounts are not available. Distributions received in excess of this estimated amount are recorded as a reduction of the cost of investments or reclassified to realized gains. The actual amounts of income, return of capital, and realized gains are only determined by each REIT after its fiscal year-end, and may differ from the estimated amounts.
(h) Distributions
Dividends from net investment income are declared quarterly in the World Equity Income Fund and Risk Managed Real Estate Fund. Dividends are reinvested in additional shares, unless shareholders request payment in cash. Distributions of net investment income in the remaining Funds and distributions of net realized gains, if any, in all Funds are declared at least annually and recorded on the ex-dividend date and are determined in accordance with U.S. federal income tax regulations which may differ from U.S. GAAP.
(i) Class Allocations
Interest and dividend income, most expenses, all realized gains and losses, and all unrealized appreciation and depreciation are allocated to the classes based upon the value of the outstanding shares in each Class. Certain costs, such as distribution and service fees are charged directly to specific classes. In addition, certain expenses have been allocated to the individual Funds in the Trust based on the respective net assets of each Fund included in the Trust.
106 | THE GUGGENHEIM FUNDS SEMI-ANNUAL REPORT | |
NOTES TO FINANCIAL STATEMENTS (Unaudited)(continued) |
(j) Earnings Credits
Under the fee arrangement with the custodian, the Funds may earn credits based on overnight custody cash balances. These credits are utilized to reduce related custodial expenses. The custodian fees disclosed in the Statements of Operations are before the reduction in expense from the related earnings credits, if any. Earnings credits for the period ended March 31, 2020, are disclosed in the Statements of Operations.
(k) Cash
The Funds may leave cash overnight in their cash account with the custodian. Periodically, a Fund may have cash due to the custodian bank as an overdraft balance. A fee is incurred on this overdraft, calculated by multiplying the overdraft by a rate based on the federal funds rate, which was 0.08% at March 31, 2020.
(l) Indemnifications
Under the Funds’ organizational documents, the Trustees and Officers are indemnified against certain liabilities arising out of the performance of their duties to the Trust. In addition, throughout the normal course of business, the Funds enter into contracts that contain a variety of representations and warranties which provide general indemnifications. The Funds’ maximum exposure under these arrangements is unknown, as this would involve future claims that may be made against the Funds and/or their affiliates that have not yet occurred. However, based on experience, the Funds expect the risk of loss to be remote.
Note 2 – Financial Instruments and Derivatives
As part of their investment strategy, the Funds utilize short sales and a variety of derivative instruments. These investments involve, to varying degrees, elements of market risk and risks in excess of amounts recognized in the Statements of Assets and Liabilities. Valuation and accounting treatment of these instruments can be found under Significant Accounting Policies in Note 1 of these Notes to Financial Statements.
Short Sales
A short sale is a transaction in which a Fund sells a security it does not own. If the security sold short decreases in price between the time the Fund sells the security and closes its short position, the Fund will realize a gain on the transaction. Conversely, if the security increases in price during the period, the Fund will realize a loss on the transaction. The risk of such price increases is the principal risk of engaging in short sales.
Derivatives
Derivatives are instruments whose values depend on, or are derived from, in whole or in part, the value of one or more other assets, such as securities, currencies, commodities or indices. Derivative instruments may be used to increase investment flexibility (including to maintain cash reserves while maintaining exposure to certain other assets), for risk management (hedging) purposes, to facilitate trading, to reduce transaction costs and to pursue higher investment returns. Derivative instruments may also be used to mitigate certain investment risks, such as foreign currency exchange rate risk, interest rate risk and credit risk. U.S. GAAP requires disclosures to enable investors to better understand how and why a Fund uses derivative instruments, how these derivative instruments are accounted for and their effects on the Fund’s financial position and results of operations.
The Funds may utilize derivatives for the following purposes:
Hedge: an investment made in order to reduce the risk of adverse price movements in a security, by taking an offsetting position to protect against broad market moves.
Index Exposure: the use of an instrument to obtain exposure to a listed or other type of index.
Leverage: gaining total exposure to equities or other assets on the long and short sides at greater than 100% of invested capital.
For any Fund whose investment strategy consistently involves applying leverage, the value of the Fund’s shares will tend to increase or decrease more than the value of any increase or decrease in the underlying index or other asset. In addition, because an investment in derivative instruments generally requires a small investment relative to the amount of investment exposure assumed, an opportunity for increased net income is created; but, at the same time, leverage risk will increase. The Fund’s use of leverage, through borrowings or instruments such as derivatives, may cause the Fund to be more volatile and riskier than if they had not been leveraged.
Futures Contracts
A futures contract is an agreement to purchase (long) or sell (short) an agreed amount of securities or other instruments at a set price for delivery at a future date. There are significant risks associated with a Fund’s use of futures contracts, including (i) there may be an imperfect or no correlation between the changes in market value of the underlying asset and the prices of futures contracts; (ii) there may not be a liquid secondary market for a futures contract; (iii) trading restrictions or limitations may be imposed by an exchange; and (iv) government regulations may restrict trading in futures contracts. When investing in futures, there is minimal counterparty credit risk to a Fund because futures
| | THE GUGGENHEIM FUNDS SEMI-ANNUAL REPORT | 107 |
NOTES TO FINANCIAL STATEMENTS (Unaudited)(continued) |
are exchange-traded and the exchange’s clearinghouse, as counterparty to all exchange-traded futures, guarantees against default. Cash deposits are shown as segregated cash with broker on the Statements of Assets and Liabilities; securities held as collateral are noted on the Schedules of Investments.
The following table represents the Funds’ use and volume of futures on a monthly basis:
| | | | Average Notional Amount | |
Fund | Use | | Long | | | Short | |
StylePlus—Large Core Fund | Index exposure | | $ | 4,369,308 | | | $ | — | |
StylePlus—Mid Growth Fund | Index exposure | | | 1,902,768 | | | | — | |
World Equity Income Fund | Hedge | | | — | | | | 3,417,660 | |
Swap Agreements
A swap is an agreement that obligates two parties to exchange a series of cash flows at specified intervals based upon or calculated by reference to changes in specified prices or rates for a specified amount of an underlying asset. When utilizing over-the-counter (“OTC”) swaps, a fund bears the risk of loss of the amount expected to be received under a swap agreement in the event of the default or bankruptcy of a swap agreement counterparty or if the underlying asset declines in value. Certain standardized swaps are subject to mandatory central clearing and are executed on a multi-lateral or other trade facility platform, such as a registered exchange. There is limited counterparty credit risk with respect to centrally-cleared swaps as the transaction is facilitated through a central clearinghouse, much like exchange-traded futures contracts. For a fund utilizing centrally cleared swaps, the exchange bears the risk of loss resulting from a counterparty not being able to pay. There is no guarantee that a fund or an underlying fund could eliminate its exposure under an outstanding swap agreement by entering into an offsetting swap agreement with the same or another party.
Total return and custom basket swaps involve commitments where single or multiple cash flows are exchanged based on the price of an underlying reference asset (such as an index or custom basket of securities) for a fixed or variable interest rate. Total return and custom basket swaps will usually be computed based on the current value of the reference asset as of the close of regular trading on the NYSE or other exchange, with the swap value being adjusted to include dividends accrued, financing charges and/or interest associated with the swap agreement. When utilizing total return or custom basket swaps, a fund bears the risk of loss of the amount expected to be received under a swap agreement in the event of the default or bankruptcy of a swap agreement counterparty or if the underlying reference asset declines in value.
The following table represents the Funds’ use and volume of total return and custom basket swaps on a monthly basis:
| | | | Average Notional Amount | |
Fund | Use | | Long | | | Short | |
Alpha Opportunity Fund | Hedge, Leverage | | $ | 17,055,991 | | | $ | 68,996,110 | |
Market Neutral Real Estate Fund | Leverage | | | — | | | | 8,761,117 | |
Risk Managed Real Estate Fund | Leverage | | | 56,643,783 | | | | 55,825,707 | |
StylePlus—Large Core Fund | Index exposure | | | 154,400,816 | | | | — | |
StylePlus—Mid Growth Fund | Index exposure | | | 65,300,898 | | | | — | |
Derivative Investment Holdings Categorized by Risk Exposure
The following is a summary of the location of derivative investments on the Funds’ Statements of Assets and Liabilities as of March 31, 2020:
Derivative Investment Type | Asset Derivatives | Liability Derivatives |
Equity/Currency contracts | — | Variation margin on futures contracts |
Equity contracts | Unrealized appreciation on OTC swap agreements | Unrealized depreciation on OTC swap agreements |
108 | THE GUGGENHEIM FUNDS SEMI-ANNUAL REPORT | |
NOTES TO FINANCIAL STATEMENTS (Unaudited)(continued) |
The following table sets forth the fair value of the Funds’ derivative investments categorized by primary risk exposure at March 31, 2020:
Asset Derivative Investments Value |
Fund | | Futures
Equity
Risk* | | | Swaps
Equity
Risk | | | Futures
Currency
Risk* | | | Total Value at
March 31,
2020 | |
Alpha Opportunity Fund | | $ | — | | | $ | 3,166,925 | | | $ | — | | | $ | 3,166,925 | |
Market Neutral Real Estate Fund | | | — | | | | 1,669,388 | | | | — | | | | 1,669,388 | |
Risk Managed Real Estate Fund | | | — | | | | 12,953,567 | | | | — | | | | 12,953,567 | |
StylePlus—Large Core Fund | | | 568,392 | | | | — | | | | — | | | | 568,392 | |
StylePlus—Mid Growth Fund | | | 260,322 | | | | — | | | | — | | | | 260,322 | |
World Equity Income Fund | | | — | | | | — | | | | 106,573 | | | | 106,573 | |
Liability Derivative Investments Value |
Fund | | Futures
Equity
Risk* | | | Swaps
Equity
Risk | | | Futures
Currency
Risk* | | | Total Value at
March 31,
2020 | |
Alpha Opportunity Fund | | $ | — | | | $ | 1,714,739 | | | $ | — | | | $ | 1,714,739 | |
Risk Managed Real Estate Fund | | | — | | | | 3,389,754 | | | | — | | | | 3,389,754 | |
StylePlus—Large Core Fund | | | — | | | | 18,032,112 | | | | — | | | | 18,032,112 | |
StylePlus—Mid Growth Fund | | | — | | | | 8,289,607 | | | | — | | | | 8,289,607 | |
World Equity Income Fund | | | — | | | | — | | | | 12,575 | | | | 12,575 | |
* | Includes cumulative appreciation (depreciation) of futures contracts as reported on the Schedules of Investments. Variation margin is reported within the Statements of Assets and Liabilities. |
The following is a summary of the location of derivative investments on the Funds’ Statements of Operations for the period ended March 31, 2020:
Derivative Investment Type | Location of Gain (Loss) on Derivatives |
Equity/Currency contracts | Net realized gain (loss) on futures contracts |
| | Net change in unrealized appreciation (depreciation) on futures contracts |
Equity contracts | Net realized gain (loss) on swap agreements |
| Net change in unrealized appreciation (depreciation) on swap agreements |
The following is a summary of the Funds’ realized gain (loss) and change in unrealized appreciation (depreciation) on derivative investments recognized on the Statements of Operations categorized by primary risk exposure for the period ended March 31, 2020:
Realized Gain (Loss) on Derivative Investments Recognized on the Statements of Operations |
Fund | | Futures
Equity
Risk | | | Swaps
Equity
Risk | | | Futures
Currency
Risk | | | Total | |
Alpha Opportunity Fund | | $ | — | | | $ | 155,999 | | | $ | — | | | $ | 155,999 | |
Market Neutral Real Estate Fund | | | — | | | | 160,735 | | | | — | | | | 160,735 | |
Risk Managed Real Estate Fund | | | — | | | | 1,012,571 | | | | — | | | | 1,012,571 | |
StylePlus—Large Core Fund | | | (1,667,401 | ) | | | (830,951 | ) | | | — | | | | (2,498,352 | ) |
StylePlus—Mid Growth Fund | | | (1,122,570 | ) | | | (199,017 | ) | | | — | | | | (1,321,587 | ) |
World Equity Income Fund | | | — | | | | — | | | | 42,699 | | | | 42,699 | |
| | THE GUGGENHEIM FUNDS SEMI-ANNUAL REPORT | 109 |
NOTES TO FINANCIAL STATEMENTS (Unaudited)(continued) |
Change in Unrealized Appreciation (Depreciation) on Derivative Investments Recognized on the Statements of Operations |
Fund | | Futures
Equity
Risk | | | Swaps
Equity
Risk | | | Futures
Currency
Risk | | | Total | |
Alpha Opportunity Fund | | $ | — | | | $ | 3,719,853 | | | $ | — | | | $ | 3,719,853 | |
Market Neutral Real Estate Fund | | | — | | | | 1,939,521 | | | | — | | | | 1,939,521 | |
Risk Managed Real Estate Fund | | | — | | | | 7,181,365 | | | | — | | | | 7,181,365 | |
StylePlus—Large Core Fund | | | 607,607 | | | | (18,032,112 | ) | | | — | | | | (17,424,505 | ) |
StylePlus—Mid Growth Fund | | | 275,389 | | | | (8,289,607 | ) | | | — | | | | (8,014,218 | ) |
World Equity Income Fund | | | — | | | | — | | | | 83,605 | | | | 83,605 | |
In conjunction with short sales and the use of derivative instruments, the Funds are required to maintain collateral in various forms. Depending on the financial instrument utilized and the broker involved, the Funds use margin deposits at the broker, cash and/or securities segregated at the custodian bank, discount notes or repurchase agreements allocated to the Funds as collateral.
Foreign Investments
There are several risks associated with exposure to foreign currencies, foreign issuers and emerging markets. A fund’s indirect and direct exposure to foreign currencies subjects the Fund to the risk that those currencies will decline in value relative to the U.S. dollar, or in the case of short positions, that the U.S. dollar will decline in value relative to the currency being hedged. Currency rates in foreign countries may fluctuate significantly over short periods of time for a number of reasons, including changes in interest rates and the imposition of currency controls or other political developments in the U.S. or abroad. In addition, the Fund may incur transaction costs in connection with conversions between various currencies. The Fund may, but is not obligated to, engage in currency hedging transactions, which generally involve buying currency forward, options or futures contracts. However, not all currency risks may be effectively hedged, and in some cases the costs of hedging techniques may outweigh expected benefits. In such instances, the value of securities denominated in foreign currencies can change significantly when foreign currencies strengthen or weaken relative to the U.S. dollar.
The Funds may invest in securities of foreign companies directly, or in financial instruments, such as ADRs and exchange-traded funds, which are indirectly linked to the performance of foreign issuers. Foreign markets can be more volatile than the U.S. market due to increased risks of adverse issuer, political, regulatory, market, or economic developments and can perform differently from the U.S. market. Investing in securities of foreign companies directly, or in financial instruments that are indirectly linked to the performance of foreign issuers, may involve risks not typically associated with investing in U.S. issuers. The value of securities denominated in foreign currencies, and of dividends from such securities, can change significantly when foreign currencies strengthen or weaken relative to the U.S. dollar. Foreign securities markets generally have less trading volume and less liquidity than U.S. markets, and prices in some foreign markets may fluctuate more than those of securities traded on U.S. markets. Many foreign countries lack accounting and disclosure standards comparable to those that apply to U.S. companies, and it may be more difficult to obtain reliable information regarding a foreign issuer’s financial condition and operations. Transaction costs and costs associated with custody services are generally higher for foreign securities than they are for U.S. securities. Some foreign governments levy withholding taxes against dividend and interest income. Although in some countries portions of these taxes are recoverable, the non-recovered portion will reduce the income received by the Funds.
The Trust has established counterparty credit guidelines and enters into transactions only with financial institutions of investment grade or better. The Trust monitors the counterparty credit risk.
Note 3 – Offsetting
In the normal course of business, the Funds enter into transactions subject to enforceable master netting arrangements or other similar arrangements. Generally, the right to offset in those agreements allows the Funds to counteract the exposure to a specific counterparty with collateral received from or delivered to that counterparty based on the terms of the arrangements. These arrangements provide for the right to liquidate upon the occurrence of an event of default, credit event upon merger or additional termination event.
In order to better define their contractual rights and to secure rights that will help the Funds mitigate their counterparty risk, the Funds may enter into an International Swaps and Derivatives Association, Inc. Master Agreement (“ISDA Master Agreement”) or similar agreement with their derivative contract counterparties. An ISDA Master Agreement is a bilateral agreement between a fund and a counterparty that governs
110 | THE GUGGENHEIM FUNDS SEMI-ANNUAL REPORT | |
NOTES TO FINANCIAL STATEMENTS (Unaudited)(continued) |
OTC derivatives, including foreign exchange contracts, and typically contains, among other things, collateral posting terms and netting provisions in the event of a default and/or termination event. The provisions of the ISDA Master Agreement typically permit a single net payment in the event of a default (close-out netting) or similar event, including the bankruptcy or insolvency of the counterparty.
For derivatives traded under an ISDA Master Agreement, the collateral requirements are typically calculated by netting the mark-to-market amount for each transaction under such agreement and comparing that amount to the value of any collateral currently pledged by the Funds and the counterparty. For financial reporting purposes, cash collateral that has been pledged to cover obligations of the Funds and cash collateral received from the counterparty, if any, are reported separately on the Statements of Assets and Liabilities as segregated cash with broker/receivable for variation margin, or payable for swap settlement/variation margin. Cash and/or securities pledged or received as collateral by the Funds in connection with an OTC derivative subject to an ISDA Master Agreement generally may not be invested, sold or rehypothecated by the counterparty or the Funds, as applicable, absent an event of default under such agreement, in which case such collateral generally may be applied towards obligations due to and payable by such counterparty or the Funds, as applicable. Generally, the amount of collateral due from or to a counterparty must exceed a minimum transfer amount threshold (e.g., $300,000) before a transfer is required to be made. To the extent amounts due to the Funds from their counterparties are not fully collateralized, contractually or otherwise, the Funds bear the risk of loss from counterparty nonperformance. The Funds attempt to mitigate counterparty risk by only entering into agreements with counterparties that they believe to be of good standing and by monitoring the financial stability of those counterparties.
For financial reporting purposes, the Funds do not offset derivative assets and derivative liabilities that are subject to netting arrangements in the Statements of Assets and Liabilities.
The following tables present derivative financial instruments and secured financing transactions that are subject to enforceable netting arrangements:
| | | | | | | | | | | | | | | | Gross Amounts Not Offset
in the Statements of
Assets and Liabilities | | | | | |
Fund | Instrument | | Gross
Amounts of
Recognized
Assets1 | | | Gross
Amounts
Offset in the
Statements
of Assets and
Liabilities | | | Net Amount
of Assets
Presented on
the Statements
of Assets and
Liabilities | | | Financial
Instruments | | | Cash
Collateral
Received | | | Net
Amount | |
Alpha Opportunity Fund | Custom basket swap agreements | | $ | 3,166,925 | | | $ | — | | | $ | 3,166,925 | | | $ | (1,714,739 | ) | | $ | (773,907 | ) | | $ | 678,279 | |
Market Neutral Real Estate Fund | Custom basket swap agreements | | | 1,669,388 | | | | — | | | | 1,669,388 | | | | — | | | | (1,207,218 | ) | | | 462,170 | |
Risk Managed Real Estate Fund | Custom basket swap agreements | | | 12,953,567 | | | | — | | | | 12,953,567 | | | | (3,389,754 | ) | | | (4,800,956 | ) | | | 4,762,857 | |
| | THE GUGGENHEIM FUNDS SEMI-ANNUAL REPORT | 111 |
NOTES TO FINANCIAL STATEMENTS (Unaudited)(continued) |
| | | | | | | | | | | | | | | | Gross Amounts Not Offset
in the Statements of
Assets and Liabilities | | | | | |
Fund | Instrument | | Gross
Amounts of
Recognized
Liabilities1 | | | Gross
Amounts
Offset in the
Statements
of Assets and
Liabilities | | | Net Amount
of Liabilities
Presented on
the Statements
of Assets and
Liabilities | | | Financial
Instruments | | | Cash
Collateral
Pledged | | | Net
Amount | |
Alpha Opportunity Fund | Custom basket swap agreements | | $ | 1,714,739 | | | $ | — | | | $ | 1,714,739 | | | $ | (1,714,739 | ) | | $ | — | | | $ | — | |
Risk Managed Real Estate Fund | Custom basket swap agreements | | | 3,389,754 | | | | — | | | | 3,389,754 | | | | (3,389,754 | ) | | | — | | | | — | |
StylePlus—Large Core Fund | Swap equity contracts | | | 18,032,112 | | | | — | | | | 18,032,112 | | | | — | | | | (17,570,000 | ) | | | 462,112 | |
StylePlus—Mid Growth Fund | Swap equity contracts | | | 8,289,607 | | | | — | | | | 8,289,607 | | | | — | | | | (7,860,000 | ) | | | 429,607 | |
1 | Exchange-traded or centrally-cleared derivatives are excluded from these reported amounts. |
The Funds have the right to offset deposits against any related derivative liabilities outstanding with each counterparty with the exception of exchange-traded or centrally-cleared derivatives. The following table presents deposits held by others in connection with derivative investments as of March 31, 2020.
Fund | Counterparty/
Clearing Agent | Asset Type | | Cash Pledged | | | Cash Received | |
Alpha Opportunity Fund | Goldman Sachs International | Custom basket swap agreements | | $ | — | | | $ | 1,756,000 | |
Market Neutral Real Estate Fund | Goldman Sachs International | Custom basket swap agreements | | | — | | | | 380,000 | |
| Morgan Stanley Capital Services LLC | Custom basket swap agreements | | | — | | | | 1,370,000 | |
Market Neutral Real Estate Fund Total | | | | | — | | | | 1,750,000 | |
Risk Managed Real Estate Fund | Morgan Stanley Capital Services LLC | Custom basket swap agreements | | | — | | | | 5,080,000 | |
StylePlus—Large Core Fund | Citibank, N.A. | Total return swap agreements | | | 17,570,000 | | | | — | |
| Morgan Stanley Capital Services LLC | Futures contracts | | | 732,000 | | | | — | |
StylePlus—Large Core Fund Total | | | | | 18,302,000 | | | | — | |
StylePlus—Mid Growth Fund | Morgan Stanley Capital Services LLC | Futures contracts | | | 297,000 | | | | — | |
| Wells Fargo Bank, N.A. | Total return swap agreements | | | 7,860,000 | | | | — | |
StylePlus—Mid Growth Fund Total | | | | | 8,157,000 | | | | — | |
World Equity Income Fund | BofA Securities, Inc. | Futures contracts | | | 99,050 | | | | — | |
Note 4 – Fair Value Measurement
In accordance with U.S. GAAP, fair value is defined as the price that the Funds would receive to sell an investment or pay to transfer a liability in an orderly transaction with an independent buyer in the principal market, or in the absence of a principal market, the most advantageous market for the investment or liability. U.S. GAAP establishes a three-tier fair value hierarchy based on the types of inputs used to value assets and liabilities and requires corresponding disclosure. The hierarchy and the corresponding inputs are summarized below:
Level 1 — | quoted prices in active markets for identical assets or liabilities. |
Level 2 — | significant other observable inputs (for example quoted prices for securities that are similar based on characteristics such as interest rates, prepayment speeds, credit risk, etc.). |
112 | THE GUGGENHEIM FUNDS SEMI-ANNUAL REPORT | |
NOTES TO FINANCIAL STATEMENTS (Unaudited)(continued) |
Level 3 — | significant unobservable inputs based on the best information available under the circumstances, to the extent observable inputs are not available, which may include assumptions. |
The types of inputs available depend on a variety of factors, such as the type of security and the characteristics of the markets in which it trades, if any. Fair valuation determinations that rely on fewer or no observable inputs require greater judgment. Accordingly, fair value determinations for Level 3 securities require the greatest amount of judgment.
The inputs or methodologies used for valuing securities are not necessarily an indication of the risk associated with investing in those securities. The suitability of the techniques and sources employed to determine fair valuation are regularly monitored and subject to change.
Note 5 – Investment Advisory Agreement and Other Agreements
Under the terms of an investment advisory contract, the Funds pay GI investment advisory fees calculated at the annualized rates below, based on the average daily net assets of the Funds:
Fund | Management Fees
(as a % of Net Assets) |
Alpha Opportunity Fund | 0.90% |
Large Cap Value Fund | 0.65% |
Market Neutral Real Estate Fund | 1.10% |
Risk Managed Real Estate Fund | 0.75% |
Small Cap Value Fund | 0.75% |
StylePlus—Large Core Fund | 0.75% |
StylePlus—Mid Growth Fund | 0.75% |
World Equity Income Fund | 0.70% |
GI pays operating expenses on behalf of the Trust, such as audit and accounting related services, legal services, custody, printing and mailing, among others, on a pass-through basis. Such expenses are allocated to various Funds within the complex based on relative net assets.
The Board has adopted Distribution Plans related to the offering of A-Class, C-Class and P-Class shares pursuant to Rule 12b-1 under the 1940 Act. The plans provide for payments at an annual rate of 0.25% of the average daily net assets of the Fund’s A-Class and P-Class shares, and 1.00% of the average daily net assets of the Fund’s C-Class shares.
| | THE GUGGENHEIM FUNDS SEMI-ANNUAL REPORT | 113 |
NOTES TO FINANCIAL STATEMENTS (Unaudited)(continued) |
Contractual expense limitation agreements for the following Funds provide that the total expenses be limited to a percentage of average net assets for each class of shares, exclusive of brokerage costs, dividends or interest on securities sold short, expenses of other investment companies in which a Fund invests, interest, taxes, litigation, indemnification and extraordinary expenses. The limits are listed below:
| | Limit | | Effective
Date | | | Contract
End Date | |
Alpha Opportunity Fund – A-Class | | | 1.76% | | | 05/31/17 | | | | 02/01/21 | |
Alpha Opportunity Fund – C-Class | | | 2.51% | | | 05/31/17 | | | | 02/01/21 | |
Alpha Opportunity Fund – P-Class | | | 1.76% | | | 05/31/17 | | | | 02/01/21 | |
Alpha Opportunity Fund – Institutional Class | | | 1.51% | | | 05/31/17 | | | | 02/01/21 | |
Large Cap Value Fund – A-Class | | | 1.15% | | | 11/30/12 | | | | 02/01/21 | |
Large Cap Value Fund – C-Class | | | 1.90% | | | 11/30/12 | | | | 02/01/21 | |
Large Cap Value Fund – P-Class | | | 1.15% | | | 05/01/15 | | | | 02/01/21 | |
Large Cap Value Fund – Institutional Class | | | 0.90% | | | 06/05/13 | | | | 02/01/21 | |
Market Neutral Real Estate Fund – A-Class | | | 1.65% | | | 02/26/16 | | | | 02/01/21 | |
Market Neutral Real Estate Fund – C-Class | | | 2.40% | | | 02/26/16 | | | | 02/01/21 | |
Market Neutral Real Estate Fund – P-Class | | | 1.65% | | | 02/26/16 | | | | 02/01/21 | |
Market Neutral Real Estate Fund – Institutional Class | | | 1.40% | | | 02/26/16 | | | | 02/01/21 | |
Risk Managed Real Estate Fund – A-Class | | | 1.30% | | | 03/26/14 | | | | 02/01/21 | |
Risk Managed Real Estate Fund – C-Class | | | 2.05% | | | 03/26/14 | | | | 02/01/21 | |
Risk Managed Real Estate Fund – P-Class | | | 1.30% | | | 05/01/15 | | | | 02/01/21 | |
Risk Managed Real Estate Fund – Institutional Class | | | 1.10% | | | 03/26/14 | | | | 02/01/21 | |
Small Cap Value Fund – A-Class | | | 1.30% | | | 11/30/12 | | | | 02/01/21 | |
Small Cap Value Fund – C-Class | | | 2.05% | | | 11/30/12 | | | | 02/01/21 | |
Small Cap Value Fund – P-Class | | | 1.30% | | | 05/01/15 | | | | 02/01/21 | |
Small Cap Value Fund – Institutional Class | | | 1.05% | | | 11/30/12 | | | | 02/01/21 | |
World Equity Income Fund – A-Class | | | 1.22% | | | 08/15/13 | | | | 02/01/21 | |
World Equity Income Fund – C-Class | | | 1.97% | | | 08/15/13 | | | | 02/01/21 | |
World Equity Income Fund – P-Class | | | 1.22% | | | 05/01/15 | | | | 02/01/21 | |
World Equity Income Fund – Institutional Class | | | 0.97% | | | 08/15/13 | | | | 02/01/21 | |
114 | THE GUGGENHEIM FUNDS SEMI-ANNUAL REPORT | |
NOTES TO FINANCIAL STATEMENTS (Unaudited)(continued) |
GI is entitled to reimbursement by the Funds for fees waived or expenses reimbursed during any of the previous 36 months, beginning on the date of the expense limitation agreement, if on any day the estimated operating expenses are less than the indicated percentages. For purposes of this arrangement, GI is entitled to recoupment of previously waived fees or reimbursed expenses for 36 months from the date of the waiver or reimbursement by GI. At March 31, 2020, the amount of fees waived or expenses reimbursed that are subject to recoupment and will expire during the years ended September 30, are presented in the following table:
Fund | | 2020 | | | 2021 | | | 2022 | | | 2023 | | | Total | |
Alpha Opportunity Fund | | | | | | | | | | | | | | | | | | | | |
A-Class | | $ | — | | | $ | — | | | $ | 57 | | | $ | 613 | | | $ | 670 | |
C-Class | | | 3,924 | | | | 574 | | | | 594 | | | | 520 | | | | 5,612 | |
P-Class | | | — | | | | — | | | | 33 | | | | 31 | | | | 64 | |
Institutional Class | | | — | | | | — | | | | — | | | | 237 | | | | 237 | |
Large Cap Value Fund | | | | | | | | | | | | | | | | | | | | |
A-Class | | | 75,497 | | | | 93,910 | | | | 86,271 | | | | 64,004 | | | | 319,682 | |
C-Class | | | 4,699 | | | | 6,839 | | | | 5,745 | | | | 3,718 | | | | 21,001 | |
P-Class | | | 370 | | | | 552 | | | | 654 | | | | 465 | | | | 2,041 | |
Institutional Class | | | 1,829 | | | | 3,127 | | | | 9,093 | | | | 1,983 | | | | 16,032 | |
Market Neutral Real Estate Fund | | | | | | | | | | | | | | | | | | | | |
A-Class | | | 2,802 | | | | 13,868 | | | | 61,944 | | | | 35,253 | | | | 113,867 | |
C-Class | | | 3,650 | | | | 4,083 | | | | 3,045 | | | | 1,403 | | | | 12,181 | |
P-Class | | | 5,047 | | | | 16,626 | | | | 6,884 | | | | 3,240 | | | | 31,797 | |
Institutional Class | | | 125,324 | | | | 164,604 | | | | 115,010 | | | | 50,370 | | | | 455,308 | |
Risk Managed Real Estate Fund | | | | | | | | | | | | | | | | | | | | |
A-Class | | | — | | | | — | | | | — | | | | — | | | | — | |
C-Class | | | 545 | | | | 1,513 | | | | 741 | | | | 349 | | | | 3,148 | |
P-Class | | | — | | | | — | | | | 2,541 | | | | 6,193 | | | | 8,734 | |
Institutional Class | | | — | | | | — | | | | — | | | | — | | | | — | |
Small Cap Value Fund | | | | | | | | | | | | | | | | | | | | |
A-Class | | | 33,796 | | | | 91,854 | | | | 101,616 | | | | 57,300 | | | | 284,566 | |
C-Class | | | 15,350 | | | | 31,586 | | | | 21,993 | | | | 11,637 | | | | 80,566 | |
P-Class | | | 216 | | | | 215 | | | | 491 | | | | 380 | | | | 1,302 | |
Institutional Class | | | 12,771 | | | | 34,694 | | | | 35,461 | | | | 22,669 | | | | 105,595 | |
World Equity Income Fund | | | | | | | | | | | | | | | | | | | | |
A-Class | | | 84,254 | | | | 111,231 | | | | 89,463 | | | | 65,261 | | | | 350,209 | |
C-Class | | | 8,307 | | | | 12,493 | | | | 11,022 | | | | 7,235 | | | | 39,057 | |
P-Class | | | 340 | | | | 531 | | | | 317 | | | | 198 | | | | 1,386 | |
Institutional Class | | | 3,184 | | | | 5,983 | | | | 27,702 | | | | 11,210 | | | | 48,079 | |
For the period ended March 31, 2020, GI recouped amounts from the Funds as follows:
Alpha Opportunity Fund | | $ | 1,323 | |
Large Cap Value Fund | | | 42 | |
Market Neutral Real Estate Fund | | | 62 | |
Risk Managed Real Estate Fund | | | 21,586 | |
World Equity Income Fund | | | 4 | |
If a Fund invests in a fund that is advised by the same adviser or an affiliated adviser, the investing Fund’s adviser has agreed to waive fees at the investing fund level to the extent necessary to offset the proportionate share of any management fee paid by each Fund with respect to its investment in such affiliated fund. Fee waivers will be calculated at the investing Fund level without regard to any expense cap, if any, in effect for the investing Fund. Fees waived under this arrangement are not subject to reimbursement to GI. For the period ended March 31, 2020, the following Funds waived fees related to investments in affiliated funds:
Fund | | Amount Waived | |
StylePlus—Large Core Fund | | $ | 29,869 | |
StylePlus—Mid Growth Fund | | | 9,841 | |
For the period ended March 31, 2020, GFD retained sales charges of $87,029 relating to sales of A-Class shares of the Trust.
| | THE GUGGENHEIM FUNDS SEMI-ANNUAL REPORT | 115 |
NOTES TO FINANCIAL STATEMENTS (Unaudited)(continued) |
Certain trustees and officers of the Trust are also officers of GI and/or GFD. The Trust does not compensate its officers or trustees who are officers, directors and/or employees of GI or GFD.
MUFG Investor Services (US), LLC (“MUIS”) acts as the Funds’ administrator, transfer agent and accounting agent. As administrator, transfer agent and accounting agent, MUIS maintains the books and records of the Funds’ securities and cash. The Bank of New York Mellon Corp. (“BNY”) acts as the Funds’ custodian. As custodian, BNY is responsible for the custody of the Funds’ assets. For providing the aforementioned administrative and accounting services, MUIS is entitled to receive a monthly fee equal to a percentage of the Funds’ average daily net assets and out of pocket expenses. For providing the aforementioned transfer agent and custodian services, MUIS and BNY are entitled to receive a monthly fee based on the number of transactions during the month and the number of accounts under management, subject to certain minimum monthly fees, and out of pocket expenses.
At March 31, 2020, GI and its affiliates owned over twenty percent of the outstanding shares of the Funds, as follows:
Fund | | Percent of Outstanding
Shares Owned | |
Alpha Opportunity Fund | | | 61 | % |
Market Neutral Real Estate Fund | | | 22 | % |
Note 6 – Federal Income Tax Information
The Funds intend to comply with the provisions of Subchapter M of the Internal Revenue Code applicable to regulated investment companies and will distribute substantially all taxable net investment income and capital gains sufficient to relieve the Funds from all, or substantially all, federal income, excise and state income taxes. Therefore, no provision for federal or state income tax or federal excise tax is required.
Tax positions taken or expected to be taken in the course of preparing the Funds’ tax returns are evaluated to determine whether the tax positions are “more-likely-than-not” of being sustained by the applicable tax authority. Tax positions not deemed to meet the more-likely-than-not threshold would be recorded as a tax benefit or expense in the current year. Management has analyzed the Funds’ tax positions taken, or to be taken, on U.S. federal income tax returns for all open tax years, and has concluded that no provision for income tax is required in the Funds’ financial statements. The Funds’ U.S. federal income tax returns are subject to examination by the Internal Revenue Service (“IRS”) for a period of three years after they are filed.
At March 31, 2020, the cost of investments for U.S. federal income tax purposes, the aggregate gross unrealized appreciation for all investments for which there was an excess of value over tax cost, and the aggregate gross unrealized depreciation for all investments for which there was an excess of tax cost over value, were as follows:
Fund | | Tax
Cost | | | Tax
Unrealized
Appreciation | | | Tax
Unrealized
Depreciation | | | Net
Unrealized
Appreciation/
(Depreciation) | |
Alpha Opportunity Fund | | $ | 39,964,064 | | | $ | 3,354,178 | | | $ | (9,949,314 | ) | | $ | (6,595,136 | ) |
Large Cap Value Fund | | | 35,095,304 | | | | 1,836,036 | | | | (7,340,510 | ) | | | (5,504,474 | ) |
Market Neutral Real Estate Fund | | | 27,410,089 | | | | 2,264,822 | | | | (638,745 | ) | | | 1,626,077 | |
Risk Managed Real Estate Fund | | | 215,918,849 | | | | 20,021,509 | | | | (42,331,801 | ) | | | (22,310,292 | ) |
Small Cap Value Fund | | | 6,194,554 | | | | 256,803 | | | | (1,871,601 | ) | | | (1,614,798 | ) |
StylePlus—Large Core Fund | | | 168,476,956 | | | | 1,562,438 | | | | (27,661,981 | ) | | | (26,099,543 | ) |
StylePlus—Mid Growth Fund | | | 71,265,507 | | | | 512,059 | | | | (13,158,713 | ) | | | (12,646,654 | ) |
World Equity Income Fund | | | 42,621,219 | | | | 1,664,832 | | | | (7,699,817 | ) | | | (6,034,985 | ) |
116 | THE GUGGENHEIM FUNDS SEMI-ANNUAL REPORT | |
NOTES TO FINANCIAL STATEMENTS (Unaudited)(continued) |
Note 7 – Securities Transactions
For the period ended March 31, 2020, the cost of purchases and proceeds from sales of investment securities, excluding government securities, short-term investments and derivatives, were as follows:
Fund | | Purchases | | | Sales | |
Alpha Opportunity Fund | | $ | 74,592,568 | | | $ | 123,186,277 | |
Large Cap Value Fund | | | 6,434,552 | | | | 23,731,587 | |
Market Neutral Real Estate Fund | | | 24,014,734 | | | | 17,291,531 | |
Risk Managed Real Estate Fund | | | 320,846,910 | | | | 300,445,523 | |
Small Cap Value Fund | | | 2,474,636 | | | | 10,014,668 | |
StylePlus—Large Core Fund | | | 66,491,658 | | | | 100,407,252 | |
StylePlus—Mid Growth Fund | | | 34,288,407 | | | | 50,737,638 | |
World Equity Income Fund | | | 67,416,675 | | | | 90,340,809 | |
Note 8 – Line of Credit
The Trust, along with other affiliated trusts, secured a 364-day committed, $1,205,000,000 line of credit from Citibank, N.A., which was in place through October 4, 2019, at which time the line of credit was renewed with an increased commitment amount of $1,230,000,000. A Fund may draw (borrow) from the line of credit as a temporary measure for emergency purposes, to facilitate redemption requests, or for other short-term liquidity purposes consistent with the Fund’s investment objective and program. For example, it may be advantageous for the Fund to borrow money rather than sell existing portfolio positions to meet redemption requests. Fees related to borrowings, if any, vary under this arrangement between the greater of Citibank’s “base rate”, LIBOR plus 1%, or the federal funds rate plus 1/2 of 1%.
The commitment fee that may be paid by the Funds is at an annualized rate of 0.15% of the average daily amount of their allocated unused commitment amount. The allocated commitment fee amount for each Fund is referenced in the Statement of Operations under “Line of credit fees”. The Funds did not have any borrowings under this agreement as of and for the period ended March 31, 2020.
Note 9 – Other Liabilities
StylePlus—Large Core Fund wrote put option contracts through Lehman Brothers Inc., (“LBI”) that were exercised prior to the option contracts’ expiration and prior to the bankruptcy filing by LBI, during September 2008. These transactions have not settled and the securities have not been delivered to the Fund as of March 31, 2020.
The Fund recorded a liability equal to the difference between the strike price on the put options and the market price of the underlying security on the exercise date. The amount of the liability recorded by the Fund as of March 31, 2020, was $18,615 and is included in payable for miscellaneous in the Statement of Assets and Liabilities. On May 15, 2020 after the period end, the Fund revised the amount of the liability to $0 after it was determined the Fund has no future obligation related to this matter.
Note 10 – Large Shareholder Risk
As of March 31, 2020, 60.7% of the Alpha Opportunity Fund (the “Fund”) was held by Guggenheim Macro Opportunities Fund. The Fund may experience adverse effects if a large number of shares of the Fund are held by a single shareholder (e.g., an institutional investor, financial intermediary or another GI Fund). The Fund is subject to the risk that a redemption by those shareholders of all or a large portion of the Fund could cause the Fund to liquidate its assets at inopportune times, or at a loss or depressed value, which could adversely impact the Fund’s performance and cause the value of a shareholder’s investment to decline. Redemptions of a large number of shares also may increase transaction costs or, by necessitating a sale of portfolio securities, have adverse tax consequences for shareholders. They also potentially limit the use of any capital loss carryforwards and certain other losses to offset future realized capital gains (if any) and may limit or prevent a Fund’s use of tax equalization.
Note 11 – COVID-19 and Recent Developments
The global ongoing crisis caused by the outbreak of COVID-19 is causing materially reduced consumer demand and economic output, disrupting supply chains, resulting in market closures, travel restrictions and quarantines, and adversely impacting local and global economies. Investors should be aware that in light of the current uncertainty, volatility and distress in economies, financial markets, and labor and health conditions all over the world, the Funds’ investments and a shareholder’s investment in a Fund are subject to sudden and substantial losses, increased
| | THE GUGGENHEIM FUNDS SEMI-ANNUAL REPORT | 117 |
NOTES TO FINANCIAL STATEMENTS (Unaudited)(concluded) |
volatility and other adverse events. Firms through which investors invest with the Funds, the Funds, their service providers, the markets in which they invest and market intermediaries are also impacted by quarantines and similar measures intended to contain the ongoing pandemic, which can obstruct their functioning and subject them to heightened operational risks
Note 12 – Subsequent Events
The Funds evaluated subsequent events through the date the financial statements were available for issue and determined there were no material events that would require adjustment to or disclosure in the Funds’ financial statements.
118 | THE GUGGENHEIM FUNDS SEMI-ANNUAL REPORT | |
OTHER INFORMATION (Unaudited) |
Proxy Voting Information
A description of the policies and procedures that the Trust uses to determine how to vote proxies relating to securities held in the Funds’ portfolios is available, without charge and upon request, by calling 800.820.0888. This information is also available from the EDGAR database on the SEC’s website at https://www.sec.gov.
Information regarding how the Funds’ voted proxies relating to portfolio securities during the most recent 12-month period ended June 30 is available without charge, upon request, by calling 800.820.0888. This information is also available from the EDGAR database on the SEC’s website at https://www.sec.gov.
Sector Classification
Information in the “Schedule of Investments” is categorized by sectors using sector-level Classifications defined by the Bloomberg Industry Classification System, a widely recognized industry classification system provider. Each Fund’s registration statement has investment policies relating to concentration in specific sectors/industries. For purposes of these investment policies, the Funds usually classify sectors/industries based on industry-level Classifications used by widely recognized industry classification system providers such as Bloomberg Industry Classification System, Global Industry Classification Standards and Barclays Global Classification Scheme.
Quarterly Portfolio Schedules Information
The Trust files its complete schedule of portfolio holdings with the SEC for the first and third quarters of each fiscal year as an exhibit to its reports on Form N-PORT, and for reporting periods ended prior to March 31, 2019, filed such information on Form N-Q. The Funds’ Forms N-PORT and N-Q are available on the SEC’s website at https://www.sec.gov. The Funds’ Forms N-PORT and N-Q may be reviewed and copied at the SEC’s Public Reference Room in Washington, DC, and that information on the operation of the Public Reference Room may be obtained by calling 800-SEC-0330. Copies of the portfolio holdings are also available to shareholders, without charge and upon request, by calling 800.820.0888.
| | THE GUGGENHEIM FUNDS SEMI-ANNUAL REPORT | 119 |
INFORMATION ON BOARD OF TRUSTEES AND OFFICERS (Unaudited) |
A Board of Trustees oversees the Trust, as well as other trusts of GI, in which its members have no stated term of service, and continue to serve after election until resignation. The Statement of Additional Information includes further information about Fund Trustees and Officers, and can be obtained without charge by visiting guggenheiminvestments.com or by calling 800.820.0888.
Name, Address*
and Year of Birth | Position(s)
Held with
Trust | Term of Office
and Length of
Time Served** | Principal Occupation(s)
During Past Five Years | Number of
Portfolios
in Fund
Complex
Overseen | Other
Directorships Held
by Trustees*** |
INDEPENDENT TRUSTEES | | | |
Randall C. Barnes (1951) | Trustee | Since 2014 | Current: Private Investor (2001-present). Former: Senior Vice President and Treasurer, PepsiCo, Inc. (1993-1997); President, Pizza Hut International (1991-1993); Senior Vice President, Strategic Planning and New Business Development, PepsiCo, Inc. (1987-1990). | 157 | Current: Purpose Investments Funds (2013-present). Former: Managed Duration Investment Grade Municipal Fund (2006-2016). |
Angela Brock-Kyle (1959) | Trustee | Since 2019 | Current: Founder and Chief Executive Officer, B.O.A.R.D.S. (2013-present). Former: Senior Leader, TIAA (1987-2012). | 156 | Current: Hunt Companies, Inc. (2019-present). Former: Infinity Property & Casualty Corp. (2014-2018). |
Donald A. Chubb, Jr. (1946) | Trustee and Chair of the Valuation Oversight Committee | Since 1994 | Current: Retired Former: Business broker and manager of commercial real estate, Griffith & Blair, Inc. (1997-2017). | 156 | Former: Midland Care, Inc. (2011-2016). |
Jerry B. Farley (1946) | Trustee and Chair of the Audit Committee | Since 2005 | Current: President, Washburn University (1997-present). | 156 | Current: CoreFirst Bank & Trust (2000-present). Former: Westar Energy, Inc. (2004-2018). |
Roman Friedrich III (1946) | Trustee and Chair of the Contracts Review Committee | Since 2014 | Current: Founder and Managing Partner, Roman Friedrich & Company (1998-present). | 156 | Former: Zincore Metals, Inc. (2009-2019). |
Thomas F. Lydon, Jr. (1960) | Trustee and Vice Chair of the Contracts Review Committee | Since 2019 | Current: President, Global Trends Investments (1996-present); Co-Chief Executive Officer, ETF Flows, LLC (2019-present); Chief Executive Officer, Lydon Media (2016-present). | 156 | Current: US Global Investors (GROW) (1995-present). Former: Harvest Volatility Edge Trust (3) (2017-2019). |
120 | THE GUGGENHEIM FUNDS SEMI-ANNUAL REPORT | |
INFORMATION ON BOARD OF TRUSTEES AND OFFICERS (Unaudited)(continued) |
Name, Address*
and Year of Birth | Position(s)
Held with
Trust | Term of Office
and Length of
Time Served** | Principal Occupation(s)
During Past Five Years | Number of
Portfolios
in Fund
Complex
Overseen | Other
Directorships Held
by Trustees*** |
INDEPENDENT TRUSTEES - concluded | | |
Ronald A. Nyberg (1953) | Trustee and Chair of the Nominating and Governance Committee | Since 2014 | Current: Partner, Momkus LLC (2016-present). Former: Partner, Nyberg & Cassioppi, LLC (2000-2016); Executive Vice President, General Counsel, and Corporate Secretary, Van Kampen Investments (1982-1999). | 157 | Current: PPM Funds (9) (2018 - present); Edward-Elmhurst Healthcare System (2012-present). Former: Western Asset Inflation-Linked Opportunities & Income Fund (2004-April 2020); Western Asset Inflation- Linked Income Fund (2003-April 2020); Managed Duration Investment Grade Municipal Fund (2003-2016). |
Sandra G. Sponem (1958) | Trustee | Since 2019 | Current: Retired. Former: Senior Vice President and Chief Financial Officer, M.A. Mortenson-Companies, Inc. (2007-2017). | 156 | Current: SPDR Series Trust (78) (2018-present); SPDR Index Shares Funds (31) (2018-present); SSGA Active Trust (12) (2018-present); and SSGA Master Trust (1) (2018-present). |
Ronald E. Toupin, Jr. (1958) | Trustee, Chair of the Board and Chair of the Executive Committee | Since 2014 | Current: Portfolio Consultant (2010-present); Member, Governing Council, Independent Directors Council (2013-present); Governor, Board of Governors, Investment Company Institute (2018-present). Former: Member, Executive Committee, Independent Directors Council (2016-2018); Vice President, Manager and Portfolio Manager, Nuveen Asset Management (1998-1999); Vice President, Nuveen Investment Advisory Corp. (1992-1999); Vice President and Manager, Nuveen Unit Investment Trusts (1991-1999); and Assistant Vice President and Portfolio Manager, Nuveen Unit Investment Trusts (1988-1999), each of John Nuveen & Co., Inc. (1982-1999). | 156 | Former: Western Asset Inflation-Linked Opportunities & Income Fund (2004-April 2020); Western Asset Inflation- Linked Income Fund (2003-April 2020); Managed Duration Investment Grade Municipal Fund (2003-2016). |
| | THE GUGGENHEIM FUNDS SEMI-ANNUAL REPORT | 121 |
INFORMATION ON BOARD OF TRUSTEES AND OFFICERS (Unaudited)(continued) |
Name, Address*
and Year of Birth | Position(s)
Held with
Trust | Term of Office
and Length of
Time Served** | Principal Occupation(s)
During Past Five Years | Number of
Portfolios
in Fund
Complex
Overseen | Other
Directorships Held
by Trustees*** |
INTERESTED TRUSTEE | | | | |
Amy J. Lee**** (1961) | Trustee, Vice President and Chief Legal Officer | Since 2018 (Trustee) Since 2014
(Chief Legal Officer) Since 2007
(Vice President) | Current: Interested Trustee, certain other funds in the Fund Complex (2018-present); Chief Legal Officer, certain other funds in the Fund Complex (2014-present); Vice President, certain other funds in the Fund Complex (2007-present); Senior Managing Director, Guggenheim Investments (2012-present). Former: President and Chief Executive Officer, certain other funds in the Fund Complex (2017-2019); Vice President, Associate General Counsel and Assistant Secretary, Security Benefit Life Insurance Company and Security Benefit Corporation (2004-2012). | 156 | None. |
* | The business address of each Trustee is c/o Guggenheim Investments, 227 West Monroe Street, Chicago, Illinois 60606. |
** | Each Trustee serves an indefinite term, until his or her successor is elected and qualified. Time served includes time served in the respective position for the Predecessor Corporation. |
*** | Each Trustee also serves on the boards of trustees of Guggenheim Funds Trust, Guggenheim Variable Funds Trust, Guggenheim Strategy Funds Trust, Fiduciary/Claymore Energy Infrastructure Fund, Guggenheim Taxable Municipal Managed Duration Trust, Guggenheim Strategic Opportunities Fund, Guggenheim Enhanced Equity Income Fund, Guggenheim Energy & Income Fund, Guggenheim Credit Allocation Fund, Rydex Series Funds, Rydex Dynamic Funds, Rydex Variable Funds and Transparent Value Trust. Messrs. Barnes and Nyberg also serve on the board of trustees of Advent Convertible & Income Fund. |
**** | This Trustee is deemed to be an “interested person” of the Funds under the 1940 Act by reason of her position with the Funds’ Investment Manager and/or the parent of the Investment Manager. |
122 | THE GUGGENHEIM FUNDS SEMI-ANNUAL REPORT | |
INFORMATION ON BOARD OF TRUSTEES AND OFFICERS (Unaudited)(continued) |
Name, Address*
and Year of Birth | Position(s)
Held with
Trust | Term of Office
and Length of
Time Served** | Principal Occupation(s)
During Past Five Years |
OFFICERS | | | |
Brian E. Binder (1972) | President and Chief Executive Officer | Since 2018 | Current: President and Chief Executive Officer, certain other funds in the Fund Complex (2018-present); President, Chief Executive Officer and Chairman of the Board of Managers, Guggenheim Funds Investment Advisors, LLC (2018-present); President and Chief Executive Officer, Security Investors, LLC (2018-present); Board Member of Guggenheim Partners Fund Management (Europe) Limited (2018-present); Senior Managing Director and Chief Administrative Officer, Guggenheim Investments (2018-present). Former: Managing Director and President, Deutsche Funds, and Head of US Product, Trading and Fund Administration, Deutsche Asset Management (2013-2018); Managing Director, Head of Business Management and Consulting, Invesco Ltd. (2010-2012). |
James M. Howley (1972) | Assistant Treasurer | Since 2014 | Current: Managing Director, Guggenheim Investments (2004-present); Assistant Treasurer, certain other funds in the Fund Complex (2006-present). Former: Manager, Mutual Fund Administration of Van Kampen Investments, Inc. (1996-2004). |
Mark E. Mathiasen (1978) | Secretary | Since 2014 | Current: Secretary, certain other funds in the Fund Complex (2007-present); Managing Director, Guggenheim Investments (2007-present). |
Glenn McWhinnie (1969) | Assistant Treasurer | Since 2016 | Current: Vice President, Guggenheim Investments (2009-present); Assistant Treasurer, certain other funds in the Fund Complex (2016-present). |
Michael P. Megaris (1984) | Assistant Secretary | Since 2014 | Current: Assistant Secretary, certain other funds in the Fund Complex (2014-present); Director, Guggenheim Investments (2012-present). |
Elisabeth Miller (1968) | Chief Compliance Officer | Since 2012 | Current: Chief Compliance Officer, certain other funds in the Fund Complex (2012-present); Senior Managing Director, Guggenheim Investments (2012-present). Vice President, Guggenheim Funds Distributors, LLC (2014-present). Former: Chief Compliance Officer, Security Investors, LLC and Guggenheim Funds Investment Advisors, LLC (2012-2018); Chief Compliance Officer, Guggenheim Distributors, LLC (2009-2014); Senior Manager, Security Investors, LLC (2004-2014); Senior Manager, Guggenheim Distributors, LLC (2004-2014). |
Margaux Misantone (1978) | AML Officer | Since 2017 | Current: Chief Compliance Officer, Security Investors, LLC and Guggenheim Funds Investment Advisors, LLC (2018-present); AML Officer, Security Investors, LLC and certain other funds in the Fund Complex (2017-present); Managing Director, Guggenheim Investments (2015-present). Former: Assistant Chief Compliance Officer, Security Investors, LLC and Guggenheim Funds Investments Advisors, LLC (2015-2018). |
William Rehder (1967) | Assistant Vice President | Since 2018 | Current: Managing Director, Guggenheim Investments (2002-present). |
| | THE GUGGENHEIM FUNDS SEMI-ANNUAL REPORT | 123 |
INFORMATION ON BOARD OF TRUSTEES AND OFFICERS (Unaudited)(concluded) |
Name, Address*
and Year of Birth | Position(s)
Held with
Trust | Term of Office
and Length of
Time Served** | Principal Occupation(s)
During Past Five Years |
OFFICERS - concluded | |
Kimberly J. Scott (1974) | Assistant Treasurer | Since 2014 | Current: Director, Guggenheim Investments (2012-present); Assistant Treasurer, certain other funds in the Fund Complex (2012-present). Former: Financial Reporting Manager, Invesco, Ltd. (2010-2011); Vice President/Assistant Treasurer, Mutual Fund Administration for Van Kampen Investments, Inc./Morgan Stanley Investment Management (2009-2010); Manager of Mutual Fund Administration, Van Kampen Investments, Inc./Morgan Stanley Investment Management (2005-2009). |
Bryan Stone (1979) | Vice President | Since 2014 | Current: Vice President, certain other funds in the Fund Complex (2014-present); Managing Director, Guggenheim Investments (2013-present). Former: Senior Vice President, Neuberger Berman Group LLC (2009-2013); Vice President, Morgan Stanley (2002-2009). |
John L. Sullivan (1955) | Chief Financial Officer, Chief Accounting Officer and Treasurer | Since 2014 | Current: Chief Financial Officer, Chief Accounting Officer and Treasurer, certain other funds in the Fund Complex (2010-present); Senior Managing Director, Guggenheim Investments (2010-present). Former: Managing Director and Chief Compliance Officer, each of the funds in the Van Kampen Investments fund complex (2004-2010); Managing Director and Head of Fund Accounting and Administration, Morgan Stanley Investment Management (2002-2004); Chief Financial Officer and Treasurer, Van Kampen Funds (1996-2004). |
Jon Szafran (1989) | Assistant Treasurer | Since 2017 | Current: Vice President, Guggenheim Investments (2017-present); Assistant Treasurer, certain other funds in the Fund Complex (2017-present). Former: Assistant Treasurer of Henderson Global Funds and Manager of US Fund Administration, Henderson Global Investors (North America) Inc. (“HGINA”), (2017); Senior Analyst of US Fund Administration, HGINA (2014–2017); Senior Associate of Fund Administration, Cortland Capital Market Services, LLC (2013-2014); Experienced Associate, PricewaterhouseCoopers LLP (2012-2013). |
* | The business address of each officer is c/o Guggenheim Investments, 227 West Monroe Street, Chicago, Illinois 60606. |
** | Each officer serves an indefinite term, until his or her successor is duly elected and qualified. |
124 | THE GUGGENHEIM FUNDS SEMI-ANNUAL REPORT | |
GUGGENHEIM INVESTMENTS PRIVACY NOTICE (Unaudited) |
Who We Are
This Privacy Notice describes the data protection practices of Guggenheim Investments. Guggenheim Investments as used herein refers to the affiliated investment management businesses of Guggenheim Partners, LLC: Guggenheim Funds Investment Advisors, LLC, Guggenheim Partners Investment Management, LLC, Guggenheim Funds Distributors, LLC, Security Investors, LLC, Guggenheim Investment Advisors (Europe) Limited, Guggenheim Real Estate, LLC, GS Gamma Advisors, LLC, Guggenheim Partners India Management, LLC, Guggenheim Partners Europe Limited, as well as the funds in the Guggenheim Funds complex (the “Funds”) (“Guggenheim Investments,” “we,” “us,” or “our”).
Guggenheim Partners Investment Management Holdings, LLC, located at 330 Madison Avenue, New York, New York 10017 is the data controller for your information. The affiliates who are also controllers of certain of your information are: Guggenheim Investment Advisors (Europe) Limited, Guggenheim Partners Europe Limited, Guggenheim Partners, LLC, Guggenheim Funds Investment Advisors, LLC, Guggenheim Partners Investment Management, LLC, Guggenheim Funds Distributors, LLC and Security Investors, LLC, as well as the Funds.
Our Commitment to You
Guggenheim Investments considers your privacy our utmost concern. When you become our client or investor, you entrust us with not only your hard-earned money but also with your personal and financial information. Because we have access to your private information, we hold ourselves to the highest standards in its safekeeping and use. We strictly limit how we share your information with others, whether you are a current or former Guggenheim Investments client or investor.
The Information We Collect About You
We collect certain nonpublic personal information about you from information you provide on applications, other forms, our website, and/or from third parties including investment advisors. This information includes Social Security or other tax identification number, assets, income, tax information, retirement and estate plan information, transaction history, account balance, payment history, bank account information, marital status, family relationships, information that we collect on our website through the use of “cookies,” and other personal information that you or others provide to us. We may also collect such information through your inquiries by mail, e-mail or telephone. We may also collect customer due diligence information, as required by applicable law and regulation, through third party service providers.
How We Handle Your Personal Information
The legal basis for using your information as set out in this Privacy Notice is as follows: (a) use of your personal data is necessary to perform our obligations under any contract with you (such as a contract for us to provide financial services to you); or (b) where use of your personal data is not necessary for performance of a contract, use of your personal data is necessary for our legitimate interests or the legitimate interests of others (for example, to enforce the legal terms governing our services, operate and market our website and other services we offer, ensure safe environments for our personnel and others, make and receive payments, prevent fraud and to know the customer to whom we are providing the services). Some processing is done to comply with applicable law.
In addition to the specific uses described above, we also use your information in the following manner:
| | ● | We use your information in connection with servicing your accounts. |
| | ● | We use information to respond to your requests or questions. For example, we might use your information to respond to your customer feedback. |
| | ● | We use information to improve our products and services. We may use your information to make our website and products better. We may use your information to customize your experience with us. |
| | ● | We use information for security purposes. We may use your information to protect our company and our customers. |
| | ● | We use information to communicate with you. For example, we will communicate with you about your account or our relationship. We may contact you about your feedback. We might also contact you about this Privacy Notice. We may also enroll you in our email newsletter. |
| | THE GUGGENHEIM FUNDS SEMI-ANNUAL REPORT | 125 |
GUGGENHEIM INVESTMENTS PRIVACY NOTICE (Unaudited)(continued) |
| | ● | We use information as otherwise permitted by law, as we may notify you. |
| | ● | Aggregate/Anonymous Data. We may aggregate and/or anonymize any information collected through the website so that such information can no longer be linked to you or your device (“Aggregate/Anonymous Information”). We may use Aggregate/Anonymous Information for any purpose, including without limitation for research and marketing purposes, and may also share such data with any third parties, including advertisers, promotional partners, and sponsors. |
We do not sell information about current or former clients or their accounts to third parties. Nor do we share this information, except when necessary to complete transactions at your request, to make you aware of investment products and services that we or our affiliates offer, or as permitted or required by law.
We provide information about you to companies and individuals not affiliated with Guggenheim Investments to complete certain transactions or account changes, or to perform services for us related to your account. For example, if you ask to transfer assets from another financial institution to Guggenheim Investments, we must provide certain information about you to that company to complete the transaction. We provide the third party with only the information necessary to carry out its responsibilities and only for that purpose. And we require these third parties to treat your private information with the same high degree of confidentiality that we do. To alert you to other Guggenheim Investments products and services, we share your information within our family of affiliated companies. You may limit our sharing with affiliated companies as set out below. We may also share information with any successor to all or part of our business, or in connection with steps leading up to a merger or acquisition. For example, if part of our business was sold we may give customer information as part of that transaction. We may also share information about you with your consent.
We will release information about you if you direct us to do so, if we are compelled by law to do so, or in other circumstances as permitted by law (for example, to protect your account from fraud).
If you close your account(s) or become an inactive client or investor, we will continue to adhere to the privacy policies and practices described in this notice.
Opt-Out Provisions and Your Data Choices
The law allows you to “opt out” of certain kinds of information sharing with third parties. We do not share personal information about you with any third parties that triggers this opt-out right. This means YOU ARE ALREADY OPTED OUT.
When you are no longer our client or investor, we continue to share your information as described in this notice, and you may contact us at any time to limit our sharing by sending an email to CorporateDataPrivacy@GuggenheimPartners.com.
European Union Data Subjects and certain others: In addition to the choices set forth above, residents of the European Union and certain other jurisdictions have certain rights to (1) request access to or rectification or deletion of information we collect about them, (2) request a restriction on the processing of their information, (3) object to the processing of their information, or (4) request the portability of certain information. To exercise these or other rights, please contact us using the contact information below. We will consider all requests and provide our response within the time period stated by applicable law. Please note, however, that certain information may be exempt from such requests in some circumstances, which may include if we need to keep processing your information for our legitimate interests or to comply with a legal obligation. We may request you provide us with information necessary to confirm your identity before responding to your request.
Residents of France and certain other jurisdictions may also provide us with instructions regarding the manner in which we may continue to store, erase and share your information after your death, and where applicable, the person you have designated to exercise these rights after your death.
How We Protect Privacy Online
We take steps to protect your privacy when you use our web site – www.guggenheiminvestments.com – by using secure forms of online communication, including encryption technology, Secure Socket Layer (SSL) protocol, firewalls and user names and passwords. These safeguards vary based on the sensitivity of the information that we collect and store. However, we cannot and do not guarantee that these measures will prevent every unauthorized attempt to access, use, or disclose your information since despite our efforts, no Internet and/or other
126 | THE GUGGENHEIM FUNDS SEMI-ANNUAL REPORT | |
GUGGENHEIM INVESTMENTS PRIVACY NOTICE (Unaudited)(concluded) |
electronic transmissions can be completely secure. Our web site uses “http cookies”—tiny pieces of information that we ask your browser to store. We use cookies for session management and security features on the Guggenheim Investments web site. We do not use them to pull data from your hard drive, to learn your e-mail address, or to view data in cookies created by other web sites. We will not share the information in our cookies or give others access to it. See the legal information area on our web site for more details about web site security and privacy features.
How We Safeguard Your Personal Information and Data Retention
We restrict access to nonpublic personal information about you to our employees and in some cases to third parties (for example, the service providers described above) as permitted by law. We maintain strict physical, electronic and procedural safeguards that comply with federal standards to guard your nonpublic personal information.
We keep your information for no longer than necessary for the purposes for which it is processed. The length of time for which we retain information depends on the purposes for which we collected and use it and/or as required to comply with applicable laws. Information may persist in copies made for backup and business continuity purposes for additional time.
International Visitors
If you are not a resident of the United States, please be aware that your information may be transferred to, stored and processed in the United States where our servers are located and our databases are operated. The data protection and other laws of the United States and other countries might not be as comprehensive as those in your country.
In such cases, we ensure that a legal basis for such a transfer exists and that adequate protection is provided as required by applicable law, for example, by using standard contractual clauses or by transferring your data to a jurisdiction that has obtained an adequacy finding. Individuals whose data may be transferred on the basis of standard contractual clauses may contact us as described below.
We’ll Keep You Informed
If you have any questions or concerns about how we treat your personal data, we encourage you to consult with us first. You may also contact the relevant supervisory authority.
We reserve the right to modify this policy at any time and will inform you promptly of material changes. You may access our privacy policy from our web site at www.guggenheiminvestments.com. Should you have any questions regarding our privacy policy, contact us by email at CorporateDataPrivacy@GuggenheimPartners.com.
| | THE GUGGENHEIM FUNDS SEMI-ANNUAL REPORT | 127 |
This page intentionally left blank.
This page intentionally left blank.
This page intentionally left blank.
This page intentionally left blank.
This page intentionally left blank.
This page intentionally left blank.
3.31.2020
Guggenheim Funds Semi-Annual Report
| |
Guggenheim Diversified Income Fund | | |
Guggenheim High Yield Fund | | |
Guggenheim Investment Grade Bond Fund | | |
Guggenheim Municipal Income Fund | | |
Beginning on January 1, 2021, paper copies of the Funds’ annual and semi-annual shareholder reports may no longer be sent by mail, unless you specifically request paper copies of the reports from a fund or from your financial intermediary. Instead, the reports will be made available on a website, and you will be notified by mail each time a report is posted and provided with a website link to access the report.
If you already elected to receive shareholder reports electronically, you will not be affected by this change and you need not take any action. At any time, you may elect to receive reports and other communications from a fund electronically by calling 800.820.0888, going to GuggenheimInvestments.com/myaccount, or by contacting your financial intermediary.
You may elect to receive all future shareholder reports in paper free of charge. If you hold shares of a fund directly, you can inform the Fund that you wish to receive paper copies of reports by calling 800.820.0888. If you hold shares of a fund through a financial intermediary, please contact the financial intermediary to make this election. Your election to receive reports in paper will apply to all Guggenheim Funds in which you are invested and may apply to all funds held with your financial intermediary.
GuggenheimInvestments.com | SBINC-SEMI-0320x0920 |

| | |
DEAR SHAREHOLDER | 2 |
ECONOMIC AND MARKET OVERVIEW | 4 |
ABOUT SHAREHOLDERS’ FUND EXPENSES | 6 |
DIVERSIFIED INCOME FUND | 9 |
HIGH YIELD FUND | 19 |
INVESTMENT GRADE BOND FUND | 38 |
MUNICIPAL INCOME FUND | 63 |
NOTES TO FINANCIAL STATEMENTS | 77 |
OTHER INFORMATION | 96 |
INFORMATION ON BOARD OF TRUSTEES AND OFFICERS | 97 |
GUGGENHEIM INVESTMENTS PRIVACY NOTICE | 102 |
| | THE GUGGENHEIM FUNDS SEMI-ANNUAL REPORT | 1 |
Dear Shareholder:
The six-month period ended March 31, 2020, concluded on a somber note. Even though markets performed well for most of the period, the emergence of a novel and highly contagious form of coronavirus in the last weeks of the period adversely impacted global commercial activity and contributed to significant volatility in certain markets, unseen since the great recession of 2008.
As it spread beyond Asia to virtually every country in the world, many governments and businesses instituted quarantines and closures, which has resulted in significant disruption in manufacturing, supply chains, consumer demand and economic activity. The U.S. Federal Reserve responded quickly to provide liquidity in order to ensure that the U.S. markets continued to function efficiently. The fiscal policy included a spending bill worth over $2 trillion to assist consumers, states, small businesses and certain industries. While these actions helped stabilize the market, volatile conditions continued into April.
As discussed in this shareholder report, these events have affected performance of many of our funds (the “Fund” or “Funds”). We encourage you to read the Economic and Market Overview section of the report, which follows this letter.
Security Investors, LLC and Guggenheim Partners Investment Management, LLC (“GPIM”) (together, “Investment Advisers”), serve as the investment advisers to the Funds. The Investment Advisers are affiliates of Guggenheim Partners, LLC (“Guggenheim”), a global, diversified financial services firm. Guggenheim Funds Distributors, LLC serves as the distributor to the Funds and is also an affiliate of Guggenheim.
Together, we are committed to the safety and prosperity of our clients, our employees, and our shareholders. The resources of the firm are being made fully available not only to support our clients, but also to support our employees and their families.
Please practice the appropriate prudence for the protection not only of your health and that of your friends and loved ones but also for our neighbors and communities. Thank you for the trust you place in us.
Sincerely,
Guggenheim Partners Investment Management, LLC
Security Investors, LLC
April 30, 2020
Read a prospectus and summary prospectus (if available) carefully before investing. It contains the investment objectives, risks, charges, expenses and other information, which should be considered carefully before investing. Obtain a prospectus and summary prospectus (if available) at guggenheiminvestments.com or call 800.820.0888.
This material is not intended as a recommendation or as investment advice of any kind, including in connection with rollovers, transfers, and distributions. Such material is not provided in a fiduciary capacity, may not be relied upon for or in connection with the making of investment decisions, and does not constitute a solicitation of an offer to buy or sell securities. All content has been provided for informational or educational purposes only and is not intended to be and should not be construed as legal or tax advice and/or a legal opinion. Always consult a financial, tax and/or legal professional regarding your specific situation.
The global ongoing crisis caused by the outbreak of COVID-19 is causing materially reduced consumer demand and economic output, disrupting supply chains, resulting in market closures, travel restrictions and quarantines, and adversely impacting local and global economies. Investors should be aware that in light of the current uncertainty, volatility and distress in economies, financial markets, and labor and health conditions all over the world, the Funds’ investments and a shareholder’s investment in a Fund are subject to sudden and substantial losses, increased volatility and other adverse events. Firms through which investors invest with the Funds, the Funds, their service providers, the markets in which they invest and market intermediaries are also impacted by quarantines and similar measures intended to contain the ongoing pandemic, which can obstruct their functioning and subject them to heightened operational risks.
Diversified Income Fund may not be suitable for all investors. ● The Fund’s market value will change in response to interest rate changes and market conditions among other factors. In general, bond prices rise when interest rates fall and vice versa. ● The Fund’s exposure to high yield securities may subject the Fund to greater volatility. ● Derivatives may pose risks in addition to and greater than those associated with investing directly in securities or other investments, including risks relating to leverage, imperfect correlations with underlying investments or the Fund’s other portfolio holdings, high price volatility, lack of availability, counterparty credit, liquidity, valuation and legal restrictions. ● Stock prices, especially stock prices of smaller companies, can be volatile as they reflect changes in the issuing company’s financial conditions and changes in the overall market ● Some asset-backed securities, including mortgage-backed securities, may have structures that make their reaction to interest rates and other factors difficult to predict, making their prices very volatile and they are subject to liquidity risk.● The Fund’s investments in other investment vehicles subject the Fund to those risks and expenses affecting the investment vehicle. ● The Fund’s investments in foreign securities carry additional risks when compared to U.S. securities, due to the impact of diplomatic, political or economic developments in the country in question (investments in emerging markets securities are generally subject to an
2 | THE GUGGENHEIM FUNDS SEMI-ANNUAL REPORT | |
even greater level of risk). ● Investments in syndicated bank loans generally offer a floating interest rate and involve special types of risks. ● Master limited partnerships (“MLPs”) are subject to certain risks inherent in the structure of MLPs, including tax risks, limited control and voting rights and potential conflicts of interest. MLPs that concentrate in a particular industry or a particular geographic region are subject to risks associated with such industry or region. ● The Fund’s investments in real estate securities subject the Fund to the same risks as direct investments in real estate, which is particularly sensitive to economic downturns. ● The Fund’s investments and investment strategies, including investments in MLPs and certain investment vehicles, may be subject to special and complex federal income tax provisions that may adversely affect the Fund and its distributions to shareholders. ● Leveraging will exaggerate the effect on NAV of any increase or decrease in the market value of the Fund’s portfolio. ● Please read the prospectus for more detailed information regarding these and other risks.
High Yield Fund may not be suitable for all investors. ● The Fund’s market value will change in response to interest rate changes and market conditions among other factors. In general, bond prices rise when interest rates fall and vice versa. ● The Fund’s exposure to high yield securities may subject the Fund to greater volatility. ● The Fund may invest in derivative instruments, which may be more volatile and less liquid, increasing the risk of loss when compared to traditional securities. Certain of the derivative instruments are also subject to the risks of counterparty default and adverse tax treatment. ●The Fund’s use of leverage, through borrowings or instruments such as derivatives, may cause the Fund to be more volatile than if it had not been leveraged. ● Instruments and strategies (such as borrowing transactions and reverse repurchase agreements) may provide leveraged exposure to a particular investment, which will magnify any gains or losses on those investments. ● The Fund may invest in foreign securities which carry additional risks when compared to U.S. securities, due to the impact of diplomatic, political, or economic developments in the country in question (investments in emerging markets securities are generally subject to an even greater level of risk). ● Investments in syndicated bank loans generally offer a floating interest rate and involve special types of risks. ● The Fund’s investments in other investment vehicles subject the Fund to those risks and expenses affecting the investment vehicle. ● The Fund’s investments in restricted securities may involve financial and liquidity risk. ● You may have a gain or loss when you sell your shares. ● It is important to note that the Fund is not guaranteed by the U.S. government. ● Please read the prospectus for more detailed information regarding these and other risks.
Investment Grade Bond Fund may not be suitable for all investors. ● The Fund’s market value will change in response to interest rate changes and market conditions among other factors. In general, bond prices rise when interest rates fall and vice versa. ● The Fund’s exposure to high yield securities may subject the Fund to greater volatility. ● When market conditions are deemed appropriate, the Fund may use leverage to the full extent permitted by its investment policies and restrictions and applicable law. Leveraging will exaggerate the effect on net asset value of any increase or decrease in the market value of the Fund’s portfolio. ● The Fund may invest in derivative instruments, which may be more volatile and less liquid, increasing the risk of loss when compared to traditional securities. Certain of the derivative instruments are also subject to the risks of counterparty default and adverse tax treatment. ● Instruments and strategies (such as borrowing transactions and reverse repurchase agreements) may provide leveraged exposure to a particular investment, which will magnify any gains or losses on those investments. ● Investments in reverse repurchase agreements expose the Fund to the many of the same risks as investments in derivatives. ● The Fund’s investments in other investment vehicles subject the Fund to those risks and expenses affecting the investment vehicle. ● The Fund’s investments in foreign securities carry additional risks when compared to U.S. securities, due to the impact of diplomatic, political or economic developments in the country in question (investments in emerging markets securities are generally subject to an even greater level of risk). ● Investments in syndicated bank loans generally offer a floating interest rate and involve special types of risks. ● The Fund’s investments in municipal securities can be affected by events that affect the municipal bond market. ● The Fund’s investments in real estate securities subject the Fund to the same risks as direct investments in real estate, which is particularly sensitive to economic downturns. ● The Fund’s investments in restricted securities may involve financial and liquidity risk. ● You may have a gain or loss when you sell your shares. ● It is important to note that the Fund is not guaranteed by the U.S. government. ● Please read the prospectus for more detailed information regarding these and other risks.
Municipal Income Fund may not be suitable for all investors. ● The Fund will be significantly affected by events that affect the municipal bond market, which could include unfavorable legislative or political developments and adverse changes in the financial conditions of state and municipal issuers or the federal government in case it provides financial support to the municipality. Income from municipal bonds held by the Fund could be declared taxable because of changes in tax laws. The Fund may invest in securities that generate taxable income. A portion of the Fund’s otherwise tax-exempt dividends may be taxable to those shareholders subject to the alternative minimum tax. ● Certain sectors of the municipal bond market have special risks that can affect them more significantly than the market as a whole. Because many municipal instruments are issued to finance similar projects, conditions in these industries can significantly affect the Fund and the overall municipal market. ● Municipalities currently experience budget shortfalls, which could cause them to default on their debt and thus subject the Fund to unforeseen losses. ● Like other funds that hold bonds and other fixed-income investments, the Fund’s market value will change in response to interest rate changes and market conditions, among other factors. In general, bond prices rise when interest rates fall and vice versa. ● The Fund’s exposure to high-yield securities may subject the Fund to greater volatility. ● When market conditions are deemed appropriate, the Fund will leverage to the full extent permitted by its investment policies and restrictions and applicable law. Leveraging will exaggerate the effect on net asset value of any increase or decrease in the market value of the Fund’s portfolio. ● The Fund may invest in derivative instruments, which may be more volatile and less liquid, increasing the risk of loss when compared to traditional securities. Certain of the derivative instruments are also subject to the risks of counterparty default and adverse tax treatment. ●Instruments and strategies (such as reverse repurchase agreements, unfunded commitments, tender option bonds, and borrowings) may expose the Fund to many of the same risks as investments in derivatives and may provide leveraged exposure to a particular investment, which will magnify any gains or losses on those investments. ● The Fund’s investments in other investment vehicles subject the Fund to those risks and expenses affecting the investment vehicle. ● The Fund’s investments in foreign securities carry additional risks when compared to U.S. securities, due to the impact of diplomatic, political, or economic developments in the country in question (investments in emerging markets securities are generally subject to an even greater level of risk). ● Investments in syndicated bank loans generally offer a floating interest rate and involve special types of risks. ● The Fund is subject to active trading risks that may increase volatility and impact its ability to achieve its investment objective. ● You may have a gain or loss when you sell your shares. ● It is important to note that the Fund is not guaranteed by the U.S. government. ● Please read the prospectus for more detailed information regarding these and other risks.
| | THE GUGGENHEIM FUNDS SEMI-ANNUAL REPORT | 3 |
ECONOMIC AND MARKET OVERVIEW (Unaudited) | March 31, 2020 |
The six-month period ended March 31, 2020, was a wild ride for markets. While the U.S. economy was generally in good shape in 2019, recessionary fears rose throughout the year, prompting the U.S. Federal Reserve (the “Fed”) to announce a rate cut on July 31, the first since 2008, amid growing downside risks to policymakers’ baseline growth and inflation forecasts. Key among those risks were slowing global growth, the threat of additional U.S.-China tariffs, and the possible ramifications surrounding Brexit. The Fed subsequently cut rates twice more in 2019, which caused markets to rally toward the end of the year and into early 2020. Stocks reached new highs and credit spreads tightened to historic levels. Since then, the global outbreak of the coronavirus, COVID-19, has been at the center of everything. As of this writing, COVID-19 has spread to 210 countries, resulted in over 2.5 million cases, and caused over 170,000 deaths. Thus far, the U.S. makes up more than 30% of global cases, and 25% of global deaths. States have required the labor force to work from home if possible, individuals to practice social distancing, and non-essential businesses to shut down.
Closures, quarantines, and social distancing efforts have impacted the travel, hospitality, restaurants, and retail industries, with activity down 100% in some areas of the country. Further exacerbating the decline in output will be reduced business investment, which was already stalling due to falling profits, trade conflicts, and political uncertainty. The coronavirus shock and collapse in oil prices will likely further depress capital expenditures.
In response to the crisis, the Federal Open Market Committee cut rates by a further 125 basis points in the first quarter of 2020 and passed a series of stimulus programs. Among these were the Primary and Secondary Market Corporate Credit Facilities, which are lending programs primarily targeting investment-grade corporate bond issuers, implemented in concert with the U.S. Treasury. It was only after the announcement of this program that corporate credit found some relief from the selloff, but we expect this relief may be temporary.
With an alphabet soup of monetary programs targeting relief from the coronavirus impact, fiscal policy has also stepped up to the plate with a spending bill worth over $2 trillion that aims to assist consumers, states, small businesses, and certain industries. There is no question that these programs will help ease the economic fallout from virus containment measures, but even $2 trillion may be too small given the magnitude of the economic shock that we are facing. Additionally, it is far from clear that fiscal measures are an adequate solution to the issue at hand: the physical impediment to consumer spending. Fiscal and monetary policy can do their part, but ultimately it is public health policy that will likely be the greatest determinant of the economic outlook.
For the six months ended March 31, 2020, the Standard & Poor’s 500® (“S&P 500”) Index* returned -12.31%. The decline, while significant, represents something of a recovery in stocks. The S&P 500 peaked at 3,386.15 on February 19, 2020, before plummeting 33.9% to a low of 2,237.40 on March 23, 2020, then recovering some lost ground by the end of the month.
The consensus estimate for S&P 500 earnings per share in 2020 is still around $150. Our research shows S&P 500 earnings per share could fall below $100. Similarly, economists have no way to calibrate how bad the economic data could be based on history. The March U.S. non-farm payrolls report was evidence of this, as it showed a decline in payrolls of 700,000 jobs versus survey expectations of a decline of only 100,000 jobs. We currently expect that second quarter U.S. real gross domestic product (“GDP”) quarter-over-quarter growth could fall by 40% annualized and the unemployment rate could rise to at least 20%. Beyond that, the severity of the crisis depends on containment of the virus and the effectiveness of social distancing measures put in place, but expectations for a quick and sustained V-shaped recovery appear overly optimistic.
For the six months ended March 31, 2020, the MSCI Europe-Australasia-Far East (“EAFE”) Index* returned -16.37%. The return of the MSCI Emerging Markets Index* was -14.45%.
In the bond market, the Bloomberg Barclays U.S. Aggregate Bond Index* posted a 3.33% return for the six-month period, while the Bloomberg Barclays U.S. Corporate High Yield Index* returned -10.40%. The return of the ICE Bank of America (“BofA”) Merrill Lynch 3-Month U.S. Treasury Bill Index* was 1.04% for the six-month period.
The opinions and forecasts expressed may not actually come to pass. This information is subject to change at any time, based on market and other conditions, and should not be construed as a recommendation of any specific security or strategy.
4 | THE GUGGENHEIM FUNDS SEMI-ANNUAL REPORT | |
ECONOMIC AND MARKET OVERVIEW (Unaudited)(concluded) | March 31, 2020 |
*Index Definitions:
The following indices are referenced throughout this report. Indices are unmanaged and not available for direct investment. Index performance does not reflect transaction costs, fees, or expenses.
Bloomberg Barclays Municipal Bond Index is a broad market performance benchmark for the tax-exempt bond market. The bonds included in this index must have a minimum credit rating of at least Baa.
Bloomberg Barclays U.S. Aggregate Bond Index is a broad-based flagship benchmark that measures the investment grade, U.S. dollar-denominated, fixed-rate taxable bond market, including U.S. Treasuries, government-related and corporate securities, mortgage-backed securities or “MBS” (agency fixed-rate and hybrid adjustable-rate mortgage, or “ARM”, pass-throughs), asset-backed securities (“ABS”), and commercial mortgage-backed securities (“CMBS”) (agency and non-agency).
Bloomberg Barclays U.S. Corporate High Yield Index measures the U.S. dollar-denominated, high yield, fixed-rate corporate bond market. Securities are classified as high yield if the middle rating of Moody’s, Fitch, and S&P is Ba1/BB +/BB + or below.
ICE BofA Merrill Lynch 3-Month U.S. Treasury Bill Index is an unmanaged market index of U.S. Treasury securities maturing in 90 days that assumes reinvestment of all income.
MSCI EAFE Index is a free float-adjusted market capitalization index that is designed to measure the equity market performance of developed markets, excluding the U.S. & Canada.
MSCI Emerging Markets Index is a free float-adjusted market capitalization weighted index that is designed to measure equity market performance in the global emerging markets.
S&P 500® is a broad-based index, the performance of which is based on the performance of 500 widely held common stocks chosen for market size, liquidity, and industry group representation.
| | THE GUGGENHEIM FUNDS SEMI-ANNUAL REPORT | 5 |
ABOUT SHAREHOLDERS’ FUND EXPENSES (Unaudited) | |
All mutual funds have operating expenses, and it is important for our shareholders to understand the impact of costs on their investments. Shareholders of a fund incur two types of costs: (i) transaction costs, including sales charges (loads) on purchase payments, reinvested dividends, other distributions, and exchange fees, and (ii) ongoing costs, including management fees, administrative services, and shareholder reports, among others. These ongoing costs, or operating expenses, are deducted from a fund’s gross income and reduce the investment return of the fund.
A fund’s expenses are expressed as a percentage of its average net assets, which is known as the expense ratio. The following examples are intended to help investors understand the ongoing costs (in dollars) of investing in a fund and to compare these costs with the ongoing costs of investing in other mutual funds.
The examples are based on an investment of $1,000 made at the beginning of the period and held for the entire six-month period beginning September 30, 2019 and ending March 31, 2020.
The following tables illustrate the Funds’ costs in two ways:
Table 1. Based on actual Fund return: This section helps investors estimate the actual expenses paid over the period. The “Ending Account Value” shown is derived from the Fund’s actual return, and the fifth column shows the dollar amount that would have been paid by an investor who started with $1,000 in the Fund. Investors may use the information here, together with the amount invested, to estimate the expenses paid over the period. Simply divide the Fund’s account value by $1,000 (for example, an $8,600 account value divided by $1,000 = 8.6), then multiply the result by the number provided under the heading “Expenses Paid During Period.”
Table 2. Based on hypothetical 5% return: This section is intended to help investors compare a fund’s cost with those of other mutual funds. The table provides information about hypothetical account values and hypothetical expenses based on the Fund’s actual expense ratio and an assumed rate of return of 5% per year before expenses, which is not the Fund’s actual return. The hypothetical account values and expenses may not be used to estimate the actual ending account balance or expenses paid during the period. The example is useful in making comparisons because the U.S. Securities and Exchange Commission (the “SEC”) requires all mutual funds to calculate expenses based on the 5% return. Investors can assess a fund’s costs by comparing this hypothetical example with the hypothetical examples that appear in shareholder reports of other funds.
The calculations illustrated above assume no shares were bought or sold during the period. Actual costs may have been higher or lower, depending on the amount of investment and the timing of any purchases or redemptions.
Please note that the expenses shown in the table are meant to highlight your ongoing costs only and do not reflect any transactional costs, such as sales charges (loads) on purchase payments, and contingent deferred sales charges (“CDSC”) on redemptions, if any. Therefore, the second table is useful in comparing ongoing costs only, and will not help you determine the relative total costs of owning different funds. In addition, if these transactional costs were included, your costs would have been higher.
More information about the Funds’ expenses, including annual expense ratios for periods up to five years (subject to the Fund’s inception date), can be found in the Financial Highlights section of this report. For additional information on operating expenses and other shareholder costs, please refer to the appropriate Fund prospectus.
6 | THE GUGGENHEIM FUNDS SEMI-ANNUAL REPORT | |
ABOUT SHAREHOLDERS’ FUND EXPENSES (Unaudited)(continued) | |
| Expense
Ratio1 | Fund
Return | Beginning
Account Value
September 30, 2019 | Ending
Account Value
March 31, 2020 | Expenses
Paid During
Period2 |
Table 1. Based on actual Fund return3 | | | | | |
Diversified Income Fund | | | | | |
A-Class | 0.85% | (10.92%) | $ 1,000.00 | $ 890.80 | $ 4.02 |
C-Class | 1.58% | (11.22%) | 1,000.00 | 887.80 | 7.46 |
P-Class | 0.85% | (10.91%) | 1,000.00 | 890.90 | 4.02 |
Institutional Class | 0.60% | (10.78%) | 1,000.00 | 892.20 | 2.84 |
High Yield Fund | | | | | |
A-Class | 1.29% | (12.26%) | 1,000.00 | 877.40 | 6.05 |
C-Class | 2.04% | (12.56%) | 1,000.00 | 874.40 | 9.56 |
P-Class | 1.29% | (12.25%) | 1,000.00 | 877.50 | 6.05 |
Institutional Class | 1.03% | (12.02%) | 1,000.00 | 879.80 | 4.84 |
R6-Class | 0.90% | (12.11%) | 1,000.00 | 878.90 | 4.23 |
Investment Grade Bond Fund | | | | | |
A-Class | 0.80% | 2.37% | 1,000.00 | 1,023.70 | 4.05 |
C-Class | 1.55% | 2.00% | 1,000.00 | 1,020.00 | 7.83 |
P-Class | 0.80% | 2.37% | 1,000.00 | 1,023.70 | 4.05 |
Institutional Class | 0.51% | 2.57% | 1,000.00 | 1,025.70 | 2.58 |
Municipal Income Fund | | | | | |
A-Class | 0.81% | (0.36%) | 1,000.00 | 996.40 | 4.04 |
C-Class | 1.56% | (0.73%) | 1,000.00 | 992.70 | 7.77 |
P-Class | 0.81% | (0.52%) | 1,000.00 | 994.80 | 4.04 |
Institutional Class | 0.56% | (0.31%) | 1,000.00 | 996.90 | 2.80 |
| | THE GUGGENHEIM FUNDS SEMI-ANNUAL REPORT | 7 |
ABOUT SHAREHOLDERS’ FUND EXPENSES (Unaudited)(concluded) | |
| Expense
Ratio1 | Fund
Return | Beginning
Account Value
September 30, 2019 | Ending
Account Value
March 31, 2020 | Expenses
Paid During
Period2 |
Table 2. Based on hypothetical 5% return (before expenses) | | | |
Diversified Income Fund | | | | | |
A-Class | 0.85% | 5.00% | $ 1,000.00 | $ 1,020.75 | $ 4.29 |
C-Class | 1.58% | 5.00% | 1,000.00 | 1,017.10 | 7.97 |
P-Class | 0.85% | 5.00% | 1,000.00 | 1,020.75 | 4.29 |
Institutional Class | 0.60% | 5.00% | 1,000.00 | 1,022.00 | 3.03 |
High Yield Fund | | | | | |
A-Class | 1.29% | 5.00% | 1,000.00 | 1,018.55 | 6.51 |
C-Class | 2.04% | 5.00% | 1,000.00 | 1,014.80 | 10.28 |
P-Class | 1.29% | 5.00% | 1,000.00 | 1,018.55 | 6.51 |
Institutional Class | 1.03% | 5.00% | 1,000.00 | 1,019.85 | 5.20 |
R6-Class | 0.90% | 5.00% | 1,000.00 | 1,020.50 | 4.55 |
Investment Grade Bond Fund | | | | | |
A-Class | 0.80% | 5.00% | 1,000.00 | 1,021.00 | 4.04 |
C-Class | 1.55% | 5.00% | 1,000.00 | 1,017.25 | 7.82 |
P-Class | 0.80% | 5.00% | 1,000.00 | 1,021.00 | 4.04 |
Institutional Class | 0.51% | 5.00% | 1,000.00 | 1,022.45 | 2.58 |
Municipal Income Fund | | | | | |
A-Class | 0.81% | 5.00% | 1,000.00 | 1,020.95 | 4.09 |
C-Class | 1.56% | 5.00% | 1,000.00 | 1,017.20 | 7.87 |
P-Class | 0.81% | 5.00% | 1,000.00 | 1,020.95 | 4.09 |
Institutional Class | 0.56% | 5.00% | 1,000.00 | 1,022.20 | 2.83 |
1 | Annualized and excludes expenses of the underlying funds in which the Funds invest, if any. This ratio represents net expenses, which may include expenses that are excluded from the expense limitation agreement. Excluding these expenses, the annualized net expense ratios for the period would be: |
| | | A-Class | C-Class | P-Class | Institutional
Class | R6-Class |
| | Diversified Income Fund | 0.83% | 1.58% | 0.82% | 0.58% | N/A |
| | High Yield Fund | 1.16% | 1.91% | 1.16% | 0.91% | 0.78% |
| | Investment Grade Bond Fund | 0.79% | 1.54% | 0.79% | 0.50% | N/A |
| | Municipal Income Fund | 0.80% | 1.55% | 0.80% | 0.55% | N/A |
2 | Expenses are equal to the Fund’s annualized expense ratio, net of any applicable fee waivers, multiplied by the average account value over the period, multiplied by 183/366 (to reflect the one-half year period). |
3 | Actual cumulative return at net asset value for the period September 30, 2019 to March 31, 2020. |
8 | THE GUGGENHEIM FUNDS SEMI-ANNUAL REPORT | |
PERFORMANCE REPORT AND FUND PROFILE (Unaudited) | March 31, 2020 |
DIVERSIFIED INCOME FUND
OBJECTIVE: Seeks to achieve high current income with consideration for capital appreciation.
Holdings Diversification (Market Exposure as % of Net Assets)
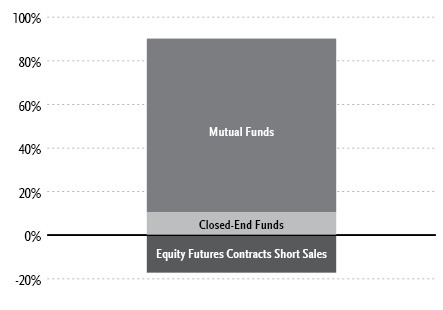
“Holdings Diversification (Market Exposure as % of Net Assets)” excludes any temporary cash investments or investments in Guggenheim Ultra Short Duration Fund.
Inception Dates: |
A-Class | January 29, 2016 |
C-Class | January 29, 2016 |
P-Class | January 29, 2016 |
Institutional Class | January 29, 2016 |
Ten Largest Holdings (% of Total Net Assets) |
Guggenheim Investment Grade Bond Fund — Institutional Class | 22.4% |
Guggenheim Floating Rate Strategies Fund — R6-Class | 15.7% |
Guggenheim High Yield Fund — R6-Class | 15.6% |
Guggenheim Risk Managed Real Estate Fund — Institutional Class | 10.8% |
Guggenheim RBP Dividend Fund — Institutional Class | 10.1% |
Guggenheim Ultra Short Duration Fund — Institutional Class | 7.1% |
Guggenheim World Equity Income Fund — Institutional Class | 5.1% |
John Hancock Premium Dividend Fund | 0.4% |
Neuberger Berman High Yield Strategies Fund, Inc. | 0.3% |
AllianzGI Diversified Income & Convertible Fund | 0.3% |
Top Ten Total | 87.8% |
| | |
“Ten Largest Holdings” excludes any temporary cash or derivative investments. |
| | THE GUGGENHEIM FUNDS SEMI-ANNUAL REPORT | 9 |
PERFORMANCE REPORT AND FUND PROFILE (Unaudited)(concluded) | March 31, 2020 |
Average Annual Returns*
Periods Ended March 31, 2020
| 6 Month† | 1 Year | Since
Inception
(01/29/16) |
A-Class Shares | (10.92%) | (7.26%) | 2.88% |
A-Class Shares with sales charge‡ | (14.47%) | (10.98%) | 1.88% |
C-Class Shares | (11.22%) | (7.95%) | 2.13% |
C-Class Shares with CDSC§ | (12.09%) | (8.84%) | 2.13% |
P-Class Shares | (10.91%) | (7.31%) | 2.87% |
Institutional Class Shares | (10.78%) | (7.04%) | 3.14% |
Bloomberg Barclays U.S. Aggregate Bond Index | 3.33% | 8.93% | 3.96% |
* | The performance data above represents past performance that is not predictive of future results. The investment return and principal value of an investment in the Fund will fluctuate so that an investor’s shares, when redeemed, may be worth more or less than their original cost. Returns are historical and include changes in principal and reinvested dividends and capital gains and do not reflect the effect of taxes. The Bloomberg Barclays U.S. Aggregate Bond Index is an unmanaged index and, unlike the Fund, has no management fees or operating expenses to reduce its reported return. |
† | 6 month returns are not annualized. |
‡ | Fund returns are calculated using the maximum sales charge of 4.00%. |
§ | Fund returns include a CDSC of 1% if redeemed within 12 months of purchase. |
10 | THE GUGGENHEIM FUNDS SEMI-ANNUAL REPORT | |
SCHEDULE OF INVESTMENTS (Unaudited) | March 31, 2020 |
DIVERSIFIED INCOME FUND | |
| | Shares | | | Value | |
MUTUAL FUNDS† - 86.8% |
Guggenheim Investment Grade Bond Fund — Institutional Class1 | | | 69,878 | | | $ | 1,340,257 | |
Guggenheim Floating Rate Strategies Fund — R6-Class1 | | | 43,415 | | | | 939,497 | |
Guggenheim High Yield Fund — R6-Class1 | | | 101,256 | | | | 937,627 | |
Guggenheim Risk Managed Real Estate Fund — Institutional Class1 | | | 22,864 | | | | 647,744 | |
Guggenheim RBP Dividend Fund — Institutional Class1 | | | 73,761 | | | | 605,581 | |
Guggenheim Ultra Short Duration Fund — Institutional Class1 | | | 43,600 | | | | 425,969 | |
Guggenheim World Equity Income Fund — Institutional Class1 | | | 25,240 | | | | 307,174 | |
Total Mutual Funds | | | | |
(Cost $5,595,462) | | | | | | | 5,203,849 | |
| | | | | | | | | |
CLOSED-END FUNDS† - 10.5% |
John Hancock Premium Dividend Fund | | | 1,750 | | | | 21,333 | |
Neuberger Berman High Yield Strategies Fund, Inc. | | | 2,113 | | | | 18,341 | |
AllianzGI Diversified Income & Convertible Fund | | | 1,000 | | | | 17,990 | |
Eaton Vance Tax-Managed Buy-Write Opportunities Fund | | | 1,470 | | | | 17,728 | |
John Hancock Income Securities Trust | | | 1,250 | | | | 17,425 | |
Apollo Tactical Income Fund, Inc. | | | 1,535 | | | | 17,392 | |
PIMCO Corporate & Income Strategy Fund | | | 1,300 | | | | 17,342 | |
Western Asset High Income Fund II, Inc. | | | 3,448 | | | | 17,275 | |
Western Asset Premier Bond Fund | | | 1,529 | | | | 17,232 | |
Eaton Vance Tax-Managed Buy-Write Income Fund | | | 1,400 | | | | 17,066 | |
BlackRock Enhanced Capital and Income Fund, Inc. | | | 1,284 | | | | 16,679 | |
BlackRock Enhanced Equity Dividend Trust | | | 2,500 | | | | 16,325 | |
Calamos Convertible Opportunities and Income Fund | | | 1,944 | | | | 16,213 | |
Eaton Vance Tax-Advantaged Dividend Income Fund | | | 962 | | | | 16,190 | |
Ares Dynamic Credit Allocation Fund, Inc. | | | 1,500 | | | | 16,185 | |
PIMCO Corporate & Income Opportunity Fund | | | 1,250 | | | | 16,138 | |
John Hancock Investors Trust | | | 1,278 | | | | 16,077 | |
Eaton Vance Tax-Advantaged Global Dividend Income Fund | | | 1,340 | | | | 16,013 | |
Eaton Vance Limited Duration Income Fund | | | 1,500 | | | | 15,855 | |
Reaves Utility Income Fund | | | 550 | | | | 15,812 | |
BlackRock Corporate High Yield Fund, Inc. | | | 1,792 | | | | 15,770 | |
PIMCO Dynamic Income Fund | | | 695 | | | | 15,353 | |
Voya Global Advantage and Premium Opportunity Fund | | | 1,999 | | | | 15,312 | |
Brookfield Real Assets Income Fund, Inc. | | | 1,040 | | | | 15,267 | |
Cohen & Steers REIT and Preferred and Income Fund, Inc. | | | 940 | | | | 15,153 | |
BlackRock Limited Duration Income Trust | | | 1,200 | | | | 15,144 | |
Cohen & Steers Infrastructure Fund, Inc. | | | 800 | | | | 15,080 | |
DoubleLine Income Solutions Fund | | | 1,123 | | | | 14,981 | |
Clough Global Equity Fund | | | 1,690 | | | | 14,956 | |
Blackstone / GSO Strategic Credit Fund | | | 1,410 | | | | 14,678 | |
Eaton Vance Enhanced Equity Income Fund II | | | 1,058 | | | | 14,674 | |
Pioneer High Income Trust | | | 2,284 | | | | 14,663 | |
PGIM High Yield Bond Fund, Inc. | | | 1,242 | | | | 14,382 | |
BlackRock Credit Allocation Income Trust | | | 1,205 | | | | 14,050 | |
Western Asset Emerging Markets Debt Fund, Inc. | | | 1,330 | | | | 14,005 | |
Ivy High Income Opportunities Fund | | | 1,308 | | | | 13,603 | |
Western Asset Global Corporate Defined Opportunity Fund, Inc. | | | 983 | | | | 13,497 | |
KKR Income Opportunities Fund | | | 1,266 | | | | 13,496 | |
Apollo Senior Floating Rate Fund, Inc. | | | 1,074 | | | | 12,469 | |
Western Asset Global High Income Fund, Inc. | | | 1,650 | | | | 12,342 | |
Total Closed-End Funds | | | | |
(Cost $725,222) | | | | | | | 629,486 | |
| | | | | | | | | |
MONEY MARKET FUND† - 1.1% |
Goldman Sachs Financial Square Treasury Instruments Fund — Institutional Shares, 0.52%2 | | | 67,165 | | | | 67,165 | |
Total Money Market Fund | | | | |
(Cost $67,165) | | | | | | | 67,165 | |
| | | | | | | | | |
Total Investments - 98.4% | | | | |
(Cost $6,387,849) | | $ | 5,900,500 | |
Other Assets & Liabilities, net - 1.6% | | | 95,601 | |
Total Net Assets - 100.0% | | $ | 5,996,101 | |
SEE NOTES TO FINANCIAL STATEMENTS. | THE GUGGENHEIM FUNDS SEMI-ANNUAL REPORT | 11 |
SCHEDULE OF INVESTMENTS (Unaudited)(continued) | March 31, 2020 |
DIVERSIFIED INCOME FUND | |
Futures Contracts |
Description | | Number of
Contracts | | | Expiration
Date | | | Notional
Amount | | | Value and
Unrealized
Depreciation** | |
Equity Futures Contracts Sold Short† |
S&P 500 Index Mini Futures Contracts | | | 8 | | | | Jun 2020 | | | $ | 1,029,000 | | | $ | (77,117 | ) |
** | Includes cumulative appreciation (depreciation). Variation margin is reported within the Statement of Assets and Liabilities. |
† | Value determined based on Level 1 inputs — See Note 4. |
1 | Affiliated issuer. |
2 | Rate indicated is the 7-day yield as of March 31, 2020. |
| | REIT — Real Estate Investment Trust |
| | |
| | See Sector Classification in Other Information section. |
The following table summarizes the inputs used to value the Fund’s investments at March 31, 2020 (See Note 4 in the Notes to Financial Statements):
Investments in Securities (Assets) | | Level 1
Quoted
Prices | | | Level 2
Significant
Observable
Inputs | | | Level 3
Significant
Unobservable
Inputs | | | Total | |
Mutual Funds | | $ | 5,203,849 | | | $ | — | | | $ | — | | | $ | 5,203,849 | |
Closed-End Funds | | | 629,486 | | | | — | | | | — | | | | 629,486 | |
Money Market Fund | | | 67,165 | | | | — | | | | — | | | | 67,165 | |
Total Assets | | $ | 5,900,500 | | | $ | — | | | $ | — | | | $ | 5,900,500 | |
Investments in Securities (Liabilities) | | Level 1
Quoted
Prices | | | Level 2
Significant
Observable
Inputs | | | Level 3
Significant
Unobservable
Inputs | | | Total | |
Equity Futures Contracts** | | $ | 77,117 | | | $ | — | | | $ | — | | | $ | 77,117 | |
** | This derivative is reported as unrealized appreciation/depreciation at period end. |
12 | THE GUGGENHEIM FUNDS SEMI-ANNUAL REPORT | SEE NOTES TO FINANCIAL STATEMENTS. |
SCHEDULE OF INVESTMENTS (Unaudited)(concluded) | March 31, 2020 |
DIVERSIFIED INCOME FUND | |
Affiliated Transactions
Investments representing 5% or more of the outstanding voting shares of a company, or control of or by, or common control under Guggenheim Investments (“GI”), result in that company being considered an affiliated issuer, as defined in the 1940 Act.
Transactions during the period ended March 31, 2020, in which the company is an affiliated issuer, were as follows:
Security Name | | Value
09/30/19 | | | Additions | | | Reductions | | | Realized
Gain (Loss) | | | Change in
Unrealized
Appreciation
(Depreciation) | | | Value
03/31/20 | | | Shares
03/31/20 | | | Investment
Income | | | Capital Gain
Distributions | |
Mutual Funds | | | | | | | | | | | | | | | | | | | | | | | | | | | | | | | | | |
Guggenheim Floating Rate Strategies Fund — R6-Class | | $ | 1,282,310 | | | $ | 28,581 | | | $ | (200,996 | ) | | $ | (19,488 | ) | | $ | (150,910 | ) | | $ | 939,497 | | | | 43,415 | | | $ | 28,581 | | | $ | — | |
Guggenheim High Yield Fund — R6-Class | | | 1,545,504 | | | | 46,821 | | | | (475,002 | ) | | | (7,728 | ) | | | (171,968 | ) | | | 937,627 | | | | 101,256 | | | | 46,822 | | | | — | |
Guggenheim Investment Grade Bond Fund — Institutional Class | | | 1,545,121 | | | | 162,928 | | | | (385,000 | ) | | | (1,722 | ) | | | 18,930 | | | | 1,340,257 | | | | 69,878 | | | | 16,932 | | | | — | |
Guggenheim Limited Duration Fund — R6-Class | | | 766,309 | | | | 7,526 | | | | (763,441 | ) | | | (6,713 | ) | | | (3,681 | ) | | | — | | | | — | | | | 7,527 | | | | — | |
Guggenheim RBP Dividend Fund — Institutional Class | | | — | | | | 864,118 | | | | (65,000 | ) | | | (27,258 | ) | | | (166,279 | ) | | | 605,581 | | | | 73,761 | | | | 5,305 | | | | — | |
Guggenheim Risk Managed Real Estate Fund — Institutional Class | | | 762,161 | | | | 78,095 | | | | (62,989 | ) | | | (1,834 | ) | | | (127,689 | ) | | | 647,744 | | | | 22,864 | | | | 9,585 | | | | 28,509 | |
Guggenheim Ultra Short Duration Fund — Institutional Class | | | — | | | | 628,482 | | | | (202,000 | ) | | | (1,323 | ) | | | 810 | | | | 425,969 | | | | 43,600 | | | | 237 | | | | — | |
Guggenheim World Equity Income Fund — Institutional Class | | | 367,036 | | | | 85,268 | | | | (83,999 | ) | | | (8,239 | ) | | | (52,892 | ) | | | 307,174 | | | | 25,240 | | | | 4,268 | | | | 1,000 | |
| | | $ | 6,268,441 | | | $ | 1,901,819 | | | $ | (2,238,427 | ) | | $ | (74,305 | ) | | $ | (653,679 | ) | | $ | 5,203,849 | | | | | | | $ | 119,257 | | | $ | 29,509 | |
SEE NOTES TO FINANCIAL STATEMENTS. | THE GUGGENHEIM FUNDS SEMI-ANNUAL REPORT | 13 |
STATEMENT OF ASSETS AND LIABILITIES (Unaudited) |
March 31, 2020 |
Assets: |
Investments in unaffiliated issuers, at value (cost $792,387) | | $ | 696,651 | |
Investments in affiliated issuers, at value (cost $5,595,462) | | | 5,203,849 | |
Segregated cash with broker | | | 96,000 | |
Prepaid expenses | | | 41,031 | |
Receivables: |
Dividends | | | 21,130 | |
Variation margin on futures contracts | | | 15,480 | |
Investment Adviser | | | 14,358 | |
Interest | | | 39 | |
Fund shares sold | | | 30 | |
Total assets | | | 6,088,568 | |
| | | | | |
Liabilities: |
Overdraft due to custodian bank | | | 899 | |
Payable for: |
Securities purchased | | | 69,238 | |
Professional fees | | | 8,609 | |
Transfer agent/maintenance fees | | | 4,392 | |
Trustees’ fees* | | | 1,389 | |
Distribution and service fees | | | 426 | |
Fund shares redeemed | | | 301 | |
Miscellaneous | | | 7,213 | |
Total liabilities | | | 92,467 | |
Net assets | | $ | 5,996,101 | |
| | | | | |
Net assets consist of: |
Paid in capital | | $ | 6,507,397 | |
Total distributable earnings (loss) | | | (511,296 | ) |
Net assets | | $ | 5,996,101 | |
| | | | | |
A-Class: |
Net assets | | $ | 246,116 | |
Capital shares outstanding | | | 10,452 | |
Net asset value per share | | $ | 23.55 | |
Maximum offering price per share (Net asset value divided by 96.00%) | | $ | 24.53 | |
| | | | | |
C-Class: |
Net assets | | $ | 126,910 | |
Capital shares outstanding | | | 5,406 | |
Net asset value per share | | $ | 23.48 | |
| | | | | |
P-Class: |
Net assets | | $ | 117,293 | |
Capital shares outstanding | | | 4,985 | |
Net asset value per share | | $ | 23.53 | |
| | | | | |
Institutional Class: |
Net assets | | $ | 5,505,782 | |
Capital shares outstanding | | | 233,857 | |
Net asset value per share | | $ | 23.54 | |
STATEMENT OF OPERATIONS (Unaudited) |
Six-Month Period Ended March 31, 2020 |
Investment Income: |
Dividends from securities of unaffiliated issuers | | $ | 35,692 | |
Dividends from securities of affiliated issuers | | | 119,257 | |
Interest | | | 363 | |
Total investment income | | | 155,312 | |
| | | | | |
Expenses: |
Management fees | | | 27,432 | |
Distribution and service fees: |
A-Class | | | 347 | |
C-Class | | | 3,751 | |
P-Class | | | 164 | |
Transfer agent/maintenance fees: |
A-Class | | | 699 | |
C-Class | | | 1,784 | |
P-Class | | | 335 | |
Institutional Class | | | 10,338 | |
Registration fees | | | 39,725 | |
Professional fees | | | 18,346 | |
Fund accounting/administration fees | | | 12,529 | |
Trustees’ fees* | | | 9,430 | |
Custodian fees | | | 5,237 | |
Tax expense | | | 783 | |
Line of credit fees | | | 85 | |
Miscellaneous | | | 9,600 | |
Total expenses | | | 140,585 | |
Less: |
Expenses reimbursed by Adviser: |
A-Class | | | (2,843 | ) |
C-Class | | | (7,391 | ) |
P-Class | | | (1,350 | ) |
Institutional Class | | | (57,956 | ) |
Expenses waived by Adviser | | | (44,853 | ) |
Earnings credits applied | | | (4 | ) |
Total waived/reimbursed expenses | | | (114,397 | ) |
Net expenses | | | 26,188 | |
Net investment income | | | 129,124 | |
| | | | | |
Net Realized and Unrealized Gain (Loss): |
Net realized gain (loss) on: |
Investments in unaffiliated issuers | | | 69,836 | |
Investments in affiliated issuers | | | (74,305 | ) |
Distributions received from affiliated investment companies | | | 29,509 | |
Net realized gain | | | 25,040 | |
Net change in unrealized appreciation (depreciation) on: |
Investments in unaffiliated issuers | | | (214,370 | ) |
Investments in affiliated issuers | | | (653,679 | ) |
Futures contracts | | | (77,117 | ) |
Net change in unrealized appreciation (depreciation) | | | (945,166 | ) |
Net realized and unrealized loss | | | (920,126 | ) |
Net decrease in net assets resulting from operations | | $ | (791,002 | ) |
* | Relates to Trustees not deemed “interested persons” within the meaning of Section 2(a)(19) of the 1940 Act. |
14 | THE GUGGENHEIM FUNDS SEMI-ANNUAL REPORT | SEE NOTES TO FINANCIAL STATEMENTS. |
STATEMENTS OF CHANGES IN NET ASSETS |
| | Six-Month
Period Ended
March 31,
2020
(Unaudited) | | | Year Ended
September 30,
2019 | |
Increase (Decrease) in Net Assets from Operations: | | | | | | | | |
Net investment income | | $ | 129,124 | | | $ | 227,085 | |
Net realized gain on investments | | | 25,040 | | | | 23,485 | |
Net change in unrealized appreciation (depreciation) on investments | | | (945,166 | ) | | | 126,253 | |
Net increase (decrease) in net assets resulting from operations | | | (791,002 | ) | | | 376,823 | |
| | | | | | | | | |
Distributions to shareholders: | | | | | | | | |
A-Class | | | (5,668 | ) | | | (6,205 | ) |
C-Class | | | (12,446 | ) | | | (14,082 | ) |
P-Class | | | (2,683 | ) | | | (5,168 | ) |
Institutional Class | | | (133,614 | ) | | | (254,600 | ) |
Total distributions to shareholders | | | (154,411 | ) | | | (280,055 | ) |
| | | | | | | | | |
Capital share transactions: | | | | | | | | |
Proceeds from sale of shares | | | | | | | | |
A-Class | | | 7,519 | | | | 128,478 | |
C-Class | | | 19,477 | | | | 706,268 | |
P-Class | | | 502 | | | | 1,939 | |
Institutional Class | | | 9,011 | | | | 105,353 | |
Distributions reinvested | | | | | | | | |
A-Class | | | 5,668 | | | | 6,205 | |
C-Class | | | 12,446 | | | | 14,082 | |
P-Class | | | 2,683 | | | | 5,168 | |
Institutional Class | | | 133,614 | | | | 254,600 | |
Cost of shares redeemed | | | | | | | | |
A-Class | | | (9,027 | ) | | | (15 | ) |
C-Class | | | (629,606 | ) | | | (70,916 | ) |
P-Class | | | (110 | ) | | | (2,340 | ) |
Institutional Class | | | (1,467 | ) | | | (22,132 | ) |
Net increase (decrease) from capital share transactions | | | (449,290 | ) | | | 1,126,690 | |
Net increase (decrease) in net assets | | | (1,394,703 | ) | | | 1,223,458 | |
| | | | | | | | | |
Net assets: | | | | | | | | |
Beginning of period | | | 7,390,804 | | | | 6,167,346 | |
End of period | | $ | 5,996,101 | | | $ | 7,390,804 | |
| | | | | | | | | |
Capital share activity: | | | | | | | | |
Shares sold | | | | | | | | |
A-Class | | | 279 | | | | 4,778 | |
C-Class | | | 730 | | | | 27,051 | |
P-Class | | | 19 | | | | 72 | |
Institutional Class | | | 330 | | | | 4,087 | |
Shares issued from reinvestment of distributions | | | | | | | | |
A-Class | | | 214 | | | | 239 | |
C-Class | | | 466 | | | | 535 | |
P-Class | | | 102 | | | | 199 | |
Institutional Class | | | 5,055 | | | | 9,798 | |
Shares redeemed | | | | | | | | |
A-Class | | | (332 | ) | | | (1 | ) |
C-Class | | | (26,031 | ) | | | (2,764 | ) |
P-Class | | | (4 | ) | | | (88 | ) |
Institutional Class | | | (55 | ) | | | (830 | ) |
Net increase (decrease) in shares | | | (19,227 | ) | | | 43,076 | |
SEE NOTES TO FINANCIAL STATEMENTS. | THE GUGGENHEIM FUNDS SEMI-ANNUAL REPORT | 15 |
This table is presented to show selected data for a share outstanding throughout each period and to assist shareholders in evaluating a Fund’s performance for the periods presented.
A-Class | | Period Ended
March 31,
2020a | | | Year Ended
September 30,
2019 | | | Year Ended
September 30,
2018 | | | Year Ended
September 30,
2017 | | | Period Ended
September 30,
2016b | |
Per Share Data |
Net asset value, beginning of period | | $ | 26.99 | | | $ | 26.70 | | | $ | 27.58 | | | $ | 27.12 | | | $ | 25.00 | |
Income (loss) from investment operations: |
Net investment income (loss)c | | | .46 | | | | .86 | | | | .91 | | | | .96 | | | | .76 | |
Net gain (loss) on investments (realized and unrealized) | | | (3.35 | ) | | | .50 | | | | (.70 | ) | | | .89 | | | | 2.03 | |
Total from investment operations | | | (2.89 | ) | | | 1.36 | | | | .21 | | | | 1.85 | | | | 2.79 | |
Less distributions from: |
Net investment income | | | (.46 | ) | | | (.77 | ) | | | (.90 | ) | | | (.95 | ) | | | (.67 | ) |
Net realized gains | | | (.09 | ) | | | (.30 | ) | | | (.19 | ) | | | (.44 | ) | | | — | |
Total distributions | | | (.55 | ) | | | (1.07 | ) | | | (1.09 | ) | | | (1.39 | ) | | | (.67 | ) |
Net asset value, end of period | | $ | 23.55 | | | $ | 26.99 | | | $ | 26.70 | | | $ | 27.58 | | | $ | 27.12 | |
|
Total Returnd | | | (10.92 | %) | | | 5.31 | % | | | 0.78 | % | | | 7.00 | % | | | 11.29 | % |
Ratios/Supplemental Data |
Net assets, end of period (in thousands) | | $ | 246 | | | $ | 278 | | | $ | 141 | | | $ | 138 | | | $ | 132 | |
Ratios to average net assets: |
Net investment income (loss) | | | 3.42 | % | | | 3.26 | % | | | 3.37 | % | | | 3.53 | % | | | 4.35 | % |
Total expensese | | | 4.13 | % | | | 4.03 | % | | | 4.83 | % | | | 4.16 | % | | | 3.31 | % |
Net expensesf,g,h | | | 0.85 | % | | | 0.85 | % | | | 0.84 | % | | | 0.85 | % | | | 0.77 | % |
Portfolio turnover rate | | | 33 | % | | | 58 | % | | | 37 | % | | | 44 | % | | | 83 | % |
C-Class | | Period Ended
March 31,
2020a | | | Year Ended
September 30,
2019 | | | Year Ended
September 30,
2018 | | | Year Ended
September 30,
2017 | | | Period Ended
September 30,
2016b | |
Per Share Data |
Net asset value, beginning of period | | $ | 27.00 | | | $ | 26.69 | | | $ | 27.56 | | | $ | 27.11 | | | $ | 25.00 | |
Income (loss) from investment operations: |
Net investment income (loss)c | | | .33 | | | | .69 | | | | .71 | | | | .76 | | | | .63 | |
Net gain (loss) on investments (realized and unrealized) | | | (3.31 | ) | | | .46 | | | | (.69 | ) | | | .87 | | | | 2.03 | |
Total from investment operations | | | (2.98 | ) | | | 1.15 | | | | .02 | | | | 1.63 | | | | 2.66 | |
Less distributions from: |
Net investment income | | | (.45 | ) | | | (.54 | ) | | | (.70 | ) | | | (.74 | ) | | | (.55 | ) |
Net realized gains | | | (.09 | ) | | | (.30 | ) | | | (.19 | ) | | | (.44 | ) | | | — | |
Total distributions | | | (.54 | ) | | | (.84 | ) | | | (.89 | ) | | | (1.18 | ) | | | (.55 | ) |
Net asset value, end of period | | $ | 23.48 | | | $ | 27.00 | | | $ | 26.69 | | | $ | 27.56 | | | $ | 27.11 | |
|
Total Returnd | | | (11.22 | %) | | | 4.50 | % | | | 0.08 | % | | | 6.17 | % | | | 10.74 | % |
Ratios/Supplemental Data |
Net assets, end of period (in thousands) | | $ | 127 | | | $ | 816 | | | $ | 145 | | | $ | 137 | | | $ | 118 | |
Ratios to average net assets: |
Net investment income (loss) | | | 2.43 | % | | | 2.59 | % | | | 2.63 | % | | | 2.78 | % | | | 3.58 | % |
Total expensese | | | 4.78 | % | | | 4.74 | % | | | 5.65 | % | | | 5.13 | % | | | 4.05 | % |
Net expensesf,g,h | | | 1.58 | % | | | 1.59 | % | | | 1.59 | % | | | 1.60 | % | | | 1.52 | % |
Portfolio turnover rate | | | 33 | % | | | 58 | % | | | 37 | % | | | 44 | % | | | 83 | % |
16 | THE GUGGENHEIM FUNDS SEMI-ANNUAL REPORT | SEE NOTES TO FINANCIAL STATEMENTS. |
FINANCIAL HIGHLIGHTS (continued) |
This table is presented to show selected data for a share outstanding throughout each period and to assist shareholders in evaluating a Fund’s performance for the periods presented.
P-Class | | Period Ended
March 31,
2020a | | | Year Ended
September 30,
2019 | | | Year Ended
September 30,
2018 | | | Year Ended
September 30,
2017 | | | Period Ended
September 30,
2016b | |
Per Share Data |
Net asset value, beginning of period | | $ | 26.97 | | | $ | 26.70 | | | $ | 27.58 | | | $ | 27.11 | | | $ | 25.00 | |
Income (loss) from investment operations: |
Net investment income (loss)c | | | .46 | | | | .85 | | | | .91 | | | | .95 | | | | .74 | |
Net gain (loss) on investments (realized and unrealized) | | | (3.35 | ) | | | .51 | | | | (.70 | ) | | | .89 | | | | 2.05 | |
Total from investment operations | | | (2.89 | ) | | | 1.36 | | | | .21 | | | | 1.84 | | | | 2.79 | |
Less distributions from: |
Net investment income | | | (.46 | ) | | | (.79 | ) | | | (.90 | ) | | | (.93 | ) | | | (.68 | ) |
Net realized gains | | | (.09 | ) | | | (.30 | ) | | | (.19 | ) | | | (.44 | ) | | | — | |
Total distributions | | | (.55 | ) | | | (1.09 | ) | | | (1.09 | ) | | | (1.37 | ) | | | (.68 | ) |
Net asset value, end of period | | $ | 23.53 | | | $ | 26.97 | | | $ | 26.70 | | | $ | 27.58 | | | $ | 27.11 | |
|
Total Return | | | (10.91 | %) | | | 5.23 | % | | | 0.82 | % | | | 7.00 | % | | | 11.27 | % |
Ratios/Supplemental Data |
Net assets, end of period (in thousands) | | $ | 117 | | | $ | 131 | | | $ | 125 | | | $ | 123 | | | $ | 111 | |
Ratios to average net assets: |
Net investment income (loss) | | | 3.42 | % | | | 3.22 | % | | | 3.37 | % | | | 3.51 | % | | | 4.32 | % |
Total expensese | | | 4.14 | % | | | 3.97 | % | | | 4.82 | % | | | 4.23 | % | | | 3.21 | % |
Net expensesf,g,h | | | 0.85 | % | | | 0.85 | % | | | 0.84 | % | | | 0.85 | % | | | 0.80 | % |
Portfolio turnover rate | | | 33 | % | | | 58 | % | | | 37 | % | | | 44 | % | | | 83 | % |
SEE NOTES TO FINANCIAL STATEMENTS. | THE GUGGENHEIM FUNDS SEMI-ANNUAL REPORT | 17 |
FINANCIAL HIGHLIGHTS (concluded) |
This table is presented to show selected data for a share outstanding throughout each period and to assist shareholders in evaluating a Fund’s performance for the periods presented.
Institutional Class | | Period Ended
March 31,
2020a | | | Year Ended
September 30,
2019 | | | Year Ended
September 30,
2018 | | | Year Ended
September 30,
2017 | | | Period Ended
September 30,
2016b | |
Per Share Data |
Net asset value, beginning of period | | $ | 26.98 | | | $ | 26.72 | | | $ | 27.59 | | | $ | 27.11 | | | $ | 25.00 | |
Income (loss) from investment operations: |
Net investment income (loss)c | | | .49 | | | | .92 | | | | .98 | | | | 1.03 | | | | .79 | |
Net gain (loss) on investments (realized and unrealized) | | | (3.35 | ) | | | .49 | | | | (.70 | ) | | | .89 | | | | 2.04 | |
Total from investment operations | | | (2.86 | ) | | | 1.41 | | | | .28 | | | | 1.92 | | | | 2.83 | |
Less distributions from: |
Net investment income | | | (.49 | ) | | | (.85 | ) | | | (.96 | ) | | | (1.00 | ) | | | (.72 | ) |
Net realized gains | | | (.09 | ) | | | (.30 | ) | | | (.19 | ) | | | (.44 | ) | | | — | |
Total distributions | | | (.58 | ) | | | (1.15 | ) | | | (1.15 | ) | | | (1.44 | ) | | | (.72 | ) |
Net asset value, end of period | | $ | 23.54 | | | $ | 26.98 | | | $ | 26.72 | | | $ | 27.59 | | | $ | 27.11 | |
|
Total Return | | | (10.78 | %) | | | 5.52 | % | | | 1.06 | % | | | 7.30 | % | | | 11.44 | % |
Ratios/Supplemental Data |
Net assets, end of period (in thousands) | | $ | 5,506 | | | $ | 6,165 | | | $ | 5,757 | | | $ | 5,619 | | | $ | 5,239 | |
Ratios to average net assets: |
Net investment income (loss) | | | 3.67 | % | | | 3.47 | % | | | 3.62 | % | | | 3.78 | % | | | 4.57 | % |
Total expensese | | | 3.71 | % | | | 3.58 | % | | | 4.42 | % | | | 3.83 | % | | | 2.93 | % |
Net expensesf,g,h | | | 0.60 | % | | | 0.60 | % | | | 0.60 | % | | | 0.59 | % | | | 0.54 | % |
Portfolio turnover rate | | | 33 | % | | | 58 | % | | | 37 | % | | | 44 | % | | | 83 | % |
a | Unaudited figures for the period ended March 31, 2020. Percentage amounts for the period, except total return and portfolio turnover rate, have been annualized. |
b | Since commencement of operations: January 29, 2016. Percentage amounts for the period, except total return and portfolio turnover rate, have been annualized. |
c | Net investment income (loss) per share was computed using average shares outstanding throughout the period. |
d | Total return does not reflect the impact of any applicable sales charges. |
e | Does not include expenses of the underlying funds in which the Fund invests. |
f | Net expense information reflects the expense ratios after expense waivers and reimbursements, as applicable. |
g | The portion of the ratios of net expenses to average net assets attributable to recoupments of prior fee reductions or expense reimbursements for the periods presented was as follows: |
| | | 03/31/20a | 09/30/19 | 09/30/18 | 09/30/17 |
| | A-Class | — | — | — | 0.19% |
| | C-Class | — | — | — | 0.19% |
| | P-Class | — | — | — | 0.16% |
| | Institutional Class | — | — | — | 0.16% |
h | Net expenses may include expenses that are excluded from the expense limitation agreement. Excluding these expenses, the net expense ratios for the periods would be: |
| | | 03/31/20a | 09/30/19 | 09/30/18 | 09/30/17 | 09/30/16 |
| | A-Class | 0.83% | 0.85% | 0.84% | 0.82% | 0.76% |
| | C-Class | 1.58% | 1.59% | 1.58% | 1.57% | 1.52% |
| | P-Class | 0.82% | 0.85% | 0.84% | 0.82% | 0.79% |
| | Institutional Class | 0.58% | 0.60% | 0.59% | 0.57% | 0.54% |
18 | THE GUGGENHEIM FUNDS SEMI-ANNUAL REPORT | SEE NOTES TO FINANCIAL STATEMENTS. |
PERFORMANCE REPORT AND FUND PROFILE (Unaudited) | March 31, 2020 |
HIGH YIELD FUND
OBJECTIVE: Seeks high current income. Capital appreciation is a secondary objective.
Holdings Diversification (Market Exposure as % of Net Assets)
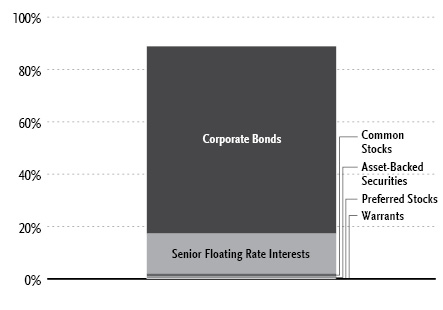
“Holdings Diversification (Market Exposure as % of Net Assets)” excludes any temporary cash investments.
Portfolio Composition by Quality Rating1 |
Rating | % of Total
Investments |
Fixed Income Instruments | |
AAA | 0.4% |
A | 0.2% |
BBB | 8.0% |
BB | 40.0% |
B | 25.5% |
CCC | 7.5% |
CC | 0.0%** |
NR2 | 1.6% |
Other Instruments | 16.8% |
Total Investments | 100.0% |
Inception Dates: |
A-Class | August 5, 1996 |
C-Class | May 1, 2000 |
P-Class | May 1, 2015 |
Institutional Class | July 11, 2008 |
R6-Class | May 15, 2017 |
Ten Largest Holdings (% of Total Net Assets) |
LBC Tank Terminals Holding Netherlands BV, 6.88% | 1.9% |
Terraform Global Operating LLC, 6.13% | 1.6% |
Altice France S.A., 7.38% | 1.6% |
LoanCore Capital Markets LLC / JLC Finance Corp., 6.88% | 1.5% |
Great Lakes Dredge & Dock Corp., 8.00% | 1.5% |
EIG Investors Corp., 10.88% | 1.3% |
Indigo Natural Resources LLC, 6.88% | 1.2% |
Virgin Media Secured Finance plc, 5.50% | 1.2% |
CCO Holdings LLC / CCO Holdings Capital Corp., 4.75% | 1.2% |
Fidelity & Guaranty Life Holdings, Inc., 5.50% | 1.2% |
Top Ten Total | 14.2% |
| | |
“Ten Largest Holdings” excludes any temporary cash or derivative investments. |
1 | Source: BlackRock Solutions. Credit quality ratings are measured on a scale that generally ranges from AAA (highest) to D (lowest). All securities except for those labeled “NR” have been rated by Moody’s, Standard & Poor’s (“S&P”), or Fitch, each of which is a Nationally Recognized Statistical Rating Organization (“NRSRO”). For purposes of this presentation, when ratings are available from more than one agency, the highest rating is used. Guggenheim Investments has converted ratings to the equivalent S&P rating. Security ratings are determined at the time of purchase and may change thereafter. |
2 | NR securities do not necessarily indicate low credit quality. |
** | Less than 0.1%. |
| | THE GUGGENHEIM FUNDS SEMI-ANNUAL REPORT | 19 |
PERFORMANCE REPORT AND FUND PROFILE (Unaudited)(concluded) | March 31, 2020 |
Average Annual Returns*
Periods Ended March 31, 2020
| 6 Month† | 1 Year | 5 Year | 10 Year |
A-Class Shares | (12.26%) | (8.44%) | 2.01% | 4.63% |
A-Class Shares with sales charge‡ | (15.74%) | (12.12%) | 1.02% | 4.12% |
C-Class Shares | (12.56%) | (9.10%) | 1.26% | 3.84% |
C-Class Shares with CDSC§ | (13.41%) | (9.97%) | 1.26% | 3.84% |
Institutional Class Shares | (12.02%) | (8.08%) | 2.32% | 4.92% |
Bloomberg Barclays U.S. Corporate High Yield Index | (10.40%) | (6.94%) | 2.78% | 5.64% |
| | 6 Month† | 1 Year | Since
Inception
(05/01/15) |
P-Class Shares | | (12.25%) | (8.34%) | 1.77% |
Bloomberg Barclays U.S. Corporate High Yield Index | | (10.40%) | (6.94%) | 2.57% |
| | 6 Month† | 1 Year | Since
Inception
(05/15/17) |
R6-Class Shares | | (12.11%) | (8.01%) | (0.99%) |
Bloomberg Barclays U.S. Corporate High Yield Index | | (10.40%) | (6.94%) | 0.28% |
* | The performance data above represents past performance that is not predictive of future results. The investment return and principal value of an investment in the Fund will fluctuate so that an investor’s shares, when redeemed, may be worth more or less than their original cost. Returns are historical and include changes in principal and reinvested dividends and capital gains and do not reflect the effect of taxes. The Bloomberg Barclays U.S. Corporate High Yield Index is an unmanaged index and, unlike the Fund, has no management fees or operating expenses to reduce its reported return. |
† | 6 month returns are not annualized. |
‡ | Effective October 1, 2015, the maximum sales charge decreased from 4.75% to 4.00%. A 4.75% maximum sales charge is used in the calculation of the Average Annual Returns based on subscriptions made prior to October 1, 2015, and a 4.00% maximum sales charge is used to calculate performance for periods based on subscriptions made on or after October 2, 2015. |
§ | Fund returns include a CDSC of 1% if redeemed within 12 months of purchase. |
20 | THE GUGGENHEIM FUNDS SEMI-ANNUAL REPORT | |
SCHEDULE OF INVESTMENTS (Unaudited) | March 31, 2020 |
HIGH YIELD FUND | |
| | | Shares | | | Value | |
COMMON STOCKS† - 1.0% |
| | | | | | | |
| Consumer, Non-cyclical - 0.3% |
Chef Holdings, Inc.*,†††,1 | | | 7,502 | | | $ | 662,679 | |
ATD New Holdings, Inc.*,†† | | | 21,488 | | | | 322,320 | |
Targus Group International Equity, Inc.*,†††,1,2 | | | 12,825 | | | | 22,187 | |
Cengage Learning Holdings II, Inc.*,†† | | | 2,107 | | | | 14,749 | |
| Spectrum Brands Holdings, Inc. | | | 2 | | | | 73 | |
| Crimson Wine Group Ltd.* | | | 8 | | | | 47 | |
| Total Consumer, Non-cyclical | | | | | | | 1,022,055 | |
| | | | | | | | | |
| Utilities - 0.3% | | | | | | | | |
TexGen Power LLC††† | | | 26,665 | | | | 826,615 | |
| | | | | | | | | |
| Communications - 0.2% | | | | | | | | |
MediaNews Group, Inc.*,†††,1 | | | 1,107 | | | | 742,278 | |
| | | | | | | | | |
| Consumer, Cyclical - 0.2% |
Metro-Goldwyn-Mayer, Inc.*,†† | | | 7,040 | | | | 475,200 | |
| | | | | | | | | |
| Energy - 0.0% |
| SandRidge Energy, Inc.* | | | 51,278 | | | | 46,104 | |
Legacy Reserves, Inc.*,†††,1 | | | 3,452 | | | | 3,452 | |
| Total Energy | | | | | | | 49,556 | |
| | | | | | | | | |
| Industrial - 0.0% |
BP Holdco LLC*,†††,1,2 | | | 23,711 | | | | 6,212 | |
Vector Phoenix Holdings, LP*,†††,1 | | | 23,711 | | | | 1,684 | |
| Total Industrial | | | | | | | 7,896 | |
| | | | | | | | | |
| Financial - 0.0% |
| Jefferies Financial Group, Inc. | | | 81 | | | | 1,107 | |
| | | | | | | | | |
| Total Common Stocks | | | | | | | | |
| (Cost $4,849,210) | | | | | | | 3,124,707 | |
| | | | | | | | | |
| PREFERRED STOCKS†† - 0.3% |
| Financial - 0.3% |
| American Equity Investment Life Holding Co., 5.95% | | | 54,000 | | | | 860,760 | |
| | | | | | | | | |
| Industrial - 0.0% |
U.S. Shipping Corp.*,†††,1 | | | 14,718 | | | | — | |
| Total Preferred Stocks | | | | | | | | |
| (Cost $1,725,000) | | | | | | | 860,760 | |
| | | | | | | | | |
| WARRANTS†† - 0.0% |
| SandRidge Energy, Inc. | | | | | | | | |
| $41.34, 10/04/22* | | | 488 | | | | 2 | |
| SandRidge Energy, Inc. | | | | | | | | |
| $42.03, 10/04/22* | | | 205 | | | | 1 | |
| Total Warrants | | | | | | | | |
| (Cost $43,811) | | | | | | | 3 | |
| | | | | | | | | |
| MONEY MARKET FUND† - 16.5% |
Dreyfus Treasury Securities Cash Management Fund — Institutional Shares, 0.51%5 | | | 51,842,180 | | | | 51,842,180 | |
| Total Money Market Fund | | | | | | | | |
| (Cost $51,842,180) | | | | | | | 51,842,180 | |
| | | | | | | | | |
| | | | Face
Amount~ | | | | | |
| CORPORATE BONDS†† - 71.6% |
| Consumer, Non-cyclical - 13.8% | | | | | | | | |
| HCA, Inc. | | | | | | | | |
| 3.50% due 09/01/30 | | | 2,950,000 | | | | 2,676,274 | |
| 5.88% due 02/01/29 | | | 2,050,000 | | | | 2,167,875 | |
| Kraft Heinz Foods Co. | | | | | | | | |
| 5.00% due 06/04/42 | | | 2,175,000 | | | | 2,059,260 | |
| 4.38% due 06/01/46 | | | 1,200,000 | | | | 1,080,981 | |
4.63% due 10/01/396 | | | 675,000 | | | | 604,488 | |
| Vector Group Ltd. | | | | | | | | |
6.13% due 02/01/256 | | | 3,565,000 | | | | 3,244,150 | |
| FAGE International S.A. / FAGE USA Dairy Industry, Inc. | | | | | | | | |
5.63% due 08/15/266 | | | 3,590,000 | | | | 2,836,100 | |
| Midas Intermediate Holdco II LLC / Midas Intermediate Holdco II Finance, Inc. | | | | | | | | |
7.88% due 10/01/226 | | | 4,027,000 | | | | 2,577,280 | |
| Tenet Healthcare Corp. | | | | | | | | |
6.25% due 02/01/276 | | | 1,450,000 | | | | 1,413,750 | |
5.13% due 11/01/276 | | | 600,000 | | | | 571,500 | |
| 5.13% due 05/01/25 | | | 525,000 | | | | 501,375 | |
| Harsco Corp. | | | | | | | | |
5.75% due 07/31/276 | | | 2,650,000 | | | | 2,452,151 | |
| Bausch Health Companies, Inc. | | | | | | | | |
7.00% due 03/15/246 | | | 1,900,000 | | | | 1,935,606 | |
6.50% due 03/15/226 | | | 250,000 | | | | 252,500 | |
| Centene Corp. | | | | | | | | |
4.25% due 12/15/276 | | | 1,000,000 | | | | 980,000 | |
5.38% due 06/01/266 | | | 950,000 | | | | 978,605 | |
| Prime Security Services Borrower LLC / Prime Finance, Inc. | | | | | | | | |
5.75% due 04/15/266 | | | 1,600,000 | | | | 1,568,000 | |
5.25% due 04/15/246 | | | 325,000 | | | | 321,032 | |
| Sysco Corp. | | | | | | | | |
| 5.95% due 04/01/30 | | | 1,700,000 | | | | 1,784,728 | |
| KeHE Distributors LLC / KeHE Finance Corp. | | | | | | | | |
8.63% due 10/15/266 | | | 1,750,000 | | | | 1,758,750 | |
| Nathan’s Famous, Inc. | | | | | | | | |
6.63% due 11/01/256 | | | 1,850,000 | | | | 1,720,500 | |
| Beverages & More, Inc. | | | | | | | | |
11.50% due 06/15/227 | | | 3,275,000 | | | | 1,670,250 | |
SEE NOTES TO FINANCIAL STATEMENTS. | THE GUGGENHEIM FUNDS SEMI-ANNUAL REPORT | 21 |
SCHEDULE OF INVESTMENTS (Unaudited)(continued) | March 31, 2020 |
HIGH YIELD FUND | |
| | Face
Amount~ | | | Value | |
Nielsen Finance LLC / Nielsen Finance Co. | | | | | | | | |
5.00% due 04/15/226 | | | 1,725,000 | | | $ | 1,590,139 | |
Par Pharmaceutical, Inc. | | | | | | | | |
7.50% due 04/01/276,8 | | | 1,375,000 | | | | 1,368,125 | |
AMN Healthcare, Inc. | | | | | | | | |
4.63% due 10/01/276 | | | 1,275,000 | | | | 1,208,008 | |
Carriage Services, Inc. | | | | | | | | |
6.63% due 06/01/266 | | | 900,000 | | | | 884,250 | |
Avanos Medical, Inc. | | | | | | | | |
6.25% due 10/15/22 | | | 775,000 | | | | 761,438 | |
DaVita, Inc. | | | | | | | | |
5.00% due 05/01/25 | | | 700,000 | | | | 699,083 | |
Endo Dac / Endo Finance LLC / Endo Finco, Inc. | | | | | | | | |
6.00% due 07/15/236 | | | 750,000 | | | | 543,285 | |
Charles River Laboratories International, Inc. | | | | | | | | |
4.25% due 05/01/286 | | | 545,000 | | | | 525,325 | |
Sotheby’s | | | | | | | | |
7.38% due 10/15/276 | | | 425,000 | | | | 338,406 | |
United Rentals North America, Inc. | | | | | | | | |
3.88% due 11/15/27 | | | 325,000 | | | | 307,125 | |
Total Consumer, Non-cyclical | | | | | | | 43,380,339 | |
| | | | | | | | | |
Communications - 12.6% | | | | | | | | |
CCO Holdings LLC / CCO Holdings Capital Corp. | | | | | | | | |
4.75% due 03/01/306,8 | | | 3,850,000 | | | | 3,830,750 | |
4.50% due 05/01/326 | | | 1,000,000 | | | | 975,200 | |
4.50% due 08/15/306 | | | 800,000 | | | | 784,000 | |
Altice France S.A. | | | | | | | | |
7.38% due 05/01/266,8 | | | 5,150,000 | | | | 5,112,147 | |
Virgin Media Secured Finance plc | | | | | | | | |
5.50% due 05/15/296 | | | 3,850,000 | | | | 3,836,140 | |
5.50% due 08/15/266 | | | 600,000 | | | | 609,000 | |
Level 3 Financing, Inc. | | | | | | | | |
3.88% due 11/15/296,8 | | | 1,950,000 | | | | 1,830,153 | |
4.63% due 09/15/276 | | | 1,200,000 | | | | 1,192,680 | |
5.63% due 02/01/23 | | | 859,000 | | | | 854,705 | |
5.25% due 03/15/26 | | | 200,000 | | | | 199,875 | |
EIG Investors Corp. | | | | | | | | |
10.88% due 02/01/24 | | | 4,644,000 | | | | 3,947,400 | |
Cengage Learning, Inc. | | | | | | | | |
9.50% due 06/15/246 | | | 3,564,000 | | | | 2,637,360 | |
CSC Holdings LLC | | | | | | | | |
6.50% due 02/01/296 | | | 2,400,000 | | | | 2,588,376 | |
McGraw-Hill Global Education Holdings LLC / McGraw-Hill Global Education Finance | | | | | | | | |
7.88% due 05/15/246 | | | 2,900,000 | | | | 2,160,500 | |
Houghton Mifflin Harcourt Publishers, Inc. | | | | | | | | |
9.00% due 02/15/256 | | | 1,500,000 | | | | 1,320,000 | |
Cogent Communications Group, Inc. | | | | | | | | |
5.38% due 03/01/226 | | | 1,175,000 | | | | 1,180,875 | |
Sirius XM Radio, Inc. | | | | | | | | |
5.50% due 07/01/296 | | | 1,050,000 | | | | 1,071,000 | |
Ziggo Bond Company BV | | | | | | | | |
5.13% due 02/28/306 | | | 750,000 | | | | 735,000 | |
6.00% due 01/15/276 | | | 250,000 | | | | 242,500 | |
Telenet Finance Luxembourg Note | | | | | | | | |
5.50% due 03/01/28 | | | 1,000,000 | | | | 930,000 | |
LCPR Senior Secured Financing DAC | | | | | | | | |
6.75% due 10/15/276 | | | 900,000 | | | | 886,500 | |
Lamar Media Corp. | | | | | | | | |
3.75% due 02/15/286 | | | 875,000 | | | | 820,208 | |
Netflix, Inc. | | | | | | | | |
3.63% due 06/15/30 | | | EUR 675,000 | | | | 731,089 | |
Sprint Corp. | | | | | | | | |
7.25% due 02/01/286 | | | 726,000 | | | | 729,630 | |
Ziggo BV | | | | | | | | |
4.88% due 01/15/306,8 | | | 400,000 | | | | 389,574 | |
MDC Partners, Inc. | | | | | | | | |
6.50% due 05/01/246 | | | 315,000 | | | | 236,250 | |
Total Communications | | | | | | | 39,830,912 | |
| | | | | | | | | |
Financial - 12.4% | | | | | | | | |
Jefferies Finance LLC / JFIN Company-Issuer Corp. | | | | | | | | |
7.25% due 08/15/246 | | | 3,300,000 | | | | 2,838,000 | |
6.25% due 06/03/266 | | | 2,525,000 | | | | 2,335,625 | |
LoanCore Capital Markets LLC / JLC Finance Corp. | | | | | | | | |
6.88% due 06/01/206 | | | 5,075,000 | | | | 4,808,562 | |
Fidelity & Guaranty Life Holdings, Inc. | | | | | | | | |
5.50% due 05/01/256 | | | 3,700,000 | | | | 3,654,860 | |
Hunt Companies, Inc. | | | | | | | | |
6.25% due 02/15/266 | | | 4,315,000 | | | | 3,225,462 | |
Newmark Group, Inc. | | | | | | | | |
6.13% due 11/15/238 | | | 2,900,000 | | | | 2,949,962 | |
AmWINS Group, Inc. | | | | | | | | |
7.75% due 07/01/266 | | | 2,500,000 | | | | 2,450,000 | |
Quicken Loans, Inc. | | | | | | | | |
5.25% due 01/15/286,8 | | | 2,100,000 | | | | 2,053,380 | |
5.75% due 05/01/256 | | | 325,000 | | | | 323,375 | |
NFP Corp. | | | | | | | | |
6.88% due 07/15/256 | | | 1,150,000 | | | | 1,132,750 | |
8.00% due 07/15/256 | | | 1,200,000 | | | | 1,098,000 | |
Springleaf Finance Corp. | | | | | | | | |
7.13% due 03/15/26 | | | 1,050,000 | | | | 1,039,500 | |
5.38% due 11/15/29 | | | 475,000 | | | | 434,625 | |
6.63% due 01/15/28 | | | 450,000 | | | | 425,250 | |
6.13% due 03/15/24 | | | 275,000 | | | | 270,892 | |
American Equity Investment Life Holding Co. | | | | | | | | |
5.00% due 06/15/278 | | | 1,322,000 | | | | 1,271,110 | |
USI, Inc. | | | | | | | | |
6.88% due 05/01/256 | | | 1,150,000 | | | | 1,069,500 | |
Greystar Real Estate Partners LLC | | | | | | | | |
5.75% due 12/01/256,8 | | | 1,050,000 | | | | 950,313 | |
Goldman Sachs Group, Inc. | | | | | | | | |
5.30%3,4 | | | 950,000 | | | | 921,500 | |
Oxford Finance LLC / Oxford Finance Company-Issuer II, Inc. | | | | | | | | |
6.38% due 12/15/226 | | | 942,000 | | | | 909,030 | |
22 | THE GUGGENHEIM FUNDS SEMI-ANNUAL REPORT | SEE NOTES TO FINANCIAL STATEMENTS. |
SCHEDULE OF INVESTMENTS (Unaudited)(continued) | March 31, 2020 |
HIGH YIELD FUND | |
| | Face
Amount~ | | | Value | |
CNO Financial Group, Inc. | | | | | | | | |
5.25% due 05/30/29 | | | 900,000 | | | $ | 873,253 | |
Assurant, Inc. | | | | | | | | |
7.00% due 03/27/484 | | | 950,000 | | | | 817,000 | |
Iron Mountain, Inc. | | | | | | | | |
4.88% due 09/15/296 | | | 780,000 | | | | 732,716 | |
Wilton Re Finance LLC | | | | | | | | |
5.88% due 03/30/334,6,8 | | | 650,000 | | | | 697,225 | |
LPL Holdings, Inc. | | | | | | | | |
4.63% due 11/15/276 | | | 600,000 | | | | 548,772 | |
SBA Communications Corp. | | | | | | | | |
3.88% due 02/15/276 | | | 475,000 | | | | 476,188 | |
Service Properties Trust | | | | | | | | |
4.95% due 02/15/278 | | | 500,000 | | | | 378,892 | |
Alliant Holdings Intermediate LLC / Alliant Holdings Company-Issuer | | | | | | | | |
6.75% due 10/15/276 | | | 316,000 | | | | 295,902 | |
Total Financial | | | | | | | 38,981,644 | |
| | | | | | | | | |
Industrial - 11.1% | | | | | | | | |
Great Lakes Dredge & Dock Corp. | | | | | | | | |
8.00% due 05/15/22 | | | 4,850,000 | | | | 4,746,928 | |
Masonite International Corp. | | | | | | | | |
5.38% due 02/01/286 | | | 1,800,000 | | | | 1,769,040 | |
5.75% due 09/15/266 | | | 1,400,000 | | | | 1,372,000 | |
Grinding Media Inc. / MC Grinding Media Canada Inc. | | | | | | | | |
7.38% due 12/15/236 | | | 2,950,000 | | | | 2,751,760 | |
Cleaver-Brooks, Inc. | | | | | | | | |
7.88% due 03/01/236,8 | | | 2,975,000 | | | | 2,469,250 | |
Signature Aviation US Holdings, Inc. | | | | | | | | |
4.00% due 03/01/286 | | | 2,400,000 | | | | 2,166,720 | |
Amsted Industries, Inc. | | | | | | | | |
5.63% due 07/01/276 | | | 1,225,000 | | | | 1,191,821 | |
4.63% due 05/15/306 | | | 1,050,000 | | | | 937,125 | |
Standard Industries, Inc. | | | | | | | | |
4.75% due 01/15/286 | | | 1,970,000 | | | | 1,814,271 | |
EnerSys | | | | | | | | |
4.38% due 12/15/276 | | | 1,850,000 | | | | 1,739,000 | |
JELD-WEN, Inc. | | | | | | | | |
4.88% due 12/15/276 | | | 1,950,000 | | | | 1,720,875 | |
Trinity Industries, Inc. | | | | | | | | |
4.55% due 10/01/24 | | | 1,765,000 | | | | 1,504,202 | |
New Enterprise Stone & Lime Company, Inc. | | | | | | | | |
6.25% due 03/15/266 | | | 1,525,000 | | | | 1,403,000 | |
Reynolds Group Issuer, Inc. / Reynolds Group Issuer LLC / Reynolds Group Issuer Luxembourg | | | | | | | | |
5.33% (3 Month USD LIBOR + 3.50%) due 07/15/216,8,9 | | | 792,000 | | | | 772,200 | |
5.13% due 07/15/236 | | | 500,000 | | | | 495,000 | |
Berry Global, Inc. | | | | | | | | |
4.88% due 07/15/266 | | | 1,150,000 | | | | 1,161,500 | |
EnPro Industries, Inc. | | | | | | | | |
5.75% due 10/15/26 | | | 1,200,000 | | | | 1,155,000 | |
Graphic Packaging International LLC | | | | | | | | |
3.50% due 03/15/286 | | | 1,225,000 | | | | 1,102,132 | |
American Woodmark Corp. | | | | | | | | |
4.88% due 03/15/266 | | | 1,175,000 | | | | 1,095,688 | |
TransDigm, Inc. | | | | | | | | |
6.25% due 03/15/266,8 | | | 975,000 | | | | 971,344 | |
Silgan Holdings, Inc. | | | | | | | | |
4.13% due 02/01/286 | | | 850,000 | | | | 784,125 | |
Moog, Inc. | | | | | | | | |
4.25% due 12/15/276 | | | 625,000 | | | | 564,062 | |
Swissport Financing SARL | | | | | | | | |
5.25% due 08/15/24 | | | EUR 800,000 | | | | 522,766 | |
Summit Materials LLC / Summit Materials Finance Corp. | | | | | | | | |
6.50% due 03/15/276 | | | 525,000 | | | | 496,125 | |
Sealed Air Corp. | | | | | | | | |
4.00% due 12/01/276 | | | 400,000 | | | | 372,040 | |
Total Industrial | | | | | | | 35,077,974 | |
| | | | | | | | | |
Consumer, Cyclical - 7.4% | | | | | | | | |
LBC Tank Terminals Holding Netherlands BV | | | | | | | | |
6.88% due 05/15/236 | | | 6,265,000 | | | | 5,873,438 | |
Suburban Propane Partners, LP/Suburban Energy Finance Corp. | | | | | | | | |
5.75% due 03/01/25 | | | 1,950,000 | | | | 1,803,750 | |
5.88% due 03/01/278 | | | 1,610,000 | | | | 1,483,212 | |
Williams Scotsman International, Inc. | | | | | | | | |
6.88% due 08/15/236 | | | 2,550,000 | | | | 2,320,500 | |
7.88% due 12/15/226 | | | 494,000 | | | | 481,897 | |
Wabash National Corp. | | | | | | | | |
5.50% due 10/01/256 | | | 2,110,000 | | | | 1,677,450 | |
Superior Plus Limited Partnership / Superior General Partner, Inc. | | | | | | | | |
7.00% due 07/15/266 | | | 1,500,000 | | | | 1,462,500 | |
Anixter, Inc. | | | | | | | | |
6.00% due 12/01/25 | | | 1,400,000 | | | | 1,370,250 | |
HD Supply, Inc. | | | | | | | | |
5.38% due 10/15/266 | | | 1,350,000 | | | | 1,312,362 | |
Sabre GLBL, Inc. | | | | | | | | |
5.38% due 04/15/236 | | | 1,300,000 | | | | 1,189,500 | |
Titan International, Inc. | | | | | | | | |
6.50% due 11/30/23 | | | 1,985,000 | | | | 893,250 | |
Boyne USA, Inc. | | | | | | | | |
7.25% due 05/01/256 | | | 782,000 | | | | 746,810 | |
1011778 BC ULC / New Red Finance, Inc. | | | | | | | | |
3.88% due 01/15/286 | | | 550,000 | | | | 522,500 | |
Panther BF Aggregator 2, LP / Panther Finance Company, Inc. | | | | | | | | |
8.50% due 05/15/276 | | | 575,000 | | | | 501,630 | |
Yum! Brands, Inc. | | | | | | | | |
7.75% due 04/01/256 | | | 475,000 | | | | 498,750 | |
Cedar Fair, LP | | | | | | | | |
5.25% due 07/15/296 | | | 375,000 | | | | 316,875 | |
Brookfield Residential Properties, Inc. / Brookfield Residential US Corp. | | | | | | | | |
4.88% due 02/15/306 | | | 415,000 | | | | 315,276 | |
SEE NOTES TO FINANCIAL STATEMENTS. | THE GUGGENHEIM FUNDS SEMI-ANNUAL REPORT | 23 |
SCHEDULE OF INVESTMENTS (Unaudited)(continued) | March 31, 2020 |
HIGH YIELD FUND | |
| | Face
Amount~ | | | Value | |
AMC Entertainment Holdings, Inc. | | | | | | | | |
6.13% due 05/15/27 | | | 500,000 | | | $ | 207,500 | |
Allison Transmission, Inc. | | | | | | | | |
4.75% due 10/01/276 | | | 200,000 | | | | 184,000 | |
Party City Holdings, Inc. | | | | | | | | |
6.63% due 08/01/266 | | | 991,000 | | | | 99,100 | |
Total Consumer, Cyclical | | | | | | | 23,260,550 | |
| | | | | | | | | |
Energy - 6.5% | | | | | | | | |
Indigo Natural Resources LLC | | | | | | | | |
6.88% due 02/15/266 | | | 5,815,000 | | | | 3,837,900 | |
American Midstream Partners Limited Partnership / American Midstream Finance Corp. | | | | | | | | |
9.50% due 12/15/216 | | | 3,565,000 | | | | 3,351,100 | |
Exterran Energy Solutions Limited Partnership / EES Finance Corp. | | | | | | | | |
8.13% due 05/01/25 | | | 3,642,000 | | | | 2,403,720 | |
PDC Energy, Inc. | | | | | | | | |
6.13% due 09/15/24 | | | 2,750,000 | | | | 1,467,812 | |
NuStar Logistics, LP | | | | | | | | |
5.63% due 04/28/27 | | | 1,510,000 | | | | 1,160,888 | |
6.00% due 06/01/26 | | | 300,000 | | | | 222,000 | |
Global Partners Limited Partnership / GLP Finance Corp. | | | | | | | | |
7.00% due 08/01/27 | | | 1,500,000 | | | | 1,125,000 | |
Range Resources Corp. | | | | | | | | |
5.00% due 03/15/238 | | | 1,210,000 | | | | 883,300 | |
5.88% due 07/01/22 | | | 245,000 | | | | 176,400 | |
CVR Energy, Inc. | | | | | | | | |
5.75% due 02/15/286 | | | 1,375,000 | | | | 1,027,813 | |
Antero Resources Corp. | | | | | | | | |
5.13% due 12/01/22 | | | 1,913,000 | | | | 994,760 | |
CNX Resources Corp. | | | | | | | | |
5.88% due 04/15/22 | | | 923,000 | | | | 844,545 | |
Basic Energy Services, Inc. | | | | | | | | |
10.75% due 10/15/237 | | | 1,225,000 | | | | 802,375 | |
Pattern Energy Group, Inc. | | | | | | | | |
5.88% due 02/01/246 | | | 775,000 | | | | 769,327 | |
Crestwood Midstream Partners Limited Partnership / Crestwood Midstream Finance Corp. | | | | | | | | |
5.63% due 05/01/276 | | | 1,250,000 | | | | 687,137 | |
Unit Corp. | | | | | | | | |
6.63% due 05/15/21 | | | 4,992,000 | | | | 353,933 | |
Summit Midstream Holdings LLC / Summit Midstream Finance Corp. | | | | | | | | |
5.75% due 04/15/25 | | | 2,475,000 | | | | 272,250 | |
Antero Midstream Partners Limited Partnership / Antero Midstream Finance Corp. | | | | | | | | |
5.75% due 01/15/286 | | | 225,000 | | | | 144,000 | |
Bruin E&P Partners LLC | | | | | | | | |
8.88% due 08/01/237 | | | 1,008,000 | | | | 70,560 | |
SandRidge Energy, Inc. | | | | | | | | |
7.50% due 03/15/21†††,1 | | | 250,000 | | | | — | |
Total Energy | | | | | | | 20,594,820 | |
| | | | | | | | | |
Basic Materials - 2.9% | | | | | | | | |
Alcoa Nederland Holding BV | | | | | | | | |
6.75% due 09/30/246 | | | 1,750,000 | | | | 1,696,975 | |
6.13% due 05/15/286 | | | 650,000 | | | | 591,500 | |
7.00% due 09/30/266 | | | 600,000 | | | | 558,000 | |
Novelis Corp. | | | | | | | | |
5.88% due 09/30/266,8 | | | 1,000,000 | | | | 981,365 | |
4.75% due 01/30/306 | | | 950,000 | | | | 845,500 | |
Kaiser Aluminum Corp. | | | | | | | | |
4.63% due 03/01/286 | | | 1,415,000 | | | | 1,255,812 | |
Neon Holdings, Inc. | | | | | | | | |
10.13% due 04/01/266 | | | 1,190,000 | | | | 1,065,960 | |
Compass Minerals International, Inc. | | | | | | | | |
6.75% due 12/01/276 | | | 925,000 | | | | 835,044 | |
United States Steel Corp. | | | | | | | | |
6.88% due 08/15/258 | | | 850,000 | | | | 592,705 | |
Valvoline, Inc. | | | | | | | | |
4.25% due 02/15/306 | | | 375,000 | | | | 351,525 | |
Yamana Gold, Inc. | | | | | | | | |
4.63% due 12/15/27 | | | 256,000 | | | | 256,535 | |
Mirabela Nickel Ltd. | | | | | | | | |
due 06/24/197,10 | | | 278,115 | | | | 13,906 | |
Total Basic Materials | | | | | | | 9,044,827 | |
| | | | | | | | | |
Utilities - 2.7% | | | | | | | | |
Terraform Global Operating LLC | | | | | | | | |
6.13% due 03/01/266 | | | 5,330,000 | | | | 5,196,750 | |
AmeriGas Partners, LP / AmeriGas Finance Corp. | | | | | | | | |
5.50% due 05/20/25 | | | 1,400,000 | | | | 1,288,000 | |
5.75% due 05/20/27 | | | 550,000 | | | | 511,569 | |
Clearway Energy Operating LLC | | | | | | | | |
5.75% due 10/15/25 | | | 1,200,000 | | | | 1,188,000 | |
DPL, Inc. | | | | | | | | |
7.25% due 10/15/21 | | | 512,000 | | | | 504,320 | |
Total Utilities | | | | | | | 8,688,639 | |
| | | | | | | | | |
Technology - 2.2% | | | | | | | | |
MSCI, Inc. | | | | | | | | |
4.00% due 11/15/296,8 | | | 1,875,000 | | | | 1,862,587 | |
3.63% due 09/01/306 | | | 250,000 | | | | 237,187 | |
NCR Corp. | | | | | | | | |
6.13% due 09/01/296 | | | 1,675,000 | | | | 1,564,283 | |
Qorvo, Inc. | | | | | | | | |
4.38% due 10/15/296 | | | 1,350,000 | | | | 1,255,500 | |
PTC, Inc. | | | | | | | | |
4.00% due 02/15/286 | | | 850,000 | | | | 816,255 | |
Open Text Holdings, Inc. | | | | | | | | |
4.13% due 02/15/306 | | | 750,000 | | | | 705,188 | |
24 | THE GUGGENHEIM FUNDS SEMI-ANNUAL REPORT | SEE NOTES TO FINANCIAL STATEMENTS. |
SCHEDULE OF INVESTMENTS (Unaudited)(continued) | March 31, 2020 |
HIGH YIELD FUND | |
| | Face
Amount~ | | | Value | |
CDK Global, Inc. | | | | | | | | |
5.25% due 05/15/296 | | | 500,000 | | | $ | 510,000 | |
Total Technology | | | | | | | 6,951,000 | |
| | | | | | | | | |
Total Corporate Bonds | | | | |
(Cost $262,157,954) | | | 225,810,705 | |
| | | | | | | | | |
SENIOR FLOATING RATE INTERESTS††,9 - 15.4% |
Consumer, Cyclical - 3.6% | | | | | | | | |
World Triathlon Corp. | | | | | | | | |
5.25% (1 Month USD LIBOR + 4.25%, Rate Floor: 5.25%) due 08/15/26 | | | 1,585,526 | | | | 1,490,394 | |
Power Solutions (Panther) | | | | | | | | |
4.44% (1 Month USD LIBOR + 3.50%, Rate Floor: 3.50%) due 04/30/26 | | | 1,620,938 | | | | 1,475,053 | |
American Tire Distributors, Inc. | | | | | | | | |
8.55% (1 Month USD LIBOR + 7.50% and 3 Month USD LIBOR + 7.50%, Rate Floor: 8.50%) due 09/02/24 | | | 1,323,436 | | | | 873,468 | |
7.20% (3 Month USD LIBOR + 6.00%, Rate Floor: 7.00%) due 09/01/23 | | | 330,924 | | | | 307,759 | |
Midas Intermediate Holdco II LLC | | | | | | | | |
4.02% (3 Month USD LIBOR + 2.75%, Rate Floor: 3.75%) due 08/18/21 | | | 1,273,671 | | | | 988,687 | |
BBB Industries, LLC | | | | | | | | |
5.49% (1 Month USD LIBOR + 4.50%, Rate Floor: 4.50%) due 08/01/25 | | | 1,251,123 | | | | 938,342 | |
1011778 BC Unlimited Liability Co. | | | | | | | | |
2.74% (1 Month USD LIBOR + 1.75%, Rate Floor: 1.75%) due 11/19/26 | | | 897,750 | | | | 825,930 | |
Playtika Holding Corp. | | | | | | | | |
7.07% (3 Month USD LIBOR + 6.00%, Rate Floor: 7.00%) due 12/09/24 | | | 888,750 | | | | 825,053 | |
Alexander Mann | | | | | | | | |
5.73% (3 Month GBP LIBOR + 5.00%, Rate Floor: 5.00%) due 06/16/25††† | | GBP | 1,100,000 | | | | 820,589 | |
PT Intermediate Holdings III LLC | | | | | | | | |
6.95% (3 Month USD LIBOR + 5.50%, Rate Floor: 6.50%) due 10/15/25††† | | | 748,125 | | | | 613,463 | |
Sotheby’s | | | | | | | | |
6.50% (1 Month USD LIBOR + 5.50%, Rate Floor: 6.50%) due 01/15/27 | | | 611,748 | | | | 470,025 | |
EnTrans International, LLC | | | | | | | | |
6.99% (1 Month USD LIBOR + 6.00%, Rate Floor: 6.00%) due 11/01/24††† | | | 547,500 | | | | 459,900 | |
Blue Nile, Inc. | | | | | | | | |
8.11% (3 Month USD LIBOR + 6.50%, Rate Floor: 7.50%) due 02/17/23 | | | 668,438 | | | | 394,378 | |
American Express GBT | | | | | | | | |
due 02/26/27††† | | | 462,611 | | | | 393,219 | |
Accuride Corp. | | | | | | | | |
6.70% (3 Month USD LIBOR + 5.25%, Rate Floor: 6.25%) due 11/17/23 | | | 966,038 | | | | 386,415 | |
Belk, Inc. | | | | | | | | |
7.75% (3 Month USD LIBOR + 6.75%, Rate Floor: 7.75%) due 07/31/25 | | | 391,985 | | | | 216,376 | |
Total Consumer, Cyclical | | | | | | | 11,479,051 | |
| | | | | | | | | |
Communications - 3.4% | | | | | | | | |
Resource Label Group LLC | | | | | | | | |
6.41% (3 Month USD LIBOR + 4.50%, Rate Floor: 5.50%) due 05/26/23 | | | 1,841,059 | | | | 1,610,927 | |
10.41% (3 Month USD LIBOR + 8.50%, Rate Floor: 9.50%) due 11/26/23††† | | | 1,500,000 | | | | 1,275,000 | |
Market Track LLC | | | | | | | | |
6.03% (3 Month USD LIBOR + 4.25%, Rate Floor: 5.25%) due 06/05/24 | | | 2,437,500 | | | | 1,950,000 | |
Cengage Learning Acquisitions, Inc. | | | | | | | | |
5.25% (1 Month USD LIBOR + 4.25%, Rate Floor: 5.25%) due 06/07/23 | | | 2,383,569 | | | | 1,920,751 | |
McGraw-Hill Global Education Holdings LLC | | | | | | | | |
5.45% (3 Month USD LIBOR + 4.00%, Rate Floor: 5.00%) due 05/04/22 | | | 1,825,974 | | | | 1,485,120 | |
GTT Communications, Inc. | | | | | | | | |
3.74% (1 Month USD LIBOR + 2.75%, Rate Floor: 2.75%) due 05/31/25 | | | 1,424,625 | | | | 995,457 | |
Liberty Cablevision Of Puerto Rico LLC | | | | | | | | |
5.70% (1 Month USD LIBOR + 5.00%, Rate Floor: 5.00%) due 10/15/26 | | | 650,000 | | | | 595,562 | |
Houghton Mifflin Co. | | | | | | | | |
7.25% (1 Month USD LIBOR + 6.25%, Rate Floor: 7.25%) due 11/22/24 | | | 641,875 | | | | 565,922 | |
Telenet Financing USD LLC | | | | | | | | |
2.70% (1 Month USD LIBOR + 2.00%, Rate Floor: 2.00%) due 04/28/28 | | | 300,000 | | | | 273,300 | |
Total Communications | | | | | | | 10,672,039 | |
| | | | | | | | | |
Industrial - 3.1% | | | | | | | | |
Bhi Investments LLC | | | | | | | | |
6.34% (3 Month USD LIBOR + 4.50%, Rate Floor: 5.50%) due 08/28/24††† | | | 1,865,645 | | | | 1,492,516 | |
10.67% (3 Month USD LIBOR + 8.75%, Rate Floor: 9.75%) due 02/28/25†††,1 | | | 1,500,000 | | | | 1,455,000 | |
Diversitech Holdings, Inc. | | | | | | | | |
8.95% (3 Month USD LIBOR + 7.50%, Rate Floor: 8.50%) due 06/02/25††† | | | 2,650,000 | | | | 2,093,500 | |
Gardner Denver, Inc. | | | | | | | | |
2.74% (1 Month USD LIBOR + 1.75%, Rate Floor: 1.75%) due 03/01/27 | | | 1,600,000 | | | | 1,496,000 | |
STS Operating, Inc. (SunSource) | | | | | | | | |
5.25% (1 Month USD LIBOR + 4.25%, Rate Floor: 5.25%) due 12/11/24 | | | 984,656 | | | | 787,725 | |
American Bath Group LLC | | | | | | | | |
5.25% (1 Month USD LIBOR + 4.25%, Rate Floor: 5.25%) due 09/29/23 | | | 702,407 | | | | 593,534 | |
SEE NOTES TO FINANCIAL STATEMENTS. | THE GUGGENHEIM FUNDS SEMI-ANNUAL REPORT | 25 |
SCHEDULE OF INVESTMENTS (Unaudited)(continued) | March 31, 2020 |
HIGH YIELD FUND | |
| | Face
Amount~ | | | Value | |
YAK MAT (YAK ACCESS LLC) | | | | | | | | |
11.20% (3 Month USD LIBOR + 10.00%, Rate Floor: 10.00%) due 07/10/26††† | | | 950,000 | | | $ | 570,000 | |
Bioplan USA, Inc. | | | | | | | | |
5.82% (3 Month USD LIBOR + 4.75%, Rate Floor: 5.75%) due 09/23/21††† | | | 695,396 | | | | 472,869 | |
Avison Young (Canada), Inc. | | | | | | | | |
6.61% (3 Month USD LIBOR + 5.00%, Rate Floor: 5.00%) due 01/31/26 | | | 543,125 | | | | 431,785 | |
ProAmpac PG Borrower LLC | | | | | | | | |
10.19% (3 Month USD LIBOR + 8.50%, Rate Floor: 9.50%) due 11/18/24 | | | 350,000 | | | | 259,000 | |
National Technical Systems | | | | | | | | |
7.00% (1 Month USD LIBOR + 6.00% and 3 Month USD LIBOR + 6.00%, Rate Floor: 7.00%) due 06/12/21†††,1 | | | 248,125 | | | | 238,200 | |
Total Industrial | | | | | | | 9,890,129 | |
| | | | | | | | | |
Consumer, Non-cyclical - 2.3% | | | | | | | | |
Endo Luxembourg Finance Co. | | | | | | | | |
5.25% (1 Month USD LIBOR + 4.25%, Rate Floor: 5.00%) due 04/29/24 | | | 1,592,581 | | | | 1,421,379 | |
Cambrex Corp. | | | | | | | | |
6.00% (1 Month USD LIBOR + 5.00%, Rate Floor: 6.00%) due 12/04/26 | | | 1,571,063 | | | | 1,311,837 | |
Packaging Coordinators Midco, Inc. | | | | | | | | |
4.34% (1 Month USD LIBOR + 3.50% and 6 Month USD LIBOR + 3.50%, Rate Floor: 3.50%) due 07/01/21†††,1 | | | 1,338,462 | | | | 1,181,192 | |
ScribeAmerica Intermediate Holdco LLC (Healthchannels) | | | | | | | | |
5.11% (1 Month USD LIBOR + 4.50%, Rate Floor: 4.50%) due 04/03/25††† | | | 1,176,000 | | | | 1,023,120 | |
CTI Foods Holding Co. LLC | | | | | | | | |
8.77% (3 Month USD LIBOR + 7.00%, Rate Floor: 8.00%) due 05/03/24†††,1 | | | 590,249 | | | | 560,736 | |
10.77% (3 Month USD LIBOR + 9.00%, Rate Floor: 10.00%) due 05/03/24 | | | 308,871 | | | | 284,162 | |
Springs Window Fashions | | | | | | | | |
9.57% (3 Month USD LIBOR + 8.50%, Rate Floor: 8.50%) due 06/15/26 | | | 1,025,000 | | | | 843,913 | |
Hearthside Group Holdings LLC | | | | | | | | |
4.68% (1 Month USD LIBOR + 3.69%, Rate Floor: 3.69%) due 05/23/25 | | | 736,875 | | | | 611,606 | |
Moran Foods LLC | | | | | | | | |
due 12/05/2310 | | | 1,315,314 | | | | 65,766 | |
Total Consumer, Non-cyclical | | | | | | | 7,303,711 | |
| | | | | | | | | |
Technology - 1.5% | | | | | | | | |
Planview, Inc. | | | | | | | | |
6.87% (2 Month USD LIBOR + 5.25%, Rate Floor: 6.25%) due 01/27/23†††,1 | | | 1,164,000 | | | | 1,110,692 | |
7.02% (3 Month USD LIBOR + 5.25%, Rate Floor: 6.25%) due 01/27/23†††,1 | | | 415,557 | | | | 396,525 | |
GlobalFoundries, Inc. | | | | | | | | |
6.25% (3 Month USD LIBOR + 4.75%, Rate Floor: 4.75%) due 06/05/26 | | | 1,492,500 | | | | 1,268,625 | |
Aston FinCo SARL | | | | | | | | |
6.13% (3 Month USD LIBOR + 4.25%, Rate Floor: 4.25%) due 10/09/26 | | | 800,000 | | | | 708,000 | |
Cvent, Inc. | | | | | | | | |
4.75% (1 Month USD LIBOR + 3.75%, Rate Floor: 4.75%) due 11/29/24 | | | 738,693 | | | | 522,013 | |
Cypress Intermediate Holdings III, Inc. | | | | | | | | |
3.68% (3 Month USD LIBOR + 2.75%, Rate Floor: 2.75%) due 10/27/23†††,1 | | | 487,500 | | | | 450,414 | |
3.68% (3 Month USD LIBOR + 2.75%, Rate Floor: 2.75%) due 04/27/22 | | | 46,747 | | | | 43,190 | |
Aspect Software, Inc. | | | | | | | | |
6.00% (1 Month USD LIBOR + 5.00%, Rate Floor: 6.00%) due 01/15/24††† | | | 435,869 | | | | 329,809 | |
6.23% (3 Month USD LIBOR + 5.00%, Rate Floor: 6.00%) due 07/17/23†††,1 | | | 39,062 | | | | 38,628 | |
Total Technology | | | | | | | 4,867,896 | |
| | | | | | | | | |
Basic Materials - 0.7% | | | | | | | | |
ICP Industrial, Inc. | | | | | | | | |
5.07% (3 Month USD LIBOR + 4.00%, Rate Floor: 5.00%) due 11/03/23 | | | 1,223,958 | | | | 1,101,562 | |
Big River Steel LLC | | | | | | | | |
6.45% (3 Month USD LIBOR + 5.00%, Rate Floor: 6.00%) due 08/23/23††† | | | 877,500 | | | | 833,625 | |
DCG Acquisition Corp. | | | | | | | | |
5.36% (1 Month USD LIBOR + 4.50%, Rate Floor: 4.50%) due 09/30/26 | | | 98,729 | | | | 87,869 | |
5.87% (3 Month USD LIBOR + 4.50%, Rate Floor: 4.50%) due 09/30/26 | | | 15,985 | | | | 14,227 | |
Total Basic Materials | | | | | | | 2,037,283 | |
| | | | | | | | | |
Financial - 0.4% | | | | | | | | |
Jefferies Finance LLC | | | | | | | | |
4.25% (1 Month USD LIBOR + 3.25%, Rate Floor: 3.25%) due 06/03/26 | | | 1,416,432 | | | | 1,170,922 | |
| | | | | | | | | |
Utilities - 0.3% | | | | | | | | |
Panda Power | | | | | | | | |
7.95% (3 Month USD LIBOR + 6.50%, Rate Floor: 7.50%) due 08/21/20 | | | 1,099,864 | | | | 912,887 | |
| | | | | | | | | |
Energy - 0.1% | | | | | | | | |
Permian Production Partners LLC | | | | | | | | |
due 05/20/24†††,10 | | | 1,187,500 | | | | 178,125 | |
Summit Midstream Partners, LP | | | | | | | | |
7.00% (1 Month USD LIBOR + 6.00%, Rate Floor: 7.00%) due 05/13/22 | | | 263,475 | | | | 97,486 | |
Total Energy | | | | | | | 275,611 | |
| | | | | | | | | |
Total Senior Floating Rate Interests | | | | |
(Cost $59,935,308) | | | 48,609,529 | |
| | | | | | | | | |
26 | THE GUGGENHEIM FUNDS SEMI-ANNUAL REPORT | SEE NOTES TO FINANCIAL STATEMENTS. |
SCHEDULE OF INVESTMENTS (Unaudited)(continued) | March 31, 2020 |
HIGH YIELD FUND | |
| | Face
Amount~ | | | Value | |
ASSET-BACKED SECURITIES†† - 0.6% |
Collateralized Loan Obligations - 0.6% | | | | |
Barings Middle Market CLO Ltd. | | | | | | | | |
2019-IA, 2.94% (3 Month USD LIBOR + 1.75%, Rate Floor: 1.75%) due 10/15/316,9 | | | 1,500,000 | | | $ | 1,311,730 | |
WhiteHorse X Ltd. | | | | | | | | |
2015-10A, 7.14% (3 Month USD LIBOR + 5.30%, Rate Floor: 5.30%) due 04/17/276,9 | | | 750,000 | | | | 529,351 | |
WhiteHorse VII Ltd. | | | | | | | | |
2013-1A, 6.48% (3 Month USD LIBOR + 4.80%, Rate Floor: 0.00%) due 11/24/256,9 | | | 186,899 | | | | 129,945 | |
Total Collateralized Loan Obligations | | | | | | | 1,971,026 | |
| | | | | | | | | |
Total Asset-Backed Securities | | | | |
(Cost $2,329,666) | | | 1,971,026 | |
| | | | | | | | | |
Total Investments - 105.4% | | | | |
(Cost $382,883,129) | | $ | 332,218,910 | |
Other Assets & Liabilities, net - (5.4)% | | | (16,951,036 | ) |
Total Net Assets - 100.0% | | $ | 315,267,874 | |
Forward Foreign Currency Exchange Contracts†† |
Counterparty | | Contracts to Sell | | | Currency | | | Settlement
Date | | | Settlement
Value | | | Value at
March 31,
2020 | | | Unrealized
Appreciation | |
Barclays Bank plc | | | 3,292,000 | | | | EUR | | | | 04/17/20 | | | $ | 3,691,021 | | | $ | 3,631,105 | | | $ | 59,916 | |
Barclays Bank plc | | | 1,045,000 | | | | GBP | | | | 04/17/20 | | | | 1,317,898 | | | | 1,299,769 | | | | 18,129 | |
| | | | | | | | | | | | | | | | | | | | | | | $ | 78,045 | |
| | | | | | | | | | | | | | | | | | | | | | | | | |
Counterparty | | Contracts to Buy | | | Currency | | | Settlement
Date | | | Settlement
Value | | | Value at
March 31,
2020 | | | Unrealized
Appreciation | |
JPMorgan Chase Bank, N.A. | | | 224,000 | | | | GBP | | | | 04/17/20 | | | $ | 270,517 | | | $ | 278,611 | | | $ | 8,094 | |
JPMorgan Chase Bank, N.A. | | | 460,000 | | | | EUR | | | | 04/17/20 | | | | 501,215 | | | | 507,385 | | | | 6,170 | |
Morgan Stanley Capital Services LLC | | | 129,000 | | | | GBP | | | | 04/17/20 | | | | 154,701 | | | | 160,449 | | | | 5,748 | |
Barclays Bank plc | | | 71,000 | | | | EUR | | | | 04/17/20 | | | | 75,842 | | | | 78,314 | | | | 2,472 | |
| | | | | | | | | | | | | | | | | | | | | | | $ | 22,484 | |
SEE NOTES TO FINANCIAL STATEMENTS. | THE GUGGENHEIM FUNDS SEMI-ANNUAL REPORT | 27 |
SCHEDULE OF INVESTMENTS (Unaudited)(continued) | March 31, 2020 |
HIGH YIELD FUND | |
~ | The face amount is denominated in U.S. dollars unless otherwise indicated. |
* | Non-income producing security. |
† | Value determined based on Level 1 inputs, unless otherwise noted — See Note 4. |
†† | Value determined based on Level 2 inputs, unless otherwise noted — See Note 4. |
††† | Value determined based on Level 3 inputs — See Note 4. |
1 | Security was fair valued by the Valuation Committee at March 31, 2020. The total market value of fair valued securities amounts to $6,869,879, (cost $7,003,748) or 2.2% of total net assets. |
2 | Affiliated issuer. |
3 | Perpetual maturity. |
4 | Security has a fixed rate coupon which will convert to a floating or variable rate coupon on a future date. |
5 | Rate indicated is the 7-day yield as of March 31, 2020. |
6 | Security is a 144A or Section 4(a)(2) security. These securities have been determined to be liquid under guidelines established by the Board of Trustees. The total market value of 144A or Section 4(a)(2) securities is $169,208,853 (cost $186,842,648), or 53.7% of total net assets. |
7 | Security is a 144A or Section 4(a)(2) security. These securities have been determined to be illiquid and restricted under guidelines established by the Board of Trustees. The total market value of 144A or Section 4(a)(2) illiquid and restricted securities is $2,557,091 (cost $5,372,944), or 0.8% of total net assets — See Note 10. |
8 | All or a portion of this security has been physically segregated or earmarked in connection with reverse repurchase agreements. At March 31, 2020, the total market value of segregated or earmarked security was $30,847,594 — See Note 6. |
9 | Variable rate security. Rate indicated is the rate effective at March 31, 2020. In some instances, the effective rate is limited by a minimum rate floor or a maximum rate cap established by the issuer. The settlement status of a position may also impact the effective rate indicated. In some cases, a position may be unsettled at period end and may not have a stated effective rate. In instances where multiple underlying reference rates and spread amounts are shown, the effective rate is based on a weighted average. |
10 | Security is in default of interest and/or principal obligations. |
| | EUR — Euro |
| | GBP — British Pound |
| | LIBOR — London Interbank Offered Rate |
| | plc — Public Limited Company |
| | SARL — Société à Responsibilité Limitée |
| | |
| | See Sector Classification in Other Information section. |
The following table summarizes the inputs used to value the Fund’s investments at March 31, 2020 (See Note 4 in the Notes to Financial Statements):
Investments in Securities (Assets) | | Level 1
Quoted
Prices | | | Level 2
Significant
Observable
Inputs | | | Level 3
Significant
Unobservable
Inputs | | | Total | |
Common Stocks | | $ | 47,331 | | | $ | 812,269 | | | $ | 2,265,107 | | | $ | 3,124,707 | |
Preferred Stocks | | | — | | | | 860,760 | | | | — | * | | | 860,760 | |
Warrants | | | — | | | | 3 | | | | — | | | | 3 | |
Money Market Fund | | | 51,842,180 | | | | — | | | | — | | | | 51,842,180 | |
Corporate Bonds | | | — | | | | 225,810,705 | | | | — | * | | | 225,810,705 | |
Senior Floating Rate Interests | | | — | | | | 32,622,407 | | | | 15,987,122 | | | | 48,609,529 | |
Asset-Backed Securities | | | — | | | | 1,971,026 | | | | — | | | | 1,971,026 | |
Forward Foreign Currency Exchange Contracts** | | | — | | | | 100,529 | | | | — | | | | 100,529 | |
Total Assets | | $ | 51,889,511 | | | $ | 262,177,699 | | | $ | 18,252,229 | | | $ | 332,319,439 | |
Investments in Securities (Liabilities) | | Level 1
Quoted
Prices | | | Level 2
Significant
Observable
Inputs | | | Level 3
Significant
Unobservable
Inputs | | | Total | |
Unfunded Loan Commitments (Note 9) | | $ | — | | | $ | — | | | $ | 206,951 | | | $ | 206,951 | |
* | Security has a market value of $0. |
** | This derivative is reported as unrealized appreciation/depreciation at period end. |
28 | THE GUGGENHEIM FUNDS SEMI-ANNUAL REPORT | SEE NOTES TO FINANCIAL STATEMENTS. |
SCHEDULE OF INVESTMENTS (Unaudited)(continued) | March 31, 2020 |
HIGH YIELD FUND | |
The Fund may hold assets and/or liabilities in which the fair value approximates the carrying amount for financial statement purposes. As of the period end, reverse repurchase agreements of $20,875,801 are categorized as Level 2 within the disclosure hierarchy — See Note 6.
The following is summary of significant unobservable inputs used in the fair valuation of assets and liabilities categorized within the Level 3 of the fair value hierarchy:
Category | | Ending Balance at
March 31, 2020 | | Valuation Technique | Unobservable Inputs | | Input Range | | | Weighted Average* | |
Assets: | | | | | | | | | | | | | | |
Common Stocks | | $ | 1,438,492 | | Enterprise Value | Valuation Multiple | | | 1.5x-9.1x | | | | 6.0x | |
Common Stocks | | | 826,615 | | Third Party Pricing | Broker Quote | | | — | | | | — | |
Senior Floating Rate Interests | | | 10,555,735 | | Third Party Pricing | Broker Quote | | | — | | | | — | |
Senior Floating Rate Interests | | | 1,908,434 | | Model Price | Purchase Price | | | — | | | | — | |
Senior Floating Rate Interests | | | 1,455,000 | | Model Price | Market Comparable Yields | | | 9.9 | % | | | — | |
Senior Floating Rate Interests | | | 1,110,692 | | Yield Analysis | Yield | | | 8.5 | % | | | — | |
Senior Floating Rate Interests | | | 560,736 | | Enterprise Value | Valuation Multiple | | | 9.1x | | | | — | |
Senior Floating Rate Interests | | | 396,525 | | Model Price | Liquidation Value | | | — | | | | — | |
Total | | $ | 18,252,229 | | | | | | | | | | | |
Liabilities: | | | | | | | | | | | | | | |
Unfunded Loan Commitments | | $ | 206,951 | | Model Price | Purchase Price | | | — | | | | — | |
* | Inputs are weighted by the fair value of the instruments. |
Significant changes in a quote, valuation multiple, liquidation value, market comparable yields or yield would generally result in significant changes in the fair value of the security. Any remaining Level 3 securities held by the Fund and excluded from the table above, were not considered material to the Fund.
The Fund’s fair valuation leveling guidelines were revised to classify a single daily broker quote, or a vendor price based on a single daily or monthly broker quote, as Level 3 rather than Level 2, if such a quote or price cannot be supported with other available market information.
Transfers between Level 2 and Level 3 may occur as markets fluctuate and/or the availability of data used in an investment’s valuation changes. For the period ended March 31, 2020, the Fund had securities with a total value of $7,636,028 transfer from Level 2 to Level 3 to due to lack of observable inputs and had securities with a total market value of $5,341,029 transfer out of Level 3 to Level 2 due to the availability of current and reliable market-based data provided by a third-party pricing service which utilizes significant observable inputs. There were no other securities that transferred between levels.
SEE NOTES TO FINANCIAL STATEMENTS. | THE GUGGENHEIM FUNDS SEMI-ANNUAL REPORT | 29 |
SCHEDULE OF INVESTMENTS (Unaudited)(concluded) | March 31, 2020 |
HIGH YIELD FUND | |
Summary of Fair Value Level 3 Activity
Following is a reconciliation of Level 3 assets for which significant unobservable inputs were used to determine fair value for the period ended March 31, 2020:
| | | Assets | | | | | | | Liabilities | |
| | Common
Stocks | | | Senior
Floating Rate
Interests | | | Preferred
Stocks | | | Total Assets | | | Unfunded
Loan
Commitments | |
Beginning Balance | | $ | 2,042,728 | | | $ | 18,366,284 | | | $ | 534,846 | | | $ | 20,943,858 | | | $ | (301,483 | ) |
Purchases/(Receipts) | | | 17,289 | | | | 3,626,882 | | | | — | | | | 3,644,171 | | | | (118,777 | ) |
(Sales, maturities and paydowns)/Fundings | | | (74,868 | ) | | | (7,136,016 | ) | | | — | | | | (7,210,884 | ) | | | 404,072 | |
Amortization of discount/premiums | | | — | | | | 116,281 | | | | — | | | | 116,281 | | | | — | |
Corporate actions | | | 160,573 | | | | — | | | | (160,573 | ) | | | — | | | | — | |
Total realized gains or losses included in earnings | | | 14,338 | | | | (129,921 | ) | | | — | | | | (115,583 | ) | | | (58,265 | ) |
Total change in unrealized appreciation (depreciation) included in earnings | | | 105,047 | | | | (1,151,387 | ) | | | (374,273 | ) | | | (1,420,613 | ) | | | (132,498 | ) |
Transfers into Level 3 | | | — | | | | 7,636,028 | | | | — | | | | 7,636,028 | | | | — | |
Transfers out of Level 3 | | | — | | | | (5,341,029 | ) | | | — | | | | (5,341,029 | ) | | | — | |
Ending Balance | | $ | 2,265,107 | | | $ | 15,987,122 | | | $ | — | | | $ | 18,252,229 | | | $ | (206,951 | ) |
Net change in unrealized appreciation (depreciation) for investments in Level 3 securities still held at March 31, 2020 | | $ | 105,047 | | | $ | (757,496 | ) | | $ | — | | | $ | (652,449 | ) | | $ | (186,336 | ) |
Affiliated Transactions
Investments representing 5% or more of the outstanding voting shares of a company, or control of or by, or common control under Guggenheim Investments, result in that company being considered an affiliated issuer, as defined in the 1940 Act.
Transactions during the period ended March 31, 2020, in which the company is an affiliated issuer, were as follows:
Security Name | | Value
09/30/19 | | | Additions | | | Reductions | | | Realized
Gain (Loss) | | | Change in
Unrealized
Appreciation
(Depreciation) | | | Value
03/31/20 | | | Shares/Face
Amount
03/31/20 | |
Common Stocks | | | | | | | | | | | | | | | | | | | | | | | | | | | | |
BP Holdco LLC*,1 | | $ | 8,372 | | | $ | — | | | $ | — | | | $ | — | | | $ | (2,160 | ) | | $ | 6,212 | | | | 23,711 | |
Targus Group International Equity, Inc.*,1 | | | 21,720 | | | | — | | | | — | | | | — | | | | 467 | | | | 22,187 | | | | 12,825 | |
Senior Floating Rate Interests | | | | | | | | | | | | | | | | | | | | | | | | | | | | |
Targus Group International, Inc. due 05/24/16 | | | — | ** | | | — | | | | — | | | | (139,369 | ) | | | 139,369 | | | | — | | | | — | |
| | | $ | 30,092 | | | $ | — | | | $ | — | | | $ | (139,369 | ) | | $ | 137,676 | | | $ | 28,399 | | | | | |
* | Non-income producing security. |
** | Market value is less than $1. |
1 | Security was fair valued by the Valuation Committee at March 31, 2020. The total market value of fair valued and affiliated securities amounts to $28,399, (cost $12,729) or less than 0.1% of total net assets. |
30 | THE GUGGENHEIM FUNDS SEMI-ANNUAL REPORT | SEE NOTES TO FINANCIAL STATEMENTS. |
STATEMENT OF ASSETS AND LIABILITIES (Unaudited) |
March 31, 2020 |
Assets: |
Investments in unaffiliated issuers, at value (cost $382,870,400) | | $ | 332,190,511 | |
Investments in affiliated issuers, at value (cost $12,729) | | | 28,399 | |
Foreign currency, at value (cost $6,594) | | | 6,594 | |
Cash | | | 215,201 | |
Segregated cash with broker | | | 1,821 | |
Unrealized appreciation on forward foreign currency exchange contracts | | | 100,529 | |
Prepaid expenses | | | 46,221 | |
Receivables: |
Securities sold | | | 5,632,335 | |
Interest | | | 4,586,217 | |
Fund shares sold | | | 1,354,338 | |
Dividends | | | 26,277 | |
Foreign tax reclaims | | | 16,131 | |
Total assets | | | 344,204,574 | |
| | | | | |
Liabilities: |
Unfunded loan commitments, at value (Note 9) (commitment fees received $352,800) | | | 206,951 | |
Reverse repurchase agreements (Note 6) | | | 20,875,801 | |
Payable for: |
Securities purchased | | | 4,132,166 | |
Fund shares redeemed | | | 3,187,859 | |
Distributions to shareholders | | | 227,815 | |
Management fees | | | 156,119 | |
Distribution and service fees | | | 27,606 | |
Transfer agent/maintenance fees | | | 21,832 | |
Fund accounting/administration fees | | | 16,825 | |
Due to Investment Adviser | | | 6,540 | |
Trustees’ fees* | | | 919 | |
Miscellaneous | | | 76,267 | |
Total liabilities | | | 28,936,700 | |
Net assets | | $ | 315,267,874 | |
| | | | | |
Net assets consist of: |
Paid in capital | | $ | 393,976,819 | |
Total distributable earnings (loss) | | | (78,708,945 | ) |
Net assets | | $ | 315,267,874 | |
| | | | | |
A-Class: |
Net assets | | $ | 51,184,531 | |
Capital shares outstanding | | | 5,518,737 | |
Net asset value per share | | $ | 9.27 | |
Maximum offering price per share (Net asset value divided by 96.00%) | | $ | 9.66 | |
| | | | | |
C-Class: |
Net assets | | $ | 16,479,163 | |
Capital shares outstanding | | | 1,761,879 | |
Net asset value per share | | $ | 9.35 | |
| | | | | |
P-Class: |
Net assets | | $ | 5,691,878 | |
Capital shares outstanding | | | 613,299 | |
Net asset value per share | | $ | 9.28 | |
| | | | | |
Institutional Class: |
Net assets | | $ | 121,853,650 | |
Capital shares outstanding | | | 16,126,808 | |
Net asset value per share | | $ | 7.56 | |
| | | | | |
R6-Class: |
Net assets | | $ | 120,058,652 | |
Capital shares outstanding | | | 12,959,285 | |
Net asset value per share | | $ | 9.26 | |
* | Relates to Trustees not deemed “interested persons” within the meaning of Section 2(a)(19) of the 1940 Act. |
SEE NOTES TO FINANCIAL STATEMENTS. | THE GUGGENHEIM FUNDS SEMI-ANNUAL REPORT | 31 |
STATEMENT OF OPERATIONS (Unaudited) |
Six-Month Period Ended March 31, 2020 |
Investment Income: |
Dividends from securities of unaffiliated issuers | | $ | 495,858 | |
Interest from securities of unaffiliated issuers | | | 14,054,251 | |
Total investment income | | | 14,550,109 | |
| | | | | |
Expenses: |
Management fees | | | 1,233,720 | |
Distribution and service fees: |
A-Class | | | 80,134 | |
C-Class | | | 107,423 | |
P-Class | | | 9,888 | |
Transfer agent/maintenance fees: |
A-Class | | | 24,710 | |
C-Class | | | 11,963 | |
P-Class | | | 6,223 | |
Institutional Class | | | 104,345 | |
R6-Class | | | 491 | |
Interest expense | | | 243,980 | |
Fund accounting/administration fees | | | 158,617 | |
Professional fees | | | 51,163 | |
Custodian fees | | | 20,929 | |
Line of credit fees | | | 17,497 | |
Trustees’ fees* | | | 13,158 | |
Miscellaneous | | | 98,415 | |
Recoupment of previously waived fees: |
A-Class | | | 23,916 | |
C-Class | | | 3,998 | |
P-Class | | | 178 | |
Institutional Class | | | 33,974 | |
R6-Class | | | 6,529 | |
Total expenses | | | 2,251,251 | |
Less: |
Expenses reimbursed by Adviser: |
A-Class | | | (2,597 | ) |
C-Class | | | (771 | ) |
P-Class | | | (693 | ) |
Institutional Class | | | (18,716 | ) |
Earnings credits applied | | | (1,853 | ) |
Total waived/reimbursed expenses | | | (24,630 | ) |
Net expenses | | | 2,226,621 | |
Net investment income | | | 12,323,488 | |
| | | | | |
Net Realized and Unrealized Gain (Loss): |
Net realized gain (loss) on: |
Investments in unaffiliated issuers | | $ | (15,961,871 | ) |
Investments in affiliated issuers | | | (139,369 | ) |
Forward foreign currency exchange contracts | | | (69,475 | ) |
Foreign currency transactions | | | 33,105 | |
Net realized loss | | | (16,137,610 | ) |
Net change in unrealized appreciation (depreciation) on: |
Investments in unaffiliated issuers | | | (42,246,225 | ) |
Investments in affiliated issuers | | | 137,676 | |
Forward foreign currency exchange contracts | | | 77,793 | |
Foreign currency translations | | | (28,879 | ) |
Net change in unrealized appreciation (depreciation) | | | (42,059,635 | ) |
Net realized and unrealized loss | | | (58,197,245 | ) |
Net decrease in net assets resulting from operations | | $ | (45,873,757 | ) |
* | Relates to Trustees not deemed “interested persons” within the meaning of Section 2(a)(19) of the 1940 Act. |
32 | THE GUGGENHEIM FUNDS SEMI-ANNUAL REPORT | SEE NOTES TO FINANCIAL STATEMENTS. |
STATEMENTS OF CHANGES IN NET ASSETS |
| | Six-Month
Period Ended
March 31,
2020
(Unaudited) | | | Year Ended
September 30,
2019 | |
Increase (Decrease) in Net Assets from Operations: | | | | | | | | |
Net investment income | | $ | 12,323,488 | | | $ | 24,882,058 | |
Net realized loss on investments | | | (16,137,610 | ) | | | (8,958,152 | ) |
Net change in unrealized appreciation (depreciation) on investments | | | (42,059,635 | ) | | | 5,141,186 | |
Net increase (decrease) in net assets resulting from operations | | | (45,873,757 | ) | | | 21,065,092 | |
| | | | | | | | | |
Distributions to shareholders: | | | | | | | | |
A-Class | | | (1,976,721 | ) | | | (4,333,588 | ) |
C-Class | | | (583,913 | ) | | | (1,132,868 | ) |
P-Class | | | (244,034 | ) | | | (529,844 | ) |
Institutional Class | | | (5,562,161 | ) | | | (9,833,829 | ) |
R6-Class | | | (4,836,805 | ) | | | (9,923,537 | ) |
Total distributions to shareholders | | | (13,203,634 | ) | | | (25,753,666 | ) |
| | | | | | | | | |
Capital share transactions: | | | | | | | | |
Proceeds from sale of shares | | | | | | | | |
A-Class | | | 6,621,218 | | | | 11,548,636 | |
C-Class | | | 3,512,935 | | | | 5,391,154 | |
P-Class | | | 795,947 | | | | 2,776,059 | |
Institutional Class | | | 48,296,115 | | | | 113,823,859 | |
R6-Class | | | 2,905,326 | | | | 7,397,981 | |
Redemption fees collected | | | | | | | | |
A-Class | | | 3,656 | | | | 3,471 | |
C-Class | | | 1,215 | | | | 1,022 | |
P-Class | | | 455 | | | | 454 | |
Institutional Class | | | 9,377 | | | | 6,625 | |
R6-Class | | | 8,463 | | | | 7,944 | |
Distributions reinvested | | | | | | | | |
A-Class | | | 1,776,828 | | | | 3,805,869 | |
C-Class | | | 529,707 | | | | 997,942 | |
P-Class | | | 244,010 | | | | 528,810 | |
Institutional Class | | | 4,266,401 | | | | 7,714,249 | |
R6-Class | | | 4,836,805 | | | | 9,923,323 | |
Cost of shares redeemed | | | | | | | | |
A-Class | | | (15,684,319 | ) | | | (21,398,303 | ) |
C-Class | | | (6,394,037 | ) | | | (6,478,775 | ) |
P-Class | | | (2,392,699 | ) | | | (7,072,377 | ) |
Institutional Class | | | (88,000,200 | ) | | | (66,675,004 | ) |
R6-Class | | | (17,013,355 | ) | | | (53,462,016 | ) |
Net increase (decrease) from capital share transactions | | | (55,676,152 | ) | | | 8,840,923 | |
Net increase (decrease) in net assets | | | (114,753,543 | ) | | | 4,152,349 | |
| | | | | | | | | |
Net assets: | | | | | | | | |
Beginning of period | | | 430,021,417 | | | | 425,869,068 | |
End of period | | $ | 315,267,874 | | | $ | 430,021,417 | |
| | | | | | | | | |
SEE NOTES TO FINANCIAL STATEMENTS. | THE GUGGENHEIM FUNDS SEMI-ANNUAL REPORT | 33 |
STATEMENTS OF CHANGES IN NET ASSETS (concluded) |
| | Six-Month
Period Ended
March 31,
2020
(Unaudited) | | | Year Ended
September 30,
2019 | |
Capital share activity: | | | | | | | | |
Shares sold | | | | | | | | |
A-Class | | | 658,360 | | | | 1,071,432 | |
C-Class | | | 322,832 | | | | 495,246 | |
P-Class | | | 74,471 | | | | 257,789 | |
Institutional Class | | | 5,666,512 | | | | 13,057,496 | |
R6-Class | | | 272,110 | | | | 690,356 | |
Shares issued from reinvestment of distributions | | | | | | | | |
A-Class | | | 167,616 | | | | 353,785 | |
C-Class | | | 49,564 | | | | 91,997 | |
P-Class | | | 22,981 | | | | 49,100 | |
Institutional Class | | | 492,492 | | | | 877,350 | |
R6-Class | | | 457,242 | | | | 922,818 | |
Shares redeemed | | | | | | | | |
A-Class | | | (1,539,098 | ) | | | (1,986,805 | ) |
C-Class | | | (606,447 | ) | | | (598,161 | ) |
P-Class | | | (233,313 | ) | | | (654,928 | ) |
Institutional Class | | | (10,347,961 | ) | | | (7,604,434 | ) |
R6-Class | | | (1,692,525 | ) | | | (4,951,144 | ) |
Net increase (decrease) in shares | | | (6,235,164 | ) | | | 2,071,897 | |
34 | THE GUGGENHEIM FUNDS SEMI-ANNUAL REPORT | SEE NOTES TO FINANCIAL STATEMENTS. |
This table is presented to show selected data for a share outstanding throughout each period and to assist shareholders in evaluating a Fund’s performance for the periods presented.
A-Class | | Period Ended
March 31,
2020a | | | Year Ended
September 30,
2019 | | | Year Ended
September 30,
2018 | | | Year Ended
September 30,
2017 | | | Year Ended
September 30,
2016 | | | Year Ended
September 30,
2015 | |
Per Share Data |
Net asset value, beginning of period | | $ | 10.90 | | | $ | 11.04 | | | $ | 11.50 | | | $ | 11.16 | | | $ | 10.79 | | | $ | 12.02 | |
Income (loss) from investment operations: |
Net investment income (loss)b | | | .31 | | | | .64 | | | | .68 | | | | .64 | | | | .67 | | | | .69 | |
Net gain (loss) on investments (realized and unrealized) | | | (1.61 | ) | | | (.12 | ) | | | (.46 | ) | | | .35 | | | | .41 | | | | (.97 | ) |
Total from investment operations | | | (1.30 | ) | | | .52 | | | | .22 | | | | .99 | | | | 1.08 | | | | (.28 | ) |
Less distributions from: |
Net investment income | | | (.33 | ) | | | (.66 | ) | | | (.68 | ) | | | (.65 | ) | | | (.72 | ) | | | (.74 | ) |
Net realized gains | | | — | | | | — | | | | — | | | | — | | | | — | | | | (.22 | ) |
Total distributions | | | (.33 | ) | | | (.66 | ) | | | (.68 | ) | | | (.65 | ) | | | (.72 | ) | | | (.96 | ) |
Redemption fees collected | | | — | h | | | — | h | | | — | h | | | — | h | | | .01 | | | | .01 | |
Net asset value, end of period | | $ | 9.27 | | | $ | 10.90 | | | $ | 11.04 | | | $ | 11.50 | | | $ | 11.16 | | | $ | 10.79 | |
|
Total Returnc | | | (12.26 | %) | | | 4.99 | % | | | 2.00 | % | | | 9.11 | % | | | 10.71 | % | | | (2.40 | %) |
Ratios/Supplemental Data |
Net assets, end of period (in thousands) | | $ | 51,185 | | | $ | 67,916 | | | $ | 75,028 | | | $ | 126,097 | | | $ | 87,045 | | | $ | 73,236 | |
Ratios to average net assets: |
Net investment income (loss) | | | 5.79 | % | | | 5.94 | % | | | 6.05 | % | | | 5.63 | % | | | 6.32 | % | | | 6.01 | % |
Total expensesd | | | 1.30 | % | | | 1.27 | % | | | 1.35 | % | | | 1.31 | % | | | 1.25 | % | | | 1.27 | % |
Net expensese,f,g | | | 1.29 | % | | | 1.26 | % | | | 1.33 | % | | | 1.29 | % | | | 1.23 | % | | | 1.20 | % |
Portfolio turnover rate | | | 25 | % | | | 61 | % | | | 61 | % | | | 62 | % | | | 55 | % | | | 72 | % |
C-Class | | Period Ended
March 31,
2020a | | | Year Ended
September 30,
2019 | | | Year Ended
September 30,
2018 | | | Year Ended
September 30,
2017 | | | Year Ended
September 30,
2016 | | | Year Ended
September 30,
2015 | |
Per Share Data |
Net asset value, beginning of period | | $ | 10.99 | | | $ | 11.14 | | | $ | 11.60 | | | $ | 11.26 | | | $ | 10.88 | | | $ | 12.12 | |
Income (loss) from investment operations: |
Net investment income (loss)b | | | .27 | | | | .56 | | | | .60 | | | | .56 | | | | .60 | | | | .61 | |
Net gain (loss) on investments (realized and unrealized) | | | (1.62 | ) | | | (.12 | ) | | | (.46 | ) | | | .35 | | | | .41 | | | | (.98 | ) |
Total from investment operations | | | (1.35 | ) | | | .44 | | | | .14 | | | | .91 | | | | 1.01 | | | | (.37 | ) |
Less distributions from: |
Net investment income | | | (.29 | ) | | | (.59 | ) | | | (.60 | ) | | | (.57 | ) | | | (.64 | ) | | | (.66 | ) |
Net realized gains | | | — | | | | — | | | | — | | | | — | | | | — | | | | (.22 | ) |
Total distributions | | | (.29 | ) | | | (.59 | ) | | | (.60 | ) | | | (.57 | ) | | | (.64 | ) | | | (.88 | ) |
Redemption fees collected | | | — | h | | | — | h | | | — | h | | | — | h | | | .01 | | | | .01 | |
Net asset value, end of period | | $ | 9.35 | | | $ | 10.99 | | | $ | 11.14 | | | $ | 11.60 | | | $ | 11.26 | | | $ | 10.88 | |
|
Total Returnc | | | (12.56 | %) | | | 4.12 | % | | | 1.27 | % | | | 8.38 | % | | | 9.81 | % | | | (3.14 | %) |
Ratios/Supplemental Data |
Net assets, end of period (in thousands) | | $ | 16,479 | | | $ | 21,935 | | | $ | 22,350 | | | $ | 30,461 | | | $ | 26,941 | | | $ | 13,671 | |
Ratios to average net assets: |
Net investment income (loss) | | | 5.05 | % | | | 5.17 | % | | | 5.31 | % | | | 4.92 | % | | | 5.52 | % | | | 5.25 | % |
Total expensesd | | | 2.04 | % | | | 2.03 | % | | | 2.11 | % | | | 2.05 | % | | | 2.01 | % | | | 2.01 | % |
Net expensese,f,g | | | 2.04 | % | | | 2.02 | % | | | 2.09 | % | | | 2.03 | % | | | 1.98 | % | | | 1.95 | % |
Portfolio turnover rate | | | 25 | % | | | 61 | % | | | 61 | % | | | 62 | % | | | 55 | % | | | 72 | % |
SEE NOTES TO FINANCIAL STATEMENTS. | THE GUGGENHEIM FUNDS SEMI-ANNUAL REPORT | 35 |
FINANCIAL HIGHLIGHTS (continued) |
This table is presented to show selected data for a share outstanding throughout each period and to assist shareholders in evaluating a Fund’s performance for the periods presented.
P-Class | | Period Ended
March 31,
2020a | | | Year Ended
September 30,
2019 | | | Year Ended
September 30,
2018 | | | Year Ended
September 30,
2017 | | | Year Ended
September 30,
2016 | | | Period Ended
September 30,
2015i | |
Per Share Data |
Net asset value, beginning of period | | $ | 10.91 | | | $ | 11.05 | | | $ | 11.51 | | | $ | 11.17 | | | $ | 10.80 | | | $ | 11.53 | |
Income (loss) from investment operations: |
Net investment income (loss)b | | | .31 | | | | .64 | | | | .68 | | | | .64 | | | | .67 | | | | .27 | |
Net gain (loss) on investments (realized and unrealized) | | | (1.61 | ) | | | (.12 | ) | | | (.46 | ) | | | .37 | | | | .42 | | | | (.73 | ) |
Total from investment operations | | | (1.30 | ) | | | .52 | | | | .22 | | | | 1.01 | | | | 1.09 | | | | (.46 | ) |
Less distributions from: |
Net investment income | | | (.33 | ) | | | (.66 | ) | | | (.68 | ) | | | (.67 | ) | | | (.72 | ) | | | (.27 | ) |
Total distributions | | | (.33 | ) | | | (.66 | ) | | | (.68 | ) | | | (.67 | ) | | | (.72 | ) | | | (.27 | ) |
Redemption fees collected | | | — | h | | | — | h | | | — | h | | | — | h | | | — | h | | | — | h |
Net asset value, end of period | | $ | 9.28 | | | $ | 10.91 | | | $ | 11.05 | | | $ | 11.51 | | | $ | 11.17 | | | $ | 10.80 | |
|
Total Return | | | (12.25 | %) | | | 4.98 | % | | | 1.95 | % | | | 9.24 | % | | | 10.74 | % | | | (4.06 | %) |
Ratios/Supplemental Data |
Net assets, end of period (in thousands) | | $ | 5,692 | | | $ | 8,170 | | | $ | 12,124 | | | $ | 16,883 | | | $ | 3,178 | | | $ | 10 | |
Ratios to average net assets: |
Net investment income (loss) | | | 5.79 | % | | | 5.93 | % | | | 6.00 | % | | | 5.58 | % | | | 6.20 | % | | | 5.76 | % |
Total expensesd | | | 1.31 | % | | | 1.30 | % | | | 1.45 | % | | | 1.29 | % | | | 1.17 | % | | | 3.36 | % |
Net expensese,f,g | | | 1.29 | % | | | 1.28 | % | | | 1.39 | % | | | 1.22 | % | | | 1.17 | % | | | 1.19 | % |
Portfolio turnover rate | | | 25 | % | | | 61 | % | | | 61 | % | | | 62 | % | | | 55 | % | | | 72 | % |
Institutional Class | | Period Ended
March 31,
2020a | | | Year Ended
September 30,
2019 | | | Year Ended
September 30,
2018 | | | Year Ended
September 30,
2017 | | | Year Ended
September 30,
2016 | | | Year Ended
September 30,
2015 | |
Per Share Data |
Net asset value, beginning of period | | $ | 8.88 | | | $ | 9.01 | | | $ | 9.38 | | | $ | 9.11 | | | $ | 8.81 | | | $ | 9.87 | |
Income (loss) from investment operations: |
Net investment income (loss)b | | | .26 | | | | .54 | | | | .58 | | | | .56 | | | | .58 | | | | .58 | |
Net gain (loss) on investments (realized and unrealized) | | | (1.30 | ) | | | (.10 | ) | | | (.38 | ) | | | .28 | | | | .34 | | | | (.79 | ) |
Total from investment operations | | | (1.04 | ) | | | .44 | | | | .20 | | | | .84 | | | | .92 | | | | (.21 | ) |
Less distributions from: |
Net investment income | | | (.28 | ) | | | (.57 | ) | | | (.57 | ) | | | (.57 | ) | | | (.62 | ) | | | (.64 | ) |
Net realized gains | | | — | | | | — | | | | — | | | | — | | | | — | | | | (.22 | ) |
Total distributions | | | (.28 | ) | | | (.57 | ) | | | (.57 | ) | | | (.57 | ) | | | (.62 | ) | | | (.86 | ) |
Redemption fees collected | | | — | h | | | — | h | | | — | h | | | — | h | | | — | h | | | .01 | |
Net asset value, end of period | | $ | 7.56 | | | $ | 8.88 | | | $ | 9.01 | | | $ | 9.38 | | | $ | 9.11 | | | $ | 8.81 | |
|
Total Return | | | (12.02 | %) | | | 5.15 | % | | | 2.27 | % | | | 9.56 | % | | | 10.95 | % | | | (2.21 | %) |
Ratios/Supplemental Data |
Net assets, end of period (in thousands) | | $ | 121,854 | | | $ | 180,442 | | | $ | 125,945 | | | $ | 194,280 | | | $ | 141,833 | | | $ | 75,167 | |
Ratios to average net assets: |
Net investment income (loss) | | | 6.05 | % | | | 6.17 | % | | | 6.28 | % | | | 6.00 | % | | | 6.58 | % | | | 6.21 | % |
Total expensesd | | | 1.06 | % | | | 0.99 | % | | | 1.14 | % | | | 0.94 | % | | | 0.95 | % | | | 0.94 | % |
Net expensese,f,g | | | 1.03 | % | | | 0.97 | % | | | 1.11 | % | | | 0.93 | % | | | 0.94 | % | | | 0.94 | % |
Portfolio turnover rate | | | 25 | % | | | 61 | % | | | 61 | % | | | 62 | % | | | 55 | % | | | 72 | % |
36 | THE GUGGENHEIM FUNDS SEMI-ANNUAL REPORT | SEE NOTES TO FINANCIAL STATEMENTS. |
FINANCIAL HIGHLIGHTS (concluded) |
This table is presented to show selected data for a share outstanding throughout each period and to assist shareholders in evaluating a Fund’s performance for the periods presented.
R6-Class | | Period Ended
March 31,
2020a | | | Year Ended
September 30,
2019 | | | Year Ended
September 30,
2018 | | | Period Ended
September 30,
2017j | |
Per Share Data |
Net asset value, beginning of period | | $ | 10.89 | | | $ | 11.03 | | | $ | 11.49 | | | $ | 11.45 | |
Income (loss) from investment operations: |
Net investment income (loss)b | | | .33 | | | | .68 | | | | .72 | | | | .24 | |
Net gain (loss) on investments (realized and unrealized) | | | (1.61 | ) | | | (.12 | ) | | | (.46 | ) | | | .04 | |
Total from investment operations | | | (1.28 | ) | | | .56 | | | | .26 | | | | .28 | |
Less distributions from: |
Net investment income | | | (.35 | ) | | | (.70 | ) | | | (.72 | ) | | | (.24 | ) |
Total distributions | | | (.35 | ) | | | (.70 | ) | | | (.72 | ) | | | (.24 | ) |
Redemption fees collected | | | — | h | | | — | h | | | — | h | | | — | h |
Net asset value, end of period | | $ | 9.26 | | | $ | 10.89 | | | $ | 11.03 | | | $ | 11.49 | |
|
Total Return | | | (12.11 | %) | | | 5.39 | % | | | 2.34 | % | | | 2.49 | % |
Ratios/Supplemental Data |
Net assets, end of period (in thousands) | | $ | 120,059 | | | $ | 151,558 | | | $ | 190,421 | | | $ | 200,099 | |
Ratios to average net assets: |
Net investment income (loss) | | | 6.17 | % | | | 6.31 | % | | | 6.41 | % | | | 5.41 | % |
Total expensesd | | | 0.90 | % | | | 0.89 | % | | | 1.00 | % | | | 0.82 | % |
Net expensese,f,g | | | 0.90 | % | | | 0.88 | % | | | 1.00 | % | | | 0.82 | % |
Portfolio turnover rate | | | 25 | % | | | 61 | % | | | 61 | % | | | 62 | % |
a | Unaudited figures for the period ended March 31, 2020. Percentage amounts for the period, except total return and portfolio turnover rate, have been annualized. |
b | Net investment income (loss) per share was computed using average shares outstanding throughout the period. |
c | Total return does not reflect the impact of any applicable sales charges. |
d | Does not include expenses of the underlying funds in which the Fund invests. |
e | Net expense information reflects the expense ratios after expense waivers and reimbursements, as applicable. |
f | The portion of the ratios of net expenses to average net assets attributable to recoupments of prior fee reductions or expense reimbursements for the periods presented was as follows: |
| | | 03/31/20a | 09/30/19 | 09/30/18 | 09/30/17 |
| | A-Class | 0.07% | 0.05% | — | 0.09% |
| | C-Class | 0.04% | 0.05% | — | 0.06% |
| | P-Class | 0.00%* | 0.01% | 0.03% | 0.00%* |
| | Institutional Class | 0.04% | 0.02% | 0.04% | 0.00%* |
| | R6-Class | 0.01% | 0.00%* | — | — |
g | Net expenses may include expenses that are excluded from the expense limitation agreement. Excluding these expenses, the net expense ratios for the periods would be: |
| | | 03/31/20a | 09/30/19 | 09/30/18 | 09/30/17 | 09/30/16 | 09/30/15 |
| | A-Class | 1.16% | 1.15% | 1.10% | 1.15% | 1.16% | 1.16% |
| | C-Class | 1.91% | 1.91% | 1.86% | 1.89% | 1.91% | 1.91% |
| | P-Class | 1.16% | 1.16% | 1.16% | 1.08% | 1.09% | 1.16% |
| | Institutional Class | 0.91% | 0.88% | 0.88% | 0.79% | 0.87% | 0.91% |
| | R6-Class | 0.78% | 0.77% | 0.77% | 0.79% | — | — |
h | Redemption fees collected are less than $0.01 per share. |
i | Since commencement of operations: May 1, 2015. Percentage amounts for the period, except total return and portfolio turnover rate, have been annualized. |
j | Since commencement of operations: May 15, 2017. Percentage amounts for the period, except total return and portfolio turnover rate, have been annualized. |
SEE NOTES TO FINANCIAL STATEMENTS. | THE GUGGENHEIM FUNDS SEMI-ANNUAL REPORT | 37 |
PERFORMANCE REPORT AND FUND PROFILE (Unaudited) | March 31, 2020 |
INVESTMENT GRADE BOND FUND
OBJECTIVE: Seeks to provide current income.
Holdings Diversification (Market Exposure as % of Net Assets)
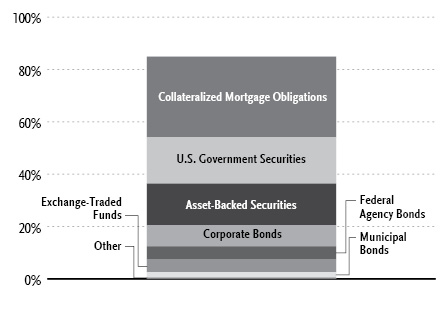
“Holdings Diversification (Market Exposure as % of Net Assets)” excludes any temporary cash investments.
Portfolio Composition by Quality Rating1 |
Rating | % of Total
Investments |
Fixed Income Instruments | |
AAA | 54.7% |
AA | 4.2% |
A | 7.0% |
BBB | 10.1% |
BB | 0.2% |
B | 0.7% |
CCC | 0.8% |
CC | 0.3% |
C | 0.2% |
NR2 | 3.0% |
Other Instruments | 18.8% |
Total Investments | 100.0% |
Inception Dates: |
A-Class | August 15, 1985 |
C-Class | May 1, 2000 |
P-Class | May 1, 2015 |
Institutional Class | January 29, 2013 |
Ten Largest Holdings (% of Total Net Assets) |
U.S. Treasury Bonds | 4.6% |
iShares iBoxx $ Investment Grade Corporate Bond ETF | 4.3% |
U.S. Treasury Notes, 2.38% due 02/29/24 | 3.0% |
U.S. Treasury Notes, 1.88% due 02/28/22 | 1.9% |
U.S. Treasury Notes, 1.63% due 10/31/26 | 1.8% |
U.S. Treasury Notes, 1.50% due 10/31/24 | 1.7% |
U.S. Treasury Notes, 1.75% due 06/30/24 | 1.2% |
U.S. Treasury Notes, 1.50% due 09/30/24 | 1.1% |
U.S. Treasury Notes, 1.63% due 09/30/26 | 1.1% |
U.S. Treasury Notes, 2.50% due 02/28/26 | 1.0% |
Top Ten Total | 21.7% |
| | |
“Ten Largest Holdings” excludes any temporary cash or derivative investments. |
1 | Source: BlackRock Solutions. Credit quality ratings are measured on a scale that generally ranges from AAA (highest) to D (lowest). All securities except for those labeled “NR” have been rated by Moody’s, Standard & Poor’s (“S&P”), or Fitch, each of which is a Nationally Recognized Statistical Rating Organization (“NRSRO”). For purposes of this presentation, when ratings are available from more than one agency, the highest rating is used. Guggenheim Investments has converted ratings to the equivalent S&P rating. Security ratings are determined at the time of purchase and may change thereafter. |
2 | NR securities do not necessarily indicate low credit quality. |
38 | THE GUGGENHEIM FUNDS SEMI-ANNUAL REPORT | |
PERFORMANCE REPORT AND FUND PROFILE (Unaudited)(concluded) | March 31, 2020 |
Average Annual Returns*
Periods Ended March 31, 2020
| 6 Month† | 1 Year | 5 Year | 10 Year |
A-Class Shares | 2.37% | 6.18% | 3.81% | 4.85% |
A-Class Shares with sales charge‡ | (1.73%) | 1.93% | 2.80% | 4.35% |
C-Class Shares | 2.00% | 5.41% | 3.06% | 4.10% |
C-Class Shares with CDSC§ | 1.00% | 4.41% | 3.06% | 4.10% |
Bloomberg Barclays U.S. Aggregate Bond Index | 3.33% | 8.93% | 3.36% | 3.88% |
| 6 Month† | 1 Year | 5 Year | Since
Inception
(01/29/13) |
Institutional Class Shares | 2.57% | 6.49% | 4.11% | 4.61% |
Bloomberg Barclays U.S. Aggregate Bond Index | 3.33% | 8.93% | 3.36% | 3.20% |
| | 6 Month† | 1 Year | Since
Inception
(05/01/15) |
P-Class Shares | | 2.37% | 6.17% | 3.91% |
Bloomberg Barclays U.S. Aggregate Bond Index | | 3.33% | 8.93% | 3.56% |
* | The performance data above represents past performance that is not predictive of future results. The investment return and principal value of an investment in the Fund will fluctuate so that an investor’s shares, when redeemed, may be worth more or less than their original cost. Returns are historical and include changes in principal and reinvested dividends and capital gains and do not reflect the effect of taxes. The Bloomberg Barclays U.S. Aggregate Bond Index is an unmanaged index and, unlike the Fund, has no management fees or operating expenses to reduce its reported return. |
† | 6 month returns are not annualized. |
‡ | Effective October 1, 2015, the maximum sales charge decreased from 4.75% to 4.00%. A 4.75% maximum sales charge is used in the calculation of the Average Annual Returns based on subscriptions made prior to October 1, 2015, and a 4.00% maximum sales charge is used to calculate performance for periods based on subscriptions made on or after October 1, 2015. |
§ | Fund returns include a CDSC of 1% if redeemed within 12 months of purchase. |
| | THE GUGGENHEIM FUNDS SEMI-ANNUAL REPORT | 39 |
SCHEDULE OF INVESTMENTS (Unaudited) | March 31, 2020 |
INVESTMENT GRADE BOND FUND | |
| | | Shares | | | Value | |
COMMON STOCKS††† - 0.0% |
| | | | | | | |
| Industrial - 0.0% |
Constar International Holdings LLC* ,1 | | | 68 | | | $ | — | |
| | | | | | | | | |
| Total Common Stocks | | | | | | | | |
| (Cost $—) | | | | | | | — | |
| | | | | | | | | |
| EXCHANGE-TRADED FUNDS† - 4.9% |
| iShares iBoxx $ Investment Grade Corporate Bond ETF | | | 324,700 | | | | 40,103,697 | |
| iShares iBoxx High Yield Corporate Bond ETF | | | 65,980 | | | | 5,085,079 | |
| Total Exchange-Traded Funds | | | | | | | | |
| (Cost $44,538,554) | | | | | | | 45,188,776 | |
| | | | | | | | | |
| MONEY MARKET FUND† - 13.8% |
Dreyfus Treasury Securities Cash Management Fund — Institutional Shares, 0.51%2 | | | 127,290,524 | | | | 127,290,524 | |
| Total Money Market Fund | | | | | | | | |
| (Cost $127,290,524) | | | | | | | 127,290,524 | |
| | | | | | | | | |
| | | | Face
Amount~ | | | | | |
| COLLATERALIZED MORTGAGE OBLIGATIONS†† - 30.8% |
| Government Agency - 15.8% | | | | | | | | |
| Fannie Mae | | | | | | | | |
| 3.59% due 02/01/29 | | | 6,435,000 | | | | 7,468,358 | |
| 3.71% due 02/01/34 | | | 5,700,000 | | | | 6,724,769 | |
| 3.03% due 02/01/30 | | | 5,100,000 | | | | 5,682,091 | |
| 3.66% due 03/01/34 | | | 4,000,000 | | | | 4,745,602 | |
| 2.43% due 01/01/30 | | | 4,500,000 | | | | 4,721,377 | |
| 3.60% due 03/01/31 | | | 4,000,000 | | | | 4,601,650 | |
| 2.55% due 12/01/29 | | | 3,000,000 | | | | 3,186,589 | |
| 3.00% due 12/01/29 | | | 2,500,000 | | | | 2,802,432 | |
| 3.61% due 04/01/34 | | | 2,300,000 | | | | 2,703,944 | |
| 3.49% due 04/01/30 | | | 2,300,000 | | | | 2,668,408 | |
| 3.37% due 05/01/31 | | | 2,250,000 | | | | 2,614,810 | |
| 4.17% due 02/01/49 | | | 2,000,000 | | | | 2,496,116 | |
| 3.26% due 05/01/34 | | | 2,000,000 | | | | 2,294,171 | |
| 3.09% due 10/01/29 | | | 2,000,000 | | | | 2,253,663 | |
| 3.11% due 04/01/30 | | | 1,963,760 | | | | 2,180,194 | |
| 2.81% due 09/01/39 | | | 2,000,000 | | | | 2,179,285 | |
| 2.70% due 10/01/39 | | | 1,985,458 | | | | 2,151,092 | |
| 2.39% due 02/01/27 | | | 2,000,000 | | | | 2,129,694 | |
| 2.46% due 01/01/30 | | | 2,000,000 | | | | 2,107,802 | |
| 2.30% due 11/01/29 | | | 2,000,000 | | | | 2,088,476 | |
| 2.40% due 03/01/40 | | | 2,000,000 | | | | 1,977,779 | |
| 3.33% due 05/01/34 | | | 1,500,000 | | | | 1,710,238 | |
| 3.13% due 01/01/30 | | | 1,500,000 | | | | 1,695,638 | |
| 3.01% due 12/01/27 | | | 1,500,000 | | | | 1,650,855 | |
| 2.86% due 09/01/29 | | | 1,450,000 | | | | 1,609,222 | |
| 3.68% due 04/01/34 | | | 1,000,000 | | | | 1,189,072 | |
| 4.24% due 08/01/48 | | | 1,000,000 | | | | 1,181,508 | |
3.51% due 04/01/34 | | | 1,000,000 | | | | 1,175,479 | |
4.27% due 12/01/33 | | | 981,691 | | | | 1,172,497 | |
3.70% due 03/01/31 | | | 1,000,000 | | | | 1,167,040 | |
3.66% due 03/01/34 | | | 985,741 | | | | 1,166,811 | |
3.56% due 04/01/30 | | | 1,000,000 | | | | 1,164,760 | |
3.48% due 04/01/30 | | | 1,000,000 | | | | 1,161,689 | |
3.34% due 05/01/34 | | | 1,000,000 | | | | 1,161,330 | |
3.31% due 01/01/33 | | | 1,000,000 | | | | 1,159,974 | |
3.43% due 09/01/34 | | | 1,000,000 | | | | 1,159,328 | |
3.67% due 03/01/30 | | | 1,000,000 | | | | 1,158,972 | |
3.74% due 02/01/30 | | | 1,000,000 | | | | 1,157,194 | |
3.42% due 04/01/30 | | | 1,000,000 | | | | 1,156,514 | |
3.36% due 05/01/34 | | | 987,319 | | | | 1,147,572 | |
3.56% due 03/01/31 | | | 1,000,000 | | | | 1,144,471 | |
3.19% due 02/01/30 | | | 1,000,000 | | | | 1,140,781 | |
3.18% due 01/01/30 | | | 1,000,000 | | | | 1,134,468 | |
3.05% due 01/01/30 | | | 1,000,000 | | | | 1,126,191 | |
3.83% due 05/01/49 | | | 1,000,000 | | | | 1,119,147 | |
2.99% due 01/01/40 | | | 1,000,000 | | | | 1,110,169 | |
2.79% due 01/01/32 | | | 997,333 | | | | 1,104,688 | |
3.53% due 04/01/33 | | | 1,000,000 | | | | 1,097,859 | |
3.23% due 01/01/30 | | | 966,977 | | | | 1,095,208 | |
3.12% due 01/01/30 | | | 964,153 | | | | 1,082,672 | |
3.46% due 08/01/49 | | | 991,058 | | | | 1,064,951 | |
2.57% due 10/01/29 | | | 1,000,000 | | | | 1,063,468 | |
2.34% due 05/01/27 | | | 998,669 | | | | 1,062,288 | |
2.96% due 11/01/29 | | | 900,000 | | | | 1,003,725 | |
2.69% due 10/01/34 | | | 992,395 | | | | 972,390 | |
3.08% due 10/01/32 | | | 850,000 | | | | 964,714 | |
2.90% due 11/01/29 | | | 850,000 | | | | 944,165 | |
4.07% due 05/01/49 | | | 791,310 | | | | 871,549 | |
4.37% due 10/01/48 | | | 736,951 | | | | 840,398 | |
3.14% due 09/01/32 | | | 650,000 | | | | 743,275 | |
2.99% due 09/01/29 | | | 650,000 | | | | 726,683 | |
4.25% due 05/01/48 | | | 653,641 | | | | 707,728 | |
3.17% due 01/01/30 | | | 550,000 | | | | 624,410 | |
2.82% due 10/01/29 | | | 550,000 | | | | 608,775 | |
3.05% due 10/01/29 | | | 500,000 | | | | 561,148 | |
3.22% due 01/01/30 | | | 450,000 | | | | 512,887 | |
3.94% due 10/01/36 | | | 342,957 | | | | 416,217 | |
Freddie Mac Multifamily Structured Pass Through Certificates | | | | | | | | |
2019-1513, 2.80% due 08/25/34 | | | 3,950,000 | | | | 4,305,075 | |
2017-KGX1, 3.00% due 10/25/27 | | | 3,500,000 | | | | 3,920,316 | |
2017-KW03, 3.02% due 06/25/27 | | | 3,000,000 | | | | 3,366,899 | |
2020-KJ28, 2.31% due 10/25/27 | | | 1,850,000 | | | | 1,974,632 | |
2018-K073, 3.45% (WAC) due 01/25/283 | | | 1,200,000 | | | | 1,371,321 | |
2019-KJ27, 2.59% due 03/25/25 | | | 1,150,000 | | | | 1,226,779 | |
2018-K078, 3.92% due 06/25/28 | | | 1,000,000 | | | | 1,178,097 | |
2018-K074, 3.60% due 02/25/28 | | | 1,000,000 | | | | 1,148,610 | |
2017-K066, 3.20% due 06/25/27 | | | 1,000,000 | | | | 1,120,276 | |
Federal National Mortgage Association | | | | | | | | |
2.20% due 11/01/27 | | | 2,600,000 | | | | 2,684,360 | |
2.68% due 04/01/50††† | | | 1,000,000 | | | | 1,076,344 | |
40 | THE GUGGENHEIM FUNDS SEMI-ANNUAL REPORT | SEE NOTES TO FINANCIAL STATEMENTS. |
SCHEDULE OF INVESTMENTS (Unaudited)(continued) | March 31, 2020 |
INVESTMENT GRADE BOND FUND | |
| | Face
Amount~ | | | Value | |
Fannie Mae-Aces | | | | | | | | |
2017-M11, 2.98% due 08/25/29 | | | 2,500,000 | | | $ | 2,728,511 | |
Freddie Mac | | | | | | | | |
2018-4762, 4.00% due 01/15/46 | | | 1,000,000 | | | | 1,082,345 | |
Total Government Agency | | | | | | | 145,951,985 | |
| | | | | | | | | |
Residential Mortgage Backed Securities - 11.4% | | | | |
New Residential Advance Receivables Trust Advance Receivables Backed | | | | | | | | |
2019-T3, 2.51% due 09/15/524 | | | 4,450,000 | | | | 4,241,199 | |
2019-T4, 2.33% due 10/15/514 | | | 3,750,000 | | | | 3,633,443 | |
2019-T5, 2.43% due 10/15/514 | | | 3,000,000 | | | | 2,932,526 | |
2019-T2, 2.52% due 08/15/534 | | | 2,000,000 | | | | 1,871,638 | |
CIM Trust | | | | | | | | |
2018-R2, 3.69% (WAC) due 08/25/573,4 | | | 2,495,588 | | | | 2,543,579 | |
2018-R4, 4.07% (WAC) due 12/26/573,4 | | | 2,389,947 | | | | 2,451,406 | |
Verus Securitization Trust | | | | | | | | |
2020-1, 2.42% (WAC) due 01/25/603,4 | | | 2,456,298 | | | | 2,357,689 | |
2019-4, 2.64% due 11/25/594,5 | | | 2,081,642 | | | | 2,107,586 | |
2019-4, 2.85% due 11/25/594,5 | | | 1,619,055 | | | | 1,639,106 | |
Cascade Funding Mortgage Trust | | | | | | | | |
2018-RM2, 4.00% (WAC) due 10/25/683,4 | | | 3,684,564 | | | | 3,643,046 | |
2019-RM3, 2.80% (WAC) due 06/25/693,4 | | | 887,717 | | | | 853,233 | |
New Residential Mortgage Loan Trust | | | | | | | | |
2018-2A, 3.50% (WAC) due 02/25/583,4 | | | 1,449,343 | | | | 1,475,847 | |
2019-6A, 3.50% (WAC) due 09/25/593,4 | | | 941,539 | | | | 958,634 | |
2017-5A, 2.45% (1 Month USD LIBOR + 1.50%, Rate Floor: 1.50%) due 06/25/573,4 | | | 811,538 | | | | 768,993 | |
2018-1A, 4.00% (WAC) due 12/25/573,4 | | | 664,002 | | | | 686,524 | |
BRAVO Residential Funding Trust | | | | | | | | |
2019-NQM1, 2.67% (WAC) due 07/25/593,4 | | | 2,101,146 | | | | 2,062,587 | |
2019-NQM2, 2.75% (WAC) due 11/25/593,4 | | | 1,713,802 | | | | 1,655,445 | |
Structured Asset Securities Corporation Mortgage Loan Trust | | | | | | | | |
2007-WF1, 1.16% (1 Month USD LIBOR + 0.21%, Rate Floor: 0.21%) due 02/25/373 | | | 2,451,401 | | | | 2,248,200 | |
2006-BC3, 1.11% (1 Month USD LIBOR + 0.16%, Rate Floor: 0.16%) due 10/25/363 | | | 878,062 | | | | 759,800 | |
2006-BC4, 1.12% (1 Month USD LIBOR + 0.17%, Rate Floor: 0.17%) due 12/25/363 | | | 670,903 | | | | 613,723 | |
GSAA Home Equity Trust | | | | | | | | |
2005-6, 1.38% (1 Month USD LIBOR + 0.43%, Rate Floor: 0.43%) due 06/25/353 | | | 3,150,000 | | | | 2,950,127 | |
Homeward Opportunities Fund I Trust | | | | | | | | |
2019-3, 2.68% (WAC) due 11/25/593,4 | | | 1,840,759 | | | | 1,751,641 | |
2019-2, 2.70% (WAC) due 09/25/593,4 | | | 1,164,570 | | | | 1,116,354 | |
Starwood Mortgage Residential Trust | | | | | | | | |
2020-1, 2.41% (WAC) due 02/25/503,4 | | | 956,894 | | | | 918,074 | |
2020-1, 2.56% (WAC) due 02/25/503,4 | | | 956,894 | | | | 918,011 | |
2020-1, 2.28% (WAC) due 02/25/503,4 | | | 956,894 | | | | 917,961 | |
Soundview Home Loan Trust | | | | | | | | |
2006-OPT5, 1.09% (1 Month USD LIBOR + 0.14%, Rate Floor: 0.14%) due 07/25/363 | | | 2,541,705 | | | | 2,324,252 | |
Home Equity Loan Trust | | | | | | | | |
2007-FRE1, 1.14% (1 Month USD LIBOR + 0.19%, Rate Floor: 0.19%) due 04/25/373 | | | 2,780,561 | | | | 2,318,941 | |
CSMC Trust | | | | | | | | |
2018-RPL9, 3.85% (WAC) due 09/25/573,4 | | | 2,272,671 | | | | 2,315,120 | |
Towd Point Mortgage Trust | | | | | | | | |
2017-6, 2.75% (WAC) due 10/25/573,4 | | | 1,704,080 | | | | 1,705,410 | |
2017-5, 1.55% (1 Month USD LIBOR + 0.60%, Rate Floor: 0.00%) due 02/25/573,4 | | | 361,831 | | | | 349,118 | |
2018-1, 3.00% (WAC) due 01/25/583,4 | | | 251,092 | | | | 252,244 | |
RALI Series Trust | | | | | | | | |
2006-QO10, 1.11% (1 Month USD LIBOR + 0.16%, Rate Floor: 0.16%) due 01/25/373 | | | 2,273,094 | | | | 1,884,952 | |
2006-QO2, 1.17% (1 Month USD LIBOR + 0.22%, Rate Floor: 0.22%) due 02/25/463 | | | 1,741,419 | | | | 412,150 | |
Ocwen Master Advance Receivables Trust | | | | | | | | |
2019-T2, 2.42% due 08/15/514 | | | 2,300,000 | | | | 2,265,483 | |
HarborView Mortgage Loan Trust | | | | | | | | |
2006-12, 0.94% (1 Month USD LIBOR + 0.19%, Rate Floor: 0.19%) due 01/19/383 | | | 1,702,924 | | | | 1,357,659 | |
2006-14, 0.90% (1 Month USD LIBOR + 0.15%, Rate Floor: 0.15%) due 01/25/473 | | | 832,045 | | | | 648,938 | |
Angel Oak Mortgage Trust | | | | | | | | |
2020-1, 2.77% (WAC) due 12/25/593,4 | | | 1,978,146 | | | | 1,960,173 | |
NRPL Trust | | | | | | | | |
2019-3A, 3.00% due 07/25/594 | | | 1,933,914 | | | | 1,943,792 | |
Freddie Mac STACR REMIC Trust | | | | | | | | |
2020-DNA2, 1.70% (1 Month USD LIBOR + 0.75%, Rate Floor: 0.75%) due 02/25/503,4 | | | 2,000,000 | | | | 1,904,623 | |
Residential Mortgage Loan Trust | | | | | | | | |
2020-1, 2.68% (WAC) due 02/25/243,4 | | | 989,223 | | | | 946,448 | |
2020-1, 2.38% (WAC) due 02/25/243,4 | | | 989,223 | | | | 946,387 | |
SG Residential Mortgage Trust | | | | | | | | |
2019-3, 2.70% (WAC) due 09/25/593,4 | | | 1,935,263 | | | | 1,867,915 | |
Argent Securities Incorporated Asset-Backed Pass-Through Certificates Series | | | | | | | | |
2005-W2, 1.44% (1 Month USD LIBOR + 0.49%, Rate Floor: 0.49%) due 10/25/353 | | | 2,000,000 | | | | 1,863,823 | |
NovaStar Mortgage Funding Trust Series | | | | | | | | |
2007-2, 1.15% (1 Month USD LIBOR + 0.20%, Rate Cap/Floor: 11.00%/0.20%) due 09/25/373 | | | 1,958,700 | | | | 1,764,910 | |
Fannie Mae Connecticut Avenue Securities | | | | | | | | |
2016-C06, 5.20% (1 Month USD LIBOR + 4.25%, Rate Floor: 0.00%) due 04/25/293 | | | 1,000,000 | | | | 961,797 | |
SEE NOTES TO FINANCIAL STATEMENTS. | THE GUGGENHEIM FUNDS SEMI-ANNUAL REPORT | 41 |
SCHEDULE OF INVESTMENTS (Unaudited)(continued) | March 31, 2020 |
INVESTMENT GRADE BOND FUND | |
| | Face
Amount~ | | | Value | |
2016-C01, 7.70% (1 Month USD LIBOR + 6.75%, Rate Floor: 0.00%) due 08/25/283 | | | 740,570 | | | $ | 707,163 | |
JP Morgan Mortgage Acquisition Trust | | | | | | | | |
2006-WMC4, 1.07% (1 Month USD LIBOR + 0.12%, Rate Floor: 0.12%) due 12/25/363 | | | 3,085,921 | | | | 1,567,939 | |
SPS Servicer Advance Receivables Trust Advance Receivables Backed Notes | | | | | | | | |
2019-T1, 2.24% due 10/15/514 | | | 1,500,000 | | | | 1,466,834 | |
Countrywide Asset-Backed Certificates | | | | | | | | |
2006-6, 1.12% (1 Month USD LIBOR + 0.17%, Rate Floor: 0.17%) due 09/25/363 | | | 1,560,384 | | | | 1,465,445 | |
American Home Mortgage Investment Trust | | | | | | | | |
2007-1, 2.08% due 05/25/476 | | | 8,625,827 | | | | 1,446,152 | |
Starwood Mortgage Residential Trust | | | | | | | | |
2019-1, 2.94% (WAC) due 06/25/493,4 | | | 1,426,701 | | | | 1,417,164 | |
LSTAR Securities Investment Limited | | | | | | | | |
2019-5, 3.08% (1 Month USD LIBOR + 1.50%, Rate Floor: 1.50%) due 11/01/243,4 | | | 1,371,491 | | | | 1,351,556 | |
Alternative Loan Trust | | | | | | | | |
2007-OA4, 1.12% (1 Month USD LIBOR + 0.17%, Rate Floor: 0.17%) due 05/25/473 | | | 1,439,556 | | | | 1,171,972 | |
Citigroup Mortgage Loan Trust | | | | | | | | |
2019-IMC1, 2.72% (WAC) due 07/25/493,4 | | | 1,148,104 | | | | 1,106,814 | |
Freddie Mac STACR Trust | | | | | | | | |
2019-DNA4, 1.65% (1 Month USD LIBOR + 0.70%, Rate Floor: 0.00%) due 10/25/493,4 | | | 1,108,114 | | | | 1,093,273 | |
Deephaven Residential Mortgage Trust | | | | | | | | |
2019-3A, 2.96% (WAC) due 07/25/593,4 | | | 737,473 | | | | 704,348 | |
2017-3A, 2.58% (WAC) due 10/25/473,4 | | | 388,041 | | | | 388,117 | |
Freddie Mac Stacr REMIC Trust | | | | | | | | |
2020-DNA1, 1.65% (1 Month USD LIBOR + 0.70%, Rate Floor: 0.00%) due 01/25/503,4 | | | 1,000,000 | | | | 969,802 | |
Connecticut Avenue Securities Trust | | | | | | | | |
2020-R01, 1.75% (1 Month USD LIBOR + 0.80%, Rate Floor: 0.00%) due 01/25/403,4 | | | 989,541 | | | | 946,153 | |
Park Place Securities Incorporated Asset Backed Pass Through Certificates | | | | | | | | |
2005-WHQ3, 1.89% (1 Month USD LIBOR + 0.95%, Rate Floor: 0.63%) due 06/25/353 | | | 1,000,000 | | | | 944,810 | |
GSAMP Trust | | | | | | | | |
2007-NC1, 1.08% (1 Month USD LIBOR + 0.13%, Rate Floor: 0.13%) due 12/25/463 | | | 1,709,572 | | | | 900,405 | |
Structured Asset Investment Loan Trust | | | | | | | | |
2005-11, 1.67% (1 Month USD LIBOR + 0.72%, Rate Floor: 0.36%) due 01/25/363 | | | 987,145 | | | | 897,192 | |
Connecticut Avenue Securities Trust | | | | | | | | |
2019-R07, 1.72% (1 Month USD LIBOR + 0.77%, Rate Floor: 0.00%) due 10/25/393,4 | | | 868,977 | | | | 847,485 | |
Asset Backed Securities Corporation Home Equity Loan Trust Series AEG | | | | | | | | |
2006-HE1, 1.35% (1 Month USD LIBOR + 0.40%, Rate Floor: 0.40%) due 01/25/363 | | | 1,000,000 | | | | 825,418 | |
Nationstar HECM Loan Trust | | | | | | | | |
2019-2A, 2.27% (WAC) due 11/25/293,4 | | | 768,140 | | | | 758,497 | |
Legacy Mortgage Asset Trust | | | | | | | | |
2018-GS3, 4.00% due 06/25/584,5 | | | 730,471 | | | | 701,336 | |
Nationstar Home Equity Loan Trust | | | | | | | | |
2007-B, 1.17% (1 Month USD LIBOR + 0.22%, Rate Floor: 0.22%) due 04/25/373 | | | 697,666 | | | | 661,080 | |
Luminent Mortgage Trust | | | | | | | | |
2006-2, 1.15% (1 Month USD LIBOR + 0.20%, Rate Floor: 0.20%) due 02/25/463 | | | 865,254 | | | | 644,845 | |
Bear Stearns Asset Backed Securities I Trust | | | | | | | | |
2006-HE9, 1.09% (1 Month USD LIBOR + 0.14%, Rate Floor: 0.14%) due 11/25/363 | | | 705,039 | | | | 632,994 | |
COLT Mortgage Loan Trust | | | | | | | | |
2018-3, 3.69% (WAC) due 10/26/483,4 | | | 625,388 | | | | 618,486 | |
LSTAR Securities Investment Trust | | | | | | | | |
2019-1, 3.28% (1 Month USD LIBOR + 1.70%, Rate Floor: 0.00%) due 03/01/243,4 | | | 595,430 | | | | 586,594 | |
CSMC Series | | | | | | | | |
2015-12R, 2.16% (WAC) due 11/30/373,4 | | | 567,359 | | | | 538,817 | |
Deutsche Alt-A Securities Mortgage Loan Trust Series | | | | | | | | |
2007-OA2, 2.74% (1 Year CMT Rate + 0.77%, Rate Floor: 0.77%) due 04/25/473 | | | 578,348 | | | | 463,214 | |
CIT Mortgage Loan Trust | | | | | | | | |
2007-1, 2.40% (1 Month USD LIBOR + 1.45%, Rate Floor: 1.45%) due 10/25/373,4 | | | 379,192 | | | | 373,654 | |
Banc of America Funding Trust | | | | | | | | |
2015-R4, 1.80% (1 Month USD LIBOR + 0.17%, Rate Floor: 0.17%) due 01/27/353,4 | | | 321,963 | | | | 314,686 | |
MASTR Adjustable Rate Mortgages Trust | | | | | | | | |
2003-5, 3.07% (WAC) due 11/25/333 | | | 373,927 | | | | 306,613 | |
Washington Mutual Mortgage Pass-Through Certificates WMALT Series Trust | | | | | | | | |
2006-AR9, 2.81% (1 Year CMT Rate + 0.84%, Rate Floor: 0.84%) due 11/25/463 | | | 389,498 | | | | 302,465 | |
GSMSC Resecuritization Trust | | | | | | | | |
2015-5R, 1.77% (1 Month USD LIBOR + 0.14%, Rate Floor: 0.14%) due 04/26/373,4 | | | 267,347 | | | | 264,710 | |
Angel Oak Mortgage Trust LLC | | | | | | | | |
2017-3, 2.71% (WAC) due 11/25/473,4 | | | 243,489 | | | | 238,373 | |
42 | THE GUGGENHEIM FUNDS SEMI-ANNUAL REPORT | SEE NOTES TO FINANCIAL STATEMENTS. |
SCHEDULE OF INVESTMENTS (Unaudited)(continued) | March 31, 2020 |
INVESTMENT GRADE BOND FUND | |
| | Face
Amount~ | | | Value | |
UCFC Manufactured Housing Contract | | | | | | | | |
1997-2, 7.38% due 10/15/28 | | | 111,762 | | | $ | 115,218 | |
Total Residential Mortgage Backed Securities | | | | | | | 105,810,131 | |
| | | | | | | | | |
Commercial Mortgage Backed Securities - 2.2% | | | | |
Morgan Stanley Capital I Trust | | | | | | | | |
2014-CPT, 3.45% (WAC) due 07/13/293,4 | | | 3,000,000 | | | | 2,958,968 | |
COMM Mortgage Trust | | | | | | | | |
2015-CR24, 0.77% (WAC) due 08/10/483,6 | | | 45,905,458 | | | | 1,530,672 | |
2015-CR26, 0.95% (WAC) due 10/10/483,6 | | | 9,341,873 | | | | 381,430 | |
Four Times Square Trust Commercial Mortgage Pass-Through Certificates Series | | | | | | | | |
2006-4TS, 5.40% due 12/13/284 | | | 1,842,242 | | | | 1,824,357 | |
Citigroup Commercial Mortgage Trust | | | | | | | | |
2019-GC43, 0.63% (WAC) due 11/10/523,6 | | | 19,989,307 | | | | 931,903 | |
2016-GC37, 1.75% (WAC) due 04/10/493,6 | | | 3,693,296 | | | | 288,295 | |
2016-C2, 1.76% (WAC) due 08/10/493,6 | | | 2,430,404 | | | | 202,266 | |
2016-P5, 1.52% (WAC) due 10/10/493,6 | | | 1,933,698 | | | | 126,902 | |
Benchmark Mortgage Trust | | | | | | | | |
2019-B14, 0.79% (WAC) due 12/15/623,6 | | | 19,976,123 | | | | 1,011,263 | |
GRACE Mortgage Trust | | | | | | | | |
2014-GRCE, 3.37% due 06/10/284 | | | 1,000,000 | | | | 1,005,068 | |
Bancorp Commercial Mortgage Trust | | | | | | | | |
2018-CR3, 1.96% (1 Month USD LIBOR + 1.25%, Rate Floor: 1.25%) due 01/15/333,4 | | | 1,000,000 | | | | 940,989 | |
GS Mortgage Securities Trust | | | | | | | | |
2020-GC45, 0.68% (WAC) due 02/13/533,6 | | | 18,996,193 | | | | 933,049 | |
GS Mortgage Securities Trust | | | | | | | | |
2019-GC42, 0.81% (WAC) due 09/01/523,6 | | | 14,981,644 | | | | 873,409 | |
GS Mortgage Securities Corporation Trust | | | | | | | | |
2020-UPTN, 3.25% (WAC) due 02/10/373,4 | | | 1,000,000 | | | | 863,999 | |
CSAIL Commercial Mortgage Trust | | | | | | | | |
2019-C15, 1.05% (WAC) due 03/15/523,6 | | | 12,475,050 | | | | 844,118 | |
GS Mortgage Securities Corporation Trust | | | | | | | | |
2020-DUNE, 2.06% (1 Month USD LIBOR + 1.35%, Rate Floor: 1.35%) due 12/15/363,4 | | | 1,000,000 | | | | 797,671 | |
BENCHMARK Mortgage Trust | | | | | | | | |
2018-B6, 0.44% (WAC) due 10/10/513,6 | | | 31,347,589 | | | | 790,291 | |
SG Commercial Mortgage Securities Trust | | | | | | | | |
2016-C5, 1.98% (WAC) due 10/10/483,6 | | | 9,617,666 | | | | 763,128 | |
UBS Commercial Mortgage Trust | | | | | | | | |
2017-C2, 1.09% (WAC) due 08/15/503,6 | | | 11,147,453 | | | | 642,590 | |
JPMDB Commercial Mortgage Securities Trust | | | | | | | | |
2016-C2, 1.67% (WAC) due 06/15/493,6 | | | 8,702,264 | | | | 523,080 | |
Morgan Stanley Capital I Trust | | | | | | | | |
2016-UB11, 1.61% (WAC) due 08/15/493,6 | | | 7,315,643 | | | | 494,728 | |
GE Business Loan Trust | | | | | | | | |
2007-1A, 0.88% (1 Month USD LIBOR + 0.17%, Rate Floor: 0.17%) due 04/15/353,4 | | | 446,321 | | | | 405,777 | |
Wells Fargo Commercial Mortgage Trust | | | | | | | | |
2016-NXS5, 1.49% (WAC) due 01/15/593,6 | | | 4,208,431 | | | | 254,836 | |
2016-C37, 0.98% (WAC) due 12/15/493,6 | | | 3,735,222 | | | | 138,088 | |
CFCRE Commercial Mortgage Trust | | | | | | | | |
2016-C3, 1.02% (WAC) due 01/10/483,6 | | | 5,743,065 | | | | 273,628 | |
CD Mortgage Trust | | | | | | | | |
2016-CD1, 1.41% (WAC) due 08/10/493,6 | | | 2,514,002 | | | | 160,671 | |
Total Commercial Mortgage Backed Securities | | | | | | | 19,961,176 | |
| | | | | | | | | |
Military Housing - 1.4% | | | | | | | | |
Freddie Mac Military Housing Bonds Resecuritization Trust Certificates | | | | | | | | |
2015-R1, 3.48% (WAC) due 11/25/553,4 | | | 3,909,129 | | | | 4,495,878 | |
2015-R1, 4.11% (WAC) due 11/25/523,11 | | | 1,611,799 | | | | 1,859,235 | |
2015-R1, 0.52% (WAC) due 11/25/553,4,6 | | | 10,535,581 | | | | 770,787 | |
Capmark Military Housing Trust | | | | | | | | |
2006-RILY, 6.15% due 07/10/51†††,1,4 | | | 2,330,806 | | | | 3,087,679 | |
2007-ROBS, 6.06% due 10/10/52†††,1,4 | | | 468,503 | | | | 649,196 | |
2007-AETC, 5.75% due 02/10/524 | | | 276,874 | | | | 344,468 | |
GMAC Commercial Mortgage Asset Corp. | | | | | | | | |
2007-HCKM, 6.11% due 08/10/524 | | | 1,473,771 | | | | 1,831,097 | |
Total Military Housing | | | | | | | 13,038,340 | |
| | | | | | | | | |
Total Collateralized Mortgage Obligations | | | | |
(Cost $275,511,478) | | | 284,761,632 | |
| | | | | | | | | |
U.S. GOVERNMENT SECURITIES†† - 17.7% |
U.S. Treasury Notes |
2.38% due 02/29/24 | | | 25,382,000 | | | | 27,401,653 | |
1.88% due 02/28/22 | | | 16,730,000 | | | | 17,260,655 | |
1.63% due 10/31/26 | | | 15,753,000 | | | | 16,862,479 | |
1.50% due 10/31/24 | | | 14,919,000 | | | | 15,690,009 | |
1.75% due 06/30/24 | | | 10,388,000 | | | | 11,000,730 | |
1.50% due 09/30/24 | | | 10,192,000 | | | | 10,709,562 | |
1.63% due 09/30/26 | | | 9,196,000 | | | | 9,842,594 | |
2.50% due 02/28/26 | | | 8,048,000 | | | | 8,990,496 | |
1.88% due 06/30/26 | | | 2,551,000 | | | | 2,763,949 | |
U.S. Treasury Bonds |
due 02/15/507 | | | 64,352,000 | | | | 42,727,404 | |
Total U.S. Government Securities | | | | |
(Cost $155,123,318) | | | | | | | 163,249,531 | |
| | | | | | | | | |
ASSET-BACKED SECURITIES†† - 15.9% |
Collateralized Loan Obligations - 9.0% | | | | |
Palmer Square Loan Funding Ltd. | | | | | | | | |
2018-4A, 2.59% (3 Month USD LIBOR + 0.90%, Rate Floor: 0.00%) due 11/15/263,4 | | | 3,595,754 | | | | 3,478,063 | |
2019-3A, 2.55% (3 Month USD LIBOR + 0.85%, Rate Floor: 0.85%) due 08/20/273,4 | | | 1,292,877 | | | | 1,262,086 | |
2018-4A, 3.14% (3 Month USD LIBOR + 1.45%, Rate Floor: 0.00%) due 11/15/263,4 | | | 1,000,000 | | | | 870,408 | |
SEE NOTES TO FINANCIAL STATEMENTS. | THE GUGGENHEIM FUNDS SEMI-ANNUAL REPORT | 43 |
SCHEDULE OF INVESTMENTS (Unaudited)(continued) | March 31, 2020 |
INVESTMENT GRADE BOND FUND | |
| | Face
Amount~ | | | Value | |
Midocean Credit Clo VII | | | | | | | | |
2020-7A, 2.79% (3 Month USD LIBOR + 1.04%, Rate Floor: 0.00%) due 07/15/293,4 | | | 3,000,000 | | | $ | 2,799,860 | |
2020-7A, 3.33% (3 Month USD LIBOR + 1.60%, Rate Floor: 0.00%) due 07/15/293,4 | | | 2,000,000 | | | | 1,702,420 | |
2020-7A, 3.20% (3 Month USD LIBOR + 1.45%, Rate Floor: 0.00%) due 07/15/293,4 | | | 1,000,000 | | | | 934,767 | |
BXMT 2020-FL2 Ltd. | | | | | | | | |
2020-FL2, 1.70% (1 Month USD LIBOR + 0.90%, Rate Floor: 0.90%) due 02/16/373,4 | | | 4,250,000 | | | | 3,986,772 | |
2020-FL2, 2.20% (1 Month USD LIBOR + 1.40%, Rate Floor: 1.40%) due 02/16/373,4 | | | 1,000,000 | | | | 918,760 | |
THL Credit Wind River CLO Ltd. | | | | | | | | |
2017-2A, 2.70% (3 Month USD LIBOR + 0.87%, Rate Floor: 0.00%) due 10/15/273,4 | | | 3,240,077 | | | | 3,142,139 | |
2019-1A, 2.71% (3 Month USD LIBOR + 0.88%, Rate Floor: 0.00%) due 01/15/263,4 | | | 1,614,963 | | | | 1,607,054 | |
Venture XIV CLO Ltd. | | | | | | | | |
2020-14A, 2.73% (3 Month USD LIBOR + 1.03%, Rate Floor: 1.03%) due 08/28/293,4 | | | 4,250,000 | | | | 3,966,279 | |
GoldenTree Loan Management US CLO 1 Ltd. | | | | | | | | |
2020-1A, 2.60% (3 Month USD LIBOR + 0.95%, Rate Floor: 0.95%) due 04/20/293,4 | | | 3,000,000 | | | | 2,799,040 | |
2020-1A, 3.10% (3 Month USD LIBOR + 1.45%, Rate Floor: 1.45%) due 04/20/293,4 | | | 1,000,000 | | | | 851,179 | |
Golub Capital Partners CLO Ltd. | | | | | | | | |
2018-36A, 3.04% (3 Month USD LIBOR + 1.30%, Rate Floor: 0.00%) due 02/05/313,4 | | | 4,100,000 | | | | 3,602,355 | |
NewStar Clarendon Fund CLO LLC | | | | | | | | |
2019-1A, 3.09% (3 Month USD LIBOR + 1.30%, Rate Floor: 0.00%) due 01/25/273,4 | | | 2,912,402 | | | | 2,843,133 | |
Denali Capital CLO XI Ltd. | | | | | | | | |
2018-1A, 2.95% (3 Month USD LIBOR + 1.13%, Rate Floor: 0.00%) due 10/20/283,4 | | | 3,000,000 | | | | 2,816,112 | |
Marathon CLO V Ltd. | | | | | | | | |
2017-5A, 2.57% (3 Month USD LIBOR + 0.87%, Rate Floor: 0.00%) due 11/21/273,4 | | | 1,727,901 | | | | 1,661,338 | |
2017-5A, 3.15% (3 Month USD LIBOR + 1.45%, Rate Floor: 0.00%) due 11/21/273,4 | | | 1,000,000 | | | | 882,247 | |
Crown Point CLO III Ltd. | | | | | | | | |
2017-3A, 3.28% (3 Month USD LIBOR + 1.45%, Rate Floor: 0.00%) due 12/31/273,4 | | | 2,000,000 | | | | 1,753,413 | |
2017-3A, 2.74% (3 Month USD LIBOR + 0.91%, Rate Floor: 0.00%) due 12/31/273,4 | | | 787,676 | | | | 776,472 | |
KREF 2018-FL1 Ltd. | | | | | | | | |
2018-FL1, 1.90% (1 Month USD LIBOR + 1.10%, Rate Floor: 1.10%) due 06/15/363,4 | | | 2,500,000 | | | | 2,343,772 | |
KVK CLO Ltd. | | | | | | | | |
2017-1A, 2.74% (3 Month USD LIBOR + 0.90%, Rate Floor: 0.00%) due 01/14/283,4 | | | 1,250,000 | | | | 1,210,650 | |
2018-1A, 2.63% (3 Month USD LIBOR + 0.93%, Rate Floor: 0.00%) due 05/20/293,4 | | | 1,000,000 | | | | 968,817 | |
Venture XII CLO Ltd. | | | | | | | | |
2018-12A, 2.41% (3 Month USD LIBOR + 0.80%, Rate Floor: 0.80%) due 02/28/263,4 | | | 1,347,581 | | | | 1,303,321 | |
2018-12A, 2.81% (3 Month USD LIBOR + 1.20%, Rate Floor: 1.20%) due 02/28/263,4 | | | 1,000,000 | | | | 871,367 | |
MP CLO VIII Ltd. | | | | | | | | |
2018-2A, 2.71% (3 Month USD LIBOR + 0.91%, Rate Floor: 0.00%) due 10/28/273,4 | | | 2,171,817 | | | | 2,101,506 | |
Newfleet CLO 2016-1 Ltd. | | | | | | | | |
2018-1A, 2.77% (3 Month USD LIBOR + 0.95%, Rate Floor: 0.00%) due 04/20/283,4 | | | 2,000,000 | | | | 1,880,345 | |
Golub Capital Partners CLO Ltd. | | | | | | | | |
2017-16A, 3.64% (3 Month USD LIBOR + 1.85%, Rate Floor: 0.00%) due 07/25/293,4 | | | 2,000,000 | | | | 1,811,840 | |
Carlyle Global Market Strategies CLO Ltd. | | | | | | | | |
2018-2A, 2.57% (3 Month USD LIBOR + 0.78%, Rate Floor: 0.00%) due 04/27/273,4 | | | 1,849,815 | | | | 1,790,693 | |
Cerberus Loan Funding XVII Ltd. | | | | | | | | |
2016-3A, 4.36% (3 Month USD LIBOR + 2.53%, Rate Floor: 0.00%) due 01/15/283,4 | | | 2,000,000 | | | | 1,790,080 | |
Fortress Credit Opportunities XI CLO Ltd. | | | | | | | | |
2018-11A, 3.13% (3 Month USD LIBOR + 1.30%, Rate Floor: 0.00%) due 04/15/313,4 | | | 2,000,000 | | | | 1,754,740 | |
NXT Capital CLO LLC | | | | | | | | |
2017-1A, 3.52% (3 Month USD LIBOR + 1.70%, Rate Floor: 0.00%) due 04/20/293,4 | | | 1,800,000 | | | | 1,685,246 | |
44 | THE GUGGENHEIM FUNDS SEMI-ANNUAL REPORT | SEE NOTES TO FINANCIAL STATEMENTS. |
SCHEDULE OF INVESTMENTS (Unaudited)(continued) | March 31, 2020 |
INVESTMENT GRADE BOND FUND | |
| | Face
Amount~ | | | Value | |
Halcyon Loan Advisors Funding Ltd. | | | | | | | | |
2017-3A, 2.72% (3 Month USD LIBOR + 0.90%, Rate Floor: 0.00%) due 10/18/273,4 | | | 1,733,453 | | | $ | 1,679,952 | |
Mountain View CLO Ltd. | | | | | | | | |
2018-1A, 2.63% (3 Month USD LIBOR + 0.80%, Rate Floor: 0.80%) due 10/15/263,4 | | | 1,614,065 | | | | 1,591,814 | |
OCP CLO 2013-4 Ltd. | | | | | | | | |
2020-4A, 3.25% (3 Month USD LIBOR + 1.45%, Rate Floor: 1.45%) due 04/24/293,4 | | | 1,500,000 | | | | 1,276,447 | |
Garrison BSL CLO Ltd. | | | | | | | | |
2018-1A, 2.79% (3 Month USD LIBOR + 0.95%, Rate Floor: 0.00%) due 07/17/283,4 | | | 1,300,000 | | | | 1,219,734 | |
BSPRT Issuer Ltd. | | | | | | | | |
2018-FL3, 1.76% (1 Month USD LIBOR + 1.05%, Rate Floor: 1.05%) due 03/15/283,4 | | | 1,202,476 | | | | 1,130,044 | |
NXT Capital CLO 2015-1 LLC | | | | | | | | |
2018-1A, 3.42% (3 Month USD LIBOR + 1.60%, Rate Floor: 0.00%) due 04/21/273,4 | | | 1,000,000 | | | | 996,731 | |
Shackleton 2014-VI-R CLO Ltd. | | | | | | | | |
2018-6RA, 2.86% (3 Month USD LIBOR + 1.02%, Rate Floor: 1.02%) due 07/17/283,4 | | | 1,000,000 | | | | 962,484 | |
TCP Waterman CLO Ltd. | | | | | | | | |
2016-1A, 2.79% (3 Month USD LIBOR + 2.05%, Rate Floor: 0.00%) due 12/15/283,4 | | | 1,000,000 | | | | 958,966 | |
GPMT 2019-FL2 Ltd. | | | | | | | | |
2019-FL2, 2.01% (1 Month USD LIBOR + 1.30%, Rate Floor: 1.30%) due 02/22/363,4 | | | 1,000,000 | | | | 942,409 | |
FDF I Ltd. | | | | | | | | |
2015-1A, 4.40% due 11/12/304 | | | 1,000,000 | | | | 929,987 | |
FDF II Ltd. | | | | | | | | |
2016-2A, 4.29% due 05/12/314 | | | 1,000,000 | | | | 929,668 | |
Diamond CLO Ltd. | | | | | | | | |
2018-1A, 3.30% (3 Month USD LIBOR + 1.50%, Rate Floor: 1.50%) due 07/22/303,4 | | | 1,000,000 | | | | 929,445 | |
LoanCore Issuer Ltd. | | | | | | | | |
2018-CRE1, 2.21% (1 Month USD LIBOR + 1.50%, Rate Floor: 1.50%) due 05/15/283,4 | | | 1,000,000 | | | | 889,904 | |
NewStar Fairfield Fund CLO Ltd. | | | | | | | | |
2018-2A, 3.09% (3 Month USD LIBOR + 1.27%, Rate Floor: 1.27%) due 04/20/303,4 | | | 1,000,000 | | | | 878,445 | |
MONROE CAPITAL BSL CLO Ltd. | | | | | | | | |
2017-1A, 3.43% (3 Month USD LIBOR + 1.75%, Rate Floor: 0.00%) due 05/22/273,4 | | | 1,000,000 | | | | 875,143 | |
OCP CLO 2014-7 Ltd. | | | | | | | | |
2018-7A, 2.42% (3 Month USD LIBOR + 0.60%, Rate Floor: 0.00%) due 07/20/293,4 | | | 714,286 | | | | 711,831 | |
Golub Capital Partners CLO Ltd. | | | | | | | | |
2017-17A, 3.44% (3 Month USD LIBOR + 1.65%, Rate Floor: 0.00%) due 10/25/303,4 | | | 750,000 | | | | 698,095 | |
Dryden 37 Senior Loan Fund | | | | | | | | |
2015-37A, due 01/15/314,9 | | | 1,000,000 | | | | 667,933 | |
Fortress Credit Opportunities IX CLO Ltd. | | | | | | | | |
2017-9A, 3.24% (3 Month USD LIBOR + 1.55%, Rate Floor: 0.00%) due 11/15/293,4 | | | 636,000 | | | | 589,020 | |
BDS | | | | | | | | |
2018-FL2, 1.75% (1 Month USD LIBOR + 0.95%, Rate Floor: 0.95%) due 08/15/353,4 | | | 625,095 | | | | 580,794 | |
Avery Point V CLO Ltd. | | | | | | | | |
2017-5A, 2.82% (3 Month USD LIBOR + 0.98%, Rate Floor: 0.00%) due 07/17/263,4 | | | 502,631 | | | | 490,755 | |
Monroe Capital CLO Ltd. | | | | | | | | |
2017-1A, 3.15% (3 Month USD LIBOR + 1.35%, Rate Floor: 0.00%) due 10/22/263,4 | | | 417,215 | | | | 409,583 | |
Treman Park CLO Ltd. | | | | | | | | |
2015-1A, due 10/20/284,9 | | | 500,000 | | | | 343,031 | |
Copper River CLO Ltd. | | | | | | | | |
2007-1A, due 01/20/219,11 | | | 700,000 | | | | 71,591 | |
Babson CLO Ltd. | | | | | | | | |
2014-IA, due 07/20/254,9 | | | 650,000 | | | | 22,490 | |
Total Collateralized Loan Obligations | | | | | | | 82,942,570 | |
| | | | | | | | | |
Financial - 3.0% | | | | | | | | |
Station Place Securitization Trust | | | | | | | | |
2019-6, 1.53% (1 Month USD LIBOR + 0.60%, Rate Floor: 0.60%) due 07/24/21†††,3,4 | | | 5,500,000 | | | | 5,500,000 | |
2019-5, 1.63% (1 Month USD LIBOR + 0.70%, Rate Floor: 0.70%) due 06/24/20†††,1,3,4 | | | 2,950,000 | | | | 2,950,000 | |
2019-2, 1.48% (1 Month USD LIBOR + 0.55%, Rate Floor: 0.55%) due 04/24/21†††,1,3,4 | | | 1,400,000 | | | | 1,400,000 | |
2019-9, 1.63% (1 Month USD LIBOR + 0.70%, Rate Floor: 0.00%) due 10/24/20†††,1,3,4 | | | 1,350,000 | | | | 1,350,000 | |
2019-WL1, 1.60% (1 Month USD LIBOR + 0.65%, Rate Floor: 0.65%) due 08/25/52†††,1,3,4 | | | 666,667 | | | | 666,667 | |
Barclays Bank plc | | | | | | | | |
GMTN, 1.67% (1 Month USD LIBOR + 0.68%) due 07/31/20†††,1,3,4 | | | 6,400,000 | | | | 6,400,000 | |
Aesf Vi Verdi LP | | | | | | | | |
2.15% due 11/25/24††† | | EUR | 5,000,000 | | | | 5,294,312 | |
SEE NOTES TO FINANCIAL STATEMENTS. | THE GUGGENHEIM FUNDS SEMI-ANNUAL REPORT | 45 |
SCHEDULE OF INVESTMENTS (Unaudited)(continued) | March 31, 2020 |
INVESTMENT GRADE BOND FUND | |
| | Face
Amount~ | | | Value | |
Oxford Finance Funding 2020-1 LLC | | | | | | | | |
2020-1A, 3.10% due 02/15/284 | | | 1,500,000 | | | $ | 1,439,595 | |
Madison Avenue Secured Funding Trust | | | | | | | | |
2019-1, 2.23% (1 Month USD LIBOR + 1.50%, Rate Floor: 1.50%) due 11/11/20†††,1,3,4 | | | 1,300,000 | | | | 1,300,000 | |
Nassau LLC | | | | | | | | |
2019-1, 3.98% due 08/15/344 | | | 1,179,797 | | | | 1,108,529 | |
Total Financial | | | | | | | 27,409,103 | |
| | | | | | | | | |
Transport-Aircraft - 1.5% | | | | | | | | |
AASET US Ltd. | | | | | | | | |
2018-2A, 4.45% due 11/18/384 | | | 2,893,762 | | | | 2,297,735 | |
Castlelake Aircraft Securitization Trust | | | | | | | | |
2018-1, 4.13% due 06/15/434 | | | 1,485,815 | | | | 1,079,770 | |
2017-1, 3.97% due 07/15/42 | | | 1,430,056 | | | | 1,056,613 | |
MAPS Ltd. | | | | | | | | |
2018-1A, 4.21% due 05/15/434 | | | 2,131,500 | | | | 1,602,310 | |
Sapphire Aviation Finance I Ltd. | | | | | | | | |
2018-1A, 4.25% due 03/15/404 | | | 2,059,854 | | | | 1,552,266 | |
SAPPHIRE AVIATION FINANCE II Ltd. | | | | | | | | |
2020-1A, 3.23% due 03/15/404 | | | 2,250,000 | | | | 1,455,301 | |
AASET 2020-1 Trust | | | | | | | | |
2020-1A, 3.35% due 01/16/404 | | | 1,959,012 | | | | 1,404,134 | |
AIM Aviation Finance Ltd. | | | | | | | | |
2015-1A, 4.21% due 02/15/404 | | | 779,601 | | | | 675,378 | |
WAVE 2019-1 LLC | | | | | | | | |
2019-1, 3.60% due 09/15/444 | | | 964,300 | | | | 632,052 | |
Raspro Trust | | | | | | | | |
2005-1A, 2.89% (3 Month USD LIBOR + 0.93%, Rate Floor: 0.93%) due 03/23/243,4 | | | 542,298 | | | | 508,930 | |
Falcon Aerospace Ltd. | | | | | | | | |
2017-1, 4.58% due 02/15/424 | | | 523,345 | | | | 415,370 | |
Turbine Engines Securitization Ltd. | | | | | | | | |
2013-1A, 5.13% due 12/13/4811 | | | 422,684 | | | | 371,962 | |
AASET Trust | | | | | | | | |
2017-1A, 3.97% due 05/16/424 | | | 420,871 | | | | 330,673 | |
Total Transport-Aircraft | | | | | | | 13,382,494 | |
| | | | | | | | | |
Net Lease - 0.7% | | | | | | | | |
Capital Automotive LLC | | | | | | | | |
2017-1A, 3.87% due 04/15/474 | | | 2,830,402 | | | | 2,480,388 | |
Store Master Funding I-VII | | | | | | | | |
2016-1A, 3.96% due 10/20/464 | | | 2,716,755 | | | | 1,958,479 | |
STORE Master Funding LLC | | | | | | �� | | |
2014-1A, 5.00% due 04/20/444 | | | 1,456,250 | | | | 1,180,724 | |
CARS-DB4, LP | | | | | | | | |
2020-1A, 3.81% due 02/15/504 | | | 1,000,000 | | | | 898,530 | |
2020-1A, 3.48% due 02/15/504 | | | 250,000 | | | | 234,444 | |
Total Net Lease | | | | | | | 6,752,565 | |
| | | | | | | | | |
Transport-Container - 0.7% | | | | | | | | |
Textainer Marine Containers Ltd. | | | | | | | | |
2017-2A, 3.52% due 06/20/424 | | | 2,174,990 | | | | 1,933,989 | |
Global SC Finance II SRL | | | | | | | | |
2014-1A, 3.19% due 07/17/294 | | | 1,516,667 | | | | 1,424,846 | |
CLI Funding LLC | | | | | | | | |
2018-1A, 4.03% due 04/18/434 | | | 1,037,123 | | | | 985,130 | |
CAL Funding III Ltd. | | | | | | | | |
2018-1A, 3.96% due 02/25/434 | | | 989,583 | | | | 980,721 | |
Textainer Marine Containers V Ltd. | | | | | | | | |
2017-1A, 3.72% due 05/20/424 | | | 738,148 | | | | 664,178 | |
Cronos Containers Program Ltd. | | | | | | | | |
2013-1A, 3.08% due 04/18/284 | | | 555,000 | | | | 540,988 | |
Total Transport-Container | | | | | | | 6,529,852 | |
| | | | | | | | | |
Collateralized Debt Obligations - 0.5% | | | | |
Anchorage Credit Funding Ltd. | | | | | | | | |
2016-4A, 3.50% due 02/15/354 | | | 3,750,000 | | | | 3,484,915 | |
2016-3A, 3.85% due 10/28/334 | | | 1,000,000 | | | | 929,371 | |
Putnam Structured Product Funding Ltd. | | | | | | | | |
2003-1A, 2.68% (1 Month USD LIBOR + 1.00%, Rate Floor: 0.00%) due 10/15/383,4 | | | 157,222 | | | | 155,397 | |
Total Collateralized Debt Obligations | | | | | | | 4,569,683 | |
| | | | | | | | | |
Whole Business - 0.2% | | | | | | | | |
Domino’s Pizza Master Issuer LLC | | | | | | | | |
2017-1A, 3.04% (3 Month USD LIBOR + 1.25%, Rate Floor: 0.00%) due 07/25/473,4 | | | 977,500 | | | | 914,813 | |
Applebee’s Funding LLC / IHOP Funding LLC | | | | | | | | |
2019-1A, 4.72% due 06/07/494 | | | 1,000,000 | | | | 863,670 | |
Wendy’s Funding LLC | | | | | | | | |
2015-1A, 4.50% due 06/15/454 | | | 429,750 | | | | 410,347 | |
Drug Royalty III Limited Partnership | | | | | | | | |
2016-1A, 3.98% due 04/15/274 | | | 63,225 | | | | 63,165 | |
Total Whole Business | | | | | | | 2,251,995 | |
| | | | | | | | | |
Infrastructure - 0.2% | | | | | | | | |
Vantage Data Centers Issuer LLC | | | | | | | | |
2018-1A, 4.07% due 02/16/434 | | | 979,167 | | | | 957,274 | |
Secured Tenant Site Contract Revenue Notes Series | | | | | | | | |
2018-1A, 3.97% due 06/15/484 | | | 1,067,192 | | | | 885,648 | |
Total Infrastructure | | | | | | | 1,842,922 | |
| | | | | | | | | |
Diversified Payment Rights - 0.1% | | | | | | | | |
Bib Merchant Voucher Receivables Ltd. | | | | | | | | |
4.18% due 04/07/28††† | | | 1,000,000 | | | | 1,034,057 | |
| | | | | | | | | |
Insurance - 0.0% | | | | | | | | |
Chesterfield Financial Holdings LLC | | | | | | | | |
2014-1A, 4.50% due 12/15/34†††,4 | | | 385,500 | | | | 401,952 | |
Total Asset-Backed Securities | | | | |
(Cost $160,901,496) | | | 147,117,193 | |
| | | | | | | | | |
CORPORATE BONDS†† - 8.2% |
Financial - 3.0% | | | | | | | | |
Goldman Sachs Group, Inc. | | | | | | | | |
3.50% due 04/01/25 | | | 2,250,000 | | | | 2,300,007 | |
Discover Bank | | | | | | | | |
3.10% due 06/04/20 | | | 2,000,000 | | | | 1,997,000 | |
46 | THE GUGGENHEIM FUNDS SEMI-ANNUAL REPORT | SEE NOTES TO FINANCIAL STATEMENTS. |
SCHEDULE OF INVESTMENTS (Unaudited)(continued) | March 31, 2020 |
INVESTMENT GRADE BOND FUND | |
| | Face
Amount~ | | | Value | |
JPMorgan Chase & Co. | | | | | | | | |
4.49% due 03/24/3110 | | | 1,600,000 | | | $ | 1,849,597 | |
Standard Chartered plc | | | | | | | | |
4.64% due 04/01/314,10 | | | 1,800,000 | | | | 1,845,792 | |
AXIS Specialty Finance LLC | | | | | | | | |
5.88% due 06/01/20 | | | 1,800,000 | | | | 1,812,728 | |
Lloyds Bank Corporate Markets plc NY | | | | | | | | |
2.11% (3 Month USD LIBOR + 0.37%) due 08/05/203 | | | 1,730,000 | | | | 1,728,644 | |
Standard Chartered Bank | | | | | | | | |
2.15% (3 Month USD LIBOR + 0.40%) due 08/04/203 | | | 1,710,000 | | | | 1,708,825 | |
UBS AG | | | | | | | | |
1.58% (3 Month USD LIBOR + 0.58%, Rate Floor: 0.00%) due 06/08/203,4 | | | 1,700,000 | | | | 1,694,551 | |
American Tower Corp. | | | | | | | | |
2.80% due 06/01/20 | | | 1,650,000 | | | | 1,637,036 | |
Credit Suisse Group AG | | | | | | | | |
4.19% due 04/01/314,10 | | | 1,500,000 | | | | 1,536,018 | |
Aflac, Inc. | | | | | | | | |
3.60% due 04/01/30 | | | 1,500,000 | | | | 1,519,254 | |
American Express Co. | | | | | | | | |
2.20% due 10/30/20 | | | 1,290,000 | | | | 1,286,426 | |
Alexandria Real Estate Equities, Inc. | | | | | | | | |
4.90% due 12/15/30 | | | 1,050,000 | | | | 1,139,401 | |
Pershing Square Holdings Ltd. | | | | | | | | |
5.50% due 07/15/224 | | | 1,000,000 | | | | 960,000 | |
Ameriprise Financial, inc. | | | | | | | | |
3.00% due 04/02/25 | | | 690,000 | | | | 687,081 | |
Santander UK plc | | | | | | | | |
2.06% (3 Month USD LIBOR + 0.30%) due 11/03/203 | | | 629,000 | | | | 628,084 | |
2.13% due 11/03/20 | | | 211,000 | | | | 209,788 | |
HSBC Holdings plc | | | | | | | | |
4.95% due 03/31/30 | | | 750,000 | | | | 818,999 | |
AerCap Ireland Capital DAC / AerCap Global Aviation Trust | | | | | | | | |
4.25% due 07/01/20 | | | 785,000 | | | | 774,399 | |
American Equity Investment Life Holding Co. | | | | | | | | |
5.00% due 06/15/27 | | | 486,000 | | | | 467,292 | |
Marsh & McLennan Cos., Inc. | | | | | | | | |
4.80% due 07/15/21 | | | 400,000 | | | | 410,508 | |
Crown Castle International Corp. | | | | | | | | |
3.30% due 07/01/30 | | | 400,000 | | | | 396,716 | |
Assurant, Inc. | | | | | | | | |
2.48% (3 Month USD LIBOR + 1.25%) due 03/26/213 | | | 289,000 | | | | 289,000 | |
Total Financial | | | | | | | 27,697,146 | |
| | | | | | | | | |
Consumer, Non-cyclical - 2.3% | | | | | | | | |
Sysco Corp. | | | | | | | | |
5.95% due 04/01/30 | | | 6,860,000 | | | | 7,201,903 | |
Reynolds American, Inc. | | | | | | | | |
3.25% due 06/12/20 | | | 1,920,000 | | | | 1,914,240 | |
Mondelez International, Inc. | | | | | | | | |
3.00% due 05/07/20 | | | 1,920,000 | | | | 1,900,800 | |
Zimmer Biomet Holdings, Inc. | | | | | | | | |
2.70% due 04/01/20 | | | 1,795,000 | | | | 1,795,000 | |
Kraft Heinz Foods Co. | | | | | | | | |
4.38% due 06/01/46 | | | 1,260,000 | | | | 1,135,030 | |
5.00% due 06/04/42 | | | 300,000 | | | | 284,036 | |
4.88% due 10/01/494 | | | 200,000 | | | | 181,853 | |
2.80% due 07/02/20 | | | 84,000 | | | | 83,376 | |
Allergan, Inc./United States | | | | | | | | |
3.38% due 09/15/20 | | | 1,635,000 | | | | 1,652,575 | |
Constellation Brands, Inc. | | | | | | | | |
2.25% due 11/06/20 | | | 1,480,000 | | | | 1,471,692 | |
BAT Capital Corp. | | | | | | | | |
4.70% due 04/02/27 | | | 1,410,000 | | | | 1,432,795 | |
Thermo Fisher Scientific, Inc. | | | | | | | | |
4.50% due 03/25/30 | | | 1,000,000 | | | | 1,124,137 | |
Coca-Cola European Partners plc | | | | | | | | |
3.50% due 09/15/20 | | | 550,000 | | | | 555,212 | |
Quest Diagnostics, Inc. | | | | | | | | |
4.70% due 04/01/21 | | | 300,000 | | | | 303,453 | |
Humana, Inc. | | | | | | | | |
2.50% due 12/15/20 | | | 120,000 | | | | 119,462 | |
Conagra Brands, Inc. | | | | | | | | |
2.38% (3 Month USD LIBOR + 0.50%) due 10/09/203 | | | 100,000 | | | | 98,607 | |
Total Consumer, Non-cyclical | | | | | | | 21,254,171 | |
| | | | | | | | | |
Industrial - 1.0% | | | | | | | | |
Penske Truck Leasing Company Lp / PTL Finance Corp. | | | | | | | | |
3.65% due 07/29/214 | | | 2,200,000 | | | | 2,227,313 | |
Fortive Corp. | | | | | | | | |
2.35% due 06/15/21 | | | 2,200,000 | | | | 2,138,926 | |
Rolls-Royce plc | | | | | | | | |
2.38% due 10/14/204 | | | 1,800,000 | | | | 1,696,260 | |
Aviation Capital Group LLC | | | | | | | | |
2.88% due 01/20/224 | | | 700,000 | | | | 632,790 | |
John Hopkins University | | | | | | | | |
2.81% due 01/01/60 | | | 1,000,000 | | | | 902,831 | |
Fox Corp. | | | | | | | | |
3.05% due 04/07/25 | | | 450,000 | | | | 449,298 | |
Ingersoll-Rand Luxembourg Finance S.A. | | | | | | | | |
2.63% due 05/01/20 | | | 320,000 | | | | 320,042 | |
Oshkosh Corp. | | | | | | | | |
3.10% due 03/01/30 | | | 240,000 | | | | 232,331 | |
Vulcan Materials Co. | | | | | | | | |
1.34% (3 Month USD LIBOR + 0.60%) due 06/15/203 | | | 200,000 | | | | 198,422 | |
Total Industrial | | | | | | | 8,798,213 | |
| | | | | | | | | |
Utilities - 0.6% | | | | | | | | |
Puget Energy, Inc. | | | | | | | | |
6.00% due 09/01/21 | | | 2,180,000 | | | | 2,235,869 | |
NextEra Energy Capital Holdings, Inc. | | | | | | | | |
1.83% (3 Month USD LIBOR + 0.45%) due 09/28/203 | | | 1,830,000 | | | | 1,831,553 | |
Exelon Corp. | | | | | | | | |
2.85% due 06/15/20 | | | 860,000 | | | | 859,905 | |
SEE NOTES TO FINANCIAL STATEMENTS. | THE GUGGENHEIM FUNDS SEMI-ANNUAL REPORT | 47 |
SCHEDULE OF INVESTMENTS (Unaudited)(continued) | March 31, 2020 |
INVESTMENT GRADE BOND FUND | |
| | Face
Amount~ | | | Value | |
PSEG Power LLC | | | | | | | | |
5.13% due 04/15/20 | | | 250,000 | | | $ | 250,097 | |
Pennsylvania Electric Co. | | | | | | | | |
5.20% due 04/01/20 | | | 50,000 | | | | 50,000 | |
Total Utilities | | | | | | | 5,227,424 | |
| | | | | | | | | |
Energy - 0.4% | | | | | | | | |
Exxon Mobil Corp. | | | | | | | | |
3.48% due 03/19/30 | | | 2,350,000 | | | | 2,595,422 | |
Sabine Pass Liquefaction LLC | | | | | | | | |
5.63% due 02/01/21 | | | 1,100,000 | | | | 1,067,041 | |
Reliance Holding USA, Inc. | | | | | | | | |
4.50% due 10/19/204 | | | 350,000 | | | | 352,394 | |
Total Energy | | | | | | | 4,014,857 | |
| | | | | | | | | |
Communications - 0.4% | | | | | | | | |
ViacomCBS, Inc. | | | | | | | | |
4.75% due 05/15/25 | | | 2,260,000 | | | | 2,270,552 | |
Verizon Communications, Inc. | | | | | | | | |
3.15% due 03/22/30 | | | 1,000,000 | | | | 1,077,154 | |
Telefonica Emisiones S.A. | | | | | | | | |
5.13% due 04/27/20 | | | 430,000 | | | | 430,030 | |
Altice France S.A. | | | | | | | | |
7.38% due 05/01/264 | | | 200,000 | | | | 198,530 | |
Total Communications | | | | | | | 3,976,266 | |
| | | | | | | | | |
Consumer, Cyclical - 0.3% | | | | | | | | |
Marriott International, Inc. | | | | | | | | |
2.18% (3 Month USD LIBOR + 0.60%) due 12/01/203 | | | 1,900,000 | | | | 1,778,002 | |
McDonald’s Corp. | | | | | | | | |
3.50% due 07/15/20 | | | 1,221,000 | | | | 1,226,347 | |
Aramark Services, Inc. | | | | | | | | |
5.00% due 02/01/284 | | | 85,000 | | | | 79,103 | |
Total Consumer, Cyclical | | | | | | | 3,083,452 | |
| | | | | | | | | |
Technology - 0.2% | | | | | | | | |
Fiserv, Inc. | | | | | | | | |
2.70% due 06/01/20 | | | 2,000,000 | | | | 1,993,773 | |
| | | | | | | | | |
Total Corporate Bonds | | | | |
(Cost $75,588,143) | | | 76,045,302 | |
| | | | | | | | | |
FEDERAL AGENCY BONDS†† - 4.9% |
Residual Funding Corporation Principal Strips |
due 04/15/308 | | | 7,530,000 | | | | 6,457,830 | |
due 01/15/308 | | | 4,755,000 | | | | 4,102,460 | |
Fannie Mae Principal Strips |
due 07/15/378,12 | | | 13,000,000 | | | | 9,134,342 | |
Freddie Mac Principal Strips |
due 07/15/328,12 | | | 10,550,000 | | | | 8,563,259 | |
Tennessee Valley Authority Principal |
due 01/15/488 | | | 9,700,000 | | | | 4,806,041 | |
due 01/15/388 | | | 4,000,000 | | | | 2,567,913 | |
Federal Farm Credit Banks Funding Corp. |
2.43% due 01/29/37 | | | 3,000,000 | | | | 3,315,056 | |
2.88% due 10/01/40 | | | 350,000 | | | | 412,568 | |
Tennessee Valley Authority |
4.25% due 09/15/65 | | | 1,300,000 | | | | 1,869,605 | |
5.38% due 04/01/56 | | | 600,000 | | | | 1,075,807 | |
United States International Development Finance Corp. | | | | | | | | |
due 01/17/267 | | | 800,000 | | | | 856,792 | |
1.79% due 10/15/29 | | | 600,000 | | | | 626,451 | |
Freddie Mac |
due 01/02/347 | | | 1,850,000 | | | | 1,447,982 | |
Total Federal Agency Bonds | | | | |
(Cost $38,349,766) | | | | | | | 45,236,106 | |
| | | | | | | | | |
MUNICIPAL BONDS†† - 2.0% |
California - 0.8% | | | | | | | | |
State of California General Obligation Unlimited | | | | | | | | |
7.55% due 04/01/39 | | | 700,000 | | | | 1,135,890 | |
7.35% due 11/01/39 | | | 650,000 | | | | 1,004,699 | |
Newport Mesa Unified School District General Obligation Unlimited | | | | | | | | |
due 08/01/447 | | | 2,000,000 | | | | 848,500 | |
due 08/01/417 | | | 1,540,000 | | | | 744,713 | |
due 08/01/467 | | | 750,000 | | | | 292,140 | |
California Institute of Technology | | | | | | | | |
3.65% due 09/01/19 | | | 1,600,000 | | | | 1,655,450 | |
Beverly Hills Unified School District California General Obligation Unlimited | | | | | | | | |
due 08/01/397 | | | 1,410,000 | | | | 700,544 | |
Cypress School District General Obligation Unlimited | | | | | | | | |
due 08/01/487 | | | 1,000,000 | | | | 361,320 | |
Los Angeles Department of Water & Power Power System Revenue Revenue Bonds | | | | | | | | |
6.17% due 07/01/40 | | | 250,000 | | | | 252,105 | |
Hanford Joint Union High School District General Obligation Unlimited | | | | | | | | |
due 08/01/397 | | | 500,000 | | | | 242,840 | |
Total California | | | | | | | 7,238,201 | |
| | | | | | | | | |
New York - 0.6% | | | | | | | | |
Triborough Bridge & Tunnel Authority Revenue Bonds | | | | | | | | |
0.87% (VRDN) due 01/01/3314 | | | 1,890,000 | | | | 1,890,000 | |
New York City Transitional Finance Authority Future Tax Secured Revenue Bonds | | | | | | | | |
0.80% (VRDN) due 02/01/4514 | | | 1,130,000 | | | | 1,130,000 | |
0.75% (VRDN) due 02/01/4514 | | | 550,000 | | | | 550,000 | |
City of New York New York General Obligation Unlimited | | | | | | | | |
0.80% due 03/01/423 | | | 1,130,000 | | | | 1,130,000 | |
0.75% due 03/01/403 | | | 420,000 | | | | 420,000 | |
Total New York | | | | | | | 5,120,000 | |
| | | | | | | | | |
48 | THE GUGGENHEIM FUNDS SEMI-ANNUAL REPORT | SEE NOTES TO FINANCIAL STATEMENTS. |
SCHEDULE OF INVESTMENTS (Unaudited)(continued) | March 31, 2020 |
INVESTMENT GRADE BOND FUND | |
| | Face
Amount~ | | | Value | |
Illinois - 0.2% | | | | | | | | |
Illinois Finance Authority Revenue Bonds | | | | | | | | |
0.75% (VRDN) due 08/15/4214 | | | 880,000 | | | $ | 880,000 | |
State of Illinois General Obligation Unlimited | | | | | | | | |
5.65% due 12/01/38 | | | 500,000 | | | | 558,455 | |
Cook County School District No. 155 Calumet City General Obligation Unlimited | | | | | | | | |
5.30% due 12/01/22 | | | 5,000 | | | | 5,488 | |
Total Illinois | | | | | | | 1,443,943 | |
| | | | | | | | | |
Texas - 0.2% | | | | | | | | |
Grand Parkway Transportation Corp. Revenue Bonds | | | | | | | | |
3.31% due 10/01/49 | | | 1,500,000 | | | | 1,434,255 | |
| | | | | | | | | |
Georgia - 0.1% | | | | | | | | |
Central Storage Safety Project Trust | | | | | | | | |
4.82% due 02/01/3811 | | | 1,000,000 | | | | 1,162,252 | |
| | | | | | | | | |
Idaho - 0.1% | | | | | | | | |
Boise State University Revenue Bonds | | | | | | | | |
3.06% due 04/01/40 | | | 1,150,000 | | | | 1,038,668 | |
| | | | | | | | | |
Pennsylvania - 0.0% | | | | | | | | |
Hospitals & Higher Education Facilities Authority of Philadelphia Revenue Bonds | | | | | | | | |
0.75% (VRDN) due 07/01/4114 | | | 340,000 | | | | 340,000 | |
0.76% (VRDN) due 07/01/2514 | | | 300,000 | | | | 300,000 | |
Total Pennsylvania | | | | | | | 640,000 | |
| | | | | | | | | |
Arizona - 0.0% | | | | | | | | |
State of Arizona Certificate Of Participation | | | | | | | | |
5.00% due 10/01/24 | | | 400,000 | | | | 400,000 | |
Total Municipal Bonds | | | | |
(Cost $18,243,236) | | | 18,477,319 | |
| | | | | | | | | |
FOREIGN GOVERNMENT DEBT†† - 0.2% |
Government of Japan |
due 04/13/207 | | JPY | 168,000,000 | | | | 1,562,645 | |
Total Foreign Government Debt | | | | |
(Cost $1,529,286) | | | | | | | 1,562,645 | |
| | | | | | | | | |
SENIOR FLOATING RATE INTERESTS††,3 - 0.1% |
Consumer, Non-cyclical - 0.1% | | | | | | | | |
Packaging Coordinators Midco, Inc. | | | | | | | | |
5.08% (3 Month USD LIBOR + 4.00%, Rate Floor: 5.00%) due 06/30/23††† | | | 496,512 | | | | 427,001 | |
Elanco Animal Health, Inc. | | | | | | | | |
due 02/04/27 | | | 400,000 | | | | 378,000 | |
Total Consumer, Non-cyclical | | | | | | | 805,001 | |
| | | | | | | | | |
Financial - 0.0% | | | | | | | | |
RPI (Royalty Pharma) 2019 Intermediate Finance Trust | | | | | | | | |
2.74% (1 Month USD LIBOR + 1.75%, Rate Floor: 1.75%) due 02/11/27 | | | 99,750 | | | | 91,770 | |
Total Senior Floating Rate Interests | | | | |
(Cost $992,762) | | | 896,771 | |
| | | | | | | | | |
COMMERCIAL PAPER††,13 - 1.8% |
American Electric Power |
1.81% due 04/01/204 | | | 9,000,000 | | | | 9,000,000 | |
Nasdaq, Inc. |
1.76% due 04/01/204 | | | 8,000,000 | | | | 8,000,000 | |
Total Commercial Paper | | | | |
(Cost $17,000,000) | | | | | | | 17,000,000 | |
| | | | | | | | |
| | | Notional
Value | | | | | |
OTC OPTIONS PURCHASED†† - 0.2% |
Put options on: | | | | | | | | |
Bank of America, N.A. 2Y-10 CMS CAP Expiring July 2022 with strike price of $0.40 | | | 380,500,000 | | | $ | 810,465 | |
Morgan Stanley Capital Services LLC 2Y-10 CMS CAP Expiring July 2022 with strike price of $0.40 | | | 227,800,000 | | | | 485,214 | |
Goldman Sachs International 2Y-10 CMS CAP Expiring July 2022 with strike price of $0.61 | | | 192,600,000 | | | | 261,936 | |
Goldman Sachs International 2Y-10 CMS CAP Expiring July 2022 with strike price of $0.40 | | | 54,700,000 | | | | 116,511 | |
Bank of America, N.A. 2Y-10 CMS CAP Expiring July 2022 with strike price of $0.61 | | | 28,400,000 | | | | 38,624 | |
Total OTC Options Purchased | | | | |
(Cost $1,814,555) | | | | | | | 1,712,750 | |
| | | | | | | | | |
Total Investments - 100.5% | | | | |
(Cost $916,883,118) | | $ | 928,538,549 | |
Other Assets & Liabilities, net - (0.5)% | | | (4,546,681 | ) |
Total Net Assets - 100.0% | | $ | 923,991,868 | |
SEE NOTES TO FINANCIAL STATEMENTS. | THE GUGGENHEIM FUNDS SEMI-ANNUAL REPORT | 49 |
SCHEDULE OF INVESTMENTS (Unaudited)(continued) | March 31, 2020 |
INVESTMENT GRADE BOND FUND | |
Futures Contracts |
| |
Description | | Number of
Contracts | | Expiration
Date | | Notional
Amount | | | Value and
Unrealized
(Depreciation)** | |
Interest Rate Future Contracts Sold Short† |
U.S. Treasury 10 Year Note Futures Contracts | | | 100 | | Jun 2020 | | $ | 13,885,938 | | | $ | (10,470 | ) |
Centrally Cleared Credit Default Swap Agreements Protection Sold†† |
| |
Counterparty | Exchange | Index | | Protection
Premium
Rate | | | Payment
Frequency | | | Maturity
Date | | | Notional
Amount | | | Value | | | Upfront
Premiums
Received | | | Unrealized
Appreciation** | |
BofA Securities, Inc. | ICE | CDX.NA.HY.33.V3 | | | 5.00 | % | Quarterly | 12/20/24 | | $ | 14,553,000 | | | $ | (887,276 | ) | | $ | (1,356,506 | ) | | $ | 469,230 | |
BofA Securities, Inc. | ICE | CDX.NA.IG.34 | | | 1.00 | % | Quarterly | 06/20/25 | | | 164,380,000 | | | | (1,153,523 | ) | | | (3,239,709 | ) | | | 2,086,186 | |
| | | | | | | | | | | | | | | | | | | | | $ | (2,040,799 | ) | | $ | (4,596,215 | ) | | $ | 2,555,416 | |
Centrally Cleared Interest Rate Swap Agreements†† |
| |
Counterparty | Exchange | Floating
Rate
Type | Floating
Rate Index | | Fixed
Rate | | | Payment
Frequency | | | Maturity
Date | | | Notional
Amount | | | Value | | | Upfront
Premiums
Paid | | | Unrealized
Appreciation** | |
BofA Securities, Inc. | CME | Pay | Federal Funds Rate | 0.47% | Annually | 03/09/25 | | $ | 53,830,000 | | | $ | 657,092 | | | $ | 534 | | | $ | 656,558 | |
BofA Securities, Inc. | CME | Pay | Federal Funds Rate | 1.23% | Annually | 08/22/21 | | | 26,300,000 | | | | 426,272 | | | | 254 | | | | 426,018 | |
BofA Securities, Inc. | CME | Pay | Federal Funds Rate | 1.37% | Annually | 12/04/21 | | | 19,400,000 | | | | 423,001 | | | | 291 | | | | 422,710 | |
BofA Securities, Inc. | CME | Pay | Federal Funds Rate | 1.33% | Annually | 11/29/21 | | | 18,500,000 | | | | 390,213 | | | | 287 | | | | 389,926 | |
| | | | | | | | | | | | | | | | | | | | | | $ | 1,896,578 | | | $ | 1,366 | | | $ | 1,895,212 | |
Total Return Swap Agreements |
Counterparty | Reference Obligation | Financing
Rate Pay | Payment
Frequency | | Maturity
Date | | | Units | | | Notional
Amount | | | Value and
Unrealized
Appreciation | |
OTC Sovereign Debt Swap Agreements†† |
Deutsche Bank AG | Korea Monetary Stabilization Bond | 2.20% (3 Month USD LIBOR + 0.45%) | At Maturity | | | 08/04/21 | | | | N/A | | | $ | 2,902,286 | | | $ | 1,943 | |
Forward Foreign Currency Exchange Contracts†† |
Counterparty | | Contracts
to Sell | | | Currency | | | Settlement
Date | | | Settlement
Value | | | Value at
March 31,
2020 | | | Unrealized
Appreciation | |
Citibank N.A., New York | | | 25,520,000 | | | | BRL | | | | 07/01/21 | | | $ | 6,062,070 | | | $ | 4,824,244 | | | $ | 1,237,826 | |
Morgan Stanley Capital Services LLC | | | 12,250,000 | | | | BRL | | | | 04/01/20 | | | | 3,002,160 | | | | 2,359,990 | | | | 642,170 | |
Goldman Sachs International | | | 7,880,000 | | | | BRL | | | | 07/01/20 | | | | 2,046,222 | | | | 1,515,414 | | | | 530,808 | |
Bank of America, N.A. | | | 1,042,521,000 | | | | JPY | | | | 08/02/21 | | | | 10,287,867 | | | | 9,849,649 | | | | 438,218 | |
Goldman Sachs International | | | 37,600,000 | | | | MXN | | | | 05/21/20 | | | | 2,001,480 | | | | 1,574,100 | | | | 427,380 | |
Citibank N.A., New York | | | 6,480,000 | | | | BRL | | | | 07/01/20 | | | | 1,669,071 | | | | 1,246,178 | | | | 422,893 | |
Goldman Sachs International | | | 8,600,000 | | | | BRL | | | | 07/01/21 | | | | 2,014,759 | | | | 1,625,725 | | | | 389,034 | |
Goldman Sachs International | | | 20,150,410 | | | | ILS | | | | 08/01/22 | | | | 6,078,555 | | | | 5,791,570 | | | | 286,985 | |
Goldman Sachs International | | | 6,558,825 | | | | EUR | | | | 07/30/21 | | | | 7,618,895 | | | | 7,340,948 | | | | 277,947 | |
Citibank N.A., New York | | | 560,280,000 | | | | JPY | | | | 07/01/21 | | | | 5,516,847 | | | | 5,288,765 | | | | 228,082 | |
JPMorgan Chase Bank, N.A. | | | 6,317,025 | | | | EUR | | | | 07/30/21 | | | | 7,290,921 | | | | 7,070,314 | | | | 220,607 | |
Barclays Bank plc | | | 518,259,000 | | | | JPY | | | | 07/01/21 | | | | 5,095,458 | | | | 4,892,108 | | | | 203,350 | |
50 | THE GUGGENHEIM FUNDS SEMI-ANNUAL REPORT | SEE NOTES TO FINANCIAL STATEMENTS. |
SCHEDULE OF INVESTMENTS (Unaudited)(continued) | March 31, 2020 |
INVESTMENT GRADE BOND FUND | |
Forward Foreign Currency Exchange Contracts†† (continued) |
Counterparty | | Contracts
to Sell | | | Currency | | | Settlement
Date | | | Settlement
Value | | | Value at
March 31,
2020 | | | Unrealized
Appreciation
(Depreciation) | |
Morgan Stanley Capital Services LLC | | | 520,260,000 | | | | JPY | | | | 08/02/21 | | | $ | 5,106,095 | | | $ | 4,915,372 | | | $ | 190,723 | |
JPMorgan Chase Bank, N.A. | | | 3,800,000 | | | | BRL | | | | 07/01/21 | | | | 902,720 | | | | 718,344 | | | | 184,376 | |
Citibank N.A., New York | | | 520,260,000 | | | | JPY | | | | 05/06/21 | | | | 5,073,728 | | | | 4,903,340 | | | | 170,388 | |
Barclays Bank plc | | | 15,880,000 | | | | MXN | | | | 04/08/20 | | | | 820,222 | | | | 668,909 | | | | 151,313 | |
Citibank N.A., New York | | | 15,200,000 | | | | MXN | | | | 04/23/20 | | | | 782,746 | | | | 638,920 | | | | 143,826 | |
Citibank N.A., New York | | | 16,360,000 | | | | MXN | | | | 04/08/20 | | | | 832,824 | | | | 689,128 | | | | 143,696 | |
Goldman Sachs International | | | 23,694,600 | | | | ILS | | | | 04/30/21 | | | | 6,937,800 | | | | 6,815,215 | | | | 122,585 | |
Goldman Sachs International | | | 12,470,100 | | | | ILS | | | | 01/31/22 | | | | 3,690,332 | | | | 3,579,985 | | | | 110,347 | |
Goldman Sachs International | | | 272,035,950 | | | | JPY | | | | 12/20/21 | | | | 2,687,837 | | | | 2,580,181 | | | | 107,656 | |
Citibank N.A., New York | | | 11,540,000 | | | | MXN | | | | 04/02/20 | | | | 587,023 | | | | 486,505 | | | | 100,518 | |
Barclays Bank plc | | | 208,104,000 | | | | JPY | | | | 06/01/21 | | | | 2,037,040 | | | | 1,962,758 | | | | 74,282 | |
Deutsche Bank AG | | | 3,538,917,763 | | | | KRW | | | | 08/04/21 | | | | 3,018,010 | | | | 2,953,443 | | | | 64,567 | |
Bank of America, N.A. | | | 1,100,400 | | | | EUR | | | | 06/15/20 | | | | 1,265,432 | | | | 1,216,631 | | | | 48,801 | |
Goldman Sachs International | | | 943,200 | | | | EUR | | | | 06/15/20 | | | | 1,085,227 | | | | 1,042,827 | | | | 42,400 | |
Bank of America, N.A. | | | 4,156,700 | | | | ILS | | | | 01/31/22 | | | | 1,232,345 | | | | 1,193,328 | | | | 39,017 | |
Morgan Stanley Capital Services LLC | | | 5,010,000 | | | | EUR | | | | 06/30/20 | | | | 5,578,484 | | | | 5,542,248 | | | | 36,236 | |
Goldman Sachs International | | | 6,249,808 | | | | ILS | | | | 02/01/21 | | | | 1,820,492 | | | | 1,794,196 | | | | 26,296 | |
Citibank N.A., New York | | | 4,141,000 | | | | ILS | | | | 04/30/21 | | | | 1,209,581 | | | | 1,191,065 | | | | 18,516 | |
Goldman Sachs International | | | 416,000 | | | | EUR | | | | 04/30/20 | | | | 477,069 | | | | 459,110 | | | | 17,959 | |
Bank of America, N.A. | | | 2,222,000 | | | | ILS | | | | 04/30/21 | | | | 649,688 | | | | 639,108 | | | | 10,580 | |
Goldman Sachs International | | | 48,825 | | | | EUR | | | | 07/30/20 | | | | 55,499 | | | | 54,061 | | | | 1,438 | |
Goldman Sachs International | | | 149,590 | | | | ILS | | | | 07/30/21 | | | | 44,391 | | | | 42,999 | | | | 1,392 | |
Goldman Sachs International | | | 235,243 | | | | ILS | | | | 04/30/20 | | | | 67,725 | | | | 66,498 | | | | 1,227 | |
Bank of America, N.A. | | | 216,700 | | | | ILS | | | | 02/01/21 | | | | 63,316 | | | | 62,210 | | | | 1,106 | |
JPMorgan Chase Bank, N.A. | | | 47,025 | | | | EUR | | | | 07/30/20 | | | | 53,139 | | | | 52,068 | | | | 1,071 | |
Goldman Sachs International | | | 150,410 | | | | ILS | | | | 07/31/20 | | | | 43,781 | | | | 42,783 | | | | 998 | |
Bank of America, N.A. | | | 521,000 | | | | JPY | | | | 02/01/21 | | | | 5,089 | | | | 4,897 | | | | 192 | |
Deutsche Bank AG | | | 9,447,763 | | | | KRW | | | | 08/05/20 | | | | 7,962 | | | | 7,797 | | | | 165 | |
Bank of America, N.A. | | | 521,000 | | | | JPY | | | | 08/03/20 | | | | 5,036 | | | | 4,871 | | | | 165 | |
Deutsche Bank AG | | | 9,242,377 | | | | KRW | | | | 05/11/20 | | | | 7,762 | | | | 7,597 | | | | 165 | |
Deutsche Bank AG | | | 9,447,763 | | | | KRW | | | | 02/04/21 | | | | 8,010 | | | | 7,849 | | | | 161 | |
Deutsche Bank AG | | | 9,447,763 | | | | KRW | | | | 11/04/20 | | | | 7,986 | | | | 7,825 | | | | 161 | |
Deutsche Bank AG | | | 9,139,684 | | | | KRW | | | | 05/07/21 | | | | 7,769 | | | | 7,613 | | | | 156 | |
Bank of America, N.A. | | | 22,060 | | | | ILS | | | | 04/30/20 | | | | 6,348 | | | | 6,236 | | | | 112 | |
Citibank N.A., New York | | | 280,000 | | | | JPY | | | | 01/04/21 | | | | 2,733 | | | | 2,630 | | | | 103 | |
Barclays Bank plc | | | 259,000 | | | | JPY | | | | 01/04/21 | | | | 2,524 | | | | 2,433 | | | | 91 | |
Citibank N.A., New York | | | 280,000 | | | | JPY | | | | 07/01/20 | | | | 2,705 | | | | 2,615 | | | | 90 | |
Morgan Stanley Capital Services LLC | | | 260,000 | | | | JPY | | | | 02/01/21 | | | | 2,525 | | | | 2,444 | | | | 81 | |
Barclays Bank plc | | | 259,000 | | | | JPY | | | | 07/01/20 | | | | 2,499 | | | | 2,419 | | | | 80 | |
Citibank N.A., New York | | | 260,000 | | | | JPY | | | | 11/02/20 | | | | 2,508 | | | | 2,438 | | | | 70 | |
Morgan Stanley Capital Services LLC | | | 260,000 | | | | JPY | | | | 08/03/20 | | | | 2,499 | | | | 2,431 | | | | 68 | |
Citibank N.A., New York | | | 260,000 | | | | JPY | | | | 05/01/20 | | | | 2,481 | | | | 2,422 | | | | 59 | |
Goldman Sachs International | | | 135,950 | | | | JPY | | | | 06/21/21 | | | | 1,330 | | | | 1,283 | | | | 47 | |
Goldman Sachs International | | | 135,950 | | | | JPY | | | | 12/21/20 | | | | 1,315 | | | | 1,276 | | | | 39 | |
Goldman Sachs International | | | 135,950 | | | | JPY | | | | 06/22/20 | | | | 1,302 | | | | 1,269 | | | | 33 | |
Barclays Bank plc | | | 104,000 | | | | JPY | | | | 12/01/20 | | | | 1,007 | | | | 976 | | | | 31 | |
Barclays Bank plc | | | 104,000 | | | | JPY | | | | 06/01/20 | | | | 997 | | | | 970 | | | | 27 | |
Citibank N.A., New York | | | 4,112 | | | | ILS | | | | 04/30/20 | | | | 1,181 | | | | 1,162 | | | | 19 | |
Citibank N.A., New York | | | 168,000,000 | | | | JPY | | | | 04/13/20 | | | | 1,535,221 | | | | 1,563,570 | | | | (28,349 | ) |
| | | | | | | | | | | | | | | | | | | | | | | $ | 7,090,380 | |
SEE NOTES TO FINANCIAL STATEMENTS. | THE GUGGENHEIM FUNDS SEMI-ANNUAL REPORT | 51 |
SCHEDULE OF INVESTMENTS (Unaudited)(continued) | March 31, 2020 |
INVESTMENT GRADE BOND FUND | |
| Forward Foreign Currency Exchange Contracts†† (continued) |
| Counterparty | | | Contracts
to Buy | | | | Currency | | | Settlement
Date | | | Settlement
Value | | | | Value at
March 31,
2020 | | | | Unrealized
Appreciation
(Depreciation) | |
| Goldman Sachs International | | | 20,150,410 | | | | ILS | | | 08/01/22 | | $ | 5,413,139 | | | $ | 5,791,570 | | | $ | 378,431 | |
| Goldman Sachs International | | | 16,626,800 | | | | ILS | | | 01/31/22 | | | 4,529,327 | | | | 4,773,314 | | | | 243,987 | |
| Goldman Sachs International | | | 15,028,800 | | | | ILS | | | 04/30/21 | | | 4,191,666 | | | | 4,322,694 | | | | 131,028 | |
| JPMorgan Chase Bank, N.A. | | | 15,028,800 | | | | ILS | | | 04/30/21 | | | 4,234,658 | | | | 4,322,694 | | | | 88,036 | |
| Goldman Sachs International | | | 6,467,101 | | | | ILS | | | 02/01/21 | | | 1,805,125 | | | | 1,856,576 | | | | 51,451 | |
| Goldman Sachs International | | | 520,260,000 | | | | JPY | | | 05/06/21 | | | 4,876,828 | | | | 4,903,340 | | | | 26,512 | |
| JPMorgan Chase Bank, N.A. | | | 208,104,000 | | | | JPY | | | 06/01/21 | | | 1,953,111 | | | | 1,962,758 | | | | 9,647 | |
| Goldman Sachs International | | | 150,410 | | | | ILS | | | 07/31/20 | | | 39,791 | | | | 42,783 | | | | 2,992 | |
| Goldman Sachs International | | | 149,590 | | | | ILS | | | 07/30/21 | | | 40,136 | | | | 42,999 | | | | 2,863 | |
| Goldman Sachs International | | | 149,208 | | | | ILS | | | 04/30/20 | | | 41,008 | | | | 42,177 | | | | 1,169 | |
| JPMorgan Chase Bank, N.A. | | | 149,208 | | | | ILS | | | 04/30/20 | | | 41,454 | | | | 42,177 | | | | 723 | |
| Goldman Sachs International | | | 260,000 | | | | JPY | | | 11/02/20 | | | 2,424 | | | | 2,438 | | | | 14 | |
| Goldman Sachs International | | | 260,000 | | | | JPY | | | 05/01/20 | | | 2,410 | | | | 2,422 | | | | 12 | |
| JPMorgan Chase Bank, N.A. | | | 104,000 | | | | JPY | | | 12/01/20 | | | 970 | | | | 976 | | | | 6 | |
| JPMorgan Chase Bank, N.A. | | | 104,000 | | | | JPY | | | 06/01/20 | | | 966 | | | | 970 | | | | 4 | |
| Barclays Bank plc | | | 135,950 | | | | JPY | | | 12/21/20 | | | 1,280 | | | | 1,276 | | | | (4 | ) |
| Barclays Bank plc | | | 135,950 | | | | JPY | | | 06/21/21 | | | 1,288 | | | | 1,283 | | | | (5 | ) |
| Barclays Bank plc | | | 135,950 | | | | JPY | | | 06/22/20 | | | 1,274 | | | | 1,269 | | | | (5 | ) |
| JPMorgan Chase Bank, N.A. | | | 781,000 | | | | JPY | | | 02/01/21 | | | 7,357 | | | | 7,341 | | | | (16 | ) |
| JPMorgan Chase Bank, N.A. | | | 781,000 | | | | JPY | | | 08/03/20 | | | 7,320 | | | | 7,302 | | | | (18 | ) |
| JPMorgan Chase Bank, N.A. | | | 539,000 | | | | JPY | | | 07/01/20 | | | 5,202 | | | | 5,034 | | | | (168 | ) |
| JPMorgan Chase Bank, N.A. | | | 539,000 | | | | JPY | | | 01/04/21 | | | 5,234 | | | | 5,063 | | | | (171 | ) |
| Goldman Sachs International | | | 95,850 | | | | EUR | | | 07/30/20 | | | 108,737 | | | | 106,130 | | | | (2,607 | ) |
| Goldman Sachs International | | | 416,000 | | | | EUR | | | 04/30/20 | | | 467,540 | | | | 459,110 | | | | (8,430 | ) |
| Barclays Bank plc | | | 272,035,950 | | | | JPY | | | 12/20/21 | | | 2,593,041 | | | | 2,580,181 | | | | (12,860 | ) |
| JPMorgan Chase Bank, N.A. | | | 1,562,781,000 | | | | JPY | | | 08/02/21 | | | 14,794,859 | | | | 14,765,020 | | | | (29,839 | ) |
| JPMorgan Chase Bank, N.A. | | | 2,043,600 | | | | EUR | | | 06/15/20 | | | 2,300,406 | | | | 2,259,458 | | | | (40,948 | ) |
| JPMorgan Chase Bank, N.A. | | | 12,703,000 | | | | BRL | | | 07/01/21 | | | 2,461,822 | | | | 2,401,347 | | | | (60,475 | ) |
| Goldman Sachs International | | | 14,360,000 | | | | BRL | | | 07/01/20 | | | 2,825,348 | | | | 2,761,592 | | | | (63,756 | ) |
| Citibank N.A., New York | | | 25,217,000 | | | | BRL | | | 07/01/21 | | | 4,835,975 | | | | 4,766,966 | | | | (69,009 | ) |
| JPMorgan Chase Bank, N.A. | | | 11,540,000 | | | | MXN | | | 04/02/20 | | | 600,713 | | | | 486,505 | | | | (114,208 | ) |
| Goldman Sachs International | | | 15,200,000 | | | | MXN | | | 04/23/20 | | | 788,320 | | | | 638,920 | | | | (149,400 | ) |
| Morgan Stanley Capital Services LLC | | | 12,250,000 | | | | BRL | | | 04/01/20 | | | 2,616,618 | | | | 2,359,990 | | | | (256,628 | ) |
| Goldman Sachs International | | | 37,600,000 | | | | MXN | | | 05/21/20 | | | 1,875,798 | | | | 1,574,100 | | | | (301,698 | ) |
| Goldman Sachs International | | | 32,240,000 | | | | MXN | | | 04/08/20 | | | 1,676,774 | | | | 1,358,038 | | | | (318,736 | ) |
| JPMorgan Chase Bank, N.A. | | | 1,078,539,000 | | | | JPY | | | 07/01/21 | | | 10,531,065 | | | | 10,180,873 | | | | (350,192 | ) |
| Goldman Sachs International | | | 12,875,850 | | | | EUR | | | 07/30/21 | | | 14,775,038 | | | | 14,411,261 | | | | (363,777 | ) |
| | | | | | | | | | | | | | | | | | | | | $ | (1,206,075 | ) |
52 | THE GUGGENHEIM FUNDS SEMI-ANNUAL REPORT | SEE NOTES TO FINANCIAL STATEMENTS. |
SCHEDULE OF INVESTMENTS (Unaudited)(continued) | March 31, 2020 |
INVESTMENT GRADE BOND FUND | |
~ | The face amount is denominated in U.S. dollars unless otherwise indicated. |
* | Non-income producing security. |
** | Includes cumulative appreciation (depreciation). Variation margin is reported within the Statement of Assets and Liabilities. |
† | Value determined based on Level 1 inputs — See Note 4. |
†† | Value determined based on Level 2 inputs, unless otherwise noted — See Note 4. |
††† | Value determined based on Level 3 inputs — See Note 4. |
1 | Security was fair valued by the Valuation Committee at March 31, 2020. The total market value of fair valued securities amounts to $17,803,542, (cost $17,223,433) or 1.9% of total net assets. |
2 | Rate indicated is the 7-day yield as of March 31, 2020. |
3 | Variable rate security. Rate indicated is the rate effective at March 31, 2020. In some instances, the effective rate is limited by a minimum rate floor or a maximum rate cap established by the issuer. The settlement status of a position may also impact the effective rate indicated. In some cases, a position may be unsettled at period end and may not have a stated effective rate. In instances where multiple underlying reference rates and spread amounts are shown, the effective rate is based on a weighted average. |
4 | Security is a 144A or Section 4(a)(2) security. These securities have been determined to be liquid under guidelines established by the Board of Trustees. The total market value of 144A or Section 4(a)(2) securities is $258,580,624 (cost $273,118,955), or 28.0% of total net assets. |
5 | Security is a step up/down bond. The coupon increases or decreases at regular intervals until the bond reaches full maturity. Rate indicated is the rate at March 31, 2020. See table below for additional step information for each security. |
6 | Security is an interest-only strip. |
7 | Zero coupon rate security. |
8 | Security is a principal-only strip. |
9 | Security has no stated coupon. However, it is expected to receive residual cash flow payments on defined deal dates. |
10 | Security has a fixed rate coupon which will convert to a floating or variable rate coupon on a future date. |
11 | Security is a 144A or Section 4(a)(2) security. These securities have been determined to be illiquid and restricted under guidelines established by the Board of Trustees. The total market value of 144A or Section 4(a)(2) illiquid and restricted securities is $3,465,040 (cost $3,377,525), or 0.4% of total net assets — See Note 10. |
12 | All or a portion of this security is pledged as collateral for put options purchased contracts at March 31, 2020. |
13 | Rate indicated is the effective yield at the time of purchase. |
14 | The rate is adjusted periodically by the counterparty, allows the holder to tender the security upon a rate reset, and is not based upon a set reference rate and spread. Rate indicated is the rate effective at March 31, 2020. |
| | BofA — Bank of America |
| | BRL — Brazilian Real |
| | CDX.NA.HY.33.V3 — Credit Default Swap North American High Yield Series 33 Index |
| | CDX.NA.IG.34 — Credit Default Swap North American Investment Grade Series 34 Index |
| | CME — Chicago Mercantile Exchange |
| | CMS — Constant Maturity Swap |
| | CMT — Constant Maturity Treasury |
| | EUR — Euro |
| | ICE — Intercontinental Exchange |
| | ILS — Israeli New Shekel |
| | JPY — Japanese Yen |
| | KRW — South Korean Won |
| | LIBOR — London Interbank Offered Rate |
| | MXN — Mexican Peso |
| | plc — Public Limited Company |
| | REMIC — Real Estate Mortgage Investment Conduit |
| | VRDN — Variable Rate Demand Note |
| | WAC — Weighted Average Coupon |
| | |
| | See Sector Classification in Other Information section. |
SEE NOTES TO FINANCIAL STATEMENTS. | THE GUGGENHEIM FUNDS SEMI-ANNUAL REPORT | 53 |
SCHEDULE OF INVESTMENTS (Unaudited)(continued) | March 31, 2020 |
INVESTMENT GRADE BOND FUND | |
The following table summarizes the inputs used to value the Fund’s investments at March 31, 2020 (See Note 4 in the Notes to Financial Statements):
Investments in Securities (Assets) | | Level 1
Quoted
Prices | | | Level 2
Significant
Observable
Inputs | | | Level 3
Significant
Unobservable
Inputs | | | Total | |
Common Stocks | | $ | — | | | $ | — | | | $ | — | * | | $ | — | |
Exchange-Traded Funds | | | 45,188,776 | | | | — | | | | — | | | | 45,188,776 | |
Money Market Fund | | | 127,290,524 | | | | — | | | | — | | | | 127,290,524 | |
Collateralized Mortgage Obligations | | | — | | | | 279,948,413 | | | | 4,813,219 | | | | 284,761,632 | |
U.S. Government Securities | | | — | | | | 163,249,531 | | | | — | | | | 163,249,531 | |
Asset-Backed Securities | | | — | | | | 120,820,205 | | | | 26,296,988 | | | | 147,117,193 | |
Corporate Bonds | | | — | | | | 76,045,302 | | | | — | | | | 76,045,302 | |
Federal Agency Bonds | | | — | | | | 45,236,106 | | | | — | | | | 45,236,106 | |
Municipal Bonds | | | — | | | | 18,477,319 | | | | — | | | | 18,477,319 | |
Foreign Government Debt | | | — | | | | 1,562,645 | | | | — | | | | 1,562,645 | |
Senior Floating Rate Interests | | | — | | | | 469,770 | | | | 427,001 | | | | 896,771 | |
Commercial Paper | | | — | | | | 17,000,000 | | | | — | | | | 17,000,000 | |
Options Purchased | | | — | | | | 1,712,750 | | | | — | | | | 1,712,750 | |
Credit Default Swap Agreements** | | | — | | | | 2,555,416 | | | | — | | | | 2,555,416 | |
Interest Rate Swap Agreements** | | | — | | | | 1,895,212 | | | | — | | | | 1,895,212 | |
Total Return Swap Agreements** | | | — | | | | 1,943 | | | | — | | | | 1,943 | |
Forward Foreign Currency Exchange Contracts** | | | — | | | | 8,055,604 | | | | — | | | | 8,055,604 | |
Total Assets | | $ | 172,479,300 | | | $ | 737,030,216 | | | $ | 31,537,208 | | | $ | 941,046,724 | |
Investments in Securities (Liabilities) | | Level 1
Quoted
Prices | | | Level 2
Significant
Observable
Inputs | | | Level 3
Significant
Unobservable
Inputs | | | Total | |
Interest Rate Futures contracts** | | $ | 10,470 | | | $ | — | | | $ | — | | | $ | 10,470 | |
Forward Foreign Currency Exchange Contracts** | | | — | | | | 2,171,299 | | | | — | | | | 2,171,299 | |
Total Liabilities | | $ | 10,470 | | | $ | 2,171,299 | | | $ | — | | | $ | 2,181,769 | |
* | Includes securities with a market value of $0. |
** | This derivative is reported as unrealized appreciation/depreciation at period end. |
The following is a summary of significant unobservable inputs used in the fair valuation of assets and liabilities categorized within level 3 of the fair value hierarchy:
Category | | Ending Balance at
March 31, 2020 | | Valuation Technique | Unobservable Inputs | | Input Range | | | Weighted Average* | |
Assets: | | | | | | | | | | | | | | |
Asset-Backed Securities | | $ | 14,066,667 | | Model Price | Purchase Price | | | — | | | | — | |
Asset-Backed Securities | | | 10,794,312 | | Option Adjusted Spread off prior month broker quote | Broker Quote | | | — | | | | — | |
Asset-Backed Securities | | | 1,034,057 | | Yield Analysis | Yield | | | 6.6 | % | | | — | |
Asset-Backed Securities | | | 401,952 | | Third Party Pricing | Broker Quote | | | — | | | | — | |
Collateralized Mortgage Obligations | | | 3,736,875 | | Model Price | Purchase Price | | | — | | | | — | |
Collateralized Mortgage Obligations | | | 1,076,344 | | Option Adjusted Spread off prior month broker quote | Broker Quote | | | — | | | | — | |
Senior Floating Rate Interests | | | 427,001 | | Third Party Pricing | Broker Quote | | | — | | | | — | |
Total | | $ | 31,537,208 | | | | | | | | | | | |
* | Inputs are weighted by the fair value of the instruments. |
54 | THE GUGGENHEIM FUNDS SEMI-ANNUAL REPORT | SEE NOTES TO FINANCIAL STATEMENTS. |
SCHEDULE OF INVESTMENTS (Unaudited)(continued) | March 31, 2020 |
INVESTMENT GRADE BOND FUND | |
Significant changes in quote or yield would generally result in significant changes in the fair value of the security. Any remaining Level 3 securities held by the Fund and excluded from the table above, were not considered material to the Fund.
The Fund’s fair valuation leveling guidelines were revised to classify a single daily broker quote, or a vendor price based on a single daily or monthly broker quote, as Level 3 rather than Level 2, if such a quote or price cannot be supported with other available market information.
Transfers between Level 2 and Level 3 may occur as markets fluctuate and/or the availability of data used in an investment’s valuation changes. For the period ended March 31, 2020, the Fund had securities with a total value of $7,982,495 transfer into Level 3 from Level 2 due to lack of observable inputs.
Summary of Fair Value Level 3 Activity
Following is a reconciliation of Level 3 assets for which significant unobservable inputs were used to determine fair value for the period ended March 31, 2020:
| | | Assets | | | | | | | Liabilities | |
| | Asset-Backed
Securities | | | Collateralized
Mortgage
Obligations | | | Senior
Floating Rate
Interests | | | Total Assets | | | Unfunded
Loan
Commitments | |
Beginning Balance | | $ | 9,617,851 | | | $ | 4,988,695 | | | $ | — | | | $ | 14,606,546 | | | $ | (929 | ) |
Purchases/(Receipts) | | | 13,122,406 | | | | 1,020,625 | | | | — | | | | 14,143,031 | | | | — | |
(Sales, maturities and paydowns)/Fundings | | | (136,039 | ) | | | (5,103,125 | ) | | | — | | | | (5,239,164 | ) | | | 800 | |
Amortization of premiums/discounts | | | — | | | | — | | | | — | | | | — | | | | — | |
Total realized gains (losses) included in earnings | | | 3,554 | | | | — | | | | — | | | | 3,554 | | | | (600 | ) |
Total change in unrealized appreciation (depreciation) included in earnings | | | (129,403 | ) | | | 170,149 | | | | — | | | | 40,746 | | | | 729 | |
Transfers into Level 3 | | | 3,818,619 | | | | 3,736,875 | | | | 427,001 | | | | 7,982,495 | | | | — | |
Ending Balance | | $ | 26,296,988 | | | $ | 4,813,219 | | | $ | 427,001 | | | $ | 31,537,208 | | | $ | — | |
Net change in unrealized appreciation (depreciation) for investments in Level 3 securities still held at March 31, 2020 | | $ | (126,797 | ) | | $ | 55,719 | | | $ | — | | | $ | (71,078 | ) | | $ | — | |
Step Coupon Bonds
The following table discloses additional information related to step coupon bonds held by the Fund. Certain securities are subject to multiple rate changes prior to maturity. For those securities a range of rates and corresponding dates have been provided. Rates for all step coupon bonds held by the Fund are scheduled to increase, none are scheduled to decrease.
Name | | Coupon Rate at
Next Reset Date | | | Next Rate
Reset Date | | | Future Reset Rate(s) | | | Future Reset Date(s) | |
Legacy Mortgage Asset Trust 2018-GS3, 4.00% due 06/25/58 | | | 7.00 | % | | | 07/26/21 | | | | 8.00 | % | | | 07/26/22 | |
Verus Securitization Trust 2019-4, 2.64% due 11/25/59 | | | 3.64 | % | | | 10/26/23 | | | | — | | | | — | |
Verus Securitization Trust 2019-4 2019-4, 2.85% due 11/25/59 | | | 3.85 | % | | | 10/26/23 | | | | — | | | | — | |
SEE NOTES TO FINANCIAL STATEMENTS. | THE GUGGENHEIM FUNDS SEMI-ANNUAL REPORT | 55 |
SCHEDULE OF INVESTMENTS (Unaudited)(concluded) | March 31, 2020 |
INVESTMENT GRADE BOND FUND | |
Affiliated Transactions
Investments representing 5% or more of the outstanding voting shares of a company, or control of or by, or common control under Guggenheim Investments (“GI”), result in that company being considered an affiliated issuer, as defined in the 1940 Act.
Transactions during the period ended March 31, 2020, in which the company is an affiliated issuer, were as follows:
Security Name | | Value
09/30/19 | | | Additions | | | Reductions | | | Realized
Gain (Loss) | | | Change in
Unrealized
Appreciation
(Depreciation) | | | Value
03/31/20 | | | Shares/Face
Amount
03/31/20 | | | Investment
Income | |
Mutual Funds | | | | | | | | | | | | | | | | | | | | | | | | | | | | | | | | |
Guggenheim Floating Rate Strategies Fund — R6-Class | | $ | 2,544,445 | | | $ | 4,107 | | | $ | (2,529,944 | ) | | $ | (100,065 | ) | | $ | 81,457 | | | $ | — | | | | — | | | $ | 4,107 | |
56 | THE GUGGENHEIM FUNDS SEMI-ANNUAL REPORT | SEE NOTES TO FINANCIAL STATEMENTS. |
INVESTMENT GRADE BOND FUND | |
STATEMENT OF ASSETS AND LIABILITIES (Unaudited) |
March 31, 2020 |
Assets: |
Investments, at value (cost $916,883,118) | | $ | 928,538,549 | |
Cash | | | 1,917,687 | |
Segregated cash with broker | | | 15,459,774 | |
Unamortized upfront premiums paid on interest rate swap agreements | | | 1,366 | |
Unrealized appreciation on OTC swap agreements | | | 1,943 | |
Unrealized appreciation on forward foreign currency exchange contracts | | | 8,055,604 | |
Prepaid expenses | | | 70,399 | |
Receivables: |
Securities sold | | | 14,924,537 | |
Fund shares sold | | | 2,447,975 | |
Interest | | | 2,337,798 | |
Protection fees on credit default swap agreements | | | 85,132 | |
Foreign tax reclaims | | | 15,494 | |
Total assets | | | 973,856,258 | |
| | | | | |
Liabilities: |
Segregated cash due to broker | | | 7,998,601 | |
Unamortized upfront premiums received on credit default swap agreements | | | 4,596,215 | |
Unrealized depreciation on forward foreign currency exchange contracts | | | 2,171,299 | |
Payable for: |
Securities purchased | | | 30,597,716 | |
Fund shares redeemed | | | 2,922,953 | |
Variation margin on credit default swap agreements | | | 760,833 | |
Management fees | | | 167,179 | |
Swap settlement | | | 169,413 | |
Distributions to shareholders | | | 125,889 | |
Distribution and service fees | | | 61,484 | |
Fund accounting/administration fees | | | 46,633 | |
Variation margin on interest rate swap agreements | | | 36,150 | |
Transfer agent/maintenance fees | | | 19,849 | |
Variation margin on futures contracts | | | 10,470 | |
Trustees’ fees* | | | 1,227 | |
Due to Investment Adviser | | | 769 | |
Miscellaneous | | | 177,710 | |
Total liabilities | | | 49,864,390 | |
Net assets | | $ | 923,991,868 | |
| | | | | |
Net assets consist of: |
Paid in capital | | $ | 893,679,974 | |
Total distributable earnings (loss) | | | 30,311,894 | |
Net assets | | $ | 923,991,868 | |
| | | | | |
A-Class: |
Net assets | | $ | 158,300,413 | |
Capital shares outstanding | | | 8,240,717 | |
Net asset value per share | | $ | 19.21 | |
Maximum offering price per share (Net asset value divided by 96.00%) | | $ | 20.01 | |
| | | | | |
C-Class: |
Net assets | | $ | 24,802,305 | |
Capital shares outstanding | | | 1,296,614 | |
Net asset value per share | | $ | 19.13 | |
| | | | | |
P-Class: |
Net assets | | $ | 42,772,136 | |
Capital shares outstanding | | | 2,224,612 | |
Net asset value per share | | $ | 19.23 | |
| | | | | |
Institutional Class: |
Net assets | | $ | 698,117,014 | |
Capital shares outstanding | | | 36,388,727 | |
Net asset value per share | | $ | 19.18 | |
* | Relates to Trustees not deemed “interested persons” within the meaning of Section 2(a)(19) of the 1940 Act. |
SEE NOTES TO FINANCIAL STATEMENTS. | THE GUGGENHEIM FUNDS SEMI-ANNUAL REPORT | 57 |
INVESTMENT GRADE BOND FUND | |
STATEMENT OF OPERATIONS (Unaudited) |
Six-Month Period Ended March 31, 2020 |
Investment Income: |
Dividends from securities of unaffiliated issuers | | $ | 82,773 | |
Dividends from securities of affiliated issuers | | | 4,107 | |
Interest | | | 11,061,976 | |
Total investment income | | | 11,148,856 | |
| | | | | |
Expenses: |
Management fees | | | 1,737,416 | |
Distribution and service fees: |
A-Class | | | 198,900 | |
C-Class | | | 117,699 | |
P-Class | | | 58,889 | |
Transfer agent/maintenance fees: |
A-Class | | | 49,378 | |
C-Class | | | 12,014 | |
P-Class | | | 37,441 | |
Institutional Class | | | 250,230 | |
Fund accounting/administration fees | | | 342,953 | |
Professional fees | | | 112,258 | |
Custodian fees | | | 72,844 | |
Line of credit fees | | | 33,035 | |
Trustees’ fees* | | | 18,387 | |
Miscellaneous | | | 145,888 | |
Recoupment of previously waived fees: |
A-Class | | | 2,362 | |
C-Class | | | 143 | |
Total expenses | | | 3,189,837 | |
Less: |
Expenses reimbursed by Adviser: |
A Class | | | (19,080 | ) |
C Class | | | (7,410 | ) |
P Class | | | (27,476 | ) |
Institutional Class | | | (246,461 | ) |
Expenses waived by Adviser | | | (205,903 | ) |
Earnings credits applied | | | (4,491 | ) |
Total waived/reimbursed expenses | | | (510,821 | ) |
Net expenses | | | 2,679,016 | |
Net investment income | | | 8,469,840 | |
| | | | | |
Net Realized and Unrealized Gain (Loss): |
Net realized gain (loss) on: |
Investments in unaffiliated issuers | | $ | 8,589,492 | |
Investments in affiliated issuers | | | (100,065 | ) |
Swap agreements | | | 3,207,343 | |
Futures contracts | | | 519,684 | |
Forward foreign currency exchange contracts | | | 770,175 | |
Foreign currency transactions | | | 231,108 | |
Net realized gain | | | 13,217,737 | |
Net change in unrealized appreciation (depreciation) on: |
Investments in unaffiliated issuers | | | (9,956,461 | ) |
Investments in affiliated issuers | | | 81,457 | |
Swap agreements | | | 6,559,814 | |
Futures contracts | | | (10,470 | ) |
Options purchased | | | 362,114 | |
Forward foreign currency exchange contracts | | | 3,450,665 | |
Foreign currency translations | | | (10,147 | ) |
Net change in unrealized appreciation (depreciation) | | | 476,972 | |
Net realized and unrealized gain | | | 13,694,709 | |
Net increase in net assets resulting from operations | | $ | 22,164,549 | |
* | Relates to Trustees not deemed “interested persons” within the meaning of Section 2(a)(19) of the 1940 Act. |
58 | THE GUGGENHEIM FUNDS SEMI-ANNUAL REPORT | SEE NOTES TO FINANCIAL STATEMENTS. |
INVESTMENT GRADE BOND FUND | |
STATEMENTS OF CHANGES IN NET ASSETS |
| | Six-Month
Period Ended
March 31,
2020
(Unaudited) | | | Year Ended
September 30,
2019 | |
Increase (Decrease) in Net Assets from Operations: | | | | | | | | |
Net investment income | | $ | 8,469,840 | | | $ | 17,215,676 | |
Net realized gain (loss) on investments | | | 13,217,737 | | | | (1,955,548 | ) |
Net change in unrealized appreciation (depreciation) on investments | | | 476,972 | | | | 27,673,850 | |
Net increase in net assets resulting from operations | | | 22,164,549 | | | | 42,933,978 | |
| | | | | | | | | |
Distributions to shareholders: | | | | | | | | |
A-Class | | | (1,477,674 | ) | | | (2,893,860 | ) |
C-Class | | | (132,204 | ) | | | (315,588 | ) |
P-Class | | | (437,804 | ) | | | (1,152,101 | ) |
Institutional Class | | | (7,120,358 | ) | | | (13,370,258 | ) |
Total distributions to shareholders | | | (9,168,040 | ) | | | (17,731,807 | ) |
| | | | | | | | | |
Capital share transactions: | | | | | | | | |
Proceeds from sale of shares | | | | | | | | |
A-Class | | | 38,742,010 | | | | 64,610,063 | |
C-Class | | | 5,292,680 | | | | 10,545,808 | |
P-Class | | | 4,180,505 | | | | 26,742,004 | |
Institutional Class | | | 224,788,293 | | | | 404,540,927 | |
Distributions reinvested | | | | | | | | |
A-Class | | | 1,405,630 | | | | 2,735,453 | |
C-Class | | | 111,554 | | | | 264,333 | |
P-Class | | | 437,804 | | | | 1,152,101 | |
Institutional Class | | | 6,482,497 | | | | 11,667,156 | |
Cost of shares redeemed | | | | | | | | |
A-Class | | | (33,586,977 | ) | | | (41,212,570 | ) |
C-Class | | | (3,483,252 | ) | | | (7,745,053 | ) |
P-Class | | | (12,675,812 | ) | | | (27,544,592 | ) |
Institutional Class | | | (156,502,181 | ) | | | (202,256,261 | ) |
Net increase from capital share transactions | | | 75,192,751 | | | | 243,499,369 | |
Net increase in net assets | | | 88,189,260 | | | | 268,701,540 | |
| | | | | | | | | |
Net assets: | | | | | | | | |
Beginning of period | | | 835,802,608 | | | | 567,101,068 | |
End of period | | $ | 923,991,868 | | | $ | 835,802,608 | |
| | | | | | | | | |
Capital share activity: | | | | | | | | |
Shares sold | | | | | | | | |
A-Class | | | 2,050,003 | | | | 3,470,553 | |
C-Class | | | 280,052 | | | | 566,982 | |
P-Class | | | 218,308 | | | | 1,452,776 | |
Institutional Class | | | 11,851,770 | | | | 21,936,510 | |
Shares issued from reinvestment of distributions | | | | | | | | |
A-Class | | | 73,903 | | | | 147,384 | |
C-Class | | | 5,887 | | | | 14,306 | |
P-Class | | | 23,006 | | | | 62,074 | |
Institutional Class | | | 341,165 | | | | 628,866 | |
Shares redeemed | | | | | | | | |
A-Class | | | (1,773,960 | ) | | | (2,223,090 | ) |
C-Class | | | (184,023 | ) | | | (416,564 | ) |
P-Class | | | (667,903 | ) | | | (1,494,589 | ) |
Institutional Class | | | (8,243,298 | ) | | | (10,939,242 | ) |
Net increase in shares | | | 3,974,910 | | | | 13,205,966 | |
SEE NOTES TO FINANCIAL STATEMENTS. | THE GUGGENHEIM FUNDS SEMI-ANNUAL REPORT | 59 |
INVESTMENT GRADE BOND FUND | |
This table is presented to show selected data for a share outstanding throughout each period and to assist shareholders in evaluating a Fund’s performance for the periods presented.
A-Class | | Period Ended
March 31,
2020a | | | Year Ended
September 30,
2019 | | | Year Ended
September 30,
2018 | | | Year Ended
September 30,
2017 | | | Year Ended
September 30,
2016 | | | Year Ended
September 30,
2015 | |
Per Share Data |
Net asset value, beginning of period | | $ | 18.94 | | | $ | 18.33 | | | $ | 18.55 | | | $ | 18.55 | | | $ | 18.10 | | | $ | 18.50 | |
Income (loss) from investment operations: |
Net investment income (loss)b | | | .16 | | | | .41 | | | | .49 | | | | .59 | | | | .64 | | | | .69 | |
Net gain (loss) on investments (realized and unrealized) | | | .29 | | | | .63 | | | | (.22 | ) | | | .02 | | | | .50 | | | | (.30 | ) |
Total from investment operations | | | .45 | | | | 1.04 | | | | .27 | | | | .61 | | | | 1.14 | | | | .39 | |
Less distributions from: |
Net investment income | | | (.18 | ) | | | (.43 | ) | | | (.49 | ) | | | (.61 | ) | | | (.69 | ) | | | (.79 | ) |
Total distributions | | | (.18 | ) | | | (.43 | ) | | | (.49 | ) | | | (.61 | ) | | | (.69 | ) | | | (.79 | ) |
Net asset value, end of period | | $ | 19.21 | | | $ | 18.94 | | | $ | 18.33 | | | $ | 18.55 | | | $ | 18.55 | | | $ | 18.10 | |
|
Total Returnc | | | 2.37 | % | | | 5.72 | % | | | 1.46 | % | | | 3.39 | % | | | 6.50 | % | | | 2.12 | % |
Ratios/Supplemental Data |
Net assets, end of period (in thousands) | | $ | 158,300 | | | $ | 149,442 | | | $ | 119,066 | | | $ | 170,624 | | | $ | 158,932 | | | $ | 115,019 | |
Ratios to average net assets: |
Net investment income (loss) | | | 1.70 | % | | | 2.23 | % | | | 2.64 | % | | | 3.19 | % | | | 3.55 | % | | | 3.72 | % |
Total expensesd | | | 0.87 | % | | | 0.89 | % | | | 0.93 | % | | | 1.07 | % | | | 1.08 | % | | | 1.17 | % |
Net expensese,f,g | | | 0.80 | % | | | 0.80 | % | | | 0.83 | % | | | 1.02 | % | | | 1.03 | % | | | 1.07 | % |
Portfolio turnover rate | | | 54 | % | | | 77 | % | | | 53 | % | | | 81 | % | | | 100 | % | | | 57 | % |
C-Class | | Period Ended
March 31,
2020a | | | Year Ended
September 30,
2019 | | | Year Ended
September 30,
2018 | | | Year Ended
September 30,
2017 | | | Year Ended
September 30,
2016 | | | Year Ended
September 30,
2015 | |
Per Share Data |
Net asset value, beginning of period | | $ | 18.86 | | | $ | 18.25 | | | $ | 18.47 | | | $ | 18.48 | | | $ | 18.02 | | | $ | 18.42 | |
Income (loss) from investment operations: |
Net investment income (loss)b | | | .09 | | | | .28 | | | | .35 | | | | .45 | | | | .51 | | | | .55 | |
Net gain (loss) on investments (realized and unrealized) | | | .29 | | | | .62 | | | | (.22 | ) | | | .02 | | | | .51 | | | | (.30 | ) |
Total from investment operations | | | .38 | | | | .90 | | | | .13 | | | | .47 | | | | 1.02 | | | | .25 | |
Less distributions from: |
Net investment income | | | (.11 | ) | | | (.29 | ) | | | (.35 | ) | | | (.48 | ) | | | (.56 | ) | | | (.65 | ) |
Total distributions | | | (.11 | ) | | | (.29 | ) | | | (.35 | ) | | | (.48 | ) | | | (.56 | ) | | | (.65 | ) |
Net asset value, end of period | | $ | 19.13 | | | $ | 18.86 | | | $ | 18.25 | | | $ | 18.47 | | | $ | 18.48 | | | $ | 18.02 | |
|
Total Returnc | | | 2.00 | % | | | 4.96 | % | | | 0.71 | % | | | 2.59 | % | | | 5.78 | % | | | 1.36 | % |
Ratios/Supplemental Data |
Net assets, end of period (in thousands) | | $ | 24,802 | | | $ | 22,531 | | | $ | 18,799 | | | $ | 28,083 | | | $ | 36,040 | | | $ | 24,111 | |
Ratios to average net assets: |
Net investment income (loss) | | | 0.96 | % | | | 1.50 | % | | | 1.92 | % | | | 2.47 | % | | | 2.81 | % | | | 3.00 | % |
Total expensesd | | | 1.66 | % | | | 1.67 | % | | | 1.75 | % | | | 1.85 | % | | | 1.90 | % | | | 1.99 | % |
Net expensese,f,g | | | 1.55 | % | | | 1.55 | % | | | 1.57 | % | | | 1.77 | % | | | 1.77 | % | | | 1.82 | % |
Portfolio turnover rate | | | 54 | % | | | 77 | % | | | 53 | % | | | 81 | % | | | 100 | % | | | 57 | % |
60 | THE GUGGENHEIM FUNDS SEMI-ANNUAL REPORT | SEE NOTES TO FINANCIAL STATEMENTS. |
INVESTMENT GRADE BOND FUND | |
FINANCIAL HIGHLIGHTS (continued) |
This table is presented to show selected data for a share outstanding throughout each period and to assist shareholders in evaluating a Fund’s performance for the periods presented.
P-Class | | Period Ended
March 31,
2020a | | | Year Ended
September 30,
2019 | | | Year Ended
September 30,
2018 | | | Year Ended
September 30,
2017 | | | Year Ended
September 30,
2016 | | | Period Ended
September 30,
2015h | |
Per Share Data |
Net asset value, beginning of period | | $ | 18.96 | | | $ | 18.34 | | | $ | 18.56 | | | $ | 18.57 | | | $ | 18.12 | | | $ | 18.45 | |
Income (loss) from investment operations: |
Net investment income (loss)b | | | .16 | | | | .41 | | | | .48 | | | | .56 | | | | .59 | | | | .25 | |
Net gain (loss) on investments (realized and unrealized) | | | .29 | | | | .63 | | | | (.21 | ) | | | .05 | | | | .55 | | | | (.26 | ) |
Total from investment operations | | | .45 | | | | 1.04 | | | | .27 | | | | .61 | | | | 1.14 | | | | (.01 | ) |
Less distributions from: |
Net investment income | | | (.18 | ) | | | (.42 | ) | | | (.49 | ) | | | (.62 | ) | | | (.69 | ) | | | (.32 | ) |
Total distributions | | | (.18 | ) | | | (.42 | ) | | | (.49 | ) | | | (.62 | ) | | | (.69 | ) | | | (.32 | ) |
Net asset value, end of period | | $ | 19.23 | | | $ | 18.96 | | | $ | 18.34 | | | $ | 18.56 | | | $ | 18.57 | | | $ | 18.12 | |
|
Total Return | | | 2.37 | % | | | 5.77 | % | | | 1.45 | % | | | 3.33 | % | | | 6.51 | % | | | (0.11 | %) |
Ratios/Supplemental Data |
Net assets, end of period (in thousands) | | $ | 42,772 | | | $ | 50,258 | | | $ | 48,263 | | | $ | 17,303 | | | $ | 3,087 | | | $ | 10 | |
Ratios to average net assets: |
Net investment income (loss) | | | 1.71 | % | | | 2.24 | % | | | 2.61 | % | | | 3.06 | % | | | 3.25 | % | | | 3.25 | % |
Total expensesd | | | 0.96 | % | | | 0.93 | % | | | 0.94 | % | | | 1.13 | % | | | 0.98 | % | | | 3.29 | % |
Net expensese,f,g | | | 0.80 | % | | | 0.80 | % | | | 0.80 | % | | | 1.01 | % | | | 0.98 | % | | | 1.09 | % |
Portfolio turnover rate | | | 54 | % | | | 77 | % | | | 53 | % | | | 81 | % | | | 100 | % | | | 57 | % |
SEE NOTES TO FINANCIAL STATEMENTS. | THE GUGGENHEIM FUNDS SEMI-ANNUAL REPORT | 61 |
INVESTMENT GRADE BOND FUND | |
FINANCIAL HIGHLIGHTS (concluded) |
This table is presented to show selected data for a share outstanding throughout each period and to assist shareholders in evaluating a Fund’s performance for the periods presented.
Institutional Class | | Period Ended
March 31,
2020a | | | Year Ended
September 30,
2019 | | | Year Ended
September 30,
2018 | | | Year Ended
September 30,
2017 | | | Year Ended
September 30,
2016 | | | Year Ended
September 30,
2015 | |
Per Share Data |
Net asset value, beginning of period | | $ | 18.91 | | | $ | 18.30 | | | $ | 18.52 | | | $ | 18.53 | | | $ | 18.07 | | | $ | 18.47 | |
Income (loss) from investment operations: |
Net investment income (loss)b | | | .19 | | | | .47 | | | | .54 | | | | .64 | | | | .62 | | | | .74 | |
Net gain (loss) on investments (realized and unrealized) | | | .28 | | | | .62 | | | | (.22 | ) | | | .02 | | | | .58 | | | | (.31 | ) |
Total from investment operations | | | .47 | | | | 1.09 | | | | .32 | | | | .66 | | | | 1.20 | | | | .43 | |
Less distributions from: |
Net investment income | | | (.20 | ) | | | (.48 | ) | | | (.54 | ) | | | (.67 | ) | | | (.74 | ) | | | (.83 | ) |
Total distributions | | | (.20 | ) | | | (.48 | ) | | | (.54 | ) | | | (.67 | ) | | | (.74 | ) | | | (.83 | ) |
Net asset value, end of period | | $ | 19.18 | | | $ | 18.91 | | | $ | 18.30 | | | $ | 18.52 | | | $ | 18.53 | | | $ | 18.07 | |
|
Total Return | | | 2.57 | % | | | 6.03 | % | | | 1.75 | % | | | 3.67 | % | | | 6.83 | % | | | 2.37 | % |
Ratios/Supplemental Data |
Net assets, end of period (in thousands) | | $ | 698,117 | | | $ | 613,571 | | | $ | 380,974 | | | $ | 142,014 | | | $ | 83,168 | | | $ | 6,910 | |
Ratios to average net assets: |
Net investment income (loss) | | | 2.00 | % | | | 2.52 | % | | | 2.92 | % | | | 3.51 | % | | | 3.41 | % | | | 4.01 | % |
Total expensesd | | | 0.63 | % | | | 0.62 | % | | | 0.60 | % | | | 0.74 | % | | | 0.76 | % | | | 0.94 | % |
Net expensese,f,g | | | 0.51 | % | | | 0.51 | % | | | 0.52 | % | | | 0.70 | % | | | 0.76 | % | | | 0.82 | % |
Portfolio turnover rate | | | 54 | % | | | 77 | % | | | 53 | % | | | 81 | % | | | 100 | % | | | 57 | % |
a | Unaudited figures for the period ended March 31, 2020. Percentage amounts for the period, except total return and portfolio turnover rate, have been annualized. |
b | Net investment income (loss) per share was computed using average shares outstanding throughout the period. |
c | Total return does not reflect the impact of any applicable sales charges. |
d | Does not include expenses of the underlying funds in which the Fund invests. |
e | Net expense information reflects the expense ratios after expense waivers and reimbursements, as applicable. |
f | The portion of the ratios of net expenses to average net assets attributable to recoupments of prior fee reductions or expense reimbursements for the years presented was as follows: |
| | | 03/31/20a | 09/30/19 | 09/30/18 | 09/30/17 |
| | A-Class | 0.00%* | — | 0.00%* | 0.05% |
| | C-Class | 0.00%* | — | 0.00%* | 0.03% |
| | P-Class | — | 0.00%* | 0.00%* | 0.01% |
| | Institutional Class | — | — | 0.00%* | 0.02% |
g | Net expenses may include expenses that are excluded from the expense limitation agreement. Excluding these expenses, the net expense ratios for the years would be: |
| | | 03/31/20a | 09/30/19 | 09/30/18 | 09/30/17 | 09/30/16 | 09/30/15 |
| | A-Class | 0.79% | 0.79% | 0.82% | 1.00% | 1.00% | 1.00% |
| | C-Class | 1.54% | 1.54% | 1.57% | 1.75% | 1.74% | 1.75% |
| | P-Class | 0.79% | 0.79% | 0.80% | 0.99% | 0.97% | 1.00% |
| | Institutional Class | 0.50% | 0.50% | 0.52% | 0.68% | 0.75% | 0.75% |
h | Since commencement of operations: May 1, 2015. Percentage amounts for the period, except total return and portfolio turnover rate, have been annualized. |
62 | THE GUGGENHEIM FUNDS SEMI-ANNUAL REPORT | SEE NOTES TO FINANCIAL STATEMENTS. |
PERFORMANCE REPORT AND FUND PROFILE (Unaudited) | March 31, 2020 |
MUNICIPAL INCOME FUND
OBJECTIVE: Seeks to provide current income with an emphasis on income exempt from federal income tax, while also considering capital appreciation.
Holdings Diversification (Market Exposure as % of Net Assets)
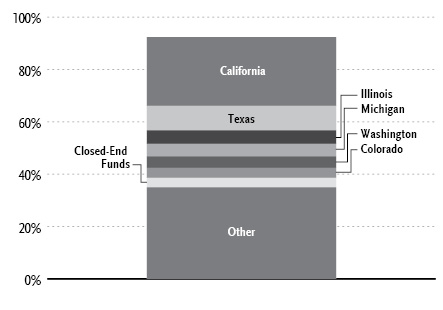
“Holdings Diversification (Market Exposure as % of Net Assets)” excludes any temporary cash investments.
Portfolio Composition by Quality Rating1 |
Rating | % of Total
Investments |
Fixed Income Instruments | |
AAA | 13.5% |
AA | 48.6% |
A | 13.7% |
BBB | 6.9% |
BB | 0.3% |
B | 1.3% |
NR2 | 3.4% |
Other Instruments | 12.3% |
Total Investments | 100.0% |
Inception Dates: |
A-Class | April 28, 2004 |
C-Class | January 13, 2012 |
P-Class | May 1, 2015 |
Institutional Class | January 13, 2012 |
Ten Largest Holdings (% of Total Net Assets) |
El Camino Healthcare District General Obligation Unlimited | 3.7% |
Stockton Public Financing Authority Revenue Bonds, 6.25% | 2.1% |
Detroit Wayne County Stadium Authority Revenue Bonds, 5.00% | 1.9% |
Tustin Unified School District General Obligation Unlimited, 6.00% | 1.9% |
Metropolitan Pier & Exposition Authority Illinois Dedicated State Tax Revenue Bonds, 5.00% | 1.8% |
Clackamas & Washington Counties School District No. 3 General Obligation Unlimited, 06/15/48 | 1.6% |
College of the Sequoias Tulare Area Improvement District No. 3 General Obligation Unlimited | 1.5% |
North Texas Tollway Authority Revenue Bonds | 1.2% |
Newport Mesa Unified School District General Obligation Unlimited, 08/01/44 | 1.2% |
Massachusetts Development Finance Agency Revenue Bonds, 6.88% | 1.1% |
Top Ten Total | 18.0% |
| | |
“Ten Largest Holdings” excludes any temporary cash investments. |
1 | Source: BlackRock Solutions. Credit quality ratings are measured on a scale that generally ranges from AAA (highest) to D (lowest). All securities except for those labeled “NR” have been rated by Moody’s, Standard & Poor’s (“S&P”), or Fitch, each of which is a Nationally Recognized Statistical Rating Organization (“NRSRO”). For purposes of this presentation, when ratings are available from more than one agency, the highest rating is used. Guggenheim Investments has converted ratings to the equivalent S&P rating. Security ratings are determined at the time of purchase and may change thereafter. |
2 | NR securities do not necessarily indicate low credit quality. |
| | THE GUGGENHEIM FUNDS SEMI-ANNUAL REPORT | 63 |
PERFORMANCE REPORT AND FUND PROFILE (Unaudited)(concluded) | March 31, 2020 |
Average Annual Returns*
Periods Ended March 31, 2020
| 6 Month† | 1 Year | 5 Year | 10 Year |
A Class Shares~ | (0.36%) | 3.34% | 2.66% | 4.67% |
A-Class Shares with sales charge‡ | (4.37%) | (0.77%) | 1.67% | 4.16% |
Bloomberg Barclays Municipal Bond Index | 0.10% | 3.85% | 3.19% | 4.15% |
| 6 Month† | 1 Year | 5 Year | Since
Inception
(01/13/12) |
C Class Shares | (0.73%) | 2.58% | 1.88% | 2.78% |
C-Class Shares with CDSC§ | (1.72%) | 1.58% | 1.88% | 2.78% |
Institutional Class Shares | (0.31%) | 3.60% | 2.90% | 3.81% |
Bloomberg Barclays Municipal Bond Index | 0.10% | 3.85% | 3.19% | 3.43% |
| | 6 Month† | 1 Year | Since
Inception
(05/01/15) |
P Class Shares | | (0.52%) | 3.26% | 2.78% |
Bloomberg Barclays Municipal Bond Index | | 0.10% | 3.85% | 3.38% |
* | The performance data above represents past performance that is not predictive of future results. The investment return and principal value of an investment in the Fund will fluctuate so that an investor’s shares, when redeemed, may be worth more or less than their original cost. Returns are historical and include changes in principal and reinvested dividends and capital gains and do not reflect the effect of taxes. The Bloomberg Barclays Municipal Bond Index is an unmanaged index and, unlike the Fund, has no management fees or operating expenses to reduce its reported return. |
† | 6 month returns are not annualized. |
‡ | Effective October 1, 2015, the maximum sales charge decreased from 4.75% to 4.00%. A 4.75% maximum sales charge is used in the calculation of the Average Annual Returns based on subscriptions made prior to October 1, 2015, and a 4.00% maximum sales charge is used to calculate performance for periods based on subscriptions made on or after October 1, 2015. |
§ | Fund returns include a CDSC of 1% if redeemed within 12 months of purchase. |
~ | Effective January 13, 2012, the Fund acquired all of the assets and liabilities of the TS&W/Claymore Tax-Advantage Balanced Fund (“TYW”), a registered closed-end management investment company. The A-Class performance prior to that date reflects performance of TYW. |
64 | THE GUGGENHEIM FUNDS SEMI-ANNUAL REPORT | |
SCHEDULE OF INVESTMENTS (Unaudited) | March 31, 2020 |
MUNICIPAL INCOME FUND | |
| | | Shares | | | Value | |
| CLOSED-END FUNDS† - 3.6% |
| BNY Mellon Strategic Municipals, Inc. | | | 50,607 | | | $ | 377,022 | |
| DWS Municipal Income Trust | | | 23,880 | | | | 257,426 | |
| BlackRock MuniVest Fund, Inc. | | | 30,457 | | | | 246,702 | |
| BlackRock MuniYield Quality Fund, Inc. | | | 14,805 | | | | 215,413 | |
| BlackRock Municipal Income Quality Trust | | | 12,482 | | | | 165,386 | |
| Invesco Trust for Investment Grade Municipals | | | 13,276 | | | | 160,507 | |
| Invesco Municipal Opportunity Trust | | | 13,799 | | | | 157,999 | |
| Invesco Municipal Trust | | | 12,294 | | | | 143,840 | |
| BlackRock MuniYield California Quality Fund, Inc. | | | 10,063 | | | | 136,152 | |
| Invesco Advantage Municipal Income Trust II | | | 10,435 | | | | 107,167 | |
| BlackRock MuniEnhanced Fund, Inc. | | | 4,945 | | | | 52,714 | |
| Eaton Vance Municipal Income Trust | | | 2,500 | | | | 29,950 | |
| BlackRock MuniHoldings Investment Quality Fund | | | 7 | | | | 92 | |
| Total Closed-End Funds | | | | | | | | |
| (Cost $2,229,598) | | | | | | | 2,050,370 | |
| | | | | | | | | |
| MONEY MARKET FUND† - 8.9% |
Dreyfus AMT-Free Tax Exempt Cash Management Fund — Institutional Shares 3.51%1 | | | 5,023,607 | | | | 5,023,607 | |
| Total Money Market Fund | | | | | | | | |
| (Cost $5,023,607) | | | | | | | 5,023,607 | |
| | | | | | | | | |
| | | | Face
Amount | | | | | |
| MUNICIPAL BONDS†† - 88.8% |
| California - 26.3% | | | | | | | | |
| El Camino Healthcare District General Obligation Unlimited | | | | | | | | |
due 08/01/292 | | $ | 2,500,000 | | | | 2,069,575 | |
| Stockton Public Financing Authority Revenue Bonds | | | | | | | | |
| 6.25% due 10/01/38 | | | 1,000,000 | | | | 1,176,210 | |
| 6.25% due 10/01/40 | | | 250,000 | | | | 294,053 | |
| 5.00% due 10/01/33 | | | 200,000 | | | | 249,388 | |
| Tustin Unified School District General Obligation Unlimited | | | | | | | | |
| 6.00% due 08/01/21 | | | 1,000,000 | | | | 1,065,770 | |
| Sierra Joint Community College District School Facilities District No. 1 General Obligation Unlimited | | | | | | | | |
due 08/01/312 | | | 705,000 | | | | 569,605 | |
due 08/01/302 | | | 415,000 | | | | 345,305 | |
| College of the Sequoias Tulare Area Improvement District No. 3 General Obligation Unlimited | | | | | | | | |
due 08/01/423,5 | | | 1,000,000 | | | | 851,120 | |
| Newport Mesa Unified School District General Obligation Unlimited | | | | | | | | |
due 08/01/392 | | | 1,300,000 | | | | 688,402 | |
Stockton Unified School District General Obligation Unlimited | | | | | | | | |
due 08/01/372 | | | 810,000 | | | | 527,756 | |
due 08/01/422 | | | 250,000 | | | | 139,438 | |
Compton Unified School District General Obligation Unlimited | | | | | | | | |
due 06/01/402 | | | 1,000,000 | | | | 558,150 | |
Los Angeles Department of Water & Power Power System Revenue Bonds | | | | | | | | |
5.00% due 07/01/43 | | | 500,000 | | | | 536,900 | |
Kings Canyon Unified School District General Obligation Unlimited | | | | | | | | |
5.00% due 08/01/28 | | | 445,000 | | | | 522,225 | |
San Diego Unified School District General Obligation Unlimited | | | | | | | | |
due 07/01/392 | | | 1,000,000 | | | | 501,020 | |
Riverside County Public Financing Authority Tax Allocation | | | | | | | | |
5.00% due 10/01/28 | | | 300,000 | | | | 373,248 | |
Oakland Unified School District/Alameda County General Obligation Unlimited | | | | | | | | |
5.00% due 08/01/22 | | | 220,000 | | | | 231,257 | |
5.00% due 08/01/40 | | | 120,000 | | | | 137,713 | |
Sacramento Municipal Utility District Revenue Bonds | | | | | | | | |
5.00% due 08/15/37 | | | 300,000 | | | | 333,675 | |
Placer Union High School District General Obligation Unlimited | | | | | | | | |
due 08/01/302 | | | 375,000 | | | | 305,704 | |
Delhi Unified School District General Obligation Unlimited | | | | | | | | |
5.00% due 08/01/44 | | | 250,000 | | | | 295,515 | |
Riverside County Redevelopment Successor Agency Tax Allocation | | | | | | | | |
due 10/01/373,5 | | | 250,000 | | | | 278,025 | |
Freddie Mac Multifamily ML Certificates Revenue Bonds | | | | | | | | |
2.49% due 07/25/35 | | | 248,883 | | | | 272,611 | |
Gustine Unified School District General Obligation Unlimited | | | | | | | | |
5.00% due 08/01/41 | | | 220,000 | | | | 257,827 | |
M-S-R Energy Authority Revenue Bonds | | | | | | | | |
6.13% due 11/01/29 | | | 195,000 | | | | 235,305 | |
Alameda Corridor Transportation Authority Revenue Bonds | | | | | | | | |
5.00% due 10/01/35 | | | 200,000 | | | | 234,760 | |
Upland Unified School District General Obligation Unlimited | | | | | | | | |
due 08/01/382 | | | 400,000 | | | | 219,776 | |
Department of Veterans Affairs Veteran’s Farm & Home Purchase Program Revenue Bonds | | | | | | | | |
3.45% due 12/01/39 | | | 200,000 | | | | 215,118 | |
Stanton Redevelopment Agency Tax Allocation | | | | | | | | |
5.00% due 12/01/40 | | | 180,000 | | | | 212,812 | |
SEE NOTES TO FINANCIAL STATEMENTS. | THE GUGGENHEIM FUNDS SEMI-ANNUAL REPORT | 65 |
SCHEDULE OF INVESTMENTS (Unaudited)(continued) | March 31, 2020 |
MUNICIPAL INCOME FUND | |
| | Face
Amount | | | Value | |
Westside Elementary School District General Obligation Unlimited | | | | | | | | |
5.00% due 08/01/48 | | $ | 155,000 | | | $ | 185,662 | |
Culver Redevelopment Agency Successor Agency Tax Allocation | | | | | | | | |
due 11/01/232 | | | 195,000 | | | | 184,844 | |
Rio Hondo Community College District General Obligation Unlimited | | | | | | | | |
due 08/01/292 | | | 200,000 | | | | 165,108 | |
Freddie Mac Multifamily VRD Certificates Revenue Bonds | | | | | | | | |
2.40% due 10/15/29 | | | 150,000 | | | | 163,563 | |
Washington Township Health Care District Revenue Bonds | | | | | | | | |
5.00% due 07/01/32 | | | 100,000 | | | | 122,073 | |
City of Los Angeles Department of Airports Revenue Bonds | | | | | | | | |
5.00% due 05/15/44 | | | 100,000 | | | | 120,544 | |
Buena Park School District General Obligation Unlimited | | | | | | | | |
5.00% due 08/01/47 | | | 100,000 | | | | 117,715 | |
Roseville Joint Union High School District General Obligation Unlimited | | | | | | | | |
due 08/01/302 | | | 100,000 | | | | 80,774 | |
Sequoia Healthcare District Revenue Bonds | | | | | | | | |
5.38% due 08/15/23 | | | 5,000 | | | | 5,280 | |
McKinleyville Union School District General Obligation Unlimited | | | | | | | | |
due 08/01/212 | | | 40,000 | | | | 3,669 | |
Total California | | | | | | | 14,847,495 | |
| | | | | | | | | |
Texas - 9.4% | | | | | | | | |
North Texas Tollway Authority Revenue Bonds | | | | | | | | |
due 01/01/362 | | | 1,000,000 | | | | 690,940 | |
Birdville Independent School District General Obligation Unlimited | | | | | | | | |
5.00% due 02/15/27 | | | 305,000 | | | | 356,557 | |
State of Texas General Obligation Unlimited | | | | | | | | |
5.00% due 10/01/29 | | | 250,000 | | | | 297,505 | |
Harris County-Houston Sports Authority Revenue Bonds | | | | | | | | |
due 11/15/532 | | | 1,000,000 | | | | 255,360 | |
Bexar County Hospital District General Obligation Limited | | | | | | | | |
5.00% due 02/15/32 | | | 200,000 | | | | 249,588 | |
United Independent School District General Obligation Unlimited | | | | | | | | |
5.00% due 08/15/49 | | | 200,000 | | | | 247,238 | |
Lindale Independent School District General Obligation Unlimited | | | | | | | | |
5.00% due 02/15/49 | | | 200,000 | | | | 242,756 | |
Clifton Higher Education Finance Corp. Revenue Bonds | | | | | | | | |
4.00% due 08/15/33 | | | 200,000 | | | | 237,562 | |
Texas Water Development Board Revenue Bonds | | | | | | | | |
5.00% due 10/15/46 | | | 200,000 | | | | 235,334 | |
Dallas Area Rapid Transit Revenue Bonds | | | | | | | | |
5.00% due 12/01/41 | | | 200,000 | | | | 234,634 | |
Bexar County Health Facilities Development Corp. Revenue Bonds | | | | | | | | |
5.00% due 07/15/22 | | | 225,000 | | | | 231,941 | |
Central Texas Regional Mobility Authority Revenue Bonds | | | | | | | | |
5.00% due 01/01/27 | | | 200,000 | | | | 221,690 | |
Arlington Higher Education Finance Corp. Revenue Bonds | | | | | | | | |
5.00% due 12/01/46 | | | 200,000 | | | | 211,512 | |
Texas Tech University Revenue Bonds | | | | | | | | |
5.00% due 08/15/32 | | | 200,000 | | | | 209,920 | |
Central Texas Turnpike System Revenue Bonds | | | | | | | | |
5.00% due 08/15/34 | | | 200,000 | | | | 208,638 | |
Grand Parkway Transportation Corp. Revenue Bonds | | | | | | | | |
5.00% due 10/01/43 | | | 175,000 | | | | 206,932 | |
Texas Municipal Gas Acquisition & Supply Corporation I Revenue Bonds | | | | | | | | |
6.25% due 12/15/26 | | | 170,000 | | | | 187,226 | |
Spring Independent School District General Obligation Unlimited | | | | | | | | |
4.00% due 08/15/37 | | | 150,000 | | | | 172,270 | |
City of Fort Worth Texas Water & Sewer System Revenue Bonds | | | | | | | | |
5.00% due 02/15/32 | | | 100,000 | | | | 124,711 | |
Hutto Independent School District General Obligation Unlimited | | | | | | | | |
5.00% due 08/01/49 | | | 100,000 | | | | 121,295 | |
Mansfield Independent School District General Obligation Unlimited | | | | | | | | |
5.00% due 02/15/44 | | | 100,000 | | | | 121,215 | |
University of North Texas System Revenue Bonds | | | | | | | | |
5.00% due 04/15/44 | | | 100,000 | | | | 120,762 | |
City of Arlington Texas Special Tax Revenue Special Tax | | | | | | | | |
5.00% due 02/15/48 | | | 100,000 | | | | 117,517 | |
Tarrant County Health Facilities Development Corp. Revenue Bonds | | | | | | | | |
6.00% due 09/01/24 | | | 10,000 | | | | 11,072 | |
City of Austin Texas Water & Wastewater System Revenue Bonds | | | | | | | | |
5.00% due 11/15/21 | | | 10,000 | | | | 10,516 | |
County of Tarrant Texas General Obligation Limited | | | | | | | | |
5.00% due 07/15/20 | | | 10,000 | | | | 10,010 | |
Leander Independent School District General Obligation Unlimited | | | | | | | | |
due 08/15/242 | | | 5,000 | | | | 2,723 | |
Total Texas | | | | | | | 5,337,424 | |
| | | | | | | | | |
66 | THE GUGGENHEIM FUNDS SEMI-ANNUAL REPORT | SEE NOTES TO FINANCIAL STATEMENTS. |
SCHEDULE OF INVESTMENTS (Unaudited)(continued) | March 31, 2020 |
MUNICIPAL INCOME FUND | |
| | Face
Amount | | | Value | |
Illinois - 5.1% | | | | | | | | |
Metropolitan Pier & Exposition Authority Illinois Dedicated State Tax Revenue Bonds | | | | | | | | |
5.00% due 06/15/50 | | $ | 1,000,000 | | | $ | 1,005,990 | |
Will County Township High School District No. 204 Joliet General Obligation Ltd. | | | | | | | | |
6.25% due 01/01/31 | | | 500,000 | | | | 518,445 | |
City of Chicago Illinois Wastewater Transmission Revenue Bonds | | | | | | | | |
5.25% due 01/01/42 | | | 400,000 | | | | 473,376 | |
Chicago O’Hare International Airport Revenue Bonds | | | | | | | | |
5.00% due 01/01/34 | | | 300,000 | | | | 333,456 | |
Metropolitan Water Reclamation District of Greater Chicago General Obligation Unlimited | | | | | | | | |
5.00% due 12/01/25 | | | 200,000 | | | | 235,578 | |
University of Illinois Revenue Bonds | | | | | | | | |
6.00% due 10/01/29 | | | 200,000 | | | | 222,862 | |
Cook County School District No. 104 Summit General Obligation Unlimited | | | | | | | | |
due 12/01/222 | | | 100,000 | | | | 96,607 | |
Total Illinois | | | | | | | 2,886,314 | |
| | | | | | | | | |
Michigan - 4.8% | | | | | | | | |
Detroit Wayne County Stadium Authority Revenue Bonds | | | | | | | | |
5.00% due 10/01/26 | | | 1,000,000 | | | | 1,085,710 | |
Detroit City School District General Obligation Unlimited | | | | | | | | |
5.00% due 05/01/32 | | | 500,000 | | | | 530,790 | |
5.00% due 05/01/30 | | | 300,000 | | | | 318,729 | |
Michigan State Hospital Finance Authority Revenue Bonds | | | | | | | | |
5.00% due 11/15/47 | | | 200,000 | | | | 230,486 | |
Michigan State Housing Development Authority Revenue Bonds | | | | | | | | |
3.35% due 12/01/34 | | | 200,000 | | | | 213,246 | |
City of Detroit Michigan Water Supply System Revenue Bonds | | | | | | | | |
5.00% due 07/01/41 | | | 200,000 | | | | 207,102 | |
Flint Hospital Building Authority Revenue Bonds | | | | | | | | |
5.00% due 07/01/25 | | | 100,000 | | | | 114,069 | |
Total Michigan | | | | | | | 2,700,132 | |
| | | | | | | | | |
Washington - 4.4% | | | | | | | | |
Greater Wenatchee Regional Events Center Public Facilities Dist Revenue Bonds | | | | | | | | |
5.00% due 09/01/27 | | | 500,000 | | | | 473,550 | |
5.25% due 09/01/32 | | | 500,000 | | | | 458,045 | |
King County School District No. 409 Tahoma General Obligation Unlimited | | | | | | | | |
5.00% due 12/01/27 | | | 325,000 | | | | 388,047 | |
Yakima & Kittitas Counties School District No. 119 Selah General Obligation Unlimited | | | | | | | | |
5.00% due 12/01/42 | | | 200,000 | | | | 243,008 | |
County of King Washington Sewer Revenue Bonds | | | | | | | | |
5.00% due 07/01/42 | | | 200,000 | | | | 240,880 | |
Washington State Convention Center Public Facilities District Revenue Bonds | | | | | | | | |
5.00% due 07/01/48 | | | 200,000 | | | | 239,564 | |
Central Puget Sound Regional Transit Authority Revenue Bonds | | | | | | | | |
5.00% due 11/01/41 | | | 200,000 | | | | 237,972 | |
State of Washington General Obligation Unlimited | | | | | | | | |
5.00% due 06/01/41 | | | 195,000 | | | | 203,026 | |
Total Washington | | | | | | | 2,484,092 | |
| | | | | | | | | |
Colorado - 3.8% | | | | | | | | |
University of Colorado Revenue Bonds | | | | | | | | |
5.00% due 06/01/22 | | | 285,000 | | | | 308,947 | |
5.00% due 06/01/26 | | | 200,000 | | | | 245,022 | |
Auraria Higher Education Center Revenue Bonds | | | | | | | | |
5.00% due 04/01/28 | | | 390,000 | | | | 453,242 | |
Denver Health & Hospital Authority Revenue Bonds | | | | | | | | |
5.00% due 12/01/30 | | | 200,000 | | | | 250,018 | |
City & County of Denver Colorado Airport System Revenue Bonds | | | | | | | | |
5.00% due 12/01/28 | | | 200,000 | | | | 243,122 | |
Board of Governors of Colorado State University System Revenue Bonds | | | | | | | | |
5.00% due 03/01/41 | | | 200,000 | | | | 237,638 | |
City & County of Denver Colorado Revenue Bonds | | | | | | | | |
due 08/01/302 | | | 200,000 | | | | 152,670 | |
Colorado Educational & Cultural Facilities Authority Revenue Bonds | | | | | | | | |
5.00% due 03/01/47 | | | 110,000 | | | | 129,426 | |
Colorado School of Mines Revenue Bonds | | | | | | | | |
5.00% due 12/01/47 | | | 100,000 | | | | 119,193 | |
Total Colorado | | | | | | | 2,139,278 | |
| | | | | | | | | |
Pennsylvania - 2.8% | | | | | | | | |
Pennsylvania Economic Development Financing Authority Revenue Bonds | | | | | | | | |
5.00% due 02/01/27 | | | 500,000 | | | | 566,710 | |
Reading School District General Obligation Unlimited | | | | | | | | |
5.00% due 02/01/27 | | | 300,000 | | | | 347,142 | |
Pittsburgh Water & Sewer Authority Revenue Bonds | | | | | | | | |
5.25% due 09/01/36 | | | 300,000 | | | | 336,693 | |
SEE NOTES TO FINANCIAL STATEMENTS. | THE GUGGENHEIM FUNDS SEMI-ANNUAL REPORT | 67 |
SCHEDULE OF INVESTMENTS (Unaudited)(continued) | March 31, 2020 |
MUNICIPAL INCOME FUND | |
| | Face
Amount | | | Value | |
Allegheny County Hospital Development Authority Revenue Bonds | | | | | | | | |
5.00% due 07/15/32 | | $ | 100,000 | | | $ | 126,923 | |
Commonwealth of Pennsylvania General Obligation Unlimited | | | | | | | | |
5.00% due 05/01/20 | | | 100,000 | | | | 100,318 | |
Northeastern Pennsylvania Hospital & Education Authority Revenue Bonds | | | | | | | | |
5.00% due 05/01/20 | | | 100,000 | | | | 100,275 | |
Delaware County Authority Revenue Bonds | | | | | | | | |
4.00% due 05/15/20 | | | 15,000 | | | | 14,896 | |
City of Erie Pennsylvania General Obligation Unlimited | | | | | | | | |
3.10% due 11/15/25 | | | 5,000 | | | | 5,196 | |
Total Pennsylvania | | | | | | | 1,598,153 | |
| | | | | | | | | |
New York - 2.4% | | | | | | | | |
New York City Transitional Finance Authority Future Tax Secured Revenue Bonds | | | | | | | | |
0.75% (VRDN ) due 11/01/364 | | | 500,000 | | | | 500,000 | |
New York State Dormitory Authority Revenue Bonds | | | | | | | | |
5.00% due 10/01/41 | | | 350,000 | | | | 362,327 | |
5.00% due 05/01/21 | | | 5,000 | | | | 5,165 | |
New York State Urban Development Corp. Revenue Bonds | | | | | | | | |
5.00% due 03/15/35 | | | 250,000 | | | | 278,518 | |
New York Transportation Development Corp. Revenue Bonds | | | | | | | | |
5.00% due 07/01/34 | | | 200,000 | | | | 206,708 | |
Canton Capital Resource Corp. Revenue Bonds | | | | | | | | |
5.00% due 05/01/20 | | | 25,000 | | | | 25,079 | |
Total New York | | | | | | | 1,377,797 | |
| | | | | | | | | |
Oregon - 2.4% | | | | | | | | |
Clackamas & Washington Counties School District No. 3 General Obligation Unlimited | | | | | | | | |
due 06/15/482 | | | 2,000,000 | | | | 892,040 | |
due 06/15/502 | | | 400,000 | | | | 166,268 | |
due 06/15/492 | | | 350,000 | | | | 150,636 | |
University of Oregon Revenue Bonds | | | | | | | | |
5.00% due 04/01/48 | | | 100,000 | | | | 120,903 | |
Total Oregon | | | | | | | 1,329,847 | |
| | | | | | | | | |
Massachusetts - 1.9% | | | | | | | | |
Massachusetts Development Finance Agency Revenue Bonds | | | | | | | | |
6.88% due 01/01/21 | | | 1,000,000 | | | | 1,041,830 | |
Commonwealth of Massachusetts General Obligation Limited | | | | | | | | |
5.00% due 06/01/20 | | | 55,000 | | | | 55,356 | |
Total Massachusetts | | | | | | | 1,097,186 | |
| | | | | | | | | |
Louisiana - 1.9% | | | | | | | | |
Louisiana Local Government Environmental Facilities & Community Development Auth Revenue Bonds | | | | | | | | |
5.00% due 10/01/37 | | | 500,000 | | | | 579,235 | |
5.00% due 10/01/26 | | | 150,000 | | | | 179,591 | |
City of Shreveport Louisiana Water & Sewer Revenue Bonds | | | | | | | | |
5.00% due 12/01/35 | | | 250,000 | | | | 302,298 | |
Louisiana Public Facilities Authority Revenue Bonds | | | | | | | | |
5.00% due 05/15/26 | | | 5,000 | | | | 5,986 | |
Total Louisiana | | | | | | | 1,067,110 | |
| | | | | | | | | |
North Carolina - 1.6% | | | | | | | | |
North Carolina Central University Revenue Bonds | | | | | | | | |
5.00% due 04/01/44 | | | 300,000 | | | | 366,327 | |
North Carolina Turnpike Authority Revenue Bonds | | | | | | | | |
5.00% due 01/01/27 | | | 300,000 | | | | 343,659 | |
County of New Hanover North Carolina Revenue Bonds | | | | | | | | |
5.00% due 10/01/22 | | | 150,000 | | | | 161,477 | |
State of North Carolina Revenue Bonds | | | | | | | | |
5.00% due 05/01/20 | | | 50,000 | | | | 50,159 | |
North Carolina Eastern Municipal Power Agency Revenue Bonds | | | | | | | | |
4.50% due 01/01/22 | | | 10,000 | | | | 10,222 | |
Total North Carolina | | | | | | | 931,844 | |
| | | | | | | | | |
District of Columbia - 1.6% | | | | | | | | |
District of Columbia General Obligation Unlimited | | | | | | | | |
5.00% due 06/01/41 | | | 285,000 | | | | 338,526 | |
5.00% due 06/01/32 | | | 275,000 | | | | 314,548 | |
5.00% due 06/01/31 | | | 175,000 | | | | 214,720 | |
District of Columbia Revenue Bonds | | | | | | | | |
5.00% due 04/01/21 | | | 25,000 | | | | 25,972 | |
5.00% due 04/01/20 | | | 15,000 | | | | 14,850 | |
Total District of Columbia | | | | | | | 908,616 | |
| | | | | | | | | |
West Virginia - 1.5% | | | | | | | | |
West Virginia Higher Education Policy Commission Revenue Bonds | | | | | | | | |
5.00% due 04/01/29 | | | 500,000 | | | | 534,810 | |
West Virginia Hospital Finance Authority Revenue Bonds | | | | | | | | |
5.00% due 06/01/42 | | | 300,000 | | | | 337,197 | |
Total West Virginia | | | | | | | 872,007 | |
| | | | | | | | | |
68 | THE GUGGENHEIM FUNDS SEMI-ANNUAL REPORT | SEE NOTES TO FINANCIAL STATEMENTS. |
SCHEDULE OF INVESTMENTS (Unaudited)(continued) | March 31, 2020 |
MUNICIPAL INCOME FUND | |
| | Face
Amount | | | Value | |
Maryland - 1.4% | | | | | | | | |
State of Maryland General Obligation Unlimited | | | | | | | | |
5.00% due 03/15/33 | | $ | 200,000 | | | | 263,956 | |
5.00% due 03/15/29 | | | 200,000 | | | | 248,286 | |
4.00% due 08/01/20 | | | 25,000 | | | | 25,182 | |
5.00% due 08/01/20 | | | 10,000 | | | | 10,005 | |
Maryland Economic Development Corp. | | | | | | | | |
5.75% due 09/01/25 | | | 150,000 | | | | 151,186 | |
Maryland Health & Higher Educational Facilities Authority Revenue Bonds | | | | | | | | |
5.00% due 05/15/20 | | | 100,000 | | | | 100,459 | |
5.00% due 07/01/27 | | | 5,000 | | | | 5,640 | |
Total Maryland | | | | | | | 804,714 | |
| | | | | | | | | |
Virginia - 1.3% | | | | | | | | |
Virginia College Building Authority Revenue Bonds | | | | | | | | |
5.00% due 02/01/25 | | | 250,000 | | | | 292,400 | |
University of Virginia Revenue Bonds | | | | | | | | |
5.00% due 04/01/38 | | | 200,000 | | | | 241,852 | |
Loudoun County Economic Development Authority Revenue Bonds | | | | | | | | |
due 07/01/492 | | | 500,000 | | | | 200,730 | |
City of Norfolk Virginia General Obligation Unlimited | | | | | | | | |
2.50% due 10/01/463 | | | 5,000 | | | | 5,122 | |
Total Virginia | | | | | | | 740,104 | |
| | | | | | | | | |
Mississippi - 1.3% | | | | | | | | |
Mississippi Development Bank Revenue Bonds | | | | | | | | |
6.50% due 10/01/31 | | | 500,000 | | | | 507,090 | |
6.25% due 10/01/26 | | | 230,000 | | | | 232,447 | |
Total Mississippi | | | | | | | 739,537 | |
| | | | | | | | | |
New Jersey - 1.3% | | | | | | | | |
New Jersey Turnpike Authority Revenue Bonds | | | | | | | | |
5.00% due 01/01/31 | | | 300,000 | | | | 363,147 | |
New Jersey Economic Development Authority Revenue Bonds | | | | | | | | |
5.00% due 06/01/28 | | | 250,000 | | | | 305,343 | |
North Hudson Sewerage Authority Revenue Bonds | | | | | | | | |
due 12/15/212 | | | 50,000 | | | | 48,942 | |
Total New Jersey | | | | | | | 717,432 | |
| | | | | | | | | |
Arizona - 1.2% | | | | | | | | |
Maricopa County Industrial Development Authority Revenue Bonds | | | | | | | | |
5.00% due 01/01/41 | | | 250,000 | | | | 286,745 | |
Salt Verde Financial Corp. Revenue Bonds | | | | | | | | |
5.00% due 12/01/32 | | | 200,000 | | | | 232,532 | |
Pinal County Elementary School District No. 4 Casa Grande General Obligation Unlimited | | | | | | | | |
5.00% due 07/01/37 | | | 100,000 | | | | 123,793 | |
Arizona State Transportation Board Excise Tax Revenue Bonds | | | | | | | | |
3.13% due 07/01/25 | | | 25,000 | | | | 24,822 | |
Total Arizona | | | | | | | 667,892 | |
| | | | | | | | | |
Oklahoma - 1.2% | | | | | | | | |
Oklahoma Development Finance Authority Revenue Bonds | | | | | | | | |
5.00% due 08/15/28 | | | 350,000 | | | | 429,828 | |
Oklahoma City Airport Trust Revenue Bonds | | | | | | | | |
5.00% due 07/01/30 | | | 200,000 | | | | 237,972 | |
Total Oklahoma | | | | | | | 667,800 | |
| | | | | | | | | |
Nebraska - 1.2% | | | | | | | | |
Central Plains Energy Project Revenue Bonds | | | | | | | | |
5.00% due 09/01/29 | | | 200,000 | | | | 234,224 | |
Nebraska Educational Health Cultural & Social Services Finance Authority Revenue Bonds | | | | | | | | |
4.00% due 01/01/33 | | | 200,000 | | | | 220,928 | |
Nebraska Investment Finance Authority Revenue Bonds | | | | | | | | |
3.40% due 09/01/39 | | | 200,000 | | | | 210,048 | |
Total Nebraska | | | | | | | 665,200 | |
| | | | | | | | | |
Arkansas - 1.1% | | | | | | | | |
County of Baxter Arkansas Revenue Bonds | | | | | | | | |
5.00% due 09/01/26 | | | 330,000 | | | | 380,523 | |
University of Arkansas Revenue Bonds | | | | | | | | |
5.00% due 11/01/47 | | | 200,000 | | | | 236,340 | |
Total Arkansas | | | | | | | 616,863 | |
| | | | | | | | | |
Wisconsin - 1.1% | | | | | | | | |
State of Wisconsin General Obligation Unlimited | | | | | | | | |
5.00% due 05/01/32 | | | 200,000 | | | | 261,838 | |
5.00% due 05/01/33 | | | 200,000 | | | | 261,128 | |
5.00% due 05/01/20 | | | 20,000 | | | | 19,864 | |
State of Wisconsin Clean Water Revenue Bonds | | | | | | | | |
5.00% due 06/01/27 | | | 35,000 | | | | 34,937 | |
Public Finance Authority Revenue Bonds | | | | | | | | |
5.00% due 12/01/20 | | | 5,000 | | | | 5,319 | |
Total Wisconsin | | | | | | | 583,086 | |
| | | | | | | | | |
Puerto Rico - 1.0% | | | | | | | | |
Puerto Rico Public Buildings Authority Revenue Bonds | | | | | | | | |
6.00% due 07/01/23 | | | 250,000 | | | | 262,577 | |
Puerto Rico Highway & Transportation Authority Revenue Bonds | | | | | | | | |
5.25% due 07/01/41 | | | 250,000 | | | | 258,515 | |
Commonwealth of Puerto Rico General Obligation Unlimited | | | | | | | | |
5.25% due 07/01/24 | | | 45,000 | | | | 46,278 | |
Total Puerto Rico | | | | | | | 567,370 | |
| | | | | | | | | |
SEE NOTES TO FINANCIAL STATEMENTS. | THE GUGGENHEIM FUNDS SEMI-ANNUAL REPORT | 69 |
SCHEDULE OF INVESTMENTS (Unaudited)(continued) | March 31, 2020 |
MUNICIPAL INCOME FUND | |
| | Face
Amount | | | Value | |
Ohio - 0.8% | | | | | | | | |
County of Miami Ohio Revenue Bonds | | | | | | | | |
5.00% due 08/01/33 | | $ | 200,000 | | | $ | 242,582 | |
American Municipal Power, Inc. Revenue Bonds | | | | | | | | |
5.00% due 02/15/41 | | | 200,000 | | | | 230,080 | |
Total Ohio | | | | | | | 472,662 | |
| | | | | | | | | |
Florida - 0.8% | | | | | | | | |
State of Florida General Obligation Unlimited | | | | | | | | |
5.00% due 06/01/32 | | | 200,000 | | | | 256,772 | |
Greater Orlando Aviation Authority Revenue Bonds | | | | | | | | |
5.00% due 10/01/32 | | | 100,000 | | | | 119,709 | |
City of Tampa Florida Revenue Bonds | | | | | | | | |
5.25% due 05/15/20 | | | 35,000 | | | | 35,173 | |
Total Florida | | | | | | | 411,654 | |
| | | | | | | | | |
Georgia - 0.6% | | | | | | | | |
Savannah Economic Development Authority Revenue Bonds | | | | | | | | |
5.00% due 12/01/28 | | | 200,000 | | | | 237,960 | |
County of Columbia Georgia Water & Sewerage Revenue Bonds | | | | | | | | |
5.00% due 06/01/20 | | | 35,000 | | | | 35,221 | |
Thomasville Hospital Authority Revenue Bonds | | | | | | | | |
5.25% due 11/02/20 | | | 25,000 | | | | 25,604 | |
Total Georgia | | | | | | | 298,785 | |
| | | | | | | | | |
Alaska - 0.5% | | | | | | | | |
University of Alaska Revenue Bonds | | | | | | | | |
5.00% due 10/01/40 | | | 260,000 | | | | 286,260 | |
| | | | | | | | | |
Nevada - 0.5% | | | | | | | | |
Las Vegas Valley Water District General Obligation Ltd. | | | | | | | | |
5.00% due 06/01/27 | | | 230,000 | | | | 269,783 | |
| | | | | | | | | |
South Carolina - 0.4% | | | | | | | | |
Charleston County Airport District Revenue Bonds | | | | | | | | |
5.00% due 07/01/43 | | | 200,000 | | | | 240,820 | |
| | | | | | | | | |
Vermont - 0.4% | | | | | | | | |
Vermont Educational & Health Buildings Financing Agency Revenue Bonds | | | | | | | | |
5.00% due 12/01/46 | | | 200,000 | | | | 229,670 | |
| | | | | | | | | |
North Dakota - 0.4% | | | | | | | | |
City of Grand Forks North Dakota Revenue Bonds | | | | | | | | |
5.00% due 12/01/24 | | | 200,000 | | | | 226,952 | |
| | | | | | | | | |
Tennessee - 0.4% | | | | | | | | |
Metropolitan Government Nashville & Davidson County Health & Educational Facs Bd Revenue Bonds | | | | | | | | |
2.48% due 12/01/37 | | | 200,000 | | | | 201,956 | |
South Dakota - 0.3% | | | | | | | | |
South Dakota Board of Regents Housing & Auxiliary Facilities System Revenue Bonds | | | | | | | | |
5.00% due 04/01/34 | | | 150,000 | | | | 182,385 | |
| | | | | | | | | |
Idaho - 0.2% | | | | | | | | |
Idaho Housing & Finance Association Revenue Bonds | | | | | | | | |
5.00% due 07/15/30 | | | 100,000 | | | | 124,105 | |
| | | | | | | | | |
Rhode Island - 0.2% | | | | | | | | |
Rhode Island Health & Educational Building Corp. Revenue Bonds | | | | | | | | |
5.00% due 05/15/42 | | | 100,000 | | | | 122,389 | |
| | | | | | | | | |
Utah - 0.2% | | | | | | | | |
South Davis Metro Fire Service Area Revenue Bonds | | | | | | | | |
5.00% due 12/01/34 | | | 100,000 | | | | 122,013 | |
| | | | | | | | | |
Kansas - 0.2% | | | | | | | | |
University of Kansas Hospital Authority Revenue Bonds | | | | | | | | |
5.00% due 09/01/48 | | | 100,000 | | | | 120,924 | |
| | | | | | | | | |
Montana - 0.2% | | | | | | | | |
Montana State Board of Regents Revenue Bonds | | | | | | | | |
5.00% due 11/15/43 | | | 100,000 | | | | 119,961 | |
| | | | | | | | | |
Iowa - 0.2% | | | | | | | | |
PEFA, Inc. Revenue Bonds | | | | | | | | |
5.00% (VRDN) due 09/01/264 | | | 100,000 | | | | 109,868 | |
University of Iowa Revenue Bonds | | | | | | | | |
4.00% due 07/01/20 | | | 10,000 | | | | 9,973 | |
Total Iowa | | | | | | | 119,841 | |
| | | | | | | | | |
Indiana - 0.2% | | | | | | | | |
Indiana Finance Authority Revenue Bonds | | | | | | | | |
5.00% due 10/01/41 | | | 100,000 | | | | 117,251 | |
| | | | | | | | | |
Guam - 0.2% | | | | | | | | |
Guam Government Waterworks Authority Revenue Bonds | | | | | | | | |
5.63% due 07/01/20 | | | 100,000 | | | | 101,092 | |
Guam Power Authority Revenue Bonds | | | | | | | | |
5.50% due 10/01/20 | | | 5,000 | | | | 5,059 | |
Total Guam | | | | | | | 106,151 | |
| | | | | | | | | |
New Mexico - 0.1% | | | | | | | | |
City of Albuquerque New Mexico Revenue Bonds | | | | | | | | |
5.00% due 07/01/25 | | | 30,000 | | | | 33,837 | |
Total Municipal Bonds | | | | |
(Cost $48,178,084) | | | 50,154,692 | |
| | | | | | | | | |
Total Investments - 101.3% | | | | |
(Cost $55,431,289) | | $ | 57,228,669 | |
Other Assets & Liabilities, net - (1.3)% | | | (714,821 | ) |
Total Net Assets - 100.0% | | $ | 56,513,848 | |
70 | THE GUGGENHEIM FUNDS SEMI-ANNUAL REPORT | SEE NOTES TO FINANCIAL STATEMENTS. |
SCHEDULE OF INVESTMENTS (Unaudited)(concluded) | March 31, 2020 |
MUNICIPAL INCOME FUND | |
† | Value determined based on Level 1 inputs — See Note 4 |
†† | Value determined based on Level 2 inputs — See Note 4. |
1 | Rate indicated is the 7-day yield as of March 31, 2020. |
2 | Zero coupon rate security. |
3 | Security is a step up/down bond. The coupon increases or decreases at regular intervals until the bond reaches full maturity. Rate indicated is the rate at March 31, 2020. See table below for additional step information for each security. |
4 | The rate is adjusted periodically by the counterparty, allows the holder to tender the security upon a rate reset, and is not based upon a set reference rate and spread. Rate indicated is the rate effective at March 31, 2020. |
5 | Security has no current coupon. However, a coupon rate will come into effect at a future rate reset date. |
| | VRDN — Variable Rate Demand Note |
| | |
| | See Sector Classification in Other Information section. |
The following table summarizes the inputs used to value the Fund’s investments at March 31, 2020 (See Note 4 in the Notes to Financial Statements):
Investments in Securities (Assets) | | Level 1
Quoted
Prices | | | Level 2
Significant
Observable
Inputs | | | Level 3
Significant
Unobservable
Inputs | | | Total | |
Closed-End Funds | | $ | 2,050,370 | | | $ | — | | | $ | — | | | $ | 2,050,370 | |
Money Market Fund | | | 5,023,607 | | | | — | | | | — | | | | 5,023,607 | |
Municipal Bonds | | | — | | | | 50,154,692 | | | | — | | | | 50,154,692 | |
Total Assets | | $ | 7,073,977 | | | $ | 50,154,692 | | | $ | — | | | $ | 57,228,669 | |
Step Coupon Bonds
The following table discloses additional information related to step coupon bonds held by the Fund. Certain securities are subject to multiple rate changes prior to maturity. For those securities a range of rates and corresponding dates have been provided. Rates for all step coupon bonds held by the Fund are scheduled to increase, none are scheduled to decrease.
Name | | Coupon Rate at Next
Reset Date | | | Next Rate
Reset Date | | | Future Reset Rate(s) | | | Future Reset Date(s) | |
City of Norfolk Virginia General Obligation Unlimited, 2.50% due 10/01/46 | | | 3.00 | % | | | 10/01/22 | | | | 3.75% - 5.00% | | | | 10/01/26 - 10/01/41 | |
College of the Sequoias Tulare Area Improvement District No. 3 General Obligation Unlimited, due 08/01/42 | | | 6.85 | % | | | 08/01/32 | | | | — | | | | — | |
Riverside County Redevelopment Successor Agency Tax Allocation, due 10/01/37 | | | 5.00 | % | | | 10/01/21 | | | | — | | | | — | |
SEE NOTES TO FINANCIAL STATEMENTS. | THE GUGGENHEIM FUNDS SEMI-ANNUAL REPORT | 71 |
STATEMENT OF ASSETS AND LIABILITIES (Unaudited) |
March 31, 2020 |
Assets: |
Investments, at value (cost $55,431,289) | | $ | 57,228,669 | |
Prepaid expenses | | | 40,551 | |
Receivables: |
Interest | | | 512,574 | |
Fund shares sold | | | 252,786 | |
Dividends | | | 3,060 | |
Total assets | | | 58,037,640 | |
| | | | | |
Liabilities: |
Overdraft due to custodian bank | | | 31,385 | |
Payable for: |
Securities purchased | | | 1,402,293 | |
Fund shares redeemed | | | 40,567 | |
Distributions to shareholders | | | 12,562 | |
Distribution and service fees | | | 9,927 | |
Transfer agent/maintenance fees | | | 3,602 | |
Fund accounting/administration fees | | | 2,888 | |
Trustees’ fees* | | | 2,467 | |
Management fees | | | 2,116 | |
Miscellaneous | | | 15,985 | |
Total liabilities | | | 1,523,792 | |
Net assets | | $ | 56,513,848 | |
| | | | | |
Net assets consist of: |
Paid in capital | | $ | 55,037,039 | |
Total distributable earnings (loss) | | | 1,476,809 | |
Net assets | | $ | 56,513,848 | |
| | | | | |
A-Class: |
Net assets | | $ | 41,350,279 | |
Capital shares outstanding | | | 3,196,649 | |
Net asset value per share | | $ | 12.94 | |
Maximum offering price per share (Net asset value divided by 96.00%) | | $ | 13.48 | |
| | | | | |
C-Class: |
Net assets | | $ | 1,813,075 | |
Capital shares outstanding | | | 140,271 | |
Net asset value per share | | $ | 12.93 | |
| | | | | |
P-Class: |
Net assets | | $ | 187,747 | |
Capital shares outstanding | | | 14,524 | |
Net asset value per share | | $ | 12.93 | |
| | | | | |
Institutional Class: |
Net assets | | $ | 13,162,747 | |
Capital shares outstanding | | | 1,017,521 | |
Net asset value per share | | $ | 12.94 | |
STATEMENT OF OPERATIONS (Unaudited) |
Six-Month Period Ended March 31, 2020 |
Investment Income: |
Dividends | | $ | 50,641 | |
Interest | | | 781,810 | |
Total investment income | | | 832,451 | |
| | | | | |
Expenses: |
Management fees | | | 145,559 | |
Distribution and service fees: |
A-Class | | | 53,085 | |
C-Class | | | 9,628 | |
P-Class | | | 272 | |
Transfer agent/maintenance fees: |
A-Class | | | 19,417 | |
C-Class | | | 1,122 | |
P-Class | | | 314 | |
Institutional Class | | | 6,255 | |
Registration fees | | | 41,570 | |
Fund accounting/administration fees | | | 22,421 | |
Professional fees | | | 17,733 | |
Trustees’ fees* | | | 8,984 | |
Custodian fees | | | 4,746 | |
Line of credit fees | | | 2,343 | |
Miscellaneous | | | 24,856 | |
Recoupment of previously waived fees: |
C-Class | | | 5 | |
Total expenses | | | 358,310 | |
Less: |
Expenses reimbursed by Adviser: |
A Class | | | (19,169 | ) |
C Class | | | (1,114 | ) |
P Class | | | (309 | ) |
Institutional Class | | | (6,215 | ) |
Expenses waived by Adviser | | | (105,085 | ) |
Earnings credits applied | | | (157 | ) |
Total waived/reimbursed expenses | | | (132,049 | ) |
Net expenses | | | 226,261 | |
Net investment income | | | 606,190 | |
| | | | | |
Net Realized and Unrealized Gain (Loss): |
Net realized gain (loss) on: |
Investments | | | (191,554 | ) |
Net realized loss | | | (191,554 | ) |
Net change in unrealized appreciation (depreciation) on: |
Investments | | | (783,009 | ) |
Net change in unrealized appreciation (depreciation) | | | (783,009 | ) |
Net realized and unrealized loss | | | (974,563 | ) |
Net decrease in net assets resulting from operations | | $ | (368,373 | ) |
* | Relates to Trustees not deemed “interested persons” within the meaning of Section 2(a)(19) of the 1940 Act. |
72 | THE GUGGENHEIM FUNDS SEMI-ANNUAL REPORT | SEE NOTES TO FINANCIAL STATEMENTS. |
STATEMENTS OF CHANGES IN NET ASSETS |
| | Six-Month
Period Ended
March 31,
2020
(Unaudited) | | | Year Ended
September 30,
2019 | |
Increase (Decrease) in Net Assets from Operations: | | | | | | | | |
Net investment income | | $ | 606,190 | | | $ | 993,833 | |
Net realized loss on investments | | | (191,554 | ) | | | (42,831 | ) |
Net change in unrealized appreciation (depreciation) on investments | | | (783,009 | ) | | | 2,182,973 | |
Net increase (decrease) in net assets resulting from operations | | | (368,373 | ) | | | 3,133,975 | |
| | | | | | | | | |
Distributions to shareholders: | | | | | | | | |
A-Class | | | (434,944 | ) | | | (736,110 | ) |
C-Class | | | (12,538 | ) | | | (39,446 | ) |
P-Class | | | (2,203 | ) | | | (2,756 | ) |
Institutional Class | | | (156,512 | ) | | | (318,435 | ) |
Total distributions to shareholders | | | (606,197 | ) | | | (1,096,747 | ) |
| | | | | | | | | |
Capital share transactions: | | | | | | | | |
Proceeds from sale of shares | | | | | | | | |
A-Class | | | 9,810,984 | | | | 26,456,149 | |
C-Class | | | 163,052 | | | | 548,605 | |
P-Class | | | 786,850 | | | | 164,344 | |
Institutional Class | | | 7,742,134 | | | | 5,941,830 | |
Distributions reinvested | | | | | | | | |
A-Class | | | 358,926 | | | | 506,049 | |
C-Class | | | 11,182 | | | | 31,368 | |
P-Class | | | 2,203 | | | | 2,756 | |
Institutional Class | | | 153,994 | | | | 305,395 | |
Cost of shares redeemed | | | | | | | | |
A-Class | | | (10,713,726 | ) | | | (11,365,476 | ) |
C-Class | | | (297,726 | ) | | | (1,103,845 | ) |
P-Class | | | (806,930 | ) | | | (3,449 | ) |
Institutional Class | | | (8,392,756 | ) | | | (1,928,600 | ) |
Net increase (decrease) from capital share transactions | | | (1,181,813 | ) | | | 19,555,126 | |
Net increase (decrease) in net assets | | | (2,156,383 | ) | | | 21,592,354 | |
| | | | | | | | | |
Net assets: | | | | | | | | |
Beginning of period | | | 58,670,231 | | | | 37,077,877 | |
End of period | | $ | 56,513,848 | | | $ | 58,670,231 | |
| | | | | | | | | |
Capital share activity: | | | | | | | | |
Shares sold | | | | | | | | |
A-Class | | | 747,470 | | | | 2,038,962 | |
C-Class | | | 12,243 | | | | 42,762 | |
P-Class | | | 58,723 | | | | 12,827 | |
Institutional Class | | | 587,221 | | | | 464,446 | |
Shares issued from reinvestment of distributions | | | | | | | | |
A-Class | | | 27,304 | | | | 39,477 | |
C-Class | | | 852 | | | | 2,466 | |
P-Class | | | 167 | | | | 214 | |
Institutional Class | | | 11,713 | | | | 23,869 | |
Shares redeemed | | | | | | | | |
A-Class | | | (817,335 | ) | | | (891,195 | ) |
C-Class | | | (23,894 | ) | | | (87,169 | ) |
P-Class | | | (60,120 | ) | | | (264 | ) |
Institutional Class | | | (645,746 | ) | | | (151,514 | ) |
Net increase (decrease) in shares | | | (101,402 | ) | | | 1,494,881 | |
SEE NOTES TO FINANCIAL STATEMENTS. | THE GUGGENHEIM FUNDS SEMI-ANNUAL REPORT | 73 |
This table is presented to show selected data for a share outstanding throughout each period and to assist shareholders in evaluating a Fund’s performance for the periods presented.
A-Class | | Period Ended
March 31,
2020a | | | Year Ended
September 30,
2019 | | | Year Ended
September 30,
2018 | | | Year Ended
September 30,
2017 | | | Year Ended
September 30,
2016 | | | Year Ended
September 30,
2015 | |
Per Share Data |
Net asset value, beginning of period | | $ | 13.12 | | | $ | 12.46 | | | $ | 12.70 | | | $ | 12.86 | | | $ | 12.52 | | | $ | 12.51 | |
Income (loss) from investment operations: |
Net investment income (loss)b | | | .13 | | | | .30 | | | | .30 | | | | .27 | | | | .26 | | | | .29 | |
Net gain (loss) on investments (realized and unrealized) | | | (.18 | ) | | | .70 | | | | (.24 | ) | | | (.15 | ) | | | .34 | | | | .01 | |
Total from investment operations | | | (.05 | ) | | | 1.00 | | | | .06 | | | | .12 | | | | .60 | | | | .30 | |
Less distributions from: |
Net investment income | | | (.13 | ) | | | (.30 | ) | | | (.30 | ) | | | (.28 | ) | | | (.26 | ) | | | (.29 | ) |
Net realized gains | | | — | | | | (.04 | ) | | | — | | | | — | | | | — | | | | — | |
Total distributions | | | (.13 | ) | | | (.34 | ) | | | (.30 | ) | | | (.28 | ) | | | (.26 | ) | | | (.29 | ) |
Net asset value, end of period | | $ | 12.94 | | | $ | 13.12 | | | $ | 12.46 | | | $ | 12.70 | | | $ | 12.86 | | | $ | 12.52 | |
|
Total Returnc | | | (0.36 | %) | | | 8.13 | % | | | 0.44 | % | | | 0.94 | % | | | 4.85 | % | | | 2.39 | % |
Ratios/Supplemental Data |
Net assets, end of period (in thousands) | | $ | 41,350 | | | $ | 42,512 | | | $ | 25,570 | | | $ | 33,515 | | | $ | 41,283 | | | $ | 49,086 | |
Ratios to average net assets: |
Net investment income (loss) | | | 2.05 | % | | | 2.31 | % | | | 2.35 | % | | | 2.19 | % | | | 2.06 | % | | | 2.28 | % |
Total expensesd | | | 1.26 | % | | | 1.34 | % | | | 1.30 | % | | | 1.20 | % | | | 1.18 | % | | | 1.17 | % |
Net expensese,f,g | | | 0.81 | % | | | 0.81 | % | | | 0.80 | % | | | 0.82 | % | | | 0.81 | % | | | 0.81 | % |
Portfolio turnover rate | | | 35 | % | | | 30 | % | | | 13 | % | | | 31 | % | | | 61 | % | | | 80 | % |
C-Class | | Period Ended
March 31,
2020a | | | Year Ended
September 30,
2019 | | | Year Ended
September 30,
2018 | | | Year Ended
September 30,
2017 | | | Year Ended
September 30,
2016 | | | Year Ended
September 30,
2015 | |
Per Share Data |
Net asset value, beginning of period | | $ | 13.11 | | | $ | 12.45 | | | $ | 12.69 | | | $ | 12.86 | | | $ | 12.52 | | | $ | 12.50 | |
Income (loss) from investment operations: |
Net investment income (loss)b | | | .09 | | | | .21 | | | | .20 | | | | .18 | | | | .16 | | | | .19 | |
Net gain (loss) on investments (realized and unrealized) | | | (.18 | ) | | | .69 | | | | (.24 | ) | | | (.17 | ) | | | .35 | | | | .02 | |
Total from investment operations | | | (.09 | ) | | | .90 | | | | (.04 | ) | | | .01 | | | | .51 | | | | .21 | |
Less distributions from: |
Net investment income | | | (.09 | ) | | | (.20 | ) | | | (.20 | ) | | | (.18 | ) | | | (.17 | ) | | | (.19 | ) |
Net realized gains | | | — | | | | (.04 | ) | | | — | | | | — | | | | — | | | | — | |
Total distributions | | | (.09 | ) | | | (.24 | ) | | | (.20 | ) | | | (.18 | ) | | | (.17 | ) | | | (.19 | ) |
Net asset value, end of period | | $ | 12.93 | | | $ | 13.11 | | | $ | 12.45 | | | $ | 12.69 | | | $ | 12.86 | | | $ | 12.52 | |
|
Total Returnc | | | (0.73 | %) | | | 7.33 | % | | | (0.30 | %) | | | 0.12 | % | | | 4.06 | % | | | 1.71 | % |
Ratios/Supplemental Data |
Net assets, end of period (in thousands) | | $ | 1,813 | | | $ | 1,981 | | | $ | 2,403 | | | $ | 3,768 | | | $ | 5,008 | | | $ | 2,472 | |
Ratios to average net assets: |
Net investment income (loss) | | | 1.30 | % | | | 1.63 | % | | | 1.60 | % | | | 1.44 | % | | | 1.26 | % | | | 1.54 | % |
Total expensesd | | | 2.04 | % | | | 2.12 | % | | | 2.11 | % | | | 1.92 | % | | | 1.89 | % | | | 1.87 | % |
Net expensese,f,g | | | 1.56 | % | | | 1.56 | % | | | 1.55 | % | | | 1.57 | % | | | 1.56 | % | | | 1.56 | % |
Portfolio turnover rate | | | 35 | % | | | 30 | % | | | 13 | % | | | 31 | % | | | 61 | % | | | 80 | % |
74 | THE GUGGENHEIM FUNDS SEMI-ANNUAL REPORT | SEE NOTES TO FINANCIAL STATEMENTS. |
FINANCIAL HIGHLIGHTS (continued) |
This table is presented to show selected data for a share outstanding throughout each period and to assist shareholders in evaluating a Fund’s performance for the periods presented.
P-Class | | Period Ended
March 31,
2020a | | | Year Ended
September 30,
2019 | | | Year Ended
September 30,
2018 | | | Year Ended
September 30,
2017 | | | Year Ended
September 30,
2016 | | | Period Ended
September 30,
2015h | |
Per Share Data |
Net asset value, beginning of period | | $ | 13.13 | | | $ | 12.46 | | | $ | 12.70 | | | $ | 12.86 | | | $ | 12.52 | | | $ | 12.64 | |
Income (loss) from investment operations: |
Net investment income (loss)b | | | .13 | | | | .29 | | | | .29 | | | | .25 | | | | .26 | | | | .13 | |
Net gain (loss) on investments (realized and unrealized) | | | (.20 | ) | | | .72 | | | | (.23 | ) | | | (.14 | ) | | | .34 | | | | (.12 | ) |
Total from investment operations | | | (.07 | ) | | | 1.01 | | | | .06 | | | | .11 | | | | .60 | | | | .01 | |
Less distributions from: |
Net investment income | | | (.13 | ) | | | (.30 | ) | | | (.30 | ) | | | (.27 | ) | | | (.26 | ) | | | (.13 | ) |
Net realized gains | | | — | | | | (.04 | ) | | | — | | | | — | | | | — | | | | — | |
Total distributions | | | (.13 | ) | | | (.34 | ) | | | (.30 | ) | | | (.27 | ) | | | (.26 | ) | | | (.13 | ) |
Net asset value, end of period | | $ | 12.93 | | | $ | 13.13 | | | $ | 12.46 | | | $ | 12.70 | | | $ | 12.86 | | | $ | 12.52 | |
|
Total Return | | | (0.52 | %) | | | 8.20 | % | | | 0.44 | % | | | 0.89 | % | | | 4.86 | % | | | 0.06 | % |
Ratios/Supplemental Data |
Net assets, end of period (in thousands) | | $ | 188 | | | $ | 207 | | | $ | 37 | | | $ | 111 | | | $ | 84 | | | $ | 10 | |
Ratios to average net assets: |
Net investment income (loss) | | | 2.03 | % | | | 2.25 | % | | | 2.32 | % | | | 2.01 | % | | | 2.00 | % | | | 2.46 | % |
Total expensesd | | | 1.46 | % | | | 1.55 | % | | | 1.72 | % | | | 1.27 | % | | | 1.21 | % | | | 3.17 | % |
Net expensese,f,g | | | 0.81 | % | | | 0.81 | % | | | 0.80 | % | | | 0.82 | % | | | 0.79 | % | | | 0.81 | % |
Portfolio turnover rate | | | 35 | % | | | 30 | % | | | 13 | % | | | 31 | % | | | 61 | % | | | 80 | % |
SEE NOTES TO FINANCIAL STATEMENTS. | THE GUGGENHEIM FUNDS SEMI-ANNUAL REPORT | 75 |
FINANCIAL HIGHLIGHTS (concluded) |
This table is presented to show selected data for a share outstanding throughout each period and to assist shareholders in evaluating a Fund’s performance for the periods presented.
Institutional Class | | Period Ended
March 31,
2020a | | | Year Ended
September 30,
2019 | | | Year Ended
September 30,
2018 | | | Year Ended
September 30,
2017 | | | Year Ended
September 30,
2016 | | | Year Ended
September 30,
2015 | |
Per Share Data |
Net asset value, beginning of period | | $ | 13.13 | | | $ | 12.46 | | | $ | 12.71 | | | $ | 12.87 | | | $ | 12.53 | | | $ | 12.51 | |
Income (loss) from investment operations: |
Net investment income (loss)b | | | .15 | | | | .33 | | | | .33 | | | | .30 | | | | .29 | | | | .32 | |
Net gain (loss) on investments (realized and unrealized) | | | (.19 | ) | | | .71 | | | | (.25 | ) | | | (.15 | ) | | | .34 | | | | .02 | |
Total from investment operations | | | (.04 | ) | | | 1.04 | | | | .08 | | | | .15 | | | | .63 | | | | .34 | |
Less distributions from: |
Net investment income | | | (.15 | ) | | | (.33 | ) | | | (.33 | ) | | | (.31 | ) | | | (.29 | ) | | | (.32 | ) |
Net realized gains | | | — | | | | (.04 | ) | | | — | | | | — | | | | — | | | | — | |
Total distributions | | | (.15 | ) | | | (.37 | ) | | | (.33 | ) | | | (.31 | ) | | | (.29 | ) | | | (.32 | ) |
Net asset value, end of period | | $ | 12.94 | | | $ | 13.13 | | | $ | 12.46 | | | $ | 12.71 | | | $ | 12.87 | | | $ | 12.53 | |
|
Total Return | | | (0.31 | %) | | | 8.48 | % | | | 0.61 | % | | | 1.19 | % | | | 5.11 | % | | | 2.73 | % |
Ratios/Supplemental Data |
Net assets, end of period (in thousands) | | $ | 13,163 | | | $ | 13,970 | | | $ | 9,067 | | | $ | 15,914 | | | $ | 24,126 | | | $ | 8,564 | |
Ratios to average net assets: |
Net investment income (loss) | | | 2.30 | % | | | 2.59 | % | | | 2.59 | % | | | 2.43 | % | | | 2.24 | % | | | 2.53 | % |
Total expensesd | | | 1.01 | % | | | 1.08 | % | | | 1.09 | % | | | 0.88 | % | | | 0.84 | % | | | 0.89 | % |
Net expensese,f,g | | | 0.56 | % | | | 0.56 | % | | | 0.55 | % | | | 0.57 | % | | | 0.56 | % | | | 0.56 | % |
Portfolio turnover rate | | | 35 | % | | | 30 | % | | | 13 | % | | | 31 | % | | | 61 | % | | | 80 | % |
a | Unaudited figures for the period ended March 31, 2020. Percentage amounts for the period, except total return and portfolio turnover rate, have been annualized. |
b | Net investment income (loss) per share was computed using average shares outstanding throughout the period. |
c | Total return does not reflect the impact of any applicable sales charges. |
d | Does not include expenses of the underlying funds in which the Fund invests. |
e | Net expense information reflects the expense ratios after expense waivers and reimbursements, as applicable. |
f | The portion of the ratios of net expenses to average net assets attributable to recoupments of prior fee reductions or expense reimbursements for the years presented was as follows: |
| | | 03/31/20a | 09/30/19 | 09/30/18 | 09/30/17 |
| | A-Class | — | 0.00%* | — | — |
| | C-Class | 0.00%* | — | — | — |
| | P-Class | — | — | — | 0.04% |
| | Institutional Class | — | — | — | — |
g | Net expenses may include expenses that are excluded from the expense limitation agreement. Excluding these expenses, the net expense ratios for the years would be: |
| | | 03/31/20a | 09/30/19 | 09/30/18 | 09/30/17 | 09/30/16 |
| | A-Class | 0.80% | 0.80% | 0.80% | 0.80% | 0.80% |
| | C-Class | 1.55% | 1.55% | 1.55% | 1.55% | 1.55% |
| | P-Class | 0.80% | 0.80% | 0.80% | 0.80% | 0.78% |
| | Institutional Class | 0.55% | 0.55% | 0.55% | 0.55% | 0.55% |
h | Since commencement of operations: May 1, 2015. Percentage amounts for the period, except total return and portfolio turnover rate, have been annualized. |
76 | THE GUGGENHEIM FUNDS SEMI-ANNUAL REPORT | SEE NOTES TO FINANCIAL STATEMENTS. |
NOTES TO FINANCIAL STATEMENTS (Unaudited) |
Note 1 – Organization and Significant Accounting Policies
Organization
Guggenheim Funds Trust (the “Trust”), a Delaware statutory trust, is registered with the SEC under the Investment Company Act of 1940 (“1940 Act”), as an open-ended investment company of the series type. Each series, in effect, is representing a separate fund (each, a “Fund”). The Trust is authorized to issue an unlimited number of no par value shares. The Trust accounts for the assets of each Fund separately.
The Trust offers a combination of five separate classes of shares: A-Class shares, C-Class shares, P-Class shares, R6-Class shares and Institutional Class shares. Sales of shares of each Class are made without a front-end sales charge at the net asset value per share (“NAV”), with the exception of A-Class shares. A-Class shares are sold at the NAV, plus the applicable front-end sales charge. The sales charge varies depending on the amount purchased. A-Class share purchases of $1 million or more are exempt from the front-end sales charge but have a 1% contingent deferred sales charge (“CDSC”), if shares are redeemed within 12 months of purchase. C-Class shares have a 1% CDSC if shares are redeemed within 12 months of purchase. C-Class shares of each Fund automatically convert to A-Class shares of the same Fund on or about the 10th day of the month following the 10-year anniversary of the purchase of the C-Class shares. This conversion will be executed without any sales charge, fee or other charge. After the conversion is completed, the shares will be subject to all features and expenses of A-Class shares. Institutional Class shares are offered primarily for direct investment by institutions such as pension and profit sharing plans, endowments, foundations and corporations. Institutional Class shares require a minimum initial investment of $2 million and a minimum account balance of $1 million. The High Yield Fund offers R6-Class shares. R6-Class shares are offered primarily through qualified retirement and benefit plans. R6-Class shares are also offered through certain other plans and platforms sponsored by financial intermediaries. Certain institutional investors and others deemed appropriate by Guggenheim Investments (“GI”) may also be eligible to purchase R6-Class shares subject to a $2 million minimum initial investment. At March 31, 2020, the Trust consisted of nineteen funds.
As of January 1, 2012, A-Class, C-Class and Institutional Class shares of High Yield Fund are subject to a 2% redemption fee when shares are redeemed or exchanged within 90 days of purchase.
This report covers the following funds (collectively, the “Funds”):
Fund | Investment
Company Type |
Diversified Income Fund | Diversified |
High Yield Fund | Diversified |
Investment Grade Bond Fund | Diversified |
Municipal Income Fund | Diversified |
Security Investors, LLC and Guggenheim Partners Investment Management, LLC (“GPIM”), which operate under the name Guggenheim Investments, provide advisory services. Guggenheim Funds Distributors, LLC (“GFD”) acts as principal underwriter for the Trust. GI and GFD are affiliated entities.
GPIM, an affiliate of GI, serves as investment sub-advisor (the “Sub-Advisor”) to the Municipal Income Fund and is responsible for the day-to-day management of the Fund’s portfolio.
Significant Accounting Policies
The Funds operate as investment companies and, accordingly, follow the investment company accounting and reporting guidance of the Financial Accounting Standards Board (“FASB”) Accounting Standards Codification Topic 946 Financial Services – Investment Companies.
The following significant accounting policies are in conformity with U.S. generally accepted accounting principles (“U.S. GAAP”) and are consistently followed by the Trust. This requires management to make estimates and assumptions that affect the reported amount of assets and liabilities, contingent assets and liabilities at the date of the financial statements, and the reported amounts of revenues and expenses during the reporting period. Actual results could differ from these estimates. All time references are based on Eastern Time.
The NAV of each Class of a fund is calculated by dividing the market value of a fund’s securities and other assets, less all liabilities, attributable to the Class by the number of outstanding shares of the Class.
(a) Valuation of Investments
The Board of Trustees of the Funds (the “Board”) has adopted policies and procedures for the valuation of the Funds’ investments (the “Valuation Procedures”). Pursuant to the Valuation Procedures, the Board has delegated to a valuation committee, consisting of representatives from Guggenheim’s investment management, fund administration, legal and compliance departments (the “Valuation Committee”), the day-to-day responsibility for implementing the Valuation Procedures,
| | THE GUGGENHEIM FUNDS SEMI-ANNUAL REPORT | 77 |
NOTES TO FINANCIAL STATEMENTS (Unaudited)(continued) |
including, under most circumstances, the responsibility for determining the fair value of the Funds’ securities and/or other assets.
Valuations of the Funds’ securities and other assets are supplied primarily by pricing services appointed pursuant to the processes set forth in the Valuation Procedures. The Valuation Committee convenes monthly, or more frequently as needed, to review the valuation of all assets which have been fair valued for reasonableness. The Funds’ officers, through the Valuation Committee and consistent with the monitoring and review responsibilities set forth in the Valuation Procedures, regularly review procedures used and valuations provided by the pricing services.
If the pricing service cannot or does not provide a valuation for a particular investment or such valuation is deemed unreliable, such investment is fair valued by the Valuation Committee.
Equity securities listed or traded on a recognized U.S. securities exchange or the National Association of Securities Dealers Automated Quotations (“NASDAQ”) National Market System shall generally be valued on the basis of the last sale price on the primary U.S. exchange or market on which the security is listed or traded; provided, however, that securities listed on NASDAQ will be valued at the NASDAQ Official Closing Price, which may not necessarily represent the last sale price. If there is no sale on the valuation date, exchange-traded U.S. equity securities will be valued on the basis of the last bid price.
Generally, trading in foreign securities markets is substantially completed each day at various times prior to the close of the New York Stock Exchange (“NYSE”). The values of foreign securities are determined as of the close of such foreign markets or the close of the NYSE, if earlier. All investments quoted in foreign currencies are valued in U.S. dollars on the basis of the foreign currency exchange rates prevailing at the close of U.S. business at 4:00 p.m. Investments in foreign securities may involve risks not present in domestic investments. The Valuation Committee will determine the current value of such foreign securities by taking into consideration certain factors which may include those discussed above, as well as the following factors, among others: the value of the securities traded on other foreign markets, ADR trading, closed-end fund trading, foreign currency exchange activity, and the trading prices of financial products that are tied to foreign securities. In addition, under the Valuation Procedures, the Valuation Committee and GI are authorized to use prices and other information supplied by a third party pricing vendor in valuing foreign securities.
Open-end investment companies are valued at their NAV as of the close of business, on the valuation date. Exchange-traded funds and closed-end investment companies are valued at the last quoted sale price.
U.S. Government securities are valued by independent pricing services, the last traded fill price, or at the reported bid price at the close of business.
Repurchase agreements are generally valued at amortized cost, provided such amounts approximate market value.
Debt securities with a maturity of greater than 60 days at acquisition are valued at prices that reflect broker-dealer supplied valuations or are obtained from independent pricing services, which may consider the trade activity, treasury spreads, yields or price of bonds of comparable quality, coupon, maturity, and type, as well as prices quoted by dealers who make markets in such securities. Short-term debt securities with a maturity of 60 days or less at acquisition are valued at amortized cost, provided such amount approximates market value.
Typically, loans are valued using information provided by an independent third party pricing service that uses broker quotes, among other inputs. If the pricing service cannot or does not provide a valuation for a particular loan, or such valuation is deemed unreliable, such investment is valued based on a quote from a broker-dealer or is fair valued by the Valuation Committee.
Exchange-traded options are valued at the mean of the bid and ask prices on the principal exchange on which they are traded. Over-the-counter (“OTC”) options are valued using a price provided by a pricing service.
The value of futures contracts is accounted for using the unrealized appreciation or depreciation on the contracts that is determined by marking the contracts to their current realized settlement prices. Financial futures contracts are valued at the 4:00 p.m. price on the valuation date. In the event that the exchange for a specific futures contract closes earlier than 4:00 p.m., the futures contract is valued at the official settlement price of the exchange. However, the underlying securities from which the futures contract value is derived are monitored until 4:00 p.m. to determine if fair valuation would provide a more accurate valuation.
The value of interest rate swap agreements entered into by a fund is accounted for using the unrealized appreciation or depreciation on the agreements that is determined using the previous day’s Chicago Mercantile Exchange close price, adjusted for the current day’s spreads.
The values of other swap agreements entered into by a fund are accounted for using the unrealized appreciation or depreciation on the agreements that are determined by marking the agreements to the last quoted value of the index or the underlying position that the swaps pertain to at the close of the NYSE.
78 | THE GUGGENHEIM FUNDS SEMI-ANNUAL REPORT | |
NOTES TO FINANCIAL STATEMENTS (Unaudited)(continued) |
Forward foreign currency exchange contracts are valued daily based on the applicable exchange rate of the underlying currency.
Investments for which market quotations are not readily available are fair-valued as determined in good faith by GI subject to review and approval by the Valuation Committee, pursuant to methods established or ratified by the Board. Valuations in accordance with these methods are intended to reflect each security’s (or asset’s or liability’s) “fair value”. Each such determination is based on a consideration of all relevant factors, which are likely to vary from one pricing context to another. Examples of such factors may include, but are not limited to market prices; sale prices; broker quotes; and models which derive prices based on inputs such as prices of securities with comparable maturities and characteristics, or based on inputs such as anticipated cash flows or collateral, spread over U.S. Treasury securities, and other information analysis. In connection with futures contracts and other derivative investments, such factors may include obtaining information as to how (a) these contracts and other derivative investments trade in the futures or other derivative markets, respectively, and (b) the securities underlying these contracts and other derivative investments trade in the cash market.
(b) U.S. Government and Agency Obligations
Certain U.S. Government and Agency Obligations are traded on a discount basis; the interest rates shown on the Schedules of Investments reflect the effective rates paid at the time of purchase by the Funds. Other securities bear interest at the rates shown, payable at fixed dates through maturity.
(c) Senior Floating Rate Interests and Loan Investments
Senior floating rate interests in which the Trust invests generally pay interest rates which are periodically adjusted by reference to a base short-term floating rate, plus a premium. These base lending rates are generally (i) the lending rate offered by one or more major European banks, such as the one-month or three-month London Inter-Bank Offered Rate (“LIBOR”), (ii) the prime rate offered by one or more major United States banks, or (iii) the bank’s certificate of deposit rate. Senior floating rate interests often require prepayments from excess cash flows or permit the borrower to repay at its election. The rate at which the borrower repays cannot be predicted with accuracy. As a result, the actual remaining maturity may be substantially less than the stated maturities disclosed in the Funds’ Schedules of Investments. The interest rate indicated is the rate in effect at March 31, 2020.
The Funds invest in loans and other similar debt obligations (“obligations”). A portion of the Funds’ investments in these obligations is sometimes referred to as “covenant lite” loans or obligations (“covenant lite obligations”), which are obligations that lack covenants or possess fewer or less restrictive covenants or constraints on borrowers than certain other types of obligations. The Funds may also obtain exposure to covenant lite obligations through investment in securitization vehicles and other structured products. In recent market conditions, many new or reissued obligations have not featured traditional covenants, which are intended to protect lenders and investors by (i) imposing certain restrictions or other limitations on a borrower’s operations or assets or (ii) providing certain rights to lenders. The Funds may have fewer rights with respect to covenant lite obligations, including fewer protections against the possibility of default and fewer remedies in the event of default. As a result, investments in (or exposure to) covenant lite obligations are subject to more risk than investments in (or exposure to) certain other types of obligations. The Funds are subject to other risks associated with investments in (or exposure to) obligations, including that obligations may not be considered “securities” and, as a result, the Funds may not be entitled to rely on the anti-fraud protections under the federal securities laws and instead may have to resort to state law and direct claims.
(d) Interests in When-Issued Securities
The Funds may purchase and sell interests in securities on a when-issued and delayed delivery basis, with payment and delivery scheduled for a future date. No income accrues to the Funds on such interests or securities in connection with such transactions prior to the date the Funds actually take delivery of such interests or securities. These transactions are subject to market fluctuations and are subject to the risk that the value at delivery may be more or less than the trade date purchase price. Although the Funds will generally purchase these securities with the intention of acquiring such securities, they may sell such securities before the settlement date.
(e) Options
Upon the purchase of an option, the premium paid is recorded as an investment, the value of which is marked-to-market daily. If a purchased option expires, the Fund realizes a loss in the amount of the cost of the option. When the Fund enters into a closing sale transaction, it realizes a gain or loss depending on whether the proceeds from the closing sale transaction are greater or less than the cost of the option. If the Fund exercises a put option, it realizes a gain or loss from the sale of the underlying security and the proceeds from such sale will be decreased by the premium originally paid. When the Fund exercises a call option, the cost of the security purchased by the Fund upon exercise increases by the premium originally paid.
When the Fund writes (sells) an option, an amount equal to the premium received is entered in that Fund’s accounting records as an asset and equivalent liability. The amount of the liability is subsequently marked-to-market to reflect the current value of the option written. When a written option expires, or if the Fund enters
| | THE GUGGENHEIM FUNDS SEMI-ANNUAL REPORT | 79 |
NOTES TO FINANCIAL STATEMENTS (Unaudited)(continued) |
into a closing purchase transaction, it realizes a gain (or loss if the cost of a closing purchase transaction exceeds the premium received when the option was sold).
(f) Futures Contracts
Upon entering into a futures contract, a Fund deposits and maintains as collateral such initial margin as required by the exchange on which the transaction is affected. Pursuant to the contract, the Fund agrees to receive from or pay to the broker an amount of cash equal to the daily fluctuation in value of the contract. Such receipts or payments are known as variation margin and are recorded by the Fund as unrealized appreciation or depreciation. When the contract is closed, the Fund records a realized gain or loss equal to the difference between the value of the contract at the time it was opened and the value at the time it was closed.
(g) Swap Agreements
Swap agreements are marked-to-market daily and the change, if any, is recorded as unrealized appreciation or depreciation. Payments received or made as a result of an agreement or termination of an agreement are recognized as realized gains or losses.
Upon entering into certain centrally-cleared swap transactions, a Fund is required to deposit with its clearing broker an amount of cash or securities as an initial margin. Subsequent variation margin receipts or payments are received or made by the Fund depending on fluctuations in the fair value of the reference entity and are recorded by the Fund as unrealized appreciation or depreciation. When the contract is closed, the Fund records a realized gain or loss equal to the difference between the value of the contract at the time it was opened and the value at the time it was closed.
Upfront payments received or made by a Fund on credit default swap agreements and interest rate swap agreements are amortized over the expected life of the agreement. Periodic payments received or paid by a Fund are recorded as realized gains or losses. Payments received or made as a result of a credit event or termination of the contract are recognized, net of a proportional amount of the upfront payment, as realized gains or losses.
(h) Currency Translations
The accounting records of the Funds are maintained in U.S. dollars. All assets and liabilities initially expressed in foreign currencies are converted into U.S. dollars at prevailing exchange rates. Purchases and sales of investment securities, dividend and interest income, and certain expenses are translated at the rates of exchange prevailing on the respective dates of such transactions. Changes in the relationship of these foreign currencies to the U.S. dollar can significantly affect the value of the investments and earnings of the Funds. Foreign investments may also subject the Funds to foreign government exchange restrictions, expropriation, taxation, or other political, social or economic developments, all of which could affect the market and/or credit risk of the investments.
The Funds do not isolate that portion of the results of operations resulting from changes in the foreign exchange rates on investments from the fluctuations arising from changes in the market prices of securities held. Such fluctuations are included with the net realized gain or loss and unrealized appreciation or depreciation on investments.
Reported net realized foreign exchange gains and losses arise from sales of foreign currencies and currency gains or losses realized between the trade and settlement dates on investment transactions. Net unrealized appreciation and depreciation arise from changes in the fair values of assets and liabilities other than investments in securities at the fiscal period end, resulting from changes in exchange rates.
(i) Forward Foreign Currency Exchange Contracts
The change in value of a forward foreign currency exchange contract is recorded as unrealized appreciation or depreciation until the contract is closed. When the contract is closed, the Funds record a realized gain or loss equal to the difference between the value at the time the contract was opened and the value at the time it was closed.
(j) Foreign Taxes
The Funds may be subject to foreign taxes (a portion of which may be reclaimable) on income, stock dividends, capital gains on investments or certain foreign currency transactions. All foreign taxes are recorded in accordance with the applicable foreign tax regulations and rates that exist in the foreign jurisdictions in which the Funds invest. These foreign taxes, if any, are paid by the Funds and reflected in their Statements of Operations as follows: foreign taxes withheld at source are presented as a reduction of income and foreign taxes on capital gains from sales of investments are included with the net realized gain (loss) on investments. Foreign taxes payable or deferred as of March 31, 2020, if any, are disclosed in the Funds’ Statements of Assets and Liabilities.
(k) Security Transactions
Security transactions are recorded on the trade date for financial reporting purposes. Realized gains and losses from securities transactions are recorded using the identified cost basis. Proceeds from lawsuits related to investment holdings are recorded as a reduction to cost if the securities are still held and as realized gains if no longer held in the respective Fund. Dividend income is recorded on the ex-dividend date, net of applicable taxes
80 | THE GUGGENHEIM FUNDS SEMI-ANNUAL REPORT | |
NOTES TO FINANCIAL STATEMENTS (Unaudited)(continued) |
withheld by foreign countries, if any. Taxable non-cash dividends are recorded as dividend income. Interest income, including amortization of premiums and accretion of discounts, is accrued on a daily basis. Interest income also includes paydown gains and losses on mortgage-backed and asset-backed securities and senior and subordinated loans. Amendment fees are earned as compensation for evaluating and accepting changes to the original loan agreement and are recognized when received. Dividend income from Real Estate Investment Trusts (“REITs”) is recorded based on the income included in the distributions received from the REIT investments using published REIT classifications, including some management estimates when actual amounts are not available. Distributions received in excess of this estimated amount are recorded as a reduction of the cost of investments or reclassified to realized gains. The actual amounts of income, return of capital, and realized gains are only determined by each REIT after its fiscal year-end, and may differ from the estimated amounts.
Income from residual collateralized loan obligations is recognized using the effective interest method. At the time of purchase, management estimates the future expected cash flows and determines the effective yield and estimated maturity date based on the estimated cash flows. Subsequent to the purchase, the estimated cash flows are updated periodically and a revised yield is calculated prospectively.
Certain Funds may receive other income from investments in senior loan interests including amendment fees, consent fees and commitment fees. For funded loans, these fees are recorded as income when received by the Funds and included in interest income on the Statements of Operations. For unfunded loans, commitment fees are included in realized gain on investments on the Statement of Operations at the end of the commitment period.
(l) Distributions
The Funds declare dividends from investment income daily, except for Diversified Income Fund, which declares monthly. Each Fund pays its shareholders from its net investment income monthly and distributes any net capital gains that it has realized, at least annually. Distributions to shareholders are recorded on the ex-dividend date. Dividends are reinvested in additional shares, unless shareholders request payment in cash. The character of distributions made during the year from net investment income or net realized gains may differ from their ultimate characterization for U.S. federal income tax purposes.
(m) Class Allocations
Interest and dividend income, most expenses, all realized gains and losses, and all unrealized appreciation and depreciation are allocated to the classes based upon the value of the outstanding shares in each Class. Certain costs, such as distribution and service fees are charged directly to specific classes. In addition, certain expenses have been allocated to the individual Funds in the Trust based on the respective net assets of each Fund included in the Trust.
(n) Earnings Credits
Under the fee arrangement with the custodian, the Funds may earn credits based on overnight custody cash balances. These credits are utilized to reduce related custodial expenses. The custodian fees disclosed in the Statements of Operations are before the reduction in expense from the related earnings credits, if any. Earnings credits for the period ended March 31, 2020, are disclosed in the Statements of Operations.
(o) Cash
The Funds may leave cash overnight in their cash account with the custodian. Periodically, a Fund may have cash due to the custodian bank as an overdraft balance. A fee is incurred on this overdraft, calculated by multiplying the overdraft by a rate based on the federal funds rate, which was 0.08% at March 31, 2020.
(p) Indemnifications
Under the Funds’ organizational documents, the Trustees and Officers are indemnified against certain liabilities arising out of the performance of their duties to the Trust. In addition, throughout the normal course of business, the Funds enter into contracts that contain a variety of representations and warranties which provide general indemnifications. The Funds’ maximum exposure under these arrangements is unknown, as this would involve future claims that may be made against the Funds and/or their affiliates that have not yet occurred. However, based on experience, the Funds expect the risk of loss to be remote.
Note 2 – Derivatives
As part of their investment strategy, the Funds utilize a variety of derivative instruments. These investments involve, to varying degrees, elements of market risk and risks in excess of amounts recognized in the Statements of Assets and Liabilities. Valuation and accounting treatment of these instruments can be found under Significant Accounting Policies in Note 1 of these Notes to Financial Statements.
Derivatives are instruments whose values depend on, or are derived from, in whole or in part, the value of one or more other assets, such as securities, currencies, commodities or indices. Derivative instruments may be used to increase investment flexibility (including to maintain cash reserves while maintaining exposure to certain other assets), for risk management (hedging) purposes, to facilitate trading, to reduce transaction costs and to pursue higher investment returns. Derivative instruments may also
| | THE GUGGENHEIM FUNDS SEMI-ANNUAL REPORT | 81 |
NOTES TO FINANCIAL STATEMENTS (Unaudited)(continued) |
be used to mitigate certain investment risks, such as foreign currency exchange rate risk, interest rate risk and credit risk. U.S. GAAP requires disclosures to enable investors to better understand how and why a Fund uses derivative instruments, how these derivative instruments are accounted for and their effects on the Fund’s financial position and results of operations.
The Funds may utilize derivatives for the following purposes:
Duration: the use of an instrument to manage the interest rate risk of a portfolio.
Hedge: an investment made in order to reduce the risk of adverse price movements in a security, by taking an offsetting position to protect against broad market moves.
Income: the use of any instrument that distributes cash flows typically based upon some rate of interest.
Index Exposure: the use of an instrument to obtain exposure to a listed or other type of index.
Options Purchased and Written
A call option on a security gives the purchaser of the option the right to buy, and the writer of a call option the obligation to sell, the underlying security. The purchaser of a put option has the right to sell, and the writer of the put option the obligation to buy, the underlying security at any time during the option period. The risk associated with purchasing options is limited to the premium originally paid.
The following table represents the Funds’ use and volume of call/put options purchased on a monthly basis:
| | | | Average Notional Amount | |
Fund | Use | | Call | | | Put | |
Investment Grade Bond Fund | Hedge | | $ | — | | | $ | 868,666,667 | |
Futures Contracts
A futures contract is an agreement to purchase (long) or sell (short) an agreed amount of securities or other instruments at a set price for delivery at a future date. There are significant risks associated with a Fund’s use of futures contracts, including (i) there may be an imperfect or no correlation between the changes in market value of the underlying asset and the prices of futures contracts; (ii) there may not be a liquid secondary market for a futures contract; (iii) trading restrictions or limitations may be imposed by an exchange; and (iv) government regulations may restrict trading in futures contracts. When investing in futures, there is minimal counterparty credit risk to a Fund because futures are exchange-traded and the exchange’s clearinghouse, as counterparty to all exchange-traded futures, guarantees against default. Cash deposits are shown as segregated cash with broker on the Statements of Assets and Liabilities; securities held as collateral are noted on the Schedules of Investments.
The following table represents the Funds’ use and volume of futures on a monthly basis:
| | | | Average Notional Amount | |
Fund | Use | | Long | | | Short | |
Diversified Income Fund | Hedge | | $ | — | | | $ | — | * |
Investment Grade Bond Fund | Duration, Hedge, Income | | | — | | | | 2,314,323 | |
* | Futures contracts were outstanding for 7 days during the period ended March 31, 2020. The daily average outstanding notional amount of futures contracts during the period was $1,020,471. |
Swap Agreements
A swap is an agreement that obligates two parties to exchange a series of cash flows at specified intervals based upon or calculated by reference to changes in specified prices or rates for a specified amount of an underlying asset. When utilizing OTC swaps, a fund bears the risk of loss of the amount expected to be received under a swap agreement in the event of the default or bankruptcy of a swap agreement counterparty or if
82 | THE GUGGENHEIM FUNDS SEMI-ANNUAL REPORT | |
NOTES TO FINANCIAL STATEMENTS (Unaudited)(continued) |
the underlying asset declines in value. Certain standardized swaps are subject to mandatory central clearing and are executed on a multi-lateral or other trade facility platform, such as a registered exchange. There is limited counterparty credit risk with respect to centrally-cleared swaps as the transaction is facilitated through a central clearinghouse, much like exchange-traded futures contracts. For a fund utilizing centrally cleared swaps, the exchange bears the risk of loss resulting from a counterparty not being able to pay. There is no guarantee that a fund or an underlying fund could eliminate its exposure under an outstanding swap agreement by entering into an offsetting swap agreement with the same or another party.
Total return swaps involve commitments where single or multiple cash flows are exchanged based on the price of an underlying reference asset (such as an index) for a fixed or variable interest rate. Total return swaps will usually be computed based on the current value of the reference asset as of the close of regular trading on the NYSE or other exchange, with the swap value being adjusted to include dividends accrued, financing charges and/or interest associated with the swap agreement. When utilizing total return swaps, a fund bears the risk of loss of the amount expected to be received under a swap agreement in the event of the default or bankruptcy of a swap agreement counterparty or if the underlying reference asset declines in value.
The following table represents the Funds’ use and volume of total return swaps on a monthly basis:
| | | | Average Notional Amount | |
Fund | Use | | Long | | | Short | |
Investment Grade Bond Fund | Income | | $ | 2,968,257 | | | $ | 7,284,119 | |
Interest rate swaps involve the exchange by the Funds with another party for their respective commitment to pay or receive a fixed or variable interest rate on a notional amount of principal. Interest rate swaps are generally centrally-cleared, but central clearing does not make interest rate swap transactions risk free.
The following table represents the Funds’ use and volume of interest rate swaps on a monthly basis:
| | | | Average Notional Amount | |
Fund | Use | | Pay Floating Rate | | | Receive Floating Rate | |
Investment Grade Bond Fund | Duration, Hedge | | $ | 112,303,833 | | | $ | 8,585,500 | |
Credit default swaps are instruments which allow for the full or partial transfer of third party credit risk, with respect to a particular entity or entities, from one counterparty to the other. A fund enters into credit default swaps as a “seller” or “buyer” of protection primarily to gain or reduce exposure to the investment grade and/or high yield bond market. A seller of credit default swaps is selling credit protection or assuming credit risk with respect to the underlying entity or entities. The buyer in a credit default swap is obligated to pay the seller a periodic stream of payments over the term of the contract provided that no event of default on an underlying reference obligation has occurred. If a credit event occurs, as defined under the terms of the swap agreement, the seller will either (i) pay to the buyer of protection an amount equal to the notional amount of the swap and take delivery of the referenced obligation or underlying securities comprising the referenced index or (ii) pay a net settlement amount in the form of cash or securities equal to the notional amount of the swap less the recovery value of the referenced obligation or underlying securities comprising the referenced index. The notional amount reflects the maximum potential amount the seller of credit protection could be required to pay to the buyer if a credit event occurs. The seller of protection receives periodic premium payments from the buyer and may also receive or pay an upfront premium adjustment to the stated periodic payments. In the event a credit default occurs on a credit default swap referencing an index, a factor adjustment will take place and the buyer of protection will receive a payment reflecting the par less the default recovery rate of the defaulted index component based on its weighting in the index. If no default occurs, the counterparty will pay the stream of payments and have no further obligations to the fund selling the credit protection. For a fund utilizing centrally cleared credit default swaps, the exchange bears the risk of loss resulting from a counterparty not being able to pay. For OTC credit default swaps, a fund bears the risk of loss of the amount expected to be received under a swap agreement in the event of the default or bankruptcy of a swap agreement counterparty, or in the case of a credit default swap in which a fund is selling credit protection, the default of a third party issuer.
| | THE GUGGENHEIM FUNDS SEMI-ANNUAL REPORT | 83 |
NOTES TO FINANCIAL STATEMENTS (Unaudited)(continued) |
The quoted market prices and resulting market values for credit default swap agreements on securities and credit indices serve as an indicator of the current status of the payment/performance risk and represent the likelihood of an expected liability (or profit) for the credit derivative had the notional amount of the swap agreement been closed/sold as of the period end. Increasing market values, in absolute terms when compared to the notional amount of the swap, represent a deterioration of the referenced entity’s credit soundness and a greater likelihood or risk of default or other credit event occurring as defined under the terms of the agreement.
The following table represents the Funds’ use and volume of credit default swaps on a monthly basis:
| | | | Average Notional Amount | |
Fund | Use | | Protection Sold | | | Protection Purchased | |
Investment Grade Bond Fund | Hedge, Index Exposure | | $ | 29,822,167 | | | $ | 116,200,000 | |
Forward Foreign Currency Exchange Contracts
A forward foreign currency exchange contract is an agreement between two parties to exchange two designated currencies at a specific time in the future. Certain types of contracts may be cash settled, in an amount equal to the change in exchange rates during the term of the contract. The contracts can be used to hedge or manage exposure to foreign currency risks with portfolio investments or to gain exposure to foreign currencies.
The market value of a forward foreign currency exchange contract changes with fluctuations in foreign currency exchange rates. Furthermore, the Funds may be exposed to risk if the counterparties cannot meet the contract terms or if the currency value changes unfavorably as compared to the U.S. dollar.
The following table represents the Funds’ use, and volume of forward foreign currency exchange contracts on a monthly basis:
| | | | Average Value | |
Fund | Use | | Purchased | | | Sold | |
High Yield Fund | Hedge | | $ | 170,793 | | | $ | 3,935,632 | |
Investment Grade Bond Fund | Hedge, Income | | | 22,725,048 | | | | 128,054,042 | |
Derivative Investment Holdings Categorized by Risk Exposure
The following is a summary of the location of derivative investments on the Funds’ Statements of Assets and Liabilities as of March 31, 2020:
Derivative Investment Type | Asset Derivatives | Liability Derivatives |
Equity/Interest Rate contracts | Variation margin on futures contracts | Variation margin on futures contracts |
Interest Rate contracts | Investments in unaffiliated, at value | |
Credit/Interest Rate contracts | Unrealized appreciation on OTC swap agreements | Unrealized depreciation on OTC swap agreements |
| | Unamortized upfront premiums paid on interest rate swap agreements | Unamortized upfront premiums received on credit default swap agreements |
| | | Variation margin on credit default swap agreements |
| | | Variation margin on interest rate swap agreements |
Currency contracts | Unrealized appreciation on forward foreign currency exchange contracts | Unrealized depreciation on forward foreign currency exchange contracts |
84 | THE GUGGENHEIM FUNDS SEMI-ANNUAL REPORT | |
NOTES TO FINANCIAL STATEMENTS (Unaudited)(continued) |
The following table sets forth the fair value of the Funds’ derivative investments categorized by primary risk exposure at March 31, 2020:
Asset Derivative Investments Value |
Fund | | Futures
Equity
Risk* | | | Futures
Interest
Rate
Risk* | | | Swaps
Interest
Rate
Risk* | | | Swaps
Credit
Risk* | | | Options
Purchased
Interest Rate
Risk | | | Forward
Foreign
Currency
Exchange
Risk | | | Total Value at
March 31,
2020 | |
High Yield Fund | | $ | — | | | $ | — | | | $ | — | | | $ | — | | | $ | — | | | $ | 100,529 | | | $ | 100,529 | |
Investment Grade Bond Fund | | | — | | | | — | | | | 1,895,212 | | | | 2,557,359 | | | | 1,712,750 | | | | 8,055,604 | | | | 14,220,925 | |
Liability Derivative Investments Value |
Fund | | Futures
Equity
Risk* | | | Futures
Interest
Rate
Risk* | | | Swaps
Interest
Rate
Risk* | | | Swaps
Credit
Risk* | | | Options
Purchased
Interest Rate
Risk | | | Forward
Foreign
Currency
Exchange
Risk | | | Total Value at
March 31,
2020 | |
Diversified Income Fund | | $ | 77,117 | | | $ | — | | | $ | — | | | $ | — | | | $ | — | | | $ | — | | | $ | 77,117 | |
Investment Grade Bond Fund | | | — | | | | 10,470 | | | | — | | | | — | | | | — | | | | 2,171,299 | | | | 2,181,769 | |
* | Includes cumulative appreciation (depreciation) of futures contracts and OTC and centrally-cleared swap agreements as reported on the Schedules of Investments. For futures contracts and centrally-cleared swap agreements, variation margin is reported within the Statements of Assets and Liabilities. |
The following is a summary of the location of derivative investments on the Funds’ Statements of Operations for the period ended March 31, 2020:
Derivative Investment Type | Location of Gain (Loss) on Derivatives |
Equity/Interest Rate contracts | Net realized gain (loss) on futures contracts |
| Net change in unrealized appreciation (depreciation) on futures contracts |
Interest Rate/Credit contracts | Net realized gain (loss) on swap agreements |
| Net change in unrealized appreciation (depreciation) on swap agreements |
Currency contracts | Net realized gain (loss) on forward foreign currency exchange contracts |
| | Net change in unrealized appreciation (depreciation) on forward foreign currency exchange contracts |
Interest Rate contracts | Net change in unrealized appreciation (depreciation) on options purchased |
The following is a summary of the Funds’ realized gain (loss) and change in unrealized appreciation (depreciation) on derivative investments recognized on the Statements of Operations categorized by primary risk exposure for the period ended March 31, 2020:
Realized Gain (Loss) on Derivative Investments Recognized on the Statements of Operations |
Fund | | Futures
Equity
Risk | | | Futures
Interest
Rate
Risk | | | Swaps
Interest
Rate
Risk | | | Swaps
Credit
Risk | | | Options
Purchased
Interest Rate
Risk | | | Forward
Foreign
Currency
Exchange
Risk | | | Total | |
High Yield Fund | | $ | — | | | $ | — | | | $ | — | | | $ | — | | | $ | — | | | $ | (69,475 | ) | | $ | (69,475 | ) |
Investment Grade Bond Fund | | | — | | | | 519,684 | | | | 1,028,565 | | | | 2,178,778 | | | | — | | | | 770,175 | | | | 4,497,202 | |
| | THE GUGGENHEIM FUNDS SEMI-ANNUAL REPORT | 85 |
NOTES TO FINANCIAL STATEMENTS (Unaudited)(continued) |
Change in Unrealized Appreciation (Depreciation) on Derivative Investments Recognized on the Statements of Operations |
Fund | | Futures
Equity
Risk | | | Futures
Interest
Rate
Risk | | | Swaps
Interest
Rate
Risk | | | Swaps
Credit
Risk | | | Options
Purchased
Interest Rate
Risk | | | Forward
Foreign
Currency
Exchange
Risk | | | Total | |
Diversified Income Fund | | $ | (77,117 | ) | | $ | — | | | $ | — | | | $ | — | | | $ | — | | | $ | — | | | $ | (77,117 | ) |
High Yield Fund | | | — | | | | — | | | | — | | | | — | | | | — | | | | 77,793 | | | | 77,793 | |
Investment Grade Bond Fund | | | — | | | | (10,470 | ) | | | 2,250,531 | | | | 4,309,283 | | | | 362,114 | | | | 3,450,665 | | | | 10,362,123 | |
In conjunction with the use of derivative instruments, the Funds are required to maintain collateral in various forms. Depending on the financial instrument utilized and the broker involved, the Funds use margin deposits at the broker, cash and/or securities segregated at the custodian bank, discount notes or repurchase agreements allocated to the Funds as collateral.
Foreign Investments
There are several risks associated with exposure to foreign currencies, foreign issuers and emerging markets. A Fund’s indirect and direct exposure to foreign currencies subjects the Fund to the risk that those currencies will decline in value relative to the U.S. dollar, or in the case of short positions, that the U.S. dollar will decline in value relative to the currency being hedged. Currency rates in foreign countries may fluctuate significantly over short periods of time for a number of reasons, including changes in interest rates and the imposition of currency controls or other political developments in the U.S. or abroad. In addition, the Fund may incur transaction costs in connection with conversions between various currencies. The Fund may, but is not obligated to, engage in currency hedging transactions, which generally involve buying currency forward, options or futures contracts. However, not all currency risks may be effectively hedged, and in some cases the costs of hedging techniques may outweigh expected benefits. In such instances, the value of securities denominated in foreign currencies can change significantly when foreign currencies strengthen or weaken relative to the U.S. dollar.
The Fund may invest in securities of foreign companies directly, or in financial instruments, such as ADRs and exchange-traded funds, which are indirectly linked to the performance of foreign issuers. Foreign markets can be more volatile than the U.S. market due to increased risks of adverse issuer, political, regulatory, market, or economic developments and can perform differently from the U.S. market. Investing in securities of foreign companies directly, or in financial instruments that are indirectly linked to the performance of foreign issuers, may involve risks not typically associated with investing in U.S. issuers. The value of securities denominated in foreign currencies, and of dividends from such securities, can change significantly when foreign currencies strengthen or weaken relative to the U.S. dollar. Foreign securities markets generally have less trading volume and less liquidity than U.S. markets, and prices in some foreign markets may fluctuate more than those of securities traded on U.S. markets. Many foreign countries lack accounting and disclosure standards comparable to those that apply to U.S. companies, and it may be more difficult to obtain reliable information regarding a foreign issuer’s financial condition and operations. Transaction costs and costs associated with custody services are generally higher for foreign securities than they are for U.S. securities. Some foreign governments levy withholding taxes against dividend and interest income. Although in some countries portions of these taxes are recoverable, the non-recovered portion will reduce the income received by the Fund.
The Trust has established counterparty credit guidelines and enters into transactions only with financial institutions of investment grade or better. The Trust monitors the counterparty credit risk.
Note 3 – Offsetting
In the normal course of business, the Funds enter into transactions subject to enforceable master netting arrangements or other similar arrangements. Generally, the right to offset in those agreements allows the Funds to counteract the exposure to a specific counterparty with collateral received from or delivered to that counterparty based on the terms of the arrangements. These arrangements provide for the right to liquidate upon the occurrence of an event of default, credit event upon merger or additional termination event.
In order to better define their contractual rights and to secure rights that will help the Funds mitigate their counterparty risk, the Funds may enter into an International Swaps and Derivatives Association, Inc. Master Agreement (“ISDA Master Agreement”) or similar agreement with their derivative contract counterparties. An ISDA Master Agreement is a bilateral agreement between a fund and a counterparty that governs
86 | THE GUGGENHEIM FUNDS SEMI-ANNUAL REPORT | |
NOTES TO FINANCIAL STATEMENTS (Unaudited)(continued) |
OTC derivatives, including foreign exchange contracts, and typically contains, among other things, collateral posting terms and netting provisions in the event of a default and/or termination event. The provisions of the ISDA Master Agreement typically permit a single net payment in the event of a default (close-out netting) or similar event, including the bankruptcy or insolvency of the counterparty.
For derivatives traded under an ISDA Master Agreement, the collateral requirements are typically calculated by netting the mark-to-market amount for each transaction under such agreement and comparing that amount to the value of any collateral currently pledged by the Funds and the counterparty. For financial reporting purposes, cash collateral that has been pledged to cover obligations of the Funds and cash collateral received from the counterparty, if any, are reported separately on the Statements of Assets and Liabilities as segregated cash with broker/receivable for variation margin, or payable for swap settlement/variation margin. Cash and/or securities pledged or received as collateral by the Funds in connection with an OTC derivative subject to an ISDA Master Agreement generally may not be invested, sold or rehypothecated by the counterparty or the Funds, as applicable, absent an event of default under such agreement, in which case such collateral generally may be applied towards obligations due to and payable by such counterparty or the Funds, as applicable. Generally, the amount of collateral due from or to a counterparty must exceed a minimum transfer amount threshold (e.g., $300,000) before a transfer is required to be made. To the extent amounts due to the Funds from their counterparties are not fully collateralized, contractually or otherwise, the Funds bear the risk of loss from counterparty nonperformance. The Funds attempt to mitigate counterparty risk by only entering into agreements with counterparties that they believe to be of good standing and by monitoring the financial stability of those counterparties.
For financial reporting purposes, the Funds do not offset derivative assets and derivative liabilities that are subject to netting arrangements in the Statements of Assets and Liabilities.
The following tables present derivative financial instruments and secured financing transactions that are subject to enforceable netting arrangements:
| | | | | | | | | | | | | | | | Gross Amounts Not Offset
in the Statements of
Assets and Liabilities | | | | | |
Fund | Instrument | | Gross
Amounts of
Recognized
Assets1 | | | Gross
Amounts
Offset in the
Statements
of Assets and
Liabilities | | | Net Amount
of Assets
Presented on
the Statements
of Assets and
Liabilities | | | Financial
Instruments | | | Cash
Collateral
Received | | | Net
Amount | |
High Yield Fund | Forward foreign currency exchange contracts | | $ | 100,529 | | | $ | — | | | $ | 100,529 | | | $ | — | | | $ | — | | | $ | 100,529 | |
Investment Grade Bond Fund | Forward foreign currency exchange contracts | | | 8,055,604 | | | | — | | | | 8,055,604 | | | | (2,079,734 | ) | | | (5,494,195 | ) | | | 481,675 | |
| | Total return swap agreements | | | 1,943 | | | | — | | | | 1,943 | | | | — | | | | — | | | | 1,943 | |
| | Options purchased contracts | | | 1,712,750 | | | | — | | | | 1,712,750 | | | | — | | | | 1,653,826 | | | | 58,924 | |
| | | | | | | | | | | | | | | | Gross Amounts Not Offset
in the Statements of
Assets and Liabilities | | | | | |
Fund | Instrument | | Gross
Amounts of
Recognized
Liabilities1 | | | Gross
Amounts
Offset in the
Statements
of Assets and
Liabilities | | | Net Amount
of Liabilities
Presented on
the Statements
of Assets and
Liabilities | | | Financial
Instruments | | | Cash
Collateral
Pledged | | | Net
Amount | |
Investment Grade Bond Fund | Forward foreign currency exchange contracts | | $ | 2,171,299 | | | $ | — | | | $ | 2,171,299 | | | $ | (2,079,734 | ) | | $ | — | | | $ | 91,565 | |
1 | Exchange-traded or centrally-cleared derivatives are excluded from these reported amounts. |
| | THE GUGGENHEIM FUNDS SEMI-ANNUAL REPORT | 87 |
NOTES TO FINANCIAL STATEMENTS (Unaudited)(continued) |
The Funds have the right to offset deposits against any related derivative liabilities outstanding with each counterparty with the exception of exchange-traded or centrally-cleared derivatives. The following table presents deposits held by others in connection with derivative investments as of March 31, 2020.
Fund | Counterparty | Asset Type | | Cash Pledged | | | Cash Received | |
Diversified Income Fund | BofA Securities, Inc. | Futures contracts | | $ | 96,000 | | | $ | — | |
High Yield Fund | Morgan Stanley Capital Services LLC | Forward foreign currency exchange contracts | | | 1,821 | | | | — | |
Investment Grade Bond Fund | BofA Securities, Inc. | Credit default swap agreements | | | 4,654,645 | | | | — | |
| | BofA Securities, Inc. | Forward foreign currency exchange contracts | | | — | | | | 325,000 | |
| | BofA Securities, Inc. | Interest rate swap agreements, Options purchased | | | 10,805,129 | | | | 1,861,589 | |
| | Citibank, N.A. | Forward foreign currency exchange contracts | | | — | | | | 2,420,000 | |
| | Goldman Sachs Group | Forward foreign currency exchange contracts, Options purchased | | | — | | | | 2,300,000 | |
| Morgan Stanley Capital Services LLC | Forward foreign currency exchange contracts, Options purchased | | | — | | | | 1,092,012 | |
Investment Grade Bond Fund Total | | | | | 15,459,774 | | | | 7,998,601 | |
Note 4 – Fair Value Measurement
In accordance with U.S. GAAP, fair value is defined as the price that the Funds would receive to sell an investment or pay to transfer a liability in an orderly transaction with an independent buyer in the principal market, or in the absence of a principal market, the most advantageous market for the investment or liability. U.S. GAAP establishes a three-tier fair value hierarchy based on the types of inputs used to value assets and liabilities and requires corresponding disclosure. The hierarchy and the corresponding inputs are summarized below:
Level 1 — | quoted prices in active markets for identical assets or liabilities. |
Level 2 — | significant other observable inputs (for example quoted prices for securities that are similar based on characteristics such as interest rates, prepayment speeds, credit risk, etc.). |
Level 3 — | significant unobservable inputs based on the best information available under the circumstances, to the extent observable inputs are not available, which may include assumptions. |
The types of inputs available depend on a variety of factors, such as the type of security and the characteristics of the markets in which it trades, if any. Fair valuation determinations that rely on fewer or no observable inputs require greater judgment. Accordingly, fair value determinations for Level 3 securities require the greatest amount of judgment.
Independent pricing services are used to value a majority of the Funds’ investments. When values are not available from a pricing service, they will be determined using a variety of sources and techniques, including: market prices; broker quotes; and models which derive prices based on inputs such as prices of securities with comparable maturities and characteristics or based on inputs such as anticipated cash flows or collateral, spread over U.S. Treasury securities, and other information and analysis. A significant portion of the Funds’ assets and liabilities are categorized as Level 2, as indicated in this report.
Quotes from broker-dealers, adjusted for fluctuations in criteria such as credit spreads and interest rates, may also be used to value the Funds’ assets and liabilities, i.e. prices provided by a broker-dealer or other market participant who has not committed to trade at that price. Although quotes are typically received from established market participants, the Funds may not have the transparency to view the underlying inputs which support the market quotations. Significant changes in a quote would generally result in significant changes in the fair value of the security.
Certain fixed income securities are valued by obtaining a monthly quote from a broker-dealer, adjusted for fluctuations in criteria such as credit spreads and interest rates.
88 | THE GUGGENHEIM FUNDS SEMI-ANNUAL REPORT | |
NOTES TO FINANCIAL STATEMENTS (Unaudited)(continued) |
Certain loans and other securities are valued using a single daily broker quote or a price from a third party vendor based on a single daily or monthly broker quote.
The inputs or methodologies used for valuing securities are not necessarily an indication of the risk associated with investing in those securities. The suitability of the techniques and sources employed to determine fair valuation are regularly monitored and subject to change.
Note 5 – Investment Advisory Agreement and Other Agreements
Under the terms of an investment advisory contract, the Funds pay GI investment advisory fees calculated at the annualized rates below, based on the average daily net assets of the Funds:
Fund | | Management Fees
(as a % of Net Assets) | |
Diversified Income Fund | | | 0.75% | |
High Yield Fund | | | 0.60% | |
Investment Grade Bond Fund | | | 0.39% | |
Municipal Income Fund | | | 0.50% | |
GI pays operating expenses on behalf of the Trust, such as audit and accounting related services, legal services, custody, printing and mailing, among others, on a pass-through basis. Such expenses are allocated to various Funds within the complex based on relative net assets.
The Board has adopted Distribution Plans related to the offering of A-Class, C-Class and P-Class shares pursuant to Rule 12b-1 under the 1940 Act. The plans provide for payments at an annual rate of 0.25% of the average daily net assets of the Fund’s A-Class and P-Class shares, and 1.00% of the average daily net assets of the Fund’s C-Class shares.
Contractual expense limitation agreements for the following Funds provide that the total expenses be limited to a percentage of average net assets for each class of shares, exclusive of brokerage costs, dividends or interest on securities sold short, expenses of other investment companies in which a Fund invests, interest, taxes, litigation, indemnification and extraordinary expenses. The limits are listed below:
| | Limit | | | Effective
Date | | | Contract
End Date | |
Diversified Income Fund - A-Class | | | 1.30% | | | | 01/29/16 | | | | 02/01/21 | |
Diversified Income Fund - C-Class | | | 2.05% | | | | 01/29/16 | | | | 02/01/21 | |
Diversified Income Fund - P-Class | | | 1.30% | | | | 01/29/16 | | | | 02/01/21 | |
Diversified Income Fund - Institutional Class | | | 1.05% | | | | 01/29/16 | | | | 02/01/21 | |
High Yield Fund A-Class | | | 1.16% | | | | 11/30/12 | | | | 02/01/21 | |
High Yield Fund C-Class | | | 1.91% | | | | 11/30/12 | | | | 02/01/21 | |
High Yield Fund P-Class | | | 1.16% | | | | 05/01/15 | | | | 02/01/21 | |
High Yield Fund - Institutional Class | | | 0.91% | | | | 11/30/12 | | | | 02/01/21 | |
High Yield Fund - R6-Class | | | 0.91% | | | | 05/15/17 | | | | 02/01/21 | |
Investment Grade Bond Fund - A-Class | | | 0.79% | | | | 11/30/12 | | | | 02/01/21 | |
Investment Grade Bond Fund - C-Class | | | 1.54% | | | | 11/30/12 | | | | 02/01/21 | |
Investment Grade Bond Fund - P-Class | | | 0.79% | | | | 05/01/15 | | | | 02/01/21 | |
Investment Grade Bond Fund - Institutional Class | | | 0.50% | | | | 11/30/12 | | | | 02/01/21 | |
Municipal Income Fund - A-Class | | | 0.80% | | | | 11/30/12 | | | | 02/01/21 | |
Municipal Income Fund - C-Class | | | 1.55% | | | | 11/30/12 | | | | 02/01/21 | |
Municipal Income Fund - P-Class | | | 0.80% | | | | 05/01/15 | | | | 02/01/21 | |
Municipal Income Fund - Institutional Class | | | 0.55% | | | | 11/30/12 | | | | 02/01/21 | |
| | THE GUGGENHEIM FUNDS SEMI-ANNUAL REPORT | 89 |
NOTES TO FINANCIAL STATEMENTS (Unaudited)(continued) |
GI is entitled to reimbursement by the Funds for fees waived or expenses reimbursed during any of the previous 36 months, beginning on the date of the expense limitation agreement, if on any day the estimated operating expenses are less than the indicated percentages. For purposes of this arrangement, GI is entitled to recoupment of previously waived fees or reimbursed expenses for 36 months from the date of the waiver or reimbursement by GI. At March 31, 2020, the amount of fees waived or expenses reimbursed that are subject to recoupment and will expire during the years ended September 30, are presented in the following table:
Fund | | 2020 | | | 2021 | | | 2022 | | | 2023 | | | Total | |
Diversified Income Fund | | | | | | | | | | | | | | | | | | | | |
A-Class | | $ | 3,873 | | | $ | 4,873 | | | $ | 4,237 | | | $ | 3,876 | | | $ | 16,859 | |
C-Class | | | 3,893 | | | | 5,069 | | | | 14,152 | | | | 10,202 | | | | 33,316 | |
P-Class | | | 3,402 | | | | 4,482 | | | | 3,371 | | | | 1,839 | | | | 13,094 | |
Institutional Class | | | 148,686 | | | | 191,684 | | | | 148,929 | | | | 80,882 | | | | 570,181 | |
High Yield Fund | | | | | | | | | | | | | | | | | | | | |
A-Class | | | — | | | | — | | | | 1,600 | | | | 2,597 | | | | 4,197 | |
C-Class | | | 10,048 | | | | 3,674 | | | | 2,743 | | | | 771 | | | | 17,236 | |
P-Class | | | 1,904 | | | | 8,622 | | | | 1,761 | | | | 693 | | | | 12,980 | |
Institutional Class | | | — | | | | — | | | | — | | | | — | | | | — | |
R6-Class | | | — | | | | — | | | | — | | | | — | | | | — | |
Investment Grade Bond Fund | | | | | | | | | | | | | | | | | | | | |
A-Class | | | 77,376 | | | | 156,533 | | | | 114,831 | | | | 55,689 | | | | 404,429 | |
C-Class | | | 25,128 | | | | 43,011 | | | | 23,323 | | | | 12,851 | | | | 104,313 | |
P-Class | | | 806 | | | | 42,627 | | | | 66,557 | | | | 38,187 | | | | 148,177 | |
Institutional Class | | | 18,798 | | | | 174,956 | | | | 535,891 | | | | 398,983 | | | | 1,128,628 | |
Municipal Income Fund | | | | | | | | | | | | | | | | | | | | |
A-Class | | | 58,980 | | | | 147,177 | | | | 153,746 | | | | 95,875 | | | | 455,778 | |
C-Class | | | 7,511 | | | | 17,294 | | | | 11,587 | | | | 4,592 | | | | 40,984 | |
P-Class | | | 472 | | | | 634 | | | | 838 | | | | 702 | | | | 2,646 | |
Institutional Class | | | 31,185 | | | | 67,892 | | | | 58,964 | | | | 30,723 | | | | 188,764 | |
For the period ended March 31, 2020, GI recouped amounts from the Funds as follows:
High Yield Fund | | $ | 68,595 | |
Investment Grade Bond Fund | | | 2,505 | |
Municipal Income Fund | | | 5 | |
If a Fund invests in a fund that is advised by the same adviser or an affiliated adviser, the investing Fund’s adviser has agreed to waive fees at the investing fund level to the extent necessary to offset the proportionate share of any management fee paid by each Fund with respect to its investment in such affiliated fund. Fee waivers will be calculated at the investing Fund level without regard to any expense cap in effect for the investing Fund. Fees waived under this arrangement are not subject to reimbursement to GI. For the period ended March 31, 2020, the following Funds waived fees related to investments in affiliated funds:
Fund | | Amount Waived | |
Diversified Income Fund | | $ | 17,594 | |
Investment Grade Bond Fund | | | 620 | |
For the period ended March 31, 2020, GFD retained sales charges of $87,029 relating to sales of A-Class shares of the Trust.
Certain trustees and officers of the Trust are also officers of GI and/or GFD. The Trust does not compensate its officers or trustees who are officers, directors and/or employees of GI or GFD.
MUFG Investor Services (US), LLC (“MUIS”) acts as the Funds’ administrator, transfer agent and accounting agent. As administrator, transfer agent and accounting agent, MUIS maintains the books and records of the Funds’ securities and cash. The Bank of New York Mellon Corp. (“BNY”) acts as the Funds’ custodian. As custodian, BNY is responsible for the custody of the Funds’ assets. For providing the aforementioned administrative and accounting services, MUIS is entitled to receive a monthly fee equal to a percentage of the Funds’ average daily net assets
90 | THE GUGGENHEIM FUNDS SEMI-ANNUAL REPORT | |
NOTES TO FINANCIAL STATEMENTS (Unaudited)(continued) |
and out of pocket expenses. For providing the aforementioned transfer agent and custodian services, MUIS and BNY are entitled to receive a monthly fee based on the number of transactions during the month and the number of accounts under management, subject to certain minimum monthly fees, and out of pocket expenses.
At March 31, 2020, GI and its affiliates owned over twenty percent of the outstanding shares of the Funds, as follows:
Fund | | Percent of Outstanding
Shares Owned | |
Diversified Income Fund | | | 95 | % |
Note 6 – Reverse Repurchase Agreements
Each of the Funds may enter into reverse repurchase agreements. Under a reverse repurchase agreement, a Fund sells securities and agrees to repurchase them at a particular price at a future date. In the event the buyer of securities under a reverse repurchase agreement files for bankruptcy or becomes insolvent, such buyer or its trustee or receiver may receive an extension of time to determine whether to enforce the Fund’s obligation to repurchase the securities, and the Fund’s use of the proceeds of the reverse repurchase agreement may effectively be restricted pending such decision.
For the period ended March 31, 2020, the following Funds entered into reverse repurchase agreements:
Fund | | Number of Days
Outstanding | | | Balance at
March 31, 2020 | | | Average Balance
Outstanding | | | Average
Interest Rate | |
High Yield Fund | 183 | | $ | 20,875,801 | | | $ | 26,554,543 | | | | 1.84 | % |
Investment Grade Bond Fund | 6 | | | — | * | | | 17,193,030 | | | | (3.73 | %) |
* | As of March 31, 2020, Investment Grade Bond Fund did not have any open reverse repurchase agreements. |
The following table presents reverse repurchase agreements that are subject to netting arrangements and offset in the Statements of Assets and Liabilities in conformity with U.S. GAAP:
| | | | | | | | | | | | | | Gross Amounts Not Offset
in the Statements of
Assets and Liabilities | | | | |
| Fund | | Instrument | | Gross
Amounts of
Recognized
Liabilities | | | Gross
Amounts
Offset in the
Statements
of Assets and
Liabilities | | | Net Amount
of Liabilities
Presented on
the Statements
of Assets and
Liabilities | | | Financial
Instruments | | | Cash
Collateral
Pledged | | | Net
Amount | |
| High Yield Fund | | Reverse repurchase agreements | | $ | 20,875,801 | | | $ | — | | | $ | 20,875,801 | | | $ | (20,875,801 | ) | | $ | — | | | $ | — | |
| | THE GUGGENHEIM FUNDS SEMI-ANNUAL REPORT | 91 |
NOTES TO FINANCIAL STATEMENTS (Unaudited)(continued) |
As of March 31, 2020, there was $20,875,801 in reverse repurchase agreements outstanding. The High Yield Fund had outstanding reverse repurchase agreements with various counterparties. Details of the reverse repurchase agreements by counterparty are as follows:
Counterparty | | Interest
Rate(s) | | | Maturity
Date(s) | | | Face
Value | |
Barclays Capital, Inc. | (1.25%) | Open Maturity | | $ | 546,941 | |
BMO Capital Markets Corp. | 1.45% - 1.50% | Open Maturity | | | 1,755,904 | |
BofA Securities, Inc. | 1.65% | 04/13/20 | | | 2,416,519 | |
Credit Suisse Securities (USA) LLC | 0.50% - 2.00% | Open Maturity | | | 7,881,303 | |
J.P. Morgan Securities LLC | 0.75% - 2.75% | Open Maturity | | | 5,872,013 | |
RBC Capital Markets LLC | 1.40% | Open Maturity | | | 2,403,121 | |
| | | | | | | | | | | $ | 20,875,801 | |
The following is a summary of the remaining contractual maturities of the reverse repurchase agreements outstanding as of period-end, aggregated by asset class of the related collateral pledged by the Fund:
Fund | | Asset
Type | | | Overnight and
Continuous | | | Up to
30 Days | | | Total | |
High Yield Fund | Corporate Bonds | | $ | 18,459,282 | | | $ | 2,416,519 | | | $ | 20,875,801 | |
Gross amount of recognized liabilities for reverse repurchase agreements | | | $ | 18,459,282 | | | $ | 2,416,519 | | | $ | 20,875,801 | |
Note 7 – Federal Income Tax Information
The Funds intend to comply with the provisions of Subchapter M of the Internal Revenue Code applicable to regulated investment companies and will distribute substantially all taxable net investment income and capital gains sufficient to relieve the Funds from all, or substantially all, federal income, excise and state income taxes. Therefore, no provision for federal or state income tax or federal excise tax is required.
Tax positions taken or expected to be taken in the course of preparing the Funds’ tax returns are evaluated to determine whether the tax positions are “more-likely-than-not” of being sustained by the applicable tax authority. Tax positions not deemed to meet the more-likely-than-not threshold would be recorded as a tax benefit or expense in the current year. Management has analyzed the Funds’ tax positions taken, or to be taken, on U.S. federal income tax returns for all open tax years, and has concluded that no provision for income tax is required in the Funds’ financial statements. The Funds’ U.S. federal income tax returns are subject to examination by the Internal Revenue Service (“IRS”) for a period of three years after they are filed.
At March 31, 2020, the cost of investments for U.S. federal income tax purposes, the aggregate gross unrealized appreciation for all investments for which there was an excess of value over tax cost, and the aggregate gross unrealized depreciation for all investments for which there was an excess of tax cost over value, were as follows:
Fund | | Tax
Cost | | | Tax
Unrealized
Appreciation | | | Tax
Unrealized
Depreciation | | | Net Unrealized
Appreciation
(Depreciation) | |
Diversified Income Fund | | $ | 6,430,998 | | | $ | 66,135 | | | $ | (673,750 | ) | | $ | (607,615 | ) |
High Yield Fund | | | 383,119,349 | | | | 1,633,600 | | | | (52,433,510 | ) | | | (50,799,910 | ) |
Investment Grade Bond Fund | | | 916,883,118 | | | | 46,732,007 | | | | (24,750,170 | ) | | | 21,981,837 | |
Municipal Income Fund | | | 55,431,289 | | | | 2,281,517 | | | | (484,137 | ) | | | 1,797,380 | |
92 | THE GUGGENHEIM FUNDS SEMI-ANNUAL REPORT | |
NOTES TO FINANCIAL STATEMENTS (Unaudited)(continued) |
Note 8 – Securities Transactions
For the period ended March 31, 2020, the cost of purchases and proceeds from sales of investment securities, excluding government securities, short-term investments and derivatives, were as follows:
Fund | | Purchases | | | Sales | |
Diversified Income Fund | | $ | 2,320,572 | | | $ | 2,925,152 | |
High Yield Fund | | | 106,046,428 | | | | 219,940,263 | |
Investment Grade Bond Fund | | | 410,595,908 | | | | 398,172,860 | |
Municipal Income Fund | | | 19,480,418 | | | | 23,214,653 | |
For the period ended March 31, 2020, the cost of purchases and proceeds from sales of government securities were as follows:
Fund | | Purchases | | | Sales | |
Investment Grade Bond Fund | | $ | 169,597,634 | | | $ | 168,060,287 | |
The Funds are permitted to purchase or sell securities from or to certain affiliated funds under specified conditions outlined in procedures adopted by the Board. The procedures have been designed to ensure that any purchase or sale of securities by a Fund from or to another fund or portfolio that is or could be considered an affiliate by virtue of having a common investment adviser (or affiliated investment advisers), common trustees and/or common officers complies with Rule 17a-7 of the 1940 Act. Further, as defined under these procedures, each transaction is effected at the current market price to save costs, where permissible. For the period ended March 31, 2020, the Funds engaged in purchases and sales of securities, pursuant to Rule 17a-7 of the 1940 Act, as follows:
Fund | | Purchases | | | Sales | | | Realized
Gain (Loss) | |
High Yield Fund | | $ | 1,502,413 | | | $ | 1,888,594 | | | $ | 85,457 | |
Investment Grade Bond Fund | | | 1,667,107 | | | | 47,763 | | | | (2,325 | ) |
Note 9 – Unfunded Loan Commitments
Pursuant to the terms of certain loan agreements, certain Funds held unfunded loan commitments as of March 31, 2020. The Funds are obligated to fund these loan commitments at the borrower’s discretion.
The unfunded loan commitments as of March 31, 2020, were as follows:
Fund | Borrower | | Maturity Date | | | Face Amount | | | Value | |
High Yield Fund | | | | | | | | | | | | |
| | American Express GBT | | | 02/26/27 | | | $ | 387,389 | | | $ | 56,172 | |
| | Aspect Software, Inc. | | | 07/15/23 | | | | 52,083 | | | | 579 | |
| | Cypress Intermediate Holdings III, Inc. | | | 04/27/22 | | | | 215,753 | | | | 16,413 | |
| | Epicor Software | | | 06/01/20 | | | | 1,000,000 | | | | 82,282 | |
| | National Technical Systems | | | 06/12/21 | | | | 1,875 | | | | 75 | |
| | Packaging Coordinators Midco, Inc. | | | 07/01/21 | | | | 161,538 | | | | 18,981 | |
| | Solera LLC | | | 03/03/21 | | | | 1,250,000 | | | | 32,449 | |
| | | | | | | | $ | 3,068,638 | | | $ | 206,951 | |
| | THE GUGGENHEIM FUNDS SEMI-ANNUAL REPORT | 93 |
NOTES TO FINANCIAL STATEMENTS (Unaudited)(continued) |
Note 10 – Restricted Securities
The securities below are considered illiquid and restricted under guidelines established by the Board:
Fund | Restricted Securities | | Acquisition Date | | | Cost | | | Value | |
High Yield Fund | Basic Energy Services, Inc. | | | | | | | | | | | | |
| | 10.75% due 10/15/23 | | | 09/25/18 | | | $ | 1,216,120 | | | $ | 802,375 | |
| | Beverages & More, Inc. | | | | | | | | | | | | |
| | 11.50% due 06/15/22 | | | 06/16/17 | | | | 2,925,136 | | | | 1,670,250 | |
| | Bruin E&P Partners LLC | | | | | | | | | | | | |
| | 8.88% due 08/01/23 | | | 11/05/18 | | | | 979,319 | | | | 70,560 | |
| | Mirabela Nickel Ltd. | | | | | | | | | | | | |
| | due 06/24/193 | | | 12/31/13 | | | | 252,369 | | | | 13,906 | |
| | | | | | | | $ | 5,372,944 | | | $ | 2,557,091 | |
| | | | | | | | | | | | | | |
Investment Grade Bond Fund | Central Storage Safety Project Trust | | | | | | | | | | | | |
| | 4.82% due 02/01/38 | | | 03/20/18 | | | | 1,025,005 | | | | 1,162,252 | |
| | Copper River CLO Ltd. | | | | | | | | | | | | |
| | 2007-1A, due 01/20/211 | | | 05/09/14 | | | | 137,352 | | | | 71,591 | |
| | Freddie Mac Military Housing Bonds Resecuritization Trust Certificates | | | | | | | | | | | | |
| | 2015-R1, 4.11% (WAC) due 11/25/522 | | | 07/26/19 | | | | 1,795,067 | | | | 1,859,235 | |
| | Turbine Engines Securitization Ltd. | | | | | | | | | | | | |
| | 2013-1A, 5.13% due 12/13/48 | | | 11/27/13 | | | | 420,101 | | | | 371,962 | |
| | | | | | | | $ | 3,377,525 | | | $ | 3,465,040 | |
1 | Security has no stated coupon. However, it is expected to receive residual cash flow payments on defined deal dates. |
2 | Variable rate security. Rate indicated is the rate effective at March 31, 2020. In some instances, the effective rate is limited by a minimum rate floor or a maximum rate cap established by the issuer. The settlement status of a position may also impact the effective rate indicated. In some cases, a position may be unsettled at period end and may not have a stated effective rate. In instances where multiple underlying reference rates and spread amounts are shown, the effective rate is based on a weighted average. |
3 | Security is in default of interest and/or principal obligations. |
Note 11 – Line of Credit
The Trust, along with other affiliated trusts, secured a 364-day committed, $1,205,000,000 line of credit from Citibank, N.A., which was in place through October 4, 2019, at which time the line of credit was renewed with an increased commitment amount of $1,230,000,000. A Fund may draw (borrow) from the line of credit as a temporary measure for emergency purposes, to facilitate redemption requests, or for other short-term liquidity purposes consistent with the Fund’s investment objective and program. For example, it may be advantageous for the Fund to borrow money rather than sell existing portfolio positions to meet redemption requests. Fees related to borrowings, if any, vary under this arrangement between the greater of Citibank’s “base rate”, LIBOR plus 1%, or the federal funds rate plus ½ of 1%.
The commitment fee that may be paid by the Funds is at an annualized rate of 0.15% of the average daily amount of their allocated unused commitment amount. The allocated commitment fee amount for each Fund is referenced in the Statement of Operations under “Line of credit fees” or included within “Miscellaneous”. The Funds did not have any borrowings under this agreement as of and for the period ended March 31, 2020.
Note 12 – Recent Accounting Pronouncements
In March 2017, the Financial Accounting Standards Board issued an Accounting Standards Update, ASU 2017-08, Receivables – Nonrefundable Fees and Other Costs (Subtopic 310-20), Premium Amortization on Purchased Callable Debt Securities (the “2017 ASU”) which amends the amortization period for certain purchased callable debt securities held at a premium, shortening such period to the earliest call date. The 2017 ASU does not require any accounting change for debt securities held at a discount; the discount continues to be amortized to maturity.
94 | THE GUGGENHEIM FUNDS SEMI-ANNUAL REPORT | |
NOTES TO FINANCIAL STATEMENTS (Unaudited)(concluded) |
As of October 1, 2019, the Funds have fully adopted the provisions of the 2017 ASU which were applied through a modified retrospective transition approach, as prescribed. The adoption resulted in a cumulative effect adjustment to reduce amortized cost and increase unrealized appreciation of investments for the affected Funds in the following amounts:
Fund | | Cumulative
Effect Adjustment | |
High Yield Fund | | $ | 154,867 | |
Investment Grade Bond Fund | | | 35,841 | |
The adoption had no impact on total distributable earnings (loss), net assets, the current period results from operations, or any prior period information presented in the financial statements.
Note 13 – COVID-19 and Recent Developments
The global ongoing crisis caused by the outbreak of COVID-19 is causing materially reduced consumer demand and economic output, disrupting supply chains, resulting in market closures, travel restrictions and quarantines, and adversely impacting local and global economies. Investors should be aware that in light of the current uncertainty, volatility and distress in economies, financial markets, and labor and health conditions all over the world, the Funds’ investments and a shareholder’s investment in a Fund are subject to sudden and substantial losses, increased volatility and other adverse events. Firms through which investors invest with the Funds, the Funds, their service providers, the markets in which they invest and market intermediaries are also impacted by quarantines and similar measures intended to contain the ongoing pandemic, which can obstruct their functioning and subject them to heightened operational risks.
Note 14 – Subsequent Events
The Funds evaluated subsequent events through the date the financial statements were available for issue and determined there were no material events that would require adjustment to or disclosure in the Funds’ financial statements.
| | THE GUGGENHEIM FUNDS SEMI-ANNUAL REPORT | 95 |
OTHER INFORMATION (Unaudited) |
Proxy Voting Information
A description of the policies and procedures that the Trust uses to determine how to vote proxies relating to securities held in the Funds’ portfolios is available, without charge and upon request, by calling 800.820.0888. This information is also available from the EDGAR database on the SEC’s website at https://www.sec.gov.
Information regarding how the Funds’ voted proxies relating to portfolio securities during the most recent 12-month period ended June 30 is available without charge, upon request, by calling 800.820.0888. This information is also available from the EDGAR database on the SEC’s website at https://www.sec.gov.
Sector Classification
Information in the “Schedule of Investments” is categorized by sectors using sector-level Classifications defined by the Bloomberg Industry Classification System, a widely recognized industry classification system provider. Each Fund’s registration statement has investment policies relating to concentration in specific sectors/industries. For purposes of these investment policies, the Funds usually classify sectors/industries based on industry-level Classifications used by widely recognized industry classification system providers such as Bloomberg Industry Classification System, Global Industry Classification Standards and Barclays Global Classification Scheme.
Quarterly Portfolio Schedules Information
The Trust files its complete schedule of portfolio holdings with the SEC for the first and third quarters of each fiscal year as an exhibit to its reports on Form N-PORT, and for reporting periods ended prior to March 31, 2019, filed such information on Form N-Q. The Funds’ Forms N-PORT and N-Q are available on the SEC’s website at https://www.sec.gov. The Funds’ Forms N-PORT and N-Q may be reviewed and copied at the SEC’s Public Reference Room in Washington, DC, and that information on the operation of the Public Reference Room may be obtained by calling 800-SEC-0330. Copies of the portfolio holdings are also available to shareholders, without charge and upon request, by calling 800.820.0888.
96 | THE GUGGENHEIM FUNDS SEMI-ANNUAL REPORT | |
INFORMATION ON BOARD OF TRUSTEES AND OFFICERS (Unaudited) |
A Board of Trustees oversees the Trust, as well as other trusts of GI, in which its members have no stated term of service, and continue to serve after election until resignation. The Statement of Additional Information includes further information about Fund Trustees and Officers, and can be obtained without charge by visiting guggenheiminvestments.com or by calling 800.820.0888.
Name, Address*
and Year of Birth | Position(s)
Held with
Trust | Term of Office
and Length of
Time Served** | Principal Occupation(s)
During Past Five Years | Number of
Portfolios
in Fund
Complex
Overseen | Other
Directorships Held
by Trustees*** |
INDEPENDENT TRUSTEES | | | |
Randall C. Barnes (1951) | Trustee | Since 2014 | Current: Private Investor (2001-present). Former: Senior Vice President and Treasurer, PepsiCo, Inc. (1993-1997); President, Pizza Hut International (1991-1993); Senior Vice President, Strategic Planning and New Business Development, PepsiCo, Inc. (1987-1990). | 157 | Current: Purpose Investments Funds (2013-present). Former: Managed Duration Investment Grade Municipal Fund (2006-2016). |
Angela Brock-Kyle (1959) | Trustee | Since 2019 | Current: Founder and Chief Executive Officer, B.O.A.R.D.S. (2013-present). Former: Senior Leader, TIAA (1987-2012). | 156 | Current: Hunt Companies, Inc. (2019-present). Former: Infinity Property & Casualty Corp. (2014-2018). |
Donald A. Chubb, Jr. (1946) | Trustee and Chair of the Valuation Oversight Committee | Since 1994 | Current: Retired Former: Business broker and manager of commercial real estate, Griffith & Blair, Inc. (1997-2017). | 156 | Former: Midland Care, Inc. (2011-2016). |
Jerry B. Farley (1946) | Trustee and Chair of the Audit Committee | Since 2005 | Current: President, Washburn University (1997-present). | 156 | Current: CoreFirst Bank & Trust (2000-present). Former: Westar Energy, Inc. (2004-2018). |
Roman Friedrich III (1946) | Trustee and Chair of the Contracts Review Committee | Since 2014 | Current: Founder and Managing Partner, Roman Friedrich & Company (1998-present). | 156 | Former: Zincore Metals, Inc. (2009-2019). |
Thomas F. Lydon, Jr. (1960) | Trustee and Vice Chair of the Contracts Review Committee | Since 2019 | Current: President, Global Trends Investments (1996-present); Co-Chief Executive Officer, ETF Flows, LLC (2019-present); Chief Executive Officer, Lydon Media (2016-present). | 156 | Current: US Global Investors (GROW) (1995-present). Former: Harvest Volatility Edge Trust (3) (2017-2019). |
| | THE GUGGENHEIM FUNDS SEMI-ANNUAL REPORT | 97 |
INFORMATION ON BOARD OF TRUSTEES AND OFFICERS (Unaudited)(continued) |
Name, Address*
and Year of Birth | Position(s)
Held with
Trust | Term of Office
and Length of
Time Served** | Principal Occupation(s)
During Past Five Years | Number of
Portfolios
in Fund
Complex
Overseen | Other
Directorships Held
by Trustees*** |
INDEPENDENT TRUSTEES - concluded | | |
Ronald A. Nyberg (1953) | Trustee and Chair of the Nominating and Governance Committee | Since 2014 | Current: Partner, Momkus LLC (2016-present). Former: Partner, Nyberg & Cassioppi, LLC (2000-2016); Executive Vice President, General Counsel, and Corporate Secretary, Van Kampen Investments (1982-1999). | 157 | Current: PPM Funds (9) (2018 - present); Edward-Elmhurst Healthcare System (2012-present). Former: Western Asset Inflation-Linked Opportunities & Income Fund (2004-April 2020); Western Asset Inflation-Linked Income Fund (2003-April 2020); Managed Duration Investment Grade Municipal Fund (2003-2016). |
Sandra G. Sponem (1958) | Trustee | Since 2019 | Current: Retired. Former: Senior Vice President and Chief Financial Officer, M.A. Mortenson-Companies, Inc. (2007-2017). | 156 | Current: SPDR Series Trust (78) (2018-present); SPDR Index Shares Funds (31) (2018-present); SSGA Active Trust (12) (2018-present); and SSGA Master Trust (1) (2018-present). |
Ronald E. Toupin, Jr. (1958) | Trustee, Chair of the Board and Chair of the Executive Committee | Since 2014 | Current: Portfolio Consultant (2010-present); Member, Governing Council, Independent Directors Council (2013-present); Governor, Board of Governors, Investment Company Institute (2018-present). Former: Member, Executive Committee, Independent Directors Council (2016-2018); Vice President, Manager and Portfolio Manager, Nuveen Asset Management (1998-1999); Vice President, Nuveen Investment Advisory Corp. (1992-1999); Vice President and Manager, Nuveen Unit Investment Trusts (1991-1999); and Assistant Vice President and Portfolio Manager, Nuveen Unit Investment Trusts (1988-1999), each of John Nuveen & Co., Inc. (1982-1999). | 156 | Former: Western Asset Inflation-Linked Opportunities & Income Fund (2004-April 2020); Western Asset Inflation-Linked Income Fund (2003-April 2020); Managed Duration Investment Grade Municipal Fund (2003-2016). |
98 | THE GUGGENHEIM FUNDS SEMI-ANNUAL REPORT | |
INFORMATION ON BOARD OF TRUSTEES AND OFFICERS (Unaudited)(continued) |
Name, Address*
and Year of Birth | Position(s)
Held with
Trust | Term of Office
and Length of
Time Served** | Principal Occupation(s)
During Past Five Years | Number of
Portfolios
in Fund
Complex
Overseen | Other
Directorships Held
by Trustees*** |
INTERESTED TRUSTEE | | | | |
Amy J. Lee**** (1961) | Trustee, Vice President and Chief Legal Officer | Since 2018 (Trustee) Since 2014
(Chief Legal Officer) Since 2007
(Vice President) | Current: Interested Trustee, certain other funds in the Fund Complex (2018-present); Chief Legal Officer, certain other funds in the Fund Complex (2014-present); Vice President, certain other funds in the Fund Complex (2007-present); Senior Managing Director, Guggenheim Investments (2012-present). Former: President and Chief Executive Officer, certain other funds in the Fund Complex (2017-2019); Vice President, Associate General Counsel and Assistant Secretary, Security Benefit Life Insurance Company and Security Benefit Corporation (2004-2012). | 156 | None. |
* | The business address of each Trustee is c/o Guggenheim Investments, 227 West Monroe Street, Chicago, Illinois 60606. |
** | Each Trustee serves an indefinite term, until his or her successor is elected and qualified. Time served includes time served in the respective position for the Predecessor Corporation. |
*** | Each Trustee also serves on the boards of trustees of Guggenheim Funds Trust, Guggenheim Variable Funds Trust, Guggenheim Strategy Funds Trust, Fiduciary/Claymore Energy Infrastructure Fund, Guggenheim Taxable Municipal Managed Duration Trust, Guggenheim Strategic Opportunities Fund, Guggenheim Enhanced Equity Income Fund, Guggenheim Energy & Income Fund, Guggenheim Credit Allocation Fund, Rydex Series Funds, Rydex Dynamic Funds, Rydex Variable Funds and Transparent Value Trust. Messrs. Barnes and Nyberg also serve on the board of trustees of Advent Convertible & Income Fund. |
**** | This Trustee is deemed to be an “interested person” of the Funds under the 1940 Act by reason of her position with the Funds’ Investment Manager and/or the parent of the Investment Manager. |
| | THE GUGGENHEIM FUNDS SEMI-ANNUAL REPORT | 99 |
INFORMATION ON BOARD OF TRUSTEES AND OFFICERS (Unaudited)(continued) |
Name, Address*
and Year of Birth | Position(s)
Held with
Trust | Term of Office
and Length of
Time Served** | Principal Occupation(s)
During Past Five Years |
OFFICERS | | | |
Brian E. Binder (1972) | President and Chief Executive Officer | Since 2018 | Current: President and Chief Executive Officer, certain other funds in the Fund Complex (2018-present); President, Chief Executive Officer and Chairman of the Board of Managers, Guggenheim Funds Investment Advisors, LLC (2018-present); President and Chief Executive Officer, Security Investors, LLC (2018-present); Board Member of Guggenheim Partners Fund Management (Europe) Limited (2018-present); Senior Managing Director and Chief Administrative Officer, Guggenheim Investments (2018-present). Former: Managing Director and President, Deutsche Funds, and Head of US Product, Trading and Fund Administration, Deutsche Asset Management (2013-2018); Managing Director, Head of Business Management and Consulting, Invesco Ltd. (2010-2012). |
James M. Howley (1972) | Assistant Treasurer | Since 2014 | Current: Managing Director, Guggenheim Investments (2004-present); Assistant Treasurer, certain other funds in the Fund Complex (2006-present). Former: Manager, Mutual Fund Administration of Van Kampen Investments, Inc. (1996-2004). |
Mark E. Mathiasen (1978) | Secretary | Since 2014 | Current: Secretary, certain other funds in the Fund Complex (2007-present); Managing Director, Guggenheim Investments (2007-present). |
Glenn McWhinnie (1969) | Assistant Treasurer | Since 2016 | Current: Vice President, Guggenheim Investments (2009-present); Assistant Treasurer, certain other funds in the Fund Complex (2016-present). |
Michael P. Megaris (1984) | Assistant Secretary | Since 2014 | Current: Assistant Secretary, certain other funds in the Fund Complex (2014-present); Director, Guggenheim Investments (2012-present). |
Elisabeth Miller (1968) | Chief Compliance Officer | Since 2012 | Current: Chief Compliance Officer, certain other funds in the Fund Complex (2012-present); Senior Managing Director, Guggenheim Investments (2012-present). Vice President, Guggenheim Funds Distributors, LLC (2014-present). Former: Chief Compliance Officer, Security Investors, LLC and Guggenheim Funds Investment Advisors, LLC (2012-2018); Chief Compliance Officer, Guggenheim Distributors, LLC (2009-2014); Senior Manager, Security Investors, LLC (2004-2014); Senior Manager, Guggenheim Distributors, LLC (2004-2014). |
Margaux Misantone (1978) | AML Officer | Since 2017 | Current: Chief Compliance Officer, Security Investors, LLC and Guggenheim Funds Investment Advisors, LLC (2018-present); AML Officer, Security Investors, LLC and certain other funds in the Fund Complex (2017-present); Managing Director, Guggenheim Investments (2015-present). Former: Assistant Chief Compliance Officer, Security Investors, LLC and Guggenheim Funds Investments Advisors, LLC (2015-2018). |
William Rehder (1967) | Assistant Vice President | Since 2018 | Current: Managing Director, Guggenheim Investments (2002-present). |
100 | THE GUGGENHEIM FUNDS SEMI-ANNUAL REPORT | |
INFORMATION ON BOARD OF TRUSTEES AND OFFICERS (Unaudited)(concluded) |
Name, Address*
and Year of Birth | Position(s)
Held with
Trust | Term of Office
and Length of
Time Served** | Principal Occupation(s)
During Past Five Years |
OFFICERS - concluded | |
Kimberly J. Scott (1974) | Assistant Treasurer | Since 2014 | Current: Director, Guggenheim Investments (2012-present); Assistant Treasurer, certain other funds in the Fund Complex (2012-present). Former: Financial Reporting Manager, Invesco, Ltd. (2010-2011); Vice President/Assistant Treasurer, Mutual Fund Administration for Van Kampen Investments, Inc./Morgan Stanley Investment Management (2009-2010); Manager of Mutual Fund Administration, Van Kampen Investments, Inc./Morgan Stanley Investment Management (2005-2009). |
Bryan Stone (1979) | Vice President | Since 2014 | Current: Vice President, certain other funds in the Fund Complex (2014-present); Managing Director, Guggenheim Investments (2013-present). Former: Senior Vice President, Neuberger Berman Group LLC (2009-2013); Vice President, Morgan Stanley (2002-2009). |
John L. Sullivan (1955) | Chief Financial Officer, Chief Accounting Officer and Treasurer | Since 2014 | Current: Chief Financial Officer, Chief Accounting Officer and Treasurer, certain other funds in the Fund Complex (2010-present); Senior Managing Director, Guggenheim Investments (2010-present). Former: Managing Director and Chief Compliance Officer, each of the funds in the Van Kampen Investments fund complex (2004-2010); Managing Director and Head of Fund Accounting and Administration, Morgan Stanley Investment Management (2002-2004); Chief Financial Officer and Treasurer, Van Kampen Funds (1996-2004). |
Jon Szafran (1989) | Assistant Treasurer | Since 2017 | Current: Vice President, Guggenheim Investments (2017-present); Assistant Treasurer, certain other funds in the Fund Complex (2017-present). Former: Assistant Treasurer of Henderson Global Funds and Manager of US Fund Administration, Henderson Global Investors (North America) Inc. (“HGINA”), (2017); Senior Analyst of US Fund Administration, HGINA (2014–2017); Senior Associate of Fund Administration, Cortland Capital Market Services, LLC (2013-2014); Experienced Associate, PricewaterhouseCoopers LLP (2012-2013). |
* | The business address of each officer is c/o Guggenheim Investments, 227 West Monroe Street, Chicago, Illinois 60606. |
** | Each officer serves an indefinite term, until his or her successor is duly elected and qualified. |
| | THE GUGGENHEIM FUNDS SEMI-ANNUAL REPORT | 101 |
GUGGENHEIM INVESTMENTS PRIVACY NOTICE (Unaudited) |
Who We Are
This Privacy Notice describes the data protection practices of Guggenheim Investments. Guggenheim Investments as used herein refers to the affiliated investment management businesses of Guggenheim Partners, LLC: Guggenheim Funds Investment Advisors, LLC, Guggenheim Partners Investment Management, LLC, Guggenheim Funds Distributors, LLC, Security Investors, LLC, Guggenheim Investment Advisors (Europe) Limited, Guggenheim Real Estate, LLC, GS Gamma Advisors, LLC, Guggenheim Partners India Management, LLC, Guggenheim Partners Europe Limited, as well as the funds in the Guggenheim Funds complex (the “Funds”) (“Guggenheim Investments,” “we,” “us,” or “our”).
Guggenheim Partners Investment Management Holdings, LLC, located at 330 Madison Avenue, New York, New York 10017 is the data controller for your information. The affiliates who are also controllers of certain of your information are: Guggenheim Investment Advisors (Europe) Limited, Guggenheim Partners Europe Limited, Guggenheim Partners, LLC, Guggenheim Funds Investment Advisors, LLC, Guggenheim Partners Investment Management, LLC, Guggenheim Funds Distributors, LLC and Security Investors, LLC, as well as the Funds.
Our Commitment to You
Guggenheim Investments considers your privacy our utmost concern. When you become our client or investor, you entrust us with not only your hard-earned money but also with your personal and financial information. Because we have access to your private information, we hold ourselves to the highest standards in its safekeeping and use. We strictly limit how we share your information with others, whether you are a current or former Guggenheim Investments client or investor.
The Information We Collect About You
We collect certain nonpublic personal information about you from information you provide on applications, other forms, our website, and/or from third parties including investment advisors. This information includes Social Security or other tax identification number, assets, income, tax information, retirement and estate plan information, transaction history, account balance, payment history, bank account information, marital status, family relationships, information that we collect on our website through the use of “cookies,” and other personal information that you or others provide to us. We may also collect such information through your inquiries by mail, e-mail or telephone. We may also collect customer due diligence information, as required by applicable law and regulation, through third party service providers.
How We Handle Your Personal Information
The legal basis for using your information as set out in this Privacy Notice is as follows: (a) use of your personal data is necessary to perform our obligations under any contract with you (such as a contract for us to provide financial services to you); or (b) where use of your personal data is not necessary for performance of a contract, use of your personal data is necessary for our legitimate interests or the legitimate interests of others (for example, to enforce the legal terms governing our services, operate and market our website and other services we offer, ensure safe environments for our personnel and others, make and receive payments, prevent fraud and to know the customer to whom we are providing the services). Some processing is done to comply with applicable law.
In addition to the specific uses described above, we also use your information in the following manner:
| | ● | We use your information in connection with servicing your accounts. |
| | ● | We use information to respond to your requests or questions. For example, we might use your information to respond to your customer feedback. |
| | ● | We use information to improve our products and services. We may use your information to make our website and products better. We may use your information to customize your experience with us. |
| | ● | We use information for security purposes. We may use your information to protect our company and our customers. |
| | ● | We use information to communicate with you. For example, we will communicate with you about your account or our relationship. We may contact you about your feedback. We might also contact you about this Privacy Notice. We may also enroll you in our email newsletter. |
102 | THE GUGGENHEIM FUNDS SEMI-ANNUAL REPORT | |
GUGGENHEIM INVESTMENTS PRIVACY NOTICE (Unaudited)(continued) |
| | ● | We use information as otherwise permitted by law, as we may notify you. |
| | ● | Aggregate/Anonymous Data. We may aggregate and/or anonymize any information collected through the website so that such information can no longer be linked to you or your device (“Aggregate/Anonymous Information”). We may use Aggregate/Anonymous Information for any purpose, including without limitation for research and marketing purposes, and may also share such data with any third parties, including advertisers, promotional partners, and sponsors. |
We do not sell information about current or former clients or their accounts to third parties. Nor do we share this information, except when necessary to complete transactions at your request, to make you aware of investment products and services that we or our affiliates offer, or as permitted or required by law.
We provide information about you to companies and individuals not affiliated with Guggenheim Investments to complete certain transactions or account changes, or to perform services for us related to your account. For example, if you ask to transfer assets from another financial institution to Guggenheim Investments, we must provide certain information about you to that company to complete the transaction. We provide the third party with only the information necessary to carry out its responsibilities and only for that purpose. And we require these third parties to treat your private information with the same high degree of confidentiality that we do. To alert you to other Guggenheim Investments products and services, we share your information within our family of affiliated companies. You may limit our sharing with affiliated companies as set out below. We may also share information with any successor to all or part of our business, or in connection with steps leading up to a merger or acquisition. For example, if part of our business was sold we may give customer information as part of that transaction. We may also share information about you with your consent.
We will release information about you if you direct us to do so, if we are compelled by law to do so, or in other circumstances as permitted by law (for example, to protect your account from fraud).
If you close your account(s) or become an inactive client or investor, we will continue to adhere to the privacy policies and practices described in this notice.
Opt-Out Provisions and Your Data Choices
The law allows you to “opt out” of certain kinds of information sharing with third parties. We do not share personal information about you with any third parties that triggers this opt-out right. This means YOU ARE ALREADY OPTED OUT.
When you are no longer our client or investor, we continue to share your information as described in this notice, and you may contact us at any time to limit our sharing by sending an email to CorporateDataPrivacy@GuggenheimPartners.com.
European Union Data Subjects and certain others: In addition to the choices set forth above, residents of the European Union and certain other jurisdictions have certain rights to (1) request access to or rectification or deletion of information we collect about them, (2) request a restriction on the processing of their information, (3) object to the processing of their information, or (4) request the portability of certain information. To exercise these or other rights, please contact us using the contact information below. We will consider all requests and provide our response within the time period stated by applicable law. Please note, however, that certain information may be exempt from such requests in some circumstances, which may include if we need to keep processing your information for our legitimate interests or to comply with a legal obligation. We may request you provide us with information necessary to confirm your identity before responding to your request.
Residents of France and certain other jurisdictions may also provide us with instructions regarding the manner in which we may continue to store, erase and share your information after your death, and where applicable, the person you have designated to exercise these rights after your death.
How We Protect Privacy Online
We take steps to protect your privacy when you use our web site – www.guggenheiminvestments.com – by using secure forms of online communication, including encryption technology, Secure Socket Layer (SSL) protocol, firewalls and user names and passwords. These safeguards vary based on the sensitivity of the information that we collect and store. However, we cannot and do not guarantee that these measures will prevent every unauthorized attempt to access, use, or disclose your information since despite our efforts, no Internet and/or other
| | THE GUGGENHEIM FUNDS SEMI-ANNUAL REPORT | 103 |
GUGGENHEIM INVESTMENTS PRIVACY NOTICE (Unaudited)(concluded) |
electronic transmissions can be completely secure. Our web site uses “http cookies”—tiny pieces of information that we ask your browser to store. We use cookies for session management and security features on the Guggenheim Investments web site. We do not use them to pull data from your hard drive, to learn your e-mail address, or to view data in cookies created by other web sites. We will not share the information in our cookies or give others access to it. See the legal information area on our web site for more details about web site security and privacy features.
How We Safeguard Your Personal Information and Data Retention
We restrict access to nonpublic personal information about you to our employees and in some cases to third parties (for example, the service providers described above) as permitted by law. We maintain strict physical, electronic and procedural safeguards that comply with federal standards to guard your nonpublic personal information.
We keep your information for no longer than necessary for the purposes for which it is processed. The length of time for which we retain information depends on the purposes for which we collected and use it and/or as required to comply with applicable laws. Information may persist in copies made for backup and business continuity purposes for additional time.
International Visitors
If you are not a resident of the United States, please be aware that your information may be transferred to, stored and processed in the United States where our servers are located and our databases are operated. The data protection and other laws of the United States and other countries might not be as comprehensive as those in your country.
In such cases, we ensure that a legal basis for such a transfer exists and that adequate protection is provided as required by applicable law, for example, by using standard contractual clauses or by transferring your data to a jurisdiction that has obtained an adequacy finding. Individuals whose data may be transferred on the basis of standard contractual clauses may contact us as described below.
We’ll Keep You Informed
If you have any questions or concerns about how we treat your personal data, we encourage you to consult with us first. You may also contact the relevant supervisory authority.
We reserve the right to modify this policy at any time and will inform you promptly of material changes. You may access our privacy policy from our web site at www.guggenheiminvestments.com. Should you have any questions regarding our privacy policy, contact us by email at CorporateDataPrivacy@GuggenheimPartners.com.
104 | THE GUGGENHEIM FUNDS SEMI-ANNUAL REPORT | |
This page intentionally left blank.
This page intentionally left blank.
This page intentionally left blank.
This page intentionally left blank.
This page intentionally left blank.
3.31.2020
Guggenheim Funds Semi-Annual Report
Guggenheim SMid Cap Value Fund | | |
Beginning on January 1, 2021, paper copies of the Fund’s annual and semi-annual shareholder reports may no longer be sent by mail, unless you specifically request paper copies of the reports from a Fund or from your financial intermediary. Instead, the reports will be made available on a website, and you will be notified by mail each time a report is posted and provided with a website link to access the report.
If you already elected to receive shareholder reports electronically, you will not be affected by this change and you need not take any action. At any time, you may elect to receive reports and other communications from a Fund electronically by calling 800.820.0888, going to GuggenheimInvestments.com/myaccount, or by contacting your financial intermediary.
You may elect to receive all future shareholder reports in paper free of charge. If you hold shares of a Fund directly, you can inform the Fund that you wish to receive paper copies of reports by calling 800.820.0888. If you hold shares of a Fund through a financial intermediary, please contact the financial intermediary to make this election. Your election to receive reports in paper will apply to all Guggenheim Funds in which you are invested and may apply to all funds held with your financial intermediary.
GuggenheimInvestments.com | SBMCV-SEMI-0320x0920 |

| | |
DEAR SHAREHOLDER | 2 |
ECONOMIC AND MARKET OVERVIEW | 4 |
ABOUT SHAREHOLDERS’ FUND EXPENSES | 6 |
SMID CAP VALUE FUND | 9 |
NOTES TO FINANCIAL STATEMENTS | 24 |
OTHER INFORMATION | 34 |
INFORMATION ON BOARD OF TRUSTEES AND OFFICERS | 35 |
GUGGENHEIM INVESTMENTS PRIVACY NOTICE | 42 |
| | THE GUGGENHEIM FUNDS SEMI-ANNUAL REPORT | 1 |
Dear Shareholder:
The six-month period ended March 31, 2020, concluded on a somber note. Even though markets performed well for most of the period, the emergence of a novel and highly contagious form of coronavirus in the last weeks of the period adversely impacted global commercial activity and contributed to significant volatility in certain markets, unseen since the great recession of 2008.
As it spread beyond Asia to virtually every country in the world, many governments and businesses instituted quarantines and closures, which has resulted in significant disruption in manufacturing, supply chains, consumer demand and economic activity. The U.S. Federal Reserve responded quickly to provide liquidity in order to ensure that the U.S. markets continued to function efficiently. The fiscal policy included a spending bill worth over $2 trillion to assist consumers, states, small businesses and certain industries. While these actions helped stabilize the market, volatile conditions continued into April.
As discussed in this semi-annual shareholder report, these events have affected performance for the SMid Cap Value Fund (the “Fund”). We encourage you to read the Economic and Market Overview section of the report, which follows this letter.
Security Investors, LLC (the “Investment Adviser”) serves as the investment adviser to the Fund. The Investment Adviser is an affiliate of Guggenheim Partners, LLC (“Guggenheim”), a global, diversified financial services firm. Guggenheim Funds Distributors, LLC serves as the distributor to the Fund and is also an affiliate of Guggenheim.
Effective following the close of business on January 3, 2020, the Guggenheim SMid Cap Value Institutional Fund merged with and into newly formed Institutional Class shares of the Guggenheim SMid Cap Value Fund. Shareholders received shares of the newly created Institutional share class of the SMid Cap Value Fund with an equivalent value to shares of the SMid Cap Value Institutional Fund held immediately prior to the merger. For more information about the merger, refer to the Notes to Financial Statements section of the report.
Together, we are committed to the safety and prosperity of our clients, our employees, and our shareholders. The resources of the firm are being made fully available not only to support our clients, but also to support our employees and their families.
Please practice the appropriate prudence for the protection not only of your health and that of your friends and loved ones but also for our neighbors and communities. Thank you for the trust you place in us.
Sincerely,
Security Investors, LLC
April 30, 2020
2 | THE GUGGENHEIM FUNDS SEMI-ANNUAL REPORT | |
Read a prospectus and summary prospectus (if available) carefully before investing. It contains the investment objectives, risks, charges, expenses and other information, which should be considered carefully before investing. Obtain a prospectus and summary prospectus (if available) at guggenheiminvestments.com or call 800.820.0888.
This material is not intended as a recommendation or as investment advice of any kind, including in connection with rollovers, transfers, and distributions. Such material is not provided in a fiduciary capacity, may not be relied upon for or in connection with the making of investment decisions, and does not constitute a solicitation of an offer to buy or sell securities. All content has been provided for informational or educational purposes only and is not intended to be and should not be construed as legal or tax advice and/or a legal opinion. Always consult a financial, tax and/or legal professional regarding your specific situation.
The global ongoing crisis caused by the outbreak of COVID-19 is causing materially reduced consumer demand and economic output, disrupting supply chains, resulting in market closures, travel restrictions and quarantines, and adversely impacting local and global economies. Investors should be aware that in light of the current uncertainty, volatility and distress in economies, financial markets, and labor and health conditions all over the world, the Fund’s investments and a shareholder’s investment in the Fund are subject to sudden and substantial losses, increased volatility and other adverse events. Firms through which investors invest with the Fund, the Fund, its service providers, the markets in which it invests and market intermediaries are also impacted by quarantines and similar measures intended to contain the ongoing pandemic, which can obstruct their functioning and subject them to heightened operational risks.
The SMid Cap Value Fund may not be suitable for all investors. ● An investment in the Fund will fluctuate and is subject to investment risks, which means investors could lose money. ● The intrinsic value of the underlying stocks may never be realized, or the stock may decline in value. ● Investments in small- and/or mid-sized company securities may present additional risks such as less predictable earnings, higher volatility and less liquidity than larger, more established companies. ● Please read the prospectus for more detailed information regarding these and other risks.
| | THE GUGGENHEIM FUNDS SEMI-ANNUAL REPORT | 3 |
ECONOMIC AND MARKET OVERVIEW (Unaudited) | March 31, 2020 |
The six-month period ended March 31, 2020, was a wild ride for markets. While the U.S. economy was generally in good shape in 2019, recessionary fears rose throughout the year, prompting the U.S. Federal Reserve (the “Fed”) to announce a rate cut on July 31, the first since 2008, amid growing downside risks to policymakers’ baseline growth and inflation forecasts. Key among those risks were slowing global growth, the threat of additional U.S.-China tariffs, and the possible ramifications surrounding Brexit. The Fed subsequently cut rates twice more in 2019, which caused markets to rally toward the end of the year and into early 2020. Stocks reached new highs and credit spreads tightened to historic levels. Since then, the global outbreak of the coronavirus, COVID-19, has been at the center of everything. As of this writing, COVID-19 has spread to 210 countries, resulted in over 2.5 million cases, and caused over 170,000 deaths. Thus far, the U.S. makes up more than 30% of global cases, and 25% of global deaths. States have required the labor force to work from home if possible, individuals to practice social distancing, and non-essential businesses to shut down.
Closures, quarantines, and social distancing efforts have impacted the travel, hospitality, restaurants, and retail industries, with activity down 100% in some areas of the country. Further exacerbating the decline in output will be reduced business investment, which was already stalling due to falling profits, trade conflicts, and political uncertainty. The coronavirus shock and collapse in oil prices will likely further depress capital expenditures.
In response to the crisis, the Federal Open Market Committee cut rates by a further 125 basis points in the first quarter of 2020 and passed a series of stimulus programs. Among these were the Primary and Secondary Market Corporate Credit Facilities, which are lending programs primarily targeting investment-grade corporate bond issuers, implemented in concert with the U.S. Treasury. It was only after the announcement of this program that corporate credit found some relief from the selloff, but we expect this relief may be temporary.
With an alphabet soup of monetary programs targeting relief from the coronavirus impact, fiscal policy has also stepped up to the plate with a spending bill worth over $2 trillion that aims to assist consumers, states, small businesses, and certain industries. There is no question that these programs will help ease the economic fallout from virus containment measures, but even $2 trillion may be too small given the magnitude of the economic shock that we are facing. Additionally, it is far from clear that fiscal measures are an adequate solution to the issue at hand: the physical impediment to consumer spending. Fiscal and monetary policy can do their part, but ultimately it is public health policy that will likely be the greatest determinant of the economic outlook.
For the six months ended March 31, 2020, the Standard & Poor’s 500® (“S&P 500”) Index* returned -12.31%. The decline, while significant, represents something of a recovery in stocks. The S&P 500 peaked at 3,386.15 on February 19, 2020, before plummeting 33.9% to a low of 2,237.40 on March 23, 2020, then recovering some lost ground by the end of the month.
The consensus estimate for S&P 500 earnings per share in 2020 is still around $150. Our research shows S&P 500 earnings per share could fall below $100. Similarly, economists have no way to calibrate how bad the economic data could be based on history. The March U.S. non-farm payrolls
4 | THE GUGGENHEIM FUNDS SEMI-ANNUAL REPORT | |
ECONOMIC AND MARKET OVERVIEW (Unaudited)(concluded) | March 31, 2020 |
report was evidence of this, as it showed a decline in payrolls of 700,000 jobs versus survey expectations of a decline of only 100,000 jobs. We currently expect that second quarter U.S. real gross domestic product (“GDP”) quarter-over-quarter growth could fall by 40% annualized and the unemployment rate could rise to at least 20%. Beyond that, the severity of the crisis depends on containment of the virus and the effectiveness of social distancing measures put in place, but expectations for a quick and sustained V-shaped recovery appear overly optimistic.
For the six months ended March 31, 2020, the MSCI Europe-Australasia-Far East (“EAFE”) Index* returned -16.37%. The return of the MSCI Emerging Markets Index* was -14.45%.
In the bond market, the Bloomberg Barclays U.S. Aggregate Bond Index* posted a 3.33% return for the six-month period, while the Bloomberg Barclays U.S. Corporate High Yield Index* returned -10.40%. The return of the ICE Bank of America (“BofA”) Merrill Lynch 3-Month U.S. Treasury Bill Index* was 1.04% for the six-month period.
The opinions and forecasts expressed may not actually come to pass. This information is subject to change at any time, based on market and other conditions, and should not be construed as a recommendation of any specific security or strategy.
*Index Definitions:
The following indices are referenced throughout this report. Indices are unmanaged and not available for direct investment. Index performance does not reflect transaction costs, fees, or expenses.
Bloomberg Barclays U.S. Aggregate Bond Index is a broad-based flagship benchmark that measures the investment grade, U.S. dollar-denominated, fixed-rate taxable bond market, including U.S. Treasuries, government-related and corporate securities, mortgage-backed securities or “MBS” (agency fixed-rate and hybrid adjustable-rate mortgage, or “ARM”, pass-throughs), asset-backed securities (“ABS”), and commercial mortgage-backed securities (“CMBS”) (agency and non-agency).
Bloomberg Barclays U.S. Corporate High Yield Index measures the U.S. dollar-denominated, high yield, fixed-rate corporate bond market. Securities are classified as high yield if the middle rating of Moody’s, Fitch, and S&P is Ba1/BB +/BB + or below.
ICE BofA Merrill Lynch 3-Month U.S. Treasury Bill Index is an unmanaged market Index of U.S. Treasury securities maturing in 90 days that assumes reinvestment of all income.
MSCI EAFE Index is a free float-adjusted market capitalization index that is designed to measure the equity market performance of developed markets, excluding the U.S. & Canada.
MSCI Emerging Markets Index is a free float-adjusted market capitalization weighted index that is designed to measure equity market performance in the global emerging markets.
Russell 2500® Value Index measures the performance of the small-to mid-cap value segment of the U.S. equity universe. It includes those Russell 2500 companies with lower price-to-book ratios and lower forecasted growth values.
S&P 500® is a broad-based index, the performance of which is based on the performance of 500 widely held common stocks chosen for market size, liquidity, and industry group representation.
| | THE GUGGENHEIM FUNDS SEMI-ANNUAL REPORT | 5 |
ABOUT SHAREHOLDERS’ FUND EXPENSES (Unaudited) |
All mutual funds have operating expenses, and it is important for our shareholders to understand the impact of costs on their investments. Shareholders of a fund incur two types of costs: (i) transaction costs, including sales charges (loads) on purchase payments, reinvested dividends, other distributions, and exchange fees, and (ii) ongoing costs, including management fees, administrative services, and shareholder reports, among others. These ongoing costs, or operating expenses, are deducted from a fund’s gross income and reduce the investment return of the fund.
A fund’s expenses are expressed as a percentage of its average net assets, which is known as the expense ratio. The following examples are intended to help investors understand the ongoing costs (in dollars) of investing in a fund and to compare these costs with the ongoing costs of investing in other mutual funds.
The examples are based on an investment of $1,000 made at the beginning of the period and held for the entire six-month period beginning September 30, 2019 and ending March 31, 2020.
The following tables illustrate the Fund’s costs in two ways:
Table 1. Based on actual Fund return: This section helps investors estimate the actual expenses paid over the period. The “Ending Account Value” shown is derived from the Fund’s actual return, and the fifth column shows the dollar amount that would have been paid by an investor who started with $1,000 in the Fund. Investors may use the information here, together with the amount invested, to estimate the expenses paid over the period. Simply divide the Fund’s account value by $1,000 (for example, an $8,600 account value divided by $1,000 = 8.6), then multiply the result by the number provided under the heading “Expenses Paid During Period.”
Table 2. Based on hypothetical 5% return: This section is intended to help investors compare a fund’s cost with those of other mutual funds. The table provides information about hypothetical account values and hypothetical expenses based on the Fund’s actual expense ratio and an assumed rate of return of 5% per year before expenses, which is not the Fund’s actual return. The hypothetical account values and expenses may not be used to estimate the actual ending account balance or expenses paid during the period. The example is useful in making comparisons because the U.S. Securities and Exchange Commission (the “SEC”) requires all mutual funds to calculate expenses based on the 5% return. Investors can assess a Fund’s costs by comparing this hypothetical example with the hypothetical examples that appear in shareholder reports of other funds.
The calculations illustrated above assume no shares were bought or sold during the period. Actual costs may have been higher or lower, depending on the amount of investment and the timing of any purchases or redemptions.
6 | THE GUGGENHEIM FUNDS SEMI-ANNUAL REPORT | |
ABOUT SHAREHOLDERS’ FUND EXPENSES (Unaudited)(continued) |
Please note that the expenses shown in the table are meant to highlight your ongoing costs only and do not reflect any transactional costs, such as sales charges (loads) on purchase payments, and contingent deferred sales charges (“CDSC”) on redemptions, if any. Therefore, the second table is useful in comparing ongoing costs only, and will not help you determine the relative total costs of owning different funds. In addition, if these transactional costs were included, your costs would have been higher.
More information about the Fund’s expenses, including annual expense ratios for periods up to five years (subject to the Fund’s inception date), can be found in the Financial Highlights section of this report. For additional information on operating expenses and other shareholder costs, please refer to the Fund’s prospectus.
| | THE GUGGENHEIM FUNDS SEMI-ANNUAL REPORT | 7 |
ABOUT SHAREHOLDERS’ FUND EXPENSES (Unaudited)(concluded) |
| Expense
Ratio1 | Fund
Return | Beginning
Account Value
September 30,
2019 | Ending
Account Value
March 31,
2020 | Expenses
Paid During
Period2 |
Table 1. Based on actual Fund return3 |
SMid Cap Value Fund |
A-Class | 1.25% | (26.34%) | $ 1,000.00 | $ 736.60 | $ 5.43 |
C-Class | 2.09% | (26.63%) | 1,000.00 | 733.70 | 9.06 |
P-Class | 1.31% | (26.34%) | 1,000.00 | 736.60 | 5.69 |
Institutional Class4 | 1.04% | (31.08%) | 1,000.00 | 689.20 | 2.14 |
|
Table 2. Based on hypothetical 5% return (before expenses) |
SMid Cap Value Fund |
A-Class | 1.25% | 5.00% | $ 1,000.00 | $ 1,018.75 | $ 6.31 |
C-Class | 2.09% | 5.00% | 1,000.00 | 1,014.55 | 10.53 |
P-Class | 1.31% | 5.00% | 1,000.00 | 1,018.45 | 6.61 |
Institutional Class | 1.04% | 5.00% | 1,000.00 | 1,019.80 | 5.25 |
1 | Annualized and excludes expenses of the underlying funds in which the Fund invests, if any. |
2 | Expenses are equal to the Fund’s annualized expense ratio, net of any applicable fee waivers, multiplied by the average account value over the period, multiplied by 183/366 (to reflect the one-half year period). |
3 | Actual cumulative return at net asset value for the period September 30, 2019 to March 31, 2020. |
4 | Since commencement of operations as of close of business January 3, 2020. Expenses paid based on actual fund return are calculated using 89 days from the commencement of operations. |
8 | THE GUGGENHEIM FUNDS SEMI-ANNUAL REPORT | |
PERFORMANCE REPORT AND FUND PROFILE (Unaudited) | March 31, 2020 |
SMID CAP VALUE FUND
OBJECTIVE: Seeks long-term growth of capital.
Holdings Diversification (Market Exposure as % of Net Assets)

“Holdings Diversification (Market Exposure as % of Net Assets)” excludes any temporary cash investments.
Inception Dates: |
A-Class | May 1, 1997 |
C-Class | January 29, 1999 |
P-Class | May 1, 2015 |
Institutional Class | January 3, 2020 |
Ten Largest Holdings (% of Total Net Assets) |
Alleghany Corp. | 3.1% |
Equity Commonwealth | 2.5% |
MDU Resources Group, Inc. | 2.3% |
Portland General Electric Co. | 2.2% |
Voya Financial, Inc. | 2.2% |
Encompass Health Corp. | 1.9% |
Bunge Ltd. | 1.9% |
Alexandria Real Estate Equities, Inc. | 1.9% |
Physicians Realty Trust | 1.8% |
Super Micro Computer, Inc. | 1.8% |
Top Ten Total | 21.6% |
| | |
“Ten Largest Holdings” excludes any temporary cash investments. |
| | THE GUGGENHEIM FUNDS SEMI-ANNUAL REPORT | 9 |
PERFORMANCE REPORT AND FUND PROFILE (Unaudited)(concluded) | March 31, 2020 |
Average Annual Returns*
Periods Ended March 31, 2020
| 6 Month† | 1 Year | 5 Year | 10 Year |
A-Class Shares | (26.34%) | (22.27%) | (0.24%) | 4.93% |
A-Class Shares with sales charge‡ | (29.84%) | (25.96%) | (1.20%) | 4.31% |
C-Class Shares | (26.63%) | (22.90%) | (1.03%) | 4.14% |
C-Class Shares with CDSC§ | (27.32%) | (23.63%) | (1.03%) | 4.14% |
Institutional Class Shares1 | (26.39%) | (21.63%) | 0.17% | 5.26% |
Russell 2500 Value Index | (30.02%) | (28.60%) | (2.14%) | 5.65% |
| | 6 Month† | 1 Year | Since
Inception
(05/01/15) |
P-Class Shares | | (26.34%) | (22.31%) | (0.03%) |
Russell 2500 Value Index | | (30.02%) | (28.60%) | (2.01%) |
* | The performance data above represents past performance that is not predictive of future results. The investment return and principal value of an investment in the Fund will fluctuate so that an investor’s shares, when redeemed, may be worth more or less than their original cost. Returns are historical and include changes in principal and reinvested dividends and capital gains and do not reflect the effect of taxes. The Russell 2500 Value Index is an unmanaged index and, unlike the Fund, has no management fees or operating expenses to reduce its reported return. |
1 | The Institutional Class shares commenced operations on January 3, 2020 in connection with the reorganization of the SMid Cap Value Institutional Fund into the Fund. The performance of the Institutional Class shares of the Fund for periods prior to January 3, 2020 reflects the performance of the Guggenheim SMid Cap Value Institutional Fund. The returns for the SMid Cap Value Institutional Fund have not been restated to reflect the fees and expenses applicable to the Institutional Class shares of the Fund. |
† | 6 month returns are not annualized. |
‡ | Effective February 22, 2011, the maximum sales charge decreased from 5.75% to 4.75%. A 5.75% maximum sales charge is used in the calculation for the Average Annual Returns based on subscriptions made prior to February 22, 2011, and a 4.75% maximum sales charge will be used to calculate performance for periods based on subscriptions made on or after February 22, 2011. |
§ | Fund returns include a CDSC of 1% if redeemed within 12 months of purchase. |
10 | THE GUGGENHEIM FUNDS SEMI-ANNUAL REPORT | |
SCHEDULE OF INVESTMENTS (Unaudited) | March 31, 2020 |
SMID CAP VALUE FUND | |
| | Shares | | | Value | |
COMMON STOCKS† - 97.8% |
| | | | | | | | | |
Financial - 33.1% |
Alleghany Corp. | | | 16,209 | | | $ | 8,953,041 | |
Equity Commonwealth REIT | | | 230,986 | | | | 7,324,566 | |
Voya Financial, Inc. | | | 156,188 | | | | 6,333,424 | |
Alexandria Real Estate Equities, Inc. REIT | | | 39,576 | | | | 5,424,287 | |
Physicians Realty Trust REIT | | | 382,791 | | | | 5,336,107 | |
Sun Communities, Inc. REIT | | | 39,591 | | | | 4,942,936 | |
Axis Capital Holdings Ltd. | | | 107,781 | | | | 4,165,736 | |
Radian Group, Inc. | | | 319,568 | | | | 4,138,406 | |
Pinnacle Financial Partners, Inc. | | | 108,970 | | | | 4,090,734 | |
KeyCorp | | | 369,478 | | | | 3,831,487 | |
Zions Bancorp North America | | | 131,869 | | | | 3,528,814 | |
Cousins Properties, Inc. REIT | | | 116,346 | | | | 3,405,447 | |
Umpqua Holdings Corp. | | | 281,976 | | | | 3,073,538 | |
Old Republic International Corp. | | | 193,837 | | | | 2,956,014 | |
First Horizon National Corp. | | | 341,719 | | | | 2,754,255 | |
WSFS Financial Corp. | | | 105,604 | | | | 2,631,652 | |
Camden Property Trust REIT | | | 31,123 | | | | 2,466,187 | |
Prosperity Bancshares, Inc. | | | 47,358 | | | | 2,285,024 | |
VICI Properties, Inc. REIT | | | 130,309 | | | | 2,168,342 | |
Medical Properties Trust, Inc. REIT | | | 124,560 | | | | 2,153,642 | |
Howard Hughes Corp.* | | | 38,001 | | | | 1,919,810 | |
Heritage Insurance Holdings, Inc. | | | 174,678 | | | | 1,870,801 | |
IBERIABANK Corp. | | | 50,775 | | | | 1,836,024 | |
Hilltop Holdings, Inc. | | | 114,190 | | | | 1,726,553 | |
Stifel Financial Corp. | | | 40,687 | | | | 1,679,559 | |
American National Insurance Co. | | | 18,227 | | | | 1,501,540 | |
Heartland Financial USA, Inc. | | | 48,817 | | | | 1,474,273 | |
Redwood Trust, Inc. REIT | | | 255,449 | | | | 1,292,572 | |
First Midwest Bancorp, Inc. | | | 51,896 | | | | 686,844 | |
Total Financial | | | 95,951,615 | |
| | | | | | | | | |
Industrial - 17.1% |
MDU Resources Group, Inc. | | | 308,249 | | | | 6,627,353 | |
Knight-Swift Transportation Holdings, Inc. | | | 113,408 | | | | 3,719,782 | |
Jacobs Engineering Group, Inc. | | | 45,754 | | | | 3,626,920 | |
Graphic Packaging Holding Co. | | | 279,720 | | | | 3,412,584 | |
Valmont Industries, Inc. | | | 27,829 | | | | 2,949,317 | |
FLIR Systems, Inc. | | | 85,790 | | | | 2,735,843 | |
Plexus Corp.* | | | 42,568 | | | | 2,322,510 | |
Rexnord Corp. | | | 102,246 | | | | 2,317,917 | |
Advanced Energy Industries, Inc.* | | | 47,257 | | | | 2,291,492 | |
Johnson Controls International plc | | | 76,754 | | | | 2,069,288 | |
Owens Corning | | | 52,142 | | | | 2,023,631 | |
PGT Innovations, Inc.* | | | 228,304 | | | | 1,915,471 | |
Crane Co. | | | 37,882 | | | | 1,863,037 | |
Park Aerospace Corp. | | | 143,193 | | | | 1,804,232 | |
Snap-on, Inc. | | | 16,290 | | | | 1,772,678 | |
GATX Corp. | | | 27,068 | | | | 1,693,374 | |
EnerSys | | | 30,785 | | | | 1,524,473 | |
Packaging Corporation of America | | | 16,910 | | | | 1,468,295 | |
Kennametal, Inc. | | | 66,439 | | | | 1,237,094 | |
Dycom Industries, Inc.* | | | 45,453 | | | | 1,165,869 | |
SEE NOTES TO FINANCIAL STATEMENTS. | THE GUGGENHEIM FUNDS SEMI-ANNUAL REPORT | 11 |
SCHEDULE OF INVESTMENTS (Unaudited)(continued) | March 31, 2020 |
SMID CAP VALUE FUND | |
| | Shares | | | Value | |
Kirby Corp.* | | | 20,618 | | | $ | 896,265 | |
Total Industrial | | | 49,437,425 | |
| | | | | | | | | |
Consumer, Non-cyclical - 11.3% |
Encompass Health Corp. | | | 87,893 | | | | 5,627,789 | |
Bunge Ltd. | | | 135,969 | | | | 5,578,808 | |
Central Garden & Pet Co. — Class A* | | | 200,015 | | | | 5,114,384 | |
Emergent BioSolutions, Inc.* | | | 71,699 | | | | 4,148,504 | |
Ingredion, Inc. | | | 53,258 | | | | 4,020,979 | |
Eagle Pharmaceuticals, Inc.* | | | 71,814 | | | | 3,303,444 | |
TreeHouse Foods, Inc.* | | | 70,850 | | | | 3,128,027 | |
MGP Ingredients, Inc. | | | 32,594 | | | | 876,453 | |
Adtalem Global Education, Inc.* | | | 31,426 | | | | 841,902 | |
Total Consumer, Non-cyclical | | | 32,640,290 | |
| | | | | | | | | |
Consumer, Cyclical - 8.2% |
LKQ Corp.* | | | 169,119 | | | | 3,468,631 | |
UniFirst Corp. | | | 22,841 | | | | 3,451,047 | |
DR Horton, Inc. | | | 84,397 | | | | 2,869,498 | |
Alaska Air Group, Inc. | | | 94,629 | | | | 2,694,087 | |
Newell Brands, Inc. | | | 183,132 | | | | 2,431,993 | |
PVH Corp. | | | 42,818 | | | | 1,611,669 | |
BorgWarner, Inc. | | | 58,870 | | | | 1,434,662 | |
Lear Corp. | | | 17,436 | | | | 1,416,675 | |
BMC Stock Holdings, Inc.* | | | 79,109 | | | | 1,402,602 | |
Skechers U.S.A., Inc. — Class A* | | | 55,597 | | | | 1,319,873 | |
Ralph Lauren Corp. — Class A | | | 17,743 | | | | 1,185,765 | |
Caleres, Inc. | | | 98,439 | | | | 511,883 | |
Total Consumer, Cyclical | | | 23,798,385 | |
| | | | | | | | | |
Utilities - 7.6% |
Portland General Electric Co. | | | 134,926 | | | | 6,468,352 | |
Southwest Gas Holdings, Inc. | | | 50,360 | | | | 3,503,042 | |
Black Hills Corp. | | | 54,696 | | | | 3,502,185 | |
AES Corp. | | | 250,157 | | | | 3,402,135 | |
Avista Corp. | | | 79,710 | | | | 3,386,878 | |
Pinnacle West Capital Corp. | | | 24,652 | | | | 1,868,375 | |
Total Utilities | | | 22,130,967 | |
| | | | | | | | | |
Technology - 7.0% |
Super Micro Computer, Inc.* | | | 249,618 | | | | 5,311,871 | |
MACOM Technology Solutions Holdings, Inc.* | | | 255,691 | | | | 4,840,230 | |
Lumentum Holdings, Inc.* | | | 40,431 | | | | 2,979,765 | |
Qorvo, Inc.* | | | 28,398 | | | | 2,289,731 | |
CSG Systems International, Inc. | | | 42,421 | | | | 1,775,319 | |
Skyworks Solutions, Inc. | | | 19,123 | | | | 1,709,214 | |
Evolent Health, Inc. — Class A* | | | 275,320 | | | | 1,494,988 | |
Total Technology | | | 20,401,118 | |
| | | | | | | | | |
Basic Materials - 6.1% |
Olin Corp. | | | 284,604 | | | | 3,321,328 | |
Reliance Steel & Aluminum Co. | | | 36,971 | | | | 3,238,290 | |
Ashland Global Holdings, Inc. | | | 64,211 | | | | 3,215,045 | |
Huntsman Corp. | | | 208,702 | | | | 3,011,570 | |
Freeport-McMoRan, Inc. | | | 355,421 | | | | 2,399,092 | |
Nucor Corp. | | | 39,296 | | | | 1,415,442 | |
Commercial Metals Co. | | | 64,984 | | | | 1,026,097 | |
Total Basic Materials | | | 17,626,864 | |
| | | | | | | | | |
12 | THE GUGGENHEIM FUNDS SEMI-ANNUAL REPORT | SEE NOTES TO FINANCIAL STATEMENTS. |
SCHEDULE OF INVESTMENTS (Unaudited)(continued) | March 31, 2020 |
SMID CAP VALUE FUND | |
| | Shares | | | Value | |
Communications - 5.6% |
Infinera Corp.* | | | 978,899 | | | $ | 5,188,165 | |
NortonLifeLock, Inc. | | | 261,741 | | | | 4,897,174 | |
Viavi Solutions, Inc.* | | | 282,669 | | | | 3,168,720 | |
Ciena Corp.* | | | 75,077 | | | | 2,988,815 | |
Total Communications | | | 16,242,874 | |
| | | | | | | | | |
Energy - 1.8% |
Parsley Energy, Inc. — Class A | | | 579,782 | | | | 3,322,151 | |
Range Resources Corp. | | | 418,464 | | | | 954,098 | |
Delek US Holdings, Inc. | | | 58,132 | | | | 916,160 | |
Antero Resources Corp.* | | | 156,452 | | | | 111,535 | |
HydroGen Corp.*,†††,1,4 | | | 1,265,700 | | | | 1 | |
Total Energy | | | 5,303,945 | |
| | | | | | | | | |
Total Common Stocks | | | | |
(Cost $358,909,264) | | | | | | | 283,533,483 | |
| | | | | | | | | |
CONVERTIBLE PREFERRED STOCKS††† - 0.0% |
Industrial - 0.0% |
Thermoenergy Corp.*1,2 | | | 1,652,084 | | | | 482 | |
Total Convertible Preferred Stocks | | | | |
(Cost $1,577,634) | | | | | | | 482 | |
| | | | | | | | | |
RIGHTS† - 0.1% |
Basic Materials - 0.1% | | | | |
Pan American Silver Corp.* | | | 516,551 | | | | 175,627 | |
Total Rights | | | | |
(Cost $—) | | | | | | | 175,627 | |
| | | | | | | | | |
EXCHANGE-TRADED FUNDS† - 1.5% |
iShares Russell 2000 Value ETF | | | 53,015 | | | | 4,348,821 | |
Total Exchange-Traded Funds | | | | |
(Cost $4,533,111) | | | | | | | 4,348,821 | |
| | | | | | | | | |
MONEY MARKET FUND† - 0.8% |
Dreyfus Treasury Securities Cash Management Fund — Institutional Shares, 0.51%3 | | | 2,275,069 | | | | 2,275,069 | |
Total Money Market Fund | | | | |
(Cost $2,275,069) | | | | | | | 2,275,069 | |
| | | | | | | | | |
Total Investments - 100.2% | | | | |
(Cost $367,295,078) | | $ | 290,333,482 | |
Other Assets & Liabilities, net - (0.2)% | | | (559,389 | ) |
Total Net Assets - 100.0% | | $ | 289,774,093 | |
* | Non-income producing security. |
† | Value determined based on Level 1 inputs, unless otherwise noted — See Note 4. |
††† | Value determined based on Level 3 inputs — See Note 4. |
1 | Security was fair valued by the Valuation Committee at March 31, 2020. The total market value of fair valued securities amounts to $483, (cost $1,580,165) or less than 0.1% of total net assets. |
2 | PIPE (Private Investment in Public Equity) — Stock issued by a company in the secondary market as a means of raising capital more quickly and less expensively than through registration of a secondary public offering. |
3 | Rate indicated is the 7-day yield as of March 31, 2020. |
4 | Affiliated issuer. |
| | plc — Public Limited Company |
| | REIT — Real Estate Investment Trust |
| | |
| | See Sector Classification in Other Information section. |
SEE NOTES TO FINANCIAL STATEMENTS. | THE GUGGENHEIM FUNDS SEMI-ANNUAL REPORT | 13 |
SCHEDULE OF INVESTMENTS (Unaudited)(concluded) | March 31, 2020 |
SMID CAP VALUE FUND | |
The following table summarizes the inputs used to value the Fund’s investments at March 31, 2020 (See Note 4 in the Notes to Financial Statements):
Investments in
Securities (Assets) | | Level 1
Quoted
Prices | | | Level 2
Significant
Observable
Inputs | | | Level 3
Significant
Unobservable
Inputs | | | Total | |
Common Stocks | | $ | 283,533,482 | | | $ | — | | | $ | 1 | | | $ | 283,533,483 | |
Convertible Preferred Stocks | | | — | | | | — | | | | 482 | | | | 482 | |
Rights | | | 175,627 | | | | — | | | | — | | | | 175,627 | |
Exchange-Traded Funds | | | 4,348,821 | | | | — | | | | — | | | | 4,348,821 | |
Money Market Fund | | | 2,275,069 | | | | — | | | | — | | | | 2,275,069 | |
Total Assets | | $ | 290,332,999 | | | $ | — | | | $ | 483 | | | $ | 290,333,482 | |
Affiliated Transactions
Investments representing 5% or more of the outstanding voting shares of a company, or control of or by, or common control under Guggenheim Investments (“GI”), result in that company being considered an affiliated issuer, as defined in the 1940 Act.
Transactions during the period ended March 31, 2020, in which the company is an affiliated issuer, were as follows:
Security Name | | Value
09/30/19 | | | Additions | | | Reductions | | | Realized
Gain (Loss) | | | Change in
Unrealized
Appreciation
(Depreciation) | | | Value
03/31/20 | | | Shares
03/31/20 | | | Investment
Income | |
Common Stock | | | | | | | | | | | | | | | | | | | | | | | | | | | | | | | | |
HydroGen Corp.*,1 | | $ | — | | | $ | 1 | | | $ | — | | | $ | — | | | $ | — | | | $ | 1 | | | | 1,265,700 | | | $ | — | |
* | Non-Income producing |
1 | Security was fair valued by the Valuation Committee at March 31, 2020. The total market value of fair valued and affiliated securities amounts to $1, (cost $2,531) or less than 0.1% of total net assets. |
14 | THE GUGGENHEIM FUNDS SEMI-ANNUAL REPORT | SEE NOTES TO FINANCIAL STATEMENTS. |
STATEMENT OF ASSETS AND LIABILITIES (Unaudited) |
SMID CAP VALUE FUND |
March 31, 2020
Assets: |
Investments in unaffiliated issuers, at value (cost $367,292,547) | | $ | 290,333,481 | |
Investments in affiliated issuers, at value (cost $2,531) | | | 1 | |
Prepaid expenses | | | 30,895 | |
Receivables: |
Dividends | | | 739,857 | |
Fund shares sold | | | 108,613 | |
Interest | | | 3,326 | |
Foreign tax reclaims | | | 302 | |
Total assets | | | 291,216,475 | |
| | | | | |
Liabilities: |
Overdraft due to custodian bank | | | 61,220 | |
Payable for: |
Fund shares redeemed | | | 496,362 | |
Management fees | | | 179,908 | |
Distribution and service fees | | | 63,023 | |
Transfer agent/maintenance fees | | | 59,607 | |
Fund accounting/administration fees | | | 14,503 | |
Trustees’ fees* | | | 351 | |
Due to Investment Adviser | | | 106 | |
Miscellaneous (Note 7) | | | 567,302 | |
Total liabilities | | | 1,442,382 | |
Net assets | | $ | 289,774,093 | |
| | | | | |
Net assets consist of: |
Paid in capital | | $ | 375,225,403 | |
Total distributable earnings (loss) | | | (85,451,310 | ) |
Net assets | | $ | 289,774,093 | |
| | | | | |
A-Class: |
Net assets | | $ | 211,338,471 | |
Capital shares outstanding | | | 9,800,911 | |
Net asset value per share | | $ | 21.56 | |
Maximum offering price per share (Net asset value divided by 95.25%) | | $ | 22.64 | |
| | | | | |
C-Class: |
Net assets | | $ | 16,949,749 | |
Capital shares outstanding | | | 1,187,623 | |
Net asset value per share | | $ | 14.27 | |
| | | | | |
P-Class: |
Net assets | | $ | 7,921,015 | |
Capital shares outstanding | | | 370,136 | |
Net asset value per share | | $ | 21.40 | |
| | | | | |
Institutional Class: |
Net assets | | $ | 53,564,858 | |
Capital shares outstanding | | | 7,620,987 | |
Net asset value per share | | $ | 7.03 | |
* | Relates to Trustees not deemed “interested persons” within the meaning of Section 2(a)(19) of the 1940 Act. |
SEE NOTES TO FINANCIAL STATEMENTS. | THE GUGGENHEIM FUNDS SEMI-ANNUAL REPORT | 15 |
STATEMENT OF OPERATIONS (Unaudited) |
SMID CAP VALUE FUND |
Six-Month Period Ended March 31, 2020
Investment Income: |
Dividends from securities of unaffiliated issuers | | $ | 7,354,453 | ** |
Interest | | | 56,710 | |
Total investment income | | | 7,411,163 | |
| | | | | |
Expenses: |
Management fees | | | 1,455,677 | |
Distribution and service fees: |
A-Class | | | 396,119 | |
C-Class | | | 135,386 | |
P-Class | | | 16,309 | |
Transfer agent/maintenance fees: |
A-Class | | | 154,254 | |
C-Class | | | 34,780 | |
P-Class | | | 11,754 | |
Institutional Class | | | 17,386 | |
Fund accounting/administration fees | | | 149,321 | |
Professional fees | | | 34,112 | |
Trustees’ fees* | | | 13,936 | |
Custodian fees | | | 6,193 | |
Line of credit fees | | | 4,662 | |
Miscellaneous | | | 125,273 | |
Recoupment of previously waived fees: |
C-Class | | | 605 | |
P-Class | | | 97 | |
Total expenses | | | 2,555,864 | |
Less: |
Expenses reimbursed by Adviser: |
A-Class | | | (14,372 | ) |
C-Class | | | (11,548 | ) |
P-Class | | | (2,154 | ) |
Institutional Class | | | (10,191 | ) |
Expenses waived by Adviser | | | (2,722 | ) |
Total waived/reimbursed expenses | | | (40,987 | ) |
Net expenses | | | 2,514,877 | |
Net investment income | | | 4,896,286 | |
| | | | | |
Net Realized and Unrealized Gain (Loss): |
Net realized gain (loss) on: |
Investments in unaffiliated issuers | | $ | 2,580,187 | |
Net realized gain | | | 2,580,187 | |
Net change in unrealized appreciation (depreciation) on: |
Investments in unaffiliated issuers | | | (117,053,713 | ) |
Net change in unrealized appreciation (depreciation) | | | (117,053,713 | ) |
Net realized and unrealized loss | | | (114,473,526 | ) |
Net decrease in net assets resulting from operations | | $ | (109,577,240 | ) |
* | Relates to Trustees not deemed “interested persons” within the meaning of Section 2(a)(19) of the 1940 Act. |
** | Dividends from securities of unaffiliated issuers for the period were elevated due to a special dividend received from one of the Fund’s holdings, which represented approximately 44% of the total amount earned for the period ended March 31, 2020. The Fund expects that the special dividend represents a one time payment and not a recurring periodic dividend. |
16 | THE GUGGENHEIM FUNDS SEMI-ANNUAL REPORT | SEE NOTES TO FINANCIAL STATEMENTS. |
STATEMENTS OF CHANGES IN NET ASSETS |
SMID CAP VALUE FUND | |
| | Six-Month
Period Ended
March 31,
2020
(Unaudited) | | | Year Ended
September 30,
2019 | |
Increase (Decrease) in Net Assets from Operations: | | | | | | | | |
Net investment income | | $ | 4,896,286 | | | $ | 2,532,870 | |
Net realized gain on investments | | | 2,580,187 | | | | 5,835,305 | |
Net change in unrealized appreciation (depreciation) on investments | | | (117,053,713 | ) | | | (24,887,120 | ) |
Net decrease in net assets resulting from operations | | | (109,577,240 | ) | | | (16,518,945 | ) |
| | | | | | | | | |
Distributions to shareholders: | | | | | | | | |
A-Class | | | (13,969,113 | ) | | | (42,473,154 | ) |
C-Class | | | (1,456,436 | ) | | | (7,586,927 | ) |
P-Class | | | (576,421 | ) | | | (2,333,056 | ) |
Total distributions to shareholders | | | (16,001,970 | ) | | | (52,393,137 | ) |
| | | | | | | | | |
Capital share transactions: | | | | | | | | |
Proceeds from sale of shares | | | | | | | | |
A-Class | | | 5,863,963 | | | | 23,839,358 | |
C-Class | | | 464,900 | | | | 1,543,100 | |
P-Class | | | 421,291 | | | | 4,916,059 | |
Institutional Class | | | 23,198,706 | * | | | — | |
Distributions reinvested | | | | | | | | |
A-Class | | | 13,561,746 | | | | 41,063,260 | |
C-Class | | | 1,311,431 | | | | 6,887,170 | |
P-Class | | | 576,421 | | | | 2,333,056 | |
Institutional Class | | | — | * | | | — | |
Net proceeds from the issuance of shares due to merger | | | 66,601,569 | a | | | — | |
Cost of shares redeemed | | | | | | | | |
A-Class | | | (54,458,519 | ) | | | (66,171,407 | ) |
C-Class | | | (8,401,545 | ) | | | (19,808,564 | ) |
P-Class | | | (3,906,623 | ) | | | (9,878,311 | ) |
Institutional Class | | | (11,071,252 | )* | | | — | |
Net increase (decrease) from capital share transactions | | | 34,162,088 | | | | (15,276,279 | ) |
Net decrease in net assets | | | (91,417,122 | ) | | | (84,188,361 | ) |
| | | | | | | | | |
Net assets: | | | | | | | | |
Beginning of period | | | 381,191,215 | | | | 465,379,576 | |
End of period | | $ | 289,774,093 | | | $ | 381,191,215 | |
SEE NOTES TO FINANCIAL STATEMENTS. | THE GUGGENHEIM FUNDS SEMI-ANNUAL REPORT | 17 |
STATEMENTS OF CHANGES IN NET ASSETS (concluded) |
SMID CAP VALUE FUND | |
| | Six-Month
Period Ended
March 31,
2020
(Unaudited) | | | Year Ended
September 30,
2019 | |
| | | | | | | | | |
Capital share activity: | | | | | | | | |
Shares sold | | | | | | | | |
A-Class | | | 199,006 | | | | 789,707 | |
C-Class | | | 22,961 | | | | 80,433 | |
P-Class | | | 15,637 | | | | 161,350 | |
Institutional Class | | | 2,491,857 | * | | | — | |
Shares issued from reinvestment of distributions | | | | | | | | |
A-Class | | | 433,009 | | | | 1,599,037 | |
C-Class | | | 63,136 | | | | 396,955 | |
P-Class | | | 18,546 | | | | 91,564 | |
Institutional Class | | | — | * | | | — | |
Issuance of shares due to mergera | | | 6,532,159 | | | | — | |
Shares redeemed | | | | | | | | |
A-Class | | | (1,835,516 | ) | | | (2,226,793 | ) |
C-Class | | | (422,683 | ) | | | (987,491 | ) |
P-Class | | | (132,274 | ) | | | (337,998 | ) |
Institutional Class | | | (1,403,029 | )* | | | — | |
Net increase (decrease) in shares | | | 5,982,809 | | | | (433,236 | ) |
* | Since commencement of operations, as of the close of business January 3, 2020. |
a | Fund merger — See Note 8. |
18 | THE GUGGENHEIM FUNDS SEMI-ANNUAL REPORT | SEE NOTES TO FINANCIAL STATEMENTS. |
FINANCIAL HIGHLIGHTS |
SMID CAP VALUE FUND | |
This table is presented to show selected data for a share outstanding throughout each period and to assist shareholders in evaluating a Fund’s performance for the periods presented.
A-Class | | Period
Ended
March 31,
2020a | | | Year
Ended
Sept. 30,
2019 | | | Year
Ended
Sept. 30,
2018 | | | Year
Ended
Sept. 30,
2017 | | | Year
Ended
Sept. 30,
2016 | | | Year
Ended
Sept. 30,
2015 | |
Per Share Data |
Net asset value, beginning of period | | $ | 30.52 | | | $ | 36.20 | | | $ | 35.37 | | | $ | 30.27 | | | $ | 30.86 | | | $ | 37.73 | |
Income (loss) from investment operations: |
Net investment income (loss)b | | | .37 | | | | .22 | | | | .06 | | | | .03 | | | | .30 | | | | .06 | |
Net gain (loss) on investments (realized and unrealized) | | | (7.99 | ) | | | (1.89 | ) | | | 3.37 | | | | 6.09 | | | | 3.95 | | | | (2.24 | ) |
Total from investment operations | | | (7.62 | ) | | | (1.67 | ) | | | 3.43 | | | | 6.12 | | | | 4.25 | | | | (2.18 | ) |
Less distributions from: |
Net investment income | | | (.30 | ) | | | (.03 | ) | | | — | | | | (.37 | ) | | | — | | | | — | |
Net realized gains | | | (1.04 | ) | | | (3.98 | ) | | | (2.60 | ) | | | (.65 | ) | | | (4.84 | ) | | | (4.69 | ) |
Total distributions | | | (1.34 | ) | | | (4.01 | ) | | | (2.60 | ) | | | (1.02 | ) | | | (4.84 | ) | | | (4.69 | ) |
Net asset value, end of period | | $ | 21.56 | | | $ | 30.52 | | | $ | 36.20 | | | $ | 35.37 | | | $ | 30.27 | | | $ | 30.86 | |
|
Total Returnc | | | (26.34 | %) | | | (2.51 | %) | | | 10.05 | % | | | 20.62 | % | | | 15.51 | % | | | (6.83 | %) |
Ratios/Supplemental Data |
Net assets, end of period (in thousands) | | $ | 211,338 | | | $ | 335,806 | | | $ | 392,495 | | | $ | 396,408 | | | $ | 407,883 | | | $ | 476,792 | |
Ratios to average net assets: |
Net investment income (loss) | | | 2.08 | % | | | 0.72 | % | | | 0.17 | % | | | 0.11 | % | | | 1.04 | % | | | 0.18 | % |
Total expensesd | | | 1.26 | % | | | 1.23 | % | | | 1.26 | % | | | 1.27 | % | | | 1.49 | % | | | 1.42 | % |
Net expensese,f,g | | | 1.25 | % | | | 1.23 | % | | | 1.26 | % | | | 1.27 | % | | | 1.49 | % | | | 1.42 | % |
Portfolio turnover rate | | | 19 | % | | | 45 | % | | | 54 | % | | | 55 | % | | | 52 | % | | | 84 | % |
SEE NOTES TO FINANCIAL STATEMENTS. | THE GUGGENHEIM FUNDS SEMI-ANNUAL REPORT | 19 |
FINANCIAL HIGHLIGHTS (continued) |
SMID CAP VALUE FUND | |
This table is presented to show selected data for a share outstanding throughout each period and to assist shareholders in evaluating a Fund’s performance for the periods presented.
C-Class | | Period
Ended
March 31,
2020a | | | Year
Ended
Sept. 30,
2019 | | | Year
Ended
Sept. 30,
2018 | | | Year
Ended
Sept. 30,
2017 | | | Year
Ended
Sept. 30,
2016 | | | Year
Ended
Sept. 30,
2015 | |
Per Share Data |
Net asset value, beginning of period | | $ | 20.48 | | | $ | 26.05 | | | $ | 26.33 | | | $ | 22.78 | | | $ | 24.54 | | | $ | 31.14 | |
Income (loss) from investment operations: |
Net investment income (loss)b | | | .16 | | | | (.02 | ) | | | (.17 | ) | | | (.17 | ) | | | .06 | | | | (.15 | ) |
Net gain (loss) on investments (realized and unrealized) | | | (5.27 | ) | | | (1.57 | ) | | | 2.49 | | | | 4.55 | | | | 3.02 | | | | (1.76 | ) |
Total from investment operations | | | (5.11 | ) | | | (1.59 | ) | | | 2.32 | | | | 4.38 | | | | 3.08 | | | | (1.91 | ) |
Less distributions from: |
Net investment income | | | (.06 | ) | | | — | | | | — | | | | (.18 | ) | | | — | | | | — | |
Net realized gains | | | (1.04 | ) | | | (3.98 | ) | | | (2.60 | ) | | | (.65 | ) | | | (4.84 | ) | | | (4.69 | ) |
Total distributions | | | (1.10 | ) | | | (3.98 | ) | | | (2.60 | ) | | | (.83 | ) | | | (4.84 | ) | | | (4.69 | ) |
Net asset value, end of period | | $ | 14.27 | | | $ | 20.48 | | | $ | 26.05 | | | $ | 26.33 | | | $ | 22.78 | | | $ | 24.54 | |
|
Total Returnc | | | (26.63 | %) | | | (3.35 | %) | | | 9.22 | % | | | 19.63 | % | | | 14.64 | % | | | (7.49 | %) |
Ratios/Supplemental Data |
Net assets, end of period (in thousands) | | $ | 16,950 | | | $ | 31,221 | | | $ | 52,996 | | | $ | 87,508 | | | $ | 98,176 | | | $ | 126,047 | |
Ratios to average net assets: |
Net investment income (loss) | | | 1.21 | % | | | (0.11 | %) | | | (0.65 | %) | | | (0.68 | %) | | | 0.27 | % | | | (0.53 | %) |
Total expensesd | | | 2.18 | % | | | 2.07 | % | | | 2.03 | % | | | 2.07 | % | | | 2.27 | % | | | 2.12 | % |
Net expensese,f,g | | | 2.09 | % | | | 2.06 | % | | | 2.03 | % | | | 2.06 | % | | | 2.27 | % | | | 2.12 | % |
Portfolio turnover rate | | | 19 | % | | | 45 | % | | | 54 | % | | | 55 | % | | | 52 | % | | | 84 | % |
20 | THE GUGGENHEIM FUNDS SEMI-ANNUAL REPORT | SEE NOTES TO FINANCIAL STATEMENTS. |
FINANCIAL HIGHLIGHTS (continued) |
SMID CAP VALUE FUND | |
This table is presented to show selected data for a share outstanding throughout each period and to assist shareholders in evaluating a Fund’s performance for the periods presented.
P-Class | | Period
Ended
March 31,
2020a | | | Year
Ended
Sept. 30,
2019 | | | Year
Ended
Sept. 30,
2018 | | | Year
Ended
Sept. 30,
2017 | | | Year
Ended
Sept. 30,
2016 | | | Period
Ended
Sept. 30,
2015h | |
Per Share Data |
Net asset value, beginning of period | | $ | 30.25 | | | $ | 35.94 | | | $ | 35.15 | | | $ | 30.18 | | | $ | 30.77 | | | $ | 33.91 | |
Income (loss) from investment operations: |
Net investment income (loss)b | | | .35 | | | | .19 | | | | .05 | | | | .01 | | | | .14 | | | | .10 | |
Net gain (loss) on investments (realized and unrealized) | | | (7.92 | ) | | | (1.88 | ) | | | 3.34 | | | | 6.08 | | | | 4.11 | | | | (3.24 | ) |
Total from investment operations | | | (7.57 | ) | | | (1.69 | ) | | | 3.39 | | | | 6.09 | | | | 4.25 | | | | (3.14 | ) |
Less distributions from: |
Net investment income | | | (.24 | ) | | | (.02 | ) | | | — | | | | (.47 | ) | | | — | | | | — | |
Net realized gains | | | (1.04 | ) | | | (3.98 | ) | | | (2.60 | ) | | | (.65 | ) | | | (4.84 | ) | | | — | |
Total distributions | | | (1.28 | ) | | | (4.00 | ) | | | (2.60 | ) | | | (1.12 | ) | | | (4.84 | ) | | | — | |
Net asset value, end of period | | $ | 21.40 | | | $ | 30.25 | | | $ | 35.94 | | | $ | 35.15 | | | $ | 30.18 | | | $ | 30.77 | |
|
Total Return | | | (26.34 | %) | | | (2.61 | %) | | | 10.03 | % | | | 20.57 | % | | | 15.61 | % | | | (9.26 | %) |
Ratios/Supplemental Data |
Net assets, end of period (in thousands) | | $ | 7,921 | | | $ | 14,165 | | | $ | 19,889 | | | $ | 22,203 | | | $ | 3,423 | | | $ | 57 | |
Ratios to average net assets: |
Net investment income (loss) | | | 2.00 | % | | | 0.63 | % | | | 0.13 | % | | | 0.02 | % | | | 0.48 | % | | | 0.71 | % |
Total expensesd | | | 1.35 | % | | | 1.35 | % | | | 1.35 | % | | | 1.25 | % | | | 1.32 | % | | | 1.32 | % |
Net expensese,f,g | | | 1.31 | % | | | 1.32 | % | | | 1.28 | % | | | 1.23 | % | | | 1.32 | % | | | 1.32 | % |
Portfolio turnover rate | | | 19 | % | | | 45 | % | | | 54 | % | | | 55 | % | | | 52 | % | | | 84 | % |
SEE NOTES TO FINANCIAL STATEMENTS. | THE GUGGENHEIM FUNDS SEMI-ANNUAL REPORT | 21 |
FINANCIAL HIGHLIGHTS (continued) |
SMID CAP VALUE FUND | |
This table is presented to show selected data for a share outstanding throughout each period and to assist shareholders in evaluating a Fund’s performance for the periods presented.
Institutional Class | | Period
Ended
March 31,
2020a,i | |
Per Share Data |
Net asset value, beginning of period | | $ | 10.20 | |
Income (loss) from investment operations: |
Net investment income (loss)b | | | .09 | |
Net gain (loss) on investments (realized and unrealized) | | | (3.26 | ) |
Total from investment operations | | | (3.17 | ) |
Net asset value, end of period | | | 7.03 | |
|
Total Return | | | (31.08 | %) |
Ratios/Supplemental Data |
Net assets, end of period (in thousands) | | $ | 53,565 | |
Ratios to average net assets: |
Net investment income (loss) | | | 3.46 | % |
Total expensesd | | | 1.11 | % |
Net expensese,f,g | | | 1.04 | % |
Portfolio turnover rate | | | 19 | % |
22 | THE GUGGENHEIM FUNDS SEMI-ANNUAL REPORT | SEE NOTES TO FINANCIAL STATEMENTS. |
FINANCIAL HIGHLIGHTS (concluded) |
SMID CAP VALUE FUND |
a | Unaudited figures for the period ended March 31, 2020. Percentage amounts for the period, except total return and portfolio turnover rate, have been annualized. |
b | Net investment income (loss) per share was computed using average shares outstanding throughout the period. |
c | Total return does not reflect the impact of any applicable sales charges. |
d | Does not include expenses of the underlying funds in which the Fund invests. |
e | Net expense information reflects the expense ratios after expense waivers and reimbursements, as applicable. |
f | Net expenses may include expenses that are excluded from the expense limitation agreement and affiliated fund waivers. Excluding these expenses, the net expense ratios for the periods would be: |
| | | 03/31/20a | 09/30/19 | 09/30/18 | 09/30/17 |
| | A-Class | 1.25% | 1.23% | 1.26% | 1.25% |
| | C-Class | 2.09% | 2.06% | 2.03% | 2.04% |
| | P-Class | 1.31% | 1.32% | 1.28% | 1.21% |
| | Institutional Class | 1.04%i | N/A | N/A | N/A |
g | The portion of the ratios of net expenses to average net assets attributable to recoupments of prior fee reductions or expense reimbursements for the periods presented would be as follows: |
| | | 03/31/20a | 09/30/19 | 09/30/18 | 09/30/17 |
| | A-Class | 0.00% | 0.00% | 0.01% | 0.00%* |
| | C-Class | 0.00%* | 0.01% | 0.01% | 0.00%* |
| | P-Class | 0.00%* | 0.04% | 0.04% | 0.00%* |
| | Institutional Class | 0.00%i | N/A | N/A | N/A |
| * | Less than 0.01% |
| h | Since commencement of operations: May 1, 2015. Percentage amounts for the period, except total return and portfolio turnover rate, have been annualized. |
| i | Since commencement of operations, as of the close of business January 3, 2020. Percentage amounts for the period, except total return and portfolio turnover rate, have been annualized. |
SEE NOTES TO FINANCIAL STATEMENTS. | THE GUGGENHEIM FUNDS SEMI-ANNUAL REPORT | 23 |
NOTES TO FINANCIAL STATEMENTS (Unaudited) |
Note 1 – Organization and Significant Accounting Policies
Organization
Guggenheim Funds Trust (the “Trust”), a Delaware statutory trust, is registered with the SEC under the Investment Company Act of 1940 (“1940 Act”), as an open-ended investment company of the series type. Each series, in effect, is representing a separate fund. The Trust is authorized to issue an unlimited number of no par value shares. The Trust accounts for the assets of each fund separately.
The Trust offers a combination of five separate classes of shares: A-Class shares, C-Class shares, P-Class shares, R6-Class shares and Institutional Class shares. Sales of shares of each Class are made without a front-end sales charge at the net asset value per share (“NAV”), with the exception of A-Class shares. A-Class shares are sold at the NAV, plus the applicable front-end sales charge. The sales charge varies depending on the amount purchased. A-Class share purchases of $1 million or more are exempt from the front-end sales charge but have a 1% contingent deferred sales charge (“CDSC”), if shares are redeemed within 12 months of purchase. C-Class shares have a 1% CDSC if shares are redeemed within 12 months of purchase. C-Class shares of each Fund automatically convert to A-Class shares of the same Fund on or about the 10th day of the month following the 10-year anniversary of the purchase of the C-Class shares. This conversion will be executed without any sales charge, fee or other charge. After the conversion is completed, the shares will be subject to all features and expenses of A-Class shares. Institutional Class shares are offered primarily for direct investment by institutions such as pension and profit sharing plans, endowments, foundations and corporations. Institutional Class shares require a minimum initial investment of $2 million and a minimum account balance of $1 million. R6-Class shares are offered primarily through qualified retirement and benefit plans. R6-Class shares are also offered through certain other plans and platforms sponsored by financial intermediaries. Certain institutional investors and others deemed appropriate by Guggenheim Investments (“GI”) may also be eligible to purchase R6-Class shares subject to a $2 million minimum initial investment. At March 31, 2020, the Trust consisted of nineteen funds (the “Funds”).
This report covers the SMid Cap Value Fund (the “Fund”), a diversified investment company. At March 31, 2020, A-Class, C-Class, P-Class and Institutional Class shares have been issued by the Fund.
Security Investors, LLC, which operates under the name Guggenheim Investments, provides advisory services. Guggenheim Funds Distributors, LLC (“GFD”) acts as principal underwriter for the Trust. GI and GFD are affiliated entities.
Significant Accounting Policies
The Fund operates as an investment company and, accordingly, follows the investment company accounting and reporting guidance of the Financial Accounting Standards Board (“FASB”) Accounting Standards Codification Topic 946 Financial Services – Investment Companies.
24 | THE GUGGENHEIM FUNDS SEMI-ANNUAL REPORT | |
NOTES TO FINANCIAL STATEMENTS (Unaudited)(continued) |
The following significant accounting policies are in conformity with U.S. generally accepted accounting principles (“U.S. GAAP”) and are consistently followed by the Trust. This requires management to make estimates and assumptions that affect the reported amount of assets and liabilities, contingent assets and liabilities at the date of the financial statements, and the reported amounts of revenues and expenses during the reporting period. Actual results could differ from these estimates. All time references are based on Eastern Time.
The NAV of each Class of the Fund is calculated by dividing the market value of the Fund’s securities and other assets, less all liabilities, attributable to the Class by the number of outstanding shares of the Class.
(a) Valuation of Investments
The Board of Trustees of the Fund (the “Board”) has adopted policies and procedures for the valuation of the Fund’s investments (the “Valuation Procedures”). Pursuant to the Valuation Procedures, the Board has delegated to a valuation committee, consisting of representatives from Guggenheim’s investment management, fund administration, legal and compliance departments (the “Valuation Committee”), the day-to-day responsibility for implementing the Valuation Procedures, including, under most circumstances, the responsibility for determining the fair value of the Fund’s securities and/or other assets.
Valuations of the Fund’s securities and other assets are supplied primarily by pricing services appointed pursuant to the processes set forth in the Valuation Procedures. The Valuation Committee convenes monthly, or more frequently as needed, to review the valuation of all assets which have been fair valued for reasonableness. The Fund’s officers, through the Valuation Committee and consistent with the monitoring and review responsibilities set forth in the Valuation Procedures, regularly review procedures used and valuations provided by the pricing services.
If the pricing service cannot or does not provide a valuation for a particular investment or such valuation is deemed unreliable, such investment is fair valued by the Valuation Committee.
Equity securities listed or traded on a recognized U.S. securities exchange or the National Association of Securities Dealers Automated Quotations (“NASDAQ”) National Market System shall generally be valued on the basis of the last sale price on the primary U.S. exchange or market on which the security is listed or traded; provided, however, that securities listed on NASDAQ will be valued at the NASDAQ Official Closing Price, which may not necessarily represent the last sale price. If there is no sale on the valuation date, exchange-traded U.S. equity securities will be valued on the basis of the last bid price.
Open-end investment companies are valued at their NAV as of the close of business, on the valuation date. Exchange-traded funds are valued at the last quoted sale price.
| | THE GUGGENHEIM FUNDS SEMI-ANNUAL REPORT | 25 |
NOTES TO FINANCIAL STATEMENTS (Unaudited)(continued) |
Investments for which market quotations are not readily available are fair-valued as determined in good faith by GI subject to review and approval by the Valuation Committee, pursuant to methods established or ratified by the Board. Valuations in accordance with these methods are intended to reflect each security’s (or asset’s or liability’s) “fair value”. Each such determination is based on a consideration of all relevant factors, which are likely to vary from one pricing context to another. Examples of such factors may include, but are not limited to market prices; sale prices; broker quotes; and models which derive prices based on inputs such as prices of securities with comparable maturities and characteristics, or based on inputs such as anticipated cash flows or collateral, spread over U.S. Treasury securities, and other information analysis.
(b) Foreign Taxes
The Fund may be subject to foreign taxes (a portion of which may be reclaimable) on income, stock dividends, capital gains on investments or certain foreign currency transactions. All foreign taxes are recorded in accordance with the applicable foreign tax regulations and rates that exist in the foreign jurisdictions in which the Fund invests. These foreign taxes, if any, are paid by the Fund and reflected in its Statement of Operations as follows: foreign taxes withheld at source are presented as a reduction of income and foreign taxes on capital gains from sales of investments are included with the net realized gain (loss) on investments. Foreign taxes payable or deferred as of March 31, 2020, if any, are disclosed in the Fund’s Statement of Assets and Liabilities.
(c) Security Transactions
Security transactions are recorded on the trade date for financial reporting purposes. Realized gains and losses from securities transactions are recorded using the identified cost basis. Proceeds from lawsuits related to investment holdings are recorded as a reduction to cost if the securities are still held and as realized gains if no longer held in the Fund. Dividend income is recorded on the ex-dividend date, net of applicable taxes withheld by foreign countries, if any. Taxable non-cash dividends are recorded as dividend income. Interest income, including amortization of premiums and accretion of discounts, is accrued on a daily basis. Dividend income from Real Estate Investment Trusts (“REITs”) is recorded based on the income included in the distributions received from the REIT investments using published REIT classifications, including some management estimates when actual amounts are not available. Distributions received in excess of this estimated amount are recorded as a reduction of the cost of investments or reclassified to realized gains. The actual amounts of income, return of capital, and realized gains are only determined by each REIT after its fiscal year-end, and may differ from the estimated amounts.
(d) Distributions
Distributions of net investment income and net realized gains, if any, are declared and paid at least annually. Dividends are reinvested in additional shares, unless shareholders request payment in cash. Distributions are recorded on the ex-dividend date and are determined in accordance with U.S. federal income tax regulations which may differ from U.S. GAAP.
26 | THE GUGGENHEIM FUNDS SEMI-ANNUAL REPORT | |
NOTES TO FINANCIAL STATEMENTS (Unaudited)(continued) |
(e) Class Allocations
Interest and dividend income, most expenses, all realized gains and losses, and all unrealized appreciation and depreciation are allocated to the classes based upon the value of the outstanding shares in each Class. Certain costs, such as distribution and service fees are charged directly to specific classes. In addition, certain expenses have been allocated to the individual Funds in the Trust based on the respective net assets of each Fund included in the Trust.
(f) Earnings Credits
Under the fee arrangement with the custodian, the Fund may earn credits based on overnight custody cash balances. These credits are utilized to reduce related custodial expenses. The custodian fees disclosed in the Statement of Operations are before the reduction in expense from the related earnings credits, if any. Earnings credits for the period ended March 31, 2020, if any, are disclosed in the Statement of Operations.
(g) Cash
The Fund may leave cash overnight in its cash account with the custodian. Periodically, the Fund may have cash due to the custodian bank as an overdraft balance. A fee is incurred on this overdraft, calculated by multiplying the overdraft by a rate based on the federal funds rate, which was 0.08% at March 31, 2020.
(h) Indemnifications
Under the Fund’s organizational documents, its Trustees and Officers are indemnified against certain liabilities arising out of the performance of their duties to the Trust. In addition, throughout the normal course of business, the Fund enters into contracts that contain a variety of representations and warranties which provide general indemnifications. The Fund’s maximum exposure under these arrangements is unknown, as this would involve future claims that may be made against the Fund and/or its affiliates that have not yet occurred. However, based on experience, the Fund expects the risk of loss to be remote.
Note 2 – Investment Advisory Agreement and Other Agreements
Under the terms of an investment advisory contract, the Fund pays GI investment advisory fees calculated at an annualized rate of 0.75% of the average daily net assets of the Fund.
GI pays operating expenses on behalf of the Trust, such as audit and accounting related services, legal services, custody, printing and mailing, among others, on a pass-through basis. Such expenses are allocated to various Funds within the complex based on relative net assets.
The Board has adopted Distribution Plans related to the offering of A-Class, C-Class and P-Class shares pursuant to Rule 12b-1 under the 1940 Act. The plans provide for payments at an annual rate of 0.25% of the average daily net assets of the Fund’s A-Class and P-Class shares, and 1.00% of the average daily net assets of the Fund’s C-Class shares.
| | THE GUGGENHEIM FUNDS SEMI-ANNUAL REPORT | 27 |
NOTES TO FINANCIAL STATEMENTS (Unaudited)(continued) |
The investment advisory contract for the Fund provides that the total expenses be limited to a percentage of average net assets for each class of shares, exclusive of brokerage costs, dividends on securities sold short, expenses of other investment companies in which a Fund invests, interest, taxes, litigation, indemnification and extraordinary expenses. The limits are listed below:
| | Limit | | | Effective
Date | | | Contract
End Date | |
A-Class | | | 1.30 | %1 | | | 01/03/20 | | | | 02/01/21 | |
C-Class | | | 2.05 | %1 | | | 01/03/20 | | | | 02/01/21 | |
P-Class | | | 1.30 | %1 | | | 01/03/20 | | | | 02/01/21 | |
Institutional Class | | | 1.05 | % | | | 01/03/20 | | | | 02/01/21 | |
1 | Prior to January 3, 2020, the expense limit for A-Class, C-Class and P-Class shares of the Fund was 1.42%, 2.12% and 1.32%, respectively. |
GI is entitled to reimbursement by the Fund for fees waived or expenses reimbursed during any of the previous 36 months, beginning on the date of the expense limitation agreement, if on any day the estimated operating expenses are less than the indicated percentages. For purposes of this arrangement, GI is entitled to recoupment of previously waived fees or reimbursed expenses for 36 months from the date of the waiver or reimbursement by GI. At March 31, 2020, the amount of fees waived or expenses reimbursed that are subject to recoupment are presented in the following table:
Fund | | 2020 | | | 2021 | | | 2022 | | | 2023 | | | Fund
Total | |
A-Class | | $ | — | | | $ | — | | | $ | — | | | $ | 16,342 | | | $ | 16,342 | |
C-Class | | | — | | | | — | | | | 1,365 | | | | 11,706 | | | | 13,071 | |
P-Class | | | — | | | | 1,167 | | | | 5,793 | | | | 2,228 | | | | 9,188 | |
Institutional Class | | | — | | | | — | | | | — | | | | 10,711 | | | | 10,711 | |
During the period ended March 31, 2020, GI recouped $702 from the Fund.
For the period ended March 31, 2020, GFD retained sales charges of $87,029 relating to sales of A-Class shares of the Trust.
Certain trustees and officers of the Trust are also officers of GI and/or GFD. The Trust does not compensate its officers or trustees who are officers, directors and/or employees of GI or GFD.
MUFG Investor Services (US), LLC (“MUIS”) acts as the Fund’s administrator, transfer agent and accounting agent. As administrator, transfer agent and accounting agent, MUIS maintains the books and records of the Fund’s securities and cash. The Bank of New York Mellon Corp. (“BNY”) acts as the Fund’s custodian. As custodian, BNY is responsible for the custody of the Fund’s assets. For providing the aforementioned administrative and accounting services, MUIS is entitled to receive a monthly fee equal to a percentage of the Fund’s average daily net assets and out of pocket expenses. For providing the aforementioned transfer agent and custodian services,
28 | THE GUGGENHEIM FUNDS SEMI-ANNUAL REPORT | |
NOTES TO FINANCIAL STATEMENTS (Unaudited)(continued) |
MUIS and BNY are entitled to receive a monthly fee based on the number of transactions during the month and the number of accounts under management, subject to certain minimum monthly fees, and out of pocket expenses.
Note 3 – Federal Income Tax Information
The Fund intends to comply with the provisions of Subchapter M of the Internal Revenue Code applicable to regulated investment companies and will distribute substantially all taxable net investment income and capital gains sufficient to relieve the Fund from all, or substantially all, federal income, excise and state income taxes. Therefore, no provision for federal or state income tax or federal excise tax is required.
Tax positions taken or expected to be taken in the course of preparing the Fund’s tax returns are evaluated to determine whether the tax positions are “more-likely-than-not” of being sustained by the applicable tax authority. Tax positions not deemed to meet the more-likely-than-not threshold would be recorded as a tax benefit or expense in the current year. Management has analyzed the Fund’s tax positions taken, or to be taken, on U.S. federal income tax returns for all open tax years, and has concluded that no provision for income tax is required in the Fund’s financial statements. The Fund’s U.S. federal income tax returns are subject to examination by the Internal Revenue Service (“IRS”) for a period of three years after they are filed.
At March 31, 2020, the cost of investments for U.S. federal income tax purposes, the aggregate gross unrealized appreciation for all investments for which there was an excess of value over tax cost, and the aggregate gross unrealized depreciation for all investments for which there was an excess of tax cost over value, were as follows:
| | Tax
Cost | | | Tax
Unrealized
Appreciation | | | Tax
Unrealized
Depreciation | | | Net
Unrealized
Appreciation/
(Depreciation) | |
| | | $ | 367,624,770 | | | $ | 19,531,841 | | | $ | (96,823,129 | ) | | $ | (77,291,288 | ) |
Note 4 – Fair Value Measurement
In accordance with U.S. GAAP, fair value is defined as the price that the Fund would receive to sell an investment or pay to transfer a liability in an orderly transaction with an independent buyer in the principal market, or in the absence of a principal market, the most advantageous market for the investment or liability. U.S. GAAP establishes a three-tier fair value hierarchy based on the types of inputs used to value assets and liabilities and requires corresponding disclosure. The hierarchy and the corresponding inputs are summarized below:
Level 1 — | quoted prices in active markets for identical assets or liabilities. |
| | THE GUGGENHEIM FUNDS SEMI-ANNUAL REPORT | 29 |
NOTES TO FINANCIAL STATEMENTS (Unaudited)(continued) |
Level 2 — | significant other observable inputs (for example quoted prices for securities that are similar based on characteristics such as interest rates, prepayment speeds, credit risk, etc.). |
Level 3 — | significant unobservable inputs based on the best information available under the circumstances, to the extent observable inputs are not available, which may include assumptions. |
The types of inputs available depend on a variety of factors, such as the type of security and the characteristics of the markets in which it trades, if any. Fair valuation determinations that rely on fewer or no observable inputs require greater judgment. Accordingly, fair value determinations for Level 3 securities require the greatest amount of judgment.
The inputs or methodologies used for valuing securities are not necessarily an indication of the risk associated with investing in those securities. The suitability of the techniques and sources employed to determine fair valuation are regularly monitored and subject to change.
Note 5 – Securities Transactions
For the period ended March 31, 2020, the cost of purchases and proceeds from sales of investment securities, excluding short-term investments, were as follows:
| | Purchases | | | Sales | |
| | | $ | 70,252,158 | | | $ | 104,018,362 | |
Note 6 – Line of Credit
The Trust, along with other affiliated trusts, secured a 364-day committed, $1,205,000,000 line of credit from Citibank, N.A., which was in place through October 4, 2019, at which time the line of credit was renewed with an increased commitment amount of $1,230,000. A Fund may draw (borrow) from the line of credit as a temporary measure for emergency purposes, to facilitate redemption requests, or for other short-term liquidity purposes consistent with the Fund’s investment objective and program. For example, it may be advantageous for the Fund to borrow money rather than sell existing portfolio positions to meet redemption requests. Fees related to borrowings, if any, vary under this arrangement between the greater of Citibank’s “base rate”, LIBOR plus 1%, or the federal funds rate plus 1/2 of 1%.
The commitment fee that may be paid by the Fund is at an annualized rate 0.15% of the average daily amount of its allocated unused commitment amount. The allocated commitment fee amount for each Fund is referenced in the Statement of Operations under “Line of credit fees”. The Fund did not have any borrowings under this agreement as of and for the period ended March 31, 2020.
30 | THE GUGGENHEIM FUNDS SEMI-ANNUAL REPORT | |
NOTES TO FINANCIAL STATEMENTS (Unaudited)(continued) |
Note 7 – Other Liabilities
The Fund wrote put options contracts through Lehman Brothers Inc., (“LBI”) that were exercised prior to the option contracts’ expiration and prior to the bankruptcy filing by LBI, during September 2008. These transactions have not settled and the securities have not been delivered to the Fund as of March 31, 2020.
The Fund recorded a liability equal to the difference between the strike price on the put options and the market prices of the underlying security on the exercise date. The amount of the liability recorded by the Fund as of March 31, 2020, was $489,534 and is included in payable for miscellaneous in the Statement of Assets and Liabilities. On May 15, 2020 after the period end, the Fund revised the amount of the liability to $0 after it was determined the Fund has no future obligation related to this matter.
Note 8 – Merger
Effective on the close of business January 3, 2020, the Guggenheim SMid Cap Value Institutional Fund (the “Acquired Fund”) reorganized with and into newly formed Institutional Class shares of the Fund (the “Acquiring Fund”). The purpose of the reorganization was to combine two funds managed by GI with comparable investment objectives and strategies. The reorganization was treated as a tax-free reorganization for federal income tax purposes and, accordingly, the basis of the assets of the Acquiring Fund reflected the historical basis of the assets of the Acquired Fund as of the date of the Reorganization. For financial reporting purposes, the Acquiring Fund was deemed to be the accounting survivor and assets received and shares issued by the Acquiring Fund were recorded at fair value.
In the merger, shareholders of the Acquired Fund received newly issued shares of the Acquiring Fund’s Institutional Class shares, having a NAV equal to the NAV of their holdings of the Acquired Fund’s shares as determined at the close of business on January 3, 2020, which was $10.20. Accordingly, shareholders received the same number of shares of the newly created Institutional Class of the Acquiring Fund with an equivalent value to shares of the Acquired Fund held immediately prior to the merger. As such, no share ratio conversions were required to effect this merger. Relevant details pertaining to the merger as of January 3, 2020 are as follows:
| | Acquired Fund
Shares prior to
reorganization | | | Institutional Class
Shares issued by
Acquiring Fund | | | Net Assets | |
Acquiring Fund | | | | | | | | | | $ | 381,345,573 | |
Acquired Fund | | | 6,532,159 | | | | 6,532,159 | | | | 66,601,569 | |
| | | | | | | | | | | $ | 447,947,142 | |
| | THE GUGGENHEIM FUNDS SEMI-ANNUAL REPORT | 31 |
NOTES TO FINANCIAL STATEMENTS (Unaudited)(continued) |
Investments
The cost, fair value and net unrealized appreciation (depreciation) of the investments of the Acquired Fund as of the date of the merger, is as follows:
Cost of investments | | $ | 61,009,544 | |
Fair value of investments | | $ | 66,604,886 | |
Net unrealized appreciation (depreciation) on investments | | $ | 5,595,342 | |
Cost and Expenses
The Investment Adviser agreed to cover all costs and expenses associated with the merger (“merger fees”). No merger fees were borne by the Acquired Fund or the Acquiring Fund.
Pro Forma Results of Operations
Assuming the acquisition had been completed on October 1, 2019, the beginning of the fiscal reporting period of the Fund, the pro forma results of operations for the period ended March 31, 2020, would be as follows:
SMid Cap Value Fund | | | |
Net investment income (loss) | | $ | 5,099,476 | |
Net realized and unrealized gains (loss) | | $ | (110,725,382 | ) |
Change in net assets resulting from operations | | $ | (105,625,906 | ) |
Because the combined investment portfolios have been managed as a single integrated portfolio since the acquisition was completed, it is not practicable to separate the amounts of revenue and earnings of Guggenheim SMid Cap Value Institutional Fund that have been included in the Fund’s Statement of Operations since January 3, 2020.
Note 9 – COVID-19 and Recent Developments
The global ongoing crisis caused by the outbreak of COVID-19 is causing materially reduced consumer demand and economic output, disrupting supply chains, resulting in market closures, travel restrictions and quarantines, and adversely impacting local and global economies. Investors should be aware that in light of the current uncertainty, volatility and distress in economies, financial markets, and labor and health conditions all over the world, the Fund’s investments and a shareholder’s investment in the Fund are subject to sudden and substantial losses, increased volatility and other adverse events. Firms through which investors invest with the Fund, the Funds, its service providers, the markets in which it invests and market intermediaries are also impacted by quarantines and similar measures intended to contain the ongoing pandemic, which can obstruct their functioning and subject them to heightened operational risks.
32 | THE GUGGENHEIM FUNDS SEMI-ANNUAL REPORT | |
NOTES TO FINANCIAL STATEMENTS (Unaudited)(concluded) |
Note 10 – Subsequent Events
The Fund evaluated subsequent events through the date the financial statements were available for issue and determined there were no material events that would require adjustment to or disclosure in the Fund’s financial statements.
| | THE GUGGENHEIM FUNDS SEMI-ANNUAL REPORT | 33 |
OTHER INFORMATION (Unaudited) |
Proxy Voting Information
A description of the policies and procedures that the Trust uses to determine how to vote proxies relating to securities held in the Fund’s portfolios is available, without charge and upon request, by calling 800.820.0888. This information is also available from the EDGAR database on the SEC’s website at https://www.sec.gov.
Information regarding how the Fund voted proxies relating to portfolio securities during the most recent 12-month period ended June 30 is available without charge, upon request, by calling 800.820.0888. This information is also available from the EDGAR database on the SEC’s website at https://www.sec.gov.
Sector Classification
Information in the Schedule of Investments is categorized by sectors using sector-level Classifications defined by the Bloomberg Industry Classification System, a widely recognized industry classification system provider. The Fund’s registration statement has investment policies relating to concentration in specific sectors/industries. For purposes of these investment policies, the Fund usually classifies sectors/industries based on industry-level Classifications used by widely recognized industry classification system providers such as Bloomberg Industry Classification System, Global Industry Classification Standards and Barclays Global Classification Scheme.
Quarterly Portfolio Schedules Information
The Trust files its complete schedule of portfolio holdings with the SEC for the first and third quarters of each fiscal year as an exhibit to its reports on Form N-PORT, and for reporting periods ended prior to March 31, 2019, filed such information on Form N-Q. The Fund’s Forms N-PORT and N-Q are available on the SEC’s website at https://www.sec.gov. The Fund’s Forms N-PORT and N-Q may be reviewed and copied at the SEC’s Public Reference Room in Washington, DC, and that information on the operation of the Public Reference Room may be obtained by calling 800-SEC-0330. Copies of the portfolio holdings are also available to shareholders, without charge and upon request, by calling 800.820.0888.
34 | THE GUGGENHEIM FUNDS SEMI-ANNUAL REPORT | |
INFORMATION ON BOARD OF TRUSTEES AND OFFICERS (Unaudited) |
A Board of Trustees oversees the Trust, as well as other trusts of GI, in which its members have no stated term of service, and continue to serve after election until resignation. The Statement of Additional Information includes further information about Fund Trustees and Officers, and can be obtained by visiting guggenheiminvestments.com or by calling 800.820.0888.
Name, Address*
and Year of Birth | Position(s)
Held with
Trust | Term of Office
and Length of
Time Served** | Principal Occupation(s)
During Past Five Years | Number of
Portfolios
in Fund
Complex
Overseen | Other Directorships
Held by Trustees*** |
INDEPENDENT TRUSTEES | | | |
Randall C. Barnes (1951) | Trustee | Since 2014 | Current: Private Investor (2001-present). Former: Senior Vice President and Treasurer, PepsiCo, Inc. (1993-1997); President, Pizza Hut International (1991-1993); Senior Vice President, Strategic Planning and New Business Development, PepsiCo, Inc. (1987-1990). | 157 | Current: Purpose Investments Funds (2013-present). Former: Managed Duration Investment Grade Municipal Fund (2006-2016). |
Angela Brock-Kyle (1959) | Trustee | Since 2019 | Current: Founder and Chief Executive Officer, B.O.A.R.D.S. (2013-present). Former: Senior Leader, TIAA (1987-2012). | 156 | Current: Hunt Companies, Inc. (2019-present). Former: Infinity Property & Casualty Corp. (2014-2018). |
Donald A.
Chubb, Jr. (1946) | Trustee and Chair of the Valuation Oversight Committee | Since 1994 | Current: Retired Former: Business broker and manager of commercial real estate, Griffith & Blair, Inc. (1997-2017). | 156 | Former: Midland Care, Inc. (2011-2016). |
Jerry B. Farley (1946) | Trustee and Chair of the Audit Committee | Since 2005 | Current: President, Washburn University (1997-present). | 156 | Current: CoreFirst Bank & Trust (2000-present). Former: Westar Energy, Inc. (2004-2018). |
| | THE GUGGENHEIM FUNDS SEMI-ANNUAL REPORT | 35 |
INFORMATION ON BOARD OF TRUSTEES AND OFFICERS (Unaudited)(continued) |
Name, Address*
and Year of Birth | Position(s)
Held with
Trust | Term of Office
and Length of
Time Served** | Principal Occupation(s)
During Past Five Years | Number of
Portfolios
in Fund
Complex
Overseen | Other Directorships
Held by Trustees*** |
INDEPENDENT TRUSTEES - continued | | | |
Roman
Friedrich III (1946) | Trustee and Chair of the Contracts Review Committee | Since 2014 | Current: Founder and Managing Partner, Roman Friedrich & Company (1998-present). | 156 | Former: Zincore Metals, Inc. (2009-2019). |
Thomas F.
Lydon, Jr. (1960) | Trustee and Vice Chair of the Contracts Review Committee | Since 2019 | Current: President, Global Trends Investments (1996-present); Co-Chief Executive Officer, ETF Flows, LLC (2019-present); Chief Executive Officer, Lydon Media (2016-present). | 156 | Current: US Global Investors (GROW) (1995-present). Former: Harvest Volatility Edge Trust (3) (2017-2019). |
Ronald A. Nyberg (1953) | Trustee and Chair of the Nominating and Governance Committee | Since 2014 | Current: Partner, Momkus LLC (2016-present). Former: Partner, Nyberg & Cassioppi, LLC (2000-2016); Executive Vice President, General Counsel, and Corporate Secretary, Van Kampen Investments (1982-1999). | 157 | Current: PPM Funds (9) (2018 - present); Edward-Elmhurst Healthcare System (2012-present). Former: Western Asset Inflation-Linked Opportunities & Income Fund (2004-April 2020); Western Asset Inflation-Linked Income Fund (2003-April 2020); Managed Duration Investment Grade Municipal Fund (2003-2016). |
36 | THE GUGGENHEIM FUNDS SEMI-ANNUAL REPORT | |
INFORMATION ON BOARD OF TRUSTEES AND OFFICERS (Unaudited)(continued) |
Name, Address*
and Year of Birth | Position(s)
Held with
Trust | Term of Office
and Length of
Time Served** | Principal Occupation(s)
During Past Five Years | Number of
Portfolios
in Fund
Complex
Overseen | Other Directorships
Held by Trustees*** |
INDEPENDENT TRUSTEES - concluded | | | |
Sandra G. Sponem (1958) | Trustee | Since 2019 | Current: Retired. Former: Senior Vice President and Chief Financial Officer, M.A. Mortenson-Companies, Inc. (2007-2017). | 156 | Current: SPDR Series Trust (78) (2018-present); SPDR Index Shares Funds (31) (2018-present); SSGA Active Trust (12) (2018-present); and SSGA Master Trust (1) (2018-present). |
Ronald E.
Toupin, Jr. (1958) | Trustee, Chair of the Board and Chair of the Executive Committee | Since 2014 | Current: Portfolio Consultant (2010-present); Member, Governing Council, Independent Directors Council (2013-present); Governor, Board of Governors, Investment Company Institute (2018-present). Former: Member, Executive Committee, Independent Directors Council (2016-2018); Vice President, Manager and Portfolio Manager, Nuveen Asset Management (1998-1999); Vice President, Nuveen Investment Advisory Corp. (1992-1999); Vice President and Manager, Nuveen Unit Investment Trusts (1991-1999); and Assistant Vice President and Portfolio Manager, Nuveen Unit Investment Trusts (1988-1999), each of John Nuveen & Co., Inc. (1982-1999). | 156 | Former: Western Asset Inflation-Linked Opportunities & Income Fund (2004-April 2020); Western Asset Inflation-Linked Income Fund (2003-April 2020); Managed Duration Investment Grade Municipal Fund (2003-2016). |
| | THE GUGGENHEIM FUNDS SEMI-ANNUAL REPORT | 37 |
INFORMATION ON BOARD OF TRUSTEES AND OFFICERS (Unaudited)(continued) |
Name, Address*
and Year of Birth | Position(s)
Held with
Trust | Term of Office
and Length of
Time Served** | Principal Occupation(s)
During Past Five Years | Number of
Portfolios
in Fund
Complex
Overseen | Other Directorships
Held by Trustees*** |
INTERESTED TRUSTEE | | |
Amy J. Lee**** (1961) | Trustee, Vice President and Chief Legal Officer | Since 2018
(Trustee)
Since 2014
(Chief Legal Officer)
Since 2007
(Vice President) | Current: Interested Trustee, certain other funds in the Fund Complex (2018-present); Chief Legal Officer, certain other funds in the Fund Complex (2014-present); Vice President, certain other funds in the Fund Complex (2007-present); Senior Managing Director, Guggenheim Investments (2012-present). Former: President and Chief Executive Officer, certain other funds in the Fund Complex (2017-2019); Vice President, Associate General Counsel and Assistant Secretary, Security Benefit Life Insurance Company and Security Benefit Corporation (2004-2012). | 156 | None. |
* | The business address of each Trustee is c/o Guggenheim Investments, 227 West Monroe Street, Chicago, Illinois 60606. |
** | Each Trustee serves an indefinite term, until his or her successor is elected and qualified. Time served includes time served in the respective position for the Predecessor Corporation. |
*** | Each Trustee also serves on the boards of trustees of Guggenheim Funds Trust, Fiduciary/Claymore Energy Infrastructures Fund, Guggenheim Taxable Municipal Managed Duration Trust, Guggenheim Strategic Opportunities Fund, Guggenheim Enhanced Equity Income Fund, Guggenheim Energy & Income Fund, Guggenheim Credit Allocation Fund, Rydex Series Funds, Rydex Dynamic Funds, Rydex Variable Funds and Transparent Value Trust, Messrs. Barnes and Nyberg also serve on the board of trustees of Advent Convertible & Income Fund. |
**** | This Trustee is deemed to be an “interested person” of the Fund under the 1940 Act by reason of her position with the Fund’s Investment Manager and/or the parent of the Investment Manager. |
38 | THE GUGGENHEIM FUNDS SEMI-ANNUAL REPORT | |
INFORMATION ON BOARD OF TRUSTEES AND OFFICERS (Unaudited)(continued) |
Name, Address*
and Year of Birth | Position(s)
Held with
Trust | Term of Office
and Length of
Time Served** | Principal Occupation(s)
During Past Five Years |
OFFICERS | | | |
Brian E. Binder (1972) | President and Chief Executive Officer | Since 2018 | Current: President and Chief Executive Officer, certain other funds in the Fund Complex (2018-present); President, Chief Executive Officer and Chairman of the Board of Managers, Guggenheim Funds Investment Advisors, LLC (2018-present); President and Chief Executive Officer, Security Investors, LLC (2018-present); Board Member of Guggenheim Partners Fund Management (Europe) Limited (2018-present); Senior Managing Director and Chief Administrative Officer, Guggenheim Investments (2018-present). Former: Managing Director and President, Deutsche Funds, and Head of US Product, Trading and Fund Administration, Deutsche Asset Management (2013-2018); Managing Director, Head of Business Management and Consulting, Invesco Ltd. (2010-2012). |
James M. Howley (1972) | Assistant Treasurer | Since 2014 | Current: Managing Director, Guggenheim Investments (2004-present); Assistant Treasurer, certain other funds in the Fund Complex (2006-present). Former: Manager, Mutual Fund Administration of Van Kampen Investments, Inc. (1996-2004). |
Mark E. Mathiasen (1978) | Secretary | Since 2014 | Current: Secretary, certain other funds in the Fund Complex (2007-present); Managing Director, Guggenheim Investments (2007-present). |
Glenn McWhinnie (1969) | Assistant Treasurer | Since 2016 | Current: Vice President, Guggenheim Investments (2009-present); Assistant Treasurer, certain other funds in the Fund Complex (2016-present). |
Michael P. Megaris (1984) | Assistant Secretary | Since 2014 | Current: Assistant Secretary, certain other funds in the Fund Complex (2014-present); Director, Guggenheim Investments (2012-present). |
Elisabeth Miller (1968) | Chief Compliance Officer | Since 2012 | Current: Chief Compliance Officer, certain other funds in the Fund Complex (2012-present); Senior Managing Director, Guggenheim Investments (2012-present). Vice President, Guggenheim Funds Distributors, LLC (2014-present). Former: Chief Compliance Officer, Security Investors, LLC and Guggenheim Funds Investment Advisors, LLC (2012-2018); Chief Compliance Officer, Guggenheim Distributors, LLC (2009-2014); Senior Manager, Security Investors, LLC (2004-2014); Senior Manager, Guggenheim Distributors, LLC (2004-2014). |
| | THE GUGGENHEIM FUNDS SEMI-ANNUAL REPORT | 39 |
INFORMATION ON BOARD OF TRUSTEES AND OFFICERS (Unaudited)(continued) |
Name, Address*
and Year of Birth | Position(s)
Held with
Trust | Term of Office
and Length of
Time Served** | Principal Occupation(s)
During Past Five Years |
OFFICERS - continued | |
Margaux Misantone (1978) | AML Officer | Since 2017 | Current: Chief Compliance Officer, Security Investors, LLC and Guggenheim Funds Investment Advisors, LLC (2018-present); AML Officer, Security Investors, LLC and certain other funds in the Fund Complex (2017-present); Managing Director, Guggenheim Investments (2015-present). Former: Assistant Chief Compliance Officer, Security Investors, LLC and Guggenheim Funds Investments Advisors, LLC (2015-2018). |
William Rehder (1967) | Assistant Vice President | Since 2018 | Current: Managing Director, Guggenheim Investments (2002-present). |
Kimberly J. Scott (1974) | Assistant Treasurer | Since 2014 | Current: Director, Guggenheim Investments (2012-present); Assistant Treasurer, certain other funds in the Fund Complex (2012-present). Former: Financial Reporting Manager, Invesco, Ltd. (2010-2011); Vice President/Assistant Treasurer, Mutual Fund Administration for Van Kampen Investments, Inc./Morgan Stanley Investment Management (2009-2010); Manager of Mutual Fund Administration, Van Kampen Investments, Inc./Morgan Stanley Investment Management (2005-2009). |
Bryan Stone (1979) | Vice President | Since 2014 | Current: Vice President, certain other funds in the Fund Complex (2014-present); Managing Director, Guggenheim Investments (2013-present). Former: Senior Vice President, Neuberger Berman Group LLC (2009-2013); Vice President, Morgan Stanley (2002-2009). |
40 | THE GUGGENHEIM FUNDS SEMI-ANNUAL REPORT | |
INFORMATION ON BOARD OF TRUSTEES AND OFFICERS (Unaudited)(concluded) |
Name, Address*
and Year of Birth | Position(s)
Held with
Trust | Term of Office
and Length of
Time Served** | Principal Occupation(s)
During Past Five Years |
OFFICERS - concluded | |
John L. Sullivan (1955) | Chief Financial Officer, Chief Accounting Officer and Treasurer | Since 2014 | Current: Chief Financial Officer, Chief Accounting Officer and Treasurer, certain other funds in the Fund Complex (2010-present); Senior Managing Director, Guggenheim Investments (2010-present). Former: Managing Director and Chief Compliance Officer, each of the funds in the Van Kampen Investments fund complex (2004-2010); Managing Director and Head of Fund Accounting and Administration, Morgan Stanley Investment Management (2002-2004); Chief Financial Officer and Treasurer, Van Kampen Funds (1996-2004). |
Jon Szafran (1989) | Assistant Treasurer | Since 2017 | Current: Vice President, Guggenheim Investments (2017-present); Assistant Treasurer, certain other funds in the Fund Complex (2017-present). Former: Assistant Treasurer of Henderson Global Funds and Manager of US Fund Administration, Henderson Global Investors (North America) Inc. (“HGINA”), (2017); Senior Analyst of US Fund Administration, HGINA (2014–2017); Senior Associate of Fund Administration, Cortland Capital Market Services, LLC (2013-2014); Experienced Associate, PricewaterhouseCoopers LLP (2012-2013). |
* | The business address of each officer is c/o Guggenheim Investments, 227 West Monroe Street, Chicago, Illinois 60606. |
** | Each officer serves an indefinite term, until his or her successor is duly elected and qualified. |
| | THE GUGGENHEIM FUNDS SEMI-ANNUAL REPORT | 41 |
GUGGENHEIM INVESTMENTS PRIVACY NOTICE (Unaudited) |
Who We Are
This Privacy Notice describes the data protection practices of Guggenheim Investments. Guggenheim Investments as used herein refers to the affiliated investment management businesses of Guggenheim Partners, LLC: Guggenheim Funds Investment Advisors, LLC, Guggenheim Partners Investment Management, LLC, Guggenheim Funds Distributors, LLC, Security Investors, LLC, Guggenheim Investment Advisors (Europe) Limited, Guggenheim Real Estate, LLC, GS Gamma Advisors, LLC, Guggenheim Partners India Management, LLC, Guggenheim Partners Europe Limited, as well as the funds in the Guggenheim Funds complex (the “Funds”) (“Guggenheim Investments,” “we,” “us,” or “our”).
Guggenheim Partners Investment Management Holdings, LLC, located at 330 Madison Avenue, New York, New York 10017 is the data controller for your information. The affiliates who are also controllers of certain of your information are: Guggenheim Investment Advisors (Europe) Limited, Guggenheim Partners Europe Limited, Guggenheim Partners, LLC, Guggenheim Funds Investment Advisors, LLC, Guggenheim Partners Investment Management, LLC, Guggenheim Funds Distributors, LLC and Security Investors, LLC, as well as the Funds.
Our Commitment to You
Guggenheim Investments considers your privacy our utmost concern. When you become our client or investor, you entrust us with not only your hard-earned money but also with your personal and financial information. Because we have access to your private information, we hold ourselves to the highest standards in its safekeeping and use. We strictly limit how we share your information with others, whether you are a current or former Guggenheim Investments client or investor.
The Information We Collect About You
We collect certain nonpublic personal information about you from information you provide on applications, other forms, our website, and/or from third parties including investment advisors. This information includes Social Security or other tax identification number, assets, income, tax information, retirement and estate plan information, transaction history, account balance, payment history, bank account information, marital status, family relationships, information that we collect on our website through the use of “cookies,” and other personal information that you or others provide to us. We may also collect such information through your inquiries by mail, e-mail or telephone. We may also collect customer due diligence information, as required by applicable law and regulation, through third party service providers.
How We Handle Your Personal Information
The legal basis for using your information as set out in this Privacy Notice is as follows: (a) use of your personal data is necessary to perform our obligations under any contract with you (such as a contract for us to provide financial services to you); or (b) where use of your personal data is not necessary for performance of a contract, use of your personal data is necessary for our legitimate interests or the legitimate interests of others (for example, to enforce the legal terms
42 | THE GUGGENHEIM FUNDS SEMI-ANNUAL REPORT | |
GUGGENHEIM INVESTMENTS PRIVACY NOTICE (Unaudited)(continued) |
governing our services, operate and market our website and other services we offer, ensure safe environments for our personnel and others, make and receive payments, prevent fraud and to know the customer to whom we are providing the services). Some processing is done to comply with applicable law.
In addition to the specific uses described above, we also use your information in the following manner:
| | ● | We use your information in connection with servicing your accounts. |
| | ● | We use information to respond to your requests or questions. For example, we might use your information to respond to your customer feedback. |
| | ● | We use information to improve our products and services. We may use your information to make our website and products better. We may use your information to customize your experience with us. |
| | ● | We use information for security purposes. We may use your information to protect our company and our customers. |
| | ● | We use information to communicate with you. For example, we will communicate with you about your account or our relationship. We may contact you about your feedback. We might also contact you about this Privacy Notice. We may also enroll you in our email newsletter. |
| | ● | We use information as otherwise permitted by law, as we may notify you. |
| | ● | Aggregate/Anonymous Data. We may aggregate and/or anonymize any information collected through the website so that such information can no longer be linked to you or your device (“Aggregate/Anonymous Information”). We may use Aggregate/Anonymous Information for any purpose, including without limitation for research and marketing purposes, and may also share such data with any third parties, including advertisers, promotional partners, and sponsors. |
We do not sell information about current or former clients or their accounts to third parties. Nor do we share this information, except when necessary to complete transactions at your request, to make you aware of investment products and services that we or our affiliates offer, or as permitted or required by law.
We provide information about you to companies and individuals not affiliated with Guggenheim Investments to complete certain transactions or account changes, or to perform services for us related to your account. For example, if you ask to transfer assets from another financial institution to Guggenheim Investments, we must provide certain information about you to that company to complete the transaction. We provide the third party with only the information necessary to carry out its responsibilities and only for that purpose. And we require these third parties to treat your private information with the same high degree of confidentiality that we do.
| | THE GUGGENHEIM FUNDS SEMI-ANNUAL REPORT | 43 |
GUGGENHEIM INVESTMENTS PRIVACY NOTICE (Unaudited)(continued) |
To alert you to other Guggenheim Investments products and services, we share your information within our family of affiliated companies. You may limit our sharing with affiliated companies as set out below. We may also share information with any successor to all or part of our business, or in connection with steps leading up to a merger or acquisition. For example, if part of our business was sold we may give customer information as part of that transaction. We may also share information about you with your consent.
We will release information about you if you direct us to do so, if we are compelled by law to do so, or in other circumstances as permitted by law (for example, to protect your account from fraud).
If you close your account(s) or become an inactive client or investor, we will continue to adhere to the privacy policies and practices described in this notice.
Opt-Out Provisions and Your Data Choices
The law allows you to “opt out” of certain kinds of information sharing with third parties. We do not share personal information about you with any third parties that triggers this opt-out right. This means YOU ARE ALREADY OPTED OUT.
When you are no longer our client or investor, we continue to share your information as described in this notice, and you may contact us at any time to limit our sharing by sending an email to CorporateDataPrivacy@GuggenheimPartners.com.
European Union Data Subjects and certain others: In addition to the choices set forth above, residents of the European Union and certain other jurisdictions have certain rights to (1) request access to or rectification or deletion of information we collect about them, (2) request a restriction on the processing of their information, (3) object to the processing of their information, or (4) request the portability of certain information. To exercise these or other rights, please contact us using the contact information below. We will consider all requests and provide our response within the time period stated by applicable law. Please note, however, that certain information may be exempt from such requests in some circumstances, which may include if we need to keep processing your information for our legitimate interests or to comply with a legal obligation. We may request you provide us with information necessary to confirm your identity before responding to your request.
Residents of France and certain other jurisdictions may also provide us with instructions regarding the manner in which we may continue to store, erase and share your information after your death, and where applicable, the person you have designated to exercise these rights after your death.
How We Protect Privacy Online
We take steps to protect your privacy when you use our web site – www.guggenheiminvestments.com – by using secure forms of online communication, including encryption technology, Secure Socket Layer (SSL) protocol, firewalls and user names and
44 | THE GUGGENHEIM FUNDS SEMI-ANNUAL REPORT | |
GUGGENHEIM INVESTMENTS PRIVACY NOTICE (Unaudited)(concluded) |
passwords. These safeguards vary based on the sensitivity of the information that we collect and store. However, we cannot and do not guarantee that these measures will prevent every unauthorized attempt to access, use, or disclose your information since despite our efforts, no Internet and/or other electronic transmissions can be completely secure. Our web site uses “http cookies”—tiny pieces of information that we ask your browser to store. We use cookies for session management and security features on the Guggenheim Investments web site. We do not use them to pull data from your hard drive, to learn your e-mail address, or to view data in cookies created by other web sites. We will not share the information in our cookies or give others access to it. See the legal information area on our web site for more details about web site security and privacy features.
How We Safeguard Your Personal Information and Data Retention
We restrict access to nonpublic personal information about you to our employees and in some cases to third parties (for example, the service providers described above) as permitted by law. We maintain strict physical, electronic and procedural safeguards that comply with federal standards to guard your nonpublic personal information.
We keep your information for no longer than necessary for the purposes for which it is processed. The length of time for which we retain information depends on the purposes for which we collected and use it and/or as required to comply with applicable laws. Information may persist in copies made for backup and business continuity purposes for additional time.
International Visitors
If you are not a resident of the United States, please be aware that your information may be transferred to, stored and processed in the United States where our servers are located and our databases are operated. The data protection and other laws of the United States and other countries might not be as comprehensive as those in your country.
In such cases, we ensure that a legal basis for such a transfer exists and that adequate protection is provided as required by applicable law, for example, by using standard contractual clauses or by transferring your data to a jurisdiction that has obtained an adequacy finding. Individuals whose data may be transferred on the basis of standard contractual clauses may contact us as described below.
We’ll Keep You Informed
If you have any questions or concerns about how we treat your personal data, we encourage you to consult with us first. You may also contact the relevant supervisory authority.
We reserve the right to modify this policy at any time and will inform you promptly of material changes. You may access our privacy policy from our web site at www.guggenheiminvestments.com. Should you have any questions regarding our privacy policy, contact us by email at CorporateDataPrivacy@GuggenheimPartners.com.
| | THE GUGGENHEIM FUNDS SEMI-ANNUAL REPORT | 45 |
This page intentionally left blank.
This page intentionally left blank.
This page intentionally left blank.
This page intentionally left blank.
3.31.2020
Guggenheim Funds Semi-Annual Report
| |
Guggenheim Capital Stewardship Fund | | |
Beginning on January 1, 2021, paper copies of the Fund’s annual and semi-annual shareholder reports may no longer be sent by mail, unless you specifically request paper copies of the reports from a Fund or from your financial intermediary. Instead, the reports will be made available on a website, and you will be notified by mail each time a report is posted and provided with a website link to access the report.
If you already elected to receive shareholder reports electronically, you will not be affected by this change and you need not take any action.
At any time, you may elect to receive reports and other communications from a Fund electronically by calling 800.820.0888, going to GuggenheimInvestments.com/myaccount, or by contacting your financial intermediary.
You may elect to receive all future shareholder reports in paper free of charge. If you hold shares of a Fund directly, you can inform the Fund that you wish to receive paper copies of reports by calling 800.820.0888. If you hold shares of a Fund through a financial intermediary, please contact the financial intermediary to make this election. Your election to receive reports in paper will apply to all Guggenheim Funds in which you are invested and may apply to all funds held with your financial intermediary.
GuggenheimInvestments.com | CSF-SEMI-0320x0920 |

| | |
DEAR SHAREHOLDER | 2 |
ECONOMIC AND MARKET OVERVIEW | 3 |
ABOUT SHAREHOLDERS’ FUND EXPENSES | 5 |
CAPITAL STEWARDSHIP FUND | 7 |
NOTES TO FINANCIAL STATEMENTS | 14 |
OTHER INFORMATION | 18 |
INFORMATION ON BOARD OF TRUSTEES AND OFFICERS | 19 |
GUGGENHEIM INVESTMENTS PRIVACY NOTICE | 24 |
| | THE GUGGENHEIM FUNDS SEMI-ANNUAL REPORT | 1 |
Dear Shareholder:
The six-month period ended March 31, 2020, concluded on a somber note. Even though markets performed well for most of the period, the emergence of a novel and highly contagious form of coronavirus in the last weeks of the period adversely impacted global commercial activity and contributed to significant volatility in certain markets, unseen since the great recession of 2008.
As it spread beyond Asia to virtually every country in the world, many governments and businesses instituted quarantines and closures, which has resulted in significant disruption in manufacturing, supply chains, consumer demand and economic activity. The U.S. Federal Reserve responded quickly to provide liquidity in order to ensure that the U.S. markets continued to function efficiently. The fiscal policy included a spending bill worth over $2 trillion to assist consumers, states, small businesses and certain industries. While these actions helped stabilize the market, volatile conditions continued into April.
As discussed in this shareholder report, these events have affected performance for the Capital Stewardship Fund (the “Fund”). We encourage you to read the Economic and Market Overview section of the report, which follows this letter.
Guggenheim Partners Investment Management, LLC (“GPIM” or the “Investment Adviser”), serves as the investment adviser to the Fund. The Investment Adviser is an affiliate of Guggenheim Partners, LLC (“Guggenheim”), a global, diversified financial services firm. Guggenheim Funds Distributors, LLC serves as the distributor to the Fund and is also an affiliate of Guggenheim.
Together, we are committed to the safety and prosperity of our clients, our employees, and our shareholders. The resources of the firm are being made fully available not only to support our clients, but also to support our employees and their families.
Please practice the appropriate prudence for the protection not only of your health and that of your friends and loved ones but also for our neighbors and communities. Thank you for the trust you place in us.
Sincerely,
Guggenheim Partners Investment Management, LLC
April 30, 2020
Read a prospectus and summary prospectus (if available) carefully before investing. It contains the investment objectives, risks, charges, expenses and other information, which should be considered carefully before investing. Obtain a prospectus and summary prospectus (if available) at guggenheiminvestments.com or call 800.820.0888.
This material is not intended as a recommendation or as investment advice of any kind, including in connection with rollovers, transfers, and distributions. Such material is not provided in a fiduciary capacity, may not be relied upon for or in connection with the making of investment decisions, and does not constitute a solicitation of an offer to buy or sell securities. All content has been provided for informational or educational purposes only and is not intended to be and should not be construed as legal or tax advice and/or a legal opinion. Always consult a financial, tax and/or legal professional regarding your specific situation.
The global ongoing crisis caused by the outbreak of COVID-19 is causing materially reduced consumer demand and economic output, disrupting supply chains, resulting in market closures, travel restrictions and quarantines, and adversely impacting local and global economies. Investors should be aware that in light of the current uncertainty, volatility and distress in economies, financial markets, and labor and health conditions all over the world, the Fund’s investments and a shareholder’s investment in the Fund are subject to sudden and substantial losses, increased volatility and other adverse events. Firms through which investors invest with the Fund, the Fund, its service providers, the markets in which it invests and market intermediaries are also impacted by quarantines and similar measures intended to contain the ongoing pandemic, which can obstruct their functioning and subject them to heightened operational risks.
There can be no assurance that any investment product will achieve its investment objective(s). There are risks associated with investing, including the entire loss of principal invested. Investing involves market risks. The investment return and principal value of any investment product will fluctuate with changes in market conditions. Please read the prospectus for more detailed information regarding these and other risks.
2 | THE GUGGENHEIM FUNDS SEMI-ANNUAL REPORT | |
ECONOMIC AND MARKET OVERVIEW (Unaudited) | March 31, 2020 |
The six-month period ended March 31, 2020, was a wild ride for markets. While the U.S. economy was generally in good shape in 2019, recessionary fears rose throughout the year, prompting the U.S. Federal Reserve (the “Fed”) to announce a rate cut on July 31, the first since 2008, amid growing downside risks to policymakers’ baseline growth and inflation forecasts. Key among those risks were slowing global growth, the threat of additional U.S.-China tariffs, and the possible ramifications surrounding Brexit. The Fed subsequently cut rates twice more in 2019, which caused markets to rally toward the end of the year and into early 2020. Stocks reached new highs and credit spreads tightened to historic levels. Since then, the global outbreak of the coronavirus, COVID-19, has been at the center of everything. As of this writing, COVID-19 has spread to 210 countries, resulted in over 2.5 million cases, and caused over 170,000 deaths. Thus far, the U.S. makes up more than 30% of global cases, and 25% of global deaths. States have required the labor force to work from home if possible, individuals to practice social distancing, and non-essential businesses to shut down.
Closures, quarantines, and social distancing efforts have impacted the travel, hospitality, restaurants, and retail industries, with activity down 100% in some areas of the country. Further exacerbating the decline in output will be reduced business investment, which was already stalling due to falling profits, trade conflicts, and political uncertainty. The coronavirus shock and collapse in oil prices will likely further depress capital expenditures.
In response to the crisis, the Federal Open Market Committee cut rates by a further 125 basis points in the first quarter of 2020 and passed a series of stimulus programs. Among these were the Primary and Secondary Market Corporate Credit Facilities, which are lending programs primarily targeting investment-grade corporate bond issuers, implemented in concert with the U.S. Treasury. It was only after the announcement of this program that corporate credit found some relief from the selloff, but we expect this relief may be temporary.
With an alphabet soup of monetary programs targeting relief from the coronavirus impact, fiscal policy has also stepped up to the plate with a spending bill worth over $2 trillion that aims to assist consumers, states, small businesses, and certain industries. There is no question that these programs will help ease the economic fallout from virus containment measures, but even $2 trillion may be too small given the magnitude of the economic shock that we are facing. Additionally, it is far from clear that fiscal measures are an adequate solution to the issue at hand: the physical impediment to consumer spending. Fiscal and monetary policy can do their part, but ultimately it is public health policy that will likely be the greatest determinant of the economic outlook.
For the six months ended March 31, 2020, the Standard & Poor’s 500® (“S&P 500”) Index* returned -12.31%. The decline, while significant, represents something of a recovery in stocks. The S&P 500 peaked at 3,386.15 on February 19, 2020, before plummeting 33.9% to a low of 2,237.40 on March 23, 2020, then recovering some lost ground by the end of the month.
The consensus estimate for S&P 500 earnings per share in 2020 is still around $150. Our research shows S&P 500 earnings per share could fall below $100. Similarly, economists have no way to calibrate how bad the economic data could be based on history. The March U.S. non-farm payrolls report was evidence of this, as it showed a decline in payrolls of 700,000 jobs versus survey expectations of a decline of only 100,000 jobs. We currently expect that second quarter U.S. real gross domestic product (“GDP”) quarter-over-quarter growth could fall by 40% annualized and the unemployment rate could rise to at least 20%. Beyond that, the severity of the crisis depends on containment of the virus and the effectiveness of social distancing measures put in place, but expectations for a quick and sustained V-shaped recovery appear overly optimistic.
For the six months ended March 31, 2020, the MSCI Europe-Australasia-Far East (“EAFE”) Index* returned -16.37%. The return of the MSCI Emerging Markets Index* was -14.45%.
In the bond market, the Bloomberg Barclays U.S. Aggregate Bond Index* posted a 3.33% return for the six-month period, while the Bloomberg Barclays U.S. Corporate High Yield Index* returned -10.40%. The return of the ICE Bank of America (“BofA”) Merrill Lynch 3-Month U.S. Treasury Bill Index* was 1.04% for the six-month period.
The opinions and forecasts expressed may not actually come to pass. This information is subject to change at any time, based on market and other conditions, and should not be construed as a recommendation of any specific security or strategy.
| | THE GUGGENHEIM FUNDS SEMI-ANNUAL REPORT | 3 |
ECONOMIC AND MARKET OVERVIEW (Unaudited)(concluded) | March 31, 2020 |
*Index Definitions:
The following indices are referenced throughout this report. Indices are unmanaged and not available for direct investment. Index performance does not reflect transaction costs, fees, or expenses.
Bloomberg Barclays U.S. Aggregate Bond Index is a broad-based flagship benchmark that measures the investment grade, U.S. dollar-denominated, fixed-rate taxable bond market, including U.S. Treasuries, government-related and corporate securities, mortgage-backed securities or “MBS” (agency fixed-rate and hybrid adjustable-rate mortgage, or “ARM”, pass-throughs), asset-backed securities (“ABS”), and commercial mortgage-backed securities (“CMBS”) (agency and non-agency).
Bloomberg Barclays U.S. Corporate High Yield Index measures the U.S. dollar-denominated, high yield, fixed-rate corporate bond market. Securities are classified as high yield if the middle rating of Moody’s, Fitch, and S&P is Ba1/BB +/BB + or below.
ICE BofA Merrill Lynch 3-Month U.S. Treasury Bill Index is an unmanaged market index of U.S. Treasury securities maturing in 90 days that assumes reinvestment of all income.
MSCI EAFE Index is a free float-adjusted market capitalization index that is designed to measure the equity market performance of developed markets, excluding the U.S. & Canada.
MSCI Emerging Markets Index is a free float-adjusted market capitalization weighted index that is designed to measure equity market performance in the global emerging markets.
S&P 500® is a broad-based index, the performance of which is based on the performance of 500 widely held common stocks chosen for market size, liquidity, and industry group representation.
4 | THE GUGGENHEIM FUNDS SEMI-ANNUAL REPORT | |
ABOUT SHAREHOLDERS’ FUND EXPENSES (Unaudited) | |
All mutual funds have operating expenses, and it is important for our shareholders to understand the impact of costs on their investments. Shareholders of a fund incur two types of costs: (i) transaction costs, including sales charges (loads) on purchase payments, reinvested dividends, other distributions, and exchange fees, and (ii) ongoing costs, including management fees, administrative services, and shareholder reports, among others. These ongoing costs, or operating expenses, are deducted from a fund’s gross income and reduce the investment return of the fund.
A fund’s expenses are expressed as a percentage of its average net assets, which is known as the expense ratio. The following examples are intended to help investors understand the ongoing costs (in dollars) of investing in a fund and to compare these costs with the ongoing costs of investing in other mutual funds.
The examples are based on an investment of $1,000 made at the beginning of the period and held for the entire six-month period beginning September 30, 2019 and ending March 31, 2020.
The following tables illustrate the Fund’s costs in two ways:
Table 1. Based on actual Fund return: This section helps investors estimate the actual expenses paid over the period. The “Ending Account Value” shown is derived from the Fund’s actual return, and the fifth column shows the dollar amount that would have been paid by an investor who started with $1,000 in the Fund. Investors may use the information here, together with the amount invested, to estimate the expenses paid over the period. Simply divide the Fund’s account value by $1,000 (for example, an $8,600 account value divided by $1,000 = 8.6), then multiply the result by the number provided under the heading “Expenses Paid During Period.”
Table 2. Based on hypothetical 5% return: This section is intended to help investors compare a fund’s cost with those of other mutual funds. The table provides information about hypothetical account values and hypothetical expenses based on the Fund’s actual expense ratio and an assumed rate of return of 5% per year before expenses, which is not the Fund’s actual return. The hypothetical account values and expenses may not be used to estimate the actual ending account balance or expenses paid during the period. The example is useful in making comparisons because the U.S. Securities and Exchange Commission (the “SEC”) requires all mutual funds to calculate expenses based on the 5% return. Investors can assess a Fund’s costs by comparing this hypothetical example with the hypothetical examples that appear in shareholder reports of other funds.
The calculations illustrated above assume no shares were bought or sold during the period. Actual costs may have been higher or lower, depending on the amount of investment and the timing of any purchases or redemptions.
Please note that the expenses shown in the table are meant to highlight your ongoing costs only and do not reflect any transactional costs, such as sales charges (loads) on purchase payments, and contingent deferred sales charges (“CDSC”) on redemptions, if any. Therefore, the second table is useful in comparing ongoing costs only, and will not help you determine the relative total costs of owning different funds. In addition, if these transactional costs were included, your costs would have been higher.
More information about the Fund’s expenses, including annual expense ratios for periods up to five years (subject to the Fund’s inception date), can be found in the Financial Highlights section of this report. For additional information on operating expenses and other shareholder costs, please refer to the Fund’s prospectus.
| | THE GUGGENHEIM FUNDS SEMI-ANNUAL REPORT | 5 |
ABOUT SHAREHOLDERS’ FUND EXPENSES (Unaudited)(concluded) | |
| Expense
Ratio1 | Fund
Return | Beginning
Account Value
September 30, 2019 | Ending
Account Value
March 31, 2020 | Expenses
Paid During
Period2 |
Table 1. Based on actual Fund return3 | | | | | |
Capital Stewardship Fund | 1.05% | (12.24%) | $1,000.00 | $ 877.60 | $ 4.93 |
|
Table 2. Based on hypothetical 5% return (before expenses) | | | | |
Capital Stewardship Fund | 1.05% | 5.00% | $1,000.00 | $ 1,019.75 | $ 5.30 |
1 | Annualized and excludes expenses of the underlying funds in which the Fund invests, if any. |
2 | Expenses are equal to the Fund’s annualized expense ratio, net of any applicable fee waivers, multiplied by the average account value over the period, multiplied by 183/366 (to reflect the one-half year period). |
3 | Actual cumulative return at net asset value for the period September 30, 2019 to March 31, 2020. |
6 | THE GUGGENHEIM FUNDS SEMI-ANNUAL REPORT | |
PERFORMANCE REPORT AND FUND PROFILE (Unaudited) | March 31, 2020 |
CAPITAL STEWARDSHIP FUND
OBJECTIVE: Seeks long-term capital appreciation.
Holdings Diversification (Market Exposure as % of Net Assets)
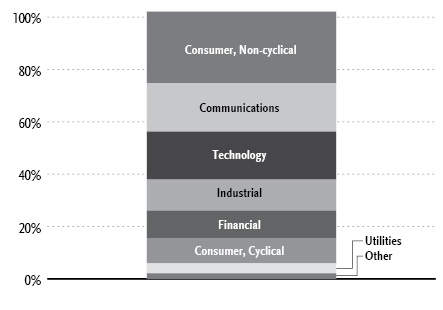
“Holdings Diversification (Market Exposure as % of Net Assets)” excludes any temporary cash investments.
Inception Date: September 26, 2014 |
Ten Largest Holdings (% of Total Net Assets) |
Microsoft Corp. | 4.9% |
Amazon.com, Inc. | 4.4% |
Apple, Inc. | 3.7% |
Verizon Communications, Inc. | 2.5% |
Home Depot, Inc. | 2.4% |
Johnson & Johnson | 2.3% |
Gilead Sciences, Inc. | 2.3% |
Amgen, Inc. | 2.2% |
Alphabet, Inc. — Class A | 2.2% |
Visa, Inc. — Class A | 1.7% |
Top Ten Total | 28.6% |
| | |
“Ten Largest Holdings” excludes any temporary cash investments. |
Average Annual Returns*
Periods Ended March 31, 2020
| 6 Month† | 1 Year | 5 Year | Since
Inception
(09/26/14) |
Capital Stewardship Fund | (12.24%) | (6.23%) | 5.35% | 5.38% |
S&P 500 Index | (12.31%) | (6.98%) | 6.73% | 7.10% |
* | The performance data above represents past performance that is not predictive of future results. The investment return and principal value of an investment in the Fund will fluctuate so that an investor’s shares, when redeemed, may be worth more or less than their original cost. Returns are historical and include changes in principal and reinvested dividends and capital gains and do not reflect the effect of taxes. The S&P 500 Index is an unmanaged index and, unlike the Fund, has no management fees or operating expenses to reduce its reported return. |
† | 6 month returns are not annualized. |
| | THE GUGGENHEIM FUNDS SEMI-ANNUAL REPORT | 7 |
SCHEDULE OF INVESTMENTS (Unaudited) | March 31, 2020 |
CAPITAL STEWARDSHIP FUND | |
| | Shares | | | Value | |
COMMON STOCKS† - 102.1% |
| | | | | | | | | |
Consumer, Non-cyclical - 27.3% |
Johnson & Johnson | | | 29,891 | | | $ | 3,919,607 | |
Gilead Sciences, Inc. | | | 51,791 | | | | 3,871,895 | |
Amgen, Inc. | | | 18,799 | | | | 3,811,121 | |
Pfizer, Inc. | | | 84,378 | | | | 2,754,098 | |
AbbVie, Inc. | | | 33,201 | | | | 2,529,584 | |
Abbott Laboratories | | | 26,427 | | | | 2,085,355 | |
Eli Lilly & Co. | | | 14,924 | | | | 2,070,257 | |
Kimberly-Clark Corp. | | | 13,866 | | | | 1,773,045 | |
Zoetis, Inc. | | | 14,424 | | | | 1,697,561 | |
Becton Dickinson and Co. | | | 7,010 | | | | 1,610,688 | |
Baxter International, Inc. | | | 18,773 | | | | 1,524,180 | |
Merck & Company, Inc. | | | 19,402 | | | | 1,492,790 | |
Illumina, Inc.* | | | 5,300 | | | | 1,447,536 | |
Procter & Gamble Co. | | | 12,570 | | | | 1,382,700 | |
General Mills, Inc. | | | 23,396 | | | | 1,234,607 | |
S&P Global, Inc. | | | 4,538 | | | | 1,112,037 | |
Stryker Corp. | | | 6,668 | | | | 1,110,155 | |
Thermo Fisher Scientific, Inc. | | | 3,144 | | | | 891,638 | |
McCormick & Company, Inc. | | | 6,313 | | | | 891,459 | |
Quest Diagnostics, Inc. | | | 9,619 | | | | 772,406 | |
Regeneron Pharmaceuticals, Inc.* | | | 1,568 | | | | 765,639 | |
IQVIA Holdings, Inc.* | | | 7,017 | | | | 756,854 | |
Vertex Pharmaceuticals, Inc.* | | | 3,077 | | | | 732,172 | |
Boston Scientific Corp.* | | | 21,701 | | | | 708,104 | |
Molson Coors Beverage Co. — Class B | | | 16,534 | | | | 644,991 | |
Cigna Corp. | | | 3,396 | | | | 601,703 | |
Kellogg Co. | | | 9,685 | | | | 581,003 | |
Biogen, Inc.* | | | 1,745 | | | | 552,083 | |
Moody’s Corp. | | | 2,577 | | | | 545,035 | |
Bristol-Myers Squibb Co. | | | 9,288 | | | | 517,713 | |
Edwards Lifesciences Corp.* | | | 2,424 | | | | 457,215 | |
Humana, Inc. | | | 1,305 | | | | 409,796 | |
Coca-Cola Co. | | | 9,015 | | | | 398,914 | |
JM Smucker Co. | | | 2,875 | | | | 319,125 | |
Colgate-Palmolive Co. | | | 3,349 | | | | 222,240 | |
Sysco Corp. | | | 4,403 | | | | 200,909 | |
PepsiCo, Inc. | | | 1,231 | | | | 147,843 | |
Total Consumer, Non-cyclical | | | | | | | 46,544,058 | |
| | | | | | | | | |
Communications - 18.5% |
Amazon.com, Inc.* | | | 3,874 | | | | 7,553,215 | |
Verizon Communications, Inc. | | | 80,611 | | | | 4,331,229 | |
Alphabet, Inc. — Class A* | | | 3,180 | | | | 3,695,001 | |
AT&T, Inc. | | | 92,459 | | | | 2,695,180 | |
Comcast Corp. — Class A | | | 70,126 | | | | 2,410,932 | |
Facebook, Inc. — Class A* | | | 14,117 | | | | 2,354,716 | |
Cisco Systems, Inc. | | | 53,311 | | | | 2,095,655 | |
eBay, Inc. | | | 45,718 | | | | 1,374,283 | |
Juniper Networks, Inc. | | | 53,978 | | | | 1,033,139 | |
Omnicom Group, Inc. | | | 14,533 | | | | 797,862 | |
Booking Holdings, Inc.* | | | 593 | | | | 797,775 | |
Motorola Solutions, Inc. | | | 5,342 | | | | 710,058 | |
CDW Corp. | | | 6,226 | | | | 580,699 | |
Charter Communications, Inc. — Class A* | | | 1,098 | | | | 479,068 | |
Discovery, Inc. — Class A* | | | 15,376 | | | | 298,910 | |
T-Mobile US, Inc.* | | | 2,883 | | | | 241,884 | |
Total Communications | | | | | | | 31,449,606 | |
| | | | | | | | | |
Technology - 18.4% |
Microsoft Corp. | | | 52,578 | | | | 8,292,076 | |
Apple, Inc. | | | 24,841 | | | | 6,316,818 | |
Accenture plc — Class A | | | 13,153 | | | | 2,147,359 | |
salesforce.com, Inc.* | | | 14,478 | | | | 2,084,542 | |
Texas Instruments, Inc. | | | 18,222 | | | | 1,820,924 | |
Oracle Corp. | | | 35,443 | | | | 1,712,960 | |
Intel Corp. | | | 30,816 | | | | 1,667,762 | |
Micron Technology, Inc.* | | | 24,284 | | | | 1,021,385 | |
Intuit, Inc. | | | 4,233 | | | | 973,590 | |
Lam Research Corp. | | | 3,685 | | | | 884,400 | |
Applied Materials, Inc. | | | 18,565 | | | | 850,648 | |
NVIDIA Corp. | | | 2,981 | | | | 785,792 | |
Cerner Corp. | | | 10,412 | | | | 655,852 | |
Adobe, Inc.* | | | 1,940 | | | | 617,386 | |
QUALCOMM, Inc. | | | 7,358 | | | | 497,769 | |
NetApp, Inc. | | | 10,840 | | | | 451,919 | |
Broadridge Financial Solutions, Inc. | | | 3,795 | | | | 359,880 | |
HubSpot, Inc.* | | | 2,261 | | | | 301,143 | |
Total Technology | | | | | | | 31,442,205 | |
| | | | | | | | | |
Industrial - 11.9% |
Honeywell International, Inc. | | | 18,379 | | | | 2,458,926 | |
Union Pacific Corp. | | | 15,306 | | | | 2,158,758 | |
United Parcel Service, Inc. — Class B | | | 19,984 | | | | 1,866,905 | |
Caterpillar, Inc. | | | 14,231 | | | | 1,651,365 | |
3M Co. | | | 11,075 | | | | 1,511,848 | |
FedEx Corp. | | | 12,019 | | | | 1,457,424 | |
CH Robinson Worldwide, Inc. | | | 18,613 | | | | 1,232,181 | |
CSX Corp. | | | 19,008 | | | | 1,089,158 | |
Gentex Corp. | | | 39,774 | | | | 881,392 | |
Ingersoll Rand, Inc.* | | | 33,144 | | | | 821,971 | |
Deere & Co. | | | 5,854 | | | | 808,789 | |
Waste Management, Inc. | | | 8,561 | | | | 792,406 | |
Republic Services, Inc. — Class A | | | 9,336 | | | | 700,760 | |
Landstar System, Inc. | | | 7,100 | | | | 680,606 | |
Illinois Tool Works, Inc. | | | 4,558 | | | | 647,783 | |
Waters Corp.* | | | 2,509 | | | | 456,764 | |
Amphenol Corp. — Class A | | | 5,359 | | | | 390,564 | |
Owens Corning | | | 8,132 | | | | 315,603 | |
United Technologies Corp. | | | 3,223 | | | | 304,026 | |
Total Industrial | | | | | | | 20,227,229 | |
| | | | | | | | | |
Financial - 10.4% |
Visa, Inc. — Class A | | | 17,885 | | | | 2,881,631 | |
Mastercard, Inc. — Class A | | | 9,916 | | | | 2,395,309 | |
American Express Co. | | | 13,772 | | | | 1,179,021 | |
Equinix, Inc. REIT | | | 1,742 | | | | 1,088,001 | |
Chubb Ltd. | | | 8,802 | | | | 983,095 | |
Intercontinental Exchange, Inc. | | | 11,585 | | | | 935,489 | |
Extra Space Storage, Inc. REIT | | | 9,232 | | | | 884,056 | |
Marsh & McLennan Companies, Inc. | | | 9,671 | | | | 836,155 | |
Allstate Corp. | | | 9,074 | | | | 832,358 | |
8 | THE GUGGENHEIM FUNDS SEMI-ANNUAL REPORT | SEE NOTES TO FINANCIAL STATEMENTS. |
SCHEDULE OF INVESTMENTS (Unaudited)(continued) | March 31, 2020 |
CAPITAL STEWARDSHIP FUND | |
| | Shares | | | Value | |
JPMorgan Chase & Co. | | | 8,883 | | | $ | 799,736 | |
Travelers Companies, Inc. | | | 7,464 | | | | 741,548 | |
Citigroup, Inc. | | | 16,805 | | | | 707,827 | |
Sun Communities, Inc. REIT | | | 5,187 | | | | 647,597 | |
Wells Fargo & Co. | | | 14,532 | | | | 417,068 | |
Aflac, Inc. | | | 10,932 | | | | 374,312 | |
CME Group, Inc. — Class A | | | 2,052 | | | | 354,811 | |
Iron Mountain, Inc. REIT | | | 13,335 | | | | 317,373 | |
Credit Acceptance Corp.* | | | 1,233 | | | | 315,266 | |
Capital One Financial Corp. | | | 5,563 | | | | 280,487 | |
Bank of America Corp. | | | 10,447 | | | | 221,790 | |
Crown Castle International Corp. REIT | | | 1,436 | | | | 207,359 | |
Morgan Stanley | | | 4,498 | | | | 152,932 | |
Ventas, Inc. REIT | | | 4,103 | | | | 109,960 | |
Total Financial | | | | | | | 17,663,181 | |
| | | | | | | | | |
Consumer, Cyclical - 9.7% |
Home Depot, Inc. | | | 22,192 | | | | 4,143,468 | |
Cummins, Inc. | | | 10,468 | | | | 1,416,530 | |
Whirlpool Corp. | | | 10,626 | | | | 911,711 | |
Southwest Airlines Co. | | | 25,091 | | | | 893,491 | |
General Motors Co. | | | 42,457 | | | | 882,256 | |
Pool Corp. | | | 4,357 | | | | 857,327 | |
NIKE, Inc. — Class B | | | 10,348 | | | | 856,194 | |
Lowe’s Companies, Inc. | | | 9,042 | | | | 778,064 | |
Delta Air Lines, Inc. | | | 24,536 | | | | 700,012 | |
Starbucks Corp. | | | 10,518 | | | | 691,454 | |
VF Corp. | | | 12,564 | | | | 679,461 | |
Vail Resorts, Inc. | | | 3,979 | | | | 587,738 | |
Best Buy Company, Inc. | | | 9,368 | | | | 533,976 | |
Hilton Worldwide Holdings, Inc. | | | 6,557 | | | | 447,450 | |
Walgreens Boots Alliance, Inc. | | | 9,200 | | | | 420,900 | |
PulteGroup, Inc. | | | 17,884 | | | | 399,171 | |
Darden Restaurants, Inc. | | | 7,257 | | | | 395,216 | |
Lululemon Athletica, Inc.* | | | 1,566 | | | | 296,835 | |
WW Grainger, Inc. | | | 1,086 | | | | 269,871 | |
Marriott International, Inc. — Class A | | | 3,302 | | | | 247,022 | |
KAR Auction Services, Inc. | | | 11,284 | | | | 135,408 | |
Total Consumer, Cyclical | | | | | | | 16,543,555 | |
| | | | | | | | | |
Utilities - 3.8% |
NextEra Energy, Inc. | | | 9,449 | | | | 2,273,618 | |
Exelon Corp. | | | 38,168 | | | | 1,404,964 | |
Duke Energy Corp. | | | 9,284 | | | | 750,890 | |
DTE Energy Co. | | | 7,560 | | | | 717,973 | |
Entergy Corp. | | | 7,376 | | | | 693,123 | |
CMS Energy Corp. | | | 3,908 | | | | 229,595 | |
Consolidated Edison, Inc. | | | 2,894 | | | | 225,732 | |
WEC Energy Group, Inc. | | | 2,052 | | | | 180,843 | |
Total Utilities | | | | | | | 6,476,738 | |
| | | | | | | | | |
Energy - 2.1% |
Chevron Corp. | | | 18,914 | | | | 1,370,508 | |
Valero Energy Corp. | | | 19,081 | | | | 865,514 | |
ConocoPhillips | | | 22,874 | | | | 704,519 | |
EOG Resources, Inc. | | | 16,728 | | | | 600,870 | |
Total Energy | | | | | | | 3,541,411 | |
| | | | | | | | | |
Total Common Stocks | | | | |
(Cost $194,389,286) | | | | | | | 173,887,983 | |
| | | | | | | | | |
EXCHANGE-TRADED FUNDS† - 0.8% |
SPDR S&P 500 ETF Trust | | | 5,250 | | | | 1,353,187 | |
Total Exchange-Traded Funds | | | | |
(Cost $1,473,335) | | | | | | | 1,353,187 | |
| | | | | | | | | |
MONEY MARKET FUND† - 0.5% |
Dreyfus Treasury Securities Cash Management Fund — Institutional Shares, 0.51%1 | | | 790,256 | | | | 790,256 | |
Total Money Market Fund | | | | |
(Cost $790,256) | | | | | | | 790,256 | |
| | | | | | | | | |
Total Investments - 103.4% | | | | |
(Cost $196,652,877) | | $ | 176,031,426 | |
Other Assets & Liabilities, net - (3.4)% | | | (5,832,431 | ) |
Total Net Assets - 100.0% | | $ | 170,198,995 | |
* | Non-income producing security. |
† | Value determined based on Level 1 inputs — See Note 4. |
1 | Rate indicated is the 7-day yield as of March 31, 2020. |
| | plc — Public Limited Company |
| | REIT — Real Estate Investment Trust |
| | |
| | See Sector Classification in Other Information section. |
SEE NOTES TO FINANCIAL STATEMENTS. | THE GUGGENHEIM FUNDS SEMI-ANNUAL REPORT | 9 |
SCHEDULE OF INVESTMENTS (Unaudited)(concluded) | March 31, 2020 |
CAPITAL STEWARDSHIP FUND | |
The following table summarizes the inputs used to value the Fund’s investments at March 31, 2020 (See Note 4 in the Notes to Financial Statements):
Investments in Securities (Assets) | | Level 1
Quoted
Prices | | | Level 2
Significant
Observable
Inputs | | | Level 3
Significant
Unobservable
Inputs | | | Total | |
Common Stocks | | $ | 173,887,983 | | | $ | — | | | $ | — | | | $ | 173,887,983 | |
Exchange-Traded Funds | | | 1,353,187 | | | | — | | | | — | | | | 1,353,187 | |
Money Market Fund | | | 790,256 | | | | — | | | | — | | | | 790,256 | |
Total Assets | | $ | 176,031,426 | | | $ | — | | | $ | — | | | $ | 176,031,426 | |
10 | THE GUGGENHEIM FUNDS SEMI-ANNUAL REPORT | SEE NOTES TO FINANCIAL STATEMENTS. |
STATEMENT OF ASSETS AND LIABILITIES (Unaudited) |
March 31, 2020 |
Assets: |
Investments, at value (cost $196,652,877) | | $ | 176,031,426 | |
Cash | | | 2,094 | |
Prepaid expenses | | | 2,868 | |
Receivables: |
Dividends | | | 158,452 | |
Interest | | | 557 | |
Total assets | | | 176,195,397 | |
| | | | | |
Liabilities: |
Payable for: |
Fund shares redeemed | | | 5,828,839 | |
Management fees | | | 131,646 | |
Fund accounting/administration fees | | | 8,581 | |
Transfer agent/maintenance fees | | | 2,403 | |
Trustees’ fees* | | | 812 | |
Miscellaneous | | | 24,121 | |
Total liabilities | | | 5,996,402 | |
Net assets | | $ | 170,198,995 | |
| | | | | |
Net assets consist of: |
Paid in capital | | $ | 181,889,775 | |
Total distributable earnings (loss) | | | (11,690,780 | ) |
Net assets | | $ | 170,198,995 | |
Capital shares outstanding | | | 7,071,091 | |
Net asset value per share | | $ | 24.07 | |
STATEMENT OF OPERATIONS (Unaudited) |
Six-Month Period Ended March 31, 2020 |
Investment Income: |
Dividends | | $ | 2,300,723 | |
Interest | | | 5,421 | |
Total investment income | | | 2,306,144 | |
| | | | | |
Expenses: |
Management fees | | | 953,145 | |
Transfer agent/maintenance fees | | | 12,750 | |
Fund accounting/administration fees | | | 81,604 | |
Professional fees | | | 31,443 | |
Trustees’ fees* | | | 10,789 | |
Custodian fees | | | 5,554 | |
Miscellaneous | | | 15,468 | |
Total expenses | | | 1,110,753 | |
Less: |
Earnings credits applied | | | (846 | ) |
Net expenses | | | 1,109,907 | |
Net investment income | | | 1,196,237 | |
| | | | | |
Net Realized and Unrealized Gain (Loss): |
Net realized gain (loss) on: |
Investments | | | 10,872,069 | |
Net realized gain | | | 10,872,069 | |
Net change in unrealized appreciation (depreciation) on: |
Investments | | | (36,304,823 | ) |
Net change in unrealized appreciation (depreciation) | | | (36,304,823 | ) |
Net realized and unrealized loss | | | (25,432,754 | ) |
Net decrease in net assets resulting from operations | | $ | (24,236,517 | ) |
* | Relates to Trustees not deemed “interested persons” within the meaning of Section 2(a)(19) of the 1940 Act. |
SEE NOTES TO FINANCIAL STATEMENTS. | THE GUGGENHEIM FUNDS SEMI-ANNUAL REPORT | 11 |
STATEMENTS OF CHANGES IN NET ASSETS |
| | Six-Month
Period Ended
March 31,
2020
(Unaudited) | | | Year Ended
September 30,
2019 | |
Increase (Decrease) in Net Assets from Operations: | | | | | | | | |
Net investment income | | $ | 1,196,237 | | | $ | 2,510,114 | |
Net realized gain on investments | | | 10,872,069 | | | | 8,372,757 | |
Net change in unrealized appreciation (depreciation) on investments | | | (36,304,823 | ) | | | (4,485,796 | ) |
Net increase (decrease) in net assets resulting from operations | | | (24,236,517 | ) | | | 6,397,075 | |
| | | | | | | | | |
Distributions to shareholders | | | (6,304,168 | ) | | | (23,268,533 | ) |
| | | | | | | | | |
Capital share transactions: | | | | | | | | |
Proceeds from sale of shares | | | 2,752,716 | | | | 45,892,534 | |
Distributions reinvested | | | 6,304,168 | | | | 23,250,378 | |
Cost of shares redeemed | | | (18,370,061 | ) | | | (62,805,517 | ) |
Net increase (decrease) from capital share transactions | | | (9,313,177 | ) | | | 6,337,395 | |
Net decrease in net assets | | | (39,853,862 | ) | | | (10,534,063 | ) |
| | | | | | | | | |
Net assets: | | | | | | | | |
Beginning of period | | | 210,052,857 | | | | 220,586,920 | |
End of period | | $ | 170,198,995 | | | $ | 210,052,857 | |
| | | | | | | | | |
Capital share activity: | | | | | | | | |
Shares sold | | | 93,917 | | | | 1,544,723 | |
Shares issued from reinvestment of distributions | | | 210,847 | | | | 1,003,473 | |
Shares redeemed | | | (673,930 | ) | | | (2,170,634 | ) |
Net increase (decrease) in shares | | | (369,166 | ) | | | 377,562 | |
12 | THE GUGGENHEIM FUNDS SEMI-ANNUAL REPORT | SEE NOTES TO FINANCIAL STATEMENTS. |
This table is presented to show selected data for a share outstanding throughout each period and to assist shareholders in evaluating a Fund’s performance for the periods presented.
Institutional Class | | Period Ended
March 31,
2020a | | | Year Ended
September 30,
2019 | | | Year Ended
September 30,
2018 | | | Year Ended
September 30,
2017 | | | Year Ended
September 30,
2016 | | | Year Ended
September 30,
2015 | |
Per Share Data |
Net asset value, beginning of period | | $ | 28.23 | | | $ | 31.23 | | | $ | 29.11 | | | $ | 26.55 | | | $ | 23.69 | | | $ | 24.79 | |
Income (loss) from investment operations: |
Net investment income (loss)b | | | .16 | | | | .33 | | | | .28 | | | | .34 | | | | .35 | | | | .31 | |
Net gain (loss) on investments (realized and unrealized) | | | (3.46 | ) | | | .05 | | | | 4.34 | | | | 3.51 | | | | 3.22 | | | | (1.33 | ) |
Total from investment operations | | | (3.30 | ) | | | .38 | | | | 4.62 | | | | 3.85 | | | | 3.57 | | | | (1.02 | ) |
Less distributions from: |
Net investment income | | | (.39 | ) | | | (.32 | ) | | | (.34 | ) | | | (.37 | ) | | | (.32 | ) | | | (.08 | ) |
Net realized gains | | | (.47 | ) | | | (3.06 | ) | | | (2.16 | ) | | | (.92 | ) | | | (.39 | ) | | | — | |
Total distributions | | | (.86 | ) | | | (3.38 | ) | | | (2.50 | ) | | | (1.29 | ) | | | (.71 | ) | | | (.08 | ) |
Net asset value, end of period | | $ | 24.07 | | | $ | 28.23 | | | $ | 31.23 | | | $ | 29.11 | | | $ | 26.55 | | | $ | 23.69 | |
|
Total Return | | | (12.24 | %) | | | 3.56 | % | | | 16.50 | % | | | 15.01 | % | | | 15.30 | % | | | (4.15 | %) |
Ratios/Supplemental Data |
Net assets, end of period (in thousands) | | $ | 170,199 | | | $ | 210,053 | | | $ | 220,587 | | | $ | 216,008 | | | $ | 208,867 | | | $ | 189,668 | |
Ratios to average net assets: |
Net investment income (loss) | | | 1.13 | % | | | 1.23 | % | | | 0.93 | % | | | 1.23 | % | | | 1.38 | % | | | 1.22 | % |
Total expensesc | | | 1.05 | % | | | 1.05 | % | | | 1.05 | % | | | 1.03 | % | | | 1.07 | % | | | 1.15 | % |
Portfolio turnover rate | | | 85 | % | | | 131 | % | | | 164 | % | | | 156 | % | | | 209 | % | | | 221 | % |
a | Unaudited figures for the period ended March 31, 2020. Percentage amounts for the period, except total return and portfolio turnover rate, have been annualized. |
b | Net investment income (loss) per share was computed using average shares outstanding throughout the period. |
c | Does not include expenses of the underlying funds in which the Fund invests. |
SEE NOTES TO FINANCIAL STATEMENTS. | THE GUGGENHEIM FUNDS SEMI-ANNUAL REPORT | 13 |
NOTES TO FINANCIAL STATEMENTS (Unaudited) |
Note 1 – Organization and Significant Accounting Policies
Organization
Guggenheim Funds Trust (the “Trust”), a Delaware statutory trust, is registered with the SEC under the Investment Company Act of 1940 (“1940 Act”), as an open-ended investment company of the series type. Each series, in effect, is representing a separate fund. The Trust is authorized to issue an unlimited number of no par value shares. The Trust accounts for the assets of each fund separately.
The Trust offers a combination of five separate classes of shares: A-Class shares, C-Class shares, P-Class shares, R6-Class shares and Institutional Class shares. Sales of shares of each Class are made without a front-end sales charge at the net asset value per share (“NAV”), with the exception of A-Class shares. A-Class shares are sold at the NAV, plus the applicable front-end sales charge. The sales charge varies depending on the amount purchased. A-Class share purchases of $1 million or more are exempt from the front-end sales charge but have a 1% contingent deferred sales charge (“CDSC”), if shares are redeemed within 12 months of purchase. C-Class shares have a 1% CDSC if shares are redeemed within 12 months of purchase. C-Class shares automatically convert to A-Class shares on or about the 10th day of the month following the 10-year anniversary of the purchase of the C-Class shares. This conversion will be executed without any sales charge, fee or other charge. After the conversion is completed, the shares will be subject to all features and expenses of A-Class shares. Institutional Class shares are offered primarily for direct investment by institutions such as pension and profit sharing plans, endowments, foundations and corporations. Institutional Class shares require a minimum initial investment of $2 million and a minimum account balance of $1 million. R6-Class shares are offered primarily through qualified retirement and benefit plans. R6-Class shares are also offered through certain other plans and platforms sponsored by financial intermediaries. Certain institutional investors and others deemed appropriate by Guggenheim Investments (“GI”) may also be eligible to purchase R6-Class shares subject to a $2 million minimum initial investment. At March 31, 2020, the Trust consisted of nineteen funds (the “Funds”).
This report covers the Capital Stewardship Fund (the “Fund”), a diversified investment company. At March 31, 2020, Institutional Class shares had been issued by the Fund.
Guggenheim Partners Investment Management, LLC (“GPIM”), which operates under the name Guggenheim Investments, provides advisory services. Guggenheim Funds Distributors, LLC (“GFD”) acts as principal underwriter for the Trust. GI and GFD are affiliated entities.
Concinnity Advisors, LP (the “Sub-Adviser”) serves as the subadviser to the Fund.
Significant Accounting Policies
The Fund operates as an investment company and, accordingly, follows the investment company accounting and reporting guidance of the Financial Accounting Standards Board (“FASB”) Accounting Standards Codification Topic 946 Financial Services – Investment Companies.
The following significant accounting policies are in conformity with U.S. generally accepted accounting principles (“U.S. GAAP”) and are consistently followed by the Trust. This requires management to make estimates and assumptions that affect the reported amount of assets and liabilities, contingent assets and liabilities at the date of the financial statements, and the reported amounts of revenues and expenses during the reporting period. Actual results could differ from these estimates. All time references are based on Eastern Time.
The NAV of the Fund is calculated by dividing the market value of the Fund’s securities and other assets, less all liabilities, by the number of outstanding shares of the Fund.
(a) Valuation of Investments
The Board of Trustees of the Fund (the “Board”) has adopted policies and procedures for the valuation of the Fund’s investments (the “Valuation Procedures”). Pursuant to the Valuation Procedures, the Board has delegated to a valuation committee, consisting of representatives from Guggenheim’s investment management, fund administration, legal and compliance departments (the “Valuation Committee”), the day-to-day responsibility for implementing the Valuation Procedures, including, under most circumstances, the responsibility for determining the fair value of the Fund’s securities and/or other assets.
Valuations of the Fund’s securities and other assets are supplied primarily by pricing services appointed pursuant to the processes set forth in the Valuation Procedures. The Valuation Committee convenes monthly, or more frequently as needed, to review the valuation of all assets which have been fair valued for reasonableness. The Fund’s officers, through the Valuation Committee and consistent with the monitoring and review responsibilities set forth in the Valuation Procedures, regularly review procedures used and valuations provided by the pricing services.
If the pricing service cannot or does not provide a valuation for a particular investment or such valuation is deemed unreliable, such investment is fair valued by the Valuation Committee.
14 | THE GUGGENHEIM FUNDS SEMI-ANNUAL REPORT | |
NOTES TO FINANCIAL STATEMENTS (Unaudited)(continued) |
Equity securities listed or traded on a recognized U.S. securities exchange or the National Association of Securities Dealers Automated Quotations (“NASDAQ”) National Market System shall generally be valued on the basis of the last sale price on the primary U.S. exchange or market on which the security is listed or traded; provided, however, that securities listed on NASDAQ will be valued at the NASDAQ Official Closing Price, which may not necessarily represent the last sale price. If there is no sale on the valuation date, exchange-traded U.S. equity securities will be valued on the basis of the last bid price.
Open-end investment companies are valued at their NAV as of the close of business, on the valuation date. Exchange-traded funds are valued at the last quoted sale price.
Investments for which market quotations are not readily available are fair-valued as determined in good faith by GI subject to review and approval by the Valuation Committee, pursuant to methods established or ratified by the Board. Valuations in accordance with these methods are intended to reflect each security’s (or asset’s or liability’s) “fair value”. Each such determination is based on a consideration of all relevant factors, which are likely to vary from one pricing context to another. Examples of such factors may include, but are not limited to market prices; sale prices; broker quotes; and models which derive prices based on inputs such as prices of securities with comparable maturities and characteristics, or based on inputs such as anticipated cash flows or collateral, spread over U.S. Treasury securities, and other information analysis.
(b) Security Transactions
Security transactions are recorded on the trade date for financial reporting purposes. Realized gains and losses from securities transactions are recorded using the identified cost basis. Proceeds from lawsuits related to investment holdings are recorded as a reduction to cost if the securities are still held and as realized gains if no longer held in the Fund. Dividend income is recorded on the ex-dividend date, net of applicable taxes withheld by foreign countries, if any. Taxable non-cash dividends are recorded as dividend income. Interest income, including amortization of premiums and accretion of discounts, is accrued on a daily basis. Amendment fees are earned as compensation for evaluating and accepting changes to the original loan agreement and are recognized when received. Dividend income from Real Estate Investment Trusts (“REITs”) is recorded based on the income included in the distributions received from the REIT investments using published REIT classifications, including some management estimates when actual amounts are not available. Distributions received in excess of this estimated amount are recorded as a reduction of the cost of investments or reclassified to realized gains. The actual amounts of income, return of capital, and realized gains are only determined by each REIT after its fiscal year-end, and may differ from the estimated amounts.
(c) Distributions
Distributions of net investment income and net realized gains, if any, are declared and paid at least annually. Dividends are reinvested in additional shares, unless shareholders request payment in cash. Distributions are recorded on the ex-dividend date and are determined in accordance with U.S. federal income tax regulations which may differ from U.S. GAAP.
(d) Expenses
Certain expenses have been allocated to the individual Funds in the Trust based on the respective net assets of each Fund included in the Trust.
(e) Earnings Credits
Under the fee arrangement with the custodian, the Fund may earn credits based on overnight custody cash balances. These credits are utilized to reduce related custodial expenses. The custodian fees disclosed in the Statement of Operations are before the reduction in expense from the related earnings credits, if any. Earnings credits for the period ended March 31, 2020, are disclosed in the Statement of Operations.
(f) Cash
The Fund may leave cash overnight in its cash account with the custodian. Periodically, the Fund may have cash due to the custodian bank as an overdraft balance. A fee is incurred on this overdraft, calculated by multiplying the overdraft by a rate based on the federal funds rate, which was 0.08% at March 31, 2020.
(g) Indemnifications
Under the Fund’s organizational documents, its Trustees and Officers are indemnified against certain liabilities arising out of the performance of their duties to the Trust. In addition, throughout the normal course of business, the Fund enters into contracts that contain a variety of representations and warranties which provide general indemnifications. The Fund’s maximum exposure under these arrangements is unknown, as this would involve future claims that may be made against the Fund and/or its affiliates that have not yet occurred. However, based on experience, the Fund expects the risk of loss to be remote.
Note 2 – Investment Advisory Agreement and Other Agreements
Under the terms of an investment advisory contract, the Fund pays GI investment advisory fees calculated at an annualized rate of 0.90% of the average daily net assets of the Fund.
| | THE GUGGENHEIM FUNDS SEMI-ANNUAL REPORT | 15 |
NOTES TO FINANCIAL STATEMENTS (Unaudited)(continued) |
GI pays operating expenses on behalf of the Trust, such as audit and accounting related services, legal services, custody, printing and mailing, among others, on a pass-through basis. Such expenses are allocated to various Funds within the complex based on relative net assets.
Certain trustees and officers of the Trust are also officers of GI and/or GFD. The Trust does not compensate its officers or trustees who are officers, directors and/or employees of GI or GFD.
MUFG Investor Services (US), LLC (“MUIS”) acts as the Fund’s administrator, transfer agent and accounting agent. As administrator, transfer agent and accounting agent, MUIS maintains the books and records of the Fund’s securities and cash. The Bank of New York Mellon Corp. (“BNY”) acts as the Fund’s custodian. As custodian, BNY is responsible for the custody of the Fund’s assets. For providing the aforementioned administrative and accounting services, MUIS is entitled to receive a monthly fee equal to a percentage of the Fund’s average daily net assets and out of pocket expenses. For providing the aforementioned transfer agent and custodian services, MUIS and BNY are entitled to receive a monthly fee based on the number of transactions during the month and the number of accounts under management, subject to certain minimum monthly fees, and out of pocket expenses.
Note 3 – Federal Income Tax Information
The Fund intends to comply with the provisions of Subchapter M of the Internal Revenue Code applicable to regulated investment companies and will distribute substantially all taxable net investment income and capital gains sufficient to relieve the Fund from all, or substantially all, federal income, excise and state income taxes. Therefore, no provision for federal or state income tax or federal excise tax is required.
Tax positions taken or expected to be taken in the course of preparing the Fund’s tax returns are evaluated to determine whether the tax positions are “more-likely-than-not” of being sustained by the applicable tax authority. Tax positions not deemed to meet the more-likely-than-not threshold would be recorded as a tax benefit or expense in the current year. Management has analyzed the Fund’s tax positions taken, or to be taken, on U.S. federal income tax returns for all open tax years, and has concluded that no provision for income tax is required in the Fund’s financial statements. The Fund’s U.S. federal income tax returns are subject to examination by the Internal Revenue Service (“IRS”) for a period of three years after they are filed.
At March 31, 2020, the cost of investments for U.S. federal income tax purposes, the aggregate gross unrealized appreciation for all investments for which there was an excess of value over tax cost, and the aggregate gross unrealized depreciation for all investments for which there was an excess of tax cost over value, were as follows:
| | Tax
Cost | | | Tax
Unrealized
Appreciation | | | Tax
Unrealized
Depreciation | | | Net
Unrealized
Appreciation/
(Depreciation) | |
| | $ | 198,735,341 | | | $ | 6,970,533 | | | $ | (29,674,448 | ) | | $ | (22,703,915 | ) |
Note 4 – Fair Value Measurement
In accordance with U.S. GAAP, fair value is defined as the price that the Fund would receive to sell an investment or pay to transfer a liability in an orderly transaction with an independent buyer in the principal market, or in the absence of a principal market, the most advantageous market for the investment or liability. U.S. GAAP establishes a three-tier fair value hierarchy based on the types of inputs used to value assets and liabilities and requires corresponding disclosure. The hierarchy and the corresponding inputs are summarized below:
Level 1 — | quoted prices in active markets for identical assets or liabilities. |
Level 2 — | significant other observable inputs (for example quoted prices for securities that are similar based on characteristics such as interest rates, prepayment speeds, credit risk, etc.). |
Level 3 — | significant unobservable inputs based on the best information available under the circumstances, to the extent observable inputs are not available, which may include assumptions. |
16 | THE GUGGENHEIM FUNDS SEMI-ANNUAL REPORT | |
NOTES TO FINANCIAL STATEMENTS (Unaudited)(concluded) |
The types of inputs available depend on a variety of factors, such as the type of security and the characteristics of the markets in which it trades, if any. Fair valuation determinations that rely on fewer or no observable inputs require greater judgment. Accordingly, fair value determinations for Level 3 securities require the greatest amount of judgment.
The inputs or methodologies used for valuing securities are not necessarily an indication of the risk associated with investing in those securities. The suitability of the techniques and sources employed to determine fair valuation are regularly monitored and subject to change.
Note 5 – Securities Transactions
For the period ended March 31, 2020, the cost of purchases and proceeds from sales of investment securities, excluding short-term investments, were as follows:
| | Purchases | | | Sales | |
| | $ | 176,202,890 | | | $ | 187,467,672 | |
Note 6 – COVID-19 and Recent Developments
The global ongoing crisis caused by the outbreak of COVID-19 is causing materially reduced consumer demand and economic output, disrupting supply chains, resulting in market closures, travel restrictions and quarantines, and adversely impacting local and global economies. Investors should be aware that in light of the current uncertainty, volatility and distress in economies, financial markets, and labor and health conditions all over the world, the Fund’s investments and a shareholder’s investment in the Fund are subject to sudden and substantial losses, increased volatility and other adverse events. Firms through which investors invest with the Fund, the Fund, its service providers, the markets in which it invests and market intermediaries are also impacted by quarantines and similar measures intended to contain the ongoing pandemic, which can obstruct their functioning and subject them to heightened operational risks.
Note 7 – Subsequent Events
The Fund evaluated subsequent events through the date the financial statements were available for issue and determined there were no material events that would require adjustment to or disclosure in the Fund’s financial statements.
| | THE GUGGENHEIM FUNDS SEMI-ANNUAL REPORT | 17 |
OTHER INFORMATION (Unaudited) |
Proxy Voting Information
A description of the policies and procedures that the Trust uses to determine how to vote proxies relating to securities held in the Fund’s portfolios is available, without charge and upon request, by calling 800.820.0888. This information is also available from the EDGAR database on the SEC’s website at https://www.sec.gov.
Information regarding how the Fund’s voted proxies relating to portfolio securities during the most recent 12-month period ended June 30 is available without charge, upon request, by calling 800.820.0888. This information is also available from the EDGAR database on the SEC’s website at https://www.sec.gov.
Sector Classification
Information in the Schedule of Investments is categorized by sectors using sector-level Classifications defined by the Bloomberg Industry Classification System, a widely recognized industry classification system provider. The Fund’s registration statement has investment policies relating to concentration in specific sectors/industries. For purposes of these investment policies, the Fund usually classifies sectors/industries based on industry-level Classifications used by widely recognized industry classification system providers such as Bloomberg Industry Classification System, Global Industry Classification Standards and Barclays Global Classification Scheme.
Quarterly Portfolio Schedules Information
The Trust files its complete schedule of portfolio holdings with the SEC for the first and third quarters of each fiscal year as an exhibit to its reports on Form N-PORT, and for reporting periods ended prior to March 31, 2019, filed such information on Form N-Q. The Fund’s Forms N-PORT and N-Q are available on the SEC’s website at https://www.sec.gov. The Fund’s Forms N-PORT and N-Q may be reviewed and copied at the SEC’s Public Reference Room in Washington, DC, and that information on the operation of the Public Reference Room may be obtained by calling 800-SEC-0330. Copies of the portfolio holdings are also available to shareholders, without charge and upon request, by calling 800.820.0888.
18 | THE GUGGENHEIM FUNDS SEMI-ANNUAL REPORT | |
INFORMATION ON BOARD OF TRUSTEES AND OFFICERS (Unaudited) |
A Board of Trustees oversees the Trust, as well as other trusts of GI, in which its members have no stated term of service, and continue to serve after election until resignation. The Statement of Additional Information includes further information about Fund Trustees and Officers, and can be obtained without charge by visiting guggenheiminvestments.com or by calling 800.820.0888.
Name, Address*
and Year of Birth | Position(s)
Held with
Trust | Term of Office
and Length of
Time Served** | Principal Occupation(s)
During Past Five Years | Number of
Portfolios
in Fund
Complex
Overseen | Other
Directorships Held
by Trustees*** |
INDEPENDENT TRUSTEES | | | |
Randall C. Barnes (1951) | Trustee | Since 2014 | Current: Private Investor (2001-present).
Former: Senior Vice President and Treasurer, PepsiCo, Inc. (1993-1997); President, Pizza Hut International (1991-1993); Senior Vice President, Strategic Planning and New Business Development, PepsiCo, Inc. (1987-1990). | 157 | Current: Purpose Investments Funds (2013-present).
Former: Managed Duration Investment Grade Municipal Fund (2006-2016). |
Angela Brock-Kyle (1959) | Trustee | Since 2019 | Current: Founder and Chief Executive Officer, B.O.A.R.D.S. (2013-present).
Former: Senior Leader, TIAA (1987-2012). | 156 | Current: Hunt Companies, Inc. (2019-present).
Former: Infinity Property & Casualty Corp. (2014-2018). |
Donald A. Chubb, Jr. (1946) | Trustee and Chair of the Valuation Oversight Committee | Since 1994 | Current: Retired
Former: Business broker and manager of commercial real estate, Griffith & Blair, Inc. (1997-2017). | 156 | Former: Midland Care, Inc. (2011-2016). |
Jerry B. Farley (1946) | Trustee and Chair of the Audit Committee | Since 2005 | Current: President, Washburn University (1997-present). | 156 | Current: CoreFirst Bank & Trust (2000-present).
Former: Westar Energy, Inc. (2004-2018). |
Roman Friedrich III (1946) | Trustee and Chair of the Contracts Review Committee | Since 2014 | Current: Founder and Managing Partner, Roman Friedrich & Company (1998-present). | 156 | Former: Zincore Metals, Inc. (2009-2019). |
Thomas F. Lydon, Jr. (1960) | Trustee and Vice Chair of the Contracts Review Committee | Since 2019 | Current: President, Global Trends Investments (1996-present); Co-Chief Executive Officer, ETF Flows, LLC (2019-present); Chief Executive Officer, Lydon Media (2016-present). | 156 | Current: US Global Investors (GROW) (1995-present).
Former: Harvest Volatility Edge Trust (3) (2017-2019). |
| | THE GUGGENHEIM FUNDS SEMI-ANNUAL REPORT | 19 |
INFORMATION ON BOARD OF TRUSTEES AND OFFICERS (Unaudited)(continued) |
Name, Address*
and Year of Birth | Position(s)
Held with
Trust | Term of Office
and Length of
Time Served** | Principal Occupation(s)
During Past Five Years | Number of
Portfolios
in Fund
Complex
Overseen | Other
Directorships Held
by Trustees*** |
INDEPENDENT TRUSTEES - concluded | | |
Ronald A. Nyberg (1953) | Trustee and Chair of the Nominating and Governance Committee | Since 2014 | Current: Partner, Momkus LLC (2016-present).
Former: Partner, Nyberg & Cassioppi, LLC (2000-2016); Executive Vice President, General Counsel, and Corporate Secretary, Van Kampen Investments (1982-1999). | 157 | Current: PPM Funds (9) (2018-present); Edward-Elmhurst Healthcare System (2012-present).
Former: Western Asset Inflation-Linked Opportunities & Income Fund (2004-April 2020); Western Asset Inflation- Linked Income Fund (2003-April 2020); Managed Duration Investment Grade Municipal Fund (2003-2016). |
Sandra G. Sponem (1958) | Trustee | Since 2019 | Current: Retired.
Former: Senior Vice President and Chief Financial Officer, M.A. Mortenson-Companies, Inc. (2007-2017). | 156 | Current: SPDR Series Trust (78) (2018-present); SPDR Index Shares Funds (31) (2018-present); SSGA Active Trust (12) (2018-present); and SSGA Master Trust (1) (2018-present). |
Ronald E. Toupin, Jr. (1958) | Trustee, Chair of the Board and Chair of the Executive Committee | Since 2014 | Current: Portfolio Consultant (2010-present); Member, Governing Council, Independent Directors Council (2013-present); Governor, Board of Governors, Investment Company Institute (2018-present).
Former: Member, Executive Committee, Independent Directors Council (2016-2018); Vice President, Manager and Portfolio Manager, Nuveen Asset Management (1998-1999); Vice President, Nuveen Investment Advisory Corp. (1992-1999); Vice President and Manager, Nuveen Unit Investment Trusts (1991-1999); and Assistant Vice President and Portfolio Manager, Nuveen Unit Investment Trusts (1988-1999), each of John Nuveen & Co., Inc. (1982-1999). | 156 | Former: Western Asset Inflation-Linked Opportunities & Income Fund (2004-April 2020); Western Asset Inflation- Linked Income Fund (2003-April 2020); Managed Duration Investment Grade Municipal Fund (2003-2016). |
20 | THE GUGGENHEIM FUNDS SEMI-ANNUAL REPORT | |
INFORMATION ON BOARD OF TRUSTEES AND OFFICERS (Unaudited)(continued) |
Name, Address*
and Year of Birth | Position(s)
Held with
Trust | Term of Office
and Length of
Time Served** | Principal Occupation(s)
During Past Five Years | Number of
Portfolios
in Fund
Complex
Overseen | Other
Directorships Held
by Trustees*** |
INTERESTED TRUSTEE | | | | |
Amy J. Lee**** (1961) | Trustee, Vice President and Chief Legal Officer | Since 2018 (Trustee) Since 2014 (Chief Legal Officer) Since 2007 (Vice President) | Current: Interested Trustee, certain other funds in the Fund Complex (2018-present); Chief Legal Officer, certain other funds in the Fund Complex (2014-present); Vice President, certain other funds in the Fund Complex (2007-present); Senior Managing Director, Guggenheim Investments (2012-present).
Former: President and Chief Executive Officer, certain other funds in the Fund Complex (2017-2019); Vice President, Associate General Counsel and Assistant Secretary, Security Benefit Life Insurance Company and Security Benefit Corporation (2004-2012). | 156 | None. |
* | The business address of each Trustee is c/o Guggenheim Investments, 227 West Monroe Street, Chicago, Illinois 60606. |
** | Each Trustee serves an indefinite term, until his or her successor is elected and qualified. Time served includes time served in the respective position for the Predecessor Corporation. |
*** | Each Trustee also serves on the boards of trustees of Guggenheim Funds Trust, Guggenheim Variable Funds Trust, Guggenheim Strategy Funds Trust, Fiduciary/Claymore Energy Infrastructure Fund, Guggenheim Taxable Municipal Managed Duration Trust, Guggenheim Strategic Opportunities Fund, Guggenheim Enhanced Equity Income Fund, Guggenheim Energy & Income Fund, Guggenheim Credit Allocation Fund, Rydex Series Funds, Rydex Dynamic Funds, Rydex Variable Funds and Transparent Value Trust. Messrs. Barnes and Nyberg also serve on the board of trustees of Advent Convertible & Income Fund. |
**** | This Trustee is deemed to be an “interested person” of the Fund under the 1940 Act by reason of her position with the Fund’s Investment Manager and/or the parent of the Investment Manager. |
| | THE GUGGENHEIM FUNDS SEMI-ANNUAL REPORT | 21 |
INFORMATION ON BOARD OF TRUSTEES AND OFFICERS (Unaudited)(continued) |
Name, Address*
and Year of Birth | Position(s)
Held with
Trust | Term of Office
and Length of
Time Served** | Principal Occupation(s)
During Past Five Years |
OFFICERS | | | |
Brian E. Binder (1972) | President and Chief Executive Officer | Since 2018 | Current: President and Chief Executive Officer, certain other funds in the Fund Complex (2018-present); President, Chief Executive Officer and Chairman of the Board of Managers, Guggenheim Funds Investment Advisors, LLC (2018-present); President and Chief Executive Officer, Security Investors, LLC (2018-present); Board Member of Guggenheim Partners Fund Management (Europe) Limited (2018-present); Senior Managing Director and Chief Administrative Officer, Guggenheim Investments (2018-present).
Former: Managing Director and President, Deutsche Funds, and Head of US Product, Trading and Fund Administration, Deutsche Asset Management (2013-2018); Managing Director, Head of Business Management and Consulting, Invesco Ltd. (2010-2012). |
James M. Howley (1972) | Assistant Treasurer | Since 2014 | Current: Managing Director, Guggenheim Investments (2004-present); Assistant Treasurer, certain other funds in the Fund Complex (2006-present).
Former: Manager, Mutual Fund Administration of Van Kampen Investments, Inc. (1996-2004). |
Mark E. Mathiasen (1978) | Secretary | Since 2014 | Current: Secretary, certain other funds in the Fund Complex (2007-present); Managing Director, Guggenheim Investments (2007-present). |
Glenn McWhinnie (1969) | Assistant Treasurer | Since 2016 | Current: Vice President, Guggenheim Investments (2009-present); Assistant Treasurer, certain other funds in the Fund Complex (2016-present). |
Michael P. Megaris (1984) | Assistant Secretary | Since 2014 | Current: Assistant Secretary, certain other funds in the Fund Complex (2014-present); Director, Guggenheim Investments (2012-present). |
Elisabeth Miller (1968) | Chief Compliance Officer | Since 2012 | Current: Chief Compliance Officer, certain other funds in the Fund Complex (2012-present); Senior Managing Director, Guggenheim Investments (2012-present). Vice President, Guggenheim Funds Distributors, LLC (2014-present).
Former: Chief Compliance Officer, Security Investors, LLC and Guggenheim Funds Investment Advisors, LLC (2012-2018); Chief Compliance Officer, Guggenheim Distributors, LLC (2009-2014); Senior Manager, Security Investors, LLC (2004-2014); Senior Manager, Guggenheim Distributors, LLC (2004-2014). |
Margaux Misantone (1978) | AML Officer | Since 2017 | Current: Chief Compliance Officer, Security Investors, LLC and Guggenheim Funds Investment Advisors, LLC (2018-present); AML Officer, Security Investors, LLC and certain other funds in the Fund Complex (2017-present); Managing Director, Guggenheim Investments (2015-present).
Former: Assistant Chief Compliance Officer, Security Investors, LLC and Guggenheim Funds Investments Advisors, LLC (2015-2018). |
William Rehder (1967) | Assistant Vice President | Since 2018 | Current: Managing Director, Guggenheim Investments (2002-present). |
22 | THE GUGGENHEIM FUNDS SEMI-ANNUAL REPORT | |
INFORMATION ON BOARD OF TRUSTEES AND OFFICERS (Unaudited)(concluded) |
Name, Address*
and Year of Birth | Position(s)
Held with
Trust | Term of Office
and Length of
Time Served** | Principal Occupation(s)
During Past Five Years |
OFFICERS - concluded | |
Kimberly J. Scott (1974) | Assistant Treasurer | Since 2014 | Current: Director, Guggenheim Investments (2012-present); Assistant Treasurer, certain other funds in the Fund Complex (2012-present).
Former: Financial Reporting Manager, Invesco, Ltd. (2010-2011); Vice President/Assistant Treasurer, Mutual Fund Administration for Van Kampen Investments, Inc./Morgan Stanley Investment Management (2009-2010); Manager of Mutual Fund Administration, Van Kampen Investments, Inc./Morgan Stanley Investment Management (2005-2009). |
Bryan Stone (1979) | Vice President | Since 2014 | Current: Vice President, certain other funds in the Fund Complex (2014-present); Managing Director, Guggenheim Investments (2013-present).
Former: Senior Vice President, Neuberger Berman Group LLC (2009-2013); Vice President, Morgan Stanley (2002-2009). |
John L. Sullivan (1955) | Chief Financial Officer, Chief Accounting Officer and Treasurer | Since 2014 | Current: Chief Financial Officer, Chief Accounting Officer and Treasurer, certain other funds in the Fund Complex (2010-present); Senior Managing Director, Guggenheim Investments (2010-present).
Former: Managing Director and Chief Compliance Officer, each of the funds in the Van Kampen Investments fund complex (2004-2010); Managing Director and Head of Fund Accounting and Administration, Morgan Stanley Investment Management (2002-2004); Chief Financial Officer and Treasurer, Van Kampen Funds (1996-2004). |
Jon Szafran (1989) | Assistant Treasurer | Since 2017 | Current: Vice President, Guggenheim Investments (2017-present); Assistant Treasurer, certain other funds in the Fund Complex (2017-present).
Former: Assistant Treasurer of Henderson Global Funds and Manager of US Fund Administration, Henderson Global Investors (North America) Inc. (“HGINA”), (2017); Senior Analyst of US Fund Administration, HGINA (2014–2017); Senior Associate of Fund Administration, Cortland Capital Market Services, LLC (2013-2014); Experienced Associate, PricewaterhouseCoopers LLP (2012-2013). |
* | The business address of each officer is c/o Guggenheim Investments, 227 West Monroe Street, Chicago, Illinois 60606. |
** | Each officer serves an indefinite term, until his or her successor is duly elected and qualified. |
| | THE GUGGENHEIM FUNDS SEMI-ANNUAL REPORT | 23 |
GUGGENHEIM INVESTMENTS PRIVACY NOTICE (Unaudited) |
Who We Are
This Privacy Notice describes the data protection practices of Guggenheim Investments. Guggenheim Investments as used herein refers to the affiliated investment management businesses of Guggenheim Partners, LLC: Guggenheim Funds Investment Advisors, LLC, Guggenheim Partners Investment Management, LLC, Guggenheim Funds Distributors, LLC, Security Investors, LLC, Guggenheim Investment Advisors (Europe) Limited, Guggenheim Real Estate, LLC, GS Gamma Advisors, LLC, Guggenheim Partners India Management, LLC, Guggenheim Partners Europe Limited, as well as the funds in the Guggenheim Funds complex (the “Funds”) (“Guggenheim Investments,” “we,” “us,” or “our”).
Guggenheim Partners Investment Management Holdings, LLC, located at 330 Madison Avenue, New York, New York 10017 is the data controller for your information. The affiliates who are also controllers of certain of your information are: Guggenheim Investment Advisors (Europe) Limited, Guggenheim Partners Europe Limited, Guggenheim Partners, LLC, Guggenheim Funds Investment Advisors, LLC, Guggenheim Partners Investment Management, LLC, Guggenheim Funds Distributors, LLC and Security Investors, LLC, as well as the Funds.
Our Commitment to You
Guggenheim Investments considers your privacy our utmost concern. When you become our client or investor, you entrust us with not only your hard-earned money but also with your personal and financial information. Because we have access to your private information, we hold ourselves to the highest standards in its safekeeping and use. We strictly limit how we share your information with others, whether you are a current or former Guggenheim Investments client or investor.
The Information We Collect About You
We collect certain nonpublic personal information about you from information you provide on applications, other forms, our website, and/or from third parties including investment advisors. This information includes Social Security or other tax identification number, assets, income, tax information, retirement and estate plan information, transaction history, account balance, payment history, bank account information, marital status, family relationships, information that we collect on our website through the use of “cookies,” and other personal information that you or others provide to us. We may also collect such information through your inquiries by mail, e-mail or telephone. We may also collect customer due diligence information, as required by applicable law and regulation, through third party service providers.
How We Handle Your Personal Information
The legal basis for using your information as set out in this Privacy Notice is as follows: (a) use of your personal data is necessary to perform our obligations under any contract with you (such as a contract for us to provide financial services to you); or (b) where use of your personal data is not necessary for performance of a contract, use of your personal data is necessary for our legitimate interests or the legitimate interests of others (for example, to enforce the legal terms governing our services, operate and market our website and other services we offer, ensure safe environments for our personnel and others, make and receive payments, prevent fraud and to know the customer to whom we are providing the services). Some processing is done to comply with applicable law.
In addition to the specific uses described above, we also use your information in the following manner:
| | ● | We use your information in connection with servicing your accounts. |
| | ● | We use information to respond to your requests or questions. For example, we might use your information to respond to your customer feedback. |
| | ● | We use information to improve our products and services. We may use your information to make our website and products better. We may use your information to customize your experience with us. |
| | ● | We use information for security purposes. We may use your information to protect our company and our customers. |
| | ● | We use information to communicate with you. For example, we will communicate with you about your account or our relationship. We may contact you about your feedback. We might also contact you about this Privacy Notice. We may also enroll you in our email newsletter. |
24 | THE GUGGENHEIM FUNDS SEMI-ANNUAL REPORT | |
GUGGENHEIM INVESTMENTS PRIVACY NOTICE (Unaudited)(continued) |
| | ● | We use information as otherwise permitted by law, as we may notify you. |
| | ● | Aggregate/Anonymous Data. We may aggregate and/or anonymize any information collected through the website so that such information can no longer be linked to you or your device (“Aggregate/Anonymous Information”). We may use Aggregate/Anonymous Information for any purpose, including without limitation for research and marketing purposes, and may also share such data with any third parties, including advertisers, promotional partners, and sponsors. |
We do not sell information about current or former clients or their accounts to third parties. Nor do we share this information, except when necessary to complete transactions at your request, to make you aware of investment products and services that we or our affiliates offer, or as permitted or required by law.
We provide information about you to companies and individuals not affiliated with Guggenheim Investments to complete certain transactions or account changes, or to perform services for us related to your account. For example, if you ask to transfer assets from another financial institution to Guggenheim Investments, we must provide certain information about you to that company to complete the transaction. We provide the third party with only the information necessary to carry out its responsibilities and only for that purpose. And we require these third parties to treat your private information with the same high degree of confidentiality that we do. To alert you to other Guggenheim Investments products and services, we share your information within our family of affiliated companies. You may limit our sharing with affiliated companies as set out below. We may also share information with any successor to all or part of our business, or in connection with steps leading up to a merger or acquisition. For example, if part of our business was sold we may give customer information as part of that transaction. We may also share information about you with your consent.
We will release information about you if you direct us to do so, if we are compelled by law to do so, or in other circumstances as permitted by law (for example, to protect your account from fraud).
If you close your account(s) or become an inactive client or investor, we will continue to adhere to the privacy policies and practices described in this notice.
Opt-Out Provisions and Your Data Choices
The law allows you to “opt out” of certain kinds of information sharing with third parties. We do not share personal information about you with any third parties that triggers this opt-out right. This means YOU ARE ALREADY OPTED OUT.
When you are no longer our client or investor, we continue to share your information as described in this notice, and you may contact us at any time to limit our sharing by sending an email to CorporateDataPrivacy@GuggenheimPartners.com.
European Union Data Subjects and certain others: In addition to the choices set forth above, residents of the European Union and certain other jurisdictions have certain rights to (1) request access to or rectification or deletion of information we collect about them, (2) request a restriction on the processing of their information, (3) object to the processing of their information, or (4) request the portability of certain information. To exercise these or other rights, please contact us using the contact information below. We will consider all requests and provide our response within the time period stated by applicable law. Please note, however, that certain information may be exempt from such requests in some circumstances, which may include if we need to keep processing your information for our legitimate interests or to comply with a legal obligation. We may request you provide us with information necessary to confirm your identity before responding to your request.
Residents of France and certain other jurisdictions may also provide us with instructions regarding the manner in which we may continue to store, erase and share your information after your death, and where applicable, the person you have designated to exercise these rights after your death.
How We Protect Privacy Online
We take steps to protect your privacy when you use our web site – www.guggenheiminvestments.com – by using secure forms of online communication, including encryption technology, Secure Socket Layer (SSL) protocol, firewalls and user names and passwords. These safeguards vary based on the sensitivity of the information that we collect and store. However, we cannot and do not guarantee that these measures will prevent every unauthorized attempt to access, use, or disclose your information since despite our efforts, no Internet and/or other
| | THE GUGGENHEIM FUNDS SEMI-ANNUAL REPORT | 25 |
GUGGENHEIM INVESTMENTS PRIVACY NOTICE (Unaudited)(concluded) |
electronic transmissions can be completely secure. Our web site uses “http cookies”—tiny pieces of information that we ask your browser to store. We use cookies for session management and security features on the Guggenheim Investments web site. We do not use them to pull data from your hard drive, to learn your e-mail address, or to view data in cookies created by other web sites. We will not share the information in our cookies or give others access to it. See the legal information area on our web site for more details about web site security and privacy features.
How We Safeguard Your Personal Information and Data Retention
We restrict access to nonpublic personal information about you to our employees and in some cases to third parties (for example, the service providers described above) as permitted by law. We maintain strict physical, electronic and procedural safeguards that comply with federal standards to guard your nonpublic personal information.
We keep your information for no longer than necessary for the purposes for which it is processed. The length of time for which we retain information depends on the purposes for which we collected and use it and/or as required to comply with applicable laws. Information may persist in copies made for backup and business continuity purposes for additional time.
International Visitors
If you are not a resident of the United States, please be aware that your information may be transferred to, stored and processed in the United States where our servers are located and our databases are operated. The data protection and other laws of the United States and other countries might not be as comprehensive as those in your country.
In such cases, we ensure that a legal basis for such a transfer exists and that adequate protection is provided as required by applicable law, for example, by using standard contractual clauses or by transferring your data to a jurisdiction that has obtained an adequacy finding. Individuals whose data may be transferred on the basis of standard contractual clauses may contact us as described below.
We’ll Keep You Informed
If you have any questions or concerns about how we treat your personal data, we encourage you to consult with us first. You may also contact the relevant supervisory authority.
We reserve the right to modify this policy at any time and will inform you promptly of material changes. You may access our privacy policy from our web site at www.guggenheiminvestments.com. Should you have any questions regarding our privacy policy, contact us by email at CorporateDataPrivacy@GuggenheimPartners.com.
26 | THE GUGGENHEIM FUNDS SEMI-ANNUAL REPORT | |
This page intentionally left blank.
This page intentionally left blank.
This page intentionally left blank.
3.31.2020
Guggenheim Funds Semi-Annual Report
|
Guggenheim Macro Opportunities Fund | | |
Beginning on January 1, 2021, paper copies of the Fund’s annual and semi-annual shareholder reports may no longer be sent by mail, unless you specifically request paper copies of the reports from a Fund or from your financial intermediary. Instead, the reports will be made available on a website, and you will be notified by mail each time a report is posted and provided with a website link to access the report.
If you already elected to receive shareholder reports electronically, you will not be affected by this change and you need not take any action. At any time, you may elect to receive reports and other communications from a Fund electronically by calling 800.820.0888, going to GuggenheimInvestments.com/myaccount, or by contacting your financial intermediary.
You may elect to receive all future shareholder reports in paper free of charge. If you hold shares of a Fund directly, you can inform the Fund that you wish to receive paper copies of reports by calling 800.820.0888. If you hold shares of a Fund through a financial intermediary, please contact the financial intermediary to make this election. Your election to receive reports in paper will apply to all Guggenheim Funds in which you are invested and may apply to all funds held with your financial intermediary.
GuggenheimInvestments.com | MO-SEMI-0320x0920 |

| | |
DEAR SHAREHOLDER | 2 |
ECONOMIC AND MARKET OVERVIEW | 4 |
ABOUT SHAREHOLDERS’ FUND EXPENSES | 6 |
MACRO OPPORTUNITIES FUND | 9 |
NOTES TO CONSOLIDATED FINANCIAL STATEMENTS | 70 |
OTHER INFORMATION | 98 |
INFORMATION ON BOARD OF TRUSTEES AND OFFICERS | 99 |
GUGGENHEIM INVESTMENTS PRIVACY NOTICE | 107 |
| | THE GUGGENHEIM FUNDS SEMI-ANNUAL REPORT | 1 |
Dear Shareholder:
The six-month period ended March 31, 2020, concluded on a somber note. Even though markets performed well for most of the period, the emergence of a novel and highly contagious form of coronavirus in the last weeks of the period adversely impacted global commercial activity and contributed to significant volatility in certain markets, unseen since the great recession of 2008.
As it spread beyond Asia to virtually every country in the world, many governments and businesses instituted quarantines and closures, which has resulted in significant disruption in manufacturing, supply chains, consumer demand and economic activity. The U.S. Federal Reserve responded quickly to provide liquidity in order to ensure that the U.S. markets continued to function efficiently. The fiscal policy included a spending bill worth over $2 trillion to assist consumers, states, small businesses and certain industries. While these actions helped stabilize the market, volatile conditions continued into April.
As discussed in this semi-annual shareholder report, these events have affected performance for the Macro Opportunities Fund (the “Fund”). We encourage you to read the Economic and Market Overview section of the report, which follows this letter.
Guggenheim Partners Investment Management, LLC (“GPIM” or the “Investment Adviser”), serves as the investment adviser to the Fund. The Investment Adviser is an affiliate of Guggenheim Partners, LLC (“Guggenheim”), a global, diversified financial services firm. Guggenheim Funds Distributors, LLC serves as the distributor to the Fund and is also an affiliate of Guggenheim.
Together, we are committed to the safety and prosperity of our clients, our employees, and our shareholders. The resources of the firm are being made fully available not only to support our clients, but also to support our employees and their families.
Please practice the appropriate prudence for the protection not only of your health and that of your friends and loved ones but also for our neighbors and communities. Thank you for the trust you place in us.
Sincerely,
Guggenheim Partners Investment Management, LLC
April 30, 2020
Read a prospectus and summary prospectus (if available) carefully before investing. It contains the investment objectives, risks, charges, expenses and other information, which should be considered carefully before investing. Obtain a prospectus and summary prospectus (if available) at guggenheiminvestments.com or call 800.820.0888.
2 | THE GUGGENHEIM FUNDS SEMI-ANNUAL REPORT | |
This material is not intended as a recommendation or as investment advice of any kind, including in connection with rollovers, transfers, and distributions. Such material is not provided in a fiduciary capacity, may not be relied upon for or in connection with the making of investment decisions, and does not constitute a solicitation of an offer to buy or sell securities. All content has been provided for informational or educational purposes only and is not intended to be and should not be construed as legal or tax advice and/or a legal opinion. Always consult a financial, tax and/or legal professional regarding your specific situation.
The global ongoing crisis caused by the outbreak of COVID-19 is causing materially reduced consumer demand and economic output, disrupting supply chains, resulting in market closures, travel restrictions and quarantines, and adversely impacting local and global economies. Investors should be aware that in light of the current uncertainty, volatility and distress in economies, financial markets, and labor and health conditions all over the world, the Fund’s investments and a shareholder’s investment in the Fund are subject to sudden and substantial losses, increased volatility and other adverse events. Firms through which investors invest with the Fund, the Fund, its service providers, the markets in which it invests and market intermediaries are also impacted by quarantines and similar measures intended to contain the ongoing pandemic, which can obstruct their functioning and subject them to heightened operational risks.
Macro Opportunities Fund may not be suitable for all investors. ● The Fund’s market value will change in response to interest rate changes and market conditions among other factors. In general, bond prices rise when interest rates fall and vice versa. ● The Fund’s exposure to high yield securities may subject the Fund to greater volatility. ● The intrinsic value of the underlying stocks in which the Fund invests may never be realized or the stock may decline in value. ● When market conditions are deemed appropriate, the Fund may use leverage to the full extent permitted by its investment policies and restrictions and applicable law. Leveraging will exaggerate the effect on net asset value of any increase or decrease in the market value of the Fund’s portfolio. ● The use of short selling involves increased risks and costs. You risk paying more for a security than you received from its sale. Theoretically, stocks sold short have the risk of unlimited losses. ● The Fund may invest in derivative instruments, which may be more volatile and less liquid, increasing the risk of loss when compared to traditional securities. Certain of the derivative instruments are also subject to the risks of counterparty default and adverse tax treatment. ● Instruments and strategies (such as borrowing transactions and reverse repurchase agreements) may provide leveraged exposure to a particular investment, which will magnify any gains or losses on those investments. ● Investments in reverse repurchase agreements expose the Fund to the many of the same risks as investments in derivatives. ● The Fund’s investments in other investment vehicles subject the Fund to those risks and expenses affecting the investment vehicle. ● The Fund’s investments in foreign securities carry additional risks when compared to U.S. securities, due to the impact of diplomatic, political or economic developments in the country in question (investments in emerging markets securities are generally subject to an even greater level of risks). ● Investments in syndicated bank loans generally offer a floating interest rate and involve special types of risks. ● A highly liquid secondary market may not exist for the commodity-linked structured notes the Fund invests in, and there can be no assurance that a highly liquid secondary market will develop. ● The Fund’s exposure to the commodity markets may subject the Fund to greater volatility as commodity-linked investments may be affected by changes in overall market movements, commodity index volatility, changes in interest rates or factors affecting a particular industry or commodity such as droughts, floods, weather, embargos, tariffs and international economic, political and regulatory developments. ● The Fund’s investments in municipal securities can be affected by events that affect the municipal bond market. ● The Fund’s investments in real estate securities subject the Fund to the same risks as direct investments in real estate, which is particularly sensitive to economic downturns. ● The Fund’s investments in restricted securities may involve financial and liquidity risk. ● You may have a gain or loss when you sell your shares. ● It is important to note that the Fund is not guaranteed by the U.S. government. ● This Fund is considered non-diversified and can invest a greater portion of its assets in securities of individual issuers than a diversified fund. As a result, changes in the market value of a single security could cause greater fluctuations in the value of fund shares than would occur in a more diversified fund. ● Please read the prospectus for more detailed information regarding these and other risks.
| | THE GUGGENHEIM FUNDS SEMI-ANNUAL REPORT | 3 |
ECONOMIC AND MARKET OVERVIEW (Unaudited) | March 31, 2020 |
The six-month period ended March 31, 2020, was a wild ride for markets. While the U.S. economy was generally in good shape in 2019, recessionary fears rose throughout the year, prompting the U.S. Federal Reserve (the “Fed”) to announce a rate cut on July 31, the first since 2008, amid growing downside risks to policymakers’ baseline growth and inflation forecasts. Key among those risks were slowing global growth, the threat of additional U.S.-China tariffs, and the possible ramifications surrounding Brexit. The Fed subsequently cut rates twice more in 2019, which caused markets to rally toward the end of the year and into early 2020. Stocks reached new highs and credit spreads tightened to historic levels. Since then, the global outbreak of the coronavirus, COVID-19, has been at the center of everything. As of this writing, COVID-19 has spread to 210 countries, resulted in over 2.5 million cases, and caused over 170,000 deaths. Thus far, the U.S. makes up more than 30% of global cases, and 25% of global deaths. States have required the labor force to work from home if possible, individuals to practice social distancing, and non-essential businesses to shut down.
Closures, quarantines, and social distancing efforts have impacted the travel, hospitality, restaurants, and retail industries, with activity down 100% in some areas of the country. Further exacerbating the decline in output will be reduced business investment, which was already stalling due to falling profits, trade conflicts, and political uncertainty. The coronavirus shock and collapse in oil prices will likely further depress capital expenditures.
In response to the crisis, the Federal Open Market Committee cut rates by a further 125 basis points in the first quarter of 2020 and passed a series of stimulus programs. Among these were the Primary and Secondary Market Corporate Credit Facilities, which are lending programs primarily targeting investment-grade corporate bond issuers, implemented in concert with the U.S. Treasury. It was only after the announcement of this program that corporate credit found some relief from the selloff, but we expect this relief may be temporary.
With an alphabet soup of monetary programs targeting relief from the coronavirus impact, fiscal policy has also stepped up to the plate with a spending bill worth over $2 trillion that aims to assist consumers, states, small businesses, and certain industries. There is no question that these programs will help ease the economic fallout from virus containment measures, but even $2 trillion may be too small given the magnitude of the economic shock that we are facing. Additionally, it is far from clear that fiscal measures are an adequate solution to the issue at hand: the physical impediment to consumer spending. Fiscal and monetary policy can do their part, but ultimately it is public health policy that will likely be the greatest determinant of the economic outlook.
For the six months ended March 31, 2020, the Standard & Poor’s 500® (“S&P 500”) Index* returned -12.31%. The decline, while significant, represents something of a recovery in stocks. The S&P 500 peaked at 3,386.15 on February 19, 2020, before plummeting 33.9% to a low of 2,237.40 on March 23, 2020, then recovering some lost ground by the end of the month.
4 | THE GUGGENHEIM FUNDS SEMI-ANNUAL REPORT | |
ECONOMIC AND MARKET OVERVIEW (Unaudited)(concluded) | March 31, 2020 |
The consensus estimate for S&P 500 earnings per share in 2020 is still around $150. Our research shows S&P 500 earnings per share could fall below $100. Similarly, economists have no way to calibrate how bad the economic data could be based on history. The March U.S. non-farm payrolls report was evidence of this, as it showed a decline in payrolls of 700,000 jobs versus survey expectations of a decline of only 100,000 jobs. We currently expect that second quarter U.S. real gross domestic product (“GDP”) quarter-over-quarter growth could fall by 40% annualized and the unemployment rate could rise to at least 20%. Beyond that, the severity of the crisis depends on containment of the virus and the effectiveness of social distancing measures put in place, but expectations for a quick and sustained V-shaped recovery appear overly optimistic.
For the six months ended March 31, 2020, the MSCI Europe-Australasia-Far East (“EAFE”) Index* returned -16.37%. The return of the MSCI Emerging Markets Index* was -14.45%.
In the bond market, the Bloomberg Barclays U.S. Aggregate Bond Index* posted a 3.33% return for the six-month period, while the Bloomberg Barclays U.S. Corporate High Yield Index* returned -10.40%. The return of the ICE Bank of America (“BofA”) Merrill Lynch 3-Month U.S. Treasury Bill Index* was 1.04% for the six-month period.
The opinions and forecasts expressed may not actually come to pass. This information is subject to change at any time, based on market and other conditions, and should not be construed as a recommendation of any specific security or strategy.
*Index Definitions:
The following indices are referenced throughout this report. Indices are unmanaged and not available for direct investment. Index performance does not reflect transaction costs, fees, or expenses.
Bloomberg Barclays U.S. Aggregate Bond Index is a broad-based flagship benchmark that measures the investment grade, U.S. dollar-denominated, fixed-rate taxable bond market, including U.S. Treasuries, government-related and corporate securities, mortgage-backed securities or “MBS” (agency fixed-rate and hybrid adjustable-rate mortgage, or “ARM”, pass-throughs), asset-backed securities (“ABS”), and commercial mortgage-backed securities (“CMBS”) (agency and non-agency).
Bloomberg Barclays U.S. Corporate High Yield Index measures the U.S. dollar-denominated, high yield, fixed-rate corporate bond market. Securities are classified as high yield if the middle rating of Moody’s, Fitch, and S&P is Ba1/BB +/BB + or below.
ICE BofA Merrill Lynch 3-Month U.S. Treasury Bill Index is an unmanaged market Index of U.S. Treasury securities maturing in 90 days that assumes reinvestment of all income.
MSCI EAFE Index is a free float-adjusted market capitalization index that is designed to measure the equity market performance of developed markets, excluding the U.S. & Canada.
MSCI Emerging Markets Index is a free float-adjusted market capitalization weighted index that is designed to measure equity market performance in the global emerging markets.
S&P 500® is a broad-based index, the performance of which is based on the performance of 500 widely held common stocks chosen for market size, liquidity, and industry group representation.
| | THE GUGGENHEIM FUNDS SEMI-ANNUAL REPORT | 5 |
ABOUT SHAREHOLDERS’ FUND EXPENSES (Unaudited) |
All mutual funds have operating expenses, and it is important for our shareholders to understand the impact of costs on their investments. Shareholders of a fund incur two types of costs: (i) transaction costs, including sales charges (loads) on purchase payments, reinvested dividends, other distributions, and exchange fees, and (ii) ongoing costs, including management fees, administrative services, and shareholder reports, among others. These ongoing costs, or operating expenses, are deducted from a fund’s gross income and reduce the investment return of the fund.
A fund’s expenses are expressed as a percentage of its average net assets, which is known as the expense ratio. The following examples are intended to help investors understand the ongoing costs (in dollars) of investing in a fund and to compare these costs with the ongoing costs of investing in other mutual funds.
The examples are based on an investment of $1,000 made at the beginning of the period and held for the entire six-month period beginning September 30, 2019 and ending March 31, 2020.
The following tables illustrate the Fund’s costs in two ways:
Table 1. Based on actual Fund return: This section helps investors estimate the actual expenses paid over the period. The “Ending Account Value” shown is derived from the Fund’s actual return, and the fifth column shows the dollar amount that would have been paid by an investor who started with $1,000 in the Fund. Investors may use the information here, together with the amount invested, to estimate the expenses paid over the period. Simply divide the Fund’s account value by $1,000 (for example, an $8,600 account value divided by $1,000 = 8.6), then multiply the result by the number provided under the heading “Expenses Paid During Period.”
Table 2. Based on hypothetical 5% return: This section is intended to help investors compare a fund’s cost with those of other mutual funds. The table provides information about hypothetical account values and hypothetical expenses based on the Fund’s actual expense ratio and an assumed rate of return of 5% per year before expenses, which is not the Fund’s actual return. The hypothetical account values and expenses may not be used to estimate the actual ending account balance or expenses paid during the period. The example is useful in making comparisons because the U.S. Securities and Exchange Commission (the “SEC”) requires all mutual funds to calculate expenses based on the 5% return. Investors can assess a Fund’s costs by comparing this hypothetical example with the hypothetical examples that appear in shareholder reports of other funds.
The calculations illustrated above assume no shares were bought or sold during the period. Actual costs may have been higher or lower, depending on the amount of investment and the timing of any purchases or redemptions.
6 | THE GUGGENHEIM FUNDS SEMI-ANNUAL REPORT | |
ABOUT SHAREHOLDERS’ FUND EXPENSES (Unaudited)(continued) |
Please note that the expenses shown in the table are meant to highlight your ongoing costs only and do not reflect any transactional costs, such as sales charges (loads) on purchase payments, and contingent deferred sales charges (“CDSC”) on redemptions, if any. Therefore, the second table is useful in comparing ongoing costs only, and will not help you determine the relative total costs of owning different funds. In addition, if these transactional costs were included, your costs would have been higher.
More information about the Fund’s expenses, including annual expense ratios for periods up to five years (subject to the Fund’s inception date), can be found in the Financial Highlights section of this report. For additional information on operating expenses and other shareholder costs, please refer to the Fund’s prospectus.
| | THE GUGGENHEIM FUNDS SEMI-ANNUAL REPORT | 7 |
ABOUT SHAREHOLDERS’ FUND EXPENSES (Unaudited)(concluded) |
| Expense
Ratio1 | Fund
Return | Beginning
Account Value
September 30,
2019 | Ending
Account Value
March 31,
2020 | Expenses
Paid During
Period2 |
Table 1. Based on actual Fund return3 |
A-Class | 1.39% | (5.86%) | $ 1,000.00 | $ 941.40 | $ 6.75 |
C-Class | 2.14% | (6.18%) | 1,000.00 | 938.20 | 10.37 |
P-Class | 1.39% | (5.82%) | 1,000.00 | 941.80 | 6.75 |
Institutional Class | 0.98% | (5.62%) | 1,000.00 | 943.80 | 4.76 |
R6-Class | 0.97% | (5.66%) | 1,000.00 | 943.40 | 4.71 |
|
Table 2. Based on hypothetical 5% return (before expenses) |
A-Class | 1.39% | 5.00% | $ 1,000.00 | $ 1,018.05 | $ 7.01 |
C-Class | 2.14% | 5.00% | 1,000.00 | 1,014.30 | 10.78 |
P-Class | 1.39% | 5.00% | 1,000.00 | 1,018.05 | 7.01 |
Institutional Class | 0.98% | 5.00% | 1,000.00 | 1,020.10 | 4.95 |
R6-Class | 0.97% | 5.00% | 1,000.00 | 1,020.15 | 4.90 |
1 | This ratio represents annualized net expenses, which may include short interest expense. Excluding these expenses, the operating expense ratios for the Fund would be 1.33%, 2.08%, 1.33%, 0.92% and 0.91% for the A-Class, C-Class, P-Class, Institutional Class and R6-Class, respectively. Excludes expenses of the underlying funds in which the Fund invests. |
2 | Expenses are equal to the Fund’s annualized expense ratio, net of any applicable fee waivers, multiplied by the average account value over the period, multiplied by 183/366 (to reflect the one-half year period). |
3 | Actual cumulative return at net asset value for the period September 30, 2019 to March 31, 2020. |
8 | THE GUGGENHEIM FUNDS SEMI-ANNUAL REPORT | |
PERFORMANCE REPORT AND FUND PROFILE (Unaudited) | March 31, 2020 |
MACRO OPPORTUNITIES FUND
OBJECTIVE: Seeks to provide total return, comprised of current income and capital appreciation.
Holdings Diversification (Market Exposure as % of Net Assets)
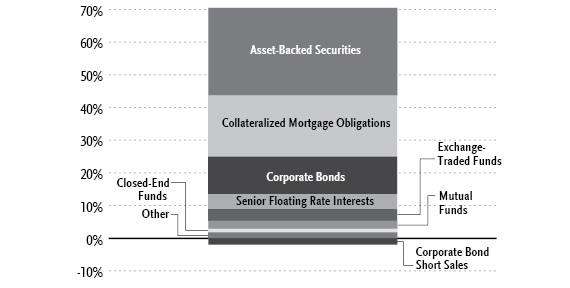
“Holdings Diversification (Market Exposure as % of Net Assets)” excludes any temporary cash investments, investments in Guggenheim Strategy Funds Trust mutual funds, or investments in Guggenheim Ultra Short Duration Fund.
Inception Dates: |
A-Class | November 30, 2011 |
C-Class | November 30, 2011 |
P-Class | May 1, 2015 |
Institutional Class | November 30, 2011 |
R6-Class | March 13, 2019 |
Ten Largest Holdings (% of Total Net Assets) |
iShares iBoxx High Yield Corporate Bond ETF | 2.7% |
Guggenheim Strategy Fund II | 2.4% |
Guggenheim Ultra Short Duration Fund — Institutional Class | 2.2% |
Guggenheim Limited Duration Fund — R6-Class | 1.5% |
Guggenheim Strategy Fund III | 1.4% |
Shackleton CLO Ltd., 2.75% | 1.4% |
Barclays Bank plc, 1.67% | 1.1% |
TSGE, 6.25% | 1.0% |
LSTAR Securities Investment Limited, 3.08% | 1.0% |
KDAC Aviation Finance Ltd., 4.21% | 0.9% |
Top Ten Total | 15.6% |
“Ten Largest Holdings” excludes any temporary cash or derivative investments. |
| | THE GUGGENHEIM FUNDS SEMI-ANNUAL REPORT | 9 |
PERFORMANCE REPORT AND FUND PROFILE (Unaudited)(continued) | March 31, 2020 |
Portfolio Composition by Quality Rating1 |
Rating | % of Total
Investments |
Fixed Income Instruments | |
AAA | 6.5% |
AA | 5.5% |
A | 12.8% |
BBB | 16.1% |
BB | 3.0% |
B | 2.7% |
CCC | 3.9% |
CC | 5.7% |
C | 0.4% |
D | 0.1% |
NR2 | 12.5% |
Other Instruments | 30.8% |
Total Investments | 100.0% |
1 | Source: BlackRock Solutions. Credit quality ratings are measured on a scale that generally ranges from AAA (highest) to D (lowest). All securities except for those labeled “NR” have been rated by Moody’s, Standard & Poor’s (“S&P”), or Fitch, each of which is a Nationally Recognized Statistical Rating Organization (“NRSRO”). For purposes of this presentation, when ratings are available from more than one agency, the highest rating is used. Guggenheim Investments converts ratings to the equivalent S&P rating. Security ratings are determined at the time of purchase and may change thereafter. |
2 | NR securities do not necessarily indicate low credit quality. |
10 | THE GUGGENHEIM FUNDS SEMI-ANNUAL REPORT | |
PERFORMANCE REPORT AND FUND PROFILE (Unaudited)(concluded) | March 31, 2020 |
Average Annual Returns*
Periods Ended March 31, 2020
| 6 Month† | 1 Year | 5 Year | Since
Inception
(11/30/11) |
A-Class Shares | (5.86%) | (4.86%) | 1.41% | 3.81% |
A-Class Shares with sales charge‡ | (9.64%) | (8.66%) | 0.42% | 3.20% |
C-Class Shares | (6.18%) | (5.57%) | 0.66% | 3.05% |
C-Class Shares with CDSC§ | (7.11%) | (6.50%) | 0.66% | 3.05% |
Institutional Class Shares | (5.62%) | (4.46%) | 1.80% | 4.19% |
ICE BofA Merrill Lynch 3-Month U.S. Treasury Bill Index | 1.04% | 2.25% | 1.19% | 0.74% |
| | 6 Month† | 1 Year | Since
Inception
(05/01/15) |
P-Class Shares | | (5.82%) | (4.85%) | 1.54% |
ICE BofA Merrill Lynch 3-Month U.S. Treasury Bill Index | | 1.04% | 2.25% | 1.21% |
| | 6 Month† | 1 Year | Since
Inception
(03/13/19) |
R6-Class Shares | | (5.66%) | (4.49%) | (4.24%) |
ICE BofA Merrill Lynch 3-Month U.S. Treasury Bill Index | | 1.04% | 2.25% | 2.28% |
* | The performance data above represents past performance that is not predictive of future results. The investment return and principal value of an investment in the Fund will fluctuate so that an investor’s shares, when redeemed, may be worth more or less than their original cost. Returns are historical and include changes in principal and reinvested dividends and capital gains and do not reflect the effect of taxes. The ICE BofA Merrill Lynch 3-Month U.S. Treasury Bill Index is an unmanaged index and, unlike the Fund, has no management fees or operating expenses to reduce its reported return. |
† | 6 month returns are not annualized. |
‡ | Effective October 1, 2015, the maximum sales charge decreased from 4.75% to 4.00%. A 4.75% maximum sales charge is used in the calculation of the Average Annual Returns based on subscriptions made prior to October 1, 2015, and a 4.00% maximum sales charge will be used to calculate performance for periods based on subscriptions made on or after October 1, 2015. |
§ | Fund returns include a CDSC of 1% if redeemed within 12 months of purchase. |
| | THE GUGGENHEIM FUNDS SEMI-ANNUAL REPORT | 11 |
CONSOLIDATED SCHEDULE OF INVESTMENTS (Unaudited) | March 31, 2020 |
MACRO OPPORTUNITIES FUND | |
| | Shares | | | Value | |
COMMON STOCKS† - 0.3% |
| | | | | | | | | |
Utilities - 0.2% |
TexGen Power LLC††† | | | 233,394 | | | $ | 7,235,214 | |
| | | | | | | | | |
Energy - 0.1% |
Maverick Natural Resources, LLC†††,1 | | | 7,168 | | | | 1,433,600 | |
SandRidge Energy, Inc.* | | | 488,408 | | | | 439,127 | |
Total Energy | | | | | | | 1,872,727 | |
| | | | | | | | | |
Consumer, Non-cyclical - 0.0% |
Chef Holdings, Inc.*,†††,1 | | | 9,061 | | | | 800,392 | |
ATD New Holdings, Inc.*,†† | | | 42,478 | | | | 637,170 | |
Cengage Learning Holdings II, Inc.*,†† | | | 21,660 | | | | 151,620 | |
Targus Group International Equity, Inc.*,†††,1,2 | | | 12,773 | | | | 22,097 | |
Total Consumer, Non-cyclical | | | 1,611,279 | |
| | | | | | | | | |
Industrial - 0.0% |
API Heat Transfer Parent LLC*,†† | | | 1,024,936 | | | | 281,858 | |
BP Holdco LLC*,†††,1,2 | | | 37,539 | | | | 9,835 | |
Vector Phoenix Holdings, LP*,†††,1 | | | 37,539 | | | | 2,665 | |
Total Industrial | | | | | | | 294,358 | |
| | | | | | | | | |
Technology - 0.0% |
Qlik Technologies, Inc. - Class A*,†††,1 | | | 177 | | | | 184,915 | |
Qlik Technologies, Inc. - Class B*,†††,1 | | | 43,738 | | | | — | |
Total Technology | | | | | | | 184,915 | |
| | | | | | | | | |
Total Common Stocks | | | | |
(Cost $24,332,707) | | | | | | | 11,198,493 | |
| | | | | | | | | |
PREFERRED STOCKS†† - 0.0% |
Financial - 0.0% |
AmTrust Financial Services, Inc., 7.75% | | | 20,784 | | | | 323,191 | |
AmTrust Financial Services, Inc., 7.25% | | | 8,253 | | | | 128,334 | |
AmTrust Financial Services, Inc., 7.63% | | | 3,502 | | | | 53,756 | |
Total Financial | | | | | | | 505,281 | |
| | | | | | | | | |
Industrial - 0.0% |
API Heat Transfer Intermediate* | | | 218 | | | | 167,030 | |
Total Preferred Stocks | | | | |
(Cost $661,567) | | | | | | | 672,311 | |
| | | | | | | | | |
EXCHANGE-TRADED FUNDS† - 3.6% |
iShares iBoxx High Yield Corporate Bond ETF | | | 1,482,120 | | | | 114,226,989 | |
iShares Silver Trust* | | | 2,854,165 | | | | 37,246,853 | |
Total Exchange-Traded Funds | | | | |
(Cost $143,877,745) | | | | | | | 151,473,842 | |
| | | | | | | | | |
MUTUAL FUNDS† - 8.4% |
Guggenheim Strategy Fund II2 | | | 4,211,833 | | | | 101,294,580 | |
Guggenheim Ultra Short Duration Fund — Institutional Class2 | | | 9,338,837 | | | | 91,240,438 | |
Guggenheim Limited Duration Fund — R6-Class2 | | | 2,524,430 | | | | 61,444,637 | |
Guggenheim Strategy Fund III2 | | | 2,507,740 | | | | 60,361,307 | |
Guggenheim Alpha Opportunity Fund — Institutional Class2 | | | 992,077 | | | | 23,174,910 | |
12 | THE GUGGENHEIM FUNDS SEMI-ANNUAL REPORT | SEE NOTES TO CONSOLIDATED FINANCIAL STATEMENTS. |
CONSOLIDATED SCHEDULE OF INVESTMENTS (Unaudited)(continued) | March 31, 2020 |
MACRO OPPORTUNITIES FUND | |
| | Shares | | | Value | |
Guggenheim Risk Managed Real Estate Fund — Institutional Class2 | | | 573,066 | | | $ | 16,234,962 | |
Total Mutual Funds | | | | |
(Cost $367,667,940) | | | | | | | 353,750,834 | |
| | | | | | | | | |
CLOSED-END FUNDS† - 1.1% |
BlackRock Corporate High Yield Fund, Inc. | | | 2,019,956 | | | | 17,775,613 | |
BlackRock Credit Allocation Income Trust | | | 682,528 | | | | 7,958,276 | |
Guggenheim Strategic Opportunities Fund2 | | | 451,744 | | | | 6,889,096 | |
Blackstone / GSO Strategic Credit Fund | | | 614,129 | | | | 6,393,083 | |
Ares Dynamic Credit Allocation Fund, Inc. | | | 284,610 | | | | 3,070,942 | |
Eaton Vance Limited Duration Income Fund | | | 200,650 | | | | 2,120,870 | |
BlackRock Debt Strategies Fund, Inc. | | | 105,004 | | | | 887,284 | |
Total Closed-End Funds | | | | |
(Cost $41,411,451) | | | | | | | 45,095,164 | |
| | | | | | | | | |
MONEY MARKET FUNDS† - 18.6% |
Federated U.S. Treasury Cash Reserve Fund — Institutional Shares, 0.46%5 | | | 748,437,600 | | | | 748,437,600 | |
Western Asset Institutional U.S. Treasury Reserves — Institutional Shares, 0.36%5 | | | 34,570,839 | | | | 34,570,839 | |
Total Money Market Funds | | | | |
(Cost $783,008,439) | | | | | | $ | 783,008,439 | |
| | | | | | | | | |
| | | Face
Amount~ | | | | | |
ASSET-BACKED SECURITIES†† - 26.9% |
Collateralized Loan Obligations - 13.4% |
Shackleton CLO Ltd. | | | | | | | | |
2017-8A, 2.75% (3 Month USD LIBOR + 0.92%, Rate Floor: 0.00%) due 10/20/276,7 | | | 61,725,866 | | | | 59,565,084 | |
2018-6RA, 2.44% (3 Month USD LIBOR + 0.60%, Rate Floor: 0.60%) due 07/17/286,7 | | | 428,571 | | | | 426,134 | |
NewStar Clarendon Fund CLO LLC | | | | | | | | |
2019-1A, 3.84% (3 Month USD LIBOR + 2.05%, Rate Floor: 0.00%) due 01/25/276,7 | | | 14,050,000 | | | | 12,777,203 | |
2019-1A, 3.09% (3 Month USD LIBOR + 1.30%, Rate Floor: 0.00%) due 01/25/276,7 | | | 12,334,877 | | | | 12,041,506 | |
SEE NOTES TO CONSOLIDATED FINANCIAL STATEMENTS. | THE GUGGENHEIM FUNDS SEMI-ANNUAL REPORT | 13 |
CONSOLIDATED SCHEDULE OF INVESTMENTS (Unaudited)(continued) | March 31, 2020 |
MACRO OPPORTUNITIES FUND | |
| | Face
Amount~ | | | Value | |
2019-1A, 4.84% (3 Month USD LIBOR + 3.05%, Rate Floor: 0.00%) due 01/25/276,7 | | | 4,500,000 | | | $ | 3,939,266 | |
2015-1A, 6.14% (3 Month USD LIBOR + 4.35%, Rate Floor: 0.00%) due 01/25/276,7 | | | 1,300,000 | | | | 1,197,511 | |
Tralee CLO III Ltd. | | | | | | | | |
2017-3A, 3.27% (3 Month USD LIBOR + 1.45%, Rate Floor: 0.00%) due 10/20/276,7 | | | 31,000,000 | | | | 27,083,268 | |
Diamond CLO Ltd. | | | | | | | | |
2018-1A, 4.40% (3 Month USD LIBOR + 2.60%, Rate Floor: 2.60%) due 07/22/306,7 | | | 13,500,000 | | | | 11,286,373 | |
2018-1A, 3.60% (3 Month USD LIBOR + 1.80%, Rate Floor: 1.80%) due 07/22/306,7 | | | 11,000,000 | | | | 9,548,224 | |
2018-1A, 5.50% (3 Month USD LIBOR + 3.70%, Rate Floor: 3.70%) due 07/22/306,7 | | | 5,000,000 | | | | 4,407,856 | |
Halcyon Loan Advisors Funding Ltd. | | | | | | | | |
2017-1A, 2.75% (3 Month USD LIBOR + 0.92%, Rate Floor: 0.00%) due 04/20/276,7 | | | 15,034,272 | | | | 14,821,368 | |
2017-3A, 2.72% (3 Month USD LIBOR + 0.90%, Rate Floor: 0.00%) due 10/18/276,7 | | | 8,667,265 | | | | 8,399,758 | |
2012-1A, 4.69% (3 Month USD LIBOR + 3.00%, Rate Floor: 0.00%) due 08/15/236,7 | | | 644,043 | | | | 542,105 | |
Telos CLO Ltd. | | | | | | | | |
2017-6A, 3.11% (3 Month USD LIBOR + 1.27%, Rate Floor: 0.00%) due 01/17/276,7 | | | 16,864,488 | | | | 16,699,660 | |
2017-6A, 4.44% (3 Month USD LIBOR + 2.60%, Rate Floor: 0.00%) due 01/17/276,7 | | | 7,500,000 | | | | 6,231,985 | |
FDF I Ltd. | | | | | | | | |
2015-1A, 5.50% due 11/12/306 | | | 12,000,000 | | | | 11,935,434 | |
2015-1A, 4.40% due 11/12/306 | | | 10,000,000 | | | | 9,299,872 | |
Crown Point CLO III Ltd. | | | | | | | | |
2017-3A, 3.28% (3 Month USD LIBOR + 1.45%, Rate Floor: 0.00%) due 12/31/276,7 | | | 15,000,000 | | | | 13,150,599 | |
2017-3A, 2.74% (3 Month USD LIBOR + 0.91%, Rate Floor: 0.00%) due 12/31/276,7 | | | 6,537,709 | | | | 6,444,716 | |
BXMT Ltd. | | | | | | | | |
2020-FL2, 2.45% (1 Month USD LIBOR + 1.65%, Rate Floor: 1.65%) due 02/16/376,7 | | | 14,000,000 | | | | 12,828,644 | |
2020-FL2, 2.75% (1 Month USD LIBOR + 1.95%, Rate Floor: 1.95%) due 02/16/376,7 | | | 8,000,000 | | | | 6,443,498 | |
14 | THE GUGGENHEIM FUNDS SEMI-ANNUAL REPORT | SEE NOTES TO CONSOLIDATED FINANCIAL STATEMENTS. |
CONSOLIDATED SCHEDULE OF INVESTMENTS (Unaudited)(continued) | March 31, 2020 |
MACRO OPPORTUNITIES FUND | |
| | Face
Amount~ | | | Value | |
Golub Capital Partners CLO Ltd. | | | | | | | | |
2018-36A, 3.84% (3 Month USD LIBOR + 2.10%, Rate Floor: 0.00%) due 02/05/316,7 | | | 20,000,000 | | | $ | 13,798,618 | |
2018-39A, 4.02% (3 Month USD LIBOR + 2.20%, Rate Floor: 2.20%) due 10/20/286,7 | | | 5,000,000 | | | | 4,115,570 | |
Treman Park CLO Ltd. | | | | | | | | |
2015-1A, due 10/20/286,8 | | | 32,400,000 | | | | 17,626,841 | |
Midocean Credit Clo VII | | | | | | | | |
2020-7A, 4.58% (3 Month USD LIBOR + 2.20%, Rate Floor: 0.00%) due 07/15/296,7 | | | 21,000,000 | | | | 17,250,101 | |
Cerberus Loan Funding XVII Ltd. | | | | | | | | |
2016-3A, 4.36% (3 Month USD LIBOR + 2.53%, Rate Floor: 0.00%) due 01/15/286,7 | | | 18,000,000 | | | | 16,110,724 | |
GoldenTree Loan Management US CLO 1 Ltd. | | | | | | | | |
2020-1A, 3.50% (3 Month USD LIBOR + 1.85%, Rate Floor: 1.85%) due 04/20/296,7 | | | 19,500,000 | | | | 16,021,288 | |
Palmer Square Loan Funding Ltd. | | | | | | | | |
2018-4A, 2.59% (3 Month USD LIBOR + 0.90%, Rate Floor: 0.00%) due 11/15/266,7 | | | 13,042,779 | | | | 12,615,881 | |
2018-4A, 3.59% (3 Month USD LIBOR + 1.90%, Rate Floor: 0.00%) due 11/15/266,7 | | | 2,800,000 | | | | 2,310,416 | |
Avery Point II CLO Ltd. | | | | | | | | |
2013-3X COM, due 01/18/258 | | | 19,800,000 | | | | 12,254,432 | |
Atlas Senior Loan Fund IX Ltd. | | | | | | | | |
2018-9A, 3.62% (3 Month USD LIBOR + 1.80%, Rate Floor: 1.80%) due 04/20/286,7 | | | 10,250,000 | | | | 8,478,506 | |
2018-9A, due 04/20/286,8 | | | 9,600,000 | | | | 2,027,453 | |
OZLM XIII Ltd. | | | | | | | | |
2018-13A, 3.87% (3 Month USD LIBOR + 2.10%, Rate Floor: 0.00%) due 07/30/276,7 | | | 12,650,000 | | | | 10,425,815 | |
Monroe Capital CLO Ltd. | | | | | | | | |
2017-1A, 3.15% (3 Month USD LIBOR + 1.35%, Rate Floor: 0.00%) due 10/22/266,7 | | | 7,718,477 | | | | 7,577,284 | |
2017-1A, 5.40% (3 Month USD LIBOR + 3.60%, Rate Floor: 0.00%) due 10/22/266,7 | | | 3,000,000 | | | | 2,689,528 | |
MP CLO VIII Ltd. | | | | | | | | |
2018-2A, 3.70% (3 Month USD LIBOR + 1.90%, Rate Floor: 0.00%) due 10/28/276,7 | | | 11,950,000 | | | | 9,881,977 | |
SEE NOTES TO CONSOLIDATED FINANCIAL STATEMENTS. | THE GUGGENHEIM FUNDS SEMI-ANNUAL REPORT | 15 |
CONSOLIDATED SCHEDULE OF INVESTMENTS (Unaudited)(continued) | March 31, 2020 |
MACRO OPPORTUNITIES FUND | |
| | Face
Amount~ | | | Value | |
TCP Waterman CLO Ltd. | | | | | | | | |
2016-1A, 3.74% (3 Month USD LIBOR + 3.00%, Rate Floor: 0.00%) due 12/15/286,7 | | | 11,000,000 | | | $ | 9,630,400 | |
Mountain Hawk II CLO Ltd. | | | | | | | | |
2018-2A, 4.17% (3 Month USD LIBOR + 2.35%, Rate Floor: 0.00%) due 07/20/246,7 | | | 8,250,000 | | | | 6,928,506 | |
2013-2A, 4.97% (3 Month USD LIBOR + 3.15%, Rate Floor: 0.00%) due 07/22/246,7 | | | 2,750,000 | | | | 2,209,431 | |
OHA Credit Partners IX Ltd. | | | | | | | | |
2013-9A, due 10/20/256,8 | | | 13,892,953 | | | | 8,562,072 | |
Golub Capital BDC CLO LLC | | | | | | | | |
2018-1A, 3.19% (3 Month USD LIBOR + 1.40%, Rate Floor: 0.00%) due 04/25/266,7 | | | 8,000,000 | | | | 7,459,834 | |
Marathon CLO V Ltd. | | | | | | | | |
2017-5A, 3.15% (3 Month USD LIBOR + 1.45%, Rate Floor: 0.00%) due 11/21/276,7 | | | 7,920,233 | | | | 6,987,602 | |
2013-5A, due 11/21/276,8 | | | 5,500,000 | | | | 352,550 | |
Flagship CLO VIII Ltd. | | | | | | | | |
2018-8A, 3.64% (3 Month USD LIBOR + 1.80%, Rate Floor: 0.00%) due 01/16/266,7 | | | 8,025,000 | | | | 6,666,606 | |
Newstar Commercial Loan Funding LLC | | | | | | | | |
2017-1A, 4.62% (3 Month USD LIBOR + 3.50%, Rate Floor: 0.00%) due 03/20/276,7 | | | 7,500,000 | | | | 6,659,051 | |
Avery Point VI CLO Ltd. | | | | | | | | |
2018-6A, 3.74% (3 Month USD LIBOR + 2.00%, Rate Floor: 0.00%) due 08/05/276,7 | | | 8,000,000 | | | | 6,584,582 | |
Venture XIV CLO Ltd. | | | | | | | | |
2020-14A, 3.91% (3 Month USD LIBOR + 2.25%, Rate Floor: 2.25%) due 08/28/296,7 | | | 8,000,000 | | | | 6,569,364 | |
Dryden 37 Senior Loan Fund | | | | | | | | |
2015-37A, due 01/15/316,8 | | | 9,500,000 | | | | 6,345,362 | |
Octagon Loan Funding Ltd. | | | | | | | | |
2014-1A, due 11/18/316,8 | | | 19,435,737 | | | | 6,246,568 | |
Marathon CRE Ltd. | | | | | | | | |
2018-FL1, 3.71% (1 Month USD LIBOR + 3.00%, Rate Floor: 3.00%) due 06/15/286,7 | | | 6,000,000 | | | | 5,525,231 | |
2018-FL1, 3.31% (1 Month USD LIBOR + 2.60%, Rate Floor: 2.60%) due 06/15/286,7 | | | 650,000 | | | | 604,804 | |
ACIS CLO Ltd. | | | | | | | | |
2014-4A, 4.31% (3 Month USD LIBOR + 2.55%, Rate Floor: 0.00%) due 05/01/266,7 | | | 3,600,000 | | | | 3,003,277 | |
16 | THE GUGGENHEIM FUNDS SEMI-ANNUAL REPORT | SEE NOTES TO CONSOLIDATED FINANCIAL STATEMENTS. |
CONSOLIDATED SCHEDULE OF INVESTMENTS (Unaudited)(continued) | March 31, 2020 |
MACRO OPPORTUNITIES FUND | |
| | Face
Amount~ | | | Value | |
2015-6A, 5.13% (3 Month USD LIBOR + 3.37%, Rate Floor: 0.00%) due 05/01/276,7 | | | 3,250,000 | | | $ | 2,701,789 | |
Dryden 41 Senior Loan Fund | | | | | | | | |
2015-41A, due 04/15/316,8 | | | 11,700,000 | | | | 5,103,306 | |
FDF II Ltd. | | | | | | | | |
2016-2A, 6.29% due 05/12/316 | | | 5,250,000 | | | | 4,964,503 | |
Silvermore CLO Ltd. | | | | | | | | |
2014-1A, 4.69% (3 Month USD LIBOR + 3.00%, Rate Floor: 0.00%) due 05/15/266,7 | | | 5,500,000 | | | | 4,670,665 | |
Hull Street CLO Ltd. | | | | | | | | |
2014-1A, 5.43% (3 Month USD LIBOR + 3.60%, Rate Floor: 0.00%) due 10/18/266,7 | | | 5,785,000 | | | | 4,385,113 | |
Sudbury Mill CLO Ltd. | | | | | | | | |
2017-1A, 4.29% (3 Month USD LIBOR + 2.45%, Rate Floor: 0.00%) due 01/17/266,7 | | | 5,000,000 | | | | 4,160,767 | |
West CLO Ltd. | | | | | | | | |
2017-1A, 2.74% (3 Month USD LIBOR + 0.92%, Rate Floor: 0.00%) due 07/18/266,7 | | | 3,878,924 | | | | 3,852,688 | |
2013-1A, due 11/07/256,8 | | | 5,300,000 | | | | 75,790 | |
WhiteHorse X Ltd. | | | | | | | | |
2015-10A, 7.14% (3 Month USD LIBOR + 5.30%, Rate Floor: 5.30%) due 04/17/276,7 | | | 4,980,000 | | | | 3,514,889 | |
Jackson Mill CLO Ltd. | | | | | | | | |
2018-1A, 3.68% (3 Month USD LIBOR + 1.85%, Rate Floor: 1.85%) due 04/15/276,7 | | | 4,150,000 | | | | 3,429,482 | |
Seneca Park CLO Limited | | | | | | | | |
2017-1A, 2.96% (3 Month USD LIBOR + 1.12%, Rate Floor: 0.00%) due 07/17/266,7 | | | 3,406,422 | | | | 3,392,094 | |
Madison Park Funding XVI Ltd. | | | | | | | | |
2016-16A, 4.47% (3 Month USD LIBOR + 2.65%, Rate Floor: 0.00%) due 04/20/266,7 | | | 4,000,000 | | | | 3,317,252 | |
Carlyle Global Market Strategies CLO Ltd. | | | | | | | | |
2012-3A, due 01/14/326,8 | | | 6,400,000 | | | | 2,188,909 | |
2013-3X SUB, due 10/15/308 | | | 4,938,326 | | | | 889,072 | |
BNPP IP CLO Ltd. | | | | | | | | |
2014-2A, 7.02% (3 Month USD LIBOR + 5.25%, Rate Floor: 0.00%) due 10/30/256,7 | | | 5,500,000 | | | | 2,864,786 | |
Adams Mill CLO Ltd. | | | | | | | | |
2014-1A, 6.83% (3 Month USD LIBOR + 5.00%, Rate Floor: 0.00%) due 07/15/266,7 | | | 4,000,000 | | | | 2,780,533 | |
Mountain Hawk III CLO Ltd. | | | | | | | | |
2014-3A, 4.62% (3 Month USD LIBOR + 2.80%, Rate Floor: 0.00%) due 04/18/256,7 | | | 3,000,000 | | | | 2,500,197 | |
SEE NOTES TO CONSOLIDATED FINANCIAL STATEMENTS. | THE GUGGENHEIM FUNDS SEMI-ANNUAL REPORT | 17 |
CONSOLIDATED SCHEDULE OF INVESTMENTS (Unaudited)(continued) | March 31, 2020 |
MACRO OPPORTUNITIES FUND | |
| | Face
Amount~ | | | Value | |
Denali Capital CLO XI Ltd. | | | | | | | | |
2018-1A, 3.97% (3 Month USD LIBOR + 2.15%, Rate Floor: 0.00%) due 10/20/286,7 | | | 2,500,000 | | | $ | 2,060,631 | |
2018-1A, 2.52% (3 Month USD LIBOR + 0.70%, Rate Floor: 0.00%) due 10/20/286,7 | | | 200,000 | | | | 195,936 | |
Venture XIII CLO Ltd. | | | | | | | | |
2013-13A, due 09/10/296,8 | | | 13,790,000 | | | | 2,128,555 | |
KVK CLO Ltd. | | | | | | | | |
2013-1A, due 01/14/286,8 | | | 11,900,000 | | | | 1,942,842 | |
Octagon Investment Partners XIX Ltd. | | | | | | | | |
2017-1A, 2.93% (3 Month USD LIBOR + 1.10%, Rate Floor: 0.00%) due 04/15/266,7 | | | 1,915,124 | | | | 1,913,720 | |
Voya CLO Ltd. | | | | | | | | |
2013-1A, due 10/15/306,8 | | | 28,970,307 | | | | 1,868,759 | |
AMMC CLO XI Ltd. | | | | | | | | |
2012-11A, due 04/30/316,8 | | | 5,650,000 | | | | 1,749,867 | |
Columbia Cent CLO Ltd. | | | | | | | | |
2018-27A, 2.49% (3 Month USD LIBOR + 0.70%, Rate Floor: 0.70%) due 10/25/286,7 | | | 874,999 | | | | 869,892 | |
Copper River CLO Ltd. | | | | | | | | |
2007-1A, due 01/20/218,9 | | | 8,150,000 | | | | 833,525 | |
Dryden 50 Senior Loan Fund | | | | | | | | |
2017-50A, due 07/15/306,8 | | | 7,895,000 | | | | 656,011 | |
Great Lakes CLO Ltd. | | | | | | | | |
2014-1A, due 10/15/296,8 | | | 1,500,000 | | | | 590,664 | |
Garrison BSL CLO Ltd. | | | | | | | | |
2018-1A, 2.54% (3 Month USD LIBOR + 0.70%, Rate Floor: 0.00%) due 07/17/286,7 | | | 571,429 | | | | 548,837 | |
Babson CLO Ltd. | | | | | | | | |
2014-IA, due 07/20/256,8 | | | 11,900,000 | | | | 411,740 | |
Dryden Senior Loan Fund | | | | | | | | |
due 01/15/318 | | | 1,897,598 | | | | 324,345 | |
TICP CLO III-2 Ltd. | | | | | | | | |
2018-3R, 2.66% (3 Month USD LIBOR + 0.84%, Rate Floor: 0.84%) due 04/20/286,7 | | | 250,000 | | | | 244,074 | |
Total Collateralized Loan Obligations | | | 563,720,971 | |
| | | | | | | | | |
Transport-Aircraft - 5.9% |
Castlelake Aircraft Securitization Trust | | | | | | | | |
2017-1, 3.97% due 07/15/42 | | | 24,018,439 | | | | 17,746,288 | |
2018-1, 4.13% due 06/15/436 | | | 23,277,774 | | | | 16,916,391 | |
2016-1, 4.45% due 08/15/41 | | | 13,837,061 | | | | 11,408,172 | |
KDAC Aviation Finance Ltd. | | | | | | | | |
2017-1A, 4.21% due 12/15/426 | | | 51,150,259 | | | | 39,182,725 | |
Raspro Trust | | | | | | | | |
2005-1A, 2.89% (3 Month USD LIBOR + 0.93%, Rate Floor: 0.93%) due 03/23/246,7 | | | 39,126,811 | | | | 36,719,338 | |
AASET US Ltd. | | | | | | | | |
2018-2A, 5.43% due 11/18/386 | | | 18,590,229 | | | | 13,768,387 | |
18 | THE GUGGENHEIM FUNDS SEMI-ANNUAL REPORT | SEE NOTES TO CONSOLIDATED FINANCIAL STATEMENTS. |
CONSOLIDATED SCHEDULE OF INVESTMENTS (Unaudited)(continued) | March 31, 2020 |
MACRO OPPORTUNITIES FUND | |
| | Face
Amount~ | | | Value | |
2018-2A, 4.45% due 11/18/386 | | | 16,661,054 | | | $ | 13,229,382 | |
AASET Trust | | | | | | | | |
2017-1A, 3.97% due 05/16/426 | | | 28,366,734 | | | | 22,287,343 | |
2020-1A, 4.34% due 01/16/406 | | | 6,611,667 | | | | 4,375,183 | |
Falcon Aerospace Ltd. | | | | | | | | |
2017-1, 4.58% due 02/15/426 | | | 24,882,692 | | | | 19,748,970 | |
Sapphire Aviation Finance I Ltd. | | | | | | | | |
2018-1A, 4.25% due 03/15/406 | | | 25,617,094 | | | | 19,304,540 | |
AIM Aviation Finance Ltd. | | | | | | | | |
2015-1A, 5.07% due 02/15/406 | | | 8,976,880 | | | | 7,319,005 | |
Apollo Aviation Securitization Equity Trust | | | | | | | | |
2017-1A, 5.93% due 05/16/426 | | | 6,744,500 | | | | 4,987,145 | |
2018-1A, 5.44% due 01/16/386 | | | 1,022,409 | | | | 808,838 | |
Sapphire Aviation Finance II Ltd. | | | | | | | | |
2020-1A, 4.34% due 03/15/406 | | | 9,750,000 | | | | 5,693,439 | |
MAPS Ltd. | | | | | | | | |
2018-1A, 4.21% due 05/15/436 | | | 6,693,763 | | | | 5,031,896 | |
Stripes Aircraft Ltd. | | | | | | | | |
2013-1 A1, 4.27% due 03/20/23††† | | | 4,426,354 | | | | 4,373,798 | |
Falcon Aerospace Limited | | | | | | | | |
2017-1, 6.30% due 02/15/426 | | | 5,767,687 | | | | 4,105,855 | |
Turbine Engines Securitization Ltd. | | | | | | | | |
2013-1A, 5.13% due 12/13/489 | | | 1,972,901 | | | | 1,736,153 | |
2013-1A, 6.38% due 12/13/489 | | | 1,467,369 | | | | 1,310,912 | |
Airplanes Pass Through Trust | | | | | | | | |
2001-1A, due 03/15/19†††,9,13 | | | 2,097,481 | | | | 20,975 | |
Total Transport-Aircraft | | | 250,074,735 | |
| | | | | | | | | |
Financial - 4.9% |
Station Place Securitization Trust | | | | | | | | |
2019-6, 1.53% (1 Month USD LIBOR + 0.60%, Rate Floor: 0.60%) due 07/24/21†††,6,7 | | | 38,000,000 | | | | 38,000,000 | |
2019-5, 1.63% (1 Month USD LIBOR + 0.70%, Rate Floor: 0.70%) due 06/24/20†††,1,6,7 | | | 18,550,000 | | | | 18,550,000 | |
2019-2, 1.48% (1 Month USD LIBOR + 0.55%, Rate Floor: 0.55%) due 04/24/21†††,1,6,7 | | | 10,200,000 | | | | 10,200,000 | |
2019-9, 1.63% (1 Month USD LIBOR + 0.70%, Rate Floor: 0.00%) due 10/24/20†††,1,6,7 | | | 7,700,000 | | | | 7,700,000 | |
Barclays Bank plc | | | | | | | | |
GMTN, 1.67% (1 Month USD LIBOR + 0.68%) due 07/31/20†††,1,6,7 | | | 47,550,000 | | | | 47,550,000 | |
SEE NOTES TO CONSOLIDATED FINANCIAL STATEMENTS. | THE GUGGENHEIM FUNDS SEMI-ANNUAL REPORT | 19 |
CONSOLIDATED SCHEDULE OF INVESTMENTS (Unaudited)(continued) | March 31, 2020 |
MACRO OPPORTUNITIES FUND | |
| | Face
Amount~ | | | Value | |
Madison Avenue Secured Funding Trust | | | | | | | | |
2019-1, 2.23% (1 Month USD LIBOR + 1.50%, Rate Floor: 1.50%) due 11/11/20†††,1,6,7 | | | 33,300,000 | | | $ | 33,300,000 | |
Aesf Vi Verdi LP | | | | | | | | |
2.15% due 11/25/24††† | | | EUR 21,000,000 | | | | 22,236,111 | |
Nassau LLC | | | | | | | | |
2019-1, 3.98% due 08/15/346 | | | 19,584,634 | | | | 18,401,581 | |
Station Place Securitization Trust Series | | | | | | | | |
2019-WL1, 1.95% (1 Month USD LIBOR + 1.00%, Rate Floor: 1.00%) due 08/25/52†††,1,6,7 | | | 5,000,000 | | | | 5,000,000 | |
2019-WL1, 1.75% (1 Month USD LIBOR + 0.80%, Rate Floor: 0.80%) due 08/25/52†††,1,6,7 | | | 3,333,333 | | | | 3,333,333 | |
Total Financial | | | 204,271,025 | |
| | | | | | | | | |
Whole Business - 1.1% |
TSGE | | | | | | | | |
2017-1, 6.25% due 09/25/31†††,1 | | | 42,550,000 | | | | 43,891,996 | |
Drug Royalty III Limited Partnership 1 | | | | | | | | |
2017-1A, 4.33% (3 Month USD LIBOR + 2.50%, Rate Floor: 2.50%) due 04/15/276,7 | | | 1,471,297 | | | | 1,460,584 | |
Total Whole Business | | | 45,352,580 | |
| | | | | | | | | |
Diversified Payment Rights - 0.4% |
Bib Merchant Voucher Receivables Ltd. | | | | | | | | |
4.18% due 04/07/28†††,1 | | | 15,300,000 | | | | 15,821,067 | |
| | | | | | | | | |
Insurance - 0.4% |
LTCG Securitization Issuer LLC | | | | | | | | |
2018-A, 4.59% due 06/15/486 | | | 15,470,326 | | | | 15,722,940 | |
| | | | | | | | | |
Collateralized Debt Obligations - 0.4% |
Anchorage Credit Funding 4 Ltd. | | | | | | | | |
2016-4A, 4.50% due 02/15/356 | | | 9,200,000 | | | | 8,707,001 | |
Putnam Structured Product Funding Ltd. | | | | | | | | |
2003-1A, 2.68% (1 Month USD LIBOR + 1.00%, Rate Floor: 0.00%) due 10/15/386,7 | | | 4,292,158 | | | | 4,242,329 | |
Banco Bradesco SA | | | | | | | | |
2014-1, 5.44% due 03/12/26††† | | | 2,039,484 | | | | 2,038,724 | |
Total Collateralized Debt Obligations | | | 14,988,054 | |
| | | | | | | | | |
Net Lease - 0.2% |
CARS-DB4, LP | | | | | | | | |
2020-1A, 4.95% due 02/15/506 | | | 10,550,000 | | | | 9,255,937 | |
| | | | | | | | | |
Transport-Container - 0.1% |
Global SC Finance II SRL | | | | | | | | |
2013-1A, 2.98% due 04/17/286 | | | 6,475,000 | | | | 6,308,676 | |
20 | THE GUGGENHEIM FUNDS SEMI-ANNUAL REPORT | SEE NOTES TO CONSOLIDATED FINANCIAL STATEMENTS. |
CONSOLIDATED SCHEDULE OF INVESTMENTS (Unaudited)(continued) | March 31, 2020 |
MACRO OPPORTUNITIES FUND | |
| | Face
Amount~ | | | Value | |
Infrastructure - 0.1% |
Secured Tenant Site Contract Revenue Notes Series | | | | | | | | |
2018-1A, 4.70% due 06/15/489 | | | 6,791,224 | | | $ | 5,612,721 | |
Total Asset-Backed Securities |
(Cost $1,331,421,486) | | | 1,131,128,706 | |
| | | | | | | | | |
COLLATERALIZED MORTGAGE OBLIGATIONS†† - 18.6% |
Residential Mortgage Backed Securities - 16.4% |
New Residential Advance Receivables Trust Advance Receivables Backed | | | | | | | | |
2019-T5, 2.60% due 10/15/516 | | | 10,028,000 | | | | 9,802,896 | |
2019-T5, 2.85% due 10/15/516 | | | 9,655,000 | | | | 9,438,827 | |
2019-T5, 2.55% due 10/15/516 | | | 9,261,000 | | | | 9,052,998 | |
2019-T4, 2.46% due 10/15/516 | | | 6,703,000 | | | | 6,494,954 | |
2019-T4, 2.51% due 10/15/516 | | | 4,595,000 | | | | 4,445,262 | |
2019-T3, 2.66% due 09/15/526 | | | 4,200,000 | | | | 4,008,015 | |
2019-T3, 2.71% due 09/15/526 | | | 3,000,000 | | | | 2,862,971 | |
2019-T4, 2.80% due 10/15/519 | | | 1,500,000 | | | | 1,453,621 | |
LSTAR Securities Investment Limited | | | | | | | | |
2019-5, 3.08% (1 Month USD LIBOR + 1.50%, Rate Floor: 1.50%) due 11/01/246,7 | | | 41,144,730 | | | | 40,546,691 | |
JP Morgan Mortgage Acquisition Trust | | | | | | | | |
2006-WMC4, 1.10% (1 Month USD LIBOR + 0.15%, Rate Floor: 0.15%) due 12/25/367 | | | 27,023,850 | | | | 13,824,818 | |
2006-WMC3, 1.10% (1 Month USD LIBOR + 0.15%, Rate Floor: 0.15%) due 08/25/367 | | | 12,093,672 | | | | 8,348,031 | |
2006-HE3, 1.11% (1 Month USD LIBOR + 0.16%, Rate Floor: 0.16%) due 11/25/367 | | | 7,831,241 | | | | 6,497,374 | |
2006-WMC4, 1.07% (1 Month USD LIBOR + 0.12%, Rate Floor: 0.12%) due 12/25/367 | | | 9,301,847 | | | | 4,726,217 | |
2006-WMC4, 1.03% (1 Month USD LIBOR + 0.08%, Rate Floor: 0.08%) due 12/25/367 | | | 3,933,147 | | | | 1,980,140 | |
Lehman XS Trust Series | | | | | | | | |
2006-16N, 1.16% (1 Month USD LIBOR + 0.21%, Rate Floor: 0.21%) due 11/25/467 | | | 20,008,894 | | | | 15,958,962 | |
2006-18N, 1.13% (1 Month USD LIBOR + 0.18%, Rate Floor: 0.18%) due 12/25/367 | | | 17,743,450 | | | | 14,844,188 | |
2006-10N, 1.16% (1 Month USD LIBOR + 0.21%, Rate Floor: 0.21%) due 07/25/467 | | | 4,622,645 | | | | 3,990,259 | |
Legacy Mortgage Asset Trust | | | | | | | | |
2018-GS3, 4.00% due 06/25/586,10 | | | 26,278,693 | | | | 25,230,541 | |
2019-GS5, 3.20% due 05/25/596 | | | 9,195,854 | | | | 9,153,530 | |
SEE NOTES TO CONSOLIDATED FINANCIAL STATEMENTS. | THE GUGGENHEIM FUNDS SEMI-ANNUAL REPORT | 21 |
CONSOLIDATED SCHEDULE OF INVESTMENTS (Unaudited)(continued) | March 31, 2020 |
MACRO OPPORTUNITIES FUND | |
| | Face
Amount~ | | | Value | |
RALI Series Trust | | | | | | | | |
2006-QO6, 1.13% (1 Month USD LIBOR + 0.18%, Rate Floor: 0.18%) due 06/25/467 | | | 35,879,495 | | | $ | 10,226,614 | |
2007-QO2, 1.10% (1 Month USD LIBOR + 0.15%, Rate Floor: 0.15%) due 02/25/477 | | | 17,455,345 | | | | 7,716,100 | |
2006-QO8, 1.15% (1 Month USD LIBOR + 0.20%, Rate Floor: 0.20%) due 10/25/467 | | | 7,970,864 | | | | 6,807,111 | |
2006-QO6, 1.18% (1 Month USD LIBOR + 0.23%, Rate Floor: 0.23%) due 06/25/467 | | | 9,335,355 | | | | 2,743,314 | |
2006-QO6, 1.21% (1 Month USD LIBOR + 0.26%, Rate Floor: 0.26%) due 06/25/467 | | | 5,889,814 | | | | 1,762,032 | |
2006-QO2, 1.22% (1 Month USD LIBOR + 0.27%, Rate Floor: 0.27%) due 02/25/467 | | | 6,964,555 | | | | 1,706,444 | |
2006-QO2, 1.29% (1 Month USD LIBOR + 0.34%, Rate Floor: 0.34%) due 02/25/467 | | | 3,726,628 | | | | 956,624 | |
2006-QO2, 1.17% (1 Month USD LIBOR + 0.22%, Rate Floor: 0.22%) due 02/25/467 | | | 249,797 | | | | 59,121 | |
Structured Asset Securities Corporation Mortgage Loan Trust | | | | | | | | |
2008-BC4, 1.58% (1 Month USD LIBOR + 0.63%, Rate Floor: 0.63%) due 11/25/377 | | | 34,260,034 | | | | 31,128,753 | |
CIM Trust | | | | | | | | |
2018-R2, 3.69% (WAC) due 08/25/576,7 | | | 30,182,485 | | | | 30,762,900 | |
WaMu Asset-Backed Certificates WaMu Series | | | | | | | | |
2007-HE2, 1.31% (1 Month USD LIBOR + 0.36%, Rate Floor: 0.36%) due 04/25/377 | | | 28,976,350 | | | | 12,865,071 | |
2007-HE2, 1.14% (1 Month USD LIBOR + 0.19%, Rate Floor: 0.19%) due 04/25/377 | | | 22,079,723 | | | | 9,400,630 | |
2007-HE4, 1.12% (1 Month USD LIBOR + 0.17%, Rate Floor: 0.17%) due 07/25/477 | | | 8,782,037 | | | | 6,105,734 | |
2007-HE4, 1.20% (1 Month USD LIBOR + 0.25%, Rate Floor: 0.25%) due 07/25/477 | | | 2,751,643 | | | | 1,740,753 | |
GSAA Home Equity Trust | | | | | | | | |
2006-12, 1.25% (1 Month USD LIBOR + 0.30%, Rate Floor: 0.15%) due 08/25/367 | | | 22,896,930 | | | | 12,014,532 | |
22 | THE GUGGENHEIM FUNDS SEMI-ANNUAL REPORT | SEE NOTES TO CONSOLIDATED FINANCIAL STATEMENTS. |
CONSOLIDATED SCHEDULE OF INVESTMENTS (Unaudited)(continued) | March 31, 2020 |
MACRO OPPORTUNITIES FUND | |
| | Face
Amount~ | | | Value | |
2006-3, 1.25% (1 Month USD LIBOR + 0.30%, Rate Floor: 0.30%) due 03/25/367 | | | 15,495,298 | | | $ | 9,711,813 | |
2006-9, 1.19% (1 Month USD LIBOR + 0.24%, Rate Floor: 0.24%) due 06/25/367 | | | 9,814,216 | | | | 4,136,628 | |
2007-7, 1.22% (1 Month USD LIBOR + 0.27%, Rate Floor: 0.27%) due 07/25/377 | | | 1,482,929 | | | | 1,345,469 | |
Long Beach Mortgage Loan Trust | | | | | | | | |
2006-6, 1.20% (1 Month USD LIBOR + 0.25%, Rate Floor: 0.25%) due 07/25/367 | | | 16,571,037 | | | | 7,066,710 | |
2006-8, 1.11% (1 Month USD LIBOR + 0.16%, Rate Floor: 0.16%) due 09/25/367 | | | 19,399,904 | | | | 6,080,655 | |
2006-4, 1.11% (1 Month USD LIBOR + 0.16%, Rate Floor: 0.16%) due 05/25/367 | | | 12,064,634 | | | | 4,583,690 | |
2006-1, 1.14% (1 Month USD LIBOR + 0.19%, Rate Floor: 0.19%) due 02/25/367 | | | 4,761,444 | | | | 3,799,909 | |
2006-6, 1.10% (1 Month USD LIBOR + 0.15%, Rate Floor: 0.15%) due 07/25/367 | | | 5,160,020 | | | | 2,121,832 | |
2006-8, 1.04% (1 Month USD LIBOR + 0.09%, Rate Floor: 0.09%) due 09/25/367 | | | 5,257,009 | | | | 1,604,373 | |
2006-6, 1.05% (1 Month USD LIBOR + 0.10%, Rate Floor: 0.10%) due 07/25/367 | | | 2,987,026 | | | | 1,205,412 | |
American Home Mortgage Assets Trust | | | | | | | | |
2006-6, 1.16% (1 Month USD LIBOR + 0.21%, Rate Floor: 0.21%) due 12/25/467 | | | 13,234,202 | | | | 9,270,860 | |
2006-1, 1.14% (1 Month USD LIBOR + 0.19%, Rate Floor: 0.19%) due 05/25/467 | | | 11,977,925 | | | | 9,064,296 | |
2006-3, 2.91% (1 Year CMT Rate + 0.94%, Rate Floor: 0.94%) due 10/25/467 | | | 7,223,479 | | | | 5,182,431 | |
Ocwen Master Advance Receivables Trust | | | | | | | | |
2019-T2, 2.42% due 08/15/516 | | | 20,000,000 | | | | 19,699,848 | |
2019-T2, 3.04% due 08/15/516 | | | 3,200,000 | | | | 3,151,830 | |
Morgan Stanley ABS Capital I Incorporated Trust | | | | | | | | |
2006-HE8, 1.17% (1 Month USD LIBOR + 0.22%, Rate Floor: 0.22%) due 10/25/367 | | | 24,258,743 | | | | 11,364,471 | |
SEE NOTES TO CONSOLIDATED FINANCIAL STATEMENTS. | THE GUGGENHEIM FUNDS SEMI-ANNUAL REPORT | 23 |
CONSOLIDATED SCHEDULE OF INVESTMENTS (Unaudited)(continued) | March 31, 2020 |
MACRO OPPORTUNITIES FUND | |
| | Face
Amount~ | | | Value | |
2007-HE6, 1.20% (1 Month USD LIBOR + 0.25%, Rate Floor: 0.25%) due 05/25/377 | | | 8,803,742 | | | $ | 7,274,724 | |
2006-HE6, 1.05% (1 Month USD LIBOR + 0.10%, Rate Floor: 0.10%) due 09/25/367 | | | 5,060,585 | | | | 2,035,296 | |
2007-HE4, 1.18% (1 Month USD LIBOR + 0.23%, Rate Floor: 0.23%) due 02/25/377 | | | 4,345,848 | | | | 1,602,637 | |
Ameriquest Mortgage Securities Trust | | | | | | | | |
2006-M3, 1.12% (1 Month USD LIBOR + 0.18%, Rate Floor: 0.18%) due 10/25/367 | | | 24,987,238 | | | | 15,114,090 | |
2006-M3, 1.05% (1 Month USD LIBOR + 0.10%, Rate Floor: 0.10%) due 10/25/367 | | | 15,636,364 | | | | 6,111,936 | |
Morgan Stanley IXIS Real Estate Capital Trust | | | | | | | | |
2006-2, 1.17% (1 Month USD LIBOR + 0.22%, Rate Floor: 0.22%) due 11/25/367 | | | 25,518,226 | | | | 10,621,755 | |
2006-2, 1.10% (1 Month USD LIBOR + 0.15%, Rate Floor: 0.15%) due 11/25/367 | | | 19,467,212 | | | | 7,985,038 | |
ACE Securities Corporation Home Equity Loan Trust Series | | | | | | | | |
2007-HE1, 1.10% (1 Month USD LIBOR + 0.15%, Rate Floor: 0.15%) due 01/25/377 | | | 18,023,357 | | | | 10,526,841 | |
2007-ASP1, 1.33% (1 Month USD LIBOR + 0.38%, Rate Floor: 0.38%) due 03/25/377 | | | 13,111,196 | | | | 6,958,080 | |
NRPL Trust | | | | | | | | |
2019-3A, 3.00% due 07/25/596 | | | 14,987,835 | | | | 15,064,384 | |
IXIS Real Estate Capital Trust | | | | | | | | |
2007-HE1, 1.11% (1 Month USD LIBOR + 0.16%, Rate Floor: 0.16%) due 05/25/377 | | | 26,368,839 | | | | 7,441,302 | |
2007-HE1, 1.18% (1 Month USD LIBOR + 0.23%, Rate Floor: 0.23%) due 05/25/377 | | | 18,681,952 | | | | 5,382,210 | |
Fannie Mae Connecticut Avenue Securities | | | | | | | | |
2016-C02, 6.95% (1 Month USD LIBOR + 6.00%, Rate Floor: 0.00%) due 09/25/287 | | | 12,949,995 | | | | 12,636,404 | |
Impac Secured Assets Trust | | | | | | | | |
2006-3, 1.15% (1 Month USD LIBOR + 0.20%, Rate Floor: 0.20%) due 11/25/367 | | | 14,222,548 | | | | 12,591,177 | |
24 | THE GUGGENHEIM FUNDS SEMI-ANNUAL REPORT | SEE NOTES TO CONSOLIDATED FINANCIAL STATEMENTS. |
CONSOLIDATED SCHEDULE OF INVESTMENTS (Unaudited)(continued) | March 31, 2020 |
MACRO OPPORTUNITIES FUND | |
| | Face
Amount~ | | | Value | |
GSAMP Trust | | | | | | | | |
2007-NC1, 1.08% (1 Month USD LIBOR + 0.13%, Rate Floor: 0.13%) due 12/25/467 | | | 23,614,191 | | | $ | 12,437,224 | |
Nationstar Home Equity Loan Trust | | | | | | | | |
2007-C, 1.12% (1 Month USD LIBOR + 0.18%, Rate Floor: 0.18%) due 06/25/377 | | | 13,597,649 | | | | 12,290,779 | |
Citigroup Mortgage Loan Trust, Inc. | | | | | | | | |
2007-AMC3, 1.20% (1 Month USD LIBOR + 0.25%, Rate Floor: 0.25%) due 03/25/377 | | | 14,857,414 | | | | 11,941,624 | |
Master Asset Backed Securities Trust | | | | | | | | |
2006-WMC3, 1.11% (1 Month USD LIBOR + 0.16%, Rate Floor: 0.16%) due 08/25/367 | | | 12,253,520 | | | | 4,795,946 | |
2006-HE3, 1.05% (1 Month USD LIBOR + 0.10%, Rate Floor: 0.10%) due 08/25/367 | | | 10,691,483 | | | | 3,733,043 | |
2006-HE3, 1.10% (1 Month USD LIBOR + 0.15%, Rate Floor: 0.15%) due 08/25/367 | | | 8,988,984 | | | | 3,200,122 | |
Home Equity Loan Trust | | | | | | | | |
2007-FRE1, 1.14% (1 Month USD LIBOR + 0.19%, Rate Floor: 0.19%) due 04/25/377 | | | 11,920,461 | | | | 9,941,466 | |
Banc of America Funding Trust | | | | | | | | |
2015-R2, 1.21% (1 Month USD LIBOR + 0.26%, Rate Floor: 0.26%) due 04/29/376,7 | | | 10,000,000 | | | | 9,359,491 | |
SPS Servicer Advance Receivables Trust Advance Receivables Backed Notes | | | | | | | | |
2019-T2, 2.52% due 10/15/526 | | | 4,000,000 | | | | 3,864,959 | |
2019-T2, 2.77% due 10/15/529 | | | 2,068,000 | | | | 1,998,485 | |
2019-T1, 2.34% due 10/15/519 | | | 1,690,000 | | | | 1,652,454 | |
2019-T1, 2.39% due 10/15/519 | | | 1,374,000 | | | | 1,343,497 | |
Alternative Loan Trust | | | | | | | | |
2007-OA7, 1.13% (1 Month USD LIBOR + 0.18%, Rate Floor: 0.18%) due 05/25/477 | | | 11,327,085 | | | | 8,845,393 | |
First NLC Trust | | | | | | | | |
2007-1, 1.23% (1 Month USD LIBOR + 0.28%, Rate Floor: 0.28%) due 08/25/376,7 | | | 8,472,573 | | | | 4,389,311 | |
2007-1, 1.02% (1 Month USD LIBOR + 0.07%, Rate Floor: 0.07%) due 08/25/376,7 | | | 6,425,023 | | | | 3,200,138 | |
WaMu Asset-Backed Certificates WaMu Series Trust | | | | | | | | |
2007-HE1, 1.18% (1 Month USD LIBOR + 0.23%, Rate Floor: 0.23%) due 01/25/377 | | | 9,528,990 | | | | 5,034,147 | |
SEE NOTES TO CONSOLIDATED FINANCIAL STATEMENTS. | THE GUGGENHEIM FUNDS SEMI-ANNUAL REPORT | 25 |
CONSOLIDATED SCHEDULE OF INVESTMENTS (Unaudited)(continued) | March 31, 2020 |
MACRO OPPORTUNITIES FUND | |
| | Face
Amount~ | | | Value | |
2007-HE4, 1.12% (1 Month USD LIBOR + 0.17%, Rate Floor: 0.17%) due 07/25/477 | | | 3,853,842 | | | $ | 2,410,868 | |
HSI Asset Securitization Corporation Trust | | | | | | | | |
2007-HE1, 1.14% (1 Month USD LIBOR + 0.19%, Rate Floor: 0.19%) due 01/25/377 | | | 7,932,337 | | | | 5,733,945 | |
Luminent Mortgage Trust | | | | | | | | |
2006-2, 1.15% (1 Month USD LIBOR + 0.20%, Rate Floor: 0.20%) due 02/25/467 | | | 7,501,607 | | | | 5,590,693 | |
CitiMortgage Alternative Loan Trust Series | | | | | | | | |
2007-A7, 1.35% (1 Month USD LIBOR + 0.40%, Rate Cap/Floor: 7.50%/0.40%) due 07/25/377 | | | 7,732,259 | | | | 5,434,207 | |
LSTAR Securities Investment Trust | | | | | | | | |
2019-1, 3.28% (1 Month USD LIBOR + 1.70%, Rate Floor: 0.00%) due 03/01/246,7 | | | 5,358,870 | | | | 5,279,345 | |
WaMu Mortgage Pass-Through Certificates WMALT Series Trust | | | | | | | | |
2006-AR9, 2.81% (1 Year CMT Rate + 0.84%, Rate Floor: 0.84%) due 11/25/467 | | | 6,115,111 | | | | 4,748,704 | |
Morgan Stanley Mortgage Loan Trust | | | | | | | | |
2006-9AR, 1.10% (1 Month USD LIBOR + 0.15%, Rate Floor: 0.15%) due 08/25/367 | | | 10,478,092 | | | | 4,078,964 | |
Nomura Resecuritization Trust | | | | | | | | |
2015-4R, 2.11% (1 Month USD LIBOR + 0.43%, Rate Floor: 0.43%) due 03/26/366,7 | | | 3,660,312 | | | | 3,521,366 | |
Alliance Bancorp Trust | | | | | | | | |
2007-OA1, 1.19% (1 Month USD LIBOR + 0.24%, Rate Floor: 0.24%) due 07/25/377 | | | 3,220,284 | | | | 2,410,149 | |
Wachovia Asset Securitization Issuance II LLC Trust | | | | | | | | |
2007-HE1, 1.09% (1 Month USD LIBOR + 0.14%, Rate Floor: 0.14%) due 07/25/376,7 | | | 1,311,240 | | | | 1,094,633 | |
Morgan Stanley Re-REMIC Trust | | | | | | | | |
2010-R5, 3.90% due 06/26/366 | | | 1,018,594 | | | | 803,707 | |
Asset Backed Securities Corporation Home Equity Loan Trust | | | | | | | | |
2006-HE5, 1.09% (1 Month USD LIBOR + 0.14%, Rate Floor: 0.14%) due 07/25/367 | | | 693,840 | | | | 646,084 | |
Total Residential Mortgage Backed Securities | | | 689,172,873 | |
26 | THE GUGGENHEIM FUNDS SEMI-ANNUAL REPORT | SEE NOTES TO CONSOLIDATED FINANCIAL STATEMENTS. |
CONSOLIDATED SCHEDULE OF INVESTMENTS (Unaudited)(continued) | March 31, 2020 |
MACRO OPPORTUNITIES FUND | |
| | Face
Amount~ | | | Value | |
Commercial Mortgage Backed Securities - 1.4% |
GS Mortgage Securities Corporation Trust | | | | | | | | |
2017-STAY, 2.86% (1 Month USD LIBOR + 2.15%, Rate Floor: 2.15%) due 07/15/326,7 | | | 16,531,000 | | | $ | 14,316,947 | |
2020-UPTN, 3.25% (WAC) due 02/10/376,7 | | | 8,256,000 | | | | 6,367,893 | |
2020-DUNE, 3.21% (1 Month USD LIBOR + 2.50%, Rate Floor: 2.50%) due 12/15/366,7 | | | 7,340,000 | | | | 5,675,878 | |
2020-DUNE, 2.61% (1 Month USD LIBOR + 1.90%, Rate Floor: 1.90%) due 12/15/366,7 | | | 2,750,000 | | | | 2,126,188 | |
Four Times Square Trust Commercial Mortgage Pass-Through Certificates Series | | | | | | | | |
2006-4TS, 5.40% due 12/13/286 | | | 10,502,623 | | | | 10,400,657 | |
Madison Avenue Trust | | | | | | | | |
2013-650M, 4.03% (WAC) due 10/12/326,7 | | | 7,180,000 | | | | 7,096,043 | |
Morgan Stanley Capital I Trust | | | | | | | | |
2014-MP, 3.47% due 08/11/336 | | | 4,735,000 | | | | 4,752,026 | |
BX Commercial Mortgage Trust | | | | | | | | |
2019-XL, 3.01% (1 Month USD LIBOR + 2.30%, Rate Floor: 2.30%) due 10/15/366,7 | | | 2,235,637 | | | | 1,877,500 | |
GE Business Loan Trust | | | | | | | | |
2007-1A, 1.16% (1 Month USD LIBOR + 0.45%, Rate Floor: 0.45%) due 04/16/356,7 | | | 1,004,222 | | | | 897,162 | |
2007-1A, 0.88% (1 Month USD LIBOR + 0.17%, Rate Floor: 0.17%) due 04/15/356,7 | | | 743,868 | | | | 676,295 | |
Wells Fargo Commercial Mortgage Trust | | | | | | | | |
2015-NXS1, 2.63% due 05/15/48 | | | 1,322,367 | | | | 1,320,776 | |
Americold LLC | | | | | | | | |
2010-ARTA, 4.95% due 01/14/296 | | | 1,000,000 | | | | 994,419 | |
JPMBB Commercial Mortgage Securities Trust | | | | | | | | |
2015-C28, 2.77% due 10/15/48 | | | 536,445 | | | | 535,717 | |
Total Commercial Mortgage Backed Securities | | | 57,037,501 | |
| | | | | | | | | |
Military Housing - 0.8% |
Freddie Mac Military Housing Bonds Resecuritization Trust Certificates | | | | | | | | |
2015-R1, 0.65% (WAC) due 11/25/526,7,11 | | | 165,785,030 | | | | 10,310,188 | |
2015-R1, 0.52% (WAC) due 11/25/556,7,11 | | | 67,074,941 | | | | 4,907,229 | |
GMAC Commercial Mortgage Asset Corp. | | | | | | | | |
2004-POKA, 6.36% due 09/10/44†††,6 | | | 9,000,000 | | | | 10,711,303 | |
SEE NOTES TO CONSOLIDATED FINANCIAL STATEMENTS. | THE GUGGENHEIM FUNDS SEMI-ANNUAL REPORT | 27 |
CONSOLIDATED SCHEDULE OF INVESTMENTS (Unaudited)(continued) | March 31, 2020 |
MACRO OPPORTUNITIES FUND | |
| | Face
Amount~ | | | Value | |
Capmark Military Housing Trust | | | | | | | | |
2007-AET2, 6.06% due 10/10/52†††,1,6 | | | 5,681,864 | | | $ | 7,877,422 | |
Total Military Housing | | | 33,806,142 | |
| | | | | | | | | |
Total Collateralized Mortgage Obligations |
(Cost $898,115,417) | | | 780,016,516 | |
| | | | | | | | | |
CORPORATE BONDS†† - 11.6% |
Financial - 4.1% |
Lloyds Bank Corporate Markets plc NY | | | | | | | | |
2.11% (3 Month USD LIBOR + 0.37%) due 08/05/207 | | | 18,210,000 | | | | 18,195,727 | |
Standard Chartered Bank | | | | | | | | |
2.15% (3 Month USD LIBOR + 0.40%) due 08/04/207 | | | 18,120,000 | | | | 18,107,544 | |
AerCap Ireland Capital DAC / AerCap Global Aviation Trust | | | | | | | | |
4.63% due 10/30/20 | | | 9,850,000 | | | | 9,555,013 | |
4.25% due 07/01/20 | | | 8,000,000 | | | | 7,891,963 | |
UBS AG | | | | | | | | |
1.58% (3 Month USD LIBOR + 0.58%, Rate Floor: 0.00%) due 06/08/206,7,12 | | | 14,689,000 | | | | 14,641,918 | |
2.06% (3 Month USD LIBOR + 0.48%) due 12/01/206,7,12 | | | 2,800,000 | | | | 2,772,938 | |
Credit Agricole Corporate & Investment Bank S.A. | | | | | | | | |
2.16% (3 Month USD LIBOR + 0.40%, Rate Floor: 0.00%) due 05/03/216,7,12 | | | 17,375,000 | | | | 16,491,533 | |
Discover Bank | | | | | | | | |
3.10% due 06/04/20 | | | 15,598,000 | | | | 15,574,603 | |
Atlas Mara Ltd. | | | | | | | | |
8.00% due 12/31/209 | | | 14,400,000 | | | | 11,664,000 | |
Credit Suisse AG NY | | | | | | | | |
2.18% (3 Month USD LIBOR + 0.40%) due 07/31/207 | | | 11,190,000 | | | | 11,182,679 | |
American International Group, Inc. | | | | | | | | |
6.40% due 12/15/20 | | | 10,339,000 | | | | 10,629,792 | |
Capital One Financial Corp. | | | | | | | | |
2.22% (3 Month USD LIBOR + 0.45%) due 10/30/207 | | | 6,745,000 | | | | 6,641,860 | |
2.47% (3 Month USD LIBOR + 0.76%) due 05/12/207 | | | 2,741,000 | | | | 2,737,466 | |
Santander UK plc | | | | | | | | |
2.06% (3 Month USD LIBOR + 0.30%) due 11/03/207,12 | | | 7,325,000 | | | | 7,314,338 | |
2.13% due 11/03/2012 | | | 975,000 | | | | 969,400 | |
American Equity Investment Life Holding Co. | | | | | | | | |
5.00% due 06/15/27 | | | 4,813,000 | | | | 4,627,725 | |
HSBC Holdings plc | | | | | | | | |
4.95% due 03/31/30 | | | 3,450,000 | | | | 3,767,394 | |
AXIS Specialty Finance LLC | | | | | | | | |
5.88% due 06/01/20 | | | 3,110,000 | | | | 3,131,991 | |
Univest Financial Corp. | | | | | | | | |
4.92% (3 Month USD LIBOR + 3.54%) due 03/30/257 | | | 2,500,000 | | | | 2,510,846 | |
Jefferies Finance LLC / JFIN Company-Issuer Corp. | | | | | | | | |
7.25% due 08/15/246,12 | | | 2,750,000 | | | | 2,365,000 | |
Total Financial | | | 170,773,730 | |
| | | | | | | | | |
Consumer, Non-cyclical - 3.2% |
Sysco Corp. | | | | | | | | |
5.95% due 04/01/30 | | | 20,280,000 | | | | 21,290,756 | |
28 | THE GUGGENHEIM FUNDS SEMI-ANNUAL REPORT | SEE NOTES TO CONSOLIDATED FINANCIAL STATEMENTS. |
CONSOLIDATED SCHEDULE OF INVESTMENTS (Unaudited)(continued) | March 31, 2020 |
MACRO OPPORTUNITIES FUND | |
| | Face
Amount~ | | | Value | |
2.60% due 10/01/2012 | | | 997,000 | | | $ | 987,575 | |
Reynolds American, Inc. | | | | | | | | |
3.25% due 06/12/2012 | | | 20,093,000 | | | | 20,032,721 | |
Mondelez International, Inc. | | | | | | | | |
3.00% due 05/07/20 | | | 20,210,000 | | | | 20,007,900 | |
Zimmer Biomet Holdings, Inc. | | | | | | | | |
2.70% due 04/01/20 | | | 17,689,000 | | | | 17,689,000 | |
Constellation Brands, Inc. | | | | | | | | |
2.25% due 11/06/20 | | | 16,236,000 | | | | 16,144,851 | |
Kraft Heinz Foods Co. | | | | | | | | |
4.38% due 06/01/46 | | | 6,320,000 | | | | 5,693,167 | |
5.20% due 07/15/45 | | | 5,725,000 | | | | 5,503,973 | |
5.00% due 06/04/4212 | | | 2,490,000 | | | | 2,357,497 | |
2.80% due 07/02/20 | | | 753,000 | | | | 747,405 | |
General Mills, Inc. | | | | | | | | |
2.38% (3 Month USD LIBOR + 0.54%) due 04/16/217 | | | 13,150,000 | | | | 12,802,304 | |
Allergan Inc./United States | | | | | | | | |
3.38% due 09/15/20 | | | 4,210,000 | | | | 4,255,255 | |
Vector Group Ltd. | | | | | | | | |
6.13% due 02/01/256,12 | | | 2,500,000 | | | | 2,275,000 | |
Sotheby’s | | | | | | | | |
7.38% due 10/15/276,12 | | | 2,830,000 | | | | 2,253,388 | |
KeHE Distributors LLC / KeHE Finance Corp. | | | | | | | | |
8.63% due 10/15/266 | | | 1,580,000 | | | | 1,587,900 | |
Conagra Brands, Inc. | | | | | | | | |
2.55% (3 Month USD LIBOR + 0.75%) due 10/22/207 | | | 786,000 | | | | 777,682 | |
Carriage Services, Inc. | | | | | | | | |
6.63% due 06/01/266 | | | 790,000 | | | | 776,175 | |
Total Consumer, Non-cyclical | | | 135,182,549 | |
| | | | | | | | | |
Industrial - 1.5% |
Encore Capital Group, Inc. | | | | | | | | |
5.63% due 08/11/24††† | | | 35,640,000 | | | | 32,994,758 | |
Textron, Inc. | | | | | | | | |
2.28% (3 Month USD LIBOR + 0.55%) due 11/10/207 | | | 10,250,000 | | | | 10,250,489 | |
Rolls-Royce plc | | | | | | | | |
2.38% due 10/14/206 | | | 10,570,000 | | | | 9,960,813 | |
Yamana Gold, Inc. | | | | | | | | |
4.76% due 03/23/22††† | | | 4,750,000 | | | | 4,519,463 | |
4.78% due 06/10/23††† | | | 99,699 | | | | 92,156 | |
Aviation Capital Group LLC | | | | | | | | |
7.13% due 10/15/206 | | | 4,500,000 | | | | 4,449,797 | |
Princess Juliana International Airport Operating Company N.V. | | | | | | | | |
5.50% due 12/20/27†††,1,9 | | | 1,326,792 | | | | 1,185,224 | |
Vulcan Materials Co. | | | | | | | | |
1.34% (3 Month USD LIBOR + 0.60%) due 06/15/207 | | | 1,050,000 | | | | 1,041,718 | |
Total Industrial | | | 64,494,418 | |
| | | | | | | | | |
Utilities - 0.9% |
NextEra Energy Capital Holdings, Inc. | | | | | | | | |
1.83% (3 Month USD LIBOR + 0.45%) due 09/28/207 | | | 17,820,000 | | | | 17,835,117 | |
Exelon Corp. | | | | | | | | |
2.85% due 06/15/20 | | | 17,356,000 | | | | 17,354,091 | |
PSEG Power LLC | | | | | | | | |
5.13% due 04/15/20 | | | 4,522,000 | | | | 4,523,761 | |
Total Utilities | | | 39,712,969 | |
SEE NOTES TO CONSOLIDATED FINANCIAL STATEMENTS. | THE GUGGENHEIM FUNDS SEMI-ANNUAL REPORT | 29 |
CONSOLIDATED SCHEDULE OF INVESTMENTS (Unaudited)(continued) | March 31, 2020 |
MACRO OPPORTUNITIES FUND | |
| | Face
Amount~ | | | Value | |
Communications - 0.9% |
Telefonica Emisiones S.A. | | | | | | | | |
5.13% due 04/27/20 | | | 17,300,000 | | | $ | 17,301,220 | |
ViacomCBS, Inc. | | | | | | | | |
4.75% due 05/15/25 | | | 10,520,000 | | | | 10,569,118 | |
Cengage Learning, Inc. | | | | | | | | |
9.50% due 06/15/246 | | | 5,039,000 | | | | 3,728,860 | |
McGraw-Hill Global Education Holdings LLC / McGraw-Hill Global Education Finance | | | | | | | | |
7.88% due 05/15/246 | | | 4,098,000 | | | | 3,053,010 | |
Sprint Corp. | | | | | | | | |
7.25% due 02/01/286 | | | 2,482,000 | | | | 2,494,410 | |
Altice France S.A. | | | | | | | | |
7.38% due 05/01/266 | | | 1,751,000 | | | | 1,738,130 | |
Total Communications | | | 38,884,748 | |
| | | | | | | | | |
Energy - 0.8% |
Marathon Petroleum Corp. | | | | | | | | |
3.40% due 12/15/20 | | | 14,880,000 | | | | 14,741,175 | |
Sabine Pass Liquefaction LLC | | | | | | | | |
5.63% due 02/01/21 | | | 13,800,000 | | | | 13,386,518 | |
Reliance Holding USA, Inc. | | | | | | | | |
4.50% due 10/19/206 | | | 3,750,000 | | | | 3,775,650 | |
Basic Energy Services, Inc. | | | | | | | | |
10.75% due 10/15/239 | | | 1,500,000 | | | | 982,500 | |
Total Energy | | | 32,885,843 | |
| | | | | | | | | |
Technology - 0.1% |
Fiserv, Inc. | | | | | | | | |
2.70% due 06/01/2012 | | | 2,850,000 | | | | 2,841,127 | |
| | | | | | | | | |
Consumer, Cyclical - 0.1% |
Panther BF Aggregator 2 Limited Partnership / Panther Finance Company, Inc. | | | | | | | | |
8.50% due 05/15/276,12 | | | 1,730,000 | | | | 1,509,252 | |
Aramark Services, Inc. | | | | | | | | |
5.00% due 02/01/286 | | | 795,000 | | | | 739,843 | |
Yum! Brands, Inc. | | | | | | | | |
7.75% due 04/01/256 | | | 200,000 | | | | 210,000 | |
Total Consumer, Cyclical | | | 2,459,095 | |
| | | | | | | | | |
Basic Materials - 0.0% |
Freeport-McMoRan, Inc. | | | | | | | | |
3.88% due 03/15/23 | | | 1,750,000 | | | | 1,653,750 | |
Mirabela Nickel Ltd. | | | | | | | | |
due 06/24/199,13 | | | 1,885,418 | | | | 94,271 | |
Total Basic Materials | | | 1,748,021 | |
| | | | | | | | | |
Total Corporate Bonds |
(Cost $502,708,782) | | | 488,982,500 | |
| | | | | | | | | |
SENIOR FLOATING RATE INTERESTS††,7 - 4.5% |
Consumer, Cyclical - 1.2% |
Mavis Tire Express Services Corp. | | | | | | | | |
4.70% (3 Month USD LIBOR + 3.25%, Rate Floor: 3.25%) due 03/20/25 | | | 7,542,405 | | | | 5,977,356 | |
AI Aqua Zip Bidco Pty Ltd. | | | | | | | | |
4.32% (3 Month USD LIBOR + 3.25%, Rate Floor: 4.25%) due 12/13/23 | | | 6,201,955 | | | | 5,271,662 | |
WESCO | | | | | | | | |
6.21% (2 Month USD LIBOR + 4.25%, Rate Floor: 5.25%) due 06/14/24†††,1 | | | CAD 3,960,000 | | | | 2,698,439 | |
30 | THE GUGGENHEIM FUNDS SEMI-ANNUAL REPORT | SEE NOTES TO CONSOLIDATED FINANCIAL STATEMENTS. |
CONSOLIDATED SCHEDULE OF INVESTMENTS (Unaudited)(continued) | March 31, 2020 |
MACRO OPPORTUNITIES FUND | |
| | Face
Amount~ | | | Value | |
5.33% (3 Month USD LIBOR + 4.25%, Rate Floor: 5.25%) due 06/14/24†††,1 | | | 2,358,000 | | | $ | 2,260,379 | |
Galls LLC | | | | | | | | |
8.03% (3 Month USD LIBOR + 6.25%, Rate Floor: 7.25%) due 01/31/25†††,1 | | | 3,204,445 | | | | 3,060,245 | |
7.39% (2 Month USD LIBOR + 6.25% and Commercial Prime Lending Rate + 5.25%, Rate Floor: 7.25%) due 01/31/24†††,1 | | | 490,540 | | | | 449,708 | |
7.92% (1 Month USD LIBOR + 6.25% and 3 Month USD LIBOR + 6.25%, Rate Floor: 7.25%) due 01/31/25†††,1 | | | 354,556 | | | | 338,601 | |
CPI Acquisition, Inc. | | | | | | | | |
6.38% (3 Month USD LIBOR + 4.50%, Rate Floor: 6.50%) due 08/17/22 | | | 5,602,372 | | | | 3,489,214 | |
Accuride Corp. | | | | | | | | |
6.70% (3 Month USD LIBOR + 5.25%, Rate Floor: 6.25%) due 11/17/23 | | | 7,811,442 | | | | 3,124,577 | |
SHO Holding I Corp. | | | | | | | | |
6.78% (3 Month USD LIBOR + 5.00%, Rate Floor: 6.00%) due 10/27/22 | | | 3,671,533 | | | | 2,827,080 | |
EnTrans International, LLC | | | | | | | | |
6.99% (1 Month USD LIBOR + 6.00%, Rate Floor: 6.00%) due 11/01/24††† | | | 3,193,750 | | | | 2,682,750 | |
Petco Animal Supplies, Inc. | | | | | | | | |
5.03% (3 Month USD LIBOR + 3.25%, Rate Floor: 4.25%) due 01/26/23 | | | 3,301,697 | | | | 2,274,869 | |
Alexander Mann | | | | | | | | |
5.73% (3 Month GBP LIBOR + 5.00%, Rate Floor: 5.00%) due 06/16/25††† | | | GBP 3,000,000 | | | | 2,237,971 | |
At Home Holding III Corp. | | | | | | | | |
5.28% (3 Month USD LIBOR + 3.50%, Rate Floor: 4.50%) due 06/03/22 | | | 2,906,087 | | | | 2,034,261 | |
Nellson Nutraceutical | | | | | | | | |
5.70% (3 Month USD LIBOR + 4.25% and Commercial Prime Lending Rate + 3.25%, Rate Floor: 5.25%) due 12/23/21 | | | 2,379,672 | | | | 1,856,144 | |
Blue Nile, Inc. | | | | | | | | |
8.11% (3 Month USD LIBOR + 6.50%, Rate Floor: 7.50%) due 02/17/23 | | | 3,018,750 | | | | 1,781,062 | |
Checkers Drive-In Restaurants, Inc. | | | | | | | | |
5.87% (3 Month USD LIBOR + 4.25%, Rate Floor: 5.25%) due 04/25/24 | | | 3,356,587 | | | | 1,762,208 | |
SEE NOTES TO CONSOLIDATED FINANCIAL STATEMENTS. | THE GUGGENHEIM FUNDS SEMI-ANNUAL REPORT | 31 |
CONSOLIDATED SCHEDULE OF INVESTMENTS (Unaudited)(continued) | March 31, 2020 |
MACRO OPPORTUNITIES FUND | |
| | Face
Amount~ | | | Value | |
Zephyr Bidco Ltd. | | | | | | | | |
7.74% (1 Month GBP LIBOR + 7.50%, Rate Floor: 7.50%) due 07/23/26††† | | | GBP 1,540,417 | | | $ | 1,627,942 | |
Belk, Inc. | | | | | | | | |
7.75% (3 Month USD LIBOR + 6.75%, Rate Floor: 7.75%) due 07/31/25 | | | 2,912,529 | | | | 1,607,716 | |
EG Finco Ltd. | | | | | | | | |
5.47% (3 Month GBP LIBOR + 4.75% and 6 Month GBP LIBOR + 4.75%, Rate Floor: 4.75%) due 02/07/25 | | | GBP 982,500 | | | | 923,291 | |
K & N Parent, Inc. | | | | | | | | |
5.82% (3 Month USD LIBOR + 4.75%, Rate Floor: 5.75%) due 10/20/23 | | | 963,986 | | | | 643,461 | |
American Tire Distributors, Inc. | | | | | | | | |
7.20% (3 Month USD LIBOR + 6.00%, Rate Floor: 7.00%) due 09/01/23 | | | 249,634 | | | | 232,160 | |
8.55% (1 Month USD LIBOR + 7.50% and 3 Month USD LIBOR + 7.50%, Rate Floor: 8.50%) due 09/02/24 | | | 164,351 | | | | 108,472 | |
Total Consumer, Cyclical | | | 49,269,568 | |
| | | | | | | | | |
Technology - 0.9% |
Planview, Inc. | | | | | | | | |
6.87% (2 Month USD LIBOR + 5.25%, Rate Floor: 6.25%) due 01/27/23†††,1 | | | 8,685,230 | | | | 8,287,472 | |
7.02% (3 Month USD LIBOR + 5.25%, Rate Floor: 6.25%) due 01/27/23†††,1 | | | 3,100,681 | | | | 2,958,679 | |
Datix Bidco Ltd. | | | | | | | | |
6.43% (6 Month USD LIBOR + 4.50%, Rate Floor: 4.50%) due 04/28/25†††,1 | | | 9,112,505 | | | | 8,605,850 | |
9.68% (6 Month USD LIBOR + 7.75%, Rate Floor: 7.75%) due 04/27/26†††,1 | | | 461,709 | | | | 432,899 | |
LANDesk Group, Inc. | | | | | | | | |
5.25% (1 Month USD LIBOR + 4.25%, Rate Floor: 5.25%) due 01/20/24 | | | 5,633,870 | | | | 4,957,806 | |
GlobalFoundries, Inc. | | | | | | | | |
6.25% (3 Month USD LIBOR + 4.75%, Rate Floor: 4.75%) due 06/05/26 | | | 4,875,500 | | | | 4,144,175 | |
Ministry Brands LLC | | | | | | | | |
5.62% (2 Month USD LIBOR + 4.00%, Rate Floor: 5.00%) due 12/02/22††† | | | 2,664,552 | | | | 2,531,325 | |
Greenway Health LLC | | | | | | | | |
4.82% (3 Month USD LIBOR + 3.75%, Rate Floor: 4.75%) due 02/16/24 | | | 3,527,456 | | | | 2,198,769 | |
Kar Finland Bidco Oy | | | | | | | | |
4.50% (3 Month EURIBOR + 4.50%, Rate Floor: 4.50%) due 11/27/23††† | | | EUR 1,000,000 | | | | 1,039,216 | |
24-7 Intouch, Inc. | | | | | | | | |
5.74% (1 Month USD LIBOR + 4.75%, Rate Floor: 4.75%) due 08/25/25††† | | | 1,162,101 | | | | 964,544 | |
32 | THE GUGGENHEIM FUNDS SEMI-ANNUAL REPORT | SEE NOTES TO CONSOLIDATED FINANCIAL STATEMENTS. |
CONSOLIDATED SCHEDULE OF INVESTMENTS (Unaudited)(continued) | March 31, 2020 |
MACRO OPPORTUNITIES FUND | |
| | Face
Amount~ | | | Value | |
Neustar, Inc. | | | | | | | | |
4.57% (3 Month USD LIBOR + 3.50%, Rate Floor: 4.50%) due 08/08/24 | | | 1,254,980 | | | $ | 946,255 | |
Aspect Software, Inc. | | | | | | | | |
6.00% (1 Month USD LIBOR + 5.00%, Rate Floor: 6.00%) due 01/15/24††† | | | 690,066 | | | | 522,152 | |
6.23% (3 Month USD LIBOR + 5.00%, Rate Floor: 6.00%) due 07/17/23†††,1 | | | 61,843 | | | | 61,155 | |
Total Technology | | | 37,650,297 | |
| | | | | | | | | |
Communications - 0.8% |
Trader Interactive | | | | | | | | |
7.57% (3 Month USD LIBOR + 6.50%, Rate Floor: 7.50%) due 06/17/24†††,1 | | | 10,789,553 | | | | 10,230,860 | |
7.72% (3 Month USD LIBOR + 6.50%, Rate Floor: 7.50%) due 06/15/23 | | | 184,615 | | | | 169,815 | |
McGraw-Hill Global Education Holdings LLC | | | | | | | | |
5.45% (3 Month USD LIBOR + 4.00%, Rate Floor: 5.00%) due 05/04/22 | | | 9,405,296 | | | | 7,649,610 | |
Zayo Group Holdings, Inc. | | | | | | | | |
3.99% (1 Month USD LIBOR + 3.00%, Rate Floor: 3.00%) due 03/09/27 | | | 6,900,000 | | | | 6,486,000 | |
Market Track LLC | | | | | | | | |
6.03% (3 Month USD LIBOR + 4.25% and 3 Month USD LIBOR + 4.25%, Rate Floor: 5.25%) due 06/05/24 | | | 4,143,750 | | | | 3,315,000 | |
Resource Label Group LLC | | | | | | | | |
6.41% (3 Month USD LIBOR + 4.50%, Rate Floor: 5.50%) due 05/26/23 | | | 1,937,957 | | | | 1,695,712 | |
10.41% (3 Month USD LIBOR + 8.50%, Rate Floor: 9.50%) due 11/26/23††† | | | 1,500,000 | | | | 1,275,000 | |
Cengage Learning Acquisitions, Inc. | | | | | | | | |
5.25% (1 Month USD LIBOR + 4.25%, Rate Floor: 5.25%) due 06/07/23 | | | 2,201,961 | | | | 1,774,406 | |
Flight Bidco, Inc. | | | | | | | | |
8.49% (1 Month USD LIBOR + 7.50%, Rate Floor: 7.50%) due 07/23/26††† | | | 1,000,000 | | | | 800,000 | |
Total Communications | | | 33,396,403 | |
| | | | | | | | | |
Industrial - 0.6% |
Tronair Parent, Inc. | | | | | | | | |
6.46% (3 Month USD LIBOR + 4.75%, Rate Floor: 5.75%) due 09/08/23††† | | | 6,549,577 | | | | 5,108,670 | |
Hillman Group, Inc. | | | | | | | | |
5.07% (3 Month USD LIBOR + 4.00%, Rate Floor: 4.00%) due 05/30/25 | | | 4,327,925 | | | | 3,359,552 | |
SEE NOTES TO CONSOLIDATED FINANCIAL STATEMENTS. | THE GUGGENHEIM FUNDS SEMI-ANNUAL REPORT | 33 |
CONSOLIDATED SCHEDULE OF INVESTMENTS (Unaudited)(continued) | March 31, 2020 |
MACRO OPPORTUNITIES FUND | |
| | Face
Amount~ | | | Value | |
Fortis Solutions Group LLC | | | | | | | | |
5.50% (1 Month USD LIBOR + 4.50%, Rate Floor: 5.50%) due 12/15/23†††,1 | | | 2,884,558 | | | $ | 2,812,444 | |
YAK MAT (YAK ACCESS LLC) | | | | | | | | |
11.20% (3 Month USD LIBOR + 10.00%, Rate Floor: 10.00%) due 07/10/26††† | | | 3,400,000 | | | | 2,040,000 | |
Hanjin International Corp. | | | | | | | | |
3.49% (1 Month USD LIBOR + 2.50%, Rate Floor: 2.50%) due 10/19/20 | | | 2,600,000 | | | | 2,028,000 | |
National Technical Systems | | | | | | | | |
7.58% (1 Month USD LIBOR + 6.00%, Rate Floor: 7.00%) due 06/12/21†††,1 | | | 1,541,175 | | | | 1,479,528 | |
7.00% (1 Month USD LIBOR + 6.00% and 3 Month USD LIBOR + 6.00%, Rate Floor: 7.00%) due 06/12/21†††,1 | | | 248,125 | | | | 238,200 | |
Bioplan USA, Inc. | | | | | | | | |
5.82% (3 Month USD LIBOR + 4.75%, Rate Floor: 5.75%) due 09/23/21††† | | | 2,431,618 | | | | 1,653,500 | |
SLR Consulting Ltd. | | | | | | | | |
4.98% (6 Month USD LIBOR + 4.00%, Rate Floor: 4.00%) due 06/23/25†††,1 | | | 1,190,970 | | | | 1,088,207 | |
6.48% (1 Month USD LIBOR + 4.00%, Rate Floor: 4.00%) due 05/23/25†††,1 | | | 311,616 | | | | 284,728 | |
4.95% (1 Month USD LIBOR + 4.00% and 6 Month USD LIBOR + 4.00%, Rate Floor: 4.00%) due 06/23/25†††,1 | | | GBP 58,680 | | | | 66,663 | |
Bhi Investments LLC | | | | | | | | |
6.34% (3 Month USD LIBOR + 4.50%, Rate Floor: 5.50%) due 08/28/24††† | | | 1,616,627 | | | | 1,293,301 | |
Safety Bidco Ltd. | | | | | | | | |
5.10% (3 Month GBP LIBOR + 4.50%, Rate Floor: 4.50%) due 10/25/24†††,1 | | | GBP 850,000 | | | | 952,806 | |
API Heat Transfer | | | | | | | | |
7.45% (3 Month USD LIBOR + 6.00%, Rate Floor: 7.00%) due 01/01/24 | | | 948,669 | | | | 772,422 | |
7.45% (3 Month USD LIBOR + 6.00%, Rate Floor: 7.00%) due 10/02/23††† | | | 169,253 | | | | 146,673 | |
Klockner Pentaplast of America, Inc. | | | | | | | | |
4.75% (1 Month EURIBOR + 4.75%, Rate Floor: 4.75%) due 06/30/22 | | | EUR 1,100,000 | | | | 864,358 | |
Diversitech Holdings, Inc. | | | | | | | | |
8.95% (3 Month USD LIBOR + 7.50%, Rate Floor: 8.50%) due 06/02/25††† | | | 1,000,000 | | | | 790,000 | |
34 | THE GUGGENHEIM FUNDS SEMI-ANNUAL REPORT | SEE NOTES TO CONSOLIDATED FINANCIAL STATEMENTS. |
CONSOLIDATED SCHEDULE OF INVESTMENTS (Unaudited)(continued) | March 31, 2020 |
MACRO OPPORTUNITIES FUND | |
| | Face
Amount~ | | | Value | |
Duran Group Holding GMBH | | | | | | | | |
4.25% (6 Month EURIBOR + 4.25%, Rate Floor: 4.25%) due 03/29/24†††,1 | | | EUR 438,217 | | | $ | 405,913 | |
4.25% (6 Month EURIBOR + 4.25%, Rate Floor: 4.25%) due 12/20/24†††,1 | | | EUR 149,592 | | | | 138,565 | |
Transcendia Holdings, Inc. | | | | | | | | |
4.57% (3 Month USD LIBOR + 3.50%, Rate Floor: 4.50%) due 05/30/24 | | | 574,531 | | | | 371,147 | |
Total Industrial | | | 25,894,677 | |
| | | | | | | | | |
Consumer, Non-cyclical - 0.6% |
Springs Window Fashions | | | | | | | | |
5.32% (3 Month USD LIBOR + 4.25%, Rate Floor: 4.25%) due 06/15/25††† | | | 6,252,205 | | | | 5,439,419 | |
9.57% (3 Month USD LIBOR + 8.50%, Rate Floor: 8.50%) due 06/15/26 | | | 5,500,000 | | | | 4,528,315 | |
ScribeAmerica Intermediate Holdco LLC (Healthchannels) | | | | | | | | |
5.11% (1 Month USD LIBOR + 4.50%, Rate Floor: 4.50%) due 04/03/25††† | | | 4,644,602 | | | | 4,040,804 | |
BCPE Eagle Buyer LLC | | | | | | | | |
5.25% (3 Month USD LIBOR + 4.25%, Rate Floor: 5.25%) due 03/18/24 | | | 2,818,849 | | | | 2,114,137 | |
Affordable Care Holdings Corp. | | | | | | | | |
6.20% (3 Month USD LIBOR + 4.75%, Rate Floor: 5.75%) due 10/24/22††† | | | 2,681,651 | | | | 1,984,422 | |
Give and Go Prepared Foods Corp. | | | | | | | | |
6.50% (Commercial Prime Lending Rate + 3.25%, Rate Floor: 4.25%) due 07/29/23 | | | 1,662,864 | | | | 1,623,371 | |
Certara, Inc. | | | | | | | | |
4.95% (3 Month USD LIBOR + 3.50%, Rate Floor: 3.50%) due 08/15/24††† | | | 1,650,342 | | | | 1,369,783 | |
CTI Foods Holding Co. LLC | | | | | | | | |
8.77% (3 Month USD LIBOR + 7.00%, Rate Floor: 8.00%) due 05/03/24†††,1 | | | 751,951 | | | | 714,353 | |
10.77% (3 Month USD LIBOR + 9.00%, Rate Floor: 10.00%) due 05/03/24 | | | 369,644 | | | | 340,073 | |
Nellson Nutraceutical | | | | | | | | |
5.70% (3 Month USD LIBOR + 4.25% and Commercial Prime Lending Rate + 3.25%, Rate Floor: 5.25%) due 12/23/21 | | | 978,380 | | | | 763,136 | |
EyeCare Partners LLC | | | | | | | | |
4.82% (3 Month USD LIBOR + 3.75%, Rate Floor: 3.75%) due 02/18/27 | | | 810,811 | | | | 648,649 | |
SEE NOTES TO CONSOLIDATED FINANCIAL STATEMENTS. | THE GUGGENHEIM FUNDS SEMI-ANNUAL REPORT | 35 |
CONSOLIDATED SCHEDULE OF INVESTMENTS (Unaudited)(continued) | March 31, 2020 |
MACRO OPPORTUNITIES FUND | |
| | Face
Amount~ | | | Value | |
Recess Holdings, Inc. | | | | | | | | |
5.20% (3 Month USD LIBOR + 3.75%, Rate Floor: 4.75%) due 09/30/24 | | | 779,531 | | | $ | 623,625 | |
Moran Foods LLC | | | | | | | | |
due 12/05/2313 | | | 1,737,622 | | | | 86,881 | |
Total Consumer, Non-cyclical | | | 24,276,968 | |
| | | | | | | | | |
Financial - 0.2% |
Teneo Holdings LLC | | | | | | | | |
6.25% (3 Month USD LIBOR + 5.25%, Rate Floor: 6.25%) due 07/11/25††† | | | 5,522,250 | | | | 4,417,800 | |
Camelia Bidco Banc Civica | | | | | | | | |
5.48% (3 Month GBP LIBOR + 4.75%, Rate Floor: 4.75%) due 10/14/24 | | | GBP 3,000,000 | | | | 3,095,860 | |
Aretec Group, Inc. | | | | | | | | |
5.24% (1 Month USD LIBOR + 4.25%, Rate Floor: 4.25%) due 10/01/25 | | | 3,851,250 | | | | 2,522,569 | |
Total Financial | | | 10,036,229 | |
| | | | | | | | | |
Energy - 0.1% |
SeaPort Financing LLC | | | | | | | | |
6.49% (1 Month USD LIBOR + 5.50%, Rate Floor: 5.50%) due 10/31/25††† | | | 3,110,625 | | | | 2,737,350 | |
Permian Production Partners LLC | | | | | | | | |
due 05/20/24†††,13 | | | 11,732,500 | | | | 1,759,875 | |
Ultra Petroleum, Inc. | | | | | | | | |
5.45% (1 Month USD LIBOR + 4.00%, Rate Floor: 5.00%) (in-kind rate was 0.25%) due 04/12/243 | | | 1,551,004 | | | | 730,259 | |
Summit Midstream Partners, LP | | | | | | | | |
7.00% (1 Month USD LIBOR + 6.00%, Rate Floor: 7.00%) due 05/13/22 | | | 1,056,868 | | | | 391,041 | |
Gavilan Resources LLC | | | | | | | | |
7.00% (1 Month USD LIBOR + 6.00%, Rate Floor: 7.00%) due 03/01/24 | | | 2,050,000 | | | | 184,500 | |
Total Energy | | | 5,803,025 | |
| | | | | | | | | |
Basic Materials - 0.1% |
ICP Industrial, Inc. | | | | | | | | |
5.07% (3 Month USD LIBOR + 4.00%, Rate Floor: 5.00%) due 11/03/23 | | | 2,447,915 | | | | 2,203,124 | |
LTI Holdings, Inc. | | | | | | | | |
4.49% (1 Month USD LIBOR + 3.50%, Rate Floor: 3.50%) due 09/06/25 | | | 1,477,500 | | | | 1,082,269 | |
Total Basic Materials | | | 3,285,393 | |
| | | | | | | | | |
Utilities - 0.0% |
Panda Power | | | | | | | | |
7.95% (3 Month USD LIBOR + 6.50%, Rate Floor: 7.50%) due 08/21/20 | | | 2,357,695 | | | | 1,956,887 | |
Total Senior Floating Rate Interests |
(Cost $248,395,882) | | | 191,569,447 | |
| | | | | | | | | |
MUNICIPAL BONDS†† - 0.9% |
New York - 0.6% |
New York City Transitional Finance Authority Future Tax Secured Revenue Revenue Bonds | | | | | | | | |
0.80% (VRDN) due 02/01/4516 | | | 4,990,000 | | | | 4,990,000 | |
0.75% (VRDN) due 02/01/4516 | | | 3,870,000 | | | | 3,870,000 | |
36 | THE GUGGENHEIM FUNDS SEMI-ANNUAL REPORT | SEE NOTES TO CONSOLIDATED FINANCIAL STATEMENTS. |
CONSOLIDATED SCHEDULE OF INVESTMENTS (Unaudited)(continued) | March 31, 2020 |
MACRO OPPORTUNITIES FUND | |
| | Face
Amount~ | | | Value | |
Triborough Bridge & Tunnel Authority Revenue Bonds | | | | | | | | |
0.87% (VRDN) due 01/01/3316 | | | 8,390,000 | | | $ | 8,390,000 | |
City of New York New York General Obligation Unlimited | | | | | | | | |
0.80% (VRDN) due 03/01/4216 | | | 5,020,000 | | | | 5,020,000 | |
0.75% (VRDN) due 03/01/4016 | | | 2,840,000 | | | | 2,840,000 | |
Total New York | | | 25,110,000 | |
| | | | | | | | | |
Illinois - 0.2% |
Illinois Finance Authority Revenue Bonds | | | | | | | | |
0.75% (VRDN) due 08/15/4216 | | | 6,225,000 | | | | 6,225,000 | |
| | | | | | | | | |
Pennsylvania - 0.1% |
Hospitals & Higher Education Facilities Authority of Philadelphia Revenue Bonds | | | | | | | | |
0.75% (VRDN) due 07/01/4116 | | | 2,355,000 | | | | 2,355,000 | |
0.76% (VRDN) due 07/01/2516 | | | 2,200,000 | | | | 2,200,000 | |
Total Pennsylvania | | | 4,555,000 | |
| | | | | | | | | |
Total Municipal Bonds |
(Cost $35,890,000) | | | 35,890,000 | |
| | | | | | | | | |
FOREIGN GOVERNMENT DEBT†† - 0.6% |
Government of Japan |
0.10% due 04/15/20 | | | JPY 1,972,900,000 | | | | 18,351,466 | |
0.00% due 04/13/204 | | | JPY 640,000,000 | | | | 5,952,931 | |
Total Foreign Government Debt |
(Cost $24,085,455) | | | | | | | 24,304,397 | |
| | | | | | | | | |
SENIOR FIXED RATE INTERESTS††† - 0.1% |
Communications - 0.1% |
MHGE Parent LLC | | | | | | | | |
11.00% due 04/20/221 | | | 4,700,000 | | | | 4,042,000 | |
Total Senior Fixed Rate Interests |
(Cost $4,639,377) | | | 4,042,000 | |
| | | | | | | | | |
REPURCHASE AGREEMENTS††,14 - 3.7% |
Societe Generale |
issued 03/09/20 at 1.30% due 04/01/20 | | | 22,458,000 | | | | 22,458,000 | |
issued 07/26/19 at 2.18% due 04/01/20 | | | 21,200,000 | | | | 21,200,000 | |
issued 03/09/20 at 2.27% due 04/01/20 | | | 9,700,318 | | | | 9,700,318 | |
issued 02/07/20 at 2.27% due 04/01/20 | | | 5,253,345 | | | | 5,253,345 | |
issued 07/09/19 at 2.27% due 04/01/20 | | | 4,874,329 | | | | 4,874,329 | |
issued 11/14/19 at 2.18% due 04/01/20 | | | 4,758,000 | | | | 4,758,000 | |
issued 03/24/20 at 2.27% due 04/01/20 | | | 3,000,000 | | | | 3,000,000 | |
issued 08/15/19 at 2.27% due 04/01/20 | | | 2,787,790 | | | | 2,787,790 | |
issued 07/22/19 at 2.27% due 04/01/20 | | | 2,405,525 | | | | 2,405,525 | |
issued 03/17/20 at 2.27% due 04/01/20 | | | 2,307,845 | | | | 2,307,845 | |
issued 01/08/20 at 2.27% due 04/01/20 | | | 2,171,805 | | | | 2,171,805 | |
SEE NOTES TO CONSOLIDATED FINANCIAL STATEMENTS. | THE GUGGENHEIM FUNDS SEMI-ANNUAL REPORT | 37 |
CONSOLIDATED SCHEDULE OF INVESTMENTS (Unaudited)(continued) | March 31, 2020 |
MACRO OPPORTUNITIES FUND | |
| | Face
Amount~ | | | Value | |
issued 03/25/20 at 2.27% due 04/01/20 | | | 1,816,261 | | | $ | 1,816,261 | |
issued 01/07/20 at 2.27% due 04/01/20 | | | 1,629,948 | | | | 1,629,948 | |
issued 11/14/19 at 2.27% due 04/01/20 | | | 1,269,000 | | | | 1,269,000 | |
issued 07/15/19 at 2.27% due 04/01/20 | | | 1,251,803 | | | | 1,251,803 | |
issued 02/06/20 at 2.27% due 04/01/20 | | | 868,849 | | | | 868,849 | |
BNP Paribas |
issued 01/31/20 at 1.93% due 05/04/20 | | | 29,807,502 | | | | 29,807,502 | |
issued 02/12/20 at 1.93% due 05/04/20 | | | 12,427,000 | | | | 12,427,000 | |
issued 03/09/20 at 1.93% due 05/04/20 | | | 3,800,710 | | | | 3,800,710 | |
issued 03/27/20 at 1.93% due 05/04/20 | | | 2,445,034 | | | | 2,445,034 | |
issued 02/18/20 at 1.93% due 05/04/20 | | | 1,770,000 | | | | 1,770,000 | |
Citigroup Global Markets, Inc. |
issued 10/24/19 at (0.25)% open maturity15 | | | 4,270,000 | | | | 4,270,000 | |
issued 03/27/20 at (0.45)% open maturity15 | | | 1,164,000 | | | | 1,164,000 | |
issued 01/27/20 at (0.25)% open maturity15 | | | 737,000 | | | | 737,000 | |
issued 03/12/20 at (0.40)% open maturity15 | | | 534,000 | | | | 534,000 | |
issued 03/26/20 at (0.15)% open maturity15 | | | 454,000 | | | | 454,000 | |
issued 10/16/19 at (0.15)% open maturity15 | | | 316,000 | | | | 316,000 | |
issued 01/14/20 at (0.15)% open maturity15 | | | 151,000 | | | | 151,000 | |
issued 03/24/20 at (0.25)% open maturity15 | | | 133,000 | | | | 133,000 | |
issued 03/27/20 at (0.35)% open maturity15 | | | 46,000 | | | | 46,000 | |
Barclays Capital, Inc. |
issued 10/24/19 at (0.45)% open maturity15 | | | 4,270,000 | | | | 4,270,000 | |
issued 03/27/20 at (0.45)% open maturity15 | | | 719,120 | | | | 719,120 | |
issued 12/16/19 at (0.45)% open maturity15 | | | 707,875 | | | | 707,875 | |
issued 02/07/20 at (14.00)% open maturity15 | | | 388,341 | | | | 388,341 | |
issued 11/22/19 at (14.00)% open maturity15 | | | 130,250 | | | | 130,250 | |
issued 02/06/20 at (14.00)% open maturity15 | | | 121,416 | | | | 121,416 | |
issued 03/23/20 at (0.25)% open maturity15 | | | 76,250 | | | | 76,250 | |
issued 03/27/20 at (0.65)% open maturity15 | | | 46,337 | | | | 46,337 | |
BofA Securities, Inc. |
issued 03/26/20 at (0.10)% open maturity15 | | | 1,415,910 | | | | 1,415,910 | |
38 | THE GUGGENHEIM FUNDS SEMI-ANNUAL REPORT | SEE NOTES TO CONSOLIDATED FINANCIAL STATEMENTS. |
CONSOLIDATED SCHEDULE OF INVESTMENTS (Unaudited)(continued) | March 31, 2020 |
MACRO OPPORTUNITIES FUND | |
| | Face
Amount~ | | | Value | |
issued 03/16/20 at (0.15)% open maturity15 | | | 966,194 | | | $ | 966,194 | |
RBC Capital Markets LLC |
issued 03/23/20 at (0.20)% open maturity15 | | | 171,563 | | | | 171,563 | |
Total Repurchase Agreements |
(Cost $154,821,320) | | | | | | | 154,821,320 | |
| | | | | | | | | |
COMMERCIAL PAPER†† - 2.0% |
American Electric Power |
1.81% due 04/01/204,6 | | | 30,000,000 | | | | 30,000,000 | |
Nasdaq, Inc. |
1.76% due 04/01/204,6 | | | 20,000,000 | | | | 20,000,000 | |
CBS Corp. |
1.85% due 04/20/204,6 | | | 20,000,000 | | | | 19,979,945 | |
Bemis Co., Inc. |
1.75% due 04/07/204,6 | | | 12,400,000 | | | | 12,396,383 | |
Total Commercial Paper |
(Cost $82,376,328) | | | | | | | 82,376,328 | |
| | | | | | | | | |
| | | Notional
Value | | | | | |
OTC OPTIONS PURCHASED†† - 0.3% |
Put options on: | | | | | | | | |
Morgan Stanley Capital Services LLC 2Y-10 CMS CAP Expiring July 2022 with strike price of $0.40 | | | 2,186,900,000 | | | | 4,658,097 | |
Bank of America, N.A. 2Y-10 CMS CAP Expiring July 2022 with strike price of $0.40 | | | 1,849,900,000 | | | | 3,940,287 | |
Goldman Sachs International 2Y-10 CMS CAP Expiring July 2022 with strike price of $0.61 | | | 1,417,800,000 | | | | 1,928,208 | |
Goldman Sachs International 2Y-10 CMS CAP Expiring July 2022 with strike price of $0.40 | | | 463,200,000 | | | | 986,616 | |
Bank of America, N.A. 2Y-10 CMS CAP Expiring July 2022 with strike price of $0.61 | | | 82,200,000 | | | | 111,792 | |
Total Put options | | | | | | | 11,625,000 | |
Total OTC Options Purchased | | | | |
(Cost $12,768,924) | | | | | | | 11,625,000 | |
| | | | | | | | | |
Total Investments - 101.2% | | | | |
(Cost $4,656,182,820) | | $ | 4,249,955,297 | |
| | | | | | | | | |
| | | Face
Amount~ | | | | | |
CORPORATE BONDS SOLD SHORT†† - (0.3)% |
Financial - (0.0)% | | | | | | | | |
Enova International, Inc. | | | | | | | | |
8.50% due 09/15/256 | | | 110,000 | | | | (94,600 | ) |
Acrisure LLC / Acrisure Finance, Inc. | | | | | | | | |
7.00% due 11/15/256 | | | 1,000,000 | | | | (860,000 | ) |
Total Financial | | | | | | | (954,600 | ) |
| | | | | | | | | |
Consumer, Non-cyclical - (0.0)% |
Quorum Health Corp. | | | | | | | | |
11.63% due 04/15/23 | | | 800,000 | | | | (520,000 | ) |
SEE NOTES TO CONSOLIDATED FINANCIAL STATEMENTS. | THE GUGGENHEIM FUNDS SEMI-ANNUAL REPORT | 39 |
CONSOLIDATED SCHEDULE OF INVESTMENTS (Unaudited)(continued) | March 31, 2020 |
MACRO OPPORTUNITIES FUND | |
| | Face
Amount~ | | | Value | |
Tenet Healthcare Corp. | | | | | | | | |
8.13% due 04/01/22 | | | 2,425,000 | | | $ | (2,309,813 | ) |
Total Consumer, Non-cyclical | | | (2,829,813 | ) |
| | | | | | | | | |
Industrial - (0.1)% | | | | | | | | |
Park-Ohio Industries, Inc. | | | | | | | | |
6.63% due 04/15/27 | | | 1,400,000 | | | | (1,106,581 | ) |
Spirit AeroSystems, Inc. | | | | | | | | |
4.60% due 06/15/28 | | | 2,294,000 | | | | (1,949,447 | ) |
Total Industrial | | | | | | | (3,056,028 | ) |
| | | | | | | | | |
Technology - (0.2)% | | | | |
Seagate HDD Cayman | | | | | | | | |
4.75% due 01/01/25 | | | 7,678,000 | | | | (7,634,849 | ) |
Total Corporate Bonds Sold Short | | | | |
(Proceeds $15,380,086) | | | (14,475,290 | ) |
Other Assets & Liabilities, net - (0.9)% | | | (36,329,742 | ) |
Total Net Assets - 100.0% | | $ | 4,199,150,265 | |
Futures Contracts |
Description | | Number of
Contracts | | | Expiration
Date | | | Notional
Amount | | | Value and
Unrealized
Depreciation** | |
Commodity Futures Contracts Sold Short† |
WTI Crude Futures Contracts | 2,525 | Nov 2020 | | $ | 84,234,000 | | | $ | (294,252 | ) |
Centrally Cleared Credit Default Swap Agreements Protection Sold†† |
| |
Counterparty | Exchange | Index | | Protection
Premium
Rate | | | Payment
Frequency | | | Maturity
Date | |
BofA Securities, Inc. | ICE | CDX.NA.HY.33.V3 | | | 5.00 | % | | | Quarterly | | | | 12/20/24 | |
Counterparty | | Notional
Amount | | | Value | | | Upfront
Premiums
Received | | | Unrealized
Appreciation** | |
BofA Securities, Inc. | | $ | 326,506,600 | | | $ | (19,906,640 | ) | | $ | (20,602,861 | ) | | $ | 696,221 | |
40 | THE GUGGENHEIM FUNDS SEMI-ANNUAL REPORT | SEE NOTES TO CONSOLIDATED FINANCIAL STATEMENTS. |
CONSOLIDATED SCHEDULE OF INVESTMENTS (Unaudited)(continued) | March 31, 2020 |
MACRO OPPORTUNITIES FUND | |
Centrally Cleared Interest Rate Swap Agreements†† |
| |
Counterparty | Exchange | Floating
Rate Type | Floating
Rate Index | | Fixed
Rate | | | Payment
Frequency | | | Maturity
Date | |
BofA Securities, Inc. | CME | Receive | 3-Month USD LIBOR | | | 3.18 | % | | | Quarterly | | | | 11/07/23 | |
BofA Securities, Inc. | CME | Receive | 3-Month USD LIBOR | | | 3.14 | % | | | Quarterly | | | | 11/06/21 | |
Counterparty | | Notional
Amount | | | Value | | | Upfront
Premiums
Paid
(Received) | | | Unrealized
Depreciation** | |
BofA Securities, Inc. | | $ | 30,090,000 | | | $ | (2,916,009 | ) | | $ | (4,288 | ) | | $ | (2,911,721 | ) |
BofA Securities, Inc. | | | 830,000,000 | | | | (34,607,547 | ) | | | 113,245 | | | | (34,720,792 | ) |
| | | | | | | $ | (37,523,556 | ) | | $ | 108,957 | | | $ | (37,632,513 | ) |
OTC Interest Rate Swap Agreements†† |
| |
Counterparty | Floating
Rate Type | Floating
Rate Index | | Fixed Rate | | | Payment
Frequency | | | Maturity
Date | |
Goldman Sachs International | Pay | 3-Month ILS TELBOR | 1.07% | | | Quarterly | | | | 03/13/30 | |
Goldman Sachs International | Pay | 3-Month ILS TELBOR | 0.95% | | | Quarterly | | | | 03/13/30 | |
Counterparty | | Notional
Amount | | | Value | | | Upfront
Premiums
Paid
(Received) | | | Unrealized
Depreciation | |
Goldman Sachs International | | | ILS 165,343,500 | | | $ | (545,225 | ) | | $ | — | | | $ | (545,225 | ) |
Goldman Sachs International | | | ILS 165,343,500 | | | | (809,305 | ) | | | — | | | | (809,305 | ) |
| | | | | | | $ | (1,354,530 | ) | | $ | — | | | $ | (1,354,530 | ) |
Total Return Swap Agreements |
Counterparty | Reference
Obligation | Financing
Rate Receive | Payment
Frequency | | Maturity
Date | | | Units | | | Notional
Amount | | | Value and
Unrealized
Appreciation
(Depreciation) | |
OTC Fixed Income Index Swap Agreements Sold Short†† |
BNP Paribas | iShares Core U.S. Aggregate Bond ETF | (1.88)% (3 Month USD LIBOR + 0.18%) | At Maturity | | | 05/21/20 | | | | 202,700 | | | $ | 23,385,499 | | | $ | (194,592 | ) |
OTC Fixed Income Index Swap Agreements†† |
Bank of America, N.A. | iShares Core U.S. Aggregate Bond ETF | 1.40% (Fixed rate) | At Maturity | | | 05/21/20 | | | | 202,700 | | | $ | 23,385,499 | | | $ | 1,082,418 | |
SEE NOTES TO CONSOLIDATED FINANCIAL STATEMENTS. | THE GUGGENHEIM FUNDS SEMI-ANNUAL REPORT | 41 |
CONSOLIDATED SCHEDULE OF INVESTMENTS (Unaudited)(continued) | March 31, 2020 |
MACRO OPPORTUNITIES FUND | |
Total Return Swap Agreements (continued) |
Counterparty | | Reference
Obligation | | | Financing
Rate Pay | | | Payment
Frequency | | | Maturity
Date | | | Units | | | Notional
Amount | | | Value and
Unrealized
Appreciation
(Depreciation) | |
OTC Sovereign Debt Swap Agreements†† |
Deutsche Bank AG | Korea Monetary Stabilization Bond | 2.20% (3 Month USD LIBOR + 0.45%) | At Maturity | | | 08/04/21 | | | | N/A | | | $ | 23,395,980 | | | $ | 15,659 | |
Forward Foreign Currency Exchange Contracts††
Counterparty | | Contracts
to Sell | | | Currency | | | Settlement
Date | | | Settlement
Value | | | Value at
March 31,
2020 | | | Unrealized
Appreciation | |
JPMorgan Chase Bank, N.A. | | | 5,702,202,000 | | | | MXN | | | | 11/25/20 | | | $ | 288,340,790 | | | $ | 232,565,540 | | | $ | 55,775,250 | |
Goldman Sachs International | | | 4,677,515,000 | | | | MXN | | | | 08/25/20 | | | | 231,505,160 | | | | 193,183,455 | | | | 38,321,705 | |
Goldman Sachs International | | | 3,805,184,000 | | | | MXN | | | | 11/25/20 | | | | 193,397,843 | | | | 155,195,251 | | | | 38,202,592 | |
JPMorgan Chase Bank, N.A. | | | 4,676,586,000 | | | | MXN | | | | 08/25/20 | | | | 231,303,568 | | | | 193,145,087 | | | | 38,158,481 | |
Citibank N.A., New York | | | 1,901,663,000 | | | | MXN | | | | 11/25/20 | | | | 96,821,581 | | | | 77,559,736 | | | | 19,261,845 | |
Citibank N.A., New York | | | 303,500,000 | | | | BRL | | | | 07/01/20 | | | | 75,789,060 | | | | 58,366,507 | | | | 17,422,553 | |
Citibank N.A., New York | | | 1,871,006,000 | | | | MXN | | | | 08/25/20 | | | | 92,395,358 | | | | 77,273,382 | | | | 15,121,976 | |
JPMorgan Chase Bank, N.A. | | | 178,600,000 | | | | BRL | | | | 07/01/21 | | | | 42,785,007 | | | | 33,762,152 | | | | 9,022,855 | |
Citibank N.A., New York | | | 122,150,000 | | | | BRL | | | | 07/01/21 | | | | 29,677,306 | | | | 23,090,967 | | | | 6,586,339 | |
Goldman Sachs International | | | 70,300,000 | | | | BRL | | | | 07/01/20 | | | | 18,254,999 | | | | 13,519,491 | | | | 4,735,508 | |
Citibank N.A., New York | | | 311,000,000 | | | | MXN | | | | 04/23/20 | | | | 15,896,065 | | | | 13,072,649 | | | | 2,823,416 | |
Citibank N.A., New York | | | 6,320,158,500 | | | | JPY | | | | 07/01/21 | | | | 62,232,010 | | | | 59,659,161 | | | | 2,572,849 | |
Barclays Bank plc | | | 6,018,007,500 | | | | JPY | | | | 07/01/21 | | | | 59,168,297 | | | | 56,807,006 | | | | 2,361,291 | |
Morgan Stanley Capital Services LLC | | | 40,200,000 | | | | BRL | | | | 04/01/20 | | | | 9,864,546 | | | | 7,744,620 | | | | 2,119,926 | |
Goldman Sachs International | | | 48,568,000 | | | | EUR | | | | 04/30/20 | | | | 55,697,783 | | | | 53,601,067 | | | | 2,096,716 | |
Barclays Bank plc | | | 92,228,427 | | | | ILS | | | | 08/01/22 | | | | 27,935,310 | | | | 26,508,014 | | | | 1,427,296 | |
Goldman Sachs International | | | 32,149,325 | | | | EUR | | | | 07/30/21 | | | | 37,345,459 | | | | 35,983,047 | | | | 1,362,412 | |
Citibank N.A., New York | | | 148,000,000 | | | | MXN | | | | 04/08/20 | | | | 7,534,107 | | | | 6,234,168 | | | | 1,299,939 | |
Barclays Bank plc | | | 132,210,000 | | | | MXN | | | | 04/08/20 | | | | 6,828,817 | | | | 5,569,049 | | | | 1,259,768 | |
Citibank N.A., New York | | | 193,819,000 | | | | ILS | | | | 04/30/21 | | | | 56,980,495 | | | | 55,747,644 | | | | 1,232,851 | |
Citibank N.A., New York | | | 118,490,000 | | | | MXN | | | | 04/02/20 | | | | 6,027,418 | | | | 4,995,320 | | | | 1,032,098 | |
JPMorgan Chase Bank, N.A. | | | 29,016,000 | | | | EUR | | | | 07/30/21 | | | | 33,489,397 | | | | 32,476,082 | | | | 1,013,315 | |
42 | THE GUGGENHEIM FUNDS SEMI-ANNUAL REPORT | SEE NOTES TO CONSOLIDATED FINANCIAL STATEMENTS. |
CONSOLIDATED SCHEDULE OF INVESTMENTS (Unaudited)(continued) | March 31, 2020 |
MACRO OPPORTUNITIES FUND | |
Forward Foreign Currency Exchange Contracts†† (continued) |
Counterparty | | Contracts
to Sell | | | Currency | | | Settlement
Date | | | Settlement
Value | | | Value at
March 31,
2020 | | | Unrealized
Appreciation | |
JPMorgan Chase Bank, N.A. | | | 5,621,809,500 | | | | JPY | | | | 09/01/20 | | | $ | 53,437,730 | | | $ | 52,610,496 | | | $ | 827,234 | |
Citibank N.A., New York | | | 5,229,613,500 | | | | JPY | | | | 06/01/20 | | | | 49,474,130 | | | | 48,776,655 | | | | 697,475 | |
Bank of America, N.A. | | | 79,971,800 | | | | ILS | | | | 04/30/21 | | | | 23,698,471 | | | | 23,002,076 | | | | 696,395 | |
Goldman Sachs International | | | 57,434,200 | | | | ILS | | | | 01/31/22 | | | | 17,016,599 | | | | 16,488,526 | | | | 528,073 | |
Deutsche Bank AG | | | 28,528,010,536 | | | | KRW | | | | 08/04/21 | | | | 24,328,851 | | | | 23,808,365 | | | | 520,486 | |
Bank of America, N.A. | | | 9,065,200 | | | | EUR | | | | 06/15/20 | | | | 10,424,754 | | | | 10,022,726 | | | | 402,028 | |
Goldman Sachs International | | | 8,850,000 | | | | BRL | | | | 07/01/21 | | | | 2,073,328 | | | | 1,672,985 | | | | 400,343 | |
Goldman Sachs International | | | 7,943,840 | | | | EUR | | | | 06/15/20 | | | | 9,140,023 | | | | 8,782,920 | | | | 357,103 | |
Goldman Sachs International | | | 72,830,756 | | | | ILS | | | | 02/01/21 | | | | 21,256,020 | | | | 20,908,259 | | | | 347,761 | |
Bank of America, N.A. | | | 2,288,143,500 | | | | JPY | | | | 06/22/20 | | | | 21,641,384 | | | | 21,360,106 | | | | 281,278 | |
Bank of America, N.A. | | | 1,973,886,450 | | | | JPY | | | | 04/15/20 | | | | 18,618,233 | | | | 18,373,026 | | | | 245,207 | |
Goldman Sachs International | | | 38,713,300 | | | | ILS | | | | 04/30/21 | | | | 11,336,276 | | | | 11,135,003 | | | | 201,273 | |
Barclays Bank plc | | | 9,239,000 | | | | GBP | | | | 04/17/20 | | | | 11,651,729 | | | | 11,491,445 | | | | 160,284 | |
Morgan Stanley Capital Services LLC | | | 21,042,000 | | | | EUR | | | | 06/30/20 | | | | 23,429,636 | | | | 23,277,443 | | | | 152,193 | |
JPMorgan Chase Bank, N.A. | | | 833,416,500 | | | | JPY | | | | 06/01/20 | | | | 7,876,911 | | | | 7,773,284 | | | | 103,627 | |
Bank of America, N.A. | | | 7,363,900 | | | | ILS | | | | 01/31/22 | | | | 2,183,190 | | | | 2,114,069 | | | | 69,121 | |
Barclays Bank plc | | | 2,536,000 | | | | EUR | | | | 04/17/20 | | | | 2,843,386 | | | | 2,797,230 | | | | 46,156 | |
Goldman Sachs International | | | 3,968,000 | | | | CAD | | | | 04/17/20 | | | | 2,866,120 | | | | 2,821,292 | | | | 44,828 | |
Citibank N.A., New York | | | 1,924,258 | | | | ILS | | | | 04/30/20 | | | | 556,891 | | | | 543,942 | | | | 12,949 | |
Goldman Sachs International | | | 92,466,974 | | | | JPY | | | | 06/22/20 | | | | 875,100 | | | | 863,191 | | | | 11,909 | |
Barclays Bank plc | | | 684,673 | | | | ILS | | | | 08/02/21 | | | | 204,026 | | | | 196,804 | | | | 7,222 | |
Bank of America, N.A. | | | 793,970 | | | | ILS | | | | 04/30/20 | | | | 231,602 | | | | 224,436 | | | | 7,166 | |
Goldman Sachs International | | | 239,325 | | | | EUR | | | | 07/30/20 | | | | 272,041 | | | | 264,992 | | | | 7,049 | |
Barclays Bank plc | | | 688,427 | | | | ILS | | | | 07/31/20 | | | | 201,303 | | | | 195,817 | | | | 5,486 | |
JPMorgan Chase Bank, N.A. | | | 216,000 | | | | EUR | | | | 07/30/20 | | | | 244,084 | | | | 239,165 | | | | 4,919 | |
Goldman Sachs International | | | 384,350 | | | | ILS | | | | 04/30/20 | | | | 110,656 | | | | 108,646 | | | | 2,010 | |
Bank of America, N.A. | | | 383,900 | | | | ILS | | | | 02/01/21 | | | | 112,169 | | | | 110,210 | | | | 1,959 | |
Deutsche Bank AG | | | 74,504,872 | | | | KRW | | | | 05/11/20 | | | | 62,572 | | | | 61,242 | | | | 1,330 | |
Deutsche Bank AG | | | 76,160,536 | | | | KRW | | | | 08/05/20 | | | | 64,184 | | | | 62,857 | | | | 1,327 | |
Deutsche Bank AG | | | 76,160,536 | | | | KRW | | | | 11/04/20 | | | | 64,379 | | | | 63,078 | | | | 1,301 | |
Deutsche Bank AG | | | 76,160,536 | | | | KRW | | | | 02/04/21 | | | | 64,571 | | | | 63,273 | | | | 1,298 | |
SEE NOTES TO CONSOLIDATED FINANCIAL STATEMENTS. | THE GUGGENHEIM FUNDS SEMI-ANNUAL REPORT | 43 |
CONSOLIDATED SCHEDULE OF INVESTMENTS (Unaudited)(continued) | March 31, 2020 |
MACRO OPPORTUNITIES FUND | |
Forward Foreign Currency Exchange Contracts†† (continued) |
Counterparty | | Contracts
to Sell | | | Currency | | | Settlement
Date | | | Settlement
Value | | | Value at
March 31,
2020 | | | Unrealized
Appreciation
(Depreciation) | |
Deutsche Bank AG | | | 73,677,040 | | | | KRW | | | | 05/07/21 | | | $ | 62,624 | | | $ | 61,368 | | | $ | 1,256 | |
Citibank N.A., New York | | | 3,158,500 | | | | JPY | | | | 01/04/21 | | | | 30,823 | | | | 29,667 | | | | 1,156 | |
Barclays Bank plc | | | 3,007,500 | | | | JPY | | | | 01/04/21 | | | | 29,300 | | | | 28,249 | | | | 1,051 | |
Citibank N.A., New York | | | 3,158,500 | | | | JPY | | | | 07/01/20 | | | | 30,507 | | | | 29,496 | | | | 1,011 | |
Barclays Bank plc | | | 3,007,500 | | | | JPY | | | | 07/01/20 | | | | 29,011 | | | | 28,086 | | | | 925 | |
JPMorgan Chase Bank, N.A. | | | 210,000 | | | | GBP | | | | 04/17/20 | | | | 260,332 | | | | 261,197 | | | | (865 | ) |
Citibank N.A., New York | | | 4,252,000 | | | | ILS | | | | 06/16/20 | | | | 1,173,907 | | | | 1,205,610 | | | | (31,703 | ) |
BNP Paribas | | | 2,940,400 | | | | ILS | | | | 06/16/20 | | | | 801,968 | | | | 833,719 | | | | (31,751 | ) |
Goldman Sachs International | | | 3,763,500 | | | | ILS | | | | 06/16/20 | | | | 1,017,713 | | | | 1,067,101 | | | | (49,388 | ) |
Citibank N.A., New York | | | 640,000,000 | | | | JPY | | | | 04/13/20 | | | | 5,848,462 | | | | 5,956,459 | | | | (107,997 | ) |
| | | | | | | | | | | | | | | | | | | | | | | $ | 269,141,466 | |
Counterparty | | Contracts
to Buy | | | Currency | | | Settlement
Date | | | Settlement
Value | | | Value at
March 31,
2020 | | | Unrealized
Appreciation | |
Goldman Sachs International | | | 312,504,100 | | | | ILS | | | | 04/30/21 | | | $ | 87,609,812 | | | $ | 89,884,724 | | | $ | 2,274,912 | |
Goldman Sachs International | | | 92,228,427 | | | | ILS | | | | 08/01/22 | | | | 24,775,937 | | | | 26,508,014 | | | | 1,732,077 | |
Goldman Sachs International | | | 64,798,100 | | | | ILS | | | | 01/31/22 | | | | 17,651,727 | | | | 18,602,596 | | | | 950,869 | |
Goldman Sachs International | | | 73,215,708 | | | | ILS | | | | 02/01/21 | | | | 20,494,850 | | | | 21,018,770 | | | | 523,920 | |
Bank of America, N.A. | | | 2,288,143,500 | | | | JPY | | | | 06/22/20 | | | | 20,913,477 | | | | 21,360,106 | | | | 446,629 | |
JPMorgan Chase Bank, N.A. | | | 1,532,000 | | | | GBP | | | | 04/17/20 | | | | 1,809,664 | | | | 1,905,497 | | | | 95,833 | |
Citibank N.A., New York | | | 4,434,000 | | | | ILS | | | | 06/16/20 | | | | 1,189,440 | | | | 1,257,214 | | | | 67,774 | |
Goldman Sachs International | | | 3,939,000 | | | | ILS | | | | 06/16/20 | | | | 1,050,400 | | | | 1,116,862 | | | | 66,462 | |
BNP Paribas | | | 7,873,500 | | | | ILS | | | | 06/16/20 | | | | 2,169,787 | | | | 2,232,448 | | | | 62,661 | |
Goldman Sachs International | | | 3,102,578 | | | | ILS | | | | 04/30/20 | | | | 856,062 | | | | 877,026 | | | | 20,964 | |
Morgan Stanley Capital Services LLC | | | 510,000 | | | | GBP | | | | 04/17/20 | | | | 618,931 | | | | 634,337 | | | | 15,406 | |
Goldman Sachs International | | | 92,466,974 | | | | JPY | | | | 06/22/20 | | | | 848,899 | | | | 863,191 | | | | 14,292 | |
Goldman Sachs International | | | 688,427 | | | | ILS | | | | 07/31/20 | | | | 182,123 | | | | 195,817 | | | | 13,694 | |
Goldman Sachs International | | | 684,673 | | | | ILS | | | | 08/02/21 | | | | 183,706 | | | | 196,804 | | | | 13,098 | |
JPMorgan Chase Bank, N.A. | | | 260,000 | | | | EUR | | | | 04/17/20 | | | | 282,283 | | | | 286,782 | | | | 4,499 | |
44 | THE GUGGENHEIM FUNDS SEMI-ANNUAL REPORT | SEE NOTES TO CONSOLIDATED FINANCIAL STATEMENTS. |
CONSOLIDATED SCHEDULE OF INVESTMENTS (Unaudited)(continued) | March 31, 2020 |
MACRO OPPORTUNITIES FUND | |
Counterparty | | Contracts
to Buy | | | Currency | | | Settlement
Date | | | Settlement
Value | | | Value at
March 31,
2020 | | | Unrealized
Appreciation
(Depreciation) | |
JPMorgan Chase Bank, N.A. | | | 147,000 | | | | CAD | | | | 04/17/20 | | | $ | 100,633 | | | $ | 104,519 | | | $ | 3,886 | |
JPMorgan Chase Bank, N.A. | | | 6,166,000 | | | | JPY | | | | 07/01/20 | | | | 59,499 | | | | 57,582 | | | | (1,917 | ) |
JPMorgan Chase Bank, N.A. | | | 6,166,000 | | | | JPY | | | | 01/04/21 | | | | 59,867 | | | | 57,915 | | | | (1,952 | ) |
Goldman Sachs International | | | 455,325 | | | | EUR | | | | 07/30/20 | | | | 516,543 | | | | 504,157 | | | | (12,386 | ) |
JPMorgan Chase Bank, N.A. | | | 17,009,040 | | | | EUR | | | | 06/15/20 | | | | 19,146,464 | | | | 18,805,646 | | | | (340,818 | ) |
Citibank N.A., New York | | | 186,900,000 | | | | BRL | | | | 07/01/20 | | | | 36,457,622 | | | | 35,942,999 | | | | (514,623 | ) |
Morgan Stanley Capital Services LLC | | | 40,200,000 | | | | BRL | | | | 04/01/20 | | | | 8,586,780 | | | | 7,744,620 | | | | (842,160 | ) |
Citibank N.A., New York | | | 309,600,000 | | | | BRL | | | | 07/01/21 | | | | 59,488,074 | | | | 58,526,102 | | | | (961,972 | ) |
Goldman Sachs International | | | 48,568,000 | | | | EUR | | | | 04/30/20 | | | | 54,585,236 | | | | 53,601,067 | | | | (984,169 | ) |
Goldman Sachs International | | | 118,490,000 | | | | MXN | | | | 04/02/20 | | | | 6,169,303 | | | | 4,995,320 | | | | (1,173,983 | ) |
Morgan Stanley Capital Services LLC | | | 186,900,000 | | | | BRL | | | | 07/01/20 | | | | 37,284,552 | | | | 35,942,999 | | | | (1,341,553 | ) |
Citibank N.A., New York | | | 6,063,030,000 | | | | JPY | | | | 06/01/20 | | | | 58,207,975 | | | | 56,549,939 | | | | (1,658,036 | ) |
Goldman Sachs International | | | 61,165,325 | | | | EUR | | | | 07/30/21 | | | | 70,187,210 | | | | 68,459,129 | | | | (1,728,081 | ) |
JPMorgan Chase Bank, N.A. | | | 5,621,809,500 | | | | JPY | | | | 09/01/20 | | | | 54,456,957 | | | | 52,610,496 | | | | (1,846,461 | ) |
Goldman Sachs International | | | 280,210,000 | | | | MXN | | | | 04/08/20 | | | | 14,575,823 | | | | 11,803,217 | | | | (2,772,606 | ) |
Goldman Sachs International | | | 311,000,000 | | | | MXN | | | | 04/23/20 | | | | 16,129,451 | | | | 13,072,649 | | | | (3,056,802 | ) |
JPMorgan Chase Bank, N.A. | | | 12,338,166,000 | | | | JPY | | | | 07/01/21 | | | | 120,472,255 | | | | 116,466,167 | | | | (4,006,088 | ) |
Citibank N.A., New York | | | 1,901,663,000 | | | | MXN | | | | 11/25/20 | | | | 92,721,532 | | | | 77,559,736 | | | | (15,161,796 | ) |
Citibank N.A., New York | | | 1,871,006,000 | | | | MXN | | | | 08/25/20 | | | | 96,443,608 | | | | 77,273,382 | | | | (19,170,226 | ) |
Goldman Sachs International | | | 3,742,941,000 | | | | MXN | | | | 08/25/20 | | | | 192,632,992 | | | | 154,585,132 | | | | (38,047,860 | ) |
JPMorgan Chase Bank, N.A. | | | 4,752,764,000 | | | | MXN | | | | 11/25/20 | | | | 232,079,966 | | | | 193,842,506 | | | | (38,237,460 | ) |
Goldman Sachs International | | | 4,754,622,000 | | | | MXN | | | | 11/25/20 | | | | 232,336,237 | | | | 193,918,285 | | | | (38,417,952 | ) |
JPMorgan Chase Bank, N.A. | | | 5,611,160,000 | | | | MXN | | | | 08/25/20 | | | | 287,218,253 | | | | 231,743,410 | | | | (55,474,843 | ) |
| | | | | | | | | | | | | | | | | | | | | | | $ | (219,446,768 | ) |
SEE NOTES TO CONSOLIDATED FINANCIAL STATEMENTS. | THE GUGGENHEIM FUNDS SEMI-ANNUAL REPORT | 45 |
CONSOLIDATED SCHEDULE OF INVESTMENTS (Unaudited)(continued) | March 31, 2020 |
MACRO OPPORTUNITIES FUND | |
~ | The face amount is denominated in U.S. dollars unless otherwise indicated. |
* | Non-income producing security. |
** | Includes cumulative appreciation (depreciation). Variation margin is reported within the Statement of Assets and Liabilities. |
† | Value determined based on Level 1 inputs, unless otherwise noted — See Note 4. |
†† | Value determined based on Level 2 inputs, unless otherwise noted — See Note 4. |
††† | Value determined based on Level 3 inputs — See Note 4. |
1 | Security was fair valued by the Valuation Committee at March 31, 2020. The total market value of fair valued securities amounts to $248,470,240, (cost $251,622,388) or 5.9% of total net assets. |
2 | Affiliated issuer. |
3 | Payment-in-kind security. |
4 | Rate indicated is the effective yield at the time of purchase. |
5 | Rate indicated is the 7-day yield as of March 31, 2020. |
6 | Security is a 144A or Section 4(a)(2) security. These securities have been determined to be liquid under guidelines established by the Board of Trustees. The total market value of 144A or Section 4(a)(2) securities is $1,457,091,507 (cost $1,654,045,506), or 34.7% of total net assets. |
7 | Variable rate security. Rate indicated is the rate effective at March 31, 2020. In some instances, the effective rate is limited by a minimum rate floor or a maximum rate cap established by the issuer. The settlement status of a position may also impact the effective rate indicated. In some cases, a position may be unsettled at period end and may not have a stated effective rate. In instances where multiple underlying reference rates and spread amounts are shown, the effective rate is based on a weighted average. |
8 | Security has no stated coupon. However, it is expected to receive residual cash flow payments on defined deal dates. |
9 | Security is a 144A or Section 4(a)(2) security. These securities have been determined to be illiquid and restricted under guidelines established by the Board of Trustees. The total market value of 144A or Section 4(a)(2) illiquid and restricted securities is $29,888,338 (cost $38,585,125), or 0.7% of total net assets — See Note 10. |
10 | Security is a step up/down bond. The coupon increases or decreases at regular intervals until the bond reaches full maturity. Rate indicated is the rate at March 31, 2020. See table below for additional step information for each security. |
11 | Security is an interest-only strip. |
12 | All or a portion of this security is pledged as reverse repurchase agreements collateral. At March 31, 2020, the total market value of the pledged securities was $76,811,687. — See Note 6. |
13 | Security is in default of interest and/or principal obligations. |
14 | Repurchase Agreements — The interest rate on repurchase agreements is market driven and based on the underlying collateral obtained. See additional disclosure in the repurchase agreements table below for more information on repurchase agreements. |
15 | The rate is adjusted periodically by the counterparty, subject to approval by the Adviser, and is not based upon a set reference rate and spread. Rate indicated is the rate effective at March 31, 2020. |
16 | The rate is adjusted periodically by the counterparty, allows the holder to tender the security upon a rate reset, and is not based upon a set reference rate and spread. Rate indicated is the rate effective at March 31, 2020. |
| | BofA — Bank of America |
| | BRL — Brazilian Real |
| | CAD — Canadian Dollar |
| | CDX.NA.HY.33.V3 — Credit Default Swap North American High Yield Series 33 Index |
| | CME — Chicago Mercantile Exchange |
| | CMS — Constant Maturity Swap |
| | CMT — Constant Maturity Treasury |
| | EUR — Euro |
| | EURIBOR — European Interbank Offered Rate |
46 | THE GUGGENHEIM FUNDS SEMI-ANNUAL REPORT | SEE NOTES TO CONSOLIDATED FINANCIAL STATEMENTS. |
CONSOLIDATED SCHEDULE OF INVESTMENTS (Unaudited)(continued) | March 31, 2020 |
MACRO OPPORTUNITIES FUND | |
| | GBP — British Pound |
| | ICE — Intercontinental Exchange |
| | ILS — Israeli New Shekel |
| | JPY — Japanese Yen |
| | KRW — South Korean Won |
| | LIBOR — London Interbank Offered Rate |
| | MXN — Mexican Peso |
| | plc — Public Limited Company |
| | REMIC — Real Estate Mortgage Investment Conduit |
| | TELBOR — Tel Aviv Interbank Offered Rate |
| | VRDN — Variable Rate Demand Note |
| | WAC — Weighted Average Coupon |
| | |
| | See Sector Classification in Other Information section. |
SEE NOTES TO CONSOLIDATED FINANCIAL STATEMENTS. | THE GUGGENHEIM FUNDS SEMI-ANNUAL REPORT | 47 |
CONSOLIDATED SCHEDULE OF INVESTMENTS (Unaudited)(continued) | March 31, 2020 |
MACRO OPPORTUNITIES FUND | |
The following table summarizes the inputs used to value the Fund’s investments at March 31, 2020 (See Note 4 in the Notes to Financial Statements):
Investments in Securities (Assets) | | Level 1
Quoted
Prices | | | Level 2
Significant
Observable
Inputs | | | Level 3
Significant
Unobservable
Inputs | | | Total | |
Common Stocks | | $ | 439,127 | | | $ | 1,070,648 | | | $ | 9,688,718 | | | $ | 11,198,493 | |
Preferred Stocks | | | — | | | | 672,311 | | | | — | | | | 672,311 | |
Exchange-Traded Funds | | | 151,473,842 | | | | — | | | | — | | | | 151,473,842 | |
Mutual Funds | | | 353,750,834 | | | | — | | | | — | | | | 353,750,834 | |
Closed-End Funds | | | 45,095,164 | | | | — | | | | — | | | | 45,095,164 | |
Money Market Funds | | | 783,008,439 | | | | — | | | | — | | | | 783,008,439 | |
Asset-Backed Securities | | | — | | | | 879,112,702 | | | | 252,016,004 | | | | 1,131,128,706 | |
Collateralized Mortgage Obligations | | | — | | | | 761,427,791 | | | | 18,588,725 | | | | 780,016,516 | |
Corporate Bonds | | | — | | | | 450,190,899 | | | | 38,791,601 | | | | 488,982,500 | |
Senior Floating Rate Interests | | | — | | | | 97,541,256 | | | | 94,028,191 | | | | 191,569,447 | |
Municipal Bonds | | | — | | | | 35,890,000 | | | | — | | | | 35,890,000 | |
Foreign Government Debt | | | — | | | | 24,304,397 | | | | — | | | | 24,304,397 | |
Senior Fixed Rate Interests | | | — | | | | — | | | | 4,042,000 | | | | 4,042,000 | |
Repurchase Agreements | | | — | | | | 154,821,320 | | | | — | | | | 154,821,320 | |
Commercial Paper | | | — | | | | 82,376,328 | | | | — | | | | 82,376,328 | |
Options Purchased | | | — | | | | 11,625,000 | | | | — | | | | 11,625,000 | |
Credit Default Swap Agreements** | | | — | | | | 696,221 | | | | — | | | | 696,221 | |
Total Return Swap Agreements** | | | — | | | | 1,098,077 | | | | — | | | | 1,098,077 | |
Forward Foreign Currency Exchange Contracts** | | | — | | | | 275,670,146 | | | | — | | | | 275,670,146 | |
Total Assets | | $ | 1,333,767,406 | | | $ | 2,776,497,096 | | | $ | 417,155,239 | | | $ | 4,527,419,741 | |
Investments in Securities (Liabilities) | | Level 1
Quoted
Prices | | | Level 2
Significant
Observable
Inputs | | | Level 3
Significant
Unobservable
Inputs | | | Total | |
Corporate Bonds | | $ | — | | | $ | 14,475,290 | | | $ | — | | | $ | 14,475,290 | |
Commodity Futures Contracts** | | | 294,252 | | | | — | | | | — | | | | 294,252 | |
Interest Rate Swap Agreements** | | | — | | | | 38,987,043 | | | | — | | | | 38,987,043 | |
Total Return Swap Agreements** | | | — | | | | 194,592 | | | | — | | | | 194,592 | |
Forward Foreign Currency Exchange Contracts** | | | — | | | | 225,975,448 | | | | — | | | | 225,975,448 | |
Unfunded Loan Commitments (Note 9) | | | — | | | | — | | | | 489,269 | | | | 489,269 | |
Total Liabilities | | $ | 294,252 | | | $ | 279,632,373 | | | $ | 489,269 | | | $ | 280,415,894 | |
** | This derivative is reported as unrealized appreciation/depreciation at period end. |
48 | THE GUGGENHEIM FUNDS SEMI-ANNUAL REPORT | SEE NOTES TO CONSOLIDATED FINANCIAL STATEMENTS. |
CONSOLIDATED SCHEDULE OF INVESTMENTS (Unaudited)(continued) | March 31, 2020 |
MACRO OPPORTUNITIES FUND | |
The Fund may hold assets and/or liabilities in which the fair value approximates the carrying amount for financial statement purposes. As of the period end, reverse repurchase agreements of $67,372,347 are categorized as Level 2 within the disclosure hierarchy — See Note 6.
The following is a summary of significant unobservable inputs used in the fair valuation of assets and liabilities categorized within Level 3 of the fair value hierarchy:
Category | | Ending
Balance at
March 31, 2020 | | Valuation
Technique | Unobservable
Inputs | | Input
Range | | | Weighted
Average* | |
Assets: | | | | | | | | | | | | | | |
Asset-Backed Securities | | $ | 125,633,333 | | Model Price | Purchase Price | | | — | | | | — | |
Asset-Backed Securities | | | 66,669,608 | | Option Adjusted Spread off prior month broker quote | Broker Quote | | | — | | | | — | |
Asset-Backed Securities | | | 59,713,063 | | Yield Analysis | Yield | | | 6.6%-7.0% | | | | 6.9% | |
Collateralized Mortgage Obligations | | | 10,711,303 | | Option Adjusted Spread off prior month broker quote | Broker Quote | | | — | | | | — | |
Collateralized Mortgage Obligations | | | 7,877,422 | | Model Price | Purchase Price | | | — | | | | — | |
Common Stocks | | | 7,235,214 | | Third Party Pricing | Broker Quote | | | — | | | | — | |
Common Stocks | | | 2,453,504 | | Enterprise Value | Valuation Multiple | | | 1.3x-15.8x | | | | 5.0x | |
Corporate Bonds | | | 37,606,377 | | Option Adjusted Spread off prior month broker quote | Broker Quote | | | — | | | | — | |
Corporate Bonds | | | 1,185,224 | | Yield Analysis | Yield | | | 8.7% | | | | — | |
Senior Fixed Rate Interests | | | 4,042,000 | | Enterprise Value | Valuation Multiple | | | 7.3x | | | | — | |
Senior Floating Rate Interests | | | 45,423,281 | | Third Party Pricing | Broker Quote | | | — | | | | — | |
Senior Floating Rate Interests | | | 38,851,627 | | Yield Analysis | Yield | | | 6.7%-10.6% | | | | 8.5% | |
Senior Floating Rate Interests | | | 3,035,709 | | Enterprise Value | Valuation Multiple | | | 8.6x-9.1x | | | | 8.7x | |
Senior Floating Rate Interests | | | 2,958,679 | | Model Price | Liquidation Value | | | — | | | | — | |
Senior Floating Rate Interests | | | 1,479,528 | | Model Price | Market Comparable Yields | | | 7.8% | | | | — | |
Senior Floating Rate Interests | | | 1,240,151 | | Model Price | Purchase Price | | | — | | | | — | |
Senior Floating Rate Interests | | | 1,039,216 | | Option Adjusted Spread off prior month broker quote | Broker Quote | | | — | | | | — | |
Total Assets | | $ | 417,155,239 | | | | | | | | | | | |
Liabilities: | | | | | | | | | | | | | | |
Unfunded Loan Commitments | | $ | 489,269 | | Model Price | Purchase Price | | | — | | | | — | |
* | Inputs are weighted by the fair value of the instruments. |
SEE NOTES TO CONSOLIDATED FINANCIAL STATEMENTS. | THE GUGGENHEIM FUNDS SEMI-ANNUAL REPORT | 49 |
CONSOLIDATED SCHEDULE OF INVESTMENTS (Unaudited)(continued) | March 31, 2020 |
MACRO OPPORTUNITIES FUND | |
Significant changes in a quote, yield, market comparable yields, liquidation value or valuation multiples would generally result in significant changes in the fair value of the security.
The Fund’s fair valuation leveling guidelines were revised to classify a single daily broker quote, or a vendor price based on a single daily or monthly broker quote, as Level 3 rather than Level 2, if such a quote or price cannot be supported with other available market information.
Transfers between Level 2 and Level 3 may occur as markets fluctuate and/or the availability of data used in an investment’s valuation changes. For the period ended March 31, 2020, the Fund had securities with a total value of $62,896,218 transfer into Level 3 from Level 2 due to lack of observable inputs and had securities with a total value of $13,651,992 transfer into Level 2 from Level 3 due to the availability of current and reliable market-based data provided by a third-party pricing service which utilizes significant observable inputs. There were no other securities that transferred between levels.
Summary of Fair Value Level 3 Activity
Following is a reconciliation of Level 3 assets for which significant unobservable inputs were used to determine fair value for the period ended March 31, 2020:
| | | Assets | |
| | Asset-
Backed
Securities | | | Collateralized
Mortgage
Obligations | | | Corporate
Bonds | | | Senior
Floating Rate
Interests | | | Common
Stocks | |
Beginning Balance | | $ | 126,277,348 | | | $ | 10,909,455 | | | $ | 44,402,417 | | | $ | 104,821,440 | | | $ | 15,982,467 | |
Purchases/(Receipts) | | | 103,624,103 | | | | — | | | | — | | | | 4,158,717 | | | | — | |
(Sales, maturities and paydowns)/Fundings | | | (3,762,004 | ) | | | — | | | | (3,960,000 | ) | | | (18,693,588 | ) | | | (551,412 | ) |
Amortization of premiums/discounts | | | 4,716 | | | | (9,808 | ) | | | (2,035 | ) | | | 442,971 | | | | — | |
Total realized gains (losses) included in earnings | | | 77,005 | | | | — | | | | — | | | | (37,420 | ) | | | 21,606 | |
Total change in unrealized appreciation (depreciation) included in earnings | | | (438,497 | ) | | | (188,344 | ) | | | (2,834,005 | ) | | | (10,894,034 | ) | | | (5,482,085 | ) |
Transfers into Level 3 | | | 26,233,333 | | | | 7,877,422 | | | | 1,185,224 | | | | 27,600,239 | | | | — | |
Transfers out of Level 3 | | | — | | | | — | | | | — | | | | (13,370,134 | ) | | | (281,858 | ) |
Ending Balance | | $ | 252,016,004 | | | $ | 18,588,725 | | | $ | 38,791,601 | | | $ | 94,028,191 | | | $ | 9,688,718 | |
Net change in unrealized appreciation (depreciation) for investments in Level 3 securities still held at March 31, 2020 | | $ | (382,040 | ) | | $ | (188,344 | ) | | $ | (2,834,005 | ) | | $ | (8,862,030 | ) | | $ | (5,459,024 | ) |
50 | THE GUGGENHEIM FUNDS SEMI-ANNUAL REPORT | SEE NOTES TO CONSOLIDATED FINANCIAL STATEMENTS. |
CONSOLIDATED SCHEDULE OF INVESTMENTS (Unaudited)(continued) | March 31, 2020 |
MACRO OPPORTUNITIES FUND | |
| | | Assets | | | | | | | Liabilities | |
| | Senior
Fixed Rate
Interests | | | Total
Assets | | | Unfunded
Loan
Commitments | |
Beginning Balance | | $ | 4,504,269 | | | $ | 306,897,396 | | | $ | (1,140,482 | ) |
Purchases/(Receipts) | | | — | | | | 107,782,820 | | | | (277,832 | ) |
(Sales, maturities and paydowns)/Fundings | | | — | | | | (26,967,004 | ) | | | 810,511 | |
Amortization of premiums/discounts | | | 14,659 | | | | 450,503 | | | | (853 | ) |
Total realized gains (losses) included in earnings | | | — | | | | 61,191 | | | | (465,793 | ) |
Total change in unrealized appreciation (depreciation) included in earnings | | | (476,928 | ) | | | (20,313,893 | ) | | | 585,180 | |
Transfers into Level 3 | | | — | | | | 62,896,218 | | | | — | |
Transfers out of Level 3 | | | — | | | | (13,651,992 | ) | | | — | |
Ending Balance | | $ | 4,042,000 | | | $ | 417,155,239 | | | $ | (489,269 | ) |
Net change in unrealized appreciation (depreciation) for investments in Level 3 securities still held at March 31, 2020 | | $ | (476,928 | ) | | $ | (18,202,371 | ) | | $ | 39,330 | |
Step Coupon Bonds
The following table discloses additional information related to step coupon bonds held by the Fund. Certain securities are subject to multiple rate changes prior to maturity. For those securities a range of rates and corresponding dates have been provided. Rates for all step coupon bonds held by the Fund are scheduled to increase, none are scheduled to decrease.
Name | | Coupon Rate at
Next Reset Date | | | Next Rate
Reset Date | | | Final Reset
Rate | | | Final Reset
Date | |
Legacy Mortgage Asset Trust 2018-GS3, 4.00% due 06/25/58 | | | 7.00 | % | | | 07/26/21 | | | | 8.00 | % | | | 07/26/22 | |
Repurchase Agreements
The Fund may engage in repurchase agreements. Repurchase agreements are fixed income securities in the form of agreements backed by collateral. These agreements typically involve the acquisition by the Fund of securities from the selling institution coupled with the agreement that the selling institution will repurchase the underlying securities at a specified price and at a fixed time in the future. The Fund may accept a wide variety of underlying securities as collateral for the repurchase agreements entered into by the Fund. Any such securities serving as collateral are marked-to-market daily in order to maintain full collateralization. Securities purchased under repurchase agreements are reflected as an asset on the Consolidated Statement of Assets and Liabilities. Interest earned is recorded as a component of interest income on the Consolidated Statement of Operations.
In connection with transactions in repurchase agreements, it is the Fund’s policy that its custodian take possession of the underlying collateral. The collateral is in the possession of the Fund’s custodian and is evaluated to ensure that its market value exceeds, at a minimum, 102% of the original face amount of the repurchase agreements, subject to minimum amounts to initiate a margin call, with the exception of where securities are being sold short. The interest rate on repurchase agreements is market driven and based on the underlying collateral obtained.
The use of repurchase agreements involves certain risks. For example, if the selling institution defaults on its obligation to repurchase the underlying securities at a time when the value of securities has declined, the Fund may incur a loss upon disposition of them. In the event of an insolvency or bankruptcy by the selling institution, the Fund’s right to control the collateral could be affected and result in certain costs and delays. In addition, the Fund could incur a loss if the value of the underlying collateral falls below the agreed upon repurchase price.
SEE NOTES TO CONSOLIDATED FINANCIAL STATEMENTS. | THE GUGGENHEIM FUNDS SEMI-ANNUAL REPORT | 51 |
CONSOLIDATED SCHEDULE OF INVESTMENTS (Unaudited)(continued) | March 31, 2020 |
MACRO OPPORTUNITIES FUND | |
At March 31, 2020, the repurchase agreements in the account were as follows:
Counterparty and
Terms of Agreement | | Face
Value | | | Repurchase
Price | | | | | | Collateral | | Par
Value | | | Fair
Value | |
Societe Generale | | | | | | | | | | | | | Connecticut Avenue Securities Trust | | | | | | | | |
1.30% - 2.27% | | | | | | | | | | | | | 3.05% | | | | | | | | |
04/01/20 | | $ | 87,752,818 | | | $ | 88,376,970 | | | | | | 06/25/39 | | $ | 38,446,455 | | | $ | 31,268,502 | |
| | | | | | | | | | | | | | | | | | | | | | |
| | | | | | | | | | | | | | Connecticut Avenue Securities Trust | | | | | | | | |
| | | | | | | | | | | | | | 3.25% | | | | | | | | |
| | | | | | | | | | | | | | 08/25/31 | | | 14,522,050 | | | | 12,018,449 | |
| | | | | | | | | | | | | | Connecticut Avenue Securities Trust | | | | | | | | |
| | | | | | | | | | | | | | 2.95% | | | | | | | | |
| | | | | | | | | | | | | | 07/25/39 | | | 13,355,000 | | | | 11,282,304 | |
| | | | | | | | | | | | | | Fannie Mae Connecticut Avenue Securities | | | | | | | | |
| | | | | | | | | | | | | | 3.95% | | | | | | | | |
| | | | | | | | | | | | | | 10/25/29 | | | 9,137,864 | | | | 8,091,578 | |
| | | | | | | | | | | | | | BX Trust | | | | | | | | |
| | | | | | | | | | | | | | 4.95% | | | | | | | | |
| | | | | | | | | | | | | | 07/15/34 | | | 8,500,000 | | | | 6,647,000 | |
| | | | | | | | | | | | | | Hawaii Hotel Trust | | | | | | | | |
| | | | | | | | | | | | | | 3.85% | | | | | | | | |
| | | | | | | | | | | | | | 05/15/38 | | | 6,000,000 | | | | 4,141,200 | |
| | | | | | | | | | | | | | Freddie Mac Structured Agency Credit Risk Debt Notes | | | | | | | | |
| | | | | | | | | | | | | | 5.60% | | | | | | | | |
| | | | | | | | | | | | | | 10/25/28 | | | 3,622,806 | | | | 3,441,666 | |
| | | | | | | | | | | | | | Fannie Mae Connecticut Avenue Securities | | | | | | | | |
| | | | | | | | | | | | | | 3.75% | | | | | | | | |
| | | | | | | | | | | | | | 02/25/30 | | | 3,671,000 | | | | 3,062,348 | |
| | | | | | | | | | | | | | JP Morgan Chase Commercial Mortgage Securities Trust | | | | | | | | |
| | | | | | | | | | | | | | 3.11% | | | | | | | | |
| | | | | | | | | | | | | | 06/15/35 | | | 3,000,000 | | | | 2,503,200 | |
| | | | | | | | | | | | | | Fannie Mae Connecticut Avenue Securities | | | | | | | | |
| | | | | | | | | | | | | | 3.30% | | | | | | | | |
| | | | | | | | | | | | | | 01/25/31 | | | 2,980,000 | | | | 2,502,604 | |
52 | THE GUGGENHEIM FUNDS SEMI-ANNUAL REPORT | SEE NOTES TO CONSOLIDATED FINANCIAL STATEMENTS. |
CONSOLIDATED SCHEDULE OF INVESTMENTS (Unaudited)(continued) | March 31, 2020 |
MACRO OPPORTUNITIES FUND | |
Counterparty and
Terms of Agreement | | Face
Value | | | Repurchase
Price | | | | | | Collateral | | Par
Value | | | Fair
Value | |
| | | | | | | | | | | | | | Fannie Mae Connecticut Avenue Securities | | | | | | | | |
| | | | | | | | | | | | | | 3.50% | | | | | | | | |
| | | | | | | | | | | | | | 12/25/30 | | $ | 2,670,000 | | | $ | 2,188,599 | |
| | | | | | | | | | | | | | Freddie Mac Structured Agency Credit Risk Debt Notes | | | | | | | | |
| | | | | | | | | | | | | | 5.20% | | | | | | | | |
| | | | | | | | | | | | | | 11/25/23 | | | 1,716,893 | | | | 1,649,591 | |
| | | | | | | | | | | | | | GS Mortgage Securities Corp. Trust | | | | | | | | |
| | | | | | | | | | | | | | 4.70% | | | | | | | | |
| | | | | | | | | | | | | | 07/15/32 | | | 1,600,000 | | | | 1,385,760 | |
| | | | | | | | | | | | | | Natixis Commercial Mortgage Securities Trust | | | | | | | | |
| | | | | | | | | | | | | | 3.99% | | | | | | | | |
| | | | | | | | | | | | | | 02/15/33 | | | 1,600,000 | | | | 1,354,880 | |
| | | | | | | | | | | | | | Carlyle Global Market Strategies CLO Ltd. | | | | | | | | |
| | | | | | | | | | | | | | 9.09% | | | | | | | | |
| | | | | | | | | | | | | | 04/22/32 | | | 1,500,000 | | | | 930,150 | |
| | | | | | | | | | | | | | HMH Trust | | | | | | | | |
| | | | | | | | | | | | | | 8.48% | | | | | | | | |
| | | | | | | | | | | | | | 07/05/31 | | | 1,019,000 | | | | 885,001 | |
| | | | | | | | | | | | | | | | | 113,341,068 | | | | 93,352,832 | |
| | | | | | | | | | | | | | | | | | | | | | |
BNP Paribas | | | | | | | | | | | | | First Franklin Mortgage Loan Trust | | | | | | | | |
1.93% | | | | | | | | | | | | | 1.45% | | | | | | | | |
05/04/20 | | $ | 50,250,246 | | | $ | 50,473,935 | | | | | | 12/25/35 | | $ | 23,433,000 | | | $ | 18,795,609 | |
| | | | | | | | | | | | | | Santander Drive Auto Receivables Trust | | | | | | | | |
| | | | | | | | | | | | | | 5.02% | | | | | | | | |
| | | | | | | | | | | | | | 09/15/25 | | | 14,450,000 | | | | 14,422,545 | |
| | | | | | | | | | | | | | HSI Asset Securitization Corp. Trust | | | | | | | | |
| | | | | | | | | | | | | | 1.14% | | | | | | | | |
| | | | | | | | | | | | | | 01/25/37 | | | 10,681,000 | | | | 7,721,295 | |
| | | | | | | | | | | | | | CPS Auto Trust | | | | | | | | |
| | | | | | | | | | | | | | 6.07% | | | | | | | | |
| | | | | | | | | | | | | | 09/15/25 | | | 6,300,000 | | | | 6,283,620 | |
| | | | | | | | | | | | | | Hertz Vehicle Financing II LP | | | | | | | | |
| | | | | | | | | | | | | | 6.03% | | | | | | | | |
| | | | | | | | | | | | | | 07/25/22 | | | 6,440,000 | | | | 6,245,512 | |
SEE NOTES TO CONSOLIDATED FINANCIAL STATEMENTS. | THE GUGGENHEIM FUNDS SEMI-ANNUAL REPORT | 53 |
CONSOLIDATED SCHEDULE OF INVESTMENTS (Unaudited)(continued) | March 31, 2020 |
MACRO OPPORTUNITIES FUND | |
Counterparty and
Terms of Agreement | | Face
Value | | | Repurchase
Price | | | | | | Collateral | | Par
Value | | | Fair
Value | |
| | | | | | | | | | | | | | Fannie Mae Connecticut Avenue Securities | | | | | | | | |
| | | | | | | | | | | | | | 3.50% | | | | | | | | |
| | | | | | | | | | | | | | 12/25/30 | | $ | 4,215,000 | | | $ | 3,455,036 | |
| | | | | | | | | | | | | | | | | 65,519,000 | | | | 56,923,617 | |
| | | | | | | | | | | | | | | | | | | | | | |
Citigroup Global Markets, Inc. | | | | | | | | | | | | | Seagate HDD Cayman | | | | | | | | |
(0.45)% - (0.15)% | | | | | | | | | | | | | 4.75% | | | | | | | | |
Open Maturity* | | $ | 7,805,000 | | | $ | 7,805,000 | | | | | | 01/01/251 | | $ | 4,000,000 | | | $ | 3,977,600 | |
| | | | | | | | | | | | | | Tenet Healthcare Corp. | | | | | | | | |
| | | | | | | | | | | | | | 8.13% | | | | | | | | |
| | | | | | | | | | | | | | 04/01/221 | | | 1,713,000 | | | | 1,631,633 | |
| | | | | | | | | | | | | | Park-Ohio Industries Inc. | | | | | | | | |
| | | | | | | | | | | | | | 6.63% | | | | | | | | |
| | | | | | | | | | | | | | 04/15/271 | | | 700,000 | | | | 553,280 | |
| | | | | | | | | | | | | | Cash Collateral | | | 517,000 | | | | 517,000 | |
| | | | | | | | | | | | | | Spirit AeroSystems Inc. | | | | | | | | |
| | | | | | | | | | | | | | 4.60% | | | | | | | | |
| | | | | | | | | | | | | | 06/15/281 | | | 562,000 | | | | 477,588 | |
| | | | | | | | | | | | | | Univision Communications Inc. | | | | | | | | |
| | | | | | | | | | | | | | 5.13% | | | | | | | | |
| | | | | | | | | | | | | | 05/15/23 | | | 310,000 | | | | 265,825 | |
| | | | | | | | | | | | | | Staples Inc. | | | | | | | | |
| | | | | | | | | | | | | | 10.75% | | | | | | | | |
| | | | | | | | | | | | | | 04/15/27 | | | 175,000 | | | | 134,277 | |
| | | | | | | | | | | | | | Acrisure LLC / Acrisure Finance Inc. | | | | | | | | |
| | | | | | | | | | | | | | 7.00% | | | | | | | | |
| | | | | | | | | | | | | | 11/15/251 | | | 150,000 | | | | 129,000 | |
| | | | | | | | | | | | | | Enova International Inc. | | | | | | | | |
| | | | | | | | | | | | | | 8.50% | | | | | | | | |
| | | | | | | | | | | | | | 09/15/251 | | | 55,000 | | | | 47,300 | |
| | | | | | | | | | | | | | | | | 8,182,000 | | | | 7,733,503 | |
| | | | | | | | | | | | | | | | | | | | | | |
Barclays Capital, Inc. | | | | | | | | | | | | | Seagate HDD Cayman | | | | | | | | |
(14.00)% - (0.25)% | | | | | | | | | | | | | 4.75% | | | | | | | | |
Open Maturity* | | $ | 6,459,589 | | | $ | 6,459,589 | | | | | | 01/01/251 | | $ | 4,000,000 | | | $ | 3,977,600 | |
| | | | | | | | | | | | | | Tenet Healthcare Corp. | | | | | | | | |
| | | | | | | | | | | | | | 8.13% | | | | | | | | |
| | | | | | | | | | | | | | 04/01/221 | | | 712,000 | | | | 678,180 | |
54 | THE GUGGENHEIM FUNDS SEMI-ANNUAL REPORT | SEE NOTES TO CONSOLIDATED FINANCIAL STATEMENTS. |
CONSOLIDATED SCHEDULE OF INVESTMENTS (Unaudited)(continued) | March 31, 2020 |
MACRO OPPORTUNITIES FUND | |
Counterparty and
Terms of Agreement | | Face
Value | | | Repurchase
Price | | | | | | Collateral | | Par
Value | | | Fair
Value | |
| | | | | | | | | | | | | | Park-Ohio Industries Inc. | | | | | | | | |
| | | | | | | | | | | | | | 6.63% | | | | | | | | |
| | | | | | | | | | | | | | 04/15/271 | | $ | 700,000 | | | $ | 553,280 | |
| | | | | | | | | | | | | | Quorum Health Corp. | | | | | | | | |
| | | | | | | | | | | | | | 11.63% | | | | | | | | |
| | | | | | | | | | | | | | 04/15/231 | | | 800,000 | | | | 520,000 | |
| | | | | | | | | | | | | | Cash Collateral | | | 496,000 | | | | 496,000 | |
| | | | | | | | | | | | | | Staples Inc. | | | | | | | | |
| | | | | | | | | | | | | | 10.75% | | | | | | | | |
| | | | | | | | | | | | | | 04/15/27 | | | 100,000 | | | | 76,730 | |
| | | | | | | | | | | | | | Enova International Inc. | | | | | | | | |
| | | | | | | | | | | | | | 8.50% | | | | | | | | |
| | | | | | | | | | | | | | 09/15/251 | | | 55,000 | | | | 47,300 | |
| | | | | | | | | | | | | | | | | 6,863,000 | | | | 6,349,090 | |
| | | | | | | | | | | | | | | | | | | | | | |
BofA Securities, Inc. | | | | | | | | | | | | | Spirit AeroSystems Inc. | | | | | | | | |
(0.15)% - (0.10)% | | | | | | | | | | | | | 4.60% | | | | | | | | |
Open Maturity* | | $ | 2,382,104 | | | $ | 2,382,104 | | | | | | 06/15/281 | | $ | 1,732,000 | | | $ | 1,471,854 | |
| | | | | | | | | | | | | | Acrisure LLC / Acrisure Finance Inc. | | | | | | | | |
| | | | | | | | | | | | | | 7.00% | | | | | | | | |
| | | | | | | | | | | | | | 11/15/251 | | | 850,000 | | | | 731,000 | |
| | | | | | | | | | | | | | Univision Communications Inc. | | | | | | | | |
| | | | | | | | | | | | | | 5.13% | | | | | | | | |
| | | | | | | | | | | | | | 05/15/23 | | | 200,000 | | | | 171,500 | |
| | | | | | | | | | | | | | | | | 2,782,000 | | | | 2,374,354 | |
| | | | | | | | | | | | | | | | | | | | | | |
RBC Capital Markets LLC | | | | | | | | | | | | | Staples Inc. | | | | | | | | |
(0.20)% | | | | | | | | | | | | | 10.75% | | | | | | | | |
Open Maturity* | | $ | 171,563 | | | $ | 171,563 | | | | | | 04/15/27 | | $ | 225,000 | | | $ | 172,643 | |
* | The rate is adjusted periodically by the counterparty, subject to approval by the Adviser, and is not based upon a set reference rate and spread. Rate indicated is the rate effective at March 31, 2020. |
1 | Collateral is related to securities which are being sold short. |
SEE NOTES TO CONSOLIDATED FINANCIAL STATEMENTS. | THE GUGGENHEIM FUNDS SEMI-ANNUAL REPORT | 55 |
CONSOLIDATED SCHEDULE OF INVESTMENTS (Unaudited)(continued) | March 31, 2020 |
MACRO OPPORTUNITIES FUND | |
Affiliated Transactions
Investments representing 5% or more of the outstanding voting shares of a company, or control of or by, or common control under Guggenheim Investments (“GI”), result in that company being considered an affiliated issuer, as defined in the 1940 Act.
The Fund may invest in certain of the underlying series of Guggenheim Strategy Funds Trust, including Guggenheim Strategy Fund II and Guggenheim Strategy Fund III, (collectively, the “Short Term Investment Vehicles”), each of which are open-end management investment companies managed by GI. The Short Term Investment Vehicles, which launched on March 11, 2014, are offered as short term investment options only to mutual funds, trusts, and other accounts managed by GI and/or its affiliates, and are not available to the public. The Short Term Investment Vehicles pay no investment management fees. The Short Term Investment Vehicles’ annual report on Form N-CSR dated September 30, 2019, is available publicly or upon request. This information is available from the EDGAR database on the SEC’s website at https://www.sec.gov/Archives/edgar/data/1601445/000089180419000405/gug78512-ncsr.htm.
Transactions during the period ended March 31, 2020, in which the company is an affiliated issuer, were as follows:
Security Name | | Value
09/30/19 | | | Additions | | | Reductions | | | Realized
Gain (Loss) | |
Closed-End Funds | | | | | | | | | | | | | | | | |
Guggenheim Strategic Opportunities Fund | | $ | — | | | $ | 6,511,771 | | | $ | — | | | $ | — | |
Common Stocks | | | | | | | | | | | | | | | | |
BP Holdco LLC*,1 | | | 13,255 | | | | — | | | | — | | | | — | |
Targus Group International Equity, Inc.*,1 | | | 21,632 | | | | — | | | | — | | | | — | |
Mutual Funds | | | | | | | | | | | | | | | | |
Guggenheim Alpha Opportunity Fund — Institutional Class | | | 69,165,665 | | | | 689,432 | | | | (40,550,000 | ) | | | (11,810,550 | ) |
Guggenheim Limited Duration Fund — R6-Class | | | 310,987,415 | | | | 3,086,457 | | | | (250,000,000 | ) | | | (2,195,874 | ) |
Guggenheim Risk Managed Real Estate Fund — Institutional Class | | | 18,768,215 | | | | 939,812 | | | | — | | | | — | |
Guggenheim Strategy Fund II | | | 103,148,435 | | | | 1,422,716 | | | | — | | | | — | |
Guggenheim Strategy Fund III | | | 81,558,334 | | | | 1,122,189 | | | | (20,000,000 | ) | | | (634,267 | ) |
Guggenheim Ultra Short Duration Fund — Institutional Class | | | 92,054,728 | | | | 956,572 | | | | — | | | | — | |
Senior Floating Rate Interests | | | | | | | | | | | | | | | | |
Targus Group International, Inc. due 05/24/16 | | | — | ** | | | — | | | | — | | | | (144,324 | ) |
| | | $ | 675,717,679 | | | $ | 14,728,949 | | | $ | (310,550,000 | ) | | $ | (14,785,015 | ) |
56 | THE GUGGENHEIM FUNDS SEMI-ANNUAL REPORT | SEE NOTES TO CONSOLIDATED FINANCIAL STATEMENTS. |
CONSOLIDATED SCHEDULE OF INVESTMENTS (Unaudited)(concluded) | March 31, 2020 |
MACRO OPPORTUNITIES FUND | |
Security Name | | Change in
Unrealized
Appreciation
(Depreciation) | | | Value
03/31/20 | | | Shares/Face
Amount
03/31/20 | | | Investment
Income | | | Capital
Gain
Distributions | |
Closed-End Funds | | | | | | | | | | | | | | | | | | | | |
Guggenheim Strategic Opportunities Fund | | $ | 377,325 | | | $ | 6,889,096 | | | | 451,744 | | | $ | — | | | $ | — | |
Common Stocks | | | | | | | | | | | | | | | | | | | | |
BP Holdco LLC*,1 | | | (3,420 | ) | | | 9,835 | | | | 37,539 | | | | — | | | | — | |
Targus Group International Equity, Inc.*,1 | | | 465 | | | | 22,097 | | | | 12,773 | | | | — | | | | — | |
Mutual Funds | | | | | | | | | | | | | | | | | | | | |
Guggenheim Alpha Opportunity Fund — Institutional Class | | | 5,680,363 | | | | 23,174,910 | | | | 992,077 | | | | 689,432 | | | | — | |
Guggenheim Limited Duration Fund — R6-Class | | | (433,361 | ) | | | 61,444,637 | | | | 2,524,430 | | | | 3,086,457 | | | | — | |
Guggenheim Risk Managed Real Estate Fund — Institutional Class | | | (3,473,065 | ) | | | 16,234,962 | | | | 573,066 | | | | 237,746 | | | | 702,031 | |
Guggenheim Strategy Fund II | | | (3,276,571 | ) | | | 101,294,580 | | | | 4,211,833 | | | | 1,422,716 | | | | — | |
Guggenheim Strategy Fund III | | | (1,684,949 | ) | | | 60,361,307 | | | | 2,507,740 | | | | 1,122,190 | | | | — | |
Guggenheim Ultra Short Duration Fund — Institutional Class | | | (1,770,862 | ) | | | 91,240,438 | | | | 9,338,837 | | | | 956,573 | | | | — | |
Senior Floating Rate Interests | | | | | | | | | | | | | | | | | | | | |
Targus Group International, Inc. due 05/24/16 | | | 144,324 | | | | — | | | | — | | | | — | | | | — | |
| | | $ | (4,439,751 | ) | | $ | 360,671,862 | | | | | | | $ | 7,515,114 | | | $ | 702,031 | |
* | Non-income producing security. |
** | Market value is less than $1. |
1 | Security was fair valued by the Valuation Committee at March 31, 2020. The total market value of fair valued and affiliated securities amounts to $31,932, (cost $18,280) or less than 0.1% of total net assets. |
SEE NOTES TO CONSOLIDATED FINANCIAL STATEMENTS. | THE GUGGENHEIM FUNDS SEMI-ANNUAL REPORT | 57 |
CONSOLIDATED STATEMENT OF ASSETS AND LIABILITIES (Unaudited) |
MACRO OPPORTUNITIES FUND |
March 31, 2020
Assets: |
Investments in unaffiliated issuers, at value (cost $4,127,163,510) | | $ | 3,734,462,115 | |
Investments in affiliated issuers, at value (cost $374,197,990) | | | 360,671,862 | |
Repurchase agreements, at value (cost $154,821,320) | | | 154,821,320 | |
Foreign currency, at value (cost $33,111) | | | 33,111 | |
Cash | | | 6,590,710 | |
Segregated cash with broker | | | 82,836,416 | |
Unamortized upfront premiums paid on interest rate swap agreements | | | 113,245 | |
Unrealized appreciation on OTC swap agreements | | | 1,098,077 | |
Unrealized appreciation on forward foreign currency exchange contracts | | | 275,670,146 | |
Prepaid expenses | | | 239,797 | |
Receivables: |
Securities sold | | | 38,682,980 | |
Fund shares sold | | | 13,293,548 | |
Interest | | | 12,538,274 | |
Dividends | | | 1,160,964 | |
Variation margin on futures contracts | | | 555,500 | |
Protection fees on credit default swap agreements | | | 544,178 | |
Foreign tax reclaims | | | 211,417 | |
Other assets | | | 2,451 | |
Total assets | | | 4,683,526,111 | |
| | | | | |
Liabilities: |
Unfunded loan commitments, at value (Note 9) (commitment fees received $1,377,151) | | | 489,269 | |
Reverse repurchase agreements (Note 6) | | | 67,372,347 | |
Securities sold short, at value (proceeds $15,380,086) | | | 14,475,290 | |
Segregated cash due to broker | | | 75,479,903 | |
Unamortized upfront premiums received on credit default swap agreements | | | 20,602,861 | |
Unamortized upfront premiums received on interest rate swap agreements | | | 4,288 | |
Unrealized depreciation on OTC swap agreements | | | 1,549,122 | |
Unrealized depreciation on forward foreign currency exchange contracts | | | 225,975,448 | |
Payable for: |
Securities purchased | | | 42,865,383 | |
Fund shares redeemed | | | 17,499,942 | |
Variation margin on interest rate swap agreements | | | 8,281,496 | |
Variation margin on credit default swap agreements | | | 3,878,863 | |
Management fees | | | 2,579,351 | |
Distributions to shareholders | | | 1,474,808 | |
Transfer agent/maintenance fees | | | 551,984 | |
Swap settlement | | | 407,378 | |
Distribution and service fees | | | 291,407 | |
Fund accounting/administration fees | | | 222,298 | |
Due to Investment Adviser | | | 31,590 | |
Trustees’ fees* | | | 25,942 | |
Miscellaneous | | | 316,876 | |
Total liabilities | | | 484,375,846 | |
Net assets | | $ | 4,199,150,265 | |
| | | | | |
* | Relates to Trustees not deemed “interested persons” within the meaning of Section 2(a)(19) of the 1940 Act. |
58 | THE GUGGENHEIM FUNDS SEMI-ANNUAL REPORT | SEE NOTES TO CONSOLIDATED FINANCIAL STATEMENTS. |
CONSOLIDATED STATEMENT OF ASSETS AND LIABILITIES (Unaudited) (concluded) |
MACRO OPPORTUNITIES FUND |
March 31, 2020
Net assets consist of: |
Paid in capital | | $ | 4,820,265,221 | |
Total distributable earnings (loss) | | | (621,114,956 | ) |
Net assets | | $ | 4,199,150,265 | |
| | | | | |
A-Class: |
Net assets | | $ | 308,079,098 | |
Capital shares outstanding | | | 12,838,376 | |
Net asset value per share | | $ | 24.00 | |
Maximum offering price per share (Net asset value divided by 96.00%) | | $ | 25.00 | |
| | | | | |
C-Class: |
Net assets | | $ | 236,574,961 | |
Capital shares outstanding | | | 9,864,488 | |
Net asset value per share | | $ | 23.98 | |
| | | | | |
P-Class: |
Net assets | | $ | 92,951,893 | |
Capital shares outstanding | | | 3,872,221 | |
Net asset value per share | | $ | 24.00 | |
| | | | | |
Institutional Class: |
Net assets | | $ | 3,504,329,511 | |
Capital shares outstanding | | | 145,835,021 | |
Net asset value per share | | $ | 24.03 | |
| | | | | |
R6-Class: |
Net assets | | $ | 57,214,802 | |
Capital shares outstanding | | | 2,382,289 | |
Net asset value per share | | $ | 24.02 | |
SEE NOTES TO CONSOLIDATED FINANCIAL STATEMENTS. | THE GUGGENHEIM FUNDS SEMI-ANNUAL REPORT | 59 |
CONSOLIDATED STATEMENT OF OPERATIONS (Unaudited) |
MACRO OPPORTUNITIES FUND |
Six-Month Period Ended March 31, 2020
Investment Income: |
Dividends from securities of unaffiliated issuers (net of foreign withholding tax of $75,147) | | $ | 3,633,932 | |
Dividends from securities of affiliated issuers | | | 7,515,114 | |
Interest from securities of unaffiliated issuers (net of foreign withholding tax of $4,646) | | | 92,014,037 | |
Total investment income | | | 103,163,083 | |
| | | | | |
Expenses: |
Management fees | | | 24,431,710 | |
Distribution and service fees: |
A-Class | | | 498,948 | |
C-Class | | | 1,430,941 | |
P-Class | | | 139,912 | |
Transfer agent/maintenance fees: |
A-Class | | | 335,994 | |
C-Class | | | 177,930 | |
P-Class | | | 90,139 | |
Institutional Class | | | 2,302,688 | |
R6-Class | | | 1,094 | |
Fund accounting/administration fees | | | 2,109,347 | |
Short sales interest expense | | | 1,303,971 | |
Professional fees | | | 372,292 | |
Custodian fees | | | 314,975 | |
Line of credit fees | | | 261,929 | |
Interest expense | | | 112,050 | |
Trustees’ fees* | | | 89,429 | |
Miscellaneous | | | 494,762 | |
Recoupment of previously waived fees: |
A-Class | | | 22,875 | |
C-Class | | | 54,803 | |
P-Class | | | 4,874 | |
Institutional Class | | | 13,122 | |
R6-Class | | | 478 | |
Total expenses | | | 34,564,263 | |
Less: |
Expenses reimbursed by Adviser: |
A-Class | | | (40,065 | ) |
C-Class | | | (3,212 | ) |
P-Class | | | (4,617 | ) |
Institutional Class | | | (2,264,297 | ) |
R6-Class | | | (1,055 | ) |
Expenses waived by Adviser | | | (2,865,159 | ) |
Earnings credits applied | | | (196,883 | ) |
Total waived/reimbursed expenses | | | (5,375,288 | ) |
Net expenses | | | 29,188,975 | |
Net investment income | | | 73,974,108 | |
* | Relates to Trustees not deemed “interested persons” within the meaning of Section 2(a)(19) of the 1940 Act. |
60 | THE GUGGENHEIM FUNDS SEMI-ANNUAL REPORT | SEE NOTES TO CONSOLIDATED FINANCIAL STATEMENTS. |
CONSOLIDATED STATEMENT OF OPERATIONS (Unaudited) (concluded) |
MACRO OPPORTUNITIES FUND |
Six-Month Period Ended March 31, 2020
Net Realized and Unrealized Gain (Loss): |
Net realized gain (loss) on: |
Investments in unaffiliated issuers | | $ | (57,385,107 | ) |
Investments in affiliated issuers | | | (14,785,015 | ) |
Distributions received from affiliated investment companies | | | 702,031 | |
Investments sold short | | | 649,283 | |
Swap agreements | | | (24,020,033 | ) |
Futures contracts | | | 35,818,266 | |
Options purchased | | | (483,700 | ) |
Forward foreign currency exchange contracts | | | 8,447,730 | |
Foreign currency transactions | | | 4,307,872 | |
Net realized loss | | | (46,748,673 | ) |
Net change in unrealized appreciation (depreciation) on: |
Investments in unaffiliated issuers | | | (321,363,285 | ) |
Investments in affiliated issuers | | | (4,439,751 | ) |
Investments sold short | | | 4,639,769 | |
Swap agreements | | | 9,382,206 | |
Futures contracts | | | (1,203,925 | ) |
Options purchased | | | 2,811,537 | |
Forward foreign currency exchange contracts | | | 24,768,901 | |
Foreign currency translations | | | 329,684 | |
Net change in unrealized appreciation (depreciation) | | | (285,074,864 | ) |
Net realized and unrealized loss | | | (331,823,537 | ) |
Net decrease in net assets resulting from operations | | $ | (257,849,429 | ) |
SEE NOTES TO CONSOLIDATED FINANCIAL STATEMENTS. | THE GUGGENHEIM FUNDS SEMI-ANNUAL REPORT | 61 |
CONSOLIDATED STATEMENTS OF CHANGES IN NET ASSETS |
MACRO OPPORTUNITIES FUND | |
| | Six-Month
Period Ended
March 31,
2020
(Unaudited) | | | Year Ended
September 30,
2019 | |
Increase (Decrease) in Net Assets from Operations: | | | | | | | | |
Net investment income | | $ | 73,974,108 | | | $ | 212,369,398 | |
Net realized loss on investments | | | (46,748,673 | ) | | | (72,715,214 | ) |
Net change in unrealized appreciation (depreciation) on investments | | | (285,074,864 | ) | | | (97,261,304 | ) |
Net increase (decrease) in net assets resulting from operations | | | (257,849,429 | ) | | | 42,392,880 | |
| | | | | | | | | |
Distributions to shareholders: | | | | | | | | |
A-Class | | | (5,237,861 | ) | | | (17,823,614 | ) |
C-Class | | | (2,679,673 | ) | | | (9,175,128 | ) |
P-Class | | | (1,465,654 | ) | | | (4,550,901 | ) |
Institutional Class | | | (69,552,505 | ) | | | (208,895,022 | ) |
R6-Class | | | (998,737 | ) | | | (329,596 | )* |
Total distributions to shareholders | | | (79,934,430 | ) | | | (240,774,261 | ) |
| | | | | | | | | |
Capital share transactions: | | | | | | | | |
Proceeds from sale of shares | | | | | | | | |
A-Class | | | 41,648,143 | | | | 162,931,285 | |
C-Class | | | 8,914,459 | | | | 43,872,896 | |
P-Class | | | 21,842,701 | | | | 59,002,809 | |
Institutional Class | | | 743,333,152 | | | | 2,492,047,740 | |
R6-Class | | | 87,522,626 | | | | 18,363,385 | * |
Distributions reinvested | | | | | | | | |
A-Class | | | 4,147,829 | | | | 14,407,024 | |
C-Class | | | 2,260,223 | | | | 7,760,314 | |
P-Class | | | 1,465,091 | | | | 4,548,842 | |
Institutional Class | | | 59,991,130 | | | | 179,928,991 | |
R6-Class | | | 998,644 | | | | 232,736 | * |
Cost of shares redeemed | | | | | | | | |
A-Class | | | (174,342,211 | ) | | | (412,939,684 | ) |
C-Class | | | (77,594,534 | ) | | | (152,124,869 | ) |
P-Class | | | (49,786,319 | ) | | | (93,643,368 | ) |
Institutional Class | | | (2,413,220,976 | ) | | | (3,174,957,945 | ) |
R6-Class | | | (27,481,959 | ) | | | (17,819,420 | )* |
Net decrease from capital share transactions | | | (1,770,302,001 | ) | | | (868,389,264 | ) |
Net decrease in net assets | | | (2,108,085,860 | ) | | | (1,066,770,645 | ) |
| | | | | | | | | |
Net assets: | | | | | | | | |
Beginning of period | | | 6,307,236,125 | | | | 7,374,006,770 | |
End of period | | $ | 4,199,150,265 | | | $ | 6,307,236,125 | |
62 | THE GUGGENHEIM FUNDS SEMI-ANNUAL REPORT | SEE NOTES TO CONSOLIDATED FINANCIAL STATEMENTS. |
CONSOLIDATED STATEMENTS OF CHANGES IN NET ASSETS (concluded) |
MACRO OPPORTUNITIES FUND | |
| | Six-Month
Period Ended
March 31,
2020
(Unaudited) | | | Year Ended
September 30,
2019 | |
Capital share activity: | | | | | | | | |
Shares sold | | | | | | | | |
A-Class | | | 1,625,938 | | | | 6,250,506 | |
C-Class | | | 347,647 | | | | 1,683,895 | |
P-Class | | | 872,429 | | | | 2,262,017 | |
Institutional Class | | | 29,332,508 | | | | 95,481,259 | |
R6-Class | | | 3,393,540 | | | | 706,773 | * |
Shares issued from reinvestment of distributions | | | | | | | | |
A-Class | | | 162,867 | | | | 553,524 | |
C-Class | | | 88,862 | | | | 298,382 | |
P-Class | | | 57,509 | | | | 174,797 | |
Institutional Class | | | 2,352,396 | | | | 6,909,300 | |
R6-Class | | | 39,237 | | | | 8,974 | * |
Shares redeemed | | | | | | | | |
A-Class | | | (6,838,227 | ) | | | (15,850,225 | ) |
C-Class | | | (3,036,655 | ) | | | (5,852,054 | ) |
P-Class | | | (1,950,012 | ) | | | (3,594,667 | ) |
Institutional Class | | | (94,633,661 | ) | | | (121,923,636 | ) |
R6-Class | | | (1,076,668 | ) | | | (689,567 | )* |
Net decrease in shares | | | (69,262,290 | ) | | | (33,580,722 | ) |
* | Since commencement of operations: March 13, 2019. |
SEE NOTES TO CONSOLIDATED FINANCIAL STATEMENTS. | THE GUGGENHEIM FUNDS SEMI-ANNUAL REPORT | 63 |
CONSOLIDATED FINANCIAL HIGHLIGHTS |
MACRO OPPORTUNITIES FUND | |
This table is presented to show selected data for a share outstanding throughout each period and to assist shareholders in evaluating a Fund’s performance for the periods presented.
A-Class | | Period
Ended
March 31,
2020a | | | Year
Ended
Sept. 30,
2019 | | | Year
Ended
Sept. 30,
2018 | | | Year
Ended
Sept. 30,
2017 | | | Year
Ended
Sept. 30,
2016 | | | Year
Ended
Sept. 30,
2015 | |
Per Share Data |
Net asset value, beginning of period | | $ | 25.82 | | | $ | 26.53 | | | $ | 26.67 | | | $ | 26.01 | | | $ | 26.07 | | | $ | 26.81 | |
Income (loss) from investment operations: |
Net investment income (loss)b | | | .31 | | | | .72 | | | | .72 | | | | .95 | | | | 1.16 | | | | .98 | |
Net gain (loss) on investments (realized and unrealized) | | | (1.79 | ) | | | (.62 | ) | | | (.08 | ) | | | .68 | | | | .21 | | | | (.55 | ) |
Total from investment operations | | | (1.48 | ) | | | .10 | | | | .64 | | | | 1.63 | | | | 1.37 | | | | .43 | |
Less distributions from: |
Net investment income | | | (.34 | ) | | | (.79 | ) | | | (.78 | ) | | | (.97 | ) | | | (1.43 | ) | | | (1.17 | ) |
Net realized gains | | | — | | | | (.02 | ) | | | — | | | | — | | | | — | | | | — | |
Total distributions | | | (.34 | ) | | | (.81 | ) | | | (.78 | ) | | | (.97 | ) | | | (1.43 | ) | | | (1.17 | ) |
Net asset value, end of period | | $ | 24.00 | | | $ | 25.82 | | | $ | 26.53 | | | $ | 26.67 | | | $ | 26.01 | | | $ | 26.07 | |
|
Total Returnc | | | (5.86 | %) | | | 0.41 | % | | | 2.42 | % | | | 6.33 | % | | | 5.57 | % | | | 1.59 | % |
Ratios/Supplemental Data |
Net assets, end of period (in thousands) | | $ | 308,079 | | | $ | 461,781 | | | $ | 714,630 | | | $ | 893,104 | | | $ | 727,602 | | | $ | 844,523 | |
Ratios to average net assets: |
Net investment income (loss) | | | 2.41 | % | | | 2.76 | % | | | 2.72 | % | | | 3.58 | % | | | 4.59 | % | | | 3.67 | % |
Total expensesd | | | 1.51 | % | | | 1.47 | % | | | 1.43 | % | | | 1.42 | % | | | 1.65 | % | | | 1.52 | % |
Net expensese,f,g | | | 1.39 | % | | | 1.39 | % | | | 1.33 | % | | | 1.27 | % | | | 1.46 | % | | | 1.38 | % |
Portfolio turnover rate | | | 23 | % | | | 46 | % | | | 66 | % | | | 61 | % | | | 61 | % | | | 40 | % |
64 | THE GUGGENHEIM FUNDS SEMI-ANNUAL REPORT | SEE NOTES TO CONSOLIDATED FINANCIAL STATEMENTS. |
CONSOLIDATED FINANCIAL HIGHLIGHTS (continued) |
MACRO OPPORTUNITIES FUND | |
This table is presented to show selected data for a share outstanding throughout each period and to assist shareholders in evaluating a Fund’s performance for the periods presented.
C-Class | | Period
Ended
March 31,
2020a | | | Year
Ended
Sept. 30,
2019 | | | Year
Ended
Sept. 30,
2018 | | | Year
Ended
Sept. 30,
2017 | | | Year
Ended
Sept. 30,
2016 | | | Year
Ended
Sept. 30,
2015 | |
Per Share Data |
Net asset value, beginning of period | | $ | 25.80 | | | $ | 26.52 | | | $ | 26.65 | | | $ | 25.99 | | | $ | 26.05 | | | $ | 26.79 | |
Income (loss) from investment operations: |
Net investment income (loss)b | | | .21 | | | | .52 | | | | .53 | | | | .75 | | | | .98 | | | | .78 | |
Net gain (loss) on investments (realized and unrealized) | | | (1.79 | ) | | | (.62 | ) | | | (.08 | ) | | | .68 | | | | .20 | | | | (.55 | ) |
Total from investment operations | | | (1.58 | ) | | | (.10 | ) | | | .45 | | | | 1.43 | | | | 1.18 | | | | .23 | |
Less distributions from: |
Net investment income | | | (.24 | ) | | | (.60 | ) | | | (.58 | ) | | | (.77 | ) | | | (1.24 | ) | | | (.97 | ) |
Net realized gains | | | — | | | | (.02 | ) | | | — | | | | — | | | | — | | | | — | |
Total distributions | | | (.24 | ) | | | (.62 | ) | | | (.58 | ) | | | (.77 | ) | | | (1.24 | ) | | | (.97 | ) |
Net asset value, end of period | | $ | 23.98 | | | $ | 25.80 | | | $ | 26.52 | | | $ | 26.65 | | | $ | 25.99 | | | $ | 26.05 | |
|
Total Returnc | | | (6.18 | %) | | | (0.37 | %) | | | 1.69 | % | | | 5.55 | % | | | 4.79 | % | | | 0.84 | % |
Ratios/Supplemental Data |
Net assets, end of period (in thousands) | | $ | 236,575 | | | $ | 321,576 | | | $ | 433,121 | | | $ | 434,634 | | | $ | 337,075 | | | $ | 374,633 | |
Ratios to average net assets: |
Net investment income (loss) | | | 1.65 | % | | | 2.00 | % | | | 1.98 | % | | | 2.83 | % | | | 3.87 | % | | | 2.90 | % |
Total expensesd | | | 2.25 | % | | | 2.20 | % | | | 2.18 | % | | | 2.14 | % | | | 2.36 | % | | | 2.24 | % |
Net expensese,f,g | | | 2.14 | % | | | 2.13 | % | | | 2.09 | % | | | 2.03 | % | | | 2.20 | % | | | 2.13 | % |
Portfolio turnover rate | | | 23 | % | | | 46 | % | | | 66 | % | | | 61 | % | | | 61 | % | | | 40 | % |
SEE NOTES TO CONSOLIDATED FINANCIAL STATEMENTS. | THE GUGGENHEIM FUNDS SEMI-ANNUAL REPORT | 65 |
CONSOLIDATED FINANCIAL HIGHLIGHTS (continued) |
MACRO OPPORTUNITIES FUND | |
This table is presented to show selected data for a share outstanding throughout each period and to assist shareholders in evaluating a Fund’s performance for the periods presented.
P-Class | | Period
Ended
March 31,
2020a | | | Year
Ended
Sept. 30,
2019 | | | Year
Ended
Sept. 30,
2018 | | | Year
Ended
Sept. 30,
2017 | | | Year
Ended
Sept. 30,
2016 | | | Period
Ended
Sept. 30,
2015h | |
Per Share Data |
Net asset value, beginning of period | | $ | 25.82 | | | $ | 26.54 | | | $ | 26.68 | | | $ | 26.02 | | | $ | 26.07 | | | $ | 26.78 | |
Income (loss) from investment operations: |
Net investment income (loss)b | | | .31 | | | | .71 | | | | .73 | | | | .92 | | | | 1.20 | | | | .37 | |
Net gain (loss) on investments (realized and unrealized) | | | (1.80 | ) | | | (.62 | ) | | | (.09 | ) | | | .71 | | | | .21 | | | | (.62 | ) |
Total from investment operations | | | (1.49 | ) | | | .09 | | | | .64 | | | | 1.63 | | | | 1.41 | | | | (.25 | ) |
Less distributions from: |
Net investment income | | | (.33 | ) | | | (.79 | ) | | | (.78 | ) | | | (.97 | ) | | | (1.46 | ) | | | (.46 | ) |
Net realized gains | | | — | | | | (.02 | ) | | | — | | | | — | | | | — | | | | — | |
Total distributions | | | (.33 | ) | | | (.81 | ) | | | (.78 | ) | | | (.97 | ) | | | (1.46 | ) | | | (.46 | ) |
Net asset value, end of period | | $ | 24.00 | | | $ | 25.82 | | | $ | 26.54 | | | $ | 26.68 | | | $ | 26.02 | | | $ | 26.07 | |
|
Total Return | | | (5.82 | %) | | | 0.37 | % | | | 2.42 | % | | | 6.33 | % | | | 5.74 | % | | | (0.95 | %) |
Ratios/Supplemental Data |
Net assets, end of period (in thousands) | | $ | 92,952 | | | $ | 126,334 | | | $ | 160,578 | | | $ | 188,980 | | | $ | 63,665 | | | $ | 63,819 | |
Ratios to average net assets: |
Net investment income (loss) | | | 2.40 | % | | | 2.73 | % | | | 2.73 | % | | | 3.48 | % | | | 4.73 | % | | | 3.36 | % |
Total expensesd | | | 1.50 | % | | | 1.46 | % | | | 1.46 | % | | | 1.44 | % | | | 1.49 | % | | | 1.43 | % |
Net expensese,f,g | | | 1.39 | % | | | 1.39 | % | | | 1.33 | % | | | 1.26 | % | | | 1.33 | % | | | 1.30 | % |
Portfolio turnover rate | | | 23 | % | | | 46 | % | | | 66 | % | | | 61 | % | | | 61 | % | | | 40 | % |
66 | THE GUGGENHEIM FUNDS SEMI-ANNUAL REPORT | SEE NOTES TO CONSOLIDATED FINANCIAL STATEMENTS. |
CONSOLIDATED FINANCIAL HIGHLIGHTS (continued) |
MACRO OPPORTUNITIES FUND | |
This table is presented to show selected data for a share outstanding throughout each period and to assist shareholders in evaluating a Fund’s performance for the periods presented.
Institutional Class | | Period
Ended
March 31,
2020a | | | Year
Ended
Sept. 30,
2019 | | | Year
Ended
Sept. 30,
2018 | | | Year
Ended
Sept. 30,
2017 | | | Year
Ended
Sept. 30,
2016 | | | Year
Ended
Sept. 30,
2015 | |
Per Share Data |
Net asset value, beginning of period | | $ | 25.85 | | | $ | 26.57 | | | $ | 26.71 | | | $ | 26.04 | | | $ | 26.10 | | | $ | 26.84 | |
Income (loss) from investment operations: |
Net investment income (loss)b | | | .36 | | | | .81 | | | | .84 | | | | 1.02 | | | | 1.26 | | | | 1.06 | |
Net gain (loss) on investments (realized and unrealized) | | | (1.79 | ) | | | (.61 | ) | | | (.09 | ) | | | .71 | | | | .21 | | | | (.54 | ) |
Total from investment operations | | | (1.43 | ) | | | .20 | | | | .75 | | | | 1.73 | | | | 1.47 | | | | .52 | |
Less distributions from: |
Net investment income | | | (.39 | ) | | | (.90 | ) | | | (.89 | ) | | | (1.06 | ) | | | (1.53 | ) | | | (1.26 | ) |
Net realized gains | | | — | | | | (.02 | ) | | | — | | | | — | | | | — | | | | — | |
Total distributions | | | (.39 | ) | | | (.92 | ) | | | (.89 | ) | | | (1.06 | ) | | | (1.53 | ) | | | (1.26 | ) |
Net asset value, end of period | | $ | 24.03 | | | $ | 25.85 | | | $ | 26.57 | | | $ | 26.71 | | | $ | 26.04 | | | $ | 26.10 | |
|
Total Return | | | (5.62 | %) | | | 0.77 | % | | | 2.83 | % | | | 6.73 | % | | | 5.97 | % | | | 1.92 | % |
Ratios/Supplemental Data |
Net assets, end of period (in thousands) | | $ | 3,504,330 | | | $ | 5,396,868 | | | $ | 6,065,678 | | | $ | 4,591,424 | | | $ | 2,204,079 | | | $ | 2,396,622 | |
Ratios to average net assets: |
Net investment income (loss) | | | 2.81 | % | | | 3.12 | % | | | 3.15 | % | | | 3.86 | % | | | 4.96 | % | | | 3.97 | % |
Total expensesd | | | 1.18 | % | | | 1.13 | % | | | 1.08 | % | | | 1.06 | % | | | 1.29 | % | | | 1.20 | % |
Net expensese,f,g | | | 0.98 | % | | | 0.98 | % | | | 0.93 | % | | | 0.91 | % | | | 1.08 | % | | | 1.05 | % |
Portfolio turnover rate | | | 23 | % | | | 46 | % | | | 66 | % | | | 61 | % | | | 61 | % | | | 40 | % |
SEE NOTES TO CONSOLIDATED FINANCIAL STATEMENTS. | THE GUGGENHEIM FUNDS SEMI-ANNUAL REPORT | 67 |
CONSOLIDATED FINANCIAL HIGHLIGHTS (continued) |
MACRO OPPORTUNITIES FUND | |
This table is presented to show selected data for a share outstanding throughout each period and to assist shareholders in evaluating a Fund’s performance for the periods presented.
R6-Class | | Period
Ended
March 31,
2020a | | | Period
Ended
Sept. 30,
2019i | |
Per Share Data |
Net asset value, beginning of period | | $ | 25.84 | | | $ | 25.98 | |
Income (loss) from investment operations: |
Net investment income (loss)b | | | .36 | | | | .36 | |
Net gain (loss) on investments (realized and unrealized) | | | (1.79 | ) | | | (.03 | ) |
Total from investment operations | | | (1.43 | ) | | | .33 | |
Less distributions from: |
Net investment income | | | (.39 | ) | | | (.47 | ) |
Total distributions | | | (.39 | ) | | | (.47 | ) |
Net asset value, end of period | | $ | 24.02 | | | $ | 25.84 | |
|
Total Return | | | (5.66 | %) | | | 1.30 | % |
Ratios/Supplemental Data |
Net assets, end of period (in thousands) | | $ | 57,215 | | | $ | 676 | |
Ratios to average net assets: |
Net investment income (loss) | | | 2.83 | % | | | 2.79 | % |
Total expensesd | | | 1.08 | % | | | 1.11 | % |
Net expensese,f,g | | | 0.97 | % | | | 1.03 | % |
Portfolio turnover rate | | | 23 | % | | | 46 | % |
68 | THE GUGGENHEIM FUNDS SEMI-ANNUAL REPORT | SEE NOTES TO CONSOLIDATED FINANCIAL STATEMENTS. |
CONSOLIDATED FINANCIAL HIGHLIGHTS (concluded) |
MACRO OPPORTUNITIES FUND |
a | Unaudited figures for the period ended March 31, 2020. Percentage amounts for the period, except total return and portfolio turnover rate, have been annualized. |
b | Net investment income (loss) per share was computed using average shares outstanding throughout the period. |
c | Total return does not reflect the impact of any applicable sales charges. |
d | Does not include expenses of the underlying funds in which the Fund invests. |
e | Net expense information reflects the expense ratios after expense waivers and reimbursements, as applicable. |
f | The portion of the ratios of net expenses to average net assets attributable to recoupments of prior fee reductions or expense reimbursements for the periods presented was as follows: |
| | | 03/31/20a | 09/30/19 | 09/30/18 | 09/30/17 |
| | A-Class | 0.01% | 0.02% | 0.04% | 0.02% |
| | C-Class | 0.04% | 0.05% | 0.11% | 0.04% |
| | P-Class | 0.01% | 0.04% | 0.04% | 0.02% |
| | Institutional Class | 0.00%* | 0.00%* | — | — |
| | R6-Class | 0.00%* | 0.00%* | N/A | N/A |
| | * | Less than 0.01% |
g | Net expenses may include expenses that are excluded from the expense limitation agreement. Excluding these expenses, the net expense ratios for the periods presented would be: |
| | | 03/31/20a | 09/30/19 | 09/30/18 | 09/30/17 | 09/30/16 | 09/30/15 |
| | A-Class | 1.33% | 1.33% | 1.31% | 1.25% | 1.28% | 1.30% |
| | C-Class | 2.08% | 2.07% | 2.06% | 2.00% | 2.02% | 2.05% |
| | P-Class | 1.33% | 1.33% | 1.31% | 1.24% | 1.15% | 1.21% |
| | Institutional Class | 0.92% | 0.92% | 0.90% | 0.88% | 0.90% | 0.97% |
| | R6-Class | 0.91% | 0.92% | N/A | N/A | N/A | N/A |
h | Since commencement of operations: May 1, 2015. Percentage amounts for the period, except total return and portfolio turnover rate, have been annualized. |
i | Since commencement of operations: March 13, 2019. Percentage amounts for the period, except total return and portfolio turnover rate, have been annualized. |
SEE NOTES TO CONSOLIDATED FINANCIAL STATEMENTS. | THE GUGGENHEIM FUNDS SEMI-ANNUAL REPORT | 69 |
NOTES TO CONSOLIDATED FINANCIAL STATEMENTS (Unaudited) |
Note 1 – Organization, Consolidation of Subsidiary and Significant Accounting Policies
Organization
Guggenheim Funds Trust (the “Trust”), a Delaware statutory trust, is registered with the SEC under the Investment Company Act of 1940 (“1940 Act”), as an open-ended investment company of the series type. Each series, in effect, is representing a separate fund. The Trust is authorized to issue an unlimited number of no par value shares. The Trust accounts for the assets of each fund separately.
The Trust offers a combination of five separate classes of shares: A-Class shares, C-Class shares, P-Class shares, R6-Class shares and Institutional Class shares. Sales of shares of each Class are made without a front-end sales charge at the net asset value per share (“NAV”), with the exception of A-Class shares. A-Class shares are sold at the NAV, plus the applicable front-end sales charge. The sales charge varies depending on the amount purchased. A-Class share purchases of $1 million or more are exempt from the front-end sales charge but have a 1% contingent deferred sales charge (“CDSC”), if shares are redeemed within 12 months of purchase. C-Class shares have a 1% CDSC if shares are redeemed within 12 months of purchase. C-Class shares automatically convert to A-Class shares on or about the 10th day of the month following the 10-year anniversary of the purchase of the C-Class shares. This conversion will be executed without any sales charge, fee or other charge. After the conversion is completed, the shares will be subject to all features and expenses of A-Class shares. Institutional Class shares are offered primarily for direct investment by institutions such as pension and profit sharing plans, endowments, foundations and corporations. Institutional Class shares require a minimum initial investment of $2 million and a minimum account balance of $1 million. R6-Class shares are offered primarily through qualified retirement and benefit plans. R6-Class shares are also offered through certain other plans and platforms sponsored by financial intermediaries. Certain institutional investors and others deemed appropriate by Guggenheim Investments (“GI”) may also be eligible to purchase R6-Class shares subject to a $2 million minimum initial investment. At March 31, 2020, the Trust consisted of nineteen funds (the “Funds”).
This report covers the Macro Opportunities Fund (the “Fund”), a diversified investment company. At March 31, 2020, A-Class, C-Class, P-Class, Institutional Class and R6-Class shares have been issued by the Fund.
Guggenheim Partners Investment Management, LLC (“GPIM”), which operates under the name Guggenheim Investments, provides advisory services. Guggenheim Funds Distributors, LLC (“GFD”) acts as principal underwriter for the Trust. GI and GFD are affiliated entities.
Consolidation of Subsidiary
The consolidated financial statements of the Fund includes the accounts of a wholly-owned and controlled Cayman Islands subsidiary (the “Subsidiary”). Significant inter-company accounts and transactions have been eliminated in consolidation for the Fund.
70 | THE GUGGENHEIM FUNDS SEMI-ANNUAL REPORT | |
NOTES TO CONSOLIDATED FINANCIAL STATEMENTS (Unaudited)(continued) |
The Fund may invest up to 25% of its total assets in its Subsidiary which acts as an investment vehicle in order to effect certain investments consistent with the Fund’s investment objectives and policies.
A summary of the Fund’s investment in its Subsidiary is as follows:
| | Inception Date
of Subsidiary | | | Subsidiary
Net Assets at
March 31,
2020 | | | % of Net Assets of
the Fund at
March 31,
2020 | |
| | | | 01/08/15 | | | $ | 89,229,504 | | | | 2.12 | % |
Significant Accounting Policies
The Fund operates as an investment company and, accordingly, follows the investment company accounting and reporting guidance of the Financial Accounting Standards Board (“FASB”) Accounting Standards Codification Topic 946 Financial Services – Investment Companies.
The following significant accounting policies are in conformity with U.S. generally accepted accounting principles (“U.S. GAAP”) and are consistently followed by the Trust. This requires management to make estimates and assumptions that affect the reported amount of assets and liabilities, contingent assets and liabilities at the date of the consolidated financial statements, and the reported amounts of revenues and expenses during the reporting period. Actual results could differ from these estimates. All time references are based on Eastern Time.
The NAV of each Class of the Fund is calculated by dividing the market value of the Fund’s securities and other assets, less all liabilities, attributable to the Class by the number of outstanding shares of the Class.
(a) Valuation of Investments
The Board of Trustees of the Fund (the “Board”) has adopted policies and procedures for the valuation of the Fund’s investments (the “Valuation Procedures”). Pursuant to the Valuation Procedures, the Board has delegated to a valuation committee, consisting of representatives from Guggenheim’s investment management, fund administration, legal and compliance departments (the “Valuation Committee”), the day-to-day responsibility for implementing the Valuation Procedures, including, under most circumstances, the responsibility for determining the fair value of the Fund’s securities and/or other assets.
Valuations of the Fund’s securities and other assets are supplied primarily by pricing services appointed pursuant to the processes set forth in the Valuation Procedures. The Valuation Committee convenes monthly, or more frequently as needed, to review the valuation of all assets which have been fair valued for reasonableness. The Fund’s officers, through the Valuation
| | THE GUGGENHEIM FUNDS SEMI-ANNUAL REPORT | 71 |
NOTES TO CONSOLIDATED FINANCIAL STATEMENTS (Unaudited)(continued) |
Committee and consistent with the monitoring and review responsibilities set forth in the Valuation Procedures, regularly review procedures used and valuations provided by the pricing services.
If the pricing service cannot or does not provide a valuation for a particular investment or such valuation is deemed unreliable, such investment is fair valued by the Valuation Committee.
Equity securities listed or traded on a recognized U.S. securities exchange or the National Association of Securities Dealers Automated Quotations (“NASDAQ”) National Market System shall generally be valued on the basis of the last sale price on the primary U.S. exchange or market on which the security is listed or traded; provided, however, that securities listed on NASDAQ will be valued at the NASDAQ Official Closing Price, which may not necessarily represent the last sale price. If there is no sale on the valuation date, exchange-traded U.S. equity securities will be valued on the basis of the last bid price.
Generally, trading in foreign securities markets is substantially completed each day at various times prior to the close of the New York Stock Exchange (“NYSE”). The values of foreign securities are determined as of the close of such foreign markets or the close of the NYSE, if earlier. All investments quoted in foreign currencies are valued in U.S. dollars on the basis of the foreign currency exchange rates prevailing at the close of U.S. business at 4:00 p.m. Investments in foreign securities may involve risks not present in domestic investments. The Valuation Committee will determine the current value of such foreign securities by taking into consideration certain factors which may include those discussed above, as well as the following factors, among others: the value of the securities traded on other foreign markets, ADR trading, closed-end fund trading, foreign currency exchange activity, and the trading prices of financial products that are tied to foreign securities. In addition, under the Valuation Procedures, the Valuation Committee and GI are authorized to use prices and other information supplied by a third party pricing vendor in valuing foreign securities.
Open-end investment companies are valued at their NAV as of the close of business, on the valuation date. Exchange-traded funds and closed-end investment companies are valued at the last quoted sale price. Money market funds are valued at their NAV.
Repurchase agreements are generally valued at amortized cost, provided such amounts approximate market value.
Debt securities with a maturity of greater than 60 days at acquisition are valued at prices that reflect broker-dealer supplied valuations or are obtained from independent pricing services, which may consider the trade activity, treasury spreads, yields or price of bonds of comparable quality, coupon, maturity, and type, as well as prices quoted by dealers who make markets in such securities. Short-term debt securities with a maturity of 60 days or less at acquisition are valued at amortized cost, provided such amount approximates market value.
72 | THE GUGGENHEIM FUNDS SEMI-ANNUAL REPORT | |
NOTES TO CONSOLIDATED FINANCIAL STATEMENTS (Unaudited)(continued) |
Typically, loans are valued using information provided by an independent third party pricing service that uses broker quotes, among other inputs. If the pricing service cannot or does not provide a valuation for a particular loan or such valuation is deemed unreliable, such investment is valued based on a quote from a broker-dealer or is fair valued by the Valuation Committee.
Exchange-traded options are valued at the mean of the bid and ask prices on the principal exchange on which they are traded. Over-the-counter (“OTC”) options are valued using a price provided by a pricing service.
The value of futures contracts is accounted for using the unrealized appreciation or depreciation on the contracts that is determined by marking the contracts to their current realized settlement prices. Financial futures contracts are valued at the 4:00 p.m. price on the valuation date. In the event that the exchange for a specific futures contract closes earlier than 4:00 p.m., the futures contract is valued at the official settlement price of the exchange. However, the underlying securities from which the futures contract value is derived are monitored until 4:00 p.m. to determine if fair valuation would provide a more accurate valuation.
The value of interest rate swap agreements entered into by the Fund is accounted for using the unrealized appreciation or depreciation on the agreements that is determined using the previous day’s Chicago Mercantile Exchange close price, adjusted for the current day’s spreads.
The values of other swap agreements entered into by the Fund are accounted for using the unrealized appreciation or depreciation on the agreements that are determined by marking the agreements to the last quoted value of the index or other underlying positions that the swaps pertain to at the close of the NYSE.
Forward foreign currency exchange contracts are valued daily based on the applicable exchange rate of the underlying currency.
Investments for which market quotations are not readily available are fair-valued as determined in good faith by GI subject to review and approval by the Valuation Committee, pursuant to methods established or ratified by the Board. Valuations in accordance with these methods are intended to reflect each security’s (or asset’s or liability’s) “fair value”. Each such determination is based on a consideration of all relevant factors, which are likely to vary from one pricing context to another. Examples of such factors may include, but are not limited to market prices; sale prices; broker quotes; and models which derive prices based on inputs such as prices of securities with comparable maturities and characteristics, or based on inputs such as anticipated cash flows or collateral, spread over U.S. Treasury securities, and other information analysis. In connection with futures contracts and other derivative investments, such factors may include obtaining information as to how (a) these contracts and other derivative investments trade in the futures or other derivative markets, respectively, and (b) the securities underlying these contracts and other derivative investments trade in the cash market.
| | THE GUGGENHEIM FUNDS SEMI-ANNUAL REPORT | 73 |
NOTES TO CONSOLIDATED FINANCIAL STATEMENTS (Unaudited)(continued) |
(b) Senior Floating Rate Interests and Loan Investments
Senior floating rate interests in which the Fund invests generally pay interest rates which are periodically adjusted by reference to a base short-term floating rate, plus a premium. These base lending rates are generally (i) the lending rate offered by one or more major European banks, such as the one-month or three-month London Inter-Bank Offered Rate (“LIBOR”), (ii) the prime rate offered by one or more major United States banks, or (iii) the bank’s certificate of deposit rate. Senior floating rate interests often require prepayments from excess cash flows or permit the borrower to repay at its election. The rate at which the borrower repays cannot be predicted with accuracy. As a result, the actual remaining maturity may be substantially less than the stated maturities disclosed in the Fund’s Consolidated Schedule of Investments. The interest rate indicated is the rate in effect at March 31, 2020.
The Fund invest in loans and other similar debt obligations (“obligations”). A portion of the Fund’s investments in these obligations is sometimes referred to as “covenant lite” loans or obligations (“covenant lite obligations”), which are obligations that lack covenants or possess fewer or less restrictive covenants or constraints on borrowers than certain other types of obligations. The Fund may also obtain exposure to covenant lite obligations through investment in securitization vehicles and other structured products. In recent market conditions, many new or reissued obligations have not featured traditional covenants, which are intended to protect lenders and investors by (i) imposing certain restrictions or other limitations on a borrower’s operations or assets or (ii) providing certain rights to lenders. The Fund may have fewer rights with respect to covenant lite obligations, including fewer protections against the possibility of default and fewer remedies in the event of default. As a result, investments in (or exposure to) covenant lite obligations are subject to more risk than investments in (or exposure to) certain other types of obligations. The Fund is subject to other risks associated with investments in (or exposure to) obligations, including that obligations may not be considered “securities” and, as a result, the Fund may not be entitled to rely on the anti-fraud protections under the federal securities laws and instead may have to resort to state law and direct claims.
(c) Interests in When-Issued Securities
The Fund may purchase and sell interests in securities on a when-issued and delayed delivery basis, with payment and delivery scheduled for a future date. No income accrues to the Fund on such interests or securities in connection with such transactions prior to the date the Fund actually take delivery of such interests or securities. These transactions are subject to market fluctuations and are subject to the risk that the value at delivery may be more or less than the trade date purchase price. Although the Fund will generally purchase these securities with the intention of acquiring such securities, they may sell such securities before the settlement date.
74 | THE GUGGENHEIM FUNDS SEMI-ANNUAL REPORT | |
NOTES TO CONSOLIDATED FINANCIAL STATEMENTS (Unaudited)(continued) |
(d) Short Sales
When the Fund engages in a short sale of a security, an amount equal to the proceeds is reflected as an asset and an equivalent liability. The amount of the liability is subsequently marked-to-market to reflect the market value of the short sale. The Fund maintains a segregated account of cash and/or securities as collateral for short sales.
Fees, if any, paid to brokers to borrow securities in connection with short sales are recorded as interest expense. In addition, the Fund must pay out the dividend rate of the equity or coupon rate of the obligation to the lender and record this as an expense. Short dividend or interest expense is a cost associated with the investment objective of short sales transactions, rather than an operational cost associated with the day-to-day management of any mutual fund. The Fund may also receive rebate income from the broker resulting from the investment of the proceeds from securities sold short.
(e) Options
Upon the purchase of an option, the premium paid is recorded as an investment, the value of which is marked-to-market daily. If a purchased option expires, the Fund realizes a loss in the amount of the cost of the option. When the Fund enters into a closing sale transaction, it realizes a gain or loss depending on whether the proceeds from the closing sale transaction are greater or less than the cost of the option. If the Fund exercises a put option, it realizes a gain or loss from the sale of the underlying security and the proceeds from such sale will be decreased by the premium originally paid. When the Fund exercises a call option, the cost of the security purchased by the Fund upon exercise increases by the premium originally paid.
When the Fund writes (sells) an option, an amount equal to the premium received is entered in that Fund’s accounting records as an asset and equivalent liability. The amount of the liability is subsequently marked-to-market to reflect the current value of the option written. When a written option expires, or if the Fund enters into a closing purchase transaction, it realizes a gain (or loss if the cost of a closing purchase transaction exceeds the premium received when the option was sold).
(f) Futures Contracts
Upon entering into a futures contract, the Fund deposits and maintains as collateral such initial margin as required by the exchange on which the transaction is affected. Pursuant to the contract, the Fund agrees to receive from or pay to the broker an amount of cash equal to the daily fluctuation in value of the contract. Such receipts or payments are known as variation margin and are recorded by the Fund as unrealized appreciation or depreciation. When the contract is closed, the Fund records a realized gain or loss equal to the difference between the value of the contract at the time it was opened and the value at the time it was closed.
| | THE GUGGENHEIM FUNDS SEMI-ANNUAL REPORT | 75 |
NOTES TO CONSOLIDATED FINANCIAL STATEMENTS (Unaudited)(continued) |
(g) Swap Agreements
Swap agreements are marked-to-market daily and the change, if any, is recorded as unrealized appreciation or depreciation. Payments received or made as a result of an agreement or termination of an agreement are recognized as realized gains or losses.
Upon entering into certain centrally-cleared swap transactions, a Fund is required to deposit with its clearing broker an amount of cash or securities as an initial margin. Subsequent variation margin receipts or payments are received or made by the Fund depending on fluctuations in the fair value of the reference entity and are recorded by the Fund as unrealized appreciation or depreciation. When the contract is closed, the Fund records a realized gain or loss equal to the difference between the value of the contract at the time it was opened and the value at the time it was closed.
Upfront payments received or made by a Fund on credit default swap agreements and interest rate swap agreements are amortized over the expected life of the agreement. Periodic payments received or paid by a Fund are recorded as realized gains or losses. Payments received or made as a result of a credit event or termination of the contract are recognized, net of a proportional amount of the upfront payment, as realized gains or losses.
(h) Currency Translations
The accounting records of the Fund are maintained in U.S. dollars. All assets and liabilities initially expressed in foreign currencies are converted into U.S. dollars at prevailing exchange rates. Purchases and sales of investment securities, dividend and interest income, and certain expenses are translated at the rates of exchange prevailing on the respective dates of such transactions. Changes in the relationship of these foreign currencies to the U.S. dollar can significantly affect the value of the investments and earnings of the Fund. Foreign investments may also subject the Fund to foreign government exchange restrictions, expropriation, taxation, or other political, social or economic developments, all of which could affect the market and/or credit risk of the investments.
The Fund does not isolate that portion of the results of operations resulting from changes in the foreign exchange rates on investments from the fluctuations arising from changes in the market prices of securities held. Such fluctuations are included with the net realized gain or loss and unrealized appreciation or depreciation on investments.
Reported net realized foreign exchange gains and losses arise from sales of foreign currencies and currency gains or losses realized between the trade and settlement dates on investment transactions. Net unrealized appreciation and depreciation arise from changes in the fair values of assets and liabilities other than investments in securities at the fiscal period end, resulting from changes in exchange rates.
76 | THE GUGGENHEIM FUNDS SEMI-ANNUAL REPORT | |
NOTES TO CONSOLIDATED FINANCIAL STATEMENTS (Unaudited)(continued) |
(i) Forward Foreign Currency Exchange Contracts
The change in value of a forward foreign currency exchange contract is recorded as unrealized appreciation or depreciation until the contract is closed. When the contract is closed, the Fund records a realized gain or loss equal to the difference between the value at the time the contract was opened and the value at the time it was closed.
(j) Foreign Taxes
The Fund may be subject to foreign taxes (a portion of which may be reclaimable) on income, stock dividends, capital gains on investments or certain foreign currency transactions. All foreign taxes are recorded in accordance with the applicable foreign tax regulations and rates that exist in the foreign jurisdictions in which the Fund invests. These foreign taxes, if any, are paid by the Fund and reflected in its Consolidated Statement of Operations as follows: foreign taxes withheld at source are presented as a reduction of income and foreign taxes on capital gains from sales of investments are included with the net realized gain (loss) on investments. Foreign taxes payable or deferred as of March 31, 2020, if any, are disclosed in the Fund’s Consolidated Statement of Assets and Liabilities.
(k) Security Transactions
Security transactions are recorded on the trade date for financial reporting purposes. Realized gains and losses from securities transactions are recorded using the identified cost basis. Proceeds from lawsuits related to investment holdings are recorded as a reduction to cost if the securities are still held and as realized gains if no longer held in the Fund. Dividend income is recorded on the ex-dividend date, net of applicable taxes withheld by foreign countries, if any. Taxable non-cash dividends are recorded as dividend income. Interest income, including amortization of premiums and accretion of discounts, is accrued on a daily basis. Interest income also includes paydown gains and losses on mortgage-backed and asset-backed securities and senior and subordinated loans. Amendment fees are earned as compensation for evaluating and accepting changes to the original loan agreement and are recognized when received. Dividend income from Real Estate Investment Trusts (“REITs”) is recorded based on the income included in the distributions received from the REIT investments using published REIT classifications, including some management estimates when actual amounts are not available. Distributions received in excess of this estimated amount are recorded as a reduction of the cost of investments or reclassified to realized gains. The actual amounts of income, return of capital, and realized gains are only determined by each REIT after its fiscal year-end, and may differ from the estimated amounts.
Income from residual collateralized loan obligations is recognized using the effective interest method. At the time of purchase, management estimates the future expected cash flows and determines the effective yield and estimated maturity date based on the estimated cash flows. Subsequent to the purchase, the estimated cash flows are updated periodically and a revised yield is calculated prospectively.
| | THE GUGGENHEIM FUNDS SEMI-ANNUAL REPORT | 77 |
NOTES TO CONSOLIDATED FINANCIAL STATEMENTS (Unaudited)(continued) |
The Fund may receive other income from investments in senior loan interests including amendment fees, consent fees and commitment fees. For funded loans, these fees are recorded as income when received by the Fund and included in interest income on the Consolidated Statement of Operations. For unfunded loans, commitment fees are included in realized gain on investments on the Consolidated Statement of Operations at the end of the commitment period.
(l) Distributions
The Fund declares dividends from investment income daily. The Fund pays its shareholders from its net investment income monthly and distributes any net capital gains that it has realized, at least annually. Distributions to shareholders are recorded on the ex-dividend date. Dividends are reinvested in additional shares, unless shareholders request payment in cash. The character of distributions made during the year from net investment income or net realized gains may differ from their ultimate characterization for U.S. federal income tax purposes.
(m) Class Allocations
Interest and dividend income, most expenses, all realized gains and losses, and all unrealized appreciation and depreciation are allocated to the classes based upon the value of the outstanding shares in each Class. Certain costs, such as distribution and service fees are charged directly to specific classes. In addition, certain expenses have been allocated to the individual Funds in the Trust based on the respective net assets of each Fund included in the Trust.
(n) Earnings Credits
Under the fee arrangement with the custodian, the Fund may earn credits based on overnight custody cash balances. These credits are utilized to reduce related custodial expenses. The custodian fees disclosed in the Consolidated Statement of Operations are before the reduction in expense from the related earnings credits, if any. Earnings credits for the period ended March 31, 2020, are disclosed in the Consolidated Statement of Operations.
(o) Cash
The Fund may leave cash overnight in its cash account with the custodian. Periodically, the Fund may have cash due to the custodian bank as an overdraft balance. A fee is incurred on this overdraft, calculated by multiplying the overdraft by a rate based on the federal funds rate, which was 0.08% at March 31, 2020.
(p) Indemnifications
Under the Fund’s organizational documents, its Trustees and Officers are indemnified against certain liabilities arising out of the performance of their duties to the Trust. In addition, throughout the normal course of business, the Fund enters into contracts that contain a variety of representations and warranties which provide general indemnifications. The Fund’s maximum
78 | THE GUGGENHEIM FUNDS SEMI-ANNUAL REPORT | |
NOTES TO CONSOLIDATED FINANCIAL STATEMENTS (Unaudited)(continued) |
exposure under these arrangements is unknown, as this would involve future claims that may be made against the Fund and/or its affiliates that have not yet occurred. However, based on experience, the Fund expects the risk of loss to be remote.
Note 2 – Financial Instruments and Derivatives
As part of its investment strategy, the Fund utilizes short sales and a variety of derivative instruments. These investments involve, to varying degrees, elements of market risk and risks in excess of amounts recognized on the Consolidated Statement of Assets and Liabilities. Valuation and accounting treatment of these instruments can be found under Significant Accounting Policies in Note 1 of these Notes to Consolidated Financial Statements.
Short Sales
A short sale is a transaction in which the Fund sells a security it does not own. If the security sold short decreases in price between the time the Fund sells the security and closes its short position, the Fund will realize a gain on the transaction. Conversely, if the security increases in price during the period, the Fund will realize a loss on the transaction. The risk of such price increases is the principal risk of engaging in short sales.
Derivatives
Derivatives are instruments whose values depend on, or are derived from, in whole or in part, the value of one or more other assets, such as securities, currencies, commodities or indices. Derivative instruments may be used to increase investment flexibility (including to maintain cash reserves while maintaining exposure to certain other assets), for risk management (hedging) purposes, to facilitate trading, to reduce transaction costs and to pursue higher investment returns. Derivative instruments may also be used to mitigate certain investment risks, such as foreign currency exchange rate risk, interest rate risk and credit risk. U.S. GAAP requires disclosures to enable investors to better understand how and why a Fund uses derivative instruments, how these derivative instruments are accounted for and their effects on the Fund’s financial position and results of operations.
The Fund utilized derivatives for the following purposes:
Duration: the use of an instrument to manage the interest rate risk of a portfolio.
Hedge: an investment made in order to reduce the risk of adverse price movements in a security, by taking an offsetting position to protect against broad market moves.
Income: the use of any instrument that distributes cash flows typically based upon some rate of interest.
Index Exposure: the use of an instrument to obtain exposure to a listed or other type of index.
Speculation: the use of an instrument to express macro-economic and other investment views.
| | THE GUGGENHEIM FUNDS SEMI-ANNUAL REPORT | 79 |
NOTES TO CONSOLIDATED FINANCIAL STATEMENTS (Unaudited)(continued) |
Options Purchased and Written
A call option on a security gives the purchaser of the option the right to buy, and the writer of a call option the obligation to sell, the underlying security. The purchaser of a put option has the right to sell, and the writer of the put option the obligation to buy, the underlying security at any time during the option period. The risk associated with purchasing options is limited to the premium originally paid.
The following table represents the Fund’s use and volume of call/put options purchased on a monthly basis:
| | | Average Notional Amount | |
Use | | Call | | | Put | |
Duration, Hedge, Speculation | | $ | — | | | $ | 6,122,833,333 | |
Futures Contracts
A futures contract is an agreement to purchase (long) or sell (short) an agreed amount of securities or other instruments at a set price for delivery at a future date. There are significant risks associated with a Fund’s use of futures contracts, including (i) there may be an imperfect or no correlation between the changes in market value of the underlying asset and the prices of futures contracts; (ii) there may not be a liquid secondary market for a futures contract; (iii) trading restrictions or limitations may be imposed by an exchange; and (iv) government regulations may restrict trading in futures contracts. When investing in futures, there is minimal counterparty credit risk to a Fund because futures are exchange-traded and the exchange’s clearinghouse, as counterparty to all exchange-traded futures, guarantees against default. Cash deposits are shown as segregated cash with broker on the Statement of Assets and Liabilities; securities held as collateral are noted on the Schedule of Investments.
The following table represents the Fund’s use and volume of futures on a monthly basis:
| | | Average Notional Amount | |
Use | | Long | | | Short | |
Hedge, Income, Speculation | | $ | — | | | $ | 78,302,785 | |
Swap Agreements
A swap is an agreement that obligates two parties to exchange a series of cash flows at specified intervals based upon or calculated by reference to changes in specified prices or rates for a specified amount of an underlying asset. When utilizing OTC swaps, the Fund bears the risk of loss of the amount expected to be received under a swap agreement in the event of the default or bankruptcy of a swap agreement counterparty or if the underlying asset declines in value. Certain standardized swaps are subject to mandatory central clearing and are executed on a multi-lateral or other trade facility platform, such as a registered exchange. There is limited counterparty credit
80 | THE GUGGENHEIM FUNDS SEMI-ANNUAL REPORT | |
NOTES TO CONSOLIDATED FINANCIAL STATEMENTS (Unaudited)(continued) |
risk with respect to centrally-cleared swaps as the transaction is facilitated through a central clearinghouse, much like exchange-traded futures contracts. For a fund utilizing centrally cleared swaps, the exchange bears the risk of loss resulting from a counterparty not being able to pay. There is no guarantee that a fund or an underlying fund could eliminate its exposure under an outstanding swap agreement by entering into an offsetting swap agreement with the same or another party.
Total return swaps involve commitments where single or multiple cash flows are exchanged based on the price of an underlying reference asset (such as an index) for a fixed or variable interest rate. Total return swaps will usually be computed based on the current value of the reference asset as of the close of regular trading on the NYSE or other exchange, with the swap value being adjusted to include dividends accrued, financing charges and/or interest associated with the swap agreement. When utilizing total return swaps, the Fund bears the risk of loss of the amount expected to be received under a swap agreement in the event of the default or bankruptcy of a swap agreement counterparty or if the underlying reference asset declines in value.
The following table represents the Fund’s use and volume of total return swaps on a monthly basis:
| | | Average Notional Amount | |
Use | | Long | | | Short | |
Income | | $ | 27,825,371 | | | $ | 106,231,439 | |
Interest rate swaps involve the exchange by the Fund with another party for its respective commitment to pay or receive a fixed or variable interest rate on a notional amount of principal. Interest rate swaps are generally centrally-cleared, but central clearing does not make interest rate swap transactions risk free.
The following table represents the Fund’s use and volume of interest rate swaps on a monthly basis:
| | | Average Notional Amount | |
Use | | Pay Floating Rate | | | Receive Floating Rate | |
Duration, Hedge | | $ | 285,048,000 | | | $ | 4,302,456,333 | |
Credit default swaps are instruments which allow for the full or partial transfer of third party credit risk, with respect to a particular entity or entities, from one counterparty to the other. The Fund enters into credit default swaps as a “seller” or “buyer” of protection primarily to gain or reduce exposure to the investment grade and/or high yield bond market. A seller of credit default swaps is selling credit protection or assuming credit risk with respect to the underlying entity or entities. The buyer in a credit default swap is obligated to pay the seller a periodic stream of payments over the term of the contract provided that no event of default on an underlying reference obligation has occurred. If a credit event occurs, as defined under the terms of the swap agreement, the
| | THE GUGGENHEIM FUNDS SEMI-ANNUAL REPORT | 81 |
NOTES TO CONSOLIDATED FINANCIAL STATEMENTS (Unaudited)(continued) |
seller will either (i) pay to the buyer of protection an amount equal to the notional amount of the swap and take delivery of the referenced obligation or underlying securities comprising the referenced index or (ii) pay a net settlement amount in the form of cash or securities equal to the notional amount of the swap less the recovery value of the referenced obligation or underlying securities comprising the referenced index. The notional amount reflects the maximum potential amount the seller of credit protection could be required to pay to the buyer if a credit event occurs. The seller of protection receives periodic premium payments from the buyer and may also receive or pay an upfront premium adjustment to the stated periodic payments. In the event a credit default occurs on a credit default swap referencing an index, a factor adjustment will take place and the buyer of protection will received a payment reflecting the par less the default recovery rate of the defaulted index component based on its weighting in the index. If no default occurs, the counterparty will pay the stream of payments and have no further obligations to the fund selling the credit protection. For a fund utilizing centrally cleared credit default swaps, the exchange bears the risk of loss resulting from a counterparty not being able to pay. For OTC credit default swaps, a fund bears the risk of loss of the amount expected to be received under a swap agreement in the event of the default or bankruptcy of a swap agreement counterparty, or in the case of a credit default swap in which a fund is selling credit protection, the default of a third party issuer.
The quoted market prices and resulting market values for credit default swap agreements on securities and credit indices serve as an indicator of the current status of the payment/performance risk and represent the likelihood of an expected liability (or profit) for the credit derivative had the notional amount of the swap agreement been closed/sold as of the period end. Increasing market values, in absolute terms when compared to the notional amount of the swap, represent a deterioration of the referenced entity’s credit soundness and a greater likelihood or risk of default or other credit event occurring as defined under the terms of the agreement.
The following table represents the Fund’s use and volume of credit default swaps on a monthly basis:
| | | Average Notional Amount | |
Use | | Protection Sold | | | Protection Purchased | |
Hedge, Index Exposure | | $ | 54,417,767 | | | $ | 782,350,000 | |
Forward Foreign Currency Exchange Contracts
A forward foreign currency exchange contract is an agreement between two parties to exchange two designated currencies at a specific time in the future. Certain types of contracts may be cash settled, in an amount equal to the change in exchange rates during the term of the contract. The contracts can be used to hedge or manage exposure to foreign currency risks with portfolio investments or to gain exposure to foreign currencies.
82 | THE GUGGENHEIM FUNDS SEMI-ANNUAL REPORT | |
NOTES TO CONSOLIDATED FINANCIAL STATEMENTS (Unaudited)(continued) |
The market value of a forward foreign currency exchange contract changes with fluctuations in foreign currency exchange rates. Furthermore, the Fund may be exposed to risk if the counterparties cannot meet the contract terms or if the currency value changes unfavorably as compared to the U.S. dollar.
The following table represents the Fund’s use, and volume of forward foreign currency exchange contracts on a monthly basis:
| | | Average Value | |
Use | | Purchased | | | Sold | |
Hedge, Income | | $ | 1,004,962,192 | | | $ | 1,843,945,328 | |
Derivative Investment Holdings Categorized by Risk Exposure
The following is a summary of the location of derivative investments on the Fund’s Consolidated Statement of Assets and Liabilities as of March 31, 2020:
Derivative Investment Type | Asset Derivatives | Liability Derivatives |
Commodity contracts | Variation margin on futures contracts | — |
Credit contracts | Unrealized appreciation on OTC swap agreements | Unamortized upfront premiums received on credit default swap agreements |
| | Variation margin on credit default swap agreements |
Interest Rate contracts | Investments in unaffiliated issuers, at value | Unrealized depreciation on OTC swap agreements |
| | Unrealized appreciation on OTC swap agreements | Unamortized upfront premiums received on interest rate swap agreements |
| Unamortized upfront premiums paid on interest rate swap agreements | Variation margin on interest rate swap agreements |
Currency contracts | Unrealized appreciation on forward foreign currency exchanges contracts | Unrealized depreciation on forward foreign currency exchanges contracts |
The following table sets forth the fair value of the Fund’s derivative investments categorized by primary risk exposure at March 31, 2020:
| | Asset Derivative Investments Value | |
| | Swaps
Interest Rate
Risk* | | | Futures
Commodity
Risk* | | | Swaps
Credit
Risk* | | | Options
Purchased
Interest Rate
Risk | | | Forward
Foreign Currency
Exchange
Risk | | | Total Value at
March 31,
2020 | |
| | $ | 1,082,418 | | | $ | — | | | $ | 711,880 | | | $ | 11,625,000 | | | $ | 275,670,146 | | | $ | 289,089,444 | |
| | THE GUGGENHEIM FUNDS SEMI-ANNUAL REPORT | 83 |
NOTES TO CONSOLIDATED FINANCIAL STATEMENTS (Unaudited)(continued) |
| | Liability Derivative Investments Value | |
| | Swaps
Interest Rate
Risk* | | | Futures
Commodity
Risk* | | | Swaps
Credit
Risk* | | | Options
Purchased
Interest Rate
Risk | | | Forward
Foreign Currency
Exchange
Risk | | | Total Value at
March 31,
2020 | |
| | $ | 39,181,635 | | | $ | 294,252 | | | $ | — | | | $ | — | | | $ | 225,975,448 | | | $ | 265,451,335 | |
* | Includes cumulative appreciation (depreciation) of exchange-traded, OTC and centrally cleared derivatives as reported on the Consolidated Schedule of Investments. For exchange-traded and centrally cleared derivatives, variation margin is reported within the Consolidated Statement of Assets and Liabilities. |
The following is a summary of the location of derivative investments on the Fund’s Consolidated Statement of Operations for the period ended March 31, 2020:
Derivative Investment Type | Location of Gain (Loss) on Derivatives |
Interest Rate/Commodity contracts | Net realized gain (loss) on futures contracts |
| Net change in unrealized appreciation (depreciation) on futures contracts |
Credit/Interest Rate contracts | Net realized gain (loss) on swap agreements |
| Net change in unrealized appreciation (depreciation) on swap agreements |
Interest Rate contracts | Net realized gain (loss) on options purchased |
| | Net change in unrealized appreciation (depreciation) on options purchased |
Currency contracts | Net realized gain (loss) on forward foreign currency exchange contracts |
| | Net change in unrealized appreciation (depreciation) on forward foreign currency exchange contracts |
The following is a summary of the Fund’s realized gain (loss) and change in unrealized appreciation (depreciation) on derivative investments recognized on the Consolidated Statement of Operations categorized by primary risk exposure for the period ended March 31, 2020:
| | Realized Gain (Loss) on Derivative Investments Recognized on the Consolidated Statement of Operations | |
| | Futures
Interest Rate
Risk | | | Swaps
Interest Rate
Risk | | | Futures
Commodity
Risk | | | Swaps
Credit
Risk | | | Options
Purchased
Interest Rate
Risk | | | Forward
Foreign
Currency
Exchange
Risk | | | Total | |
| | $ | 1,924,249 | | | $ | (2,035,334 | ) | | $ | 33,894,017 | | | $ | (21,984,699 | ) | | $ | (483,700 | ) | | $ | 8,447,730 | | | $ | 19,762,263 | |
84 | THE GUGGENHEIM FUNDS SEMI-ANNUAL REPORT | |
NOTES TO CONSOLIDATED FINANCIAL STATEMENTS (Unaudited)(continued) |
| | Change in Unrealized Appreciation (Depreciation) on Derivative Investments
Recognized on the Consolidated Statement of Operations | |
| | Futures
Interest Rate
Risk | | | Swaps
Interest Rate
Risk | | | Futures
Commodity
Risk | | | Swaps
Credit
Risk | | | Options
Purchased
Interest Rate
Risk | | | Forward
Foreign
Currency
Exchange
Risk | | | Total | |
| | $ | (909,673 | ) | | $ | (7,696,217 | ) | | $ | (294,252 | ) | | $ | 17,078,423 | | | $ | 2,811,537 | | | $ | 24,768,901 | | | $ | 35,758,719 | |
In conjunction with short sales and the use of derivative instruments, the Fund is required to maintain collateral in various forms. Depending on the financial instrument utilized and the broker involved, the Fund uses margin deposits at the broker, cash and/or securities segregated at the custodian bank, discount notes or repurchase agreements allocated to the Fund as collateral.
Foreign Investments
There are several risks associated with exposure to foreign currencies, foreign issuers and emerging markets. A fund’s indirect and direct exposure to foreign currencies subjects the Fund to the risk that those currencies will decline in value relative to the U.S. dollar, or in the case of short positions, that the U.S. dollar will decline in value relative to the currency being hedged. Currency rates in foreign countries may fluctuate significantly over short periods of time for a number of reasons, including changes in interest rates and the imposition of currency controls or other political developments in the U.S. or abroad. In addition, the Fund may incur transaction costs in connection with conversions between various currencies. The Fund may, but is not obligated to, engage in currency hedging transactions, which generally involve buying currency forward, options or futures contracts. However, not all currency risks may be effectively hedged, and in some cases the costs of hedging techniques may outweigh expected benefits. In such instances, the value of securities denominated in foreign currencies can change significantly when foreign currencies strengthen or weaken relative to the U.S. dollar.
The Fund may invest in securities of foreign companies directly, or in financial instruments, such as ADRs and exchange-traded funds, which are indirectly linked to the performance of foreign issuers. Foreign markets can be more volatile than the U.S. market due to increased risks of adverse issuer, political, regulatory, market, or economic developments and can perform differently from the U.S. market. Investing in securities of foreign companies directly, or in financial instruments that are indirectly linked to the performance of foreign issuers, may involve risks not typically associated with investing in U.S. issuers. The value of securities denominated in foreign currencies, and of dividends from such securities, can change significantly when foreign currencies strengthen or weaken relative to the U.S. dollar. Foreign securities markets generally have less trading volume and less liquidity than U.S. markets, and prices in some foreign markets may fluctuate more than those of securities traded on U.S. markets. Many foreign countries lack accounting and disclosure standards comparable to those that apply to U.S. companies, and it may be more difficult to obtain reliable information regarding a foreign issuer’s financial
| | THE GUGGENHEIM FUNDS SEMI-ANNUAL REPORT | 85 |
NOTES TO CONSOLIDATED FINANCIAL STATEMENTS (Unaudited)(continued) |
condition and operations. Transaction costs and costs associated with custody services are generally higher for foreign securities than they are for U.S. securities. Some foreign governments levy withholding taxes against dividend and interest income. Although in some countries portions of these taxes are recoverable, the non-recovered portion will reduce the income received by the Funds.
The Trust has established counterparty credit guidelines and enters into transactions only with financial institutions of investment grade or better. The Trust monitors the counterparty credit risk.
Note 3 – Offsetting
In the normal course of business, the Fund enters into transactions subject to enforceable master netting arrangements or other similar arrangements. Generally, the right to offset in those agreements allows the Fund to counteract the exposure to a specific counterparty with collateral received from or delivered to that counterparty based on the terms of the arrangements. These arrangements provide for the right to liquidate upon the occurrence of an event of default, credit event upon merger or additional termination event.
In order to better define its contractual rights and to secure rights that will help the Fund mitigate its counterparty risk, the Fund may enter into an International Swaps and Derivatives Association, Inc. Master Agreement (“ISDA Master Agreement”) or similar agreement with its derivative contract counterparties. An ISDA Master Agreement is a bilateral agreement between a fund and a counterparty that governs OTC derivatives, including foreign exchange contracts, and typically contains, among other things, collateral posting terms and netting provisions in the event of a default and/or termination event. The provisions of the ISDA Master Agreement typically permit a single net payment in the event of a default (close-out netting) or similar event, including the bankruptcy or insolvency of the counterparty.
For derivatives traded under an ISDA Master Agreement, the collateral requirements are typically calculated by netting the mark-to-market amount for each transaction under such agreement and comparing that amount to the value of any collateral currently pledged by the Fund and the counterparty. For financial reporting purposes, cash collateral that has been pledged to cover obligations of the Fund and cash collateral received from the counterparty, if any, are reported separately on the Consolidated Statement of Assets and Liabilities as segregated cash with broker/receivable for variation margin, or payable for swap settlement/variation margin. Cash and/or securities pledged or received as collateral by the Fund in connection with an OTC derivative subject to an ISDA Master Agreement generally may not be invested, sold or rehypothecated by the counterparty or the Fund, as applicable, absent an event of default under such agreement, in which case such collateral generally may be applied towards obligations due to and payable by such counterparty or the Fund, as applicable. Generally, the amount of collateral due from or to a counterparty must exceed a minimum transfer amount threshold (e.g., $300,000) before a transfer is required to be made. To the extent amounts due to the Fund from its counterparties are not fully collateralized, contractually or otherwise, the Fund bears the risk of loss from
86 | THE GUGGENHEIM FUNDS SEMI-ANNUAL REPORT | |
NOTES TO CONSOLIDATED FINANCIAL STATEMENTS (Unaudited)(continued) |
counterparty nonperformance. The Fund attempts to mitigate counterparty risk by only entering into agreements with counterparties that they believe to be of good standing and by monitoring the financial stability of those counterparties.
For financial reporting purposes, the Fund does not offset derivative assets and derivative liabilities that are subject to netting arrangements in the Consolidated Statement of Assets and Liabilities.
The following tables present derivative financial instruments and secured financing transactions that are subject to enforceable netting arrangements:
| | | | | | | | | | | | | | | Gross Amounts Not
Offset in the Consolidated
Statement of Assets
and Liabilities | | | | | |
Instrument | | Gross
Amounts of
Recognized
Assets1 | | | Gross
Amounts
Offset in the
Consolidated
Statement of
Assets and
Liabilities | | | Net Amount
of Assets
Presented
on the
Consolidated
Statement of
Assets and
Liabilities | | | Financial
Instruments | | | Cash
Collateral
Received | | | Net Amount | |
Total return swap agreements | | $ | 1,098,077 | | | $ | — | | | $ | 1,098,077 | | | $ | — | | | $ | — | | | $ | 1,098,077 | |
Forward foreign currency exchange contracts | | | 275,670,146 | | | | — | | | | 275,670,146 | | | | (226,006,358 | ) | | | (46,631,169 | ) | | | 3,032,619 | |
Options purchased | | | 11,625,000 | | | | — | | | | 11,625,000 | | | | (1,354,530 | ) | | | (4,216,188 | ) | | | 6,054,282 | |
| | | | | | | | | | | | | | | Gross Amounts Not
Offset in the Consolidated
Statement of Assets
and Liabilities | | | | | |
Instrument | | Gross
Amounts of
Recognized
Liabilities1 | | | Gross
Amounts
Offset in the
Consolidated
Statement of
Assets and
Liabilities | | | Net Amount
of Liabilities
Presented
on the
Consolidated
Statement of
Assets and
Liabilities | | | Financial
Instruments | | | Cash
Collateral
Pledged | | | Net Amount | |
Total return swap agreements | | $ | 194,592 | | | $ | — | | | $ | 194,592 | | | $ | (30,910 | ) | | $ | — | | | $ | 163,682 | |
Forward foreign currency exchange contracts | | | 225,975,448 | | | | — | | | | 225,975,448 | | | | (225,975,448 | ) | | | — | | | | — | |
Interest Rate Swap Agreements | | | 1,354,530 | | | | — | | | | 1,354,530 | | | | (1,354,530 | ) | | | — | | | | — | |
1 | Exchange-traded or centrally-cleared derivatives are excluded from these reported amounts. |
| | THE GUGGENHEIM FUNDS SEMI-ANNUAL REPORT | 87 |
NOTES TO CONSOLIDATED FINANCIAL STATEMENTS (Unaudited)(continued) |
The Fund has the right to offset deposits against any related derivative liabilities outstanding with each counterparty with the exception of exchange-traded or centrally-cleared derivatives. The following table presents deposits held by others in connection with derivative investments and repurchase agreements as of March 31, 2020.
Counterparty | Asset Type | | Cash Pledged | | | Cash Received | |
Barclays Bank plc | Forward foreign currency exchange contracts | | $ | — | | | $ | 5,679,000 | |
Barclays Bank plc | Repurchase agreements | | | — | | | | 496,000 | |
BNP Paribas | Repurchase agreements | | | — | | | | 2,902,000 | |
BofA Securities, Inc. | Credit default swap agreements | | | 19,598,796 | | | | — | |
BofA Securities, Inc. | Futures contracts | | | 16,951,200 | | | | — | |
BofA Securities, Inc. | Interest rate swap agreements | | | 46,286,420 | | | | — | |
Citibank, N.A., New York | Forward foreign currency exchange contracts | | | — | | | | 31,139,903 | |
Citigroup | Repurchase agreements | | | — | | | | 517,000 | |
Deutsche Bank | Forward foreign currency exchange contracts, Total return swap agreements | | | — | | | | 340,000 | |
Goldman Sachs International | Forward foreign currency exchange contracts, Interest rate swap agreements | | | — | | | | 5,610,000 | |
JPMorgan Chase Bank, N.A. | Forward foreign currency exchange contracts | | | — | | | | 4,780,000 | |
Morgan Stanley Capital Services LLC | Forward foreign currency exchange contracts | | | — | | | | 4,320,000 | |
Societe Generale | Repurchase agreements | | | — | | | | 19,696,000 | |
| | | | | 82,836,416 | | | | 75,479,903 | |
Note 4 – Fair Value Measurement
In accordance with U.S. GAAP, fair value is defined as the price that the Fund would receive to sell an investment or pay to transfer a liability in an orderly transaction with an independent buyer in the principal market, or in the absence of a principal market, the most advantageous market for the investment or liability. U.S. GAAP establishes a three-tier fair value hierarchy based on the types of inputs used to value assets and liabilities and requires corresponding disclosure. The hierarchy and the corresponding inputs are summarized below:
Level 1 — | quoted prices in active markets for identical assets or liabilities. |
Level 2 — | significant other observable inputs (for example quoted prices for securities that are similar based on characteristics such as interest rates, prepayment speeds, credit risk, etc.). |
Level 3 — | significant unobservable inputs based on the best information available under the circumstances, to the extent observable inputs are not available, which may include assumptions. |
88 | THE GUGGENHEIM FUNDS SEMI-ANNUAL REPORT | |
NOTES TO CONSOLIDATED FINANCIAL STATEMENTS (Unaudited)(continued) |
The types of inputs available depend on a variety of factors, such as the type of security and the characteristics of the markets in which it trades, if any. Fair valuation determinations that rely on fewer or no observable inputs require greater judgment. Accordingly, fair value determinations for Level 3 securities require the greatest amount of judgment.
Independent pricing services are used to value a majority of the Fund’s investments. When values are not available from a pricing service, they will be determined using a variety of sources and techniques, including: market prices; broker quotes; and models which derive prices based on inputs such as prices of securities with comparable maturities and characteristics or based on inputs such as anticipated cash flows or collateral, spread over U.S. Treasury securities, and other information and analysis. A significant portion of the Fund’s assets and liabilities are categorized as Level 2, as indicated in this report.
Quotes from broker-dealers, adjusted for fluctuations in criteria such as credit spreads and interest rates, may also be used to value the Fund’s assets and liabilities, i.e. prices provided by a broker-dealer or other market participant who has not committed to trade at that price. Although quotes are typically received from established market participants, the Fund may not have the transparency to view the underlying inputs which support the market quotations. Significant changes in a quote would generally result in significant changes in the fair value of the security.
Certain fixed income securities are valued by obtaining a monthly quote from a broker-dealer, adjusted for fluctuations in criteria such as credit spreads and interest rates.
Certain loans and other securities are valued using a single daily broker quote or a price from a third party vendor based on a single daily or monthly broker quote.
The inputs or methodologies used for valuing securities are not necessarily an indication of the risk associated with investing in those securities. The suitability of the techniques and sources employed to determine fair valuation are regularly monitored and subject to change.
Note 5 – Investment Advisory Agreement and Other Agreements
Under the terms of an investment advisory contract, the Fund pays GI investment advisory fees calculated at an annualized rate of 0.89% of the average daily net assets of the Fund. A breakpoint of 5 basis points (0.05%) on average daily net assets above $5 billion will apply to the Fund’s advisory fees.
GI has contractually agreed to waive the management fee it receives from the Subsidiary in an amount equal to the management fee paid to GI by the Subsidiary. This undertaking will continue in effect for so long as the Fund invests in the Subsidiary, and may not be terminated by GI unless GI obtains the prior approval of the Fund’s Board for such termination. Fees waived under this arrangement are not subject to reimbursement to GI. For the period ended March 31, 2020, the Fund waived $271,135 related to advisory fees in the Subsidiary.
| | THE GUGGENHEIM FUNDS SEMI-ANNUAL REPORT | 89 |
NOTES TO CONSOLIDATED FINANCIAL STATEMENTS (Unaudited)(continued) |
GI pays operating expenses on behalf of the Trust, such as audit and accounting related services, legal services, custody, printing and mailing, among others, on a pass-through basis. Such expenses are allocated to various Funds within the complex based on relative net assets.
The Board has adopted Distribution Plans related to the offering of A-Class, C-Class and P-Class shares pursuant to Rule 12b-1 under the 1940 Act. The plans provide for payments at an annual rate of 0.25% of the average daily net assets of the Fund’s A-Class and P-Class shares, and 1.00% of the average daily net assets of the Fund’s C-Class shares.
The investment advisory contract for the Fund provides that the total expenses be limited to a percentage of average net assets for each class of shares, exclusive of brokerage costs, dividends or interest on securities sold short, expenses of other investment companies in which a Fund invests, interest, taxes, litigation, indemnification and extraordinary expenses. The limits are listed below:
| | Limit | | | Effective
Date | | | Contract
End Date | |
Macro Opportunities Fund - A-Class | | | 1.36 | % | | | 11/30/12 | | | | 02/01/21 | |
Macro Opportunities Fund - C-Class | | | 2.11 | % | | | 11/30/12 | | | | 02/01/21 | |
Macro Opportunities Fund - P-Class | | | 1.36 | % | | | 05/01/15 | | | | 02/01/21 | |
Macro Opportunities Fund - Institutional Class | | | 0.95 | % | | | 11/30/12 | | | | 02/01/21 | |
Macro Opportunities Fund - R6-Class | | | 0.95 | % | | | 03/13/19 | | | | 02/01/21 | |
GI is entitled to reimbursement by the Fund for fees waived or expenses reimbursed during any of the previous 36 months, beginning on the date of the expense limitation agreement, if on any day the estimated operating expenses are less than the indicated percentages. For purposes of this arrangement, GI is entitled to recoupment of previously waived fees or reimbursed expenses for 36 months from the date of the waiver or reimbursement by GI. At March 31, 2020, the amount of fees waived or expenses reimbursed that are subject to recoupment and will expire during the years ended September 30, are presented in the following table:
| | 2020 | | | 2021 | | | 2022 | | | 2023 | | | Total | |
A-Class | | $ | 517,185 | | | $ | 369,679 | | | $ | 254,243 | | | $ | 146,827 | | | $ | 1,287,934 | |
C-Class | | | 95,550 | | | | 169,716 | | | | 126,349 | | | | 79,995 | | | | 471,610 | |
P-Class | | | 79,907 | | | | 123,284 | | | | 49,360 | | | | 34,598 | | | | 287,149 | |
Institutional Class | | | 2,311,414 | | | | 5,293,700 | | | | 6,566,140 | | | | 3,491,614 | | | | 17,662,868 | |
R6-Class | | | — | | | | — | | | | 4,038 | | | | 19,318 | | | | 23,356 | |
For the period ended March 31, 2020, GI recouped $96,152 from the Fund.
If the Fund invests in a fund that is advised by the same adviser or an affiliated adviser, the investing Fund’s adviser has agreed to waive fees at the investing fund level to the extent necessary to offset the proportionate share of any management fee paid by the Fund with respect to its investment in such affiliated fund. Fee waivers will be calculated at the investing Fund level
90 | THE GUGGENHEIM FUNDS SEMI-ANNUAL REPORT | |
NOTES TO CONSOLIDATED FINANCIAL STATEMENTS (Unaudited)(continued) |
without regard to any expense cap, if any, in effect for the investing Fund. Fees waived under this arrangement are not subject to reimbursement to GI. For the period ended March 31, 2020, the Fund waived $1,134,918 related to investments in affiliated funds.
For the period ended March 31, 2020, GFD retained sales charges of $87,029 relating to sales of A-Class shares of the Trust.
Certain trustees and officers of the Trust are also officers of GI and/or GFD. The Trust does not compensate its officers or trustees who are officers, directors and/or employees of GI or GFD.
MUFG Investor Services (US), LLC (“MUIS”) acts as the Fund’s administrator, transfer agent and accounting agent. As administrator, transfer agent and accounting agent, MUIS maintains the books and records of the Fund’s securities and cash. The Bank of New York Mellon Corp. (“BNY”) acts as the Fund’s custodian. As custodian, BNY is responsible for the custody of the Fund’s assets. For providing the aforementioned administrative and accounting services, MUIS is entitled to receive a monthly fee equal to a percentage of the Fund’s average daily net assets and out of pocket expenses. For providing the aforementioned transfer agent and custodian services, MUIS and BNY are entitled to receive a monthly fee based on the number of transactions during the month and the number of accounts under management, subject to certain minimum monthly fees, and out of pocket expenses.
Note 6 – Reverse Repurchase Agreements
The Fund may enter into reverse repurchase agreements. Under a reverse repurchase agreement, a Fund sells securities and agrees to repurchase them at a particular price at a future date. In the event the buyer of securities under a reverse repurchase agreement files for bankruptcy or becomes insolvent, such buyer or its trustee or receiver may receive an extension of time to determine whether to enforce the Fund’s obligation to repurchase the securities, and the Fund’s use of the proceeds of the reverse repurchase agreement may effectively be restricted pending such decision.
For the period ended March 31, 2020, the Fund entered into reverse repurchase agreements:
| | Number of Days
Outstanding | | | Balance at
March 31, 2020 | | | Average Balance
Outstanding | | | Average
Interest Rate | |
| | | | 13 | | | $ | 67,372,347 | | | $ | 62,628,010 | | | | 1.39 | % |
| | THE GUGGENHEIM FUNDS SEMI-ANNUAL REPORT | 91 |
NOTES TO CONSOLIDATED FINANCIAL STATEMENTS (Unaudited)(continued) |
The following table presents reverse repurchase agreements that are subject to netting arrangements and offset in the Consolidated Statement of Assets of Liabilities in conformity with U.S. GAAP:
| | | | | | | | | | | | | | | Gross Amounts Not
Offset in the Consolidated
Statement of Assets
and Liabilities | | | | | |
Instrument | | Gross
Amounts of
Recognized
Liabilities1 | | | Gross
Amounts
Offset in the
Consolidated
Statement of
Assets and
Liabilities | | | Net Amount
of Liabilities
Presented on
the
Consolidated
Statement of
Assets and
Liabilities | | | Financial
Instruments | | | Cash
Collateral
Pledged | | | Net Amount | |
Reverse Repurchase Agreements | | $ | 67,372,347 | | | $ | — | | | $ | 67,372,347 | | | $ | (67,372,347 | ) | | $ | — | | | $ | — | |
As of March 31, 2020, there was $67,372,347 in reverse repurchase agreements outstanding. The Fund had outstanding reverse repurchase agreements with various counterparties. Details of the reverse repurchase agreements by counterparty are as follows:
Counterparty | | Range of
Interest Rates | | | Maturity Dates | | | Repurchase Price | |
Credit Suisse | | | 1.50%-2.25% | * | | | Open Maturity | | | $ | 57,179,254 | |
J.P. Morgan Securities LLC | | | 3.00%-3.25% | | | | 04/24/20 | | | | 10,193,093 | |
| | | | | | | | | | | $ | 67,372,347 | |
* | The rate is adjusted periodically by the counterparty, subject to approval by the Adviser, and is not based upon a set reference rate and spread. Rate indicated is the rate effective at March 31, 2020. |
The following is a summary of the remaining contractual maturities of the reverse repurchase agreements outstanding as of period-end, aggregated by asset class of the related collateral pledged by the Fund:
| | | | | Overnight and
Continuous | | | Up to 30 days | | | Total | |
Corporate Bonds | | | $ | 57,179,254 | | | $ | 10,193,093 | | | $ | 67,372,347 | |
Gross amount of recognized liabilities for reverse repurchase agreements | | | $ | 57,179,254 | | | $ | 10,193,093 | | | $ | 67,372,347 | |
92 | THE GUGGENHEIM FUNDS SEMI-ANNUAL REPORT | |
NOTES TO CONSOLIDATED FINANCIAL STATEMENTS (Unaudited)(continued) |
Note 7 – Federal Income Tax Information
The Fund intends to comply with the provisions of Subchapter M of the Internal Revenue Code applicable to regulated investment companies and will distribute substantially all taxable net investment income and capital gains sufficient to relieve the Fund from all, or substantially all, federal income, excise and state income taxes. Therefore, no provision for federal or state income tax or federal excise tax is required.
Tax positions taken or expected to be taken in the course of preparing the Fund’s tax returns are evaluated to determine whether the tax positions are “more-likely-than-not” of being sustained by the applicable tax authority. Tax positions not deemed to meet the more-likely-than-not threshold would be recorded as a tax benefit or expense in the current year. Management has analyzed the Fund’s tax positions taken, or to be taken, on U.S. federal income tax returns for all open tax years, and has concluded that no provision for income tax is required in the Fund’s consolidated financial statements. The Fund’s U.S. federal income tax returns are subject to examination by the Internal Revenue Service (“IRS”) for a period of three years after they are filed.
The Fund intends to invest up to 25% of its assets in the Subsidiary which is expected to provide the Fund with exposure to the commodities markets within the limitations of the U.S. federal income tax requirements under Subchapter M of the Internal Revenue Code. The Fund has received a private letter ruling from the IRS that concludes that the income the Fund receives from the Subsidiary will constitute qualifying income for purposes of Subchapter M of the Internal Revenue Code. The Subsidiary will be classified as a corporation for U.S. federal income tax purposes. A foreign corporation, such as the Subsidiary, will generally not be subject to U.S. federal income taxation unless it is deemed to be engaged in a U.S. trade or business. If during a taxable year, the Subsidiary’s taxable losses (and other deductible items) exceed its income and gains, the net loss will not pass through to the Fund as a deductible amount for U.S. federal income tax purposes and cannot be carried forward to reduce future income from the Subsidiary in subsequent years.
At March 31, 2020, the cost of investments for U.S. federal income tax purposes, the aggregate gross unrealized appreciation for all investments for which there was an excess of value over tax cost, and the aggregate gross unrealized depreciation for all investments for which there was an excess of tax cost over value, were as follows:
| | Tax
Cost | | | Tax
Unrealized
Appreciation | | | Tax
Unrealized
Depreciation | | | Net
Unrealized
Depreciation | |
| | | $ | 4,640,847,585 | | | $ | 304,188,330 | | | $ | (697,542,799 | ) | | $ | (393,354,469 | ) |
| | THE GUGGENHEIM FUNDS SEMI-ANNUAL REPORT | 93 |
NOTES TO CONSOLIDATED FINANCIAL STATEMENTS (Unaudited)(continued) |
Note 8 – Securities Transactions
For the period ended March 31, 2020, the cost of purchases and proceeds from sales of investment securities, excluding government securities, short-term investments and derivatives, were as follows:
| | Purchases | | | Sales | |
| | $ | 985,716,293 | | | $ | 2,060,729,976 | |
For the period ended March 31, 2020, the cost of purchases and proceeds from the sales of government securities were as follows:
| | Purchases | | | Sales | |
| | $ | — | | | $ | 192,033,385 | |
The Fund is permitted to purchase or sell securities from or to certain affiliated funds under specified conditions outlined in procedures adopted by the Board. The procedures have been designed to ensure that any purchase or sale of securities by the Fund from or to another fund or portfolio that is or could be considered an affiliate by virtue of having a common investment adviser (or affiliated investment advisers), common trustees and/or common officers complies with Rule 17a-7 of the 1940 Act. Further, as defined under these procedures, each transaction is effected at the current market price to save costs, where permissible. For the period ended March 31, 2020, the Fund engaged in purchases and sales of securities, pursuant to Rule 17a-7 of the 1940 Act, as follows:
| | Purchases | | | Sales | | | Realized
Gain | |
| | $ | 497,867 | | | $ | 8,048,018 | | | $ | 390,589 | |
Note 9 – Unfunded Loan Commitments
Pursuant to the terms of certain loan agreements, the Fund held unfunded loan commitments as of March 31, 2020. The Fund is obligated to fund these loan commitments at the borrower’s discretion.
94 | THE GUGGENHEIM FUNDS SEMI-ANNUAL REPORT | |
NOTES TO CONSOLIDATED FINANCIAL STATEMENTS (Unaudited)(continued) |
The unfunded loan commitments as of March 31, 2020, were as follows:
Borrower | | Maturity
Date | | | Face
Amount | | | Value | |
Aspect Software, Inc. | | | 07/15/23 | | | $ | 82,457 | | | $ | 917 | |
Epicor Software | | | 06/01/20 | | | | 2,000,000 | | | | 164,564 | |
EyeCare Partners LLC | | | 02/18/27 | | | | 189,189 | | | | 30,743 | |
Galls LLC | | | 01/31/24 | | | | 23,499 | | | | 1,956 | |
Galls LLC | | | 01/31/25 | | | | 1,300,936 | | | | 58,542 | |
National Technical Systems | | | 06/12/21 | | | | 1,875 | | | | 75 | |
Solera LLC | | | 03/03/21 | | | | 8,100,000 | | | | 210,271 | |
Trader Interactive | | | 06/15/23 | | | | 276,923 | | | | 22,201 | |
| | | | | | | | | | | $ | 489,269 | |
Note 10 – Restricted Securities
The securities below are considered illiquid and restricted under guidelines established by the Board:
Restricted
Securities | | Acquisition
Date | | | Cost | | | Value | |
Airplanes Pass Through Trust | | | | | | | | | | | | |
2001-1A, due 03/15/193 | | | 01/18/12 | | | $ | 1,691,717 | | | $ | 20,975 | |
Atlas Mara Ltd. | | | | | | | | | | | | |
8.00% due 12/31/20 | | | 10/01/15 | | | | 13,939,220 | | | | 11,664,000 | |
Basic Energy Services, Inc. | | | | | | | | | | | | |
10.75% due 10/15/23 | | | 09/25/18 | | | | 1,489,127 | | | | 982,500 | |
Copper River CLO Ltd. | | | | | | | | | | | | |
2007-1A, due 01/20/211 | | | 05/09/14 | | | | 1,599,169 | | | | 833,525 | |
Mirabela Nickel Ltd. | | | | | | | | | | | | |
due 06/24/193 | | | 12/31/13 | | | | 1,710,483 | | | | 94,271 | |
New Residential Advance Receivables Trust Advance Receivables Backed | | | | | | | | | | | | |
2019-T4, 2.80% due 10/15/51 | | | 10/01/19 | | | | 1,499,998 | | | | 1,453,621 | |
Princess Juliana International Airport Operating Company N.V. | | | | | | | | | | | | |
5.50% due 12/20/272 | | | 12/17/12 | | | | 1,322,708 | | | | 1,185,224 | |
Secured Tenant Site Contract Revenue Notes Series | | | | | | | | | | | | |
2018-1A, 4.70% due 06/15/48 | | | 05/25/18 | | | | 6,789,709 | | | | 5,612,721 | |
SPS Servicer Advance Receivables Trust Advance Receivables Backed Notes | | | | | | | | | | | | |
2019-T2, 2.77% due 10/15/52 | | | 10/10/19 | | | | 2,067,902 | | | | 1,998,485 | |
SPS Servicer Advance Receivables Trust Advance Receivables Backed Notes | | | | | | | | | | | | |
2019-T1, 2.34% due 10/15/51 | | | 10/10/19 | | | | 1,689,935 | | | | 1,652,454 | |
| | THE GUGGENHEIM FUNDS SEMI-ANNUAL REPORT | 95 |
NOTES TO CONSOLIDATED FINANCIAL STATEMENTS (Unaudited)(continued) |
Restricted
Securities | | Acquisition
Date | | | Cost | | | Value | |
SPS Servicer Advance Receivables Trust Advance Receivables Backed Notes | | | | | | | | | | | | |
2019-T1, 2.39% due 10/15/51 | | | 10/10/19 | | | $ | 1,373,958 | | | $ | 1,343,497 | |
Turbine Engines Securitization Ltd. | | | | | | | | | | | | |
2013-1A, 5.13% due 12/13/48 | | | 11/27/13 | | | | 1,960,845 | | | | 1,736,153 | |
Turbine Engines Securitization Ltd. | | | | | | | | | | | | |
2013-1A, 6.38% due 12/13/48 | | | 11/27/13 | | | | 1,450,354 | | | | 1,310,912 | |
| | | | | | | $ | 38,585,125 | | | $ | 29,888,338 | |
1 | Security has no stated coupon. However, it is expected to receive residual cash flow payments on defined deal dates. |
2 | Security was fair valued by the Valuation Committee at March 31, 2020. |
3 | Security is in default of interest and/or principal obligations. |
Note 11 – Line of Credit
The Trust, along with other affiliated trusts, secured a 364-day committed, $1,205,000,000 line of credit from Citibank, N.A., which was in place through October 4, 2019, at which time the line of credit was renewed with an increased commitment amount of $1,230,000,000. A Fund may draw (borrow) from the line of credit as a temporary measure for emergency purposes, to facilitate redemption requests, or for other short-term liquidity purposes consistent with the Fund’s investment objective and program. For example, it may be advantageous for the Fund to borrow money rather than sell existing portfolio positions to meet redemption requests. Fees related to borrowings, if any, vary under this arrangement between the greater of Citibank’s “base rate”, LIBOR plus 1%, or the federal funds rate plus 1/2 of 1%.
The commitment fee that may be paid by the Fund is at an annualized rate of 0.15% of the average daily amount of its allocated unused commitment amount. The allocated commitment fee amount for the Fund is referenced in the Consolidated Statement of Operations under “Line of credit fees”. The Fund did not have any borrowings under this agreement as of and for the period ended March 31, 2020.
Note 12 – Recent Accounting Pronouncements
In March 2017, the Financial Accounting Standards Board issued an Accounting Standards Update, ASU 2017-08, Receivables – Nonrefundable Fees and Other Costs (Subtopic 310-20), Premium Amortization on Purchased Callable Debt Securities (the “2017 ASU”) which amends the amortization period for certain purchased callable debt securities held at a premium, shortening such period to the earliest call date. The 2017 ASU does not require any accounting change for debt securities held at a discount; the discount continues to be amortized to maturity.
96 | THE GUGGENHEIM FUNDS SEMI-ANNUAL REPORT | |
NOTES TO CONSOLIDATED FINANCIAL STATEMENTS (Unaudited)(concluded) |
As of October 1, 2019, the Fund has fully adopted the provisions of the 2017 ASU which were applied through a modified retrospective transition approach, as prescribed. The adoption resulted in a cumulative effect adjustment to reduce amortized cost and increase unrealized appreciation of investments for the Fund in the amount of $198,064.
The adoption had no impact on total distributable earnings (loss), net assets, the current period results from operations, or any prior period information presented in the consolidated financial statements.
Note 13 – COVID-19 and Recent Developments
The global ongoing crisis caused by the outbreak of COVID-19 is causing materially reduced consumer demand and economic output, disrupting supply chains, resulting in market closures, travel restrictions and quarantines, and adversely impacting local and global economies. Investors should be aware that in light of the current uncertainty, volatility and distress in economies, financial markets, and labor and health conditions all over the world, the Fund’s investments and a shareholder’s investment in the Fund are subject to sudden and substantial losses, increased volatility and other adverse events. Firms through which investors invest with the Fund, the Fund, its service providers, the markets in which it invests and market intermediaries are also impacted by quarantines and similar measures intended to contain the ongoing pandemic, which can obstruct their functioning and subject them to heightened operational risks.
Note 14 – Subsequent Events
The Fund evaluated subsequent events through the date the financial statements were available for issue and determined there were no material events that would require adjustment to or disclosure in the Fund’s financial statements.
| | THE GUGGENHEIM FUNDS SEMI-ANNUAL REPORT | 97 |
OTHER INFORMATION (Unaudited) |
Proxy Voting Information
A description of the policies and procedures that the Trust uses to determine how to vote proxies relating to securities held in the Fund’s portfolios is available, without charge and upon request, by calling 800.820.0888. This information is also available from the EDGAR database on the SEC’s website at https://www.sec.gov.
Information regarding how the Fund voted proxies relating to portfolio securities during the most recent 12-month period ended June 30 is available without charge, upon request, by calling 800.820.0888. This information is also available from the EDGAR database on the SEC’s website at https://www.sec.gov.
Sector Classification
Information in the Schedule of Investments is categorized by sectors using sector-level Classifications defined by the Bloomberg Industry Classification System, a widely recognized industry classification system provider. The Fund’s registration statement has investment policies relating to concentration in specific sectors/industries. For purposes of these investment policies, the Fund usually classifies sectors/industries based on industry-level Classifications used by widely recognized industry classification system providers such as Bloomberg Industry Classification System, Global Industry Classification Standards and Barclays Global Classification Scheme.
Quarterly Portfolio Schedules Information
The Trust files its complete schedule of portfolio holdings with the SEC for the first and third quarters of each fiscal year as an exhibit to its reports on Form N-PORT, and for reporting periods ended prior to March 31, 2019, filed such information on Form N-Q. The Fund’s Forms N-PORT and N-Q are available on the SEC’s website at https://www.sec.gov. The Fund’s Forms N-PORT and N-Q may be reviewed and copied at the SEC’s Public Reference Room in Washington, DC, and that information on the operation of the Public Reference Room may be obtained by calling 800-SEC-0330. Copies of the portfolio holdings are also available to shareholders, without charge and upon request, by calling 800.820.0888.
98 | THE GUGGENHEIM FUNDS SEMI-ANNUAL REPORT | |
INFORMATION ON BOARD OF TRUSTEES AND OFFICERS (Unaudited) |
A Board of Trustees oversees the Trust, as well as other trusts of GI, in which its members have no stated term of service, and continue to serve after election until resignation. The Statement of Additional Information includes further information about Fund Trustees and Officers, and can be obtained without charge by visiting guggenheiminvestments.com or by calling 800.820.0888.
Name, Address*
and Year of Birth | Position(s)
Held with
Trust | Term of Office
and Length of
Time Served** | Principal Occupation(s)
During Past Five Years | Number of
Portfolios
in Fund
Complex
Overseen | Other
Directorships Held
by Trustees*** |
INDEPENDENT TRUSTEES | | | |
Randall C. Barnes (1951) | Trustee | Since 2014 | Current: Private Investor (2001-present).
Former: Senior Vice President and Treasurer, PepsiCo, Inc. (1993-1997); President, Pizza Hut International (1991-1993); Senior Vice President, Strategic Planning and New Business Development, PepsiCo, Inc. (1987-1990). | 157 | Current: Purpose Investments Funds (2013-present).
Former: Managed Duration Investment Grade Municipal Fund (2006-2016). |
Angela Brock-Kyle (1959) | Trustee | Since 2019 | Current: Founder and Chief Executive Officer, B.O.A.R.D.S. (2013-present).
Former: Senior Leader, TIAA (1987-2012). | 156 | Current: Hunt Companies, Inc. (2019-present).
Former: Infinity Property & Casualty Corp. (2014-2018). |
Donald A.
Chubb, Jr. (1946) | Trustee and Chair of the Valuation Oversight Committee | Since 1994 | Current: Retired
Former: Business broker and manager of commercial real estate, Griffith & Blair, Inc. (1997-2017). | 156 | Former: Midland Care, Inc. (2011-2016). |
| | THE GUGGENHEIM FUNDS SEMI-ANNUAL REPORT | 99 |
INFORMATION ON BOARD OF TRUSTEES AND OFFICERS (Unaudited)(continued) |
Name, Address*
and Year of Birth | Position(s)
Held with
Trust | Term of Office
and Length of
Time Served** | Principal Occupation(s)
During Past Five Years | Number of
Portfolios
in Fund
Complex
Overseen | Other
Directorships Held
by Trustees*** |
INDEPENDENT TRUSTEES - continued | | | |
Jerry B. Farley (1946) | Trustee and Chair of the Audit Committee | Since 2005 | Current: President, Washburn University (1997-present). | 156 | Current: CoreFirst Bank & Trust (2000-present).
Former: Westar Energy, Inc. (2004-2018). |
Roman
Friedrich III (1946) | Trustee and Chair of the Contracts Review Committee | Since 2014 | Current: Founder and Managing Partner, Roman Friedrich & Company (1998-present). | 156 | Former: Zincore Metals, Inc. (2009-2019). |
Thomas F.
Lydon, Jr. (1960) | Trustee and Vice Chair of the Contracts Review Committee | Since 2019 | Current: President, Global Trends Investments (1996-present); Co-Chief Executive Officer, ETF Flows, LLC (2019-present); Chief Executive Officer, Lydon Media (2016-present). | 156 | Current: US Global Investors (GROW) (1995-present).
Former: Harvest Volatility Edge Trust (3) (2017-2019). |
100 | THE GUGGENHEIM FUNDS SEMI-ANNUAL REPORT | |
INFORMATION ON BOARD OF TRUSTEES AND OFFICERS (Unaudited)(continued) |
Name, Address*
and Year of Birth | Position(s)
Held with
Trust | Term of Office
and Length of
Time Served** | Principal Occupation(s)
During Past Five Years | Number of
Portfolios
in Fund
Complex
Overseen | Other
Directorships Held
by Trustees*** |
INDEPENDENT TRUSTEES - continued | | | |
Ronald A. Nyberg (1953) | Trustee and Chair of the Nominating and Governance Committee | Since 2014 | Current: Partner, Momkus LLC (2016-present).
Former: Partner, Nyberg & Cassioppi, LLC (2000-2016); Executive Vice President, General Counsel, and Corporate Secretary, Van Kampen Investments (1982-1999). | 157 | Current: PPM Funds (9) (2018 - present); Edward-Elmhurst Healthcare System (2012-present).
Former: Western Asset Inflation-Linked Opportunities & Income Fund (2004-April 2020); Western Asset Inflation-Linked Income Fund (2003-April 2020); Managed Duration Investment Grade Municipal Fund (2003-2016). |
Sandra G. Sponem (1958) | Trustee | Since 2019 | Current: Retired.
Former: Senior Vice President and Chief Financial Officer, M.A. Mortenson-Companies, Inc. (2007-2017). | 156 | Current: SPDR Series Trust (78) (2018-present); SPDR Index Shares Funds (31) (2018-present); SSGA Active Trust (12) (2018-present); and SSGA Master Trust (1) (2018-present). |
| | THE GUGGENHEIM FUNDS SEMI-ANNUAL REPORT | 101 |
INFORMATION ON BOARD OF TRUSTEES AND OFFICERS (Unaudited)(continued) |
Name, Address*
and Year of Birth | Position(s)
Held with
Trust | Term of Office
and Length of
Time Served** | Principal Occupation(s)
During Past Five Years | Number of
Portfolios
in Fund
Complex
Overseen | Other
Directorships Held
by Trustees*** |
INDEPENDENT TRUSTEES - concluded | | | |
Ronald E.
Toupin, Jr. (1958) | Trustee, Chair of the Board and Chair of the Executive Committee | Since 2014 | Current: Portfolio Consultant (2010-present); Member, Governing Council, Independent Directors Council (2013-present); Governor, Board of Governors, Investment Company Institute (2018-present).
Former: Member, Executive Committee, Independent Directors Council (2016-2018); Vice President, Manager and Portfolio Manager, Nuveen Asset Management (1998-1999); Vice President, Nuveen Investment Advisory Corp. (1992-1999); Vice President and Manager, Nuveen Unit Investment Trusts (1991-1999); and Assistant Vice President and Portfolio Manager, Nuveen Unit Investment Trusts (1988-1999), each of John Nuveen & Co., Inc. (1982-1999). | 156 | Former: Western Asset Inflation-Linked Opportunities & Income Fund (2004-April 2020); Western Asset Inflation-Linked Income Fund (2003-April 2020); Managed Duration Investment Grade Municipal Fund (2003-2016). |
102 | THE GUGGENHEIM FUNDS SEMI-ANNUAL REPORT | |
INFORMATION ON BOARD OF TRUSTEES AND OFFICERS (Unaudited)(continued) |
Name, Address*
and Year of Birth | Position(s)
Held with
Trust | Term of Office
and Length of
Time Served** | Principal Occupation(s)
During Past Five Years | Number of
Portfolios
in Fund
Complex
Overseen | Other
Directorships Held
by Trustees*** |
INTERESTED TRUSTEE | | | |
Amy J. Lee**** (1961) | Trustee, Vice President and Chief Legal Officer | Since 2018 (Trustee) Since 2014 (Chief Legal Officer) Since 2007 (Vice President) | Current: Interested Trustee, certain other funds in the Fund Complex (2018-present); Chief Legal Officer, certain other funds in the Fund Complex (2014-present); Vice President, certain other funds in the Fund Complex (2007-present); Senior Managing Director, Guggenheim Investments (2012-present).
Former: President and Chief Executive Officer, certain other funds in the Fund Complex (2017-2019); Vice President, Associate General Counsel and Assistant Secretary, Security Benefit Life Insurance Company and Security Benefit Corporation (2004-2012). | 156 | None. |
* | The business address of each Trustee is c/o Guggenheim Investments, 227 West Monroe Street, Chicago, Illinois 60606. |
** | Each Trustee serves an indefinite term, until his or her successor is elected and qualified. Time served includes time served in the respective position for the Predecessor Corporation. |
*** | Each Trustee also serves on the boards of trustees of Guggenheim Funds Trust, Guggenheim Variable Funds Trust, Guggenheim Strategy Funds Trust, Fiduciary/Claymore Energy Infrastructure Fund, Guggenheim Taxable Municipal Managed Duration Trust, Guggenheim Strategic Opportunities Fund, Guggenheim Enhanced Equity Income Fund, Guggenheim Energy & Income Fund, Guggenheim Credit Allocation Fund, Rydex Series Funds, Rydex Dynamic Funds, Rydex Variable Funds and Transparent Value Trust. Messrs. Barnes and Nyberg also serve on the board of trustees of Advent Convertible & Income Fund. |
**** | This Trustee is deemed to be an “interested person” of the Fund under the 1940 Act by reason of her position with the Fund’s Investment Manager and/or the parent of the Investment Manager. |
| | THE GUGGENHEIM FUNDS SEMI-ANNUAL REPORT | 103 |
INFORMATION ON BOARD OF TRUSTEES AND OFFICERS (Unaudited)(continued) |
Name, Address*
and Year of Birth | Position(s)
Held with
Trust | Term of Office
and Length of
Time Served** | Principal Occupation(s)
During Past Five Years |
OFFICERS | | | |
Brian E. Binder (1972) | President and Chief Executive Officer | Since 2018 | Current: President and Chief Executive Officer, certain other funds in the Fund Complex (2018-present); President, Chief Executive Officer and Chairman of the Board of Managers, Guggenheim Funds Investment Advisors, LLC (2018-present); President and Chief Executive Officer, Security Investors, LLC (2018-present); Board Member of Guggenheim Partners Fund Management (Europe) Limited (2018-present); Senior Managing Director and Chief Administrative Officer, Guggenheim Investments (2018-present).
Former: Managing Director and President, Deutsche Funds, and Head of US Product, Trading and Fund Administration, Deutsche Asset Management (2013-2018); Managing Director, Head of Business Management and Consulting, Invesco Ltd. (2010-2012). |
James M. Howley (1972) | Assistant Treasurer | Since 2014 | Current: Managing Director, Guggenheim Investments (2004-present); Assistant Treasurer, certain other funds in the Fund Complex (2006-present).
Former: Manager, Mutual Fund Administration of Van Kampen Investments, Inc. (1996-2004). |
Mark E. Mathiasen (1978) | Secretary | Since 2014 | Current: Secretary, certain other funds in the Fund Complex (2007-present); Managing Director, Guggenheim Investments (2007-present). |
Glenn McWhinnie (1969) | Assistant Treasurer | Since 2016 | Current: Vice President, Guggenheim Investments (2009-present); Assistant Treasurer, certain other funds in the Fund Complex (2016-present). |
Michael P. Megaris (1984) | Assistant Secretary | Since 2014 | Current: Assistant Secretary, certain other funds in the Fund Complex (2014-present); Director, Guggenheim Investments (2012-present). |
Elisabeth Miller (1968) | Chief Compliance Officer | Since 2012 | Current: Chief Compliance Officer, certain other funds in the Fund Complex (2012-present); Senior Managing Director, Guggenheim Investments (2012-present). Vice President, Guggenheim Funds Distributors, LLC (2014-present).
Former: Chief Compliance Officer, Security Investors, LLC and Guggenheim Funds Investment Advisors, LLC (2012-2018); Chief Compliance Officer, Guggenheim Distributors, LLC (2009-2014); Senior Manager, Security Investors, LLC (2004-2014); Senior Manager, Guggenheim Distributors, LLC (2004-2014). |
104 | THE GUGGENHEIM FUNDS SEMI-ANNUAL REPORT | |
INFORMATION ON BOARD OF TRUSTEES AND OFFICERS (Unaudited)(continued) |
Name, Address*
and Year of Birth | Position(s)
Held with
Trust | Term of Office
and Length of
Time Served** | Principal Occupation(s)
During Past Five Years |
OFFICERS - continued | |
Margaux Misantone (1978) | AML Officer | Since 2017 | Current: Chief Compliance Officer, Security Investors, LLC and Guggenheim Funds Investment Advisors, LLC (2018-present); AML Officer, Security Investors, LLC and certain other funds in the Fund Complex (2017-present); Managing Director, Guggenheim Investments (2015-present).
Former: Assistant Chief Compliance Officer, Security Investors, LLC and Guggenheim Funds Investments Advisors, LLC (2015-2018). |
William Rehder (1967) | Assistant Vice President | Since 2018 | Current: Managing Director, Guggenheim Investments (2002-present). |
Kimberly J. Scott (1974) | Assistant Treasurer | Since 2014 | Current: Director, Guggenheim Investments (2012-present); Assistant Treasurer, certain other funds in the Fund Complex (2012-present).
Former: Financial Reporting Manager, Invesco, Ltd. (2010-2011); Vice President/Assistant Treasurer, Mutual Fund Administration for Van Kampen Investments, Inc./Morgan Stanley Investment Management (2009-2010); Manager of Mutual Fund Administration, Van Kampen Investments, Inc./Morgan Stanley Investment Management (2005-2009). |
Bryan Stone (1979) | Vice President | Since 2014 | Current: Vice President, certain other funds in the Fund Complex (2014-present); Managing Director, Guggenheim Investments (2013-present).
Former: Senior Vice President, Neuberger Berman Group LLC (2009-2013); Vice President, Morgan Stanley (2002-2009). |
| | THE GUGGENHEIM FUNDS SEMI-ANNUAL REPORT | 105 |
INFORMATION ON BOARD OF TRUSTEES AND OFFICERS (Unaudited)(concluded) |
Name, Address*
and Year of Birth | Position(s)
Held with
Trust | Term of Office
and Length of
Time Served** | Principal Occupation(s)
During Past Five Years |
OFFICERS - concluded | |
John L. Sullivan (1955) | Chief Financial Officer, Chief Accounting Officer and Treasurer | Since 2014 | Current: Chief Financial Officer, Chief Accounting Officer and Treasurer, certain other funds in the Fund Complex (2010-present); Senior Managing Director, Guggenheim Investments (2010-present).
Former: Managing Director and Chief Compliance Officer, each of the funds in the Van Kampen Investments fund complex (2004-2010); Managing Director and Head of Fund Accounting and Administration, Morgan Stanley Investment Management (2002-2004); Chief Financial Officer and Treasurer, Van Kampen Funds (1996-2004). |
Jon Szafran (1989) | Assistant Treasurer | Since 2017 | Current: Vice President, Guggenheim Investments (2017-present); Assistant Treasurer, certain other funds in the Fund Complex (2017-present).
Former: Assistant Treasurer of Henderson Global Funds and Manager of US Fund Administration, Henderson Global Investors (North America) Inc. (“HGINA”), (2017); Senior Analyst of US Fund Administration, HGINA (2014–2017); Senior Associate of Fund Administration, Cortland Capital Market Services, LLC (2013-2014); Experienced Associate, PricewaterhouseCoopers LLP (2012-2013). |
* | The business address of each officer is c/o Guggenheim Investments, 227 West Monroe Street, Chicago, Illinois 60606. |
** | Each officer serves an indefinite term, until his or her successor is duly elected and qualified. |
106 | THE GUGGENHEIM FUNDS SEMI-ANNUAL REPORT | |
GUGGENHEIM INVESTMENTS PRIVACY NOTICE (Unaudited) |
Who We Are
This Privacy Notice describes the data protection practices of Guggenheim Investments. Guggenheim Investments as used herein refers to the affiliated investment management businesses of Guggenheim Partners, LLC: Guggenheim Funds Investment Advisors, LLC, Guggenheim Partners Investment Management, LLC, Guggenheim Funds Distributors, LLC, Security Investors, LLC, Guggenheim Investment Advisors (Europe) Limited, Guggenheim Real Estate, LLC, GS Gamma Advisors, LLC, Guggenheim Partners India Management, LLC, Guggenheim Partners Europe Limited, as well as the funds in the Guggenheim Funds complex (the “Funds”) (“Guggenheim Investments,” “we,” “us,” or “our”).
Guggenheim Partners Investment Management Holdings, LLC, located at 330 Madison Avenue, New York, New York 10017 is the data controller for your information. The affiliates who are also controllers of certain of your information are: Guggenheim Investment Advisors (Europe) Limited, Guggenheim Partners Europe Limited, Guggenheim Partners, LLC, Guggenheim Funds Investment Advisors, LLC, Guggenheim Partners Investment Management, LLC, Guggenheim Funds Distributors, LLC and Security Investors, LLC, as well as the Funds.
Our Commitment to You
Guggenheim Investments considers your privacy our utmost concern. When you become our client or investor, you entrust us with not only your hard-earned money but also with your personal and financial information. Because we have access to your private information, we hold ourselves to the highest standards in its safekeeping and use. We strictly limit how we share your information with others, whether you are a current or former Guggenheim Investments client or investor.
The Information We Collect About You
We collect certain nonpublic personal information about you from information you provide on applications, other forms, our website, and/or from third parties including investment advisors. This information includes Social Security or other tax identification number, assets, income, tax information, retirement and estate plan information, transaction history, account balance, payment history, bank account information, marital status, family relationships, information that we collect on our website through the use of “cookies,” and other personal information that you or others provide to us. We may also collect such information through your inquiries by mail, e-mail or telephone. We may also collect customer due diligence information, as required by applicable law and regulation, through third party service providers.
How We Handle Your Personal Information
The legal basis for using your information as set out in this Privacy Notice is as follows: (a) use of your personal data is necessary to perform our obligations under any contract with you (such as a contract for us to provide financial services to you); or (b) where use of your personal data is not necessary for performance of a contract, use of your personal data is necessary for our
| | THE GUGGENHEIM FUNDS SEMI-ANNUAL REPORT | 107 |
GUGGENHEIM INVESTMENTS PRIVACY NOTICE (Unaudited)(continued) |
legitimate interests or the legitimate interests of others (for example, to enforce the legal terms governing our services, operate and market our website and other services we offer, ensure safe environments for our personnel and others, make and receive payments, prevent fraud and to know the customer to whom we are providing the services). Some processing is done to comply with applicable law.
In addition to the specific uses described above, we also use your information in the following manner:
| | ● | We use your information in connection with servicing your accounts. |
| | ● | We use information to respond to your requests or questions. For example, we might use your information to respond to your customer feedback. |
| | ● | We use information to improve our products and services. We may use your information to make our website and products better. We may use your information to customize your experience with us. |
| | ● | We use information for security purposes. We may use your information to protect our company and our customers. |
| | ● | We use information to communicate with you. For example, we will communicate with you about your account or our relationship. We may contact you about your feedback. We might also contact you about this Privacy Notice. We may also enroll you in our email newsletter. |
| | ● | We use information as otherwise permitted by law, as we may notify you. |
| | ● | Aggregate/Anonymous Data. We may aggregate and/or anonymize any information collected through the website so that such information can no longer be linked to you or your device (“Aggregate/Anonymous Information”). We may use Aggregate/Anonymous Information for any purpose, including without limitation for research and marketing purposes, and may also share such data with any third parties, including advertisers, promotional partners, and sponsors. |
We do not sell information about current or former clients or their accounts to third parties. Nor do we share this information, except when necessary to complete transactions at your request, to make you aware of investment products and services that we or our affiliates offer, or as permitted or required by law.
We provide information about you to companies and individuals not affiliated with Guggenheim Investments to complete certain transactions or account changes, or to perform services for us related to your account. For example, if you ask to transfer assets from another financial institution to Guggenheim Investments, we must provide certain information about you to that company to complete the transaction. We provide the third party with only the information necessary to carry out its responsibilities and only for that purpose. And we require these third
108 | THE GUGGENHEIM FUNDS SEMI-ANNUAL REPORT | |
GUGGENHEIM INVESTMENTS PRIVACY NOTICE (Unaudited)(continued) |
parties to treat your private information with the same high degree of confidentiality that we do. To alert you to other Guggenheim Investments products and services, we share your information within our family of affiliated companies. You may limit our sharing with affiliated companies as set out below. We may also share information with any successor to all or part of our business, or in connection with steps leading up to a merger or acquisition. For example, if part of our business was sold we may give customer information as part of that transaction. We may also share information about you with your consent.
We will release information about you if you direct us to do so, if we are compelled by law to do so, or in other circumstances as permitted by law (for example, to protect your account from fraud).
If you close your account(s) or become an inactive client or investor, we will continue to adhere to the privacy policies and practices described in this notice.
Opt-Out Provisions and Your Data Choices
The law allows you to “opt out” of certain kinds of information sharing with third parties. We do not share personal information about you with any third parties that triggers this opt-out right. This means YOU ARE ALREADY OPTED OUT.
When you are no longer our client or investor, we continue to share your information as described in this notice, and you may contact us at any time to limit our sharing by sending an email to CorporateDataPrivacy@GuggenheimPartners.com.
European Union Data Subjects and certain others: In addition to the choices set forth above, residents of the European Union and certain other jurisdictions have certain rights to (1) request access to or rectification or deletion of information we collect about them, (2) request a restriction on the processing of their information, (3) object to the processing of their information, or (4) request the portability of certain information. To exercise these or other rights, please contact us using the contact information below. We will consider all requests and provide our response within the time period stated by applicable law. Please note, however, that certain information may be exempt from such requests in some circumstances, which may include if we need to keep processing your information for our legitimate interests or to comply with a legal obligation. We may request you provide us with information necessary to confirm your identity before responding to your request.
Residents of France and certain other jurisdictions may also provide us with instructions regarding the manner in which we may continue to store, erase and share your information after your death, and where applicable, the person you have designated to exercise these rights after your death.
How We Protect Privacy Online
We take steps to protect your privacy when you use our web site – www.guggenheiminvestments.com – by using secure forms of online communication, including encryption technology, Secure Socket Layer (SSL) protocol, firewalls and user names and
| | THE GUGGENHEIM FUNDS SEMI-ANNUAL REPORT | 109 |
GUGGENHEIM INVESTMENTS PRIVACY NOTICE (Unaudited)(concluded) |
passwords. These safeguards vary based on the sensitivity of the information that we collect and store. However, we cannot and do not guarantee that these measures will prevent every unauthorized attempt to access, use, or disclose your information since despite our efforts, no Internet and/or other electronic transmissions can be completely secure. Our web site uses “http cookies”—tiny pieces of information that we ask your browser to store. We use cookies for session management and security features on the Guggenheim Investments web site. We do not use them to pull data from your hard drive, to learn your e-mail address, or to view data in cookies created by other web sites. We will not share the information in our cookies or give others access to it. See the legal information area on our web site for more details about web site security and privacy features.
How We Safeguard Your Personal Information and Data Retention
We restrict access to nonpublic personal information about you to our employees and in some cases to third parties (for example, the service providers described above) as permitted by law. We maintain strict physical, electronic and procedural safeguards that comply with federal standards to guard your nonpublic personal information.
We keep your information for no longer than necessary for the purposes for which it is processed. The length of time for which we retain information depends on the purposes for which we collected and use it and/or as required to comply with applicable laws. Information may persist in copies made for backup and business continuity purposes for additional time.
International Visitors
If you are not a resident of the United States, please be aware that your information may be transferred to, stored and processed in the United States where our servers are located and our databases are operated. The data protection and other laws of the United States and other countries might not be as comprehensive as those in your country.
In such cases, we ensure that a legal basis for such a transfer exists and that adequate protection is provided as required by applicable law, for example, by using standard contractual clauses or by transferring your data to a jurisdiction that has obtained an adequacy finding. Individuals whose data may be transferred on the basis of standard contractual clauses may contact us as described below.
We’ll Keep You Informed
If you have any questions or concerns about how we treat your personal data, we encourage you to consult with us first. You may also contact the relevant supervisory authority.
We reserve the right to modify this policy at any time and will inform you promptly of material changes. You may access our privacy policy from our web site at www.guggenheiminvestments.com. Should you have any questions regarding our privacy policy, contact us by email at CorporateDataPrivacy@GuggenheimPartners.com.
110 | THE GUGGENHEIM FUNDS SEMI-ANNUAL REPORT | |
This page intentionally left blank.
This page intentionally left blank.
This page intentionally left blank.
3.31.2020
Guggenheim Funds Semi-Annual Report
| |
Guggenheim Floating Rate Strategies Fund | | |
Beginning on January 1, 2021, paper copies of the Fund’s annual and semi-annual shareholder reports may no longer be sent by mail, unless you specifically request paper copies of the reports from a Fund or from your financial intermediary. Instead, the reports will be made available on a website, and you will be notified by mail each time a report is posted and provided with a website link to access the report.
If you already elected to receive shareholder reports electronically, you will not be affected by this change and you need not take any action. At any time, you may elect to receive reports and other communications from a Fund electronically by calling 800.820.0888, going to GuggenheimInvestments.com/myaccount, or by contacting your financial intermediary.
You may elect to receive all future shareholder reports in paper free of charge. If you hold shares of a Fund directly, you can inform the Fund that you wish to receive paper copies of reports by calling 800.820.0888. If you hold shares of a Fund through a financial intermediary, please contact the financial intermediary to make this election. Your election to receive reports in paper will apply to all Guggenheim Funds in which you are invested and may apply to all funds held with your financial intermediary.
GuggenheimInvestments.com | FR-SEMI-0320x0920 |

| | |
DEAR SHAREHOLDER | 2 |
ECONOMIC AND MARKET OVERVIEW | 4 |
ABOUT SHAREHOLDERS’ FUND EXPENSES | 6 |
FLOATING RATE STRATEGIES FUND | 9 |
NOTES TO FINANCIAL STATEMENTS | 41 |
OTHER INFORMATION | 59 |
INFORMATION ON BOARD OF TRUSTEES AND OFFICERS | 60 |
GUGGENHEIM INVESTMENTS PRIVACY NOTICE | 67 |
| | THE GUGGENHEIM FUNDS SEMI-ANNUAL REPORT | 1 |
Dear Shareholder:
The six-month period ended March 31, 2020, concluded on a somber note. Even though markets performed well for most of the period, the emergence of a novel and highly contagious form of coronavirus in the last weeks of the period adversely impacted global commercial activity and contributed to significant volatility in certain markets, unseen since the great recession of 2008.
As it spread beyond Asia to virtually every country in the world, many governments and businesses instituted quarantines and closures, which has resulted in significant disruption in manufacturing, supply chains, consumer demand and economic activity. The U.S. Federal Reserve responded quickly to provide liquidity in order to ensure that the U.S. markets continued to function efficiently. The fiscal policy included a spending bill worth over $2 trillion to assist consumers, states, small businesses and certain industries. While these actions helped stabilize the market, volatile conditions continued into April.
As discussed in this shareholder report, these events have affected performance for the Floating Rate Strategies Fund (the “Fund”). We encourage you to read the Economic and Market Overview section of the report, which follows this letter.
Guggenheim Partners Investment Management, LLC (“GPIM” or the “Investment Adviser”), serves as the investment adviser to the Fund. The Investment Adviser is an affiliate of Guggenheim Partners, LLC (“Guggenheim”), a global, diversified financial services firm. Guggenheim Funds Distributors, LLC serves as the distributor to the Fund and is also an affiliate of Guggenheim.
Together, we are committed to the safety and prosperity of our clients, our employees, and our shareholders. The resources of the firm are being made fully available not only to support our clients, but also to support our employees and their families.
Please practice the appropriate prudence for the protection not only of your health and that of your friends and loved ones but also for our neighbors and communities. Thank you for the trust you place in us.
Sincerely,
Guggenheim Partners Investment Management, LLC
April 30, 2020
Read a prospectus and summary prospectus (if available) carefully before investing. It contains the investment objectives, risks, charges, expenses and other information, which should be considered carefully before investing. Obtain a prospectus and summary prospectus (if available) at guggenheiminvestments.com or call 800.820.0888.
2 | THE GUGGENHEIM FUNDS SEMI-ANNUAL REPORT | |
This material is not intended as a recommendation or as investment advice of any kind, including in connection with rollovers, transfers, and distributions. Such material is not provided in a fiduciary capacity, may not be relied upon for or in connection with the making of investment decisions, and does not constitute a solicitation of an offer to buy or sell securities. All content has been provided for informational or educational purposes only and is not intended to be and should not be construed as legal or tax advice and/or a legal opinion. Always consult a financial, tax and/or legal professional regarding your specific situation.
The global ongoing crisis caused by the outbreak of COVID-19 is causing materially reduced consumer demand and economic output, disrupting supply chains, resulting in market closures, travel restrictions and quarantines, and adversely impacting local and global economies. Investors should be aware that in light of the current uncertainty, volatility and distress in economies, financial markets, and labor and health conditions all over the world, the Fund’s investments and a shareholder’s investment in the Fund are subject to sudden and substantial losses, increased volatility and other adverse events. Firms through which investors invest with the Fund, the Fund, its service providers, the markets in which it invests and market intermediaries are also impacted by quarantines and similar measures intended to contain the ongoing pandemic, which can obstruct their functioning and subject them to heightened operational risks.
Floating Rate Strategies Fund may not be suitable for all investors. ● Investments in floating rate senior secured syndicated bank loans and other floating rate securities involve special types of risks, including credit rate risk, interest rate risk, liquidity risk and prepayment risk. ● The Fund’s market value will change in response to interest rate changes and market conditions among other factors. In general, bond prices rise when interest rates fall and vice versa. ● The Fund’s exposure to high yield securities may subject the Fund to greater volatility. ● When market conditions are deemed appropriate, the Fund may use leverage to the full extent permitted by its investment policies and restrictions and applicable law. Leveraging will exaggerate the effect on net asset value of any increase or decrease in the market value of the Fund’s portfolio. ● The Fund may invest in derivative instruments, which may be more volatile and less liquid, increasing the risk of loss when compared to traditional securities. Certain of the derivative instruments are also subject to the risks of counterparty default and adverse tax treatment. ● Instruments and strategies (such as borrowing transactions and reverse repurchase agreements) may provide leveraged exposure to a particular investment, which will magnify any gains or losses on those investments. ● Investments in reverse repurchase agreements and synthetic instruments (such as synthetic collateralized debt obligations) expose the Fund to the many of the same risks as investments in derivatives. ● The Fund’s investments in other investment vehicles subject the Fund to those risks and expenses affecting the investment vehicle. ● The Fund’s investments in foreign securities carry additional risks when compared to U.S. securities, due to the impact of diplomatic, political or economic developments in the country in question (investments in emerging markets securities are generally subject to an even greater level of risk). ● The Fund’s investments in real estate securities subject the Fund to the same risks as direct investments in real estate, which is particularly sensitive to economic downturns. ● The Fund’s investments in restricted securities may involve financial and liquidity risk. ● The Fund is subject to active trading risks that may increase volatility and impact its ability to achieve its investment objective. ● You may have a gain or loss when you sell your shares. ● It is important to note that the Fund is not guaranteed by the U.S. government. ● Please read the prospectus for more detailed information regarding these and other risks.
| | THE GUGGENHEIM FUNDS SEMI-ANNUAL REPORT | 3 |
ECONOMIC AND MARKET OVERVIEW (Unaudited) | March 31, 2020 |
The six-month period ended March 31, 2020, was a wild ride for markets. While the U.S. economy was generally in good shape in 2019, recessionary fears rose throughout the year, prompting the U.S. Federal Reserve (the “Fed”) to announce a rate cut on July 31, the first since 2008, amid growing downside risks to policymakers’ baseline growth and inflation forecasts. Key among those risks were slowing global growth, the threat of additional U.S.-China tariffs, and the possible ramifications surrounding Brexit. The Fed subsequently cut rates twice more in 2019, which caused markets to rally toward the end of the year and into early 2020. Stocks reached new highs and credit spreads tightened to historic levels. Since then, the global outbreak of the coronavirus, COVID-19, has been at the center of everything. As of this writing, COVID-19 has spread to 210 countries, resulted in over 2.5 million cases, and caused over 170,000 deaths. Thus far, the U.S. makes up more than 30% of global cases, and 25% of global deaths. States have required the labor force to work from home if possible, individuals to practice social distancing, and non-essential businesses to shut down.
Closures, quarantines, and social distancing efforts have impacted the travel, hospitality, restaurants, and retail industries, with activity down 100% in some areas of the country. Further exacerbating the decline in output will be reduced business investment, which was already stalling due to falling profits, trade conflicts, and political uncertainty. The coronavirus shock and collapse in oil prices will likely further depress capital expenditures.
In response to the crisis, the Federal Open Market Committee cut rates by a further 125 basis points in the first quarter of 2020 and passed a series of stimulus programs. Among these were the Primary and Secondary Market Corporate Credit Facilities, which are lending programs primarily targeting investment-grade corporate bond issuers, implemented in concert with the U.S. Treasury. It was only after the announcement of this program that corporate credit found some relief from the selloff, but we expect this relief may be temporary.
With an alphabet soup of monetary programs targeting relief from the coronavirus impact, fiscal policy has also stepped up to the plate with a spending bill worth over $2 trillion that aims to assist consumers, states, small businesses, and certain industries. There is no question that these programs will help ease the economic fallout from virus containment measures, but even $2 trillion may be too small given the magnitude of the economic shock that we are facing. Additionally, it is far from clear that fiscal measures are an adequate solution to the issue at hand: the physical impediment to consumer spending. Fiscal and monetary policy can do their part, but ultimately it is public health policy that will likely be the greatest determinant of the economic outlook.
For the six months ended March 31, 2020, the Standard & Poor’s 500® (“S&P 500”) Index* returned -12.31%. The decline, while significant, represents something of a recovery in stocks. The S&P 500 peaked at 3,386.15 on February 19, 2020, before plummeting 33.9% to a low of 2,237.40 on March 23, 2020, then recovering some lost ground by the end of the month.
The consensus estimate for S&P 500 earnings per share in 2020 is still around $150. Our research shows S&P 500 earnings per share could fall below $100. Similarly, economists have no way to calibrate how bad the economic data could be based on history. The March U.S. non-farm payrolls report was evidence of this, as it showed a decline in payrolls of 700,000 jobs versus survey
4 | THE GUGGENHEIM FUNDS SEMI-ANNUAL REPORT | |
ECONOMIC AND MARKET OVERVIEW (Unaudited)(concluded) | March 31, 2020 |
expectations of a decline of only 100,000 jobs. We currently expect that second quarter U.S. real gross domestic product (“GDP”) quarter-over-quarter growth could fall by 40% annualized and the unemployment rate could rise to at least 20%. Beyond that, the severity of the crisis depends on containment of the virus and the effectiveness of social distancing measures put in place, but expectations for a quick and sustained V-shaped recovery appear overly optimistic.
For the six months ended March 31, 2020, the MSCI Europe-Australasia-Far East (“EAFE”) Index* returned -16.37%. The return of the MSCI Emerging Markets Index* was -14.45%.
In the bond market, the Bloomberg Barclays U.S. Aggregate Bond Index* posted a 3.33% return for the six-month period, while the Bloomberg Barclays U.S. Corporate High Yield Index* returned -10.40%. The return of the ICE Bank of America (“BofA”) Merrill Lynch 3-Month U.S. Treasury Bill Index* was 1.04% for the six-month period.
The opinions and forecasts expressed may not actually come to pass. This information is subject to change at any time, based on market and other conditions, and should not be construed as a recommendation of any specific security or strategy.
*Index Definitions:
The following indices are referenced throughout this report. Indices are unmanaged and not available for direct investment. Index performance does not reflect transaction costs, fees, or expenses.
Bloomberg Barclays U.S. Aggregate Bond Index is a broad-based flagship benchmark that measures the investment grade, U.S. dollar-denominated, fixed-rate taxable bond market, including U.S. Treasuries, government-related and corporate securities, mortgage-backed securities or “MBS” (agency fixed-rate and hybrid adjustable-rate mortgage, or “ARM”, pass-throughs), asset-backed securities (“ABS”), and commercial mortgage-backed securities (“CMBS”) (agency and non-agency).
Bloomberg Barclays U.S. Corporate High Yield Index measures the U.S. dollar-denominated, high yield, fixed-rate corporate bond market. Securities are classified as high yield if the middle rating of Moody’s, Fitch, and S&P is Ba1/BB +/BB + or below.
Credit Suisse Leveraged Loan Index tracks the investable market of the U.S. dollar denominated leveraged loan market. It consists of issues rated “5B” or lower, meaning that the highest rated issues included in this index are Moody’s/S&P ratings of Baa1/BB+ or Ba1/BBB+. All loans are funded term loans with a tenor of at least one year and are made by issuers domiciled in developed countries.
ICE BofA Merrill Lynch 3-Month U.S. Treasury Bill Index is an unmanaged market index of U.S. Treasury securities maturing in 90 days that assumes reinvestment of all income.
MSCI EAFE Index is a free float-adjusted market capitalization index that is designed to measure the equity market performance of developed markets, excluding the U.S. & Canada.
MSCI Emerging Markets Index is a free float-adjusted market capitalization weighted index that is designed to measure equity market performance in the global emerging markets.
S&P 500® is a broad-based index, the performance of which is based on the performance of 500 widely held common stocks chosen for market size, liquidity, and industry group representation.
| | THE GUGGENHEIM FUNDS SEMI-ANNUAL REPORT | 5 |
ABOUT SHAREHOLDERS’ FUND EXPENSES (Unaudited) |
All mutual funds have operating expenses, and it is important for our shareholders to understand the impact of costs on their investments. Shareholders of a fund incur two types of costs: (i) transaction costs, including sales charges (loads) on purchase payments, reinvested dividends, other distributions, and exchange fees, and (ii) ongoing costs, including management fees, administrative services, and shareholder reports, among others. These ongoing costs, or operating expenses, are deducted from a fund’s gross income and reduce the investment return of the fund.
A fund’s expenses are expressed as a percentage of its average net assets, which is known as the expense ratio. The following examples are intended to help investors understand the ongoing costs (in dollars) of investing in a fund and to compare these costs with the ongoing costs of investing in other mutual funds.
The examples are based on an investment of $1,000 made at the beginning of the period and held for the entire six-month period beginning September 30, 2019 and ending March 31, 2020.
The following tables illustrate the Fund’s costs in two ways:
Table 1. Based on actual Fund return: This section helps investors estimate the actual expenses paid over the period. The “Ending Account Value” shown is derived from the Fund’s actual return, and the fifth column shows the dollar amount that would have been paid by an investor who started with $1,000 in the Fund. Investors may use the information here, together with the amount invested, to estimate the expenses paid over the period. Simply divide the Fund’s account value by $1,000 (for example, an $8,600 account value divided by $1,000 = 8.6), then multiply the result by the number provided under the heading “Expenses Paid During Period.”
Table 2. Based on hypothetical 5% return: This section is intended to help investors compare a fund’s cost with those of other mutual funds. The table provides information about hypothetical account values and hypothetical expenses based on the Fund’s actual expense ratio and an assumed rate of return of 5% per year before expenses, which is not the Fund’s actual return. The hypothetical account values and expenses may not be used to estimate the actual ending account balance or expenses paid during the period. The example is useful in making comparisons because the U.S. Securities and Exchange Commission (the “SEC”) requires all mutual funds to calculate expenses based on the 5% return. Investors can assess a Fund’s costs by comparing this hypothetical example with the hypothetical examples that appear in shareholder reports of other funds.
The calculations illustrated above assume no shares were bought or sold during the period. Actual costs may have been higher or lower, depending on the amount of investment and the timing of any purchases or redemptions.
6 | THE GUGGENHEIM FUNDS SEMI-ANNUAL REPORT | |
ABOUT SHAREHOLDERS’ FUND EXPENSES (Unaudited)(continued) |
Please note that the expenses shown in the table are meant to highlight your ongoing costs only and do not reflect any transactional costs, such as sales charges (loads) on purchase payments, and contingent deferred sales charges (“CDSC”) on redemptions, if any. Therefore, the second table is useful in comparing ongoing costs only, and will not help you determine the relative total costs of owning different funds. In addition, if these transactional costs were included, your costs would have been higher.
More information about the Fund’s expenses, including annual expense ratios for periods up to five years (subject to the Fund’s inception date), can be found in the Financial Highlights section of this report. For additional information on operating expenses and other shareholder costs, please refer to the Fund’s prospectus.
| | THE GUGGENHEIM FUNDS SEMI-ANNUAL REPORT | 7 |
ABOUT SHAREHOLDERS’ FUND EXPENSES (Unaudited)(concluded) |
| Expense
Ratio1 | Fund
Return | Beginning
Account Value
September 30,
2019 | Ending
Account Value
March 31,
2020 | Expenses
Paid During
Period2 |
Table 1. Based on actual Fund return3 |
A-Class | 1.10% | (12.39%) | $ 1,000.00 | $ 876.10 | $ 5.16 |
C-Class | 1.85% | (12.73%) | 1,000.00 | 872.70 | 8.66 |
P-Class | 1.10% | (12.39%) | 1,000.00 | 876.10 | 5.16 |
Institutional Class | 0.86% | (12.28%) | 1,000.00 | 877.20 | 4.04 |
R6-Class | 0.84% | (12.27%) | 1,000.00 | 877.30 | 3.94 |
|
Table 2. Based on hypothetical 5% return (before expenses) |
A-Class | 1.10% | 5.00% | $ 1,000.00 | $ 1,019.50 | $ 5.55 |
C-Class | 1.85% | 5.00% | 1,000.00 | 1,015.75 | 9.32 |
P-Class | 1.10% | 5.00% | 1,000.00 | 1,019.50 | 5.55 |
Institutional Class | 0.86% | 5.00% | 1,000.00 | 1,020.70 | 4.34 |
R6-Class | 0.84% | 5.00% | 1,000.00 | 1,020.80 | 4.24 |
1 | Annualized and excludes expenses of the underlying funds in which the Fund invests, if any. |
2 | Expenses are equal to the Fund’s annualized expense ratio, net of any applicable fee waivers, multiplied by the average account value over the period, multiplied by 183/366 (to reflect the one-half year period). |
3 | Actual cumulative return at net asset value for the period September 30, 2019 to March 31, 2020. |
8 | THE GUGGENHEIM FUNDS SEMI-ANNUAL REPORT | |
PERFORMANCE REPORT AND FUND PROFILE (Unaudited) | March 31, 2020 |
FLOATING RATE STRATEGIES FUND
OBJECTIVE: Seeks to provide a high level of current income while maximizing total return.
Holdings Diversification (Market Exposure as % of Net Assets)

“Holdings Diversification (Market Exposure as % of Net Assets)” excludes any temporary cash investments.
Inception Dates: |
A-Class | November 30, 2011 |
C-Class | November 30, 2011 |
P-Class | May 1, 2015 |
Institutional Class | November 30, 2011 |
R6-Class | March 13, 2019 |
Ten Largest Holdings (% of Total Net Assets) |
Planview, Inc., 6.87% | 1.7% |
American Tire Distributors, Inc., 8.55% | 1.4% |
VC GB Holdings, Inc., 4.00% | 1.4% |
GrafTech Finance, Inc., 4.50% | 1.3% |
Market Track LLC, 6.03% | 1.2% |
Ziggo Financing Partnership, 3.20% | 1.2% |
Misys Ltd., 5.28% | 1.1% |
Cengage Learning Acquisitions, Inc., 5.25% | 1.1% |
Mavis Tire Express Services Corp., 4.70% | 1.1% |
GTT Communications BV, 3.25% | 1.1% |
Top Ten Total | 12.6% |
| | |
“Ten Largest Holdings” excludes any temporary cash or derivative investments. |
| | THE GUGGENHEIM FUNDS SEMI-ANNUAL REPORT | 9 |
PERFORMANCE REPORT AND FUND PROFILE (Unaudited)(continued) | March 31, 2020 |
Average Annual Returns*
Periods Ended March 31, 2020
| 6 Month† | 1 Year | 5 Year | Since
Inception
(11/30/11) |
A-Class Shares | (12.39%) | (10.42%) | 0.26% | 2.78% |
A-Class Shares with sales charge‡ | (15.02%) | (13.10%) | (0.71%) | 2.18% |
C-Class Shares | (12.73%) | (11.10%) | (0.49%) | 2.02% |
C-Class Shares with CDSC§ | (13.59%) | (11.95%) | (0.49%) | 2.02% |
Institutional Class Shares | (12.28%) | (10.20%) | 0.50% | 3.02% |
Credit Suisse Leveraged Loan Index | (11.73%) | (9.51%) | 1.21% | 3.12% |
| | 6 Month† | 1 Year | Since
Inception
(05/01/15) |
P-Class Shares | | (12.39%) | (10.41%) | 0.11% |
Credit Suisse Leveraged Loan Index | | (11.73%) | (9.51%) | 1.04% |
| | 6 Month† | 1 Year | Since
Inception
(03/13/19) |
R6-Class Shares | | (12.27%) | (10.19%) | (9.88%) |
Credit Suisse Leveraged Loan Index | | (11.73%) | (9.51%) | (9.19%) |
* | The performance data above represents past performance that is not predictive of future results. The investment return and principal value of an investment in the Fund will fluctuate so that an investor’s shares, when redeemed, may be worth more or less than their original cost. Returns are historical and include changes in principal and reinvested dividends and capital gains and do not reflect the effect of taxes. The Credit Suisse Leveraged Loan Index is an unmanaged index and, unlike the Fund, has no management fees or operating expenses to reduce its reported return. |
† | 6 month returns are not annualized. |
‡ | Effective October 1, 2015, the maximum sales charge decreased from 4.75% to 3.00%. A 4.75% maximum sales charge is used in the calculation of the Average Annual Returns based on subscriptions made prior to October 1, 2015, and a 3.00% maximum sales charge is used to calculate performance for periods based on subscriptions made on or after October 1, 2015. |
§ | Fund returns include a CDSC of 1% if redeemed within 12 months of purchase. |
10 | THE GUGGENHEIM FUNDS SEMI-ANNUAL REPORT | |
PERFORMANCE REPORT AND FUND PROFILE (Unaudited)(concluded) | March 31, 2020 |
Portfolio Composition by Quality Rating1 |
Rating | % of Total
Investments |
Fixed Income Instruments | |
AAA | 0.4% |
AA | 0.8% |
A | 0.6% |
BBB | 5.0% |
BB | 25.2% |
B | 48.4% |
CCC | 4.4% |
CC | 0.9% |
NR2 | 3.8% |
Other Instruments | 10.5% |
Total Investments | 100.0% |
1 | Source: BlackRock Solutions. Credit quality ratings are measured on a scale that generally ranges from AAA (highest) to D (lowest). All securities except for those labeled “NR” have been rated by Moody’s, Standard & Poor’s (“S&P”), or Fitch, each of which is a Nationally Recognized Statistical Rating Organization (“NRSRO”). For purposes of this presentation, when ratings are available from more than one agency, the highest rating is used. Guggenheim Investments has converted ratings to the equivalent S&P rating. Security ratings are determined at the time of purchase and may change thereafter. |
2 | NR securities do not necessarily indicate low credit quality. |
| | THE GUGGENHEIM FUNDS SEMI-ANNUAL REPORT | 11 |
SCHEDULE OF INVESTMENTS (Unaudited) | March 31, 2020 |
FLOATING RATE STRATEGIES FUND | |
| | Shares | | | Value | |
COMMON STOCKS††† - 0.3% |
| | | | | | | | | |
Consumer, Non-cyclical - 0.2% |
Chef Holdings, Inc.*,1 | | | 14,334 | | | $ | 1,266,175 | |
Targus Group International, Inc.*,1,2 | | | 12,773 | | | | 22,098 | |
Total Consumer, Non-cyclical | | | | | | | 1,288,273 | |
| | | | | | | | | |
Industrial - 0.1% |
API Heat Transfer Parent LLC*,†† | | | 2,902,566 | | | | 798,205 | |
BP Holdco LLC*,1,2 | | | 244,278 | | | | 64,001 | |
Vector Phoenix Holdings, LP*,1 | | | 244,278 | | | | 17,344 | |
Total Industrial | | | | | | | 879,550 | |
| | | | | | | | | |
Total Common Stocks | | | | |
(Cost $3,337,771) | | | | | | | 2,167,823 | |
| | | | | | | | | |
PREFERRED STOCKS†† - 0.1% |
Industrial - 0.1% |
API Heat Transfer Intermediate* | | | 618 | | | | 473,015 | |
Total Preferred Stocks | | | | |
(Cost $493,920) | | | | | | | 473,015 | |
| | | | | | | | | |
MONEY MARKET FUND† - 9.9% |
Federated U.S. Treasury Cash Reserve Fund — Institutional Shares, 0.46%3 | | | 87,264,108 | | | | 87,264,108 | |
Total Money Market Fund | | | | |
(Cost $87,264,108) | | | | | | | 87,264,108 | |
| | | | | | | | | |
| | Face
Amount~ | | | | |
SENIOR FLOATING RATE INTERESTS††,9 - 79.5% |
Consumer, Cyclical - 19.2% |
American Tire Distributors, Inc. | | | | | | | | |
8.55% (1 Month USD LIBOR + 7.50% and 3 Month USD LIBOR + 7.50%, Rate Floor: 8.50%) due 09/02/24 | | | 19,032,114 | | | | 12,561,195 | |
7.20% (3 Month USD LIBOR + 6.00%, Rate Floor: 7.00%) due 09/01/23 | | | 2,017,146 | | | | 1,875,945 | |
AI Aqua Zip Bidco Pty Ltd. | | | | | | | | |
4.32% (3 Month USD LIBOR + 3.25%, Rate Floor: 4.25%) due 12/13/23 | | | 14,172,712 | | | | 12,046,805 | |
Mavis Tire Express Services Corp. | | | | | | | | |
4.70% (3 Month USD LIBOR + 3.25%, Rate Floor: 3.25%) due 03/20/25 | | | 12,275,686 | | | | 9,728,481 | |
Cartrawler | | | | | | | | |
4.50% (1 Month EURIBOR + 4.50%, Rate Floor: 4.50%) due 04/29/21††† | | | EUR 13,258,129 | | | | 8,768,604 | |
Argo Merchants | | | | | | | | |
5.20% (3 Month USD LIBOR + 3.75%, Rate Floor: 4.75%) due 12/06/24 | | | 10,514,844 | | | | 8,727,320 | |
Navistar, Inc. | | | | | | | | |
4.28% (1 Month USD LIBOR + 3.50%, Rate Floor: 3.50%) due 11/06/24 | | | 10,000,000 | | | | 8,600,000 | |
12 | THE GUGGENHEIM FUNDS SEMI-ANNUAL REPORT | SEE NOTES TO FINANCIAL STATEMENTS. |
SCHEDULE OF INVESTMENTS (Unaudited)(continued) | March 31, 2020 |
FLOATING RATE STRATEGIES FUND | |
| | Face
Amount~ | | | Value | |
Zephyr Bidco Ltd. | | | | | | | | |
4.74% (1 Month GBP LIBOR + 4.50%, Rate Floor: 4.50%) due 07/23/25 | | | GBP 5,265,000 | | | $ | 5,367,773 | |
7.74% (1 Month GBP LIBOR + 7.50%, Rate Floor: 7.50%) due 07/23/26††† | | | GBP 2,842,917 | | | | 3,004,450 | |
At Home Holding III Corp. | | | | | | | | |
5.28% (3 Month USD LIBOR + 3.50%, Rate Floor: 4.50%) due 06/03/22 | | | 11,906,250 | | | | 8,334,375 | |
EG Finco Ltd. | | | | | | | | |
4.00% (3 Month EURIBOR + 4.00% and 6 Month EURIBOR + 4.00%, Rate Floor: 4.00%) due 02/07/25 | | | EUR 5,408,540 | | | | 4,638,276 | |
5.07% (6 Month USD LIBOR + 4.00%, Rate Floor: 4.00%) due 02/07/25 | | | 4,160,589 | | | | 3,078,836 | |
AMC Entertainment, Inc. | | | | | | | | |
4.08% (3 Month USD LIBOR + 3.00%, Rate Floor: 3.00%) due 04/22/26 | | | 10,246,500 | | | | 7,470,313 | |
Power Solutions (Panther) | | | | | | | | |
4.44% (1 Month USD LIBOR + 3.50%, Rate Floor: 3.50%) due 04/30/26 | | | 8,104,688 | | | | 7,375,266 | |
IBC Capital Ltd. | | | | | | | | |
4.64% (3 Month USD LIBOR + 3.75%, Rate Floor: 3.75%) due 09/11/23 | | | 8,050,931 | | | | 6,803,036 | |
Life Time Fitness, Inc. | | | | | | | | |
4.36% (3 Month USD LIBOR + 2.75%, Rate Floor: 3.75%) due 06/10/22 | | | 8,635,364 | | | | 6,336,199 | |
Amaya Holdings BV | | | | | | | | |
3.75% (3 Month EURIBOR + 3.75%, Rate Floor: 3.75%) due 07/10/25 | | | EUR 5,100,000 | | | | 5,354,663 | |
Equinox Holdings, Inc. | | | | | | | | |
4.07% (3 Month USD LIBOR + 3.00%, Rate Floor: 4.00%) due 03/08/24 | | | 7,325,847 | | | | 5,315,854 | |
Nellson Nutraceutical | | | | | | | | |
5.70% (3 Month USD LIBOR + 4.25%, Rate Floor: 5.25%) due 12/23/21 | | | 5,634,549 | | | | 4,394,948 | |
Party City Holdings, Inc. | | | | | | | | |
4.08% (1 Month USD LIBOR + 2.50% and 3 Month USD LIBOR + 2.50%, Rate Floor: 3.25%) due 08/19/22 | | | 8,988,004 | | | | 4,350,014 | |
Titan US Finco LLC | | | | | | | | |
5.45% (3 Month USD LIBOR + 4.00%, Rate Floor: 4.00%) due 05/01/26 | | | 4,704,097 | | | | 4,010,243 | |
Midas Intermediate Holdco II LLC | | | | | | | | |
4.02% (3 Month USD LIBOR + 2.75%, Rate Floor: 3.75%) due 08/18/21 | | | 5,145,151 | | | | 3,993,923 | |
SEE NOTES TO FINANCIAL STATEMENTS. | THE GUGGENHEIM FUNDS SEMI-ANNUAL REPORT | 13 |
SCHEDULE OF INVESTMENTS (Unaudited)(continued) | March 31, 2020 |
FLOATING RATE STRATEGIES FUND | |
| | Face
Amount~ | | | Value | |
Packers Sanitation Services, Inc. | | | | | | | | |
4.25% (1 Month USD LIBOR + 3.25%, Rate Floor: 4.25%) due 12/04/24 | | | 4,529,758 | | | $ | 3,793,672 | |
Columbus Finance BV (SGH/Scenic) | | | | | | | | |
3.75% (3 Month EURIBOR + 3.75%, Rate Floor: 3.75%) due 03/05/27 | | | EUR 5,500,000 | | | | 3,698,192 | |
Crown Finance US, Inc. | | | | | | | | |
3.32% (3 Month USD LIBOR + 2.25%, Rate Floor: 2.25%) due 02/28/25 | | | 4,445,214 | | | | 3,000,520 | |
Playtika Holding Corp. | | | | | | | | |
7.07% (3 Month USD LIBOR + 6.00%, Rate Floor: 7.00%) due 12/09/24 | | | 3,184,688 | | | | 2,956,441 | |
Petco Animal Supplies, Inc. | | | | | | | | |
5.03% (3 Month USD LIBOR + 3.25%, Rate Floor: 4.25%) due 01/26/23 | | | 3,809,633 | | | | 2,624,837 | |
American Express GBT | | | | | | | | |
due 02/26/27††† | | | 2,857,301 | | | | 2,428,706 | |
International Car Wash Group Ltd. | | | | | | | | |
4.25% (1 Month USD LIBOR + 3.25%, Rate Floor: 4.25%) due 10/03/24 | | | 2,875,687 | | | | 2,228,658 | |
Burlington Stores, Inc. | | | | | | | | |
2.55% (1 Month USD LIBOR + 1.75%, Rate Floor: 1.75%) due 11/17/24 | | | 2,000,000 | | | | 1,900,000 | |
Belk, Inc. | | | | | | | | |
7.75% (3 Month USD LIBOR + 6.75%, Rate Floor: 7.75%) due 07/31/25 | | | 3,220,784 | | | | 1,777,873 | |
IRB Holding Corp. | | | | | | | | |
3.75% (3 Month USD LIBOR + 2.75%, Rate Floor: 3.75%) due 02/05/25 | | | 1,638,136 | | | | 1,258,301 | |
Alexander Mann | | | | | | | | |
5.73% (3 Month GBP LIBOR + 5.00%, Rate Floor: 5.00%) due 06/16/25††† | | | GBP 1,540,000 | | | | 1,148,825 | |
SHO Holding I Corp. | | | | | | | | |
6.78% (3 Month USD LIBOR + 5.00%, Rate Floor: 6.00%) due 10/27/22 | | | 569,057 | | | | 438,174 | |
Total Consumer, Cyclical | | | | | | | 169,390,718 | |
| | | | | | | | | |
Industrial - 13.8% | | | | | | | | |
VC GB Holdings, Inc. | | | | | | | | |
4.00% (1 Month USD LIBOR + 3.00%, Rate Floor: 4.00%) due 02/28/24††† | | | 14,534,903 | | | | 11,918,620 | |
STS Operating, Inc. (SunSource) | | | | | | | | |
5.25% (1 Month USD LIBOR + 4.25%, Rate Floor: 5.25%) due 12/11/24 | | | 11,592,461 | | | | 9,273,968 | |
Hillman Group, Inc. | | | | | | | | |
5.07% (3 Month USD LIBOR + 4.00%, Rate Floor: 4.00%) due 05/30/25 | | | 11,868,797 | | | | 9,213,154 | |
14 | THE GUGGENHEIM FUNDS SEMI-ANNUAL REPORT | SEE NOTES TO FINANCIAL STATEMENTS. |
SCHEDULE OF INVESTMENTS (Unaudited)(continued) | March 31, 2020 |
FLOATING RATE STRATEGIES FUND | |
| | Face
Amount~ | | | Value | |
USIC Holding, Inc. | | | | | | | | |
4.25% (1 Month USD LIBOR + 3.25%, Rate Floor: 4.25%) due 12/08/23 | | | 10,963,881 | | | $ | 9,209,660 | |
Titan Acquisition Ltd. (Husky) | | | | | | | | |
4.45% (3 Month USD LIBOR + 3.00%, Rate Floor: 3.00%) due 03/28/25 | | | 9,996,000 | | | | 8,146,740 | |
Engineered Machinery Holdings, Inc. | | | | | | | | |
4.45% (3 Month USD LIBOR + 3.00%, Rate Floor: 4.00%) due 07/19/24 | | | 9,974,490 | | | | 8,129,209 | |
Berry Global, Inc. | | | | | | | | |
2.86% (1 Month USD LIBOR + 2.00%, Rate Floor: 2.00%) due 07/01/26 | | | 7,991,124 | | | | 7,551,612 | |
American Bath Group LLC | | | | | | | | |
5.25% (1 Month USD LIBOR + 4.25%, Rate Floor: 5.25%) due 09/29/23 | | | 8,133,136 | | | | 6,872,500 | |
BWAY Holding Co. | | | | | | | | |
5.08% (3 Month USD LIBOR + 3.25%, Rate Floor: 3.25%) due 04/03/24 | | | 7,835,566 | | | | 6,351,745 | |
Altra Industrial Motion Corp. | | | | | | | | |
2.99% (1 Month USD LIBOR + 2.00%, Rate Floor: 2.00%) due 10/01/25 | | | 7,018,799 | | | | 6,099,757 | |
Hanjin International Corp. | | | | | | | | |
3.49% (1 Month USD LIBOR + 2.50%, Rate Floor: 2.50%) due 10/19/20 | | | 7,250,000 | | | | 5,655,000 | |
Consolidated Container Co. LLC | | | | | | | | |
3.75% (1 Month USD LIBOR + 2.75%, Rate Floor: 3.75%) due 05/22/24 | | | 5,487,727 | | | | 5,103,586 | |
Duran Group Holding GMBH | | | | | | | | |
4.25% (6 Month EURIBOR + 4.25%, Rate Floor: 4.25%) due 03/29/24†††,1 | | | EUR 3,992,645 | | | | 3,698,320 | |
4.25% (6 Month EURIBOR + 4.25%, Rate Floor: 4.25%) due 12/20/24†††,1 | | | EUR 1,346,330 | | | | 1,247,083 | |
Hayward Industries, Inc. | | | | | | | | |
4.49% (1 Month USD LIBOR + 3.50%, Rate Floor: 3.50%) due 08/05/24 | | | 5,705,217 | | | | 4,471,464 | |
Pelican Products, Inc. | | | | | | | | |
4.50% (3 Month USD LIBOR + 3.50%, Rate Floor: 4.50%) due 05/01/25 | | | 4,686,525 | | | | 3,708,213 | |
Charter Nex US, Inc. | | | | | | | | |
4.00% (1 Month USD LIBOR + 3.00%, Rate Floor: 4.00%) due 05/16/24 | | | 3,884,070 | | | | 3,282,039 | |
SEE NOTES TO FINANCIAL STATEMENTS. | THE GUGGENHEIM FUNDS SEMI-ANNUAL REPORT | 15 |
SCHEDULE OF INVESTMENTS (Unaudited)(continued) | March 31, 2020 |
FLOATING RATE STRATEGIES FUND | |
| | Face
Amount~ | | | Value | |
Corialis Group Ltd. | | | | | | | | |
3.25% (6 Month EURIBOR + 3.25%, Rate Floor: 3.25%) due 03/29/24 | | | EUR 3,075,000 | | | $ | 2,898,065 | |
TransDigm, Inc. | | | | | | | | |
3.24% (1 Month USD LIBOR + 2.25%, Rate Floor: 2.25%) due 05/30/25 | | | 2,959,683 | | | | 2,685,912 | |
API Heat Transfer | | | | | | | | |
7.45% (3 Month USD LIBOR + 6.00%, Rate Floor: 7.00%) due 01/01/24 | | | 2,686,583 | | | | 2,187,461 | |
7.45% (3 Month USD LIBOR + 6.00%, Rate Floor: 7.00%) due 10/02/23††† | | | 479,315 | | | | 415,371 | |
KUEHG Corp. (KinderCare) | | | | | | | | |
5.20% (3 Month USD LIBOR + 3.75%, Rate Floor: 4.75%) due 02/21/25 | | | 2,836,758 | | | | 2,102,038 | |
YAK MAT (YAK ACCESS LLC) | | | | | | | | |
11.20% (3 Month USD LIBOR + 10.00%, Rate Floor: 10.00%) due 07/10/26††† | | | 2,550,000 | | | | 1,530,000 | |
Total Industrial | | | | | | | 121,751,517 | |
| | | | | | | | | |
Communications - 11.3% |
Market Track LLC | | | | | | | | |
6.03% (3 Month USD LIBOR + 4.25%, Rate Floor: 5.25%) due 06/05/24 | | | 13,503,750 | | | | 10,803,000 | |
Ziggo Financing Partnership | | | | | | | | |
3.20% (1 Month USD LIBOR + 2.50%, Rate Floor: 2.50%) due 04/28/28 | | | 11,235,000 | | | | 10,560,900 | |
Cengage Learning Acquisitions, Inc. | | | | | | | | |
5.25% (1 Month USD LIBOR + 4.25%, Rate Floor: 5.25%) due 06/07/23 | | | 12,238,215 | | | | 9,861,921 | |
GTT Communications BV | | | | | | | | |
3.25% (3 Month EURIBOR + 3.25%, Rate Floor: 3.25%) due 05/30/25 | | | EUR 10,881,064 | | | | 9,508,697 | |
CSC Holdings, LLC | | | | | | | | |
2.86% (1 Month USD LIBOR + 2.25%, Rate Floor: 2.25%) due 07/17/25 | | | 9,974,359 | | | | 9,492,298 | |
McGraw-Hill Global Education Holdings LLC | | | | | | | | |
5.45% (3 Month USD LIBOR + 4.00%, Rate Floor: 5.00%) due 05/04/22 | | | 10,227,145 | | | | 8,318,044 | |
Sprint Communications, Inc. | | | | | | | | |
3.50% (1 Month USD LIBOR + 2.50%, Rate Floor: 3.25%) due 02/02/24 | | | 7,505,864 | | | | 7,449,570 | |
ProQuest, LLC | | | | | | | | |
4.49% (1 Month USD LIBOR + 3.50%, Rate Floor: 3.50%) due 10/23/26 | | | 7,381,500 | | | | 6,864,795 | |
16 | THE GUGGENHEIM FUNDS SEMI-ANNUAL REPORT | SEE NOTES TO FINANCIAL STATEMENTS. |
SCHEDULE OF INVESTMENTS (Unaudited)(continued) | March 31, 2020 |
FLOATING RATE STRATEGIES FUND | |
| | Face
Amount~ | | | Value | |
Virgin Media Bristol LLC | | | | | | | | |
3.20% (1 Month USD LIBOR + 2.50%, Rate Floor: 2.50%) due 01/31/28 | | | 6,116,233 | | | $ | 5,626,934 | |
SFR Group S.A. | | | | | | | | |
4.39% (1 Month USD LIBOR + 3.69%, Rate Floor: 3.69%) due 01/31/26 | | | 3,423,664 | | | | 3,184,008 | |
3.74% (1 Month USD LIBOR + 2.75%, Rate Floor: 2.75%) due 07/31/25 | | | 1,675,434 | | | | 1,537,211 | |
Zayo Group Holdings, Inc. | | | | | | | | |
3.99% (1 Month USD LIBOR + 3.00%, Rate Floor: 3.00%) due 03/09/27 | | | 4,750,000 | | | | 4,465,000 | |
Authentic Brands | | | | | | | | |
4.95% (3 Month USD LIBOR + 3.50%, Rate Floor: 4.50%) due 09/27/24 | | | 5,624,933 | | | | 4,436,666 | |
GTT Communications, Inc. | | | | | | | | |
3.74% (1 Month USD LIBOR + 2.75%, Rate Floor: 2.75%) due 05/31/25 | | | 6,189,750 | | | | 4,325,088 | |
Level 3 Financing, Inc. | | | | | | | | |
2.74% (1 Month USD LIBOR + 1.75%, Rate Floor: 1.75%) due 03/01/27 | | | 3,339,546 | | | | 3,105,778 | |
Total Communications | | | | | | | 99,539,910 | |
| | | | | | | | | |
Consumer, Non-cyclical - 11.2% |
Sigma Holding BV (Flora Food) | | | | | | | | |
3.50% (3 Month EURIBOR + 3.50% and 2 Month EURIBOR + 3.50%, Rate Floor: 3.50%) due 07/02/25 | | | EUR 9,000,000 | | | | 8,988,095 | |
Diamond (BC) BV | | | | | | | | |
3.25% (3 Month EURIBOR + 3.25%, Rate Floor: 3.25%) due 09/06/24 | | | EUR 6,900,352 | | | | 5,780,718 | |
4.78% (3 Month USD LIBOR + 3.00%, Rate Floor: 3.00%) due 09/06/24 | | | 3,989,796 | | | | 2,952,449 | |
Springs Window Fashions | | | | | | | | |
5.32% (3 Month USD LIBOR + 4.25%, Rate Floor: 4.25%) due 06/15/25††† | | | 8,601,114 | | | | 7,482,969 | |
9.57% (3 Month USD LIBOR + 8.50%, Rate Floor: 8.50%) due 06/15/26 | | | 1,350,000 | | | | 1,111,495 | |
Cidron New Bidco Ltd. | | | | | | | | |
3.25% (3 Month EURIBOR + 3.25%, Rate Floor: 3.25%) due 04/16/25 | | | EUR 8,125,000 | | | | 7,890,349 | |
PAREXEL International Corp. | | | | | | | | |
3.74% (1 Month USD LIBOR + 2.75%, Rate Floor: 2.75%) due 09/27/24 | | | 8,346,314 | | | | 7,083,934 | |
SEE NOTES TO FINANCIAL STATEMENTS. | THE GUGGENHEIM FUNDS SEMI-ANNUAL REPORT | 17 |
SCHEDULE OF INVESTMENTS (Unaudited)(continued) | March 31, 2020 |
FLOATING RATE STRATEGIES FUND | |
| | Face
Amount~ | | | Value | |
Immucor, Inc. | | | | | | | | |
6.45% (3 Month USD LIBOR + 5.00%, Rate Floor: 6.00%) due 06/15/21 | | | 7,996,574 | | | $ | 6,837,071 | |
Froneri US, Inc. | | | | | | | | |
3.24% (1 Month USD LIBOR + 2.25%, Rate Floor: 2.25%) due 01/29/27 | | | 6,900,000 | | | | 6,537,750 | |
Aspen Dental | | | | | | | | |
4.20% (3 Month USD LIBOR + 2.75%, Rate Floor: 2.75%) due 04/30/25 | | | 7,929,695 | | | | 6,486,491 | |
Dole Food Company, Inc. | | | | | | | | |
3.75% (1 Month USD LIBOR + 2.75%, Rate Floor: 3.75%) due 04/06/24 | | | 6,989,628 | | | | 6,264,454 | |
US Foods, Inc. | | | | | | | | |
2.82% (1 Month USD LIBOR + 1.75%, Rate Floor: 1.75%) due 06/27/23 | | | 5,984,456 | | | | 5,515,694 | |
IQVIA Holdings, Inc. | | | | | | | | |
3.20% (3 Month USD LIBOR + 1.75%, Rate Floor: 1.75%) due 06/11/25 | | | 4,904,397 | | | | 4,659,177 | |
Recess Holdings, Inc. | | | | | | | | |
5.20% (3 Month USD LIBOR + 3.75%, Rate Floor: 4.75%) due 09/30/24 | | | 5,651,600 | | | | 4,521,280 | |
Endo Luxembourg Finance Co. | | | | | | | | |
5.25% (1 Month USD LIBOR + 4.25%, Rate Floor: 5.00%) due 04/29/24 | | | 3,989,744 | | | | 3,560,846 | |
Grifols Worldwide Operations USA, Inc. | | | | | | | | |
2.68% (1 Week USD LIBOR + 2.00%, Rate Floor: 2.00%) due 11/15/27 | | | 3,563,679 | | | | 3,358,768 | |
CTI Foods Holding Co. LLC | | | | | | | | |
8.77% (3 Month USD LIBOR + 7.00%, Rate Floor: 8.00%) due 05/03/24†††,1 | | | 1,890,143 | | | | 1,795,636 | |
10.77% (3 Month USD LIBOR + 9.00%, Rate Floor: 10.00%) due 05/03/24 | | | 523,716 | | | | 481,819 | |
Elanco Animal Health, Inc. | | | | | | | | |
due 02/04/27 | | | 2,350,000 | | | | 2,220,750 | |
Arctic Glacier Group Holdings, Inc. | | | | | | | | |
4.95% (1 Month USD LIBOR + 3.50%, Rate Floor: 4.50%) due 03/20/24 | | | 2,272,564 | | | | 1,829,414 | |
Valeant Pharmaceuticals International, Inc. | | | | | | | | |
3.61% (1 Month USD LIBOR + 3.00%, Rate Floor: 3.00%) due 06/02/25 | | | 1,876,325 | | | | 1,775,473 | |
18 | THE GUGGENHEIM FUNDS SEMI-ANNUAL REPORT | SEE NOTES TO FINANCIAL STATEMENTS. |
SCHEDULE OF INVESTMENTS (Unaudited)(continued) | March 31, 2020 |
FLOATING RATE STRATEGIES FUND | |
| | Face
Amount~ | | | Value | |
BCPE Eagle Buyer LLC | | | | | | | | |
5.25% (3 Month USD LIBOR + 4.25%, Rate Floor: 5.25%) due 03/18/24 | | | 2,095,980 | | | $ | 1,571,985 | |
Total Consumer, Non-cyclical | | | 98,706,617 | |
| | | | | | | | | |
Technology - 11.0% | | | | | | | | |
Planview, Inc. | | | | | | | | |
6.87% (2 Month USD LIBOR + 5.25%, Rate Floor: 6.25%) due 01/27/23†††,1 | | | 15,520,000 | | | | 14,809,231 | |
Misys Ltd. | | | | | | | | |
5.28% (3 Month USD LIBOR + 3.50%, Rate Floor: 4.50%) due 06/13/24 | | | 11,760,394 | | | | 9,996,334 | |
LANDesk Group, Inc. | | | | | | | | |
5.25% (1 Month USD LIBOR + 4.25%, Rate Floor: 5.25%) due 01/20/24 | | | 10,004,873 | | | | 8,804,288 | |
Seattle SpinCo, Inc. | | | | | | | | |
3.49% (1 Month USD LIBOR + 2.50%, Rate Floor: 2.50%) due 06/21/24 | | | 9,047,729 | | | | 8,016,288 | |
Cologix Holdings, Inc. | | | | | | | | |
4.00% (1 Month USD LIBOR + 3.00%, Rate Floor: 4.00%) due 03/20/24 | | | 8,600,927 | | | | 7,343,041 | |
Cvent, Inc. | | | | | | | | |
4.75% (1 Month USD LIBOR + 3.75%, Rate Floor: 4.75%) due 11/29/24 | | | 8,490,543 | | | | 6,000,012 | |
Park Place Technologies LLC | | | | | | | | |
5.00% (1 Month USD LIBOR + 4.00%, Rate Floor: 5.00%) due 03/29/25††† | | | 6,716,177 | | | | 5,540,846 | |
9.00% (1 Month USD LIBOR + 8.00%, Rate Floor: 9.00%) due 03/30/26 | | | 408,434 | | | | 395,160 | |
EIG Investors Corp. | | | | | | | | |
5.39% (3 Month USD LIBOR + 3.75%, Rate Floor: 4.75%) due 02/09/23 | | | 7,221,796 | | | | 5,741,328 | |
Greenway Health LLC | | | | | | | | |
4.82% (3 Month USD LIBOR + 3.75%, Rate Floor: 4.75%) due 02/16/24 | | | 8,671,662 | | | | 5,405,307 | |
Micron Technology, Inc. | | | | | | | | |
2.99% (1 Month USD LIBOR + 2.00%, Rate Floor: 2.00%) due 05/29/25 | | | 5,186,145 | | | | 4,978,699 | |
WEX, Inc. | | | | | | | | |
3.24% (1 Month USD LIBOR + 2.25%, Rate Floor: 2.25%) due 05/15/26 | | | 4,651,758 | | | | 4,009,816 | |
Aspect Software, Inc. | | | | | | | | |
6.00% (1 Month USD LIBOR + 5.00%, Rate Floor: 6.00%) due 01/15/24††† | | | 4,490,490 | | | | 3,397,819 | |
6.23% (3 Month USD LIBOR + 5.00%, Rate Floor: 6.00%) due 07/17/23†††,1 | | | 402,434 | | | | 397,959 | |
SEE NOTES TO FINANCIAL STATEMENTS. | THE GUGGENHEIM FUNDS SEMI-ANNUAL REPORT | 19 |
SCHEDULE OF INVESTMENTS (Unaudited)(continued) | March 31, 2020 |
FLOATING RATE STRATEGIES FUND | |
| | Face
Amount~ | | | Value | |
II-VI, Inc. | | | | | | | | |
4.49% (1 Month USD LIBOR + 3.50%, Rate Floor: 3.50%) due 09/24/26 | | | 3,930,250 | | | $ | 3,235,893 | |
Brave Parent Holdings, Inc. | | | | | | | | |
5.78% (3 Month USD LIBOR + 4.00%, Rate Floor: 4.00%) due 04/18/25 | | | 3,201,128 | | | | 2,736,964 | |
Sabre GLBL, Inc. | | | | | | | | |
2.99% (1 Month USD LIBOR + 2.00%, Rate Floor: 2.00%) due 02/22/24 | | | 2,315,854 | | | | 1,927,948 | |
EXC Holdings III Corp. | | | | | | | | |
4.95% (3 Month USD LIBOR + 3.50%, Rate Floor: 4.50%) due 12/02/24 | | | 1,979,438 | | | | 1,692,419 | |
Miami Escrow Borrower LLC | | | | | | | | |
3.49% (1 Month USD LIBOR + 2.50%, Rate Floor: 2.50%) due 06/21/24 | | | 1,339,760 | | | | 1,187,027 | |
Optiv, Inc. | | | | | | | | |
4.25% (1 Month USD LIBOR + 3.25%, Rate Floor: 4.25%) due 02/01/24 | | | 1,239,052 | | | | 940,800 | |
Total Technology | | | | | | | 96,557,179 | |
| | | | | | | | | |
Financial - 6.0% | | | | | | | | |
NFP Corp. | | | | | | | | |
4.24% (1 Month USD LIBOR + 3.25%, Rate Floor: 3.25%) due 02/15/27 | | | 10,922,539 | | | | 9,320,531 | |
USI, Inc. | | | | | | | | |
3.99% (1 Month USD LIBOR + 3.00%, Rate Floor: 3.00%) due 05/16/24 | | | 8,113,475 | | | | 7,383,262 | |
Alliant Holdings Intermediate LLC | | | | | | | | |
3.99% (1 Month USD LIBOR + 3.00%, Rate Floor: 3.00%) due 05/09/25 | | | 7,375,880 | | | | 6,682,547 | |
AmWINS Group, Inc. | | | | | | | | |
3.75% (1 Month USD LIBOR + 2.75%, Rate Floor: 3.75%) due 01/25/24 | | | 6,981,926 | | | | 6,432,100 | |
HarbourVest Partners, LP | | | | | | | | |
3.93% (2 Month USD LIBOR + 2.25%, Rate Floor: 2.25%) due 03/03/25 | | | 6,807,677 | | | | 5,990,755 | |
Camelia Bidco Banc Civica | | | | | | | | |
5.48% (3 Month GBP LIBOR + 4.75%, Rate Floor: 4.75%) due 10/14/24 | | | GBP 5,600,000 | | | | 5,778,938 | |
Aretec Group, Inc. | | | | | | | | |
5.24% (1 Month USD LIBOR + 4.25%, Rate Floor: 4.25%) due 10/01/25 | | | 7,751,875 | | | | 5,077,478 | |
Jefferies Finance LLC | | | | | | | | |
4.25% (1 Month USD LIBOR + 3.25%, Rate Floor: 3.25%) due 06/03/26 | | | 4,664,750 | | | | 3,856,209 | |
Citadel Securities, LP | | | | | | | | |
3.74% (1 Month USD LIBOR + 2.75%, Rate Floor: 2.75%) due 02/27/26††† | | | 2,050,000 | | | | 1,824,500 | |
20 | THE GUGGENHEIM FUNDS SEMI-ANNUAL REPORT | SEE NOTES TO FINANCIAL STATEMENTS. |
SCHEDULE OF INVESTMENTS (Unaudited)(continued) | March 31, 2020 |
FLOATING RATE STRATEGIES FUND | |
| | Face
Amount~ | | | Value | |
Nexus Buyer LLC | | | | | | | | |
4.61% (1 Month USD LIBOR + 3.75%, Rate Floor: 3.75%) due 11/09/26 | | | 1,017,450 | | | $ | 902,987 | |
Total Financial | | | | | | | 53,249,307 | |
| | | | | | | | | |
Basic Materials - 5.1% |
GrafTech Finance, Inc. | | | | | | | | |
4.50% (1 Month USD LIBOR + 3.50%, Rate Floor: 4.50%) due 02/12/25 | | | 13,315,824 | | | | 11,451,608 | |
PQ Corp. | | | | | | | | |
4.03% (3 Month USD LIBOR + 2.25%, Rate Floor: 2.25%) due 02/08/27 | | | 8,328,399 | | | | 7,641,306 | |
LTI Holdings, Inc. | | | | | | | | |
4.49% (1 Month USD LIBOR + 3.50%, Rate Floor: 3.50%) due 09/06/25 | | | 9,012,750 | | | | 6,601,839 | |
Messer Industries USA, Inc. | | | | | | | | |
3.95% (3 Month USD LIBOR + 2.50%, Rate Floor: 2.50%) due 03/02/26 | | | 7,263,844 | | | | 6,421,239 | |
Arch Coal, Inc. | | | | | | | | |
3.75% (1 Month USD LIBOR + 2.75%, Rate Floor: 3.75%) due 03/07/24 | | | 6,664,219 | | | | 5,031,486 | |
Alpha 3 BV | | | | | | | | |
4.45% (3 Month USD LIBOR + 3.00%, Rate Floor: 4.00%) due 01/31/24 | | | 4,985,672 | | | | 4,536,961 | |
HB Fuller Co. | | | | | | | | |
2.77% (1 Month USD LIBOR + 2.00%, Rate Floor: 2.00%) due 10/21/24 | | | 3,518,413 | | | | 3,032,450 | |
Total Basic Materials | | | | | | | 44,716,889 | |
| | | | | | | | | |
Energy - 1.9% | | | | | | | | |
Ultra Petroleum, Inc. | | | | | | | | |
due 04/12/245 | | | 16,577,868 | | | | 7,805,357 | |
Penn Virginia Holding Corp. | | | | | | | | |
8.00% (1 Month USD LIBOR + 7.00%, Rate Floor: 8.00%) due 09/29/22††† | | | 10,890,000 | | | | 7,623,000 | |
Permian Production Partners LLC | | | | | | | | |
due 05/20/24†††,5 | | | 8,360,000 | | | | 1,254,000 | |
Summit Midstream Partners, LP | | | | | | | | |
7.00% (1 Month USD LIBOR + 6.00%, Rate Floor: 7.00%) due 05/13/22 | | | 480,394 | | | | 177,746 | |
Total Energy | | | | | | | 16,860,103 | |
| | | | | | | | | |
Total Senior Floating Rate Interests | | | | |
(Cost $874,444,874) | | | 700,772,240 | |
| | | | | | | | | |
CORPORATE BONDS†† - 4.4% |
Energy - 1.7% | | | | | | | | |
Sabine Pass Liquefaction LLC | | | | | | | | |
5.63% due 02/01/216 | | | 5,500,000 | | | | 5,335,207 | |
5.63% due 04/15/236 | | | 4,200,000 | | | | 3,908,092 | |
CNX Resources Corp. | | | | | | | | |
5.88% due 04/15/226 | | | 4,398,000 | | | | 4,024,170 | |
SEE NOTES TO FINANCIAL STATEMENTS. | THE GUGGENHEIM FUNDS SEMI-ANNUAL REPORT | 21 |
SCHEDULE OF INVESTMENTS (Unaudited)(continued) | March 31, 2020 |
FLOATING RATE STRATEGIES FUND | |
| | Face
Amount~ | | | Value | |
American Midstream Partners Limited Partnership / American Midstream Finance Corp. | | | | | | | | |
9.50% due 12/15/216,7 | | | 1,268,000 | | | $ | 1,191,920 | |
Unit Corp. | | | | | | | | |
6.63% due 05/15/21 | | | 3,166,000 | | | | 224,469 | |
Total Energy | | | | | | | 14,683,858 | |
| | | | | | | | | |
Consumer, Non-cyclical - 1.1% | | | | |
Nathan’s Famous, Inc. | | | | | | | | |
6.63% due 11/01/257 | | | 4,275,000 | | | | 3,975,750 | |
ServiceMaster Co. LLC | | | | | | | | |
5.13% due 11/15/246,7 | | | 4,000,000 | | | | 3,950,000 | |
HCA, Inc. | | | | | | | | |
4.50% due 02/15/276 | | | 1,500,000 | | | | 1,543,288 | |
Total Consumer, Non-cyclical | | | 9,469,038 | |
| | | | | | | | | |
Communications - 0.5% | | | | |
Ziggo BV | | | | | | | | |
5.50% due 01/15/276,7 | | | 4,550,000 | | | | 4,550,000 | |
MDC Partners, Inc. | | | | | | | | |
6.50% due 05/01/246,7 | | | 156,000 | | | | 117,000 | |
Total Communications | | | | | | | 4,667,000 | |
| | | | | | | | | |
Consumer, Cyclical - 0.4% |
Anixter, Inc. | | | | | | | | |
5.50% due 03/01/236 | | | 3,000,000 | | | | 2,991,600 | |
LBC Tank Terminals Holding Netherlands BV | | | | | | | | |
6.88% due 05/15/236,7 | | | 630,000 | | | | 590,625 | |
Total Consumer, Cyclical | | | 3,582,225 | |
| | | | | | | | | |
Utilities - 0.3% | | | | | | | | |
AES Corp. | | | | | | | | |
6.00% due 05/15/266 | | | 2,000,000 | | | | 1,970,000 | |
5.50% due 04/15/256 | | | 1,059,000 | | | | 1,037,820 | |
Total Utilities | | | | | | | 3,007,820 | |
| | | | | | | | | |
Industrial - 0.3% | | | | | | | | |
Ardagh Packaging Finance plc / Ardagh Holdings USA, Inc. | | | | | | | | |
4.25% due 09/15/226,7 | | | 1,500,000 | | | | 1,498,125 | |
Grinding Media, Inc. / MC Grinding Media Canada, Inc. | | | | | | | | |
7.38% due 12/15/236,7 | | | 750,000 | | | | 699,600 | |
Total Industrial | | | | | | | 2,197,725 | |
| | | | | | | | | |
Technology - 0.1% | | | | | | | | |
NCR Corp. | | | | | | | | |
6.38% due 12/15/236 | | | 800,000 | | | | 789,992 | |
| | | | | | | | | |
Financial - 0.0% | | | | | | | | |
Lincoln Financing SARL | | | | | | | | |
3.88% due 04/01/24 | | | EUR 350,000 | | | | 303,432 | |
| | | | | | | | | |
Basic Materials - 0.0% |
Mirabela Nickel Ltd. | | | | | | | | |
due 06/24/195,8 | | | 1,279,819 | | | | 63,991 | |
Total Corporate Bonds | | | | |
(Cost $44,331,056) | | | 38,765,081 | |
| | | | | | | | | |
ASSET-BACKED SECURITIES†† - 2.1% |
Collateralized Loan Obligations - 2.1% |
Cerberus Loan Funding XVII Ltd. | | | | | | | | |
2016-3A, 4.36% (3 Month USD LIBOR + 2.53%, Rate Floor: 0.00%) due 01/15/287,9 | | | 5,000,000 | | | | 4,475,201 | |
OHA Credit Partners IX Ltd. | | | | | | | | |
2013-9A, due 10/20/254,7 | | | 5,954,123 | | | | 3,669,460 | |
Avery Point II CLO Ltd. | | | | | | | | |
2013-3X COM, due 01/18/254 | | | 4,300,020 | | | | 2,661,328 | |
22 | THE GUGGENHEIM FUNDS SEMI-ANNUAL REPORT | SEE NOTES TO FINANCIAL STATEMENTS. |
SCHEDULE OF INVESTMENTS (Unaudited)(continued) | March 31, 2020 |
FLOATING RATE STRATEGIES FUND | |
| | Face
Amount~ | | | Value | |
Jamestown CLO V Ltd. | | | | | | | | |
2014-5A, 6.94% (3 Month USD LIBOR + 5.10%, Rate Floor: 0.00%) due 01/17/277,9 | | | 4,000,000 | | | $ | 2,199,994 | |
Treman Park CLO Ltd. | | | | | | | | |
2015-1A, due 10/20/284,7 | | | 3,000,000 | | | | 2,058,187 | |
Halcyon Loan Advisors Funding Ltd. | | | | | | | | |
2012-1A, 4.69% (3 Month USD LIBOR + 3.00%, Rate Floor: 0.00%) due 08/15/237,9 | | | 1,674,511 | | | | 1,409,472 | |
Newstar Commercial Loan Funding LLC | | | | | | | | |
2017-1A, 4.62% (3 Month USD LIBOR + 3.50%, Rate Floor: 0.00%) due 03/20/277,9 | | | 1,000,000 | | | | 887,873 | |
ACIS CLO Ltd. | | | | | | | | |
2015-6A, 5.13% (3 Month USD LIBOR + 3.37%, Rate Floor: 0.00%) due 05/01/277,9 | | | 1,000,000 | | | | 831,320 | |
Octagon Loan Funding Ltd. | | | | | | | | |
2014-1A, due 11/18/314,7 | | | 2,071,948 | | | | 665,916 | |
Total Collateralized Loan Obligations | | | 18,858,751 | |
| | | | | | | | | |
Transport-Aircraft - 0.0% |
Airplanes Pass Through Trust | | | | | | | | |
2001-1A, due 03/15/19†††,5,8 | | | 896,492 | | | | 8,965 | |
Total Asset-Backed Securities | | | | |
(Cost $26,229,450) | | | 18,867,716 | |
| | | | | | | | | |
COLLATERALIZED MORTGAGE OBLIGATIONS†† - 1.8% |
Residential Mortgage Backed Securities - 1.8% |
RALI Series Trust | | | | | | | | |
2006-QO6, 1.13% (1 Month USD LIBOR + 0.18%, Rate Floor: 0.18%) due 06/25/469 | | | 12,249,416 | | | | 3,491,411 | |
2006-QO2, 1.17% (1 Month USD LIBOR + 0.22%, Rate Floor: 0.22%) due 02/25/469 | | | 487,984 | | | | 115,493 | |
Washington Mutual Mortgage Pass-Through Certificates Trust | | | | | | | | |
2007-OA6, 2.78% (1 Year CMT Rate + 0.81%, Rate Floor: 0.81%) due 07/25/479 | | | 3,548,728 | | | | 2,703,932 | |
Washington Mutual Mortgage Pass-Through Certificates WMALT Series Trust | | | | | | | | |
2006-AR9, 2.81% (1 Year CMT Rate + 0.84%, Rate Floor: 0.84%) due 11/25/469 | | | 2,512,259 | | | | 1,950,901 | |
American Home Mortgage Assets Trust | | | | | | | | |
2006-4, 1.16% (1 Month USD LIBOR + 0.21%, Rate Floor: 0.21%) due 10/25/469 | | | 3,316,800 | | | | 1,941,149 | |
Lehman XS Trust Series | | | | | | | | |
2006-16N, 1.14% (1 Month USD LIBOR + 0.19%, Rate Floor: 0.19%) due 11/25/469 | | | 1,923,000 | | | | 1,541,897 | |
SEE NOTES TO FINANCIAL STATEMENTS. | THE GUGGENHEIM FUNDS SEMI-ANNUAL REPORT | 23 |
SCHEDULE OF INVESTMENTS (Unaudited)(continued) | March 31, 2020 |
FLOATING RATE STRATEGIES FUND | |
| | Face
Amount~ | | | Value | |
Wachovia Asset Securitization Issuance II LLC Trust | | | | | | | | |
2007-HE1, 1.09% (1 Month USD LIBOR + 0.14%, Rate Floor: 0.14%) due 07/25/377,9 | | | 1,701,293 | | | $ | 1,420,251 | |
Nomura Resecuritization Trust | | | | | | | | |
2015-4R, 2.11% (1 Month USD LIBOR + 0.43%, Rate Floor: 0.43%) due 03/26/367,9 | | | 1,421,731 | | | | 1,367,762 | |
Alliance Bancorp Trust | | | | | | | | |
2007-OA1, 1.19% (1 Month USD LIBOR + 0.24%, Rate Floor: 0.24%) due 07/25/379 | | | 585,506 | | | | 438,209 | |
Morgan Stanley Re-REMIC Trust | | | | | | | | |
2010-R5, 3.90% due 06/26/367 | | | 526,859 | | | | 415,710 | |
GSAA Home Equity Trust | | | | | | | | |
2007-7, 1.22% (1 Month USD LIBOR + 0.27%, Rate Floor: 0.27%) due 07/25/379 | | | 392,829 | | | | 356,416 | |
New Century Home Equity Loan Trust | | | | | | | | |
2004-4, 1.74% (1 Month USD LIBOR + 0.80%, Rate Cap/Floor: 12.50%/0.53%) due 02/25/359 | | | 234,139 | | | | 212,307 | |
Total Residential Mortgage Backed Securities | | | 15,955,438 | |
| | | | | | | | | |
Total Collateralized Mortgage Obligations |
(Cost $18,807,534) | | | 15,955,438 | |
| | | | | | | | | |
Total Investments - 98.1% | | | | |
(Cost $1,054,908,713) | | $ | 864,265,421 | |
Other Assets & Liabilities, net - 1.9% | | | 16,912,298 | |
Total Net Assets - 100.0% | | $ | 881,177,719 | |
Forward Foreign Currency Exchange Contracts†† |
Counterparty | | Contracts
to Sell | | | Currency | | | Settlement
Date | | | Settlement
Value | | | Value at
March 31,
2020 | | | Unrealized
Appreciation
(Depreciation) | |
Barclays Bank plc | | | 71,159,000 | | | | EUR | | | | 04/17/20 | | | $ | 79,784,118 | | | $ | 78,489,000 | | | $ | 1,295,118 | |
Barclays Bank plc | | | 14,994,000 | | | | GBP | | | | 04/17/20 | | | | 18,909,626 | | | | 18,649,500 | | | | 260,126 | |
JPMorgan Chase Bank, N.A. | | | 1,553,000 | | | | EUR | | | | 04/17/20 | | | | 1,716,678 | | | | 1,712,972 | | | | 3,706 | |
JPMorgan Chase Bank, N.A. | | | 461,000 | | | | GBP | | | | 04/17/20 | | | | 571,492 | | | | 573,391 | | | | (1,899 | ) |
| | | | | | | | | | | | | | | | | | | | | | | $ | 1,557,051 | |
24 | THE GUGGENHEIM FUNDS SEMI-ANNUAL REPORT | SEE NOTES TO FINANCIAL STATEMENTS. |
SCHEDULE OF INVESTMENTS (Unaudited)(continued) | March 31, 2020 |
FLOATING RATE STRATEGIES FUND | |
Forward Foreign Currency Exchange Contracts†† (concluded) |
Counterparty | | Contracts
to Buy | | | Currency | | | Settlement
Date | | | Settlement
Value | | | Value at
March 31,
2020 | | | Unrealized
Appreciation
(Depreciation) | |
JPMorgan Chase Bank, N.A. | | | 2,176,000 | | | | GBP | | | | 04/17/20 | | | $ | 2,555,092 | | | $ | 2,706,503 | | | $ | 151,411 | |
JPMorgan Chase Bank, N.A. | | | 10,598,000 | | | | EUR | | | | 04/17/20 | | | | 11,629,573 | | | | 11,689,687 | | | | 60,114 | |
Barclays Bank plc | | | 1,641,000 | | | | EUR | | | | 04/17/20 | | | | 1,752,908 | | | | 1,810,037 | | | | 57,129 | |
Morgan Stanley Capital Services LLC | | | 1,267,000 | | | | EUR | | | | 04/17/20 | | | | 1,358,264 | | | | 1,397,512 | | | | 39,248 | |
Morgan Stanley Capital Services LLC | | | 561,000 | | | | GBP | | | | 04/17/20 | | | | 676,577 | | | | 697,770 | | | | 21,193 | |
BNP Paribas | | | 40,000 | | | | GBP | | | | 04/17/20 | | | | 48,751 | | | | 49,752 | | | | 1,001 | |
Goldman Sachs International | | | 883,000 | | | | EUR | | | | 04/17/20 | | | | 984,169 | | | | 973,957 | | | | (10,212 | ) |
| | | | | | | | | | | | | | | | | | | | | | | $ | 319,884 | |
SEE NOTES TO FINANCIAL STATEMENTS. | THE GUGGENHEIM FUNDS SEMI-ANNUAL REPORT | 25 |
SCHEDULE OF INVESTMENTS (Unaudited)(continued) | March 31, 2020 |
FLOATING RATE STRATEGIES FUND | |
~ | The face amount is denominated in U.S. dollars unless otherwise indicated. |
* | Non-income producing security. |
† | Value determined based on Level 1 inputs — See Note 4. |
†† | Value determined based on Level 2 inputs, unless otherwise noted — See Note 4. |
††† | Value determined based on Level 3 inputs — See Note 4. |
1 | Security was fair valued by the Valuation Committee at March 31, 2020. The total market value of fair valued securities amounts to $23,317,847, (cost $25,527,566) or 2.6% of total net assets. |
2 | Affiliated issuer. |
3 | Rate indicated is the 7-day yield as of March 31, 2020. |
4 | Security has no stated coupon. However, it is expected to receive residual cash flow payments on defined deal dates. |
5 | Security is in default of interest and/or principal obligations. |
6 | All or a portion of this security has been physically segregated or earmarked in connection with reverse repurchase agreements. At March 31, 2020, the total market value of segregated or earmarked security was $34,197,439 — Note 10. |
7 | Security is a 144A or Section 4(a)(2) security. These securities have been determined to be liquid under guidelines established by the Board of Trustees. The total market value of 144A or Section 4(a)(2) securities is $35,974,166 (cost $42,067,325), or 4.1% of total net assets. |
8 | Security is a 144A or Section 4(a)(2) security. These securities have been determined to be illiquid and restricted under guidelines established by the Board of Trustees. The total market value of 144A or Section 4(a)(2) illiquid and restricted securities is $72,956 (cost $1,883,995), or less than 0.1% of total net assets — See Note 9. |
9 | Variable rate security. Rate indicated is the rate effective at March 31, 2020. In some instances, the effective rate is limited by a minimum rate floor or a maximum rate cap established by the issuer. The settlement status of a position may also impact the effective rate indicated. In some cases, a position may be unsettled at period end and may not have a stated effective rate. In instances where multiple underlying reference rates and spread amounts are shown, the effective rate is based on a weighted average. |
| | CMT — Constant Maturity Treasury |
| | EURIBOR — European Interbank Offered Rate |
| | EUR — Euro |
| | GBP — British Pound |
| | LIBOR — London Interbank Offered Rate |
| | plc — Public Limited Company |
| | REMIC — Real Estate Mortgage Investment Conduit |
| | SARL — Société à Responsibilité Limitée |
| | |
| | See Sector Classification in Other Information section. |
26 | THE GUGGENHEIM FUNDS SEMI-ANNUAL REPORT | SEE NOTES TO FINANCIAL STATEMENTS. |
SCHEDULE OF INVESTMENTS (Unaudited)(continued) | March 31, 2020 |
FLOATING RATE STRATEGIES FUND | |
The following table summarizes the inputs used to value the Fund’s investments at March 31, 2020 (See Note 4 in the Notes to Financial Statements):
Investments in Securities (Assets) | | Level 1
Quoted
Prices | | | Level 2
Significant
Observable
Inputs | | | Level 3
Significant
Unobservable
Inputs | | | Total | |
Common Stocks | | $ | — | | | $ | 798,205 | | | $ | 1,369,618 | | | $ | 2,167,823 | |
Preferred Stocks | | | — | | | | 473,015 | | | | — | | | | 473,015 | |
Money Market Fund | | | 87,264,108 | | | | — | | | | — | | | | 87,264,108 | |
Senior Floating Rate Interests | | | — | | | | 622,486,301 | | | | 78,285,939 | | | | 700,772,240 | |
Corporate Bonds | | | — | | | | 38,765,081 | | | | — | | | | 38,765,081 | |
Asset-Backed Securities | | | — | | | | 18,858,751 | | | | 8,965 | | | | 18,867,716 | |
Collateralized Mortgage Obligations | | | — | | | | 15,955,438 | | | | — | | | | 15,955,438 | |
Forward Foreign Currency Exchange Contracts** | | | — | | | | 1,889,046 | | | | — | | | | 1,889,046 | |
Total Assets | | $ | 87,264,108 | | | $ | 699,225,837 | | | $ | 79,664,522 | | | $ | 866,154,467 | |
Investments in Securities (Liabilities) | | Level 1
Quoted
Prices | | | Level 2
Significant
Observable
Inputs | | | Level 3
Significant
Unobservable
Inputs | | | Total | |
Forward Foreign Currency Exchange Contracts** | | $ | — | | | $ | 12,111 | | | $ | — | | | $ | 12,111 | |
Unfunded Loan Commitments (Note 8) | | | — | | | | — | | | | 352,908 | | | | 352,908 | |
Total Liabilities | | $ | — | | | $ | 12,111 | | | $ | 352,908 | | | $ | 365,019 | |
** | This derivative is reported as unrealized appreciation/depreciation at period end. |
The Fund may hold assets and/or liabilities in which the fair value approximates the carrying amount for financial statement purposes. As of the period end, reverse repurchase agreements of $27,368,288 are categorized as Level 2 within the disclosure hierarchy — See Note 10.
SEE NOTES TO FINANCIAL STATEMENTS. | THE GUGGENHEIM FUNDS SEMI-ANNUAL REPORT | 27 |
SCHEDULE OF INVESTMENTS (Unaudited)(continued) | March 31, 2020 |
FLOATING RATE STRATEGIES FUND | |
The following is summary of significant unobservable inputs used in the fair valuation of assets and liabilities categorized within the Level 3 of the fair value hierarchy:
Category | | Ending
Balance at
March 31, 2020 | | Valuation Technique | Unobservable
Inputs | | Input
Range | | | Weighted
Average* | |
Assets: | | | | | | | | | | | | | | |
Asset-Backed Securities | | $ | 8,965 | | Option Adjusted Spread off prior month broker quote | Broker Quote | — | — |
Common Stocks | | | 1,369,618 | | Enterprise Value | Valuation Multiple | 1.6x-9.1x | 8.7x |
Senior Floating Rate Interests | | | 56,337,710 | | Third Party Pricing | Broker Quote | — | — |
Senior Floating Rate Interests | | | 19,754,634 | | Yield Analysis | Yield | 8.5%-9.1% | 8.7% |
Senior Floating Rate Interests | | | 1,795,636 | | Enterprise Value | Valuation Multiple | 9.1x | — |
Senior Floating Rate Interests | | | 397,959 | | Model Price | Purchase Price | — | — |
Total | | $ | 79,664,522 | | | | | |
Liabilities: | | | | | | | | | | | | | | |
Unfunded Loan Commitments | | $ | 352,908 | | Model Price | Purchase Price | — | — |
* | Inputs are weighted by the fair value of the instruments. |
Significant changes in a quote, valuation multiple, or yield would generally result in significant changes in the fair value of the security.
The Fund’s fair valuation leveling guidelines were revised to classify a single daily broker quote, or a vendor
price based on a single daily or monthly broker quote, as Level 3 rather than Level 2, if such a quote or price cannot be supported with other available market information.
Transfers between Level 2 and Level 3 may occur as markets fluctuate and/or the availability of data used in an investment’s valuation changes. For the period ended March 31, 2020, the Fund had securities with a total value of $30,873,513 transfer from Level 2 to Level 3 to due to lack of observable inputs and had securities with a total market value of $18,665,433 transfer out of Level 3 to Level 2 due to the availability of current and reliable market-based data provided by a third-party pricing service which utilizes significant observable inputs. There were no other securities that transferred between levels.
28 | THE GUGGENHEIM FUNDS SEMI-ANNUAL REPORT | SEE NOTES TO FINANCIAL STATEMENTS. |
SCHEDULE OF INVESTMENTS (Unaudited)(continued) | March 31, 2020 |
FLOATING RATE STRATEGIES FUND | |
Summary of Fair Value Level 3 Activity
Following is a reconciliation of Level 3 assets for which significant unobservable inputs were used to determine fair value for the period ended March 31, 2020:
| | | Assets | | | | | | | Liabilities | |
| | | Common
Stocks | | | Senior
Floating Rate
Interests | | | Asset-Backed
Securities | | | Total
Assets | | | Unfunded
Loan
Commitments | |
Beginning Balance | | $ | 2,795,632 | | | $ | 76,387,868 | | | $ | 14,848 | | | $ | 79,198,348 | | | $ | (43,173 | ) |
Purchases/(Receipts) | | | — | | | | 5,241,427 | | | | — | | | | 5,241,427 | | | | (47,854 | ) |
(Sales, maturities and paydowns)/Fundings | | | (140,596 | ) | | | (3,442,843 | ) | | | — | | | | (3,583,439 | ) | | | 12,745 | |
Amortization of discount/premiums | | | — | | | | 51,104 | | | | — | | | | 51,104 | | | | — | |
Total realized gains or losses included in earnings | | | 140,596 | | | | (395,030 | ) | | | — | | | | (254,434 | ) | | | — | |
Total change in unrealized appreciation (depreciation) included in earnings | | | (627,809 | ) | | | (12,562,872 | ) | | | (5,883 | ) | | | (13,196,564 | ) | | | (274,626 | ) |
Transfers into Level 3 | | | — | | | | 30,873,513 | | | | — | | | | 30,873,513 | | | | — | |
Transfers out of Level 3 | | | (798,205 | ) | | | (17,867,228 | ) | | | — | | | | (18,665,433 | ) | | | — | |
Ending Balance | | $ | 1,369,618 | | | $ | 78,285,939 | | | $ | 8,965 | | | $ | 79,664,522 | | | $ | (352,908 | ) |
Net change in unrealized appreciation (depreciation) for investments in Level 3 securities still held at March 31, 2020 | | $ | (562,501 | ) | | $ | (10,483,876 | ) | | $ | (5,883 | ) | | $ | (11,052,260 | ) | | $ | (299,058 | ) |
SEE NOTES TO FINANCIAL STATEMENTS. | THE GUGGENHEIM FUNDS SEMI-ANNUAL REPORT | 29 |
SCHEDULE OF INVESTMENTS (Unaudited)(concluded) | March 31, 2020 |
FLOATING RATE STRATEGIES FUND | |
Affiliated Transactions
Investments representing 5% or more of the outstanding voting shares of a company, or control of or by, or common control under Guggenheim Investments, result in that company being considered an affiliated issuer, as defined in the 1940 Act.
Transactions during the period ended March 31, 2020, in which the company is an affiliated issuer, were as follows:
Security Name | | Value
09/30/19 | | | Additions | | | Reductions | | | Realized
Gain (Loss) | |
Common Stocks | | | | | | | | | | | | | | | | |
BP Holdco LLC *,1 | | $ | 86,255 | | | $ | — | | | $ | — | | | $ | — | |
Targus Group International, Inc.*,1 | | | 21,632 | | | | — | | | | — | | | | — | |
Senior Floating Rate Interests | | | | | | | | | | | | | | | | |
Targus Group International, Inc., due 05/24/16 | | | — | ** | | | — | | | | — | | | | (144,303 | ) |
| | | $ | 107,887 | | | $ | — | | | $ | — | | | $ | (144,303 | ) |
Security Name | | Change in
Unrealized
Appreciation
(Depreciation) | | | Value
03/31/20 | | | Shares/
Face Amount
03/31/20 | |
Common Stocks | | | | | | | | | | | | |
BP Holdco LLC *,1 | | $ | (22,254 | ) | | $ | 64,001 | | | | 244,278 | |
Targus Group International, Inc.*,1 | | | 466 | | | | 22,098 | | | | 12,773 | |
Senior Floating Rate Interests | | | | | | | | | | | | |
Targus Group International, Inc., due 05/24/16 | | | 144,303 | | | | — | | | | — | |
| | | $ | 122,515 | | | $ | 86,099 | | | | | |
* | Non-income producing security. |
** | Market value is less than $1. |
1 | Security was fair valued by the Valuation Committee at March 31, 2020. The total market value of fair valued and affiliated securities amounts to $86,099, (cost $91,281) or less than 0.1% of total net assets. |
30 | THE GUGGENHEIM FUNDS SEMI-ANNUAL REPORT | SEE NOTES TO FINANCIAL STATEMENTS. |
STATEMENT OF ASSETS AND LIABILITIES (Unaudited) |
FLOATING RATE STRATEGIES FUND |
March 31, 2020
Assets: |
Investments in unaffiliated issuers, at value (cost $1,054,817,432) | | $ | 864,179,322 | |
Investments in affiliated issuers, at value (cost $91,281) | | | 86,099 | |
Foreign currency, at value (cost $234,079) | | | 234,082 | |
Cash | | | 3,680,370 | |
Unrealized appreciation on forward foreign currency exchange contracts | | | 1,889,046 | |
Prepaid expenses | | | 223,547 | |
Receivables: |
Securities sold | | | 51,060,040 | |
Fund shares sold | | | 7,646,060 | |
Interest | | | 3,208,909 | |
Foreign tax reclaims | | | 60,917 | |
Total assets | | | 932,268,392 | |
| | | | | |
Liabilities: |
Unfunded loan commitments, at value (Note 8) (commitment fees received $55,903) | | | 352,908 | |
Reverse repurchase agreements (Note 10) | | | 27,368,288 | |
Segregated cash due to broker | | | 1,480,000 | |
Unrealized depreciation on forward foreign currency exchange contracts | | | 12,111 | |
Payable for: |
Securities purchased | | | 10,314,161 | |
Fund shares redeemed | | | 9,057,884 | |
Distributions to shareholders | | | 771,326 | |
Transfer agent/maintenance fees | | | 706,099 | |
Management fees | | | 460,343 | |
Distribution and service fees | | | 119,821 | |
Fund accounting/administration fees | | | 49,360 | |
Trustees’ fees* | | | 32,279 | |
Due to Investment Adviser | | | 5,563 | |
Miscellaneous | | | 360,530 | |
Total liabilities | | | 51,090,673 | |
Net assets | | $ | 881,177,719 | |
Net assets consist of: |
Paid in capital | | $ | 1,176,337,187 | |
Total distributable earnings (loss) | | | (295,159,468 | ) |
Net assets | | $ | 881,177,719 | |
| | | | | |
A-Class: |
Net assets | | $ | 149,728,198 | |
Capital shares outstanding | | | 6,925,891 | |
Net asset value per share | | $ | 21.62 | |
Maximum offering price per share (Net asset value divided by 97.00%) | | $ | 22.29 | |
| | | | | |
C-Class: |
Net assets | | $ | 76,552,105 | |
Capital shares outstanding | | | 3,542,209 | |
Net asset value per share | | $ | 21.61 | |
| | | | | |
P-Class: |
Net assets | | $ | 60,977,585 | |
Capital shares outstanding | | | 2,819,470 | |
Net asset value per share | | $ | 21.63 | |
| | | | | |
Institutional Class: |
Net assets | | $ | 592,331,882 | |
Capital shares outstanding | | | 27,374,915 | |
Net asset value per share | | $ | 21.64 | |
| | | | | |
R6-Class: |
Net assets | | $ | 1,587,949 | |
Capital shares outstanding | | | 73,383 | |
Net asset value per share | | $ | 21.64 | |
* | Relates to Trustees not deemed “interested persons” within the meaning of Section 2(a)(19) of the 1940 Act. |
SEE NOTES TO FINANCIAL STATEMENTS. | THE GUGGENHEIM FUNDS SEMI-ANNUAL REPORT | 31 |
STATEMENT OF OPERATIONS (Unaudited) |
FLOATING RATE STRATEGIES FUND |
Six-Month Period Ended March 31, 2020
Investment Income: |
Interest from securities of unaffiliated issuers | | $ | 36,689,982 | |
Total investment income | | | 36,689,982 | |
| | | | | |
Expenses: |
Management fees | | | 4,362,393 | |
Distribution and service fees: |
A-Class | | | 268,563 | |
C-Class | | | 507,325 | |
P-Class | | | 129,047 | |
Transfer agent/maintenance fees: |
A-Class | | | 164,532 | |
C-Class | | | 57,523 | |
P-Class | | | 162,128 | |
Institutional Class | | | 576,792 | |
R6-Class | | | 442 | |
Fund accounting/administration fees | | | 518,515 | |
Line of credit fees | | | 428,220 | |
Professional fees | | | 118,154 | |
Custodian fees | | | 54,988 | |
Interest expense | | | 41,868 | |
Trustees’ fees* | | | 38,788 | |
Miscellaneous | | | 214,584 | |
Recoupment of previously waived fees: |
A-Class | | | 1,039 | |
C-Class | | | 1,107 | |
P-Class | | | 233 | |
Institutional Class | | | 3,174 | |
R6-Class | | | 170 | |
Total expenses | | | 7,649,585 | |
Less: |
Expenses reimbursed by Adviser: |
A-Class | | | (173,519 | ) |
C-Class | | | (61,985 | ) |
P-Class | | | (167,058 | ) |
Institutional Class | | | (568,036 | ) |
R6-Class | | | (387 | ) |
Expenses waived by Adviser | | | (45,495 | ) |
Earnings credits applied | | | (44,415 | ) |
Total waived/reimbursed expenses | | | (1,060,895 | ) |
Net expenses | | | 6,588,690 | |
Net investment income | | | 30,101,292 | |
Net Realized and Unrealized Gain (Loss): |
Net realized gain (loss) on: |
Investments in unaffiliated issuers | | $ | (52,028,824 | ) |
Investments in affiliated issuers | | | (144,303 | ) |
Forward foreign currency exchange contracts | | | (1,166,613 | ) |
Foreign currency transactions | | | 323,505 | |
Net realized loss | | | (53,016,235 | ) |
Net change in unrealized appreciation (depreciation) on: |
Investments in unaffiliated issuers | | | (119,856,930 | ) |
Investments in affiliated issuers | | | 122,515 | |
Forward foreign currency exchange contracts | | | (200,636 | ) |
Foreign currency translations | | | 32,487 | |
Net change in unrealized appreciation (depreciation) | | | (119,902,564 | ) |
Net realized and unrealized loss | | | (172,918,799 | ) |
Net decrease in net assets resulting from operations | | $ | (142,817,507 | ) |
* | Relates to Trustees not deemed “interested persons” within the meaning of Section 2(a)(19) of the 1940 Act. |
32 | THE GUGGENHEIM FUNDS SEMI-ANNUAL REPORT | SEE NOTES TO FINANCIAL STATEMENTS. |
STATEMENTS OF CHANGES IN NET ASSETS |
FLOATING RATE STRATEGIES FUND | |
| | Six-Month
Period Ended
March 31,
2020
(Unaudited) | | | Year Ended
September 30,
2019 | |
Increase (Decrease) in Net Assets from Operations: | | | | | | | | |
Net investment income | | $ | 30,101,292 | | | $ | 108,889,005 | |
Net realized loss on investments | | | (53,016,235 | ) | | | (41,709,479 | ) |
Net change in unrealized appreciation (depreciation) on investments | | | (119,902,564 | ) | | | (39,353,594 | ) |
Net increase (decrease) in net assets resulting from operations | | | (142,817,507 | ) | | | 27,825,932 | |
| | | | | | | | | |
Distributions to shareholders: | | | | | | | | |
A-Class | | | (4,703,253 | ) | | | (14,640,261 | ) |
C-Class | | | (1,841,761 | ) | | | (5,587,635 | ) |
P-Class | | | (2,269,997 | ) | | | (13,322,706 | ) |
Institutional Class | | | (21,107,028 | ) | | | (75,137,743 | ) |
R6-Class | | | (178,568 | ) | | | (2,302,137 | )* |
Total distributions to shareholders | | | (30,100,607 | ) | | | (110,990,482 | ) |
| | | | | | | | | |
Capital share transactions: | | | | | | | | |
Proceeds from sale of shares | | | | | | | | |
A-Class | | | 45,727,828 | | | | 60,624,023 | |
C-Class | | | 4,383,586 | | | | 14,215,093 | |
P-Class | | | 10,822,672 | | | | 97,670,860 | |
Institutional Class | | | 240,526,448 | | | | 594,221,256 | |
R6-Class | | | 6,821,639 | | | | 87,641,260 | * |
Distributions reinvested | | | | | | | | |
A-Class | | | 3,657,511 | | | | 12,049,838 | |
C-Class | | | 1,388,688 | | | | 4,283,336 | |
P-Class | | | 2,268,544 | | | | 13,315,826 | |
Institutional Class | | | 16,546,976 | | | | 60,508,720 | |
R6-Class | | | 178,342 | | | | 2,301,889 | * |
Cost of shares redeemed | | | | | | | | |
A-Class | | | (105,174,399 | ) | | | (257,341,946 | ) |
C-Class | | | (27,864,841 | ) | | | (74,471,779 | ) |
P-Class | | | (75,678,428 | ) | | | (351,356,453 | ) |
Institutional Class | | | (613,863,899 | ) | | | (1,759,648,479 | ) |
R6-Class | | | (76,413,229 | ) | | | (17,825,386 | )* |
Net decrease from capital share transactions | | | (566,672,562 | ) | | | (1,513,811,942 | ) |
Net decrease in net assets | | | (739,590,676 | ) | | | (1,596,976,492 | ) |
| | | | | | | | | |
Net assets: | | | | | | | | |
Beginning of period | | | 1,620,768,395 | | | | 3,217,744,887 | |
End of period | | $ | 881,177,719 | | | $ | 1,620,768,395 | |
SEE NOTES TO FINANCIAL STATEMENTS. | THE GUGGENHEIM FUNDS SEMI-ANNUAL REPORT | 33 |
STATEMENTS OF CHANGES IN NET ASSETS (concluded) |
FLOATING RATE STRATEGIES FUND | |
| | Six-Month
Period Ended
March 31,
2020
(Unaudited) | | | Year Ended
September 30,
2019 | |
| | | | | | | | | |
Capital share activity: | | | | | | | | |
Shares sold | | | | | | | | |
A-Class | | | 1,837,732 | | | | 2,381,654 | |
C-Class | | | 174,447 | | | | 559,608 | |
P-Class | | | 432,171 | | | | 3,847,865 | |
Institutional Class | | | 9,761,164 | | | | 23,392,664 | |
R6-Class | | | 272,521 | | | | 3,453,140 | * |
Shares issued from reinvestment of distributions | | | | | | | | |
A-Class | | | 148,865 | | | | 475,414 | |
C-Class | | | 56,588 | | | | 169,122 | |
P-Class | | | 91,920 | | | | 525,337 | |
Institutional Class | | | 672,569 | | | | 2,385,506 | |
R6-Class | | | 7,152 | | | | 90,637 | * |
Shares redeemed | | | | | | | | |
A-Class | | | (4,406,042 | ) | | | (10,159,897 | ) |
C-Class | | | (1,149,148 | ) | | | (2,940,946 | ) |
P-Class | | | (3,055,413 | ) | | | (13,879,455 | ) |
Institutional Class | | | (25,270,492 | ) | | | (69,438,343 | ) |
R6-Class | | | (3,045,251 | ) | | | (704,816 | )* |
Net decrease in shares | | | (23,471,217 | ) | | | (59,842,510 | ) |
* | Since commencement of operations: March 13, 2019. |
34 | THE GUGGENHEIM FUNDS SEMI-ANNUAL REPORT | SEE NOTES TO FINANCIAL STATEMENTS. |
FINANCIAL HIGHLIGHTS |
FLOATING RATE STRATEGIES FUND | |
This table is presented to show selected data for a share outstanding throughout each period and to assist shareholders in evaluating a Fund’s performance for the periods presented.
A-Class | | Period
Ended
March 31,
2020a | | | Year
Ended
Sept. 30,
2019 | | | Year
Ended
Sept. 30,
2018 | | | Year
Ended
Sept. 30,
2017 | | | Year
Ended
Sept. 30,
2016 | | | Year
Ended
Sept. 30,
2015 | |
Per Share Data |
Net asset value, beginning of period | | $ | 25.23 | | | $ | 25.92 | | | $ | 26.01 | | | $ | 25.92 | | | $ | 25.88 | | | $ | 26.52 | |
Income (loss) from investment operations: |
Net investment income (loss)b | | | .54 | | | | 1.17 | | | | 1.04 | | | | .93 | | | | .99 | | | | 1.04 | |
Net gain (loss) on investments (realized and unrealized) | | | (3.61 | ) | | | (.67 | ) | | | (.07 | ) | | | .10 | | | | .12 | | | | (.42 | ) |
Total from investment operations | | | (3.07 | ) | | | .50 | | | | .97 | | | | 1.03 | | | | 1.11 | | | | .62 | |
Less distributions from: |
Net investment income | | | (.54 | ) | | | (1.19 | ) | | | (1.06 | ) | | | (.94 | ) | | | (1.07 | ) | | | (1.18 | ) |
Net realized gains | | | — | | | | — | | | | — | | | | — | | | | — | | | | (.08 | ) |
Total distributions | | | (.54 | ) | | | (1.19 | ) | | | (1.06 | ) | | | (.94 | ) | | | (1.07 | ) | | | (1.26 | ) |
Net asset value, end of period | | $ | 21.62 | | | $ | 25.23 | | | $ | 25.92 | | | $ | 26.01 | | | $ | 25.92 | | | $ | 25.88 | |
|
Total Returnc | | | (12.39 | %) | | | 2.01 | % | | | 3.80 | % | | | 4.03 | % | | | 4.47 | % | | | 2.36 | % |
Ratios/Supplemental Data |
Net assets, end of period (in thousands) | | $ | 149,728 | | | $ | 235,752 | | | $ | 431,562 | | | $ | 534,911 | | | $ | 452,611 | | | $ | 400,270 | |
Ratios to average net assets: |
Net investment income (loss) | | | 4.38 | % | | | 4.60 | % | | | 4.02 | % | | | 3.58 | % | | | 3.88 | % | | | 3.97 | % |
Total expensesd | | | 1.27 | % | | | 1.23 | % | | | 1.15 | % | | | 1.13 | % | | | 1.20 | % | | | 1.19 | % |
Net expensese,f,g | | | 1.10 | % | | | 1.07 | % | | | 1.03 | % | | | 1.04 | % | | | 1.03 | % | | | 1.03 | % |
Portfolio turnover rate | | | 8 | % | | | 10 | % | | | 33 | % | | | 44 | % | | | 35 | % | | | 44 | % |
SEE NOTES TO FINANCIAL STATEMENTS. | THE GUGGENHEIM FUNDS SEMI-ANNUAL REPORT | 35 |
FINANCIAL HIGHLIGHTS (continued) |
FLOATING RATE STRATEGIES FUND | |
This table is presented to show selected data for a share outstanding throughout each period and to assist shareholders in evaluating a Fund’s performance for the periods presented.
C-Class | | Period
Ended
March 31,
2020a | | | Year
Ended
Sept. 30,
2019 | | | Year
Ended
Sept. 30,
2018 | | | Year
Ended
Sept. 30,
2017 | | | Year
Ended
Sept. 30,
2016 | | | Year
Ended
Sept. 30,
2015 | |
Per Share Data |
Net asset value, beginning of period | | $ | 25.22 | | | $ | 25.91 | | | $ | 26.00 | | | $ | 25.91 | | | $ | 25.87 | | | $ | 26.51 | |
Income (loss) from investment operations: |
Net investment income (loss)b | | | .45 | | | | .98 | | | | .85 | | | | .74 | | | | .80 | | | | .85 | |
Net gain (loss) on investments (realized and unrealized) | | | (3.61 | ) | | | (.67 | ) | | | (.07 | ) | | | .10 | | | | .12 | | | | (.43 | ) |
Total from investment operations | | | (3.16 | ) | | | .31 | | | | .78 | | | | .84 | | | | .92 | | | | .42 | |
Less distributions from: |
Net investment income | | | (.45 | ) | | | (1.00 | ) | | | (.87 | ) | | | (.75 | ) | | | (.88 | ) | | | (.98 | ) |
Net realized gains | | | — | | | | — | | | | — | | | | — | | | | — | | | | (.08 | ) |
Total distributions | | | (.45 | ) | | | (1.00 | ) | | | (.87 | ) | | | (.75 | ) | | | (.88 | ) | | | (1.06 | ) |
Net asset value, end of period | | $ | 21.61 | | | $ | 25.22 | | | $ | 25.91 | | | $ | 26.00 | | | $ | 25.91 | | | $ | 25.87 | |
|
Total Returnc | | | (12.73 | %) | | | 1.26 | % | | | 3.03 | % | | | 3.26 | % | | | 3.68 | % | | | 1.63 | % |
Ratios/Supplemental Data |
Net assets, end of period (in thousands) | | $ | 76,552 | | | $ | 112,481 | | | $ | 172,906 | | | $ | 204,008 | | | $ | 197,296 | | | $ | 145,808 | |
Ratios to average net assets: |
Net investment income (loss) | | | 3.63 | % | | | 3.86 | % | | | 3.29 | % | | | 2.83 | % | | | 3.13 | % | | | 3.23 | % |
Total expensesd | | | 1.98 | % | | | 1.93 | % | | | 1.87 | % | | | 1.83 | % | | | 1.93 | % | | | 1.91 | % |
Net expensese,f,g | | | 1.85 | % | | | 1.82 | % | | | 1.78 | % | | | 1.79 | % | | | 1.78 | % | | | 1.78 | % |
Portfolio turnover rate | | | 8 | % | | | 10 | % | | | 33 | % | | | 44 | % | | | 35 | % | | | 44 | % |
36 | THE GUGGENHEIM FUNDS SEMI-ANNUAL REPORT | SEE NOTES TO FINANCIAL STATEMENTS. |
FINANCIAL HIGHLIGHTS (continued) |
FLOATING RATE STRATEGIES FUND | |
This table is presented to show selected data for a share outstanding throughout each period and to assist shareholders in evaluating a Fund’s performance for the periods presented.
P-Class | | Period
Ended
March 31,
2020a | | | Year
Ended
Sept. 30,
2019 | | | Year
Ended
Sept. 30,
2018 | | | Year
Ended
Sept. 30,
2017 | | | Year
Ended
Sept. 30,
2016 | | | Period
Ended
Sept. 30,
2015h | |
Per Share Data |
Net asset value, beginning of period | | $ | 25.24 | | | $ | 25.93 | | | $ | 26.02 | | | $ | 25.93 | | | $ | 25.89 | | | $ | 26.37 | |
Income (loss) from investment operations: |
Net investment income (loss)b | | | .55 | | | | 1.17 | | | | 1.05 | | | | .94 | | | | .99 | | | | .40 | |
Net gain (loss) on investments (realized and unrealized) | | | (3.62 | ) | | | (.67 | ) | | | (.08 | ) | | | .09 | | | | .12 | | | | (.46 | ) |
Total from investment operations | | | (3.07 | ) | | | .50 | | | | .97 | | | | 1.03 | | | | 1.11 | | | | (.06 | ) |
Less distributions from: |
Net investment income | | | (.54 | ) | | | (1.19 | ) | | | (1.06 | ) | | | (.94 | ) | | | (1.07 | ) | | | (.42 | ) |
Total distributions | | | (.54 | ) | | | (1.19 | ) | | | (1.06 | ) | | | (.94 | ) | | | (1.07 | ) | | | (.42 | ) |
Net asset value, end of period | | $ | 21.63 | | | $ | 25.24 | | | $ | 25.93 | | | $ | 26.02 | | | $ | 25.93 | | | $ | 25.89 | |
|
Total Return | | | (12.39 | %) | | | 2.01 | % | | | 3.80 | % | | | 4.03 | % | | | 4.46 | % | | | (0.24 | %) |
Ratios/Supplemental Data |
Net assets, end of period (in thousands) | | $ | 60,978 | | | $ | 135,036 | | | $ | 385,306 | | | $ | 360,829 | | | $ | 124,974 | | | $ | 20,536 | |
Ratios to average net assets: |
Net investment income (loss) | | | 4.40 | % | | | 4.59 | % | | | 4.05 | % | | | 3.59 | % | | | 3.86 | % | | | 3.68 | % |
Total expensesd | | | 1.43 | % | | | 1.22 | % | | | 1.15 | % | | | 1.16 | % | | | 1.06 | % | | | 1.04 | % |
Net expensese,f,g | | | 1.10 | % | | | 1.07 | % | | | 1.03 | % | | | 1.03 | % | | | 1.03 | % | | | 1.02 | % |
Portfolio turnover rate | | | 8 | % | | | 10 | % | | | 33 | % | | | 44 | % | | | 35 | % | | | 44 | % |
SEE NOTES TO FINANCIAL STATEMENTS. | THE GUGGENHEIM FUNDS SEMI-ANNUAL REPORT | 37 |
FINANCIAL HIGHLIGHTS (continued) |
FLOATING RATE STRATEGIES FUND | |
This table is presented to show selected data for a share outstanding throughout each period and to assist shareholders in evaluating a Fund’s performance for the periods presented.
Institutional Class | | Period
Ended
March 31,
2020a | | | Year
Ended
Sept. 30,
2019 | | | Year
Ended
Sept. 30,
2018 | | | Year
Ended
Sept. 30,
2017 | | | Year
Ended
Sept. 30,
2016 | | | Year
Ended
Sept. 30,
2015 | |
Per Share Data |
Net asset value, beginning of period | | $ | 25.25 | | | $ | 25.95 | | | $ | 26.03 | | | $ | 25.94 | | | $ | 25.90 | | | $ | 26.54 | |
Income (loss) from investment operations: |
Net investment income (loss)b | | | .57 | | | | 1.23 | | | | 1.11 | | | | 1.00 | | | | 1.05 | | | | 1.10 | |
Net gain (loss) on investments (realized and unrealized) | | | (3.61 | ) | | | (.68 | ) | | | (.07 | ) | | | .10 | | | | .12 | | | | (.42 | ) |
Total from investment operations | | | (3.04 | ) | | | .55 | | | | 1.04 | | | | 1.10 | | | | 1.17 | | | | .68 | |
Less distributions from: |
Net investment income | | | (.57 | ) | | | (1.25 | ) | | | (1.12 | ) | | | (1.01 | ) | | | (1.13 | ) | | | (1.24 | ) |
Net realized gains | | | — | | | | — | | | | — | | | | — | | | | — | | | | (.08 | ) |
Total distributions | | | (.57 | ) | | | (1.25 | ) | | | (1.12 | ) | | | (1.01 | ) | | | (1.13 | ) | | | (1.32 | ) |
Net asset value, end of period | | $ | 21.64 | | | $ | 25.25 | | | $ | 25.95 | | | $ | 26.03 | | | $ | 25.94 | | | $ | 25.90 | |
|
Total Return | | | (12.28 | %) | | | 2.21 | % | | | 4.08 | % | | | 4.28 | % | | | 4.71 | % | | | 2.59 | % |
Ratios/Supplemental Data |
Net assets, end of period (in thousands) | | $ | 592,332 | | | $ | 1,065,820 | | | $ | 2,227,970 | | | $ | 2,590,393 | | | $ | 1,643,932 | | | $ | 1,231,352 | |
Ratios to average net assets: |
Net investment income (loss) | | | 4.61 | % | | | 4.83 | % | | | 4.28 | % | | | 3.83 | % | | | 4.11 | % | | | 4.18 | % |
Total expensesd | | | 0.99 | % | | | 0.92 | % | | | 0.84 | % | | | 0.82 | % | | | 0.87 | % | | | 0.85 | % |
Net expensese,f,g | | | 0.86 | % | | | 0.83 | % | | | 0.79 | % | | | 0.79 | % | | | 0.79 | % | | | 0.79 | % |
Portfolio turnover rate | | | 8 | % | | | 10 | % | | | 33 | % | | | 44 | % | | | 35 | % | | | 44 | % |
38 | THE GUGGENHEIM FUNDS SEMI-ANNUAL REPORT | SEE NOTES TO FINANCIAL STATEMENTS. |
FINANCIAL HIGHLIGHTS (continued) |
FLOATING RATE STRATEGIES FUND |
This table is presented to show selected data for a share outstanding throughout each period and to assist shareholders in evaluating a Fund’s performance for the periods presented.
R6-Class | | Period
Ended
March 31,
2020a | | | Period
Ended
Sept. 30,
2019i | |
Per Share Data |
Net asset value, beginning of period | | $ | 25.25 | | | $ | 25.38 | |
Income (loss) from investment operations: |
Net investment income (loss)b | | | .58 | | | | .69 | |
Net gain (loss) on investments (realized and unrealized) | | | (3.62 | ) | | | (.14 | ) |
Total from investment operations | | | (3.04 | ) | | | .55 | |
Less distributions from: |
Net investment income | | | (.57 | ) | | | (.68 | ) |
Total distributions | | | (.57 | ) | | | (.68 | ) |
Net asset value, end of period | | $ | 21.64 | | | $ | 25.25 | |
|
Total Return | | | (12.27 | %) | | | 2.20 | % |
Ratios/Supplemental Data |
Net assets, end of period (in thousands) | | $ | 1,588 | | | $ | 71,680 | |
Ratios to average net assets: |
Net investment income (loss) | | | 4.64 | % | | | 4.89 | % |
Total expensesd | | | 0.85 | % | | | 0.85 | % |
Net expensese,f,g | | | 0.84 | % | | | 0.84 | % |
Portfolio turnover rate | | | 8 | % | | | 10 | % |
SEE NOTES TO FINANCIAL STATEMENTS. | THE GUGGENHEIM FUNDS SEMI-ANNUAL REPORT | 39 |
FINANCIAL HIGHLIGHTS (concluded) |
FLOATING RATE STRATEGIES FUND |
a | Unaudited figures for the period ended March 31, 2020. Percentage amounts for the period, except total return and portfolio turnover rate, have been annualized. |
b | Net investment income (loss) per share was computed using average shares outstanding throughout the period. |
c | Total return does not reflect the impact of any applicable sales charges. |
d | Does not include expenses of the underlying funds in which the Fund invests. |
e | Net expense information reflects the expense ratios after expense waivers and reimbursements, as applicable. |
f | The portion of the ratios of net expenses to average net assets attributable to recoupments of prior fee reductions or expense reimbursements for the periods presented was as follows: |
| | | 03/31/20a | 09/30/19 | 09/30/18 | 09/30/17 |
| | A-Class | 0.00%* | — | — | — |
| | C-Class | 0.00%* | — | 0.01% | — |
| | P-Class | 0.00%* | — | — | — |
| | Institutional Class | 0.00%* | — | — | 0.01% |
| | R6-Class | 0.00%* | 0.00%* | N/A | N/A |
g | Net expenses may include expenses that are excluded from the expense limitation agreement. Excluding these expenses, the net expense ratios for the periods would be: |
| | | 03/31/20a | 09/30/19 | 09/30/18 | 09/30/17 | 09/30/16 | 09/30/15 |
| | A-Class | 1.02% | 1.02% | 1.02% | 1.02% | 1.02% | 1.02% |
| | C-Class | 1.77% | 1.77% | 1.77% | 1.77% | 1.77% | 1.77% |
| | P-Class | 1.02% | 1.02% | 1.02% | 1.02% | 1.02% | 1.01% |
| | Institutional Class | 0.78% | 0.78% | 0.78% | 0.78% | 0.78% | 0.78% |
| | R6-Classi | 0.78% | 0.78% | N/A | N/A | N/A | N/A |
h | Since commencement of operations: May 1, 2015. Percentage amounts for the period, except total return and portfolio turnover rate, have been annualized. |
i | Since commencement of operations: March 13, 2019. Percentage amounts for the period, except total return and portfolio turnover rate, have been annualized. |
40 | THE GUGGENHEIM FUNDS SEMI-ANNUAL REPORT | SEE NOTES TO FINANCIAL STATEMENTS. |
NOTES TO FINANCIAL STATEMENTS (Unaudited) |
Note 1 – Organization and Significant Accounting Policies
Organization
Guggenheim Funds Trust (the “Trust”), a Delaware statutory trust, is registered with the SEC under the Investment Company Act of 1940 (“1940 Act”), as an open-ended investment company of the series type. Each series, in effect, is representing a separate fund. The Trust is authorized to issue an unlimited number of no par value shares. The Trust accounts for the assets of each fund separately.
The Trust offers a combination of five separate classes of shares: A-Class shares, C-Class shares, P-Class shares, R6-Class shares and Institutional Class shares. Sales of shares of each Class are made without a front-end sales charge at the net asset value per share (“NAV”), with the exception of A-Class shares. A-Class shares are sold at the NAV, plus the applicable front-end sales charge. The sales charge varies depending on the amount purchased. A-Class share purchases of $1 million or more are exempt from the front-end sales charge but have a 1% contingent deferred sales charge (“CDSC”), if shares are redeemed within 12 months of purchase. C-Class shares have a 1% CDSC if shares are redeemed within 12 months of purchase. C-Class shares automatically convert to A-Class shares on or about the 10th day of the month following the 10-year anniversary of the purchase of the C-Class shares. This conversion will be executed without any sales charge, fee or other charge. After the conversion is completed, the shares will be subject to all features and expenses of A-Class shares. Institutional Class shares are offered primarily for direct investment by institutions such as pension and profit sharing plans, endowments, foundations and corporations. Institutional Class shares require a minimum initial investment of $2 million and a minimum account balance of $1 million. R6-Class shares are offered primarily through qualified retirement and benefit plans. R6-Class shares are also offered through certain other plans and platforms sponsored by financial intermediaries. Certain institutional investors and others deemed appropriate by Guggenheim Investments (“GI”) may also be eligible to purchase R6-Class shares subject to a $2 million minimum initial investment. At March 31, 2020, the Trust consisted of nineteen funds (the “Funds”).
This report covers the Floating Rate Strategies Fund (the “Fund”), a diversified investment company. At March 31, 2020, A-Class, C-Class, P-Class, Institutional Class and R6-Class shares have been issued by the Fund.
Guggenheim Partners Investment Management, LLC (“GPIM”), which operates under the name Guggenheim Investments, provides advisory services. Guggenheim Funds Distributors, LLC (“GFD”) acts as principal underwriter for the Trust. GI and GFD are affiliated entities.
Significant Accounting Policies
The Fund operates as an investment company and, accordingly, follows the investment company accounting and reporting guidance of the Financial Accounting Standards Board (“FASB”) Accounting Standards Codification Topic 946 Financial Services – Investment Companies.
| | THE GUGGENHEIM FUNDS SEMI-ANNUAL REPORT | 41 |
NOTES TO FINANCIAL STATEMENTS (Unaudited)(continued) |
The following significant accounting policies are in conformity with U.S. generally accepted accounting principles (“U.S. GAAP”) and are consistently followed by the Trust. This requires management to make estimates and assumptions that affect the reported amount of assets and liabilities, contingent assets and liabilities at the date of the financial statements, and the reported amounts of revenues and expenses during the reporting period. Actual results could differ from these estimates. All time references are based on Eastern Time.
The NAV of each Class of the Fund is calculated by dividing the market value of the Fund’s securities and other assets, less all liabilities, attributable to the Class by the number of outstanding shares of the Class.
(a) Valuation of Investments
The Board of Trustees of the Fund (the “Board”) has adopted policies and procedures for the valuation of the Fund’s investments (the “Valuation Procedures”). Pursuant to the Valuation Procedures, the Board has delegated to a valuation committee, consisting of representatives from Guggenheim’s investment management, fund administration, legal and compliance departments (the “Valuation Committee”), the day-to-day responsibility for implementing the Valuation Procedures, including, under most circumstances, the responsibility for determining the fair value of the Fund’s securities and/or other assets.
Valuations of the Fund’s securities and other assets are supplied primarily by pricing services appointed pursuant to the processes set forth in the Valuation Procedures. The Valuation Committee convenes monthly, or more frequently as needed, to review the valuation of all assets which have been fair valued for reasonableness. The Fund’s officers, through the Valuation Committee and consistent with the monitoring and review responsibilities set forth in the Valuation Procedures, regularly review procedures used and valuations provided by the pricing services.
If the pricing service cannot or does not provide a valuation for a particular investment or such valuation is deemed unreliable, such investment is fair valued by the Valuation Committee.
Equity securities listed or traded on a recognized U.S. securities exchange or the National Association of Securities Dealers Automated Quotations (“NASDAQ”) National Market System shall generally be valued on the basis of the last sale price on the primary U.S. exchange or market on which the security is listed or traded; provided, however, that securities listed on NASDAQ will be valued at the NASDAQ Official Closing Price, which may not necessarily represent the last sale price. If there is no sale on the valuation date, exchange-traded U.S. equity securities will be valued on the basis of the last bid price.
Generally, trading in foreign securities markets is substantially completed each day at various times prior to the close of the New York Stock Exchange (“NYSE”). The values of foreign securities are determined as of the close of such foreign markets or the close of the NYSE, if earlier. All investments quoted in foreign currencies are valued in U.S. dollars on the basis of the foreign
42 | THE GUGGENHEIM FUNDS SEMI-ANNUAL REPORT | |
NOTES TO FINANCIAL STATEMENTS (Unaudited)(continued) |
currency exchange rates prevailing at the close of U.S. business at 4:00 p.m. Investments in foreign securities may involve risks not present in domestic investments. The Valuation Committee will determine the current value of such foreign securities by taking into consideration certain factors which may include those discussed above, as well as the following factors, among others: the value of the securities traded on other foreign markets, ADR trading, closed-end fund trading, foreign currency exchange activity, and the trading prices of financial products that are tied to foreign securities. In addition, under the Valuation Procedures, the Valuation Committee and GI are authorized to use prices and other information supplied by a third party pricing vendor in valuing foreign securities.
Open-end investment companies are valued at their NAV as of the close of business, on the valuation date.
Debt securities with a maturity of greater than 60 days at acquisition are valued at prices that reflect broker-dealer supplied valuations or are obtained from independent pricing services, which may consider the trade activity, treasury spreads, yields or price of bonds of comparable quality, coupon, maturity, and type, as well as prices quoted by dealers who make markets in such securities. Short-term debt securities with a maturity of 60 days or less at acquisition are valued at amortized cost, provided such amount approximates market value.
Typically, loans are valued using information provided by an independent third party pricing service that uses broker quotes, among other inputs. If the pricing service cannot or does not provide a valuation for a particular loan, or such valuation is deemed unreliable, such investment is valued based on a quote from a broker-dealer or is fair valued by the Valuation Committee.
Forward foreign currency exchange contracts are valued daily based on the applicable exchange rate of the underlying currency.
Investments for which market quotations are not readily available are fair-valued as determined in good faith by GI subject to review and approval by the Valuation Committee, pursuant to methods established or ratified by the Board. Valuations in accordance with these methods are intended to reflect each security’s (or asset’s or liability’s) “fair value”. Each such determination is based on a consideration of all relevant factors, which are likely to vary from one pricing context to another. Examples of such factors may include, but are not limited to market prices; sale prices; broker quotes; and models which derive prices based on inputs such as prices of securities with comparable maturities and characteristics, or based on inputs such as anticipated cash flows or collateral, spread over U.S. Treasury securities, and other information analysis. In connection with futures contracts and other derivative investments, such factors may include obtaining information as to how (a) these contracts and other derivative investments trade in the futures or other derivative markets, respectively, and (b) the securities underlying these contracts and other derivative investments trade in the cash market.
| | THE GUGGENHEIM FUNDS SEMI-ANNUAL REPORT | 43 |
NOTES TO FINANCIAL STATEMENTS (Unaudited)(continued) |
(b) Senior Floating Rate Interests and Loan Investments
Senior floating rate interests in which the Fund invests generally pay interest rates which are periodically adjusted by reference to a base short-term floating rate, plus a premium. These base lending rates are generally (i) the lending rate offered by one or more major European banks, such as the one-month or three-month London Inter-Bank Offered Rate (“LIBOR”), (ii) the prime rate offered by one or more major United States banks, or (iii) the bank’s certificate of deposit rate. Senior floating rate interests often require prepayments from excess cash flows or permit the borrower to repay at its election. The rate at which the borrower repays cannot be predicted with accuracy. As a result, the actual remaining maturity may be substantially less than the stated maturities disclosed in the Fund’s Schedule of Investments. The interest rate indicated is the rate in effect at March 31, 2020.
The Fund invests in loans and other similar debt obligations (“obligations”). A portion of the Fund’s investments in these obligations is sometimes referred to as “covenant lite” loans or obligations (“covenant lite obligations”), which are obligations that lack covenants or possess fewer or less restrictive covenants or constraints on borrowers than certain other types of obligations. The Fund may also obtain exposure to covenant lite obligations through investment in securitization vehicles and other structured products. In recent market conditions, many new or reissued obligations have not featured traditional covenants, which are intended to protect lenders and investors by (i) imposing certain restrictions or other limitations on a borrower’s operations or assets or (ii) providing certain rights to lenders. The Fund may have fewer rights with respect to covenant lite obligations, including fewer protections against the possibility of default and fewer remedies in the event of default. As a result, investments in (or exposure to) covenant lite obligations are subject to more risk than investments in (or exposure to) certain other types of obligations. The Fund is subject to other risks associated with investments in (or exposure to) obligations, including that obligations may not be considered “securities” and, as a result, the Fund may not be entitled to rely on the anti-fraud protections under the federal securities laws and instead may have to resort to state law and direct claims.
(c) Interests in When-Issued Securities
The Fund may purchase and sell interests in securities on a when-issued and delayed delivery basis, with payment and delivery scheduled for a future date. No income accrues to the Fund on such interests or securities in connection with such transactions prior to the date the Fund actually takes delivery of such interests or securities. These transactions are subject to market fluctuations and are subject to the risk that the value at delivery may be more or less than the trade date purchase price. Although the Fund will generally purchase these securities with the intention of acquiring such securities, they may sell such securities before the settlement date.
44 | THE GUGGENHEIM FUNDS SEMI-ANNUAL REPORT | |
NOTES TO FINANCIAL STATEMENTS (Unaudited)(continued) |
(d) Currency Translations
The accounting records of the Fund are maintained in U.S. dollars. All assets and liabilities initially expressed in foreign currencies are converted into U.S. dollars at prevailing exchange rates. Purchases and sales of investment securities, dividend and interest income, and certain expenses are translated at the rates of exchange prevailing on the respective dates of such transactions. Changes in the relationship of these foreign currencies to the U.S. dollar can significantly affect the value of the investments and earnings of the Fund. Foreign investments may also subject the Fund to foreign government exchange restrictions, expropriation, taxation, or other political, social or economic developments, all of which could affect the market and/or credit risk of the investments.
The Fund does not isolate that portion of the results of operations resulting from changes in the foreign exchange rates on investments from the fluctuations arising from changes in the market prices of securities held. Such fluctuations are included with the net realized gain or loss and unrealized appreciation or depreciation on investments.
Reported net realized foreign exchange gains and losses arise from sales of foreign currencies and currency gains or losses realized between the trade and settlement dates on investment transactions. Net unrealized appreciation and depreciation arise from changes in the fair values of assets and liabilities other than investments in securities at the fiscal period end, resulting from changes in exchange rates.
(e) Forward Foreign Currency Exchange Contracts
The change in value of a forward foreign currency exchange contract is recorded as unrealized appreciation or depreciation until the contract is closed. When the contract is closed, the Fund records a realized gain or loss equal to the difference between the value at the time the contract was opened and the value at the time it was closed.
(f) Foreign Taxes
The Fund may be subject to foreign taxes (a portion of which may be reclaimable) on income, stock dividends, capital gains on investments or certain foreign currency transactions. All foreign taxes are recorded in accordance with the applicable foreign tax regulations and rates that exist in the foreign jurisdictions in which the Fund invests. These foreign taxes, if any, are paid by the Fund and reflected in its Statement of Operations as follows: foreign taxes withheld at source are presented as a reduction of income and foreign taxes on capital gains from sales of investments are included with the net realized gain (loss) on investments. Foreign taxes payable or deferred as of March 31, 2020, if any, are disclosed in the Fund’s Statement of Assets and Liabilities.
(g) Security Transactions
Security transactions are recorded on the trade date for financial reporting purposes. Realized gains and losses from securities transactions are recorded using the identified cost basis. Proceeds from lawsuits related to investment holdings are recorded as a reduction to cost if
| | THE GUGGENHEIM FUNDS SEMI-ANNUAL REPORT | 45 |
NOTES TO FINANCIAL STATEMENTS (Unaudited)(continued) |
the securities are still held and as realized gains if no longer held in the Fund. Dividend income is recorded on the ex-dividend date, net of applicable taxes withheld by foreign countries, if any. Taxable non-cash dividends are recorded as dividend income. Interest income, including amortization of premiums and accretion of discounts, is accrued on a daily basis. Interest income also includes paydown gains and losses on mortgage-backed and asset-backed securities and senior and subordinated loans. Amendment fees are earned as compensation for evaluating and accepting changes to the original loan agreement and are recognized when received. Dividend income from Real Estate Investment Trusts (“REITs”) is recorded based on the income included in the distributions received from the REIT investments using published REIT classifications, including some management estimates when actual amounts are not available. Distributions received in excess of this estimated amount are recorded as a reduction of the cost of investments or reclassified to realized gains. The actual amounts of income, return of capital, and realized gains are only determined by each REIT after its fiscal year-end, and may differ from the estimated amounts.
Income from residual collateralized loan obligations is recognized using the effective interest method. At the time of purchase, management estimates the future expected cash flows and determines the effective yield and estimated maturity date based on the estimated cash flows. Subsequent to the purchase, the estimated cash flows are updated periodically and a revised yield is calculated prospectively.
The Fund may receive other income from investments in senior loan interests including amendment fees, consent fees and commitment fees. For funded loans, these fees are recorded as income when received by the Fund and included in interest income on the Statement of Operations. For unfunded loans, commitment fees are included in realized gain on investments on the Statement of Operations at the end of the commitment period.
(h) Distributions
The Fund declares dividends from investment income daily. The Fund pays its shareholders from its net investment income monthly and distributes any net capital gains that it has realized, at least annually. Distributions to shareholders are recorded on the ex-dividend date. Dividends are reinvested in additional shares, unless shareholders request payment in cash. The character of distributions made during the year from net investment income or net realized gains may differ from their ultimate characterization for U.S. federal income tax purposes.
(i) Class Allocations
Interest and dividend income, most expenses, all realized gains and losses, and all unrealized appreciation and depreciation are allocated to the classes based upon the value of the outstanding shares in each Class. Certain costs, such as distribution and service fees are charged directly to specific classes. In addition, certain expenses have been allocated to the individual Funds in the Trust based on the respective net assets of each Fund included in the Trust.
46 | THE GUGGENHEIM FUNDS SEMI-ANNUAL REPORT | |
NOTES TO FINANCIAL STATEMENTS (Unaudited)(continued) |
(j) Earnings Credits
Under the fee arrangement with the custodian, the Fund may earn credits based on overnight custody cash balances. These credits are utilized to reduce related custodial expenses. The custodian fees disclosed in the Statement of Operations are before the reduction in expense from the related earnings credits, if any. Earnings credits for the period ended March 31, 2020, are disclosed in the Statement of Operations.
(k) Cash
The Fund may leave cash overnight in its cash account with the custodian. Periodically, the Fund may have cash due to the custodian bank as an overdraft balance. A fee is incurred on this overdraft, calculated by multiplying the overdraft by a rate based on the federal funds rate, which was 0.08% at March 31, 2020.
(l) Indemnifications
Under the Fund’s organizational documents, its Trustees and Officers are indemnified against certain liabilities arising out of the performance of their duties to the Trust. In addition, throughout the normal course of business, the Fund enters into contracts that contain a variety of representations and warranties which provide general indemnifications. The Fund’s maximum exposure under these arrangements is unknown, as this would involve future claims that may be made against the Fund and/or its affiliates that have not yet occurred. However, based on experience, the Fund expects the risk of loss to be remote.
Note 2 – Derivatives
As part of its investment strategy, the Fund utilizes a variety of derivative instruments. These investments involve, to varying degrees, elements of market risk and risks in excess of amounts recognized in the Statement of Assets and Liabilities. Valuation and accounting treatment of these instruments can be found under Significant Accounting Policies in Note 1 of these Notes to Financial Statements.
Derivatives are instruments whose values depend on, or are derived from, in whole or in part, the value of one or more other assets, such as securities, currencies, commodities or indices. Derivative instruments may be used to increase investment flexibility (including to maintain cash reserves while maintaining exposure to certain other assets), for risk management (hedging) purposes, to facilitate trading, to reduce transaction costs and to pursue higher investment returns. Derivative instruments may also be used to mitigate certain investment risks, such as foreign currency exchange rate risk, interest rate risk and credit risk. U.S. GAAP requires disclosures to enable investors to better understand how and why a Fund uses derivative instruments, how these derivative instruments are accounted for and their effects on the Fund’s financial position and results of operations.
| | THE GUGGENHEIM FUNDS SEMI-ANNUAL REPORT | 47 |
NOTES TO FINANCIAL STATEMENTS (Unaudited)(continued) |
The Fund utilized derivatives for the following purpose:
Hedge: an investment made in order to reduce the risk of adverse price movements in a security, by taking an offsetting position to protect against broad market moves.
Forward Foreign Currency Exchange Contracts
A forward foreign currency exchange contract is an agreement between two parties to exchange two designated currencies at a specific time in the future. Certain types of contracts may be cash settled, in an amount equal to the change in exchange rates during the term of the contract. The contracts can be used to hedge or manage exposure to foreign currency risks with portfolio investments or to gain exposure to foreign currencies.
The market value of a forward foreign currency exchange contract changes with fluctuations in foreign currency exchange rates. Furthermore, the Fund may be exposed to risk if the counterparties cannot meet the contract terms or if the currency value changes unfavorably as compared to the U.S. dollar.
The following table represents the Fund’s use, and volume of forward foreign currency exchange contracts on a monthly basis:
| | | Average Value | |
Use | | Purchased | | | Sold | |
Hedge | | $ | 7,509,115 | | | $ | 124,131,352 | |
Derivative Investment Holdings Categorized by Risk Exposure
The following is a summary of the location of derivative investments on the Fund’s Statement of Assets and Liabilities as of March 31, 2020:
Derivative Investment Type | Asset Derivatives | Liability Derivatives |
Currency contracts | Unrealized appreciation on forward foreign currency exchange contracts | Unrealized depreciation on forward foreign currency exchange contracts |
The following table sets forth the fair value of the Fund’s derivative investments categorized by primary risk exposure at March 31, 2020:
| Primary Risk
Exposure | | Forward Foreign Currency
Exchange Risk | |
Asset Derivative Investments Value | Foreign exchange risk | | $ | 1,889,046 | |
Liability Derivative Investments Value | Foreign exchange risk | | $ | 12,111 | |
48 | THE GUGGENHEIM FUNDS SEMI-ANNUAL REPORT | |
NOTES TO FINANCIAL STATEMENTS (Unaudited)(continued) |
The following is a summary of the location of derivative investments on the Fund’s Statement of Operations for the period ended March 31, 2020:
Derivative Investment Type | Location of Gain (Loss) on Derivatives |
Currency contracts | Net realized gain (loss) on forward foreign currency exchange contracts |
| Net change in unrealized appreciation (depreciation) on forward foreign currency exchange contracts |
The following is a summary of the Fund’s realized gain (loss) and change in unrealized appreciation (depreciation) on derivative investments recognized on the Statement of Operations categorized by primary risk exposure for the period ended March 31, 2020:
Realized Gain (Loss) on Derivative Investments Recognized on the Statement of Operations |
Primary Risk Exposure | | Forward Foreign Currency
Exchange Risk | |
Foreign exchange risk | | $ | (1,166,613 | ) |
Change in Unrealized Appreciation (Depreciation) on Derivative Investments Recognized on the Statement of Operations |
Primary Risk Exposure | | Forward Foreign Currency
Exchange Risk | |
Foreign exchange risk | | $ | (200,636 | ) |
In conjunction with the use of derivative instruments, the Fund is required to maintain collateral in various forms. Depending on the financial instrument utilized and the broker involved, the Fund uses margin deposits at the broker, cash and/or securities segregated at the custodian bank, discount notes or repurchase agreements allocated to the Fund as collateral.
The Trust has established counterparty credit guidelines and enters into transactions only with financial institutions of investment grade or better. The Trust monitors the counterparty credit risk.
Note 3 – Offsetting
In the normal course of business, the Fund enters into transactions subject to enforceable master netting arrangements or other similar arrangements. Generally, the right to offset in those agreements allows the Fund to counteract the exposure to a specific counterparty with collateral received from or delivered to that counterparty based on the terms of the arrangements. These arrangements provide for the right to liquidate upon the occurrence of an event of default, credit event upon merger or additional termination event.
| | THE GUGGENHEIM FUNDS SEMI-ANNUAL REPORT | 49 |
NOTES TO FINANCIAL STATEMENTS (Unaudited)(continued) |
In order to better define its contractual rights and to secure rights that will help the Fund mitigate its counterparty risk, the Fund may enter into an International Swaps and Derivatives Association, Inc. Master Agreement (“ISDA Master Agreement”) or similar agreement with its derivative contract counterparties. An ISDA Master Agreement is a bilateral agreement between a fund and a counterparty that governs over-the-counter (“OTC”) derivatives, including foreign exchange contracts, and typically contains, among other things, collateral posting terms and netting provisions in the event of a default and/or termination event. The provisions of the ISDA Master Agreement typically permit a single net payment in the event of a default (close-out netting) or similar event, including the bankruptcy or insolvency of the counterparty.
For derivatives traded under an ISDA Master Agreement, the collateral requirements are typically calculated by netting the mark-to-market amount for each transaction under such agreement and comparing that amount to the value of any collateral currently pledged by the Fund and the counterparty. For financial reporting purposes, cash collateral that has been pledged to cover obligations of the Fund and cash collateral received from the counterparty, if any, are reported separately on the Statement of Assets and Liabilities as segregated cash with broker/receivable for variation margin, or payable for swap settlement/variation margin. Cash and/or securities pledged or received as collateral by the Fund in connection with an OTC derivative subject to an ISDA Master Agreement generally may not be invested, sold or rehypothecated by the counterparty or the Fund, as applicable, absent an event of default under such agreement, in which case such collateral generally may be applied towards obligations due to and payable by such counterparty or the Fund, as applicable. Generally, the amount of collateral due from or to a counterparty must exceed a minimum transfer amount threshold (e.g., $300,000) before a transfer is required to be made. To the extent amounts due to the Fund from its counterparties are not fully collateralized, contractually or otherwise, the Fund bears the risk of loss from counterparty nonperformance. The Fund attempts to mitigate counterparty risk by only entering into agreements with counterparties that they believe to be of good standing and by monitoring the financial stability of those counterparties.
For financial reporting purposes, the Fund does not offset derivative assets and derivative liabilities that are subject to netting arrangements in the Statement of Assets and Liabilities.
50 | THE GUGGENHEIM FUNDS SEMI-ANNUAL REPORT | |
NOTES TO FINANCIAL STATEMENTS (Unaudited)(continued) |
The following tables present derivative financial instruments and secured financing transactions that are subject to enforceable netting arrangements:
| | | | | | | | | | | | | | | | | | | Gross Amounts Not
Offset in the Statement
of Assets and Liabilities | |
Instrument | | Gross
Amounts of
Recognized
Assets | | | Gross
Amounts
Offset in the
Statement of
Assets and
Liabilities | | | Net Amount
of Assets
Presented on
the Statement
of Assets and
Liabilities | | | Financial
Instruments | | | Cash
Collateral
Received | | | Net
Amount | |
Forward foreign currency exchange contracts | | $ | 1,889,046 | | | $ | — | | | $ | 1,889,046 | | | $ | (1,899 | ) | | $ | (1,480,000 | ) | | $ | 407,147 | |
| | | | | | | | | | | | | | | | | | | Gross Amounts Not
Offset in the Statement
of Assets and Liabilities | |
Instrument | | Gross
Amounts of
Recognized
Liabilities | | | Gross
Amounts
Offset in the
Statement of
Assets and
Liabilities | | | Net Amount
of Liabilities
Presented on
the Statement
of Assets and
Liabilities | | | Financial
Instruments | | | Cash
Collateral
Pledged | | | Net
Amount | |
Forward foreign currency exchange contracts | | $ | 12,111 | | | $ | — | | | $ | 12,111 | | | $ | (1,899 | ) | | $ | — | | | $ | 10,212 | |
The Fund has the right to offset deposits against any related derivative liabilities outstanding with each counterparty with the exception of exchange-traded or centrally-cleared derivatives. The following table presents deposits held by others in connection with derivative investments as of March 31, 2020.
Counterparty | Asset Type | | Cash
Pledged | | | Cash
Received | |
Barclays Bank plc | Forward foreign currency exchange contracts | | $ | — | | | $ | 1,480,000 | |
Note 4 – Fair Value Measurement
In accordance with U.S. GAAP, fair value is defined as the price that the Fund would receive to sell an investment or pay to transfer a liability in an orderly transaction with an independent buyer in the principal market, or in the absence of a principal market, the most advantageous market for
| | THE GUGGENHEIM FUNDS SEMI-ANNUAL REPORT | 51 |
NOTES TO FINANCIAL STATEMENTS (Unaudited)(continued) |
the investment or liability. U.S. GAAP establishes a three-tier fair value hierarchy based on the types of inputs used to value assets and liabilities and requires corresponding disclosure. The hierarchy and the corresponding inputs are summarized below:
Level 1 — | quoted prices in active markets for identical assets or liabilities. |
Level 2 — | significant other observable inputs (for example quoted prices for securities that are similar based on characteristics such as interest rates, prepayment speeds, credit risk, etc.). |
Level 3 — | significant unobservable inputs based on the best information available under the circumstances, to the extent observable inputs are not available, which may include assumptions. |
The types of inputs available depend on a variety of factors, such as the type of security and the characteristics of the markets in which it trades, if any. Fair valuation determinations that rely on fewer or no observable inputs require greater judgment. Accordingly, fair value determinations for Level 3 securities require the greatest amount of judgment.
Independent pricing services are used to value a majority of the Fund’s investments. When values are not available from a pricing service, they will be determined using a variety of sources and techniques, including: market prices; broker quotes; and models which derive prices based on inputs such as prices of securities with comparable maturities and characteristics or based on inputs such as anticipated cash flows or collateral, spread over U.S. Treasury securities, and other information and analysis. A significant portion of the Fund’s assets and liabilities are categorized as Level 2, as indicated in this report.
Quotes from broker-dealers, adjusted for fluctuations in criteria such as credit spreads and interest rates, may also be used to value the Fund’s assets and liabilities, i.e. prices provided by a broker-dealer or other market participant who has not committed to trade at that price. Although quotes are typically received from established market participants, the Fund may not have the transparency to view the underlying inputs which support the market quotations. Significant changes in a quote would generally result in significant changes in the fair value of the security.
Certain fixed income securities are valued by obtaining a monthly quote from a broker-dealer, adjusted for fluctuations in criteria such as credit spreads and interest rates.
Certain loans and other securities are valued using a single daily broker quote or a price from a third party vendor based on a single daily or monthly broker quote.
The inputs or methodologies used for valuing securities are not necessarily an indication of the risk associated with investing in those securities. The suitability of the techniques and sources employed to determine fair valuation are regularly monitored and subject to change.
52 | THE GUGGENHEIM FUNDS SEMI-ANNUAL REPORT | |
NOTES TO FINANCIAL STATEMENTS (Unaudited)(continued) |
Note 5 – Investment Advisory Agreement and Other Agreements
Under the terms of an investment advisory contract, the Fund pays GI investment advisory fees calculated at an annualized rate of 0.65% of the average daily net assets of the Fund up to $5 billion; and 0.60% of the average daily net assets in excess of $5 billion.
GI pays operating expenses on behalf of the Trust, such as audit and accounting related services, legal services, custody, printing and mailing, among others, on a pass-through basis. Such expenses are allocated to various Funds within the complex based on relative net assets.
The Board has adopted Distribution Plans related to the offering of A-Class, C-Class and P-Class shares pursuant to Rule 12b-1 under the 1940 Act. The plans provide for payments at an annual rate of 0.25% of the average daily net assets of the Fund’s A-Class and P-Class shares, and 1.00% of the average daily net assets of the Fund’s C-Class shares.
The investment advisory contract for the following Fund provides that the total expenses be limited to a percentage of average net assets for each class of shares, exclusive of brokerage costs, dividends or interest on securities sold short, expenses of other investment companies in which a Fund invests, interest, taxes, litigation, indemnification and extraordinary expenses. The limits are listed below:
| | Limit | | | Effective
Date | | | Contract
End Date | |
A-Class | | | 1.02 | % | | | 11/30/12 | | | | 02/01/21 | |
C-Class | | | 1.77 | % | | | 11/30/12 | | | | 02/01/21 | |
P-Class | | | 1.02 | % | | | 05/01/15 | | | | 02/01/21 | |
Institutional Class | | | 0.78 | % | | | 11/30/12 | | | | 02/01/21 | |
R6-Class | | | 0.78 | % | | | 03/13/19 | | | | 02/01/21 | |
GI is entitled to reimbursement by the Fund for fees waived or expenses reimbursed during any of the previous 36 months, beginning on the date of the expense limitation agreement, if on any day the estimated operating expenses are less than the indicated percentages. For purposes of this arrangement, GI is entitled to recoupment of previously waived fees or reimbursed expenses for 36 months from the date of the waiver or reimbursement by GI. At March 31, 2020, the amount of fees waived or expenses reimbursed that are subject to recoupment and will expire during the years ended September 30, are presented in the following table:
| | 2020 | | | 2021 | | | 2022 | | | 2023 | | | Fund
Total | |
A-Class | | $ | 517,450 | | | $ | 572,780 | | | $ | 478,648 | | | $ | 181,013 | | | $ | 1,749,891 | |
C-Class | | | 108,761 | | | | 176,311 | | | | 165,085 | | | | 65,631 | | | | 515,788 | |
P-Class | | | 323,982 | | | | 442,125 | | | | 423,256 | | | | 170,245 | | | | 1,359,608 | |
Institutional Class | | | 859,890 | | | | 1,285,384 | | | | 1,382,501 | | | | 599,010 | | | | 4,126,785 | |
R6-Class | | | — | | | | — | | | | 2,108 | | | | 581 | | | | 2,689 | |
For the period ended March 31, 2020, GI recouped $5,723 from the Fund.
| | THE GUGGENHEIM FUNDS SEMI-ANNUAL REPORT | 53 |
NOTES TO FINANCIAL STATEMENTS (Unaudited)(continued) |
For the period ended March 31, 2020, GFD retained sales charges of $87,029 relating to sales of A-Class shares of the Trust.
Certain trustees and officers of the Trust are also officers of GI and/or GFD. The Trust does not compensate its officers or trustees who are officers, directors and/or employees of GI or GFD.
MUFG Investor Services (US), LLC (“MUIS”) acts as the Fund’s administrator, transfer agent and accounting agent. As administrator, transfer agent and accounting agent, MUIS maintains the books and records of the Fund’s securities and cash. The Bank of New York Mellon Corp. (“BNY”) acts as the Fund’s custodian. As custodian, BNY is responsible for the custody of the Fund’s assets. For providing the aforementioned administrative and accounting services, MUIS is entitled to receive a monthly fee equal to a percentage of the Fund’s average daily net assets and out of pocket expenses. For providing the aforementioned transfer agent and custodian services, MUIS and BNY are entitled to receive a monthly fee based on the number of transactions during the month and the number of accounts under management, subject to certain minimum monthly fees, and out of pocket expenses.
Note 6 – Federal Income Tax Information
The Fund intends to comply with the provisions of Subchapter M of the Internal Revenue Code applicable to regulated investment companies and will distribute substantially all taxable net investment income and capital gains sufficient to relieve the Fund from all, or substantially all, federal income, excise and state income taxes. Therefore, no provision for federal or state income tax or federal excise tax is required.
Tax positions taken or expected to be taken in the course of preparing the Fund’s tax returns are evaluated to determine whether the tax positions are “more-likely-than-not” of being sustained by the applicable tax authority. Tax positions not deemed to meet the more-likely-than-not threshold would be recorded as a tax benefit or expense in the current year. Management has analyzed the Fund’s tax positions taken, or to be taken, on U.S. federal income tax returns for all open tax years, and has concluded that no provision for income tax is required in the Fund’s financial statements. The Fund’s U.S. federal income tax returns are subject to examination by the Internal Revenue Service (“IRS”) for a period of three years after they are filed.
At March 31, 2020, the cost of investments for U.S. federal income tax purposes, the aggregate gross unrealized appreciation for all investments for which there was an excess of value over tax cost, and the aggregate gross unrealized depreciation for all investments for which there was an excess of tax cost over value, were as follows:
| | Tax
Cost | | | Tax
Unrealized
Appreciation | | | Tax
Unrealized
Depreciation | | | Net
Unrealized
Appreciation/
(Depreciation) | |
| | | $ | 1,055,715,684 | | | $ | — | | | $ | (189,573,328 | ) | | $ | (189,573,328 | ) |
54 | THE GUGGENHEIM FUNDS SEMI-ANNUAL REPORT | |
NOTES TO FINANCIAL STATEMENTS (Unaudited)(continued) |
Note 7 – Securities Transactions
For the period ended March 31, 2020, the cost of purchases and proceeds from sales of investment securities, excluding government securities, short-term investments and derivatives, were as follows:
| | Purchases | | | Sales | |
| | | $ | 97,001,195 | | | $ | 669,567,566 | |
The Fund is permitted to purchase or sell securities from or to certain affiliated funds under specified conditions outlined in procedures adopted by the Board. The procedures have been designed to ensure that any purchase or sale of securities by the Fund from or to another fund or portfolio that is or could be considered an affiliate by virtue of having a common investment adviser (or affiliated investment advisers), common trustees and/or common officers complies with Rule 17a-7 of the 1940 Act. Further, as defined under these procedures, each transaction is effected at the current market price to save costs, where permissible. For the period ended March 31, 2020, the Fund engaged in purchases and sales of securities, pursuant to Rule 17a-7 of the 1940 Act, as follows:
| | Purchases | | | Sales | | | Realized
Loss | |
| | | $ | — | | | $ | 279,306 | | | $ | (9,724 | ) |
Note 8 – Unfunded Loan Commitments
Pursuant to the terms of certain loan agreements, the Fund held unfunded loan commitments as of March 31, 2020. The Fund is obligated to fund these loan commitments at the borrower’s discretion.
The unfunded loan commitments as of March 31, 2020, were as follows:
Borrower | | Maturity
Date | | | Face
Amount | | | Value | |
American Express GBT | | | 02/26/27 | | | $ | 2,392,699 | | | $ | 346,941 | |
Aspect Software, Inc. | | | 07/15/23 | | | | 536,578 | | | | 5,967 | |
| | | | | | | $ | 2,929,277 | | | $ | 352,908 | |
| | THE GUGGENHEIM FUNDS SEMI-ANNUAL REPORT | 55 |
NOTES TO FINANCIAL STATEMENTS (Unaudited)(continued) |
Note 9 – Restricted Securities
The securities below are considered illiquid and restricted under guidelines established by the Board:
Restricted Securities | | Acquisition
Date | | | Cost | | | Value | |
Airplanes Pass Through Trust | | | | | | | | | | | | |
2001-1A, due 03/15/191 | | | 12/27/11 | | | $ | 723,184 | | | $ | 8,965 | |
Mirabela Nickel Ltd. | | | | | | | | | | | | |
due 06/24/191 | | | 12/31/13 | | | | 1,160,811 | | | | 63,991 | |
| | | | | | | $ | 1,883,995 | | | $ | 72,956 | |
1 | Security is in default of interest and/or principal obligations. |
Note 10 – Reverse Repurchase Agreements
The Fund may enter into reverse repurchase agreements. Under a reverse repurchase agreement, a Fund sells securities and agrees to repurchase them at a particular price at a future date. In the event the buyer of securities under a reverse repurchase agreement files for bankruptcy or becomes insolvent, such buyer or its trustee or receiver may receive an extension of time to determine whether to enforce the Fund’s obligation to repurchase the securities, and the Fund’s use of the proceeds of the reverse repurchase agreement may effectively be restricted pending such decision.
For the period ended March 31, 2020, the Fund entered into reverse repurchase agreements as follows:
| | Number of Days
Outstanding | | | Balance at
March 31, 2020 | | | Average Balance
Outstanding | | | Average
Interest Rate | |
| | | | 16 | | | $ | 27,368,288 | | | $ | 28,322,596 | | | | 2.71 | % |
The following table presents reverse repurchase agreements that are subject to netting arrangements and offset in the Statement of Assets and Liabilities in conformity with U.S. GAAP:
| | | | | | | | | | | | | | | | | | | Gross Amounts Not
Offset in the Statement of
Assets and Liabilities | |
Instrument | | Gross
Amounts of
Recognized
Liabilities | | | Gross
Amounts
Offset in the
Statement of
Assets and
Liabilities | | | Net Amount
of Liabilities
Presented on
the Statement
of Assets and
Liabilities | | | Financial
Instruments | | | Cash
Collateral
Pledged | | | Net Amount | |
Reverse repurchase agreements | | $ | 27,368,288 | | | $ | — | | | $ | 27,368,288 | | | $ | (27,368,288 | ) | | $ | — | | | $ | — | |
56 | THE GUGGENHEIM FUNDS SEMI-ANNUAL REPORT | |
NOTES TO FINANCIAL STATEMENTS (Unaudited)(continued) |
As of March 31, 2020, there was $27,368,288 in reverse repurchase agreements outstanding. The Fund had outstanding reverse repurchase agreements with various counterparties. Details of the reverse repurchase agreements by counterparty are as follows:
Counterparty | | Interest
Rate(s) | | | Maturity
Date(s) | | | Face
Value | |
RBC Capital Markets LLC | | | 2.75% - 2.95% | | | | 04/06/20 | | | $ | 27,368,288 | |
The following is a summary of the remaining contractual maturities of the reverse repurchase agreements outstanding as of March 31, 2020, aggregated by asset class of the related collateral pledged by the Fund:
Asset Type | | Up to 30 Days | | | Total | |
Corporate Bonds | | $ | 27,368,288 | | | $ | 27,368,288 | |
Gross amount of recognized liabilities for reverse repurchase agreements | | $ | 27,368,288 | | | $ | 27,368,288 | |
Note 11 – Line of Credit
The Trust, along with other affiliated trusts, secured a 364-day committed, $1,205,000,000 line of credit from Citibank, N.A., which was in place through October 4, 2019, at which time the line of credit was renewed with an increased commitment amount of $1,230,000,000. A Fund may draw (borrow) from the line of credit as a temporary measure for emergency purposes, to facilitate redemption requests, or for other short-term liquidity purposes consistent with the Fund’s investment objective and program. For example, it may be advantageous for the Fund to borrow money rather than sell existing portfolio positions to meet redemption requests. Fees related to borrowings, if any, vary under this arrangement between the greater of Citibank’s “base rate”, LIBOR plus 1%, or the federal funds rate plus 1/2 of 1%.
The commitment fee that may be paid by the Fund is at an annualized rate of 0.15% of the average daily amount of its allocated unused commitment amount. The allocated commitment fee amount for the Fund is referenced in the Statement of Operations under “Line of credit fees”. The Fund did not have any borrowings under this agreement as of and for the period ended March 31, 2020.
Note 12 – Recent Accounting Pronouncements
In March 2017, the Financial Accounting Standards Board issued an Accounting Standards Update, ASU 2017-08, Receivables – Nonrefundable Fees and Other Costs (Subtopic 310-20), Premium Amortization on Purchased Callable Debt Securities (the “2017 ASU”) which amends the amortization period for certain purchased callable debt securities held at a premium, shortening such period to the earliest call date. The 2017 ASU does not require any accounting change for debt securities held at a discount; the discount continues to be amortized to maturity.
| | THE GUGGENHEIM FUNDS SEMI-ANNUAL REPORT | 57 |
NOTES TO FINANCIAL STATEMENTS (Unaudited)(concluded) |
As of October 1, 2019, the Fund has fully adopted the provisions of the 2017 ASU which were applied through a modified retrospective transition approach, as prescribed. The adoption resulted in a cumulative effect adjustment to reduce amortized cost and increase unrealized appreciation of investments for the Fund in the amount of $40,594.
The adoption had no impact on total distributable earnings (loss), net assets, the current period results from operations, or any prior period information presented in the financial statements.
Note 13 – COVID-19 and Recent Developments
The global ongoing crisis caused by the outbreak of COVID-19 is causing materially reduced consumer demand and economic output, disrupting supply chains, resulting in market closures, travel restrictions and quarantines, and adversely impacting local and global economies. Investors should be aware that in light of the current uncertainty, volatility and distress in economies, financial markets, and labor and health conditions all over the world, the Fund’s investments and a shareholder’s investment in the Fund are subject to sudden and substantial losses, increased volatility and other adverse events. Firms through which investors invest with the Fund, the Fund, its service providers, the markets in which it invests and market intermediaries are also impacted by quarantines and similar measures intended to contain the ongoing pandemic, which can obstruct their functioning and subject them to heightened operational risks.
Note 14 – Subsequent Events
The Fund evaluated subsequent events through the date the financial statements were available for issue and determined there were no material events that would require adjustment to or disclosure in the Fund’s financial statements.
58 | THE GUGGENHEIM FUNDS SEMI-ANNUAL REPORT | |
OTHER INFORMATION (Unaudited) |
Proxy Voting Information
A description of the policies and procedures that the Trust uses to determine how to vote proxies relating to securities held in the Fund’s portfolios is available, without charge and upon request, by calling 800.820.0888. This information is also available from the EDGAR database on the SEC’s website at https://www.sec.gov.
Information regarding how the Fund’s voted proxies relating to portfolio securities during the most recent 12-month period ended June 30 is available without charge, upon request, by calling 800.820.0888. This information is also available from the EDGAR database on the SEC’s website at https://www.sec.gov.
Sector Classification
Information in the Schedule of Investments is categorized by sectors using sector-level Classifications defined by the Bloomberg Industry Classification System, a widely recognized industry classification system provider. The Fund’s registration statement has investment policies relating to concentration in specific sectors/industries. For purposes of these investment policies, the Fund usually classifies sectors/industries based on industry-level Classifications used by widely recognized industry classification system providers such as Bloomberg Industry Classification System, Global Industry Classification Standards and Barclays Global Classification Scheme.
Quarterly Portfolio Schedules Information
The Trust files its complete schedule of portfolio holdings with the SEC for the first and third quarters of each fiscal year as an exhibit to its reports on Form N-PORT, and for reporting periods ended prior to March 31, 2019, filed such information on Form N-Q. The Fund’s Forms N-PORT and N-Q are available on the SEC’s website at https://www.sec.gov. The Fund’s Forms N-PORT and N-Q may be reviewed and copied at the SEC’s Public Reference Room in Washington, DC, and that information on the operation of the Public Reference Room may be obtained by calling 800-SEC-0330. Copies of the portfolio holdings are also available to shareholders, without charge and upon request, by calling 800.820.0888.
| | THE GUGGENHEIM FUNDS SEMI-ANNUAL REPORT | 59 |
INFORMATION ON BOARD OF TRUSTEES AND OFFICERS (Unaudited) |
A Board of Trustees oversees the Trust, as well as other trusts of GI, in which its members have no stated term of service, and continue to serve after election until resignation. The Statement of Additional Information includes further information about Fund Trustees and Officers, and can be obtained without charge by visiting guggenheiminvestments.com or by calling 800.820.0888.
Name, Address*
and Year of Birth | Position(s)
Held with
Trust | Term of Office
and Length of
Time Served** | Principal Occupation(s)
During Past Five Years | Number of
Portfolios
in Fund
Complex
Overseen | Other Directorships
Held by Trustees*** |
INDEPENDENT TRUSTEES | | | |
Randall C. Barnes (1951) | Trustee | Since 2014 | Current: Private Investor (2001-present). Former: Senior Vice President and Treasurer, PepsiCo, Inc. (1993-1997); President, Pizza Hut International (1991-1993); Senior Vice President, Strategic Planning and New Business Development, PepsiCo, Inc. (1987-1990). | 157 | Current: Purpose Investments Funds (2013-present). Former: Managed Duration Investment Grade Municipal Fund (2006-2016). |
Angela Brock-Kyle (1959) | Trustee | Since 2019 | Current: Founder and Chief Executive Officer, B.O.A.R.D.S. (2013-present). Former: Senior Leader, TIAA (1987-2012). | 156 | Current: Hunt Companies, Inc. (2019-present). Former: Infinity Property & Casualty Corp. (2014-2018). |
Donald A. Chubb, Jr. (1946) | Trustee and Chair of the Valuation Oversight Committee | Since 1994 | Current: Retired Former: Business broker and manager of commercial real estate, Griffith & Blair, Inc. (1997-2017). | 156 | Former: Midland Care, Inc. (2011-2016). |
60 | THE GUGGENHEIM FUNDS SEMI-ANNUAL REPORT | |
INFORMATION ON BOARD OF TRUSTEES AND OFFICERS (Unaudited)(continued) |
Name, Address*
and Year of Birth | Position(s)
Held with
Trust | Term of Office
and Length of
Time Served** | Principal Occupation(s)
During Past Five Years | Number of
Portfolios
in Fund
Complex
Overseen | Other Directorships
Held by Trustees*** |
INDEPENDENT TRUSTEES - continued | | |
Jerry B. Farley (1946) | Trustee and Chair of the Audit Committee | Since 2005 | Current: President, Washburn University (1997-present). | 156 | Current: CoreFirst Bank & Trust (2000-present). Former: Westar Energy, Inc. (2004-2018). |
Roman Friedrich III (1946) | Trustee and Chair of the Contracts Review Committee | Since 2014 | Current: Founder and Managing Partner, Roman Friedrich & Company (1998-present). | 156 | Former: Zincore Metals, Inc. (2009-2019). |
Thomas F. Lydon, Jr. (1960) | Trustee and Vice Chair of the Contracts Review Committee | Since 2019 | Current: President, Global Trends Investments (1996-present); Co-Chief Executive Officer, ETF Flows, LLC (2019-present); Chief Executive Officer, Lydon Media (2016-present). | 156 | Current: US Global Investors (GROW) (1995-present). Former: Harvest Volatility Edge Trust (3) (2017-2019). |
Ronald A. Nyberg (1953) | Trustee and Chair of the Nominating and Governance Committee | Since 2014 | Current: Partner, Momkus LLC (2016-present). Former: Partner, Nyberg & Cassioppi, LLC (2000-2016); Executive Vice President, General Counsel, and Corporate Secretary, Van Kampen Investments (1982-1999). | 157 | Current: PPM Funds (9) (2018 - present); Edward-Elmhurst Healthcare System (2012-present). Former: Western Asset Inflation-Linked Opportunities & Income Fund (2004-April 2020); Western Asset Inflation-Linked Income Fund (2003-April 2020); Managed Duration Investment Grade Municipal Fund (2003-2016). |
| | THE GUGGENHEIM FUNDS SEMI-ANNUAL REPORT | 61 |
INFORMATION ON BOARD OF TRUSTEES AND OFFICERS (Unaudited)(continued) |
Name, Address*
and Year of Birth | Position(s)
Held with
Trust | Term of Office
and Length of
Time Served** | Principal Occupation(s)
During Past Five Years | Number of
Portfolios
in Fund
Complex
Overseen | Other Directorships
Held by Trustees*** |
INDEPENDENT TRUSTEES - concluded | | |
Sandra G. Sponem (1958) | Trustee | Since 2019 | Current: Retired. Former: Senior Vice President and Chief Financial Officer, M.A. Mortenson-Companies, Inc. (2007-2017). | 156 | Current: SPDR Series Trust (78) (2018-present); SPDR Index Shares Funds (31) (2018-present); SSGA Active Trust (12) (2018-present); and SSGA Master Trust (1) (2018-present). |
Ronald E. Toupin, Jr. (1958) | Trustee, Chair of the Board and Chair of the Executive Committee | Since 2014 | Current: Portfolio Consultant (2010-present); Member, Governing Council, Independent Directors Council (2013-present); Governor, Board of Governors, Investment Company Institute (2018-present). Former: Member, Executive Committee, Independent Directors Council (2016-2018); Vice President, Manager and Portfolio Manager, Nuveen Asset Management (1998-1999); Vice President, Nuveen Investment Advisory Corp. (1992-1999); Vice President and Manager, Nuveen Unit Investment Trusts (1991-1999); and Assistant Vice President and Portfolio Manager, Nuveen Unit Investment Trusts (1988-1999), each of John Nuveen & Co., Inc. (1982-1999). | 156 | Former: Western Asset Inflation-Linked Opportunities & Income Fund (2004-April 2020); Western Asset Inflation-Linked Income Fund (2003-April 2020); Managed Duration Investment Grade Municipal Fund (2003-2016). |
62 | THE GUGGENHEIM FUNDS SEMI-ANNUAL REPORT | |
INFORMATION ON BOARD OF TRUSTEES AND OFFICERS (Unaudited)(continued) |
Name, Address*
and Year of Birth | Position(s)
Held with
Trust | Term of Office
and Length of
Time Served** | Principal Occupation(s)
During Past Five Years | Number of
Portfolios
in Fund
Complex
Overseen | Other Directorships
Held by Trustees*** |
INTERESTED TRUSTEE | |
Amy J. Lee**** (1961) | Trustee, Vice President and Chief Legal Officer | Since 2018 (Trustee) Since 2014 (Chief Legal Officer) Since 2007
(Vice President) | Current: Interested Trustee, certain other funds in the Fund Complex (2018-present); Chief Legal Officer, certain other funds in the Fund Complex (2014-present); Vice President, certain other funds in the Fund Complex (2007-present); Senior Managing Director, Guggenheim Investments (2012-present). Former: President and Chief Executive Officer, certain other funds in the Fund Complex (2017-2019); Vice President, Associate General Counsel and Assistant Secretary, Security Benefit Life Insurance Company and Security Benefit Corporation (2004-2012). | 156 | None. |
* | The business address of each Trustee is c/o Guggenheim Investments, 227 West Monroe Street, Chicago, Illinois 60606. |
** | Each Trustee serves an indefinite term, until his or her successor is elected and qualified. Time served includes time served in the respective position for the Predecessor Corporation. |
*** | Each Trustee also serves on the boards of trustees of Guggenheim Funds Trust, Guggenheim Variable Funds Trust, Guggenheim Strategy Funds Trust, Fiduciary/Claymore Energy Infrastructure Fund, Guggenheim Taxable Municipal Managed Duration Trust, Guggenheim Strategic Opportunities Fund, Guggenheim Enhanced Equity Income Fund, Guggenheim Energy & Income Fund, Guggenheim Credit Allocation Fund, Rydex Series Funds, Rydex Dynamic Funds, Rydex Variable Funds and Transparent Value Trust. Messrs. Barnes and Nyberg also serve on the board of trustees of Advent Convertible & Income Fund. |
**** | This Trustee is deemed to be an “interested person” of the Fund under the 1940 Act by reason of her position with the Fund’s Investment Manager and/or the parent of the Investment Manager. |
| | THE GUGGENHEIM FUNDS SEMI-ANNUAL REPORT | 63 |
INFORMATION ON BOARD OF TRUSTEES AND OFFICERS (Unaudited)(continued) |
Name, Address*
and Year of Birth | Position(s)
Held with
Trust | Term of Office
and Length of
Time Served** | Principal Occupation(s)
During Past Five Years |
OFFICERS | | | |
Brian E. Binder (1972) | President and Chief Executive Officer | Since 2018 | Current: President and Chief Executive Officer, certain other funds in the Fund Complex (2018-present); President, Chief Executive Officer and Chairman of the Board of Managers, Guggenheim Funds Investment Advisors, LLC (2018-present); President and Chief Executive Officer, Security Investors, LLC (2018-present); Board Member of Guggenheim Partners Fund Management (Europe) Limited (2018-present); Senior Managing Director and Chief Administrative Officer, Guggenheim Investments (2018-present). Former: Managing Director and President, Deutsche Funds, and Head of US Product, Trading and Fund Administration, Deutsche Asset Management (2013-2018); Managing Director, Head of Business Management and Consulting, Invesco Ltd. (2010-2012). |
James M. Howley (1972) | Assistant Treasurer | Since 2014 | Current: Managing Director, Guggenheim Investments (2004-present); Assistant Treasurer, certain other funds in the Fund Complex (2006-present). Former: Manager, Mutual Fund Administration of Van Kampen Investments, Inc. (1996-2004). |
Mark E. Mathiasen (1978) | Secretary | Since 2014 | Current: Secretary, certain other funds in the Fund Complex (2007-present); Managing Director, Guggenheim Investments (2007-present). |
Glenn McWhinnie (1969) | Assistant Treasurer | Since 2016 | Current: Vice President, Guggenheim Investments (2009-present); Assistant Treasurer, certain other funds in the Fund Complex (2016-present). |
Michael P. Megaris (1984) | Assistant Secretary | Since 2014 | Current: Assistant Secretary, certain other funds in the Fund Complex (2014-present); Director, Guggenheim Investments (2012-present). |
64 | THE GUGGENHEIM FUNDS SEMI-ANNUAL REPORT | |
INFORMATION ON BOARD OF TRUSTEES AND OFFICERS (Unaudited)(continued) |
Name, Address*
and Year of Birth | Position(s)
Held with
Trust | Term of Office
and Length of
Time Served** | Principal Occupation(s)
During Past Five Years |
OFFICERS - continued | |
Elisabeth Miller (1968) | Chief Compliance Officer | Since 2012 | Current: Chief Compliance Officer, certain other funds in the Fund Complex (2012-present); Senior Managing Director, Guggenheim Investments (2012-present). Vice President, Guggenheim Funds Distributors, LLC (2014-present). Former: Chief Compliance Officer, Security Investors, LLC and Guggenheim Funds Investment Advisors, LLC (2012-2018); Chief Compliance Officer, Guggenheim Distributors, LLC (2009-2014); Senior Manager, Security Investors, LLC (2004-2014); Senior Manager, Guggenheim Distributors, LLC (2004-2014). |
Margaux Misantone (1978) | AML Officer | Since 2017 | Current: Chief Compliance Officer, Security Investors, LLC and Guggenheim Funds Investment Advisors, LLC (2018-present); AML Officer, Security Investors, LLC and certain other funds in the Fund Complex (2017-present); Managing Director, Guggenheim Investments (2015-present). Former: Assistant Chief Compliance Officer, Security Investors, LLC and Guggenheim Funds Investments Advisors, LLC (2015-2018). |
William Rehder (1967) | Assistant Vice President | Since 2018 | Current: Managing Director, Guggenheim Investments (2002-present). |
Kimberly J. Scott (1974) | Assistant Treasurer | Since 2014 | Current: Director, Guggenheim Investments (2012-present); Assistant Treasurer, certain other funds in the Fund Complex (2012-present). Former: Financial Reporting Manager, Invesco, Ltd. (2010-2011); Vice President/Assistant Treasurer, Mutual Fund Administration for Van Kampen Investments, Inc./Morgan Stanley Investment Management (2009-2010); Manager of Mutual Fund Administration, Van Kampen Investments, Inc./Morgan Stanley Investment Management (2005-2009). |
Bryan Stone (1979) | Vice President | Since 2014 | Current: Vice President, certain other funds in the Fund Complex (2014-present); Managing Director, Guggenheim Investments (2013-present). Former: Senior Vice President, Neuberger Berman Group LLC (2009-2013); Vice President, Morgan Stanley (2002-2009). |
| | THE GUGGENHEIM FUNDS SEMI-ANNUAL REPORT | 65 |
INFORMATION ON BOARD OF TRUSTEES AND OFFICERS (Unaudited)(concluded) |
Name, Address*
and Year of Birth | Position(s)
Held with
Trust | Term of Office
and Length of
Time Served** | Principal Occupation(s)
During Past Five Years |
OFFICERS - concluded | |
John L. Sullivan (1955) | Chief Financial Officer, Chief Accounting Officer and Treasurer | Since 2014 | Current: Chief Financial Officer, Chief Accounting Officer and Treasurer, certain other funds in the Fund Complex (2010-present); Senior Managing Director, Guggenheim Investments (2010-present). Former: Managing Director and Chief Compliance Officer, each of the funds in the Van Kampen Investments fund complex (2004-2010); Managing Director and Head of Fund Accounting and Administration, Morgan Stanley Investment Management (2002-2004); Chief Financial Officer and Treasurer, Van Kampen Funds (1996-2004). |
Jon Szafran (1989) | Assistant Treasurer | Since 2017 | Current: Vice President, Guggenheim Investments (2017-present); Assistant Treasurer, certain other funds in the Fund Complex (2017-present). Former: Assistant Treasurer of Henderson Global Funds and Manager of US Fund Administration, Henderson Global Investors (North America) Inc. (“HGINA”), (2017); Senior Analyst of US Fund Administration, HGINA (2014–2017); Senior Associate of Fund Administration, Cortland Capital Market Services, LLC (2013-2014); Experienced Associate, PricewaterhouseCoopers LLP (2012-2013). |
* | The business address of each officer is c/o Guggenheim Investments, 227 West Monroe Street, Chicago, Illinois 60606. |
** | Each officer serves an indefinite term, until his or her successor is duly elected and qualified. |
66 | THE GUGGENHEIM FUNDS SEMI-ANNUAL REPORT | |
GUGGENHEIM INVESTMENTS PRIVACY NOTICE (Unaudited) |
Who We Are
This Privacy Notice describes the data protection practices of Guggenheim Investments. Guggenheim Investments as used herein refers to the affiliated investment management businesses of Guggenheim Partners, LLC: Guggenheim Funds Investment Advisors, LLC, Guggenheim Partners Investment Management, LLC, Guggenheim Funds Distributors, LLC, Security Investors, LLC, Guggenheim Investment Advisors (Europe) Limited, Guggenheim Real Estate, LLC, GS Gamma Advisors, LLC, Guggenheim Partners India Management, LLC, Guggenheim Partners Europe Limited, as well as the funds in the Guggenheim Funds complex (the “Funds”) (“Guggenheim Investments,” “we,” “us,” or “our”).
Guggenheim Partners Investment Management Holdings, LLC, located at 330 Madison Avenue, New York, New York 10017 is the data controller for your information. The affiliates who are also controllers of certain of your information are: Guggenheim Investment Advisors (Europe) Limited, Guggenheim Partners Europe Limited, Guggenheim Partners, LLC, Guggenheim Funds Investment Advisors, LLC, Guggenheim Partners Investment Management, LLC, Guggenheim Funds Distributors, LLC and Security Investors, LLC, as well as the Funds.
Our Commitment to You
Guggenheim Investments considers your privacy our utmost concern. When you become our client or investor, you entrust us with not only your hard-earned money but also with your personal and financial information. Because we have access to your private information, we hold ourselves to the highest standards in its safekeeping and use. We strictly limit how we share your information with others, whether you are a current or former Guggenheim Investments client or investor.
The Information We Collect About You
We collect certain nonpublic personal information about you from information you provide on applications, other forms, our website, and/or from third parties including investment advisors. This information includes Social Security or other tax identification number, assets, income, tax information, retirement and estate plan information, transaction history, account balance, payment history, bank account information, marital status, family relationships, information that we collect on our website through the use of “cookies,” and other personal information that you or others provide to us. We may also collect such information through your inquiries by mail, e-mail or telephone. We may also collect customer due diligence information, as required by applicable law and regulation, through third party service providers.
How We Handle Your Personal Information
The legal basis for using your information as set out in this Privacy Notice is as follows: (a) use of your personal data is necessary to perform our obligations under any contract with you (such as a contract for us to provide financial services to you); or (b) where use of your personal data is not necessary for performance of a contract, use of your personal data is necessary for our
| | THE GUGGENHEIM FUNDS SEMI-ANNUAL REPORT | 67 |
GUGGENHEIM INVESTMENTS PRIVACY NOTICE (Unaudited)(continued) |
legitimate interests or the legitimate interests of others (for example, to enforce the legal terms governing our services, operate and market our website and other services we offer, ensure safe environments for our personnel and others, make and receive payments, prevent fraud and to know the customer to whom we are providing the services). Some processing is done to comply with applicable law.
In addition to the specific uses described above, we also use your information in the following manner:
| | ● | We use your information in connection with servicing your accounts. |
| | ● | We use information to respond to your requests or questions. For example, we might use your information to respond to your customer feedback. |
| | ● | We use information to improve our products and services. We may use your information to make our website and products better. We may use your information to customize your experience with us. |
| | ● | We use information for security purposes. We may use your information to protect our company and our customers. |
| | ● | We use information to communicate with you. For example, we will communicate with you about your account or our relationship. We may contact you about your feedback. We might also contact you about this Privacy Notice. We may also enroll you in our email newsletter. |
| | ● | We use information as otherwise permitted by law, as we may notify you. |
| | ● | Aggregate/Anonymous Data. We may aggregate and/or anonymize any information collected through the website so that such information can no longer be linked to you or your device (“Aggregate/Anonymous Information”). We may use Aggregate/Anonymous Information for any purpose, including without limitation for research and marketing purposes, and may also share such data with any third parties, including advertisers, promotional partners, and sponsors. |
We do not sell information about current or former clients or their accounts to third parties. Nor do we share this information, except when necessary to complete transactions at your request, to make you aware of investment products and services that we or our affiliates offer, or as permitted or required by law.
We provide information about you to companies and individuals not affiliated with Guggenheim Investments to complete certain transactions or account changes, or to perform services for us related to your account. For example, if you ask to transfer assets from another financial institution to Guggenheim Investments, we must provide certain information about you to that company to complete the transaction. We provide the third party with only the information necessary to carry out its responsibilities and only for that purpose. And we require these third
68 | THE GUGGENHEIM FUNDS SEMI-ANNUAL REPORT | |
GUGGENHEIM INVESTMENTS PRIVACY NOTICE (Unaudited)(continued) |
parties to treat your private information with the same high degree of confidentiality that we do. To alert you to other Guggenheim Investments products and services, we share your information within our family of affiliated companies. You may limit our sharing with affiliated companies as set out below. We may also share information with any successor to all or part of our business, or in connection with steps leading up to a merger or acquisition. For example, if part of our business was sold we may give customer information as part of that transaction. We may also share information about you with your consent.
We will release information about you if you direct us to do so, if we are compelled by law to do so, or in other circumstances as permitted by law (for example, to protect your account from fraud).
If you close your account(s) or become an inactive client or investor, we will continue to adhere to the privacy policies and practices described in this notice.
Opt-Out Provisions and Your Data Choices
The law allows you to “opt out” of certain kinds of information sharing with third parties. We do not share personal information about you with any third parties that triggers this opt-out right. This means YOU ARE ALREADY OPTED OUT.
When you are no longer our client or investor, we continue to share your information as described in this notice, and you may contact us at any time to limit our sharing by sending an email to CorporateDataPrivacy@GuggenheimPartners.com.
European Union Data Subjects and certain others: In addition to the choices set forth above, residents of the European Union and certain other jurisdictions have certain rights to (1) request access to or rectification or deletion of information we collect about them, (2) request a restriction on the processing of their information, (3) object to the processing of their information, or (4) request the portability of certain information. To exercise these or other rights, please contact us using the contact information below. We will consider all requests and provide our response within the time period stated by applicable law. Please note, however, that certain information may be exempt from such requests in some circumstances, which may include if we need to keep processing your information for our legitimate interests or to comply with a legal obligation. We may request you provide us with information necessary to confirm your identity before responding to your request.
Residents of France and certain other jurisdictions may also provide us with instructions regarding the manner in which we may continue to store, erase and share your information after your death, and where applicable, the person you have designated to exercise these rights after your death.
How We Protect Privacy Online
We take steps to protect your privacy when you use our web site – www.guggenheiminvestments.com – by using secure forms of online communication, including encryption technology, Secure Socket Layer (SSL) protocol, firewalls and user names and passwords. These safeguards vary
| | THE GUGGENHEIM FUNDS SEMI-ANNUAL REPORT | 69 |
GUGGENHEIM INVESTMENTS PRIVACY NOTICE (Unaudited)(concluded) |
based on the sensitivity of the information that we collect and store. However, we cannot and do not guarantee that these measures will prevent every unauthorized attempt to access, use, or disclose your information since despite our efforts, no Internet and/or other electronic transmissions can be completely secure. Our web site uses “http cookies”—tiny pieces of information that we ask your browser to store. We use cookies for session management and security features on the Guggenheim Investments web site. We do not use them to pull data from your hard drive, to learn your e-mail address, or to view data in cookies created by other web sites. We will not share the information in our cookies or give others access to it. See the legal information area on our web site for more details about web site security and privacy features.
How We Safeguard Your Personal Information and Data Retention
We restrict access to nonpublic personal information about you to our employees and in some cases to third parties (for example, the service providers described above) as permitted by law. We maintain strict physical, electronic and procedural safeguards that comply with federal standards to guard your nonpublic personal information.
We keep your information for no longer than necessary for the purposes for which it is processed. The length of time for which we retain information depends on the purposes for which we collected and use it and/or as required to comply with applicable laws. Information may persist in copies made for backup and business continuity purposes for additional time.
International Visitors
If you are not a resident of the United States, please be aware that your information may be transferred to, stored and processed in the United States where our servers are located and our databases are operated. The data protection and other laws of the United States and other countries might not be as comprehensive as those in your country.
In such cases, we ensure that a legal basis for such a transfer exists and that adequate protection is provided as required by applicable law, for example, by using standard contractual clauses or by transferring your data to a jurisdiction that has obtained an adequacy finding. Individuals whose data may be transferred on the basis of standard contractual clauses may contact us as described below.
We’ll Keep You Informed
If you have any questions or concerns about how we treat your personal data, we encourage you to consult with us first. You may also contact the relevant supervisory authority.
We reserve the right to modify this policy at any time and will inform you promptly of material changes. You may access our privacy policy from our web site at www.guggenheiminvestments.com. Should you have any questions regarding our privacy policy, contact us by email at CorporateDataPrivacy@GuggenheimPartners.com.
70 | THE GUGGENHEIM FUNDS SEMI-ANNUAL REPORT | |
This page intentionally left blank.
This page intentionally left blank.
This page intentionally left blank.
3.31.2020
Guggenheim Funds Semi-Annual Report
| |
Guggenheim Total Return Bond Fund | | |
Beginning on January 1, 2021, paper copies of the Fund’s annual and semi-annual shareholder reports may no longer be sent by mail, unless you specifically request paper copies of the reports from a Fund or from your financial intermediary. Instead, the reports will be made available on a website, and you will be notified by mail each time a report is posted and provided with a website link to access the report.
If you already elected to receive shareholder reports electronically, you will not be affected by this change and you need not take any action. At any time, you may elect to receive reports and other communications from a Fund electronically by calling 800.820.0888, going to GuggenheimInvestments.com/myaccount, or by contacting your financial intermediary.
You may elect to receive all future shareholder reports in paper free of charge. If you hold shares of a Fund directly, you can inform the Fund that you wish to receive paper copies of reports by calling 800.820.0888. If you hold shares of a Fund through a financial intermediary, please contact the financial intermediary to make this election. Your election to receive reports in paper will apply to all Guggenheim Funds in which you are invested and may apply to all funds held with your financial intermediary.
GuggenheimInvestments.com | TRB-SEMI-0320x0920 |

| | |
DEAR SHAREHOLDER | 2 |
ECONOMIC AND MARKET OVERVIEW | 4 |
ABOUT SHAREHOLDERS’ FUND EXPENSES | 6 |
TOTAL RETURN BOND FUND | 9 |
NOTES TO FINANCIAL STATEMENTS | 73 |
OTHER INFORMATION | 98 |
INFORMATION ON BOARD OF TRUSTEES AND OFFICERS | 99 |
GUGGENHEIM INVESTMENTS PRIVACY NOTICE | 106 |
| | THE GUGGENHEIM FUNDS SEMI-ANNUAL REPORT | 1 |
Dear Shareholder:
The six-month period ended March 31, 2020, concluded on a somber note. Even though markets performed well for most of the period, the emergence of a novel and highly contagious form of coronavirus in the last weeks of the period adversely impacted global commercial activity and contributed to significant volatility in certain markets, unseen since the great recession of 2008.
As it spread beyond Asia to virtually every country in the world, many governments and businesses instituted quarantines and closures, which has resulted in significant disruption in manufacturing, supply chains, consumer demand and economic activity. The U.S. Federal Reserve responded quickly to provide liquidity in order to ensure that the U.S. markets continued to function efficiently. The fiscal policy included a spending bill worth over $2 trillion to assist consumers, states, small businesses and certain industries. While these actions helped stabilize the market, volatile conditions continued into April.
As discussed in this shareholder report, these events have affected performance of the Total Return Bond Fund (the “Fund”). We encourage you to read the Economic and Market Overview section of the report, which follows this letter.
Guggenheim Partners Investment Management, LLC (“GPIM” or the “Investment Adviser”), serves as the investment adviser to the Fund. The Investment Adviser is an affiliate of Guggenheim Partners, LLC (“Guggenheim”), a global, diversified financial services firm. Guggenheim Funds Distributors, LLC serves as the distributor to the Fund and is also an affiliate of Guggenheim.
Together, we are committed to the safety and prosperity of our clients, our employees, and our shareholders. The resources of the firm are being made fully available not only to support our clients, but also to support our employees and their families.
Please practice the appropriate prudence for the protection not only of your health and that of your friends and loved ones but also for our neighbors and communities. Thank you for the trust you place in us.
Sincerely,
Guggenheim Partners Investment Management, LLC
April 30, 2020
Read a prospectus and summary prospectus (if available) carefully before investing. It contains the investment objectives, risks, charges, expenses and other information, which should be considered carefully before investing. Obtain a prospectus and summary prospectus (if available) at guggenheiminvestments.com or call 800.820.0888.
This material is not intended as a recommendation or as investment advice of any kind, including in connection with rollovers, transfers, and distributions. Such material is not provided in a fiduciary capacity, may not be relied upon for or in connection with the making of investment decisions, and does not constitute a solicitation of an offer to buy or sell securities. All content has
2 | THE GUGGENHEIM FUNDS SEMI-ANNUAL REPORT | |
been provided for informational or educational purposes only and is not intended to be and should not be construed as legal or tax advice and/or a legal opinion. Always consult a financial, tax and/or legal professional regarding your specific situation.
The global ongoing crisis caused by the outbreak of COVID-19 is causing materially reduced consumer demand and economic output, disrupting supply chains, resulting in market closures, travel restrictions and quarantines, and adversely impacting local and global economies. Investors should be aware that in light of the current uncertainty, volatility and distress in economies, financial markets, and labor and health conditions all over the world, the Fund’s investments and a shareholder’s investment in the Fund are subject to sudden and substantial losses, increased volatility and other adverse events. Firms through which investors invest with the Fund, the Fund, its service providers, the markets in which it invests and market intermediaries are also impacted by quarantines and similar measures intended to contain the ongoing pandemic, which can obstruct their functioning and subject them to heightened operational risks.
Total Return Bond Fund may not be suitable for all investors. ● The Fund’s market value will change in response to interest rate changes and market conditions among other factors. In general, bond prices rise when interest rates fall and vice versa. ● The Fund’s exposure to high yield securities may subject the Fund to greater volatility. ● When market conditions are deemed appropriate, the Fund will leverage to the full extent permitted by its investment policies and restrictions and applicable law. Leveraging will exaggerate the effect on net asset value of any increase or decrease in the market value of the Fund’s portfolio. ● The Fund may invest in derivative instruments, which may be more volatile and less liquid, increasing the risk of loss when compared to traditional securities. Certain of the derivative instruments are also subject to the risks of counterparty default and adverse tax treatment. ● Instruments and strategies (such as borrowing transactions and reverse repurchase agreements) may provide leveraged exposure to a particular investment, which will magnify any gains or losses on those investments. ● Investments in reverse repurchase agreements expose the Fund to the many of the same risks as investments in derivatives. ● The Fund’s investments in other investment vehicles subject the Fund to those risks and expenses affecting the investment vehicle. ● The Fund’s investments in foreign securities carry additional risks when compared to U.S. securities, due to the impact of diplomatic, political, or economic developments in the country in question (investments in emerging markets securities are generally subject to an even greater level of risk). ● Investments in syndicated bank loans generally offer a floating interest rate and involve special types of risks. ● The Fund’s investments in municipal securities can be affected by events that affect the municipal bond market. ● The Fund’s investments in real estate securities subject the Fund to the same risks as direct investments in real estate, which is particularly sensitive to economic downturns. ● The Fund’s investments in restricted securities may involve financial and liquidity risk. ● You may have a gain or loss when you sell your shares. ● It is important to note that the Fund is not guaranteed by the U.S. government. ● Please read the prospectus for more detailed information regarding these and other risks.
| | THE GUGGENHEIM FUNDS SEMI-ANNUAL REPORT | 3 |
ECONOMIC AND MARKET OVERVIEW (Unaudited) | March 31, 2020 |
The six-month period ended March 31, 2020, was a wild ride for markets. While the U.S. economy was generally in good shape in 2019, recessionary fears rose throughout the year, prompting the U.S. Federal Reserve (the “Fed”) to announce a rate cut on July 31, the first since 2008, amid growing downside risks to policymakers’ baseline growth and inflation forecasts. Key among those risks were slowing global growth, the threat of additional U.S.-China tariffs, and the possible ramifications surrounding Brexit. The Fed subsequently cut rates twice more in 2019, which caused markets to rally toward the end of the year and into early 2020. Stocks reached new highs and credit spreads tightened to historic levels. Since then, the global outbreak of the coronavirus, COVID-19, has been at the center of everything. As of this writing, COVID-19 has spread to 210 countries, resulted in over 2.5 million cases, and caused over 170,000 deaths. Thus far, the U.S. makes up more than 30% of global cases, and 25% of global deaths. States have required the labor force to work from home if possible, individuals to practice social distancing, and non-essential businesses to shut down.
Closures, quarantines, and social distancing efforts have impacted the travel, hospitality, restaurants, and retail industries, with activity down 100% in some areas of the country. Further exacerbating the decline in output will be reduced business investment, which was already stalling due to falling profits, trade conflicts, and political uncertainty. The coronavirus shock and collapse in oil prices will likely further depress capital expenditures.
In response to the crisis, the Federal Open Market Committee cut rates by a further 125 basis points in the first quarter of 2020 and passed a series of stimulus programs. Among these were the Primary and Secondary Market Corporate Credit Facilities, which are lending programs primarily targeting investment-grade corporate bond issuers, implemented in concert with the U.S. Treasury. It was only after the announcement of this program that corporate credit found some relief from the selloff, but we expect this relief may be temporary.
With an alphabet soup of monetary programs targeting relief from the coronavirus impact, fiscal policy has also stepped up to the plate with a spending bill worth over $2 trillion that aims to assist consumers, states, small businesses, and certain industries. There is no question that these programs will help ease the economic fallout from virus containment measures, but even $2 trillion may be too small given the magnitude of the economic shock that we are facing. Additionally, it is far from clear that fiscal measures are an adequate solution to the issue at hand: the physical impediment to consumer spending. Fiscal and monetary policy can do their part, but ultimately it is public health policy that will likely be the greatest determinant of the economic outlook.
For the six months ended March 31, 2020, the Standard & Poor’s 500® (“S&P 500”) Index* returned -12.31%. The decline, while significant, represents something of a recovery in stocks. The S&P 500 peaked at 3,386.15 on February 19, 2020, before plummeting 33.9% to a low of 2,237.40 on March 23, 2020, then recovering some lost ground by the end of the month.
4 | THE GUGGENHEIM FUNDS SEMI-ANNUAL REPORT | |
ECONOMIC AND MARKET OVERVIEW (Unaudited)(concluded) | March 31, 2020 |
The consensus estimate for S&P 500 earnings per share in 2020 is still around $150. Our research shows S&P 500 earnings per share could fall below $100. Similarly, economists have no way to calibrate how bad the economic data could be based on history. The March U.S. non-farm payrolls report was evidence of this, as it showed a decline in payrolls of 700,000 jobs versus survey expectations of a decline of only 100,000 jobs. We currently expect that second quarter U.S. real gross domestic product (“GDP”) quarter-over-quarter growth could fall by 40% annualized and the unemployment rate could rise to at least 20%. Beyond that, the severity of the crisis depends on containment of the virus and the effectiveness of social distancing measures put in place, but expectations for a quick and sustained V-shaped recovery appear overly optimistic.
For the six months ended March 31, 2020, the MSCI Europe-Australasia-Far East (“EAFE”) Index* returned -16.37%. The return of the MSCI Emerging Markets Index* was -14.45%.
In the bond market, the Bloomberg Barclays U.S. Aggregate Bond Index* posted a 3.33% return for the six-month period, while the Bloomberg Barclays U.S. Corporate High Yield Index* returned -10.40%. The return of the ICE Bank of America (“BofA”) Merrill Lynch 3-Month U.S. Treasury Bill Index* was 1.04% for the six-month period.
The opinions and forecasts expressed may not actually come to pass. This information is subject to change at any time, based on market and other conditions, and should not be construed as a recommendation of any specific security or strategy.
*Index Definitions:
The following indices are referenced throughout this report. Indices are unmanaged and not available for direct investment. Index performance does not reflect transaction costs, fees, or expenses.
Bloomberg Barclays U.S. Aggregate Bond Index is a broad-based flagship benchmark that measures the investment grade, U.S. dollar-denominated, fixed-rate taxable bond market, including U.S. Treasuries, government-related and corporate securities, mortgage-backed securities or “MBS” (agency fixed-rate and hybrid adjustable-rate mortgage, or “ARM”, pass-throughs), asset-backed securities (“ABS”), and commercial mortgage-backed securities (“CMBS”) (agency and non-agency).
Bloomberg Barclays U.S. Corporate High Yield Index measures the U.S. dollar-denominated, high yield, fixed-rate corporate bond market. Securities are classified as high yield if the middle rating of Moody’s, Fitch, and S&P is Ba1/BB +/BB + or below.
ICE BofA Merrill Lynch 3-Month U.S. Treasury Bill Index is an unmanaged market index of U.S. Treasury securities maturing in 90 days that assumes reinvestment of all income.
MSCI EAFE Index is a free float-adjusted market capitalization index that is designed to measure the equity market performance of developed markets, excluding the U.S. & Canada.
MSCI Emerging Markets Index is a free float-adjusted market capitalization weighted index that is designed to measure equity market performance in the global emerging markets.
S&P 500® is a broad-based index, the performance of which is based on the performance of 500 widely held common stocks chosen for market size, liquidity, and industry group representation.
| | THE GUGGENHEIM FUNDS SEMI-ANNUAL REPORT | 5 |
ABOUT SHAREHOLDERS’ FUND EXPENSES (Unaudited) |
All mutual funds have operating expenses, and it is important for our shareholders to understand the impact of costs on their investments. Shareholders of a fund incur two types of costs: (i) transaction costs, including sales charges (loads) on purchase payments, reinvested dividends, other distributions, and exchange fees, and (ii) ongoing costs, including management fees, administrative services, and shareholder reports, among others. These ongoing costs, or operating expenses, are deducted from a fund’s gross income and reduce the investment return of the fund.
A fund’s expenses are expressed as a percentage of its average net assets, which is known as the expense ratio. The following examples are intended to help investors understand the ongoing costs (in dollars) of investing in a fund and to compare these costs with the ongoing costs of investing in other mutual funds.
The examples are based on an investment of $1,000 made at the beginning of the period and held for the entire six-month period beginning September 30, 2019 and ending March 31, 2020.
The following tables illustrate the Fund’s costs in two ways:
Table 1. Based on actual Fund return: This section helps investors estimate the actual expenses paid over the period. The “Ending Account Value” shown is derived from the Fund’s actual return, and the fifth column shows the dollar amount that would have been paid by an investor who started with $1,000 in the Fund. Investors may use the information here, together with the amount invested, to estimate the expenses paid over the period. Simply divide the Fund’s account value by $1,000 (for example, an $8,600 account value divided by $1,000 = 8.6), then multiply the result by the number provided under the heading “Expenses Paid During Period.”
Table 2. Based on hypothetical 5% return: This section is intended to help investors compare a fund’s cost with those of other mutual funds. The table provides information about hypothetical account values and hypothetical expenses based on the Fund’s actual expense ratio and an assumed rate of return of 5% per year before expenses, which is not the Fund’s actual return. The hypothetical account values and expenses may not be used to estimate the actual ending account balance or expenses paid during the period. The example is useful in making comparisons because the U.S. Securities and Exchange Commission (the “SEC”) requires all mutual funds to calculate expenses based on the 5% return. Investors can assess a Fund’s costs by comparing this hypothetical example with the hypothetical examples that appear in shareholder reports of other funds.
The calculations illustrated above assume no shares were bought or sold during the period. Actual costs may have been higher or lower, depending on the amount of investment and the timing of any purchases or redemptions.
6 | THE GUGGENHEIM FUNDS SEMI-ANNUAL REPORT | |
ABOUT SHAREHOLDERS’ FUND EXPENSES (Unaudited)(continued) |
Please note that the expenses shown in the table are meant to highlight your ongoing costs only and do not reflect any transactional costs, such as sales charges (loads) on purchase payments, and contingent deferred sales charges (“CDSC”) on redemptions, if any. Therefore, the second table is useful in comparing ongoing costs only, and will not help you determine the relative total costs of owning different funds. In addition, if these transactional costs were included, your costs would have been higher.
More information about the Fund’s expenses, including annual expense ratios for periods up to five years (subject to the Fund’s inception date), can be found in the Financial Highlights section of this report. For additional information on operating expenses and other shareholder costs, please refer to the Fund’s prospectus.
| | THE GUGGENHEIM FUNDS SEMI-ANNUAL REPORT | 7 |
ABOUT SHAREHOLDERS’ FUND EXPENSES (Unaudited)(concluded) |
| Expense
Ratio1 | Fund
Return | Beginning
Account Value
September 30,
2019 | Ending
Account Value
March 31,
2020 | Expenses
Paid During
Period2 |
Table 1. Based on actual Fund return3 |
A-Class | 0.80% | 2.28% | $ 1,000.00 | $ 1,022.80 | $ 4.05 |
C-Class | 1.55% | 1.86% | 1,000.00 | 1,018.60 | 7.82 |
P-Class | 0.80% | 2.24% | 1,000.00 | 1,022.40 | 4.04 |
Institutional Class | 0.51% | 2.42% | 1,000.00 | 1,024.20 | 2.58 |
R6-Class | 0.51% | 2.42% | 1,000.00 | 1,024.20 | 2.58 |
|
Table 2. Based on hypothetical 5% return (before expenses) |
A-Class | 0.80% | 5.00% | $ 1,000.00 | $ 1,021.00 | $ 4.04 |
C-Class | 1.55% | 5.00% | 1,000.00 | 1,017.25 | 7.82 |
P-Class | 0.80% | 5.00% | 1,000.00 | 1,021.00 | 4.04 |
Institutional Class | 0.51% | 5.00% | 1,000.00 | 1,022.45 | 2.58 |
R6-Class | 0.51% | 5.00% | 1,000.00 | 1,022.45 | 2.58 |
1 | Annualized and excludes expenses of the underlying funds in which the Fund invests, if any. This ratio represents net expenses, which may include expenses that are excluded from the expense limitation agreement. Excluding these expense, the net expense ratio for the Fund would be 0.79%, 1.54%, 0.79% 0.50% and 0.50% for the A-Class, C-Class, P-Class, Institutional Class and R6-Class, respectively. |
2 | Expenses are equal to the Fund’s annualized expense ratio, net of any applicable fee waivers, multiplied by the average account value over the period, multiplied by 183/366 (to reflect the one-half year period). |
3 | Actual cumulative return at net asset value for the period September 30, 2019 to March 31, 2020. |
8 | THE GUGGENHEIM FUNDS SEMI-ANNUAL REPORT | |
PERFORMANCE REPORT AND FUND PROFILE (Unaudited) | March 31, 2020 |
TOTAL RETURN BOND FUND
OBJECTIVE: Seeks to provide total return, comprised of current income and capital appreciation.
Holdings Diversification (Market Exposure as % of Net Assets)
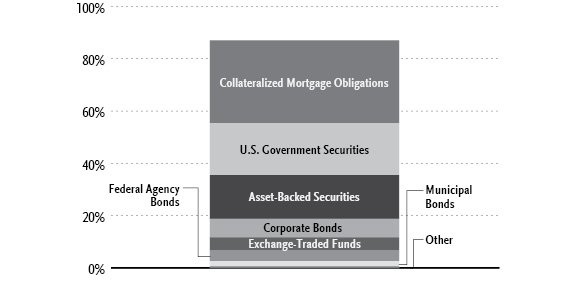
“Holdings Diversification (Market Exposure as % of Net Assets)” excludes any temporary cash investments, investments in Guggenheim Strategy Funds Trust mutual funds, or investments in Guggenheim Ultra Short Duration Fund.
| | THE GUGGENHEIM FUNDS SEMI-ANNUAL REPORT | 9 |
PERFORMANCE REPORT AND FUND PROFILE (Unaudited)(continued) | March 31, 2020 |
Inception Dates: |
A-Class | November 30, 2011 |
C-Class | November 30, 2011 |
P-Class | May 1, 2015 |
Institutional Class | November 30, 2011 |
R6-Class | October 19, 2016 |
Portfolio Composition by Quality Rating1 |
Rating | % of Total
Investments |
Fixed Income Instruments | |
AAA | 56.4% |
AA | 4.1% |
A | 8.1% |
BBB | 7.4% |
BB | 0.3% |
B | 1.4% |
CCC | 0.9% |
CC | 0.5% |
C | 0.2% |
NR2 | 2.5% |
Other Instruments | 18.2% |
Total Investments | 100.0% |
Ten Largest Holdings (% of Total Net Assets) |
iShares iBoxx $ Investment Grade Corporate Bond ETF | 4.3% |
U.S. Treasury Notes, 2.50% due 01/31/24 | 3.7% |
U.S. Treasury Notes, 2.38% due 02/29/24 | 3.3% |
U.S. Treasury Bonds, 2.88% due 05/15/49 | 2.4% |
U.S. Treasury Bonds, 2.25% | 2.4% |
U.S. Treasury Notes, 1.50% due 02/15/30 | 1.5% |
U.S. Treasury Bonds, due 02/15/50 | 1.5% |
U.S. Treasury Notes, 2.50% due 02/28/26 | 1.5% |
U.S. Treasury Notes, 1.63% due 09/30/26 | 1.2% |
U.S. Treasury Notes, 2.50% due 02/15/22 | 0.8% |
Top Ten Total | 22.6% |
| | |
“Ten Largest Holdings” excludes any temporary cash or derivative investments. |
1 | Source: BlackRock Solutions. Credit quality ratings are measured on a scale that generally ranges from AAA (highest) to D (lowest). All securities except for those labeled “NR” have been rated by Moody’s, Standard & Poor’s (“S&P”), or Fitch, each of which is a Nationally Recognized Statistical Rating Organization (“NRSRO”). For purposes of this presentation, when ratings are available from more than one agency, the highest rating is used. Guggenheim Investments has converted ratings to the equivalent S&P rating. Security ratings are determined at the time of purchase and may change thereafter. |
2 | NR securities do not necessarily indicate low credit quality. |
10 | THE GUGGENHEIM FUNDS SEMI-ANNUAL REPORT | |
PERFORMANCE REPORT AND FUND PROFILE (Unaudited)(concluded) | March 31, 2020 |
Average Annual Returns*
Periods Ended March 31, 2020
| 6 Month† | 1 Year | 5 Year | Since
Inception
(11/30/11) |
A-Class Shares | 2.28% | 6.12% | 3.79% | 5.21% |
A-Class Shares with sales charge‡ | (1.80%) | 1.86% | 2.79% | 4.60% |
C-Class Shares | 1.86% | 5.33% | 3.02% | 4.44% |
C-Class Shares with CDSC§ | 0.86% | 4.33% | 3.02% | 4.44% |
Institutional Class Shares | 2.42% | 6.46% | 4.13% | 5.56% |
Bloomberg Barclays U.S. Aggregate Bond Index | 3.33% | 8.93% | 3.36% | 3.30% |
| | 6 Month† | 1 Year | Since
Inception
(05/01/15) |
P-Class Shares | | 2.24% | 6.13% | 3.92% |
Bloomberg Barclays U.S. Aggregate Bond Index | | 3.33% | 8.93% | 3.56% |
| | 6 Month† | 1 Year | Since
Inception
(10/19/16) |
R6-Class Shares | | 2.42% | 6.42% | 4.05% |
Bloomberg Barclays U.S. Aggregate Bond Index | | 3.33% | 8.93% | 3.64% |
* | The performance data above represents past performance that is not predictive of future results. The investment return and principal value of an investment in the Fund will fluctuate so that an investor’s shares, when redeemed, may be worth more or less than their original cost. Returns are historical and include changes in principal and reinvested dividends and capital gains and do not reflect the effect of taxes. The Bloomberg Barclays U.S. Aggregate Bond Index is an unmanaged index and, unlike the Fund, has no management fees or operating expenses to reduce its reported return. |
† | 6 month returns are not annualized. |
‡ | Effective October 1, 2015, the maximum sales charge decreased from 4.75% to 4.00%. A 4.75% maximum sales charge is used in the calculation of the Average Annual Returns based on subscriptions made prior to October 1, 2015, and a 4.00% maximum sales charge will be used to calculate performance for periods based on subscriptions made on or after October 1, 2015. |
§ | Fund returns include a CDSC of 1% if redeemed within 12 months of purchase. |
| | THE GUGGENHEIM FUNDS SEMI-ANNUAL REPORT | 11 |
SCHEDULE OF INVESTMENTS (Unaudited) | March 31, 2020 |
TOTAL RETURN BOND FUND | |
| | | Shares | | | Value | |
COMMON STOCKS† - 0.0% |
| | | | | | | |
| Industrial - 0.0% |
API Heat Transfer Parent LLC*,†† | | | 42,528 | | | $ | 11,695 | |
BP Holdco LLC*,†††,1,2 | | | 532 | | | | 139 | |
Vector Phoenix Holdings, LP*,†††,1 | | | 532 | | | | 38 | |
| Total Industrial | | | | | | | 11,872 | |
| | | | | | | | | |
| Total Common Stocks |
| (Cost $21,071) | | | | | | | 11,872 | |
| | | | | | | | | |
| PREFERRED STOCKS††- 0.0% |
| Industrial - 0.0% |
| API Heat Transfer Intermediate* | | | 9 | | | | 6,931 | |
| Total Preferred Stocks |
| (Cost $7,237) | | | | | | | 6,931 | |
| | | | | | | | | |
| EXCHANGE-TRADED FUNDS†- 4.9% |
| iShares iBoxx $ Investment Grade Corporate Bond ETF | | | 5,095,600 | | | | 629,357,556 | |
| iShares iBoxx High Yield Corporate Bond ETF | | | 1,057,570 | | | | 81,506,920 | |
| Total Exchange-Traded Funds |
| (Cost $700,490,583) | | | | | | | 710,864,476 | |
| | | | | | | | | |
| MUTUAL FUNDS† - 0.5% |
Guggenheim Ultra Short Duration Fund — Institutional Class2 | | | 2,643,828 | | | | 25,830,200 | |
Guggenheim Strategy Fund III2 | | | 1,062,833 | | | | 25,582,401 | |
Guggenheim Strategy Fund II2 | | | 1,063,254 | | | | 25,571,258 | |
| Total Mutual Funds |
| (Cost $79,350,483) | | | | | | | 76,983,859 | |
| | | | | | | | | |
| MONEY MARKET FUND† - 11.7% |
Federated U.S. Treasury Cash Reserve Fund — Institutional Shares 0.46%3 | | | 1,691,965,196 | | | | 1,691,965,196 | |
| Total Money Market Fund |
| (Cost $1,691,965,196) | | | | | | | 1,691,965,196 | |
| | | | | | | | | |
| | | | Face
Amount~ | | | | | |
| COLLATERALIZED MORTGAGE OBLIGATIONS††- 31.6% |
| Government Agency - 15.8% |
| Fannie Mae | | | | | | | | |
| 3.59% due 02/01/29 | | | 110,460,101 | | | | 128,021,156 | |
| 3.37% due 06/01/39 | | | 69,825,000 | | | | 81,253,283 | |
| 2.43% due 01/01/30 | | | 71,700,000 | | | | 75,227,271 | |
| 2.89% due 10/01/29 | | | 38,458,000 | | | | 42,660,393 | |
| 3.26% due 05/01/34 | | | 37,000,000 | | | | 42,442,159 | |
| 3.01% due 09/01/29 | | | 36,899,000 | | | | 40,916,941 | |
| 3.61% due 04/01/34 | | | 31,110,000 | | | | 36,341,840 | |
| 3.71% due 04/01/34 | | | 26,913,000 | | | | 31,794,821 | |
| 3.56% due 04/01/30 | | | 26,199,308 | | | | 30,557,121 | |
| 3.33% due 05/01/34 | | | 25,400,000 | | | | 28,960,027 | |
| 3.40% due 02/01/33 | | | 25,000,000 | | | | 28,870,524 | |
| 3.60% due 03/01/31 | | | 24,586,000 | | | | 28,284,042 | |
| 3.23% due 01/01/33 | | | 23,510,582 | | | | 26,939,776 | |
| 2.40% due 03/01/40 | | | 27,004,000 | | | | 26,703,973 | |
| 3.43% due 09/01/34 | | | 22,550,000 | | | | 26,142,855 | |
| 3.68% due 04/01/34 | | | 20,000,000 | | | | 23,781,432 | |
| 2.90% due 11/01/29 | | | 21,378,000 | | | | 23,746,315 | |
| 2.81% due 09/01/39 | | | 20,780,000 | | | | 22,642,766 | |
| 2.87% due 09/01/29 | | | 20,000,000 | | | | 22,261,435 | |
| 3.49% due 04/01/30 | | | 18,469,496 | | | | 21,303,637 | |
| 3.83% due 05/01/49 | | | 19,000,000 | | | | 21,250,783 | |
| 3.56% due 03/01/31 | | | 18,550,000 | | | | 21,229,937 | |
| 2.96% due 11/01/29 | | | 18,620,000 | | | | 20,765,951 | |
| 3.17% due 02/01/28 | | | 18,350,000 | | | | 20,555,715 | |
| 2.70% due 10/01/39 | | | 18,564,028 | | | | 20,112,706 | |
| 3.66% due 03/01/31 | | | 16,821,000 | | | | 19,753,430 | |
| 4.17% due 02/01/49 | | | 15,500,000 | | | | 19,344,895 | |
| 2.30% due 11/01/29 | | | 17,060,000 | | | | 17,814,697 | |
12 | THE GUGGENHEIM FUNDS SEMI-ANNUAL REPORT | SEE NOTES TO FINANCIAL STATEMENTS. |
SCHEDULE OF INVESTMENTS (Unaudited)(continued) | March 31, 2020 |
TOTAL RETURN BOND FUND | |
| | Face
Amount~ | | | Value | |
3.62% due 04/01/34 | | | 14,435,000 | | | $ | 17,163,041 | |
2.55% due 12/01/29 | | | 15,713,000 | | | | 16,758,422 | |
4.08% due 04/01/49 | | | 12,879,000 | | | | 15,932,093 | |
3.75% due 03/01/34 | | | 13,500,000 | | | | 15,916,956 | |
3.19% due 02/01/30 | | | 13,645,551 | | | | 15,493,896 | |
3.07% due 01/01/28 | | | 13,100,000 | | | | 14,280,306 | |
2.46% due 01/01/30 | | | 13,500,000 | | | | 14,227,661 | |
3.66% due 03/01/34 | | | 11,952,115 | | | | 14,147,589 | |
2.81% due 01/01/40 | | | 12,598,841 | | | | 13,828,868 | |
3.59% due 04/01/33 | | | 11,280,000 | | | | 13,424,052 | |
2.82% due 10/01/29 | | | 12,100,000 | | | | 13,393,042 | |
3.42% due 09/01/47 | | | 12,970,600 | | | | 13,174,996 | |
4.21% due 10/01/48 | | | 9,750,000 | | | | 12,305,805 | |
3.03% due 12/01/27 | | | 10,900,000 | | | | 11,843,282 | |
3.41% due 02/01/33 | | | 10,250,000 | | | | 11,704,188 | |
3.08% due 10/01/32 | | | 10,250,000 | | | | 11,633,312 | |
3.51% due 04/01/34 | | | 9,820,000 | | | | 11,543,200 | |
3.42% due 04/01/30 | | | 9,800,000 | | | | 11,333,833 | |
3.31% due 01/01/33 | | | 9,700,000 | | | | 11,234,455 | |
3.05% due 10/01/29 | | | 9,100,000 | | | | 10,212,889 | |
2.50% due 03/01/35 | | | 9,591,677 | | | | 9,948,883 | |
3.60% due 03/01/30 | | | 8,341,000 | | | | 9,762,908 | |
3.04% due 01/01/28 | | | 8,900,000 | | | | 9,682,375 | |
3.08% due 01/01/30 | | | 8,500,000 | | | | 9,604,123 | |
3.43% due 03/01/33 | | | 8,100,000 | | | | 9,467,292 | |
2.94% due 10/01/32 | | | 8,372,070 | | | | 9,320,000 | |
1.86% due 11/01/25 | | | 8,798,000 | | | | 8,952,993 | |
3.57% due 06/01/34 | | | 7,510,000 | | | | 8,769,200 | |
3.48% due 04/01/30 | | | 7,000,000 | | | | 8,056,695 | |
3.29% due 03/01/33 | | | 6,700,000 | | | | 7,722,505 | |
2.99% due 09/01/29 | | | 6,800,000 | | | | 7,602,227 | |
3.14% due 01/01/28 | | | 6,900,000 | | | | 7,556,683 | |
3.34% due 05/01/34 | | | 6,500,000 | | | | 7,548,645 | |
3.63% due 04/01/34 | | | 6,338,000 | | | | 7,525,798 | |
4.04% due 08/01/48 | | | 6,100,000 | | | | 7,359,884 | |
2.79% due 01/01/32 | | | 6,582,399 | | | | 7,290,942 | |
2.51% due 11/01/34 | | | 6,663,000 | | | | 7,102,647 | |
2.09% due 04/01/35 | | | 6,820,000 | | | | 6,923,250 | |
2.15% due 09/01/29††† | | | 6,657,000 | | | | 6,919,322 | |
3.05% due 03/01/50 | | | 6,250,000 | | | | 6,730,868 | |
3.44% due 05/01/34 | | | 5,850,000 | | | | 6,718,552 | |
3.13% due 02/01/28 | | | 5,900,000 | | | | 6,344,030 | |
3.21% due 01/01/33 | | | 5,500,000 | | | | 6,273,028 | |
3.60% due 04/01/33 | | | 5,600,000 | | | | 6,176,599 | |
2.78% due 01/01/35 | | | 5,150,000 | | | | 5,639,128 | |
3.39% due 02/01/30 | | | 4,800,000 | | | | 5,551,644 | |
3.10% due 01/01/33 | | | 4,800,000 | | | | 5,422,224 | |
4.07% due 05/01/49 | | | 4,846,774 | | | | 5,338,236 | |
3.22% due 01/01/30 | | | 4,650,000 | | | | 5,299,833 | |
2.53% due 03/01/35 | | | 4,970,000 | | | | 5,279,505 | |
3.16% due 01/01/30 | | | 4,500,000 | | | | 5,104,797 | |
2.62% due 11/01/28 | | | 4,700,000 | | | | 5,076,341 | |
3.39% due 02/01/33 | | | 4,300,000 | | | | 4,959,922 | |
3.11% due 01/01/28 | | | 4,588,148 | | | | 4,932,834 | |
2.99% due 01/01/40 | | | 4,429,000 | | | | 4,916,938 | |
3.76% due 03/01/37 | | | 4,000,000 | | | | 4,829,285 | |
3.33% due 04/01/30 | | | 4,204,012 | | | | 4,784,158 | |
2.39% due 02/01/27 | | | 4,307,000 | | | | 4,586,296 | |
3.50% due 02/01/48 | | | 4,403,925 | | | | 4,535,413 | |
4.27% due 12/01/33 | | | 3,681,343 | | | | 4,396,864 | |
3.65% due 03/01/33 | | | 3,600,000 | | | | 4,262,394 | |
3.69% due 03/01/29 | | | 3,500,000 | | | | 4,045,496 | |
4.24% due 08/01/48 | | | 3,400,000 | | | | 4,017,126 | |
3.92% due 04/01/39 | | | 3,198,000 | | | | 3,966,908 | |
2.50% due 01/01/50 | | | 3,737,672 | | | | 3,874,799 | |
3.11% due 11/01/27 | | | 3,500,000 | | | | 3,861,025 | |
2.94% due 02/01/40 | | | 3,490,252 | | | | 3,841,254 | |
3.77% due 03/01/31 | | | 3,200,000 | | | | 3,765,168 | |
4.00% due 12/01/38 | | | 3,468,326 | | | | 3,741,336 | |
3.50% due 12/01/47 | | | 3,470,161 | | | | 3,698,573 | |
4.50% due 04/01/48 | | | 3,310,061 | | | | 3,572,504 | |
2.60% due 10/01/34 | | | 3,200,000 | | | | 3,443,584 | |
3.18% due 01/01/30 | | | 3,000,000 | | | | 3,403,403 | |
2.84% due 01/01/35 | | | 3,000,000 | | | | 3,308,112 | |
3.36% due 05/01/34 | | | 2,715,127 | | | | 3,155,823 | |
3.94% due 06/01/35 | | | 2,600,000 | | | | 3,130,693 | |
2.96% due 10/01/49 | | | 2,944,544 | | | | 3,066,666 | |
2.66% due 01/01/35 | | | 2,742,092 | | | | 2,984,910 | |
3.12% due 02/01/28 | | | 2,600,000 | | | | 2,907,554 | |
3.50% due 12/01/46 | | | 2,710,651 | | | | 2,874,726 | |
2.33% due 10/01/31 | | | 2,684,000 | | | | 2,869,857 | |
2.62% due 11/01/29 | | | 2,635,000 | | | | 2,810,871 | |
2.86% due 01/01/33 | | | 2,524,000 | | | | 2,798,853 | |
3.53% due 04/01/33 | | | 2,500,000 | | | | 2,744,649 | |
3.58% due 12/01/27 | | | 2,253,767 | | | | 2,560,128 | |
2.92% due 03/01/50 | | | 2,438,000 | | | | 2,525,664 | |
3.51% due 11/01/37 | | | 2,150,000 | | | | 2,516,724 | |
3.26% due 11/01/46 | | | 2,494,936 | | | | 2,504,341 | |
2.53% due 12/01/26 | | | 2,250,000 | | | | 2,406,692 | |
SEE NOTES TO FINANCIAL STATEMENTS. | THE GUGGENHEIM FUNDS SEMI-ANNUAL REPORT | 13 |
SCHEDULE OF INVESTMENTS (Unaudited)(continued) | March 31, 2020 |
TOTAL RETURN BOND FUND | |
| | Face
Amount~ | | | Value | |
4.00% due 01/01/46 | | | 2,220,439 | | | $ | 2,396,240 | |
3.55% due 04/01/33 | | | 2,150,000 | | | | 2,363,550 | |
2.69% due 10/01/34 | | | 2,332,128 | | | | 2,285,117 | |
3.16% due 11/01/30 | | | 1,983,781 | | | | 2,232,747 | |
2.68% due 04/01/50††† | | | 2,000,000 | | | | 2,152,688 | |
4.00% due 08/01/47 | | | 1,850,377 | | | | 2,002,411 | |
3.50% due 12/01/45 | | | 1,853,234 | | | | 1,976,874 | |
2.77% due 02/01/36 | | | 1,792,079 | | | | 1,934,366 | |
3.46% due 08/01/49 | | | 1,734,352 | | | | 1,863,665 | |
3.14% due 12/01/32 | | | 1,600,000 | | | | 1,812,870 | |
2.57% due 10/01/29 | | | 1,700,000 | | | | 1,807,896 | |
3.00% due 07/01/46 | | | 1,630,066 | | | | 1,720,505 | |
3.27% due 01/01/30 | | | 1,350,000 | | | | 1,543,150 | |
2.97% due 11/01/25 | | | 1,358,934 | | | | 1,473,543 | |
3.02% due 11/01/27 | | | 1,300,000 | | | | 1,415,650 | |
3.27% due 08/01/34 | | | 1,312,475 | | | | 1,386,315 | |
2.89% due 05/01/33 | | | 1,247,127 | | | | 1,376,451 | |
3.74% due 02/01/48 | | | 1,286,954 | | | | 1,357,676 | |
4.05% due 09/01/48 | | | 1,186,256 | | | | 1,302,190 | |
2.34% due 05/01/27 | | | 1,081,559 | | | | 1,150,458 | |
3.13% due 01/01/30 | | | 1,000,000 | | | | 1,130,426 | |
3.96% due 06/01/49 | | | 989,436 | | | | 1,102,500 | |
3.18% due 09/01/42 | | | 896,573 | | | | 996,177 | |
3.60% due 10/01/47 | | | 961,846 | | | | 992,357 | |
4.50% due 02/01/45 | | | 881,360 | | | | 967,393 | |
3.91% due 07/01/49 | | | 693,529 | | | | 852,355 | |
3.36% due 12/01/39 | | | 700,000 | | | | 814,658 | |
3.63% due 01/01/37 | | | 726,111 | | | | 790,593 | |
2.75% due 11/01/31 | | | 643,986 | | | | 699,862 | |
5.00% due 05/01/44 | | | 626,610 | | | | 685,117 | |
2.51% due 02/01/48 | | | 610,000 | | | | 617,345 | |
5.00% due 12/01/44 | | | 538,987 | | | | 592,872 | |
4.50% due 05/01/47 | | | 536,506 | | | | 584,325 | |
4.87% due 04/01/49††† | | | 543,237 | | | | 564,966 | |
3.50% due 08/01/43 | | | 526,415 | | | | 564,640 | |
4.33% due 09/01/48 | | | 342,680 | | | | 439,937 | |
4.22% due 04/01/49 | | | 315,000 | | | | 390,038 | |
Freddie Mac Multifamily Structured Pass Through Certificates | | | | | | | | |
2017-KIR3, 3.28% due 08/25/27 | | | 91,932,800 | | | | 103,763,834 | |
2017-KGX1, 3.00% due 10/25/27 | | | 81,400,000 | | | | 91,175,351 | |
2017-KW03, 3.02% due 06/25/27 | | | 65,900,000 | | | | 73,959,537 | |
2019-1513, 2.80% due 08/25/34 | | | 67,000,000 | | | | 73,022,798 | |
2018-K074, 3.60% due 02/25/28 | | | 34,823,000 | | | | 39,998,039 | |
2020-KJ28, 2.31% due 10/25/27 | | | 29,862,000 | | | | 31,873,764 | |
2017-K066, 3.20% due 06/25/27 | | | 19,507,000 | | | | 21,853,216 | |
2019-KJ27, 2.59% due 03/25/25 | | | 18,500,000 | | | | 19,735,143 | |
2017-K061, 3.44% (WAC) due 11/25/264 | | | 15,000,000 | | | | 16,733,526 | |
2016-K060, 3.30% (WAC) due 10/25/264 | | | 13,000,000 | | | | 14,366,477 | |
2018-K073, 3.45% (WAC) due 01/25/284 | | | 11,600,000 | | | | 13,256,104 | |
2018-K078, 3.92% due 06/25/28 | | | 10,150,000 | | | | 11,957,688 | |
2017-K069, 3.25% (WAC) due 09/25/274 | | | 10,000,000 | | | | 11,186,067 | |
2016-K057, 2.62% due 08/25/26 | | | 10,000,000 | | | | 10,644,664 | |
2018-K154, 3.46% due 11/25/32 | | | 8,500,000 | | | | 10,356,179 | |
2016-K152, 3.08% due 01/25/31 | | | 7,090,000 | | | | 8,054,958 | |
2017-K070, 3.36% due 12/25/27 | | | 6,000,000 | | | | 6,815,964 | |
2015-K151, 3.51% due 04/25/30 | | | 2,105,000 | | | | 2,507,183 | |
2015-K043, 0.54% (WAC) due 12/25/244,5 | | | 43,690,113 | | | | 952,702 | |
2014-K715, 2.86% due 01/25/21 | | | 436,895 | | | | 441,080 | |
14 | THE GUGGENHEIM FUNDS SEMI-ANNUAL REPORT | SEE NOTES TO FINANCIAL STATEMENTS. |
SCHEDULE OF INVESTMENTS (Unaudited)(continued) | March 31, 2020 |
TOTAL RETURN BOND FUND | |
| | Face
Amount~ | | | Value | |
Fannie Mae-Aces | | | | | | | | |
2017-M11, 2.98% due 08/25/29 | | | 52,100,000 | | | $ | 56,862,164 | |
2018-M3, 3.09% (WAC) due 02/25/304 | | | 7,800,000 | | | | 8,596,104 | |
Freddie Mac | | | | | | | | |
3.55% due 10/01/33 | | | 4,616,272 | | | | 5,376,214 | |
2018-4762, 4.00% due 01/15/46 | | | 4,673,889 | | | | 5,058,763 | |
3.50% due 01/01/44 | | | 2,185,877 | | | | 2,339,840 | |
4.00% due 02/01/46 | | | 2,032,031 | | | | 2,194,510 | |
3.26% due 09/01/45 | | | 1,909,314 | | | | 2,153,696 | |
3.00% due 08/01/46 | | | 1,656,388 | | | | 1,747,646 | |
4.50% due 06/01/48 | | | 1,603,240 | | | | 1,727,232 | |
4.00% due 11/01/45 | | | 1,586,334 | | | | 1,714,095 | |
3.40% due 04/01/31 | | | 1,000,000 | | | | 1,147,902 | |
FREMF Mortgage Trust | | | | | | | | |
2013-K29, 0.13% due 05/25/465,6 | | | 750,531,415 | | | | 2,158,153 | |
Total Government Agency | | | 2,285,974,983 | |
| | | | | | | | | |
Residential Mortgage Backed Securities - 12.0% |
New Residential Advance Receivables Trust Advance Receivables Backed | | | | | | | | |
2019-T3, 2.51% due 09/15/526 | | | 74,650,000 | | | | 71,147,310 | |
2019-T4, 2.33% due 10/15/516 | | | 62,250,000 | | | | 60,315,158 | |
2019-T5, 2.43% due 10/15/516 | | | 51,500,000 | | | | 50,341,688 | |
2019-T2, 2.52% due 08/15/536 | | | 30,500,000 | | | | 28,542,486 | |
Soundview Home Loan Trust | | | | | | | | |
2006-OPT5, 1.09% (1 Month USD LIBOR + 0.14%, Rate Floor: 0.14%) due 07/25/364 | | | 69,123,562 | | | | 63,209,772 | |
2005-OPT3, 1.42% (1 Month USD LIBOR + 0.47%, Rate Floor: 0.47%) due 11/25/354 | | | 19,495,000 | | | | 17,788,074 | |
2007-1, 1.12% (1 Month USD LIBOR + 0.17%, Rate Floor: 0.17%) due 03/25/374 | | | 1,230,060 | | | | 1,208,972 | |
Home Equity Loan Trust | | | | | | | | |
2007-FRE1, 1.14% (1 Month USD LIBOR + 0.19%, Rate Floor: 0.19%) due 04/25/374 | | | 90,001,291 | | | | 75,059,574 | |
Starwood Mortgage Residential Trust | | | | | | | | |
2020-1, 2.28% (WAC) due 02/25/504,6 | | | 28,706,821 | | | | 27,538,838 | |
2019-1, 2.94% (WAC) due 06/25/494,6 | | | 24,650,226 | | | | 24,485,449 | |
2020-1, 2.56% (WAC) due 02/25/504,6 | | | 12,439,622 | | | | 11,934,149 | |
2020-1, 2.41% (WAC) due 02/25/504,6 | | | 9,568,940 | | | | 9,180,736 | |
Verus Securitization Trust | | | | | | | | |
2020-1, 2.42% (WAC) due 01/25/604,6 | | | 38,072,614 | | | | 36,544,181 | |
2019-4, 2.64% due 11/25/596,7 | | | 35,387,911 | | | | 35,828,965 | |
Freddie Mac STACR Trust | | | | | | | | |
2020-DNA2, 1.70% (1 Month USD LIBOR + 0.75%, Rate Floor: 0.75%) due 02/25/504,6 | | | 26,500,000 | | | | 25,236,255 | |
SEE NOTES TO FINANCIAL STATEMENTS. | THE GUGGENHEIM FUNDS SEMI-ANNUAL REPORT | 15 |
SCHEDULE OF INVESTMENTS (Unaudited)(continued) | March 31, 2020 |
TOTAL RETURN BOND FUND | |
| | Face
Amount~ | | | Value | |
2019-DNA4, 1.65% (1 Month USD LIBOR + 0.70%, Rate Floor: 0.00%) due 10/25/494,6 | | | 16,843,334 | | | $ | 16,617,744 | |
2020-DNA1, 1.65% (1 Month USD LIBOR + 0.70%, Rate Floor: 0.00%) due 01/25/504,6 | | | 10,000,000 | | | | 9,698,024 | |
BRAVO Residential Funding Trust | | | | | | | | |
2019-NQM1, 2.67% (WAC) due 07/25/594,6 | | | 34,576,749 | | | | 33,942,214 | |
2019-NQM2, 2.75% (WAC) due 11/25/594,6 | | | 17,138,016 | | | | 16,554,454 | |
Structured Asset Securities Corporation Mortgage Loan Trust | | | | | | | | |
2008-BC4, 1.58% (1 Month USD LIBOR + 0.63%, Rate Floor: 0.63%) due 11/25/374 | | | 40,739,013 | | | | 37,015,569 | |
2006-BC4, 1.12% (1 Month USD LIBOR + 0.17%, Rate Floor: 0.17%) due 12/25/364 | | | 5,404,498 | | | | 4,943,877 | |
2006-BC3, 1.11% (1 Month USD LIBOR + 0.16%, Rate Floor: 0.16%) due 10/25/364 | | | 5,370,811 | | | | 4,647,445 | |
2006-BC6, 1.12% (1 Month USD LIBOR + 0.17%, Rate Floor: 0.17%) due 01/25/374 | | | 633,591 | | | | 594,858 | |
Homeward Opportunities Fund I Trust | | | | | | | | |
2019-3, 2.68% (WAC) due 11/25/594,6 | | | 28,899,922 | | | | 27,500,761 | |
2019-2, 2.70% (WAC) due 09/25/594,6 | | | 19,793,816 | | | | 18,974,297 | |
CIT Mortgage Loan Trust | | | | | | | | |
2007-1, 2.30% (1 Month USD LIBOR + 1.35%, Rate Floor: 1.35%) due 10/25/374,6 | | | 44,487,730 | | | | 42,678,250 | |
2007-1, 2.40% (1 Month USD LIBOR + 1.45%, Rate Floor: 1.45%) due 10/25/374,8 | | | 2,845,245 | | | | 2,803,694 | |
NovaStar Mortgage Funding Trust Series | | | | | | | | |
2007-2, 1.15% (1 Month USD LIBOR + 0.20%, Rate Cap/Floor: 11.00%/0.20%) due 09/25/374 | | | 46,317,504 | | | | 41,734,929 | |
CSMC Trust | | | | | | | | |
2018-RPL9, 3.85% (WAC) due 09/25/574,6 | | | 40,567,177 | | | | 41,324,887 | |
CIM Trust | | | | | | | | |
2018-R4, 4.07% (WAC) due 12/26/574,6 | | | 26,953,431 | | | | 27,646,560 | |
2018-R2, 3.69% (WAC) due 08/25/574,6 | | | 11,928,868 | | | | 12,158,263 | |
16 | THE GUGGENHEIM FUNDS SEMI-ANNUAL REPORT | SEE NOTES TO FINANCIAL STATEMENTS. |
SCHEDULE OF INVESTMENTS (Unaudited)(continued) | March 31, 2020 |
TOTAL RETURN BOND FUND | |
| | Face
Amount~ | | | Value | |
Alternative Loan Trust | | | | | | | | |
2007-OA4, 1.12% (1 Month USD LIBOR + 0.17%, Rate Floor: 0.17%) due 05/25/474 | | | 25,725,540 | | | $ | 20,943,684 | |
2007-OH3, 1.24% (1 Month USD LIBOR + 0.29%, Rate Cap/Floor: 10.00%/0.29%) due 09/25/474 | | | 9,698,132 | | | | 8,674,295 | |
2005-38, 1.30% (1 Month USD LIBOR + 0.35%, Rate Floor: 0.35%) due 09/25/354 | | | 7,271,474 | | | | 6,274,329 | |
2007-OA7, 1.13% (1 Month USD LIBOR + 0.18%, Rate Floor: 0.18%) due 05/25/474 | | | 4,202,453 | | | | 3,281,722 | |
Ocwen Master Advance Receivables Trust | | | | | | | | |
2019-T2, 2.42% due 08/15/516 | | | 39,100,000 | | | | 38,513,203 | |
New Residential Mortgage Loan Trust | | | | | | | | |
2019-6A, 3.50% (WAC) due 09/25/594,6 | | | 16,006,164 | | | | 16,296,774 | |
2018-1A, 4.00% (WAC) due 12/25/574,6 | | | 13,280,044 | | | | 13,730,482 | |
2018-2A, 3.50% (WAC) due 02/25/584,6 | | | 3,689,238 | | | | 3,756,701 | |
2017-5A, 2.45% (1 Month USD LIBOR + 1.50%, Rate Floor: 1.50%) due 06/25/574,8 | | | 2,705,128 | | | | 2,563,310 | |
Morgan Stanley ABS Capital I Incorporated Trust | | | | | | | | |
2007-HE6, 1.13% (1 Month USD LIBOR + 0.18%, Rate Floor: 0.18%) due 05/25/374 | | | 27,555,712 | | | | 22,648,946 | |
2006-NC1, 1.33% (1 Month USD LIBOR + 0.38%, Rate Floor: 0.38%) due 12/25/354 | | | 7,800,000 | | | | 7,322,631 | |
2007-HE6, 1.01% (1 Month USD LIBOR + 0.06%, Rate Floor: 0.06%) due 05/25/374 | | | 3,751,697 | | | | 3,061,480 | |
2007-HE6, 1.20% (1 Month USD LIBOR + 0.25%, Rate Floor: 0.25%) due 05/25/374 | | | 2,755,698 | | | | 2,277,093 | |
NRPL Trust | | | | | | | | |
2019-3A, 3.00% due 07/25/596 | | | 32,105,877 | | | | 32,269,855 | |
Deephaven Residential Mortgage Trust | | | | | | | | |
2019-3A, 2.96% (WAC) due 07/25/594,6 | | | 20,298,950 | | | | 19,387,191 | |
2018-4A, 4.29% (WAC) due 10/25/584,6 | | | 5,695,913 | | | | 5,775,540 | |
2017-3A, 2.58% (WAC) due 10/25/474,8 | | | 3,065,522 | | | | 3,066,121 | |
2018-1A, 3.03% (WAC) due 12/25/574,8 | | | 1,656,329 | | | | 1,636,523 | |
Cascade Funding Mortgage Trust | | | | | | | | |
2018-RM2, 4.00% (WAC) due 10/25/684,6 | | | 17,808,728 | | | | 17,608,054 | |
SEE NOTES TO FINANCIAL STATEMENTS. | THE GUGGENHEIM FUNDS SEMI-ANNUAL REPORT | 17 |
SCHEDULE OF INVESTMENTS (Unaudited)(continued) | March 31, 2020 |
TOTAL RETURN BOND FUND | |
| | Face
Amount~ | | | Value | |
2019-RM3, 2.80% (WAC) due 06/25/694,6 | | | 12,428,041 | | | $ | 11,945,259 | |
Bear Stearns Asset Backed Securities I Trust | | | | | | | | |
2006-HE9, 1.09% (1 Month USD LIBOR + 0.14%, Rate Floor: 0.14%) due 11/25/364 | | | 24,951,884 | | | | 22,516,874 | |
2006-HE3, 1.31% (1 Month USD LIBOR + 0.36%, Rate Floor: 0.36%) due 04/25/364 | | | 6,636,863 | | | | 6,513,601 | |
SG Residential Mortgage Trust | | | | | | | | |
2019-3, 2.70% (WAC) due 09/25/594,6 | | | 29,803,057 | | | | 28,765,892 | |
American Home Mortgage Investment Trust | | | | | | | | |
2007-1, 2.08% due 05/25/475 | | | 170,028,319 | | | | 28,505,877 | |
Towd Point Mortgage Trust | | | | | | | | |
2017-6, 2.75% (WAC) due 10/25/574,6 | | | 13,297,181 | | | | 13,307,557 | |
2017-5, 1.55% (1 Month USD LIBOR + 0.60%, Rate Floor: 0.00%) due 02/25/574,6 | | | 9,121,162 | | | | 8,800,675 | |
2018-1, 3.00% (WAC) due 01/25/584,6 | | | 6,013,666 | | | | 6,041,260 | |
Citigroup Mortgage Loan Trust | | | | | | | | |
2019-IMC1, 2.72% (WAC) due 07/25/494,6 | | | 17,489,457 | | | | 16,860,468 | |
2005-HE3, 1.68% (1 Month USD LIBOR + 0.74%, Rate Floor: 0.49%) due 09/25/354 | | | 11,687,000 | | | | 11,032,350 | |
SPS Servicer Advance Receivables Trust Advance Receivables Backed Notes | | | | | | | | |
2019-T1, 2.24% due 10/15/516 | | | 28,000,000 | | | | 27,380,903 | |
HSI Asset Securitization Corporation Trust | | | | | | | | |
2006-OPT2, 1.34% (1 Month USD LIBOR + 0.39%, Rate Floor: 0.39%) due 01/25/364 | | | 29,140,000 | | | | 27,114,493 | |
Angel Oak Mortgage Trust | | | | | | | | |
2020-1, 2.77% (WAC) due 12/25/594,6 | | | 11,432,694 | | | | 11,328,819 | |
2020-1, 2.67% (WAC) due 12/25/594,6 | | | 8,895,722 | | | | 8,814,821 | |
2017-3, 2.71% (WAC) due 11/25/474,6 | | | 5,437,931 | | | | 5,323,667 | |
Residential Mortgage Loan Trust | | | | | | | | |
2020-1, 2.38% (WAC) due 02/25/244,6 | | | 21,268,284 | | | | 20,347,331 | |
2020-1, 2.68% (WAC) due 02/25/244,6 | | | 5,292,340 | | | | 5,063,499 | |
RALI Series Trust | | | | | | | | |
2007-QO4, 1.14% (1 Month USD LIBOR + 0.19%, Rate Floor: 0.19%) due 05/25/474 | | | 8,024,880 | | | | 6,424,954 | |
18 | THE GUGGENHEIM FUNDS SEMI-ANNUAL REPORT | SEE NOTES TO FINANCIAL STATEMENTS. |
SCHEDULE OF INVESTMENTS (Unaudited)(continued) | March 31, 2020 |
TOTAL RETURN BOND FUND | |
| | Face
Amount~ | | | Value | |
2006-QO2, 1.17% (1 Month USD LIBOR + 0.22%, Rate Floor: 0.22%) due 02/25/464 | | | 19,362,647 | | | $ | 4,582,645 | |
2007-QO2, 1.10% (1 Month USD LIBOR + 0.15%, Rate Floor: 0.15%) due 02/25/474 | | | 10,063,225 | | | | 4,448,429 | |
2005-QO1, 1.25% (1 Month USD LIBOR + 0.30%, Rate Floor: 0.30%) due 08/25/354 | | | 3,874,369 | | | | 3,014,735 | |
2006-QS8, 1.40% (1 Month USD LIBOR + 0.45%, Rate Floor: 0.45%) due 08/25/364 | | | 3,189,508 | | | | 2,238,125 | |
2007-QO3, 1.11% (1 Month USD LIBOR + 0.16%, Rate Floor: 0.16%) due 03/25/474 | | | 1,531,154 | | | | 1,258,780 | |
2006-QO2, 1.22% (1 Month USD LIBOR + 0.27%, Rate Floor: 0.27%) due 02/25/464 | | | 4,773,047 | | | | 1,169,484 | |
Fannie Mae Connecticut Avenue Securities | | | | | | | | |
2016-C01, 7.70% (1 Month USD LIBOR + 6.75%, Rate Floor: 0.00%) due 08/25/284 | | | 11,940,364 | | | | 11,401,737 | |
2016-C06, 5.20% (1 Month USD LIBOR + 4.25%, Rate Floor: 0.00%) due 04/25/294 | | | 11,095,000 | | | | 10,671,137 | |
Connecticut Avenue Securities Trust | | | | | | | | |
2019-R07, 1.72% (1 Month USD LIBOR + 0.77%, Rate Floor: 0.00%) due 10/25/394,6 | | | 12,382,929 | | | | 12,076,662 | |
2020-R01, 1.75% (1 Month USD LIBOR + 0.80%, Rate Floor: 0.00%) due 01/25/404,6 | | | 9,895,412 | | | | 9,461,533 | |
First NLC Trust | | | | | | | | |
2005-4, 1.34% (1 Month USD LIBOR + 0.39%, Rate Cap/Floor: 14.00%/0.39%) due 02/25/364 | | | 20,857,139 | | | | 18,989,199 | |
2005-1, 1.41% (1 Month USD LIBOR + 0.46%, Rate Cap/Floor: 14.00%/0.23%) due 05/25/354 | | | 2,807,415 | | | | 2,357,746 | |
LSTAR Securities Investment Limited | | | | | | | | |
2019-5, 3.08% (1 Month USD LIBOR + 1.50%, Rate Floor: 1.50%) due 11/01/244,6 | | | 21,258,111 | | | | 20,949,124 | |
Countrywide Asset-Backed Certificates | | | | | | | | |
2006-6, 1.12% (1 Month USD LIBOR + 0.17%, Rate Floor: 0.17%) due 09/25/364 | | | 20,729,259 | | | | 19,468,020 | |
2005-15, 1.40% (1 Month USD LIBOR + 0.45%, Rate Floor: 0.45%) due 03/25/364 | | | 1,500,000 | | | | 1,261,317 | |
SEE NOTES TO FINANCIAL STATEMENTS. | THE GUGGENHEIM FUNDS SEMI-ANNUAL REPORT | 19 |
SCHEDULE OF INVESTMENTS (Unaudited)(continued) | March 31, 2020 |
TOTAL RETURN BOND FUND | |
| | Face
Amount~ | | | Value | |
GSAMP Trust | | | | | | | | |
2007-NC1, 1.08% (1 Month USD LIBOR + 0.13%, Rate Floor: 0.13%) due 12/25/464 | | | 32,935,933 | | | $ | 17,346,839 | |
2005-HE6, 1.39% (1 Month USD LIBOR + 0.44%, Rate Floor: 0.44%) due 11/25/354 | | | 229,424 | | | | 226,600 | |
Washington Mutual Mortgage Pass-Through Certificates WMALT Series Trust | | | | | | | | |
2006-AR9, 2.80% (1 Year CMT Rate + 0.83%, Rate Floor: 0.83%) due 11/25/464 | | | 13,586,495 | | | | 10,313,597 | |
2006-AR9, 2.81% (1 Year CMT Rate + 0.84%, Rate Floor: 0.84%) due 11/25/464 | | | 6,263,121 | | | | 4,863,641 | |
2006-7, 4.25% due 09/25/36 | | | 2,536,090 | | | | 1,030,517 | |
2006-8, 4.31% due 10/25/36 | | | 421,490 | | | | 201,509 | |
HarborView Mortgage Loan Trust | | | | | | | | |
2006-14, 0.90% (1 Month USD LIBOR + 0.15%, Rate Floor: 0.15%) due 01/25/474 | | | 10,306,009 | | | | 8,037,981 | |
2006-12, 0.94% (1 Month USD LIBOR + 0.19%, Rate Floor: 0.19%) due 01/19/384 | | | 8,437,608 | | | | 6,726,901 | |
Nationstar Home Equity Loan Trust | | | | | | | | |
2007-B, 1.17% (1 Month USD LIBOR + 0.22%, Rate Floor: 0.22%) due 04/25/374 | | | 15,382,282 | | | | 14,575,620 | |
Credit-Based Asset Servicing & Securitization LLC | | | | | | | | |
2006-CB2, 1.14% (1 Month USD LIBOR + 0.19%, Rate Floor: 0.19%) due 12/25/364 | | | 15,550,592 | | | | 13,707,550 | |
Legacy Mortgage Asset Trust | | | | | | | | |
2018-GS3, 4.00% due 06/25/586,7 | | | 13,623,283 | | | | 13,079,905 | |
First Franklin Mortgage Loan Trust | | | | | | | | |
2006-FF3, 1.24% (1 Month USD LIBOR + 0.29%, Rate Floor: 0.29%) due 02/25/364 | | | 8,616,000 | | | | 7,797,915 | |
2004-FF10, 2.22% (1 Month USD LIBOR + 1.28%, Rate Floor: 0.85%) due 07/25/344 | | | 5,476,264 | | | | 5,119,330 | |
COLT Mortgage Loan Trust | | | | | | | | |
2018-3, 3.69% (WAC) due 10/26/484,6 | | | 10,423,135 | | | | 10,308,100 | |
JP Morgan Mortgage Acquisition Trust | | | | | | | | |
2006-WMC4, 1.07% (1 Month USD LIBOR + 0.12%, Rate Floor: 0.12%) due 12/25/364 | | | 14,768,336 | | | | 7,503,710 | |
20 | THE GUGGENHEIM FUNDS SEMI-ANNUAL REPORT | SEE NOTES TO FINANCIAL STATEMENTS. |
SCHEDULE OF INVESTMENTS (Unaudited)(continued) | March 31, 2020 |
TOTAL RETURN BOND FUND | |
| | Face
Amount~ | | | Value | |
2006-HE2, 1.09% (1 Month USD LIBOR + 0.14%, Rate Floor: 0.14%) due 07/25/364 | | | 2,004,996 | | | $ | 1,959,000 | |
LSTAR Securities Investment Trust | | | | | | | | |
2019-1, 3.28% (1 Month USD LIBOR + 1.70%, Rate Floor: 0.00%) due 03/01/244,6 | | | 9,080,308 | | | | 8,945,556 | |
Lehman XS Trust Series | | | | | | | | |
2007-2N, 1.13% (1 Month USD LIBOR + 0.18%, Rate Floor: 0.18%) due 02/25/374 | | | 7,444,453 | | | | 6,006,171 | |
2007-15N, 1.20% (1 Month USD LIBOR + 0.25%, Rate Floor: 0.00%) due 08/25/374 | | | 3,169,508 | | | | 2,664,186 | |
Wachovia Asset Securitization Issuance II LLC Trust | | | | | | | | |
2007-HE1, 1.09% (1 Month USD LIBOR + 0.14%, Rate Floor: 0.14%) due 07/25/374,6 | | | 5,236,772 | | | | 4,371,694 | |
2007-HE2A, 1.08% (1 Month USD LIBOR + 0.13%, Rate Floor: 0.13%) due 07/25/374,6 | | | 4,439,627 | | | | 4,250,430 | |
Asset Backed Securities Corporation Home Equity Loan Trust Series AEG | | | | | | | | |
2006-HE1, 1.35% (1 Month USD LIBOR + 0.40%, Rate Floor: 0.40%) due 01/25/364 | | | 10,072,000 | | | | 8,313,614 | |
CSMC Series | | | | | | | | |
2015-12R, 2.16% (WAC) due 11/30/374,6 | | | 8,715,505 | | | | 8,277,055 | |
Deutsche Alt-A Securities Mortgage Loan Trust Series | | | | | | | | |
2006-AF1, 1.25% (1 Month USD LIBOR + 0.30%, Rate Floor: 0.30%) due 04/25/364 | | | 6,105,002 | | | | 5,059,165 | |
2007-OA2, 2.74% (1 Year CMT Rate + 0.77%, Rate Floor: 0.77%) due 04/25/474 | | | 3,478,522 | | | | 2,786,038 | |
American Home Mortgage Assets Trust | | | | | | | | |
2006-4, 1.14% (1 Month USD LIBOR + 0.19%, Rate Floor: 0.19%) due 10/25/464 | | | 10,212,610 | | | | 5,956,490 | |
2006-6, 1.14% (1 Month USD LIBOR + 0.19%, Rate Floor: 0.19%) due 12/25/464 | | | 2,351,928 | | | | 1,645,566 | |
WaMu Mortgage Pass-Through Certificates Series Trust | | | | | | | | |
2007-OA6, 2.78% (1 Year CMT Rate + 0.81%, Rate Floor: 0.81%) due 07/25/474 | | | 7,086,539 | | | | 5,399,546 | |
2006-AR13, 2.85% (1 Year CMT Rate + 0.88%, Rate Floor: 0.88%) due 10/25/464 | | | 1,439,285 | | | | 1,139,912 | |
SEE NOTES TO FINANCIAL STATEMENTS. | THE GUGGENHEIM FUNDS SEMI-ANNUAL REPORT | 21 |
SCHEDULE OF INVESTMENTS (Unaudited)(continued) | March 31, 2020 |
TOTAL RETURN BOND FUND | |
| | Face
Amount~ | | | Value | |
2006-AR11, 2.89% (1 Year CMT Rate + 0.92%, Rate Floor: 0.92%) due 09/25/464 | | | 1,209,666 | | | $ | 1,004,759 | |
Impac Secured Assets CMN Owner Trust | | | | | | | | |
2005-2, 1.20% (1 Month USD LIBOR + 0.25%, Rate Floor: 0.25%) due 03/25/364 | | | 11,117,257 | | | | 5,473,702 | |
ACE Securities Corporation Home Equity Loan Trust Series | | | | | | | | |
2005-HE2, 1.97% (1 Month USD LIBOR + 1.02%, Rate Floor: 0.68%) due 04/25/354 | | | 5,700,000 | | | | 5,332,444 | |
Structured Asset Investment Loan Trust | | | | | | | | |
2005-11, 1.67% (1 Month USD LIBOR + 0.72%, Rate Floor: 0.36%) due 01/25/364 | | | 4,725,955 | | | | 4,295,307 | |
2006-3, 1.10% (1 Month USD LIBOR + 0.15%, Rate Floor: 0.15%) due 06/25/364 | | | 879,938 | | | | 814,333 | |
Argent Securities Incorporated Asset-Backed Pass-Through Certificates Series | | | | | | | | |
2005-W2, 1.44% (1 Month USD LIBOR + 0.49%, Rate Floor: 0.49%) due 10/25/354 | | | 5,435,000 | | | | 5,064,941 | |
IndyMac INDX Mortgage Loan Trust | | | | | | | | |
2005-AR18, 1.73% (1 Month USD LIBOR + 0.78%, Rate Cap/Floor: 10.50%/0.78%) due 10/25/364 | | | 6,690,902 | | | | 4,730,723 | |
ASG Resecuritization Trust | | | | | | | | |
2010-3, 2.21% (1 Month USD LIBOR + 0.29%, Rate Cap/Floor: 10.50%/0.29%) due 12/28/454,6 | | | 5,204,948 | | | | 4,588,631 | |
Nationstar HECM Loan Trust | | | | | | | | |
2019-2A, 2.27% (WAC) due 11/25/294,6 | | | 3,840,702 | | | | 3,792,487 | |
Morgan Stanley Capital I Incorporated Trust | | | | | | | | |
2006-HE1, 1.24% (1 Month USD LIBOR + 0.29%, Rate Floor: 0.29%) due 01/25/364 | | | 3,541,325 | | | | 3,230,404 | |
CWABS Asset-Backed Certificates Trust | | | | | | | | |
2004-15, 2.30% (1 Month USD LIBOR + 1.35%, Rate Floor: 0.90%) due 04/25/354 | | | 3,490,000 | | | | 3,219,991 | |
WaMu Asset-Backed Certificates WaMu Series | | | | | | | | |
2007-HE4, 1.20% (1 Month USD LIBOR + 0.25%, Rate Floor: 0.25%) due 07/25/474 | | | 4,656,726 | | | | 2,945,952 | |
22 | THE GUGGENHEIM FUNDS SEMI-ANNUAL REPORT | SEE NOTES TO FINANCIAL STATEMENTS. |
SCHEDULE OF INVESTMENTS (Unaudited)(continued) | March 31, 2020 |
TOTAL RETURN BOND FUND | |
| | Face
Amount~ | | | Value | |
Morgan Stanley Resecuritization Trust | | | | | | | | |
2014-R9, 1.76% (1 Month USD LIBOR + 0.14%, Rate Floor: 0.14%) due 11/26/464,8 | | | 3,128,529 | | | $ | 2,843,927 | |
GE-WMC Asset-Backed Pass-Through Certificates Series | | | | | | | | |
2005-2, 1.45% (1 Month USD LIBOR + 0.50%, Rate Floor: 0.25%) due 12/25/354 | | | 2,871,228 | | | | 2,778,352 | |
Luminent Mortgage Trust | | | | | | | | |
2006-2, 1.15% (1 Month USD LIBOR + 0.20%, Rate Floor: 0.20%) due 02/25/464 | | | 3,513,785 | | | | 2,618,704 | |
GSAA Trust | | | | | | | | |
2005-10, 1.60% (1 Month USD LIBOR + 0.65%, Rate Floor: 0.65%) due 06/25/354 | | | 2,188,877 | | | | 2,124,086 | |
Nomura Resecuritization Trust | | | | | | | | |
2015-4R, 2.11% (1 Month USD LIBOR + 0.43%, Rate Floor: 0.43%) due 03/26/364,8 | | | 1,421,731 | | | | 1,367,762 | |
2015-4R, 3.25% (1 Month USD LIBOR + 0.39%, Rate Floor: 0.39%) due 12/26/364,8 | | | 716,501 | | | | 684,241 | |
GSAA Home Equity Trust | | | | | | | | |
2006-3, 1.14% (1 Month USD LIBOR + 0.19%, Rate Floor: 0.19%) due 03/25/364 | | | 3,547,892 | | | | 1,688,979 | |
2007-7, 1.22% (1 Month USD LIBOR + 0.27%, Rate Floor: 0.27%) due 07/25/374 | | | 196,414 | | | | 178,208 | |
Banc of America Funding Trust | | | | | | | | |
2015-R4, 1.80% (1 Month USD LIBOR + 0.17%, Rate Floor: 0.17%) due 01/27/354,8 | | | 1,416,638 | | | | 1,384,619 | |
RFMSI Series Trust | | | | | | | | |
2006-S11, 6.00% due 11/25/36 | | | 1,269,060 | | | | 1,165,916 | |
Impac Secured Assets Trust | | | | | | | | |
2006-2, 1.12% (1 Month USD LIBOR + 0.17%, Rate Cap/Floor: 11.50%/0.17%) due 08/25/364 | | | 1,459,994 | | | | 1,129,731 | |
GSMSC Resecuritization Trust | | | | | | | | |
2015-5R, 1.77% (1 Month USD LIBOR + 0.14%, Rate Floor: 0.14%) due 04/26/374,8 | | | 1,066,928 | | | | 1,056,405 | |
Alliance Bancorp Trust | | | | | | | | |
2007-OA1, 1.19% (1 Month USD LIBOR + 0.24%, Rate Floor: 0.24%) due 07/25/374 | | | 878,259 | | | | 657,313 | |
SEE NOTES TO FINANCIAL STATEMENTS. | THE GUGGENHEIM FUNDS SEMI-ANNUAL REPORT | 23 |
SCHEDULE OF INVESTMENTS (Unaudited)(continued) | March 31, 2020 |
TOTAL RETURN BOND FUND | |
| | Face
Amount~ | | | Value | |
UCFC Manufactured Housing Contract | | | | | | | | |
1997-2, 7.38% due 10/15/28 | | | 482,811 | | | $ | 497,740 | |
Morgan Stanley Re-REMIC Trust | | | | | | | | |
2010-R5, 3.90% due 06/26/368 | | | 234,160 | | | | 184,760 | |
Irwin Home Equity Loan Trust | | | | | | | | |
2007-1, 6.35% due 08/25/378 | | | 67,051 | | | | 65,068 | |
BCAP LLC | | | | | | | | |
2014-RR2, 2.23% (WAC) due 03/26/364,8 | | | 17,102 | | | | 16,997 | |
Total Residential Mortgage Backed Securities | | | 1,748,272,960 | |
| | | | | | | | | |
Commercial Mortgage Backed Securities - 2.4% |
Morgan Stanley Capital I Trust | | | | | | | | |
2014-MP, 3.47% due 08/11/336 | | | 86,742,500 | | | | 87,054,400 | |
2014-CPT, 3.35% due 07/13/296 | | | 15,000,000 | | | | 14,773,905 | |
2014-CPT, 3.45% (WAC) due 07/13/294,6 | | | 5,800,000 | | | | 5,720,672 | |
2016-UBS9, 4.61% (WAC) due 03/15/494 | | | 275,000 | | | | 232,461 | |
Citigroup Commercial Mortgage Trust | | | | | | | | |
2019-GC43, 0.63% (WAC) due 11/10/524,5 | | | 219,882,375 | | | | 10,250,938 | |
2019-GC41, 1.19% (WAC) due 08/10/564,5 | | | 104,885,027 | | | | 7,487,176 | |
2016-C2, 1.76% (WAC) due 08/10/494,5 | | | 33,636,791 | | | | 2,799,361 | |
2016-P4, 1.98% (WAC) due 07/10/494,5 | | | 31,977,906 | | | | 2,727,210 | |
2016-P5, 1.52% (WAC) due 10/10/494,5 | | | 30,939,165 | | | | 2,030,429 | |
2016-GC37, 1.75% (WAC) due 04/10/494,5 | | | 18,596,945 | | | | 1,451,657 | |
2015-GC35, 0.85% (WAC) due 11/10/484,5 | | | 33,348,934 | | | | 998,404 | |
2015-GC29, 1.08% (WAC) due 04/10/484,5 | | | 20,389,511 | | | | 853,894 | |
2016-C3, 1.16% (WAC) due 11/15/494,5 | | | 12,081,759 | | | | 606,483 | |
2013-GC15, 4.37% (WAC) due 09/10/464 | | | 380,000 | | | | 404,984 | |
Wells Fargo Commercial Mortgage Trust | | | | | | | | |
2017-C38, 1.06% (WAC) due 07/15/504,5 | | | 73,467,467 | | | | 4,055,955 | |
2016-BNK1, 1.76% (WAC) due 08/15/494,5 | | | 36,781,112 | | | | 3,076,935 | |
2017-RB1, 1.25% (WAC) due 03/15/504,5 | | | 40,234,197 | | | | 2,750,112 | |
2016-C35, 1.95% (WAC) due 07/15/484,5 | | | 26,471,321 | | | | 2,339,255 | |
2017-C42, 0.89% (WAC) due 12/15/504,5 | | | 35,139,682 | | | | 1,918,191 | |
2017-RC1, 1.50% (WAC) due 01/15/604,5 | | | 25,913,967 | | | | 1,828,878 | |
2016-NXS5, 1.49% (WAC) due 01/15/594,5 | | | 26,092,270 | | | | 1,579,984 | |
24 | THE GUGGENHEIM FUNDS SEMI-ANNUAL REPORT | SEE NOTES TO FINANCIAL STATEMENTS. |
SCHEDULE OF INVESTMENTS (Unaudited)(continued) | March 31, 2020 |
TOTAL RETURN BOND FUND | |
| | Face
Amount~ | | | Value | |
2015-NXS4, 0.88% (WAC) due 12/15/484,5 | | | 33,766,248 | | | $ | 1,432,739 | |
2016-C32, 4.73% (WAC) due 01/15/594 | | | 1,400,000 | | | | 1,399,287 | |
2015-P2, 0.98% (WAC) due 12/15/484,5 | | | 33,875,138 | | | | 1,240,450 | |
2015-C30, 0.89% (WAC) due 09/15/584,5 | | | 31,218,802 | | | | 1,212,607 | |
2015-NXS1, 1.12% (WAC) due 05/15/484,5 | | | 9,205,973 | | | | 396,760 | |
2015-NXS4, 4.22% (WAC) due 12/15/484 | | | 64,000 | | | | 61,463 | |
BANK | | | | | | | | |
2019-BN22, 0.61% (WAC) due 11/15/624,5 | | | 156,795,373 | | | | 7,084,407 | |
2019-BN23, 0.70% (WAC) due 12/15/524,5 | | | 99,932,504 | | | | 5,273,358 | |
2020-BN25, 0.44% (WAC) due 01/15/634,5 | | | 140,000,000 | | | | 5,058,158 | |
2017-BNK6, 0.84% (WAC) due 07/15/604,5 | | | 43,081,904 | | | | 1,872,184 | |
2017-BNK4, 1.42% (WAC) due 05/15/504,5 | | | 13,050,617 | | | | 860,686 | |
COMM Mortgage Trust | | | | | | | | |
2018-COR3, 0.45% (WAC) due 05/10/514,5 | | | 198,043,512 | | | | 6,052,031 | |
2015-CR26, 0.95% (WAC) due 10/10/484,5 | | | 85,908,600 | | | | 3,507,657 | |
2013-WWP, 3.90% due 03/10/316 | | | 2,000,000 | | | | 2,084,644 | |
2015-CR24, 0.77% (WAC) due 08/10/484,5 | | | 48,091,432 | | | | 1,603,561 | |
2015-CR23, 0.92% (WAC) due 05/10/484,5 | | | 41,989,245 | | | | 1,405,582 | |
2015-CR27, 1.10% (WAC) due 10/10/484,5 | | | 30,447,136 | | | | 1,163,071 | |
2013-CR13, 0.77% (WAC) due 11/10/464,5 | | | 37,124,161 | | | | 882,790 | |
2015-CR23, 3.80% due 05/10/48 | | | 700,000 | | | | 707,405 | |
2014-LC15, 1.10% (WAC) due 04/10/474,5 | | | 11,487,631 | | | | 404,247 | |
GS Mortgage Securities Trust | | | | | | | | |
2020-GC45, 0.68% (WAC) due 02/13/534,5 | | | 135,104,924 | | | | 6,636,043 | |
2019-GC42, 0.81% (WAC) due 09/01/524,5 | | | 69,914,338 | | | | 4,075,908 | |
2016-GS4, 2.99% due 11/10/296 | | | 4,055,000 | | | | 4,020,347 | |
2017-GS6, 1.04% (WAC) due 05/10/504,5 | | | 42,591,447 | | | | 2,441,619 | |
2015-GC28, 1.02% (WAC) due 02/10/484,5 | | | 16,406,873 | | | | 636,513 | |
CGRBS Commercial Mortgage Trust | | | | | | | | |
2013-VN05, 3.37% due 03/13/356 | | | 15,110,000 | | | | 14,960,632 | |
JPMDB Commercial Mortgage Securities Trust | | | | | | | | |
2017-C7, 0.90% (WAC) due 10/15/504,5 | | | 137,562,938 | | | | 6,608,895 | |
SEE NOTES TO FINANCIAL STATEMENTS. | THE GUGGENHEIM FUNDS SEMI-ANNUAL REPORT | 25 |
SCHEDULE OF INVESTMENTS (Unaudited)(continued) | March 31, 2020 |
TOTAL RETURN BOND FUND | |
| | Face
Amount~ | | | Value | |
2016-C4, 0.81% (WAC) due 12/15/494,5 | | | 85,989,459 | | | $ | 3,597,713 | |
2016-C2, 1.67% (WAC) due 06/15/494,5 | | | 32,232,409 | | | | 1,937,442 | |
2017-C5, 0.94% (WAC) due 03/15/504,5 | | | 8,626,859 | | | | 435,863 | |
BENCHMARK Mortgage Trust | | | | | | | | |
2019-B14, 0.79% (WAC) due 12/15/624,5 | | | 109,868,674 | | | | 5,561,948 | |
2018-B2, 0.42% (WAC) due 02/15/514,5 | | | 132,027,217 | | | | 3,052,694 | |
2018-B6, 0.44% (WAC) due 10/10/514,5 | | | 64,685,501 | | | | 1,630,760 | |
CSAIL Commercial Mortgage Trust | | | | | | | | |
2019-C15, 1.05% (WAC) due 03/15/524,5 | | | 97,305,388 | | | | 6,584,120 | |
2015-C1, 0.84% (WAC) due 04/15/504,5 | | | 52,417,456 | | | | 1,720,802 | |
Cantor Commercial Real Estate Lending | | | | | | | | |
2019-CF3, 0.72% (WAC) due 01/15/534,5 | | | 149,846,695 | | | | 7,691,361 | |
GS Mortgage Securities Corporation Trust | | | | | | | | |
2020-UPTN, 3.25% (WAC) due 02/10/374,6 | | | 4,350,000 | | | | 3,758,397 | |
2020-DUNE, 2.06% (1 Month USD LIBOR + 1.35%, Rate Floor: 1.35%) due 12/15/364,6 | | | 3,750,000 | | | | 2,991,267 | |
Bancorp Commercial Mortgage Trust | | | | | | | | |
2018-CR3, 1.96% (1 Month USD LIBOR + 1.25%, Rate Floor: 1.25%) due 01/15/334,6 | | | 7,075,000 | | | | 6,657,496 | |
Aventura Mall Trust | | | | | | | | |
2013-AVM, 3.74% (WAC) due 12/05/324,6 | | | 6,600,000 | | | | 6,516,223 | |
GRACE Mortgage Trust | | | | | | | | |
2014-GRCE, 3.37% due 06/10/286 | | | 6,000,000 | | | | 6,030,408 | |
CD Mortgage Trust | | | | | | | | |
2017-CD6, 0.96% (WAC) due 11/13/504,5 | | | 46,951,675 | | | | 2,234,599 | |
2016-CD1, 1.41% (WAC) due 08/10/494,5 | | | 34,905,947 | | | | 2,230,857 | |
2016-CD2, 0.67% (WAC) due 11/10/494,5 | | | 34,559,472 | | | | 1,033,563 | |
UBS Commercial Mortgage Trust | | | | | | | | |
2017-C5, 1.01% (WAC) due 11/15/504,5 | | | 53,844,671 | | | | 2,780,280 | |
2017-C2, 1.09% (WAC) due 08/15/504,5 | | | 43,010,589 | | | | 2,479,328 | |
BX Commercial Mortgage Trust | | | | | | | | |
2019-XL, 2.71% (1 Month USD LIBOR + 2.00%, Rate Floor: 2.00%) due 10/15/364,6 | | | 5,971,253 | | | | 5,134,234 | |
26 | THE GUGGENHEIM FUNDS SEMI-ANNUAL REPORT | SEE NOTES TO FINANCIAL STATEMENTS. |
SCHEDULE OF INVESTMENTS (Unaudited)(continued) | March 31, 2020 |
TOTAL RETURN BOND FUND | |
| | Face
Amount~ | | | Value | |
JP Morgan Chase Commercial Mortgage Securities Trust | | | | | | | | |
2016-JP3, 1.43% (WAC) due 08/15/494,5 | | | 68,759,749 | | | $ | 4,576,615 | |
JPMBB Commercial Mortgage Securities Trust | | | | | | | | |
2015-C27, 1.17% (WAC) due 02/15/484,5 | | | 75,517,559 | | | | 3,458,969 | |
2013-C12, 0.49% (WAC) due 07/15/454,5 | | | 35,799,134 | | | | 425,992 | |
CD Commercial Mortgage Trust | | | | | | | | |
2017-CD4, 1.31% (WAC) due 05/10/504,5 | | | 32,128,227 | | | | 2,041,036 | |
2017-CD3, 1.02% (WAC) due 02/10/504,5 | | | 34,498,481 | | | | 1,605,987 | |
BBCMS Mortgage Trust | | | | | | | | |
2018-C2, 0.77% (WAC) due 12/15/514,5 | | | 58,306,762 | | | | 3,097,267 | |
JPMCC Commercial Mortgage Securities Trust | | | | | | | | |
2017-JP6, 1.14% (WAC) due 07/15/504,5 | | | 58,133,950 | | | | 3,082,355 | |
CGMS Commercial Mortgage Trust | | | | | | | | |
2017-B1, 0.84% (WAC) due 08/15/504,5 | | | 65,738,129 | | | | 2,904,560 | |
Morgan Stanley Bank of America Merrill Lynch Trust | | | | | | | | |
2015-C27, 0.92% (WAC) due 12/15/474,5 | | | 71,304,163 | | | | 2,780,955 | |
Cam Commercial Mortgage Corp. | | | | | | | | |
2002-CAM2, 6.16% due 12/14/216 | | | 2,493,856 | | | | 2,339,289 | |
GE Business Loan Trust | | | | | | | | |
2007-1A, 0.88% (1 Month USD LIBOR + 0.17%, Rate Floor: 0.17%) due 04/15/354,6 | | | 2,079,111 | | | | 1,890,243 | |
CFCRE Commercial Mortgage Trust | | | | | | | | |
2016-C3, 1.02% (WAC) due 01/10/484,5 | | | 39,244,278 | | | | 1,869,790 | |
Banc of America Commercial Mortgage Trust | | | | | | | | |
2017-BNK3, 1.12% (WAC) due 02/15/504,5 | | | 24,062,060 | | | | 1,317,210 | |
DBJPM Mortgage Trust | | | | | | | | |
2017-C6, 1.03% (WAC) due 06/10/504,5 | | | 24,816,805 | | | | 1,241,446 | |
BAMLL Commercial Mortgage Securities Trust | | | | | | | | |
2012-PARK, 2.96% due 12/10/306 | | | 500,000 | | | | 504,959 | |
WFRBS Commercial Mortgage Trust | | | | | | | | |
2013-C12, 1.22% (WAC) due 03/15/484,5,6 | | | 9,069,099 | | | | 247,481 | |
GS Mortgage Securities Corporation II | | | | | | | | |
2013-GC10, 2.94% due 02/10/46 | | | 225,000 | | | | 228,614 | |
Total Commercial Mortgage Backed Securities | | | 345,696,451 | |
| | | | | | | | | |
SEE NOTES TO FINANCIAL STATEMENTS. | THE GUGGENHEIM FUNDS SEMI-ANNUAL REPORT | 27 |
SCHEDULE OF INVESTMENTS (Unaudited)(continued) | March 31, 2020 |
TOTAL RETURN BOND FUND | |
| | Face
Amount~ | | | Value | |
Military Housing - 1.4% |
Freddie Mac Military Housing Bonds Resecuritization Trust Certificates | | | | | | | | |
2015-R1, 3.48% (WAC) due 11/25/554,6 | | | 64,815,313 | | | $ | 74,532,684 | |
2015-R1, 4.45% (WAC) due 10/25/524,6 | | | 13,744,282 | | | | 15,250,371 | |
2015-R1, 4.11% (WAC) due 11/25/524,6 | | | 13,999,625 | | | | 14,472,362 | |
2015-R1, 0.52% (WAC) due 11/25/554,5,6 | | | 169,808,770 | | | | 12,423,278 | |
2015-R1, 4.11% (WAC) due 11/25/524,8 | | | 13,999,625 | | | | 1,274,904 | |
Capmark Military Housing Trust | | | | | | | | |
2006-RILY, 6.15% due 07/10/51†††,1,6 | | | 12,120,193 | | | | 16,055,932 | |
2008-AMCW, 6.90% due 07/10/55†††,6 | | | 8,292,060 | | | | 12,620,315 | |
2007-AETC, 5.75% due 02/10/526 | | | 6,842,751 | | | | 8,513,271 | |
2007-ROBS, 6.06% due 10/10/52†††,1,6 | | | 4,685,026 | | | | 6,491,962 | |
2006-RILY, 2.09% (1 Month USD LIBOR + 0.37%, Rate Floor: 0.37%) due 07/10/514,6 | | | 7,013,931 | | | | 4,717,207 | |
2007-AET2, 6.06% due 10/10/52†††,1,6 | | | 2,130,699 | | | | 2,954,033 | |
GMAC Commercial Mortgage Asset Corp. | | | | | | | | |
2007-HCKM, 6.11% due 08/10/526 | | | 22,249,188 | | | | 27,643,657 | |
2005-DRUM, 5.47% due 05/10/50†††,6 | | | 4,556,308 | | | | 4,957,749 | |
2005-BLIS, 5.25% due 07/10/50†††,1,6 | | | 2,500,000 | | | | 3,099,281 | |
Total Military Housing | | | 205,007,006 | |
| | | | | | | | | |
Total Collateralized Mortgage Obligations |
(Cost $4,460,840,336) | | | 4,584,951,400 | |
| | | | | | | | | |
U.S. GOVERNMENT SECURITIES†† - 19.9% |
U.S. Treasury Notes |
2.50% due 01/31/24 | | | 500,000,000 | | | | 541,386,720 | |
2.38% due 02/29/24 | | | 441,533,200 | | | | 476,666,134 | |
1.50% due 02/15/30 | | | 208,308,000 | | | | 224,280,993 | |
2.50% due 02/28/26 | | | 195,201,000 | | | | 218,060,868 | |
1.63% due 09/30/26 | | | 163,897,000 | | | | 175,421,008 | |
2.50% due 02/15/22 | | | 118,229,000 | | | | 123,276,824 | |
1.63% due 10/31/26 | | | 65,000,000 | | | | 69,577,930 | |
1.50% due 09/30/24 | | | 46,818,000 | | | | 49,195,477 | |
1.50% due 10/31/24 | | | 18,233,000 | | | | 19,175,276 | |
2.00% due 04/30/24 | | | 12,460,000 | | | | 13,293,262 | |
2.38% due 05/15/29 | | | 5,480,000 | | | | 6,303,926 | |
0.50% due 03/31/25 | | | 3,840,000 | | | | 3,863,550 | |
2.25% due 08/15/27 | | | 3,370,000 | | | | 3,781,114 | |
2.13% due 05/15/25 | | | 2,500,000 | | | | 2,716,309 | |
U.S. Treasury Bonds |
2.88% due 05/15/49 | | | 259,100,000 | | | | 353,539,926 | |
2.25% due 08/15/49 | | | 287,528,000 | | | | 350,278,740 | |
8.00% due 11/15/21 | | | 5,600,000 | | | | 6,308,312 | |
2.88% due 08/15/45 | | | 4,600,000 | | | | 6,163,641 | |
7.88% due 02/15/21 | | | 5,500,000 | | | | 5,872,969 | |
4.38% due 05/15/40 | | | 2,790,000 | | | | 4,436,863 | |
8.13% due 08/15/21 | | | 3,900,000 | | | | 4,325,344 | |
2.38% due 11/15/49 | | | 3,200,000 | | | | 3,986,750 | |
2.75% due 11/15/42 | | | 2,580,000 | | | | 3,337,270 | |
U.S. Treasury Strips | | | | | | | | |
due 02/15/509,10 | | | 332,820,000 | | | | 220,980,458 | |
Total U.S. Government Securities |
(Cost $2,610,051,093) | | | 2,886,229,664 | |
| | | | | | | | | |
28 | THE GUGGENHEIM FUNDS SEMI-ANNUAL REPORT | SEE NOTES TO FINANCIAL STATEMENTS. |
SCHEDULE OF INVESTMENTS (Unaudited)(continued) | March 31, 2020 |
TOTAL RETURN BOND FUND | |
| | Face
Amount~ | | | Value | |
ASSET-BACKED SECURITIES†† - 16.7% |
Collateralized Loan Obligations - 9.6% |
Midocean Credit CLO VII | | | | | | | | |
2020-7A, 2.79% (3 Month USD LIBOR + 1.04%, Rate Floor: 0.00%) due 07/15/294,6 | | | 52,000,000 | | | $ | 48,530,914 | |
2020-7A, 3.33% (3 Month USD LIBOR + 1.60%, Rate Floor: 0.00%) due 07/15/294,6 | | | 27,500,000 | | | | 23,408,278 | |
2020-7A, 3.20% (3 Month USD LIBOR + 1.45%, Rate Floor: 0.00%) due 07/15/294,6 | | | 13,800,000 | | | | 12,899,786 | |
Venture XIV CLO Ltd. | | | | | | | | |
2020-14A, 2.73% (3 Month USD LIBOR + 1.03%, Rate Floor: 1.03%) due 08/28/294,6 | | | 69,000,000 | | | | 64,393,705 | |
2020-14A, 3.91% (3 Month USD LIBOR + 2.25%, Rate Floor: 2.25%) due 08/28/294,6 | | | 22,725,000 | | | | 18,661,100 | |
BXMT Ltd. | | | | | | | | |
2020-FL2, 1.70% (1 Month USD LIBOR + 0.90%, Rate Floor: 0.90%) due 02/16/374,6 | | | 75,500,000 | | | | 70,823,824 | |
2020-FL2, 2.20% (1 Month USD LIBOR + 1.40%, Rate Floor: 1.40%) due 02/16/374,6 | | | 11,000,000 | | | | 10,106,364 | |
THL Credit Wind River CLO Ltd. | | | | | | | | |
2017-2A, 2.70% (3 Month USD LIBOR + 0.87%, Rate Floor: 0.00%) due 10/15/274,6 | | | 53,754,907 | | | | 52,130,053 | |
2019-1A, 2.71% (3 Month USD LIBOR + 0.88%, Rate Floor: 0.00%) due 01/15/264,6 | | | 27,982,904 | | | | 27,845,864 | |
Golub Capital Partners CLO Ltd. | | | | | | | | |
2018-36A, 3.04% (3 Month USD LIBOR + 1.30%, Rate Floor: 0.00%) due 02/05/314,6 | | | 76,300,000 | | | | 67,038,950 | |
GoldenTree Loan Management US CLO 1 Ltd. | | | | | | | | |
2020-1A, 2.60% (3 Month USD LIBOR + 0.95%, Rate Floor: 0.95%) due 04/20/294,6 | | | 48,250,000 | | | | 45,017,897 | |
2020-1A, 3.10% (3 Month USD LIBOR + 1.45%, Rate Floor: 1.45%) due 04/20/294,6 | | | 12,500,000 | | | | 10,639,732 | |
Palmer Square Loan Funding Ltd. | | | | | | | | |
2019-3A, 2.55% (3 Month USD LIBOR + 0.85%, Rate Floor: 0.85%) due 08/20/274,6 | | | 20,470,550 | | | | 19,983,028 | |
2018-4A, 2.59% (3 Month USD LIBOR + 0.90%, Rate Floor: 0.00%) due 11/15/264,6 | | | 19,113,066 | | | | 18,487,483 | |
SEE NOTES TO FINANCIAL STATEMENTS. | THE GUGGENHEIM FUNDS SEMI-ANNUAL REPORT | 29 |
SCHEDULE OF INVESTMENTS (Unaudited)(continued) | March 31, 2020 |
TOTAL RETURN BOND FUND | |
| | Face
Amount~ | | | Value | |
2018-4A, 3.14% (3 Month USD LIBOR + 1.45%, Rate Floor: 0.00%) due 11/15/264,6 | | | 12,000,000 | | | $ | 10,444,896 | |
NewStar Clarendon Fund CLO LLC | | | | | | | | |
2019-1A, 3.09% (3 Month USD LIBOR + 1.30%, Rate Floor: 0.00%) due 01/25/274,6 | | | 48,143,535 | | | | 46,998,494 | |
2019-1A, 4.84% (3 Month USD LIBOR + 3.05%, Rate Floor: 0.00%) due 01/25/274,6 | | | 2,000,000 | | | | 1,750,785 | |
MP CLO VIII Ltd. | | | | | | | | |
2018-2A, 2.71% (3 Month USD LIBOR + 0.91%, Rate Floor: 0.00%) due 10/28/274,6 | | | 47,730,616 | | | | 46,185,371 | |
Marathon CLO V Ltd. | | | | | | | | |
2017-5A, 2.57% (3 Month USD LIBOR + 0.87%, Rate Floor: 0.00%) due 11/21/274,6 | | | 27,937,354 | | | | 26,861,148 | |
2017-5A, 3.15% (3 Month USD LIBOR + 1.45%, Rate Floor: 0.00%) due 11/21/274,6 | | | 18,020,137 | | | | 15,898,212 | |
Halcyon Loan Advisors Funding Ltd. | | | | | | | | |
2017-3A, 2.72% (3 Month USD LIBOR + 0.90%, Rate Floor: 0.00%) due 10/18/274,6 | | | 43,813,025 | | | | 42,460,775 | |
Denali Capital CLO XI Ltd. | | | | | | | | |
2018-1A, 2.95% (3 Month USD LIBOR + 1.13%, Rate Floor: 0.00%) due 10/20/284,6 | | | 42,800,000 | | | | 40,176,531 | |
Fortress Credit Opportunities XI CLO Ltd. | | | | | | | | |
2018-11A, 3.13% (3 Month USD LIBOR + 1.30%, Rate Floor: 0.00%) due 04/15/314,6 | | | 44,300,000 | | | | 38,867,482 | |
Venture XII CLO Ltd. | | | | | | | | |
2018-12A, 2.41% (3 Month USD LIBOR + 0.80%, Rate Floor: 0.80%) due 02/28/264,6 | | | 30,801,841 | | | | 29,790,201 | |
2018-12A, 2.81% (3 Month USD LIBOR + 1.20%, Rate Floor: 1.20%) due 02/28/264,6 | | | 6,250,000 | | | | 5,446,041 | |
NXT Capital CLO LLC | | | | | | | | |
2017-1A, 3.52% (3 Month USD LIBOR + 1.70%, Rate Floor: 0.00%) due 04/20/294,6 | | | 33,000,000 | | | | 30,896,174 | |
Mountain View CLO Ltd. | | | | | | | | |
2018-1A, 2.63% (3 Month USD LIBOR + 0.80%, Rate Floor: 0.80%) due 10/15/264,6 | | | 30,963,704 | | | | 30,536,836 | |
LoanCore Issuer Ltd. | | | | | | | | |
2018-CRE1, 2.21% (1 Month USD LIBOR + 1.50%, Rate Floor: 1.50%) due 05/15/284,6 | | | 16,747,000 | | | | 14,903,226 | |
30 | THE GUGGENHEIM FUNDS SEMI-ANNUAL REPORT | SEE NOTES TO FINANCIAL STATEMENTS. |
SCHEDULE OF INVESTMENTS (Unaudited)(continued) | March 31, 2020 |
TOTAL RETURN BOND FUND | |
| | Face
Amount~ | | | Value | |
2019-CRE3, 1.76% (1 Month USD LIBOR + 1.05%, Rate Floor: 1.05%) due 04/15/344,6 | | | 15,057,000 | | | $ | 14,116,769 | |
Cerberus Loan Funding XVII Ltd. | | | | | | | | |
2016-3A, 4.36% (3 Month USD LIBOR + 2.53%, Rate Floor: 0.00%) due 01/15/284,6 | | | 31,500,000 | | | | 28,193,766 | |
Telos CLO Ltd. | | | | | | | | |
2017-6A, 3.59% (3 Month USD LIBOR + 1.75%, Rate Floor: 0.00%) due 01/17/274,6 | | | 32,000,000 | | | | 28,042,413 | |
Garrison BSL CLO Ltd. | | | | | | | | |
2018-1A, 2.79% (3 Month USD LIBOR + 0.95%, Rate Floor: 0.00%) due 07/17/284,6 | | | 27,300,000 | | | | 25,614,413 | |
FDF II Ltd. | | | | | | | | |
2016-2A, 4.29% due 05/12/316 | | | 20,500,000 | | | | 19,058,200 | |
2016-2A, 5.29% due 05/12/316 | | | 5,000,000 | | | | 4,932,628 | |
BSPRT Issuer Ltd. | | | | | | | | |
2018-FL3, 1.76% (1 Month USD LIBOR + 1.05%, Rate Floor: 1.05%) due 03/15/284,6 | | | 16,834,670 | | | | 15,820,622 | |
2018-FL4, 1.76% (1 Month USD LIBOR + 1.05%, Rate Floor: 1.05%) due 09/15/354,6 | | | 8,000,000 | | | | 7,487,118 | |
OCP CLO Ltd. | | | | | | | | |
2020-4A, 3.25% (3 Month USD LIBOR + 1.45%, Rate Floor: 1.45%) due 04/24/294,6 | | | 25,500,000 | | | | 21,699,605 | |
Crown Point CLO III Ltd. | | | | | | | | |
2017-3A, 2.74% (3 Month USD LIBOR + 0.91%, Rate Floor: 0.00%) due 12/31/274,6 | | | 13,272,338 | | | | 13,083,550 | |
2017-3A, 3.28% (3 Month USD LIBOR + 1.45%, Rate Floor: 0.00%) due 12/31/274,6 | | | 8,280,000 | | | | 7,259,131 | |
NewStar Fairfield Fund CLO Ltd. | | | | | | | | |
2018-2A, 3.09% (3 Month USD LIBOR + 1.27%, Rate Floor: 1.27%) due 04/20/304,6 | | | 21,400,000 | | | | 18,798,714 | |
GPMT Ltd. | | | | | | | | |
2019-FL2, 2.01% (1 Month USD LIBOR + 1.30%, Rate Floor: 1.30%) due 02/22/364,6 | | | 17,999,000 | | | | 16,962,425 | |
Diamond CLO Ltd. | | | | | | | | |
2018-1A, 3.30% (3 Month USD LIBOR + 1.50%, Rate Floor: 1.50%) due 07/22/304,6 | | | 18,000,000 | | | | 16,730,001 | |
Monroe Capital CLO Ltd. | | | | | | | | |
2017-1A, 3.50% (3 Month USD LIBOR + 1.70%, Rate Floor: 0.00%) due 10/22/264,6 | | | 10,100,000 | | | | 9,188,339 | |
SEE NOTES TO FINANCIAL STATEMENTS. | THE GUGGENHEIM FUNDS SEMI-ANNUAL REPORT | 31 |
SCHEDULE OF INVESTMENTS (Unaudited)(continued) | March 31, 2020 |
TOTAL RETURN BOND FUND | |
| | Face
Amount~ | | | Value | |
2017-1A, 3.15% (3 Month USD LIBOR + 1.35%, Rate Floor: 0.00%) due 10/22/264,6 | | | 7,635,034 | | | $ | 7,495,367 | |
FDF I Ltd. | | | | | | | | |
2015-1A, 4.40% due 11/12/306 | | | 15,000,000 | | | | 13,949,808 | |
Shackleton CLO Ltd. | | | | | | | | |
2017-8A, 3.13% (3 Month USD LIBOR + 1.30%, Rate Floor: 0.00%) due 10/20/274,6 | | | 5,510,000 | | | | 4,791,598 | |
2017-8A, 2.75% (3 Month USD LIBOR + 0.92%, Rate Floor: 0.00%) due 10/20/274,6 | | | 4,878,335 | | | | 4,707,563 | |
2018-6RA, 2.86% (3 Month USD LIBOR + 1.02%, Rate Floor: 1.02%) due 07/17/284,6 | | | 3,500,000 | | | | 3,368,695 | |
Seneca Park CLO Limited | | | | | | | | |
2017-1A, 3.34% (3 Month USD LIBOR + 1.50%, Rate Floor: 0.00%) due 07/17/264,6 | | | 12,900,000 | | | | 12,499,495 | |
KVK CLO Ltd. | | | | | | | | |
2017-1A, 2.74% (3 Month USD LIBOR + 0.90%, Rate Floor: 0.00%) due 01/14/284,6 | | | 8,600,000 | | | | 8,329,275 | |
2018-1A, 2.63% (3 Month USD LIBOR + 0.93%, Rate Floor: 0.00%) due 05/20/294,6 | | | 4,000,000 | | | | 3,875,267 | |
KREF Ltd. | | | | | | | | |
2018-FL1, 1.90% (1 Month USD LIBOR + 1.10%, Rate Floor: 1.10%) due 06/15/364,6 | | | 12,806,000 | | | | 12,005,740 | |
Golub Capital Partners CLO 17 Ltd. | | | | | | | | |
2017-17A, 3.44% (3 Month USD LIBOR + 1.65%, Rate Floor: 0.00%) due 10/25/304,6 | | | 12,600,000 | | | | 11,727,992 | |
Newstar Commercial Loan Funding LLC | | | | | | | | |
2017-1A, 3.62% (3 Month USD LIBOR + 2.50%, Rate Floor: 0.00%) due 03/20/274,6 | | | 12,750,000 | | | | 11,701,547 | |
Sudbury Mill CLO Ltd. | | | | | | | | |
2017-1A, 3.49% (3 Month USD LIBOR + 1.65%, Rate Floor: 0.00%) due 01/17/264,6 | | | 11,850,000 | | | | 11,341,723 | |
Marathon CLO VII Ltd. | | | | | | | | |
2017-7A, 3.45% (3 Month USD LIBOR + 1.65%, Rate Floor: 0.00%) due 10/28/254,6 | | | 12,600,000 | | | | 11,333,700 | |
Mountain Hawk II CLO Ltd. | | | | | | | | |
2018-2A, 3.42% (3 Month USD LIBOR + 1.60%, Rate Floor: 0.00%) due 07/20/244,6 | | | 11,343,139 | | | | 11,234,767 | |
Avery Point V CLO Ltd. | | | | | | | | |
2017-5A, 2.82% (3 Month USD LIBOR + 0.98%, Rate Floor: 0.00%) due 07/17/264,6 | | | 11,409,720 | | | | 11,140,133 | |
32 | THE GUGGENHEIM FUNDS SEMI-ANNUAL REPORT | SEE NOTES TO FINANCIAL STATEMENTS. |
SCHEDULE OF INVESTMENTS (Unaudited)(continued) | March 31, 2020 |
TOTAL RETURN BOND FUND | |
| | Face
Amount~ | | | Value | |
Flagship VII Ltd. | | | | | | | | |
2017-7A, 3.37% (3 Month USD LIBOR + 1.55%, Rate Floor: 0.00%) due 01/20/264,6 | | | 10,935,694 | | | $ | 10,857,588 | |
Fortress Credit Opportunities IX CLO Ltd. | | | | | | | | |
2017-9A, 3.24% (3 Month USD LIBOR + 1.55%, Rate Floor: 0.00%) due 11/15/294,6 | | | 11,527,000 | | | | 10,675,518 | |
Neuberger Berman CLO XVI-S Ltd. | | | | | | | | |
2018-16SA, 2.68% (3 Month USD LIBOR + 0.85%, Rate Floor: 0.00%) due 01/15/284,6 | | | 8,900,000 | | | | 8,699,664 | |
Treman Park CLO Ltd. | | | | | | | | |
2015-1A, due 10/20/286,11 | | | 13,600,000 | | | | 7,994,506 | |
TCP Waterman CLO Ltd. | | | | | | | | |
2016-1A, 2.79% (3 Month USD LIBOR + 2.05%, Rate Floor: 0.00%) due 12/15/284,6 | | | 7,150,000 | | | | 6,856,606 | |
Dryden 37 Senior Loan Fund | | | | | | | | |
2015-37A, due 01/15/316,11 | | | 10,000,000 | | | | 6,679,328 | |
ACIS CLO Ltd. | | | | | | | | |
2015-6A, 4.24% (3 Month USD LIBOR + 2.48%, Rate Floor: 0.00%) due 05/01/274,6 | | | 7,500,000 | | | | 6,578,556 | |
BDS | | | | | | | | |
2018-FL2, 1.75% (1 Month USD LIBOR + 0.95%, Rate Floor: 0.95%) due 08/15/354,6 | | | 6,751,023 | | | | 6,272,578 | |
TICP CLO I Ltd. | | | | | | | | |
2018-1A, 2.62% (3 Month USD LIBOR + 0.80%, Rate Floor: 0.00%) due 07/20/274,6 | | | 6,348,573 | | | | 6,222,355 | |
Golub Capital Partners CLO 16 Ltd. | | | | | | | | |
2017-16A, 3.64% (3 Month USD LIBOR + 1.85%, Rate Floor: 0.00%) due 07/25/294,6 | | | 6,700,000 | | | | 6,069,663 | |
Ready Capital Mortgage Financing LLC | | | | | | | | |
2019-FL3, 1.95% (1 Month USD LIBOR + 1.00%, Rate Floor: 1.00%) due 03/25/344,6 | | | 5,985,000 | | | | 5,641,657 | |
California Street CLO XII Ltd. | | | | | | | | |
2017-12A, 3.33% (3 Month USD LIBOR + 1.50%, Rate Floor: 0.00%) due 10/15/254,6 | | | 5,750,000 | | | | 5,475,339 | |
GoldenTree Loan Opportunities IX Ltd. | | | | | | | | |
2018-9A, 2.89% (3 Month USD LIBOR + 1.11%, Rate Floor: 1.11%) due 10/29/294,6 | | | 5,152,000 | | | | 4,888,593 | |
SEE NOTES TO FINANCIAL STATEMENTS. | THE GUGGENHEIM FUNDS SEMI-ANNUAL REPORT | 33 |
SCHEDULE OF INVESTMENTS (Unaudited)(continued) | March 31, 2020 |
TOTAL RETURN BOND FUND | |
| | Face
Amount~ | | | Value | |
TICP CLO III-2 Ltd. | | | | | | | | |
2018-3R, 2.66% (3 Month USD LIBOR + 0.84%, Rate Floor: 0.84%) due 04/20/284,6 | | | 5,000,000 | | | $ | 4,881,472 | |
Avery Point II CLO Ltd. | | | | | | | | |
2013-3X COM, due 01/18/2511 | | | 7,500,060 | | | | 4,641,867 | |
West CLO Ltd. | | | | | | | | |
2017-1A, 2.74% (3 Month USD LIBOR + 0.92%, Rate Floor: 0.00%) due 07/18/264,6 | | | 4,439,398 | | | | 4,409,371 | |
Oaktree CLO Ltd. | | | | | | | | |
2017-1A, 2.69% (3 Month USD LIBOR + 0.87%) due 10/20/274,6 | | | 4,500,000 | | | | 4,372,944 | |
Atlas Senior Loan Fund III Ltd. | | | | | | | | |
2017-1A, 2.99% (3 Month USD LIBOR + 1.30%, Rate Floor: 0.00%) due 11/17/274,6 | | | 4,300,000 | | | | 3,763,799 | |
OHA Credit Partners IX Ltd. | | | | | | | | |
2013-9A, due 10/20/256,11 | | | 5,954,123 | | | | 3,669,460 | |
Carlyle Global Market Strategies CLO Ltd. | | | | | | | | |
2012-3A, due 01/14/326,11 | | | 8,920,000 | | | | 3,050,792 | |
Golub Capital Partners CLO 39B Ltd. | | | | | | | | |
2018-39A, 3.22% (3 Month USD LIBOR + 1.40%, Rate Floor: 1.40%) due 10/20/284,6 | | | 3,100,000 | | | | 2,917,747 | |
MONROE CAPITAL BSL CLO Ltd. | | | | | | | | |
2017-1A, 3.43% (3 Month USD LIBOR + 1.75%, Rate Floor: 0.00%) due 05/22/274,6 | | | 3,000,000 | | | | 2,625,428 | |
Newfleet CLO Ltd. | | | | | | | | |
2018-1A, 2.77% (3 Month USD LIBOR + 0.95%, Rate Floor: 0.00%) due 04/20/284,6 | | | 2,750,000 | | | | 2,585,474 | |
Wellfleet CLO Ltd. | | | | | | | | |
2018-2A, 3.40% (3 Month USD LIBOR + 1.58%, Rate Floor: 1.58%) due 10/20/284,6 | | | 2,500,000 | | | | 2,222,612 | |
Ocean Trails CLO IV | | | | | | | | |
2017-4A, 3.51% (3 Month USD LIBOR + 1.80%, Rate Floor: 0.00%) due 08/13/254,6 | | | 2,500,000 | | | | 2,097,773 | |
Catamaran CLO Ltd. | | | | | | | | |
2016-2A, 3.87% (3 Month USD LIBOR + 2.05%, Rate Floor: 2.05%) due 10/18/264,6 | | | 1,750,000 | | | | 1,539,548 | |
Ivy Hill Middle Market Credit Fund IX Ltd. | | | | | | | | |
2017-9A, 3.57% (3 Month USD LIBOR + 1.75%, Rate Floor: 0.00%) due 01/18/304,6 | | | 1,000,000 | | | | 774,751 | |
2017-9A, 4.17% (3 Month USD LIBOR + 2.35%, Rate Floor: 0.00%) due 01/18/304,6 | | | 1,000,000 | | | | 725,444 | |
34 | THE GUGGENHEIM FUNDS SEMI-ANNUAL REPORT | SEE NOTES TO FINANCIAL STATEMENTS. |
SCHEDULE OF INVESTMENTS (Unaudited)(continued) | March 31, 2020 |
TOTAL RETURN BOND FUND | |
| | Face
Amount~ | | | Value | |
Golub Capital BDC CLO 2014 LLC | | | | | | | | |
2018-1A, 2.74% (3 Month USD LIBOR + 0.95%, Rate Floor: 0.00%) due 04/25/264,6 | | | 1,438,439 | | | $ | 1,417,701 | |
Voya CLO Ltd. | | | | | | | | |
2013-1A, due 10/15/306,11 | | | 10,575,071 | | | | 682,156 | |
Dryden XXV Senior Loan Fund | | | | | | | | |
2017-25A, 3.18% (3 Month USD LIBOR + 1.35%, Rate Floor: 0.00%) due 10/15/274,6 | | | 766,703 | | | | 666,673 | |
Venture XIII CLO Ltd. | | | | | | | | |
2013-13A, due 09/10/296,11 | | | 3,700,000 | | | | 571,113 | |
Atlas Senior Loan Fund IX Ltd. | | | | | | | | |
2018-9A, due 04/20/286,11 | | | 1,200,000 | | | | 253,432 | |
Great Lakes CLO Ltd. | | | | | | | | |
2014-1A, due 10/15/296,11 | | | 461,538 | | | | 181,743 | |
Copper River CLO Ltd. | | | | | | | | |
2007-1A, due 01/20/218,11 | | | 1,500,000 | | | | 153,409 | |
Babson CLO Ltd. | | | | | | | | |
2014-IA, due 07/20/256,11 | | | 1,300,000 | | | | 44,980 | |
Total Collateralized Loan Obligations | | | 1,398,835,154 | |
| | | | | | | | | |
Financial - 2.9% |
Station Place Securitization Trust | | | | | | | | |
2019-6, 1.53% (1 Month USD LIBOR + 0.60%, Rate Floor: 0.60%) due 07/24/21†††,4,6 | | | 74,050,000 | | | | 74,050,000 | |
2019-5, 1.63% (1 Month USD LIBOR + 0.70%, Rate Floor: 0.70%) due 06/24/20†††,1,4,6 | | | 40,300,000 | | | | 40,300,000 | |
2019-9, 1.63% (1 Month USD LIBOR + 0.70%, Rate Floor: 0.00%) due 10/24/20†††,1,4,6 | | | 28,450,000 | | | | 28,450,000 | |
2019-2, 1.48% (1 Month USD LIBOR + 0.55%, Rate Floor: 0.55%) due 04/24/21†††,1,4,6 | | | 20,250,000 | | | | 20,250,000 | |
2019-WL1, 1.60% (1 Month USD LIBOR + 0.65%, Rate Floor: 0.65%) due 08/25/52†††,1,4,6 | | | 10,166,667 | | | | 10,166,667 | |
Barclays Bank plc | | | | | | | | |
GMTN, 1.67% (1 Month USD LIBOR + 0.68%) due 07/31/20†††,1,4,6 | | | 108,050,000 | | | | 108,050,000 | |
Aesf Vi Verdi LP | | | | | | | | |
2.15% due 11/25/24††† | | EUR | 49,186,383 | | | | 52,081,613 | |
3.85% due 11/25/24††† | | | 15,311,851 | | | | 14,762,156 | |
Oxford Finance Funding | | | | | | | | |
2020-1A, 3.10% due 02/15/286 | | | 23,250,000 | | | | 22,313,722 | |
SEE NOTES TO FINANCIAL STATEMENTS. | THE GUGGENHEIM FUNDS SEMI-ANNUAL REPORT | 35 |
SCHEDULE OF INVESTMENTS (Unaudited)(continued) | March 31, 2020 |
TOTAL RETURN BOND FUND | |
| | Face
Amount~ | | | Value | |
Madison Avenue Secured Funding Trust | | | | | | | | |
2019-1, 2.23% (1 Month USD LIBOR + 1.50%, Rate Floor: 1.50%) due 11/11/20†††,1,4,6 | | | 21,350,000 | | | $ | 21,350,000 | |
Nassau LLC | | | | | | | | |
2019-1, 3.98% due 08/15/346 | | | 19,867,785 | | | | 18,667,628 | |
Industrial DPR Funding Ltd. | | | | | | | | |
2016-1A, 5.24% due 04/15/266 | | | 3,637,700 | | | | 3,820,218 | |
Total Financial | | | 414,262,004 | |
| | | | | | | | | |
Transport-Aircraft - 1.7% |
AASET US Ltd. | | | | | | | | |
2018-2A, 4.45% due 11/18/386 | | | 46,738,642 | | | | 37,111,898 | |
2018-2A, 5.43% due 11/18/386 | | | 8,768,976 | | | | 6,494,522 | |
Castlelake Aircraft Securitization Trust | | | | | | | | |
2018-1, 4.13% due 06/15/436 | | | 29,922,670 | | | | 21,745,361 | |
2017-1, 3.97% due 07/15/42 | | | 13,975,547 | | | | 10,325,986 | |
Sapphire Aviation Finance I Ltd. | | | | | | | | |
2018-1A, 4.25% due 03/15/406 | | | 38,013,671 | | | | 28,646,357 | |
KDAC Aviation Finance Ltd. | | | | | | | | |
2017-1A, 4.21% due 12/15/426 | | | 34,822,416 | | | | 26,675,078 | |
AASET Trust | | | | | | | | |
2020-1A, 3.35% due 01/16/406 | | | 28,160,802 | | | | 20,184,424 | |
2017-1A, 3.97% due 05/16/426 | | | 7,512,555 | | | | 5,902,508 | |
SAPPHIRE AVIATION FINANCE II Ltd. | | | | | | | | |
2020-1A, 3.23% due 03/15/406 | | | 37,250,000 | | | | 24,093,315 | |
MAPS Ltd. | | | | | | | | |
2018-1A, 4.21% due 05/15/436 | | | 26,473,230 | | | | 19,900,697 | |
AIM Aviation Finance Ltd. | | | | | | | | |
2015-1A, 4.21% due 02/15/406 | | | 15,179,296 | | | | 13,150,009 | |
2015-1A, 5.07% due 02/15/406 | | | 1,261,120 | | | | 1,028,213 | |
Raspro Trust | | | | | | | | |
2005-1A, 2.89% (3 Month USD LIBOR + 0.93%, Rate Floor: 0.93%) due 03/23/244,6 | | | 13,015,155 | | | | 12,214,333 | |
Falcon Aerospace Ltd. | | | | | | | | |
2017-1, 4.58% due 02/15/426 | | | 7,897,757 | | | | 6,268,316 | |
WAVE LLC | | | | | | | | |
2019-1, 3.60% due 09/15/446 | | | 8,437,625 | | | | 5,530,457 | |
Stripes Aircraft Ltd. | | | | | | | | |
2013-1 A1, 4.27% due 03/20/23††† | | | 908,983 | | | | 898,191 | |
Turbine Engines Securitization Ltd. | | | | | | | | |
2013-1A, 5.13% due 12/13/488 | | | 704,848 | | | | 620,267 | |
ECAF I Ltd. | | | | | | | | |
2015-1A, 3.47% due 06/15/406 | | | 515,068 | | | | 453,999 | |
Airplanes Pass Through Trust | | | | | | | | |
2001-1A, due 03/15/19†††,8,16 | | | 409,604 | | | | 4,096 | |
Total Transport-Aircraft | | | 241,248,027 | |
| | | | | | | | | |
Net Lease - 0.8% |
Capital Automotive LLC | | | | | | | | |
2017-1A, 3.87% due 04/15/476 | | | 51,277,447 | | | | 44,936,365 | |
36 | THE GUGGENHEIM FUNDS SEMI-ANNUAL REPORT | SEE NOTES TO FINANCIAL STATEMENTS. |
SCHEDULE OF INVESTMENTS (Unaudited)(continued) | March 31, 2020 |
TOTAL RETURN BOND FUND | |
| | Face
Amount~ | | | Value | |
Capital Automotive REIT | | | | | | | | |
2020-1A, 3.81% due 02/15/506 | | | 13,350,000 | | | $ | 11,995,376 | |
2014-1A, 3.66% due 10/15/446 | | | 11,343,223 | | | | 10,234,026 | |
2020-1A, 3.48% due 02/15/506 | | | 7,750,000 | | | | 7,267,748 | |
Store Master Funding I-VII | | | | | | | | |
2016-1A, 3.96% due 10/20/466 | | | 29,228,533 | | | | 21,070,534 | |
2016-1A, 4.32% due 10/20/466 | | | 11,832,576 | | | | 8,360,799 | |
STORE Master Funding I LLC | | | | | | | | |
2015-1A, 4.17% due 04/20/456 | | | 7,753,587 | | | | 5,661,946 | |
2015-1A, 3.75% due 04/20/456 | | | 1,463,125 | | | | 1,294,762 | |
STORE Master Funding LLC | | | | | | | | |
2014-1A, 5.00% due 04/20/446 | | | 4,368,750 | | | | 3,542,172 | |
Total Net Lease | | | 114,363,728 | |
| | | | | | | | | |
Transport-Container - 0.7% |
Textainer Marine Containers Ltd. | | | | | | | | |
2017-2A, 3.52% due 06/20/426 | | | 38,722,583 | | | | 34,431,915 | |
CLI Funding LLC | | | | | | | | |
2018-1A, 4.03% due 04/18/436 | | | 23,614,489 | | | | 22,430,648 | |
CAL Funding III Ltd. | | | | | | | | |
2018-1A, 3.96% due 02/25/436 | | | 18,247,917 | | | | 18,084,492 | |
Global SC Finance II SRL | | | | | | | | |
2014-1A, 3.19% due 07/17/296 | | | 12,904,667 | | | | 12,123,408 | |
Textainer Marine Containers V Ltd. | | | | | | | | |
2017-1A, 3.72% due 05/20/426 | | | 12,806,861 | | | | 11,523,479 | |
Cronos Containers Program Ltd. | | | | | | | | |
2013-1A, 3.08% due 04/18/286 | | | 4,887,083 | | | | 4,763,702 | |
Total Transport-Container | | | 103,357,644 | |
| | | | | | | | | |
Collateralized Debt Obligations - 0.4% |
Anchorage Credit Funding Ltd. | | | | | | | | |
2016-4A, 3.50% due 02/15/356 | | | 55,600,000 | | | | 51,669,675 | |
2016-3A, 3.85% due 10/28/336 | | | 7,500,000 | | | | 6,970,284 | |
Putnam Structured Product Funding Ltd. | | | | | | | | |
2003-1A, 2.68% (1 Month USD LIBOR + 1.00%, Rate Floor: 0.00%) due 10/15/384,6 | | | 5,549,933 | | | | 5,485,503 | |
Total Collateralized Debt Obligations | | | 64,125,462 | |
| | | | | | | | | |
Whole Business - 0.2% |
Domino’s Pizza Master Issuer LLC | | | | | | | | |
2017-1A, 3.04% (3 Month USD LIBOR + 1.25%, Rate Floor: 0.00%) due 07/25/474,6 | | | 16,813,000 | | | | 15,734,782 | |
Wendy’s Funding LLC | | | | | | | | |
2015-1A, 4.50% due 06/15/456 | | | 6,732,750 | | | | 6,428,766 | |
Planet Fitness Master Issuer LLC | | | | | | | | |
2018-1A, 4.26% due 09/05/486 | | | 2,955,000 | | | | 2,784,881 | |
Applebee’s Funding LLC / IHOP Funding LLC | | | | | | | | |
2019-1A, 4.72% due 06/07/496 | | | 2,750,000 | | | | 2,375,092 | |
Drug Royalty III Limited Partnership 1 | | | | | | | | |
2017-1A, 3.60% due 04/15/276 | | | 957,230 | | | | 953,315 | |
SEE NOTES TO FINANCIAL STATEMENTS. | THE GUGGENHEIM FUNDS SEMI-ANNUAL REPORT | 37 |
SCHEDULE OF INVESTMENTS (Unaudited)(continued) | March 31, 2020 |
TOTAL RETURN BOND FUND | |
| | Face
Amount~ | | | Value | |
Drug Royalty III Limited Partnership | | | | | | | | |
2016-1A, 3.98% due 04/15/276 | | | 284,511 | | | $ | 284,243 | |
Total Whole Business | | | 28,561,079 | |
| | | | | | | | | |
Infrastructure - 0.2% |
Secured Tenant Site Contract Revenue Notes Series | | | | | | | | |
2018-1A, 3.97% due 06/15/486 | | | 22,265,512 | | | | 18,477,837 | |
Vantage Data Centers Issuer LLC | | | | | | | | |
2018-1A, 4.07% due 02/16/436 | | | 10,232,292 | | | | 10,003,518 | |
Total Infrastructure | | | 28,481,355 | |
| | | | | | | | | |
Diversified Payment Rights - 0.2% |
Bib Merchant Voucher Receivables Ltd. | | | | | | | | |
4.18% due 04/07/28††† | | | 21,400,000 | | | | 22,128,812 | |
CCR Incorporated MT100 Payment Rights Master Trust | | | | | | | | |
2012-CA, 4.75% due 07/10/226 | | | 316,667 | | | | 323,399 | |
Total Diversified Payment Rights | | | 22,452,211 | |
| | | | | | | | | |
Insurance - 0.0% |
Chesterfield Financial Holdings LLC | | | | | | | | |
2014-1A, 4.50% due 12/15/34†††,6 | | | 3,212,500 | | | | 3,349,603 | |
| | | | | | | | | |
Transport-Rail - 0.0% |
TRIP Rail Master Funding LLC | | | | | | | | |
2017-1A, 2.71% due 08/15/476 | | | 1,548,295 | | | | 1,531,244 | |
Total Asset-Backed Securities |
(Cost $2,662,687,186) | | | 2,420,567,511 | |
| | | | | | | | | |
CORPORATE BONDS†† - 7.1% |
Financial - 2.8% |
AXIS Specialty Finance LLC | | | | | | | | |
5.88% due 06/01/20 | | | 32,000,000 | | | | 32,226,278 | |
Standard Chartered plc | | | | | | | | |
4.64% due 04/01/316,12 | | | 28,100,000 | | | | 28,814,864 | |
2.10% (3 Month USD LIBOR + 1.20%) due 09/10/224,6 | | | 1,900,000 | | | | 1,823,449 | |
JPMorgan Chase & Co. | | | | | | | | |
4.49% due 03/24/3112 | | | 25,200,000 | | | | 29,131,155 | |
Lloyds Bank Corporate Markets plc NY | | | | | | | | |
2.11% (3 Month USD LIBOR + 0.37%) due 08/05/204 | | | 29,100,000 | | | | 29,077,191 | |
Standard Chartered Bank | | | | | | | | |
2.15% (3 Month USD LIBOR + 0.40%) due 08/04/204 | | | 28,810,000 | | | | 28,790,196 | |
UBS AG | | | | | | | | |
1.58% (3 Month USD LIBOR + 0.58%, Rate Floor: 0.00%) due 06/08/204,6 | | | 22,000,000 | | | | 21,929,484 | |
2.06% (3 Month USD LIBOR + 0.48%) due 12/01/204,6 | | | 6,000,000 | | | | 5,942,011 | |
Credit Suisse Group AG | | | | | | | | |
4.19% due 04/01/316,12 | | | 23,500,000 | | | | 24,064,276 | |
Aflac, Inc. | | | | | | | | |
3.60% due 04/01/30 | | | 23,500,000 | | | | 23,801,647 | |
Discover Bank | | | | | | | | |
3.10% due 06/04/20 | | | 23,200,000 | | | | 23,165,200 | |
Goldman Sachs Group, Inc. | | | | | | | | |
3.50% due 04/01/25 | | | 22,500,000 | | | | 23,000,070 | |
American Express Co. | | | | | | | | |
2.20% due 10/30/20 | | | 20,449,000 | | | | 20,392,352 | |
38 | THE GUGGENHEIM FUNDS SEMI-ANNUAL REPORT | SEE NOTES TO FINANCIAL STATEMENTS. |
SCHEDULE OF INVESTMENTS (Unaudited)(continued) | March 31, 2020 |
TOTAL RETURN BOND FUND | |
| | Face
Amount~ | | | Value | |
Alexandria Real Estate Equities, Inc. | | | | | | | | |
4.90% due 12/15/30 | | | 17,050,000 | | | $ | 18,501,703 | |
HSBC Holdings plc | | | | | | | | |
4.95% due 03/31/30 | | | 11,750,000 | | | | 12,830,981 | |
Ameriprise Financial, Inc. | | | | | | | | |
3.00% due 04/02/25 | | | 10,740,000 | | | | 10,694,570 | |
Swedbank AB | | | | | | | | |
2.65% due 03/10/216 | | | 8,100,000 | | | | 8,094,200 | |
American Equity Investment Life Holding Co. | | | | | | | | |
5.00% due 06/15/27 | | | 7,964,000 | | | | 7,657,428 | |
American Tower Corp. | | | | | | | | |
2.80% due 06/01/20 | | | 6,920,000 | | | | 6,865,630 | |
Assurant, Inc. | | | | | | | | |
2.48% (3 Month USD LIBOR + 1.25%) due 03/26/214 | | | 4,608,000 | | | | 4,608,000 | |
6.75% due 02/15/34 | | | 1,450,000 | | | | 1,927,347 | |
RBC USA Holdco Corp. | | | | | | | | |
5.25% due 09/15/20 | | | 6,429,000 | | | | 6,433,785 | |
Marsh & McLennan Cos., Inc. | | | | | | | | |
4.80% due 07/15/21 | | | 5,870,000 | | | | 6,024,208 | |
Crown Castle International Corp. | | | | | | | | |
3.30% due 07/01/30 | | | 6,050,000 | | | | 6,000,329 | |
Atlas Mara Ltd. | | | | | | | | |
8.00% due 12/31/208 | | | 6,600,000 | | | | 5,346,000 | |
Pershing Square Holdings Ltd. | | | | | | | | |
5.50% due 07/15/226 | | | 5,500,000 | | | | 5,280,000 | |
Fort Knox Military Housing Privatization Project | | | | | | | | |
5.82% due 02/15/526 | | | 1,911,745 | | | | 2,388,896 | |
1.05% (1 Month USD LIBOR + 0.34%) due 02/15/524,8 | | | 1,714,609 | | | | 1,027,198 | |
Transatlantic Holdings, Inc. | | | | | | | | |
8.00% due 11/30/39 | | | 1,135,000 | | | | 1,679,420 | |
Mastercard, Inc. | | | | | | | | |
3.30% due 03/26/27 | | | 1,510,000 | | | | 1,645,178 | |
Charles Schwab Corp. | | | | | | | | |
4.20% due 03/24/25 | | | 1,510,000 | | | | 1,593,233 | |
Berkshire Hathaway Finance Corp. | | | | | | | | |
1.85% due 03/12/30 | | | 1,580,000 | | | | 1,533,856 | |
Brookfield Finance, Inc. | | | | | | | | |
4.85% due 03/29/29 | | | 1,410,000 | | | | 1,495,905 | |
Lexington Realty Trust | | | | | | | | |
4.25% due 06/15/23 | | | 1,300,000 | | | | 1,307,640 | |
Univest Financial Corp. | | | | | | | | |
4.92% (3 Month USD LIBOR + 3.54%) due 03/30/254 | | | 1,000,000 | | | | 1,004,338 | |
Atlantic Marine Corporations Communities LLC | | | | | | | | |
5.37% due 12/01/506 | | | 780,736 | | | | 892,977 | |
Janus Capital Group, Inc. | | | | | | | | |
4.88% due 08/01/25 | | | 780,000 | | | | 791,920 | |
Pacific Beacon LLC | | | | | | | | |
5.51% due 07/15/366 | | | 500,000 | | | | 654,843 | |
Capital One Financial Corp. | | | | | | | | |
2.47% (3 Month USD LIBOR + 0.76%) due 05/12/204 | | | 400,000 | | | | 399,484 | |
Total Financial | | | 408,837,242 | |
| | | | | | | | | |
Consumer, Non-cyclical - 2.2% |
Sysco Corp. | | | | | | | | |
5.95% due 04/01/30 | | | 107,560,000 | | | | 112,920,795 | |
Mondelez International, Inc. | | | | | | | | |
3.00% due 05/07/20 | | | 32,300,000 | | | | 31,977,000 | |
Zimmer Biomet Holdings, Inc. | | | | | | | | |
2.70% due 04/01/20 | | | 30,310,000 | | | | 30,310,000 | |
Constellation Brands, Inc. | | | | | | | | |
2.25% due 11/06/20 | | | 28,230,000 | | | | 28,071,516 | |
Kraft Heinz Foods Co. | | | | | | | | |
4.38% due 06/01/46 | | | 12,680,000 | | | | 11,422,366 | |
SEE NOTES TO FINANCIAL STATEMENTS. | THE GUGGENHEIM FUNDS SEMI-ANNUAL REPORT | 39 |
SCHEDULE OF INVESTMENTS (Unaudited)(continued) | March 31, 2020 |
TOTAL RETURN BOND FUND | |
| | Face
Amount~ | | | Value | |
4.88% due 10/01/496 | | | 7,650,000 | | | $ | 6,955,872 | |
5.00% due 06/04/42 | | | 6,300,000 | | | | 5,964,752 | |
5.20% due 07/15/45 | | | 1,630,000 | | | | 1,567,070 | |
BAT Capital Corp. | | | | | | | | |
4.70% due 04/02/27 | | | 22,390,000 | | | | 22,751,971 | |
3.22% due 09/06/26 | | | 1,800,000 | | | | 1,711,589 | |
Thermo Fisher Scientific, Inc. | | | | | | | | |
4.50% due 03/25/30 | | | 15,750,000 | | | | 17,705,163 | |
General Mills, Inc. | | | | | | | | |
2.38% (3 Month USD LIBOR + 0.54%) due 04/16/214 | | | 12,963,000 | | | | 12,620,249 | |
Coca-Cola European Partners plc | | | | | | | | |
3.50% due 09/15/20 | | | 9,200,000 | | | | 9,287,186 | |
Quest Diagnostics, Inc. | | | | | | | | |
4.70% due 04/01/21 | | | 5,000,000 | | | | 5,057,550 | |
ERAC USA Finance LLC | | | | | | | | |
5.25% due 10/01/206 | | | 4,260,000 | | | | 4,328,005 | |
Reynolds American, Inc. | | | | | | | | |
6.88% due 05/01/20 | | | 2,890,000 | | | | 2,897,551 | |
McKesson Corp. | | | | | | | | |
4.88% due 03/15/44 | | | 1,650,000 | | | | 1,853,237 | |
Humana, Inc. | | | | | | | | |
2.50% due 12/15/20 | | | 1,785,000 | | | | 1,777,003 | |
Baxter International, Inc. | | | | | | | | |
3.75% due 10/01/256 | | | 1,510,000 | | | | 1,600,388 | |
Archer-Daniels-Midland Co. | | | | | | | | |
2.75% due 03/27/25 | | | 1,510,000 | | | | 1,541,081 | |
Philip Morris International, Inc. | | | | | | | | |
6.38% due 05/16/38 | | | 1,110,000 | | | | 1,408,713 | |
Cardinal Health, Inc. | | | | | | | | |
4.50% due 11/15/44 | | | 1,450,000 | | | | 1,401,935 | |
Conagra Brands, Inc. | | | | | | | | |
2.38% (3 Month USD LIBOR + 0.50%) due 10/09/204 | | | 1,350,000 | | | | 1,331,203 | |
Coca-Cola Co. | | | | | | | | |
2.95% due 03/25/25 | | | 1,140,000 | | | | 1,221,342 | |
Global Payments, Inc. | | | | | | | | |
3.80% due 04/01/21 | | | 700,000 | | | | 704,385 | |
Total Consumer, Non-cyclical | | | 318,387,922 | |
| | | | | | | | | |
Industrial - 0.5% |
Rolls-Royce plc | | | | | | | | |
2.38% due 10/14/206 | | | 20,350,000 | | | | 19,177,156 | |
Aviation Capital Group LLC | | | | | | | | |
2.88% due 01/20/226 | | | 10,691,000 | | | | 9,664,508 | |
7.13% due 10/15/206 | | | 7,940,000 | | | | 7,851,421 | |
Penske Truck Leasing Company LP / PTL Finance Corp. | | | | | | | | |
3.65% due 07/29/216 | | | 11,590,000 | | | | 11,733,894 | |
Fox Corp. | | | | | | | | |
3.05% due 04/07/25 | | | 7,100,000 | | | | 7,088,924 | |
Ryder System, Inc. | | | | | | | | |
2.50% due 05/11/20 | | | 6,967,000 | | | | 6,965,167 | |
Ingersoll-Rand Luxembourg Finance S.A. | | | | | | | | |
2.63% due 05/01/20 | | | 4,247,000 | | | | 4,247,552 | |
Oshkosh Corp. | | | | | | | | |
3.10% due 03/01/30 | | | 3,800,000 | | | | 3,678,575 | |
Princess Juliana International Airport Operating Company N.V. | | | | | | | | |
5.50% due 12/20/27†††,1,8 | | | 2,005,616 | | | | 1,791,617 | |
CRH America, Inc. | | | | | | | | |
3.88% due 05/18/256 | | | 1,410,000 | | | | 1,420,809 | |
Tyco Electronics Group S.A. | | | | | | | | |
4.88% due 01/15/21 | | | 1,000,000 | | | | 1,019,147 | |
Vulcan Materials Co. | | | | | | | | |
1.34% (3 Month USD LIBOR + 0.60%) due 06/15/204 | | | 895,000 | | | | 887,940 | |
Total Industrial | | | 75,526,710 | |
| | | | | | | | | |
Energy - 0.5% |
Exxon Mobil Corp. | | | | | | | | |
3.48% due 03/19/30 | | | 37,450,000 | | | | 41,361,082 | |
40 | THE GUGGENHEIM FUNDS SEMI-ANNUAL REPORT | SEE NOTES TO FINANCIAL STATEMENTS. |
SCHEDULE OF INVESTMENTS (Unaudited)(continued) | March 31, 2020 |
TOTAL RETURN BOND FUND | |
| | Face
Amount~ | | | Value | |
2.99% due 03/19/25 | | | 1,580,000 | | | $ | 1,673,431 | |
Sabine Pass Liquefaction LLC | | | | | | | | |
5.63% due 02/01/21 | | | 18,152,000 | | | | 17,608,122 | |
Marathon Petroleum Corp. | | | | | | | | |
3.40% due 12/15/20 | | | 4,800,000 | | | | 4,755,218 | |
5.13% due 03/01/21 | | | 2,200,000 | | | | 2,133,026 | |
TransCanada PipeLines Ltd. | | | | | | | | |
6.10% due 06/01/40 | | | 1,200,000 | | | | 1,282,155 | |
Apache Corp. | | | | | | | | |
5.10% due 09/01/40 | | | 1,450,000 | | | | 640,491 | |
Total Energy | | | 69,453,525 | |
| | | | | | | | | |
Communications - 0.4% |
ViacomCBS, Inc. | | | | | | | | |
4.75% due 05/15/25 | | | 35,680,000 | | | | 35,846,589 | |
Verizon Communications, Inc. | | | | | | | | |
3.15% due 03/22/30 | | | 16,240,000 | | | | 17,492,972 | |
Altice France S.A. | | | | | | | | |
7.38% due 05/01/266 | | | 3,050,000 | | | | 3,027,582 | |
Telefonica Emisiones S.A. | | | | | | | | |
5.13% due 04/27/20 | | | 2,710,000 | | | | 2,710,191 | |
Alibaba Group Holding Ltd. | | | | | | | | |
4.50% due 11/28/34 | | | 1,330,000 | | | | 1,585,362 | |
AT&T, Inc. | | | | | | | | |
6.35% due 03/15/40 | | | 1,170,000 | | | | 1,480,449 | |
Thomson Reuters Corp. | | | | | | | | |
5.65% due 11/23/43 | | | 1,290,000 | | | | 1,446,557 | |
Motorola Solutions, Inc. | | | | | | | | |
5.50% due 09/01/44 | | | 360,000 | | | | 362,921 | |
Total Communications | | | 63,952,623 | |
| | | | | | | | | |
Utilities - 0.4% |
NextEra Energy Capital Holdings, Inc. | | | | | | | | |
1.83% (3 Month USD LIBOR + 0.45%) due 09/28/204 | | | 30,310,000 | | | | 30,335,713 | |
Southern Power Co. | | | | | | | | |
2.38% due 06/01/20 | | | 13,295,000 | | | | 13,293,648 | |
5.25% due 07/15/43 | | | 1,350,000 | | | | 1,334,850 | |
Virginia Electric & Power Co. | | | | | | | | |
8.88% due 11/15/38 | | | 1,100,000 | | | | 1,734,865 | |
PSEG Power LLC | | | | | | | | |
5.13% due 04/15/20 | | | 1,081,000 | | | | 1,081,421 | |
Pennsylvania Electric Co. | | | | | | | | |
5.20% due 04/01/20 | | | 1,000,000 | | | | 1,000,000 | |
Indiana Michigan Power Co. | | | | | | | | |
6.05% due 03/15/37 | | | 720,000 | | | | 840,066 | |
Total Utilities | | | 49,620,563 | |
| | | | | | | | | |
Consumer, Cyclical - 0.2% |
Marriott International, Inc. | | | | | | | | |
2.18% (3 Month USD LIBOR + 0.60%) due 12/01/204 | | | 30,350,000 | | | | 28,401,242 | |
HP Communities LLC | | | | | | | | |
5.86% due 09/15/536 | | | 1,420,000 | | | | 2,060,503 | |
Aramark Services, Inc. | | | | | | | | |
5.00% due 02/01/286 | | | 1,295,000 | | | | 1,205,153 | |
Yum! Brands, Inc. | | | | | | | | |
7.75% due 04/01/256 | | | 100,000 | | | | 105,000 | |
Total Consumer, Cyclical | | | 31,771,898 | |
| | | | | | | | | |
Technology - 0.1% |
Fiserv, Inc. | | | | | | | | |
2.70% due 06/01/20 | | | 7,430,000 | | | | 7,406,869 | |
QUALCOMM, Inc. | | | | | | | | |
2.25% due 05/20/20 | | | 2,600,000 | | | | 2,599,662 | |
Intel Corp. | | | | | | | | |
3.40% due 03/25/25 | | | 1,510,000 | | | | 1,647,404 | |
Citrix Systems, Inc. | | | | | | | | |
3.30% due 03/01/30 | | | 1,500,000 | | | | 1,393,791 | |
Total Technology | | | 13,047,726 | |
| | | | | | | | | |
SEE NOTES TO FINANCIAL STATEMENTS. | THE GUGGENHEIM FUNDS SEMI-ANNUAL REPORT | 41 |
SCHEDULE OF INVESTMENTS (Unaudited)(continued) | March 31, 2020 |
TOTAL RETURN BOND FUND | |
| | Face
Amount~ | | | Value | |
Basic Materials - 0.0% |
Southern Copper Corp. | | | | | | | | |
7.50% due 07/27/35 | | | 1,150,000 | | | $ | 1,355,619 | |
Total Corporate Bonds |
(Cost $1,021,123,403) | | | 1,031,953,828 | |
| | | | | | | | | |
FEDERAL AGENCY BONDS†† - 4.2% |
Residual Funding Corporation Principal Strips |
due 01/15/309,10 | | | 114,494,000 | | | | 98,781,706 | |
due 04/15/309,10 | | | 105,860,000 | | | | 90,786,972 | |
Freddie Mac Principal Strips |
due 07/15/329,10,13 | | | 123,250,000 | | | | 100,039,972 | |
Fannie Mae Principal Strips |
due 07/15/379,10 | | | 86,350,000 | | | | 60,673,110 | |
due 11/15/309,10 | | | 37,570,000 | | | | 31,702,424 | |
due 08/06/389,10 | | | 2,250,000 | | | | 1,535,512 | |
Tennessee Valley Authority |
4.25% due 09/15/65 | | | 32,550,000 | | | | 46,812,044 | |
5.38% due 04/01/56 | | | 8,360,000 | | | | 14,989,582 | |
due 09/15/535,9 | | | 1,612,000 | | | | 692,596 | |
due 09/15/555,9 | | | 1,612,000 | | | | 655,773 | |
due 09/15/565,9 | | | 1,612,000 | | | | 637,096 | |
due 03/15/575,9 | | | 1,612,000 | | | | 626,383 | |
due 09/15/575,9 | | | 1,612,000 | | | | 618,865 | |
due 09/15/585,9 | | | 1,612,000 | | | | 603,177 | |
due 03/15/595,9 | | | 1,612,000 | | | | 595,842 | |
due 09/15/595,9 | | | 1,612,000 | | | | 587,300 | |
due 09/15/605,9 | | | 1,612,000 | | | | 563,892 | |
due 09/15/545,9 | | | 1,020,000 | | | | 425,626 | |
due 03/15/615,9 | | | 1,020,000 | | | | 347,957 | |
due 09/15/615,9 | | | 1,020,000 | | | | 343,419 | |
due 09/15/625,9 | | | 1,020,000 | | | | 333,119 | |
due 03/15/635,9 | | | 1,020,000 | | | | 328,758 | |
due 09/15/635,9 | | | 1,020,000 | | | | 318,936 | |
due 09/15/645,9 | | | 1,020,000 | | | | 310,516 | |
due 03/15/655,9 | | | 1,020,000 | | | | 305,034 | |
due 09/15/655,9 | | | 1,020,000 | | | | 300,966 | |
Freddie Mac |
due 01/02/349 | | | 18,000,000 | | | | 14,088,468 | |
due 03/15/309 | | | 12,050,000 | | | | 10,277,013 | |
due 07/15/309 | | | 8,600,000 | | | | 7,275,881 | |
due 01/15/319 | | | 7,750,000 | | | | 6,487,420 | |
due 11/15/389 | | | 5,000,000 | | | | 3,455,899 | |
due 09/15/309 | | | 2,906,000 | | | | 2,453,597 | |
due 03/15/319 | | | 2,500,000 | | | | 2,086,975 | |
due 07/15/319 | | | 1,800,000 | | | | 1,494,389 | |
due 01/15/309 | | | 1,050,000 | | | | 897,897 | |
Tennessee Valley Authority Principal Strips |
due 01/15/489,10 | | | 34,650,000 | | | | 17,167,972 | |
due 01/15/389,10 | | | 15,800,000 | | | | 10,143,257 | |
Federal Farm Credit Bank Funding Corp. |
2.43% due 01/29/37 | | | 12,720,000 | | | | 14,055,837 | |
3.08% due 08/12/39 | | | 7,550,000 | | | | 7,598,398 | |
2.59% due 02/26/35 | | | 2,150,000 | | | | 2,170,304 | |
3.11% due 08/05/48 | | | 1,500,000 | | | | 1,904,793 | |
U.S. International Development Finance Corp. |
3.17% due 10/05/34 | | | 11,567,288 | | | | 13,218,890 | |
1.79% due 10/15/29 | | | 9,900,000 | | | | 10,336,444 | |
Fannie Mae |
due 01/15/329 | | | 9,413,000 | | | | 7,692,015 | |
due 07/15/329,10 | | | 3,963,000 | | | | 3,212,352 | |
due 01/15/359 | | | 2,250,000 | | | | 1,714,835 | |
due 01/15/339,10 | | | 1,450,000 | | | | 1,160,358 | |
Federal Home Loan Bank |
3.25% due 06/10/39 | | | 4,500,000 | | | | 5,274,651 | |
3.63% due 06/22/43 | | | 3,850,000 | | | | 4,891,153 | |
2.69% due 09/26/34 | | | 1,350,000 | | | | 1,382,978 | |
Federal Farm Credit Bank |
3.58% due 04/11/47 | | | 4,900,000 | | | | 6,672,615 | |
2.53% due 09/04/29 | | | 3,600,000 | | | | 3,617,214 | |
Fannie Mae Interest Strips |
due 02/06/335,9 | | | 1,456,000 | | | | 1,167,011 | |
Total Federal Agency Bonds |
(Cost $522,556,970) | | | | | | | 615,815,193 | |
| | | | | | | | | |
MUNICIPAL BONDS†† - 2.0% |
California - 0.8% |
State of California General Obligation Unlimited | | | | | | | | |
7.55% due 04/01/39 | | | 11,900,000 | | | | 19,310,130 | |
7.35% due 11/01/39 | | | 10,135,000 | | | | 15,665,568 | |
California Institute of Technology | | | | | | | | |
3.65% due 09/01/19 | | | 25,185,000 | | | | 26,057,822 | |
Poway Unified School District General Obligation Unlimited | | | | | | | | |
due 08/01/409 | | | 10,000,000 | | | | 6,001,300 | |
due 08/01/389 | | | 8,460,000 | | | | 5,409,747 | |
42 | THE GUGGENHEIM FUNDS SEMI-ANNUAL REPORT | SEE NOTES TO FINANCIAL STATEMENTS. |
SCHEDULE OF INVESTMENTS (Unaudited)(continued) | March 31, 2020 |
TOTAL RETURN BOND FUND | |
| | Face
Amount~ | | | Value | |
Newport Mesa Unified School District General Obligation Unlimited | | | | | | | | |
due 08/01/459 | | | 8,565,000 | | | $ | 3,481,929 | |
due 08/01/399 | | | 4,000,000 | | | | 2,118,160 | |
due 08/01/389 | | | 2,000,000 | | | | 1,307,000 | |
due 08/01/409 | | | 2,500,000 | | | | 1,266,425 | |
due 08/01/419 | | | 2,000,000 | | | | 967,160 | |
due 08/01/439 | | | 1,900,000 | | | | 841,320 | |
San Diego Unified School District General Obligation Unlimited | | | | | | | | |
due 07/01/399 | | | 7,150,000 | | | | 4,441,652 | |
2.60% due 07/01/33 | | | 3,000,000 | | | | 3,033,030 | |
due 07/01/469 | | | 2,200,000 | | | | 1,076,680 | |
due 07/01/439 | | | 1,350,000 | | | | 736,709 | |
Cypress School District General Obligation Unlimited | | | | | | | | |
due 08/01/489 | | | 14,450,000 | | | | 5,221,074 | |
California State University Revenue Bonds | | | | | | | | |
2.98% due 11/01/51 | | | 5,000,000 | | | | 4,979,350 | |
Los Angeles Department of Water & Power System Revenue Bonds | | | | | | | | |
6.17% due 07/01/40 | | | 3,750,000 | | | | 3,781,575 | |
Beverly Hills Unified School District California General Obligation Unlimited | | | | | | | | |
due 08/01/349 | | | 5,295,000 | | | | 3,480,562 | |
Placentia-Yorba Linda Unified School District General Obligation Unlimited | | | | | | | | |
due 08/01/419 | | | 5,325,000 | | | | 3,084,080 | |
San Bernardino Community College District General Obligation Unlimited | | | | | | | | |
due 08/01/449 | | | 4,750,000 | | | | 2,331,205 | |
Upland Unified School District General Obligation Unlimited | | | | | | | | |
due 08/01/509 | | | 5,040,000 | | | | 1,995,134 | |
Hanford Joint Union High School District General Obligation Unlimited | | | | | | | | |
due 08/01/419 | | | 4,125,000 | | | | 1,805,513 | |
San Marcos Unified School District General Obligation Unlimited | | | | | | | | |
due 08/01/479 | | | 3,600,000 | | | | 1,668,204 | |
Antelope Valley Community College District General Obligation Unlimited | | | | | | | | |
due 02/15/259 | | | 2,800,000 | | | | 1,612,520 | |
Oakland Redevelopment Agency Successor Agency Tax Allocation | | | | | | | | |
4.00% due 09/01/39 | | | 1,100,000 | | | | 1,148,059 | |
Wiseburn School District General Obligation Unlimited | | | | | | | | |
due 08/01/349 | | | 900,000 | | | | 646,740 | |
Santa Ana Unified School District Public Facilities Corp. General Obligation Unlimited | | | | | | | | |
due 08/01/359 | | | 700,000 | | | | 480,326 | |
Total California | | | 123,948,974 | |
| | | | | | | | | |
SEE NOTES TO FINANCIAL STATEMENTS. | THE GUGGENHEIM FUNDS SEMI-ANNUAL REPORT | 43 |
SCHEDULE OF INVESTMENTS (Unaudited)(continued) | March 31, 2020 |
TOTAL RETURN BOND FUND | |
| | Face
Amount~ | | | Value | |
New York - 0.4% |
Triborough Bridge & Tunnel Authority Revenue Bonds | | | | | | | | |
0.87% (VRDN) due 01/01/3317 | | | 19,310,000 | | | $ | 19,310,000 | |
New York City Transitional Finance Authority Future Tax Secured Revenue Bonds | | | | | | | | |
0.80% (VRDN) due 02/01/4517 | | | 11,475,000 | | | | 11,475,000 | |
0.75% (VRDN) due 02/01/4517 | | | 6,165,000 | | | | 6,165,000 | |
City of New York New York General Obligation Unlimited | | | | | | | | |
0.80% (VRDN) due 03/01/4217 | | | 11,560,000 | | | | 11,560,000 | |
0.75% (VRDN) due 03/01/4017 | | | 4,440,000 | | | | 4,440,000 | |
Total New York | | | 52,950,000 | |
| | | | | | | | | |
Illinois - 0.2% |
Illinois Finance Authority Revenue Bonds | | | | | | | | |
0.75% (VRDN) due 08/15/4217 | | | 9,835,000 | | | | 9,835,000 | |
State of Illinois General Obligation Unlimited | | | | | | | | |
5.65% due 12/01/38 | | | 5,350,000 | | | | 5,975,469 | |
6.63% due 02/01/35 | | | 1,820,000 | | | | 2,153,096 | |
University of Chicago | | | | | | | | |
2.76% due 04/01/45 | | | 8,000,000 | | | | 7,547,196 | |
City of Chicago Illinois General Obligation Unlimited | | | | | | | | |
6.31% due 01/01/44 | | | 4,500,000 | | | | 6,160,185 | |
Total Illinois | | | 31,670,946 | |
| | | | | | | | | |
Georgia - 0.2% |
Central Storage Safety Project Trust | | | | | | | | |
4.82% due 02/01/388 | | | 20,500,000 | | | | 23,826,159 | |
Ohio - 0.1% |
Northeast Ohio Regional Sewer District Revenue Bonds | | | | | | | | |
3.30% due 11/15/49 | | | 10,750,000 | | | | 11,094,323 | |
Ohio Turnpike & Infrastructure Commission Revenue Bonds | | | | | | | | |
3.20% due 02/15/48 | | | 5,200,000 | | | | 5,227,196 | |
Total Ohio | | | 16,321,519 | |
| | | | | | | | | |
Texas - 0.1% |
Wylie Independent School District General Obligation Unlimited | | | | | | | | |
due 08/15/469 | | | 10,000,000 | | | | 3,752,100 | |
due 08/15/439 | | | 4,000,000 | | | | 1,707,080 | |
Central Texas Turnpike System Revenue Bonds | | | | | | | | |
3.03% due 08/15/41 | | | 3,150,000 | | | | 2,912,522 | |
Harris County-Houston Sports Authority Revenue Bonds | | | | | | | | |
due 11/15/459 | | | 2,850,000 | | | | 1,122,729 | |
due 11/15/419 | | | 1,500,000 | | | | 727,590 | |
Total Texas | | | 10,222,021 | |
| | | | | | | | | |
Pennsylvania - 0.1% |
Hospitals & Higher Education Facilities Authority of Philadelphia Revenue Bonds | | | | | | | | |
0.75% (VRDN) due 07/01/4117 | | | 3,740,000 | | | | 3,740,000 | |
0.76% (VRDN) due 07/01/2517 | | | 3,500,000 | | | | 3,500,000 | |
Trustees of the University of Pennsylvania | | | | | | | | |
4.01% due 08/15/47 | | | 1,250,000 | | | | 1,332,413 | |
44 | THE GUGGENHEIM FUNDS SEMI-ANNUAL REPORT | SEE NOTES TO FINANCIAL STATEMENTS. |
SCHEDULE OF INVESTMENTS (Unaudited)(continued) | March 31, 2020 |
TOTAL RETURN BOND FUND | |
| | Face
Amount~ | | | Value | |
Pennsylvania Economic Development Financing Authority Revenue Bonds | | | | | | | | |
due 01/01/419 | | | 995,000 | | | $ | 540,852 | |
due 01/01/379 | | | 570,000 | | | | 356,609 | |
Altoona Water Authority Revenue Bonds | | | | | | | | |
7.06% due 12/01/20 | | | 25,000 | | | | 26,005 | |
6.34% due 12/01/20 | | | 5,000 | | | | 5,127 | |
Armstrong School District General Obligation Limited | | | | | | | | |
6.88% due 03/15/21 | | | 25,000 | | | | 26,393 | |
Total Pennsylvania | | | 9,527,399 | |
| | | | | | | | | |
Arizona - 0.1% |
State of Arizona Certificate Of Participation | | | | | | | | |
5.00% due 10/01/24 | | | 6,550,000 | | | | 6,550,000 | |
Northern Arizona University Revenue Bonds | | | | | | | | |
3.09% due 08/01/39 | | | 2,350,000 | | | | 2,174,972 | |
Total Arizona | | | 8,724,972 | |
| | | | | | | | | |
Maryland - 0.0% |
Johns Hopkins University | | | | | | | | |
2.81% due 01/01/60 | | | 8,750,000 | | | | 7,899,772 | |
| | | | | | | | | |
North Carolina - 0.0% |
Charlotte Housing Authority Revenue Bonds | | | | | | | | |
3.02% due 01/01/38 | | | 4,125,000 | | | | 4,284,843 | |
| | | | | | | | | |
Oregon - 0.0% |
Washington & Multnomah Counties School District No. 48J Beaverton General Obligation Unlimited | | | | | | | | |
due 06/15/339 | | | 3,850,000 | | | | 2,544,157 | |
| | | | | | | | | |
Washington - 0.0% |
Central Washington University Revenue Bonds | | | | | | | | |
6.95% due 05/01/40 | | | 1,750,000 | | | | 2,167,883 | |
Klickitat County Public Utility District No. 1 Revenue Bonds | | | | | | | | |
5.25% due 12/01/21 | | | 15,000 | | | | 15,904 | |
Total Washington | | | 2,183,787 | |
| | | | | | | | | |
Florida - 0.0% |
County of Miami-Dade Florida Revenue Bonds | | | | | | | | |
due 10/01/419 | | | 4,100,000 | | | | 2,147,170 | |
| | | | | | | | | |
Virginia - 0.0% |
Montgomery County Economic Development Authority Revenue Bonds | | | | | | | | |
4.66% due 06/01/21 | | | 25,000 | | | | 26,064 | |
| | | | | | | | | |
Minnesota - 0.0% |
Dakota & Washington Counties Housing & Redevelopment Authority/City of Bloomington Minnesota Revenue Bonds | | | | | | | | |
8.38% due 09/01/21 | | | 5,000 | | | | 5,414 | |
Total Municipal Bonds |
(Cost $282,738,049) | | | 296,283,197 | |
| | | | | | | | | |
FOREIGN GOVERNMENT DEBT†† - 0.3% |
Government of Japan |
0.00% due 04/13/2015 | | JPY | 2,302,000,000 | | | | 21,411,950 | |
0.10% due 04/15/20 | | JPY | 2,082,050,000 | | | | 19,366,754 | |
United Mexican States |
0.00% due 04/08/2015 | | MXN | 130,000,000 | | | | 5,472,656 | |
Total Foreign Government Debt |
(Cost $45,859,307) | | | | | | | 46,251,360 | |
| | | | | | | | | |
SEE NOTES TO FINANCIAL STATEMENTS. | THE GUGGENHEIM FUNDS SEMI-ANNUAL REPORT | 45 |
SCHEDULE OF INVESTMENTS (Unaudited)(continued) | March 31, 2020 |
TOTAL RETURN BOND FUND | |
| | Face
Amount~ | | | Value | |
SENIOR FLOATING RATE INTERESTS††,4 - 0.1% |
Consumer, Non-cyclical - 0.1% |
Elanco Animal Health, Inc. | | | | | | | | |
due 02/04/27 | | | 6,850,000 | | | $ | 6,473,250 | |
Packaging Coordinators Midco, Inc. | | | | | | | | |
5.08% (3 Month USD LIBOR + 4.00%, Rate Floor: 5.00%) due 06/30/23††† | | | 2,282,430 | | | | 1,962,889 | |
Total Consumer, Non-cyclical | | | 8,436,139 | |
| | | | | | | | | |
Basic Materials - 0.0% |
Road Infrastructure Investment | | | | | | | | |
4.50% (1 Month USD LIBOR + 3.50% and Commercial Prime Lending Rate + 2.50%, Rate Floor: 4.50%) due 06/13/23 | | | 4,305,739 | | | | 3,100,132 | |
| | | | | | | | | |
Industrial - 0.0% |
Hayward Industries, Inc. | | | | | | | | |
4.49% (1 Month USD LIBOR + 3.50%, Rate Floor: 3.50%) due 08/05/24 | | | 2,010,140 | | | | 1,575,447 | |
Hillman Group, Inc. | | | | | | | | |
5.07% (3 Month USD LIBOR + 4.00%, Rate Floor: 4.00%) due 05/30/25 | | | 982,500 | | | | 762,666 | |
API Heat Transfer | | | | | | | | |
7.45% (3 Month USD LIBOR + 6.00%, Rate Floor: 7.00%) due 01/01/24 | | | 39,364 | | | | 32,051 | |
7.45% (3 Month USD LIBOR + 6.00%, Rate Floor: 7.00%) due 10/02/23††† | | | 7,023 | | | | 6,086 | |
Total Industrial | | | 2,376,250 | |
| | | | | | | | | |
Consumer, Cyclical - 0.0% |
Whatabrands, LLC | | | | | | | | |
due 07/31/26 | | | 698,250 | | | | 572,858 | |
1011778 BC Unlimited Liability Co. | | | | | | | | |
2.74% (1 Month USD LIBOR + 1.75%, Rate Floor: 1.75%) due 11/19/26 | | | 399,000 | | | | 367,080 | |
Total Consumer, Cyclical | | | 939,938 | |
| | | | | | | | | |
Financial - 0.0% |
RPI (Royalty Pharma) 2019 Intermediate Finance Trust | | | | | | | | |
2.74% (1 Month USD LIBOR + 1.75%, Rate Floor: 1.75%) due 02/11/27 | | | 199,500 | | | | 183,540 | |
| | | | | | | | | |
Technology - 0.0% |
Aspect Software, Inc. | | | | | | | | |
6.00% (1 Month USD LIBOR + 5.00%, Rate Floor: 6.00%) due 01/15/24††† | | | 9,782 | | | | 7,402 | |
6.23% (3 Month USD LIBOR + 5.00%, Rate Floor: 6.00%) due 07/17/23†††,1 | | | 877 | | | | 867 | |
Total Technology | | | 8,269 | |
| | | | | | | | | |
Total Senior Floating Rate Interests |
(Cost $17,541,248) | | | 15,044,268 | |
| | | | | | | | | |
46 | THE GUGGENHEIM FUNDS SEMI-ANNUAL REPORT | SEE NOTES TO FINANCIAL STATEMENTS. |
SCHEDULE OF INVESTMENTS (Unaudited)(continued) | March 31, 2020 |
TOTAL RETURN BOND FUND | |
| | Face
Amount~ | | | Value | |
REPURCHASE AGREEMENTS††,14 - 1.2% |
Societe Generale |
issued 03/09/20 at 1.30% due 04/01/20 | | | 56,530,000 | | | $ | 56,530,000 | |
issued 07/09/19 at 2.27% due 04/01/20 | | | 18,482,278 | | | | 18,482,278 | |
issued 11/01/19 at 2.18% due 04/01/20 | | | 9,431,000 | | | | 9,431,000 | |
issued 12/06/19 at 1.18% due 04/01/20 | | | 5,876,000 | | | | 5,876,000 | |
issued 12/04/19 at 2.27% due 04/01/20 | | | 4,376,947 | | | | 4,376,947 | |
issued 10/25/19 at 2.27% due 04/01/20 | | | 1,440,000 | | | | 1,440,000 | |
BNP Paribas |
issued 01/31/20 at 1.93% due 05/04/20 | | | 40,902,792 | | | | 40,902,792 | |
issued 03/13/20 at 1.93% due 05/04/20 | | | 21,545,132 | | | | 21,545,132 | |
issued 03/27/20 at 1.93% due 05/04/20 | | | 8,420,075 | | | | 8,420,075 | |
Total Repurchase Agreements |
(Cost $167,004,224) | | | | | | | 167,004,224 | |
| | | | | | | | | |
COMMERCIAL PAPER†† - 0.6% |
American Electric Power |
1.81% due 04/01/206,15 | | | 31,000,000 | | | | 31,000,000 | |
CBS Corp. |
1.85% due 04/20/206,15 | | | 30,000,000 | | | | 29,969,917 | |
Nasdaq, Inc. |
1.76% due 04/01/206,15 | | | 20,900,000 | | | | 20,900,000 | |
E.I. du Pont de Nemours & Co. |
1.64% due 04/22/206,15 | | | 12,000,000 | | | | 11,988,240 | |
Total Commercial Paper |
(Cost $93,858,157) | | | | | | | 93,858,157 | |
| | | | | | | | | |
| | | Notional
Value | | | | | |
OTC OPTIONS PURCHASED†† - 0.2% |
Put options on: | | | | | | | | |
BofA Merrill Lynch 2Y-10 CMS CAP Expiring July 2022 with strike price of $0.40 | | | 5,927,600,000 | | | | 12,625,788 | |
Morgan Stanley Capital Services LLC 2Y-10 CMS CAP Expiring July 2022 with strike price of $0.40 | | | 3,921,300,000 | | | | 8,352,369 | |
Goldman Sachs International 2Y-10 CMS CAP Expiring July 2022 with strike price of $0.61 | | | 3,122,900,000 | | | | 4,247,144 | |
Goldman Sachs International 2Y-10 CMS CAP Expiring July 2022 with strike price of $0.40 | | | 816,100,000 | | | | 1,738,293 | |
SEE NOTES TO FINANCIAL STATEMENTS. | THE GUGGENHEIM FUNDS SEMI-ANNUAL REPORT | 47 |
SCHEDULE OF INVESTMENTS (Unaudited)(continued) | March 31, 2020 |
TOTAL RETURN BOND FUND | |
| | | Notional
Value | | | Value | |
| BofA Merrill Lynch 2Y-10 CMS CAP Expiring July 2022 with strike price of $0.61 | | | 432,100,000 | | | $ | 587,656 | |
| Total OTC Options Purchased |
| (Cost $29,493,876) | | | | | | | 27,551,250 | |
| | | | | | | | | |
| Total Investments - 101.0% |
| (Cost $14,385,588,419) | | | | | | $ | 14,665,342,386 | |
| Other Assets & Liabilities, net - (1.0)% | | | | | | | (147,177,351 | ) |
| Total Net Assets - 100.0% | | | | | | $ | 14,518,165,035 | |
Futures Contracts |
Description | | Number of
Contracts | | | Expiration
Date | | | Notional
Amount | | | Value and
Unrealized
Depreciation** | |
Interest Rate Future Contracts Sold Short† |
U.S. Treasury 10 Year Note Futures Contracts | | | 1,567 | | | | Jun 2020 | | | $ | 217,592,641 | | | $ | (164,066 | ) |
Centrally Cleared Credit Default Swap Agreements Protection Sold†† |
Counterparty | Exchange | Index | | Protection
Premium
Rate | | | Payment
Frequency | | | Maturity
Date | | | Notional
Amount | |
BofA Securities, Inc. | ICE | CDX.NA.HY.33.V3 | 5.00% | Quarterly | | | 12/20/24 | | | $ | 232,985,200 | |
BofA Securities, Inc. | ICE | CDX.NA.IG.34 | 1.00% | Quarterly | | | 06/20/25 | | | | 2,579,790,000 | |
| | | | | | | | | | | | | | | | | | | |
| Counterparty | | Value | | | Upfront
Premiums
Received | | | Unrealized
Appreciation** | |
| BofA Securities, Inc. | | $ | (14,204,774 | ) | | $ | (23,203,472 | ) | | $ | 8,998,698 | |
| BofA Securities, Inc. | | | (18,103,470 | ) | | | (50,847,243 | ) | | | 32,743,773 | |
| | | $ | (32,308,244 | ) | | $ | (74,050,715 | ) | | $ | 41,742,471 | |
48 | THE GUGGENHEIM FUNDS SEMI-ANNUAL REPORT | SEE NOTES TO FINANCIAL STATEMENTS. |
SCHEDULE OF INVESTMENTS (Unaudited)(continued) | March 31, 2020 |
TOTAL RETURN BOND FUND | |
Centrally Cleared Interest Rate Swap Agreements†† |
Counterparty | Exchange | Floating
Rate Type | Floating Rate Index | | Fixed
Rate | | Payment
Frequency | | Maturity Date | |
BofA Securities, Inc. | CME | Pay | Federal Funds Rate | 0.47% | Annually | 03/09/25 |
BofA Securities, Inc. | CME | Pay | Federal Funds Rate | 1.23% | Annually | 08/22/21 |
BofA Securities, Inc. | CME | Pay | Federal Funds Rate | 1.37% | Annually | 12/04/21 |
BofA Securities, Inc. | CME | Pay | Federal Funds Rate | 1.34% | Annually | 11/27/21 |
BofA Securities, Inc. | CME | Pay | Federal Funds Rate | 1.27% | Annually | 02/07/23 |
BofA Securities, Inc. | CME | Pay | Federal Funds Rate | 0.59% | Annually | 03/07/22 |
Counterparty | | Notional
Amount | | | Value | | | Upfront
Premiums
Paid | | | Unrealized
Appreciation** | |
BofA Securities, Inc. | | $ | 962,150,000 | | | $ | 11,744,782 | | | $ | 4,564 | | | $ | 11,740,218 | |
BofA Securities, Inc. | | | 456,100,000 | | | | 7,392,492 | | | | 999 | | | | 7,391,493 | |
BofA Securities, Inc. | | | 175,200,000 | | | | 3,820,096 | | | | 617 | | | | 3,819,479 | |
BofA Securities, Inc. | | | 164,500,000 | | | | 3,487,660 | | | | 588 | | | | 3,487,072 | |
BofA Securities, Inc. | | | 82,400,000 | | | | 2,737,176 | | | | 481 | | | | 2,736,695 | |
BofA Securities, Inc. | | | 150,000,000 | | | | 1,480,470 | | | | 649 | | | | 1,479,821 | |
| | | | | | | $ | 30,662,676 | | | $ | 7,898 | | | $ | 30,654,778 | |
Total Return Swap Agreements | | | | |
Counterparty | Index | Financing
Rate Pay | Payment
Frequency | | Maturity
Date | | | Units | | | Notional
Amount | | | Value and
Unrealized
Appreciation | |
OTC Sovereign Debt Swap Agreements†† | | | | | | | | | | | | |
Deutsche Bank AG | Korea Monetary Stabilization Bond | 2.20% (3 Month USD LIBOR + 0.45%) | At Maturity | 08/04/21 | N/A | | $ | 48,549,127 | | | $ | 32,495 | |
Forward Foreign Currency Exchange Contracts†† |
Counterparty | | Contracts
to Sell | | | Currency | | | Settlement
Date | | | Settlement
Value | | | Value at
March 31,
2020 | | | Unrealized
Appreciation | |
Citibank N.A., New York | | | 436,650,000 | | | | BRL | | | | 07/01/21 | | | $ | 103,795,925 | | | $ | 82,543,355 | | | $ | 21,252,570 | |
Morgan Stanley Capital Services LLC | | | 382,700,000 | | | | BRL | | | | 04/01/20 | | | | 93,832,677 | | | | 73,728,013 | | | | 20,104,664 | |
Goldman Sachs International | | | 133,295,000 | | | | BRL | | | | 07/01/20 | | | | 34,613,088 | | | | 25,634,147 | | | | 8,978,941 | |
Goldman Sachs International | | | 645,400,000 | | | | MXN | | | | 05/21/20 | | | | 34,355,188 | | | | 27,019,259 | | | | 7,335,929 | |
Bank of America, N.A. | | | 17,346,669,000 | | | | JPY | | | | 08/02/21 | | | | 171,181,418 | | | | 163,889,837 | | | | 7,291,581 | |
Citibank N.A., New York | | | 109,000,000 | | | | BRL | | | | 07/01/20 | | | | 28,075,418 | | | | 20,961,942 | | | | 7,113,476 | |
Citibank N.A., New York | | | 762,900,000 | | | | MXN | | | | 04/23/20 | | | | 39,011,015 | | | | 32,067,922 | | | | 6,943,093 | |
Goldman Sachs International | | | 149,210,000 | | | | BRL | | | | 07/01/21 | | | | 34,956,073 | | | | 28,206,330 | | | | 6,749,743 | |
SEE NOTES TO FINANCIAL STATEMENTS. | THE GUGGENHEIM FUNDS SEMI-ANNUAL REPORT | 49 |
SCHEDULE OF INVESTMENTS (Unaudited)(continued) | March 31, 2020 |
TOTAL RETURN BOND FUND | |
Counterparty | | Contracts
to Sell | | | Currency | | | Settlement
Date | | | Settlement
Value | | | Value at
March 31,
2020 | | | Unrealized
Appreciation | |
Goldman Sachs International | | | 108,769,700 | | | | EUR | | | | 07/30/21 | | | $ | 126,349,603 | | | $ | 121,740,201 | | | $ | 4,609,402 | |
JPMorgan Chase Bank, N.A. | | | 107,510,325 | | | | EUR | | | | 07/30/21 | | | | 124,085,192 | | | | 120,330,649 | | | | 3,754,543 | |
Citibank N.A., New York | | | 404,290,000 | | | | MXN | | | | 04/02/20 | | | | 20,565,659 | | | | 17,044,123 | | | | 3,521,536 | |
JPMorgan Chase Bank, N.A. | | | 10,005,000,000 | | | | JPY | | | | 07/01/21 | | | | 97,867,554 | | | | 94,442,238 | | | | 3,425,316 | |
Barclays Bank plc | | | 351,900,000 | | | | MXN | | | | 04/08/20 | | | | 18,176,089 | | | | 14,822,997 | | | | 3,353,092 | |
JPMorgan Chase Bank, N.A. | | | 67,200,000 | | | | BRL | | | | 07/01/21 | | | | 15,963,891 | | | | 12,703,340 | | | | 3,260,551 | |
Morgan Stanley Capital Services LLC | | | 8,674,335,000 | | | | JPY | | | | 08/02/21 | | | | 85,134,311 | | | | 81,954,371 | | | | 3,179,940 | |
Citibank N.A., New York | | | 8,674,335,000 | | | | JPY | | | | 05/06/21 | | | | 84,594,646 | | | | 81,753,760 | | | | 2,840,886 | |
Citibank N.A., New York | | | 295,450,000 | | | | MXN | | | | 04/08/20 | | | | 15,040,216 | | | | 12,445,168 | | | | 2,595,048 | |
Goldman Sachs International | | | 427,522,900 | | | | ILS | | | | 04/30/21 | | | | 125,180,154 | | | | 122,967,276 | | | | 2,212,878 | |
Goldman Sachs International | | | 4,532,865,300 | | | | JPY | | | | 12/20/21 | | | | 44,786,734 | | | | 42,992,895 | | | | 1,793,839 | |
Goldman Sachs International | | | 164,231,850 | | | | ILS | | | | 01/31/22 | | | | 48,573,459 | | | | 47,148,584 | | | | 1,424,875 | |
Barclays Bank plc | | | 3,469,734,000 | | | | JPY | | | | 06/01/21 | | | | 33,963,724 | | | | 32,725,213 | | | | 1,238,511 | |
Bank of America, N.A. | | | 24,366,000 | | | | EUR | | | | 06/15/20 | | | | 28,020,291 | | | | 26,939,697 | | | | 1,080,594 | |
Deutsche Bank AG | | | 59,198,631,145 | | | | KRW | | | | 08/04/21 | | | | 50,484,932 | | | | 49,404,869 | | | | 1,080,063 | |
Goldman Sachs International | | | 67,282,219 | | | | ILS | | | | 08/01/22 | | | | 20,296,295 | | | | 19,338,051 | | | | 958,244 | |
Goldman Sachs International | | | 20,907,600 | | | | EUR | | | | 06/15/20 | | | | 24,055,867 | | | | 23,115,998 | | | | 939,869 | |
JPMorgan Chase Bank, N.A. | | | 5,930,964,000 | | | | JPY | | | | 09/01/20 | | | | 56,376,377 | | | | 55,503,651 | | | | 872,726 | |
Citibank N.A., New York | | | 5,517,757,500 | | | | JPY | | | | 06/01/20 | | | | 52,200,082 | | | | 51,464,177 | | | | 735,905 | |
Bank of America, N.A. | | | 75,749,000 | | | | ILS | | | | 01/31/22 | | | | 22,457,456 | | | | 21,746,440 | | | | 711,016 | |
Goldman Sachs International | | | 112,111,771 | | | | ILS | | | | 02/01/21 | | | | 32,654,345 | | | | 32,185,053 | | | | 469,292 | |
Goldman Sachs International | | | 28,886,625 | | | | ILS | | | | 11/30/22 | | | | 8,761,487 | | | | 8,314,021 | | | | 447,466 | |
Morgan Stanley Capital Services LLC | | | 49,287,000 | | | | EUR | | | | 06/30/20 | | | | 54,879,596 | | | | 54,523,113 | | | | 356,483 | |
Goldman Sachs International | | | 7,904,000 | | | | EUR | | | | 04/30/20 | | | | 9,064,307 | | | | 8,723,086 | | | | 341,221 | |
Citibank N.A., New York | | | 75,123,800 | | | | ILS | | | | 04/30/21 | | | | 21,943,567 | | | | 21,607,659 | | | | 335,908 | |
Bank of America, N.A. | | | 2,413,206,000 | | | | JPY | | | | 06/22/20 | | | | 22,824,232 | | | | 22,527,580 | | | | 296,652 | |
Bank of America, N.A. | | | 2,083,091,025 | | | | JPY | | | | 04/15/20 | | | | 19,648,280 | | | | 19,389,507 | | | | 258,773 | |
JPMorgan Chase Bank, N.A. | | | 879,339,450 | | | | JPY | | | | 06/01/20 | | | | 8,310,945 | | | | 8,201,608 | | | | 109,337 | |
Bank of America, N.A. | | | 33,128,000 | | | | ILS | | | | 04/30/21 | | | | 9,634,434 | | | | 9,528,519 | | | | 105,915 | |
50 | THE GUGGENHEIM FUNDS SEMI-ANNUAL REPORT | SEE NOTES TO FINANCIAL STATEMENTS. |
SCHEDULE OF INVESTMENTS (Unaudited)(continued) | March 31, 2020 |
TOTAL RETURN BOND FUND | |
Counterparty | | Contracts
to Sell | | | Currency | | | Settlement
Date | | | Settlement
Value | | | Value at
March 31,
2020 | | | Unrealized
Appreciation
(Depreciation) | |
Goldman Sachs International | | | 809,700 | | | | EUR | | | | 07/30/20 | | | $ | 920,386 | | | $ | 896,537 | | | $ | 23,849 | |
Goldman Sachs International | | | 4,244,498 | | | | ILS | | | | 04/30/20 | | | | 1,221,971 | | | | 1,199,819 | | | | 22,152 | |
Bank of America, N.A. | | | 3,949,000 | | | | ILS | | | | 02/01/21 | | | | 1,153,835 | | | | 1,133,679 | | | | 20,156 | |
JPMorgan Chase Bank, N.A. | | | 800,325 | | | | EUR | | | | 07/30/20 | | | | 904,383 | | | | 886,157 | | | | 18,226 | |
Goldman Sachs International | | | 99,838,432 | | | | JPY | | | | 06/22/20 | | | | 945,114 | | | | 932,004 | | | | 13,110 | |
Goldman Sachs International | | | 130,000,000 | | | | MXN | | | | 04/08/20 | | | | 5,484,616 | | | | 5,475,958 | | | | 8,658 | |
Goldman Sachs International | | | 499,481 | | | | ILS | | | | 07/30/21 | | | | 148,223 | | | | 143,575 | | | | 4,648 | |
Goldman Sachs International | | | 356,625 | | | | ILS | | | | 11/30/21 | | | | 106,445 | | | | 102,425 | | | | 4,020 | |
Citibank N.A., New York | | | 745,838 | | | | ILS | | | | 04/30/20 | | | | 214,315 | | | | 210,831 | | | | 3,484 | |
Goldman Sachs International | | | 502,219 | | | | ILS | | | | 07/31/20 | | | | 146,185 | | | | 142,852 | | | | 3,333 | |
Bank of America, N.A. | | | 8,669,000 | | | | JPY | | | | 02/01/21 | | | | 84,687 | | | | 81,489 | | | | 3,198 | |
Deutsche Bank AG | | | 154,605,468 | | | | KRW | | | | 05/11/20 | | | | 129,844 | | | | 127,084 | | | | 2,760 | |
Deutsche Bank AG | | | 158,041,146 | | | | KRW | | | | 08/05/20 | | | | 133,188 | | | | 130,435 | | | | 2,753 | |
Bank of America, N.A. | | | 8,669,000 | | | | JPY | | | | 08/03/20 | | | | 83,799 | | | | 81,047 | | | | 2,752 | |
Deutsche Bank AG | | | 158,041,145 | | | | KRW | | | | 11/04/20 | | | | 133,594 | | | | 130,894 | | | | 2,700 | |
Deutsche Bank AG | | | 158,041,145 | | | | KRW | | | | 02/04/21 | | | | 133,990 | | | | 131,297 | | | | 2,693 | |
Deutsche Bank AG | | | 152,887,630 | | | | KRW | | | | 05/07/21 | | | | 129,951 | | | | 127,344 | | | | 2,607 | |
Goldman Sachs International | | | 358,579 | | | | ILS | | | | 11/30/20 | | | | 105,125 | | | | 102,690 | | | | 2,435 | |
JPMorgan Chase Bank, N.A. | | | 5,000,000 | | | | JPY | | | | 01/04/21 | | | | 48,459 | | | | 46,963 | | | | 1,496 | |
Morgan Stanley Capital Services LLC | | | 4,335,000 | | | | JPY | | | | 02/01/21 | | | | 42,095 | | | | 40,749 | | | | 1,346 | |
JPMorgan Chase Bank, N.A. | | | 5,000,000 | | | | JPY | | | | 07/01/20 | | | | 47,966 | | | | 46,693 | | | | 1,273 | |
Citibank N.A., New York | | | 4,335,000 | | | | JPY | | | | 11/02/20 | | | | 41,820 | | | | 40,645 | | | | 1,175 | |
Bank of America, N.A. | | | 328,899 | | | | ILS | | | | 04/30/20 | | | | 94,116 | | | | 92,972 | | | | 1,144 | |
Morgan Stanley Capital Services LLC | | | 4,335,000 | | | | JPY | | | | 08/03/20 | | | | 41,662 | | | | 40,528 | | | | 1,134 | |
Citibank N.A., New York | | | 4,335,000 | | | | JPY | | | | 05/01/20 | | | | 41,379 | | | | 40,388 | | | | 991 | |
Goldman Sachs International | | | 2,265,300 | | | | JPY | | | | 06/21/21 | | | | 22,154 | | | | 21,377 | | | | 777 | |
Goldman Sachs International | | | 2,265,300 | | | | JPY | | | | 12/21/20 | | | | 21,919 | | | | 21,269 | | | | 650 | |
Barclays Bank plc | | | 1,734,000 | | | | JPY | | | | 12/01/20 | | | | 16,788 | | | | 16,271 | | | | 517 | |
Barclays Bank plc | | | 1,734,000 | | | | JPY | | | | 06/01/20 | | | | 16,618 | | | | 16,173 | | | | 445 | |
Citibank N.A., New York | | | 2,302,000,000 | | | | JPY | | | | 04/13/20 | | | | 21,036,187 | | | | 21,424,638 | | | | (388,451 | ) |
| | | | | | | | | | | | | | | | | | | | | | | $ | 131,845,909 | |
SEE NOTES TO FINANCIAL STATEMENTS. | THE GUGGENHEIM FUNDS SEMI-ANNUAL REPORT | 51 |
SCHEDULE OF INVESTMENTS (Unaudited)(continued) | March 31, 2020 |
TOTAL RETURN BOND FUND | |
Counterparty | | Contracts
to Buy | | | Currency | | | Settlement
Date | | | Settlement
Value | | | Value at
March 31,
2020 | | | Unrealized
Appreciation
(Depreciation) | |
Goldman Sachs International | | | 239,980,850 | | | | ILS | | | | 01/31/22 | | | $ | 65,373,467 | | | $ | 68,895,024 | | | $ | 3,521,557 | |
Goldman Sachs International | | | 267,887,350 | | | | ILS | | | | 04/30/21 | | | | 74,716,169 | | | | 77,051,727 | | | | 2,335,558 | |
JPMorgan Chase Bank, N.A. | | | 267,887,350 | | | | ILS | | | | 04/30/21 | | | | 75,482,488 | | | | 77,051,727 | | | | 1,569,239 | |
Goldman Sachs International | | | 67,282,219 | | | | ILS | | | | 08/01/22 | | | | 18,074,471 | | | | 19,338,051 | | | | 1,263,580 | |
Goldman Sachs International | | | 116,071,591 | | | | ILS | | | | 02/01/21 | | | | 32,426,110 | | | | 33,321,838 | | | | 895,728 | |
Citibank N.A., New York | | | 2,413,206,000 | | | | JPY | | | | 06/22/20 | | | | 21,895,441 | | | | 22,527,580 | | | | 632,139 | |
Goldman Sachs International | | | 28,886,625 | | | | ILS | | | | 11/30/22 | | | | 7,727,829 | | | | 8,314,021 | | | | 586,192 | |
Goldman Sachs International | | | 8,674,335,000 | | | | JPY | | | | 05/06/21 | | | | 81,311,727 | | | | 81,753,760 | | | | 442,033 | |
JPMorgan Chase Bank, N.A. | | | 3,469,734,000 | | | | JPY | | | | 06/01/21 | | | | 32,564,374 | | | | 32,725,213 | | | | 160,839 | |
JPMorgan Chase Bank, N.A. | | | 97,573,132 | | | | JPY | | | | 06/22/20 | | | | 881,595 | | | | 910,857 | | | | 29,262 | |
Goldman Sachs International | | | 2,659,617 | | | | ILS | | | | 04/30/20 | | | | 730,965 | | | | 751,811 | | | | 20,846 | |
JPMorgan Chase Bank, N.A. | | | 2,659,617 | | | | ILS | | | | 04/30/20 | | | | 738,926 | | | | 751,811 | | | | 12,885 | |
Goldman Sachs International | | | 502,219 | | | | ILS | | | | 07/31/20 | | | | 132,862 | | | | 142,852 | | | | 9,990 | |
Goldman Sachs International | | | 499,481 | | | | ILS | | | | 07/30/21 | | | | 134,017 | | | | 143,575 | | | | 9,558 | |
Goldman Sachs International | | | 358,579 | | | | ILS | | | | 11/30/20 | | | | 95,064 | | | | 102,690 | | | | 7,626 | |
Goldman Sachs International | | | 356,625 | | | | ILS | | | | 11/30/21 | | | | 95,100 | | | | 102,425 | | | | 7,325 | |
Goldman Sachs International | | | 4,335,000 | | | | JPY | | | | 11/02/20 | | | | 40,408 | | | | 40,645 | | | | 237 | |
Goldman Sachs International | | | 4,335,000 | | | | JPY | | | | 05/01/20 | | | | 40,191 | | | | 40,388 | | | | 197 | |
JPMorgan Chase Bank, N.A. | | | 1,734,000 | | | | JPY | | | | 12/01/20 | | | | 16,179 | | | | 16,271 | | | | 92 | |
JPMorgan Chase Bank, N.A. | | | 1,734,000 | | | | JPY | | | | 06/01/20 | | | | 16,100 | | | | 16,173 | | | | 73 | |
Barclays Bank plc | | | 2,265,300 | | | | JPY | | | | 12/21/20 | | | | 21,330 | | | | 21,269 | | | | (61 | ) |
Barclays Bank plc | | | 2,265,300 | | | | JPY | | | | 06/22/20 | | | | 21,229 | | | | 21,147 | | | | (82 | ) |
52 | THE GUGGENHEIM FUNDS SEMI-ANNUAL REPORT | SEE NOTES TO FINANCIAL STATEMENTS. |
SCHEDULE OF INVESTMENTS (Unaudited)(continued) | March 31, 2020 |
TOTAL RETURN BOND FUND | |
Counterparty | | Contracts
to Buy | | | Currency | | | Settlement
Date | | | Settlement
Value | | | Value at
March 31,
2020 | | | Unrealized
Depreciation | |
Barclays Bank plc | | | 2,265,300 | | | | JPY | | | | 06/21/21 | | | $ | 21,468 | | | $ | 21,377 | | | $ | (91 | ) |
JPMorgan Chase Bank, N.A. | | | 13,004,000 | | | | JPY | | | | 02/01/21 | | | | 122,505 | | | | 122,238 | | | | (267 | ) |
JPMorgan Chase Bank, N.A. | | | 13,004,000 | | | | JPY | | | | 08/03/20 | | | | 121,874 | | | | 121,575 | | | | (299 | ) |
JPMorgan Chase Bank, N.A. | | | 5,000,000 | | | | JPY | | | | 07/01/20 | | | | 48,247 | | | | 46,693 | | | | (1,554 | ) |
JPMorgan Chase Bank, N.A. | | | 5,000,000 | | | | JPY | | | | 01/04/21 | | | | 48,547 | | | | 46,964 | | | | (1,583 | ) |
Goldman Sachs International | | | 1,610,025 | | | | EUR | | | | 07/30/20 | | | | 1,826,493 | | | | 1,782,694 | | | | (43,799 | ) |
Goldman Sachs International | | | 7,904,000 | | | | EUR | | | | 04/30/20 | | | | 8,883,250 | | | | 8,723,086 | | | | (160,164 | ) |
Barclays Bank plc | | | 4,532,865,300 | | | | JPY | | | | 12/20/21 | | | | 43,207,181 | | | | 42,992,895 | | | | (214,286 | ) |
JPMorgan Chase Bank, N.A. | | | 26,021,004,000 | | | | JPY | | | | 08/02/21 | | | | 246,341,039 | | | | 245,844,208 | | | | (496,831 | ) |
JPMorgan Chase Bank, N.A. | | | 45,273,600 | | | | EUR | | | | 06/15/20 | | | | 50,962,862 | | | | 50,055,695 | | | | (907,167 | ) |
JPMorgan Chase Bank, N.A. | | | 218,775,000 | | | | BRL | | | | 07/01/21 | | | | 42,398,256 | | | | 41,356,745 | | | | (1,041,511 | ) |
Goldman Sachs International | | | 242,295,000 | | | | BRL | | | | 07/01/20 | | | | 47,671,831 | | | | 46,596,088 | | | | (1,075,743 | ) |
Citibank N.A., New York | | | 434,285,000 | | | | BRL | | | | 07/01/21 | | | | 83,284,769 | | | | 82,096,281 | | | | (1,188,488 | ) |
Citibank N.A., New York | | | 6,397,096,950 | | | | JPY | | | | 06/01/20 | | | | 61,415,177 | | | | 59,665,785 | | | | (1,749,392 | ) |
JPMorgan Chase Bank, N.A. | | | 5,930,964,000 | | | | JPY | | | | 09/01/20 | | | | 57,451,653 | | | | 55,503,651 | | | | (1,948,002 | ) |
JPMorgan Chase Bank, N.A. | | | 10,005,000,000 | | | | JPY | | | | 07/01/21 | | | | 97,690,768 | | | | 94,442,238 | | | | (3,248,530 | ) |
JPMorgan Chase Bank, N.A. | | | 404,290,000 | | | | MXN | | | | 04/02/20 | | | | 21,045,262 | | | | 17,044,123 | | | | (4,001,139 | ) |
Goldman Sachs International | | | 645,400,000 | | | | MXN | | | | 05/21/20 | | | | 32,197,877 | | | | 27,019,259 | | | | (5,178,618 | ) |
Goldman Sachs International | | | 216,280,025 | | | | EUR | | | | 07/30/21 | | | | 248,181,328 | | | | 242,070,849 | | | | (6,110,479 | ) |
Goldman Sachs International | | | 647,350,000 | | | | MXN | | | | 04/08/20 | | | | 33,668,098 | | | | 27,268,165 | | | | (6,399,933 | ) |
Goldman Sachs International | | | 762,900,000 | | | | MXN | | | | 04/23/20 | | | | 39,566,423 | | | | 32,067,922 | | | | (7,498,501 | ) |
Morgan Stanley Capital Services LLC | | | 382,700,000 | | | | BRL | | | | 04/01/20 | | | | 81,745,298 | | | | 73,728,014 | | | | (8,017,284 | ) |
| | | | | | | | | | | | | | | | | | | | | | | $ | (37,778,848 | ) |
SEE NOTES TO FINANCIAL STATEMENTS. | THE GUGGENHEIM FUNDS SEMI-ANNUAL REPORT | 53 |
SCHEDULE OF INVESTMENTS (Unaudited)(continued) | March 31, 2020 |
TOTAL RETURN BOND FUND | |
~ | The face amount is denominated in U.S. dollars unless otherwise indicated. |
* | Non-income producing security. |
** | Includes cumulative appreciation (depreciation). Variation margin is reported within the Statement of Assets and Liabilities. |
† | Value determined based on Level 1 inputs, unless otherwise noted — See Note 4. |
†† | Value determined based on Level 2 inputs, unless otherwise noted — See Note 4. |
††† | Value determined based on Level 3 inputs — See Note 4. |
1 | Security was fair valued by the Valuation Committee at March 31, 2020. The total market value of fair valued securities amounts to $258,960,536, (cost $253,888,016) or 1.8% of total net assets. |
2 | Affiliated issuer. |
3 | Rate indicated is the 7-day yield as of March 31, 2020. |
4 | Variable rate security. Rate indicated is the rate effective at March 31, 2020. In some instances, the effective rate is limited by a minimum rate floor or a maximum rate cap established by the issuer. The settlement status of a position may also impact the effective rate indicated. In some cases, a position may be unsettled at period end and may not have a stated effective rate. In instances where multiple underlying reference rates and spread amounts are shown, the effective rate is based on a weighted average. |
5 | Security is an interest-only strip. |
6 | Security is a 144A or Section 4(a)(2) security. These securities have been determined to be liquid under guidelines established by the Board of Trustees. The total market value of 144A or Section 4(a)(2) securities is $3,988,009,211 (cost $4,240,902,943), or 27.5% of total net assets. |
7 | Security is a step up/down bond. The coupon increases or decreases at regular intervals until the bond reaches full maturity. Rate indicated is the rate at March 31, 2020. See table below for additional step information for each security. |
8 | Security is a 144A or Section 4(a)(2) security. These securities have been determined to be illiquid and restricted under guidelines established by the Board of Trustees. The total market value of 144A or Section 4(a)(2) illiquid and restricted securities is $51,717,077 (cost $51,192,115), or 0.4% of total net assets — See Note 10. |
9 | Zero coupon rate security. |
10 | Security is a principal-only strip. |
11 | Security has no stated coupon. However, it is expected to receive residual cash flow payments on defined deal dates. |
12 | Security has a fixed rate coupon which will convert to a floating or variable rate coupon on a future date. |
13 | All or a portion of this security is pledged as collateral for put options purchased contracts at March 31, 2020. |
14 | Repurchase Agreements — The interest rate on repurchase agreements is market driven and based on the underlying collateral obtained. See additional disclosure in the repurchase agreements table below for more information on repurchase agreements. |
15 | Rate indicated is the effective yield at the time of purchase. |
16 | Security is in default of interest and/or principal obligations. |
17 | The rate is adjusted periodically by the counterparty, allows the holder to tender the security upon a rate reset, and is not based upon a set reference rate and spread. Rate indicated is the rate effective at March 31, 2020. |
| | BofA — Bank of America |
| | BRL — Brazilian Real |
| | CDX.NA.HY.33.V3 — Credit Default Swap North American High Yield Series 33 Index |
| | CDX.NA.IG.34 — Credit Default Swap North American Investment Grade Series 34 Index |
| | CME — Chicago Mercantile Exchange |
| | CMS — Constant Maturity Swap |
| | CMT — Constant Maturity Treasury |
| | EUR — Euro |
| | ICE — Intercontinental Exchange |
| | ILS — Israeli New Shekel |
54 | THE GUGGENHEIM FUNDS SEMI-ANNUAL REPORT | SEE NOTES TO FINANCIAL STATEMENTS. |
SCHEDULE OF INVESTMENTS (Unaudited)(continued) | March 31, 2020 |
TOTAL RETURN BOND FUND | |
| | JPY — Japanese Yen |
| | KRW — South Korean Won |
| | LIBOR — London Interbank Offered Rate |
| | MXN — Mexican Peso |
| | plc — Public Limited Company |
| | REIT — Real Estate Investment Trust |
| | REMIC — Real Estate Mortgage Investment Conduit |
| | VRDN — Variable Rate Demand Note |
| | WAC — Weighted Average Coupon |
| | |
| | See Sector Classification in Other Information section. |
SEE NOTES TO FINANCIAL STATEMENTS. | THE GUGGENHEIM FUNDS SEMI-ANNUAL REPORT | 55 |
SCHEDULE OF INVESTMENTS (Unaudited)(continued) | March 31, 2020 |
TOTAL RETURN BOND FUND | |
The following table summarizes the inputs used to value the Fund’s investments at March 31, 2020 (See Note 4 in the Notes to Financial Statements):
Investments in Securities (Assets) | | Level 1
Quoted
Prices | | | Level 2
Significant
Observable
Inputs | | | Level 3
Significant
Unobservable
Inputs | | | Total | |
Common Stocks | | $ | — | | | $ | 11,695 | | | $ | 177 | | | $ | 11,872 | |
Preferred Stocks | | | — | | | | 6,931 | | | | — | | | | 6,931 | |
Exchange-Traded Funds | | | 710,864,476 | | | | — | | | | — | | | | 710,864,476 | |
Mutual Funds | | | 76,983,859 | | | | — | | | | — | | | | 76,983,859 | |
Money Market Fund | | | 1,691,965,196 | | | | — | | | | — | | | | 1,691,965,196 | |
Collateralized Mortgage Obligations | | | — | | | | 4,529,135,152 | | | | 55,816,248 | | | | 4,584,951,400 | |
U.S. Government Securities | | | — | | | | 2,886,229,664 | | | | — | | | | 2,886,229,664 | |
Asset-Backed Securities | | | — | | | | 2,024,726,373 | | | | 395,841,138 | | | | 2,420,567,511 | |
Corporate Bonds | | | — | | | | 1,030,162,211 | | | | 1,791,617 | | | | 1,031,953,828 | |
Federal Agency Bonds | | | — | | | | 615,815,193 | | | | — | | | | 615,815,193 | |
Municipal Bonds | | | — | | | | 296,283,197 | | | | — | | | | 296,283,197 | |
Foreign Government Debt | | | — | | | | 46,251,360 | | | | — | | | | 46,251,360 | |
Senior Floating Rate Interests | | | — | | | | 13,067,024 | | | | 1,977,244 | | | | 15,044,268 | |
Repurchase Agreements | | | — | | | | 167,004,224 | | | | — | | | | 167,004,224 | |
Commercial Paper | | | — | | | | 93,858,157 | | | | — | | | | 93,858,157 | |
Options Purchased | | | — | | | | 27,551,250 | | | | — | | | | 27,551,250 | |
Credit Default Swap Agreements** | | | — | | | | 41,742,471 | | | | — | | | | 41,742,471 | |
Interest Rate Swap Agreements** | | | — | | | | 30,654,778 | | | | — | | | | 30,654,778 | |
Total Return Swap Agreements** | | | — | | | | 32,495 | | | | — | | | | 32,495 | |
Forward Foreign Currency Exchange Contracts** | | | — | | | | 143,739,316 | | | | — | | | | 143,739,316 | |
Total Assets | | $ | 2,479,813,531 | | | $ | 11,946,271,491 | | | $ | 455,426,424 | | | $ | 14,881,511,446 | |
Investments in Securities (Liabilities) | | Level 1
Quoted
Prices | | | Level 2
Significant
Observable
Inputs | | | Level 3
Significant
Unobservable
Inputs | | | Total | |
Interest Rate Futures Contracts** | | $ | 164,066 | | | $ | — | | | $ | — | | | $ | 164,066 | |
Forward Foreign Currency Exchange Contracts** | | | — | | | | 49,672,255 | | | | — | | | | 49,672,255 | |
Unfunded Loan Commitments (Note 9) | | | — | | | | — | | | | 13 | | | | 13 | |
Total Liabilities | | $ | 164,066 | | | $ | 49,672,255 | | | $ | 13 | | | $ | 49,836,334 | |
** | This derivative is reported as unrealized appreciation/depreciation at period end. |
56 | THE GUGGENHEIM FUNDS SEMI-ANNUAL REPORT | SEE NOTES TO FINANCIAL STATEMENTS. |
SCHEDULE OF INVESTMENTS (Unaudited)(continued) | March 31, 2020 |
TOTAL RETURN BOND FUND | |
The following is a summary of significant unobservable inputs used in the fair valuation of assets and liabilities categorized within Level 3 of the fair value hierarchy:
| Category | | Ending Balance at March 31, 2020 | | | Valuation Technique | | Unobservable Inputs | | Input
Range | | | Weighted Average* | |
| Assets: | | | | | | | | | | | | | |
| Asset-Backed Securities | | $ | 228,566,667 | | | Model Price | | Purchase Price | | | — | | | | — | |
| Asset-Backed Securities | | | 141,796,056 | | | Option Adjusted Spread off the prior month end broker quote | | Broker Quote | | | — | | | | — | |
| Asset-Backed Securities | | | 22,128,812 | | | Yield Analysis | | Yield | | | 6.6 | % | | | — | |
| Asset-Backed Securities | | | 3,349,603 | | | Third Party Pricing | | Broker Quote | | | — | | | | — | |
| Collateralized Mortgage Obligations | | | 28,601,208 | | | Model Price | | Purchase Price | | | — | | | | — | |
| Collateralized Mortgage Obligations | | | 14,594,725 | | | Option Adjusted Spread off the prior month end broker quote | | Broker Quote | | | — | | | | — | |
| Collateralized Mortgage Obligations | | | 12,620,315 | | | Third Party Pricing | | Broker Quote | | | — | | | | — | |
| Common Stocks | | | 177 | | | Enterprise Value | | Valuation Multiple | | | 1.6x-7.8x | | | | 2.9 | x |
| Corporate Bonds | | | 1,791,617 | | | Yield Analysis | | Yield | | | 8.7 | % | | | — | |
| Senior Floating Rate Interests | | | 1,976,377 | | | Third Party Pricing | | Broker Quote | | | — | | | | — | |
| Senior Floating Rate Interests | | | 867 | | | Model Price | | Purchase Price | | | — | | | | — | |
| Total assets | | $ | 455,426,424 | | | | | | | | | | | | | |
| | | | | | | | | | | | | | | | | |
| Liabilities: | | | | | | | | | | | | | | | | |
| Unfunded Loan Commitments | | | 13 | | | Model Price | | Purchase Price | | | — | | | | — | |
* | Inputs are weighted by the fair value of the instruments. |
Significant changes in a quote, yield, market comparable yields, or valuation multiples would generally result in significant changes in the fair value of the security.
The Fund’s fair valuation leveling guidelines were revised to classify a single daily broker quote, or a vendor price based on a single daily or monthly broker quote, as Level 3 rather than Level 2, if such a quote or price cannot be supported with other available market information.
Transfers between Level 2 and Level 3 may occur as markets fluctuate and/or the availability of data used in an investment’s valuation changes. For the period ended March 31, 2020, the Fund had assets with a total value of $107,199,701 transfer into Level 3 from Level 2 due to lack of observable inputs and had assets with a total value of $43,746 transfer out of Level 3 into Level 2 due to changes in the securities valuation methods based on the availability of observable market inputs.
SEE NOTES TO FINANCIAL STATEMENTS. | THE GUGGENHEIM FUNDS SEMI-ANNUAL REPORT | 57 |
SCHEDULE OF INVESTMENTS (Unaudited)(continued) | March 31, 2020 |
TOTAL RETURN BOND FUND | |
Summary of Fair Value Level 3 Activity
Following is a reconciliation of Level 3 assets for which significant unobservable inputs were used to determine fair value for the period ended March 31, 2020:
| | | Assets | | | | | | | Liabilities | |
| | Asset-
Backed
Securities | | | Collateralized
Mortgage
Obligations | | | Corporate
Bonds | | | Senior
Floating
Rate
Interests | | | Common
Stocks | | | Total
Assets | | | Unfunded
Loan
Commitments | |
Beginning Balance | | $ | 137,712,008 | | | $ | 61,127,008 | | | $ | 6,422,750 | | | $ | 2,274,404 | | | $ | 12,885 | | | $ | 207,549,055 | | | $ | (263,215 | ) |
Purchases/(Receipts) | | | 198,053,554 | | | | 8,710,732 | | | | — | | | | 864 | | | | — | | | | 149,888,847 | | | | — | |
(Sales, maturities and paydowns)/Fundings | | | (362,092 | ) | | | (56,907,221 | ) | | | (6,562,080 | ) | | | (2,235,844 | ) | | | — | | | | (9,190,934 | ) | | | 251,217 | |
Amortization of premiums/discounts | | | 986 | | | | (2,286 | ) | | | — | | | | (100 | ) | | | — | | | | (1,400 | ) | | | — | |
Total realized gains (losses) included in earnings | | | 5,923 | | | | (1,946 | ) | | | 562,080 | | | | (46,769 | ) | | | — | | | | 519,288 | | | | (201,420 | ) |
Total change in unrealized appreciation (depreciation) included in earnings | | | (1,785,511 | ) | | | 1,668,438 | | | | (422,750 | ) | | | 46,449 | | | | (1,013 | ) | | | (494,387 | ) | | | 213,405 | |
Transfers into Level 3 | | | 62,216,270 | | | | 41,221,523 | | | | 1,791,617 | | | | 1,970,291 | | | | — | | | | 107,199,701 | | | | — | |
Transfers out of Level 3 | | | — | | | | — | | | | — | | | | (32,051 | ) | | | (11,695 | ) | | | (43,746 | ) | | | — | |
Ending Balance | | $ | 395,841,138 | | | $ | 55,816,248 | | | $ | 1,791,617 | | | $ | 1,977,244 | | | $ | 177 | | | $ | 455,426,424 | | | $ | (13 | ) |
Net change in unrealized appreciation (depreciation) for investments in Level 3 securities still held at March 31, 2020 | | $ | (1,781,168 | ) | | $ | 409,033 | | | $ | — | | | $ | (239 | ) | | $ | (55 | ) | | $ | (1,372,429 | ) | | $ | — | |
Step Coupon Bonds
The following table discloses additional information related to step coupon bonds held by the Fund. Certain securities are subject to multiple rate changes prior to maturity. For those securities a range of rates and corresponding dates have been provided. Rates for all step coupon bonds held by the Fund are scheduled to increase, none are scheduled to decrease.
Name | | Coupon Rate at
Next Reset Date | | | Next Rate
Reset Date | | | Future Reset
Rate(s) | | | Future Reset
Date(s) | |
Legacy Mortgage Asset Trust 2018-GS3, 4.00% due 06/25/58 | | | 7.00 | % | | | 07/25/21 | | | | 8.00 | % | | | 07/26/22 | |
Verus Securitization Trust 2019-4, 2.64% due 11/25/59 | | | 3.64 | % | | | 10/26/23 | | | | — | | | | — | |
58 | THE GUGGENHEIM FUNDS SEMI-ANNUAL REPORT | SEE NOTES TO FINANCIAL STATEMENTS. |
SCHEDULE OF INVESTMENTS (Unaudited)(continued) | March 31, 2020 |
TOTAL RETURN BOND FUND | |
Repurchase Agreements
The Fund may engage in repurchase agreements. Repurchase agreements are fixed income securities in the form of agreements backed by collateral. These agreements typically involve the acquisition by the Fund of securities from the selling institution coupled with the agreement that the selling institution will repurchase the underlying securities at a specified price and at a fixed time in the future. The Fund may accept a wide variety of underlying securities as collateral for the repurchase agreements entered into by the Fund. Any such securities serving as collateral are marked-to-market daily in order to maintain full collateralization. Securities purchased under repurchase agreements are reflected as an asset on the Statement of Assets and Liabilities. Interest earned is recorded as a component of interest income on the Statement of Operations.
In connection with transactions in repurchase agreements, it is the Fund’s policy that its custodian take possession of the underlying collateral. The collateral is in the possession of the Fund’s custodian and is evaluated to ensure that its market value exceeds, at a minimum, 102% of the original face amount of the repurchase agreements.
The use of repurchase agreements involves certain risks. For example, if the selling institution defaults on its obligation to repurchase the underlying securities at a time when the value of securities has declined, the Fund may incur a loss upon disposition of them. In the event of an insolvency or bankruptcy by the selling institution, the Fund’s right to control the collateral could be affected and result in certain costs and delays. In addition, the Fund could incur a loss if the value of the underlying collateral falls below the agreed upon repurchase price.
At March 31, 2020, the repurchase agreements in the account were as follows:
Counterparty and
Terms of Agreement | | Face
Value | | | Repurchase
Price | | | Collateral | | Par
Value | | | Fair
Value | |
| | | | | | | | | | | Cash Collateral | | $ | 30,412,000 | | | $ | 30,412,000 | |
| | | | | | | | | | | | | | | | | | | |
Societe Generale | | | | | | | | | | GS Mortgage Securities Corp. Trust | | | | | | | | |
1.18% - 2.27% | | | | | | | | | | 4.70% | | | | | | | | |
04/01/20 | | $ | 96,136,225 | | | $ | 96,647,356 | | | 07/15/32 | | | 14,971,000 | | | | 12,966,383 | |
| | | | | | | | | | | | | | | | | | | |
| | | | | | | | | | | Morgan Stanley Capital I Trust | | | | | | | | |
| | | | | | | | | | | 5.05% | | | | | | | | |
| | | | | | | | | | | 11/15/34 | | | 21,800,000 | | | | 11,608,500 | |
| | | | | | | | | | | | | | | | | | | |
| | | | | | | | | | | JP Morgan Chase Commercial Mortgage Securities Trust | | | | | | | | |
| | | | | | | | | | | 3.70% | | | | | | | | |
| | | | | | | | | | | 06/15/35 | | | 14,000,000 | | | | 10,627,400 | |
| | | | | | | | | | | | | | | | | | | |
SEE NOTES TO FINANCIAL STATEMENTS. | THE GUGGENHEIM FUNDS SEMI-ANNUAL REPORT | 59 |
SCHEDULE OF INVESTMENTS (Unaudited)(continued) | March 31, 2020 |
TOTAL RETURN BOND FUND | |
Counterparty and
Terms of Agreement | | Face
Value | | | Repurchase
Price | | | Collateral | | Par
Value | | | Fair
Value | |
| | | | | | | | | | | Hawaii Hotel Trust | | | | | | | | |
| | | | | | | | | | | 3.85% | | | | | | | | |
| | | | | | | | | | | 05/15/38 | | $ | 14,300,000 | | | $ | 9,869,860 | |
| | | | | | | | | | | | | | | | | | | |
| | | | | | | | | | | Freddie Mac Structured Agency Credit Risk Debt Notes | | | | | | | | |
| | | | | | | | | | | 3.60% | | | | | | | | |
| | | | | | | | | | | 12/25/29 | | | 11,760,000 | | | | 9,523,248 | |
| | | | | | | | | | | | | | | | | | | |
| | | | | | | | | | | HMH Trust | | | | | | | | |
| | | | | | | | | | | 8.48% | | | | | | | | |
| | | | | | | | | | | 07/05/31 | | | 6,857,000 | | | | 5,955,304 | |
| | | | | | | | | | | | | | | | | | | |
| | | | | | | | | | | Motel 6 Trust | | | | | | | | |
| | | | | | | | | | | 4.95% | | | | | | | | |
| | | | | | | | | | | 08/15/34 | | | 9,553,000 | | | | 4,845,282 | |
| | | | | | | | | | | | | | | | | | | |
| | | | | | | | | | | JP Morgan Chase Commercial Mortgage Securities Trust | | | | | | | | |
| | | | | | | | | | | 3.11% | | | | | | | | |
| | | | | | | | | | | 06/15/35 | | | 5,700,000 | | | | 4,756,080 | |
| | | | | | | | | | | | | | | | | | | |
| | | | | | | | | | | Freddie Mac Stacr Trust | | | | | | | | |
| | | | | | | | | | | 3.30% | | | | | | | | |
| | | | | | | | | | | 02/25/49 | | | 5,407,000 | | | | 4,564,589 | |
| | | | | | | | | | | | | | | | | | | |
| | | | | | | | | | | JP Morgan Chase Commercial Mortgage Securities Trust | | | | | | | | |
| | | | | | | | | | | 3.70% | | | | | | | | |
| | | | | | | | | | | 07/15/36 | | | 7,500,000 | | | | 4,460,250 | |
| | | | | | | | | | | | | | | | | | | |
| | | | | | | | | | | Natixis Commercial Mortgage Securities Trust | | | | | | | | |
| | | | | | | | | | | 3.99% | | | | | | | | |
| | | | | | | | | | | 02/15/33 | | | 5,011,000 | | | | 4,243,315 | |
| | | | | | | | | | | | | | | | | | | |
| | | | | | | | | | | Waikiki Beach Hotel Trust | | | | | | | | |
| | | | | | | | | | | 3.79% | | | | | | | | |
| | | | | | | | | | | 12/15/33 | | | 3,502,000 | | | | 2,189,801 | |
| | | | | | | | | | | | | | | | | | | |
| | | | | | | | | | | Hilton USA Trust | | | | | | | | |
| | | | | | | | | | | 4.33% | | | | | | | | |
| | | | | | | | | | | 11/05/38 | | | 1,066,000 | | | | 589,498 | |
| | | | | | | | | | | | | | 151,839,000 | | | | 116,611,510 | |
| | | | | | | | | | | | | | | | | | | |
60 | THE GUGGENHEIM FUNDS SEMI-ANNUAL REPORT | SEE NOTES TO FINANCIAL STATEMENTS. |
SCHEDULE OF INVESTMENTS (Unaudited)(continued) | March 31, 2020 |
TOTAL RETURN BOND FUND | |
Counterparty and
Terms of Agreement | | Face
Value | | | Repurchase
Price | | | Collateral | | Par
Value | | | Fair
Value | |
BNP Paribas | | | | | | | | | | HSI Asset Securitization Corp. Trust | | | | | | | | |
1.93% | | | | | | | | | | 1.14% | | | | | | | | |
05/04/20 | | $ | 70,867,999 | | | $ | 71,144,926 | | | 01/25/37 | | $ | 32,031,000 | | | $ | 23,155,210 | |
| | | | | | | | | | | | | | | | | | | |
| | | | | | | | | | | Bear Stearns Mortgage Funding Trust | | | | | | | | |
| | | | | | | | | | | 1.15% | | | | | | | | |
| | | | | | | | | | | 02/25/37 | | | 16,832,000 | | | | 15,317,120 | |
| | | | | | | | | | | | | | | | | | | |
| | | | | | | | | | | Morgan Stanley ABS Capital I Inc. Trust | | | | | | | | |
| | | | | | | | | | | 1.62% | | | | | | | | |
| | | | | | | | | | | 09/25/35 | | | 17,232,000 | | | | 13,776,984 | |
| | | | | | | | | | | | | | | | | | | |
| | | | | | | | | | | JP Morgan Mortgage Acquisition Corp. | | | | | | | | |
| | | | | | | | | | | 1.57% | | | | | | | | |
| | | | | | | | | | | 12/25/35 | | | 16,459,000 | | | | 13,652,741 | |
| | | | | | | | | | | | | | | | | | | |
| | | | | | | | | | | MASTR Adjustable Rate Mortgages Trust | | | | | | | | |
| | | | | | | | | | | 1.15% | | | | | | | | |
| | | | | | | | | | | 05/25/47 | | | 11,882,000 | | | | 12,731,563 | |
| | | | | | | | | | | | | | | | | | | |
| | | | | | | | | | | Fannie Mae Connecticut Avenue Securities | | | | | | | | |
| | | | | | | | | | | 3.50% | | | | | | | | |
| | | | | | | | | | | 12/25/30 | | | 14,517,000 | | | | 11,899,585 | |
| | | | | | | | | | | | | | | | | | | |
| | | | | | | | | | | Countrywide Asset-Backed Certificates | | | | | | | | |
| | | | | | | | | | | 1.09% | | | | | | | | |
| | | | | | | | | | | 07/25/37 | | | 12,991,000 | | | | 11,473,651 | |
| | | | | | | | | | | | | | | | | | | |
| | | | | | | | | | | Long Beach Mortgage Loan Trust | | | | | | | | |
| | | | | | | | | | | 2.00% | | | | | | | | |
| | | | | | | | | | | 06/25/35 | | | 7,300,000 | | | | 6,389,690 | |
| | | | | | | | | | | | | | 129,244,000 | | | | 108,396,544 | |
Affiliated Transactions
Investments representing 5% or more of the outstanding voting shares of a company, or control of or by, or common control under Guggenheim Investments (“GI”), result in that company being considered an affiliated issuer, as defined in the 1940 Act.
SEE NOTES TO FINANCIAL STATEMENTS. | THE GUGGENHEIM FUNDS SEMI-ANNUAL REPORT | 61 |
SCHEDULE OF INVESTMENTS (Unaudited)(concluded) | March 31, 2020 |
TOTAL RETURN BOND FUND | |
The Fund may invest in certain of the underlying series of Guggenheim Strategy Funds Trust, including Guggenheim Strategy Fund II and Guggenheim Strategy Fund III, (collectively, the “Short Term Investment Vehicles”), each of which are open-end management investment companies managed by GI. The Short Term Investment Vehicles, which launched on March 11, 2014, are offered as short term investment options only to mutual funds, trusts, and other accounts managed by GI and/or its affiliates, and are not available to the public. The Short Term Investment Vehicles pay no investment management fees. The Short Term Investment Vehicles’ annual report on Form N-CSR dated September 30, 2019, is available publicly or upon request. This information is available from the EDGAR database on the SEC’s website at https://www.sec.gov/Archives/edgar/data/1601445/000089180419000405/gug78512-ncsr.htm.
Transactions during the period ended March 31, 2020, in which the company is an affiliated issuer, were as follows:
Security Name | | Value
09/30/19 | | | Additions | | | Reductions | | | Realized
Gain (Loss) | |
Common Stocks | | | | | | | | | | | | | | | | |
BP Holdco LLC*,1 | | $ | 188 | | | $ | — | | | $ | — | | | $ | — | |
Mutual Funds | | | | | | | | | | | | | | | | |
Guggenheim Floating Rate Strategies Fund — R6-Class | | | 47,451,399 | | | | 70,842 | | | | (47,199,315 | ) | | | (1,797,792 | ) |
Guggenheim Strategy Fund II | | | 26,039,254 | | | | 359,156 | | | | — | | | | — | |
Guggenheim Strategy Fund III | | | 26,014,479 | | | | 362,853 | | | | — | | | | — | |
Guggenheim Ultra Short Duration Fund — Institutional Class | | | 26,060,726 | | | | 270,806 | | | | — | | | | — | |
| | | $ | 125,566,046 | | | $ | 1,063,657 | | | $ | (47,199,315 | ) | | $ | (1,797,792 | ) |
Security Name | | Change in
Unrealized
Appreciation
(Depreciation) | | | Value
03/31/20 | | | Shares
03/31/20 | | | Investment
Income | |
Common Stocks | | | | | | | | | | | | | | | | |
BP Holdco LLC*,1 | | $ | (49 | ) | | $ | 139 | | | | 532 | | | $ | — | |
Mutual Funds | | | | | | | | | | | | | | | | |
Guggenheim Floating Rate Strategies Fund — R6-Class | | | 1,474,866 | | | | — | | | | — | | | | 70,842 | |
Guggenheim Strategy Fund II | | | (827,152 | ) | | | 25,571,258 | | | | 1,063,254 | | | | 359,157 | |
Guggenheim Strategy Fund III | | | (794,931 | ) | | | 25,582,401 | | | | 1,062,833 | | | | 362,853 | |
Guggenheim Ultra Short Duration Fund — Institutional Class | | | (501,332 | ) | | | 25,830,200 | | | | 2,643,828 | | | | 270,806 | |
| | | $ | (648,598 | ) | | $ | 76,983,998 | | | | | | | $ | 1,063,658 | |
* | Non-income producing security. |
1 | Security was fair valued by the Valuation Committee at March 31, 2020. The total market value of fair valued and affiliated securities amounts to $139, (cost $188) or less than 0.1% of total net assets. |
62 | THE GUGGENHEIM FUNDS SEMI-ANNUAL REPORT | SEE NOTES TO FINANCIAL STATEMENTS. |
STATEMENT OF ASSETS AND LIABILITIES (Unaudited) |
TOTAL RETURN BOND FUND |
March 31, 2020
Assets: |
Investments in unaffiliated issuers, at value (cost $14,139,233,524) | | $ | 14,421,354,164 | |
Investments in affiliated issuers, at value (cost $79,350,671) | | | 76,983,998 | |
Repurchase agreements, at value (cost $167,004,224) | | | 167,004,224 | |
Cash | | | 3,024,691 | |
Segregated cash with broker | | | 74,953,240 | |
Unamortized upfront premiums paid on interest rate swap agreements | | | 7,898 | |
Unrealized appreciation on OTC swap agreements | | | 32,495 | |
Unrealized appreciation on forward foreign currency exchange contracts | | | 143,739,316 | |
Prepaid expenses | | | 487,646 | |
Receivables: |
Securities sold | | | 267,294,635 | |
Fund shares sold | | | 81,951,957 | |
Interest | | | 41,449,881 | |
Protection fees on credit default swap agreements | | | 1,343,685 | |
Foreign tax reclaims | | | 184,862 | |
Dividends | | | 144,620 | |
Investment Adviser | | | 563 | |
Total assets | | | 15,279,957,875 | |
| | | | | |
Liabilities: |
Unfunded loan commitments, at value (Note 9) (commitment fees received $18) | | | 13 | |
Segregated cash due to broker | | | 127,169,348 | |
Unamortized upfront premiums received on credit default swap agreements | | | 74,050,715 | |
Unrealized depreciation on forward foreign currency exchange contracts | | | 49,672,255 | |
Payable for: |
Securities purchased | | | 433,974,971 | |
Fund shares redeemed | | | 50,168,822 | |
Variation margin on credit default swap agreements | | | 11,995,252 | |
Distributions to shareholders | | | 4,630,114 | |
Management fees | | | 3,133,197 | |
Swap settlement | | | 2,705,263 | |
Fund accounting/administration fees | | | 737,863 | |
Variation margin on interest rate swap agreements | | | 571,674 | |
Distribution and service fees | | | 494,082 | |
Transfer agent/maintenance fees | | | 249,453 | |
Variation margin on futures contracts | | | 164,067 | |
Trustees’ fees* | | | 28,056 | |
Miscellaneous | | | 2,047,695 | |
Total liabilities | | | 761,792,840 | |
Net assets | | $ | 14,518,165,035 | |
| | | | | |
Net assets consist of: |
Paid in capital | | $ | 14,045,415,442 | |
Total distributable earnings (loss) | | | 472,749,593 | |
Net assets | | $ | 14,518,165,035 | |
| | | | | |
A-Class: |
Net assets | | $ | 558,185,157 | |
Capital shares outstanding | | | 20,101,525 | |
Net asset value per share | | $ | 27.77 | |
Maximum offering price per share (Net asset value divided by 96.00%) | | $ | 28.93 | |
| | | | | |
C-Class: |
Net assets | | $ | 279,991,173 | |
Capital shares outstanding | | | 10,082,117 | |
Net asset value per share | | $ | 27.77 | |
| | | | | |
P-Class: |
Net assets | | $ | 716,858,965 | |
Capital shares outstanding | | | 25,822,237 | |
Net asset value per share | | $ | 27.76 | |
| | | | | |
Institutional Class: |
Net assets | | $ | 12,833,595,268 | |
Capital shares outstanding | | | 461,768,956 | |
Net asset value per share | | $ | 27.79 | |
| | | | | |
R6-Class: |
Net assets | | $ | 129,534,472 | |
Capital shares outstanding | | | 4,658,144 | |
Net asset value per share | | $ | 27.81 | |
* | Relates to Trustees not deemed “interested persons” within the meaning of Section 2(a)(19) of the 1940 Act. |
SEE NOTES TO FINANCIAL STATEMENTS. | THE GUGGENHEIM FUNDS SEMI-ANNUAL REPORT | 63 |
STATEMENT OF OPERATIONS (Unaudited) |
TOTAL RETURN BOND FUND |
Six-Month Period Ended March 31, 2020
Investment Income: |
Dividends from securities of unaffiliated issuers | | $ | 833,940 | |
Dividends from securities of affiliated issuers | | | 1,063,658 | |
Interest from unaffiliated issuers | | | 187,026,257 | |
Total investment income | | | 188,923,855 | |
| | | | | |
Expenses: |
Management fees | | | 28,076,321 | |
Distribution and service fees: |
A-Class | | | 754,960 | |
C-Class | | | 1,420,517 | |
P-Class | | | 991,293 | |
Transfer agent/maintenance fees: |
A-Class | | | 425,274 | |
C-Class | | | 138,333 | |
P-Class | | | 498,992 | |
Institutional Class | | | 4,803,740 | |
R6-Class | | | 5,348 | |
Fund accounting/administration fees | | | 5,543,530 | |
Custodian fees | | | 573,425 | |
Line of credit fees | | | 557,207 | |
Professional fees | | | 513,171 | |
Trustees’ fees* | | | 185,047 | |
Miscellaneous | | | 1,053,003 | |
Recoupment of previously waived fees: |
A-Class | | | 886 | |
C-Class | | | 2,296 | |
P-Class | | | 1,187 | |
Institutional Class | | | 5,804 | |
R6-Class | | | 1,885 | |
Total expenses | | | 45,552,219 | |
Less: |
Expenses reimbursed by Adviser: |
A-Class | | | (290,239 | ) |
C-Class | | | (75,185 | ) |
P-Class | | | (320,845 | ) |
Institutional Class | | | (4,479,702 | ) |
R6-Class | | | (3,689 | ) |
Expenses waived by Adviser | | | (309,788 | ) |
Earnings credits applied | | | (145,057 | ) |
Total waived/reimbursed expenses | | | (5,624,505 | ) |
Net expenses | | | 39,927,714 | |
Net investment income | | | 148,996,141 | |
| | | | | |
Net Realized and Unrealized Gain (Loss): |
Net realized gain (loss) on: |
Investments in unaffiliated issuers | | | 128,771,205 | |
Investments in affiliated issuers | | | (1,797,792 | ) |
Investments sold short | | | (201,420 | ) |
Swap agreements | | | 54,651,605 | |
Futures contracts | | | 8,291,406 | |
Forward foreign currency exchange contracts | | | 10,829,283 | |
Foreign currency transactions | | | (108,373,729 | ) |
Net realized gain | | | 92,170,558 | |
Net change in unrealized appreciation (depreciation) on: |
Investments in unaffiliated issuers | | | (69,540,779 | ) |
Investments in affiliated issuers | | | (648,598 | ) |
Swap agreements | | | 106,701,296 | |
Futures contracts | | | (164,066 | ) |
Options purchased | | | 5,787,528 | |
Forward foreign currency exchange contracts | | | 53,777,596 | |
Foreign currency translations | | | (158,697 | ) |
Net change in unrealized appreciation (depreciation) | | | 95,754,280 | |
Net realized and unrealized gain | | | 187,924,838 | |
Net increase in net assets resulting from operations | | $ | 336,920,979 | |
* | Relates to Trustees not deemed “interested persons” within the meaning of Section 2(a)(19) of the 1940 Act. |
64 | THE GUGGENHEIM FUNDS SEMI-ANNUAL REPORT | SEE NOTES TO FINANCIAL STATEMENTS. |
STATEMENTS OF CHANGES IN NET ASSETS |
TOTAL RETURN BOND FUND | |
| | Six-Month
Period Ended
March 31,
2020
(Unaudited) | | | Year Ended
September 30,
2019 | |
Increase (Decrease) in Net Assets from Operations: | | | | | | | | |
Net investment income | | $ | 148,996,141 | | | $ | 313,602,971 | |
Net realized gain (loss) on investments | | | 92,170,558 | | | | (13,501,878 | ) |
Net change in unrealized appreciation (depreciation) on investments | | | 95,754,280 | | | | 424,184,656 | |
Net increase in net assets resulting from operations | | | 336,920,979 | | | | 724,285,749 | |
| | | | | | | | | |
Distributions to shareholders: | | | | | | | | |
A-Class | | | (5,961,313 | ) | | | (17,650,066 | ) |
C-Class | | | (1,741,694 | ) | | | (5,704,804 | ) |
P-Class | | | (7,833,536 | ) | | | (21,602,062 | ) |
Institutional Class | | | (142,576,762 | ) | | | (321,960,314 | ) |
R6-Class | | | (1,378,932 | ) | | | (1,386,227 | ) |
Total distributions to shareholders | | | (159,492,237 | ) | | | (368,303,473 | ) |
| | | | | | | | | |
Capital share transactions: | | | | | | | | |
Proceeds from sale of shares | | | | | | | | |
A-Class | | | 112,485,757 | | | | 291,044,602 | |
C-Class | | | 28,928,199 | | | | 79,694,391 | |
P-Class | | | 157,784,323 | | | | 351,341,399 | |
Institutional Class | | | 3,578,107,846 | | | | 6,140,295,101 | |
R6-Class | | | 107,209,970 | | | | 24,004,225 | |
Distributions reinvested | | | | | | | | |
A-Class | | | 5,329,481 | | | | 15,903,479 | |
C-Class | | | 1,446,338 | | | | 4,753,753 | |
P-Class | | | 7,733,911 | | | | 21,298,550 | |
Institutional Class | | | 117,966,370 | | | | 260,717,634 | |
R6-Class | | | 1,378,509 | | | | 1,386,227 | |
Cost of shares redeemed | | | | | | | | |
A-Class | | | (176,398,877 | ) | | | (304,339,035 | ) |
C-Class | | | (39,914,313 | ) | | | (71,478,334 | ) |
P-Class | | | (277,012,950 | ) | | | (313,106,525 | ) |
Institutional Class | | | (3,156,915,260 | ) | | | (3,528,943,102 | ) |
R6-Class | | | (36,525,523 | ) | | | (8,999,085 | ) |
Net increase from capital share transactions | | | 431,603,781 | | | | 2,963,573,280 | |
Net increase in net assets | | | 609,032,523 | | | | 3,319,555,556 | |
| | | | | | | | | |
Net assets: | | | | | | | | |
Beginning of period | | | 13,909,132,512 | | | | 10,589,576,956 | |
End of period | | $ | 14,518,165,035 | | | $ | 13,909,132,512 | |
| | | | | | | | | |
SEE NOTES TO FINANCIAL STATEMENTS. | THE GUGGENHEIM FUNDS SEMI-ANNUAL REPORT | 65 |
STATEMENTS OF CHANGES IN NET ASSETS (concluded) |
TOTAL RETURN BOND FUND | |
| | Six-Month
Period Ended
March 31,
2020
(Unaudited) | | | Year Ended
September 30,
2019 | |
Capital share activity: | | | | | | | | |
Shares sold | | | | | | | | |
A-Class | | | 4,103,348 | | | | 10,870,632 | |
C-Class | | | 1,056,337 | | | | 2,970,672 | |
P-Class | | | 5,734,928 | | | | 13,120,761 | |
Institutional Class | | | 129,959,469 | | | | 228,795,854 | |
R6-Class | | | 3,907,705 | | | | 890,426 | |
Shares issued from reinvestment of distributions | | | | | | | | |
A-Class | | | 193,678 | | | | 592,684 | |
C-Class | | | 52,541 | | | | 177,175 | |
P-Class | | | 281,194 | | | | 793,377 | |
Institutional Class | | | 4,281,730 | | | | 9,694,369 | |
R6-Class | | | 49,984 | | | | 51,500 | |
Shares redeemed | | | | | | | | |
A-Class | | | (6,423,641 | ) | | | (11,329,916 | ) |
C-Class | | | (1,456,072 | ) | | | (2,663,801 | ) |
P-Class | | | (10,093,156 | ) | | | (11,696,424 | ) |
Institutional Class | | | (114,696,858 | ) | | | (131,586,335 | ) |
R6-Class | | | (1,318,216 | ) | | | (334,949 | ) |
Net increase in shares | | | 15,632,971 | | | | 110,346,025 | |
66 | THE GUGGENHEIM FUNDS SEMI-ANNUAL REPORT | SEE NOTES TO FINANCIAL STATEMENTS. |
FINANCIAL HIGHLIGHTS |
TOTAL RETURN BOND FUND | |
This table is presented to show selected data for a share outstanding throughout each period and to assist shareholders in evaluating a Fund’s performance for the periods presented.
A-Class | | Period
Ended
March 31,
2020a | | | Year
Ended
Sept. 30,
2019 | | | Year
Ended
Sept. 30,
2018 | | | Year
Ended
Sept. 30,
2017 | | | Year
Ended
Sept. 30,
2016 | | | Year
Ended
Sept. 30,
2015 | |
Per Share Data |
Net asset value, beginning of period | | $ | 27.42 | | | $ | 26.69 | | | $ | 27.05 | | | $ | 27.23 | | | $ | 26.50 | | | $ | 26.94 | |
Income (loss) from investment operations: |
Net investment income (loss)b | | | .25 | | | | .64 | | | | .72 | | | | .83 | | | | .96 | | | | .94 | |
Net gain (loss) on investments (realized and unrealized) | | | .37 | | | | .85 | | | | (.37 | ) | | | .05 | | | | .81 | | | | (.25 | ) |
Total from investment operations | | | .62 | | | | 1.49 | | | | .35 | | | | .88 | | | | 1.77 | | | | .69 | |
Less distributions from: |
Net investment income | | | (.27 | ) | | | (.65 | ) | | | (.71 | ) | | | (.95 | ) | | | (1.04 | ) | | | (1.09 | ) |
Net realized gains | | | — | | | | (.11 | ) | | | — | | | | (.11 | ) | | | — | | | | (.04 | ) |
Total distributions | | | (.27 | ) | | | (.76 | ) | | | (.71 | ) | | | (1.06 | ) | | | (1.04 | ) | | | (1.13 | ) |
Net asset value, end of period | | $ | 27.77 | | | $ | 27.42 | | | $ | 26.69 | | | $ | 27.05 | | | $ | 27.23 | | | $ | 26.50 | |
|
Total Returnc | | | 2.28 | % | | | 5.70 | % | | | 1.28 | % | | | 3.33 | % | | | 6.88 | % | | | 2.56 | % |
Ratios/Supplemental Data |
Net assets, end of period (in thousands) | | $ | 558,185 | | | $ | 609,602 | | | $ | 589,760 | | | $ | 744,989 | | | $ | 548,223 | | | $ | 435,760 | |
Ratios to average net assets: |
Net investment income (loss) | | | 1.83 | % | | | 2.37 | % | | | 2.66 | % | | | 3.08 | % | | | 3.63 | % | | | 3.50 | % |
Total expensesd | | | 0.90 | % | | | 0.96 | % | | | 0.93 | % | | | 1.02 | % | | | 1.15 | % | | | 1.10 | % |
Net expensese,f,g | | | 0.80 | % | | | 0.80 | % | | | 0.81 | % | | | 0.87 | % | | | 0.97 | % | | | 0.91 | % |
Portfolio turnover rate | | | 41 | % | | | 68 | % | | | 48 | % | | | 72 | % | | | 86 | % | | | 74 | % |
SEE NOTES TO FINANCIAL STATEMENTS. | THE GUGGENHEIM FUNDS SEMI-ANNUAL REPORT | 67 |
FINANCIAL HIGHLIGHTS (continued) |
TOTAL RETURN BOND FUND | |
This table is presented to show selected data for a share outstanding throughout each period and to assist shareholders in evaluating a Fund’s performance for the periods presented.
C-Class | | Period
Ended
March 31,
2020a | | | Year
Ended
Sept. 30,
2019 | | | Year
Ended
Sept. 30,
2018 | | | Year
Ended
Sept. 30,
2017 | | | Year
Ended
Sept. 30,
2016 | | | Year
Ended
Sept. 30,
2015 | |
Per Share Data |
Net asset value, beginning of period | | $ | 27.43 | | | $ | 26.69 | | | $ | 27.05 | | | $ | 27.23 | | | $ | 26.50 | | | $ | 26.94 | |
Income (loss) from investment operations: |
Net investment income (loss)b | | | .15 | | | | .43 | | | | .52 | | | | .65 | | | | .75 | | | | .74 | |
Net gain (loss) on investments (realized and unrealized) | | | .36 | | | | .87 | | | | (.38 | ) | | | .03 | | | | .82 | | | | (.25 | ) |
Total from investment operations | | | .51 | | | | 1.30 | | | | .14 | | | | .68 | | | | 1.57 | | | | .49 | |
Less distributions from: |
Net investment income | | | (.17 | ) | | | (.45 | ) | | | (.50 | ) | | | (.75 | ) | | | (.84 | ) | | | (.89 | ) |
Net realized gains | | | — | | | | (.11 | ) | | | — | | | | (.11 | ) | | | — | | | | (.04 | ) |
Total distributions | | | (.17 | ) | | | (.56 | ) | | | (.50 | ) | | | (.86 | ) | | | (.84 | ) | | | (.93 | ) |
Net asset value, end of period | | $ | 27.77 | | | $ | 27.43 | | | $ | 26.69 | | | $ | 27.05 | | | $ | 27.23 | | | $ | 26.50 | |
|
Total Returnc | | | 1.86 | % | | | 4.95 | % | | | 0.53 | % | | | 2.58 | % | | | 6.08 | % | | | 1.82 | % |
Ratios/Supplemental Data |
Net assets, end of period (in thousands) | | $ | 279,991 | | | $ | 286,050 | | | $ | 265,486 | | | $ | 251,177 | | | $ | 216,255 | | | $ | 89,320 | |
Ratios to average net assets: |
Net investment income (loss) | | | 1.08 | % | | | 1.62 | % | | | 1.93 | % | | | 2.44 | % | | | 2.82 | % | | | 2.75 | % |
Total expensesd | | | 1.61 | % | | | 1.60 | % | | | 1.62 | % | | | 1.74 | % | | | 1.83 | % | | | 1.80 | % |
Net expensese,f,g | | | 1.55 | % | | | 1.55 | % | | | 1.55 | % | | | 1.60 | % | | | 1.69 | % | | | 1.63 | % |
Portfolio turnover rate | | | 41 | % | | | 68 | % | | | 48 | % | | | 72 | % | | | 86 | % | | | 74 | % |
68 | THE GUGGENHEIM FUNDS SEMI-ANNUAL REPORT | SEE NOTES TO FINANCIAL STATEMENTS. |
FINANCIAL HIGHLIGHTS (continued) |
TOTAL RETURN BOND FUND | |
This table is presented to show selected data for a share outstanding throughout each period and to assist shareholders in evaluating a Fund’s performance for the periods presented.
P-Class | | Period
Ended
March 31,
2020a | | | Year
Ended
Sept. 30,
2019 | | | Year
Ended
Sept. 30,
2018 | | | Year
Ended
Sept. 30,
2017 | | | Year
Ended
Sept. 30,
2016 | | | Period
Ended
Sept. 30,
2015h | |
Per Share Data |
Net asset value, beginning of period | | $ | 27.42 | | | $ | 26.69 | | | $ | 27.04 | | | $ | 27.23 | | | $ | 26.49 | | | $ | 26.98 | |
Income (loss) from investment operations: |
Net investment income (loss)b | | | .25 | | | | .63 | | | | .72 | | | | .85 | | | | .96 | | | | .36 | |
Net gain (loss) on investments (realized and unrealized) | | | .36 | | | | .86 | | | | (.36 | ) | | | .03 | | | | .84 | | | | (.43 | ) |
Total from investment operations | | | .61 | | | | 1.49 | | | | .36 | | | | .88 | | | | 1.80 | | | | (.07 | ) |
Less distributions from: |
Net investment income | | | (.27 | ) | | | (.65 | ) | | | (.71 | ) | | | (.96 | ) | | | (1.06 | ) | | | (.42 | ) |
Net realized gains | | | — | | | | (.11 | ) | | | — | | | | (.11 | ) | | | — | | | | — | |
Total distributions | | | (.27 | ) | | | (.76 | ) | | | (.71 | ) | | | (1.07 | ) | | | (1.06 | ) | | | (.42 | ) |
Net asset value, end of period | | $ | 27.76 | | | $ | 27.42 | | | $ | 26.69 | | | $ | 27.04 | | | $ | 27.23 | | | $ | 26.49 | |
|
Total Return | | | 2.24 | % | | | 5.70 | % | | | 1.32 | % | | | 3.34 | % | | | 6.97 | % | | | (0.21 | %) |
Ratios/Supplemental Data |
Net assets, end of period (in thousands) | | $ | 716,859 | | | $ | 819,770 | | | $ | 738,694 | | | $ | 572,644 | | | $ | 161,928 | | | $ | 12,509 | |
Ratios to average net assets: |
Net investment income (loss) | | | 1.83 | % | | | 2.37 | % | | | 2.69 | % | | | 3.14 | % | | | 3.58 | % | | | 3.20 | % |
Total expensesd | | | 0.88 | % | | | 0.87 | % | | | 0.91 | % | | | 1.03 | % | | | 0.96 | % | | | 1.02 | % |
Net expensese,f,g | | | 0.80 | % | | | 0.80 | % | | | 0.80 | % | | | 0.86 | % | | | 0.82 | % | | | 0.84 | % |
Portfolio turnover rate | | | 41 | % | | | 68 | % | | | 48 | % | | | 72 | % | | | 86 | % | | | 74 | % |
SEE NOTES TO FINANCIAL STATEMENTS. | THE GUGGENHEIM FUNDS SEMI-ANNUAL REPORT | 69 |
FINANCIAL HIGHLIGHTS (continued) |
TOTAL RETURN BOND FUND | |
This table is presented to show selected data for a share outstanding throughout each period and to assist shareholders in evaluating a Fund’s performance for the periods presented.
Institutional Class | | Period
Ended
March 31,
2020a | | | Year
Ended
Sept. 30,
2019 | | | Year
Ended
Sept. 30,
2018 | | | Year
Ended
Sept. 30,
2017 | | | Year
Ended
Sept. 30,
2016 | | | Year
Ended
Sept. 30,
2015 | |
Per Share Data |
Net asset value, beginning of period | | $ | 27.45 | | | $ | 26.71 | | | $ | 27.07 | | | $ | 27.26 | | | $ | 26.53 | | | $ | 26.97 | |
Income (loss) from investment operations: |
Net investment income (loss)b | | | .29 | | | | .71 | | | | .80 | | | | .93 | | | | 1.05 | | | | 1.03 | |
Net gain (loss) on investments (realized and unrealized) | | | .36 | | | | .87 | | | | (.37 | ) | | | .04 | | | | .82 | | | | (.25 | ) |
Total from investment operations | | | .65 | | | | 1.58 | | | | .43 | | | | .97 | | | | 1.87 | | | | .78 | |
Less distributions from: |
Net investment income | | | (.31 | ) | | | (.73 | ) | | | (.79 | ) | | | (1.05 | ) | | | (1.14 | ) | | | (1.18 | ) |
Net realized gains | | | — | | | | (.11 | ) | | | — | | | | (.11 | ) | | | — | | | | (.04 | ) |
Total distributions | | | (.31 | ) | | | (.84 | ) | | | (.79 | ) | | | (1.16 | ) | | | (1.14 | ) | | | (1.22 | ) |
Net asset value, end of period | | $ | 27.79 | | | $ | 27.45 | | | $ | 26.71 | | | $ | 27.07 | | | $ | 27.26 | | | $ | 26.53 | |
|
Total Return | | | 2.42 | % | | | 6.03 | % | | | 1.59 | % | | | 3.68 | % | | | 7.26 | % | | | 2.91 | % |
Ratios/Supplemental Data |
Net assets, end of period (in thousands) | | $ | 12,833,595 | | | $ | 12,138,270 | | | $ | 8,957,902 | | | $ | 6,418,897 | | | $ | 3,024,918 | | | $ | 1,409,171 | |
Ratios to average net assets: |
Net investment income (loss) | | | 2.12 | % | | | 2.64 | % | | | 2.99 | % | | | 3.47 | % | | | 3.94 | % | | | 3.83 | % |
Total expensesd | | | 0.58 | % | | | 0.58 | % | | | 0.58 | % | | | 0.68 | % | | | 0.79 | % | | | 0.76 | % |
Net expensese,f,g | | | 0.51 | % | | | 0.51 | % | | | 0.50 | % | | | 0.52 | % | | | 0.59 | % | | | 0.57 | % |
Portfolio turnover rate | | | 41 | % | | | 68 | % | | | 48 | % | | | 72 | % | | | 86 | % | | | 74 | % |
70 | THE GUGGENHEIM FUNDS SEMI-ANNUAL REPORT | SEE NOTES TO FINANCIAL STATEMENTS. |
FINANCIAL HIGHLIGHTS (continued) |
TOTAL RETURN BOND FUND |
This table is presented to show selected data for a share outstanding throughout each period and to assist shareholders in evaluating a Fund’s performance for the periods presented.
R6-Class | | Period
Ended
March 31,
2020a | | | Year
Ended
Sept. 30,
2019 | | | Year
Ended
Sept. 30,
2018 | | | Period
Ended
Sept. 30,
2017i | |
Per Share Data |
Net asset value, beginning of period | | $ | 27.46 | | | $ | 26.73 | | | $ | 27.09 | | | $ | 27.15 | |
Income (loss) from investment operations: |
Net investment income (loss)b | | | .29 | | | | .71 | | | | .81 | | | | .86 | |
Net gain (loss) on investments (realized and unrealized) | | | .37 | | | | .86 | | | | (.38 | ) | | | .18 | |
Total from investment operations | | | .66 | | | | 1.57 | | | | .43 | | | | 1.04 | |
Less distributions from: |
Net investment income | | | (.31 | ) | | | (.73 | ) | | | (.79 | ) | | | (.99 | ) |
Net realized gains | | | — | | | | (.11 | ) | | | — | | | | (.11 | ) |
Total distributions | | | (.31 | ) | | | (.84 | ) | | | (.79 | ) | | | (1.10 | ) |
Net asset value, end of period | | $ | 27.81 | | | $ | 27.46 | | | $ | 26.73 | | | $ | 27.09 | |
|
Total Return | | | 2.42 | % | | | 5.99 | % | | | 1.59 | % | | | 3.97 | % |
Ratios/Supplemental Data |
Net assets, end of period (in thousands) | | $ | 129,534 | | | $ | 55,441 | | | $ | 37,735 | | | $ | 13,709 | |
Ratios to average net assets: |
Net investment income (loss) | | | 2.11 | % | | | 2.64 | % | | | 3.00 | % | | | 3.35 | % |
Total expensesd | | | 0.52 | % | | | 0.52 | % | | | 0.53 | % | | | 0.65 | % |
Net expensese,f,g | | | 0.51 | % | | | 0.51 | % | | | 0.50 | % | | | 0.51 | % |
Portfolio turnover rate | | | 41 | % | | | 68 | % | | | 48 | % | | | 72 | % |
SEE NOTES TO FINANCIAL STATEMENTS. | THE GUGGENHEIM FUNDS SEMI-ANNUAL REPORT | 71 |
FINANCIAL HIGHLIGHTS (concluded) |
TOTAL RETURN BOND FUND |
a | Unaudited figures for the period ended March 31, 2020. Percentage amounts for the period, except total return and portfolio turnover rate, have been annualized. |
b | Net investment income (loss) per share was computed using average shares outstanding throughout the period. |
c | Total return does not reflect the impact of any applicable sales charges. |
d | Does not include expenses of the underlying funds in which the Fund invests. |
e | Net expense information reflects the expense ratios after expense waivers and reimbursements, as applicable. |
f | The portion of the ratios of net expenses to average net assets attributable to recoupments of prior fee reductions or expense reimbursements for the periods presented was as follows: |
| | | 03/31/20a | 09/30/19 | 09/30/18 | 09/30/17 |
| | A-Class | 0.00%* | — | 0.00%* | 0.01% |
| | C-Class | 0.00%* | — | 0.00%* | 0.01% |
| | P-Class | 0.00%* | 0.00%* | 0.00%* | 0.01% |
| | Institutional Class | 0.00%* | — | 0.00%* | — |
| | R6-Class | 0.00%* | 0.00%* | 0.00%* | — |
g | Net expenses may include expenses that are excluded from the expense limitation agreement. Excluding these expenses, the net expense ratios for the periods presented would be: |
| | | 03/31/20a | 09/30/19 | 09/30/18 | 09/30/17 | 09/30/16 | 09/30/15 |
| | A-Class | 0.79% | 0.79% | 0.80% | 0.84% | 0.87% | 0.84% |
| | C-Class | 1.54% | 1.54% | 1.55% | 1.57% | 1.60% | 1.56% |
| | P-Class | 0.79% | 0.79% | 0.80% | 0.83% | 0.75% | 0.75% |
| | Institutional Class | 0.50% | 0.50% | 0.49% | 0.49% | 0.49% | 0.50% |
| | R6-Class | 0.50% | 0.50% | 0.49% | 0.48% | N/A | N/A |
h | Since commencement of operations: May 1, 2015. Percentage amounts for the period, except total return and portfolio turnover rate, have been annualized. |
i | Since commencement of operations: October 19, 2016. Percentage amounts for the period, except total return and portfolio turnover rate, have been annualized. |
72 | THE GUGGENHEIM FUNDS SEMI-ANNUAL REPORT | SEE NOTES TO FINANCIAL STATEMENTS. |
NOTES TO FINANCIAL STATEMENTS (Unaudited) |
Note 1 – Organization and Significant Accounting Policies
Organization
Guggenheim Funds Trust (the “Trust”), a Delaware statutory trust, is registered with the SEC under the Investment Company Act of 1940 (“1940 Act”), as an open-ended investment company of the series type. Each series, in effect, is representing a separate fund. The Trust is authorized to issue an unlimited number of no par value shares. The Trust accounts for the assets of each fund separately.
The Trust offers a combination of five separate classes of shares: A-Class shares, C-Class shares, P-Class shares, Institutional Class shares and R6-Class shares. Sales of shares of each Class are made without a front-end sales charge at the net asset value per share (“NAV”), with the exception of A-Class shares. A-Class shares are sold at the NAV, plus the applicable front-end sales charge. The sales charge varies depending on the amount purchased. A-Class share purchases of $1 million or more are exempt from the front-end sales charge but have a 1% contingent deferred sales charge (“CDSC”), if shares are redeemed within 12 months of purchase. C-Class shares have a 1% CDSC if shares are redeemed within 12 months of purchase. C-Class shares automatically convert to A-Class shares on or about the 10th day of the month following the 10-year anniversary of the purchase of the C-Class shares. This conversion will be executed without any sales charge, fee or other charge. After the conversion is completed, the shares will be subject to all features and expenses of A-Class shares. Institutional Class shares are offered primarily for direct investment by institutions such as pension and profit sharing plans, endowments, foundations and corporations. Institutional Class shares require a minimum initial investment of $2 million and a minimum account balance of $1 million. R6-Class shares are offered primarily through qualified retirement and benefit plans. R6-Class shares are also offered through certain other plans and platforms sponsored by financial intermediaries. Certain institutional investors and others deemed appropriate by Guggenheim Investments (“GI”) may also be eligible to purchase R6-Class shares subject to a $2 million minimum initial investment. At March 31, 2020, the Trust consisted of nineteen funds (the “Funds”).
This report covers the Total Return Bond Fund (the “Fund”), a diversified investment company. At March 31, 2020, A-Class, C-Class, P-Class, Institutional Class and R6-Class shares have been issued by the Fund.
Guggenheim Partners Investment Management, LLC (“GPIM”), which operates under the name Guggenheim Investments, provides advisory services. Guggenheim Funds Distributors, LLC (“GFD”) acts as principal underwriter for the Trust. GI and GFD are affiliated entities.
Significant Accounting Policies
The Fund operates as an investment company and, accordingly, follows the investment company accounting and reporting guidance of the Financial Accounting Standards Board (“FASB”) Accounting Standards Codification Topic 946 Financial Services – Investment Companies.
| | THE GUGGENHEIM FUNDS SEMI-ANNUAL REPORT | 73 |
NOTES TO FINANCIAL STATEMENTS (Unaudited)(continued) |
The following significant accounting policies are in conformity with U.S. generally accepted accounting principles (“U.S. GAAP”) and are consistently followed by the Trust. This requires management to make estimates and assumptions that affect the reported amount of assets and liabilities, contingent assets and liabilities at the date of the financial statements, and the reported amounts of revenues and expenses during the reporting period. Actual results could differ from these estimates. All time references are based on Eastern Time.
The NAV of each Class of the Fund is calculated by dividing the market value of the Fund’s securities and other assets, less all liabilities, attributable to the Class by the number of outstanding shares of the Class.
(a) Valuation of Investments
The Board of Trustees of the Fund (the “Board”) has adopted policies and procedures for the valuation of the Fund’s investments (the “Valuation Procedures”). Pursuant to the Valuation Procedures, the Board has delegated to a valuation committee, consisting of representatives from Guggenheim’s investment management, fund administration, legal and compliance departments (the “Valuation Committee”), the day-to-day responsibility for implementing the Valuation Procedures, including, under most circumstances, the responsibility for determining the fair value of the Fund’s securities and/or other assets.
Valuations of the Fund’s securities and other assets are supplied primarily by pricing services appointed pursuant to the processes set forth in the Valuation Procedures. The Valuation Committee convenes monthly, or more frequently as needed, to review the valuation of all assets which have been fair valued for reasonableness. The Fund’s officers, through the Valuation Committee and consistent with the monitoring and review responsibilities set forth in the Valuation Procedures, regularly review procedures used and valuations provided by the pricing services.
If the pricing service cannot or does not provide a valuation for a particular investment or such valuation is deemed unreliable, such investment is fair valued by the Valuation Committee.
Equity securities listed or traded on a recognized U.S. securities exchange or the National Association of Securities Dealers Automated Quotations (“NASDAQ”) National Market System shall generally be valued on the basis of the last sale price on the primary U.S. exchange or market on which the security is listed or traded; provided, however, that securities listed on NASDAQ will be valued at the NASDAQ Official Closing Price, which may not necessarily represent the last sale price. If there is no sale on the valuation date, exchange-traded U.S. equity securities will be valued on the basis of the last bid price.
Generally, trading in foreign securities markets is substantially completed each day at various times prior to the close of the New York Stock Exchange (“NYSE”). The values of foreign securities are determined as of the close of such foreign markets or the close of the NYSE, if earlier. All investments quoted in foreign currencies are valued in U.S. dollars on the basis of the foreign
74 | THE GUGGENHEIM FUNDS SEMI-ANNUAL REPORT | |
NOTES TO FINANCIAL STATEMENTS (Unaudited)(continued) |
currency exchange rates prevailing at the close of U.S. business at 4:00 p.m. Investments in foreign securities may involve risks not present in domestic investments. The Valuation Committee will determine the current value of such foreign securities by taking into consideration certain factors which may include those discussed above, as well as the following factors, among others: the value of the securities traded on other foreign markets, ADR trading, closed-end fund trading, foreign currency exchange activity, and the trading prices of financial products that are tied to foreign securities. In addition, under the Valuation Procedures, the Valuation Committee and GI are authorized to use prices and other information supplied by a third party pricing vendor in valuing foreign securities.
Open-end investment companies are valued at their NAV as of the close of business, on the valuation date. Exchange-traded funds and closed-end investment companies are valued at the last quoted sale price.
U.S. Government securities are valued by independent pricing services, the last traded fill price, or at the reported bid price at the close of business.
Repurchase agreements are generally valued at amortized cost, provided such amounts approximate market value.
Debt securities with a maturity of greater than 60 days at acquisition are valued at prices that reflect broker-dealer supplied valuations or are obtained from independent pricing services, which may consider the trade activity, treasury spreads, yields or price of bonds of comparable quality, coupon, maturity, and type, as well as prices quoted by dealers who make markets in such securities. Short-term debt securities with a maturity of 60 days or less at acquisition are valued at amortized cost, provided such amount approximates market value.
Typically, loans are valued using information provided by an independent third party pricing service that uses broker quotes, among other inputs. If the pricing service cannot or does not provide a valuation for a particular loan or such valuation is deemed unreliable, such investment is valued based on a quote from a broker-dealer or is fair valued by the Valuation Committee.
Exchange-traded options are valued at the mean of the bid and ask prices on the principal exchange on which they are traded. Over-the-counter (“OTC”) options are valued using a price provided by a pricing service.
The value of futures contracts is accounted for using the unrealized appreciation or depreciation on the contracts that is determined by marking the contracts to their current realized settlement prices. Financial futures contracts are valued at the 4:00 p.m. price on the valuation date. In the event that the exchange for a specific futures contract closes earlier than 4:00 p.m., the futures contract is valued at the official settlement price of the exchange. However, the underlying securities from which the futures contract value is derived are monitored until 4:00 p.m. to determine if fair valuation would provide a more accurate valuation.
| | THE GUGGENHEIM FUNDS SEMI-ANNUAL REPORT | 75 |
NOTES TO FINANCIAL STATEMENTS (Unaudited)(continued) |
The value of interest rate swap agreements entered into by the Fund is accounted for using the unrealized appreciation or depreciation on the agreements that is determined using the previous day’s Chicago Mercantile Exchange close price, adjusted for the current day’s spreads.
The values of other swap agreements entered into by the Fund are accounted for using the unrealized appreciation or depreciation on the agreements that are determined by marking the agreements to the last quoted value of the index or other underlying positions that the swaps pertain to at the close of the NYSE.
Forward foreign currency exchange contracts are valued daily based on the applicable exchange rate of the underlying currency.
Investments for which market quotations are not readily available are fair-valued as determined in good faith by GI subject to review and approval by the Valuation Committee, pursuant to methods established or ratified by the Board. Valuations in accordance with these methods are intended to reflect each security’s (or asset’s or liability’s) “fair value”. Each such determination is based on a consideration of all relevant factors, which are likely to vary from one pricing context to another. Examples of such factors may include, but are not limited to market prices; sale prices; broker quotes; and models which derive prices based on inputs such as prices of securities with comparable maturities and characteristics, or based on inputs such as anticipated cash flows or collateral, spread over U.S. Treasury securities, and other information analysis. In connection with futures contracts and other derivative investments, such factors may include obtaining information as to how (a) these contracts and other derivative investments trade in the futures or other derivative markets, respectively, and (b) the securities underlying these contracts and other derivative investments trade in the cash market.
(b) U.S. Government and Agency Obligations
Certain U.S. Government and Agency Obligations are traded on a discount basis; the interest rates shown on the Schedule of Investments reflect the effective rates paid at the time of purchase by the Fund. Other securities bear interest at the rates shown, payable at fixed dates through maturity.
(c) Senior Floating Rate Interests and Loan Investments
Senior floating rate interests in which the Fund invests generally pay interest rates which are periodically adjusted by reference to a base short-term floating rate, plus a premium. These base lending rates are generally (i) the lending rate offered by one or more major European banks, such as the one-month or three-month London Inter-Bank Offered Rate (“LIBOR”), (ii) the prime rate offered by one or more major United States banks, or (iii) the bank’s certificate of deposit rate. Senior floating rate interests often require prepayments from excess cash flows or permit the borrower to repay at its election. The rate at which the borrower repays cannot be predicted
76 | THE GUGGENHEIM FUNDS SEMI-ANNUAL REPORT | |
NOTES TO FINANCIAL STATEMENTS (Unaudited)(continued) |
with accuracy. As a result, the actual remaining maturity may be substantially less than the stated maturities disclosed in the Fund’s Schedule of Investments. The interest rate indicated is the rate in effect at March 31, 2020.
The Fund invests in loans and other similar debt obligations (“obligations”). A portion of the Fund’s investments in these obligations is sometimes referred to as “covenant lite” loans or obligations (“covenant lite obligations”), which are obligations that lack covenants or possess fewer or less restrictive covenants or constraints on borrowers than certain other types of obligations. The Fund may also obtain exposure to covenant lite obligations through investment in securitization vehicles and other structured products. In recent market conditions, many new or reissued obligations have not featured traditional covenants, which are intended to protect lenders and investors by (i) imposing certain restrictions or other limitations on a borrower’s operations or assets or (ii) providing certain rights to lenders. The Fund may have fewer rights with respect to covenant lite obligations, including fewer protections against the possibility of default and fewer remedies in the event of default. As a result, investments in (or exposure to) covenant lite obligations are subject to more risk than investments in (or exposure to) certain other types of obligations. The Fund is subject to other risks associated with investments in (or exposure to) obligations, including that obligations may not be considered “securities” and, as a result, the Fund may not be entitled to rely on the anti-fraud protections under the federal securities laws and instead may have to resort to state law and direct claims.
(d) Interests in When-Issued Securities
The Fund may purchase and sell interests in securities on a when-issued and delayed delivery basis, with payment and delivery scheduled for a future date. No income accrues to the Fund on such interests or securities in connection with such transactions prior to the date the Fund actually take delivery of such interests or securities. These transactions are subject to market fluctuations and are subject to the risk that the value at delivery may be more or less than the trade date purchase price. Although the Fund will generally purchase these securities with the intention of acquiring such securities, they may sell such securities before the settlement date.
(e) Options
Upon the purchase of an option, the premium paid is recorded as an investment, the value of which is marked-to-market daily. If a purchased option expires, the Fund realizes a loss in the amount of the cost of the option. When the Fund enters into a closing sale transaction, it realizes a gain or loss depending on whether the proceeds from the closing sale transaction are greater or less than the cost of the option. If the Fund exercises a put option, it realizes a gain or loss from the sale of the underlying security and the proceeds from such sale will be decreased by the premium originally paid. When the Fund exercises a call option, the cost of the security purchased by the Fund upon exercise increases by the premium originally paid.
| | THE GUGGENHEIM FUNDS SEMI-ANNUAL REPORT | 77 |
NOTES TO FINANCIAL STATEMENTS (Unaudited)(continued) |
When the Fund writes (sells) an option, an amount equal to the premium received is entered in that Fund’s accounting records as an asset and equivalent liability. The amount of the liability is subsequently marked-to-market to reflect the current value of the option written. When a written option expires, or if the Fund enters into a closing purchase transaction, it realizes a gain (or loss if the cost of a closing purchase transaction exceeds the premium received when the option was sold).
(f) Futures Contracts
Upon entering into a futures contract, the Fund deposits and maintains as collateral such initial margin as required by the exchange on which the transaction is affected. Pursuant to the contract, the Fund agrees to receive from or pay to the broker an amount of cash equal to the daily fluctuation in value of the contract. Such receipts or payments are known as variation margin and are recorded by the Fund as unrealized appreciation or depreciation. When the contract is closed, the Fund records a realized gain or loss equal to the difference between the value of the contract at the time it was opened and the value at the time it was closed.
(g) Swap Agreements
Swap agreements are marked-to-market daily and the change, if any, is recorded as unrealized appreciation or depreciation. Payments received or made as a result of an agreement or termination of an agreement are recognized as realized gains or losses.
Upon entering into certain centrally-cleared swap transactions, a Fund is required to deposit with its clearing broker an amount of cash or securities as an initial margin. Subsequent variation margin receipts or payments are received or made by the Fund depending on fluctuations in the fair value of the reference entity and are recorded by the Fund as unrealized appreciation or depreciation. When the contract is closed, the Fund records a realized gain or loss equal to the difference between the value of the contract at the time it was opened and the value at the time it was closed.
Upfront payments received or made by a Fund on credit default swap agreements and interest rate swap agreements are amortized over the expected life of the agreement. Periodic payments received or paid by a Fund are recorded as realized gains or losses. Payments received or made as a result of a credit event or termination of the contract are recognized, net of a proportional amount of the upfront payment, as realized gains or losses.
(h) Forward Foreign Currency Exchange Contracts
The change in value of a forward foreign currency exchange contract is recorded as unrealized appreciation or depreciation until the contract is closed. When the contract is closed, the Fund records a realized gain or loss equal to the difference between the value at the time the contract was opened and the value at the time it was closed.
78 | THE GUGGENHEIM FUNDS SEMI-ANNUAL REPORT | |
NOTES TO FINANCIAL STATEMENTS (Unaudited)(continued) |
(i) Currency Translations
The accounting records of the Fund are maintained in U.S. dollars. All assets and liabilities initially expressed in foreign currencies are converted into U.S. dollars at prevailing exchange rates. Purchases and sales of investment securities, dividend and interest income, and certain expenses are translated at the rates of exchange prevailing on the respective dates of such transactions. Changes in the relationship of these foreign currencies to the U.S. dollar can significantly affect the value of the investments and earnings of the Fund. Foreign investments may also subject the Fund to foreign government exchange restrictions, expropriation, taxation, or other political, social or economic developments, all of which could affect the market and/or credit risk of the investments.
The Fund does not isolate that portion of the results of operations resulting from changes in the foreign exchange rates on investments from the fluctuations arising from changes in the market prices of securities held. Such fluctuations are included with the net realized gain or loss and unrealized appreciation or depreciation on investments.
Reported net realized foreign exchange gains and losses arise from sales of foreign currencies and currency gains or losses realized between the trade and settlement dates on investment transactions. Net unrealized appreciation and depreciation arise from changes in the fair values of assets and liabilities other than investments in securities at the fiscal period end, resulting from changes in exchange rates.
(j) Foreign Taxes
The Fund may be subject to foreign taxes (a portion of which may be reclaimable) on income, stock dividends, capital gains on investments or certain foreign currency transactions. All foreign taxes are recorded in accordance with the applicable foreign tax regulations and rates that exist in the foreign jurisdictions in which the Fund invests. These foreign taxes, if any, are paid by the Fund and reflected in its Statement of Operations as follows: foreign taxes withheld at source are presented as a reduction of income and foreign taxes on capital gains from sales of investments are included with the net realized gain (loss) on investments. Foreign taxes payable or deferred as of March 31, 2020, if any, are disclosed in the Fund’s Statement of Assets and Liabilities.
(k) Security Transactions
Security transactions are recorded on the trade date for financial reporting purposes. Realized gains and losses from securities transactions are recorded using the identified cost basis. Proceeds from lawsuits related to investment holdings are recorded as a reduction to cost if the securities are still held and as realized gains if no longer held in the Fund. Dividend income is recorded on the ex-dividend date, net of applicable taxes withheld by foreign countries, if any. Taxable non-cash dividends are recorded as dividend income. Interest income, including amortization of premiums and accretion of discounts, is accrued on a daily basis. Interest income also includes paydown gains and losses on mortgage-backed and asset-backed securities and senior and subordinated loans. Amendment fees are earned as compensation for evaluating and
| | THE GUGGENHEIM FUNDS SEMI-ANNUAL REPORT | 79 |
NOTES TO FINANCIAL STATEMENTS (Unaudited)(continued) |
accepting changes to the original loan agreement and are recognized when received. Dividend income from Real Estate Investment Trusts (“REITs”) is recorded based on the income included in the distributions received from the REIT investments using published REIT classifications, including some management estimates when actual amounts are not available. Distributions received in excess of this estimated amount are recorded as a reduction of the cost of investments or reclassified to realized gains. The actual amounts of income, return of capital, and realized gains are only determined by each REIT after its fiscal year-end, and may differ from the estimated amounts.
Income from residual collateralized loan obligations is recognized using the effective interest method. At the time of purchase, management estimates the future expected cash flows and determines the effective yield and estimated maturity date based on the estimated cash flows. Subsequent to the purchase, the estimated cash flows are updated periodically and a revised yield is calculated prospectively.
The Fund may receive other income from investments in senior loan interests including amendment fees, consent fees and commitment fees. For funded loans, these fees are recorded as income when received by the Fund and included in interest income on the Statement of Operations. For unfunded loans, commitment fees are included in realized gain on investments on the Statement of Operations at the end of the commitment period.
(l) Distributions
The Fund declares dividends from investment income daily. The Fund pays its shareholders from its net investment income monthly and distributes any net capital gains that it has realized, at least annually. Distributions to shareholders are recorded on the ex-dividend date. Dividends are reinvested in additional shares, unless shareholders request payment in cash. The character of distributions made during the year from net investment income or net realized gains may differ from their ultimate characterization for U.S. federal income tax purposes.
(m) Class Allocations
Interest and dividend income, most expenses, all realized gains and losses, and all unrealized appreciation and depreciation are allocated to the classes based upon the value of the outstanding shares in each Class. Certain costs, such as distribution and service fees are charged directly to specific classes. In addition, certain expenses have been allocated to the individual Funds in the Trust based on the respective net assets of each Fund included in the Trust.
(n) Earnings Credits
Under the fee arrangement with the custodian, the Fund may earn credits based on overnight custody cash balances. These credits are utilized to reduce related custodial expenses. The custodian fees disclosed in the Statement of Operations are before the reduction in expense from the related earnings credits, if any. Earnings credits for the period ended March 31, 2020, are disclosed in the Statement of Operations.
80 | THE GUGGENHEIM FUNDS SEMI-ANNUAL REPORT | |
NOTES TO FINANCIAL STATEMENTS (Unaudited)(continued) |
(o) Cash
The Fund may leave cash overnight in its cash account with the custodian. Periodically, the Fund may have cash due to the custodian bank as an overdraft balance. A fee is incurred on this overdraft, calculated by multiplying the overdraft by a rate based on the federal funds rate, which was 0.08% at March 31, 2020.
(p) Indemnifications
Under the Fund’s organizational documents, its Trustees and Officers are indemnified against certain liabilities arising out of the performance of their duties to the Trust. In addition, throughout the normal course of business, the Fund enters into contracts that contain a variety of representations and warranties which provide general indemnifications. The Fund’s maximum exposure under these arrangements is unknown, as this would involve future claims that may be made against the Fund and/or its affiliates that have not yet occurred. However, based on experience, the Fund expects the risk of loss to be remote.
Note 2 – Derivatives
As part of its investment strategy, the Fund utilizes a variety of derivative instruments. These investments involve, to varying degrees, elements of market risk and risks in excess of amounts recognized in the Statement of Assets and Liabilities. Valuation and accounting treatment of these instruments can be found under Significant Accounting Policies in Note 1 of these Notes to Financial Statements.
Derivatives are instruments whose values depend on, or are derived from, in whole or in part, the value of one or more other assets, such as securities, currencies, commodities or indices. Derivative instruments may be used to increase investment flexibility (including to maintain cash reserves while maintaining exposure to certain other assets), for risk management (hedging) purposes, to facilitate trading, to reduce transaction costs and to pursue higher investment returns. Derivative instruments may also be used to mitigate certain investment risks, such as foreign currency exchange rate risk, interest rate risk and credit risk. U.S. GAAP requires disclosures to enable investors to better understand how and why a Fund uses derivative instruments, how these derivative instruments are accounted for and their effects on the Fund’s financial position and results of operations.
The Fund utilized derivatives for the following purposes:
Duration: the use of an instrument to manage the interest rate risk of a portfolio.
Hedge: an investment made in order to reduce the risk of adverse price movements in a security, by taking an offsetting position to protect against broad market moves.
Income: the use of any instrument that distributes cash flows typically based upon some rate of interest.
| | THE GUGGENHEIM FUNDS SEMI-ANNUAL REPORT | 81 |
NOTES TO FINANCIAL STATEMENTS (Unaudited)(continued) |
Index Exposure: the use of an instrument to obtain exposure to a listed or other type of index.
Options Purchased and Written
A call option on a security gives the purchaser of the option the right to buy, and the writer of a call option the obligation to sell, the underlying security. The purchaser of a put option has the right to sell, and the writer of the put option the obligation to buy, the underlying security at any time during the option period. The risk associated with purchasing options is limited to the premium originally paid.
The following table represents the Fund’s use and volume of call/put options purchased on a monthly basis:
| | | Average Notional Amount | |
Use | | Call | | | Put | |
Hedge | | $ | — | | | $ | 14,047,833,333 | |
Futures Contracts
A futures contract is an agreement to purchase (long) or sell (short) an agreed amount of securities or other instruments at a set price for delivery at a future date. There are significant risks associated with a Fund’s use of futures contracts, including (i) there may be an imperfect or no correlation between the changes in market value of the underlying asset and the prices of futures contracts; (ii) there may not be a liquid secondary market for a futures contract; (iii) trading restrictions or limitations may be imposed by an exchange; and (iv) government regulations may restrict trading in futures contracts. When investing in futures, there is minimal counterparty credit risk to a Fund because futures are exchange-traded and the exchange’s clearinghouse, as counterparty to all exchange-traded futures, guarantees against default. Cash deposits are shown as segregated cash with broker on the Statement of Assets and Liabilities; securities held as collateral are noted on the Schedule of Investments.
The following table represents the Fund’s use and volume of futures on a monthly basis:
| | | Average Notional Amount | |
Use | | Long | | | Short | |
Duration, Hedge, Income | | $ | — | | | $ | 36,265,440 | |
Swap Agreements
A swap is an agreement that obligates two parties to exchange a series of cash flows at specified intervals based upon or calculated by reference to changes in specified prices or rates for a specified amount of an underlying asset. When utilizing OTC swaps, the Fund bears the risk of loss of the amount expected to be received under a swap agreement in the event of the default or bankruptcy of a swap agreement counterparty or if the underlying asset declines in value. Certain
82 | THE GUGGENHEIM FUNDS SEMI-ANNUAL REPORT | |
NOTES TO FINANCIAL STATEMENTS (Unaudited)(continued) |
standardized swaps are subject to mandatory central clearing and are executed on a multi-lateral or other trade facility platform, such as a registered exchange. There is limited counterparty credit risk with respect to centrally-cleared swaps as the transaction is facilitated through a central clearinghouse, much like exchange-traded futures contracts. For a fund utilizing centrally cleared swaps, the exchange bears the risk of loss resulting from a counterparty not being able to pay. There is no guarantee that a fund or an underlying fund could eliminate its exposure under an outstanding swap agreement by entering into an offsetting swap agreement with the same or another party.
Total return swaps involve commitments where single or multiple cash flows are exchanged based on the price of an underlying reference asset (such as an index) for a fixed or variable interest rate. Total return swaps will usually be computed based on the current value of the reference asset as of the close of regular trading on the NYSE or other exchange, with the swap value being adjusted to include dividends accrued, financing charges and/or interest associated with the swap agreement. When utilizing total return swaps, the Fund bears the risk of loss of the amount expected to be received under a swap agreement in the event of the default or bankruptcy of a swap agreement counterparty or if the underlying reference asset declines in value.
The following table represents the Fund’s use and volume of total return swaps on a monthly basis:
| | | Average Notional Amount | |
Use | | Long | | | Short | |
Income | | $ | 49,652,683 | | | $ | 76,705,774 | |
Interest rate swaps involve the exchange by the Fund with another party for its respective commitment to pay or receive a fixed or variable interest rate on a notional amount of principal. Interest rate swaps are generally centrally-cleared, but central clearing does not make interest rate swap transactions risk free.
The following table represents the Fund’s use and volume of interest rate swaps on a monthly basis:
| | | Average Notional Amount | |
Use | | Pay Floating Rate | | | Receive Floating Rate | |
Duration, Hedge | | $ | 1,809,818,667 | | | $ | 144,900,333 | |
Credit default swaps are instruments which allow for the full or partial transfer of third party credit risk, with respect to a particular entity or entities, from one counterparty to the other. The Fund enters into credit default swaps as a “seller” or “buyer” of protection primarily to gain or reduce exposure to the investment grade and/or high yield bond market. A seller of credit default swaps is selling credit protection or assuming credit risk with respect to the underlying entity or entities. The buyer in a credit default swap is obligated to pay the seller a periodic stream of payments over
| | THE GUGGENHEIM FUNDS SEMI-ANNUAL REPORT | 83 |
NOTES TO FINANCIAL STATEMENTS (Unaudited)(continued) |
the term of the contract provided that no event of default on an underlying reference obligation has occurred. If a credit event occurs, as defined under the terms of the swap agreement, the seller will either (i) pay to the buyer of protection an amount equal to the notional amount of the swap and take delivery of the referenced obligation or underlying securities comprising the referenced index or (ii) pay a net settlement amount in the form of cash or securities equal to the notional amount of the swap less the recovery value of the referenced obligation or underlying securities comprising the referenced index. The notional amount reflects the maximum potential amount the seller of credit protection could be required to pay to the buyer if a credit event occurs. The seller of protection receives periodic premium payments from the buyer and may also receive or pay an upfront premium adjustment to the stated periodic payments. In the event a credit default occurs on a credit default swap referencing an index, a factor adjustment will take place and the buyer of protection will receive a payment reflecting the par less the default recovery rate of the defaulted index component based on its weighting in the index. If no default occurs, the counterparty will pay the stream of payments and have no further obligations to the fund selling the credit protection. For a fund utilizing centrally cleared credit default swaps, the exchange bears the risk of loss resulting from a counterparty not being able to pay. For OTC credit default swaps, a fund bears the risk of loss of the amount expected to be received under a swap agreement in the event of the default or bankruptcy of a swap agreement counterparty, or in the case of a credit default swap in which a fund is selling credit protection, the default of a third party issuer.
The quoted market prices and resulting market values for credit default swap agreements on securities and credit indices serve as an indicator of the current status of the payment/performance risk and represent the likelihood of an expected liability (or profit) for the credit derivative had the notional amount of the swap agreement been closed/sold as of the period end. Increasing market values, in absolute terms when compared to the notional amount of the swap, represent a deterioration of the referenced entity’s credit soundness and a greater likelihood or risk of default or other credit event occurring as defined under the terms of the agreement.
The following table represents the Fund’s use and volume of credit default swaps on a monthly basis:
| | | Average Notional Amount | |
Use | | Protection Sold | | | Protection Purchased | |
Hedge, Index Exposure | | $ | 468,795,867 | | | $ | 1,790,575,000 | |
Forward Foreign Currency Exchange Contracts
A forward foreign currency exchange contract is an agreement between two parties to exchange two designated currencies at a specific time in the future. Certain types of contracts may be cash settled, in an amount equal to the change in exchange rates during the term of the contract. The contracts can be used to hedge or manage exposure to foreign currency risks with portfolio investments or to gain exposure to foreign currencies.
84 | THE GUGGENHEIM FUNDS SEMI-ANNUAL REPORT | |
NOTES TO FINANCIAL STATEMENTS (Unaudited)(continued) |
The market value of a forward foreign currency exchange contract changes with fluctuations in foreign currency exchange rates. Furthermore, the Fund may be exposed to risk if the counterparties cannot meet the contract terms or if the currency value changes unfavorably as compared to the U.S. dollar.
The following table represents the Fund’s use, and volume of forward foreign currency exchange contracts on a monthly basis:
| | | Average Value | |
Use | | Purchased | | | Sold | |
Hedge, Income | | $ | 441,269,072 | | | $ | 2,108,707,889 | |
Derivative Investment Holdings Categorized by Risk Exposure
The following is a summary of the location of derivative investments on the Fund’s Statement of Assets and Liabilities as of March 31, 2020:
Derivative Investment Type | Asset Derivatives | Liability Derivatives |
Currency contracts | Unrealized appreciation on forward foreign currency exchange contracts | Unrealized depreciation on forward foreign currency exchange contracts |
Interest Rate contracts | Investments in unaffiliated issuers, at value | Variation margin on interest rate swap agreements |
| | Unamortized upfront premiums paid on interest rate swap agreements | Variation margin on futures contracts |
Credit contracts | Unrealized appreciation on OTC swap agreements | Variation margin on credit default swap agreements |
| | | Unamortized upfront premiums received on credit default swap agreements |
The following table sets forth the fair value of the Fund’s derivative investments categorized by primary risk exposure at March 31, 2020:
| | Asset Derivative Investments Value | |
| | Futures
Interest
Rate
Risk* | | | Swaps
Interest
Rate Risk* | | | Swaps
Credit
Risk* | | | Options
Purchased
Interest
Rate Risk | | | Forward
Foreign
Currency
Exchange
Risk | | | Total Value at
March 31,
2020 | |
| | $ | — | | | $ | 30,654,778 | | | $ | 41,774,966 | | | $ | 27,551,250 | | | $ | 143,739,316 | | | $ | 243,720,310 | |
| | THE GUGGENHEIM FUNDS SEMI-ANNUAL REPORT | 85 |
NOTES TO FINANCIAL STATEMENTS (Unaudited)(continued) |
| | Liability Derivative Investments Value | |
| | Futures
Interest
Rate
Risk* | | | Swaps
Interest
Rate
Risk* | | | Swaps
Credit
Risk* | | | Options
Purchased
Interest
Rate Risk | | | Forward
Foreign
Currency
Exchange
Risk | | | Total Value at
March 31,
2020 | |
| | $ | 164,066 | | | $ | — | | | $ | — | | | $ | — | | | $ | 49,672,255 | | | $ | 49,836,321 | |
* | Includes cumulative appreciation (depreciation) of exchange-traded, OTC and centrally-cleared derivatives as reported on the Schedules of Investments. For exchange-traded and centrally cleared derivatives, variation margin is reported within the Statements of Assets and Liabilities. |
The following is a summary of the location of derivative investments on the Fund’s Statement of Operations for the period ended March 31, 2020:
Derivative Investment Type | Location of Gain (Loss) on Derivatives |
Currency contracts | Net realized gain (loss) on forward foreign currency exchange contracts |
| | Net change in unrealized appreciation (depreciation) on forward foreign currency exchange contracts |
Interest Rate/Credit contracts | Net realized gain (loss) on swap agreements |
| | Net change in unrealized appreciation (depreciation) on swap agreements |
Interest Rate contracts | Net realized gain (loss) on futures contracts |
| Net change in unrealized appreciation (depreciation) on futures contracts |
| Net change in unrealized appreciation (depreciation) on options purchased |
The following is a summary of the Fund’s realized gain (loss) and change in unrealized appreciation (depreciation) on derivative investments recognized on the Statement of Operations categorized by primary risk exposure for the period ended March 31, 2020:
| | Realized Gain (Loss) on Derivative Investments Recognized on the Statement of Operations | |
| | Futures
Interest
Rate
Risk | | | Swaps
Interest
Rate
Risk | | | Swaps
Credit
Risk | | | Options
Purchased
Interest
Rate
Risk | | | Forward
Foreign
Currency
Exchange
Risk | | | Total | |
| | $ | 8,291,406 | | | $ | 22,695,437 | | | $ | 31,956,168 | | | $ | — | | | $ | 10,829,283 | | | $ | 73,772,294 | |
86 | THE GUGGENHEIM FUNDS SEMI-ANNUAL REPORT | |
NOTES TO FINANCIAL STATEMENTS (Unaudited)(continued) |
| | Change in Unrealized Appreciation (Depreciation) on Derivative Investments Recognized on the Statement of Operations | |
| | Futures
Interest
Rate
Risk | | | Swaps
Interest
Rate
Risk | | | Swaps
Credit
Risk | | | Options
Purchased
Interest Rate
Risk | | | Forward
Foreign
Currency
Exchange
Risk | | | Total | |
| | $ | (164,066 | ) | | $ | 36,978,119 | | | $ | 69,723,177 | | | $ | 5,787,528 | | | $ | 53,777,596 | | | $ | 166,102,354 | |
In conjunction with the use of derivative instruments, the Fund is required to maintain collateral in various forms. Depending on the financial instrument utilized and the broker involved, the Fund uses margin deposits at the broker, cash and/or securities segregated at the custodian bank, discount notes or repurchase agreements allocated to the Fund as collateral.
Foreign Investments
There are several risks associated with exposure to foreign currencies, foreign issuers and emerging markets. A fund’s indirect and direct exposure to foreign currencies subjects the Fund to the risk that those currencies will decline in value relative to the U.S. dollar, or in the case of short positions, that the U.S. dollar will decline in value relative to the currency being hedged. Currency rates in foreign countries may fluctuate significantly over short periods of time for a number of reasons, including changes in interest rates and the imposition of currency controls or other political developments in the U.S. or abroad. In addition, the Fund may incur transaction costs in connection with conversions between various currencies. The Fund may, but is not obligated to, engage in currency hedging transactions, which generally involve buying currency forward, options or futures contracts. However, not all currency risks may be effectively hedged, and in some cases the costs of hedging techniques may outweigh expected benefits. In such instances, the value of securities denominated in foreign currencies can change significantly when foreign currencies strengthen or weaken relative to the U.S. dollar.
The Fund may invest in securities of foreign companies directly, or in financial instruments, such as ADRs and exchange-traded funds, which are indirectly linked to the performance of foreign issuers. Foreign markets can be more volatile than the U.S. market due to increased risks of adverse issuer, political, regulatory, market, or economic developments and can perform differently from the U.S. market. Investing in securities of foreign companies directly, or in financial instruments that are indirectly linked to the performance of foreign issuers, may involve risks not typically associated with investing in U.S. issuers. The value of securities denominated in foreign currencies, and of dividends from such securities, can change significantly when foreign currencies strengthen or weaken relative to the U.S. dollar. Foreign securities markets generally have less trading volume and less liquidity than U.S. markets, and prices in some foreign markets may fluctuate more than those of securities traded on U.S. markets. Many foreign countries lack accounting and disclosure standards comparable to those that apply to U.S. companies, and it may be more difficult to obtain reliable information regarding a foreign issuer’s financial condition and operations. Transaction costs and costs associated with custody services are
| | THE GUGGENHEIM FUNDS SEMI-ANNUAL REPORT | 87 |
NOTES TO FINANCIAL STATEMENTS (Unaudited)(continued) |
generally higher for foreign securities than they are for U.S. securities. Some foreign governments levy withholding taxes against dividend and interest income. Although in some countries portions of these taxes are recoverable, the non-recovered portion will reduce the income received by the Funds.
The Trust has established counterparty credit guidelines and enters into transactions only with financial institutions of investment grade or better. The Trust monitors the counterparty credit risk.
Note 3 – Offsetting
In the normal course of business, the Fund enters into transactions subject to enforceable master netting arrangements or other similar arrangements. Generally, the right to offset in those agreements allows the Fund to counteract the exposure to a specific counterparty with collateral received from or delivered to that counterparty based on the terms of the arrangements. These arrangements provide for the right to liquidate upon the occurrence of an event of default, credit event upon merger or additional termination event.
In order to better define its contractual rights and to secure rights that will help the Fund mitigate its counterparty risk, the Fund may enter into an International Swaps and Derivatives Association, Inc. Master Agreement (“ISDA Master Agreement”) or similar agreement with its derivative contract counterparties. An ISDA Master Agreement is a bilateral agreement between a fund and a counterparty that governs OTC derivatives, including foreign exchange contracts, and typically contains, among other things, collateral posting terms and netting provisions in the event of a default and/or termination event. The provisions of the ISDA Master Agreement typically permit a single net payment in the event of a default (close-out netting) or similar event, including the bankruptcy or insolvency of the counterparty.
For derivatives traded under an ISDA Master Agreement, the collateral requirements are typically calculated by netting the mark-to-market amount for each transaction under such agreement and comparing that amount to the value of any collateral currently pledged by the Fund and the counterparty. For financial reporting purposes, cash collateral that has been pledged to cover obligations of the Fund and cash collateral received from the counterparty, if any, are reported separately on the Statement of Assets and Liabilities as segregated cash with broker/receivable for variation margin, or payable for swap settlement/variation margin. Cash and/or securities pledged or received as collateral by the Fund in connection with an OTC derivative subject to an ISDA Master Agreement generally may not be invested, sold or rehypothecated by the counterparty or the Fund, as applicable, absent an event of default under such agreement, in which case such collateral generally may be applied towards obligations due to and payable by such counterparty or the Fund, as applicable. Generally, the amount of collateral due from or to a counterparty must exceed a minimum transfer amount threshold (e.g., $300,000) before a transfer is required to be made. To the extent amounts due to the Fund from its counterparties are not fully collateralized, contractually or otherwise, the Fund bears the risk of loss from
88 | THE GUGGENHEIM FUNDS SEMI-ANNUAL REPORT | |
NOTES TO FINANCIAL STATEMENTS (Unaudited)(continued) |
counterparty nonperformance. The Fund attempts to mitigate counterparty risk by only entering into agreements with counterparties that they believe to be of good standing and by monitoring the financial stability of those counterparties.
For financial reporting purposes, the Fund does not offset derivative assets and derivative liabilities that are subject to netting arrangements in the Statement of Assets and Liabilities.
The following tables present derivative financial instruments and secured financing transactions that are subject to enforceable netting arrangements:
| | | | | | | | | | | | | | | Gross Amounts Not Offset
in the Statement of
Assets and Liabilities | | | | | |
Instrument | | Gross
Amounts of
Recognized
Assets1 | | | Gross
Amounts
Offset in the
Statement of
Assets and
Liabilities | | | Net Amount
of Assets
Presented on
the Statement
of Assets and
Liabilities | | | Financial
Instruments | | | Cash
Collateral
Received | | | Net
Amount | |
Forward foreign currency exchange contracts | | $ | 143,739,316 | | | $ | — | | | $ | 143,739,316 | | | $ | (43,686,818 | ) | | $ | (87,559,139 | ) | | $ | 12,493,359 | |
Total return swap agreements | | | 32,495 | | | | — | | | | 32,495 | | | | — | | | | — | | | | 32,495 | |
Options purchased contracts | | | 27,551,250 | | | | — | | | | 27,551,250 | | | | (5,985,437 | ) | | | (7,623,717 | ) | | | 13,942,096 | |
| | | | | | | | | | | | | | | Gross Amounts Not Offset
in the Statement of
Assets and Liabilities | | | | | |
Instrument | | Gross
Amounts of
Recognized
Liabilities1 | | | Gross
Amounts
Offset in the
Statement of
Assets and
Liabilities | | | Net Amount
of Liabilities
Presented on
the Statement
of Assets and
Liabilities | | | Financial
Instruments | | | Cash
Collateral
Pledged | | | Net
Amount | |
Forward foreign currency exchange contracts | | $ | 49,672,255 | | | $ | — | | | $ | 49,672,255 | | | $ | (49,672,255 | ) | | $ | — | | | $ | — | |
1 | Exchange-traded or centrally-cleared derivatives are excluded from these reported amounts. |
| | THE GUGGENHEIM FUNDS SEMI-ANNUAL REPORT | 89 |
NOTES TO FINANCIAL STATEMENTS (Unaudited)(continued) |
The Fund has the right to offset deposits against any related derivative liabilities outstanding with each counterparty with the exception of exchange-traded or centrally-cleared derivatives. The following table presents deposits held by others in connection with derivative investments and repurchase agreements as of March 31, 2020.
Counterparty | Asset Type | | Cash Pledged | | | Cash Received | |
Barclays Bank plc | Forward foreign currency exchange contracts | | $ | — | | | $ | 4,631,000 | |
BNP Paribas | Repurchase agreements | | | — | | | | 525,000 | |
BofA Securities, Inc. | Credit default swap agreements | | | 74,953,240 | | | | — | |
Citibank, N.A., New York | Forward foreign currency exchange contracts | | | — | | | | 43,446,417 | |
Deutsche Bank AG | Futures contracts, Total return swap agreements | | | — | | | | 734,900 | |
Goldman Sachs International | Forward foreign currency exchange contracts, Options purchased | | | — | | | | 24,170,031 | |
Morgan Stanley Capital Services LLC | Forward foreign currency exchange contracts, Options purchased | | | — | | | | 23,250,000 | |
Societe Generale | Repurchase agreements | | | — | | | | 30,412,000 | |
Total | | | $ | 74,953,240 | | | $ | 127,169,348 | |
Note 4 – Fair Value Measurement
In accordance with U.S. GAAP, fair value is defined as the price that the Fund would receive to sell an investment or pay to transfer a liability in an orderly transaction with an independent buyer in the principal market, or in the absence of a principal market, the most advantageous market for the investment or liability. U.S. GAAP establishes a three-tier fair value hierarchy based on the types of inputs used to value assets and liabilities and requires corresponding disclosure. The hierarchy and the corresponding inputs are summarized below:
Level 1 — | quoted prices in active markets for identical assets or liabilities. |
Level 2 — | significant other observable inputs (for example quoted prices for securities that are similar based on characteristics such as interest rates, prepayment speeds, credit risk, etc.). |
Level 3 — | significant unobservable inputs based on the best information available under the circumstances, to the extent observable inputs are not available, which may include assumptions. |
The types of inputs available depend on a variety of factors, such as the type of security and the characteristics of the markets in which it trades, if any. Fair valuation determinations that rely on fewer or no observable inputs require greater judgment. Accordingly, fair value determinations for Level 3 securities require the greatest amount of judgment.
90 | THE GUGGENHEIM FUNDS SEMI-ANNUAL REPORT | |
NOTES TO FINANCIAL STATEMENTS (Unaudited)(continued) |
Independent pricing services are used to value a majority of the Fund’s investments. When values are not available from a pricing service, they will be determined using a variety of sources and techniques, including: market prices; broker quotes; and models which derive prices based on inputs such as prices of securities with comparable maturities and characteristics or based on inputs such as anticipated cash flows or collateral, spread over U.S. Treasury securities, and other information and analysis. A significant portion of the Fund’s assets and liabilities are categorized as Level 2, as indicated in this report.
Quotes from broker-dealers, adjusted for fluctuations in criteria such as credit spreads and interest rates, may also be used to value the Fund’s assets and liabilities, i.e. prices provided by a broker-dealer or other market participant who has not committed to trade at that price. Although quotes are typically received from established market participants, the Fund may not have the transparency to view the underlying inputs which support the market quotations. Significant changes in a quote would generally result in significant changes in the fair value of the security.
Certain fixed income securities are valued by obtaining a monthly quote from a broker-dealer, adjusted for fluctuations in criteria such as credit spreads and interest rates.
Certain loans and other securities are valued using a single daily broker quote or a price from a third party vendor based on a single daily or monthly broker quote.
The inputs or methodologies used for valuing securities are not necessarily an indication of the risk associated with investing in those securities. The suitability of the techniques and sources employed to determine fair valuation are regularly monitored and subject to change.
Note 5 – Investment Advisory Agreement and Other Agreements
Under the terms of an investment advisory contract, the Fund pays GI investment advisory fees calculated at an annualized rate of 0.39% of the average daily net assets of the Fund.
GI pays operating expenses on behalf of the Trust, such as audit and accounting related services, legal services, custody, printing and mailing, among others, on a pass-through basis. Such expenses are allocated to various Funds within the complex based on relative net assets.
The Board has adopted Distribution Plans related to the offering of A-Class, C-Class and P-Class shares pursuant to Rule 12b-1 under the 1940 Act. The plans provide for payments at an annual rate of 0.25% of the average daily net assets of the Fund’s A-Class and P-Class shares, and 1.00% of the average daily net assets of the Fund’s C-Class shares.
| | THE GUGGENHEIM FUNDS SEMI-ANNUAL REPORT | 91 |
NOTES TO FINANCIAL STATEMENTS (Unaudited)(continued) |
The investment advisory contract for the Fund provides that the total expenses be limited to a percentage of average net assets for each class of shares, exclusive of brokerage costs, dividends or interest on securities sold short, expenses of other investment companies in which a Fund invests, interest, taxes, litigation, indemnification and extraordinary expenses. The limits are listed below:
| | Limit | | | Effective
Date | | | Contract
End Date | |
Total Return Bond Fund - A-Class | | | 0.79 | % | | | 11/20/17 | | | | 02/01/21 | |
Total Return Bond Fund - C-Class | | | 1.54 | % | | | 11/20/17 | | | | 02/01/21 | |
Total Return Bond Fund - P-Class | | | 0.79 | % | | | 11/20/17 | | | | 02/01/21 | |
Total Return Bond Fund - Institutional Class | | | 0.50 | % | | | 11/30/12 | | | | 02/01/21 | |
Total Return Bond Fund - R6-Class | | | 0.50 | % | | | 10/19/16 | | | | 02/01/21 | |
GI is entitled to reimbursement by the Fund for fees waived or expenses reimbursed during any of the previous 36 months, beginning on the date of the expense limitation agreement, if on any day the estimated operating expenses are less than the indicated percentages. For purposes of this arrangement, GI is entitled to recoupment of previously waived fees or reimbursed expenses for 36 months from the date of the waiver or reimbursement by GI. At March 31, 2020, the amount of fees waived or expenses reimbursed that are subject to recoupment and will expire during the years ended September 30, are presented in the following table:
Fund | | 2020 | | | 2021 | | | 2022 | | | 2023 | | | Total | |
A-Class | | $ | 591,343 | | | $ | 807,942 | | | $ | 970,954 | | | $ | 300,811 | | | $ | 2,671,050 | |
C-Class | | | 183,454 | | | | 141,993 | | | | 139,409 | | | | 80,570 | | | | 545,426 | |
P-Class | | | 444,803 | | | | 661,267 | | | | 529,763 | | | | 334,458 | | | | 1,970,291 | |
Institutional Class | | | 5,153,504 | | | | 5,917,973 | | | | 6,918,582 | | | | 4,714,114 | | | | 22,704,173 | |
R6-Class | | | — | | | | 4,318 | | | | 3,324 | | | | 6,052 | | | | 13,694 | |
For the period ended March 31, 2020, GI recouped $12,058 from the Fund.
If the Fund invests in a fund that is advised by the same adviser or an affiliated adviser, the investing Fund’s adviser has agreed to waive fees at the investing fund level to the extent necessary to offset the proportionate share of any management fee paid by the Fund with respect to its investment in such affiliated fund. Fee waivers will be calculated at the investing Fund level without regard to any expense cap, if any, in effect for the investing Fund. Fees waived under this arrangement are not subject to reimbursement to GI. For the period ended March 31, 2020, the Fund waived $43,443 related to investments in affiliated funds.
For the period ended March 31, 2020, GFD retained sales charges of $87,029 relating to sales of A-Class shares of the Trust.
Certain trustees and officers of the Trust are also officers of GI and/or GFD. The Trust does not compensate its officers or trustees who are officers, directors and/or employees of GI or GFD.
92 | THE GUGGENHEIM FUNDS SEMI-ANNUAL REPORT | |
NOTES TO FINANCIAL STATEMENTS (Unaudited)(continued) |
MUFG Investor Services (US), LLC (“MUIS”) acts as the Fund’s administrator, transfer agent and accounting agent. As administrator, transfer agent and accounting agent, MUIS maintains the books and records of the Fund’s securities and cash. The Bank of New York Mellon Corp. (“BNY”) acts as the Fund’s custodian. As custodian, BNY is responsible for the custody of the Fund’s assets. For providing the aforementioned administrative and accounting services, MUIS is entitled to receive a monthly fee equal to a percentage of the Fund’s average daily net assets and out of pocket expenses. For providing the aforementioned transfer agent and custodian services, MUIS and BNY are entitled to receive a monthly fee based on the number of transactions during the month and the number of accounts under management, subject to certain minimum monthly fees, and out of pocket expenses.
Note 6 – Reverse Repurchase Agreements
The Fund may enter into reverse repurchase agreements. Under a reverse repurchase agreement, a Fund sells securities and agrees to repurchase them at a particular price at a future date. In the event the buyer of securities under a reverse repurchase agreement files for bankruptcy or becomes insolvent, such buyer or its trustee or receiver may receive an extension of time to determine whether to enforce the Fund’s obligation to repurchase the securities, and the Fund’s use of the proceeds of the reverse repurchase agreement may effectively be restricted pending such decision.
For the period ended March 31, 2020, the Fund entered into reverse repurchase agreements as follows:
| | Number of Days
Outstanding | | | Balance at
March 31, 2020 | | | Average Balance
Outstanding | | | Average
Interest Rate | |
| | | | 5 | | | $ | — | | | $ | 323,624,800 | | | | 3.84 | % |
Note 7 – Federal Income Tax Information
The Fund intends to comply with the provisions of Subchapter M of the Internal Revenue Code applicable to regulated investment companies and will distribute substantially all taxable net investment income and capital gains sufficient to relieve the Fund from all, or substantially all, federal income, excise and state income taxes. Therefore, no provision for federal or state income tax or federal excise tax is required.
Tax positions taken or expected to be taken in the course of preparing the Fund’s tax returns are evaluated to determine whether the tax positions are “more-likely-than-not” of being sustained by the applicable tax authority. Tax positions not deemed to meet the more-likely-than-not threshold would be recorded as a tax benefit or expense in the current year. Management has analyzed the Fund’s tax positions taken, or to be taken, on U.S. federal income tax returns for all open tax years, and has concluded that no provision for income tax is required in the Fund’s financial statements. The Fund’s U.S. federal income tax returns are subject to examination by the Internal Revenue Service (“IRS”) for a period of three years after they are filed.
| | THE GUGGENHEIM FUNDS SEMI-ANNUAL REPORT | 93 |
NOTES TO FINANCIAL STATEMENTS (Unaudited)(continued) |
At March 31, 2020, the cost of investments for U.S. federal income tax purposes, the aggregate gross unrealized appreciation for all investments for which there was an excess of value over tax cost, and the aggregate gross unrealized depreciation for all investments for which there was an excess of tax cost over value, were as follows:
| | Tax Cost | | | Tax
Unrealized
Appreciation | | | Tax
Unrealized
Depreciation | | | Net Unrealized
Appreciation
(Depreciation) | |
| | $ | 14,386,231,601 | | | $ | 889,396,831 | | | $ | (443,953,307 | ) | | $ | 445,443,524 | |
Note 8 – Securities Transactions
For the period ended March 31, 2020, the cost of purchases and proceeds from sales of investment securities, excluding government securities, short-term investments and derivatives, were as follows:
| | Purchases | | | Sales | |
| | | $ | 3,407,585,304 | | | $ | 3,576,662,749 | |
For the period ended March 31, 2020, the cost of purchases and proceeds from sales of government securities were as follows:
| | Purchases | | | Sales | |
| | | $ | 1,629,618,646 | | | $ | 1,575,903,256 | |
The Fund is permitted to purchase or sell securities from or to certain affiliated funds under specified conditions outlined in procedures adopted by the Board. The procedures have been designed to ensure that any purchase or sale of securities by the Fund from or to another fund or portfolio that is or could be considered an affiliate by virtue of having a common investment adviser (or affiliated investment advisers), common trustees and/or common officers complies with Rule 17a-7 of the 1940 Act. Further, as defined under these procedures, each transaction is effected at the current market price to save costs, where permissible. For the period ended March 31, 2020, the Fund engaged in purchases and sales of securities, pursuant to Rule 17a-7 of the 1940 Act, as follows:
| | Purchases | | | Sales | | | Realized
Gain (Loss) | |
| | | $ | 4,966,438 | | | $ | 7,363,311 | | | $ | 240,327 | |
Note 9 – Unfunded Loan Commitments
Pursuant to the terms of certain loan agreements, the Fund held unfunded loan commitments as of March 31, 2020. The Fund is obligated to fund these loan commitments at the borrower’s discretion.
94 | THE GUGGENHEIM FUNDS SEMI-ANNUAL REPORT | |
NOTES TO FINANCIAL STATEMENTS (Unaudited)(continued) |
The unfunded loan commitments as of March 31, 2020, were as follows:
Borrower | Maturity
Date | | Face
Amount | | | Value | |
Aspect Software, Inc. | 07/15/23 | | $ | 1,169 | | | $ | 13 | |
Note 10 – Restricted Securities
The securities below are considered illiquid and restricted under guidelines established by the Board:
Restricted Securities | Acquisition
Date | | Cost | | | Value | |
Airplanes Pass Through Trust | | | | | | | | | |
2001-1A, due 03/15/194 | 11/30/11 | | $ | 335,966 | | | $ | 4,096 | |
Atlas Mara Ltd. | | | | | | | | | |
8.00% due 12/31/20 | 10/01/15 | | | 6,388,286 | | | | 5,346,000 | |
Banc of America Funding Trust | | | | | | | | | |
2015-R4, 1.80% (1 Month USD LIBOR + 0.17%, Rate Floor 0.17%) due 01/27/351 | 10/21/15 | | | 1,365,054 | | | | 1,384,619 | |
BCAP LLC | | | | | | | | | |
2014-RR2, 2.23% (WAC) due 03/26/361 | 02/17/15 | | | 16,685 | | | | 16,997 | |
Central Storage Safety Project Trust | | | | | | | | | |
4.82% due 02/01/38 | 02/02/18 | | | 21,209,274 | | | | 23,826,159 | |
CIT Mortgage Loan Trust | | | | | | | | | |
2007-1, 2.40% (1 Month USD LIBOR + 1.45%, Rate Floor: 1.45%) due 10/25/371 | 04/10/14 | | | 2,793,917 | | | | 2,803,694 | |
Copper River CLO Ltd. | | | | | | | | | |
2007-1A, due 01/20/212 | 05/09/14 | | | 294,347 | | | | 153,409 | |
Deephaven Residential Mortgage Trust | | | | | | | | | |
2018-1A, 3.03% (WAC) due 12/25/571 | 09/05/19 | | | 1,656,412 | | | | 1,636,523 | |
2017-3A, 2.58% (WAC) due 10/25/471 | 11/01/17 | | | 3,065,522 | | | | 3,066,121 | |
Fort Knox Military Housing Privatization Project | | | | | | | | | |
1.05% (1 Month USD LIBOR + 0.34%) due 02/15/521 | 04/09/15 | | | 1,123,925 | | | | 1,027,198 | |
Freddie Mac Military Housing Bonds Resecuritization Trust Certificates | | | | | | | | | |
2015-R1, 4.11% (WAC) due 11/25/521 | 07/26/19 | | | 1,230,903 | | | | 1,274,904 | |
GSMSC Resecuritization Trust | | | | | | | | | |
2015-5R, 1.77% (1 Month USD LIBOR + 0.14%, Rate Floor: 0.14%) due 04/26/371 | 08/24/18 | | | 1,065,998 | | | | 1,056,405 | |
Irwin Home Equity Loan Trust | | | | | | | | | |
2007-1, 6.35% due 08/25/37 | 02/27/15 | | | 67,075 | | | | 65,068 | |
Morgan Stanley Re-REMIC Trust | | | | | | | | | |
2010-R5, 3.90% due 06/26/36 | 07/18/14 | | | 188,418 | | | | 184,760 | |
Morgan Stanley Resecuritization Trust | | | | | | | | | |
2014-R9, 1.76% (1 Month USD LIBOR + 0.14%, Rate Floor: 0.14%) due 11/26/461 | 01/16/15 | | | 2,900,730 | | | | 2,843,927 | |
| | THE GUGGENHEIM FUNDS SEMI-ANNUAL REPORT | 95 |
NOTES TO FINANCIAL STATEMENTS (Unaudited)(continued) |
Restricted Securities | Acquisition
Date | | Cost | | | Value | |
New Residential Mortgage Loan Trust | | | | | | | | | |
2017-5A, 2.45% (1 Month USD LIBOR + 1.50%, Rate Floor: 1.50%) due 06/25/571 | 08/09/17 | | $ | 2,756,886 | | | $ | 2,563,310 | |
Nomura Resecuritization Trust | | | | | | | | | |
2015-4R, 2.11% (1 Month USD LIBOR + 0.43%, Rate Floor: 0.43%) due 03/26/361 | 03/20/15 | | | 1,329,655 | | | | 1,367,762 | |
2015-4R, 3.25% (1 Month USD LIBOR + 0.39%, Rate Floor: 0.39%) due 12/26/361 | 04/22/15 | | | 703,076 | | | | 684,241 | |
Princess Juliana International Airport Operating Company N.V. | | | | | | | | | |
5.50% due 12/20/273 | 12/17/12 | | | 1,999,445 | | | | 1,791,617 | |
Turbine Engines Securitization Ltd. | | | | | | | | | |
2013-1A, 5.13% due 12/13/48 | 11/27/13 | | | 700,541 | | | | 620,267 | |
| | | | $ | 51,192,115 | | | $ | 51,717,077 | |
1 | Variable rate security. Rate indicated is the rate effective at March 31, 2020. In some instances, the effective rate is limited by a minimum rate floor or a maximum rate cap established by the issuer. The settlement status of a position may also impact the effective rate indicated. In some cases, a position may be unsettled at period end and may not have a stated effective rate. In instances where multiple underlying reference rates and spread amounts are shown, the effective rate is based on a weighted average. |
2 | Security has no stated coupon. However, it is expected to receive residual cash flow payments on defined deal dates. |
3 | Security was fair valued by the Valuation Committee at March 31, 2020. The total market value of fair valued and restricted securities amounts to $1,791,617, (cost $1,999,445) or less than 0.1% of total net assets. |
4 | Security is in default of interest and/or principal obligations. |
Note 11 – Line of Credit
The Trust, along with other affiliated trusts, secured a 364-day committed, $1,205,000,000 line of credit from Citibank, N.A., which was in place through October 4, 2019, at which time the line of credit was renewed with an increased commitment amount of $1,230,000,000. A Fund may draw (borrow) from the line of credit as a temporary measure for emergency purposes, to facilitate redemption requests, or for other short-term liquidity purposes consistent with the Fund’s investment objective and program. For example, it may be advantageous for the Fund to borrow money rather than sell existing portfolio positions to meet redemption requests. Fees related to borrowings, if any, vary under this arrangement between the greater of Citibank’s “base rate”, LIBOR plus 1%, or the federal funds rate plus 1/2 of 1%.
The commitment fee that may be paid by the Fund is at an annualized rate of 0.15% of the average daily amount of its allocated unused commitment amount. The allocated commitment fee amount for the Fund is referenced in the Statement of Operations under “Line of credit fees”. The Fund did not have any borrowings under this agreement as of and for the period ended March 31, 2020.
96 | THE GUGGENHEIM FUNDS SEMI-ANNUAL REPORT | |
NOTES TO FINANCIAL STATEMENTS (Unaudited)(concluded) |
Note 12 – Recent Accounting Pronouncements
In March 2017, the Financial Accounting Standards Board issued an Accounting Standards Update, ASU 2017-08, Receivables – Nonrefundable Fees and Other Costs (Subtopic 310-20), Premium Amortization on Purchased Callable Debt Securities (the “2017 ASU”) which amends the amortization period for certain purchased callable debt securities held at a premium, shortening such period to the earliest call date. The 2017 ASU does not require any accounting change for debt securities held at a discount; the discount continues to be amortized to maturity.
As of October 1, 2019, the Fund has fully adopted the provisions of the 2017 ASU which were applied through a modified retrospective transition approach, as prescribed. The adoption resulted in a cumulative effect adjustment to reduce amortized cost and increase unrealized appreciation of investments for the Fund in the amount of $236,134.
The adoption had no impact on total distributable earnings (loss), net assets, the current period results from operations, or any prior period information presented in the financial statements.
Note 13 – COVID-19 and Recent Developments
The global ongoing crisis caused by the outbreak of COVID-19 is causing materially reduced consumer demand and economic output, disrupting supply chains, resulting in market closures, travel restrictions and quarantines, and adversely impacting local and global economies. Investors should be aware that in light of the current uncertainty, volatility and distress in economies, financial markets, and labor and health conditions all over the world, the Fund’s investments and a shareholder’s investment in the Fund are subject to sudden and substantial losses, increased volatility and other adverse events. Firms through which investors invest with the Fund, the Fund, its service providers, the markets in which it invests and market intermediaries are also impacted by quarantines and similar measures intended to contain the ongoing pandemic, which can obstruct their functioning and subject them to heightened operational risks.
Note 14 – Subsequent Events
The Fund evaluated subsequent events through the date the financial statements were available for issue and determined there were no material events that would require adjustment to or disclosure in the Fund’s financial statements.
| | THE GUGGENHEIM FUNDS SEMI-ANNUAL REPORT | 97 |
OTHER INFORMATION (Unaudited) |
Proxy Voting Information
A description of the policies and procedures that the Trust uses to determine how to vote proxies relating to securities held in the Fund’s portfolios is available, without charge and upon request, by calling 800.820.0888. This information is also available from the EDGAR database on the SEC’s website at https://www.sec.gov.
Information regarding how the Fund voted proxies relating to portfolio securities during the most recent 12-month period ended June 30 is available without charge, upon request, by calling 800.820.0888. This information is also available from the EDGAR database on the SEC’s website at https://www.sec.gov.
Sector Classification
Information in the Schedule of Investments is categorized by sectors using sector-level Classifications defined by the Bloomberg Industry Classification System, a widely recognized industry classification system provider. The Fund’s registration statement has investment policies relating to concentration in specific sectors/industries. For purposes of these investment policies, the Fund usually classifies sectors/industries based on industry-level Classifications used by widely recognized industry classification system providers such as Bloomberg Industry Classification System, Global Industry Classification Standards and Barclays Global Classification Scheme.
Quarterly Portfolio Schedules Information
The Trust files its complete schedule of portfolio holdings with the SEC for the first and third quarters of each fiscal year as an exhibit to its reports on Form N-PORT, and for reporting periods ended prior to March 31, 2019, filed such information on Form N-Q. The Fund’s Forms N-PORT and N-Q are available on the SEC’s website at https://www.sec.gov. The Fund’s Forms N-PORT and N-Q may be reviewed and copied at the SEC’s Public Reference Room in Washington, DC, and that information on the operation of the Public Reference Room may be obtained by calling 800-SEC-0330. Copies of the portfolio holdings are also available to shareholders, without charge and upon request, by calling 800.820.0888.
98 | THE GUGGENHEIM FUNDS SEMI-ANNUAL REPORT | |
INFORMATION ON BOARD OF TRUSTEES AND OFFICERS (Unaudited) |
A Board of Trustees oversees the Trust, as well as other trusts of GI, in which its members have no stated term of service, and continue to serve after election until resignation. The Statement of Additional Information includes further information about Fund Trustees and Officers, and can be obtained without charge by visiting guggenheiminvestments.com or by calling 800.820.0888.
Name, Address*
and Year of Birth | Position(s)
Held with
Trust | Term of Office
and Length of
Time Served** | Principal Occupation(s)
During Past Five Years | Number of
Portfolios
in Fund
Complex
Overseen | Other Directorships
Held by Trustees*** |
INDEPENDENT TRUSTEES | | | |
Randall C. Barnes (1951) | Trustee | Since 2014 | Current: Private Investor (2001-present). Former: Senior Vice President and Treasurer, PepsiCo, Inc. (1993-1997); President, Pizza Hut International (1991-1993); Senior Vice President, Strategic Planning and New Business Development, PepsiCo, Inc. (1987-1990). | 157 | Current: Purpose Investments Funds (2013-present). Former: Managed Duration Investment Grade Municipal Fund (2006-2016). |
Angela Brock-Kyle (1959) | Trustee | Since 2019 | Current: Founder and Chief Executive Officer, B.O.A.R.D.S. (2013-present). Former: Senior Leader, TIAA (1987-2012). | 156 | Current: Hunt Companies, Inc. (2019-present). Former: Infinity Property & Casualty Corp. (2014-2018). |
Donald A. Chubb, Jr. (1946) | Trustee and Chair of the Valuation Oversight Committee | Since 1994 | Current: Retired Former: Business broker and manager of commercial real estate, Griffith & Blair, Inc. (1997-2017). | 156 | Former: Midland Care, Inc. (2011-2016). |
| | THE GUGGENHEIM FUNDS SEMI-ANNUAL REPORT | 99 |
INFORMATION ON BOARD OF TRUSTEES AND OFFICERS (Unaudited)(continued) |
Name, Address*
and Year of Birth | Position(s)
Held with
Trust | Term of Office
and Length of
Time Served** | Principal Occupation(s)
During Past Five Years | Number of
Portfolios
in Fund
Complex
Overseen | Other Directorships
Held by Trustees*** |
INDEPENDENT TRUSTEES - continued | | |
Jerry B. Farley (1946) | Trustee and Chair of the Audit Committee | Since 2005 | Current: President, Washburn University (1997-present). | 156 | Current: CoreFirst Bank & Trust (2000-present). Former: Westar Energy, Inc. (2004-2018). |
Roman Friedrich III (1946) | Trustee and Chair of the Contracts Review Committee | Since 2014 | Current: Founder and Managing Partner, Roman Friedrich & Company (1998-present). | 156 | Former: Zincore Metals, Inc. (2009-2019). |
Thomas F. Lydon, Jr. (1960) | Trustee and Vice Chair of the Contracts Review Committee | Since 2019 | Current: President, Global Trends Investments (1996-present); Co-Chief Executive Officer, ETF Flows, LLC (2019-present); Chief Executive Officer, Lydon Media (2016-present). | 156 | Current: US Global Investors (GROW) (1995-present). Former: Harvest Volatility Edge Trust (3) (2017-2019). |
Ronald A. Nyberg (1953) | Trustee and Chair of the Nominating and Governance Committee | Since 2014 | Current: Partner, Momkus LLC (2016-present). Former: Partner, Nyberg & Cassioppi, LLC (2000-2016); Executive Vice President, General Counsel, and Corporate Secretary, Van Kampen Investments (1982-1999). | 157 | Current: PPM Funds (9) (2018 - present); Edward-Elmhurst Healthcare System (2012-present). Former: Western Asset Inflation-Linked Opportunities & Income Fund (2004-April 2020); Western Asset Inflation-Linked Income Fund (2003-April 2020); Managed Duration Investment Grade Municipal Fund (2003-2016). |
100 | THE GUGGENHEIM FUNDS SEMI-ANNUAL REPORT | |
INFORMATION ON BOARD OF TRUSTEES AND OFFICERS (Unaudited)(continued) |
Name, Address*
and Year of Birth | Position(s)
Held with
Trust | Term of Office
and Length of
Time Served** | Principal Occupation(s)
During Past Five Years | Number of
Portfolios
in Fund
Complex
Overseen | Other Directorships
Held by Trustees*** |
INDEPENDENT TRUSTEES - concluded | | |
Sandra G. Sponem (1958) | Trustee | Since 2019 | Current: Retired. Former: Senior Vice President and Chief Financial Officer, M.A. Mortenson-Companies, Inc. (2007-2017). | 156 | Current: SPDR Series Trust (78) (2018-present); SPDR Index Shares Funds (31) (2018-present); SSGA Active Trust (12) (2018-present); and SSGA Master Trust (1) (2018-present). |
Ronald E. Toupin, Jr. (1958) | Trustee, Chair of the Board and Chair of the Executive Committee | Since 2014 | Current: Portfolio Consultant (2010-present); Member, Governing Council, Independent Directors Council (2013-present); Governor, Board of Governors, Investment Company Institute (2018-present). Former: Member, Executive Committee, Independent Directors Council (2016-2018); Vice President, Manager and Portfolio Manager, Nuveen Asset Management (1998-1999); Vice President, Nuveen Investment Advisory Corp. (1992-1999); Vice President and Manager, Nuveen Unit Investment Trusts (1991-1999); and Assistant Vice President and Portfolio Manager, Nuveen Unit Investment Trusts (1988-1999), each of John Nuveen & Co., Inc. (1982-1999). | 156 | Former: Western Asset Inflation-Linked Opportunities & Income Fund (2004-April 2020); Western Asset Inflation-Linked Income Fund (2003-April 2020); Managed Duration Investment Grade Municipal Fund (2003-2016). |
| | THE GUGGENHEIM FUNDS SEMI-ANNUAL REPORT | 101 |
INFORMATION ON BOARD OF TRUSTEES AND OFFICERS (Unaudited)(continued) |
Name, Address*
and Year of Birth | Position(s)
Held with
Trust | Term of Office
and Length of
Time Served** | Principal Occupation(s)
During Past Five Years | Number of
Portfolios
in Fund
Complex
Overseen | Other Directorships
Held by Trustees*** |
INTERESTED TRUSTEE | |
Amy J. Lee**** (1961) | Trustee, Vice President and Chief Legal Officer | Since 2018 (Trustee) Since 2014 (Chief Legal Officer) Since 2007 (Vice President) | Current: Interested Trustee, certain other funds in the Fund Complex (2018-present); Chief Legal Officer, certain other funds in the Fund Complex (2014-present); Vice President, certain other funds in the Fund Complex (2007-present); Senior Managing Director, Guggenheim Investments (2012-present). Former: President and Chief Executive Officer, certain other funds in the Fund Complex (2017-2019); Vice President, Associate General Counsel and Assistant Secretary, Security Benefit Life Insurance Company and Security Benefit Corporation (2004-2012). | 156 | None. |
* | The business address of each Trustee is c/o Guggenheim Investments, 227 West Monroe Street, Chicago, Illinois 60606. |
** | Each Trustee serves an indefinite term, until his or her successor is elected and qualified. Time served includes time served in the respective position for the Predecessor Corporation. |
*** | Each Trustee also serves on the boards of trustees of Guggenheim Funds Trust, Guggenheim Variable Funds Trust, Guggenheim Strategy Funds Trust, Fiduciary/Claymore Energy Infrastructure Fund, Guggenheim Taxable Municipal Managed Duration Trust, Guggenheim Strategic Opportunities Fund, Guggenheim Enhanced Equity Income Fund, Guggenheim Energy & Income Fund, Guggenheim Credit Allocation Fund, Rydex Series Funds, Rydex Dynamic Funds, Rydex Variable Funds and Transparent Value Trust. Messrs. Barnes and Nyberg also serve on the board of trustees of Advent Convertible & Income Fund. |
**** | This Trustee is deemed to be an “interested person” of the Fund under the 1940 Act by reason of her position with the Fund’s Investment Manager and/or the parent of the Investment Manager. |
102 | THE GUGGENHEIM FUNDS SEMI-ANNUAL REPORT | |
INFORMATION ON BOARD OF TRUSTEES AND OFFICERS (Unaudited)(continued) |
Name, Address*
and Year of Birth | Position(s)
Held with
Trust | Term of Office
and Length of
Time Served** | Principal Occupation(s)
During Past Five Years |
OFFICERS | | | |
Brian E. Binder (1972) | President and Chief Executive Officer | Since 2018 | Current: President and Chief Executive Officer, certain other funds in the Fund Complex (2018-present); President, Chief Executive Officer and Chairman of the Board of Managers, Guggenheim Funds Investment Advisors, LLC (2018-present); President and Chief Executive Officer, Security Investors, LLC (2018-present); Board Member of Guggenheim Partners Fund Management (Europe) Limited (2018-present); Senior Managing Director and Chief Administrative Officer, Guggenheim Investments (2018-present). Former: Managing Director and President, Deutsche Funds, and Head of US Product, Trading and Fund Administration, Deutsche Asset Management (2013-2018); Managing Director, Head of Business Management and Consulting, Invesco Ltd. (2010-2012). |
James M. Howley (1972) | Assistant Treasurer | Since 2014 | Current: Managing Director, Guggenheim Investments (2004-present); Assistant Treasurer, certain other funds in the Fund Complex (2006-present). Former: Manager, Mutual Fund Administration of Van Kampen Investments, Inc. (1996-2004). |
Mark E. Mathiasen (1978) | Secretary | Since 2014 | Current: Secretary, certain other funds in the Fund Complex (2007-present); Managing Director, Guggenheim Investments (2007-present). |
Glenn McWhinnie (1969) | Assistant Treasurer | Since 2016 | Current: Vice President, Guggenheim Investments (2009-present); Assistant Treasurer, certain other funds in the Fund Complex (2016-present). |
Michael P. Megaris (1984) | Assistant Secretary | Since 2014 | Current: Assistant Secretary, certain other funds in the Fund Complex (2014-present); Director, Guggenheim Investments (2012-present). |
Elisabeth Miller (1968) | Chief Compliance Officer | Since 2012 | Current: Chief Compliance Officer, certain other funds in the Fund Complex (2012-present); Senior Managing Director, Guggenheim Investments (2012-present). Vice President, Guggenheim Funds Distributors, LLC (2014-present). Former: Chief Compliance Officer, Security Investors, LLC and Guggenheim Funds Investment Advisors, LLC (2012-2018); Chief Compliance Officer, Guggenheim Distributors, LLC (2009-2014); Senior Manager, Security Investors, LLC (2004-2014); Senior Manager, Guggenheim Distributors, LLC (2004-2014). |
| | THE GUGGENHEIM FUNDS SEMI-ANNUAL REPORT | 103 |
INFORMATION ON BOARD OF TRUSTEES AND OFFICERS (Unaudited)(continued) |
Name, Address*
and Year of Birth | Position(s)
Held with
Trust | Term of Office
and Length of
Time Served** | Principal Occupation(s)
During Past Five Years |
OFFICERS - continued | |
Margaux Misantone (1978) | AML Officer | Since 2017 | Current: Chief Compliance Officer, Security Investors, LLC and Guggenheim Funds Investment Advisors, LLC (2018-present); AML Officer, Security Investors, LLC and certain other funds in the Fund Complex (2017-present); Managing Director, Guggenheim Investments (2015-present). Former: Assistant Chief Compliance Officer, Security Investors, LLC and Guggenheim Funds Investments Advisors, LLC (2015-2018). |
William Rehder (1967) | Assistant Vice President | Since 2018 | Current: Managing Director, Guggenheim Investments (2002-present). |
Kimberly J. Scott (1974) | Assistant Treasurer | Since 2014 | Current: Director, Guggenheim Investments (2012-present); Assistant Treasurer, certain other funds in the Fund Complex (2012-present). Former: Financial Reporting Manager, Invesco, Ltd. (2010-2011); Vice President/Assistant Treasurer, Mutual Fund Administration for Van Kampen Investments, Inc./Morgan Stanley Investment Management (2009-2010); Manager of Mutual Fund Administration, Van Kampen Investments, Inc./Morgan Stanley Investment Management (2005-2009). |
Bryan Stone (1979) | Vice President | Since 2014 | Current: Vice President, certain other funds in the Fund Complex (2014-present); Managing Director, Guggenheim Investments (2013-present). Former: Senior Vice President, Neuberger Berman Group LLC (2009-2013); Vice President, Morgan Stanley (2002-2009). |
John L. Sullivan (1955) | Chief Financial Officer, Chief Accounting Officer and Treasurer | Since 2014 | Current: Chief Financial Officer, Chief Accounting Officer and Treasurer, certain other funds in the Fund Complex (2010-present); Senior Managing Director, Guggenheim Investments (2010-present). Former: Managing Director and Chief Compliance Officer, each of the funds in the Van Kampen Investments fund complex (2004-2010); Managing Director and Head of Fund Accounting and Administration, Morgan Stanley Investment Management (2002-2004); Chief Financial Officer and Treasurer, Van Kampen Funds (1996-2004). |
104 | THE GUGGENHEIM FUNDS SEMI-ANNUAL REPORT | |
INFORMATION ON BOARD OF TRUSTEES AND OFFICERS (Unaudited)(concluded) |
Name, Address*
and Year of Birth | Position(s)
Held with
Trust | Term of Office
and Length of
Time Served** | Principal Occupation(s)
During Past Five Years |
OFFICERS - concluded | |
Jon Szafran (1989) | Assistant Treasurer | Since 2017 | Current: Vice President, Guggenheim Investments (2017-present); Assistant Treasurer, certain other funds in the Fund Complex (2017-present). Former: Assistant Treasurer of Henderson Global Funds and Manager of US Fund Administration, Henderson Global Investors (North America) Inc. (“HGINA”), (2017); Senior Analyst of US Fund Administration, HGINA (2014–2017); Senior Associate of Fund Administration, Cortland Capital Market Services, LLC (2013-2014); Experienced Associate, PricewaterhouseCoopers LLP (2012-2013). |
* | The business address of each officer is c/o Guggenheim Investments, 227 West Monroe Street, Chicago, Illinois 60606. |
** | Each officer serves an indefinite term, until his or her successor is duly elected and qualified. |
| | THE GUGGENHEIM FUNDS SEMI-ANNUAL REPORT | 105 |
GUGGENHEIM INVESTMENTS PRIVACY NOTICE (Unaudited) |
Who We Are
This Privacy Notice describes the data protection practices of Guggenheim Investments. Guggenheim Investments as used herein refers to the affiliated investment management businesses of Guggenheim Partners, LLC: Guggenheim Funds Investment Advisors, LLC, Guggenheim Partners Investment Management, LLC, Guggenheim Funds Distributors, LLC, Security Investors, LLC, Guggenheim Investment Advisors (Europe) Limited, Guggenheim Real Estate, LLC, GS Gamma Advisors, LLC, Guggenheim Partners India Management, LLC, Guggenheim Partners Europe Limited, as well as the funds in the Guggenheim Funds complex (the “Funds”) (“Guggenheim Investments,” “we,” “us,” or “our”).
Guggenheim Partners Investment Management Holdings, LLC, located at 330 Madison Avenue, New York, New York 10017 is the data controller for your information. The affiliates who are also controllers of certain of your information are: Guggenheim Investment Advisors (Europe) Limited, Guggenheim Partners Europe Limited, Guggenheim Partners, LLC, Guggenheim Funds Investment Advisors, LLC, Guggenheim Partners Investment Management, LLC, Guggenheim Funds Distributors, LLC and Security Investors, LLC, as well as the Funds.
Our Commitment to You
Guggenheim Investments considers your privacy our utmost concern. When you become our client or investor, you entrust us with not only your hard-earned money but also with your personal and financial information. Because we have access to your private information, we hold ourselves to the highest standards in its safekeeping and use. We strictly limit how we share your information with others, whether you are a current or former Guggenheim Investments client or investor.
The Information We Collect About You
We collect certain nonpublic personal information about you from information you provide on applications, other forms, our website, and/or from third parties including investment advisors. This information includes Social Security or other tax identification number, assets, income, tax information, retirement and estate plan information, transaction history, account balance, payment history, bank account information, marital status, family relationships, information that we collect on our website through the use of “cookies,” and other personal information that you or others provide to us. We may also collect such information through your inquiries by mail, e-mail or telephone. We may also collect customer due diligence information, as required by applicable law and regulation, through third party service providers.
How We Handle Your Personal Information
The legal basis for using your information as set out in this Privacy Notice is as follows: (a) use of your personal data is necessary to perform our obligations under any contract with you (such as a contract for us to provide financial services to you); or (b) where use of your personal data is not necessary for performance of a contract, use of your personal data is necessary for our
106 | THE GUGGENHEIM FUNDS SEMI-ANNUAL REPORT | |
GUGGENHEIM INVESTMENTS PRIVACY NOTICE (Unaudited)(continued) |
legitimate interests or the legitimate interests of others (for example, to enforce the legal terms governing our services, operate and market our website and other services we offer, ensure safe environments for our personnel and others, make and receive payments, prevent fraud and to know the customer to whom we are providing the services). Some processing is done to comply with applicable law.
In addition to the specific uses described above, we also use your information in the following manner:
| | ● | We use your information in connection with servicing your accounts. |
| | ● | We use information to respond to your requests or questions. For example, we might use your information to respond to your customer feedback. |
| | ● | We use information to improve our products and services. We may use your information to make our website and products better. We may use your information to customize your experience with us. |
| | ● | We use information for security purposes. We may use your information to protect our company and our customers. |
| | ● | We use information to communicate with you. For example, we will communicate with you about your account or our relationship. We may contact you about your feedback. We might also contact you about this Privacy Notice. We may also enroll you in our email newsletter. |
| | ● | We use information as otherwise permitted by law, as we may notify you. |
| | ● | Aggregate/Anonymous Data. We may aggregate and/or anonymize any information collected through the website so that such information can no longer be linked to you or your device (“Aggregate/Anonymous Information”). We may use Aggregate/Anonymous Information for any purpose, including without limitation for research and marketing purposes, and may also share such data with any third parties, including advertisers, promotional partners, and sponsors. |
We do not sell information about current or former clients or their accounts to third parties. Nor do we share this information, except when necessary to complete transactions at your request, to make you aware of investment products and services that we or our affiliates offer, or as permitted or required by law.
We provide information about you to companies and individuals not affiliated with Guggenheim Investments to complete certain transactions or account changes, or to perform services for us related to your account. For example, if you ask to transfer assets from another financial institution to Guggenheim Investments, we must provide certain information about you to that company to complete the transaction. We provide the third party with only the information necessary to carry out its responsibilities and only for that purpose. And we require these third
| | THE GUGGENHEIM FUNDS SEMI-ANNUAL REPORT | 107 |
GUGGENHEIM INVESTMENTS PRIVACY NOTICE (Unaudited)(continued) |
parties to treat your private information with the same high degree of confidentiality that we do. To alert you to other Guggenheim Investments products and services, we share your information within our family of affiliated companies. You may limit our sharing with affiliated companies as set out below. We may also share information with any successor to all or part of our business, or in connection with steps leading up to a merger or acquisition. For example, if part of our business was sold we may give customer information as part of that transaction. We may also share information about you with your consent.
We will release information about you if you direct us to do so, if we are compelled by law to do so, or in other circumstances as permitted by law (for example, to protect your account from fraud).
If you close your account(s) or become an inactive client or investor, we will continue to adhere to the privacy policies and practices described in this notice.
Opt-Out Provisions and Your Data Choices
The law allows you to “opt out” of certain kinds of information sharing with third parties. We do not share personal information about you with any third parties that triggers this opt-out right. This means YOU ARE ALREADY OPTED OUT.
When you are no longer our client or investor, we continue to share your information as described in this notice, and you may contact us at any time to limit our sharing by sending an email to CorporateDataPrivacy@GuggenheimPartners.com.
European Union Data Subjects and certain others: In addition to the choices set forth above, residents of the European Union and certain other jurisdictions have certain rights to (1) request access to or rectification or deletion of information we collect about them, (2) request a restriction on the processing of their information, (3) object to the processing of their information, or (4) request the portability of certain information. To exercise these or other rights, please contact us using the contact information below. We will consider all requests and provide our response within the time period stated by applicable law. Please note, however, that certain information may be exempt from such requests in some circumstances, which may include if we need to keep processing your information for our legitimate interests or to comply with a legal obligation. We may request you provide us with information necessary to confirm your identity before responding to your request.
Residents of France and certain other jurisdictions may also provide us with instructions regarding the manner in which we may continue to store, erase and share your information after your death, and where applicable, the person you have designated to exercise these rights after your death.
How We Protect Privacy Online
We take steps to protect your privacy when you use our web site – www.guggenheiminvestments.com – by using secure forms of online communication, including encryption technology, Secure Socket Layer (SSL) protocol, firewalls and user names and passwords. These safeguards vary
108 | THE GUGGENHEIM FUNDS SEMI-ANNUAL REPORT | |
GUGGENHEIM INVESTMENTS PRIVACY NOTICE (Unaudited)(concluded) |
based on the sensitivity of the information that we collect and store. However, we cannot and do not guarantee that these measures will prevent every unauthorized attempt to access, use, or disclose your information since despite our efforts, no Internet and/or other electronic transmissions can be completely secure. Our web site uses “http cookies”—tiny pieces of information that we ask your browser to store. We use cookies for session management and security features on the Guggenheim Investments web site. We do not use them to pull data from your hard drive, to learn your e-mail address, or to view data in cookies created by other web sites. We will not share the information in our cookies or give others access to it. See the legal information area on our web site for more details about web site security and privacy features.
How We Safeguard Your Personal Information and Data Retention
We restrict access to nonpublic personal information about you to our employees and in some cases to third parties (for example, the service providers described above) as permitted by law. We maintain strict physical, electronic and procedural safeguards that comply with federal standards to guard your nonpublic personal information.
We keep your information for no longer than necessary for the purposes for which it is processed. The length of time for which we retain information depends on the purposes for which we collected and use it and/or as required to comply with applicable laws. Information may persist in copies made for backup and business continuity purposes for additional time.
International Visitors
If you are not a resident of the United States, please be aware that your information may be transferred to, stored and processed in the United States where our servers are located and our databases are operated. The data protection and other laws of the United States and other countries might not be as comprehensive as those in your country.
In such cases, we ensure that a legal basis for such a transfer exists and that adequate protection is provided as required by applicable law, for example, by using standard contractual clauses or by transferring your data to a jurisdiction that has obtained an adequacy finding. Individuals whose data may be transferred on the basis of standard contractual clauses may contact us as described below.
We’ll Keep You Informed
If you have any questions or concerns about how we treat your personal data, we encourage you to consult with us first. You may also contact the relevant supervisory authority.
We reserve the right to modify this policy at any time and will inform you promptly of material changes. You may access our privacy policy from our web site at www.guggenheiminvestments.com. Should you have any questions regarding our privacy policy, contact us by email at CorporateDataPrivacy@GuggenheimPartners.com.
| | THE GUGGENHEIM FUNDS SEMI-ANNUAL REPORT | 109 |
This page intentionally left blank.
This page intentionally left blank.
This page intentionally left blank.
This page intentionally left blank.
3.31.2020
Guggenheim Funds Semi-Annual Report
| |
Guggenheim Ultra Short Duration Fund | | |
Beginning on January 1, 2021, paper copies of the Fund’s annual and semi-annual shareholder reports may no longer be sent by mail, unless you specifically request paper copies of the reports from a Fund or from your financial intermediary. Instead, the reports will be made available on a website, and you will be notified by mail each time a report is posted and provided with a website link to access the report.
If you already elected to receive shareholder reports electronically, you will not be affected by this change and you need not take any action. At any time, you may elect to receive reports and other communications from a Fund electronically by calling 800.820.0888, going to GuggenheimInvestments.com/myaccount, or by contacting your financial intermediary.
You may elect to receive all future shareholder reports in paper free of charge. If you hold shares of a Fund directly, you can inform the Fund that you wish to receive paper copies of reports by calling 800.820.0888. If you hold shares of a Fund through a financial intermediary, please contact the financial intermediary to make this election. Your election to receive reports in paper will apply to all Guggenheim Funds in which you are invested and may apply to all funds held with your financial intermediary.
GuggenheimInvestments.com | USD-SEMI-0320x0920 |

| | |
DEAR SHAREHOLDER | 2 |
ECONOMIC AND MARKET OVERVIEW | 4 |
ABOUT SHAREHOLDERS’ FUND EXPENSES | 7 |
ULTRA SHORT DURATION FUND | 10 |
NOTES TO FINANCIAL STATEMENTS | 39 |
OTHER INFORMATION | 60 |
INFORMATION ON BOARD OF TRUSTEES AND OFFICERS | 61 |
GUGGENHEIM INVESTMENTS PRIVACY NOTICE | 68 |
| | THE GUGGENHEIM FUNDS SEMI-ANNUAL REPORT | 1 |
Dear Shareholder:
The six-month period ended March 31, 2020, concluded on a somber note. Even though markets performed well for most of the period, the emergence of a novel and highly contagious form of coronavirus in the last weeks of the period adversely impacted global commercial activity and contributed to significant volatility in certain markets, unseen since the great recession of 2008.
As it spread beyond Asia to virtually every country in the world, many governments and businesses instituted quarantines and closures, which has resulted in significant disruption in manufacturing, supply chains, consumer demand and economic activity. The U.S. Federal Reserve responded quickly to provide liquidity in order to ensure that the U.S. markets continued to function efficiently. The fiscal policy included a spending bill worth over $2 trillion to assist consumers, states, small businesses and certain industries. While these actions helped stabilize the market, volatile conditions continued into April.
As discussed in this semi-annual shareholder report, these events have affected performance for the Ultra Short Duration Fund (the “Fund”). We encourage you to read the Economic and Market Overview section of the report, which follows this letter.
Guggenheim Partners Investment Management, LLC (“GPIM” or the “Investment Adviser”), serves as the investment adviser to the Fund. The Investment Adviser is an affiliate of Guggenheim Partners, LLC (“Guggenheim”), a global, diversified financial services firm. Guggenheim Funds Distributors, LLC serves as the distributor to the Fund and is also an affiliate of Guggenheim.
Together, we are committed to the safety and prosperity of our clients, our employees, and our shareholders. The resources of the firm are being made fully available not only to support our clients, but also to support our employees and their families.
Please practice the appropriate prudence for the protection not only of your health and that of your friends and loved ones but also for our neighbors and communities. Thank you for the trust you place in us.
Sincerely,
Guggenheim Partners Investment Management, LLC
April 30, 2020
Read a prospectus and summary prospectus (if available) carefully before investing. It contains the investment objectives, risks, charges, expenses and other information, which should be considered carefully before investing. Obtain a prospectus and summary prospectus (if available) at guggenheiminvestments.com or call 800.820.0888.
2 | THE GUGGENHEIM FUNDS SEMI-ANNUAL REPORT | |
This material is not intended as a recommendation or as investment advice of any kind, including in connection with rollovers, transfers, and distributions. Such material is not provided in a fiduciary capacity, may not be relied upon for or in connection with the making of investment decisions, and does not constitute a solicitation of an offer to buy or sell securities. All content has been provided for informational or educational purposes only and is not intended to be and should not be construed as legal or tax advice and/or a legal opinion. Always consult a financial, tax and/or legal professional regarding your specific situation.
The global ongoing crisis caused by the outbreak of COVID-19 is causing materially reduced consumer demand and economic output, disrupting supply chains, resulting in market closures, travel restrictions and quarantines, and adversely impacting local and global economies. Investors should be aware that in light of the current uncertainty, volatility and distress in economies, financial markets, and labor and health conditions all over the world, the Fund’s investments and a shareholder’s investment in the Fund are subject to sudden and substantial losses, increased volatility and other adverse events. Firms through which investors invest with the Fund, the Fund, its service providers, the markets in which it invests and market intermediaries are also impacted by quarantines and similar measures intended to contain the ongoing pandemic, which can obstruct their functioning and subject them to heightened operational risks.
Ultra Short Duration Fund may not be suitable for all investors. The investments in fixed-income instruments are subject to the possibility that interest rates could rise, causing the value of the holdings and share price to decline. Investors in asset- backed securities, including collateralized loan obligations (CLOs) generally receive payments that are part interest and part return of principal. These payments may vary based on the rate loans are repaid. Some asset-backed securities may have structures that make their reaction to interest rates and other factors difficult to predict, making their prices volatile and they are subject to liquidity and valuation risk. CLOs bear similar risks to investing in loans directly. Investments in loans involve special types of risks, including credit, interest rate, counterparty, prepayment, liquidity, and valuation risks. Loans are often below investment grade, may be unrated, and typically offer a fixed or floating interest rate. High yield and unrated debt securities are at a greater risk of default than investment grade bonds and may be less liquid, which may increase volatility. The use of leverage, through borrowings or instruments such as derivatives, may cause the fund to be more volatile and riskier than if it had not been leveraged. The more a fund invests in leveraged instruments, the more the leverage will magnify any gains or losses on those investments. Foreign securities carry unique or additional risks when compared to U.S. securities, including currency fluctuations, adverse political and economic developments, unreliable or untimely information, less liquidity and more volatility, limited legal recourse and higher transactional costs, all of which are enhanced when investing in emerging markets. In addition, investments in emerging markets are subject to risks associated with trading in smaller markets, lower volumes of trading, and being subject to lower levels of government regulation and less extensive accounting, financial and other reporting requirements. Please read the prospectus for more detailed information regarding these and other risks.
| | THE GUGGENHEIM FUNDS SEMI-ANNUAL REPORT | 3 |
ECONOMIC AND MARKET OVERVIEW (Unaudited) | March 31, 2020 |
The six-month period ended March 31, 2020, was a wild ride for markets. While the U.S. economy was generally in good shape in 2019, recessionary fears rose throughout the year, prompting the U.S. Federal Reserve (the “Fed”) to announce a rate cut on July 31, the first since 2008, amid growing downside risks to policymakers’ baseline growth and inflation forecasts. Key among those risks were slowing global growth, the threat of additional U.S.-China tariffs, and the possible ramifications surrounding Brexit. The Fed subsequently cut rates twice more in 2019, which caused markets to rally toward the end of the year and into early 2020. Stocks reached new highs and credit spreads tightened to historic levels. Since then, the global outbreak of the coronavirus, COVID-19, has been at the center of everything. As of this writing, COVID-19 has spread to 210 countries, resulted in over 2.5 million cases, and caused over 170,000 deaths. Thus far, the U.S. makes up more than 30% of global cases, and 25% of global deaths. States have required the labor force to work from home if possible, individuals to practice social distancing, and non-essential businesses to shut down.
Closures, quarantines, and social distancing efforts have impacted the travel, hospitality, restaurants, and retail industries, with activity down 100% in some areas of the country. Further exacerbating the decline in output will be reduced business investment, which was already stalling due to falling profits, trade conflicts, and political uncertainty. The coronavirus shock and collapse in oil prices will likely further depress capital expenditures.
In response to the crisis, the Federal Open Market Committee cut rates by a further 125 basis points in the first quarter of 2020 and passed a series of stimulus programs. Among these were the Primary and Secondary Market Corporate Credit Facilities, which are lending programs primarily targeting investment-grade corporate bond issuers, implemented in concert with the U.S. Treasury. It was only after the announcement of this program that corporate credit found some relief from the selloff, but we expect this relief may be temporary.
With an alphabet soup of monetary programs targeting relief from the coronavirus impact, fiscal policy has also stepped up to the plate with a spending bill worth over $2 trillion that aims to assist consumers, states, small businesses, and certain industries. There is no question that these programs will help ease the economic fallout from virus containment measures, but even $2 trillion may be too small given the magnitude of the economic shock that we are facing. Additionally, it is far from clear that fiscal measures are an adequate solution to the issue at hand: the physical impediment to consumer spending. Fiscal and monetary policy can do their part, but ultimately it is public health policy that will likely be the greatest determinant of the economic outlook.
For the six months ended March 31, 2020, the Standard & Poor’s 500® (“S&P 500”) Index* returned -12.31%. The decline, while significant, represents something of a recovery in stocks. The S&P 500 peaked at 3,386.15 on February 19, 2020, before plummeting 33.9% to a low of 2,237.40 on March 23, 2020, then recovering some lost ground by the end of the month.
4 | THE GUGGENHEIM FUNDS SEMI-ANNUAL REPORT | |
ECONOMIC AND MARKET OVERVIEW (Unaudited)(continued) | March 31, 2020 |
The consensus estimate for S&P 500 earnings per share in 2020 is still around $150. Our research shows S&P 500 earnings per share could fall below $100. Similarly, economists have no way to calibrate how bad the economic data could be based on history. The March U.S. non-farm payrolls report was evidence of this, as it showed a decline in payrolls of 700,000 jobs versus survey expectations of a decline of only 100,000 jobs. We currently expect that second quarter U.S. real gross domestic product (“GDP”) quarter-over-quarter growth could fall by 40% annualized and the unemployment rate could rise to at least 20%. Beyond that, the severity of the crisis depends on containment of the virus and the effectiveness of social distancing measures put in place, but expectations for a quick and sustained V-shaped recovery appear overly optimistic.
For the six months ended March 31, 2020, the MSCI Europe-Australasia-Far East (“EAFE”) Index* returned -16.37%. The return of the MSCI Emerging Markets Index* was -14.45%.
In the bond market, the Bloomberg Barclays U.S. Aggregate Bond Index* posted a 3.33% return for the six-month period, while the Bloomberg Barclays U.S. Corporate High Yield Index* returned -10.40%. The return of the ICE Bank of America (“BofA”) Merrill Lynch 3-Month U.S. Treasury Bill Index* was 1.04% for the six-month period.
The opinions and forecasts expressed may not actually come to pass. This information is subject to change at any time, based on market and other conditions, and should not be construed as a recommendation of any specific security or strategy.
*Index Definitions:
The following indices are referenced throughout this report. Indices are unmanaged and not available for direct investment. Index performance does not reflect transaction costs, fees, or expenses.
Bloomberg Barclays U.S. Aggregate Bond Index is a broad-based flagship benchmark that measures the investment grade, U.S. dollar-denominated, fixed-rate taxable bond market, including U.S. Treasuries, government-related and corporate securities, mortgage-backed securities or “MBS” (agency fixed-rate and hybrid adjustable-rate mortgage, or “ARM”, pass-throughs), asset-backed securities (“ABS”), and commercial mortgage-backed securities (“CMBS”) (agency and non-agency).
Bloomberg Barclays U.S. Corporate High Yield Index measures the U.S. dollar-denominated, high yield, fixed-rate corporate bond market. Securities are classified as high yield if the middle rating of Moody’s, Fitch, and S&P is Ba1/BB +/BB + or below.
Bloomberg Barclays 1-3 Month U.S. Treasury Bill Index includes all publicly issued zero-coupon U.S. Treasury Bills that have a remaining maturity of less than 3 months and more than 1 month, are rated investment grade, and have $250 million or more of outstanding face value. In addition, the securities must be denominated in U.S. dollars and must be fixed rate and nonconvertible. The 1-3 Month U.S. Treasury Bill Index is market capitalization weighted and the securities in the index are updated on the last business day of each month.
ICE BofA Merrill Lynch 3-Month U.S. Treasury Bill Index is an unmanaged market Index of U.S. Treasury securities maturing in 90 days that assumes reinvestment of all income.
MSCI EAFE Index is a free float-adjusted market capitalization index that is designed to measure the equity market performance of developed markets, excluding the U.S. & Canada.
| | THE GUGGENHEIM FUNDS SEMI-ANNUAL REPORT | 5 |
ECONOMIC AND MARKET OVERVIEW (Unaudited)(concluded) | March 31, 2020 |
MSCI Emerging Markets Index is a free float-adjusted market capitalization weighted index that is designed to measure equity market performance in the global emerging markets.
S&P 500® is a broad-based index, the performance of which is based on the performance of 500 widely held common stocks chosen for market size, liquidity, and industry group representation.
6 | THE GUGGENHEIM FUNDS SEMI-ANNUAL REPORT | |
ABOUT SHAREHOLDERS’ FUND EXPENSES (Unaudited) |
All mutual funds have operating expenses, and it is important for our shareholders to understand the impact of costs on their investments. Shareholders of a fund incur two types of costs: (i) transaction costs, including sales charges (loads) on purchase payments, reinvested dividends, other distributions, and exchange fees, and (ii) ongoing costs, including management fees, administrative services, and shareholder reports, among others. These ongoing costs, or operating expenses, are deducted from a fund’s gross income and reduce the investment return of the fund.
A fund’s expenses are expressed as a percentage of its average net assets, which is known as the expense ratio. The following examples are intended to help investors understand the ongoing costs (in dollars) of investing in a fund and to compare these costs with the ongoing costs of investing in other mutual funds.
The examples are based on an investment of $1,000 made at the beginning of the period and held for the entire six-month period beginning September 30, 2019 and ending March 31, 2020.
The following tables illustrate the Fund’s costs in two ways:
Table 1. Based on actual Fund return: This section helps investors estimate the actual expenses paid over the period. The “Ending Account Value” shown is derived from the Fund’s actual return, and the fifth column shows the dollar amount that would have been paid by an investor who started with $1,000 in the Fund. Investors may use the information here, together with the amount invested, to estimate the expenses paid over the period. Simply divide the Fund’s account value by $1,000 (for example, an $8,600 account value divided by $1,000 = 8.6), then multiply the result by the number provided under the heading “Expenses Paid During Period.”
Table 2. Based on hypothetical 5% return: This section is intended to help investors compare a fund’s cost with those of other mutual funds. The table provides information about hypothetical account values and hypothetical expenses based on the Fund’s actual expense ratio and an assumed rate of return of 5% per year before expenses, which is not the Fund’s actual return. The hypothetical account values and expenses may not be used to estimate the actual ending account balance or expenses paid during the period. The example is useful in making comparisons because the U.S. Securities and Exchange Commission (the “SEC”) requires all mutual funds to calculate expenses based on the 5% return. Investors can assess a Fund’s costs by comparing this hypothetical example with the hypothetical examples that appear in shareholder reports of other funds.
The calculations illustrated above assume no shares were bought or sold during the period. Actual costs may have been higher or lower, depending on the amount of investment and the timing of any purchases or redemptions.
| | THE GUGGENHEIM FUNDS SEMI-ANNUAL REPORT | 7 |
ABOUT SHAREHOLDERS’ FUND EXPENSES (Unaudited)(continued) |
Please note that the expenses shown in the table are meant to highlight your ongoing costs only and do not reflect any transactional costs, such as sales charges (loads) on purchase payments, and contingent deferred sales charges (“CDSC”) on redemptions, if any. Therefore, the second table is useful in comparing ongoing costs only, and will not help you determine the relative total costs of owning different funds. In addition, if these transactional costs were included, your costs would have been higher.
More information about the Fund’s expenses, including annual expense ratios for periods up to five years (subject to the Fund’s inception date), can be found in the Financial Highlights section of this report. For additional information on operating expenses and other shareholder costs, please refer to the Fund’s prospectus.
8 | THE GUGGENHEIM FUNDS SEMI-ANNUAL REPORT | |
ABOUT SHAREHOLDERS’ FUND EXPENSES (Unaudited)(concluded) |
| Expense
Ratio1 | Fund
Return | Beginning
Account Value
September 30,
2019 | Ending
Account Value
March 31,
2020 | Expenses
Paid During
Period2 |
Table 1. Based on actual Fund return3 |
Ultra Short Duration Fund |
A-Class | 0.59% | (1.01%) | $ 1,000.00 | $ 989.90 | $ 2.94 |
Institutional Class | 0.34% | (0.88%) | 1,000.00 | 991.20 | 1.69 |
|
Table 2. Based on hypothetical 5% return (before expenses) |
Ultra Short Duration Fund |
A-Class | 0.59% | 5.00% | $ 1,000.00 | $ 1,022.05 | $ 2.98 |
Institutional Class | 0.34% | 5.00% | 1,000.00 | 1,023.30 | 1.72 |
1 | Annualized. |
2 | Expenses are equal to the Fund’s annualized expense ratio, net of any applicable fee waivers, multiplied by the average account value over the period, multiplied by 183/366 (to reflect the one-half year period). |
3 | Actual cumulative return at net asset value for the period September 30, 2019 to March 31, 2020. |
| | THE GUGGENHEIM FUNDS SEMI-ANNUAL REPORT | 9 |
PERFORMANCE REPORT AND FUND PROFILE (Unaudited) | March 31, 2020 |
ULTRA SHORT DURATION FUND
OBJECTIVE: Seeks a high level of income consistent with the preservation of capital.
Holdings Diversification (Market Exposure as % of Net Assets)
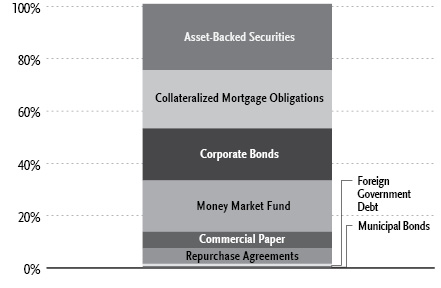
“Holdings Diversification (Market Exposure as % of Net Assets)”
Inception Dates: |
A-Class | November 30, 2018 |
Institutional Class | March 11, 2014 |
Ten Largest Holdings (% of Total Net Assets) |
Discover Card Execution Note Trust, 1.88% | 2.5% |
Ocwen Master Advance Receivables Trust, 2.51% | 2.0% |
Marathon CLO V Ltd., 2.57% | 1.3% |
TICP CLO VII Ltd., 2.06% | 1.1% |
Halcyon Loan Advisors Funding Ltd., 2.72% | 1.0% |
OZLM XII Ltd., 2.82% | 0.9% |
Greywolf CLO III Ltd., 2.30% | 0.9% |
Mountain View CLO Ltd., 2.63% | 0.8% |
Verus Securitization Trust, 2.42% | 0.8% |
MP CLO VIII Ltd., 2.71% | 0.8% |
Top Ten Total | 12.1% |
| | |
“Ten Largest Holdings” excludes any temporary cash or derivative investments. |
10 | THE GUGGENHEIM FUNDS SEMI-ANNUAL REPORT | |
PERFORMANCE REPORT AND FUND PROFILE (Unaudited)(continued) | March 31, 2020 |
Average Annual Returns*
Periods Ended March 31, 2020
| 6 Month† | 1 Year | 5 Year | Since
Inception
(03/11/14) |
Institutional Class Shares | (0.88%) | 0.40% | 1.70% | 1.56% |
Bloomberg Barclays 1-3 Month U.S. Treasury Bill Index | 0.91% | 2.08% | 1.12% | 0.92% |
| | 6 Month† | 1 Year | Since
Inception
(11/30/18) |
A-Class Shares | | (1.01%) | 0.25% | 0.65% |
Bloomberg Barclays 1-3 Month U.S. Treasury Bill Index | | 0.91% | 2.08% | 2.16% |
* | The performance data above represents past performance that is not predictive of future results. The investment return and principal value of an investment in the Fund will fluctuate so that an investor’s shares, when redeemed, may be worth more or less than their original cost. Returns are historical and include changes in principal and reinvested dividends and capital gains and do not reflect the effect of taxes. The Bloomberg Barclays 1-3 Month U.S. Treasury Bill Index is an unmanaged index and, unlike the Fund, has no management fees or operating expenses to reduce its reported return. |
† | 6 month returns are not annualized. |
| | THE GUGGENHEIM FUNDS SEMI-ANNUAL REPORT | 11 |
PERFORMANCE REPORT AND FUND PROFILE (Unaudited)(concluded) | March 31, 2020 |
Portfolio Composition by Quality Rating1 |
Rating | % of Total
Investments |
Fixed Income Instruments | |
AAA | 35.3% |
AA | 4.6% |
A | 13.2% |
BBB | 17.7% |
BB | 0.5% |
B | 1.1% |
NR2 | 2.4% |
Other Instruments | 25.2% |
Total Investments | 100.0% |
1 | Source: BlackRock Solutions. Credit quality ratings are measured on a scale that generally ranges from AAA (highest) to D (lowest). All securities except for those labeled “NR” have been rated by Moody’s, Standard & Poor’s (“S&P”), or Fitch, each of which is a Nationally Recognized Statistical Rating Organization (“NRSRO”). For purposes of this presentation, when ratings are available from more than one agency, the highest rating is used. Guggenheim Investments converts ratings to the equivalent S&P rating. Security ratings are determined at the time of purchase and may change thereafter. |
2 | NR securities do not necessarily indicate low credit quality. |
12 | THE GUGGENHEIM FUNDS SEMI-ANNUAL REPORT | |
SCHEDULE OF INVESTMENTS (Unaudited) | March 31, 2020 |
ULTRA SHORT DURATION FUND | |
| | Shares | | | Value | |
MONEY MARKET FUND† - 19.6% |
Dreyfus Treasury Securities Cash Management Fund — Institutional Shares, 0.51%1 | | | 78,855,659 | | | $ | 78,855,659 | |
Total Money Market Fund | | | | |
(Cost $78,855,659) | | | | | | | 78,855,659 | |
| | | | | | | | | |
| | | Face
Amount~ | | | | | |
ASSET-BACKED SECURITIES†† - 25.3% |
Collateralized Loan Obligations - 18.6% |
Marathon CLO V Ltd. | | | | | | | | |
2017-5A, 2.57% (3 Month USD LIBOR + 0.87%, Rate Floor: 0.00%) due 11/21/272,3 | | | 5,303,290 | | | | 5,098,996 | |
TICP CLO VII Ltd. | | | | | | | | |
2020-7A, 2.06% (3 Month USD LIBOR + 0.55%, Rate Floor: 0.55%) due 04/15/332,3 | | | 4,500,000 | | | | 4,419,868 | |
Halcyon Loan Advisors Funding Ltd. | | | | | | | | |
2017-3A, 2.72% (3 Month USD LIBOR + 0.90%, Rate Floor: 0.00%) due 10/18/272,3 | | | 4,030,278 | | | | 3,905,887 | |
OZLM XII Ltd. | | | | | | | | |
2018-12A, 2.82% (3 Month USD LIBOR + 1.05%, Rate Floor: 0.00%) due 04/30/272,3 | | | 3,600,000 | | | | 3,510,799 | |
Greywolf CLO III Ltd. | | | | | | | | |
2020-3RA, 2.30% (3 Month USD LIBOR + 0.50%, Rate Floor: 0.50%) due 04/15/332,3 | | | 3,500,000 | | | | 3,442,813 | |
THL Credit Wind River CLO Ltd. | | | | | | | | |
2017-2A, 2.70% (3 Month USD LIBOR + 0.87%, Rate Floor: 0.00%) due 10/15/272,3 | | | 2,632,563 | | | | 2,552,988 | |
2019-1A, 2.71% (3 Month USD LIBOR + 0.88%, Rate Floor: 0.00%) due 01/15/262,3 | | | 880,889 | | | | 876,575 | |
Mountain View CLO Ltd. | | | | | | | | |
2018-1A, 2.63% (3 Month USD LIBOR + 0.80%, Rate Floor: 0.80%) due 10/15/262,3 | | | 3,359,891 | | | | 3,313,571 | |
MP CLO VIII Ltd. | | | | | | | | |
2018-2A, 2.71% (3 Month USD LIBOR + 0.91%, Rate Floor: 0.00%) due 10/28/272,3 | | | 3,405,804 | | | | 3,295,543 | |
Midocean Credit Clo VII | | | | | | | | |
2020-7A, 2.79% (3 Month USD LIBOR + 1.04%, Rate Floor: 0.00%) due 07/15/292,3 | | | 3,500,000 | | | | 3,266,504 | |
SEE NOTES TO FINANCIAL STATEMENTS. | THE GUGGENHEIM FUNDS SEMI-ANNUAL REPORT | 13 |
SCHEDULE OF INVESTMENTS (Unaudited)(continued) | March 31, 2020 |
ULTRA SHORT DURATION FUND | |
| | Face
Amount~ | | | Value | |
GPMT Ltd. | | | | | | | | |
2019-FL2, 2.01% (1 Month USD LIBOR + 1.30%, Rate Floor: 1.30%) due 02/22/362,3 | | | 3,000,000 | | | $ | 2,827,228 | |
2018-FL1, 1.67% (1 Month USD LIBOR + 0.90%, Rate Floor: 0.90%) due 11/21/352,3 | | | 341,116 | | | | 316,425 | |
BXMT Ltd. | | | | | | | | |
2020-FL2, 1.70% (1 Month USD LIBOR + 0.90%, Rate Floor: 0.90%) due 02/16/372,3 | | | 3,250,000 | | | | 3,048,708 | |
California Street CLO IX, LP | | | | | | | | |
2019-9A, 2.54% (3 Month USD LIBOR + 0.70%, Rate Floor: 0.00%) due 07/16/322,3 | | | 2,750,000 | | | | 2,662,092 | |
Venture XIV CLO Ltd. | | | | | | | | |
2020-14A, 2.73% (3 Month USD LIBOR + 1.03%, Rate Floor: 1.03%) due 08/28/292,3 | | | 2,500,000 | | | | 2,333,105 | |
Palmer Square Loan Funding Ltd. | | | | | | | | |
2018-4A, 2.59% (3 Month USD LIBOR + 0.90%, Rate Floor: 0.00%) due 11/15/262,3 | | | 1,307,547 | | | | 1,264,750 | |
2019-3A, 2.55% (3 Month USD LIBOR + 0.85%, Rate Floor: 0.85%) due 08/20/272,3 | | | 861,918 | | | | 841,391 | |
Newfleet CLO Ltd. | | | | | | | | |
2018-1A, 2.77% (3 Month USD LIBOR + 0.95%, Rate Floor: 0.00%) due 04/20/282,3 | | | 2,000,000 | | | | 1,880,345 | |
GoldentTree Loan Management US CLO 1 Ltd. | | | | | | | | |
2020-1A, 2.60% (3 Month USD LIBOR + 0.95%, Rate Floor: 0.95%) due 04/20/292,3 | | | 2,000,000 | | | | 1,866,027 | |
West CLO Ltd. | | | | | | | | |
2017-1A, 2.74% (3 Month USD LIBOR + 0.92%, Rate Floor: 0.00%) due 07/18/262,3 | | | 1,864,547 | | | | 1,851,936 | |
Crown Point CLO III Ltd. | | | | | | | | |
2017-3A, 2.74% (3 Month USD LIBOR + 0.91%, Rate Floor: 0.00%) due 12/31/272,3 | | | 1,811,654 | | | | 1,785,885 | |
KVK CLO Ltd. | | | | | | | | |
2017-1A, 2.74% (3 Month USD LIBOR + 0.90%, Rate Floor: 0.00%) due 01/14/282,3 | | | 1,800,000 | | | | 1,743,337 | |
BlueMountain CLO XXV Ltd. | | | | | | | | |
2019-25A, 2.48% (3 Month USD LIBOR + 0.65%, Rate Floor: 0.65%) due 07/15/322,3 | | | 1,750,000 | | | | 1,720,741 | |
Seneca Park CLO Limited | | | | | | | | |
2017-1A, 2.96% (3 Month USD LIBOR + 1.12%, Rate Floor: 0.00%) due 07/17/262,3 | | | 1,686,091 | | | | 1,678,999 | |
14 | THE GUGGENHEIM FUNDS SEMI-ANNUAL REPORT | SEE NOTES TO FINANCIAL STATEMENTS. |
SCHEDULE OF INVESTMENTS (Unaudited)(continued) | March 31, 2020 |
ULTRA SHORT DURATION FUND | |
| | Face
Amount~ | | | Value | |
Garrison BSL CLO Ltd. | | | | | | | | |
2018-1A, 2.79% (3 Month USD LIBOR + 0.95%, Rate Floor: 0.00%) due 07/17/282,3 | | | 1,750,000 | | | $ | 1,641,950 | |
Fortress Credit Opportunities XI CLO Ltd. | | | | | | | | |
2018-11A, 3.13% (3 Month USD LIBOR + 1.30%, Rate Floor: 0.00%) due 04/15/312,3 | | | 1,800,000 | | | | 1,579,266 | |
Mountain Hawk II CLO Ltd. | | | | | | | | |
2018-2A, 3.42% (3 Month USD LIBOR + 1.60%, Rate Floor: 0.00%) due 07/20/242,3 | | | 1,538,053 | | | | 1,523,358 | |
NewStar Clarendon Fund CLO LLC | | | | | | | | |
2019-1A, 3.09% (3 Month USD LIBOR + 1.30%, Rate Floor: 0.00%) due 01/25/272,3 | | | 1,541,860 | | | | 1,505,188 | |
Voya CLO Ltd. | | | | | | | | |
2019-2A, 2.47% (3 Month USD LIBOR + 0.65%, Rate Floor: 0.65%) due 07/20/322,3 | | | 1,406,250 | | | | 1,352,348 | |
Neuberger Berman CLO XX Ltd. | | | | | | | | |
2017-20A, 2.63% (3 Month USD LIBOR + 0.80%, Rate Floor: 0.00%) due 01/15/282,3 | | | 1,400,000 | | | | 1,317,989 | |
Neuberger Berman CLO XVI-S Ltd. | | | | | | | | |
2018-16SA, 2.68% (3 Month USD LIBOR + 0.85%, Rate Floor: 0.00%) due 01/15/282,3 | | | 1,000,000 | | | | 977,490 | |
TICP CLO I Ltd. | | | | | | | | |
2018-1A, 2.62% (3 Month USD LIBOR + 0.80%, Rate Floor: 0.00%) due 07/20/272,3 | | | 976,704 | | | | 957,285 | |
KREF Ltd. | | | | | | | | |
2018-FL1, 1.90% (1 Month USD LIBOR + 1.10%, Rate Floor: 1.10%) due 06/15/362,3 | | | 1,000,000 | | | | 937,509 | |
LoanCore Issuer Ltd. | | | | | | | | |
2018-CRE1, 2.21% (1 Month USD LIBOR + 1.50%, Rate Floor: 1.50%) due 05/15/282,3 | | | 1,000,000 | | | | 889,904 | |
BSPRT Issuer Ltd. | | | | | | | | |
2018-FL3, 1.76% (1 Month USD LIBOR + 1.05%, Rate Floor: 1.05%) due 03/15/282,3 | | | 721,486 | | | | 678,027 | |
BDS | | | | | | | | |
2018-FL2, 1.75% (1 Month USD LIBOR + 0.95%, Rate Floor: 0.95%) due 08/15/352,3 | | | 625,095 | | | | 580,794 | |
Venture XVI CLO Ltd. | | | | | | | | |
2018-16A, 2.68% (3 Month USD LIBOR + 0.85%, Rate Floor: 0.85%) due 01/15/282,3 | | | 400,000 | | | | 376,425 | |
SEE NOTES TO FINANCIAL STATEMENTS. | THE GUGGENHEIM FUNDS SEMI-ANNUAL REPORT | 15 |
SCHEDULE OF INVESTMENTS (Unaudited)(continued) | March 31, 2020 |
ULTRA SHORT DURATION FUND | |
| | Face
Amount~ | | | Value | |
Fortress Credit Opportunities IX CLO Ltd. | | | | | | | | |
2017-9A, 3.24% (3 Month USD LIBOR + 1.55%, Rate Floor: 0.00%) due 11/15/292,3 | | | 382,000 | | | $ | 353,782 | |
Babson CLO Limited | | | | | | | | |
2017-IA, 2.97% (3 Month USD LIBOR + 1.15%, Rate Floor: 0.00%) due 07/20/252,3 | | | 340,177 | | | | 339,229 | |
Golub Capital Partners CLO 17 Ltd. | | | | | | | | |
2017-17A, 3.44% (3 Month USD LIBOR + 1.65%, Rate Floor: 0.00%) due 10/25/302,3 | | | 350,000 | | | | 325,778 | |
Total Collateralized Loan Obligations | | | | | | | 74,840,835 | |
| | | | | | | | | |
Financial - 3.0% | | | | | | | | |
Station Place Securitization Trust | | | | | | | | |
2019-5, 1.63% (1 Month USD LIBOR + 0.70%, Rate Floor: 0.70%) due 06/24/20†††,2,3,4 | | | 3,050,000 | | | | 3,050,000 | |
2019-6, 1.53% (1 Month USD LIBOR + 0.60%, Rate Floor: 0.60%) due 07/24/21†††,2,3 | | | 1,850,000 | | | | 1,850,000 | |
2019-2, 1.48% (1 Month USD LIBOR + 0.55%, Rate Floor: 0.55%) due 04/24/21†††,2,3,4 | | | 900,000 | | | | 900,000 | |
2019-WL1, 1.60% (1 Month USD LIBOR + 0.65%, Rate Floor: 0.65%) due 08/25/52†††,2,3,4 | | | 666,667 | | | | 666,667 | |
2019-9, 1.63% (1 Month USD LIBOR + 0.70%, Rate Floor: 0.00%) due 10/24/20†††,2,3,4 | | | 600,000 | | | | 600,000 | |
Barclays Bank plc | | | | | | | | |
GMTN, 2.18% (1 Month USD LIBOR + 0.60%) due 06/02/20†††,2,3,4 | | | 2,150,000 | | | | 2,150,000 | |
GMTN, 1.67% (1 Month USD LIBOR + 0.68%) due 07/31/20†††,2,3,4 | | | 2,000,000 | | | | 2,000,000 | |
Madison Avenue Secured Funding Trust | | | | | | | | |
2019-1, 2.23% (1 Month USD LIBOR + 1.50%, Rate Floor: 1.50%) due 11/11/20†††,2,3,4 | | | 700,000 | | | | 700,000 | |
Total Financial | | | | | | | 11,916,667 | |
| | | | | | | | | |
Credit Card - 2.5% | | | | | | | | |
Discover Card Execution Note Trust | | | | | | | | |
2017-A6, 1.88% due 02/15/23 | | | 10,000,000 | | | | 9,988,316 | |
| | | | | | | | | |
Transport-Container - 0.9% | | | | |
Global SC Finance II SRL | | | | | | | | |
2014-1A, 3.19% due 07/17/292 | | | 2,816,667 | | | | 2,646,143 | |
Cronos Containers Program Ltd. | | | | | | | | |
2013-1A, 3.08% due 04/18/282 | | | 935,792 | | | | 912,166 | |
Total Transport-Container | | | | | | | 3,558,309 | |
| | | | | | | | | |
Transport-Aircraft - 0.3% | | | | |
AIM Aviation Finance Ltd. | | | | | | | | |
2015-1A, 4.21% due 02/15/402 | | | 917,178 | | | | 794,562 | |
Raspro Trust | | | | | | | | |
2005-1A, 2.89% (3 Month USD LIBOR + 0.93%, Rate Floor: 0.93%) due 03/23/242,3 | | | 542,298 | | | | 508,931 | |
Total Transport-Aircraft | | | | | | | 1,303,493 | |
Total Asset-Backed Securities | | | | |
(Cost $104,963,202) | | | 101,607,620 | |
| | | | | | | | | |
16 | THE GUGGENHEIM FUNDS SEMI-ANNUAL REPORT | SEE NOTES TO FINANCIAL STATEMENTS. |
SCHEDULE OF INVESTMENTS (Unaudited)(continued) | March 31, 2020 |
ULTRA SHORT DURATION FUND | |
| | Face
Amount~ | | | Value | |
COLLATERALIZED MORTGAGE OBLIGATIONS†† - 22.3% |
Residential Mortgage Backed Securities - 19.2% |
New Residential Advance Receivables Trust Advance Receivables Backed | | | | | | | | |
2019-T5, 2.43% due 10/15/512 | | | 3,000,000 | | | $ | 2,932,526 | |
2019-T4, 2.33% due 10/15/512 | | | 3,000,000 | | | | 2,906,755 | |
2019-T3, 2.51% due 09/15/522 | | | 2,550,000 | | | | 2,430,350 | |
Ocwen Master Advance Receivables Trust | | | | | | | | |
2019-T1, 2.51% due 08/15/502 | | | 8,200,000 | | | | 8,176,518 | |
Verus Securitization Trust | | | | | | | | |
2020-1, 2.42% (WAC) due 01/25/602,3 | | | 3,438,817 | | | | 3,300,765 | |
2019-4, 2.64% due 11/25/592,5 | | | 2,312,935 | | | | 2,341,762 | |
2019-4, 2.85% due 11/25/592,5 | | | 1,248,985 | | | | 1,264,453 | |
CSMC Series | | | | | | | | |
2014-7R, 1.78% (WAC) due 10/27/362,3 | | | 3,029,513 | | | | 2,937,565 | |
2014-2R, 1.83% (1 Month USD LIBOR + 0.20%, Rate Floor: 0.20%) due 02/27/462,3 | | | 2,713,268 | | | | 2,570,660 | |
New Residential Mortgage Loan Trust | | | | | | | | |
2019-1A, 3.50% (WAC) due 10/25/592,3 | | | 2,407,872 | | | | 2,415,787 | |
2018-2A, 3.50% (WAC) due 02/25/582,3 | | | 1,712,860 | | | | 1,744,183 | |
Towd Point Mortgage Trust | | | | | | | | |
2018-2, 3.25% (WAC) due 03/25/582,3 | | | 1,305,104 | | | | 1,319,561 | |
2017-6, 2.75% (WAC) due 10/25/572,3 | | | 1,192,856 | | | | 1,193,787 | |
2017-5, 1.55% (1 Month USD LIBOR + 0.60%, Rate Floor: 0.00%) due 02/25/572,3 | | | 663,357 | | | | 640,049 | |
Deephaven Residential Mortgage Trust | | | | | | | | |
2019-3A, 2.96% (WAC) due 07/25/592,3 | | | 3,134,261 | | | | 2,993,481 | |
CIM Trust | | | | | | | | |
2018-R4, 4.07% (WAC) due 12/26/572,3 | | | 2,906,691 | | | | 2,981,439 | |
Soundview Home Loan Trust | | | | | | | | |
2006-OPT5, 1.09% (1 Month USD LIBOR + 0.14%, Rate Floor: 0.14%) due 07/25/363 | | | 2,893,781 | | | | 2,646,207 | |
Residential Mortgage Loan Trust | | | | | | | | |
2020-1, 2.38% (WAC) due 02/25/242,3 | | | 2,720,362 | | | | 2,602,566 | |
Freddie Mac STACR Trust | | | | | | | | |
2020-DNA1, 1.65% (1 Month USD LIBOR + 0.70%, Rate Floor: 0.00%) due 01/25/502,3 | | | 1,000,000 | | | | 969,802 | |
2020-DNA2, 1.70% (1 Month USD LIBOR + 0.75%, Rate Floor: 0.75%) due 02/25/502,3 | | | 1,000,000 | | | | 952,311 | |
2019-DNA4, 1.65% (1 Month USD LIBOR + 0.70%, Rate Floor: 0.00%) due 10/25/492,3 | | | 554,057 | | | | 546,636 | |
Morgan Stanley ABS Capital I Incorporated Trust | | | | | | | | |
2006-NC1, 1.33% (1 Month USD LIBOR + 0.38%, Rate Floor: 0.38%) due 12/25/353 | | | 2,550,000 | | | | 2,393,937 | |
Starwood Mortgage Residential Trust | | | | | | | | |
2020-1, 2.28% (WAC) due 02/25/502,3 | | | 1,674,565 | | | | 1,606,432 | |
2019-1, 2.94% (WAC) due 06/25/492,3 | | | 792,612 | | | | 787,313 | |
SEE NOTES TO FINANCIAL STATEMENTS. | THE GUGGENHEIM FUNDS SEMI-ANNUAL REPORT | 17 |
SCHEDULE OF INVESTMENTS (Unaudited)(continued) | March 31, 2020 |
ULTRA SHORT DURATION FUND | |
| | Face
Amount~ | | | Value | |
Homeward Opportunities Fund I Trust | | | | | | | | |
2019-3, 2.68% (WAC) due 11/25/592,3 | | | 1,702,702 | | | $ | 1,620,268 | |
2019-2, 2.70% (WAC) due 09/25/592,3 | | | 776,380 | | | | 744,236 | |
Connecticut Avenue Securities Trust | | | | | | | | |
2020-R01, 1.75% (1 Month USD LIBOR + 0.80%, Rate Floor: 0.00%) due 01/25/402,3 | | | 1,236,927 | | | | 1,182,692 | |
2019-R07, 1.72% (1 Month USD LIBOR + 0.77%, Rate Floor: 0.00%) due 10/25/392,3 | | | 1,086,222 | | | | 1,059,356 | |
2019-R05, 1.70% (1 Month USD LIBOR + 0.75%, Rate Floor: 0.00%) due 07/25/392,3 | | | 31,078 | | | | 30,748 | |
CIT Mortgage Loan Trust | | | | | | | | |
2007-1, 2.30% (1 Month USD LIBOR + 1.35%, Rate Floor: 1.35%) due 10/25/372,3 | | | 2,155,944 | | | | 2,068,254 | |
Accredited Mortgage Loan Trust | | | | | | | | |
2006-2, 1.21% (1 Month USD LIBOR + 0.26%, Rate Floor: 0.26%) due 09/25/363 | | | 2,174,474 | | | | 1,999,497 | |
Angel Oak Mortgage Trust | | | | | | | | |
2020-1, 2.47% (WAC) due 12/25/592,3 | | | 1,730,878 | | | | 1,715,746 | |
Citigroup Mortgage Loan Trust | | | | | | | | |
2007-WFH2, 1.35% (1 Month USD LIBOR + 0.40%, Rate Floor: 0.40%) due 03/25/373 | | | 1,000,000 | | | | 963,294 | |
2019-IMC1, 2.72% (WAC) due 07/25/492,3 | | | 765,403 | | | | 737,876 | |
CWABS Incorporated Asset-Backed Certificates Trust | | | | | | | | |
2004-4, 1.67% (1 Month USD LIBOR + 0.72%, Rate Floor: 0.48%) due 07/25/343 | | | 1,701,847 | | | | 1,600,604 | |
Argent Securities Incorporated Asset-Backed Pass-Through Certificates Series | | | | | | | | |
2005-W2, 1.44% (1 Month USD LIBOR + 0.49%, Rate Floor: 0.49%) due 10/25/353 | | | 1,550,000 | | | | 1,444,463 | |
Ameriquest Mortgage Securities Incorporated Asset-Backed Pass-Through Ctfs Series | | | | | | | | |
2005-R10, 1.38% (1 Month USD LIBOR + 0.43%, Rate Floor: 0.43%) due 01/25/363 | | | 1,500,000 | | | | 1,443,707 | |
NRPL Trust | | | | | | | | |
2019-3A, 3.00% due 07/25/592 | | | 1,208,696 | | | | 1,214,870 | |
Banc of America Funding Trust | | | | | | | | |
2015-R2, 1.21% (1 Month USD LIBOR + 0.26%, Rate Floor: 0.26%) due 04/29/372,3 | | | 1,200,000 | | | | 1,123,139 | |
BRAVO Residential Funding Trust | | | | | | | | |
2019-NQM1, 2.67% (WAC) due 07/25/592,3 | | | 1,142,728 | | | | 1,121,758 | |
Nationstar HECM Loan Trust | | | | | | | | |
2019-2A, 2.27% (WAC) due 11/25/292,3 | | | 768,140 | | | | 758,497 | |
18 | THE GUGGENHEIM FUNDS SEMI-ANNUAL REPORT | SEE NOTES TO FINANCIAL STATEMENTS. |
SCHEDULE OF INVESTMENTS (Unaudited)(continued) | March 31, 2020 |
ULTRA SHORT DURATION FUND | |
| | Face
Amount~ | | | Value | |
COLT Mortgage Loan Trust | | | | | | | | |
2018-3, 3.69% (WAC) due 10/26/482,3 | | | 479,464 | | | $ | 474,173 | |
2018-2, 3.47% (WAC) due 07/27/482,3 | | | 280,777 | | | | 276,813 | |
GE-WMC Asset-Backed Pass-Through Certificates Series | | | | | | | | |
2005-2, 1.45% (1 Month USD LIBOR + 0.50%, Rate Floor: 0.25%) due 12/25/353 | | | 506,262 | | | | 489,886 | |
Cascade Funding Mortgage Trust | | | | | | | | |
2019-RM3, 2.80% (WAC) due 06/25/692,3 | | | 443,859 | | | | 426,616 | |
Total Residential Mortgage Backed Securities | | | | | | | 77,151,338 | |
| | | | | | | | | |
Commercial Mortgage Backed Securities - 3.1% |
Morgan Stanley Capital I Trust | | | | | | | | |
2018-H3, 0.83% (WAC) due 07/15/513,6 | | | 46,601,311 | | | | 2,333,029 | |
2014-CPT, 3.35% due 07/13/292 | | | 1,000,000 | | | | 984,927 | |
Americold LLC Trust | | | | | | | | |
2010-ARTA, 7.44% due 01/14/292 | | | 2,524,000 | | | | 2,527,134 | |
GRACE Mortgage Trust | | | | | | | | |
2014-GRCE, 3.37% due 06/10/282 | | | 2,000,000 | | | | 2,010,136 | |
Citigroup Commercial Mortgage Trust | | | | | | | | |
2019-GC41, 1.19% (WAC) due 08/10/563,6 | | | 24,972,625 | | | | 1,782,661 | |
BENCHMARK Mortgage Trust | | | | | | | | |
2019-B14, 0.79% (WAC) due 12/15/623,6 | | | 34,958,214 | | | | 1,769,711 | |
JPMDB Commercial Mortgage Securities Trust | | | | | | | | |
2018-C8, 0.65% (WAC) due 06/15/513,6 | | | 29,689,394 | | | | 1,072,627 | |
Total Commercial Mortgage Backed Securities | | | | | | | 12,480,225 | |
| | | | | | | | | |
Total Collateralized Mortgage Obligations | | | | |
(Cost $92,151,295) | | | 89,631,563 | |
| | | | | | | | | |
CORPORATE BONDS†† - 20.0% |
Financial - 8.9% | | | | | | | | |
Wells Fargo & Co. | | | | | | | | |
2.66% (3 Month USD LIBOR + 0.93%) due 02/11/223 | | | 2,800,000 | | | | 2,746,120 | |
HSBC Holdings plc | | | | | | | | |
2.29% (3 Month USD LIBOR + 0.60%) due 05/18/213 | | | 2,600,000 | | | | 2,546,787 | |
Capital One Financial Corp. | | | | | | | | |
2.22% (3 Month USD LIBOR + 0.45%) due 10/30/203 | | | 2,535,000 | | | | 2,496,236 | |
Credit Agricole S.A. | | | | | | | | |
1.87% (3 Month USD LIBOR + 0.97%) due 06/10/202,3 | | | 2,495,000 | | | | 2,488,597 | |
UBS Group AG | | | | | | | | |
3.62% (3 Month USD LIBOR + 1.78%, Rate Floor: 0.00%) due 04/14/212,3 | | | 1,400,000 | | | | 1,371,096 | |
2.64% (3 Month USD LIBOR + 1.44%) due 09/24/202,3 | | | 1,100,000 | | | | 1,090,989 | |
Lloyds Bank plc | | | | | | | | |
2.23% (3 Month USD LIBOR + 0.49%) due 05/07/213 | | | 2,600,000 | | | | 2,449,454 | |
SEE NOTES TO FINANCIAL STATEMENTS. | THE GUGGENHEIM FUNDS SEMI-ANNUAL REPORT | 19 |
SCHEDULE OF INVESTMENTS (Unaudited)(continued) | March 31, 2020 |
ULTRA SHORT DURATION FUND | |
| | Face
Amount~ | | | Value | |
Svenska Handelsbanken AB | | | | | | | | |
2.15% (3 Month USD LIBOR + 0.47%) due 05/24/213 | | | 2,250,000 | | | $ | 2,191,239 | |
American Express Co. | | | | | | | | |
2.22% (3 Month USD LIBOR + 0.53%) due 05/17/213 | | | 2,150,000 | | | | 2,091,855 | |
AvalonBay Communities, Inc. | | | | | | | | |
2.26% (3 Month USD LIBOR + 0.43%) due 01/15/213 | | | 2,050,000 | | | | 2,017,440 | |
Synchrony Bank | | | | | | | | |
3.65% due 05/24/21 | | | 1,720,000 | | | | 1,692,519 | |
Sumitomo Mitsui Financial Group, Inc. | | | | | | | | |
2.68% (3 Month USD LIBOR + 1.68%) due 03/09/213 | | | 1,350,000 | | | | 1,335,504 | |
Willis Towers Watson plc | | | | | | | | |
5.75% due 03/15/21 | | | 1,200,000 | | | | 1,229,616 | |
Discover Bank | | | | | | | | |
3.10% due 06/04/20 | | | 1,100,000 | | | | 1,098,350 | |
AerCap Ireland Capital DAC / AerCap Global Aviation Trust | | | | | | | | |
4.25% due 07/01/20 | | | 900,000 | | | | 887,846 | |
4.63% due 10/30/20 | | | 150,000 | | | | 145,508 | |
Goldman Sachs Group, Inc. | | | | | | | | |
3.45% (3 Month USD LIBOR + 1.77%) due 02/25/213 | | | 1,050,000 | | | | 1,028,556 | |
AXIS Specialty Finance LLC | | | | | | | | |
5.88% due 06/01/20 | | | 1,000,000 | | | | 1,007,071 | |
Standard Chartered Bank | | | | | | | | |
2.15% (3 Month USD LIBOR + 0.40%) due 08/04/203 | | | 920,000 | | | | 919,368 | |
Santander UK plc | | | | | | | | |
2.20% (3 Month USD LIBOR + 0.62%) due 06/01/213 | | | 980,000 | | | | 914,195 | |
UBS AG | | | | | | | | |
1.58% (3 Month USD LIBOR + 0.58%, Rate Floor: 0.00%) due 06/08/202,3 | | | 870,000 | | | | 867,211 | |
Mitsubishi UFJ Financial Group, Inc. | | | | | | | | |
3.46% (3 Month USD LIBOR + 1.88%) due 03/01/213 | | | 672,000 | | | | 668,405 | |
ANZ New Zealand Int’l Ltd. | | | | | | | | |
2.85% due 08/06/202 | | | 600,000 | | | | 599,780 | |
Essex Portfolio, LP | | | | | | | | |
5.20% due 03/15/21 | | | 300,000 | | | | 304,905 | |
Swedbank AB | | | | | | | | |
2.65% due 03/10/212 | | | 300,000 | | | | 299,785 | |
Australia & New Zealand Banking Group Ltd. | | | | | | | | |
2.57% (3 Month USD LIBOR + 0.99%) due 06/01/212,3 | | | 300,000 | | | | 295,962 | |
Citigroup, Inc. | | | | | | | | |
2.76% (3 Month USD LIBOR + 1.38%) due 03/30/213 | | | 250,000 | | | | 248,188 | |
American Tower Corp. | | | | | | | | |
2.80% due 06/01/20 | | | 230,000 | | | | 228,193 | |
Marsh & McLennan Cos., Inc. | | | | | | | | |
4.80% due 07/15/21 | | | 200,000 | | | | 205,254 | |
Assurant, Inc. | | | | | | | | |
2.48% (3 Month USD LIBOR + 1.25%) due 03/26/213 | | | 194,000 | | | | 194,000 | |
Total Financial | | | | | | | 35,660,029 | |
| | | | | | | | | |
20 | THE GUGGENHEIM FUNDS SEMI-ANNUAL REPORT | SEE NOTES TO FINANCIAL STATEMENTS. |
SCHEDULE OF INVESTMENTS (Unaudited)(continued) | March 31, 2020 |
ULTRA SHORT DURATION FUND | |
| | Face
Amount~ | | | Value | |
Consumer, Non-cyclical - 5.3% | | | | |
Sysco Corp. | | | | | | | | |
5.65% due 04/01/25 | | | 2,850,000 | | | $ | 2,967,021 | |
Express Scripts Holding Co. | | | | | | | | |
2.33% (3 Month USD LIBOR + 0.75%) due 11/30/203 | | | 2,530,000 | | | | 2,508,132 | |
Zimmer Biomet Holdings, Inc. | | | | | | | | |
1.80% (3 Month USD LIBOR + 0.75%) due 03/19/213 | | | 1,400,000 | | | | 1,383,125 | |
2.70% due 04/01/20 | | | 1,070,000 | | | | 1,070,000 | |
General Mills, Inc. | | | | | | | | |
2.38% (3 Month USD LIBOR + 0.54%) due 04/16/213 | | | 2,450,000 | | | | 2,385,220 | |
Bayer US Finance II LLC | | | | | | | | |
1.85% (3 Month USD LIBOR + 0.63%) due 06/25/212,3 | | | 1,700,000 | | | | 1,687,202 | |
AbbVie, Inc. | | | | | | | | |
2.05% (3 Month USD LIBOR + 0.35%) due 05/21/212,3 | | | 1,300,000 | | | | 1,262,942 | |
Global Payments, Inc. | | | | | | | | |
3.80% due 04/01/21 | | | 1,200,000 | | | | 1,207,516 | |
Altria Group, Inc. | | | | | | | | |
4.75% due 05/05/21 | | | 1,154,000 | | | | 1,178,883 | |
Ingredion, Inc. | | | | | | | | |
4.63% due 11/01/20 | | | 1,143,000 | | | | 1,143,695 | |
Constellation Brands, Inc. | | | | | | | | |
2.25% due 11/06/20 | | | 1,050,000 | | | | 1,044,105 | |
Mondelez International, Inc. | | | | | | | | |
3.00% due 05/07/20 | | | 1,040,000 | | | | 1,029,600 | |
CVS Health Corp. | | | | | | | | |
1.72% (3 Month USD LIBOR + 0.72%) due 03/09/213 | | | 1,050,000 | | | | 1,028,446 | |
Conagra Brands, Inc. | | | | | | | | |
2.55% (3 Month USD LIBOR + 0.75%) due 10/22/203 | | | 524,000 | | | | 518,455 | |
Keurig Dr Pepper, Inc. | | | | | | | | |
3.55% due 05/25/21 | | | 500,000 | | | | 505,865 | |
Coca-Cola European Partners plc | | | | | | | | |
3.50% due 09/15/20 | | | 300,000 | | | | 302,843 | |
Quest Diagnostics, Inc. | | | | | | | | |
4.70% due 04/01/21 | | | 150,000 | | | | 151,727 | |
Total Consumer, Non-cyclical | | | | | | | 21,374,777 | |
| | | | | | | | | |
Industrial - 2.5% | | | | | | | | |
Siemens Financieringsmaatschappij N.V. | | | | | | | | |
1.35% (3 Month USD LIBOR + 0.61%) due 03/16/222,3 | | | 1,870,000 | | | | 1,789,421 | |
Aviation Capital Group LLC | | | | | | | | |
2.88% due 01/20/222 | | | 1,200,000 | | | | 1,084,783 | |
7.13% due 10/15/202 | | | 500,000 | | | | 494,422 | |
Penske Truck Leasing Company Lp / PTL Finance Corp. | | | | | | | | |
3.65% due 07/29/212 | | | 1,294,000 | | | | 1,310,065 | |
Fortive Corp. | | | | | | | | |
2.35% due 06/15/21 | | | 1,300,000 | | | | 1,263,911 | |
Rolls-Royce plc | | | | | | | | |
2.38% due 10/14/202 | | | 1,313,000 | | | | 1,237,327 | |
Tyco Electronics Group S.A. | | | | | | | | |
4.88% due 01/15/21 | | | 1,200,000 | | | | 1,222,976 | |
Textron, Inc. | | | | | | | | |
2.28% (3 Month USD LIBOR + 0.55%) due 11/10/203 | | | 600,000 | | | | 600,029 | |
Ryder System, Inc. | | | | | | | | |
2.50% due 05/11/20 | | | 540,000 | | | | 539,858 | |
Northrop Grumman Corp. | | | | | | | | |
3.50% due 03/15/21 | | | 250,000 | | | | 251,130 | |
Ingersoll-Rand Luxembourg Finance S.A. | | | | | | | | |
2.63% due 05/01/20 | | | 170,000 | | | | 170,022 | |
Total Industrial | | | | | | | 9,963,944 | |
| | | | | | | | | |
SEE NOTES TO FINANCIAL STATEMENTS. | THE GUGGENHEIM FUNDS SEMI-ANNUAL REPORT | 21 |
SCHEDULE OF INVESTMENTS (Unaudited)(continued) | March 31, 2020 |
ULTRA SHORT DURATION FUND | |
| | Face
Amount~ | | | Value | |
Energy - 1.1% | | | | | | | | |
Marathon Petroleum Corp. | | | | | | | | |
3.40% due 12/15/20 | | | 885,000 | | | $ | 876,743 | |
5.13% due 03/01/21 | | | 310,000 | | | | 300,563 | |
Halliburton Co. | | | | | | | | |
3.25% due 11/15/21 | | | 1,130,000 | | | | 1,097,995 | |
Sabine Pass Liquefaction LLC | | | | | | | | |
5.63% due 02/01/21 | | | 1,025,000 | | | | 994,289 | |
Reliance Holding USA, Inc. | | | | | | | | |
4.50% due 10/19/202 | | | 900,000 | | | | 906,156 | |
Phillips 66 | | | | | | | | |
2.25% (3 Month USD LIBOR + 0.60%) due 02/26/213 | | | 350,000 | | | | 327,401 | |
Total Energy | | | | | | | 4,503,147 | |
| | | | | | | | | |
Utilities - 0.8% | | | | | | | | |
Puget Energy, Inc. | | | | | | | | |
6.00% due 09/01/21 | | | 1,300,000 | | | | 1,333,316 | |
NextEra Energy Capital Holdings, Inc. | | | | | | | | |
1.83% (3 Month USD LIBOR + 0.45%) due 09/28/203 | | | 1,000,000 | | | | 1,000,848 | |
Southern Power Co. | | | | | | | | |
2.38% due 06/01/20 | | | 400,000 | | | | 399,959 | |
Eversource Energy | | | | | | | | |
2.50% due 03/15/21 | | | 250,000 | | | | 247,878 | |
PSEG Power LLC | | | | | | | | |
5.13% due 04/15/20 | | | 130,000 | | | | 130,051 | |
Total Utilities | | | | | | | 3,112,052 | |
| | | | | | | | | |
Consumer, Cyclical - 0.5% | | | | |
Marriott International, Inc. | | | | | | | | |
2.18% (3 Month USD LIBOR + 0.60%) due 12/01/203 | | | 1,000,000 | | | | 935,791 | |
1.65% (3 Month USD LIBOR + 0.65%) due 03/08/213 | | | 700,000 | | | | 598,378 | |
McDonald’s Corp. | | | | | | | | |
3.50% due 07/15/20 | | | 700,000 | | | | 703,065 | |
Total Consumer, Cyclical | | | | | | | 2,237,234 | |
| | | | | | | | | |
Communications - 0.5% | | | | |
Telefonica Emisiones S.A. | | | | | | | | |
5.46% due 02/16/21 | | | 1,125,000 | | | | 1,140,667 | |
5.13% due 04/27/20 | | | 75,000 | | | | 75,005 | |
ViacomCBS, Inc. | | | | | | | | |
4.75% due 05/15/25 | | | 940,000 | | | | 944,389 | |
Total Communications | | | | | | | 2,160,061 | |
| | | | | | | | | |
Technology - 0.3% | | | | | | | | |
Fiserv, Inc. | | | | | | | | |
2.70% due 06/01/20 | | | 1,100,000 | | | | 1,096,576 | |
| | | | | | | | | |
Basic Materials - 0.1% | | | | | | | | |
Georgia-Pacific LLC | | | | | | | | |
5.40% due 11/01/202 | | | 363,000 | | | | 366,469 | |
Total Corporate Bonds | | | | |
(Cost $82,069,500) | | | 80,474,289 | |
| | | | | | | | | |
FOREIGN GOVERNMENT DEBT†† - 1.1% |
Kingdom of Spain |
4.00% due 04/30/20 | | EUR | 2,950,000 | | | | 3,261,259 | |
Government of Japan |
0.10% due 04/15/20 | | JPY | 131,700,000 | | | | 1,225,043 | |
Total Foreign Government Debt | | | | |
(Cost $4,559,736) | | | | | | | 4,486,302 | |
| | | | | | | | | |
MUNICIPAL BONDS†† - 0.4% |
New York - 0.3% | | | | | | | | |
Triborough Bridge & Tunnel Authority Revenue Bonds | | | | | | | | |
0.87% (VRDN) due 01/01/339 | | | 390,000 | | | | 390,000 | |
New York City Transitional Finance Authority Future Tax Secured Revenue Revenue Bonds | | | | | | | | |
0.80% (VRDN) due 02/01/459 | | | 230,000 | | | | 230,000 | |
0.75% (VRDN) due 02/01/459 | | | 110,000 | | | | 110,000 | |
22 | THE GUGGENHEIM FUNDS SEMI-ANNUAL REPORT | SEE NOTES TO FINANCIAL STATEMENTS. |
SCHEDULE OF INVESTMENTS (Unaudited)(continued) | March 31, 2020 |
ULTRA SHORT DURATION FUND | |
| | Face
Amount~ | | | Value | |
City of New York New York General Obligation Unlimited | | | | | | | | |
0.80% (VRDN) due 03/01/429 | | | 230,000 | | | $ | 230,000 | |
0.75% (VRDN) due 03/01/409 | | | 100,000 | | | | 100,000 | |
Total New York | | | | | | | 1,060,000 | |
| | | | | | | | | |
Illinois - 0.1% | | | | | | | | |
Illinois Finance Authority Revenue Bonds | | | | | | | | |
0.75% (VRDN) due 08/15/429 | | | 190,000 | | | | 190,000 | |
| | | | | | | | | |
Pennsylvania - 0.0% | | | | | | | | |
Hospitals & Higher Education Facilities Authority of Philadelphia Revenue Bonds | | | | | | | | |
0.76% (VRDN) due 07/01/259 | | | 100,000 | | | | 100,000 | |
0.75% (VRDN) due 07/01/419 | | | 70,000 | | | | 70,000 | |
Total Pennsylvania | | | | | | | 170,000 | |
| | | | | | | | | |
Arizona - 0.0% | | | | | | | | |
State of Arizona Certificate Of Participation | | | | | | | | |
5.00% due 10/01/24 | | | 150,000 | | | | 150,000 | |
Total Municipal Bonds | | | | |
(Cost $1,570,000) | | | 1,570,000 | |
| | | | | | | | | |
REPURCHASE AGREEMENTS††,7 - 5.8% |
Societe Generale |
issued 03/09/20 at 1.18% due 04/01/20 | | | 5,004,177 | | | | 5,004,177 | |
issued 03/09/20 at 1.30% due 04/01/20 | | | 2,250,000 | | | | 2,250,000 | |
issued 07/09/19 at 2.27% due 04/01/20 | | | 1,779,207 | | | | 1,779,207 | |
issued 07/26/19 at 2.18% due 04/01/20 | | | 1,650,000 | | | | 1,650,000 | |
issued 12/06/19 at 1.18% due 04/01/20 | | | 1,490,000 | | | | 1,490,000 | |
issued 03/09/20 at 2.27% due 04/01/20 | | | 1,146,102 | | | | 1,146,102 | |
issued 10/25/19 at 2.27% due 04/01/20 | | | 879,993 | | | | 879,993 | |
BNP Paribas |
issued 01/31/20 at 1.93% due 05/04/20 | | | 6,560,000 | | | | 6,560,000 | |
issued 03/09/20 at 1.93% due 05/04/20 | | | 2,390,460 | | | | 2,390,460 | |
Total Repurchase Agreements | | | | |
(Cost $23,149,939) | | | | | | | 23,149,939 | |
| | | | | | | | | |
SEE NOTES TO FINANCIAL STATEMENTS. | THE GUGGENHEIM FUNDS SEMI-ANNUAL REPORT | 23 |
SCHEDULE OF INVESTMENTS (Unaudited)(continued) | March 31, 2020 |
ULTRA SHORT DURATION FUND | |
| | Face
Amount~ | | | Value | |
COMMERCIAL PAPER†† - 6.4% |
Entergy Corp. | | | | | | | | |
1.85% due 04/28/202,8 | | | 5,600,000 | | | $ | 5,592,931 | |
DowDuPont, Inc. | | | | | | | | |
1.77% due 04/03/202,8 | | | 5,400,000 | | | | 5,398,087 | |
NextEra Energy Capital Holdings, Inc. | | | | | | | | |
1.79% due 04/07/202,8 | | | 5,400,000 | | | | 5,397,060 | |
Ecolab, Inc. | | | | | | | | |
1.81% due 04/08/202,8 | | | 5,400,000 | | | | 5,396,573 | |
American Electric Power | | | | | | | | |
1.81% due 04/01/202,8 | | | 4,000,000 | | | | 4,000,000 | |
Total Commercial Paper | | | | |
(Cost $25,788,137) | | | | | | | 25,784,651 | |
| | | | | | | | | |
Total Investments - 100.9% | | | | |
(Cost $413,107,468) | | $ | 405,560,023 | |
Other Assets & Liabilities, net - (0.9)% | | | (3,723,790 | ) |
Total Net Assets - 100.0% | | $ | 401,836,233 | |
Total Return Swap Agreements |
| |
Counterparty | Reference
Obligation | Financing
Rate
Pay | | Payment
Frequency | | Maturity
Date | | | Units | | Notional
Amount | | | Value and
Unrealized
Appreciation | |
OTC Sovereign Debt Swap Agreements†† |
Deutsche Bank AG | Korea Monetary Stabilization Bond | 2.20% (3 Month USD LIBOR + 0.45%) | | At Maturity | | | 08/04/21 | | | N/A | | $ | 1,530,117 | | | $ | 1,024 | |
Forward Foreign Currency Exchange Contracts†† |
| |
Counterparty | Contracts
to Sell | Currency | Settlement
Date | | Settlement
Value | | | Value at
March 31,
2020 | | | Unrealized
Appreciation | |
Morgan Stanley Capital Services LLC | 27,100,000 | BRL | 04/01/20 | | $ | 6,645,455 | | | $ | 5,220,876 | | | $ | 1,424,579 | |
Citibank N.A., New York | 17,700,000 | BRL | 07/01/20 | | | 4,423,347 | | | | 3,403,911 | | | | 1,019,436 | |
Citibank N.A., New York | 83,450,000 | MXN | 04/02/20 | | | 4,244,984 | | | | 3,518,099 | | | | 726,885 | |
Goldman Sachs International | 51,900,000 | MXN | 05/21/20 | | | 2,762,681 | | | | 2,172,760 | | | | 589,921 | |
JPMorgan Chase Bank, N.A. | 9,900,000 | BRL | 07/01/21 | | | 2,372,110 | | | | 1,871,474 | | | | 500,636 | |
Citibank N.A., New York | 8,240,000 | BRL | 07/01/21 | | | 1,997,146 | | | | 1,557,672 | | | | 439,474 | |
Goldman Sachs International | 4,460,000 | BRL | 07/01/20 | | | 1,158,141 | | | | 857,709 | | | | 300,432 | |
Citibank N.A., New York | 30,830,000 | MXN | 04/08/20 | | | 1,569,436 | | | | 1,298,645 | | | | 270,791 | |
24 | THE GUGGENHEIM FUNDS SEMI-ANNUAL REPORT | SEE NOTES TO FINANCIAL STATEMENTS. |
SCHEDULE OF INVESTMENTS (Unaudited)(continued) | March 31, 2020 |
ULTRA SHORT DURATION FUND | |
Forward Foreign Currency Exchange Contracts†† (continued) |
| |
Counterparty | Contracts
to Sell | Currency | Settlement
Date | | Settlement
Value | | | Value at
March 31,
2020 | | | Unrealized
Appreciation | |
Citibank N.A., New York | 464,232,000 | JPY | 07/01/21 | | $ | 4,571,102 | | | $ | 4,382,120 | | | $ | 188,982 | |
Barclays Bank plc | 429,214,500 | JPY | 07/01/21 | | | 4,219,983 | | | | 4,051,572 | | | | 168,411 | |
Goldman Sachs International | 3,068,000 | EUR | 04/30/20 | | | 3,518,383 | | | | 3,385,935 | | | | 132,448 | |
Barclays Bank plc | 8,523,623 | ILS | 08/01/22 | | | 2,581,743 | | | | 2,449,834 | | | | 131,909 | |
Goldman Sachs International | 18,261,214 | ILS | 02/01/21 | | | 5,336,845 | | | | 5,242,431 | | | | 94,414 | |
Goldman Sachs International | 2,216,500 | EUR | 07/30/21 | | | 2,574,742 | | | | 2,480,812 | | | | 93,930 | |
JPMorgan Chase Bank, N.A. | 2,407,925 | EUR | 07/30/21 | | | 2,779,155 | | | | 2,695,064 | | | | 84,091 | |
Barclays Bank plc | 7,250,000 | MXN | 04/08/20 | | | 374,472 | | | | 305,390 | | | | 69,082 | |
Citibank N.A., New York | 6,900,000 | MXN | 04/23/20 | | | 355,326 | | | | 290,036 | | | | 65,290 | |
JPMorgan Chase Bank, N.A. | 373,186,500 | JPY | 09/01/20 | | | 3,547,299 | | | | 3,492,386 | | | | 54,913 | |
Citibank N.A., New York | 347,173,500 | JPY | 06/01/20 | | | 3,284,394 | | | | 3,238,091 | | | | 46,303 | |
Goldman Sachs International | 860,000 | BRL | 07/01/21 | | | 201,476 | | | | 162,573 | | | | 38,903 | |
Deutsche Bank AG | 1,865,755,963 | KRW | 08/04/21 | | | 1,591,127 | | | | 1,557,087 | | | | 34,040 | |
Bank of America, N.A. | 3,949,100 | ILS | 04/30/21 | | | 1,169,117 | | | | 1,135,869 | | | | 33,248 | |
Citibank N.A., New York | 4,100,600 | ILS | 04/30/21 | | | 1,211,791 | | | | 1,179,444 | | | | 32,347 | |
Goldman Sachs International | 3,270,500 | ILS | 01/31/22 | | | 968,617 | | | | 938,914 | | | | 29,703 | |
Bank of America, N.A. | 513,520 | EUR | 06/15/20 | | | 590,535 | | | | 567,761 | | | | 22,774 | |
Goldman Sachs International | 4,177,700 | ILS | 04/30/21 | | | 1,223,305 | | | | 1,201,620 | | | | 21,685 | |
Goldman Sachs International | 419,200 | EUR | 06/15/20 | | | 482,324 | | | | 463,479 | | | | 18,845 | |
Bank of America, N.A. | 152,076,000 | JPY | 06/22/20 | | | 1,438,342 | | | | 1,419,648 | | | | 18,694 | |
Bank of America, N.A. | 131,765,850 | JPY | 04/15/20 | | | 1,242,852 | | | | 1,226,483 | | | | 16,369 | |
JPMorgan Chase Bank, N.A. | 55,327,650 | JPY | 06/01/20 | | | 522,921 | | | | 516,042 | | | | 6,879 | |
Bank of America, N.A. | 643,550 | ILS | 01/31/22 | | | 190,795 | | | | 184,754 | | | | 6,041 | |
Goldman Sachs International | 6,167,835 | JPY | 06/22/20 | | | 58,372 | | | | 57,578 | | | | 794 | |
Barclays Bank plc | 63,277 | ILS | 08/02/21 | | | 18,856 | | | | 18,188 | | | | 668 | |
Barclays Bank plc | 63,623 | ILS | 07/31/20 | | | 18,604 | | | | 18,097 | | | | 507 | |
Goldman Sachs International | 16,500 | EUR | 07/30/20 | | | 18,756 | | | | 18,270 | | | | 486 | |
JPMorgan Chase Bank, N.A. | 17,925 | EUR | 07/30/20 | | | 20,255 | | | | 19,847 | | | | 408 | |
Citibank N.A., New York | 40,711 | ILS | 04/30/20 | | | 11,852 | | | | 11,508 | | | | 344 | |
Bank of America, N.A. | 39,207 | ILS | 04/30/20 | | | 11,425 | | | | 11,083 | | | | 342 | |
Goldman Sachs International | 41,614 | ILS | 04/30/20 | | | 11,981 | | | | 11,763 | | | | 218 | |
Bank of America, N.A. | 33,550 | ILS | 02/01/21 | | | 9,803 | | | | 9,632 | | | | 171 | |
Deutsche Bank AG | 4,980,963 | KRW | 08/05/20 | | | 4,198 | | | | 4,111 | | | | 87 | |
Deutsche Bank AG | 4,872,681 | KRW | 05/11/20 | | | 4,092 | | | | 4,005 | | | | 87 | |
Deutsche Bank AG | 4,980,963 | KRW | 11/04/20 | | | 4,210 | | | | 4,125 | | | | 85 | |
Citibank N.A., New York | 232,000 | JPY | 01/04/21 | | | 2,264 | | | | 2,179 | | | | 85 | |
Deutsche Bank AG | 4,980,963 | KRW | 02/04/21 | | | 4,223 | | | | 4,138 | | | | 85 | |
Deutsche Bank AG | 4,818,541 | KRW | 05/07/21 | | | 4,095 | | | | 4,013 | | | | 82 | |
Barclays Bank plc | 214,500 | JPY | 01/04/21 | | | 2,090 | | | | 2,015 | | | | 75 | |
Citibank N.A., New York | 232,000 | JPY | 07/01/20 | | | 2,241 | | | | 2,167 | | | | 74 | |
Barclays Bank plc | 214,500 | JPY | 07/01/20 | | | 2,069 | | | | 2,003 | | | | 66 | |
| | | | | | | | | | | | | | $ | 6,686,119 | |
SEE NOTES TO FINANCIAL STATEMENTS. | THE GUGGENHEIM FUNDS SEMI-ANNUAL REPORT | 25 |
SCHEDULE OF INVESTMENTS (Unaudited)(continued) | March 31, 2020 |
ULTRA SHORT DURATION FUND | |
Forward Foreign Currency Exchange Contracts†† (continued) |
| |
Counterparty | Contracts
to Buy | Currency | Settlement
Date | | Settlement
Value | | | Value at
March 31,
2020 | | | Unrealized
Appreciation
(Depreciation) | |
Goldman Sachs International | 18,294,856 | ILS | 02/01/21 | | $ | 5,128,074 | | | $ | 5,252,089 | | | $ | 124,015 | |
Barclays Bank plc | 8,523,623 | ILS | 08/01/22 | | | 2,345,521 | | | | 2,449,834 | | | | 104,313 | |
Goldman Sachs International | 6,120,600 | ILS | 04/30/21 | | | 1,707,090 | | | | 1,760,452 | | | | 53,362 | |
Citibank N.A., New York | 152,076,000 | JPY | 06/22/20 | | | 1,379,812 | | | | 1,419,648 | | | | 39,836 | |
Goldman Sachs International | 3,914,050 | ILS | 01/31/22 | | | 1,086,029 | | | | 1,123,667 | | | | 37,638 | |
JPMorgan Chase Bank, N.A. | 6,120,600 | ILS | 04/30/21 | | | 1,724,599 | | | | 1,760,452 | | | | 35,853 | |
JPMorgan Chase Bank, N.A. | 6,167,835 | JPY | 06/22/20 | | | 55,728 | | | | 57,578 | | | | 1,850 | |
Barclays Bank plc | 63,277 | ILS | 07/30/21 | | | 17,340 | | | | 18,189 | | | | 849 | |
Barclays Bank plc | 63,623 | ILS | 07/31/20 | | | 17,291 | | | | 18,097 | | | | 806 | |
Goldman Sachs International | 60,766 | ILS | 04/30/20 | | | 16,701 | | | | 17,177 | | | | 476 | |
JPMorgan Chase Bank, N.A. | 60,766 | ILS | 04/30/20 | | | 16,883 | | | | 17,177 | | | | 294 | |
JPMorgan Chase Bank, N.A. | 446,500 | JPY | 07/01/20 | | | 4,309 | | | | 4,170 | | | | (139 | ) |
JPMorgan Chase Bank, N.A. | 446,500 | JPY | 01/04/21 | | | 4,335 | | | | 4,194 | | | | (141 | ) |
Goldman Sachs International | 34,425 | EUR | 07/30/20 | | | 39,053 | | | | 38,117 | | | | (936 | ) |
JPMorgan Chase Bank, N.A. | 932,720 | EUR | 06/15/20 | | | 1,049,929 | | | | 1,031,240 | | | | (18,689 | ) |
JPMorgan Chase Bank, N.A. | 6,365,000 | BRL | 07/01/21 | | | 1,233,528 | | | | 1,203,226 | | | | (30,302 | ) |
Citibank N.A., New York | 12,635,000 | BRL | 07/01/21 | | | 2,423,071 | | | | 2,388,493 | | | | (34,578 | ) |
Goldman Sachs International | 6,900,000 | MXN | 04/23/20 | | | 357,856 | | | | 290,036 | | | | (67,820 | ) |
Goldman Sachs International | 22,160,000 | BRL | 07/01/20 | | | 4,360,007 | | | | 4,261,620 | | | | (98,387 | ) |
Citibank N.A., New York | 402,501,150 | JPY | 06/01/20 | | | 3,864,203 | | | | 3,754,132 | | | | (110,071 | ) |
JPMorgan Chase Bank, N.A. | 373,186,500 | JPY | 09/01/20 | | | 3,614,958 | | | | 3,492,386 | | | | (122,572 | ) |
Goldman Sachs International | 4,624,425 | EUR | 07/30/21 | | | 5,306,528 | | | | 5,175,876 | | | | (130,652 | ) |
JPMorgan Chase Bank, N.A. | 893,446,500 | JPY | 07/01/21 | | | 8,723,786 | | | | 8,433,692 | | | | (290,094 | ) |
Goldman Sachs International | 38,080,000 | MXN | 04/08/20 | | | 1,980,507 | | | | 1,604,035 | | | | (376,472 | ) |
Goldman Sachs International | 51,900,000 | MXN | 05/21/20 | | | 2,589,200 | | | | 2,172,760 | | | | (416,440 | ) |
Morgan Stanley Capital Services LLC | 27,100,000 | BRL | 04/01/20 | | | 5,788,601 | | | | 5,220,876 | | | | (567,725 | ) |
JPMorgan Chase Bank, N.A. | 83,450,000 | MXN | 04/02/20 | | | 4,343,979 | | | | 3,518,099 | | | | (825,880 | ) |
| | | | | | | | | | | | | | $ | (2,691,606 | ) |
26 | THE GUGGENHEIM FUNDS SEMI-ANNUAL REPORT | SEE NOTES TO FINANCIAL STATEMENTS. |
SCHEDULE OF INVESTMENTS (Unaudited)(continued) | March 31, 2020 |
ULTRA SHORT DURATION FUND | |
~ | The face amount is denominated in U.S. dollars unless otherwise indicated. |
† | Value determined based on Level 1 inputs — See Note 4. |
†† | Value determined based on Level 2 inputs, unless otherwise noted — See Note 4. |
††† | Value determined based on Level 3 inputs — See Note 4. |
1 | Rate indicated is the 7-day yield as of March 31, 2020. |
2 | Security is a 144A or Section 4(a)(2) security. These securities have been determined to be liquid under guidelines established by the Board of Trustees. The total market value of 144A or Section 4(a)(2) securities is $204,248,102 (cost $209,400,856), or 50.8% of total net assets. |
3 | Variable rate security. Rate indicated is the rate effective at March 31, 2020. In some instances, the effective rate is limited by a minimum rate floor or a maximum rate cap established by the issuer. The settlement status of a position may also impact the effective rate indicated. In some cases, a position may be unsettled at period end and may not have a stated effective rate. In instances where multiple underlying reference rates and spread amounts are shown, the effective rate is based on a weighted average. |
4 | Security was fair valued by the Valuation Committee at March 31, 2020. The total market value of fair valued securities amounts to $10,066,667, (cost $10,066,667) or 2.5% of total net assets. |
5 | Security is a step up/down bond. The coupon increases or decreases at regular intervals until the bond reaches full maturity. Rate indicated is the rate at March 31, 2020. See table below for additional step information for each security. |
6 | Security is an interest-only strip. |
7 | Repurchase Agreements — See additional disclosure in the repurchase agreements table below for more information on repurchase agreements. |
8 | Rate indicated is the effective yield at the time of purchase. |
9 | The rate is adjusted periodically by the counterparty, allows the holder to tender the security upon a rate reset, and is not based upon a set reference rate and spread. Rate indicated is the rate effective at March 31, 2020. |
| | BofA — Bank of America |
| | BRL — Brazilian Real |
| | EUR — Euro |
| | ILS — Israeli New Shekel |
| | JPY — Japanese Yen |
| | KRW — South Korean Won |
| | LIBOR — London Interbank Offered Rate |
| | MXN — Mexican Peso |
| | plc — Public Limited Company |
| | VRDN — Variable Rate Demand Note |
| | WAC — Weighted Average Coupon |
| | |
| | See Sector Classification in Other Information section. |
SEE NOTES TO FINANCIAL STATEMENTS. | THE GUGGENHEIM FUNDS SEMI-ANNUAL REPORT | 27 |
SCHEDULE OF INVESTMENTS (Unaudited)(continued) | March 31, 2020 |
ULTRA SHORT DURATION FUND | |
The following table summarizes the inputs used to value the Fund’s investments at March 31, 2020 (See Note 4 in the Notes to Financial Statements):
Investments in Securities (Assets) | | Level 1
Quoted
Prices | | | Level 2
Significant
Observable
Inputs | | | Level 3
Significant
Unobservable
Inputs | | | Total | |
Money Market Fund | | $ | 78,855,659 | | | $ | — | | | $ | — | | | $ | 78,855,659 | |
Asset-Backed Securities | | | — | | | | 89,690,953 | | | | 11,916,667 | | | | 101,607,620 | |
Collateralized Mortgage Obligations | | | — | | | | 89,631,563 | | | | — | | | | 89,631,563 | |
Corporate Bonds | | | — | | | | 80,474,289 | | | | — | | | | 80,474,289 | |
Foreign Government Debt | | | — | | | | 4,486,302 | | | | — | | | | 4,486,302 | |
Municipal Bonds | | | — | | | | 1,570,000 | | | | — | | | | 1,570,000 | |
Repurchase Agreements | | | — | | | | 23,149,939 | | | | — | | | | 23,149,939 | |
Commercial Paper | | | — | | | | 25,784,651 | | | | — | | | | 25,784,651 | |
Total Return Swap Agreements** | | | — | | | | 1,024 | | | | — | | | | 1,024 | |
Forward Foreign Currency Exchange Contracts** | | | — | | | | 7,085,411 | | | | — | | | | 7,085,411 | |
Total Assets | | $ | 78,855,659 | | | $ | 321,874,132 | | | $ | 11,916,667 | | | $ | 412,646,458 | |
Investments in Securities (Liabilities) | | Level 1
Quoted
Prices | | | Level 2
Significant
Observable
Inputs | | | Level 3
Significant
Unobservable
Inputs | | | Total | |
Forward Foreign Currency Exchange Contracts** | | $ | — | | | $ | 3,090,898 | | | $ | — | | | $ | 3,090,898 | |
** | This derivative is reported as unrealized appreciation/depreciation at period end. |
The following is a summary of significant unobservable inputs used in the fair valuation of assets categorized within Level 3 of the fair value hierarchy:
Category | | Ending
Balance at
March 31,
2020 | | Valuation Technique | Unobservable Inputs | | Input
Range | | | Weighted
Average | |
Assets: | | | | | | | | | | | | | | |
Asset-Backed Securities | | $ | 10,066,667 | | Model Price | Purchase Price | — | — |
Asset-Backed Securities | | | 1,850,000 | | Option Adjusted Spread off prior month broker quote | Broker Quote | — | — |
Total Assets | | $ | 11,916,667 | | | | | | | | | | | |
Significant changes in a quote would generally result in significant changes in the fair value of the security.
The Fund’s fair valuation leveling guidelines were revised to classify a single daily broker quote, or a vendor price based on a single daily or monthly broker quote, as Level 3 rather than Level 2, if such a quote or price cannot be supported with other available market information.
28 | THE GUGGENHEIM FUNDS SEMI-ANNUAL REPORT | SEE NOTES TO FINANCIAL STATEMENTS. |
SCHEDULE OF INVESTMENTS (Unaudited)(continued) | March 31, 2020 |
ULTRA SHORT DURATION FUND | |
Transfers between Level 2 and Level 3 may occur as markets fluctuate and/or the availability of data used in an investment’s valuation changes. For the period ended March 31, 2020, the Fund had securities with a total value of $4,316,667 transfer into Level 3 from Level 2 due to lack of observable inputs.
Summary of Fair Value Level 3 Activity
Following is a reconciliation of Level 3 assets for which significant unobservable inputs were used to determine fair value for the period ended March 31, 2020:
| | | Assets | |
| | Asset-Backed
Securities | |
Beginning Balance | | $ | 4,900,000 | |
Purchases/(Receipts) | | | 2,700,000 | |
(Sales, maturities and paydowns)/Fundings | | | — | |
Amortization of premiums/discounts | | | — | |
Total realized gains (losses) included in earnings | | | — | |
Total change in unrealized appreciation (depreciation) included in earnings | | | — | |
Transfers into Level 3 | | | 4,316,667 | |
Ending Balance | | $ | 11,916,667 | |
Net change in unrealized appreciation (depreciation) for investments in Level 3 securities still held at March 31, 2020 | | $ | — | |
Step Coupon Bonds
The following table discloses additional information related to step coupon bonds held by the Fund. Certain securities are subject to multiple rate changes prior to maturity. For those securities a range of rates and corresponding dates have been provided. Rates for all step coupon bonds held by the Fund are scheduled to increase, none are scheduled to decrease.
Name | | Coupon Rate at
Next Reset Date | | | Next Rate
Reset Date | |
Verus Securitization Trust 2019-4, 2.64% due 11/25/59 | | | 3.64 | % | | | 10/26/23 | |
Verus Securitization Trust 2019-4, 2.85% due 11/25/59 | | | 3.85 | % | | | 10/26/23 | |
Repurchase Agreements
The Fund may engage in repurchase agreements. Repurchase agreements are fixed income securities in the form of agreements backed by collateral. These agreements typically involve the acquisition by the Fund of securities from the selling institution coupled with the agreement that the selling institution will repurchase the underlying securities at a specified price and at a fixed time in the future. The Fund may accept a wide variety of underlying securities as collateral for the repurchase agreements entered into by the Fund. Any such securities serving as collateral are marked-to-market daily in order to maintain full collateralization. Securities purchased under repurchase agreements are reflected as an asset on the Statement of Assets and Liabilities. Interest earned is recorded as a component of interest income on the Statement of Operations.
In connection with transactions in repurchase agreements, it is the Fund’s policy that its custodian take possession of the underlying collateral. The collateral is in the possession of the Fund’s custodian and is evaluated to ensure that its market value exceeds, at a minimum, 102% of the original face amount of the repurchase agreements.
SEE NOTES TO FINANCIAL STATEMENTS. | THE GUGGENHEIM FUNDS SEMI-ANNUAL REPORT | 29 |
SCHEDULE OF INVESTMENTS (Unaudited)(continued) | March 31, 2020 |
ULTRA SHORT DURATION FUND | |
The use of repurchase agreements involves certain risks. For example, if the selling institution defaults on its obligation to repurchase the underlying securities at a time when the value of securities has declined, the Fund may incur a loss upon disposition of them. In the event of an insolvency or bankruptcy by the selling institution, the Fund’s right to control the collateral could be affected and result in certain costs and delays. In addition, the Fund could incur a loss if the value of the underlying collateral falls below the agreed upon repurchase price.
At March 31, 2020, the repurchase agreements in the account were as follows:
Counterparty and
Terms of Agreement | | Face
Value | | | Repurchase
Price | | | Collateral | | Par
Value | | | Fair
Value | |
BNP Paribas | | | | | | | | | | Bear Stearns Mortgage Funding Trust | | | | | | | | |
1.93% | | | | | | | | | | 1.15% | | | | | | | | |
05/04/20 | | $ | 8,950,460 | | | $ | 8,989,663 | | | 02/25/37 | | $ | 16,829,000 | | | $ | 15,314,390 | |
| | | | | | | | | | | HSI Asset Securitization Corp. Trust | | | | | | | | |
| | | | | | | | | | | 1.14% | | | | | | | | |
| | | | | | | | | | | 01/25/37 | | | 4,558,000 | | | | 3,294,978 | |
| | | | | | | | | | | | | | 21,387,000 | | | | 18,609,368 | |
| | | | | | | | | | | | | | | | | | | |
Societe Generale | | | | | | | | | | Connecticut Avenue Securities Trust | | | | | | | | |
1.18% - 2.27% | | | | | | | | | | 3.05% | | | | | | | | |
04/01/20 | | | 14,199,479 | | | | 14,275,448 | | | 06/25/39 | | | 7,647,000 | | | | 6,219,305 | |
| | | | | | | | | | | Cash Collateral | | | 3,847,000 | | | | 3,847,000 | |
| | | | | | | | | | | Freddie Mac Structured Agency Credit Risk Debt Notes | | | | | | | | |
| | | | | | | | | | | 3.25% | | | | | | | | |
| | | | | | | | | | | 09/25/30 | | | 2,046,060 | | | | 1,723,192 | |
| | | | | | | | | | | Fannie Mae Connecticut Avenue Securities | | | | | | | | |
| | | | | | | | | | | 3.30% | | | | | | | | |
| | | | | | | | | | | 01/25/31 | | | 1,536,000 | | | | 1,289,933 | |
| | | | | | | | | | | Hilton USA Trust | | | | | | | | |
| | | | | | | | | | | 4.33% | | | | | | | | |
| | | | | | | | | | | 11/05/38 | | | 1,814,000 | | | | 1,003,142 | |
| | | | | | | | | | | Fannie Mae Connecticut Avenue Securities | | | | | | | | |
| | | | | | | | | | | 3.50% | | | | | | | | |
| | | | | | | | | | | 12/25/30 | | | 1,100,000 | | | | 901,670 | |
| | | | | | �� | | | | | BXP Trust | | | | | | | | |
| | | | | | | | | | | 4.70% | | | | | | | | |
| | | | | | | | | | | 11/15/34 | | | 1,106,000 | | | | 898,957 | |
| | | | | | | | | | | Citigroup Commercial Mortgage Trust | | | | | | | | |
| | | | | | | | | | | 3.50% | | | | | | | | |
| | | | | | | | | | | 12/15/36 | | | 1,100,000 | | | | 700,700 | |
30 | THE GUGGENHEIM FUNDS SEMI-ANNUAL REPORT | SEE NOTES TO FINANCIAL STATEMENTS. |
SCHEDULE OF INVESTMENTS (Unaudited)(concluded) | March 31, 2020 |
ULTRA SHORT DURATION FUND | |
Counterparty and
Terms of Agreement | | Face
Value | | | Repurchase
Price | | | Collateral | | Par
Value | | | Fair
Value | |
| | | | | | | | | | | Freddie Mac Structured Agency Credit Risk Debt Notes | | | | | | | | |
| | | | | | | | | | | 3.60% | | | | | | | | |
| | | | | | | | | | | 12/25/29 | | $ | 623,000 | | | $ | 504,505 | |
| | | | | | | | | | | Ashford Hospitality Trust | | | | | | | | |
| | | | | | | | | | | 3.80% | | | | | | | | |
| | | | | | | | | | | 04/15/35 | | | 626,000 | | | | 468,373 | |
| | | | | | | | | | | | | | 21,445,060 | | | | 17,556,777 | |
SEE NOTES TO FINANCIAL STATEMENTS. | THE GUGGENHEIM FUNDS SEMI-ANNUAL REPORT | 31 |
STATEMENT OF ASSETS AND LIABILITIES (Unaudited) |
ULTRA SHORT DURATION FUND |
March 31, 2020
Assets: |
Investments, at value (cost $389,957,529) | | $ | 382,410,084 | |
Repurchase agreements, at value (cost $23,149,939) | | | 23,149,939 | |
Cash | | | 2,497,745 | |
Segregated cash with broker | | | 1,037,117 | |
Unrealized appreciation on OTC swap agreements | | | 1,024 | |
Unrealized appreciation on forward foreign currency exchange contracts | | | 7,085,411 | |
Prepaid expenses | | | 40,563 | |
Receivables: |
Interest | | | 1,184,087 | |
Securities sold | | | 993,520 | |
Fund shares sold | | | 831,656 | |
Foreign tax reclaims | | | 32,413 | |
Dividends | | | 7,897 | |
Total assets | | | 419,271,456 | |
| | | | | |
Liabilities: |
Segregated cash due to broker | | | 9,303,017 | |
Unrealized depreciation on forward foreign currency exchange contracts | | | 3,090,898 | |
Payable for: |
Securities purchased | | | 3,761,873 | |
Fund shares redeemed | | | 967,366 | |
Distributions to shareholders | | | 129,347 | |
Management fees | | | 51,056 | |
Swap settlement | | | 26,208 | |
Fund accounting/administration fees | | | 11,916 | |
Distribution and service fees | | | 10,672 | |
Trustees’ fees* | | | 1,959 | |
Transfer agent/maintenance fees | | | 1,027 | |
Miscellaneous | | | 79,884 | |
Total liabilities | | | 17,435,223 | |
Net assets | | $ | 401,836,233 | |
| | | | | |
Net assets consist of: |
Paid in capital | | $ | 409,393,075 | |
Total distributable earnings (loss) | | | (7,556,842 | ) |
Net assets | | $ | 401,836,233 | |
| | | | | |
A-Class: |
Net assets | | $ | 46,464,911 | |
Capital shares outstanding | | | 4,752,620 | |
Net asset value per share | | $ | 9.78 | |
| | | | | |
Institutional Class: |
Net assets | | $ | 355,371,322 | |
Capital shares outstanding | | | 36,357,240 | |
Net asset value per share | | $ | 9.77 | |
* | Relates to Trustees not deemed “interested persons” within the meaning of Section 2(a)(19) of the 1940 Act. |
32 | THE GUGGENHEIM FUNDS SEMI-ANNUAL REPORT | SEE NOTES TO FINANCIAL STATEMENTS. |
STATEMENT OF OPERATIONS (Unaudited) |
ULTRA SHORT DURATION FUND |
Six-Month Period Ended March 31, 2020
Investment Income: |
Dividends | | $ | 108,291 | |
Interest | | | 5,440,431 | |
Total investment income | | | 5,548,722 | |
| | | | | |
Expenses: |
Management fees | | | 631,043 | |
Distribution and service fees: |
A-Class | | | 62,326 | |
Transfer agent/maintenance fees: |
A-Class | | | 8,169 | |
Institutional Class | | | 27,155 | |
Fund accounting/administration fees | | | 75,726 | |
Custodian fees | | | 61,357 | |
Professional fees | | | 34,946 | |
Trustees’ fees* | | | 15,417 | |
Line of credit fees | | | 11,795 | |
Miscellaneous | | | 40,335 | |
Recoupment of previously waived fees: |
A-Class | | | 714 | |
Institutional Class | | | 5,085 | |
Total expenses | | | 974,068 | |
Less: |
Expenses reimbursed by Adviser: |
A-Class | | | (7,202 | ) |
Institutional Class | | | (21,676 | ) |
Expenses waived by Adviser | | | (28,156 | ) |
Earnings credits applied | | | (12,008 | ) |
Total waived/reimbursed expenses | | | (69,042 | ) |
Net expenses | | | 905,026 | |
Net investment income | | | 4,643,696 | |
| | | | | |
Net Realized and Unrealized Gain (Loss): |
Net realized gain (loss) on: |
Investments | | | (2,371,096 | ) |
Investments sold short | | | (256 | ) |
Swap agreements | | | (636,573 | ) |
Futures contracts | | | 372,360 | |
Forward foreign currency exchange contracts | | | (157,209 | ) |
Foreign currency transactions | | | 293,253 | |
Net realized loss | | | (2,499,521 | ) |
Net change in unrealized appreciation (depreciation) on: |
Investments | | | (7,370,833 | ) |
Swap agreements | | | 1,275,427 | |
Futures contracts | | | (62,852 | ) |
Forward foreign currency exchange contracts | | | 2,452,221 | |
Foreign currency translations | | | (4,583 | ) |
Net change in unrealized appreciation (depreciation) | | | (3,710,620 | ) |
Net realized and unrealized loss | | | (6,210,141 | ) |
Net decrease in net assets resulting from operations | | $ | (1,566,445 | ) |
* | Relates to Trustees not deemed “interested persons” within the meaning of Section 2(a)(19) of the 1940 Act. |
SEE NOTES TO FINANCIAL STATEMENTS. | THE GUGGENHEIM FUNDS SEMI-ANNUAL REPORT | 33 |
STATEMENTS OF CHANGES IN NET ASSETS |
ULTRA SHORT DURATION FUND | |
| | Six-Month
Period Ended
March 31,
2020
(Unaudited) | | | Year Ended
September 30,
2019 | |
Increase (Decrease) in Net Assets from Operations: | | | | | | | | |
Net investment income | | $ | 4,643,696 | | | $ | 9,869,976 | |
Net realized loss on investments | | | (2,499,521 | ) | | | (28,026 | ) |
Net change in unrealized appreciation (depreciation) on investments | | | (3,710,620 | ) | | | (548,358 | ) |
Net increase (decrease) in net assets resulting from operations | | | (1,566,445 | ) | | | 9,293,592 | |
| | | | | | | | | |
Distributions to shareholders: | | | | | | | | |
A-Class | | | (447,529 | ) | | | (139,082 | ) |
Institutional Class | | | (4,685,067 | ) | | | (10,924,443 | ) |
Total distributions to shareholders | | | (5,132,596 | ) | | | (11,063,525 | ) |
| | | | | | | | | |
Capital share transactions: | | | | | | | | |
Proceeds from sale of shares | | | | | | | | |
A-Class | | | 54,254,608 | | | | 36,269,668 | |
Institutional Class | | | 250,290,731 | | | | 403,303,618 | |
Distributions reinvested | | | | | | | | |
A-Class | | | 443,963 | | | | 137,329 | |
Institutional Class | | | 3,864,425 | | | | 8,651,860 | |
Cost of shares redeemed | | | | | | | | |
A-Class | | | (38,382,502 | ) | | | (5,241,855 | ) |
Institutional Class | | | (316,503,923 | ) | | | (342,911,050 | ) |
Net increase (decrease) from capital share transactions | | | (46,032,698 | ) | | | 100,209,570 | |
Net increase (decrease) in net assets | | | (52,731,739 | ) | | | 98,439,637 | |
| | | | | | | | | |
Net assets: | | | | | | | | |
Beginning of period | | | 454,567,972 | | | | 356,128,335 | |
End of period | | $ | 401,836,233 | | | $ | 454,567,972 | |
| | | | | | | | | |
34 | THE GUGGENHEIM FUNDS SEMI-ANNUAL REPORT | SEE NOTES TO FINANCIAL STATEMENTS. |
STATEMENTS OF CHANGES IN NET ASSETS (concluded) |
ULTRA SHORT DURATION FUND | |
| | Six-Month
Period Ended
March 31,
2020
(Unaudited) | | | Year Ended
September 30,
2019 | |
Capital share activity: | | | | | | | | |
Shares sold | | | | | | | | |
A-Class | | | 5,446,523 | | | | 3,638,332 | |
Institutional Class | | | 25,295,120 | | | | 40,454,632 | 1 |
Shares issued from reinvestment of distributions | | | | | | | | |
A-Class | | | 44,711 | | | | 13,774 | |
Institutional Class | | | 389,834 | | | | 867,866 | 1 |
Shares redeemed | | | | | | | | |
A-Class | | | (3,864,881 | ) | | | (525,839 | ) |
Institutional Class | | | (31,839,450 | ) | | | (34,376,508 | )1 |
Net increase (decrease) in shares | | | (4,528,143 | ) | | | 10,072,257 | |
1 | The capital share activity for the period October 1, 2018 to November 30, 2018 has been restated to reflect the reorganization of the Guggenheim Strategy Fund I with and into the Guggenheim Ultra Short Duration Fund — Institutional Class effective November 30, 2018. In conjunction with the reorganization, Guggenheim Ultra Short Duration Fund issued 2.501601322 Institutional Class shares for every 1 share of Guggenheim Strategy Fund I. See Note 10 in Notes to Financial Statements. |
SEE NOTES TO FINANCIAL STATEMENTS. | THE GUGGENHEIM FUNDS SEMI-ANNUAL REPORT | 35 |
FINANCIAL HIGHLIGHTS |
ULTRA SHORT DURATION FUND | |
This table is presented to show selected data for a share outstanding throughout each period and to assist shareholders in evaluating a Fund’s performance for the periods presented.
A-Class | | Period
Ended
March 31,
2020a | | | Period
Ended
Sept. 30,
2019b | |
Per Share Data |
Net asset value, beginning of period | | $ | 9.97 | | | $ | 10.00 | |
Income (loss) from investment operations: |
Net investment income (loss)c | | | .08 | | | | .17 | |
Net gain (loss) on investments (realized and unrealized) | | | (.18 | ) | | | .02 | i |
Total from investment operations | | | (.10 | ) | | | .19 | |
Less distributions from: |
Net investment income | | | (.09 | ) | | | (.21 | ) |
Net realized gains | | | — | | | | (.01 | ) |
Total distributions | | | (.09 | ) | | | (.22 | ) |
Net asset value, end of period | | $ | 9.78 | | | $ | 9.97 | |
|
Total Return | | | (1.01 | %) | | | 1.89 | % |
Ratios/Supplemental Data |
Net assets, end of period (in thousands) | | $ | 46,465 | | | $ | 31,154 | |
Ratios to average net assets: |
Net investment income (loss) | | | 1.61 | % | | | 2.05 | % |
Total expenses | | | 0.63 | % | | | 0.61 | % |
Net expensesf,g,h | | | 0.59 | % | | | 0.58 | % |
Portfolio turnover rate | | | 39 | % | | | 55 | % |
36 | THE GUGGENHEIM FUNDS SEMI-ANNUAL REPORT | SEE NOTES TO FINANCIAL STATEMENTS. |
FINANCIAL HIGHLIGHTS (continued) |
ULTRA SHORT DURATION FUND | |
This table is presented to show selected data for a share outstanding throughout each period and to assist shareholders in evaluating a Fund’s performance for the periods presented.
Institutional Class | | Period
Ended
March 31,
2020a | | | Year
Ended
Sept. 30,
2019e | | | Year
Ended
Sept. 30,
2018e | | | Year
Ended
Sept. 30,
2017e | | | Year
Ended
Sept. 30,
2016e | | | Year
Ended
Sept. 30,
2015e | |
Per Share Data |
Net asset value, beginning of period | | $ | 9.96 | | | $ | 10.01 | | | $ | 10.04 | | | $ | 9.99 | | | $ | 9.95 | | | $ | 9.96 | |
Income (loss) from investment operations: |
Net investment income (loss)c | | | .09 | | | | .28 | | | | .24 | | | | .17 | | | | .14 | | | | .11 | |
Net gain (loss) on investments (realized and unrealized) | | | (.18 | ) | | | (.04 | ) | | | — | | | | .06 | | | | .04 | | | | (.01 | ) |
Total from investment operations | | | (.09 | ) | | | .24 | | | | .24 | | | | .23 | | | | .18 | | | | .10 | |
Less distributions from: |
Net investment income | | | (.10 | ) | | | (.28 | ) | | | (.27 | ) | | | (.18 | ) | | | (.14 | ) | | | (.11 | ) |
Net realized gains | | | — | | | | (.01 | ) | | | — | d | | | — | | | | — | | | | — | |
Total distributions | | | (.10 | ) | | | (.29 | ) | | | (.27 | ) | | | (.18 | ) | | | (.14 | ) | | | (.11 | ) |
Net asset value, end of period | | $ | 9.77 | | | $ | 9.96 | | | $ | 10.01 | | | $ | 10.04 | | | $ | 9.99 | | | $ | 9.95 | |
|
Total Return | | | (0.88 | %) | | | 2.37 | % | | | 2.48 | % | | | 2.24 | % | | | 1.95 | % | | | 1.06 | % |
Ratios/Supplemental Data |
Net assets, end of period (in thousands) | | $ | 355,371 | | | $ | 423,414 | | | $ | 356,128 | | | $ | 426,592 | | | $ | 407,371 | | | $ | 957,190 | |
Ratios to average net assets: |
Net investment income (loss) | | | 1.86 | % | | | 2.54 | % | | | 2.44 | % | | | 1.73 | % | | | 1.37 | % | | | 1.14 | % |
Total expenses | | | 0.36 | % | | | 0.30 | % | | | 0.07 | % | | | 0.08 | % | | | 0.07 | % | | | 0.04 | % |
Net expensesf,g,h | | | 0.34 | % | | | 0.29 | % | | | 0.07 | % | | | 0.08 | % | | | 0.07 | % | | | 0.04 | % |
Portfolio turnover rate | | | 39 | % | | | 55 | % | | | 74 | % | | | 65 | % | | | 66 | % | | | 46 | % |
SEE NOTES TO FINANCIAL STATEMENTS. | THE GUGGENHEIM FUNDS SEMI-ANNUAL REPORT | 37 |
FINANCIAL HIGHLIGHTS (concluded) |
ULTRA SHORT DURATION FUND | |
a | Unaudited figures for the period ended March 31, 2020. Percentage amounts for the period, except total return and portfolio turnover rate, have been annualized. |
b | Since commencement of operations: November 30, 2018. Percentage amounts for the period, except total return and portfolio turnover rate, have been annualized. |
c | Net investment income (loss) per share was computed using average shares outstanding throughout the period. |
d | Distributions from realized gains are less than $0.01 per share. |
e | The per share data for the years ended September 30, 2015 through September 30, 2018 and the period October 1, 2018 to November 30, 2018 has been restated to reflect the reorganization of the Guggenheim Strategy Fund I with and into the Guggenheim Ultra Short Duration Fund effective November 30, 2018. In conjunction with the reorganization, Guggenheim Ultra Short Duration Fund issued 2.501601322 Institutional Class shares for every 1 share of Guggenheim Strategy Fund I. See Note 10 in Notes to Financial Statements. |
f | Net expense information reflects the expense ratios after expense waivers and reimbursements, as applicable. |
g | The portion of the ratios of net expenses to average net assets attributable to recoupments of prior fee reductions or expense reimbursements for the periods presented was as follows: |
| | | 03/31/20a | 09/30/19 |
| | A-Class | 0.00%* | — |
| | Institutional Class | 0.00%* | 0.00%* |
h | Net expenses may include expenses that are excluded from the expense limitation agreement. Excluding these expenses, the net expense ratios for the periods would be: |
| | | 03/31/20a | 09/30/19 | 09/30/18 | 09/30/17 | 09/30/16 | 09/30/15 |
| | A-Class | 0.58% | 0.58% | N/A | N/A | N/A | N/A |
| | Institutional Class | 0.33% | 0.29% | 0.07% | 0.08% | 0.07% | 0.04% |
i | The amount shown for a share outstanding throughout the period does not accord with the aggregate net losses on investments for the period because of the sales and repurchases of fund shares in relation to fluctuating market value of the investments of the Fund. |
38 | THE GUGGENHEIM FUNDS SEMI-ANNUAL REPORT | SEE NOTES TO FINANCIAL STATEMENTS. |
NOTES TO FINANCIAL STATEMENTS (Unaudited) |
Note 1 – Organization and Significant Accounting Policies
Organization
Guggenheim Funds Trust (the “Trust”), a Delaware statutory trust, is registered with the SEC under the Investment Company Act of 1940 (“1940 Act”), as an open-ended investment company of the series type. Each series, in effect, is representing a separate fund. The Trust is authorized to issue an unlimited number of no par value shares. The Trust accounts for the assets of each fund separately.
The Trust offers a combination of five separate classes of shares: A-Class shares, C-Class shares, P-Class shares, R6-Class shares and Institutional Class shares. Sales of shares of each Class are made without a front-end sales charge at the net asset value per share (“NAV”), with the exception of A-Class shares. A-Class shares are sold at the NAV, plus the applicable front-end sales charge. The sales charge varies depending on the amount purchased. A-Class share purchases of $1 million or more are exempt from the front-end sales charge but have a 1% contingent deferred sales charge (“CDSC”), if shares are redeemed within 12 months of purchase. C-Class shares have a 1% CDSC if shares are redeemed within 12 months of purchase. C-Class shares automatically convert to A-Class shares on or about the 10th day of the month following the 10-year anniversary of the purchase of the C-Class shares. This conversion will be executed without any sales charge, fee or other charge. After the conversion is completed, the shares will be subject to all features and expenses of A-Class shares. Institutional Class shares are offered primarily for direct investment by institutions such as pension and profit sharing plans, endowments, foundations and corporations. Institutional Class shares require a minimum initial investment of $2 million and a minimum account balance of $1 million. R6-Class shares are offered primarily through qualified retirement and benefit plans. R6-Class shares are also offered through certain other plans and platforms sponsored by financial intermediaries. Certain institutional investors and others deemed appropriate by Guggenheim Investments (“GI”) may also be eligible to purchase R6-Class shares subject to a $2 million minimum initial investment. At March 31, 2020, the Trust consisted of nineteen funds (the “Funds”).
This report covers the Ultra Short Duration Fund (the “Fund”), a diversified investment company. At March 31, 2020, only A-Class and Institutional Class shares have been issued by the Fund.
Guggenheim Partners Investment Management, LLC (“GPIM”), which operates under the name Guggenheim Investments, provides advisory services. Guggenheim Funds Distributors, LLC (“GFD”) acts as principal underwriter for the Trust. GI and GFD are affiliated entities.
Significant Accounting Policies
The Fund operates as an investment company and, accordingly, follows the investment company accounting and reporting guidance of the Financial Accounting Standards Board (“FASB”) Accounting Standards Codification Topic 946 Financial Services – Investment Companies.
| | THE GUGGENHEIM FUNDS SEMI-ANNUAL REPORT | 39 |
NOTES TO FINANCIAL STATEMENTS (Unaudited)(continued) |
The following significant accounting policies are in conformity with U.S. generally accepted accounting principles (“U.S. GAAP”) and are consistently followed by the Trust. This requires management to make estimates and assumptions that affect the reported amount of assets and liabilities, contingent assets and liabilities at the date of the financial statements, and the reported amounts of revenues and expenses during the reporting period. Actual results could differ from these estimates. All time references are based on Eastern Time.
The NAV of each Class of the Fund is calculated by dividing the market value of the Fund’s securities and other assets, less all liabilities, attributable to the Class by the number of outstanding shares of the Class.
(a) Valuation of Investments
The Board of Trustees of the Fund (the “Board”) has adopted policies and procedures for the valuation of the Fund’s investments (the “Valuation Procedures”). Pursuant to the Valuation Procedures, the Board has delegated to a valuation committee, consisting of representatives from Guggenheim’s investment management, fund administration, legal and compliance departments (the “Valuation Committee”), the day-to-day responsibility for implementing the Valuation Procedures, including, under most circumstances, the responsibility for determining the fair value of the Fund’s securities and/or other assets.
Valuations of the Fund’s securities and other assets are supplied primarily by pricing services appointed pursuant to the processes set forth in the Valuation Procedures. The Valuation Committee convenes monthly, or more frequently as needed, to review the valuation of all assets which have been fair valued for reasonableness. The Fund’s officers, through the Valuation Committee and consistent with the monitoring and review responsibilities set forth in the Valuation Procedures, regularly review procedures used and valuations provided by the pricing services.
If the pricing service cannot or does not provide a valuation for a particular investment or such valuation is deemed unreliable, such investment is fair valued by the Valuation Committee.
Generally, trading in foreign securities markets is substantially completed each day at various times prior to the close of the New York Stock Exchange (“NYSE”). The values of foreign securities are determined as of the close of such foreign markets or the close of the NYSE, if earlier. All investments quoted in foreign currencies are valued in U.S. dollars on the basis of the foreign currency exchange rates prevailing at the close of U.S. business at 4:00 p.m. Investments in foreign securities may involve risks not present in domestic investments. The Valuation Committee will determine the current value of such foreign securities by taking into consideration certain factors which may include those discussed above, as well as the following factors, among
40 | THE GUGGENHEIM FUNDS SEMI-ANNUAL REPORT | |
NOTES TO FINANCIAL STATEMENTS (Unaudited)(continued) |
others: the value of the securities traded on other foreign markets, ADR trading, closed-end fund trading, foreign currency exchange activity, and the trading prices of financial products that are tied to foreign securities. In addition, under the Valuation Procedures, the Valuation Committee and GI are authorized to use prices and other information supplied by a third party pricing vendor in valuing foreign securities.
Open-end investment companies are valued at their NAV as of the close of business, on the valuation date. Exchange-traded funds and closed-end investment companies are valued at the last quoted sale price. Money market funds are valued at their NAV.
Repurchase agreements are generally valued at amortized cost, provided such amounts approximate market value.
Debt securities with a maturity of greater than 60 days at acquisition are valued at prices that reflect broker-dealer supplied valuations or are obtained from independent pricing services, which may consider the trade activity, treasury spreads, yields or price of bonds of comparable quality, coupon, maturity, and type, as well as prices quoted by dealers who make markets in such securities. Short-term debt securities with a maturity of 60 days or less at acquisition are valued at amortized cost, provided such amount approximates market value.
The value of futures contracts is accounted for using the unrealized appreciation or depreciation on the contracts that is determined by marking the contracts to their current realized settlement prices. Financial futures contracts are valued at the 4:00 p.m. price on the valuation date. In the event that the exchange for a specific futures contract closes earlier than 4:00 p.m., the futures contract is valued at the official settlement price of the exchange. However, the underlying securities from which the futures contract value is derived are monitored until 4:00 p.m. to determine if fair valuation would provide a more accurate valuation.
The value of interest rate swap agreements entered into by the Fund is accounted for using the unrealized appreciation or depreciation on the agreements that is determined using the previous day’s Chicago Mercantile Exchange close price, adjusted for the current day’s spreads.
The values of other swap agreements entered into by the Fund are accounted for using the unrealized appreciation or depreciation on the agreements that are determined by marking the agreements to the last quoted value of the index or other underlying position that the swaps pertain to at the close of the NYSE.
Forward foreign currency exchange contracts are valued daily based on the applicable exchange rate of the underlying currency.
Investments for which market quotations are not readily available are fair-valued as determined in good faith by GI subject to review and approval by the Valuation Committee, pursuant to methods established or ratified by the Board. Valuations in accordance with these methods are intended to reflect each security’s (or asset’s or liability’s) “fair value”. Each such determination is based on a consideration of all relevant factors, which are likely to vary from one pricing context to
| | THE GUGGENHEIM FUNDS SEMI-ANNUAL REPORT | 41 |
NOTES TO FINANCIAL STATEMENTS (Unaudited)(continued) |
another. Examples of such factors may include, but are not limited to market prices; sale prices; broker quotes; and models which derive prices based on inputs such as prices of securities with comparable maturities and characteristics, or based on inputs such as anticipated cash flows or collateral, spread over U.S. Treasury securities, and other information analysis. In connection with futures contracts and other derivative investments, such factors may include obtaining information as to how (a) these contracts and other derivative investments trade in the futures or other derivative markets, respectively, and (b) the securities underlying these contracts and other derivative investments trade in the cash market.
(b) Interests in When-Issued Securities
The Fund may purchase and sell interests in securities on a when-issued and delayed delivery basis, with payment and delivery scheduled for a future date. No income accrues to the Fund on such interests or securities in connection with such transactions prior to the date the Fund actually takes delivery of such interests or securities. These transactions are subject to market fluctuations and are subject to the risk that the value at delivery may be more or less than the trade date purchase price. Although the Fund will generally purchase these securities with the intention of acquiring such securities, they may sell such securities before the settlement date.
(c) Short Sales
When the Fund engages in a short sale of a security, an amount equal to the proceeds is reflected as an asset and an equivalent liability. The amount of the liability is subsequently marked-to-market to reflect the market value of the short sale. The Fund maintains a segregated account of cash and/or securities as collateral for short sales.
Fees, if any, paid to brokers to borrow securities in connection with short sales are recorded as interest expense. In addition, the Fund must pay out the dividend rate of the equity or coupon rate of the obligation to the lender and record this as an expense. Short dividend or interest expense is a cost associated with the investment objective of short sales transactions, rather than an operational cost associated with the day-to-day management of any mutual fund. The Fund may also receive rebate income from the broker resulting from the investment of the proceeds from securities sold short.
(d) Futures Contracts
Upon entering into a futures contract, the Fund deposits and maintains as collateral such initial margin as required by the exchange on which the transaction is affected. Pursuant to the contract, the Fund agrees to receive from or pay to the broker an amount of cash equal to the daily fluctuation in value of the contract. Such receipts or payments are known as variation margin and are recorded by the Fund as unrealized appreciation or depreciation. When the contract is closed, the Fund records a realized gain or loss equal to the difference between the value of the contract at the time it was opened and the value at the time it was closed.
42 | THE GUGGENHEIM FUNDS SEMI-ANNUAL REPORT | |
NOTES TO FINANCIAL STATEMENTS (Unaudited)(continued) |
(e) Swap Agreements
Swap agreements are marked-to-market daily and the change, if any, is recorded as unrealized appreciation or depreciation. Payments received or made as a result of an agreement or termination of an agreement are recognized as realized gains or losses.
Upon entering into certain centrally-cleared swap transactions, a Fund is required to deposit with its clearing broker an amount of cash or securities as an initial margin. Subsequent variation margin receipts or payments are received or made by the Fund depending on fluctuations in the fair value of the reference entity and are recorded by the Fund as unrealized appreciation or depreciation. When the contract is closed, the Fund records a realized gain or loss equal to the difference between the value of the contract at the time it was opened and the value at the time it was closed.
Upfront payments received or made by a Fund on credit default swap agreements and interest rate swap agreements are amortized over the expected life of the agreement. Periodic payments received or paid by a Fund are recorded as realized gains or losses. Payments received or made as a result of a credit event or termination of the contract are recognized, net of a proportional amount of the upfront payment, as realized gains or losses.
(f) Currency Translations
The accounting records of the Fund are maintained in U.S. dollars. All assets and liabilities initially expressed in foreign currencies are converted into U.S. dollars at prevailing exchange rates. Purchases and sales of investment securities, dividend and interest income, and certain expenses are translated at the rates of exchange prevailing on the respective dates of such transactions. Changes in the relationship of these foreign currencies to the U.S. dollar can significantly affect the value of the investments and earnings of the Fund. Foreign investments may also subject the Fund to foreign government exchange restrictions, expropriation, taxation, or other political, social or economic developments, all of which could affect the market and/or credit risk of the investments.
The Fund does not isolate that portion of the results of operations resulting from changes in the foreign exchange rates on investments from the fluctuations arising from changes in the market prices of securities held. Such fluctuations are included with the net realized gain or loss and unrealized appreciation or depreciation on investments.
Reported net realized foreign exchange gains and losses arise from sales of foreign currencies and currency gains or losses realized between the trade and settlement dates on investment transactions. Net unrealized appreciation and depreciation arise from changes in the fair values of assets and liabilities other than investments in securities at the fiscal period end, resulting from changes in exchange rates.
| | THE GUGGENHEIM FUNDS SEMI-ANNUAL REPORT | 43 |
NOTES TO FINANCIAL STATEMENTS (Unaudited)(continued) |
(g) Forward Foreign Currency Exchange Contracts
The change in value of a forward foreign currency exchange contract is recorded as unrealized appreciation or depreciation until the contract is closed. When the contract is closed, the Fund records a realized gain or loss equal to the difference between the value at the time the contract was opened and the value at the time it was closed.
(h) Foreign Taxes
The Fund may be subject to foreign taxes (a portion of which may be reclaimable) on income, stock dividends, capital gains on investments or certain foreign currency transactions. All foreign taxes are recorded in accordance with the applicable foreign tax regulations and rates that exist in the foreign jurisdictions in which the Fund invests. These foreign taxes, if any, are paid by the Fund and reflected in its Statement of Operations as follows: foreign taxes withheld at source are presented as a reduction of income and foreign taxes on capital gains from sales of investments are included with the net realized gain (loss) on investments. Foreign taxes payable or deferred as of March 31, 2020, if any, are disclosed in the Fund’s Statement of Assets and Liabilities.
(i) Security Transactions
Security transactions are recorded on the trade date for financial reporting purposes. Realized gains and losses from securities transactions are recorded using the identified cost basis. Proceeds from lawsuits related to investment holdings are recorded as a reduction to cost if the securities are still held and as realized gains if no longer held in the Fund. Dividend income is recorded on the ex-dividend date, net of applicable taxes withheld by foreign countries, if any. Taxable non-cash dividends are recorded as dividend income. Interest income, including amortization of premiums and accretion of discounts, is accrued on a daily basis. Interest income also includes paydown gains and losses on mortgage-backed and asset-backed securities.
(j) Distributions
The Fund declares dividends from investment income daily. The Fund pays its shareholders from its net investment income monthly and distributes any net capital gains that it has realized, at least annually. Distributions to shareholders are recorded on the ex-dividend date. Dividends are reinvested in additional shares, unless shareholders request payment in cash. The character of distributions made during the year from net investment income or net realized gains may differ from their ultimate characterization for U.S. federal income tax purposes.
(k) Class Allocations
Interest and dividend income, most expenses, all realized gains and losses, and all unrealized appreciation and depreciation are allocated to the classes based upon the value of the outstanding shares in each Class. Certain costs, such as distribution and service fees are charged directly to specific classes. In addition, certain expenses have been allocated to the individual Funds in the Trust based on the respective net assets of each Fund included in the Trust.
44 | THE GUGGENHEIM FUNDS SEMI-ANNUAL REPORT | |
NOTES TO FINANCIAL STATEMENTS (Unaudited)(continued) |
(l) Earnings Credits
Under the fee arrangement with the custodian, the Fund may earn credits based on overnight custody cash balances. These credits are utilized to reduce related custodial expenses. The custodian fees disclosed in the Statement of Operations are before the reduction in expense from the related earnings credits, if any. Earnings credits for the period ended March 31, 2020, are disclosed in the Statement of Operations.
(m) Cash
The Fund may leave cash overnight in its cash account with the custodian. Periodically, the Fund may have cash due to the custodian bank as an overdraft balance. A fee is incurred on this overdraft, calculated by multiplying the overdraft by a rate based on the federal funds rate, which was 0.08% at March 31, 2020.
(n) Indemnifications
Under the Fund’s organizational documents, its Trustees and Officers are indemnified against certain liabilities arising out of the performance of their duties to the Trust. In addition, throughout the normal course of business, the Fund enters into contracts that contain a variety of representations and warranties which provide general indemnifications. The Fund’s maximum exposure under these arrangements is unknown, as this would involve future claims that may be made against the Fund and/or its affiliates that have not yet occurred. However, based on experience, the Fund expects the risk of loss to be remote.
Note 2 – Financial Instruments and Derivatives
As part of its investment strategy, the Fund utilizes short sales and a variety of derivative instruments. These investments involve, to varying degrees, elements of market risk and risks in excess of amounts recognized in the Statement of Assets and Liabilities. Valuation and accounting treatment of these instruments can be found under Significant Accounting Policies in Note 1 of these Notes to Financial Statements.
Short Sales
Fees, if any, paid to brokers to borrow securities in connection with short sales are recorded as interest expense. In addition, the Fund must pay out the dividend rate of the equity or coupon rate of the obligation to the lender and record this as an expense. Short dividend or interest expense is a cost associated with the investment objective of short sales transactions, rather than an operational cost associated with the day-to-day management of any mutual fund. The Fund may also receive rebate income from the broker resulting from the investment of the proceeds from securities sold short.
| | THE GUGGENHEIM FUNDS SEMI-ANNUAL REPORT | 45 |
NOTES TO FINANCIAL STATEMENTS (Unaudited)(continued) |
Derivatives
Derivatives are instruments whose values depend on, or are derived from, in whole or in part, the value of one or more other assets, such as securities, currencies, commodities or indices. Derivative instruments may be used to increase investment flexibility (including to maintain cash reserves while maintaining exposure to certain other assets), for risk management (hedging) purposes, to facilitate trading, to reduce transaction costs and to pursue higher investment returns. Derivative instruments may also be used to mitigate certain investment risks, such as foreign currency exchange rate risk, interest rate risk and credit risk. U.S. GAAP requires disclosures to enable investors to better understand how and why a Fund uses derivative instruments, how these derivative instruments are accounted for and their effects on the Fund’s financial position and results of operations.
The Fund utilized derivatives for the following purposes:
Duration: the use of an instrument to manage the interest rate risk of a portfolio.
Hedge: an investment made in order to reduce the risk of adverse price movements in a security, by taking an offsetting position to protect against broad market moves.
Income: the use of any instrument that distributes cash flows typically based upon some rate of interest.
Futures Contracts
A futures contract is an agreement to purchase (long) or sell (short) an agreed amount of securities or other instruments at a set price for delivery at a future date. There are significant risks associated with a Fund’s use of futures contracts, including (i) there may be an imperfect or no correlation between the changes in market value of the underlying asset and the prices of futures contracts; (ii) there may not be a liquid secondary market for a futures contract; (iii) trading restrictions or limitations may be imposed by an exchange; and (iv) government regulations may restrict trading in futures contracts. When investing in futures, there is minimal counterparty credit risk to a Fund because futures are exchange-traded and the exchange’s clearinghouse, as counterparty to all exchange-traded futures, guarantees against default. Cash deposits are shown as segregated cash with broker on the Statement of Assets and Liabilities; securities held as collateral are noted on the Schedule of Investments.
The following table represents the Fund’s use and volume of futures on a monthly basis:
| | | Average Notional Amount | |
Use | | Long | | | Short | |
Duration, Income | | $ | — | * | | $ | 4,440,188 | |
* | Futures contracts were outstanding for 20 days during the period ended March 31, 2020. The daily average outstanding notional amount of futures contracts during the period was $8,198,672. |
46 | THE GUGGENHEIM FUNDS SEMI-ANNUAL REPORT | |
NOTES TO FINANCIAL STATEMENTS (Unaudited)(continued) |
Swap Agreements
A swap is an agreement that obligates two parties to exchange a series of cash flows at specified intervals based upon or calculated by reference to changes in specified prices or rates for a specified amount of an underlying asset. When utilizing over-the-counter (“OTC”) swaps, the Fund bears the risk of loss of the amount expected to be received under a swap agreement in the event of the default or bankruptcy of a swap agreement counterparty or if the underlying asset declines in value. Certain standardized swaps are subject to mandatory central clearing and are executed on a multi-lateral or other trade facility platform, such as a registered exchange. There is limited counterparty credit risk with respect to centrally-cleared swaps as the transaction is facilitated through a central clearinghouse, much like exchange-traded futures contracts. For a fund utilizing centrally cleared swaps, the exchange bears the risk of loss resulting from a counterparty not being able to pay. There is no guarantee that a fund or an underlying fund could eliminate its exposure under an outstanding swap agreement by entering into an offsetting swap agreement with the same or another party.
Total return swaps involve commitments where single or multiple cash flows are exchanged based on the price of an underlying reference asset (such as an index) for a fixed or variable interest rate. Total return swaps will usually be computed based on the current value of the reference asset as of the close of regular trading on the NYSE or other exchange, with the swap value being adjusted to include dividends accrued, financing charges and/or interest associated with the swap agreement. When utilizing total return swaps, the Fund bears the risk of loss of the amount expected to be received under a swap agreement in the event of the default or bankruptcy of a swap agreement counterparty or if the underlying reference asset declines in value.
The following table represents the Fund’s use and volume of total return swaps on a monthly basis:
| | | Average Notional Amount | |
Use | | Long | | | Short | |
Income | | $ | 1,564,897 | | | $ | — | |
Interest rate swaps involve the exchange by the Fund with another party for its respective commitment to pay or receive a fixed or variable interest rate on a notional amount of principal. Interest rate swaps are generally centrally-cleared, but central clearing does not make interest rate swap transactions risk free.
The following table represents the Fund’s use and volume of interest rate swaps on a monthly basis:
| | | Average Notional Amount | |
Use | | Pay Floating Rate | | | Receive Floating Rate | |
Hedge, Income | | $ | 3,315,500 | | | $ | 18,232,167 | |
| | THE GUGGENHEIM FUNDS SEMI-ANNUAL REPORT | 47 |
NOTES TO FINANCIAL STATEMENTS (Unaudited)(continued) |
Credit default swaps are instruments which allow for the full or partial transfer of third party credit risk, with respect to a particular entity or entities, from one counterparty to the other. The Fund enters into credit default swaps as a “seller” or “buyer” of protection primarily to gain or reduce exposure to the investment grade and/or high yield bond market. A seller of credit default swaps is selling credit protection or assuming credit risk with respect to the underlying entity or entities. The buyer in a credit default swap is obligated to pay the seller a periodic stream of payments over the term of the contract provided that no event of default on an underlying reference obligation has occurred. If a credit event occurs, as defined under the terms of the swap agreement, the seller will either (i) pay to the buyer of protection an amount equal to the notional amount of the swap and take delivery of the referenced obligation or underlying securities comprising the referenced index or (ii) pay a net settlement amount in the form of cash or securities equal to the notional amount of the swap less the recovery value of the referenced obligation or underlying securities comprising the referenced index. The notional amount reflects the maximum potential amount the seller of credit protection could be required to pay to the buyer if a credit event occurs. The seller of protection receives periodic premium payments from the buyer and may also receive or pay an upfront premium adjustment to the stated periodic payments. In the event a credit default occurs on a credit default swap referencing an index, a factor adjustment will take place and the buyer of protection will received a payment reflecting the par less the default recovery rate of the defaulted index component based on its weighting in the index. If no default occurs, the counterparty will pay the stream of payments and have no further obligations to the fund selling the credit protection. For a fund utilizing centrally cleared credit default swaps, the exchange bears the risk of loss resulting from a counterparty not being able to pay. For OTC credit default swaps, a fund bears the risk of loss of the amount expected to be received under a swap agreement in the event of the default or bankruptcy of a swap agreement counterparty, or in the case of a credit default swap in which a fund is selling credit protection, the default of a third party issuer.
The quoted market prices and resulting market values for credit default swap agreements on securities and credit indices serve as an indicator of the current status of the payment/performance risk and represent the likelihood of an expected liability (or profit) for the credit derivative had the notional amount of the swap agreement been closed/sold as of the period end. Increasing market values, in absolute terms when compared to the notional amount of the swap, represent a deterioration of the referenced entity’s credit soundness and a greater likelihood or risk of default or other credit event occurring as defined under the terms of the agreement.
The following table represents the Fund’s use and volume of credit default swaps on a monthly basis:
| | | Average Notional Amount | |
Use | | Protection Sold | | | Protection Purchased | |
Hedge | | $ | — | | | $ | 29,233,333 | |
48 | THE GUGGENHEIM FUNDS SEMI-ANNUAL REPORT | |
NOTES TO FINANCIAL STATEMENTS (Unaudited)(continued) |
Forward Foreign Currency Exchange Contracts
A forward foreign currency exchange contract is an agreement between two parties to exchange two designated currencies at a specific time in the future. Certain types of contracts may be cash settled, in an amount equal to the change in exchange rates during the term of the contract. The contracts can be used to hedge or manage exposure to foreign currency risks with portfolio investments or to gain exposure to foreign currencies.
The market value of a forward foreign currency exchange contract changes with fluctuations in foreign currency exchange rates. Furthermore, the Fund may be exposed to risk if the counterparties cannot meet the contract terms or if the currency value changes unfavorably as compared to the U.S. dollar.
The following table represents the Fund’s use, and volume of forward foreign currency exchange contracts on a monthly basis:
| | | Average Value | |
Use | | Purchased | | | Sold | |
Hedge, Income | | $ | 18,534,007 | | | $ | 96,627,475 | |
Derivative Investment Holdings Categorized by Risk Exposure
The following is a summary of the location of derivative investments on the Fund’s Statement of Assets and Liabilities as of March 31, 2020:
Derivative Investment Type | Asset Derivatives | Liability Derivatives |
Credit contracts | Unrealized appreciation on OTC swap agreements | |
Currency contracts | Unrealized appreciation on forward foreign currency exchange contracts | Unrealized depreciation on forward foreign currency exchange contracts |
The following table sets forth the fair value of the Fund’s derivative investments categorized by primary risk exposure at March 31, 2020:
Asset Derivative Investments Value |
| | Swaps
Credit
Risk | | | Forward
Foreign Currency
Exchange Risk | | | Total Value at
March 31,
2020 | |
| | | $ | 1,024 | | | $ | 7,085,411 | | | $ | 7,086,435 | |
| | THE GUGGENHEIM FUNDS SEMI-ANNUAL REPORT | 49 |
NOTES TO FINANCIAL STATEMENTS (Unaudited)(continued) |
Liability Derivative Investments Value |
| | Swaps
Credit
Risk | | | Forward
Foreign Currency
Exchange Risk | | | Total Value at
March 31,
2020 | |
| | | $ | — | | | $ | 3,090,898 | | | $ | 3,090,898 | |
The following is a summary of the location of derivative investments on the Fund’s Statement of Operations for the period ended March 31, 2020:
Derivative Investment Type | Location of Gain (Loss) on Derivatives |
Interest Rate contracts | Net realized gain (loss) on futures contracts |
| Net change in unrealized appreciation (depreciation) on futures contracts |
Interest Rate/Credit contracts | Net realized gain (loss) on swap agreements |
| | Net change in unrealized appreciation (depreciation) on swap agreements |
Currency contracts | Net realized gain (loss) on forward foreign currency exchange contracts |
| | Net change in unrealized appreciation (depreciation) on forward foreign currency exchange contracts |
The following is a summary of the Fund’s realized gain (loss) and change in unrealized appreciation (depreciation) on derivative investments recognized on the Statement of Operations categorized by primary risk exposure for the period ended March 31, 2020:
Realized Gain (Loss) on Derivative Investments Recognized on the Statement of Operations |
| | Futures
Interest Rate
Risk | | | Swaps
Interest Rate
Risk | | | Swaps
Credit
Risk | | | Forward
Foreign Currency
Exchange Risk | | | Total | |
| | | $ | 372,360 | | | $ | (1,203,136 | ) | | $ | 566,563 | | | $ | (157,209 | ) | | $ | (421,422 | ) |
Change in Unrealized Appreciation (Depreciation) on Derivative Investments Recognized on the Statement of Operations |
| | Futures
Interest Rate
Risk | | | Swaps
Interest Rate
Risk | | | Swaps
Credit
Risk | | | Forward
Foreign Currency
Exchange Risk | | | Total | |
| | | $ | (62,852 | ) | | $ | 783,864 | | | $ | 491,563 | | | $ | 2,452,221 | | | $ | 3,664,796 | |
In conjunction with the use of derivative instruments, the Fund is required to maintain collateral in various forms. Depending on the financial instrument utilized and the broker involved, the Fund uses margin deposits at the broker, cash and/or securities segregated at the custodian bank, discount notes or repurchase agreements allocated to the Fund as collateral.
50 | THE GUGGENHEIM FUNDS SEMI-ANNUAL REPORT | |
NOTES TO FINANCIAL STATEMENTS (Unaudited)(continued) |
The Trust has established counterparty credit guidelines and enters into transactions only with financial institutions of investment grade or better. The Trust monitors the counterparty credit risk.
Foreign Investments
There are several risks associated with exposure to foreign currencies, foreign issuers and emerging markets. A fund’s indirect and direct exposure to foreign currencies subjects the Fund to the risk that those currencies will decline in value relative to the U.S. dollar, or in the case of short positions, that the U.S. dollar will decline in value relative to the currency being hedged. Currency rates in foreign countries may fluctuate significantly over short periods of time for a number of reasons, including changes in interest rates and the imposition of currency controls or other political developments in the U.S. or abroad. In addition, the Fund may incur transaction costs in connection with conversions between various currencies. The Fund may, but is not obligated to, engage in currency hedging transactions, which generally involve buying currency forward, options or futures contracts. However, not all currency risks may be effectively hedged, and in some cases the costs of hedging techniques may outweigh expected benefits. In such instances, the value of securities denominated in foreign currencies can change significantly when foreign currencies strengthen or weaken relative to the U.S. dollar.
The Fund may invest in securities of foreign companies directly, or in financial instruments, such as ADRs and exchange-traded funds, which are indirectly linked to the performance of foreign issuers. Foreign markets can be more volatile than the U.S. market due to increased risks of adverse issuer, political, regulatory, market, or economic developments and can perform differently from the U.S. market. Investing in securities of foreign companies directly, or in financial instruments that are indirectly linked to the performance of foreign issuers, may involve risks not typically associated with investing in U.S. issuers. The value of securities denominated in foreign currencies, and of dividends from such securities, can change significantly when foreign currencies strengthen or weaken relative to the U.S. dollar. Foreign securities markets generally have less trading volume and less liquidity than U.S. markets, and prices in some foreign markets may fluctuate more than those of securities traded on U.S. markets. Many foreign countries lack accounting and disclosure standards comparable to those that apply to U.S. companies, and it may be more difficult to obtain reliable information regarding a foreign issuer’s financial condition and operations. Transaction costs and costs associated with custody services are generally higher for foreign securities than they are for U.S. securities. Some foreign governments levy withholding taxes against dividend and interest income. Although in some countries portions of these taxes are recoverable, the non-recovered portion will reduce the income received by the Fund.
Note 3 – Offsetting
In the normal course of business, the Fund enters into transactions subject to enforceable master netting arrangements or other similar arrangements. Generally, the right to offset in those agreements allows the Fund to counteract the exposure to a specific counterparty with collateral
| | THE GUGGENHEIM FUNDS SEMI-ANNUAL REPORT | 51 |
NOTES TO FINANCIAL STATEMENTS (Unaudited)(continued) |
received from or delivered to that counterparty based on the terms of the arrangements. These arrangements provide for the right to liquidate upon the occurrence of an event of default, credit event upon merger or additional termination event.
In order to better define its contractual rights and to secure rights that will help the Fund mitigate its counterparty risk, the Fund may enter into an International Swaps and Derivatives Association, Inc. Master Agreement (“ISDA Master Agreement”) or similar agreement with its derivative contract counterparties. An ISDA Master Agreement is a bilateral agreement between a fund and a counterparty that governs OTC derivatives, including foreign exchange contracts, and typically contains, among other things, collateral posting terms and netting provisions in the event of a default and/or termination event. The provisions of the ISDA Master Agreement typically permit a single net payment in the event of a default (close-out netting) or similar event, including the bankruptcy or insolvency of the counterparty.
For derivatives traded under an ISDA Master Agreement, the collateral requirements are typically calculated by netting the mark-to-market amount for each transaction under such agreement and comparing that amount to the value of any collateral currently pledged by the Fund and the counterparty. For financial reporting purposes, cash collateral that has been pledged to cover obligations of the Fund and cash collateral received from the counterparty, if any, are reported separately on the Statement of Assets and Liabilities as segregated cash with broker/receivable for variation margin, or payable for swap settlement/variation margin. Cash and/or securities pledged or received as collateral by the Fund in connection with an OTC derivative subject to an ISDA Master Agreement generally may not be invested, sold or rehypothecated by the counterparty or the Fund, as applicable, absent an event of default under such agreement, in which case such collateral generally may be applied towards obligations due to and payable by such counterparty or the Fund, as applicable. Generally, the amount of collateral due from or to a counterparty must exceed a minimum transfer amount threshold (e.g., $300,000) before a transfer is required to be made. To the extent amounts due to the Fund from its counterparties are not fully collateralized, contractually or otherwise, the Fund bears the risk of loss from counterparty nonperformance. The Fund attempts to mitigate counterparty risk by only entering into agreements with counterparties that they believe to be of good standing and by monitoring the financial stability of those counterparties.
For financial reporting purposes, the Fund does not offset derivative assets and derivative liabilities that are subject to netting arrangements in the Statement of Assets and Liabilities.
52 | THE GUGGENHEIM FUNDS SEMI-ANNUAL REPORT | |
NOTES TO FINANCIAL STATEMENTS (Unaudited)(continued) |
The following tables present derivative financial instruments and secured financing transactions that are subject to enforceable netting arrangements:
| | | | | | | | | | | | | | | Gross Amounts Not Offset
in the Statement of
Assets and Liabilities | | | | | |
Instrument | | Gross
Amounts of
Recognized
Assets1 | | | Gross
Amounts
Offset in the
Statement of
Assets and
Liabilities | | | Net Amount
of Assets
Presented on
the Statement
of Assets and
Liabilities | | | Financial
Instruments | | | Cash
Collateral
Received | | | Net
Amount | |
Forward foreign currency exchange contracts | | $ | 7,085,411 | | | $ | — | | | $ | 7,085,411 | | | $ | (2,488,005 | ) | | $ | (4,562,940 | ) | | $ | 34,466 | |
Total return swap agreements | | | 1,024 | | | | — | | | | 1,024 | | | | — | | | | — | | | | 1,024 | |
| | | | | | | | | | | | | | | Gross Amounts Not Offset
in the Statement of
Assets and Liabilities | | | | | |
Instrument | | Gross
Amounts of
Recognized
Liabilities1 | | | Gross
Amounts
Offset in the
Statement of
Assets and
Liabilities | | | Net Amount
of Liabilities
Presented on
the Statement
of Assets and
Liabilities | | | Financial
Instruments | | | Cash
Collateral
Pledged | | | Net
Amount | |
Forward foreign currency exchange contracts | | $ | 3,090,898 | | | $ | — | | | $ | 3,090,898 | | | $ | (2,488,005 | ) | | $ | (602,893 | ) | | $ | — | |
1 | Exchange-traded or centrally-cleared derivatives are excluded from these reported amounts. |
| | THE GUGGENHEIM FUNDS SEMI-ANNUAL REPORT | 53 |
NOTES TO FINANCIAL STATEMENTS (Unaudited)(continued) |
The Fund has the right to offset deposits against any related derivative liabilities outstanding with each counterparty with the exception of exchange-traded or centrally-cleared derivatives. The following table presents deposits held by others in connection with derivative investments and repurchase agreements as of March 31, 2020.
Counterparty | Asset Type | | Cash Pledged | | | Cash Received | |
Barclays Bank plc | Forward foreign currency exchange contracts | | $ | — | | | $ | 560,000 | |
BofA Securities, Inc. | Credit default swap agreements | | | 221,015 | | | | 221,015 | |
Bank of America, N.A. | Forward foreign currency exchange contracts | | | — | | | | 255,000 | |
BofA Securities, Inc. | Interest rate swap agreements | | | 126,102 | | | | 2 | |
Citibank, N.A., New York | Forward foreign currency exchange contracts | | | — | | | | 2,780,000 | |
Goldman Sachs International | Forward foreign currency exchange contracts | | | — | | | | 660,000 | |
JPMorgan Chase Bank, N.A. | Forward foreign currency exchange contracts | | | 690,000 | | | | — | |
Morgan Stanley Capital Services LLC | Forward foreign currency exchange contracts | | | — | | | | 980,000 | |
Societe Generale | Repurchase agreements | | | — | | | | 3,847,000 | |
| | | | | 1,037,117 | | | | 9,303,017 | |
Note 4 – Fair Value Measurement
In accordance with U.S. GAAP, fair value is defined as the price that the Fund would receive to sell an investment or pay to transfer a liability in an orderly transaction with an independent buyer in the principal market, or in the absence of a principal market, the most advantageous market for the investment or liability. U.S. GAAP establishes a three-tier fair value hierarchy based on the types of inputs used to value assets and liabilities and requires corresponding disclosure. The hierarchy and the corresponding inputs are summarized below:
Level 1 — | quoted prices in active markets for identical assets or liabilities. |
Level 2 — | significant other observable inputs (for example quoted prices for securities that are similar based on characteristics such as interest rates, prepayment speeds, credit risk, etc.). |
Level 3 — | significant unobservable inputs based on the best information available under the circumstances, to the extent observable inputs are not available, which may include assumptions. |
The types of inputs available depend on a variety of factors, such as the type of security and the characteristics of the markets in which it trades, if any. Fair valuation determinations that rely on fewer or no observable inputs require greater judgment. Accordingly, fair value determinations for Level 3 securities require the greatest amount of judgment.
54 | THE GUGGENHEIM FUNDS SEMI-ANNUAL REPORT | |
NOTES TO FINANCIAL STATEMENTS (Unaudited)(continued) |
Independent pricing services are used to value a majority of the Fund’s investments. When values are not available from a pricing service, they will be determined using a variety of sources and techniques, including: market prices; broker quotes; and models which derive prices based on inputs such as prices of securities with comparable maturities and characteristics or based on inputs such as anticipated cash flows or collateral, spread over U.S. Treasury securities, and other information and analysis. A significant portion of the Fund’s assets and liabilities are categorized as Level 2, as indicated in this report.
Quotes from broker-dealers, adjusted for fluctuations in criteria such as credit spreads and interest rates, may also be used to value the Fund’s assets and liabilities, i.e. prices provided by a broker-dealer or other market participant who has not committed to trade at that price. Although quotes are typically received from established market participants, the Fund may not have the transparency to view the underlying inputs which support the market quotations. Significant changes in a quote would generally result in significant changes in the fair value of the security.
Certain fixed income securities are valued by obtaining a monthly quote from a broker-dealer, adjusted for fluctuations in criteria such as credit spreads and interest rates.
The inputs or methodologies used for valuing securities are not necessarily an indication of the risk associated with investing in those securities. The suitability of the techniques and sources employed to determine fair valuation are regularly monitored and subject to change.
Note 5 – Investment Advisory Agreement and Other Agreements
Under the terms of an investment advisory contract, the Fund pays GI investment advisory fees calculated at an annualized rate of 0.25% of the average daily net assets of the Fund.
GI pays operating expenses on behalf of the Trust, such as audit and accounting related services, legal services, custody, printing and mailing, among others, on a pass-through basis. Such expenses are allocated to various Funds within the complex based on relative net assets.
The Board has adopted a Distribution Plan related to the offering of A-Class shares pursuant to Rule 12b-1 under the 1940 Act. The plan provides for payments at an annual rate of 0.25% of the average daily net assets of the Fund’s A-Class shares.
The investment advisory contract for the Fund provides that the total expenses be limited to a percentage of average net assets for each class of shares, exclusive of brokerage costs, dividends or interest on securities sold short, expenses of other investment companies in which a Fund invests, interest, taxes, litigation, indemnification and extraordinary expenses. The limits are listed below:
| | Limit | | | Effective
Date | | | Contract
End Date | |
Ultra Short Duration Fund - A-Class | | | 0.58 | % | | | 11/30/18 | | | | 02/01/21 | |
Ultra Short Duration Fund - Institutional Class | | | 0.33 | % | | | 11/30/18 | | | | 02/01/21 | |
| | THE GUGGENHEIM FUNDS SEMI-ANNUAL REPORT | 55 |
NOTES TO FINANCIAL STATEMENTS (Unaudited)(continued) |
GI is entitled to reimbursement by the Fund for fees waived or expenses reimbursed during any of the previous 36 months, beginning on the date of the expense limitation agreement, if on any day the estimated operating expenses are less than the indicated percentages. For purposes of this arrangement, GI is entitled to recoupment of previously waived fees or reimbursed expenses for 36 months from the date of the waiver or reimbursement by GI. At March 31, 2020, the amount of fees waived or expenses reimbursed that are subject to recoupment and will expire during the years ended September 30, are presented in the following table:
| | 2020 | | | 2021 | | | 2022 | | | 2023 | | | Total | |
A-Class | | $ | — | | | $ | — | | | $ | 976 | | | $ | 10,371 | | | $ | 11,347 | |
Institutional Class | | | — | | | | — | | | | 12,628 | | | | 46,663 | | | | 59,291 | |
For the period ended March 31, 2020, GI recouped $5,799 from the Fund.
For the period ended March 31, 2020, GFD retained sales charges of $87,029 relating to sales of A-Class shares of the Trust.
Certain trustees and officers of the Trust are also officers of GI and/or GFD. The Trust does not compensate its officers or trustees who are officers, directors and/or employees of GI or GFD.
MUFG Investor Services (US), LLC (“MUIS”) acts as the Fund’s administrator, transfer agent and accounting agent. As administrator, transfer agent and accounting agent, MUIS maintains the books and records of the Fund’s securities and cash. The Bank of New York Mellon Corp. (“BNY”) acts as the Fund’s custodian. As custodian, BNY is responsible for the custody of the Fund’s assets. For providing the aforementioned administrative and accounting services, MUIS is entitled to receive a monthly fee equal to a percentage of the Fund’s average daily net assets and out of pocket expenses. For providing the aforementioned transfer agent and custodian services, MUIS and BNY are entitled to receive a monthly fee based on the number of transactions during the month and the number of accounts under management, subject to certain minimum monthly fees, and out of pocket expenses.
At March 31, 2020, GI and its affiliates owned 60% of the outstanding shares of the Fund.
Note 6 – Federal Income Tax Information
The Fund intends to comply with the provisions of Subchapter M of the Internal Revenue Code applicable to regulated investment companies and will distribute substantially all taxable net investment income and capital gains sufficient to relieve the Fund from all, or substantially all, federal income, excise and state income taxes. Therefore, no provision for federal or state income tax or federal excise tax is required.
Tax positions taken or expected to be taken in the course of preparing the Fund’s tax returns are evaluated to determine whether the tax positions are “more-likely-than-not” of being sustained by the applicable tax authority. Tax positions not deemed to meet the more-likely-than-not threshold would be recorded as a tax benefit or expense in the current year. Management has analyzed the
56 | THE GUGGENHEIM FUNDS SEMI-ANNUAL REPORT | |
NOTES TO FINANCIAL STATEMENTS (Unaudited)(continued) |
Fund’s tax positions taken, or to be taken, on U.S. federal income tax returns for all open tax years, and has concluded that no provision for income tax is required in the Fund’s financial statements. The Fund’s U.S. federal income tax returns are subject to examination by the Internal Revenue Service (“IRS”) for a period of three years after they are filed.
At March 31, 2020, the cost of investments for U.S. federal income tax purposes, the aggregate gross unrealized appreciation for all investments for which there was an excess of value over tax cost, and the aggregate gross unrealized depreciation for all investments for which there was an excess of tax cost over value, were as follows:
| | Tax Cost | | | Tax
Unrealized
Appreciation | | | Tax
Unrealized
Depreciation | | | Net
Unrealized
Depreciation | |
| | | $ | 413,107,468 | | | $ | 7,342,360 | | | $ | (10,894,268 | ) | | $ | (3,551,908 | ) |
Note 7 – Securities Transactions
For the period ended March 31, 2020, the cost of purchases and proceeds from sales of investment securities, excluding government securities, short-term investments and derivatives, were as follows:
| | Purchases | | | Sales | |
| | | $ | 110,963,506 | | | $ | 156,055,671 | |
For the period ended March 31, 2020, the cost of purchases and proceeds from the sales of government securities were as follows:
| | Purchases | | | Sales | |
| | | $ | — | | | $ | 13,231,664 | |
The Fund is permitted to purchase or sell securities from or to certain affiliated funds under specified conditions outlined in procedures adopted by the Board. The procedures have been designed to ensure that any purchase or sale of securities by the Fund from or to another fund or portfolio that is or could be considered an affiliate by virtue of having a common investment adviser (or affiliated investment advisers), common trustees and/or common officers complies with Rule 17a-7 of the 1940 Act. Further, as defined under these procedures, each transaction is effected at the current market price to save costs, where permissible. For the period ended March 31, 2020, the Fund engaged in purchases and sales of securities, pursuant to Rule 17a-7 of the 1940 Act, as follows:
| | Purchases | | | Sales | | | Realized
Gain (Loss) | |
| | | $ | 2,020,840 | | | $ | — | | | $ | — | |
| | THE GUGGENHEIM FUNDS SEMI-ANNUAL REPORT | 57 |
NOTES TO FINANCIAL STATEMENTS (Unaudited)(continued) |
Note 8 – Line of Credit
The Trust, along with other affiliated trusts, secured a 364-day committed, $1,205,000,000 line of credit from Citibank, N.A., which was in place through October 4, 2019, at which time the line of credit was renewed with an increased commitment amount of $1,230,000,000. A Fund may draw (borrow) from the line of credit as a temporary measure for emergency purposes, to facilitate redemption requests, or for other short-term liquidity purposes consistent with the Fund’s investment objective and program. For example, it may be advantageous for the Fund to borrow money rather than sell existing portfolio positions to meet redemption requests. Fees related to borrowings, if any, vary under this arrangement between the greater of Citibank’s “base rate”, LIBOR plus 1%, or the federal funds rate plus 1/2 of 1%.
The commitment fee that may be paid by the Fund is at an annualized rate of 0.15% of the average daily amount of its allocated unused commitment amount. The allocated commitment fee amount for the Fund is referenced in the Statement of Operations under “Line of credit fees”. The Fund did not have any borrowings under this agreement as of and for the period ended March 31, 2020.
Note 9 – Recent Accounting Pronouncements
In March 2017, the Financial Accounting Standards Board issued an Accounting Standards Update, ASU 2017-08, Receivables – Nonrefundable Fees and Other Costs (Subtopic 310-20), Premium Amortization on Purchased Callable Debt Securities (the “2017 ASU”) which amends the amortization period for certain purchased callable debt securities held at a premium, shortening such period to the earliest call date. The 2017 ASU does not require any accounting change for debt securities held at a discount; the discount continues to be amortized to maturity.
As of October 1, 2019, the Fund has fully adopted the provisions of the 2017 ASU which were applied through a modified retrospective transition approach, as prescribed. The adoption resulted in a cumulative effect adjustment to reduce amortized cost and increase unrealized appreciation of investments for the Fund in the amount of $29,759.
The adoption had no impact on total distributable earnings (loss), net assets, the current period results from operations, or any prior period information presented in the financial statements.
Note 10 – Merger
On November 14, 2018, the Board approved the reorganization of Guggenheim Strategy Fund I with and into the Guggenheim Ultra Short Duration Fund, a newly organized series of Guggenheim Funds Trust. The reorganization of Guggenheim Strategy Fund I took place on November 30, 2018. For financial reporting purposes, Guggenheim Strategy Fund I is the accounting survivor in the reorganization and, as such, its financial and performance history prior to the reorganization has been carried forward and reflected in Guggenheim Ultra Short Duration Fund’s financial statements and financial highlights. In conjunction with the reorganization, shareholders of Guggenheim Strategy Fund I received Institutional Class shares of Guggenheim Ultra Short Duration Fund at a ratio of 2.501601322 shares for every 1 share of Guggenheim
58 | THE GUGGENHEIM FUNDS SEMI-ANNUAL REPORT | |
NOTES TO FINANCIAL STATEMENTS (Unaudited)(concluded) |
Strategy Fund I. The effect of this reorganization resulted in an increase in the number of shares outstanding and a corresponding decrease in the net asset value per share. The capital share activity in the Statements of Changes in Net Assets for the year ended September 30, 2018 and the period October 1, 2018 to November 30, 2018, and the per share data in the Financial Highlights for the years ended September 30, 2015 through September 30, 2018 and the period October 1, 2018 to November 30, 2018 have been given retroactive effect to reflect the ratio of shares issued in the reorganization. There were no changes in net assets, results of operations or total return as a result of these transactions.
Note 11 – COVID-19 and Recent Developments
The global ongoing crisis caused by the outbreak of COVID-19 is causing materially reduced consumer demand and economic output, disrupting supply chains, resulting in market closures, travel restrictions and quarantines, and adversely impacting local and global economies. Investors should be aware that in light of the current uncertainty, volatility and distress in economies, financial markets, and labor and health conditions all over the world, the Fund’s investments and a shareholder’s investment in the Fund are subject to sudden and substantial losses, increased volatility and other adverse events. Firms through which investors invest with the Fund, the Fund, its service providers, the markets in which it invests and market intermediaries are also impacted by quarantines and similar measures intended to contain the ongoing pandemic, which can obstruct their functioning and subject them to heightened operational risks.
Note 12 – Subsequent Events
The Fund evaluated subsequent events through the date the financial statements were available for issue and determined there were no material events that would require adjustment to or disclosure in the Fund’s financial statements.
| | THE GUGGENHEIM FUNDS SEMI-ANNUAL REPORT | 59 |
OTHER INFORMATION (Unaudited) |
Proxy Voting Information
A description of the policies and procedures that the Trust uses to determine how to vote proxies relating to securities held in the Fund’s portfolios is available, without charge and upon request, by calling 800.820.0888. This information is also available from the EDGAR database on the SEC’s website at https://www.sec.gov.
Information regarding how the Fund voted proxies relating to portfolio securities during the most recent 12-month period ended June 30 is available without charge, upon request, by calling 800.820.0888. This information is also available from the EDGAR database on the SEC’s website at https://www.sec.gov.
Sector Classification
Information in the Schedule of Investments is categorized by sectors using sector-level Classifications defined by the Bloomberg Industry Classification System, a widely recognized industry classification system provider. The Fund’s registration statement has investment policies relating to concentration in specific sectors/industries. For purposes of these investment policies, the Fund usually classifies sectors/industries based on industry-level Classifications used by widely recognized industry classification system providers such as Bloomberg Industry Classification System, Global Industry Classification Standards and Barclays Global Classification Scheme.
Quarterly Portfolio Schedules Information
The Trust files its complete schedule of portfolio holdings with the SEC for the first and third quarters of each fiscal year as an exhibit to its reports on Form N-PORT, and for reporting periods ended prior to March 31, 2019, filed such information on Form N-Q. The Fund’s Forms N-PORT and N-Q are available on the SEC’s website at https://www.sec.gov. The Fund’s Forms N-PORT and N-Q may be reviewed and copied at the SEC’s Public Reference Room in Washington, DC, and that information on the operation of the Public Reference Room may be obtained by calling 800-SEC-0330. Copies of the portfolio holdings are also available to shareholders, without charge and upon request, by calling 800.820.0888.
60 | THE GUGGENHEIM FUNDS SEMI-ANNUAL REPORT | |
INFORMATION ON BOARD OF TRUSTEES AND OFFICERS (Unaudited) |
A Board of Trustees oversees the Trust, as well as other trusts of GI, in which its members have no stated term of service, and continue to serve after election until resignation. The Statement of Additional Information includes further information about Fund Trustees and Officers, and can be obtained without charge by visiting guggenheiminvestments.com or by calling 800.820.0888.
Name, Address*
and Year of Birth | Position(s)
Held with
Trust | Term of Office
and Length of
Time Served** | Principal Occupation(s)
During Past Five Years | Number of
Portfolios
in Fund
Complex
Overseen | Other Directorships
Held by Trustees*** |
INDEPENDENT TRUSTEES | | | |
Randall C. Barnes (1951) | Trustee | Since 2014 | Current: Private Investor (2001-present). Former: Senior Vice President and Treasurer, PepsiCo, Inc. (1993-1997); President, Pizza Hut International (1991-1993); Senior Vice President, Strategic Planning and New Business Development, PepsiCo, Inc. (1987-1990). | 157 | Current: Purpose Investments Funds (2013-present). Former: Managed Duration Investment Grade Municipal Fund (2006-2016). |
Angela Brock-Kyle (1959) | Trustee | Since 2019 | Current: Founder and Chief Executive Officer, B.O.A.R.D.S. (2013-present). Former: Senior Leader, TIAA (1987-2012). | 156 | Current: Hunt Companies, Inc. (2019-present). Former: Infinity Property & Casualty Corp. (2014-2018). |
Donald A. Chubb, Jr. (1946) | Trustee and Chair of the Valuation Oversight Committee | Since 1994 | Current: Retired Former: Business broker and manager of commercial real estate, Griffith & Blair, Inc. (1997-2017). | 156 | Former: Midland Care, Inc. (2011-2016). |
| | THE GUGGENHEIM FUNDS SEMI-ANNUAL REPORT | 61 |
INFORMATION ON BOARD OF TRUSTEES AND OFFICERS (Unaudited)(continued) |
Name, Address*
and Year of Birth | Position(s)
Held with
Trust | Term of Office
and Length of
Time Served** | Principal Occupation(s)
During Past Five Years | Number of
Portfolios
in Fund
Complex
Overseen | Other Directorships
Held by Trustees*** |
INDEPENDENT TRUSTEES - continued | | |
Jerry B. Farley (1946) | Trustee and Chair of the Audit Committee | Since 2005 | Current: President, Washburn University (1997-present). | 156 | Current: CoreFirst Bank & Trust (2000-present). Former: Westar Energy, Inc. (2004-2018). |
Roman Friedrich III (1946) | Trustee and Chair of the Contracts Review Committee | Since 2014 | Current: Founder and Managing Partner, Roman Friedrich & Company (1998-present). | 156 | Former: Zincore Metals, Inc. (2009-2019). |
Thomas F. Lydon, Jr. (1960) | Trustee and Vice Chair of the Contracts Review Committee | Since 2019 | Current: President, Global Trends Investments (1996-present); Co-Chief Executive Officer, ETF Flows, LLC (2019-present); Chief Executive Officer, Lydon Media (2016-present). | 156 | Current: US Global Investors (GROW) (1995-present). Former: Harvest Volatility Edge Trust (3) (2017-2019). |
Ronald A. Nyberg (1953) | Trustee and Chair of the Nominating and Governance Committee | Since 2014 | Current: Partner, Momkus LLC (2016-present). Former: Partner, Nyberg & Cassioppi, LLC (2000-2016); Executive Vice President, General Counsel, and Corporate Secretary, Van Kampen Investments (1982-1999). | 157 | Current: PPM Funds (9) (2018 - present); Edward-Elmhurst Healthcare System (2012-present). Former: Western Asset Inflation-Linked Opportunities & Income Fund (2004-April 2020); Western Asset Inflation-Linked Income Fund (2003-April 2020); Managed Duration Investment Grade Municipal Fund (2003-2016). |
62 | THE GUGGENHEIM FUNDS SEMI-ANNUAL REPORT | |
INFORMATION ON BOARD OF TRUSTEES AND OFFICERS (Unaudited)(continued) |
Name, Address*
and Year of Birth | Position(s)
Held with
Trust | Term of Office
and Length of
Time Served** | Principal Occupation(s)
During Past Five Years | Number of
Portfolios
in Fund
Complex
Overseen | Other Directorships
Held by Trustees*** |
INDEPENDENT TRUSTEES - concluded | | |
Sandra G. Sponem (1958) | Trustee | Since 2019 | Current: Retired. Former: Senior Vice President and Chief Financial Officer, M.A. Mortenson-Companies, Inc. (2007-2017). | 156 | Current: SPDR Series Trust (78) (2018-present); SPDR Index Shares Funds (31) (2018-present); SSGA Active Trust (12) (2018-present); and SSGA Master Trust (1) (2018-present). |
Ronald E. Toupin, Jr. (1958) | Trustee, Chair of the Board and Chair of the Executive Committee | Since 2014 | Current: Portfolio Consultant (2010-present); Member, Governing Council, Independent Directors Council (2013-present); Governor, Board of Governors, Investment Company Institute (2018-present). Former: Member, Executive Committee, Independent Directors Council (2016-2018); Vice President, Manager and Portfolio Manager, Nuveen Asset Management (1998-1999); Vice President, Nuveen Investment Advisory Corp. (1992-1999); Vice President and Manager, Nuveen Unit Investment Trusts (1991-1999); and Assistant Vice President and Portfolio Manager, Nuveen Unit Investment Trusts (1988-1999), each of John Nuveen & Co., Inc. (1982-1999). | 156 | Former: Western Asset Inflation-Linked Opportunities & Income Fund (2004-April 2020); Western Asset Inflation-Linked Income Fund (2003-April 2020); Managed Duration Investment Grade Municipal Fund (2003-2016). |
| | THE GUGGENHEIM FUNDS SEMI-ANNUAL REPORT | 63 |
INFORMATION ON BOARD OF TRUSTEES AND OFFICERS (Unaudited)(continued) |
Name, Address*
and Year of Birth | Position(s)
Held with
Trust | Term of Office
and Length of
Time Served** | Principal Occupation(s)
During Past Five Years | Number of
Portfolios
in Fund
Complex
Overseen | Other Directorships
Held by Trustees*** |
INTERESTED TRUSTEE | |
Amy J. Lee**** (1961) | Trustee, Vice President and Chief Legal Officer | Since 2018 (Trustee) Since 2014 (Chief Legal Officer) Since 2007 (Vice President) | Current: Interested Trustee, certain other funds in the Fund Complex (2018-present); Chief Legal Officer, certain other funds in the Fund Complex (2014-present); Vice President, certain other funds in the Fund Complex (2007-present); Senior Managing Director, Guggenheim Investments (2012-present). Former: President and Chief Executive Officer, certain other funds in the Fund Complex (2017-2019); Vice President, Associate General Counsel and Assistant Secretary, Security Benefit Life Insurance Company and Security Benefit Corporation (2004-2012). | 156 | None. |
* | The business address of each Trustee is c/o Guggenheim Investments, 227 West Monroe Street, Chicago, Illinois 60606. |
** | Each Trustee serves an indefinite term, until his or her successor is elected and qualified. Time served includes time served in the respective position for the Predecessor Corporation. |
*** | Each Trustee also serves on the boards of trustees of Guggenheim Funds Trust, Guggenheim Variable Funds Trust, Guggenheim Strategy Funds Trust, Fiduciary/Claymore Energy Infrastructure Fund, Guggenheim Taxable Municipal Managed Duration Trust, Guggenheim Strategic Opportunities Fund, Guggenheim Enhanced Equity Income Fund, Guggenheim Energy & Income Fund, Guggenheim Credit Allocation Fund, Rydex Series Funds, Rydex Dynamic Funds, Rydex Variable Funds and Transparent Value Trust. Messrs. Barnes and Nyberg also serve on the board of trustees of Advent Convertible & Income Fund. |
**** | This Trustee is deemed to be an “interested person” of the Fund under the 1940 Act by reason of her position with the Fund’s Investment Manager and/or the parent of the Investment Manager. |
64 | THE GUGGENHEIM FUNDS SEMI-ANNUAL REPORT | |
INFORMATION ON BOARD OF TRUSTEES AND OFFICERS (Unaudited)(continued) |
Name, Address*
and Year of Birth | Position(s)
Held with
Trust | Term of Office
and Length of
Time Served** | Principal Occupation(s)
During Past Five Years |
OFFICERS | | | |
Brian E. Binder (1972) | President and Chief Executive Officer | Since 2018 | Current: President and Chief Executive Officer, certain other funds in the Fund Complex (2018-present); President, Chief Executive Officer and Chairman of the Board of Managers, Guggenheim Funds Investment Advisors, LLC (2018-present); President and Chief Executive Officer, Security Investors, LLC (2018-present); Board Member of Guggenheim Partners Fund Management (Europe) Limited (2018-present); Senior Managing Director and Chief Administrative Officer, Guggenheim Investments (2018-present). Former: Managing Director and President, Deutsche Funds, and Head of US Product, Trading and Fund Administration, Deutsche Asset Management (2013-2018); Managing Director, Head of Business Management and Consulting, Invesco Ltd. (2010-2012). |
James M. Howley (1972) | Assistant Treasurer | Since 2014 | Current: Managing Director, Guggenheim Investments (2004-present); Assistant Treasurer, certain other funds in the Fund Complex (2006-present). Former: Manager, Mutual Fund Administration of Van Kampen Investments, Inc. (1996-2004). |
Mark E. Mathiasen (1978) | Secretary | Since 2014 | Current: Secretary, certain other funds in the Fund Complex (2007-present); Managing Director, Guggenheim Investments (2007-present). |
Glenn McWhinnie (1969) | Assistant Treasurer | Since 2016 | Current: Vice President, Guggenheim Investments (2009-present); Assistant Treasurer, certain other funds in the Fund Complex (2016-present). |
Michael P. Megaris (1984) | Assistant Secretary | Since 2014 | Current: Assistant Secretary, certain other funds in the Fund Complex (2014-present); Director, Guggenheim Investments (2012-present). |
| | THE GUGGENHEIM FUNDS SEMI-ANNUAL REPORT | 65 |
INFORMATION ON BOARD OF TRUSTEES AND OFFICERS (Unaudited)(continued) |
Name, Address*
and Year of Birth | Position(s)
Held with
Trust | Term of Office
and Length of
Time Served** | Principal Occupation(s)
During Past Five Years |
OFFICERS - continued | |
Elisabeth Miller (1968) | Chief Compliance Officer | Since 2012 | Current: Chief Compliance Officer, certain other funds in the Fund Complex (2012-present); Senior Managing Director, Guggenheim Investments (2012-present). Vice President, Guggenheim Funds Distributors, LLC (2014-present). Former: Chief Compliance Officer, Security Investors, LLC and Guggenheim Funds Investment Advisors, LLC (2012-2018); Chief Compliance Officer, Guggenheim Distributors, LLC (2009-2014); Senior Manager, Security Investors, LLC (2004-2014); Senior Manager, Guggenheim Distributors, LLC (2004-2014). |
Margaux Misantone (1978) | AML Officer | Since 2017 | Current: Chief Compliance Officer, Security Investors, LLC and Guggenheim Funds Investment Advisors, LLC (2018-present); AML Officer, Security Investors, LLC and certain other funds in the Fund Complex (2017-present); Managing Director, Guggenheim Investments (2015-present). Former: Assistant Chief Compliance Officer, Security Investors, LLC and Guggenheim Funds Investments Advisors, LLC (2015-2018). |
William Rehder (1967) | Assistant Vice President | Since 2018 | Current: Managing Director, Guggenheim Investments (2002-present). |
Kimberly J. Scott (1974) | Assistant Treasurer | Since 2014 | Current: Director, Guggenheim Investments (2012-present); Assistant Treasurer, certain other funds in the Fund Complex (2012-present). Former: Financial Reporting Manager, Invesco, Ltd. (2010-2011); Vice President/Assistant Treasurer, Mutual Fund Administration for Van Kampen Investments, Inc./Morgan Stanley Investment Management (2009-2010); Manager of Mutual Fund Administration, Van Kampen Investments, Inc./Morgan Stanley Investment Management (2005-2009). |
Bryan Stone (1979) | Vice President | Since 2014 | Current: Vice President, certain other funds in the Fund Complex (2014-present); Managing Director, Guggenheim Investments (2013-present). Former: Senior Vice President, Neuberger Berman Group LLC (2009-2013); Vice President, Morgan Stanley (2002-2009). |
66 | THE GUGGENHEIM FUNDS SEMI-ANNUAL REPORT | |
INFORMATION ON BOARD OF TRUSTEES AND OFFICERS (Unaudited)(concluded) |
Name, Address*
and Year of Birth | Position(s)
Held with
Trust | Term of Office
and Length of
Time Served** | Principal Occupation(s)
During Past Five Years |
OFFICERS - concluded | |
John L. Sullivan (1955) | Chief Financial Officer, Chief Accounting Officer and Treasurer | Since 2014 | Current: Chief Financial Officer, Chief Accounting Officer and Treasurer, certain other funds in the Fund Complex (2010-present); Senior Managing Director, Guggenheim Investments (2010-present). Former: Managing Director and Chief Compliance Officer, each of the funds in the Van Kampen Investments fund complex (2004-2010); Managing Director and Head of Fund Accounting and Administration, Morgan Stanley Investment Management (2002-2004); Chief Financial Officer and Treasurer, Van Kampen Funds (1996-2004). |
Jon Szafran (1989) | Assistant Treasurer | Since 2017 | Current: Vice President, Guggenheim Investments (2017-present); Assistant Treasurer, certain other funds in the Fund Complex (2017-present). Former: Assistant Treasurer of Henderson Global Funds and Manager of US Fund Administration, Henderson Global Investors (North America) Inc. (“HGINA”), (2017); Senior Analyst of US Fund Administration, HGINA (2014–2017); Senior Associate of Fund Administration, Cortland Capital Market Services, LLC (2013-2014); Experienced Associate, PricewaterhouseCoopers LLP (2012-2013). |
* | The business address of each officer is c/o Guggenheim Investments, 227 West Monroe Street, Chicago, Illinois 60606. |
** | Each officer serves an indefinite term, until his or her successor is duly elected and qualified. |
| | THE GUGGENHEIM FUNDS SEMI-ANNUAL REPORT | 67 |
GUGGENHEIM INVESTMENTS PRIVACY NOTICE (Unaudited) |
Who We Are
This Privacy Notice describes the data protection practices of Guggenheim Investments. Guggenheim Investments as used herein refers to the affiliated investment management businesses of Guggenheim Partners, LLC: Guggenheim Funds Investment Advisors, LLC, Guggenheim Partners Investment Management, LLC, Guggenheim Funds Distributors, LLC, Security Investors, LLC, Guggenheim Investment Advisors (Europe) Limited, Guggenheim Real Estate, LLC, GS Gamma Advisors, LLC, Guggenheim Partners India Management, LLC, Guggenheim Partners Europe Limited, as well as the funds in the Guggenheim Funds complex (the “Funds”) (“Guggenheim Investments,” “we,” “us,” or “our”).
Guggenheim Partners Investment Management Holdings, LLC, located at 330 Madison Avenue, New York, New York 10017 is the data controller for your information. The affiliates who are also controllers of certain of your information are: Guggenheim Investment Advisors (Europe) Limited, Guggenheim Partners Europe Limited, Guggenheim Partners, LLC, Guggenheim Funds Investment Advisors, LLC, Guggenheim Partners Investment Management, LLC, Guggenheim Funds Distributors, LLC and Security Investors, LLC, as well as the Funds.
Our Commitment to You
Guggenheim Investments considers your privacy our utmost concern. When you become our client or investor, you entrust us with not only your hard-earned money but also with your personal and financial information. Because we have access to your private information, we hold ourselves to the highest standards in its safekeeping and use. We strictly limit how we share your information with others, whether you are a current or former Guggenheim Investments client or investor.
The Information We Collect About You
We collect certain nonpublic personal information about you from information you provide on applications, other forms, our website, and/or from third parties including investment advisors. This information includes Social Security or other tax identification number, assets, income, tax information, retirement and estate plan information, transaction history, account balance, payment history, bank account information, marital status, family relationships, information that we collect on our website through the use of “cookies,” and other personal information that you or others provide to us. We may also collect such information through your inquiries by mail, e-mail or telephone. We may also collect customer due diligence information, as required by applicable law and regulation, through third party service providers.
How We Handle Your Personal Information
The legal basis for using your information as set out in this Privacy Notice is as follows: (a) use of your personal data is necessary to perform our obligations under any contract with you (such as a contract for us to provide financial services to you); or (b) where use of your personal data is not necessary for performance of a contract, use of your personal data is necessary for our
68 | THE GUGGENHEIM FUNDS SEMI-ANNUAL REPORT | |
GUGGENHEIM INVESTMENTS PRIVACY NOTICE (Unaudited)(continued) |
legitimate interests or the legitimate interests of others (for example, to enforce the legal terms governing our services, operate and market our website and other services we offer, ensure safe environments for our personnel and others, make and receive payments, prevent fraud and to know the customer to whom we are providing the services). Some processing is done to comply with applicable law.
In addition to the specific uses described above, we also use your information in the following manner:
| | ● | We use your information in connection with servicing your accounts. |
| | ● | We use information to respond to your requests or questions. For example, we might use your information to respond to your customer feedback. |
| | ● | We use information to improve our products and services. We may use your information to make our website and products better. We may use your information to customize your experience with us. |
| | ● | We use information for security purposes. We may use your information to protect our company and our customers. |
| | ● | We use information to communicate with you. For example, we will communicate with you about your account or our relationship. We may contact you about your feedback. We might also contact you about this Privacy Notice. We may also enroll you in our email newsletter. |
| | ● | We use information as otherwise permitted by law, as we may notify you. |
| | ● | Aggregate/Anonymous Data. We may aggregate and/or anonymize any information collected through the website so that such information can no longer be linked to you or your device (“Aggregate/Anonymous Information”). We may use Aggregate/Anonymous Information for any purpose, including without limitation for research and marketing purposes, and may also share such data with any third parties, including advertisers, promotional partners, and sponsors. |
We do not sell information about current or former clients or their accounts to third parties. Nor do we share this information, except when necessary to complete transactions at your request, to make you aware of investment products and services that we or our affiliates offer, or as permitted or required by law.
We provide information about you to companies and individuals not affiliated with Guggenheim Investments to complete certain transactions or account changes, or to perform services for us related to your account. For example, if you ask to transfer assets from another financial institution to Guggenheim Investments, we must provide certain information about you to that company to complete the transaction. We provide the third party with only the information necessary to carry out its responsibilities and only for that purpose. And we require these third
| | THE GUGGENHEIM FUNDS SEMI-ANNUAL REPORT | 69 |
GUGGENHEIM INVESTMENTS PRIVACY NOTICE (Unaudited)(continued) |
parties to treat your private information with the same high degree of confidentiality that we do. To alert you to other Guggenheim Investments products and services, we share your information within our family of affiliated companies. You may limit our sharing with affiliated companies as set out below. We may also share information with any successor to all or part of our business, or in connection with steps leading up to a merger or acquisition. For example, if part of our business was sold we may give customer information as part of that transaction. We may also share information about you with your consent.
We will release information about you if you direct us to do so, if we are compelled by law to do so, or in other circumstances as permitted by law (for example, to protect your account from fraud).
If you close your account(s) or become an inactive client or investor, we will continue to adhere to the privacy policies and practices described in this notice.
Opt-Out Provisions and Your Data Choices
The law allows you to “opt out” of certain kinds of information sharing with third parties. We do not share personal information about you with any third parties that triggers this opt-out right. This means YOU ARE ALREADY OPTED OUT.
When you are no longer our client or investor, we continue to share your information as described in this notice, and you may contact us at any time to limit our sharing by sending an email to CorporateDataPrivacy@GuggenheimPartners.com.
European Union Data Subjects and certain others: In addition to the choices set forth above, residents of the European Union and certain other jurisdictions have certain rights to (1) request access to or rectification or deletion of information we collect about them, (2) request a restriction on the processing of their information, (3) object to the processing of their information, or (4) request the portability of certain information. To exercise these or other rights, please contact us using the contact information below. We will consider all requests and provide our response within the time period stated by applicable law. Please note, however, that certain information may be exempt from such requests in some circumstances, which may include if we need to keep processing your information for our legitimate interests or to comply with a legal obligation. We may request you provide us with information necessary to confirm your identity before responding to your request.
Residents of France and certain other jurisdictions may also provide us with instructions regarding the manner in which we may continue to store, erase and share your information after your death, and where applicable, the person you have designated to exercise these rights after your death.
70 | THE GUGGENHEIM FUNDS SEMI-ANNUAL REPORT | |
GUGGENHEIM INVESTMENTS PRIVACY NOTICE (Unaudited)(continued) |
How We Protect Privacy Online
We take steps to protect your privacy when you use our web site – www.guggenheiminvestments.com – by using secure forms of online communication, including encryption technology, Secure Socket Layer (SSL) protocol, firewalls and user names and passwords. These safeguards vary based on the sensitivity of the information that we collect and store. However, we cannot and do not guarantee that these measures will prevent every unauthorized attempt to access, use, or disclose your information since despite our efforts, no Internet and/or other electronic transmissions can be completely secure. Our web site uses “http cookies”—tiny pieces of information that we ask your browser to store. We use cookies for session management and security features on the Guggenheim Investments web site. We do not use them to pull data from your hard drive, to learn your e-mail address, or to view data in cookies created by other web sites. We will not share the information in our cookies or give others access to it. See the legal information area on our web site for more details about web site security and privacy features.
How We Safeguard Your Personal Information and Data Retention
We restrict access to nonpublic personal information about you to our employees and in some cases to third parties (for example, the service providers described above) as permitted by law. We maintain strict physical, electronic and procedural safeguards that comply with federal standards to guard your nonpublic personal information.
We keep your information for no longer than necessary for the purposes for which it is processed. The length of time for which we retain information depends on the purposes for which we collected and use it and/or as required to comply with applicable laws. Information may persist in copies made for backup and business continuity purposes for additional time.
International Visitors
If you are not a resident of the United States, please be aware that your information may be transferred to, stored and processed in the United States where our servers are located and our databases are operated. The data protection and other laws of the United States and other countries might not be as comprehensive as those in your country.
In such cases, we ensure that a legal basis for such a transfer exists and that adequate protection is provided as required by applicable law, for example, by using standard contractual clauses or by transferring your data to a jurisdiction that has obtained an adequacy finding. Individuals whose data may be transferred on the basis of standard contractual clauses may contact us as described below.
We’ll Keep You Informed
If you have any questions or concerns about how we treat your personal data, we encourage you to consult with us first. You may also contact the relevant supervisory authority.
| | THE GUGGENHEIM FUNDS SEMI-ANNUAL REPORT | 71 |
GUGGENHEIM INVESTMENTS PRIVACY NOTICE (Unaudited)(concluded) |
We reserve the right to modify this policy at any time and will inform you promptly of material changes. You may access our privacy policy from our web site at www.guggenheiminvestments.com. Should you have any questions regarding our privacy policy, contact us by email at CorporateDataPrivacy@GuggenheimPartners.com.
72 | THE GUGGENHEIM FUNDS SEMI-ANNUAL REPORT | |
This page intentionally left blank.
3.31.2020
Guggenheim Funds Semi-Annual Report
| |
Guggenheim Limited Duration Fund | | |
Beginning on January 1, 2021, paper copies of the Fund’s annual and semi-annual shareholder reports may no longer be sent by mail, unless you specifically request paper copies of the reports from a Fund or from your financial intermediary. Instead, the reports will be made available on a website, and you will be notified by mail each time a report is posted and provided with a website link to access the report.
If you already elected to receive shareholder reports electronically, you will not be affected by this change and you need not take any action. At any time, you may elect to receive reports and other communications from a Fund electronically by calling 800.820.0888, going to GuggenheimInvestments.com/myaccount, or by contacting your financial intermediary.
You may elect to receive all future shareholder reports in paper free of charge. If you hold shares of a Fund directly, you can inform the Fund that you wish to receive paper copies of reports by calling 800.820.0888. If you hold shares of a Fund through a financial intermediary, please contact the financial intermediary to make this election. Your election to receive reports in paper will apply to all Guggenheim Funds in which you are invested and may apply to all funds held with your financial intermediary.
GuggenheimInvestments.com | LD-SEMI-0320x0920 |

| | |
DEAR SHAREHOLDER | 2 |
ECONOMIC AND MARKET OVERVIEW | 4 |
ABOUT SHAREHOLDERS’ FUND EXPENSES | 6 |
LIMITED DURATION FUND | 8 |
NOTES TO FINANCIAL STATEMENTS | 35 |
OTHER INFORMATION | 50 |
INFORMATION ON BOARD OF TRUSTEES AND OFFICERS | 51 |
GUGGENHEIM INVESTMENTS PRIVACY NOTICE | 56 |
| | THE GUGGENHEIM FUNDS SEMI-ANNUAL REPORT | 1 |
Dear Shareholder:
The six-month period ended March 31, 2020, concluded on a somber note. Even though markets performed well for most of the period, the emergence of a novel and highly contagious form of coronavirus in the last weeks of the period adversely impacted global commercial activity and contributed to significant volatility in certain markets, unseen since the great recession of 2008.
As it spread beyond Asia to virtually every country in the world, many governments and businesses instituted quarantines and closures, which has resulted in significant disruption in manufacturing, supply chains, consumer demand and economic activity. The U.S. Federal Reserve responded quickly to provide liquidity in order to ensure that the U.S. markets continued to function efficiently. The fiscal policy included a spending bill worth over $2 trillion to assist consumers, states, small businesses and certain industries. While these actions helped stabilize the market, volatile conditions continued into April.
As discussed in this semi-annual shareholder report, these events have affected performance for the Limited Duration Fund. We encourage you to read the Economic and Market Overview section of the report, which follows this letter.
Guggenheim Partners Investment Management, LLC (“GPIM” or the “Investment Adviser”), serves as the investment adviser to the Fund. The Adviser is an affiliate of Guggenheim Partners, LLC (“Guggenheim”), a global, diversified financial services firm. Guggenheim Funds Distributors, LLC serves as the distributor to the Fund and is also an affiliate of Guggenheim.
Together, we are committed to the safety and prosperity of our clients, our employees, and our shareholders. The resources of the firm are being made fully available not only to support our clients, but also to support our employees and their families.
Please practice the appropriate prudence for the protection not only of your health and that of your friends and loved ones but also for our neighbors and communities. Thank you for the trust you place in us.
Sincerely,
Guggenheim Partners Investment Management, LLC
April 30, 2020
Read a prospectus and summary prospectus (if available) carefully before investing. It contains the investment objectives, risks, charges, expenses and other information, which should be considered carefully before investing. Obtain a prospectus and summary prospectus (if available) at guggenheiminvestments.com or call 800.820.0888.
This material is not intended as a recommendation or as investment advice of any kind, including in connection with rollovers, transfers, and distributions. Such material is not provided in a fiduciary capacity, may not be relied upon for or in connection with the making of investment decisions, and does not constitute a solicitation of an offer to buy or sell securities. All content has been provided for informational or educational purposes only and is not intended to be and should not be construed as legal or tax advice and/or a legal opinion. Always consult a financial, tax and/or legal professional regarding your specific situation.
The global ongoing crisis caused by the outbreak of COVID-19 is causing materially reduced consumer demand and economic output, disrupting supply chains, resulting in market closures, travel restrictions and quarantines, and adversely impacting local and global economies. Investors should be aware that in light of the current uncertainty, volatility and distress in economies, financial markets, and labor and health conditions all over the world, the Fund’s investments and a shareholder’s investment in the Fund are subject to sudden and substantial losses, increased volatility and other adverse events. Firms through which investors invest with the Fund, the Fund, its service providers, the markets in which it invests and market intermediaries are also impacted by quarantines and similar measures intended to contain the ongoing pandemic, which can obstruct their functioning and subject them to heightened operational risks.
2 | THE GUGGENHEIM FUNDS SEMI-ANNUAL REPORT | |
Limited Duration Fund may not be suitable for all investors. ● The Fund’s market value will change in response to interest rate changes and market conditions among other factors. In general, bond prices rise when interest rates fall and vice versa. ● The Fund’s exposure to high yield securities may subject the Fund to greater volatility. ● When market conditions are deemed appropriate, the Fund may use leverage to the full extent permitted by its investment policies and restrictions and applicable law. Leveraging will exaggerate the effect on net asset value of any increase or decrease in the market value of the Fund’s portfolio. ● The Fund may invest in derivative instruments, which may be more volatile and less liquid, increasing the risk of loss when compared to traditional securities. Certain of the derivative instruments are also subject to the risks of counterparty default and adverse tax treatment. ● Instruments and strategies (such as borrowing transactions and reverse repurchase agreements) may provide leveraged exposure to a particular investment, which will magnify any gains or losses on those investments. ● Investments in reverse repurchase agreements expose the Fund to the many of the same risks as investments in derivatives. ● The Fund’s investments in other investment vehicles subject the Fund to those risks and expenses affecting the investment vehicle. ● The Fund’s investments in foreign securities carry additional risks when compared to U.S. securities, due to the impact of diplomatic, political or economic developments in the country in question (investments in emerging markets securities are generally subject to an even greater level of risks). ● Investments in syndicated bank loans generally offer a floating interest rate and involve special types of risks. ● The Fund’s investments in municipal securities can be affected by events that affect the municipal bond market. ● The Fund’s investments in real estate securities subject the Fund to the same risks as direct investments in real estate, which is particularly sensitive to economic downturns. ● The Fund’s investments in restricted securities may involve financial and liquidity risk. ● You may have a gain or loss when you sell your shares. ● It is important to note that the Fund is not guaranteed by the U.S. government. ● Please read the prospectus for more detailed information regarding these and other risks.
| | THE GUGGENHEIM FUNDS SEMI-ANNUAL REPORT | 3 |
ECONOMIC AND MARKET OVERVIEW (Unaudited) | March 31, 2020 |
The six-month period ended March 31, 2020, was a wild ride for markets. While the U.S. economy was generally in good shape in 2019, recessionary fears rose throughout the year, prompting the U.S. Federal Reserve (the “Fed”) to announce a rate cut on July 31, the first since 2008, amid growing downside risks to policymakers’ baseline growth and inflation forecasts. Key among those risks were slowing global growth, the threat of additional U.S.-China tariffs, and the possible ramifications surrounding Brexit. The Fed subsequently cut rates twice more in 2019, which caused markets to rally toward the end of the year and into early 2020. Stocks reached new highs and credit spreads tightened to historic levels. Since then, the global outbreak of the coronavirus, COVID-19, has been at the center of everything. As of this writing, COVID-19 has spread to 210 countries, resulted in over 2.5 million cases, and caused over 170,000 deaths. Thus far, the U.S. makes up more than 30% of global cases, and 25% of global deaths. States have required the labor force to work from home if possible, individuals to practice social distancing, and non-essential businesses to shut down.
Closures, quarantines, and social distancing efforts have impacted the travel, hospitality, restaurants, and retail industries, with activity down 100% in some areas of the country. Further exacerbating the decline in output will be reduced business investment, which was already stalling due to falling profits, trade conflicts, and political uncertainty. The coronavirus shock and collapse in oil prices will likely further depress capital expenditures.
In response to the crisis, the Federal Open Market Committee cut rates by a further 125 basis points in the first quarter of 2020 and passed a series of stimulus programs. Among these were the Primary and Secondary Market Corporate Credit Facilities, which are lending programs primarily targeting investment-grade corporate bond issuers, implemented in concert with the U.S. Treasury. It was only after the announcement of this program that corporate credit found some relief from the selloff, but we expect this relief may be temporary.
With an alphabet soup of monetary programs targeting relief from the coronavirus impact, fiscal policy has also stepped up to the plate with a spending bill worth over $2 trillion that aims to assist consumers, states, small businesses, and certain industries. There is no question that these programs will help ease the economic fallout from virus containment measures, but even $2 trillion may be too small given the magnitude of the economic shock that we are facing. Additionally, it is far from clear that fiscal measures are an adequate solution to the issue at hand: the physical impediment to consumer spending. Fiscal and monetary policy can do their part, but ultimately it is public health policy that will likely be the greatest determinant of the economic outlook.
For the six months ended March 31, 2020, the Standard & Poor’s 500® (“S&P 500”) Index* returned -12.31%. The decline, while significant, represents something of a recovery in stocks. The S&P 500 peaked at 3,386.15 on February 19, 2020, before plummeting 33.9% to a low of 2,237.40 on March 23, 2020, then recovering some lost ground by the end of the month.
The consensus estimate for S&P 500 earnings per share in 2020 is still around $150. Our research shows S&P 500 earnings per share could fall below $100. Similarly, economists have no way to calibrate how bad the economic data could be based on history. The March U.S. non-farm payrolls report was evidence of this, as it showed a decline in payrolls of 700,000 jobs versus survey expectations of a decline of only 100,000 jobs. We currently expect that second quarter U.S. real gross domestic product (“GDP”) quarter-over-quarter growth could fall by 40% annualized and the unemployment rate could rise to at least 20%. Beyond that, the severity of the crisis depends on containment of the virus and the effectiveness of social distancing measures put in place, but expectations for a quick and sustained V-shaped recovery appear overly optimistic.
For the six months ended March 31, 2020, the MSCI Europe-Australasia-Far East (“EAFE”) Index* returned -16.37%. The return of the MSCI Emerging Markets Index* was -14.45%.
In the bond market, the Bloomberg Barclays U.S. Aggregate Bond Index* posted a 3.33% return for the six-month period, while the Bloomberg Barclays U.S. Corporate High Yield Index* returned -10.40%. The return of the ICE Bank of America (“BofA”) Merrill Lynch 3-Month U.S. Treasury Bill Index* was 1.04% for the six-month period.
The opinions and forecasts expressed may not actually come to pass. This information is subject to change at any time, based on market and other conditions, and should not be construed as a recommendation of any specific security or strategy.
4 | THE GUGGENHEIM FUNDS SEMI-ANNUAL REPORT | |
ECONOMIC AND MARKET OVERVIEW (Unaudited)(concluded) | March 31, 2020 |
*Index Definitions:
The following indices are referenced throughout this report. Indices are unmanaged and not available for direct investment. Index performance does not reflect transaction costs, fees, or expenses.
Bloomberg Barclays U.S. Aggregate Bond Index is a broad-based flagship benchmark that measures the investment grade, U.S. dollar-denominated, fixed-rate taxable bond market, including U.S. Treasuries, government-related and corporate securities, mortgage-backed securities or “MBS” (agency fixed-rate and hybrid adjustable-rate mortgage, or “ARM”, pass-throughs), asset-backed securities (“ABS”), and commercial mortgage-backed securities (“CMBS”) (agency and non-agency).
Bloomberg Barclays U.S. Corporate High Yield Index measures the U.S. dollar-denominated, high yield, fixed-rate corporate bond market. Securities are classified as high yield if the middle rating of Moody’s, Fitch, and S&P is Ba1/BB +/BB + or below.
Bloomberg Barclays U.S. Aggregate Bond 1-3 Year Total Return Index measures the performance of publicly issued investment grade corporate, U.S. Treasury and government agency securities with remaining maturities of one to three years.
ICE BofA Merrill Lynch 3-Month U.S. Treasury Bill Index is an unmanaged market Index of U.S. Treasury securities maturing in 90 days that assumes reinvestment of all income.
MSCI EAFE Index is a free float-adjusted market capitalization index that is designed to measure the equity market performance of developed markets, excluding the U.S. & Canada.
MSCI Emerging Markets Index is a free float-adjusted market capitalization weighted index that is designed to measure equity market performance in the global emerging markets.
S&P 500® is a broad-based index, the performance of which is based on the performance of 500 widely held common stocks chosen for market size, liquidity, and industry group representation.
| | THE GUGGENHEIM FUNDS SEMI-ANNUAL REPORT | 5 |
ABOUT SHAREHOLDERS’ FUND EXPENSES (Unaudited) | |
All mutual funds have operating expenses, and it is important for our shareholders to understand the impact of costs on their investments. Shareholders of a fund incur two types of costs: (i) transaction costs, including sales charges (loads) on purchase payments, reinvested dividends, other distributions, and exchange fees, and (ii) ongoing costs, including management fees, administrative services, and shareholder reports, among others. These ongoing costs, or operating expenses, are deducted from a fund’s gross income and reduce the investment return of the fund.
A fund’s expenses are expressed as a percentage of its average net assets, which is known as the expense ratio. The following examples are intended to help investors understand the ongoing costs (in dollars) of investing in a fund and to compare these costs with the ongoing costs of investing in other mutual funds.
The examples are based on an investment of $1,000 made at the beginning of the period and held for the entire six-month period beginning September 30, 2019 and ending March 31, 2020.
The following tables illustrate the Fund’s costs in two ways:
Table 1. Based on actual Fund return: This section helps investors estimate the actual expenses paid over the period. The “Ending Account Value” shown is derived from the Fund’s actual return, and the fifth column shows the dollar amount that would have been paid by an investor who started with $1,000 in the Fund. Investors may use the information here, together with the amount invested, to estimate the expenses paid over the period. Simply divide the Fund’s account value by $1,000 (for example, an $8,600 account value divided by $1,000 = 8.6), then multiply the result by the number provided under the heading “Expenses Paid During Period.”
Table 2. Based on hypothetical 5% return: This section is intended to help investors compare a fund’s cost with those of other mutual funds. The table provides information about hypothetical account values and hypothetical expenses based on the Fund’s actual expense ratio and an assumed rate of return of 5% per year before expenses, which is not the Fund’s actual return. The hypothetical account values and expenses may not be used to estimate the actual ending account balance or expenses paid during the period. The example is useful in making comparisons because the U.S. Securities and Exchange Commission (the “SEC”) requires all mutual funds to calculate expenses based on the 5% return. Investors can assess a Fund’s costs by comparing this hypothetical example with the hypothetical examples that appear in shareholder reports of other funds.
The calculations illustrated above assume no shares were bought or sold during the period. Actual costs may have been higher or lower, depending on the amount of investment and the timing of any purchases or redemptions.
Please note that the expenses shown in the table are meant to highlight your ongoing costs only and do not reflect any transactional costs, such as sales charges (loads) on purchase payments, and contingent deferred sales charges (“CDSC”) on redemptions, if any. Therefore, the second table is useful in comparing ongoing costs only, and will not help you determine the relative total costs of owning different funds. In addition, if these transactional costs were included, your costs would have been higher.
More information about the Fund’s expenses, including annual expense ratios for periods up to five years (subject to the Fund’s inception date), can be found in the Financial Highlights section of this report. For additional information on operating expenses and other shareholder costs, please refer to the Fund’s prospectus.
6 | THE GUGGENHEIM FUNDS SEMI-ANNUAL REPORT | |
ABOUT SHAREHOLDERS’ FUND EXPENSES (Unaudited)(concluded) | |
| Expense
Ratio1 | Fund
Return | Beginning
Account Value
September 30, 2019 | Ending
Account Value
March 31, 2020 | Expenses
Paid During
Period2 |
Table 1. Based on actual Fund return3 | | | | | |
A-Class | 0.75% | (0.38%) | $ 1,000.00 | $ 996.20 | $ 3.74 |
C-Class | 1.50% | (0.71%) | 1,000.00 | 992.90 | 7.47 |
P-Class | 0.75% | (0.38%) | 1,000.00 | 996.20 | 3.74 |
Institutional Class | 0.50% | (0.21%) | 1,000.00 | 997.90 | 2.50 |
R6-Class | 0.50% | (0.25%) | 1,000.00 | 997.50 | 2.50 |
|
Table 2. Based on hypothetical 5% return (before expenses) | | | | |
A-Class | 0.75% | 5.00% | $ 1,000.00 | $ 1,021.25 | $ 3.79 |
C-Class | 1.50% | 5.00% | 1,000.00 | 1,017.50 | 7.57 |
P-Class | 0.75% | 5.00% | 1,000.00 | 1,021.25 | 3.79 |
Institutional Class | 0.50% | 5.00% | 1,000.00 | 1,022.50 | 2.53 |
R6-Class | 0.50% | 5.00% | 1,000.00 | 1,022.50 | 2.53 |
1 | Annualized and excludes expenses of the underlying funds in which the Fund invests, if any. |
2 | Expenses are equal to the Fund’s annualized expense ratio, net of any applicable fee waivers, multiplied by the average account value over the period, multiplied by 183/366 (to reflect the one-half year period). |
3 | Actual cumulative return at net asset value for the period September 30, 2019 to March 31, 2020. |
| | THE GUGGENHEIM FUNDS SEMI-ANNUAL REPORT | 7 |
PERFORMANCE REPORT AND FUND PROFILE (Unaudited) | March 31, 2020 |
LIMITED DURATION FUND
OBJECTIVE: Seeks to provide a high level of income consistent with preservation of capital.
Holdings Diversification (Market Exposure as % of Net Assets)

“Holdings Diversification (Market Exposure as % of Net Assets)” excludes any temporary cash investments, investments in Guggenheim Strategy Funds Trust mutual funds, or investments in Guggenheim Ultra Short Duration Fund.
Portfolio Composition by Quality Rating1 |
Rating | % of Total
Investments |
Fixed Income Instruments | |
AAA | 40.6% |
AA | 6.5% |
A | 14.0% |
BBB | 10.1% |
BB | 1.1% |
B | 1.8% |
CCC | 0.9% |
NR2 | 3.6% |
Other Instruments | 21.4% |
Total Investments | 100.0% |
Inception Dates: |
A-Class | December 16, 2013 |
C-Class | December 16, 2013 |
P-Class | May 1, 2015 |
Institutional Class | December 16, 2013 |
R6-Class | March 13, 2019 |
Ten Largest Holdings (% of Total Net Assets) |
U.S. Treasury Notes, 1.50% due 01/15/23 | 4.9% |
U.S. Treasury Notes, 1.13% due 02/15/30 | 2.0% |
U.S. Treasury Notes, 1.50% | 1.4% |
Marathon CLO V Ltd., 2.57% | 1.1% |
MP CLO VIII Ltd., 2.71% | 1.1% |
Wells Fargo & Co., 2.66% | 1.0% |
Santander UK plc, 2.20% | 1.0% |
CIM Trust, 4.07% | 1.0% |
CIM Trust, 3.69% | 0.9% |
Golub Capital Partners CLO Ltd., 3.04% | 0.9% |
Top Ten Total | 15.3% |
| | |
“Ten Largest Holdings” excludes any temporary cash or derivative investments. |
1 | Source: BlackRock Solutions. Credit quality ratings are measured on a scale that generally ranges from AAA (highest) to D (lowest). All securities except for those labeled “NR” have been rated by Moody’s, Standard & Poor’s (“S&P”), or Fitch, each of which is a Nationally Recognized Statistical Rating Organization (“NRSRO”). For purposes of this presentation, when ratings are available from more than one agency, the highest rating is used. Guggenheim Investments has converted ratings to the equivalent S&P rating. Security ratings are determined at the time of purchase and may change thereafter. |
2 | NR securities do not necessarily indicate low credit quality. |
8 | THE GUGGENHEIM FUNDS SEMI-ANNUAL REPORT | |
PERFORMANCE REPORT AND FUND PROFILE (Unaudited)(concluded) | March 31, 2020 |
Average Annual Returns*
Periods Ended March 31, 2020
| 6 Month† | 1 Year | 5 Year | Since
Inception
(12/16/13) |
A-Class Shares | (0.38%) | 1.10% | 2.06% | 2.16% |
A-Class Shares with sales charge‡ | (2.63%) | (1.19%) | 1.60% | 1.79% |
C-Class Shares | (0.71%) | 0.38% | 1.31% | 1.40% |
C-Class Shares with CDSC§ | (1.70%) | (0.61%) | 1.31% | 1.40% |
Institutional Class Shares | (0.21%) | 1.39% | 2.33% | 2.43% |
Bloomberg Barclays U.S. Aggregate Bond 1-3 Total Return Index | 2.38% | 4.63% | 1.93% | 1.75% |
| | 6 Month† | 1 Year | Since
Inception
(05/01/15) |
P-Class Shares | | (0.38%) | 1.10% | 2.03% |
Bloomberg Barclays U.S. Aggregate Bond 1-3 Total Return Index | | 2.38% | 4.63% | 1.96% |
| | 6 Month† | 1 Year | Since
Inception
(03/13/19)† |
R6-Class Shares | | (0.25%) | 1.38% | 1.50% |
Bloomberg Barclays U.S. Aggregate Bond 1-3 Total Return Index | | 2.38% | 4.63% | 4.63% |
* | The performance data above represents past performance that is not predictive of future results. The investment return and principal value of an investment in the Fund will fluctuate so that an investor’s shares, when redeemed, may be worth more or less than their original cost. Returns are historical and include changes in principal and reinvested dividends and capital gains and do not reflect the effect of taxes. The Bloomberg Barclays U.S. Aggregate Bond 1-3 Total Return Index is an unmanaged index and, unlike the Fund, has no management fees or operating expenses to reduce its reported return. |
† | 6 month returns and since commencement of operations return for R6-Class shares are not annualized. |
‡ | Fund returns are calculated using the maximum sales charge of 2.25%. |
§ | Fund returns include a CDSC of 1% if redeemed within 12 months of purchase. |
| | THE GUGGENHEIM FUNDS SEMI-ANNUAL REPORT | 9 |
SCHEDULE OF INVESTMENTS (Unaudited) | March 31, 2020 |
LIMITED DURATION FUND | |
| | Shares | | | Value | |
EXCHANGE-TRADED FUNDS† - 0.2% |
iShares iBoxx High Yield Corporate Bond ETF | | | 55,730 | | | $ | 4,295,111 | |
Total Exchange-Traded Funds | | | | |
(Cost $3,866,296) | | | | | | | 4,295,111 | |
| | | | | | | | | |
MUTUAL FUNDS† - 0.8% |
Guggenheim Strategy Fund II1 | | | 519,515 | | | | 12,494,347 | |
Guggenheim Ultra Short Duration Fund — Institutional Class1 | | | 880,239 | | | | 8,599,932 | |
Total Mutual Funds | | | | |
(Cost $21,718,456) | | | | | | | 21,094,279 | |
| | | | | | | | | |
MONEY MARKET FUND† - 15.2% |
Dreyfus Treasury Securities Cash Management Fund — Institutional Shares 0.51%2 | | | 421,741,465 | | | | 421,741,465 | |
Total Money Market Fund | | | | |
(Cost $421,741,465) | | | | | | | 421,741,465 | |
| | | | | | | | | |
| | | Face
Amount~ | | | | | |
COLLATERALIZED MORTGAGE OBLIGATIONS†† - 26.8% |
Residential Mortgage Backed Securities - 20.3% | | | | |
CIM Trust | | | | | | | | |
2018-R4, 4.07% (WAC) due 12/26/573,4 | | | 25,837,261 | | | | 26,501,686 | |
2018-R2, 3.69% (WAC) due 08/25/573,4 | | | 25,538,981 | | | | 26,030,100 | |
New Residential Advance Receivables Trust Advance Receivables Backed | | | | | | | | |
2019-T4, 2.33% due 10/15/513 | | | 23,000,000 | | | | 22,285,119 | |
2019-T3, 2.51% due 09/15/523 | | | 19,350,000 | | | | 18,442,069 | |
2019-T5, 2.43% due 10/15/513 | | | 11,000,000 | | | | 10,752,594 | |
Towd Point Mortgage Trust | | | | | | | | |
2017-6, 2.75% (WAC) due 10/25/573,4 | | | 23,628,110 | | | | 23,646,547 | |
2018-2, 3.25% (WAC) due 03/25/583,4 | | | 11,615,426 | | | | 11,744,089 | |
2017-5, 1.55% (1 Month USD LIBOR + 0.60%, Rate Floor: 0.00%) due 02/25/573,4 | | | 11,660,011 | | | | 11,250,317 | |
2018-1, 3.00% (WAC) due 01/25/583,4 | | | 1,782,757 | | | | 1,790,937 | |
Structured Asset Securities Corporation Mortgage Loan Trust | | | | | | | | |
2007-WF1, 1.16% (1 Month USD LIBOR + 0.21%, Rate Floor: 0.21%) due 02/25/374 | | | 16,553,723 | | | | 15,181,555 | |
2008-BC4, 1.58% (1 Month USD LIBOR + 0.63%, Rate Floor: 0.63%) due 11/25/374 | | | 12,740,087 | | | | 11,575,675 | |
2006-BC3, 1.11% (1 Month USD LIBOR + 0.16%, Rate Floor: 0.16%) due 10/25/364 | | | 1,653,683 | | | | 1,430,957 | |
2006-BC4, 1.12% (1 Month USD LIBOR + 0.17%, Rate Floor: 0.17%) due 12/25/364 | | | 1,528,168 | | | | 1,397,924 | |
2007-BC1, 1.08% (1 Month USD LIBOR + 0.13%, Rate Floor: 0.13%) due 02/25/374 | | | 243,535 | | | | 217,444 | |
Soundview Home Loan Trust | | | | | | | | |
2006-OPT5, 1.09% (1 Month USD LIBOR + 0.14%, Rate Floor: 0.14%) due 07/25/364 | | | 19,822,402 | | | | 18,126,518 | |
2006-1, 1.25% (1 Month USD LIBOR + 0.30%, Rate Floor: 0.30%) due 02/25/364 | | | 5,625,448 | | | | 5,461,577 | |
2005-OPT3, 1.42% (1 Month USD LIBOR + 0.47%, Rate Floor: 0.47%) due 11/25/354 | | | 4,000,000 | | | | 3,649,772 | |
Verus Securitization Trust | | | | | | | | |
2019-4, 2.64% due 11/25/593,5 | | | 15,959,254 | | | | 16,158,161 | |
2020-1, 2.42% (WAC) due 01/25/603,4 | | | 8,351,412 | | | | 8,016,143 | |
New Residential Mortgage Loan Trust | | | | | | | | |
2018-2A, 3.50% (WAC) due 02/25/583,4 | | | 14,822,830 | | | | 15,093,890 | |
2018-1A, 4.00% (WAC) due 12/25/573,4 | | | 3,851,213 | | | | 3,981,840 | |
2019-6A, 3.50% (WAC) due 09/25/593,4 | | | 2,824,617 | | | | 2,875,901 | |
2017-5A, 2.45% (1 Month USD LIBOR + 1.50%, Rate Floor: 1.50%) due 06/25/574 | | | 1,577,992 | | | | 1,495,264 | |
Starwood Mortgage Residential Trust | | | | | | | | |
2020-1, 2.28% (WAC) due 02/25/503,4 | | | 10,047,387 | | | | 9,638,593 | |
2019-1, 2.94% (WAC) due 06/25/493,4 | | | 6,974,983 | | | | 6,928,359 | |
Home Equity Loan Trust | | | | | | | | |
2007-FRE1, 1.14% (1 Month USD LIBOR + 0.19%, Rate Floor: 0.19%) due 04/25/374 | | | 19,145,714 | | | | 15,967,206 | |
Cascade Funding Mortgage Trust | | | | | | | | |
2018-RM2, 4.00% (WAC) due 10/25/683,4 | | | 12,281,881 | | | | 12,143,485 | |
2019-RM3, 2.80% (WAC) due 06/25/693,4 | | | 3,550,869 | | | | 3,412,931 | |
CSMC Trust | | | | | | | | |
2018-RPL9, 3.85% (WAC) due 09/25/573,4 | | | 13,636,026 | | | | 13,890,718 | |
Ameriquest Mortgage Securities Incorporated Asset-Backed Pass-Through Ctfs Series | | | | | | | | |
2005-R10, 1.38% (1 Month USD LIBOR + 0.43%, Rate Floor: 0.43%) due 01/25/364 | | | 12,500,000 | | | | 12,030,895 | |
Freddie Mac STACR Trust | | | | | | | | |
2020-DNA2, 1.70% (1 Month USD LIBOR + 0.75%, Rate Floor: 0.75%) due 02/25/503,4 | | | 6,000,000 | | | | 5,713,869 | |
2019-DNA4, 1.65% (1 Month USD LIBOR + 0.70%, Rate Floor: 0.00%) due 10/25/493,4 | | | 4,432,456 | | | | 4,373,091 | |
2020-DNA1, 1.65% (1 Month USD LIBOR + 0.70%, Rate Floor: 0.00%) due 01/25/503,4 | | | 2,000,000 | | | | 1,939,605 | |
NovaStar Mortgage Funding Trust Series | | | | | | | | |
2007-2, 1.15% (1 Month USD LIBOR + 0.20%, Rate Cap/Floor: 11.00%/0.20%) due 09/25/374 | | | 13,230,829 | | | | 11,921,794 | |
BRAVO Residential Funding Trust | | | | | | | | |
2019-NQM1, 2.67% (WAC) due 07/25/593,4 | | | 9,363,000 | | | | 9,191,175 | |
2019-NQM2, 2.75% (WAC) due 11/25/593,4 | | | 2,570,702 | | | | 2,483,168 | |
Homeward Opportunities Fund I Trust | | | | | | | | |
2019-3, 2.68% (WAC) due 11/25/593,4 | | | 6,902,848 | | | | 6,568,653 | |
2019-2, 2.70% (WAC) due 09/25/593,4 | | | 5,279,386 | | | | 5,060,805 | |
10 | THE GUGGENHEIM FUNDS SEMI-ANNUAL REPORT | SEE NOTES TO FINANCIAL STATEMENTS. |
SCHEDULE OF INVESTMENTS (Unaudited)(continued) | March 31, 2020 |
LIMITED DURATION FUND | |
| | Face
Amount~ | | | Value | |
Bear Stearns Asset-Backed Securities I Trust | | | | | | | | |
2006-HE9, 1.09% (1 Month USD LIBOR + 0.14%, Rate Floor: 0.14%) due 11/25/364 | | | 7,964,862 | | | $ | 7,188,633 | |
2006-HE3, 1.31% (1 Month USD LIBOR + 0.36%, Rate Floor: 0.36%) due 04/25/364 | | | 4,366,357 | | | | 4,285,264 | |
Banc of America Funding Trust | | | | | | | | |
2015-R2, 1.21% (1 Month USD LIBOR + 0.26%, Rate Floor: 0.26%) due 04/29/373,4 | | | 10,278,000 | | | | 9,619,685 | |
2015-R4, 1.80% (1 Month USD LIBOR + 0.17%, Rate Floor: 0.17%) due 01/27/354 | | | 1,802,994 | | | | 1,762,243 | |
CIT Mortgage Loan Trust | | | | | | | | |
2007-1, 2.30% (1 Month USD LIBOR + 1.35%, Rate Floor: 1.35%) due 10/25/373,4 | | | 10,152,328 | | | | 9,739,395 | |
2007-1, 2.40% (1 Month USD LIBOR + 1.45%, Rate Floor: 1.45%) due 10/25/374 | | | 609,583 | | | | 600,681 | |
Alternative Loan Trust | | | | | | | | |
2007-OA7, 1.09% (1 Month USD LIBOR + 0.14%, Rate Floor: 0.14%) due 05/25/474 | | | 8,105,621 | | | | 6,298,004 | |
2007-OH3, 1.24% (1 Month USD LIBOR + 0.29%, Rate Cap/Floor: 10.00%/0.29%) due 09/25/474 | | | 3,277,699 | | | | 2,931,671 | |
Ocwen Master Advance Receivables Trust | | | | | | | | |
2019-T2, 2.42% due 08/15/513 | | | 9,000,000 | | | | 8,864,932 | |
NRPL Trust | | | | | | | | |
2019-3A, 3.00% due 07/25/593 | | | 8,460,875 | | | | 8,504,088 | |
American Home Mortgage Investment Trust | | | | | | | | |
2006-3, 1.31% (1 Month USD LIBOR + 0.36%, Rate Cap/Floor: 10.50%/0.18%) due 12/25/464 | | | 8,839,047 | | | | 7,071,985 | |
Angel Oak Mortgage Trust 2020-1 | | | | | | | | |
2020-1, 2.47% (WAC) due 12/25/593,4 | | | 6,923,511 | | | | 6,862,985 | |
Argent Securities Incorporated Asset-Backed Pass-Through Certificates Series | | | | | | | | |
2005-W2, 1.44% (1 Month USD LIBOR + 0.49%, Rate Floor: 0.49%) due 10/25/354 | | | 7,250,000 | | | | 6,756,361 | |
Park Place Securities Incorporated Asset-Backed Pass Through Certificates Ser | | | | | | | | |
2005-WHQ3, 1.89% (1 Month USD LIBOR + 0.95%, Rate Floor: 0.63%) due 06/25/354 | | | 7,025,000 | | | | 6,637,287 | |
Morgan Stanley Home Equity Loan Trust | | | | | | | | |
2006-2, 1.23% (1 Month USD LIBOR + 0.28%, Rate Floor: 0.28%) due 02/25/364 | | | 6,908,128 | | | | 6,481,562 | |
Residential Mortgage Loan Trust | | | | | | | | |
2020-1, 2.38% (WAC) due 02/25/243,4 | | | 5,935,335 | | | | 5,678,325 | |
Countrywide Asset-Backed Certificates | | | | | | | | |
2006-6, 1.12% (1 Month USD LIBOR + 0.17%, Rate Floor: 0.17%) due 09/25/364 | | | 4,161,025 | | | | 3,907,854 | |
2006-5, 1.24% (1 Month USD LIBOR + 0.29%, Rate Floor: 0.29%) due 08/25/364 | | | 1,391,708 | | | | 1,317,797 | |
First NLC Trust | | | | | | | | |
2005-4, 1.34% (1 Month USD LIBOR + 0.39%, Rate Cap/Floor: 14.00%/0.39%) due 02/25/364 | | | 5,707,551 | | | | 5,196,389 | |
Deephaven Residential Mortgage Trust | | | | | | | | |
2019-3A, 2.96% (WAC) due 07/25/593,4 | | | 3,318,629 | | | | 3,169,568 | |
2017-3A, 2.58% (WAC) due 10/25/474 | | | 1,629,771 | | | | 1,630,090 | |
HarborView Mortgage Loan Trust | | | | | | | | |
2006-14, 0.90% (1 Month USD LIBOR + 0.15%, Rate Floor: 0.15%) due 01/25/474 | | | 3,239,932 | | | | 2,526,925 | |
2006-12, 0.94% (1 Month USD LIBOR + 0.19%, Rate Floor: 0.19%) due 01/19/384 | | | 2,820,467 | | | | 2,248,623 | |
Nationstar Home Equity Loan Trust | | | | | | | | |
2007-B, 1.17% (1 Month USD LIBOR + 0.22%, Rate Floor: 0.22%) due 04/25/374 | | | 4,955,217 | | | | 4,695,361 | |
Nationstar HECM Loan Trust | | | | | | | | |
2019-2A, 2.27% (WAC) due 11/25/293,4 | | | 4,724,063 | | | | 4,664,759 | |
Connecticut Avenue Securities Trust | | | | | | | | |
2019-R07, 1.72% (1 Month USD LIBOR + 0.77%, Rate Floor: 0.00%) due 10/25/393,4 | | | 3,041,421 | | | | 2,966,198 | |
2020-R01, 1.75% (1 Month USD LIBOR + 0.80%, Rate Floor: 0.00%) due 01/25/403,4 | | | 1,731,697 | | | | 1,655,768 | |
FBR Securitization Trust | | | | | | | | |
2005-2, 1.70% (1 Month USD LIBOR + 0.75%, Rate Cap/Floor: 14.00%/0.50%) due 09/25/354 | | | 4,809,079 | | | | 4,616,977 | |
Structured Asset Investment Loan Trust | | | | | | | | |
2006-3, 1.10% (1 Month USD LIBOR + 0.15%, Rate Floor: 0.15%) due 06/25/364 | | | 4,312,987 | | | | 3,991,429 | |
2005-2, 1.68% (1 Month USD LIBOR + 0.74%, Rate Floor: 0.49%) due 03/25/354 | | | 439,028 | | | | 422,625 | |
2005-1, 1.67% (1 Month USD LIBOR + 0.72%, Rate Floor: 0.48%) due 02/25/353,4 | | | 174,302 | | | | 171,011 | |
JP Morgan Mortgage Acquisition Trust | | | | | | | | |
2006-HE2, 1.09% (1 Month USD LIBOR + 0.14%, Rate Floor: 0.14%) due 07/25/364 | | | 4,589,751 | | | | 4,484,457 | |
Legacy Mortgage Asset Trust | | | | | | | | |
2018-GS3, 4.00% due 06/25/583,5 | | | 4,492,396 | | | | 4,313,212 | |
Citigroup Mortgage Loan Trust | | | | | | | | |
2019-IMC1, 2.72% (WAC) due 07/25/493,4 | | | 3,827,015 | | | | 3,689,380 | |
COLT Mortgage Loan Trust | | | | | | | | |
2018-3, 3.69% (WAC) due 10/26/483,4 | | | 3,648,097 | | | | 3,607,835 | |
CWABS Incorporated Asset-Backed Certificates Trust | | | | | | | | |
2004-4, 1.67% (1 Month USD LIBOR + 0.72%, Rate Floor: 0.48%) due 07/25/344 | | | 3,422,294 | | | | 3,218,701 | |
Credit-Based Asset Servicing & Securitization LLC | | | | | | | | |
2006-CB2, 1.14% (1 Month USD LIBOR + 0.19%, Rate Floor: 0.19%) due 12/25/364 | | | 3,483,333 | | | | 3,070,491 | |
SEE NOTES TO FINANCIAL STATEMENTS. | THE GUGGENHEIM FUNDS SEMI-ANNUAL REPORT | 11 |
SCHEDULE OF INVESTMENTS (Unaudited)(continued) | March 31, 2020 |
LIMITED DURATION FUND | |
| | Face
Amount~ | | | Value | |
CSMC Series | | | | | | | | |
2015-12R, 2.16% (WAC) due 11/30/373,4 | | | 2,967,723 | | | $ | 2,818,426 | |
2014-2R, 1.83% (1 Month USD LIBOR + 0.20%, Rate Floor: 0.20%) due 02/27/463,4 | | | 187,923 | | | | 178,046 | |
LSTAR Securities Investment Trust | | | | | | | | |
2019-1, 3.28% (1 Month USD LIBOR + 1.70%, Rate Floor: 0.00%) due 03/01/243,4 | | | 2,977,150 | | | | 2,932,969 | |
Asset-Backed Securities Corporation Home Equity Loan Trust Series AEG | | | | | | | | |
2006-HE1, 1.35% (1 Month USD LIBOR + 0.40%, Rate Floor: 0.40%) due 01/25/364 | | | 3,350,000 | | | | 2,765,152 | |
Citigroup Mortgage Loan Trust 2007-WFHE2 | | | | | | | | |
2007-WFH2, 1.35% (1 Month USD LIBOR + 0.40%, Rate Floor: 0.40%) due 03/25/374 | | | 2,500,000 | | | | 2,408,235 | |
ACE Securities Corporation Home Equity Loan Trust Series | | | | | | | | |
2005-HE2, 1.97% (1 Month USD LIBOR + 1.02%, Rate Floor: 0.68%) due 04/25/354 | | | 2,000,000 | | | | 1,871,033 | |
Morgan Stanley ABS Capital I Incorporated Trust | | | | | | | | |
2006-NC1, 1.33% (1 Month USD LIBOR + 0.38%, Rate Floor: 0.38%) due 12/25/354 | | | 1,500,000 | | | | 1,408,198 | |
Morgan Stanley Capital I Incorporated Trust | | | | | | | | |
2006-HE1, 1.24% (1 Month USD LIBOR + 0.29%, Rate Floor: 0.29%) due 01/25/364 | | | 1,406,115 | | | | 1,282,661 | |
First Franklin Mortgage Loan Trust | | | | | | | | |
2004-FF10, 2.22% (1 Month USD LIBOR + 1.28%, Rate Floor: 0.85%) due 07/25/344 | | | 1,072,726 | | | | 1,002,807 | |
Deutsche Alt-A Securities Mortgage Loan Trust Series | | | | | | | | |
2006-AF1, 1.25% (1 Month USD LIBOR + 0.30%, Rate Floor: 0.30%) due 04/25/364 | | | 1,109,253 | | | | 919,229 | |
Nomura Resecuritization Trust | | | | | | | | |
2015-4R, 2.11% (1 Month USD LIBOR + 0.43%, Rate Floor: 0.43%) due 03/26/364 | | | 947,821 | | | | 911,842 | |
GE-WMC Asset-Backed Pass-Through Certificates Series | | | | | | | | |
2005-2, 1.45% (1 Month USD LIBOR + 0.50%, Rate Floor: 0.25%) due 12/25/354 | | | 824,483 | | | | 797,814 | |
Encore Credit Receivables Trust | | | | | | | | |
2005-4, 1.61% (1 Month USD LIBOR + 0.66%, Rate Floor: 0.44%) due 01/25/364 | | | 460,384 | | | | 452,041 | |
GSMSC Resecuritization Trust | | | | | | | | |
2015-5R, 1.77% (1 Month USD LIBOR + 0.14%, Rate Floor: 0.14%) due 04/26/374 | | | 352,898 | | | | 349,417 | |
UCFC Manufactured Housing Contract | | | | | | | | |
1997-2, 7.38% due 10/15/28 | | | 286,110 | | | | 294,957 | |
GSAMP Trust | | | | | | | | |
2005-HE6, 1.39% (1 Month USD LIBOR + 0.44%, Rate Floor: 0.44%) due 11/25/354 | | | 129,051 | | | | 127,462 | |
Morgan Stanley Re-REMIC Trust | | | | | | | | |
2010-R5, 3.90% due 06/26/36 | | | 93,664 | | | | 73,904 | |
Total Residential Mortgage Backed Securities | | | | | | | 563,813,170 | |
| | | | | | | | | |
Government Agency - 3.6% | | | | | | | | |
Fannie Mae | | | | | | | | |
2.34% due 11/01/22 | | | 13,550,000 | | | | 14,014,314 | |
3.59% due 02/01/29 | | | 10,200,000 | | | | 11,587,045 | |
2.63% due 09/01/21 | | | 7,150,000 | | | | 7,256,554 | |
3.01% due 12/01/27 | | | 4,600,000 | | | | 5,098,185 | |
2.99% due 03/01/30 | | | 4,000,000 | | | | 4,481,667 | |
3.71% due 03/01/31 | | | 3,000,000 | | | | 3,520,837 | |
3.13% due 01/01/30 | | | 3,050,000 | | | | 3,447,798 | |
3.23% due 01/01/30 | | | 2,900,930 | | | | 3,285,623 | |
3.12% due 01/01/30 | | | 2,892,458 | | | | 3,248,017 | |
3.21% due 08/01/27 | | | 2,136,416 | | | | 2,372,632 | |
3.17% due 01/01/30 | | | 1,700,000 | | | | 1,929,994 | |
3.22% due 01/01/30 | | | 1,300,000 | | | | 1,481,674 | |
2.25% due 07/01/21 | | | 962,856 | | | | 970,858 | |
Freddie Mac Multifamily Structured Pass Through Certificates | | | | | | | | |
2018-K074, 3.60% due 02/25/28 | | | 14,000,000 | | | | 16,080,537 | |
2017-KGX1, 3.00% due 10/25/27 | | | 14,000,000 | | | | 15,681,264 | |
2018-K078, 3.92% due 06/25/28 | | | 3,350,000 | | | | 3,946,626 | |
2013-K035, 0.38% (WAC) due 08/25/234,6 | | | 104,419,536 | | | | 1,143,916 | |
Total Government Agency | | | | | | | 99,547,541 | |
| | | | | | | | | |
Commercial Mortgage Backed Securities - 2.9% | | | | |
Morgan Stanley Capital I Trust | | | | | | | | |
2014-MP, 3.47% due 08/11/333 | | | 18,800,000 | | | | 18,867,599 | |
2014-CPT, 3.45% (WAC) due 07/13/293,4 | | | 5,000,000 | | | | 4,931,614 | |
2014-MP, 3.69% (WAC) due 08/11/333,4 | | | 2,365,000 | | | | 2,379,679 | |
Americold LLC Trust | | | | | | | | |
2010-ARTA, 6.81% due 01/14/293 | | | 8,995,000 | | | | 8,990,583 | |
Wells Fargo Commercial Mortgage Trust | | | | | | | | |
2017-C38, 1.06% (WAC) due 07/15/504,6 | | | 25,468,722 | | | | 1,406,064 | |
2016-C37, 0.98% (WAC) due 12/15/494,6 | | | 37,208,554 | | | | 1,375,570 | |
2017-C42, 0.89% (WAC) due 12/15/504,6 | | | 14,847,753 | | | | 810,503 | |
2015-LC22, 0.78% (WAC) due 09/15/584,6 | | | 22,168,052 | | | | 733,392 | |
2017-RB1, 1.25% (WAC) due 03/15/504,6 | | | 9,735,922 | | | | 665,476 | |
2016-NXS5, 1.49% (WAC) due 01/15/594,6 | | | 5,891,803 | | | | 356,770 | |
JPMDB Commercial Mortgage Securities Trust | | | | | | | | |
2016-C4, 0.81% (WAC) due 12/15/494,6 | | | 39,086,118 | | | | 1,635,324 | |
2018-C8, 0.65% (WAC) due 06/15/514,6 | | | 42,633,970 | | | | 1,540,293 | |
2016-C2, 1.67% (WAC) due 06/15/494,6 | | | 8,702,264 | | | | 523,080 | |
2017-C5, 0.94% (WAC) due 03/15/504,6 | | | 3,543,359 | | | | 179,025 | |
JP Morgan Chase Commercial Mortgage Securities Trust | | | | | | | | |
2016-JP2, 1.82% (WAC) due 08/15/494,6 | | | 37,238,123 | | | | 3,281,818 | |
12 | THE GUGGENHEIM FUNDS SEMI-ANNUAL REPORT | SEE NOTES TO FINANCIAL STATEMENTS. |
SCHEDULE OF INVESTMENTS (Unaudited)(continued) | March 31, 2020 |
LIMITED DURATION FUND | |
| | Face
Amount~ | | | Value | |
COMM Mortgage Trust | | | | | | | | |
2015-CR24, 0.77% (WAC) due 08/10/484,6 | | | 63,939,744 | | | $ | 2,132,007 | |
2018-COR3, 0.45% (WAC) due 05/10/514,6 | | | 35,558,786 | | | | 1,086,645 | |
Banc of America Commercial Mortgage Trust | | | | | | | | |
2017-BNK3, 1.12% (WAC) due 02/15/504,6 | | | 33,158,693 | | | | 1,815,180 | |
2016-UB10, 1.96% (WAC) due 07/15/494,6 | | | 18,724,477 | | | | 1,311,219 | |
DBJPM Mortgage Trust | | | | | | | | |
2017-C6, 1.03% (WAC) due 06/10/504,6 | | | 62,388,064 | | | | 3,120,925 | |
BENCHMARK Mortgage Trust | | | | | | | | |
2018-B2, 0.42% (WAC) due 02/15/514,6 | | | 123,205,579 | | | | 2,848,722 | |
UBS Commercial Mortgage Trust | | | | | | | | |
2017-C2, 1.09% (WAC) due 08/15/504,6 | | | 30,841,286 | | | | 1,777,834 | |
2017-C5, 1.01% (WAC) due 11/15/504,6 | | | 13,866,847 | | | | 716,017 | |
Morgan Stanley Bank of America Merrill Lynch Trust | | | | | | | | |
2015-C27, 0.92% (WAC) due 12/15/474,6 | | | 34,125,637 | | | | 1,330,944 | |
2017-C34, 0.81% (WAC) due 11/15/524,6 | | | 24,440,705 | | | | 1,110,813 | |
Aventura Mall Trust | | | | | | | | |
2013-AVM, 3.74% (WAC) due 12/05/323,4 | | | 2,200,000 | | | | 2,172,074 | |
Bancorp Commercial Mortgage Trust | | | | | | | | |
2018-CR3, 1.96% (1 Month USD LIBOR + 1.25%, Rate Floor: 1.25%) due 01/15/333,4 | | | 2,200,000 | | | | 2,070,175 | |
CSAIL Commercial Mortgage Trust | | | | | | | | |
2019-C15, 1.05% (WAC) due 03/15/524,6 | | | 19,960,079 | | | | 1,350,589 | |
2016-C6, 1.90% (WAC) due 01/15/494,6 | | | 7,546,722 | | | | 588,868 | |
BBCMS Mortgage Trust | | | | | | | | |
2018-C2, 0.77% (WAC) due 12/15/514,6 | | | 29,900,904 | | | | 1,588,342 | |
BAMLL Commercial Mortgage Securities Trust | | | | | | | | |
2012-PARK, 2.96% due 12/10/303 | | | 1,300,000 | | | | 1,312,893 | |
CD Mortgage Trust | | | | | | | | |
2017-CD6, 0.96% (WAC) due 11/13/504,6 | | | 14,672,399 | | | | 698,312 | |
2016-CD1, 1.41% (WAC) due 08/10/494,6 | | | 6,865,158 | | | | 438,756 | |
CD Commercial Mortgage Trust | | | | | | | | |
2017-CD4, 1.31% (WAC) due 05/10/504,6 | | | 16,997,502 | | | | 1,079,814 | |
CGMS Commercial Mortgage Trust | | | | | | | | |
2017-B1, 0.84% (WAC) due 08/15/504,6 | | | 22,109,236 | | | | 976,870 | |
Citigroup Commercial Mortgage Trust | | | | | | | | |
2016-C2, 1.76% (WAC) due 08/10/494,6 | | | 6,610,699 | | | | 550,164 | |
2016-GC37, 1.75% (WAC) due 04/10/494,6 | | | 3,693,296 | | | | 288,295 | |
Americold LLC | | | | | | | | |
2010-ARTA, 4.95% due 01/14/293 | | | 840,000 | | | | 835,312 | |
GS Mortgage Securities Trust | | | | | | | | |
2017-GS6, 1.04% (WAC) due 05/10/504,6 | | | 11,503,161 | | | | 659,436 | |
BANK | | | | | | | | |
2017-BNK6, 0.84% (WAC) due 07/15/604,6 | | | 15,136,885 | | | | 657,795 | |
JPMBB Commercial Mortgage Securities Trust | | | | | | | | |
2013-C17, 0.76% (WAC) due 01/15/474,6 | | | 23,163,669 | | | | 538,778 | |
GE Business Loan Trust | | | | | | | | |
2007-1A, 0.88% (1 Month USD LIBOR + 0.17%, Rate Floor: 0.17%) due 04/15/353,4 | | | 150,633 | | | | 136,950 | |
Total Commercial Mortgage Backed Securities | | | | | | | 80,870,519 | |
| | | | | | | | | |
Total Collateralized Mortgage Obligations | | | | |
(Cost $757,116,775) | | | 744,231,230 | |
ASSET-BACKED SECURITIES†† - 24.5% |
Collateralized Loan Obligations - 15.8% | | | | |
Marathon CLO V Ltd. | | | | | | | | |
2017-5A, 2.57% (3 Month USD LIBOR + 0.87%, Rate Floor: 0.00%) due 11/21/273,4 | | | 31,877,254 | | | | 30,649,275 | |
MP CLO VIII Ltd. | | | | | | | | |
2018-2A, 2.71% (3 Month USD LIBOR + 0.91%, Rate Floor: 0.00%) due 10/28/273,4 | | | 29,911,844 | | | | 28,943,469 | |
Golub Capital Partners CLO Ltd. | | | | | | | | |
2018-36A, 3.04% (3 Month USD LIBOR + 1.30%, Rate Floor: 0.00%) due 02/05/313,4 | | | 27,500,000 | | | | 24,162,138 | |
Shackleton CLO Ltd. | | | | | | | | |
2017-8A, 2.75% (3 Month USD LIBOR + 0.92%, Rate Floor: 0.00%) due 10/20/273,4 | | | 22,898,305 | | | | 22,096,725 | |
Midocean Credit CLO VII | | | | | | | | |
2020-7A, 2.79% (3 Month USD LIBOR + 1.04%, Rate Floor: 0.00%) due 07/15/293,4 | | | 20,500,000 | | | | 19,132,379 | |
Halcyon Loan Advisors Funding Ltd. | | | | | | | | |
2017-3A, 2.72% (3 Month USD LIBOR + 0.90%, Rate Floor: 0.00%) due 10/18/273,4 | | | 18,937,974 | | | | 18,353,471 | |
2012-1A, 4.69% (3 Month USD LIBOR + 3.00%, Rate Floor: 0.00%) due 08/15/233,4 | | | 322,021 | | | | 271,052 | |
BXMT Ltd. | | | | | | | | |
2020-FL2, 1.70% (1 Month USD LIBOR + 0.90%, Rate Floor: 0.90%) due 02/16/373,4 | | | 17,000,000 | | | | 15,947,086 | |
2020-FL2, 2.20% (1 Month USD LIBOR + 1.40%, Rate Floor: 1.40%) due 02/16/373,4 | | | 2,000,000 | | | | 1,837,521 | |
Palmer Square Loan Funding Ltd. | | | | | | | | |
2018-4A, 2.59% (3 Month USD LIBOR + 0.90%, Rate Floor: 0.00%) due 11/15/263,4 | | | 7,028,064 | | | | 6,798,031 | |
2019-3A, 2.55% (3 Month USD LIBOR + 0.85%, Rate Floor: 0.85%) due 08/20/273,4 | | | 5,817,946 | | | | 5,679,387 | |
2018-4A, 3.14% (3 Month USD LIBOR + 1.45%, Rate Floor: 0.00%) due 11/15/263,4 | | | 3,500,000 | | | | 3,046,428 | |
Garrison BSL CLO Ltd. | | | | | | | | |
2018-1A, 2.79% (3 Month USD LIBOR + 0.95%, Rate Floor: 0.00%) due 07/17/283,4 | | | 15,770,000 | | | | 14,796,311 | |
Mountain View CLO Ltd. | | | | | | | | |
2018-1A, 2.63% (3 Month USD LIBOR + 0.80%, Rate Floor: 0.80%) due 10/15/263,4 | | | 14,559,529 | | | | 14,358,810 | |
SEE NOTES TO FINANCIAL STATEMENTS. | THE GUGGENHEIM FUNDS SEMI-ANNUAL REPORT | 13 |
SCHEDULE OF INVESTMENTS (Unaudited)(continued) | March 31, 2020 |
LIMITED DURATION FUND | |
| | Face
Amount~ | | | Value | |
Venture XII CLO Ltd. | | | | | | | | |
2018-12A, 2.41% (3 Month USD LIBOR + 0.80%, Rate Floor: 0.80%) due 02/28/263,4 | | | 14,759,215 | | | $ | 14,274,471 | |
Venture XIV CLO Ltd. | | | | | | | | |
2020-14A, 2.73% (3 Month USD LIBOR + 1.03%, Rate Floor: 1.03%) due 08/28/293,4 | | | 15,000,000 | | | | 13,998,632 | |
NewStar Clarendon Fund CLO LLC | | | | | | | | |
2019-1A, 3.09% (3 Month USD LIBOR + 1.30%, Rate Floor: 0.00%) due 01/25/273,4 | | | 13,705,419 | | | | 13,379,451 | |
Telos CLO Ltd. | | | | | | | | |
2017-6A, 3.11% (3 Month USD LIBOR + 1.27%, Rate Floor: 0.00%) due 01/17/273,4 | | | 13,451,035 | | | | 13,319,568 | |
Carlyle Global Market Strategies CLO Ltd. | | | | | | | | |
2018-2A, 2.57% (3 Month USD LIBOR + 0.78%, Rate Floor: 0.00%) due 04/27/273,4 | | | 12,828,065 | | | | 12,418,063 | |
THL Credit Wind River CLO Ltd. | | | | | | | | |
2017-2A, 2.70% (3 Month USD LIBOR + 0.87%, Rate Floor: 0.00%) due 10/15/273,4 | | | 12,757,804 | | | | 12,372,173 | |
Flagship CLO VIII Ltd. | | | | | | | | |
2018-8A, 2.69% (3 Month USD LIBOR + 0.85%, Rate Floor: 0.00%) due 01/16/263,4 | | | 12,141,080 | | | | 12,061,191 | |
Fortress Credit Opportunities XI CLO Ltd. | | | | | | | | |
2018-11A, 3.13% (3 Month USD LIBOR + 1.30%, Rate Floor: 0.00%) due 04/15/313,4 | | | 13,450,000 | | | | 11,800,624 | |
GoldentTree Loan Management US CLO 1 Ltd. | | | | | | | | |
2020-1A, 2.60% (3 Month USD LIBOR + 0.95%, Rate Floor: 0.95%) due 04/20/293,4 | | | 12,000,000 | | | | 11,196,161 | |
NXT Capital CLO LLC | | | | | | | | |
2017-1A, 3.52% (3 Month USD LIBOR + 1.70%, Rate Floor: 0.00%) due 04/20/293,4 | | | 7,700,000 | | | | 7,209,107 | |
KREF Ltd. | | | | | | | | |
2018-FL1, 1.90% (1 Month USD LIBOR + 1.10%, Rate Floor: 1.10%) due 06/15/363,4 | | | 7,500,000 | | | | 7,031,318 | |
Crown Point CLO III Ltd. | | | | | | | | |
2017-3A, 2.74% (3 Month USD LIBOR + 0.91%, Rate Floor: 0.00%) due 12/31/273,4 | | | 6,829,149 | | | | 6,732,011 | |
GPMT Ltd. | | | | | | | | |
2019-FL2, 2.01% (1 Month USD LIBOR + 1.30%, Rate Floor: 1.30%) due 02/22/363,4 | | | 6,250,000 | | | | 5,890,058 | |
Cerberus Loan Funding XVII Ltd. | | | | | | | | |
2016-3A, 4.36% (3 Month USD LIBOR + 2.53%, Rate Floor: 0.00%) due 01/15/283,4 | | | 6,500,000 | | | | 5,817,761 | |
NewStar Fairfield Fund CLO Ltd. | | | | | | | | |
2018-2A, 3.09% (3 Month USD LIBOR + 1.27%, Rate Floor: 1.27%) due 04/20/303,4 | | | 6,600,000 | | | | 5,797,734 | |
Diamond CLO Ltd. | | | | | | | | |
2018-1A, 3.30% (3 Month USD LIBOR + 1.50%, Rate Floor: 1.50%) due 07/22/303,4 | | | 6,000,000 | | | | 5,576,667 | |
KVK CLO Ltd. | | | | | | | | |
2018-1A, 2.40% (3 Month USD LIBOR + 0.70%, Rate Floor: 0.00%) due 05/20/293,4 | | | 2,840,903 | | | | 2,809,736 | |
2017-1A, 2.74% (3 Month USD LIBOR + 0.90%, Rate Floor: 0.00%) due 01/14/283,4 | | | 2,600,000 | | | | 2,518,153 | |
West CLO Ltd. | | | | | | | | |
2017-1A, 2.74% (3 Month USD LIBOR + 0.92%, Rate Floor: 0.00%) due 07/18/263,4 | | | 5,327,277 | | | | 5,291,245 | |
Seneca Park CLO Limited | | | | | | | | |
2017-1A, 3.34% (3 Month USD LIBOR + 1.50%, Rate Floor: 0.00%) due 07/17/263,4 | | | 4,000,000 | | | | 3,875,812 | |
2017-1A, 2.96% (3 Month USD LIBOR + 1.12%, Rate Floor: 0.00%) due 07/17/263,4 | | | 907,895 | | | | 904,076 | |
BSPRT Issuer Ltd. | | | | | | | | |
2018-FL3, 1.76% (1 Month USD LIBOR + 1.05%, Rate Floor: 1.05%) due 03/15/283,4 | | | 3,847,925 | | | | 3,616,142 | |
2018-FL4, 1.76% (1 Month USD LIBOR + 1.05%, Rate Floor: 1.05%) due 09/15/353,4 | | | 1,000,000 | | | | 935,890 | |
FDF I Ltd. | | | | | | | | |
2015-1A, 4.40% due 11/12/303 | | | 4,500,000 | | | | 4,184,942 | |
TCP Waterman CLO Ltd. | | | | | | | | |
2016-1A, 2.79% (3 Month USD LIBOR + 2.05%, Rate Floor: 0.00%) due 12/15/283,4 | | | 4,000,000 | | | | 3,835,864 | |
FDF II Ltd. | | | | | | | | |
2016-2A, 4.29% due 05/12/313 | | | 4,000,000 | | | | 3,718,673 | |
HPS Loan Management Ltd. | | | | | | | | |
2019-19, 2.39% (3 Month USD LIBOR + 0.60%, Rate Floor: 0.60%) due 07/25/303,4 | | | 3,428,572 | | | | 3,383,553 | |
Monroe Capital CLO Ltd. | | | | | | | | |
2017-1A, 3.15% (3 Month USD LIBOR + 1.35%, Rate Floor: 0.00%) due 10/22/263,4 | | | 3,379,441 | | | | 3,317,622 | |
14 | THE GUGGENHEIM FUNDS SEMI-ANNUAL REPORT | SEE NOTES TO FINANCIAL STATEMENTS. |
SCHEDULE OF INVESTMENTS (Unaudited)(continued) | March 31, 2020 |
LIMITED DURATION FUND | |
| | Face
Amount~ | | | Value | |
LoanCore Issuer Ltd. | | | | | | | | |
2018-CRE1, 2.21% (1 Month USD LIBOR + 1.50%, Rate Floor: 1.50%) due 05/15/283,4 | | | 3,500,000 | | | $ | 3,114,665 | |
Avery Point V CLO Ltd. | | | | | | | | |
2017-5A, 2.82% (3 Month USD LIBOR + 0.98%, Rate Floor: 0.00%) due 07/17/263,4 | | | 3,166,574 | | | | 3,091,755 | |
Newfleet CLO Ltd. | | | | | | | | |
2018-1A, 2.77% (3 Month USD LIBOR + 0.95%, Rate Floor: 0.00%) due 04/20/283,4 | | | 3,000,000 | | | | 2,820,517 | |
Fortress Credit Opportunities IX CLO Ltd. | | | | | | | | |
2017-9A, 3.24% (3 Month USD LIBOR + 1.55%, Rate Floor: 0.00%) due 11/15/293,4 | | | 2,982,000 | | | | 2,761,724 | |
Newstar Commercial Loan Funding LLC | | | | | | | | |
2017-1A, 3.62% (3 Month USD LIBOR + 2.50%, Rate Floor: 0.00%) due 03/20/273,4 | | | 3,000,000 | | | | 2,753,305 | |
Marathon CLO VII Ltd. | | | | | | | | |
2017-7A, 3.45% (3 Month USD LIBOR + 1.65%, Rate Floor: 0.00%) due 10/28/253,4 | | | 3,000,000 | | | | 2,698,500 | |
Hull Street CLO Ltd. | | | | | | | | |
2017-1A, 3.05% (3 Month USD LIBOR + 1.22%, Rate Floor: 0.00%) due 10/18/263,4 | | | 2,446,934 | | | | 2,429,424 | |
Northwoods Capital XII-B Ltd. | | | | | | | | |
2018-12BA, 1.49% (3 Month USD LIBOR + 0.75%, Rate Floor: 0.75%) due 06/15/313,4 | | | 2,406,250 | | | | 2,330,351 | |
Golub Capital Partners CLO 17 Ltd. | | | | | | | | |
2017-17A, 3.44% (3 Month USD LIBOR + 1.65%, Rate Floor: 0.00%) due 10/25/303,4 | | | 2,500,000 | | | | 2,326,983 | |
Oaktree CLO Ltd. | | | | | | | | |
2017-1A, 2.69% (3 Month USD LIBOR + 0.87%) due 10/20/273,4 | | | 2,000,000 | | | | 1,943,531 | |
ACIS CLO Ltd. | | | | | | | | |
2014-4A, 3.18% (3 Month USD LIBOR + 1.42%, Rate Floor: 0.00%) due 05/01/263,4 | | | 1,916,881 | | | | 1,902,817 | |
Cent CLO Ltd. | | | | | | | | |
2013-19A, 3.11% (3 Month USD LIBOR + 1.33%, Rate Floor: 0.00%) due 10/29/253,4 | | | 1,487,565 | | | | 1,478,698 | |
California Street CLO XII Ltd. | | | | | | | | |
2017-12A, 3.33% (3 Month USD LIBOR + 1.50%, Rate Floor: 0.00%) due 10/15/253,4 | | | 1,250,000 | | | | 1,190,291 | |
Dryden 37 Senior Loan Fund | | | | | | | | |
2015-37A, due 01/15/313,7 | | | 1,500,000 | | | | 1,001,899 | |
Treman Park CLO Ltd. | | | | | | | | |
2015-1A, due 10/20/283,7 | | | 1,000,000 | | | | 686,063 | |
LCM XXII Ltd. | | | | | | | | |
2018-22A, 2.42% (3 Month USD LIBOR + 0.60%, Rate Floor: 0.60%) due 10/20/283,4 | | | 631,944 | | | | 622,392 | |
OHA Credit Partners IX Ltd. | | | | | | | | |
2013-9A, due 10/20/253,7 | | | 992,354 | | | | 611,577 | |
LMREC, Inc. | | | | | | | | |
2016-CRE2, 3.33% (1 Month USD LIBOR + 1.70%, Rate Floor: 1.70%) due 11/24/313,4 | | | 67,451 | | | | 66,916 | |
Copper River CLO Ltd. | | | | | | | | |
2007-1A, due 01/20/217,8 | | | 500,000 | | | | 51,137 | |
Total Collateralized Loan Obligations | | | | | | | 437,221,326 | |
| | | | | | | | | |
Financial - 3.1% | | | | | | | | |
Station Place Securitization Trust | | | | | | | | |
2019-6, 1.53% (1 Month USD LIBOR + 0.60%, Rate Floor: 0.60%) due 07/24/21†††,3,4 | | | 18,500,000 | | | | 18,500,000 | |
2019-5, 1.63% (1 Month USD LIBOR + 0.70%, Rate Floor: 0.70%) due 06/24/20†††,3,4,9 | | | 10,800,000 | | | | 10,800,000 | |
2019-9, 1.63% (1 Month USD LIBOR + 0.70%, Rate Floor: 0.00%) due 10/24/20†††,3,4,9 | | | 7,200,000 | | | | 7,200,000 | |
2019-2, 1.48% (1 Month USD LIBOR + 0.55%, Rate Floor: 0.55%) due 04/24/21†††,3,4,9 | | | 5,400,000 | | | | 5,400,000 | |
2019-WL1, 1.60% (1 Month USD LIBOR + 0.65%, Rate Floor: 0.65%) due 08/25/52†††,3,4,9 | | | 3,333,333 | | | | 3,333,333 | |
Barclays Bank plc | | | | | | | | |
GMTN, 2.18% (1 Month USD LIBOR + 0.60%) due 06/02/20†††,3,4,9 | | | 16,450,000 | | | | 16,450,000 | |
GMTN, 1.67% (1 Month USD LIBOR + 0.68%) due 07/31/20†††,3,4,9 | | | 13,950,000 | | | | 13,950,000 | |
Madison Avenue Secured Funding Trust | | | | | | | | |
2019-1, 2.23% (1 Month USD LIBOR + 1.50%, Rate Floor: 1.50%) due 11/11/20†††,3,4,9 | | | 6,200,000 | | | | 6,200,000 | |
Aesf Vi Verdi LP | | | | | | | | |
2.15% due 11/25/24††† | | | EUR 5,000,000 | | | | 5,294,312 | |
Total Financial | | | | | | | 87,127,645 | |
| | | | | | | | | |
Transport-Aircraft - 2.4% | | | | | | | | |
AASET US Ltd. | | | | | | | | |
2018-2A, 4.45% due 11/18/383 | | | 17,494,107 | | | | 13,890,851 | |
2018-1A, 3.84% due 01/16/383 | | | 1,080,832 | | | | 897,034 | |
Castlelake Aircraft Securitization Trust | | | | | | | | |
2018-1, 4.13% due 06/15/433 | | | 9,781,618 | | | | 7,108,484 | |
2017-1, 3.97% due 07/15/42 | | | 3,770,148 | | | | 2,785,615 | |
Sapphire Aviation Finance I Ltd. | | | | | | | | |
2018-1A, 4.25% due 03/15/403 | | | 12,583,836 | | | | 9,482,932 | |
KDAC Aviation Finance Ltd. | | | | | | | | |
2017-1A, 4.21% due 12/15/423 | | | 9,672,893 | | | | 7,409,744 | |
SEE NOTES TO FINANCIAL STATEMENTS. | THE GUGGENHEIM FUNDS SEMI-ANNUAL REPORT | 15 |
SCHEDULE OF INVESTMENTS (Unaudited)(continued) | March 31, 2020 |
LIMITED DURATION FUND | |
| | Face
Amount~ | | | Value | |
MAPS Ltd. | | | | | | | | |
2018-1A, 4.21% due 05/15/433 | | | 8,952,300 | | | $ | 6,729,704 | |
SAPPHIRE AVIATION FINANCE II Ltd. | | | | | | | | |
2020-1A, 3.23% due 03/15/403 | | | 8,250,000 | | | | 5,336,103 | |
AIM Aviation Finance Ltd. | | | | | | | | |
2015-1A, 4.21% due 02/15/403 | | | 4,723,467 | | | | 4,091,997 | |
Raspro Trust | | | | | | | | |
2005-1A, 2.89% (3 Month USD LIBOR + 0.93%, Rate Floor: 0.93%) due 03/23/243,4 | | | 3,253,789 | | | | 3,053,583 | |
AASET Trust | | | | | | | | |
2017-1A, 3.97% due 05/16/423 | | | 3,787,843 | | | | 2,976,055 | |
Falcon Aerospace Ltd. | | | | | | | | |
2017-1, 4.58% due 02/15/423 | | | 1,784,132 | | | | 1,416,035 | |
ECAF I Ltd. | | | | | | | | |
2015-1A, 3.47% due 06/15/403 | | | 515,068 | | | | 453,999 | |
Total Transport-Aircraft | | | | | | | 65,632,136 | |
| | | | | | | | | |
Transport-Container - 1.2% | | | | | | | | |
Textainer Marine Containers Ltd. | | | | | | | | |
2017-2A, 3.52% due 06/20/423 | | | 12,053,326 | | | | 10,717,754 | |
CLI Funding LLC | | | | | | | | |
2018-1A, 4.03% due 04/18/433 | | | 7,259,860 | | | | 6,895,908 | |
CAL Funding III Ltd. | | | | | | | | |
2018-1A, 3.96% due 02/25/433 | | | 5,700,000 | | | | 5,648,952 | |
Global SC Finance II SRL | | | | | | | | |
2013-1A, 2.98% due 04/17/283 | | | 4,863,958 | | | | 4,739,017 | |
Textainer Marine Containers V Ltd. | | | | | | | | |
2017-1A, 3.72% due 05/20/423 | | | 4,355,071 | | | | 3,918,647 | |
Cronos Containers Program Ltd. | | | | | | | | |
2013-1A, 3.08% due 04/18/283 | | | 1,362,833 | | | | 1,328,427 | |
Total Transport-Container | | | | | | | 33,248,705 | |
| | | | | | | | | |
Net Lease - 1.0% | | | | | | | | |
Capital Automotive LLC REIT | | | | | | | | |
2017-1A, 3.87% due 04/15/473 | | | 15,944,597 | | | | 13,972,853 | |
2020-1A, 3.19% due 02/15/503 | | | 4,000,000 | | | | 3,697,392 | |
2014-1A, 3.66% due 10/15/443 | | | 953,212 | | | | 860,002 | |
STORE Master Funding I LLC | | | | | | | | |
2015-1A, 4.17% due 04/20/453 | | | 10,436,958 | | | | 7,621,440 | |
2015-1A, 3.75% due 04/20/453 | | | 1,755,750 | | | | 1,553,714 | |
Total Net Lease | | | | | | | 27,705,401 | |
| | | | | | | | | |
Collateralized Debt Obligations - 0.5% | | | | | | | | |
Anchorage Credit Funding Ltd. | | | | | | | | |
2016-4A, 3.50% due 02/15/353 | | | 11,650,000 | | | | 10,826,470 | |
2016-3A, 3.85% due 10/28/333 | | | 1,500,000 | | | | 1,394,057 | |
Putnam Structured Product Funding Ltd. | | | | | | | | |
2003-1A, 2.68% (1 Month USD LIBOR + 1.00%, Rate Floor: 0.00%) due 10/15/383,4 | | | 471,666 | | | | 466,190 | |
Total Collateralized Debt Obligations | | | | | | | 12,686,717 | |
| | | | | | | | | |
Infrastructure - 0.3% | | | | | | | | |
Secured Tenant Site Contract Revenue Notes Series | | | | | | | | |
2018-1A, 3.97% due 06/15/483 | | | 7,276,311 | | | | 6,038,509 | |
Vantage Data Centers Issuer LLC | | | | | | | | |
2018-1A, 4.07% due 02/16/433 | | | 3,133,333 | | | | 3,063,278 | |
Total Infrastructure | | | | | | | 9,101,787 | |
| | | | | | | | | |
Whole Business - 0.2% | | | | | | | | |
Domino’s Pizza Master Issuer LLC | | | | | | | | |
2017-1A, 3.04% (3 Month USD LIBOR + 1.25%, Rate Floor: 0.00%) due 07/25/473,4 | | | 5,131,875 | | | | 4,802,768 | |
Drug Royalty III Limited Partnership | | | | | | | | |
2016-1A, 3.98% due 04/15/273 | | | 126,449 | | | | 126,330 | |
Total Whole Business | | | | | | | 4,929,098 | |
| | | | | | | | | |
Transport-Rail - 0.0% | | | | | | | | |
TRIP Rail Master Funding LLC | | | | | | | | |
2017-1A, 2.71% due 08/15/473 | | | 442,370 | | | | 437,498 | |
| | | | | | | | | |
Insurance - 0.0% | | | | | | | | |
Chesterfield Financial Holdings LLC | | | | | | | | |
2014-1A, 4.50% due 12/15/34†††,3 | | | 385,500 | | | | 401,952 | |
Total Asset-Backed Securities | | | | |
(Cost $732,940,194) | | | 678,492,265 | |
| | | | | | | | | |
CORPORATE BONDS†† - 17.0% |
Financial - 8.4% | | | | | | | | |
Wells Fargo & Co. | | | | | | | | |
2.66% (3 Month USD LIBOR + 0.93%) due 02/11/224 | | | 29,450,000 | | | | 28,883,294 | |
Santander UK plc | | | | | | | | |
2.20% (3 Month USD LIBOR + 0.62%) due 06/01/214 | | | 30,740,000 | | | | 28,675,860 | |
Capital One Financial Corp. | | | | | | | | |
2.47% (3 Month USD LIBOR + 0.76%) due 05/12/204 | | | 22,900,000 | | | | 22,870,476 | |
Mitsubishi UFJ Financial Group, Inc. | | | | | | | | |
2.44% (3 Month USD LIBOR + 0.65%) due 07/26/214 | | | 11,450,000 | | | | 10,973,530 | |
1.83% (3 Month USD LIBOR + 1.06%) due 09/13/214 | | | 5,068,000 | | | | 4,950,149 | |
3.46% (3 Month USD LIBOR + 1.88%) due 03/01/214 | | | 247,000 | | | | 245,679 | |
Citibank North America | | | | | | | | |
2.38% (3 Month USD LIBOR + 0.57%) due 07/23/214 | | | 16,390,000 | | | | 16,108,738 | |
Svenska Handelsbanken AB | | | | | | | | |
2.15% (3 Month USD LIBOR + 0.47%) due 05/24/214 | | | 13,500,000 | | | | 13,147,433 | |
3.35% due 05/24/21 | | | 1,179,000 | | | | 1,193,169 | |
UBS Group AG | | | | | | | | |
2.95% due 09/24/203 | | | 7,670,000 | | | | 7,682,850 | |
3.62% (3 Month USD LIBOR + 1.78%, Rate Floor: 0.00%) due 04/14/213,4 | | | 5,700,000 | | | | 5,582,320 | |
2.64% (3 Month USD LIBOR + 1.44%) due 09/24/203,4 | | | 1,000,000 | | | | 991,808 | |
16 | THE GUGGENHEIM FUNDS SEMI-ANNUAL REPORT | SEE NOTES TO FINANCIAL STATEMENTS. |
SCHEDULE OF INVESTMENTS (Unaudited)(continued) | March 31, 2020 |
LIMITED DURATION FUND | |
| | Face
Amount~ | | | Value | |
Credit Agricole S.A. | | | | | | | | |
1.87% (3 Month USD LIBOR + 0.97%) due 06/10/203,4 | | | 11,550,000 | | | $ | 11,520,358 | |
Standard Chartered Bank | | | | | | | | |
2.15% (3 Month USD LIBOR + 0.40%) due 08/04/204 | | | 10,170,000 | | | | 10,163,009 | |
ANZ New Zealand Int’l Ltd. | | | | | | | | |
2.85% due 08/06/203 | | | 10,000,000 | | | | 9,996,335 | |
Goldman Sachs Group, Inc. | | | | | | | | |
3.50% due 04/01/25 | | | 6,900,000 | | | | 7,053,355 | |
1.94% (3 Month USD LIBOR + 1.20%) due 09/15/204 | | | 1,000,000 | | | | 999,278 | |
JPMorgan Chase & Co. | | | | | | | | |
2.26% (3 Month USD LIBOR + 0.68%) due 06/01/214 | | | 8,100,000 | | | | 8,051,457 | |
Citizens Bank North America/Providence RI | | | | | | | | |
2.22% (3 Month USD LIBOR + 0.57%) due 05/26/204 | | | 8,050,000 | | | | 7,996,458 | |
Lloyds Bank plc | | | | | | | | |
2.23% (3 Month USD LIBOR + 0.49%) due 05/07/214 | | | 8,050,000 | | | | 7,583,886 | |
Westpac Banking Corp. | | | | | | | | |
2.70% (3 Month USD LIBOR + 0.85%) due 01/11/224 | | | 5,000,000 | | | | 4,896,572 | |
Bank of America Corp. | | | | | | | | |
2.56% (3 Month USD LIBOR + 0.65%) due 10/01/214 | | | 4,200,000 | | | | 4,105,392 | |
Alexandria Real Estate Equities, Inc. | | | | | | | | |
4.90% due 12/15/30 | | | 3,500,000 | | | | 3,798,004 | |
Essex Portfolio, LP | | | | | | | | |
5.20% due 03/15/21 | | | 2,650,000 | | | | 2,693,326 | |
Lloyds Bank Corporate Markets plc NY | | | | | | | | |
2.11% (3 Month USD LIBOR + 0.37%) due 08/05/204 | | | 2,070,000 | | | | 2,068,378 | |
Ameriprise Financial, Inc. | | | | | | | | |
3.00% due 04/02/25 | | | 2,060,000 | | | | 2,051,286 | |
AXIS Specialty Finance LLC | | | | | | | | |
5.88% due 06/01/20 | | | 1,994,000 | | | | 2,008,100 | |
Sumitomo Mitsui Financial Group, Inc. | | | | | | | | |
2.68% (3 Month USD LIBOR + 1.68%) due 03/09/214 | | | 1,000,000 | | | | 989,262 | |
2.96% (3 Month USD LIBOR + 1.14%) due 10/19/214 | | | 702,000 | | | | 687,865 | |
Morgan Stanley | | | | | | | | |
1.72% (3 Month USD LIBOR + 0.98%) due 06/16/204 | | | 1,650,000 | | | | 1,645,134 | |
Assurant, Inc. | | | | | | | | |
2.48% (3 Month USD LIBOR + 1.25%) due 03/26/214 | | | 1,592,000 | | | | 1,592,000 | |
Mizuho Financial Group, Inc. | | | | | | | | |
1.91% (3 Month USD LIBOR + 1.14%) due 09/13/214 | | | 1,500,000 | | | | 1,456,556 | |
UBS AG | | | | | | | | |
2.06% (3 Month USD LIBOR + 0.48%) due 12/01/203,4 | | | 1,000,000 | | | | 990,335 | |
Total Financial | | | | | | | 233,651,652 | |
| | | | | | | | | |
Consumer, Non-cyclical - 4.7% | | | | | | | | |
Express Scripts Holding Co. | | | | | | | | |
2.33% (3 Month USD LIBOR + 0.75%) due 11/30/204 | | | 21,875,000 | | | | 21,685,922 | |
Sysco Corp. | | | | | | | | |
5.65% due 04/01/25 | | | 20,550,000 | | | | 21,393,786 | |
Zimmer Biomet Holdings, Inc. | | | | | | | | |
1.80% (3 Month USD LIBOR + 0.75%) due 03/19/214 | | | 11,050,000 | | | | 10,916,807 | |
2.70% due 04/01/20 | | | 9,780,000 | | | | 9,780,000 | |
General Mills, Inc. | | | | | | | | |
2.38% (3 Month USD LIBOR + 0.54%) due 04/16/214 | | | 20,750,000 | | | | 20,201,355 | |
Mondelez International, Inc. | | | | | | | | |
3.00% due 05/07/20 | | | 11,330,000 | | | | 11,216,700 | |
CVS Health Corp. | | | | | | | | |
1.72% (3 Month USD LIBOR + 0.72%) due 03/09/214 | | | 9,200,000 | | | | 9,011,145 | |
Coca-Cola European Partners plc | | | | | | | | |
3.50% due 09/15/20 | | | 7,000,000 | | | | 7,066,337 | |
Reynolds American, Inc. | | | | | | | | |
6.88% due 05/01/20 | | | 4,802,000 | | | | 4,814,547 | |
Thermo Fisher Scientific, Inc. | | | | | | | | |
4.13% due 03/25/25 | | | 4,200,000 | | | | 4,495,065 | |
BAT Capital Corp. | | | | | | | | |
4.70% due 04/02/27 | | | 4,220,000 | | | | 4,288,223 | |
Cigna Corp. | | | | | | | | |
1.49% (3 Month USD LIBOR + 0.65%) due 09/17/214 | | | 4,100,000 | | | | 3,936,000 | |
Conagra Brands, Inc. | | | | | | | | |
2.55% (3 Month USD LIBOR + 0.75%) due 10/22/204 | | | 444,000 | | | | 439,301 | |
Constellation Brands, Inc. | | | | | | | | |
2.25% due 11/06/20 | | | 380,000 | | | | 377,867 | |
Total Consumer, Non-cyclical | | | | | | | 129,623,055 | |
| | | | | | | | | |
Industrial - 1.5% | | | | | | | | |
Siemens Financieringsmaatschappij N.V. | | | | | | | | |
1.35% (3 Month USD LIBOR + 0.61%) due 03/16/223,4 | | | 20,410,000 | | | | 19,530,531 | |
Aviation Capital Group LLC | | | | | | | | |
2.88% due 01/20/223 | | | 8,000,000 | | | | 7,231,883 | |
7.13% due 10/15/203 | | | 2,500,000 | | | | 2,472,110 | |
Rolls-Royce plc | | | | | | | | |
2.38% due 10/14/203 | | | 6,550,000 | | | | 6,172,500 | |
Textron, Inc. | | | | | | | | |
2.28% (3 Month USD LIBOR + 0.55%) due 11/10/204 | | | 5,700,000 | | | | 5,700,272 | |
Fox Corp. | | | | | | | | |
3.05% due 04/07/25 | | | 1,360,000 | | | | 1,357,878 | |
Total Industrial | | | | | | | 42,465,174 | |
| | | | | | | | | |
Energy - 1.3% | | | | | | | | |
Marathon Petroleum Corp. | | | | | | | | |
3.40% due 12/15/20 | | | 9,800,000 | | | | 9,708,570 | |
SEE NOTES TO FINANCIAL STATEMENTS. | THE GUGGENHEIM FUNDS SEMI-ANNUAL REPORT | 17 |
SCHEDULE OF INVESTMENTS (Unaudited)(continued) | March 31, 2020 |
LIMITED DURATION FUND | |
| | Face
Amount~ | | | Value | |
Exxon Mobil Corp. | | | | | | | | |
2.99% due 03/19/25 | | | 7,800,000 | | | $ | 8,261,240 | |
Phillips 66 | | | | | | | | |
2.25% (3 Month USD LIBOR + 0.60%) due 02/26/214 | | | 8,700,000 | | | | 8,138,259 | |
Sabine Pass Liquefaction LLC | | | | | | | | |
5.63% due 02/01/21 | | | 7,600,000 | | | | 7,372,285 | |
Reliance Holding USA, Inc. | | | | | | | | |
4.50% due 10/19/203 | | | 2,000,000 | | | | 2,013,680 | |
Total Energy | | | | | | | 35,494,034 | |
| | | | | | | | | |
Communications - 0.7% | | | | | | | | |
Telefonica Emisiones S.A. | | | | | | | | |
5.13% due 04/27/20 | | | 9,600,000 | | | | 9,600,677 | |
ViacomCBS, Inc. | | | | | | | | |
4.75% due 05/15/25 | | | 6,860,000 | | | | 6,892,029 | |
Verizon Communications, Inc. | | | | | | | | |
3.00% due 03/22/27 | | | 2,100,000 | | | | 2,212,392 | |
Total Communications | | | | | | | 18,705,098 | |
| | | | | | | | | |
Utilities - 0.4% | | | | | | | | |
NextEra Energy Capital Holdings, Inc. | | | | | | | | |
1.83% (3 Month USD LIBOR + 0.45%) due 09/28/204 | | | 10,010,000 | | | | 10,018,492 | |
PSEG Power LLC | | | | | | | | |
5.13% due 04/15/20 | | | 1,290,000 | | | | 1,290,502 | |
Total Utilities | | | | | | | 11,308,994 | |
| | | | | | | | | |
Consumer, Cyclical - 0.0% | | | | | | | | |
Aramark Services, Inc. | | | | | | | | |
5.00% due 02/01/283 | | | 275,000 | | | | 255,920 | |
Total Corporate Bonds | | | | |
(Cost $478,680,903) | | | 471,503,927 | |
| | | | | | | | | |
U.S. GOVERNMENT SECURITIES†† - 8.9% |
U.S. Treasury Notes |
1.50% due 01/15/2310 | | | 132,000,000 | | | | 136,516,875 | |
1.13% due 02/28/25 | | | 52,890,000 | | | | 54,829,989 | |
1.50% due 02/15/30 | | | 35,330,000 | | | | 38,039,093 | |
1.88% due 02/28/22 | | | 15,670,000 | | | | 16,167,033 | |
Total U.S. Government Securities | | | | |
(Cost $240,092,995) | | | | | | | 245,552,990 | |
| | | | | | | | | |
MUNICIPAL BONDS†† - 0.8% |
New York - 0.6% | | | | | | | | |
Triborough Bridge & Tunnel Authority Revenue Bonds | | | | | | | | |
0.87% (VRDN) due 01/01/3313 | | | 6,730,000 | | | | 6,730,000 | |
New York City Transitional Finance Authority Future Tax Secured Revenue Revenue Bonds | | | | | | | | |
0.80% (VRDN) due 02/01/4513 | | | 3,990,000 | | | | 3,990,000 | |
0.75% (VRDN) due 02/01/4513 | | | 1,490,000 | | | | 1,490,000 | |
City of New York New York General Obligation Unlimited | | | | | | | | |
0.80% (VRDN) due 03/01/4213 | | | 4,030,000 | | | | 4,030,000 | |
0.75% (VRDN) due 03/01/4013 | | | 1,070,000 | | | | 1,070,000 | |
Total New York | | | | | | | 17,310,000 | |
| | | | | | | | | |
Illinois - 0.1% | | | | | | | | |
Illinois Finance Authority Revenue Bonds | | | | | | | | |
0.75% (VRDN) due 08/15/4213 | | | 2,380,000 | | | | 2,380,000 | |
Pennsylvania - 0.0% | | | | | | | | |
Hospitals & Higher Education Facilities Authority of Philadelphia Revenue Bonds | | | | | | | | |
0.76% (VRDN) due 07/01/2513 | | | 900,000 | | | | 900,000 | |
0.75% (VRDN) due 07/01/4113 | | | 900,000 | | | | 900,000 | |
Total Pennsylvania | | | | | | | 1,800,000 | |
| | | | | | | | | |
Arizona - 0.1% | | | | | | | | |
State of Arizona Certificate Of Participation | | | | | | | | |
5.00% due 10/01/24 | | | 1,350,000 | | | | 1,350,000 | |
Total Municipal Bonds | | | | |
(Cost $22,840,000) | | | 22,840,000 | |
| | | | | | | | | |
FOREIGN GOVERNMENT DEBT†† - 0.6% |
Government of Japan |
0.10% due 04/15/20 | | | JPY 1,204,700,000 | | | | 11,205,845 | |
due 04/13/20 | | | JPY 690,000,000 | | | | 6,418,004 | |
Total Foreign Government Debt | | | | |
(Cost $17,430,747) | | | | | | | 17,623,849 | |
| | | | | | | | | |
SENIOR FLOATING RATE INTERESTS††,4 - 0.0% |
Technology - 0.0% | | | | | | | | |
Neustar, Inc. | | | | | | | | |
4.57% (3 Month USD LIBOR + 3.50%, Rate Floor: 4.50%) due 08/08/24 | | | 104,939 | | | | 79,124 | |
Total Senior Floating Rate Interests | | | | |
(Cost $105,390) | | | 79,124 | |
| | | | | | | | | |
REPURCHASE AGREEMENTS††,11 - 5.4% |
Societe Generale |
issued 03/09/20 at 1.30% due 04/01/20 | | | 23,490,000 | | | | 23,490,000 | |
issued 03/09/20 at 2.27% due 04/01/20 | | | 18,406,085 | | | | 18,406,085 | |
issued 12/05/19 at 2.18% (3 Month USD LIBOR + 0.40%) due 04/01/204 | | | 11,000,000 | | | | 11,000,000 | |
issued 03/27/20 at 2.18% due 04/01/20 | | | 8,049,000 | | | | 8,049,000 | |
issued 07/26/19 at 2.18% (3 Month USD LIBOR + 0.40%) due 04/01/204 | | | 8,000,000 | | | | 8,000,000 | |
issued 03/09/20 at 1.18% due 04/01/20 | | | 6,000,000 | | | | 6,000,000 | |
issued 03/09/20 at 2.18% due 04/01/20 | | | 4,946,000 | | | | 4,946,000 | |
18 | THE GUGGENHEIM FUNDS SEMI-ANNUAL REPORT | SEE NOTES TO FINANCIAL STATEMENTS. |
SCHEDULE OF INVESTMENTS (Unaudited)(continued) | March 31, 2020 |
LIMITED DURATION FUND | |
| | Face
Amount~ | | | Value | |
issued 10/11/19 at 2.18% (3 Month USD LIBOR + 0.40%) due 04/01/204 | | | 4,865,000 | | | $ | 4,865,000 | |
issued 03/17/20 at 2.18% due 04/01/20 | | | 4,758,000 | | | | 4,758,000 | |
issued 02/10/20 at 2.18% due 04/01/20 | | | 3,218,000 | | | | 3,218,000 | |
issued 11/27/19 at 2.18% (3 Month USD LIBOR + 0.40%) due 04/01/204 | | | 1,568,000 | | | | 1,568,000 | |
BNP Paribas |
issued 01/31/20 at 1.93% due 05/04/20 | | | 31,024,099 | | | | 31,024,099 | |
issued 03/09/20 at 1.93% due 05/04/20 | | | 25,615,964 | | | | 25,615,964 | |
Total Repurchase Agreements | | | | |
(Cost $150,940,148) | | | | | | | 150,940,148 | |
| | | | | | | | | |
COMMERCIAL PAPER†† - 0.9% |
Bemis Co., Inc. |
1.42% due 04/09/203,12 | | | 20,411,000 | | | | 20,404,559 | |
UDR, Inc. |
1.42% due 04/03/203,12 | | | 4,900,000 | | | | 4,899,614 | |
Total Commercial Paper | | | | |
(Cost $25,304,173) | | | | | | | 25,304,173 | |
| |
Contracts
| | | | |
OTC OPTIONS PURCHASED†† - 0.1% |
Put options on: | | | | | | | | |
Goldman Sachs International 2Y-10 CMS CAP Expiring July 2022 with strike price of $0.40 | | | 772,000,000 | | | | 1,644,360 | |
Goldman Sachs International 2Y-10 CMS CAP Expiring July 2022 with strike price of $0.61 | | | 296,000,000 | | | | 402,560 | |
Bank of America, N.A. 2Y-10 CMS CAP Expiring July 2022 with strike price of $0.40 | | | 115,000,000 | | | | 244,950 | |
Total Put options | | | | | | | 2,291,870 | |
Total OTC Options Purchased | | | | |
(Cost $2,446,140) | | | | | | | 2,291,870 | |
| | | | | | | | | |
Total Investments - 101.2% | | | | |
(Cost $2,875,223,682) | | $ | 2,805,990,431 | |
Other Assets & Liabilities, net - (1.2)% | | | (34,127,421 | ) |
Total Net Assets - 100.0% | | $ | 2,771,863,010 | |
Centrally Cleared Credit Default Swap Agreements Protection Purchased†† |
| |
Counterparty | Exchange | Index | | Protection
Premium
Rate | | Payment
Frequency | | Maturity
Date | | | Notional
Amount | | | Value | | | Upfront
Premiums
Received | | | Unrealized
Appreciation** | |
BofA Securities, Inc. | ICE | CDX.NA.HY.33.V3 | | | 5.00 | % | Quarterly | 12/20/24 | | $ | 12,259,800 | | | $ | (747,462 | ) | | $ | (1,148,151 | ) | | $ | 400,689 | |
Centrally Cleared Interest Rate Swap Agreements†† |
| |
Counterparty | Exchange | Floating
Rate
Type | Floating
Rate Index | | Fixed
Rate | | Payment
Frequency | | Maturity
Date | | | Notional
Amount | | | Value | | | Upfront
Premiums Paid | | | Unrealized
Appreciation** | |
BofA Securities, Inc. | CME | Pay | Federal Funds Rate | 1.37% | Annually | 12/04/21 | | $ | 177,800,000 | | | $ | 3,876,786 | | | $ | 622 | | | $ | 3,876,164 | |
BofA Securities, Inc. | CME | Pay | Federal Funds Rate | 1.31% | Annually | 11/25/21 | | | 98,600,000 | | | | 2,030,173 | | | | 449 | | | | 2,029,724 | |
BofA Securities, Inc. | CME | Pay | Federal Funds Rate | 0.62% | Annually | 03/04/22 | | | 180,305,000 | | | | 1,871,959 | | | | — | | | | 1,871,959 | |
BofA Securities, Inc. | CME | Pay | Federal Funds Rate | 1.40% | Annually | 12/13/21 | | | 54,950,000 | | | | 1,249,714 | | | | 371 | | | | 1,249,343 | |
BofA Securities, Inc. | CME | Pay | Federal Funds Rate | 1.36% | Annually | 12/09/21 | | | 46,500,000 | | | | 1,019,436 | | | | 350 | | | | 1,019,086 | |
BofA Securities, Inc. | CME | Pay | Federal Funds Rate | 1.37% | Annually | 09/30/21 | | | 43,200,000 | | | | 846,383 | | | | 304 | | | | 846,079 | |
BofA Securities, Inc. | CME | Pay | Federal Funds Rate | 1.23% | Annually | 08/22/21 | | | 44,400,000 | | | | 719,637 | | | | 285 | | | | 719,352 | |
BofA Securities, Inc. | CME | Pay | Federal Funds Rate | 1.27% | Annually | 02/07/23 | | | 18,420,000 | | | | 611,879 | | | | 329 | | | | 611,550 | |
SEE NOTES TO FINANCIAL STATEMENTS. | THE GUGGENHEIM FUNDS SEMI-ANNUAL REPORT | 19 |
SCHEDULE OF INVESTMENTS (Unaudited)(continued) | March 31, 2020 |
LIMITED DURATION FUND | |
Centrally Cleared Interest Rate Swap Agreements†† (continued) |
| |
Counterparty | Exchange | Floating
Rate
Type | Floating
Rate Index | | Fixed
Rate | | Payment
Frequency | | Maturity
Date | | | Notional
Amount | | | Value | | | Upfront
Premiums Paid | | | Unrealized
Appreciation** | |
BofA Securities, Inc. | CME | Pay | Federal Funds Rate | 1.46% | Annually | 09/17/21 | | | 29,600,000 | | | $ | 605,616 | | | $ | 84 | | | $ | 605,532 | |
| | | | | | | | | | | | | | | | | | | $ | 12,831,583 | | | $ | 2,794 | | | $ | 12,828,789 | |
Total Return Swap Agreements |
Counterparty | Reference Obligation | Financing Rate
Pay (Receive) | Payment
Frequency | | Maturity Date | | | Units | | | Notional
Amount | | | Value and
Unrealized
Appreciation
(Depreciation) | |
OTC Fixed Income Index Swap Agreements Sold Short†† |
BNP Paribas | iShares Core U.S. Aggregate Bond ETF | (1.88)% (3 Month USD LIBOR + 0.18%) | At Maturity | | | 05/21/20 | | | | 127,050 | | | $ | 14,657,759 | | | $ | (121,968 | ) |
OTC Fixed Income Index Swap Agreements†† |
Bank of America, N.A. | iShares Core U.S. Aggregate Bond ETF | 1.40% | At Maturity | | | 05/21/20 | | | | 127,050 | | | | 14,657,759 | | | | 678,447 | |
OTC Sovereign Debt Swap Agreements†† |
Deutsche Bank AG | Korea Monetary Stabilization Bond | 2.20% (3 Month USD LIBOR + 0.45%) | At Maturity | | | 08/04/21 | | | | N/A | | | | 12,862,853 | | | | 8,609 | |
Forward Foreign Currency Exchange Contracts†† |
| |
Counterparty | | Contracts to
Sell | | | Currency | | | Settlement
Date | | | Settlement
Value | | | Value at
March 31,
2020 | | | Unrealized
Appreciation | |
Morgan Stanley Capital Services LLC | | | 173,420,000 | | | | BRL | | | | 04/01/20 | | | $ | 42,530,495 | | | $ | 33,409,752 | | | $ | 9,120,743 | |
Citibank N.A., New York | | | 121,120,000 | | | | BRL | | | | 07/01/21 | | | | 28,823,146 | | | | 22,896,258 | | | | 5,926,888 | |
Citibank N.A., New York | | | 541,950,000 | | | | MXN | | | | 04/02/20 | | | | 27,568,227 | | | | 22,847,615 | | | | 4,720,612 | |
Goldman Sachs International | | | 38,600,000 | | | | BRL | | | | 07/01/20 | | | | 10,023,371 | | | | 7,423,220 | | | | 2,600,151 | |
Citibank N.A., New York | | | 31,600,000 | | | | BRL | | | | 07/01/20 | | | | 8,139,295 | | | | 6,077,040 | | | | 2,062,255 | |
Goldman Sachs International | | | 40,300,000 | | | | BRL | | | | 07/01/21 | | | | 9,441,255 | | | | 7,618,223 | | | | 1,823,032 | |
Citibank N.A., New York | | | 206,200,000 | | | | MXN | | | | 04/08/20 | | | | 10,496,844 | | | | 8,685,712 | | | | 1,811,132 | |
Goldman Sachs International | | | 141,700,000 | | | | MXN | | | | 05/21/20 | | | | 7,542,811 | | | | 5,932,180 | | | | 1,610,631 | |
Goldman Sachs International | | | 26,208,000 | | | | EUR | | | | 04/30/20 | | | | 30,055,334 | | | | 28,923,916 | | | | 1,131,418 | |
JPMorgan Chase Bank, N.A. | | | 18,300,000 | | | | BRL | | | | 07/01/21 | | | | 4,347,310 | | | | 3,459,392 | | | | 887,918 | |
Citibank N.A., New York | | | 93,700,000 | | | | MXN | | | | 04/23/20 | | | | 4,764,447 | | | | 3,938,608 | | | | 825,839 | |
JPMorgan Chase Bank, N.A. | | | 21,006,375 | | | | EUR | | | | 07/30/21 | | | | 24,244,928 | | | | 23,511,330 | | | | 733,598 | |
Goldman Sachs International | | | 116,779,244 | | | | ILS | | | | 02/01/21 | | | | 34,113,576 | | | | 33,524,992 | | | | 588,584 | |
Bank of America, N.A. | | | 13,152,400 | | | | EUR | | | | 06/15/20 | | | | 15,124,931 | | | | 14,541,643 | | | | 583,288 | |
Goldman Sachs International | | | 11,989,250 | | | | EUR | | | | 07/30/21 | | | | 13,927,013 | | | | 13,418,937 | | | | 508,076 | |
JPMorgan Chase Bank, N.A. | | | 3,433,716,000 | | | | JPY | | | | 09/01/20 | | | | 32,638,955 | | | | 32,133,693 | | | | 505,262 | |
Goldman Sachs International | | | 11,224,080 | | | | EUR | | | | 06/15/20 | | | | 12,914,202 | | | | 12,409,641 | | | | 504,561 | |
Citibank N.A., New York | | | 3,193,596,000 | | | | JPY | | | | 06/01/20 | | | | 30,212,632 | | | | 29,786,701 | | | | 425,931 | |
Goldman Sachs International | | | 73,012,900 | | | | ILS | | | | 04/30/21 | | | | 21,378,670 | | | | 21,000,506 | | | | 378,164 | |
Goldman Sachs International | | | 42,231,650 | | | | ILS | | | | 01/31/22 | | | | 12,500,228 | | | | 12,124,094 | | | | 376,134 | |
Citibank N.A., New York | | | 912,456,000 | | | | JPY | | | | 07/01/21 | | | | 8,984,580 | | | | 8,613,132 | | | | 371,448 | |
Barclays Bank plc | | | 843,421,500 | | | | JPY | | | | 07/01/21 | | | | 8,292,415 | | | | 7,961,481 | | | | 330,934 | |
Deutsche Bank AG | | | 15,684,387,227 | | | | KRW | | | | 08/04/21 | | | | 13,375,735 | | | | 13,089,578 | | | | 286,157 | |
Bank of America, N.A. | | | 1,397,698,500 | | | | JPY | | | | 06/22/20 | | | | 13,219,507 | | | | 13,047,690 | | | | 171,817 | |
Bank of America, N.A. | | | 1,205,302,350 | | | | JPY | | | | 04/15/20 | | | | 11,368,739 | | | | 11,219,010 | | | | 149,729 | |
Bank of America, N.A. | | | 13,124,200 | | | | ILS | | | | 01/31/22 | | | | 3,890,958 | | | | 3,767,768 | | | | 123,190 | |
20 | THE GUGGENHEIM FUNDS SEMI-ANNUAL REPORT | SEE NOTES TO FINANCIAL STATEMENTS. |
SCHEDULE OF INVESTMENTS (Unaudited)(continued) | March 31, 2020 |
LIMITED DURATION FUND | |
Forward Foreign Currency Exchange Contracts†† (continued) |
| |
Counterparty | | Contracts to
Sell | | | Currency | | | Settlement
Date | | | Settlement
Value | | | Value at
March 31,
2020 | | | Unrealized
Appreciation
(Depreciation) | |
JPMorgan Chase Bank, N.A. | | | 509,054,400 | | | | JPY | | | | 06/01/20 | | | $ | 4,811,251 | | | $ | 4,747,955 | | | $ | 63,296 | |
Citibank N.A., New York | | | 12,524,000 | | | | ILS | | | | 04/30/21 | | | | 3,658,245 | | | | 3,602,245 | | | | 56,000 | |
Morgan Stanley Capital Services LLC | | | 5,010,000 | | | | EUR | | | | 06/30/20 | | | | 5,578,484 | | | | 5,542,248 | | | | 36,236 | |
Bank of America, N.A. | | | 5,454,000 | | | | ILS | | | | 04/30/21 | | | | 1,586,157 | | | | 1,568,720 | | | | 17,437 | |
Goldman Sachs International | | | 56,471,082 | | | | JPY | | | | 06/22/20 | | | | 534,438 | | | | 527,165 | | | | 7,273 | |
Goldman Sachs International | | | 724,881 | | | | ILS | | | | 04/30/20 | | | | 208,691 | | | | 204,907 | | | | 3,784 | |
JPMorgan Chase Bank, N.A. | | | 156,375 | | | | EUR | | | | 07/30/20 | | | | 176,707 | | | | 173,146 | | | | 3,561 | |
Bank of America, N.A. | | | 684,200 | | | | ILS | | | | 02/01/21 | | | | 199,912 | | | | 196,420 | | | | 3,492 | |
Goldman Sachs International | | | 89,250 | | | | EUR | | | | 07/30/20 | | | | 101,451 | | | | 98,822 | | | | 2,629 | |
Deutsche Bank AG | | | 40,961,962 | | | | KRW | | | | 05/11/20 | | | | 34,401 | | | | 33,670 | | | | 731 | |
Deutsche Bank AG | | | 41,872,227 | | | | KRW | | | | 08/05/20 | | | | 35,288 | | | | 34,558 | | | | 730 | |
Deutsche Bank AG | | | 41,872,227 | | | | KRW | | | | 11/04/20 | | | | 35,395 | | | | 34,680 | | | | 715 | |
Deutsche Bank AG | | | 41,872,227 | | | | KRW | | | | 02/04/21 | | | | 35,501 | | | | 34,787 | | | | 714 | |
Deutsche Bank AG | | | 40,506,828 | | | | KRW | | | | 05/07/21 | | | | 34,430 | | | | 33,739 | | | | 691 | |
Citibank N.A., New York | | | 124,340 | | | | ILS | | | | 04/30/20 | | | | 35,729 | | | | 35,148 | | | | 581 | |
Bank of America, N.A. | | | 54,148 | | | | ILS | | | | 04/30/20 | | | | 15,494 | | | | 15,306 | | | | 188 | |
Citibank N.A., New York | | | 456,000 | | | | JPY | | | | 01/04/21 | | | | 4,450 | | | | 4,283 | | | | 167 | |
Barclays Bank plc | | | 421,500 | | | | JPY | | | | 01/04/21 | | | | 4,106 | | | | 3,959 | | | | 147 | |
Citibank N.A., New York | | | 456,000 | | | | JPY | | | | 07/01/20 | | | | 4,404 | | | | 4,258 | | | | 146 | |
Barclays Bank plc | | | 421,500 | | | | JPY | | | | 07/01/20 | | | | 4,066 | | | | 3,936 | | | | 130 | |
Citibank N.A., New York | | | 690,000,000 | | | | JPY | | | | 04/13/20 | | | | 6,305,373 | | | | 6,421,807 | | | | (116,434 | ) |
| | | | | | | | | | | | | | | | | | | | | | | $ | 38,639,706 | |
| Counterparty | | Contracts to
Buy | | | Currency | | | Settlement
Date | | Settlement
Value | | | Value at
March 31,
2020 | | | Unrealized
Appreciation
(Depreciation) | |
| JPMorgan Chase Bank, N.A. | | | 3,702,650,400 | | | | JPY | | | 06/01/20 | | $ | 33,410,789 | | | $ | 34,534,656 | | | $ | 1,123,867 | |
| Barclays Bank plc | | | 32,995,625 | | | | EUR | | | 07/30/21 | | | 35,907,159 | | | | 36,930,267 | | | | 1,023,108 | |
| Goldman Sachs International | | | 117,465,319 | | | | ILS | | | 02/01/21 | | | 32,919,631 | | | | 33,721,950 | | | | 802,319 | |
| Citibank N.A., New York | | | 3,433,716,000 | | | | JPY | | | 09/01/20 | | | 31,534,529 | | | | 32,133,693 | | | | 599,164 | |
| Goldman Sachs International | | | 55,355,850 | | | | ILS | | | 01/31/22 | | | 15,359,558 | | | | 15,891,862 | | | | 532,304 | |
| Goldman Sachs International | | | 45,495,450 | | | | ILS | | | 04/30/21 | | | 12,689,086 | | | | 13,085,735 | | | | 396,649 | |
| Citibank N.A., New York | | | 1,397,698,500 | | | | JPY | | | 06/22/20 | | | 12,681,563 | | | | 13,047,690 | | | | 366,127 | |
| JPMorgan Chase Bank, N.A. | | | 1,755,877,500 | | | | JPY | | | 07/01/21 | | | 16,249,098 | | | | 16,574,613 | | | | 325,515 | |
| JPMorgan Chase Bank, N.A. | | | 45,495,450 | | | | ILS | | | 04/30/21 | | | 12,819,230 | | | | 13,085,735 | | | | 266,505 | |
| JPMorgan Chase Bank, N.A. | | | 56,471,082 | | | | JPY | | | 06/22/20 | | | 510,229 | | | | 527,165 | | | | 16,936 | |
| Barclays Bank plc | | | 245,625 | | | | EUR | | | 07/30/20 | | | 264,412 | | | | 271,967 | | | | 7,555 | |
| Goldman Sachs International | | | 451,684 | | | | ILS | | | 04/30/20 | | | 124,140 | | | | 127,680 | | | | 3,540 | |
| JPMorgan Chase Bank, N.A. | | | 451,684 | | | | ILS | | | 04/30/20 | | | 125,492 | | | | 127,680 | | | | 2,188 | |
| JPMorgan Chase Bank, N.A. | | | 877,500 | | | | JPY | | | 01/04/21 | | | 8,074 | | | | 8,242 | | | | 168 | |
| JPMorgan Chase Bank, N.A. | | | 877,500 | | | | JPY | | | 07/01/20 | | | 8,030 | | | | 8,195 | | | | 165 | |
| JPMorgan Chase Bank, N.A. | | | 60,205,000 | | | | BRL | | | 07/01/21 | | | 11,667,636 | | | | 11,381,021 | | | | (286,615 | ) |
| Goldman Sachs International | | | 70,200,000 | | | | BRL | | | 07/01/20 | | | 13,811,935 | | | | 13,500,260 | | | | (311,675 | ) |
| Citibank N.A., New York | | | 119,515,000 | | | | BRL | | | 07/01/21 | | | 22,919,924 | | | | 22,592,853 | | | | (327,071 | ) |
| JPMorgan Chase Bank, N.A. | | | 24,376,480 | | | | EUR | | | 06/15/20 | | | 27,439,726 | | | | 26,951,284 | | | | (488,442 | ) |
| Goldman Sachs International | | | 26,208,000 | | | | EUR | | | 04/30/20 | | | 29,454,988 | | | | 28,923,916 | | | | (531,072 | ) |
| Goldman Sachs International | | | 93,700,000 | | | | MXN | | | 04/23/20 | | | 4,859,580 | | | | 3,938,608 | | | | (920,972 | ) |
| Goldman Sachs International | | | 141,700,000 | | | | MXN | | | 05/21/20 | | | 7,069,165 | | | | 5,932,180 | | | | (1,136,985 | ) |
| Goldman Sachs International | | | 206,200,000 | | | | MXN | | | 04/08/20 | | | 10,724,279 | | | | 8,685,712 | | | | (2,038,567 | ) |
| Morgan Stanley Capital Services LLC | | | 173,420,000 | | | | BRL | | | 04/01/20 | | | 37,042,775 | | | | 33,409,753 | | | | (3,633,022 | ) |
| JPMorgan Chase Bank, N.A. | | | 541,950,000 | | | | MXN | | | 04/02/20 | | | 28,211,134 | | | | 22,847,615 | | | | (5,363,519 | ) |
| | | | | | | | | | | | | | | | | | | | | $ | (9,571,830 | ) |
SEE NOTES TO FINANCIAL STATEMENTS. | THE GUGGENHEIM FUNDS SEMI-ANNUAL REPORT | 21 |
SCHEDULE OF INVESTMENTS (Unaudited)(continued) | March 31, 2020 |
LIMITED DURATION FUND | |
~ | The face amount is denominated in U.S. dollars unless otherwise indicated. |
** | Includes cumulative appreciation (depreciation). Variation margin is reported within the Statement of Assets and Liabilities. |
† | Value determined based on Level 1 inputs — See Note 4. |
†† | Value determined based on Level 2 inputs, unless otherwise noted — See Note 4. |
††† | Value determined based on Level 3 inputs — See Note 4. |
1 | Affiliated issuer. |
2 | Rate indicated is the 7-day yield as of March 31, 2020. |
3 | Security is a 144A or Section 4(a)(2) security. These securities have been determined to be liquid under guidelines established by the Board of Trustees. The total market value of 144A or Section 4(a)(2) securities is $1,171,153,312 (cost $1,231,417,333), or 42.3% of total net assets. |
4 | Variable rate security. Rate indicated is the rate effective at March 31, 2020. In some instances, the effective rate is limited by a minimum rate floor or a maximum rate cap established by the issuer. The settlement status of a position may also impact the effective rate indicated. In some cases, a position may be unsettled at period end and may not have a stated effective rate. In instances where multiple underlying reference rates and spread amounts are shown, the effective rate is based on a weighted average. |
5 | Security is a step up/down bond. The coupon increases or decreases at regular intervals until the bond reaches full maturity. Rate indicated is the rate at March 31, 2020. See table below for additional step information for each security. |
6 | Security is an interest-only strip. |
7 | Security has no stated coupon. However, it is expected to receive residual cash flow payments on defined deal dates. |
8 | Security is a 144A or Section 4(a)(2) security. These securities have been determined to be illiquid and restricted under guidelines established by the Board of Trustees. The total market value of 144A or Section 4(a)(2) illiquid and restricted securities is $51,137 (cost $98,116), or less than 0.1% of total net assets — See Note 8. |
9 | Security was fair valued by the Valuation Committee at March 31, 2020. The total market value of fair valued securities amounts to $63,333,333, (cost $63,333,333) or 2.3% of total net assets. |
10 | All or a portion of this security is pledged as collateral for open call options written contracts at March 31, 2020. |
11 | Repurchase Agreements — The interest rate on repurchase agreements is market driven and based on the underlying collateral obtained. See additional disclosure in the repurchase agreements table below for more information on repurchase agreements. |
12 | Rate indicated is the effective yield at the time of purchase. |
13 | The rate is adjusted periodically by the counterparty, allows the holder to tender the security upon a rate reset, and is not based upon a set reference rate and spread. Rate indicated is the rate effective at March 31, 2020. |
| | BofA — Bank of America |
| | BRL — Brazilian Real |
| | CDX.NA.HY.33.V3 — Credit Default Swap North American High Yield Series 33 Index |
| | CME — Chicago Mercantile Exchange |
| | CMS — Constant Maturity Swap |
| | EUR — Euro |
| | ICE — Intercontinental Exchange |
| | ILS — Israeli New Shekel |
| | JPY — Japanese Yen |
| | KRW — South Korean Won |
| | LIBOR — London Interbank Offered Rate |
| | MXN — Mexican Peso |
| | plc — Public Limited Company |
| | REIT — Real Estate Investment Trust |
| | VRDN — Variable Rate Demand Note |
| | WAC — Weighted Average Coupon |
| | |
| | See Sector Classification in Other Information section. |
22 | THE GUGGENHEIM FUNDS SEMI-ANNUAL REPORT | SEE NOTES TO FINANCIAL STATEMENTS. |
SCHEDULE OF INVESTMENTS (Unaudited)(continued) | March 31, 2020 |
LIMITED DURATION FUND | |
The following table summarizes the inputs used to value the Fund’s investments at March 31, 2020 (See Note 4 in the Notes to Financial Statements):
Investments in Securities (Assets) | | Level 1
Quoted
Prices | | | Level 2
Significant
Observable
Inputs | | | Level 3
Significant
Unobservable
Inputs | | | Total | |
Exchange-Traded Funds | | $ | 4,295,111 | | | $ | — | | | $ | — | | | $ | 4,295,111 | |
Mutual Funds | | | 21,094,279 | | | | — | | | | — | | | | 21,094,279 | |
Money Market Fund | | | 421,741,465 | | | | — | | | | — | | | | 421,741,465 | |
Collateralized Mortgage Obligations | | | — | | | | 744,231,230 | | | | — | | | | 744,231,230 | |
Asset-Backed Securities | | | — | | | | 590,962,668 | | | | 87,529,597 | | | | 678,492,265 | |
Corporate Bonds | | | — | | | | 471,503,927 | | | | — | | | | 471,503,927 | |
U.S. Government Securities | | | — | | | | 245,552,990 | | | | — | | | | 245,552,990 | |
Municipal Bonds | | | — | | | | 22,840,000 | | | | — | | | | 22,840,000 | |
Foreign Government Debt | | | — | | | | 17,623,849 | | | | — | | | | 17,623,849 | |
Senior Floating Rate Interests | | | — | | | | 79,124 | | | | — | | | | 79,124 | |
Repurchase Agreements | | | — | | | | 150,940,148 | | | | — | | | | 150,940,148 | |
Commercial Paper | | | — | | | | 25,304,173 | | | | — | | | | 25,304,173 | |
Options Purchased | | | — | | | | 2,291,870 | | | | — | | | | 2,291,870 | |
Credit Default Swap Agreements** | | | — | | | | 400,689 | | | | — | | | | 400,689 | |
Interest Rate Swap Agreements** | | | — | | | | 12,828,789 | | | | — | | | | 12,828,789 | |
Forward Foreign Currency Exchange Contracts** | | | — | | | | 44,222,250 | | | | — | | | | 44,222,250 | |
Total Return Swap Agreements** | | | — | | | | 687,056 | | | | — | | | | 687,056 | |
Total Assets | | $ | 447,130,855 | | | $ | 2,329,468,763 | | | $ | 87,529,597 | | | $ | 2,864,129,215 | |
Investments in Securities (Liabilities) | | Level 1
Quoted
Prices | | | Level 2
Significant
Observable
Inputs | | | Level 3
Significant
Unobservable
Inputs | | | Total | |
Forward Foreign Currency Exchange Contracts** | | $ | — | | | $ | 15,154,374 | | | $ | — | | | $ | 15,154,374 | |
Total Return Swap Agreements** | | | — | | | | 121,968 | | | | — | | | | 121,968 | |
Total Liabilities | | $ | — | | | $ | 15,276,342 | | | $ | — | | | $ | 15,276,342 | |
** | This derivative is reported as unrealized appreciation/depreciation at period end. |
The following is a summary of significant unobservable inputs used in the fair valuation of assets and liabilities categorized within Level 3 of the fair value hierarchy:
Category | | Ending Balance at
March 31, 2020 | | Valuation Technique | Unobservable Inputs | | Input Range | | | Weighted
Average | |
Assets: | | | | | | | | | | | | | | |
Asset-Backed Securities | | $ | 63,333,333 | | Model Price | Purchase Price | | | — | | | | — | |
Asset-Backed Securities | | | 23,794,312 | | Option Adjusted Spread off prior month broker quote | Broker Quote | | | — | | | | — | |
Asset-Backed Securities | | | 401,952 | | Third Party Pricing | Broker Quote | | | — | | | | — | |
Total | | $ | 87,529,597 | | | | | | | | | | | |
Significant changes in a quote would generally result in significant changes in the fair value of the security.
The Fund’s fair valuation leveling guidelines were revised to classify a single daily broker quote, or a vendor price based on a single daily or monthly broker quote, as Level 3 rather than Level 2, if such a quote or price cannot be supported with other available market information.
SEE NOTES TO FINANCIAL STATEMENTS. | THE GUGGENHEIM FUNDS SEMI-ANNUAL REPORT | 23 |
SCHEDULE OF INVESTMENTS (Unaudited)(continued) | March 31, 2020 |
LIMITED DURATION FUND | |
Transfers between Level 2 and Level 3 may occur as markets fluctuate and/or the availability of data used in an investment’s valuation changes. For the period ended March 31, 2020, the Fund had securities with a total value of $32,785,285 transfer into Level 3 from Level 2 due to lack of observable inputs.
Summary of Fair Value Level 3 Activity
Following is a reconciliation of Level 3 assets for which significant unobservable inputs were used to determine fair value for the period ended March 31, 2020:
| | | Assets | | | Liabilities | |
| | Asset-Backed
Securities | | | Unfunded Loan
Commitments | |
Beginning Balance | | $ | 29,300,000 | | | $ | (6,385 | ) |
Purchases/(Receipts) | | | 25,572,405 | | | | — | |
(Sales, maturities and paydowns)/Fundings | | | — | | | | 5,502 | |
Amortization of premiums/discounts | | | — | | | | — | |
Total realized gains (losses) included in earnings | | | — | | | | (4,127 | ) |
Total change in unrealized appreciation (depreciation) included in earnings | | | (128,093 | ) | | | 5,010 | |
Transfers into Level 3 | | | 32,785,285 | | | | — | |
Ending Balance | | $ | 87,529,597 | | | $ | — | |
Net change in unrealized appreciation (depreciation) for investments in Level 3 securities still held at March 31, 2020 | | $ | (128,093 | ) | | $ | — | |
Step Coupon Bonds
The following table discloses additional information related to step coupon bonds held by the Fund. Certain securities are subject to multiple rate changes prior to maturity. For those securities a range of rates and corresponding dates have been provided. Rates for all step coupon bonds held by the Fund are scheduled to increase, none are scheduled to decrease.
Name | | Coupon Rate at
Next Reset Date | | | Next Rate
Reset Date | | | Future
Reset Rate | | | Future
Reset Date | |
Legacy Mortgage Asset Trust 2018-GS3, 4.00% due 06/25/58 | | | 7.00 | % | | | 07/25/21 | | | | 8.00 | % | | | 07/26/22 | |
Verus Securitization Trust 2019-4, 2.64% due 11/25/59 | | | 3.64 | % | | | 10/26/23 | | | | — | | | | — | |
Repurchase Agreements
The Fund may engage in repurchase agreements. Repurchase agreements are fixed income securities in the form of agreements backed by collateral. These agreements typically involve the acquisition by the Fund of securities from the selling institution coupled with the agreement that the selling institution will repurchase the underlying securities at a specified price and at a fixed time in the future. The Fund may accept a wide variety of underlying securities as collateral for the repurchase agreements entered into by the Fund. Any such securities serving as collateral are marked-to-market daily in order to maintain full collateralization. Securities purchased under repurchase agreements are reflected as an asset on the Statement of Assets and Liabilities. Interest earned is recorded as a component of interest income on the Statement of Operations.
In connection with transactions in repurchase agreements, it is the Fund’s policy that its custodian take possession of the underlying collateral. The collateral is in the possession of the Fund’s custodian and is evaluated to ensure that its market value exceeds, at a minimum, 102% of the original face amount of the repurchase agreements.
The use of repurchase agreements involves certain risks. For example, if the selling institution defaults on its obligation to repurchase the underlying securities at a time when the value of securities has declined, the Fund may incur a loss upon disposition of them. In the event of an insolvency or bankruptcy by the selling institution, the Fund’s right to control the collateral could be affected and result in certain costs and delays. In addition, the Fund could incur a loss if the value of the underlying collateral falls below the agreed upon repurchase price.
24 | THE GUGGENHEIM FUNDS SEMI-ANNUAL REPORT | SEE NOTES TO FINANCIAL STATEMENTS. |
SCHEDULE OF INVESTMENTS (Unaudited)(continued) | March 31, 2020 |
LIMITED DURATION FUND | |
At March 31, 2020, the repurchase agreements in the account were as follows:
Counterparty and
Terms of Agreement | | Face
Value | | | Repurchase
Price | | | Collateral | | Par
Value | | | Fair
Value | |
BNP Paribas | | | | | | | | | | RALI Series Trust | | | | | | | | |
1.93% | | | | | | | | | | 1.25% | | | | | | | | |
05/04/20 | | $ | 56,640,063 | | | $ | 56,868,456 | | | 08/25/35 | | $ | 169,917,000 | | | $ | 132,212,418 | |
| | | | | | | | | | | RBSSP Resecuritization Trust | | | | | | | | |
| | | | | | | | | | | 4.46% | | | | | | | | |
| | | | | | | | | | | 07/26/45 | | | 20,149,996 | | | | 16,688,227 | |
| | | | | | | | | | | Morgan Stanley ABS Capital I Inc. Trust | | | | | | | | |
| | | | | | | | | | | 1.10% | | | | | | | | |
| | | | | | | | | | | 11/25/36 | | | 27,790,000 | | | | 15,531,831 | |
| | | | | | | | | | | Nationstar Home Equity Loan Trust | | | | | | | | |
| | | | | | | | | | | 1.27% | | | | | | | | |
| | | | | | | | | | | 04/25/37 | | | 11,626,000 | | | | 9,893,726 | |
| | | | | | | | | | | Structured Asset Securities Corp. Mortgage Loan Trust | | | | | | | | |
| | | | | | | | | | | 1.15% | | | | | | | | |
| | | | | | | | | | | 06/25/37 | | | 10,213,000 | | | | 5,702,939 | |
| | | | | | | | | | | | | | 239,695,996 | | | | 180,029,141 | |
| | | | | | | | | | | | | | | | | | | |
Societe Generale | | | | | | | | | | Cash Collateral | | | 22,895,000 | | | | 22,895,000 | |
1.18% - 2.27% 04/01/20 | | | 94,300,085 | | | | 94,633,476 | | | Fannie Mae Connecticut Avenue Securities | | | | | | | | |
| | | | | | | | | | | 3.30% | | | | | | | | |
| | | | | | | | | | | 01/25/31 | | | 13,562,000 | | | | 11,389,368 | |
| | | | | | | | | | | Freddie Mac Structured Agency Credit Risk Debt Notes | | | | | | | | |
| | | | | | | | | | | 5.60% | | | | | | | | |
| | | | | | | | | | | 10/25/28 | | | 10,873,847 | | | | 10,330,155 | |
| | | | | | | | | | | Freddie Mac Stacr Remic Trust | | | | | | | | |
| | | | | | | | | | | 3.91% | | | | | | | | |
| | | | | | | | | | | 03/25/50 | | | 15,020,000 | | | | 9,665,370 | |
| | | | | | | | | | | Freddie Mac Structured Agency Credit Risk Debt Notes | | | | | | | | |
| | | | | | | | | | | 3.60% | | | | | | | | |
| | | | | | | | | | | 12/25/29 | | | 9,826,000 | | | | 7,957,095 | |
| | | | | | | | | | | Fannie Mae Connecticut Avenue Securities | | | | | | | | |
| | | | | | | | | | | 3.95% | | | | | | | | |
| | | | | | | | | | | 10/25/29 | | | 8,891,336 | | | | 7,873,278 | |
| | | | | | | | | | | Fannie Mae Connecticut Avenue Securities | | | | | | | | |
| | | | | | | | | | | 4.60% | | | | | | | | |
| | | | | | | | | | | 09/25/29 | | | 9,411,473 | | | | 6,793,201 | |
| | | | | | | | | | | Connecticut Avenue Securities Trust | | | | | | | | |
| | | | | | | | | | | 3.35% | | | | | | | | |
| | | | | | | | | | | 04/25/31 | | | 6,388,294 | | | | 5,461,352 | |
| | | | | | | | | | | Waikiki Beach Hotel Trust | | | | | | | | |
| | | | | | | | | | | 3.79% | | | | | | | | |
| | | | | | | | | | | 12/15/33 | | | 8,730,000 | | | | 5,458,869 | |
| | | | | | | | | | | Ashford Hospitality Trust | | | | | | | | |
| | | | | | | | | | | 3.80% | | | | | | | | |
| | | | | | | | | | | 04/15/35 | | | 7,250,000 | | | | 5,424,450 | |
SEE NOTES TO FINANCIAL STATEMENTS. | THE GUGGENHEIM FUNDS SEMI-ANNUAL REPORT | 25 |
SCHEDULE OF INVESTMENTS (Unaudited)(continued) | March 31, 2020 |
LIMITED DURATION FUND | |
Counterparty and
Terms of Agreement | | Face
Value | | | Repurchase
Price | | | Collateral | | Par
Value | | | Fair
Value | |
| | | | | | | | | | | GS Mortgage Securities Corp. Trust | | | | | | | | |
| | | | | | | | | | | 4.70% | | | | | | | | |
| | | | | | | | | | | 07/15/32 | | $ | 6,066,000 | | | $ | 5,253,762 | |
| | | | | | | | | | | Citigroup Commercial Mortgage Trust | | | | | | | | |
| | | | | | | | | | | 3.50% | | | | | | | | |
| | | | | | | | | | | 12/15/36 | | | 7,389,000 | | | | 4,706,793 | |
| | | | | | | | | | | Credit Suisse Mortgage Capital Certificates | | | | | | | | |
| | | | | | | | | | | 3.35% | | | | | | | | |
| | | | | | | | | | | 05/15/36 | | | 5,000,000 | | | | 3,751,000 | |
| | | | | | | | | | | Atrium Hotel Portfolio Trust | | | | | | | | |
| | | | | | | | | | | 4.10% | | | | | | | | |
| | | | | | | | | | | 06/15/35 | | | 4,361,000 | | | | 3,186,147 | |
| | | | | | | | | | | Carlyle Global Market Strategies CLO Ltd. | | | | | | | | |
| | | | | | | | | | | 9.09% | | | | | | | | |
| | | | | | | | | | | 04/22/32 | | | 4,592,000 | | | | 2,847,499 | |
| | | | | | | | | | | HMH Trust | | | | | | | | |
| | | | | | | | | | | 8.48% | | | | | | | | |
| | | | | | | | | | | 07/05/31 | | | 1,830,000 | | | | 1,589,355 | |
| | | | | | | | | | | Hilton USA Trust | | | | | | | | |
| | | | | | | | | | | 4.33% | | | | | | | | |
| | | | | | | | | | | 11/05/38 | | | 1,814,000 | | | | 1,003,142 | |
| | | | | | | | | | | Connecticut Avenue Securities Trust | | | | | | | | |
| | | | | | | | | | | 3.05% | | | | | | | | |
| | | | | | | | | | | 06/25/39 | | | 306,000 | | | | 248,870 | |
| | | | | | | | | | | | | | 144,205,950 | | | | 115,834,706 | |
Affiliated Transactions
Investments representing 5% or more of the outstanding voting shares of a company, or control of or by, or common control under Guggenheim Investments (“GI”), result in that company being considered an affiliated issuer, as defined in the 1940 Act.
The Fund may invest in certain of the underlying series of Guggenheim Strategy Funds Trust, including Guggenheim Strategy Fund II and Guggenheim Strategy Fund III, (collectively, the “Short Term Investment Vehicles”), each of which are open-end management investment companies managed by GI. The Short Term Investment Vehicles, which launched on March 11, 2014, are offered as short term investment options only to mutual funds, trusts, and other accounts managed by GI and/or its affiliates, and are not available to the public. The Short Term Investment Vehicles pay no investment management fees. The Short Term Investment Vehicles’ annual report on Form N-CSR dated September 30, 2019, is available publicly or upon request. This information is available from the EDGAR database on the SEC’s website at https://www.sec.gov/Archives/edgar/data/1601445/000089180419000405/gug78512-ncsr.htm.
26 | THE GUGGENHEIM FUNDS SEMI-ANNUAL REPORT | SEE NOTES TO FINANCIAL STATEMENTS. |
SCHEDULE OF INVESTMENTS (Unaudited)(concluded) | March 31, 2020 |
LIMITED DURATION FUND | |
Transactions during the period ended March 31, 2020, in which the company is an affiliated issuer, were as follows:
Security Name | | Value
09/30/19 | | | Additions | | | Reductions | | | Realized
Gain (Loss) | | | Change in
Unrealized
Appreciation
(Depreciation) | | | Value
03/31/20 | | | Shares
03/31/20 | | | Investment
Income | |
Mutual Funds | | | | | | | | | | | | | | | | | | | | | | | | | | | | | | | | |
Guggenheim Floating Rate Strategies Fund — R6-Class | | $ | 20,181,794 | | | $ | 19,169 | | | $ | (20,115,702 | ) | | $ | (715,383 | ) | | $ | 630,122 | | | $ | — | | | | — | | | $ | 19,169 | |
Guggenheim Strategy Fund II | | | 12,723,014 | | | | 175,487 | | | | — | | | | — | | | | (404,154 | ) | | | 12,494,347 | | | | 519,515 | | | | 175,487 | |
Guggenheim Strategy Fund III | | | 10,915,565 | | | | 146,828 | | | | (10,662,075 | ) | | | (481,526 | ) | | | 81,208 | | | | — | | | | — | | | | 132,141 | |
Guggenheim Ultra Short Duration Fund — Institutional Class | | | 8,676,684 | | | | 90,162 | | | | — | | | | — | | | | (166,914 | ) | | | 8,599,932 | | | | 880,239 | | | | 90,163 | |
| | | $ | 52,497,057 | | | $ | 431,646 | | | $ | (30,777,777 | ) | | $ | (1,196,909 | ) | | $ | 140,262 | | | $ | 21,094,279 | | | | | | | $ | 416,960 | |
SEE NOTES TO FINANCIAL STATEMENTS. | THE GUGGENHEIM FUNDS SEMI-ANNUAL REPORT | 27 |
STATEMENT OF ASSETS AND LIABILITIES (Unaudited) |
March 31, 2020 |
Assets: |
Investments in unaffiliated issuers, at value (cost $2,702,565,078) | | $ | 2,633,956,004 | |
Investments in affiliated issuers, at value (cost $21,718,456) | | | 21,094,279 | |
Repurchase agreements, at value (cost $150,940,148) | | | 150,940,148 | |
Cash | | | 13,369,131 | |
Segregated cash with broker | | | 1,495,923 | |
Unamortized upfront premiums paid on interest rate swap agreements | | | 2,794 | |
Unrealized appreciation on OTC swap agreements | | | 687,056 | |
Unrealized appreciation on forward foreign currency exchange contracts | | | 44,222,250 | |
Prepaid expenses | | | 155,135 | |
Receivables: |
Fund shares sold | | | 15,141,816 | |
Interest | | | 7,518,095 | |
Securities sold | | | 4,290,379 | |
Swap settlement | | | 2,564,115 | |
Foreign tax reclaims | | | 91,443 | |
Dividends | | | 69,547 | |
Protection fees on credit default swap agreements | | | 20,433 | |
Total assets | | | 2,895,618,548 | |
| | | | | |
Liabilities: |
Segregated cash due to broker | | | 56,382,566 | |
Unamortized upfront premiums received on credit default swap agreements | | | 1,148,151 | |
Unrealized depreciation on OTC swap agreements | | | 121,968 | |
Unrealized depreciation on forward foreign currency exchange contracts | | | 15,154,374 | |
Payable for: |
Securities purchased | | | 34,849,978 | |
Fund shares redeemed | | | 10,151,314 | |
Variation margin on interest rate swap agreements | | | 3,256,610 | |
Distributions to shareholders | | | 929,506 | |
Management fees | | | 722,281 | |
Transfer agent/maintenance fees | | | 260,763 | |
Distribution and service fees | | | 181,077 | |
Fund accounting/administration fees | | | 148,483 | |
Variation margin on credit default swap agreements | | | 145,862 | |
Trustees’ fees* | | | 20,785 | |
Due to Investment Adviser | | | 4,152 | |
Miscellaneous | | | 277,668 | |
Total liabilities | | | 123,755,538 | |
Net assets | | $ | 2,771,863,010 | |
| | | | | |
Net assets consist of: |
Paid in capital | | $ | 2,821,081,368 | |
Total distributable earnings (loss) | | | (49,218,358 | ) |
Net assets | | $ | 2,771,863,010 | |
| | | | | |
A-Class: |
Net assets | | $ | 449,936,696 | |
Capital shares outstanding | | | 18,468,144 | |
Net asset value per share | | $ | 24.36 | |
Maximum offering price per share (Net asset value divided by 97.75%) | | $ | 24.92 | |
| | | | | |
C-Class: |
Net assets | | $ | 81,546,238 | |
Capital shares outstanding | | | 3,349,363 | |
Net asset value per share | | $ | 24.35 | |
| | | | | |
P-Class: |
Net assets | | $ | 77,864,054 | |
Capital shares outstanding | | | 3,196,145 | |
Net asset value per share | | $ | 24.36 | |
| | | | | |
Institutional Class: |
Net assets | | $ | 2,064,107,101 | |
Capital shares outstanding | | | 84,741,128 | |
Net asset value per share | | $ | 24.36 | |
| | | | | |
R6-Class: |
Net assets | | $ | 98,408,921 | |
Capital shares outstanding | | | 4,042,395 | |
Net asset value per share | | $ | 24.34 | |
* | Relates to Trustees not deemed “interested persons” within the meaning of Section 2(a)(19) of the 1940 Act. |
28 | THE GUGGENHEIM FUNDS SEMI-ANNUAL REPORT | SEE NOTES TO FINANCIAL STATEMENTS. |
STATEMENT OF OPERATIONS (Unaudited) |
Six-Month Period Ended March 31, 2020 |
Investment Income: |
Dividends from securities of unaffiliated issuers | | $ | 603,351 | |
Dividends from securities of affiliated issuers | | | 416,960 | |
Interest from unaffiliated issuers | | | 39,726,049 | |
Total investment income | | | 40,746,360 | |
| | | | | |
Expenses: |
Management fees | | | 6,383,258 | |
Distribution and service fees: |
A-Class | | | 665,511 | |
C-Class | | | 418,324 | |
P-Class | | | 117,525 | |
Transfer agent/maintenance fees: |
A-Class | | | 216,556 | |
C-Class | | | 40,515 | |
P-Class | | | 87,940 | |
Institutional Class | | | 1,027,796 | |
R6-Class | | | 593 | |
Fund accounting/administration fees | | | 1,262,763 | |
Custodian fees | | | 196,335 | |
Professional fees | | | 143,774 | |
Line of credit fees | | | 87,112 | |
Trustees’ fees* | | | 66,242 | |
Miscellaneous | | | 320,914 | |
Recoupment of previously waived fees: |
A-Class | | | 1,377 | |
C-Class | | | 623 | |
P-Class | | | 106 | |
Institutional Class | | | 1,111 | |
R6-Class | | | 1,754 | |
Total expenses | | | 11,040,129 | |
Less: |
Expenses reimbursed by Adviser: |
A Class | | | (212,631 | ) |
C Class | | | (39,828 | ) |
P Class | | | (87,126 | ) |
Institutional Class | | | (1,008,971 | ) |
R6 Class | | | (429 | ) |
Expenses waived by Adviser | | | (207,335 | ) |
Earnings credits applied | | | (41,824 | ) |
Total waived/reimbursed expenses | | | (1,598,144 | ) |
Net expenses | | | 9,441,985 | |
Net investment income | | | 31,304,375 | |
| | | | | |
Net Realized and Unrealized Gain (Loss): |
Net realized gain (loss) on: |
Investments in unaffiliated issuers | | $ | (13,790,331 | ) |
Investments in affiliated issuers | | | (1,196,909 | ) |
Swap agreements | | | 17,996,442 | |
Futures contracts | | | 859,141 | |
Forward foreign currency exchange contracts | | | 2,565,708 | |
Foreign currency transactions | | | 1,130,280 | |
Net realized gain | | | 7,564,331 | |
Net change in unrealized appreciation (depreciation) on: |
Investments in unaffiliated issuers | | | (87,908,076 | ) |
Investments in affiliated issuers | | | 140,262 | |
Swap agreements | | | 23,280,323 | |
Options purchased | | | 474,261 | |
Forward foreign currency exchange contracts | | | 18,081,581 | |
Foreign currency translations | | | (29,615 | ) |
Net change in unrealized appreciation (depreciation) | | | (45,961,264 | ) |
Net realized and unrealized loss | | | (38,396,933 | ) |
Net decrease in net assets resulting from operations | | $ | (7,092,558 | ) |
* | Relates to Trustees not deemed “interested persons” within the meaning of Section 2(a)(19) of the 1940 Act. |
SEE NOTES TO FINANCIAL STATEMENTS. | THE GUGGENHEIM FUNDS SEMI-ANNUAL REPORT | 29 |
STATEMENTS OF CHANGES IN NET ASSETS |
| | Six-Month
Period Ended
March 31,
2020
(Unaudited) | | | Year Ended
September 30,
2019 | |
Increase (Decrease) in Net Assets from Operations: | | | | | | | | |
Net investment income | | $ | 31,304,375 | | | $ | 89,348,269 | |
Net realized gain (loss) on investments | | | 7,564,331 | | | | (18,621,599 | ) |
Net change in unrealized appreciation (depreciation) on investments | | | (45,961,264 | ) | | | 21,087,059 | |
Net increase (decrease) in net assets resulting from operations | | | (7,092,558 | ) | | | 91,813,729 | |
| | | | | | | | | |
Distributions to shareholders: | | | | | | | | |
A-Class | | | (4,946,327 | ) | | | (14,490,141 | ) |
C-Class | | | (462,525 | ) | | | (1,345,090 | ) |
P-Class | | | (877,313 | ) | | | (3,585,141 | ) |
Institutional Class | | | (23,541,695 | ) | | | (70,974,312 | ) |
R6-Class | | | (3,455,381 | ) | | | (4,640,230 | ) |
Total distributions to shareholders | | | (33,283,241 | ) | | | (95,034,914 | ) |
| | | | | | | | | |
Capital share transactions: | | | | | | | | |
Proceeds from sale of shares | | | | | | | | |
A-Class | | | 110,282,577 | | | | 309,962,216 | |
C-Class | | | 13,691,983 | | | | 41,603,888 | |
P-Class | | | 11,864,142 | | | | 71,749,161 | |
Institutional Class | | | 649,395,095 | | | | 1,798,075,210 | |
R6-Class | | | 54,366,919 | | | | 309,636,132 | |
Distributions reinvested | | | | | | | | |
A-Class | | | 3,962,842 | | | | 11,798,782 | |
C-Class | | | 364,398 | | | | 1,030,733 | |
P-Class | | | 873,389 | | | | 3,570,643 | |
Institutional Class | | | 18,909,170 | | | | 58,289,694 | |
R6-Class | | | 3,455,379 | | | | 4,640,204 | |
Cost of shares redeemed | | | | | | | | |
A-Class | | | (228,482,161 | ) | | | (378,427,690 | ) |
C-Class | | | (16,538,064 | ) | | | (28,468,610 | ) |
P-Class | | | (42,445,063 | ) | | | (156,281,336 | ) |
Institutional Class | | | (996,688,165 | ) | | | (2,061,077,029 | ) |
R6-Class | | | (270,996,702 | ) | | | (490,000 | ) |
Net decrease from capital share transactions | | | (687,984,261 | ) | | | (14,388,002 | ) |
Net decrease in net assets | | | (728,360,060 | ) | | | (17,609,187 | ) |
| | | | | | | | | |
Net assets: | | | | | | | | |
Beginning of period | | | 3,500,223,070 | | | | 3,517,832,257 | |
End of period | | $ | 2,771,863,010 | | | $ | 3,500,223,070 | |
| | | | | | | | | |
30 | THE GUGGENHEIM FUNDS SEMI-ANNUAL REPORT | SEE NOTES TO FINANCIAL STATEMENTS. |
STATEMENTS OF CHANGES IN NET ASSETS (concluded) |
| | Six-Month
Period Ended
March 31,
2020
(Unaudited) | | | Year Ended
September 30,
2019 | |
Capital share activity: | | | | | | | | |
Shares sold | | | | | | | | |
A-Class | | | 4,469,872 | | | | 12,576,401 | |
C-Class | | | 555,677 | | | | 1,689,208 | |
P-Class | | | 480,143 | | | | 2,910,455 | |
Institutional Class | | | 26,340,504 | | | | 72,971,122 | |
R6-Class | | | 2,203,494 | | | | 12,596,998 | |
Shares issued from reinvestment of distributions | | | | | | | | |
A-Class | | | 160,911 | | | | 478,517 | |
C-Class | | | 14,809 | | | | 41,842 | |
P-Class | | | 35,462 | | | | 144,833 | |
Institutional Class | | | 767,931 | | | | 2,365,246 | |
R6-Class | | | 140,350 | | | | 188,173 | |
Shares redeemed | | | | | | | | |
A-Class | | | (9,273,710 | ) | | | (15,351,648 | ) |
C-Class | | | (671,855 | ) | | | (1,155,901 | ) |
P-Class | | | (1,723,834 | ) | | | (6,342,173 | ) |
Institutional Class | | | (40,505,060 | ) | | | (83,680,392 | ) |
R6-Class | | | (11,066,750 | ) | | | (19,870 | ) |
Net decrease in shares | | | (28,072,056 | ) | | | (587,189 | ) |
SEE NOTES TO FINANCIAL STATEMENTS. | THE GUGGENHEIM FUNDS SEMI-ANNUAL REPORT | 31 |
This table is presented to show selected data for a share outstanding throughout each period and to assist shareholders in evaluating a Fund’s performance for the periods presented.
A-Class | | Period Ended
March 31,
2020a | | | Year Ended
September 30,
2019 | | | Year Ended
September 30,
2018 | | | Year Ended
September 30,
2017 | | | Year Ended
September 30,
2016 | | | Year Ended
September 30,
2015 | |
Per Share Data |
Net asset value, beginning of period | | $ | 24.68 | | | $ | 24.70 | | | $ | 24.86 | | | $ | 24.71 | | | $ | 24.65 | | | $ | 24.97 | |
Income (loss) from investment operations: |
Net investment income (loss)b | | | .21 | | | | .54 | | | | .51 | | | | .53 | | | | .67 | | | | .69 | |
Net gain (loss) on investments (realized and unrealized) | | | (.30 | ) | | | .01 | | | | (.09 | ) | | | .20 | | | | .08 | | | | (.16 | ) |
Total from investment operations | | | (.09 | ) | | | .55 | | | | .42 | | | | .73 | | | | .75 | | | | .53 | |
Less distributions from: |
Net investment income | | | (.23 | ) | | | (.57 | ) | | | (.57 | ) | | | (.58 | ) | | | (.69 | ) | | | (.84 | ) |
Net realized gains | | | — | | | | — | c | | | (.01 | ) | | | — | c | | | — | | | | (.01 | ) |
Total distributions | | | (.23 | ) | | | (.57 | ) | | | (.58 | ) | | | (.58 | ) | | | (.69 | ) | | | (.85 | ) |
Net asset value, end of period | | $ | 24.36 | | | $ | 24.68 | | | $ | 24.70 | | | $ | 24.86 | | | $ | 24.71 | | | $ | 24.65 | |
|
Total Returnd | | | (0.38 | %) | | | 2.27 | % | | | 1.69 | % | | | 2.95 | % | | | 3.16 | % | | | 2.15 | % |
Ratios/Supplemental Data |
Net assets, end of period (in thousands) | | $ | 449,937 | | | $ | 570,353 | | | $ | 627,570 | | | $ | 509,410 | | | $ | 215,856 | | | $ | 117,628 | |
Ratios to average net assets: |
Net investment income (loss) | | | 1.74 | % | | | 2.18 | % | | | 2.07 | % | | | 2.14 | % | | | 2.73 | % | | | 2.79 | % |
Total expensese | | | 0.85 | % | | | 0.83 | % | | | 0.81 | % | | | 0.86 | % | | | 0.93 | % | | | 0.99 | % |
Net expensesf,g,h | | | 0.75 | % | | | 0.75 | % | | | 0.75 | % | | | 0.81 | % | | | 0.84 | % | | | 0.87 | % |
Portfolio turnover rate | | | 27 | % | | | 72 | % | | | 45 | % | | | 55 | % | | | 39 | % | | | 26 | % |
C-Class | | Period Ended
March 31,
2020a | | | Year Ended
September 30,
2019 | | | Year Ended
September 30,
2018 | | | Year Ended
September 30,
2017 | | | Year Ended
September 30,
2016 | | | Year Ended
September 30,
2015 | |
Per Share Data |
Net asset value, beginning of period | | $ | 24.66 | | | $ | 24.68 | | | $ | 24.84 | | | $ | 24.70 | | | $ | 24.63 | | | $ | 24.96 | |
Income (loss) from investment operations: |
Net investment income (loss)b | | | .12 | | | | .35 | | | | .33 | | | | .35 | | | | .48 | | | | .49 | |
Net gain (loss) on investments (realized and unrealized) | | | (.29 | ) | | | .02 | | | | (.10 | ) | | | .18 | | | | .10 | | | | (.16 | ) |
Total from investment operations | | | (.17 | ) | | | .37 | | | | .23 | | | | .53 | | | | .58 | | | | .33 | |
Less distributions from: |
Net investment income | | | (.14 | ) | | | (.39 | ) | | | (.38 | ) | | | (.39 | ) | | | (.51 | ) | | | (.65 | ) |
Net realized gains | | | — | | | | — | c | | | (.01 | ) | | | — | c | | | — | | | | (.01 | ) |
Total distributions | | | (.14 | ) | | | (.39 | ) | | | (.39 | ) | | | (.39 | ) | | | (.51 | ) | | | (.66 | ) |
Net asset value, end of period | | $ | 24.35 | | | $ | 24.66 | | | $ | 24.68 | | | $ | 24.84 | | | $ | 24.70 | | | $ | 24.63 | |
|
Total Returnd | | | (0.71 | %) | | | 1.51 | % | | | 0.94 | % | | | 2.18 | % | | | 2.39 | % | | | 1.37 | % |
Ratios/Supplemental Data |
Net assets, end of period (in thousands) | | $ | 81,546 | | | $ | 85,100 | | | $ | 70,981 | | | $ | 50,743 | | | $ | 26,802 | | | $ | 10,323 | |
Ratios to average net assets: |
Net investment income (loss) | | | 0.99 | % | | | 1.42 | % | | | 1.34 | % | | | 1.41 | % | | | 1.98 | % | | | 1.96 | % |
Total expensese | | | 1.62 | % | | | 1.60 | % | | | 1.59 | % | | | 1.65 | % | | | 1.73 | % | | | 1.76 | % |
Net expensesf,g,h | | | 1.50 | % | | | 1.50 | % | | | 1.51 | % | | | 1.56 | % | | | 1.58 | % | | | 1.62 | % |
Portfolio turnover rate | | | 27 | % | | | 72 | % | | | 45 | % | | | 55 | % | | | 39 | % | | | 26 | % |
32 | THE GUGGENHEIM FUNDS SEMI-ANNUAL REPORT | SEE NOTES TO FINANCIAL STATEMENTS. |
FINANCIAL HIGHLIGHTS (continued) |
This table is presented to show selected data for a share outstanding throughout each period and to assist shareholders in evaluating a Fund’s performance for the periods presented.
P-Class | | Period Ended
March 31,
2020a | | | Year Ended
September 30,
2019 | | | Year Ended
September 30,
2018 | | | Year Ended
September 30,
2017 | | | Year Ended
September 30,
2016 | | | Period Ended
September 30,
2015i | |
Per Share Data |
Net asset value, beginning of period | | $ | 24.68 | | | $ | 24.70 | | | $ | 24.86 | | | $ | 24.72 | | | $ | 24.65 | | | $ | 24.86 | |
Income (loss) from investment operations: |
Net investment income (loss)b | | | .21 | | | | .54 | | | | .52 | | | | .47 | | | | .68 | | | | .25 | |
Net gain (loss) on investments (realized and unrealized) | | | (.30 | ) | | | .01 | | | | (.10 | ) | | | .24 | | | | .08 | | | | (.17 | ) |
Total from investment operations | | | (.09 | ) | | | .55 | | | | .42 | | | | .71 | | | | .76 | | | | .08 | |
Less distributions from: |
Net investment income | | | (.23 | ) | | | (.57 | ) | | | (.57 | ) | | | (.57 | ) | | | (.69 | ) | | | (.29 | ) |
Net realized gains | | | — | | | | — | c | | | (.01 | ) | | | — | c | | | — | | | | — | |
Total distributions | | | (.23 | ) | | | (.57 | ) | | | (.58 | ) | | | (.57 | ) | | | (.69 | ) | | | (.29 | ) |
Net asset value, end of period | | $ | 24.36 | | | $ | 24.68 | | | $ | 24.70 | | | $ | 24.86 | | | $ | 24.72 | | | $ | 24.65 | |
|
Total Return | | | (0.38 | %) | | | 2.27 | % | | | 1.69 | % | | | 2.93 | % | | | 3.17 | % | | | 0.32 | % |
Ratios/Supplemental Data |
Net assets, end of period (in thousands) | | $ | 77,864 | | | $ | 108,691 | | | $ | 189,965 | | | $ | 92,503 | | | $ | 1,646 | | | $ | 2,736 | |
Ratios to average net assets: |
Net investment income (loss) | | | 1.74 | % | | | 2.18 | % | | | 2.12 | % | | | 1.89 | % | | | 2.76 | % | | | 2.39 | % |
Total expensese | | | 0.95 | % | | | 0.88 | % | | | 0.87 | % | | | 0.92 | % | | | 0.94 | % | | | 0.94 | % |
Net expensesf,g,h | | | 0.75 | % | | | 0.75 | % | | | 0.75 | % | | | 0.81 | % | | | 0.84 | % | | | 0.88 | % |
Portfolio turnover rate | | | 27 | % | | | 72 | % | | | 45 | % | | | 55 | % | | | 39 | % | | | 26 | % |
Institutional Class | | Period Ended
March 31,
2020a | | | Year Ended
September 30,
2019 | | | Year Ended
September 30,
2018 | | | Year Ended
September 30,
2017 | | | Year Ended
September 30,
2016 | | | Year Ended
September 30,
2015 | |
Per Share Data |
Net asset value, beginning of period | | $ | 24.67 | | | $ | 24.69 | | | $ | 24.85 | | | $ | 24.71 | | | $ | 24.64 | | | $ | 24.96 | |
Income (loss) from investment operations: |
Net investment income (loss)b | | | .24 | | | | .60 | | | | .58 | | | | .59 | | | | .73 | | | | .78 | |
Net gain (loss) on investments (realized and unrealized) | | | (.29 | ) | | | .01 | | | | (.11 | ) | | | .19 | | | | .09 | | | | (.19 | ) |
Total from investment operations | | | (.05 | ) | | | .61 | | | | .47 | | | | .78 | | | | .82 | | | | .59 | |
Less distributions from: |
Net investment income | | | (.26 | ) | | | (.63 | ) | | | (.62 | ) | | | (.64 | ) | | | (.75 | ) | | | (.90 | ) |
Net realized gains | | | — | | | | — | c | | | (.01 | ) | | | — | c | | | — | | | | (.01 | ) |
Total distributions | | | (.26 | ) | | | (.63 | ) | | | (.63 | ) | | | (.64 | ) | | | (.75 | ) | | | (.91 | ) |
Net asset value, end of period | | $ | 24.36 | | | $ | 24.67 | | | $ | 24.69 | | | $ | 24.85 | | | $ | 24.71 | | | $ | 24.64 | |
|
Total Return | | | (0.21 | %) | | | 2.52 | % | | | 1.95 | % | | | 3.21 | % | | | 3.43 | % | | | 2.41 | % |
Ratios/Supplemental Data |
Net assets, end of period (in thousands) | | $ | 2,064,107 | | | $ | 2,421,315 | | | $ | 2,629,316 | | | $ | 1,637,509 | | | $ | 476,591 | | | $ | 176,322 | |
Ratios to average net assets: |
Net investment income (loss) | | | 1.99 | % | | | 2.43 | % | | | 2.35 | % | | | 2.36 | % | | | 2.97 | % | | | 3.14 | % |
Total expensese | | | 0.61 | % | | | 0.57 | % | | | 0.56 | % | | | 0.61 | % | | | 0.67 | % | | | 0.73 | % |
Net expensesf,g,h | | | 0.50 | % | | | 0.50 | % | | | 0.50 | % | | | 0.56 | % | | | 0.58 | % | | | 0.62 | % |
Portfolio turnover rate | | | 27 | % | | | 72 | % | | | 45 | % | | | 55 | % | | | 39 | % | | | 26 | % |
SEE NOTES TO FINANCIAL STATEMENTS. | THE GUGGENHEIM FUNDS SEMI-ANNUAL REPORT | 33 |
FINANCIAL HIGHLIGHTS (concluded) |
This table is presented to show selected data for a share outstanding throughout each period and to assist shareholders in evaluating a Fund’s performance for the periods presented.
R6-Class | | Period Ended
March 31,
2020a | | | Period Ended
September 30,
2019j | |
Per Share Data |
Net asset value, beginning of period | | $ | 24.66 | | | $ | 24.58 | |
Income (loss) from investment operations: |
Net investment income (loss)b | | | .25 | | | | .31 | |
Net gain (loss) on investments (realized and unrealized) | | | (.31 | ) | | | .14 | |
Total from investment operations | | | (.06 | ) | | | .45 | |
Less distributions from: |
Net investment income | | | (.26 | ) | | | (.37 | ) |
Total distributions | | | (.26 | ) | | | (.37 | ) |
Net asset value, end of period | | $ | 24.34 | | | $ | 24.66 | |
|
Total Return | | | (0.25 | %) | | | 1.83 | % |
Ratios/Supplemental Data |
Net assets, end of period (in thousands) | | $ | 98,409 | | | $ | 314,764 | |
Ratios to average net assets: |
Net investment income (loss) | | | 1.99 | % | | | 2.24 | % |
Total expensese | | | 0.52 | % | | | 0.51 | % |
Net expensesf,g,h | | | 0.50 | % | | | 0.50 | % |
Portfolio turnover rate | | | 27 | % | | | 72 | % |
a | Unaudited figures for the period ended March 31, 2020. Percentage amounts for the period, except total return and portfolio turnover rate, have been annualized. |
b | Net investment income (loss) per share was computed using average shares outstanding throughout the period. |
c | Distributions from realized gains are less than $0.01 per share. |
d | Total return does not reflect the impact of any applicable sales charges. |
e | Does not include expenses of the underlying funds in which the Fund invests. |
f | Net expense information reflects the expense ratios after expense waivers and reimbursements, as applicable. |
g | The portion of the ratios of net expenses to average net assets attributable to recoupments of prior fee reductions or expense reimbursements for the periods presented was as follows: |
| | | 03/31/20 | 09/30/19 | 09/30/18 | 09/30/17 |
| | A-Class | 0.00%* | 0.00%* | — | — |
| | C-Class | 0.00%* | — | — | 0.00%* |
| | P-Class | 0.00%* | 0.00%* | — | 0.00%* |
| | Institutional Class | 0.00%* | 0.00%* | — | — |
| | R6-Class | 0.00%* | 0.00%* | — | — |
h | Net expenses may include expenses that are excluded from the expense limitation agreement. Excluding these expenses, the net expense ratios for the periods would be: |
| | | 03/31/20 | 09/30/19 | 09/30/18 | 09/30/17 | 09/30/16 | 9/30/15 |
| | A-Class | 0.75% | 0.75% | 0.75% | 0.79% | 0.80% | 0.80% |
| | C-Class | 1.50% | 1.50% | 1.50% | 1.54% | 1.55% | 1.55% |
| | P-Class | 0.75% | 0.75% | 0.75% | 0.79% | 0.80% | 0.80% |
| | Institutional Class | 0.50% | 0.50% | 0.50% | 0.54% | 0.55% | 0.55% |
| | R6-Class | 0.50% | 0.50% | N/A | N/A | N/A | N/A |
i | Since commencement of operations: May 1, 2015. Percentage amounts for the period, except total return and portfolio turnover rate, have been annualized. |
j | Since commencement of operations: March 13, 2019. Percentage amounts for the period, except total return and portfolio turnover rate, have been annualized. |
34 | THE GUGGENHEIM FUNDS SEMI-ANNUAL REPORT | SEE NOTES TO FINANCIAL STATEMENTS. |
NOTES TO FINANCIAL STATEMENTS (Unaudited) |
Note 1 – Organization and Significant Accounting Policies
Organization
Guggenheim Funds Trust (the “Trust”), a Delaware statutory trust, is registered with the SEC under the Investment Company Act of 1940 (“1940 Act”), as an open-ended investment company of the series type. Each series, in effect, is representing a separate fund. The Trust is authorized to issue an unlimited number of no par value shares. The Trust accounts for the assets of each Fund separately.
The Trust offers a combination of five separate classes of shares: A-Class shares, C-Class shares, P-Class shares, R6-Class shares and Institutional Class shares. Sales of shares of each Class are made without a front-end sales charge at the net asset value per share (“NAV”), with the exception of A-Class shares. A-Class shares are sold at the NAV, plus the applicable front-end sales charge. The sales charge varies depending on the amount purchased. A-Class share purchases of $1 million or more are exempt from the front-end sales charge but have a 1% contingent deferred sales charge (“CDSC”), if shares are redeemed within 12 months of purchase. C-Class shares have a 1% CDSC if shares are redeemed within 12 months of purchase. C-Class shares of the Fund automatically convert to A-Class shares on or about the 10th day of the month following the 10-year anniversary of the purchase of the C-Class shares. This conversion will be executed without any sales charge, fee or other charge. After the conversion is completed, the shares will be subject to all features and expenses of A-Class shares. Institutional Class shares are offered primarily for direct investment by institutions such as pension and profit sharing plans, endowments, foundations and corporations. Institutional Class shares require a minimum initial investment of $2 million and a minimum account balance of $1 million. R6-Class shares are offered primarily through qualified retirement and benefit plans. R6-Class shares are also offered through certain other plans and platforms sponsored by financial intermediaries. Certain institutional investors and others deemed appropriate by Guggenheim Investments (“GI”) may also be eligible to purchase R6-Class shares subject to a $2 million minimum initial investment. At March 31, 2020, the Trust consisted of nineteen funds (the “Funds”).
This report covers the Limited Duration Fund (the “Fund”), a diversified investment company. At March 31, 2020, A-Class, C-Class, P-Class, Institutional Class and R6-Class shares have been issued by the Fund.
Guggenheim Partners Investments Management, LLC (“GPIM”), LLC which operates under the name Guggenheim Investments, provides advisory services. Guggenheim Funds Distributors, LLC (“GFD”) acts as principal underwriter for the Trust. GI and GFD are affiliated entities.
Significant Accounting Policies
The Fund operates as an investment company and, accordingly, follows the investment company accounting and reporting guidance of the Financial Accounting Standards Board (“FASB”) Accounting Standards Codification Topic 946 Financial Services – Investment Companies.
The following significant accounting policies are in conformity with U.S. generally accepted accounting principles (“U.S. GAAP”) and are consistently followed by the Trust. This requires management to make estimates and assumptions that affect the reported amount of assets and liabilities, contingent assets and liabilities at the date of the financial statements, and the reported amounts of revenues and expenses during the reporting period. Actual results could differ from these estimates. All time references are based on Eastern Time.
The NAV of each Class of the Fund is calculated by dividing the market value of the Fund’s securities and other assets, less all liabilities, attributable to the Class by the number of outstanding shares of the Class.
(a) Valuation of Investments
The Board of Trustees of the Fund (the “Board”) has adopted policies and procedures for the valuation of the Fund’s investments (the “Valuation Procedures”). Pursuant to the Valuation Procedures, the Board has delegated to a valuation committee, consisting of representatives from Guggenheim’s investment management, fund administration, legal and compliance departments (the “Valuation Committee”), the day-to-day responsibility for implementing the Valuation Procedures, including, under most circumstances, the responsibility for determining the fair value of the Fund’s securities and/or other assets.
Valuations of the Fund’s securities and other assets are supplied primarily by pricing services appointed pursuant to the processes set forth in the Valuation Procedures. The Valuation Committee convenes monthly, or more frequently as needed, to review the valuation of all assets which have been fair valued for reasonableness. The Fund’s officers, through the Valuation Committee and consistent with the monitoring and review responsibilities set forth in the Valuation Procedures, regularly review procedures used and valuations provided by the pricing services.
If the pricing service cannot or does not provide a valuation for a particular investment or such valuation is deemed unreliable, such investment is fair valued by the Valuation Committee.
| | THE GUGGENHEIM FUNDS SEMI-ANNUAL REPORT | 35 |
NOTES TO FINANCIAL STATEMENTS (Unaudited)(continued) |
Generally, trading in foreign securities markets is substantially completed each day at various times prior to the close of the New York Stock Exchange (“NYSE”). The values of foreign securities are determined as of the close of such foreign markets or the close of the NYSE, if earlier. All investments quoted in foreign currencies are valued in U.S. dollars on the basis of the foreign currency exchange rates prevailing at the close of U.S. business at 4:00 p.m. Investments in foreign securities may involve risks not present in domestic investments. The Valuation Committee will determine the current value of such foreign securities by taking into consideration certain factors which may include those discussed above, as well as the following factors, among others: the value of the securities traded on other foreign markets, ADR trading, closed-end fund trading, foreign currency exchange activity, and the trading prices of financial products that are tied to foreign securities. In addition, under the Valuation Procedures, the Valuation Committee and GI are authorized to use prices and other information supplied by a third party pricing vendor in valuing foreign securities.
Open-end investment companies are valued at their NAV as of the close of business, on the valuation date. Exchange-traded funds and closed-end investment companies are valued at the last quoted sale price.
U.S. Government securities are valued by independent pricing services, the last traded fill price, or at the reported bid price at the close of business.
Repurchase agreements are generally valued at amortized cost, provided such amounts approximate market value.
Debt securities with a maturity of greater than 60 days at acquisition are valued at prices that reflect broker-dealer supplied valuations or are obtained from independent pricing services, which may consider the trade activity, treasury spreads, yields or price of bonds of comparable quality, coupon, maturity, and type, as well as prices quoted by dealers who make markets in such securities. Short-term debt securities with a maturity of 60 days or less at acquisition are valued at amortized cost, provided such amount approximates market value.
Typically, loans are valued using information provided by an independent third party pricing service that uses broker quotes, among other inputs. If the pricing service cannot or does not provide a valuation for a particular loan or such valuation is deemed unreliable, such investment is valued based on a quote from a broker-dealer or is fair valued by the Valuation Committee.
Exchange-traded options are valued at the mean of the bid and ask prices on the principal exchange on which they are traded. Over-the-counter (“OTC”) options are valued using a price provided by a pricing service.
The value of interest rate swap agreements entered into by the Fund is accounted for using the unrealized appreciation or depreciation on the agreements that is determined using the previous day’s Chicago Mercantile Exchange close price, adjusted for the current day’s spreads.
The values of other swap agreements entered into by the Fund are accounted for using the unrealized appreciation or depreciation on the agreements that are determined by marking the agreements to the last quoted value of the index or other underlying position that the swaps pertain to at the close of the NYSE.
Forward foreign currency exchange contracts are valued daily based on the applicable exchange rate of the underlying currency.
Investments for which market quotations are not readily available are fair-valued as determined in good faith by GI subject to review and approval by the Valuation Committee, pursuant to methods established or ratified by the Board. Valuations in accordance with these methods are intended to reflect each security’s (or asset’s or liability’s) “fair value”. Each such determination is based on a consideration of all relevant factors, which are likely to vary from one pricing context to another. Examples of such factors may include, but are not limited to market prices; sale prices; broker quotes; and models which derive prices based on inputs such as prices of securities with comparable maturities and characteristics, or based on inputs such as anticipated cash flows or collateral, spread over U.S. Treasury securities, and other information analysis.
In connection with futures contracts and other derivative investments, such factors may include obtaining information as to how (a) these contracts and other derivative investments trade in the futures or other derivative markets, respectively, and (b) the securities underlying these contracts and other derivative investments trade in the cash market.
(b) U.S. Government and Agency Obligations
Inflation-Indexed bonds are fixed-income securities whose principal value is periodically adjusted to the rate of inflation. The interest rate on these securities is generally fixed at issuance at a rate lower than typical bonds. Over the life of an inflation-indexed bond however, interest will be paid based on a principal value which is adjusted for inflation. Any increase in the principal amount of an inflation-indexed bond is recognized as a component of Interest on the Statement of Operations, even though principal is not received until maturity.
(c) Senior Floating Rate Interests and Loan Investments
Senior floating rate interests in which the Fund invests generally pay interest rates which are periodically adjusted by reference to a base short-term floating rate, plus a premium. These base
36 | THE GUGGENHEIM FUNDS SEMI-ANNUAL REPORT | |
NOTES TO FINANCIAL STATEMENTS (Unaudited)(continued) |
lending rates are generally (i) the lending rate offered by one or more major European banks, such as the one-month or three-month London Inter-Bank Offered Rate (“LIBOR”), (ii) the prime rate offered by one or more major United States banks, or (iii) the bank’s certificate of deposit rate. Senior floating rate interests often require prepayments from excess cash flows or permit the borrower to repay at its election. The rate at which the borrower repays cannot be predicted with accuracy. As a result, the actual remaining maturity may be substantially less than the stated maturities disclosed in the Fund’s Schedule of Investments. The interest rate indicated is the rate in effect at March 31, 2020.
The Fund invests in loans and other similar debt obligations (“obligations”). A portion of the Fund’s investments in these obligations is sometimes referred to as “covenant lite” loans or obligations (“covenant lite obligations”), which are obligations that lack covenants or possess fewer or less restrictive covenants or constraints on borrowers than certain other types of obligations. The Fund may also obtain exposure to covenant lite obligations through investment in securitization vehicles and other structured products. In recent market conditions, many new or reissued obligations have not featured traditional covenants, which are intended to protect lenders and investors by (i) imposing certain restrictions or other limitations on a borrower’s operations or assets or (ii) providing certain rights to lenders. The Fund may have fewer rights with respect to covenant lite obligations, including fewer protections against the possibility of default and fewer remedies in the event of default. As a result, investments in (or exposure to) covenant lite obligations are subject to more risk than investments in (or exposure to) certain other types of obligations. The Fund is subject to other risks associated with investments in (or exposure to) obligations, including that obligations may not be considered “securities” and, as a result, the Fund may not be entitled to rely on the anti-fraud protections under the federal securities laws and instead may have to resort to state law and direct claims.
(d) Interests in When-Issued Securities
The Fund may purchase and sell interests in securities on a when-issued and delayed delivery basis, with payment and delivery scheduled for a future date. No income accrues to the Fund on such interests or securities in connection with such transactions prior to the date the Fund actually take delivery of such interests or securities. These transactions are subject to market fluctuations and are subject to the risk that the value at delivery may be more or less than the trade date purchase price. Although the Fund will generally purchase these securities with the intention of acquiring such securities, they may sell such securities before the settlement date.
(e) Options
Upon the purchase of an option, the premium paid is recorded as an investment, the value of which is marked-to-market daily. If a purchased option expires, the Fund realizes a loss in the amount of the cost of the option. When the Fund enters into a closing sale transaction, it realizes a gain or loss depending on whether the proceeds from the closing sale transaction are greater or less than the cost of the option. If the Fund exercises a put option, it realizes a gain or loss from the sale of the underlying security and the proceeds from such sale will be decreased by the premium originally paid. When the Fund exercises a call option, the cost of the security purchased by the Fund upon exercise increases by the premium originally paid.
When the Fund writes (sells) an option, an amount equal to the premium received is entered in that Fund’s accounting records as an asset and equivalent liability. The amount of the liability is subsequently marked-to-market to reflect the current value of the option written. When a written option expires, or if the Fund enters into a closing purchase transaction, it realizes a gain (or loss if the cost of a closing purchase transaction exceeds the premium received when the option was sold).
(f) Swap Agreements
Swap agreements are marked-to-market daily and the change, if any, is recorded as unrealized appreciation or depreciation. Payments received or made as a result of an agreement or termination of an agreement are recognized as realized gains or losses.
Upon entering into certain centrally-cleared swap transactions, a Fund is required to deposit with its clearing broker an amount of cash or securities as an initial margin. Subsequent variation margin receipts or payments are received or made by the Fund depending on fluctuations in the fair value of the reference entity and are recorded by the Fund as unrealized appreciation or depreciation. When the contract is closed, the Fund records a realized gain or loss equal to the difference between the value of the contract at the time it was opened and the value at the time it was closed.
Upfront payments received or made by a Fund on credit default swap agreements and interest rate swap agreements are amortized over the expected life of the agreement. Periodic payments received or paid by a Fund are recorded as realized gains or losses. Payments received or made as a result of a credit event or termination of the contract are recognized, net of a proportional amount of the upfront payment, as realized gains or losses.
| | THE GUGGENHEIM FUNDS SEMI-ANNUAL REPORT | 37 |
NOTES TO FINANCIAL STATEMENTS (Unaudited)(continued) |
(g) Currency Translations
The accounting records of the Fund are maintained in U.S. dollars. All assets and liabilities initially expressed in foreign currencies are converted into U.S. dollars at prevailing exchange rates. Purchases and sales of investment securities, dividend and interest income, and certain expenses are translated at the rates of exchange prevailing on the respective dates of such transactions. Changes in the relationship of these foreign currencies to the U.S. dollar can significantly affect the value of the investments and earnings of the Fund. Foreign investments may also subject the Fund to foreign government exchange restrictions, expropriation, taxation, or other political, social or economic developments, all of which could affect the market and/or credit risk of the investments.
The Fund does not isolate that portion of the results of operations resulting from changes in the foreign exchange rates on investments from the fluctuations arising from changes in the market prices of securities held. Such fluctuations are included with the net realized gain or loss and unrealized appreciation or depreciation on investments.
Reported net realized foreign exchange gains and losses arise from sales of foreign currencies and currency gains or losses realized between the trade and settlement dates on investment transactions. Net unrealized appreciation and depreciation arise from changes in the fair values of assets and liabilities other than investments in securities at the fiscal period end, resulting from changes in exchange rates.
(h) Forward Foreign Currency Exchange Contracts
The change in value of the contract is recorded as unrealized appreciation or depreciation until the contract is closed. When the contract is closed, the Fund records a realized gain or loss equal to the difference between the value at the time the contract was opened and the value at the time it was closed.
(i) Foreign Taxes
The Fund may be subject to foreign taxes (a portion of which may be reclaimable) on income, stock dividends, capital gains on investments or certain foreign currency transactions. All foreign taxes are recorded in accordance with the applicable foreign tax regulations and rates that exist in the foreign jurisdictions in which the Fund invests. These foreign taxes, if any, are paid by the Fund and reflected in its Statement of Operations as follows: foreign taxes withheld at source are presented as a reduction of income and foreign taxes on capital gains from sales of investments are included with the net realized gain (loss) on investments. Foreign taxes payable or deferred as of March 31, 2020, if any, are disclosed in the Fund’s Statement of Assets and Liabilities.
(j) Security Transactions
Security transactions are recorded on the trade date for financial reporting purposes. Realized gains and losses from securities transactions are recorded using the identified cost basis. Proceeds from lawsuits related to investment holdings are recorded as a reduction to cost if the securities are still held and as realized gains if no longer held in the Fund. Dividend income is recorded on the ex-dividend date, net of applicable taxes withheld by foreign countries, if any. Taxable non-cash dividends are recorded as dividend income. Interest income, including amortization of premiums and accretion of discounts, is accrued on a daily basis. Interest income also includes paydown gains and losses on mortgage-backed and asset-backed securities and senior and subordinated loans. Amendment fees are earned as compensation for evaluating and accepting changes to the original loan agreement and are recognized when received. Dividend income from Real Estate Investment Trusts (“REITs”) is recorded based on the income included in the distributions received from the REIT investments using published REIT classifications, including some management estimates when actual amounts are not available. Distributions received in excess of this estimated amount are recorded as a reduction of the cost of investments or reclassified to realized gains. The actual amounts of income, return of capital, and realized gains are only determined by each REIT after its fiscal year-end, and may differ from the estimated amounts.
Income from residual collateralized loan obligations is recognized using the effective interest method. At the time of purchase, management estimates the future expected cash flows and determines the effective yield and estimated maturity date based on the estimated cash flows. Subsequent to the purchase, the estimated cash flows are updated periodically and a revised yield is calculated prospectively.
The Fund may receive other income from investments in senior loan interests including amendment fees, consent fees and commitment fees. For funded loans, these fees are recorded as income when received by the Fund and included in interest income on the Statement of Operations. For unfunded loans, commitment fees are included in realized gain on investments on the Statement of Operations at the end of the commitment period.
(k) Distributions
The Fund declares dividends from investment income daily. The Fund pays its shareholders from its net investment income monthly and distributes any net capital gains that it has realized, at least annually. Distributions to shareholders are recorded on the ex-dividend date. Dividends are reinvested in additional shares, unless shareholders request payment in cash. The character of distributions made during the year from net investment income or net realized gains may differ from their ultimate characterization for U.S. federal income tax purposes.
38 | THE GUGGENHEIM FUNDS SEMI-ANNUAL REPORT | |
NOTES TO FINANCIAL STATEMENTS (Unaudited)(continued) |
(l) Class Allocations
Interest and dividend income, most expenses, all realized gains and losses, and all unrealized appreciation and depreciation are allocated to the classes based upon the value of the outstanding shares in each Class. Certain costs, such as distribution and service fees are charged directly to specific classes. In addition, certain expenses have been allocated to the individual Funds in the Trust based on the respective net assets of each Fund included in the Trust.
(m) Earnings Credits
Under the fee arrangement with the custodian, the Fund may earn credits based on overnight custody cash balances. These credits are utilized to reduce related custodial expenses. The custodian fees disclosed in the Statement of Operations are before the reduction in expense from the related earnings credits, if any. Earnings credits for the period ended March 31, 2020, are disclosed in the Statement of Operations.
(n) Cash
The Fund may leave cash overnight in its cash account with the custodian. Periodically, the Fund may have cash due to the custodian bank as an overdraft balance. A fee is incurred on this overdraft, calculated by multiplying the overdraft by a rate based on the federal funds rate, which was 0.08% at March 31, 2020.
(o) Indemnifications
Under the Fund’s organizational documents, its Trustees and Officers are indemnified against certain liabilities arising out of the performance of their duties to the Trust. In addition, throughout the normal course of business, the Fund enters into contracts that contain a variety of representations and warranties which provide general indemnifications. The Fund’s maximum exposure under these arrangements is unknown, as this would involve future claims that may be made against the Fund and/or its affiliates that have not yet occurred. However, based on experience, the Fund expects the risk of loss to be remote.
Note 2 – Derivatives
As part of its investment strategy, the Fund utilizes a variety of derivative instruments. These investments involve, to varying degrees, elements of market risk and risks in excess of amounts recognized in the Statement of Assets and Liabilities. Valuation and accounting treatment of these instruments can be found under Significant Accounting Policies in Note 1 of these Notes to Financial Statements.
Derivatives are instruments whose values depend on, or are derived from, in whole or in part, the value of one or more other assets, such as securities, currencies, commodities or indices. Derivative instruments may be used to increase investment flexibility (including to maintain cash reserves while maintaining exposure to certain other assets), for risk management (hedging) purposes, to facilitate trading, to reduce transaction costs and to pursue higher investment returns. Derivative instruments may also be used to mitigate certain investment risks, such as foreign currency exchange rate risk, interest rate risk and credit risk. U.S. GAAP requires disclosures to enable investors to better understand how and why a Fund uses derivative instruments, how these derivative instruments are accounted for and their effects on the Fund’s financial position and results of operations.
The Fund utilized derivatives for the following purposes:
Duration: the use of an instrument to manage the interest rate risk of a portfolio.
Hedge: an investment made in order to reduce the risk of adverse price movements in a security, by taking an offsetting position to protect against broad market moves.
Income: the use of any instrument that distributes cash flows typically based upon some rate of interest.
Index Exposure: the use of an instrument to obtain exposure to listed or other type of index.
| | THE GUGGENHEIM FUNDS SEMI-ANNUAL REPORT | 39 |
NOTES TO FINANCIAL STATEMENTS (Unaudited)(continued) |
Options Purchased
A call option on a security gives the purchaser of the option the right to buy, and the writer of a call option the obligation to sell, the underlying security. The purchaser of a put option has the right to sell, and the writer of the put option the obligation to buy, the underlying security at any time during the option period. The risk associated with purchasing options is limited to the premium originally paid.
The following table represents the Fund’s use and volume of call/put options purchased on a monthly basis:
| | | Average Notional Amount | |
Use | | Call | | | Put | |
Hedge | | $ | — | | | $ | 1,183,000,000 | |
Swap Agreements
A swap is an agreement that obligates two parties to exchange a series of cash flows at specified intervals based upon or calculated by reference to changes in specified prices or rates for a specified amount of an underlying asset. When utilizing OTC swaps, the Fund bears the risk of loss of the amount expected to be received under a swap agreement in the event of the default or bankruptcy of a swap agreement counterparty or if the underlying asset declines in value. Certain standardized swaps are subject to mandatory central clearing and are executed on a multi-lateral or other trade facility platform, such as a registered exchange. There is limited counterparty credit risk with respect to centrally-cleared swaps as the transaction is facilitated through a central clearinghouse, much like exchange-traded futures contracts. For a fund utilizing centrally cleared swaps, the exchange bears the risk of loss resulting from a counterparty not being able to pay. There is no guarantee that a fund or an underlying fund could eliminate its exposure under an outstanding swap agreement by entering into an offsetting swap agreement with the same or another party.
Total return swaps involve commitments where single or multiple cash flows are exchanged based on the price of an underlying reference asset (such as an index) for a fixed or variable interest rate. Total return swaps will usually be computed based on the current value of the reference asset as of the close of regular trading on the NYSE or other exchange, with the swap value being adjusted to include dividends accrued, financing charges and/or interest associated with the swap agreement. When utilizing total return swaps, the Fund bears the risk of loss of the amount expected to be received under a swap agreement in the event of the default or bankruptcy of a swap agreement counterparty or if the underlying reference asset declines in value.
The following table represents the Fund’s use and volume of total return swaps on a monthly basis:
| | | Average Notional Amount | |
Use | | Long | | | Short | |
Income | | $ | 15,598,195 | | | $ | 37,945,739 | |
Interest rate swaps involve the exchange by the Fund with another party for its respective commitment to pay or receive a fixed or variable interest rate on a notional amount of principal. Interest rate swaps are generally centrally-cleared, but central clearing does not make interest rate swap transactions risk free.
The following table represents the Fund’s use and volume of interest rate swaps on a monthly basis:
| | | Average Notional Amount | |
Use | | Pay Floating Rate | | | Receive Floating Rate | |
Duration, Hedge | | $ | 843,697,833 | | | $ | 48,140,333 | |
Credit default swaps are instruments which allow for the full or partial transfer of third party credit risk, with respect to a particular entity or entities, from one counterparty to the other. The Fund enters into credit default swaps as a “seller” or “buyer” of protection primarily to gain or reduce exposure to the investment grade and/or high yield bond market. A seller of credit default swaps is selling credit protection or assuming credit risk with respect to the underlying entity or entities. The buyer in a credit default swap is obligated to pay the seller a periodic stream of payments over the term of the contract provided that no event of default on an underlying reference obligation has occurred. If a credit
40 | THE GUGGENHEIM FUNDS SEMI-ANNUAL REPORT | |
NOTES TO FINANCIAL STATEMENTS (Unaudited)(continued) |
event occurs, as defined under the terms of the swap agreement, the seller will either (i) pay to the buyer of protection an amount equal to the notional amount of the swap and take delivery of the referenced obligation or underlying securities comprising the referenced index or (ii) pay a net settlement amount in the form of cash or securities equal to the notional amount of the swap less the recovery value of the referenced obligation or underlying securities comprising the referenced index. The notional amount reflects the maximum potential amount the seller of credit protection could be required to pay to the buyer if a credit event occurs. The seller of protection receives periodic premium payments from the buyer and may also receive or pay an upfront premium adjustment to the stated periodic payments. In the event a credit default occurs on a credit default swap referencing an index, a factor adjustment will take place and the buyer of protection will received a payment reflecting the par less the default recovery rate of the defaulted index component based on its weighting in the index. If no default occurs, the counterparty will pay the stream of payments and have no further obligations to the fund selling the credit protection. For a fund utilizing centrally cleared credit default swaps, the exchange bears the risk of loss resulting from a counterparty not being able to pay. For OTC credit default swaps, a fund bears the risk of loss of the amount expected to be received under a swap agreement in the event of the default or bankruptcy of a swap agreement counterparty, or in the case of a credit default swap in which a fund is selling credit protection, the default of a third party issuer.
The quoted market prices and resulting market values for credit default swap agreements on securities and credit indices serve as an indicator of the current status of the payment/performance risk and represent the likelihood of an expected liability (or profit) for the credit derivative had the notional amount of the swap agreement been closed/sold as of the period end. Increasing market values, in absolute terms when compared to the notional amount of the swap, represent a deterioration of the referenced entity’s credit soundness and a greater likelihood or risk of default or other credit event occurring as defined under the terms of the agreement.
The following table represents the Fund’s use and volume of credit default swaps on a monthly basis:
| | | Average Notional Amount | |
Use | | Protection Sold | | | Protection Purchased | |
Hedge, Index Exposure | | $ | — | * | | $ | 556,330,000 | |
* | Credit default swap agreements were outstanding for 13 days during the period ended March 31, 2020. The daily average outstanding notional amount of credit default swap agreements during the period was $13,961,030. |
Forward Foreign Currency Exchange Contracts
A forward foreign currency exchange contract is an agreement between two parties to exchange two designated currencies at a specific time in the future. Certain types of contracts may be cash settled, in an amount equal to the change in exchange rates during the term of the contract. The contracts can be used to hedge or manage exposure to foreign currency risks with portfolio investments or to gain exposure to foreign currencies.
The market value of a forward foreign currency exchange contract changes with fluctuations in foreign currency exchange rates. Furthermore, the Fund may be exposed to risk if the counterparties cannot meet the contract terms or if the currency value changes unfavorably as compared to the U.S. dollar.
The following table represents the Fund’s use and volume of forward foreign currency exchange contracts on a monthly basis:
| | | Average Value | |
Use | | Purchased | | | Sold | |
Hedge, Income | | $ | 138,952,823 | | | $ | 624,022,760 | |
| | THE GUGGENHEIM FUNDS SEMI-ANNUAL REPORT | 41 |
NOTES TO FINANCIAL STATEMENTS (Unaudited)(continued) |
Derivative Investment Holdings Categorized by Risk Exposure
The following is a summary of the location of derivative investments on the Fund’s Statement of Assets and Liabilities as of March 31, 2020:
Derivative Investment Type | Asset Derivatives | Liability Derivatives |
Interest rate/Credit contracts | Unamortized upfront premiums paid on interest rate swap agreements | Unamortized upfront premiums received on credit default swap agreements |
| | Unrealized appreciation on OTC swap agreements | Unrealized depreciation on OTC swap agreements |
| | | Variation margin on interest rate swap agreements |
| | | Variation margin on credit default swap agreements |
Interest rate contracts | Investments in unaffiliated issuers, at value | |
Currency contracts | Unrealized appreciation on forward foreign currency exchange contracts | Unrealized depreciation on forward foreign currency exchange contracts |
The following table sets forth the fair value of the Fund’s derivative investments categorized by primary risk exposure at March 31, 2020:
| | | Asset Derivative Investments Value | |
| | Swaps
Interest
Rate
Risk* | | | Swaps
Credit
Risk* | | | Options
Purchased
Interest Rate
Risk | | | Forward
Foreign
Currency
Exchange
Risk | | | Total Value at
March 31,
2020 | |
| | | $ | 13,507,236 | | | $ | 409,298 | | | $ | 2,291,870 | | | $ | 44,222,250 | | | $ | 60,430,654 | |
| | | Liability Derivative Investments Value | |
| | Swaps
Interest
Rate
Risk* | | | Swaps
Credit
Risk* | | | Options
Purchased
Interest Rate
Risk | | | Forward
Foreign
Currency
Exchange
Risk | | | Total Value at
March 31,
2020 | |
| | | $ | — | | | $ | 121,968 | | | $ | — | | | $ | 15,154,374 | | | $ | 15,276,342 | |
* | Includes cumulative appreciation (depreciation) of OTC and centrally cleared derivatives as reported on the Schedule of Investments. For exchange-traded and centrally cleared derivatives, variation margin is reported within the Statement of Assets and Liabilities. |
The following is a summary of the location of derivative investments on the Fund’s Statement of Operations for the period ended March 31, 2020:
Derivative Investment Type | Location of Gain (Loss) on Derivatives |
Interest rate contracts/Credit contracts | Net realized gain (loss) on swap agreements |
| | Net change in unrealized appreciation (depreciation) on swap agreements |
Interest Rate | Net realized gain (loss) on futures contracts |
| | Net change in unrealized appreciation (depreciation) on options purchased |
Currency contracts | Net realized gain (loss) on forward foreign currency exchange contracts |
| | Net change in unrealized appreciation (depreciation) on forward foreign currency exchange contracts |
42 | THE GUGGENHEIM FUNDS SEMI-ANNUAL REPORT | |
NOTES TO FINANCIAL STATEMENTS (Unaudited)(continued) |
The following is a summary of the Fund’s realized gain (loss) and change in unrealized appreciation (depreciation) on derivative investments recognized on the Statement of Operations categorized by primary risk exposure for the period ended March 31, 2020:
| | | Realized Gain (Loss) on Derivative Investments Recognized on the Statement of Operations | |
| | Futures
Interest
Rate
Risk | | | Swaps
Interest
Rate
Risk | | | Swaps
Credit
Risk | | | Options
Purchased
Interest Rate
Risk | | | Forward
Foreign
Currency
Exchange
Risk | | | Total | |
| | | $ | 859,141 | | | $ | 8,218,252 | | | $ | 9,778,190 | | | $ | — | | | | 2,565,708 | | | $ | 21,421,291 | |
| | | Change in Unrealized Appreciation (Depreciation) on Derivative Investments Recognized on the Statement of Operations | |
| | Futures
Interest
Rate
Risk | | | Swaps
Interest
Rate
Risk | | | Swaps
Credit
Risk | | | Options
Purchased
Interest Rate
Risk | | | Forward
Foreign
Currency
Exchange
Risk | | | Total | |
| | | $ | — | | | $ | 13,937,319 | | | $ | 9,343,004 | | | $ | 474,261 | | | | 18,081,581 | | | $ | 41,836,165 | |
In conjunction with the use of derivative instruments, the Fund is required to maintain collateral in various forms. Depending on the financial instrument utilized and the broker involved, the Fund uses margin deposits at the broker, cash and/or securities segregated at the custodian bank, discount notes or repurchase agreements allocated to the Fund as collateral.
Foreign Investments
There are several risks associated with exposure to foreign currencies, foreign issuers and emerging markets. A fund’s indirect and direct exposure to foreign currencies subjects the Fund to the risk that those currencies will decline in value relative to the U.S. dollar, or in the case of short positions, that the U.S. dollar will decline in value relative to the currency being hedged. Currency rates in foreign countries may fluctuate significantly over short periods of time for a number of reasons, including changes in interest rates and the imposition of currency controls or other political developments in the U.S. or abroad. In addition, the Fund may incur transaction costs in connection with conversions between various currencies. The Fund may, but is not obligated to, engage in currency hedging transactions, which generally involve buying currency forward, options or futures contracts. However, not all currency risks may be effectively hedged, and in some cases the costs of hedging techniques may outweigh expected benefits. In such instances, the value of securities denominated in foreign currencies can change significantly when foreign currencies strengthen or weaken relative to the U.S. dollar.
The Fund may invest in securities of foreign companies directly, or in financial instruments, such as ADRs and exchange-traded funds, which are indirectly linked to the performance of foreign issuers. Foreign markets can be more volatile than the U.S. market due to increased risks of adverse issuer, political, regulatory, market, or economic developments and can perform differently from the U.S. market. Investing in securities of foreign companies directly, or in financial instruments that are indirectly linked to the performance of foreign issuers, may involve risks not typically associated with investing in U.S. issuers. The value of securities denominated in foreign currencies, and of dividends from such securities, can change significantly when foreign currencies strengthen or weaken relative to the U.S. dollar. Foreign securities markets generally have less trading volume and less liquidity than U.S. markets, and prices in some foreign markets may fluctuate more than those of securities traded on U.S. markets. Many foreign countries lack accounting and disclosure standards comparable to those that apply to U.S. companies, and it may be more difficult to obtain reliable information regarding a foreign issuer’s financial condition and operations. Transaction costs and costs associated with custody services are generally higher for foreign securities than they are for U.S. securities. Some foreign governments levy withholding taxes against dividend and interest income. Although in some countries portions of these taxes are recoverable, the non-recovered portion will reduce the income received by the Fund.
The Trust has established counterparty credit guidelines and enters into transactions only with financial institutions of investment grade or better. The Trust monitors the counterparty credit risk.
| | THE GUGGENHEIM FUNDS SEMI-ANNUAL REPORT | 43 |
NOTES TO FINANCIAL STATEMENTS (Unaudited)(continued) |
Note 3 – Offsetting
In the normal course of business, the Fund enters into transactions subject to enforceable master netting arrangements or other similar arrangements. Generally, the right to offset in those agreements allows the Fund to counteract the exposure to a specific counterparty with collateral received from or delivered to that counterparty based on the terms of the arrangements. These arrangements provide for the right to liquidate upon the occurrence of an event of default, credit event upon merger or additional termination event.
In order to better define its contractual rights and to secure rights that will help the Fund mitigate its counterparty risk, the Fund may enter into an International Swaps and Derivatives Association, Inc. Master Agreement (“ISDA Master Agreement”) or similar agreement with its derivative contract counterparties. An ISDA Master Agreement is a bilateral agreement between a fund and a counterparty that governs OTC derivatives, including foreign exchange contracts, and typically contains, among other things, collateral posting terms and netting provisions in the event of a default and/or termination event. The provisions of the ISDA Master Agreement typically permit a single net payment in the event of a default (close-out netting) or similar event, including the bankruptcy or insolvency of the counterparty.
For derivatives traded under an ISDA Master Agreement, the collateral requirements are typically calculated by netting the mark-to-market amount for each transaction under such agreement and comparing that amount to the value of any collateral currently pledged by the Fund and the counterparty. For financial reporting purposes, cash collateral that has been pledged to cover obligations of the Fund and cash collateral received from the counterparty, if any, are reported separately on the Statement of Assets and Liabilities as segregated cash with broker/receivable for variation margin, or payable for swap settlement/variation margin. Cash and/or securities pledged or received as collateral by the Fund in connection with an OTC derivative subject to an ISDA Master Agreement generally may not be invested, sold or rehypothecated by the counterparty or the Fund, as applicable, absent an event of default under such agreement, in which case such collateral generally may be applied towards obligations due to and payable by such counterparty or the Fund, as applicable. Generally, the amount of collateral due from or to a counterparty must exceed a minimum transfer amount threshold (e.g., $300,000) before a transfer is required to be made. To the extent amounts due to the Fund from its counterparties are not fully collateralized, contractually or otherwise, the Fund bears the risk of loss from counterparty nonperformance. The Fund attempts to mitigate counterparty risk by only entering into agreements with counterparties that they believe to be of good standing and by monitoring the financial stability of those counterparties.
For financial reporting purposes, the Fund does not offset derivative assets and derivative liabilities that are subject to netting arrangements in the Statement of Assets and Liabilities.
The following tables present derivative financial instruments and secured financing transactions that are subject to enforceable netting arrangements:
| | | | | | | | | | | | | | | Gross Amounts Not Offset
in the Statement of
Assets and Liabilities | | | | | |
Instrument | | Gross
Amounts of
Recognized
Assets1 | | | Gross
Amounts
Offset in the
Statement of
Assets and
Liabilities | | | Net Amount
of Assets
Presented on
the Statement
of Assets and
Liabilities | | | Financial
Instruments | | | Cash
Collateral
Received | | | Net Amount | |
Total return swap agreements | | $ | 687,056 | | | $ | — | | | $ | 687,056 | | | $ | — | | | $ | (678,447 | ) | | $ | 8,609 | |
Forward foreign currency exchange contracts | | | 44,222,250 | | | | — | | | | 44,222,250 | | | | (12,944,777 | ) | | | (29,905,861 | ) | | | 1,371,612 | |
Options purchased | | | 2,291,870 | | | | — | | | | 2,291,870 | | | | — | | | | — | | | | 2,291,870 | |
44 | THE GUGGENHEIM FUNDS SEMI-ANNUAL REPORT | |
NOTES TO FINANCIAL STATEMENTS (Unaudited)(continued) |
| | | | | | | | | | | | | | | Gross Amounts Not Offset
in the Statement of
Assets and Liabilities | | | | | |
Instrument | | Gross
Amounts of
Recognized
Liabilities1 | | | Gross
Amounts
Offset in the
Statement of
Assets and
Liabilities | | | Net Amount
of Liabilities
Presented on
the Statement
of Assets and
Liabilities | | | Financial
Instruments | | | Cash
Collateral
Pledged | | | Net Amount | |
Total return swap agreements | | $ | 121,968 | | | $ | — | | | $ | 121,968 | | | $ | — | | | $ | — | | | $ | 121,968 | |
Forward foreign currency exchange contracts | | | 15,154,374 | | | | — | | | | 15,154,374 | | | | (12,944,777 | ) | | | — | | | | 2,209,597 | |
The Fund has the right to offset deposits against any related derivative liabilities outstanding with each counterparty with the exception of exchange-traded or centrally-cleared derivatives. The following table presents deposits held by others in connection with derivative investments and repurchase agreements as of March 31, 2020.
Counterparty | Asset Type | | Cash Pledged | | | Cash Received | |
Barclays Bank plc | Forward foreign currency exchange contracts | | $ | — | | | $ | 1,470,000 | |
BNP Paribas | Repurchase agreements | | | — | | | | 486,000 | |
BofA Securities, Inc. | Credit default swap agreements | | | 1,110,667 | | | | — | |
BofA Securities, Inc. | Interest rate swap agreements | | | 385,256 | | | | — | |
Citibank, N.A. | Forward foreign currency exchange contracts | | | — | | | | 17,331,566 | |
Deutsche Bank | Forward foreign currency exchange contracts, Total return swap agreements | | | — | | | | 280,000 | |
Goldman Sachs Group | Forward foreign currency exchange contracts | | | — | | | | 8,380,000 | |
Morgan Stanley Capital Services LLC | Forward foreign currency exchange contracts | | | — | | | | 5,540,000 | |
Societe Generale | Repurchase agreements | | | — | | | | 22,895,000 | |
| | | | $ | 1,495,923 | | | $ | 56,382,566 | |
Note 4 – Fair Value Measurement
In accordance with U.S. GAAP, fair value is defined as the price that the Fund would receive to sell an investment or pay to transfer a liability in an orderly transaction with an independent buyer in the principal market, or in the absence of a principal market, the most advantageous market for the investment or liability. U.S. GAAP establishes a three-tier fair value hierarchy based on the types of inputs used to value assets and liabilities and requires corresponding disclosure. The hierarchy and the corresponding inputs are summarized below:
Level 1 — | quoted prices in active markets for identical assets or liabilities. |
Level 2 — | significant other observable inputs (for example quoted prices for securities that are similar based on characteristics such as interest rates, prepayment speeds, credit risk, etc.). |
Level 3 — | significant unobservable inputs based on the best information available under the circumstances, to the extent observable inputs are not available, which may include assumptions. |
The types of inputs available depend on a variety of factors, such as the type of security and the characteristics of the markets in which it trades, if any. Fair valuation determinations that rely on fewer or no observable inputs require greater judgment. Accordingly, fair value determinations for Level 3 securities require the greatest amount of judgment.
Independent pricing services are used to value a majority of the Fund’s investments. When values are not available from a pricing service, they will be determined using a variety of sources and techniques, including: market prices; broker quotes; and models which derive prices based on inputs such as prices of securities with comparable maturities and characteristics or based on inputs such as anticipated cash flows or collateral, spread over U.S. Treasury securities, and other information and analysis. A significant portion of the Fund’s assets and liabilities are categorized as Level 2, as indicated in this report.
| | THE GUGGENHEIM FUNDS SEMI-ANNUAL REPORT | 45 |
NOTES TO FINANCIAL STATEMENTS (Unaudited)(continued) |
Quotes from broker-dealers, adjusted for fluctuations in criteria such as credit spreads and interest rates, may also be used to value the Fund’s assets and liabilities, i.e. prices provided by a broker-dealer or other market participant who has not committed to trade at that price. Although quotes are typically received from established market participants, the Fund may not have the transparency to view the underlying inputs which support the market quotations. Significant changes in a quote would generally result in significant changes in the fair value of the security.
Certain fixed income securities are valued by obtaining a monthly quote from a broker-dealer, adjusted for fluctuations in criteria such as credit spreads and interest rates.
Certain loans and other securities are valued using a single daily broker quote or a price from a third party vendor based on a single daily or monthly broker quote.
The inputs or methodologies used for valuing securities are not necessarily an indication of the risk associated with investing in those securities. The suitability of the techniques and sources employed to determine fair valuation are regularly monitored and subject to change.
Note 5 – Investment Advisory Agreement and Other Agreements
Under the terms of an investment advisory contract, the Fund pays GI investment advisory fees calculated at an annualized rate of 0.39%, of the average daily net assets of the Fund.
GI pays operating expenses on behalf of the Trust, such as audit and accounting related services, legal services, custody, printing and mailing, etc., on a pass-through basis. Such expenses are allocated to various Funds within the complex based on relative net assets.
The Board has adopted Distribution Plans related to the offering of A-Class, C-Class and P-Class shares pursuant to Rule 12b-1 under the 1940 Act. The plans provide for payments at an annual rate of 0.25% of the average daily net assets of the Fund’s A-Class and P-Class shares, and 1.00% of the average daily net assets of the Fund’s C-Class shares.
The investment advisory contract for the Fund provides that the total expenses be limited to a percentage of average net assets for each class of shares, exclusive of brokerage costs, dividends or interest on securities sold short, expenses of other investment companies in which a Fund invests, interest, taxes, litigation, indemnification and extraordinary expenses. The limits are listed below:
| | Limit | | | Effective
Date | | | Contract
End Date | |
Limited Duration Fund - A-Class | | | 0.75 | % | | | 12/01/13 | | | | 02/01/21 | |
Limited Duration Fund - C-Class | | | 1.50 | % | | | 12/01/13 | | | | 02/01/21 | |
Limited Duration Fund - P-Class | | | 0.75 | % | | | 05/01/15 | | | | 02/01/21 | |
Limited Duration Fund - Institutional Class | | | 0.50 | % | | | 12/01/13 | | | | 02/01/21 | |
Limited Duration Fund - R6-Class | | | 0.50 | % | | | 03/13/19 | | | | 02/01/21 | |
GI is entitled to reimbursement by the Fund for fees waived or expenses reimbursed during any of the previous 36 months, beginning on the date of the expense limitation agreement, if on any day the estimated operating expenses are less than the indicated percentages. For purposes of this arrangement, GI is entitled to recoupment of previously waived fees or reimbursed expenses for 36 months from the date of the waiver or reimbursement by GI. At March 31, 2020, the amount of fees waived or expenses reimbursed that are subject to recoupment and will expire during the years ended September 30, are presented in the following table:
| | 2020 | | | 2021 | | | 2022 | | | 2023 | | | Fund Total | |
A-Class | | $ | 88,064 | | | $ | 282,834 | | | $ | 451,627 | | | $ | 244,110 | | | $ | 1,066,635 | |
C-Class | | | 15,847 | | | | 47,300 | | | | 78,366 | | | | 44,888 | | | | 186,401 | |
P-Class | | | 38,750 | | | | 163,906 | | | | 194,676 | | | | 92,647 | | | | 489,979 | |
Institutional Class | | | 373,644 | | �� | | 896,378 | | | | 1,856,165 | | | | 1,141,255 | | | | 4,267,442 | |
R6-Class | | | — | | | | — | | | | 9,814 | | | | 19,442 | | | | 29,256 | |
For the period ended March 31, 2020, GI recouped $4,971 from the Fund.
46 | THE GUGGENHEIM FUNDS SEMI-ANNUAL REPORT | |
NOTES TO FINANCIAL STATEMENTS (Unaudited)(continued) |
If the Fund invests in a fund that is advised by the same adviser or an affiliated adviser, the investing Fund’s adviser has agreed to waive fees at the investing fund level to the extent necessary to offset the proportionate share of any management fee paid by the Fund with respect to its investment in such affiliated fund. Fee waivers will be calculated at the investing Fund level without regard to any expense cap, if any, in effect for the investing Fund. Fees waived under this arrangement are not subject to reimbursement to GI. For the period ended March 31, 2020, the Fund waived $13,978 related to investments in affiliated funds.
For the period ended March 31, 2020, GFD retained sales charges of $87,029 relating to sales of A-Class shares of the Trust.
Certain trustees and officers of the Trust are also officers of GI and/or GFD. The Trust does not compensate its officers or trustees who are officers, directors and/or employees of GI or GFD.
MUFG Investor Services (US), LLC (“MUIS”) acts as the Fund’s administrator, transfer agent and accounting agent. As administrator, transfer agent and accounting agent, MUIS maintains the books and records of the Fund’s securities and cash. The Bank of New York Mellon Corp. (“BNY”) acts as the Fund’s custodian. As custodian, BNY is responsible for the custody of the Fund’s assets. For providing the aforementioned administrative and accounting services, MUIS is entitled to receive a monthly fee equal to a percentage of the Fund’s average daily net assets and out of pocket expenses. For providing the aforementioned transfer agent and custodian services, MUIS and BNY are entitled to receive a monthly fee based on the number of transactions during the month and the number of accounts under management, subject to certain minimum monthly fees, and out of pocket expenses.
Note 6 – Federal Income Tax Information
The Fund intends to comply with the provisions of Subchapter M of the Internal Revenue Code applicable to regulated investment companies and will distribute substantially all taxable net investment income and capital gains sufficient to relieve the Fund from all, or substantially all, federal income, excise and state income taxes. Therefore, no provision for federal or state income tax or federal excise tax is required.
Tax positions taken or expected to be taken in the course of preparing the Fund’s tax returns are evaluated to determine whether the tax positions are “more-likely-than-not” of being sustained by the applicable tax authority. Tax positions not deemed to meet the more-likely-than-not threshold would be recorded as a tax benefit or expense in the current year. Management has analyzed the Fund’s tax positions taken, or to be taken, on U.S. federal income tax returns for all open tax years, and has concluded that no provision for income tax is required in the Fund’s financial statements. The Fund’s U.S. federal income tax returns are subject to examination by the Internal Revenue Service (“IRS”) for a period of three years after they are filed.
At March 31, 2020, the cost of investments for U.S. federal income tax purposes, the aggregate gross unrealized appreciation for all investments for which there was an excess of value over tax cost, and the aggregate gross unrealized depreciation for all investments for which there was an excess of tax cost over value, were as follows:
| | Tax Cost | | | Tax
Unrealized
Appreciation | | | Tax
Unrealized
Depreciation | | | Net
Unrealized
Depreciation | |
| | | $ | 2,876,449,239 | | | $ | 78,982,446 | | | $ | (106,578,812 | ) | | $ | (27,596,366 | ) |
Note 7 – Securities Transactions
For the period ended March 31, 2020, the cost of purchases and proceeds from sales of investment securities, excluding government securities, short-term investments and derivatives, were as follows:
| | Purchases | | | Sales | |
| | | $ | 425,571,894 | | | $ | 946,017,882 | |
| | THE GUGGENHEIM FUNDS SEMI-ANNUAL REPORT | 47 |
NOTES TO FINANCIAL STATEMENTS (Unaudited)(continued) |
For the period ended March 31, 2020, the cost of purchases and proceeds from the sales of government securities were as follows:
| | Purchases | | | Sales | |
| | | $ | 251,574,556 | | | $ | 450,311,747 | |
The Fund is permitted to purchase or sell securities from or to certain affiliated funds under specified conditions outlined in procedures adopted by the Board. The procedures have been designed to ensure that any purchase or sale of securities by the Fund from or to another fund or portfolio that is or could be considered an affiliate by virtue of having a common investment adviser (or affiliated investment advisers), common trustees and/or common officers complies with Rule 17a-7 of the 1940 Act. Further, as defined under these procedures, each transaction is effected at the current market price to save costs, where permissible. For the period ended March 31, 2020, the Fund engaged in purchases and sales of securities, pursuant to Rule 17a-7 of the 1940 Act, as follows:
| | Purchases | | | Sales | | | Realized Loss | |
| | | $ | — | | | $ | 248,444 | | | $ | (12,038 | ) |
Note 8 – Restricted Securities
The securities below are considered illiquid and restricted under guidelines established by the Board:
Restricted Securities | Acquisition Date | | Cost | | | Value | |
Copper River CLO Ltd. | | | | | | | | | |
2007-1A, due 1/20/211 | 05/09/14 | | $ | 98,116 | | | $ | 51,137 | |
1 | Security has no stated coupon. However, it is expected to receive residual cash flow payments on defined deal dates. |
Note 9 – Line of Credit
The Trust, along with other affiliated trusts, secured a 364-day committed, $1,205,000,000 line of credit from Citibank, N.A., which was in place through October 4, 2019, at which time the line of credit was renewed with an increased commitment amount of $1,230,000,000. A Fund may draw (borrow) from the line of credit as a temporary measure for emergency purposes, to facilitate redemption requests, or for other short-term liquidity purposes consistent with the Fund’s investment objective and program. For example, it may be advantageous for the Fund to borrow money rather than sell existing portfolio positions to meet redemption requests. Fees related to borrowings, if any, vary under this arrangement between the greater of Citibank’s “base rate”, LIBOR plus 1%, or the federal funds rate plus 1/2 of 1%.
The commitment fee that may be paid by the Fund is at an annualized rate of 0.15% of the average daily amount of its allocated unused commitment amount. The allocated commitment fee amount for the Fund is referenced in the Statement of Operations under “Line of credit fees” or included within “Miscellaneous”. The Fund did not have any borrowings under this agreement as of and for the period ended March 31, 2020.
Note 10 – Recent Accounting Pronouncements
In March 2017, the Financial Accounting Standards Board issued an Accounting Standards Update, ASU 2017-08, Receivables – Nonrefundable Fees and Other Costs (Subtopic 310-20), Premium Amortization on Purchased Callable Debt Securities (the “2017 ASU”) which amends the amortization period for certain purchased callable debt securities held at a premium, shortening such period to the earliest call date. The 2017 ASU does not require any accounting change for debt securities held at a discount; the discount continues to be amortized to maturity.
48 | THE GUGGENHEIM FUNDS SEMI-ANNUAL REPORT | |
NOTES TO FINANCIAL STATEMENTS (Unaudited)(concluded) |
As of October 1, 2019, the Fund has fully adopted the provisions of the 2017 ASU which were applied through a modified retrospective transition approach, as prescribed. The adoption resulted in a cumulative effect adjustment to reduce amortized cost and increase unrealized appreciaiton of investments for the Fund in the amount of $363,948.
The adoption had no impact on total distributable earnings (loss), net assets, the current period results from operations, or any prior period information presented in the financial statements.
Note 11 –- COVID-19 and Recent Developments
The global ongoing crisis caused by the outbreak of COVID-19 is causing materially reduced consumer demand and economic output, disrupting supply chains, resulting in market closures, travel restrictions and quarantines, and adversely impacting local and global economies. Investors should be aware that in light of the current uncertainty, volatility and distress in economies, financial markets, and labor and health conditions all over the world, the Fund’s investments and a shareholder’s investment in the Fund are subject to sudden and substantial losses, increased volatility and other adverse events. Firms through which investors invest with the Fund, the Fund, its service providers, the markets in which it invests and market intermediaries are also impacted by quarantines and similar measures intended to contain the ongoing pandemic, which can obstruct their functioning and subject them to heightened operational risks.
Note 12 – Subsequent Events
The Fund evaluated subsequent events through the date the financial statements were available for issue and determined there were no material events that would require adjustment to or disclosure in the Fund’s financial statements.
| | THE GUGGENHEIM FUNDS SEMI-ANNUAL REPORT | 49 |
OTHER INFORMATION (Unaudited) |
Proxy Voting Information
A description of the policies and procedures that the Trust uses to determine how to vote proxies relating to securities held in the Fund’s portfolios is available, without charge and upon request, by calling 800.820.0888. This information is also available from the EDGAR database on the SEC’s website at https://www.sec.gov.
Information regarding how the Fund voted proxies relating to portfolio securities during the most recent 12-month period ended June 30 is available without charge, upon request, by calling 800.820.0888. This information is also available from the EDGAR database on the SEC’s website at https://www.sec.gov.
Sector Classification
Information in the Schedule of Investments is categorized by sectors using sector-level Classifications defined by the Bloomberg Industry Classification System, a widely recognized industry classification system provider. The Fund’s registration statement has investment policies relating to concentration in specific sectors/industries. For purposes of these investment policies, the Fund usually classifies sectors/industries based on industry-level Classifications used by widely recognized industry classification system providers such as Bloomberg Industry Classification System, Global Industry Classification Standards and Barclays Global Classification Scheme.
Quarterly Portfolio Schedules Information
The Trust files its complete schedule of portfolio holdings with the SEC for the first and third quarters of each fiscal year as an exhibit to its reports on Form N-PORT, and for reporting periods ended prior to March 31, 2019, filed such information on Form N-Q. The Fund’s Forms N-PORT and N-Q are available on the SEC’s website at https://www.sec.gov. The Fund’s Forms N-PORT and N-Q may be reviewed and copied at the SEC’s Public Reference Room in Washington, DC, and that information on the operation of the Public Reference Room may be obtained by calling 800-SEC-0330. Copies of the portfolio holdings are also available to shareholders, without charge and upon request, by calling 800.820.0888.
50 | THE GUGGENHEIM FUNDS SEMI-ANNUAL REPORT | |
INFORMATION ON BOARD OF TRUSTEES AND OFFICERS (Unaudited) |
A Board of Trustees oversees the Trust, as well as other trusts of GI, in which its members have no stated term of service, and continue to serve after election until resignation. The Statement of Additional Information includes further information about Fund Trustees and Officers, and can be obtained without charge by visiting guggenheiminvestments.com or by calling 800.820.0888.
Name, Address*
and Year of Birth | Position(s)
Held with
Trust | Term of Office
and Length of
Time Served** | Principal Occupation(s)
During Past Five Years | Number of
Portfolios
in Fund
Complex
Overseen | Other
Directorships Held
by Trustees*** |
INDEPENDENT TRUSTEES | | | |
Randall C. Barnes (1951) | Trustee | Since 2014 | Current: Private Investor (2001-present). Former: Senior Vice President and Treasurer, PepsiCo, Inc. (1993-1997); President, Pizza Hut International (1991-1993); Senior Vice President, Strategic Planning and New Business Development, PepsiCo, Inc. (1987-1990). | 157 | Current: Purpose Investments Funds (2013-present). Former: Managed Duration Investment Grade Municipal Fund (2006-2016). |
Angela Brock-Kyle (1959) | Trustee | Since 2019 | Current: Founder and Chief Executive Officer, B.O.A.R.D.S. (2013-present). Former: Senior Leader, TIAA (1987-2012). | 156 | Current: Hunt Companies, Inc. (2019-present). Former: Infinity Property & Casualty Corp. (2014-2018). |
Donald A. Chubb, Jr. (1946) | Trustee and Chair of the Valuation Oversight Committee | Since 1994 | Current: Retired Former: Business broker and manager of commercial real estate, Griffith & Blair, Inc. (1997-2017). | 156 | Former: Midland Care, Inc. (2011-2016). |
Jerry B. Farley (1946) | Trustee and Chair of the Audit Committee | Since 2005 | Current: President, Washburn University (1997-present). | 156 | Current: CoreFirst Bank & Trust (2000-present). Former: Westar Energy, Inc. (2004-2018). |
Roman Friedrich III (1946) | Trustee and Chair of the Contracts Review Committee | Since 2014 | Current: Founder and Managing Partner, Roman Friedrich & Company (1998-present). | 156 | Former: Zincore Metals, Inc. (2009-2019). |
Thomas F. Lydon, Jr. (1960) | Trustee and Vice Chair of the Contracts Review Committee | Since 2019 | Current: President, Global Trends Investments (1996-present); Co-Chief Executive Officer, ETF Flows, LLC (2019-present); Chief Executive Officer, Lydon Media (2016-present). | 156 | Current: US Global Investors (GROW) (1995-present). Former: Harvest Volatility Edge Trust (3) (2017-2019). |
| | THE GUGGENHEIM FUNDS SEMI-ANNUAL REPORT | 51 |
INFORMATION ON BOARD OF TRUSTEES AND OFFICERS (Unaudited)(continued) |
Name, Address*
and Year of Birth | Position(s)
Held with
Trust | Term of Office
and Length of
Time Served** | Principal Occupation(s)
During Past Five Years | Number of
Portfolios
in Fund
Complex
Overseen | Other
Directorships Held
by Trustees*** |
INDEPENDENT TRUSTEES - concluded | | |
Ronald A. Nyberg (1953) | Trustee and Chair of the Nominating and Governance Committee | Since 2014 | Current: Partner, Momkus LLC (2016-present). Former: Partner, Nyberg & Cassioppi, LLC (2000-2016); Executive Vice President, General Counsel, and Corporate Secretary, Van Kampen Investments (1982-1999). | 157 | Current: PPM Funds (9) (2018 - present); Edward-Elmhurst Healthcare System (2012-present). Former: Western Asset Inflation-Linked Opportunities & Income Fund (2004-April 2020); Western Asset Inflation-Linked Income Fund (2003-April 2020); Managed Duration Investment Grade Municipal Fund (2003-2016). |
Sandra G. Sponem (1958) | Trustee | Since 2019 | Current: Retired. Former: Senior Vice President and Chief Financial Officer, M.A. Mortenson-Companies, Inc. (2007-2017). | 156 | Current: SPDR Series Trust (78) (2018-present); SPDR Index Shares Funds (31) (2018-present); SSGA Active Trust (12) (2018-present); and SSGA Master Trust (1) (2018-present). |
Ronald E. Toupin, Jr. (1958) | Trustee, Chair of the Board and Chair of the Executive Committee | Since 2014 | Current: Portfolio Consultant (2010-present); Member, Governing Council, Independent Directors Council (2013-present); Governor, Board of Governors, Investment Company Institute (2018-present). Former: Member, Executive Committee, Independent Directors Council (2016-2018); Vice President, Manager and Portfolio Manager, Nuveen Asset Management (1998-1999); Vice President, Nuveen Investment Advisory Corp. (1992-1999); Vice President and Manager, Nuveen Unit Investment Trusts (1991-1999); and Assistant Vice President and Portfolio Manager, Nuveen Unit Investment Trusts (1988-1999), each of John Nuveen & Co., Inc. (1982-1999). | 156 | Former: Western Asset Inflation-Linked Opportunities & Income Fund (2004-April 2020); Western Asset Inflation-Linked Income Fund (2003-April 2020); Managed Duration Investment Grade Municipal Fund (2003-2016). |
52 | THE GUGGENHEIM FUNDS SEMI-ANNUAL REPORT | |
INFORMATION ON BOARD OF TRUSTEES AND OFFICERS (Unaudited)(continued) |
Name, Address*
and Year of Birth | Position(s)
Held with
Trust | Term of Office
and Length of
Time Served** | Principal Occupation(s)
During Past Five Years | Number of
Portfolios
in Fund
Complex
Overseen | Other
Directorships Held
by Trustees*** |
INTERESTED TRUSTEE | | | | |
Amy J. Lee**** (1961) | Trustee, Vice President and Chief Legal Officer | Since 2018 (Trustee) Since 2014
(Chief Legal Officer) Since 2007
(Vice President) | Current: Interested Trustee, certain other funds in the Fund Complex (2018-present); Chief Legal Officer, certain other funds in the Fund Complex (2014-present); Vice President, certain other funds in the Fund Complex (2007-present); Senior Managing Director, Guggenheim Investments (2012-present). Former: President and Chief Executive Officer, certain other funds in the Fund Complex (2017-2019); Vice President, Associate General Counsel and Assistant Secretary, Security Benefit Life Insurance Company and Security Benefit Corporation (2004-2012). | 156 | None. |
* | The business address of each Trustee is c/o Guggenheim Investments, 227 West Monroe Street, Chicago, Illinois 60606. |
** | Each Trustee serves an indefinite term, until his or her successor is elected and qualified. Time served includes time served in the respective position for the Predecessor Corporation. |
*** | Each Trustee also serves on the boards of trustees of Guggenheim Funds Trust, Guggenheim Variable Funds Trust, Guggenheim Strategy Funds Trust, Fiduciary/Claymore Energy Infrastructure Fund, Guggenheim Taxable Municipal Managed Duration Trust, Guggenheim Strategic Opportunities Fund, Guggenheim Enhanced Equity Income Fund, Guggenheim Energy & Income Fund, Guggenheim Credit Allocation Fund, Rydex Series Funds, Rydex Dynamic Funds, Rydex Variable Funds and Transparent Value Trust. Messrs. Barnes and Nyberg also serve on the board of trustees of Advent Convertible & Income Fund. |
**** | This Trustee is deemed to be an “interested person” of the Fund under the 1940 Act by reason of her position with the Fund’s Investment Manager and/or the parent of the Investment Manager. |
| | THE GUGGENHEIM FUNDS SEMI-ANNUAL REPORT | 53 |
INFORMATION ON BOARD OF TRUSTEES AND OFFICERS (Unaudited)(continued) |
Name, Address*
and Year of Birth | Position(s)
Held with
Trust | Term of Office
and Length of
Time Served** | Principal Occupation(s)
During Past Five Years |
OFFICERS | | | |
Brian E. Binder (1972) | President and Chief Executive Officer | Since 2018 | Current: President and Chief Executive Officer, certain other funds in the Fund Complex (2018-present); President, Chief Executive Officer and Chairman of the Board of Managers, Guggenheim Funds Investment Advisors, LLC (2018-present); President and Chief Executive Officer, Security Investors, LLC (2018-present); Board Member of Guggenheim Partners Fund Management (Europe) Limited (2018-present); Senior Managing Director and Chief Administrative Officer, Guggenheim Investments (2018-present). Former: Managing Director and President, Deutsche Funds, and Head of US Product, Trading and Fund Administration, Deutsche Asset Management (2013-2018); Managing Director, Head of Business Management and Consulting, Invesco Ltd. (2010-2012). |
James M. Howley (1972) | Assistant Treasurer | Since 2014 | Current: Managing Director, Guggenheim Investments (2004-present); Assistant Treasurer, certain other funds in the Fund Complex (2006-present). Former: Manager, Mutual Fund Administration of Van Kampen Investments, Inc. (1996-2004). |
Mark E. Mathiasen (1978) | Secretary | Since 2014 | Current: Secretary, certain other funds in the Fund Complex (2007-present); Managing Director, Guggenheim Investments (2007-present). |
Glenn McWhinnie (1969) | Assistant Treasurer | Since 2016 | Current: Vice President, Guggenheim Investments (2009-present); Assistant Treasurer, certain other funds in the Fund Complex (2016-present). |
Michael P. Megaris (1984) | Assistant Secretary | Since 2014 | Current: Assistant Secretary, certain other funds in the Fund Complex (2014-present); Director, Guggenheim Investments (2012-present). |
Elisabeth Miller (1968) | Chief Compliance Officer | Since 2012 | Current: Chief Compliance Officer, certain other funds in the Fund Complex (2012-present); Senior Managing Director, Guggenheim Investments (2012-present). Vice President, Guggenheim Funds Distributors, LLC (2014-present). Former: Chief Compliance Officer, Security Investors, LLC and Guggenheim Funds Investment Advisors, LLC (2012-2018); Chief Compliance Officer, Guggenheim Distributors, LLC (2009-2014); Senior Manager, Security Investors, LLC (2004-2014); Senior Manager, Guggenheim Distributors, LLC (2004-2014). |
Margaux Misantone (1978) | AML Officer | Since 2017 | Current: Chief Compliance Officer, Security Investors, LLC and Guggenheim Funds Investment Advisors, LLC (2018-present); AML Officer, Security Investors, LLC and certain other funds in the Fund Complex (2017-present); Managing Director, Guggenheim Investments (2015-present). Former: Assistant Chief Compliance Officer, Security Investors, LLC and Guggenheim Funds Investments Advisors, LLC (2015-2018). |
William Rehder (1967) | Assistant Vice President | Since 2018 | Current: Managing Director, Guggenheim Investments (2002-present). |
54 | THE GUGGENHEIM FUNDS SEMI-ANNUAL REPORT | |
INFORMATION ON BOARD OF TRUSTEES AND OFFICERS (Unaudited)(concluded) |
Name, Address*
and Year of Birth | Position(s)
Held with
Trust | Term of Office
and Length of
Time Served** | Principal Occupation(s)
During Past Five Years |
OFFICERS - concluded | |
Kimberly J. Scott (1974) | Assistant Treasurer | Since 2014 | Current: Director, Guggenheim Investments (2012-present); Assistant Treasurer, certain other funds in the Fund Complex (2012-present). Former: Financial Reporting Manager, Invesco, Ltd. (2010-2011); Vice President/Assistant Treasurer, Mutual Fund Administration for Van Kampen Investments, Inc./Morgan Stanley Investment Management (2009-2010); Manager of Mutual Fund Administration, Van Kampen Investments, Inc./Morgan Stanley Investment Management (2005-2009). |
Bryan Stone (1979) | Vice President | Since 2014 | Current: Vice President, certain other funds in the Fund Complex (2014-present); Managing Director, Guggenheim Investments (2013-present). Former: Senior Vice President, Neuberger Berman Group LLC (2009-2013); Vice President, Morgan Stanley (2002-2009). |
John L. Sullivan (1955) | Chief Financial Officer, Chief Accounting Officer and Treasurer | Since 2014 | Current: Chief Financial Officer, Chief Accounting Officer and Treasurer, certain other funds in the Fund Complex (2010-present); Senior Managing Director, Guggenheim Investments (2010-present). Former: Managing Director and Chief Compliance Officer, each of the funds in the Van Kampen Investments fund complex (2004-2010); Managing Director and Head of Fund Accounting and Administration, Morgan Stanley Investment Management (2002-2004); Chief Financial Officer and Treasurer, Van Kampen Funds (1996-2004). |
Jon Szafran (1989) | Assistant Treasurer | Since 2017 | Current: Vice President, Guggenheim Investments (2017-present); Assistant Treasurer, certain other funds in the Fund Complex (2017-present). Former: Assistant Treasurer of Henderson Global Funds and Manager of US Fund Administration, Henderson Global Investors (North America) Inc. (“HGINA”), (2017); Senior Analyst of US Fund Administration, HGINA (2014–2017); Senior Associate of Fund Administration, Cortland Capital Market Services, LLC (2013-2014); Experienced Associate, PricewaterhouseCoopers LLP (2012-2013). |
* | The business address of each officer is c/o Guggenheim Investments, 227 West Monroe Street, Chicago, Illinois 60606. |
** | Each officer serves an indefinite term, until his or her successor is duly elected and qualified. |
| | THE GUGGENHEIM FUNDS SEMI-ANNUAL REPORT | 55 |
GUGGENHEIM INVESTMENTS PRIVACY NOTICE (Unaudited) |
Who We Are
This Privacy Notice describes the data protection practices of Guggenheim Investments. Guggenheim Investments as used herein refers to the affiliated investment management businesses of Guggenheim Partners, LLC: Guggenheim Funds Investment Advisors, LLC, Guggenheim Partners Investment Management, LLC, Guggenheim Funds Distributors, LLC, Security Investors, LLC, Guggenheim Investment Advisors (Europe) Limited, Guggenheim Real Estate, LLC, GS Gamma Advisors, LLC, Guggenheim Partners India Management, LLC, Guggenheim Partners Europe Limited, as well as the funds in the Guggenheim Funds complex (the “Funds”) (“Guggenheim Investments,” “we,” “us,” or “our”).
Guggenheim Partners Investment Management Holdings, LLC, located at 330 Madison Avenue, New York, New York 10017 is the data controller for your information. The affiliates who are also controllers of certain of your information are: Guggenheim Investment Advisors (Europe) Limited, Guggenheim Partners Europe Limited, Guggenheim Partners, LLC, Guggenheim Funds Investment Advisors, LLC, Guggenheim Partners Investment Management, LLC, Guggenheim Funds Distributors, LLC and Security Investors, LLC, as well as the Funds.
Our Commitment to You
Guggenheim Investments considers your privacy our utmost concern. When you become our client or investor, you entrust us with not only your hard-earned money but also with your personal and financial information. Because we have access to your private information, we hold ourselves to the highest standards in its safekeeping and use. We strictly limit how we share your information with others, whether you are a current or former Guggenheim Investments client or investor.
The Information We Collect About You
We collect certain nonpublic personal information about you from information you provide on applications, other forms, our website, and/or from third parties including investment advisors. This information includes Social Security or other tax identification number, assets, income, tax information, retirement and estate plan information, transaction history, account balance, payment history, bank account information, marital status, family relationships, information that we collect on our website through the use of “cookies,” and other personal information that you or others provide to us. We may also collect such information through your inquiries by mail, e-mail or telephone. We may also collect customer due diligence information, as required by applicable law and regulation, through third party service providers.
How We Handle Your Personal Information
The legal basis for using your information as set out in this Privacy Notice is as follows: (a) use of your personal data is necessary to perform our obligations under any contract with you (such as a contract for us to provide financial services to you); or (b) where use of your personal data is not necessary for performance of a contract, use of your personal data is necessary for our legitimate interests or the legitimate interests of others (for example, to enforce the legal terms governing our services, operate and market our website and other services we offer, ensure safe environments for our personnel and others, make and receive payments, prevent fraud and to know the customer to whom we are providing the services). Some processing is done to comply with applicable law.
In addition to the specific uses described above, we also use your information in the following manner:
| | ● | We use your information in connection with servicing your accounts. |
| | ● | We use information to respond to your requests or questions. For example, we might use your information to respond to your customer feedback. |
| | ● | We use information to improve our products and services. We may use your information to make our website and products better. We may use your information to customize your experience with us. |
| | ● | We use information for security purposes. We may use your information to protect our company and our customers. |
| | ● | We use information to communicate with you. For example, we will communicate with you about your account or our relationship. We may contact you about your feedback. We might also contact you about this Privacy Notice. We may also enroll you in our email newsletter. |
56 | THE GUGGENHEIM FUNDS SEMI-ANNUAL REPORT | |
GUGGENHEIM INVESTMENTS PRIVACY NOTICE (Unaudited)(continued) |
| | ● | We use information as otherwise permitted by law, as we may notify you. |
| | ��� | Aggregate/Anonymous Data. We may aggregate and/or anonymize any information collected through the website so that such information can no longer be linked to you or your device (“Aggregate/Anonymous Information”). We may use Aggregate/Anonymous Information for any purpose, including without limitation for research and marketing purposes, and may also share such data with any third parties, including advertisers, promotional partners, and sponsors. |
We do not sell information about current or former clients or their accounts to third parties. Nor do we share this information, except when necessary to complete transactions at your request, to make you aware of investment products and services that we or our affiliates offer, or as permitted or required by law.
We provide information about you to companies and individuals not affiliated with Guggenheim Investments to complete certain transactions or account changes, or to perform services for us related to your account. For example, if you ask to transfer assets from another financial institution to Guggenheim Investments, we must provide certain information about you to that company to complete the transaction. We provide the third party with only the information necessary to carry out its responsibilities and only for that purpose. And we require these third parties to treat your private information with the same high degree of confidentiality that we do. To alert you to other Guggenheim Investments products and services, we share your information within our family of affiliated companies. You may limit our sharing with affiliated companies as set out below. We may also share information with any successor to all or part of our business, or in connection with steps leading up to a merger or acquisition. For example, if part of our business was sold we may give customer information as part of that transaction. We may also share information about you with your consent.
We will release information about you if you direct us to do so, if we are compelled by law to do so, or in other circumstances as permitted by law (for example, to protect your account from fraud).
If you close your account(s) or become an inactive client or investor, we will continue to adhere to the privacy policies and practices described in this notice.
Opt-Out Provisions and Your Data Choices
The law allows you to “opt out” of certain kinds of information sharing with third parties. We do not share personal information about you with any third parties that triggers this opt-out right. This means YOU ARE ALREADY OPTED OUT.
When you are no longer our client or investor, we continue to share your information as described in this notice, and you may contact us at any time to limit our sharing by sending an email to CorporateDataPrivacy@GuggenheimPartners.com.
European Union Data Subjects and certain others: In addition to the choices set forth above, residents of the European Union and certain other jurisdictions have certain rights to (1) request access to or rectification or deletion of information we collect about them, (2) request a restriction on the processing of their information, (3) object to the processing of their information, or (4) request the portability of certain information. To exercise these or other rights, please contact us using the contact information below. We will consider all requests and provide our response within the time period stated by applicable law. Please note, however, that certain information may be exempt from such requests in some circumstances, which may include if we need to keep processing your information for our legitimate interests or to comply with a legal obligation. We may request you provide us with information necessary to confirm your identity before responding to your request.
Residents of France and certain other jurisdictions may also provide us with instructions regarding the manner in which we may continue to store, erase and share your information after your death, and where applicable, the person you have designated to exercise these rights after your death.
How We Protect Privacy Online
We take steps to protect your privacy when you use our web site – www.guggenheiminvestments.com – by using secure forms of online communication, including encryption technology, Secure Socket Layer (SSL) protocol, firewalls and user names and passwords. These safeguards vary based on the sensitivity of the information that we collect and store. However, we cannot and do not guarantee that these measures will prevent every unauthorized attempt to access, use, or disclose your information since despite our efforts, no Internet and/or other
| | THE GUGGENHEIM FUNDS SEMI-ANNUAL REPORT | 57 |
GUGGENHEIM INVESTMENTS PRIVACY NOTICE (Unaudited)(concluded) |
electronic transmissions can be completely secure. Our web site uses “http cookies”—tiny pieces of information that we ask your browser to store. We use cookies for session management and security features on the Guggenheim Investments web site. We do not use them to pull data from your hard drive, to learn your e-mail address, or to view data in cookies created by other web sites. We will not share the information in our cookies or give others access to it. See the legal information area on our web site for more details about web site security and privacy features.
How We Safeguard Your Personal Information and Data Retention
We restrict access to nonpublic personal information about you to our employees and in some cases to third parties (for example, the service providers described above) as permitted by law. We maintain strict physical, electronic and procedural safeguards that comply with federal standards to guard your nonpublic personal information.
We keep your information for no longer than necessary for the purposes for which it is processed. The length of time for which we retain information depends on the purposes for which we collected and use it and/or as required to comply with applicable laws. Information may persist in copies made for backup and business continuity purposes for additional time.
International Visitors
If you are not a resident of the United States, please be aware that your information may be transferred to, stored and processed in the United States where our servers are located and our databases are operated. The data protection and other laws of the United States and other countries might not be as comprehensive as those in your country.
In such cases, we ensure that a legal basis for such a transfer exists and that adequate protection is provided as required by applicable law, for example, by using standard contractual clauses or by transferring your data to a jurisdiction that has obtained an adequacy finding. Individuals whose data may be transferred on the basis of standard contractual clauses may contact us as described below.
We’ll Keep You Informed
If you have any questions or concerns about how we treat your personal data, we encourage you to consult with us first. You may also contact the relevant supervisory authority.
We reserve the right to modify this policy at any time and will inform you promptly of material changes. You may access our privacy policy from our web site at www.guggenheiminvestments.com. Should you have any questions regarding our privacy policy, contact us by email at CorporateDataPrivacy@GuggenheimPartners.com.
58 | THE GUGGENHEIM FUNDS SEMI-ANNUAL REPORT | |
This page intentionally left blank.
This page intentionally left blank.
This page intentionally left blank.
Not required at this time.
| Item 3. | Audit Committee Financial Expert. |
The registrant's Board of Trustees has determined that it has at least one audit committee financial expert serving on its audit committee (the “Audit Committee”), Sandra G. Sponem. Ms. Sponem is “independent,” meaning that she is not an “interested person” of the Registrant (as that term is defined in Section 2(a)(19) of the Investment Company Act of 1940, as amended) and she does not accept any consulting, advisory, or other compensatory fee from the Registrant (except in her capacity as a Board or committee member).
Under applicable securities laws, a person who is determined to be an audit committee financial expert will not be deemed an "expert" for any purpose, including without limitation for the purposes of Section 11 of the Securities Act of 1933, as a result of being designated or identified as an audit committee financial expert. The designation or identification of a person as an audit committee financial expert does not impose on such person any duties, obligations, or liabilities that are greater than the duties, obligations, and liabilities imposed on such person as a member of the audit committee and Board of Trustees in the absence of such designation or identification.
| Item 4. | Principal Accountant Fees and Services. |
Not required at this time.
| Item 5. | Audit Committee of Listed Registrants. |
Not applicable.
The Schedule of Investments is included under Item 1 of this form.
| Item 7. | Disclosure of Proxy Voting Policies and Procedures for Closed-End Management Investment Companies. |
Not applicable.
| Item 8. | Portfolio Managers of Closed-end Management Investment Companies |
Not applicable
| Item 9. | Purchases of Equity Securities by Closed-End Management Investment Company and Affiliated Purchasers. |
Not applicable.
| Item 10. | Submission of Matters to a Vote of Security Holders. |
The registrant does not currently have in place procedures by which shareholders may recommend nominees to the registrant’s board.
There have been no changes to the procedures by which shareholders may recommend nominees to the registrant’s board.
| Item 11. | Controls and Procedures. |
| (a) | The registrant’s President (principal executive officer) and Treasurer (principal financial officer) have evaluated the registrant’s disclosure controls and procedures (as defined in Rule 30a-3(c) under the Investment Company Act) as of a date within 90 days of this filing and have concluded that based on such evaluation as required by Rule 30a-3(b) under the Investment Company Act, that the registrant’s disclosure controls and procedures were effective as of that date in ensuring that information required to be disclosed by the registrant in this Form N-CSR was recorded, processed, summarized, and reported within the time periods specified in the Securities and Exchange Commission’s rules and forms.. |
| (b) | The registrant’s principal executive officer and principal financial officer are aware of no change in the registrant’s internal control over financial reporting that occurred during the period covered by this report that has materially affected, or is reasonably likely to materially affect, the registrant’s internal control over financial reporting. |
| Item 12. | Disclosure of Securities Lending Activities for Closed-End Management Investment Companies. |
Not Applicable.
SIGNATURES
Pursuant to the requirements of the Securities Exchange Act of 1934 and the Investment Company Act of 1940, the registrant has duly caused this report to be signed on its behalf by the undersigned, thereunto duly authorized.
| (Registrant) | Guggenheim Funds Trust | |
| | | |
| By (Signature and Title)* | /s/ Brian E. Binder |
| | Brian E. Binder, President and Chief Executive Officer |
| | | |
| Date | June 9, 2020 | |
| | | |
| Pursuant to the requirements of the Securities Exchange Act of 1934 and the Investment Company Act of 1940, this report has been signed below by the following persons on behalf of the registrant and in the capacities and on the dates indicated. |
| | | |
| By (Signature and Title)* | /s/ Brian E. Binder | |
| | Brian E. Binder, President and Chief Executive Officer | |
| | | |
| Date | June 9, 2020 | |
| | | |
| By (Signature and Title)* | /s/ John L. Sullivan |
| | John L. Sullivan, Chief Financial Officer, Chief Accounting Officer and Treasurer |
| | | |
| Date | June 9, 2020 | |
| * | Print the name and title of each signing officer under his or her signature. |


