UNITED STATES
SECURITIES AND EXCHANGE COMMISSION
Washington, D.C. 20549
FORM N-CSR
CERTIFIED SHAREHOLDER REPORT OF REGISTERED
MANAGEMENT INVESTMENT COMPANIES
Investment Company Act file number 811- 01136
Guggenheim Funds Trust
(Exact name of registrant as specified in charter)
805 King Farm Boulevard, Suite 600
Rockville, Maryland 20850
(Address of principal executive offices) (Zip code)
Amy J. Lee
Guggenheim Funds Trust
805 King Farm Boulevard, Suite 600
Rockville, Maryland 20850
(Name and address of agent for service)
Registrant's telephone number, including area code: 1-301-296-5100
Date of fiscal year end: September 30
Date of reporting period: March 31, 2017
Form N-CSR is to be used by management investment companies to file reports with the Commission not later than 10 days after the transmission to stockholders of any report that is required to be transmitted to stockholders under Rule 30e‑1 under the Investment Company Act of 1940 (17 CFR 270.30e‑1). The Commission may use the information provided on Form N‑CSR in its regulatory, disclosure review, inspection, and policymaking roles.
A registrant is required to disclose the information specified by Form N‑CSR, and the Commission will make this information public. A registrant is not required to respond to the collection of information contained in Form N‑CSR unless the Form displays a currently valid Office of Management and Budget (“OMB”) control number. Please direct comments concerning the accuracy of the information collection burden estimate and any suggestions for reducing the burden to Secretary, Securities and Exchange Commission, 450 Fifth Street, NW, Washington, DC 20549‑0609. The OMB has reviewed this collection of information under the clearance requirements of 44 U.S.C. §3507.
| Item 1. | Reports to Stockholders. |
The registrant’s semi-annual report transmitted to shareholders pursuant to Rule 30e-1 under the Investment Company Act of 1940, as amended (the “Investment Company Act”), is as follows:
3.31.2017
Guggenheim Funds Semi-Annual Report
Guggenheim Funds Trust-Equity |
Guggenheim Alpha Opportunity Fund | | |
Guggenheim Large Cap Value Fund | | |
Guggenheim Market Neutral Real Estate Fund | | |
Guggenheim Risk Managed Real Estate Fund | | |
Guggenheim Small Cap Value Fund | | |
Guggenheim StylePlus—Large Core Fund | | |
Guggenheim StylePlus—Mid Growth Fund | | |
Guggenheim World Equity Income Fund | | |
GuggenheimInvestments.com | SBE-SEMI-0317x0917 |
DEAR SHAREHOLDER | 2 |
ECONOMIC AND MARKET OVERVIEW | 3 |
ABOUT SHAREHOLDERS’ FUND EXPENSES | 5 |
ALPHA OPPORTUNITY FUND | 8 |
LARGE CAP VALUE FUND | 20 |
MARKET NEUTRAL REAL ESTATE FUND | 29 |
RISK MANAGED REAL ESTATE FUND | 37 |
SMALL CAP VALUE FUND | 48 |
STYLEPLUS—LARGE CORE FUND | 58 |
STYLEPLUS—MID GROWTH FUND | 69 |
WORLD EQUITY INCOME FUND | 80 |
NOTES TO FINANCIAL STATEMENTS | 90 |
OTHER INFORMATION | 104 |
INFORMATION ON BOARD OF TRUSTEES AND OFFICERS | 105 |
GUGGENHEIM INVESTMENTS PRIVACY POLICIES | 109 |
| | THE GUGGENHEIM FUNDS SEMI-ANNUAL REPORT | 1 |
Dear Shareholder:
Security Investors, LLC and Guggenheim Partners Investment Management, LLC (the “Investment Advisers”) are pleased to present the shareholder report for a selection of our Funds (the “Funds”) for the six-month period ended March 31, 2017.
The Investment Advisers are part of Guggenheim Investments, which represents the investment management businesses of Guggenheim Partners, LLC (“Guggenheim”), a global, diversified financial services firm.
Guggenheim Funds Distributors, LLC is the distributor of the Funds. Guggenheim Funds Distributors, LLC is affiliated with Guggenheim and the Investment Advisers.
We encourage you to read the Economic and Market Overview section of the report, which follows this letter.
We are committed to providing innovative investment solutions and appreciate the trust you place in us.
Sincerely,

Donald C. Cacciapaglia
President and Chief Executive Officer
April 30, 2017
Read a prospectus and summary prospectus (if available) carefully before investing. It contains the investment objectives, risks, charges, expenses and other information, which should be considered carefully before investing. Obtain a prospectus and summary prospectus (if available) at guggenheiminvestments.com or call 800.820.0888.
There can be no assurance that any investment product will achieve its investment objective(s). There are risks associated with investing, including the entire loss of principal invested. Investing involves market risks. The investment return and principal value of any investment product will fluctuate with changes in market conditions.
2 | THE GUGGENHEIM FUNDS SEMI-ANNUAL REPORT | |
ECONOMIC AND MARKET OVERVIEW (Unaudited) | March 31, 2017 |
The market optimism that helped lift risk asset prices after the presidential election in November continued through the early part of 2017. The Standard & Poor’s 500® (“S&P 500”) Index* set a new record, high yield corporate bond spreads approached cycle lows, and the 10-year Treasury yield rose to 2.63%, the highest level since 2014. Risk appetite faded as the first quarter drew to a close, however, as investors grappled with the implications of an unsuccessful healthcare reform bill and growing geopolitical risks.
Much of the rise in asset valuations since Donald Trump’s victory has been based on anticipation of his pro-growth policies coming to fruition, an outcome that is far from certain. Asset valuations could be getting a bit ahead of themselves, and becoming more sensitive to a temporary growth scare or setback, especially since the rollout of Trump’s new policies will not be smooth or easy.
Nevertheless, the underlying economy remains on a good trajectory. Tracking estimates for first-quarter real U.S. Gross Domestic Product (“GDP”) growth have fallen in recent weeks despite strong gains in consumer and business sentiment since the election. In late April, after the period ended, the initial estimate of first-quarter GDP growth was 0.7%. However, we attribute a large portion of the apparent weakness to seasonal factors that have depressed as-reported first quarter GDP growth over the past several years. In keeping with this pattern, we would expect the final first-quarter GDP number to be revised higher. More importantly, the prospects for quarterly GDP growth appear stronger going forward.
Consumer spending should benefit from solid income and wealth gains, with household net worth sitting at an all-time high. Recent job gains have been strong, and we anticipate a further acceleration of wage growth as the labor market continues to tighten. Buoyant consumer sentiment and low household debt service outlays also support our positive outlook. On the business investment side, we expect various factors to be supportive, including the uptick in global industrial production growth, the ongoing rise in U.S. oil drilling activity, the surge in small-business optimism, and the recovery in corporate earnings.
On March 15, the Federal Open Market Committee (“FOMC”) raised the U.S. Federal Reserve (the “Fed”) funds target rate by 25 basis points to a range of 0.75–1.0%. The hike itself had little impact on markets because several FOMC members had indicated in the weeks leading up to the meeting that a hike was likely. Looking ahead, we believe that the market is underpricing the likely pace of Fed rate hikes in 2017 and 2018, particularly now that market optimism about fiscal stimulus is waning.
Importantly, Chair Yellen noted that the FOMC’s baseline forecast of two additional rate increases in 2017 and three more in 2018 was not conditioned on expectations for fiscal stimulus. Rather, it reflected a need to gradually remove accommodation due to the fact that the Fed has essentially achieved its dual mandate objectives for employment and inflation. Fiscal easing, she explained, could result in a faster pace of tightening, if it materializes. Markets are skeptical and are pricing in only 1.5 more rate hikes in 2017 and another 1.5 rate hikes in 2018, according to fed funds futures contracts. We expect that the Fed will deliver three more rate hikes in 2017 and another four in 2018.
We expect to see equity and credit investors take more chips off the table unless there is concrete progress on fiscal legislation in Washington, particularly as the Fed demonstrates its desire to tighten even without fiscal stimulus. While we are optimistic about the near-term U.S. economic outlook, current valuations and growing political risks warrant a more defensive stance.
For the six months ended March 31, 2017, the S&P 500 Index* returned 10.12%. The MSCI Europe-Australasia-Far East (“EAFE”) Index* returned 6.48%. The return of the MSCI Emerging Markets Index* was 6.80%.
In the bond market, the Bloomberg Barclays U.S. Aggregate Bond Index* posted a -2.18% return for the period, while the Bloomberg Barclays U.S. Corporate High Yield Index* returned 4.50%. The return of the Bank of America (“BofA”) Merrill Lynch 3-Month U.S. Treasury Bill Index* was 0.19% for the 12-month period.
The opinions and forecasts expressed may not actually come to pass. This information is subject to change at any time, based on market and other conditions, and should not be construed as a recommendation of any specific security or strategy.
| | THE GUGGENHEIM FUNDS SEMI-ANNUAL REPORT | 3 |
ECONOMIC AND MARKET OVERVIEW (Unaudited)(concluded) | March 31, 2017 |
*Index Definitions
The following indices are referenced throughout this report. Indices are unmanaged and not available for direct investment. Index performance does not reflect transaction costs, fees, or expenses.
Bloomberg Barclays U.S. Aggregate Bond Index is a broad-based flagship benchmark that measures the investment grade, U.S. dollar-denominated, fixed-rate taxable bond market, including U.S. Treasuries, government-related and corporate securities, mortgage-backed securities or “MBS” (agency fixed-rate and hybrid adjustable-rate mortgage, or “ARM”, pass-throughs), asset-backed securities (“ABS”), and commercial mortgage-backed securities (“CMBS”) (agency and non-agency).
Bloomberg Barclays U.S. Corporate High Yield Index measures the U.S. dollar-denominated, high yield, fixed-rate corporate bond market. Securities are classified as high yield if the middle rating of Moody’s, Fitch, and S&P is Ba1/BB +/BB + or below.
BofA Merrill Lynch 3-Month U.S. Treasury Bill Index is an unmanaged market index of U.S. Treasury securities maturing in 90 days that assumes reinvestment of all income.
MSCI EAFE Index is a free float-adjusted market capitalization index that is designed to measure the equity market performance of developed markets, excluding the U.S. & Canada.
MSCI Emerging Markets Index is a free float-adjusted market capitalization weighted index that is designed to measure equity market performance in the global emerging markets.
S&P 500® Index is a capitalization-weighted index of 500 stocks designed to measure the performance of the broad economy, representing all major industries and is considered a representation of the U.S. stock market.
4 | THE GUGGENHEIM FUNDS SEMI-ANNUAL REPORT | |
ABOUT SHAREHOLDERS’ FUND EXPENSES (Unaudited) | |
All mutual funds have operating expenses, and it is important for our shareholders to understand the impact of costs on their investments. Shareholders of a fund incur two types of costs: (i) transaction costs, including sales charges (loads) on purchase payments, reinvested dividends, other distributions, and exchange fees, and (ii) ongoing costs, including management fees, administrative services, and shareholder reports, among others. These ongoing costs, or operating expenses, are deducted from a fund’s gross income and reduce the investment return of the fund.
A fund’s expenses are expressed as a percentage of its average net assets, which is known as the expense ratio. The following examples are intended to help investors understand the ongoing costs (in dollars) of investing in a fund and to compare these costs with the ongoing costs of investing in other mutual funds.
The examples are based on an investment of $1,000 made at the beginning of the period and held for the entire six-month period beginning September 30, 2016 and ending March 31, 2017.
The following tables illustrate the Funds’ costs in two ways:
Table 1. Based on actual Fund return: This section helps investors estimate the actual expenses paid over the period. The “Ending Account Value” shown is derived from the Fund’s actual return, and the fifth column shows the dollar amount that would have been paid by an investor who started with $1,000 in the Fund. Investors may use the information here, together with the amount invested, to estimate the expenses paid over the period. Simply divide the Fund’s account value by $1,000 (for example, an $8,600 account value divided by $1,000 = 8.6), then multiply the result by the number provided under the heading “Expenses Paid During Period.”
Table 2. Based on hypothetical 5% return: This section is intended to help investors compare a Fund’s cost with those of other mutual funds. The table provides information about hypothetical account values and hypothetical expenses based on the Fund’s actual expense ratio and an assumed rate of return of 5% per year before expenses, which is not the Fund’s actual return. The hypothetical account values and expenses may not be used to estimate the actual ending account balance or expenses paid during the period. The example is useful in making comparisons because the U.S. Securities and Exchange Commission (the “SEC”) requires all mutual funds to calculate expenses based on the 5% return. Investors can assess a Fund’s costs by comparing this hypothetical example with the hypothetical examples that appear in shareholder reports of other funds.
The calculations illustrated above assume no shares were bought or sold during the period. Actual costs may have been higher or lower, depending on the amount of investment and the timing of any purchases or redemptions.
Please note that the expenses shown in the table are meant to highlight your ongoing costs only and do not reflect any transactional costs, such as sales charges (loads) on purchase payments, and contingent deferred sales charges (“CDSC”) on redemptions, if any. Therefore, the second table is useful in comparing ongoing costs only, and will not help you determine the relative total costs of owning different funds. In addition, if these transactional costs were included, your costs would have been higher.
More information about the Funds’ expenses, including annual expense ratios for periods up to five years (subject to the Fund’s inception date), can be found in the Financial Highlights section of this report. For additional information on operating expenses and other shareholder costs, please refer to the appropriate Fund prospectus.
| | THE GUGGENHEIM FUNDS SEMI-ANNUAL REPORT | 5 |
ABOUT SHAREHOLDERS’ FUND EXPENSES (Unaudited)(continued) | |
| Expense
Ratio1 | Fund
Return | Beginning
Account Value
September 30, 2016 | Ending
Account Value
March 31, 2017 | Expenses
Paid During
Period2 |
Table 1. Based on actual Fund return3 | | | | | |
Alpha Opportunity Fund | | | | | |
A-Class | 2.35% | 10.57% | $ 1,000.00 | $ 1,105.70 | $ 12.34 |
C-Class | 3.09% | 10.18% | 1,000.00 | 1,101.80 | 16.19 |
P-Class | 2.00% | 10.71% | 1,000.00 | 1,107.10 | 10.51 |
Institutional Class | 1.63% | 10.91% | 1,000.00 | 1,109.10 | 8.57 |
Large Cap Value Fund | | | | | |
A-Class | 1.17% | 12.74% | 1,000.00 | 1,127.40 | 6.21 |
C-Class | 1.92% | 12.26% | 1,000.00 | 1,122.60 | 10.16 |
P-Class | 1.17% | 12.69% | 1,000.00 | 1,126.90 | 6.20 |
Institutional Class | 0.93% | 12.84% | 1,000.00 | 1,128.40 | 4.93 |
Market Neutral Real Estate Fund | | | | | |
A-Class | 1.66% | 4.70% | 1,000.00 | 1,047.00 | 8.47 |
C-Class | 2.41% | 4.31% | 1,000.00 | 1,043.10 | 12.28 |
P-Class | 1.67% | 4.70% | 1,000.00 | 1,047.00 | 8.52 |
Institutional Class | 1.41% | 4.82% | 1,000.00 | 1,048.20 | 7.20 |
Risk Managed Real Estate Fund | | | | | |
A-Class | 1.32% | 2.03% | 1,000.00 | 1,020.30 | 6.60 |
C-Class | 2.07% | 1.65% | 1,000.00 | 1,016.50 | 10.36 |
P-Class | 1.31% | 2.04% | 1,000.00 | 1,020.40 | 6.55 |
Institutional Class | 0.95% | 2.23% | 1,000.00 | 1,022.30 | 4.79 |
Small Cap Value Fund | | | | | |
A-Class | 1.32% | 13.30% | 1,000.00 | 1,133.00 | 7.02 |
C-Class | 2.07% | 12.90% | 1,000.00 | 1,129.00 | 10.99 |
P-Class | 1.32% | 13.25% | 1,000.00 | 1,132.50 | 7.02 |
Institutional Class | 1.07% | 13.44% | 1,000.00 | 1,134.40 | 5.69 |
StylePlus—Large Core Fund | | | | | |
A-Class | 1.25% | 10.31% | 1,000.00 | 1,103.10 | 6.55 |
C-Class | 2.14% | 9.85% | 1,000.00 | 1,098.50 | 11.20 |
P-Class | 1.48% | 10.15% | 1,000.00 | 1,101.50 | 7.75 |
Institutional Class | 0.90% | 10.53% | 1,000.00 | 1,105.30 | 4.72 |
StylePlus—Mid Growth Fund | | | | | |
A-Class | 1.27% | 7.90% | 1,000.00 | 1,079.00 | 6.58 |
C-Class | 2.17% | 7.46% | 1,000.00 | 1,074.60 | 11.22 |
P-Class | 1.60% | 7.70% | 1,000.00 | 1,077.00 | 8.29 |
Institutional Class | 1.05% | 8.08% | 1,000.00 | 1,080.80 | 5.45 |
World Equity Income Fund | | | | | |
A-Class | 1.23% | 5.26% | 1,000.00 | 1,052.60 | 6.29 |
C-Class | 1.98% | 4.90% | 1,000.00 | 1,049.00 | 10.11 |
P-Class | 1.23% | 5.21% | 1,000.00 | 1,052.10 | 6.29 |
Institutional Class | 0.98% | 5.46% | 1,000.00 | 1,054.60 | 5.02 |
6 | THE GUGGENHEIM FUNDS SEMI-ANNUAL REPORT | |
ABOUT SHAREHOLDERS’ FUND EXPENSES (Unaudited)(concluded) | |
| Expense
Ratio1 | Fund
Return | Beginning
Account Value
September 30, 2016 | Ending
Account Value
March 31, 2017 | Expenses
Paid During
Period2 |
Table 2. Based on hypothetical 5% return (before expenses) | | | | |
Alpha Opportunity Fund | | | | | |
A-Class | 2.35% | 5.00% | $ 1,000.00 | $ 1,013.21 | $ 11.80 |
C-Class | 3.09% | 5.00% | 1,000.00 | 1,009.52 | 15.48 |
P-Class | 2.00% | 5.00% | 1,000.00 | 1,014.96 | 10.05 |
Institutional Class | 1.63% | 5.00% | 1,000.00 | 1,016.80 | 8.20 |
Large Cap Value Fund | | | | | |
A-Class | 1.17% | 5.00% | 1,000.00 | 1,019.10 | 5.89 |
C-Class | 1.92% | 5.00% | 1,000.00 | 1,015.36 | 9.65 |
P-Class | 1.17% | 5.00% | 1,000.00 | 1,019.10 | 5.89 |
Institutional Class | 0.93% | 5.00% | 1,000.00 | 1,020.29 | 4.68 |
Market Neutral Real Estate Fund | | | | | |
A-Class | 1.66% | 5.00% | 1,000.00 | 1,016.65 | 8.35 |
C-Class | 2.41% | 5.00% | 1,000.00 | 1,012.91 | 12.09 |
P-Class | 1.67% | 5.00% | 1,000.00 | 1,016.60 | 8.40 |
Institutional Class | 1.41% | 5.00% | 1,000.00 | 1,017.90 | 7.09 |
Risk Managed Real Estate Fund | | | | | |
A-Class | 1.32% | 5.00% | 1,000.00 | 1,018.40 | 6.59 |
C-Class | 2.07% | 5.00% | 1,000.00 | 1,014.66 | 10.35 |
P-Class | 1.31% | 5.00% | 1,000.00 | 1,018.45 | 6.54 |
Institutional Class | 0.95% | 5.00% | 1,000.00 | 1,020.19 | 4.78 |
Small Cap Value Fund | | | | | |
A-Class | 1.32% | 5.00% | 1,000.00 | 1,018.35 | 6.64 |
C-Class | 2.07% | 5.00% | 1,000.00 | 1,014.61 | 10.40 |
P-Class | 1.32% | 5.00% | 1,000.00 | 1,018.35 | 6.64 |
Institutional Class | 1.07% | 5.00% | 1,000.00 | 1,019.60 | 5.39 |
StylePlus—Large Core Fund | | | | | |
A-Class | 1.25% | 5.00% | 1,000.00 | 1,018.70 | 6.29 |
C-Class | 2.14% | 5.00% | 1,000.00 | 1,014.26 | 10.75 |
P-Class | 1.48% | 5.00% | 1,000.00 | 1,017.55 | 7.44 |
Institutional Class | 0.90% | 5.00% | 1,000.00 | 1,020.44 | 4.53 |
StylePlus—Mid Growth Fund | | | | | |
A-Class | 1.27% | 5.00% | 1,000.00 | 1,018.60 | 6.39 |
C-Class | 2.17% | 5.00% | 1,000.00 | 1,014.11 | 10.90 |
P-Class | 1.60% | 5.00% | 1,000.00 | 1,016.95 | 8.05 |
Institutional Class | 1.05% | 5.00% | 1,000.00 | 1,019.70 | 5.29 |
World Equity Income Fund | | | | | |
A-Class | 1.23% | 5.00% | 1,000.00 | 1,018.80 | 6.19 |
C-Class | 1.98% | 5.00% | 1,000.00 | 1,015.06 | 9.95 |
P-Class | 1.23% | 5.00% | 1,000.00 | 1,018.80 | 6.19 |
Institutional Class | 0.98% | 5.00% | 1,000.00 | 1,020.04 | 4.94 |
1 | This ratio represents annualized net expenses, which may include short dividend and interest expenses. Excluding these expenses, the operating expense ratio for the Alpha Opportunity Fund would be 2.11%, 2.85%, 1.78% and 1.41% and the Risk Managed Real Estate Fund would be 1.28%, 2.04%, 1.28%, and 0.92% for the A-Class, C-Class, P-Class and Institutional Class respectively. Excludes expenses of the underlying funds in which the Funds invests. |
2 | Expenses are equal to the Fund's annualized expense ratio, net of any applicable fee waivers, multiplied by the average account value over the period, multiplied by 182/365 (to reflect the one-half year period). |
3 | Actual cumulative return at net asset value for the period September 30, 2016 to March 31, 2017. |
| | THE GUGGENHEIM FUNDS SEMI-ANNUAL REPORT | 7 |
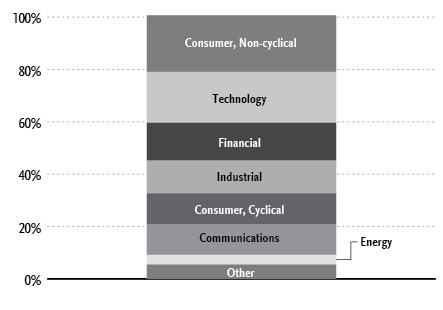
FUND PROFILE (Unaudited) | March 31, 2017 |
ALPHA OPPORTUNITY FUND
OBJECTIVE: Seeks long-term growth of capital.
Holdings Diversification (Market Exposure as % of Net Assets)

“Holdings Diversification (Market Exposure as % of Net Assets)” excludes any temporary cash investments.
Inception Dates: |
A-Class | July 7, 2003 |
C-Class | July 7, 2003 |
P-Class | May 1, 2015 |
Institutional Class | November 7, 2008 |
Ten Largest Long Holdings (% of Total Net Assets) |
CVS Health Corp. | 1.9% |
FirstEnergy Corp. | 1.5% |
Express Scripts Holding Co. | 1.5% |
UGI Corp. | 1.5% |
International Business Machines Corp. | 1.5% |
Tyson Foods, Inc. — Class A | 1.5% |
CA, Inc. | 1.5% |
Verizon Communications, Inc. | 1.4% |
Exelon Corp. | 1.4% |
Emerson Electric Co. | 1.3% |
Top Ten Total | 15.0% |
“Ten Largest Long Holdings” excludes any temporary cash or derivative investments.
8 | THE GUGGENHEIM FUNDS SEMI-ANNUAL REPORT | |
SCHEDULE OF INVESTMENTS (Unaudited) | March 31, 2017 |
ALPHA OPPORTUNITY FUND | |
| | Shares | | | Value | |
| | | | | | | |
COMMON STOCKS† - 96.9% | |
| | | | | | | |
Consumer, Non-cyclical - 28.4% | |
Express Scripts Holding Co.*,1 | | | 51,899 | | | $ | 3,420,663 | |
Tyson Foods, Inc. — Class A1 | | | 54,446 | | | | 3,359,863 | |
DaVita, Inc.*,1 | | | 41,726 | | | | 2,836,116 | |
General Mills, Inc.1 | | | 46,071 | | | | 2,718,649 | |
Quest Diagnostics, Inc.1 | | | 27,075 | | | | 2,658,494 | |
Pfizer, Inc.1 | | | 68,164 | | | | 2,331,890 | |
Kimberly-Clark Corp.1 | | | 16,843 | | | | 2,217,044 | |
Johnson & Johnson1 | | | 17,702 | | | | 2,204,784 | |
Dean Foods Co. | | | 111,099 | | | | 2,184,206 | |
Laboratory Corp. of America Holdings*,1 | | | 14,610 | | | | 2,096,097 | |
AmerisourceBergen Corp. — Class A1 | | | 23,474 | | | | 2,077,449 | |
Sysco Corp.1 | | | 39,364 | | | | 2,043,779 | |
Deluxe Corp.2 | | | 27,455 | | | | 1,981,427 | |
Whole Foods Market, Inc. | | | 66,146 | | | | 1,965,859 | |
Sanderson Farms, Inc. | | | 16,513 | | | | 1,714,710 | |
United Natural Foods, Inc.* | | | 38,956 | | | | 1,684,068 | |
Ingredion, Inc.2 | | | 12,835 | | | | 1,545,719 | |
HCA Holdings, Inc.*,2 | | | 17,055 | | | | 1,517,724 | |
SpartanNash Co.2 | | | 41,877 | | | | 1,465,276 | |
AbbVie, Inc.1 | | | 20,599 | | | | 1,342,231 | |
JM Smucker Co.1 | | | 9,998 | | | | 1,310,538 | |
ManpowerGroup, Inc.1 | | | 12,592 | | | | 1,291,562 | |
Universal Corp.1 | | | 18,074 | | | | 1,278,736 | |
Darling Ingredients, Inc.*,2 | | | 84,463 | | | | 1,226,403 | |
Dr Pepper Snapple Group, Inc.1 | | | 12,464 | | | | 1,220,475 | |
Flowers Foods, Inc.2 | | | 57,808 | | | | 1,122,053 | |
Total System Services, Inc. | | | 20,483 | | | | 1,095,021 | |
United Therapeutics Corp.*,2 | | | 7,571 | | | | 1,024,962 | |
MEDNAX, Inc.*,1 | | | 13,245 | | | | 918,938 | |
Post Holdings, Inc.* | | | 10,272 | | | | 899,005 | |
Robert Half International, Inc. | | | 18,011 | | | | 879,477 | |
Varian Medical Systems, Inc.* | | | 9,131 | | | | 832,108 | |
United Rentals, Inc.*,1 | | | 6,560 | | | | 820,328 | |
Magellan Health, Inc.* | | | 11,831 | | | | 816,931 | |
Hill-Rom Holdings, Inc. | | | 11,544 | | | | 815,007 | |
Chemed Corp.2 | | | 4,374 | | | | 799,086 | |
HealthSouth Corp. | | | 18,299 | | | | 783,380 | |
Cambrex Corp.*,2 | | | 13,314 | | | | 732,936 | |
Centene Corp.* | | | 9,975 | | | | 710,818 | |
Boston Beer Company, Inc. — Class A* | | | 4,607 | | | | 666,403 | |
Campbell Soup Co. | | | 11,428 | | | | 654,139 | |
H&R Block, Inc.2 | | | 27,818 | | | | 646,769 | |
Total Consumer, Non-cyclical | | | | | | | 63,911,123 | |
| | | | | | | | | |
Industrial - 13.7% | |
Emerson Electric Co. | | | 48,942 | | | | 2,929,668 | |
Boeing Co. | | | 14,775 | | | | 2,613,106 | |
TE Connectivity Ltd. | | | 30,381 | | | | 2,264,904 | |
Timken Co.2 | | | 40,018 | | | | 1,808,814 | |
Huntington Ingalls Industries, Inc.2 | | | 8,465 | | | | 1,695,032 | |
Keysight Technologies, Inc.*,2 | | | 39,823 | | | | 1,439,203 | |
Arrow Electronics, Inc.*,2 | | | 19,500 | | | | 1,431,495 | |
Jacobs Engineering Group, Inc. | | | 25,549 | | | | 1,412,349 | |
Fluor Corp.2 | | | 23,454 | | | | 1,234,149 | |
Saia, Inc.*,2 | | | 27,104 | | | | 1,200,707 | |
ITT, Inc.2 | | | 28,698 | | | | 1,177,192 | |
Harris Corp.1 | | | 10,432 | | | | 1,160,769 | |
Sanmina Corp.* | | | 26,377 | | | | 1,070,906 | |
Barnes Group, Inc.2 | | | 20,166 | | | | 1,035,323 | |
Crane Co.2 | | | 13,668 | | | | 1,022,777 | |
Methode Electronics, Inc.2 | | | 21,609 | | | | 985,370 | |
Vishay Intertechnology, Inc.2 | | | 59,431 | | | | 977,640 | |
ArcBest Corp.2 | | | 35,399 | | | | 920,374 | |
Applied Industrial Technologies, Inc.2 | | | 14,764 | | | | 913,153 | |
Trinity Industries, Inc. | | | 28,615 | | | | 759,728 | |
FLIR Systems, Inc. | | | 19,920 | | | | 722,698 | |
Federal Signal Corp.2 | | | 50,430 | | | | 696,438 | |
Owens-Illinois, Inc.* | | | 34,113 | | | | 695,223 | |
Werner Enterprises, Inc. | | | 24,506 | | | | 642,057 | |
Total Industrial | | | | | | | 30,809,075 | |
| | | | | | | | | |
Consumer, Cyclical - 13.4% | |
CVS Health Corp.1 | | | 55,099 | | | | 4,325,272 | |
Wal-Mart Stores, Inc.1 | | | 32,158 | | | | 2,317,949 | |
UniFirst Corp. | | | 16,140 | | | | 2,283,003 | |
Walgreens Boots Alliance, Inc. | | | 27,162 | | | | 2,255,804 | |
Brinker International, Inc.2 | | | 43,428 | | | | 1,909,095 | |
Alaska Air Group, Inc.1 | | | 19,647 | | | | 1,811,846 | |
Big Lots, Inc.1 | | | 33,483 | | | | 1,629,952 | |
Southwest Airlines Co.1 | | | 27,226 | | | | 1,463,670 | |
JetBlue Airways Corp.*,1 | | | 65,927 | | | | 1,358,755 | |
Herman Miller, Inc. | | | 38,912 | | | | 1,227,674 | |
Hawaiian Holdings, Inc.* | | | 25,833 | | | | 1,199,943 | |
Tailored Brands, Inc. | | | 78,550 | | | | 1,173,537 | |
Dick’s Sporting Goods, Inc. | | | 23,834 | | | | 1,159,762 | |
Darden Restaurants, Inc. | | | 11,905 | | | | 996,091 | |
Ralph Lauren Corp. — Class A | | | 11,959 | | | | 976,094 | |
DineEquity, Inc. | | | 16,497 | | | | 897,767 | |
Children’s Place, Inc. | | | 7,246 | | | | 869,882 | |
Cooper-Standard Holdings, Inc.* | | | 7,445 | | | | 825,874 | |
American Airlines Group, Inc.1 | | | 18,562 | | | | 785,173 | |
Allegiant Travel Co. — Class A | | | 4,843 | | | | 776,091 | |
Total Consumer, Cyclical | | | | | | | 30,243,234 | |
| | | | | | | | | |
Utilities - 13.0% | |
FirstEnergy Corp.1 | | | 108,351 | | | | 3,447,729 | |
UGI Corp.2 | | | 69,189 | | | | 3,417,937 | |
Exelon Corp.1 | | | 85,060 | | | | 3,060,459 | |
Ameren Corp.1 | | | 53,449 | | | | 2,917,781 | |
Edison International1 | | | 28,340 | | | | 2,256,147 | |
Hawaiian Electric Industries, Inc. | | | 65,944 | | | | 2,196,595 | |
WEC Energy Group, Inc. | | | 31,303 | | | | 1,897,901 | |
Xcel Energy, Inc.1 | | | 38,248 | | | | 1,700,124 | |
Eversource Energy | | | 27,011 | | | | 1,587,706 | |
Southwest Gas Holdings, Inc.1 | | | 17,808 | | | | 1,476,461 | |
American Electric Power Company, Inc.1 | | | 20,622 | | | | 1,384,355 | |
AES Corp. | | | 99,175 | | | | 1,108,776 | |
National Fuel Gas Co. | | | 17,860 | | | | 1,064,813 | |
Pinnacle West Capital Corp.2 | | | 11,644 | | | | 970,877 | |
SEE NOTES TO FINANCIAL STATEMENTS. | THE GUGGENHEIM FUNDS SEMI-ANNUAL REPORT | 9 |
SCHEDULE OF INVESTMENTS (Unaudited)(continued) | March 31, 2017 |
ALPHA OPPORTUNITY FUND | |
| | Shares | | | Value | |
| | | | | | | |
PG&E Corp. | | | 10,168 | | | $ | 674,748 | |
Total Utilities | | | | | | | 29,162,409 | |
| | | | | | | | | |
Technology - 11.7% | |
International Business Machines Corp.1 | | | 19,506 | | | | 3,396,775 | |
CA, Inc.1 | | | 103,707 | | | | 3,289,586 | |
Oracle Corp.1 | | | 64,986 | | | | 2,899,025 | |
Apple, Inc.1 | | | 15,438 | | | | 2,217,823 | |
Convergys Corp.2 | | | 101,856 | | | | 2,154,254 | |
HP, Inc.1 | | | 109,904 | | | | 1,965,084 | |
Xerox Corp. | | | 204,032 | | | | 1,497,595 | |
NCR Corp.* | | | 29,679 | | | | 1,355,737 | |
Cerner Corp.* | | | 22,537 | | | | 1,326,303 | |
NetApp, Inc.1 | | | 28,382 | | | | 1,187,787 | |
KLA-Tencor Corp.1 | | | 10,671 | | | | 1,014,492 | |
CACI International, Inc. — Class A*,2 | | | 7,831 | | | | 918,576 | |
Seagate Technology plc | | | 19,215 | | | | 882,545 | |
Skyworks Solutions, Inc.1 | | | 8,006 | | | | 784,428 | |
Sykes Enterprises, Inc.*,2 | | | 23,540 | | | | 692,076 | |
Icad, Inc.*,2 | | | 90,329 | | | | 434,482 | |
VeriFone Systems, Inc.* | | | 14,640 | | | | 274,207 | |
Total Technology | | | | | | | 26,290,775 | |
| | | | | | | | | |
Financial - 10.6% | |
Aflac, Inc.1 | | | 35,671 | | | | 2,583,294 | |
Old Republic International Corp.1 | | | 91,764 | | | | 1,879,327 | |
Federated Investors, Inc. — Class B | | | 70,978 | | | | 1,869,561 | |
Equity Residential1 | | | 25,413 | | | | 1,581,197 | |
Interactive Brokers Group, Inc. — Class A1 | | | 42,494 | | | | 1,475,392 | |
LaSalle Hotel Properties | | | 46,909 | | | | 1,358,015 | |
Franklin Resources, Inc.1 | | | 31,352 | | | | 1,321,173 | |
Prudential Financial, Inc.1 | | | 12,384 | | | | 1,321,125 | |
Aspen Insurance Holdings Ltd.2 | | | 22,412 | | | | 1,166,545 | |
Hanover Insurance Group, Inc. | | | 11,898 | | | | 1,071,534 | |
American Financial Group, Inc. | | | 10,233 | | | | 976,433 | |
Selective Insurance Group, Inc.2 | | | 20,535 | | | | 968,225 | |
Host Hotels & Resorts, Inc.1 | | | 48,024 | | | | 896,128 | |
Bank of New York Mellon Corp. | | | 18,442 | | | | 871,016 | |
State Street Corp.1 | | | 9,851 | | | | 784,238 | |
Citigroup, Inc.1 | | | 12,145 | | | | 726,514 | |
Cullen/Frost Bankers, Inc. | | | 7,828 | | | | 696,457 | |
Unum Group1 | | | 14,595 | | | | 684,360 | |
Ameriprise Financial, Inc.2 | | | 5,203 | | | | 674,725 | |
Umpqua Holdings Corp. | | | 36,484 | | | | 647,226 | |
CNO Financial Group, Inc.2 | | | 15,349 | | | | 314,654 | |
Total Financial | | | | | | | 23,867,139 | |
| | | | | | | | | |
Communications - 5.5% | |
Verizon Communications, Inc.1 | | | 63,781 | | | | 3,109,324 | |
VeriSign, Inc.* | | | 24,438 | | | | 2,128,794 | |
Discovery Communications, Inc. — Class A*,1 | | | 69,796 | | | | 2,030,366 | |
Cogent Communications Holdings, Inc. | | | 46,564 | | | | 2,004,580 | |
Juniper Networks, Inc.1 | | | 59,675 | | | | 1,660,755 | |
News Corp. — Class A | | | 54,894 | | | | 713,622 | |
eBay, Inc.*,1 | | | 20,591 | | | | 691,240 | |
Total Communications | | | | | | | 12,338,681 | |
| | | | | | | | | |
Basic Materials - 0.6% | |
Domtar Corp. | | | 23,914 | | | | 873,339 | |
AK Steel Holding Corp.* | | | 82,256 | | | | 591,421 | |
Total Basic Materials | | | | | | | 1,464,760 | |
| | | | | | | | | |
Total Common Stocks | | | | | | | | |
(Cost $209,218,876) | | | | | | | 218,087,196 | |
| | | | | | | | | |
SHORT-TERM INVESTMENTS† - 3.9% | |
Goldman Sachs Financial Square Treasury Instruments Fund - Institutional Class 0.56%3 | | | 8,691,931 | | | | 8,691,931 | |
Total Short-Term Investments | | | | | | | | |
(Cost $8,691,931) | | | | | | | 8,691,931 | |
| | | | | | | | | |
Total Investments - 100.8% | | | | | | | | |
(Cost $217,910,807) | | | | | | $ | 226,779,127 | |
| | | | | | | | | |
COMMON STOCKS SOLD SHORT† - (12.0)% | |
Consumer, Non-cyclical - (0.3)% | |
Cantel Medical Corp. | | | 8,408 | | | | (673,481 | ) |
| | | | | | | | | |
Industrial - (0.4)% | |
EnPro Industries, Inc. | | | 11,792 | | | | (839,119 | ) |
| | | | | | | | | |
Consumer, Cyclical - (1.1)% | |
Crocs, Inc.* | | | 102,641 | | | | (725,672 | ) |
Papa John’s International, Inc. | | | 10,610 | | | | (849,225 | ) |
Pool Corp. | | | 7,919 | | | | (944,974 | ) |
Total Consumer, Cyclical | | | | | | | (2,519,871 | ) |
| | | | | | | | | |
Communications - (1.6)% | |
Amazon.com, Inc.* | | | 3,964 | | | | (3,514,244 | ) |
| | | | | | | | | |
Basic Materials - (2.2)% | |
NewMarket Corp. | | | 1,809 | | | | (819,893 | ) |
Royal Gold, Inc. | | | 29,772 | | | | (2,085,528 | ) |
Sensient Technologies Corp. | | | 26,537 | | | | (2,103,323 | ) |
Total Basic Materials | | | | | | | (5,008,744 | ) |
| | | | | | | | | |
Technology - (2.3)% | |
CommVault Systems, Inc.* | | | 15,502 | | | | (787,502 | ) |
Cypress Semiconductor Corp. | | | 75,386 | | | | (1,037,311 | ) |
Medidata Solutions, Inc.* | | | 18,178 | | | | (1,048,689 | ) |
Silicon Laboratories, Inc.* | | | 15,763 | | | | (1,159,369 | ) |
Ultimate Software Group, Inc.* | | | 6,087 | | | | (1,188,243 | ) |
Total Technology | | | | | | | (5,221,114 | ) |
| | | | | | | | | |
Financial - (4.1)% | |
Life Storage, Inc. | | | 7,988 | | | | (655,975 | ) |
American Assets Trust, Inc. | | | 16,152 | | | | (675,800 | ) |
Community Bank System, Inc. | | | 14,751 | | | | (811,010 | ) |
Glacier Bancorp, Inc. | | | 25,483 | | | | (864,638 | ) |
EastGroup Properties, Inc. | | | 12,156 | | | | (893,831 | ) |
Morgan Stanley | | | 26,577 | | | | (1,138,559 | ) |
Webster Financial Corp. | | | 25,610 | | | | (1,281,524 | ) |
10 | THE GUGGENHEIM FUNDS SEMI-ANNUAL REPORT | SEE NOTES TO FINANCIAL STATEMENTS. |
SCHEDULE OF INVESTMENTS (Unaudited)(continued) | March 31, 2017 |
ALPHA OPPORTUNITY FUND | |
| | Shares | | | Value | |
| | | | | | | |
Federal Realty Investment Trust | | | 10,991 | | | $ | (1,467,299 | ) |
Associated Banc-Corp. | | | 61,891 | | | | (1,510,140 | ) |
Total Financial | | | | | | | (9,298,776 | ) |
| | | | | | | | | |
Total Common Stocks Sold Short | | | | | | | | |
(Proceeds $25,471,957) | | | | | | $ | (27,075,349 | ) |
Total Securities Sold Short- (12.0)% | | | | | | | | |
(Proceeds $25,471,957) | | | | | | $ | (27,075,349 | ) |
Other Assets & Liabilities, net - 11.2% | | | | | | | 25,252,295 | |
Total Net Assets - 100.0% | | | | | | $ | 224,956,073 | |
| | | | | | Unrealized
Gain (Loss) | |
| | | | | | | | | |
OTC EQUITY SWAP AGREEMENTS †† | |
Morgan Stanley
February 2019 Alpha Opportunity Portfolio Short Custom Basket Swap 0.56%5
Terminating 02/01/19
(Notional Value $196,034,618) | | | | | | $ | (2,865,366 | ) |
Morgan Stanley
February 2019 Alpha Opportunity Portfolio Long Custom Basket Swap 1.28%4
Terminating 02/01/19
(Notional Value $96,189,485) | | | | | | $ | (152,365 | ) |
| | | | | | | | | |
| | | Shares | | | | | |
| | | | | | | | | |
CUSTOM BASKET OF LONG SECURITIES4 | |
Cisco Systems, Inc. | | | 89,466 | | | | 164,602 | |
Best Buy Co., Inc. | | | 30,894 | | | | 136,065 | |
CenterPoint Energy, Inc. | | | 121,361 | | | | 130,654 | |
PPL Corp. | | | 79,692 | | | | 127,561 | |
Lam Research Corp. | | | 10,889 | | | | 110,852 | |
Archer-Daniels-Midland Co. | | | 56,217 | | | | 109,252 | |
Cardinal Health, Inc. | | | 29,788 | | | | 106,146 | |
Consolidated Edison, Inc. | | | 27,048 | | | | 90,788 | |
Teradyne, Inc. | | | 41,313 | | | | 84,275 | |
Western Union Co. | | | 166,865 | | | | 83,682 | |
Entergy Corp. | | | 20,321 | | | | 78,180 | |
Everest Re Group Ltd. | | | 12,454 | | | | 67,976 | |
DST Systems, Inc. | | | 10,017 | | | | 61,549 | |
McKesson Corp. | | | 11,355 | | | | 54,420 | |
Principal Financial Group, Inc. | | | 17,200 | | | | 51,744 | |
Allstate Corp. | | | 20,484 | | | | 50,635 | |
Hologic, Inc.* | | | 18,040 | | | | 43,293 | |
Scripps Networks Interactive, Inc. — Class A | | | 28,740 | | | | 42,174 | |
Conagra Brands, Inc. | | | 49,432 | | | | 32,536 | |
Teradata Corp.* | | | 46,866 | | | | 24,623 | |
Eastman Chemical Co. | | | 8,679 | | | | 24,264 | |
Travelers Cos., Inc. | | | 21,550 | | | | 21,040 | |
Public Service Enterprise Group, Inc. | | | 33,166 | | | | 18,612 | |
Hospitality Properties Trust | | | 22,070 | | | | 13,597 | |
Omnicom Group, Inc. | | | 7,989 | | | | 12,262 | |
Cummins, Inc. | | | 10,793 | | | | 10,741 | |
Tier REIT, Inc. | | | 40,364 | | | | 6,122 | |
Wabash National Corp. | | | 56,784 | | | | 6,057 | |
Hilton Worldwide Holdings, Inc. | | | 11,806 | | | | 5,968 | |
Masco Corp. | | | 66,743 | | | | 4,100 | |
UnitedHealth Group, Inc. | | | 10,553 | | | | 2,182 | |
Chesapeake Lodging Trust | | | 28,828 | | | | (1,124 | ) |
Hartford Financial Services Group, Inc. | | | 6,492 | | | | (2,402 | ) |
Pitney Bowes, Inc. | | | 56,165 | | | | (2,895 | ) |
Casey’s General Stores, Inc. | | | 10,504 | | | | (2,947 | ) |
Merck & Company, Inc. | | | 30,407 | | | | (3,078 | ) |
Textron, Inc. | | | 16,115 | | | | (4,993 | ) |
Corning, Inc. | | | 80,002 | | | | (6,540 | ) |
Biogen, Inc.* | | | 2,801 | | | | (12,514 | ) |
Amgen, Inc. | | | 9,955 | | | | (21,197 | ) |
United Continental Holdings, Inc.* | | | 20,809 | | | | (21,355 | ) |
Carlisle Companies, Inc. | | | 14,521 | | | | (23,326 | ) |
Cedar Realty Trust, Inc. | | | 131,306 | | | | (33,162 | ) |
Bed Bath & Beyond, Inc. | | | 51,046 | | | | (34,624 | ) |
AECOM* | | | 24,756 | | | | (41,608 | ) |
Owens & Minor, Inc. | | | 54,672 | | | | (43,904 | ) |
Ford Motor Co. | | | 54,888 | | | | (45,213 | ) |
SYNNEX Corp. | | | 8,751 | | | | (59,038 | ) |
Michael Kors Holdings Ltd.* | | | 43,660 | | | | (63,786 | ) |
WellCare Health Plans, Inc.* | | | 12,796 | | | | (65,407 | ) |
Mallinckrodt plc* | | | 14,250 | | | | (68,723 | ) |
Gilead Sciences, Inc. | | | 34,278 | | | | (96,041 | ) |
Delta Air Lines, Inc. | | | 52,778 | | | | (109,022 | ) |
EMCOR Group, Inc. | | | 19,165 | | | | (109,434 | ) |
Kroger Co. | | | 65,881 | | | | (147,493 | ) |
InterDigital, Inc. | | | 21,075 | | | | (172,612 | ) |
Molina Healthcare, Inc.* | | | 27,458 | | | | (175,602 | ) |
Target Corp. | | | 41,771 | | | | (318,268 | ) |
Telephone & Data Systems, Inc. | | | 130,248 | | | | (341,068 | ) |
Total Custom Basket of Long Securities | | | | | | | (251,424 | ) |
| | | | | | | | | |
CUSTOM BASKET OF SHORT SECURITIES5 | |
Compass Minerals International, Inc. | | | (25,911 | ) | | | 276,462 | |
Lithia Motors, Inc. — Class A | | | (14,054 | ) | | | 194,493 | |
New York Community Bancorp, Inc. | | | (167,337 | ) | | | 167,470 | |
Allegheny Technologies, Inc. | | | (58,959 | ) | | | 167,409 | |
Freeport-McMoRan, Inc.* | | | (60,322 | ) | | | 141,914 | |
CarMax, Inc.* | | | (21,636 | ) | | | 133,797 | |
People’s United Financial, Inc. | | | (164,369 | ) | | | 114,880 | |
FactSet Research Systems, Inc. | | | (7,517 | ) | | | 89,655 | |
First Horizon National Corp. | | | (65,208 | ) | | | 86,445 | |
U.S. Bancorp | | | (29,136 | ) | | | 84,330 | |
Martin Marietta Materials, Inc. | | | (11,187 | ) | | | 84,312 | |
Goldman Sachs Group, Inc. | | | (6,524 | ) | | | 82,851 | |
Vulcan Materials Co. | | | (22,890 | ) | | | 80,175 | |
Eagle Materials, Inc. | | | (10,773 | ) | | | 77,963 | |
Balchem Corp. | | | (19,729 | ) | | | 66,650 | |
Signature Bank* | | | (6,914 | ) | | | 64,609 | |
SEE NOTES TO FINANCIAL STATEMENTS. | THE GUGGENHEIM FUNDS SEMI-ANNUAL REPORT | 11 |
SCHEDULE OF INVESTMENTS (Unaudited)(continued) | March 31, 2017 |
ALPHA OPPORTUNITY FUND | |
| | Shares | | | Unrealized
Gain (Loss) | |
| | | | | | | |
Concho Resources, Inc.* | | | (8,136 | ) | | $ | 64,042 | |
Trustmark Corp. | | | (30,526 | ) | | | 51,450 | |
Packaging Corporation of America | | | (18,922 | ) | | | 50,815 | |
Taubman Centers, Inc. | | | (17,580 | ) | | | 49,070 | |
Bottomline Technologies de, Inc.* | | | (27,953 | ) | | | 48,948 | |
Bank of the Ozarks, Inc. | | | (16,736 | ) | | | 48,663 | |
MB Financial, Inc. | | | (25,215 | ) | | | 48,020 | |
United States Steel Corp. | | | (33,989 | ) | | | 47,663 | |
Lexington Realty Trust | | | (67,748 | ) | | | 46,841 | |
Citizens Financial Group, Inc. | | | (19,166 | ) | | | 45,735 | |
Coty, Inc. — Class A | | | (47,239 | ) | | | 42,823 | |
KeyCorp | | | (49,129 | ) | | | 37,824 | |
Fulton Financial Corp. | | | (54,103 | ) | | | 37,293 | |
Valley National Bancorp | | | (91,536 | ) | | | 35,555 | |
CME Group, Inc. — Class A | | | (11,472 | ) | | | 33,743 | |
Acadia Realty Trust | | | (22,257 | ) | | | 32,793 | |
Old National Bancorp | | | (45,385 | ) | | | 31,211 | |
Iron Mountain, Inc. | | | (34,597 | ) | | | 30,309 | |
PTC, Inc.* | | | (28,235 | ) | | | 25,497 | |
ABM Industries, Inc. | | | (35,220 | ) | | | 23,357 | |
Alexandria Real Estate Equities, Inc. | | | (9,123 | ) | | | 22,617 | |
American Campus Communities, Inc. | | | (30,900 | ) | | | 19,962 | |
WD-40 Co. | | | (8,242 | ) | | | 19,843 | |
MarketAxess Holdings, Inc. | | | (6,962 | ) | | | 17,239 | |
Newell Brands, Inc. | | | (33,102 | ) | | | 16,543 | |
EI du Pont de Nemours & Co. | | | (32,132 | ) | | | 13,824 | |
Commerce Bancshares, Inc. | | | (19,159 | ) | | | 13,553 | |
Provident Financial Services, Inc. | | | (25,090 | ) | | | 13,142 | |
Lennox International, Inc. | | | (4,015 | ) | | | 12,858 | |
Acuity Brands, Inc. | | | (3,329 | ) | | | 11,011 | |
Cheniere Energy, Inc.* | | | (15,207 | ) | | | 8,599 | |
Uniti Group, Inc. | | | (26,589 | ) | | | 7,944 | |
Quaker Chemical Corp. | | | (7,753 | ) | | | 7,446 | |
NVIDIA Corp. | | | (10,920 | ) | | | 6,542 | |
BancorpSouth, Inc. | | | (28,576 | ) | | | 6,278 | |
Washington Federal, Inc. | | | (31,291 | ) | | | 5,911 | |
Realty Income Corp. | | | (14,262 | ) | | | 4,149 | |
General Electric Co. | | | (83,538 | ) | | | 3,978 | |
Ligand Pharmaceuticals, Inc. — Class B* | | | (6,322 | ) | | | 3,661 | |
Choice Hotels International, Inc. | | | (10,778 | ) | | | 3,618 | |
Chevron Corp. | | | (6,297 | ) | | | 3,595 | |
Semtech Corp.* | | | (25,805 | ) | | | 2,107 | |
Mattel, Inc. | | | (29,759 | ) | | | 1,314 | |
Hershey Co. | | | (8,298 | ) | | | (362 | ) |
Bemis Company, Inc. | | | (17,510 | ) | | | (689 | ) |
Carrizo Oil & Gas, Inc.* | | | (23,935 | ) | | | (2,010 | ) |
Mercury General Corp. | | | (15,774 | ) | | | (2,382 | ) |
Rockwell Automation, Inc. | | | (4,366 | ) | | | (2,410 | ) |
Black Hills Corp. | | | (21,975 | ) | | | (3,246 | ) |
Alexander & Baldwin, Inc. | | | (15,246 | ) | | | (3,506 | ) |
Loews Corp. | | | (30,894 | ) | | | (4,365 | ) |
Digital Realty Trust, Inc. | | | (7,686 | ) | | | (4,768 | ) |
Public Storage | | | (4,832 | ) | | | (5,086 | ) |
National Retail Properties, Inc. | | | (15,917 | ) | | | (5,169 | ) |
Avery Dennison Corp. | | | (8,421 | ) | | | (9,645 | ) |
Extra Space Storage, Inc. | | | (11,782 | ) | | | (10,428 | ) |
| | | | | | | | Unrealized Loss | |
| | | | | | | | | |
Gulfport Energy Corp.* | | | (41,311 | ) | | | (15,370 | ) |
Douglas Emmett, Inc. | | | (57,962 | ) | | | (15,428 | ) |
Intercontinental Exchange, Inc. | | | (16,657 | ) | | | (15,530 | ) |
Ball Corp. | | | (45,415 | ) | | | (16,273 | ) |
Tyler Technologies, Inc.* | | | (4,655 | ) | | | (16,978 | ) |
AO Smith Corp. | | | (13,651 | ) | | | (18,393 | ) |
NIKE, Inc. — Class B | | | (31,914 | ) | | | (19,027 | ) |
Royal Caribbean Cruises Ltd. | | | (7,707 | ) | | | (19,959 | ) |
UDR, Inc. | | | (24,951 | ) | | | (20,064 | ) |
Education Realty Trust, Inc. | | | (26,011 | ) | | | (21,204 | ) |
MSCI, Inc. — Class A | | | (6,916 | ) | | | (22,454 | ) |
Netflix, Inc.* | | | (4,685 | ) | | | (26,400 | ) |
Equifax, Inc. | | | (12,941 | ) | | | (26,761 | ) |
Bio-Rad Laboratories, Inc. — Class A* | | | (3,391 | ) | | | (27,211 | ) |
Roper Technologies, Inc. | | | (7,344 | ) | | | (27,294 | ) |
O’Reilly Automotive, Inc.* | | | (4,500 | ) | | | (27,801 | ) |
Parsley Energy, Inc. — Class A* | | | (21,606 | ) | | | (29,780 | ) |
Essex Property Trust, Inc. | | | (5,155 | ) | | | (30,881 | ) |
Fastenal Co. | | | (30,654 | ) | | | (30,918 | ) |
AptarGroup, Inc. | | | (12,807 | ) | | | (31,107 | ) |
salesforce.com, Inc.* | | | (24,633 | ) | | | (31,634 | ) |
Deltic Timber Corp. | | | (16,969 | ) | | | (32,165 | ) |
Monolithic Power Systems, Inc. | | | (8,874 | ) | | | (32,728 | ) |
Domino’s Pizza, Inc. | | | (8,633 | ) | | | (33,021 | ) |
Trimble, Inc.* | | | (22,226 | ) | | | (34,250 | ) |
Global Payments, Inc. | | | (12,596 | ) | | | (34,387 | ) |
Autodesk, Inc.* | | | (14,577 | ) | | | (34,591 | ) |
S&P Global, Inc. | | | (6,613 | ) | | | (34,676 | ) |
Scotts Miracle-Gro Co. — Class A | | | (23,292 | ) | | | (35,281 | ) |
PPG Industries, Inc. | | | (10,114 | ) | | | (36,750 | ) |
Weingarten Realty Investors | | | (67,798 | ) | | | (38,481 | ) |
Senior Housing Properties Trust | | | (79,829 | ) | | | (39,411 | ) |
KBR, Inc. | | | (48,779 | ) | | | (40,171 | ) |
Duke Realty Corp. | | | (34,355 | ) | | | (40,584 | ) |
Newfield Exploration Co.* | | | (19,877 | ) | | | (43,153 | ) |
Four Corners Property Trust, Inc. | | | (32,358 | ) | | | (44,390 | ) |
First Industrial Realty Trust, Inc. | | | (62,097 | ) | | | (44,573 | ) |
Fortinet, Inc.* | | | (24,750 | ) | | | (45,113 | ) |
Red Hat, Inc.* | | | (8,237 | ) | | | (47,379 | ) |
NiSource, Inc. | | | (35,479 | ) | | | (48,290 | ) |
Aqua America, Inc. | | | (23,802 | ) | | | (48,846 | ) |
Ulta Beauty, Inc.* | | | (4,044 | ) | | | (50,823 | ) |
Xylem, Inc. | | | (34,930 | ) | | | (53,696 | ) |
Take-Two Interactive Software, Inc.* | | | (22,075 | ) | | | (54,350 | ) |
CoreSite Realty Corp. | | | (15,037 | ) | | | (54,924 | ) |
Starbucks Corp. | | | (16,850 | ) | | | (55,334 | ) |
DCT Industrial Trust, Inc. | | | (22,285 | ) | | | (56,211 | ) |
RPM International, Inc. | | | (25,172 | ) | | | (57,131 | ) |
Healthcare Realty Trust, Inc. | | | (26,647 | ) | | | (58,439 | ) |
Allegion plc | | | (9,880 | ) | | | (59,719 | ) |
Orbital ATK, Inc. | | | (7,796 | ) | | | (62,055 | ) |
Facebook, Inc. — Class A* | | | (13,978 | ) | | | (63,512 | ) |
Healthcare Services Group, Inc. | | | (39,308 | ) | | | (63,924 | ) |
Atmos Energy Corp. | | | (27,050 | ) | | | (68,326 | ) |
MDC Holdings, Inc. | | | (41,985 | ) | | | (68,492 | ) |
Expedia, Inc. | | | (16,248 | ) | | | (68,731 | ) |
12 | THE GUGGENHEIM FUNDS SEMI-ANNUAL REPORT | SEE NOTES TO FINANCIAL STATEMENTS. |
SCHEDULE OF INVESTMENTS (Unaudited)(concluded) | March 31, 2017 |
ALPHA OPPORTUNITY FUND | |
| | Shares | | | Unrealized
Loss | |
| | | | | | | |
Copart, Inc.* | | | (18,709 | ) | | $ | (73,670 | ) |
Ecolab, Inc. | | | (22,958 | ) | | | (74,334 | ) |
Weyerhaeuser Co. | | | (58,416 | ) | | | (74,764 | ) |
Symantec Corp. | | | (41,841 | ) | | | (77,417 | ) |
South Jersey Industries, Inc. | | | (30,807 | ) | | | (78,934 | ) |
New Jersey Resources Corp. | | | (42,435 | ) | | | (81,385 | ) |
Toll Brothers, Inc. | | | (22,250 | ) | | | (84,712 | ) |
Alliant Energy Corp. | | | (45,949 | ) | | | (88,569 | ) |
Five Below, Inc.* | | | (24,798 | ) | | | (93,426 | ) |
Marriott Vacations Worldwide Corp. | | | (8,455 | ) | | | (95,500 | ) |
Financial Engines, Inc. | | | (22,873 | ) | | | (97,519 | ) |
Align Technology, Inc.* | | | (6,647 | ) | | | (97,764 | ) |
Dominion Resources, Inc. | | | (30,636 | ) | | | (106,376 | ) |
Sempra Energy | | | (19,245 | ) | | | (111,236 | ) |
Priceline Group, Inc.* | | | (902 | ) | | | (128,259 | ) |
Wynn Resorts Ltd. | | | (8,571 | ) | | | (132,321 | ) |
Bob Evans Farms, Inc. | | | (18,536 | ) | | | (146,237 | ) |
Adobe Systems, Inc.* | | | (12,110 | ) | | | (152,226 | ) |
Vertex Pharmaceuticals, Inc.* | | | (7,672 | ) | | | (166,723 | ) |
Equinix, Inc. | | | (8,451 | ) | | | (174,785 | ) |
American Tower Corp. — Class A | | | (15,062 | ) | | | (180,126 | ) |
Crown Castle International Corp. | | | (35,600 | ) | | | (200,426 | ) |
International Flavors & Fragrances, Inc. | | | (26,207 | ) | | | (215,013 | ) |
Panera Bread Co. — Class A* | | | (7,219 | ) | | | (283,153 | ) |
FMC Corp. | | | (34,274 | ) | | | (335,086 | ) |
Total Custom Basket of Short Securities | | | | | | | (2,607,600 | ) |
* | Non-income producing security. |
† | Value determined based on Level 1 inputs — See Note 4. |
†† | Value determined based on Level 2 inputs — See Note 4. |
1 | All or a portion of this security is pledged as equity swap collateral at March 31, 2017. |
2 | All or a portion of this security is pledged as short security collateral at March 31, 2017. |
3 | Rate indicated is the 7 day yield as of March 31, 2017. |
4 | Total Return is based on the return of the custom basket of long securities +/- financing at a variable rate. Rate indicated is rate effective at March 31, 2017. |
5 | Total Return is based on the return of the custom basket of short securities +/- financing at a variable rate. Rate indicated is rate effective at March 31, 2017. |
| | plc — Public Limited Company |
| | |
| | See Sector Classification in Other Information section. |
The following table summarizes the inputs used to value the Fund’s investments at March 31, 2017 (See Note 4 in the Notes to Financial Statements):
Investments in Securities (Assets) | | Level 1 | | | Level 2 | | | Level 2 -
Other* | | | Level 3 | | | Total | |
Common Stocks | | $ | 218,087,196 | | | $ | — | | | $ | — | | | $ | — | | | $ | 218,087,196 | |
Short Term Investments | | | 8,691,931 | | | | — | | | | — | | | | — | | | | 8,691,931 | |
Total | | $ | 226,779,127 | | | $ | — | | | $ | — | | | $ | — | | | $ | 226,779,127 | |
| | | | | | | | | | | | | | | | | | | | | |
Investments in Securities (Liabilities) | | Level 1 | | | Level 2 | | | Level 2 -
Other* | | | Level 3 | | | Total | |
Common Stocks | | $ | 27,075,349 | | | $ | — | | | $ | — | | | $ | — | | | $ | 27,075,349 | |
Equity Index Swap Agreements | | | — | | | | — | | | | 3,017,731 | | | | — | | | | 3,017,731 | |
Total | | $ | 27,075,349 | | | $ | — | | | $ | 3,017,731 | | | $ | — | | | $ | 30,093,080 | |
* | Other financial instruments include futures contracts and/or swaps, which are reported as unrealized gain/loss at period end. |
Transfers between investment levels may occur as the markets fluctuate and/or the availability of data used in an investment’s valuation changes. Transfers between valuation levels, if any, are in comparison to the valuation levels at the end of the previous fiscal year, and are effective using the fair value as of the end of the previous fiscal period.
For the period ended March 31, 2017, there were no transfers between levels.
SEE NOTES TO FINANCIAL STATEMENTS. | THE GUGGENHEIM FUNDS SEMI-ANNUAL REPORT | 13 |
STATEMENT OF ASSETS AND LIABILITIES (Unaudited) | |
March 31, 2017 | |
Assets: | |
Investments, at value (cost $217,910,807) | | $ | 226,779,127 | |
Segregated cash with broker | | | 27,762,723 | |
Prepaid expenses | | | 59,466 | |
Receivables: | |
Swap settlement | | | 1,566,826 | |
Fund shares sold | | | 159,411 | |
Dividends | | | 268,048 | |
Investment adviser | | | 3,316 | |
Other assets | | | 8,341 | |
Total assets | | | 256,607,258 | |
| | | | | |
Liabilities: | |
Securities sold short, at value (proceeds $25,471,957) | | | 27,075,349 | |
Unrealized depreciation on swap agreements | | | 3,017,731 | |
Overdraft due to custodian bank | | | 1,232,270 | |
Payable for: | |
Management fees | | | 225,385 | |
Fund accounting/administration fees | | | 13,925 | |
Transfer agent/maintenance fees | | | 10,137 | |
Distribution and service fees | | | 9,401 | |
Fund shares redeemed | | | 7,884 | |
Trustees’ fees* | | | 1,812 | |
Miscellaneous | | | 57,291 | |
Total liabilities | | | 31,651,185 | |
Net assets | | $ | 224,956,073 | |
| | | | | |
Net assets consist of: | |
Paid in capital | | $ | 218,287,797 | |
Accumulated net investment loss | | | (535,204 | ) |
Accumulated net realized gain on investments | | | 2,956,283 | |
Net unrealized appreciation on investments | | | 4,247,197 | |
Net assets | | $ | 224,956,073 | |
| | | | | |
A-Class: | |
Net assets | | $ | 21,903,180 | |
Capital shares outstanding | | | 1,038,985 | |
Net asset value per share | | $ | 21.08 | |
Maximum offering price per share (Net asset value divided by 95.25%) | | $ | 22.13 | |
| | | | | |
C-Class: | |
Net assets | | $ | 2,348,561 | |
Capital shares outstanding | | | 125,800 | |
Net asset value per share | | $ | 18.67 | |
| | | | | |
P-Class: | |
Net assets | | $ | 13,742,080 | |
Capital shares outstanding | | | 650,101 | |
Net asset value per share | | $ | 21.14 | |
| | | | | |
Institutional Class: | |
Net assets | | $ | 186,962,252 | |
Capital shares outstanding | | | 6,287,646 | |
Net asset value per share | | $ | 29.73 | |
STATEMENT OF OPERATIONS (Unaudited) | |
Period Ended March 31, 2017 | |
Investment Income: | |
Dividends | | $ | 1,194,453 | |
Interest | | | 12,436 | |
Total investment income | | | 1,206,889 | |
| | | | | |
Expenses: | |
Management fees | | | 786,623 | |
Transfer agent/maintenance fees: | |
A-Class | | | 11,479 | |
C-Class | | | 1,576 | |
P-Class | | | 6,777 | |
Institutional Class | | | 4,890 | |
Distribution and service fees: | |
A-Class | | | 24,981 | |
C-Class | | | 9,557 | |
P-Class | | | 12,115 | |
Fund accounting/administration fees | | | 48,128 | |
Short sales dividend expense | | | 127,343 | |
Prime broker interest expense | | | 9,927 | |
Custodian fees | | | 6,734 | |
Trustees’ fees* | | | 3,468 | |
Miscellaneous | | | 31,643 | |
Total expenses | | | 1,085,241 | |
Less: | |
Expenses reimbursed by Adviser | | | (393 | ) |
Net expenses | | | 1,084,848 | |
Net investment income | | | 122,041 | |
| | | | | |
Net Realized and Unrealized Gain (Loss): | |
Net realized gain (loss) on: | |
Investments | | | 5,699,354 | |
Swap agreements | | | 31,690 | |
Securities sold short | | | (597,788 | ) |
Net realized gain | | | 5,133,256 | |
Net change in unrealized appreciation (depreciation) on: | |
Investments | | | 5,604,484 | |
Securities sold short | | | (14,645 | ) |
Swap agreements | | | (1,107,430 | ) |
Net change in unrealized appreciation (depreciation) | | | 4,482,409 | |
Net realized and unrealized gain | | | 9,615,665 | |
Net increase in net assets resulting from operations | | $ | 9,737,706 | |
* | Relates to Trustees not deemed “interested persons” within the meaning of Section 2(a)(19) of the 1940 Act. |
14 | THE GUGGENHEIM FUNDS SEMI-ANNUAL REPORT | SEE NOTES TO FINANCIAL STATEMENTS. |
STATEMENTS OF CHANGES IN NET ASSETS |
| | Period Ended
March 31,
2017
(Unaudited) | | | Year Ended
September 30,
2016 | |
Increase (Decrease) in Net Assets from Operations: | | | | | | |
Net investment income (loss) | | $ | 122,041 | | | $ | (455,465 | ) |
Net realized gain on investments | | | 5,133,256 | | | | 1,231,333 | |
Net change in unrealized appreciation (depreciation) on investments | | | 4,482,409 | | | | 1,541,556 | |
Net increase in net assets resulting from operations | | | 9,737,706 | | | | 2,317,424 | |
| | | | | | | | | |
Distributions to shareholders from: | | | | | | | | |
Net realized gains | | | | | | | | |
A-Class | | | (6,584 | ) | | | — | |
C-Class | | | (650 | ) | | | — | |
P-Class | | | (1,760 | ) | | | — | |
Institutional Class | | | (14,412 | ) | | | — | |
Total distributions to shareholders | | | (23,406 | ) | | | — | |
| | | | | | | | | |
Capital share transactions: | | | | | | | | |
Proceeds from sale of shares | | | | | | | | |
A-Class | | | 8,980,564 | | | | 13,416,725 | |
C-Class | | | 724,580 | | | | 1,144,266 | |
P-Class | | | 12,779,938 | | | | 6,055,462 | |
Institutional Class | | | 125,621,007 | | | | 11,962,236 | |
Distributions reinvested | | | | | | | | |
A-Class | | | 6,049 | | | | — | |
C-Class | | | 630 | | | | — | |
P-Class | | | 1,760 | | | | — | |
Institutional Class | | | 14,397 | | | | — | |
Cost of shares redeemed | | | | | | | | |
A-Class | | | (5,044,267 | ) | | | (9,133,848 | ) |
C-Class | | | (98,055 | ) | | | (831,133 | ) |
P-Class | | | (4,172,918 | ) | | | (1,749,969 | ) |
Institutional Class | | | (2,166,797 | ) | | | (7,711,248 | ) |
Net increase from capital share transactions | | | 136,646,888 | | | | 13,152,491 | |
Net increase in net assets | | | 146,361,188 | | | | 15,469,915 | |
| | | | | | | | | |
Net assets: | | | | | | | | |
Beginning of period | | | 78,594,885 | | | | 63,124,970 | |
End of period | | $ | 224,956,073 | | | $ | 78,594,885 | |
Accumulated net investment loss at end of period | | $ | (535,204 | ) | | $ | (657,245 | ) |
SEE NOTES TO FINANCIAL STATEMENTS. | THE GUGGENHEIM FUNDS SEMI-ANNUAL REPORT | 15 |
STATEMENTS OF CHANGES IN NET ASSETS (concluded) |
| | Period Ended
March 31,
2017
(Unaudited) | | | Year Ended
September 30,
2016 | |
Capital share activity: | | | | | | |
Shares sold | | | | | | |
A-Class | | | 442,495 | | | | 702,394 | |
C-Class | | | 39,957 | | | | 68,002 | |
P-Class | | | 616,751 | | | | 317,616 | |
Institutional Class | | | 4,252,917 | | | | 448,620 | |
Shares issued from reinvestment of distributions | | | | | | | | |
A-Class | | | 302 | | | | — | |
C-Class | | | 35 | | | | — | |
P-Class | | | 88 | | | | — | |
Institutional Class | | | 510 | | | | — | |
Shares redeemed | | | | | | | | |
A-Class | | | (244,648 | ) | | | (486,062 | ) |
C-Class | | | (5,585 | ) | | | (49,650 | ) |
P-Class | | | (199,803 | ) | | | (91,817 | ) |
Institutional Class | | | (74,412 | ) | | | (295,069 | ) |
Net increase in shares | | | 4,828,607 | | | | 614,034 | |
16 | THE GUGGENHEIM FUNDS SEMI-ANNUAL REPORT | SEE NOTES TO FINANCIAL STATEMENTS. |
This table is presented to show selected data for a share outstanding throughout each period and to assist shareholders in evaluating a Fund’s performance for the periods presented.
A-Class | | Period Ended
March 31,
2017a | | | Year Ended
September 30, 2016 | | | Year Ended
September 30, 2015 | | | Year Ended
September 30, 2014 | | | Year Ended
September 30, 2013 | | | Year Ended
September 30, 2012 | |
Per Share Data | | | | | | | | | | | | | | | | | | |
Net asset value, beginning of period | | $ | 19.08 | | | $ | 18.39 | | | $ | 18.01 | | | $ | 16.22 | | | $ | 13.33 | | | $ | 9.82 | |
Income (loss) from investment operations: | |
Net investment income (loss)b | | | (.04 | ) | | | (.19 | ) | | | (.35 | ) | | | (.13 | ) | | | .03 | | | | (— | )c |
Net gain (loss) on investments (realized and unrealized) | | | 2.05 | | | | .88 | | | | .73 | | | | 1.92 | | | | 2.86 | | | | 3.48 | |
Payments by affiliates | | | — | | | | — | | | | — | | | | — | | | | — | | | | .03 | |
Total from investment operations | | | 2.01 | | | | .69 | | | | .38 | | | | 1.79 | | | | 2.89 | | | | 3.51 | |
Less distributions from: | |
Net investment income | | | — | | | | — | | | | (— | )d | | | — | | | | — | | | | — | |
Net realized gains | | | (.01 | ) | | | — | | | | — | | | | — | | | | — | | | | — | |
Total distributions | | | (.01 | ) | | | — | | | | (— | )d | | | — | | | | — | | | | — | |
Net asset value, end of period | | $ | 21.08 | | | $ | 19.08 | | | $ | 18.39 | | | $ | 18.01 | | | $ | 16.22 | | | $ | 13.33 | |
| |
Total Returnf | | | 10.57 | % | | | 3.70 | % | | | 2.13 | % | | | 11.04 | % | | | 21.38 | % | | | 35.74 | %e |
Ratios/Supplemental Data | |
Net assets, end of period (in thousands) | | $ | 21,903 | | | $ | 16,041 | | | $ | 11,485 | | | $ | 7,989 | | | $ | 7,749 | | | $ | 7,250 | |
Ratios to average net assets: | |
Net investment income (loss) | | | (0.37 | %) | | | (1.02 | %) | | | (1.88 | %) | | | (0.73 | %) | | | 0.19 | % | | | (0.01 | %) |
Total expensesj | | | 2.35 | % | | | 2.69 | % | | | 3.92 | % | | | 3.25 | % | | | 3.99 | % | | | 2.99 | % |
Net expensesh,i | | | 2.35 | % | | | 2.69 | % | | | 2.94 | % | | | 2.12 | % | | | 2.14 | % | | | 2.21 | % |
Portfolio turnover rate | | | 90 | % | | | 235 | % | | | 124 | % | | | — | | | | 488 | % | | | 707 | % |
C-Class | | Period Ended
March 31,
2017a | | | Year Ended
September 30, 2016 | | | Year Ended
September 30, 2015 | | | Year Ended
September 30, 2014 | | | Year Ended
September 30, 2013 | | | Year Ended
September 30, 2012 | |
Per Share Data | | | | | | | | | | | | | | | | | | |
Net asset value, beginning of period | | $ | 16.96 | | | $ | 16.47 | | | $ | 16.25 | | | $ | 14.74 | | | $ | 12.21 | | | $ | 9.07 | |
Income (loss) from investment operations: | |
Net investment income (loss)b | | | (.10 | ) | | | (.29 | ) | | | (.44 | ) | | | (.23 | ) | | | (.07 | ) | | | (.09 | ) |
Net gain (loss) on investments (realized and unrealized) | | | 1.82 | | | | .78 | | | | .66 | | | | 1.74 | | | | 2.60 | | | | 3.21 | |
Payments by affiliates | | | — | | | | — | | | | (— | )d | | | — | | | | — | | | | .02 | |
Total from investment operations | | | 1.72 | | | | .49 | | | | .22 | | | | 1.51 | | | | 2.53 | | | | 3.14 | |
Less distributions from: | |
Net investment income | | | — | | | | — | | | | (— | )d | | | — | | | | — | | | | — | |
Net realized gains | | | (.01 | ) | | | — | | | | — | | | | — | | | | — | | | | — | |
Total distributions | | | (.01 | ) | | | — | | | | (— | )d | | | — | | | | — | | | | — | |
Net asset value, end of period | | $ | 18.67 | | | $ | 16.96 | | | $ | 16.47 | | | $ | 16.25 | | | $ | 14.74 | | | $ | 12.21 | |
| |
Total Returnf | | | 10.18 | % | | | 2.91 | % | | | 1.38 | % | | | 10.24 | % | | | 20.48 | % | | | 34.62 | %e |
Ratios/Supplemental Data | |
Net assets, end of period (in thousands) | | $ | 2,349 | | | $ | 1,550 | | | $ | 1,203 | | | $ | 1,117 | | | $ | 1,206 | | | $ | 1,497 | |
Ratios to average net assets: | |
Net investment income (loss) | | | (1.11 | %) | | | (1.72 | %) | | | (2.64 | %) | | | (1.46 | %) | | | (0.56 | %) | | | (0.76 | %) |
Total expensesj | | | 3.09 | % | | | 3.91 | % | | | 4.81 | % | | | 4.11 | % | | | 4.84 | % | | | 3.80 | % |
Net expensesh,i | | | 3.09 | % | | | 3.46 | % | | | 3.68 | % | | | 2.87 | % | | | 2.89 | % | | | 2.96 | % |
Portfolio turnover rate | | | 90 | % | | | 235 | % | | | 124 | % | | | — | | | | 488 | % | | | 707 | % |
SEE NOTES TO FINANCIAL STATEMENTS. | THE GUGGENHEIM FUNDS SEMI-ANNUAL REPORT | 17 |
FINANCIAL HIGHLIGHTS (continued) |
This table is presented to show selected data for a share outstanding throughout each period and to assist shareholders in evaluating a Fund’s performance for the periods presented.
P-Class | | Period Ended
March 31,
2017a | | | Year Ended
September 30,
2016 | | | Period Ended
September 30,
2015g | |
Per Share Data | | | | | | | | | |
Net asset value, beginning of period | | $ | 19.11 | | | $ | 18.39 | | | $ | 19.11 | |
Income (loss) from investment operations: | |
Net investment income (loss)b | | | (— | )c | | | (.12 | ) | | | (.13 | ) |
Net gain (loss) on investments (realized and unrealized) | | | 2.04 | | | | .84 | | | | (.59 | ) |
Total from investment operations | | | 2.04 | | | | .72 | | | | (.72 | ) |
Less distributions from: | |
Net realized gains | | | (.01 | ) | | | — | | | | — | |
Total distributions | | | (.01 | ) | | | — | | | | — | |
Net asset value, end of period | | $ | 21.14 | | | $ | 19.11 | | | $ | 18.39 | |
| |
Total Returnf | | | 10.71 | % | | | 3.86 | % | | | (3.77 | %) |
Ratios/Supplemental Data | |
Net assets, end of period (in thousands) | | $ | 13,742 | | | $ | 4,453 | | | $ | 134 | |
Ratios to average net assets: | |
Net investment income (loss) | | | (0.04 | %) | | | (0.65 | %) | | | (1.77 | %) |
Total expensesj | | | 2.00 | % | | | 2.44 | % | | | 3.31 | % |
Net expensesh,i | | | 2.00 | % | | | 2.44 | % | | | 2.87 | % |
Portfolio turnover rate | | | 90 | % | | | 235 | % | | | 124 | % |
18 | THE GUGGENHEIM FUNDS SEMI-ANNUAL REPORT | SEE NOTES TO FINANCIAL STATEMENTS. |
FINANCIAL HIGHLIGHTS (concluded) |
This table is presented to show selected data for a share outstanding throughout each period and to assist shareholders in evaluating a Fund’s performance for the periods presented.
Institutional Class | | Period Ended
March 31,
2017a | | | Year Ended
September 30, 2016 | | | Year Ended
September 30, 2015 | | | Year Ended
September 30, 2014 | | | Year Ended
September 30, 2013 | | | Year Ended
September 30, 2012 | |
Per Share Data | | | | | | | | | | | | | | | | | | |
Net asset value, beginning of period | | $ | 26.82 | | | $ | 25.73 | | | $ | 25.13 | | | $ | 22.58 | | | $ | 18.52 | | | $ | 13.53 | |
Income (loss) from investment operations: | |
Net investment income (loss)b | | | .06 | | | | (.13 | ) | | | (.40 | ) | | | (.12 | ) | | | .09 | | | | .04 | |
Net gain (loss) on investments (realized and unrealized) | | | 2.86 | | | | 1.22 | | | | 1.00 | | | | 2.67 | | | | 3.97 | | | | 4.82 | |
Payments by affiliates | | | — | | | | — | | | | — | | | | — | | | | — | | | | .13 | |
Total from investment operations | | | 2.92 | | | | 1.09 | | | | .60 | | | | 2.55 | | | | 4.06 | | | | 4.99 | |
Less distributions from: | |
Net investment income | | | — | | | | — | | | | (— | )d | | | — | | | | — | | | | — | |
Net realized gains | | | (.01 | ) | | | — | | | | — | | | | — | | | | — | | | | — | |
Total distributions | | | (.01 | ) | | | — | | | | (— | )d | | | — | | | | — | | | | — | |
Net asset value, end of period | | $ | 29.73 | | | $ | 26.82 | | | $ | 25.73 | | | $ | 25.13 | | | $ | 22.58 | | | $ | 18.52 | |
| |
Total Returnf | | | 10.91 | % | | | 4.20 | % | | | 2.41 | % | | | 11.29 | % | | | 21.60 | % | | | 36.88 | %e |
Ratios/Supplemental Data | |
Net assets, end of period (in thousands) | | $ | 186,962 | | | $ | 56,550 | | | $ | 50,304 | | | $ | 1,645 | | | $ | 1,740 | | | $ | 1,518 | |
Ratios to average net assets: | |
Net investment income (loss) | | | 0.39 | % | | | (0.49 | %) | | | (1.55 | %) | | | (0.48 | %) | | | 0.43 | % | | | 0.24 | % |
Total expensesj | | | 1.63 | % | | | 2.23 | % | | | 2.80 | % | | | 2.90 | % | | | 3.67 | % | | | 2.68 | % |
Net expensesh,i | | | 1.63 | % | | | 2.23 | % | | | 2.80 | % | | | 1.87 | % | | | 1.90 | % | | | 1.96 | % |
Portfolio turnover rate | | | 90 | % | | | 235 | % | | | 124 | % | | | — | | | | 488 | % | | | 707 | % |
a | Unaudited figures for the period ended March 31, 2017. Percentage amounts for the period, except total return and portfolio turnover rate, have been annualized. |
b | Net investment income (loss) per share was computed using average shares outstanding throughout the period. |
c | Net investment income is less than $0.01 per share. |
d | Distributions from net investment income are less than $0.01 per share. |
e | For the year ended September 30, 2012, 0.30%, 0.22% and 0.96% of the Fund’s A-Class, C-Class and Institutional Class, respectively, total return consisted of a voluntary reimbursement by the Adviser for losses incurred during fund trading. Excluding this item, total return would have been 35.44%, 34.40% and 35.92% for the Fund’s A-Class, C-Class and Institutional Class, respectively. |
f | Total return does not reflect the impact of any applicable sales charges and has not been annualized. |
g | Since commencement of operations: May 1, 2015. Percentage amounts for the period, except total return and portfolio turnover rate, have been annualized. |
h | Net expense information reflects the expense ratios after expense waivers. |
i | Net expenses may include expenses that are excluded from the expense limitation agreement and recouped amounts. Excluding these expenses, the net expense ratios for the periods would be: |
| | | 03/31/17 | 09/30/16 | 09/30/15 | 09/30/14 | 09/30/13 | 09/30/12 |
| | A-Class | 2.11% | 2.11% | 2.11% | 2.11% | 2.11% | 2.11% |
| | C-Class | 2.85% | 2.86% | 2.86% | 2.86% | 2.86% | 2.86% |
| | P-Class | 1.78% | 1.87% | 2.10% | — | — | — |
| | Institutional Class | 1.41% | 1.63% | 1.86% | 1.86% | 1.86% | 1.86% |
j | Does not include expenses of the underlying funds in which the Fund invests. |
SEE NOTES TO FINANCIAL STATEMENTS. | THE GUGGENHEIM FUNDS SEMI-ANNUAL REPORT | 19 |
FUND PROFILE (Unaudited) | March 31, 2017 |
LARGE CAP VALUE FUND
OBJECTIVE: Seeks long-term growth of capital.
Holdings Diversification (Market Exposure as % of Net Assets)

“Holdings Diversification (Market Exposure as % of Net Assets)” excludes any temporary cash investments.
Inception Dates: |
A-Class | August 7, 1944 |
C-Class | January 29, 1999 |
P-Class | May 1, 2015 |
Institutional Class | June 7, 2013 |
Ten Largest Holdings (% of Total Net Assets) |
JPMorgan Chase & Co. | 3.5% |
Berkshire Hathaway, Inc. — Class B | 2.7% |
Johnson & Johnson | 2.7% |
Cisco Systems, Inc. | 2.4% |
Bank of America Corp. | 2.3% |
Chevron Corp. | 2.3% |
Citigroup, Inc. | 2.3% |
Exxon Mobil Corp. | 2.3% |
Wells Fargo & Co. | 1.9% |
Pfizer, Inc. | 1.7% |
Top Ten Total | 24.1% |
“Ten Largest Holdings” excludes any temporary cash investments.
20 | THE GUGGENHEIM FUNDS SEMI-ANNUAL REPORT | |
SCHEDULE OF INVESTMENTS (Unaudited) | March 31, 2017 |
LARGE CAP VALUE FUND | |
| | Shares | | | Value | |
| | | | | | | |
COMMON STOCKS† - 98.1% | |
| | | | | | | |
Financial - 27.0% | |
JPMorgan Chase & Co. | | | 27,199 | | | $ | 2,389,160 | |
Berkshire Hathaway, Inc. — Class B* | | | 11,038 | | | | 1,839,814 | |
Bank of America Corp. | | | 67,490 | | | | 1,592,089 | |
Citigroup, Inc. | | | 25,977 | | | | 1,553,944 | |
Wells Fargo & Co. | | | 23,115 | | | | 1,286,580 | |
Unum Group | | | 15,767 | | | | 739,315 | |
BB&T Corp. | | | 16,038 | | | | 716,898 | |
SunTrust Banks, Inc. | | | 11,705 | | | | 647,287 | |
Charles Schwab Corp. | | | 15,623 | | | | 637,575 | |
Zions Bancorporation | | | 15,175 | | | | 637,350 | |
Assured Guaranty Ltd. | | | 16,397 | | | | 608,493 | |
Piedmont Office Realty Trust, Inc. — Class A | | | 26,043 | | | | 556,799 | |
T. Rowe Price Group, Inc. | | | 7,844 | | | | 534,569 | |
American International Group, Inc. | | | 8,283 | | | | 517,107 | |
Equity Residential | | | 7,579 | | | | 471,565 | |
E*TRADE Financial Corp.* | | | 13,072 | | | | 456,082 | |
KeyCorp | | | 25,002 | | | | 444,536 | |
Host Hotels & Resorts, Inc. | | | 21,622 | | | | 403,467 | |
Morgan Stanley | | | 8,519 | | | | 364,954 | |
Allstate Corp. | | | 4,396 | | | | 358,230 | |
Sun Communities, Inc. | | | 4,155 | | | | 333,771 | |
Regions Financial Corp. | | | 19,250 | | | | 279,703 | |
Prudential Financial, Inc. | | | 2,583 | | | | 275,554 | |
Ally Financial, Inc. | | | 12,556 | | | | 255,263 | |
Hanover Insurance Group, Inc. | | | 2,338 | | | | 210,560 | |
Federated Investors, Inc. — Class B | | | 7,699 | | | | 202,792 | |
Hartford Financial Services Group, Inc. | | | 1,938 | | | | 93,160 | |
Total Financial | | | | | | | 18,406,617 | |
| | | | | | | | | |
Consumer, Non-cyclical - 17.7% | |
Johnson & Johnson | | | 14,664 | | | | 1,826,400 | |
Pfizer, Inc. | | | 33,904 | | | | 1,159,856 | |
Merck & Company, Inc. | | | 15,708 | | | | 998,086 | |
Procter & Gamble Co. | | | 9,976 | | | | 896,344 | |
Zimmer Biomet Holdings, Inc. | | | 5,817 | | | | 710,314 | |
Bunge Ltd. | | | 8,567 | | | | 679,020 | |
Quest Diagnostics, Inc. | | | 6,325 | | | | 621,052 | |
HCA Holdings, Inc.* | | | 6,588 | | | | 586,266 | |
United Rentals, Inc.* | | | 4,034 | | | | 504,452 | |
Tyson Foods, Inc. — Class A | | | 7,904 | | | | 487,756 | |
Hormel Foods Corp. | | | 13,071 | | | | 452,649 | |
Mondelez International, Inc. — Class A | | | 9,916 | | | | 427,181 | |
Philip Morris International, Inc. | | | 3,338 | | | | 376,860 | |
Akorn, Inc.* | | | 15,271 | | | | 367,726 | |
DaVita, Inc.* | | | 5,093 | | | | 346,171 | |
Hershey Co. | | | 3,131 | | | | 342,062 | |
UnitedHealth Group, Inc. | | | 2,051 | | | | 336,385 | |
Medtronic plc | | | 3,728 | | | | 300,328 | |
Dr Pepper Snapple Group, Inc. | | | 2,983 | | | | 292,095 | |
Ingredion, Inc. | | | 1,421 | | | | 171,131 | |
AmerisourceBergen Corp. — Class A | | | 1,931 | | | | 170,894 | |
Total Consumer, Non-cyclical | | | | | | | 12,053,028 | |
| | | | | | | | | |
Industrial - 12.8% | |
General Electric Co. | | | 26,811 | | | | 798,967 | |
Orbital ATK, Inc. | | | 7,812 | | | | 765,575 | |
Republic Services, Inc. — Class A | | | 11,626 | | | | 730,229 | |
WestRock Co. | | | 12,721 | | | | 661,874 | |
Owens Corning | | | 9,943 | | | | 610,202 | |
Jabil Circuit, Inc. | | | 20,425 | | | | 590,690 | |
Timken Co. | | | 12,804 | | | | 578,741 | |
Corning, Inc. | | | 20,220 | | | | 545,940 | |
United Technologies Corp. | | | 4,360 | | | | 489,236 | |
FLIR Systems, Inc. | | | 13,063 | | | | 473,926 | |
Carlisle Companies, Inc. | | | 4,273 | | | | 454,690 | |
Harris Corp. | | | 3,800 | | | | 422,826 | |
Eaton Corp. plc | | | 4,622 | | | | 342,721 | |
CH Robinson Worldwide, Inc. | | | 4,261 | | | | 329,333 | |
Honeywell International, Inc. | | | 2,534 | | | | 316,421 | |
Snap-on, Inc. | | | 1,873 | | | | 315,919 | |
Crown Holdings, Inc.* | | | 5,929 | | | | 313,941 | |
Total Industrial | | | | | | | 8,741,231 | |
| | | | | | | | | |
Energy - 10.6% | |
Chevron Corp. | | | 14,694 | | | | 1,577,695 | |
Exxon Mobil Corp. | | | 18,875 | | | | 1,547,939 | |
Kinder Morgan, Inc. | | | 36,145 | | | | 785,792 | |
Marathon Oil Corp. | | | 39,981 | | | | 631,700 | |
Hess Corp. | | | 10,503 | | | | 506,350 | |
Rowan Companies plc — Class A* | | | 32,342 | | | | 503,888 | |
Whiting Petroleum Corp.* | | | 51,184 | | | | 484,201 | |
Valero Energy Corp. | | | 6,256 | | | | 414,710 | |
Apache Corp. | | | 5,271 | | | | 270,877 | |
Laredo Petroleum, Inc.* | | | 11,069 | | | | 161,607 | |
Schlumberger Ltd. | | | 1,770 | | | | 138,237 | |
Chesapeake Energy Corp.* | | | 22,394 | | | | 133,020 | |
QEP Resources, Inc.* | | | 8,380 | | | | 106,510 | |
Total Energy | | | | | | | 7,262,526 | |
| | | | | | | | | |
Consumer, Cyclical - 9.1% | |
Wal-Mart Stores, Inc. | | | 13,463 | | | | 970,412 | |
Lear Corp. | | | 5,220 | | | | 739,048 | |
Southwest Airlines Co. | | | 11,939 | | | | 641,840 | |
Goodyear Tire & Rubber Co. | | | 16,221 | | | | 583,956 | |
CVS Health Corp. | | | 6,851 | | | | 537,804 | |
DR Horton, Inc. | | | 15,314 | | | | 510,109 | |
JetBlue Airways Corp.* | | | 21,229 | | | | 437,530 | |
Target Corp. | | | 7,523 | | | | 415,194 | |
Carnival Corp. | | | 6,345 | | | | 373,784 | |
PACCAR, Inc. | | | 5,153 | | | | 346,282 | |
PVH Corp. | | | 3,280 | | | | 339,382 | |
MGM Resorts International | | | 10,869 | | | | 297,811 | |
Total Consumer, Cyclical | | | | | | | 6,193,152 | |
| | | | | | | | | |
Utilities - 6.6% | |
Ameren Corp. | | | 12,863 | | | | 702,192 | |
FirstEnergy Corp. | | | 21,412 | | | | 681,331 | |
Exelon Corp. | | | 18,280 | | | | 657,714 | |
Public Service Enterprise Group, Inc. | | | 14,367 | | | | 637,176 | |
Edison International | | | 6,979 | | | | 555,598 | |
SEE NOTES TO FINANCIAL STATEMENTS. | THE GUGGENHEIM FUNDS SEMI-ANNUAL REPORT | 21 |
SCHEDULE OF INVESTMENTS (Unaudited)(concluded) | March 31, 2017 |
LARGE CAP VALUE FUND | |
| | Shares | | | Value | |
| | | | | | | |
UGI Corp. | | | 11,068 | | | $ | 546,759 | |
OGE Energy Corp. | | | 15,287 | | | | 534,739 | |
Duke Energy Corp. | | | 2,116 | | | | 173,533 | |
Total Utilities | | | | | | | 4,489,042 | |
| | | | | | | | | |
Technology - 5.8% | |
Intel Corp. | | | 30,932 | | | | 1,115,717 | |
QUALCOMM, Inc. | | | 11,755 | | | | 674,032 | |
Teradata Corp.* | | | 17,402 | | | | 541,550 | |
Micron Technology, Inc.* | | | 14,814 | | | | 428,125 | |
Apple, Inc. | | | 2,826 | | | | 405,983 | |
Lam Research Corp. | | | 2,961 | | | | 380,074 | |
VMware, Inc. — Class A* | | | 2,657 | | | | 244,816 | |
NCR Corp.* | | | 4,081 | | | | 186,420 | |
Total Technology | | | | | | | 3,976,717 | |
| | | | | | | | | |
Communications - 5.6% | |
Cisco Systems, Inc. | | | 47,683 | | | | 1,611,685 | |
AT&T, Inc. | | | 13,603 | | | | 565,205 | |
EchoStar Corp. — Class A* | | | 6,441 | | | | 366,815 | |
Walt Disney Co. | | | 3,188 | | | | 361,488 | |
Time Warner, Inc. | | | 3,495 | | | | 341,496 | |
Scripps Networks Interactive, Inc. — Class A | | | 4,338 | | | | 339,969 | |
Verizon Communications, Inc. | | | 5,184 | | | | 252,720 | |
Total Communications | | | | | | | 3,839,378 | |
| | | | | | | | | |
Basic Materials - 2.9% | |
Dow Chemical Co. | | | 17,852 | | | | 1,134,316 | |
Reliance Steel & Aluminum Co. | | | 6,421 | | | | 513,809 | |
Nucor Corp. | | | 3,081 | | | | 183,997 | |
Freeport-McMoRan, Inc.* | | | 13,123 | | | | 175,323 | |
Total Basic Materials | | | | | | | 2,007,445 | |
| | | | | | | | | |
Total Common Stocks | | | | | | | | |
(Cost $56,960,516) | | | | | | | 66,969,136 | |
| | | | | | | | | |
EXCHANGE-TRADED FUNDS† - 0.9% | |
iShares Russell 1000 Value ETF | | | 5,340 | | | | 613,780 | |
Total Exchange-Traded Funds | | | | | | | | |
(Cost $622,359) | | | | | | | 613,780 | |
| | | | | | | | | |
SHORT-TERM INVESTMENTS† - 1.0% | |
Dreyfus Treasury Prime Cash Management Institutional Shares 0.50%1 | | | 674,101 | | | | 674,101 | |
Total Short-Term Investments | | | | | | | | |
(Cost $674,101) | | | | | | | 674,101 | |
| | | | | | | | | |
Total Investments - 100.0% | | | | | | | | |
(Cost $58,256,976) | | | | | | $ | 68,257,017 | |
Other Assets & Liabilities, net - 0.0% | | | | | | | (10,647 | ) |
Total Net Assets - 100.0% | | | | | | $ | 68,246,370 | |
* | Non-income producing security. |
† | Value determined based on Level 1 inputs — See Note 4. |
1 | Rate indicated is the 7 day yield as of March 31, 2017. |
| | plc — Public Limited Company |
| | |
| | See Sector Classification in Other Information section. |
The following table summarizes the inputs used to value the Fund’s investments at March 31, 2017 (See Note 4 in the Notes to Financial Statements):
Investments in Securities (Assets) | | Level 1 | | | Level 2 | | | Level 3 | | | Total | |
Common Stocks | | $ | 66,969,136 | | | $ | — | | | $ | — | | | $ | 66,969,136 | |
Exchange-Traded Funds | | | 613,780 | | | | — | | | | — | | | | 613,780 | |
Short Term Investments | | | 674,101 | | | | — | | | | — | | | | 674,101 | |
Total | | $ | 68,257,017 | | | $ | — | | | $ | — | | | $ | 68,257,017 | |
Transfers between investment levels may occur as the markets fluctuate and/or the availability of data used in an investment’s valuation changes. Transfers between valuation levels, if any, are in comparison to the valuation levels at the end of the previous fiscal year, and are effective using the fair value as of the end of the previous fiscal period.
For the period ended March 31, 2017, there were no transfers between levels.
22 | THE GUGGENHEIM FUNDS SEMI-ANNUAL REPORT | SEE NOTES TO FINANCIAL STATEMENTS. |
STATEMENT OF ASSETS AND LIABILITIES (Unaudited) |
March 31, 2017 |
Assets: | |
Investments, at value (cost $58,256,976) | | $ | 68,257,017 | |
Prepaid expenses | | | 57,234 | |
Receivables: | |
Fund shares sold | | | 33,607 | |
Dividends | | | 64,730 | |
Total assets | | | 68,412,588 | |
| | | | | |
Liabilities: | |
Payable for: | |
Fund shares redeemed | | | 66,309 | |
Management fees | | | 38,289 | |
Transfer agent/maintenance fees | | | 23,834 | |
Distribution and service fees | | | 16,785 | |
Legal fees | | | 13,000 | |
Fund accounting/administration fees | | | 4,689 | |
Trustees’ fees* | | | 3,312 | |
Total liabilities | | | 166,218 | |
Net assets | | $ | 68,246,370 | |
| | | | | |
Net assets consist of: | |
Paid in capital | | $ | 55,116,734 | |
Undistributed net investment income | | | 241,605 | |
Accumulated net realized gain on investments | | | 2,887,990 | |
Net unrealized appreciation on investments | | | 10,000,041 | |
Net assets | | $ | 68,246,370 | |
| | | | | |
A-Class: | |
Net assets | | $ | 62,217,348 | |
Capital shares outstanding | | | 1,382,860 | |
Net asset value per share | | $ | 44.99 | |
Maximum offering price per share (Net asset value divided by 95.25%) | | $ | 47.23 | |
| | | | | |
C-Class: | |
Net assets | | $ | 3,928,230 | |
Capital shares outstanding | | | 94,358 | |
Net asset value per share | | $ | 41.63 | |
| | | | | |
P-Class: | |
Net assets | | $ | 158,446 | |
Capital shares outstanding | | | 3,526 | |
Net asset value per share | | $ | 44.94 | |
| | | | | |
Institutional Class: | |
Net assets | | $ | 1,942,346 | |
Capital shares outstanding | | | 43,603 | |
Net asset value per share | | $ | 44.55 | |
STATEMENT OF OPERATIONS (Unaudited) |
Period Ended March 31, 2017 |
Investment Income: | |
Dividends | | $ | 627,488 | |
Interest | | | 2,751 | |
Total investment income | | | 630,239 | |
| | | | | |
Expenses: | |
Management fees | | | 208,883 | |
Transfer agent/maintenance fees: | |
A-Class | | | 23,223 | |
C-Class | | | 2,860 | |
P-Class | | | 441 | |
Institutional Class | | | 164 | |
Distribution and service fees: | |
A-Class | | | 74,744 | |
C-Class | | | 18,282 | |
P-Class | | | 178 | |
Fund accounting/administration fees | | | 25,799 | |
Line of credit fees | | | 6,297 | |
Trustees’ fees* | | | 5,981 | |
Custodian fees | | | 861 | |
Miscellaneous | | | 25,438 | |
Total expenses | | | 393,151 | |
Less: | |
Expenses reimbursed by Adviser: | | | | |
A-Class | | | (2,547 | ) |
C-Class | | | (1,584 | ) |
P-Class | | | (386 | ) |
Total reimbursed expenses | | | (4,517 | ) |
Net expenses | | | 388,634 | |
Net investment income | | | 241,605 | |
| | | | | |
Net Realized and Unrealized Gain (Loss): | |
Net realized gain (loss) on: | |
Investments | | | 2,984,522 | |
Net realized gain | | | 2,984,522 | |
Net change in unrealized appreciation (depreciation) on: | |
Investments | | | 4,384,790 | |
Net change in unrealized appreciation (depreciation) | | | 4,384,790 | |
Net realized and unrealized gain | | | 7,369,312 | |
Net increase in net assets resulting from operations | | $ | 7,610,917 | |
* | Relates to Trustees not deemed “interested persons” within the meaning of Section 2(a)(19) of the 1940 Act. |
SEE NOTES TO FINANCIAL STATEMENTS. | THE GUGGENHEIM FUNDS SEMI-ANNUAL REPORT | 23 |
STATEMENTS OF CHANGES IN NET ASSETS |
| | Period Ended
March 31,
2017
(Unaudited) | | | Year Ended
September 30,
2016 | |
Increase (Decrease) in Net Assets from Operations: | | | | | | |
Net investment income | | $ | 241,605 | | | $ | 802,166 | |
Net realized gain on investments | | | 2,984,522 | | | | 2,362,410 | |
Net change in unrealized appreciation (depreciation) on investments | | | 4,384,790 | | | | 5,158,045 | |
Net increase in net assets resulting from operations | | | 7,610,917 | | | | 8,322,621 | |
| | | | | | | | | |
Distributions to shareholders from: | | | | | | | | |
Net investment income | | | | | | | | |
A-Class | | | (784,293 | ) | | | (433,473 | ) |
C-Class | | | (25,737 | ) | | | (6,564 | ) |
P-Class | | | (1,769 | ) | | | (6,451 | ) |
Institutional Class | | | (1,859 | ) | | | (31,516 | ) |
Net realized gains | | | | | | | | |
A-Class | | | (1,894,547 | ) | | | (3,188,410 | ) |
C-Class | | | (126,909 | ) | | | (263,930 | ) |
P-Class | | | (4,388 | ) | | | (38,749 | ) |
Institutional Class | | | (2,387 | ) | | | (178,457 | ) |
Total distributions to shareholders | | | (2,841,889 | ) | | | (4,147,550 | ) |
| | | | | | | | | |
Capital share transactions: | | | | | | | | |
Proceeds from sale of shares | | | | | | | | |
A-Class | | | 5,225,706 | | | | 13,212,897 | |
C-Class | | | 754,532 | | | | 638,542 | |
P-Class | | | 20,114 | | | | 4,067,215 | |
Institutional Class | | | 1,898,394 | | | | 68,775 | |
Distributions reinvested | | | | | | | | |
A-Class | | | 2,617,497 | | | | 3,509,323 | |
C-Class | | | 151,423 | | | | 266,750 | |
P-Class | | | 6,157 | | | | 45,199 | |
Institutional Class | | | 4,245 | | | | 209,973 | |
Cost of shares redeemed | | | | | | | | |
A-Class | | | (5,400,936 | ) | | | (11,004,700 | ) |
C-Class | | | (310,644 | ) | | | (1,369,222 | ) |
P-Class | | | (961 | ) | | | (3,997,610 | ) |
Institutional Class | | | (50,533 | ) | | | (2,476,303 | ) |
Net increase from capital share transactions | | | 4,914,994 | | | | 3,170,839 | |
Net increase in net assets | | | 9,684,022 | | | | 7,345,910 | |
| | | | | | | | | |
Net assets: | | | | | | | | |
Beginning of period | | | 58,562,348 | | | | 51,216,438 | |
End of period | | $ | 68,246,370 | | | $ | 58,562,348 | |
Undistributed net investment income at end of period | | $ | 241,605 | | | $ | 813,658 | |
24 | THE GUGGENHEIM FUNDS SEMI-ANNUAL REPORT | SEE NOTES TO FINANCIAL STATEMENTS. |
STATEMENTS OF CHANGES IN NET ASSETS (concluded) |
| | Period Ended
March 31,
2017
(Unaudited) | | | Year Ended
September 30,
2016 | |
Capital share activity: | | | | | | |
Shares sold | | | | | | |
A-Class | | | 121,458 | | | | 352,919 | |
C-Class | | | 18,732 | | | | 17,640 | |
P-Class | | | 466 | | | | 105,931 | |
Institutional Class | | | 43,680 | | | | 1,722 | |
Shares issued from reinvestment of distributions | | | | | | | | |
A-Class | | | 61,879 | | | | 92,667 | |
C-Class | | | 3,857 | | | | 7,563 | |
P-Class | | | 146 | | | | 1,194 | |
Institutional Class | | | 101 | | | | 5,548 | |
Shares redeemed | | | | | | | | |
A-Class | | | (124,518 | ) | | | (280,411 | ) |
C-Class | | | (7,733 | ) | | | (37,647 | ) |
P-Class | | | (23 | ) | | | (104,417 | ) |
Institutional Class | | | (1,125 | ) | | | (71,269 | ) |
Net increase in shares | | | 116,920 | | | | 91,440 | |
SEE NOTES TO FINANCIAL STATEMENTS. | THE GUGGENHEIM FUNDS SEMI-ANNUAL REPORT | 25 |
This table is presented to show selected data for a share outstanding throughout each period and to assist shareholders in evaluating a Fund’s performance for the periods presented.
A-Class | | Period Ended
March 31,
2017a | | | Year Ended
September 30, 2016 | | | Year Ended
September 30, 2015 | | | Year Ended
September 30, 2014 | | | Year Ended
September 30, 2013 | | | Year Ended
September 30, 2012 | |
Per Share Data | | | | | | | | | | | | | | | | | | |
Net asset value, beginning of period | | $ | 41.78 | | | $ | 39.11 | | | $ | 43.80 | | | $ | 38.28 | | | $ | 31.25 | | | $ | 24.58 | |
Income (loss) from investment operations: | |
Net investment income (loss)b | | | .17 | | | | .58 | | | | .36 | | | | .30 | | | | .29 | | | | .25 | |
Net gain (loss) on investments (realized and unrealized) | | | 5.03 | | | | 5.23 | | | | (3.36 | ) | | | 5.51 | | | | 7.03 | | | | 6.58 | |
Total from investment operations | | | 5.20 | | | | 5.81 | | | | (3.00 | ) | | | 5.81 | | | | 7.32 | | | | 6.83 | |
Less distributions from: | |
Net investment income | | | (.58 | ) | | | (.37 | ) | | | (.35 | ) | | | (.29 | ) | | | (.29 | ) | | | (.16 | ) |
Net realized gains | | | (1.41 | ) | | | (2.77 | ) | | | (1.34 | ) | | | — | | | | — | | | | — | |
Total distributions | | | (1.99 | ) | | | (3.14 | ) | | | (1.69 | ) | | | (.29 | ) | | | (.29 | ) | | | (.16 | ) |
Net asset value, end of period | | $ | 44.99 | | | $ | 41.78 | | | $ | 39.11 | | | $ | 43.80 | | | $ | 38.28 | | | $ | 31.25 | |
| |
Total Returnc | | | 12.74 | % | | | 15.69 | % | | | (7.19 | %) | | | 15.25 | % | | | 23.62 | % | | | 27.90 | % |
Ratios/Supplemental Data | |
Net assets, end of period (in thousands) | | $ | 62,217 | | | $ | 55,325 | | | $ | 45,318 | | | $ | 60,281 | | | $ | 47,307 | | | $ | 41,173 | |
Ratios to average net assets: | |
Net investment income (loss) | | | 0.79 | % | | | 1.48 | % | | | 0.85 | % | | | 0.72 | % | | | 0.82 | % | | | 0.86 | % |
Total expensesd | | | 1.18 | % | | | 1.34 | % | | | 1.35 | % | | | 1.48 | % | | | 1.48 | % | | | 1.65 | % |
Net expensese | | | 1.17 | %h | | | 1.17 | %h | | | 1.16 | %h | | | 1.17 | %h | | | 1.15 | % | | | 1.18 | % |
Portfolio turnover rate | | | 20 | % | | | 56 | % | | | 60 | % | | | 40 | % | | | 43 | % | | | 16 | % |
C-Class | | Period Ended
March 31,
2017a | | | Year Ended
September 30, 2016 | | | Year Ended
September 30, 2015 | | | Year Ended
September 30, 2014 | | | Year Ended
September 30, 2013 | | | Year Ended
September 30, 2012 | |
Per Share Data | | | | | | | | | | | | | | | | | | |
Net asset value, beginning of period | | $ | 38.68 | | | $ | 36.38 | | | $ | 40.91 | | | $ | 35.86 | | | $ | 29.30 | | | $ | 23.08 | |
Income (loss) from investment operations: | |
Net investment income (loss)b | | | .01 | | | | .27 | | | | .04 | | | | (.02 | ) | | | .02 | | | | .03 | |
Net gain (loss) on investments (realized and unrealized) | | | 4.63 | | | | 4.87 | | | | (3.13 | ) | | | 5.16 | | | | 6.62 | | | | 6.19 | |
Total from investment operations | | | 4.64 | | | | 5.14 | | | | (3.09 | ) | | | 5.14 | | | | 6.64 | | | | 6.22 | |
Less distributions from: | |
Net investment income | | | (.28 | ) | | | (.07 | ) | | | (.10 | ) | | | (.09 | ) | | | (.08 | ) | | | — | |
Net realized gains | | | (1.41 | ) | | | (2.77 | ) | | | (1.34 | ) | | | — | | | | — | | | | — | |
Total distributions | | | (1.69 | ) | | | (2.84 | ) | | | (1.44 | ) | | | (.09 | ) | | | (.08 | ) | | | — | |
Net asset value, end of period | | $ | 41.63 | | | $ | 38.68 | | | $ | 36.38 | | | $ | 40.91 | | | $ | 35.86 | | | $ | 29.30 | |
| |
Total Returnc | | | 12.26 | % | | | 14.87 | % | | | (7.89 | %) | | | 14.35 | % | | | 22.73 | % | | | 26.95 | % |
Ratios/Supplemental Data | |
Net assets, end of period (in thousands) | | $ | 3,928 | | | $ | 3,075 | | | $ | 3,345 | | | $ | 3,963 | | | $ | 3,494 | | | $ | 2,257 | |
Ratios to average net assets: | |
Net investment income (loss) | | | 0.04 | % | | | 0.75 | % | | | 0.10 | % | | | (0.04 | %) | | | 0.08 | % | | | 0.12 | % |
Total expensesd | | | 2.00 | % | | | 2.18 | % | | | 2.16 | % | | | 2.33 | % | | | 2.47 | % | | | 2.45 | % |
Net expensese | | | 1.92 | %h | | | 1.92 | %h | | | 1.91 | %h | | | 1.92 | %h | | | 1.90 | % | | | 1.93 | % |
Portfolio turnover rate | | | 20 | % | | | 56 | % | | | 60 | % | | | 40 | % | | | 43 | % | | | 16 | % |
26 | THE GUGGENHEIM FUNDS SEMI-ANNUAL REPORT | SEE NOTES TO FINANCIAL STATEMENTS. |
FINANCIAL HIGHLIGHTS (continued) |
This table is presented to show selected data for a share outstanding throughout each period and to assist shareholders in evaluating a Fund’s performance for the periods presented.
P-Class | | Period Ended
March 31,
2017a | | | Year Ended
September 30,
2016 | | | Period Ended
September 30,
2015f | |
Per Share Data | | | | | | | | | |
Net asset value, beginning of period | | $ | 41.74 | | | $ | 39.13 | | | $ | 43.64 | |
Income (loss) from investment operations: | |
Net investment income (loss)b | | | .17 | | | | 1.40 | | | | .22 | |
Net gain (loss) on investments (realized and unrealized) | | | 5.00 | | | | 4.44 | | | | (4.73 | ) |
Total from investment operations | | | 5.17 | | | | 5.84 | | | | (4.51 | ) |
Less distributions from: | |
Net investment income | | | (.56 | ) | | | (.46 | ) | | | — | |
Net realized gains | | | (1.41 | ) | | | (2.77 | ) | | | — | |
Total distributions | | | (1.97 | ) | | | (3.23 | ) | | | — | |
Net asset value, end of period | | $ | 44.94 | | | $ | 41.74 | | | $ | 39.13 | |
| |
Total Returnc | | | 12.69 | % | | | 15.83 | % | | | (10.38 | %) |
Ratios/Supplemental Data | |
Net assets, end of period (in thousands) | | $ | 158 | | | $ | 123 | | | $ | 9 | |
Ratios to average net assets: | |
Net investment income (loss) | | | 0.79 | % | | | 3.61 | % | | | 1.21 | % |
Total expensesd | | | 1.72 | % | | | 1.41 | % | | | 3.29 | % |
Net expensese,h | | | 1.17 | % | | | 1.17 | % | | | 1.16 | % |
Portfolio turnover rate | | | 20 | % | | | 56 | % | | | 60 | % |
SEE NOTES TO FINANCIAL STATEMENTS. | THE GUGGENHEIM FUNDS SEMI-ANNUAL REPORT | 27 |
FINANCIAL HIGHLIGHTS (concluded) |
This table is presented to show selected data for a share outstanding throughout each period and to assist shareholders in evaluating a Fund’s performance for the periods presented.
Institutional Class | | Period Ended
March 31,
2017a | | | Year Ended
September 30, 2016 | | | Year Ended
September 30, 2015 | | | Year Ended
September 30, 2014 | | | Period Ended
September 30, 2013g | |
Per Share Data | | | | | | | | | | | | | | | |
Net asset value, beginning of period | | $ | 41.84 | | | $ | 39.17 | | | $ | 43.87 | | | $ | 38.32 | | | $ | 36.84 | |
Income (loss) from investment operations: | |
Net investment income (loss)b | | | .28 | | | | .83 | | | | .47 | | | | .40 | | | | .13 | |
Net gain (loss) on investments (realized and unrealized) | | | 4.93 | | | | 5.10 | | | | (3.37 | ) | | | 5.51 | | | | 1.35 | |
Total from investment operations | | | 5.21 | | | | 5.93 | | | | (2.90 | ) | | | 5.91 | | | | 1.48 | |
Less distributions from: | |
Net investment income | | | (1.09 | ) | | | (.49 | ) | | | (.46 | ) | | | (.36 | ) | | | — | |
Net realized gains | | | (1.41 | ) | | | (2.77 | ) | | | (1.34 | ) | | | — | | | | — | |
Total distributions | | | (2.50 | ) | | | (3.26 | ) | | | (1.80 | ) | | | (.36 | ) | | | — | |
Net asset value, end of period | | $ | 44.55 | | | $ | 41.84 | | | $ | 39.17 | | | $ | 43.87 | | | $ | 38.32 | |
| |
Total Returnc | | | 12.84 | % | | | 15.98 | % | | | (6.97 | %) | | | 15.52 | % | | | 4.02 | % |
Ratios/Supplemental Data | |
Net assets, end of period (in thousands) | | $ | 1,942 | | | $ | 40 | | | $ | 2,544 | | | $ | 3,339 | | | $ | 2,831 | |
Ratios to average net assets: | |
Net investment income (loss) | | | 1.25 | % | | | 2.13 | % | | | 1.09 | % | | | 0.96 | % | | | 1.12 | % |
Total expensesd | | | 0.93 | % | | | 1.04 | % | | | 0.98 | % | | | 1.08 | % | | | 1.12 | % |
Net expensese | | | 0.93 | %h | | | 0.92 | %h | | | 0.91 | %h | | | 0.92 | %h | | | 0.89 | % |
Portfolio turnover rate | | | 20 | % | | | 56 | % | | | 60 | % | | | 40 | % | | | 43 | % |
a | Unaudited figures for the period ended March 31, 2017. Percentage amounts for the period, except total return and portfolio turnover rate, have been annualized. |
b | Net investment income (loss) per share was computed using average shares outstanding throughout the period. |
c | Total return does not reflect the impact of any applicable sales charges and has not been annualized. |
d | Does not include expenses of the underlying funds in which the Fund invests. |
e | Net expense information reflects the expense ratios after expense waivers and reimbursements, as applicable. |
f | Since commencement of operations: May 1, 2015. Percentage amounts for the period, except total return and portfolio turnover rate, have been annualized. |
g | Since commencement of operations: June 7, 2013. Percentage amounts for the period, except total return and portfolio turnover rate, have been annualized. |
h | Net expenses may include expenses that are excluded from the expense limitation agreement. Excluding these expenses, the net expense ratios for the periods presented would be: |
| | | 03/31/17 | 09/30/16 | 09/30/15 | 09/30/14 | |
| | A-Class | 1.15% | 1.15% | 1.15% | 1.15% | |
| | C-Class | 1.90% | 1.90% | 1.90% | 1.90% | |
| | P-Class | 1.15% | 1.15% | 1.15% | — | |
| | Institutional Class | 0.90% | 0.90% | 0.90% | 0.90% | |
28 | THE GUGGENHEIM FUNDS SEMI-ANNUAL REPORT | SEE NOTES TO FINANCIAL STATEMENTS. |
FUND PROFILE (Unaudited) | March 31, 2017 |
MARKET NEUTRAL REAL ESTATE FUND
OBJECTIVE: Seeks to provide capital appreciation, while limiting exposure to general stock market risk.
Holdings Diversification (Market Exposure as % of Net Assets)
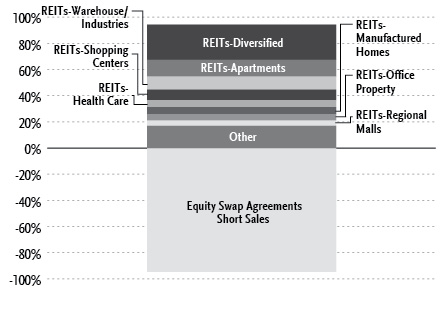
“Holdings Diversification (Market Exposure as % of Net Assets)” excludes any temporary cash investments.
Inception Dates: |
A-Class | February 26, 2016 |
C-Class | February 26, 2016 |
P-Class | February 26, 2016 |
Institutional Class | February 26, 2016 |
Ten Largest Holdings (% of Total Net Assets) |
Weyerhaeuser Co. | 4.1% |
Invitation Homes, Inc. | 4.1% |
Rayonier, Inc. | 4.0% |
Rexford Industrial Realty, Inc. | 3.8% |
Equity Residential | 3.4% |
Colony Starwood Homes | 3.3% |
Physicians Realty Trust | 3.3% |
CyrusOne, Inc. | 3.3% |
Equinix, Inc. | 3.2% |
Hilton Worldwide Holdings, Inc. | 3.1% |
Top Ten Total | 35.6% |
“Ten Largest Holdings” excludes any temporary cash or derivative investments.
| | THE GUGGENHEIM FUNDS SEMI-ANNUAL REPORT | 29 |
SCHEDULE OF INVESTMENTS (Unaudited) | March 31, 2017 |
MARKET NEUTRAL REAL ESTATE FUND | |
| | Shares | | | Value | |
| | | | | | | |
COMMON STOCKS† - 94.3% | |
| | | | | | | |
REITs - 82.6% | |
REITs-Diversified - 26.9% | |
Weyerhaeuser Co. | | | 6,279 | | | $ | 213,361 | |
Rayonier, Inc. | | | 7,414 | | | | 210,114 | |
Equinix, Inc.1 | | | 419 | | | | 167,755 | |
Crown Castle International Corp.1 | | | 1,629 | | | | 153,859 | |
Gramercy Property Trust | | | 5,671 | | | | 149,147 | |
Tier REIT, Inc. | | | 8,460 | | | | 146,866 | |
STORE Capital Corp. | | | 6,111 | | | | 145,931 | |
American Tower Corp. — Class A1 | | | 945 | | | | 114,855 | |
Vornado Realty Trust | | | 1,037 | | | | 104,021 | |
Total REITs-Diversified | | | | | | | 1,405,909 | |
| | | | | | | | | |
REITs-Apartments - 12.8% | |
Invitation Homes, Inc.* | | | 9,740 | | | | 212,625 | |
Equity Residential1 | | | 2,860 | | | | 177,949 | |
Colony Starwood Homes | | | 5,097 | | | | 173,043 | |
Monogram Residential Trust, Inc. | | | 10,028 | | | | 99,979 | |
Total REITs-Apartments | | | | | | | 663,596 | |
| | | | | | | | | |
REITs-Warehouse/Industries - 9.9% | |
Rexford Industrial Realty, Inc. | | | 8,775 | | | | 197,614 | |
CyrusOne, Inc. | | | 3,288 | | | | 169,233 | |
EastGroup Properties, Inc. | | | 1,991 | | | | 146,398 | |
Total REITs-Warehouse/Industries | | | | | | | 513,245 | |
| | | | | | | | | |
REITs-Shopping Centers - 8.1% | |
Regency Centers Corp. | | | 2,363 | | | | 156,879 | |
Federal Realty Investment Trust1 | | | 1,086 | | | | 144,981 | |
Acadia Realty Trust | | | 3,898 | | | | 117,174 | |
Total REITs-Shopping Centers | | | | | | | 419,034 | |
| | | | | | | | | |
REITs-Health Care - 5.4% | |
Physicians Realty Trust | | | 8,588 | | | | 170,643 | |
Healthcare Trust of America, Inc. — Class A | | | 3,421 | | | | 107,625 | |
Total REITs-Health Care | | | | | | | 278,268 | |
| | | | | | | | | |
REITs-Manufactured Homes - 5.3% | |
Sun Communities, Inc. | | | 1,932 | | | | 155,197 | |
Equity LifeStyle Properties, Inc. | | | 1,575 | | | | 121,370 | |
Total REITs-Manufactured Homes | | | | | | | 276,567 | |
| | | | | | | | | |
REITs-Office Property - 4.8% | |
Alexandria Real Estate Equities, Inc. | | | 1,429 | | | | 157,933 | |
Mack-Cali Realty Corp. | | | 3,494 | | | | 94,128 | |
Total REITs-Office Property | | | | | | | 252,061 | |
| | | | | | | | | |
REITs-Regional Malls - 4.0% | |
Pennsylvania Real Estate Investment Trust | | | 6,964 | | | | 105,435 | |
GGP, Inc. | | | 4,457 | | | | 103,313 | |
Total REITs-Regional Malls | | | | | | | 208,748 | |
| | | | | | | | | |
REITs-Mortgage - 3.0% | |
Blackstone Mortgage Trust, Inc. — Class A | | | 5,020 | | | | 155,419 | |
| | | | | | | | | |
REITs-Storage - 2.4% | |
National Storage Affiliates Trust | | | 5,156 | | | | 123,228 | |
Total REITs | | | | | | | 4,296,075 | |
| | | | | | | | | |
Lodging - 6.8% | |
Casino Hotels - 3.7% | |
Boyd Gaming Corp.* | | | 5,149 | | | | 113,329 | |
MGM Resorts International | | | 2,809 | | | | 76,967 | |
Total Casino Hotels | | | | | | | 190,296 | |
| | | | | | | | | |
Hotels & Motels - 3.1% | |
Hilton Worldwide Holdings, Inc.1 | | | 2,776 | | | | 162,285 | |
Total Lodging | | | | | | | 352,581 | |
| | | | | | | | | |
Insurance - 2.8% | |
Financial Guarantee Insurance - 2.8% | |
MGIC Investment Corp.* | | | 14,348 | | | | 145,345 | |
| | | | | | | | | |
Entertainment - 2.1% | |
Gambling (Non-Hotel) - 2.1% | |
Pinnacle Entertainment, Inc.* | | | 5,598 | | | | 109,273 | |
| | | | | | | | | |
Total Common Stocks | | | | | | | | |
(Cost $4,610,471) | | | | | | | 4,903,274 | |
| | | | | | | | | |
SHORT-TERM INVESTMENTS† - 10.7% | |
Goldman Sachs Financial Square Treasury Instruments Fund - Institutional Class 0.56%2 | | | 558,509 | | | | 558,509 | |
Total Short-Term Investments | | | | | | | | |
(Cost $558,509) | | | | | | | 558,509 | |
| | | | | | | | | |
Total Investments - 105.0% | | | | | | | | |
(Cost $5,168,980) | | | | | | $ | 5,461,783 | |
Other Assets & Liabilities, net - (5.0)% | | | | | | | (260,510 | ) |
Total Net Assets - 100.0% | | | | | | $ | 5,201,273 | |
| | | | | | Unrealized Gain (Loss) | |
| | |
OTC EQUITY SWAP AGREEMENTS†† | |
Morgan Stanley
February 2018 Market Neutral Real Estate Portfolio Short Custom Basket Swap 0.56%3,
Terminating 02/28/18 (Notional Value $4,926,555) | | | | | | $ | (235,181 | ) |
| | | | | | | | | |
| | | Shares | | | | | |
| | | | | | | | | |
CUSTOM BASKET OF SHORT SECURITIES3 | |
Brixmor Property Group, Inc. | | | (7,109 | ) | | | 26,009 | |
National Retail Properties, Inc. | | | (3,503 | ) | | | 19,224 | |
Realty Income Corp. | | | (3,004 | ) | | | 16,314 | |
Senior Housing Properties Trust | | | (8,079 | ) | | | 6,758 | |
30 | THE GUGGENHEIM FUNDS SEMI-ANNUAL REPORT | SEE NOTES TO FINANCIAL STATEMENTS. |
SCHEDULE OF INVESTMENTS (Unaudited)(concluded) | March 31, 2017 |
MARKET NEUTRAL REAL ESTATE FUND | |
| | Shares | | | Unrealized Gain (Loss) | |
| | | | | | | |
Hersha Hospitality Trust | | | (1,029 | ) | | $ | 2,142 | |
Urban Edge Properties | | | (3,908 | ) | | | 1,987 | |
Weingarten Realty Investors | | | (3,040 | ) | | | 1,267 | |
Life Storage, Inc. | | | (1,252 | ) | | | 10 | |
Macerich Co. | | | (1,608 | ) | | | (797 | ) |
DuPont Fabros Technology, Inc. | | | (2,081 | ) | | | (1,225 | ) |
LaSalle Hotel Properties | | | (3,532 | ) | | | (1,254 | ) |
Digital Realty Trust, Inc. | | | (1,830 | ) | | | (1,737 | ) |
Chesapeake Lodging Trust | | | (4,328 | ) | | | (2,196 | ) |
DiamondRock Hospitality Co. | | | (9,714 | ) | | | (3,525 | ) |
Extra Space Storage, Inc. | | | (1,425 | ) | | | (3,745 | ) |
PS Business Parks, Inc. | | | (928 | ) | | | (4,668 | ) |
UDR, Inc. | | | (4,379 | ) | | | (6,849 | ) |
AvalonBay Communities, Inc. | | | (900 | ) | | | (10,641 | ) |
Lexington Realty Trust | | | (9,205 | ) | | | (14,514 | ) |
Piedmont Office Realty Trust, Inc. — Class A | | | (8,553 | ) | | | (17,126 | ) |
Omega Healthcare Investors, Inc. | | | (5,028 | ) | | | (21,116 | ) |
Government Properties Income Trust | | | (7,804 | ) | | | (21,298 | ) |
iShares U.S. Real Estate ETF | | | (16,038 | ) | | | (21,419 | ) |
Host Hotels & Resorts, Inc. | | | (6,628 | ) | | | (21,510 | ) |
EPR Properties | | | (2,096 | ) | | | (24,088 | ) |
Sabra Health Care REIT, Inc. | | | (6,342 | ) | | | (29,809 | ) |
Iron Mountain, Inc. | | | (5,761 | ) | | | (33,764 | ) |
STAG Industrial, Inc. | | | (6,241 | ) | | | (47,058 | ) |
Total Custom Basket of Short Securities | | | | | | | (214,628 | ) |
* | Non-income producing security. |
† | Value determined based on Level 1 inputs — See Note 4. |
†† | Value determined based on Level 2 inputs — See Note 4. |
1 | All or a portion of this security is pledged as equity swap collateral at March 31, 2017. |
2 | Rate indicated is the 7 day yield as of March 31, 2017. |
3 | Total return is based on the return of the custom basket of short securities +/- financing at a variable rate. Rate indicated is the rate effective at March 31, 2017. |
| | REIT — Real Estate Investment Trust |
| | |
| | See Sector Classification in Other Information section. |
The following table summarizes the inputs used to value the Fund’s investments at March 31, 2017 (See Note 4 in the Notes to Financial Statements):
Investments in Securities (Assets) | | Level 1 | | | Level 2 | | | Level 2 -
Other* | | | Level 3 | | | Total | |
Common Stocks | | $ | 4,903,274 | | | $ | — | | | $ | — | | | $ | — | | | $ | 4,903,274 | |
Short-Term Investments | | | 558,509 | | | | — | | | | — | | | | — | | | | 558,509 | |
Total | | $ | 5,461,783 | | | $ | — | | | $ | — | | | $ | — | | | $ | 5,461,783 | |
| | | | | | | | | | | | | | | | | | | | |
Investments in Securities (Liabilities) | | Level 1 | | | Level 2 | | | Level 2 -
Other* | | | Level 3 | | | Total | |
Equity Swap Agreements | | $ | — | | | $ | — | | | $ | 235,181 | | | $ | — | | | $ | 235,181 | |
* | Other financial instruments include swaps, which are reported as unrealized gain/loss at period end. |
Transfers between investment levels may occur as the markets fluctuate and/or the availability of data used in an investment’s valuation changes. Transfers between valuation levels, if any, are in comparison to the valuation levels at the end of the previous fiscal year, and are effective using the fair value as of the end of the previous fiscal period.
For the period ended March 31, 2017, there were no transfers between levels.
SEE NOTES TO FINANCIAL STATEMENTS. | THE GUGGENHEIM FUNDS SEMI-ANNUAL REPORT | 31 |
MARKET NEUTRAL REAL ESTATE FUND | |
STATEMENT OF ASSETS AND LIABILITIES (Unaudited) |
March 31, 2017 |
Assets: | |
Investments, at value (cost $5,168,980) | | $ | 5,461,783 | |
Prepaid expenses | | | 95,697 | |
Cash | | | 2,530 | |
Receivables: | |
Swap settlement | | | 66,186 | |
Dividends | | | 18,736 | |
Total assets | | | 5,644,932 | |
| | | | | |
Liabilities: | |
Unrealized depreciation on swap agreements | | | 235,181 | |
Payable for: | |
Securities purchased | | | 206,255 | |
Transfer agent/maintenance fees | | | 4,828 | |
Trustees’ fees* | | | 1,207 | |
Distribution and service fees | | | 168 | |
Management fees | | | (3,980 | ) |
Total liabilities | | | 443,659 | |
Net assets | | $ | 5,201,273 | |
| | | | | |
Net assets consist of: | |
Paid in capital | | $ | 4,734,334 | |
Undistributed net investment income | | | 274,360 | |
Accumulated net realized gain on investments | | | 134,957 | |
Net unrealized appreciation on investments | | | 57,622 | |
Net assets | | $ | 5,201,273 | |
| | | | | |
A-Class: | |
Net assets | | $ | 105,304 | |
Capital shares outstanding | | | 4,112 | |
Net asset value per share | | $ | 25.61 | |
Maximum offering price per share (Net asset value divided by 95.25%) | | $ | 26.89 | |
| | | | | |
C-Class: | |
Net assets | | $ | 138,647 | |
Capital shares outstanding | | | 5,459 | |
Net asset value per share | | $ | 25.40 | |
| | | | | |
P-Class: | |
Net assets | | $ | 130,295 | |
Capital shares outstanding | | | 5,090 | |
Net asset value per share | | $ | 25.60 | |
| | | | | |
Institutional Class: | |
Net assets | | $ | 4,827,027 | |
Capital shares outstanding | | | 188,000 | |
Net asset value per share | | $ | 25.68 | |
STATEMENT OF OPERATIONS (Unaudited) |
Period Ended March 31, 2017 |
Investment Income: | |
Dividends | | $ | 45,719 | |
Interest | | | 890 | |
Total investment income | | | 46,609 | |
| | | | | |
Expenses: | |
Management fees | | | 28,079 | |
Transfer agent/maintenance fees: | |
A-Class | | | 92 | |
C-Class | | | 110 | |
P-Class | | | 163 | |
Institutional Class | | | 2,269 | |
Distribution and service fees: | |
A-Class | | | 129 | |
C-Class | | | 625 | |
P-Class | | | 161 | |
Fund accounting/administration fees | | | 12,465 | |
Registration fees | | | 9,293 | |
Professional fees | | | 8,101 | |
Insurance expense | | | 3,473 | |
Trustees’ fees* | | | 2,653 | |
Line of credit fees | | | 791 | |
Miscellaneous | | | (2,770 | ) |
Total expenses | | | 65,634 | |
Less: | |
Expenses waived by Adviser | | | (25,876 | ) |
Expenses reimbursed by Adviser: | | | | |
A-Class | | | (133 | ) |
C-Class | | | (150 | ) |
P-Class | | | (196 | ) |
Institutional Class | | | (2,195 | ) |
Total waived/reimbursed expenses | | | (28,550 | ) |
Net expenses | | | 37,084 | |
Net investment income | | | 9,525 | |
| | | | | |
Net Realized and Unrealized Gain (Loss): | |
Net realized gain (loss) on: | |
Investments | | | 158,049 | |
Swap agreements | | | 18,662 | |
Net realized gain | | | 176,711 | |
Net change in unrealized appreciation (depreciation) on: | |
Investments | | | 21,615 | |
Swap agreements | | | 29,654 | |
Net change in unrealized appreciation (depreciation) | | | 51,269 | |
Net realized and unrealized gain | | | 227,980 | |
Net increase in net assets resulting from operations | | $ | 237,505 | |
* | Relates to Trustees not deemed “interested persons” within the meaning of Section 2(a)(19) of the 1940 Act. |
32 | THE GUGGENHEIM FUNDS SEMI-ANNUAL REPORT | SEE NOTES TO FINANCIAL STATEMENTS. |
MARKET NEUTRAL REAL ESTATE FUND | |
STATEMENTS OF CHANGES IN NET ASSETS |
| | Period Ended
March 31,
2017
(Unaudited) | | | Period Ended September 30,
2016* | |
Increase (Decrease) in Net Assets from Operations: | | | | | | |
Net investment income | | $ | 9,525 | | | $ | 54,619 | |
Net realized gain (loss) on investments | | | 176,711 | | | | (163,479 | ) |
Net change in unrealized appreciation (depreciation) on investments | | | 51,269 | | | | 6,353 | |
Net increase (decrease) in net assets resulting from operations | | | 237,505 | | | | (102,507 | ) |
| | | | | | | | | |
Capital share transactions: | | | | | | | | |
Proceeds from sale of shares | | | | | | | | |
A-Class | | | 784 | | | | 102,011 | |
C-Class | | | 36,949 | | | | 100,000 | |
P-Class | | | 3,322 | | | | 125,772 | |
Institutional Class | | | — | | | | 4,700,000 | |
Cost of shares redeemed | | | | | | | | |
A-Class | | | — | | | | — | |
C-Class | | | — | | | | — | |
P-Class | | | (2,563 | ) | | | — | |
Institutional Class | | | — | | | | — | |
Net increase from capital share transactions | | | 38,492 | | | | 5,027,783 | |
Net increase in net assets | | | 275,997 | | | | 4,925,276 | |
| | | | | | | | | |
Net assets: | | | | | | | | |
Beginning of year | | | 4,925,276 | | | | — | |
End of year | | $ | 5,201,273 | | | $ | 4,925,276 | |
Undistributed net investment income at end of year | | $ | 274,360 | | | $ | 264,835 | |
| | | | | | | | | |
Capital share activity: | | | | | | | | |
Shares sold | | | | | | | | |
A-Class | | | 30 | | | | 4,082 | |
C-Class | | | 1,459 | | | | 4,000 | |
P-Class | | | 131 | | | | 5,059 | |
Institutional Class | | | — | | | | 188,000 | |
Shares redeemed | | | | | | | | |
P-Class | | | (100 | ) | | | — | |
Net increase in shares | | | 1,520 | | | | 201,141 | |
* | Since commencement of operations: February 26, 2016. |
SEE NOTES TO FINANCIAL STATEMENTS. | THE GUGGENHEIM FUNDS SEMI-ANNUAL REPORT | 33 |
MARKET NEUTRAL REAL ESTATE FUND | |
This table is presented to show selected data for a share outstanding throughout each period and to assist shareholders in evaluating a Fund’s performance for the periods presented.
A-Class | | Period Ended
March 31,
2017a | | | Period Ended
September 30,
2016b | |
Per Share Data | | | | | | |
Net asset value, beginning of period | | $ | 24.45 | | | $ | 25.00 | |
Income (loss) from investment operations: | |
Net investment income (loss)c | | | .02 | | | | .24 | |
Net gain (loss) on investments (realized and unrealized) | | | 1.14 | | | | (.79 | ) |
Total from investment operations | | | 1.16 | | | | (.55 | ) |
Net asset value, end of period | | $ | 25.61 | | | $ | 24.45 | |
| |
Total Returne | | | 4.70 | % | | | (2.20 | %) |
Ratios/Supplemental Data | |
Net assets, end of period (in thousands) | | $ | 105 | | | $ | 100 | |
Ratios to average net assets: | |
Net investment income (loss) | | | 0.16 | % | | | 1.66 | % |
Total expenses | | | 2.86 | % | | | 3.74 | % |
Net expensesd,f | | | 1.66 | % | | | 1.64 | % |
Portfolio turnover rate | | | 72 | % | | | 135 | % |
C-Class | | Period Ended
March 31,
2017a | | | Period Ended
September 30,
2016b | |
Per Share Data | | | | | | |
Net asset value, beginning of period | | $ | 24.35 | | | $ | 25.00 | |
Income (loss) from investment operations: | |
Net investment income (loss)c | | | (.08 | ) | | | .12 | |
Net gain (loss) on investments (realized and unrealized) | | | 1.13 | | | | (.77 | ) |
Total from investment operations | | | 1.05 | | | | (.65 | ) |
Net asset value, end of period | | $ | 25.40 | | | $ | 24.35 | |
| |
Total Returne | | | 4.31 | % | | | (2.60 | %) |
Ratios/Supplemental Data | |
Net assets, end of period (in thousands) | | $ | 139 | | | $ | 97 | |
Ratios to average net assets: | |
Net investment income (loss) | | | (0.69 | %) | | | 0.93 | % |
Total expenses | | | 3.63 | % | | | 4.47 | % |
Net expensesd,f | | | 2.41 | % | | | 2.38 | % |
Portfolio turnover rate | | | 72 | % | | | 135 | % |
34 | THE GUGGENHEIM FUNDS SEMI-ANNUAL REPORT | SEE NOTES TO FINANCIAL STATEMENTS. |
MARKET NEUTRAL REAL ESTATE FUND | |
FINANCIAL HIGHLIGHTS (continued) |
This table is presented to show selected data for a share outstanding throughout each period and to assist shareholders in evaluating a Fund’s performance for the periods presented.
P-Class | | Period Ended
March 31,
2017a | | | Period Ended
September 30,
2016b | |
Per Share Data | | | | | | |
Net asset value, beginning of period | | $ | 24.45 | | | $ | 25.00 | |
Income (loss) from investment operations: | |
Net investment income (loss)c | | | .02 | | | | .26 | |
Net gain (loss) on investments (realized and unrealized) | | | 1.13 | | | | .81 | |
Total from investment operations | | | 1.15 | | | | (.55 | ) |
Net asset value, end of period | | $ | 25.60 | | | $ | 24.45 | |
| |
Total Returne | | | 4.70 | % | | | (2.20 | %) |
Ratios/Supplemental Data | |
Net assets, end of period (in thousands) | | $ | 130 | | | $ | 124 | |
Ratios to average net assets: | |
Net investment income (loss) | | | 0.15 | % | | | 1.64 | % |
Total expenses | | | 2.93 | % | | | 3.65 | % |
Net expensesd,f | | | 1.67 | % | | | 1.66 | % |
Portfolio turnover rate | | | 72 | % | | | 135 | % |
SEE NOTES TO FINANCIAL STATEMENTS. | THE GUGGENHEIM FUNDS SEMI-ANNUAL REPORT | 35 |
MARKET NEUTRAL REAL ESTATE FUND | |
FINANCIAL HIGHLIGHTS (concluded) |
This table is presented to show selected data for a share outstanding throughout each period and to assist shareholders in evaluating a Fund’s performance for the periods presented.
Institutional Class | | Period Ended
March 31,
2017a | | | Period Ended
September 30,
2016b | |
Per Share Data | | | | | | |
Net asset value, beginning of period | | $ | 24.49 | | | $ | 25.00 | |
Income (loss) from investment operations: | |
Net investment income (loss)c | | | .05 | | | | .28 | |
Net gain (loss) on investments (realized and unrealized) | | | 1.14 | | | | (.79 | ) |
Total from investment operations | | | 1.19 | | | | (.51 | ) |
Net asset value, end of period | | $ | 25.68 | | | $ | 24.49 | |
| |
Total Returne | | | 4.82 | % | | | (2.04 | %) |
Ratios/Supplemental Data | |
Net assets, end of period (in thousands) | | $ | 4,827 | | | $ | 4,604 | |
Ratios to average net assets: | |
Net investment income (loss) | | | 0.41 | % | | | 1.92 | % |
Total expenses | | | 2.52 | % | | | 3.41 | % |
Net expensesd,f | | | 1.41 | % | | | 1.39 | % |
Portfolio turnover rate | | | 72 | % | | | 135 | % |
a | Unaudited figures for the period ended March 31, 2017. Percentage amounts for the period, except total return and portfolio turnover rate, have been annualized. |
b | Since commencement of operations: February 26, 2016. Percentage amounts for the period, except total return and portfolio turnover rate, have been annualized. |
c | Net investment income (loss) per share was computed using average shares outstanding throughout the period. |
d | Net expense information reflects the expense ratios after expense waivers and reimbursements, as applicable. |
e | Total return does not reflect the impact of any applicable sales charges and has not been annualized. |
f | Net expenses may include expenses that are excluded from the expense limitation agreement and recouped amounts. Excluding these expenses, the net expense ratios for the periods presented would be: |
| | | 03/31/17 | 09/30/16 |
| | A-Class | 1.63% | 1.63% |
| | C-Class | 2.38% | 2.37% |
| | P-Class | 1.64% | 1.65% |
| | Institutional Class | 1.38% | 1.38% |
36 | THE GUGGENHEIM FUNDS SEMI-ANNUAL REPORT | SEE NOTES TO FINANCIAL STATEMENTS. |
FUND PROFILE (Unaudited) | March 31, 2017 |
RISK MANAGED REAL ESTATE FUND
OBJECTIVE: Seeks to provide total return, comprised of capital appreciation and current income.
Holdings Diversification (Market Exposure as % of Net Assets)
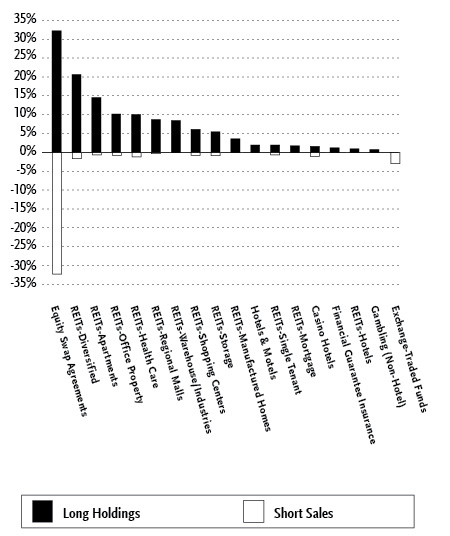
“Holdings Diversification (Market Exposure as % of Net Assets)” excludes any temporary cash investments.
Inception Dates: |
A-Class | March 28, 2014 |
C-Class | March 28, 2014 |
P-Class | May 1, 2015 |
Institutional Class | March 28, 2014 |
Ten Largest Long Holdings (% of Total Net Assets) |
Simon Property Group, Inc. | 5.9% |
Equinix, Inc. | 4.7% |
Prologis, Inc. | 3.5% |
Public Storage | 3.3% |
Equity Residential | 2.7% |
Alexandria Real Estate Equities, Inc. | 2.3% |
Boston Properties, Inc. | 2.3% |
Welltower, Inc. | 2.3% |
Vornado Realty Trust | 2.2% |
Physicians Realty Trust | 2.1% |
Top Ten Total | 31.3% |
“Ten Largest Long Holdings” excludes any temporary cash or derivative investments.
| | THE GUGGENHEIM FUNDS SEMI-ANNUAL REPORT | 37 |
SCHEDULE OF INVESTMENTS (Unaudited) | March 31, 2017 |
RISK MANAGED REAL ESTATE FUND | |
| | Shares | | | Value | |
| | | | | | | |
COMMON STOCKS† - 97.3% | |
| | | | | | | |
REITs - 91.9% | |
REITs-Diversified - 20.7% | |
Equinix, Inc. | | | 13,206 | | | $ | 5,287,285 | |
Vornado Realty Trust | | | 24,531 | | | | 2,460,704 | |
Weyerhaeuser Co. | | | 61,264 | | | | 2,081,750 | |
Gramercy Property Trust | | | 78,786 | | | | 2,072,072 | |
Rayonier, Inc. | | | 67,096 | | | | 1,901,501 | |
STORE Capital Corp. | | | 74,645 | | | | 1,782,523 | |
Crown Castle International Corp. | | | 17,490 | | | | 1,651,931 | |
Duke Realty Corp. | | | 60,777 | | | | 1,596,612 | |
Tier REIT, Inc. | | | 82,172 | | | | 1,426,506 | |
Digital Realty Trust, Inc. | | | 9,631 | | | | 1,024,642 | |
Washington Real Estate Investment Trust | | | 31,129 | | | | 973,715 | |
American Tower Corp. — Class A1 | | | 6,916 | | | | 840,571 | |
Total REITs-Diversified | | | | | | | 23,099,812 | |
| | | | | | | | | |
REITs-Apartments - 14.5% | |
Equity Residential | | | 49,038 | | | | 3,051,143 | |
AvalonBay Communities, Inc.1 | | | 13,376 | | | | 2,455,834 | |
Invitation Homes, Inc.* | | | 96,788 | | | | 2,112,882 | |
Essex Property Trust, Inc.1 | | | 8,752 | | | | 2,026,351 | |
Colony Starwood Homes | | | 57,496 | | | | 1,951,989 | |
Mid-America Apartment Communities, Inc. | | | 14,782 | | | | 1,503,921 | |
Monogram Residential Trust, Inc. | | | 139,865 | | | | 1,394,454 | |
Camden Property Trust1 | | | 11,092 | | | | 892,462 | |
Apartment Investment & Management Co. — Class A | | | 18,153 | | | | 805,086 | |
Total REITs-Apartments | | | | | | | 16,194,122 | |
| | | | | | | | | |
REITs-Office Property - 10.1% | |
Alexandria Real Estate Equities, Inc.1 | | | 23,690 | | | | 2,618,220 | |
Boston Properties, Inc.1 | | | 19,669 | | | | 2,604,373 | |
SL Green Realty Corp. | | | 14,412 | | | | 1,536,607 | |
Mack-Cali Realty Corp. | | | 47,178 | | | | 1,270,975 | |
Kilroy Realty Corp. | | | 17,380 | | | | 1,252,750 | |
Hudson Pacific Properties, Inc. | | | 31,541 | | | | 1,092,580 | |
Highwoods Properties, Inc. | | | 17,876 | | | | 878,248 | |
Total REITs-Office Property | | | | | | | 11,253,753 | |
| | | | | | | | | |
REITs-Health Care - 10.0% | |
Welltower, Inc. | | | 35,895 | | | | 2,542,084 | |
Physicians Realty Trust | | | 119,275 | | | | 2,369,994 | |
Ventas, Inc. | | | 33,716 | | | | 2,192,889 | |
HCP, Inc.2 | | | 69,968 | | | | 2,188,599 | |
Healthcare Trust of America, Inc. — Class A | | | 58,054 | | | | 1,826,379 | |
Total REITs-Health Care | | | | | | | 11,119,945 | |
| | | | | | | | | |
REITs-Regional Malls - 8.7% | |
Simon Property Group, Inc. | | | 38,102 | | | | 6,554,687 | |
GGP, Inc.2 | | | 73,420 | | | | 1,701,876 | |
Pennsylvania Real Estate Investment Trust | | | 58,623 | | | | 887,552 | |
Tanger Factory Outlet Centers, Inc. | | | 18,661 | | | | 611,521 | |
Total REITs-Regional Malls | | | | | | | 9,755,636 | |
| | | | | | | | | |
REITs-Warehouse/Industries - 8.4% | |
Prologis, Inc.2 | | | 75,707 | | | | 3,927,679 | |
CyrusOne, Inc. | | | 37,894 | | | | 1,950,404 | |
Rexford Industrial Realty, Inc. | | | 81,690 | | | | 1,839,659 | |
EastGroup Properties, Inc. | | | 23,069 | | | | 1,696,264 | |
Total REITs-Warehouse/Industries | | | | | | | 9,414,006 | |
| | | | | | | | | |
REITs-Shopping Centers - 6.1% | |
Federal Realty Investment Trust1 | | | 15,819 | | | | 2,111,838 | |
Regency Centers Corp. | | | 31,791 | | | | 2,110,604 | |
Acadia Realty Trust | | | 47,901 | | | | 1,439,904 | |
Retail Opportunity Investments Corp. | | | 56,472 | | | | 1,187,606 | |
Total REITs-Shopping Centers | | | | | | | 6,849,952 | |
| | | | | | | | | |
REITs-Storage - 5.4% | |
Public Storage | | | 17,021 | | | | 3,726,067 | |
National Storage Affiliates Trust | | | 61,690 | | | | 1,474,391 | |
Extra Space Storage, Inc. | | | 10,667 | | | | 793,518 | |
Total REITs-Storage | | | | | | | 5,993,976 | |
| | | | | | | | | |
REITs-Manufactured Homes - 3.6% | |
Sun Communities, Inc. | | | 27,434 | | | | 2,203,773 | |
Equity LifeStyle Properties, Inc.1 | | | 23,671 | | | | 1,824,087 | |
Total REITs-Manufactured Homes | | | | | | | 4,027,860 | |
| | | | | | | | | |
REITs-Single Tenant - 1.9% | |
Realty Income Corp. | | | 19,639 | | | | 1,169,110 | |
Spirit Realty Capital, Inc. | | | 91,605 | | | | 927,959 | |
Total REITs-Single Tenant | | | | | | | 2,097,069 | |
| | | | | | | | | |
REITs-Mortgage - 1.6% | |
Blackstone Mortgage Trust, Inc. — Class A | | | 59,510 | | | | 1,842,430 | |
| | | | | | | | | |
REITs-Hotels - 0.9% | |
Apple Hospitality REIT, Inc. | | | 51,231 | | | | 978,511 | |
Total REITs | | | | | | | 102,627,072 | |
| | | | | | | | | |
Lodging - 3.5% | |
Casino Hotels - 1.6% | |
MGM Resorts International | | | 33,654 | | | | 922,120 | |
Boyd Gaming Corp.* | | | 37,303 | | | | 821,039 | |
Total Casino Hotels | | | | | | | 1,743,159 | |
| | | | | | | | | |
Hotels & Motels - 1.9% | |
Hilton Worldwide Holdings, Inc. | | | 23,460 | | | | 1,371,472 | |
Choice Hotels International, Inc. | | | 13,019 | | | | 814,989 | |
Total Hotels & Motels | | | | | | | 2,186,461 | |
Total Lodging | | | | | | | 3,929,620 | |
| | | | | | | | | |
Insurance - 1.2% | |
Financial Guarantee Insurance - 1.2% | |
MGIC Investment Corp.* | | | 129,797 | | | | 1,314,844 | |
| | | | | | | | | |
Entertainment - 0.7% | |
Gambling (Non-Hotel) - 0.7% | |
Pinnacle Entertainment, Inc.* | | | 40,502 | | | | 790,599 | |
| | | | | | | | | |
Total Common Stocks | | | | | | | | |
(Cost $104,610,425) | | | | | | | 108,662,135 | |
38 | THE GUGGENHEIM FUNDS SEMI-ANNUAL REPORT | SEE NOTES TO FINANCIAL STATEMENTS. |
SCHEDULE OF INVESTMENTS (Unaudited)(continued) | March 31, 2017 |
RISK MANAGED REAL ESTATE FUND | |
| | Shares | | | Value | |
| | | | | | | |
SHORT-TERM INVESTMENTS† - 4.2% | |
Dreyfus Treasury Prime Cash Management Institutional Shares 0.50%3 | | | 4,672,394 | | | $ | 4,672,394 | |
Total Short-Term Investments | | | | | | | | |
(Cost $4,672,394) | | | | | | | 4,672,394 | |
| | | | | | | | | |
Total Investments - 101.5% | | | | | | | | |
(Cost $109,282,819) | | | | | | $ | 113,334,529 | |
| | | | | | | | | |
COMMON STOCKS SOLD SHORT† - (8.1)% | |
| | | | | | | | | |
REITs - (8.1)% | |
REITs-Regional Malls - (0.2)% | |
Macerich Co. | | | (4,154 | ) | | | (267,518 | ) |
| | | | | | | | | |
REITs-Apartments - (0.7)% | |
UDR, Inc. | | | (10,820 | ) | | | (392,333 | ) |
AvalonBay Communities, Inc. | | | (2,148 | ) | | | (394,373 | ) |
Total REITs-Apartments | | | | | | | (786,706 | ) |
| | | | | | | | | |
REITs-Single Tenant - (0.7)% | |
National Retail Properties, Inc. | | | (8,606 | ) | | | (375,394 | ) |
Realty Income Corp. | | | (7,366 | ) | | | (438,498 | ) |
Total REITs-Single Tenant | | | | | | | (813,892 | ) |
| | | | | | | | | |
REITs-Office Property - (0.8)% | |
Government Properties Income Trust | | | (19,506 | ) | | | (408,261 | ) |
Piedmont Office Realty Trust, Inc. — Class A | | | (20,090 | ) | | | (429,524 | ) |
Total REITs-Office Property | | | | | | | (837,785 | ) |
| | | | | | | | | |
REITs-Shopping Centers - (0.8)% | |
Weingarten Realty Investors | | | (7,828 | ) | | | (261,377 | ) |
Urban Edge Properties | | | (10,062 | ) | | | (264,631 | ) |
Brixmor Property Group, Inc. | | | (18,286 | ) | | | (392,418 | ) |
Total REITs-Shopping Centers | | | | | | | (918,426 | ) |
| | | | | | | | | |
REITs-Storage - (0.9)% | |
Extra Space Storage, Inc. | | | (3,416 | ) | | | (254,116 | ) |
Life Storage, Inc. | | | (3,232 | ) | | | (265,412 | ) |
Iron Mountain, Inc. | | | (13,433 | ) | | | (479,155 | ) |
Total REITs-Storage | | | | | | | (998,683 | ) |
| | | | | | | | | |
REITs-Hotels - (1.1)% | |
Hersha Hospitality Trust | | | (4,780 | ) | | | (89,816 | ) |
LaSalle Hotel Properties | | | (9,141 | ) | | | (264,632 | ) |
Chesapeake Lodging Trust | | | (11,208 | ) | | | (268,544 | ) |
DiamondRock Hospitality Co. | | | (24,769 | ) | | | (276,174 | ) |
Host Hotels & Resorts, Inc. | | | (16,678 | ) | | | (311,211 | ) |
Total REITs-Hotels | | | | | | | (1,210,377 | ) |
| | | | | | | | | |
REITs-Health Care - (1.2)% | |
Senior Housing Properties Trust | | | (20,662 | ) | | | (418,406 | ) |
Omega Healthcare Investors, Inc. | | | (12,867 | ) | | | (424,482 | ) |
Sabra Health Care REIT, Inc. | | | (15,990 | ) | | | (446,601 | ) |
Total REITs-Health Care | | | | | | | (1,289,489 | ) |
| | | | | | | | | |
REITs-Diversified - (1.7)% | |
Lexington Realty Trust | | | (19,578 | ) | | | (195,388 | ) |
DuPont Fabros Technology, Inc. | | | (5,152 | ) | | | (255,488 | ) |
PS Business Parks, Inc. | | | (2,229 | ) | | | (255,800 | ) |
EPR Properties | | | (4,920 | ) | | | (362,260 | ) |
STAG Industrial, Inc. | | | (14,854 | ) | | | (371,647 | ) |
Digital Realty Trust, Inc. | | | (4,741 | ) | | | (504,395 | ) |
Total REITs-Diversified | | | | | | | (1,944,978 | ) |
Total REITs | | | | | | | (9,067,854 | ) |
| | | | | | | | | |
Total Common Stocks Sold Short | | | | | | | | |
(Cost $(8,986,810)) | | | | | | | (9,067,854 | ) |
| | | | | | | | | |
EXCHANGE-TRADED FUNDS SOLD SHORT† - (3.0)% | |
iShares U.S. Real Estate ETF | | | 42,316 | | | | (3,321,383 | ) |
Total Exchange-Traded Funds Sold Short | | | | | | | | |
(Proceeds $3,264,934) | | | | | | | (3,321,383 | ) |
Total Securities Sold Short- (11.1)% | | | | | | | | |
(Proceeds $12,251,744) | | | | | | $ | (12,389,237 | ) |
Other Assets & Liabilities, net - 9.6% | | | | | | | 10,718,178 | |
Total Net Assets - 100.0% | | | | | | $ | 111,663,470 | |
| | | | | | Unrealized Gain (Loss) | |
| | | | | | | | | |
OTC EQUITY SWAP AGREEMENTS†† | |
Morgan Stanley
June 2017 Risk Managed Real Estate Portfolio Short Custom Basket Swap 0.56%5,
Terminating 06/12/17
(Notional Value $36,017,391) | | | | | | $ | (1,470,502 | ) |
Morgan Stanley
June 2017 Risk Managed Real Estate Portfolio Long Custom Basket Swap 1.28%4,
Terminating 06/12/17
(Notional Value $36,003,551) | | | | | | $ | 2,103,937 | |
| | | | | | | | | |
| | | Shares | | | | | |
| | | | | | | | | |
CUSTOM BASKET OF LONG SECURITIES4 | | | | | | | | |
Rexford Industrial Realty, Inc. | | | 65,075 | | | | 219,619 | |
Equinix, Inc. | | | 3,155 | | | | 218,788 | |
Sun Communities, Inc. | | | 14,817 | | | | 205,037 | |
Colony Starwood Homes | | | 37,314 | | | | 186,814 | |
EastGroup Properties, Inc. | | | 14,149 | | | | 178,132 | |
Equity LifeStyle Properties, Inc. | | | 11,073 | | | | 169,367 | |
Hilton Worldwide Holdings, Inc. | | | 20,086 | | | | 150,584 | |
American Tower Corp. — Class A | | | 6,827 | | | | 143,036 | |
Gramercy Property Trust | | | 41,175 | | | | 139,034 | |
Invitation Homes, Inc.* | | | 70,325 | | | | 115,685 | |
Weyerhaeuser Co. | | | 45,265 | | | | 113,434 | |
National Storage Affiliates Trust | | | 38,332 | | | | 88,151 | |
SEE NOTES TO FINANCIAL STATEMENTS. | THE GUGGENHEIM FUNDS SEMI-ANNUAL REPORT | 39 |
SCHEDULE OF INVESTMENTS (Unaudited)(continued) | March 31, 2017 |
RISK MANAGED REAL ESTATE FUND | |
| | Shares | | | Unrealized Gain (Loss) | |
| | | | | | | |
Boyd Gaming Corp.* | | | 37,282 | | | $ | 81,551 | |
Crown Castle International Corp. | | | 12,661 | | | | 67,789 | |
CyrusOne, Inc. | | | 22,991 | | | | 63,562 | |
Alexandria Real Estate Equities, Inc. | | | 10,271 | | | | 51,977 | |
Blackstone Mortgage Trust, Inc. — Class A | | | 36,831 | | | | 49,490 | |
Healthcare Trust of America, Inc. — Class A | | | 24,745 | | | | 38,375 | |
Pinnacle Entertainment, Inc.* | | | 39,784 | | | | 37,087 | |
Vornado Realty Trust | | | 7,795 | | | | 22,541 | |
Pennsylvania Real Estate Investment Trust | | | 50,464 | | | | 12,717 | |
Regency Centers Corp. | | | 17,348 | | | | 10,005 | |
Rayonier, Inc. | | | 52,675 | | | | 10,000 | |
GGP, Inc. | | | 32,312 | | | | 5,613 | |
STORE Capital Corp. | | | 46,249 | | | | 2,423 | |
MGM Resorts International | | | 20,153 | | | | — | |
Park Hotels & Resorts, Inc. | | | 3,473 | | | | (3,278 | ) |
Mack-Cali Realty Corp. | | | 28,526 | | | | (20,026 | ) |
Physicians Realty Trust | | | 59,019 | | | | (33,574 | ) |
Monogram Residential Trust, Inc. | | | 73,334 | | | | (35,559 | ) |
Equity Residential | | | 20,331 | | | | (37,467 | ) |
Tier REIT, Inc. | | | 61,140 | | | | (49,606 | ) |
MGIC Investment Corp.* | | | 105,499 | | | | (52,528 | ) |
Federal Realty Investment Trust | | | 7,801 | | | | (54,065 | ) |
Acadia Realty Trust | | | 29,433 | | | | (129,502 | ) |
Total Custom Basket of Long Securities | | | | | | | 1,965,206 | |
| | | | | | | | | |
CUSTOM BASKET OF SHORT SECURITIES5 | |
Brixmor Property Group, Inc. | | | (51,029 | ) | | | 186,166 | |
National Retail Properties, Inc. | | | (25,452 | ) | | | 141,539 | |
Realty Income Corp. | | | (21,416 | ) | | | 119,505 | |
Senior Housing Properties Trust | | | (58,064 | ) | | | 58,485 | |
Hersha Hospitality Trust | | | (7,555 | ) | | | 16,028 | |
Investors Real Estate Trust | | | (24,753 | ) | | | 14,778 | |
Urban Edge Properties | | | (28,050 | ) | | | 14,261 | |
Weingarten Realty Investors | | | (21,832 | ) | | | 9,102 | |
Life Storage, Inc. | | | (9,023 | ) | | | 74 | |
Macerich Co. | | | (11,589 | ) | | | (5,744 | ) |
DuPont Fabros Technology, Inc. | | | (15,013 | ) | | | (8,835 | ) |
LaSalle Hotel Properties | | | (25,498 | ) | | | (9,052 | ) |
Chesapeake Lodging Trust | | | (31,303 | ) | | | (15,886 | ) |
Digital Realty Trust, Inc. | | | (13,895 | ) | | | (24,185 | ) |
DiamondRock Hospitality Co. | | | (69,059 | ) | | | (25,062 | ) |
Extra Space Storage, Inc. | | | (10,335 | ) | | | (27,160 | ) |
PS Business Parks, Inc. | | | (6,926 | ) | | | (34,841 | ) |
UDR, Inc. | | | (32,009 | ) | | | (41,729 | ) |
AvalonBay Communities, Inc. | | | (6,512 | ) | | | (76,991 | ) |
Lexington Realty Trust | | | (64,258 | ) | | | (81,948 | ) |
Host Hotels & Resorts, Inc. | | | (51,134 | ) | | | (95,156 | ) |
Piedmont Office Realty Trust, Inc. — Class A | | | (62,238 | ) | | | (98,626 | ) |
Government Properties Income Trust | | | (58,186 | ) | | | (119,220 | ) |
Omega Healthcare Investors, Inc. | | | (36,160 | ) | | | (153,962 | ) |
Iron Mountain, Inc. | | | (38,773 | ) | | | (160,678 | ) |
iShares U.S. Real Estate ETF | | | (118,049 | ) | | | (168,250 | ) |
Sabra Health Care REIT, Inc. | | | (46,924 | ) | | | (220,725 | ) |
EPR Properties | | | (15,257 | ) | | | (244,561 | ) |
STAG Industrial, Inc. | | | (46,012 | ) | | | (270,772 | ) |
Total Custom Basket of Short Securities | | | | | | | (1,323,445 | ) |
* | Non-income producing security. |
† | Value determined based on Level 1 inputs — See Note 4. |
†† | Value determined based on Level 2 inputs — See Note 4. |
1 | All or a portion of this security is pledged as short security collateral at March 31, 2017. |
2 | All or a portion of this security is pledged as equity swap collateral at March 31, 2017. |
3 | Rate indicated is the 7 day yield as of March 31, 2017. |
4 | Total Return is based on the return of the custom basket of long securities +/ - financing at a variable rate. Rate indicated is rate effective at March 31, 2017. |
5 | Total Return is based on the return of the custom basket of short securities +/- financing at a variable rate. Rate indicated is rate effective at March 31, 2017. |
| | REIT — Real Estate Investment Trust |
| | |
| | See Sector Classification in Other Information section. |
40 | THE GUGGENHEIM FUNDS SEMI-ANNUAL REPORT | SEE NOTES TO FINANCIAL STATEMENTS. |
SCHEDULE OF INVESTMENTS (Unaudited)(concluded) | March 31, 2017 |
RISK MANAGED REAL ESTATE FUND | |
The following table summarizes the inputs used to value the Fund’s investments at March 31, 2017 (See Note 4 in the Notes to Financial Statements):
Investments in Securities (Assets) | | Level 1 | | | Level 2 | | | Level 2 -
Other* | | | Level 3 | | | Total | |
Common Stocks | | $ | 108,662,135 | | | $ | — | | | $ | — | | | $ | — | | | $ | 108,662,135 | |
Short-Term Investments | | | 4,672,394 | | | | — | | | | — | | | | — | | | | 4,672,394 | |
Equity Swap Agreements | | | — | | | | — | | | | 2,103,937 | | | | — | | | | 2,103,937 | |
Total | | $ | 113,334,529 | | | $ | — | | | $ | 2,103,937 | | | $ | — | | | $ | 115,438,466 | |
| | | | | | | | | | | | | | | | | | | | |
Investments in Securities (Liabilities) | | Level 1 | | | Level 2 | | | Level 2 -
Other* | | | Level 3 | | | Total | |
Common Stocks | | $ | 9,067,854 | | | $ | — | | | $ | — | | | $ | — | | | $ | 9,067,854 | |
Exchange-Traded Funds | | | 3,321,383 | | | | — | | | | — | | | | — | | | | 3,321,383 | |
Equity Swap Agreements | | | — | | | | — | | | | 1,470,502 | | | | — | | | | 1,470,502 | |
Total | | $ | 12,389,237 | | | $ | — | | | $ | 1,470,502 | | | $ | — | | | $ | 13,859,739 | |
* | Other financial instruments include swaps, which are reported as unrealized gain/loss at period end. |
Transfers between investment levels may occur as the markets fluctuate and/or the availability of data used in an investment’s valuation changes. Transfers between valuation levels, if any, are in comparison to the valuation levels at the end of the previous fiscal year, and are effective using the fair value as of the end of the previous fiscal period.
For the period ended March 31, 2017, there were no transfers between levels.
SEE NOTES TO FINANCIAL STATEMENTS. | THE GUGGENHEIM FUNDS SEMI-ANNUAL REPORT | 41 |
RISK MANAGED REAL ESTATE FUND | |
STATEMENT OF ASSETS AND LIABILITIES (Unaudited) |
March 31, 2017 |
Assets: | |
Investments, at value (cost $109,282,819) | | $ | 113,334,529 | |
Segregated cash with broker | | | 10,218,510 | |
Unrealized appreciation on swap agreements | | | 2,103,937 | |
Prepaid expenses | | | 43,632 | |
Receivables: | |
Swap settlement | | | 206,640 | |
Securities sold | | | 1,382,983 | |
Dividends | | | 318,272 | |
Other assets | | | 2,649 | |
Total assets | | | 127,611,152 | |
| | | | | |
Liabilities: | |
Securities sold short, at value (proceeds $12,251,744) | | | 12,389,237 | |
Unrealized depreciation on swap agreements | | | 1,470,502 | |
Overdraft due to custodian bank | | | 336,544 | |
Payable for: | |
Securities purchased | | | 1,575,979 | |
Management fees | | | 70,597 | |
Fund accounting/administration fees | | | 7,529 | |
Transfer agent/maintenance fees | | | 3,445 | |
Trustees’ fees* | | | 1,283 | |
Fund shares redeemed | | | 628 | |
Distribution and service fees | | | 584 | |
Miscellaneous | | | 91,354 | |
Total liabilities | | | 15,947,682 | |
Net assets | | $ | 111,663,470 | |
| | | | | |
Net assets consist of: | |
Paid in capital | | $ | 106,132,385 | |
Accumulated net investment loss | | | (1,964,947 | ) |
Accumulated net realized gain on investments | | | 2,948,380 | |
Net unrealized appreciation on investments | | | 4,547,652 | |
Net assets | | $ | 111,663,470 | |
| | | | | |
A-Class: | |
Net assets | | $ | 468,268 | |
Capital shares outstanding | | | 16,480 | |
Net asset value per share | | $ | 28.41 | |
Maximum offering price per share (Net asset value divided by 95.25%) | | $ | 29.83 | |
| | | | | |
C-Class: | |
Net assets | | $ | 554,762 | |
Capital shares outstanding | | | 19,633 | |
Net asset value per share | | $ | 28.26 | |
| | | | | |
P-Class: | |
Net assets | | $ | 91,837 | |
Capital shares outstanding | | | 3,216 | |
Net asset value per share | | $ | 28.56 | |
| | | | | |
Institutional Class: | |
Net assets | | $ | 110,548,603 | |
Capital shares outstanding | | | 3,846,360 | |
Net asset value per share | | $ | 28.74 | |
STATEMENT OF OPERATIONS (Unaudited) |
Period Ended March 31, 2017 |
Investment Income: | |
Dividends | | $ | 377,765 | |
Interest | | | 7,003 | |
Total investment income | | | 384,768 | |
| | | | | |
Expenses: | |
Management fees | | | 411,065 | |
Transfer agent/maintenance fees: | |
A-Class | | | 606 | |
C-Class | | | 915 | |
P-Class | | | 190 | |
Institutional Class | | | 11,740 | |
Distribution and service fees: | |
A-Class | | | 750 | |
C-Class | | | 2,698 | |
P-Class | | | 118 | |
Fund accounting/administration fees | | | 44,030 | |
Line of credit fees | | | 11,696 | |
Prime broker interest expense | | | 5,371 | |
Trustees’ fees* | | | 3,562 | |
Short sales dividend expense | | | 3,292 | |
Custodian fees | | | 1,157 | |
Miscellaneous | | | 30,494 | |
Total expenses | | | 527,684 | |
Less: | |
Expenses waived by Adviser | | | (24 | ) |
Expenses reimbursed by Adviser: | | | | |
A-Class | | | (223 | ) |
C-Class | | | (488 | ) |
P-Class | | | (126 | ) |
Total waived/reimbursed expenses | | | (861 | ) |
Net expenses | | | 526,823 | |
Net investment loss | | | (142,055 | ) |
| | | | | |
Net Realized and Unrealized Gain (Loss): | |
Net realized gain (loss) on: | |
Investments | | | 2,572,521 | |
Swap agreements | | | 1,732,080 | |
Securities sold short | | | 782,361 | |
Net realized gain | | | 5,086,962 | |
Net change in unrealized appreciation (depreciation) on: | |
Investments | | | (2,896,231 | ) |
Securities sold short | | | 161,965 | |
Swap agreements | | | 98,223 | |
Net change in unrealized appreciation (depreciation) | | | (2,636,043 | ) |
Net realized and unrealized gain | | | 2,450,919 | |
Net increase in net assets resulting from operations | | $ | 2,308,864 | |
* | Relates to Trustees not deemed “interested persons” within the meaning of Section 2(a)(19) of the 1940 Act. |
42 | THE GUGGENHEIM FUNDS SEMI-ANNUAL REPORT | SEE NOTES TO FINANCIAL STATEMENTS. |
RISK MANAGED REAL ESTATE FUND | |
STATEMENTS OF CHANGES IN NET ASSETS |
| | Period Ended
March 31,
2017
(Unaudited) | | | Year Ended
September 30,
2016 | |
Increase (Decrease) in Net Assets from Operations: | | | | | | |
Net investment income (loss) | | $ | (142,055 | ) | | $ | 1,008,071 | |
Net realized gain on investments | | | 5,086,962 | | | | 5,047,620 | |
Net change in unrealized appreciation (depreciation) on investments | | | (2,636,043 | ) | | | 9,597,857 | |
Net increase in net assets resulting from operations | | | 2,308,864 | | | | 15,653,548 | |
| | | | | | | | | |
Distributions to shareholders from: | | | | | | | | |
Net investment income | | | | | | | | |
A-Class | | | (6,292 | ) | | | (15,560 | ) |
C-Class | | | (4,963 | ) | | | (7,069 | ) |
P-Class | | | (1,211 | ) | | | (1,363 | ) |
Institutional Class | | | (1,329,089 | ) | | | (3,816,066 | ) |
Net realized gains | | | | | | | | |
A-Class | | | (14,684 | ) | | | (43,834 | ) |
C-Class | | | (13,682 | ) | | | (32,752 | ) |
P-Class | | | (2,734 | ) | | | (4,335 | ) |
Institutional Class | | | (2,669,186 | ) | | | (13,211,585 | ) |
Total distributions to shareholders | | | (4,041,841 | ) | | | (17,132,564 | ) |
| | | | | | | | | |
Capital share transactions: | | | | | | | | |
Proceeds from sale of shares | | | | | | | | |
A-Class | | | 48,246 | | | | 785,426 | |
C-Class | | | 47,135 | | | | 452,351 | |
P-Class | | | 69,391 | | | | 73,853 | |
Institutional Class | | | 1,053,029 | | | | 3,584,478 | |
Distributions reinvested | | | | | | | | |
A-Class | | | 19,304 | | | | 54,041 | |
C-Class | | | 15,829 | | | | 39,469 | |
P-Class | | | 3,944 | | | | 5,698 | |
Institutional Class | | | 3,172,104 | | | | 13,011,489 | |
Cost of shares redeemed | | | | | | | | |
A-Class | | | (332,603 | ) | | | (474,048 | ) |
C-Class | | | (17,447 | ) | | | (58,044 | ) |
P-Class | | | (61,541 | ) | | | (26,988 | ) |
Institutional Class | | | (3,786,788 | ) | | | (9,175,287 | ) |
Net increase from capital share transactions | | | 230,603 | | | | 8,272,438 | |
Net increase (decrease) in net assets | | | (1,502,374 | ) | | | 6,793,422 | |
| | | | | | | | | |
Net assets: | | | | | | | | |
Beginning of period | | | 113,165,844 | | | | 106,372,422 | |
End of period | | $ | 111,663,470 | | | $ | 113,165,844 | |
Accumulated net investment loss at end of period | | $ | (1,964,947 | ) | | $ | (481,337 | ) |
SEE NOTES TO FINANCIAL STATEMENTS. | THE GUGGENHEIM FUNDS SEMI-ANNUAL REPORT | 43 |
RISK MANAGED REAL ESTATE FUND | |
STATEMENTS OF CHANGES IN NET ASSETS (concluded) |
| | Period Ended
March 31,
2017
(Unaudited) | | | Year Ended
September 30,
2016 | |
Capital share activity: | | | | | | |
Shares sold | | | | | | |
A-Class | | | 1,727 | | | | 27,279 | |
C-Class | | | 1,686 | | | | 15,548 | |
P-Class | | | 2,398 | | | | 2,578 | |
Institutional Class | | | 36,796 | | | | 132,744 | |
Shares issued from reinvestment of distributions | | | | | | | | |
A-Class | | | 687 | | | | 2,003 | |
C-Class | | | 566 | | | | 1,472 | |
P-Class | | | 140 | | | | 210 | |
Institutional Class | | | 111,556 | | | | 477,316 | |
Shares redeemed | | | | | | | | |
A-Class | | | (11,671 | ) | | | (15,824 | ) |
C-Class | | | (622 | ) | | | (2,239 | ) |
P-Class | | | (2,157 | ) | | | (952 | ) |
Institutional Class | | | (134,765 | ) | | | (317,907 | ) |
Net increase in shares | | | 6,341 | | | | 322,228 | |
44 | THE GUGGENHEIM FUNDS SEMI-ANNUAL REPORT | SEE NOTES TO FINANCIAL STATEMENTS. |
RISK MANAGED REAL ESTATE FUND | |
This table is presented to show selected data for a share outstanding throughout each period and to assist shareholders in evaluating a Fund’s performance for the periods presented.
A-Class | | Period Ended
March 31,
2017a | | | Year Ended
September 30,
2016 | | | Year Ended
September 30,
2015 | | | Period Ended
September 30,
2014b | |
Per Share Data | | | | | | | | | | | | |
Net asset value, beginning of period | | $ | 28.87 | | | $ | 29.77 | | | $ | 26.99 | | | $ | 25.00 | |
Income (loss) from investment operations: | |
Net investment income (loss)c | | | (.09 | ) | | | .19 | | | | (.21 | ) | | | .02 | |
Net gain (loss) on investments (realized and unrealized) | | | .66 | | | | 3.84 | | | | 3.18 | | | | 2.06 | |
Total from investment operations | | | .57 | | | | 4.03 | | | | 2.97 | | | | 2.08 | |
Less distributions from: | |
Net investment income | | | (.32 | ) | | | (1.12 | ) | | | (.05 | ) | | | (.09 | ) |
Net realized gains | | | (.71 | ) | | | (3.81 | ) | | | (.14 | ) | | | — | |
Total distributions | | | (1.03 | ) | | | (4.93 | ) | | | (.19 | ) | | | (.09 | ) |
Net asset value, end of period | | $ | 28.41 | | | $ | 28.87 | | | $ | 29.77 | | | $ | 26.99 | |
| |
Total Returng | | | 2.03 | % | | | 14.88 | % | | | 10.97 | % | | | 8.35 | % |
Ratios/Supplemental Data | |
Net assets, end of period (in thousands) | | $ | 468 | | | $ | 743 | | | $ | 366 | | | $ | 107 | |
Ratios to average net assets: | |
Net investment income (loss) | | | (0.67 | %) | | | 0.66 | % | | | (0.67 | %) | | | 0.16 | % |
Total expensesd | | | 1.38 | % | | | 1.93 | % | | | 3.41 | % | | | 4.22 | %h |
Net expensese,i | | | 1.32 | % | | | 1.78 | % | | | 3.04 | % | | | 3.32 | % |
Portfolio turnover rate | | | 55 | % | | | 133 | % | | | 214 | % | | | 57 | % |
C-Class | | Period Ended
March 31,
2017a | | | Year Ended
September 30,
2016 | | | Year Ended
September 30,
2015 | | | Period Ended
September 30,
2014b | |
Per Share Data | | | | | | | | | | | | |
Net asset value, beginning of period | | $ | 28.77 | | | $ | 29.56 | | | $ | 26.95 | | | $ | 25.00 | |
Income (loss) from investment operations: | |
Net investment income (loss)c | | | (.20 | ) | | | .02 | | | | (.43 | ) | | | (.23 | ) |
Net gain (loss) on investments (realized and unrealized) | | | .66 | | | | 3.77 | | | | 3.18 | | | | 2.19 | |
Total from investment operations | | | .46 | | | | 3.79 | | | | 2.75 | | | | 1.96 | |
Less distributions from: | |
Net investment income | | | (.26 | ) | | | (.77 | ) | | | — | | | | (.01 | ) |
Net realized gains | | | (.71 | ) | | | (3.81 | ) | | | (.14 | ) | | | — | |
Total distributions | | | (.97 | ) | | | (4.58 | ) | | | (.14 | ) | | | (.01 | ) |
Net asset value, end of period | | $ | 28.26 | | | $ | 28.77 | | | $ | 29.56 | | | $ | 26.95 | |
| |
Total Returng | | | 1.65 | % | | | 14.00 | % | | | 10.20 | % | | | 7.85 | % |
Ratios/Supplemental Data | |
Net assets, end of period (in thousands) | | $ | 555 | | | $ | 518 | | | $ | 95 | | | $ | 52 | |
Ratios to average net assets: | |
Net investment income (loss) | | | (1.40 | %) | | | 0.08 | % | | | (1.42 | %) | | | (1.60 | %) |
Total expensesd | | | 2.27 | % | | | 3.32 | % | | | 5.76 | % | | | 9.33 | %h |
Net expensese,i | | | 2.07 | % | | | 2.53 | % | | | 3.76 | % | | | 2.67 | % |
Portfolio turnover rate | | | 55 | % | | | 133 | % | | | 214 | % | | | 57 | % |
SEE NOTES TO FINANCIAL STATEMENTS. | THE GUGGENHEIM FUNDS SEMI-ANNUAL REPORT | 45 |
RISK MANAGED REAL ESTATE FUND | |
FINANCIAL HIGHLIGHTS (continued) |
This table is presented to show selected data for a share outstanding throughout each period and to assist shareholders in evaluating a Fund’s performance for the periods presented.
P-Class | | Period Ended
March 31,
2017a | | | Year Ended
September 30,
2016 | | | Period Ended
September 30,
2015f | |
Per Share Data | | | | | | | | | |
Net asset value, beginning of period | | $ | 29.01 | | | $ | 29.77 | | | $ | 30.89 | |
Income (loss) from investment operations: | |
Net investment income (loss)c | | | (.08 | ) | | | .16 | | | | .04 | |
Net gain (loss) on investments (realized and unrealized) | | | .67 | | | | 3.88 | | | | (1.16 | ) |
Total from investment operations | | | .59 | | | | 4.04 | | | | (1.12 | ) |
Less distributions from: | |
Net investment income | | | (.33 | ) | | | (.99 | ) | | | — | |
Net realized gains | | | (.71 | ) | | | (3.81 | ) | | | — | |
Total distributions | | | (1.04 | ) | | | (4.80 | ) | | | — | |
Net asset value, end of period | | $ | 28.56 | | | $ | 29.01 | | | $ | 29.77 | |
| |
Total Returng | | | 2.04 | % | | | 14.87 | % | | | (3.63 | %) |
Ratios/Supplemental Data | |
Net assets, end of period (in thousands) | | $ | 92 | | | $ | 82 | | | $ | 30 | |
Ratios to average net assets: | |
Net investment income (loss) | | | (0.60 | %) | | | 0.56 | % | | | 0.30 | % |
Total expensesd | | | 1.58 | % | | | 1.88 | % | | | 4.04 | %h |
Net expensese,i | | | 1.31 | % | | | 1.78 | % | | | 2.94 | % |
Portfolio turnover rate | | | 55 | % | | | 133 | % | | | 214 | % |
46 | THE GUGGENHEIM FUNDS SEMI-ANNUAL REPORT | SEE NOTES TO FINANCIAL STATEMENTS. |
RISK MANAGED REAL ESTATE FUND | |
FINANCIAL HIGHLIGHTS (concluded) |
This table is presented to show selected data for a share outstanding throughout each period and to assist shareholders in evaluating a Fund’s performance for the periods presented.
Institutional Class | | Period Ended
March 31,
2017a | | | Year Ended
September 30,
2016 | | | Year Ended
September 30,
2015 | | | Period Ended
September 30,
2014b | |
Per Share Data | | | | | | | | | | | | |
Net asset value, beginning of period | | $ | 29.18 | | | $ | 29.90 | | | $ | 27.00 | | | $ | 25.00 | |
Income (loss) from investment operations: | |
Net investment income (loss)c | | | (.04 | ) | | | .26 | | | | (.11 | ) | | | .02 | |
Net gain (loss) on investments (realized and unrealized) | | | .66 | | | | 3.89 | | | | 3.18 | | | | 2.09 | |
Total from investment operations | | | .62 | | | | 4.15 | | | | 3.07 | | | | 2.11 | |
Less distributions from: | |
Net investment income | | | (.35 | ) | | | (1.06 | ) | | | (.03 | ) | | | (.11 | ) |
Net realized gains | | | (.71 | ) | | | (3.81 | ) | | | (.14 | ) | | | — | |
Total distributions | | | (1.06 | ) | | | (4.87 | ) | | | (.17 | ) | | | (.11 | ) |
Net asset value, end of period | | $ | 28.74 | | | $ | 29.18 | | | $ | 29.90 | | | $ | 27.00 | |
| |
Total Returng | | | 2.23 | % | | | 15.20 | % | | | 11.36 | % | | | 8.44 | % |
Ratios/Supplemental Data | |
Net assets, end of period (in thousands) | | $ | 110,549 | | | $ | 111,823 | | | $ | 105,882 | | | $ | 103,993 | |
Ratios to average net assets: | |
Net investment income (loss) | | | (0.25 | %) | | | 0.91 | % | | | (0.35 | %) | | | 0.11 | % |
Total expensesd | | | 0.95 | % | | | 1.50 | % | | | 2.70 | % | | | 2.69 | %h |
Net expensese,i | | | 0.95 | % | | | 1.50 | % | | | 2.70 | % | | | 2.58 | % |
Portfolio turnover rate | | | 55 | % | | | 133 | % | | | 214 | % | | | 57 | % |
a | Unaudited figures for the period ended March 31, 2017. Percentage amounts for the period, except total return and portfolio turnover rate, have been annualized. |
b | Since commencement of operations: March 28, 2014. Percentage amounts for the period, except total return and portfolio turnover rate, have been annualized. |
c | Net investment income (loss) per share was computed using average shares outstanding throughout the period. |
d | Does not include expenses of the underlying funds in which the Fund invests. |
e | Net expense information reflects the expense ratios after expense waivers and reimbursements, as applicable. |
f | Since commencement of operations: May 1, 2015. Percentage amounts for the period, except total return and portfolio turnover rate, have been annualized. |
g | Total return does not reflect the impact of any applicable sales charges and has not been annualized. |
h | Due to limited length of Fund operations, ratios for this period are not indicative of future performance. |
i | Net expenses may include expenses that are excluded from the expense limitation agreement and recouped amounts. Excluding these expenses, the net expense ratios for the periods presented would be: |
| | | 03/31/17 | 09/30/16 | 09/30/15 | 09/30/14 | |
| | A-Class | 1.28% | 1.29% | 1.30% | 1.30% | |
| | C-Class | 2.04% | 2.03% | 2.05% | 2.05% | |
| | P-Class | 1.28% | 1.28% | 1.30% | — | |
| | Institutional Class | 0.92% | 1.00% | 0.99% | 1.10% | |
SEE NOTES TO FINANCIAL STATEMENTS. | THE GUGGENHEIM FUNDS SEMI-ANNUAL REPORT | 47 |
FUND PROFILE (Unaudited) | March 31, 2017 |
SMALL CAP VALUE FUND
OBJECTIVE: Seeks long-term capital appreciation.
Holdings Diversification (Market Exposure as % of Net Assets)
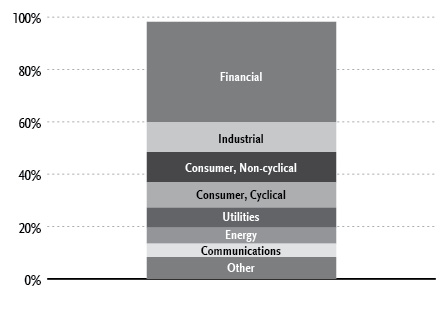
“Holdings Diversification (Market Exposure as % of Net Assets)” excludes any temporary cash investments.
Inception Dates: |
A-Class | July 11, 2008 |
C-Class | July 11, 2008 |
P-Class | May 1, 2015 |
Institutional Class | July 11, 2008 |
Ten Largest Holdings (% of Total Net Assets) |
Century Communities, Inc. | 1.7% |
Fulton Financial Corp. | 1.7% |
Cathay General Bancorp | 1.7% |
Portland General Electric Co. | 1.6% |
Wintrust Financial Corp. | 1.5% |
Sanmina Corp. | 1.5% |
1st Source Corp. | 1.4% |
UniFirst Corp. | 1.4% |
Avista Corp. | 1.4% |
Berkshire Hills Bancorp, Inc. | 1.4% |
Top Ten Total | 15.3% |
“Ten Largest Holdings” excludes any temporary cash investments.
48 | THE GUGGENHEIM FUNDS SEMI-ANNUAL REPORT | |
SCHEDULE OF INVESTMENTS (Unaudited) | March 31, 2017 |
SMALL CAP VALUE FUND | |
| | Shares | | | Value | |
| | | | | | | |
COMMON STOCKS† - 97.9% | |
| | | | | | | |
Financial - 38.3% | |
Fulton Financial Corp. | | | 20,015 | | | $ | 357,268 | |
Cathay General Bancorp | | | 9,350 | | | | 352,308 | |
Wintrust Financial Corp. | | | 4,747 | | | | 328,114 | |
1st Source Corp. | | | 6,582 | | | | 309,025 | |
Berkshire Hills Bancorp, Inc. | | | 8,290 | | | | 298,854 | |
Navigators Group, Inc. | | | 4,849 | | | | 263,300 | |
First Citizens BancShares, Inc. — Class A | | | 731 | | | | 245,156 | |
Prosperity Bancshares, Inc. | | | 3,506 | | | | 244,403 | |
Argo Group International Holdings Ltd. | | | 3,564 | | | | 241,639 | |
Hanmi Financial Corp. | | | 7,838 | | | | 241,019 | |
Equity Commonwealth* | | | 7,511 | | | | 234,493 | |
Horace Mann Educators Corp. | | | 5,460 | | | | 224,133 | |
Investors Bancorp, Inc. | | | 15,524 | | | | 223,235 | |
Umpqua Holdings Corp. | | | 11,974 | | | | 212,419 | |
Trustmark Corp. | | | 6,555 | | | | 208,384 | |
Radian Group, Inc. | | | 11,320 | | | | 203,307 | |
Hanover Insurance Group, Inc. | | | 2,246 | | | | 202,275 | |
TriCo Bancshares | | | 5,304 | | | | 188,451 | |
Valley National Bancorp | | | 15,305 | | | | 180,599 | |
Forestar Group, Inc.* | | | 12,448 | | | | 169,915 | |
Hersha Hospitality Trust | | | 8,989 | | | | 168,903 | |
Farmer Mac — Class C | | | 2,878 | | | | 165,686 | |
Old National Bancorp | | | 8,989 | | | | 155,959 | |
EPR Properties | | | 1,931 | | | | 142,180 | |
MBIA, Inc.* | | | 15,734 | | | | 133,267 | |
Hancock Holding Co. | | | 2,899 | | | | 132,049 | |
FNB Corp. | | | 8,476 | | | | 126,038 | |
Capital Bank Financial Corp. — Class A | | | 2,890 | | | | 125,426 | |
Flagstar Bancorp, Inc.* | | | 4,350 | | | | 122,627 | |
Cousins Properties, Inc. | | | 14,190 | | | | 117,351 | |
CubeSmart | | | 4,519 | | | | 117,313 | |
Genworth Financial, Inc. — Class A* | | | 27,235 | | | | 112,208 | |
Redwood Trust, Inc. | | | 6,732 | | | | 111,819 | |
Lexington Realty Trust | | | 11,180 | | | | 111,576 | |
Summit Hotel Properties, Inc. | | | 6,894 | | | | 110,166 | |
IBERIABANK Corp. | | | 1,384 | | | | 109,474 | |
Sunstone Hotel Investors, Inc. | | | 7,112 | | | | 109,027 | |
First Industrial Realty Trust, Inc. | | | 4,032 | | | | 107,372 | |
LaSalle Hotel Properties | | | 3,699 | | | | 107,086 | |
First Merchants Corp. | | | 2,683 | | | | 105,496 | |
MB Financial, Inc. | | | 2,462 | | | | 105,423 | |
DCT Industrial Trust, Inc. | | | 2,156 | | | | 103,747 | |
Hilltop Holdings, Inc. | | | 3,682 | | | | 101,145 | |
iStar, Inc.* | | | 8,379 | | | | 98,872 | |
CoreCivic, Inc. | | | 3,031 | | | | 95,234 | |
Washington Federal, Inc. | | | 2,450 | | | | 81,095 | |
Stifel Financial Corp.* | | | 1,494 | | | | 74,984 | |
Sterling Bancorp | | | 2,704 | | | | 64,085 | |
Janus Capital Group, Inc. | | | 3,253 | | | | 42,940 | |
Total Financial | | | | | | | 8,186,845 | |
| | | | | | | | | |
Industrial - 11.5% | |
Sanmina Corp.* | | | 8,063 | | | | 327,358 | |
Methode Electronics, Inc. | | | 5,199 | | | | 237,074 | |
TriMas Corp.* | | | 10,008 | | | | 207,666 | |
GATX Corp. | | | 2,775 | | | | 169,164 | |
ITT, Inc. | | | 4,014 | | | | 164,654 | |
Werner Enterprises, Inc. | | | 5,298 | | | | 138,808 | |
Argan, Inc. | | | 1,989 | | | | 131,572 | |
Trinseo S.A. | | | 1,715 | | | | 115,077 | |
FLIR Systems, Inc. | | | 3,142 | | | | 113,992 | |
Summit Materials, Inc. — Class A* | | | 4,606 | | | | 113,814 | |
Kirby Corp.* | | | 1,608 | | | | 113,445 | |
Crane Co. | | | 1,499 | | | | 112,170 | |
Marten Transport Ltd. | | | 4,721 | | | | 110,707 | |
Ryder System, Inc. | | | 1,447 | | | | 109,162 | |
Esterline Technologies Corp.* | | | 1,244 | | | | 107,046 | |
Scorpio Tankers, Inc. | | | 22,984 | | | | 102,049 | |
Oshkosh Corp. | | | 812 | | | | 55,695 | |
Rand Logistics, Inc.* | | | 34,819 | | | | 22,284 | |
Total Industrial | | | | | | | 2,451,737 | |
| | | | | | | | | |
Consumer, Non-cyclical - 11.4% | |
Dean Foods Co. | | | 15,013 | | | | 295,155 | |
Sanderson Farms, Inc. | | | 2,145 | | | | 222,737 | |
Emergent BioSolutions, Inc.* | | | 7,628 | | | | 221,517 | |
Molina Healthcare, Inc.* | | | 4,632 | | | | 211,219 | |
Premier, Inc. — Class A* | | | 5,405 | | | | 172,041 | |
Fresh Del Monte Produce, Inc. | | | 2,474 | | | | 146,535 | |
Air Methods Corp.* | | | 3,197 | | | | 137,471 | |
Navigant Consulting, Inc.* | | | 5,940 | | | | 135,788 | |
HealthSouth Corp. | | | 3,050 | | | | 130,571 | |
AMN Healthcare Services, Inc.* | | | 3,100 | | | | 125,860 | |
Carriage Services, Inc. — Class A | | | 4,310 | | | | 116,887 | |
Community Health Systems, Inc.* | | | 12,809 | | | | 113,616 | |
Lannett Company, Inc.* | | | 4,962 | | | | 110,901 | |
FTI Consulting, Inc.* | | | 2,544 | | | | 104,736 | |
Universal Corp. | | | 1,145 | | | | 81,009 | |
United Rentals, Inc.* | | | 612 | | | | 76,531 | |
Darling Ingredients, Inc.* | | | 3,076 | | | | 44,664 | |
Total Consumer, Non-cyclical | | | | | | | 2,447,238 | |
| | | | | | | | | |
Consumer, Cyclical - 9.9% | |
Century Communities, Inc.* | | | 14,066 | | | | 357,276 | |
UniFirst Corp. | | | 2,125 | | | | 300,581 | |
Wabash National Corp. | | | 13,263 | | | | 274,411 | |
International Speedway Corp. — Class A | | | 5,946 | | | | 219,705 | |
Cooper Tire & Rubber Co. | | | 2,768 | | | | 122,761 | |
Meritage Homes Corp.* | | | 3,028 | | | | 111,430 | |
Asbury Automotive Group, Inc.* | | | 1,775 | | | | 106,678 | |
Tenneco, Inc. | | | 1,680 | | | | 104,866 | |
Unifi, Inc.* | | | 3,498 | | | | 99,308 | |
Hawaiian Holdings, Inc.* | | | 2,099 | | | | 97,499 | |
La-Z-Boy, Inc. | | | 3,019 | | | | 81,513 | |
Tuesday Morning Corp.* | | | 14,740 | | | | 55,275 | |
Caleres, Inc. | | | 2,045 | | | | 54,028 | |
Genesco, Inc.* | | | 908 | | | | 50,349 | |
Deckers Outdoor Corp.* | | | 770 | | | | 45,992 | |
DSW, Inc. — Class A | | | 2,004 | | | | 41,443 | |
Total Consumer, Cyclical | | | | | | | 2,123,115 | |
SEE NOTES TO FINANCIAL STATEMENTS. | THE GUGGENHEIM FUNDS SEMI-ANNUAL REPORT | 49 |
SCHEDULE OF INVESTMENTS (Unaudited)(continued) | March 31, 2017 |
SMALL CAP VALUE FUND | |
| | Shares | | | Value | |
| | | | | | | |
Utilities - 7.5% | |
Portland General Electric Co. | | | 7,660 | | | $ | 340,258 | |
Avista Corp. | | | 7,683 | | | | 300,021 | |
Spire, Inc. | | | 4,200 | | | | 283,500 | |
Black Hills Corp. | | | 3,818 | | | | 253,782 | |
ONE Gas, Inc. | | | 2,124 | | | | 143,582 | |
Calpine Corp.* | | | 9,927 | | | | 109,693 | |
ALLETE, Inc. | | | 1,391 | | | | 94,185 | |
Southwest Gas Holdings, Inc. | | | 999 | | | | 82,827 | |
Total Utilities | | | | | | | 1,607,848 | |
| | | | | | | | | |
Energy - 6.1% | |
Oasis Petroleum, Inc.* | | | 20,144 | | | | 287,254 | |
Laredo Petroleum, Inc.* | | | 16,817 | | | | 245,528 | |
Rowan Companies plc — Class A* | | | 7,640 | | | | 119,031 | |
Chesapeake Energy Corp.* | | | 18,597 | | | | 110,466 | |
Oceaneering International, Inc. | | | 3,934 | | | | 106,533 | |
Delek US Holdings, Inc. | | | 4,363 | | | | 105,890 | |
Western Refining, Inc. | | | 2,774 | | | | 97,284 | |
MRC Global, Inc.* | | | 5,304 | | | | 97,222 | |
Gulfport Energy Corp.* | | | 4,906 | | | | 84,334 | |
Jones Energy, Inc. — Class A* | | | 19,332 | | | | 49,297 | |
Total Energy | | | | | | | 1,302,839 | |
| | | | | | | | | |
Communications - 5.2% | |
Viavi Solutions, Inc.* | | | 25,599 | | | | 274,421 | |
DigitalGlobe, Inc.* | | | 6,676 | | | | 218,639 | |
Bankrate, Inc.* | | | 18,066 | | | | 174,337 | |
NeoPhotonics Corp.* | | | 17,137 | | | | 154,404 | |
Infinera Corp.* | | | 12,200 | | | | 124,806 | |
Scholastic Corp. | | | 2,417 | | | | 102,892 | |
Time, Inc. | | | 2,850 | | | | 55,148 | |
Total Communications | | | | | | | 1,104,647 | |
| | | | | | | | | |
Technology - 5.0% | |
IXYS Corp. | | | 14,972 | | | | 217,843 | |
Axcelis Technologies, Inc.* | | | 9,706 | | | | 182,472 | |
MicroStrategy, Inc. — Class A* | | | 857 | | | | 160,945 | |
Photronics, Inc.* | | | 14,292 | | | | 152,924 | |
Cray, Inc.* | | | 5,362 | | | | 117,428 | |
Maxwell Technologies, Inc.* | | | 19,762 | | | | 114,817 | |
ManTech International Corp. — Class A | | | 2,096 | | | | 72,584 | |
InnerWorkings, Inc.* | | | 5,611 | | | | 55,886 | |
Total Technology | | | | | | | 1,074,899 | |
| | | | | | | | | |
Basic Materials - 3.0% | |
Kaiser Aluminum Corp. | | | 2,709 | | | | 216,450 | |
Reliance Steel & Aluminum Co. | | | 2,412 | | | | 193,008 | |
Olin Corp. | | | 3,701 | | | | 121,652 | |
Chemtura Corp.* | | | 3,411 | | | | 113,927 | |
Total Basic Materials | | | | | | | 645,037 | |
| | | | | | | | | |
Total Common Stocks | | | | | | | | |
(Cost $17,967,615) | | | | | | | 20,944,205 | |
| | | | | | | | | |
CONVERTIBLE PREFERRED STOCKS††† - 0.0%** | |
Thermoenergy Corp.*, 1,3 | | | 6,250 | | | | — | |
Total Convertible Preferred Stocks | | | | | | | | |
(Cost $5,968) | | | | | | | — | |
| | | | | | | | | |
EXCHANGE-TRADED FUNDS† - 0.3% | |
iShares Russell 2000 Value ETF | | | 500 | | | | 59,080 | |
Total Exchange-Traded Funds | | | | | | | | |
(Cost $60,035) | | | | | | | 59,080 | |
| | | | | | | | | |
SHORT-TERM INVESTMENTS† - 1.9% | |
Dreyfus Treasury Prime Cash Management Institutional Shares 0.50%2 | | | 398,335 | | | | 398,335 | |
Total Short-Term Investments | | | | | | | | |
(Cost $398,335) | | | | | | | 398,335 | |
| | | | | | | | | |
Total Investments - 100.1% | | | | | | | | |
(Cost $18,431,953) | | | | | | $ | 21,401,620 | |
Other Assets & Liabilities, net - (0.1)% | | | | | | | (18,935 | ) |
Total Net Assets - 100.0% | | | | | | $ | 21,382,685 | |
* | Non-income producing security. |
** | Less than 0.1% of net assets. |
† | Value determined based on Level 1 inputs — See Note 4. |
††† | Value determined based on Level 3 inputs — See Note 4. |
1 | PIPE (Private Investment in Public Equity) Stock — issued by a company in the secondary market as a means of raising capital more quickly and less expensively than through registration of a secondary public offering. |
2 | Rate indicated is the 7 day yield as of March 31, 2017. |
3 | Illiquid security. |
| | plc — Public Limited Company |
| | |
| | See Sector Classification in Other Information section. |
50 | THE GUGGENHEIM FUNDS SEMI-ANNUAL REPORT | SEE NOTES TO FINANCIAL STATEMENTS. |
SCHEDULE OF INVESTMENTS (Unaudited)(concluded) | March 31, 2017 |
SMALL CAP VALUE FUND | |
The following table summarizes the inputs used to value the Fund’s investments at March 31, 2017 (See Note 4 in the Notes to Financial Statements):
Investments in Securities (Assets) | | Level 1 | | | Level 2 | | | Level 3 | | | Total | |
Common Stocks | | $ | 20,944,205 | | | $ | — | | | $ | — | | | $ | 20,944,205 | |
Convertible Preferred Stocks | | | — | | | | — | | | | — | * | | | — | |
Exchanged-Traded Funds | | | 59,080 | | | | — | | | | — | | | | 59,080 | |
Short Term Investments | | | 398,335 | | | | — | | | | — | | | | 398,335 | |
Total | | $ | 21,401,620 | | | $ | — | | | $ | 0 | | | $ | 21,401,620 | |
* | Security has a market value of $0. |
Transfers between investment levels may occur as the markets fluctuate and/or the availability of data used in an investment’s valuation changes. Transfers between valuation levels, if any, are in comparison to the valuation levels at the end of the previous fiscal year, and are effective using the fair value as of the end of the previous fiscal period.
For the period ended March 31, 2017, there were no transfers between levels.
SEE NOTES TO FINANCIAL STATEMENTS. | THE GUGGENHEIM FUNDS SEMI-ANNUAL REPORT | 51 |
STATEMENT OF ASSETS AND LIABILITIES (Unaudited) |
March 31, 2017 |
Assets: | |
Investments, at value (cost $18,431,953) | | $ | 21,401,620 | |
Prepaid expenses | | | 29,833 | |
Receivables: | |
Securities sold | | | 86,023 | |
Fund shares sold | | | 28,571 | |
Dividends | | | 25,413 | |
Total assets | | | 21,571,460 | |
| | | | | |
Liabilities: | |
Payable for: | |
Securities purchased | | | 144,200 | |
Transfer agent/maintenance fees | | | 12,252 | |
Management fees | | | 7,562 | |
Fund shares redeemed | | | 7,290 | |
Distribution and service fees | | | 6,598 | |
Trustees’ fees* | | | 1,472 | |
Miscellaneous | | | 9,401 | |
Total liabilities | | | 188,775 | |
Net assets | | $ | 21,382,685 | |
| | | | | |
Net assets consist of: | |
Paid in capital | | $ | 17,749,345 | |
Accumulated net investment loss | | | (93,822 | ) |
Accumulated net realized gain on investments | | | 757,495 | |
Net unrealized appreciation on investments | | | 2,969,667 | |
Net assets | | $ | 21,382,685 | |
| | | | | |
A-Class: | |
Net assets | | $ | 12,307,521 | |
Capital shares outstanding | | | 803,264 | |
Net asset value per share | | $ | 15.32 | |
Maximum offering price per share (Net asset value divided by 95.25%) | | $ | 16.08 | |
| | | | | |
C-Class: | |
Net assets | | $ | 4,736,055 | |
Capital shares outstanding | | | 334,024 | |
Net asset value per share | | $ | 14.18 | |
| | | | | |
P-Class: | |
Net assets | | $ | 12,858 | |
Capital shares outstanding | | | 838 | |
Net asset value per share | | $ | 15.34 | |
| | | | | |
Institutional Class: | |
Net assets | | $ | 4,326,251 | |
Capital shares outstanding | | | 306,748 | |
Net asset value per share | | $ | 14.10 | |
STATEMENT OF OPERATIONS (Unaudited) |
Period Ended March 31, 2017 |
Investment Income: | |
Dividends | | $ | 150,250 | |
Interest | | | 1,010 | |
Total investment income | | | 151,260 | |
| | | | | |
Expenses: | |
Management fees | | | 94,502 | |
Transfer agent/maintenance fees: | |
A-Class | | | 11,721 | |
C-Class | | | 5,713 | |
P-Class | | | 93 | |
Institutional Class | | | 937 | |
Distribution and service fees: | |
A-Class | | | 17,651 | |
C-Class | | | 24,415 | |
P-Class | | | 21 | |
Fund accounting/administration fees | | | 12,450 | |
Registration fees | | | 20,711 | |
Trustees’ fees* | | | 2,838 | |
Line of credit fees | | | 1,981 | |
Custodian fees | | | 1,154 | |
Miscellaneous | | | 13,557 | |
Total expenses | | | 207,744 | |
Less: | |
Expenses waived by Adviser | | | (37,021 | ) |
Expenses reimbursed by Adviser: | | | | |
A-Class | | | (11,402 | ) |
C-Class | | | (5,534 | ) |
P-Class | | | (70 | ) |
Institutional Class | | | (928 | ) |
Total waived/reimbursed expenses | | | (54,955 | ) |
Net expenses | | | 152,789 | |
Net investment loss | | | (1,529 | ) |
| | | | | |
Net Realized and Unrealized Gain (Loss): | |
Net realized gain (loss) on: | |
Investments | | | 1,058,266 | |
Net realized gain | | | 1,058,266 | |
Net change in unrealized appreciation (depreciation) on: | |
Investments | | | 1,423,849 | |
Net change in unrealized appreciation (depreciation) | | | 1,423,849 | |
Net realized and unrealized gain | | | 2,482,115 | |
Net increase in net assets resulting from operations | | $ | 2,480,586 | |
* | Relates to Trustees not deemed “interested persons” within the meaning of Section 2(a)(19) of the 1940 Act. |
52 | THE GUGGENHEIM FUNDS SEMI-ANNUAL REPORT | SEE NOTES TO FINANCIAL STATEMENTS. |
STATEMENTS OF CHANGES IN NET ASSETS |
| | Period Ended
March 31,
2017
(Unaudited) | | | Year Ended
September 30,
2016 | |
Increase (Decrease) in Net Assets from Operations: | | | | | | |
Net investment loss | | $ | (1,529 | ) | | $ | (16,872 | ) |
Net realized gain (loss) on investments | | | 1,058,266 | | | | (211,102 | ) |
Net change in unrealized appreciation (depreciation) on investments | | | 1,423,849 | | | | 2,754,456 | |
Net increase in net assets resulting from operations | | | 2,480,586 | | | | 2,526,482 | |
| | | | | | | | | |
Distributions to shareholders from: | | | | | | | | |
Net investment income | | | | | | | | |
A-Class | | | (88,266 | ) | | | — | |
P-Class | | | (72 | ) | | | — | |
Institutional Class | | | (3,955 | ) | | | — | |
Net realized gains | | | | | | | | |
A-Class | | | — | | | | (955,328 | ) |
C-Class | | | — | | | | (396,113 | ) |
P-Class | | | — | | | | (707 | ) |
Institutional Class | | | — | | | | (41,348 | ) |
Total distributions to shareholders | | | (92,293 | ) | | | (1,393,496 | ) |
| | | | | | | | | |
Capital share transactions: | | | | | | | | |
Proceeds from sale of shares | | | | | | | | |
A-Class | | | 3,126,678 | | | | 3,421,000 | |
C-Class | | | 150,910 | | | | 750,596 | |
P-Class | | | 9,534 | | | | 709 | |
Institutional Class | | | 4,702,777 | | | | 272,695 | |
Distributions reinvested | | | | | | | | |
A-Class | | | 86,816 | | | | 939,682 | |
C-Class | | | — | | | | 387,206 | |
P-Class | | | 72 | | | | 707 | |
Institutional Class | | | 3,294 | | | | 31,740 | |
Cost of shares redeemed | | | | | | | | |
A-Class | | | (5,878,942 | ) | | | (4,780,880 | ) |
C-Class | | | (785,817 | ) | | | (1,836,314 | ) |
P-Class | | | (8,902 | ) | | | (559 | ) |
Institutional Class | | | (748,844 | ) | | | (489,765 | ) |
Net increase (decrease) from capital share transactions | | | 657,576 | | | | (1,303,183 | ) |
Net increase (decrease) in net assets | | | 3,045,869 | | | | (170,197 | ) |
| | | | | | | | | |
Net assets: | | | | | | | | |
Beginning of period | | | 18,336,816 | | | | 18,507,013 | |
End of period | | $ | 21,382,685 | | | $ | 18,336,816 | |
Accumulated net investment loss at end of period | | $ | (93,822 | ) | | $ | — | |
SEE NOTES TO FINANCIAL STATEMENTS. | THE GUGGENHEIM FUNDS SEMI-ANNUAL REPORT | 53 |
STATEMENTS OF CHANGES IN NET ASSETS (concluded) |
| | Period Ended
March 31,
2017
(Unaudited) | | | Year Ended
September 30,
2016 | |
Capital share activity: | | | | | | |
Shares sold | | | | | | |
A-Class | | | 215,052 | | | | 266,786 | |
C-Class | | | 10,844 | | | | 65,317 | |
P-Class | | | 636 | | | | 58 | |
Institutional Class | | | 337,180 | | | | 23,593 | |
Shares issued from reinvestment of distributions | | | | | | | | |
A-Class | | | 5,894 | | | | 74,756 | |
C-Class | | | — | | | | 33,151 | |
P-Class | | | 5 | | | | 56 | |
Institutional Class | | | 243 | | | | 2,743 | |
Shares redeemed | | | | | | | | |
A-Class | | | (393,931 | ) | | | (372,375 | ) |
C-Class | | | (55,848 | ) | | | (152,218 | ) |
P-Class | | | (580 | ) | | | (43 | ) |
Institutional Class | | | (53,096 | ) | | | (42,731 | ) |
Net increase (decrease) in shares | | | 66,399 | | | | (100,907 | ) |
54 | THE GUGGENHEIM FUNDS SEMI-ANNUAL REPORT | SEE NOTES TO FINANCIAL STATEMENTS. |
This table is presented to show selected data for a share outstanding throughout each period and to assist shareholders in evaluating a Fund’s performance for the periods presented.
A-Class | | Period Ended
March 31,
2017a | | | Year Ended
September 30, 2016 | | | Year Ended
September 30, 2015 | | | Year Ended
September 30, 2014 | | | Year Ended
September 30, 2013 | | | Year Ended
September 30, 2012 | |
Per Share Data | | | | | | | | | | | | | | | | | | |
Net asset value, beginning of period | | $ | 13.61 | | | $ | 12.78 | | | $ | 16.82 | | | $ | 17.81 | | | $ | 15.04 | | | $ | 11.66 | |
Income (loss) from investment operations: | |
Net investment income (loss)b | | | .01 | | | | .01 | | | | .02 | | | | (.03 | ) | | | (— | )c | | | (.03 | ) |
Net gain (loss) on investments (realized and unrealized) | | | 1.79 | | | | 1.81 | | | | (.60 | ) | | | .26 | | | | 4.05 | | | | 3.73 | |
Total from investment operations | | | 1.80 | | | | 1.82 | | | | (.58 | ) | | | .23 | | | | 4.05 | | | | 3.70 | |
Less distributions from: | |
Net investment income | | | (.09 | ) | | | — | | | | (.09 | ) | | | (.03 | ) | | | (.01 | ) | | | — | |
Net realized gains | | | — | | | | (.99 | ) | | | (3.37 | ) | | | (1.19 | ) | | | (1.27 | ) | | | (.32 | ) |
Total distributions | | | (.09 | ) | | | (.99 | ) | | | (3.46 | ) | | | (1.22 | ) | | | (1.28 | ) | | | (.32 | ) |
Net asset value, end of period | | $ | 15.32 | | | $ | 13.61 | | | $ | 12.78 | | | $ | 16.82 | | | $ | 17.81 | | | $ | 15.04 | |
| |
Total Returnd | | | 13.30 | % | | | 14.81 | % | | | (5.23 | %) | | | 1.07 | % | | | 29.39 | % | | | 32.19 | % |
Ratios/Supplemental Data | |
Net assets, end of period (in thousands) | | $ | 12,308 | | | $ | 13,283 | | | $ | 12,866 | | | $ | 17,342 | | | $ | 16,487 | | | $ | 12,294 | |
Ratios to average net assets: | |
Net investment income (loss) | | | 0.14 | % | | | 0.12 | % | | | 0.13 | % | | | (0.14 | %) | | | (0.02 | %) | | | (0.24 | %) |
Total expensese | | | 1.85 | % | | | 2.29 | % | | | 1.99 | % | | | 1.85 | % | | | 1.91 | % | | | 2.14 | % |
Net expensesf | | | 1.32 | %h | | | 1.32 | %h | | | 1.32 | %h | | | 1.32 | %h | | | 1.30 | % | | | 1.30 | % |
Portfolio turnover rate | | | 27 | % | | | 64 | % | | | 62 | % | | | 45 | % | | | 34 | % | | | 62 | % |
C-Class | | Period Ended
March 31,
2017a | | | Year Ended
September 30, 2016 | | | Year Ended
September 30, 2015 | | | Year Ended
September 30, 2014 | | | Year Ended
September 30, 2013 | | | Year Ended
September 30, 2012 | |
Per Share Data | | | | | | | | | | | | | | | | | | |
Net asset value, beginning of period | | $ | 12.57 | | | $ | 11.95 | | | $ | 15.96 | | | $ | 17.05 | | | $ | 14.54 | | | $ | 11.36 | |
Income (loss) from investment operations: | |
Net investment income (loss)b | | | (.04 | ) | | | (.08 | ) | | | (.09 | ) | | | (.15 | ) | | | (.12 | ) | | | (.14 | ) |
Net gain (loss) on investments (realized and unrealized) | | | 1.65 | | | | 1.69 | | | | (.55 | ) | | | .25 | | | | 3.90 | | | | 3.64 | |
Total from investment operations | | | 1.61 | | | | 1.61 | | | | (.64 | ) | | | .10 | | | | 3.78 | | | | 3.50 | |
Less distributions from: | |
Net realized gains | | | — | | | | (.99 | ) | | | (3.37 | ) | | | (1.19 | ) | | | (1.27 | ) | | | (.32 | ) |
Total distributions | | | — | | | | (.99 | ) | | | (3.37 | ) | | | (1.19 | ) | | | (1.27 | ) | | | (.32 | ) |
Net asset value, end of period | | $ | 14.18 | | | $ | 12.57 | | | $ | 11.95 | | | $ | 15.96 | | | $ | 17.05 | | | $ | 14.54 | |
| |
Total Returnd | | | 12.90 | % | | | 14.02 | % | | | (5.97 | %) | | | 0.30 | % | | | 28.34 | % | | | 31.35 | % |
Ratios/Supplemental Data | |
Net assets, end of period (in thousands) | | $ | 4,736 | | | $ | 4,762 | | | $ | 5,173 | | | $ | 8,527 | | | $ | 5,885 | | | $ | 3,026 | |
Ratios to average net assets: | |
Net investment income (loss) | | | (0.59 | %) | | | (0.64 | %) | | | (0.65 | %) | | | (0.87 | %) | | | (0.75 | %) | | | (1.00 | %) |
Total expensese | | | 2.66 | % | | | 3.04 | % | | | 2.72 | % | | | 2.51 | % | | | 2.58 | % | | | 2.70 | % |
Net expensesf | | | 2.07 | %h | | | 2.07 | %h | | | 2.08 | %h | | | 2.07 | %h | | | 2.05 | % | | | 2.05 | % |
Portfolio turnover rate | | | 27 | % | | | 64 | % | | | 62 | % | | | 45 | % | | | 34 | % | | | 62 | % |
SEE NOTES TO FINANCIAL STATEMENTS. | THE GUGGENHEIM FUNDS SEMI-ANNUAL REPORT | 55 |
FINANCIAL HIGHLIGHTS (continued) |
This table is presented to show selected data for a share outstanding throughout each period and to assist shareholders in evaluating a Fund’s performance for the periods presented.
P-Class | | Period Ended
March 31,
2017a | | | Year Ended
September 30,
2016 | | | Period Ended
September 30,
2015g | |
Per Share Data | | | | | | | | | |
Net asset value, beginning of period | | $ | 13.60 | | | $ | 12.77 | | | $ | 14.33 | |
Income (loss) from investment operations: | |
Net investment income (loss)b | | | — | c | | | .02 | | | | .04 | |
Net gain (loss) on investments (realized and unrealized) | | | 1.81 | | | | 1.80 | | | | (1.60 | ) |
Total from investment operations | | | 1.81 | | | | 1.82 | | | | (1.56 | ) |
Less distributions from: | |
Net investment income | | | (.07 | ) | | | — | | | | — | |
Net realized gains | | | — | | | | (.99 | ) | | | — | |
Total distributions | | | (.07 | ) | | | (.99 | ) | | | — | |
Net asset value, end of period | | $ | 15.34 | | | $ | 13.60 | | | $ | 12.77 | |
| |
Total Returnd | | | 13.25 | % | | | 14.88 | % | | | (10.82 | %) |
Ratios/Supplemental Data | |
Net assets, end of period (in thousands) | | $ | 13 | | | $ | 11 | | | $ | 9 | |
Ratios to average net assets: | |
Net investment income (loss) | | | 0.02 | % | | | 0.13 | % | | | 0.60 | % |
Total expensese | | | 2.79 | % | | | 2.50 | % | | | 4.04 | % |
Net expensesf,h | | | 1.32 | % | | | 1.32 | % | | | 1.31 | % |
Portfolio turnover rate | | | 27 | % | | | 64 | % | | | 62 | % |
56 | THE GUGGENHEIM FUNDS SEMI-ANNUAL REPORT | SEE NOTES TO FINANCIAL STATEMENTS. |
FINANCIAL HIGHLIGHTS (concluded) |
This table is presented to show selected data for a share outstanding throughout each period and to assist shareholders in evaluating a Fund’s performance for the periods presented.
Institutional Class | | Period Ended
March 31,
2017a | | | Year Ended
September 30, 2016 | | | Year Ended
September 30, 2015 | | | Year Ended
September 30, 2014 | | | Year Ended
September 30, 2013 | | | Year Ended
September 30, 2012 | |
Per Share Data | | | | | | | | | | | | | | | | | | |
Net asset value, beginning of period | | $ | 12.54 | | | $ | 11.82 | | | $ | 17.04 | | | $ | 18.04 | | | $ | 15.21 | | | $ | 11.76 | |
Income (loss) from investment operations: | |
Net investment income (loss)b | | | .03 | | | | .04 | | | | .05 | | | | .01 | | | | .04 | | | | — | c |
Net gain (loss) on investments (realized and unrealized) | | | 1.65 | | | | 1.67 | | | | (.49 | ) | | | .25 | | | | 4.10 | | | | 3.77 | |
Total from investment operations | | | 1.68 | | | | 1.71 | | | | (.44 | ) | | | .26 | | | | 4.14 | | | | 3.77 | |
Less distributions from: | |
Net investment income | | | (.12 | ) | | | — | | | | (1.41 | ) | | | (.07 | ) | | | (.04 | ) | | | — | |
Net realized gains | | | — | | | | (.99 | ) | | | (3.37 | ) | | | (1.19 | ) | | | (1.27 | ) | | | (.32 | ) |
Total distributions | | | (.12 | ) | | | (.99 | ) | | | (4.78 | ) | | | (1.26 | ) | | | (1.31 | ) | | | (.32 | ) |
Net asset value, end of period | | $ | 14.10 | | | $ | 12.54 | | | $ | 11.82 | | | $ | 17.04 | | | $ | 18.04 | | | $ | 15.21 | |
| |
Total Returnd | | | 13.44 | % | | | 15.18 | % | | | (5.01 | %) | | | 1.21 | % | | | 29.74 | % | | | 32.51 | % |
Ratios/Supplemental Data | |
Net assets, end of period (in thousands) | | $ | 4,326 | | | $ | 281 | | | $ | 459 | | | $ | 753 | | | $ | 22,315 | | | $ | 18,591 | |
Ratios to average net assets: | |
Net investment income (loss) | | | 0.40 | % | | | 0.30 | % | | | 0.33 | % | | | 0.05 | % | | | 0.23 | % | | | 0.02 | % |
Total expensese | | | 1.40 | % | | | 2.09 | % | | | 1.70 | % | | | 1.33 | % | | | 1.34 | % | | | 1.44 | % |
Net expensesf | | | 1.07 | %h | | | 1.07 | %h | | | 1.07 | %h | | | 1.07 | %h | | | 1.05 | % | | | 1.05 | % |
Portfolio turnover rate | | | 27 | % | | | 64 | % | | | 62 | % | | | 45 | % | | | 34 | % | | | 62 | % |
a | Unaudited figures for the period ended March 31, 2017. Percentage amounts for the period, except total return and portfolio turnover rate, have been annualized. |
b | Net investment income (loss) per share was computed using average shares outstanding throughout the period. |
c | Net investment income is less than $0.01 per share. |
d | Total return does not reflect the impact of any applicable sales charges and has not been annualized. |
e | Does not include expenses of the underlying funds in which the Fund invests. |
f | Net expense information reflects the expense ratios after expense waivers and reimbursements, as applicable. |
g | Since commencement of operations: May 1, 2015. Percentage amounts for the period, except total return and portfolio turnover rate, have been annualized. |
h | Net expenses may include expenses that are excluded from the expense limitation agreement. Excluding these expenses, the net expense ratios for the periods presented would be: |
| | | 03/31/17 | 09/30/16 | 09/30/15 | 09/30/14 | |
| | A-Class | 1.30% | 1.30% | 1.30% | 1.30% | |
| | C-Class | 2.05% | 2.05% | 2.05% | 2.05% | |
| | P-Class | 1.30% | 1.30% | 1.30% | — | |
| | Institutional Class | 1.05% | 1.05% | 1.05% | 1.05% | |
SEE NOTES TO FINANCIAL STATEMENTS. | THE GUGGENHEIM FUNDS SEMI-ANNUAL REPORT | 57 |
FUND PROFILE (Unaudited) | March 31, 2017 |
STYLEPLUS—LARGE CORE FUND
OBJECTIVE: Seeks long-term growth of capital.
Holdings Diversification (Market Exposure as % of Net Assets)

“Holdings Diversification (Market Exposure as % of Net Assets)” excludes any temporary cash investments or investments in Guggenheim Strategy Funds Trust mutual funds. Investments in those Funds will significantly increase the portfolio’s exposure to certain other asset categories (and their associated risks), which may cause the Fund to deviate from its principal investment strategy, including: (i) high yield, high risk debt securities rated below the top four long-term rating categories by a nationally recognized statistical rating organization (also known as “junk bonds”); (ii) securities issued by the U.S. government or its agencies and instrumentalities; (iii) CLOs and similar investments; and (iv) other short-term fixed income securities.
Inception Dates: |
A-Class | September 10, 1962 |
C-Class | January 29, 1999 |
P-Class | May 1, 2015 |
Institutional Class | March 1, 2012 |
Ten Largest Holdings (% of Total Net Assets) |
Guggenheim Strategy Fund III | 32.2% |
Guggenheim Strategy Fund II | 28.6% |
Guggenheim Strategy Fund I | 11.4% |
Guggenheim Limited Duration Fund — Institutional Class | 7.6% |
Apple, Inc. | 0.8% |
Johnson & Johnson | 0.5% |
JPMorgan Chase & Co. | 0.4% |
Pfizer, Inc. | 0.4% |
Verizon Communications, Inc. | 0.3% |
Merck & Company, Inc. | 0.3% |
Top Ten Total | 82.5% |
“Ten Largest Holdings” excludes any temporary cash or derivative investments.
58 | THE GUGGENHEIM FUNDS SEMI-ANNUAL REPORT | |
SCHEDULE OF INVESTMENTS (Unaudited) | March 31, 2017 |
STYLEPLUS—LARGE CORE FUND | |
| | Shares | | | Value | |
| | | | | | | |
COMMON STOCKS† - 17.1% | |
| | | | | | | |
Consumer, Non-cyclical - 5.3% | |
Johnson & Johnson | | | 7,919 | | | $ | 986,312 | |
Pfizer, Inc. | | | 22,084 | | | | 755,494 | |
Merck & Company, Inc. | | | 11,023 | | | | 700,401 | |
UnitedHealth Group, Inc. | | | 3,978 | | | | 652,432 | |
Medtronic plc | | | 7,086 | | | | 570,848 | |
Amgen, Inc. | | | 3,460 | | | | 567,682 | |
AbbVie, Inc. | | | 8,710 | | | | 567,544 | |
Gilead Sciences, Inc. | | | 7,972 | | | | 541,458 | |
Allergan plc | | | 2,260 | | | | 539,959 | |
Biogen, Inc.* | | | 1,681 | | | | 459,619 | |
Becton Dickinson and Co. | | | 2,445 | | | | 448,511 | |
Kroger Co. | | | 14,819 | | | | 437,012 | |
General Mills, Inc. | | | 7,295 | | | | 430,478 | |
Sysco Corp. | | | 8,165 | | | | 423,927 | |
Express Scripts Holding Co.* | | | 6,199 | | | | 408,576 | |
Eli Lilly & Co. | | | 4,567 | | | | 384,130 | |
Kimberly-Clark Corp. | | | 2,907 | | | | 382,648 | |
HCA Holdings, Inc.* | | | 3,688 | | | | 328,195 | |
Kellogg Co. | | | 4,507 | | | | 327,253 | |
McKesson Corp. | | | 2,175 | | | | 322,466 | |
Abbott Laboratories | | | 3,643 | | | | 161,786 | |
Archer-Daniels-Midland Co. | | | 2,519 | | | | 115,975 | |
Zimmer Biomet Holdings, Inc. | | | 947 | | | | 115,638 | |
Cardinal Health, Inc. | | | 1,362 | | | | 111,071 | |
Procter & Gamble Co. | | | 1,191 | | | | 107,011 | |
Aetna, Inc. | | | 781 | | | | 99,617 | |
Anthem, Inc. | | | 593 | | | | 98,070 | |
Total Consumer, Non-cyclical | | | | | | | 11,044,113 | |
| | | | | | | | | |
Financial - 2.6% | |
JPMorgan Chase & Co. | | | 10,660 | | | | 936,374 | |
Citigroup, Inc. | | | 11,348 | | | | 678,837 | |
Bank of New York Mellon Corp. | | | 9,715 | | | | 458,839 | |
Prudential Financial, Inc. | | | 4,167 | | | | 444,535 | |
Aflac, Inc. | | | 5,978 | | | | 432,927 | |
State Street Corp. | | | 5,414 | | | | 431,009 | |
Travelers Cos., Inc. | | | 3,544 | | | | 427,194 | |
Allstate Corp. | | | 5,241 | | | | 427,089 | |
Synchrony Financial | | | 8,757 | | | | 300,365 | |
Capital One Financial Corp. | | | 2,934 | | | | 254,260 | |
Berkshire Hathaway, Inc. — Class B* | | | 1,345 | | | | 224,185 | |
Host Hotels & Resorts, Inc. | | | 6,342 | | | | 118,342 | |
Equity Residential | | | 1,805 | | | | 112,307 | |
Wells Fargo & Co. | | | 1,910 | | | | 106,311 | |
Chubb Ltd. | | | 779 | | | | 106,139 | |
Bank of America Corp. | | | 4,373 | | | | 103,159 | |
Total Financial | | | | | | | 5,561,872 | |
| | | | | | | | | |
Technology - 2.5% | |
Apple, Inc. | | | 11,699 | | | | 1,680,679 | |
International Business Machines Corp. | | | 3,744 | | | | 651,980 | |
Oracle Corp. | | | 14,264 | | | | 636,317 | |
Microsoft Corp. | | | 8,542 | | | | 562,576 | |
HP, Inc. | | | 24,612 | | | | 440,063 | |
Fidelity National Information Services, Inc. | | | 5,092 | | | | 405,425 | |
Intel Corp. | | | 8,888 | | | | 320,590 | |
Micron Technology, Inc.* | | | 8,741 | | | | 252,615 | |
QUALCOMM, Inc. | | | 3,053 | | | | 175,059 | |
Broadcom Ltd. | | | 639 | | | | 139,915 | |
Hewlett Packard Enterprise Co. | | | 3,923 | | | | 92,975 | |
Total Technology | | | | | | | 5,358,194 | |
| | | | | | | | | |
Communications - 1.8% | |
Verizon Communications, Inc. | | | 15,093 | | | | 735,783 | |
Cisco Systems, Inc. | | | 20,262 | | | | 684,856 | |
Comcast Corp. — Class A | | | 16,764 | | | | 630,159 | |
Alphabet, Inc. — Class C* | | | 653 | | | | 541,703 | |
AT&T, Inc. | | | 11,800 | | | | 490,290 | |
Amazon.com, Inc.* | | | 280 | | | | 248,231 | |
Facebook, Inc. — Class A* | | | 1,591 | | | | 226,002 | |
Twenty-First Century Fox, Inc. — Class A | | | 3,688 | | | | 119,454 | |
Omnicom Group, Inc. | | | 1,333 | | | | 114,918 | |
Total Communications | | | | | | | 3,791,396 | |
| | | | | | | | | |
Consumer, Cyclical - 1.7% | |
CVS Health Corp. | | | 8,548 | | | | 671,017 | |
Walgreens Boots Alliance, Inc. | | | 5,970 | | | | 495,809 | |
Wal-Mart Stores, Inc. | | | 6,457 | | | | 465,421 | |
Southwest Airlines Co. | | | 8,292 | | | | 445,778 | |
Delta Air Lines, Inc. | | | 9,510 | | | | 437,080 | |
Ford Motor Co. | | | 36,729 | | | | 427,525 | |
General Motors Co. | | | 10,663 | | | | 377,044 | |
Target Corp. | | | 4,470 | | | | 246,699 | |
Dollar General Corp. | | | 1,545 | | | | 107,733 | |
Total Consumer, Cyclical | | | | | | | 3,674,106 | |
| | | | | | | | | |
Industrial - 1.4% | |
Boeing Co. | | | 3,153 | | | | 557,640 | |
United Technologies Corp. | | | 4,766 | | | | 534,793 | |
FedEx Corp. | | | 2,406 | | | | 469,531 | |
Emerson Electric Co. | | | 7,555 | | | | 452,242 | |
Eaton Corp. plc | | | 6,062 | | | | 449,497 | |
Waste Management, Inc. | | | 5,889 | | | | 429,426 | |
General Electric Co. | | | 3,959 | | | | 117,978 | |
Total Industrial | | | | | | | 3,011,107 | |
| | | | | | | | | |
Energy - 0.8% | |
Marathon Petroleum Corp. | | | 8,470 | | | | 428,074 | |
Valero Energy Corp. | | | 6,385 | | | | 423,262 | |
ConocoPhillips | | | 7,197 | | | | 358,914 | |
Exxon Mobil Corp. | | | 3,044 | | | | 249,639 | |
Anadarko Petroleum Corp. | | | 2,326 | | | | 144,212 | |
Chevron Corp. | | | 1,047 | | | | 112,416 | |
Total Energy | | | | | | | 1,716,517 | |
| | | | | | | | | |
Utilities - 0.7% | |
American Electric Power Company, Inc. | | | 6,595 | | | | 442,722 | |
PG&E Corp. | | | 6,642 | | | | 440,763 | |
Exelon Corp. | | | 12,242 | | | | 440,467 | |
SEE NOTES TO FINANCIAL STATEMENTS. | THE GUGGENHEIM FUNDS SEMI-ANNUAL REPORT | 59 |
SCHEDULE OF INVESTMENTS (Unaudited)(continued) | March 31, 2017 |
STYLEPLUS—LARGE CORE FUND | |
| | Shares | | | Value | |
| | | | | | | |
NextEra Energy, Inc. | | | 861 | | | $ | 110,527 | |
Total Utilities | | | | | | | 1,434,479 | |
| | | | | | | | | |
Basic Materials - 0.3% | |
LyondellBasell Industries N.V. — Class A | | | 4,858 | | | | 443,001 | |
Dow Chemical Co. | | | 1,766 | | | | 112,212 | |
Total Basic Materials | | | | | | | 555,213 | |
| | | | | | | | | |
Total Common Stocks | | | | | | | | |
(Cost $33,565,810) | | | | | | | 36,146,997 | |
| | | | | | | | | |
MUTUAL FUNDS† - 79.8% | |
Guggenheim Strategy Fund III1 | | | 2,726,382 | | | | 68,186,806 | |
Guggenheim Strategy Fund II1 | | | 2,423,986 | | | | 60,599,639 | |
Guggenheim Strategy Fund I1 | | | 962,165 | | | | 24,102,239 | |
Guggenheim Limited Duration Fund — Institutional Class1 | | | 647,916 | | | | 16,022,950 | |
Total Mutual Funds | | | | | | | | |
(Cost $167,963,681) | | | | | | | 168,911,634 | |
| | | | | | | | | |
SHORT-TERM INVESTMENTS† - 3.0% | |
Dreyfus Treasury Prime Cash Management Institutional Shares 0.50%2 | | | 6,419,680 | | | | 6,419,680 | |
Total Short-Term Investments | | | | | | | | |
(Cost $6,419,680) | | | | | | | 6,419,680 | |
| | | | | | | | | |
Total Investments - 99.9% | | | | | | | | |
(Cost $207,949,171) | | | | | | $ | 211,478,311 | |
Other Assets & Liabilities, net - 0.1% | | | | | | | 263,039 | |
Total Net Assets - 100.0% | | | | | | $ | 211,741,350 | |
| | Contracts | | | Unrealized
Gain (Loss) | |
| | | | | | | |
EQUITY FUTURES CONTRACTS PURCHASED† | |
June 2017 S&P 500 Index
Mini Futures Contracts
(Aggregate Value of
Contracts $235,800) | | | 2 | | | $ | (512 | ) |
| | | | | | | | | |
| | | Units | | | | | |
| | | | | | | | | |
OTC EQUITY INDEX SWAP AGREEMENTS†† | |
Deutsche Bank Swap
August 2017 S&P 500 Index Swap 0.98%3,
Terminating 08/03/17
(Notional Value $177,027,380) | | | 39,010 | | | $ | 21,278,019 | |
* | Non-income producing security. |
† | Value determined based on Level 1 inputs — See Note 4. |
†† | Value determined based on Level 2 inputs — See Note 4. |
1 | Affiliated issuer — See Note 8. |
2 | Rate indicated is the 7 day yield as of March 31, 2017. |
3 | Total Return based on S&P 500 Index +/- financing at a variable rate. Rate indicated is the rate effective at March 31, 2017. |
| | plc — Public Limited Company |
| | |
| | See Sector Classification in Other Information section. |
60 | THE GUGGENHEIM FUNDS SEMI-ANNUAL REPORT | SEE NOTES TO FINANCIAL STATEMENTS. |
SCHEDULE OF INVESTMENTS (Unaudited)(concluded) | March 31, 2017 |
STYLEPLUS—LARGE CORE FUND | |
The following table summarizes the inputs used to value the Fund’s investments at March 31, 2017 (See Note 4 in the Notes to Financial Statements):
Investments in Securities (Assets) | | Level 1 | | | Level 1 -
Other* | | | Level 2 | | | Level 2 -
Other* | | | Level 3 | | | Total | |
Common Stocks | | $ | 36,146,997 | | | $ | — | | | $ | — | | | $ | — | | | $ | — | | | $ | 36,146,997 | |
Equity Index Swap Agreements | | | — | | | | — | | | | — | | | | 21,278,019 | | | | — | | | | 21,278,019 | |
Mutual Funds | | | 168,911,634 | | | | — | | | | — | | | | — | | | | — | | | | 168,911,634 | |
Short-Term Investments | | | 6,419,680 | | | | — | | | | — | | | | — | | | | — | | | | 6,419,680 | |
Total | | $ | 211,478,311 | | | $ | — | | | $ | — | | | $ | 21,278,019 | | | $ | — | | | $ | 232,756,330 | |
| | | | | | | | | | | | | | | | | | | | | | | | |
Investments in Securities (Liabilities) | | Level 1 | | | Level 1 -
Other* | | | Level 2 | | | Level 2 -
Other* | | | Level 3 | | | Total | |
Equity Futures Contracts | | $ | — | | | $ | 512 | | | $ | — | | | $ | — | | | $ | — | | | $ | 512 | |
* | Other financial instruments include futures contracts and/or swaps, which are reported as unrealized gain/loss at period end. |
Transfers between investment levels may occur as the markets fluctuate and/or the availability of data used in an investment’s valuation changes. Transfers between valuation levels, if any, are in comparison to the valuation levels at the end of the previous fiscal year, and are effective using the fair value as of the end of the previous fiscal period.
For the period ended March 31, 2017, there were no transfers between levels.
SEE NOTES TO FINANCIAL STATEMENTS. | THE GUGGENHEIM FUNDS SEMI-ANNUAL REPORT | 61 |
STYLEPLUS—LARGE CORE FUND | |
STATEMENT OF ASSETS AND LIABILITIES (Unaudited) |
March 31, 2017 |
Assets: | |
Investments in unaffiliated issuers, at value (cost $39,985,490) | | $ | 42,566,677 | |
Investments in affiliated issuers, at value (cost $167,963,681) | | | 168,911,634 | |
Total investments (cost $207,949,171) | | | 211,478,311 | |
Unrealized appreciation on swap agreements | | | 21,278,019 | |
Cash | | | 721,119 | |
Segregated cash with broker | | | 233,000 | |
Prepaid expenses | | | 67,935 | |
Receivables: | |
Fund shares sold | | | 103,234 | |
Dividends | | | 403,925 | |
Total assets | | | 234,285,543 | |
| | | | | |
Liabilities: | |
Segregated cash due to broker | | | 21,700,000 | |
Payable for: | |
Securities purchased | | | 388,690 | |
Fund shares redeemed | | | 158,451 | |
Management fees | | | 130,222 | |
Distribution and service fees | | | 45,838 | |
Transfer agent/maintenance fees | | | 40,062 | |
Fund accounting/administration fees | | | 14,435 | |
Trustees’ fees* | | | 11,239 | |
Variation margin | | | 660 | |
Miscellaneous | | | 54,596 | |
Total liabilities | | | 22,544,193 | |
Net assets | | $ | 211,741,350 | |
| | | | | |
Net assets consist of: | |
Paid in capital | | $ | 184,346,624 | |
Undistributed net investment income | | | 852,745 | |
Accumulated net realized gain on investments | | | 1,735,334 | |
Net unrealized appreciation on investments | | | 24,806,647 | |
Net assets | | $ | 211,741,350 | |
| | | | | |
A-Class: | |
Net assets | | $ | 203,400,685 | |
Capital shares outstanding | | | 8,665,346 | |
Net asset value per share | | $ | 23.47 | |
Maximum offering price per share (Net asset value divided by 95.25%) | | $ | 24.64 | |
| | | | | |
C-Class: | |
Net assets | | $ | 2,600,809 | |
Capital shares outstanding | | | 141,034 | |
Net asset value per share | | $ | 18.44 | |
| | | | | |
P-Class: | |
Net assets | | $ | 675,190 | |
Capital shares outstanding | | | 29,000 | |
Net asset value per share | | $ | 23.28 | |
| | | | | |
Institutional Class: | |
Net assets | | $ | 5,064,666 | |
Capital shares outstanding | | | 216,957 | |
Net asset value per share | | $ | 23.34 | |
* | Relates to Trustees not deemed “interested persons” within the meaning of Section 2(a)(19) of the 1940 Act. |
62 | THE GUGGENHEIM FUNDS SEMI-ANNUAL REPORT | SEE NOTES TO FINANCIAL STATEMENTS. |
STYLEPLUS—LARGE CORE FUND | |
STATEMENT OF OPERATIONS (Unaudited) |
Period Ended March 31, 2017 |
Investment Income: | |
Dividends from securities of affiliated issuers | | $ | 2,078,210 | |
Dividends from securities of unaffiliated issuers | | | 409,809 | |
Interest | | | (17,439 | ) |
Total investment income | | | 2,470,580 | |
| | | | | |
Expenses: | |
Management fees | | | 760,971 | |
Transfer agent/maintenance fees: | |
A-Class | | | 117,736 | |
C-Class | | | 3,477 | |
P-Class | | | 748 | |
Institutional Class | | | 315 | |
Distribution and service fees: | |
A-Class | | | 244,140 | |
C-Class | | | 13,477 | |
P-Class | | | 533 | |
Fund accounting/administration fees | | | 81,493 | |
Line of credit fees | | | 15,433 | |
Trustees’ fees* | | | 7,485 | |
Custodian fees | | | 7,283 | |
Miscellaneous | | | 60,628 | |
Total expenses | | | 1,313,719 | |
Less: | |
Expenses waived by Adviser | | | (34,493 | ) |
Net expenses | | | 1,279,226 | |
Net investment income | | | 1,191,354 | |
| | | | | |
Net Realized and Unrealized Gain (Loss): | |
Net realized gain (loss) on: | |
Investments in unaffiliated issuers | | $ | 1,771,247 | |
Investments in affiliated issuers | | | 2,771 | |
Swap agreements | | | 1,669 | |
Futures contracts | | | 254,120 | |
Net realized gain | | | 2,029,807 | |
Net change in unrealized appreciation (depreciation) on: | |
Investments in unaffiliated issuers | | | 1,041,462 | |
Investments in affiliated issuers | | | 282,413 | |
Swap agreements | | | 15,553,276 | |
Futures contracts | | | (40,345 | ) |
Net change in unrealized appreciation (depreciation) | | | 16,836,806 | |
Net realized and unrealized gain | | | 18,866,613 | |
Net increase in net assets resulting from operations | | $ | 20,057,967 | |
* | Relates to Trustees not deemed “interested persons” within the meaning of Section 2(a)(19) of the 1940 Act. |
SEE NOTES TO FINANCIAL STATEMENTS. | THE GUGGENHEIM FUNDS SEMI-ANNUAL REPORT | 63 |
STYLEPLUS—LARGE CORE FUND | |
STATEMENTS OF CHANGES IN NET ASSETS |
| | Period Ended
March 31,
2017
(Unaudited) | | | Year Ended
September 30,
2016 | |
Increase (Decrease) in Net Assets from Operations: | | | | | | |
Net investment income | | $ | 1,191,354 | | | $ | 1,478,222 | |
Net realized gain on investments | | | 2,029,807 | | | | 4,857,319 | |
Net change in unrealized appreciation (depreciation) on investments | | | 16,836,806 | | | | 21,789,542 | |
Net increase in net assets resulting from operations | | | 20,057,967 | | | | 28,125,083 | |
| | | | | | | | | |
Distributions to shareholders from: | | | | | | | | |
Net investment income | | | | | | | | |
A-Class | | | (1,414,912 | ) | | | (1,021,091 | ) |
P-Class | | | (3,434 | ) | | | (120 | ) |
Institutional Class | | | (47,453 | ) | | | (18,603 | ) |
Net realized gains | | | | | | | | |
A-Class | | | (3,716,323 | ) | | | (19,593,831 | ) |
C-Class | | | (65,682 | ) | | | (390,350 | ) |
P-Class | | | (7,548 | ) | | | (1,552 | ) |
Institutional Class | | | (86,390 | ) | | | (208,131 | ) |
Total distributions to shareholders | | | (5,341,742 | ) | | | (21,233,678 | ) |
| | | | | | | | | |
Capital share transactions: | | | | | | | | |
Proceeds from sale of shares | | | | | | | | |
A-Class | | | 6,373,012 | | | | 10,388,479 | |
C-Class | | | 136,106 | | | | 970,129 | |
P-Class | | | 290,166 | | | | 400,232 | |
Institutional Class | | | 728,187 | | | | 5,594,239 | |
Distributions reinvested | | | | | | | | |
A-Class | | | 4,827,591 | | | | 19,338,091 | |
C-Class | | | 63,911 | | | | 381,661 | |
P-Class | | | 10,982 | | | | 1,672 | |
Institutional Class | | | 133,180 | | | | 225,550 | |
Cost of shares redeemed | | | | | | | | |
A-Class | | | (10,961,145 | ) | | | (25,363,728 | ) |
C-Class | | | (435,953 | ) | | | (1,501,528 | ) |
P-Class | | | (57,830 | ) | | | (46,532 | ) |
Institutional Class | | | (363,921 | ) | | | (1,831,412 | ) |
Net increase from capital share transactions | | | 744,286 | | | | 8,556,853 | |
Net increase in net assets | | | 15,460,511 | | | | 15,448,258 | |
| | | | | | | | | |
Net assets: | | | | | | | | |
Beginning of period | | | 196,280,839 | | | | 180,832,581 | |
End of period | | $ | 211,741,350 | | | $ | 196,280,839 | |
Undistributed net investment income at end of period | | $ | 852,745 | | | $ | 1,127,190 | |
64 | THE GUGGENHEIM FUNDS SEMI-ANNUAL REPORT | SEE NOTES TO FINANCIAL STATEMENTS. |
STYLEPLUS—LARGE CORE FUND | |
STATEMENTS OF CHANGES IN NET ASSETS (concluded) |
| | Period Ended
March 31,
2017
(Unaudited) | | | Year Ended
September 30,
2016 | |
Capital share activity: | | | | | | |
Shares sold | | | | | | |
A-Class | | | 288,531 | | | | 494,691 | |
C-Class | | | 7,852 | | | | 59,504 | |
P-Class | | | 12,487 | | | | 20,095 | |
Institutional Class | | | 32,191 | | | | 266,874 | |
Shares issued from reinvestment of distributions | | | | | | | | |
A-Class | | | 223,506 | | | | 960,661 | |
C-Class | | | 3,755 | | | | 23,881 | |
P-Class | | | 513 | | | | 83 | |
Institutional Class | | | 6,203 | | | | 11,274 | |
Shares redeemed | | | | | | | | |
A-Class | | | (489,977 | ) | | | (1,219,870 | ) |
C-Class | | | (24,472 | ) | | | (90,686 | ) |
P-Class | | | (2,625 | ) | | | (2,213 | ) |
Institutional Class | | | (16,416 | ) | | | (97,608 | ) |
Net increase in shares | | | 41,548 | | | | 426,686 | |
SEE NOTES TO FINANCIAL STATEMENTS. | THE GUGGENHEIM FUNDS SEMI-ANNUAL REPORT | 65 |
STYLEPLUS—LARGE CORE FUND | |
This table is presented to show selected data for a share outstanding throughout each period and to assist shareholders in evaluating a Fund’s performance for the periods presented.
A-Class | | Period Ended
March 31,
2017a | | | Year Ended
September 30, 2016 | | | Year Ended
September 30, 2015 | | | Year Ended
September 30, 2014 | | | Year Ended
September 30, 2013 | | | Year Ended
September 30, 2012 | |
Per Share Data | | | | | | | | | | | | | | | | | | |
Net asset value, beginning of period | | $ | 21.86 | | | $ | 21.14 | | | $ | 24.53 | | | $ | 24.27 | | | $ | 21.25 | | | $ | 16.79 | |
Income (loss) from investment operations: | |
Net investment income (loss)b | | | .13 | | | | .16 | | | | .11 | | | | .20 | | | | .06 | | | | .06 | |
Net gain (loss) on investments (realized and unrealized) | | | 2.07 | | | | 3.04 | | | | (.12 | ) | | | 4.45 | | | | 3.04 | | | | 4.42 | |
Total from investment operations | | | 2.20 | | | | 3.20 | | | | (.01 | ) | | | 4.65 | | | | 3.10 | | | | 4.48 | |
Less distributions from: | |
Net investment income | | | (.16 | ) | | | (.13 | ) | | | (.22 | ) | | | (.06 | ) | | | (.08 | ) | | | (.02 | ) |
Net realized gains | | | (.43 | ) | | | (2.35 | ) | | | (3.16 | ) | | | (4.33 | ) | | | — | | | | — | |
Total distributions | | | (.59 | ) | | | (2.48 | ) | | | (3.38 | ) | | | (4.39 | ) | | | (.08 | ) | | | (.02 | ) |
Net asset value, end of period | | $ | 23.47 | | | $ | 21.86 | | | $ | 21.14 | | | $ | 24.53 | | | $ | 24.27 | | | $ | 21.25 | |
| |
Total Returnc | | | 10.31 | % | | | 16.13 | % | | | (0.84 | %) | | | 21.59 | % | | | 14.64 | % | | | 26.71 | % |
Ratios/Supplemental Data | |
Net assets, end of period (in thousands) | | $ | 203,401 | | | $ | 188,979 | | | $ | 177,748 | | | $ | 192,850 | | | $ | 175,601 | | | $ | 171,907 | |
Ratios to average net assets: | |
Net investment income (loss) | | | 1.18 | % | | | 0.79 | % | | | 0.48 | % | | | 0.86 | % | | | 0.26 | % | | | 0.32 | % |
Total expensesd | | | 1.29 | % | | | 1.33 | % | | | 1.32 | % | | | 1.41 | % | | | 1.37 | % | | | 1.36 | % |
Net expensese | | | 1.25 | % | | | 1.31 | % | | | 1.32 | % | | | 1.39 | % | | | 1.37 | % | | | 1.36 | % |
Portfolio turnover rate | | | 13 | % | | | 50 | % | | | 65 | % | | | 107 | % | | | 217 | % | | | 101 | % |
C-Class | | Period Ended
March 31,
2017a | | | Year Ended
September 30, 2016 | | | Year Ended
September 30, 2015 | | | Year Ended
September 30, 2014 | | | Year Ended
September 30, 2013 | | | Year Ended
September 30, 2012 | |
Per Share Data | | | | | | | | | | | | | | | | | | |
Net asset value, beginning of period | | $ | 17.22 | | | $ | 17.17 | | | $ | 20.55 | | | $ | 21.12 | | | $ | 18.60 | | | $ | 14.81 | |
Income (loss) from investment operations: | |
Net investment income (loss)b | | | .03 | | | | (.02 | ) | | | (.08 | ) | | | (.02 | ) | | | (.15 | ) | | | (.10 | ) |
Net gain (loss) on investments (realized and unrealized) | | | 1.62 | | | | 2.42 | | | | (.06 | ) | | | 3.78 | | | | 2.67 | | | | 3.89 | |
Total from investment operations | | | 1.65 | | | | 2.40 | | | | (.14 | ) | | | 3.76 | | | | 2.52 | | | | 3.79 | |
Less distributions from: | |
Net investment income | | | — | | | | — | | | | (.08 | ) | | | — | | | | — | | | | — | |
Net realized gains | | | (.43 | ) | | | (2.35 | ) | | | (3.16 | ) | | | (4.33 | ) | | | — | | | | — | |
Total distributions | | | (.43 | ) | | | (2.35 | ) | | | (3.24 | ) | | | (4.33 | ) | | | — | | | | — | |
Net asset value, end of period | | $ | 18.44 | | | $ | 17.22 | | | $ | 17.17 | | | $ | 20.55 | | | $ | 21.12 | | | $ | 18.60 | |
| |
Total Returnc | | | 9.85 | % | | | 15.00 | % | | | (1.72 | %) | | | 20.40 | % | | | 13.55 | % | | | 25.59 | % |
Ratios/Supplemental Data | |
Net assets, end of period (in thousands) | | $ | 2,601 | | | $ | 2,650 | | | $ | 2,767 | | | $ | 3,042 | | | $ | 2,275 | | | $ | 1,669 | |
Ratios to average net assets: | |
Net investment income (loss) | | | 0.29 | % | | | (0.14 | %) | | | (0.44 | %) | | | (0.08 | %) | | | (0.77 | %) | | | (0.55 | %) |
Total expensesd | | | 2.17 | % | | | 2.27 | % | | | 2.25 | % | | | 2.36 | % | | | 2.34 | % | | | 2.22 | % |
Net expensese | | | 2.14 | % | | | 2.25 | % | | | 2.25 | % | | | 2.34 | % | | | 2.34 | % | | | 2.22 | % |
Portfolio turnover rate | | | 13 | % | | | 50 | % | | | 65 | % | | | 107 | % | | | 217 | % | | | 101 | % |
66 | THE GUGGENHEIM FUNDS SEMI-ANNUAL REPORT | SEE NOTES TO FINANCIAL STATEMENTS. |
STYLEPLUS—LARGE CORE FUND | |
FINANCIAL HIGHLIGHTS (continued) |
This table is presented to show selected data for a share outstanding throughout each period and to assist shareholders in evaluating a Fund’s performance for the periods presented.
P-Class | | Period Ended
March 31,
2017a | | | Year Ended
September 30,
2016 | | | Period Ended
September 30,
2015f | |
Per Share Data | | | | | | | | | |
Net asset value, beginning of period | | $ | 21.75 | | | $ | 21.11 | | | $ | 23.12 | |
Income (loss) from investment operations: | |
Net investment income (loss)b | | | .10 | | | | .21 | | | | .03 | |
Net gain (loss) on investments (realized and unrealized) | | | 2.06 | | | | 2.97 | | | | (2.04 | ) |
Total from investment operations | | | 2.16 | | | | 3.18 | | | | (2.01 | ) |
Less distributions from: | |
Net investment income | | | (.20 | ) | | | (.19 | ) | | | — | |
Net realized gains | | | (.43 | ) | | | (2.35 | ) | | | — | |
Total distributions | | | (.63 | ) | | | (2.54 | ) | | | — | |
Net asset value, end of period | | $ | 23.28 | | | $ | 21.75 | | | $ | 21.11 | |
| |
Total Returnc | | | 10.15 | % | | | 16.08 | % | | | (8.69 | %) |
Ratios/Supplemental Data | |
Net assets, end of period (in thousands) | | $ | 675 | | | $ | 405 | | | $ | 14 | |
Ratios to average net assets: | |
Net investment income (loss) | | | 0.94 | % | | | 1.02 | % | | | 0.31 | % |
Total expensesd | | | 1.52 | % | | | 1.22 | % | | | 1.38 | % |
Net expensese | | | 1.48 | % | | | 1.19 | % | | | 1.38 | % |
Portfolio turnover rate | | | 13 | % | | | 50 | % | | | 65 | % |
SEE NOTES TO FINANCIAL STATEMENTS. | THE GUGGENHEIM FUNDS SEMI-ANNUAL REPORT | 67 |
STYLEPLUS—LARGE CORE FUND | |
FINANCIAL HIGHLIGHTS (concluded) |
This table is presented to show selected data for a share outstanding throughout each period and to assist shareholders in evaluating a Fund’s performance for the periods presented.
Institutional Class | | Period Ended
March 31,
2017a | | | Year Ended
September 30, 2016 | | | Year Ended
September 30, 2015 | | | Year Ended
September 30, 2014 | | | Year Ended
September 30, 2013 | | | Period Ended
September 30, 2012g | |
Per Share Data | | | | | | | | | | | | | | | | | | |
Net asset value, beginning of period | | $ | 21.78 | | | $ | 21.00 | | | $ | 24.42 | | | $ | 24.25 | | | $ | 21.28 | | | $ | 20.84 | |
Income (loss) from investment operations: | |
Net investment income (loss)b | | | .17 | | | | .24 | | | | .12 | | | | .23 | | | | .06 | | | | .07 | |
Net gain (loss) on investments (realized and unrealized) | | | 2.06 | | | | 3.10 | | | | (.10 | ) | | | 4.38 | | | | 3.06 | | | | .37 | |
Total from investment operations | | | 2.23 | | | | 3.34 | | | | .02 | | | | 4.61 | | | | 3.12 | | | | .44 | |
Less distributions from: | |
Net investment income | | | (.24 | ) | | | (.21 | ) | | | (.28 | ) | | | (.11 | ) | | | (.15 | ) | | | — | |
Net realized gains | | | (.43 | ) | | | (2.35 | ) | | | (3.16 | ) | | | (4.33 | ) | | | — | | | | — | |
Total distributions | | | (.67 | ) | | | (2.56 | ) | | | (3.44 | ) | | | (4.44 | ) | | | (.15 | ) | | | — | |
Net asset value, end of period | | $ | 23.34 | | | $ | 21.78 | | | $ | 21.00 | | | $ | 24.42 | | | $ | 24.25 | | | $ | 21.28 | |
| |
Total Returnc | | | 10.53 | % | | | 17.00 | % | | | (0.75 | %) | | | 21.50 | % | | | 14.79 | % | | | 2.11 | % |
Ratios/Supplemental Data | |
Net assets, end of period (in thousands) | | $ | 5,065 | | | $ | 4,247 | | | $ | 303 | | | $ | 80 | | | $ | 26 | | | $ | 10 | |
Ratios to average net assets: | |
Net investment income (loss) | | | 1.53 | % | | | 1.11 | % | | | 0.52 | % | | | 0.97 | % | | | 0.26 | % | | | 0.59 | % |
Total expensesd | | | 0.93 | % | | | 0.99 | % | | | 1.25 | % | | | 1.39 | % | | | 1.25 | % | | | 1.12 | % |
Net expensese | | | 0.90 | % | | | 0.97 | % | | | 1.25 | % | | | 1.37 | % | | | 1.25 | % | | | 1.12 | % |
Portfolio turnover rate | | | 13 | % | | | 50 | % | | | 65 | % | | | 107 | % | | | 217 | % | | | 101 | % |
a | Unaudited figures for the period ended March 31, 2017. Percentage amounts for the period, except total return and portfolio turnover rate, have been annualized. |
b | Net investment income (loss) per share was computed using average shares outstanding throughout the period. |
c | Total return does not reflect the impact of any applicable sales charges and has not been annualized. |
d | Does not include expenses of the underlying funds in which the Fund invests. |
e | Net expense information reflects the expense ratios after expense waivers. |
f | Since commencement of operations: May 1, 2015. Percentage amounts for the period, except total return and portfolio turnover rate, have been annualized. |
g | Since commencement of operations: March 1, 2012. Percentage amounts for the period, except total return and portfolio turnover rate, have been annualized. |
68 | THE GUGGENHEIM FUNDS SEMI-ANNUAL REPORT | SEE NOTES TO FINANCIAL STATEMENTS. |
FUND PROFILE (Unaudited) | March 31, 2017 |
STYLEPLUS—MID GROWTH FUND
OBJECTIVE: Seeks long-term growth of capital.
Holdings Diversification (Market Exposure as % of Net Assets)
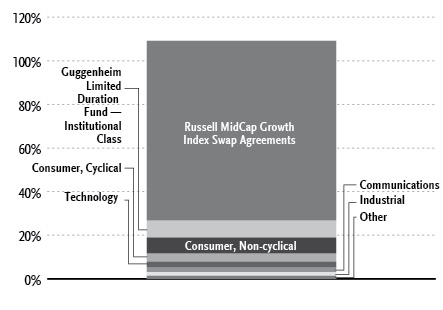
“Holdings Diversification (Market Exposure as % of Net Assets)” excludes any temporary cash investments or investments in Guggenheim Strategy Funds Trust mutual funds. Investments in those Funds will significantly increase the portfolio’s exposure to certain other asset categories (and their associated risks), which may cause the Fund to deviate from its principal investment strategy, including: (i) high yield, high risk debt securities rated below the top four long-term rating categories by a nationally recognized statistical rating organization (also known as “junk bonds”); (ii) securities issued by the U.S. government or its agencies and instrumentalities; (iii) CLOs and similar investments; and (iv) other short-term fixed income securities.
Inception Dates: |
A-Class | September 17, 1969 |
C-Class | January 29, 1999 |
P-Class | May 1, 2015 |
Institutional Class | March 1, 2012 |
Ten Largest Holdings (% of Total Net Assets) |
Guggenheim Strategy Fund III | 33.1% |
Guggenheim Strategy Fund II | 25.2% |
Guggenheim Strategy Fund I | 12.6% |
Guggenheim Limited Duration Fund — Institutional Class | 7.8% |
AmerisourceBergen Corp. — Class A | 0.3% |
Lam Research Corp. | 0.3% |
Omnicom Group, Inc. | 0.3% |
Western Union Co. | 0.2% |
Tyson Foods, Inc. — Class A | 0.2% |
Laboratory Corp. of America Holdings | 0.2% |
Top Ten Total | 80.2% |
“Ten Largest Holdings” excludes any temporary cash or derivative investments.
| | THE GUGGENHEIM FUNDS SEMI-ANNUAL REPORT | 69 |
SCHEDULE OF INVESTMENTS (Unaudited) | March 31, 2017 |
STYLEPLUS—MID GROWTH FUND | |
| | Shares | | | Value | |
| | | | | | | |
COMMON STOCKS† - 18.3% | |
| | | | | | | |
Consumer, Non-cyclical - 7.2% | |
AmerisourceBergen Corp. — Class A | | | 2,608 | | | $ | 230,808 | |
Western Union Co. | | | 9,958 | | | | 202,645 | |
Tyson Foods, Inc. — Class A | | | 3,197 | | | | 197,287 | |
Laboratory Corp. of America Holdings* | | | 1,317 | | | | 188,950 | |
Zimmer Biomet Holdings, Inc. | | | 1,469 | | | | 179,379 | |
United Rentals, Inc.* | | | 1,431 | | | | 178,947 | |
Zoetis, Inc. | | | 3,296 | | | | 175,908 | |
DaVita, Inc.* | | | 2,574 | | | | 174,955 | |
Nielsen Holdings plc | | | 4,231 | | | | 174,782 | |
Centene Corp.* | | | 2,447 | | | | 174,373 | |
Conagra Brands, Inc. | | | 4,118 | | | | 166,119 | |
Hologic, Inc.* | | | 3,740 | | | | 159,137 | |
WellCare Health Plans, Inc.* | | | 1,066 | | | | 149,464 | |
HealthSouth Corp. | | | 3,456 | | | | 147,951 | |
Cardinal Health, Inc. | | | 1,698 | | | | 138,472 | |
McKesson Corp. | | | 915 | | | | 135,658 | |
Kellogg Co. | | | 1,863 | | | | 135,272 | |
Varian Medical Systems, Inc.* | | | 1,406 | | | | 128,129 | |
Campbell Soup Co. | | | 2,085 | | | | 119,345 | |
Mylan N.V.* | | | 3,022 | | | | 117,828 | |
Total System Services, Inc. | | | 2,193 | | | | 117,238 | |
Dr Pepper Snapple Group, Inc. | | | 1,187 | | | | 116,231 | |
HCA Holdings, Inc.* | | | 1,288 | | | | 114,619 | |
Intuitive Surgical, Inc.* | | | 149 | | | | 114,204 | |
Henry Schein, Inc.* | | | 667 | | | | 113,370 | |
Sysco Corp. | | | 2,118 | | | | 109,967 | |
General Mills, Inc. | | | 1,760 | | | | 103,858 | |
Kroger Co. | | | 3,520 | | | | 103,805 | |
Sabre Corp. | | | 4,746 | | | | 100,568 | |
United Therapeutics Corp.* | | | 716 | | | | 96,932 | |
Charles River Laboratories International, Inc.* | | | 1,076 | | | | 96,786 | |
Avis Budget Group, Inc.* | | | 3,114 | | | | 92,112 | |
Incyte Corp.* | | | 655 | | | | 87,554 | |
Hill-Rom Holdings, Inc. | | | 1,231 | | | | 86,909 | |
Ingredion, Inc. | | | 683 | | | | 82,254 | |
CR Bard, Inc. | | | 330 | | | | 82,018 | |
CoreLogic, Inc.* | | | 1,948 | | | | 79,323 | |
Robert Half International, Inc. | | | 1,586 | | | | 77,444 | |
Molina Healthcare, Inc.* | | | 1,623 | | | | 74,009 | |
Edwards Lifesciences Corp.* | | | 743 | | | | 69,894 | |
Universal Health Services, Inc. — Class B | | | 524 | | | | 65,212 | |
MEDNAX, Inc.* | | | 934 | | | | 64,801 | |
Vantiv, Inc. — Class A* | | | 990 | | | | 63,479 | |
Spectrum Brands Holdings, Inc. | | | 383 | | | | 53,241 | |
Lamb Weston Holdings, Inc. | | | 1,238 | | | | 52,070 | |
TreeHouse Foods, Inc.* | | | 612 | | | | 51,812 | |
Flowers Foods, Inc. | | | 2,571 | | | | 49,903 | |
Quintiles IMS Holdings, Inc.* | | | 616 | | | | 49,606 | |
Cooper Cos., Inc. | | | 245 | | | | 48,973 | |
Whole Foods Market, Inc. | | | 1,602 | | | | 47,611 | |
Gartner, Inc.* | | | 434 | | | | 46,868 | |
ResMed, Inc. | | | 645 | | | | 46,421 | |
Patterson Companies, Inc. | | | 1,022 | | | | 46,225 | |
Ionis Pharmaceuticals, Inc.* | | | 1,138 | | | | 45,748 | |
Seattle Genetics, Inc.* | | | 721 | | | | 45,322 | |
Total Consumer, Non-cyclical | | | | | | | 5,971,796 | |
| | | | | | | | | |
Consumer, Cyclical - 3.8% | |
Dollar Tree, Inc.* | | | 2,211 | | | | 173,475 | |
Lear Corp. | | | 1,178 | | | | 166,782 | |
Dollar General Corp. | | | 2,192 | | | | 152,848 | |
Delphi Automotive plc | | | 1,656 | | | | 133,291 | |
Alaska Air Group, Inc. | | | 1,408 | | | | 129,845 | |
Michael Kors Holdings Ltd.* | | | 3,294 | | | | 125,534 | |
Newell Brands, Inc. | | | 2,617 | | | | 123,444 | |
Liberty Interactive Corporation QVC Group — Class A* | | | 5,489 | | | | 109,890 | |
Nordstrom, Inc. | | | 2,331 | | | | 108,555 | |
Southwest Airlines Co. | | | 2,004 | | | | 107,735 | |
Ross Stores, Inc. | | | 1,626 | | | | 107,105 | |
Delta Air Lines, Inc. | | | 2,330 | | | | 107,087 | |
JetBlue Airways Corp.* | | | 4,957 | | | | 102,164 | |
PACCAR, Inc. | | | 1,484 | | | | 99,725 | |
Ralph Lauren Corp. — Class A | | | 1,181 | | | | 96,393 | |
Marriott International, Inc. — Class A | | | 1,003 | | | | 94,462 | |
AutoZone, Inc.* | | | 130 | | | | 93,997 | |
Darden Restaurants, Inc. | | | 1,090 | | | | 91,200 | |
Wyndham Worldwide Corp. | | | 1,072 | | | | 90,359 | |
WW Grainger, Inc. | | | 375 | | | | 87,285 | |
Dick’s Sporting Goods, Inc. | | | 1,686 | | | | 82,041 | |
BorgWarner, Inc. | | | 1,855 | | | | 77,520 | |
Target Corp. | | | 1,125 | | | | 62,089 | |
Sally Beauty Holdings, Inc.* | | | 2,966 | | | | 60,625 | |
Genuine Parts Co. | | | 647 | | | | 59,789 | |
O’Reilly Automotive, Inc.* | | | 219 | | | | 59,095 | |
Bed Bath & Beyond, Inc. | | | 1,277 | | | | 50,390 | |
Under Armour, Inc. — Class C* | | | 2,622 | | | | 47,983 | |
Casey’s General Stores, Inc. | | | 424 | | | | 47,594 | |
Aramark | | | 1,261 | | | | 46,493 | |
Hawaiian Holdings, Inc.* | | | 962 | | | | 44,685 | |
Advance Auto Parts, Inc. | | | 301 | | | | 44,626 | |
Whirlpool Corp. | | | 258 | | | | 44,203 | |
AutoNation, Inc.* | | | 1,030 | | | | 43,559 | |
Total Consumer, Cyclical | | | | | | | 3,071,868 | |
| | | | | | | | | |
Technology - 2.7% | |
Lam Research Corp. | | | 1,743 | | | | 223,731 | |
NVIDIA Corp. | | | 1,689 | | | | 183,982 | |
Skyworks Solutions, Inc. | | | 1,525 | | | | 149,420 | |
Fiserv, Inc.* | | | 1,268 | | | | 146,213 | |
Citrix Systems, Inc.* | | | 1,708 | | | | 142,430 | |
Fidelity National Information Services, Inc. | | | 1,758 | | | | 139,972 | |
Microchip Technology, Inc. | | | 1,791 | | | | 132,140 | |
NCR Corp.* | | | 2,821 | | | | 128,863 | |
Cerner Corp.* | | | 1,988 | | | | 116,994 | |
Electronic Arts, Inc.* | | | 1,268 | | | | 113,512 | |
KLA-Tencor Corp. | | | 1,123 | | | | 106,764 | |
Teradata Corp.* | | | 3,327 | | | | 103,536 | |
Maxim Integrated Products, Inc. | | | 1,838 | | | | 82,636 | |
Akamai Technologies, Inc.* | | | 1,289 | | | | 76,953 | |
70 | THE GUGGENHEIM FUNDS SEMI-ANNUAL REPORT | SEE NOTES TO FINANCIAL STATEMENTS. |
SCHEDULE OF INVESTMENTS (Unaudited)(continued) | March 31, 2017 |
STYLEPLUS—MID GROWTH FUND | |
| | Shares | | | Value | |
| | | | | | | |
Activision Blizzard, Inc. | | | 1,470 | | | $ | 73,294 | |
Qorvo, Inc.* | | | 942 | | | | 64,584 | |
Paychex, Inc. | | | 1,067 | | | | 62,846 | |
Pitney Bowes, Inc. | | | 4,650 | | | | 60,962 | |
Nuance Communications, Inc.* | | | 3,231 | | | | 55,929 | |
Black Knight Financial Services, Inc. — Class A* | | | 1,257 | | | | 48,143 | |
Total Technology | | | | | | | 2,212,904 | |
| | | | | | | | | |
Communications - 2.0% | |
Omnicom Group, Inc. | | | 2,466 | | | | 212,594 | |
Discovery Communications, Inc. — Class A* | | | 6,118 | | | | 177,973 | |
Zayo Group Holdings, Inc.* | | | 4,617 | | | | 151,899 | |
Scripps Networks Interactive, Inc. — Class A | | | 1,772 | | | | 138,872 | |
CDW Corp. | | | 1,866 | | | | 107,687 | |
CommScope Holding Company, Inc.* | | | 2,422 | | | | 101,022 | |
F5 Networks, Inc.* | | | 665 | | | | 94,809 | |
VeriSign, Inc.* | | | 1,081 | | | | 94,166 | |
eBay, Inc.* | | | 2,763 | | | | 92,754 | |
IAC/InterActiveCorp* | | | 1,197 | | | | 88,243 | |
Palo Alto Networks, Inc.* | | | 608 | | | | 68,509 | |
Twitter, Inc.* | | | 4,025 | | | | 60,174 | |
Expedia, Inc. | | | 426 | | | | 53,748 | |
Motorola Solutions, Inc. | | | 620 | | | | 53,456 | |
AMC Networks, Inc. — Class A* | | | 893 | | | | 52,401 | |
Interpublic Group of Cos., Inc. | | | 2,054 | | | | 50,467 | |
Total Communications | | | | | | | 1,598,774 | |
| | | | | | | | | |
Industrial - 1.8% | |
Textron, Inc. | | | 2,784 | | | | 132,491 | |
Ingersoll-Rand plc | | | 1,502 | | | | 122,143 | |
Masco Corp. | | | 3,168 | | | | 107,680 | |
Stanley Black & Decker, Inc. | | | 759 | | | | 100,848 | |
TransDigm Group, Inc. | | | 456 | | | | 100,394 | |
Huntington Ingalls Industries, Inc. | | | 460 | | | | 92,110 | |
Spirit AeroSystems Holdings, Inc. — Class A | | | 1,534 | | | | 88,849 | |
Waste Management, Inc. | | | 1,071 | | | | 78,097 | |
Rockwell Collins, Inc. | | | 755 | | | | 73,356 | |
Carlisle Companies, Inc. | | | 679 | | | | 72,252 | |
Stericycle, Inc.* | | | 787 | | | | 65,234 | |
Amphenol Corp. — Class A | | | 880 | | | | 62,630 | |
Swift Transportation Co. — Class A* | | | 2,624 | | | | 53,897 | |
Clean Harbors, Inc.* | | | 930 | | | | 51,727 | |
Fortune Brands Home & Security, Inc. | | | 840 | | | | 51,114 | |
PerkinElmer, Inc. | | | 844 | | | | 49,003 | |
Johnson Controls International plc | | | 1,129 | | | | 47,553 | |
Owens-Illinois, Inc.* | | | 2,287 | | | | 46,609 | |
Waters Corp.* | | | 288 | | | | 45,017 | |
Total Industrial | | | | | | | 1,441,004 | |
| | | | | | | | | |
Financial - 0.7% | |
SBA Communications Corp.* | | | 1,358 | | | | 163,462 | |
Alliance Data Systems Corp. | | | 626 | | | | 155,874 | |
CBRE Group, Inc. — Class A* | | | 1,520 | | | | 52,881 | |
Federated Investors, Inc. — Class B | | | 1,747 | | | | 46,016 | |
Ameriprise Financial, Inc. | | | 349 | | | | 45,258 | |
Invesco Ltd. | | | 1,463 | | | | 44,812 | |
Lincoln National Corp. | | | 669 | | | | 43,786 | |
Total Financial | | | | | | | 552,089 | |
| | | | | | | | | |
Basic Materials - 0.1% | |
Steel Dynamics, Inc. | | | 1,333 | | | | 46,335 | |
| | | | | | | | | |
Total Common Stocks | | | | | | | | |
(Cost $14,068,139) | | | | | | | 14,894,770 | |
| | | | | | | | | |
MUTUAL FUNDS† - 78.7% | |
Guggenheim Strategy Fund III1 | | | 1,076,983 | | | | 26,935,345 | |
Guggenheim Strategy Fund II1 | | | 821,640 | | | | 20,540,999 | |
Guggenheim Strategy Fund I1 | | | 408,023 | | | | 10,220,982 | |
Guggenheim Limited Duration Fund - Institutional Class1 | | | 257,684 | | | | 6,372,515 | |
Total Mutual Funds | | | | | | | | |
(Cost $63,724,241) | | | | | | | 64,069,841 | |
| | | | | | | | | |
SHORT-TERM INVESTMENTS† - 3.3% | |
Dreyfus Treasury Prime Cash Management Institutional Shares 0.50%2 | | | 2,701,165 | | | | 2,701,165 | |
Total Short-Term Investments | | | | | | | | |
(Cost $2,701,165) | | | | | | | 2,701,165 | |
| | | | | | | | | |
Total Investments - 100.3% | | | | | | | | |
(Cost $80,493,545) | | | | | | $ | 81,665,776 | |
Other Assets & Liabilities, net - (0.3)% | | | | | | | (281,493 | ) |
Total Net Assets - 100.0% | | | | | | $ | 81,384,283 | |
| | Contracts | | | Unrealized
Gain | |
| | | | | | | | | |
EQUITY FUTURES CONTRACTS PURCHASED† | |
June 2017 S&P MidCap 400 Index
Mini Futures Contracts
(Aggregate Value of
Contracts $343,660) | | | 2 | | | $ | 2,383 | |
June 2017 NASDAQ-100 Index
Mini Futures Contracts
(Aggregate Value of
Contracts $108,730) | | | 1 | | | | 1,013 | |
(Total Aggregate Value of Contracts $452,390) | | | | | | $ | 3,396 | |
SEE NOTES TO FINANCIAL STATEMENTS. | THE GUGGENHEIM FUNDS SEMI-ANNUAL REPORT | 71 |
SCHEDULE OF INVESTMENTS (Unaudited)(concluded) | March 31, 2017 |
STYLEPLUS—MID GROWTH FUND | |
| | Units | | | Unrealized
Gain | |
| | | | | | | |
OTC EQUITY INDEX SWAP AGREEMENTS†† | |
Deutsche Bank Swap
August 2017
Russell Midcap Growth Index Swap 0.95%3,
Terminating 08/03/17
(Notional Value $67,078,927) | | | 27,747 | | | $ | 6,995,746 | |
* | Non-income producing security. |
† | Value determined based on Level 1 inputs — See Note 4. |
†† | Value determined based on Level 2 inputs — See Note 4. |
1 | Affiliated issuer — See Note 8. |
2 | Rate indicated is the 7 day yield as of March 31, 2017. |
3 | Total Return based on Russell Midcap Growth Index +/- financing at a variable rate. Rate indicated is the rate effective at March 31, 2017. |
| | plc — Public Limited Company |
| | |
| | See Sector Classification in Other Information section. |
The following table summarizes the inputs used to value the Fund’s investments at March 31, 2017 (See Note 4 in the Notes to Financial Statements):
Investments in Securities (Assets) | | Level 1 | | | Level 1 -
Other* | | | Level 2 | | | Level 2 -
Other* | | | Level 3 | | | Total | |
Common Stocks | | $ | 14,894,770 | | | $ | — | | | $ | — | | | $ | — | | | $ | — | | | $ | 14,894,770 | |
Equity Futures Contracts | | | — | | | | 3,396 | | | | — | | | | — | | | | — | | | | 3,396 | |
Equity Index Swap Agreements | | | — | | | | — | | | | — | | | | 6,995,746 | | | | — | | | | 6,995,746 | |
Mutual Funds | | | 64,069,841 | | | | — | | | | — | | | | — | | | | — | | | | 64,069,841 | |
Short-Term Investments | | | 2,701,165 | | | | — | | | | — | | | | — | | | | — | | | | 2,701,165 | |
Total | | $ | 81,665,776 | | | $ | 3,396 | | | $ | — | | | $ | 6,995,746 | | | $ | — | | | $ | 88,664,918 | |
* | Other financial instruments include futures contracts and/or swaps, which are reported as unrealized gain/loss at period end. |
Transfers between investment levels may occur as the markets fluctuate and/or the availability of data used in an investment’s valuation changes. Transfers between valuation levels, if any, are in comparison to the valuation levels at the end of the previous fiscal year, and are effective using the fair value as of the end of the previous fiscal period.
For the period ended March 31, 2017, there were no transfers between levels.
72 | THE GUGGENHEIM FUNDS SEMI-ANNUAL REPORT | SEE NOTES TO FINANCIAL STATEMENTS. |
STYLEPLUS—MID GROWTH FUND | |
STATEMENT OF ASSETS AND LIABILITIES (Unaudited) |
March 31, 2017 |
Assets: | |
Investments in unaffiliated issuers, at value (cost $16,769,304) | | $ | 17,595,935 | |
Investments in affiliated issuers, at value (cost $63,724,241) | | | 64,069,841 | |
Total investments (cost $80,493,545) | | | 81,665,776 | |
Unrealized appreciation on swap agreements | | | 6,995,746 | |
Segregated cash with broker | | | 88,850 | |
Prepaid expenses | | | 61,673 | |
Cash | | | 431 | |
Receivables: | |
Variation margin | | | 40 | |
Fund shares sold | | | 84 | |
Dividends | | | 147,712 | |
Investment adviser | | | 31 | |
Other assets | | | 27,600 | |
Total assets | | | 88,987,943 | |
| | | | | |
Liabilities: | |
Segregated cash due to broker | | | 6,770,000 | |
Payable for: | |
Fund shares redeemed | | | 546,689 | |
Securities purchased | | | 147,322 | |
Management fees | | | 50,034 | |
Transfer agent/maintenance fees | | | 25,827 | |
Distribution and service fees | | | 19,729 | |
Fund accounting/administration fees | | | 5,553 | |
Trustees’ fees* | | | 593 | |
Miscellaneous | | | 37,913 | |
Total liabilities | | | 7,603,660 | |
Net assets | | $ | 81,384,283 | |
| | | | | |
Net assets consist of: | |
Paid in capital | | $ | 74,903,859 | |
Undistributed net investment income | | | 196,812 | |
Accumulated net realized loss on investments | | | (1,887,761 | ) |
Net unrealized appreciation on investments | | | 8,171,373 | |
Net assets | | $ | 81,384,283 | |
| | | | | |
A-Class: | |
Net assets | | $ | 77,288,142 | |
Capital shares outstanding | | | 1,778,490 | |
Net asset value per share | | $ | 43.46 | |
Maximum offering price per share (Net asset value divided by 95.25%) | | $ | 45.63 | |
| | | | | |
C-Class: | |
Net assets | | $ | 3,798,116 | |
Capital shares outstanding | | | 115,633 | |
Net asset value per share | | $ | 32.85 | |
| | | | | |
P-Class: | |
Net assets | | $ | 107,737 | |
Capital shares outstanding | | | 2,505 | |
Net asset value per share | | $ | 43.01 | |
| | | | | |
Institutional Class: | |
Net assets | | $ | 190,288 | |
Capital shares outstanding | | | 4,372 | |
Net asset value per share | | $ | 43.52 | |
* | Relates to Trustees not deemed “interested persons” within the meaning of Section 2(a)(19) of the 1940 Act. |
SEE NOTES TO FINANCIAL STATEMENTS. | THE GUGGENHEIM FUNDS SEMI-ANNUAL REPORT | 73 |
STYLEPLUS—MID GROWTH FUND | |
STATEMENT OF OPERATIONS (Unaudited) |
Period Ended March 31, 2017 |
Investment Income: | |
Dividends from securities of affiliated issuers | | $ | 802,325 | |
Dividends from securities of unaffiliated issuers | | | 98,819 | |
Interest | | | (4,944 | ) |
Total investment income | | | 896,200 | |
| | | | | |
Expenses: | |
Management fees | | | 295,071 | |
Transfer agent/maintenance fees: | |
A-Class | | | 42,094 | |
C-Class | | | 4,874 | |
P-Class | | | 227 | |
Institutional Class | | | 101 | |
Distribution and service fees: | |
A-Class | | | 93,395 | |
C-Class | | | 18,614 | |
P-Class | | | 129 | |
Fund accounting/administration fees | | | 31,600 | |
Line of credit fees | | | 6,883 | |
Custodian fees | | | 6,564 | |
Trustees’ fees* | | | 3,246 | |
Miscellaneous | | | 28,931 | |
Total expenses | | | 531,729 | |
Less: | |
Expenses waived by Adviser | | | (13,718 | ) |
Net expenses | | | 518,011 | |
Net investment income | | | 378,189 | |
| | | | | |
Net Realized and Unrealized Gain (Loss): | |
Net realized gain (loss) on: | |
Investments in unaffiliated issuers | | | 356,523 | |
Investments in affiliated issuers | | | 9,551 | |
Futures contracts | | | 190,567 | |
Net realized gain | | | 556,641 | |
Net change in unrealized appreciation (depreciation) on: | |
Investments in unaffiliated issuers | | | 732,393 | |
Investments in affiliated issuers | | | 98,216 | |
Swap agreements | | | 4,333,556 | |
Futures contracts | | | 3,396 | |
Net change in unrealized appreciation (depreciation) | | | 5,167,561 | |
Net realized and unrealized gain | | | 5,724,202 | |
Net increase in net assets resulting from operations | | $ | 6,102,391 | |
* | Relates to Trustees not deemed “interested persons” within the meaning of Section 2(a)(19) of the 1940 Act. |
74 | THE GUGGENHEIM FUNDS SEMI-ANNUAL REPORT | SEE NOTES TO FINANCIAL STATEMENTS. |
STYLEPLUS—MID GROWTH FUND | |
STATEMENTS OF CHANGES IN NET ASSETS |
| | Period Ended
March 31,
2017
(Unaudited) | | | Year Ended
September 30,
2016 | |
Increase (Decrease) in Net Assets from Operations: | | | | | | |
Net investment income | | $ | 378,189 | | | $ | 330,289 | |
Net realized gain (loss) on investments | | | 556,641 | | | | (2,408,876 | ) |
Net change in unrealized appreciation (depreciation) on investments | | | 5,167,561 | | | | 10,387,058 | |
Net increase in net assets resulting from operations | | | 6,102,391 | | | | 8,308,471 | |
| | | | | | | | | |
Distributions to shareholders from: | | | | | | | | |
Net investment income | | | | | | | | |
A-Class | | | (439,170 | ) | | | (86,688 | ) |
P-Class | | | (843 | ) | | | (63 | ) |
Institutional Class | | | (931 | ) | | | (170 | ) |
Net realized gains | | | | | | | | |
A-Class | | | — | | | | (9,333,165 | ) |
C-Class | | | — | | | | (773,702 | ) |
P-Class | | | — | | | | (1,713 | ) |
Institutional Class | | | — | | | | (7,288 | ) |
Total distributions to shareholders | | | (440,944 | ) | | | (10,202,789 | ) |
| | | | | | | | | |
Capital share transactions: | | | | | | | | |
Proceeds from sale of shares | | | | | | | | |
A-Class | | | 4,975,269 | | | | 3,894,517 | |
C-Class | | | 179,915 | | | | 584,068 | |
P-Class | | | 170 | | | | 82,974 | |
Institutional Class | | | 109,146 | | | | 94,989 | |
Distributions reinvested | | | | | | | | |
A-Class | | | 412,206 | | | | 9,015,453 | |
C-Class | | | — | | | | 758,694 | |
P-Class | | | 843 | | | | 1,776 | |
Institutional Class | | | 872 | | | | 6,154 | |
Cost of shares redeemed | | | | | | | | |
A-Class | | | (5,651,416 | ) | | | (12,325,038 | ) |
C-Class | | | (412,323 | ) | | | (2,028,207 | ) |
P-Class | | | (2,084 | ) | | | (272 | ) |
Institutional Class | | | (44,519 | ) | | | (40,892 | ) |
Net increase (decrease) from capital share transactions | | | (431,921 | ) | | | 44,216 | |
Net increase (decrease) in net assets | | | 5,229,526 | | | | (1,850,102 | ) |
| | | | | | | | | |
Net assets: | | | | | | | | |
Beginning of period | | | 76,154,757 | | | | 78,004,859 | |
End of period | | $ | 81,384,283 | | | $ | 76,154,757 | |
Undistributed net investment income at end of period | | $ | 196,812 | | | $ | 259,567 | |
SEE NOTES TO FINANCIAL STATEMENTS. | THE GUGGENHEIM FUNDS SEMI-ANNUAL REPORT | 75 |
STYLEPLUS—MID GROWTH FUND | |
STATEMENTS OF CHANGES IN NET ASSETS (concluded) |
| | Period Ended
March 31,
2017
(Unaudited) | | | Year Ended
September 30,
2016 | |
Capital share activity: | | | | | | |
Shares sold | | | | | | |
A-Class | | | 123,534 | | | | 98,799 | |
C-Class | | | 5,900 | | | | 19,452 | |
P-Class | | | 4 | | | | 2,227 | |
Institutional Class | | | 2,624 | | | | 2,436 | |
Shares issued from reinvestment of distributions | | | | | | | | |
A-Class | | | 10,323 | | | | 236,875 | |
C-Class | | | — | | | | 26,225 | |
P-Class | | | 21 | | | | 47 | |
Institutional Class | | | 22 | | | | 161 | |
Shares redeemed | | | | | | | | |
A-Class | | | (136,665 | ) | | | (318,222 | ) |
C-Class | | | (13,253 | ) | | | (67,971 | ) |
P-Class | | | (49 | ) | | | (7 | ) |
Institutional Class | | | (1,069 | ) | | | (1,090 | ) |
Net decrease in shares | | | (8,608 | ) | | | (1,068 | ) |
76 | THE GUGGENHEIM FUNDS SEMI-ANNUAL REPORT | SEE NOTES TO FINANCIAL STATEMENTS. |
STYLEPLUS—MID GROWTH FUND | |
This table is presented to show selected data for a share outstanding throughout each period and to assist shareholders in evaluating a Fund’s performance for the periods presented.
A-Class | | Period Ended
March 31,
2017a | | | Year Ended
September 30, 2016 | | | Year Ended
September 30, 2015 | | | Year Ended
September 30, 2014 | | | Year Ended
September 30, 2013 | | | Year Ended
September 30, 2012 | |
Per Share Data | | | | | | | | | | | | | | | | | | |
Net asset value, beginning of period | | $ | 40.52 | | | $ | 41.49 | | | $ | 45.82 | | | $ | 43.54 | | | $ | 36.40 | | | $ | 28.67 | |
Income (loss) from investment operations: | |
Net investment income (loss)b | | | .21 | | | | .19 | | | | .07 | | | | .16 | | | | (.16 | ) | | | (.25 | ) |
Net gain (loss) on investments (realized and unrealized) | | | 2.97 | | | | 4.25 | | | | .63 | | | | 6.21 | | | | 7.30 | | | | 7.98 | |
Total from investment operations | | | 3.18 | | | | 4.44 | | | | .70 | | | | 6.37 | | | | 7.14 | | | | 7.73 | |
Less distributions from: | |
Net investment income | | | (.24 | ) | | | (.05 | ) | | | — | | | | — | | | | — | | | | — | |
Net realized gains | | | — | | | | (5.36 | ) | | | (5.03 | ) | | | (4.09 | ) | | | — | | | | — | |
Total distributions | | | (.24 | ) | | | (5.41 | ) | | | (5.03 | ) | | | (4.09 | ) | | | — | | | | — | |
Net asset value, end of period | | $ | 43.46 | | | $ | 40.52 | | | $ | 41.49 | | | $ | 45.82 | | | $ | 43.54 | | | $ | 36.40 | |
| |
Total Returnc | | | 7.90 | % | | | 11.55 | % | | | 1.04 | % | | | 15.61 | % | | | 19.62 | % | | | 26.96 | % |
Ratios/Supplemental Data | |
Net assets, end of period (in thousands) | | $ | 77,288 | | | $ | 72,179 | | | $ | 73,178 | | | $ | 77,363 | | | $ | 70,767 | | | $ | 65,767 | |
Ratios to average net assets: | |
Net investment income (loss) | | | 1.00 | % | | | 0.48 | % | | | 0.16 | % | | | 0.36 | % | | | (0.40 | %) | | | (0.74 | %) |
Total expensesd | | | 1.31 | % | | | 1.45 | % | | | 1.47 | % | | | 1.67 | % | | | 1.57 | % | | | 1.62 | % |
Net expensese | | | 1.27 | % | | | 1.43 | % | | | 1.47 | % | | | 1.65 | % | | | 1.57 | % | | | 1.62 | % |
Portfolio turnover rate | | | 17 | % | | | 61 | % | | | 75 | % | | | 112 | % | | | 214 | % | | | 149 | % |
C-Class | | Period Ended
March 31,
2017a | | | Year Ended
September 30, 2016 | | | Year Ended
September 30, 2015 | | | Year Ended
September 30, 2014 | | | Year Ended
September 30, 2013 | | | Year Ended
September 30, 2012 | |
Per Share Data | | | | | | | | | | | | | | | | | | |
Net asset value, beginning of period | | $ | 30.58 | | | $ | 32.78 | | | $ | 37.48 | | | $ | 36.63 | | | $ | 30.92 | | | $ | 24.55 | |
Income (loss) from investment operations: | |
Net investment income (loss)b | | | .02 | | | | (.12 | ) | | | (.25 | ) | | | (.20 | ) | | | (.45 | ) | | | (.46 | ) |
Net gain (loss) on investments (realized and unrealized) | | | 2.25 | | | | 3.28 | | | | .58 | | | | 5.14 | | | | 6.16 | | | | 6.83 | |
Total from investment operations | | | 2.27 | | | | 3.16 | | | | .33 | | | | 4.94 | | | | 5.71 | | | | 6.37 | |
Less distributions from: | |
Net realized gains | | | — | | | | (5.36 | ) | | | (5.03 | ) | | | (4.09 | ) | | | — | | | | — | |
Total distributions | | | — | | | | (5.36 | ) | | | (5.03 | ) | | | (4.09 | ) | | | — | | | | — | |
Net asset value, end of period | | $ | 32.85 | | | $ | 30.58 | | | $ | 32.78 | | | $ | 37.48 | | | $ | 36.63 | | | $ | 30.92 | |
| |
Total Returnc | | | 7.46 | % | | | 10.55 | % | | | 0.20 | % | | | 14.56 | % | | | 18.47 | % | | | 25.95 | % |
Ratios/Supplemental Data | |
Net assets, end of period (in thousands) | | $ | 3,798 | | | $ | 3,760 | | | $ | 4,762 | | | $ | 4,329 | | | $ | 4,103 | | | $ | 4,346 | |
Ratios to average net assets: | |
Net investment income (loss) | | | 0.10 | % | | | (0.42 | %) | | | (0.68 | %) | | | (0.55 | %) | | | (1.36 | %) | | | (1.57 | %) |
Total expensesd | | | 2.21 | % | | | 2.34 | % | | | 2.31 | % | | | 2.57 | % | | | 2.53 | % | | | 2.45 | % |
Net expensese | | | 2.17 | % | | | 2.32 | % | | | 2.31 | % | | | 2.55 | % | | | 2.53 | % | | | 2.45 | % |
Portfolio turnover rate | | | 17 | % | | | 61 | % | | | 75 | % | | | 112 | % | | | 214 | % | | | 149 | % |
SEE NOTES TO FINANCIAL STATEMENTS. | THE GUGGENHEIM FUNDS SEMI-ANNUAL REPORT | 77 |
STYLEPLUS—MID GROWTH FUND | |
FINANCIAL HIGHLIGHTS (continued) |
This table is presented to show selected data for a share outstanding throughout each period and to assist shareholders in evaluating a Fund’s performance for the periods presented.
P-Class | | Period Ended
March 31,
2017a | | | Year Ended
September 30,
2016 | | | Period Ended
September 30,
2015f | |
Per Share Data | | | | | | | | | |
Net asset value, beginning of period | | $ | 40.27 | | | $ | 41.48 | | | $ | 45.96 | |
Income (loss) from investment operations: | |
Net investment income (loss)b | | | .14 | | | | .26 | | | | — | g |
Net gain (loss) on investments (realized and unrealized) | | | 2.93 | | | | 4.09 | | | | (4.48 | ) |
Total from investment operations | | | 3.07 | | | | 4.35 | | | | (4.48 | ) |
Less distributions from: | |
Net investment income | | | (.33 | ) | | | (.20 | ) | | | — | |
Net realized gains | | | — | | | | (5.36 | ) | | | — | |
Total distributions | | | (.33 | ) | | | (5.56 | ) | | | — | |
Net asset value, end of period | | $ | 43.01 | | | $ | 40.27 | | | $ | 41.48 | |
| |
Total Returnc | | | 7.70 | % | | | 11.36 | % | | | (9.75 | %) |
Ratios/Supplemental Data | |
Net assets, end of period (in thousands) | | $ | 108 | | | $ | 102 | | | $ | 11 | |
Ratios to average net assets: | |
Net investment income (loss) | | | 0.68 | % | | | 0.69 | % | | | 0.00 | % |
Total expensesd | | | 1.63 | % | | | 1.39 | % | | | 1.49 | % |
Net expensese | | | 1.60 | % | | | 1.35 | % | | | 1.49 | % |
Portfolio turnover rate | | | 17 | % | | | 61 | % | | | 75 | % |
78 | THE GUGGENHEIM FUNDS SEMI-ANNUAL REPORT | SEE NOTES TO FINANCIAL STATEMENTS. |
STYLEPLUS—MID GROWTH FUND | |
FINANCIAL HIGHLIGHTS (concluded) |
This table is presented to show selected data for a share outstanding throughout each period and to assist shareholders in evaluating a Fund’s performance for the periods presented.
Institutional Class | | Period Ended
March 31,
2017a | | | Year Ended
September 30, 2016 | | | Year Ended
September 30, 2015 | | | Year Ended
September 30, 2014 | | | Year Ended
September 30, 2013 | | | Period Ended
September 30, 2012h | |
Per Share Data | | | | | | | | | | | | | | | | | | |
Net asset value, beginning of period | | $ | 40.59 | | | $ | 41.64 | | | $ | 45.96 | | | $ | 43.72 | | | $ | 36.46 | | | $ | 36.16 | |
Income (loss) from investment operations: | |
Net investment income (loss)b | | | .25 | | | | .19 | | | | .11 | | | | .11 | | | | (.07 | ) | | | (.08 | ) |
Net gain (loss) on investments (realized and unrealized) | | | 2.99 | | | | 4.25 | | | | .60 | | | | 6.22 | | | | 7.33 | | | | .38 | |
Total from investment operations | | | 3.24 | | | | 4.44 | | | | .71 | | | | 6.33 | | | | 7.26 | | | | .30 | |
Less distributions from: | |
Net investment income | | | (.31 | ) | | | (.13 | ) | | | — | | | | — | | | | — | | | | — | |
Net realized gains | | | — | | | | (5.36 | ) | | | (5.03 | ) | | | (4.09 | ) | | | — | | | | — | |
Total distributions | | | (.31 | ) | | | (5.49 | ) | | | (5.03 | ) | | | (4.09 | ) | | | — | | | | — | |
Net asset value, end of period | | $ | 43.52 | | | $ | 40.59 | | | $ | 41.64 | | | $ | 45.96 | | | $ | 43.72 | | | $ | 36.46 | |
| |
Total Returnc | | | 8.08 | % | | | 11.50 | % | | | 1.08 | % | | | 15.42 | % | | | 19.91 | % | | | 0.83 | % |
Ratios/Supplemental Data | |
Net assets, end of period (in thousands) | | $ | 190 | | | $ | 113 | | | $ | 54 | | | $ | 30 | | | $ | 21 | | | $ | 10 | |
Ratios to average net assets: | |
Net investment income (loss) | | | 1.22 | % | | | 0.48 | % | | | 0.23 | % | | | 0.24 | % | | | (0.17 | %) | | | (0.41 | %) |
Total expensesd | | | 1.08 | % | | | 1.46 | % | | | 1.41 | % | | | 1.81 | % | | | 1.33 | % | | | 1.37 | % |
Net expensese | | | 1.05 | % | | | 1.44 | % | | | 1.41 | % | | | 1.79 | % | | | 1.33 | % | | | 1.37 | % |
Portfolio turnover rate | | | 17 | % | | | 61 | % | | | 75 | % | | | 112 | % | | | 214 | % | | | 149 | % |
a | Unaudited figures for the period ended March 31, 2017. Percentage amounts for the period, except total return and portfolio turnover rate, have been annualized. |
b | Net investment income (loss) per share was computed using average shares outstanding throughout the period. |
c | Total return does not reflect the impact of any applicable sales charges and has not been annualized. |
d | Does not include expenses of the underlying funds in which the Fund invests. |
e | Net expense information reflects the expense ratios after expense waivers. |
f | Since commencement of operations: May 1, 2015. Percentage amounts for the period, except total return and portfolio turnover rate, have been annualized. |
g | Net investment income is less than $0.01 per share. |
h | Since commencement of operations: March 1, 2012. Percentage amounts for the period, except total return and portfolio turnover rate, have been annualized. |
SEE NOTES TO FINANCIAL STATEMENTS. | THE GUGGENHEIM FUNDS SEMI-ANNUAL REPORT | 79 |
FUND PROFILE (Unaudited) | March 31, 2017 |
WORLD EQUITY INCOME FUND
OBJECTIVE: Seeks to provide total return, comprised of capital appreciation and income.
Holdings Diversification (Market Exposure as % of Net Assets)
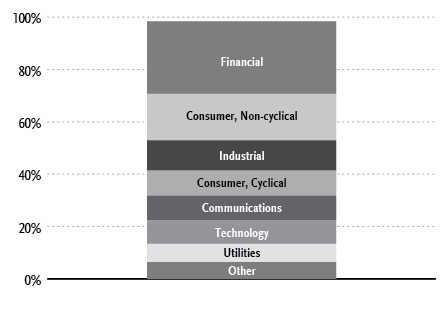
“Holdings Diversification (Market Exposure as % of Net Assets)” excludes any temporary cash investments.
Country Diversification
At March 31, 2017, the investment diversification of the Fund by country was as follows:
Country | % of Common Stocks | Value |
United States | 55% | $48,357,502 |
United Kingdom | 8% | 6,891,084 |
Japan | 6% | 5,382,643 |
Canada | 5% | 4,793,653 |
Switzerland | 4% | 3,335,225 |
Sweden | 4% | 3,306,830 |
Singapore | 2% | 2,172,710 |
Other | 16% | 14,418,947 |
Total Securities | 100% | $88,658,594 |
“Country Diversification” exclude any temporary cash or derivative investments.
Inception Dates: |
A-Class | October 1, 1993 |
C-Class | January 29, 1999 |
P-Class | May 1, 2015 |
Institutional Class | May 2, 2011 |
Ten Largest Holdings (% of Total Net Assets) |
Johnson & Johnson | 1.8% |
Exxon Mobil Corp. | 1.7% |
Wells Fargo & Co. | 1.5% |
Procter & Gamble Co. | 1.5% |
AT&T, Inc. | 1.5% |
Apple, Inc. | 1.4% |
Pfizer, Inc. | 1.4% |
Merck & Company, Inc. | 1.3% |
Roche Holding AG | 1.3% |
Verizon Communications, Inc. | 1.2% |
Top Ten Total | 14.6% |
“Ten Largest Holdings” excludes any temporary cash investments.
80 | THE GUGGENHEIM FUNDS SEMI-ANNUAL REPORT | |
SCHEDULE OF INVESTMENTS (Unaudited) | March 31, 2017 |
WORLD EQUITY INCOME FUND | |
| | Shares | | | Value | |
| | | | | | | |
COMMON STOCKS† - 98.4% | |
| | | | | | | |
Financial - 27.7% | |
Wells Fargo & Co. | | | 23,700 | | | $ | 1,319,142 | |
U.S. Bancorp | | | 16,200 | | | | 834,300 | |
CME Group, Inc. — Class A | | | 6,900 | | | | 819,720 | |
Everest Re Group Ltd. | | | 3,500 | | | | 818,334 | |
Nordea Bank AB | | | 71,300 | | | | 814,075 | |
Swiss Re AG | | | 8,600 | | | | 772,435 | |
Intercontinental Exchange, Inc. | | | 12,700 | | | | 760,349 | |
Skandinaviska Enskilda Banken AB — Class A | | | 67,700 | | | | 753,326 | |
Cincinnati Financial Corp. | | | 9,900 | | | | 715,474 | |
Marsh & McLennan Companies, Inc. | | | 9,600 | | | | 709,344 | |
Swedbank AB — Class A | | | 30,400 | | | | 704,369 | |
Annaly Capital Management, Inc. | | | 63,100 | | | | 701,041 | |
Hang Seng Bank Ltd. | | | 33,600 | | | | 681,380 | |
Allianz AG | | | 3,600 | | | | 666,958 | |
CoreCivic, Inc. | | | 21,100 | | | | 662,962 | |
AXA S.A. | | | 25,300 | | | | 654,701 | |
JPMorgan Chase & Co. | | | 7,200 | | | | 632,448 | |
RenaissanceRe Holdings Ltd. | | | 4,300 | | | | 621,995 | |
People’s United Financial, Inc. | | | 31,600 | | | | 575,120 | |
Vicinity Centres | | | 256,058 | | | | 553,629 | |
Axis Capital Holdings Ltd. | | | 8,100 | | | | 542,943 | |
Government Properties Trust, Inc.* | | | 129,600 | | | | 509,924 | |
AGNC Investment Corp. | | | 24,800 | | | | 493,272 | |
Chubb Ltd. | | | 3,600 | | | | 490,500 | |
CI Financial Corp. | | | 23,700 | | | | 471,024 | |
Ascendas Real Estate Investment Trust | | | 259,200 | | | | 466,943 | |
H&R Real Estate Investment Trust | | | 25,800 | | | | 447,574 | |
Hysan Development Company Ltd. — Class A* | | | 98,500 | | | | 446,776 | |
First Capital Realty, Inc. | | | 28,200 | | | | 424,744 | |
T. Rowe Price Group, Inc. | | | 6,200 | | | | 422,530 | |
BB&T Corp. | | | 9,100 | | | | 406,770 | |
CapitaLand Mall Trust | | | 283,900 | | | | 399,816 | |
Liberty Property Trust | | | 10,300 | | | | 397,065 | |
Japan Retail Fund Investment Corp. | | | 200 | | | | 392,365 | |
ING Groep N.V. | | | 25,800 | | | | 390,042 | |
Sampo Oyj — Class A | | | 7,300 | | | | 346,269 | |
Reinsurance Group of America, Inc. — Class A | | | 2,600 | | | | 330,148 | |
Bank of Montreal | | | 4,000 | | | | 298,771 | |
Lloyds Banking Group plc | | | 326,800 | | | | 271,563 | |
RioCan Real Estate Investment Trust | | | 13,100 | | | | 258,089 | |
Gecina S.A. | | | 1,900 | | | | 257,847 | |
New York Community Bancorp, Inc. | | | 18,200 | | | | 254,254 | |
CNP Assurances | | | 12,400 | | | | 252,419 | |
Banco Bilbao Vizcaya Argentaria S.A. | | | 30,000 | | | | 232,690 | |
Loews Corp. | | | 4,600 | | | | 215,142 | |
Societe Generale S.A. | | | 4,200 | | | | 213,069 | |
Investec plc | | | 30,300 | | | | 206,341 | |
Singapore Exchange Ltd. | | | 30,700 | | | | 168,989 | |
PNC Financial Services Group, Inc. | | | 1,400 | | | | 168,336 | |
Total Financial | | | | | | | 24,947,317 | |
| | | | | | | | | |
Consumer, Non-cyclical - 17.8% | |
Johnson & Johnson | | | 13,200 | | | | 1,644,060 | |
Procter & Gamble Co. | | | 14,648 | | | | 1,316,123 | |
Pfizer, Inc. | | | 36,100 | | | | 1,234,981 | |
Merck & Company, Inc. | | | 18,900 | | | | 1,200,906 | |
Roche Holding AG | | | 4,500 | | | | 1,149,410 | |
UnitedHealth Group, Inc. | | | 6,000 | | | | 984,060 | |
GlaxoSmithKline plc | | | 46,800 | | | | 973,119 | |
Automatic Data Processing, Inc. | | | 8,900 | | | | 911,271 | |
Diageo plc | | | 31,300 | | | | 895,546 | |
Wm Morrison Supermarkets plc | | | 195,395 | | | | 587,335 | |
Cardinal Health, Inc. | | | 7,200 | | | | 587,160 | |
Dr Pepper Snapple Group, Inc. | | | 5,642 | | | | 552,465 | |
Eli Lilly & Co. | | | 6,400 | | | | 538,304 | |
Western Union Co. | | | 25,400 | | | | 516,890 | |
Nielsen Holdings plc | | | 12,100 | | | | 499,851 | |
Asahi Group Holdings Ltd. | | | 10,667 | | | | 403,204 | |
Wesfarmers Ltd. | | | 9,100 | | | | 313,345 | |
Hutchison Port Holdings Trust — Class U | | | 616,900 | | | | 256,014 | |
Otsuka Holdings Company Ltd. | | | 5,500 | | | | 248,111 | |
H&R Block, Inc. | | | 10,400 | | | | 241,800 | |
Takeda Pharmaceutical Company Ltd. | | | 5,100 | | | | 239,550 | |
Nestle S.A. | | | 3,000 | | | | 230,212 | |
United Rentals, Inc.* | | | 1,700 | | | | 212,585 | |
Reed Elsevier plc | | | 8,100 | | | | 158,631 | |
Atlantia SpA | | | 6,000 | | | | 154,913 | |
Total Consumer, Non-cyclical | | | | | | | 16,049,846 | |
| | | | | | | | | |
Industrial - 11.5% | |
Lockheed Martin Corp. | | | 3,542 | | | | 947,839 | |
3M Co. | | | 4,800 | | | | 918,384 | |
Waste Management, Inc. | | | 12,200 | | | | 889,624 | |
Honeywell International, Inc. | | | 6,600 | | | | 824,142 | |
Republic Services, Inc. — Class A | | | 11,500 | | | �� | 722,315 | |
CH Robinson Worldwide, Inc. | | | 9,300 | | | | 718,798 | |
Expeditors International of Washington, Inc. | | | 12,700 | | | | 717,423 | |
United Parcel Service, Inc. — Class B | | | 6,100 | | | | 654,530 | |
MTR Corporation Ltd. | | | 111,000 | | | | 623,449 | |
Fraport AG Frankfurt Airport Services Worldwide | | | 7,000 | | | | 495,370 | |
Deere & Co. | | | 4,400 | | | | 478,984 | |
Avnet, Inc. | | | 10,100 | | | | 462,176 | |
Garmin Ltd. | | | 8,300 | | | | 424,213 | |
Northrop Grumman Corp. | | | 1,400 | | | | 332,976 | |
Kuehne + Nagel International AG | | | 1,900 | | | | 268,455 | |
Raytheon Co. | | | 1,300 | | | | 198,250 | |
General Electric Co. | | | 6,000 | | | | 178,800 | |
BAE Systems plc | | | 20,200 | | | | 162,491 | |
General Dynamics Corp. | | | 800 | | | | 149,760 | |
FLIR Systems, Inc. | | | 4,000 | | | | 145,120 | |
Total Industrial | | | | | | | 10,313,099 | |
| | | | | | | | | |
Consumer, Cyclical - 9.7% | |
McDonald’s Corp. | | | 7,600 | | | | 985,036 | |
Wal-Mart Stores, Inc. | | | 13,475 | | | | 971,278 | |
Home Depot, Inc. | | | 6,100 | | | | 895,663 | |
SEE NOTES TO FINANCIAL STATEMENTS. | THE GUGGENHEIM FUNDS SEMI-ANNUAL REPORT | 81 |
SCHEDULE OF INVESTMENTS (Unaudited)(continued) | March 31, 2017 |
WORLD EQUITY INCOME FUND | |
| | Shares | | | Value | |
| | | | | | | |
Mitsui & Company Ltd. | | | 52,300 | | | $ | 757,545 | |
Ford Motor Co. | | | 59,700 | | | | 694,908 | |
WW Grainger, Inc. | | | 2,800 | | | | 651,728 | |
Compass Group plc | | | 28,400 | | | | 535,903 | |
Japan Airlines Company Ltd. | | | 16,000 | | | | 506,768 | |
Sankyo Company Ltd. | | | 14,600 | | | | 487,869 | |
Berkeley Group Holdings plc | | | 11,500 | | | | 461,960 | |
Yue Yuen Industrial Holdings Ltd. | | | 115,500 | | | | 454,033 | |
Darden Restaurants, Inc. | | | 4,700 | | | | 393,249 | |
Fastenal Co. | | | 7,100 | | | | 365,650 | |
Hennes & Mauritz AB — Class B* | | | 12,100 | | | | 309,258 | |
Lawson, Inc. | | | 3,688 | | | | 250,118 | |
Total Consumer, Cyclical | | | | | | | 8,720,966 | |
| | | | | | | | | |
Communications - 9.4% | |
AT&T, Inc. | | | 31,400 | | | | 1,304,670 | |
Verizon Communications, Inc. | | | 22,900 | | | | 1,116,375 | |
Telia Company AB | | | 173,000 | | | | 725,802 | |
Shaw Communications, Inc. — Class B | | | 31,800 | | | | 659,267 | |
BCE, Inc. | | | 11,500 | | | | 509,171 | |
Alphabet, Inc. — Class C* | | | 600 | | | | 497,736 | |
Thomson Reuters Corp. | | | 11,000 | | | | 475,700 | |
Singapore Telecommunications Ltd. | | | 168,200 | | | | 471,347 | |
Telefonica Deutschland Holding AG | | | 91,200 | | | | 452,449 | |
Singapore Press Holdings Ltd. | | | 161,400 | | | | 409,601 | |
SES S.A. | | | 17,400 | | | | 404,787 | |
HKT Trust & HKT Ltd. | | | 305,200 | | | | 393,501 | |
Bezeq The Israeli Telecommunication Corporation Ltd. | | | 186,000 | | | | 334,316 | |
Facebook, Inc. — Class A* | | | 1,600 | | | | 227,280 | |
TDC A/S | | | 35,000 | | | | 180,500 | |
Amazon.com, Inc.* | | | 200 | | | | 177,308 | |
Deutsche Telekom AG | | | 8,100 | | | | 141,942 | |
Total Communications | | | | | | | 8,481,752 | |
| | | | | | | | | |
Technology - 8.9% | |
Apple, Inc. | | | 8,800 | | | | 1,264,208 | |
International Business Machines Corp. | | | 6,000 | | | | 1,044,841 | |
Accenture plc — Class A | | | 8,100 | | | | 971,028 | |
Canon, Inc. | | | 30,400 | | | | 947,841 | |
Paychex, Inc. | | | 13,100 | | | | 771,590 | |
CA, Inc. | | | 20,500 | | | | 650,260 | |
Fidelity National Information Services, Inc. | | | 7,800 | | | | 621,036 | |
Microsoft Corp. | | | 9,100 | | | | 599,326 | |
NTT Data Corp. | | | 9,700 | | | | 460,058 | |
Oracle Corporation Japan | | | 7,700 | | | | 439,901 | |
Ricoh Company Ltd. | | | 30,300 | | | | 249,313 | |
Total Technology | | | | | | | 8,019,402 | |
| | | | | | | | | |
Utilities - 7.0% | |
Southern Co. | | | 15,560 | | | | 774,578 | |
CLP Holdings Ltd. | | | 65,437 | | | | 684,133 | |
SSE plc | | | 36,500 | | | | 675,028 | |
PPL Corp. | | | 17,554 | | | | 656,344 | |
Duke Energy Corp. | | | 6,373 | | | | 522,650 | |
Red Electrica Corporation S.A. | | | 24,100 | | | | 462,819 | |
Snam SpA | | | 102,800 | | | | 444,629 | |
DTE Energy Co. | | | 3,993 | | | | 407,725 | |
AGL Energy Ltd. | | | 18,200 | | | | 366,670 | |
Emera, Inc. | | | 10,300 | | | | 363,871 | |
Dominion Resources, Inc. | | | 4,368 | | | | 338,826 | |
CenterPoint Energy, Inc. | | | 10,412 | | | | 287,058 | |
SCANA Corp. | | | 2,789 | | | | 182,261 | |
Sempra Energy | | | 1,299 | | | | 143,540 | |
Total Utilities | | | | | | | 6,310,132 | |
| | | | | | | | | |
Energy - 4.9% | |
Exxon Mobil Corp. | | | 18,100 | | | | 1,484,381 | |
BP plc | | | 157,100 | | | | 900,554 | |
Phillips 66 | | | 6,000 | | | | 475,320 | |
Kinder Morgan, Inc. | | | 17,500 | | | | 380,450 | |
OMV AG | | | 7,200 | | | | 283,337 | |
Valero Energy Corp. | | | 4,000 | | | | 265,160 | |
Petrofac Ltd. | | | 20,600 | | | | 237,077 | |
Woodside Petroleum Ltd. | | | 9,100 | | | | 223,033 | |
Inter Pipeline Ltd. | | | 9,100 | | | | 191,806 | |
Total Energy | | | | | | | 4,441,118 | |
| | | | | | | | | |
Basic Materials - 1.5% | |
Potash Corporation of Saskatchewan, Inc. | | | 40,600 | | | | 693,636 | |
LyondellBasell Industries N.V. — Class A | | | 3,900 | | | | 355,641 | |
Rio Tinto plc | | | 8,100 | | | | 325,685 | |
Total Basic Materials | | | | | | | 1,374,962 | |
| | | | | | | | | |
Total Common Stocks | | | | | | | | |
(Cost $81,582,424) | | | | | | | 88,658,594 | |
| | | | | | | | | |
SHORT-TERM INVESTMENTS† - 1.1% | |
Goldman Sachs Financial Square Treasury Instruments Fund - Institutional Class 0.56%1 | | | 995,496 | | | | 995,496 | |
Total Short-Term Investments | | | | | | | | |
(Cost $995,496) | | | | | | | 995,496 | |
| | | | | | | | | |
Total Investments - 99.5% | | | | | | | | |
(Cost $82,577,920) | | | | | | $ | 89,654,090 | |
Other Assets & Liabilities, net - 0.5% | | | | | | | 456,788 | |
Total Net Assets - 100.0% | | | | | | $ | 90,110,878 | |
* | Non-income producing security. |
† | Value determined based on Level 1 inputs — See Note 4. |
1 | Rate indicated is the 7 day yield as of March 31, 2017. |
| | plc — Public Limited Company |
| | |
| | See Sector Classification in Other Information section. |
82 | THE GUGGENHEIM FUNDS SEMI-ANNUAL REPORT | SEE NOTES TO FINANCIAL STATEMENTS. |
SCHEDULE OF INVESTMENTS (Unaudited)(concluded) | March 31, 2017 |
WORLD EQUITY INCOME FUND | |
The following table summarizes the inputs used to value the Fund’s investments at March 31, 2017 (See Note 4 in the Notes to Financial Statements):
Investments in Securities (Assets) | | Level 1 | | | Level 2 | | | Level 3 | | | Total | |
Common Stocks | | $ | 88,658,594 | | | $ | — | | | $ | — | | | $ | 88,658,594 | |
Short Term Investments | | | 995,496 | | | | — | | | | — | | | | 995,496 | |
Total | | $ | 89,654,090 | | | $ | — | | | $ | — | | | $ | 89,654,090 | |
Transfers between investment levels may occur as the markets fluctuate and/or the availability of data used in an investment’s valuation changes. Transfers between valuation levels, if any, are in comparison to the valuation levels at the end of the previous fiscal year, and are effective using the fair value as of the end of the previous fiscal period.
For the period ended March 31, 2017, there were no transfers between levels.
SEE NOTES TO FINANCIAL STATEMENTS. | THE GUGGENHEIM FUNDS SEMI-ANNUAL REPORT | 83 |
STATEMENT OF ASSETS AND LIABILITIES (Unaudited) |
March 31, 2017 |
Assets: | |
Investments, at value (cost $82,577,920) | | $ | 89,654,090 | |
Foreign currency, at value (cost $80,598) | | | 80,631 | |
Prepaid expenses | | | 38,957 | |
Receivables: | |
Fund shares sold | | | 101,201 | |
Dividends | | | 320,942 | |
Foreign taxes reclaim | | | 191,285 | |
Total assets | | | 90,387,106 | |
| | | | | |
Liabilities: | |
Overdraft due to custodian bank | | | 8,801 | |
Payable for: | |
Fund shares redeemed | | | 137,677 | |
Management fees | | | 55,269 | |
Transfer agent/maintenance fees | | | 33,800 | |
Distribution and service fees | | | 22,516 | |
Fund accounting/administration fees | | | 6,183 | |
Trustees’ fees* | | | 1,622 | |
Miscellaneous | | | 10,360 | |
Total liabilities | | | 276,228 | |
Net assets | | $ | 90,110,878 | |
| | | | | |
Net assets consist of: | |
Paid in capital | | $ | 103,684,016 | |
Accumulated net investment loss | | | (293,389 | ) |
Accumulated net realized loss on investments | | | (20,347,860 | ) |
Net unrealized appreciation on investments | | | 7,068,111 | |
Net assets | | $ | 90,110,878 | |
| | | | | |
A-Class: | |
Net assets | | $ | 81,566,707 | |
Capital shares outstanding | | | 5,779,285 | |
Net asset value per share | | $ | 14.11 | |
Maximum offering price per share (Net asset value divided by 95.25%) | | $ | 14.81 | |
| | | | | |
C-Class: | |
Net assets | | $ | 5,892,220 | |
Capital shares outstanding | | | 487,018 | |
Net asset value per share | | $ | 12.10 | |
| | | | | |
P-Class: | |
Net assets | | $ | 139,066 | |
Capital shares outstanding | | | 9,722 | |
Net asset value per share | | $ | 14.30 | |
| | | | | |
Institutional Class: | |
Net assets | | $ | 2,512,885 | |
Capital shares outstanding | | | 179,399 | |
Net asset value per share | | $ | 14.01 | |
STATEMENT OF OPERATIONS (Unaudited) |
Period Ended March 31, 2017 |
Investment Income: | |
Dividends (net of foreign withholding tax of $103,872) | | $ | 1,497,017 | |
Interest | | | 269 | |
Other income | | | 1,088 | |
Total investment income | | | 1,498,374 | |
| | | | | |
Expenses: | |
Management fees | | | 314,566 | |
Transfer agent/maintenance fees: | |
A-Class | | | 39,285 | |
C-Class | | | 6,408 | |
P-Class | | | 625 | |
Institutional Class | | | 1,036 | |
Distribution and service fees: | |
A-Class | | | 101,527 | |
C-Class | | | 27,849 | |
P-Class | | | 172 | |
Fund accounting/administration fees | | | 36,058 | |
Line of credit fees | | | 9,477 | |
Custodian fees | | | 3,752 | |
Trustees’ fees* | | | 3,524 | |
Miscellaneous | | | 30,995 | |
Total expenses | | | 575,274 | |
Less: | |
Expenses reimbursed by Adviser: | | | | |
A-Class | | | (747 | ) |
C-Class | | | (3,261 | ) |
P-Class | | | (556 | ) |
Total reimbursed expenses | | | (4,564 | ) |
Net expenses | | | 570,710 | |
Net investment income | | | 927,664 | |
| | | | | |
Net Realized and Unrealized Gain (Loss): | |
Net realized gain (loss) on: | |
Investments | | | 1,439,342 | |
Futures contracts | | | (200,154 | ) |
Foreign currency | | | (14,575 | ) |
Net realized gain | | | 1,224,613 | |
Net change in unrealized appreciation (depreciation) on: | |
Investments | | | 2,471,705 | |
Futures contracts | | | 19,765 | |
Foreign currency | | | (3,788 | ) |
Net change in unrealized appreciation (depreciation) | | | 2,487,682 | |
Net realized and unrealized gain | | | 3,712,295 | |
Net increase in net assets resulting from operations | | $ | 4,639,959 | |
* | Relates to Trustees not deemed “interested persons” within the meaning of Section 2(a)(19) of the 1940 Act. |
84 | THE GUGGENHEIM FUNDS SEMI-ANNUAL REPORT | SEE NOTES TO FINANCIAL STATEMENTS. |
STATEMENTS OF CHANGES IN NET ASSETS |
| | Period Ended
March 31,
2017
(Unaudited) | | | Year Ended
September 30,
2016 | |
Increase (Decrease) in Net Assets from Operations: | | | | | | |
Net investment income | | $ | 927,664 | | | $ | 2,035,182 | |
Net realized gain (loss) on investments | | | 1,224,613 | | | | (1,633,024 | ) |
Net change in unrealized appreciation (depreciation) on investments | | | 2,487,682 | | | | 10,283,016 | |
Net increase in net assets resulting from operations | | | 4,639,959 | | | | 10,685,174 | |
| | | | | | | | | |
Distributions to shareholders from: | | | | | | | | |
Net investment income | | | | | | | | |
A-Class | | | (816,779 | ) | | | (1,891,462 | ) |
C-Class | | | (46,575 | ) | | | (96,485 | ) |
P-Class | | | (1,406 | ) | | | (3,486 | ) |
Institutional Class | | | (30,793 | ) | | | (76,190 | ) |
Total distributions to shareholders | | | (895,553 | ) | | | (2,067,623 | ) |
| | | | | | | | | |
Capital share transactions: | | | | | | | | |
Proceeds from sale of shares | | | | | | | | |
A-Class | | | 7,759,969 | | | | 18,583,958 | |
C-Class | | | 691,309 | | | | 1,520,462 | |
P-Class | | | 7,965 | | | | 1,274,125 | |
Institutional Class | | | 891,347 | | | | 2,057,895 | |
Distributions reinvested | | | | | | | | |
A-Class | | | 811,306 | | | | 1,834,883 | |
C-Class | | | 42,264 | | | | 84,172 | |
P-Class | | | 1,406 | | | | 3,486 | |
Institutional Class | | | 24,373 | | | | 39,956 | |
Cost of shares redeemed | | | | | | | | |
A-Class | | | (10,966,956 | ) | | | (21,141,116 | ) |
C-Class | | | (516,639 | ) | | | (2,663,968 | ) |
P-Class | | | (9,613 | ) | | | (1,141,200 | ) |
Institutional Class | | | (1,356,576 | ) | | | (4,137,425 | ) |
Net decrease from capital share transactions | | | (2,619,845 | ) | | | (3,684,772 | ) |
Net increase in net assets | | | 1,124,561 | | | | 4,932,779 | |
| | | | | | | | | |
Net assets: | | | | | | | | |
Beginning of period | | | 88,986,317 | | | | 84,053,538 | |
End of period | | $ | 90,110,878 | | | $ | 88,986,317 | |
Accumulated net investment loss at end of period | | $ | (293,389 | ) | | $ | (325,500 | ) |
SEE NOTES TO FINANCIAL STATEMENTS. | THE GUGGENHEIM FUNDS SEMI-ANNUAL REPORT | 85 |
STATEMENTS OF CHANGES IN NET ASSETS (concluded) |
| | Period Ended
March 31,
2017
(Unaudited) | | | Year Ended
September 30,
2016 | |
Capital share activity: | | | | | | |
Shares sold | | | | | | |
A-Class | | | 574,310 | | | | 1,431,215 | |
C-Class | | | 58,486 | | | | 135,606 | |
P-Class | | | 578 | | | | 98,351 | |
Institutional Class | | | 65,738 | | | | 158,922 | |
Shares issued from reinvestment of distributions | | | | | | | | |
A-Class | | | 58,041 | | | | 138,084 | |
C-Class | | | 3,532 | | | | 7,362 | |
P-Class | | | 99 | | | | 265 | |
Institutional Class | | | 1,753 | | | | 3,033 | |
Shares redeemed | | | | | | | | |
A-Class | | | (803,060 | ) | | | (1,610,092 | ) |
C-Class | | | (44,017 | ) | | | (236,515 | ) |
P-Class | | | (676 | ) | | | (89,636 | ) |
Institutional Class | | | (98,101 | ) | | | (323,244 | ) |
Net decrease in shares | | | (183,317 | ) | | | (286,649 | ) |
86 | THE GUGGENHEIM FUNDS SEMI-ANNUAL REPORT | SEE NOTES TO FINANCIAL STATEMENTS. |
This table is presented to show selected data for a share outstanding throughout each period and to assist shareholders in evaluating a Fund’s performance for the periods presented.
A-Class | | Period Ended
March 31,
2017a | | | Year Ended
September 30, 2016 | | | Year Ended
September 30, 2015 | | | Year Ended
September 30, 2014 | | | Year Ended
September 30, 2013 | | | Year Ended
September 30, 2012 | |
Per Share Data | | | | | | | | | | | | | | | | | | |
Net asset value, beginning of period | | $ | 13.54 | | | $ | 12.28 | | | $ | 13.51 | | | $ | 12.60 | | | $ | 10.55 | | | $ | 9.70 | |
Income (loss) from investment operations: | |
Net investment income (loss)b | | | .14 | | | | .31 | | | | .29 | | | | .38 | | | | .18 | | | | .15 | |
Net gain (loss) on investments (realized and unrealized) | | | .57 | | | | 1.26 | | | | (1.18 | ) | | | .95 | | | | 2.16 | | | | .70 | |
Total from investment operations | | | .71 | | | | 1.57 | | | | (.89 | ) | | | 1.33 | | | | 2.34 | | | | .85 | |
Less distributions from: | |
Net investment income | | | (.14 | ) | | | (.31 | ) | | | (.34 | ) | | | (.42 | ) | | | (.29 | ) | | | (— | )c |
Total distributions | | | (.14 | ) | | | (.31 | ) | | | (.34 | ) | | | (.42 | ) | | | (.29 | ) | | | (— | )c |
Net asset value, end of period | | $ | 14.11 | | | $ | 13.54 | | | $ | 12.28 | | | $ | 13.51 | | | $ | 12.60 | | | $ | 10.55 | |
| |
Total Returnd | | | 5.26 | % | | | 12.85 | % | | | (6.70 | %) | | | 10.62 | % | | | 22.58 | % | | | 8.82 | % |
Ratios/Supplemental Data | |
Net assets, end of period (in thousands) | | $ | 81,567 | | | $ | 80,575 | | | $ | 73,568 | | | $ | 78,783 | | | $ | 65,966 | | | $ | 61,838 | |
Ratios to average net assets: | |
Net investment income (loss) | | | 2.10 | % | | | 2.36 | % | | | 2.21 | % | | | 2.81 | % | | | 1.59 | % | | | 1.45 | % |
Total expensesh | | | 1.23 | % | | | 1.48 | % | | | 1.48 | % | | | 1.66 | % | | | 1.93 | % | | | 2.05 | % |
Net expensese | | | 1.23 | %g | | | 1.48 | %g | | | 1.43 | %g | | | 1.49 | %g | | | 1.59 | % | | | 1.63 | % |
Portfolio turnover rate | | | 29 | % | | | 51 | % | | | 131 | % | | | 131 | % | | | 154 | % | | | 41 | % |
C-Class | | Period Ended
March 31,
2017a | | | Year Ended
September 30, 2016 | | | Year Ended
September 30, 2015 | | | Year Ended
September 30, 2014 | | | Year Ended
September 30, 2013 | | | Year Ended
September 30, 2012 | |
Per Share Data | | | | | | | | | | | | | | | | | | |
Net asset value, beginning of period | | $ | 11.63 | | | $ | 10.55 | | | $ | 11.61 | | | $ | 10.79 | | | $ | 9.01 | | | $ | 8.33 | |
Income (loss) from investment operations: | |
Net investment income (loss)b | | | .08 | | | | .18 | | | | .17 | | | | .25 | | | | .08 | | | | .06 | |
Net gain (loss) on investments (realized and unrealized) | | | .49 | | | | 1.09 | | | | (1.02 | ) | | | .81 | | | | 1.84 | | | | .62 | |
Total from investment operations | | | .57 | | | | 1.27 | | | | (.85 | ) | | | 1.06 | | | | 1.92 | | | | .68 | |
Less distributions from: | |
Net investment income | | | (.10 | ) | | | (.19 | ) | | | (.21 | ) | | | (.24 | ) | | | (.14 | ) | | | — | |
Total distributions | | | (.10 | ) | | | (.19 | ) | | | (.21 | ) | | | (.24 | ) | | | (.14 | ) | | | — | |
Net asset value, end of period | | $ | 12.10 | | | $ | 11.63 | | | $ | 10.55 | | | $ | 11.61 | | | $ | 10.79 | | | $ | 9.01 | |
| |
Total Returnd | | | 4.90 | % | | | 12.05 | % | | | (7.40 | %) | | | 9.79 | % | | | 21.57 | % | | | 8.16 | % |
Ratios/Supplemental Data | |
Net assets, end of period (in thousands) | | $ | 5,892 | | | $ | 5,455 | | | $ | 5,936 | | | $ | 5,337 | | | $ | 3,377 | | | $ | 3,015 | |
Ratios to average net assets: | |
Net investment income (loss) | | | 1.39 | % | | | 1.59 | % | | | 1.50 | % | | | 2.13 | % | | | 0.80 | % | | | 0.68 | % |
Total expensesh | | | 2.11 | % | | | 2.35 | % | | | 2.28 | % | | | 2.62 | % | | | 2.89 | % | | | 2.88 | % |
Net expensese | | | 1.98 | %g | | | 2.23 | %g | | | 2.23 | %g | | | 2.24 | %g | | | 2.35 | % | | | 2.38 | % |
Portfolio turnover rate | | | 29 | % | | | 51 | % | | | 131 | % | | | 131 | % | | | 154 | % | | | 41 | % |
SEE NOTES TO FINANCIAL STATEMENTS. | THE GUGGENHEIM FUNDS SEMI-ANNUAL REPORT | 87 |
FINANCIAL HIGHLIGHTS (continued) |
This table is presented to show selected data for a share outstanding throughout each period and to assist shareholders in evaluating a Fund’s performance for the periods presented.
P-Class | | Period Ended
March 31,
2017a | | | Year Ended
September 30,
2016 | | | Period Ended
September 30,
2015f | |
Per Share Data | | | | | | | | | |
Net asset value, beginning of period | | $ | 13.73 | | | $ | 12.33 | | | $ | 13.62 | |
Income (loss) from investment operations: | |
Net investment income (loss)b | | | .15 | | | | .33 | | | | .12 | |
Net gain (loss) on investments (realized and unrealized) | | | .56 | | | | 1.35 | | | | (1.29 | ) |
Total from investment operations | | | .71 | | | | 1.68 | | | | (1.17 | ) |
Less distributions from: | |
Net investment income | | | (.14 | ) | | | (.28 | ) | | | (.12 | ) |
Total distributions | | | (.14 | ) | | | (.28 | ) | | | (.12 | ) |
Net asset value, end of period | | $ | 14.30 | | | $ | 13.73 | | | $ | 12.33 | |
| |
Total Returnd | | | 5.21 | % | | | 13.73 | % | | | (8.64 | %) |
Ratios/Supplemental Data | |
Net assets, end of period (in thousands) | | $ | 139 | | | $ | 133 | | | $ | 9 | |
Ratios to average net assets: | |
Net investment income (loss) | | | 2.12 | % | | | 2.58 | % | | | 2.14 | % |
Total expensesh | | | 2.04 | % | | | 1.33 | % | | | 3.54 | % |
Net expensese,g | | | 1.23 | % | | | 1.33 | % | | | 1.48 | % |
Portfolio turnover rate | | | 29 | % | | | 51 | % | | | 131 | % |
88 | THE GUGGENHEIM FUNDS SEMI-ANNUAL REPORT | SEE NOTES TO FINANCIAL STATEMENTS. |
FINANCIAL HIGHLIGHTS (concluded) |
This table is presented to show selected data for a share outstanding throughout each period and to assist shareholders in evaluating a Fund’s performance for the periods presented.
Institutional Class | | Period Ended
March 31,
2017a | | | Year Ended
September
30, 2016 | | | Year Ended
September 30, 2015 | | | Year Ended
September 30, 2014 | | | Year Ended
September 30, 2013 | | | Year Ended
September 30, 2012 | |
Per Share Data | | | | | | | | | | | | | | | | | | |
Net asset value, beginning of period | | $ | 13.44 | | | $ | 12.23 | | | $ | 13.45 | | | $ | 12.53 | | | $ | 10.50 | | | $ | 9.70 | |
Income (loss) from investment operations: | |
Net investment income (loss)b | | | .16 | | | | .31 | | | | .36 | | | | .44 | | | | .28 | | | | .28 | |
Net gain (loss) on investments (realized and unrealized) | | | .57 | | | | 1.28 | | | | (1.21 | ) | | | .90 | | | | 2.10 | | | | .52 | |
Total from investment operations | | | .73 | | | | 1.59 | | | | (.85 | ) | | | 1.34 | | | | 2.38 | | | | .80 | |
Less distributions from: | |
Net investment income | | | (.16 | ) | | | (.38 | ) | | | (.37 | ) | | | (.42 | ) | | | (.35 | ) | | | (— | )c |
Total distributions | | | (.16 | ) | | | (.38 | ) | | | (.37 | ) | | | (.42 | ) | | | (.35 | ) | | | (— | )c |
Net asset value, end of period | | $ | 14.01 | | | $ | 13.44 | | | $ | 12.23 | | | $ | 13.45 | | | $ | 12.53 | | | $ | 10.50 | |
| |
Total Returnd | | | 5.46 | % | | | 13.11 | % | | | (6.42 | %) | | | 10.83 | % | | | 23.17 | % | | | 8.17 | % |
Ratios/Supplemental Data | |
Net assets, end of period (in thousands) | | $ | 2,513 | | | $ | 2,824 | | | $ | 4,541 | | | $ | 911 | | | $ | 252 | | | $ | 90 | |
Ratios to average net assets: | |
Net investment income (loss) | | | 2.33 | % | | | 2.42 | % | | | 2.70 | % | | | 3.27 | % | | | 2.42 | % | | | 2.70 | % |
Total expensesh | | | 0.98 | % | | | 1.30 | % | | | 1.23 | % | | | 1.33 | % | | | 1.73 | % | | | 1.90 | % |
Net expensese | | | 0.98 | %g | | | 1.22 | %g | | | 1.23 | %g | | | 1.23 | %g | | | 1.26 | % | | | 1.32 | % |
Portfolio turnover rate | | | 29 | % | | | 51 | % | | | 131 | % | | | 131 | % | | | 154 | % | | | 41 | % |
a | Unaudited figures for the period ended March 31, 2017. Percentage amounts for the period, except total return and portfolio turnover rate, have been annualized. |
b | Net investment income (loss) per share was computed using average shares outstanding throughout the period. |
c | Distributions from net investment income are less than $0.01 per share. |
d | Total return does not reflect the impact of any applicable sales charges and has not been annualized. |
e | Net expense information reflects the expense ratios after expense waivers and reimbursements, as applicable. |
f | Since commencement of operations: May 1, 2015. Percentage amounts for the period, except total return and portfolio turnover rate, have been annualized. |
g | Net expenses may include expenses that are excluded from the expense limitation agreement and recouped amounts. Excluding these expenses, the net expense ratios for the periods presented would be: |
| | | 03/31/17 | 09/30/16 | 09/30/15 | 09/30/14 | |
| | A-Class | 1.22% | 1.46% | 1.46% | 1.46% | |
| | C-Class | 1.97% | 2.21% | 2.21% | 2.21% | |
| | P-Class | 1.22% | 1.32% | 1.46% | — | |
| | Institutional Class | 0.97% | 1.21% | 1.21% | 1.21% | |
h | Does not include expenses of the underlying funds in which the Fund invests. |
SEE NOTES TO FINANCIAL STATEMENTS. | THE GUGGENHEIM FUNDS SEMI-ANNUAL REPORT | 89 |
NOTES TO FINANCIAL STATEMENTS (Unaudited) |
1. Organization and Significant Accounting Policies
Organization
Guggenheim Funds Trust (the “Trust”), a Delaware statutory trust, is registered with the SEC under the Investment Company Act of 1940 (“1940 Act”), as an open-ended investment company of the series type. Each series, in effect, is representing a separate Fund. The Trust is authorized to issue an unlimited number of shares. The Trust accounts for the assets of each Fund separately.
The Trust offers a combination of five separate classes of shares, A-Class shares, C-Class shares, P-Class shares, R6-Class shares and Institutional Class shares. Sales of shares of each Class are made without a front-end sales charge at the net asset value per share (“NAV”), with the exception of A-Class shares. A-Class shares are sold at the NAV, plus the applicable front-end sales charge. The sales charge varies depending on the amount purchased. A-Class share purchases of $1 million or more are exempt from the front-end sales charge but have a 1% contingent deferred sales charge (“CDSC”), if shares are redeemed within 12 months of purchase. C-Class shares have a 1% CDSC if shares are redeemed within 12 months of purchase. Institutional Class shares are offered primarily for direct investment by institutions such as pension and profit sharing plans, endowments, foundations and corporations. Institutional Class shares require a minimum initial investment of $2 million and a minimum account balance of $1 million. At March 31, 2017, the Trust consisted of nineteen funds.
This report covers the Alpha Opportunity Fund, Large Cap Value Fund, Market Neutral Real Estate Fund, Risk Managed Real Estate Fund, Small Cap Value Fund, StylePlus—Large Core Fund, StylePlus—Mid Growth Fund and World Equity Income Fund (the “Funds”), each a diversified investment company, with the exception of the Large Cap Value Fund, Market Neutral Real Estate Fund and Risk Managed Real Estate Fund, which are each a non-diversified investment company. Only A-Class, C-Class, P-Class and Institutional Class shares had been issued by the Funds.
Security Investors, LLC and Guggenheim Partners Investment Management, LLC, which operates under the name Guggenheim Investments (“GI”), provides advisory services. Guggenheim Funds Distributors, LLC (“GFD”) acts as principal underwriter for the Trust. GI and GFD are affiliated entities.
Significant Accounting Policies
The Funds operate as investment companies and, accordingly, follow the investment company accounting and reporting guidance of the Financial Accounting Standards Board (“FASB”) Accounting Standards Codification Topic 946 Financial Services – Investment Companies.
The following significant accounting policies are in conformity with U.S. generally accepted accounting principles (“U.S. GAAP”) and are consistently followed by the Trust. This requires management to make estimates and assumptions that affect the reported amount of assets and liabilities, contingent assets and liabilities at the date of the financial statements, and the reported amounts of revenues and expenses during the reporting period. Actual results could differ from these estimates. All time references are based on Eastern Time.
The NAV of each Class of the Funds is calculated by dividing the market value of the Fund’s securities and other assets, less all liabilities, attributable to the Class by the number of outstanding shares of the Class.
A. The Board of Trustees of the Funds (the “Board”) has adopted policies and procedures for the valuation of the Funds’ investments (the “Valuation Procedures”). Pursuant to the Valuation Procedures, the Board has delegated to a valuation committee, consisting of representatives from Guggenheim’s investment management, fund administration, legal and compliance departments (the “Valuation Committee”), the day-to-day responsibility for implementing the Valuation Procedures, including, under most circumstances, the responsibility for determining the fair value of the Funds’ securities and/or other assets.
Valuations of the Funds’ securities are supplied primarily by pricing services appointed pursuant to the processes set forth in the Valuation Procedures. The Valuation Committee convenes monthly, or more frequently as needed, to review the valuation of all assets which have been fair valued for reasonableness. The Funds’ officers, through the Valuation Committee and consistent with the monitoring and review responsibilities set forth in the Valuation Procedures, regularly review procedures used and valuations provided by the pricing services.
If the pricing service cannot or does not provide a valuation for a particular investment or such valuation is deemed unreliable, such investment is fair valued by the Valuation Committee.
Equity securities listed on an exchange (New York Stock Exchange (“NYSE”) or American Stock Exchange) are valued at the last quoted sales price as of the close of business on the NYSE, usually 4:00 p.m. on the valuation date. Equity securities listed on the NASDAQ market system are valued at the NASDAQ Official Closing Price on the valuation date, which may not necessarily represent the last sale price. If there has been no sale on such exchange or NASDAQ on a given day, the security is valued at the closing bid price on that day.
90 | THE GUGGENHEIM FUNDS SEMI-ANNUAL REPORT | |
NOTES TO FINANCIAL STATEMENTS (Unaudited)(continued) |
Generally, trading in foreign securities markets is substantially completed each day at various times prior to the close of the NYSE. The values of foreign securities are determined as of the close of such foreign markets or the close of the NYSE, if earlier. All investments quoted in foreign currencies are valued in U.S. dollars on the basis of the foreign currency exchange rates prevailing at the close of business. Investments in foreign securities may involve risks not present in domestic investments. The Valuation Committee will determine the current value of such foreign securities by taking into consideration certain factors which may include those discussed above, as well as the following factors, among others: the value of the securities traded on other foreign markets, ADR trading, closed-end fund trading, foreign currency exchange activity, and the trading prices of financial products that are tied to foreign securities. In addition, the Board has authorized the Valuation Committee and GI to use prices and other information supplied by a third party pricing vendor in valuing foreign securities.
Open-end investment companies (“mutual funds”) are valued at their NAV as of the close of business, on the valuation date. Exchange-traded funds (“ETFs”) and closed-end investment companies (“CEFs”) are valued at the last quoted sales price.
The value of futures contracts is accounted for using the unrealized gain or loss on the contracts that is determined by marking the contracts to their current realized settlement prices. Financial futures contracts are valued at the 4:00 p.m. price on the valuation date. In the event that the exchange for a specific futures contract closes earlier than 4:00 p.m., the futures contract is valued at the Official Settlement Price of the exchange. However, the underlying securities from which the futures contract value is derived are monitored until 4:00 p.m. to determine if fair valuation would provide a more accurate valuation.
The values of OTC swap agreements entered into by a Fund are accounted for using the unrealized gains or losses on the agreements that are determined by marking the agreements to the last quoted value of the index that the swaps pertain to at the close of the NYSE. The swaps’ values are then adjusted to include dividends accrued, financing charges and/or interest associated with the swap agreements.
The value of equity swaps with custom portfolio baskets shall be computed by using the last exchange sale price for each underlying equity security within the swap agreement. A custom portfolio equity swap will be adjusted to include dividends accrued, financing charges and/or interest, as applicable, under the swap agreement.
Investments for which market quotations are not readily available are fair-valued as determined in good faith by GI under the direction of the Board using methods established or ratified by the Board. Valuations in accordance with these methods are intended to reflect each security’s (or asset’s) “fair value.” Each such determination is based on a consideration of all relevant factors, which are likely to vary from one pricing context to another. Examples of such factors may include, but are not limited to market prices; sale prices; broker quotes; and models which derive prices based on inputs such as prices of securities with comparable maturities and characteristics, or based on inputs such as anticipated cash flows or collateral, spread over Treasuries, and other information analysis.
In connection with futures contracts and other derivative investments, such factors may include obtaining information as to how (a) these contracts and other derivative investments trade in the futures or other derivative markets, respectively, and (b) the securities underlying these contracts and other derivative investments trade in the cash market.
B. When a Fund engages in a short sale of a security, an amount equal to the proceeds is reflected as an asset and an equivalent liability. The amount of the liability is subsequently marked-to-market to reflect the market value of the short sale. The Fund maintains a segregated account of cash and/or securities as collateral for short sales.
Fees, if any, paid to brokers to borrow securities in connection with short sales are recorded as interest expense. In addition, the Fund must pay out the dividend rate of the equity or coupon rate of the obligation to the lender and record this as an expense. Short dividend or interest expense is a cost associated with the investment objective of short sales transactions, rather than an operational cost associated with the day-to-day management of any mutual fund. The Fund may also receive rebate income from the broker resulting from the investment of the proceeds from securities sold short.
C. Upon entering into a futures contract, a Fund deposits and maintains as collateral such initial margin as required by the exchange on which the transaction is affected. Pursuant to the contract, the Fund agrees to receive from or pay to the broker an amount of cash equal to the daily fluctuation in value of the contract. Such receipts or payments are known as variation margin and are recorded by the Fund as unrealized gains or losses. When the contract is closed, the Fund records a realized gain or loss equal to the difference between the value of the contract at the time it was opened and the value at the time it was closed.
D. Swap agreements are marked-to-market daily and the change, if any, is recorded as unrealized gain or loss. Payments received or made as a result of an agreement or termination of an agreement are recognized as realized gains or losses.
| | THE GUGGENHEIM FUNDS SEMI-ANNUAL REPORT | 91 |
NOTES TO FINANCIAL STATEMENTS (Unaudited)(continued) |
E. Security transactions are recorded on the trade date for financial reporting purposes. Realized gains and losses from securities transactions are recorded using the identified cost basis. Proceeds from lawsuits related to investment holdings are recorded as realized gains in the respective Fund. Dividend income is recorded on the ex-dividend date, net of applicable taxes withheld by foreign countries. Taxable non-cash dividends are recorded as dividend income. Interest income, including amortization of premiums and accretion of discounts, is accrued on a daily basis. Interest income also includes paydown gains and losses on mortgage-backed and asset-backed securities and senior and subordinated loans. Amendment fees are earned as compensation for evaluating and accepting changes to the original loan agreement and are recognized when received. Dividend income from REITs is recorded based on the income included in the distributions received from the REIT investments using published REIT classifications, including some management estimates when actual amounts are not available. Distributions received in excess of this estimated amount are recorded as a reduction of the cost of investments or reclassified to capital gains. The actual amounts of income, return of capital, and capital gains are only determined by each REIT after its fiscal year-end, and may differ from the estimated amounts.
F. Dividends from net investment income are declared quarterly in the World Equity Income Fund and Risk Managed Real Estate Fund. Dividends are reinvested in additional shares unless shareholders request payment in cash. Distributions of net investment income in the remaining Funds and distributions of net realized gains, if any, in all Funds are declared at least annually and recorded on the ex-dividend date and are determined in accordance with income tax regulations which may differ from U.S. GAAP.
G. Interest and dividend income, most expenses, all realized gains and losses, and all unrealized gains and losses are allocated to the classes based upon the value of the outstanding shares in each Class. Certain costs, such as distribution and service fees are charged directly to specific classes. In addition, certain expenses have been allocated to the individual Funds in the Trust on a pro rata basis upon the respective aggregate net assets of each Fund included in the Trust.
H. Under the fee arrangement with the custodian, the Funds may earn credits based on overnight custody cash balances. These credits are utilized to reduce related custodial expenses. The custodian fees disclosed in the Statement of Operations are before the reduction in expense from the related earnings credits, if any. For the period ended March 31, 2017, there were no earnings credits received.
I. The Funds may leave cash overnight in their cash account with the custodian. Periodically, a Fund may have cash due to the custodian bank as an overdraft balance. A fee is incurred on this overdraft, calculated by multiplying the overdraft by a rate based on the federal funds rate, which was 0.82% at March 31, 2017.
92 | THE GUGGENHEIM FUNDS SEMI-ANNUAL REPORT | |
NOTES TO FINANCIAL STATEMENTS (Unaudited)(continued) |
J. The accounting records of the Fund are maintained in U.S. dollars. All assets and liabilities initially expressed in foreign currencies are converted into U.S. dollars at prevailing exchange rates. Purchases and sales of investment securities, dividend and interest income, and certain expenses are translated at the rates of exchange prevailing on the respective dates of such transactions.
Changes in the relationship of these foreign currencies to the U.S. dollar can significantly affect the value of the investments and earnings of the Funds. Foreign investments may also subject the Funds to foreign government exchange restrictions, expropriation, taxation or other political, social or economic developments, all of which could affect the market and/or credit risk of the investments.
The Funds do not isolate that portion of the results of operations resulting from changes in the foreign exchange rates on investments from the fluctuations arising from changes in the market prices of securities held. Such fluctuations are included with the net realized and unrealized gain or loss on investments.
Reported net realized foreign exchange gains and losses arise from sales of foreign currencies and currency gains or losses realized between the trade and settlement dates on investment transactions. Net unrealized exchange gains and losses arise from changes in the fair values of assets and liabilities other than investments in securities at the fiscal period end, resulting from changes in exchange rates.
K. Under the Funds’ organizational documents, the Trustees and Officers are indemnified against certain liabilities arising out of the performance of their duties to the Trust. In addition, throughout the normal course of business, the Funds enter into contracts that contain a variety of representations and warranties which provide general indemnifications. The Funds’ maximum exposure under these arrangements is unknown, as this would involve future claims that may be made against the Funds and/or their affiliates that have not yet occurred. However, based on experience, the Funds expect the risk of loss to be remote.
2. Financial Instruments and Derivatives
As part of their investment strategy, the Funds utilize short sales and a variety of derivative instruments. These investments involve, to varying degrees, elements of market risk and risks in excess of the amounts recognized in the Statements of Assets and Liabilities. Valuation and accounting treatment of these instruments can be found under Significant Accounting Policies in Note 1 of these Notes to Financial Statements.
Short Sales
A short sale is a transaction in which a Fund sells a security it does not own. If the security sold short decreases in price between the time the Fund sells the security and closes its short position, the Fund will realize a gain on the transaction. Conversely, if the security increases in price during the period, the Fund will realize a loss on the transaction. The risk of such price increases is the principal risk of engaging in short sales.
Derivatives
Derivatives are instruments whose values depend on, or are derived from, in whole or in part, the value of one or more other assets, such as securities, currencies, commodities or indices. Derivative instruments may be used to increase investment flexibility (including to maintain cash reserves while maintaining exposure to certain other assets), for risk management (hedging) purposes, to facilitate trading, to reduce transaction costs and to pursue higher investment returns. Derivative instruments may also be used to mitigate certain investment risks, such as foreign currency exchange rate risk, interest rate risk and credit risk. U.S. GAAP requires disclosures to enable investors to better understand how and why a Fund uses derivative instruments, how these derivative instruments are accounted for and their effects on the Fund’s financial position and results of operations. The Funds may utilize derivatives for the following purposes:
Hedge: an investment made in order to reduce the risk of adverse price movements in a security, by taking an offsetting position to protect against broad market moves.
Index Exposure: the use of an instrument to obtain exposure to a listed or other type of index.
Leverage: gaining total exposure to equities or other assets on the long and short sides at greater than 100% of invested capital.
| | THE GUGGENHEIM FUNDS SEMI-ANNUAL REPORT | 93 |
NOTES TO FINANCIAL STATEMENTS (Unaudited)(continued) |
For any Fund whose investment strategy consistently involves applying leverage, the value of the Fund’s shares will tend to increase or decrease more than the value of any increase or decrease in the underlying index or other asset. In addition, because an investment in derivative instruments generally requires a small investment relative to the amount of investment exposure assumed, an opportunity for increased net income is created; but, at the same time, leverage risk will increase. The Fund’s use of leverage, through borrowings or instruments such as derivatives, may cause the Fund to be more volatile and riskier than if they had not been leveraged.
Futures
A futures contract is an agreement to purchase (long) or sell (short) an agreed amount of securities or other instruments at a set price for delivery at a future date. There are significant risks associated with a Fund’s use of futures contracts, including (i) there may be an imperfect or no correlation between the changes in market value of the underlying asset and the prices of futures contracts; (ii) there may not be a liquid secondary market for a futures contract; (iii) trading restrictions or limitations may be imposed by an exchange; and (iv) government regulations may restrict trading in futures contracts. When investing in futures, there is minimal counterparty credit risk to a Fund because futures are exchange-traded and the exchange’s clearinghouse, as counterparty to all exchange-traded futures, guarantees against default. Cash deposits are shown as segregated cash with broker on the Statements of Assets and Liabilities; securities held as collateral are noted on the Schedules of Investments.
The following table represents the Funds’ use and volume of futures on a quarterly basis:
Fund | Use | | Long | | | Short | |
StylePlus—Large Core Fund | Index exposure | | $ | 1,915,816 | | | $ | — | |
StylePlus—Mid Growth Fund | Index exposure | | | 694,820 | | | | — | |
World Equity Income Fund | Hedge | | | — | | | | 10,378,082 | |
Swaps
A swap is an agreement that obligates two parties to exchange a series of cash flows at specified intervals based upon or calculated by reference to changes in specified prices or rates for a specified amount of an underlying asset. A Fund utilizing OTC swaps bears the risk of loss of the amount expected to be received under a swap agreement in the event of the default or bankruptcy of a swap agreement counterparty or if the underlying asset declines in value. Certain standardized swaps are subject to mandatory central clearing. Central clearing generally reduces counterparty credit risk and increases liquidity, but central clearing does not make swap transactions risk-free. Additionally, there is no guarantee that a Fund or an underlying fund could eliminate its exposure under an outstanding swap agreement by entering into an offsetting swap agreement with the same or another party.
Total return swaps involve commitments where single or multiple cash flows are exchanged based on the price of an underlying reference asset (such as index or basket) or a fixed or variable interest rate. Index swaps will usually be computed based on the current index value as of the close of regular trading on the NYSE or other exchange, with the swap value being adjusted to include dividends accrued, financing charges and/or interest associated with the swap agreement. A fund utilizing a total return index swap bears the risk of loss of the amount expected to be received under a swap agreement in the event of the default or bankruptcy of a swap agreement counterparty or if the underlying index declines in value.
The following table represents the Funds’ use and volume of total return swaps on a quarterly basis:
| | | | Average Notional | |
Fund | Use | | Long | | | Short | |
Alpha Opportunity Fund | Hedge, Leverage | | $ | 59,281,032 | | | $ | 73,702,143 | |
Market Neutral Real Estate Fund | Leverage | | | — | | | | 4,674,336 | |
Risk Managed Real Estate Fund | Leverage | | | 33,128,711 | | | | 33,535,716 | |
StylePlus—Large Core Fund | Index exposure | | | 164,875,726 | | | | — | |
StylePlus—Mid Growth Fund | Index exposure | | | 63,404,733 | | | | — | |
94 | THE GUGGENHEIM FUNDS SEMI-ANNUAL REPORT | |
NOTES TO FINANCIAL STATEMENTS (Unaudited)(continued) |
Derivative Investment Holdings Categorized by Risk Exposure
The following is a summary of the location of derivative investments on the Funds’ Statements of Assets and Liabilities as of March 31, 2017:
Derivative Investment Type | Asset Derivatives | Liability Derivatives |
Equity | Variation margin | Variation margin |
| Unrealized appreciation on swap agreements | Unrealized depreciation on swap agreements |
The following table sets forth the fair value of the Funds’ derivative investments categorized by primary risk exposure at March 31, 2017:
Asset Derivative Investments Value | |
Fund | | Futures
Equity
Contracts* | | | Swaps
Equity
Contracts | | | Total Value at
March 31,
2017 | |
Risk Managed Real Estate Fund | | $ | — | | | $ | 2,103,937 | | | $ | 2,103,937 | |
StylePlus—Large Core Fund | | | — | | | | 21,278,019 | | | | 21,278,019 | |
StylePlus—Mid Growth Fund | | | 3,396 | | | | 6,995,746 | | | | 6,999,142 | |
Liability Derivative Investments Value | |
Fund | | Futures
Equity
Contracts* | | | Swaps
Equity
Contracts | | | Total Value at
March 31,
2017 | |
Alpha Opportunity Fund | | $ | — | | | $ | 3,017,731 | | | $ | 3,017,731 | |
Market Neutral Real Estate Fund | | | — | | | | 235,181 | | | | 235,181 | |
Risk Managed Real Estate Fund | | | — | | | | 1,470,502 | | | | 1,470,502 | |
StylePlus—Large Core Fund | | | 512 | | | | — | | | | 512 | |
* | Includes cumulative appreciation (depreciation) of futures contracts as reported on the Schedules of Investments. Only current day’s variation margin is reported within the Statements of Assets and Liabilities. |
The following is a summary of the location of derivative investments on the Funds’ Statements of Operations for the period ended March 31, 2017:
Derivative Investment Type | Location of Gain (Loss) on Derivatives |
Equity/Currency contracts | Net realized gain (loss) on futures contracts |
| Net change in unrealized appreciation (depreciation) on futures contracts |
| Net realized gain (loss) on swap agreements |
| Net change in unrealized appreciation (depreciation) on swap agreements |
The following is a summary of the Funds’ realized gain (loss) and change in unrealized appreciation (depreciation) on derivative investments recognized on the Statements of Operations categorized by primary risk exposure for the period ended March 31, 2017:
Realized Gain (Loss) on Derivative Investments Recognized on the Statements of Operations | |
Fund | | Futures
Equity
Contracts | | | Swaps
Equity
Contracts | | | Futures
Currency
Contracts | | | Total | |
Alpha Opportunity Fund | | $ | — | | | $ | 31,690 | | | $ | — | | | $ | 31,690 | |
Market Neutral Real Estate Fund | | | — | | | | 18,662 | | | | — | | | | 18,662 | |
Risk Managed Real Estate Fund | | | — | | | | 1,732,080 | | | | — | | | | 1,732,080 | |
StylePlus—Large Core Fund | | | 254,120 | | | | 1,669 | | | | — | | | | 255,789 | |
StylePlus—Mid Growth Fund | | | 190,567 | | | | — | | | | — | | | | 190,567 | |
World Equity Income Fund | | | — | | | | — | | | | (200,154 | ) | | | (200,154 | ) |
| | THE GUGGENHEIM FUNDS SEMI-ANNUAL REPORT | 95 |
NOTES TO FINANCIAL STATEMENTS (Unaudited)(continued) |
Change in Unrealized Appreciation (Depreciation) on Derivative Investments Recognized on the Statements of Operations | |
Fund | | Futures
Equity
Contracts | | | Swaps
Equity
Contracts | | | Futures
Currency
Contracts | | | Total | |
Alpha Opportunity Fund | | $ | — | | | $ | (1,107,430 | ) | | $ | — | | | $ | (1,107,430 | ) |
Market Neutral Real Estate Fund | | | — | | | | 29,654 | | | | — | | | | 29,654 | |
Risk Managed Real Estate Fund | | | — | | | | 98,223 | | | | — | | | | 98,223 | |
StylePlus—Large Core Fund | | | (40,345 | ) | | | 15,553,276 | | | | — | | | | 15,512,931 | |
StylePlus—Mid Growth Fund | | | 3,396 | | | | 4,333,556 | | | | — | | | | 4,336,952 | |
World Equity Income Fund | | | — | | | | — | | | | 19,765 | | | | 19,765 | |
In conjunction with the use of short sales and derivative instruments, the Funds are required to maintain collateral in various forms. The Funds use, where appropriate, depending on the financial instrument utilized and the broker involved, margin deposits at the broker, cash and/or securities segregated at the custodian bank, discount notes or the repurchase agreements allocated to the Funds.
There are several risks associated with exposure to foreign currencies, foreign issuers and emerging markets. A Fund’s indirect and direct exposure to foreign currencies subjects the Fund to the risk that those currencies will decline in value relative to the U.S. dollar, or in the case of short positions, that the U.S. dollar will decline in value relative to the currency being hedged. Currency rates in foreign countries may fluctuate significantly over short periods of time for a number of reasons, including changes in interest rates and the imposition of currency controls or other political developments in the U.S. or abroad. In addition, the Fund may incur transaction costs in connection with conversions between various currencies. The Fund may, but is not obligated to, engage in currency hedging transactions, which generally involve buying currency forward, options or futures contracts. However, not all currency risks may be effectively hedged, and in some cases the costs of hedging techniques may outweigh expected benefits. In such instances, the value of securities denominated in foreign currencies can change significantly when foreign currencies strengthen or weaken relative to the U.S. dollar.
Certain Funds may invest in securities of foreign companies directly, or in financial instruments, such as ADRs and exchange-traded funds, which are indirectly linked to the performance of foreign issuers. Foreign markets can be more volatile than the U.S. market due to increased risks of adverse issuer, political, regulatory, market, or economic developments and can perform differently from the U.S. market. Investing in securities of foreign companies directly, or in financial instruments that are indirectly linked to the performance of foreign issuers, may involve risks not typically associated with investing in U.S. issuers. The value of securities denominated in foreign currencies, and of dividends from such securities, can change significantly when foreign currencies strengthen or weaken relative to the U.S. dollar. Foreign securities markets generally have less trading volume and less liquidity than U.S. markets, and prices in some foreign markets may fluctuate more than those of securities traded on U.S. markets. Many foreign countries lack accounting and disclosure standards comparable to those that apply to U.S. companies, and it may be more difficult to obtain reliable information regarding a foreign issuer’s financial condition and operations. Transaction costs and costs associated with custody services are generally higher for foreign securities than they are for U.S. securities. Some foreign governments levy withholding taxes against dividend and interest income. Although in some countries portions of these taxes are recoverable, the non-recovered portion will reduce the income received by the Fund.
The Trust has established counterparty credit guidelines and enters into transactions only with financial institutions of investment grade or better. The Trust monitors the counterparty credit risk.
96 | THE GUGGENHEIM FUNDS SEMI-ANNUAL REPORT | |
NOTES TO FINANCIAL STATEMENTS (Unaudited)(continued) |
3. Fees and Other Transactions with Affiliates
Under the terms of an investment advisory contract, the Funds pay GI investment advisory fees calculated at the annualized rates below, based on the average daily net assets of the Funds:
Fund | Management Fees
(as a % of Net Assets) |
Alpha Opportunity Fund | 1.25% |
Large Cap Value Fund | 0.65% |
Market Neutral Real Estate Fund | 1.10% |
Risk Managed Real Estate Fund | 0.75% |
Small Cap Value Fund | 0.75%* |
StylePlus—Large Core Fund | 0.75% |
StylePlus—Mid Growth Fund | 0.75% |
World Equity Income Fund | 0.70% |
* | Rate effective February 1, 2017. Prior to February 1, 2017, the Fund paid GI 1.00% of the average daily net assets of the Fund. |
GI engages external service providers to perform other necessary services for the Trust, such as audit and accounting related services, legal services, custody, printing and mailing, etc., on a pass-through basis. Such expenses are allocated to various Funds within the complex based on relative net assets.
The Funds have adopted Distribution Plans related to the offering of A-Class, C-Class and P-Class shares pursuant to Rule 12b-1 under the 1940 Act. The plans provide for payments at an annual rate of 0.25% of the average daily net assets of each Fund’s A-Class and P-Class shares, and 1.00% of the average daily net assets of each Fund’s C-Class shares.
The investment advisory contracts for the following Funds provide that the total expenses be limited to a percentage of average net assets for each class of shares, exclusive of brokerage costs, dividends on securities sold short, expenses of other investment companies in which a Fund invests, interest, taxes, litigation, indemnification and extraordinary expenses. The limits are listed below:
| Limit | Effective
Date | Contract
End Date |
Alpha Opportunity Fund – A-Class | 2.11% | 11/30/12 | 02/01/18 |
Alpha Opportunity Fund – C-Class | 2.86% | 11/30/12 | 02/01/18 |
Alpha Opportunity Fund – P-Class | 2.11% | 05/01/15 | 02/01/18 |
Alpha Opportunity Fund – Institutional Class | 1.86% | 11/30/12 | 02/01/18 |
Large Cap Value Fund – A-Class | 1.15% | 11/30/12 | 02/01/18 |
Large Cap Value Fund – C-Class | 1.90% | 11/30/12 | 02/01/18 |
Large Cap Value Fund – P-Class | 1.15% | 05/01/15 | 02/01/18 |
Large Cap Value Fund – Institutional Class | 0.90% | 06/15/13 | 02/01/18 |
Market Neutral Real Estate Fund – A-Class | 1.65% | 02/26/16 | 02/01/18 |
Market Neutral Real Estate Fund – C-Class | 2.40% | 02/26/16 | 02/01/18 |
Market Neutral Real Estate Fund – P-Class | 1.65% | 02/26/16 | 02/01/18 |
Market Neutral Real Estate Fund – Institutional Class | 1.40% | 02/26/16 | 02/01/18 |
Risk Managed Real Estate Fund – A-Class | 1.30% | 03/26/14 | 02/01/18 |
Risk Managed Real Estate Fund – C-Class | 2.05% | 03/26/14 | 02/01/18 |
Risk Managed Real Estate Fund – P-Class | 1.30% | 05/01/15 | 02/01/18 |
Risk Managed Real Estate Fund – Institutional Class | 1.10% | 03/26/14 | 02/01/18 |
Small Cap Value Fund – A-Class | 1.30% | 11/30/12 | 02/01/18 |
Small Cap Value Fund – C-Class | 2.05% | 11/30/12 | 02/01/18 |
Small Cap Value Fund – P-Class | 1.30% | 05/01/15 | 02/01/18 |
Small Cap Value Fund – Institutional Class | 1.05% | 11/30/12 | 02/01/18 |
World Equity Income Fund – A-Class | 1.22% | 08/15/13 | 02/01/18 |
World Equity Income Fund – C-Class | 1.97% | 08/15/13 | 02/01/18 |
World Equity Income Fund – P-Class | 1.22% | 05/01/15 | 02/01/18 |
World Equity Income Fund – Institutional Class | 0.97% | 08/15/13 | 02/01/18 |
| | THE GUGGENHEIM FUNDS SEMI-ANNUAL REPORT | 97 |
NOTES TO FINANCIAL STATEMENTS (Unaudited)(continued) |
GI is entitled to reimbursement by the Funds for fees waived or expenses reimbursed during any of the previous 36 months, beginning on the date of the expense limitation agreement, if on any day the estimated operating expenses are less than the indicated percentages. At March 31, 2017, the amount of fees waived or expenses reimbursed that are subject to recoupment are presented in the following table:
Fund | | Expires
2017 | | | Expires
2018 | | | Expires
2019 | | | Expires
2020 | | | Fund
Total | |
Alpha Opportunity Fund | | | | | | | | | | | | | | | |
A-Class | | $ | 41,181 | | | $ | 92,503 | | | $ | — | | | $ | — | | | $ | 133,684 | |
C-Class | | | 9,224 | | | | 12,810 | | | | 7,081 | | | | — | | | | 29,115 | |
P-Class | | | — | | | | — | | | | — | | | | 393 | | | | 393 | |
Institutional Class | | | 8,751 | | | | — | | | | — | | | | — | | | | 8,751 | |
Large Cap Value Fund | | | | | | | | | | | | | | | | | | | | |
A-Class | | | 77,995 | | | | 95,743 | | | | 87,212 | | | | 2,542 | | | | 263,492 | |
C-Class | | | 6,737 | | | | 9,943 | | | | 9,306 | | | | 1,584 | | | | 27,570 | |
P-Class | | | — | | | | 85 | | | | 338 | | | | 392 | | | | 815 | |
Institutional Class | | | 2,117 | | | | 2,123 | | | | 1,129 | | | | — | | | | 5,369 | |
Market Neutral Real Estate | | | | | | | | | | | | | | | | | | | | |
A-Class | | | — | | | | — | | | | 1,232 | | | | 614 | | | | 1,846 | |
C-Class | | | — | | | | — | | | | 1,202 | | | | 760 | | | | 1,962 | |
P-Class | | | — | | | | — | | | | 1,242 | | | | 813 | | | | 2,055 | |
Institutional Class | | | — | | | | — | | | | 54,673 | | | | 26,363 | | | | 81,036 | |
Risk Managed Real Estate Fund | | | | | | | | | | | | | | | | | | | | |
A-Class | | | 136 | | | | 2,392 | | | | 918 | | | | 193 | | | | 3,639 | |
C-Class | | | 2,092 | | | | 2,095 | | | | 2,257 | | | | 539 | | | | 6,983 | |
P-Class | | | — | | | | 87 | | | | 58 | | | | 129 | | | | 274 | |
Institutional Class | | | — | | | | — | | | | — | | | | — | | | | — | |
Small Cap Value Fund | | | | | | | | | | | | | | | | | | | | |
A-Class | | | 52,604 | | | | 105,165 | | | | 123,706 | | | | 37,531 | | | | 319,006 | |
C-Class | | | 21,447 | | | | 44,550 | | | | 49,668 | | | | 14,520 | | | | 130,185 | |
P-Class | | | — | | | | 110 | | | | 116 | | | | 120 | | | | 346 | |
Institutional Class | | | 29,494 | | | | 4,007 | | | | 4,063 | | | | 2,783 | | | | 40,347 | |
World Equity Income Fund | | | | | | | | | | | | | | | | | | | | |
A-Class | | | 6,952 | | | | — | | | | — | | | | 273 | | | | 7,225 | |
C-Class | | | 6,018 | | | | 2,930 | | | | 7,207 | | | | 3,735 | | | | 19,890 | |
P-Class | | | — | | | | — | | | | — | | | | 556 | | | | 556 | |
Institutional Class | | | — | | | | — | | | | 2,280 | | | | — | | | | 2,280 | |
For the period ended March 31, 2017, GI recouped $36,655 from the Alpha Opportunity Fund. This amount is included in Management Fees in the Statement of Operations.
If a Fund invests in an affiliated fund, the investing Fund’s adviser has agreed to waive fees at the investing fund level. Fee waivers will be calculated at the investing Fund level without regard to any expense cap, if any, in effect for the investing Fund. Fees waived under this arrangement are not subject to reimbursement to GI. For the period ended March 31, 2017, the following Funds waived fees related to investments in affiliated funds:
Fund | | Amount | |
StylePlus-Large Core Fund | | $ | 34,493 | |
StylePlus-Mid Growth Fund | | | 13,718 | |
For the period ended March 31, 2017, GFD retained sales charges of $356,038 relating to sales of A-Class shares of the Trust.
Certain trustees and officers of the Trust are also officers of GI and GFD.
On October 4, 2016, Rydex Fund Services, LLC (“RFS”) was purchased by MUFG Investor Services and as of that date RFS ceased to be an affiliate of GI. In connection with its acquisition, RFS changed its name to MUFG Investor Services (US), LLC (“MUIS”). This change had no impact on the financial statements of the Trust.
98 | THE GUGGENHEIM FUNDS SEMI-ANNUAL REPORT | |
NOTES TO FINANCIAL STATEMENTS (Unaudited)(continued) |
MUIS acts as the Trust’s administrator, transfer agent and accounting agent. As administrator, transfer agent and accounting agent, MUIS is responsible for maintaining the books and records of the Trust’s securities and cash. For providing the aforementioned administrative and accounting services, MUIS is entitled to receive a monthly fee equal to a percentage of the Funds’ fees and out of pocket expenses. For providing the aforementioned transfer agent services, MUIS is entitled to receive a monthly fee based on the number of transactions during the month and the number of accounts under management subject to certain minimum monthly fees and out of pocket expenses.
At March 31, 2017, GI and its affiliates owned over twenty percent of the outstanding shares of the Funds, as follows:
Fund | Percent of outstanding shares owned |
Alpha Opportunity Fund | 72% |
Large Cap Value Fund | 43% |
Market Neutral Real Estate Fund | 99% |
Small Cap Value Fund | 31% |
StylePlus—Large Core Fund | 20% |
StylePlus—Mid Growth Fund | 25% |
World Equity Income Fund | 51% |
4. Fair Value Measurement
In accordance with U.S. GAAP, fair value is defined as the price that the Funds would receive to sell an investment or pay to transfer a liability in an orderly transaction with an independent buyer in the principal market, or in the absence of a principal market, the most advantageous market for the investment or liability. U.S. GAAP establishes a three-tier fair value hierarchy based on the types of inputs used to value assets and liabilities and requires corresponding disclosure. The hierarchy and the corresponding inputs are summarized below:
| Level 1 | — | quoted prices in active markets for identical assets or liabilities. |
Level 2 | — | significant other observable inputs (for example quoted prices for securities that are similar based on characteristics such as interest rates, prepayment speeds, credit risk, etc.). |
Level 3 | — | significant unobservable inputs based on the best information available under the circumstances, to the extent observable inputs are not available, which may include assumptions. |
The types of inputs available depend on a variety of factors, such as the type of security and the characteristics of the markets in which it trades, if any. Fair valuation determinations that rely on fewer or no observable inputs require greater judgment. Accordingly, fair value determinations for Level 3 securities require the greatest amount of judgment.
The inputs or methodologies used for valuing securities are not necessarily an indication of the risk associated with investing in those securities. The suitability of the techniques and sources employed to determine fair valuation are regularly monitored and subject to change.
5. Offsetting
In the normal course of business, the Funds enter into transactions subject to enforceable master netting arrangements or other similar arrangements. Generally, the right to offset in those agreements allows the Funds to counteract the exposure to a specific counterparty with collateral received from or delivered to that counterparty based on the terms of the arrangements. These arrangements provide for the right to liquidate upon the occurrence of an event of default, credit event upon merger or additional termination event.
In order to better define their contractual rights and to secure rights that will help the Funds mitigate their counterparty risk, the Funds may enter into an International Swaps and Derivatives Association, Inc. Master Agreement (“ISDA Master Agreement”) or similar agreement with their derivative contract counterparties. An ISDA Master Agreement is a bilateral agreement between a Fund and a counterparty that governs OTC derivatives, including foreign exchange contracts, and typically contains, among other things, collateral posting terms and netting provisions in the event of a default and/or termination event. The provisions of the ISDA Master Agreement typically permit a single net payment in the event of a default (close-out netting) or similar event, including the bankruptcy or insolvency of the counterparty.
| | THE GUGGENHEIM FUNDS SEMI-ANNUAL REPORT | 99 |
NOTES TO FINANCIAL STATEMENTS (Unaudited)(continued) |
For derivatives traded under an ISDA Master Agreement, the collateral requirements are typically calculated by netting the mark-to-market amount for each transaction under such agreement and comparing that amount to the value of any collateral currently pledged by the Funds and the counterparty. For financial reporting purposes, cash collateral that has been pledged to cover obligations of the Funds and cash collateral received from the counterparty, if any, are reported separately on the Statements of Assets and Liabilities as segregated cash with broker/receivable for variation margin, or payable for swap settlement/variation margin. Generally, the amount of collateral due from or to a counterparty must exceed a minimum transfer amount threshold (e.g., $300,000) before a transfer is required to be made. To the extent amounts due to the Funds from their counterparties are not fully collateralized, contractually or otherwise, the Funds bear the risk of loss from counterparty nonperformance. The Funds attempt to mitigate counterparty risk by only entering into agreements with counterparties that they believe to be of good standing and by monitoring the financial stability of those counterparties.
For financial reporting purposes, the Funds do not offset derivative assets and derivative liabilities that are subject to netting arrangements in the Statements of Assets and Liabilities.
The following tables present derivative financial instruments and secured financing transactions that are subject to enforceable netting arrangements and offset in the Statements of Assets and Liabilities in conformity with U.S. GAAP:
| | | | | | | | | | | | Gross Amounts Not Offset
in the Statements of
Assets and Liabilities | | | | |
Fund | Instrument | | Gross
Amounts of
Recognized Assets1 | | | Gross Amounts Offset In the Statements of Assets and Liabilities | | | Net Amount of Assets Presented on the Statements of Assets and Liabilities | | | Financial
Instruments | | | Cash
Collateral
Received | | | Net
Amount | |
Risk Managed Real Estate Fund | Swap equity contracts | | $ | 2,103,937 | | | $ | — | | | $ | 2,103,937 | | | $ | 1,470,502 | | | $ | — | | | $ | 633,435 | |
StylePlus—Large Core Fund | Swap equity contracts | | | 21,278,019 | | | | — | | | | 21,278,019 | | | | — | | | | 21,278,019 | | | | — | |
StylePlus—Mid Growth Fund | Swap equity contracts | | | 6,995,746 | | | | — | | | | 6,995,746 | | | | — | | | | 6,770,000 | | | | 225,746 | |
| | | | | | | | | | | | Gross Amounts Not Offset
in the Statements of
Assets and Liabilities | | | | |
Fund | Instrument | | Gross
Amounts of
Recognized Liabilities1 | | | Gross Amounts Offset In the Statements of Assets and Liabilities | | | Net Amount of Liabilities Presented on the Statements of Assets and Liabilities | | | Financial
Instruments | | | Cash
Collateral
Pledged | | | Net
Amount | |
Alpha Opportunity Fund | Swap equity contracts | | $ | 3,017,731 | | | $ | — | | | $ | 3,017,731 | | | $ | 3,017,731 | | | $ | — | | | $ | — | |
Market Neutral Real Estate Fund | Swap equity contracts | | | 235,181 | | | | — | | | | 235,181 | | | | 235,181 | | | | — | | | | — | |
Risk Managed Real Estate Fund | Swap equity contracts | | | 1,470,502 | | | | — | | | | 1,470,502 | | | | 1,470,502 | | | | — | | | | — | |
1 | Exhange-traded futures are excluded from these reported amounts. |
6. Federal Income Tax Information
The Funds intend to comply with the provisions of Subchapter M of the Internal Revenue Code applicable to regulated investment companies and will distribute substantially all taxable net investment income and capital gains sufficient to relieve the Funds from all, or substantially all, federal income, excise and state income taxes. Therefore, no provision for federal or state income tax is required.
Tax positions taken or expected to be taken in the course of preparing the Funds’ tax returns are evaluated to determine whether the tax positions are “more-likely-than-not” of being sustained by the applicable tax authority. Tax positions not deemed to meet the more-likely-than-not threshold would be recorded as a tax benefit or expense in the current year. Management has analyzed the Funds’ tax positions taken, or to be
100 | THE GUGGENHEIM FUNDS SEMI-ANNUAL REPORT | |
NOTES TO FINANCIAL STATEMENTS (Unaudited)(continued) |
taken, on federal income tax returns for all open tax years, and has concluded that no provision for income tax is required in the Funds’ financial statements. The Funds’ federal tax returns are subject to examination by the Internal Revenue Service for a period of three years after they are filed.
At March 31, 2017, the cost of securities for federal income tax purposes, the aggregate gross unrealized gain for all securities for which there was an excess of value over tax cost, and the aggregate gross unrealized loss for all securities for which there was an excess of tax cost over value were as follows:
Fund | | Tax
Cost | | | Tax
Unrealized
Gain | | | Tax
Unrealized
Loss | | | Net
Unrealized
Gain (Loss) | |
Alpha Opportunity Fund | | $ | 219,258,984 | | | $ | 11,068,400 | | | $ | (3,548,257 | ) | | $ | 7,520,143 | |
Large Cap Value Fund | | | 58,321,771 | | | | 11,164,618 | | | | (1,229,372 | ) | | | 9,935,246 | |
Market Neutral Real Estate Fund | | | 5,183,290 | | | | 346,553 | | | | (68,060 | ) | | | 278,493 | |
Risk Managed Real Estate Fund | | | 108,875,451 | | | | 6,088,052 | | | | (3,220,357 | ) | | | 2,867,695 | |
Small Cap Value Fund | | | 18,467,760 | | | | 3,759,083 | | | | (825,223 | ) | | | 2,933,860 | |
StylePlus—Large Core Fund | | | 208,208,401 | | | | 4,202,679 | | | | (932,770 | ) | | | 3,269,909 | |
StylePlus—Mid Growth Fund | | | 80,552,949 | | | | 1,593,056 | | | | (480,229 | ) | | | 1,112,827 | |
World Equity Income Fund | | | 82,823,323 | | | | 8,877,099 | | | | (2,046,332 | ) | | | 6,830,767 | |
7. Securities Transactions
For the period ended March 31, 2017, the cost of purchases and proceeds from sales of investment securities, excluding government securities, short-term investments and derivatives, were as follows:
Fund | | Purchases | | | Sales | |
Alpha Opportunity Fund | | $ | 242,147,800 | | | $ | 122,867,460 | |
Large Cap Value Fund | | | 16,449,344 | | | | 12,664,937 | |
Market Neutral Real Estate Fund | | | 3,699,879 | | | | 3,223,893 | |
Risk Managed Real Estate Fund | | | 71,044,737 | | | | 63,352,512 | |
Small Cap Value Fund | | | 5,808,962 | | | | 5,351,670 | |
StylePlus—Large Core Fund | | | 38,483,409 | | | | 26,176,115 | |
StylePlus—Mid Growth Fund | | | 15,965,697 | | | | 13,207,428 | |
World Equity Income Fund | | | 25,458,218 | | | | 29,200,138 | |
The Funds are permitted to purchase or sell securities from or to certain affiliated funds under specified conditions outlined in procedures adopted by the Board of the Trust. The procedures have been designed to ensure that any purchase or sale of securities by a Fund from or to another fund or portfolio that is or could be considered an affiliate by virtue of having a common investment adviser (or affiliated investment advisers), common Trustees and/or common officers complies with Rule 17a-7 of the 1940 Act. Further, as defined under these procedures, each transaction is effected at the current market price to save costs, where permissible. For the period ended March 31, 2017, the Funds did not engage in purchases and sales of securities, pursuant to Rule 17a-7 of the 1940 Act.
8. Affiliated Transactions
Investments representing 5% or more of the outstanding voting shares of a portfolio company of a fund, or control of or by, or common control under GI, result in that portfolio company being considered an affiliated company of such fund, as defined in the 1940 Act.
The Funds may invest in the Guggenheim Strategy Funds Trust consisting of Guggenheim Strategy Fund I, Guggenheim Strategy Fund II, Guggenheim Strategy Fund III, and Guggenheim Variable Insurance Strategy Fund III (collectively, the “Cash Management Funds”), open-end management investment companies managed by GI. The Cash Management Funds, which launched on March 11, 2014, are offered as cash management options only to mutual funds, trusts, and other accounts managed by GI and/or its affiliates, and are not available to the public. The Cash Management Funds pay no investment management fees. The Cash Management Funds’ annual report on Form N-CSR dated September 30, 2016, is available publicly or upon request. This information is available from the EDGAR database on the SEC’s website at https://www.sec.gov/Archives/edgar/data/1601445/000089180416001923/gug65857-ncsr.htm.
| | THE GUGGENHEIM FUNDS SEMI-ANNUAL REPORT | 101 |
NOTES TO FINANCIAL STATEMENTS (Unaudited)(continued) |
Transactions during the period ended March 31, 2017, in which the portfolio company is an “affiliated person,” were as follows:
Affiliated issuers by Fund | | Value
09/30/16 | | | Additions | | | Reductions | | | Value
03/31/17 | | | Shares
03/31/17 | | | Investment
Income | | | Realized
Gain | |
StylePlus—Large Core Fund | | | | | | | | | | | | | | | | | | | | | |
Guggenheim Limited Duration Fund — Institutional Class | | $ | 15,768,627 | | | $ | 15,863,143 | | | $ | — | | | $ | 16,022,950 | | | | 647,916 | | | $ | 238,562 | | | $ | 2,771 | |
Guggenheim Strategy Fund I | | | 23,831,360 | | | | 213,416 | | | | — | | | | 24,102,239 | | | | 962,165 | | | | 212,679 | | | | — | |
Guggenheim Strategy Fund II | | | 49,693,469 | | | | 10,775,864 | | | | — | | | | 60,599,639 | | | | 2,423,986 | | | | 641,517 | | | | — | |
Guggenheim Strategy Fund III | | | 67,119,862 | | | | 985,407 | | | | — | | | | 68,186,806 | | | | 2,726,382 | | | | 985,452 | | | | — | |
| | | | 156,413,318 | | | | 27,837,830 | | | | — | | | | 168,911,634 | | | | | | | | 2,078,210 | | | | 2,771 | |
| | | | | | | | | | | | | | | | | | | | | | | | | | | | | |
StylePlus—Mid Growth Fund | | | | | | | | | | | | | | | | | | | | | | | | | | | | |
Guggenheim Limited Duration Fund — Institutional Class | | $ | 6,271,368 | | | $ | 6,308,757 | | | $ | — | | | $ | 6,372,515 | | | | 257,684 | | | $ | 94,879 | | | $ | 1,102 | |
Guggenheim Strategy Fund I | | | 8,222,675 | | | | 3,487,425 | | | | (1,509,328 | ) | | | 10,220,982 | | | | 408,023 | | | | 77,017 | | | | 8,449 | |
Guggenheim Strategy Fund II | | | 20,250,726 | | | | 241,241 | | | | — | | | | 20,540,999 | | | | 821,640 | | | | 241,153 | | | | — | |
Guggenheim Strategy Fund III | | | 26,513,876 | | | | 389,258 | | | | — | | | | 26,935,345 | | | | 1,076,983 | | | | 389,276 | | | | — | |
| | | | 61,258,645 | | | | 10,426,681 | | | | (1,509,328 | ) | | | 64,069,841 | | | | | | | | 802,325 | | | | 9,551 | |
9. Line of Credit
The Trust, with the exception of Capital Stewardship Fund, and certain affiliated funds, secured a 364-day committed, $800,000,000 line of credit from Citibank, N.A., which was in place through October 6, 2016, at which time the line of credit was renewed, with an increased commitment amount to $1,000,000,000. A Fund may draw (borrow) from the line of credit as a temporary measure for emergency purposes, to facilitate redemption requests, or for other short-term liquidity purposes consistent with the Fund’s investment objective and program. For example, it may be advantageous for the Fund to borrow money rather than sell existing portfolio positions to meet redemption requests. Fees related to borrowings, if any, vary under this arrangement between the greater of Citibank’s “base rate”, LIBOR plus 1%, or the federal funds rate 0.82% at March 31, 2017, plus 1/2 of 1%. All affiliated funds that participate in the line of credit paid upfront costs totaling $2,032,388 to renew the line of credit.
The commitment fee that may be paid by the Funds is at an annualized rate of 0.15% of the average daily amount of their unused commitment amount. The Funds did not have any borrowings under this agreement as of and for the period ended March 31, 2017.
The allocated commitment fee amount for each Fund is referenced in the Statement of Operations under “Line of credit fees” and the effect on the expense ratio is included in the Financial Highlights.
10. Other Liabilities
StylePlus—Large Core Fund wrote put option contracts through Lehman Brothers Inc., (“LBI”) that were exercised prior to the option contracts’ expiration and prior to the bankruptcy filing by LBI, during September, 2008. However, these transactions have not settled and the securities have not been delivered to the Fund as of March 31, 2017.
Although the ultimate resolution of these transactions is uncertain, the Fund has recorded a liability equal to the difference between the strike price on the put options and the market price of the underlying security on the exercise date. The amount of the liability recorded in miscellaneous payables by the Fund as of March 31, 2017, was $18,615.
11. Large Shareholder Risk
As of March 31, 2017, 57.5% of the Alpha Opportunity Fund (the “Fund”) was held by Macro Opportunities Fund. The Fund may experience adverse effects if a large number of shares of the Fund are held by a single shareholder (e.g., an institutional investor, financial intermediary or another GI Fund). The Fund is subject to the risk that a redemption by those shareholders of all or a large portion of the Fund could cause the Fund to liquidate its assets at inopportune times, or at a loss or depressed value, which could adversely impact the Fund’s performance and cause the value of a shareholder’s investment to decline. Redemptions of a large number of shares also may increase transaction costs or, by necessitating a sale of portfolio securities, have adverse tax consequences for shareholders. They also potentially limit the use of any capital loss carryforwards and certain other losses to off set future realized capital gains (if any) and may limit or prevent a Fund’s use of tax equalization.
102 | THE GUGGENHEIM FUNDS SEMI-ANNUAL REPORT | |
NOTES TO FINANCIAL STATEMENTS (Unaudited)(concluded) |
12. Subsequent Event
At a meeting held on May 23-24, 2017, the Board of Trustees of Guggenheim Funds Trust (the “Board”) approved a reduction in the advisory fee paid by the Alpha Opportunity Fund effective May 31, 2017 from 1.25% to 0.90%. The Board also approved an equivalent reduction in the expense limitation for each share class of the Fund, effective as of the same date. Accordingly, the following changes to the Prospectus are effective May 31, 2017.
| | THE GUGGENHEIM FUNDS SEMI-ANNUAL REPORT | 103 |
OTHER INFORMATION (Unaudited) |
Proxy Voting Information
A description of the policies and procedures that the Trust uses to determine how to vote proxies relating to securities held in the Funds’ portfolios is available, without charge and upon request, by calling 800.820.0888. This information is also available from the EDGAR database on the SEC’s website at https://www.sec.gov.
Information regarding how the Funds voted proxies relating to portfolio securities during the most recent 12-month period ended June 30 is available without charge, upon request, by calling 800.820.0888. This information is also available from the EDGAR database on the SEC’s website at https://www.sec.gov.
Sector Classification
Information in the “Schedule of Investments” is categorized by sectors using sector-level Classifications defined by the Bloomberg Industry Classification System, a widely recognized industry classification system provider. Each Fund’s registration statement has investment policies relating to concentration in specific sectors/industries. For purposes of these investment policies, the Funds usually classify sectors/industries based on industry-level Classifications used by widely recognized industry classification system providers such as Bloomberg Industry Classification System, Global Industry Classification Standards and Barclays Global Classification Scheme.
Quarterly Portfolio Schedules Information
The Trust files its complete schedule of portfolio holdings with the SEC for the first and third quarters of each fiscal year on Form N-Q; which are available on the SEC’s website at https://www.sec.gov. The Funds’ Forms N-Q may be reviewed and copied at the SEC’s Public Reference Room in Washington, DC, and that information on the operation of the Public Reference Room may be obtained by calling 800-SEC-0330. Copies of the portfolio holdings are also available to shareholders, without charge and upon request, by calling 800.820.0888.
104 | THE GUGGENHEIM FUNDS SEMI-ANNUAL REPORT | |
INFORMATION ON BOARD OF TRUSTEES AND OFFICERS (Unaudited) |
Name, Address* and Year of Birth | Position(s)
Held with
the Trust | Term of Office and Length of Time Served** | Principal Occupation(s) During Past Five Years | Number of Portfolios in Fund Complex Overseen | Other
Directorships
Held by Trustees |
INDEPENDENT TRUSTEES | | | |
Randall C. Barnes (1951) | Trustee | Since 2014 | Current: Private Investor (2001-present). Former: Senior Vice President and Treasurer, PepsiCo, Inc. (1993-1997); President, Pizza Hut International (1991-1993); Senior Vice President, Strategic Planning and New Business Development, PepsiCo, Inc. (1987-1990). | 98 | Current: Trustee, Purpose Investments Inc. (2014-Present). |
Donald A. Chubb, Jr. (1946) | Trustee | Since 1994 | Current: Business broker and manager of commercial real estate, Griffith & Blair, Inc. (1997-present). | 95 | Former: Midland Care, Inc. (2011-2016). |
Jerry B. Farley (1946) | Trustee | Since 2005 | Current: President, Washburn University (1997-present). | 95 | Current: Westar Energy, Inc. (2004-present); CoreFirst Bank & Trust (2000-present). |
Roman Friedrich III (1946) | Trustee and Chairman of the Contracts Review Committee | Since 2014 | Current: Founder and Managing Partner, Roman Friedrich & Company (1998-present). Former: Senior Managing Director, MLV & Co. LLC (2010-2011). | 95 | Current: Zincore Metals, Inc. (2009-present). Former: Axiom Gold and Silver Corp. (2011-2012). |
Robert B. Karn III (1942) | Trustee and Chairman of the Audit Committee | Since 2014 | Current: Consultant (1998-present). Former: Arthur Andersen (1965-1997) and Managing Partner, Financial and Economic Consulting, St. Louis office (1987-1997). | 95 | Current: GP Natural Resource Partners, LLC (2002- present). Former: Peabody Energy Company (2003- Apr. 2017). |
Ronald A. Nyberg (1953) | Trustee and Chairman of the Nominating and Governance Committee | Since 2014 | Current: Partner, Momkus McCluskey Roberts, LLC (2016-present). Former: Partner, Nyberg & Cassioppi, LLC (2000-2016); Executive Vice President, General Counsel, and Corporate Secretary, Van Kampen Investments (1982-1999). | 100 | Current: Edward-Elmhurst Healthcare System (2012-present). |
| | THE GUGGENHEIM FUNDS SEMI-ANNUAL REPORT | 105 |
INFORMATION ON BOARD OF TRUSTEES AND OFFICERS (Unaudited)(continued) |
Name, Address* and Year of Birth | Position(s)
Held with
the Trust | Term of Office and Length of Time Served** | Principal Occupation(s) During Past Five Years | Number of Portfolios in Fund Complex Overseen | Other
Directorships Held by Trustees |
INDEPENDENT TRUSTEES - concluded | | |
Maynard F. Oliverius (1943) | Trustee | Since 1998 | Current: Retired. Former: President and CEO, Stormont-Vail HealthCare (1996-2012). | 95 | Current: Robert J. Dole Institute of Politics (2016-present); Stormont-Vail Foundation (2013-present); University of Minnesota MHA Alumni Philanthropy Committee (2009-present); Fort Hays State University Foundation (1999-present). Former: Topeka Community Foundation (2009-2014). |
Ronald E. Toupin, Jr. (1958) | Trustee and Chairman of the Board | Since 2014 | Current: Portfolio Consultant (2010-present). Former: Vice President, Manager and Portfolio Manager, Nuveen Asset Management (1998-1999); Vice President, Nuveen Investment Advisory Corp. (1992-1999); Vice President and Manager, Nuveen Unit Investment Trusts (1991-1999); and Assistant Vice President and Portfolio Manager, Nuveen Unit Investment Trusts (1988-1999), each of John Nuveen & Co., Inc. (1982-1999). | 97 | Former: Bennett Group of Funds (2011-2013). |
INTERESTED TRUSTEE | |
Donald C. Cacciapaglia*** (1951) | President, Chief Executive Officer and Trustee | Since 2012 | Current: President and CEO, certain other funds in the Fund Complex (2012-present); Vice Chairman, Guggenheim Investments (2010-present). Former: Chairman and CEO, Channel Capital Group, Inc. (2002-2010). | 230 | Current: Clear Spring Life Insurance Company (2015-present); Guggenheim Partners Japan, Ltd. (2014-present); Guggenheim Partners Investment Management Holdings, LLC (2014-present); Delaware Life (2013-present); Guggenheim Life and Annuity Company (2011-present); Paragon Life Insurance Company of Indiana (2011-present). |
* | The business address of each Trustee is c/o Guggenheim Investments, 227 West Monroe Street, Chicago, Illinois 60606. |
** | Each Trustee serves an indefinite term, until his successor is elected and qualified. Time served includes time served in the respective position for the Predecessor Corporation. |
*** | This Trustee is deemed to be an “interested person” of the Funds under the 1940 Act by reason of his position with the Funds’ Investment Manager and/or the parent of the Investment Manager. |
106 | THE GUGGENHEIM FUNDS SEMI-ANNUAL REPORT | |
INFORMATION ON BOARD OF TRUSTEES AND OFFICERS (Unaudited)(continued) |
Name, Address* and Year of Birth | Position(s)
Held with
the Trust | Term of Office and Length of Time Served** | Principal Occupations
During Past Five Years |
OFFICERS | | | |
William H. Belden, III (1965) | Vice President | Since 2014 | Current: Vice President, certain other funds in the Fund Complex (2006-present); Managing Director, Guggenheim Funds Investment Advisors, LLC (2005-present). Former: Vice President of Management, Northern Trust Global Investments (1999-2005). |
Joanna M. Catalucci (1966) | AML Officer | Since 2016 | Current: Chief Compliance Officer, certain funds in the Fund Complex (2012-present); Senior Managing Director, Guggenheim Investments (2014-present); AML Officer, certain funds in the Fund Complex (2016-present). Former: Chief Compliance Officer and Secretary, certain other funds in the Fund Complex (2008-2012); Senior Vice President & Chief Compliance Officer, Security Investors, LLC and certain affiliates (2010-2012); Chief Compliance Officer and Senior Vice President, Rydex Advisors, LLC and certain affiliates (2010-2011). |
James M. Howley (1972) | Assistant Treasurer | Since 2014 | Current: Managing Director, Guggenheim Investments (2004-present); Assistant Treasurer, certain other funds in the Fund Complex (2006-present). Former: Manager, Mutual Fund Administration of Van Kampen Investments, Inc. (1996-2004). |
Keith D. Kemp (1960) | Assistant Treasurer | Since 2016 | Current: Treasurer and Assistant Treasurer, certain other funds in the Fund Complex (2010-present); Managing Director of Guggenheim Partners Investment Management, LLC (2015-present); Chief Financial Officer, Guggenheim Specialized Products, LLC (2016-present). Former: Managing Director and Director, Transparent Value, LLC (2010-2016); Director, Guggenheim Partners Investment Management, LLC (2010-2015); Chief Operating Officer, Macquarie Capital Investment Management (2007-2009). |
Amy J. Lee (1961) | Vice President and Chief Legal Officer | Since 2007 (Vice President) Since 2014 (Chief Legal Officer) | Current: Chief Legal Officer, certain other funds in the Fund Complex (2013-present); Senior Managing Director, Guggenheim Investments (2012-present). Former: Vice President, Associate General Counsel and Assistant Secretary, Security Benefit Life Insurance Company and Security Benefit Corporation (2004-2012). |
Mark E. Mathiasen (1978) | Secretary | Since 2014 | Current: Secretary, certain other funds in the Fund Complex (2007-present); Managing Director, Guggenheim Investments (2007-present). |
Glenn McWhinnie (1969) | Assistant Treasurer | Since 2016 | Current: Vice President, Guggenheim Investments (2009-present). Former: Tax Compliance Manager, Ernst & Young LLP (1996-2009). |
Michael P. Megaris (1984) | Assistant Secretary | Since 2014 | Current: Assistant Secretary, certain other funds in the Fund Complex (2014-present); Vice President, Guggenheim Investments (2012-present). Former: J.D., University of Kansas School of Law (2009-2012). |
| | THE GUGGENHEIM FUNDS SEMI-ANNUAL REPORT | 107 |
INFORMATION ON BOARD OF TRUSTEES AND OFFICERS (Unaudited)(concluded) |
Name, Address* and Year of Birth | Position(s)
Held with
the Trust | Term of Office and Length of Time Served** | Principal Occupations
During Past Five Years |
OFFICERS - concluded | |
Elisabeth Miller (1968) | Chief Compliance Officer | Since 2012 | Current: CCO, certain other funds in the Fund Complex (2012-present); CCO, Security Investors, LLC (2012-present); CCO, Guggenheim Funds Investment Advisors, LLC (2012-present); Managing Director, Guggenheim Investments (2012-present); Vice President, Guggenheim Funds Distributors, LLC (March 2014-present). Former: CCO, Guggenheim Distributors, LLC (2009-March 2014); Senior Manager, Security Investors, LLC (2004-2009); Senior Manager, Guggenheim Distributors, LLC (2004-2009). |
Adam J. Nelson (1979) | Assistant Treasurer | Since 2015 | Current: Vice President, Guggenheim Investments (2015-present); Assistant Treasurer, certain other funds in the Fund Complex (2015-present). Former: Assistant Vice President and Fund Administration Director, State Street Corporation (2013-2015); Fund Administration Assistant Director, State Street (2011-2013); Fund Administration Manager, State Street (2009-2011). |
Kimberly J. Scott (1974) | Assistant Treasurer | Since 2014 | Current: Director, Guggenheim Investments (2012-present); Assistant Treasurer, certain other funds in the Fund Complex (2012-present). Former: Financial Reporting Manager, Invesco, Ltd. (2010-2011); Vice President/Assistant Treasurer, Mutual Fund Administration for Van Kampen Investments, Inc./Morgan Stanley Investment Management (2009-2010); Manager of Mutual Fund Administration, Van Kampen Investments, Inc./Morgan Stanley Investment Management (2005-2009). |
Bryan Stone (1979) | Vice President | Since 2014 | Current: Vice President, certain other funds in the Fund Complex (2014-present); Director, Guggenheim Investments (2013-present). Former: Senior Vice President, Neuberger Berman Group LLC (2009-2013); Vice President, Morgan Stanley (2002-2009). |
John L. Sullivan (1955) | Chief Financial Officer and Treasurer | Since 2014 | Current: CFO, Chief Accounting Officer and Treasurer, certain other funds in the Fund Complex (2010-present); Senior Managing Director, Guggenheim Investments (2010-present). Former: Managing Director and CCO, each of the funds in the Van Kampen Investments fund complex (2004-2010); Managing Director and Head of Fund Accounting and Administration, Morgan Stanley Investment Management (2002-2004); CFO and Treasurer, Van Kampen Funds (1996-2004). |
* | The business address of each officer is c/o Guggenheim Investments, 227 West Monroe Street, Chicago, Illinois 60606. |
** | Each officer serves an indefinite term, until his or her successor is duly elected and qualified. Time served includes time served in the respective position for the Predecessor Corporation. |
108 | THE GUGGENHEIM FUNDS SEMI-ANNUAL REPORT | |
GUGGENHEIM INVESTMENTS PRIVACY POLICIES (Unaudited) |
Guggenheim Investments as used herein refers to Guggenheim Partners, LLC, Guggenheim Funds Investment Advisors, LLC, Guggenheim Partners Investment Management, LLC, Guggenheim Funds Distributors, LLC and Security Investors, LLC as well as the funds in the Guggenheim Funds complex (the “funds”).
Our Commitment to You
When you become a Guggenheim Investments investor, you entrust us with not only your hard-earned money but also with personal and financial information about you. We recognize that your relationship with us is based on trust and that you expect us to act responsibly and in your best interests. Because we have access to personal information about you, we hold ourselves to high standards in its safekeeping and use. This means, most importantly, that we do not sell client or account information to anyone—whether you are a current or former Guggenheim Investments client.
The Information We Collect About You and How We Collect It
In the course of doing business with shareholders and investors, we collect nonpublic personal information about you. You typically provide personal information when you complete a Guggenheim Investments account application or when you request a transaction that involves Rydex and Guggenheim Funds or one of the Guggenheim affiliated companies. “Nonpublic personal information” is personally identifiable information about you. For example it includes your name and address, Social Security or taxpayer identification number, assets, income, account balance, bank account information and investment activity (e.g. purchase and redemption history).
How We Share Your Personal Information
As a matter of policy, we do not disclose your nonpublic personal information to nonaffiliated third parties except as required or permitted by law. As emphasized above, we do not sell information about current or former clients or their accounts to third parties. Nor do we share such information, except when necessary to complete transactions at your request or to make you aware of related investment products and services that we offer. Additional details about how we handle your personal information are provided below.
To complete certain transactions or account changes that you direct, it may be necessary to provide your personal information to companies, individuals or groups that are not affiliated with Guggenheim Investments. For example if you ask to transfer assets from another financial institution to Guggenheim Investments, we will need to provide certain information about you to that company to complete the transaction. In connection with servicing your accounts or to alert you to other Guggenheim Investments investment products and services, we may share your information within the Guggenheim Investments family of affiliated companies. This would include, for example, sharing your information within Guggenheim Investments so we can make you aware of new funds or the services offered through another Guggenheim Investments affiliated company. In certain instances, we may contract with nonaffiliated companies to perform services for us. Where necessary, we will disclose information we have about you to these third parties. In all such cases, we provide the third party with only the information necessary to carry out its assigned responsibilities and only for that purpose. And we require these third parties to treat your personal information with the same high degree of confidentiality that we do. In certain instances, we may share information with other financial institutions regarding individuals and entities in response to the U.S.A. Patriot Act. Finally we will share personal information about you if we are compelled by law to do so, if you direct us to do so with your consent, or in other circumstances as permitted by law.
How We Safeguard Your Personal Information
We maintain physical, electronic and procedural safeguards to protect your personal information. Within Guggenheim Investments, access to such information is limited to those who need it to perform their jobs such as servicing your account, resolving problems or informing you of new products and services.
| | THE GUGGENHEIM FUNDS SEMI-ANNUAL REPORT | 109 |
3.31.2017
Guggenheim Funds Semi-Annual Report
| |
Guggenheim Diversified Income Fund | | |
Guggenheim High Yield Fund | | |
Guggenheim Investment Grade Bond Fund | | |
Guggenheim Limited Duration Fund | | |
Guggenheim Municipal Income Fund | | |
GuggenheimInvestments.com | SBINC-SEMI-0317x0917 |
DEAR SHAREHOLDER | 2 |
ECONOMIC AND MARKET OVERVIEW | 3 |
ABOUT SHAREHOLDERS’ FUND EXPENSES | 5 |
DIVERSIFIED INCOME FUND | 8 |
HIGH YIELD FUND | 17 |
INVESTMENT GRADE BOND FUND | 35 |
LIMITED DURATION FUND | 53 |
MUNICIPAL INCOME FUND | 73 |
NOTES TO FINANCIAL STATEMENTS | 83 |
OTHER INFORMATION | 100 |
INFORMATION ON BOARD OF TRUSTEES AND OFFICERS | 101 |
GUGGENHEIM INVESTMENTS PRIVACY POLICIES | 105 |
| | THE GUGGENHEIM FUNDS SEMI-ANNUAL REPORT | 1 |
Dear Shareholder:
Security Investors, LLC and Guggenheim Partners Investment Management, LLC (the “Investment Advisers”) are pleased to present the shareholder report for a selection of our Funds (the “Funds”) for the six-month period ended March 31, 2017.
The Investment Advisers are part of Guggenheim Investments, which represents the investment management businesses of Guggenheim Partners, LLC (“Guggenheim”), a global, diversified financial services firm.
Guggenheim Funds Distributors, LLC is the distributor of the Funds. Guggenheim Funds Distributors, LLC is affiliated with Guggenheim and the Investment Advisers.
We encourage you to read the Economic and Market Overview section of the report, which follows this letter.
We are committed to providing innovative investment solutions and appreciate the trust you place in us.
Sincerely,
Donald C. Cacciapaglia
President and Chief Executive Officer
April 30, 2017
Read a prospectus and summary prospectus (if available) carefully before investing. It contains the investment objectives, risks, charges, expenses and other information, which should be considered carefully before investing. Obtain a prospectus and summary prospectus (if available) at guggenheiminvestments.com or call 800.820.0888.
There can be no assurance that any investment product will achieve its investment objective(s). There are risks associated with investing, including the entire loss of principal invested. Investing involves market risks. The investment return and principal value of any investment product will fluctuate with changes in market conditions.
2 | THE GUGGENHEIM FUNDS SEMI-ANNUAL REPORT | |
ECONOMIC AND MARKET OVERVIEW (Unaudited) | March 31, 2017 |
The market optimism that helped lift risk asset prices after the presidential election in November continued through the early part of 2017. The Standard & Poor’s 500® (“S&P 500®”) Index set a new record, high yield corporate bond spreads approached cycle lows, and the 10-year Treasury yield rose to 2.63%, the highest level since 2014. Risk appetite faded as the first quarter drew to a close, however, as investors grappled with the implications of an unsuccessful healthcare reform bill and growing geopolitical risks.
Much of the rise in asset valuations since Donald Trump’s victory has been based on anticipation of his pro-growth policies coming to fruition, an outcome that is far from certain. Asset valuations could be getting a bit ahead of themselves, and becoming more sensitive to a temporary growth scare or setback, especially since the rollout of Trump’s new policies will not be smooth or easy.
Nevertheless, the underlying economy remains on a good trajectory. Tracking estimates for first-quarter real U.S. Gross Domestic Product (“GDP”) growth have fallen in recent weeks despite strong gains in consumer and business sentiment since the election. In late April, after the period ended, the initial estimate of first-quarter GDP growth was 0.7%. However, we attribute a large portion of the apparent weakness to seasonal factors that have depressed as-reported first quarter GDP growth over the past several years. In keeping with this pattern, we would expect the final first-quarter GDP number to be revised higher. More importantly, the prospects for quarterly U.S. GDP growth appear stronger going forward.
Consumer spending should benefit from solid income and wealth gains, with household net worth sitting at an all-time high. Recent job gains have been strong, and we anticipate a further acceleration of wage growth as the labor market continues to tighten. Buoyant consumer sentiment and low household debt service outlays also support our positive outlook. On the business investment side, we expect various factors to be supportive, including the uptick in global industrial production growth, the ongoing rise in U.S. oil drilling activity, the surge in small-business optimism, and the recovery in corporate earnings.
On March 15, the Federal Open Market Committee (“FOMC”) raised the U.S. Federal Reserve (the ”Fed”) funds target rate by 25 basis points to a range of 0.75–1.0%. The hike itself had little impact on markets because several FOMC members had indicated in the weeks leading up to the meeting that a hike was likely. Looking ahead, we believe that the market is underpricing the likely pace of Fed rate hikes in 2017 and 2018, particularly now that market optimism about fiscal stimulus is waning.
Importantly, Chair Yellen noted that the FOMC’s baseline forecast of two additional rate increases in 2017 and three more in 2018 was not conditioned on expectations for fiscal stimulus. Rather, it reflected a need to gradually remove accommodation due to the fact that the Fed has essentially achieved its dual mandate objectives for employment and inflation. Fiscal easing, she explained, could result in a faster pace of tightening, if it materializes. Markets are skeptical and are pricing in only 1.5 more rate hikes in 2017 and another 1.5 rate hikes in 2018, according to fed funds futures contracts. We expect that the Fed will deliver three more rate hikes in 2017 and another four in 2018.
We expect to see equity and credit investors take more chips off the table unless there is concrete progress on fiscal legislation in Washington, particularly as the Fed demonstrates its desire to tighten even without fiscal stimulus. While we are optimistic about the near-term U.S. economic outlook, current valuations and growing political risks warrant a more defensive stance.
For the six months ended March 31, 2017, the S&P 500 Index* returned 10.12%. The MSCI Europe-Australasia-Far East (“EAFE”) Index* returned 6.48%. The return of the MSCI Emerging Markets Index* was 6.80%.
In the bond market, the Bloomberg Barclays U.S. Aggregate Bond Index* posted a -2.18% return for the period, while the Bloomberg Barclays U.S. Corporate High Yield Index* returned 4.50%. The return of the Bank of America (“BofA”) Merrill Lynch 3-Month U.S. Treasury Bill Index* was 0.19% for the 12-month period.
The opinions and forecasts expressed may not actually come to pass. This information is subject to change at any time, based on market and other conditions, and should not be construed as a recommendation of any specific security or strategy.
| | THE GUGGENHEIM FUNDS SEMI-ANNUAL REPORT | 3 |
ECONOMIC AND MARKET OVERVIEW (Unaudited)(concluded) | March 31, 2017 |
*Index Definitions
The following indices are referenced throughout this report. Indices are unmanaged and not available for direct investment. Index performance does not reflect transaction costs, fees, or expenses.
Bloomberg Barclays U.S. Aggregate Bond Index is a broad-based flagship benchmark that measures the investment grade, U.S. dollar-denominated, fixed-rate taxable bond market, including U.S. Treasuries, government-related and corporate securities, mortgage-backed securities or “MBS” (agency fixed-rate and hybrid adjustable-rate mortgage, or “ARM”, pass-throughs), asset-backed securities (“ABS”), and commercial mortgage-backed securities (“CMBS”) (agency and non-agency).
Bloomberg Barclays U.S. Corporate High Yield Index measures the U.S. dollar-denominated, high yield, fixed-rate corporate bond market. Securities are classified as high yield if the middle rating of Moody’s, Fitch, and S&P is Ba1/BB +/BB + or below.
BofA Merrill Lynch 3-Month U.S. Treasury Bill Index is an unmanaged market index of U.S. Treasury securities maturing in 90 days that assumes reinvestment of all income.
MSCI EAFE Index is a free float-adjusted market capitalization index that is designed to measure the equity market performance of developed markets, excluding the U.S. & Canada.
MSCI Emerging Markets Index is a free float-adjusted market capitalization weighted index that is designed to measure equity market performance in the global emerging markets.
S&P 500® Index is a capitalization-weighted index of 500 stocks designed to measure the performance of the broad economy, representing all major industries and is considered a representation of the U.S. stock market.
4 | THE GUGGENHEIM FUNDS SEMI-ANNUAL REPORT | |
ABOUT SHAREHOLDERS’ FUND EXPENSES (Unaudited) | |
All mutual funds have operating expenses, and it is important for our shareholders to understand the impact of costs on their investments. Shareholders of a fund incur two types of costs: (i) transaction costs, including sales charges (loads) on purchase payments, reinvested dividends, other distributions, and exchange fees, and (ii) ongoing costs, including management fees, administrative services, and shareholder reports, among others. These ongoing costs, or operating expenses, are deducted from a fund’s gross income and reduce the investment return of the fund.
A fund’s expenses are expressed as a percentage of its average net assets, which is known as the expense ratio. The following examples are intended to help investors understand the ongoing costs (in dollars) of investing in a fund and to compare these costs with the ongoing costs of investing in other mutual funds.
The examples are based on an investment of $1,000 made at the beginning of the period and held for the entire six-month period beginning September 30, 2016 and ending March 31, 2017.
The following tables illustrate the Funds’ costs in two ways:
Table 1. Based on actual Fund return: This section helps investors estimate the actual expenses paid over the period. The “Ending Account Value” shown is derived from the Fund’s actual return, and the fifth column shows the dollar amount that would have been paid by an investor who started with $1,000 in the Fund. Investors may use the information here, together with the amount invested, to estimate the expenses paid over the period. Simply divide the Fund’s account value by $1,000 (for example, an $8,600 account value divided by $1,000 = 8.6), then multiply the result by the number provided under the heading “Expenses Paid During Period.”
Table 2. Based on hypothetical 5% return: This section is intended to help investors compare a Fund’s cost with those of other mutual funds. The table provides information about hypothetical account values and hypothetical expenses based on the Fund’s actual expense ratio and an assumed rate of return of 5% per year before expenses, which is not the Fund’s actual return. The hypothetical account values and expenses may not be used to estimate the actual ending account balance or expenses paid during the period. The example is useful in making comparisons because the U.S. Securities and Exchange Commission (the “SEC”) requires all mutual funds to calculate expenses based on the 5% return. Investors can assess a Fund’s costs by comparing this hypothetical example with the hypothetical examples that appear in shareholder reports of other funds.
The calculations illustrated above assume no shares were bought or sold during the period. Actual costs may have been higher or lower, depending on the amount of investment and the timing of any purchases or redemptions.
Please note that the expenses shown in the table are meant to highlight your ongoing costs only and do not reflect any transactional costs, such as sales charges (loads) on purchase payments, and contingent deferred sales charges (“CDSC”) on redemptions, if any. Therefore, the second table is useful in comparing ongoing costs only, and will not help you determine the relative total costs of owning different funds. In addition, if these transactional costs were included, your costs would have been higher.
More information about the Funds’ expenses, including annual expense ratios for periods up to five years (subject to the Fund’s inception date), can be found in the Financial Highlights section of this report. For additional information on operating expenses and other shareholder costs, please refer to the appropriate Fund prospectus.
More information about a Fund’s expenses, including annual expense ratios for the past five years, can be found in the Financial Highlights section of this report. For additional information on operating expenses and other shareholder costs, please refer to the appropriate Fund prospectus.
| | THE GUGGENHEIM FUNDS SEMI-ANNUAL REPORT | 5 |
ABOUT SHAREHOLDERS’ FUND EXPENSES (Unaudited)(continued) | |
| Expense
Ratio1 | Fund
Return | Beginning
Account Value
September 30, 2016 | Ending
Account Value
March 31, 2017 | Expenses
Paid During
Period2 |
Table 1. Based on actual Fund return3 | | | | | |
Diversified Income Fund | | | | | |
A-Class | 0.88% | 3.13% | $ 1,000.00 | $ 1,031.30 | $ 4.46 |
C-Class | 1.63% | 2.74% | 1,000.00 | 1,027.40 | 8.24 |
P-Class | 0.88% | 3.17% | 1,000.00 | 1,031.70 | 4.46 |
Institutional Class | 0.63% | 3.28% | 1,000.00 | 1,032.80 | 3.19 |
High Yield Fund | | | | | |
A-Class | 1.28% | 5.22% | 1,000.00 | 1,052.20 | 6.55 |
C-Class | 2.03% | 4.80% | 1,000.00 | 1,048.00 | 10.37 |
P-Class | 1.18% | 5.31% | 1,000.00 | 1,053.10 | 6.04 |
Institutional Class | 0.88% | 5.48% | 1,000.00 | 1,054.80 | 4.51 |
Investment Grade Bond Fund | | | | | |
A-Class | 1.02% | 0.22% | 1,000.00 | 1,002.20 | 5.09 |
C-Class | 1.77% | (0.20%) | 1,000.00 | 998.00 | 8.82 |
P-Class | 1.00% | 0.17% | 1,000.00 | 1,001.70 | 4.99 |
Institutional Class | 0.66% | 0.35% | 1,000.00 | 1,003.50 | 3.30 |
Limited Duration Fund | | | | | |
A-Class | 0.81% | 1.48% | 1,000.00 | 1,014.80 | 4.07 |
C-Class | 1.56% | 1.10% | 1,000.00 | 1,011.00 | 7.82 |
P-Class | 0.81% | 1.47% | 1,000.00 | 1,014.70 | 4.07 |
Institutional Class | 0.56% | 1.61% | 1,000.00 | 1,016.10 | 2.81 |
Municipal Income Fund | | | | | |
A-Class | 0.82% | (2.38%) | 1,000.00 | 976.20 | 4.04 |
C-Class | 1.57% | (2.82%) | 1,000.00 | 971.80 | 7.72 |
P-Class | 0.82% | (2.48%) | 1,000.00 | 975.20 | 4.04 |
Institutional Class | 0.57% | (2.34%) | 1,000.00 | 976.60 | 2.81 |
6 | THE GUGGENHEIM FUNDS SEMI-ANNUAL REPORT | |
ABOUT SHAREHOLDERS’ FUND EXPENSES (Unaudited)(concluded) | |
| Expense
Ratio1 | Fund
Return | Beginning
Account Value
September 30, 2016 | Ending
Account Value
March 31, 2017 | Expenses
Paid During
Period2 |
Table 2. Based on hypothetical 5% return (before expenses) | | | | |
Diversified Income Fund | | | | | |
A-Class | 0.88% | 5.00% | $ 1,000.00 | $ 1,020.54 | $ 4.43 |
C-Class | 1.63% | 5.00% | 1,000.00 | 1,016.80 | 8.20 |
P-Class | 0.88% | 5.00% | 1,000.00 | 1,020.54 | 4.43 |
Institutional Class | 0.63% | 5.00% | 1,000.00 | 1,021.79 | 3.18 |
High Yield Fund | | | | | |
A-Class | 1.28% | 5.00% | 1,000.00 | 1,018.55 | 6.44 |
C-Class | 2.03% | 5.00% | 1,000.00 | 1,014.81 | 10.20 |
P-Class | 1.18% | 5.00% | 1,000.00 | 1,019.05 | 5.94 |
Institutional Class | 0.88% | 5.00% | 1,000.00 | 1,020.54 | 4.43 |
Investment Grade Bond Fund | | | | | |
A-Class | 1.02% | 5.00% | 1,000.00 | 1,019.85 | 5.14 |
C-Class | 1.77% | 5.00% | 1,000.00 | 1,016.11 | 8.90 |
P-Class | 1.00% | 5.00% | 1,000.00 | 1,019.95 | 5.04 |
Institutional Class | 0.66% | 5.00% | 1,000.00 | 1,021.64 | 3.33 |
Limited Duration Fund | | | | | |
A-Class | 0.81% | 5.00% | 1,000.00 | 1,020.89 | 4.08 |
C-Class | 1.56% | 5.00% | 1,000.00 | 1,017.15 | 7.85 |
P-Class | 0.81% | 5.00% | 1,000.00 | 1,020.89 | 4.08 |
Institutional Class | 0.56% | 5.00% | 1,000.00 | 1,022.14 | 2.82 |
Municipal Income Fund | | | | | |
A-Class | 0.82% | 5.00% | 1,000.00 | 1,020.84 | 4.13 |
C-Class | 1.57% | 5.00% | 1,000.00 | 1,017.10 | 7.90 |
P-Class | 0.82% | 5.00% | 1,000.00 | 1,020.84 | 4.13 |
Institutional Class | 0.57% | 5.00% | 1,000.00 | 1,022.09 | 2.87 |
1 | Annualized and excludes expenses of the underlying funds in which the Funds invest. |
2 | Expenses are equal to the Fund's annualized expense ratio, net of any applicable fee waivers, multiplied by the average account value over the period, multiplied by 182/365 (to reflect the one-half year period). |
3 | Actual cumulative return at net asset value for the period September 30, 2016 to March 31, 2017. |
| | THE GUGGENHEIM FUNDS SEMI-ANNUAL REPORT | 7 |
FUND PROFILE (Unaudited) | March 31, 2017 |
DIVERSIFIED INCOME FUND
OBJECTIVE: Seeks to achieve high current income with consideration for capital appreciation.
Holdings Diversification (Market Exposure as % of Net Assets)
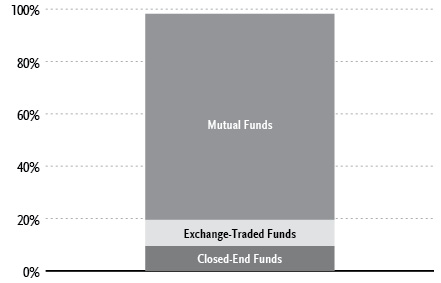
“Holdings Diversification (Market Exposure as % of Net Assets)” excludes any temporary cash investments.
Inception Dates: |
A-Class | January 29, 2016 |
C-Class | January 29, 2016 |
P-Class | January 29, 2016 |
Institutional Class | January 29, 2016 |
Ten Largest Holdings (% of Total Net Assets) |
Guggenheim High Yield Fund — Institutional Class | 30.9% |
Guggenheim Limited Duration Fund — Institutional Class | 23.7% |
Guggenheim Investment Grade Bond Fund — Institutional Class | 13.6% |
Guggenheim S&P High Income Infrastructure ETF | 10.1% |
Guggenheim World Equity Income Fund — Institutional Class | 5.9% |
Guggenheim Risk Managed Real Estate Fund — Institutional Class | 4.6% |
Neuberger Berman High Yield Strategies Fund, Inc. | 0.3% |
First Trust Enhanced Equity Income Fund | 0.3% |
Avenue Income Credit Strategies Fund | 0.3% |
BlackRock Enhanced Capital and Income Fund, Inc. | 0.3% |
Top Ten Total | 90.0% |
“Ten Largest Holdings” excludes any temporary cash or derivative investments. |
8 | THE GUGGENHEIM FUNDS SEMI-ANNUAL REPORT | |
SCHEDULE OF INVESTMENTS (Unaudited) | March 31, 2017 |
DIVERSIFIED INCOME FUND | |
| | Shares | | | Value | |
| | | | | | | |
EXCHANGE-TRADED FUNDS† - 10.1% | |
Guggenheim S&P High Income Infrastructure ETF1 | | | 21,275 | | | $ | 585,914 | |
Total Exchange-Traded Funds | | | | | | | | |
(Cost $447,192) | | | | | | | 585,914 | |
| | | | | | | | | |
MUTUAL FUNDS† - 78.7% | |
Guggenheim High Yield Fund — Institutional Class 1 | | | 192,875 | | | | 1,791,813 | |
Guggenheim Limited Duration Fund — Institutional Class 1 | | | 55,467 | | | | 1,371,710 | |
Guggenheim Investment Grade Bond Fund — Institutional Class 1 | | | 43,168 | | | | 787,387 | |
Guggenheim World Equity Income Fund — Institutional Class 1 | | | 24,597 | | | | 344,603 | |
Guggenheim Risk Managed Real Estate Fund — Institutional Class 1 | | | 9,344 | | | | 268,551 | |
Total Mutual Funds | | | | | | | | |
(Cost $4,372,825) | | | | | | | 4,564,064 | |
| | | | | | | | | |
CLOSED-END FUNDS† - 9.4% | | | | | | | | |
Neuberger Berman High Yield Strategies Fund, Inc. | | | 1,346 | | | | 15,989 | |
First Trust Enhanced Equity Income Fund | | | 1,100 | | | | 15,884 | |
Avenue Income Credit Strategies Fund | | | 1,134 | | | | 15,831 | |
BlackRock Enhanced Capital and Income Fund, Inc. | | | 1,076 | | | | 15,408 | |
Western Asset High Income Fund II, Inc. | | | 2,108 | | | | 15,220 | |
John Hancock Premium Dividend Fund | | | 907 | | | | 14,430 | |
First Trust Strategic High Income Fund II | | | 1,100 | | | | 14,333 | |
Salient Midstream & MLP Fund | | | 1,070 | | | | 14,317 | |
New America High Income Fund, Inc. | | | 1,517 | | | | 14,305 | |
Royce Value Trust, Inc. | | | 1,000 | | | | 14,000 | |
AllianzGI Convertible & Income Fund | | | 2,064 | | | | 13,953 | |
ClearBridge American Energy MLP Fund, Inc. | | | 1,400 | | | | 13,888 | |
Eaton Vance Tax-Managed Diversified Equity Income Fund | | | 1,250 | | | | 13,838 | |
Blackstone / GSO Strategic Credit Fund | | | 868 | | | | 13,749 | |
Calamos Convertible and High Income Fund | | | 1,206 | | | | 13,736 | |
PIMCO Income Strategy Fund II | | | 1,364 | | | | 13,708 | |
Invesco Dynamic Credit Opportunities Fund | | | 1,120 | | | | 13,698 | |
PIMCO Income Opportunity Fund | | | 551 | | | | 13,681 | |
John Hancock Investors Trust | | | 798 | | | | 13,598 | |
Ivy High Income Opportunities Fund | | | 890 | | | | 13,573 | |
Pioneer High Income Trust | | | 1,350 | | | | 13,325 | |
BlackRock Multi-Sector Income Trust | | | 766 | | | | 13,259 | |
AllianceBernstein Global High Income Fund, Inc. | | | 1,050 | | | | 13,209 | |
AllianzGI Equity & Convertible Income Fund | | | 683 | | | | 13,182 | |
Barings Global Short Duration High Yield Fund | | | 665 | | | | 13,154 | |
DoubleLine Income Solutions Fund | | | 650 | | | | 13,046 | |
Pioneer Floating Rate Trust | | | 1,065 | | | | 13,014 | |
Nuveen Credit Strategies Income Fund | | | 1,488 | | | | 12,931 | |
John Hancock Preferred Income Fund III | | | 700 | | | | 12,908 | |
BlackRock Credit Allocation Income Trust | | | 978 | | | | 12,870 | |
BlackRock Enhanced Equity Dividend Trust | | | 1,500 | | | | 12,825 | |
Western Asset High Yield Defined Opportunity Fund, Inc. | | | 834 | | | | 12,810 | |
Eaton Vance Enhanced Equity Income Fund II | | | 946 | | | | 12,780 | |
KKR Income Opportunities Fund | | | 750 | | | | 12,758 | |
Western Asset Premier Bond Fund | | | 951 | | | | 12,696 | |
Tortoise Pipeline & Energy Fund, Inc. | | | 600 | | | | 12,672 | |
BlackRock Corporate High Yield Fund, Inc. | | | 1,150 | | | | 12,558 | |
Cohen & Steers Total Return Realty Fund, Inc. | | | 1,000 | | | | 12,320 | |
Duff & Phelps Global Utility Income Fund, Inc. | | | 750 | | | | 12,195 | |
Eaton Vance Tax-Managed Buy-Write Income Fund | | | 700 | | | | 11,403 | |
Total Closed-End Funds | | | | | | | | |
(Cost $496,341) | | | | | | | 543,054 | |
| | | | | | | | | |
SHORT-TERM INVESTMENTS† - 0.1% | |
Goldman Sachs Financial Square Treasury Instruments Fund — Institutional Class 0.56%2 | | | 5,484 | | | | 5,484 | |
Total Short-Term Investments | | | | | | | | |
(Cost $5,484) | | | | | | | 5,484 | |
| | | | | | | | | |
Total Investments - 98.3% | | | | | | | | |
(Cost $5,321,842) | | | | | | $ | 5,698,516 | |
Other Assets & Liabilities, net - 1.7% | | | | | | | 100,254 | |
Total Net Assets - 100.0% | | | | | | $ | 5,798,770 | |
† | Value determined based on Level 1 inputs — See Note 4. |
1 | Affiliated issuer — See Note 8. |
2 | Rate indicated is the 7 day yield as of March 31, 2017. |
| | |
| | See Sector Classification in Other Information section. |
SEE NOTES TO FINANCIAL STATEMENTS. | THE GUGGENHEIM FUNDS SEMI-ANNUAL REPORT | 9 |
SCHEDULE OF INVESTMENTS (Unaudited)(concluded) | March 31, 2017 |
DIVERSIFIED INCOME FUND | |
The following table summarizes the inputs used to value the Fund’s investments at March 31, 2017 (See Note 4 in the Notes to Financial Statements):
Investments in Securities (Assets) | | Level 1 | | | Level 2 | | | Level 3 | | | Total | |
Closed-End Funds | | $ | 543,054 | | | $ | — | | | $ | — | | | $ | 543,054 | |
Exchange-Traded Funds | | | 585,914 | | | | — | | | | — | | | | 585,914 | |
Mutual Funds | | | 4,564,064 | | | | — | | | | — | | | | 4,564,064 | |
Short Term Investments | | | 5,484 | | | | — | | | | — | | | | 5,484 | |
Total | | $ | 5,698,516 | | | $ | — | | | $ | — | | | $ | 5,698,516 | |
Transfers between investment levels may occur as the markets fluctuate and/or the availability of data used in an investment’s valuation changes. Transfers between valuation levels, if any, are in comparison to the valuation levels at the end of the previous fiscal year, and are effective using the fair value as of the end of the previous fiscal period.
For the period ended March 31, 2017, there were no transfers between levels.
10 | THE GUGGENHEIM FUNDS SEMI-ANNUAL REPORT | SEE NOTES TO FINANCIAL STATEMENTS. |
STATEMENT OF ASSETS AND LIABILITIES (Unaudited) |
March 31, 2017 |
Assets: | |
Investments in unaffiliated issuers, at value (cost $501,825) | | $ | 548,538 | |
Investments in affiliated issuers, at value (cost $4,820,017) | | | 5,149,978 | |
Total investments (cost $5,321,842) | | | 5,698,516 | |
Prepaid expenses | | | 102,551 | |
Cash | | | 6,756 | |
Receivables: | |
Dividends | | | 19,643 | |
Investment adviser | | | 6,086 | |
Total assets | | | 5,833,552 | |
| | | | | |
Liabilities: | |
Payable for: | |
Securities purchased | | | 19,713 | |
Direct shareholders expense | | | 6,770 | |
Transfer agent/maintenance fees | | | 4,892 | |
Custodian fees | | | 1,324 | |
Trustees’ fees* | | | 1,220 | |
Distribution and service fees | | | 164 | |
Fund shares redeemed | | | 2 | |
Miscellaneous | | | 697 | |
Total liabilities | | | 34,782 | |
Net assets | | $ | 5,798,770 | |
| | | | | |
Net assets consist of: | |
Paid in capital | | $ | 5,398,213 | |
Undistributed net investment income | | | 8,151 | |
Accumulated net realized gain on investments | | | 15,732 | |
Net unrealized appreciation on investments | | | 376,674 | |
Net assets | | $ | 5,798,770 | |
| | | | | |
A-Class: | |
Net assets | | $ | 144,283 | |
Capital shares outstanding | | | 5,330 | |
Net asset value per share | | $ | 27.07 | |
Maximum offering price per share (Net asset value divided by 96.00%) | | $ | 28.20 | |
| | | | | |
C-Class: | |
Net assets | | $ | 129,749 | |
Capital shares outstanding | | | 4,796 | |
Net asset value per share | | $ | 27.05 | |
| | | | | |
P-Class: | |
Net assets | | $ | 115,214 | |
Capital shares outstanding | | | 4,257 | |
Net asset value per share | | $ | 27.06 | |
| | | | | |
Institutional Class: | |
Net assets | | $ | 5,409,524 | |
Capital shares outstanding | | | 199,838 | |
Net asset value per share | | $ | 27.07 | |
STATEMENT OF OPERATIONS (Unaudited) |
Period Ended March 31, 2017 |
Investment Income: | |
Dividends from securities of affiliated issuers | | $ | 85,003 | |
Dividends from securities of unaffiliated issuers (net of foreign withholding tax of $32) | | | 48,127 | |
Interest | | | 49 | |
Total investment income | | | 133,179 | |
| | | | | |
Expenses: | |
Management fees | | | 21,126 | |
Transfer agent/maintenance fees | |
A-Class | | | 181 | |
C-Class | | | 236 | |
P-Class | | | 202 | |
Institutional Class | | | 4,007 | |
Distribution and service fees: | |
A-Class | | | 174 | |
C-Class | | | 604 | |
P-Class | | | 140 | |
Fund accounting/administration fees | | | 12,465 | |
Professional fees | | | 6,937 | |
Registration fees | | | 6,443 | |
Trustees’ fees* | | | 3,491 | |
Insurance expense | | | 3,476 | |
Line of credit fees | | | 891 | |
Miscellaneous | | | 1,618 | |
Total expenses | | | 61,991 | |
Less: | |
Expenses waived by Adviser: | | | (38,597 | ) |
Expenses reimbursed by Adviser: | | | | |
A-Class | | | (213 | ) |
C-Class | | | (268 | ) |
P-Class | | | (197 | ) |
Institutional Class | | | (3,932 | ) |
Total waived/reimbursed expenses | | | (43,207 | ) |
Net expenses | | | 18,784 | |
Net investment income | | | 114,395 | |
| | | | | |
Net Realized and Unrealized Gain (Loss): | |
Net realized gain (loss) on: | |
Investments in unaffiliated issuers | | | 17,614 | |
Investments in affiliated issuers | | | 35,751 | |
Net realized gain | | | 53,365 | |
Net change in unrealized appreciation (depreciation) on: | |
Investments in unaffiliated issuers | | | (6,788 | ) |
Investments in affiliated issuers | | | 21,487 | |
Net change in unrealized appreciation (depreciation) | | | 14,699 | |
Net realized and unrealized gain | | | 68,064 | |
Net increase in net assets resulting from operations | | $ | 182,459 | |
* | Relates to Trustees not deemed “interested persons” within the meaning of Section 2(a)(19) of the 1940 Act. |
SEE NOTES TO FINANCIAL STATEMENTS. | THE GUGGENHEIM FUNDS SEMI-ANNUAL REPORT | 11 |
STATEMENTS OF CHANGES IN NET ASSETS |
| | Period Ended
March 31,
2017
(Unaudited) | | | Period Ended September 30,
2016a | |
Increase (Decrease) in Net Assets from Operations: | | | | | | |
Net investment income | | $ | 114,395 | | | $ | 159,987 | |
Net realized gain on investments | | | 53,365 | | | | 50,887 | |
Net change in unrealized appreciation (depreciation) on investments | | | 14,699 | | | | 361,975 | |
Net increase in net assets resulting from operations | | | 182,459 | | | | 572,849 | |
| | | | | | | | | |
Distributions to shareholders from: | | | | | | | | |
Net investment income | | | | | | | | |
A-Class | | | (2,777 | ) | | | (3,059 | ) |
C-Class | | | (1,944 | ) | | | (2,279 | ) |
P-Class | | | (2,253 | ) | | | (2,744 | ) |
Institutional Class | | | (112,891 | ) | | | (136,669 | ) |
Net realized gains | | | | | | | | |
A-Class | | | (2,257 | ) | | | — | |
C-Class | | | (1,912 | ) | | | — | |
P-Class | | | (1,799 | ) | | | — | |
Institutional Class | | | (84,531 | ) | | | — | |
Total distributions to shareholders | | | (210,364 | ) | | | (144,751 | ) |
| | | | | | | | | |
Capital share transactions: | | | | | | | | |
Proceeds from sale of shares | | | | | | | | |
A-Class | | | 7,750 | | | | 119,796 | |
C-Class | | | 8,902 | | | | 107,000 | |
P-Class | | | 450 | | | | 100,100 | |
Institutional Class | | | — | | | | 4,700,000 | |
Distributions reinvested | | | | | | | | |
A-Class | | | 5,034 | | | | 3,059 | |
C-Class | | | 3,856 | | | | 2,279 | |
P-Class | | | 4,052 | | | | 2,744 | |
Institutional Class | | | 197,422 | | | | 136,669 | |
Cost of shares redeemed | | | | | | | | |
A-Class | | | (35 | ) | | | (91 | ) |
C-Class | | | (300 | ) | | | — | |
P-Class | | | (110 | ) | | | — | |
Net increase from capital share transactions | | | 227,021 | | | | 5,171,556 | |
Net increase in net assets | | | 199,116 | | | | 5,599,654 | |
| | | | | | | | | |
Net assets: | | | | | | | | |
Beginning of year | | | 5,599,654 | | | | — | |
End of year | | $ | 5,798,770 | | | $ | 5,599,654 | |
Undistributed net investment income at end of year | | $ | 8,151 | | | $ | 13,621 | |
12 | THE GUGGENHEIM FUNDS SEMI-ANNUAL REPORT | SEE NOTES TO FINANCIAL STATEMENTS. |
STATEMENTS OF CHANGES IN NET ASSETS (concluded) |
| | Period Ended
March 31,
2017
(Unaudited) | | | Period Ended September 30,
2016a | |
Capital share activity: | | | | | | |
Shares sold | | | | | | |
A-Class | | | 291 | | | | 4,757 | |
C-Class | | | 330 | | | | 4,260 | |
P-Class | | | 17 | | | | 4,004 | |
Institutional Class | | | — | | | | 188,000 | |
Shares issued from reinvestment of distributions | | | | | | | | |
A-Class | | | 171 | | | | 116 | |
C-Class | | | 131 | | | | 87 | |
P-Class | | | 137 | | | | 104 | |
Institutional Class | | | 6,641 | | | | 5,197 | |
Shares redeemed | | | | | | | | |
A-Class | | | (1 | ) | | | (4 | ) |
C-Class | | | (12 | ) | | | — | |
P-Class | | | (5 | ) | | | — | |
Net increase in shares | | | 7,700 | | | | 206,521 | |
a | Since commencement of operations: January 29, 2016. |
SEE NOTES TO FINANCIAL STATEMENTS. | THE GUGGENHEIM FUNDS SEMI-ANNUAL REPORT | 13 |
This table is presented to show selected data for a share outstanding throughout each period and to assist shareholders in evaluating a Fund’s performance for the periods presented.
A-Class | | Period Ended
March 31,
2017a | | | Period Ended
September 30,
2016b | |
Per Share Data | | | | | | |
Net asset value, beginning of period | | $ | 27.12 | | | $ | 25.00 | |
Income (loss) from investment operations: | |
Net investment income (loss)c | | | .52 | | | | .76 | |
Net gain (loss) on investments (realized and unrealized) | | | .31 | | | | 2.03 | |
Total from investment operations | | | .83 | | | | 2.79 | |
Less distributions from: | |
Net investment income | | | (.44 | ) | | | (.67 | ) |
Net realized gains | | | (.44 | ) | | | — | |
Total distributions | | | (.88 | ) | | | (.67 | ) |
Net asset value, end of period | | $ | 27.07 | | | $ | 27.12 | |
| |
Total Returnd | | | 3.13 | % | | | 11.29 | % |
Ratios/Supplemental Data | |
Net assets, end of period (in thousands) | | $ | 144 | | | $ | 132 | |
Ratios to average net assets: | |
Net investment income (loss) | | | 3.85 | % | | | 4.35 | % |
Total expensese | | | 2.51 | % | | | 3.31 | % |
Net expensesf,g | | | 0.88 | % | | | 0.77 | % |
Portfolio turnover rate | | | 34 | % | | | 83 | % |
C-Class | | Period Ended
March 31,
2017a | | | Period Ended
September 30,
2016b | |
Per Share Data | | | | | | |
Net asset value, beginning of period | | $ | 27.11 | | | $ | 25.00 | |
Income (loss) from investment operations: | |
Net investment income (loss)c | | | .45 | | | | .63 | |
Net gain (loss) on investments (realized and unrealized) | | | .28 | | | | 2.03 | |
Total from investment operations | | | .73 | | | | 2.66 | |
Less distributions from: | |
Net investment income | | | (.35 | ) | | | (.55 | ) |
Net realized gains | | | (.44 | ) | | | — | |
Total distributions | | | (.79 | ) | | | (.55 | ) |
Net asset value, end of period | | $ | 27.05 | | | $ | 27.11 | |
| |
Total Returnd | | | 2.74 | % | | | 10.74 | % |
Ratios/Supplemental Data | |
Net assets, end of period (in thousands) | | $ | 130 | | | $ | 118 | |
Ratios to average net assets: | |
Net investment income (loss) | | | 3.09 | % | | | 3.58 | % |
Total expensese | | | 3.39 | % | | | 4.05 | % |
Net expensesf,g | | | 1.63 | % | | | 1.52 | % |
Portfolio turnover rate | | | 34 | % | | | 83 | % |
14 | THE GUGGENHEIM FUNDS SEMI-ANNUAL REPORT | SEE NOTES TO FINANCIAL STATEMENTS. |
FINANCIAL HIGHLIGHTS (continued) |
This table is presented to show selected data for a share outstanding throughout each period and to assist shareholders in evaluating a Fund’s performance for the periods presented.
P-Class | | Period Ended
March 31,
2017a | | | Period Ended
September 30,
2016b | |
Per Share Data | | | | | | |
Net asset value, beginning of period | | $ | 27.11 | | | $ | 25.00 | |
Income (loss) from investment operations: | |
Net investment income (loss)c | | | .48 | | | | .74 | |
Net gain (loss) on investments (realized and unrealized) | | | .35 | | | | 2.05 | |
Total from investment operations | | | .83 | | | | 2.79 | |
Less distributions from: | |
Net investment income | | | (.44 | ) | | | (.68 | ) |
Net realized gains | | | (.44 | ) | | | — | |
Total distributions | | | (.88 | ) | | | (.68 | ) |
Net asset value, end of period | | $ | 27.06 | | | $ | 27.11 | |
| |
Total Returnd | | | 3.17 | % | | | 11.27 | % |
Ratios/Supplemental Data | |
Net assets, end of period (in thousands) | | $ | 115 | | | $ | 111 | |
Ratios to average net assets: | |
Net investment income (loss) | | | 3.84 | % | | | 4.32 | % |
Total expensese | | | 2.61 | % | | | 3.21 | % |
Net expensesf,g | | | 0.88 | % | | | 0.80 | % |
Portfolio turnover rate | | | 34 | % | | | 83 | % |
SEE NOTES TO FINANCIAL STATEMENTS. | THE GUGGENHEIM FUNDS SEMI-ANNUAL REPORT | 15 |
FINANCIAL HIGHLIGHTS (concluded) |
This table is presented to show selected data for a share outstanding throughout each period and to assist shareholders in evaluating a Fund’s performance for the periods presented.
Institutional Class | | Period Ended
March 31,
2017a | | | Period Ended
September 30,
2016b | |
Per Share Data | | | | | | |
Net asset value, beginning of period | | $ | 27.11 | | | $ | 25.00 | |
Income (loss) from investment operations: | |
Net investment income (loss)c | | | .55 | | | | .79 | |
Net gain (loss) on investments (realized and unrealized) | | | .32 | | | | 2.04 | |
Total from investment operations | | | .87 | | | | 2.83 | |
Less distributions from: | |
Net investment income | | | (.47 | ) | | | (.72 | ) |
Net realized gains | | | (.44 | ) | | | — | |
Total distributions | | | (.91 | ) | | | (.72 | ) |
Net asset value, end of period | | $ | 27.07 | | | $ | 27.11 | |
| |
Total Returnd | | | 3.28 | % | | | 11.44 | % |
Ratios/Supplemental Data | |
Net assets, end of period (in thousands) | | $ | 5,410 | | | $ | 5,238 | |
Ratios to average net assets: | |
Net investment income (loss) | | | 4.09 | % | | | 4.57 | % |
Total expensese | | | 2.15 | % | | | 2.93 | % |
Net expensesf,g | | | 0.63 | % | | | 0.54 | % |
Portfolio turnover rate | | | 34 | % | | | 83 | % |
a | Unaudited figures for the period ended March 31, 2017. Percentage amounts for the period, except total return and portfolio turnover rate, have been annualized. |
b | Since commencement of operations: January 29, 2016. Percentage amounts for the period, except total return and portfolio turnover rate, have been annualized. |
c | Net investment income (loss) per share was computed using average shares outstanding throughout the period. |
d | Total return does not reflect the impact of any applicable sales charges and has not been annualized. |
e | Does not include expenses of the underlying funds in which the Fund invests. |
f | Net expense information reflects the expense ratios after expense waivers. |
g | Net expenses may include expenses that are excluded from the expense limitation agreement and affiliated fund waivers. Excluding these expenses, the net expense ratios for the years would be: |
| | | 03/31/17 | 09/30/16 | |
| | A-Class | 0.85% | 0.76% | |
| | C-Class | 1.60% | 1.52% | |
| | P-Class | 0.85% | 0.79% | |
| | Institutional Class | 0.60% | 0.54% | |
16 | THE GUGGENHEIM FUNDS SEMI-ANNUAL REPORT | SEE NOTES TO FINANCIAL STATEMENTS. |
FUND PROFILE (Unaudited) | March 31, 2017 |
HIGH YIELD FUND
OBJECTIVE: Seeks high current income. Capital appreciation is a secondary objective.
Holdings Diversification (Market Exposure as % of Net Assets)
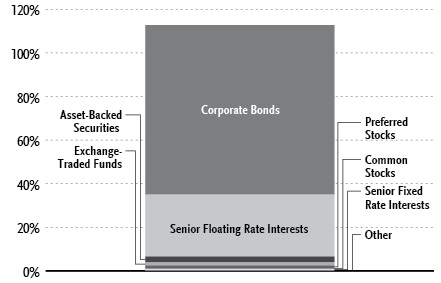
“Holdings Diversification (Market Exposure as % of Net Assets)” excludes any temporary cash investments.
Portfolio Composition by Quality Rating1 |
Rating | % of Total Investments |
Fixed Income Instruments | |
AAA | 0.1% |
AA | 0.1% |
A | 0.2% |
BBB | 6.1% |
BB | 37.6% |
B | 39.1% |
CCC | 7.3% |
CC | 0.4% |
NR2 | 1.8% |
Total | 92.7% |
Other Instruments | 7.3% |
Total Investments | 100.0% |
The chart above reflects percentages of the value of total investments. |
Inception Dates: |
A-Class | August 5, 1996 |
C-Class | May 1, 2000 |
P-Class | May 1, 2015 |
Institutional Class | July 11, 2008 |
Ten Largest Holdings (% of Total Net Assets) |
Vector Group Ltd. | 1.9% |
Kennedy-Wilson, Inc. | 1.6% |
Eldorado Gold Corp. | 1.4% |
CCO Holdings LLC / CCO Holdings Capital Corp. | 1.4% |
LBC Tank Terminals Holding Netherlands BV | 1.3% |
American Midstream Partners Limited Partnership / American Midstream Finance Corp. | 1.2% |
SPDR Bloomberg Barclays High Yield Bond ETF | 1.1% |
Jefferies Finance LLC / JFIN Company-Issuer Corp. | 1.1% |
WMG Acquisition Corp. | 1.0% |
Unit Corp. | 1.0% |
Top Ten Total | 13.0% |
“Ten Largest Holdings” excludes any temporary cash or derivative investments. |
1 | Source: BlackRock Solutions. Credit quality ratings are measured on a scale that generally ranges from AAA (highest) to D (lowest). All securities except for those labeled “NR” have been rated by a Nationally Recognized Statistical Rating Organization (“NRSRO”). For purposes of this presentation, when ratings are available from more than one agency, the highest rating is used. Guggenheim Investments converts ratings to the equivalent S&P rating. |
2 | NR securities do not necessarily indicate low credit quality. |
| | THE GUGGENHEIM FUNDS SEMI-ANNUAL REPORT | 17 |
SCHEDULE OF INVESTMENTS (Unaudited) | March 31, 2017 |
HIGH YIELD FUND | |
| | Shares | | | Value | |
| | | | | | | |
COMMON STOCKS† - 0.9% | |
| | | | | | | |
Energy - 0.4% | |
SandRidge Energy, Inc.* | | | 51,923 | | | $ | 960,056 | |
Titan Energy LLC*,1 | | | 17,186 | | | | 312,785 | |
Approach Resources, Inc.* | | | 51,060 | | | | 128,161 | |
Stallion Oilfield Holdings Ltd.*,††† | | | 8,257 | | | | 5,161 | |
Total Energy | | | | | | | 1,406,163 | |
| | | | | | | | | |
Technology - 0.3% | |
Aspect Software Parent, Inc.*,†††,1 | | | 64,681 | | | | 968,308 | |
Total Technology | | | | | | | 968,308 | |
| | | | | | | | | |
Consumer, Cyclical - 0.2% | |
Metro-Goldwyn-Mayer, Inc.*,†† | | | 7,040 | | | | 686,400 | |
| | | | | | | | | |
Communications - 0.0% | |
Cengage Learning Acquisitions, Inc.*,†† | | | 2,107 | | | | 25,811 | |
| | | | | | | | | |
Consumer, Non-cyclical - 0.0% | |
Targus Group International Equity, Inc*,†††,1 | | | 13,240 | | | | 19,330 | |
Crimson Wine Group Ltd.* | | | 8 | | | | 80 | |
Total Consumer, Non-cyclical | | | | | | | 19,410 | |
| | | | | | | | | |
Diversified - 0.0% | |
Leucadia National Corp. | | | 81 | | | | 2,106 | |
| | | | | | | | | |
Basic Materials - 0.0% | |
Mirabela Nickel Ltd.*,†††,1 | | | 1,044,540 | | | | 80 | |
| | | | | | | | | |
Total Common Stocks | | | | | | | | |
(Cost $4,555,278) | | | | | | | 3,108,278 | |
| | | | | | | | | |
PREFERRED STOCKS†† - 1.1% | |
Financial - 0.5% | |
Morgan Stanley 6.38%†,2,3 | | | 46,000 | | | | 1,272,360 | |
Aspen Insurance Holdings Ltd. 5.95%2,3 | | | 19,965 | | | | 538,256 | |
Total Financial | | | | | | | 1,810,616 | |
| | | | | | | | | |
Industrial - 0.5% | |
Seaspan Corp. 6.38% due 04/30/191 | | | 60,625 | | | | 1,521,688 | |
U.S. Shipping Corp.*,1 | | | 14,718 | | | | 14,718 | |
Total Industrial | | | | | | | 1,536,406 | |
| | | | | | | | | |
Communications - 0.1% | |
Medianews Group, Inc.* | | | 11,074 | | | | 276,850 | |
Total Preferred Stocks | | | | | | | | |
(Cost $3,707,846) | | | | | | | 3,623,872 | |
| | | | | | | | | |
WARRANTS†† - 0.0%** | |
Comstock Resources, Inc. | | | | | | | | |
$0.01, 09/06/18 | | | 9,075 | | | | 83,671 | |
SandRidge Energy, Inc. | | | | | | | | |
$41.34, 10/04/22† | | | 488 | | | | 493 | |
SandRidge Energy, Inc. | | | | | | | | |
$42.03, 10/04/22† | | | 205 | | | | 205 | |
Total Warrants | | | | | | | | |
(Cost $108,149) | | | | | | | 84,369 | |
| | | | | | | | | |
EXCHANGE-TRADED FUNDS† - 1.5% | |
SPDR Bloomberg Barclays High Yield Bond ETF | | | 102,000 | | | | 3,766,860 | |
SPDR Bloomberg Barclays Short Term High Yield Bond ETF | | | 44,814 | | | | 1,252,999 | |
Total Exchange-Traded Funds | | | | | | | | |
(Cost $4,897,711) | | | | | | | 5,019,859 | |
| | | | | | | | | |
SHORT-TERM INVESTMENTS† - 4.8% | |
Dreyfus Treasury Securities Cash Management Fund — Institutional Class 0.50%4 | | | 16,104,881 | | | | 16,104,881 | |
Total Short-Term Investments | | | | | | | | |
(Cost $16,104,881) | | | | | | | 16,104,881 | |
| | | | | | | | | |
| | | Face
Amount10 | | | | | |
| | | | | | | | | |
CORPORATE BONDS†† - 77.8% | |
Communications - 16.1% | |
CCO Holdings LLC / CCO Holdings Capital Corp. | | | | | | | | |
5.13% due 05/01/27 | | $ | 4,550,000 | | | | 4,572,749 | |
5.88% due 04/01/24 | | | 1,000,000 | | | | 1,055,000 | |
5.25% due 09/30/22 | | | 1,000,000 | | | | 1,037,500 | |
DISH DBS Corp. | | | | | | | | |
7.75% due 07/01/26 | | | 2,575,000 | | | | 2,993,437 | |
5.88% due 11/15/24 | | | 2,400,000 | | | | 2,520,600 | |
SFR Group S.A. | | | | | | | | |
7.38% due 05/01/266 | | | 2,250,000 | | | | 2,317,500 | |
6.00% due 05/15/226 | | | 1,875,000 | | | | 1,942,969 | |
6.25% due 05/15/246 | | | 1,000,000 | | | | 1,006,250 | |
CSC Holdings LLC | | | | | | | | |
6.75% due 11/15/21 | | | 2,650,000 | | | | 2,873,594 | |
5.25% due 06/01/24 | | | 1,550,000 | | | | 1,544,188 | |
5.50% due 04/15/276 | | | 550,000 | | | | 558,938 | |
T-Mobile USA, Inc. | | | | | | | | |
6.25% due 04/01/21 | | | 1,600,000 | | | | 1,650,000 | |
6.73% due 04/28/22 | | | 1,450,000 | | | | 1,500,170 | |
6.63% due 04/28/21 | | | 1,250,000 | | | | 1,291,875 | |
6.13% due 01/15/22 | | | 500,000 | | | | 528,125 | |
Sprint Communications, Inc. | | | | | | | | |
9.00% due 11/15/186 | | | 1,800,000 | | | | 1,959,750 | |
7.00% due 03/01/206 | | | 1,375,000 | | | | 1,498,750 | |
MDC Partners, Inc. | | | | | | | | |
6.50% due 05/01/246 | | | 3,350,000 | | | | 3,195,063 | |
Inmarsat Finance plc | | | | | | | | |
4.88% due 05/15/226 | | | 2,550,000 | | | | 2,524,500 | |
Virgin Media Secured Finance plc | | | | | | | | |
5.00% due 04/15/27 | | GBP | 1,600,000 | | | | 2,027,313 | |
18 | THE GUGGENHEIM FUNDS SEMI-ANNUAL REPORT | SEE NOTES TO FINANCIAL STATEMENTS. |
SCHEDULE OF INVESTMENTS (Unaudited)(continued) | March 31, 2017 |
HIGH YIELD FUND | |
| | Face
Amount10 | | Value | |
| | | | | | |
5.25% due 01/15/266 | | $ | 250,000 | | $ | 251,250 | |
Cengage Learning, Inc. | | | | | | | |
9.50% due 06/15/246 | | | 2,350,000 | | | 2,103,250 | |
Sirius XM Radio, Inc. | | | | | | | |
5.38% due 07/15/266 | | | 1,350,000 | | | 1,380,375 | |
5.38% due 04/15/256 | | | 675,000 | | | 690,863 | |
Altice Financing S.A. | | | | | | | |
6.63% due 02/15/236 | | | 1,700,000 | | | 1,769,700 | |
Sprint Spectrum Company LLC / Sprint Spectrum Co II LLC / Sprint Spectrum Co III LLC | | | | | | | |
3.36% due 09/20/216 | | | 1,700,000 | | | 1,695,750 | |
EIG Investors Corp. | | | | | | | |
10.88% due 02/01/24 | | | 1,450,000 | | | 1,540,625 | |
Zayo Group LLC / Zayo Capital, Inc. | | | | | | | |
5.75% due 01/15/276 | | | 925,000 | | | 975,690 | |
Comcast Corp. | | | | | | | |
3.20% due 07/15/36 | | | 1,000,000 | | | 887,473 | |
McGraw-Hill Global Education Holdings LLC / McGraw-Hill Global Education Finance | | | | | | | |
7.88% due 05/15/246 | | | 900,000 | | | 870,750 | |
Anixter, Inc. | | | | | | | |
5.50% due 03/01/23 | | | 650,000 | | | 674,375 | |
Ziggo Secured Finance BV | | | | | | | |
5.50% due 01/15/276 | | | 650,000 | | | 649,935 | |
Level 3 Financing, Inc. | | | | | | | |
5.25% due 03/15/26 | | | 550,000 | | | 552,750 | |
Match Group, Inc. | | | | | | | |
6.38% due 06/01/24 | | | 500,000 | | | 540,935 | |
Sirius XM Canada Holdings, Inc. | | | | | | | |
5.63% due 04/23/216 | | CAD | 500,000 | | | 376,922 | |
Total Communications | | | | | | 53,558,914 | |
| | | | | | | | |
Financial - 11.7% | |
Jefferies Finance LLC / JFIN Company-Issuer Corp. | | | | | | | |
7.38% due 04/01/206 | | | 3,600,000 | | | 3,636,000 | |
7.50% due 04/15/216 | | | 1,900,000 | | | 1,916,625 | |
6.88% due 04/15/226 | | | 400,000 | | | 382,000 | |
Kennedy-Wilson, Inc. | | | | | | | |
5.88% due 04/01/24 | | | 5,050,000 | | | 5,176,250 | |
FBM Finance, Inc. | | | | | | | |
8.25% due 08/15/216 | | | 2,877,000 | | | 3,049,620 | |
Citigroup, Inc. | | | | | | | |
6.25%2,3 | | | 1,400,000 | | | 1,510,250 | |
6.30%2,3 | | | 700,000 | | | 729,750 | |
5.95%2,3 | | | 600,000 | | | 624,756 | |
American Equity Investment Life Holding Co. | | | | | | | |
6.63% due 07/15/21 | | | 2,650,000 | | | 2,749,375 | |
NFP Corp. | | | | | | | |
9.00% due 07/15/216 | | | 2,400,000 | | | 2,536,440 | |
Greystar Real Estate Partners LLC | | | | | | | |
8.25% due 12/01/226 | | | 1,869,000 | | | 2,016,184 | |
Lincoln Finance Ltd. | | | | | | | |
7.38% due 04/15/216 | | | 1,700,000 | | | 1,802,000 | |
GEO Group, Inc. | | | | | | | |
5.88% due 10/15/24 | | | 925,000 | | | 945,812 | |
6.00% due 04/15/26 | | | 800,000 | | | 810,179 | |
NewStar Financial, Inc. | | | | | | | |
7.25% due 05/01/20 | | | 1,350,000 | | | 1,373,625 | |
Garfunkelux Holding Co. 3 S.A. | | | | | | | |
8.50% due 11/01/22 | | GBP | 700,000 | | | 934,269 | |
Capital One Financial Corp. | | | | | | | |
3.75% due 07/28/26 | | | 900,000 | | | 871,540 | |
Goldman Sachs Group, Inc. | | | | | | | |
5.30%2,3 | | | 850,000 | | | 865,938 | |
Icahn Enterprises, LP / Icahn Enterprises Finance Corp. | | | | | | | |
5.88% due 02/01/22 | | | 800,000 | | | 812,000 | |
PNC Financial Services Group, Inc. | | | | | | | |
5.00%2,3 | | | 750,000 | | | 746,250 | |
Bank of America Corp. | | | | | | | |
6.10%2,3 | | | 700,000 | | | 741,650 | |
Cabot Financial Luxembourg S.A. | | | | | | | |
7.50% due 10/01/23 | | GBP | 550,000 | | | 724,591 | |
Wilton Re Finance LLC | | | | | | | |
5.88% due 03/30/332,6 | | | 650,000 | | | 662,188 | |
M&T Bank Corp. | | | | | | | |
5.13%2,3 | | | 600,000 | | | 597,000 | |
Hospitality Properties Trust | | | | | | | |
4.95% due 02/15/27 | | | 500,000 | | | 513,407 | |
EPR Properties | | | | | | | |
5.75% due 08/15/22 | | | 450,000 | | | 488,005 | |
HUB International Ltd. | | | | | | | |
9.25% due 02/15/216 | | | 450,000 | | | 464,310 | |
Compass Bank | | | | | | | |
3.88% due 04/10/25 | | | 450,000 | | | 441,737 | |
Majid AL Futtaim Holding | | | | | | | |
7.13%3 | | | 300,000 | | | 316,560 | |
Fidelity & Guaranty Life Holdings, Inc. | | | | | | | |
6.38% due 04/01/216 | | | 300,000 | | | 300,750 | |
Quicken Loans, Inc. | | | | | | | |
5.75% due 05/01/256 | | | 250,000 | | | 245,625 | |
Lock AS | | | | | | | |
7.00% due 08/15/21 | | EUR | 50,000 | | | 56,145 | |
Total Financial | | | | | | 39,040,831 | |
| | | | | | | | |
Energy - 10.9% | |
American Midstream Partners Limited Partnership / American Midstream Finance Corp. | | | | | | | |
8.50% due 12/15/21 | | | 3,850,000 | | | 3,927,000 | |
Unit Corp. | | | | | | | |
6.63% due 05/15/21 | | | 3,475,000 | | | 3,422,874 | |
Comstock Resources, Inc. | | | | | | | |
10.00% due 03/15/20 | | | 3,300,000 | | | 3,300,000 | |
Sabine Pass Liquefaction LLC | | | | | | | |
6.25% due 03/15/22 | | | 1,861,000 | | | 2,065,301 | |
5.00% due 03/15/27 | | | 600,000 | | | 627,202 | |
CONSOL Energy, Inc. | | | | | | | |
8.00% due 04/01/23 | | | 1,300,000 | | | 1,366,625 | |
SEE NOTES TO FINANCIAL STATEMENTS. | THE GUGGENHEIM FUNDS SEMI-ANNUAL REPORT | 19 |
SCHEDULE OF INVESTMENTS (Unaudited)(continued) | March 31, 2017 |
HIGH YIELD FUND | |
| | Face
Amount10 | | | Value | |
| | | | | | | |
5.88% due 04/15/22 | | $ | 1,050,000 | | | $ | 1,038,188 | |
EP Energy LLC / Everest Acquisition Finance, Inc. | | | | | | | | |
8.00% due 02/15/256 | | | 1,150,000 | | | | 1,069,500 | |
9.38% due 05/01/20 | | | 650,000 | | | | 612,755 | |
6.38% due 06/15/23 | | | 650,000 | | | | 498,875 | |
Exterran Energy Solutions Limited Partnership / EES Finance Corp. | | | | | | | | |
8.13% due 05/01/25 | | | 1,975,000 | | | | 2,014,500 | |
Alta Mesa Holdings, LP / Alta Mesa Finance Services Corp. | | �� | | | | | | |
7.88% due 12/15/24 | | | 1,650,000 | | | | 1,720,125 | |
Gibson Energy, Inc. | | | | | | | | |
5.25% due 07/15/246 | | | 2,250,000 | | | | 1,691,920 | |
Legacy Reserves Limited Partnership / Legacy Reserves Finance Corp. | | | | | | | | |
6.63% due 12/01/21 | | | 1,090,000 | | | | 817,500 | |
8.00% due 12/01/20 | | | 965,000 | | | | 733,400 | |
QEP Resources, Inc. | | | | | | | | |
5.25% due 05/01/23 | | | 850,000 | | | | 833,332 | |
6.88% due 03/01/21 | | | 650,000 | | | | 690,625 | |
Cheniere Corpus Christi Holdings LLC | | | | | | | | |
5.88% due 03/31/25 | | | 1,350,000 | | | | 1,407,375 | |
Pattern Energy Group, Inc. | | | | | | | | |
5.88% due 02/01/246 | | | 1,375,000 | | | | 1,392,187 | |
Antero Resources Corp. | | | | | | | | |
5.63% due 06/01/23 | | | 1,000,000 | | | | 1,022,500 | |
5.13% due 12/01/22 | | | 300,000 | | | | 303,938 | |
TerraForm Power Operating LLC | | | | | | | | |
6.38% due 02/01/236,7 | | | 1,250,000 | | | | 1,298,438 | |
BreitBurn Energy Partners Limited Partnership / BreitBurn Finance Corp. | | | | | | | | |
7.88% due 04/15/228 | | | 1,750,000 | | | | 1,050,000 | |
Summit Midstream Holdings LLC / Summit Midstream Finance Corp. | | | | | | | | |
5.75% due 04/15/25 | | | 1,000,000 | | | | 995,000 | |
Crestwood Midstream Partners Limited Partnership / Crestwood Midstream Finance Corp. | | | | | | | | |
5.75% due 04/01/25 | | | 700,000 | | | | 714,875 | |
FTS International, Inc. | | | | | | | | |
8.63% due 06/15/202,6 | | | 700,000 | | | | 709,625 | |
Trinidad Drilling Ltd. | | | | | | | | |
6.63% due 02/15/256 | | | 625,000 | | | | 624,219 | |
Whiting Petroleum Corp. | | | | | | | | |
5.75% due 03/15/21 | | | 250,000 | | | | 247,500 | |
Schahin II Finance Company SPV Ltd. | | | | | | | | |
5.88% due 09/25/225,8 | | | 217,167 | | | | 24,974 | |
SandRidge Energy, Inc. | | | | | | | | |
7.50% due 03/15/211 | | | 250,000 | | | | 25 | |
SemGroup, LP | | | | | | | | |
8.75% due 11/15/15†††,1 | | | 1,300,000 | | | | 1 | |
Total Energy | | | | | | | 36,220,379 | |
| | | | | | | | | |
Consumer, Non-cyclical - 10.1% | |
Vector Group Ltd. | | | | | | | | |
6.13% due 02/01/256 | | | 6,250,000 | | | | 6,382,812 | |
Valeant Pharmaceuticals International, Inc. | | | | | | | | |
7.00% due 03/15/246 | | | 2,050,000 | | | | 2,103,812 | |
6.50% due 03/15/226 | | | 1,050,000 | | | | 1,080,188 | |
Post Holdings, Inc. | | | | | | | | |
5.50% due 03/01/256 | | | 2,700,000 | | | | 2,713,500 | |
Midas Intermediate Holdco II LLC / Midas Intermediate Holdco II Finance, Inc. | | | | | | | | |
7.88% due 10/01/226 | | | 2,477,000 | | | | 2,557,503 | |
WEX, Inc. | | | | | | | | |
4.75% due 02/01/236 | | | 2,200,000 | | | | 2,164,157 | |
Tenet Healthcare Corp. | | | | | | | | |
7.50% due 01/01/22 | | | 1,850,000 | | | | 1,998,000 | |
Bumble Bee Holdings, Inc. | | | | | | | | |
9.00% due 12/15/176 | | | 1,950,000 | | | | 1,901,250 | |
HCA, Inc. | | | | | | | | |
6.50% due 02/15/20 | | | 1,000,000 | | | | 1,094,380 | |
5.88% due 02/15/26 | | | 750,000 | | | | 791,250 | |
Bumble Bee Holdco SCA | | | | | | | | |
9.63% due 03/15/186 | | | 1,724,000 | | | | 1,672,280 | |
KeHE Distributors LLC / KeHE Finance Corp. | | | | | | | | |
7.63% due 08/15/216 | | | 1,470,000 | | | | 1,481,025 | |
Central Garden & Pet Co. | | | | | | | | |
6.13% due 11/15/23 | | | 1,350,000 | | | | 1,424,250 | |
Halyard Health, Inc. | | | | | | | | |
6.25% due 10/15/22 | | | 1,300,000 | | | | 1,339,000 | |
AMN Healthcare, Inc. | | | | | | | | |
5.13% due 10/01/246 | | | 950,000 | | | | 959,500 | |
Nielsen Company Luxembourg SARL | | | | | | | | |
5.00% due 02/01/256 | | | 900,000 | | | | 896,625 | |
Albertsons Cos. LLC / Safeway Inc. / New Albertson’s Inc / Albertson’s LLC | | | | | | | | |
6.63% due 06/15/24 | | | 750,000 | | | | 766,875 | |
Acadia Healthcare Company, Inc. | | | | | | | | |
6.50% due 03/01/24 | | | 600,000 | | | | 631,500 | |
US Foods, Inc. | | | | | | | | |
5.88% due 06/15/246 | | | 600,000 | | | | 622,500 | |
Kinetic Concepts Incorporated / KCI USA Inc | | | | | | | | |
7.88% due 02/15/216 | | | 520,000 | | | | 551,200 | |
DaVita, Inc. | | | | | | | | |
5.00% due 05/01/25 | | | 450,000 | | | | 451,125 | |
Total Consumer, Non-cyclical | | | | | | | 33,582,732 | |
| | | | | | | | | |
Consumer, Cyclical - 7.9% | |
WMG Acquisition Corp. | | | | | | | | |
6.75% due 04/15/226 | | | 3,300,000 | | | | 3,469,125 | |
Ferrellgas Limited Partnership / Ferrellgas Finance Corp. | | | | | | | | |
6.75% due 06/15/23 | | | 2,600,000 | | | | 2,444,000 | |
6.50% due 05/01/21 | | | 700,000 | | | | 665,000 | |
Wynn Las Vegas LLC / Wynn Las Vegas Capital Corp. | | | | | | | | |
5.50% due 03/01/256 | | | 3,000,000 | | | | 3,048,750 | |
20 | THE GUGGENHEIM FUNDS SEMI-ANNUAL REPORT | SEE NOTES TO FINANCIAL STATEMENTS. |
SCHEDULE OF INVESTMENTS (Unaudited)(continued) | March 31, 2017 |
HIGH YIELD FUND | |
| | Face
Amount10 | | | Value | |
| | | | | | | |
Ferrellgas, LP / Ferrellgas Finance Corp. | | | | | | |
6.75% due 01/15/225 | | $ | 3,125,000 | | | $ | 2,953,125 | |
Nathan’s Famous, Inc. | | | | | | | | |
10.00% due 03/15/206 | | | 2,200,000 | | | | 2,365,000 | |
L Brands, Inc. | | | | | | | | |
6.75% due 07/01/36 | | | 1,050,000 | | | | 1,000,440 | |
7.60% due 07/15/37 | | | 700,000 | | | | 686,000 | |
6.88% due 11/01/35 | | | 175,000 | | | | 168,875 | |
AMC Entertainment Holdings, Inc. | | | | | | | | |
6.13% due 05/15/27 | | | 1,100,000 | | | | 1,109,625 | |
5.88% due 11/15/26 | | | 500,000 | | | | 505,625 | |
Seminole Hard Rock Entertainment Inc. / Seminole Hard Rock International LLC | | | | | | | | |
5.88% due 05/15/216 | | | 1,400,000 | | | | 1,421,000 | |
Suburban Propane Partners Limited Partnership/Suburban Energy Finance Corp. | | | | | | | | |
5.88% due 03/01/27 | | | 1,100,000 | | | | 1,083,500 | |
5.75% due 03/01/25 | | | 100,000 | | | | 98,500 | |
NPC International Incorporated / NPC Quality Burgers Inc / NPC Operating Company B Inc | | | | | | | | |
10.50% due 01/15/20 | | | 1,129,000 | | | | 1,163,999 | |
TVL Finance PLC | | | | | | | | |
8.50% due 05/15/23 | | GBP | 700,000 | | | | 964,418 | |
Reliance Intermediate Holdings, LP | | | | | | | | |
6.50% due 04/01/236 | | | 825,000 | | | | 878,625 | |
Carrols Restaurant Group, Inc. | | | | | | | | |
8.00% due 05/01/22 | | | 650,000 | | | | 693,875 | |
Suburban Propane Partners, LP / Suburban Energy Finance Corp. | | | | | | | | |
5.50% due 06/01/24 | | | 650,000 | | | | 640,250 | |
Group 1 Automotive, Inc. | | | | | | | | |
5.25% due 12/15/236 | | | 550,000 | | | | 555,500 | |
QVC, Inc. | | | | | | | | |
4.85% due 04/01/24 | | | 400,000 | | | | 402,398 | |
Total Consumer, Cyclical | | | | | | | 26,317,630 | |
| | | | | | | | | |
Industrial - 7.2% | |
StandardAero Aviation Holdings, Inc. | | | | | | | | |
10.00% due 07/15/236 | | | 3,175,000 | | | | 3,405,188 | |
Grinding Media Inc. / MC Grinding Media Canada Inc. | | | | | | | | |
7.38% due 12/15/235,6 | | | 3,225,000 | | | | 3,386,249 | |
Novelis Corp. | | | | | | | | |
5.88% due 09/30/266 | | | 2,600,000 | | | | 2,655,250 | |
6.25% due 08/15/246 | | | 500,000 | | | | 521,250 | |
Amsted Industries, Inc. | | | | | | | | |
5.38% due 09/15/246 | | | 2,275,000 | | | | 2,280,688 | |
BWAY Holding Co. | | | | | | | | |
5.50% due 04/15/246 | | | 1,650,000 | | | | 1,663,415 | |
Reynolds Group Issuer Incorporated / Reynolds Group Issuer LLC / Reynolds Group Issuer Luxembourg | | | | | | | | |
5.75% due 10/15/20 | | | 800,000 | | | | 823,007 | |
4.52% due 07/15/212,6 | | | 550,000 | | | | 562,722 | |
6.88% due 02/15/21 | | | 259,254 | | | | 266,384 | |
Ardagh Packaging Finance plc / Ardagh Holdings USA, Inc. | | | | | | | | |
4.25% due 09/15/226 | | | 900,000 | | | | 909,000 | |
7.25% due 05/15/246 | | | 375,000 | | | | 401,250 | |
Quintiles IMS, Inc. | | | | | | | | |
3.25% due 03/15/25 | | EUR | 1,150,000 | | | | 1,215,395 | |
Summit Materials LLC / Summit Materials Finance Corp. | | | | | | | | |
8.50% due 04/15/22 | | | 1,050,000 | | | | 1,155,000 | |
Standard Industries, Inc. | | | | | | | | |
5.50% due 02/15/235,6 | | | 700,000 | | | | 715,750 | |
5.00% due 02/15/276 | | | 300,000 | | | | 294,000 | |
Ardagh Packaging Finance PLC | | | | | | | | |
6.75% due 05/15/24 | | EUR | 850,000 | | | | 993,747 | |
Levi Strauss & Co. | | | | | | | | |
3.38% due 03/15/27 | | EUR | 750,000 | | | | 801,539 | |
Reynolds Group Issuer, Inc. / Reynolds Group Issuer LLC | | | | | | | | |
5.13% due 07/15/236 | | | 700,000 | | | | 719,250 | |
Infor US, Inc. | | | | | | | | |
5.75% due 05/15/22 | | EUR | 550,000 | | | | 606,127 | |
LMI Aerospace, Inc. | | | | | | | | |
7.38% due 07/15/19 | | | 436,000 | | | | 452,350 | |
Moog, Inc. | | | | | | | | |
5.25% due 12/01/226 | | | 200,000 | | | | 205,000 | |
Total Industrial | | | | | | | 24,032,561 | |
| | | | | | | | | |
Technology - 5.0% | |
First Data Corp. | | | | | | | | |
5.75% due 01/15/245,6 | | | 2,350,000 | | | | 2,424,025 | |
5.00% due 01/15/246 | | | 1,750,000 | | | | 1,780,625 | |
7.00% due 12/01/236 | | | 350,000 | | | | 375,375 | |
Micron Technology, Inc. | | | | | | | | |
5.25% due 08/01/23 | | | 1,950,000 | | | | 1,998,750 | |
7.50% due 09/15/236 | | | 1,760,000 | | | | 1,964,600 | |
NCR Corp. | | | | | | | | |
6.38% due 12/15/235 | | | 2,350,000 | | | | 2,473,375 | |
5.88% due 12/15/21 | | | 750,000 | | | | 781,875 | |
Epicor Software | | | | | | | | |
9.40% due 06/21/23†††,1 | | | 2,000,000 | | | | 1,954,000 | |
Open Text Corp. | | | | | | | | |
5.88% due 06/01/266 | | | 1,250,000 | | | | 1,309,375 | |
Infor US, Inc. | | | | | | | | |
6.50% due 05/15/22 | | | 600,000 | | | | 616,560 | |
Oracle Corp. | | | | | | | | |
3.85% due 07/15/365 | | | 550,000 | | | | 537,393 | |
Microsoft Corp. | | | | | | | | |
4.20% due 11/03/355 | | | 450,000 | | | | 471,788 | |
Total Technology | | | | | | | 16,687,741 | |
| | | | | | | | | |
Basic Materials - 4.2% | |
Eldorado Gold Corp. | | | | | | | | |
6.13% due 12/15/206 | | | 4,700,000 | | | | 4,817,500 | |
Alcoa Nederland Holding B.V. | | | | | | | | |
7.00% due 09/30/266 | | | 2,475,000 | | | | 2,697,750 | |
6.75% due 09/30/246 | | | 1,100,000 | | | | 1,179,750 | |
SEE NOTES TO FINANCIAL STATEMENTS. | THE GUGGENHEIM FUNDS SEMI-ANNUAL REPORT | 21 |
SCHEDULE OF INVESTMENTS (Unaudited)(continued) | March 31, 2017 |
HIGH YIELD FUND | |
| | Face
Amount10 | | | Value | |
| | | | | | | |
Constellium N.V. | | | | | | |
7.88% due 04/01/216 | | $ | 2,200,000 | | | $ | 2,348,500 | |
GCP Applied Technologies, Inc. | | | | | | | | |
9.50% due 02/01/236 | | | 1,180,000 | | | | 1,339,300 | |
PQ Corp. | | | | | | | | |
6.75% due 11/15/226 | | | 800,000 | | | | 852,000 | |
Yamana Gold, Inc. | | | | | | | | |
4.95% due 07/15/24 | | | 625,000 | | | | 628,125 | |
Mirabela Nickel Ltd. | | | | | | | | |
2.38% due 06/24/191 | | | 278,115 | | | | 19,468 | |
1.00% due 09/10/44†††,1 | | | 5,561 | | | | — | |
Total Basic Materials | | | | | | | 13,882,393 | |
| | | | | | | | | |
Utilities - 4.1% | |
LBC Tank Terminals Holding Netherlands BV | | | | | | | | |
6.88% due 05/15/236 | | | 4,090,000 | | | | 4,243,865 | |
Terraform Global Operating LLC | | | | | | | | |
9.75% due 08/15/226 | | | 3,000,000 | | | | 3,363,750 | |
AES Corp. | | | | | | | | |
6.00% due 05/15/26 | | | 2,900,000 | | | | 3,001,500 | |
4.88% due 05/15/23 | | | 350,000 | | | | 348,250 | |
AmeriGas Partners Limited Partnership / AmeriGas Finance Corp. | | | | | | | | |
5.50% due 05/20/25 | | | 1,500,000 | | | | 1,488,750 | |
5.75% due 05/20/27 | | | 1,250,000 | | | | 1,234,063 | |
Total Utilities | | | | | | | 13,680,178 | |
| | | | | | | | | |
Diversified - 0.6% | |
HRG Group, Inc. | | | | | | | | |
7.88% due 07/15/19 | | | 1,885,000 | | | | 1,950,975 | |
Total Corporate Bonds | | | | | | | | |
(Cost $254,610,429) | | | | | | | 258,954,334 | |
| | | | | | | | | |
SENIOR FLOATING RATE INTERESTS††,2 - 28.5% | |
Consumer, Cyclical - 5.8% | |
Men’s Wearhouse | | | | | | | | |
4.53% due 06/18/21 | | | 1,576,348 | | | | 1,494,897 | |
Sears Holdings Corp. | | | | | | | | |
5.50% due 06/30/18 | | | 1,446,898 | | | | 1,427,451 | |
Leslie’s Poolmart, Inc. | | | | | | | | |
4.77% due 08/16/23 | | | 1,246,867 | | | | 1,250,608 | |
BC Equity Ventures LLC | | | | | | | | |
7.50% due 08/31/22 | | | 1,215,813 | | | | 1,225,697 | |
Sky Bet | | | | | | | | |
5.50% due 02/25/22 | | GBP | 950,000 | | | | 1,201,338 | |
Fitness International LLC | | | | | | | | |
5.40% due 07/01/20 | | | 1,155,019 | | | | 1,168,013 | |
Equinox Holdings, Inc. | | | | | | | | |
4.25% due 03/08/24 | | | 1,050,000 | | | | 1,057,550 | |
BBB Industries, LLC | | | | | | | | |
6.00% due 11/03/21 | | | 1,050,000 | | | | 1,050,662 | |
Smart & Final Stores LLC | | | | | | | | |
4.58% due 11/15/22 | | | 1,000,000 | | | | 981,250 | |
CH Hold Corp. | | | | | | | | |
4.00% due 02/01/24 | | | 954,545 | | | | 960,511 | |
Mavis Tire | | | | | | | | |
6.25% due 11/02/20†††,1 | | | 933,375 | | | | 923,955 | |
Greektown Holdings LLC | | | | | | | | |
3.75% due 03/20/24 | | | 900,000 | | | | 899,442 | |
Talbots, Inc. | | | | | | | | |
5.50% due 03/19/20 | | | 1,005,031 | | | | 896,488 | |
Belk, Inc. | | | | | | | | |
5.76% due 12/12/22 | | | 965,890 | | | | 813,415 | |
Navistar Inc. | | | | | | | | |
5.00% due 08/07/20 | | | 790,000 | | | | 797,900 | |
Blue Nile, Inc. | | | | | | | | |
7.50% due 02/17/23 | | | 775,000 | | | | 759,500 | |
Accuride Corp. | | | | | | | | |
8.15% due 11/17/23 | | | 573,563 | | | | 569,978 | |
National Vision, Inc. | | | | | | | | |
6.75% due 03/11/22 | | | 450,000 | | | | 435,938 | |
4.00% due 03/12/21 | | | 99,743 | | | | 99,660 | |
Advantage Sales & Marketing LLC | | | | | | | | |
3.86% due 07/25/19†††,1 | | | 440,000 | | | | 413,700 | |
Station Casinos LLC | | | | | | | | |
3.45% due 06/08/23 | | | 400,000 | | | | 400,100 | |
Alexander Mann Solutions Ltd. | | | | | | | | |
5.90% due 12/20/19 | | | 401,363 | | | | 393,335 | |
Acosta, Inc. | | | | | | | | |
3.82% due 09/26/19†††,1 | | | 155,556 | | | | 145,252 | |
Total Consumer, Cyclical | | | | | | | 19,366,640 | |
| | | | | | | | | |
Technology - 5.8% | |
Solera LLC | | | | | | | | |
4.25% due 03/03/23 | | | 1,341,253 | | | | 1,346,470 | |
5.41% due 03/03/21†††,1 | | | 1,000,000 | | | | 889,615 | |
Verisure Cayman 2 | | | | | | | | |
3.00% due 10/21/22 | | EUR | 1,400,000 | | | | 1,496,326 | |
3.75% due 10/21/22 | | EUR | 500,000 | | | | 536,557 | |
EIG Investors Corp. | | | | | | | | |
6.04% due 02/09/23 | | | 1,428,141 | | | | 1,437,666 | |
Advanced Computer Software | | | | | | | | |
10.56% due 01/31/231 | | | 800,000 | | | | 727,336 | |
6.56% due 03/18/22 | | | 539,000 | | | | 521,483 | |
TIBCO Software, Inc. | | | | | | | | |
5.50% due 12/04/20 | | | 1,227,590 | | | | 1,239,608 | |
Active Network LLC | | | | | | | | |
6.00% due 11/13/20 | | | 1,205,153 | | | | 1,206,659 | |
Planview, Inc. (PHNTM Holdings, Inc.) | | | | | | | | |
6.25% due 01/27/23†††,1 | | | 1,200,000 | | | | 1,182,000 | |
Cypress Intermediate Holdings III, Inc. | | | | | | | | |
4.00% due 03/31/24 | | | 1,150,000 | | | | 1,130,450 | |
GTT Communications, Inc. | | | | | | | | |
5.00% due 01/09/24 | | | 1,097,250 | | | | 1,110,966 | |
Infor (US), Inc. | | | | | | | | |
3.75% due 02/01/22 | | EUR | 950,000 | | | | 1,019,884 | |
Sparta Holding Corp. | | | | | | | | |
6.65% due 07/28/20†††,1 | | | 859,551 | | | | 854,787 | |
Kronos, Inc. | | | | | | | | |
5.03% due 11/01/23 | | | 847,875 | | | | 852,208 | |
Go Daddy Operating Company LLC | | | | | | | | |
3.41% due 02/15/24 | | | 708,559 | | | | 709,182 | |
Aspect Software, Inc. | | | | | | | | |
11.28% due 05/25/20 | | | 664,618 | | | | 663,787 | |
22 | THE GUGGENHEIM FUNDS SEMI-ANNUAL REPORT | SEE NOTES TO FINANCIAL STATEMENTS. |
SCHEDULE OF INVESTMENTS (Unaudited)(continued) | March 31, 2017 |
HIGH YIELD FUND | |
| | Face
Amount10 | | | Value | |
| | | | | | | |
Masergy Holdings, Inc. | | | | | | |
5.50% due 12/15/23 | | $ | 648,375 | | | $ | 652,427 | |
Diebold, Inc. | | | | | | | | |
5.38% due 11/06/23 | | | 556,500 | | | | 564,324 | |
Cypress Holdings | | | | | | | | |
7.75% due 03/31/25 | | | 400,000 | | | | 391,656 | |
Oberthur Technologies of America Corp. | | | | | | | | |
3.75% due 01/10/24 | | | 381,579 | | | | 383,964 | |
GlobalLogic Holdings, Inc. | | | | | | | | |
5.65% due 06/20/22 | | | 277,002 | | | | 277,694 | |
Total Technology | | | | | | | 19,195,049 | |
| | | | | | | | | |
Consumer, Non-cyclical - 5.4% | |
CTI Foods Holding Co. LLC | | | | | | | | |
4.65% due 06/29/20 | | | 1,550,000 | | | | 1,534,499 | |
8.40% due 06/28/21 | | | 590,000 | | | | 531,000 | |
Albertson’s LLC | | | | | | | | |
3.98% due 08/25/21 | | | 1,364,072 | | | | 1,369,650 | |
Change Healthcare Holdings, Inc. | | | | | | | | |
3.75% due 03/01/24 | | | 1,150,000 | | | | 1,151,438 | |
American Tire Distributors, Inc. | | | | | | | | |
5.25% due 09/01/21 | | | 1,131,244 | | | | 1,132,658 | |
Give and Go Prepared Foods Corp. | | | | | | | | |
6.65% due 07/29/23 | | | 1,089,824 | | | | 1,100,723 | |
ADMI Corp. | | | | | | | | |
4.80% due 04/29/22 | | | 1,000,000 | | | | 1,008,130 | |
IHC Holding Corp. | | | | | | | | |
7.02% due 04/30/21†††,1 | | | 837,250 | | | | 828,704 | |
7.25% due 04/30/21†††,1 | | | 159,200 | | | | 158,961 | |
Reddy Ice Holdings, Inc. | | | | | | | | |
6.75% due 05/01/19 | | | 972,899 | | | | 951,009 | |
Project Ruby Ultimate Parent Corp. | | | | | | | | |
4.75% due 02/09/24 | | | 900,000 | | | | 902,628 | |
Lineage Logistics LLC | | | | | | | | |
4.50% due 04/07/21 | | | 829,411 | | | | 828,897 | |
ABB Concise Optical Group LLC | | | | | | | | |
6.13% due 06/15/23 | | | 796,000 | | | | 802,965 | |
Pinnacle Foods Finance LLC | | | | | | | | |
2.81% due 02/02/24 | | | 798,000 | | | | 800,809 | |
Arctic Glacier Group Holdings, Inc. | | | | | | | | |
5.25% due 03/20/24 | | | 775,000 | | | | 781,781 | |
Halyard Health | | | | | | | | |
3.73% due 11/01/21 | | | 675,000 | | | | 680,488 | |
JBS USA Lux SA | | | | | | | | |
3.29% due 10/30/22 | | | 650,000 | | | | 652,035 | |
American Seafoods | | | | | | | | |
6.02% due 08/19/211 | | | 555,628 | | | | 556,784 | |
Sterigenics-Norion Holdings | | | | | | | | |
4.00% due 05/16/22 | | | 550,000 | | | | 547,855 | |
PT Intermediate Holdings III LLC | | | | | | | | |
7.50% due 06/23/22†††,1 | | | 497,500 | | | | 497,500 | |
NES Global Talent | | | | | | | | |
6.54% due 10/03/191 | | | 477,708 | | | | 429,938 | |
Pelican Products, Inc. | | | | | | | | |
9.40% due 04/09/21 | | | 300,000 | | | | 297,000 | |
Quorum Business Solutions | | | | | | | | |
5.75% due 08/06/211 | | | 215,050 | | | | 203,222 | |
PT Intermediate Holdings III, LLC | | | | | | | | |
7.50% due 06/23/221 | | | 110,000 | | | | 108,900 | |
8.13% due 06/23/22†††,1 | | | 32,917 | | | | 29,928 | |
Packaging Coordinators Midco, Inc. | | | | | | | | |
6.14% due 07/01/21†††,1 | | | 115,385 | | | | 103,118 | |
Targus Group International, Inc. | | | | | | | | |
due 05/24/16†††,1,9 | | | 153,489 | | | | — | |
Total Consumer, Non-cyclical | | | | | | | 17,990,620 | |
| | | | | | | | | |
Industrial - 3.8% | |
Advanced Integration Technology LP | | | | | | | | |
6.50% due 07/22/21 | | | 1,525,500 | | | | 1,535,033 | |
VC GB Holdings, Inc. | | | | | | | | |
4.75% due 02/28/24 | | | 1,250,000 | | | | 1,256,249 | |
Milacron LLC | | | | | | | | |
3.98% due 09/28/23 | | | 1,197,000 | | | | 1,202,243 | |
CareCore National LLC | | | | | | | | |
5.50% due 03/05/21 | | | 1,147,348 | | | | 1,150,216 | |
ProAmpac PG Borrower LLC | | | | | | | | |
5.06% due 11/20/23 | | | 650,000 | | | | 654,550 | |
9.56% due 11/18/24 | | | 350,000 | | | | 354,813 | |
SRS Distribution, Inc. | | | | | | | | |
9.79% due 02/24/23 | | | 950,000 | | | | 983,250 | |
American Bath Group LLC | | | | | | | | |
6.40% due 09/30/23 | | | 947,796 | | | | 954,120 | |
Bioplan USA, Inc. | | | | | | | | |
5.75% due 09/23/21 | | | 845,685 | | | | 829,829 | |
ILPEA Parent, Inc. | | | | | | | | |
6.50% due 03/02/23 | | | 650,000 | | | | 647,563 | |
USIC Holding, Inc. | | | | | | | | |
5.17% due 12/08/23 | | | 523,688 | | | | 526,306 | |
Hardware Holdings LLC | | | | | | | | |
7.68% due 03/30/20†††,1 | | | 526,500 | | | | 515,970 | |
Avis Budget Car Rental LLC | | | | | | | | |
3.15% due 03/15/22 | | | 498,750 | | | | 499,373 | |
CPM Holdings, Inc. | | | | | | | | |
5.25% due 04/11/22 | | | 492,500 | | | | 498,656 | |
BWAY Holding Co. | | | | | | | | |
3.25% due 04/03/24 | | | 400,000 | | | | 398,752 | |
Wencor Group | | | | | | | | |
4.48% due 06/19/191 | | | 233,846 | | | | 219,666 | |
Hunter Defense Technologies | | | | | | | | |
7.01% due 08/05/191 | | | 228,333 | | | | 205,500 | |
Mast Global | | | | | | | | |
7.75% due 09/12/19†††,1 | | | 143,917 | | | | 143,323 | |
NANA Development Corp. | | | | | | | | |
8.00% due 03/15/181 | | | 22,222 | | | | 21,667 | |
Total Industrial | | | | | | | 12,597,079 | |
| | | | | | | | | |
Utilities - 2.8% | |
Viva Alamo LLC | | | | | | | | |
5.30% due 02/22/21 | | | 2,295,378 | | | | 2,180,610 | |
Moss Creek Resources LLC | | | | | | | | |
9.00% due 03/29/221 | | | 1,350,000 | | | | 1,329,426 | |
Invenergy Thermal Operating I, LLC | | | | | | | | |
6.65% due 10/19/22 | | | 1,012,536 | | | | 972,034 | |
Panda Power | | | | | | | | |
SEE NOTES TO FINANCIAL STATEMENTS. | THE GUGGENHEIM FUNDS SEMI-ANNUAL REPORT | 23 |
SCHEDULE OF INVESTMENTS (Unaudited)(continued) | March 31, 2017 |
HIGH YIELD FUND | |
| | Face
Amount10 | | | Value | |
| | | | | | | |
7.65% due 08/21/20 | | $ | 980,667 | | | $ | 962,279 | |
Dynegy, Inc. | | | | | | | | |
4.25% due 06/27/23 | | | 900,000 | | | | 901,737 | |
Exgen Texas Power LLC | | | | | | | | |
5.90% due 09/18/21 | | | 1,338,306 | | | | 868,226 | |
MRP Generation Holding | | | | | | | | |
8.15% due 10/18/22 | | | 721,375 | | | | 716,866 | |
Panda Temple II Power | | | | | | | | |
7.25% due 04/03/19 | | | 604,632 | | | | 523,763 | |
Terraform AP Acquisition Holdings LLC | | | | | | | | |
5.65% due 06/26/22 | | | 491,080 | | | | 494,764 | |
Stonewall | | | | | | | | |
6.65% due 11/15/21 | | | 400,000 | | | | 389,000 | |
Total Utilities | | | | | | | 9,338,705 | |
| | | | | | | | | |
Financial - 2.0% | |
National Financial Partners Corp. | | | | | | | | |
4.65% due 01/08/24 | | | 1,546,125 | | | | 1,561,587 | |
Americold Realty Operating Partnership, LP | | | | | | | | |
4.75% due 12/01/22 | | | 1,486,269 | | | | 1,500,210 | |
LPL Holdings, Inc. | | | | | | | | |
3.77% due 03/11/24 | | | 1,000,000 | | | | 1,000,630 | |
Acrisure LLC | | | | | | | | |
5.90% due 11/22/23 | | | 963,492 | | | | 977,944 | |
York Risk Services | | | | | | | | |
4.90% due 10/01/211 | | | 733,125 | | | | 712,048 | |
American Stock Transfer & Trust | | | | | | | | |
5.75% due 06/26/20 | | | 554,148 | | | | 552,762 | |
Integro Parent, Inc. | | | | | | | | |
6.80% due 10/28/22 | | | 444,503 | | | | 444,503 | |
Total Financial | | | | | | | 6,749,684 | |
| | | | | | | | | |
Communications - 1.9% | |
Sprint Communications, Inc. | | | | | | | | |
3.50% due 02/02/24 | | | 1,600,000 | | | | 1,598,863 | |
Ziggo Secured Finance BV | | | | | | | | |
3.41% due 04/15/25 | | | 1,100,000 | | | | 1,098,163 | |
Cengage Learning Acquisitions, Inc. | | | | | | | | |
5.25% due 06/07/23 | | | 991,314 | | | | 943,295 | |
Neustar, Inc. | | | | | | | | |
3.25% due 09/02/19 | | | 450,000 | | | | 455,436 | |
4.75% due 03/01/24 | | | 250,000 | | | | 252,813 | |
Altice US Finance I Corp. | | | | | | | | |
2.25% due 07/15/25 | | | 650,000 | | | | 648,986 | |
Anaren, Inc. | | | | | | | | |
9.40% due 08/18/211 | | | 500,000 | | | | 486,875 | |
Houghton Mifflin Co. | | | | | | | | |
4.00% due 05/31/21 | | | 498,731 | | | | 458,832 | |
MergerMarket Ltd. | | | | | | | | |
4.56% due 02/04/21 | | | 291,000 | | | | 290,273 | |
Charter Communications Operating, LLC | | | | | | | | |
3.23% due 01/15/24 | | | 149,623 | | | | 150,268 | |
Total Communications | | | | | | | 6,383,804 | |
| | | | | | | | | |
Energy - 0.6% | |
Veresen Midstream LP | | | | | | | | |
4.50% due 03/31/22 | | | 735,000 | | | | 741,431 | |
Cactus Wellhead | | | | | | | | |
7.15% due 07/31/20 | | | 687,449 | | | | 653,420 | |
PSS Companies | | | | | | | | |
5.65% due 01/28/201 | | | 531,357 | | | | 425,086 | |
Associated Asphalt Partners LLC | | | | | | | | |
6.25% due 03/29/24 | | | 300,000 | | | | 301,125 | |
Total Energy | | | | | | | 2,121,062 | |
| | | | | | | | | |
Basic Materials - 0.4% | |
Zep, Inc. | | | | | | | | |
5.00% due 06/27/22 | | | 985,000 | | | | 997,312 | |
PQ Corp. | | | | | | | | |
5.29% due 11/04/22 | | | 347,379 | | | | 350,916 | |
Total Basic Materials | | | | | | | 1,348,228 | |
Total Senior Floating Rate Interests | | | | | | | | |
(Cost $95,335,103) | | | | | | | 95,090,871 | |
| | | | | | | | | |
ASSET-BACKED SECURITIES†† - 2.6% | |
Collateralized Loan Obligations - 2.6% | |
OCP CLO Ltd. | | | | | | | | |
2014-6A, 5.97% due 07/17/262,6 | | | 1,500,000 | | | | 1,433,238 | |
2014-6A, 4.67% due 07/17/262,6 | | | 1,000,000 | | | | 999,242 | |
2013-4A, 6.04% due 10/24/252,6 | | | 500,000 | | | | 474,625 | |
Catamaran CLO Ltd. | | | | | | | | |
2014-1A, 5.53% due 04/20/262,6 | | | 750,000 | | | | 692,444 | |
WhiteHorse X Ltd. | | | | | | | | |
2015-10A, 6.32% due 04/17/272,6 | | | 750,000 | | | | 680,211 | |
WhiteHorse VII Ltd. | | | | | | | | |
2013-1A, 5.85% due 11/24/252,6 | | | 600,000 | | | | 561,131 | |
Eaton Vance CLO Ltd. | | | | | | | | |
2014-1A, 6.05% due 07/15/262,6 | | | 600,000 | | | | 560,982 | |
Longfellow Place CLO Ltd. | | | | | | | | |
2013-1A, 6.77% due 01/15/242,6 | | | 500,000 | | | | 495,935 | |
THL Credit Wind River CLO Ltd. | | | | | | | | |
2014-2A, 6.27% due 07/15/262,6 | | | 500,000 | | | | 480,085 | |
KVK CLO Ltd. | | | | | | | | |
2015-1A, 6.80% due 05/20/272,6 | | | 500,000 | | | | 475,137 | |
Regatta IV Funding Ltd. | | | | | | | | |
2014-1A, 5.99% due 07/25/262,6 | | | 500,000 | | | | 470,457 | |
Jamestown CLO III Ltd. | | | | | | | | |
2013-3A, 5.62% due 01/15/262,6 | | | 500,000 | | | | 466,435 | |
NewMark Capital Funding CLO Ltd. | | | | | | | | |
2014-2A, 5.80% due 06/30/262,6 | | | 500,000 | | | | 463,082 | |
MP CLO V Ltd. | | | | | | | | |
2014-1A, 6.92% due 07/18/262,6 | | | 250,000 | | | | 230,003 | |
Shackleton CLO | | | | | | | | |
2014-6A, 6.77% due 07/17/262,6 | | | 250,000 | | | | 210,430 | |
Total Collateralized Loan Obligations | | | | | | | 8,693,437 | |
| | | | | | | | | |
Collateralized Debt Obligations - 0.0% | |
SRERS Funding Ltd. | | | | | | | | |
2011-RS, 1.10% due 05/09/462,6 | | | 60,322 | | | | 59,593 | |
Total Asset-Backed Securities | | | | | | | | |
(Cost $7,434,673) | | | | | | | 8,753,030 | |
24 | THE GUGGENHEIM FUNDS SEMI-ANNUAL REPORT | SEE NOTES TO FINANCIAL STATEMENTS. |
SCHEDULE OF INVESTMENTS (Unaudited)(continued) | March 31, 2017 |
HIGH YIELD FUND | |
| | Face
Amount10 | | | Value | |
| | | | | | | |
SENIOR FIXED RATE INTERESTS†† - 0.4% | |
Consumer, Non-cyclical - 0.2% | |
Hanger, Inc. | | | | | | |
11.50% due 08/01/19 | | $ | 575,000 | | | $ | 579,312 | |
Targus International LLC | | | | | | | | |
7.50% due 12/31/19†††,1 | | | 61,827 | | | | 86,453 | |
Total Consumer, Non-cyclical | | | | | | | 665,765 | |
| | | | | | | | | |
Financial - 0.2% | |
Magic Newco, LLC | | | | | | | | |
12.00% due 06/12/19 | | | 500,000 | | | | 523,750 | |
Total Senior Fixed Rate Interests | | | | | | | | |
(Cost $1,160,527) | | | | | | | 1,189,515 | |
| | | | | | | | | |
Total Investments - 117.6% | | | | | | | | |
(Cost $387,914,597) | | | | | | $ | 391,929,009 | |
Other Assets & Liabilities, net - (17.6)% | | | | | | | (58,733,214 | ) |
Total Net Assets - 100.0% | | | | | | $ | 333,195,795 | |
FORWARD FOREIGN CURRENCY EXCHANGE CONTRACTS†† | |
Counterparty | | Contracts
to Sell | | Currency | Settlement
Date | | Settlement Value | | | Value at
March 31,
2017 | | | Net Unrealized Appreciation/(Depreciation) | |
Morgan Stanley | | | (948,000 | ) | EUR | 04/11/17 | | $ | 1,023,353 | | | $ | 1,011,785 | | | $ | 11,568 | |
J.P. Morgan | | | (2,768,000 | ) | CAD | 04/11/17 | | | 2,069,293 | | | | 2,081,802 | | | | (12,509 | ) |
Bank of America | | | (5,943,000 | ) | EUR | 04/11/17 | | | 6,300,572 | | | | 6,342,870 | | | | (42,298 | ) |
Barclays | | | (4,755,000 | ) | GBP | 04/11/17 | | | 5,798,709 | | | | 5,958,934 | | | | (160,225 | ) |
| | | | | | | | | | | | | | | | | $ | (203,464 | ) |
| * | Non-income producing security. |
| ** | Less than 0.1% of net assets. |
† | Value determined based on Level 1 inputs, unless otherwise noted — See Note 4. |
†† | Value determined based on Level 2 inputs, unless otherwise noted — See Note 4. |
††† | Value determined based on Level 3 inputs — See Note 4. |
1 | Illiquid security. |
2 | Variable rate security. Rate indicated is rate effective at March 31, 2017. |
3 | Perpetual maturity. |
4 | Rate indicated is the 7 day yield as of March 31, 2017. |
5 | Security is a 144A or Section 4(a)(2) security. These securities have been determined to be illiquid and restricted under guidelines established by the Board of Trustees. The total market value of 144A or Section 4(a)(2)illiquid or restricted securities is $24,974 (cost $139,296), or 0.00% of total net assets. |
6 | Security is a 144A or Section 4(a)(2) security. The total market value of 144A or Section 4(a)(2) securities is $163,976,345 (cost $159,244,475), or 49.2% of total net assets. These securities have been determined to be liquid under guidelines established by the Board of Trustees. |
7 | Security is a step up/step down bond. The coupon increases or decreases at regular intervals until the bond reaches full maturity. Rate indicated is rate effective as of March 31, 2017. |
8 | Security is in default of interest and/or principal obligations. |
9 | Security with no rate was unsettled at March 31, 2017. |
10 | The face amount is denominated in U.S. dollars unless otherwise noted. |
| | plc — Public Limited Company |
| | REIT — Real Estate Investment Trust |
| | CAD — Canadian Dollar |
| | EUR — Euro |
| | GBP — British Pound |
| | |
| | See Sector Classification in Other Information section. |
SEE NOTES TO FINANCIAL STATEMENTS. | THE GUGGENHEIM FUNDS SEMI-ANNUAL REPORT | 25 |
SCHEDULE OF INVESTMENTS (Unaudited)(continued) | March 31, 2017 |
HIGH YIELD FUND | |
The following table summarizes the inputs used to value the Fund’s investments at March 31, 2017 (See Note 4 in the Notes to Financial Statements):
Investments in Securities (Assets) | | Level 1 | | | Level 2 | | | Level 2 -
Other* | | | Level 3 | | | Total | |
Asset Backed Securities | | $ | — | | | $ | 8,753,030 | | | $ | — | | | $ | — | | | $ | 8,753,030 | |
Common Stocks | | | 1,403,188 | | | | 712,211 | | | | — | | | | 992,879 | | | | 3,108,278 | |
Corporate Bonds | | | — | | | | 257,000,333 | | | | — | | | | 1,954,001 | | | | 258,954,334 | |
Currency Contracts | | | — | | | | — | | | | 11,568 | | | | — | | | | 11,568 | |
Exchange-Traded Funds | | | 5,019,859 | | | | — | | | | — | | | | — | | | | 5,019,859 | |
Preferred Stocks | | | 1,272,360 | | | | 2,351,512 | | | | — | | | | — | | | | 3,623,872 | |
Senior Fixed Rate Interests | | | — | | | | 1,103,062 | | | | — | | | | 86,453 | | | | 1,189,515 | |
Senior Floating Rate Interests | | | — | | | | 88,404,058 | | | | — | | | | 6,686,813 | | | | 95,090,871 | |
Short Term Investments | | | 16,104,881 | | | | — | | | | — | | | | — | | | | 16,104,881 | |
Warrants | | | 698 | | | | 83,671 | | | | — | | | | — | | | | 84,369 | |
Total | | $ | 23,800,986 | | | $ | 358,407,877 | | | $ | 11,568 | | | $ | 9,720,146 | | | $ | 391,940,577 | |
| | | | | | | | | | | | | | | | | | | | | |
Investments in Securities (Liabilities) | | Level 1 | | | Level 2 | | | Level 2 -
Other* | | | Level 3 | | | Total | |
Currency Contracts | | $ | — | | | $ | — | | | $ | 215,032 | | | $ | — | | | $ | 215,032 | |
Unfunded Loan Commitments | | | — | | | | — | | | | 512,339 | | | | 260,325 | | | | 772,664 | |
Total | | $ | — | | | $ | — | | | $ | 727,371 | | | $ | 260,325 | | | $ | 987,696 | |
* | Other financial instruments include forward foreign currency exchange contracts, which are reported as unrealized gain/loss at period end. |
Transfers between investment levels may occur as the markets fluctuate and/or the availability of data used in an investment’s valuation changes. Transfers between valuation levels, if any, are in comparison to the valuation levels at the end of the previous fiscal year, and are effective using the fair value as of the end of the previous fiscal period.
As of March 31, 2017, High Yield Fund had securities with the total value of $4,727,265 transfer out of Level 3 into Level 2 and securities with a total value of $1,075,364 transfer out of Level 2 into Level 3 due to changes in securities’ valuation methods using observable market input. There were no other transfers between levels.
The following is a summary of significant unobservable inputs used in the fair valuation of assets and liabilities categorized within Level 3 of the fair value hierarchy:
Category | | Ending Balance
at 03/31/17 | | Valuation Technique | Unobservable
Inputs | | Input
Values | |
Common Stocks | | $ | 968,308 | | Enterprise Value | Valuation Multiple | | | 7.0 | x |
Common Stocks | | | 19,330 | | Enterprise Value | Valuation Multiple | | | 6.4 | x |
Common Stocks | | | 5,161 | | Option Adjusted Spread off the prior month end broker mark over the 3 month LIBOR | Indicative Quote | | | — | |
Common Stocks | | | 80 | | Model Price | Liquidation value | | | — | |
Corporate Bonds | | | 1,954,001 | | Model Price | Market Comparable Yields | | | 8.7 | % |
Senior Fixed Rate Interests | | | 86,453 | | Enterprise Value | Valuation Multiple | | | 6.4 | x |
Senior Floating Rate Interests | | | 4,001,178 | | Model Price | Purchase Price | | | — | |
Senior Floating Rate Interests | | | 1,182,000 | | Model Price | Trade Price | | | — | |
Senior Floating Rate Interests | | | 987,665 | | Model Price | Market Comparable Yields | | | 5.7 | % |
Senior Floating Rate Interests | | | 515,970 | | Option Adjusted Spread off the prior month end broker mark over the 3 month LIBOR | Indicative Quote | | | — | |
Total | | $ | 9,720,146 | | | | | | | |
Any remaining Level 3 securities held by the Funds and excluded from the tables above, were not considered material to the Funds.
26 | THE GUGGENHEIM FUNDS SEMI-ANNUAL REPORT | SEE NOTES TO FINANCIAL STATEMENTS. |
SCHEDULE OF INVESTMENTS (Unaudited)(concluded) | March 31, 2017 |
HIGH YIELD FUND | |
Summary of Fair Value Level 3 Activity
Following is a reconciliation of Level 3 assets for which significant unobservable inputs were used to determine fair value for the period ended March 31, 2017:
LEVEL 3 - Fair value measurement using significant unobservable inputs
| | Senior Floating
Rate Interests | | | Senior Fixed Rate Interests | | | Corporate
Bonds | | | Common
Stocks | | | Preferred
Stocks | | | Total | |
HIGH YIELD FUND | | | | | | | | | | | | | | | | | | |
Assets: | | | | | | | | | | | | | | | | | | |
Beginning Balance | | $ | 5,940,635 | | | $ | 80,401 | | | $ | 4,465,758 | | | $ | 1,029,981 | | | $ | 27,596 | | | $ | 11,544,371 | |
Purchases | | | 2,878,535 | | | | 4,328 | | | | — | | | | 33,552 | | | | — | | | | 2,916,415 | |
Sales, maturities and paydowns | | | (1,082,901 | ) | | | — | | | | — | | | | — | | | | — | | | | (1,082,901 | ) |
Corporate actions | | | — | | | | — | | | | — | | | | 427,339 | | | | — | | | | 427,339 | |
Total realized gains or losses included in earnings | | | (11,889 | ) | | | — | | | | — | | | | — | | | | — | | | | (11,889 | ) |
Total change in unrealized gains or losses included in earnings | | | 77,045 | | | | 1,724 | | | | — | | | | (500,057 | ) | | | — | | | | (421,288 | ) |
Transfers into Level 3 | | | 1,073,300 | | | | — | | | | — | | | | 2,064 | | | | — | | | | 1,075,364 | |
Transfers out of Level 3 | | | (2,187,912 | ) | | | — | | | | (2,511,757 | ) | | | — | | | | (27,596 | ) | | | (4,727,265 | ) |
Ending Balance | | $ | 6,686,813 | | | $ | 86,453 | | | $ | 1,954,001 | | | $ | 992,879 | | | $ | — | | | $ | 9,720,146 | |
Net Change in unrealized appreciation (depreciation) for investments in securities still held at March 31, 2017 | | $ | 49,131 | | | $ | 2,506 | | | $ | (2,883 | ) | | $ | (500,057 | ) | | $ | — | | | $ | (451,303 | ) |
SEE NOTES TO FINANCIAL STATEMENTS. | THE GUGGENHEIM FUNDS SEMI-ANNUAL REPORT | 27 |
STATEMENT OF ASSETS AND LIABILITIES (Unaudited) |
March 31, 2017 |
Assets: | |
Investments, at value (cost $387,914,597) | | $ | 391,929,009 | |
Foreign currency, at value (cost $739) | | | 739 | |
Cash | | | 424,747 | |
Prepaid expenses | | | 65,508 | |
Unrealized appreciation of forward foreign currency exchange contracts | | | 11,568 | |
Receivables: | |
Securities sold | | | 13,379,370 | |
Interest | | | 4,931,201 | |
Fund shares sold | | | 1,630,026 | |
Foreign taxes reclaim | | | 16,460 | |
Dividends | | | 7,425 | |
Total assets | | | 412,396,053 | |
| | | | | |
Liabilities: | |
Reverse Repurchase Agreements | | | 60,538,766 | |
Unfunded loan commitments, at value (Note 9) (proceeds $1,371,197) | | | 772,664 | |
Unrealized depreciation on forward foreign currency exchange contracts | | | 215,032 | |
Payable for: | |
Securities purchased | | | 15,930,550 | |
Fund shares redeemed | | | 1,016,500 | |
Management fees | | | 186,930 | |
Interest from reverse repurchase agreements | | | 57,688 | |
Transfer agent/maintenance fees | | | 53,174 | |
Distribution and service fees | | | 51,398 | |
Fund accounting/administration fees | | | 23,140 | |
Trustees’ fees* | | | 3,286 | |
Miscellaneous | | | 351,130 | |
Total liabilities | | | 79,200,258 | |
Commitments and Contingent Liabilities (Note 14) | | | — | |
Net assets | | $ | 333,195,795 | |
| | | | | |
Net assets consist of: | |
Paid in capital | | $ | 331,217,515 | |
Accumulated net investment loss | | | (297,614 | ) |
Accumulated net realized loss on investments | | | (2,141,930 | ) |
Net unrealized appreciation on investments | | | 4,417,824 | |
Net assets | | $ | 333,195,795 | |
| | | | | |
A-Class: | |
Net assets | | $ | 116,420,740 | |
Capital shares outstanding | | | 10,222,316 | |
Net asset value per share | | $ | 11.39 | |
Maximum offering price per share (Net asset value divided by 96.00%) | | $ | 11.86 | |
| | | | | |
C-Class: | |
Net assets | | $ | 28,531,340 | |
Capital shares outstanding | | | 2,484,320 | |
Net asset value per share | | $ | 11.48 | |
| | | | | |
P-Class: | |
Net assets | | $ | 14,531,880 | |
Capital shares outstanding | | | 1,275,202 | |
Net asset value per share | | $ | 11.40 | |
| | | | | |
Institutional Class: | |
Net assets | | $ | 173,711,835 | |
Capital shares outstanding | | | 18,705,052 | |
Net asset value per share | | $ | 9.29 | |
* | Relates to Trustees not deemed “interested persons” within the meaning of Section 2(a)(19) of the 1940 Act. |
28 | THE GUGGENHEIM FUNDS SEMI-ANNUAL REPORT | SEE NOTES TO FINANCIAL STATEMENTS. |
STATEMENT OF OPERATIONS (Unaudited) |
Period Ended March 31, 2017 |
Investment Income: | |
Interest | | $ | 10,720,364 | |
Dividends | | | 197,756 | |
Total investment income | | | 10,918,120 | |
| | | | | |
Expenses: | |
Management fees | | | 968,645 | |
Transfer agent/maintenance fees | |
A-Class | | | 39,354 | |
C-Class | | | 15,271 | |
P-Class | | | 2,771 | |
Institutional Class | | | 29,294 | |
Distribution and service fees: | |
A-Class | | | 123,354 | |
C-Class | | | 138,173 | |
P-Class | | | 8,756 | |
Fund accounting/administration fees | | | 121,506 | |
Interest expense | | | 159,878 | |
Line of credit fees | | | 26,142 | |
Custodian fees | | | 8,175 | |
Trustees’ fees* | | | 5,026 | |
Miscellaneous | | | 58,967 | |
Total expenses | | | 1,705,312 | |
Less: | |
Expenses waived by Adviser: | | | (883 | ) |
Expenses reimbursed by Adviser: | | | | |
P-Class | | | (968 | ) |
Institutional Class | | | (407 | ) |
Total waived/reimbursed expenses | | | (2,258 | ) |
Net expenses | | | 1,703,054 | |
Net investment income | | | 9,215,066 | |
| | | | | |
Net Realized and Unrealized Gain (Loss): | |
Net realized gain (loss) on: | |
Investments | | $ | 2,108,789 | |
Foreign currency | | | 64,098 | |
Forward foreign currency exchange contracts | | | 842,016 | |
Net realized gain | | | 3,014,903 | |
Net change in unrealized appreciation (depreciation) on: | |
Investments | | | 2,820,782 | |
Foreign currency | | | 12,524 | |
Forward foreign currency exchange contracts | | | (287,104 | ) |
Net change in unrealized appreciation (depreciation) | | | 2,546,202 | |
Net realized and unrealized gain | | | 5,561,105 | |
Net increase in net assets resulting from operations | | $ | 14,776,171 | |
* | Relates to Trustees not deemed “interested persons” within the meaning of Section 2(a)(19) of the 1940 Act. |
SEE NOTES TO FINANCIAL STATEMENTS. | THE GUGGENHEIM FUNDS SEMI-ANNUAL REPORT | 29 |
STATEMENTS OF CHANGES IN NET ASSETS |
| | Period Ended
March 31,
2017
(Unaudited) | | | Year Ended
September 30,
2016 | |
Increase (Decrease) in Net Assets from Operations: | | | | | | |
Net investment income | | $ | 9,215,066 | | | $ | 13,635,030 | |
Net realized gain (loss) on investments | | | 3,014,903 | | | | (3,898,866 | ) |
Net change in unrealized appreciation (depreciation) on investments | | | 2,546,202 | | | | 16,190,861 | |
Net increase in net assets resulting from operations | | | 14,776,171 | | | | 25,927,025 | |
| | | | | | | | | |
Distributions to shareholders from: | | | | | | | | |
Net investment income | | | | | | | | |
A-Class | | | (3,007,683 | ) | | | (5,021,892 | ) |
C-Class | | | (742,757 | ) | | | (1,046,425 | ) |
P-Class | | | (212,534 | ) | | | (86,534 | ) |
Institutional Class | | | (5,512,657 | ) | | | (8,343,089 | ) |
Total distributions to shareholders | | | (9,475,631 | ) | | | (14,497,940 | ) |
| | | | | | | | | |
Capital share transactions: | | | | | | | | |
Proceeds from sale of shares | | | | | | | | |
A-Class | | | 40,939,875 | | | | 38,862,308 | |
C-Class | | | 4,585,346 | | | | 15,767,122 | |
P-Class | | | 12,970,485 | | | | 3,039,848 | |
Institutional Class | | | 116,351,694 | | | | 132,721,401 | |
Redemption fees collected | | | | | | | | |
A-Class | | | 12,722 | | | | 58,517 | |
C-Class | | | 3,763 | | | | 11,173 | |
P-Class | | | 930 | | | | 214 | |
Institutional Class | | | 23,913 | | | | 67,613 | |
Distributions reinvested | | | | | | | | |
A-Class | | | 2,659,156 | | | | 4,590,806 | |
C-Class | | | 598,289 | | | | 831,218 | |
P-Class | | | 212,534 | | | | 86,534 | |
Institutional Class | | | 4,586,471 | | | | 7,079,015 | |
Cost of shares redeemed | | | | | | | | |
A-Class | | | (16,012,210 | ) | | | (32,283,621 | ) |
C-Class | | | (4,146,789 | ) | | | (4,511,046 | ) |
P-Class | | | (1,905,868 | ) | | | (161,209 | ) |
Institutional Class | | | (91,981,388 | ) | | | (80,676,896 | ) |
Net increase from capital share transactions | | | 68,898,923 | | | | 85,482,997 | |
Net increase in net assets | | | 74,199,463 | | | | 96,912,082 | |
| | | | | | | | | |
Net assets: | | | | | | | | |
Beginning of period | | | 258,996,332 | | | | 162,084,250 | |
End of period | | $ | 333,195,795 | | | $ | 258,996,332 | |
Accumulated net investment loss at end of period | | $ | (297,614 | ) | | $ | (37,049 | ) |
30 | THE GUGGENHEIM FUNDS SEMI-ANNUAL REPORT | SEE NOTES TO FINANCIAL STATEMENTS. |
STATEMENTS OF CHANGES IN NET ASSETS (concluded) |
| | Period Ended
March 31,
2017
(Unaudited) | | | Year Ended
September 30,
2016 | |
Capital share activity: | | | | | | |
Shares sold | | | | | | |
A-Class | | | 3,608,251 | | | | 3,698,743 | |
C-Class | | | 402,046 | | | | 1,482,332 | |
P-Class | | | 1,140,473 | | | | 290,517 | |
Institutional Class | | | 12,596,388 | | | | 15,474,086 | |
Shares issued from reinvestment of distributions | | | | | | | | |
A-Class | | | 235,038 | | | | 431,226 | |
C-Class | | | 52,466 | | | | 77,164 | |
P-Class | | | 18,992 | | | | 8,117 | |
Institutional Class | | | 497,411 | | | | 813,446 | |
Shares redeemed | | | | | | | | |
A-Class | | | (1,418,300 | ) | | | (3,117,471 | ) |
C-Class | | | (363,654 | ) | | | (422,663 | ) |
P-Class | | | (168,800 | ) | | | (14,985 | ) |
Institutional Class | | | (9,966,016 | ) | | | (9,241,452 | ) |
Net increase in shares | | | 6,634,295 | | | | 9,479,060 | |
SEE NOTES TO FINANCIAL STATEMENTS. | THE GUGGENHEIM FUNDS SEMI-ANNUAL REPORT | 31 |
This table is presented to show selected data for a share outstanding throughout each period and to assist shareholders in evaluating a Fund’s performance for the periods presented.
A-Class | | Period Ended
March 31,
2017a | | | Year Ended
September 30,
2016 | | | Year Ended
September 30,
2015 | | | Year Ended
September 30,
2014 | | | Year Ended
September 30,
2013 | | | Period Ended
September 30,
2012b | |
Per Share Data | | | | | | | | | | | | | | | | | | |
Net asset value, beginning of period | | $ | 11.16 | | | $ | 10.79 | | | $ | 12.02 | | | $ | 11.85 | | | $ | 11.95 | | | $ | 11.12 | |
Income (loss) from investment operations: | |
Net investment income (loss)c | | | .33 | | | | .67 | | | | .69 | | | | .72 | | | | .81 | | | | .58 | |
Net gain (loss) on investments (realized and unrealized) | | | .24 | | | | .41 | | | | (.97 | ) | | | .27 | | | | .27 | | | | .84 | |
Total from investment operations | | | .57 | | | | 1.08 | | | | (.28 | ) | | | .99 | | | | 1.08 | | | | 1.42 | |
Less distributions from: | |
Net investment income | | | (.34 | ) | | | (.72 | ) | | | (.74 | ) | | | (.83 | ) | | | (.90 | ) | | | (.59 | ) |
Net realized gains | | | — | | | | — | | | | (.22 | ) | | | — | | | | (.29 | ) | | | — | |
Total distributions | | | (.34 | ) | | | (.72 | ) | | | (.96 | ) | | | (.83 | ) | | | (1.19 | ) | | | (.59 | ) |
Redemption fees collected | | | — | d | | | .01 | | | | .01 | | | | .01 | | | | .01 | | | | — | d |
Net asset value, end of period | | $ | 11.39 | | | $ | 11.16 | | | $ | 10.79 | | | $ | 12.02 | | | $ | 11.85 | | | $ | 11.95 | |
| |
Total Returnh | | | 5.22 | % | | | 10.71 | % | | | (2.40 | %) | | | 9.18 | % | | | 9.54 | % | | | 12.93 | % |
Ratios/Supplemental Data | |
Net assets, end of period (in thousands) | | $ | 116,421 | | | $ | 87,045 | | | $ | 73,236 | | | $ | 82,854 | | | $ | 70,451 | | | $ | 64,174 | |
Ratios to average net assets: | |
Net investment income (loss) | | | 5.93 | % | | | 6.32 | % | | | 6.01 | % | | | 5.91 | % | | | 6.84 | % | | | 7.19 | % |
Total expensese | | | 1.28 | % | | | 1.25 | % | | | 1.27 | % | | | 1.32 | % | | | 1.41 | % | | | 1.44 | % |
Net expensesf,i | | | 1.28 | % | | | 1.23 | % | | | 1.20 | % | | | 1.26 | % | | | 1.18 | % | | | 1.17 | % |
Portfolio turnover rate | | | 38 | % | | | 55 | % | | | 72 | % | | | 97 | % | | | 101 | % | | | 55 | % |
C-Class | | Period Ended
March 31,
2017a | | | Year Ended
September 30,
2016 | | | Year Ended
September 30,
2015 | | | Year Ended
September 30,
2014 | | | Year Ended
September 30,
2013 | | | Period Ended
September 30,
2012b | |
Per Share Data | | | | | | | | | | | | | | | | | | |
Net asset value, beginning of period | | $ | 11.26 | | | $ | 10.88 | | | $ | 12.12 | | | $ | 11.95 | | | $ | 12.03 | | | $ | 11.20 | |
Income (loss) from investment operations: | |
Net investment income (loss)c | | | .30 | | | | .60 | | | | .61 | | | | .63 | | | | .73 | | | | .56 | |
Net gain (loss) on investments (realized and unrealized) | | | .22 | | | | .41 | | | | (.98 | ) | | | .27 | | | | .27 | | | | .80 | |
Total from investment operations | | | .52 | | | | 1.01 | | | | (.37 | ) | | | .90 | | | | 1.00 | | | | 1.36 | |
Less distributions from: | |
Net investment income | | | (.30 | ) | | | (.64 | ) | | | (.66 | ) | | | (.74 | ) | | | (.80 | ) | | | (.53 | ) |
Net realized gains | | | — | | | | — | | | | (.22 | ) | | | — | | | | (.29 | ) | | | — | |
Total distributions | | | (.30 | ) | | | (.64 | ) | | | (.88 | ) | | | (.74 | ) | | | (1.09 | ) | | | (.53 | ) |
Redemption fees collected | | | — | d | | | .01 | | | | .01 | | | | .01 | | | | .01 | | | | — | d |
Net asset value, end of period | | $ | 11.48 | | | $ | 11.26 | | | $ | 10.88 | | | $ | 12.12 | | | $ | 11.95 | | | $ | 12.03 | |
| |
Total Returnh | | | 4.80 | % | | | 9.81 | % | | | (3.14 | %) | | | 8.46 | % | | | 8.69 | % | | | 12.33 | % |
Ratios/Supplemental Data | |
Net assets, end of period (in thousands) | | $ | 28,531 | | | $ | 26,941 | | | $ | 13,671 | | | $ | 14,674 | | | $ | 9,463 | | | $ | 9,054 | |
Ratios to average net assets: | |
Net investment income (loss) | | | 5.20 | % | | | 5.52 | % | | | 5.25 | % | | | 5.14 | % | | | 6.10 | % | | | 6.37 | % |
Total expensese | | | 2.03 | % | | | 2.01 | % | | | 2.01 | % | | | 2.09 | % | | | 2.17 | % | | | 2.19 | % |
Net expensesf,i | | | 2.03 | % | | | 1.98 | % | | | 1.95 | % | | | 2.01 | % | | | 1.93 | % | | | 1.92 | % |
Portfolio turnover rate | | | 38 | % | | | 55 | % | | | 72 | % | | | 97 | % | | | 101 | % | | | 55 | % |
32 | THE GUGGENHEIM FUNDS SEMI-ANNUAL REPORT | SEE NOTES TO FINANCIAL STATEMENTS. |
FINANCIAL HIGHLIGHTS (continued) |
This table is presented to show selected data for a share outstanding throughout each period and to assist shareholders in evaluating a Fund’s performance for the periods presented.
P-Class | | Period Ended
March 31,
2017a | | | Year Ended
September 30,
2016 | | | Period Ended
September 30,
2015g | |
Per Share Data | | | | | | | | | |
Net asset value, beginning of period | | $ | 11.17 | | | $ | 10.80 | | | $ | 11.53 | |
Income (loss) from investment operations: | |
Net investment income (loss)c | | | .34 | | | | .67 | | | | .27 | |
Net gain (loss) on investments (realized and unrealized) | | | .25 | | | | .42 | | | | (.73 | ) |
Total from investment operations | | | .59 | | | | 1.09 | | | | (.46 | ) |
Less distributions from: | |
Net investment income | | | (.36 | ) | | | (.72 | ) | | | (.27 | ) |
Total distributions | | | (.36 | ) | | | (.72 | ) | | | (.27 | ) |
Redemption fees collected | | | — | d | | | — | d | | | — | d |
Net asset value, end of period | | $ | 11.40 | | | $ | 11.17 | | | $ | 10.80 | |
| |
Total Returnh | | | 5.31 | % | | | 10.74 | % | | | (4.06 | %) |
Ratios/Supplemental Data | |
Net assets, end of period (in thousands) | | $ | 14,532 | | | $ | 3,178 | | | $ | 10 | |
Ratios to average net assets: | |
Net investment income (loss) | | | 5.96 | % | | | 6.20 | % | | | 5.76 | % |
Total expensese | | | 1.20 | % | | | 1.17 | % | | | 3.36 | % |
Net expensesf,i | | | 1.18 | % | | | 1.17 | % | | | 1.19 | % |
Portfolio turnover rate | | | 38 | % | | | 55 | % | | | 72 | % |
SEE NOTES TO FINANCIAL STATEMENTS. | THE GUGGENHEIM FUNDS SEMI-ANNUAL REPORT | 33 |
FINANCIAL HIGHLIGHTS (concluded) |
This table is presented to show selected data for a share outstanding throughout each period and to assist shareholders in evaluating a Fund’s performance for the periods presented.
Institutional Class | | Period Ended
March 31,
2017a | | | Year Ended
September 30,
2016 | | | Year Ended
September 30,
2015 | | | Year Ended
September 30,
2014 | | | Year Ended
September 30,
2013 | | | Period Ended
September 30,
2012b | |
Per Share Data | | | | | | | | | | | | | | | | | | |
Net asset value, beginning of period | | $ | 9.11 | | | $ | 8.81 | | | $ | 9.87 | | | $ | 9.74 | | | $ | 9.90 | | | $ | 9.26 | |
Income (loss) from investment operations: | |
Net investment income (loss)c | | | .29 | | | | .58 | | | | .58 | | | | .61 | | | | .70 | | | | .55 | |
Net gain (loss) on investments (realized and unrealized) | | | .19 | | | | .34 | | | | (.79 | ) | | | .23 | | | | .22 | | | | .64 | |
Total from investment operations | | | .48 | | | | .92 | | | | (.21 | ) | | | .84 | | | | .92 | | | | 1.19 | |
Less distributions from: | |
Net investment income | | | (.30 | ) | | | (.62 | ) | | | (.64 | ) | | | (.72 | ) | | | (.80 | ) | | | (.55 | ) |
Net realized gains | | | — | | | | — | | | | (.22 | ) | | | — | | | | (.29 | ) | | | — | |
Total distributions | | | (.30 | ) | | | (.62 | ) | | | (.86 | ) | | | (.72 | ) | | | (1.09 | ) | | | (.55 | ) |
Redemption fees collected | | | — | d | | | — | d | | | .01 | | | | .01 | | | | .01 | | | | — | d |
Net asset value, end of period | | $ | 9.29 | | | $ | 9.11 | | | $ | 8.81 | | | $ | 9.87 | | | $ | 9.74 | | | $ | 9.90 | |
| |
Total Returnh | | | 5.48 | % | | | 10.95 | % | | | (2.21 | %) | | | 9.50 | % | | | 9.97 | % | | | 13.17 | % |
Ratios/Supplemental Data | |
Net assets, end of period (in thousands) | | $ | 173,712 | | | $ | 141,833 | | | $ | 75,167 | | | $ | 36,880 | | | $ | 18,755 | | | $ | 9,974 | |
Ratios to average net assets: | |
Net investment income (loss) | | | 6.32 | % | | | 6.58 | % | | | 6.21 | % | | | 6.12 | % | | | 7.12 | % | | | 7.42 | % |
Total expensese | | | 0.88 | % | | | 0.95 | % | | | 0.94 | % | | | 1.01 | % | | | 1.01 | % | | | 1.11 | % |
Net expensesf,i | | | 0.88 | % | | | 0.94 | % | | | 0.94 | % | | | 1.01 | % | | | 0.93 | % | | | 0.92 | % |
Portfolio turnover rate | | | 38 | % | | | 55 | % | | | 72 | % | | | 97 | % | | | 101 | % | | | 55 | % |
a | Unaudited figures for the period ended March 31, 2017. Percentage amounts for the period, except total return and portfolio turnover rate, have been annualized. |
b | The Fund changed its fiscal year end from December 31 to September 30 in 2012. |
c | Net investment income (loss) per share was computed using average shares outstanding throughout the period. |
d | Redemption fees collected are less than $0.01 per share. |
e | Does not include expenses of the underlying funds in which the Fund invests. |
f | Net expense information reflects the expense ratios after expense waivers. |
g | Since commencement of operations: May 1, 2015. Percentage amounts for the period, except total return and portfolio turnover rate, have been annualized. |
h | Total return does not reflect the impact of any applicable sales charges and has not been annualized. |
i | Net expenses may include expenses that are excluded from the expense limitation agreement. Excluding these expenses, the net expense ratios for the years would be: |
| | | 03/31/17 | 09/30/16 | 09/30/15 | 09/30/14 | |
| | A-Class | 1.16% | 1.16% | 1.16% | 1.16% | |
| | C-Class | 1.91% | 1.91% | 1.91% | 1.91% | |
| | P-Class | 1.03% | 1.09% | 1.16% | — | |
| | Institutional Class | 0.76% | 0.87% | 0.91% | 0.91% | |
34 | THE GUGGENHEIM FUNDS SEMI-ANNUAL REPORT | SEE NOTES TO FINANCIAL STATEMENTS. |
FUND PROFILE (Unaudited) | March 31, 2017 |
INVESTMENT GRADE BOND FUND
OBJECTIVE: Seeks to provide current income.
Holdings Diversification (Market Exposure as % of Net Assets)
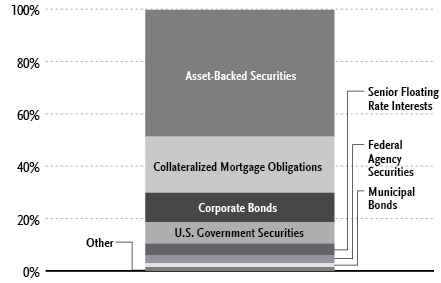
“Holdings Diversification (Market Exposure as % of Net Assets)” excludes any temporary cash investments.
Inception Dates: |
A-Class | August 15, 1985 |
C-Class | May 1, 2000 |
P-Class | May 1, 2015 |
Institutional Class | January 29, 2013 |
Ten Largest Holdings (% of Total Net Assets) |
U.S. Treasury Bond | 7.9% |
Anchorage Credit Funding Ltd. | 1.2% |
Fortress Credit Opportunities III CLO, LP | 1.1% |
Golub Capital Partners CLO Ltd. | 1.1% |
LSTAR Securities Investment Ltd. | 1.0% |
Fortress Credit Opportunities VII CLO Ltd. | 1.0% |
Catamaran CLO Ltd. | 1.0% |
Capital Automotive REIT | 1.0% |
GSAA Trust | 0.9% |
LSTAR Commercial Mortgage Trust | 0.9% |
Top Ten Total | 17.1% |
“Ten Largest Holdings” excludes any temporary cash or derivative investments. |
| | THE GUGGENHEIM FUNDS SEMI-ANNUAL REPORT | 35 |
FUND PROFILE (Unaudited)(concluded) | March 31, 2017 |
Portfolio Composition by Quality Rating1 |
Rating | % of Total Investments |
Fixed Income Instruments | |
AAA | 25.2% |
AA | 20.7% |
A | 19.6% |
BBB | 15.5% |
BB | 2.2% |
B | 3.8% |
CCC | 2.2% |
CC | 0.8% |
NR2 | 8.1% |
Total | 98.1% |
Other Instruments | 1.9% |
Total Investments | 100.0% |
The chart above reflects percentages of the value of total investments. |
1 | Source: BlackRock Solutions. Credit quality ratings are measured on a scale that generally ranges from AAA (highest) to D (lowest). All securities except for those labeled “NR” have been rated by a Nationally Recognized Statistical Rating Organization (“NRSRO”). For purposes of this presentation, when ratings are available from more than one agency, the highest rating is used. Guggenheim Investments converts ratings to the equivalent S&P rating. |
2 | NR securities do not necessarily indicate low credit quality. |
36 | THE GUGGENHEIM FUNDS SEMI-ANNUAL REPORT | |
SCHEDULE OF INVESTMENTS (Unaudited) | March 31, 2017 |
INVESTMENT GRADE BOND FUND | |
| | Shares | | | Value | |
| | | | | | | |
UNIT INVESTMENT TRUST† - 0.0%** | |
| | | | | | | |
Financial - 0.0%** | |
Rescap Liquidating Trust* | | | 5,199 | | | $ | 55,629 | |
| | | | | | | | | |
Total Unit Investment Trust | | | | | | | | |
(Cost $262,501) | | | | | | | 55,692 | |
| | | | | | | | | |
COMMON STOCKS - 0.0%** | | | | | | | | |
Industrial - 0.0%** | |
Constar International Holdings LLC*,†††,1 | | | 68 | | | | — | |
| | | | | | | | | |
Total Common Stocks | | | | | | | | |
(Cost $—) | | | | | | | — | |
| | | | | | | | | |
PREFERRED STOCKS†† - 0.9% | |
Financial - 0.7% | |
Woodbourne Capital Trust IV 0.02% †††,2,3,13 | | | 950,000 | | | | 568,357 | |
Woodbourne Capital Trust II 0.02% †††,2,3,13 | | | 950,000 | | | | 568,357 | |
Woodbourne Capital Trust I 0.02% †††,2,3,13 | | | 950,000 | | | | 568,356 | |
Woodbourne Capital Trust III 0.02% †††,2,3,13 | | | 950,000 | | | | 567,693 | |
Total Financial | | | | | | | 2,272,763 | |
| | | | | | | | | |
Industrial - 0.2% | |
Seaspan Corp. 6.38% due 04/30/191 | | | 20,575 | | | | 516,433 | |
Constar International Holdings LLC*,†††,1 | | | 7 | | | | — | |
Total Industrial | | | | | | | 516,433 | |
Total Preferred Stocks | | | | | | | | |
(Cost $4,332,729) | | | | | | | 2,789,196 | |
| | | | | | | | | |
SHORT-TERM INVESTMENTS† - 0.9% | |
Dreyfus Treasury Securities Cash Management Fund — Institutional Class 0.50%5 | | | 2,651,038 | | | | 2,651,038 | |
Total Short-Term Investments | | | | | | | | |
(Cost $2,651,038) | | | | | | | 2,651,038 | |
| | | | | | | | | |
| | | Face
Amount14 | | | | | |
| | | | | | | | | |
ASSET-BACKED SECURITIES†† - 48.5% | |
Collateralized Loan Obligations - 36.9% | |
Golub Capital Partners CLO Ltd. | | | | | | | | |
2016-33A, 3.37% due 11/21/282,4 | | $ | 3,500,000 | | | | 3,488,404 | |
2015-25A, 2.83% due 08/05/272,4 | | | 1,500,000 | | | | 1,500,284 | |
2014-21A, 3.49% due 10/25/262,4 | | | 600,000 | | | | 591,381 | |
2013-17A, 4.87% due 10/25/252,4 | | | 250,000 | | | | 250,619 | |
Fortress Credit Opportunities III CLO, LP | | | | | | | | |
2017-3A, 2.96% due 04/28/262,4 | | | 4,100,000 | | | | 4,093,891 | |
2014-3A, 4.26% due 04/28/262,4 | | | 300,000 | | | | 299,997 | |
2014-3A, 3.51% due 04/28/262,4 | | | 300,000 | | | | 298,983 | |
Great Lakes CLO Ltd. | | | | | | | | |
2015-1A, 2.97% due 07/15/262,4 | | | 1,000,000 | | | | 1,003,199 | |
2014-1A, 2.87% due 04/15/252,4 | | | 1,000,000 | | | | 1,001,021 | |
2012-1A, 5.12% due 01/15/232,4 | | | 1,000,000 | | | | 999,939 | |
2012-1A, 3.77% due 01/15/232,4 | | | 1,000,000 | | | | 998,827 | |
2014-1A, 4.72% due 04/15/252,4 | | | 250,000 | | | | 247,172 | |
Fortress Credit Opportunities V CLO Ltd. | | | | | | | | |
2017-5A, 2.86% due 10/15/262,4 | | | 2,500,000 | | | | 2,501,623 | |
2014-5A, 3.66% due 10/15/262,4 | | | 1,000,000 | | | | 999,500 | |
Fortress Credit BSL II Ltd. | | | | | | | | |
2017-2A, 2.80% due 10/19/252,4 | | | 2,300,000 | | | | 2,294,641 | |
2013-2A, 3.27% due 10/19/252,4 | | | 1,000,000 | | | | 1,001,565 | |
KVK CLO Ltd. | | | | | | | | |
2017-1A, 2.84% due 05/15/262,4 | | | 1,600,000 | | | | 1,598,858 | |
2015-1A, 5.05% due 05/20/272,4 | | | 1,250,000 | | | | 1,228,289 | |
2013-1A, due 04/14/254,6 | | | 1,000,000 | | | | 452,958 | |
Fortress Credit Opportunities VII CLO Ltd. | | | | | | | | |
2016-7A, 2.98% due 12/15/282,4 | | | 3,000,000 | | | | 3,004,865 | |
Catamaran CLO Ltd. | | | | | | | | |
2016-1A, 3.10% due 12/20/232,4 | | | 3,000,000 | | | | 3,000,833 | |
PFP Ltd. | | | | | | | | |
2017-3, 1.83% due 01/14/352,4 | | | 1,750,000 | | | | 1,754,183 | |
2015-2, 2.93% due 07/14/342,4 | | | 1,000,000 | | | | 999,135 | |
WhiteHorse VI Ltd. | | | | | | | | |
2016-1A, 2.93% due 02/03/252,4 | | | 1,500,000 | | | | 1,498,889 | |
2016-1A, 3.78% due 02/03/252,4 | | | 1,000,000 | | | | 1,000,265 | |
CIFC Funding Ltd. | | | | | | | | |
2015-2A, 3.00% due 12/05/242,4 | | | 1,500,000 | | | | 1,499,629 | |
2015-3A, 3.12% due 10/19/272,4 | | | 1,000,000 | | | | 998,986 | |
Shackleton CLO Ltd. | | | | | | | | |
2016-7A, 2.97% due 04/15/272,4 | | | 1,500,000 | | | | 1,499,928 | |
2015-8A, 3.98% due 10/20/272,4 | | | 1,000,000 | | | | 997,074 | |
OCP CLO Ltd. | | | | | | | | |
2014-6A, 5.97% due 07/17/262,4 | | | 1,400,000 | | | | 1,337,689 | |
2016-11A, 3.43% due 04/26/282,4 | | | 1,000,000 | | | | 999,942 | |
Telos CLO Ltd. | | | | | | | | |
2013-3A, 4.02% due 01/17/242,4 | | | 1,250,000 | | | | 1,250,465 | |
2007-2A, 3.22% due 04/15/222,4 | | | 1,100,000 | | | | 1,071,169 | |
Dryden XXVI Senior Loan Fund | | | | | | | | |
2013-26A, 3.52% due 07/15/252,4 | | | 2,250,000 | | | | 2,250,001 | |
Venture XIX CLO Ltd. | | | | | | | | |
2016-19A, 3.02% due 01/15/272,4 | | | 2,100,000 | | | | 2,099,900 | |
TCP Waterman CLO LLC | | | | | | | | |
2016-1A, 3.18% due 12/15/282,4 | | | 1,000,000 | | | | 1,010,440 | |
2016-1A, 3.43% due 12/15/282,4 | | | 1,000,000 | | | | 999,956 | |
Madison Park Funding XVI Ltd. | | | | | | | | |
2016-16A, 2.93% due 04/20/262,4 | | | 2,000,000 | | | | 2,004,278 | |
FS Senior Funding Ltd. | | | | | | | | |
2015-1A, 2.82% due 05/28/252,4 | | | 2,000,000 | | | | 2,000,100 | |
Northwoods Capital IX Ltd. | | | | | | | | |
2012-9A, 3.27% due 01/18/242,4 | | | 2,000,000 | | | | 1,999,890 | |
Flagship CLO VIII Ltd. | | | | | | | | |
2017-8A, 2.29% due 01/16/262,4 | | | 2,000,000 | | | | 1,995,197 | |
OZLM Funding II Ltd. | | | | | | | | |
2016-2A, 3.64% due 10/30/272,4 | | | 2,000,000 | | | | 1,994,431 | |
Cerberus Loan Funding XVII Ltd. | | | | | | | | |
2016-3A, 3.48% due 01/15/282,4 | | | 2,000,000 | | | | 1,993,523 | |
ABPCI Direct Lending Fund CLO I LLC | | | | | | | | |
2016-1A, 3.65% due 12/22/282,4 | | | 2,000,000 | | | | 1,989,471 | |
SEE NOTES TO FINANCIAL STATEMENTS. | THE GUGGENHEIM FUNDS SEMI-ANNUAL REPORT | 37 |
SCHEDULE OF INVESTMENTS (Unaudited)(continued) | March 31, 2017 |
INVESTMENT GRADE BOND FUND | |
| | Face
Amount14 | | | Value | |
| | | | | | | |
NXT Capital CLO LLC | | | | | | |
2017-1A, 2.86% due 04/20/292,4 | | $ | 1,800,000 | | | $ | 1,796,880 | |
Ivy Hill Middle Market Credit Fund VII Ltd. | | | | | | | | |
2013-7A, 3.33% due 10/20/252,4 | | | 1,000,000 | | | | 976,347 | |
2013-7A, 4.48% due 10/20/252,4 | | | 600,000 | | | | 580,541 | |
Venture CLO Ltd. | | | | | | | | |
2013-14A, 3.80% due 08/28/252,4 | | | 1,550,000 | | | | 1,549,717 | |
Cent CLO 20 Ltd. | | | | | | | | |
2014-20A, 3.04% due 01/25/262,4 | | | 1,500,000 | | | | 1,506,540 | |
Oaktree EIF I Ltd. | | | | | | | | |
2016-A1, 3.62% due 10/18/272,4 | | | 1,500,000 | | | | 1,502,477 | |
OZLM IX Ltd. | | | | | | | | |
2017-9A, 2.69% due 01/20/272,4 | | | 1,400,000 | | | | 1,395,681 | |
Grayson CLO Ltd. | | | | | | | | |
2006-1A, 1.44% due 11/01/212,4 | | | 1,400,000 | | | | 1,367,716 | |
WhiteHorse VIII Ltd. | | | | | | | | |
2014-1A, 3.08% due 05/01/262,4 | | | 1,100,000 | | | | 1,102,774 | |
Steele Creek CLO Ltd. | | | | | | | | |
2017-1A, 2.89% due 08/21/262,4 | | | 1,100,000 | | | | 1,099,994 | |
Rockwall CDO II Ltd. | | | | | | | | |
2007-1A, 1.58% due 08/01/242,4 | | | 1,100,000 | | | | 1,091,563 | |
Cerberus Loan Funding XVI, LP | | | | | | | | |
2016-2A, 3.37% due 11/15/272,4 | | | 1,000,000 | | | | 1,009,051 | |
AIMCO CLO Series | | | | | | | | |
2015-AA, 3.32% due 01/15/282,4 | | | 1,000,000 | | | | 1,008,457 | |
Recette CLO LLC | | | | | | | | |
2015-1A, 3.83% due 10/20/272,4 | | | 1,000,000 | | | | 1,006,019 | |
Vibrant CLO Ltd. | | | | | | | | |
2015-1A, 3.12% due 07/17/242,4 | | | 1,000,000 | | | | 1,005,612 | |
AMMC CLO XI Ltd. | | | | | | | | |
2016-11A, 3.89% due 10/30/232,4 | | | 1,000,000 | | | | 1,005,089 | |
AMMC CLO XV Ltd. | | | | | | | | |
2016-15A, 3.01% due 12/09/262,4 | | | 1,000,000 | | | | 1,003,697 | |
Northwoods Capital XIV Ltd. | | | | | | | | |
2017-14A, 2.79% due 11/12/252,4 | | | 1,000,000 | | | | 1,001,137 | |
Fortress Credit Investments IV Ltd. | | | | | | | | |
2015-4A, 2.92% due 07/17/232,4 | | | 1,000,000 | | | | 1,001,108 | |
TICP CLO I Ltd. | | | | | | | | |
2014-1A, 4.03% due 04/26/262,4 | | | 1,000,000 | | | | 1,000,090 | |
Atrium XI | | | | | | | | |
2014-11A, 4.24% due 10/23/252,4 | | | 1,000,000 | | | | 1,000,084 | |
Marathon CLO IV Ltd. | | | | | | | | |
2012-4A, 4.06% due 05/20/232,4 | | | 1,000,000 | | | | 1,000,047 | |
Mountain Hawk I CLO Ltd. | | | | | | | | |
2013-1A, 3.21% due 01/20/242,4 | | | 1,000,000 | | | | 1,000,030 | |
TICP CLO III Ltd. | | | | | | | | |
2014-3A, 3.38% due 01/20/272,4 | | | 1,000,000 | | | | 1,000,000 | |
Atlas Senior Loan Fund V Ltd. | | | | | | | | |
2016-1A, 3.53% due 07/16/262,4 | | | 1,000,000 | | | | 999,949 | |
Figueroa CLO Ltd. | | | | | | | | |
2013-1A, 3.80% due 03/21/242,4 | | | 1,000,000 | | | | 999,920 | |
Nelder Grove CLO Ltd. | | | | | | | | |
2017-1A, 2.80% due 08/28/262,4 | | | 1,000,000 | | | | 999,846 | |
Marea CLO Ltd. | | | | | | | | |
2015-1A, 2.82% due 10/15/232,4 | | | 1,000,000 | | | | 999,785 | |
Betony CLO Ltd. | | | | | | | | |
2016-1A, 2.97% due 04/15/272,4 | | | 1,000,000 | | | | 998,889 | |
KKR CLO Ltd. | | | | | | | | |
2015-12, 3.32% due 07/15/272,4 | | | 1,000,000 | | | | 998,817 | |
Eaton Vance CLO 2014-1 Ltd. | | | | | | | | |
2017-1A, 2.62% due 07/15/262,4 | | | 1,000,000 | | | | 997,583 | |
Babson CLO Ltd. | | | | | | | | |
2012-2A, due 05/15/234,6 | | | 1,000,000 | | | | 594,801 | |
2014-IA, due 07/20/254,6 | | | 650,000 | | | | 402,726 | |
Garrison Funding Ltd. | | | | | | | | |
2016-2A, 4.20% due 09/29/272,4 | | | 1,000,000 | | | | 997,362 | |
Venture XII CLO Ltd. | | | | | | | | |
2017-12A, 2.67% due 02/28/262,4 | | | 1,000,000 | | | | 997,252 | |
Vibrant CLO III Ltd. | | | | | | | | |
2016-3A, 3.08% due 04/20/262,4 | | | 1,000,000 | | | | 996,339 | |
Black Diamond CLO Ltd. | | | | | | | | |
2013-1A, 4.28% due 02/01/232,4 | | | 950,000 | | | | 950,245 | |
Jamestown CLO VI Ltd. | | | | | | | | |
2015-6A, 5.80% due 02/20/272,4 | | | 1,000,000 | | | | 948,468 | |
Dryden 37 Senior Loan Fund | | | | | | | | |
2015-37A, due 04/15/274,6 | | | 1,000,000 | | | | 939,141 | |
Saranac CLO II Ltd. | | | | | | | | |
2014-2A, 6.20% due 02/20/252,4 | | | 1,000,000 | | | | 915,000 | |
COA Summit CLO Limited | | | | | | | | |
2014-1A, 3.83% due 04/20/232,4 | | | 800,000 | | | | 799,928 | |
Newstar Trust | | | | | | | | |
2012-2A, 4.28% due 01/20/232,4 | | | 750,000 | | | | 753,336 | |
ACIS CLO Ltd. | | | | | | | | |
2013-1A, 3.97% due 04/18/242,4 | | | 500,000 | | | | 500,994 | |
2013-2A, 4.23% due 10/14/222,4 | | | 250,000 | | | | 249,698 | |
Cerberus Onshore II CLO LLC | | | | | | | | |
2014-1A, 3.72% due 10/15/232,4 | | | 500,000 | | | | 500,256 | |
2014-1A, 3.72% due 10/15/232,4 | | | 250,000 | | | | 249,861 | |
KKR CLO Trust | | | | | | | | |
2012-1A, 4.43% due 12/15/242,4 | | | 500,000 | | | | 500,268 | |
Cent CLO | | | | | | | | |
2014-16A, 3.28% due 08/01/242,4 | | | 500,000 | | | | 500,043 | |
Treman Park CLO Ltd. | | | | | | | | |
2015-1A, due 04/20/274,6 | | | 500,000 | | | | 448,500 | |
Eastland CLO Ltd. | | | | | | | | |
2007-1A, 1.43% due 05/01/222,4 | | | 450,000 | | | | 441,851 | |
Halcyon Loan Advisors Funding Ltd. | | | | | | | | |
2012-2A, 5.65% due 12/20/242,4 | | | 350,000 | | | | 350,106 | |
DIVCORE CLO Ltd. | | | | | | | | |
2013-1A, 4.81% due 11/15/322,4 | | | 300,000 | | | | 299,425 | |
ALM XIV Ltd. | | | | | | | | |
2014-14A, 3.99% due 07/28/262,4 | | | 250,000 | | | | 251,000 | |
TICC CLO LLC | | | | | | | | |
2012-1A, 5.68% due 08/25/232,4 | | | 250,000 | | | | 250,111 | |
Gallatin CLO VII Ltd. | | | | | | | | |
2014-1A, 3.92% due 07/15/232,4 | | | 250,000 | | | | 250,013 | |
NewStar Arlington Senior Loan Program LLC | | | | | | | | |
2014-1A, 4.34% due 07/25/252,4 | | | 250,000 | | | | 247,480 | |
Keuka Park CLO Ltd. | | | | | | | | |
2013-1A, due 10/21/244,6 | | | 250,000 | | | | 126,486 | |
Copper River CLO Ltd. | | | | | | | | |
2007-1A, due 01/20/216,13 | | | 700,000 | | | | 98,415 | |
Total Collateralized Loan Obligations | | | | | | | 114,665,935 | |
38 | THE GUGGENHEIM FUNDS SEMI-ANNUAL REPORT | SEE NOTES TO FINANCIAL STATEMENTS. |
SCHEDULE OF INVESTMENTS (Unaudited)(continued) | March 31, 2017 |
INVESTMENT GRADE BOND FUND | |
| | Face
Amount14 | | | Value | |
| | | | | | | |
Transport-Aircraft - 5.1% | |
Apollo Aviation Securitization Equity Trust | | | | | | |
2016-2, 4.21% due 11/15/41 | | $ | 2,327,280 | | | $ | 2,329,271 | |
2016-1A, 4.88% due 03/17/364 | | | 1,350,000 | | | | 1,356,750 | |
2014-1, 5.13% due 12/15/292 | | | 1,140,315 | | | | 1,138,889 | |
2014-1, 7.38% due 12/15/292 | | | 570,157 | | | | 569,445 | |
Willis Engine Securitization Trust II | | | | | | | | |
2012-A, 5.50% due 09/15/374 | | | 1,935,343 | | | | 1,920,828 | |
Castlelake Aircraft Securitization Trust | | | | | | | | |
2015-1A, 4.70% due 12/15/404 | | | 1,278,849 | | | | 1,305,080 | |
2014-1, 5.25% due 02/15/29 | | | 408,039 | | | | 407,019 | |
2014-1, 7.50% due 02/15/29 | | | 161,814 | | | | 161,814 | |
Emerald Aviation Finance Ltd. | | | | | | | | |
2013-1, 4.65% due 10/15/384 | | | 921,977 | | | | 926,587 | |
2013-1, 6.35% due 10/15/384 | | | 184,395 | | | | 184,395 | |
Falcon Aerospace Ltd. | | | | | | | | |
2017-1, 4.58% due 02/15/42 | | | 1,093,840 | | | | 1,102,712 | |
ECAF I Ltd. | | | | | | | | |
2015-1A, 4.95% due 06/15/404 | | | 974,062 | | | | 943,846 | |
Rise Ltd. | | | | | | | | |
2014-1A, 4.75% due 02/12/39 | | | 899,896 | | | | 895,397 | |
AIM Aviation Finance Ltd. | | | | | | | | |
2015-1A, 4.21% due 02/15/404 | | | 851,190 | | | | 847,999 | |
Diamond Head Aviation Ltd. | | | | | | | | |
2015-1, 3.81% due 07/14/284 | | | 674,906 | | | | 675,239 | |
Turbine Engines Securitization Ltd. | | | | | | | | |
2013-1A, 5.13% due 12/13/4813 | | | 656,488 | | | | 650,281 | |
AABS | | | | | | | | |
2013-1 A, 4.88% due 01/10/38 | | | 269,222 | | | | 268,549 | |
Total Transport-Aircraft | | | | | | | 15,684,101 | |
| | | | | | | | | |
Collateralized Debt Obligations - 2.8% | |
Anchorage Credit Funding Ltd. | | | | | | | | |
2016-4A, 3.50% due 02/15/354 | | | 3,750,000 | | | | 3,736,329 | |
2016-3A, 3.85% due 10/28/334 | | | 1,000,000 | | | | 1,014,586 | |
FDF II Ltd. | | | | | | | | |
2016-2A, 4.29% due 05/12/314 | | | 1,000,000 | | | | 1,004,802 | |
Putnam Structured Product Funding Ltd. | | | | | | | | |
2003-1A, 1.91% due 10/15/382,4 | | | 833,546 | | | | 756,513 | |
Triaxx Prime CDO Ltd. | | | | | | | | |
2006-2A, 1.05% due 10/02/392,4 | | | 698,626 | | | | 680,835 | |
Highland Park CDO I Ltd. | | | | | | | | |
2006-1A, 1.45% due 11/25/512,4 | | | 536,905 | | | | 498,739 | |
SRERS Funding Ltd. | | | | | | | | |
2011-RS, 1.10% due 05/09/462,4 | | | 656,837 | | | | 469,610 | |
N-Star REL CDO VIII Ltd. | | | | | | | | |
2006-8A, 1.15% due 02/01/412,4 | | | 266,698 | | | | 265,188 | |
RAIT CRE CDO I Ltd. | | | | | | | | |
2006-1X A1B, 1.31% due 11/20/46 | | | 181,236 | | | | 180,218 | |
Total Collateralized Debt Obligations | | | | | | | 8,606,820 | |
| | | | | | | | | |
Net Lease - 1.9% | |
Capital Automotive REIT | | | | | | | | |
2017-1A, 3.87% due 04/15/474 | | | 3,000,000 | | | | 2,999,130 | |
Store Master Funding I-VII | | | | | | | | |
2016-1A, 3.96% due 10/20/464 | | | 2,878,968 | | | | 2,752,294 | |
Total Net Lease | | | | | | | 5,751,424 | |
| | | | | | | | | |
Whole Business - 1.4% | |
Taco Bell Funding LLC | | | | | | | | |
2016-1A, 4.97% due 05/25/464 | | | 1,940,250 | | | | 1,969,435 | |
Wendys Funding LLC | | | | | | | | |
2015-1A, 4.50% due 06/15/454 | | | 1,477,500 | | | | 1,438,305 | |
Drug Royalty III Limited Partnership | | | | | | | | |
2016-1A, 3.98% due 04/15/274 | | | 849,838 | | | | 849,926 | |
Total Whole Business | | | | | | | 4,257,666 | |
| | | | | | | | | |
Insurance - 0.2% | |
Chesterfield Financial Holdings LLC | | | | | | | | |
2014-1A, 4.50% due 12/15/344 | | | 594,000 | | | | 591,262 | |
| | | | | | | | | |
Diversified Payment Rights - 0.2% | |
CIC Receivables Master Trust | | | | | | | | |
REGD, 4.89% due 10/07/21††† | | | 263,657 | | | | 271,404 | |
Garanti Diversified Payment Rights Finance Co. | | | | | | | | |
2007-A, 1.20% due 07/09/172 | | | 208,000 | | | | 207,525 | |
Total Diversified Payment Rights | | | | | | | 478,929 | |
Total Asset-Backed Securities | | | | | | | | |
(Cost $149,288,146) | | | | | | | 150,036,137 | |
| | | | | | | | | |
COLLATERALIZED MORTGAGE OBLIGATIONS†† - 21.5% | |
Residential Mortgage Backed Securities - 12.6% | |
LSTAR Securities Investment Ltd. | | | | | | | | |
2016-4, 2.78% due 10/01/212,4 | | | 3,033,743 | | | | 3,009,531 | |
2015-6, 2.78% due 05/01/202,4 | | | 1,242,284 | | | | 1,237,625 | |
2016-3, 2.78% due 09/01/212,4 | | | 1,145,562 | | | | 1,131,133 | |
American Home Mortgage Investment Trust | | | | | | | | |
2007-1, 5.27% due 05/25/477 | | | 11,449,277 | | | | 2,101,166 | |
2006-1, 1.38% due 03/25/462 | | | 1,171,258 | | | | 972,798 | |
GSAA Trust | | | | | | | | |
2005-6, 1.41% due 06/25/352 | | | 3,150,000 | | | | 2,853,714 | |
LSTAR Commercial Mortgage Trust | | | | | | | | |
2016-7, 2.78% due 12/01/212,4 | | | 2,814,582 | | | | 2,789,955 | |
Countrywide Asset-Backed Certificates | | | | | | | | |
2006-6, 1.15% due 09/25/362 | | | 2,536,115 | | | | 2,364,312 | |
LSTAR Securities Investment Trust | | | | | | | | |
2016-2, 2.78% due 03/01/212,4 | | | 1,548,272 | | | | 1,540,530 | |
2015-10, 2.78% due 11/02/202,4 | | | 457,968 | | | | 457,825 | |
GCAT A1, | | | | | | | | |
3.38% due 03/25/47 | | | 1,900,000 | | | | 1,898,183 | |
Banc of America Funding Trust | | | | | | | | |
2015-R4, 0.95% due 01/27/352,4 | | | 905,533 | | | | 849,395 | |
2014-R7, 0.92% due 09/26/362,4 | | | 749,043 | | | | 718,706 | |
Structured Asset Investment Loan Trust | | | | | | | | |
2005-11, 1.34% due 01/25/362 | | | 1,606,264 | | | | 1,452,275 | |
NRPL Trust | | | | | | | | |
2014-2A, 3.75% due 10/25/572,4 | | | 778,193 | | | | 783,747 | |
2015-1A, 3.88% due 11/01/544 | | | 495,957 | | | | 492,773 | |
VOLT LIII LLC | | | | | | | | |
2016-NP13, 3.88% due 12/26/464 | | | 1,275,219 | | | | 1,272,010 | |
CSMC Series | | | | | | | | |
2015-12R, 1.27% due 11/30/372,4 | | | 1,271,818 | | | | 1,199,455 | |
CIM Trust | | | | | | | | |
2017-2, 2.78% due 12/25/572,4 | | | 1,000,000 | | | | 992,529 | |
SEE NOTES TO FINANCIAL STATEMENTS. | THE GUGGENHEIM FUNDS SEMI-ANNUAL REPORT | 39 |
SCHEDULE OF INVESTMENTS (Unaudited)(continued) | March 31, 2017 |
INVESTMENT GRADE BOND FUND | |
| | Face
Amount14 | | | Value | |
| | | | | | | |
VOLT LIV LLC | | | | | | |
2017-NPL1, 3.63% due 02/25/472,4 | | $ | 984,299 | | | $ | 980,845 | |
RALI Series Trust | | | | | | | | |
2006-QO2, 1.20% due 02/25/462 | | | 2,176,994 | | | | 943,732 | |
Bayview Opportunity Master Fund IVb Trust | | | | | | | | |
2017-RN1, 3.60% due 02/28/322,4 | | | 944,284 | | | | 942,903 | |
Luminent Mortgage Trust | | | | | | | | |
2006-2, 1.18% due 02/25/462 | | | 1,256,303 | | | | 933,048 | |
CIT Mortgage Loan Trust | | | | | | | | |
2007-1, 2.43% due 10/25/372,4 | | | 944,491 | | | | 924,779 | |
VOLT XLVIII LLC | | | | | | | | |
2016-NPL8, 3.50% due 07/25/464 | | | 896,781 | | | | 901,624 | |
Stanwich Mortgage Loan Co. | | | | | | | | |
2016-NPA1, 3.84% due 10/16/462,4 | | | 897,267 | | | | 895,981 | |
Deutsche Alt-A Securities Mortgage Loan Trust Series | | | | | | | | |
2007-OA2, 1.41% due 04/25/472 | | | 860,001 | | | | 729,792 | |
VOLT XLII LLC | | | | | | | | |
2016-NPL2, 4.25% due 03/26/464 | | | 718,807 | | | | 724,212 | |
VOLT XLI LLC | | | | | | | | |
2016-NPL1, 4.25% due 02/26/464 | | | 682,865 | | | | 686,121 | |
MASTR Adjustable Rate Mortgages Trust | | | | | | | | |
2003-5, 2.75% due 11/25/332 | | | 709,184 | | | | 638,064 | |
American Home Mortgage Assets Trust | | | | | | | | |
2007-1, 1.34% due 02/25/472 | | | 1,013,060 | | | | 587,497 | |
Washington Mutual Mortgage Pass-Through Certificates WMALT Series Trust | | | | | | | | |
2006-AR9, 1.48% due 11/25/462 | | | 591,797 | | | | 474,645 | |
Nationstar HECM Loan Trust | | | | | | | | |
2016-1A, 2.98% due 02/25/264 | | | 459,379 | | | | 459,379 | |
UCFC Manufactured Housing Contract | | | | | | | | |
1997-2, 7.38% due 10/15/28 | | | 201,715 | | | | 208,067 | |
Nomura Resecuritization Trust | | | | | | | | |
2012-1R, 1.22% due 08/27/472,4 | | | 86,057 | | | | 85,403 | |
Total Residential Mortgage Backed Securities | | | | | | | 39,233,754 | |
| | | | | | | | | |
Commercial Mortgage Backed Securities - 7.6% | |
Citigroup Commercial Mortgage Trust | | | | | | | | |
2016-GC36, 4.76% due 02/10/492 | | | 1,400,000 | | | | 1,446,196 | |
2016-P5, 4.32% due 10/10/492 | | | 1,000,000 | | | | 951,871 | |
2016-GC37, 1.81% due 04/10/492 | | | 3,829,633 | | | | 455,584 | |
2016-C2, 1.80% due 08/10/492 | | | 2,491,336 | | | | 315,278 | |
2016-P5, 1.56% due 10/10/492 | | | 1,993,213 | | | | 199,503 | |
Cosmopolitan Hotel Trust | | | | | | | | |
2016-CSMO, 3.01% due 11/15/332,4 | | | 1,500,000 | | | | 1,515,917 | |
2016-CSMO, 3.56% due 11/15/332,4 | | | 1,000,000 | | | | 1,013,733 | |
JPMDB Commercial Mortgage Securities Trust | | | | | | | | |
2016-C2, 3.40% due 06/15/492 | | | 1,700,000 | | | | 1,596,602 | |
2016-C2, 1.71% due 06/15/492 | | | 8,913,123 | | | | 896,460 | |
COMM Mortgage Trust | | | | | | | | |
2015-CR26, 4.49% due 10/10/482 | | | 1,217,000 | | | | 1,164,990 | |
2015-CR26, 1.05% due 10/10/482 | | | 10,108,034 | | | | 630,282 | |
Americold LLC Trust | | | | | | | | |
2010-ARTA, 7.44% due 01/14/294 | | | 1,250,000 | | | | 1,400,194 | |
GS Mortgage Securities Trust | | | | | | | | |
2014-GSFL, 2.66% due 07/15/312,4 | | | 1,400,000 | | | | 1,386,503 | |
SG Commercial Mortgage Securities Trust | | | | | | | | |
2016-C5, 2.03% due 10/10/482 | | | 9,940,728 | | | | 1,269,417 | |
GS Mortgage Securities Corporation Trust | | | | | | | | |
2016-ICE2, 5.16% due 02/15/332,4 | | | 1,200,000 | | | | 1,228,164 | |
Wells Fargo Commercial Mortgage Trust | | | | | | | | |
2016-C32, 1.36% due 01/15/592 | | | 6,394,516 | | | | 537,758 | |
2016-NXS5, 1.57% due 01/15/592 | | | 4,954,378 | | | | 446,420 | |
2016-C37, 1.05% due 12/15/492 | | | 3,889,230 | | | | 238,857 | |
Motel 6 Trust | | | | | | | | |
2015-MTL6, 4.53% due 02/05/304 | | | 1,150,000 | | | | 1,157,841 | |
JP Morgan Chase Commercial Mortgage Securities Trust | | | | | | | | |
2014-CBM, 2.86% due 10/15/292,4 | | | 1,000,000 | | | | 1,004,993 | |
Morgan Stanley Bank of America Merrill Lynch Trust | | | | | | | | |
2014-C19, 4.75% due 12/15/46†††,4 | | | 1,000,000 | | | | 998,987 | |
BAMLL Commercial Mortgage Securities Trust | | | | | | | | |
2014-ICTS, 2.81% due 06/15/282,4 | | | 1,000,000 | | | | 965,632 | |
Morgan Stanley Capital I Trust | | | | | | | | |
2016-UB11, 1.68% due 08/15/492 | | | 7,728,342 | | | | 819,232 | |
JPMCC Commercial Mortgage Securities Trust | | | | | | | | |
2017-JP5, 1.28% due 03/15/507 | | | 7,000,000 | | | | 530,771 | |
LSTAR Commercial Mortgage Trust | | | | | | | | |
2014-2, 4.91% due 01/20/412,4 | | | 500,000 | | | | 503,254 | |
CFCRE Commercial Mortgage Trust | | | | | | | | |
2016-C3, 1.09% due 01/10/482 | | | 5,944,475 | | | | 424,462 | |
CD Mortgage Trust | | | | | | | | |
2016-CD1, 1.44% due 08/10/492 | | | 2,589,512 | | | | 251,208 | |
GreenPoint Mortgage Funding Trust | | | | | | | | |
2007-AR1, 1.06% due 02/25/472 | | | 11 | | | | 11 | |
Total Commercial Mortgage Backed Securities | | | | | | | 23,350,120 | |
| | | | | | | | | |
Military Housing - 1.3% | |
GMAC Commercial Mortgage Asset Corp. | | | | | | | | |
2003-PRES, 6.24% due 10/10/414 | | | 1,398,824 | | | | 1,596,636 | |
2007-HCKM, 6.11% due 08/10/52†††,13 | | | 1,512,383 | | | | 1,532,365 | |
Capmark Military Housing Trust | | | | | | | | |
2007-ROBS, 6.06% due 10/10/5213 | | | 480,599 | | | | 482,324 | |
2007-AETC, 5.75% due 02/10/5213 | | | 335,203 | | | | 327,641 | |
Total Military Housing | | | | | | | 3,938,966 | |
Total Collateralized Mortgage Obligations | | | | | | | | |
(Cost $66,412,786) | | | | | | | 66,522,840 | |
| | | | | | | | | |
CORPORATE BONDS†† - 11.1% | |
Financial - 6.2% | |
Bank of America Corp. | | | | | | | | |
6.50% due 12/31/492,3 | | | 2,400,000 | | | | 2,619,000 | |
6.30% due 12/31/492,3 | | | 350,000 | | | | 380,625 | |
6.10% due 03/12/492,3 | | | 250,000 | | | | 264,875 | |
Citigroup, Inc. | | | | | | | | |
5.95% due 12/31/492,3 | | | 2,400,000 | | | | 2,499,024 | |
5.90% due 12/31/492,3 | | | 500,000 | | | | 521,875 | |
6.25% due 12/31/492,3 | | | 100,000 | | | | 107,875 | |
American Equity Investment Life Holding Co. | | | | | | | | |
6.63% due 07/15/21 | | | 1,458,000 | | | | 1,512,675 | |
40 | THE GUGGENHEIM FUNDS SEMI-ANNUAL REPORT | SEE NOTES TO FINANCIAL STATEMENTS. |
SCHEDULE OF INVESTMENTS (Unaudited)(continued) | March 31, 2017 |
INVESTMENT GRADE BOND FUND | |
| | Face
Amount14 | | | Value | |
| | | | | | | |
Hospitality Properties Trust | | | | | | |
5.25% due 02/15/26 | | $ | 1,050,000 | | | $ | 1,100,276 | |
4.95% due 02/15/27 | | | 400,000 | | | | 410,726 | |
Mid-Atlantic Military Family Communities LLC | | | | | | | | |
5.30% due 08/01/504 | | | 1,274,320 | | | | 1,199,033 | |
KeyCorp | | | | | | | | |
5.00% due 12/31/492,3 | | | 1,150,000 | | | | 1,138,500 | |
Jefferies Group LLC | | | | | | | | |
4.85% due 01/15/27 | | | 900,000 | | | | 918,707 | |
Aurora Military Housing LLC | | | | | | | | |
6.89% due 01/15/47†††,4 | | | 750,000 | | | | 844,756 | |
JPMorgan Chase & Co. | | | | | | | | |
6.00% due 12/31/492,3 | | | 800,000 | | | | 834,240 | |
Infinity Property & Casualty Corp. | | | | | | | | |
5.00% due 09/19/22 | | | 700,000 | | | | 739,295 | |
Voya Financial, Inc. | | | | | | | | |
5.65% due 05/15/532 | | | 700,000 | | | | 712,250 | |
AmTrust Financial Services, Inc. | | | | | | | | |
6.13% due 08/15/231 | | | 652,000 | | | | 684,172 | |
Wilton Re Finance LLC | | | | | | | | |
5.88% due 03/30/332,4 | | | 475,000 | | | | 483,906 | |
Pacific Northwest Communities LLC | | | | | | | | |
5.91% due 06/15/5013 | | | 400,000 | | | | 432,412 | |
GEO Group, Inc. | | | | | | | | |
5.88% due 10/15/24 | | | 385,000 | | | | 393,662 | |
6.00% due 04/15/26 | | | 30,000 | | | | 30,382 | |
BBC Military Housing-Navy Northeast LLC | | | | | | | | |
6.30% due 10/15/49†††,1 | | | 415,000 | | | | 415,579 | |
Atlantic Marine Corporations Communities LLC | | | | | | | | |
5.43% due 12/01/5013 | | | 380,442 | | | | 371,262 | |
ACC Group Housing LLC | | | | | | | | |
6.35% due 07/15/5413 | | | 300,000 | | | | 344,935 | |
Wells Fargo & Co. | | | | | | | | |
5.88% due 12/31/492,3 | | | 200,000 | | | | 215,588 | |
Cadence Bank North America | | | | | | | | |
6.25% due 06/28/2913 | | | 200,000 | | | | 200,000 | |
TIG Holdings, Inc. | | | | | | | | |
8.60% due 01/15/2713 | | | 34,000 | | | | 30,600 | |
Total Financial | | | | | | | 19,406,230 | |
| | | | | | | | | |
Consumer, Non-cyclical - 1.5% | |
Offutt AFB America First Community LLC | | | | | | | | |
5.46% due 09/01/504 | | | 1,920,300 | | | | 1,828,893 | |
Danone S.A. | | | | | | | | |
2.95% due 11/02/264 | | | 1,650,000 | | | | 1,577,331 | |
Bumble Bee Holdings, Inc. | | | | | | | | |
9.00% due 12/15/174 | | | 1,100,000 | | | | 1,072,500 | |
Tenet Healthcare Corp. | | | | | | | | |
4.63% due 06/15/202 | | | 300,000 | | | | 301,500 | |
Total Consumer, Non-cyclical | | | | | | | 4,780,224 | |
| | | | | | | | | |
Energy - 1.3% | |
ConocoPhillips | | | | | | | | |
6.50% due 02/01/39 | | | 1,400,000 | | | | 1,783,092 | |
Buckeye Partners, LP | | | | | | | | |
3.95% due 12/01/26 | | | 773,000 | | | | 757,070 | |
4.35% due 10/15/24 | | | 339,000 | | | | 344,456 | |
Sunoco Logistics Partners Operations, LP | | | | | | | | |
3.90% due 07/15/26 | | | 665,000 | | | | 642,520 | |
Hess Corp. | | | | | | | | |
4.30% due 04/01/27 | | | 350,000 | | | | 343,774 | |
Total Energy | | | | | | | 3,870,912 | |
| | | | | | | | | |
Basic Materials - 1.2% | |
Yamana Gold, Inc. | | | | | | | | |
4.95% due 07/15/24 | | | 1,485,000 | | | | 1,492,425 | |
Newcrest Finance Pty Ltd. | | | | | | | | |
4.20% due 10/01/224 | | | 1,390,000 | | | | 1,427,811 | |
BHP Billiton Finance USA Ltd. | | | | | | | | |
6.75% due 10/19/752,4 | | | 750,000 | | | | 848,250 | |
Total Basic Materials | | | | | | | 3,768,486 | |
| | | | | | | | | |
Consumer, Cyclical - 0.4% | |
Northern Group Housing LLC | | | | | | | | |
6.80% due 08/15/5313 | | | 600,000 | | | | 720,318 | |
HP Communities LLC | | | | | | | | |
5.78% due 03/15/4613 | | | 500,000 | | | | 534,070 | |
Total Consumer, Cyclical | | | | | | | 1,254,388 | |
| | | | | | | | | |
Technology - 0.2% | |
Micron Technology, Inc. | | | | | | | | |
7.50% due 09/15/234 | | | 510,000 | | | | 569,288 | |
| | | | | | | | | |
Diversified - 0.1% | |
HRG Group, Inc. | | | | | | | | |
7.88% due 07/15/19 | | | 435,000 | | | | 450,225 | |
| | | | | | | | | |
Utilities - 0.1% | |
LBC Tank Terminals Holding Netherlands BV | | | | | | | | |
6.88% due 05/15/234 | | | 200,000 | | | | 207,524 | |
| | | | | | | | | |
Communications - 0.1% | |
SFR Group S.A. | | | | | | | | |
6.25% due 05/15/244 | | | 200,000 | | | | 201,250 | |
| | | | | | | | | |
Industrial - 0.0%** | |
Constar International, Inc | | | | | | | | |
11.00% due 12/31/17†††,1 | | | 4,091 | | | | — | |
Total Corporate Bonds | | | | | | | | |
(Cost $33,967,517) | | | | | | | 34,508,527 | |
| | | | | | | | | |
U.S. GOVERNMENT SECURITIES†† - 8.2% | |
U.S. Treasury Bond | | | | | | | | |
1.94% due 11/15/448,9 | | | 57,711,000 | | | | 24,466,001 | |
2.88% due 11/15/46 | | | 820,000 | | | | 795,624 | |
Total U.S. Treasury Bond | | | | | | | 25,261,625 | |
Total U.S. Government Securities | | | | | | | | |
(Cost $26,991,073) | | | | | | | 25,261,625 | |
SEE NOTES TO FINANCIAL STATEMENTS. | THE GUGGENHEIM FUNDS SEMI-ANNUAL REPORT | 41 |
SCHEDULE OF INVESTMENTS (Unaudited)(continued) | March 31, 2017 |
INVESTMENT GRADE BOND FUND | |
| | Face
Amount14 | | | Value | |
| | | | | | | |
FEDERAL AGENCY SECURITIES†† - 4..5% | |
Freddie Mac Strips11 | | | | | | |
due 03/15/318 | | $ | 2,950,000 | | | $ | 1,844,889 | |
due 09/15/298 | | | 2,600,000 | | | | 1,738,620 | |
due 07/15/328 | | | 2,700,000 | | | | 1,569,518 | |
Total Freddie Mac Strips | | | | | | | 5,153,027 | |
Fannie Mae Principal Strips11 | | | | | | | | |
due 05/15/308 | | | 3,150,000 | | | | 2,041,224 | |
due 05/15/298 | | | 1,750,000 | | | | 1,154,309 | |
due 01/15/308 | | | 1,000,000 | | | | 656,776 | |
Total Fannie Mae Principal Strips | | | | | | | 3,852,309 | |
Freddie Mac11 | | | | | | | | |
due 12/14/298 | | | 2,900,000 | | | | 1,921,307 | |
due 01/02/348 | | | 850,000 | | | | 471,764 | |
6.75% due 03/15/31 | | | 287,000 | | | | 410,717 | |
Total Freddie Mac | | | | | | | 2,803,788 | |
Tennessee Valley Authority | | | | | | | | |
5.38% due 04/01/56 | | | 600,000 | | | | 765,348 | |
4.25% due 09/15/65 | | | 700,000 | | | | 734,518 | |
Total Tennessee Valley Authority | | | | | | | 1,499,866 | |
Federal Home Loan Bank12 | | | | | | | | |
5.50% due 07/15/36 | | | 500,000 | | | | 662,397 | |
Total Federal Agency Securities | | | | | | | | |
(Cost $14,728,928) | | | | | | | 13,971,387 | |
| | | | | | | | | |
SENIOR FLOATING RATE INTERESTS††,2 - 4.4% | |
Technology - 1.2% | |
Epicor Software | | | | | | | | |
4.75% due 06/01/22 | | | 1,572,084 | | | | 1,573,657 | |
Equinix, Inc. | | | | | | | | |
3.25% due 12/22/23 | | EUR | 1,000,000 | | | | 1,075,653 | |
Compucom Systems, Inc. | | | | | | | | |
4.25% due 05/11/20 | | | 702,678 | | | | 583,222 | |
EIG Investors Corp. | | | | | | | | |
6.04% due 02/09/23 | | | 443,216 | | | | 446,172 | |
Total Technology | | | | | | | 3,678,704 | |
| | | | | | | | | |
Communications - 1.0% | |
Cengage Learning Acquisitions, Inc. | | | | | | | | |
5.25% due 06/07/23 | | | 1,589,866 | | | | 1,512,853 | |
Internet Brands | | | | | | | | |
4.75% due 07/08/21 | | | 619,118 | | | | 622,154 | |
MergerMarket Ltd. | | | | | | | | |
4.56% due 02/04/21 | | | 582,000 | | | | 580,545 | |
Proquest LLC | | | | | | | | |
5.25% due 10/24/21 | | | 492,409 | | | | 499,179 | |
Total Communications | | | | | | | 3,214,731 | |
| | | | | | | | | |
Utilities - 0.6% | |
TPF II Power LLC | | | | | | | | |
due 10/02/2310 | | | 1,271,642 | | | | 1,275,774 | |
The Dayton Power and Light Co. | | | | | | | | |
4.24% due 08/24/22 | | | 698,250 | | | | 702,614 | |
Total Utilities | | | | | | | 1,978,388 | |
| | | | | | | | | |
Consumer, Non-cyclical - 0.6% | |
Packaging Coordinators Midco, Inc. | | | | | | | | |
5.00% due 06/30/23 | | | 696,500 | | | | 693,456 | |
5.25% due 09/01/21 | | | 521,013 | | | | 521,664 | |
DJO Finance LLC | | | | | | | | |
4.25% due 06/08/20 | | | 496,222 | | | | 479,370 | |
MPH Acquisition Holdings LLC | | | | | | | | |
4.90% due 06/07/23 | | | 144,352 | | | | 146,105 | |
NES Global Talent | | | | | | | | |
6.54% due 10/03/191 | | | 118,969 | | | | 107,072 | |
Total Consumer, Non-cyclical | | | | | | | 1,947,667 | |
| | | | | | | | | |
Industrial - 0.5% | |
Travelport Finance Luxembourg Sarl | | | | | | | | |
4.29% due 09/02/21 | | | 1,302,187 | | | | 1,310,872 | |
CareCore National LLC | | | | | | | | |
5.50% due 03/05/21 | | | 121,365 | | | | 121,669 | |
Total Industrial | | | | | | | 1,432,541 | |
| | | | | | | | | |
Consumer, Cyclical - 0.4% | |
Petco Animal Supplies, Inc. | | | | | | | | |
4.29% due 01/26/23 | | | 1,190,977 | | | | 1,119,817 | |
| | | | | | | | | |
Financial - 0.1% | |
Magic Newco, LLC | | | | | | | | |
5.00% due 12/12/18 | | | 240,565 | | | | 241,267 | |
American Stock Transfer & Trust | | | | | | | | |
5.75% due 06/26/20 | | | 94,163 | | | | 93,928 | |
Total Financial | | | | | | | 335,195 | |
Total Senior Floating Rate Interests | | | | | | | | |
(Cost $13,851,312) | | | | | | | 13,707,043 | |
| | | | | | | | | |
MUNICIPAL BONDS†† - 1.5% | |
California - 0.5% | |
San Mateo County Community College District General Obligation Unlimited | | | | | | | | |
due 09/01/348 | | | 2,000,000 | | | | 1,047,140 | |
Beverly Hills Unified School District California General Obligation Unlimited | | | | | | | | |
due 08/01/398 | | | 1,410,000 | | | | 558,501 | |
Total California | | | | | | | 1,605,641 | |
| | | | | | | | | |
Ohio - 0.4% | |
American Municipal Power, Inc. Revenue Bonds | | | | | | | | |
8.08% due 02/15/50 | | | 980,000 | | | | 1,510,905 | |
| | | | | | | | | |
Michigan - 0.4% | |
Detroit City School District General Obligation Unlimited | | | | | | | | |
7.75% due 05/01/39 | | | 850,000 | | | | 1,113,296 | |
| | | | | | | | | |
Illinois - 0.2% | |
State of Illinois General Obligation Unlimited | | | | | | | | |
5.65% due 12/01/38 | | | 500,000 | | | | 528,780 | |
Total Municipal Bonds | | | | | | | | |
(Cost $4,674,499) | | | | | | | 4,758,622 | |
42 | THE GUGGENHEIM FUNDS SEMI-ANNUAL REPORT | SEE NOTES TO FINANCIAL STATEMENTS. |
SCHEDULE OF INVESTMENTS (Unaudited)(continued) | March 31, 2017 |
INVESTMENT GRADE BOND FUND | |
| | Face
Amount14 | | | Value | |
| | | | | | | |
FOREIGN GOVERNMENT BONDS†† - 0.3% | |
Dominican Republic International Bond | | | | | | |
6.85% due 01/27/454 | | $ | 450,000 | | | $ | 464,625 | |
Kenya Government International Bond | | | | | | | | |
6.88% due 06/24/244 | | | 460,000 | | | | 457,755 | |
Total Foreign Government Bonds | | | | | | | | |
(Cost $907,999) | | | | | | | 922,380 | |
| | | | | | | | | |
COMMERCIAL PAPER†† - 1.6% | |
Kellogg Co | | | | | | | | |
0.98% due 04/03/17 | | | 3,000,000 | | | | 2,999,836 | |
Western Union Co/The | | | | | | | | |
1.10% due 04/04/17 | | | 2,000,000 | | | | 1,999,817 | |
Total Commercial Paper | | | | | | | | |
(Cost $4,999,653) | | | | | | | 4,999,653 | |
| | Contracts | | | | |
| | | | | | | |
OPTIONS PURCHASED† - 0.2% | |
Call options on: | | | | | | |
Bank of America Merrill Lynch June 2017
iShares 20+ Year Treasury Bond ETF,
Expiring with strike price of $120.00 | | | 1,798 | | | $ | 481,864 | |
Total Options Purchased | | | | | | | | |
(Cost $314,650) | | | | | | | 481,864 | |
| | | | | | | | | |
Total Investments - 103.6% | | | | | | | | |
(Cost $323,382,831) | | | | | | $ | 320,665,941 | |
| | | | | | | | | |
OPTIONS WRITTEN† - (0.1)% | |
Call options on: | | | | | | | | |
Bank of America Merrill Lynch June 2017
iShares 20+ Year Treasury Bond ETF,
Expiring with strike price of $123.00 | | | 1,798 | | | | (260,710 | ) |
Total Options Written | | | | | | | | |
(Premiums received $163,618) | | | | | | | (260,710 | ) |
Other Assets & Liabilities, net - (3.5)% | | | | | | | (10,795,012 | ) |
Total Net Assets - 100.0% | | | | | | $ | 309,610,219 | |
CENTRALLY CLEARED INTEREST RATE SWAP AGREEMENTS†† | |
Counterparty | Exchange | Floating
Rate | Floating
Rate Index | | Fixed Rate | | Maturity
Date | | Notional
Amount | | | Market
Value | | | Unrealized
Appreciation | |
Merrill Lynch | CME | Receive | 3-Month USD-LIBOR | | | 2.16 | % | 02/13/24 | | $ | (6,200,000 | ) | | $ | 28,657 | | | $ | 28,657 | |
FORWARD FOREIGN CURRENCY EXCHANGE CONTRACTS†† | |
Counterparty | | Contracts to Sell | | Currency | Settlement
Date | | Settlement
Value | | | Value at
March 31,
2017 | | | Net
Unrealized
Depreciation | |
Bank of America | | | (1,020,000 | ) | EUR | 04/11/17 | | $ | 1,081,370 | | | $ | 1,088,630 | | | $ | (7,260 | ) |
SEE NOTES TO FINANCIAL STATEMENTS. | THE GUGGENHEIM FUNDS SEMI-ANNUAL REPORT | 43 |
SCHEDULE OF INVESTMENTS (Unaudited)(continued) | March 31, 2017 |
INVESTMENT GRADE BOND FUND | |
* | Non-income producing security. |
** | Less than 0.1% of net assets. |
† | Value determined based on Level 1 inputs — See Note 4. |
†† | Value determined based on Level 2 inputs, unless otherwise noted — See Note 4. |
††† | Value determined based on Level 3 inputs — See Note 4. |
1 | Illiquid security. |
2 | Variable rate security. Rate indicated is rate effective at March 31, 2017. |
3 | Perpetual maturity. |
4 | Security is a 144A or Section 4(a)(2) security. The total market value of 144A or Section 4(a)(2) securities is $188,786,435 (cost $186,941,429), or 61.0% of total net assets. These securities have been determined to be liquid under guidelines established by the Board of Trustees. |
5 | Rate indicated is the 7 day yield as of March 31, 2017. |
6 | Security has no stated coupon. However, it is expected to receive residual cash flow payments on defined deal dates. |
7 | Security is an interest-only strip. Rate indicated is effective yield at March 31, 2017. |
8 | Zero coupon rate security. |
9 | Rate indicated is the effective yield at time of purchase. |
10 | Security with no rate was unsettled at March 31, 2017. |
11 | On September 7, 2008, the issuer was placed in conservatorship by the Federal Housing Finance Agency (FHFA). As conservator, the FHFA has full powers to control the assets and operations of the firm. |
12 | The issuer operates under a Congressional charter; its securities are neither issued nor guaranteed by the U.S. Government. |
13 | Security is a 144A or Section 4(a)(2) security. These securities are considered illiquid and restricted under guidelines established by the Board of Trustees. The total market value of 144A or Section 4(a)(2) securities is $7,997,386 (cost $10,324,608), or 2.6% of total net assets — See Note 12. |
14 | The face amount is denominated in U.S. dollars, unless otherwise noted. |
| | REIT — Real Estate Investment Trust |
| | CME — Chicago Mercantile Exchange |
| | EUR — Euro |
| | |
| | See Sector Classification in Other Information section. |
44 | THE GUGGENHEIM FUNDS SEMI-ANNUAL REPORT | SEE NOTES TO FINANCIAL STATEMENTS. |
SCHEDULE OF INVESTMENTS (Unaudited)(continued) | March 31, 2017 |
INVESTMENT GRADE BOND FUND | |
The following table summarizes the inputs used to value the Fund’s investments at March 31, 2017 (See Note 4 in the Notes to Financial Statements):
Investments in Securities (Assets) | | Level 1 | | | Level 2 | | | Level 2 -
Other* | | | Level 3 | | | Total | |
Asset Backed Securities | | $ | — | | | $ | 149,764,734 | | | $ | — | | | $ | 271,404 | | | $ | 150,036,137 | |
Collateralized Mortgage Obligations | | | — | | | | 63,991,488 | | | | — | | | | 2,531,352 | | | | 66,522,840 | |
Commercial Paper | | | — | | | | 4,999,653 | | | | — | | | | — | | | | 4,999,653 | |
Common Stocks | | | — | | | | — | | | | — | | | | — | ** | | | — | ** |
Corporate Bonds | | | — | | | | 33,248,191 | | | | — | | | | 1,260,335 | | | | 34,508,527 | |
Federal Agency Securities | | | — | | | | 13,971,387 | | | | — | | | | — | | | | 13,971,387 | |
Foreign Government Bonds | | | — | | | | 922,380 | | | | — | | | | — | | | | 922,380 | |
Interest Rate Swap Agreements | | | — | | | | — | | | | 28,657 | | | | — | | | | 28,657 | |
Municipal Bonds | | | — | | | | 4,758,622 | | | | — | | | | — | | | | 4,758,622 | |
Options Purchased | | | 481,864 | | | | — | | | | — | | | | — | | | | 481,864 | |
Preferred Stocks | | | — | | | | 516,433 | | | | — | | | | 2,272,763 | | | | 2,789,196 | |
Senior Floating Rate Interests | | | — | | | | 13,707,043 | | | | — | | | | — | | | | 13,707,043 | |
Short Term Investments | | | 2,651,038 | | | | — | | | | — | | | | — | | | | 2,651,038 | |
Unit Investment Trust | | | 55,629 | | | | — | | | | — | | | | — | | | | 55,629 | |
U.S. Government Securities | | | — | | | | 25,261,625 | | | | — | | | | — | | | | 25,261,625 | |
Total | | $ | 3,188,531 | | | $ | 311,141,556 | | | $ | 28,657 | | | $ | 6,335,854 | | | $ | 320,694,598 | |
| | | | | | | | | | | | | | | | | | | | | |
Investments in Securities (Liabilities) | | Level 1 | | | Level 2 | | | Level 2 -
Other* | | | Level 3 | | | Total | |
Currency Contracts | | $ | — | | | $ | — | | | $ | 7,260 | | | $ | — | | | $ | 7,260 | |
Options Written | | | 260,710 | | | | — | | | | — | | | | — | | | | 260,710 | |
Total | | $ | 260,710 | | | $ | — | | | $ | 7,260 | | | $ | — | | | $ | 267,970 | |
* | Other financial instruments include forward foreign currency exchange contracts and/or swaps, which are reported as unrealized gain/loss at period end. |
** | Market value of security is $0. |
Transfers between investment levels may occur as the markets fluctuate and/or the availability of data used in an investment’s valuation changes. Transfers between valuation levels, if any, are in comparison to the valuation levels at the end of the previous fiscal year, and are effective using the fair value as of the end of the previous fiscal period.
As of March 31, 2017, Investment Grade Bond Fund had securities with the total value $1,014,089 transfer out of Level 3 into Level 2 due changes in securities’ valuation methods using observable inputs. There were no other transfers between levels.
The following is a summary of significant unobservable inputs used in the fair valuation of assets and liabilities categorized within Level 3 of the fair value hierarchy:
Category | | Ending Balance
at 03/31/17 | | Valuation Technique | Unobservable
Inputs |
Collateralized Mortgage Obligations | | $ | 2,531,352 | | Option Adjusted Spread off the prior month end broker mark over the 3 month LIBOR | Indicative Quote |
Corporate Bonds | | | 1,531,739 | | Option Adjusted Spread off the prior month end broker mark over the 3 month LIBOR | Indicative Quote |
Preferred Stocks | | | 2,272,763 | | Option Adjusted Spread off the prior month end broker mark over the 3 month LIBOR | Indicative Quote |
Total | | $ | 6,335,854 | | | |
Any remaining Level 3 securities held by the Funds and excluded from the tables above, were not considered material to the Funds.
SEE NOTES TO FINANCIAL STATEMENTS. | THE GUGGENHEIM FUNDS SEMI-ANNUAL REPORT | 45 |
SCHEDULE OF INVESTMENTS (Unaudited)(concluded) | March 31, 2017 |
INVESTMENT GRADE BOND FUND | |
Summary of Fair Value Level 3 Activity
Following is a reconciliation of Level 3 assets for which significant unobservable inputs were used to determine fair value for the period ended March 31, 2017:
LEVEL 3 - Fair value measurement using significant unobservable inputs
| | Collateralized Mortgage Obligations | | | Asset Backed Securities | | | Corporate
Bonds | | | Preferred
Stocks | | | Total | |
INVESTMENT GRADE BOND | | | | | | | | | | | | | | | |
Assets: | | | | | | | | | | | | | | | |
Beginning Balance | | $ | — | | | $ | 1,304,702 | | | $ | 1,384,591 | | | $ | 2,282,127 | | | $ | 4,971,420 | |
Purchases | | | 2,751,144 | | | | — | | | | — | | | | — | | | | 2,751,144 | |
Sales, maturities and paydowns | | | (4,817 | ) | | | (24,375 | ) | | | — | | | | — | | | | (29,192 | ) |
Total realized gains or losses included in earnings | | | — | | | | — | | | | — | | | | — | | | | — | |
Total change in unrealized gains or losses included in earnings | | | (214,975 | ) | | | 5,166 | | | | (124,256 | ) | | | (9,364 | ) | | | (343,429 | ) |
Transfers into Level 3 | | | — | | | | — | | | | — | | | | — | | | | — | |
Transfers out of Level 3 | | | — | | | | (1,014,089 | ) | | | — | | | | — | | | | (1,014,089 | ) |
Ending Balance | | $ | 2,531,352 | | | $ | 271,404 | | | $ | 1,260,335 | | | $ | 2,272,763 | | | $ | 6,335,854 | |
Net Change in unrealized appreciation (depreciation) for investments in securities still held at March 31, 2017 | | $ | (213,158 | ) | | $ | 5,166 | | | $ | (123,552 | ) | | $ | (9,363 | ) | | $ | (340,907 | ) |
46 | THE GUGGENHEIM FUNDS SEMI-ANNUAL REPORT | SEE NOTES TO FINANCIAL STATEMENTS. |
INVESTMENT GRADE BOND FUND | |
STATEMENT OF ASSETS AND LIABILITIES (Unaudited) |
March 31, 2017 |
Assets: | |
Investments, at value (cost $323,382,831) | | $ | 320,665,941 | |
Foreign currency, at value (cost $6,935) | | | 6,935 | |
Segregated cash with broker | | | 167,000 | |
Prepaid expenses | | | 74,025 | |
Unrealized appreciation on swap agreements | | | 28,657 | |
Receivables: | |
Securities sold | | | 3,468,659 | |
Fund shares sold | | | 305,662 | |
Interest | | | 1,586,045 | |
Total assets | | | 326,302,924 | |
| | | | | |
Liabilities: | |
Reverse Repurchase Agreements | | | 793,350 | |
Options written, at value (premiums received $163,618) | | | 260,710 | |
Segregated cash due to broker | | | 26,640 | |
Unrealized depreciation on forward foreign currency exchange contracts | | | 7,260 | |
Overdraft due to custodian bank | | | 6,713 | |
Payable for: | |
Securities purchased | | | 14,687,549 | |
Fund shares redeemed | | | 645,085 | |
Management fees | | | 138,938 | |
Distribution and service fees | | | 60,866 | |
Transfer agent/maintenance fees | | | 29,455 | |
Fund accounting/administration fees | | | 20,585 | |
Swap settlement | | | 10,923 | |
Interest from reverse repurchase agreements | | | 14 | |
Miscellaneous | | | 4,617 | |
Total liabilities | | | 16,692,705 | |
Net assets | | $ | 309,610,219 | |
| | | | | |
Net assets consist of: | |
Paid in capital | | $ | 334,535,632 | |
Accumulated net investment loss | | | (874,745 | ) |
Accumulated net realized loss on investments | | | (21,258,083 | ) |
Net unrealized depreciation on investments | | | (2,792,585 | ) |
Net assets | | $ | 309,610,219 | |
| | | | | |
A-Class: | |
Net assets | | $ | 164,619,401 | |
Capital shares outstanding | | | 9,010,481 | |
Net asset value per share | | $ | 18.27 | |
Maximum offering price per share (Net asset value divided by 96.00%) | | $ | 19.03 | |
| | | | | |
C-Class: | |
Net assets | | $ | 30,581,804 | |
Capital shares outstanding | | | 1,680,870 | |
Net asset value per share | | $ | 18.19 | |
| | | | | |
P-Class: | |
Net assets | | $ | 2,177,888 | |
Capital shares outstanding | | | 119,112 | |
Net asset value per share | | $ | 18.28 | |
| | | | | |
Institutional Class: | |
Net assets | | $ | 112,231,126 | |
Capital shares outstanding | | | 6,151,633 | |
Net asset value per share | | $ | 18.24 | |
SEE NOTES TO FINANCIAL STATEMENTS. | THE GUGGENHEIM FUNDS SEMI-ANNUAL REPORT | 47 |
INVESTMENT GRADE BOND FUND | |
STATEMENT OF OPERATIONS (Unaudited) |
Period Ended March 31, 2017 |
Investment Income: | |
Interest | | $ | 6,452,481 | |
Dividends | | | 80,217 | |
Total investment income | | | 6,532,698 | |
| | | | | |
Expenses: | |
Management fees | | | 800,711 | |
Transfer agent/maintenance fees | |
A-Class | | | 58,159 | |
C-Class | | | 24,701 | |
P-Class | | | 3,533 | |
Institutional Class | | | 7,539 | |
Distribution and service fees: | |
A-Class | | | 200,995 | |
C-Class | | | 159,379 | |
P-Class | | | 3,099 | |
Fund accounting/administration fees | | | 118,481 | |
Line of credit fees | | | 26,029 | |
Interest expense | | | 8,200 | |
Custodian fees | | | 6,621 | |
Trustees’ fees* | | | 2,850 | |
Miscellaneous | | | 32,642 | |
Total expenses | | | 1,452,939 | |
Less: | |
Expenses waived by Adviser: | | | | |
C-Class | | | (2,491 | ) |
P-Class | | | (1,976 | ) |
Total waived/reimbursed expenses | | | (4,467 | ) |
Net expenses | | | 1,448,472 | |
Net investment income | | | 5,084,226 | |
| | | | | |
Net Realized and Unrealized Gain (Loss): | |
Net realized gain (loss) on: | |
Investments | | $ | 76,746 | |
Swap agreements | | | 3,618 | |
Foreign currency | | | (26,297 | ) |
Forward foreign currency exchange contracts | | | 14,234 | |
Net realized gain | | | 68,301 | |
Net change in unrealized appreciation (depreciation) on: | |
Investments | | | (4,537,900 | ) |
Swap agreements | | | 28,657 | |
Options purchased | | | 167,214 | |
Options written | | | (97,092 | ) |
Forward foreign currency exchange contracts | | | (7,260 | ) |
Net change in unrealized appreciation (depreciation) | | | (4,446,381 | ) |
Net realized and unrealized loss | | | (4,378,080 | ) |
Net increase in net assets resulting from operations | | $ | 706,146 | |
* | Relates to Trustees not deemed “interested persons” within the meaning of Section 2(a)(19) of the 1940 Act. |
48 | THE GUGGENHEIM FUNDS SEMI-ANNUAL REPORT | SEE NOTES TO FINANCIAL STATEMENTS. |
INVESTMENT GRADE BOND FUND | |
STATEMENTS OF CHANGES IN NET ASSETS |
| | Period Ended
March 31,
2017
(Unaudited) | | | Year Ended
September 30,
2016 | |
Increase (Decrease) in Net Assets from Operations: | | | | | | |
Net investment income | | $ | 5,084,226 | | | $ | 6,639,023 | |
Net realized gain on investments | | | 68,301 | | | | 2,098,723 | |
Net change in unrealized appreciation (depreciation) on investments | | | (4,446,381 | ) | | | 4,628,363 | |
Net increase in net assets resulting from operations | | | 706,146 | | | | 13,366,109 | |
| | | | | | | | | |
Distributions to shareholders from: | | | | | | | | |
Net investment income | | | | | | | | |
A-Class | | | (2,804,145 | ) | | | (4,978,867 | ) |
C-Class | | | (438,296 | ) | | | (868,592 | ) |
P-Class | | | (43,607 | ) | | | (57,008 | ) |
Institutional Class | | | (1,925,711 | ) | | | (1,157,024 | ) |
Total distributions to shareholders | | | (5,211,759 | ) | | | (7,061,491 | ) |
| | | | | | | | | |
Capital share transactions: | | | | | | | | |
Proceeds from sale of shares | | | | | | | | |
A-Class | | | 34,823,692 | | | | 66,630,224 | |
C-Class | | | 3,183,956 | | | | 19,854,556 | |
P-Class | | | 705,541 | | | | 3,885,131 | |
Institutional Class | | | 45,033,073 | | | | 85,970,913 | |
Distributions reinvested | | | | | | | | |
A-Class | | | 2,595,425 | | | | 4,737,216 | |
C-Class | | | 384,987 | | | | 761,108 | |
P-Class | | | 43,607 | | | | 57,008 | |
Institutional Class | | | 1,868,108 | | | | 893,933 | |
Cost of shares redeemed | | | | | | | | |
A-Class | | | (29,222,213 | ) | | | (31,331,066 | ) |
C-Class | | | (8,474,081 | ) | | | (9,542,796 | ) |
P-Class | | | (1,606,287 | ) | | | (946,105 | ) |
Institutional Class | | | (16,446,948 | ) | | | (12,097,691 | ) |
Net increase from capital share transactions | | | 32,888,860 | | | | 128,872,431 | |
Net increase in net assets | | | 28,383,247 | | | | 135,177,049 | |
| | | | | | | | | |
Net assets: | | | | | | | | |
Beginning of period | | | 281,226,972 | | | | 146,049,923 | |
End of period | | $ | 309,610,219 | | | $ | 281,226,972 | |
Accumulated net investment loss at end of period | | $ | (874,745 | ) | | $ | (747,212 | ) |
| | | | | | | | | |
Capital share activity: | | | | | | | | |
Shares sold | | | | | | | | |
A-Class | | | 1,907,202 | | | | 3,676,365 | |
C-Class | | | 175,395 | | | | 1,100,204 | |
P-Class | | | 38,734 | | | | 214,391 | |
Institutional Class | | | 2,464,439 | | | | 4,719,258 | |
Shares issued from reinvestment of distributions | | | | | | | | |
A-Class | | | 142,426 | | | | 261,551 | |
C-Class | | | 21,213 | | | | 42,199 | |
P-Class | | | 2,393 | | | | 3,148 | |
Institutional Class | | | 102,678 | | | | 48,739 | |
Shares redeemed | | | | | | | | |
A-Class | | | (1,604,744 | ) | | | (1,727,722 | ) |
C-Class | | | (466,193 | ) | | | (529,935 | ) |
P-Class | | | (88,257 | ) | | | (51,857 | ) |
Institutional Class | | | (904,259 | ) | | | (661,553 | ) |
Net increase in shares | | | 1,791,027 | | | | 7,094,788 | |
SEE NOTES TO FINANCIAL STATEMENTS. | THE GUGGENHEIM FUNDS SEMI-ANNUAL REPORT | 49 |
INVESTMENT GRADE BOND FUND | |
This table is presented to show selected data for a share outstanding throughout each period and to assist shareholders in evaluating a Fund’s performance for the periods presented.
A-Class | | Period Ended
March 31,
2017a | | | Year Ended
September 30,
2016 | | | Year Ended
September 30,
2015 | | | Year Ended
September 30,
2014 | | | Year Ended
September 30,
2013 | | | Period Ended
September 30,
2012b | |
Per Share Data | | | | | | | | | | | | | | | | | | |
Net asset value, beginning of period | | $ | 18.55 | | | $ | 18.10 | | | $ | 18.50 | | | $ | 17.81 | | | $ | 17.92 | | | $ | 17.41 | |
Income (loss) from investment operations: | |
Net investment income (loss)c | | | .31 | | | | .64 | | | | .69 | | | | .65 | | | | .61 | | | | .27 | |
Net gain (loss) on investments (realized and unrealized) | | | (.27 | ) | | | .50 | | | | (.30 | ) | | | .83 | | | | (.04 | ) | | | .51 | |
Total from investment operations | | | .04 | | | | 1.14 | | | | .39 | | | | 1.48 | | | | .57 | | | | .78 | |
Less distributions from: | |
Net investment income | | | (.32 | ) | | | (.69 | ) | | | (.79 | ) | | | (.79 | ) | | | (.68 | ) | | | (.27 | ) |
Total distributions | | | (.32 | ) | | | (.69 | ) | | | (.79 | ) | | | (.79 | ) | | | (.68 | ) | | | (.27 | ) |
Net asset value, end of period | | $ | 18.27 | | | $ | 18.55 | | | $ | 18.10 | | | $ | 18.50 | | | $ | 17.81 | | | $ | 17.92 | |
| |
Total Returnd | | | 0.22 | % | | | 6.50 | % | | | 2.12 | % | | | 8.47 | % | | | 3.21 | % | | | 4.51 | % |
Ratios/Supplemental Data | |
Net assets, end of period (in thousands) | | $ | 164,619 | | | $ | 158,932 | | | $ | 115,019 | | | $ | 99,565 | | | $ | 83,642 | | | $ | 98,063 | |
Ratios to average net assets: | |
Net investment income (loss) | | | 3.40 | % | | | 3.55 | % | | | 3.72 | % | | | 3.55 | % | | | 3.40 | % | | | 2.04 | % |
Total expensesg | | | 1.02 | % | | | 1.08 | % | | | 1.17 | % | | | 1.19 | % | | | 1.21 | % | | | 1.15 | % |
Net expensesh,i | | | 1.02 | % | | | 1.03 | % | | | 1.07 | % | | | 1.05 | % | | | 1.04 | % | | | 1.00 | % |
Portfolio turnover rate | | | 45 | % | | | 100 | % | | | 57 | % | | | 61 | % | | | 119 | % | | | 52 | % |
C-Class | | Period Ended
March 31,
2017a | | | Year Ended
September 30,
2016 | | | Year Ended
September 30,
2015 | | | Year Ended
September 30,
2014 | | | Year Ended
September 30,
2013 | | | Period Ended
September 30,
2012b | |
Per Share Data | | | | | | | | | | | | | | | | | | |
Net asset value, beginning of period | | $ | 18.48 | | | $ | 18.02 | | | $ | 18.42 | | | $ | 17.73 | | | $ | 17.82 | | | $ | 17.31 | |
Income (loss) from investment operations: | |
Net investment income (loss)c | | | .24 | | | | .51 | | | | .55 | | | | .51 | | | | .48 | | | | .17 | |
Net gain (loss) on investments (realized and unrealized) | | | (.28 | ) | | | .51 | | | | (.30 | ) | | | .83 | | | | (.05 | ) | | | .51 | |
Total from investment operations | | | (.04 | ) | | | 1.02 | | | | .25 | | | | 1.34 | | | | .43 | | | | .68 | |
Less distributions from: | |
Net investment income | | | (.25 | ) | | | (.56 | ) | | | (.65 | ) | | | (.65 | ) | | | (.52 | ) | | | (.17 | ) |
Total distributions | | | (.25 | ) | | | (.56 | ) | | | (.65 | ) | | | (.65 | ) | | | (.52 | ) | | | (.17 | ) |
Net asset value, end of period | | $ | 18.19 | | | $ | 18.48 | | | $ | 18.02 | | | $ | 18.42 | | | $ | 17.73 | | | $ | 17.82 | |
| |
Total Returnd | | | (0.20 | %) | | | 5.78 | % | | | 1.36 | % | | | 7.69 | % | | | 2.42 | % | | | 3.95 | % |
Ratios/Supplemental Data | |
Net assets, end of period (in thousands) | | $ | 30,582 | | | $ | 36,040 | | | $ | 24,111 | | | $ | 20,673 | | | $ | 17,876 | | | $ | 20,929 | |
Ratios to average net assets: | |
Net investment income (loss) | | | 2.66 | % | | | 2.81 | % | | | 3.00 | % | | | 2.80 | % | | | 2.65 | % | | | 1.29 | % |
Total expensesg | | | 1.79 | % | | | 1.90 | % | | | 1.99 | % | | | 1.99 | % | | | 2.03 | % | | | 1.92 | % |
Net expensesh,i | | | 1.77 | % | | | 1.77 | % | | | 1.82 | % | | | 1.80 | % | | | 1.79 | % | | | 1.75 | % |
Portfolio turnover rate | | | 45 | % | | | 100 | % | | | 57 | % | | | 61 | % | | | 119 | % | | | 52 | % |
50 | THE GUGGENHEIM FUNDS SEMI-ANNUAL REPORT | SEE NOTES TO FINANCIAL STATEMENTS. |
INVESTMENT GRADE BOND FUND | |
FINANCIAL HIGHLIGHTS (continued) |
This table is presented to show selected data for a share outstanding throughout each period and to assist shareholders in evaluating a Fund’s performance for the periods presented.
P-Class | | Period Ended
March 31,
2017a | | | Year Ended
September 30,
2016 | | | Period Ended
September 30,
2015e | |
Per Share Data | | | | | | | | | |
Net asset value, beginning of period | | $ | 18.57 | | | $ | 18.12 | | | $ | 18.45 | |
Income (loss) from investment operations: | |
Net investment income (loss)c | | | .31 | | | | .59 | | | | .25 | |
Net gain (loss) on investments (realized and unrealized) | | | (.28 | ) | | | .55 | | | | (.26 | ) |
Total from investment operations | | | .03 | | | | 1.14 | | | | (.01 | ) |
Less distributions from: | |
Net investment income | | | (.32 | ) | | | (.69 | ) | | | (.32 | ) |
Total distributions | | | (.32 | ) | | | (.69 | ) | | | (.32 | ) |
Net asset value, end of period | | $ | 18.28 | | | $ | 18.57 | | | $ | 18.12 | |
| |
Total Returnd | | | 0.17 | % | | | 6.51 | % | | | (0.11 | %) |
Ratios/Supplemental Data | |
Net assets, end of period (in thousands) | | $ | 2,178 | | | $ | 3,087 | | | $ | 10 | |
Ratios to average net assets: | |
Net investment income (loss) | | | 3.43 | % | | | 3.25 | % | | | 3.25 | % |
Total expensesg | | | 1.16 | % | | | 0.98 | % | | | 3.29 | % |
Net expensesh,i | | | 1.00 | % | | | 0.98 | % | | | 1.09 | % |
Portfolio turnover rate | | | 45 | % | | | 100 | % | | | 57 | % |
SEE NOTES TO FINANCIAL STATEMENTS. | THE GUGGENHEIM FUNDS SEMI-ANNUAL REPORT | 51 |
INVESTMENT GRADE BOND FUND | |
FINANCIAL HIGHLIGHTS (concluded) |
This table is presented to show selected data for a share outstanding throughout each period and to assist shareholders in evaluating a Fund’s performance for the periods presented.
Institutional Class | | Period Ended
March 31,
2017a | | | Year Ended
September 30,
2016 | | | Year Ended
September 30,
2015 | | | Year Ended
September 30,
2014 | | | Period Ended
September 30,
2013f | |
Per Share Data | | | | | | | | | | | | | | | |
Net asset value, beginning of period | | $ | 18.53 | | | $ | 18.07 | | | $ | 18.47 | | | $ | 17.80 | | | $ | 18.00 | |
Income (loss) from investment operations: | |
Net investment income (loss)c | | | .34 | | | | .62 | | | | .74 | | | | .68 | | | | .46 | |
Net gain (loss) on investments (realized and unrealized) | | | (.28 | ) | | | .58 | | | | (.31 | ) | | | .83 | | | | (.21 | ) |
Total from investment operations | | | .06 | | | | 1.20 | | | | .43 | | | | 1.51 | | | | .25 | |
Less distributions from: | |
Net investment income | | | (.35 | ) | | | (.74 | ) | | | (.83 | ) | | | (.84 | ) | | | (.45 | ) |
Total distributions | | | (.35 | ) | | | (.74 | ) | | | (.83 | ) | | | (.84 | ) | | | (.45 | ) |
Net asset value, end of period | | $ | 18.24 | | | $ | 18.53 | | | $ | 18.07 | | | $ | 18.47 | | | $ | 17.80 | |
| |
Total Returnd | | | 0.35 | % | | | 6.83 | % | | | 2.37 | % | | | 8.64 | % | | | 1.35 | % |
Ratios/Supplemental Data | |
Net assets, end of period (in thousands) | | $ | 112,231 | | | $ | 83,168 | | | $ | 6,910 | | | $ | 5,909 | | | $ | 174 | |
Ratios to average net assets: | |
Net investment income (loss) | | | 3.76 | % | | | 3.41 | % | | | 4.01 | % | | | 3.72 | % | | | 3.85 | % |
Total expensesg | | | 0.65 | % | | | 0.76 | % | | | 0.94 | % | | | 0.88 | % | | | 1.17 | % |
Net expensesh,i | | | 0.66 | % | | | 0.76 | % | | | 0.82 | % | | | 0.78 | % | | | 0.82 | % |
Portfolio turnover rate | | | 45 | % | | | 100 | % | | | 57 | % | | | 61 | % | | | 119 | % |
a | Unaudited figures for the period ended March 31, 2017. Percentage amounts for the period, except total return and portfolio turnover rate, have been annualized. |
b | The Fund changed its fiscal year end from December 31 to September 30 in 2012. |
c | Net investment income (loss) per share was computed using average shares outstanding throughout the period. |
d | Total return does not reflect the impact of any applicable sales charges and has not been annualized. |
e | Since commencement of operations: May 1, 2015. Percentage amounts for the period, except total return and portfolio turnover rate, have been annualized. |
f | Since commencement of operations: January 29, 2013. Percentage amounts for the period, except total return and portfolio turnover rate, have been annualized. |
g | Does not include expenses of the underlying funds in which the Fund invests. |
h | Net expense information reflects the expense ratios after expense waivers. |
i | Net expenses may include expenses that are excluded from the expense limitation agreement. Excluding these expenses, the net expense ratios for the years would be: |
| 03/31/17 | 09/30/16 | 09/30/15 | 09/30/14 | 09/30/13 |
A-Class | 1.00% | 1.00% | 1.00% | 1.00% | 1.02% |
C-Class | 1.75% | 1.74% | 1.75% | 1.75% | 1.77% |
P-Class | 0.99% | 0.97% | 1.00% | — | — |
Institutional Class | 0.64% | 0.75% | 0.75% | 0.75% | 0.77% |
52 | THE GUGGENHEIM FUNDS SEMI-ANNUAL REPORT | SEE NOTES TO FINANCIAL STATEMENTS. |
FUND PROFILE (Unaudited) | March 31, 2017 |
LIMITED DURATION FUND
OBJECTIVE: Seeks to provide a high level of income consistent with preservation of capital.
Holdings Diversification (Market Exposure as % of Net Assets)
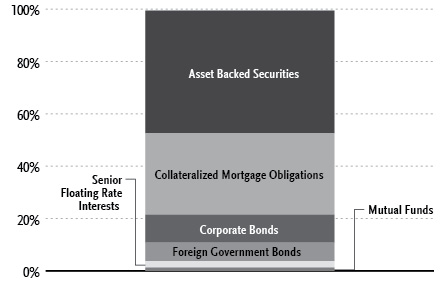
“Holdings Diversification (Market Exposure as % of Net Assets)” excludes any temporary cash investments or investments in Guggenheim Strategy Funds Trust mutual funds. Investments in those Funds do not provide “market exposure” to meet the Fund’s investment objective, but will significantly increase the portfolio’s exposure to certain other asset categories (and their associated risks), which may cause the Fund to deviate from its principal investment strategy, including: (i) high yield, high risk debt securities rated below the top four long-term rating categories by a nationally recognized statistical rating organization (also known as “junk bonds”); (ii) securities issued by the U.S. government or its agencies and instrumentalities; (iii) CLOs and similar investments; and (iv) other short-term fixed income securities.
Inception Dates: |
A-Class | December 16, 2013 |
C-Class | December 16, 2013 |
P-Class | May 1, 2015 |
Institutional Class | December 16, 2013 |
Ten Largest Holdings (% of Total Net Assets) |
Republic of Portugal Government Bond | 1.9% |
Kingdom of Spain Government Bond | 1.8% |
Venture XVI CLO Ltd. | 1.4% |
CIT Mortgage Loan Trust | 1.4% |
Station Place Securitization Trust | 1.4% |
Fortress Credit BSL II Ltd. | 1.3% |
FirstKey Master Funding | 1.3% |
Fortress Credit Opportunities VII CLO Ltd. | 1.2% |
Floating Rate Strategies Fund - Institutional Class | 1.2% |
JP Morgan Mortgage Acquisition Trust | 1.1% |
Top Ten Total | 14.0% |
“Ten Largest Holdings” excludes any temporary cash or derivative investments. |
| | THE GUGGENHEIM FUNDS SEMI-ANNUAL REPORT | 53 |
FUND PROFILE (Unaudited)(concluded) | March 31, 2017 |
Portfolio Composition by Quality Rating1 |
Rating | % of Total Investments |
Fixed Income Instruments | |
AAA | 27.0% |
AA | 13.8% |
A | 14.9% |
BBB | 16.0% |
BB | 5.0% |
B | 6.3% |
CCC | 0.7% |
CC | 0.1% |
NR2 | 9.4% |
Total | 93.2% |
Other Instruments | 6.8% |
Total Investments | 100.0% |
The chart above reflects percentages of the value of total investments. |
1 | Source: BlackRock Solutions. Credit quality ratings are measured on a scale that generally ranges from AAA (highest) to D (lowest). All securities except for those labeled “NR” have been rated by a Nationally Recognized Statistical Rating Organization (“NRSRO”). For purposes of this presentation, when ratings are available from more than one agency, the highest rating is used. Guggenheim Investments converts ratings to the equivalent S&P rating. |
2 | NR securities do not necessarily indicate low credit quality. |
54 | THE GUGGENHEIM FUNDS SEMI-ANNUAL REPORT | |
SCHEDULE OF INVESTMENTS (Unaudited) | March 31, 2017 |
LIMITED DURATION FUND | |
| | Shares | | | Value | |
| | | | | | | |
MUTUAL FUNDS† - 3.5% | |
Guggenheim Floating Rate Strategies Fund - Institutional Class1 | | | 629,435 | | | $ | 16,415,673 | |
Guggenheim Strategy Fund I1 | | | 517,272 | | | | 12,957,662 | |
Guggenheim Strategy Fund II1 | | | 487,233 | | | | 12,180,825 | |
Guggenheim Strategy Fund III1 | | | 280,729 | | | | 7,021,027 | |
Total Mutual Funds | | | | | | | | |
(Cost $48,421,293) | | | | | | | 48,575,187 | |
| | | | | | | | | |
SHORT-TERM INVESTMENTS† - 3.0% | |
Dreyfus Treasury Securities Cash Management Fund - Institutional Class 0.50%2 | | | 42,119,763 | | | | 42,119,763 | |
Total Short-Term Investments | | | | | | | | |
(Cost $42,119,763) | | | | | | | 42,119,763 | |
| | | | | | | | | |
| | | Face
Amount12 | | | | | |
| | | | | | | | | |
ASSET-BACKED SECURITIES†† - 46.9% | |
Collateralized Loan Obligations - 39.2% | |
Venture XVI CLO Ltd. | | | | | | | | |
2017-16A, 2.27% due 04/15/263,4 | | $ | 20,000,000 | | | | 19,999,106 | |
2014-16A, 2.52% due 04/15/263,4 | | | 9,200,000 | | | | 9,200,000 | |
Fortress Credit BSL II Ltd. | | | | | | | | |
2017-2A, 2.30% due 10/19/253,4 | | | 19,000,000 | | | | 18,976,692 | |
2013-2A, 2.52% due 10/19/253,4 | | | 5,000,000 | | | | 5,002,732 | |
2013-2A, 3.27% due 10/19/253,4 | | | 1,500,000 | | | | 1,502,348 | |
Great Lakes CLO Ltd. | | | | | | | | |
2014-1A, 2.87% due 04/15/253,4 | | | 10,000,000 | | | | 10,010,212 | |
2015-1A, 2.97% due 07/15/263,4 | | | 5,000,000 | | | | 5,015,993 | |
2012-1A, 2.85% due 01/15/233,4 | | | 4,457,693 | | | | 4,461,541 | |
2014-1A, 4.72% due 04/15/253,4 | | | 250,000 | | | | 247,172 | |
Fortress Credit Opportunities III CLO, LP | | | | | | | | |
2017-3A, 2.84% due 04/28/263,4 | | | 16,000,000 | | | | 15,979,366 | |
2017-3A, 4.00% due 04/28/264 | | | 1,800,000 | | | | 1,795,388 | |
2014-3A, 3.51% due 04/28/263,4 | | | 1,000,000 | | | | 996,612 | |
CIFC Funding Ltd. | | | | | | | | |
2016-1A, 2.99% due 01/22/273,4 | | | 8,500,000 | | | | 8,500,307 | |
2014-4A, 2.38% due 10/17/263,4 | | | 5,000,000 | | | | 5,004,184 | |
2015-2A, 3.00% due 12/05/243,4 | | | 2,000,000 | | | | 1,999,506 | |
2015-2A, 3.80% due 12/05/243,4 | | | 1,990,000 | | | | 1,993,348 | |
Fortress Credit Opportunities VII CLO Ltd. | | | | | | | | |
2016-7A, 2.98% due 12/15/283,4 | | | 17,000,000 | | | | 17,027,565 | |
Golub Capital Partners CLO Ltd. | | | | | | | | |
2016-33A, 3.37% due 11/21/283,4 | | | 9,000,000 | | | | 8,970,180 | |
2015-25A, 2.83% due 08/05/273,4 | | | 5,000,000 | | | | 5,000,945 | |
2015-23A, 3.18% due 05/05/273,4 | | | 1,000,000 | | | | 1,004,050 | |
2015-24A, 4.78% due 02/05/273,4 | | | 1,000,000 | | | | 995,426 | |
2014-21A, 3.49% due 10/25/263,4 | | | 500,000 | | | | 492,817 | |
2014-18A, 4.54% due 04/25/263,4 | | | 250,000 | | | | 249,551 | |
2014-18A, 5.04% due 04/25/263,4 | | | 250,000 | | | | 245,050 | |
TICP 2014-3A AR | | | | | | | | |
2.33% due 01/20/27 | | | 13,350,000 | | | | 13,363,787 | |
TICP CLO III Ltd. | | | | | | |
2014-3A, 2.57% due 01/20/273,4 | | | 13,350,000 | | | | 13,350,000 | |
Steele Creek CLO Ltd. | | | | | | | | |
2014-1A, 2.37% due 08/21/263,4 | | | 11,300,000 | | | | 11,285,602 | |
2017-1A, 2.89% due 08/21/263,4 | | | 2,000,000 | | | | 1,999,988 | |
Fortress Credit Opportunities V CLO Ltd. | | | | | | | | |
2017-5A, 3.06% due 10/15/263,4 | | | 7,200,000 | | | | 7,204,997 | |
2017-5A, 3.40% due 10/15/264 | | | 4,000,000 | | | | 4,004,147 | |
2014-5A, 4.56% due 10/15/263,4 | | | 1,000,000 | | | | 999,664 | |
2014-5A, 3.66% due 10/15/263,4 | | | 1,000,000 | | | | 999,500 | |
Carlyle Global Market Strategies CLO Ltd. | | | | | | | | |
2013-2A, 2.17% due 04/18/253,4 | | | 9,130,000 | | | | 9,130,000 | |
2013-4A, 2.49% due 10/15/253,4 | | | 2,000,000 | | | | 2,008,444 | |
PFP Ltd. | | | | | | | | |
2017-3, 1.83% due 01/14/353,4 | | | 6,750,000 | | | | 6,766,132 | |
2015-2, 2.93% due 07/14/343,4 | | | 3,000,000 | | | | 2,997,406 | |
Northwoods Capital X Ltd. | | | | | | | | |
2017-10A, 2.48% due 11/04/253,4 | | | 7,500,000 | | | | 7,504,712 | |
2013-10A, 2.93% due 11/04/253,4 | | | 2,250,000 | | | | 2,249,992 | |
OCP CLO Ltd. | | | | | | | | |
2016-11A, 3.43% due 04/26/283,4 | | | 3,750,000 | | | | 3,749,784 | |
2016-2A, 3.05% due 11/22/253,4 | | | 2,000,000 | | | | 2,017,469 | |
2013-4A, 3.79% due 10/24/253,4 | | | 2,000,000 | | | | 2,000,000 | |
2016-11A, 4.48% due 04/26/283,4 | | | 1,500,000 | | | | 1,499,865 | |
Vibrant CLO III Ltd. | | | | | | | | |
2016-3A, 2.51% due 04/20/263,4 | | | 8,800,000 | | | | 8,781,731 | |
ABPCI Direct Lending Fund CLO I LLC | | | | | | | | |
2016-1A, 3.65% due 12/22/283,4 | | | 8,000,000 | | | | 7,957,885 | |
NXT Capital CLO LLC | | | | | | | | |
2017-1A, 2.86% due 04/20/293,4 | | | 7,700,000 | | | | 7,686,651 | |
TICP CLO II Ltd. | | | | | | | | |
2017-2A, 2.70% due 07/20/263,4 | | | 7,500,000 | | | | 7,506,301 | |
Seneca Park CLO Limited | | | | | | | | |
2017-1A, 2.44% due 07/17/263,4 | | | 7,500,000 | | | | 7,504,628 | |
Garrison Funding Ltd. | | | | | | | | |
2015-1A, 2.50% due 05/25/273,4 | | | 3,000,000 | | | | 2,999,924 | |
2016-2A, 3.26% due 09/29/273,4 | | | 2,000,000 | | | | 2,013,403 | |
2015-1A, 3.55% due 05/25/273,4 | | | 2,000,000 | | | | 2,000,202 | |
Flagship CLO VIII Ltd. | | | | | | | | |
2017-8A, 2.29% due 01/16/263,4 | | | 6,900,000 | | | | 6,883,429 | |
Cerberus Loan Funding XVII Ltd. | | | | | | | | |
2016-3A, 3.48% due 01/15/283,4 | | | 6,500,000 | | | | 6,478,951 | |
KVK CLO Ltd. | | | | | | | | |
2017-1A, 2.84% due 05/15/263,4 | | | 5,600,000 | | | | 5,596,004 | |
2014-2A, 4.02% due 07/15/263,4 | | | 500,000 | | | | 499,973 | |
2013-1A, due 04/14/254,5 | | | 750,000 | | | | 339,719 | |
A Voce CLO Ltd. | | | | | | | | |
2017-1A, 2.31% due 07/15/263,4 | | | 6,400,000 | | | | 6,392,459 | |
Venture XIX CLO Ltd. | | | | | | | | |
2016-19A, 3.02% due 01/15/273,4 | | | 6,100,000 | | | | 6,099,707 | |
Crown Point CLO II Ltd. | | | | | | | | |
2013-2A, 2.95% due 12/31/233,4 | | | 6,000,000 | | | | 5,991,288 | |
Catamaran CLO Ltd. | | | | | | | | |
2016-1A, 3.10% due 12/20/233,4 | | | 3,250,000 | | | | 3,250,901 | |
2014-1A, 3.68% due 04/20/263,4 | | | 2,750,000 | | | | 2,722,859 | |
SEE NOTES TO FINANCIAL STATEMENTS. | THE GUGGENHEIM FUNDS SEMI-ANNUAL REPORT | 55 |
SCHEDULE OF INVESTMENTS (Unaudited)(continued) | March 31, 2017 |
LIMITED DURATION FUND | |
| | Face
Amount12 | | | Value | |
| | | | | | | |
Cent CLO Ltd. | | | | | | |
2013-19A, 2.37% due 10/29/253,4 | | $ | 3,850,000 | | | $ | 3,849,442 | |
2014-20A, 2.52% due 01/25/263,4 | | | 2,100,000 | | | | 2,100,862 | |
Regatta V Funding Ltd. | | | | | | | | |
2017-1A, 2.27% due 10/25/263,4 | | | 4,900,000 | | | | 4,899,677 | |
2014-1A, 2.60% due 10/25/263,4 | | | 1,000,000 | | | | 1,000,000 | |
GoldenTree Loan Opportunities VII Ltd. | | | | | | | | |
2013-7A, 2.19% due 04/25/253,4 | | | 5,750,000 | | | | 5,747,500 | |
Northwoods Capital Ltd. | | | | | | | | |
2014-14A, 2.33% due 11/12/253,4 | | | 5,700,000 | | | | 5,703,503 | |
Cent CDO 14 Ltd. | | | | | | | | |
2007-14A, 1.72% due 04/15/213,4 | | | 6,000,000 | | | | 5,638,035 | |
Cent CLO LP | | | | | | | | |
2014-21A, 2.27% due 07/27/263,4 | | | 5,500,000 | | | | 5,497,645 | |
Acis CLO Ltd. | | | | | | | | |
2013-1A, 1.89% due 04/18/243,4 | | | 5,500,000 | | | | 5,461,947 | |
Tuolumne Grove CLO Limited | | | | | | | | |
2017-1A, due 04/25/263,4 | | | 5,400,000 | | | | 5,390,607 | |
Galaxy XVIII CLO Ltd. | | | | | | | | |
2017-18A, 2.32% due 10/15/263,4 | | | 5,300,000 | | | | 5,299,762 | |
Venture XII CLO Ltd. | | | | | | | | |
2017-12A, 2.67% due 02/28/263,4 | | | 5,100,000 | | | | 5,085,987 | |
Voya CLO Ltd. | | | | | | | | |
2013-1A, 3.92% due 04/15/243,4 | | | 2,300,000 | | | | 2,300,007 | |
2015-3A, 7.53% due 10/20/273,4 | | | 1,950,000 | | | | 1,784,821 | |
2015-3A, 3.97% due 10/15/223,4 | | | 1,000,000 | | | | 999,964 | |
OZLM IX Ltd. | | | | | | | | |
2017-9A, 2.69% due 01/20/273,4 | | | 5,100,000 | | | | 5,084,268 | |
Flagship CLO | | | | | | | | |
2014-8A, 2.09% due 01/16/263,4 | | | 5,000,000 | | | | 4,993,321 | |
Symphony CLO XIV Ltd. | | | | | | | | |
2017-14A, 2.86% due 07/14/263,4 | | | 4,700,000 | | | | 4,701,778 | |
Oaktree EIF I Ltd. | | | | | | | | |
2016-A1, 3.62% due 10/18/273,4 | | | 4,500,000 | | | | 4,507,431 | |
Shackleton CLO Ltd. | | | | | | | | |
2016-7A, 2.97% due 04/15/273,4 | | | 4,250,000 | | | | 4,249,797 | |
Cerberus Loan Funding XVI, LP | | | | | | | | |
2016-2A, 3.07% due 11/15/273,4 | | | 4,000,000 | | | | 4,047,680 | |
TCP Waterman CLO LLC | | | | | | | | |
2016-1A, 3.18% due 12/15/283,4 | | | 4,000,000 | | | | 4,041,761 | |
Newstar Commercial Loan Funding LLC | | | | | | | | |
2017-1A, 3.54% due 03/20/273,4 | | | 3,000,000 | | | | 2,999,994 | |
2016-1A, 4.80% due 02/25/283,4 | | | 1,000,000 | | | | 1,002,048 | |
WhiteHorse VI Ltd. | | | | | | | | |
2016-1A, 2.93% due 02/03/253,4 | | | 4,000,000 | | | | 3,997,037 | |
ACIS CLO Ltd. | | | | | | | | |
2014-4A, 2.45% due 05/01/263,4 | | | 4,000,000 | | | | 3,991,274 | |
Vibrant CLO III Ltd. | | | | | | | | |
2016-3A, 3.08% due 04/20/263,4 | | | 4,000,000 | | | | 3,985,356 | |
FS Senior Funding Ltd. | | | | | | | | |
2015-1A, 2.82% due 05/28/253,4 | | | 2,000,000 | | | | 2,000,100 | |
2015-1A, 3.67% due 05/28/253,4 | | | 2,000,000 | | | | 1,979,738 | |
Fortress Credit Opportunities VI CLO Ltd. | | | | | | | | |
2015-6A, 3.01% due 10/10/263,4 | | | 2,750,000 | | | | 2,749,771 | |
2015-6A, 3.81% due 10/10/263,4 | | | 1,000,000 | | | | 995,856 | |
WhiteHorse VIII Ltd. | | | | | | | | |
2014-1A, 2.53% due 05/01/263,4 | | | 3,450,000 | | | | 3,430,893 | |
Flagship VII Ltd. | | | | | | | | |
2017-7A, 2.28% due 01/20/263,4 | | | 3,300,000 | | | | 3,295,943 | |
Northwoods Capital XIV Ltd. | | | | | | | | |
2017-14A, 2.79% due 11/12/253,4 | | | 3,000,000 | | | | 3,003,412 | |
Fifth Street SLF II Ltd. | | | | | | | | |
2015-2A, 2.96% due 09/29/273,4 | | | 3,000,000 | | | | 3,002,656 | |
Cavalry CLO II | | | | | | | | |
2013-2A, 2.37% due 01/17/243,4 | | | 3,000,000 | | | | 3,000,000 | |
RFTI Issuer Ltd. | | | | | | | | |
2015-FL1, 2.66% due 08/15/303,4 | | | 2,986,696 | | | | 2,984,420 | |
Venture XI CLO Ltd. | | | | | | | | |
2015-11A, 2.99% due 11/14/223,4 | | | 3,000,000 | | | | 2,982,256 | |
Black Diamond CLO Ltd. | | | | | | | | |
2012-1A, 2.43% due 02/01/233,4 | | | 2,553,578 | | | | 2,550,232 | |
Atrium XI | | | | | | | | |
2014-11A, 4.24% due 10/23/253,4 | | | 2,500,000 | | | | 2,500,211 | |
Ares XXVI CLO Ltd. | | | | | | | | |
2013-1A, 3.77% due 04/15/253,4 | | | 2,500,000 | | | | 2,499,880 | |
KKR CLO Ltd. | | | | | | | | |
2015-12, 3.32% due 07/15/273,4 | | | 2,500,000 | | | | 2,497,043 | |
AMMC CLO XV Ltd. | | | | | | | | |
2016-15A, 3.01% due 12/09/263,4 | | | 2,400,000 | | | | 2,408,874 | |
Nelder Grove CLO Ltd. | | | | | | | | |
2017-1A, 2.80% due 08/28/263,4 | | | 2,400,000 | | | | 2,399,631 | |
LCM XXII Ltd. | | | | | | | | |
2016-22A, 2.31% due 10/20/283,4 | | | 2,300,000 | | | | 2,300,679 | |
Vibrant CLO Ltd. | | | | | | | | |
2015-1A, 3.12% due 07/17/243,4 | | | 2,000,000 | | | | 2,011,223 | |
Cereberus ICQ Levered LLC | | | | | | | | |
2015-1A, 3.07% due 11/06/253,4 | | | 2,000,000 | | | | 2,004,332 | |
Madison Park Funding XVI Ltd. | | | | | | | | |
2016-16A, 2.93% due 04/20/263,4 | | | 2,000,000 | | | | 2,004,278 | |
KKR CLO Trust | | | | | | | | |
2012-1A, 3.33% due 12/15/243,4 | | | 2,000,000 | | | | 2,000,503 | |
Atlas Senior Loan Fund V Ltd. | | | | | | | | |
2016-1A, 3.53% due 07/16/263,4 | | | 2,000,000 | | | | 1,999,898 | |
Northwoods Capital IX Ltd. | | | | | | | | |
2012-9A, 3.27% due 01/18/243,4 | | | 2,000,000 | | | | 1,999,890 | |
Marea CLO Ltd. | | | | | | | | |
2015-1A, 3.77% due 10/15/233,4 | | | 1,000,000 | | | | 999,965 | |
2015-1A, 2.82% due 10/15/233,4 | | | 1,000,000 | | | | 999,785 | |
OHA Loan Funding Ltd. | | | | | | | | |
2013-1A, 2.49% due 07/23/253,4 | | | 2,000,000 | | | | 1,998,567 | |
Fortress Credit Funding V, LP | | | | | | | | |
2015-5A, 3.69% due 08/15/223,4 | | | 2,000,000 | | | | 1,997,973 | |
Dryden XXIV Senior Loan Fund | | | | | | | | |
2015-24RA, 3.74% due 11/15/233,4 | | | 2,000,000 | | | | 1,995,807 | |
OZLM Funding II Ltd. | | | | | | | | |
2016-2A, 3.64% due 10/30/273,4 | | | 2,000,000 | | | | 1,994,431 | |
Airlie CLO Ltd. | | | | | | | | |
2006-2A, 2.48% due 12/20/203,4 | | | 2,000,000 | | | | 1,977,372 | |
Resource Capital Corp. | | | | | | | | |
2014-CRE2, 3.44% due 04/15/323,4 | | | 2,000,000 | | | | 1,970,032 | |
56 | THE GUGGENHEIM FUNDS SEMI-ANNUAL REPORT | SEE NOTES TO FINANCIAL STATEMENTS. |
SCHEDULE OF INVESTMENTS (Unaudited)(continued) | March 31, 2017 |
LIMITED DURATION FUND | |
| | Face
Amount12 | | | Value | |
| | | | | | | |
Flatiron CLO Ltd. | | | | | | |
2017-1A, 2.64% due 07/17/263,4 | | $ | 1,700,000 | | | $ | 1,694,990 | |
Tralee CLO III Ltd. | | | | | | | | |
2016-3A, 3.03% due 07/20/263,4 | | | 1,600,000 | | | | 1,601,079 | |
Battalion CLO VII Ltd. | | | | | | | | |
2014-7A, 2.62% due 10/17/263,4 | | | 1,500,000 | | | | 1,501,029 | |
Tuolumne Grove CLO Ltd. | | | | | | | | |
2014-1A, 3.14% due 04/25/263,4 | | | 1,500,000 | | | | 1,500,000 | |
Betony CLO Ltd. | | | | | | | | |
2016-1A, 2.97% due 04/15/273,4 | | | 1,500,000 | | | | 1,498,334 | |
Dryden 37 Senior Loan Fund | | | | | | | | |
2015-37A, due 04/15/274,5 | | | 1,500,000 | | | | 1,408,711 | |
Dryden 30 Senior Loan Fund | | | | | | | | |
2013-30A, 3.89% due 11/15/253,4 | | | 1,330,000 | | | | 1,327,493 | |
Highbridge Loan Management Ltd. | | | | | | | | |
2014-2014, 3.09% due 07/28/253,4 | | | 1,250,000 | | | | 1,249,940 | |
Venture VII CDO Ltd. | | | | | | | | |
2006-7A, 1.26% due 01/20/223,4 | | | 1,245,366 | | | | 1,237,084 | |
Kingsland V Ltd. | | | | | | | | |
2007-5A, 1.82% due 07/14/213,4 | | | 1,070,000 | | | | 1,036,433 | |
CFIP CLO Ltd. | | | | | | | | |
2014-1A, 2.49% due 04/13/253,4 | | | 1,000,000 | | | | 1,003,082 | |
Fortress Credit Investments IV Ltd. | | | | | | | | |
2015-4A, 2.92% due 07/17/233,4 | | | 1,000,000 | | | | 1,001,108 | |
Benefit Street Partners CLO Ltd. | | | | | | | | |
2015-IA, 4.12% due 10/15/253,4 | | | 1,000,000 | | | | 1,001,007 | |
Adirondack Park CLO Ltd. | | | | | | | | |
2013-1A, 4.02% due 04/15/243,4 | | | 1,000,000 | | | | 1,000,797 | |
Anchorage Capital CLO 4 Ltd. | | | | | | | | |
2014-4A, 3.20% due 07/28/263,4 | | | 1,000,000 | | | | 1,000,177 | |
Cent CLO | | | | | | | | |
2014-16A, 3.28% due 08/01/243,4 | | | 500,000 | | | | 500,043 | |
2014-16A, 4.23% due 08/01/243,4 | | | 500,000 | | | | 500,020 | |
Duane Street CLO IV Ltd. | | | | | | | | |
2007-4A, 3.29% due 11/14/213,4 | | | 1,000,000 | | | | 1,000,032 | |
Battalion CLO Ltd. | | | | | | | | |
2007-1A, 3.17% due 07/14/223,4 | | | 1,000,000 | | | | 999,982 | |
Oaktree EIF II Series Ltd. | | | | | | | | |
2014-A2, 3.34% due 11/15/253,4 | | | 1,000,000 | | | | 999,919 | |
Rockwall CDO II Ltd. | | | | | | | | |
2007-1A, 1.58% due 08/01/243,4 | | | 1,000,000 | | | | 992,330 | |
Resource Capital Corp | | | | | | | | |
2015-CRE3, 4.09% due 03/15/323,4 | | | 1,000,000 | | | | 991,564 | |
Madison Park Funding V Ltd. | | | | | | | | |
2007-5A, 2.50% due 02/26/213,4 | | | 1,000,000 | | | | 980,206 | |
Ivy Hill Middle Market Credit Fund VII Ltd. | | | | | | | | |
2013-7A, 3.33% due 10/20/253,4 | | | 1,000,000 | | | | 976,347 | |
Treman Park CLO Ltd. | | | | | | | | |
2015-1A, due 04/20/274,5 | | | 1,000,000 | | | | 897,000 | |
OHA Credit Partners IX Ltd. | | | | | | | | |
2013-9A, due 10/20/254,5 | | | 1,000,000 | | | | 892,252 | |
Cerberus Onshore II CLO LLC | | | | | | | | |
2014-1A, 3.72% due 10/15/233,4 | | | 500,000 | | | | 500,256 | |
2014-1A, 3.72% due 10/15/233,4 | | | 250,000 | | | | 249,861 | |
2014-1A, 3.02% due 10/15/233,4 | | | 138,676 | | | | 138,696 | |
LMREC, Inc. | | | | | | | | |
2016-CRE2, 2.48% due 11/24/313,4 | | | 534,000 | | | | 532,815 | |
Halcyon Loan Advisors Funding Ltd. | | | | | | | | |
2012-1A, 4.04% due 08/15/233,4 | | | 500,000 | | | | 501,597 | |
ALM XIV Ltd. | | | | | | | | |
2014-14A, 4.49% due 07/28/263,4 | | | 500,000 | | | | 501,281 | |
Gallatin CLO VII Ltd. | | | | | | | | |
2014-1A, 3.92% due 07/15/233,4 | | | 500,000 | | | | 500,026 | |
NZCG Funding Ltd. | | | | | | | | |
2015-2A, 3.39% due 04/27/273,4 | | | 500,000 | | | | 499,990 | |
Figueroa CLO Ltd. | | | | | | | | |
2013-1A, 3.80% due 03/21/243,4 | | | 500,000 | | | | 499,960 | |
Telos CLO Ltd. | | | | | | | | |
2013-4A, 3.77% due 07/17/243,4 | | | 500,000 | | | | 498,960 | |
COA Summit CLO Ltd. | | | | | | | | |
2014-1A, 4.88% due 04/20/233,4 | | | 500,000 | | | | 494,898 | |
WhiteHorse IV Ltd. | | | | | | | | |
2007-4A, 2.47% due 01/17/203,4 | | | 500,000 | | | | 492,630 | |
NewStar Arlington Senior Loan Program LLC | | | | | | | | |
2014-1A, 4.34% due 07/25/253,4 | | | 250,000 | | | | 247,480 | |
2014-1A, 5.29% due 07/25/253,4 | | | 250,000 | | | | 239,424 | |
Babson CLO Ltd. | | | | | | | | |
2012-2A, due 05/15/234,5 | | | 750,000 | | | | 446,101 | |
Keuka Park CLO Ltd. | | | | | | | | |
2013-1A, due 10/21/244,5 | | | 500,000 | | | | 252,972 | |
Kingsland IV Ltd. | | | | | | | | |
2007-4A, 2.47% due 04/16/213,4 | | | 250,000 | | | | 241,023 | |
Copper River CLO Ltd. | | | | | | | | |
2007-1A, due 01/20/213,5,11 | | | 500,000 | | | | 70,296 | |
Total Collateralized Loan Obligations | | | | | | | 545,103,975 | |
| | | | | | | | | |
Transport-Aircraft - 2.2% | |
Apollo Aviation Securitization Equity Trust | | | | | | | | |
2016-2, 4.21% due 11/15/41 | | | 6,400,020 | | | | 6,405,497 | |
2016-1A, 4.88% due 03/17/364 | | | 4,770,000 | | | | 4,793,850 | |
2014-1, 5.13% due 12/15/293 | | | 950,262 | | | | 949,075 | |
2014-1, 7.38% due 12/15/293 | | | 380,105 | | | | 379,630 | |
Castlelake Aircraft Securitization Trust | | | | | | | | |
2015-1A, 4.70% due 12/15/404 | | | 5,115,395 | | | | 5,220,319 | |
2014-1, 5.25% due 02/15/29 | | | 163,216 | | | | 162,808 | |
2014-1, 7.50% due 02/15/29 | | | 161,814 | | | | 161,814 | |
Falcon Aerospace Ltd. | | | | | | | | |
2017-1, 4.58% due 02/15/42 | | | 3,729,000 | | | | 3,759,246 | |
ECAF I Ltd. | | | | | | | | |
2015-1A, 3.47% due 06/15/404 | | | 1,491,867 | | | | 1,476,949 | |
2015-1A, 5.80% due 06/15/404 | | | 879,834 | | | | 844,640 | |
Harbour Aircraft Investments Ltd. | | | | | | | | |
2016-1A, 4.70% due 07/15/41 | | | 1,835,400 | | | | 1,839,225 | |
AIM Aviation Finance Ltd. | | | | | | | | |
2015-1A, 4.21% due 02/15/404 | | | 1,702,381 | | | | 1,695,997 | |
Diamond Head Aviation Ltd. | | | | | | | | |
2015-1, 3.81% due 07/14/284 | | | 1,349,812 | | | | 1,350,478 | |
Atlas Ltd. | | | | | | | | |
2014-1 A, 4.88% due 12/15/39 | | | 864,600 | | | | 862,439 | |
AABS | | | | | | | | |
2013-1 A, 4.88% due 01/10/38 | | | 538,443 | | | | 537,097 | |
SEE NOTES TO FINANCIAL STATEMENTS. | THE GUGGENHEIM FUNDS SEMI-ANNUAL REPORT | 57 |
SCHEDULE OF INVESTMENTS (Unaudited)(continued) | March 31, 2017 |
LIMITED DURATION FUND | |
| | Face
Amount12 | | | Value | |
| | | | | | | |
Rise Ltd. | | | | | | |
2014-1A, 4.75% due 02/12/39 | | $ | 359,958 | | | $ | 358,159 | |
Total Transport-Aircraft | | | | | | | 30,797,223 | |
| | | | | | | | | |
Collateralized Debt Obligations - 2.2% | |
Anchorage Credit Funding Ltd. | | | | | | | | |
2016-4A, 3.50% due 02/15/354 | | | 10,250,000 | | | | 10,212,633 | |
2016-3A, 3.85% due 10/28/334 | | | 1,500,000 | | | | 1,521,879 | |
FDF II Ltd. | | | | | | | | |
2016-2A, 4.29% due 05/12/314 | | | 4,000,000 | | | | 4,019,208 | |
RB Commercial Trust | | | | | | | | |
2012-RS1, 5.35% due 01/26/224 | | | 3,349,867 | | | | 3,459,499 | |
FDF I Ltd. | | | | | | | | |
2015-1A, 4.40% due 11/12/304 | | | 3,000,000 | | | | 2,956,969 | |
Triaxx Prime CDO Ltd. | | | | | | | | |
2006-2A, 1.05% due 10/02/393,4 | | | 2,940,804 | | | | 2,865,916 | |
Putnam Structured Product Funding Ltd. | | | | | | | | |
2003-1A, 1.91% due 10/15/383,4 | | | 2,500,639 | | | | 2,269,538 | |
SRERS Funding Ltd. | | | | | | | | |
2011-RS, 1.10% due 05/09/463,4 | | | 1,449,821 | | | | 1,432,303 | |
H2 Asset Funding Ltd. | | | | | | | | |
2014-1A, 2.88% due 03/19/37 | | | 1,000,000 | | | | 997,041 | |
Wrightwood Capital Real Estate CDO Ltd. | | | | | | | | |
2005-1A, 1.48% due 11/21/403,4 | | | 700,000 | | | | 686,744 | |
Total Collateralized Debt Obligations | | | | | | | 30,421,730 | |
| | | | | | | | | |
Net Lease - 1.3% | |
Capital Automotive REIT | | | | | | | | |
2017-1A, 3.87% due 04/15/474 | | | 12,200,000 | | | | 12,196,463 | |
2014-1A, 3.66% due 10/15/444 | | | 1,000,000 | | | | 974,454 | |
Store Master Funding LLC | | | | | | | | |
2012-1A, 5.77% due 08/20/424 | | | 3,726,844 | | | | 3,754,128 | |
2013-1A, 4.16% due 03/20/434 | | | 933,635 | | | | 926,209 | |
Spirit Master Funding LLC | | | | | | | | |
2014-1A, 5.05% due 07/20/404 | | | 501,150 | | | | 507,840 | |
Total Net Lease | | | | | | | 18,359,094 | |
| | | | | | | | | |
Whole Business - 1.2% | |
Taco Bell Funding LLC | | | | | | | | |
2016-1A, 4.38% due 05/25/464 | | | 3,681,500 | | | | 3,729,220 | |
2016-1A, 4.97% due 05/25/464 | | | 3,482,500 | | | | 3,534,884 | |
DB Master Finance LLC | | | | | | | | |
2015-1A, 3.98% due 02/20/454 | | | 3,831,800 | | | | 3,894,346 | |
Sonic Capital LLC | | | | | | | | |
2016-1A, 4.47% due 05/20/464 | | | 1,988,333 | | | | 1,959,421 | |
Drug Royalty III Limited Partnership | | | | | | | | |
2016-1A, 3.98% due 04/15/274 | | | 1,699,675 | | | | 1,699,851 | |
Drug Royalty II Limited Partnership 2 | | | | | | | | |
2014-1, 3.48% due 07/15/234 | | | 811,167 | | | | 804,361 | |
Wendys Funding LLC | | | | | | | | |
2015-1A, 4.08% due 06/15/454 | | | 768,300 | | | | 773,433 | |
Miramax LLC | | | | | | | | |
2014-1A, 3.34% due 07/20/264 | | | 596,800 | | | | 592,916 | |
Total Whole Business | | | | | | | 16,988,432 | |
| | | | | | | | | |
Transport-Container - 0.8% | |
Global SC Finance II SRL | | | | | | | | |
2013-1A, 2.98% due 04/17/284 | | | 9,596,458 | | | | 9,343,271 | |
2013-2A, 3.67% due 11/17/284 | | | 1,941,100 | | | | 1,913,097 | |
Total Transport-Container | | | | | | | 11,256,368 | |
| | | | | | | | | |
Insurance - 0.0% | |
Chesterfield Financial Holdings LLC | | | | | | | | |
2014-1A, 4.50% due 12/15/344 | | | 594,000 | | | | 591,262 | |
| | | | | | | | | |
Automotive - 0.0% | |
Hertz Vehicle Financing LLC | | | | | | | | |
2016-2A, 4.99% due 03/25/224 | | | 477,000 | | | | 482,313 | |
| | | | | | | | | |
Diversified Payment Rights - 0.0% | |
CCR, Inc. MT100 Payment Rights Master Trust | | | | | | | | |
2010-CX, 1.30% due 07/10/173 | | | 138,820 | | | | 138,545 | |
Total Asset-Backed Securities | | | | | | | | |
(Cost $652,601,531) | | | | | | | 654,138,942 | |
| | | | | | | | | |
COLLATERALIZED MORTGAGE OBLIGATIONS†† - 31.2% | |
Residential Mortgage Backed Securities - 20.5% | |
FirstKey Master Funding | | | | | | | | |
2017-R1, 1.01% due 11/03/413,4 | | | 31,500,000 | | | | 31,044,014 | |
LSTAR Securities Investment Ltd. | | | | | | | | |
2017-1, 2.78% due 01/01/223,4 | | | 9,398,804 | | | | 9,375,307 | |
2016-4, 2.78% due 10/01/213,4 | | | 5,234,651 | | | | 5,192,873 | |
2015-6, 2.78% due 05/01/203,4 | | | 4,450,481 | | | | 4,433,792 | |
2016-3, 2.78% due 09/01/213,4 | | | 3,436,685 | | | | 3,393,400 | |
CIT Mortgage Loan Trust | | | | | | | | |
2007-1, 2.33% due 10/25/373,4 | | | 19,256,482 | | | | 19,118,695 | |
2007-1, 2.43% due 10/25/373,4 | | | 1,518,351 | | | | 1,486,662 | |
JP Morgan Mortgage Acquisition Trust | | | | | | | | |
2006-HE2, 1.12% due 07/25/363 | | | 15,926,146 | | | | 15,310,033 | |
Bayview Opportunity Master Fund IVb Trust | | | | | | | | |
2017-RN1, 3.60% due 02/28/323,4 | | | 7,743,130 | | | | 7,731,808 | |
2017-NPL1, 3.60% due 01/28/324 | | | 4,177,252 | | | | 4,166,049 | |
LSTAR Securities Investment Trust | | | | | | | | |
2016-2, 2.78% due 03/01/213,4 | | | 5,188,803 | | | | 5,162,859 | |
2016-5, 2.78% due 11/01/213,4 | | | 3,133,933 | | | | 3,118,000 | |
2015-10, 2.78% due 11/02/203,4 | | | 2,442,496 | | | | 2,441,733 | |
Countrywide Asset-Backed Certificates | | | | | | | | |
2006-6, 1.15% due 09/25/363 | | | 6,762,973 | | | | 6,304,829 | |
2006-5, 1.27% due 08/25/363 | | | 3,170,441 | | | | 3,041,922 | |
GCAT | | | | | | | | |
A1, 3.38% due 03/25/47 | | | 8,100,000 | | | | 8,092,256 | |
LSTAR Commercial Mortgage Trust | | | | | | | | |
2016-7, 2.78% due 12/01/213,4 | | | 8,152,581 | | | | 8,081,246 | |
First NLC Trust | | | | | | | | |
2005-4, 1.37% due 02/25/363 | | | 8,360,000 | | | | 7,850,140 | |
VOLT XLVIII LLC | | | | | | | | |
2016-NPL8, 3.50% due 07/25/464 | | | 7,622,640 | | | | 7,663,800 | |
Nationstar HECM Loan Trust | | | | | | | | |
2016-1A, 2.98% due 02/25/264 | | | 5,494,174 | | | | 5,494,174 | |
2015-2A, 2.88% due 11/25/254 | | | 1,034,645 | | | | 1,034,976 | |
2016-3A, 2.01% due 08/25/264 | | | 707,638 | | | | 703,820 | |
58 | THE GUGGENHEIM FUNDS SEMI-ANNUAL REPORT | SEE NOTES TO FINANCIAL STATEMENTS. |
SCHEDULE OF INVESTMENTS (Unaudited)(continued) | March 31, 2017 |
LIMITED DURATION FUND | |
| | Face
Amount12 | | | Value | |
| | | | | | | |
Stanwich Mortgage Loan Co. | | | | | | |
2016-NPA1, 3.84% due 10/16/463,4 | | $ | 7,178,140 | | | $ | 7,167,851 | |
VOLT L LLC | | | | | | | | |
2016-NP10, 3.50% due 09/25/463,4 | | | 6,870,348 | | | | 6,913,346 | |
CSMC Series | | | | | | | | |
2015-12R, 1.27% due 11/30/373,4 | | | 6,652,586 | | | | 6,274,074 | |
2014-2R, 0.98% due 02/27/463,4 | | | 385,335 | | | | 361,216 | |
Ellington Loan Acquisition Trust | | | | | | | | |
2007-2, 1.93% due 05/25/373,4 | | | 6,005,608 | | | | 5,999,949 | |
CWABS Incorporated Asset-Backed Certificates Trust | | | | | | | | |
2004-4, 1.70% due 07/25/343 | | | 6,261,986 | | | | 5,930,564 | |
GSMSC Resecuritization Trust | | | | | | | | |
2015-5R, 0.91% due 02/26/373,4 | | | 3,256,069 | | | | 2,895,724 | |
2015-7R, 0.93% due 09/26/373,4 | | | 2,982,262 | | | | 2,821,518 | |
Credit-Based Asset Servicing & Securitization LLC | | | | | | | | |
2006-CB2, 1.17% due 12/25/363 | | | 5,989,058 | | | | 5,561,040 | |
LVII Resecuritization Trust | | | | | | | | |
2009-3, 5.30% due 11/27/373,4 | | | 5,000,000 | | | | 5,066,955 | |
CIM Trust | | | | | | | | |
2017-2, 2.78% due 12/25/573,4 | | | 5,000,000 | | | | 4,962,643 | |
Banc of America Funding Trust | | | | | | | | |
2015-R4, 0.95% due 01/27/353,4 | | | 5,070,985 | | | | 4,756,612 | |
VOLT LIV LLC | | | | | | | | |
2017-NPL1, 3.63% due 02/25/473,4 | | | 4,183,269 | | | | 4,168,590 | |
VOLT LI LLC | | | | | | | | |
2016-NP11, 3.50% due 10/25/464 | | | 4,096,543 | | | | 4,126,614 | |
VOLT XLI LLC | | | | | | | | |
2016-NPL1, 4.25% due 02/26/464 | | | 4,097,189 | | | | 4,116,726 | |
VOLT LIII LLC | | | | | | | | |
2016-NP13, 3.88% due 12/26/464 | | | 3,923,751 | | | | 3,913,878 | |
Bear Stearns Asset Backed Securities I Trust | | | | | | | | |
2006-HE3, 1.34% due 04/25/363 | | | 4,000,000 | | | | 3,792,070 | |
Soundview Home Loan Trust | | | | | | | | |
2005-OPT3, 1.45% due 11/25/353 | | | 4,000,000 | | | | 3,608,082 | |
2003-1, 4.36% due 08/25/313 | | | 140,447 | | | | 137,860 | |
VOLT XXXIX LLC | | | | | | | | |
2015-NP13, 4.13% due 10/25/454 | | | 3,715,934 | | | | 3,724,007 | |
VOLT LII LLC | | | | | | | | |
2016-NP12, 3.63% due 11/26/464 | | | 3,681,123 | | | | 3,665,691 | |
VOLT XL LLC | | | | | | | | |
2015-NP14, 4.38% due 11/27/454 | | | 2,842,532 | | | | 2,870,326 | |
NRPL Trust | | | | | | | | |
2014-2A, 3.75% due 10/25/573,4 | | | 1,485,641 | | | | 1,496,245 | |
2015-1A, 3.88% due 11/01/544 | | | 1,322,552 | | | | 1,314,063 | |
GCAT LLC | | | | | | | | |
2015-1, 3.63% due 05/26/203,4 | | | 2,631,194 | | | | 2,631,459 | |
VOLT XXXVI LLC | | | | | | | | |
2015-NP10, 3.63% due 07/25/453,4 | | | 1,980,383 | | | | 1,985,172 | |
First Franklin Mortgage Loan Trust | | | | | | | | |
2004-FF10, 2.26% due 07/25/343 | | | 1,953,097 | | | | 1,890,513 | |
VOLT XXXIII LLC | | | | | | | | |
2015-NPL5, 3.50% due 03/25/554 | | | 1,881,551 | | | | 1,888,558 | |
Deutsche Alt-A Securities Mortgage Loan Trust Series | | | | | | | | |
2006-AF1, 1.08% due 04/25/363 | | | 2,041,300 | | | | 1,785,160 | |
Global Mortgage Securitization Ltd. | | | | | | | | |
2005-A, 1.25% due 04/25/323,4 | | | 1,795,196 | | | | 1,699,727 | |
Nomura Resecuritization Trust | | | | | | | | |
2015-4R, 1.66% due 03/26/363,4 | | | 1,598,836 | | | | 1,525,130 | |
2012-1R, 1.22% due 08/27/473,4 | | | 129,086 | | | | 128,105 | |
AJAX Mortgage Loan Trust | | | | | | | | |
2015-A, 3.88% due 11/25/543,4 | | | 1,555,229 | | | | 1,551,266 | |
Bayview Opportunity Master Fund Trust | | | | | | | | |
2016-LT1, 3.47% due 10/28/313,4 | | | 1,531,462 | | | | 1,523,847 | |
VOLT XXVII LLC | | | | | | | | |
2014-NPL7, 3.38% due 08/27/574 | | | 1,503,465 | | | | 1,501,751 | |
Morgan Stanley ABS Capital I Incorporated Trust | | | | | | | | |
2006-NC1, 1.36% due 12/25/353 | | | 1,500,000 | | | | 1,398,681 | |
Structured Asset Investment Loan Trust | | | | | | | | |
2005-2, 1.72% due 03/25/353 | | | 959,676 | | | | 917,907 | |
2005-1, 1.70% due 02/25/353,4 | | | 479,356 | | | | 471,170 | |
VOLT XXXIV LLC | | | | | | | | |
2015-NPL7, 3.25% due 02/25/553,4 | | | 1,258,490 | | | | 1,256,547 | |
Encore Credit Receivables Trust | | | | | | | | |
2005-4, 1.42% due 01/25/363 | | | 1,077,390 | | | | 1,056,047 | |
VOLT XLII LLC | | | | | | | | |
2016-NPL2, 4.25% due 03/26/464 | | | 1,006,330 | | | | 1,013,896 | |
Ocwen Master Advance Receivables Trust | | | | | | | | |
2015-T3, 3.21% due 11/15/474 | | | 1,000,000 | | | | 987,702 | |
Vericrest Opportunity Loan Trust | | | | | | | | |
2015-NPL3, 3.38% due 10/25/584 | | | 958,397 | | | | 954,639 | |
BCAP LLC | | | | | | | | |
2014-RR3, 0.92% due 10/26/363,4 | | | 850,144 | | | | 829,747 | |
UCFC Manufactured Housing Contract | | | | | | | | |
1997-2, 7.38% due 10/15/28 | | | 516,391 | | | | 532,651 | |
Structured Asset Securities Corporation Mortgage Loan Trust | | | | | | | | |
2007-BC1, 1.11% due 02/25/373 | | | 526,474 | | | | 472,149 | |
First Frankin Mortgage Loan Trust | | | | | | | | |
2006-FF4, 1.17% due 03/25/363 | | | 462,268 | | | | 440,202 | |
GSAMP Trust | | | | | | | | |
2005-HE6, 1.42% due 11/25/353 | | | 439,526 | | | | 432,256 | |
GreenPoint Mortgage Funding Trust | | | | | | | | |
2005-HE4, 1.45% due 07/25/303 | | | 286,754 | | | | 281,857 | |
Accredited Mortgage Loan Trust | | | | | | | | |
2007-1, 1.11% due 02/25/373 | | | 226,772 | | | | 222,051 | |
Morgan Stanley Re-REMIC Trust | | | | | | | | |
2010-R5, 1.60% due 06/26/364 | | | 178,455 | | | | 130,696 | |
Total Residential Mortgage Backed Securities | | | | | | | 285,396,918 | |
| | | | | | | | | |
Commercial Mortgage Backed Securities - 8.1% | |
Cosmopolitan Hotel Trust | | | | | | | | |
2016-CSMO, 2.31% due 11/15/333,4 | | | 10,000,000 | | | | 10,081,348 | |
2016-CSMO, 3.01% due 11/15/333,4 | | | 2,000,000 | | | | 2,021,223 | |
Bayview Opportunity Master Fund IIIa Trust | | | | | | | | |
2016-RN3, 3.60% due 09/29/313,4 | | | 10,798,362 | | | | 10,782,274 | |
SEE NOTES TO FINANCIAL STATEMENTS. | THE GUGGENHEIM FUNDS SEMI-ANNUAL REPORT | 59 |
SCHEDULE OF INVESTMENTS (Unaudited)(continued) | March 31, 2017 |
LIMITED DURATION FUND | |
| | Face
Amount12 | | | Value | |
| | | | | | | |
Chicago Skyscraper Trust | | | | | | |
2017-SKY, 1.71% due 04/15/303,4 | | $ | 9,000,000 | | | $ | 9,005,040 | |
GS Mortgage Securities Corporation Trust | | | | | | | | |
2016-ICE2, 4.16% due 02/15/333,4 | | | 6,400,000 | | | | 6,491,790 | |
Wells Fargo Commercial Mortgage Trust | | | | | | | | |
2016-C37, 1.05% due 12/15/493 | | | 38,742,713 | | | | 2,379,384 | |
2016-C32, 1.36% due 01/15/593 | | | 23,149,138 | | | | 1,946,766 | |
2015-LC22, 0.91% due 09/15/583 | | | 24,604,779 | | | | 1,318,363 | |
2017-RB1, 1.45% due 03/15/503 | | | 10,000,000 | | | | 995,000 | |
2016-NXS5, 1.57% due 01/15/593 | | | 6,936,129 | | | | 624,988 | |
Motel 6 Trust | | | | | | | | |
2015-MTL6, 5.28% due 02/05/304 | | | 4,131,000 | | | | 4,152,117 | |
2015-MTL6, 3.30% due 02/05/304 | | | 1,600,000 | | | | 1,605,270 | |
GS Mortgage Securities Trust | | | | | | | | |
2014-GSFL, 2.66% due 07/15/313,4 | | | 3,600,000 | | | | 3,565,292 | |
2014-GSFL, 3.16% due 07/15/313,4 | | | 2,000,000 | | | | 1,985,510 | |
Banc of America Commercial Mortgage Trust | | | | | | | | |
2017-BNK3, 1.15% due 02/15/503 | | | 33,879,632 | | | | 2,838,940 | |
2016-UB10, 2.01% due 07/15/493 | | | 19,388,562 | | | | 2,322,025 | |
CGGS Commercial Mortgage Trust | | | | | | | | |
2016-RNDA, 4.39% due 02/10/334 | | | 5,000,000 | | | | 5,080,027 | |
JP Morgan Chase Commercial Mortgage Securities Trust | | | | | | | | |
2016-WIKI, 4.01% due 10/05/313,4 | | | 3,000,000 | | | | 2,932,010 | |
2014-CBM, 2.86% due 10/15/293,4 | | | 1,100,000 | | | | 1,105,492 | |
2014-FL5, 2.87% due 07/15/313,4 | | | 1,000,000 | | | | 988,925 | |
GAHR Commercial Mortgage Trust | | | | | | | | |
2015-NRF, 3.38% due 12/15/343,4 | | | 4,500,000 | | | | 4,329,014 | |
2015-NRF, 2.21% due 12/15/343,4 | | | 366,093 | | | | 367,539 | |
VSD | | | | | | | | |
2017-PLT1 A, 3.60% due 12/25/43 | | | 4,000,000 | | | | 3,989,888 | |
Americold LLC Trust | | | | | | | | |
2010-ARTA, 7.44% due 01/14/294 | | | 3,500,000 | | | | 3,920,542 | |
JPMCC Commercial Mortgage Securities Trust | | | | | | | | |
2017-JP5, 1.28% due 03/15/503 | | | 48,450,000 | | | | 3,673,692 | |
Americold 2010 LLC Trust | | | | | | | | |
2010-ARTA, 6.81% due 01/14/294 | | | 2,605,000 | | | | 2,908,228 | |
BAMLL Commercial Mortgage Securities Trust | | | | | | | | |
2014-ICTS, 2.31% due 06/15/283,4 | | | 2,750,000 | | | | 2,662,114 | |
Morgan Stanley Bank of America Merrill Lynch Trust | | | | | | | | |
2015-C27, 1.04% due 12/15/473 | | | 31,483,678 | | | | 1,941,350 | |
Hyatt Hotel Portfolio Trust | | | | | | | | |
2015-HYT, 3.96% due 11/15/293,4 | | | 1,900,000 | | | | 1,911,291 | |
BXHTL Mortgage Trust | | | | | | | | |
2015-JWRZ, 3.76% due 05/15/293,4 | | | 1,775,000 | | | | 1,783,353 | |
JPMBB Commercial Mortgage Securities Trust | | | | | | | | |
2013-C17, 0.95% due 01/15/473 | | | 33,085,137 | | | | 1,444,881 | |
Citigroup Commercial Mortgage Trust | | | | | | | | |
2016-C2, 1.80% due 08/10/493 | | | 6,776,433 | | | | 857,555 | |
2016-GC37, 1.81% due 04/10/493 | | | 3,829,633 | | | | 455,584 | |
BHMS Mortgage Trust | | | | | | | | |
2014-ATLS, 2.28% due 07/05/333,4 | | | 1,300,000 | | | | 1,302,037 | |
Morgan Stanley Capital I Trust | | | | | | | | |
2015-XLF1, 3.09% due 08/14/313,4 | | | 1,135,000 | | | | 1,136,632 | |
CSAIL Commercial Mortgage Trust | | | | | | | | |
2016-C6, 1.81% due 01/15/493 | | | 9,969,457 | | | | 1,135,707 | |
CDGJ Commercial Mortgage Trust | | | | | | | | |
2014-BXCH, 3.41% due 12/15/273,4 | | | 1,000,000 | | | | 1,004,213 | |
JPMDB Commercial Mortgage Securities Trust | | | | | | | | |
2017-C5, 1.18% due 03/15/503 | | | 58,000,000 | | | | 4,356,380 | |
2016-C2, 1.71% due 06/15/493 | | | 8,913,123 | | | | 896,460 | |
CD Mortgage Trust | | | | | | | | |
2016-CD1, 1.44% due 08/10/493 | | | 7,071,360 | | | | 685,990 | |
LSTAR Commercial Mortgage Trust | | | | | | | | |
2014-2, 4.21% due 01/20/413,4 | | | 500,000 | | | | 498,597 | |
GE Business Loan Trust | | | | | | | | |
2007-1A, 1.08% due 04/16/353,4 | | | 435,614 | | | | 408,497 | |
GreenPoint Mortgage Funding Trust | | | | | | | | |
2007-AR1, 1.06% due 02/25/473 | | | 16 | | | | 16 | |
Total Commercial Mortgage Backed Securities | | | | | | | 113,891,344 | |
| | | | | | | | | |
Financial - 2.1% | |
Station Place Securitization Trust | | | | | | | | |
2017-1A, 1.88% due 02/25/49†††,3,4 | | | 19,100,000 | | | | 19,079,167 | |
2017-1, 2.23% due 02/25/49†††,3,4 | | | 10,000,000 | | | | 9,989,467 | |
Total Financial | | | | | | | 29,068,634 | |
| | | | | | | | | |
Government Agency - 0.5% | |
FREMF Mortgage Trust | | | | | | | | |
2014-K715, 4.13% due 02/25/463,4 | | | 4,250,000 | | | | 4,325,725 | |
Freddie Mac Multifamily Structured Pass Through Certificates | | | | | | | | |
2013-K035, 0.43% due 08/25/233,7 | | | 111,322,737 | | | | 2,454,945 | |
Total Government Agency | | | | | | | 6,780,670 | |
Total Collateralized Mortgage Obligations | | | | | | | | |
(Cost $433,422,528) | | | | | | | 435,137,566 | |
| | | | | | | | | |
CORPORATE BONDS†† - 10.6% | |
Financial - 7.4% | |
Bank of America Corp. | | | | | | | | |
6.10%3,8 | | | 5,300,000 | | | | 5,615,350 | |
6.30%3,8 | | | 4,701,000 | | | | 5,112,338 | |
6.50%3,8 | | | 3,250,000 | | | | 3,546,563 | |
Citigroup, Inc. | | | | | | | | |
6.25%3,8 | | | 8,795,000 | | | | 9,487,605 | |
5.95%3,8 | | | 3,450,000 | | | | 3,592,347 | |
5.95%3,8 | | | 645,000 | | | | 673,219 | |
Credit Agricole S.A. | | | | | | | | |
2.08% due 06/10/203,4 | | | 11,550,000 | | | | 11,605,139 | |
Sumitomo Mitsui Trust Bank Ltd. | | | | | | | | |
1.93% due 10/18/193,4 | | | 7,600,000 | | | | 7,660,890 | |
Bank of Nova Scotia | | | | | | | | |
1.78% due 06/14/193 | | | 6,750,000 | | | | 6,775,839 | |
Huntington National Bank | | | | | | | | |
1.62% due 03/10/203 | | | 6,000,000 | | | | 6,002,928 | |
Swedbank AB | | | | | | | | |
1.82% due 03/14/223,4 | | | 5,800,000 | | | | 5,802,529 | |
Santander UK plc | | | | | | | | |
2.60% due 03/14/193 | | | 5,700,000 | | | | 5,796,854 | |
Danske Bank A/S | | | | | | | | |
1.68% due 09/06/193,4 | | | 5,600,000 | | | | 5,614,353 | |
Wells Fargo & Co. | | | | | | | | |
60 | THE GUGGENHEIM FUNDS SEMI-ANNUAL REPORT | SEE NOTES TO FINANCIAL STATEMENTS. |
SCHEDULE OF INVESTMENTS (Unaudited)(continued) | March 31, 2017 |
LIMITED DURATION FUND | |
| | Face
Amount12 | | | Value | |
| | | | | | | |
5.88%3,8 | | $ | 4,950,000 | | | $ | 5,335,813 | |
Westpac Banking Corp. | | | | | | | | |
1.86% due 01/11/223 | | | 5,000,000 | | | | 5,033,960 | |
Sumitomo Mitsui Financial Group, Inc. | | | | | | | | |
1.99% due 01/11/223 | | | 5,000,000 | | | | 5,003,305 | |
Voya Financial, Inc. | | | | | | | | |
5.65% due 05/15/533 | | | 2,400,000 | | | | 2,442,000 | |
JPMorgan Chase & Co. | | | | | | | | |
6.00%3,8 | | | 1,400,000 | | | | 1,459,920 | |
6.10%3,8 | | | 250,000 | | | | 264,188 | |
KeyCorp | | | | | | | | |
5.00%3,8 | | | 1,650,000 | | | | 1,633,500 | |
American Equity Investment Life Holding Co. | | | | | | | | |
6.63% due 07/15/21 | | | 1,300,000 | | | | 1,348,750 | |
Citizens Financial Group, Inc. | | | | | | | | |
5.50%3,8 | | | 1,000,000 | | | | 1,026,250 | |
Northern Trust Corp. | | | | | | | | |
4.60%3,8 | | | 1,000,000 | | | | 980,000 | |
GEO Group, Inc. | | | | | | | | |
5.88% due 10/15/24 | | | 355,000 | | | | 362,988 | |
US Bancorp | | | | | | | | |
5.30%3,8 | | | 200,000 | | | | 203,750 | |
Total Financial | | | | | | | 102,380,378 | |
| | | | | | | | | |
Communications - 1.5% | |
Deutsche Telekom International Finance BV | | | | | | | | |
1.60% due 01/17/203,4 | | | 9,400,000 | | | | 9,400,319 | |
AT&T, Inc. | | | | | | | | |
2.08% due 06/30/203 | | | 6,600,000 | | | | 6,677,121 | |
SFR Group S.A. | | | | | | | | |
6.25% due 05/15/244 | | | 3,000,000 | | | | 3,018,750 | |
T-Mobile USA, Inc. | | | | | | | | |
6.25% due 04/01/21 | | | 875,000 | | | | 902,344 | |
Total Communications | | | | | | | 19,998,534 | |
| | | | | | | | | |
Consumer, Non-cyclical - 0.7% | |
Tenet Healthcare Corp. | | | | | | | | |
4.63% due 06/15/203 | | | 3,850,000 | | | | 3,869,250 | |
6.25% due 11/01/18 | | | 975,000 | | | | 1,023,141 | |
Aetna, Inc. | | | | | | | | |
1.76% due 12/08/173 | | | 3,000,000 | | | | 3,011,385 | |
Bumble Bee Holdings, Inc. | | | | | | | | |
9.00% due 12/15/174 | | | 2,016,000 | | | | 1,965,600 | |
Total Consumer, Non-cyclical | | | | | | | 9,869,376 | |
| | | | | | | | | |
Basic Materials - 0.5% | |
Newcrest Finance Pty Ltd. | | | | | | | | |
4.20% due 10/01/224 | | | 5,450,000 | | | | 5,598,251 | |
Yamana Gold, Inc. | | | | | | | | |
4.95% due 07/15/24 | | | 1,375,000 | | | | 1,381,875 | |
Constellium N.V. | | | | | | | | |
7.88% due 04/01/214 | | | 600,000 | | | | 640,500 | |
Total Basic Materials | | | | | | | 7,620,626 | |
| | | | | | | | | |
Industrial - 0.4% | |
CNH Industrial Capital LLC | | | | | | | | |
3.88% due 07/16/18 | | | 1,550,000 | | | | 1,577,125 | |
3.63% due 04/15/18 | | | 850,000 | | | | 859,563 | |
Ardagh Packaging Finance plc / Ardagh Holdings USA, Inc. | | | | | | | | |
4.29% due 05/15/213,4 | | | 1,500,000 | | | | 1,535,625 | |
Reynolds Group Issuer Incorporated / Reynolds Group Issuer LLC / Reynolds Group Issuer Lu | | | | | | | | |
4.52% due 07/15/213,4 | | | 1,100,000 | | | | 1,125,443 | |
Dynagas LNG Partners Limited Partnership / Dynagas Finance, Inc. | | | | | | | | |
6.25% due 10/30/196 | | | 600,000 | | | | 592,500 | |
Total Industrial | | | | | | | 5,690,256 | |
| | | | | | | | | |
Diversified - 0.1% | |
HRG Group, Inc. | | | | | | | | |
7.88% due 07/15/19 | | | 1,740,000 | | | | 1,800,900 | |
| | | | | | | | | |
Utilities - 0.0% | |
AES Corp. | | | | | | | | |
4.05% due 06/01/193 | | | 534,000 | | | | 534,001 | |
| | | | | | | | | |
Energy - 0.0% | |
Schahin II Finance Company SPV Ltd. | | | | | | | | |
5.88% due 09/25/229,11 | | | 390,900 | | | | 44,954 | |
Total Corporate Bonds | | | | | | | | |
(Cost $147,129,133) | | | | | | | 147,939,025 | |
| | | | | | | | | |
FOREIGN GOVERNMENT BONDS†† - 7.1% | |
Republic of Portugal Government Bond | | | | | | | | |
due 05/19/17 | | | 24,130,000 | | | | 25,754,663 | |
Kingdom of Spain Government Bond | | | | | | | | |
due 04/07/17 | | | 24,110,000 | | | | 25,723,824 | |
Republic of Italy Government Bond | | | | | | | | |
due 04/28/17 | | | 12,885,000 | | | | 13,750,713 | |
due 04/13/17 | | | 11,220,000 | | | | 11,971,607 | |
Total Republic of Italy Government Bond | | | | | | | 25,722,320 | |
Mexico (United Mexican States) Government Bond | | | | | | | | |
due 05/25/17 | | MXN | 21,432,000 | | | | 11,333,142 | |
due 06/08/17 | | MXN | 1,590,000 | | | | 838,577 | |
Total Mexico (United Mexican States) Government Bond | | | | | | | 12,171,719 | |
Czech Republic Government Bond | | | | | | | | |
0.85% due 03/17/18 | | CSK | 118,000,000 | | | | 4,733,613 | |
Kenya Government International Bond | | | | | | | | |
6.88% due 06/24/244 | | | 2,420,000 | | | | 2,408,190 | |
Dominican Republic International Bond | | | | | | | | |
5.95% due 01/25/274 | | | 2,350,000 | | | | 2,399,938 | |
Total Foreign Government Bonds | | | | | | | | |
(Cost $98,721,903) | | | | | | | 98,914,267 | |
SEE NOTES TO FINANCIAL STATEMENTS. | THE GUGGENHEIM FUNDS SEMI-ANNUAL REPORT | 61 |
SCHEDULE OF INVESTMENTS (Unaudited)(continued) | March 31, 2017 |
LIMITED DURATION FUND | |
| | Face
Amount12 | | | Value | |
| | | | | | | |
SENIOR FLOATING RATE INTERESTS††,3 - 2.5% | |
Consumer, Cyclical - 0.8% | |
Smart & Final Stores LLC | | | | | | |
4.58% due 11/15/22 | | $ | 1,770,796 | | | $ | 1,737,594 | |
Advantage Sales & Marketing LLC | | | | | | | | |
4.25% due 07/23/21 | | | 1,534,304 | | | | 1,517,043 | |
Equinox Holdings, Inc. | | | | | | | | |
4.25% due 03/08/24 | | | 1,500,000 | | | | 1,510,785 | |
BJ’s Wholesale Club, Inc. | | | | | | | | |
4.75% due 02/03/24 | | | 1,215,000 | | | | 1,185,925 | |
PetSmart Inc | | | | | | | | |
4.02% due 03/11/22 | | | 791,940 | | | | 755,312 | |
Acosta, Inc. | | | | | | | | |
4.29% due 09/26/21 | | | 786,655 | | | | 735,522 | |
Trader Corp. | | | | | | | | |
4.25% due 09/28/23 | | | 675,000 | | | | 676,404 | |
National Vision, Inc. | | | | | | | | |
4.00% due 03/12/21 | | | 593,878 | | | | 593,385 | |
NPC International, Inc. | | | | | | | | |
4.75% due 12/28/18 | | | 395,795 | | | | 397,279 | |
Fitness International LLC | | | | | | | | |
5.40% due 07/01/20 | | | 240,403 | | | | 243,108 | |
Total Consumer, Cyclical | | | | | | | 9,352,357 | |
| | | | | | | | | |
Consumer, Non-cyclical - 0.5% | |
Sterigenics-Norion Holdings | | | | | | | | |
4.00% due 05/16/22 | | | 2,825,000 | | | | 2,813,983 | |
DJO Finance LLC | | | | | | | | |
4.25% due 06/08/20 | | | 2,010,200 | | | | 1,941,934 | |
Albertson’s LLC | | | | | | | | |
4.40% due 12/21/22 | | | 1,240,648 | | | | 1,247,782 | |
American Tire Distributors, Inc. | | | | | | | | |
5.25% due 09/01/21 | | | 686,496 | | | | 687,354 | |
Dole Food Company, Inc. | | | | | | | | |
4.58% due 11/01/18 | | | 494,606 | | | | 494,759 | |
Grocery Outlet, Inc. | | | | | | | | |
5.15% due 10/21/21 | | | 394,960 | | | | 395,331 | |
Total Consumer, Non-cyclical | | | | | | | 7,581,143 | |
| | | | | | | | | |
Industrial - 0.5% | |
Travelport Finance Luxembourg Sarl | | | | | | | | |
4.29% due 09/02/21 | | | 3,720,944 | | | | 3,745,762 | |
Filtration Group Corp. | | | | | | | | |
4.30% due 11/23/20 | | | 1,342,161 | | | | 1,351,114 | |
Engility Corp. | | | | | | | | |
4.23% due 08/12/20 | | | 975,000 | | | | 979,271 | |
CHI Overhead Doors, Inc. | | | | | | | | |
4.25% due 07/29/22 | | | 500,000 | | | | 499,165 | |
Berlin Packaging LLC | | | | | | | | |
4.50% due 10/01/21 | | | 273,606 | | | | 274,875 | |
Total Industrial | | | | | | | 6,850,187 | |
| | | | | | | | | |
Communications - 0.4% | |
Cengage Learning Acquisitions, Inc. | | | | | | | | |
5.25% due 06/07/23 | | | 4,369,861 | | | | 4,158,184 | |
Internet Brands | | | | | | | | |
4.75% due 07/08/21 | | | 1,098,975 | | | | 855,241 | |
Neustar, Inc. | | | | | | | | |
3.25% due 09/02/19 | | | 800,000 | | | | 809,664 | |
Total Communications | | | | | | | 5,823,089 | |
| | | | | | | | | |
Technology - 0.3% | |
Epicor Software | | | | | | | | |
4.75% due 06/01/22 | | | 3,950,098 | | | | 3,954,048 | |
5.00% due 06/01/22 | | | 294,952 | | | | 295,445 | |
Eze Castle Software, Inc. | | | | | | | | |
4.15% due 04/06/20 | | | 248,110 | | | | 248,963 | |
Total Technology | | | | | | | 4,498,456 | |
| | | | | | | | | |
Basic Materials - 0.0%* | |
Royal Holdings, Inc. | | | | | | | | |
4.40% due 06/20/22 | | | 600,000 | | | | 605,436 | |
| | | | | | | | | |
Financial - 0.0%* | |
Magic Newco, LLC | | | | | | | | |
5.00% due 12/12/18 | | | 197,930 | | | | 198,508 | |
Total Senior Floating Rate Interests | | | | | | | | |
(Cost $35,062,391) | | | | | | | 34,909,176 | |
| | | | | | | | | |
COMMERCIAL PAPER†† - 4.7% | |
CVS Health Corp. | | | | | | | | |
1.22% due 04/17/17 | | | 20,000,000 | | | | 19,989,156 | |
Mondelez International, Inc. | | | | | | | | |
1.18% due 04/24/17 | | | 20,000,000 | | | | 19,984,922 | |
General Mills Inc | | | | | | | | |
1.15% due 04/11/17 | | | 9,000,000 | | | | 8,997,125 | |
American Water Capital Corp. | | | | | | | | |
1.14% due 04/12/17 | | | 7,000,000 | | | | 6,997,476 | |
Marriott International, Inc./MD | | | | | | | | |
1.25% due 04/24/17 | | | 5,000,000 | | | | 4,996,007 | |
Harley-Davidson Financial Services, Inc. | | | | | | | | |
1.14% due 05/03/17 | | | 5,000,000 | | | | 4,994,933 | |
Total Commercial Paper | | | | | | | | |
(Cost $65,959,619) | | | | | | | 65,959,619 | |
| | | | | | | | | |
REPURCHASE AGREEMENTS††,10 - 1.1% | |
Mizuho Securities LLC | | | | | | | | |
issued 03/23/17 at 1.75%
due 06/06/17 | | | 12,973,000 | | | | 12,973,000 | |
issued 03/06/17 at 1.75%
due 06/06/17 | | | 2,047,000 | | | | 2,047,000 | |
Total Repurchase Agreements | | | | | | | | |
(Cost $15,020,000) | | | | | | | 15,020,000 | |
| | | | | | | | | |
Total Investments - 110.6% | | | | | | | | |
(Cost $1,538,458,161) | | | | | | $ | 1,542,713,545 | |
Other Assets & Liabilities, net - (10.6)% | | | | | | | (147,431,966 | ) |
Total Net Assets - 100.0% | | | | | | $ | 1,395,281,578 | |
62 | THE GUGGENHEIM FUNDS SEMI-ANNUAL REPORT | SEE NOTES TO FINANCIAL STATEMENTS. |
SCHEDULE OF INVESTMENTS (Unaudited)(continued) | March 31, 2017 |
LIMITED DURATION FUND | |
FORWARD FOREIGN CURRENCY EXCHANGE CONTRACTS†† | |
Counterparty | | Contracts to Sell | | Currency | Settlement
Date | | Settlement
Value | | | Value at
March 31,
2017 | | | Net Unrealized Appreciation/(Depreciation) | |
J.P. Morgan | | | (12,890,000 | ) | EUR | 04/07/17 | | $ | 13,953,876 | | | $ | 13,754,421 | | | $ | 199,455 | |
BNP Paribas | | | (12,885,000 | ) | EUR | 04/28/17 | | | 13,959,093 | | | | 13,764,161 | | | | 194,932 | |
J.P. Morgan | | | (13,130,000 | ) | EUR | 05/19/17 | | | 14,235,060 | | | | 14,040,799 | | | | 194,261 | |
Bank of America | | | (119,003,000 | ) | CSK | 03/19/18 | | | 4,913,419 | | | | 4,797,280 | | | | 116,139 | |
Bank of America | | | (11,220,000 | ) | EUR | 04/07/17 | | | 11,954,719 | | | | 11,972,429 | | | | (17,710 | ) |
Bank of America | | | (11,220,000 | ) | EUR | 04/13/17 | | | 11,952,161 | | | | 11,976,179 | | | | (24,018 | ) |
J.P. Morgan | | | (15,900,000 | ) | MXN | 06/08/17 | | | 801,008 | | | | 840,814 | | | | (39,806 | ) |
Bank of America | | | (11,000,000 | ) | EUR | 05/19/17 | | | 11,681,626 | | | | 11,763,046 | | | | (81,420 | ) |
Bank of America | | | (214,320,000 | ) | MXN | 05/25/17 | | | 10,846,153 | | | | 11,358,460 | | | | (512,307 | ) |
| | | | | | | | | | | | | | | | | $ | 29,526 | |
* | Less than 0.1% of net assets. |
† | Value determined based on Level 1 inputs, unless otherwise noted — See Note 4. |
†† | Value determined based on Level 2 inputs, unless otherwise noted — See Note 4. |
††† | Value determined based on Level 3 inputs — See Note 4. |
1 | Affiliated issuer — See Note 8. |
2 | Rate indicated is the 7 day yield as of March 31, 2017. |
3 | Variable rate security. Rate indicated is rate effective at March 31, 2017. |
4 | Security is a 144A or Section 4(a)(2) security. The total market value of 144A or Section 4(a)(2) securities is $1,014,691,192 (cost $1,011,093,832), or 72.6% of total net assets. These securities have been determined to be liquid under guidelines established by the Board of Trustees. |
5 | Security has no stated coupon. However, it is expected to receive residual cash flow payments on defined deal dates. |
6 | Illiquid security. |
7 | Maturity date indicated is next interest reset date. |
8 | Perpetual maturity. |
9 | Security is in default of interest and/or principal obligations. |
10 | Repurchase Agreement — See Note 11. |
11 | Security is a 144A or Section 4(a)(2) security. These securities are considered illiquid and restricted under guidelines established by the Board of Trustees. The total market value of 144A or Section 4(a)(2) securities is $115,250 (cost $960,036), or 0.09% of total net assets — See Note 12. |
12 | Face amount is denominated in U.S. dollars unless otherwise noted. |
| | plc — Public Limited Company |
| | REIT — Real Estate Investment Trust |
| | CSK — Czech Koruna |
| | EUR — Euro |
| | MXN — Mexican Peso |
| | |
| | See Sector Classification in Other Information section. |
SEE NOTES TO FINANCIAL STATEMENTS. | THE GUGGENHEIM FUNDS SEMI-ANNUAL REPORT | 63 |
SCHEDULE OF INVESTMENTS (Unaudited)(continued) | March 31, 2017 |
LIMITED DURATION FUND | |
The following table summarizes the inputs used to value the Fund’s investments at March 31, 2017 (See Note 4 in the Notes to Financial Statements):
Investments in Securities (Assets) | | Level 1 | | | Level 2 | | | Level 2 -
Other* | | | Level 3 | | | Total | |
Asset Backed Securities | | $ | — | | | $ | 654,138,942 | | | $ | — | | | $ | — | | | $ | 654,138,942 | |
Collateralized Mortgage Obligations | | | — | | | | 406,068,932 | | | | — | | | | 29,068,634 | | | | 435,137,566 | |
Commercial Paper | | | — | | | | 65,959,619 | | | | — | | | | — | | | | 65,959,619 | |
Corporate Bonds | | | — | | | | 147,939,025 | | | | — | | | | — | | | | 147,939,025 | |
Forward Foreign Currency Exchange Contracts | | | — | | | | — | | | | 704,787 | | | | — | | | | 704,787 | |
Foreign Government Bonds | | | — | | | | 98,914,267 | | | | — | | | | — | | | | 98,914,267 | |
Mutual Funds | | | 48,575,187 | | | | — | | | | — | | | | — | | | | 48,575,187 | |
Repurchase Agreements | | | — | | | | 15,020,000 | | | | — | | | | — | | | | 15,020,000 | |
Senior Floating Rate Interests | | | — | | | | 34,909,176 | | | | — | | | | — | | | | 34,909,176 | |
Short Term Investments | | | 42,119,763 | | | | — | | | | — | | | | — | | | | 42,119,763 | |
Total | | $ | 90,694,950 | | | $ | 1,422,949,961 | | | $ | 704,787 | | | $ | 29,068,634 | | | $ | 1,543,418,332 | |
| | | | | | | | | | | | | | | | | | | | | |
Investments in Securities (Liabilities) | | Level 1 | | | Level 2 | | | Level 2 -
Other* | | | Level 3 | | | Total | |
Forward Foreign Currency Exchange Contracts | | $ | — | | | $ | — | | | $ | 675,261 | | | $ | — | | | $ | 675,261 | |
* | Other financial instruments include forward foreign currency exchange contracts, which are reported as unrealized gain/loss at period end.. |
Transfers between investment levels may occur as the markets fluctuate and/or the availability of data used in an investment’s valuation changes. Transfers between valuation levels, if any, are in comparison to the valuation levels at the end of the previous fiscal year, and are effective using the fair value as of the end of the previous fiscal period.
As of March 31, 2017, Limited Duration Fund had securities with the total value $12,070,529 transfer out of Level 3 into Level 2 due to changes in securities’ valuation methods using observable inputs. There were no other transfers between levels.
The following is a summary of significant unobservable inputs used in the fair valuation of assets and liabilities categorized within Level 3 of the fair value hierarchy:
Category | | Ending Balance
at 03/31/17 | | Valuation Technique | Unobservable
Inputs |
Collateralized Mortgage Obligations | | $ | 29,068,634 | | Option Adjusted Spread off the prior month end broker mark over the 3 month LIBOR | Indicative Quote |
Total | | $ | 29,068,634 | | | |
Any remaining Level 3 securities held by the Funds and excluded from the tables above, were not considered material to the Funds.
64 | THE GUGGENHEIM FUNDS SEMI-ANNUAL REPORT | SEE NOTES TO FINANCIAL STATEMENTS. |
SCHEDULE OF INVESTMENTS (Unaudited)(concluded) | March 31, 2017 |
LIMITED DURATION FUND | |
Summary of Fair Value Level 3 Activity
Following is a reconciliation of Level 3 assets for which significant unobservable inputs were used to determine fair value for the period ended March 31, 2017:
LEVEL 3 - Fair value measurement using significant unobservable inputs
| | Collateralized
Mortgage
Obligations | | | Asset-Backed
Securities | | | Corporate
Bonds | | | Total | |
LIMITED DURATION | | | | | | | | | | | | |
Assets: | | | | | | | | | | | | |
Beginning Balance | | $ | 954,102 | | | $ | 1,521,134 | | | $ | 9,595,293 | | | $ | 12,070,529 | |
Purchases | | | 29,100,000 | | | | — | | | | — | | | | 29,100,000 | |
Sales, maturities and paydowns | | | — | | | | — | | | | — | | | | — | |
Total realized gains or losses included in earnings | | | — | | | | — | | | | — | | | | — | |
Total change in unrealized gains or losses included in earnings | | | (31,366 | ) | | | — | | | | — | | | | (31,366 | ) |
Transfers into Level 3 | | | — | | | | — | | | | — | | | | — | |
Transfers out of Level 3 | | | (954,102 | ) | | | (1,521,134 | ) | | | (9,595,293 | ) | | | (12,070,529 | ) |
Ending Balance | | $ | 29,068,634 | | | $ | — | | | $ | — | | | $ | 29,068,634 | |
Net Change in unrealized appreciation (depreciation) for investments in securities still held at March 31, 2017 | | $ | (31,366 | ) | | $ | — | | | $ | — | | | $ | (31,366 | ) |
SEE NOTES TO FINANCIAL STATEMENTS. | THE GUGGENHEIM FUNDS SEMI-ANNUAL REPORT | 65 |
STATEMENT OF ASSETS AND LIABILITIES (Unaudited) |
March 31, 2017 |
Assets: | |
Investments in unaffiliated issuers, at value (cost $1,475,016,868) | | $ | 1,479,118,358 | |
Investments in affiliated issuers, at value (cost $48,421,293) | | | 48,575,187 | |
Repurchase agreements, at value (cost $15,020,000) | | | 15,020,000 | |
Total investments (cost $1,538,458,161) | | | 1,542,713,545 | |
Segregated cash with broker | | | 977,289 | |
Prepaid expenses | | | 151,044 | |
Unrealized appreciation on forward foreign currency exchange contracts | | | 704,787 | |
Receivables: | |
Securities sold | | | 1,629,127 | |
Fund shares sold | | | 21,607,465 | |
Dividends | | | 108,170 | |
Interest | | | 4,573,876 | |
Total assets | | | 1,572,465,303 | |
| | | | | |
Liabilities: | |
Overdraft due to custodian bank | | | 265,784 | |
Unrealized depreciation of forward foreign currency exchange contract | | | 675,261 | |
Payable for: | |
Securities purchased | | | 166,536,136 | |
Fund shares redeemed | | | 8,804,665 | |
Management fees | | | 438,100 | |
Distribution and service fees | | | 93,555 | |
Fund accounting/administration fees | | | 85,501 | |
Transfer agent/maintenance fees | | | 5,423 | |
Trustees’ fees* | | | 1,940 | |
Miscellaneous | | | 277,360 | |
Total liabilities | | | 177,183,725 | |
Net assets | | $ | 1,395,281,578 | |
| | | | | |
Net assets consist of: | |
Paid in capital | | $ | 1,390,804,030 | |
Accumulated net investment loss | | | (1,233,005 | ) |
Accumulated net realized gain on investments | | | 1,425,667 | |
Net unrealized appreciation on investments | | | 4,284,886 | |
Net assets | | $ | 1,395,281,578 | |
| | | | | |
A-Class: | |
Net assets | | $ | 321,057,149 | |
Capital shares outstanding | | | 12,978,817 | |
Net asset value per share | | $ | 24.74 | |
Maximum offering price per share (Net asset value divided by 97.75%) | | $ | 25.31 | |
| | | | | |
C-Class: | |
Net assets | | $ | 32,428,408 | |
Capital shares outstanding | | | 1,311,749 | |
Net asset value per share | | $ | 24.72 | |
| | | | | |
P-Class: | |
Net assets | | $ | 34,495,764 | |
Capital shares outstanding | | | 1,394,558 | |
Net asset value per share | | $ | 24.74 | |
| | | | | |
Institutional Class: | |
Net assets | | $ | 1,007,300,257 | |
Capital shares outstanding | | | 40,732,672 | |
Net asset value per share | | $ | 24.73 | |
* | Relates to Trustees not deemed “interested persons” within the meaning of Section 2(a)(19) of the 1940 Act. |
66 | THE GUGGENHEIM FUNDS SEMI-ANNUAL REPORT | SEE NOTES TO FINANCIAL STATEMENTS. |
STATEMENT OF OPERATIONS (Unaudited) |
Period Ended March 31, 2017 |
Investment Income: | |
Interest | | $ | 16,112,423 | |
Dividends from securities of affiliated issuers | | | 370,407 | |
Dividends from securities of unaffiliated issuers | | | 6,066 | |
Total investment income | | | 16,488,896 | |
| | | | | |
Expenses: | |
Management fees | | | 2,123,533 | |
Transfer agent/maintenance fees | |
A-Class | | | 52,117 | |
C-Class | | | 14,193 | |
P-Class | | | 2,688 | |
Institutional Class | | | 24,633 | |
Distribution and service fees: | |
A-Class | | | 312,028 | |
C-Class | | | 137,096 | |
P-Class | | | 13,531 | |
Fund accounting/administration fees | | | 378,709 | |
Line of credit fees | | | 79,272 | |
Custodian fees | | | 8,948 | |
Trustees’ fees* | | | 8,741 | |
Miscellaneous | | | 133,782 | |
Total expenses | | | 3,289,271 | |
Less: | |
Expenses waived by Adviser: | | | (86,635 | ) |
Expense reimbursed by Adviser: | | | | |
A-Class | | | (49,893 | ) |
C-Class | | | (13,732 | ) |
P-Class | | | (2,298 | ) |
Institutional Class | | | (24,388 | ) |
Total waived/reimbursed expenses | | | (176,946 | ) |
Net expenses | | | 3,112,325 | |
Net investment income | | | 13,376,571 | |
| | | | | |
Net Realized and Unrealized Gain (Loss): | |
Net realized gain (loss) on: | |
Investments in unaffiliated issuers | | $ | 1,711,646 | |
Investments in affiliated issuers | | | 5,998 | |
Foreign currency | | | 56,454 | |
Forward foreign currency exchange contracts | | | (173,066 | ) |
Net realized gain | | | 1,601,032 | |
Net change in unrealized appreciation (depreciation) on: | |
Investments in unaffiliated issuers | | | 493,719 | |
Investments in affiliated issuers | | | 41,255 | |
Foreign currency | | | (25 | ) |
Forward foreign currency exchange contracts | | | 29,527 | |
Net change in unrealized appreciation (depreciation) | | | 564,476 | |
Net realized and unrealized gain | | | 2,165,508 | |
Net increase in net assets resulting from operations | | $ | 15,542,079 | |
* | Relates to Trustees not deemed “interested persons” within the meaning of Section 2(a)(19) of the 1940 Act. |
SEE NOTES TO FINANCIAL STATEMENTS. | THE GUGGENHEIM FUNDS SEMI-ANNUAL REPORT | 67 |
STATEMENTS OF CHANGES IN NET ASSETS |
| | Period Ended
March 31,
2017
(Unaudited) | | | Year Ended
September 30,
2016 | |
Increase (Decrease) in Net Assets from Operations: | | | | | | |
Net investment income | | $ | 13,376,571 | | | $ | 15,051,006 | |
Net realized gain on investments | | | 1,601,032 | | | | 329,409 | |
Net change in unrealized appreciation (depreciation) on investments | | | 564,476 | | | | 5,500,562 | |
Net increase in net assets resulting from operations | | | 15,542,079 | | | | 20,880,977 | |
| | | | | | | | | |
Distributions to shareholders from: | | | | | | | | |
Net investment income | | | | | | | | |
A-Class | | | (3,400,124 | ) | | | (5,091,611 | ) |
C-Class | | | (274,457 | ) | | | (443,426 | ) |
P-Class | | | (141,210 | ) | | | (58,350 | ) |
Institutional Class | | | (9,844,079 | ) | | | (9,932,238 | ) |
Net realized gains | | | | | | | | |
A-Class | | | (40,107 | ) | | | — | |
C-Class | | | (4,814 | ) | | | — | |
P-Class | | | (512 | ) | | | — | |
Institutional Class | | | (103,662 | ) | | | — | |
Total distributions to shareholders | | | (13,808,965 | ) | | | (15,525,625 | ) |
| | | | | | | | | |
Capital share transactions: | | | | | | | | |
Proceeds from sale of shares | | | | | | | | |
A-Class | | | 176,388,151 | | | | 197,623,014 | |
C-Class | | | 11,709,010 | | | | 24,267,204 | |
P-Class | | | 36,877,330 | | | | 1,976,882 | |
Institutional Class | | | 661,515,742 | | | | 545,334,586 | |
Distributions reinvested | | | | | | | | |
A-Class | | | 2,766,688 | | | | 4,329,140 | |
C-Class | | | 196,701 | | | | 327,005 | |
P-Class | | | 141,210 | | | | 58,350 | |
Institutional Class | | | 9,033,775 | | | | 8,366,742 | |
Cost of shares redeemed | | | | | | | | |
A-Class | | | (74,297,530 | ) | | | (105,025,329 | ) |
C-Class | | | (6,308,092 | ) | | | (8,309,387 | ) |
P-Class | | | (4,219,893 | ) | | | (3,110,231 | ) |
Institutional Class | | | (141,148,936 | ) | | | (257,307,806 | ) |
Net increase from capital share transactions | | | 672,654,156 | | | | 408,530,170 | |
Net increase in net assets | | | 674,387,270 | | | | 413,885,522 | |
| | | | | | | | | |
Net assets: | | | | | | | | |
Beginning of period | | | 720,894,308 | | | | 307,008,786 | |
End of period | | $ | 1,395,281,578 | | | $ | 720,894,308 | |
Accumulated net investment loss at end of period | | $ | (1,233,005 | ) | | $ | (949,706 | ) |
68 | THE GUGGENHEIM FUNDS SEMI-ANNUAL REPORT | SEE NOTES TO FINANCIAL STATEMENTS. |
STATEMENTS OF CHANGES IN NET ASSETS (concluded) |
| | Period Ended
March 31,
2017
(Unaudited) | | | Year Ended
September 30,
2016 | |
Capital share activity: | | | | | | |
Shares sold | | | | | | |
A-Class | | | 7,142,149 | | | | 8,081,165 | |
C-Class | | | 474,272 | | | | 992,734 | |
P-Class | | | 1,493,003 | | | | 80,811 | |
Institutional Class | | | 26,795,980 | | | | 22,327,682 | |
Shares issued from reinvestment of distributions | | | | | | | | |
A-Class | | | 111,996 | | | | 176,965 | |
C-Class | | | 7,969 | | | | 13,376 | |
P-Class | | | 5,791 | | | | 2,393 | |
Institutional Class | | | 365,752 | | | | 341,766 | |
Shares redeemed | | | | | | | | |
A-Class | | | (3,009,157 | ) | | | (4,296,150 | ) |
C-Class | | | (255,627 | ) | | | (340,015 | ) |
P-Class | | | (170,818 | ) | | | (127,607 | ) |
Institutional Class | | | (5,717,529 | ) | | | (10,535,961 | ) |
Net increase in shares | | | 27,243,781 | | | | 16,717,159 | |
SEE NOTES TO FINANCIAL STATEMENTS. | THE GUGGENHEIM FUNDS SEMI-ANNUAL REPORT | 69 |
This table is presented to show selected data for a share outstanding throughout each period and to assist shareholders in evaluating a Fund’s performance for the periods presented.
A-Class | | Period Ended
March 31,
2017a | | | Year Ended
September 30,
2016 | | | Year Ended
September 30,
2015 | | | Period Ended
September 30,
2014b | |
Per Share Data | | | | | | | | | | | | |
Net asset value, beginning of period | | $ | 24.71 | | | $ | 24.65 | | | $ | 24.97 | | | $ | 25.00 | |
Income (loss) from investment operations: | |
Net investment income (loss)c | | | .33 | | | | .67 | | | | .69 | | | | .52 | |
Net gain (loss) on investments (realized and unrealized) | | | .04 | | | | .08 | | | | (.16 | ) | | | (.08 | ) |
Total from investment operations | | | .37 | | | | .75 | | | | .53 | | | | .44 | |
Less distributions from: | |
Net investment income | | | (.34 | ) | | | (.69 | ) | | | (.84 | ) | | | (.47 | ) |
Net realized gains | | | (— | )d | | | — | | | | (.01 | ) | | | — | |
Total distributions | | | (.34 | ) | | | (.69 | ) | | | (.85 | ) | | | (.47 | ) |
Net asset value, end of period | | $ | 24.74 | | | $ | 24.71 | | | $ | 24.65 | | | $ | 24.97 | |
| |
Total Returnh | | | 1.48 | % | | | 3.16 | % | | | 2.15 | % | | | 1.75 | % |
Ratios/Supplemental Data | |
Net assets, end of period (in thousands) | | $ | 321,057 | | | $ | 215,856 | | | $ | 117,628 | | | $ | 17,035 | |
Ratios to average net assets: | |
Net investment income (loss) | | | 2.66 | % | | | 2.73 | % | | | 2.79 | % | | | 2.67 | % |
Total expensese | | | 0.87 | % | | | 0.93 | % | | | 0.99 | % | | | 1.14 | % |
Net expensesf,i | | | 0.81 | % | | | 0.84 | % | | | 0.87 | % | | | 0.83 | % |
Portfolio turnover rate | | | 25 | % | | | 39 | % | | | 26 | % | | | 40 | % |
C-Class | | Period Ended
March 31,
2017a | | | Year Ended
September 30,
2016 | | | Year Ended
September 30,
2015 | | | Period Ended
September 30,
2014b | |
Per Share Data | | | | | | | | | | | | |
Net asset value, beginning of period | | $ | 24.70 | | | $ | 24.63 | | | $ | 24.96 | | | $ | 25.00 | |
Income (loss) from investment operations: | |
Net investment income (loss)c | | | .24 | | | | .48 | | | | .49 | | | | .38 | |
Net gain (loss) on investments (realized and unrealized) | | | .03 | | | | .10 | | | | (.16 | ) | | | (.09 | ) |
Total from investment operations | | | .27 | | | | .58 | | | | .33 | | | | .29 | |
Less distributions from: | |
Net investment income | | | (.25 | ) | | | (.51 | ) | | | (.65 | ) | | | (.33 | ) |
Net realized gains | | | (— | )d | | | — | | | | (.01 | ) | | | — | |
Total distributions | | | (.25 | ) | | | (.51 | ) | | | (.66 | ) | | | (.33 | ) |
Net asset value, end of period | | $ | 24.72 | | | $ | 24.70 | | | $ | 24.63 | | | $ | 24.96 | |
| |
Total Returnh | | | 1.10 | % | | | 2.39 | % | | | 1.37 | % | | | 1.13 | % |
Ratios/Supplemental Data | |
Net assets, end of period (in thousands) | | $ | 32,428 | | | $ | 26,802 | | | $ | 10,323 | | | $ | 643 | |
Ratios to average net assets: | |
Net investment income (loss) | | | 1.93 | % | | | 1.98 | % | | | 1.96 | % | | | 1.93 | % |
Total expensese | | | 1.68 | % | | | 1.73 | % | | | 1.76 | % | | | 2.14 | % |
Net expensesf,i | | | 1.56 | % | | | 1.58 | % | | | 1.62 | % | | | 1.56 | % |
Portfolio turnover rate | | | 25 | % | | | 39 | % | | | 26 | % | | | 40 | % |
70 | THE GUGGENHEIM FUNDS SEMI-ANNUAL REPORT | SEE NOTES TO FINANCIAL STATEMENTS. |
FINANCIAL HIGHLIGHTS (continued) |
This table is presented to show selected data for a share outstanding throughout each period and to assist shareholders in evaluating a Fund’s performance for the periods presented.
P-Class | | Period Ended
March 31,
2017a | | | Year Ended
September 30,
2016 | | | Period Ended
September 30,
2015g | |
Per Share Data | | | | | | | | | |
Net asset value, beginning of period | | $ | 24.72 | | | $ | 24.65 | | | $ | 24.86 | |
Income (loss) from investment operations: | |
Net investment income (loss)c | | | .32 | | | | .68 | | | | .25 | |
Net gain (loss) on investments (realized and unrealized) | | | .04 | | | | .08 | | | | (.17 | ) |
Total from investment operations | | | .36 | | | | .76 | | | | .08 | |
Less distributions from: | |
Net investment income | | | (.34 | ) | | | (.69 | ) | | | (.29 | ) |
Net realized gains | | | (— | )d | | | — | | | | — | |
Total distributions | | | (.34 | ) | | | (.69 | ) | | | (.29 | ) |
Net asset value, end of period | | $ | 24.74 | | | $ | 24.72 | | | $ | 24.65 | |
| |
Total Returnh | | | 1.47 | % | | | 3.17 | % | | | 0.32 | % |
Ratios/Supplemental Data | |
Net assets, end of period (in thousands) | | $ | 34,496 | | | $ | 1,646 | | | $ | 2,736 | |
Ratios to average net assets: | |
Net investment income (loss) | | | 2.57 | % | | | 2.76 | % | | | 2.39 | % |
Total expensese | | | 0.87 | % | | | 0.94 | % | | | 0.94 | % |
Net expensesf,i | | | 0.81 | % | | | 0.84 | % | | | 0.88 | % |
Portfolio turnover rate | | | 25 | % | | | 39 | % | | | 26 | % |
SEE NOTES TO FINANCIAL STATEMENTS. | THE GUGGENHEIM FUNDS SEMI-ANNUAL REPORT | 71 |
FINANCIAL HIGHLIGHTS (concluded) |
This table is presented to show selected data for a share outstanding throughout each period and to assist shareholders in evaluating a Fund’s performance for the periods presented.
Institutional Class | | Period Ended
March 31,
2017a | | | Year Ended
September 30,
2016 | | | Year Ended
September 30,
2015 | | | Period Ended
September 30,
2014b | |
Per Share Data | | | | | | | | | | | | |
Net asset value, beginning of period | | $ | 24.71 | | | $ | 24.64 | | | $ | 24.96 | | | $ | 25.00 | |
Income (loss) from investment operations: | |
Net investment income (loss)c | | | .36 | | | | .73 | | | | .78 | | | | .57 | |
Net gain (loss) on investments (realized and unrealized) | | | .04 | | | | .09 | | | | (.19 | ) | | | (.08 | ) |
Total from investment operations | | | .40 | | | | .82 | | | | .59 | | | | .49 | |
Less distributions from: | |
Net investment income | | | (.37 | ) | | | (.75 | ) | | | (.90 | ) | | | (.53 | ) |
Net realized gains | | | (— | )d | | | — | | | | (.01 | ) | | | — | |
Total distributions | | | (.38 | ) | | | (.75 | ) | | | (.91 | ) | | | (.53 | ) |
Net asset value, end of period | | $ | 24.73 | | | $ | 24.71 | | | $ | 24.64 | | | $ | 24.96 | |
| |
Total Returnh | | | 1.61 | % | | | 3.43 | % | | | 2.41 | % | | | 1.98 | % |
Ratios/Supplemental Data | |
Net assets, end of period (in thousands) | | $ | 1,007,300 | | | $ | 476,590 | | | $ | 176,322 | | | $ | 69,150 | |
Ratios to average net assets: | |
Net investment income (loss) | | | 2.94 | % | | | 2.97 | % | | | 3.14 | % | | | 2.90 | % |
Total expensese | | | 0.59 | % | | | 0.67 | % | | | 0.73 | % | | | 0.96 | % |
Net expensesf,i | | | 0.56 | % | | | 0.58 | % | | | 0.62 | % | | | 0.57 | % |
Portfolio turnover rate | | | 25 | % | | | 39 | % | | | 26 | % | | | 40 | % |
a | Unaudited figures for the period ended March 31, 2017. Percentage amounts for the period, except total return and portfolio turnover rate, have been annualized. |
b | Since commencement of operations: December 16, 2013. Percentage amounts for the period, except total return and portfolio turnover rate, have been annualized. |
c | Net investment income (loss) per share was computed using average shares outstanding throughout the period. |
d | Distributions from realized gains are less than $0.01 per share. |
e | Does not include expenses of the underlying funds in which the Fund invests. |
f | Net expense information reflects the expense ratios after expense waivers. |
g | Since commencement of operations: May 1, 2015. Percentage amounts for the period, except total return and portfolio turnover rate, have been annualized. |
h | Total return does not reflect the impact of any applicable sales charges and has not been annualized. |
i | Net expenses may include expenses that are excluded from the expense limitation agreement. Excluding these expenses, the net expense ratios for the years would be: |
| 03/31/17 | 09/30/16 | 09/30/15 | 09/30/14 |
A-Class | 0.79% | 0.80% | 0.80% | 0.79% |
C-Class | 1.54% | 1.55% | 1.55% | 1.52% |
P-Class | 0.79% | 0.80% | 0.80% | — |
Institutional Class | 0.54% | 0.55% | 0.55% | 0.54% |
72 | THE GUGGENHEIM FUNDS SEMI-ANNUAL REPORT | SEE NOTES TO FINANCIAL STATEMENTS. |
FUND PROFILE (Unaudited) | March 31, 2017 |
MUNICIPAL INCOME FUND
OBJECTIVE: Seeks to provide current income with an emphasis on income exempt from federal income tax, while also considering capital appreciation.
Holdings Diversification (Market Exposure as % of Net Assets)
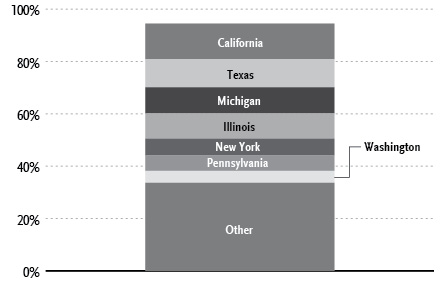
“Holdings Diversification (Market Exposure as % of Net Assets)” excludes any temporary cash investments.
Portfolio Composition by Quality Rating1 |
| Rating | % of Total Investments |
| Fixed Income Instruments | |
| AAA | 7.2% |
| AA | 60.3% |
| A | 10.9% |
| BBB | 14.0% |
| BB | 1.4% |
| B | 0.5% |
NR2 | 1.0% |
| Total | 95.3% |
| Other Instruments | 4.7% |
| Total Investments | 100.0% |
The chart above reflects percentages of the value of total investments. |
Inception Dates: |
A-Class | April 28, 2004 |
C-Class | January 13, 2012 |
P-Class | May 1, 2015 |
Institutional Class | January 13, 2012 |
Ten Largest Holdings (% of Total Net Assets) |
City of Detroit Michigan Sewage Disposal System Revenue Revenue Bonds | 3.3% |
Detroit Wayne County Stadium Authority Revenue Bonds | 3.1% |
Puerto Rico Electric Power Authority Revenue Bonds | 2.7% |
North Texas Tollway Authority Revenue Bonds | 2.4% |
Stockton Public Financing Authority Revenue Bonds | 2.3% |
Tustin Unified School District General Obligation Unlimited | 2.3% |
Massachusetts Development Finance Agency Revenue Bonds | 2.2% |
Hudson County Improvement Authority Revenue Bonds | 2.1% |
Detroit City School District General Obligation Unlimited | 2.1% |
Southern Illinois University Revenue Bonds | 1.9% |
Top Ten Total | 24.4% |
“Ten Largest Holdings” excludes any temporary cash investments. |
1 | Source: BlackRock Solutions. Credit quality ratings are measured on a scale that generally ranges from AAA (highest) to D (lowest). All securities except for those labeled “NR” have been rated by a Nationally Recognized Statistical Rating Organization (“NRSRO”). For purposes of this presentation, when ratings are available from more than one agency, the highest rating is used. Guggenheim Investments converts ratings to the equivalent S&P rating. |
2 | NR securities do not necessarily indicate low credit quality. |
| | THE GUGGENHEIM FUNDS SEMI-ANNUAL REPORT | 73 |
SCHEDULE OF INVESTMENTS (Unaudited) | March 31, 2017 |
MUNICIPAL INCOME FUND | |
| | Shares | | | Value | |
| | | | | | | |
SHORT-TERM INVESTMENTS† - 4.6% | |
Dreyfus AMT-Free Tax Exempt Cash Management Fund — Institutional Class 0.61%1 | | | 2,429,476 | | | $ | 2,429,476 | |
Total Short-Term Investments | | | | | | | | |
(Cost $2,429,476) | | | | | | | 2,429,476 | |
| | | | | | | | | |
| | | Face
Amount | | | | | |
| | | | | | | | | |
MUNICIPAL BONDS†† - 94.4% | |
California - 13.6% | |
Stockton Public Financing Authority Revenue Bonds | | | | | | | | |
6.25% due 10/01/38 | | $ | 1,000,000 | | | | 1,206,200 | |
6.25% due 10/01/40 | | | 250,000 | | | | 301,550 | |
Tustin Unified School District General Obligation Unlimited | | | | | | | | |
6.00% due 08/01/36 | | | 1,000,000 | | | | 1,192,180 | |
College of the Sequoias Tulare Area Improvement District No. 3 General Obligation Unlimited | | | | | | | | |
6.85% due 08/01/422 | | | 1,000,000 | | | | 599,720 | |
State of California General Obligation Unlimited | | | | | | | | |
5.00% due 03/01/26 | | | 500,000 | | | | 596,275 | |
Sacramento Municipal Utility District Revenue Bonds | | | | | | | | |
5.00% due 08/15/37 | | | 500,000 | | | | 560,365 | |
Los Angeles Department of Water & Power Revenue Bonds | | | | | | | | |
5.00% due 07/01/43 | | | 500,000 | | | | 559,825 | |
Kings Canyon Unified School District General Obligation Unlimited | | | | | | | | |
5.00% due 08/01/28 | | | 445,000 | | | | 521,237 | |
San Diego Unified School District General Obligation Unlimited | | | | | | | | |
due 07/01/393 | | | 1,000,000 | | | | 400,230 | |
Oakland Unified School District/Alameda County General Obligation Unlimited | | | | | | | | |
5.00% due 08/01/22 | | | 300,000 | | | | 339,435 | |
M-S-R Energy Authority Revenue Bonds | | | | | | | | |
6.13% due 11/01/29 | | | 200,000 | | | | 250,040 | |
Alameda Corridor Transportation Authority Revenue Bonds | | | | | | | | |
5.00% due 10/01/35 | | | 200,000 | | | | 223,898 | |
Stanton Redevelopment Agency Tax Allocation | | | | | | | | |
5.00% due 12/01/40 | | | 180,000 | | | | 199,017 | |
Culver Redevelopment Agency Tax Allocation | | | | | | | | |
due 11/01/233 | | | 195,000 | | | | 152,344 | |
Total California | | | | | | | 7,102,316 | |
| | | | | | | | | |
Texas - 10.8% | |
North Texas Tollway Authority Revenue Bonds | | | | | | | | |
5.75% due 01/01/40 | | | 1,470,000 | | | | 1,521,973 | |
Dallas Area Rapid Transit Revenue Bonds | | | | | | |
5.00% due 12/01/35 | | | 500,000 | | | | 570,880 | |
5.00% due 12/01/41 | | | 200,000 | | | | 225,438 | |
Texas Tech University Revenue Bonds | | | | | | | | |
5.00% due 08/15/32 | | | 500,000 | | | | 559,905 | |
North Texas Tollway Authority | | | | | | | | |
due 01/01/363 | | | 1,000,000 | | | | 457,020 | |
Birdville Independent School District General Obligation Unlimited | | | | | | | | |
5.00% due 02/15/27 | | | 305,000 | | | | 361,599 | |
Clint Independent School District General Obligation Unlimited | | | | | | | | |
5.00% due 08/15/31 | | | 300,000 | | | | 347,730 | |
State of Texas General Obligation Unlimited | | | | | | | | |
5.00% due 10/01/29 | | | 250,000 | | | | 295,180 | |
Texas Municipal Gas Acquisition & Supply Corporation I Revenue Bonds | | | | | | | | |
6.25% due 12/15/26 | | | 200,000 | | | | 237,126 | |
Central Texas Regional Mobility Authority Revenue Bonds | | | | | | | | |
5.00% due 01/01/27 | | | 200,000 | | | | 230,408 | |
Texas Water Development Board Revenue Bonds | | | | | | | | |
5.00% due 10/15/46 | | | 200,000 | | | | 228,506 | |
Central Texas Turnpike System Revenue Bonds | | | | | | | | |
5.00% due 08/15/34 | | | 200,000 | | | | 217,710 | |
Arlington Higher Education Finance Corp. Revenue Bonds | | | | | | | | |
5.00% due 12/01/46 | | | 200,000 | | | | 208,874 | |
Harris County-Houston Sports Authority Revenue Bonds | | | | | | | | |
due 11/15/533 | | | 1,000,000 | | | | 175,150 | |
Total Texas | | | | | | | 5,637,499 | |
| | | | | | | | | |
Michigan - 10.1% | |
City of Detroit Michigan Sewage Disposal System Revenue Revenue Bonds | | | | | | | | |
1.27% due 07/01/324 | | | 2,000,000 | | | | 1,710,319 | |
Detroit Wayne County Stadium Authority Revenue Bonds | | | | | | | | |
5.00% due 10/01/26 | | | 1,490,000 | | | | 1,612,164 | |
Detroit City School District General Obligation Unlimited | | | | | | | | |
5.00% due 05/01/32 | | | 1,000,000 | | | | 1,067,350 | |
5.00% due 05/01/30 | | | 300,000 | | | | 322,275 | |
City of Detroit Michigan Water Supply System Revenue Revenue Bonds | | | | | | | | |
4.75% due 07/01/29 | | | 230,000 | | | | 239,071 | |
5.00% due 07/01/41 | | | 200,000 | | | | 212,716 | |
Total Michigan | | | | | | | 5,163,895 | |
| | | | | | | | | |
Illinois - 9.7% | |
Southern Illinois University Revenue Bonds | | | | | | | | |
5.00% due 04/01/32 | | | 1,000,000 | | | | 1,011,010 | |
4.00% due 04/01/17 | | | 1,000,000 | | | | 1,000,000 | |
Chicago Transit Authority Revenue Bonds | | | | | | | | |
5.25% due 06/01/26 | | | 740,000 | | | | 759,477 | |
74 | THE GUGGENHEIM FUNDS SEMI-ANNUAL REPORT | SEE NOTES TO FINANCIAL STATEMENTS. |
SCHEDULE OF INVESTMENTS (Unaudited)(continued) | March 31, 2017 |
MUNICIPAL INCOME FUND | |
| | Face
Amount | | | Value | |
| | | | | | | |
City of Chicago Illinois General Obligation Unlimited | | | | | | |
4.75% due 01/01/28 | | $ | 500,000 | | | $ | 501,215 | |
5.00% due 01/01/23 | | | 70,000 | | | | 71,559 | |
5.00% due 01/01/22 | | | 5,000 | | | | 5,037 | |
Will County Township High School District No. 204 Joliet General Obligation Ltd. | | | | | | | | |
6.25% due 01/01/31 | | | 500,000 | | | | 571,710 | |
Chicago O’Hare International Airport Revenue Bonds | | | | | | | | |
5.00% due 01/01/34 | | | 300,000 | | | | 333,309 | |
Chicago Board of Education General Obligation Unlimited | | | | | | | | |
5.25% due 12/01/26 | | | 320,000 | | | | 272,477 | |
Metropolitan Water Reclamation District of Greater Chicago General Obligation Unlimited | | | | | | | | |
5.00% due 12/01/25 | | | 200,000 | | | | 236,484 | |
University of Illinois Revenue Bonds | | | | | | | | |
6.00% due 10/01/29 | | | 200,000 | | | | 233,748 | |
Metropolitan Pier & Exposition Authority Revenue Bonds | | | | | | | | |
due 06/15/453 | | | 500,000 | | | | 125,200 | |
Total Illinois | | | | | | | 5,121,226 | |
| | | | | | | | | |
New York - 6.1% | |
New York State Dormitory Authority Revenue Bonds | | | | | | | | |
5.00% due 10/01/41 | | | 350,000 | | | | 390,996 | |
5.00% due 12/01/275 | | | 200,000 | | | | 223,938 | |
New York City Transitional Finance Authority Future Tax Secured Revenue Revenue Bonds | | | | | | | | |
5.00% due 11/01/29 | | | 500,000 | | | | 593,955 | |
City of New York New York General Obligation Unlimited | | | | | | | | |
5.00% due 08/01/28 | | | 500,000 | | | | 589,575 | |
New York City Water & Sewer System Revenue Bonds | | | | | | | | |
5.00% due 06/15/39 | | | 500,000 | | | | 566,405 | |
New York Transportation Development Corp. Revenue Bonds | | | | | | | | |
5.00% due 07/01/34 | | | 200,000 | | | | 217,224 | |
5.00% due 08/01/26 | | | 200,000 | | | | 209,920 | |
New York State Urban Development Corp. Revenue Bonds | | | | | | | | |
5.00% due 03/15/35 | | | 250,000 | | | | 285,558 | |
Westchester County Healthcare Corp. Revenue Bonds | | | | | | | | |
5.00% due 11/01/44 | | | 200,000 | | | | 210,068 | |
Total New York | | | | | | | 3,287,639 | |
| | | | | | | | | |
Pennsylvania - 5.9% | |
Pennsylvania Economic Development Financing Authority Revenue Bonds | | | | | | | | |
5.00% due 02/01/27 | | | 500,000 | | | | 578,725 | |
5.00% due 03/15/31 | | | 500,000 | | | | 572,045 | |
Pennsylvania Turnpike Commission Revenue Bonds | | | | | | | | |
2.18% due 12/01/204 | | | 500,000 | | | | 504,505 | |
1.89% due 12/01/214 | | | 500,000 | | | | 502,255 | |
Pittsburgh Water & Sewer Authority Revenue Bonds | | | | | | | | |
5.25% due 09/01/36 | | | 500,000 | | | | 564,895 | |
Reading School District General Obligation Unlimited | | | | | | | | |
5.00% due 02/01/27 | | | 300,000 | | | | 337,452 | |
Total Pennsylvania | | | | | | | 3,059,877 | |
| | | | | | | | | |
Washington - 4.4% | |
Greater Wenatchee Regional Events Center Public Facilities Dist Revenue Bonds | | | | | | | | |
5.00% due 09/01/27 | | | 500,000 | | | | 516,490 | |
5.25% due 09/01/32 | | | 500,000 | | | | 510,360 | |
King County Public Hospital District No. 1 General Obligation Ltd. | | | | | | | | |
5.00% due 12/01/37 | | | 500,000 | | | | 523,460 | |
King County School District No. 409 Tahoma General Obligation Unlimited | | | | | | | | |
5.00% due 12/01/27 | | | 325,000 | | | | 386,714 | |
Central Puget Sound Regional Transit Authority Revenue Bonds | | | | | | | | |
5.00% due 11/01/41 | | | 200,000 | | | | 229,150 | |
State of Washington General Obligation Unlimited | | | | | | | | |
5.00% due 06/01/41 | | | 195,000 | | | | 217,053 | |
Total Washington | | | | | | | 2,383,227 | |
| | | | | | | | | |
Arizona - 3.2% | |
Arizona Health Facilities Authority Revenue Bonds | | | | | | | | |
1.48% due 01/01/374 | | | 1,000,000 | | | | 870,190 | |
Arizona State University Revenue Bonds | | | | | | | | |
5.00% due 07/01/34 | | | 500,000 | | | | 569,445 | |
Salt Verde Financial Corp. Revenue Bonds | | | | | | | | |
5.00% due 12/01/32 | | | 200,000 | | | | 228,128 | |
Total Arizona | | | | | | | 1,667,763 | |
| | | | | | | | | |
New Jersey - 3.1% | |
Hudson County Improvement Authority Revenue Bonds | | | | | | | | |
6.00% due 01/01/40 | | | 1,000,000 | | | | 1,094,930 | |
New Jersey Health Care Facilities Financing Authority Revenue Bonds | | | | | | | | |
5.00% due 07/01/41 | | | 300,000 | | | | 316,104 | |
5.00% due 07/01/36 | | | 200,000 | | | | 211,832 | |
Total New Jersey | | | | | | | 1,622,866 | |
| | | | | | | | | |
Puerto Rico - 2.8% | |
Puerto Rico Electric Power Authority Revenue Bonds | | | | | | | | |
1.19% due 07/01/294 | | | 1,845,000 | | | | 1,418,915 | |
SEE NOTES TO FINANCIAL STATEMENTS. | THE GUGGENHEIM FUNDS SEMI-ANNUAL REPORT | 75 |
SCHEDULE OF INVESTMENTS (Unaudited)(continued) | March 31, 2017 |
MUNICIPAL INCOME FUND | |
| | Face
Amount | | | Value | |
| | | | | | | |
District of Columbia - 2.7% | |
District of Columbia General Obligation Unlimited | | | | | | |
5.00% due 06/01/41 | | $ | 285,000 | | | $ | 324,738 | |
5.00% due 06/01/32 | | | 275,000 | | | | 315,761 | |
5.00% due 06/01/31 | | | 175,000 | | | | 207,239 | |
District of Columbia Water & Sewer Authority Revenue Bonds | | | | | | | | |
5.00% due 10/01/45 | | | 500,000 | | | | 564,135 | |
Total District of Columbia | | | | | | | 1,411,873 | |
| | | | | | | | | |
Florida - 2.3% | |
School Board of Miami-Dade County Certificate Of Participation | | | | | | | | |
5.00% due 05/01/27 | | | 500,000 | | | | 578,165 | |
City of Jacksonville Florida Revenue Bonds | | | | | | | | |
5.00% due 10/01/29 | | | 300,000 | | | | 337,413 | |
Miami Beach Redevelopment Agency Tax Allocation | | | | | | | | |
5.00% due 02/01/40 | | | 300,000 | | | | 330,765 | |
Total Florida | | | | | | | 1,246,343 | |
| | | | | | | | | |
Massachusetts - 2.2% | |
Massachusetts Development Finance Agency Revenue Bonds | | | | | | | | |
6.88% due 01/01/41 | | | 1,000,000 | | | | 1,139,460 | |
| | | | | | | | | |
Colorado - 1.9% | |
University of Colorado Revenue Bonds | | | | | | | | |
5.00% due 06/01/37 | | | 285,000 | | | | 318,445 | |
5.00% due 06/01/41 | | | 200,000 | | | | 227,374 | |
Auraria Higher Education Center Revenue Bonds | | | | | | | | |
5.00% due 04/01/28 | | | 390,000 | | | | 456,752 | |
Total Colorado | | | | | | | 1,002,571 | |
| | | | | | | | | |
Louisiana - 1.8% | |
Louisiana Local Government Environmental Facilities & Community Development Auth Revenue Bonds | | | | | | | | |
5.00% due 10/01/37 | | | 500,000 | | | | 552,410 | |
5.00% due 10/01/26 | | | 150,000 | | | | 174,542 | |
Louisiana Public Facilities Authority Revenue Bonds | | | | | | | | |
5.00% due 07/01/39 | | | 200,000 | | | | 218,180 | |
Total Louisiana | | | | | | | 945,132 | |
| | | | | | | | | |
North Carolina - 1.8% | |
North Carolina Turnpike Authority Revenue Bonds | | | | | | | | |
5.00% due 01/01/27 | | | 800,000 | | | | 943,992 | |
| | | | | | | | | |
West Virginia - 1.7% | |
West Virginia Higher Education Policy Commission Revenue Bonds | | | | | | | | |
5.00% due 04/01/29 | | | 500,000 | | | | 557,480 | |
West Virginia Hospital Finance Authority Revenue Bonds | | | | | | | | |
5.00% due 06/01/42 | | | 300,000 | | | | 327,462 | |
Total West Virginia | | | | | | | 884,942 | |
| | | | | | | | | |
Mississippi - 1.6% | |
Mississippi Development Bank Revenue Bonds | | | | | | | | |
6.50% due 10/01/31 | | | 500,000 | | | | 559,745 | |
6.25% due 10/01/26 | | | 230,000 | | | | 259,261 | |
Total Mississippi | | | | | | | 819,006 | |
| | | | | | | | | |
Georgia - 1.5% | |
City of Atlanta Georgia Water & Wastewater Revenue Revenue Bonds | | | | | | | | |
5.00% due 11/01/40 | | | 500,000 | | | | 563,645 | |
Savannah Economic Development Authority Revenue Bonds | | | | | | | | |
5.00% due 12/01/28 | | | 200,000 | | | | 230,552 | |
Total Georgia | | | | | | | 794,197 | |
| | | | | | | | | |
Ohio - 1.5% | |
University of Cincinnati Revenue Bonds | | | | | | | | |
5.00% due 06/01/36 | | | 500,000 | | | | 562,545 | |
American Municipal Power, Inc. Revenue Bonds | | | | | | | | |
5.00% due 02/15/41 | | | 200,000 | | | | 220,458 | |
Total Ohio | | | | | | | 783,003 | |
| | | | | | | | | |
Virginia - 1.3% | |
County of Fairfax Virginia General Obligation Unlimited | | | | | | | | |
5.00% due 10/01/32 | | | 300,000 | | | | 355,068 | |
Virginia College Building Authority Revenue Bonds | | | | | | | | |
5.00% due 02/01/28 | | | 250,000 | | | | 294,690 | |
Total Virginia | | | | | | | 649,758 | |
| | | | | | | | | |
Maryland - 1.0% | |
Maryland State Transportation Authority Revenue Bonds | | | | | | | | |
5.00% due 07/01/35 | | | 500,000 | | | | 523,655 | |
| | | | | | | | | |
Indiana - 0.9% | |
Indiana Finance Authority Revenue Bonds | | | | | | | | |
5.50% due 04/01/24 | | | 400,000 | | | | 445,156 | |
| | | | | | | | | |
Kentucky - 0.8% | |
City of Ashland Kentucky Revenue Bonds | | | | | | | | |
5.00% due 02/01/22 | | | 200,000 | | | | 210,986 | |
Kentucky Economic Development Finance Authority Revenue Bonds | | | | | | | | |
5.00% due 07/01/37 | | | 200,000 | | | | 208,972 | |
Total Kentucky | | | | | | | 419,958 | |
76 | THE GUGGENHEIM FUNDS SEMI-ANNUAL REPORT | SEE NOTES TO FINANCIAL STATEMENTS. |
SCHEDULE OF INVESTMENTS (Unaudited)(concluded) | March 31, 2017 |
MUNICIPAL INCOME FUND | |
| | Face
Amount | | | Value | |
| | | | | | | |
South Carolina - 0.7% | |
Anderson County School District No. 5 General Obligation Unlimited | | | | | | |
5.00% due 03/01/27 | | $ | 300,000 | | | $ | 360,633 | |
| | | | | | | | | |
Nevada - 0.5% | |
Las Vegas Valley Water District General Obligation Ltd. | | | | | | | | |
5.00% due 06/01/27 | | | 230,000 | | | | 271,874 | |
| | | | | | | | | |
Vermont - 0.4% | |
Vermont Educational & Health Buildings Financing Agency Revenue Bonds | | | | | | | | |
5.00% due 12/01/46 | | | 200,000 | | | | 217,452 | |
Total Municipal Bonds | | | | | | | | |
(Cost $49,083,899) | | | | | | | 49,324,228 | |
| | | | | | | | | |
Total Investments - 99.0% | | | | | | | | |
(Cost $51,513,375) | | | | | | $ | 51,753,704 | |
Other Assets & Liabilities, net - 1.0% | | | | | | | 518,422 | |
Total Net Assets - 100.0% | | | | | | $ | 52,272,126 | |
† | Value determined based on Level 1 inputs — See Note 4. |
†† | Value determined based on Level 2 inputs — See Note 4. |
1 | Rate indicated is the 7 day yield as of March 31, 2017. |
2 | Security is a step up/step down bond. The coupon increases or decreases at regular intervals until the bond reaches full maturity. Rate indicated is the rate effective at March 31, 2017. |
3 | Zero coupon rate security. |
4 | Variable rate security. Rate indicated is rate effective at March 31, 2017. |
5 | Security is a 144A or Section 4(a)(2) security. The total market value of 144A or Section 4(a)(2) securities is $223,938 (cost $219,192), or 0.4% of total net assets. These securities have been determined to be liquid under guidelines established by the Board of Trustees. |
| | |
| | See Sector Classification in Other Information section. |
The following table summarizes the inputs used to value the Fund’s investments at March 31, 2017 (See Note 4 in the Notes to Financial Statements):
Investments in Securities (Assets) | | Level 1 | | | Level 2 | | | Level 3 | | | Total | |
Municipal Bonds | | $ | — | | | $ | 49,324,228 | | | $ | — | | | $ | 49,324,228 | |
Short Term Investments | | | 2,429,476 | | | | — | | | | — | | | | 2,429,476 | |
Total | | $ | 2,429,476 | | | $ | 49,324,228 | | | $ | — | | | $ | 51,753,704 | |
Transfers between investment levels may occur as the markets fluctuate and/or the availability of data used in an investment’s valuation changes. Transfers between valuation levels, if any, are in comparison to the valuation levels at the end of the previous fiscal year, and are effective using the fair value as of the end of the previous fiscal period.
For the period ended March 31, 2017, there were no transfers between levels.
SEE NOTES TO FINANCIAL STATEMENTS. | THE GUGGENHEIM FUNDS SEMI-ANNUAL REPORT | 77 |
STATEMENT OF ASSETS AND LIABILITIES (Unaudited) |
March 31, 2017 |
Assets: | |
Investments, at value (cost $51,513,375) | | $ | 51,753,704 | |
Prepaid expenses | | | 43,491 | |
Receivables: | |
Interest | | | 611,070 | |
Fund shares sold | | | 229,566 | |
Total assets | | | 52,637,831 | |
| | | | | |
Liabilities: | |
Payable for: | |
Securities purchased | | | 173,988 | |
Fund shares redeemed | | | 79,637 | |
Transfer agent/maintenance fees | | | 34,085 | |
Distributions to Shareholders | | | 31,192 | |
Distribution and service fees | | | 10,288 | |
Management fees | | | 9,030 | |
Fund accounting/administration fees | | | 3,370 | |
Trustees’ fees* | | | 436 | |
Miscellaneous | | | 23,679 | |
Total liabilities | | | 365,705 | |
Net assets | | $ | 52,272,126 | |
| | | | | |
Net assets consist of: | |
Paid in capital | | $ | 79,441,402 | |
Accumulated net investment loss | | | (1 | ) |
Accumulated net realized loss on investments | | | (27,409,604 | ) |
Net unrealized appreciation on investments | | | 240,329 | |
Net assets | | $ | 52,272,126 | |
| | | | | |
A-Class: | |
Net assets | | $ | 31,499,117 | |
Capital shares outstanding | | | 2,536,099 | |
Net asset value per share | | $ | 12.42 | |
Maximum offering price per share (Net asset value divided by 96.00%) | | $ | 12.94 | |
| | | | | |
C-Class: | |
Net assets | | $ | 4,194,759 | |
Capital shares outstanding | | | 337,970 | |
Net asset value per share | | $ | 12.41 | |
| | | | | |
P-Class: | |
Net assets | | $ | 367,763 | |
Capital shares outstanding | | | 29,626 | |
Net asset value per share | | $ | 12.41 | |
| | | | | |
Institutional Class: | |
Net assets | | $ | 16,210,487 | |
Capital shares outstanding | | | 1,304,777 | |
Net asset value per share | | $ | 12.42 | |
STATEMENT OF OPERATIONS (Unaudited) |
Period Ended March 31, 2017 |
Investment Income: | |
Interest | | $ | 888,667 | |
Total investment income | | | 888,667 | |
| | | | | |
Expenses: | |
Management fees | | | 150,379 | |
Transfer agent/maintenance fees | |
A-Class | | | 32,981 | |
C-Class | | | 2,736 | |
P-Class | | | 199 | |
Institutional Class | | | 6,773 | |
Distribution and service fees: | |
A-Class | | | 43,324 | |
C-Class | | | 22,692 | |
P-Class | | | 120 | |
Fund accounting/administration fees | | | 24,176 | |
Registration fees | | | 28,356 | |
Line of credit fees | | | 5,980 | |
Trustees’ fees* | | | 3,263 | |
Custodian fees | | | 474 | |
Miscellaneous | | | 17,382 | |
Total expenses | | | 338,835 | |
Less: | |
Expenses waived by Adviser: | | | (60,235 | ) |
Expenses reimbursed by Adviser: | | | | |
A-Class | | | (31,595 | ) |
C-Class | | | (2,650 | ) |
P-Class | | | (193 | ) |
Institutional Class | | | (6,623 | ) |
Total waived/reimbursed expenses | | | (101,296 | ) |
Net expenses | | | 237,539 | |
Net investment income | | | 651,128 | |
| | | | | |
Net Realized and Unrealized Gain (Loss): | |
Net realized gain (loss) on: | |
Investments | | | 85,240 | |
Net realized gain | | | 85,240 | |
Net change in unrealized appreciation (depreciation) on: | |
Investments | | | (2,625,260 | ) |
Net change in unrealized appreciation (depreciation) | | | (2,625,260 | ) |
Net realized and unrealized loss | | | (2,540,020 | ) |
Net decrease in net assets resulting from operations | | $ | (1,888,892 | ) |
* | Relates to Trustees not deemed “interested persons” within the meaning of Section 2(a)(19) of the 1940 Act. |
78 | THE GUGGENHEIM FUNDS SEMI-ANNUAL REPORT | SEE NOTES TO FINANCIAL STATEMENTS. |
STATEMENTS OF CHANGES IN NET ASSETS |
| | Period Ended
March 31,
2017
(Unaudited) | | | Year Ended
September 30,
2016 | |
Increase (Decrease) in Net Assets from Operations: | | | | | | |
Net investment income | | $ | 651,128 | | | $ | 1,364,886 | |
Net realized gain on investments | | | 85,240 | | | | 647,792 | |
Net change in unrealized appreciation (depreciation) on investments | | | (2,625,260 | ) | | | 1,067,522 | |
Net increase (decrease) in net assets resulting from operations | | | (1,888,892 | ) | | | 3,080,200 | |
| | | | | | | | | |
Distributions to shareholders from: | | | | | | | | |
Net investment income | | | | | | | | |
A-Class | | | (370,883 | ) | | | (1,005,003 | ) |
C-Class | | | (31,542 | ) | | | (54,384 | ) |
P-Class | | | (1,000 | ) | | | (803 | ) |
Institutional Class | | | (247,703 | ) | | | (304,697 | ) |
Total distributions to shareholders | | | (651,128 | ) | | | (1,364,887 | ) |
| | | | | | | | | |
Capital share transactions: | | | | | | | | |
Proceeds from sale of shares | | | | | | | | |
A-Class | | | 1,825,769 | | | | 19,465,560 | |
C-Class | | | 516,956 | | | | 5,088,386 | |
P-Class | | | 326,153 | | | | 79,335 | |
Institutional Class | | | 4,834,669 | | | | 18,451,425 | |
Distributions reinvested | | | | | | | | |
A-Class | | | 229,542 | | | | 617,221 | |
C-Class | | | 20,846 | | | | 38,398 | |
P-Class | | | 1,000 | | | | 812 | |
Institutional Class | | | 182,618 | | | | 207,229 | |
Cost of shares redeemed | | | | | | | | |
A-Class | | | (10,449,861 | ) | | | (29,246,762 | ) |
C-Class | | | (1,169,441 | ) | | | (2,681,765 | ) |
P-Class | | | (40,838 | ) | | | (6,443 | ) |
Institutional Class | | | (11,967,064 | ) | | | (3,358,814 | ) |
Net increase (decrease) from capital share transactions | | | (15,689,651 | ) | | | 8,654,583 | |
Net increase (decrease) in net assets | | | (18,229,671 | ) | | | 10,369,896 | |
| | | | | | | | | |
Net assets: | | | | | | | | |
Beginning of period | | | 70,501,797 | | | | 60,131,901 | |
End of period | | $ | 52,272,126 | | | $ | 70,501,797 | |
Accumulated net investment loss at end of period | | $ | (1 | ) | | $ | (1 | ) |
| | | | | | | | | |
Capital share activity: | | | | | | | | |
Shares sold | | | | | | | | |
A-Class | | | 144,063 | | | | 1,533,459 | |
C-Class | | | 41,092 | | | | 399,596 | |
P-Class | | | 26,299 | | | | 6,189 | |
Institutional Class | | | 383,426 | | | | 1,437,935 | |
Shares issued from reinvestment of distributions | | | | | | | | |
A-Class | | | 18,476 | | | | 48,393 | |
C-Class | | | 1,680 | | | | 3,006 | |
P-Class | | | 81 | | | | 63 | |
Institutional Class | | | 14,702 | | | | 16,176 | |
Shares redeemed | | | | | | | | |
A-Class | | | (835,568 | ) | | | (2,292,204 | ) |
C-Class | | | (94,387 | ) | | | (210,500 | ) |
P-Class | | | (3,309 | ) | | | (496 | ) |
Institutional Class | | | (968,369 | ) | | | (262,663 | ) |
Net increase (decrease) in shares | | | (1,271,814 | ) | | | 678,953 | |
SEE NOTES TO FINANCIAL STATEMENTS. | THE GUGGENHEIM FUNDS SEMI-ANNUAL REPORT | 79 |
This table is presented to show selected data for a share outstanding throughout each period and to assist shareholders in evaluating a Fund’s performance for the periods presented.
A-Class† | | Period Ended
March 31,
2017a | | | Year Ended
September 30,
2016 | | | Year Ended
September 30,
2015 | | | Year Ended
September 30,
2014 | | | Year Ended
September 30,
2013 | | | Period Ended
September 30,
2012b | |
Per Share Data | | | | | | | | | | | | | | | | | | |
Net asset value, beginning of period | | $ | 12.86 | | | $ | 12.52 | | | $ | 12.51 | | | $ | 11.59 | | | $ | 12.59 | | | $ | 11.82 | |
Income (loss) from investment operations: | |
Net investment income (loss)c | | | .13 | | | | .26 | | | | .29 | | | | .36 | | | | .38 | | | | .26 | |
Distributions to preferred shareholders from: | | | | | | | | | | | | | | | | | | | | | | | | |
Net investment income | | | — | | | | — | | | | — | | | | — | | | | — | | | | (.01 | ) |
Net gain (loss) on investments (realized and unrealized) | | | (.44 | ) | | | .34 | | | | .01 | | | | .92 | | | | (1.00 | ) | | | .78 | |
Total from investment operations | | | (.31 | ) | | | .60 | | | | .30 | | | | 1.28 | | | | (.62 | ) | | | 1.03 | |
Less distributions from: | |
Net investment income | | | (.13 | ) | | | (.26 | ) | | | (.29 | ) | | | (.36 | ) | | | (.38 | ) | | | (.26 | ) |
Total distributions | | | (.13 | ) | | | (.26 | ) | | | (.29 | ) | | | (.36 | ) | | | (.38 | ) | | | (.26 | ) |
Net asset value, end of period | | $ | 12.42 | | | $ | 12.86 | | | $ | 12.52 | | | $ | 12.51 | | | $ | 11.59 | | | $ | 12.59 | |
| |
Total Returng | | | (2.38 | %) | | | 4.85 | % | | | 2.39 | % | | | 11.20 | % | | | (5.09 | %) | | | 8.91 | % |
Ratios/Supplemental Data | |
Net assets, end of period (in thousands) | | $ | 31,499 | | | $ | 41,283 | | | $ | 49,086 | | | $ | 44,090 | | | $ | 50,463 | | | $ | 77,609 | |
Ratios to average net assets: | |
Net investment income (loss) | | | 2.14 | % | | | 2.06 | % | | | 2.28 | % | | | 3.00 | % | | | 3.04 | % | | | 2.78 | % |
Total expenses | | | 1.20 | % | | | 1.18 | % | | | 1.17 | % | | | 1.29 | % | | | 1.14 | % | | | 1.15 | % |
Net expensesd,h | | | 0.82 | % | | | 0.81 | % | | | 0.81 | % | | | 0.83 | % | | | 0.82 | % | | | 0.87 | % |
Portfolio turnover rate | | | 17 | % | | | 61 | % | | | 80 | % | | | 173 | % | | | 91 | % | | | 121 | % |
C-Class | | Period Ended
March 31,
2017a | | | Year Ended
September 30,
2016 | | | Year Ended
September 30,
2015 | | | Year Ended
September 30,
2014 | | | Year Ended
September 30,
2013 | | | Period Ended
September 30,
2012e | |
Per Share Data | | | | | | | | | | | | | | | | | | |
Net asset value, beginning of period | | $ | 12.86 | | | $ | 12.52 | | | $ | 12.50 | | | $ | 11.59 | | | $ | 12.58 | | | $ | 11.98 | |
Income (loss) from investment operations: | |
Net investment income (loss)c | | | .09 | | | | .16 | | | | .19 | | | | .27 | | | | .28 | | | | .20 | |
Net gain (loss) on investments (realized and unrealized) | | | (.45 | ) | | | .35 | | | | .02 | | | | .91 | | | | (.98 | ) | | | .62 | |
Total from investment operations | | | (.36 | ) | | | .51 | | | | .21 | | | | 1.18 | | | | (.70 | ) | | | .82 | |
Less distributions from: | |
Net investment income | | | (.09 | ) | | | (.17 | ) | | | (.19 | ) | | | (.27 | ) | | | (.29 | ) | | | (.22 | ) |
Total distributions | | | (.09 | ) | | | (.17 | ) | | | (.19 | ) | | | (.27 | ) | | | (.29 | ) | | | (.22 | ) |
Net asset value, end of period | | $ | 12.41 | | | $ | 12.86 | | | $ | 12.52 | | | $ | 12.50 | | | $ | 11.59 | | | $ | 12.58 | |
| |
Total Returng | | | (2.82 | %) | | | 4.06 | % | | | 1.71 | % | | | 10.28 | % | | | (5.70 | %) | | | 7.04 | % |
Ratios/Supplemental Data | |
Net assets, end of period (in thousands) | | $ | 4,195 | | | $ | 5,008 | | | $ | 2,472 | | | $ | 1,082 | | | $ | 1,495 | | | $ | 1,176 | |
Ratios to average net assets: | |
Net investment income (loss) | | | 1.39 | % | | | 1.26 | % | | | 1.54 | % | | | 2.24 | % | | | 2.30 | % | | | 2.36 | % |
Total expenses | | | 1.88 | % | | | 1.89 | % | | | 1.87 | % | | | 2.08 | % | | | 1.93 | % | | | 1.94 | % |
Net expensesd,h | | | 1.57 | % | | | 1.56 | % | | | 1.56 | % | | | 1.58 | % | | | 1.57 | % | | | 1.55 | % |
Portfolio turnover rate | | | 17 | % | | | 61 | % | | | 80 | % | | | 173 | % | | | 91 | % | | | 121 | % |
80 | THE GUGGENHEIM FUNDS SEMI-ANNUAL REPORT | SEE NOTES TO FINANCIAL STATEMENTS. |
FINANCIAL HIGHLIGHTS (continued) |
This table is presented to show selected data for a share outstanding throughout each period and to assist shareholders in evaluating a Fund’s performance for the periods presented.
P-Class | | Period Ended
March 31,
2017a | | | Year Ended
September 30,
2016 | | | Period Ended
September 30,
2015f | |
Per Share Data | | | | | | | | | |
Net asset value, beginning of period | | $ | 12.86 | | | $ | 12.52 | | | $ | 12.64 | |
Income (loss) from investment operations: | |
Net investment income (loss)c | | | .13 | | | | .26 | | | | .13 | |
Net gain (loss) on investments (realized and unrealized) | | | (.45 | ) | | | .34 | | | | (.12 | ) |
Total from investment operations | | | (.32 | ) | | | .60 | | | | .01 | |
Less distributions from: | |
Net investment income | | | (.13 | ) | | | (.26 | ) | | | (.13 | ) |
Total distributions | | | (.13 | ) | | | (.26 | ) | | | (.13 | ) |
Net asset value, end of period | | $ | 12.41 | | | $ | 12.86 | | | $ | 12.52 | |
| |
Total Returng | | | (2.48 | %) | | | 4.86 | % | | | 0.06 | % |
Ratios/Supplemental Data | |
Net assets, end of period (in thousands) | | $ | 368 | | | $ | 84 | | | $ | 10 | |
Ratios to average net assets: | |
Net investment income (loss) | | | 2.07 | % | | | 2.00 | % | | | 2.46 | % |
Total expenses | | | 1.42 | % | | | 1.21 | % | | | 3.17 | % |
Net expensesd,h | | | 0.82 | % | | | 0.79 | % | | | 0.81 | % |
Portfolio turnover rate | | | 17 | % | | | 61 | % | | | 80 | % |
SEE NOTES TO FINANCIAL STATEMENTS. | THE GUGGENHEIM FUNDS SEMI-ANNUAL REPORT | 81 |
FINANCIAL HIGHLIGHTS (concluded) |
This table is presented to show selected data for a share outstanding throughout each period and to assist shareholders in evaluating a Fund’s performance for the periods presented.
Institutional Class | | Period Ended
March 31,
2017a | | | Year Ended
September 30,
2016 | | | Year Ended
September 30,
2015 | | | Year Ended
September 30,
2014 | | | Year Ended
September 30,
2013 | | | Period Ended
September 30,
2012e | |
Per Share Data | | | | | | | | | | | | | | | | | | |
Net asset value, beginning of period | | $ | 12.87 | | | $ | 12.53 | | | $ | 12.51 | | | $ | 11.60 | | | $ | 12.59 | | | $ | 11.98 | |
Income (loss) from investment operations: | |
Net investment income (loss)c | | | .15 | | | | .29 | | | | .32 | | | | .39 | | | | .40 | | | | .29 | |
Net gain (loss) on investments (realized and unrealized) | | | (.45 | ) | | | .34 | | | | .02 | | | | .91 | | | | (.98 | ) | | | .62 | |
Total from investment operations | | | (.30 | ) | | | .63 | | | | .34 | | | | 1.30 | | | | (.58 | ) | | | .91 | |
Less distributions from: | |
Net investment income | | | (.15 | ) | | | (.29 | ) | | | (.32 | ) | | | (.39 | ) | | | (.41 | ) | | | (.30 | ) |
Total distributions | | | (.15 | ) | | | (.29 | ) | | | (.32 | ) | | | (.39 | ) | | | (.41 | ) | | | (.30 | ) |
Net asset value, end of period | | $ | 12.42 | | | $ | 12.87 | | | $ | 12.53 | | | $ | 12.51 | | | $ | 11.60 | | | $ | 12.59 | |
| |
Total Returng | | | (2.34 | %) | | | 5.11 | % | | | 2.73 | % | | | 11.38 | % | | | (4.76 | %) | | | 7.76 | % |
Ratios/Supplemental Data | |
Net assets, end of period (in thousands) | | $ | 16,210 | | | $ | 24,126 | | | $ | 8,564 | | | $ | 6,451 | | | $ | 6,343 | | | $ | 1,051 | |
Ratios to average net assets: | |
Net investment income (loss) | | | 2.37 | % | | | 2.24 | % | | | 2.53 | % | | | 3.23 | % | | | 3.35 | % | | | 3.37 | % |
Total expenses | | | 0.83 | % | | | 0.84 | % | | | 0.89 | % | | | 0.97 | % | | | 0.93 | % | | | 0.86 | % |
Net expensesd,h | | | 0.57 | % | | | 0.56 | % | | | 0.56 | % | | | 0.58 | % | | | 0.57 | % | | | 0.55 | % |
Portfolio turnover rate | | | 17 | % | | | 61 | % | | | 80 | % | | | 173 | % | | | 91 | % | | | 121 | % |
† | Effective January 13, 2012, the Fund acquired all of the assets and liabilities of the TS&W/Claymore Tax-Advantage Balanced Fund (“TYW”), a registered closed-end management investment company. The A-Class financial highlights for the periods prior to that date reflect performance of TYW. |
a | Unaudited figures for the period ended March 31, 2017. Percentage amounts for the period, except total return and portfolio turnover rate, have been annualized. |
b | Prior to January 13, 2012, the Fund’s fiscal year end was December 31. Percentage amounts for the period, except total return and portfolio turnover rate, have been annualized. |
c | Net investment income (loss) per share was computed using average shares outstanding throughout the period. |
d | Net expense information reflects the expense ratios after expense waivers. |
e | Since commencement of operations: January 13, 2012. Percentage amounts for the period, except total return and portfolio turnover rate, have been annualized. |
f | Since commencement of operations: May 1, 2015. Percentage amounts for the period, except total return and portfolio turnover rate, have been annualized. |
g | Total return does not reflect the impact of any applicable sales charges and has not been annualized. |
h | Net expenses may include expenses that are excluded from the expense limitation agreement. Excluding these expenses, the net expense ratios for the years would be: |
| 03/31/17 | 09/30/16 | 09/30/15 | 09/30/14 |
A-Class | 0.80% | 0.80% | 0.80% | 0.80% |
C-Class | 1.55% | 1.55% | 1.55% | 1.54% |
P-Class | 0.80% | 0.78% | 0.81% | — |
Institutional Class | 0.55% | 0.55% | 0.55% | 0.55% |
82 | THE GUGGENHEIM FUNDS SEMI-ANNUAL REPORT | SEE NOTES TO FINANCIAL STATEMENTS. |
NOTES TO FINANCIAL STATEMENTS (Unaudited) |
1. Organization and Significant Accounting Policies
Organization
Guggenheim Funds Trust (the “Trust”), a Delaware statutory trust, is registered with the SEC under the Investment Company Act of 1940 (“1940 Act”), as an open-ended investment company of the series type. Each series, in effect, is representing a separate Fund. The Trust is authorized to issue an unlimited number of shares. The Trust accounts for the assets of each Fund separately.
The Trust offers a combination of five separate classes of shares, A-Class shares, C-Class shares, P-Class shares, R6-Class shares and Institutional Class shares. Sales of shares of each Class are made without a front-end sales charge at the net asset value per share (“NAV”), with the exception of A-Class shares. A-Class shares are sold at the NAV, plus the applicable front-end sales charge. The sales charge varies depending on the amount purchased, but will not exceed 2.25% for the Limited Duration Fund and 4.00% for the remaining Funds. A-Class share purchases of $1 million or more are exempt from the front-end sales charge but have a 1% contingent deferred sales charge (“CDSC”), if shares are redeemed within 12 months of purchase. B-Class shares previously offered have been converted to A-Class shares effective August 8, 2015 for the funds in the Trust. C-Class shares have a 1% CDSC if shares are redeemed within 12 months of purchase. Institutional Class shares are offered primarily for direct investment by institutions such as pension and profit sharing plans, endowments, foundations and corporations. Institutional Class shares require a minimum initial investment of $2 million and a minimum account balance of $1 million. At March 31, 2017, the Trust consisted of nineteen funds.
As of January 1, 2012, A-Class, C-Class, P-Class and Institutional Class shares of High Yield Fund are subject to a 2% redemption fee when shares are redeemed or exchanged within 90 days of purchase.
This report covers the Diversified Income Fund, High Yield Fund, Investment Grade Bond Fund, Limited Duration Fund, and Municipal Income Fund (the “Funds”), each a diversified investment company. Only A-Class, C-Class, P-Class and Institutional Class shares had been issued by the Funds.
Security Investors, LLC and Guggenheim Partners Investment Management, LLC, which operates under the name Guggenheim Investments (“GI”), provides advisory services. Guggenheim Funds Distributors, LLC (“GFD”) acts as principal underwriter for the Trust. GI and GFD are affiliated entities. Guggenheim Partners Investment Management (“GPIM”), an affiliate of GI, serves as investment sub-advisor (the “Sub-Advisor”) to the Municipal Income Fund and is responsible for the day-to-day management of the Fund’s portfolio.
Significant Accounting Policies
The Funds operate as investment companies and, accordingly, follow the investment company accounting and reporting guidance of the Financial Accounting Standards Board (“FASB”) Accounting Standards Codification Topic 946 Financial Services – Investment Companies.
The following significant accounting policies are in conformity with U.S. generally accepted accounting principles (“U.S. GAAP”) and are consistently followed by the Trust. This requires management to make estimates and assumptions that affect the reported amount of assets and liabilities, contingent assets and liabilities at the date of the financial statements, and the reported amounts of revenues and expenses during the reporting period. Actual results could differ from these estimates. All time references are based on Eastern Time.
The NAV of each Class of the Funds is calculated by dividing the market value of the Fund’s securities and other assets, less all liabilities, attributable to the Class by the number of outstanding shares of the Class.
A. The Board of Trustees of the Funds (the “Board”) has adopted policies and procedures for the valuation of the Funds’ investments (the “Valuation Procedures”). Pursuant to the Valuation Procedures, the Board has delegated to a valuation committee, consisting of representatives from Guggenheim’s investment management, fund administration, legal and compliance departments (the “Valuation Committee”), the day-to-day responsibility for implementing the Valuation Procedures, including, under most circumstances, the responsibility for determining the fair value of the Funds’ securities and/or other assets.
Valuations of the Funds’ securities are supplied primarily by pricing services appointed pursuant to the processes set forth in the Valuation Procedures. The Valuation Committee convenes monthly, or more frequently as needed, to review the valuation of all assets which have been fair valued for reasonableness. The Funds’ officers, through the Valuation Committee and consistent with the monitoring and review responsibilities set forth in the Valuation Procedures, regularly review procedures used and valuations provided by the pricing services.
If the pricing service cannot or does not provide a valuation for a particular investment or such valuation is deemed unreliable, such investment is fair valued by the Valuation Committee.
Equity securities listed on an exchange (New York Stock Exchange (“NYSE”) or American Stock Exchange) are valued at the last quoted sales price as of the close of business on the NYSE, usually 4:00 p.m. on the valuation date. Equity securities listed on
| | THE GUGGENHEIM FUNDS SEMI-ANNUAL REPORT | 83 |
NOTES TO FINANCIAL STATEMENTS (Unaudited)(continued) |
the NASDAQ market system are valued at the NASDAQ Official Closing Price on the valuation date, which may not necessarily represent the last sale price. If there has been no sale on such exchange or NASDAQ on a given day, the security is valued at the closing bid price on that day.
Generally, trading in foreign securities markets is substantially completed each day at various times prior to the close of the NYSE. The values of foreign securities are determined as of the close of such foreign markets or the close of the NYSE, if earlier. All investments quoted in foreign currencies are valued in U.S. dollars on the basis of the foreign currency exchange rates prevailing at the close of business. Investments in foreign securities may involve risks not present in domestic investments. The Valuation Committee will determine the current value of such foreign securities by taking into consideration certain factors which may include those discussed above, as well as the following factors, among others: the value of the securities traded on other foreign markets, ADR trading, closed-end fund trading, foreign currency exchange activity, and the trading prices of financial products that are tied to foreign securities. In addition, the Board has authorized the Valuation Committee and GI to use prices and other information supplied by a third party pricing vendor in valuing foreign securities.
Open-end investment companies (“mutual funds”) are valued at their NAV as of the close of business, on the valuation date. Exchange-traded funds (“ETFs”) and closed-end investment companies (“CEFs”) are valued at the last quoted sales price.
U.S. Government securities are valued by either independent pricing services, the last traded fill price, or at the reported bid price at the close of business.
Debt securities with a maturity of greater than 60 days at acquisition are valued at prices that reflect broker-dealer supplied valuations or are obtained from independent pricing services, which may consider the trade activity, treasury spreads, yields or price of bonds of comparable quality, coupon, maturity, and type, as well as prices quoted by dealers who make markets in such securities. Short-term debt securities with a maturity of 60 days or less at acquisition are valued at amortized cost, provided such amount approximates market value.
Repurchase agreements are valued at amortized cost, provided such amounts approximate market value.
Typically, loans are valued using information provided by an independent third party pricing service which uses broker quotes in a non-active market.
Investments for which market quotations are not readily available are fair-valued as determined in good faith by GI under the direction of the Board using methods established or ratified by the Board. Valuations in accordance with these methods are intended to reflect each security’s (or asset’s) “fair value.” Each such determination is based on a consideration of all relevant factors, which are likely to vary from one pricing context to another. Examples of such factors may include, but are not limited to market prices; sale prices; broker quotes; and models which derive prices based on inputs such as prices of securities with comparable maturities and characteristics, or based on inputs such as anticipated cash flows or collateral, spread over Treasuries, and other information analysis.
In connection with other derivative investments, such factors may include obtaining information as to how (a) these contracts and other derivative investments trade in the futures or other derivative markets, respectively, and (b) the securities underlying these contracts and other derivative investments trade in the cash market.
B. Certain U.S. Government and Agency Obligations are traded on a discount basis; the interest rates shown on the Schedules of Investments reflect the effective rates paid at the time of purchase by the Funds. Other securities bear interest at the rates shown, payable at fixed dates through maturity.
C. Senior loans in which the Funds invest generally pay interest rates which are periodically adjusted by reference to a base short-term floating rate, plus a premium. These base lending rates are generally (i) the lending rate offered by one or more major European banks, such as the one-month or three-month London Inter-Bank Offered Rate (LIBOR), (ii) the prime rate offered by one or more major United States banks, or (iii) the bank’s certificate of deposit rate. Senior floating rate interests often require prepayments from excess cash flows or permit the borrower to repay at its election. The rate at which the borrower repays cannot be predicted with accuracy. As a result, the actual remaining maturity may be substantially less than the stated maturities shown. The interest rate indicated is the rate in effect at March 31, 2017.
D. The Funds may purchase and sell interests in securities on a when-issued and delayed delivery basis, with payment and delivery scheduled for a future date. No income accrues to the Fund on such interests or securities in connection with such transactions prior to the date the Funds actually take delivery of such interests or securities. These transactions are subject to market fluctuations and are subject to the risk that the value at delivery may be more or less than the trade date purchase price. Although the Funds will generally purchase these securities with the intention of acquiring such securities, they may sell such securities before the settlement date.
84 | THE GUGGENHEIM FUNDS SEMI-ANNUAL REPORT | |
NOTES TO FINANCIAL STATEMENTS (Unaudited)(continued) |
E. Upon the purchase of an option, the premium paid is recorded as an investment, the value of which is marked-to-market daily. If a purchased option expires, the Fund realizes a loss in the amount of the cost of the option. When the Fund enters into a closing sale transaction, it realizes a gain or loss depending on whether the proceeds from the closing sale transaction are greater or less than the cost of the option. If the Fund exercises a put option, it realizes a gain or loss from the sale of the underlying security and the proceeds from such sale will be decreased by the premium originally paid. When the Fund exercises a call option, the cost of the security purchased by the Fund upon exercise increases by the premium originally paid.
When the Fund writes (sells) an option, an amount equal to the premium received is entered in that Fund’s accounting records as an asset and equivalent liability. The amount of the liability is subsequently marked-to-market to reflect the current value of the option written. When a written option expires, or if the Fund enters into a closing purchase transaction, it realizes a gain (or loss if the cost of a closing purchase transaction exceeds the premium received when the option was sold).
F. Swap agreements are marked-to-market daily and the change, if any, is recorded as unrealized gain or loss. Payments received or made as a result of an agreement or termination of an agreement are recognized as realized gains or losses.
G. Forward foreign currency exchange contracts are valued daily based on the applicable exchange rate of the underlying currency. The change in value of the contract is recorded as unrealized appreciation or depreciation until the contract is closed. When the contract is closed, the Funds record a realized gain or loss equal to the difference between the value at the time the contract was opened and the value at the time it was closed.
H. Security transactions are recorded on the trade date for financial reporting purposes. Realized gains and losses from securities transactions are recorded using the identified cost basis. Proceeds from lawsuits related to investment holdings are recorded as realized gains in the respective Fund. Dividend income is recorded on the ex-dividend date, net of applicable taxes withheld by foreign countries. Taxable non-cash dividends are recorded as dividend income. Interest income, including amortization of premiums and accretion of discounts, is accrued on a daily basis. Interest income also includes paydown gains and losses on mortgage-backed and asset-backed securities and senior and subordinated loans. Amendment fees are earned as compensation for evaluating and accepting changes to the original loan agreement and are recognized when received. Dividend income from REITs is recorded based on the income included in the distributions received from the REIT investments using published REIT classifications, including some management estimates when actual amounts are not available. Distributions received in excess of this estimated amount are recorded as a reduction of the cost of investments or reclassified to capital gains. The actual amounts of income, return of capital, and capital gains are only determined by each REIT after its fiscal year-end, and may differ from the estimated amounts.
I. The Funds declare dividends from investment income daily except Diversified Income Fund, which declares montly. Each Fund pays its shareholders from its net investment income monthly and distributes any net capital gains that it has realized, at least annually. Distributions to shareholders are recorded on the ex-dividend date. Dividends are reinvested in additional shares unless shareholders request payment in cash. The character of distributions made during the year from net investment income or net realized gains may differ from their ultimate characterization for federal income tax purposes.
J. Interest and dividend income, most expenses, all realized gains and losses, and all unrealized gains and losses are allocated to the classes based upon the value of the outstanding shares in each Class. Certain costs, such as distribution and service fees are charged directly to specific classes. In addition, certain expenses have been allocated to the individual Funds in the Trust on a pro rata basis upon the respective aggregate net assets of each Fund included in the Trust.
K. Under the fee arrangement with the custodian, the Funds may earn credits based on overnight custody cash balances. These credits are utilized to reduce related custodial expenses. The custodian fees disclosed in the Statement of Operations are before the reduction in expense from the related earnings credits, if any. For the period ended March 31, 2017, there were no earnings credits received.
L. The Funds may leave cash overnight in their cash account with the custodian. Periodically, a Fund may have cash due to the custodian bank as an overdraft balance. A fee is incurred on this overdraft, calculated by multiplying the overdraft by a rate based on the federal funds rate, which was 0.82% at March 31, 2017.
M. The accounting records of the Funds are maintained in U.S. dollars. All assets and liabilities initially expressed in foreign currencies are converted into U.S. dollars at prevailing exchange rates. Purchases and sales of investment securities, dividend and interest income, and certain expenses are translated at the rates of exchange prevailing on the respective dates of such transactions. Changes in the relationship of these foreign currencies to the U.S. dollar can significantly affect the value of the investments and earnings of the Funds. Foreign investments may also subject the Funds to foreign government exchange restrictions, expropriation, taxation or other political, social or economic developments, all of which could affect the market and/or credit risk of the investments. The Funds do not isolate that portion of the results of
| | THE GUGGENHEIM FUNDS SEMI-ANNUAL REPORT | 85 |
NOTES TO FINANCIAL STATEMENTS (Unaudited)(continued) |
operations resulting from changes in the foreign exchange rates on investments from the fluctuations arising from changes in the market prices of Securities held. Such fluctuations are included with the net realized and unrealized gain or loss on investments. Reported net realized foreign exchange gains and losses arise from sales of foreign currencies and currency gains or losses realized between the trade and settlement dates on investment transactions. Net unrealized exchange gains and losses arise from changes in the fair values of assets and liabilities other than investments in securities at the fiscal period end, resulting from changes in exchange rates.
N. Under the Funds’ organizational documents, the Trustees and Officers are indemnified against certain liabilities arising out of the performance of their duties to the Trust. In addition, throughout the normal course of business, the Funds enter into contracts that contain a variety of representations and warranties which provide general indemnifications. The Funds’ maximum exposure under these arrangements is unknown, as this would involve future claims that may be made against the Funds and/or their affiliates that have not yet occurred. However, based on experience, the Funds expect the risk of loss to be remote.
2. Financial Instruments and Derivatives
As part of their investment strategy, the Funds utilize a variety of derivative instruments. These investments involve, to varying degrees, elements of market risk and risks in excess of the amounts recognized in the Statements of Assets and Liabilities. Valuation and accounting treatment of these instruments can be found under Significant Accounting Policies in Note 1 of these Notes to Financial Statements.
Derivatives
Derivatives are instruments whose values depend on, or are derived from, in whole or in part, the value of one or more other assets, such as securities, currencies, commodities or indices. Derivative instruments may be used to increase investment flexibility (including to maintain cash reserves while maintaining exposure to certain other assets), for risk management (hedging) purposes, to facilitate trading, to reduce transaction costs and to pursue higher investment returns. Derivative instruments may also be used to mitigate certain investment risks, such as foreign currency exchange rate risk, interest rate risk and credit risk. U.S. GAAP requires disclosures to enable investors to better understand how and why a Fund uses derivative instruments, how these derivative instruments are accounted for and their effects on the Fund’s financial position and results of operations. The Funds may utilize derivatives for the following purposes:
Duration: the use of an instrument to manage the interest rate risk of a portfolio.
Hedge: an investment made in order to reduce the risk of adverse price movements in a security, by taking an offsetting position to protect against broad market moves.
Options Purchased and Written
A call option on a security gives the purchaser of the option the right to buy, and the writer of a call option the obligation to sell, the underlying security. The purchaser of a put option has the right to sell, and the writer of the put option the obligation to buy, the underlying security at any time during the option period. The risk associated with purchasing options is limited to the premium originally paid.
The following table represents the Funds’ use, and volume of call/put options purchased on a quarterly basis:
Fund | Use | | Average Number of Contracts | |
Investment Grade Bond Fund | Duration, Hedge | | | 450 | |
The risk in writing a call option is that a Fund may incur a loss if the market price of the underlying security increases and the option is exercised. The risk in writing a put option is that a Fund may incur a loss if the market price of the underlying security decreases and the option is exercised. In addition, there may be an imperfect correlation between the movement in prices of options and the underlying securities where a Fund may not be able to enter into a closing transaction because of an illiquid secondary market; or, for OTC options, a Fund may be at risk because of the counterparty’s inability to perform.
86 | THE GUGGENHEIM FUNDS SEMI-ANNUAL REPORT | |
NOTES TO FINANCIAL STATEMENTS (Unaudited)(continued) |
The following tables represent the Funds’ use and activity of options written for the period ended March 31, 2017:
Fund | Use | | Average
Notional | |
Investment Grade Bond Fund | Duration, Hedge | | $ | 450 | |
Written Call Options | | | |
| | | Investment Grade Bond Fund | |
| | Number of contracts | | | Premium amount | |
Balance at September 30, 2016 | | | — | | | $ | — | |
Options Written | | | 1,798 | | | | 163,618 | |
Options terminated in closing purchase transactions | | | — | | | | — | |
Options expired | | | — | | | | — | |
Options exercised | | | — | | | | — | |
Balance at March 31, 2017 | | | 1,798 | | | $ | 163,618 | |
Swaps
A swap is an agreement that obligates two parties to exchange a series of cash flows at specified intervals based upon or calculated by reference to changes in specified prices or rates for a specified amount of an underlying asset. A Fund utilizing OTC swaps bears the risk of loss of the amount expected to be received under a swap agreement in the event of the default or bankruptcy of a swap agreement counterparty or if the underlying asset declines in value. Certain standardized swaps are subject to mandatory central clearing. Central clearing generally reduces counterparty credit risk and increases liquidity, but central clearing does not make swap transactions risk-free. For Funds utilizing interest rate swaps, the exchange bears the risk of loss Additionally, there is no guarantee that a Fund or an underlying fund could eliminate its exposure under an outstanding swap agreement by entering into an offsetting swap agreement with the same or another party.
Interest rate swaps involve the exchange by the Fund with another party for its respective commitment to pay or receive interest on a notional amount of principal. Interest rate swaps are generally valued using the closing price from the prior day, subject to an adjustment for the current day’s spreads. Interest rate swaps are generally subject to mandatory central clearing, but central clearing does not make interest rate swap transactions risk free.
The following table represents the Fund’s use and volume of interest rate swaps on a quarterly basis:
| | | | Average Notional | |
Fund | Use | | Long | | | Short | |
Intermediate Bond Fund | Duration, Hedge | | $ | — | | | $ | 1,550,000 | |
Forward Foreign Currency Exchange Contracts
A forward foreign currency exchange contract is an agreement between two parties to exchange two designated currencies at a specific time in the future. Certain types of contracts may be cash settled, in an amount equal to the change in exchange rates during the term of the contract. The contracts can be used to hedge or manage exposure to foreign currency risks with portfolio investments or to gain exposure to foreign currencies.
The market value of a forward foreign currency exchange contract changes with fluctuations in foreign currency exchange rates. Furthermore, the Funds may be exposed to risk if the counterparties cannot meet the contract terms or if the currency value changes unfavorably as compared to the U.S. dollar.
| | THE GUGGENHEIM FUNDS SEMI-ANNUAL REPORT | 87 |
NOTES TO FINANCIAL STATEMENTS (Unaudited)(continued) |
The following table represents the Funds’ use, and volume of forward currency exchange contracts on a quarterly basis:
| | | | Average Settlement | |
Fund | Use | | Purchased | | | Sold | |
High Yield Fund | Hedge | | $ | 14,901,412 | | | $ | 683,859 | |
Investment Grade Bond Fund | Hedge | | | 270,343 | | | | — | |
Limited Duration Fund | Hedge, Income | | | 23,574,279 | | | | — | |
Derivative Investment Holdings Categorized by Risk Exposure
The following is a summary of the location of derivative investments on the Funds’ Statements of Assets and Liabilities as of March 31, 2017:
Derivative Investment Type | Asset Derivatives | Liability Derivatives |
Currency contracts | Unrealized appreciation on forward foreign currency exchange contracts | Unrealized depreciation on forward foreign currency exchange contracts |
Interest rate contracts | Unrealized appreciation on swap agreements | Unrealized appreciation on swap agreements |
The following table sets forth the fair value of the Funds’ derivative investments categorized by primary risk exposure at March 31, 2017:
Asset Derivative Investments Value | |
Fund | | Options
Written Equity
Contracts | | | Options
Purchased
Equity
Contracts | | | Forward
Foreign
Currency
Exchange
Contracts | | | Total Value at
March 31, 2017 | |
High Yield Fund | | $ | — | | | $ | — | | | $ | 11,568 | | | $ | 11,568 | |
Investment Grade Bond Fund | | | — | | | | 481,864 | | | | — | | | | 481,864 | |
Limited Duration Fund | | | — | | | | — | | | | 704,787 | | | | 704,787 | |
Liability Derivative Investments Value | |
Fund | | Options
Written Equity
Contracts | | | Options
Purchased
Equity
Contracts | | | Forward
Foreign
Currency
Exchange
Contracts | | | Total Value at
March 31, 2017 | |
High Yield Fund | | $ | — | | | $ | — | | | $ | (215,032 | ) | | $ | 215,032 | |
Investment Grade Bond Fund | | | 260,710 | | | | — | | | | (7,260 | ) | | | 267,970 | |
Limited Duration Fund | | | — | | | | — | | | | (675,261 | ) | | | 675,261 | |
The following is a summary of the location of derivative investments on the Funds’ Statements of Operations for the period ended March 31, 2017:
Derivative Investment Type | Location of Gain (Loss) on Derivatives |
Interest rate contracts | Net realized gain (loss) on swap agreements |
| Net change in unrealized appreciation (depreciation) on swap agreements |
| Net change in unrealized appreciation (depreciation) on forward foreign currency exchange contracts |
Currency contracts | Net realized gain (loss) on options purchased Net change in unrealized appreciation (depreciation) on options purchased |
| | Net realized gain (loss) on options written |
| | Net change in unrealized appreciation (depreciation) on options written |
88 | THE GUGGENHEIM FUNDS SEMI-ANNUAL REPORT | |
NOTES TO FINANCIAL STATEMENTS (Unaudited)(continued) |
The following is a summary of the Funds’ realized gain (loss) and change in unrealized appreciation (depreciation) on derivative investments recognized on the Statements of Operations categorized by primary risk exposure for the period ended March 31, 2017:
Realized Gain (Loss) on Derivative Investments Recognized on the Statements of Operations | |
Fund | | Swaps
Equity
Contracts | | | Options
Written Equity
Contracts | | | Options
Purchased
Equity
Contracts | | | Forward
Foreign
Currency
Exchange Contracts | | | Total | |
High Yield Fund | | $ | — | | | $ | — | | | $ | — | | | $ | 515,316 | | | $ | 515,316 | |
Investment Grade Bond Fund | | | 3,618 | | | | — | | | | — | | | | 14,234 | | | | 17,852 | |
Limited Duration Fund | | | — | | | | — | | | | — | | | | (173,066 | ) | | | (173,066 | ) |
Change in Unrealized Appreciation (Depreciation) on Derivative Investments Recognized on the Statements of Operations | |
Fund | | Swaps
Equity
Contracts | | | Options
Written Equity
Contracts | | | Options
Purchased
Equity
Contracts | | | Forward
Foreign
Currency
Exchange Contracts | | | Total | |
High Yield Fund | | $ | — | | | $ | — | | | $ | — | | | $ | (287,104 | ) | | $ | (287,104 | ) |
Investment Grade Bond Fund | | | — | | | | (97,092 | ) | | | 167,214 | | | | (7,260 | ) | | | 62,862 | |
Limited Duration Fund | | | — | | | | — | | | | — | | | | 29,526 | | | | 29,526 | |
In conjunction with the use of short sales and derivative instruments, the Funds are required to maintain collateral in various forms. The Funds use, where appropriate, depending on the financial instrument utilized and the broker involved, margin deposits at the broker, cash and/or securities segregated at the custodian bank, discount notes or the repurchase agreements allocated to the Funds.
The Trust has established counterparty credit guidelines and enters into transactions only with financial institutions of investment grade or better. The Trust monitors the counterparty credit risk.
3. Fees and Other Transactions with Affiliates
Under the terms of an investment advisory contract, the Funds pay GI investment advisory fees calculated at the annualized rates below, based on the average daily net assets of the Funds:
Fund | | Management Fees
(as a % of Net Assets) | |
Diversified Income Fund | | | 0.75 | % |
High Yield Fund | | | 0.60 | % |
Investment Grade Bond Fund | | | 0.50 | %* |
Limited Duration Fund | | | 0.45 | % |
Municipal Income Fund | | | 0.50 | % |
* | At a meeting that occurred on November 16, 2016, the Board approved to add an advisory fee breakpoint (“breakpoint”) to the Investment Grade Bond Fund (the “Fund”). Under the terms of an investment advisory contract, the Fund pays GI investment advisory fees calculated at an annualized rate of 0.50% of the average daily net assets of the Fund. Effective January 30, 2017, a breakpoint of 5 basis points (0.05%) on average daily net assets above $5 billion will apply to the Fund’s advisory fees. |
GI engages external service providers to perform other necessary services for the Trust, such as audit and accounting related services, legal services, custody, printing and mailing, etc., on a pass-through basis. Such expenses are allocated to various Funds within the complex based on relative net assets.
| | THE GUGGENHEIM FUNDS SEMI-ANNUAL REPORT | 89 |
NOTES TO FINANCIAL STATEMENTS (Unaudited)(continued) |
The Funds have adopted Distribution Plans related to the offering of A-Class, C-Class and P-Class shares pursuant to Rule 12b-1 under the 1940 Act. The plans provide for payments at an annual rate of 0.25% of the average daily net assets of each Fund’s A-Class and P-Class shares, and 1.00% of the average daily net assets of each Fund’s C-Class shares.
The investment advisory contracts for the following Funds provide that the total expenses be limited to a percentage of average net assets for each class of shares, exclusive of brokerage costs, dividends on securities sold short, expenses of other investment companies in which a Fund invests, interest, taxes, litigation, indemnification and extraordinary expenses. The limits are listed below:
| | Limit | | Effective
Date | Contract
End Date |
Diversified Income Fund — A-Class* | | | 1.30 | % | 01/29/16 | 02/01/18 |
Diversified Income Fund — C-Class** | | | 2.05 | % | 01/29/16 | 02/01/18 |
Diversified Income Fund — P-Class** | | | 1.30 | % | 01/29/16 | 02/01/18 |
Diversified Income Fund — Institutional Class** | | | 1.05 | % | 01/29/16 | 02/01/18 |
High Yield Fund — A-Class | | | 1.16 | % | 11/30/12 | 02/01/18 |
High Yield Fund — C-Class | | | 1.91 | % | 11/30/12 | 02/01/18 |
High Yield Fund — P-Class* | | | 1.16 | % | 05/01/15 | 02/01/18 |
High Yield Fund — Institutional Class | | | 0.91 | % | 11/30/12 | 02/01/18 |
Investment Grade Bond Fund — A-Class | | | 1.00 | % | 11/30/12 | 02/01/18 |
Investment Grade Bond Fund — C-Class | | | 1.75 | % | 11/30/12 | 02/01/18 |
Investment Grade Bond Fund — P-Class* | | | 1.00 | % | 05/01/15 | 02/01/18 |
Investment Grade Bond Fund — Institutional Class | | | 0.75 | % | 11/30/12 | 02/01/18 |
Limited Duration Fund — A-Class | | | 0.80 | % | 12/01/13 | 02/01/18 |
Limited Duration Fund — C-Class | | | 1.55 | % | 12/01/13 | 02/01/18 |
Limited Duration Fund — P-Class* | | | 0.80 | % | 05/01/15 | 02/01/18 |
Limited Duration Fund — Institutional Class | | | 0.55 | % | 12/01/13 | 02/01/18 |
Municipal Income Fund — A-Class | | | 0.80 | % | 11/30/12 | 02/01/18 |
Municipal Income Fund — C-Class | | | 1.55 | % | 11/30/12 | 02/01/18 |
Municipal Income Fund — P-Class* | | | 0.80 | % | 05/01/15 | 02/01/18 |
Municipal Income Fund — Institutional Class | | | 0.55 | % | 11/30/12 | 02/01/18 |
* | Since the commencement of operations: May 1, 2015 |
** | Since the commencement of operations: January 29, 2016 |
GI is entitled to reimbursement by the Funds for fees waived or expenses reimbursed during any of the previous 36 months, beginning on the date of the expense limitation agreement, if on any day the estimated operating expenses are less than the indicated percentages. At March 31, 2017, the amount of fees waived or expenses reimbursed that are subject to recoupment are presented in the following table:
Fund | | Expires
2017 | | | Expires
2018 | | | Expires
2019 | | | Expires
2020 | | | Fund
Total | |
Diversified Income Fund | | | | | | | | | | | | | | | |
A-Class | | $ | — | | | $ | — | | | $ | 1,574 | | | $ | 798 | | | $ | 2,372 | |
C-Class | | | — | | | | — | | | | 1,435 | | | | 775 | | | | 2,210 | |
P-Class | | | — | | | | — | | | | 1,339 | | | | 699 | | | | 2,038 | |
Institutional Class | | | — | | | | — | | | | 61,811 | | | | 27,353 | | | | 89,164 | |
High Yield Fund | | | | | | | | | | | | | | | | | | | | |
A-Class | | $ | 7,489 | | | $ | 54,498 | | | $ | 12,450 | | | $ | — | | | $ | 74,437 | |
C-Class | | | 611 | | | | 9,486 | | | | 4,537 | | | | — | | | | 14,634 | |
P-Class | | | — | | | | — | | | | — | | | | 968 | | | | 968 | |
Institutional Class | | | — | | | | — | | | | 11,528 | | | | 1,290 | | | | 12,818 | |
Investment Grade Bond Fund | | | | | | | | | | | | | | | | | | | | |
A-Class | | $ | 63,932 | | | $ | 109,791 | | | $ | 73,385 | | | $ | — | | | $ | 247,108 | |
C-Class | | | 16,068 | | | | 40,125 | | | | 35,023 | | | | 2,491 | | | | 93,707 | |
P-Class | | | — | | | | 49 | | | | — | | | | 1,976 | | | | 2,024 | |
Institutional Class | | | — | | | | — | | | | — | | | | — | | | | — | |
90 | THE GUGGENHEIM FUNDS SEMI-ANNUAL REPORT | |
NOTES TO FINANCIAL STATEMENTS (Unaudited)(continued) |
Fund | | Expires
2017 | | | Expires
2018 | | | Expires
2019 | | | Expires
2020 | | | Fund
Total | |
Limited Duration Fund | | | | | | | | | | | | | | | |
A-Class | | $ | 9,855 | | | $ | 66,925 | | | $ | 171,814 | | | $ | 61,024 | | | $ | 309,618 | |
C-Class | | | 1,263 | | | | 5,382 | | | | 31,279 | | | | 15,598 | | | | 53,522 | |
P-Class | | | — | | | | 338 | | | | 1,840 | | | | 2,527 | | | | 4,705 | |
Institutional Class | | | 75,595 | | | | 107,741 | | | | 287,680 | | | | 59,157 | | | | 530,173 | |
Municipal Income Fund | | | | | | | | | | | | | | | | | | | | |
A-Class | | $ | 106,674 | | | $ | 181,845 | | | $ | 178,718 | | | $ | 66,985 | | | $ | 534,222 | |
C-Class | | | 1,992 | | | | 6,114 | | | | 13,957 | | | | 7,188 | | | | 29,251 | |
P-Class | | | — | | | | 96 | | | | 169 | | | | 287 | | | | 552 | |
Institutional Class | | | 13,794 | | | | 26,091 | | | | 36,640 | | | | 26,836 | | | | 103,362 | |
For the period ended March 31, 2017, no amounts were recouped by GI.
If a Fund invests in an affiliated fund, the investing Fund’s adviser has agreed to waive fees at the investing fund level. Fee waivers will be calculated at the investing Fund level without regard to any expense cap, if any, in effect for the investing Fund. Fees waived under this arrangement are not subject to reimbursement to GI. For the period March 31, 2017, the Diversified Income Fund and Limited Duration Fund waived $15,382and $25,290, respectively, related to investments in affiliated funds.
For the period ended March 31, 2017, GFD retained sales charges of $712,076 relating to sales of A-Class shares of the Trust.
Certain trustees and officers of the Trust are also officers of GI and GFD.
At March 31, 2017, GI and its affiliates owned over twenty percent of the outstanding shares of the Funds, as follows:
Fund | | Percent of
Oustanding
Shares Owned | |
Diversified Income Fund | | | 99 | % |
Investment Grade Bond Fund | | | 40 | % |
4. Fair Value Measurement
In accordance with U.S. GAAP, fair value is defined as the price that the Funds would receive to sell an investment or pay to transfer a liability in an orderly transaction with an independent buyer in the principal market, or in the absence of a principal market, the most advantageous market for the investment or liability. U.S. GAAP establishes a three-tier fair value hierarchy based on the types of inputs used to value assets and liabilities and requires corresponding disclosure. The hierarchy and the corresponding inputs are summarized below:
Level 1 — | quoted prices in active markets for identical assets or liabilities. |
Level 2 — | significant other observable inputs (for example quoted prices for securities that are similar based on characteristics such as interest rates, prepayment speeds, credit risk, etc.). |
Level 3 — | significant unobservable inputs based on the best information available under the circumstances, to the extent observable inputs are not available, which may include assumptions. |
The types of inputs available depend on a variety of factors, such as the type of security and the characteristics of the markets in which it trades, if any. Fair valuation determinations that rely on fewer or no observable inputs require greater judgment. Accordingly, fair value determinations for Level 3 securities require the greatest amount of judgment.
| | THE GUGGENHEIM FUNDS SEMI-ANNUAL REPORT | 91 |
NOTES TO FINANCIAL STATEMENTS (Unaudited)(continued) |
Independent pricing services are used to value a majority of the Funds’ investments. When values are not available from a pricing service, they may be computed by the Funds’ investment adviser or an affiliate. In any event, values may be determined using a variety of sources and techniques, including: market prices; broker quotes; and models which derive prices based on inputs such as prices of securities with comparable maturities and characteristics or based on inputs such as anticipated cash flows or collateral, spread over Treasuries, and other information and analysis. A significant portion of the Funds’ assets and liabilities are categorized as Level 2 or Level 3, as indicated in this report.
Indicative quotes from broker-dealers, adjusted for fluctuations in criteria such as credit spreads and interest rates, may be also used to value the Funds’ assets and liabilities, i.e. prices provided by a broker-dealer or other market participant who has not committed to trade at that price. Although indicative quotes are typically received from established market participants, the Funds may not have the transparency to view the underlying inputs which support the market quotations. Significant changes in an indicative quote would generally result in significant changes in the fair value of the security. Certain fixed income securities are valued by obtaining a monthly indicative quote from a broker-dealer, adjusted for fluctuations in criteria such as credit spreads and interest rates.
The inputs or methodologies used for valuing securities are not necessarily an indication of the risk associated with investing in those securities. The suitability of the techniques and sources employed to determine fair valuation are regularly monitored and subject to change.
5. Reverse Repurchase Agreements
Each of the Funds may enter into reverse repurchase agreements. Under a reverse repurchase agreement, a Fund sells securities and agrees to repurchase them at a particular price at a future date. In the event the buyer of securities under a reverse repurchase agreement files for bankruptcy or becomes insolvent, such buyer or its trustee or receiver may receive an extension of time to determine whether to enforce the Fund’s obligation to repurchase the securities, and the Fund’s use of the proceeds of the reverse repurchase agreement may effectively be restricted pending such decision.
For the period ended March 31, 2017, the following Funds entered into reverse repurchase agreements:
Fund | | Number of Days
Outstanding | | | Balance at
March 31, 2017 | | | Average Balance
Outstanding | | | Average
Interest Rate | |
High Yield Fund | | | 182 | | | $ | 60,538,766 | | | $ | 29,105,157 | | | | 1.1 | % |
Investment Grade Bond Fund | | | 140 | | | | 793,350 | | | | 17,787,857 | | | | 0.1 | % |
The following table presents reverse repurchase agreements that are subject to netting arrangements and offset in the Statements of Assets of Liabilities in conformity with U.S. GAAP:
| | | | | | | | | | | | Gross Amounts Not Offset
in the Statements of
Assets and Liabilities | | | | |
Fund | Instrument | | Gross Amounts of Recognized Liabilities | | | Gross Amounts Offset In the Statements of Assets and Liabilities | | | Net Amount of Liabilities Presented on the Statements of Assets and Liabilities | | | Financial Instruments | | | Cash
Collateral
Received | | | Net
Amount | |
High Yield Fund | Reverse repurchase agreements | | $ | 60,538,766 | | | $ | — | | | $ | 60,538,766 | | | $ | 60,538,766 | | | $ | — | | | $ | — | |
Investment Grade Bond Fund | Reverse repurchase agreements | | | 793,350 | | | | — | | | | 793,350 | | | | 793,350 | | | | — | | | | — | |
92 | THE GUGGENHEIM FUNDS SEMI-ANNUAL REPORT | |
NOTES TO FINANCIAL STATEMENTS (Unaudited)(continued) |
The following is a summary of the remaining contractual maturities of the reverse repurchase agreements outstanding as of period-end, aggregated by asset class of the related collateral pledged by the Fund:
| | Overnight and Continuous | | | Up to 30 days | | | Total | |
Investment Grade Bond Fund | | | | | | | | | |
U.S. Treasury Bond | | $ | — | | | $ | 793,350 | | | $ | 793,350 | |
Gross amount of recognized liabilities for reverse repurchase agreements | | | — | | | | 793,350 | | | | 793,350 | |
| | | | | | | | | | | | | |
High Yield Fund | | | | | | | | | | | | |
Corporate Bonds | | $ | 187,500 | | | $ | 60,351,266 | | | $ | 60,538,766 | |
Gross amount of recognized liabilities for reverse repurchase agreements | | | 187,500 | | | | 60,351,266 | | | | 60,538,766 | |
6. Federal Income Tax Information
The Funds intend to comply with the provisions of Subchapter M of the Internal Revenue Code applicable to regulated investment companies and will distribute substantially all taxable net investment income and capital gains sufficient to relieve the Funds from all, or substantially all, federal income, excise and state income taxes. Therefore, no provision for federal or state income tax is required.
Tax positions taken or expected to be taken in the course of preparing the Funds’ tax returns are evaluated to determine whether the tax positions are “more-likely-than-not” of being sustained by the applicable tax authority. Tax positions not deemed to meet the more-likely-than-not threshold would be recorded as a tax benefit or expense in the current year. Management has analyzed the Funds’ tax positions taken, or to be taken, on federal income tax returns for all open tax years, and has concluded that no provision for income tax is required in the Funds’ financial statements. The Funds’ federal tax returns are subject to examination by the Internal Revenue Service for a period of three years after they are filed.
At March 31, 2017, the cost of securities for federal income tax purposes, the aggregate gross unrealized gain for all securities for which there was an excess of value over tax cost, and the aggregate gross unrealized loss for all securities for which there was an excess of tax cost over value were as follows:
Fund | | Tax
Cost | | | Tax
Unrealized
Gain | | | Tax
Unrealized
Loss | | | Net
Unrealized
Gain (Loss) | |
Diversified Income Fund | | $ | 5,321,931 | | | $ | 387,519 | | | $ | (10,934 | ) | | $ | 376,585 | |
High Yield Fund | | | 388,223,906 | | | | 11,258,250 | | | | (7,553,147 | ) | | | 3,705,103 | |
Investment Grade Bond Fund | | | 323,651,844 | | | | 4,863,139 | | | | (7,849,042 | ) | | | (2,985,903 | ) |
Limited Duration Fund | | | 1,538,519,050 | | | | 8,440,398 | | | | (4,245,903 | ) | | | 4,194,495 | |
Municipal Income Fund | | | 51,513,375 | | | | 1,124,538 | | | | (884,209 | ) | | | 240,329 | |
7. Securities Transactions
For the period ended March 31, 2017, the cost of purchases and proceeds from sales of investment securities, excluding government securities, short-term investments and derivatives, were as follows:
Fund | | Purchases | | | Sales | |
Diversified Income Fund | | $ | 2,024,061 | | | $ | 1,877,170 | |
High Yield Fund | | | 193,130,871 | | | | 124,099,319 | |
Investment Grade Bond Fund | | | 147,467,962 | | | | 88,435,997 | |
Limited Duration Fund | | | 902,399,417 | | | | 226,920,741 | |
Municipal Income Fund | | | 9,208,571 | | | | 22,635,787 | |
| | THE GUGGENHEIM FUNDS SEMI-ANNUAL REPORT | 93 |
NOTES TO FINANCIAL STATEMENTS (Unaudited)(continued) |
For the year ended March 31, 2017, the cost of purchases and proceeds from sales of government securities were as follows:
Fund | | Purchases | | | Sales | |
Investment Grade Bond | | $ | 49,176,560 | | | $ | 46,810,172 | |
The Funds are permitted to purchase or sell securities from or to certain affiliated funds under specified conditions outlined in procedures adopted by the Board of the Trust. The procedures have been designed to ensure that any purchase or sale of securities by a Fund from or to another fund or portfolio that is or could be considered an affiliate by virtue of having a common investment adviser (or affiliated investment advisers), common Trustees and/or common officers complies with Rule 17a-7 of the 1940 Act. Further, as defined under these procedures, each transaction is effected at the current market price to save costs, where permissible. For the period ended March 31, 2017, the Funds engaged in purchases and sales of securities, pursuant to Rule 17a-7 of the 1940 Act, as follows:
Fund | | Purchases | | | Sales | | | Realized
Gain | |
High Yield Fund | | $ | 18,972,125 | | | $ | 2,569,563 | | | $ | 123,786 | |
Investment Grade Bond Fund | | | 1,244,420 | | | | 1,215,531 | | | | 56,462 | |
Limited Duration Fund | | | 1,104,708 | | | | 1,287,359 | | | | 111,049 | |
8. Affiliated Transactions
Investments representing 5% or more of the outstanding voting shares of a portfolio company of a fund, or control of or by, or common control under GI, result in that portfolio company being considered an affiliated company of such fund, as defined in the 1940 Act.
The Funds may invest in the Guggenheim Strategy Funds Trust consisting of Guggenheim Strategy Fund I, Guggenheim Strategy Fund II, Guggenheim Strategy Fund III, and Guggenheim Variable Insurance Strategy Fund III (collectively, the “Cash Management Funds”), open-end management investment companies managed by GI. The Cash Management Funds, which launched on March 11, 2014, are offered as cash management options only to mutual funds, trusts, and other accounts managed by GI and/or its affiliates, and are not available to the public. The Cash Management Funds pay no investment management fees. The Cash Management Funds’ annual report on Form N-CSR dated September 30, 2016, is available publicly or upon request. This information is available from the EDGAR database on the SEC’s website at https://www.sec.gov/Archives/edgar/data/1601445/000089180416001923/gug65857-ncsr.htm.
Transactions during the period ended March 31, 2017, in which the portfolio company is an “affiliated person,” were as follows:
Affiliated issuers by Fund | | Value
09/30/16 | | | Additions | | | Reductions | | | Value
03/31/17 | | | Shares
03/31/17 | | | Investment
Income | | | Realized
Gain (Loss) | |
Diversified Income Fund | | | | | | | | | | | | | | | | | | | | | |
Guggenheim Floating Rate Strategies Fund - Institutional Class | | $ | 1,155,330 | | | $ | 1,822 | | | $ | (1,158,038 | ) | | $ | — | | | | — | | | $ | 2,027 | | | $ | 29,329 | |
Guggenheim High Yield Fund - Institutional Class | | | 1,189,250 | | | | 602,240 | | | | (33,000 | ) | | | 1,791,813 | | | | 192,875 | | | | 56,086 | | | | 227 | |
Guggenheim Investment Grade Bond Fund - Institutional Class | | | 1,106,383 | | | | 30,324 | | | | (335,000 | ) | | | 787,387 | | | | 43,168 | | | | — | | | | (229 | ) |
Guggenheim Limited Duration Fund - Institutional Class | | | 382,050 | | | | 1,366,041 | | | | — | | | | 1,371,710 | | | | 55,467 | | | | 3,326 | | | | — | |
Guggenheim Risk Managed Real Estate Fund - Institutional Class | | | 262,695 | | | | 9,631 | | | | — | | | | 268,551 | | | | 9,344 | | | | 3,206 | | | | 6,424 | |
Guggenheim S&P High Income Infrastructure ETF | | | 565,983 | | | | — | | | | — | | | | 585,914 | | | | 21,275 | | | | 16,360 | | | | — | |
Guggenheim World Equity Income Fund - Institutional Class | | | 327,003 | | | | 3,954 | | | | — | | | | 344,603 | | | | 24,597 | | | | 3,998 | | | | — | |
| | | $ | 4,988,694 | | | $ | 2,014,012 | | | $ | (1,526,038 | ) | | $ | 5,149,978 | | | | | | | $ | 85,003 | | | $ | 35,751 | |
94 | THE GUGGENHEIM FUNDS SEMI-ANNUAL REPORT | |
NOTES TO FINANCIAL STATEMENTS (Unaudited)(continued) |
Affiliated issuers by Fund | | Value
09/30/16 | | | Additions | | | Reductions | | | Value
03/31/17 | | | Shares
03/31/17 | | | Investment
Income | | | Realized
Gain (Loss) | |
Limited Duration Fund | | | | | | | | | | | | | | | | | | | | | |
Guggenheim Floating Rate Strategies Fund - Institutional Class | | $ | 1,283,886 | | | $ | 15,142,128 | | | $ | — | | | $ | 16,415,673 | | | | 629,435 | | | $ | 139,497 | | | $ | — | |
Guggenheim Strategy Fund I | | | 12,071,811 | | | | 1,856,047 | | | | (1,000,000 | ) | | | 12,957,662 | | | | 517,272 | | | | 105,604 | | | | 5,998 | |
Guggenheim Strategy Fund II | | | 5,047,051 | | | | 7,109,487 | | | | — | | | | 12,180,825 | | | | 487,233 | | | | 108,680 | | | | — | |
Guggenheim Strategy Fund III | | | — | | | | 7,017,525 | | | | — | | | | 7,021,027 | | | | 280,729 | | | | 16,625 | | | | — | |
| | | $ | 18,402,748 | | | $ | 31,125,187 | | | $ | (1,000,000 | ) | | $ | 48,575,187 | | | | | | | $ | 370,406 | | | $ | 5,998 | |
9. Loan Commitments
Pursuant to the terms of certain loan agreements, certain Funds held unfunded loan commitments as of March 31, 2017. The Funds are obligated to fund these loan commitments at the borrower’s discretion.
Borrower | Maturity Date | | Face Amount | | | Value | |
High Yield Fund | | | | | | | |
Acosta, Inc. | 09/26/19 | | $ | 844,444 | | | $ | 55,935 | |
Acrisure LLC | 11/22/23 | | | 36,508 | | | | — | |
Advantage Sales & Marketing LLC | 07/25/19 | | | 660,000 | | | | 39,348 | |
AMC Entertainment Holdings, Inc. | 04/30/17 | | | 2,700,000 | | | | — | |
BBB Industries, LLC | 11/04/19 | | | 1,000,000 | | | | 71,736 | |
CH Hold Corp. | 08/01/17 | | | 95,455 | | | | 157 | |
Epicor Software | 06/01/20 | | | 1,000,000 | | | | 78,760 | |
Eyemart Express | 12/18/19 | | | 600,000 | | | | 39,524 | |
Go Daddy Operating Company LLC | 12/12/17 | | | 1,458,559 | | | | — | |
Hillman Group, Inc. | 06/30/19 | | | 1,000,000 | | | | 48,889 | |
Learning Care Group (US), Inc. | 05/05/19 | | | 500,000 | | | | 35,747 | |
Moss Creek Resources LLC | 03/29/22 | | | 450,000 | | | | — | |
National Technical Systems | 06/12/21 | | | 250,000 | | | | 21,865 | |
Oberthur Technologies of America Corp. | 01/10/24 | | | 618,421 | | | | — | |
Packaging Coordinators Midco, Inc. | 07/01/21 | | | 1,384,615 | | | | 147,173 | |
Pro Mach Group, Inc. | 10/22/19 | | | 900,000 | | | | 55,514 | |
PT Intermediate Holdings III, LLC | 06/23/22 | | | 217,083 | | | | 19,713 | |
Signode Industrial Group US, Inc. | 05/01/19 | | | 1,800,000 | | | | 93,501 | |
Solera LLC | 03/03/21 | | | 250,000 | | | | 27,596 | |
Wencor Group | 06/19/19 | | | 716,154 | | | | 37,206 | |
| | | | $ | 16,481,239 | | | $ | 772,664 | |
10. Line of Credit
The Trust, with the exception of Capital Stewardship Fund, and certain affiliated funds, secured a 364-day committed, $800,000,000 line of credit from Citibank, N.A., which was in place through October 6, 2016, at which time the line of credit was renewed, with an increased commitment amount to $1,000,000,000. A Fund may draw (borrow) from the line of credit as a temporary measure for emergency purposes, to facilitate redemption requests, or for other short-term liquidity purposes consistent with the Fund’s investment objective and program. For example, it may be advantageous for the Fund to borrow money rather than sell existing portfolio positions to meet redemption requests. Fees related to borrowings, if any, vary under this arrangement between the greater of Citibank’s “base rate”, LIBOR plus 1%, or the federal funds rate 0.82% at March 31, 2017, plus 1/2 of 1%. All affiliated funds that participate in the line of credit paid upfront costs totaling $2,032,388 to renew the line of credit.
The commitment fee that may be paid by the Funds is at an annualized rate of 0.15% of the average daily amount of their unused commitment amount. The Funds did not have any borrowings under this agreement as of and for the period ended March 31, 2017.
The allocated commitment fee amount for each Fund is referenced in the Statement of Operations under “Line of credit fees” and the effect on the expense ratio is included in the Financial Highlights.
| | THE GUGGENHEIM FUNDS SEMI-ANNUAL REPORT | 95 |
NOTES TO FINANCIAL STATEMENTS (Unaudited)(continued) |
11. Repurchase Agreements
In connection with transactions in repurchase agreements, it is the Funds’ policy that their custodian takes possession of the underlying collateral. The collateral is in the possession of the Funds’ custodian and is evaluated to ensure that its market value exceeds, at a minimum, 102% of the original face amount of the repurchase agreements.
Fund | Counterparty and
Terms of Agreement | Face
Value | Repurchase
Price | | Collateral | Par
Value | Fair
Value |
Limited Duration Bond Fund | Mizuho Securities LLC | | | | Countrywide Asset-Backed Certificate | | |
| | 1.75% | | | | 5.57% | | |
| | Due 06/06/17 | $ | 15,020,000 | $ | 15,076,655 | | 05/25/36 | $ | 6,800,000 | $ | 7,468,526 |
| | | | | | | | |
| | | | | | HarborView Mortgage Loan Trust | | |
| | | | | | 0.00% | | |
| | | | | | 03/19/37 | 46,400,000 | 20,074,391 |
| | | | | | | | |
| | | | | | Option One Mortgage Loan Trust | | |
| | | | | | 0.00% | | |
| | | | | | 02/25/37 | | 42,500,000 | | 26,052,516 |
| | | | | | | 95,700,000 | 53,595,432 |
In the event of counterparty default, the Funds have the right to collect the collateral to offset losses incurred. There is potential loss to the Funds in the event the Funds are delayed or prevented from exercising their rights to dispose of the collateral securities, including the risk of a possible decline in the value of the underlying securities during the period while the Funds seek to assert their rights. The Funds’ investment adviser, acting under the supervision of the Board of Trustees, reviews the value of the collateral and the creditworthiness of those banks and dealers with which the Funds enter into repurchase agreements to evaluate potential risks.
96 | THE GUGGENHEIM FUNDS SEMI-ANNUAL REPORT | |
NOTES TO FINANCIAL STATEMENTS (Unaudited)(continued) |
12. Restricted Securities
The securities below are considered illiquid and restricted under guidelines established by the Board of Trustees.
Fund | | Restricted Securities | | Acquisition Date | | Cost | | | Value | |
High Yield Fund | | Schahin II Finance Company SPV Ltd. | | | | | | | | |
| | | 5.88% due 09/25/22 | | 03/21/12 | | $ | 139,296 | | | $ | 24,974 | |
| | | | | | | | | | | | | |
Investment Grade Bond Fund | | GMAC Commercial Mortgage Asset Corp. | | | | | | | | | | |
| | | 6.11% due 08/10/52 | | 10/07/16 | | | 1,743,937 | | | | 1,532,365 | |
| | | Northern Group Housing LLC | | | | | | | | | | |
| | | 6.8% due 08/15/53 | | 07/25/13 | | | 600,000 | | | | 720,318 | |
| | | Turbine Engines Securitization Ltd. | | | | | | | | | | |
| | | 5.13% due 12/13/48 | | 11/27/13 | | | 650,509 | | | | 650,281 | |
| | | Woodbourne Capital Trust IV | | | | | | | | | | |
| | | | 0.02% | | 01/20/06 | | | 954,589 | | | | 568,357 | |
| | | Woodbourne Capital Trust II | | | | | | | | | | |
| | | | 0.02% | | 01/20/06 | | | 954,589 | | | | 568,357 | |
| | | Woodbourne Capital Trust III | | | | | | | | | | |
| | | | 0.02% | | 01/20/06 | | | 954,589 | | | | 567,693 | |
| | | Woodbourne Capital Trust I | | | | | | | | | | |
| | | | 0.02% | | 01/20/06 | | | 954,589 | | | | 568,356 | |
| | | HP Communities LLC | | | | | | | | | | |
| | | 5.78% due 03/15/46 | | 08/23/16 | | | 593,340 | | | | 534,070 | |
| | | ACC Group Housing LLC | | | | | | | | | | |
| | | 6.35% due 07/15/54 | | 06/03/14 | | | 300,000 | | | | 344,935 | |
| | | Atlantic Marine Corporations Communities LLC | | | | | | | | | | |
| | | 5.43% due 12/01/50 | | 07/25/14 | | | 366,102 | | | | 371,262 | |
| | | Capmark Military Housing Trust | | | | | | | | | | |
| | | 6.06% due 10/10/52 | | 04/23/15 | | | 472,193 | | | | 482,324 | |
| | | Pacific Northwest Communities LLC | | | | | | | | | | |
| | | 5.91% due 06/15/50 | | 05/22/14 | | | 400,000 | | | | 432,412 | |
| | | Capmark Military Housing Trust | | | | | | | | | | |
| | | 5.75% due 02/10/52 | | 09/18/14 | | | 331,819 | | | | 327,641 | |
| | | Cadence Bank North America | | | | | | | | | | |
| | | 6.25% due 06/28/29 | | 06/06/14 | | | 200,000 | | | | 200,000 | |
| | | Copper River CLO Ltd. | | | | | | | | | | |
| | | due 01/20/21 | | 05/09/14 | | | 819,000 | | | | 98,415 | |
| | | TIG Holdings, Inc. | | | | | | | | | | |
| | | 8.6% due 01/15/27 | | 06/29/05 | | | 29,353 | | | | 30,600 | |
| | | | | | | | | 10,324,608 | | | | 7,997,385 | |
Limited Duration Bond Fund | | Copper River CLO Ltd. | | | | | | | | | | |
| | | due 01/20/21 | | 05/09/14 | | | 585,000 | | | | 70,296 | |
| | | Schahin II Finance Company SPV Ltd. | | | | | | | | | | |
| | | 5.88% due 09/25/22 | | 03/21/12 | | | 375,036 | | | | 44,954 | |
| | | | | | | | | 960,036 | | | | 115,250 | |
| | THE GUGGENHEIM FUNDS SEMI-ANNUAL REPORT | 97 |
NOTES TO FINANCIAL STATEMENTS (Unaudited)(continued) |
13. Offsetting
In the normal course of business, the Fund enters into transactions subject to enforceable master netting arrangements or other similar arrangements. Generally, the right to offset in those agreements allows the Fund to counteract the exposure to a specific counterparty with collateral received from or delivered to that counterparty based on the terms of the arrangements. These arrangements provide for the right to liquidate upon the occurrence of an event of default, credit event upon merger or additional termination event.
In order to better define their contractual rights and to secure rights that will help the Fund mitigate its counterparty risk, the Fund may enter into an International Swaps and Derivatives Association, Inc. Master Agreement (“ISDA Master Agreement”) or similar agreement with its derivative contract counterparties. An ISDA Master Agreement is a bilateral agreement between a Fund and a counterparty that governs OTC derivatives, including foreign exchange contracts, and typically contains, among other things, collateral posting terms and netting provisions in the event of a default and/or termination event. The provisions of the ISDA Master Agreement typically permit a single net payment in the event of a default (close-out netting) or similar event, including the bankruptcy or insolvency of the counterparty.
For derivatives traded under an ISDA Master Agreement, the collateral requirements are typically calculated by netting the mark-to-market amount for each transaction under such agreement and comparing that amount to the value of any collateral currently pledged by the Fund and the counterparty. For financial reporting purposes, cash collateral that has been pledged to cover obligations of the Fund and cash collateral received from the counterparty, if any, are reported separately on the Statement of Assets and Liabilities as segregated cash with broker/receivable for variation margin, or payable for swap settlement/variation margin. Generally, the amount of collateral due from or to a counterparty must exceed a minimum transfer amount threshold (e.g., $300,000) before a transfer is required to be made. To the extent amounts due to the Fund from its counterparties are not fully collateralized, contractually or otherwise, the Fund bears the risk of loss from counterparty nonperformance. The Fund attempts to mitigate counterparty risk by only entering into agreements with counterparties that they believe to be of good standing and by monitoring the financial stability of those counterparties.
For financial reporting purposes, the Fund does not offset derivative assets and derivative liabilities that are subject to netting arrangements in the Statements of Assets and Liabilities. The following tables present derivative financial instruments and secured financing transactions that are subject to enforceable netting arrangements and offset in the Statements of Assets and Liabilities in conformity with U.S. GAAP:
| | | | | | | | | | | | Gross Amounts Not Offset
in the Statements of
Assets and Liabilities | | | | |
Fund | Instrument | | Gross Amounts of
Recognized Asset | �� | | Gross
Amounts
Offset in the
Statements of
Assets and
Liabilities | | | Net Amount
of Asset
Presented on
the Statements
of Assets and
Liabilities | | | Financial Instruments | | | Cash
Collateral
Received | | | Net
Amount | |
High Yield Fund | Forward foreign
currency exchange
contracts | | $ | 11,568 | | | $ | — | | | $ | 11,568 | | | $ | — | | | $ | — | | | $ | 11,568 | |
Limited Duration Fund | Forward foreign
currency exchange
contracts | | | 704,787 | | | | — | | | | 704,787 | | | | 155,945 | | | | — | | | | 548,842 | |
| | | | | | | | | | | | Gross Amounts Not Offset
in the Statements of
Assets and Liabilities | | | | |
Fund | Instrument | | Gross
Amounts of
Recognized
Liabilities | | | Gross
Amounts
Offset in the
Statements of
Assets and
Liabilities | | | Net Amount
of Liabilities
Presented on
the Statements
of Assets and
Liabilities | | | Financial Instruments | | | Cash
Collateral
Received | | | Net
Amount | |
High Yield Fund | Forward foreign
currency exchange
contracts | | $ | 215,032 | | | $ | — | | | $ | 215,032 | | | $ | — | | | $ | — | | | $ | 215,032 | |
Investment Grade Bond Fund | Forward foreign
currency exchange
contracts | | | 7,260 | | | | — | | | | 7,260 | | | | — | | | | — | | | | 7,260 | |
Limited Duration Fund | Forward foreign
currency exchange
contracts | | | 675,261 | | | | — | | | | 675,261 | | | | 155,945 | | | | 295,000 | | | | 224,316 | |
98 | THE GUGGENHEIM FUNDS SEMI-ANNUAL REPORT | |
NOTES TO FINANCIAL STATEMENTS (Unaudited)(concluded) |
14. Legal Proceedings
Motors Liquidation Company
On or about June of 2015, the Guggenheim High Yield Fund was served and became a party to the case entitled Official Committee of Unsecured Creditors of Motors Liquidation Company v. JPMorgan Chase Bank, N.A., et al., Adversary Proceeding No. 09-00504 (MG) (Bankr. S.D.N.Y.), brought by the Motors Liquidation Avoidance Action Trust (the “Motors Trust”). The lawsuit was initially filed in the United States Bankruptcy Court for the Southern District of New York on July 31, 2009 by the Official Committee of Unsecured Creditors of Motors Liquidation Company (f/k/a General Motors) against the former holders of an approximately $1.5 billion term loan issued pursuant to a term loan agreement, dated as of November 29, 2006 (the “Term Loan”), between General Motors, as borrower, JPMorgan Chase Bank, N.A., as administrative agent (“JPMorgan”), and various institutions as lenders, including the Guggenheim High Yield Fund (f/k/a Security Income Fund – High Yield Series). The Term Loan lenders received a full repayment of the Term Loan pursuant to a June 1, 2009 court order issued in connection with the General Motors chapter 11 bankruptcy filing. The plaintiff is seeking a court order that the lenders return at least a portion of the proceeds received in 2009 based on the contention that certain UCC financing statements securing the indebtedness due under the Term Loan were terminated (thus releasing collateral secured by the UCC financing statement), rendering the Term Loan under-secured or completely unsecured. As a result, the lawsuit alleges that the Term Loan lenders were unsecured creditors at the time General Motors filed for bankruptcy, and should not have been paid as fully secured creditors.
After being served, the Guggenheim High Yield Fund filed a motion to dismiss the lawsuit on November 19, 2015. On June 30, 2016, the Bankruptcy Court denied the motion to dismiss, holding that the orders extending the time to serve defendants were valid. On July 14, 2016, the Guggenheim High Yield Fund filed a motion for leave to file an interlocutory appeal of the Bankruptcy Court’s decision, which was denied on March 8, 2017.
On December 18, 2015, the Guggenheim High Yield Fund filed cross-claims against co-defendant JPMorgan related to JPMorgan’s actions as administrative agent in connection with the Term Loan and the termination of the UCC financing statements. The Guggenheim High Yield Fund and JPMorgan are exchanging discovery on the cross-claims.
On November 10, 2016, the Motors Trust filed a stipulation and proposed order dismissing its third claim for relief as set forth in its amended complaint, which was so Ordered on November 17, 2016.
On April 24, 2017, a trial commenced in the Bankruptcy Court for the Southern District of New York on the collateral status and valuation of 40 representative assets (the “Representative Asset Trial”). The evidentiary potion of the trial concluded on May 5, 2017, and closing arguments will be held on June 5, 2017.
The parties have agreed to attend a mediation in front of former District Court Judge Joseph J. Farnan in an attempt to consensually resolve the dispute. It is anticipated that the Bankruptcy Court’s decision in the Representative Asset Trial will inform the mediation.
This lawsuit does not allege any wrongdoing on the part of the Guggenheim High Yield Fund and the Fund intends to vigorously defend the matter. If the plaintiff is successful, it is reasonably possible that the Guggenheim High Yield Fund will be required to make payments in some amount (but not likely to exceed approximately $1,000,000), although the Fund may recover some or all of this amount from its cross-claims against co-defendant JPMorgan. At this stage of the proceedings, the Guggenheim High Yield Fund is unable to make a reliable prediction as to the outcome of this lawsuit or the affect, if any, on the Fund’s net asset value.
| | THE GUGGENHEIM FUNDS SEMI-ANNUAL REPORT | 99 |
OTHER INFORMATION (Unaudited) |
Proxy Voting Information
A description of the policies and procedures that the Trust uses to determine how to vote proxies relating to securities held in the Funds’ portfolios is available, without charge and upon request, by calling 800.820.0888. This information is also available from the EDGAR database on the SEC’s website at https://www.sec.gov.
Information regarding how the Funds voted proxies relating to portfolio securities during the most recent 12-month period ended June 30 is available without charge, upon request, by calling 800.820.0888. This information is also available from the EDGAR database on the SEC’s website at https://www.sec.gov.
Sector Classification
Information in the “Schedule of Investments” is categorized by sectors using sector-level Classifications defined by the Bloomberg Industry Classification System, a widely recognized industry classification system provider. Each Fund’s registration statement has investment policies relating to concentration in specific sectors/industries. For purposes of these investment policies, the Funds usually classify sectors/industries based on industry-level Classifications used by widely recognized industry classification system providers such as Bloomberg Industry Classification System, Global Industry Classification Standards and Barclays Global Classification Scheme.
Quarterly Portfolio Schedules Information
The Trust files its complete schedule of portfolio holdings with the SEC for the first and third quarters of each fiscal year on Form N-Q; which are available on the SEC’s website at https://www.sec.gov. The Funds’ Forms N-Q may be reviewed and copied at the SEC’s Public Reference Room in Washington, DC, and that information on the operation of the Public Reference Room may be obtained by calling 800-SEC-0330. Copies of the portfolio holdings are also available to shareholders, without charge and upon request, by calling 800.820.0888.
100 | THE GUGGENHEIM FUNDS SEMI-ANNUAL REPORT | |
INFORMATION ON BOARD OF TRUSTEES AND OFFICERS (Unaudited) |
Name, Address* and Year of Birth | Position(s)
Held with
the Trust | Term of Office and Length of Time Served** | Principal Occupation(s) During Past Five Years | Number of Portfolios in Fund Complex Overseen | Other
Directorships
Held by Trustees |
INDEPENDENT TRUSTEES | | | |
Randall C. Barnes
(1951) | Trustee | Since 2014 | Current: Private Investor (2001-present).
Former: Senior Vice President and Treasurer, PepsiCo, Inc. (1993-1997); President, Pizza Hut International (1991-1993); Senior Vice President, Strategic Planning and New Business Development, PepsiCo, Inc. (1987-1990). | 98 | Current: Trustee, Purpose Investments Inc. (2014-Present). |
Donald A. Chubb, Jr.
(1946 ) | Trustee | Since 1994 | Current: Business broker and manager of commercial real estate, Griffith & Blair, Inc. (1997-present). | 95 | Former: Midland Care, Inc. (2011-2016). |
Jerry B. Farley
(1946) | Trustee | Since 2005 | Current: President, Washburn University (1997-present). | 95 | Current: Westar Energy, Inc. (2004-present); CoreFirst Bank & Trust (2000-present). |
Roman Friedrich III
(1946) | Trustee and Chairman of the Contracts Review Committee | Since 2014 | Current: Founder and Managing Partner, Roman Friedrich & Company (1998-present).
Former: Senior Managing Director, MLV & Co. LLC (2010-2011). | 95 | Current: Zincore Metals, Inc. (2009-present).
Former: Axiom Gold and Silver Corp. (2011-2012). |
Robert B. Karn III
(1942) | Trustee and Chairman of the Audit Committee | Since 2014 | Current: Consultant (1998-present).
Former: Arthur Andersen (1965-1997) and Managing Partner, Financial and Economic Consulting, St. Louis office (1987-1997). | 95 | Current: GP Natural Resource Partners, LLC (2002- present).
Former: Peabody Energy Company (2003- Apr. 2017). |
Ronald A. Nyberg
(1953) | Trustee and Chairman of the Nominating and Governance Committee | Since 2014 | Current: Partner, Momkus McCluskey Roberts, LLC (2016-present).
Former: Partner, Nyberg & Cassioppi, LLC (2000-2016); Executive Vice President, General Counsel, and Corporate Secretary, Van Kampen Investments (1982-1999). | 100 | Current: Edward-Elmhurst Healthcare System (2012-present). |
| | THE GUGGENHEIM FUNDS SEMI-ANNUAL REPORT | 101 |
INFORMATION ON BOARD OF TRUSTEES AND OFFICERS (Unaudited)(continued) |
Name, Address* and Year of Birth | Position(s)
Held with
the Trust | Term of Office and Length of Time Served** | Principal Occupation(s) During Past Five Years | Number of Portfolios in Fund Complex Overseen | Other
Directorships Held by Trustees |
INDEPENDENT TRUSTEES - concluded | | |
Maynard F. Oliverius
(1943) | Trustee | Since 1998 | Current: Retired.
Former: President and CEO, Stormont-Vail HealthCare (1996-2012). | 95 | Current: Robert J. Dole Institute of Politics (2016-present); Stormont-Vail Foundation (2013-present); University of Minnesota MHA Alumni Philanthropy Committee (2009-present); Fort Hays State University Foundation (1999-present).
Former: Topeka Community Foundation (2009-2014). |
Ronald E. Toupin, Jr.
(1958) | Trustee and Chairman of the Board | Since 2014 | Current: Portfolio Consultant (2010-present).
Former: Vice President, Manager and Portfolio Manager, Nuveen Asset Management (1998-1999); Vice President, Nuveen Investment Advisory Corp. (1992-1999); Vice President and Manager, Nuveen Unit Investment Trusts (1991-1999); and Assistant Vice President and Portfolio Manager, Nuveen Unit Investment Trusts (1988-1999), each of John Nuveen & Co., Inc. (1982-1999). | 97 | Former: Bennett Group of Funds (2011-2013). |
INTERESTED TRUSTEE | |
Donald C. Cacciapaglia***
(1951) | President, Chief Executive Officer and Trustee | Since 2012 | Current: President and CEO, certain other funds in the Fund Complex (2012-present); Vice Chairman, Guggenheim Investments (2010-present).
Former: Chairman and CEO, Channel Capital Group, Inc. (2002-2010). | 230 | Current: Clear Spring Life Insurance Company (2015-present); Guggenheim Partners Japan, Ltd. (2014-present); Guggenheim Partners Investment Management Holdings, LLC (2014-present); Delaware Life (2013-present); Guggenheim Life and Annuity Company (2011-present); Paragon Life Insurance Company of Indiana (2011-present). |
* | The business address of each Trustee is c/o Guggenheim Investments, 227 West Monroe Street, Chicago, Illinois 60606. |
** | Each Trustee serves an indefinite term, until his successor is elected and qualified. Time served includes time served in the respective position for the Predecessor Corporation. |
*** | This Trustee is deemed to be an “interested person” of the Funds under the 1940 Act by reason of his position with the Funds' Investment Manager and/or the parent of the Investment Manager. |
102 | THE GUGGENHEIM FUNDS SEMI-ANNUAL REPORT | |
INFORMATION ON BOARD OF TRUSTEES AND OFFICERS (Unaudited)(continued) |
Name, Address* and Year of Birth | Position(s)
Held with
the Trust | Term of Office and Length of Time Served** | Principal Occupations
During Past Five Years |
OFFICERS | | | |
William H. Belden, III
(1965) | Vice President | Since 2014 | Current: Vice President, certain other funds in the Fund Complex (2006-present); Managing Director, Guggenheim Funds Investment Advisors, LLC (2005-present).
Former: Vice President of Management, Northern Trust Global Investments (1999-2005). |
Joanna M. Catalucci
(1966) | AML Officer | Since 2016 | Current: Chief Compliance Officer, certain funds in the Fund Complex (2012-present); Senior Managing Director, Guggenheim Investments (2014-present); AML Officer, certain funds in the Fund Complex (2016-present).
Former: Chief Compliance Officer and Secretary, certain other funds in the Fund Complex (2008-2012); Senior Vice President & Chief Compliance Officer, Security Investors, LLC and certain affiliates (2010-2012); Chief Compliance Officer and Senior Vice President, Rydex Advisors, LLC and certain affiliates (2010-2011). |
James M. Howley
(1972) | Assistant Treasurer | Since 2014 | Current: Managing Director, Guggenheim Investments (2004-present) ; Assistant Treasurer, certain other funds in the Fund Complex (2006-present).
Former: Manager, Mutual Fund Administration of Van Kampen Investments, Inc. (1996-2004). |
Keith D. Kemp
(1960) | Assistant Treasurer | Since 2016 | Current: Treasurer and Assistant Treasurer, certain other funds in the Fund Complex (2010-present); Managing Director of Guggenheim Partners Investment Management, LLC (2015-present); Chief Financial Officer, Guggenheim Specialized Products, LLC (2016-present).
Former: Managing Director and Director, Transparent Value, LLC (2010-2016); Director, Guggenheim Partners Investment Management, LLC (2010-2015); Chief Operating Officer, Macquarie Capital Investment Management (2007-2009). |
Amy J. Lee
(1961) | Vice President and Chief Legal Officer | Since 2007 (Vice President) Since 2014 (Chief Legal Officer) | Current: Chief Legal Officer, certain other funds in the Fund Complex (2013-present); Senior Managing Director, Guggenheim Investments (2012-present).
Former: Vice President, Associate General Counsel and Assistant Secretary, Security Benefit Life Insurance Company and Security Benefit Corporation (2004-2012). |
Mark E. Mathiasen
(1978) | Secretary | Since 2014 | Current: Secretary, certain other funds in the Fund Complex (2007-present); Managing Director, Guggenheim Investments (2007-present). |
Glenn McWhinnie
(1969) | Assistant Treasurer | Since 2016 | Current: Vice President, Guggenheim Investments (2009-present).
Former: Tax Compliance Manager, Ernst & Young LLP (1996-2009). |
Michael P. Megaris
(1984) | Assistant Secretary | Since 2014 | Current: Assistant Secretary, certain other funds in the Fund Complex (2014-present); Vice President, Guggenheim Investments (2012-present).
Former: J.D., University of Kansas School of Law (2009-2012). |
| | THE GUGGENHEIM FUNDS SEMI-ANNUAL REPORT | 103 |
INFORMATION ON BOARD OF TRUSTEES AND OFFICERS (Unaudited)(concluded) |
Name, Address* and Year of Birth | Position(s)
Held with
the Trust | Term of Office and Length of Time Served** | Principal Occupations
During Past Five Years |
OFFICERS - concluded | |
Elisabeth Miller
(1968) | Chief Compliance Officer | Since 2012 | Current: CCO, certain other funds in the Fund Complex (2012-present); CCO, Security Investors, LLC (2012-present); CCO, Guggenheim Funds Investment Advisors, LLC (2012-present); Managing Director, Guggenheim Investments (2012-present); Vice President, Guggenheim Funds Distributors, LLC (March 2014-present).
Former: CCO, Guggenheim Distributors, LLC (2009-March 2014); Senior Manager, Security Investors, LLC (2004-2009); Senior Manager, Guggenheim Distributors, LLC (2004-2009). |
Adam J. Nelson
(1979) | Assistant Treasurer | Since 2015 | Current: Vice President, Guggenheim Investments (2015-present); Assistant Treasurer, certain other funds in the Fund Complex (2015-present).
Former: Assistant Vice President and Fund Administration Director, State Street Corporation (2013-2015); Fund Administration Assistant Director, State Street (2011-2013); Fund Administration Manager, State Street (2009-2011). |
Kimberly J. Scott
(1974) | Assistant Treasurer | Since 2014 | Current: Director, Guggenheim Investments (2012-present) ; Assistant Treasurer, certain other funds in the Fund Complex (2012-present).
Former: Financial Reporting Manager, Invesco, Ltd. (2010-2011); Vice President/Assistant Treasurer, Mutual Fund Administration for Van Kampen Investments, Inc./Morgan Stanley Investment Management (2009-2010); Manager of Mutual Fund Administration, Van Kampen Investments, Inc./Morgan Stanley Investment Management (2005-2009). |
Bryan Stone
(1979) | Vice President | Since 2014 | Current: Vice President, certain other funds in the Fund Complex (2014-present); Director, Guggenheim Investments (2013-present).
Former: Senior Vice President, Neuberger Berman Group LLC (2009-2013); Vice President, Morgan Stanley (2002-2009). |
John L. Sullivan
(1955) | Chief Financial Officer and Treasurer | Since 2014 | Current: CFO, Chief Accounting Officer and Treasurer, certain other funds in the Fund Complex (2010-present); Senior Managing Director, Guggenheim Investments (2010-present).
Former: Managing Director and CCO, each of the funds in the Van Kampen Investments fund complex (2004-2010); Managing Director and Head of Fund Accounting and Administration, Morgan Stanley Investment Management (2002-2004); CFO and Treasurer, Van Kampen Funds (1996-2004). |
* | The business address of each officer is c/o Guggenheim Investments, 227 West Monroe Street, Chicago, Illinois 60606. |
** | Each officer serves an indefinite term, until his or her successor is duly elected and qualified. Time served includes time served in the respective position for the Predecessor Corporation. |
104 | THE GUGGENHEIM FUNDS SEMI-ANNUAL REPORT | |
GUGGENHEIM INVESTMENTS PRIVACY POLICIES (Unaudited) |
Guggenheim Investments as used herein refers to Guggenheim Partners, LLC, Guggenheim Funds Investment Advisors, LLC, Guggenheim Partners Investment Management, LLC, Guggenheim Funds Distributors, LLC and Security Investors, LLC as well as the funds in the Guggenheim Funds complex (the “funds”).
Our Commitment to You
When you become a Guggenheim Investments investor, you entrust us with not only your hard-earned money but also with personal and financial information about you. We recognize that your relationship with us is based on trust and that you expect us to act responsibly and in your best interests. Because we have access to personal information about you, we hold ourselves to high standards in its safekeeping and use. This means, most importantly, that we do not sell client or account information to anyone—whether you are a current or former Guggenheim Investments client.
The Information We Collect About You and How We Collect It
In the course of doing business with shareholders and investors, we collect nonpublic personal information about you. You typically provide personal information when you complete a Guggenheim Investments account application or when you request a transaction that involves Rydex and Guggenheim Funds or one of the Guggenheim affiliated companies. “Nonpublic personal information” is personally identifiable information about you. For example it includes your name and address, Social Security or taxpayer identification number, assets, income, account balance, bank account information and investment activity (e.g. purchase and redemption history).
How We Share Your Personal Information
As a matter of policy, we do not disclose your nonpublic personal information to nonaffiliated third parties except as required or permitted by law. As emphasized above, we do not sell information about current or former clients or their accounts to third parties. Nor do we share such information, except when necessary to complete transactions at your request or to make you aware of related investment products and services that we offer. Additional details about how we handle your personal information are provided below.
To complete certain transactions or account changes that you direct, it may be necessary to provide your personal information to companies, individuals or groups that are not affiliated with Guggenheim Investments. For example if you ask to transfer assets from another financial institution to Guggenheim Investments, we will need to provide certain information about you to that company to complete the transaction. In connection with servicing your accounts or to alert you to other Guggenheim Investments investment products and services, we may share your information within the Guggenheim Investments family of affiliated companies. This would include, for example, sharing your information within Guggenheim Investments so we can make you aware of new funds or the services offered through another Guggenheim Investments affiliated company. In certain instances, we may contract with nonaffiliated companies to perform services for us. Where necessary, we will disclose information we have about you to these third parties. In all such cases, we provide the third party with only the information necessary to carry out its assigned responsibilities and only for that purpose. And we require these third parties to treat your personal information with the same high degree of confidentiality that we do. In certain instances, we may share information with other financial institutions regarding individuals and entities in response to the U.S.A. Patriot Act. Finally we will share personal information about you if we are compelled by law to do so, if you direct us to do so with your consent, or in other circumstances as permitted by law.
How We Safeguard Your Personal Information
We maintain physical, electronic and procedural safeguards to protect your personal information. Within Guggenheim Investments, access to such information is limited to those who need it to perform their jobs such as servicing your account, resolving problems or informing you of new products and services.
| | THE GUGGENHEIM FUNDS SEMI-ANNUAL REPORT | 105 |
This page intentionally left blank.
This page intentionally left blank.
This page intentionally left blank.
This page intentionally left blank.
3.31.2017
Guggenheim Funds Semi-Annual Report
| |
Guggenheim Mid Cap Value Fund | | |
GuggenheimInvestments.com | SBMCV-SEMI-0317x0917 |
DEAR SHAREHOLDER | 2 |
ECONOMIC AND MARKET OVERVIEW | 3 |
ABOUT SHAREHOLDERS’ FUND EXPENSES | 5 |
MID CAP VALUE FUND | 8 |
NOTES TO FINANCIAL STATEMENTS | 20 |
OTHER INFORMATION | 27 |
INFORMATION ON BOARD OF TRUSTEES AND OFFICERS | 28 |
GUGGENHEIM INVESTMENTS PRIVACY POLICIES | 35 |
| | THE GUGGENHEIM FUNDS SEMI-ANNUAL REPORT | 1 |
Dear Shareholder:
Security Investors, LLC (the “Investment Adviser”) is pleased to present the shareholder report for Guggenheim Mid Cap Value Fund (the “Fund”) for the six-month period ended March 31, 2017.
The Investment Adviser is part of Guggenheim Investments, which represents the investment management businesses of Guggenheim Partners, LLC (“Guggenheim”), a global, diversified financial services firm.
Guggenheim Funds Distributors, LLC is the distributor of the Fund. Guggenheim Funds Distributors, LLC is affiliated with Guggenheim and the Investment Adviser.
We encourage you to read the Economic and Market Overview section of the report, which follows this letter.
We are committed to providing innovative investment solutions and appreciate the trust you place in us.
Sincerely,

Donald C. Cacciapaglia
President and Chief Executive Officer
April 30, 2017
Read a prospectus and summary prospectus (if available) carefully before investing. It contains the investment objectives, risks, charges, expenses and other information, which should be considered carefully before investing. Obtain a prospectus and summary prospectus (if available) at guggenheiminvestments.com or call 800.820.0888.
There can be no assurance that any investment product will achieve its investment objective(s). There are risks associated with investing, including the entire loss of principal invested. Investing involves market risks. The investment return and principal value of any investment product will fluctuate with changes in market conditions.
2 | THE GUGGENHEIM FUNDS SEMI-ANNUAL REPORT | |
ECONOMIC AND MARKET OVERVIEW (Unaudited) | March 31, 2017 |
The market optimism that helped lift risk asset prices after the presidential election in November continued through the early part of 2017. The Standard & Poor’s 500® (“S&P 500”) Index* set a new record, high yield corporate bond spreads approached cycle lows, and the 10-year Treasury yield rose to 2.63%, the highest level since 2014. Risk appetite faded as the first quarter drew to a close, however, as investors grappled with the implications of an unsuccessful healthcare reform bill and growing geopolitical risks.
Much of the rise in asset valuations since Donald Trump’s victory has been based on anticipation of his pro-growth policies coming to fruition, an outcome that is far from certain. Asset valuations could be getting a bit ahead of themselves, and becoming more sensitive to a temporary growth scare or setback, especially since the rollout of Trump’s new policies will not be smooth or easy.
Nevertheless, the underlying economy remains on a good trajectory. Tracking estimates for first-quarter real U.S. Gross Domestic Product (“GDP”) growth have fallen in recent weeks despite strong gains in consumer and business sentiment since the election. In late April, after the period ended, the initial estimate of first-quarter GDP growth was 0.7%. However, we attribute a large portion of the apparent weakness to seasonal factors that have depressed as-reported first quarter GDP growth over the past several years. In keeping with this pattern, we would expect the final first-quarter GDP number to be revised higher. More importantly, the prospects for quarterly GDP growth appear stronger going forward.
Consumer spending should benefit from solid income and wealth gains, with household net worth sitting at an all-time high. Recent job gains have been strong, and we anticipate a further acceleration of wage growth as the labor market continues to tighten. Buoyant consumer sentiment and low household debt service outlays also support our positive outlook. On the business investment side, we expect various factors to be supportive, including the uptick in global industrial production growth, the ongoing rise in U.S. oil drilling activity, the surge in small-business optimism, and the recovery in corporate earnings.
On March 15, the Federal Open Market Committee (“FOMC”) raised the U.S. Federal Reserve (the “Fed”) funds target rate by 25 basis points to a range of 0.75–1.0%. The hike itself had little impact on markets because several FOMC members had indicated in the weeks leading up to the meeting that a hike was likely. Looking ahead, we believe that the market is underpricing the likely pace of Fed rate hikes in 2017 and 2018, particularly now that market optimism about fiscal stimulus is waning.
Importantly, Chair Yellen noted that the FOMC’s baseline forecast of two additional rate increases in 2017 and three more in 2018 was not conditioned on expectations for fiscal stimulus. Rather, it reflected a need to gradually remove accommodation due to the fact that the Fed has essentially achieved its dual mandate objectives for employment and inflation. Fiscal easing, she explained, could result in a faster pace of tightening, if it materializes. Markets are skeptical and are pricing in only 1.5 more rate hikes in 2017 and another 1.5 rate hikes in 2018, according to fed funds futures contracts. We expect that the Fed will deliver three more rate hikes in 2017 and another four in 2018.
| | THE GUGGENHEIM FUNDS SEMI-ANNUAL REPORT | 3 |
ECONOMIC AND MARKET OVERVIEW (Unaudited)(concluded) | March 31, 2017 |
We expect to see equity and credit investors take more chips off the table unless there is concrete progress on fiscal legislation in Washington, particularly as the Fed demonstrates its desire to tighten even without fiscal stimulus. While we are optimistic about the near-term U.S. economic outlook, current valuations and growing political risks warrant a more defensive stance.
For the six months ended March 31, 2017, the S&P 500 Index* returned 10.12%. The MSCI Europe-Australasia-Far East (“EAFE”) Index* returned 6.48%. The return of the MSCI Emerging Markets Index* was 6.80%.
In the bond market, the Bloomberg Barclays U.S. Aggregate Bond Index* posted a -2.18% return for the period, while the Bloomberg Barclays U.S. Corporate High Yield Index* returned 4.50%. The return of the Bank of America (“BofA”) Merrill Lynch 3-Month U.S. Treasury Bill Index* was 0.19% for the 12-month period.
The opinions and forecasts expressed may not actually come to pass. This information is subject to change at any time, based on market and other conditions, and should not be construed as a recommendation of any specific security or strategy.
*Index Definitions:
The following indices are referenced throughout this report. Indices are unmanaged and not available for direct investment. Index performance does not reflect transaction costs, fees, or expenses.
Bloomberg Barclays U.S. Aggregate Bond Index is a broad-based flagship benchmark that measures the investment grade, U.S. dollar-denominated, fixed-rate taxable bond market, including U.S. Treasuries, government-related and corporate securities, mortgage-backed securities or “MBS” (agency fixed-rate and hybrid adjustable-rate mortgage, or “ARM”, pass-throughs), asset-backed securities (“ABS”), and commercial mortgage-backed securities (“CMBS”) (agency and non-agency).
Bloomberg Barclays U.S. Corporate High Yield Index measures the U.S. dollar-denominated, high yield, fixed-rate corporate bond market. Securities are classified as high yield if the middle rating of Moody’s, Fitch, and S&P is Ba1/BB +/BB + or below.
BofA Merrill Lynch 3-Month U.S. Treasury Bill Index is an unmanaged market index of U.S. Treasury securities maturing in 90 days that assumes reinvestment of all income.
MSCI EAFE Index is a free float-adjusted market capitalization index that is designed to measure the equity market performance of developed markets, excluding the U.S. & Canada.
MSCI Emerging Markets Index is a free float-adjusted market capitalization weighted index that is designed to measure equity market performance in the global emerging markets.
S&P 500® Index is a capitalization-weighted index of 500 stocks designed to measure the performance of the broad economy, representing all major industries and is considered a representation of the U.S. stock market.
4 | THE GUGGENHEIM FUNDS SEMI-ANNUAL REPORT | |
ABOUT SHAREHOLDERS’ FUND EXPENSES (Unaudited) |
All mutual funds have operating expenses, and it is important for our shareholders to understand the impact of costs on their investments. Shareholders of a fund incur two types of costs: (i) transaction costs, including sales charges (loads) on purchase payments, reinvested dividends, other distributions, and exchange fees, and (ii) ongoing costs, including management fees, administrative services, and shareholder reports, among others. These ongoing costs, or operating expenses, are deducted from a fund’s gross income and reduce the investment return of the fund.
A fund’s expenses are expressed as a percentage of its average net assets, which is known as the expense ratio. The following examples are intended to help investors understand the ongoing costs (in dollars) of investing in a fund and to compare these costs with the ongoing costs of investing in other mutual funds.
The examples are based on an investment of $1,000 made at the beginning of the period and held for the entire six-month period beginning September 30, 2016 and ending March 31, 2017.
The following tables illustrate the Fund’s costs in two ways:
Table 1. Based on actual Fund return: This section helps investors estimate the actual expenses paid over the period. The “Ending Account Value” shown is derived from the Fund’s actual return, and the fifth column shows the dollar amount that would have been paid by an investor who started with $1,000 in the Fund. Investors may use the information here, together with the amount invested, to estimate the expenses paid over the period. Simply divide the Fund’s account value by $1,000 (for example, an $8,600 account value divided by $1,000 = 8.6), then multiply the result by the number provided under the heading “Expenses Paid During Period.”
Table 2. Based on hypothetical 5% return: This section is intended to help investors compare a Fund’s cost with those of other mutual funds. The table provides information about hypothetical account values and hypothetical expenses based on the Fund’s actual expense ratio and an assumed rate of return of 5% per year before expenses, which is not the Fund’s actual return. The hypothetical account values and expenses may not be used to estimate the actual ending account balance or expenses paid during the period. The example is useful in making comparisons because the U.S. Securities and Exchange Commission (the “SEC”) requires all mutual funds to calculate expenses based on the 5% return. Investors can assess a Fund’s costs by comparing this hypothetical example with the hypothetical examples that appear in shareholder reports of other funds.
The calculations illustrated above assume no shares were bought or sold during the period. Actual costs may have been higher or lower, depending on the amount of investment and the timing of any purchases or redemptions.
| | THE GUGGENHEIM FUNDS SEMI-ANNUAL REPORT | 5 |
ABOUT SHAREHOLDERS’ FUND EXPENSES (Unaudited)(continued) |
Please note that the expenses shown in the table are meant to highlight your ongoing costs only and do not reflect any transactional costs, such as sales charges (loads) on purchase payments, and contingent deferred sales charges (“CDSC”) on redemptions, if any. Therefore, the second table is useful in comparing ongoing costs only, and will not help you determine the relative total costs of owning different funds. In addition, if these transactional costs were included, your costs would have been higher.
More information about the Fund’s expenses, including annual expense ratios for periods up to five years (subject to the Fund’s inception date), can be found in the Financial Highlights section of this report. For additional information on operating expenses and other shareholder costs, please refer to the Fund’s prospectus.
6 | THE GUGGENHEIM FUNDS SEMI-ANNUAL REPORT | |
ABOUT SHAREHOLDERS’ FUND EXPENSES (Unaudited)(concluded) |
| | Expense
Ratio1 | Fund
Return | Beginning
Account Value
September 30,
2016 | Ending
Account Value
March 31,
2017 | Expenses
Paid During
Period2 |
Table 1. Based on actual Fund return3 |
Mid Cap Value Fund |
A-Class | 1.31% | 13.87% | $ 1,000.00 | $ 1,138.70 | $ 6.99 |
C-Class | 2.14% | 13.41% | 1,000.00 | 1,134.10 | 11.39 |
P-Class | 1.26% | 13.85% | 1,000.00 | 1,138.50 | 6.72 |
| |
Table 2. Based on hypothetical 5% return (before expenses) |
Mid Cap Value Fund |
A-Class | 1.31% | 5.00% | $ 1,000.00 | $ 1,018.40 | $ 6.59 |
C-Class | 2.14% | 5.00% | 1,000.00 | 1,014.26 | 10.75 |
P-Class | 1.26% | 5.00% | 1,000.00 | 1,018.65 | 6.34 |
1 | Annualized and excludes expenses of the underlying funds in which the Fund invests. |
2 | Expenses are equal to the Fund's annualized expense ratio, net of any applicable fee waivers, multiplied by the average account value over the period, multiplied by 182/365 (to reflect the one-half year period). |
3 | Actual cumulative return at net asset value for the period September 30, 2016 to March 31, 2017. |
| | THE GUGGENHEIM FUNDS SEMI-ANNUAL REPORT | 7 |
FUND PROFILE (Unaudited) | March 31, 2017 |
MID CAP VALUE FUND
OBJECTIVE: Seeks long-term growth of capital.
Holdings Diversification (Market Exposure as % of Net Assets)
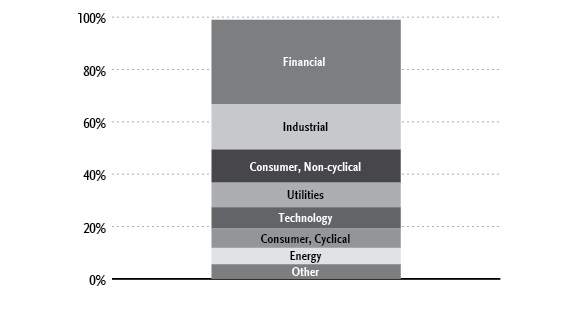
“Holdings Diversification (Market Exposure as % of Net Assets)” excludes any temporary cash investments.
Inception Dates: |
A-Class | May 1, 1997 |
C-Class | January 29, 1999 |
P-Class | May 1, 2015 |
Ten Largest Holdings (% of Total Net Assets) |
Zions Bancorporation | 2.0% |
KeyCorp | 2.0% |
WestRock Co. | 1.8% |
Wintrust Financial Corp. | 1.8% |
OGE Energy Corp. | 1.6% |
Alleghany Corp. | 1.5% |
Huntington Bancshares, Inc. | 1.5% |
Oshkosh Corp. | 1.4% |
UniFirst Corp. | 1.4% |
Gentex Corp. | 1.4% |
Top Ten Total | 16.4% |
“Ten Largest Holdings” excludes any temporary cash investments. |
8 | THE GUGGENHEIM FUNDS SEMI-ANNUAL REPORT | |
SCHEDULE OF INVESTMENTS (Unaudited) | March 31, 2017 |
MID CAP VALUE FUND | |
| | |
Shares
| | | Value | |
| | | | | | | |
COMMON STOCKS† - 99.0% | |
| | | | | | | |
Financial - 32.2% | |
Zions Bancorporation | | | 257,324 | | | $ | 10,807,608 | |
KeyCorp | | | 606,788 | | | | 10,788,691 | |
Wintrust Financial Corp. | | | 136,985 | | | | 9,468,403 | |
Alleghany Corp.* | | | 13,408 | | | | 8,241,361 | |
Huntington Bancshares, Inc. | | | 599,471 | | | | 8,026,917 | |
Unum Group | | | 152,454 | | | | 7,148,568 | |
Equity Commonwealth* | | | 211,651 | | | | 6,607,744 | |
Popular, Inc. | | | 161,294 | | | | 6,569,505 | |
Radian Group, Inc. | | | 360,961 | | | | 6,482,859 | |
E*TRADE Financial Corp.* | | | 176,549 | | | | 6,159,795 | |
First American Financial Corp. | | | 144,078 | | | | 5,659,384 | |
Prosperity Bancshares, Inc. | | | 76,194 | | | | 5,311,484 | |
Alexandria Real Estate Equities, Inc. | | | 46,202 | | | | 5,106,245 | |
EastGroup Properties, Inc. | | | 65,008 | | | | 4,780,038 | |
Sun Communities, Inc. | | | 56,475 | | | | 4,536,637 | |
Howard Hughes Corp.* | | | 37,553 | | | | 4,403,089 | |
Hanover Insurance Group, Inc. | | | 46,262 | | | | 4,166,356 | |
EPR Properties | | | 54,969 | | | | 4,047,368 | |
Assured Guaranty Ltd. | | | 102,181 | | | | 3,791,937 | |
Cousins Properties, Inc. | | | 450,768 | | | | 3,727,851 | |
First Merchants Corp. | | | 92,831 | | | | 3,650,115 | |
First Industrial Realty Trust, Inc. | | | 115,802 | | | | 3,083,807 | |
Lexington Realty Trust | | | 305,773 | | | | 3,051,615 | |
Redwood Trust, Inc. | | | 183,428 | | | | 3,046,739 | |
National Storage Affiliates Trust | | | 127,313 | | | | 3,042,781 | |
DCT Industrial Trust, Inc. | | | 62,198 | | | | 2,992,968 | |
IBERIABANK Corp. | | | 37,822 | | | | 2,991,720 | |
CubeSmart | | | 107,948 | | | | 2,802,330 | |
Piedmont Office Realty Trust, Inc. — Class A | | | 129,331 | | | | 2,765,097 | |
Spirit Realty Capital, Inc. | | | 268,225 | | | | 2,717,119 | |
Customers Bancorp, Inc.* | | | 84,893 | | | | 2,676,676 | |
CoreCivic, Inc. | | | 82,972 | | | | 2,606,980 | |
Camden Property Trust | | | 30,148 | | | | 2,425,708 | |
Monogram Residential Trust, Inc. | | | 234,338 | | | | 2,336,350 | |
PacWest Bancorp | | | 41,599 | | | | 2,215,563 | |
Fulton Financial Corp. | | | 108,522 | | | | 1,937,118 | |
Farmer Mac — Class C | | | 27,313 | | | | 1,572,409 | |
Apartment Investment & Management Co. — Class A | | | 28,602 | | | | 1,268,499 | |
Total Financial | | | | | | | 173,015,434 | |
| | | | | | | | | |
Industrial - 17.4% | |
WestRock Co. | | | 185,477 | | | | 9,650,368 | |
Oshkosh Corp. | | | 113,034 | | | | 7,753,002 | |
Gentex Corp. | | | 350,216 | | | | 7,470,106 | |
Corning, Inc. | | | 261,760 | | | | 7,067,520 | |
Orbital ATK, Inc. | | | 66,638 | | | | 6,530,524 | |
Kirby Corp.* | | | 83,253 | | | | 5,873,499 | |
FLIR Systems, Inc. | | | 128,731 | | | | 4,670,361 | |
Harris Corp. | | | 41,737 | | | | 4,644,076 | |
Covenant Transportation Group, Inc. — Class A* | | | 244,072 | | | | 4,588,554 | |
Crane Co. | | | 56,455 | | | | 4,224,528 | |
ITT, Inc. | | | 100,601 | | | | 4,126,653 | |
Scorpio Tankers, Inc. | | | 877,137 | | | | 3,894,488 | |
Werner Enterprises, Inc. | | | 145,448 | | | | 3,810,738 | |
Summit Materials, Inc. — Class A* | | | 151,149 | | | | 3,734,892 | |
Owens Corning | | | 47,516 | | | | 2,916,057 | |
Huntington Ingalls Industries, Inc. | | | 14,417 | | | | 2,886,860 | |
Sonoco Products Co. | | | 51,982 | | | | 2,750,887 | |
Valmont Industries, Inc. | | | 17,605 | | | | 2,737,578 | |
Owens-Illinois, Inc.* | | | 132,137 | | | | 2,692,952 | |
Fabrinet* | | | 38,100 | | | | 1,601,343 | |
Total Industrial | | | | | | | 93,624,986 | |
| | | | | | | | | |
Consumer, Non-cyclical - 12.6% | |
Quest Diagnostics, Inc. | | | 68,021 | | | | 6,678,982 | |
Bunge Ltd. | | | 80,132 | | | | 6,351,262 | |
SEE NOTES TO FINANCIAL STATEMENTS. | THE GUGGENHEIM FUNDS SEMI-ANNUAL REPORT | 9 |
SCHEDULE OF INVESTMENTS (Unaudited)(continued) | March 31, 2017 |
MID CAP VALUE FUND | |
| | |
Shares
| | | Value | |
| | | | | | | |
Emergent BioSolutions, Inc.* | | | 196,152 | | | $ | 5,696,254 | |
Navigant Consulting, Inc.* | | | 243,235 | | | | 5,560,352 | |
Sanderson Farms, Inc. | | | 47,871 | | | | 4,970,925 | |
Perrigo Company plc | | | 74,614 | | | | 4,953,623 | |
United Rentals, Inc.* | | | 33,153 | | | | 4,145,783 | |
Premier, Inc. — Class A* | | | 124,090 | | | | 3,949,785 | |
Dermira, Inc.* | | | 97,835 | | | | 3,337,152 | |
Acadia Healthcare Co., Inc.* | | | 70,950 | | | | 3,093,420 | |
Dean Foods Co. | | | 157,120 | | | | 3,088,979 | |
Sprouts Farmers Market, Inc.* | | | 131,055 | | | | 3,029,992 | |
Akorn, Inc.* | | | 122,633 | | | | 2,953,003 | |
HealthSouth Corp. | | | 64,208 | | | | 2,748,744 | |
Hormel Foods Corp. | | | 76,696 | | | | 2,655,982 | |
Molina Healthcare, Inc.* | | | 56,288 | | | | 2,566,733 | |
Community Health Systems, Inc.* | | | 205,820 | | | | 1,825,623 | |
Total Consumer, Non-cyclical | | | | 67,606,594 | |
| | | | | | | | | |
Utilities - 9.5% | |
OGE Energy Corp. | | | 239,771 | | | | 8,387,190 | |
Black Hills Corp. | | | 98,951 | | | | 6,577,273 | |
Ameren Corp. | | | 113,039 | | | | 6,170,799 | |
Portland General Electric Co. | | | 124,750 | | | | 5,541,395 | |
Pinnacle West Capital Corp. | | | 62,742 | | | | 5,231,428 | |
Avista Corp. | | | 123,279 | | | | 4,814,045 | |
UGI Corp. | | | 92,499 | | | | 4,569,450 | |
AES Corp. | | | 349,829 | | | | 3,911,088 | |
Calpine Corp.* | | | 278,143 | | | | 3,073,480 | |
ONE Gas, Inc. | | | 43,958 | | | | 2,971,561 | |
Total Utilities | | | | | | | 51,247,709 | |
| | | | | | | | | |
Technology - 8.0% | |
Micron Technology, Inc.* | | | 244,873 | | | | 7,076,830 | |
Lam Research Corp. | | | 44,542 | | | | 5,717,411 | |
CSRA, Inc. | | | 164,143 | | | | 4,807,748 | |
Cray, Inc.* | | | 211,248 | | | | 4,626,331 | |
Analog Devices, Inc. | | | 53,862 | | | | 4,413,991 | |
Qorvo, Inc.* | | | 62,174 | | | | 4,262,649 | |
IXYS Corp. | | | 290,974 | | | | 4,233,672 | |
Maxwell Technologies, Inc.* | | | 578,897 | | | | 3,363,392 | |
Photronics, Inc.* | | | 282,080 | | | | 3,018,256 | |
Western Digital Corp. | | | 19,028 | | | | 1,570,381 | |
Total Technology | | | | | | | 43,090,661 | |
| | | | | | | | | |
Consumer, Cyclical - 7.5% | |
UniFirst Corp. | | | 53,152 | | | | 7,518,351 | |
PVH Corp. | | | 63,791 | | | | 6,600,455 | |
DR Horton, Inc. | | | 192,435 | | | | 6,410,010 | |
Goodyear Tire & Rubber Co. | | | 128,617 | | | | 4,630,212 | |
CalAtlantic Group, Inc. | | | 84,934 | | | | 3,180,778 | |
Deckers Outdoor Corp.* | | | 46,980 | | | | 2,806,115 | |
PACCAR, Inc. | | | 40,635 | | | | 2,730,672 | |
JetBlue Airways Corp.* | | | 126,845 | | | | 2,614,275 | |
AutoNation, Inc.* | | | 58,106 | | | | 2,457,303 | |
Williams-Sonoma, Inc. | | | 27,869 | | | | 1,494,336 | |
Total Consumer, Cyclical | | | | | | | 40,442,507 | |
| | | | | | | | | |
Energy - 6.3% | |
Marathon Oil Corp. | | | 339,473 | | | | 5,363,673 | |
Whiting Petroleum Corp.* | | | 443,521 | | | | 4,195,709 | |
Oceaneering International, Inc. | | | 152,371 | | | | 4,126,207 | |
MRC Global, Inc.* | | | 201,830 | | | | 3,699,544 | |
Chesapeake Energy Corp.* | | | 573,154 | | | | 3,404,535 | |
Rowan Companies plc — Class A* | | | 202,999 | | | | 3,162,724 | |
Oasis Petroleum, Inc.* | | | 216,589 | | | | 3,088,559 | |
Tesoro Corp. | | | 30,706 | | | | 2,489,028 | |
Western Refining, Inc. | | | 70,909 | | | | 2,486,779 | |
Gulfport Energy Corp.* | | | 90,204 | | | | 1,550,607 | |
Total Energy | | | | | | | 33,567,365 | |
| | | | | | | | | |
Basic Materials - 2.8% | |
Reliance Steel & Aluminum Co. | | | 68,300 | | | | 5,465,365 | |
Westlake Chemical Corp. | | | 46,660 | | | | 3,081,893 | |
Nucor Corp. | | | 47,415 | | | | 2,831,624 | |
10 | THE GUGGENHEIM FUNDS SEMI-ANNUAL REPORT | SEE NOTES TO FINANCIAL STATEMENTS. |
SCHEDULE OF INVESTMENTS (Unaudited)(continued) | March 31, 2017 |
MID CAP VALUE FUND | |
| | |
Shares
| | | Value | |
| | | | | | | |
Olin Corp. | | | 80,373 | | | $ | 2,641,861 | |
Newmont Mining Corp. | | | 36,448 | | | | 1,201,326 | |
Total Basic Materials | | | | | | | 15,222,069 | |
| | | | | | | | | |
Communications - 2.7% | |
Scripps Networks Interactive, Inc. — Class A | | | 74,029 | | | | 5,801,652 | |
DigitalGlobe, Inc.* | | | 123,682 | | | | 4,050,586 | |
Infinera Corp.* | | | 322,488 | | | | 3,299,052 | |
NeoPhotonics Corp.* | | | 125,678 | | | | 1,132,359 | |
Total Communications | | | | | | | 14,283,649 | |
| | | | | | | | | |
Total Common Stocks | | | | | | | | |
(Cost $439,666,064) | | | | | | | 532,100,974 | |
| | | | | | | | | |
CONVERTIBLE PREFERRED STOCKS††† - 0.0%** | |
Thermoenergy Corp. *,1,3 | | | 858,334 | | | | 10 | |
Total Convertible Preferred Stocks | | | | | |
(Cost $819,654) | | | | | | | 10 | |
| | | | | | | | | |
SHORT-TERM INVESTMENTS† - 1.6% | |
Dreyfus Treasury Prime Cash Management Institutional Shares 0.50%2 | | | 8,425,177 | | | | 8,425,177 | |
Total Short-Term Investments | | | | | |
(Cost $8,425,177) | | | | | | | 8,425,177 | |
| | | | | | | | | |
Total Investments - 100.6% | | | | | |
(Cost $448,910,895) | | | | | | $ | 540,526,161 | |
Other Assets & Liabilities, net - (0.6)% | | | | (3,421,928 | ) |
Total Net Assets - 100.0% | | | | | | $ | 537,104,233 | |
* | Non-income producing security. |
** | Less than 0.1% of net assets. |
† | Value determined based on Level 1 inputs — See Note 3. |
††† | Value determined based on Level 3 inputs — See Note 3. |
1 | PIPE (Private Investment in Public Equity) — Stock issued by a company in the secondary market as a means of raising capital more quickly and less expensively than through registration of a secondary public offering. |
2 | Rate indicated is the 7 day yield as of March 31, 2017. |
3 | Illiquid security. |
| | plc — Public Limited Company |
| | |
| | See Sector Classification in Other Information section. |
SEE NOTES TO FINANCIAL STATEMENTS. | THE GUGGENHEIM FUNDS SEMI-ANNUAL REPORT | 11 |
SCHEDULE OF INVESTMENTS (Unaudited)(concluded) | March 31, 2017 |
MID CAP VALUE FUND | |
The following table summarizes the inputs used to value the Fund’s investments at March 31, 2017 (See Note 3 in the Notes to Financial Statements):
Investments in Securities (Assets) | | Level 1 | | | Level 2 | | | Level 3 | | | Total | |
Common Stocks | | $ | 532,100,974 | | | $ | — | | | $ | — | | | $ | 532,100,974 | |
Convertible Preferred Stocks | | | — | | | | — | | | | 10 | | | | 10 | |
Short Term Investments | | | 8,425,177 | | | | — | | | | — | | | | 8,425,177 | |
Total | | $ | 540,526,151 | | | $ | — | | | $ | 10 | | | $ | 540,526,161 | |
Transfers between investment levels may occur as the markets fluctuate and/or the availability of data used in an investment’s valuation changes. Transfers between valuation levels, if any, are in comparison to the valuation levels at the end of the previous fiscal year, and are effective using the fair value as of the end of the previous fiscal period.
For the period ended March 31, 2017, there were no transfers between levels.
12 | THE GUGGENHEIM FUNDS SEMI-ANNUAL REPORT | SEE NOTES TO FINANCIAL STATEMENTS. |
STATEMENT OF ASSETS AND LIABILITIES (Unaudited) |
MID CAP VALUE FUND |
March 31, 2017
Assets: | |
Investments, at value (cost $448,910,895) | | $ | 540,526,161 | |
Prepaid expenses | | | 39,573 | |
Cash | | | 9,941 | |
Receivables: | |
Securities sold | | | 6,063,698 | |
Fund shares sold | | | 342,800 | |
Dividends | | | 597,015 | |
Foreign taxes reclaim | | | 13,049 | |
Total assets | | | 547,592,237 | |
| | | | | |
Liabilities: | |
Payable for: | |
Securities purchased | | | 8,027,594 | |
Fund shares redeemed | | | 1,028,145 | |
Management fees | | | 345,819 | |
Transfer agent/maintenance fees | | | 239,841 | |
Distribution and service fees | | | 177,326 | |
Trustees’ fees* | | | 39,277 | |
Fund accounting/administration fees | | | 36,888 | |
Miscellaneous | | | 593,114 | |
Total liabilities | | | 10,488,004 | |
Net assets | | $ | 537,104,233 | |
| | | | | |
Net assets consist of: | |
Paid in capital | | $ | 409,975,001 | |
Undistributed net investment income | | | 106,708 | |
Accumulated net realized gain on investments | | | 35,407,258 | |
Net unrealized appreciation on investments | | | 91,615,266 | |
Net assets | | $ | 537,104,233 | |
| | | | | |
A-Class: | |
Net assets | | $ | 433,238,783 | |
Capital shares outstanding | | | 12,972,533 | |
Net asset value per share | | $ | 33.40 | |
Maximum offering price per share (Net asset value divided by 95.25%) | | $ | 35.07 | |
| | | | | |
C-Class: | |
Net assets | | $ | 95,991,059 | |
Capital shares outstanding | | | 3,845,481 | |
Net asset value per share | | $ | 24.96 | |
| | | | | |
P-Class: | |
Net assets | | $ | 7,874,391 | |
Capital shares outstanding | | | 237,274 | |
Net asset value per share | | $ | 33.19 | |
* | Relates to Trustees not deemed “interested persons” within the meaning of Section 2(a)(19) of the 1940 Act. |
SEE NOTES TO FINANCIAL STATEMENTS. | THE GUGGENHEIM FUNDS SEMI-ANNUAL REPORT | 13 |
STATEMENT OF OPERATIONS (Unaudited) |
MID CAP VALUE FUND |
Period Ended March 31, 2017
Investment Income: | |
Dividends (net of foreign withholding tax of $10,034) | | $ | 4,025,593 | |
Interest | | | 8,499 | |
Total investment income | | | 4,034,092 | |
| | | | | |
Expenses: | |
Management fees | | | 2,171,973 | |
Transfer agent/maintenance fees | |
A-Class | | | 252,014 | |
C-Class | | | 92,690 | |
P-Class | | | 2,096 | |
Distribution and service fees: | |
A-Class | | | 539,266 | |
C-Class | | | 494,372 | |
P-Class | | | 5,998 | |
Fund accounting/administration fees | | | 214,867 | |
Line of credit fees | | | 52,327 | |
Custodian fees | | | 4,759 | |
Trustees’ fees* | | | 18 | |
Miscellaneous | | | 97,004 | |
Total expenses | | | 3,927,384 | |
Net investment income | | | 106,708 | |
| | | | | |
Net Realized and Unrealized Gain (Loss): | |
Net realized gain (loss) on: | |
Investments | | $ | 39,554,985 | |
Net realized gain | | | 39,554,985 | |
Net change in unrealized appreciation (depreciation) on: | |
Investments | | | 29,159,683 | |
Net change in unrealized appreciation (depreciation) | | | 29,159,683 | |
Net realized and unrealized gain | | | 68,714,668 | |
Net increase in net assets resulting from operations | | $ | 68,821,376 | |
* | Relates to Trustees not deemed “interested persons” within the meaning of Section 2(a)(19) of the 1940 Act. |
14 | THE GUGGENHEIM FUNDS SEMI-ANNUAL REPORT | SEE NOTES TO FINANCIAL STATEMENTS. |
STATEMENTS OF CHANGES IN NET ASSETS |
MID CAP VALUE FUND | |
| | | Period Ended
March 31,
2017
(Unaudited) | | | Year Ended
September 30,
2016 | |
Increase (Decrease) in Net Assets from Operations: | | | | | | |
Net investment income | | $ | 106,708 | | | $ | 4,724,687 | |
Net realized gain on investments | | | 39,554,985 | | | | 17,533,078 | |
Net change in unrealized appreciation (depreciation) on investments | | | 29,159,683 | | | | 53,021,430 | |
Net increase in net assets resulting from operations | | | 68,821,376 | | | | 75,279,195 | |
| | | | | | | | | |
Distributions to shareholders from: | | | | | | | | |
Net investment income | | | | | | | | |
A-Class | | | (4,950,404 | ) | | | — | |
C-Class | | | (780,189 | ) | | | — | |
P-Class | | | (49,828 | ) | | | — | |
Net realized gains | | | | | | | | |
A-Class | | | (8,613,768 | ) | | | (71,175,868 | ) |
C-Class | | | (2,669,531 | ) | | | (23,558,203 | ) |
P-Class | | | (67,525 | ) | | | (15,730 | ) |
Total distributions to shareholders | | | (17,131,245 | ) | | | (94,749,801 | ) |
| | | | | | | | | |
Capital share transactions: | | | | | | | | |
Proceeds from sale of shares | | | | | | | | |
A-Class | | | 25,695,371 | | | | 32,844,791 | |
C-Class | | | 4,072,136 | | | | 5,397,137 | |
P-Class | | | 5,959,376 | | | | 4,471,143 | |
Distributions reinvested | | | | | | | | |
A-Class | | | 12,673,544 | | | | 65,228,180 | |
C-Class | | | 3,069,526 | | | | 20,922,534 | |
P-Class | | | 117,352 | | | | 15,730 | |
Cost of shares redeemed | | | | | | | | |
A-Class | | | (55,223,772 | ) | | | (156,281,880 | ) |
C-Class | | | (18,466,479 | ) | | | (45,239,145 | ) |
P-Class | | | (1,965,576 | ) | | | (1,301,763 | ) |
Net decrease from capital share transactions | | | (24,068,522 | ) | | | (73,943,273 | ) |
Net increase (decrease) in net assets | | | 27,621,609 | | | | (93,413,879 | ) |
| | | | | | | | | |
Net assets: | | | | | | | | |
Beginning of period | | | 509,482,624 | | | | 602,896,503 | |
End of period | | $ | 537,104,233 | | | $ | 509,482,624 | |
Undistributed net investment income at end of period | | $ | 106,708 | | | $ | 5,780,421 | |
SEE NOTES TO FINANCIAL STATEMENTS. | THE GUGGENHEIM FUNDS SEMI-ANNUAL REPORT | 15 |
STATEMENTS OF CHANGES IN NET ASSETS (concluded) |
MID CAP VALUE FUND | |
| | | Period Ended
March 31,
2017
(Unaudited) | | | Year Ended
September 30,
2016 | |
Capital share activity: | | | | | | |
Shares sold | | | | | | |
A-Class | | | 806,607 | | | | 1,179,023 | |
C-Class | | | 171,206 | | | | 256,114 | |
P-Class | | | 184,564 | | | | 157,411 | |
Shares issued from reinvestment of distributions | | | | | | | | |
A-Class | | | 398,539 | | | | 2,398,977 | |
C-Class | | | 128,809 | | | | 1,015,657 | |
P-Class | | | 3,715 | | | | 581 | |
Shares redeemed | | | | | | | | |
A-Class | | | (1,708,831 | ) | | | (5,552,921 | ) |
C-Class | | | (763,920 | ) | | | (2,098,789 | ) |
P-Class | | | (64,421 | ) | | | (46,438 | ) |
Net decrease in shares | | | (843,732 | ) | | | (2,690,385 | ) |
16 | THE GUGGENHEIM FUNDS SEMI-ANNUAL REPORT | SEE NOTES TO FINANCIAL STATEMENTS. |
FINANCIAL HIGHLIGHTS |
MID CAP VALUE FUND | |
This table is presented to show selected data for a share outstanding throughout each period and to assist shareholders in evaluating a Fund’s performance for the periods presented.
A-Class | | Period Ended
March 31,
2017a | | | Year Ended
Sept. 30,
2016 | | | Year Ended
Sept. 30,
2015 | | | Year Ended
Sept. 30,
2014 | | | Year Ended
Sept. 30,
2013 | | | Year Ended
Sept. 30,
2012 | |
Per Share Data | | | | | | | | | | | | | | | | | | |
Net asset value, beginning of period | | $ | 30.27 | | | $ | 30.86 | | | $ | 37.73 | | | $ | 38.15 | | | $ | 33.05 | | | $ | 27.13 | |
Income (loss) from investment operations: | |
Net investment income (loss)b | | | .03 | | | | .30 | | | | .06 | | | | .03 | | | | .04 | | | | (.07 | ) |
Net gain (loss) on investments (realized and unrealized) | | | 4.12 | | | | 3.95 | | | | (2.24 | ) | | | 2.04 | | | | 8.59 | | | | 6.54 | |
Total from investment operations | | | 4.15 | | | | 4.25 | | | | (2.18 | ) | | | 2.07 | | | | 8.63 | | | | 6.47 | |
Less distributions from: | |
Net investment income | | | (.37 | ) | | | — | | | | — | | | | — | | | | — | | | | — | |
Net realized gains | | | (.65 | ) | | | (4.84 | ) | | | (4.69 | ) | | | (2.49 | ) | | | (3.53 | ) | | | (.55 | ) |
Total distributions | | | (1.02 | ) | | | (4.84 | ) | | | (4.69 | ) | | | (2.49 | ) | | | (3.53 | ) | | | (.55 | ) |
Net asset value, end of period | | $ | 33.40 | | | $ | 30.27 | | | $ | 30.86 | | | $ | 37.73 | | | $ | 38.15 | | | $ | 33.05 | |
| | |
Total Returnc | | | 13.87 | % | | | 15.51 | % | | | (6.83 | %) | | | 5.52 | % | | | 28.93 | % | | | 24.13 | % |
Ratios/Supplemental Data | |
Net assets, end of period (in thousands) | | $ | 433,239 | | | $ | 407,883 | | | $ | 476,792 | | | $ | 1,017,208 | | | $ | 1,038,762 | | | $ | 903,221 | |
Ratios to average net assets: | |
Net investment income (loss) | | | 0.19 | % | | | 1.04 | % | | | 0.18 | % | | | 0.08 | % | | | 0.11 | % | | | (0.22 | %) |
Total expensesf | | | 1.31 | %g | | | 1.49 | % | | | 1.42 | % | | | 1.39 | % | | | 1.39 | % | | | 1.46 | % |
Portfolio turnover rate | | | 31 | % | | | 52 | % | | | 84 | % | | | 35 | % | | | 23 | % | | | 19 | % |
SEE NOTES TO FINANCIAL STATEMENTS. | THE GUGGENHEIM FUNDS SEMI-ANNUAL REPORT | 17 |
FINANCIAL HIGHLIGHTS (continued) |
MID CAP VALUE FUND | |
This table is presented to show selected data for a share outstanding throughout each period and to assist shareholders in evaluating a Fund’s performance for the periods presented.
C-Class | | Period Ended
March 31,
2017a | | | Year Ended
Sept. 30,
2016 | | | Year Ended
Sept. 30,
2015 | | | Year Ended
Sept. 30,
2014 | | | Year Ended
Sept. 30,
2013 | | | Year Ended
Sept. 30,
2012 | |
Per Share Data | | | | | | | | | | | | | | | | | | |
Net asset value, beginning of period | | $ | 22.78 | | | $ | 24.54 | | | $ | 31.14 | | | $ | 32.13 | | | $ | 28.57 | | | $ | 23.68 | |
Income (loss) from investment operations: | |
Net investment income (loss)b | | | (.07 | ) | | | .06 | | | | (.15 | ) | | | (.21 | ) | | | (.18 | ) | | | (.25 | ) |
Net gain (loss) on investments (realized and unrealized) | | | 3.08 | | | | 3.02 | | | | (1.76 | ) | | | 1.71 | | | | 7.27 | | | | 5.69 | |
Total from investment operations | | | 3.01 | | | | 3.08 | | | | (1.91 | ) | | | 1.50 | | | | 7.09 | | | | 5.44 | |
Less distributions from: | |
Net investment income | | | (.18 | ) | | | — | | | | — | | | | — | | | | — | | | | — | |
Net realized gains | | | (.65 | ) | | | (4.84 | ) | | | (4.69 | ) | | | (2.49 | ) | | | (3.53 | ) | | | (.55 | ) |
Total distributions | | | (.83 | ) | | | (4.84 | ) | | | (4.69 | ) | | | (2.49 | ) | | | (3.53 | ) | | | (.55 | ) |
Net asset value, end of period | | $ | 24.96 | | | $ | 22.78 | | | $ | 24.54 | | | $ | 31.14 | | | $ | 32.13 | | | $ | 28.57 | |
| | |
Total Returnc | | | 13.41 | % | | | 14.64 | % | | | (7.49 | %) | | | 4.74 | % | | | 27.98 | % | | | 23.28 | % |
Ratios/Supplemental Data | |
Net assets, end of period (in thousands) | | $ | 95,991 | | | $ | 98,176 | | | $ | 126,047 | | | $ | 192,942 | | | $ | 219,695 | | | $ | 191,249 | |
Ratios to average net assets: | |
Net investment income (loss) | | | (0.61 | %) | | | 0.27 | % | | | (0.53 | %) | | | (0.65 | %) | | | (0.62 | %) | | | (0.92 | %) |
Total expensesf | | | 2.14 | %g | | | 2.27 | % | | | 2.12 | % | | | 2.12 | % | | | 2.12 | % | | | 2.17 | % |
Portfolio turnover rate | | | 31 | % | | | 52 | % | | | 84 | % | | | 35 | % | | | 23 | % | | | 19 | % |
18 | THE GUGGENHEIM FUNDS SEMI-ANNUAL REPORT | SEE NOTES TO FINANCIAL STATEMENTS. |
FINANCIAL HIGHLIGHTS (concluded) |
MID CAP VALUE FUND |
This table is presented to show selected data for a share outstanding throughout each period and to assist shareholders in evaluating a Fund’s performance for the periods presented.
P-Class | | Period Ended
March 31,
2017a | | | Year Ended
Sept. 30,
2016 | | | Period Ended
Sept. 30,
2015d | |
Per Share Data | | | | | | | | | |
Net asset value, beginning of period | | $ | 30.18 | | | $ | 30.77 | | | $ | 33.91 | |
Income (loss) from investment operations: | |
Net investment income (loss)b | | | — | e | | | .14 | | | | .10 | |
Net gain (loss) on investments (realized and unrealized) | | | 4.13 | | | | 4.11 | | | | (3.24 | ) |
Total from investment operations | | | 4.13 | | | | 4.25 | | | | (3.14 | ) |
Less distributions from: | |
Net investment income | | | (.47 | ) | | | — | | | | — | |
Net realized gains | | | (.65 | ) | | | (4.84 | ) | | | — | |
Total distributions | | | (1.12 | ) | | | (4.84 | ) | | | — | |
Net asset value, end of period | | $ | 33.19 | | | $ | 30.18 | | | $ | 30.77 | |
| | |
Total Returnc | | | 13.85 | % | | | 15.61 | % | | | (9.26 | %) |
Ratios/Supplemental Data | |
Net assets, end of period (in thousands) | | $ | 7,874 | | | $ | 3,423 | | | $ | 57 | |
Ratios to average net assets: | |
Net investment income (loss) | | | 0.02 | % | | | 0.48 | % | | | 0.71 | % |
Total expensesf | | | 1.26 | %g | | | 1.32 | % | | | 1.32 | % |
Portfolio turnover rate | | | 31 | % | | | 52 | % | | | 84 | % |
a | Unaudited figures for the period ended March 31, 2017. Percentage amounts for the period, except total return and portfolio turnover rate, have been annualized. |
b | Net investment income (loss) per share was computed using average shares outstanding throughout the period. |
c | Total return does not reflect the impact of any applicable sales charges and has not been annualized. |
d | Since commencement of operations: May 1, 2015. Percentage amounts for the period, except total return and portfolio turnover rate, have been annualized. |
e | Net investment income is less than $0.01 per share. |
f | Does not include expenses of the underlying funds in which the fund invests. |
g | Total expenses may include expenses that are excluded from the expense limitation agreement. Excluding these expenses, operating expense ratio for the periods would be: |
| | | 03/31/17 |
| | A-Class | 1.30% |
| | C-Class | 2.12% |
| | P-Class | 1.24% |
SEE NOTES TO FINANCIAL STATEMENTS. | THE GUGGENHEIM FUNDS SEMI-ANNUAL REPORT | 19 |
NOTES TO FINANCIAL STATEMENTS (Unaudited) |
1. Organization and Significant Accounting Policies
Organization
Guggenheim Funds Trust (the “Trust”), a Delaware statutory trust, is registered with the SEC under the Investment Company Act of 1940 (“1940 Act”), as an open-ended investment company of the series type. Each series, in effect, is representing a separate Fund. The Trust is authorized to issue an unlimited number of shares. The Trust accounts for the assets of each Fund separately.
The Trust offers a combination of five separate classes of shares, A-Class shares, C-Class shares, P-Class shares, R6-Class shares and Institutional Class shares. Sales of shares of each Class are made without a front-end sales charge at the net asset value per share (“NAV”), with the exception of A-Class shares. A-Class shares are sold at the NAV, plus the applicable front-end sales charge. The sales charge varies depending on the amount purchased. A-Class share purchases of $1 million or more are exempt from the front-end sales charge but have a 1% contingent deferred sales charge (“CDSC”), if shares are redeemed within 12 months of purchase. C-Class shares have a 1% CDSC if shares are redeemed within 12 months of purchase. Institutional Class shares are offered primarily for direct investment by institutions such as pension and profit sharing plans, endowments, foundations and corporations. Institutional Class shares require a minimum initial investment of $2 million and a minimum account balance of $1 million. At March 31, 2017, the Trust consisted of nineteen funds (the “Funds”).
This report covers the Mid Cap Value Fund (the “Fund”), a diversified investment company. Only A-Class, C-Class and P-Class shares had been issued by the Fund.
Security Investors, LLC, which operates under the name Guggenheim Investments (“GI”) provides advisory services. Guggenheim Funds Distributors, LLC (“GFD”) acts as principal underwriter for the Trust. GI and GFD are affiliated entities.
Significant Accounting Policies
The Fund operates as an investment company and, accordingly, follows the investment company accounting and reporting guidance of the Financial Accounting Standards Board (“FASB”) Accounting Standards Codification Topic 946 Financial Services – Investment Companies.
The following significant accounting policies are in conformity with U.S. generally accepted accounting principles (“U.S. GAAP”) and are consistently followed by the Trust. This requires management to make estimates and assumptions that affect the reported amount of assets and liabilities, contingent assets and liabilities at the date of the financial statements, and the reported amounts of revenues and expenses during the reporting period. Actual results could differ from these estimates. All time references are based on Eastern Time.
The NAV of each Class of the Fund is calculated by dividing the market value of the Fund’s securities and other assets, less all liabilities, attributable to the Class by the number of outstanding shares of the Class.
20 | THE GUGGENHEIM FUNDS SEMI-ANNUAL REPORT | |
NOTES TO FINANCIAL STATEMENTS (Unaudited)(continued) |
A. The Board of Trustees of the Fund (the “Board”) has adopted policies and procedures for the valuation of the Fund’s investments (the “Valuation Procedures”). Pursuant to the Valuation Procedures, the Board has delegated to a valuation committee, consisting of representatives from Guggenheim’s investment management, fund administration, legal and compliance departments (the “Valuation Committee”), the day-to-day responsibility for implementing the Valuation Procedures, including, under most circumstances, the responsibility for determining the fair value of the Fund’s securities and/or other assets.
Valuations of the Fund’s securities are supplied primarily by pricing services appointed pursuant to the processes set forth in the Valuation Procedures. The Valuation Committee convenes monthly, or more frequently as needed, to review the valuation of all assets which have been fair valued for reasonableness. The Fund’s officers, through the Valuation Committee and consistent with the monitoring and review responsibilities set forth in the Valuation Procedures, regularly review procedures used and valuations provided by the pricing services.
If the pricing service cannot or does not provide a valuation for a particular investment or such valuation is deemed unreliable, such investment is fair valued by the Valuation Committee.
Equity securities listed on an exchange (New York Stock Exchange (“NYSE”) or American Stock Exchange) are valued at the last quoted sales price as of the close of business on the NYSE, usually 4:00 p.m. on the valuation date. Equity securities listed on the NASDAQ market system are valued at the NASDAQ Official Closing Price on the valuation date, which may not necessarily represent the last sale price. If there has been no sale on such exchange or NASDAQ on a given day, the security is valued at the closing bid price on that day.
Open-end investment companies (“Mutual Funds”) are valued at their NAV as of the close of business, on the valuation date.
Investments for which market quotations are not readily available are fair-valued as determined in good faith by GI under the direction of the Board using methods established or ratified by the Board. Valuations in accordance with these methods are intended to reflect each security’s (or asset’s) “fair value.” Each such determination is based on a consideration of all relevant factors, which are likely to vary from one pricing context to another. Examples of such factors may include, but are not limited to market prices; sale prices; broker quotes; and models which derive prices based on inputs such as prices of securities with comparable maturities and characteristics, or based on inputs such as anticipated cash flows or collateral, spread over Treasuries, and other information analysis.
B. Security transactions are recorded on the trade date for financial reporting purposes. Realized gains and losses from securities transactions are recorded using the identified cost basis. Proceeds from lawsuits related to investment holdings are recorded as realized gains in the Fund. Dividend income is recorded on the ex-dividend date, net of applicable taxes withheld by foreign countries. Taxable non-cash dividends are recorded as dividend income. Interest income, including amortization of premiums and accretion of discounts, is accrued on a daily basis.
| | THE GUGGENHEIM FUNDS SEMI-ANNUAL REPORT | 21 |
NOTES TO FINANCIAL STATEMENTS (Unaudited)(continued) |
Interest income also includes paydown gains and losses on mortgage-backed and asset-backed securities and senior and subordinated loans. Amendment fees are earned as compensation for evaluating and accepting changes to the original loan agreement and are recognized when received. Dividend income from REITs is recorded based on the income included in the distributions received from the REIT investments using published REIT classifications, including some management estimates when actual amounts are not available. Distributions received in excess of this estimated amount are recorded as a reduction of the cost of investments or reclassified to capital gains. The actual amounts of income, return of capital, and capital gains are only determined by each REIT after its fiscal year-end, and may differ from the estimated amounts.
C. Distributions of net investment income and net realized gains, if any, are declared and paid at least annually. Dividends are reinvested in additional shares unless shareholders request payment in cash. Distributions are recorded on the ex-dividend date and are determined in accordance with income tax regulations which may differ from U.S. GAAP.
D. Interest and dividend income, most expenses, all realized gains and losses, and all unrealized gains and losses are allocated to the classes based upon the value of the outstanding shares in each Class. Certain costs, such as distribution and service fees are charged directly to specific classes. In addition, certain expenses have been allocated to the individual Funds in the Trust on a pro rata basis upon the respective aggregate net assets of each Fund included in the Trust.
E. Under the fee arrangement with the custodian, the Fund may earn credits based on overnight custody cash balances. These credits are utilized to reduce related custodial expenses. The custodian fees disclosed in the Statement of Operations are before the reduction in expense from the related earnings credits, if any. For the period ended March 31, 2017, there were no earnings credits received.
F. The Fund may leave cash overnight in its cash account with the custodian. Periodically, the Fund may have cash due to the custodian bank as an overdraft balance. A fee is incurred on this overdraft, calculated by multiplying the overdraft by a rate based on the federal funds rate, which was 0.82% at March 31, 2017.
G. Under the Fund’s organizational documents, its Trustees and Officers are indemnified against certain liabilities arising out of the performance of their duties to the Trust. In addition, throughout the normal course of business, the Fund enters into contracts that contain a variety of representations and warranties which provide general indemnifications. The Fund’s maximum exposure under these arrangements is unknown, as this would involve future claims that may be made against the Fund and/or its affiliates that have not yet occurred. However, based on experience, the Fund expects the risk of loss to be remote.
22 | THE GUGGENHEIM FUNDS SEMI-ANNUAL REPORT | |
NOTES TO FINANCIAL STATEMENTS (Unaudited)(continued) |
2. Fees and Other Transactions with Affiliates
Under the terms of an investment advisory contract, effective February 1, 2017, the Fund pays GI investment advisory fees calculated at an annualized rate of 0.75% of the average daily net assets of the Fund. Prior to February 1, 2017, the Fund paid GI investment advisory fees calculated at 1.00% of the average daily net assets of $200 million or less and 0.75% of the average daily net assets of the Fund in excess of $200 million.
GI engages external service providers to perform other necessary services for the Trust, such as audit and accounting related services, legal services, custody, printing and mailing, etc., on a pass-through basis. Such expenses are allocated to various Funds within the complex based on relative net assets.
The Fund has adopted Distribution Plans related to the offering of A-Class, C-Class and P-Class shares pursuant to Rule 12b-1 under the 1940 Act. The plans provide for payments at an annual rate of 0.25% of the average daily net assets of the Fund’s A-Class and P-Class shares, and 1.00% of the average daily net assets of the Fund’s C-Class shares.
The investment advisory contracts for the following Fund provides that the total expenses be limited to a percentage of average net assets for each class of shares, exclusive of brokerage costs, dividends on securities sold short, expenses of other investment companies in which a Fund invests, interest, taxes, litigation, indemnification and extraordinary expenses. The limits are listed below:
| | Limit | Effective
Date | Contract
End Date |
Mid Cap Value Fund – A-Class | 1.42% | 01/30/17 | 02/01/18 |
Mid Cap Value Fund – C-Class | 2.12% | 01/30/17 | 02/01/18 |
Mid Cap Value Fund – P-Class | 1.32% | 01/30/17 | 02/01/18 |
During the period ended March 31, 2017, no fees were waived or amounts recouped by GI.
For the period ended March 31, 2017, GFD retained sales charges of $356,038 relating to sales of A-Class shares of the Trust.
At March 31, 2017, GI and its affiliates owned twenty-two percent of the outstanding shares of the Fund.
Certain trustees and officers of the Trust are also officers of GI and GFD.
On October 4, 2016, Rydex Fund Services, LLC (“RFS”) was purchased by MUFG Investor Services and as of that date RFS ceased to be an affiliate of GI. In connection with its acquisition, RFS changed its name to MUFG Investor Services (US), LLC (“MUIS”). This change had no impact on the financial statements of the Trust.
| | THE GUGGENHEIM FUNDS SEMI-ANNUAL REPORT | 23 |
NOTES TO FINANCIAL STATEMENTS (Unaudited)(continued) |
MUIS acts as the Trust’s administrator, transfer agent and accounting agent. As administrator, transfer agent and accounting agent, MUIS is responsible for maintaining the books and records of the Trust’s securities and cash. For providing the aforementioned administrative and accounting services, MUIS is entitled to receive a monthly fee equal to a percentage of the Fund’s fees and out of pocket expenses. For providing the aforementioned transfer agent services, MUIS is entitled to receive a monthly fee based on the number of transactions during the month and the number of accounts under management subject to certain minimum monthly fees and out of pocket expenses.
3. Fair Value Measurement
In accordance with U.S. GAAP, fair value is defined as the price that the Fund would receive to sell an investment or pay to transfer a liability in an orderly transaction with an independent buyer in the principal market, or in the absence of a principal market, the most advantageous market for the investment or liability. U.S. GAAP establishes a three-tier fair value hierarchy based on the types of inputs used to value assets and liabilities and requires corresponding disclosure. The hierarchy and the corresponding inputs are summarized below:
Level 1 — | quoted prices in active markets for identical assets or liabilities. |
Level 2 — | significant other observable inputs (for example quoted prices for securities that are similar based on characteristics such as interest rates, prepayment speeds, credit risk, etc.). |
Level 3 — | significant unobservable inputs based on the best information available under the circumstances, to the extent observable inputs are not available, which may include assumptions. |
The types of inputs available depend on a variety of factors, such as the type of security and the characteristics of the markets in which it trades, if any. Fair valuation determinations that rely on fewer or no observable inputs require greater judgment. Accordingly, fair value determinations for Level 3 securities require the greatest amount of judgment.
The inputs or methodologies used for valuing securities are not necessarily an indication of the risk associated with investing in those securities. The suitability of the techniques and sources employed to determine fair valuation are regularly monitored and subject to change.
4. Federal Income Tax Information
The Fund intends to comply with the provisions of Subchapter M of the Internal Revenue Code applicable to regulated investment companies and will distribute substantially all taxable net investment income and capital gains sufficient to relieve the Fund from all, or substantially all, federal income, excise and state income taxes. Therefore, no provision for federal or state income tax is required.
24 | THE GUGGENHEIM FUNDS SEMI-ANNUAL REPORT | |
NOTES TO FINANCIAL STATEMENTS (Unaudited)(continued) |
Tax positions taken or expected to be taken in the course of preparing the Fund’s tax returns are evaluated to determine whether the tax positions are “more-likely-than-not” of being sustained by the applicable tax authority. Tax positions not deemed to meet the more-likely-than-not threshold would be recorded as a tax benefit or expense in the current year. Management has analyzed the Fund’s tax positions taken, or to be taken, on federal income tax returns for all open tax years, and has concluded that no provision for income tax is required in the Fund’s financial statements. The Fund’s federal tax returns are subject to examination by the Internal Revenue Service for a period of three years after they are filed.
At March 31, 2017, the cost of securities for federal income tax purposes, the aggregate gross unrealized gain for all securities for which there was an excess of value over tax cost, and the aggregate gross unrealized loss for all securities for which there was an excess of tax cost over value were as follows:
Fund | | Tax
Cost | | | Tax
Unrealized
Gain | | | Tax
Unrealized
Loss | | | Net
Unrealized
Gain | |
Mid Cap Value Fund | | $ | 449,353,014 | | | $ | 105,615,322 | | | $ | (14,442,175 | ) | | $ | 91,173,147 | |
5. Securities Transactions
For the period ended March 31, 2017, the cost of purchases and proceeds from sales of investment securities, excluding government securities, short-term investments and derivatives, were as follows:
Fund | | Purchases | | | Sales | |
Mid Cap Value Fund | | $ | 164,878,224 | | | $ | 209,901,554 | |
The Fund is permitted to purchase or sell securities from or to certain affiliated funds under specified conditions outlined in procedures adopted by the Board of the Trust. The procedures have been designed to ensure that any purchase or sale of securities by a Fund from or to another fund or portfolio that is or could be considered an affiliate by virtue of having a common investment adviser (or affiliated investment advisers), common Trustees and/or common officers complies with Rule 17a-7 of the 1940 Act. Further, as defined under these procedures, each transaction is effected at the current market price to save costs, where permissible. For the period ended March 31, 2017, the Fund did not engage in purchases and sales of securities, pursuant to Rule 17a-7 of the 1940 Act.
6. Line of Credit
The Trust, with the exception of Capital Stewardship Fund, and certain affiliated funds, secured a 364-day committed, $800,000,000 line of credit from Citibank, N.A., which was in place through October 6, 2016, at which time the line of credit was renewed, with an increased commitment amount to $1,000,000,000. A Fund may draw (borrow) from the line of credit as a temporary
| | THE GUGGENHEIM FUNDS SEMI-ANNUAL REPORT | 25 |
NOTES TO FINANCIAL STATEMENTS (Unaudited)(concluded) |
measure for emergency purposes, to facilitate redemption requests, or for other short-term liquidity purposes consistent with the Fund’s investment objective and program. For example, it may be advantageous for the Fund to borrow money rather than sell existing portfolio positions to meet redemption requests. Fees related to borrowings, if any, vary under this arrangement between the greater of Citibank’s “base rate”, LIBOR plus 1%, or the federal funds rate 0.82% at March 31, 2017, plus 1/2 of 1%. All affiliated funds that participate in the line of credit paid upfront costs totaling $2,032,388 to renew the line of credit.
The commitment fee that may be paid by the Funds is at an annualized rate of 0.15% of the average daily amount of their unused commitment amount. The Funds did not have any borrowings under this agreement as of and for the period ended March 31, 2017.
The allocated commitment fee amount for each Fund is referenced in the Statement of Operations under “Line of credit fees” and the effect on the expense ratio is included in the Financial Highlights.
7. Other Liabilities
The Fund wrote put option contracts through Lehman Brothers Inc., (“LBI”) that were exercised prior to the option contracts’ expiration and prior to the bankruptcy filing by LBI, during September, 2008. However, these transactions have not settled and the securities have not been delivered to the Fund as of March 31, 2017.
Although the ultimate resolution of these transactions is uncertain, the Fund has recorded a liability equal to the difference between the strike price on the put options and the market price of the underlying security on the exercise date. The amount of the liability recorded in miscellaneous payables by the Fund as of March 31, 2017, was $473,594.
26 | THE GUGGENHEIM FUNDS SEMI-ANNUAL REPORT | |
OTHER INFORMATION (Unaudited) |
Proxy Voting Information
A description of the policies and procedures that the Trust uses to determine how to vote proxies relating to securities held in the Funds’ portfolios is available, without charge and upon request, by calling 800.820.0888. This information is also available from the EDGAR database on the SEC’s website at https://www.sec.gov.
Information regarding how the Funds voted proxies relating to portfolio securities during the most recent 12-month period ended June 30 is available without charge, upon request, by calling 800.820.0888. This information is also available from the EDGAR database on the SEC’s website at https://www.sec.gov.
Sector Classification
Information in the “Schedule of Investments” is categorized by sectors using sector-level Classifications defined by the Bloomberg Industry Classification System, a widely recognized industry classification system provider. Each Fund’s registration statement has investment policies relating to concentration in specific sectors/industries. For purposes of these investment policies, the Funds usually classify sectors/industries based on industry-level Classifications used by widely recognized industry classification system providers such as Bloomberg Industry Classification System, Global Industry Classification Standards and Barclays Global Classification Scheme.
Quarterly Portfolio Schedules Information
The Trust files its complete schedule of portfolio holdings with the SEC for the first and third quarters of each fiscal year on Form N-Q; which are available on the SEC’s website at https://www.sec.gov. The Funds’ Forms N-Q may be reviewed and copied at the SEC’s Public Reference Room in Washington, DC, and that information on the operation of the Public Reference Room may be obtained by calling 800-SEC-0330. Copies of the portfolio holdings are also available to shareholders, without charge and upon request, by calling 800.820.0888.
| | THE GUGGENHEIM FUNDS SEMI-ANNUAL REPORT | 27 |
INFORMATION ON BOARD OF TRUSTEES AND OFFICERS (Unaudited) |
Name, Address*
and Year of Birth | Position(s) Held with the Trust | Term of Office and Length of Time Served** | Principal Occupation(s) During Past Five Years | Number of Portfolios in Fund Complex Overseen | Other Directorships
Held by Trustees |
INDEPENDENT TRUSTEES | | | |
Randall C. Barnes
(1951) | Trustee | Since 2014 | Current: Private Investor (2001-present). Former: Senior Vice President and Treasurer, PepsiCo, Inc. (1993-1997); President, Pizza Hut International (1991-1993); Senior Vice President, Strategic Planning and New Business Development, PepsiCo, Inc. (1987-1990). | 98 | Current: Trustee, Purpose Investments Inc. (2014-Present). |
Donald A.
Chubb, Jr.
(1946 ) | Trustee | Since 1994 | Current: Business broker and manager of commercial real estate, Griffith & Blair, Inc. (1997-present). | 95 | Former: Midland Care, Inc. (2011-2016). |
Jerry B. Farley
(1946) | Trustee | Since 2005 | Current: President, Washburn University (1997-present). | 95 | Current: Westar Energy, Inc. (2004-present); CoreFirst Bank & Trust (2000-present). |
Roman
Friedrich III
(1946) | Trustee and Chairman of the Contracts Review Committee | Since 2014 | Current: Founder and Managing Partner, Roman Friedrich & Company (1998-present). Former: Senior Managing Director, MLV & Co. LLC (2010-2011). | 95 | Current: Zincore Metals, Inc. (2009-present). Former: Axiom Gold and Silver Corp. (2011-2012). |
28 | THE GUGGENHEIM FUNDS SEMI-ANNUAL REPORT | |
INFORMATION ON BOARD OF TRUSTEES AND OFFICERS (Unaudited)(continued) |
Name, Address*
and Year of Birth | Position(s) Held with the Trust | Term of Office and Length of Time Served** | Principal Occupation(s)
During Past Five Years | Number of Portfolios in Fund Complex Overseen | Other Directorships
Held by Trustees |
INDEPENDENT TRUSTEES - continued | | |
Robert B. Karn III
(1942) | Trustee and Chairman of the Audit Committee | Since 2014 | Current: Consultant (1998-present). Former: Arthur Andersen (1965-1997) and Managing Partner, Financial and Economic Consulting, St. Louis office (1987-1997). | 95 | Current: GP Natural Re-source Partners, LLC (2002-present). Former: Peabody Energy Company (2003-Apr. 2017). |
Ronald A. Nyberg
(1953) | Trustee and Chairman of the Nominating and Governance Committee | Since 2014 | Current: Partner, Momkus McCluskey Roberts, LLC (2016-present). Former: Partner, Nyberg & Cassioppi, LLC (2000-2016); Executive Vice President, General Counsel, and Corporate Secretary, Van Kampen Investments (1982-1999). | 100 | Current: Edward-Elmhurst Healthcare System (2012-present). |
Maynard F. Oliverius
(1943) | Trustee | Since 1998 | Current: Retired. Former: President and CEO, Stormont-Vail HealthCare (1996-2012). | 95 | Current: Robert J. Dole Institute of Politics (2016-present); Stormont-Vail Foundation (2013-present); University of Minnesota MHA Alumni Philanthropy Committee (2009-present); Fort Hays State University Foundation (1999-present). Former: Topeka Community Foundation (2009-2014). |
| | THE GUGGENHEIM FUNDS SEMI-ANNUAL REPORT | 29 |
INFORMATION ON BOARD OF TRUSTEES AND OFFICERS (Unaudited)(continued) |
Name, Address*
and Year of Birth | Position(s) Held with the Trust | Term of Office and Length of Time Served** | Principal Occupation(s)
During Past Five Years | Number of Portfolios in Fund Complex Overseen | Other Directorships
Held by Trustees |
INDEPENDENT TRUSTEES - concluded | | |
Ronald E.
Toupin, Jr.
(1958) | Trustee and Chairman of the Board | Since 2014 | Current: Portfolio Consultant (2010-present). Former: Vice President, Manager and Portfolio Manager, Nuveen Asset Management (1998-1999); Vice President, Nuveen Investment Advisory Corp. (1992-1999); Vice President and Manager, Nuveen Unit Investment Trusts (1991-1999); and Assistant Vice President and Portfolio Manager, Nuveen Unit Investment Trusts (1988-1999), each of John Nuveen & Co., Inc. (1982-1999). | 97 | Former: Bennett Group of Funds (2011-2013). |
30 | THE GUGGENHEIM FUNDS SEMI-ANNUAL REPORT | |
INFORMATION ON BOARD OF TRUSTEES AND OFFICERS (Unaudited)(continued) |
Name, Address*
and Year of Birth | Position(s) Held with the Trust | Term of Office and Length of Time Served** | Principal Occupation(s)
During Past Five Years | Number of Portfolios in Fund Complex Overseen | Other Directorships
Held by Trustees |
INTERESTED TRUSTEE | |
Donald C. Cacciapaglia***
(1951) | President, Chief Executive Officer and Trustee | Since 2012 | Current: President and CEO, certain other funds in the Fund Complex (2012-present); Vice Chairman, Guggenheim Investments (2010-present). Former: Chairman and CEO, Channel Capital Group, Inc. (2002-2010). | 230 | Current: Clear Spring Life Insurance Company (2015-present); Guggenheim Partners Japan, Ltd. (2014-present); Guggenheim Partners Investment Management Holdings, LLC (2014-present); Delaware Life (2013-present); Guggenheim Life and Annuity Company (2011-present); Paragon Life Insurance Company of Indiana (2011-present). |
* | The business address of each Trustee is c/o Guggenheim Investments, 227 West Monroe Street, Chicago, Illinois 60606. |
** | Each Trustee serves an indefinite term, until his successor is elected and qualified. Time served includes time served in the respective position for the Predecessor Corporation. |
*** | This Trustee is deemed to be an “interested person” of the Funds under the 1940 Act by reason of his position with the Funds’ Investment Manager and/or the parent of the Investment Manager. |
| | THE GUGGENHEIM FUNDS SEMI-ANNUAL REPORT | 31 |
INFORMATION ON BOARD OF TRUSTEES AND OFFICERS (Unaudited)(continued) |
Name, Address*
and Year of Birth | Position(s) held with the Trust | Term of Office and Length of Time Served** | Principal Occupations
During Past Five Years |
OFFICERS | | | |
William H.
Belden, III
(1965) | Vice President | Since 2014 | Current: Vice President, certain other funds in the Fund Complex (2006-present); Managing Director, Guggenheim Funds Investment Advisors, LLC (2005-present). Former: Vice President of Management, Northern Trust Global Investments (1999-2005). |
Joanna M. Catalucci
(1966) | AML Officer | Since 2016 | Current: Chief Compliance Officer, certain funds in the Fund Complex (2012-present); Senior Managing Director, Guggenheim Investments (2014-present); AML Officer, certain funds in the Fund Complex (2016-present). Former: Chief Compliance Officer and Secretary, certain other funds in the Fund Complex (2008-2012); Senior Vice President & Chief Compliance Officer, Security Investors, LLC and certain affiliates (2010-2012); Chief Compliance Officer and Senior Vice President, Rydex Advisors, LLC and certain affiliates (2010-2011). |
James M. Howley
(1972) | Assistant Treasurer | Since 2014 | Current: Managing Director, Guggenheim Investments (2004-present); Assistant Treasurer, certain other funds in the Fund Complex (2006-present). Former: Manager, Mutual Fund Administration of Van Kampen Investments, Inc. (1996-2004). |
Keith D. Kemp
(1960) | Assistant Treasurer | Since 2016 | Current: Treasurer and Assistant Treasurer, certain other funds in the Fund Complex (2010-present); Managing Director of Guggenheim Partners Investment Management, LLC (2015-present); Chief Financial Officer, Guggenheim Specialized Products, LLC (2016-present). Former: Managing Director and Director, Transparent Value, LLC (2010-2016); Director, Guggenheim Partners Investment Management, LLC (2010-2015); Chief Operating Officer, Macquarie Capital In-vestment Management (2007-2009). |
Amy J. Lee
(1961) | Vice President and Chief Legal Officer | Since 2007 (Vice President) Since 2014 (Chief Legal Officer) | Current: Chief Legal Officer, certain other funds in the Fund Complex (2013-present); Senior Managing Director, Guggenheim Investments (2012-present). Former: Vice President, Associate General Counsel and Assistant Secretary, Security Benefit Life Insurance Company and Security Benefit Corporation (2004-2012). |
32 | THE GUGGENHEIM FUNDS SEMI-ANNUAL REPORT | |
INFORMATION ON BOARD OF TRUSTEES AND OFFICERS (Unaudited)(continued) |
Name, Address*
and Year of Birth | Position(s) held with the Trust | Term of Office and Length of Time Served** | Principal Occupations
During Past Five Years |
OFFICERS - continued | |
Mark E. Mathiasen
(1978) | Secretary | Since 2014 | Current: Secretary, certain other funds in the Fund Complex (2007-present); Managing Director, Guggenheim Investments (2007-present). |
Glenn McWhinnie
(1969) | Assistant Treasurer | Since 2016 | Current: Vice President, Guggenheim Investments (2009-present). Former: Tax Compliance Manager, Ernst & Young LLP (1996-2009). |
Michael P. Megaris
(1984) | Assistant Secretary | Since 2014 | Current: Assistant Secretary, certain other funds in the Fund Complex (2014-present); Vice President, Guggenheim Investments (2012-present). Former: J.D., University of Kansas School of Law (2009-2012). |
Elisabeth Miller
(1968) | Chief Compliance Officer | Since 2012 | Current: CCO, certain other funds in the Fund Complex (2012-present); CCO, Security Investors, LLC (2012-present); CCO, Guggenheim Funds Investment Advisors, LLC (2012-present); Managing Director, Guggenheim Investments (2012-present); Vice President, Guggenheim Funds Distributors, LLC (March 2014-present). Former: CCO, Guggenheim Distributors, LLC (2009-March 2014); Senior Manager, Security Investors, LLC (2004-2009); Senior Manager, Guggenheim Distributors, LLC (2004-2009). |
Adam J. Nelson
(1979) | Assistant Treasurer | Since 2015 | Current: Vice President, Guggenheim Investments (2015-present); Assistant Treasurer, certain other funds in the Fund Complex (2015-present). Former: Assistant Vice President and Fund Administration Director, State Street Corporation (2013-2015); Fund Administration Assistant Director, State Street (2011-2013); Fund Administration Manager, State Street (2009-2011). |
| | THE GUGGENHEIM FUNDS SEMI-ANNUAL REPORT | 33 |
INFORMATION ON BOARD OF TRUSTEES AND OFFICERS (Unaudited)(concluded) |
Name, Address*
and Year of Birth | Position(s) held with the Trust | Term of Office and Length of Time Served** | Principal Occupations
During Past Five Years |
OFFICERS - concluded | |
Kimberly J. Scott
(1974) | Assistant Treasurer | Since 2014 | Current: Director, Guggenheim Investments (2012-present) ; Assistant Treasurer, certain other funds in the Fund Complex (2012-present). Former: Financial Reporting Manager, Invesco, Ltd. (2010-2011); Vice President/Assistant Treasurer, Mutual Fund Administration for Van Kampen Investments, Inc./Morgan Stanley Investment Management (2009-2010); Manager of Mutual Fund Administration, Van Kampen Investments, Inc./Morgan Stanley Investment Management (2005-2009). |
Bryan Stone
(1979) | Vice President | Since 2014 | Current: Vice President, certain other funds in the Fund Complex (2014-present); Director, Guggenheim Investments (2013-present). Former: Senior Vice President, Neuberger Berman Group LLC (2009-2013); Vice President, Morgan Stanley (2002-2009). |
John L. Sullivan
(1955) | Chief Financial Officer and Treasurer | Since 2014 | Current: CFO, Chief Accounting Officer and Treasurer, certain other funds in the Fund Complex (2010-present); Senior Managing Director, Guggenheim Investments (2010-present). Former: Managing Director and CCO, each of the funds in the Van Kampen Investments fund complex (2004-2010); Managing Director and Head of Fund Accounting and Administration, Morgan Stanley Investment Management (2002-2004); CFO and Treasurer, Van Kampen Funds (1996-2004). |
* | The business address of each officer is c/o Guggenheim Investments, 227 West Monroe Street, Chicago, Illinois 60606. |
** | Each officer serves an indefinite term, until his or her successor is duly elected and qualified. Time served includes time served in the respective position for the Predecessor Corporation. |
34 | THE GUGGENHEIM FUNDS SEMI-ANNUAL REPORT | |
GUGGENHEIM INVESTMENTS PRIVACY POLICIES (Unaudited) |
Guggenheim Investments as used herein refers to Guggenheim Partners, LLC, Guggenheim Funds Investment Advisors, LLC, Guggenheim Partners Investment Management, LLC, Guggenheim Funds Distributors, LLC and Security Investors, LLC as well as the funds in the Guggenheim Funds complex (the “funds”).
Our Commitment to You
When you become a Guggenheim Investments investor, you entrust us with not only your hard-earned money but also with personal and financial information about you. We recognize that your relationship with us is based on trust and that you expect us to act responsibly and in your best interests. Because we have access to personal information about you, we hold ourselves to high standards in its safekeeping and use. This means, most importantly, that we do not sell client or account information to anyone—whether you are a current or former Guggenheim Investments client.
The Information We Collect About You and How We Collect It
In the course of doing business with shareholders and investors, we collect nonpublic personal information about you. You typically provide personal information when you complete a Guggenheim Investments account application or when you request a transaction that involves Rydex and Guggenheim Funds or one of the Guggenheim affiliated companies. “Nonpublic personal information” is personally identifiable information about you. For example it includes your name and address, Social Security or taxpayer identification number, assets, income, account balance, bank account information and investment activity (e.g. purchase and redemption history).
How We Share Your Personal Information
As a matter of policy, we do not disclose your nonpublic personal information to nonaffiliated third parties except as required or permitted by law. As emphasized above, we do not sell information about current or former clients or their accounts to third parties. Nor do we share such information, except when necessary to complete transactions at your request or to make you aware of related investment products and services that we offer. Additional details about how we handle your personal information are provided below.
To complete certain transactions or account changes that you direct, it may be necessary to provide your personal information to companies, individuals or groups that are not affiliated with Guggenheim Investments. For example if you ask to transfer assets from another financial institution to Guggenheim Investments, we will need to provide certain information about you to that company to complete the transaction. In connection with servicing your accounts or to alert you to other Guggenheim Investments investment products and services, we may share your information within the Guggenheim Investments family of affiliated companies. This would include, for example, sharing your information within Guggenheim Investments so we can make you aware of new funds or the services offered through another Guggenheim Investments
| | THE GUGGENHEIM FUNDS SEMI-ANNUAL REPORT | 35 |
GUGGENHEIM INVESTMENTS PRIVACY POLICIES (Unaudited)(concluded) |
affiliated company. In certain instances, we may contract with nonaffiliated companies to perform services for us. Where necessary, we will disclose information we have about you to these third parties. In all such cases, we provide the third party with only the information necessary to carry out its assigned responsibilities and only for that purpose. And we require these third parties to treat your personal information with the same high degree of confidentiality that we do. In certain instances, we may share information with other financial institutions regarding individuals and entities in response to the U.S.A. Patriot Act. Finally we will share personal information about you if we are compelled by law to do so, if you direct us to do so with your consent, or in other circumstances as permitted by law.
How We Safeguard Your Personal Information
We maintain physical, electronic and procedural safeguards to protect your personal information. Within Guggenheim Investments, access to such information is limited to those who need it to perform their jobs such as servicing your account, resolving problems or informing you of new products and services.
36 | THE GUGGENHEIM FUNDS SEMI-ANNUAL REPORT | |
This page intentionally left blank.
This page intentionally left blank.
This page intentionally left blank.
This page intentionally left blank.
This page intentionally left blank.
3.31.2017
Guggenheim Funds Semi-Annual Report
| |
| Guggenheim Mid Cap Value Institutional Fund | | |
| GuggenheimInvestments.com | SBMCVI-SEMI-0317x0917 |
| DEAR SHAREHOLDER | 2 |
| ECONOMIC AND MARKET OVERVIEW | 3 |
| ABOUT SHAREHOLDERS’ FUND EXPENSES | 5 |
| MID CAP VALUE INSTITUTIONAL FUND | 8 |
| NOTES TO FINANCIAL STATEMENTS | 16 |
| OTHER INFORMATION | 23 |
| INFORMATION ON BOARD OF TRUSTEES AND OFFICERS | 24 |
| GUGGENHEIM INVESTMENTS PRIVACY POLICIES | 31 |
| | THE GUGGENHEIM FUNDS SEMI-ANNUAL REPORT | 1 |
Dear Shareholder:
Security Investors, LLC (the “Investment Adviser”) is pleased to present the shareholder report for Guggenheim Mid Cap Value Institutional Fund (the “Fund”) for the six-month period ended March 31, 2017.
The Investment Adviser is part of Guggenheim Investments, which represents the investment management businesses of Guggenheim Partners, LLC (“Guggenheim”), a global, diversified financial services firm.
Guggenheim Funds Distributors, LLC is the distributor of the Fund. Guggenheim Funds Distributors, LLC is affiliated with Guggenheim and the Investment Adviser.
We encourage you to read the Economic and Market Overview section of the report, which follows this letter.
We are committed to providing innovative investment solutions and appreciate the trust you place in us.
Sincerely,
Donald C. Cacciapaglia
President and Chief Executive Officer
April 30, 2017
Read a prospectus and summary prospectus (if available) carefully before investing. It contains the investment objectives, risks, charges, expenses and other information, which should be considered carefully before investing. Obtain a prospectus and summary prospectus (if available) at guggenheiminvestments.com or call 800.820.0888.
There can be no assurance that any investment product will achieve its investment objective(s). There are risks associated with investing, including the entire loss of principal invested. Investing involves market risks. The investment return and principal value of any investment product will fluctuate with changes in market conditions.
| 2 | THE GUGGENHEIM FUNDS SEMI-ANNUAL REPORT | |
ECONOMIC AND MARKET OVERVIEW (Unaudited) | March 31, 2017 |
The market optimism that helped lift risk asset prices after the presidential election in November continued through the early part of 2017. The Standard & Poor’s 500®(“S&P 500”) Index* set a new record, high yield corporate bond spreads approached cycle lows, and the 10-year Treasury yield rose to 2.63%, the highest level since 2014. Risk appetite faded as the first quarter drew to a close, however, as investors grappled with the implications of an unsuccessful healthcare reform bill and growing geopolitical risks.
Much of the rise in asset valuations since Donald Trump’s victory has been based on anticipation of his pro-growth policies coming to fruition, an outcome that is far from certain. Asset valuations could be getting a bit ahead of themselves, and becoming more sensitive to a temporary growth scare or setback, especially since the rollout of Trump’s new policies will not be smooth or easy.
Nevertheless, the underlying economy remains on a good trajectory. Tracking estimates for first-quarter real U.S. Gross Domestic Product (“GDP”) growth have fallen in recent weeks despite strong gains in consumer and business sentiment since the election. In late April, after the period ended, the initial estimate of first-quarter GDP growth was 0.7%. However, we attribute a large portion of the apparent weakness to seasonal factors that have depressed as-reported first quarter GDP growth over the past several years. In keeping with this pattern, we would expect the final first-quarter GDP number to be revised higher. More importantly, the prospects for quarterly GDP growth appear stronger going forward.
Consumer spending should benefit from solid income and wealth gains, with household net worth sitting at an all-time high. Recent job gains have been strong, and we anticipate a further acceleration of wage growth as the labor market continues to tighten. Buoyant consumer sentiment and low household debt service outlays also support our positive outlook. On the business investment side, we expect various factors to be supportive, including the uptick in global industrial production growth, the ongoing rise in U.S. oil drilling activity, the surge in small-business optimism, and the recovery in corporate earnings.
On March 15, the Federal Open Market Committee (“FOMC”) raised the U.S. Federal Reserve (the “Fed”) funds target rate by 25 basis points to a range of 0.75–1.0%. The hike itself had little impact on markets because several FOMC members had indicated in the weeks leading up to the meeting that a hike was likely. Looking ahead, we believe that the market is underpricing the likely pace of Fed rate hikes in 2017 and 2018, particularly now that market optimism about fiscal stimulus is waning.
Importantly, Chair Yellen noted that the FOMC’s baseline forecast of two additional rate increases in 2017 and three more in 2018 was not conditioned on expectations for fiscal stimulus. Rather, it reflected a need to gradually remove accommodation due to the fact that the Fed has essentially achieved its dual mandate objectives for employment and inflation. Fiscal easing, she explained, could result in a faster pace of tightening, if it materializes. Markets are skeptical and are pricing in only 1.5 more rate hikes in 2017 and another 1.5 rate hikes in 2018, according to fed funds futures contracts. We expect that the Fed will deliver three more rate hikes in 2017 and another four in 2018.
| | THE GUGGENHEIM FUNDS SEMI-ANNUAL REPORT | 3 |
ECONOMIC AND MARKET OVERVIEW (Unaudited)(concluded) | March 31, 2017 |
We expect to see equity and credit investors take more chips off the table unless there is concrete progress on fiscal legislation in Washington, particularly as the Fed demonstrates its desire to tighten even without fiscal stimulus. While we are optimistic about the near-term U.S. economic outlook, current valuations and growing political risks warrant a more defensive stance.
For the six months ended March 31, 2017, the S&P 500 Index returned 10.12%. The MSCI Europe-Australasia-Far East (“EAFE”) Index* returned 6.48%. The return of the MSCI Emerging Markets Index* was 6.80%.
In the bond market, the Bloomberg Barclays U.S. Aggregate Bond Index* posted a -2.18% return for the period, while the Bloomberg Barclays U.S. Corporate High Yield Index* returned 4.50%. The return of the Bank of America (“BofA”) Merrill Lynch 3-Month U.S. Treasury Bill Index* was 0.19% for the 12-month period.
The opinions and forecasts expressed may not actually come to pass. This information is subject to change at any time, based on market and other conditions, and should not be construed as a recommendation of any specific security or strategy.
*Index Definitions
The following indices are referenced throughout this report. Indices are unmanaged and not available for direct investment. Index performance does not reflect transaction costs, fees, or expenses.
Bloomberg Barclays U.S. Aggregate Bond Index is a broad-based flagship benchmark that measures the investment grade, U.S. dollar-denominated, fixed-rate taxable bond market, including U.S. Treasuries, government-related and corporate securities, mortgage-backed securities or “MBS” (agency fixed-rate and hybrid adjustable-rate mortgage, or “ARM”, pass-throughs), asset-backed securities (“ABS”), and commercial mortgage-backed securities (“CMBS”) (agency and non-agency).
Bloomberg Barclays U.S. Corporate High Yield Index measures the U.S. dollar-denominated, high yield, fixed-rate corporate bond market. Securities are classified as high yield if the middle rating of Moody’s, Fitch, and S&P is Ba1/BB +/BB + or below.
BofA Merrill Lynch 3-Month U.S. Treasury Bill Index is an unmanaged market index of U.S. Treasury securities maturing in 90 days that assumes reinvestment of all income.
MSCI EAFE Index is a free float-adjusted market capitalization index that is designed to measure the equity market performance of developed markets, excluding the U.S. & Canada.
MSCI Emerging Markets Index is a free float-adjusted market capitalization weighted index that is designed to measure equity market performance in the global emerging markets.
S&P 500® Index is a capitalization-weighted index of 500 stocks designed to measure the performance of the broad economy, representing all major industries and is considered a representation of the U.S. stock market.
| 4 | THE GUGGENHEIM FUNDS SEMI-ANNUAL REPORT | |
ABOUT SHAREHOLDERS’ FUND EXPENSES (Unaudited) |
All mutual funds have operating expenses, and it is important for our shareholders to understand the impact of costs on their investments. Shareholders of a fund incur two types of costs: (i) transaction costs, including sales charges (loads) on purchase payments, reinvested dividends, other distributions, and exchange fees, and (ii) ongoing costs, including management fees, administrative services, and shareholder reports, among others. These ongoing costs, or operating expenses, are deducted from a fund’s gross income and reduce the investment return of the fund.
A fund’s expenses are expressed as a percentage of its average net assets, which is known as the expense ratio. The following examples are intended to help investors understand the ongoing costs (in dollars) of investing in a fund and to compare these costs with the ongoing costs of investing in other mutual funds.
The examples are based on an investment of $1,000 made at the beginning of the period and held for the entire six-month period beginning September 30, 2016 and ending March 31, 2017.
The following tables illustrate the Fund’s costs in two ways:
Table 1. Based on actual Fund return: This section helps investors estimate the actual expenses paid over the period. The “Ending Account Value” shown is derived from the Fund’s actual return, and the fifth column shows the dollar amount that would have been paid by an investor who started with $1,000 in the Fund. Investors may use the information here, together with the amount invested, to estimate the expenses paid over the period. Simply divide the Fund’s account value by $1,000 (for example, an $8,600 account value divided by $1,000 = 8.6), then multiply the result by the number provided under the heading “Expenses Paid During Period.”
Table 2. Based on hypothetical 5% return: This section is intended to help investors compare a Fund’s cost with those of other mutual funds. The table provides information about hypothetical account values and hypothetical expenses based on the Fund’s actual expense ratio and an assumed rate of return of 5% per year before expenses, which is not the Fund’s actual return. The hypothetical account values and expenses may not be used to estimate the actual ending account balance or expenses paid during the period. The example is useful in making comparisons because the U.S. Securities and Exchange Commission (the “SEC”) requires all mutual funds to calculate expenses based on the 5% return. Investors can assess a Fund’s costs by comparing this hypothetical example with the hypothetical examples that appear in shareholder reports of other funds.
The calculations illustrated above assume no shares were bought or sold during the period. Actual costs may have been higher or lower, depending on the amount of investment and the timing of any purchases or redemptions.
| | THE GUGGENHEIM FUNDS SEMI-ANNUAL REPORT | 5 |
ABOUT SHAREHOLDERS’ FUND EXPENSES (Unaudited)(continued) |
Please note that the expenses shown in the table are meant to highlight your ongoing costs only and do not reflect any transactional costs, such as sales charges (loads) on purchase payments, and contingent deferred sales charges (“CDSC”) on redemptions, if any. Therefore, the second table is useful in comparing ongoing costs only, and will not help you determine the relative total costs of owning different funds. In addition, if these transactional costs were included, your costs would have been higher.
More information about the Fund’s expenses, including annual expense ratios for periods up to five years (subject to the Fund’s inception date), can be found in the Financial Highlights section of this report. For additional information on operating expenses and other shareholder costs, please refer to the Fund’s prospectus.
| 6 | THE GUGGENHEIM FUNDS SEMI-ANNUAL REPORT | |
ABOUT SHAREHOLDERS’ FUND EXPENSES (Unaudited)(concluded) |
| | Expense
Ratio1 | Fund
Return | Beginning
Account Value
September 30,
2016 | Ending
Account Value
March 31,
2017 | Expenses
Paid During
Period2 |
Table 1. Based on actual Fund return3 |
| Mid Cap Value Institutional Fund | 1.11% | 13.68% | $ 1,000.00 | $ 1,136.80 | $ 5.91 |
| |
| Table 2. Based on hypothetical 5% return (before expenses) |
| Mid Cap Value Institutional Fund | 1.11% | 5.00% | $ 1,000.00 | $ 1,019.40 | $ 5.59 |
1 | Annualized and excludes expenses of the underlying funds in which the Fund invests. |
2 | Expenses are equal to the Fund's annualized expense ratio, net of any applicable fee waivers, multiplied by the average account value over the period, multiplied by 182/365 (to reflect the one-half year period). |
3 | Actual cumulative return at net asset value for the period September 30, 2016 to March 31, 2017. |
| | THE GUGGENHEIM FUNDS SEMI-ANNUAL REPORT | 7 |
FUND PROFILE (Unaudited) | March 31, 2017 |
MID CAP VALUE INSTITUTIONAL FUND
OBJECTIVE: Seeks long-term growth of capital.
Holdings Diversification (Market Exposure as % of Net Assets)
“Holdings Diversification (Market Exposure as % of Net Assets)” excludes any temporary cash investments.
Inception Date: July 11, 2008 |
| Ten Largest Holdings (% of Total Net Assets) |
| Zions Bancorporation | 2.0% |
| KeyCorp | 2.0% |
| WestRock Co. | 1.8% |
| Wintrust Financial Corp. | 1.8% |
| OGE Energy Corp. | 1.6% |
| Alleghany Corp. | 1.5% |
| Huntington Bancshares, Inc. | 1.5% |
| Oshkosh Corp. | 1.5% |
| UniFirst Corp. | 1.4% |
| Gentex Corp. | 1.4% |
| Top Ten Total | 16.5% |
| “Ten Largest Holdings” excludes any temporary cash investments. |
8 | THE GUGGENHEIM FUNDS SEMI-ANNUAL REPORT | |
SCHEDULE OF INVESTMENTS (Unaudited) | March 31, 2017 |
| MID CAP VALUE INSTITUTIONAL FUND | |
| | |
Shares | | |
Value | |
| | | | | | | |
COMMON STOCKS† - 99.2% | |
| | | | | | | |
| Financial - 32.4% | |
| Zions Bancorporation | | | 37,688 | | | $ | 1,582,896 | |
| KeyCorp | | | 88,707 | | | | 1,577,209 | |
| Wintrust Financial Corp. | | | 20,104 | | | | 1,389,588 | |
| Alleghany Corp.* | | | 1,951 | | | | 1,199,201 | |
| Huntington Bancshares, Inc. | | | 87,717 | | | | 1,174,531 | |
| Unum Group | | | 22,376 | | | | 1,049,211 | |
| Equity Commonwealth* | | | 32,048 | | | | 1,000,538 | |
| Popular, Inc. | | | 23,633 | | | | 962,572 | |
| Radian Group, Inc. | | | 52,807 | | | | 948,414 | |
| E*TRADE Financial Corp.* | | | 25,761 | | | | 898,801 | |
| First American Financial Corp. | | | 21,121 | | | | 829,633 | |
| EPR Properties | | | 11,203 | | | | 824,877 | |
| Prosperity Bancshares, Inc. | | | 11,212 | | | | 781,589 | |
| Alexandria Real Estate Equities, Inc. | | | 6,798 | | | | 751,315 | |
| EastGroup Properties, Inc. | | | 9,502 | | | | 698,683 | |
| Sun Communities, Inc. | | | 8,110 | | | | 651,476 | |
| Howard Hughes Corp.* | | | 5,529 | | | | 648,275 | |
| Hanover Insurance Group, Inc. | | | 6,909 | | | | 622,225 | |
| Assured Guaranty Ltd. | | | 14,874 | | | | 551,974 | |
| Cousins Properties, Inc. | | | 60,892 | | | | 503,577 | |
| First Merchants Corp. | | | 12,587 | | | | 494,921 | |
| IBERIABANK Corp. | | | 5,534 | | | | 437,739 | |
| First Industrial Realty Trust, Inc. | | | 16,356 | | | | 435,560 | |
| Lexington Realty Trust | | | 42,846 | | | | 427,603 | |
| Redwood Trust, Inc. | | | 25,727 | | | | 427,325 | |
| National Storage Affiliates Trust | | | 17,833 | | | | 426,209 | |
| DCT Industrial Trust, Inc. | | | 8,668 | | | | 417,104 | |
| Spirit Realty Capital, Inc. | | | 39,026 | | | | 395,333 | |
| Customers Bancorp, Inc.* | | | 12,356 | | | | 389,585 | |
| CoreCivic, Inc. | | | 12,247 | | | | 384,801 | |
| CubeSmart | | | 14,665 | | | | 380,703 | |
| Piedmont Office Realty Trust, Inc. — Class A | | | 17,491 | | | | 373,958 | |
| Camden Property Trust | | | 4,414 | | | | 355,151 | |
| Monogram Residential Trust, Inc. | | | 32,985 | | | | 328,860 | |
| PacWest Bancorp | | | 6,045 | | | | 321,957 | |
| Fulton Financial Corp. | | | 15,774 | | | | 281,566 | |
| Farmer Mac — Class C | | | 3,849 | | | | 221,587 | |
| Apartment Investment & Management Co. — Class A | | | 3,928 | | | | 174,207 | |
| Total Financial | | | | | | | 25,320,754 | |
| | | | | | | | | |
| Industrial - 17.5% | |
| WestRock Co. | | | 27,698 | | | | 1,441,127 | |
| Oshkosh Corp. | | | 16,582 | | | | 1,137,359 | |
| Gentex Corp. | | | 51,145 | | | | 1,090,923 | |
| Corning, Inc. | | | 38,464 | | | | 1,038,528 | |
| Orbital ATK, Inc. | | | 9,802 | | | | 960,596 | |
| Kirby Corp.* | | | 12,165 | | | | 858,240 | |
| Harris Corp. | | | 6,129 | | | | 681,974 | |
| FLIR Systems, Inc. | | | 18,749 | | | | 680,214 | |
| Covenant Transportation Group, Inc. — Class A* | | | 34,396 | | | | 646,645 | |
| Crane Co. | | | 8,266 | | | | 618,544 | |
| ITT, Inc. | | | 14,828 | | | | 608,245 | |
| Scorpio Tankers, Inc. | | | 127,724 | | | | 567,095 | |
| Werner Enterprises, Inc. | | | 21,317 | | | | 558,505 | |
| Summit Materials, Inc. — Class A* | | | 22,313 | | | | 551,355 | |
| Owens Corning | | | 6,963 | | | | 427,319 | |
| Huntington Ingalls Industries, Inc. | | | 2,041 | | | | 408,690 | |
| Sonoco Products Co. | | | 7,722 | | | | 408,648 | |
| Valmont Industries, Inc. | | | 2,561 | | | | 398,236 | |
| Owens-Illinois, Inc.* | | | 19,214 | | | | 391,581 | |
| Fabrinet* | | | 5,355 | | | | 225,071 | |
| Total Industrial | | | | | | | 13,698,895 | |
| | | | | | | | | |
| Consumer, Non-cyclical - 12.5% | |
| Quest Diagnostics, Inc. | | | 9,942 | | | | 976,204 | |
| Bunge Ltd. | | | 11,904 | | | | 943,511 | |
| SEE NOTES TO FINANCIAL STATEMENTS. | THE GUGGENHEIM FUNDS SEMI-ANNUAL REPORT | 9 |
SCHEDULE OF INVESTMENTS (Unaudited)(continued) | March 31, 2017 |
| MID CAP VALUE INSTITUTIONAL FUND | |
| | |
Shares | | |
Value | |
| | | | | | | |
| Emergent BioSolutions, Inc.* | | | 28,868 | | | $ | 838,327 | |
| Navigant Consulting, Inc.* | | | 34,459 | | | | 787,733 | |
| Sanderson Farms, Inc. | | | 7,014 | | | | 728,334 | |
| Perrigo Company plc | | | 10,943 | | | | 726,506 | |
| United Rentals, Inc.* | | | 4,866 | | | | 608,493 | |
| Premier, Inc. — Class A* | | | 18,201 | | | | 579,338 | |
| Dermira, Inc.* | | | 13,835 | | �� | | 471,912 | |
| Acadia Healthcare Co., Inc.* | | | 10,395 | | | | 453,222 | |
| Dean Foods Co. | | | 22,883 | | | | 449,880 | |
| Akorn, Inc.* | | | 17,856 | | | | 429,972 | |
| Sprouts Farmers Market, Inc.* | | | 18,101 | | | | 418,495 | |
| HealthSouth Corp. | | | 9,100 | | | | 389,571 | |
| Hormel Foods Corp. | | | 11,168 | | | | 386,748 | |
| Molina Healthcare, Inc.* | | | 8,372 | | | | 381,763 | |
| Community Health Systems, Inc.* | | | 27,961 | | | | 248,014 | |
| Total Consumer, Non-cyclical | | | | 9,818,023 | |
| | | | | | | | | |
| Utilities - 9.6% | |
| OGE Energy Corp. | | | 35,196 | | | | 1,231,157 | |
| Black Hills Corp. | | | 14,469 | | | | 961,754 | |
| Ameren Corp. | | | 16,544 | | | | 903,137 | |
| Portland General Electric Co. | | | 18,098 | | | | 803,913 | |
| Pinnacle West Capital Corp. | | | 9,180 | | | | 765,428 | |
| Avista Corp. | | | 18,137 | | | | 708,250 | |
| UGI Corp. | | | 13,467 | | | | 665,270 | |
| AES Corp. | | | 51,253 | | | | 573,009 | |
| Calpine Corp.* | | | 40,459 | | | | 447,072 | |
| ONE Gas, Inc. | | | 6,224 | | | | 420,742 | |
| Total Utilities | | | | | | | 7,479,732 | |
| | | | | | | | | |
| Technology - 8.0% | |
| Micron Technology, Inc.* | | | 35,884 | | | | 1,037,047 | |
| Lam Research Corp. | | | 6,523 | | | | 837,291 | |
| CSRA, Inc. | | | 24,092 | | | | 705,655 | |
| Cray, Inc.* | | | 30,830 | | | | 675,177 | |
| Analog Devices, Inc. | | | 8,002 | | | | 655,764 | |
| Qorvo, Inc.* | | | 9,235 | | | | 633,152 | |
| IXYS Corp. | | | 40,633 | | | | 591,210 | |
| Maxwell Technologies, Inc.* | | | 81,428 | | | | 473,097 | |
| Photronics, Inc.* | | | 39,565 | | | | 423,346 | |
| Western Digital Corp. | | | 2,566 | | | | 211,772 | |
| Total Technology | | | | | | | 6,243,511 | |
| | | | | | | | | |
| Consumer, Cyclical - 7.5% | |
| UniFirst Corp. | | | 7,802 | | | | 1,103,592 | |
| PVH Corp. | | | 9,348 | | | | 967,238 | |
| DR Horton, Inc. | | | 28,306 | | | | 942,873 | |
| Goodyear Tire & Rubber Co. | | | 18,937 | | | | 681,732 | |
| CalAtlantic Group, Inc. | | | 12,408 | | | | 464,680 | |
| Deckers Outdoor Corp.* | | | 6,835 | | | | 408,255 | |
| PACCAR, Inc. | | | 5,710 | | | | 383,712 | |
| JetBlue Airways Corp.* | | | 17,856 | | | | 368,012 | |
| AutoNation, Inc.* | | | 8,548 | | | | 361,495 | |
| Williams-Sonoma, Inc. | | | 3,910 | | | | 209,654 | |
| Total Consumer, Cyclical | | | | | | | 5,891,243 | |
| | | | | | | | | |
| Energy - 6.2% | |
| Marathon Oil Corp. | | | 49,364 | | | | 779,951 | |
| Oceaneering International, Inc. | | | 22,727 | | | | 615,447 | |
| Whiting Petroleum Corp.* | | | 62,387 | | | | 590,181 | |
| MRC Global, Inc.* | | | 29,506 | | | | 540,845 | |
| Chesapeake Energy Corp.* | | | 80,388 | | | | 477,505 | |
| Rowan Companies plc — Class A* | | | 29,781 | | | | 463,988 | |
| Oasis Petroleum, Inc.* | | | 30,670 | | | | 437,354 | |
| Tesoro Corp. | | | 4,351 | | | | 352,692 | |
| Western Refining, Inc. | | | 9,945 | | | | 348,771 | |
| Gulfport Energy Corp.* | | | 12,566 | | | | 216,010 | |
HydroGen Corp.*,†††,1 | | | 1,265,700 | | | | 1 | |
| Total Energy | | | | | | | 4,822,745 | |
| | | | | | | | | |
| Basic Materials - 2.9% | |
| Reliance Steel & Aluminum Co. | | | 10,029 | | | | 802,520 | |
| Westlake Chemical Corp. | | | 6,869 | | | | 453,697 | |
10 | THE GUGGENHEIM FUNDS SEMI-ANNUAL REPORT | SEE NOTES TO FINANCIAL STATEMENTS. |
SCHEDULE OF INVESTMENTS (Unaudited)(concluded) | March 31, 2017 |
| MID CAP VALUE INSTITUTIONAL FUND | |
| | |
Shares | | |
Value | |
| | | | | | | |
| Nucor Corp. | | | 6,950 | | | $ | 415,054 | |
| Olin Corp. | | | 11,694 | | | | 384,382 | |
| Newmont Mining Corp. | | | 5,412 | | | | 178,380 | |
| Total Basic Materials | | | | | | | 2,234,033 | |
| | | | | | | | | |
| Communications - 2.6% | |
| Scripps Networks Interactive, Inc. — Class A | | | 10,866 | | | | 851,568 | |
| DigitalGlobe, Inc.* | | | 17,994 | | | | 589,304 | |
| Infinera Corp.* | | | 45,274 | | | | 463,153 | |
| NeoPhotonics Corp.* | | | 17,664 | | | | 159,153 | |
| Total Communications | | | | | | | 2,063,178 | |
| | | | | | | | | |
| Total Common Stocks | | | | | | | | |
| (Cost $65,720,712) | | | | | | | 77,572,114 | |
| | | | | | | | | |
CONVERTIBLE PREFERRED STOCKS††† - 0.0%** | |
Thermoenergy Corp.*,2,4 | | | 793,750 | | | | 10 | |
| Total Convertible Preferred Stocks | | | | | |
| (Cost $757,980) | | | | | | | 10 | |
| | | | | | | | | |
SHORT-TERM INVESTMENTS† - 1.3% | |
Dreyfus Treasury Securities Cash Management Fund — Institutional Class 0.50%3 | | | 981,774 | | | | 981,774 | |
| Total Short-Term Investments | | | | | |
| (Cost $981,774) | | | | | | | 981,774 | |
| | | | | | | | | |
| Total Investments - 100.5% | | | | | |
| (Cost $67,460,466) | | | | | | $ | 78,553,898 | |
| Other Assets & Liabilities, net - (0.5)% | | | | (427,305 | ) |
| Total Net Assets - 100.0% | | | | | | $ | 78,126,593 | |
| * | Non-income producing security. |
| ** | Less than 0.1% of net assets. |
† | Value determined based on Level 1 inputs, unless otherwise noted — See Note 3. |
††† | Value determined based on Level 3 inputs — See Note 3. |
1 | Affiliated issuer — See Note 6. |
2 | PIPE (Private Investment in Public Equity) — Stock issued by a company in the secondary market as a means of raising capital more quickly and less expensively than through registration of a secondary public offering. |
3 | Rate indicated is the 7 day yield as of March 31, 2017. |
4 | Illiquid Security. |
| | plc — Public Limited Company |
| | |
| | See Sector Classification in Other Information section. |
The following table summarizes the inputs used to value the Fund’s investments at March 31, 2017 (See Note 3 in the Notes to Financial Statements):
| Investments in Securities (Assets) | | Level 1 | | | Level 2 | | | Level 3 | | | Total | |
| Common Stocks | | $ | 77,572,113 | | | $ | — | | | $ | 1 | | | $ | 77,572,114 | |
| Convertible Preferred Stocks | | | — | | | | — | | | | 10 | | | | 10 | |
| Short-Term Investments | | | 981,774 | | | | — | | | | — | | | | 981,774 | |
| Total | | $ | 78,553,887 | | | $ | — | | | $ | 11 | | | $ | 78,553,898 | |
Transfers between investment levels may occur as the markets fluctuate and/or the availability of data used in an investment’s valuation changes. Transfers between valuation levels, if any, are in comparison to the valuation levels at the end of the previous fiscal year, and are effective using the fair value as of the end of the previous fiscal period.
For the period ended March 31, 2017, there were no transfers between levels.
| SEE NOTES TO FINANCIAL STATEMENTS. | THE GUGGENHEIM FUNDS SEMI-ANNUAL REPORT | 11 |
STATEMENT OF ASSETS AND LIABILITIES (Unaudited) |
| MID CAP VALUE INSTITUTIONAL FUND |
March 31, 2017
| Assets: | |
| Investments in unaffiliated issuers, at value (cost $67,457,935) | | $ | 78,553,897 | |
| Investments in affiliated issuers, at value (cost $2,531) | | | 1 | |
| Total investments (cost $67,460,466) | | | 78,553,898 | |
| Prepaid expenses | | | 20,855 | |
| Cash | | | 6,592 | |
| Receivables: | |
| Securities sold | | | 817,514 | |
| Fund shares sold | | | 66,975 | |
| Dividends | | | 84,820 | |
| Foreign taxes reclaim | | | 10,107 | |
| Total assets | | | 79,560,761 | |
| | | | | |
| Liabilities: | |
| Payable for: | |
| Securities purchased | | | 1,174,358 | |
| Fund shares redeemed | | | 73,040 | |
| Management fees | | | 48,705 | |
| Trustees’ fees* | | | 20,296 | |
| Transfer agent/maintenance fees | | | 16,209 | |
| Fund accounting/administration fees | | | 5,195 | |
| Miscellaneous | | | 96,365 | |
| Total liabilities | | | 1,434,168 | |
| Net assets | | $ | 78,126,593 | |
| | | | | |
| Net assets consist of: | |
| Paid in capital | | | 64,217,063 | |
| Accumulated net investment loss | | | (358,457 | ) |
| Accumulated net realized gain on investments | | | 3,174,555 | |
| Net unrealized appreciation on investments | | | 11,093,432 | |
| Net assets | | $ | 78,126,593 | |
| Capital shares outstanding | | | 7,032,048 | |
| Net asset value per share | | $ | 11.11 | |
| * | Relates to Trustees not deemed “interested persons” within the meaning of Section 2(a)(19) of the 1940 Act. |
12 | THE GUGGENHEIM FUNDS SEMI-ANNUAL REPORT | SEE NOTES TO FINANCIAL STATEMENTS. |
STATEMENT OF OPERATIONS (Unaudited) |
| MID CAP VALUE INSTITUTIONAL FUND |
Period Ended March 31, 2017
| Investment Income: | |
| Dividends from unaffiliated issuers (net of foreign withholding tax of $1,542) | | $ | 485,260 | |
| Interest | | | 2,329 | |
| Total investment income | | | 487,589 | |
| | | | | |
| Expenses: | |
| Management fees | | | 266,091 | |
| Transfer agent/maintenance fees | | | 56,696 | |
| Fund accounting/administration fees | | | 28,494 | |
| Trustees’ fees* | | | 6,845 | |
| Custodian fees | | | 1,157 | |
| Miscellaneous | | | 34,270 | |
| Total expenses | | | 393,553 | |
| Net investment income | | | 94,036 | |
| | | | | |
| Net Realized and Unrealized Gain (Loss): | |
| Net realized gain (loss) on: | |
| Investments in unaffiliated issuers | | | 5,060,832 | |
| Net realized gain | | | 5,060,832 | |
| Net change in unrealized appreciation (depreciation) on: | |
| Investments in unaffiliated issuers | | | 3,774,701 | |
| Net change in unrealized appreciation (depreciation) | | | 3,774,701 | |
| Net realized and unrealized gain | | | 8,835,533 | |
| Net increase in net assets resulting from operations | | $ | 8,929,569 | |
| * | Relates to Trustees not deemed “interested persons” within the meaning of Section 2(a)(19) of the 1940 Act. |
| SEE NOTES TO FINANCIAL STATEMENTS. | THE GUGGENHEIM FUNDS SEMI-ANNUAL REPORT | 13 |
| STATEMENTS OF CHANGES IN NET ASSETS |
| MID CAP VALUE INSTITUTIONAL FUND | |
| | | Period Ended
March 31,
2017
(Unaudited) | | | Year Ended
September 30,
2016 | |
| Increase (Decrease) in Net Assets from Operations: | | | | | | |
| Net investment income | | $ | 94,036 | | | $ | 3,042,350 | |
| Net realized gain on investments | | | 5,060,832 | | | | 17,153,748 | |
| Net change in unrealized appreciation (depreciation) on investments | | | 3,774,701 | | | | 8,094,425 | |
| Net increase in net assets resulting from operations | | | 8,929,569 | | | | 28,290,523 | |
| | | | | | | | | |
| Distributions to shareholders from: | | | | | | | | |
| Net investment income | | | (3,140,884 | ) | | | (3,255,047 | ) |
| Net realized gains | | | (4,043,650 | ) | | | (25,619,255 | ) |
| Total distributions to shareholders | | | (7,184,534 | ) | | | (28,874,302 | ) |
| | | | | | | | | |
| Capital share transactions: | | | | | | | | |
| Proceeds from sale of shares | | | 17,243,126 | | | | 76,460,927 | |
| Distributions reinvested | | | 3,569,315 | | | | 5,764,338 | |
| Cost of shares redeemed | | | (15,240,423 | ) | | | (298,201,787 | ) |
| Net increase (decrease) from capital share transactions | | | 5,572,018 | | | | (215,976,522 | ) |
| Net increase (decrease) in net assets | | | 7,317,053 | | | | (216,560,301 | ) |
| | | | | | | | | |
| Net assets: | | | | | | | | |
| Beginning of period | | | 70,809,540 | | | | 287,369,841 | |
| End of period | | $ | 78,126,593 | | | $ | 70,809,540 | |
| (Accumulated net investment loss)/Undistributed net investment income at end of period | | $ | (358,457 | ) | | $ | 2,688,391 | |
| | | | | | | | | |
| Capital share activity: | | | | | | | | |
| Shares sold | | | 1,578,110 | | | | 7,868,173 | |
| Shares issued from reinvestment of distributions | | | 337,685 | | | | 592,429 | |
| Shares redeemed | | | (1,382,708 | ) | | | (29,559,662 | ) |
| Net increase (decrease) in shares | | | 533,087 | | | | (21,099,060 | ) |
14 | THE GUGGENHEIM FUNDS SEMI-ANNUAL REPORT | SEE NOTES TO FINANCIAL STATEMENTS. |
| FINANCIAL HIGHLIGHTS |
| MID CAP VALUE INSTITUTIONAL FUND | |
This table is presented to show selected data for a share outstanding throughout each period and to assist shareholders in evaluating a Fund’s performance for the periods presented.
| Institutional Class | | Period Ended
March 31,
2017a | | | Year Ended
Sept. 30,
2016 | | | Year Ended
Sept. 30,
2015 | | | Year Ended
Sept. 30,
2014 | | | Year Ended
Sept. 30,
2013 | | | Year Ended
Sept. 30,
2012 | |
| Per Share Data | | | | | | | | | | | | | | | | | | |
| Net asset value, beginning of period | | $ | 10.90 | | | $ | 10.41 | | | $ | 12.92 | | | $ | 13.09 | | | $ | 11.29 | | | $ | 9.97 | |
| Income (loss) from investment operations: | |
Net investment income (loss)b | | | .01 | | | | .15 | | | | .06 | | | | .06 | | | | .06 | | | | .03 | |
| Net gain (loss) on investments (realized and unrealized) | | | 1.41 | | | | 1.43 | | | | (.66 | ) | | | .65 | | | | 2.90 | | | | 2.30 | |
| Total from investment operations | | | 1.42 | | | | 1.58 | | | | (.60 | ) | | | .71 | | | | 2.96 | | | | 2.33 | |
| Less distributions from: | |
| Net investment income | | | (.53 | ) | | | (.12 | ) | | | (.07 | ) | | | (.07 | ) | | | (.04 | ) | | | (.04 | ) |
| Net realized gains | | | (.68 | ) | | | (.97 | ) | | | (1.84 | ) | | | (.81 | ) | | | (1.12 | ) | | | (.97 | ) |
| Total distributions | | | (1.21 | ) | | | (1.09 | ) | | | (1.91 | ) | | | (.88 | ) | | | (1.16 | ) | | | (1.01 | ) |
| Net asset value, end of period | | $ | 11.11 | | | $ | 10.90 | | | $ | 10.41 | | | $ | 12.92 | | | $ | 13.09 | | | $ | 11.29 | |
| |
Total Returnc | | | 13.68 | % | | | 16.28 | % | | | (5.85 | %) | | | 5.53 | % | | | 28.89 | % | | | 24.96 | % |
| Ratios/Supplemental Data | |
| Net assets, end of period (in thousands) | | $ | 78,127 | | | $ | 70,810 | | | $ | 287,370 | | | $ | 598,101 | | | $ | 571,465 | | | $ | 490,741 | |
| Ratios to average net assets: | |
| Net investment income (loss) | | | 0.26 | % | | | 1.52 | % | | | 0.52 | % | | | 0.42 | % | | | 0.51 | % | | | 0.30 | % |
Total expensesd | | | 1.11 | % | | | 1.14 | % | | | 1.05 | % | | | 1.05 | % | | | 1.01 | % | | | 1.01 | % |
| Net expenses | | | 1.11 | % | | | 1.14 | % | | | 1.05 | % | | | 1.05 | % | | | 1.01 | % | | | 0.98 | %e |
| Portfolio turnover rate | | | 43 | % | | | 149 | % | | | 95 | % | | | 41 | % | | | 24 | % | | | 33 | % |
a | Unaudited figures for the period ended March 31, 2017. Percentage amounts for the period, except total return and portfolio turnover rate, have been annualized. |
b | Net investment income (loss) per share was computed using average shares outstanding throughout the period. |
c | Total return does not reflect the impact of any applicable sales charges and has not been annualized. |
d | Does not include expenses of the underlying funds in which the Fund invests. |
e | Net expense information reflects the expense ratio after expense waivers and reimbursements. |
| SEE NOTES TO FINANCIAL STATEMENTS. | THE GUGGENHEIM FUNDS SEMI-ANNUAL REPORT | 15 |
NOTES TO FINANCIAL STATEMENTS (Unaudited) |
1. Organization and Significant Accounting Policies
Organization
Guggenheim Funds Trust (the “Trust”), a Delaware statutory trust, is registered with the SEC under the Investment Company Act of 1940 (“1940 Act”), as an open-ended investment company of the series type. Each series, in effect, is representing a separate Fund. The Trust is authorized to issue an unlimited number of shares. The Trust accounts for the assets of each Fund separately.
The Trust offers a combination of five separate classes of shares, A-Class shares, C-Class shares, P-Class shares, R6-Class shares and Institutional Class shares. Sales of shares of each Class are made without a front-end sales charge at the net asset value per share (“NAV”), with the exception of A-Class shares. A-Class shares are sold at the NAV, plus the applicable front-end sales charge. The sales charge varies depending on the amount purchased. A-Class share purchases of $1 million or more are exempt from the front-end sales charge but have a 1% contingent deferred sales charge (“CDSC”), if shares are redeemed within 12 months of purchase. Institutional Class shares are offered primarily for direct investment by institutions such as pension and profit sharing plans, endowments, foundations and corporations. Institutional Class shares require a minimum initial investment of $2 million and a minimum account balance of $1 million. At March 31, 2017, the Trust consisted of nineteen funds (the “Funds”).
This report covers the Mid Cap Value Institutional Fund (the “Fund”), a diversified investment company.
Security Investors, LLC, which operates under the name Guggenheim Investments (“GI”), provides advisory services. Guggenheim Funds Distributors, LLC (“GFD”) acts as principal underwriter for the Trust. GI and GFD are affiliated entities.
Significant Accounting Policies
The Fund operates as an investment company and, accordingly, follows the investment company accounting and reporting guidance of the Financial Accounting Standards Board (“FASB”) Accounting Standards Codification Topic 946 Financial Services – Investment Companies.
The following significant accounting policies are in conformity with U.S. generally accepted accounting principles (“U.S. GAAP”) and are consistently followed by the Trust. This requires management to make estimates and assumptions that affect the reported amount of assets and liabilities, contingent assets and liabilities at the date of the financial statements, and the reported amounts of revenues and expenses during the reporting period. Actual results could differ from these estimates. All time references are based on Eastern Time.
The NAV of the Fund is calculated by dividing the market value of the Fund’s securities and other assets, less all liabilities, by the number of outstanding shares of the Fund.
| 16 | THE GUGGENHEIM FUNDS SEMI-ANNUAL REPORT | |
NOTES TO FINANCIAL STATEMENTS (Unaudited)(continued) |
A. The Board of Trustees of the Fund (the “Board”) has adopted policies and procedures for the valuation of the Fund’s investments (the “Valuation Procedures”). Pursuant to the Valuation Procedures, the Board has delegated to a valuation committee, consisting of representatives from Guggenheim’s investment management, fund administration, legal and compliance departments (the “Valuation Committee”), the day-to-day responsibility for implementing the Valuation Procedures, including, under most circumstances, the responsibility for determining the fair value of the Fund’s securities and/or other assets.
Valuations of the Fund’s securities are supplied primarily by pricing services appointed pursuant to the processes set forth in the Valuation Procedures. The Valuation Committee convenes monthly, or more frequently as needed, to review the valuation of all assets which have been fair valued for reasonableness. The Fund’s officers, through the Valuation Committee and consistent with the monitoring and review responsibilities set forth in the Valuation Procedures, regularly review procedures used and valuations provided by the pricing services.
If the pricing service cannot or does not provide a valuation for a particular investment or such valuation is deemed unreliable, such investment is fair valued by the Valuation Committee.
Equity securities listed on an exchange (New York Stock Exchange (“NYSE”) or American Stock Exchange) are valued at the last quoted sales price as of the close of business on the NYSE, usually 4:00 p.m. on the valuation date. Equity securities listed on the NASDAQ market system are valued at the NASDAQ Official Closing Price on the valuation date, which may not necessarily represent the last sale price. If there has been no sale on such exchange or NASDAQ on a given day, the security is valued at the closing bid price on that day.
Open-end investment companies (“mutual funds”) are valued at their NAV as of the close of business, on the valuation date.
Investments for which market quotations are not readily available are fair-valued as determined in good faith by GI under the direction of the Board using methods established or ratified by the Board. Valuations in accordance with these methods are intended to reflect each security’s (or asset’s) “fair value.” Each such determination is based on a consideration of all relevant factors, which are likely to vary from one pricing context to another. Examples of such factors may include, but are not limited to market prices; sale prices; broker quotes; and models which derive prices based on inputs such as prices of securities with comparable maturities and characteristics, or based on inputs such as anticipated cash flows or collateral, spread over Treasuries, and other information analysis.
B. Security transactions are recorded on the trade date for financial reporting purposes. Realized gains and losses from securities transactions are recorded using the identified cost basis. Proceeds from lawsuits related to investment holdings are recorded as realized gains in the Fund. Dividend income is recorded on the ex-dividend date, net of applicable taxes withheld by foreign countries. Taxable non-cash dividends are recorded as dividend income. Interest income, including amortization of premiums and accretion of discounts, is accrued on a daily basis.
| | THE GUGGENHEIM FUNDS SEMI-ANNUAL REPORT | 17 |
NOTES TO FINANCIAL STATEMENTS (Unaudited)(continued) |
Interest income also includes paydown gains and losses or mortgage-backed and asset-backed securities and senior and subordinated loans. Amendment fees are earned on compensation for evaluating and accepting changes to the original loan agreement and are recognized when received. Dividend income from REITs is recorded based on the income included in the distributions received from the REIT investments using published REIT classifications, including some management estimates when actual amounts are not available. Distributions received in excess of this estimated amount are recorded as a reduction of the cost of investments or reclassified to capital gains. The actual amounts of income, return of capital, and capital gains are only determined by each REIT after its fiscal year-end, and may differ from the estimated amounts.
C. Distributions of net investment income and net realized gains, if any, are declared and paid at least annually. Dividends are reinvested in additional shares unless shareholders request payment in cash. Distributions are recorded on the ex-dividend date and are determined in accordance with income tax regulations which may differ from U.S. GAAP.
D. Certain expenses have been allocated to the individual Funds in the Trust on a pro rata basis upon the respective aggregate net assets of each Fund included in the Trust.
E. Under the fee arrangement with the custodian, the Fund may earn credits based on overnight custody cash balances. These credits are utilized to reduce related custodial expenses. The custodian fees disclosed in the Statement of Operations are before the reduction in expense from the related earnings credits, if any. For the year period ended March 31, 2017, there were no earnings credits received.
F. The Fund may leave cash overnight in its cash account with the custodian. Periodically, the Fund may have cash due to the custodian bank as an overdraft balance. A fee is incurred on this overdraft, calculated by multiplying the overdraft by a rate based on the federal funds rate, which was 0.82% at March 31, 2017.
G. Under the Fund’s organizational documents, its Trustees and Officers are indemnified against certain liabilities arising out of the performance of their duties to the Trust. In addition, throughout the normal course of business, the Fund enters into contracts that contain a variety of representations and warranties which provide general indemnifications. The Fund’s maximum exposure under these arrangements is unknown, as this would involve future claims that may be made against the Fund and/or its affiliates that have not yet occurred. However, based on experience, the Fund expects the risk of loss to be remote.
2. Fees and Other Transactions with Affiliates
Under the terms of an investment advisory contract, the Fund pays GI investment advisory fees calculated at an annualized rate of 0.75% of the average daily net assets of the Fund.
| 18 | THE GUGGENHEIM FUNDS SEMI-ANNUAL REPORT | |
NOTES TO FINANCIAL STATEMENTS (Unaudited)(continued) |
GI engages external service providers to perform other necessary services for the Trust, such as audit and accounting related services, legal services, custody, printing and mailing, etc., on a pass-through basis. Such expenses are allocated to various Funds within the complex based on relative net assets.
Certain trustees and officers of the Trust are also officers of GI and GFD.
On October 4, 2016, Rydex Fund Services, LLC (“RFS”) was purchased by MUFG Investor Services and as of that date RFS ceased to be an affiliate of GI. In connection with its with its acquisition, RFS changed its name to MUFG Investor Services (US), LLC (“MUIS”). This change has no impact on the financial statements of the Trust.
MUIS acts as the Trust’s administrator, transfer agent and accounting agent. As administrator, transfer agent and accounting agent, MUIS is responsible for maintaining the books and records of the Trust’s securities and cash. For providing the aforementioned administrative and accounting services, MUIS is entitled to receive a monthly fee equal to a percentage of the Funds’ average daily net assets and out of pocket expenses. For providing the aforementioned transfer agent services, MUIS is entitled to receive a monthly fee based on the number of transactions during the month and the number of accounts under management subject to certain minimum monthly fees and out of pocket expenses.
3. Fair Value Measurement
In accordance with U.S. GAAP, fair value is defined as the price that the Fund would receive to sell an investment or pay to transfer a liability in an orderly transaction with an independent buyer in the principal market, or in the absence of a principal market, the most advantageous market for the investment or liability. U.S. GAAP establishes a three-tier fair value hierarchy based on the types of inputs used to value assets and liabilities and requires corresponding disclosure. The hierarchy and the corresponding inputs are summarized below:
| Level 1 — | quoted prices in active markets for identical assets or liabilities. |
| Level 2 — | significant other observable inputs (for example quoted prices for securities that are similar based on characteristics such as interest rates, prepayment speeds, credit risk, etc.). |
| Level 3 — | significant unobservable inputs based on the best information available under the circumstances, to the extent observable inputs are not available, which may include assumptions. |
The types of inputs available depend on a variety of factors, such as the type of security and the characteristics of the markets in which it trades, if any. Fair valuation determinations that rely on fewer or no observable inputs require greater judgment. Accordingly, fair value determinations for Level 3 securities require the greatest amount of judgment.
| | THE GUGGENHEIM FUNDS SEMI-ANNUAL REPORT | 19 |
NOTES TO FINANCIAL STATEMENTS (Unaudited)(continued) |
The inputs or methodologies used for valuing securities are not necessarily an indication of the risk associated with investing in those securities. The suitability of the techniques and sources employed to determine fair valuation are regularly monitored and subject to change.
4. Federal Income Tax Information
The Fund intends to comply with the provisions of Subchapter M of the Internal Revenue Code applicable to regulated investment companies and will distribute substantially all taxable net investment income and capital gains sufficient to relieve the Fund from all, or substantially all, federal income, excise and state income taxes. Therefore, no provision for federal or state income tax is required.
Tax positions taken or expected to be taken in the course of preparing the Fund’s tax returns are evaluated to determine whether the tax positions are “more-likely-than-not” of being sustained by the applicable tax authority. Tax positions not deemed to meet the more-likely-than-not threshold would be recorded as a tax benefit or expense in the current year. Management has analyzed the Fund’s tax positions taken, or to be taken, on Federal income tax returns for all open tax years, and has concluded that no provision for income tax is required in the Fund’s financial statements. The Fund’s federal tax returns are subject to examination by the Internal Revenue Service for a period of three years after they are filed.
At March 31, 2017, the cost of securities for Federal income tax purposes, the aggregate gross unrealized gain for all securities for which there was an excess of value over tax cost, and the aggregate gross unrealized loss for all securities for which there was an excess of tax cost over value were as follows:
| Fund | | Tax
Cost | | | Tax
Unrealized
Gain | | | Tax
Unrealized
Loss | | | Net
Unrealized
Gain | |
| Mid Cap Value Institutional Fund | | $ | 68,311,768 | | | $ | 12,688,424 | | | $ | (2,446,294 | ) | | $ | 10,242,130 | |
5. Securities Transactions
For the period ended March 31, 2017, the cost of purchases and proceeds from sales of investment securities, excluding government securities, short-term investments and derivatives, were as follows:
| Fund | | Purchases | | | Sales | |
| Mid Cap Value Institutional Fund | | $ | 30,114,353 | | | $ | 32,078,353 | |
The Fund is permitted to purchase or sell securities from or to certain affiliated funds under specified conditions outlined in procedures adopted by the Board of the Trust. The procedures have been designed to ensure that any purchase or sale of securities by a Fund from or to another fund or portfolio that is or could be considered an affiliate by virtue of having a common
| 20 | THE GUGGENHEIM FUNDS SEMI-ANNUAL REPORT | |
NOTES TO FINANCIAL STATEMENTS (Unaudited)(continued) |
investment adviser (or affiliated investment advisers), common Trustees and/or common officers complies with Rule 17a-7 of the 1940 Act. Further, as defined under these procedures, each transaction is effected at the current market price to save costs, where permissible. For the period ended March 31, 2017, the Fund did not engage in purchases and sales of securities, pursuant to Rule 17a-7 of the 1940 Act.
6. Affiliated Transactions
Investments representing 5% or more of the outstanding voting shares of a portfolio company of a fund, or control of or by, or common control under GI, result in that portfolio company being considered an affiliated company of such fund, as defined in the 1940 Act.
Transactions during the period ended March 31, 2017, in which the portfolio company is an “affiliated person,” were as follows:
| Affiliated issuers | | Value
09/30/16 | | | Additions | | | Reductions | | | Value
03/31/17 | | | Shares
03/31/17 | | | Investment
Income | |
| HydroGen Corp. | | $ | 1 | | | $ | — | | | $ | — | | | $ | 1 | | | | 1,265,700 | | | $ | — | |
7. Line of Credit
The Trust, with the exception of Capital Stewardship Fund, and certain affiliated funds, secured a 364-day committed, $800,000,000 line of credit from Citibank, N.A., which was in place through October 6, 2016, at which time the line of credit was renewed, with an increased commitment amount to $1,000,000,000. A Fund may draw (borrow) from the line of credit as a temporary measure for emergency purposes, to facilitate redemption requests, or for other short-term liquidity purposes consistent with the Fund’s investment objective and program. For example, it may be advantageous for the Fund to borrow money rather than sell existing portfolio positions to meet redemption requests. Fees related to borrowings, if any, vary under this arrangement between the greater of Citibank’s “base rate”, LIBOR plus 1%, or the federal funds rate 0.82% at March 31, 2017, plus 1/2 of 1%. All affiliated funds that participate in the line of credit paid upfront costs totaling $2,032,388 to renew the line of credit.
The commitment fee that may be paid by the Funds is at an annualized rate of 0.15% of the average daily amount of their unused commitment amount. The Funds did not have any borrowings under this agreement as of and for the period ended March 31, 2017.
The allocated commitment fee amount for each Fund is referenced in the Statement of Operations under “Miscellaneous fees” and the effect on the expense ratio is included in the Financial Highlights.
| | THE GUGGENHEIM FUNDS SEMI-ANNUAL REPORT | 21 |
NOTES TO FINANCIAL STATEMENTS (Unaudited)(concluded) |
8. Other Liabilities
The Fund wrote put option contracts through Lehman Brothers Inc., (“LBI”) that were exercised prior to the option contracts’ expiration and prior to the bankruptcy filing by LBI, during September 2008. However, these transactions have not settled and the securities have not been delivered to the Fund as of March 31, 2017.
Although the ultimate resolution of these transactions is uncertain, the Fund has recorded a liability on its books equal to the difference between the strike price on the put options and the market price of the underlying security on the exercise date. The amount of the liability recorded in miscellaneous payables by the Fund as of March 31, 2017 was $15,940.
| 22 | THE GUGGENHEIM FUNDS SEMI-ANNUAL REPORT | |
OTHER INFORMATION (Unaudited) |
Proxy Voting Information
A description of the policies and procedures that the Trust uses to determine how to vote proxies relating to securities held in the Funds’ portfolios is available, without charge and upon request, by calling 800.820.0888. This information is also available from the EDGAR database on the SEC’s website at https://www.sec.gov.
Information regarding how the Funds voted proxies relating to portfolio securities during the most recent 12-month period ended June 30 is available without charge, upon request, by calling 800.820.0888. This information is also available from the EDGAR database on the SEC’s website at https://www.sec.gov.
Sector Classification
Information in the “Schedule of Investments” is categorized by sectors using sector-level Classifications defined by the Bloomberg Industry Classification System, a widely recognized industry classification system provider. Each Fund’s registration statement has investment policies relating to concentration in specific sectors/industries. For purposes of these investment policies, the Fund usually classifies sectors/industries based on industry-level Classifications used by widely recognized industry classification system providers such as Bloomberg Industry Classification System, Global Industry Classification Standards and Barclays Global Classification Scheme.
Quarterly Portfolio Schedules Information
The Trust files its complete schedule of portfolio holdings with the SEC for the first and third quarters of each fiscal year on Form N-Q; which are available on the SEC’s website at https://www.sec.gov. The Fund’s Forms N-Q may be reviewed and copied at the SEC’s Public Reference Room in Washington, DC, and that information on the operation of the Public Reference Room may be obtained by calling 800-SEC-0330. Copies of the portfolio holdings are also available to shareholders, without charge and upon request, by calling 800.820.0888.
| | THE GUGGENHEIM FUNDS SEMI-ANNUAL REPORT | 23 |
INFORMATION ON BOARD OF TRUSTEES AND OFFICERS (Unaudited) |
Name, Address*
and Year of Birth | Position(s) Held with the Trust | Term of Office
and Length of
Time Served** | Principal Occupation(s)
During Past Five Years | Number of
Portfolios in
Fund Complex
Overseen | Other Directorships
Held by Trustees |
| INDEPENDENT TRUSTEES | | | |
Randall C. Barnes (1951) | Trustee | Since 2014 | Current: Private Investor (2001-present). Former: Senior Vice President and Treasurer, PepsiCo, Inc. (1993-1997); President, Pizza Hut International (1991-1993); Senior Vice President, Strategic Planning and New Business Development, PepsiCo, Inc. (1987-1990). | 98 | Current: Trustee, Purpose Investments Inc. (2014-Present). |
Donald A.
Chubb, Jr. (1946) | Trustee | Since 1994 | Current: Business broker and manager of commercial real estate, Griffith & Blair, Inc. (1997-present). | 95 | Former: Midland Care, Inc. (2011-2016). |
Jerry B. Farley (1946) | Trustee | Since 2005 | Current: President, Washburn University (1997-present). | 95 | Current: Westar Energy, Inc. (2004-present); CoreFirst Bank & Trust (2000-present). |
Roman
Friedrich III (1946) | Trustee and Chairman of the Contracts Review Committee | Since 2014 | Current: Founder and Managing Partner, Roman Friedrich & Company (1998-present). Former: Senior Managing Director, MLV & Co. LLC (2010-2011). | 95 | Current: Zincore Metals, Inc. (2009-present). Former: Axiom Gold and Silver Corp. (2011-2012). |
| 24 | THE GUGGENHEIM FUNDS SEMI-ANNUAL REPORT | |
INFORMATION ON BOARD OF TRUSTEES AND OFFICERS (Unaudited)(continued) |
Name, Address*
and Year of Birth | Position(s) Held
with the Trust | Term of Office
and Length of
Time Served** | Principal Occupation(s)
During Past Five Years | Number of
Portfolios in
Fund Complex
Overseen | Other Directorships
Held by Trustees |
| INDEPENDENT TRUSTEES - continued | | |
Robert B. Karn III (1942) | Trustee and Chairman of the Audit Committee | Since 2014 | Current: Consultant (1998-present). Former: Arthur Andersen (1965-1997) and Managing Partner, Financial and Economic Consulting, St. Louis office (1987-1997). | 95 | Current: GP Natural Resource Partners, LLC (2002- present). Former: Peabody Energy Company (2003- Apr. 2017). |
Ronald A. Nyberg (1953) | Trustee and Chairman of the Nominating and Governance Committee | Since 2014 | Current: Partner, Momkus McCluskey Roberts, LLC (2016-present). Former: Partner, Nyberg & Cassioppi, LLC (2000-2016); Executive Vice President, General Counsel, and Corporate Secretary, Van Kampen Investments (1982-1999). | 100 | Current: Edward-Elmhurst Healthcare System (2012-present). |
| | THE GUGGENHEIM FUNDS SEMI-ANNUAL REPORT | 25 |
INFORMATION ON BOARD OF TRUSTEES AND OFFICERS (Unaudited)(continued) |
Name, Address*
and Year of Birth | Position(s) Held
with the Trust | Term of Office
and Length of
Time Served** | Principal Occupation(s)
During Past Five Years | Number of
Portfolios in
Fund Complex
Overseen | Other Directorships
Held by Trustees |
| INDEPENDENT TRUSTEES - concluded | | |
Maynard F. Oliverius (1943) | Trustee | Since 1998 | Current: Retired. Former: President and CEO, Stormont-Vail HealthCare (1996-2012). | 95 | Current: Robert J. Dole Institute of Politics (2016-present); Stormont-Vail Foundation (2013-present); University of Minnesota MHA Alumni Philanthropy Committee (2009-present); Fort Hays State University Foundation (1999-present). Former: Topeka Community Foundation (2009-2014). |
Ronald E.
Toupin, Jr. (1958) | Trustee and Chairman of the Board | Since 2014 | Current: Portfolio Consultant (2010-present). Former: Vice President, Manager and Portfolio Manager, Nuveen Asset Management (1998-1999); Vice President, Nuveen Investment Advisory Corp. (1992-1999); Vice President and Manager, Nuveen Unit Investment Trusts (1991-1999); and Assistant Vice President and Portfolio Manager, Nuveen Unit Investment Trusts (1988-1999), each of John Nuveen & Co., Inc. (1982-1999). | 97 | Former: Bennett Group of Funds (2011-2013). |
| 26 | THE GUGGENHEIM FUNDS SEMI-ANNUAL REPORT | |
INFORMATION ON BOARD OF TRUSTEES AND OFFICERS (Unaudited)(continued) |
Name, Address*
and Year of Birth | Position(s) Held
with the Trust | Term of Office
and Length of
Time Served** | Principal Occupation(s)
During Past Five Years | Number of
Portfolios in
Fund Complex
Overseen | Other Directorships
Held by Trustees |
| INTERESTED TRUSTEE | |
Donald C. Cacciapaglia*** (1951) | President, Chief Executive Officer and Trustee | Since 2012 | Current: President and CEO, certain other funds in the Fund Complex (2012-present); Vice Chairman, Guggenheim Investments (2010-present). Former: Chairman and CEO, Channel Capital Group, Inc. (2002-2010). | 230 | Current: Clear Spring Life Insurance Company (2015-present); Guggenheim Partners Japan, Ltd. (2014-present); Guggenheim Partners Investment Management Holdings, LLC (2014-present); Delaware Life (2013-present); Guggenheim Life and Annuity Company (2011-present); Paragon Life Insurance Company of Indiana (2011-present). |
| * | The business address of each Trustee is c/o Guggenheim Investments, 227 West Monroe Street, Chicago, Illinois 60606. |
| ** | Each Trustee serves an indefinite term, until his successor is elected and qualified. Time served includes time served in the respective position for the Predecessor Corporation. |
| *** | This Trustee is deemed to be an “interested person” of the Funds under the 1940 Act by reason of his position with the Funds' Investment Manager and/or the parent of the Investment Manager. |
| | THE GUGGENHEIM FUNDS SEMI-ANNUAL REPORT | 27 |
INFORMATION ON BOARD OF TRUSTEES AND OFFICERS (Unaudited)(continued) |
Name, Address*
and Year of Birth | Position(s) Held
with the Trust | Term of Office
and Length of
Time Served** | Principal Occupations
During Past Five Years |
| OFFICERS | | | |
William H.
Belden, III (1965) | Vice President | Since 2014 | Current: Vice President, certain other funds in the Fund Complex (2006-present); Managing Director, Guggenheim Funds Investment Advisors, LLC (2005-present). Former: Vice President of Management, Northern Trust Global Investments (1999-2005). |
Joanna M.
Catalucci (1966) | AML Officer | Since 2016 | Current: Chief Compliance Officer, certain funds in the Fund Complex (2012-present); Senior Managing Director, Guggenheim Investments (2014-present); AML Officer, certain funds in the Fund Complex (2016-present). Former: Chief Compliance Officer and Secretary, certain other funds in the Fund Complex (2008-2012); Senior Vice President & Chief Compliance Officer, Security Investors, LLC and certain affiliates (2010-2012); Chief Compliance Officer and Senior Vice President, Rydex Advisors, LLC and certain affiliates (2010-2011). |
James M. Howley (1972) | Assistant Treasurer | Since 2014 | Current: Managing Director, Guggenheim Investments (2004-present); Assistant Treasurer, certain other funds in the Fund Complex (2006-present). Former: Manager, Mutual Fund Administration of Van Kampen Investments, Inc. (1996-2004). |
Keith D. Kemp (1960) | Assistant Treasurer | Since 2016 | Current: Treasurer and Assistant Treasurer, certain other funds in the Fund Complex (2010-present); Managing Director of Guggenheim Partners Investment Management, LLC (2015-present); Chief Financial Officer, Guggenheim Specialized Products, LLC (2016-present). Former: Managing Director and Director, Transparent Value, LLC (2010-2016); Director, Guggenheim Partners Investment Management, LLC (2010-2015); Chief Operating Officer, Macquarie Capital Investment Management (2007-2009). |
| 28 | THE GUGGENHEIM FUNDS SEMI-ANNUAL REPORT | |
INFORMATION ON BOARD OF TRUSTEES AND OFFICERS (Unaudited)(continued) |
Name, Address*
and Year of Birth | Position(s) Held
with the Trust | Term of Office
and Length of
Time Served** | Principal Occupations
During Past Five Years |
| OFFICERS - continued | |
Amy J. Lee (1961) | Vice President and Chief Legal Officer | Since 2007 (Vice President) Since 2014 (Chief Legal Officer) | Current: Chief Legal Officer, certain other funds in the Fund Complex (2013-present); Senior Managing Director, Guggenheim Investments (2012-present). Former: Vice President, Associate General Counsel and Assistant Secretary, Security Benefit Life Insurance Company and Security Benefit Corporation (2004-2012). |
Mark E. Mathiasen (1978) | Secretary | Since 2014 | Current: Secretary, certain other funds in the Fund Complex (2007-present); Managing Director, Guggenheim Investments (2007-present). |
Glenn McWhinnie (1969) | Assistant Treasurer | Since 2016 | Current: Vice President, Guggenheim Investments (2009-present). Former: Tax Compliance Manager, Ernst & Young LLP (1996-2009). |
Michael P. Megaris (1984) | Assistant Secretary | Since 2014 | Current: Assistant Secretary, certain other funds in the Fund Complex (2014-present); Vice President, Guggenheim Investments (2012-present). Former: J.D., University of Kansas School of Law (2009-2012). |
Elisabeth Miller (1968) | Chief Compliance Officer | Since 2012 | Current: CCO, certain other funds in the Fund Complex (2012-present); CCO, Security Investors, LLC (2012-present); CCO, Guggenheim Funds Investment Advisors, LLC (2012-present); Managing Director, Guggenheim Investments (2012-present); Vice President, Guggenheim Funds Distributors, LLC (March 2014-present). Former: CCO, Guggenheim Distributors, LLC (2009-March 2014); Senior Manager, Security Investors, LLC (2004-2009); Senior Manager, Guggenheim Distributors, LLC (2004-2009). |
| | THE GUGGENHEIM FUNDS SEMI-ANNUAL REPORT | 29 |
INFORMATION ON BOARD OF TRUSTEES AND OFFICERS (Unaudited)(concluded) |
Name, Address*
and Year of Birth | Position(s) Held
with the Trust | Term of Office
and Length of
Time Served** | Principal Occupations
During Past Five Years |
| OFFICERS - concluded | |
Adam J. Nelson (1979) | Assistant Treasurer | Since 2015 | Current: Vice President, Guggenheim Investments (2015-present); Assistant Treasurer, certain other funds in the Fund Complex (2015-present). Former: Assistant Vice President and Fund Administration Director, State Street Corporation (2013-2015); Fund Administration Assistant Director, State Street (2011-2013); Fund Administration Manager, State Street (2009-2011). |
Kimberly J. Scott (1974) | Assistant Treasurer | Since 2014 | Current: Director, Guggenheim Investments (2012-present); Assistant Treasurer, certain other funds in the Fund Complex (2012-present). Former: Financial Reporting Manager, Invesco, Ltd. (2010-2011); Vice President/Assistant Treasurer, Mutual Fund Administration for Van Kampen Investments, Inc./Morgan Stanley Investment Management (2009-2010); Manager of Mutual Fund Administration, Van Kampen Investments, Inc./Morgan Stanley Investment Management (2005-2009). |
Bryan Stone (1979) | Vice President | Since 2014 | Current: Vice President, certain other funds in the Fund Complex (2014-present); Director, Guggenheim Investments (2013-present). Former: Senior Vice President, Neuberger Berman Group LLC (2009-2013); Vice President, Morgan Stanley (2002-2009). |
John L. Sullivan (1955) | Chief Financial Officer and Treasurer | Since 2014 | Current: CFO, Chief Accounting Officer and Treasurer, certain other funds in the Fund Complex (2010-present); Senior Managing Director, Guggenheim Investments (2010-present). Former: Managing Director and CCO, each of the funds in the Van Kampen Investments fund complex (2004-2010); Managing Director and Head of Fund Accounting and Administration, Morgan Stanley Investment Management (2002-2004); CFO and Treasurer, Van Kampen Funds (1996-2004). |
| * | The business address of each officer is c/o Guggenheim Investments, 227 West Monroe Street, Chicago, Illinois 60606. |
| ** | Each officer serves an indefinite term, until his or her successor is duly elected and qualified. Time served includes time served in the respective position for the Predecessor Corporation. |
| 30 | THE GUGGENHEIM FUNDS SEMI-ANNUAL REPORT | |
GUGGENHEIM INVESTMENTS PRIVACY POLICIES (Unaudited) |
Guggenheim Investments as used herein refers to Guggenheim Partners, LLC, Guggenheim Funds Investment Advisors, LLC, Guggenheim Partners Investment Management, LLC, Guggenheim Funds Distributors, LLC and Security Investors, LLC as well as the funds in the Guggenheim Funds complex (the “funds”).
Our Commitment to You
When you become a Guggenheim Investments investor, you entrust us with not only your hard-earned money but also with personal and financial information about you. We recognize that your relationship with us is based on trust and that you expect us to act responsibly and in your best interests. Because we have access to personal information about you, we hold ourselves to high standards in its safekeeping and use. This means, most importantly, that we do not sell client or account information to anyone—whether you are a current or former Guggenheim Investments client.
The Information We Collect About You and How We Collect It
In the course of doing business with shareholders and investors, we collect nonpublic personal information about you. You typically provide personal information when you complete a Guggenheim Investments account application or when you request a transaction that involves Rydex and Guggenheim Funds or one of the Guggenheim affiliated companies. “Nonpublic personal information” is personally identifiable information about you. For example it includes your name and address, Social Security or taxpayer identification number, assets, income, account balance, bank account information and investment activity (e.g. purchase and redemption history).
How We Share Your Personal Information
As a matter of policy, we do not disclose your nonpublic personal information to nonaffiliated third parties except as required or permitted by law. As emphasized above, we do not sell information about current or former clients or their accounts to third parties. Nor do we share such information, except when necessary to complete transactions at your request or to make you aware of related investment products and services that we offer. Additional details about how we handle your personal information are provided below.
To complete certain transactions or account changes that you direct, it may be necessary to provide your personal information to companies, individuals or groups that are not affiliated with Guggenheim Investments. For example if you ask to transfer assets from another financial institution to Guggenheim Investments, we will need to provide certain information about you to that company to complete the transaction. In connection with servicing your accounts or to alert you to other Guggenheim Investments investment products and services, we may share your information within the Guggenheim Investments family of affiliated companies. This would include, for example, sharing your information within Guggenheim Investments so we can make you aware of new funds or the services offered through another Guggenheim Investments
| | THE GUGGENHEIM FUNDS SEMI-ANNUAL REPORT | 31 |
GUGGENHEIM INVESTMENTS PRIVACY POLICIES (Unaudited)(concluded) |
affiliated company. In certain instances, we may contract with nonaffiliated companies to perform services for us. Where necessary, we will disclose information we have about you to these third parties. In all such cases, we provide the third party with only the information necessary to carry out its assigned responsibilities and only for that purpose. And we require these third parties to treat your personal information with the same high degree of confidentiality that we do. In certain instances, we may share information with other financial institutions regarding individuals and entities in response to the U.S.A. Patriot Act. Finally we will share personal information about you if we are compelled by law to do so, if you direct us to do so with your consent, or in other circumstances as permitted by law.
How We Safeguard Your Personal Information
We maintain physical, electronic and procedural safeguards to protect your personal information. Within Guggenheim Investments, access to such information is limited to those who need it to perform their jobs such as servicing your account, resolving problems or informing you of new products and services.
| 32 | THE GUGGENHEIM FUNDS SEMI-ANNUAL REPORT | |
This page intentionally left blank.
3.31.2017
Guggenheim Funds Semi-Annual Report
| |
| Guggenheim Capital Stewardship Fund | | |
| GuggenheimInvestments.com | CSF-SEMI-0317x0917 |
| DEAR SHAREHOLDER | 2 |
| ECONOMIC AND MARKET OVERVIEW | 3 |
| ABOUT SHAREHOLDERS’ FUND EXPENSES | 5 |
| CAPITAL STEWARDSHIP FUND | 7 |
| NOTES TO FINANCIAL STATEMENTS | 14 |
| OTHER INFORMATION | 18 |
| INFORMATION ON BOARD OF TRUSTEES AND OFFICERS | 19 |
| GUGGENHEIM INVESTMENTS PRIVACY POLICIES | 23 |
| | THE GUGGENHEIM FUNDS SEMI-ANNUAL REPORT | 1 |
Dear Shareholder:
Guggenheim Partners Investment Management, LLC (“GPIM” or the “Investment Adviser”) is pleased to present the shareholder report for Guggenheim Capital Stewardship Fund (the “Fund”) for the six-month period ended March 31, 2017.
Concinnity Advisors, LP serves as the Fund’s sub-adviser (the “Sub-Adviser”).
The Investment Adviser is part of Guggenheim Investments, which represents the investment management businesses of Guggenheim Partners, LLC (“Guggenheim”), a global, diversified financial services firm.
Guggenheim Funds Distributors, LLC is the distributor of the Funds. Guggenheim Funds Distributors, LLC is affiliated with Guggenheim and GPIM.
We encourage you to read the Economic and Market Overview section of the report, which follows this letter.
We are committed to providing innovative investment solutions and appreciate the trust you place in us.
Sincerely,
Donald C. Cacciapaglia
President and Chief Executive Officer
April 30, 2017
Read a prospectus and summary prospectus (if available) carefully before investing. It contains the investment objectives, risks, charges, expenses and other information, which should be considered carefully before investing. Obtain a prospectus and summary prospectus (if available) at guggenheiminvestments.com or call 800.820.0888.
There can be no assurance that any investment product will achieve its investment objective(s). There are risks associated with investing, including the entire loss of principal invested. Investing involves market risks. The investment return and principal value of any investment product will fluctuate with changes in market conditions.
| 2 | THE GUGGENHEIM FUNDS SEMI-ANNUAL REPORT | |
ECONOMIC AND MARKET OVERVIEW (Unaudited) | March 31, 2017 |
The market optimism that helped lift risk asset prices after the presidential election in November continued through the early part of 2017. The Standard & Poor’s 500® (“S&P 500”) Index* set a new record, high yield corporate bond spreads approached cycle lows, and the 10-year Treasury yield rose to 2.63%, the highest level since 2014. Risk appetite faded as the first quarter drew to a close, however, as investors grappled with the implications of an unsuccessful healthcare reform bill and growing geopolitical risks.
Much of the rise in asset valuations since Donald Trump’s victory has been based on anticipation of his pro-growth policies coming to fruition, an outcome that is far from certain. Asset valuations could be getting a bit ahead of themselves, and becoming more sensitive to a temporary growth scare or setback, especially since the rollout of Trump’s new policies will not be smooth or easy.
Nevertheless, the underlying economy remains on a good trajectory. Tracking estimates for first-quarter real U.S. Gross Domestic Product (“GDP”) growth have fallen in recent weeks despite strong gains in consumer and business sentiment since the election. In late April, after the period ended, the initial estimate of first-quarter GDP growth was 0.7%. However, we attribute a large portion of the apparent weakness to seasonal factors that have depressed as-reported first quarter GDP growth over the past several years. In keeping with this pattern, we would expect the final first-quarter GDP number to be revised higher. More importantly, the prospects for quarterly GDP growth appear stronger going forward.
Consumer spending should benefit from solid income and wealth gains, with household net worth sitting at an all-time high. Recent job gains have been strong, and we anticipate a further acceleration of wage growth as the labor market continues to tighten. Buoyant consumer sentiment and low household debt service outlays also support our positive outlook. On the business investment side, we expect various factors to be supportive, including the uptick in global industrial production growth, the ongoing rise in U.S. oil drilling activity, the surge in small-business optimism, and the recovery in corporate earnings.
On March 15, the Federal Open Market Committee (“FOMC”) raised the U.S. Federal Reserve (the “Fed”) funds target rate by 25 basis points to a range of 0.75–1.0%. The hike itself had little impact on markets because several FOMC members had indicated in the weeks leading up to the meeting that a hike was likely. Looking ahead, we believe that the market is underpricing the likely pace of Fed rate hikes in 2017 and 2018, particularly now that market optimism about fiscal stimulus is waning.
Importantly, Chair Yellen noted that the FOMC’s baseline forecast of two additional rate increases in 2017 and three more in 2018 was not conditioned on expectations for fiscal stimulus. Rather, it reflected a need to gradually remove accommodation due to the fact that the Fed has essentially achieved its dual mandate objectives for employment and inflation. Fiscal easing, she explained, could result in a faster pace of tightening, if it materializes. Markets are skeptical and are pricing in only 1.5 more rate hikes in 2017 and another 1.5 rate hikes in 2018, according to fed funds futures contracts. We expect that the Fed will deliver three more rate hikes in 2017 and another four in 2018.
We expect to see equity and credit investors take more chips off the table unless there is concrete progress on fiscal legislation in Washington, particularly as the Fed demonstrates its desire to tighten even without fiscal stimulus. While we are optimistic about the near-term U.S. economic outlook, current valuations and growing political risks warrant a more defensive stance.
For the six months ended March 31, 2017, the S&P 500 Index* returned 10.12%. The MSCI Europe-Australasia-Far East (“EAFE��) Index* returned 6.48%. The return of the MSCI Emerging Markets Index* was 6.80%.
In the bond market, the Bloomberg Barclays U.S. Aggregate Bond Index* posted a -2.18% return for the period, while the Bloomberg Barclays U.S. Corporate High Yield Index* returned 4.50%. The return of the Bank of America (“BofA”) Merrill Lynch 3-Month U.S. Treasury Bill Index* was 0.19% for the 12-month period.
The opinions and forecasts expressed may not actually come to pass. This information is subject to change at any time, based on market and other conditions, and should not be construed as a recommendation of any specific security or strategy.
| | THE GUGGENHEIM FUNDS SEMI-ANNUAL REPORT | 3 |
ECONOMIC AND MARKET OVERVIEW (Unaudited)(concluded) | March 31, 2017 |
*Index Definitions:
The following indices are referenced throughout this report. Indices are unmanaged and not available for direct investment. Index performance does not reflect transaction costs, fees, or expenses.
Bloomberg Barclays U.S. Aggregate Bond Index is a broad-based flagship benchmark that measures the investment grade, U.S. dollar-denominated, fixed-rate taxable bond market, including U.S. Treasuries, government-related and corporate securities, mortgage-backed securities or “MBS” (agency fixed-rate and hybrid adjustable-rate mortgage, or “ARM”, pass-throughs), asset-backed securities (“ABS”), and commercial mortgage-backed securities (“CMBS”) (agency and non-agency).
Bloomberg Barclays U.S. Corporate High Yield Index measures the U.S. dollar-denominated, high yield, fixed-rate corporate bond market. Securities are classified as high yield if the middle rating of Moody’s, Fitch, and S&P is Ba1/BB +/BB + or below.
BofA Merrill Lynch 3-Month U.S. Treasury Bill Index is an unmanaged market index of U.S. Treasury securities maturing in 90 days that assumes reinvestment of all income.
MSCI EAFE Index is a free float-adjusted market capitalization index that is designed to measure the equity market performance of developed markets, excluding the U.S. & Canada.
MSCI Emerging Markets Index is a free float-adjusted market capitalization weighted index that is designed to measure equity market performance in the global emerging markets.
S&P 500® Index is a capitalization-weighted index of 500 stocks designed to measure the performance of the broad economy, representing all major industries and is considered a representation of the U.S. stock market.
| 4 | THE GUGGENHEIM FUNDS SEMI-ANNUAL REPORT | |
ABOUT SHAREHOLDERS’ FUND EXPENSES (Unaudited) | |
All mutual funds have operating expenses, and it is important for our shareholders to understand the impact of costs on their investments. Shareholders of a fund incur two types of costs: (i) transaction costs, including sales charges (loads) on purchase payments, reinvested dividends, other distributions, and exchange fees, and (ii) ongoing costs, including management fees, administrative services, and shareholder reports, among others. These ongoing costs, or operating expenses, are deducted from a fund’s gross income and reduce the investment return of the fund.
A fund’s expenses are expressed as a percentage of its average net assets, which is known as the expense ratio. The following examples are intended to help investors understand the ongoing costs (in dollars) of investing in a fund and to compare these costs with the ongoing costs of investing in other mutual funds.
The examples are based on an investment of $1,000 made at the beginning of the period and held for the entire six-month period beginning September 30, 2016 and ending March 31, 2017.
The following tables illustrate the Fund’s costs in two ways:
Table 1. Based on actual Fund return: This section helps investors estimate the actual expenses paid over the period. The “Ending Account Value” shown is derived from the Fund’s actual return, and the fifth column shows the dollar amount that would have been paid by an investor who started with $1,000 in the Fund. Investors may use the information here, together with the amount invested, to estimate the expenses paid over the period. Simply divide the Fund’s account value by $1,000 (for example, an $8,600 account value divided by $1,000 = 8.6), then multiply the result by the number provided under the heading “Expenses Paid During Period.”
Table 2. Based on hypothetical 5% return: This section is intended to help investors compare a Fund’s cost with those of other mutual funds. The table provides information about hypothetical account values and hypothetical expenses based on the Fund’s actual expense ratio and an assumed rate of return of 5% per year before expenses, which is not the Fund’s actual return. The hypothetical account values and expenses may not be used to estimate the actual ending account balance or expenses paid during the period. The example is useful in making comparisons because the U.S. Securities and Exchange Commission (the “SEC”) requires all mutual funds to calculate expenses based on the 5% return. Investors can assess a Fund’s costs by comparing this hypothetical example with the hypothetical examples that appear in shareholder reports of other funds.
The calculations illustrated above assume no shares were bought or sold during the period. Actual costs may have been higher or lower, depending on the amount of investment and the timing of any purchases or redemptions.
Please note that the expenses shown in the table are meant to highlight your ongoing costs only and do not reflect any transactional costs, such as sales charges (loads) on purchase payments, and contingent deferred sales charges (“CDSC”) on redemptions, if any. Therefore, the second table is useful in comparing ongoing costs only, and will not help you determine the relative total costs of owning different funds. In addition, if these transactional costs were included, your costs would have been higher.
More information about the Fund’s expenses, including annual expense ratios for periods up to five years (subject to the Fund’s inception date), can be found in the Financial Highlights section of this report. For additional information on operating expenses and other shareholder costs, please refer to the Fund’s prospectus.
| | THE GUGGENHEIM FUNDS SEMI-ANNUAL REPORT | 5 |
ABOUT SHAREHOLDERS’ FUND EXPENSES (Unaudited)(concluded) | |
| Expense
Ratio1 | Fund
Return | Beginning
Account Value
September 30,
2016 | Ending
Account Value
March 31,
2017 | Expenses
Paid During
Period2 |
Table 1. Based on actual Fund return3 | | | | | |
| Capital Stewardship Fund | | | | | |
| Institutional Class | 1.00% | 8.22% | $ 1,000.00 | $ 1,082.20 | $ 5.19 |
|
| Table 2. Based on hypothetical 5% return (before expenses) | | | | |
| Capital Stewardship Fund | | | | | |
| Institutional Class | 1.00% | 5.00% | $ 1,000.00 | $ 1,019.95 | $ 5.04 |
1 | Annualized and excludes expenses of the underlying funds in which the Funds invest. |
2 | Expenses are equal to the Fund's annualized expense ratio, net of any applicable fee waivers, multiplied by the average account value over the period, multiplied by 182/365 (to reflect the one-half year period). |
3 | Actual cumulative return at net asset value for the period September 30, 2016 to March 31, 2017. |
| 6 | THE GUGGENHEIM FUNDS SEMI-ANNUAL REPORT | |
FUND PROFILE (Unaudited) | March 31, 2017 |
CAPITAL STEWARDSHIP FUND
OBJECTIVE: Seeks long-term capital appreciation.
Holdings Diversification (Market Exposure as % of Net Assets)
“Holdings Diversification (Market Exposure as % of Net Assets)” excludes any temporary cash investments.
Inception Date: September 26, 2014 |
| Ten Largest Holdings (% of Total Net Assets) |
| Johnson & Johnson | 3.2% |
| JPMorgan Chase & Co. | 2.9% |
| Apple, Inc. | 2.6% |
| Intel Corp. | 2.4% |
| Alphabet, Inc. — Class A | 2.4% |
| International Business Machines Corp. | 2.3% |
| AT&T, Inc. | 2.1% |
| Oracle Corp. | 1.9% |
| Verizon Communications, Inc. | 1.8% |
| Cisco Systems, Inc. | 1.7% |
| Top Ten Total | 23.3% |
| “Ten Largest Holdings” excludes any temporary cash investments. |
| | THE GUGGENHEIM FUNDS SEMI-ANNUAL REPORT | 7 |
SCHEDULE OF INVESTMENTS (Unaudited) | March 31, 2017 |
| CAPITAL STEWARDSHIP FUND | |
| | | Shares | | | Value | |
| | | | | | | |
COMMON STOCKS† - 100.6% | |
| | | | | | | |
| Consumer, Non-cyclical - 21.6% | |
| Johnson & Johnson | | | 57,258 | | | $ | 7,131,485 | |
| Amgen, Inc. | | | 16,557 | | | | 2,716,508 | |
| AbbVie, Inc. | | | 39,801 | | | | 2,593,433 | |
| ManpowerGroup, Inc. | | | 21,977 | | | | 2,254,181 | |
| Cardinal Health, Inc. | | | 26,466 | | | | 2,158,302 | |
| Merck & Company, Inc. | | | 26,985 | | | | 1,714,627 | |
| DaVita, Inc.* | | | 25,133 | | | | 1,708,290 | |
| General Mills, Inc. | | | 27,090 | | | | 1,598,581 | |
| Aetna, Inc. | | | 12,030 | | | | 1,534,426 | |
| Procter & Gamble Co. | | | 15,030 | | | | 1,350,446 | |
| Becton Dickinson and Co. | | | 7,030 | | | | 1,289,584 | |
| WellCare Health Plans, Inc.* | | | 8,526 | | | | 1,195,430 | |
| Ingredion, Inc. | | | 9,667 | | | | 1,164,197 | |
| Cigna Corp. | | | 7,683 | | | | 1,125,483 | |
| Molson Coors Brewing Co. — Class B | | | 11,566 | | | | 1,106,982 | |
| Sysco Corp. | | | 20,681 | | | | 1,073,757 | |
| Whole Foods Market, Inc. | | | 33,970 | | | | 1,009,588 | |
| Conagra Brands, Inc. | | | 24,945 | | | | 1,006,281 | |
| Varian Medical Systems, Inc.* | | | 10,210 | | | | 930,437 | |
| Danaher Corp. | | | 10,325 | | | | 883,097 | |
| Kimberly-Clark Corp. | | | 6,349 | | | | 835,719 | |
| Eli Lilly & Co. | | | 9,616 | | | | 808,802 | |
| Molina Healthcare, Inc.* | | | 17,556 | | | | 800,554 | |
| Thermo Fisher Scientific, Inc. | | | 5,088 | | | | 781,517 | |
| Automatic Data Processing, Inc. | | | 7,500 | | | | 767,925 | |
| Coca-Cola Co. | | | 17,343 | | | | 736,037 | |
| PepsiCo, Inc. | | | 5,986 | | | | 669,594 | |
| Biogen, Inc.* | | | 2,420 | | | | 661,676 | |
| Cooper Cos., Inc. | | | 3,215 | | | | 642,646 | |
| United Natural Foods, Inc.* | | | 14,182 | | | | 613,088 | |
| JM Smucker Co. | | | 4,518 | | | | 592,219 | |
| Bristol-Myers Squibb Co. | | | 9,935 | | | | 540,265 | |
| Deluxe Corp. | | | 7,403 | | | | 534,275 | |
| Estee Lauder Cos., Inc. — Class A | | | 5,917 | | | | 501,702 | |
| Abbott Laboratories | | | 10,754 | | | | 477,585 | |
| Celgene Corp.* | | | 3,601 | | | | 448,072 | |
| Premier, Inc. — Class A* | | | 13,148 | | | | 418,501 | |
| PAREXEL International Corp.* | | | 5,462 | | | | 344,707 | |
| Zoetis, Inc. | | | 5,010 | | | | 267,384 | |
| Clorox Co. | | | 1,870 | | | | 252,132 | |
| Sabre Corp. | | | 10,954 | | | | 232,115 | |
| Total Consumer, Non-cyclical | | | | | | | 47,471,630 | |
| | | | | | | | | |
| Technology - 19.5% | |
| Apple, Inc. | | | 40,056 | | | | 5,754,444 | |
| Intel Corp. | | | 147,535 | | | | 5,321,587 | |
| International Business Machines Corp. | | | 28,421 | | | | 4,949,233 | |
| Oracle Corp. | | | 91,814 | | | | 4,095,823 | |
| Microsoft Corp. | | | 51,240 | | | | 3,374,666 | |
| Lam Research Corp. | | | 16,285 | | | | 2,090,343 | |
| Western Digital Corp. | | | 22,884 | | | | 1,888,617 | |
| QUALCOMM, Inc. | | | 31,531 | | | | 1,807,988 | |
| Pitney Bowes, Inc. | | | 112,714 | | | | 1,477,681 | |
| Cognizant Technology Solutions Corp. — Class A* | | | 20,274 | | | | 1,206,708 | |
| HP, Inc. | | | 66,091 | | | | 1,181,707 | |
| VMware, Inc. — Class A* | | | 12,784 | | | | 1,177,918 | |
| Analog Devices, Inc. | | | 14,113 | | | | 1,156,560 | |
| Jack Henry & Associates, Inc. | | | 12,306 | | | | 1,145,689 | |
| Akamai Technologies, Inc.* | | | 14,824 | | | | 884,993 | |
| Cerner Corp.* | | | 14,431 | | | | 849,264 | |
| Paychex, Inc. | | | 14,261 | | | | 839,973 | |
| Xilinx, Inc. | | | 13,999 | | | | 810,402 | |
| Teradata Corp.* | | | 23,216 | | | | 722,482 | |
| Applied Materials, Inc. | | | 18,466 | | | | 718,327 | |
| Teradyne, Inc. | | | 18,899 | | | | 587,759 | |
| Texas Instruments, Inc. | | | 5,393 | | | | 434,460 | |
| NVIDIA Corp. | | | 3,129 | | | | 340,842 | |
| Total Technology | | | | | | | 42,817,466 | |
| | | | | | | | | |
| Financial - 14.4% | |
| JPMorgan Chase & Co. | | | 71,455 | | | | 6,276,608 | |
| Citigroup, Inc. | | | 47,149 | | | | 2,820,453 | |
| Prudential Financial, Inc. | | | 18,785 | | | | 2,003,984 | |
| Aflac, Inc. | | | 26,778 | | | | 1,939,263 | |
| Northern Trust Corp. | | | 19,105 | | | | 1,654,111 | |
| U.S. Bancorp | | | 32,053 | | | | 1,650,729 | |
| Berkshire Hathaway, Inc. — Class B* | | | 9,735 | | | | 1,622,630 | |
| Capital One Financial Corp. | | | 15,926 | | | | 1,380,147 | |
| Travelers Cos., Inc. | | | 10,272 | | | | 1,238,187 | |
| PNC Financial Services Group, Inc. | | | 10,188 | | | | 1,225,005 | |
| KeyCorp | | | 68,311 | | | | 1,214,570 | |
| Cullen/Frost Bankers, Inc. | | | 13,359 | | | | 1,188,550 | |
| CIT Group, Inc. | | | 27,537 | | | | 1,182,163 | |
| Hartford Financial Services Group, Inc. | | | 21,949 | | | | 1,055,089 | |
| MetLife, Inc. | | | 18,954 | | | | 1,001,150 | |
| Goldman Sachs Group, Inc. | | | 4,121 | | | | 946,676 | |
| Navient Corp. | | | 63,945 | | | | 943,828 | |
| T. Rowe Price Group, Inc. | | | 8,326 | | | | 567,417 | |
| Hospitality Properties Trust | | | 14,467 | | | | 456,145 | |
| Allstate Corp. | | | 4,156 | | | | 338,672 | |
| Nasdaq, Inc. | | | 4,766 | | | | 330,999 | |
| Interactive Brokers Group, Inc. — Class A | | | 9,059 | | | | 314,528 | |
| Jones Lang LaSalle, Inc. | | | 2,820 | | | | 314,289 | |
| Total Financial | | | | | | | 31,665,193 | |
| | | | | | | | | |
| Industrial - 12.5% | |
| Fluor Corp. | | | 43,338 | | | | 2,280,446 | |
| Cummins, Inc. | | | 13,711 | | | | 2,073,103 | |
| Boeing Co. | | | 11,328 | | | | 2,003,469 | |
| Union Pacific Corp. | | | 18,906 | | | | 2,002,523 | |
| Corning, Inc. | | | 71,924 | | | | 1,941,948 | |
| Jabil Circuit, Inc. | | | 67,023 | | | | 1,938,305 | |
| United Technologies Corp. | | | 14,685 | | | | 1,647,804 | |
| 3M Co. | | | 7,387 | | | | 1,413,355 | |
| Lockheed Martin Corp. | | | 5,238 | | | | 1,401,689 | |
| Raytheon Co. | | | 8,226 | | | | 1,254,465 | |
| Deere & Co. | | | 10,012 | | | | 1,089,906 | |
| Rockwell Collins, Inc. | | | 11,120 | | | | 1,080,419 | |
| FedEx Corp. | | | 4,842 | | | | 944,916 | |
8 | THE GUGGENHEIM FUNDS SEMI-ANNUAL REPORT | SEE NOTES TO FINANCIAL STATEMENTS. |
SCHEDULE OF INVESTMENTS (Unaudited)(continued) | March 31, 2017 |
| CAPITAL STEWARDSHIP FUND | |
| | | Shares | | | Value | |
| | | | | | | |
| Bemis Company, Inc. | | | 17,929 | | | $ | 876,011 | |
| Gentex Corp. | | | 40,090 | | | | 855,120 | |
| Sonoco Products Co. | | | 16,077 | | | | 850,795 | |
| CSX Corp. | | | 17,863 | | | | 831,523 | |
| Eaton Corp. plc | | | 9,905 | | | | 734,456 | |
| Waste Management, Inc. | | | 8,217 | | | | 599,184 | |
| Honeywell International, Inc. | | | 3,937 | | | | 491,613 | |
| United Parcel Service, Inc. — Class B | | | 3,806 | | | | 408,384 | |
| Eagle Materials, Inc. | | | 3,828 | | | | 371,852 | |
| Ingersoll-Rand plc | | | 4,247 | | | | 345,366 | |
| Total Industrial | | | | | | | 27,436,652 | |
| | | | | | | | | |
| Consumer, Cyclical - 11.9% | |
| CVS Health Corp. | | | 30,806 | | | | 2,418,271 | |
| Goodyear Tire & Rubber Co. | | | 62,193 | | | | 2,238,948 | |
| Alaska Air Group, Inc. | | | 23,142 | | | | 2,134,154 | |
| Ford Motor Co. | | | 172,407 | | | | 2,006,818 | |
| Wal-Mart Stores, Inc. | | | 27,595 | | | | 1,989,048 | |
| Delta Air Lines, Inc. | | | 40,012 | | | | 1,838,951 | |
| General Motors Co. | | | 43,345 | | | | 1,532,679 | |
| Target Corp. | | | 26,555 | | | | 1,465,570 | |
| Kohl’s Corp. | | | 35,217 | | | | 1,401,989 | |
| Nu Skin Enterprises, Inc. — Class A | | | 22,275 | | | | 1,237,154 | |
| WW Grainger, Inc. | | | 4,906 | | | | 1,141,921 | |
| Southwest Airlines Co. | | | 20,347 | | | | 1,093,855 | |
| Macy’s, Inc. | | | 35,402 | | | | 1,049,315 | |
| Best Buy Co., Inc. | | | 18,332 | | | | 901,018 | |
| McDonald’s Corp. | | | 5,585 | | | | 723,872 | |
| Nordstrom, Inc. | | | 12,735 | | | | 593,069 | |
| PVH Corp. | | | 5,262 | | | | 544,459 | |
| Whirlpool Corp. | | | 2,773 | | | | 475,098 | |
| Scotts Miracle-Gro Co. — Class A | | | 5,070 | | | | 473,487 | |
| Hanesbrands, Inc. | | | 21,027 | | | | 436,521 | |
| Coach, Inc. | | | 6,846 | | | | 282,945 | |
| Harley-Davidson, Inc. | | | 3,015 | | | | 182,408 | |
| Total Consumer, Cyclical | | | | | | | 26,161,550 | |
| | | | | | | | | |
| Communications - 11.6% | |
| Alphabet, Inc. — Class A* | | | 6,136 | | | | 5,202,101 | |
| AT&T, Inc. | | | 112,385 | | | | 4,669,596 | |
| Verizon Communications, Inc. | | | 80,074 | | | | 3,903,608 | |
| Cisco Systems, Inc. | | | 110,916 | | | | 3,748,961 | |
| Juniper Networks, Inc. | | | 68,921 | | | | 1,918,071 | |
| Comcast Corp. — Class A | | | 38,948 | | | | 1,464,055 | |
| Omnicom Group, Inc. | | | 16,518 | | | | 1,424,017 | |
| Motorola Solutions, Inc. | | | 14,365 | | | | 1,238,551 | |
| Sprint Corp.* | | | 63,229 | | | | 548,828 | |
| T-Mobile US, Inc.* | | | 8,238 | | | | 532,092 | |
| InterDigital, Inc. | | | 4,404 | | | | 380,065 | |
| Time Warner, Inc. | | | 3,052 | | | | 298,211 | |
| Netflix, Inc.* | | | 1,219 | | | | 180,180 | |
| Total Communications | | | | | | | 25,508,336 | |
| | | | | | | | | |
| Energy - 3.8% | |
| Marathon Petroleum Corp. | | | 33,302 | | | | 1,683,083 | |
| ConocoPhillips | | | 32,074 | | | | 1,599,530 | |
| Chevron Corp. | | | 13,345 | | | | 1,432,853 | |
| Hess Corp. | | | 25,153 | | | | 1,212,626 | |
| Schlumberger Ltd. | | | 13,113 | | | | 1,024,125 | |
| EOG Resources, Inc. | | | 6,120 | | | | 597,006 | |
| Anadarko Petroleum Corp. | | | 7,525 | | | | 466,550 | |
| Occidental Petroleum Corp. | | | 4,947 | | | | 313,442 | |
| Total Energy | | | | | | | 8,329,215 | |
| | | | | | | | | |
| Basic Materials - 2.8% | |
| Air Products & Chemicals, Inc. | | | 10,307 | | | | 1,394,433 | |
| Praxair, Inc. | | | 10,326 | | | | 1,224,664 | |
| Reliance Steel & Aluminum Co. | | | 14,667 | | | | 1,173,653 | |
| Westlake Chemical Corp. | | | 16,318 | | | | 1,077,804 | |
| Compass Minerals International, Inc. | | | 14,776 | | | | 1,002,552 | |
| International Flavors & Fragrances, Inc. | | | 1,403 | | | | 185,940 | |
| Total Basic Materials | | | | | | | 6,059,046 | |
| | | | | | | | | |
| Utilities - 2.5% | |
| Exelon Corp. | | | 51,947 | | | | 1,869,054 | |
| Entergy Corp. | | | 23,916 | | | | 1,816,659 | |
| Consolidated Edison, Inc. | | | 16,947 | | | | 1,316,104 | |
| Xcel Energy, Inc. | | | 10,112 | | | | 449,478 | |
| Total Utilities | | | | | | | 5,451,295 | |
| | | | | | | | | |
| Total Common Stocks | | | | | | | | |
| (Cost $203,425,687) | | | | | | | 220,900,383 | |
| | | | | | | | | |
EXCHANGE-TRADED FUNDS† - 0.2% | |
| SPDR S&P 500 ETF Trust | | | 1,800 | | | | 424,332 | |
| Total Exchange-Traded Funds | | | | | | | | |
| (Cost $415,381) | | | | | | | 424,332 | |
| | | | | | | | | |
SHORT-TERM INVESTMENTS† - 0.3% | |
Dreyfus Treasury Prime Cash Management Institutional Shares 0.50%1 | | | 745,179 | | | | 745,179 | |
| Total Short-Term Investments | | | | | | | | |
| (Cost $745,179) | | | | | | | 745,179 | |
| | | | | | | | | |
| Total Investments - 101.1% | | | | | | | | |
| (Cost $204,586,247) | | | | | | $ | 222,069,894 | |
| Other Assets & Liabilities, net - (1.1)% | | | | | | | (2,404,873 | ) |
| Total Net Assets - 100.0% | | | | | | $ | 219,665,021 | |
| * | Non-income producing security. |
† | Value determined based on Level 1 inputs — See Note 3. |
1 | Rate indicated is the 7 day yield as of March 31, 2017. |
| | plc — Public Limited Company |
| | |
| | See Sector Classification in Other Information section. |
| SEE NOTES TO FINANCIAL STATEMENTS. | THE GUGGENHEIM FUNDS SEMI-ANNUAL REPORT | 9 |
SCHEDULE OF INVESTMENTS (Unaudited)(concluded) | March 31, 2017 |
| CAPITAL STEWARDSHIP FUND | |
The following table summarizes the inputs used to value the Fund’s investments at March 31, 2017 (See Note 3 in the Notes to Financial Statements):
Investments in Securities (Assets) | | Level 1 | | | Level 2 | | | Level 3 | | | Total | |
Common Stocks | | $ | 220,900,383 | | | $ | — | | | $ | — | | | $ | 220,900,383 | |
Exchange-Traded Funds | | | 424,332 | | | | — | | | | — | | | | 424,332 | |
Short-Term Investments | | | 745,179 | | | | — | | | | — | | | | 745,179 | |
Total | | $ | 222,069,894 | | | $ | — | | | $ | — | | | $ | 222,069,894 | |
Transfers between investment levels may occur as the markets fluctuate and/or the availability of data used in an investment’s valuation changes. Transfers between valuation levels, if any, are in comparison to the valuation levels at the end of the previous fiscal year, and are effective using the fair value as of the end of the previous fiscal period.
For the period ended March 31, 2017, there were no transfers between levels.
10 | THE GUGGENHEIM FUNDS SEMI-ANNUAL REPORT | SEE NOTES TO FINANCIAL STATEMENTS. |
STATEMENT OF ASSETS AND LIABILITIES (Unaudited) |
| March 31, 2017 |
| Assets: | |
| Investments, at value (cost $204,586,247) | | $ | 222,069,894 | |
| Prepaid expenses | | | 5,626 | |
| Cash | | | 1,697 | |
| Receivables: | |
| Dividends | | | 200,999 | |
| Total assets | | | 222,278,216 | |
| | | | | |
| Liabilities: | |
| Payable for: | |
| Fund shares redeemed | | | 2,403,215 | |
| Management fees | | | 170,407 | |
| Fund accounting/administration fees | | | 15,148 | |
| Trustees’ fees* | | | 5,011 | |
| Transfer agent/maintenance fees | | | 3,167 | |
| Miscellaneous | | | 16,247 | |
| Total liabilities | | | 2,613,195 | |
| Net assets | | $ | 219,665,021 | |
| | | | | |
| Net assets consist of: | |
| Paid in capital | | $ | 201,165,802 | |
| Undistributed net investment income | | | 684,748 | |
| Accumulated net realized gain on investments | | | 330,824 | |
| Net unrealized appreciation on investments | | | 17,483,647 | |
| | | | | |
| Institutional Class: | | | | |
| Net assets | | $ | 219,665,021 | |
| Capital shares outstanding | | | 8,018,274 | |
| Net asset value per share | | $ | 27.40 | |
STATEMENT OF OPERATIONS (Unaudited) |
| Period Ended March 31, 2017 |
| Investment Income: | |
| Dividends (net of foreign withholding tax of $366) | | $ | 2,470,213 | |
| Interest | | | 684 | |
| Total investment income | | | 2,470,897 | |
| | | | | |
| Expenses: | |
| Management fees | | | 963,012 | |
| Transfer agent/maintenance fees | | | 12,959 | |
| Fund accounting/administration fees | | | 85,942 | |
| Trustees’ fees* | | | 2,719 | |
| Custodian fees | | | 582 | |
| Miscellaneous | | | 10,133 | |
| Total expenses | | | 1,075,347 | |
| Net investment income | | | 1,395,550 | |
| | | | | |
| Net Realized and Unrealized Gain (Loss): | |
| Net realized gain (loss) on: | |
| Investments | | | 3,496,211 | |
| Net realized gain | | | 3,496,211 | |
| Net change in unrealized appreciation (depreciation) on: | |
| Investments | | | 12,129,916 | |
| Net change in unrealized appreciation (depreciation) | | | 12,129,916 | |
| Net realized and unrealized gain | | | 15,626,127 | |
| Net increase in net assets resulting from operations | | $ | 17,021,677 | |
| * | Relates to Trustees not deemed “interested persons” within the meaning of Section 2(a)(19) of the 1940 Act. |
| SEE NOTES TO FINANCIAL STATEMENTS. | THE GUGGENHEIM FUNDS SEMI-ANNUAL REPORT | 11 |
| STATEMENTS OF CHANGES IN NET ASSETS |
| | | Period Ended
March 31,
2017
(Unaudited) | | | Year Ended
September 30,
2016 | |
| Increase (Decrease) in Net Assets from Operations: | | | | | | |
| Net investment income | | $ | 1,395,550 | | | $ | 2,810,492 | |
| Net realized gain on investments | | | 3,496,211 | | | | 7,701,198 | |
| Net change in unrealized appreciation (depreciation) on investments | | | 12,129,916 | | | | 18,164,398 | |
| Net increase in net assets resulting from operations | | | 17,021,677 | | | | 28,676,088 | |
| | | | | | | | | |
| Distributions to shareholders from: | | | | | | | | |
| Net investment income | | | (2,861,435 | ) | | | (2,583,368 | ) |
| Net realized gains | | | (7,195,557 | ) | | | (3,078,358 | ) |
| Total distributions to shareholders | | | (10,056,992 | ) | | | (5,661,726 | ) |
| | | | | | | | | |
| Capital share transactions: | | | | | | | | |
| Proceeds from sale of shares | | | 5,207,987 | | | | 40,409,661 | |
| Distributions reinvested | | | 10,033,367 | | | | 5,389,571 | |
| Cost of shares redeemed | | | (11,407,673 | ) | | | (49,615,134 | ) |
| Net increase (decrease) from capital share transactions | | | 3,833,681 | | | | (3,815,902 | ) |
| Net increase in net assets | | | 10,798,366 | | | | 19,198,460 | |
| | | | | | | | | |
| Net assets: | | | | | | | | |
| Beginning of period | | | 208,866,655 | | | | 189,668,195 | |
| End of period | | $ | 219,665,021 | | | $ | 208,866,655 | |
| Undistributed net investment income at end of period | | $ | 684,748 | | | $ | 2,150,633 | |
| | | | | | | | | |
| Capital share activity: | | | | | | | | |
| Shares sold | | | 200,616 | | | | 1,615,108 | |
| Shares issued from reinvestment of distributions | | | 382,515 | | | | 218,644 | |
| Shares redeemed | | | (430,579 | ) | | | (1,974,077 | ) |
| Net increase (decrease) in shares | | | 152,552 | | | | (140,325 | ) |
12 | THE GUGGENHEIM FUNDS SEMI-ANNUAL REPORT | SEE NOTES TO FINANCIAL STATEMENTS. |
This table is presented to show selected data for a share outstanding throughout each period and to assist shareholders in evaluating a Fund’s performance for the periods presented.
| Institutional Class | | Period Ended
March 31,
2017a | | | Year Ended
September 30,
2016 | | | Year Ended
September 30,
2015 | | | Period Ended
September 30,
2014b | |
| Per Share Data | | | | | | | | | | | | |
| Net asset value, beginning of period | | $ | 26.55 | | | $ | 23.69 | | | $ | 24.79 | | | $ | 25.00 | |
| Income (loss) from investment operations: | |
Net investment income (loss)c | | | .17 | | | | .35 | | | | .31 | | | | — | d |
| Net gain (loss) on investments (realized and unrealized) | | | 1.97 | | | | 3.22 | | | | (1.33 | ) | | | (.21 | ) |
| Total from investment operations | | | 2.14 | | | | 3.57 | | | | (1.02 | ) | | | (.21 | ) |
| Less distributions from: | |
| Net investment income | | | (.37 | ) | | | (.32 | ) | | | (.08 | ) | | | — | |
| Net realized gains | | | (.92 | ) | | | (.39 | ) | | | — | | | | — | |
| Total distributions | | | (1.29 | ) | | | (.71 | ) | | | (.08 | ) | | | — | |
| Net asset value, end of period | | $ | 27.40 | | | $ | 26.55 | | | $ | 23.69 | | | $ | 24.79 | |
| | |
Total Returnf | | | 8.22 | % | | | 15.30 | % | | | (4.15 | %) | | | (0.84 | %) |
| Ratios/Supplemental Data | |
| Net assets, end of period (in thousands) | | $ | 219,665 | | | $ | 208,867 | | | $ | 189,668 | | | $ | 209,015 | |
| Ratios to average net assets: | |
| Net investment income (loss) | | | 1.30 | % | | | 1.38 | % | | | 1.22 | % | | | 0.13 | % |
Total expensese | | | 1.00 | % | | | 1.07 | % | | | 1.15 | % | | | 1.24 | % |
| Portfolio turnover rate | | | 87 | % | | | 209 | % | | | 221 | % | | | — | |
a | Unaudited figures for the period ended March 31, 2017. Percentage amounts for the period, except total return and portfolio turnover rate, have been annualized. |
b | Since commencement of operations: September 26, 2014. Percentage amounts for the period, except total return and portfolio turnover rate, have been annualized. |
c | Net investment income (loss) per share was computed using average shares outstanding throughout the period. |
d | Net investment income is less than $0.01 per share. |
e | Does not include expenses of the underlying funds in which the Fund invests. |
f | Total return does not reflect the impact of any applicable sales charge and has not been annualized. |
| SEE NOTES TO FINANCIAL STATEMENTS. | THE GUGGENHEIM FUNDS SEMI-ANNUAL REPORT | 13 |
NOTES TO FINANCIAL STATEMENTS (Unaudited) |
1. Organization and Significant Accounting Policies
Organization
Guggenheim Funds Trust (the “Trust”), a Delaware statutory trust, is registered with the SEC under the Investment Company Act of 1940 (“1940 Act”), as an open-ended investment company of the series type. Each series, in effect, is representing a separate Fund. The Trust is authorized to issue an unlimited number of shares. The Trust accounts for the assets of each Fund separately.
The Trust offers a combination of five separate classes of shares, A-Class shares, C-Class shares, P-Class shares, R6-Class shares and Institutional Class shares. Sales of shares of each Class are made without a front-end sales charge at the net asset value per share (“NAV”), with the exception of A-Class shares. A-Class shares are sold at the NAV, plus the applicable front-end sales charge. The sales charge varies depending on the amount purchased. A-Class share purchases of $1 million or more are exempt from the front-end sales charge but have a 1% contingent deferred sales charge (“CDSC”), if shares are redeemed within 12 months of purchase. C-Class shares have a 1% CDSC if shares are redeemed within 12 months of purchase. Institutional Class shares are offered primarily for direct investment by institutions such as pension and profit sharing plans, endowments, foundations and corporations. Institutional Class shares require a minimum initial investment of $2 million and a minimum account balance of $1 million. Institutional Class shares are offered without a front-end sales charge or a CDSC. At March 31, 2017, the Trust consisted of nineteen funds (the “Funds”).
This report covers the Capital Stewardship Fund (the “Fund”), a diversified investment company. As of March 31, 2017 only Institutional Class shares of the Fund were offered for subscription.
Guggenheim Partners Investment Management, LLC, which operates under the name Guggenheim Investments (“GI”) provides advisory services. Guggenheim Funds Distributors, LLC (“GFD”) acts as principal underwriter for the Trust. GI and GFD are affiliated entities.
Concinnity Advisors, LP (the “Sub-Adviser”) serves as the sub-adviser to the Fund and is responsible for the day-to-day management of the Fund’s portfolio.
Significant Accounting Policies
The Fund operates as an investment company and, accordingly, follows the investment company accounting and reporting guidance of the Financial Accounting Standards Board (“FASB”) Accounting Standards Codification Topic 946 Financial Services – Investment Companies.
The following significant accounting policies are in conformity with U.S. generally accepted accounting principles (“U.S. GAAP”) and are consistently followed by the Trust. This requires management to make estimates and assumptions that affect the reported amount of assets and liabilities, contingent assets and liabilities at the date of the financial statements, and the reported amounts of revenues and expenses during the reporting period. Actual results could differ from these estimates. All time references are based on Eastern Time.
The NAV of the Fund is calculated by dividing the market value of the Fund’s securities and other assets, less all liabilities.
A. The Board of Trustees of the Fund (the “Board”) has adopted policies and procedures for the valuation of the Fund’s investments (the “Valuation Procedures”). Pursuant to the Valuation Procedures, the Board has delegated to a valuation committee, consisting of representatives from Guggenheim’s investment management, fund administration, legal and compliance departments (the “Valuation Committee”), the day-to-day responsibility for implementing the Valuation Procedures, including, under most circumstances, the responsibility for determining the fair value of the Fund’s securities and/or other assets.
Valuations of the Fund’s securities are supplied primarily by pricing services appointed pursuant to the processes set forth in the Valuation Procedures. The Valuation Committee convenes monthly, or more frequently as needed, to review the valuation of all assets which have been fair valued for reasonableness. The Fund’s officers, through the Valuation Committee and consistent with the monitoring and review responsibilities set forth in the Valuation Procedures, regularly review procedures used and valuations provided by the pricing services.
If the pricing service cannot or does not provide a valuation for a particular investment or such valuation is deemed unreliable, such investment is fair valued by the Valuation Committee.
Equity securities listed on an exchange (New York Stock Exchange (“NYSE”) or American Stock Exchange) are valued at the last quoted sales price as of the close of business on the NYSE, usually 4:00 p.m. on the valuation date. Equity securities listed on the NASDAQ market system are valued at the NASDAQ Official Closing Price on the valuation date, which may not necessarily represent the last sale price. If there has been no sale on such exchange or NASDAQ on a given day, the security is valued at the closing bid price on that day.
Open-end investment companies (“mutual funds”) are valued at their NAV as of the close of business, on the valuation date. Exchange-traded funds (“ETFs”) and closed-end investment companies (“CEFs”) are valued at the last quoted sales price.
| 14 | THE GUGGENHEIM FUNDS SEMI-ANNUAL REPORT | |
NOTES TO FINANCIAL STATEMENTS (Unaudited)(continued) |
Investments for which market quotations are not readily available are fair-valued as determined in good faith by GI under the direction of the Board using methods established or ratified by the Board. Valuations in accordance with these methods are intended to reflect each security’s (or asset’s) “fair value.” Each such determination is based on a consideration of all relevant factors, which are likely to vary from one pricing context to another. Examples of such factors may include, but are not limited to market prices; sale prices; broker quotes; and models which derive prices based on inputs such as prices of securities with comparable maturities and characteristics, or based on inputs such as anticipated cash flows or collateral, spread over Treasuries, and other information analysis.
B. Security transactions are recorded on the trade date for financial reporting purposes. Realized gains and losses from securities transactions are recorded using the identified cost basis. Proceeds from lawsuits related to investment holdings are recorded as realized gains in the Fund. Dividend income is recorded on the ex-dividend date, net of applicable taxes withheld by foreign countries. Taxable non-cash dividends are recorded as dividend income. Interest income, including amortization of premiums and accretion of discounts, is accrued on a daily basis. Interest income also includes paydown gains and losses on mortgage-backed and asset-backed securities and senior and subordinated loans. Amendment fees are earned as compensation for evaluating and accepting changes to the original loan agreement and are recognized when received. Dividend income from REITs is recorded based on the income included in the distributions received from the REIT investments using published REIT classifications, including some management estimates when actual amounts are not available. Distributions received in excess of this estimated amount are recorded as a reduction of the cost of investments or reclassified to capital gains. The actual amounts of income, return of capital, and capital gains are only determined by each REIT after its fiscal year-end, and may differ from the estimated amounts.
C. Distributions of net investment income and net realized gains, if any, are declared and paid at least annually. Dividends are reinvested in additional shares unless shareholders request payment in cash. Distributions are recorded on the ex-dividend date and are determined in accordance with income tax regulations which may differ from U.S. GAAP.
D. Certain expenses have been allocated to the individual Funds in the Trust on a pro rata basis upon the respective aggregate net assets of each Fund included in the Trust.
E. Under the fee arrangement with the custodian, the Fund may earn credits based on overnight custody cash balances. These credits are utilized to reduce related custodial expenses. The custodian fees disclosed in the Statement of Operations are before the reduction in expense from the related earnings credits, if any. For the period ended March 31, 2017, there were no earnings credits received.
The Fund may leave cash overnight in its cash account with the custodian. Periodically, the Fund may have cash due to the custodian bank as an overdraft balance. A fee is incurred on this overdraft, calculated by multiplying the overdraft by a rate based on the federal funds rate, which was 0.82% at March 31, 2017.
F. Under the Fund’s organizational documents, its Trustees and Officers are indemnified against certain liabilities arising out of the performance of their duties to the Trust. In addition, throughout the normal course of business, the Fund enters into contracts that contain a variety of representations and warranties which provide general indemnifications. The Fund’s maximum exposure under these arrangements is unknown, as this would involve future claims that may be made against the Fund and/or its affiliates that have not yet occurred. However, based on experience, the Fund expects the risk of loss to be remote.
2. Fees and Other Transactions with Affiliates
Under the terms of an investment advisory contract, the Fund pays GI investment advisory fees calculated at an annualized rate of 0.90% of the average daily net assets of the Fund.
GI engages external service providers to perform other necessary services for the Trust, such as audit and accounting related services, legal services, custody, printing and mailing, etc., on a pass-through basis. Such expenses are allocated to various Funds within the complex based on relative net assets.
Certain trustees and officers of the Trust are also officers of GI and GFD.
On October 4, 2016, Rydex Fund Services, LLC (“RFS”) was purchased by MUFG Investor Services and as of that date RFS ceased to be an affiliate of GI. In connection with its acquisition, RFS changed its name to MUFG Investor Services (US), LLC (“MUIS”). This change had no impact on the financial statements of the Trust.
MUIS acts as the Trust’s administrator, transfer agent and accounting agent. As administrator, transfer agent and accounting agent, MUIS is responsible for maintaining the books and records of the Trust’s securities and cash. For providing the aforementioned administrative and accounting services, MUIS is entitled to receive a monthly fee equal to a percentage of the
| | THE GUGGENHEIM FUNDS SEMI-ANNUAL REPORT | 15 |
NOTES TO FINANCIAL STATEMENTS (Unaudited)(continued) |
Fund’s fees and out of pocket expenses. For providing the aforementioned transfer agent services, MUIS is entitled to receive a monthly fee based on the number of transactions during the month and the number of accounts under management subject to certain minimum monthly fees and out of pocket expenses.
3. Fair Value Measurement
In accordance with U.S. GAAP, fair value is defined as the price that the Fund would receive to sell an investment or pay to transfer a liability in an orderly transaction with an independent buyer in the principal market, or in the absence of a principal market, the most advantageous market for the investment or liability. U.S. GAAP establishes a three-tier fair value hierarchy based on the types of inputs used to value assets and liabilities and requires corresponding disclosure. The hierarchy and the corresponding inputs are summarized below:
| Level 1 — | quoted prices in active markets for identical assets or liabilities. |
| Level 2 — | significant other observable inputs (for example quoted prices for securities that are similar based on characteristics such as interest rates, prepayment speeds, credit risk, etc.). |
| Level 3 — | significant unobservable inputs based on the best information available under the circumstances, to the extent observable inputs are not available, which may include assumptions. |
The types of inputs available depend on a variety of factors, such as the type of security and the characteristics of the markets in which it trades, if any. Fair valuation determinations that rely on fewer or no observable inputs require greater judgment. Accordingly, fair value determinations for Level 3 securities require the greatest amount of judgment.
The inputs or methodologies used for valuing securities are not necessarily an indication of the risk associated with investing in those securities. The suitability of the techniques and sources employed to determine fair valuation are regularly monitored and subject to change.
4. Federal Income Tax Information
The Fund intends to comply with the provisions of Subchapter M of the Internal Revenue Code applicable to regulated investment companies and will distribute substantially all taxable net investment income and capital gains sufficient to relieve the Fund from all, or substantially all, federal income, excise and state income taxes. Therefore, no provision for federal or state income tax is required.
Tax positions taken or expected to be taken in the course of preparing the Fund’s tax returns are evaluated to determine whether the tax positions are “more-likely-than-not” of being sustained by the applicable tax authority. Tax positions not deemed to meet the more-likely-than-not threshold would be recorded as a tax benefit or expense in the current year. Management has analyzed the Fund’s tax positions taken, or to be taken, on federal income tax returns for all open tax years, and has concluded that no provision for income tax is required in the Fund’s financial statements. The Fund’s federal tax returns are subject to examination by the Internal Revenue Service for a period of three years after they are filed.
At March 31, 2017, the cost of securities for federal income tax purposes, the aggregate gross unrealized gain for all securities for which there was an excess of value over tax cost, and the aggregate gross unrealized loss for all securities for which there was an excess of tax cost over value were as follows:
| Fund | | Tax
Cost | | | Tax
Unrealized
Gain | | | Tax
Unrealized
Loss | | | Net
Unrealized
Gain | |
| Capital Stewardship Fund | | $ | 205,629,845 | | | $ | 20,208,387 | | | $ | (3,768,338 | ) | | $ | 16,440,049 | |
| 16 | THE GUGGENHEIM FUNDS SEMI-ANNUAL REPORT | |
NOTES TO FINANCIAL STATEMENTS (Unaudited)(concluded) |
5. Securities Transactions
For the period ended March 31, 2017, the cost of purchases and proceeds from sales of investment securities, excluding government securities, short-term investments and derivatives, were as follows:
| Fund | | Purchases | | | Sales | |
| Capital Stewardship Fund | | $ | 187,388,503 | | | $ | 192,235,188 | |
The Fund is permitted to purchase or sell securities from or to certain affiliated funds under specified conditions outlined in procedures adopted by the Board of the Trust. The procedures have been designed to ensure that any purchase or sale of securities by a Fund from or to another fund or portfolio that is or could be considered an affiliate by virtue of having a common investment adviser (or affiliated investment advisers), common Trustees and/or common officers complies with Rule 17a-7 of the 1940 Act. Further, as defined under these procedures, each transaction is effected at the current market price to save costs, where permissible. For the period ended March 31, 2017, the Fund did not engage in purchases and sales of securities, pursuant to Rule 17a-7 of the 1940 Act.
| | THE GUGGENHEIM FUNDS SEMI-ANNUAL REPORT | 17 |
OTHER INFORMATION (Unaudited) |
Proxy Voting Information
A description of the policies and procedures that the Trust uses to determine how to vote proxies relating to securities held in the Funds’ portfolios is available, without charge and upon request, by calling 800.820.0888. This information is also available from the EDGAR database on the SEC’s website at https://www.sec.gov.
Information regarding how the Funds voted proxies relating to portfolio securities during the most recent 12-month period ended June 30 is available without charge, upon request, by calling 800.820.0888. This information is also available from the EDGAR database on the SEC’s website at https://www.sec.gov.
Sector Classification
Information in the “Schedule of Investments” is categorized by sectors using sector-level Classifications defined by the Bloomberg Industry Classification System, a widely recognized industry classification system provider. Each Fund’s registration statement has investment policies relating to concentration in specific sectors/industries. For purposes of these investment policies, the Funds usually classify sectors/industries based on industry-level Classifications used by widely recognized industry classification system providers such as Bloomberg Industry Classification System, Global Industry Classification Standards and Barclays Global Classification Scheme.
Quarterly Portfolio Schedules Information
The Trust files its complete schedule of portfolio holdings with the SEC for the first and third quarters of each fiscal year on Form N-Q; which are available on the SEC’s website at https://www.sec.gov. The Funds’ Forms N-Q may be reviewed and copied at the SEC’s Public Reference Room in Washington, DC, and that information on the operation of the Public Reference Room may be obtained by calling 800-SEC-0330. Copies of the portfolio holdings are also available to shareholders, without charge and upon request, by calling 800.820.0888.
| 18 | THE GUGGENHEIM FUNDS SEMI-ANNUAL REPORT | |
INFORMATION ON BOARD OF TRUSTEES AND OFFICERS (Unaudited) |
| Name, Address* and Year of Birth | Position(s)
Held with
the Trust | Term of Office and Length of Time Served** | Principal Occupation(s) During Past Five Years | Number of Portfolios in Fund Complex Overseen | Other
Directorships
Held by Trustees |
| INDEPENDENT TRUSTEES | | | |
Randall C. Barnes
(1951) | Trustee | Since 2014 | Current: Private Investor (2001-present). Former: Senior Vice President and Treasurer, PepsiCo, Inc. (1993-1997); President, Pizza Hut International (1991-1993); Senior Vice President, Strategic Planning and New Business Development, PepsiCo, Inc. (1987-1990). | 98 | Current: Trustee, Purpose Investments Inc. (2014-Present). |
Donald A. Chubb, Jr.
(1946 ) | Trustee | Since 1994 | Current: Business broker and manager of commercial real estate, Griffith & Blair, Inc. (1997-present). | 95 | Former: Midland Care, Inc. (2011-2016). |
Jerry B. Farley
(1946) | Trustee | Since 2005 | Current: President, Washburn University (1997-present). | 95 | Current: Westar Energy, Inc. (2004-present); CoreFirst Bank & Trust (2000-present). |
Roman Friedrich III
(1946) | Trustee and Chairman of the Contracts Review Committee | Since 2014 | Current: Founder and Managing Partner, Roman Friedrich & Company (1998-present). Former: Senior Managing Director, MLV & Co. LLC (2010-2011). | 95 | Current: Zincore Metals, Inc. (2009-present). Former: Axiom Gold and Silver Corp. (2011-2012). |
Robert B. Karn III
(1942) | Trustee and Chairman of the Audit Committee | Since 2014 | Current: Consultant (1998-present). Former: Arthur Andersen (1965-1997) and Managing Partner, Financial and Economic Consulting, St. Louis office (1987-1997). | 95 | Current: GP Natural Resource Partners, LLC (2002- present). Former: Peabody Energy Company (2003- Apr. 2017). |
Ronald A. Nyberg
(1953) | Trustee and Chairman of the Nominating and Governance Committee | Since 2014 | Current: Partner, Momkus McCluskey Roberts, LLC (2016-present). Former: Partner, Nyberg & Cassioppi, LLC (2000-2016); Executive Vice President, General Counsel, and Corporate Secretary, Van Kampen Investments (1982-1999). | 100 | Current: Edward-Elmhurst Healthcare System (2012-present). |
| | THE GUGGENHEIM FUNDS SEMI-ANNUAL REPORT | 19 |
INFORMATION ON BOARD OF TRUSTEES AND OFFICERS (Unaudited)(continued) |
| Name, Address* and Year of Birth | Position(s)
Held with
the Trust | Term of Office and Length of Time Served** | Principal Occupation(s) During Past Five Years | Number of Portfolios in Fund Complex Overseen | Other
Directorships
Held by Trustees |
| INDEPENDENT TRUSTEES - continued | | |
Maynard F. Oliverius
(1943) | Trustee | Since 1998 | Current: Retired. Former: President and CEO, Stormont-Vail HealthCare (1996-2012). | 95 | Current: Robert J. Dole Institute of Politics (2016-present); Stormont-Vail Foundation (2013-present); University of Minnesota MHA Alumni Philanthropy Committee (2009-present); Fort Hays State University Foundation (1999-present). Former: Topeka Community Foundation (2009-2014). |
Ronald E. Toupin, Jr.
(1958) | Trustee and Chairman of the Board | Since 2014 | Current: Portfolio Consultant (2010-present). Former: Vice President, Manager and Portfolio Manager, Nuveen Asset Management (1998-1999); Vice President, Nuveen Investment Advisory Corp. (1992-1999); Vice President and Manager, Nuveen Unit Investment Trusts (1991-1999); and Assistant Vice President and Portfolio Manager, Nuveen Unit Investment Trusts (1988-1999), each of John Nuveen & Co., Inc. (1982-1999). | 97 | Former: Bennett Group of Funds (2011-2013). |
| INTERESTED TRUSTEE | |
Donald C. Cacciapaglia***
(1951) | President, Chief Executive Officer and Trustee | Since 2012 | Current: President and CEO, certain other funds in the Fund Complex (2012-present); Vice Chairman, Guggenheim Investments (2010-present). Former: Chairman and CEO, Channel Capital Group, Inc. (2002-2010). | 230 | Current: Clear Spring Life Insurance Company (2015-present); Guggenheim Partners Japan, Ltd. (2014-present); Guggenheim Partners Investment Management Holdings, LLC (2014-present); Delaware Life (2013-present); Guggenheim Life and Annuity Company (2011-present); Paragon Life Insurance Company of Indiana (2011-present). |
| * | The business address of each Trustee is c/o Guggenheim Investments, 227 West Monroe Street, Chicago, Illinois 60606. |
| ** | Each Trustee serves an indefinite term, until his successor is elected and qualified. Time served includes time served in the respective position for the Predecessor Corporation. |
| *** | This Trustee is deemed to be an "interested person" of the Funds under the 1940 Act by reason of his position with the Funds' Investment Manager and/or the parent of the Investment Manager. |
| 20 | THE GUGGENHEIM FUNDS SEMI-ANNUAL REPORT | |
INFORMATION ON BOARD OF TRUSTEES AND OFFICERS (Unaudited)(continued) |
Name, Address* and Year of Birth | Position(s)
Held with
the Trust | Term of Office and Length of Time Served** | Principal Occupations
During Past Five Years |
| OFFICERS | | | |
William H. Belden, III
(1965) | Vice President | Since 2014 | Current: Vice President, certain other funds in the Fund Complex (2006-present); Managing Director, Guggenheim Funds Investment Advisors, LLC (2005-present). Former: Vice President of Management, Northern Trust Global Investments (1999-2005). |
Joanna M. Catalucci
(1966) | AML Officer | Since 2016 | Current: Chief Compliance Officer, certain funds in the Fund Complex (2012-present); Senior Managing Director, Guggenheim Investments (2014-present); AML Officer, certain funds in the Fund Complex (2016-present). Former: Chief Compliance Officer and Secretary, certain other funds in the Fund Complex (2008-2012); Senior Vice President & Chief Compliance Officer, Security Investors, LLC and certain affiliates (2010-2012); Chief Compliance Officer and Senior Vice President, Rydex Advisors, LLC and certain affiliates (2010-2011). |
James M. Howley
(1972) | Assistant Treasurer | Since 2014 | Current: Managing Director, Guggenheim Investments (2004-present) ; Assistant Treasurer, certain other funds in the Fund Complex (2006-present). Former: Manager, Mutual Fund Administration of Van Kampen Investments, Inc. (1996-2004). |
Keith D. Kemp
(1960) | Assistant Treasurer | Since 2016 | Current: Treasurer and Assistant Treasurer, certain other funds in the Fund Complex (2010-present); Managing Director of Guggenheim Partners Investment Management, LLC (2015-present); Chief Financial Officer, Guggenheim Specialized Products, LLC (2016-present). Former: Managing Director and Director, Transparent Value, LLC (2010-2016); Director, Guggenheim Partners Investment Management, LLC (2010-2015); Chief Operating Officer, Macquarie Capital Investment Management (2007-2009). |
Amy J. Lee
(1961) | Vice President and Chief Legal Officer | Since 2007 (Vice President) Since 2014 (Chief Legal Officer) | Current: Chief Legal Officer, certain other funds in the Fund Complex (2013-present); Senior Managing Director, Guggenheim Investments (2012-present). Former: Vice President, Associate General Counsel and Assistant Secretary, Security Benefit Life Insurance Company and Security Benefit Corporation (2004-2012). |
Mark E. Mathiasen
(1978) | Secretary | Since 2014 | Current: Secretary, certain other funds in the Fund Complex (2007-present); Managing Director, Guggenheim Investments (2007-present). |
Glenn McWhinnie
(1969) | Assistant Treasurer | Since 2016 | Current: Vice President, Guggenheim Investments (2009-present). Former: Tax Compliance Manager, Ernst & Young LLP (1996-2009). |
Michael P. Megaris
(1984) | Assistant Secretary | Since 2014 | Current: Assistant Secretary, certain other funds in the Fund Complex (2014-present); Vice President, Guggenheim Investments (2012-present). Former: J.D., University of Kansas School of Law (2009-2012). |
| | THE GUGGENHEIM FUNDS SEMI-ANNUAL REPORT | 21 |
INFORMATION ON BOARD OF TRUSTEES AND OFFICERS (Unaudited)(concluded) |
Name, Address* and Year of Birth | Position(s)
Held with
the Trust | Term of Office and Length of Time Served** | Principal Occupations
During Past Five Years |
| OFFICERS - continued | |
Elisabeth Miller
(1968) | Chief Compliance Officer | Since 2012 | Current: CCO, certain other funds in the Fund Complex (2012-present); CCO, Security Investors, LLC (2012-present); CCO, Guggenheim Funds Investment Advisors, LLC (2012-present); Managing Director, Guggenheim Investments (2012-present); Vice President, Guggenheim Funds Distributors, LLC (March 2014-present). Former: CCO, Guggenheim Distributors, LLC (2009-March 2014); Senior Manager, Security Investors, LLC (2004-2009); Senior Manager, Guggenheim Distributors, LLC (2004-2009). |
Adam J. Nelson
(1979) | Assistant Treasurer | Since 2015 | Current: Vice President, Guggenheim Investments (2015-present); Assistant Treasurer, certain other funds in the Fund Complex (2015-present). Former: Assistant Vice President and Fund Administration Director, State Street Corporation (2013-2015); Fund Administration Assistant Director, State Street (2011-2013); Fund Administration Manager, State Street (2009-2011). |
Kimberly J. Scott
(1974) | Assistant Treasurer | Since 2014 | Current: Director, Guggenheim Investments (2012-present) ; Assistant Treasurer, certain other funds in the Fund Complex (2012-present). Former: Financial Reporting Manager, Invesco, Ltd. (2010-2011); Vice President/Assistant Treasurer, Mutual Fund Administration for Van Kampen Investments, Inc./Morgan Stanley Investment Management (2009-2010); Manager of Mutual Fund Administration, Van Kampen Investments, Inc./Morgan Stanley Investment Management (2005-2009). |
Bryan Stone
(1979) | Vice President | Since 2014 | Current: Vice President, certain other funds in the Fund Complex (2014-present); Director, Guggenheim Investments (2013-present). Former: Senior Vice President, Neuberger Berman Group LLC (2009-2013); Vice President, Morgan Stanley (2002-2009). |
John L. Sullivan
(1955) | Chief Financial Officer and Treasurer | Since 2014 | Current: CFO, Chief Accounting Officer and Treasurer, certain other funds in the Fund Complex (2010-present); Senior Managing Director, Guggenheim Investments (2010-present). Former: Managing Director and CCO, each of the funds in the Van Kampen Investments fund complex (2004-2010); Managing Director and Head of Fund Accounting and Administration, Morgan Stanley Investment Management (2002-2004); CFO and Treasurer, Van Kampen Funds (1996-2004). |
| * | The business address of each officer is c/o Guggenheim Investments, 227 West Monroe Street, Chicago, Illinois 60606. |
| ** | Each officer serves an indefinite term, until his or her successor is duly elected and qualified. Time served includes time served in the respective position for the Predecessor Corporation. |
| 22 | THE GUGGENHEIM FUNDS SEMI-ANNUAL REPORT | |
GUGGENHEIM INVESTMENTS PRIVACY POLICIES (Unaudited) |
Guggenheim Investments as used herein refers to Guggenheim Partners, LLC, Guggenheim Funds Investment Advisors, LLC, Guggenheim Partners Investment Management, LLC, Guggenheim Funds Distributors, LLC and Security Investors, LLC as well as the funds in the Guggenheim Funds complex (the “funds”).
Our Commitment to You
When you become a Guggenheim Investments investor, you entrust us with not only your hard-earned money but also with personal and financial information about you. We recognize that your relationship with us is based on trust and that you expect us to act responsibly and in your best interests. Because we have access to personal information about you, we hold ourselves to high standards in its safekeeping and use. This means, most importantly, that we do not sell client or account information to anyone—whether you are a current or former Guggenheim Investments client.
The Information We Collect About You and How We Collect It
In the course of doing business with shareholders and investors, we collect nonpublic personal information about you. You typically provide personal information when you complete a Guggenheim Investments account application or when you request a transaction that involves Rydex and Guggenheim Funds or one of the Guggenheim affiliated companies. “Nonpublic personal information” is personally identifiable information about you. For example it includes your name and address, Social Security or taxpayer identification number, assets, income, account balance, bank account information and investment activity (e.g. purchase and redemption history).
How We Share Your Personal Information
As a matter of policy, we do not disclose your nonpublic personal information to nonaffiliated third parties except as required or permitted by law. As emphasized above, we do not sell information about current or former clients or their accounts to third parties. Nor do we share such information, except when necessary to complete transactions at your request or to make you aware of related investment products and services that we offer. Additional details about how we handle your personal information are provided below.
To complete certain transactions or account changes that you direct, it may be necessary to provide your personal information to companies, individuals or groups that are not affiliated with Guggenheim Investments. For example if you ask to transfer assets from another financial institution to Guggenheim Investments, we will need to provide certain information about you to that company to complete the transaction. In connection with servicing your accounts or to alert you to other Guggenheim Investments investment products and services, we may share your information within the Guggenheim Investments family of affiliated companies. This would include, for example, sharing your information within Guggenheim Investments so we can make you aware of new funds or the services offered through another Guggenheim Investments affiliated company. In certain instances, we may contract with nonaffiliated companies to perform services for us. Where necessary, we will disclose information we have about you to these third parties. In all such cases, we provide the third party with only the information necessary to carry out its assigned responsibilities and only for that purpose. And we require these third parties to treat your personal information with the same high degree of confidentiality that we do. In certain instances, we may share information with other financial institutions regarding individuals and entities in response to the U.S.A. Patriot Act. Finally we will share personal information about you if we are compelled by law to do so, if you direct us to do so with your consent, or in other circumstances as permitted by law.
How We Safeguard Your Personal Information
We maintain physical, electronic and procedural safeguards to protect your personal information. Within Guggenheim Investments, access to such information is limited to those who need it to perform their jobs such as servicing your account, resolving problems or informing you of new products and services.
| | THE GUGGENHEIM FUNDS SEMI-ANNUAL REPORT | 23 |
This page intentionally left blank.
This page intentionally left blank.
This page intentionally left blank.
This page intentionally left blank.
This page intentionally left blank.
This page intentionally left blank.
3.31.2017
Guggenheim Funds Semi-Annual Report
| |
| Guggenheim Macro Opportunities Fund | | |
| GuggenheimInvestments.com | MO-SEMI-0317x0917 |
| DEAR SHAREHOLDER | 2 |
| ECONOMIC AND MARKET OVERVIEW | 3 |
| ABOUT SHAREHOLDERS’ FUND EXPENSES | 5 |
| MACRO OPPORTUNITIES FUND | 8 |
| NOTES TO CONSOLIDATED FINANCIAL STATEMENTS | 56 |
| OTHER INFORMATION | 80 |
| INFORMATION ON BOARD OF TRUSTEES AND OFFICERS | 81 |
| GUGGENHEIM INVESTMENTS PRIVACY POLICIES | 88 |
| | THE GUGGENHEIM FUNDS SEMI-ANNUAL REPORT | 1 |
Dear Shareholder:
Guggenheim Partners Investment Management, LLC (the “Investment Adviser”) is pleased to present the shareholder report for Guggenheim Macro Opportunities Fund (the “Fund”) for the six-month period ended March 31, 2017.
The Investment Adviser is part of Guggenheim Investments, which represents the investment management businesses of Guggenheim Partners, LLC (“Guggenheim”), a global, diversified financial services firm.
Guggenheim Funds Distributors, LLC is the distributor of the Funds. Guggenheim Funds Distributors, LLC is affiliated with Guggenheim and the Investment Adviser.
We encourage you to read the Economic and Market Overview section of the report, which follows this letter.
We are committed to providing innovative investment solutions and appreciate the trust you place in us.
Sincerely,
Donald C. Cacciapaglia
President and Chief Executive Officer
April 30, 2017
Read a prospectus and summary prospectus (if available) carefully before investing. It contains the investment objectives, risks, charges, expenses and other information, which should be considered carefully before investing. Obtain a prospectus and summary prospectus (if available) at guggenheiminvestments.com or call 800.820.0888.
There can be no assurance that any investment product will achieve its investment objective(s). There are risks associated with investing, including the entire loss of principal invested. Investing involves market risks. The investment return and principal value of any investment product will fluctuate with changes in market conditions.
| 2 | THE GUGGENHEIM FUNDS SEMI-ANNUAL REPORT | |
ECONOMIC AND MARKET OVERVIEW (Unaudited) | March 31, 2017 |
The market optimism that helped lift risk asset prices after the presidential election in November continued through the early part of 2017. The Standard & Poor’s 500® (“S&P”) Index* Index set a new record, high yield corporate bond spreads approached cycle lows, and the 10-year Treasury yield rose to 2.63%, the highest level since 2014. Risk appetite faded as the first quarter drew to a close, however, as investors grappled with the implications of an unsuccessful healthcare reform bill and growing geopolitical risks.
Much of the rise in asset valuations since Donald Trump’s victory has been based on anticipation of his pro-growth policies coming to fruition, an outcome that is far from certain. Asset valuations could be getting a bit ahead of themselves, and becoming more sensitive to a temporary growth scare or setback, especially since the rollout of Trump’s new policies will not be smooth or easy.
Nevertheless, the underlying economy remains on a good trajectory. Tracking estimates for first-quarter real U.S. Gross Domestic Product (“GDP”) growth have fallen in recent weeks despite strong gains in consumer and business sentiment since the election. In late April, after the period ended, the initial estimate of first-quarter GDP growth was 0.7%. However, we attribute a large portion of the apparent weakness to seasonal factors that have depressed as-reported first quarter GDP growth over the past several years. In keeping with this pattern, we would expect the final first-quarter GDP number to be revised higher. More importantly, the prospects for quarterly GDP growth appear stronger going forward.
Consumer spending should benefit from solid income and wealth gains, with household net worth sitting at an all-time high. Recent job gains have been strong, and we anticipate a further acceleration of wage growth as the labor market continues to tighten. Buoyant consumer sentiment and low household debt service outlays also support our positive outlook. On the business investment side, we expect various factors to be supportive, including the uptick in global industrial production growth, the ongoing rise in U.S. oil drilling activity, the surge in small-business optimism, and the recovery in corporate earnings.
On March 15, the Federal Open Market Committee (“FOMC”) raised the U.S. Federal Reserve (the “Fed”) funds target rate by 25 basis points to a range of 0.75–1.0%. The hike itself had little impact on markets because several FOMC members had indicated in the weeks leading up to the meeting that a hike was likely. Looking ahead, we believe that the market is underpricing the likely pace of Fed rate hikes in 2017 and 2018, particularly now that market optimism about fiscal stimulus is waning.
Importantly, Chair Yellen noted that the FOMC’s baseline forecast of two additional rate increases in 2017 and three more in 2018 was not conditioned on expectations for fiscal stimulus. Rather, it reflected a need to gradually remove accommodation due to the fact that the Fed has essentially achieved its dual mandate objectives for employment and inflation. Fiscal easing, she explained, could result in a faster pace of tightening, if it materializes. Markets are skeptical and are pricing in only 1.5 more rate hikes in 2017 and another 1.5 rate hikes in 2018, according to fed funds futures contracts. We expect that the Fed will deliver three more rate hikes in 2017 and another four in 2018.
| | THE GUGGENHEIM FUNDS SEMI-ANNUAL REPORT | 3 |
ECONOMIC AND MARKET OVERVIEW (Unaudited)(concluded) | March 31, 2017 |
We expect to see equity and credit investors take more chips off the table unless there is concrete progress on fiscal legislation in Washington, particularly as the Fed demonstrates its desire to tighten even without fiscal stimulus. While we are optimistic about the near-term U.S. economic outlook, current valuations and growing political risks warrant a more defensive stance.
For the six months ended March 31, 2017, the S&P 500 Index returned 10.12%. The MSCI Europe-Australasia-Far East (“EAFE”) Index* returned 6.48%. The return of the MSCI Emerging Markets Index* was 6.80%.
In the bond market, the Bloomberg Barclays U.S. Aggregate Bond Index* posted a -2.18% return for the period, while the Bloomberg Barclays U.S. Corporate High Yield Index* returned 4.50%. The return of the Bank of America (“BofA”) Merrill Lynch 3-Month U.S. Treasury Bill Index* was 0.19% for the 12-month period.
The opinions and forecasts expressed may not actually come to pass. This information is subject to change at any time, based on market and other conditions, and should not be construed as a recommendation of any specific security or strategy.
*Index Definitions
The following indices are referenced throughout this report. Indices are unmanaged and not available for direct investment. Index performance does not reflect transaction costs, fees, or expenses.
Bloomberg Barclays U.S. Aggregate Bond Index is a broad-based flagship benchmark that measures the investment grade, U.S. dollar-denominated, fixed-rate taxable bond market, including U.S. Treasuries, government-related and corporate securities, mortgage-backed securities or “MBS” (agency fixed-rate and hybrid adjustable-rate mortgage, or “ARM”, pass-throughs), asset-backed securities (“ABS”), and commercial mortgage-backed securities (“CMBS”) (agency and non-agency).
Bloomberg Barclays U.S. Corporate High Yield Index measures the U.S. dollar-denominated, high yield, fixed-rate corporate bond market. Securities are classified as high yield if the middle rating of Moody’s, Fitch, and S&P is Ba1/BB +/BB + or below.
BofA Merrill Lynch 3-Month U.S. Treasury Bill Index is an unmanaged market index of U.S. Treasury securities maturing in 90 days that assumes reinvestment of all income.
MSCI EAFE Index is a free float-adjusted market capitalization index that is designed to measure the equity market performance of developed markets, excluding the U.S. & Canada.
MSCI Emerging Markets Index is a free float-adjusted market capitalization weighted index that is designed to measure equity market performance in the global emerging markets.
S&P 500® Index is a capitalization-weighted index of 500 stocks designed to measure the performance of the broad economy, representing all major industries and is considered a representation of the U.S. stock market.
| 4 | THE GUGGENHEIM FUNDS SEMI-ANNUAL REPORT | |
ABOUT SHAREHOLDERS’ FUND EXPENSES (Unaudited) |
All mutual funds have operating expenses, and it is important for our shareholders to understand the impact of costs on their investments. Shareholders of a fund incur two types of costs: (i) transaction costs, including sales charges (loads) on purchase payments, reinvested dividends, other distributions, and exchange fees, and (ii) ongoing costs, including management fees, administrative services, and shareholder reports, among others. These ongoing costs, or operating expenses, are deducted from a fund’s gross income and reduce the investment return of the fund.
A fund’s expenses are expressed as a percentage of its average net assets, which is known as the expense ratio. The following examples are intended to help investors understand the ongoing costs (in dollars) of investing in a fund and to compare these costs with the ongoing costs of investing in other mutual funds.
The examples are based on an investment of $1,000 made at the beginning of the period and held for the entire six-month period beginning September 30, 2016 and ending March 31, 2017.
The following tables illustrate the Fund’s costs in two ways:
Table 1. Based on actual Fund return: This section helps investors estimate the actual expenses paid over the period. The “Ending Account Value” shown is derived from the Fund’s actual return, and the fifth column shows the dollar amount that would have been paid by an investor who started with $1,000 in the Fund. Investors may use the information here, together with the amount invested, to estimate the expenses paid over the period. Simply divide the Fund’s account value by $1,000 (for example, an $8,600 account value divided by $1,000 = 8.6), then multiply the result by the number provided under the heading “Expenses Paid During Period.”
Table 2. Based on hypothetical 5% return: This section is intended to help investors compare a Fund’s cost with those of other mutual funds. The table provides information about hypothetical account values and hypothetical expenses based on the Fund’s actual expense ratio and an assumed rate of return of 5% per year before expenses, which is not the Fund’s actual return. The hypothetical account values and expenses may not be used to estimate the actual ending account balance or expenses paid during the period. The example is useful in making comparisons because the U.S. Securities and Exchange Commission (the “SEC”) requires all mutual funds to calculate expenses based on the 5% return. Investors can assess a Fund’s costs by comparing this hypothetical example with the hypothetical examples that appear in shareholder reports of other funds.
The calculations illustrated above assume no shares were bought or sold during the period. Actual costs may have been higher or lower, depending on the amount of investment and the timing of any purchases or redemptions.
| | THE GUGGENHEIM FUNDS SEMI-ANNUAL REPORT | 5 |
ABOUT SHAREHOLDERS’ FUND EXPENSES (Unaudited)(continued) |
Please note that the expenses shown in the table are meant to highlight your ongoing costs only and do not reflect any transactional costs, such as sales charges (loads) on purchase payments, and contingent deferred sales charges (“CDSC”) on redemptions, if any. Therefore, the second table is useful in comparing ongoing costs only, and will not help you determine the relative total costs of owning different funds. In addition, if these transactional costs were included, your costs would have been higher.
More information about the Fund’s expenses, including annual expense ratios for periods up to five years (subject to the Fund’s inception date), can be found in the Financial Highlights section of this report. For additional information on operating expenses and other shareholder costs, please refer to the Fund’s prospectus.
| 6 | THE GUGGENHEIM FUNDS SEMI-ANNUAL REPORT | |
ABOUT SHAREHOLDERS’ FUND EXPENSES (Unaudited)(concluded) |
| | Expense
Ratio1 | Fund
Return | Beginning
Account Value
September 30,
2016 | Ending
Account Value
March 31,
2017 | Expenses
Paid During
Period2 |
Table 1. Based on actual Fund return3 |
| Macro Opportunities Fund |
| A-Class | 1.27% | 4.35% | $ 1,000.00 | $ 1,043.50 | $ 6.47 |
| C-Class | 2.04% | 4.00% | 1,000.00 | 1,040.00 | 10.38 |
| P-Class | 1.23% | 4.35% | 1,000.00 | 1,043.50 | 6.27 |
| Institutional Class | 0.93% | 4.56% | 1,000.00 | 1,045.60 | 4.74 |
| Table 2. Based on hypothetical 5% return (before expenses) |
| Macro Opportunities Fund |
| A-Class | 1.27% | 5.00% | $ 1,000.00 | $ 1,018.60 | $ 6.39 |
| C-Class | 2.04% | 5.00% | 1,000.00 | 1,014.76 | 10.25 |
| P-Class | 1.23% | 5.00% | 1,000.00 | 1,018.80 | 6.19 |
| Institutional Class | 0.93% | 5.00% | 1,000.00 | 1,020.29 | 4.68 |
1 | Annualized and excludes expenses of the underlying funds in which the Funds invest. |
2 | Expenses are equal to the Fund's annualized expense ratio, net of any applicable fee waivers, multiplied by the average account value over the period, multiplied by 182/365 (to reflect the one-half year period). |
3 | Actual cumulative return at net asset value for the period September 30, 2016 to March 31, 2017. |
| | THE GUGGENHEIM FUNDS SEMI-ANNUAL REPORT | 7 |
FUND PROFILE (Unaudited) | March 31, 2017 |
MACRO OPPORTUNITIES FUND
OBJECTIVE: Seeks to provide total return, comprised of current income and capital appreciation.
Consolidated Holdings Diversification (Market Exposure as % of Net Assets)
“Consolidated Holdings Diversification (Market Exposure as % of Net Assets)” excludes any temporary cash investments or investments in Guggenheim Strategy Funds Trust mutual funds. Investments in those Funds do not provide “market exposure” to meet the Fund’s investment objective, but will significantly increase the portfolio’s exposure to certain other asset categories (and their associated risks), which may cause the Fund to deviate from its principal investment strategy, including: (i) high yield, high risk debt securities rated below the top four long-term rating categories by a nationally recognized statistical rating organization (also known as “junk bonds”); (ii) securities issued by the U.S. government or its agencies and instrumentalities; (iii) CLOs and similar investments; and (iv) other short-term fixed income securities.
8 | THE GUGGENHEIM FUNDS SEMI-ANNUAL REPORT | |
FUND PROFILE (Unaudited)(concluded) | March 31, 2017 |
| Inception Dates: |
| A-Class | November 30, 2011 |
| C-Class | November 30, 2011 |
| P-Class | May 1, 2015 |
| Institutional Class | November 30, 2011 |
| Ten Long Largest Holdings (% of Total Net Assets) |
| Guggenheim Alpha Opportunity Fund - Institutional Class | 3.3% |
| Guggenheim Limited Duration Fund - Institutional Class | 3.2% |
| Guggenheim Strategy Fund I | 1.7% |
| CIM Trust | 1.2% |
| LSTAR Commercial Mortgage Trust | 1.2% |
| Fortress Credit Opportunities III CLO, LP | 1.1% |
| Octagon Loan Funding Ltd. | 1.0% |
| Bayview Opportunity Master Fund IIIa Trust | 1.0% |
| Bayview Opportunity Master Fund IVb Trust | 1.0% |
| FirstKey Master Funding | 1.0% |
| Top Ten Total | 15.7% |
| “Ten Long Largest Holdings” excludes any temporary cash or derivative investments. |
Portfolio Composition by Quality Rating1 |
| Rating | % of Total Investments |
| Fixed Income Instruments | |
| AAA | 5.2% |
| AA | 4.3% |
| A | 14.5% |
| BBB | 20.9% |
| BB | 7.4% |
| B | 14.5% |
| CCC | 4.0% |
| CC | 0.4% |
NR2 | 13.1% |
| Other Instruments | 15.7% |
| Total Investments | 100.0% |
| The chart above reflects percentages of the value of total investments. |
1 | Source: BlackRock Solutions. Credit quality ratings are measured on a scale that generally ranges from AAA (highest) to D (lowest). All securities except for those labeled “NR” have been rated by a Nationally Recognized Statistical Rating Organization (“NRSRO”). For purposes of this presentation, when ratings are available from more than one agency, the highest rating is used. Guggenheim Investments converts ratings to the equivalent S&P rating. |
2 | NR securities do not necessarily indicate low credit quality. |
| | THE GUGGENHEIM FUNDS SEMI-ANNUAL REPORT | 9 |
CONSOLIDATED SCHEDULE OF INVESTMENTS (Unaudited) | March 31, 2017 |
| MACRO OPPORTUNITIES FUND | |
| | | Shares | | | Value | |
| | | | | | | | | |
COMMON STOCKS† - 3.6% | |
| | | | | | | | | |
| CONSUMER, NON-CYCLICAL - 1.0% | |
Express Scripts Holding Co.*,1 | | | 39,702 | | | $ | 2,616,759 | |
Western Union Co.1 | | | 127,815 | | | | 2,601,034 | |
Tyson Foods, Inc. — Class A1 | | | 40,636 | | | | 2,507,648 | |
General Mills, Inc.1 | | | 34,884 | | | | 2,058,505 | |
Quest Diagnostics, Inc.1 | | | 20,387 | | | | 2,001,799 | |
Cardinal Health, Inc.1 | | | 22,625 | | | | 1,845,068 | |
Gilead Sciences, Inc.1 | | | 26,107 | | | | 1,773,187 | |
| Pfizer, Inc. | | | 51,150 | | | | 1,749,842 | |
| Dean Foods Co. | | | 84,765 | | | | 1,666,480 | |
Kimberly-Clark Corp.1 | | | 12,630 | | | | 1,662,487 | |
Johnson & Johnson1 | | | 13,299 | | | | 1,656,390 | |
Laboratory Corp. of America Holdings*,1 | | | 10,997 | | | | 1,577,740 | |
Deluxe Corp.1 | | | 20,915 | | | | 1,509,436 | |
Kroger Co.1 | | | 50,505 | | | | 1,489,392 | |
| Whole Foods Market, Inc. | | | 49,426 | | | | 1,468,941 | |
WellCare Health Plans, Inc.*,1 | | | 9,910 | | | | 1,389,480 | |
Sanderson Farms, Inc.1 | | | 12,543 | | | | 1,302,465 | |
UnitedHealth Group, Inc.1 | | | 7,919 | | | | 1,298,795 | |
McKesson Corp.1 | | | 8,564 | | | | 1,269,699 | |
Ingredion, Inc.1 | | | 9,687 | | | | 1,166,605 | |
HCA Holdings, Inc.*,1 | | | 12,977 | | | | 1,154,823 | |
SpartanNash Co.1 | | | 32,139 | | | | 1,124,544 | |
AbbVie, Inc.1 | | | 15,448 | | | | 1,006,592 | |
JM Smucker Co.1 | | | 7,512 | | | | 984,673 | |
Molina Healthcare, Inc.*,1 | | | 21,479 | | | | 979,442 | |
Darling Ingredients, Inc.*,1 | | | 65,025 | | | | 944,163 | |
Dr Pepper Snapple Group, Inc.1 | | | 9,292 | | | | 909,873 | |
| Total System Services, Inc. | | | 15,386 | | | | 822,536 | |
United Therapeutics Corp.*,1 | | | 5,826 | | | | 788,724 | |
| Varian Medical Systems, Inc.* | | | 6,988 | | | | 636,816 | |
Hill-Rom Holdings, Inc.1 | | | 8,888 | | | | 627,493 | |
Magellan Health, Inc.*,1 | | | 8,971 | | | | 619,448 | |
Chemed Corp.1 | | | 3,302 | | | | 603,242 | |
HealthSouth Corp.1 | | | 13,916 | | | | 595,744 | |
Hologic, Inc.*,1 | | | 13,716 | | | | 583,616 | |
Biogen, Inc.*,1 | | | 2,093 | | | | 572,268 | |
| Centene Corp.* | | | 7,610 | | | | 542,289 | |
| Boston Beer Company, Inc. — Class A* | | | 3,495 | | | | 505,552 | |
| H&R Block, Inc. | | | 21,438 | | | | 498,434 | |
| Campbell Soup Co. | | | 8,650 | | | | 495,126 | |
Targus Group International Equity, Inc*,†††,2 | | | 13,186 | | | | 19,252 | |
| Total Consumer, Non-cyclical | | | 49,626,402 | |
| | | | | | | | | |
| INDUSTRIAL - 0.5% | |
| Emerson Electric Co. | | | 37,309 | | | | 2,233,317 | |
| Boeing Co. | | | 11,239 | | | | 1,987,730 | |
| TE Connectivity Ltd. | | | 22,913 | | | | 1,708,164 | |
Timken Co.1 | | | 29,489 | | | | 1,332,903 | |
Huntington Ingalls Industries, Inc.1 | | | 6,513 | | | | 1,304,163 | |
Cummins, Inc.1 | | | 8,160 | | | | 1,233,792 | |
Keysight Technologies, Inc.*,1 | | | 32,369 | | | | 1,169,816 | |
Arrow Electronics, Inc.*,1 | | | 14,825 | | | | 1,088,303 | |
| Jacobs Engineering Group, Inc. | | | 19,069 | | | | 1,054,134 | |
Fluor Corp.1 | | | 17,619 | | | | 927,112 | |
Saia, Inc.*,1 | | | 20,726 | | | | 918,161 | |
EMCOR Group, Inc.1 | | | 14,453 | | | | 909,816 | |
ITT, Inc.1 | | | 21,533 | | | | 883,283 | |
Sanmina Corp.*,1 | | | 19,950 | | | | 809,971 | |
Barnes Group, Inc.1 | | | 15,248 | | | | 782,832 | |
Crane Co.1 | | | 10,373 | | | | 776,212 | |
10 | THE GUGGENHEIM FUNDS SEMI-ANNUAL REPORT | SEE NOTES TO FINANCIAL STATEMENTS. |
CONSOLIDATED SCHEDULE OF INVESTMENTS (Unaudited)(continued) | March 31, 2017 |
| MACRO OPPORTUNITIES FUND | |
| | | Shares | | | Value | |
| | | | | | | | | |
Methode Electronics, Inc.1 | | | 16,647 | | | $ | 759,103 | |
Vishay Intertechnology, Inc.1 | | | 45,572 | | | | 749,659 | |
SYNNEX Corp.1 | | | 6,647 | | | | 744,065 | |
Applied Industrial Technologies, Inc.1 | | | 11,224 | | | | 694,204 | |
ArcBest Corp.1 | | | 26,093 | | | | 678,418 | |
FLIR Systems, Inc.1 | | | 15,114 | | | | 548,336 | |
Federal Signal Corp.1 | | | 38,465 | | | | 531,202 | |
| Owens-Illinois, Inc.* | | | 25,943 | | | | 528,718 | |
Werner Enterprises, Inc.1 | | | 18,688 | | | | 489,626 | |
| Total Industrial | | | | | | | 24,843,040 | |
| | | | | | | | | |
| FINANCIAL - 0.5% | |
Everest Re Group Ltd.1 | | | 9,401 | | | | 2,198,048 | |
Travelers Cos., Inc.1 | | | 16,235 | | | | 1,956,966 | |
Aflac, Inc.1 | | | 26,899 | | | | 1,948,025 | |
| Federated Investors, Inc. — Class B | | | 52,069 | | | | 1,371,497 | |
Allstate Corp.1 | | | 15,397 | | | | 1,254,702 | |
| Equity Residential | | | 19,190 | | | | 1,194,002 | |
Interactive Brokers Group, Inc. — Class A1 | | | 31,780 | | | | 1,103,402 | |
| LaSalle Hotel Properties | | | 35,438 | | | | 1,025,930 | |
Prudential Financial, Inc.1 | | | 9,251 | | | | 986,897 | |
Franklin Resources, Inc.1 | | | 22,895 | | | | 964,795 | |
Aspen Insurance Holdings Ltd.1 | | | 16,997 | | | | 884,694 | |
Principal Financial Group, Inc.1 | | | 12,851 | | | | 811,027 | |
Hanover Insurance Group, Inc.1 | | | 8,975 | | | | 808,289 | |
American Financial Group, Inc.1 | | | 7,719 | | | | 736,547 | |
Selective Insurance Group, Inc.1 | | | 15,429 | | | | 727,478 | |
| Host Hotels & Resorts, Inc. | | | 36,646 | | | | 683,814 | |
| Bank of New York Mellon Corp. | | | 13,866 | | | | 654,891 | |
State Street Corp.1 | | | 7,302 | | | | 581,312 | |
Citigroup, Inc.1 | | | 9,125 | | | | 545,858 | |
Cullen/Frost Bankers, Inc.1 | | | 5,966 | | | | 530,795 | |
| Unum Group | | | 10,831 | | | | 507,866 | |
Ameriprise Financial, Inc.1 | | | 3,872 | | | | 502,121 | |
Umpqua Holdings Corp.1 | | | 27,539 | | | | 488,542 | |
Hartford Financial Services Group, Inc.1 | | | 8,360 | | | | 401,865 | |
| Total Financial | | | | | | | 22,869,363 | |
| | | | | | | | | |
| TECHNOLOGY - 0.4% | |
International Business Machines Corp.1 | | | 14,571 | | | | 2,537,395 | |
CA, Inc.1 | | | 78,994 | | | | 2,505,689 | |
Oracle Corp.1 | | | 49,147 | | | | 2,192,448 | |
Apple, Inc.1 | | | 11,517 | | | | 1,654,532 | |
Convergys Corp.1 | | | 76,181 | | | | 1,611,228 | |
HP, Inc.1 | | | 82,219 | | | | 1,470,076 | |
| Xerox Corp. | | | 151,911 | | | | 1,115,027 | |
Teradata Corp.*,1 | | | 34,708 | | | | 1,080,113 | |
NCR Corp.*,1 | | | 22,393 | | | | 1,022,912 | |
| Cerner Corp.* | | | 17,156 | | | | 1,009,631 | |
DST Systems, Inc.1 | | | 7,551 | | | | 924,998 | |
NetApp, Inc.1 | | | 21,317 | | | | 892,117 | |
| KLA-Tencor Corp. | | | 8,027 | | | | 763,127 | |
CACI International, Inc. — Class A*,1 | | | 6,018 | | | | 705,911 | |
| Seagate Technology plc | | | 14,665 | | | | 673,563 | |
| Skyworks Solutions, Inc. | | | 5,993 | | | | 587,194 | |
Sykes Enterprises, Inc.*,1 | | | 17,800 | | | | 523,320 | |
VeriFone Systems, Inc.*,1 | | | 19,618 | | | | 367,445 | |
Icad, Inc.*,1 | | | 57,263 | | | | 275,435 | |
Qlik Technologies, Inc. A*,†††,2 | | | 177 | | | | 176,810 | |
| SEE NOTES TO FINANCIAL STATEMENTS. | THE GUGGENHEIM FUNDS SEMI-ANNUAL REPORT | 11 |
CONSOLIDATED SCHEDULE OF INVESTMENTS (Unaudited)(continued) | March 31, 2017 |
| MACRO OPPORTUNITIES FUND | |
| | | Shares | | | Value | |
| | | | | | | | | |
Qlik Technologies, Inc. B*,†††,2 | | | 43,738 | | | $ | 1,786 | |
Qlik Technologies, Inc.*,†††,2 | | | 11,400 | | | | 1 | |
| Total Technology | | | | | | | 22,090,758 | |
| | | | | | | | | |
| CONSUMER, CYCLICAL - 0.4% | |
CVS Health Corp.1 | | | 41,128 | | | | 3,228,548 | |
Delta Air Lines, Inc.1 | | | 39,043 | | | | 1,794,416 | |
Wal-Mart Stores, Inc.1 | | | 24,256 | | | | 1,748,372 | |
UniFirst Corp.1 | | | 12,355 | | | | 1,747,615 | |
Walgreens Boots Alliance, Inc.1 | | | 20,632 | | | | 1,713,488 | |
| Brinker International, Inc. | | | 33,809 | | | | 1,486,244 | |
Hawaiian Holdings, Inc.*,1 | | | 20,434 | | | | 949,159 | |
Herman Miller, Inc.1 | | | 29,526 | | | | 931,545 | |
| Tailored Brands, Inc. | | | 60,220 | | | | 899,686 | |
| Dick’s Sporting Goods, Inc. | | | 18,092 | | | | 880,357 | |
| Darden Restaurants, Inc. | | | 9,081 | | | | 759,807 | |
| Ralph Lauren Corp. — Class A | | | 9,017 | | | | 735,968 | |
| DineEquity, Inc. | | | 12,500 | | | | 680,250 | |
Children’s Place, Inc.1 | | | 5,553 | | | | 666,638 | |
Cooper-Standard Holdings, Inc.*,1 | | | 5,596 | | | | 620,764 | |
| Allegiant Travel Co. — Class A | | | 3,699 | | | | 592,765 | |
| Total Consumer, Cyclical | | | | | | | 19,435,622 | |
| | | | | | | | | |
| UTILITIES - 0.4% | |
CenterPoint Energy, Inc.1 | | | 92,379 | | | | 2,546,889 | |
Exelon Corp.1 | | | 65,066 | | | | 2,341,075 | |
Edison International1 | | | 21,658 | | | | 1,724,193 | |
Consolidated Edison, Inc.1 | | | 20,598 | | | | 1,599,641 | |
WEC Energy Group, Inc.1 | | | 23,861 | | | | 1,446,692 | |
| Xcel Energy, Inc. | | | 29,192 | | | | 1,297,584 | |
| Eversource Energy | | | 20,677 | | | | 1,215,394 | |
Public Service Enterprise Group, Inc.1 | | | 25,521 | | | | 1,131,856 | |
Southwest Gas Holdings, Inc.1 | | | 13,605 | | | | 1,127,991 | |
American Electric Power Company, Inc.1 | | | 15,736 | | | | 1,056,358 | |
AES Corp.1 | | | 76,529 | | | | 855,594 | |
| National Fuel Gas Co. | | | 13,478 | | | | 803,558 | |
Pinnacle West Capital Corp.1 | | | 8,923 | | | | 744,000 | |
| PG&E Corp. | | | 7,774 | | | | 515,883 | |
| Total Utilities | | | | | | | 18,406,708 | |
| | | | | | | | | |
| ENERGY - 0.2% | |
| SandRidge Energy, Inc.* | | | 507,188 | | | | 9,377,907 | |
| Approach Resources, Inc.* | | | 696,348 | | | | 1,747,833 | |
Titan Energy LLC*,2 | | | 35,116 | | | | 639,111 | |
| Total Energy | | | | | | | 11,764,851 | |
| | | | | | | | | |
| COMMUNICATIONS - 0.2% | |
Verizon Communications, Inc.1 | | | 48,217 | | | | 2,350,579 | |
Cisco Systems, Inc.1 | | | 67,291 | | | | 2,274,436 | |
Cogent Communications Holdings, Inc.1 | | | 34,090 | | | | 1,467,575 | |
InterDigital, Inc.1 | | | 15,879 | | | | 1,370,358 | |
| News Corp. — Class A | | | 41,370 | | | | 537,810 | |
Cengage Learning Acquisitions, Inc.*,†† | | | 21,660 | | | | 265,335 | |
| Total Communications | | | | | | | 8,266,093 | |
| | | | | | | | | |
| BASIC MATERIALS - 0.0%** | |
| Domtar Corp. | | | 18,073 | | | | 660,026 | |
| AK Steel Holding Corp.* | | | 63,417 | | | | 455,968 | |
12 | THE GUGGENHEIM FUNDS SEMI-ANNUAL REPORT | SEE NOTES TO FINANCIAL STATEMENTS. |
CONSOLIDATED SCHEDULE OF INVESTMENTS (Unaudited)(continued) | March 31, 2017 |
| MACRO OPPORTUNITIES FUND | |
| | | Shares | | | Value | |
| | | | | | | | | |
Mirabela Nickel Ltd.*,†††,2 | | | 7,057,522 | | | $ | 539 | |
| Total Basic Materials | | | | | | | 1,116,533 | |
| | | | | | | | | |
| Total Common Stocks | | | | | | | | |
| (Cost $169,162,282) | | | | | | | 178,419,370 | |
| | | | | | | | | |
PREFERRED STOCKS†† - 0.4% | |
| INDUSTRIAL - 0.3% | |
Seaspan Corp. 6.38% due 04/30/192 | | | 572,000 | | | | 14,357,200 | |
| | | | | | | | | |
| FINANCIAL - 0.1% | |
Cent CLO 16, LP due 08/1/24*,4 | | | 7,000 | | | | 3,875,768 | |
BreitBurn Energy Partners 8.00% due 12/31/49*,†††,2 | | | 389,684 | | | | 60,731 | |
| Total Financial | | | | | | | 3,936,499 | |
| Total Preferred Stocks | | | | | | | | |
| (Cost $20,786,219) | | | | | | | 18,293,699 | |
| | | | | | | | | |
WARRANTS†† - 0.0%** | |
| Comstock Resources, Inc. | | | | | | | | |
| $0.01, 09/06/18 | | | 15,538 | | | | 143,260 | |
| Total Warrants | | | | | | | | |
| (Cost $70,124) | | | | | | | 143,260 | |
| | | | | | | | | |
MUTUAL FUNDS† - 9.4% | |
Guggenheim Alpha Opportunity Fund — Institutional Class5 | | | 5,591,810 | | | | 166,244,516 | |
Guggenheim Limited Duration Fund — Institutional Class5 | | | 6,519,834 | | | | 161,235,498 | |
Guggenheim Strategy Fund I5 | | | 3,404,090 | | | | 85,272,458 | |
Guggenheim Strategy Fund II5 | | | 1,259,793 | | | | 31,494,837 | |
Guggenheim Risk Managed Real Estate Fund —Institutional Class5 | | | 494,825 | | | | 14,221,264 | |
Guggenheim Floating Rate Strategies Fund — Institutional Class5 | | | 486,739 | | | | 12,694,154 | |
| Total Mutual Funds | | | | | | | | |
| (Cost $461,627,818) | | | | | | | 471,162,727 | |
| | | | | | | | | |
SHORT-TERM INVESTMENTS† - 3.7% | |
Federated U.S. Treasury Cash Reserve Fund — Institutional Class 0.48%6 | | | 180,753,999 | | | | 180,753,999 | |
Western Asset Institutional U.S.Treasury Reserves —Institutional Class 0.55%6 | | | 4,360,869 | | | | 4,360,869 | |
| Total Short-Term Investments | | | | | |
| (Cost $185,114,868) | | | | | | | 185,114,868 | |
| | | | | | | | | |
| | | Face
Amount15 | | | | |
| | | | | | | | | |
ASSET-BACKED SECURITIES†† - 34.3% | |
| COLLATERALIZED LOAN OBLIGATIONS - 28.3% | |
| Fortress Credit Opportunities III CLO, LP | | | | | | | | |
2017-3A, 2.96%, due 04/28/268 | | $ | 64,300,000 | | | | 64,203,971 | |
2014-3A, 4.26% due 04/28/267,8 | | | 5,500,000 | | | | 5,499,944 | |
| Octagon Loan Funding Ltd. | | | | | | | | |
2014-1X, due 11/18/264 | | | 52,700,000 | | | | 47,757,413 | |
| Fortress Credit BSL II Ltd. | | | | | | | | |
2017-2A,2.49%, due 10/19/258 | | | 32,400,000 | | | | 32,349,777 | |
| SEE NOTES TO FINANCIAL STATEMENTS. | THE GUGGENHEIM FUNDS SEMI-ANNUAL REPORT | 13 |
CONSOLIDATED SCHEDULE OF INVESTMENTS (Unaudited)(continued) | March 31, 2017 |
| MACRO OPPORTUNITIES FUND | |
| | | Face
Amount15 | | | Value | |
| | | | | | | | | |
| Golub Capital Partners CLO Ltd. | | | | | | | | |
2016-33A, 3.37% due 11/21/287,8 | | $ | 17,500,000 | | | $ | 17,442,017 | |
2015-25A, 3.68% due 08/05/277,8 | | | 6,000,000 | | | | 5,959,367 | |
2014-21A, 4.34% due 10/25/267,8 | | | 4,300,000 | | | | 4,212,399 | |
2014-18A, 4.54% due 04/25/267,8 | | | 2,200,000 | | | | 2,196,049 | |
2014-18A, 5.04% due 04/25/267,8 | | | 1,200,000 | | | | 1,176,239 | |
| CIFC Funding Ltd. | | | | | | | | |
2014-2A, 5.65% due 05/24/267,8 | | | 10,000,000 | | | | 9,538,049 | |
2015-2A, 4.75% due 12/05/247,8 | | | 6,250,000 | | | | 6,251,947 | |
2013-2A, 4.62% due 04/21/257,8 | | | 4,250,000 | | | | 4,259,604 | |
2014-3A, 5.79% due 07/22/267,8 | | | 4,000,000 | | | | 3,851,170 | |
2014-5A, 7.57% due 01/17/277,8 | | | 2,500,000 | | | | 2,343,668 | |
2014-1A, 6.27% due 04/18/257,8 | | | 2,500,000 | | | | 2,206,769 | |
2014-1A, 3.82% due 04/18/257,8 | | | 1,750,000 | | | | 1,749,965 | |
| Recette CLO LLC | | | | | | | | |
2015-1X F, 3.79% due 01/28/267,8 | | | 29,000,000 | | | | 28,847,332 | |
| Treman Park CLO Ltd. | | | | | | | | |
2015-1A, due 04/20/274,8 | | | 32,400,000 | | | | 26,511,827 | |
| Tuolumne Grove CLO Ltd. | | | | | | | | |
2017-1A, 2.33%, due 04/25/268 | | | 21,600,000 | | | | 21,562,427 | |
2014-1A, 5.79% due 04/25/267,8 | | | 4,750,000 | | | | 4,285,261 | |
| A Voce CLO Ltd. | | | | | | | | |
2017-1A, 2.31%, due 07/15/268 | | | 24,375,000 | | | | 24,346,279 | |
| Galaxy XVIII CLO Ltd. | | | | | | | | |
2017-18A, 2.32% due 10/15/267,8 | | | 19,000,000 | | | | 18,999,148 | |
2014-18A, 6.52% due 10/15/267,8 | | | 3,050,000 | | | | 2,625,215 | |
2014-18A, 4.02% due 10/15/267,8 | | | 2,500,000 | | | | 2,500,000 | |
| ABPCI Direct Lending Fund CLO I LLC | | | | | | | | |
2016-1A, 3.65% due 12/22/287,8 | | | 24,000,000 | | | | 23,873,655 | |
2016-1A AT, 8.48% due 10/20/277,8 | | | 500,000 | | | | 486,916 | |
| RFTI Issuer Ltd. | | | | | | | | |
2015-FL1, 4.79% due 08/15/307,16 | | | 22,841,000 | | | | 22,876,104 | |
| Voya CLO Ltd. | | | | | | | | |
2013-1X, due 04/15/244 | | | 20,000,000 | | | | 12,431,301 | |
2015-3A, 4.97% due 10/15/227,8 | | | 4,000,000 | | | | 3,999,830 | |
2014-3A, 6.44% due 07/25/267,8 | | | 2,850,000 | | | | 2,481,415 | |
2014-2A, 3.97% due 07/17/267,8 | | | 2,000,000 | | | | 1,999,928 | |
2015-3A, 7.53% due 10/20/277,8 | | | 2,000,000 | | | | 1,830,586 | |
| KVK CLO Ltd. | | | | | | | | |
2014-2A, 4.02% due 07/15/267,8 | | | 8,250,000 | | | | 8,249,561 | |
2014-2A, 5.77% due 07/15/267,8 | | | 7,200,000 | | | | 6,195,348 | |
2013-1A, due 04/14/254,8 | | | 11,900,000 | | | | 5,390,203 | |
2014-3A, due 10/15/264,8 | | | 2,500,000 | | | | 869,553 | |
| Shackleton CLO Ltd. | | | | | | | | |
2014-5A, 3.73% due 05/07/267,8 | | | 10,750,000 | | | | 10,672,504 | |
2013-4A, 3.88% due 01/13/257,8 | | | 7,250,000 | | | | 7,255,187 | |
2014-6A, 4.62% due 07/17/267,8 | | | 2,068,000 | | | | 2,037,116 | |
| Fortress Credit Opportunities V CLO Ltd. | | | | | | | | |
2017-5A, 4.93%, due 10/15/268 | | | 13,100,000 | | | | 13,114,355 | |
14 | THE GUGGENHEIM FUNDS SEMI-ANNUAL REPORT | SEE NOTES TO FINANCIAL STATEMENTS. |
CONSOLIDATED SCHEDULE OF INVESTMENTS (Unaudited)(continued) | March 31, 2017 |
| MACRO OPPORTUNITIES FUND | |
| | | Face
Amount15 | | | Value | |
| | | | | | | | | |
2014-5A, 5.51% due 10/15/267,8 | | $ | 3,500,000 | | | $ | 3,493,007 | |
2014-5A, 4.56% due 10/15/267,8 | | | 3,000,000 | | | | 2,998,992 | |
| Regatta V Funding Ltd. | | | | | | | | |
2017-1A, 2.27% due 10/25/267,8 | | | 19,400,000 | | | | 19,398,722 | |
| Northwoods Capital X Ltd. | | | | | | | | |
2017-10A, 2.49%, due 11/04/258 | | | 19,200,000 | | | | 19,209,041 | |
| Cerberus Loan Funding XVII Ltd. | | | | | | | | |
2016-3A, 3.48% due 01/15/287,8 | | | 18,000,000 | | | | 17,941,710 | |
| TICP CLO II Ltd. | | | | | | | | |
2017-2A, 2.31%, due 07/20/268 | | | 15,950,000 | | | | 15,960,515 | |
2014-2A, 4.03% due 07/20/267,8 | | | 1,300,000 | | | | 1,300,000 | |
| Avery Point II CLO Ltd. | | | | | | | | |
2013-3X COM, due 01/18/254 | | | 19,800,000 | | | | 16,967,811 | |
| TICP CLO Ltd. | | | | | | | | |
| 2014-3A, 2.33%, due 01/20/27 | | | 16,850,000 | | | | 16,867,401 | |
| Babson CLO Ltd. | | | | | | | | |
2012-2A, due 05/15/234,8 | | | 11,850,000 | | | | 7,048,397 | |
2014-IA, due 07/20/254,8 | | | 6,400,000 | | | | 3,965,304 | |
2013-IIA, 4.27% due 01/18/257,8 | | | 3,500,000 | | | | 3,482,497 | |
2014-3A, 6.12% due 01/15/267,8 | | | 2,500,000 | | | | 2,369,413 | |
| Betony CLO Ltd. | | | | | | | | |
2015-1A, 6.37% due 04/15/277,8 | | | 11,000,000 | | | | 10,451,503 | |
2016-1A, 3.87% due 04/15/277,8 | | | 5,450,000 | | | | 5,457,175 | |
| Fortress Credit Opportunities VII CLO Ltd. | | | | | | | | |
2016-7A, 3.88% due 12/15/287,8 | | | 16,000,000 | | | | 15,903,250 | |
| Resource Capital Corp. | | | | | | | | |
2015-CRE4, 3.94% due 08/15/327,8 | | | 7,750,000 | | | | 7,517,500 | |
2015-CRE3, 4.94% due 03/15/327,8 | | | 7,000,000 | | | | 6,926,472 | |
| Venture XIX CLO Ltd. | | | | | | | | |
2016-19A, 3.87% due 01/15/277,8 | | | 14,350,000 | | | | 14,315,969 | |
| KVK CLO 2014-1 Ltd. | | | | | | | | |
2017-1A, 3.44% due 05/15/267,8 | | | 13,250,000 | | | | 13,190,857 | |
| Seneca Park CLO Limited | | | | | | | | |
2017-1A, 2.20%, due 07/17/267,8 | | | 13,132,000 | | | | 13,140,702 | |
| Venture XVI CLO Ltd. | | | | | | | | |
2017-16A, 2.27%, due 04/15/267,8 | | | 10,300,000 | | | | 10,299,540 | |
2014-16A, 3.77% due 04/15/267,8 | | | 2,250,000 | | | | 2,250,000 | |
| OHA Credit Partners IX Ltd. | | | | | | | | |
2013-9A, due 10/20/254,8 | | | 14,000,000 | | | | 12,491,522 | |
| Fortress Credit Opportunities VI CLO Ltd. | | | | | | | | |
2015-6A, 6.36% due 10/10/267,8 | | | 5,400,000 | | | | 5,386,680 | |
2015-6A, 3.81% due 10/10/267,8 | | | 4,000,000 | | | | 3,983,425 | |
2015-6A, 4.76% due 10/10/267,8 | | | 3,000,000 | | | | 2,972,983 | |
| Flagship VII Ltd. | | | | | | | | |
2017-7A, 2.28%, due 01/20/268 | | | 12,100,000 | | | | 12,085,123 | |
| Northwoods Capital XII Ltd. | | | | | | | | |
2017-12A, 3.50% due 09/15/257,8 | | | 12,000,000 | | | | 12,032,430 | |
| Octagon Investment Partners XIX Ltd. | | | | | | | | |
2017-1A, 2.07% due 04/15/267,8 | | | 11,800,000 | | | | 11,779,459 | |
| KVK CLO 2013-2 Ltd. | | | | | | | | |
2017-2A, 3.60% due 01/15/267,8 | | | 11,500,000 | | | | 11,462,009 | |
| SEE NOTES TO FINANCIAL STATEMENTS. | THE GUGGENHEIM FUNDS SEMI-ANNUAL REPORT | 15 |
CONSOLIDATED SCHEDULE OF INVESTMENTS (Unaudited)(continued) | March 31, 2017 |
| MACRO OPPORTUNITIES FUND | |
| | | Face
Amount15 | | | Value | |
| | | | | | | | | |
| TCP Waterman CLO LLC | | | | | | | | |
2016-1A, 4.13% due 12/15/287,8 | | $ | 11,000,000 | | | $ | 11,053,336 | |
| NewStar Clarendon Fund CLO LLC | | | | | | | | |
2015-1A, 3.74% due 01/25/277,8 | | | 7,000,000 | | | | 6,984,706 | |
2015-1A, 4.39% due 01/25/277,8 | | | 4,000,000 | | | | 3,979,903 | |
| Northwoods Capital XIV Ltd. | | | | | | | | |
2017-14A, 3.44% due 11/12/257,8 | | | 10,750,000 | | | | 10,760,517 | |
| ACIS CLO Ltd. | | | | | | | | |
2014-4A, 3.58% due 05/01/267,8 | | | 3,600,000 | | | | 3,479,189 | |
2015-6A, 4.40% due 05/01/277,8 | | | 3,250,000 | | | | 3,249,938 | |
2013-1A, 5.52% due 04/18/247,8 | | | 2,100,000 | | | | 2,099,933 | |
2013-2A, 4.87% due 10/14/227,8 | | | 1,800,000 | | | | 1,793,357 | |
| Carlyle Global Market Strategies CLO Ltd. | | | | | | | | |
2012-3A, due 10/04/244,8 | | | 6,400,000 | | | | 5,186,888 | |
2014-2A, 4.93% due 07/20/237,8 | | | 3,000,000 | | | | 2,999,853 | |
2013-3X SUB, due 07/15/254 | | | 4,000,000 | | | | 2,276,315 | |
| Telos CLO Ltd. | | | | | | | | |
2014-6A, 4.02% due 01/17/277,8 | | | 5,000,000 | | | | 5,001,860 | |
2013-3A, 4.02% due 01/17/247,8 | | | 2,750,000 | | | | 2,751,023 | |
2013-3A, 5.27% due 01/17/247,8 | | | 2,550,000 | | | | 2,551,645 | |
| Great Lakes CLO Ltd. | | | | | | | | |
2015-1A, 4.77% due 07/15/267,8 | | | 4,250,000 | | | | 4,134,542 | |
2014-1A, 4.72% due 04/15/257,8 | | | 3,000,000 | | | | 2,966,067 | |
2014-1A, 5.22% due 04/15/257,8 | | | 1,500,000 | | | | 1,453,081 | |
2012-1A, due 01/15/234,16 | | | 3,250,000 | | | | 1,377,576 | |
| OCP CLO Ltd. | | | | | | | | |
2014-7A, 4.03% due 10/20/267,8 | | | 5,000,000 | | | | 4,999,685 | |
2015-9A, 6.47% due 07/15/277,8 | | | 3,000,000 | | | | 2,923,069 | |
2014-6A, 4.12% due 07/17/267,8 | | | 2,000,000 | | | | 1,999,916 | |
| Flagship CLO VIII Ltd. | | | | | | | | |
2017-8A, 3.54% due 01/16/267,8 | | | 9,825,000 | | | | 9,792,356 | |
| Dryden 41 Senior Loan Fund | | | | | | | | |
2015-41A, due 01/15/284,8 | | | 10,500,000 | | | | 8,377,101 | |
2015-41A, 7.92% due 01/15/287,8 | | | 1,500,000 | | | | 1,387,851 | |
| Longfellow Place CLO Ltd. | | | | | | | | |
2013-1A, 6.77% due 01/15/247,8 | | | 9,250,000 | | | | 9,174,794 | |
| Benefit Street Partners CLO V Ltd. | | | | | | | | |
2017-VA, 3.38% due 10/20/267,8 | | | 9,000,000 | | | | 9,064,517 | |
| Dryden 37 Senior Loan Fund | | | | | | | | |
2015-37A, due 04/15/274,8 | | | 9,500,000 | | | | 8,921,835 | |
| Steele Creek CLO 2014-1 Ltd. | | | | | | | | |
2017-1A, 3.59% due 08/21/267,8 | | | 8,550,000 | | | | 8,527,562 | |
| Venture XIII CLO Ltd. | | | | | | | | |
2013-13A, due 06/10/254,8 | | | 11,040,000 | | | | 5,602,260 | |
2013-13A, 6.41% due 06/10/257,8 | | | 2,900,000 | | | | 2,857,609 | |
| Steele Creek CLO Ltd. | | | | | | | | |
2015-1A, 7.55% due 02/21/277,8 | | | 7,550,000 | | | | 6,818,699 | |
2015-1A, 5.05% due 02/21/277,8 | | | 1,350,000 | | | | 1,349,780 | |
| Figueroa CLO Ltd. | | | | | | | | |
2013-2A, 4.90% due 12/18/257,8 | | | 5,000,000 | | | | 5,000,150 | |
16 | THE GUGGENHEIM FUNDS SEMI-ANNUAL REPORT | SEE NOTES TO FINANCIAL STATEMENTS. |
CONSOLIDATED SCHEDULE OF INVESTMENTS (Unaudited)(continued) | March 31, 2017 |
| MACRO OPPORTUNITIES FUND | |
| | | Face
Amount15 | | | Value | |
| | | | | | | | | |
2013-1A, 5.85% due 03/21/247,8 | | $ | 1,750,000 | | | $ | 1,684,871 | |
2014-1A, 6.72% due 01/15/277,8 | | | 1,500,000 | | | | 1,410,502 | |
| TICP CLO III Ltd. | | | | | | | | |
2014-3A, 4.78% due 01/20/277,8 | | | 8,000,000 | | | | 7,999,618 | |
| Galaxy XIX CLO Ltd. | | | | | | | | |
2015-19A, due 01/24/274,8 | | | 5,500,000 | | | | 4,960,996 | |
2015-19A, 4.44% due 01/24/277,8 | | | 3,000,000 | | | | 3,000,093 | |
| Atlas Senior Loan Fund IV Ltd. | | | | | | | | |
2014-2A, 4.49% due 02/17/267,8 | | | 3,990,000 | | | | 3,969,649 | |
2014-2A, 3.74% due 02/17/267,8 | | | 3,900,000 | | | | 3,888,172 | |
| Newstar Commercial Loan Funding 2017-1 LLC | | | | | | | | |
2017-1A, 4.54% due 03/20/277,8 | | | 7,500,000 | | | | 7,499,928 | |
| Nelder Grove CLO Ltd. | | | | | | | | |
2017-1A, 3.60% due 08/28/267,8 | | | 7,450,000 | | | | 7,448,795 | |
| Cent CLO | | | | | | | | |
2014-16A, 4.23% due 08/01/247,8 | | | 7,250,000 | | | | 7,250,295 | |
| Fortress Credit Investments IV Ltd. | | | | | | | | |
2015-4A, 4.52% due 07/17/237,8 | | | 7,300,000 | | | | 7,098,374 | |
| Catamaran CLO Ltd. | | | | | | | | |
2012-1A, 4.00% due 12/20/237,8 | | | 7,000,000 | | | | 7,000,703 | |
2015-1A, 4.14% due 04/22/277,8 | | | 4,000,000 | | | | 4,030,448 | |
2012-1A, 7.40% due 12/20/237,8 | | | 3,250,000 | | | | 2,942,178 | |
| Benefit Street Partners CLO Ltd. | | | | | | | | |
2015-IA, 4.12% due 10/15/257,8 | | | 6,500,000 | | | | 6,506,546 | |
| Dryden XXXI Senior Loan Fund | | | | | | | | |
2017-31A, 2.24%, due 04/18/268 | | | 6,500,000 | | | | 6,488,688 | |
| Blue Hill CLO Ltd. | | | | | | | | |
2017-1A, 3.42% due 01/15/267,8 | | | 6,500,000 | | | | 6,486,664 | |
| Venture XI CLO Ltd. | | | | | | | | |
2015-11A, 3.99% due 11/14/227,8 | | | 4,000,000 | | | | 3,976,962 | |
2015-11A, 4.99% due 11/14/227,8 | | | 2,500,000 | | | | 2,500,140 | |
| Cerberus Onshore II CLO-2 LLC | | | | | | | | |
2014-1A, 5.03% due 10/15/237,8 | | | 3,500,000 | | | | 3,467,342 | |
2014-1A, 4.23% due 10/15/237,8 | | | 3,000,000 | | | | 2,993,866 | |
| Madison Park Funding XIII Ltd. | | | | | | | | |
2014-13A, 6.87% due 01/19/257,8 | | | 6,750,000 | | | | 6,441,567 | |
| OZLM VI Ltd. | | | | | | | | |
2017-6A, 3.60% due 04/17/267,8 | | | 6,325,000 | | | | 6,324,781 | |
| Shackleton II CLO Ltd. | | | | | | | | |
2016-2A, 4.93% due 10/20/237,8 | | | 6,250,000 | | | | 6,255,022 | |
| Newstar Commercial Loan Funding LLC | | | | | | | | |
2015-1A, 4.88% due 01/20/277,8 | | | 5,000,000 | | | | 4,999,652 | |
2014-1A, 5.78% due 04/20/257,8 | | | 1,250,000 | | | | 1,223,970 | |
| Atlas Senior Loan Fund II Ltd. | | | | | | | | |
2012-2A, due 01/30/244,8 | | | 9,600,000 | | | | 6,117,547 | |
| WhiteHorse VII Ltd. | | | | | | | | |
2013-1A, 5.85% due 11/24/257,8 | | | 6,500,000 | | | | 6,078,915 | |
| Shackleton VII CLO Ltd. | | | | | | | | |
2016-7A, 3.87% due 04/15/277,8 | | | 6,000,000 | | | | 5,996,326 | |
| SEE NOTES TO FINANCIAL STATEMENTS. | THE GUGGENHEIM FUNDS SEMI-ANNUAL REPORT | 17 |
CONSOLIDATED SCHEDULE OF INVESTMENTS (Unaudited)(continued) | March 31, 2017 |
| MACRO OPPORTUNITIES FUND | |
| | | Face
Amount15 | | | Value | |
| | | | | | | | | |
| Flatiron CLO 2014-1 Ltd. | | | | | | | | |
2017-1A, 3.44% due 07/17/267,8 | | $ | 6,000,000 | | | $ | 5,974,038 | |
| ALM XIV Ltd. | | | | | | | | |
2014-14A, 3.99% due 07/28/267,8 | | | 3,100,000 | | | | 3,112,406 | |
2014-14A, 4.49% due 07/28/267,8 | | | 2,500,000 | | | | 2,506,403 | |
| CIFC Funding 2015-I Ltd. | | | | | | | | |
2016-1A, 3.84% due 01/22/277,8 | | | 5,550,000 | | | | 5,580,619 | |
| Hull Street CLO Ltd. | | | | | | | | |
2014-1A, 4.62% due 10/18/267,8 | | | 5,785,000 | | | | 5,576,401 | |
| Silvermore CLO Ltd. | | | | | | | | |
2014-1A, 4.04% due 05/15/267,8 | | | 5,500,000 | | | | 5,519,199 | |
| Fortress Credit BSL Ltd. | | | | | | | | |
2013-1A, 3.92% due 01/19/257,8 | | | 5,500,000 | | | | 5,499,806 | |
| Dryden XXVIII Senior Loan Fund | | | | | | | | |
2013-28A, 4.94% due 08/15/257,8 | | | 6,000,000 | | | | 5,498,974 | |
| Shackleton CLO | | | | | | | | |
2014-6A, 6.77% due 07/17/267,8 | | | 6,500,000 | | | | 5,471,178 | |
| Saranac CLO II Ltd. | | | | | | | | |
2014-2A, 6.20% due 02/20/257,8 | | | 5,750,000 | | | | 5,261,250 | |
| Mountain Hawk II CLO Ltd. | | | | | | | | |
2013-2A, 4.18% due 07/22/247,8 | | | 2,750,000 | | | | 2,585,324 | |
2013-2A, 3.63% due 07/22/247,8 | | | 2,500,000 | | | | 2,476,814 | |
| BNPP IP CLO Ltd. | | | | | | | | |
2014-2A, 6.29% due 10/30/257,8 | | | 5,500,000 | | | | 5,032,632 | |
| Marea CLO Ltd. | | | | | | | | |
2015-1A, 4.77% due 10/15/237,8 | | | 5,000,000 | | | | 4,999,912 | |
| KKR Financial CLO Ltd. | | | | | | | | |
2015-12, 4.02% due 07/15/277,8 | | | 5,000,000 | | | | 4,999,734 | |
| Ares XXXIII CLO Ltd. | | | | | | | | |
2016-1A, 3.90% due 12/05/257,8 | | | 5,000,000 | | | | 4,999,498 | |
| Fortress Credit Funding V, LP | | | | | | | | |
2015-5A, 4.69% due 08/15/227,8 | | | 5,000,000 | | | | 4,991,604 | |
| NXT Capital CLO 2017-1 LLC | | | | | | | | |
2017-1A, 3.81%, due 04/20/298 | | | 5,000,000 | | | | 4,979,857 | |
| Golub Capital Partners CLO 18 Ltd. | | | | | | | | |
2014-18A, 3.54% due 04/25/267,8 | | | 5,000,000 | | | | 4,935,346 | |
| Fifth Street SLF II Ltd. | | | | | | | | |
2015-2A, 3.85% due 09/29/277,8 | | | 5,000,000 | | | | 4,886,480 | |
| MP CLO III Ltd. | | | | | | | | |
2013-1A, 7.13% due 04/20/257,8 | | | 4,000,000 | | | | 3,789,716 | |
2013-1A, 3.78% due 04/20/257,8 | | | 1,000,000 | | | | 999,900 | |
| Golub Capital Partners CLO 24M Ltd. | | | | | | | | |
2015-24A, 5.28% due 02/05/277,8 | | | 5,000,000 | | | | 4,772,188 | |
| NewStar Arlington Senior Loan Program LLC | | | | | | | | |
2014-1A, 5.29% due 07/25/257,8 | | | 2,750,000 | | | | 2,633,666 | |
2014-1A, 4.34% due 07/25/257,8 | | | 2,000,000 | | | | 1,979,842 | |
| Avery Point IV CLO Ltd. | | | | | | | | |
2014-1A, 6.04% due 04/25/267,8 | | | 5,570,000 | | | | 4,596,370 | |
| WhiteHorse X Ltd. | | | | | | | | |
2015-10A, 6.32% due 04/17/277,8 | | | 4,980,000 | | | | 4,516,604 | |
| Vibrant Clo III Ltd. | | | | | | | | |
2016-3A, 3.98% due 04/20/267,8 | | | 4,500,000 | | | | 4,512,595 | |
| Venture X CLO Ltd. | | | | | | | | |
2016-10A, 4.96% due 07/20/227,8 | | | 4,500,000 | | | | 4,500,055 | |
18 | THE GUGGENHEIM FUNDS SEMI-ANNUAL REPORT | SEE NOTES TO FINANCIAL STATEMENTS. |
CONSOLIDATED SCHEDULE OF INVESTMENTS (Unaudited)(continued) | March 31, 2017 |
| MACRO OPPORTUNITIES FUND | |
| | | Face
Amount15 | | | Value | |
| | | | | | | | | |
| AMMC CLO XV Ltd. | | | | | | | | |
2016-15A, 3.91% due 12/09/267,8 | | $ | 4,500,000 | | | $ | 4,475,954 | |
| MP CLO V Ltd. | | | | | | | | |
2014-1A, 5.97% due 07/18/267,8 | | | 2,500,000 | | | | 2,388,130 | |
2014-1A, 6.92% due 07/18/267,8 | | | 2,250,000 | | | | 2,070,028 | |
| Halcyon Loan Advisors Funding Ltd. | | | | | | | | |
2012-2A, 4.00% due 12/20/247,8 | | | 3,250,000 | | | | 3,255,393 | |
2012-1A, 4.04% due 08/15/237,8 | | | 1,000,000 | | | | 1,003,194 | |
| Franklin CLO VI Ltd. | | | | | | | | |
2007-6A, 3.29% due 08/09/197,8 | | | 4,165,000 | | | | 4,133,855 | |
| Ares CLO Ltd. | | | | | | | | |
2016-3A, 4.92% due 01/17/247,8 | | | 4,100,000 | | | | 4,100,172 | |
| OHA Loan Funding 2013-1 Ltd. | | | | | | | | |
2017-1A, 4.09% due 07/23/257,8 | | | 4,100,000 | | | | 4,096,536 | |
| Octagon Investment Partners XVI Ltd. | | | | | | | | |
2013-1A, 6.52% due 07/17/257,8 | | | 4,500,000 | | | | 4,096,378 | |
| Madison Park Funding XVI Ltd. | | | | | | | | |
2016-16A, 3.68% due 04/20/267,8 | | | 4,000,000 | | | | 4,003,712 | |
| Adirondack Park CLO Ltd. | | | | | | | | |
2013-1A, 4.67% due 04/15/247,8 | | | 4,000,000 | | | | 4,002,035 | |
| Symphony Clo V Ltd. | | | | | | | | |
2007-5A, 5.27% due 01/15/247,8 | | | 4,000,000 | | | | 3,999,753 | |
| Oaktree EIF II Series Ltd. | | | | | | | | |
2014-A2, 4.24% due 11/17/257,8 | | | 4,000,000 | | | | 3,994,072 | |
| JFIN CLO Ltd. | | | | | | | | |
2007-1A, 3.83% due 07/20/217,8 | | | 4,000,000 | | | | 3,989,934 | |
| Airlie CLO Ltd. | | | | | | | | |
2006-2A, 2.48% due 12/20/207,8 | | | 4,000,000 | | | | 3,954,743 | |
| TICP CLO I Ltd. | | | | | | | | |
2014-1A, 5.53% due 04/26/267,8 | | | 4,200,000 | | | | 3,933,892 | |
| THL Credit Wind River CLO Ltd. | | | | | | | | |
2015-2A, 8.82% due 10/15/277,8 | | | 4,075,000 | | | | 3,920,443 | |
| Golub Capital Partners CLO 25M Ltd. | | | | | | | | |
2015-25A, 4.68% due 08/05/277,8 | | | 4,000,000 | | | | 3,898,980 | |
| Adams Mill CLO Ltd. | | | | | | | | |
2014-1A, 6.02% due 07/15/267,8 | | | 4,000,000 | | | | 3,788,069 | |
| Marathon CLO VI Ltd. | | | | | | | | |
2014-6A, 3.88% due 05/13/257,8 | | | 3,780,000 | | | | 3,779,806 | |
| Keuka Park CLO Ltd. | | | | | | | | |
2013-1A, 5.99% due 10/21/247,8 | | | 2,250,000 | | | | 2,247,251 | |
2013-1A, due 10/21/244,8 | | | 3,000,000 | | | | 1,517,830 | |
| Mountain View CLO Ltd. | | | | | | | | |
2015-9A, 6.37% due 07/15/277,8 | | | 4,000,000 | | | | 3,736,229 | |
| Tuolumne Grove CLO Limited | | | | | | | | |
2017-1A, 3.56%, due 04/25/268 | | | 3,750,000 | | | | 3,731,320 | |
| Garrison Funding Ltd. | | | | | | | | |
2016-2A, 5.06% due 09/29/277,8 | | | 3,700,000 | | | | 3,636,143 | |
| Grayson CLO Ltd. | | | | | | | | |
2006-1A, 1.44% due 11/01/217,8 | | | 3,700,000 | | | | 3,614,679 | |
| Jamestown CLO VI Ltd. | | | | | | | | |
2015-6A, 4.30% due 02/20/277,8 | | | 3,750,000 | | | | 3,564,036 | |
| Ares XXVI CLO Ltd. | | | | | | | | |
2013-1A, 3.77% due 04/15/257,8 | | | 2,000,000 | | | | 1,999,904 | |
| SEE NOTES TO FINANCIAL STATEMENTS. | THE GUGGENHEIM FUNDS SEMI-ANNUAL REPORT | 19 |
CONSOLIDATED SCHEDULE OF INVESTMENTS (Unaudited)(continued) | March 31, 2017 |
| MACRO OPPORTUNITIES FUND | |
| | | Face
Amount15 | | | Value | |
| | | | | | | | | |
2013-1A, 4.77% due 04/15/257,8 | | $ | 1,500,000 | | | $ | 1,499,963 | |
| AMMC CLO XI Ltd. | | | | | | | | |
2012-11A, due 10/30/234,8 | | | 5,650,000 | | | | 3,497,612 | |
| OZLM IX Ltd. | | | | | | | | |
2017-9A, 3.39% due 01/20/277,8 | | | 3,500,000 | | | | 3,484,419 | |
| Primus Clo II Ltd. | | | | | | | | |
2007-2A, 1.97% due 07/15/217,8 | | | 3,500,000 | | | | 3,477,388 | |
| Fifth Street Senior Loan Fund I LLC | | | | | | | | |
2015-1A, 4.78% due 01/20/277,8 | | | 3,500,000 | | | | 3,465,102 | |
| West CLO Ltd. | | | | | | | | |
2013-1A, due 11/07/254,8 | | | 5,300,000 | | | | 2,447,339 | |
2013-1A, 3.93% due 11/07/257,8 | | | 1,000,000 | | | | 1,007,558 | |
| NewMark Capital Funding CLO Ltd. | | | | | | | | |
2014-2A, 4.50% due 06/30/267,8 | | | 3,500,000 | | | | 3,442,804 | |
| Cerberus Loan Funding XVI, LP | | | | | | | | |
2016-2A, 4.82% due 11/15/277,8 | | | 3,350,000 | | | | 3,390,180 | |
| Mountain Hawk I CLO Ltd. | | | | | | | | |
2013-1A, 3.75% due 01/20/247,8 | | | 3,400,000 | | | | 3,383,174 | |
| Ivy Hill Middle Market Credit Fund IX Ltd. | | | | | | | | |
2014-9A, 4.32% due 10/18/257,8 | | | 3,500,000 | | | | 3,371,683 | |
| PFP 2017-3 Ltd. | | | | | | | | |
2017-3, 3.28% due 01/14/357,8 | | | 3,250,000 | | | | 3,260,693 | |
| Oaktree EIF II Series B1 Ltd. | | | | | | | | |
2015-B1A, 4.14% due 02/15/267,8 | | | 3,250,000 | | | | 3,249,707 | |
| DIVCORE CLO Ltd. | | | | | | | | |
2013-1A, 4.81% due 11/15/327,8 | | | 3,250,000 | | | | 3,243,767 | |
| Flatiron CLO Ltd. | | | | | | | | |
2013-1A, 4.62% due 01/17/267,8 | | | 3,200,000 | | | | 3,203,277 | |
| Recette CLO LLC | | | | | | | | |
2015-1A, 8.48% due 10/20/277,8 | | | 3,250,000 | | | | 3,164,952 | |
| Marathon CLO V Ltd. | | | | | | | | |
2013-5A, due 02/21/254,8 | | | 5,500,000 | | | | 3,018,249 | |
| Marathon CLO VII Ltd. | | | | | | | | |
2014-7A, 4.54% due 10/28/257,8 | | | 3,000,000 | | | | 3,002,002 | |
| Vibrant CLO Ltd. | | | | | | | | |
2015-1A, 4.92% due 07/17/247,8 | | | 3,000,000 | | | | 3,000,126 | |
| Vibrant CLO II Ltd. | | | | | | | | |
2013-2A, 3.79% due 07/24/247,8 | | | 3,000,000 | | | | 2,999,791 | |
| Mountain Hawk III CLO Ltd. | | | | | | | | |
2014-3A, 3.82% due 04/18/257,8 | | | 3,000,000 | | | | 2,993,318 | |
| Sound Point CLO I Ltd. | | | | | | | | |
2012-1A, 5.61% due 10/20/237,8 | | | 2,750,000 | | | | 2,750,230 | |
| Symphony CLO XII Ltd. | | | | | | | | |
2013-12A, 4.52% due 10/15/257,8 | | | 2,700,000 | | | | 2,700,000 | |
| Westwood CDO II Ltd. | | | | | | | | |
2007-2A, 2.84% due 04/25/227,8 | | | 2,550,000 | | | | 2,510,742 | |
| Symphony CLO XI Ltd. | | | | | | | | |
2013-11A, 5.02% due 01/17/257,8 | | | 2,500,000 | | | | 2,499,931 | |
| Gallatin CLO VII Ltd. | | | | | | | | |
2014-1A, 4.78% due 07/15/237,8 | | | 2,500,000 | | | | 2,458,168 | |
| Octagon Investment Partners XIV Ltd. | | | | | | | | |
2012-1A, 7.52% due 01/15/247,8 | | | 2,550,000 | | | | 2,425,893 | |
| MP CLO VI Ltd. | | | | | | | | |
2014-2A, 6.77% due 01/15/277,8 | | | 2,300,000 | | | | 2,265,790 | |
20 | THE GUGGENHEIM FUNDS SEMI-ANNUAL REPORT | SEE NOTES TO FINANCIAL STATEMENTS. |
CONSOLIDATED SCHEDULE OF INVESTMENTS (Unaudited)(continued) | March 31, 2017 |
| MACRO OPPORTUNITIES FUND | |
| | | Face
Amount15 | | | Value | |
| | | | | | | | | |
| Venture CLO Ltd. | | | | | | | | |
2013-14A, 3.80% due 08/28/257,8 | | $ | 2,250,000 | | | $ | 2,249,589 | |
| Callidus Debt Partners CLO Fund VI Ltd. | | | | | | | | |
2007-6A, 4.04% due 10/23/217,8 | | | 2,100,000 | | | | 2,099,849 | |
| AIMCO CLO Series | | | | | | | | |
2015-AA, 4.32% due 01/15/287,8 | | | 2,000,000 | | | | 2,010,010 | |
| AMMC CLO XIV Ltd. | | | | | | | | |
2014-14A, 3.84% due 07/27/267,8 | | | 2,000,000 | | | | 1,999,846 | |
| Cent CLO 21 Ltd. | | | | | | | | |
2017-21A, 3.46% due 07/27/267,8 | | | 2,000,000 | | | | 1,994,650 | |
| Cerberus Onshore II CLO LLC | | | | | | | | |
2014-1A, 4.52% due 10/15/237,8 | | | 1,000,000 | | | | 997,229 | |
2014-1A, 5.02% due 10/15/237,8 | | | 1,000,000 | | | | 990,276 | |
| Lime Street CLO Ltd. | | | | | | | | |
2007-1A, 3.65% due 06/20/217,8 | | | 2,000,000 | | | | 1,973,619 | |
| NXT Capital CLO LLC | | | | | | | | |
2015-1A, 5.19% due 04/21/277,8 | | | 2,000,000 | | | | 1,861,234 | |
| Atlas Senior Loan Fund VI Ltd. | | | | | | | | |
2017-6A, 3.38% due 10/15/267,8 | | | 1,800,000 | | | | 1,793,022 | |
| Madison Park Funding XI Ltd. | | | | | | | | |
2013-11A, 4.54% due 10/23/257,8 | | | 1,750,000 | | | | 1,751,304 | |
| Octagon Investment Partners XV Ltd. | | | | | | | | |
2013-1A, 3.87% due 01/19/257,8 | | | 1,750,000 | | | | 1,749,895 | |
| Jefferson Mill CLO Ltd. | | | | | | | | |
2015-1A, 6.63% due 07/20/277,8 | | | 1,750,000 | | | | 1,669,533 | |
| MCF CLO IV LLC | | | | | | | | |
2014-1A, 6.78% due 10/15/257,8 | | | 1,750,000 | | | | 1,590,741 | |
| Greywolf CLO III Ltd. | | | | | | | | |
2014-1A, 3.89% due 04/22/267,8 | | | 1,500,000 | | | | 1,499,150 | |
| Saranac CLO I Ltd. | | | | | | | | |
2013-1A, 3.73% due 10/26/247,8 | | | 1,500,000 | | | | 1,496,584 | |
| Kingsland IV Ltd. | | | | | | | | |
2007-4A, 2.47% due 04/16/217,8 | | | 1,500,000 | | | | 1,446,136 | |
| Venture XX CLO Ltd. | | | | | | | | |
2015-20A, 7.32% due 04/15/277,8 | | | 1,600,000 | | | | 1,439,595 | |
| Eaton Vance CLO Ltd. | | | | | | | | |
2014-1A, 6.05% due 07/15/267,8 | | | 1,500,000 | | | | 1,402,455 | |
| Duane Street CLO IV Ltd. | | | | | | | | |
2007-4A, 3.29% due 11/14/217,8 | | | 1,400,000 | | | | 1,400,045 | |
| GoldenTree Loan Opportunities III Ltd. | | | | | | | | |
2007-3A, 4.23% due 05/01/227,8 | | | 1,250,000 | | | | 1,247,541 | |
| COA Summit CLO Ltd. | | | | | | | | |
2014-1A, 4.88% due 04/20/237,8 | | | 1,250,000 | | | | 1,237,245 | |
| Copper River CLO Ltd. | | | | | | | | |
2007-1A, due 01/20/214,16 | | | 8,150,000 | | | | 1,145,829 | |
| Ares XXV CLO Ltd. | | | | | | | | |
2013-3A, due 01/17/244,8 | | | 2,000,000 | | | | 1,080,317 | |
| Cavalry CLO II | | | | | | | | |
2013-2A, 5.02% due 01/17/247,8 | | | 1,000,000 | | | | 1,000,039 | |
| Northwoods Capital XI Ltd. | | | | | | | | |
2017-11A, due 04/15/257,8 | | | 1,000,000 | | | | 1,000,034 | |
| WhiteHorse VIII Ltd. | | | | | | | | |
2014-1A, 3.78% due 05/01/267,8 | | | 1,000,000 | | | | 999,900 | |
| Eastland CLO Ltd. | | | | | | | | |
2007-1A, 1.43% due 05/01/227,8 | | | 1,000,000 | | | | 981,892 | |
| SEE NOTES TO FINANCIAL STATEMENTS. | THE GUGGENHEIM FUNDS SEMI-ANNUAL REPORT | 21 |
CONSOLIDATED SCHEDULE OF INVESTMENTS (Unaudited)(continued) | March 31, 2017 |
| MACRO OPPORTUNITIES FUND | |
| | | Face
Amount15 | | | Value | |
| | | | | | | | | |
| Gramercy Park CLO Ltd. | | | | | | | | |
2012-1A, due 07/17/234,8 | | $ | 2,650,000 | | | $ | 437,248 | |
2012-1X, due 07/17/234 | | | 1,250,000 | | | | 206,249 | |
| ICE EM CLO | | | | | | | | |
2007-1A, 2.19% due 08/15/227,8 | | | 512,366 | | | | 508,791 | |
| Rockwall CDO Ltd. | | | | | | | | |
2007-1A, 1.28% due 08/01/247,8 | | | 388,250 | | | | 387,280 | |
| Fortress Credit Opportunities | | | | | | | | |
2005-1A, 0.94% due 07/15/197,16 | | | 276,691 | | | | 269,287 | |
| Marathon CLO II Ltd. | | | | | | | | |
2005-2A, due 12/20/19†††,4,8 | | | 2,250,000 | | | | 2 | |
| Total Collateralized Loan Obligations | | | 1,423,279,487 | |
| | | | | | | | | |
| TRANSPORT-AIRCRAFT - 3.9% | |
| Apollo Aviation Securitization Equity Trust | | | | | | | | |
2014-1, 7.38% due 12/15/297 | | | 15,014,145 | | | | 14,995,378 | |
2014-1, 5.13% due 12/15/297 | | | 14,253,936 | | | | 14,236,118 | |
2016-2, 5.93% due 11/15/418 | | | 10,860,640 | | | | 10,868,188 | |
| 2016-2, 4.21% due 11/15/41 | | | 9,697,000 | | | | 9,705,301 | |
| 2016-1A, 6.50% due 03/17/36 | | | 5,400,000 | | | | 5,427,000 | |
| 2016-2, 7.87% due 11/15/41 | | | 4,479,840 | | | | 4,475,548 | |
| ECAF I Ltd. | | | | | | | | |
2015-1A, 5.80% due 06/15/408 | | | 26,175,050 | | | | 25,128,047 | |
| Falcon Aerospace Ltd. | | | | | | | | |
| 2017-1, 4.58% due 02/15/42 | | | 15,612,080 | | | | 15,738,710 | |
| AIM Aviation Finance Ltd. | | | | | | | | |
2015-1A, 5.07% due 02/15/408 | | | 15,704,464 | | | | 15,390,375 | |
| Falcon Aerospace Limited | | | | | | | | |
| 2017-1, 6.30% due 02/15/42 | | | 11,684,200 | | | | 11,755,801 | |
| Rise Ltd. | | | | | | | | |
| 2014-1 B, 6.50% due 02/12/39 | | | 6,478,678 | | | | 6,540,238 | |
| 2014-1 A, 4.75% due 02/12/39 | | | 5,039,418 | | | | 5,014,221 | |
2015-1A, 5.75% due 12/15/408 | | | 10,795,920 | | | | 10,622,290 | |
| Castlelake Aircraft Securitization Trust | | | | | | | | |
| 2014-1, 7.50% due 02/15/29 | | | 6,109,186 | | | | 6,109,186 | |
| 2014-1, 5.25% due 02/15/29 | | | 3,356,022 | | | | 3,347,632 | |
| Stripes 2103 Aircraft 1 Ltd. | | | | | | | | |
2013-1 A1, 4.48% due 03/20/23†††,2 | | | 8,057,599 | | | | 7,868,019 | |
| Atlas Ltd. | | | | | | | | |
| 2014-1 A, 4.88% due 12/15/39 | | | 6,268,350 | | | | 6,252,679 | |
| Emerald Aviation Finance Ltd. | | | | | | | | |
2013-1, 6.35% due 10/15/388 | | | 5,163,073 | | | | 5,163,073 | |
| Turbine Engines Securitization Ltd. | | | | | | | | |
2013-1A, 5.13% due 12/13/4816 | | | 3,064,194 | | | | 3,035,219 | |
2013-1A, 6.38% due 12/13/4816 | | | 2,148,766 | | | | 2,009,096 | |
| Eagle I Ltd. | | | | | | | | |
2014-1A, 5.29% due 12/15/398 | | | 4,511,719 | | | | 4,452,128 | |
| Willis Engine Securitization Trust II | | | | | | | | |
2012-A, 5.50% due 09/15/378 | | | 4,222,567 | | | | 4,190,898 | |
| AASET | | | | | | | | |
| 2014-1 C, 10.00% due 12/15/29 | | | 2,479,722 | | | | 2,473,523 | |
22 | THE GUGGENHEIM FUNDS SEMI-ANNUAL REPORT | SEE NOTES TO FINANCIAL STATEMENTS. |
CONSOLIDATED SCHEDULE OF INVESTMENTS (Unaudited)(continued) | March 31, 2017 |
| MACRO OPPORTUNITIES FUND | |
| | | Face
Amount15 | | | Value | |
| | | | | | | | | |
| AABS Ltd. | | | | | | | | |
| 2013-1 A, 4.88% due 01/10/38 | | $ | 2,126,852 | | | $ | 2,121,535 | |
| Airplanes Pass Through Trust | | | | | | | | |
2001-1A, 1.46% due 03/15/197,16 | | | 3,791,006 | | | | 1,175,212 | |
| Total Transport-Aircraft | | | | | | | 198,095,415 | |
| | | | | | | | | |
| COLLATERALIZED DEBT OBLIGATIONS - 1.9% | |
| Triaxx Prime CDO Ltd. | | | | | | | | |
2006-2A, 1.05% due 10/02/397,8 | | | 24,590,400 | | | | 23,964,199 | |
| Putnam Structured Product Funding Ltd. | | | | | | | | |
2003-1A, 1.91% due 10/15/387,8 | | | 15,795,704 | | | | 14,335,917 | |
| SRERS Funding Ltd. | | | | | | | | |
2011-RS, 1.10% due 05/09/467,8 | | | 19,552,241 | | | | 13,155,716 | |
| FDF I Ltd. | | | | | | | | |
2015-1A, 5.50% due 11/12/308 | | | 12,000,000 | | | | 12,108,195 | |
| Wrightwood Capital Real Estate CDO Ltd. | | | | | | | | |
2005-1A, 1.48% due 11/21/407,8 | | | 5,000,000 | | | | 4,905,315 | |
| Anchorage Credit Funding 4 Ltd. | | | | | | | | |
2016-4A, 4.50% due 02/15/358 | | | 5,000,000 | | | | 4,824,477 | |
| FDF II Ltd. | | | | | | | | |
2016-2A, 6.29% due 05/12/318 | | | 4,750,000 | | | | 4,739,667 | |
| N-Star REL CDO VIII Ltd. | | | | | | | | |
2006-8A, 1.15% due 02/01/417,8 | | | 4,320,505 | | | | 4,296,053 | |
| Highland Park CDO I Ltd. | | | | | | | | |
2006-1A, 1.45% due 11/25/517,8 | | | 4,429,468 | | | | 4,114,591 | |
| Static Repackaging Trust Ltd. | | | | | | | | |
2004-1A, 2.08% due 05/10/397,8 | | | 3,529,459 | | | | 3,456,311 | |
| Banco Bradesco SA | | | | | | | | |
2014-1, 5.44% due 03/12/26†††,7,16 | | | 2,935,159 | | | | 2,959,810 | |
| RAIT CRE CDO I Ltd. | | | | | | | | |
| 2006-1X A1B, 1.31% due 11/20/46 | | | 2,230,594 | | | | 2,218,070 | |
| Pasadena CDO Ltd. | | | | | | | | |
2002-1A, 2.00% due 06/19/377,8 | | | 639,645 | | | | 632,791 | |
| Total Collateralized Debt Obligations | | | 95,711,112 | |
| | | | | | | | | |
| DIVERSIFIED PAYMENT RIGHTS - 0.1% | |
| CIC Receivables Master Trust | | | | | | | | |
REGD, 4.89% due 10/07/21††† | | | 5,712,571 | | | | 5,880,415 | |
| CCR, Inc. MT100 Payment Rights Master Trust | | | | | | | | |
2010-CX, 1.30% due 07/10/177 | | | 1,262,818 | | | | 1,260,317 | |
| Garanti Diversified Payment Rights Finance Co. | | | | | | | | |
2007-A, 1.20% due 07/09/177 | | | 52,000 | | | | 51,881 | |
| Total Diversified Payment Rights | | | 7,192,613 | |
| | | | | | | | | |
| CREDIT CARD - 0.0%** | |
| Credit Card Pass-Through Trust | | | | | | | | |
2012-BIZ, 0.00%, due 12/15/498 | | | 142,999 | | | | 106,709 | |
| Total Asset-Backed Securities | | | | | |
| (Cost $1,692,512,238) | | | | | | | 1,724,385,336 | |
| SEE NOTES TO FINANCIAL STATEMENTS. | THE GUGGENHEIM FUNDS SEMI-ANNUAL REPORT | 23 |
CONSOLIDATED SCHEDULE OF INVESTMENTS (Unaudited)(continued) | March 31, 2017 |
| MACRO OPPORTUNITIES FUND | |
| | | Face
Amount15 | | | Value | |
| | | | | | | | | |
COLLATERALIZED MORTGAGE OBLIGATIONS†† - 18.5% | |
| RESIDENTIAL MORTGAGE BACKED SECURITIES - 14.6% | |
| LSTAR Securities Investment Ltd. | | | | | | | | |
2017-1, 2.78% due 01/01/227,8 | | $ | 43,680,941 | | | $ | 43,571,739 | |
2016-4, 2.78% due 10/01/217,8 | | | 34,526,881 | | | | 34,251,322 | |
2016-5, 2.78% due 11/01/217,8 | | | 14,143,935 | | | | 14,072,027 | |
2016-3, 2.78% due 09/01/217,8 | | | 10,512,211 | | | | 10,379,812 | |
| FirstKey Master Funding | | | | | | | | |
2017-R1, 1.01% due 11/03/417,8 | | | 87,500,000 | | | | 81,837,301 | |
| Bayview Opportunity Master Fund IVb Trust | | | | | | | | |
2017-RN1, 3.60% due 02/28/327,8 | | | 45,325,641 | | | | 45,259,365 | |
2017-NPL1, 3.60% due 01/28/328 | | | 17,680,462 | | | | 17,633,044 | |
| CIM Trust | | | | | | | | |
2017-2, 2.78% due 12/25/577,8 | | | 59,290,000 | | | | 58,847,014 | |
| LSTAR Commercial Mortgage Trust | | | | | | | | |
2016-7, 2.78% due 12/01/21††,7,8 | | | 59,009,160 | | | | 58,492,829 | |
| Bayview Opportunity Master Fund IIIa Trust | | | | | | | | |
2016-RN3, 3.60% due 09/29/317,8 | | | 46,125,501 | | | | 46,056,783 | |
| GCAT | | | | | | | | |
| A1, 3.38% due 03/25/47 | | | 29,900,000 | | | | 29,871,415 | |
| Stanwich Mortgage Loan Co. | | | | | | | | |
2016-NPA1, 3.84% due 10/16/467,8 | | | 24,226,222 | | | | 24,191,496 | |
| RALI Series Trust | | | | | | | | |
2006-QO10, 1.14% due 01/25/377 | | | 10,366,663 | | | | 8,793,592 | |
2007-QO2, 1.13% due 02/25/477 | | | 12,297,920 | | | | 7,292,399 | |
2006-QO2, 1.25% due 02/25/467 | | | 13,528,610 | | | | 5,998,964 | |
2006-QO2, 1.20% due 02/25/467 | | | 3,906,495 | | | | 1,693,474 | |
| NRPL Trust | | | | | | | | |
2015-1A, 3.88% due 11/01/548 | | | 16,653,478 | | | | 16,546,578 | |
2014-2A, 3.75% due 10/25/577,8 | | | 5,376,605 | | | | 5,414,982 | |
| American Home Mortgage Assets Trust | | | | | | | | |
2007-1, 1.34% due 02/25/477 | | | 33,056,780 | | | | 19,170,390 | |
| VOLT LI LLC | | | | | | | | |
2016-NP11, 3.50% due 10/25/468 | | | 17,624,663 | | | | 17,754,035 | |
| VOLT LIV LLC | | | | | | | | |
2017-NPL1, 3.63% due 02/25/477,8 | | | 17,717,374 | | | | 17,655,204 | |
| VOLT LIII LLC | | | | | | | | |
2016-NP13, 3.88% due 12/26/468 | | | 16,675,941 | | | | 16,633,983 | |
| VOLT LII LLC | | | | | | | | |
2016-NP12, 3.63% due 11/26/468 | | | 16,565,053 | | | | 16,495,610 | |
| Lehman XS Trust Series | | | | | | | | |
2006-16N, 1.17% due 11/25/467 | | | 10,866,880 | | | | 9,305,565 | |
2006-10N, 1.19% due 07/25/467 | | | 7,944,316 | | | | 6,640,712 | |
| VOLT XLVIII LLC | | | | | | | | |
2016-NPL8, 3.50% due 07/25/468 | | | 14,716,484 | | | | 14,795,949 | |
| RALI Series 2006-QO8 Trust | | | | | | | | |
2006-QO8, 1.18% due 10/25/467 | | | 15,300,570 | | | | 13,221,642 | |
| AJAX Mortgage Loan Trust | | | | | | | | |
2015-A, 3.88% due 11/25/547,8 | | | 10,108,988 | | | | 10,083,231 | |
| Nomura Resecuritization Trust | | | | | | | | |
2015-4R, 1.66% due 03/26/367,8 | | | 6,174,414 | | | | 5,889,773 | |
24 | THE GUGGENHEIM FUNDS SEMI-ANNUAL REPORT | SEE NOTES TO FINANCIAL STATEMENTS. |
CONSOLIDATED SCHEDULE OF INVESTMENTS (Unaudited)(continued) | March 31, 2017 |
| MACRO OPPORTUNITIES FUND | |
| | | Face
Amount15 | | | Value | |
| | | | | | | | | |
2012-1R, 1.22% due 08/27/477,8 | | $ | 3,855,355 | | | $ | 3,826,055 | |
| Merrill Lynch Alternative Note Asset Trust Series | | | | | | | | |
2007-OAR3, 0.97% due 07/25/377 | | | 11,907,301 | | | | 9,632,520 | |
| GSAA Home Equity Trust | | | | | | | | |
2006-3, 1.28% due 03/25/367 | | | 5,227,284 | | | | 3,678,889 | |
2007-7, 1.25% due 07/25/377 | | | 3,434,041 | | | | 3,120,366 | |
2006-14, 1.23% due 09/25/367 | | | 4,190,646 | | | | 2,525,606 | |
| Luminent Mortgage Trust | | | | | | | | |
2006-2, 1.18% due 02/25/467 | | | 10,891,934 | | | | 8,089,366 | |
| RALI Series 2006-QO3 Trust | | | | | | | | |
2006-QO3, 1.19% due 04/25/467 | | | 15,693,009 | | | | 7,887,325 | |
| Washington Mutual Mortgage Pass-Through Certificates WMALT Series Trust | | | | | | | | |
2006-AR9, 1.48% due 11/25/467 | | | 9,291,214 | | | | 7,451,924 | |
| GSAA Trust | | | | | | | | |
2006-9, 1.22% due 06/25/367 | | | 13,821,526 | | | | 7,450,171 | |
| HSI Asset Securitization Corporation Trust | | | | | | | | |
2005-OPT1, 1.40% due 11/25/357 | | | 7,320,000 | | | | 6,672,883 | |
| American Home Mortgage Investment Trust | | | | | | | | |
2006-1, 1.38% due 03/25/467 | | | 5,686,459 | | | | 4,722,937 | |
| GCAT LLC | | | | | | | | |
2015-1, 3.63% due 05/26/207,8 | | | 3,195,022 | | | | 3,195,343 | |
| Alliance Bancorp Trust | | | | | | | | |
2007-OA1, 1.22% due 07/25/377 | | | 4,301,337 | | | | 3,129,908 | |
| Wachovia Asset Securitization Issuance II LLC Trust | | | | | | | | |
2007-HE1, 1.12% due 07/25/377,8 | | | 2,264,207 | | | | 2,073,235 | |
| Morgan Stanley Re-REMIC Trust | | | | | | | | |
2010-R5, 1.60% due 06/26/368 | | | 1,940,693 | | | | 1,421,323 | |
| First Franklin Mortgage Loan Trust | | | | | | | | |
2006-FF1, 1.42% due 01/25/367 | | | 1,225,000 | | | | 1,123,570 | |
| Asset Backed Securities Corporation Home Equity Loan Trust | | | | | | | | |
2006-HE5, 1.12% due 07/25/367 | | | 1,137,568 | | | | 1,004,888 | |
| GreenPoint Mortgage Funding Trust | | | | | | | | |
2007-AR1, 1.06% due 02/25/477 | | | 270 | | | | 270 | |
| Total Residential Mortgage Backed Securities | | | 734,856,809 | |
| | | | | | | | | |
| COMMERCIAL MORTGAGE BACKED SECURITIES - 3.3% | |
| Cosmopolitan Hotel Trust | | | | | | | | |
2016-CSMO, 5.56% due 11/15/337,8 | | | 41,183,000 | | | | 41,879,314 | |
| Motel 6 Trust | | | | | | | | |
2015-MTL6, 5.28% due 02/05/308 | | | 40,150,000 | | | | 40,355,243 | |
| GS Mortgage Securities Corporation Trust | | | | | | | | |
2016-ICE2, 9.41% due 02/15/337,8 | | | 28,300,000 | | | | 28,868,029 | |
| GAHR Commercial Mortgage Trust | | | | | | | | |
2015-NRF, 3.38% due 12/15/347,8 | | | 22,600,000 | | | | 21,741,268 | |
| SEE NOTES TO FINANCIAL STATEMENTS. | THE GUGGENHEIM FUNDS SEMI-ANNUAL REPORT | 25 |
CONSOLIDATED SCHEDULE OF INVESTMENTS (Unaudited)(continued) | March 31, 2017 |
| MACRO OPPORTUNITIES FUND | |
| | | Face
Amount15 | | | Value | |
| | | | | | | | | |
| GS Mortgage Securities Trust | | | | | | | | |
2014-GSFL, 4.81% due 07/15/317,8 | | $ | 11,660,000 | | | $ | 11,716,854 | |
| CDGJ Commercial Mortgage Trust | | | | | | | | |
2014-BXCH, 5.16% due 12/15/277,8 | | | 11,240,852 | | | | 11,318,324 | |
| BXHTL Mortgage Trust | | | | | | | | |
2015-JWRZ, 4.60% due 05/15/297,8 | | | 5,000,000 | | | | 5,028,224 | |
| GE Business Loan Trust | | | | | | | | |
2007-1A, 1.36% due 04/16/357,8 | | | 2,904,093 | | | | 2,644,354 | |
| GS Mortgage Securities Corp Trust | | | | | | | | |
2016-ICE2, 6.66% due 02/15/337,8 | | | 1,750,000 | | | | 1,805,853 | |
| Total Commercial Mortgage Backed Securities | | | 165,357,463 | |
| | | | | | | | | |
| FINANCIAL - 0.3% | |
| Station Place Securitization Trust | | | | | | | | |
2017-1, 3.23% due 02/25/49†††,7,8 | | | 15,000,000 | | | | 14,984,455 | |
| | | | | | | | | |
| MILITARY HOUSING - 0.2% | |
| Capmark Military Housing Trust | | | | | | | | |
2007-AET2, 6.06% due 10/10/5216 | | | 5,828,424 | | | | 6,028,106 | |
| Offutt AFB America First Community LLC | | | | | | | | |
5.46% due 09/01/508 | | | 5,760,899 | | | | 5,486,680 | |
| Total Military Housing | | | 11,514,786 | |
| Total Collateralized Mortgage Obligations | | | | | |
| (Cost $925,161,519) | | | | | | | 926,713,513 | |
| | | | | | | | | |
SENIOR FLOATING RATE INTERESTS††,7 - 14.3% | |
| CONSUMER, CYCLICAL - 3.1% | |
| Petco Animal Supplies, Inc. | | | | | | | | |
| 4.29% due 01/26/23 | | | 15,320,560 | | | | 14,405,156 | |
| Gates Global, Inc. | | | | | | | | |
| 4.40% due 07/05/21 | | | 8,600,360 | | | | 8,606,810 | |
| 3.50% due 04/01/24 | | EUR | 3,750,000 | | | | 4,000,013 | |
| Advantage Sales & Marketing LLC | | | | | | | | |
| 4.25% due 07/23/21 | | | 8,941,130 | | | | 8,840,542 | |
3.86% due 07/25/19†††,2 | | | 600,000 | | | | 564,137 | |
| Mavis Tire | | | | | | | | |
6.25% due 11/02/20†††,2 | | | 9,235,500 | | | | 9,142,292 | |
| National Vision, Inc. | | | | | | | | |
| 4.00% due 03/12/21 | | | 7,161,152 | | | | 7,155,208 | |
| 6.75% due 03/11/22 | | | 650,000 | | | | 629,688 | |
| Life Time Fitness, Inc. | | | | | | | | |
| 4.00% due 06/10/22 | | | 7,390,826 | | | | 7,403,759 | |
| Navistar Inc. | | | | | | | | |
| 5.00% due 08/07/20 | | | 7,018,750 | | | | 7,088,938 | |
| Sears Holdings Corp. | | | | | | | | |
| 5.50% due 06/30/18 | | | 6,615,058 | | | | 6,526,152 | |
| Belk, Inc. | | | | | | | | |
| 5.76% due 12/12/22 | | | 7,273,052 | | | | 6,124,928 | |
| Fitness International LLC | | | | | | | | |
| 5.40% due 07/01/20 | | | 5,100,215 | | | | 5,157,593 | |
| Leslie’s Poolmart, Inc. | | | | | | | | |
| 4.77% due 08/16/23 | | | 4,691,855 | | | | 4,705,930 | |
| Sky Bet | | | | | | | | |
| 5.50% due 02/25/22 | | GBP | 3,700,000 | | | | 4,678,894 | |
| Floor and Decor Outlets of America, Inc. | | | | | | | | |
| 4.50% due 09/30/23 | | | 4,452,625 | | | | 4,474,888 | |
| Amaya Holdings B.V. | | | | | | | | |
| 4.65% due 08/01/21 | | | 4,330,309 | | | | 4,337,541 | |
| Accuride Corp. | | | | | | | | |
| 8.15% due 11/17/23 | | | 4,289,250 | | | | 4,262,442 | |
| Eyemart Express | | | | | | | | |
| 5.19% due 12/17/21 | | | 4,195,833 | | | | 4,237,792 | |
| Neiman Marcus Group, Inc. | | | | | | | | |
| 4.25% due 10/25/20 | | | 4,648,486 | | | | 3,728,736 | |
| BBB Industries, LLC | | | | | | | | |
| 6.00% due 11/03/21 | | | 3,677,030 | | | | 3,679,347 | |
26 | THE GUGGENHEIM FUNDS SEMI-ANNUAL REPORT | SEE NOTES TO FINANCIAL STATEMENTS. |
CONSOLIDATED SCHEDULE OF INVESTMENTS (Unaudited)(continued) | March 31, 2017 |
| MACRO OPPORTUNITIES FUND | |
| | | Face
Amount15 | | | Value | |
| | | | | | | | | |
| P.F. Chang’s China Bistro, Inc. | | | | | | | | |
4.53% due 07/02/19††† | | $ | 3,618,073 | | | $ | 3,545,711 | |
| Blue Nile, Inc. | | | | | | | | |
| 7.50% due 02/17/23 | | | 3,500,000 | | | | 3,430,000 | |
| Acosta, Inc. | | | | | | | | |
| 4.29% due 09/26/21 | | | 2,453,216 | | | | 2,293,757 | |
3.82% due 09/26/19†††,2 | | | 933,333 | | | | 871,510 | |
| Smart & Final Stores LLC | | | | | | | | |
| 4.58% due 11/15/22 | | | 3,200,000 | | | | 3,140,000 | |
| Men’s Wearhouse | | | | | | | | |
| 4.53% due 06/18/21 | | | 3,160,388 | | | | 2,997,090 | |
| BJ’s Wholesale Club, Inc. | | | | | | | | |
| 4.75% due 02/03/24 | | | 2,750,000 | | | | 2,684,193 | |
| Packers Holdings | | | | | | | | |
| 4.80% due 12/02/21 | | | 2,055,725 | | | | 2,071,143 | |
| Dealer Tire LLC | | | | | | | | |
| 4.94% due 12/22/21 | | | 1,955,175 | | | | 1,979,615 | |
| CH Hold Corp. | | | | | | | | |
| 4.00% due 02/01/24 | | | 1,772,727 | | | | 1,783,807 | |
| 4.00% due 08/01/17 | | | 18,182 | | | | — | |
| Peer Holding BV | | | | | | | | |
4.25% due 02/25/222 | | EUR | 1,600,000 | | | | 1,731,117 | |
| Med Finance Merger Sub LLC | | | | | | | | |
7.40% due 08/16/21†††,2 | | | 1,576,639 | | | | 1,565,148 | |
| 1-800 Contacts | | | | | | | | |
| 4.28% due 01/22/23 | | | 1,460,278 | | | | 1,468,791 | |
| GVC Holdings plc | | | | | | | | |
| 3.25% due 03/02/23 | | EUR | 1,300,000 | | | | 1,393,897 | |
| NPC International, Inc. | | | | | | | | |
| 4.75% due 12/28/18 | | | 1,276,800 | | | | 1,281,588 | |
| Alexander Mann Solutions Ltd. | | | | | | | | |
| 5.90% due 12/20/19 | | | 1,043,543 | | | | 1,022,672 | |
| Richmond UK Bidco Ltd. | | | | | | | | |
| 4.51% due 03/04/24 | | GBP | 800,000 | | | | 1,013,036 | |
| K & N Parent, Inc. | | | | | | | | |
| 5.75% due 10/20/23 | | | 997,500 | | | | 999,994 | |
| Focus Brands Inc. | | | | | | | | |
| 5.00% due 10/05/23 | | | 726,000 | | | | 726,000 | |
| Global Blue Finance Sarl | | | | | | | | |
| 4.50% due 12/12/22 | | EUR | 500,000 | | | | 540,707 | |
| Rite Aid Corp. | | | | | | | | |
| 5.75% due 08/21/20 | | | 100,000 | | | | 100,125 | |
| Total Consumer, Cyclical | | | 156,390,687 | |
| | | | | | | | | |
| TECHNOLOGY - 3.0% | |
| Epicor Software | | | | | | | | |
| 4.75% due 06/01/22 | | | 14,896,170 | | | | 14,911,066 | |
| 5.00% due 06/01/22 | | | 7,598,101 | | | | 7,610,790 | |
| EIG Investors Corp. | | | | | | | | |
| 6.04% due 02/09/23 | | | 18,023,997 | | | | 18,144,216 | |
| 6.53% due 11/08/19 | | | 3,132,118 | | | | 3,143,863 | |
| TIBCO Software, Inc. | | | | | | | | |
| 5.50% due 12/04/20 | | | 11,573,609 | | | | 11,686,914 | |
| Severin Acquisition LLC | | | | | | | | |
6.02% due 07/30/21†††,2 | | | 3,447,500 | | | | 3,447,500 | |
5.90% due 07/30/21†††,2 | | | 3,450,000 | | | | 3,415,500 | |
6.15% due 07/30/21†††,2 | | | 2,629,788 | | | | 2,629,788 | |
6.52% due 07/30/21†††,2 | | | 796,000 | | | | 796,000 | |
| Advanced Computer Software | | | | | | | | |
10.56% due 01/31/232 | | | 5,000,000 | | | | 4,545,850 | |
| 6.56% due 03/18/22 | | | 3,430,000 | | | | 3,318,525 | |
| Project Alpha Intermediate Holding, Inc. | | | | | | | | |
9.25% due 08/22/22††† | | | 7,960,000 | | | | 7,821,663 | |
| Planview, Inc. (PHNTM Holdings, Inc.) | | | | | | | | |
6.25% due 01/27/23†††,2 | | | 6,600,000 | | | | 6,501,000 | |
| Nimbus Acquisition Topco Ltd. | | | | | | | | |
7.25% due 07/15/21†††,2 | | GBP | 5,050,000 | | | | 6,252,137 | |
| LANDesk Group, Inc. | | | | | | | | |
| 5.25% due 01/20/24 | | | 6,075,000 | | | | 6,101,609 | |
| SEE NOTES TO FINANCIAL STATEMENTS. | THE GUGGENHEIM FUNDS SEMI-ANNUAL REPORT | 27 |
CONSOLIDATED SCHEDULE OF INVESTMENTS (Unaudited)(continued) | March 31, 2017 |
| MACRO OPPORTUNITIES FUND | |
| | | Face
Amount15 | | | Value | |
| | | | | | | | | |
| Solera LLC | | | | | | | | |
5.41% due 03/03/21†††,2 | | $ | 6,480,000 | | | $ | 5,764,704 | |
| Kronos, Inc. | | | | | | | | |
| 5.03% due 11/01/23 | | | 4,488,750 | | | | 4,511,688 | |
| Masergy Holdings, Inc. | | | | | | | | |
| 5.50% due 12/15/23 | | | 3,990,000 | | | | 4,014,938 | |
| Active Network LLC | | | | | | | | |
| 6.00% due 11/13/20 | | | 3,974,534 | | | | 3,979,502 | |
| Cypress Holdings | | | | | | | | |
| 7.75% due 03/31/25 | | | 3,843,750 | | | | 3,763,569 | |
| Ipreo Holdings | | | | | | | | |
| 4.40% due 08/06/21 | | | 3,222,944 | | | | 3,198,772 | |
| Micron Technology, Inc. | | | | | | | | |
| 4.74% due 04/26/22 | | | 3,027,125 | | | | 3,037,538 | |
| Diebold, Inc. | | | | | | | | |
| 5.38% due 11/06/23 | | | 2,862,000 | | | | 2,902,240 | |
| Ceridian Corp. | | | | | | | | |
| 4.54% due 09/15/20 | | | 2,631,835 | | | | 2,608,807 | |
| Infor (US), Inc. | | | | | | | | |
| 3.75% due 02/01/22 | | EUR | 2,200,000 | | | | 2,361,837 | |
| Mirion Technologies | | | | | | | | |
| 5.90% due 03/31/22 | | | 2,205,000 | | | | 2,199,488 | |
| Sparta Holding Corp. | | | | | | | | |
6.65% due 07/28/20†††,2 | | | 1,814,608 | | | | 1,804,549 | |
| CPI Acquisition, Inc. | | | | | | | | |
| 5.83% due 08/17/22 | | | 1,722,372 | | | | 1,598,930 | |
| Compucom Systems, Inc. | | | | | | | | |
| 4.25% due 05/11/20 | | | 1,865,732 | | | | 1,548,558 | |
| Verisure Cayman 2 | | | | | | | | |
| 3.00% due 10/21/22 | | EUR | 1,400,000 | | | | 1,496,326 | |
| MRI Software LLC | | | | | | | | |
5.40% due 06/23/21††† | | | 1,381,433 | | | | 1,367,619 | |
| GTT Communications, Inc. | | | | | | | | |
| 5.00% due 01/09/24 | | | 1,296,750 | | | | 1,312,959 | |
| GlobalLogic Holdings, Inc. | | | | | | | | |
| 5.65% due 06/20/22 | | | 1,238,590 | | | | 1,241,686 | |
| Aspect Software, Inc. | | | | | | | | |
| 11.28% due 05/25/20 | | | 1,052,219 | | | | 1,050,904 | |
| Oberthur Technologies of America Corp. | | | | | | | | |
| 3.75% due 01/10/24 | | | 877,632 | | | | 883,117 | |
| Hyland Software, Inc. | | | | | | | | |
| 4.23% due 07/01/22 | | | 617,873 | | | | 624,824 | |
| Oberthur Technologies Group SAS | | | | | | | | |
| 3.75% due 01/10/24 | | EUR | 516,607 | | | | 550,961 | |
| Eze Castle Software, Inc. | | | | | | | | |
| 7.65% due 04/05/21 | | | 400,000 | | | | 396,500 | |
| Total Technology | | | | | | | 152,546,437 | |
| | | | | | | | | |
| CONSUMER, NON-CYCLICAL - 2.3% | |
| IHC Holding Corp. | | | | | | | | |
7.02% due 04/30/21†††,2 | | | 7,387,500 | | | | 7,312,090 | |
7.25% due 04/30/21†††,2 | | | 1,442,750 | | | | 1,440,586 | |
| Affordable Care Holdings Corp. | | | | | | | | |
| 5.75% due 10/24/22 | | | 7,159,375 | | | | 7,159,375 | |
| Lineage Logistics LLC | | | | | | | | |
| 4.50% due 04/07/21 | | | 6,350,049 | | | | 6,346,112 | |
| One Call Medical, Inc. | | | | | | | | |
| 5.09% due 11/27/20 | | | 6,040,337 | | | | 5,642,701 | |
| American Seafoods | | | | | | | | |
6.02% due 08/19/212 | | | 5,525,556 | | | | 5,537,049 | |
| Springs Industries, Inc. | | | | | | | | |
7.50% due 06/01/21†††,2 | | | 5,074,500 | | | | 5,074,500 | |
| At Home Holding III Corp. | | | | | | | | |
| 4.54% due 06/03/22 | | | 4,912,500 | | | | 4,900,219 | |
| ABB Concise Optical Group LLC | | | | | | | | |
| 6.13% due 06/15/23 | | | 4,557,100 | | | | 4,596,975 | |
| Grocery Outlet, Inc. | | | | | | | | |
| 5.15% due 10/21/21 | | | 4,361,329 | | | | 4,365,429 | |
| Project Ruby Ultimate Parent Corp. | | | | | | | | |
| 4.75% due 02/09/24 | | | 4,300,000 | | | | 4,312,556 | |
| Chobani LLC | | | | | | | | |
| 5.25% due 10/09/23 | | | 4,139,625 | | | | 4,174,108 | |
28 | THE GUGGENHEIM FUNDS SEMI-ANNUAL REPORT | SEE NOTES TO FINANCIAL STATEMENTS. |
CONSOLIDATED SCHEDULE OF INVESTMENTS (Unaudited)(continued) | March 31, 2017 |
| MACRO OPPORTUNITIES FUND | |
| | | Face
Amount15 | | | Value | |
| | | | | | | | | |
| Authentic Brands | | | | | | | | |
| 5.17% due 05/27/21 | | $ | 4,056,104 | | | $ | 4,086,525 | |
| Arctic Glacier Group Holdings, Inc. | | | | | | | | |
| 5.25% due 03/20/24 | | | 3,700,000 | | | | 3,732,375 | |
| American Tire Distributors, Inc. | | | | | | | | |
| 5.25% due 09/01/21 | | | 3,649,326 | | | | 3,653,888 | |
| DJO Finance LLC | | | | | | | | |
| 4.25% due 06/08/20 | | | 3,715,396 | | | | 3,589,221 | |
| SHO Holding I Corp. | | | | | | | | |
6.00% due 10/27/222 | | | 3,390,000 | | | | 3,373,050 | |
| Packaging Coordinators Midco, Inc. | | | | | | | | |
| 5.00% due 06/30/23 | | | 3,184,000 | | | | 3,170,086 | |
| Give and Go Prepared Foods Corp. | | | | | | | | |
| 6.65% due 07/29/23 | | | 2,796,723 | | | | 2,824,690 | |
| Dole Food Company, Inc. | | | | | | | | |
| 4.00% due 03/23/24 | | | 2,800,000 | | | | 2,816,800 | |
| Chef’s Warehouse Parent LLC | | | | | | | | |
6.75% due 06/22/222 | | | 2,599,202 | | | | 2,621,945 | |
| Culligan Holding, Inc. | | | | | | | | |
| 5.00% due 12/13/23 | | | 2,500,000 | | | | 2,534,375 | |
| IVC Acquisition Midco Ltd. | | | | | | | | |
| 4.50% due 01/26/24 | | GBP | 1,800,000 | | | | 2,266,633 | |
| CTI Foods Holding Co. LLC | | | | | | | | |
| 4.65% due 06/29/20 | | | 1,250,000 | | | | 1,237,500 | |
| 8.40% due 06/28/21 | | | 1,035,000 | | | | 931,500 | |
| Reddy Ice Holdings, Inc. | | | | | | | | |
| 6.75% due 05/01/19 | | | 1,056,481 | | | | 1,032,710 | |
10.75% due 10/01/192 | | | 1,125,000 | | | | 1,004,996 | |
| Bioclinica-Synowledge Holdings Corp. | | | | | | | | |
| 5.25% due 10/20/23 | | | 2,000,000 | | | | 2,017,500 | |
| Nellson Nutraceutical (US) | | | | | | | | |
| 6.15% due 12/23/21 | | | 1,811,948 | | | | 1,798,358 | |
| BCPE Eagle Buyer LLC | | | | | | | | |
| 5.33% due 03/18/24 | | | 1,700,000 | | | | 1,697,875 | |
| AMAG Pharmaceuticals | | | | | | | | |
| 4.75% due 08/17/21 | | | 1,625,190 | | | | 1,623,841 | |
| ADMI Corp. | | | | | | | | |
| 4.80% due 04/29/22 | | | 1,300,000 | | | | 1,310,569 | |
| CPI Holdco LLC | | | | | | | | |
| 5.15% due 03/21/24 | | | 1,200,000 | | | | 1,206,000 | |
| Nellson Nutraceutical (CAD) | | | | | | | | |
| 6.15% due 12/23/21 | | | 1,125,431 | | | | 1,116,991 | |
| Press Ganey Holdings, Inc. | | | | | | | | |
| 4.25% due 10/23/23 | | | 997,500 | | | | 999,375 | |
| NES Global Talent | | | | | | | | |
6.54% due 10/03/192 | | | 1,035,035 | | | | 931,531 | |
| Constellation Brands, Inc. | | | | | | | | |
| 4.89% due 12/15/23 | | | 623,438 | | | | 627,920 | |
| Quorum Business Solutions | | | | | | | | |
5.75% due 08/06/212 | | | 654,925 | | | | 618,904 | |
| Alpha BidCo SAS | | | | | | | | |
| 3.50% due 01/29/23 | | EUR | 279,950 | | | | 301,440 | |
| Cheese Bidco B.V. | | | | | | | | |
| 3.50% due 02/06/24 | | EUR | 120,050 | | | | 129,266 | |
| Targus Group International, Inc. | | | | | | | | |
due 05/24/16†††,2,9 | | | 152,876 | | | | — | |
| Total Consumer, Non-cyclical | | | 114,117,564 | |
| | | | | | | | | |
| INDUSTRIAL - 2.2% | |
| Travelport Finance Luxembourg Sarl | | | | | | | | |
| 4.29% due 09/02/21 | | | 10,210,186 | | | | 10,278,287 | |
| DAE Aviation | | | | | | | | |
| 5.25% due 07/07/22 | | | 6,750,848 | | | | 6,776,163 | |
| USIC Holding, Inc. | | | | | | | | |
| 5.17% due 12/08/23 | | | 6,010,938 | | | | 6,040,992 | |
| Optiv, Inc. | | | | | | | | |
| 4.25% due 02/01/24 | | | 5,525,000 | | | | 5,549,200 | |
| Advanced Integration Technology LP | | | | | | | | |
| 6.50% due 07/22/21 | | | 5,295,000 | | | | 5,328,094 | |
| CareCore National LLC | | | | | | | | |
| 5.50% due 03/05/21 | | | 5,080,258 | | | | 5,092,959 | |
| BWAY Holding Co. | | | | | | | | |
| 3.25% due 04/03/24 | | | 4,500,000 | | | | 4,485,960 | |
| SEE NOTES TO FINANCIAL STATEMENTS. | THE GUGGENHEIM FUNDS SEMI-ANNUAL REPORT | 29 |
CONSOLIDATED SCHEDULE OF INVESTMENTS (Unaudited)(continued) | March 31, 2017 |
| MACRO OPPORTUNITIES FUND | |
| | | Face
Amount15 | | | Value | |
| | | | | | | | | |
| Kuehg Corp. | | | | | | | | |
| 5.40% due 08/12/22 | | $ | 4,426,922 | | | $ | 4,449,057 | |
| ProAmpac PG Borrower LLC | | | | | | | | |
| 5.06% due 11/20/23 | | | 4,250,000 | | | | 4,279,750 | |
| Pro Mach Group, Inc. | | | | | | | | |
| 4.75% due 10/22/21 | | | 4,251,635 | | | | 4,255,632 | |
| GYP Holdings III Corp. | | | | | | | | |
| 4.54% due 04/01/21 | | | 4,234,405 | | | | 4,248,506 | |
| VC GB Holdings, Inc. | | | | | | | | |
| 4.75% due 02/28/24 | | | 4,075,000 | | | | 4,095,375 | |
| Tronair Parent, Inc. | | | | | | | | |
| 5.86% due 09/08/23 | | | 3,988,315 | | | | 3,948,432 | |
| SI Organization | | | | | | | | |
| 5.65% due 11/22/19 | | | 3,680,116 | | | | 3,716,917 | |
| CHI Overhead Doors, Inc. | | | | | | | | |
| 4.25% due 07/29/22 | | | 3,649,507 | | | | 3,643,412 | |
| Hardware Holdings LLC | | | | | | | | |
7.68% due 03/30/20†††,2 | | | 3,071,250 | | | | 3,009,825 | |
| Bioplan USA, Inc. | | | | | | | | |
| 5.75% due 09/23/21 | | | 2,959,026 | | | | 2,903,544 | |
| NVA Holdings, Inc. | | | | | | | | |
| 4.65% due 08/14/21 | | | 2,855,574 | | | | 2,880,560 | |
| Milacron LLC | | | | | | | | |
| 3.98% due 09/28/23 | | | 2,294,250 | | | | 2,304,299 | |
| Capstone Logistics | | | | | | | | |
| 5.50% due 10/07/21 | | | 2,186,003 | | | | 2,169,608 | |
| Corialis Group Ltd. | | | | | | | | |
| 3.75% due 03/11/24 | | EUR | 2,000,000 | | | | 2,140,467 | |
| Thermasys Corp. | | | | | | | | |
5.25% due 05/03/192 | | | 2,199,125 | | | | 1,968,217 | |
| Zodiac Pool Solutions LLC | | | | | | | | |
| 5.65% due 12/20/23 | | | 1,795,500 | | | | 1,805,968 | |
| National Technical Systems | | | | | | | | |
7.25% due 06/12/21†††,2 | | | 1,841,615 | | | | 1,795,575 | |
| Hillman Group, Inc. | | | | | | | | |
| 4.65% due 06/30/21 | | | 1,767,822 | | | | 1,780,338 | |
| Survitec | | | | | | | | |
5.55% due 03/12/222 | | GBP | 1,125,000 | | | | 1,380,532 | |
| 4.00% due 03/12/22 | | EUR | 300,000 | | | | 319,268 | |
| CPM Holdings, Inc. | | | | | | | | |
| 5.25% due 04/11/22 | | | 1,674,500 | | | | 1,695,431 | |
| Douglas Dynamics LLC | | | | | | | | |
| 4.50% due 12/31/21 | | | 1,526,187 | | | | 1,530,002 | |
| Swissport Investments S.A. | | | | | | | | |
| 6.25% due 02/09/22 | | EUR | 1,250,000 | | | | 1,352,369 | |
| Reynolds Group Holdings, Inc. | | | | | | | | |
| 3.98% due 02/05/23 | | | 1,197,000 | | | | 1,201,118 | |
| Constantia Lux Parent S.A. | | | | | | | | |
| 4.00% due 04/30/22 | | | 985,031 | | | | 985,652 | |
| Mast Global | | | | | | | | |
7.75% due 09/12/19†††,2 | | | 978,634 | | | | 974,596 | |
| American Bath Group LLC | | | | | | | | |
| 6.40% due 09/30/23 | | | 652,580 | | | | 657,057 | |
| Filtration Group Corp. | | | | | | | | |
| 4.30% due 11/23/20 | | | 500,000 | | | | 503,335 | |
| Tank Holdings Corp. | | | | | | | | |
| 5.25% due 03/16/22 | | | 445,652 | | | | 445,282 | |
| Doncasters Group Ltd. | | | | | | | | |
| 9.50% due 10/09/20 | | | 456,207 | | | | 438,337 | |
| Ceva Group Plc (United Kingdom) | | | | | | | | |
8.00% due 03/19/19†††,2 | | | 480,000 | | | | 421,200 | |
| Hunter Fan Co. | | | | | | | | |
6.50% due 12/20/172 | | | 391,931 | | | | 388,012 | |
| Hunter Defense Technologies | | | | | | | | |
7.01% due 08/05/192 | | | 365,333 | | | | 328,800 | |
| NANA Development Corp. | | | | | | | | |
8.00% due 03/15/182 | | | 260,000 | | | | 253,500 | |
| Wencor Group | | | | | | | | |
4.48% due 06/19/192 | | | 123,077 | | | | 115,614 | |
| Total Industrial | | | | | | | 111,937,242 | |
| | | | | | | | | |
| COMMUNICATIONS - 1.2% | |
| Cengage Learning Acquisitions, Inc. | | | | | | | | |
| 5.25% due 06/07/23 | | | 27,019,060 | | | | 25,710,258 | |
30 | THE GUGGENHEIM FUNDS SEMI-ANNUAL REPORT | SEE NOTES TO FINANCIAL STATEMENTS. |
CONSOLIDATED SCHEDULE OF INVESTMENTS (Unaudited)(continued) | March 31, 2017 |
| MACRO OPPORTUNITIES FUND | |
| | | Face
Amount15 | | | Value | |
| | | | | | | | | |
| Radiate HoldCo LLC | | | | | | | | |
| 3.98% due 02/01/24 | | $ | 4,200,000 | | | $ | 4,216,338 | |
| Mcgraw-Hill Global Education Holdings LLC | | | | | | | | |
| 5.00% due 05/04/22 | | | 4,168,500 | | | | 4,117,561 | |
| SFR Group SA | | | | | | | | |
| 4.29% due 01/14/25 | | | 4,039,875 | | | | 4,039,875 | |
| Anaren, Inc. | | | | | | | | |
5.65% due 02/18/212 | | | 1,862,113 | | | | 1,850,474 | |
9.40% due 08/18/212 | | | 1,500,000 | | | | 1,460,625 | |
| Proquest LLC | | | | | | | | |
| 5.25% due 10/24/21 | | | 2,999,539 | | | | 3,040,783 | |
| Internet Brands | | | | | | | | |
4.75% due 07/08/21††† | | | 2,606,603 | | | | 2,616,590 | |
| Neustar, Inc. | | | | | | | | |
| 4.75% due 03/01/24 | | | 2,500,000 | | | | 2,528,125 | |
| Ziggo Secured Finance BV | | | | | | | | |
| 3.00% due 04/15/25 | | EUR | 2,250,000 | | | | 2,396,503 | |
| Telenet Financing USD LLC | | | | | | | | |
| 3.91% due 01/31/25 | | | 2,200,000 | | | | 2,200,286 | |
| MergerMarket Ltd. | | | | | | | | |
| 4.56% due 02/04/21 | | | 1,164,975 | | | | 1,162,062 | |
| Bureau van Dijk Electronic Publishing BV | | | | | | | | |
4.84% due 09/20/212 | | GBP | 787,910 | | | | 991,112 | |
| Virgin Media SFA Finance Ltd. | | | | | | | | |
| 3.83% due 01/31/26 | | GBP | 750,000 | | | | 941,640 | |
| Sesac Holdco II LLC | | | | | | | | |
| 4.26% due 02/23/24 | | | 750,000 | | | | 749,378 | |
| Liberty Cablevision of Puerto Rico LLC | | | | | | | | |
| 4.52% due 01/07/22 | | | 600,000 | | | | 597,252 | |
| Total Communications | | | | | | | 58,618,862 | |
| | | | | | | | | |
| UTILITIES - 1.0% | |
| Invenergy Thermal Operating I, LLC | | | | | | | | |
| 6.65% due 10/19/22 | | | 11,905,088 | | | | 11,428,883 | |
| Dynegy, Inc. | | | | | | | | |
| 4.25% due 06/27/23 | | | 9,300,000 | | | | 9,317,948 | |
| Viva Alamo LLC | | | | | | | | |
5.30% due 02/22/21††† | | | 6,157,367 | | | | 5,849,498 | |
| Helix Gen Funding LLC | | | | | | | | |
| 4.75% due 03/08/24 | | | 4,370,000 | | | | 4,430,088 | |
| EFS Cogen Holdings I LLC | | | | | | | | |
| 4.65% due 06/28/23 | | | 3,938,285 | | | | 3,969,949 | |
| MRP Generation Holding | | | | | | | | |
| 8.15% due 10/18/22 | | | 3,482,500 | | | | 3,460,734 | |
| Panda Hummel | | | | | | | | |
| 7.00% due 10/27/22 | | | 3,525,000 | | | | 3,406,031 | |
| Terraform AP Acquisition Holdings LLC | | | | | | | | |
| 5.65% due 06/26/22 | | | 2,755,283 | | | | 2,775,948 | |
| Lightstone HoldCo LLC | | | | | | | | |
| 5.54% due 01/30/24 | | | 1,700,000 | | | | 1,708,926 | |
| Exgen Texas Power LLC | | | | | | | | |
| 5.90% due 09/18/21 | | | 2,361,613 | | | | 1,532,097 | |
| Osmose Utility Services, Inc. | | | | | | | | |
| 4.90% due 08/22/22 | | | 1,326,009 | | | | 1,329,325 | |
| Panda Power | | | | | | | | |
| 7.65% due 08/21/20 | | | 1,315,063 | | | | 1,290,405 | |
| Panda Temple II Power | | | | | | | | |
| 7.25% due 04/03/19 | | | 1,285,989 | | | | 1,113,988 | |
| Stonewall | | | | | | | | |
| 6.65% due 11/15/21 | | | 500,000 | | | | 486,250 | |
| Panda Hummel Station | | | | | | | | |
| 7.00% due 10/27/22 | | | 200,000 | | | | 193,250 | |
| Total Utilities | | | | | | | 52,293,320 | |
| | | | | | | | | |
| FINANCIAL - 0.9% | |
| National Financial Partners Corp. | | | | | | | | |
| 4.65% due 01/08/24 | | | 7,880,250 | | | | 7,959,052 | |
| Americold Realty Operating Partnership, LP | | | | | | | | |
| 4.75% due 12/01/22 | | | 7,467,322 | | | | 7,537,365 | |
| Acrisure LLC | | | | | | | | |
| 5.90% due 11/22/23 | | | 5,877,302 | | | | 5,965,461 | |
| Hyperion Insurance | | | | | | | | |
| 5.50% due 04/29/22 | | | 3,532,477 | | | | 3,542,050 | |
| SEE NOTES TO FINANCIAL STATEMENTS. | THE GUGGENHEIM FUNDS SEMI-ANNUAL REPORT | 31 |
CONSOLIDATED SCHEDULE OF INVESTMENTS (Unaudited)(continued) | March 31, 2017 |
| MACRO OPPORTUNITIES FUND | |
| | | Face
Amount15 | | | Value | |
| | | | | | | | | |
| Alliant Holdings I L.P. | | | | | | | | |
| 4.39% due 08/12/22 | | $ | 3,486,656 | | | $ | 3,501,614 | |
| Magic Newco, LLC | | | | | | | | |
| 5.00% due 12/12/18 | | | 3,319,793 | | | | 3,329,487 | |
| York Risk Services | | | | | | | | |
4.90% due 10/01/212 | | | 3,033,436 | | | | 2,946,225 | |
| Assured Partners, Inc. | | | | | | | | |
| 5.25% due 10/21/22 | | | 2,408,299 | | | | 2,423,953 | |
| Integro Parent, Inc. | | | | | | | | |
| 6.80% due 10/28/22 | | | 2,222,516 | | | | 2,222,516 | |
| Capital Automotive L.P. | | | | | | | | |
| 4.00% due 03/25/24 | | | 2,000,000 | | | | 2,020,000 | |
| American Stock Transfer & Trust | | | | | | | | |
| 5.75% due 06/26/20 | | | 1,553,695 | | | | 1,549,811 | |
| Ryan LLC | | | | | | | | |
6.75% due 08/07/202 | | | 1,145,512 | | | | 1,131,193 | |
| Total Financial | | | | | | | 44,128,727 | |
| | | | | | | | | |
| BASIC MATERIALS - 0.4% | |
| PQ Corp. | | | | | | | | |
| 5.29% due 11/04/22 | | | 4,145,359 | | | | 4,187,559 | |
| Platform Specialty Products | | | | | | | | |
| 4.25% due 06/07/20 | | EUR | 1,968,302 | | | | 2,106,857 | |
| 4.50% due 06/07/20 | | | 828,130 | | | | 835,823 | |
| Hoffmaster Group, Inc. | | | | | | | | |
| 5.50% due 11/21/23 | | | 2,443,875 | | | | 2,471,369 | |
| Dubois Chemicals, Inc. | | | | | | | | |
| 4.88% due 03/15/24 | | | 2,400,000 | | | | 2,413,008 | |
| Zep, Inc. | | | | | | | | |
| 5.00% due 06/27/22 | | | 1,970,000 | | | | 1,994,625 | |
| ASP Chromaflo Dutch I B.V. | | | | | | | | |
| 5.00% due 11/20/23 | | | 1,692,548 | | | | 1,699,961 | |
| ASP Chromaflo Intermediate Holdings, Inc. | | | | | | | | |
| 5.00% due 11/20/23 | | | 1,301,640 | | | | 1,307,341 | |
| Ferro Corp. | | | | | | | | |
| 2.75% due 02/14/24 | | EUR | 600,000 | | | | 638,536 | |
| Arch Coal, Inc. | | | | | | | | |
| 5.00% due 03/07/24 | | | 500,000 | | | | 498,905 | |
| Nexeo Solutions LLC | | | | | | | | |
| 4.81% due 06/09/23 | | | 300,000 | | | | 302,250 | |
| Total Basic Materials | | | | | | | 18,456,234 | |
| | | | | | | | | |
| ENERGY - 0.1% | |
| Cactus Wellhead | | | | | | | | |
| 7.15% due 07/31/20 | | | 3,095,073 | | | | 2,941,868 | |
| Gavilan Resources LLC | | | | | | | | |
| 7.00% due 03/01/24 | | | 1,500,000 | | | | 1,481,250 | |
| Summit Midstream Partners, LP | | | | | | | | |
| 7.02% due 05/13/22 | | | 1,300,000 | | | | 1,322,750 | |
| Linn Energy LLC / Linn Energy Finance Corp. | | | | | | | | |
| 4.32% due 02/27/21 | | | 578,009 | | | | 534,658 | |
| 8.33% due 02/27/21 | | | 289,005 | | | | 290,450 | |
| PSS Companies | | | | | | | | |
5.65% due 01/28/202 | | | 850,365 | | | | 680,292 | |
| Total Energy | | | | | | | 7,251,268 | |
| Total Senior Floating Rate Interests | | | | | |
| (Cost $718,595,107) | | | | | | | 715,740,341 | |
| | | | | | | | | |
CORPORATE BONDS†† - 9.7% | |
| FINANCIAL - 6.4% | |
| Citigroup, Inc. | | | | | | | | |
6.25%7,10 | | | 31,670,000 | | | | 34,164,012 | |
5.95%7,10 | | | 16,169,000 | | | | 16,876,394 | |
5.95%7,10 | | | 6,050,000 | | | | 6,299,623 | |
5.90%7,10 | | | 3,300,000 | | | | 3,444,375 | |
| Bank of America Corp. | | | | | | | | |
6.10%7,10 | | | 31,313,000 | | | | 33,176,123 | |
6.50%7,10 | | | 13,948,000 | | | | 15,220,755 | |
6.30%7,10 | | | 11,100,000 | | | | 12,071,250 | |
| JPMorgan Chase & Co. | | | | | | | | |
6.10%7,10 | | | 22,250,000 | | | | 23,512,688 | |
6.00%7,10 | | | 11,635,000 | | | | 12,132,978 | |
| Wells Fargo & Co. | | | | | | | | |
5.88%7,10 | | | 29,550,000 | | | | 31,853,186 | |
| Goldman Sachs Group, Inc. | | | | | | | | |
5.30%7,10 | | | 23,680,000 | | | | 24,124,000 | |
| Jefferies Finance LLC / JFIN Company-Issuer Corp. | | | | | | | | |
7.38% due 04/01/208 | | | 10,974,000 | | | | 11,083,739 | |
32 | THE GUGGENHEIM FUNDS SEMI-ANNUAL REPORT | SEE NOTES TO FINANCIAL STATEMENTS. |
CONSOLIDATED SCHEDULE OF INVESTMENTS (Unaudited)(continued) | March 31, 2017 |
| MACRO OPPORTUNITIES FUND | |
| | | Face
Amount15 | | | Value | |
| | | | | | | | | |
7.50% due 04/15/218 | | $ | 8,826,000 | | | $ | 8,903,228 | |
6.88% due 04/15/228 | | | 1,625,000 | | | | 1,551,875 | |
| Bank of New York Mellon Corp. | | | | | | | | |
4.63%7,10 | | | 14,650,000 | | | | 14,064,000 | |
| Atlas Mara Ltd. | | | | | | | | |
8.00% due 12/31/202 | | | 14,400,000 | | | | 11,908,800 | |
| Voya Financial, Inc. | | | | | | | | |
5.65% due 05/15/537 | | | 10,960,000 | | | | 11,151,800 | |
| GEO Group, Inc. | | | | | | | | |
| 5.88% due 10/15/24 | | | 5,060,000 | | | | 5,173,850 | |
| 6.00% due 04/15/26 | | | 2,194,000 | | | | 2,221,915 | |
| KeyCorp | | | | | | | | |
5.00%7,10 | | | 7,250,000 | | | | 7,177,500 | |
| Customers Bank | | | | | | | | |
6.13% due 06/26/297,16 | | | 4,500,000 | | | | 4,601,250 | |
| QBE Insurance Group Ltd. | | | | | | | | |
7.25% due 11/24/437,8 | | | 3,800,000 | | | | 4,313,000 | |
| Citizens Financial Group, Inc. | | | | | | | | |
5.50%7,10 | | | 4,000,000 | | | | 4,105,000 | |
| Greystar Real Estate Partners LLC | | | | | | | | |
8.25% due 12/01/228 | | | 3,600,000 | | | | 3,883,500 | |
| FBM Finance, Inc. | | | | | | | | |
8.25% due 08/15/218 | | | 3,200,000 | | | | 3,392,000 | |
| NFP Corp. | | | | | | | | |
9.00% due 07/15/218 | | | 3,061,000 | | | | 3,235,018 | |
| M&T Bank Corp. | | | | | | | | |
5.13%7,10 | | | 2,600,000 | | | | 2,587,000 | |
| Univest Corporation of Pennsylvania | | | | | | | | |
5.10% due 03/30/252,7 | | | 2,500,000 | | | | 2,543,750 | |
| Jefferies LoanCore LLC / JLC Finance Corp. | | | | | | | | |
6.88% due 06/01/208 | | | 1,700,000 | | | | 1,721,250 | |
| Northern Trust Corp. | | | | | | | | |
4.60%7,10 | | | 1,300,000 | | | | 1,274,000 | |
| NewStar Financial, Inc. | | | | | | | | |
| 7.25% due 05/01/20 | | | 1,225,000 | | | | 1,246,438 | |
| US Bancorp | | | | | | | | |
5.30%7,10 | | | 1,200,000 | | | | 1,222,500 | |
| Total Financial | | | | | | | 320,236,797 | |
| | | | | | | | | |
| BASIC MATERIALS - 0.6% | |
| BHP Billiton Finance USA Ltd. | | | | | | | | |
6.75% due 10/19/757,8 | | | 14,500,000 | | | | 16,399,500 | |
| Yamana Gold, Inc. | | | | | | | | |
| 4.95% due 07/15/24 | | | 12,800,000 | | | | 12,864,000 | |
| GCP Applied Technologies, Inc. | | | | | | | | |
9.50% due 02/01/238 | | | 450,000 | | | | 510,750 | |
| Mirabela Nickel Ltd. | | | | | | | | |
2.38% due 06/24/192 | | | 1,885,418 | | | | 131,979 | |
1.00% due 09/10/44†††,2 | | | 37,690 | | | | — | |
| New Day Aluminum | | | | | | | | |
10.00% due 10/28/20†††,2 | | | 47,328 | | | | 40,229 | |
| Total Basic Materials | | | | | | | 29,946,458 | |
| | | | | | | | | |
| CONSUMER, CYCLICAL - 0.6% | |
| Ferrellgas Limited Partnership / Ferrellgas Finance Corp. | | | | | | | | |
| 6.50% due 05/01/21 | | | 10,000,000 | | | | 9,500,000 | |
| 6.75% due 06/15/23 | | | 5,700,000 | | | | 5,358,000 | |
| Ferrellgas, LP / Ferrellgas Finance Corp. | | | | | | | | |
| 6.75% due 01/15/22 | | | 6,653,000 | | | | 6,287,085 | |
| Nathan’s Famous, Inc. | | | | | | | | |
10.00% due 03/15/208 | | | 4,355,000 | | | | 4,681,625 | |
| Carrols Restaurant Group, Inc. | | | | | | | | |
| 8.00% due 05/01/22 | | | 2,574,000 | | | | 2,747,745 | |
| Total Consumer, Cyclical | | | 28,574,455 | |
| | | | | | | | | |
| ENERGY - 0.6% | |
| CONSOL Energy, Inc. | | | | | | | | |
| 8.00% due 04/01/23 | | | 10,300,000 | | | | 10,827,875 | |
| BreitBurn Energy Partners Limited Partnership / BreitBurn Finance Corp. | | | | | | | | |
9.25% due 05/18/20†††,2,11 | | | 5,037,000 | | | | 4,910,071 | |
| SEE NOTES TO FINANCIAL STATEMENTS. | THE GUGGENHEIM FUNDS SEMI-ANNUAL REPORT | 33 |
CONSOLIDATED SCHEDULE OF INVESTMENTS (Unaudited)(continued) | March 31, 2017 |
| MACRO OPPORTUNITIES FUND | |
| | | Face
Amount15 | | | Value | |
| | | | | | | | | |
| American Midstream Partners Limited Partnership / American Midstream Finance Corp. | | | | | | | | |
| 8.50% due 12/15/21 | | $ | 4,475,000 | | | $ | 4,564,500 | |
| Hess Corp. | | | | | | | | |
| 7.30% due 08/15/31 | | | 2,950,000 | | | | 3,475,669 | |
| EP Energy LLC / Everest Acquisition Finance, Inc. | | | | | | | | |
8.00% due 02/15/258 | | | 2,000,000 | | | | 1,860,000 | |
| Unit Corp. | | | | | | | | |
| 6.63% due 05/15/21 | | | 1,175,000 | | | | 1,157,375 | |
| Schahin II Finance Company SPV Ltd. | | | | | | | | |
5.88% due 09/25/2211,16 | | | 7,557,400 | | | | 869,101 | |
| Alta Mesa Holdings, LP / Alta Mesa Finance Services Corp. | | | | | | | | |
| 7.88% due 12/15/24 | | | 785,000 | | | | 818,363 | |
| Total Energy | | | | | | | 28,482,954 | |
| | | | | | | | | |
| CONSUMER, NON-CYCLICAL - 0.5% | |
| Bumble Bee Holdings, Inc. | | | | | | | | |
9.00% due 12/15/178 | | | 18,709,000 | | | | 18,241,275 | |
| Kinetic Concepts Incorporated / KCI USA Inc | | | | | | | | |
7.88% due 02/15/218 | | | 3,615,000 | | | | 3,831,900 | |
| Bumble Bee Holdco SCA | | | | | | | | |
9.63% due 03/15/188 | | | 1,826,000 | | | | 1,771,220 | |
| KeHE Distributors LLC / KeHE Finance Corp. | | | | | | | | |
7.63% due 08/15/218 | | | 1,125,000 | | | | 1,133,438 | |
| Total Consumer, Non-cyclical | | | 24,977,833 | |
| | | | | | | | | |
| INDUSTRIAL - 0.3% | |
| StandardAero Aviation Holdings, Inc. | | | | | | | | |
10.00% due 07/15/238 | | | 6,300,000 | | | | 6,756,750 | |
| Dynagas LNG Partners Limited Partnership / Dynagas Finance, Inc. | | | | | | | | |
6.25% due 10/30/192 | | | 5,950,000 | | | | 5,875,625 | |
| Princess Juliana International Airport Operating Company N.V. | | | | | | | | |
5.50% due 12/20/27†††,8 | | | 1,707,294 | | | | 1,705,575 | |
| LMI Aerospace, Inc. | | | | | | | | |
| 7.38% due 07/15/19 | | | 1,550,000 | | | | 1,608,125 | |
| Infor US, Inc. | | | | | | | | |
| 5.75% due 05/15/22 | | EUR | 1,120,000 | | | | 1,234,294 | |
| Grinding Media Inc. / MC Grinding Media Canada Inc. | | | | | | | | |
7.38% due 12/15/238 | | | 200,000 | | | | 210,000 | |
| Total Industrial | | | | | | | 17,390,369 | |
| | | | | | | | | |
| DIVERSIFIED - 0.3% | |
| HRG Group, Inc. | | | | | | | | |
| 7.88% due 07/15/19 | | | 15,017,000 | | | | 15,542,595 | |
| | | | | | | | | |
| COMMUNICATIONS - 0.2% | |
| MDC Partners, Inc. | | | | | | | | |
6.50% due 05/01/248 | | | 7,746,000 | | | | 7,387,748 | |
| McGraw-Hill Global Education Holdings LLC / McGraw-Hill Global Education Finance | | | | | | | | |
7.88% due 05/15/248 | | | 2,400,000 | | | | 2,322,000 | |
| EIG Investors Corp. | | | | | | | | |
| 10.88% due 02/01/24 | | | 1,100,000 | | | | 1,168,750 | |
| Cengage Learning, Inc. | | | | | | | | |
9.50% due 06/15/248 | | | 1,175,000 | | | | 1,051,625 | |
| Total Communications | | | | | | | 11,930,123 | |
| | | | | | | | | |
| TECHNOLOGY - 0.1% | |
| Micron Technology, Inc. | | | | | | | | |
7.50% due 09/15/238 | | | 2,250,000 | | | | 2,511,563 | |
| Epicor Software | | | | | | | | |
9.40% due 06/21/23†††,2 | | | 1,850,000 | | | | 1,807,450 | |
| Total Technology | | | | | | | 4,319,013 | |
34 | THE GUGGENHEIM FUNDS SEMI-ANNUAL REPORT | SEE NOTES TO FINANCIAL STATEMENTS. |
CONSOLIDATED SCHEDULE OF INVESTMENTS (Unaudited)(continued) | March 31, 2017 |
| MACRO OPPORTUNITIES FUND | |
| | | Face
Amount15 | | | Value | |
| | | | | | | | | |
| UTILITIES - 0.1% | |
| Terraform Global Operating LLC | | | | | | | | |
9.75% due 08/15/228 | | $ | 3,100,000 | | | $ | 3,475,875 | |
| Total Corporate Bonds | | | | | | | | |
| (Cost $482,340,127) | | | | | | | 484,876,472 | |
| | | | | | | | | |
FOREIGN GOVERNMENT BONDS†† - 0.7% | |
| Dominican Republic International Bond | | | | | | | | |
6.85% due 01/27/458 | | | 16,525,000 | | | | 17,062,063 | |
| Kenya Government International Bond | | | | | | | | |
6.88% due 06/24/248 | | | 16,900,000 | | | | 16,817,528 | |
| Senegal Government International Bond | | | | | | | | |
6.25% due 07/30/248 | | | 200,000 | | | | 201,620 | |
| Total Foreign Government Bonds | | | | | |
| (Cost $33,192,810) | | | | | | | 34,081,211 | |
| | | | | | | | | |
SENIOR FIXED RATE INTERESTS††,7 - 0.0%** | |
| FINANCIAL - 0.0%** | |
| Magic Newco, LLC | | | | | | | | |
| 12.00% due 06/12/19 | | | 1,075,000 | | | | 1,126,063 | |
| | | | | | | | | |
| CONSUMER, NON-CYCLICAL - 0.0%** | |
| Targus International LLC | | | | | | | | |
7.50% due 12/31/19†††,2 | | | 61,579 | | | | 86,106 | |
| Total Senior Fixed Rate Interests | | | | | |
| (Cost $1,279,547) | | | | | | | 1,212,169 | |
| | | | | | | | | |
COMMERCIAL PAPER†† - 11.8% | |
| Marriott International Inc/MD | | | | | | | | |
| 1.25% due 04/24/17 | | | 30,500,000 | | | | 30,475,642 | |
| 1.08% due 04/07/17 | | | 28,000,000 | | | | 27,994,960 | |
| 1.34% due 05/16/17 | | | 10,000,000 | | | | 9,983,000 | |
| Total Marriott International Inc/MD | | | | | | | 68,453,602 | |
| Nissan Motor Acceptance Corp | | | | | | | | |
| 1.07% due 04/10/17 | | | 50,000,000 | | | | 49,986,625 | |
| 1.06% due 04/27/17 | | | 10,500,000 | | | | 10,491,962 | |
| Total Nissan Motor Acceptance Corp | | | | | | | 60,478,587 | |
| Mondelez International Inc | | | | | | | | |
| 1.30% due 06/12/17 | | | 40,000,000 | | | | 39,892,203 | |
| 0.97% due 04/20/17 | | | 20,000,000 | | | | 19,989,761 | |
| Total Mondelez International Inc | | | | | | | 59,881,964 | |
| Hyundai Capital America | | | | | | | | |
| 1.24% due 04/24/17 | | | 51,900,000 | | | | 51,858,884 | |
| Total Hyundai Capital America | | | | | | | 51,858,884 | |
| Whirlpool Corp | | | | | | | | |
| 1.16% due 04/26/17 | | | 50,000,000 | | | | 49,958,333 | |
| Ryder System Inc | | | | | | | | |
| 1.15% due 04/17/17 | | | 29,000,000 | | | | 28,985,178 | |
| 1.14% due 05/08/17 | | | 20,000,000 | | | | 19,975,950 | |
| Total Ryder System Inc | | | | | | | 48,961,128 | |
| General Mills Inc | | | | | | | | |
| 1.08% due 04/03/17 | | | 19,000,000 | | | | 18,998,860 | |
| 1.08% due 04/04/17 | | | 17,500,000 | | | | 17,498,425 | |
| Total General Mills Inc | | | | | | | 36,497,285 | |
| Omnicom Capital Inc | | | | | | | | |
| 1.08% due 05/08/17 | | | 35,500,000 | | | | 35,458,583 | |
| Cox Enterprises Inc | | | | | | | | |
| 0.97% due 04/10/17 | | | 31,500,000 | | | | 31,490,786 | |
| 0.82% due 04/03/17 | | | 2,000,000 | | | | 1,999,870 | |
| Total Cox Enterprises Inc | | | | | | | 33,490,656 | |
| CVS Health Corp | | | | | | | | |
| 1.23% due 04/18/17 | | | 30,000,000 | | | | 29,982,575 | |
| Bemis Co Inc | | | | | | | | |
| 1.15% due 04/03/17 | | | 18,750,000 | | | | 18,748,802 | |
| 1.15% due 04/04/17 | | | 10,000,000 | | | | 9,999,042 | |
| Total Bemis Co Inc | | | | | | | 28,747,844 | |
| Clorox Co/The | | | | | | | | |
| 1.13% due 05/05/17 | | | 17,075,000 | | | | 17,056,777 | |
| 1.13% due 04/24/17 | | | 11,600,000 | | | | 11,591,625 | |
| Total Clorox Co/The | | | | | | | 28,648,402 | |
| Wal-Mart Stores Inc | | | | | | | | |
| 0.82% due 04/17/17 | | | 28,000,000 | | | | 27,989,796 | |
| SEE NOTES TO FINANCIAL STATEMENTS. | THE GUGGENHEIM FUNDS SEMI-ANNUAL REPORT | 35 |
CONSOLIDATED SCHEDULE OF INVESTMENTS (Unaudited)(continued) | March 31, 2017 |
| MACRO OPPORTUNITIES FUND | |
| | | Face
Amount15 | | | Value | |
| | | | | | | | | |
| American Water Capital Corp | | | | | | | | |
| 1.03% due 04/03/17 | | $ | 20,000,000 | | | $ | 19,998,767 | |
| McDonald’s Corp | | | | | | | | |
| 1.18% due 04/27/17 | | | 10,000,000 | | | | 9,991,478 | |
| Total Commercial Paper | | | | | | | | |
| (Cost $590,401,681) | | | | | | | 590,397,884 | |
| | | | | | | | | |
REPURCHASE AGREEMENTS††,12 - 0.1% | |
| Jefferies & Company, Inc. | | | | | | | | |
issued 03/10/17 at 3.95%
due 04/10/17 | | | 2,956,000 | | | | 2,956,000 | |
issued 03/15/17 at 4.01%
due 04/18/17 | | | 1,685,000 | | | | 1,685,000 | |
| Barclays | | | | | | | | |
issued 03/17/17 at 0.50%
open maturity1 | | | 1,056,250 | | | | 1,056,250 | |
issued 03/17/17 at 0.25%
open maturity1 | | | 316,875 | | | | 316,875 | |
issued 03/17/17 at 0.50%
open maturity1 | | | 255,313 | | | | 255,313 | |
| Total Repurchase Agreements | | | | | |
| (Cost $6,269,438) | | | | | | | 6,269,438 | |
| | | Contracts | | | | |
| | | | | | | | | |
OPTIONS PURCHASED† - 0.6% | |
| Call options on: | | | | | | | | |
Bank of America Merrill
Lynch June 2017
iShares 20+ year
Treasury Bond ETF
Expiring with strike
price of $120.00 | | | 57,976 | | | $ | 15,537,568 | |
| | | | | | | | | |
| Put options on: | | | | | | | | |
Bank of America Merrill
Lynch December
2019 EUR/DLR
Expiring with strike
price of $97.63 | | | 8,995 | | | $ | 9,950,718 | |
| | | | | | | | | |
| | | Notional | | | | |
| | | | | | | | | |
Bank of America Merrill
Lynch November
2017 EUR/GBP
Expiring with strike
price of $0.87†† | | $ | 169,360,000 | | | | 5,717,007 | |
| Total Put Options | | | | | | | 15,667,725 | |
| Total Options Purchased | | | | | | | | |
| (Cost $28,015,195) | | | | | | | 31,205,293 | |
| Total Investments - 106.9% | | | | | |
| (Cost $5,314,528,973) | | | | | | $ | 5,368,015,581 | |
36 | THE GUGGENHEIM FUNDS SEMI-ANNUAL REPORT | SEE NOTES TO FINANCIAL STATEMENTS. |
CONSOLIDATED SCHEDULE OF INVESTMENTS (Unaudited)(continued) | March 31, 2017 |
| MACRO OPPORTUNITIES FUND | |
| | | Shares | | | Value | |
| | | | | | | | | |
COMMON STOCKS SOLD SHORT† - (0.9)% | |
| CONSUMER, NON-CYCLICAL - 0.0%** | |
| Cantel Medical Corp. | | | 6,352 | | | $ | (508,795 | ) |
| | | | | | | | | |
| UTILITIES - 0.0%** | | | | | | | | |
| South Jersey Industries, Inc. | | | 23,508 | | | | (838,060 | ) |
| | | | | | | | | |
| COMMUNICATIONS - (0.1)% | |
| Amazon.com, Inc.* | | | 2,966 | | | | (2,629,479 | ) |
| | | | | | | | | |
| CONSUMER, CYCLICAL - (0.1)% | |
| Crocs, Inc.* | | | | | | | | |
| Papa John’s International, Inc. | | | 77,889 | | | | (550,675 | ) |
| Pool Corp. | | | 8,077 | | | | (646,483 | ) |
| Wynn Resorts Ltd. | | | 6,039 | | | | (720,634 | ) |
| CarMax, Inc.* | | | 6,571 | | | | (753,102 | ) |
| | | | 15,913 | | | | (942,368 | ) |
| Total Consumer, Cyclical | | | | | | | (3,613,262 | ) |
| | | | | | | | | |
| INDUSTRIAL – (0.1)% | | | | | | | | |
| EnPro Industries, Inc. | | | | | | | | |
| Martin Marietta Materials, Inc. | | | 8,906 | | | | (633,751 | ) |
| Vulcan Materials Co. | | | 8,560 | | | | (1,868,220 | ) |
| | | | 17,490 | | | | (2,107,194 | ) |
| Total Industrial | | | | | | | (4,609,165 | ) |
| | | | | | | | | |
| TECHNOLOGY - (0.1)% | |
| CommVault Systems, Inc.* | | | | | | | | |
| Semtech Corp.* | | | 11,557 | | | | (587,096 | ) |
| Cypress Semiconductor Corp. | | | 19,411 | | | | (656,092 | ) |
| Medidata Solutions, Inc.* | | | 55,947 | | | | (769,831 | ) |
| Silicon Laboratories, Inc.* | | | 13,753 | | | | (793,411 | ) |
| Ultimate Software Group, Inc.* | | | 11,837 | | | | (870,611 | ) |
| Autodesk, Inc.* | | | 4,520 | | | | (882,349 | ) |
| | | | 11,050 | | | | (955,494 | ) |
| Total Technology | | | | | | | (5,514,884 | ) |
| | | | | | | | | |
| BASIC MATERIALS - (0.1)% | |
| NewMarket Corp. | | | | | | | | |
| Balchem Corp. | | | 1,373 | | | | (622,285 | ) |
| Royal Gold, Inc. | | | 15,104 | | | | (1,244,872 | ) |
| Sensient Technologies Corp. | | | 22,385 | | | | (1,568,069 | ) |
| FMC Corp. | | | 20,147 | | | | (1,596,851 | ) |
| | | | 26,222 | | | | (1,824,789 | ) |
| Total Basic Materials | | | | | | | (6,856,866 | ) |
| | | | | | | | | |
| FINANCIAL - (0.4)% | | | | | | | | |
| Life Storage, Inc. | | | | | | | | |
| American Assets Trust, Inc. | | | 6,047 | | | | (496,580 | ) |
| Community Bank System, Inc. | | | 12,111 | | | | (506,724 | ) |
| Realty Income Corp. | | | 11,256 | | | | (618,855 | ) |
| Bank of the Ozarks, Inc. | | | 10,898 | | | | (648,758 | ) |
| Glacier Bancorp, Inc. | | | 12,577 | | | | (654,130 | ) |
| Extra Space Storage, Inc. | | | 19,291 | | | | (654,544 | ) |
| EastGroup Properties, Inc. | | | 8,962 | | | | (666,683 | ) |
| Mercury General Corp. | | | 9,224 | | | | (678,241 | ) |
| Morgan Stanley | | | 11,833 | | | | (721,695 | ) |
| Taubman Centers, Inc. | | | 19,834 | | | | (849,689 | ) |
| Essex Property Trust, Inc. | | | 13,257 | | | | (875,227 | ) |
| Webster Financial Corp. | | | 3,913 | | | | (905,977 | ) |
| Federal Realty Investment Trust | | | 19,321 | | | | (966,823 | ) |
| Associated Banc-Corp. | | | 8,373 | | | | (1,117,796 | ) |
| American Tower Corp. — Class A | | | 46,785 | | | | (1,141,554 | ) |
| Douglas Emmett, Inc. | | | 11,393 | | | | (1,384,705 | ) |
| People’s United Financial, Inc. | | | 43,921 | | | | (1,686,566 | ) |
| Crown Castle International Corp. | | | 124,127 | | | | (2,259,111 | ) |
| Total Financial | | | 26,754 | | | | (2,526,915 | ) |
| Total Common Stocks Sold Short | | | | | |
| (Proceeds $39,378,495) | | | | | | | (43,931,084 | ) |
| SEE NOTES TO FINANCIAL STATEMENTS. | THE GUGGENHEIM FUNDS SEMI-ANNUAL REPORT | 37 |
CONSOLIDATED SCHEDULE OF INVESTMENTS (Unaudited)(continued) | March 31, 2017 |
| MACRO OPPORTUNITIES FUND | |
| | | Face
Amount | | | Value | |
| | | | | | | | | |
CORPORATE BONDS SOLD SHORT†† - (0.0)% | |
| Envision Healthcare Corp. | | | | | | | | |
5.13% due 07/01/228 | | | | | | | | |
| Nature’s Bounty Co. | | $ | 250,000 | | | $ | (254,453 | ) |
7.63% due 05/15/218 | | | 1,300,000 | | | | (1,368,250 | ) |
| Total Corporate Bonds Sold Short | | | | | |
| (Proceeds $1,571,635) | | | | | | | (1,622,703 | ) |
| | | | | | | | | |
| | | Contracts | | | | |
| | | | | | | | | |
OPTIONS WRITTEN† - (0.2)% | |
| Call options on: | | | | | | | | |
Bank of America Merrill
Lynch June 2017
iShares 20+ Year
Treasury Bond ETF
Expiring with strike
price of $123.00 | | | 57,976 | | | | (8,406,520 | ) |
| | | Notional | | | | |
| | | | | | | | | |
| Put options on: | | | | | | | | |
Bank of America Merrill
Lynch December
2019 EUR/DLR
Expiring with strike
price of $96.25†† | | $ | 8,995 | | | | (2,192,531 | ) |
| Total Options Written | | | | | | | | |
| (Proceeds $8,755,082) | | | | | | | (10,599,051 | ) |
| Total Securities Sold Short - (1.1)% | | | | | |
| (Proceeds $49,705,212) | | | | | | | (56,152,838 | ) |
| Other Assets & Liabilities, net - (5.8)% | | | (290,433,361 | ) |
| Total Net Assets - 100.0% | | $ | 5,021,429,382 | | |
| | | | | | | | | |
| | | | | | Unrealized
Gain (Loss) | |
| | | | | | | | | |
OTC EQUITY SWAP AGREEMENTS†† | |
Morgan Stanley November 2017 Macro
Opportunities Long
Custom Basket Swap
1.48%13,
Terminating 11/30/17
(Notional Value $72,072,621) | | | | | | $ | 4,509,213 | |
| | | | | | | | | |
OTC EQUITY SWAP AGREEMENTS SOLD SHORT†† | |
Morgan Stanley November 2017 Macro
Opportunities Short
Custom Basket Swap
0.56%14,
Terminating 11/30/17
(Notional Value $124,735,770) | | | | | | $ | (6,117,365 | ) |
| | | | | | | | | |
| | | Shares | | | | |
| | | | | | | | | |
CUSTOM BASKET OF LONG SECURITIES13 | |
| Wabash National Corp. | | | 43,729 | | | $ | 289,203 | |
| Teradyne, Inc. | | | 30,849 | | | | 270,469 | |
| Alaska Air Group, Inc. | | | 14,495 | | | | 251,001 | |
| Scripps Networks Interactive, Inc. — Class A | | | 21,489 | | | | 245,100 | |
| United Continental Holdings, Inc.* | | | 15,499 | | | | 231,709 | |
| Southwest Airlines Co. | | | 20,237 | | | | 222,629 | |
| Best Buy Co., Inc. | | | 23,895 | | | | 190,784 | |
| ManpowerGroup, Inc. | | | 9,576 | | | | 179,013 | |
| Universal Corp. | | | 13,975 | | | | 168,613 | |
| United Rentals, Inc.* | | | 4,959 | | | | 163,217 | |
| UGI Corp. | | | 52,934 | | | | 154,511 | |
| Old Republic International Corp. | | | 68,443 | | | | 153,648 | |
| PPL Corp. | | | 60,689 | | | | 150,201 | |
| Discovery Communications, Inc. — Class A* | | | 52,761 | | | | 135,538 | |
38 | THE GUGGENHEIM FUNDS SEMI-ANNUAL REPORT | SEE NOTES TO FINANCIAL STATEMENTS. |
CONSOLIDATED SCHEDULE OF INVESTMENTS (Unaudited)(continued) | March 31, 2017 |
| MACRO OPPORTUNITIES FUND | |
| | | Shares | | | Unrealized
Gain | |
| | | | | | | | | |
| Conagra Brands, Inc. | | | 37,363 | | | $ | 135,489 | |
| Trinity Industries, Inc. | | | 22,789 | | | | 134,949 | |
| Harris Corp. | | | 7,856 | | | | 132,329 | |
| Ameren Corp. | | | 40,987 | | | | 132,088 | |
| Cambrex Corp.* | | | 10,174 | | | | 127,327 | |
| Post Holdings, Inc.* | | | 7,828 | | | | 124,924 | |
| Robert Half International, Inc. | | | 13,668 | | | | 111,527 | |
| DaVita, Inc.* | | | 31,493 | | | | 105,949 | |
| Archer-Daniels-Midland Co. | | | 42,373 | | | | 97,450 | |
| AECOM* | | | 18,544 | | | | 94,530 | |
| Amgen, Inc. | | | 6,971 | | | | 92,333 | |
| Flowers Foods, Inc. | | | 43,803 | | | | 91,241 | |
| AmerisourceBergen Corp. — Class A | | | 17,781 | | | | 90,280 | |
| JetBlue Airways Corp.* | | | 50,057 | | | | 85,345 | |
| Juniper Networks, Inc. | | | 46,008 | | | | 78,988 | |
| VeriSign, Inc.* | | | 18,192 | | | | 77,788 | |
| Entergy Corp. | | | 15,510 | | | | 71,170 | |
| CNO Financial Group, Inc. | | | 20,568 | | | | 68,778 | |
| Textron, Inc. | | | 12,098 | | | | 66,977 | |
| Lam Research Corp. | | | 8,208 | | | | 63,642 | |
| Hawaiian Electric Industries, Inc. | | | 50,111 | | | | 61,910 | |
| American Airlines Group, Inc. | | | 13,955 | | | | 61,064 | |
| eBay, Inc.* | | | 15,747 | | | | 57,622 | |
| Owens & Minor, Inc. | | | 40,607 | | | | 39,628 | |
| Big Lots, Inc. | | | 25,771 | | | | 39,517 | |
| United Natural Foods, Inc.* | | | 29,605 | | | | 35,833 | |
| Masco Corp. | | | 50,411 | | | | 31,496 | |
| MEDNAX, Inc.* | | | 10,130 | | | | 25,106 | |
| Eastman Chemical Co. | | | 6,595 | | | | 17,875 | |
| Carlisle Companies, Inc. | | | 11,014 | | | | 13,846 | |
| Omnicom Group, Inc. | | | 6,068 | | | | 10,099 | |
| Hospitality Properties Trust | | | 16,731 | | | | 9,638 | |
| Sysco Corp. | | | 30,242 | | | | 8,411 | |
| Hilton Worldwide Holdings, Inc. | | | 8,847 | | | | 5,416 | |
| Tier REIT, Inc. | | | 30,220 | | | | 2,696 | |
| | | | | | | | | |
| | | | | | | | Unrealized
Gain (Loss) | |
| | | | | | | | | |
| Chesapeake Lodging Trust | | | 21,955 | | | | 1,424 | |
| Corning, Inc. | | | 59,614 | | | | (2,478 | ) |
| Merck & Company, Inc. | | | 22,767 | | | | (3,613 | ) |
| Bed Bath & Beyond, Inc. | | | 38,791 | | | | (8,107 | ) |
| Casey’s General Stores, Inc. | | | 8,013 | | | | (13,133 | ) |
| FirstEnergy Corp. | | | 83,147 | | | | (16,979 | ) |
| Cedar Realty Trust, Inc. | | | 100,761 | | | | (24,402 | ) |
| Ford Motor Co. | | | 41,103 | | | | (46,693 | ) |
| Mallinckrodt plc* | | | 10,540 | | | | (76,263 | ) |
| Pitney Bowes, Inc. | | | 40,799 | | | | (80,222 | ) |
| Telephone & Data Systems, Inc. | | | 98,600 | | | | (82,721 | ) |
| Michael Kors Holdings Ltd.* | | | 33,366 | | | | (168,118 | ) |
| Target Corp. | | | 31,520 | | | | (232,390 | ) |
| Total Custom Basket of Long Securities | | $ | 4,455,202 | |
| | | | | | | | | |
CUSTOM BASKET OF SHORT SECURITIES14 | |
| Mattel, Inc. | | | (22,943 | ) | | | 93,005 | |
| Compass Minerals International, Inc. | | | (19,638 | ) | | | 69,422 | |
| FactSet Research Systems, Inc. | | | (5,609 | ) | | | 62,459 | |
| Trustmark Corp. | | | (23,186 | ) | | | 59,922 | |
| American Campus Communities, Inc. | | | (23,444 | ) | | | 48,499 | |
| New York Community Bancorp, Inc. | | | (127,318 | ) | | | 48,041 | |
| U.S. Bancorp | | | (21,841 | ) | | | 44,482 | |
| Signature Bank* | | | (5,192 | ) | | | 41,643 | |
| Concho Resources, Inc.* | | | (6,201 | ) | | | 41,372 | |
| First Industrial Realty Trust, Inc. | | | (47,086 | ) | | | 36,499 | |
| Acadia Realty Trust | | | (16,648 | ) | | | 35,895 | |
| Packaging Corporation of America | | | (14,007 | ) | | | 32,664 | |
| Coty, Inc. — Class A | | | (36,462 | ) | | | 31,988 | |
| Provident Financial Services, Inc. | | | (19,087 | ) | | | 29,728 | |
| SEE NOTES TO FINANCIAL STATEMENTS. | THE GUGGENHEIM FUNDS SEMI-ANNUAL REPORT | 39 |
CONSOLIDATED SCHEDULE OF INVESTMENTS (Unaudited)(continued) | March 31, 2017 |
| MACRO OPPORTUNITIES FUND | |
| | | Shares | | | Unrealized
Gain (Loss) | |
| | | | | | | | | |
| Washington Federal, Inc. | | | (23,982 | ) | | $ | 26,685 | |
| KeyCorp | | | (36,853 | ) | | | 26,381 | |
| Valley National Bancorp | | | (69,017 | ) | | | 22,317 | |
| Commerce Bancshares, Inc. | | | (14,455 | ) | | | 22,295 | |
| Newell Brands, Inc. | | | (24,983 | ) | | | 19,439 | |
| Lithia Motors, Inc. — Class A | | | (10,610 | ) | | | 17,183 | |
| WD-40 Co. | | | (6,158 | ) | | | 15,628 | |
| ABM Industries, Inc. | | | (26,682 | ) | | | 15,220 | |
| EI du Pont de Nemours & Co. | | | (24,181 | ) | | | 14,843 | |
| Citizens Financial Group, Inc. | | | (14,401 | ) | | | 14,240 | |
| General Electric Co. | | | (63,457 | ) | | | 12,657 | |
| Lennox International, Inc. | | | (3,024 | ) | | | 9,924 | |
| Loews Corp. | | | (23,284 | ) | | | 9,630 | |
| Iron Mountain, Inc. | | | (26,293 | ) | | | 9,015 | |
| Acuity Brands, Inc. | | | (2,506 | ) | | | 6,854 | |
| Cheniere Energy, Inc.* | | | (11,746 | ) | | | 5,548 | |
| O’Reilly Automotive, Inc.* | | | (3,408 | ) | | | 4,096 | |
| Chevron Corp. | | | (4,749 | ) | | | 1,915 | |
| Choice Hotels International, Inc. | | | (8,181 | ) | | | 1,775 | |
| Ligand Pharmaceuticals, Inc. — Class B* | | | (4,795 | ) | | | 1,453 | |
| Bemis Company, Inc. | | | (13,080 | ) | | | 1,425 | |
| Bottomline Technologies de, Inc.* | | | (20,931 | ) | | | (641 | ) |
| Hershey Co. | | | (6,255 | ) | | | (1,045 | ) |
| Rockwell Automation, Inc. | | | (3,313 | ) | | | (2,097 | ) |
| Ball Corp. | | | (34,182 | ) | | | (2,152 | ) |
| National Retail Properties, Inc. | | | (12,210 | ) | | | (3,256 | ) |
| Carrizo Oil & Gas, Inc.* | | | (18,047 | ) | | | (3,487 | ) |
| Healthcare Realty Trust, Inc. | | | (20,305 | ) | | | (4,857 | ) |
| | | | | | | | | |
| | | | | | | | Unrealized
Loss | |
| | | | | | | | | |
| Uniti Group, Inc. | | | (19,890 | ) | | | (5,997 | ) |
| Alexandria Real Estate Equities, Inc. | | | (6,895 | ) | | | (6,513 | ) |
| Avery Dennison Corp. | | | (6,406 | ) | | | (9,070 | ) |
| Black Hills Corp. | | | (17,039 | ) | | | (11,038 | ) |
| Quaker Chemical Corp. | | | (5,981 | ) | | | (11,151 | ) |
| Public Storage | | | (3,638 | ) | | | (11,639 | ) |
| Monolithic Power Systems, Inc. | | | (6,629 | ) | | | (11,844 | ) |
| AO Smith Corp. | | | (10,298 | ) | | | (12,300 | ) |
| Duke Realty Corp. | | | (25,972 | ) | | | (12,511 | ) |
| Gulfport Energy Corp.* | | | (31,362 | ) | | | (16,249 | ) |
| MSCI, Inc. — Class A | | | (5,236 | ) | | | (17,256 | ) |
| CME Group, Inc. — Class A | | | (8,642 | ) | | | (19,963 | ) |
| Equifax, Inc. | | | (9,808 | ) | | | (20,053 | ) |
| UDR, Inc. | | | (18,824 | ) | | | (21,305 | ) |
| AptarGroup, Inc. | | | (9,579 | ) | | | (21,676 | ) |
| Education Realty Trust, Inc. | | | (19,618 | ) | | | (22,390 | ) |
| NiSource, Inc. | | | (26,989 | ) | | | (23,015 | ) |
| Parsley Energy, Inc. — Class A* | | | (16,651 | ) | | | (23,227 | ) |
| Weingarten Realty Investors | | | (51,382 | ) | | | (25,846 | ) |
| Alexander & Baldwin, Inc. | | | (11,804 | ) | | | (28,230 | ) |
| Aqua America, Inc. | | | (18,570 | ) | | | (28,285 | ) |
| Senior Housing Properties Trust | | | (60,421 | ) | | | (29,133 | ) |
| Tyler Technologies, Inc.* | | | (3,513 | ) | | | (29,758 | ) |
| International Flavors & Fragrances, Inc. | | | (19,707 | ) | | | (29,992 | ) |
| Roper Technologies, Inc. | | | (5,522 | ) | | | (31,930 | ) |
| KBR, Inc. | | | (36,461 | ) | | | (32,071 | ) |
| Expedia, Inc. | | | (12,427 | ) | | | (32,491 | ) |
| Newfield Exploration Co.* | | | (14,850 | ) | | | (34,275 | ) |
| Allegion plc | | | (7,456 | ) | | | (34,625 | ) |
| NIKE, Inc. — Class B | | | (23,770 | ) | | | (38,335 | ) |
| Fastenal Co. | | | (23,358 | ) | | | (39,106 | ) |
40 | THE GUGGENHEIM FUNDS SEMI-ANNUAL REPORT | SEE NOTES TO FINANCIAL STATEMENTS. |
CONSOLIDATED SCHEDULE OF INVESTMENTS (Unaudited)(continued) | March 31, 2017 |
| MACRO OPPORTUNITIES FUND | |
| | | Shares | | | Unrealized
Loss | |
| | | | | | | | | |
| Fortinet, Inc.* | | | (18,564 | ) | | $ | (39,539 | ) |
| Xylem, Inc. | | | (26,391 | ) | | | (39,791 | ) |
| Orbital ATK, Inc. | | | (5,983 | ) | | | (42,854 | ) |
| Lexington Realty Trust | | | (50,787 | ) | | | (43,074 | ) |
| Goldman Sachs Group, Inc. | | | (4,882 | ) | | | (43,297 | ) |
| DCT Industrial Trust, Inc. | | | (16,809 | ) | | | (43,544 | ) |
| Digital Realty Trust, Inc. | | | (5,721 | ) | | | (43,743 | ) |
| PPG Industries, Inc. | | | (7,589 | ) | | | (43,820 | ) |
| Intercontinental Exchange, Inc. | | | (12,567 | ) | | | (44,472 | ) |
| Red Hat, Inc.* | | | (6,142 | ) | | | (45,307 | ) |
| MarketAxess Holdings, Inc. | | | (5,203 | ) | | | (47,602 | ) |
| Healthcare Services Group, Inc. | | | (29,714 | ) | | | (48,171 | ) |
| MB Financial, Inc. | | | (19,137 | ) | | | (48,935 | ) |
| Global Payments, Inc. | | | (9,560 | ) | | | (51,695 | ) |
| Dominion Resources, Inc. | | | (23,317 | ) | | | (51,722 | ) |
| Sempra Energy | | | (14,658 | ) | | | (52,477 | ) |
| salesforce.com, Inc.* | | | (18,481 | ) | | | (53,158 | ) |
| Toll Brothers, Inc. | | | (16,791 | ) | | | (54,217 | ) |
| Symantec Corp. | | | (31,660 | ) | | | (54,266 | ) |
| Starbucks Corp. | | | (12,950 | ) | | | (56,169 | ) |
| Deltic Timber Corp. | | | (13,313 | ) | | | (57,896 | ) |
| Atmos Energy Corp. | | | (20,649 | ) | | | (60,120 | ) |
| Bio-Rad Laboratories, Inc. — Class A* | | | (2,528 | ) | | | (60,463 | ) |
| Old National Bancorp | | | (34,517 | ) | | | (65,157 | ) |
| RPM International, Inc. | | | (19,168 | ) | | | (65,583 | ) |
| Trimble, Inc.* | | | (16,680 | ) | | | (73,549 | ) |
| Four Corners Property Trust, Inc. | | | (24,576 | ) | | | (74,267 | ) |
| First Horizon National Corp. | | | (48,639 | ) | | | (77,726 | ) |
| Eagle Materials, Inc. | | | (8,200 | ) | | | (80,885 | ) |
| Netflix, Inc.* | | | (3,523 | ) | | | (82,500 | ) |
| Align Technology, Inc.* | | | (5,016 | ) | | | (86,055 | ) |
| Scotts Miracle-Gro Co. — Class A | | | (17,552 | ) | | | (87,196 | ) |
| Facebook, Inc. — Class A* | | | (10,504 | ) | | | (89,066 | ) |
| Fulton Financial Corp. | | | (40,912 | ) | | | (92,711 | ) |
| Alliant Energy Corp. | | | (35,203 | ) | | | (95,379 | ) |
| Weyerhaeuser Co. | | | (43,221 | ) | | | (97,260 | ) |
| BancorpSouth, Inc. | | | (21,527 | ) | | | (99,682 | ) |
| CoreSite Realty Corp. | | | (11,418 | ) | | | (102,004 | ) |
| Freeport-McMoRan, Inc.* | | | (45,568 | ) | | | (106,050 | ) |
| Royal Caribbean Cruises Ltd. | | | (5,880 | ) | | | (110,716 | ) |
| S&P Global, Inc. | | | (4,944 | ) | | | (111,136 | ) |
| New Jersey Resources Corp. | | | (32,789 | ) | | | (112,203 | ) |
| Priceline Group, Inc.* | | | (681 | ) | | | (116,379 | ) |
| Five Below, Inc.* | | | (19,102 | ) | | | (121,246 | ) |
| Domino’s Pizza, Inc. | | | (6,517 | ) | | | (121,781 | ) |
| Vertex Pharmaceuticals, Inc.* | | | (5,770 | ) | | | (124,719 | ) |
| MDC Holdings, Inc. | | | (30,886 | ) | | | (130,930 | ) |
| Ecolab, Inc. | | | (17,285 | ) | | | (131,059 | ) |
| Marriott Vacations Worldwide Corp. | | | (6,367 | ) | | | (143,137 | ) |
| Allegheny Technologies, Inc. | | | (45,388 | ) | | | (147,788 | ) |
| Ulta Beauty, Inc.* | | | (3,101 | ) | | | (158,974 | ) |
| Adobe Systems, Inc.* | | | (9,561 | ) | | | (167,280 | ) |
| Financial Engines, Inc. | | | (17,291 | ) | | | (181,218 | ) |
| NVIDIA Corp. | | | (8,114 | ) | | | (182,444 | ) |
| Copart, Inc.* | | | (14,094 | ) | | | (187,390 | ) |
| Equinix, Inc. | | | (6,164 | ) | | | (192,207 | ) |
| Take-Two Interactive Software, Inc.* | | | (16,678 | ) | | | (196,748 | ) |
| PTC, Inc.* | | | (21,349 | ) | | | (223,229 | ) |
| United States Steel Corp. | | | (26,120 | ) | | | (234,360 | ) |
| Bob Evans Farms, Inc. | | | (14,072 | ) | | | (282,765 | ) |
| Panera Bread Co. — Class A* | | | (5,489 | ) | | | (309,182 | ) |
| Total Custom Basket of Short Securities | | $ | (5,962,960 | ) |
| SEE NOTES TO FINANCIAL STATEMENTS. | THE GUGGENHEIM FUNDS SEMI-ANNUAL REPORT | 41 |
CONSOLIDATED SCHEDULE OF INVESTMENTS (Unaudited)(continued) | March 31, 2017 |
| MACRO OPPORTUNITIES FUND | |
CENTRALLY CLEARED INTEREST RATE SWAP AGREEMENTS†† | |
| Counterparty | Exchange | Floating
Rate | Floating Rate Index | | Fixed
Rate | | Maturity
Date | | Notional
Amount | | | Market
Value | | | Unrealized
Appreciation (Depreciation) | |
| BOA Merrill Lynch | CME | Receive | 3-Month USD-LIBOR | | | 1.71 | % | 12/16/19 | | $ | (20,800,000 | ) | | $ | 29,393 | | | $ | 29,393 | |
| BOA Merrill Lynch | CME | Receive | 3-Month USD-LIBOR | | | 1.59 | % | 07/02/18 | | | (34,550,000 | ) | | | (62,153 | ) | | | (62,153 | ) |
| BOA Merrill Lynch | CME | Receive | 3-Month USD-LIBOR | | | 2.73 | % | 07/02/23 | | | (23,800,000 | ) | | | (771,006 | ) | | | (771,006 | ) |
| | | | | | | | | | | | | | | | | | | $ | (803,766 | ) |
FORWARD FOREIGN CURRENCY EXCHANGE CONTRACTS†† | |
| Counterparty | | Contracts
to Buy (Sell) | | Currency | Settlement
Date | | Settlement
Value | | | Value at
March 31,
2017 | | | Net
Unrealized
Appreciation/
(Depreciation) | |
| J.P. Morgan | | | (6,121,000 | ) | EUR | 05/02/17 | | $ | 6,642,313 | | | $ | 6,540,008 | | | $ | 102,305 | |
| J.P. Morgan | | | 3,459,000 | | GBP | 04/11/17 | | | (4,272,819 | ) | | | (4,334,795 | ) | | | 61,976 | |
| J.P. Morgan | | | (1,900,000 | ) | EUR | 04/11/17 | | | 2,055,682 | | | | 2,027,840 | | | | 27,842 | |
| Morgan Stanley | | | (2,194,000 | ) | EUR | 04/11/17 | | | 2,368,395 | | | | 2,341,622 | | | | 26,773 | |
| J.P. Morgan | | | (1,300,000 | ) | EUR | 04/11/17 | | | 1,405,059 | | | | 1,387,470 | | | | 17,589 | |
| Citigroup | | | (298,000 | ) | EUR | 04/11/17 | | | 323,981 | | | | 318,051 | | | | 5,930 | |
| Deutsche Bank | | | (103,000 | ) | EUR | 05/02/17 | | | 111,449 | | | | 110,051 | | | | 1,398 | |
| Bank of America | | | (9,920,000 | ) | EUR | 04/11/17 | | | 10,516,857 | | | | 10,587,460 | | | | (70,603 | ) |
| Barclays | | | (15,798,000 | ) | GBP | 04/11/17 | | | 19,265,613 | | | | 19,797,946 | | | | (532,333 | ) |
| | | | | | | | | | | | | | | | | $ | (359,123 | ) |
42 | THE GUGGENHEIM FUNDS SEMI-ANNUAL REPORT | SEE NOTES TO FINANCIAL STATEMENTS. |
CONSOLIDATED SCHEDULE OF INVESTMENTS (Unaudited)(continued) | March 31, 2017 |
| MACRO OPPORTUNITIES FUND | |
| * | Non-income producing security. |
| ** | Less than 0.1% of net assets. |
† | Value determined based on Level 1 inputs, unless otherwise noted — See Note 4. |
†† | Value determined based on Level 2 inputs, unless otherwise noted — See Note 4. |
††† | Value determined based on Level 3 inputs — See Note 4. |
1 | All or a portion of this security is pledged as short security collateral at March 31, 2017. |
2 | Illiquid security. |
3 | Zero coupon rate security. |
4 | Security has no stated coupon. However, it is expected to receive residual cash flow payments on defined deal dates. |
5 | Affiliated issuer — See Note 8. |
6 | Rate indicated is the 7 day yield as of March 31, 2017. |
7 | Variable rate security. Rate indicated is rate effective at March 31, 2017. |
8 | Security is a 144A or Section 4(a)(2) security. These securities have been determined to be liquid under guidelines established by the Board of Trustees. The total market value of 144A or Section 4(a)(2) securities is $2,334,766,163 (cost $2,278,579,406), or 46.5% of total net assets. |
9 | Security with no rate was unsettled at March 31, 2017. |
10 | Perpetual maturity. |
11 | Security is in default of interest and/or principal obligations. |
12 | Repurchase Agreements — See Note 11. |
13 | Total Return is based on the return of long basket of securities +/- financing at a variable rate. Rate indicated is rate effective at March 31, 2017. |
14 | Total Return is based on the return of short basket of securities +/- financing at a variable rate. Rate indicated is rate effective at March 31, 2017. |
15 | The face amount is denominated in U.S. Dollars unless otherwise indicated. |
16 | Security is a 144A or Section 4(a)(2) security. These securities are considered illiquid and restricted under guidelines established by the Board of Trustees. The total market value of 144A or Section 4(a)(2) securities is $46,346,590 (cost $62,012,709), or 0.9% of total net assets — See Note 13. |
| | plc — Public Limited Company |
| | REIT — Real Estate Investment Trust |
| | CME — Chicago Mercantile Exchange |
| | EUR — Euro |
| | GBP — British Pound |
| | |
| | See Sector Classification in Other Information section. |
| SEE NOTES TO FINANCIAL STATEMENTS. | THE GUGGENHEIM FUNDS SEMI-ANNUAL REPORT | 43 |
CONSOLIDATED SCHEDULE OF INVESTMENTS (Unaudited)(continued) | March 31, 2017 |
| MACRO OPPORTUNITIES FUND | |
The following table summarizes the inputs used to value the Fund’s investments at March 30, 2017 (See Note 4 in the Notes to Financial Statements):
| Investments in Securities (Assets) | | Level 1 | | | Level 2 | | | Level 2 - Other* | | | Level 3 | | | Total | |
| Asset-Backed Securities | | $ | — | | | $ | 1,707,677,090 | | | $ | — | | | $ | 16,708,246 | | | $ | 1,724,385,336 | |
| Collateralized Mortgage Obligations | | | — | | | | 911,729,058 | | | | — | | | | 14,984,455 | | | | 926,713,513 | |
| Commercial Paper | | | — | | | | 590,397,884 | | | | — | | | | — | | | | 590,397,884 | |
| Common Stocks | | | 177,955,647 | | | | 265,335 | | | | — | | | | 198,388 | | | | 178,419,370 | |
| Corporate Bonds | | | — | | | | 476,413,147 | | | | — | | | | 8,463,325 | | | | 484,876,472 | |
| Equity Swap Agreements | | | — | | | | — | | | | 4,509,213 | | | | — | | | | 4,509,213 | |
| Forward Foreign Currency Exchange Contracts | | | — | | | | — | | | | 243,813 | | | | — | | | | 243,813 | |
| Foreign Government Bonds | | | — | | | | 34,081,211 | | | | — | | | | — | | | | 34,081,211 | |
| Interest Rate Swap Agreements | | | — | | | | — | | | | 29,393 | | | | — | | | | 29,393 | |
| Mutual Funds | | | 471,162,727 | | | | — | | | | — | | | | — | | | | 471,162,727 | |
| Options Purchased | | | 25,488,286 | | | | 5,717,007 | | | | — | | | | — | | | | 31,205,293 | |
| Preferred Stocks | | | — | | | | 18,232,968 | | | | — | | | | 60,731 | | | | 18,293,699 | |
| Repurchase Agreement | | | — | | | | 6,269,438 | | | | — | | | | — | | | | 6,269,438 | |
| Senior Fixed Rate Interests | | | — | | | | 1,126,063 | | | | — | | | | 86,106 | | | | 1,212,169 | |
| Senior Floating Rate Interests | | | — | | | | 645,136,041 | | | | — | | | | 70,604,300 | | | | 715,740,341 | |
| Short-Term Investments | | | 185,114,868 | | | | — | | | | — | | | | — | | | | 185,114,868 | |
| Warrants | | | — | | | | 143,260 | | | | — | | | | — | | | | 143,260 | |
| Total | | $ | 859,721,528 | | | $ | 4,397,188,502 | | | $ | 4,782,419 | | | $ | 111,105,551 | | | $ | 5,372,798,000 | |
| Investments in Securities (Liabilities) | | Level 1 | | | Level 2 | | | Level 2 - Other* | | | Level 3 | | | Total | |
| Common Stocks | | $ | 43,931,084 | | | $ | — | | | $ | — | | | $ | — | | | $ | 43,931,084 | |
| Corporate Bonds | | | — | | | | 1,622,703 | | | | — | | | | — | | | | 1,622,703 | |
| Equity Swap Agreements | | | — | | | | — | | | | 6,117,365 | | | | — | | | | 6,117,365 | |
| Forward Foreign Currency Exchange Contracts | | | — | | | | — | | | | 602,936 | | | | — | | | | 602,936 | |
| Interest Rate Swap Agreements | | | — | | | | — | | | | 833,159 | | | | — | | | | 833,159 | |
| Options Written | | | 8,406,520 | | | | 2,192,531 | | | | — | | | | — | | | | 10,599,051 | |
| Unfunded Loan Commitments | | | — | | | | — | | | | 934,599 | | | | 455,154 | | | | 1,389,753 | |
| Total | | $ | 52,337,604 | | | $ | 3,815,234 | | | $ | 8,488,059 | | | $ | 455,154 | | | $ | 65,096,051 | |
| * | Other financial instruments include forward foreign currency contracts or swaps, which are reported as unrealized gain/loss at year end. |
44 | THE GUGGENHEIM FUNDS SEMI-ANNUAL REPORT | SEE NOTES TO FINANCIAL STATEMENTS. |
CONSOLIDATED SCHEDULE OF INVESTMENTS (Unaudited)(continued) | March 31, 2017 |
| MACRO OPPORTUNITIES FUND | |
The following is a summary of significant unobservable inputs used in the fair valuation of assets and liabilities categorized within Level 3 of the fair value hierarchy:
| Category | | Level 3 | | Valuation Technique | Unobservable
Inputs | | Input
Range | |
| Asset Backed Securities | | $ | 16,708,246 | | Option Adjusted Spread off the prior month end broker mark over the 3 month LIBOR | Indicative Quote | | | — | |
| Collateralized Mortgage Obligations | | | 14,984,455 | | Option Adjusted Spread off the prior month end broker mark over the 3 month LIBOR | Indicative Quote | | | — | |
| Common Stocks | | | 178,597 | | Model Price | Purchase Price | | | — | |
| Common Stocks | | | 19,252 | | Enterprise Value | Valuation Multiple | | | 6.4 | % |
| Common Stocks | | | 539 | | Model Price | Liquidation value | | | — | |
| Corporate Bonds | | | 4,910,071 | | Option Adjusted Spread off the prior month end broker mark over the 3 month LIBOR | Indicative Quote | | | — | |
| Corporate Bonds | | | 1,807,450 | | Model Price | Market Comparable Yields | | | 8.7 | % |
| Corporate Bonds | | | 1,705,575 | | OAS off prior broker quote | Indicative Quote | | | — | |
| Corporate Bonds | | | 40,229 | | Model Price | Market Comparable Yields | | | 12.8 | % |
| Preferred Stocks | | | 60,731 | | Model Price | Market Comparable Yields | | | — | |
| Senior Fixed Rate Interests | | | 86,106 | | Enterprise Value | Valuation Multiple | | | 6.4 | x |
| Senior Floating Rate Interests | | | 34,760,736 | | Model Price | Purchase Price | | | — | |
| Senior Floating Rate Interests | | | 10,288,788 | | Model Price | Market Comparable Yields | | | 4.6 | % |
| Senior Floating Rate Interests | | | 8,752,676 | | Model Price | Market Comparable Yields | | | 5.7 | % |
| Senior Floating Rate Interests | | | 6,501,000 | | Model Price | Trade Price | | | — | |
| Senior Floating Rate Interests | | | 5,074,500 | | Model Price | Market Comparable Yields | | | 5.5 | % |
| Senior Floating Rate Interests | | | 3,431,025 | | Option Adjusted Spread off the prior month end broker mark over the 3 month LIBOR | Indicative Quote | | | — | |
Senior Floating Rate Interests
| | | 1,795,575 | | Model Price | Market Comparable Yields | | | 5.8 | % |
| Total | | $ | 111,105,551 | | | | | | | |
Transfers between investment levels may occur as the markets fluctuate and/or the availability of data used in an investment’s valuation changes. Transfers between valuation levels, if any, are in comparison to the valuation levels at the end of the previous fiscal year, and are effective using the fair value as of the end of the previous fiscal period.
As of December 31, 2016, the Fund had securities with a total value of $3,522,846 transfer into Level 3 from Level 2 and securities with a total value of $5,143,776 transfer out of Level 3 into Level 2 due to the availability of current and reliable market-based data provided by a third-party pricing service which utilizes significant observable inputs. There were no other securities that transferred between levels.
| SEE NOTES TO FINANCIAL STATEMENTS. | THE GUGGENHEIM FUNDS SEMI-ANNUAL REPORT | 45 |
CONSOLIDATED SCHEDULE OF INVESTMENTS (Unaudited)(concluded) | March 31, 2017 |
| MACRO OPPORTUNITIES FUND | |
Summary of Fair Value Level 3 Activity
Following is a reconciliation of Level 3 assets for which significant unobservable inputs were used to determine fair value for the period ended March 31, 2017:
LEVEL 3 - Fair value measurement using significant unobservable inputs
| | | Senior Floating Rate Interests / Senior Fixed Rate Interests | | | Asset Backed Securities | | | Collateralized Mortgage Obligations | | | Corporate Bonds | | | Common
Stocks /
Preferred
Stocks | | | Total | |
| MACRO OPPORTUNITIES | | | | | | | | | | | | | | | | | | |
| Assets: | | | | | | | | | | | | | | | | | | |
| Beginning Balance | | $ | 58,771,052 | | | $ | 17,737,017 | | | $ | — | | | $ | 8,508,365 | | | $ | 91,922 | | | $ | 85,108,356 | |
| Purchases | | | 18,052,811 | | | | — | | | | 15,000,000 | | | | 550 | | | | (11,400 | )* | | | 33,041,961 | |
| Sales, maturities and paydowns | | | (5,989,893 | ) | | | (1,196,125 | ) | | | — | | | | (57,573 | ) | | | — | | | | (7,243,591 | ) |
| Total realized gains or losses included in earnings | | | (113,862 | ) | | | — | | | | — | | | | (58 | ) | | | — | | | | (113,920 | ) |
| Total change in unrealized gains or losses included in earnings | | | 328,085 | | | | 167,354 | | | | (15,545 | ) | | | 1,453,780 | | | | 1 | | | | 1,933,675 | |
| Transfers into Level 3 | | | 3,344,250 | | | | — | | | | — | | | | — | | | | 178,596 | | | | 3,522,846 | |
| Transfers out of Level 3 | | | (3,702,037 | ) | | | — | | | | — | | | | (1,441,739 | ) | | | — | | | | (5,143,776 | ) |
| Ending Balance | | $ | 70,690,406 | | | $ | 16,708,246 | | | $ | 14,984,455 | | | $ | 8,463,325 | | | $ | 259,119 | | | $ | 111,105,551 | |
| Net Change in unrealized appreciation (depreciation) for investments in securities still held at March 31, 2017 | | $ | 160,623 | | | $ | 160,195 | | | $ | (15,545 | ) | | $ | 1,450,648 | | | $ | 1 | | | $ | 1,755,922 | |
| * | Prior year purchase reversal. |
46 | THE GUGGENHEIM FUNDS SEMI-ANNUAL REPORT | SEE NOTES TO FINANCIAL STATEMENTS. |
CONSOLIDATED STATEMENT OF ASSETS AND LIABILITIES (Unaudited) |
| MACRO OPPORTUNITIES FUND |
March 31, 2017
| Assets: | |
| Investments in unaffiliated issuers, at value (cost $4,846,631,717) | | $ | 4,890,583,416 | |
| Investments in affiliated issuers, at value (cost $461,627,818) | | | 471,162,727 | |
| Repurchase agreements, at value (cost $6,269,438) | | | 6,269,438 | |
| Total investments (cost $5,314,528,973) | | | 5,368,015,581 | |
| Foreign currency, at value (cost $27,957) | | | 27,777 | |
| Cash | | | 39,997,738 | |
| Segregated cash with broker | | | 15,275,055 | |
| Unrealized appreciation on swap agreements | | | 4,538,606 | |
| Unrealized appreciation on forward foreign currency exchange contracts | | | 243,813 | |
| Prepaid expenses | | | 222,684 | |
| Receivables: | |
| Securities sold | | | 37,291,785 | |
| Fund shares sold | | | 35,387,260 | |
| Interest | | | 20,924,945 | |
| Dividends | | | 822,575 | |
| Swap settlement | | | 458,346 | |
| Foreign taxes reclaim | | | 23,673 | |
| Total assets | | | 5,523,229,838 | |
| | | | | |
| Liabilities: | |
| Securities sold short, at value (proceeds $40,950,130) | | | 45,553,787 | |
| Segregated cash due to broker | | | 17,407,133 | |
| Options written, at value (premiums received $8,755,082) | | | 10,599,051 | |
| Unrealized depreciation on swap agreements | | | 6,950,524 | |
| Unfunded loan commitments, at value (Note 9) (proceeds $2,545,590) | | | 1,389,753 | |
| Unrealized depreciation on forward foreign currency exchange contracts | | | 602,936 | |
| Payable for: | |
| Securities purchased | | $ | 402,629,604 | |
| Fund shares redeemed | | | 10,104,647 | |
| Management fees | | | 3,050,051 | |
| Transfer agent/maintenance fees | | | 708,642 | |
| Distribution and service fees | | | 544,824 | |
| Fund accounting/administration fees | | | 327,074 | |
| Trustees’ fees* | | | 98,558 | |
| Miscellaneous | | | 1,833,872 | |
| Total liabilities | | | 501,800,456 | |
| Net assets | | $ | 5,021,429,382 | |
| | | | | |
| Net assets consist of: | |
| Paid in capital | | $ | 5,089,584,388 | |
| Accumulated net investment loss | | | (29,767,074 | ) |
| Accumulated net realized loss on investments | | | (83,864,132 | ) |
| Net unrealized appreciation on investments | | | 45,476,200 | |
| Net assets | | $ | 5,021,429,382 | |
| | | | | |
| A-Class: | |
| Net assets | | $ | 861,539,674 | |
| Capital shares outstanding | | | 32,394,392 | |
| Net asset value per share | | $ | 26.60 | |
| Maximum offering price per share (Net asset value divided by 96.00%) | | $ | 27.71 | |
| | | | | |
| C-Class: | |
| Net assets | | $ | 390,092,904 | |
| Capital shares outstanding | | | 14,677,520 | |
| Net asset value per share | | $ | 26.58 | |
| | | | | |
| P-Class: | |
| Net assets | | $ | 194,408,945 | |
| Capital shares outstanding | | | 7,307,804 | |
| Net asset value per share | | $ | 26.60 | |
| | | | | |
| Institutional Class: | |
| Net assets | | $ | 3,575,387,859 | |
| Capital shares outstanding | | | 134,270,668 | |
| Net asset value per share | | $ | 26.63 | |
| * | Relates to Trustees not deemed “interested persons” within the meaning of Section 2(a)(19) of the 1940 Act. |
| SEE NOTES TO FINANCIAL STATEMENTS. | THE GUGGENHEIM FUNDS SEMI-ANNUAL REPORT | 47 |
CONSOLIDATED STATEMENT OF OPERATIONS (Unaudited) |
| MACRO OPPORTUNITIES FUND |
Period Ended March 31, 2017
| Investment Income: | |
| Interest | | $ | 98,539,004 | |
| Dividends from securities of affiliated issuers | | | 3,234,422 | |
| Dividends from securities of unaffiliated issuers | | | 1,090,425 | |
| Total investment income | | | 102,863,851 | |
| | | | | |
| Expenses: | |
| Management fees | | | 17,756,576 | |
| Transfer agent/maintenance fees | |
| A-Class | | | 451,238 | |
| C-Class | | | 209,732 | |
| P-Class | | | 67,761 | |
| Institutional Class | | | 269,214 | |
| Distribution and service fees: | |
| A-Class | | | 964,088 | |
| C-Class | | | 1,771,151 | |
| P-Class | | | 154,914 | |
| Fund accounting/administration fees | | | 1,599,726 | |
| Line of credit fees | | | 368,595 | |
| Prime broker interest expense | | | 253,242 | |
| Trustees’ fees* | | | 37,360 | |
| Custodian fees | | | 32,161 | |
| Miscellaneous | | | 502,410 | |
| Total expenses | | | 24,438,168 | |
| Less: | |
| Expenses waived by Adviser | | | (1,992,564 | ) |
| Expenses reimbursed by Adviser: | |
| A-Class | | | (104,548 | ) |
| C-Class | | | (17,921 | ) |
| P-Class | | | (32,826 | ) |
| Institutional Class | | | (275,954 | ) |
| Total waived expenses | | | (2,423,813 | ) |
| Net expenses | | | 22,014,355 | |
| Net investment income | | | 80,849,496 | |
| | | | | |
| Net Realized and Unrealized Gain (Loss): | |
| Net realized gain (loss) on: | |
| Investments in unaffiliated issuers | | $ | 24,292,133 | |
| Investments in affiliated issuers | | | 1,092,106 | |
| Realized gain distributions received from investment company shares | | | 45,169 | |
| Swap agreements | | | 10,239,079 | |
| Foreign currency | | | 1,270,676 | |
| Forward currency exchange contracts | | | 1,571,215 | |
| Securities sold short | | | 2,292,993 | |
| Options purchased | | | (5,940,195 | ) |
| Options written | | | 2,321,664 | |
| Net realized gain | | | 37,184,840 | |
| Net change in unrealized appreciation (depreciation) on: | |
| Investments in unaffiliated issuers | | | 42,178,317 | |
| Investments in affiliated issuers | | | 5,573,986 | |
| Securities sold short | | | (794,238 | ) |
| Swap agreements | | | 2,631,546 | |
| Options purchased | | | 7,089,769 | |
| Options written | | | (3,961,581 | ) |
| Foreign currency | | | 50,379 | |
| Forward foreign currency exchange contracts | | | (673,766 | ) |
| Net change in unrealized appreciation (depreciation) | | | 52,094,412 | |
| Net realized and unrealized gain | | | 89,279,252 | |
| Net increase in net assets resulting from operations | | $ | 170,128,748 | |
| * | Relates to Trustees not deemed “interested persons” within the meaning of Section 2(a)(19) of the 1940 Act. |
48 | THE GUGGENHEIM FUNDS SEMI-ANNUAL REPORT | SEE NOTES TO FINANCIAL STATEMENTS. |
| CONSOLIDATED STATEMENTS OF CHANGES IN NET ASSETS |
| MACRO OPPORTUNITIES FUND | |
| | | Period Ended
March 31,
2017
(Unaudited) | | | Year Ended
September 30,
2016 | |
| Increase (Decrease) in Net Assets from Operations: | | | | | | |
| Net investment income | | $ | 80,849,496 | | | $ | 157,150,208 | |
| Net realized gain (loss) on investments | | | 37,184,840 | | | | (65,495,116 | ) |
| Net change in unrealized appreciation (depreciation) on investments | | | 52,094,412 | | | | 75,814,822 | |
| Net increase in net assets resulting from operations | | | 170,128,748 | | | | 167,469,914 | |
| | | | | | | | | |
| Distributions to shareholders from: | | | | | | | | |
| Net investment income | | | | | | | | |
| A-Class | | | (15,839,792 | ) | | | (43,084,447 | ) |
| C-Class | | | (5,930,473 | ) | | | (17,221,539 | ) |
| P-Class | | | (2,449,700 | ) | | | (3,524,032 | ) |
| Institutional Class | | | (60,012,057 | ) | | | (129,098,070 | ) |
| Total distributions to shareholders | | | (84,232,022 | ) | | | (192,928,088 | ) |
| | | | | | | | | |
| Capital share transactions: | | | | | | | | |
| Proceeds from sale of shares | | | | | | | | |
| A-Class | | | 275,188,072 | | | | 282,051,379 | |
| C-Class | | | 88,218,934 | | | | 78,368,484 | |
| P-Class | | | 144,878,749 | | | | 52,735,159 | |
| Institutional Class | | | 1,628,757,428 | | | | 1,037,025,887 | |
| Distributions reinvested | | | | | | | | |
| A-Class | | | 12,811,057 | | | | 34,200,550 | |
| C-Class | | | 4,993,805 | | | | 14,434,110 | |
| P-Class | | | 2,449,700 | | | | 3,524,032 | |
| Institutional Class | | | 51,709,376 | | | | 111,104,610 | |
| Cost of shares redeemed | | | | | | | | |
| A-Class | | | (170,961,503 | ) | | | (427,797,431 | ) |
| C-Class | | | (47,998,957 | ) | | | (127,965,462 | ) |
| P-Class | | | (19,080,579 | ) | | | (56,282,422 | ) |
| Institutional Class | | | (367,854,666 | ) | | | (1,323,116,513 | ) |
| Net increase (decrease) from capital share transactions | | | 1,603,111,416 | | | | (321,717,617 | ) |
| Net increase (decrease) in net assets | | | 1,689,008,142 | | | | (347,175,791 | ) |
| | | | | | | | | |
| Net assets: | | | | | | | | |
| Beginning of period | | | 3,332,421,240 | | | | 3,679,597,031 | |
| End of period | | $ | 5,021,429,382 | | | $ | 3,332,421,240 | |
| Accumulated net investment loss at end of period | | $ | (29,767,074 | ) | | $ | (26,384,548 | ) |
| SEE NOTES TO FINANCIAL STATEMENTS. | THE GUGGENHEIM FUNDS SEMI-ANNUAL REPORT | 49 |
CONSOLIDATED STATEMENTS OF CHANGES IN NET ASSETS (concluded) |
| MACRO OPPORTUNITIES FUND | |
| | | Period Ended
March 31,
2017
(Unaudited) | | | Year Ended
September 30,
2016 | |
| Capital share activity: | | | | | | |
| Shares sold | | | | | | |
| A-Class | | | 10,425,703 | | | | 11,100,448 | |
| C-Class | | | 3,342,550 | | | | 3,085,029 | |
| P-Class | | | 5,489,571 | | | | 2,066,333 | |
| Institutional Class | | | 61,619,216 | | | | 40,790,744 | |
| Shares issued from reinvestment of distributions | | | | | | | | |
| A-Class | | | 485,702 | | | | 1,349,655 | |
| C-Class | | | 189,496 | | | | 570,223 | |
| P-Class | | | 93,365 | | | | 139,423 | |
| Institutional Class | | | 1,956,252 | | | | 4,378,100 | |
| Shares redeemed | | | | | | | | |
| A-Class | | | (6,490,655 | ) | | | (16,874,688 | ) |
| C-Class | | | (1,822,454 | ) | | | (5,070,813 | ) |
| P-Class | | | (722,274 | ) | | | (2,206,800 | ) |
| Institutional Class | | | (13,942,113 | ) | | | (52,364,340 | ) |
| Net increase (decrease) in shares | | | 60,624,359 | | | | (13,036,686 | ) |
50 | THE GUGGENHEIM FUNDS SEMI-ANNUAL REPORT | SEE NOTES TO FINANCIAL STATEMENTS. |
| FINANCIAL HIGHLIGHTS |
| MACRO OPPORTUNITIES FUND | |
This table is presented to show selected data for a share outstanding throughout each period and to assist shareholders in evaluating a Fund’s performance for the periods presented.
| A-Class | | Period Ended
March 31,
2017a,h | | | Year Ended
Sept. 30,
2016h | | | Year Ended
Sept. 30,
2015h | | | Year Ended
Sept. 30,
2014 | | | Year Ended
Sept. 30,
2013 | | | Period Ended
Sept. 30,
2012b | |
| Per Share Data | | | | | | | | | | | | | | | | | | |
| Net asset value, beginning of period | | $ | 26.01 | | | $ | 26.07 | | | $ | 26.81 | | | $ | 26.31 | | | $ | 26.53 | | | $ | 25.00 | |
| Income (loss) from investment operations: | |
Net investment income (loss)c | | | .52 | | | | 1.16 | | | | .98 | | | | 1.10 | | | | 1.37 | | | | .99 | |
| Net gain (loss) on investments (realized and unrealized) | | | .61 | | | | .21 | | | | (.55 | ) | | | .69 | | | | (.04 | ) | | | 1.52 | |
| Total from investment operations | | | 1.13 | | | | 1.37 | | | | .43 | | | | 1.79 | | | | 1.33 | | | | 2.51 | |
| Less distributions from: | |
| Net investment income | | | (.54 | ) | | | (1.43 | ) | | | (1.17 | ) | | | (1.27 | ) | | | (1.43 | ) | | | (.98 | ) |
| Net realized gains | | | — | | | | — | | | | — | | | | — | | | | (.12 | ) | | | — | |
| Return of capital | | | — | | | | — | | | | — | | | | (.02 | ) | | | — | | | | — | |
| Total distributions | | | (.54 | ) | | | (1.43 | ) | | | (1.17 | ) | | | (1.29 | ) | | | (1.55 | ) | | | (.98 | ) |
| Net asset value, end of period | | $ | 26.60 | | | $ | 26.01 | | | $ | 26.07 | | | $ | 26.81 | | | $ | 26.31 | | | $ | 26.53 | |
| | |
Total Returni | | | 4.35 | % | | | 5.57 | % | | | 1.59 | % | | | 6.88 | % | | | 5.01 | % | | | 10.19 | % |
| Ratios/Supplemental Data | |
| Net assets, end of period (in thousands) | | $ | 861,540 | | | $ | 727,602 | | | $ | 844,523 | | | $ | 357,765 | | | $ | 334,751 | | | $ | 83,081 | |
| Ratios to average net assets: | |
| Net investment income (loss) | | | 3.93 | % | | | 4.59 | % | | | 3.67 | % | | | 4.08 | % | | | 5.11 | % | | | 4.61 | % |
Total expensesd | | | 1.40 | % | | | 1.65 | % | | | 1.52 | % | | | 1.51 | % | | | 1.56 | % | | | 1.61 | % |
Net expensese,g | | | 1.27 | % | | | 1.46 | % | | | 1.38 | % | | | 1.36 | % | | | 1.41 | % | | | 1.37 | % |
| Portfolio turnover rate | | | 27 | % | | | 61 | % | | | 40 | % | | | 54 | % | | | 84 | % | | | 46 | % |
| SEE NOTES TO FINANCIAL STATEMENTS. | THE GUGGENHEIM FUNDS SEMI-ANNUAL REPORT | 51 |
FINANCIAL HIGHLIGHTS (continued) |
| MACRO OPPORTUNITIES FUND | |
This table is presented to show selected data for a share outstanding throughout each period and to assist shareholders in evaluating a Fund’s performance for the periods presented.
| C-Class | | Period Ended
March 31,
2017a,h | | | Year Ended
Sept. 30,
2016h | | | Year Ended
Sept. 30,
2015h | | | Year Ended
Sept. 30,
2014 | | | Year Ended
Sept. 30,
2013 | | | Period Ended
Sept. 30,
2012b | |
| Per Share Data | | | | | | | | | | | | | | | | | | |
| Net asset value, beginning of period | | $ | 25.99 | | | $ | 26.05 | | | $ | 26.79 | | | $ | 26.29 | | | $ | 26.51 | | | $ | 25.00 | |
| Income (loss) from investment operations: | |
Net investment income (loss)c | | | .42 | | | | .98 | | | | .78 | | | | .90 | | | | 1.17 | | | | .82 | |
| Net gain (loss) on investments (realized and unrealized) | | | .61 | | | | .20 | | | | (.55 | ) | | | .69 | | | | (.03 | ) | | | 1.53 | |
| Total from investment operations | | | 1.03 | | | | 1.18 | | | | .23 | | | | 1.59 | | | | 1.14 | | | | 2.35 | |
| Less distributions from: | |
| Net investment income | | | (.44 | ) | | | (1.24 | ) | | | (.97 | ) | | | (1.07 | ) | | | (1.24 | ) | | | (.84 | ) |
| Net realized gains | | | — | | | | — | | | | — | | | | — | | | | (.12 | ) | | | — | |
| Return of capital | | | — | | | | — | | | | — | | | | (.02 | ) | | | — | | | | — | |
| Total distributions | | | (.44 | ) | | | (1.24 | ) | | | (.97 | ) | | | (1.09 | ) | | | (1.36 | ) | | | (.84 | ) |
| Net asset value, end of period | | $ | 26.58 | | | $ | 25.99 | | | $ | 26.05 | | | $ | 26.79 | | | $ | 26.29 | | | $ | 26.51 | |
| | |
Total Returni | | | 4.00 | % | | | 4.79 | % | | | 0.84 | % | | | 6.10 | % | | | 4.26 | % | | | 9.54 | % |
| Ratios/Supplemental Data | |
| Net assets, end of period (in thousands) | | $ | 390,093 | | | $ | 337,075 | | | $ | 374,633 | | | $ | 248,359 | | | $ | 163,129 | | | $ | 32,711 | |
| Ratios to average net assets: | |
| Net investment income (loss) | | | 3.17 | % | | | 3.87 | % | | | 2.90 | % | | | 3.34 | % | | | 4.36 | % | | | 3.83 | % |
Total expensesd | | | 2.15 | % | | | 2.36 | % | | | 2.24 | % | | | 2.22 | % | | | 2.29 | % | | | 2.31 | % |
Net expensese,g | | | 2.04 | % | | | 2.20 | % | | | 2.13 | % | | | 2.10 | % | | | 2.15 | % | | | 2.11 | % |
| Portfolio turnover rate | | | 27 | % | | | 61 | % | | | 40 | % | | | 54 | % | | | 84 | % | | | 46 | % |
52 | THE GUGGENHEIM FUNDS SEMI-ANNUAL REPORT | SEE NOTES TO FINANCIAL STATEMENTS. |
FINANCIAL HIGHLIGHTS (continued) |
| MACRO OPPORTUNITIES FUND |
This table is presented to show selected data for a share outstanding throughout each period and to assist shareholders in evaluating a Fund’s performance for the periods presented.
| P-Class | | Period Ended
March 31,
2017a,h | | | Year Ended
Sept. 30,
2016h | | | Period Ended
Sept. 30,
2015f,h | |
| Per Share Data | | | | | | | | | |
| Net asset value, beginning of period | | $ | 26.02 | | | $ | 26.07 | | | $ | 26.78 | |
| Income (loss) from investment operations: | |
Net investment income (loss)c | | | .50 | | | | 1.20 | | | | .37 | |
| Net gain (loss) on investments (realized and unrealized) | | | .62 | | | | .21 | | | | (.62 | ) |
| Total from investment operations | | | 1.12 | | | | 1.41 | | | | (.25 | ) |
| Less distributions from: | |
| Net investment income | | | (.54 | ) | | | (1.46 | ) | | | (.46 | ) |
| Total distributions | | | (.54 | ) | | | (1.46 | ) | | | (.46 | ) |
| Net asset value, end of period | | $ | 26.60 | | | $ | 26.02 | | | $ | 26.07 | |
| | |
Total Returni | | | 4.35 | % | | | 5.74 | % | | | (0.95 | %) |
| Ratios/Supplemental Data | |
| Net assets, end of period (in thousands) | | $ | 194,409 | | | $ | 63,665 | | | $ | 63,819 | |
| Ratios to average net assets: | |
| Net investment income (loss) | | | 3.79 | % | | | 4.73 | % | | | 3.36 | % |
Total expensesd | | | 1.39 | % | | | 1.49 | % | | | 1.43 | % |
Net expensese,g | | | 1.23 | % | | | 1.33 | % | | | 1.30 | % |
| Portfolio turnover rate | | | 27 | % | | | 61 | % | | | 40 | % |
| SEE NOTES TO FINANCIAL STATEMENTS. | THE GUGGENHEIM FUNDS SEMI-ANNUAL REPORT | 53 |
FINANCIAL HIGHLIGHTS (continued) |
| MACRO OPPORTUNITIES FUND |
This table is presented to show selected data for a share outstanding throughout each period and to assist shareholders in evaluating a Fund’s performance for the periods presented.
| Institutional Class | | Period Ended
March 31,
2017a,h | | | Year Ended
Sept. 30,
2016h | | | Year Ended
Sept. 30,
2015h | | | Year Ended
Sept. 30,
2014 | | | Year Ended
Sept. 30,
2013 | | | Period Ended
Sept. 30,
2012b | |
| Per Share Data | | | | | | | | | | | | | | | | | | |
| Net asset value, beginning of period | | $ | 26.04 | | | $ | 26.10 | | | $ | 26.84 | | | $ | 26.34 | | | $ | 26.56 | | | $ | 25.00 | |
| Income (loss) from investment operations: | |
Net investment income (loss)c | | | .55 | | | | 1.26 | | | | 1.06 | | | | 1.18 | | | | 1.46 | | | | 1.12 | |
| Net gain (loss) on investments (realized and unrealized) | | | .63 | | | | .21 | | | | (.54 | ) | | | .70 | | | | (.04 | ) | | | 1.47 | |
| Total from investment operations | | | 1.18 | | | | 1.47 | | | | (.52 | ) | | | 1.88 | | | | 1.42 | | | | 2.59 | |
| Less distributions from: | |
| Net investment income | | | (.59 | ) | | | (1.53 | ) | | | (1.26 | ) | | | (1.36 | ) | | | (1.52 | ) | | | (1.03 | ) |
| Net realized gains | | | — | | | | — | | | | — | | | | — | | | | (.12 | ) | | | — | |
| Return of capital | | | — | | | | — | | | | — | | | | (.02 | ) | | | — | | | | — | |
| Total distributions | | | (.59 | ) | | | (1.53 | ) | | | (1.26 | ) | | | (1.38 | ) | | | (1.64 | ) | | | (1.03 | ) |
| Net asset value, end of period | | $ | 26.63 | | | $ | 26.04 | | | $ | 26.10 | | | $ | 26.84 | | | $ | 26.34 | | | $ | 26.56 | |
| | |
Total Returni | | | 4.56 | % | | | 5.97 | % | | | 1.92 | % | | | 7.23 | % | | | 5.35 | % | | | 10.55 | % |
| Ratios/Supplemental Data | |
| Net assets, end of period (in thousands) | | $ | 3,575,388 | | | $ | 2,204,079 | | | $ | 2,396,622 | | | $ | 914,366 | | | $ | 416,727 | | | $ | 106,716 | |
| Ratios to average net assets: | |
| Net investment income (loss) | | | 4.21 | % | | | 4.96 | % | | | 3.97 | % | | | 4.37 | % | | | 5.43 | % | | | 5.22 | % |
Total expensesd | | | 1.05 | % | | | 1.29 | % | | | 1.20 | % | | | 1.18 | % | | | 1.23 | % | | | 1.31 | % |
Net expensese,g | | | 0.93 | % | | | 1.08 | % | | | 1.05 | % | | | 1.02 | % | | | 1.09 | % | | | 1.06 | % |
| Portfolio turnover rate | | | 27 | % | | | 61 | % | | | 40 | % | | | 54 | % | | | 84 | % | | | 46 | % |
54 | THE GUGGENHEIM FUNDS SEMI-ANNUAL REPORT | SEE NOTES TO FINANCIAL STATEMENTS. |
FINANCIAL HIGHLIGHTS (concluded) |
| MACRO OPPORTUNITIES FUND |
a | Unaudited figures for the period ended March 31, 2017. Percentage amounts for the period, except total return and portfolio turnover rate, have been annualized. |
b | Since commencement of operations: November 30, 2011. Percentage amounts for the period, except total return and portfolio turnover rate, have been annualized. |
c | Net investment income (loss) per share was computed using average shares outstanding throughout the period. |
d | Does not include expenses of the underlying funds in which the Fund invests. |
e | Net expense information reflects the expense ratios after expense waivers. |
f | Since commencement of operations: May 1, 2015. Percentage amounts for the period, except total return and portfolio turnover rate, have been annualized. |
g | Net expenses may include expenses that are excluded from the expense limitation agreement and affiliated fee waivers. Excluding these expenses, the net expense ratios for the periods would be: |
| | 03/31/17 | 09/30/16 | 09/30/15 | 09/30/14 | 09/30/13 | 09/30/12 |
| A-Class | 1.24% | 1.28% | 1.30% | 1.27% | 1.29% | 1.29% |
| C-Class | 2.01% | 2.02% | 2.05% | 2.01% | 2.01% | 2.02% |
| P-Class | 1.20% | 1.15% | 1.21% | N/A | N/A | N/A |
| Institutional Class | 0.90% | 0.90% | 0.97% | 0.94% | 0.96% | 0.96% |
h | Consolidated. |
i | Total return does not reflect the impact of any applicable sales charges and has not been annualized. |
| SEE NOTES TO FINANCIAL STATEMENTS. | THE GUGGENHEIM FUNDS SEMI-ANNUAL REPORT | 55 |
NOTES TO CONSOLIDATED FINANCIAL STATEMENTS (Unaudited) |
1. Organization, Consolidation of Subsidiary and Significant Accounting Policies
Organization
Guggenheim Funds Trust (the “Trust”), a Delaware statutory trust, is registered with the SEC under the Investment Company Act of 1940 (“1940 Act”), as an open-ended investment company of the series type. Each series, in effect, is representing a separate Fund. The Trust is authorized to issue an unlimited number of shares. The Trust accounts for the assets of each Fund separately.
The Trust offers a combination of five separate classes of shares, A-Class shares, C-Class shares, P-Class shares, R6-Class shares and Institutional Class shares. Sales of shares of each Class are made without a front-end sales charge at the net asset value per share (“NAV”), with the exception of A-Class shares. A-Class shares are sold at the NAV, plus the applicable front-end sales charge. The sales charge varies depending on the amount purchased. A-Class share purchases of $1 million or more are exempt from the front-end sales charge but have a 1% contingent deferred sales charge (“CDSC”), if shares are redeemed within 12 months of purchase. B-Class shares previously offered have been converted to A-Class shares effective July 31, 2014 for the Alpha Opportunity Fund, and effective August 8, 2015 for the other funds in the Trust. C-Class shares have a 1% CDSC if shares are redeemed within 12 months of purchase. Institutional Class shares are offered primarily for direct investment by institutions such as pension and profit sharing plans, endowments, foundations and corporations. Institutional Class shares require a minimum initial investment of $2 million and a minimum account balance of $1 million. At March 31, 2017, the Trust consisted of nineteen funds (the “Funds”).
This report covers the Macro Opportunities Fund (the “Fund”), a non-diversified investment company.
Guggenheim Partners Investment Management, LLC, which operates under the name Guggenheim Investments (“GI”), provides advisory services. Guggenheim Funds Distributors, LLC (“GFD”) acts as principal underwriter for the Trust. GI and GFD are affiliated entities.
Consolidation of Subsidiary
The consolidated financial statements of the Fund includes the accounts of a wholly-owned and controlled Cayman Islands subsidiary (the “Subsidiary”). Significant inter-company accounts and transactions have been eliminated in consolidation for the Fund.
The Fund may invest up to 25% of its total assets in its Subsidiary which acts as an investment vehicle in order to effect certain investments consistent with the Fund’s investment objective and policies.
| 56 | THE GUGGENHEIM FUNDS SEMI-ANNUAL REPORT | |
NOTES TO CONSOLIDATED FINANCIAL STATEMENTS (Unaudited)(continued) |
A summary of the Fund’s investment in its Subsidiary is as follows:
| Fund | Commencement Date of Subsidiary | | Subsidiary
Net Assets at
March 31, 2017 | | | % of Net Assets of the Fund at March 31, 2017 | |
| Macro Opportunities Fund | 01/08/15 | | $ | 4,333,342 | | | | 0.09 | % |
Significant Accounting Policies
The Fund operates as an investment company and, accordingly, follows the investment company accounting and reporting guidance of the Financial Accounting Standards Board (“FASB”) Accounting Standards Codification Topic 946 Financial Services – Investment Companies.
The following significant accounting policies are in conformity with U.S. generally accepted accounting principles (“U.S. GAAP”) and are consistently followed by the Trust. This requires management to make estimates and assumptions that affect the reported amount of assets and liabilities, contingent assets and liabilities at the date of the financial statements, and the reported amounts of revenues and expenses during the reporting period. Actual results could differ from these estimates. All time references are based on Eastern Time.
The NAV of each Class of the Fund is calculated by dividing the market value of the Fund’s securities and other assets, less all liabilities, attributable to the Class by the number of outstanding shares of the Class.
A. The Board of Trustees of the Fund (the “Board”) has adopted policies and procedures for the valuation of the Fund’s investments (the “Valuation Procedures”). Pursuant to the Valuation Procedures, the Board has delegated to a valuation committee, consisting of representatives from Guggenheim’s investment management, fund administration, legal and compliance departments (the “Valuation Committee”), the day-to-day responsibility for implementing the Valuation Procedures, including, under most circumstances, the responsibility for determining the fair value of the Fund’s securities and/or other assets.
Valuations of the Fund’s securities are supplied primarily by pricing services appointed pursuant to the processes set forth in the Valuation Procedures. The Valuation Committee convenes monthly, or more frequently as needed, to review the valuation of all assets which have been fair valued for reasonableness. The Fund’s officers, through the Valuation Committee and consistent with the monitoring and review responsibilities set forth in the Valuation Procedures, regularly review procedures used and valuations provided by the pricing services.
If the pricing service cannot or does not provide a valuation for a particular investment or such valuation is deemed unreliable, such investment is fair valued by the Valuation Committee.
Equity securities listed on an exchange (New York Stock Exchange (“NYSE”) or American Stock Exchange) are valued at the last quoted sales price as of the close of business on the NYSE, usually 4:00 p.m. on the valuation date. Equity securities listed on the NASDAQ market system
| | THE GUGGENHEIM FUNDS SEMI-ANNUAL REPORT | 57 |
NOTES TO CONSOLIDATED FINANCIAL STATEMENTS (Unaudited)(continued) |
are valued at the NASDAQ Official Closing Price on the valuation date, which may not necessarily represent the last sale price. If there has been no sale on such exchange or NASDAQ on a given day, the security is valued at the closing bid price on that day.
Generally, trading in foreign securities markets is substantially completed each day at various times prior to the close of the NYSE. The values of foreign securities are determined as of the close of such foreign markets or the close of the NYSE, if earlier. All investments quoted in foreign currencies are valued in U.S. dollars on the basis of the foreign currency exchange rates prevailing at the close of business. Investments in foreign securities may involve risks not present in domestic investments. The Valuation Committee will determine the current value of such foreign securities by taking into consideration certain factors which may include those discussed above, as well as the following factors, among others: the value of the securities traded on other foreign markets, ADR trading, closed-end fund trading, foreign currency exchange activity, and the trading prices of financial products that are tied to foreign securities. In addition, the Board has authorized the Valuation Committee and GI to use prices and other information supplied by a third party pricing vendor in valuing foreign securities.
Open-end investment companies (“mutual funds”) are valued at their NAV as of the close of business, on the valuation date. Exchange-traded funds (“ETFs”) and closed-end investment companies (“CEFs”) are valued at the last quoted sales price.
Debt securities with a maturity of greater than 60 days at acquisition are valued at prices that reflect broker-dealer supplied valuations or are obtained from independent pricing services, which may consider the trade activity, treasury spreads, yields or price of bonds of comparable quality, coupon, maturity, and type, as well as prices quoted by dealers who make markets in such securities. Short-term debt securities with a maturity of 60 days or less at acquisition are valued at amortized cost, provided such amount approximates market value.
Repurchase agreements are valued at amortized cost, provided such amounts approximate market value.
Typically, loans are valued using information provided by an independent third party pricing service which uses broker quotes in a non-active market.
Listed options are valued at the Official Settlement Price listed by the exchange, usually as of 4:00 p.m. Long options are valued using the bid price and short options are valued using the ask price. In the event that a settlement price is not available, fair valuation is enacted. Over-the-counter (“OTC”) options are valued using the average bid price (for long options) or average ask price (for short options) obtained from one or more security dealers.
The value of interest rate swap agreements entered into by a Fund is accounted for using the unrealized gain or loss on the agreements that is determined using the spread priced off the previous day’s Chicago Mercantile Exchange (“CME”) price.
| 58 | THE GUGGENHEIM FUNDS SEMI-ANNUAL REPORT | |
NOTES TO CONSOLIDATED FINANCIAL STATEMENTS (Unaudited)(continued) |
The value of equity swaps with custom portfolio baskets shall be computed by using the last exchange sale price for each underlying equity security within the swap agreement. A custom portfolio equity swap will be adjusted to include dividends accrued, financing charges and/or interest, as applicable, under the swap agreement.
Investments for which market quotations are not readily available are fair- valued as determined in good faith by GI under the direction of the Board using methods established or ratified by the Board. Valuations in accordance with these methods are intended to reflect each security’s (or asset’s) “fair value.” Each such determination is based on a consideration of all relevant factors, which are likely to vary from one pricing context to another. Examples of such factors may include, but are not limited to market prices; sale prices; broker quotes; and models which derive prices based on inputs such as prices of securities with comparable maturities and characteristics, or based on inputs such as anticipated cash flows or collateral, spread over Treasuries, and other information analysis.
In connection with other derivative investments, such factors may include obtaining information as to how (a) these contracts and other derivative investments trade in the futures or other derivative markets, respectively, and (b) the securities underlying these contracts and other derivative investments trade in the cash market.
B. Senior loans in which the Fund invests generally pay interest rates which are periodically adjusted by reference to a base short-term floating rate, plus a premium. These base lending rates are generally (i) the lending rate offered by one or more major European banks, such as the one-month or three-month London Inter-Bank Offered Rate (LIBOR), (ii) the prime rate offered by one or more major United States banks, or (iii) the bank’s certificate of deposit rate. Senior floating rate interests often require prepayments from excess cash flows or permit the borrower to repay at its election. The rate at which the borrower repays cannot be predicted with accuracy. As a result, the actual remaining maturity may be substantially less than the stated maturities shown. The interest rate indicated is the rate in effect at March 31, 2017.
C. The Fund may purchase and sell interests in securities on a when-issued and delayed delivery basis, with payment and delivery scheduled for a future date. No income accrues to the Fund on such interests or securities in connection with such transactions prior to the date the Fund actually take delivery of such interests or securities. These transactions are subject to market fluctuations and are subject to the risk that the value at delivery may be more or less than the trade date purchase price. Although the Fund will generally purchase these securities with the intention of acquiring such securities, they may sell such securities before the settlement date.
D. When the Fund engages in a short sale of a security, an amount equal to the proceeds is reflected as an asset and an equivalent liability. The amount of the liability is subsequently marked-to-market to reflect the market value of the short sale. The Fund maintains a segregated account of cash and/or securities as collateral for short sales.
| | THE GUGGENHEIM FUNDS SEMI-ANNUAL REPORT | 59 |
NOTES TO CONSOLIDATED FINANCIAL STATEMENTS (Unaudited)(continued) |
Fees, if any, paid to brokers to borrow securities in connection with short sales are recorded as interest expense. In addition, the Fund must pay out the dividend rate of the equity or coupon rate of the obligation to the lender and record this as an expense. Short dividend or interest expense is a cost associated with the investment objective of short sales transactions, rather than an operational cost associated with the day-to-day management of any mutual fund. The Fund may also receive rebate income from the broker resulting from the investment of the proceeds from securities sold short.
E. Upon the purchase of an option, the premium paid is recorded as an investment, the value of which is marked-to-market daily. If a purchased option expires, the Fund realizes a loss in the amount of the cost of the option. When the Fund enters into a closing sale transaction, it realizes a gain or loss depending on whether the proceeds from the closing sale transaction are greater or less than the cost of the option. If the Fund exercises a put option, it realizes a gain or loss from the sale of the underlying security and the proceeds from such sale will be decreased by the premium originally paid. When the Fund exercises a call option, the cost of the security purchased by the Fund upon exercise increases by the premium originally paid.
When the Fund writes (sells) an option, an amount equal to the premium received is entered in that Fund’s accounting records as an asset and equivalent liability. The amount of the liability is subsequently marked-to-market to reflect the current value of the option written. When a written option expires, or if the Fund enters into a closing purchase transaction, it realizes a gain (or loss if the cost of a closing purchase transaction exceeds the premium received when the option was sold).
F. Swap agreements are marked-to-market daily and the change, if any, is recorded as unrealized gain or loss. Payments received or made as a result of an agreement or termination of an agreement are recognized as realized gains or losses.
G. Forward foreign currency exchange contracts are valued daily based on the applicable exchange rate of the underlying currency. The change in value of the contract is recorded as unrealized appreciation or depreciation until the contract is closed. When the contract is closed, the Fund records a realized gain or loss equal to the difference between the value at the time the contract was opened and the value at the time it was closed.
H. Security transactions are recorded on the trade date for financial reporting purposes. Realized gains and losses from securities transactions are recorded using the identified cost basis. Proceeds from lawsuits related to investment holdings are recorded as realized gains in the Fund. Dividend income is recorded on the ex-dividend date, net of applicable taxes withheld by foreign countries. Taxable non-cash dividends are recorded as dividend income. Interest income, including amortization of premiums and accretion of discounts, is accrued on a daily basis. Interest income also includes paydown gains and losses on mortgage-backed and asset-backed securities and senior and subordinated loans. Amendment fees are earned as compensation for evaluating and accepting changes to the original loan agreement and are recognized when received. Dividend income from REITs is recorded based on the income included in the
| 60 | THE GUGGENHEIM FUNDS SEMI-ANNUAL REPORT | |
NOTES TO CONSOLIDATED FINANCIAL STATEMENTS (Unaudited)(continued) |
distributions received from the REIT investments using published REIT classifications, including some management estimates when actual amounts are not available. Distributions received in excess of this estimated amount are recorded as a reduction of the cost of investments or reclassified to capital gains. The actual amounts of income, return of capital, and capital gains are only determined by each REIT after its fiscal year-end, and may differ from the estimated amounts.
I. The Fund declares dividends from investment income daily. The Fund pays its shareholders from its net investment income monthly and distributes any net capital gains that it has realized, at least annually. Distributions to shareholders are recorded on the ex-dividend date. Dividends are reinvested in additional shares unless shareholders request payment in cash. The character of distributions made during the year from net investment income or net realized gains may differ from their ultimate characterization for federal income tax purposes.
J. Interest and dividend income, most expenses, all realized gains and losses, and all unrealized gains and losses are allocated to the classes based upon the value of the outstanding shares in each Class. Certain costs, such as distribution and service fees are charged directly to specific classes. In addition, certain expenses have been allocated to the individual Funds in the Trust on a pro rata basis upon the respective aggregate net assets of each Fund included in the Trust.
K. Under the fee arrangement with the custodian, the Fund may earn credits based on overnight custody cash balances. These credits are utilized to reduce related custodial expenses. The custodian fees disclosed in the Statement of Operations are before the reduction in expense from the related earnings credits, if any. For the period ended March 31, 2017, there were no earnings credits received.
L. The Fund may leave cash overnight in its cash account with the custodian. Periodically, the Fund may have cash due to the custodian bank as an overdraft balance. A fee is incurred on this overdraft, calculated by multiplying the overdraft by a rate based on the federal funds rate, which was 0.82% at March 31, 2017.
M. Under the Fund’s organizational documents, its Trustees and Officers are indemnified against certain liabilities arising out of the performance of their duties to the Trust. In addition, throughout the normal course of business, the Fund enters into contracts that contain a variety of representations and warranties which provide general indemnifications. The Fund’s maximum exposure under these arrangements is unknown, as this would involve future claims that may be made against the Fund and/or its affiliates that have not yet occurred. However, based on experience, the Fund expects the risk of loss to be remote.
N. The accounting records of the Fund are maintained in U.S. dollars. All assets and liabilities initially expressed in foreign currencies are converted into U.S. dollars at prevailing exchange rates. Purchases and sales of investment securities, dividend and interest income, and certain expenses are translated at the rates of exchange prevailing on the respective dates of such transactions. Changes in the relationship of these foreign currencies to the U.S. dollar can significantly affect the value of the investments and earnings of the Funds. Foreign investments
| | THE GUGGENHEIM FUNDS SEMI-ANNUAL REPORT | 61 |
NOTES TO CONSOLIDATED FINANCIAL STATEMENTS (Unaudited)(continued) |
may also subject the Funds to foreign government exchange restrictions, expropriation, taxation or other political, social or economic developments, all of which could affect the market and/or credit risk of the investments.
The Funds do not isolate that portion of the results of operations resulting from changes in the foreign exchange rates on investments from the fluctuations arising from changes in the market prices of securities held. Such fluctuations are included with the net realized and unrealized gain or loss on investments.
Reported net realized foreign exchange gains and losses arise from sales of foreign currencies and currency gains or losses realized between the trade and settlement dates on investment transactions. Net unrealized exchange gains and losses arise from changes in the fair values of assets and liabilities other than investments in securities at the fiscal period end, resulting from changes in exchange rates.
2. Financial Instruments and Derivatives
As part of its investment strategy, the Fund utilizes short sales and a variety of derivative instruments. These investments involve, to varying degrees, elements of market risk and risks in excess of the amounts recognized in the Statement of Assets and Liabilities. Valuation and accounting treatment of these instruments can be found under Significant Accounting Policies in Note 1 of these Notes to Financial Statements.
Short Sales
A short sale is a transaction in which a Fund sells a security it does not own. If the security sold short decreases in price between the time the Fund sells the security and closes its short position, the Fund will realize a gain on the transaction. Conversely, if the security increases in price during the period, the Fund will realize a loss on the transaction. The risk of such price increases is the principal risk of engaging in short sales.
Derivatives
Derivatives are instruments whose values depend on, or are derived from, in whole or in part, the value of one or more other assets, such as securities, currencies, commodities or indices. Derivative instruments may be used to increase investment flexibility (including to maintain cash reserves while maintaining exposure to certain other assets), for risk management (hedging) purposes, to facilitate trading, to reduce transaction costs and to pursue higher investment returns. Derivative instruments may also be used to mitigate certain investment risks, such as foreign currency exchange rate risk, interest rate risk and credit risk. U.S. GAAP requires disclosures to enable investors to better understand how and why a Fund uses derivative instruments, how these derivative instruments are accounted for and their effects on the Fund’s financial position and results of operations.
| 62 | THE GUGGENHEIM FUNDS SEMI-ANNUAL REPORT | |
NOTES TO CONSOLIDATED FINANCIAL STATEMENTS (Unaudited)(continued) |
The Funds may utilize derivatives for the following purposes:
Duration: the use of an instrument to manage the interest rate risk of a portfolio.
Hedge: an investment made in order to reduce the risk of adverse price movements in a security, by taking an offsetting position to protect against broad market moves.
Index Exposure: the use of an instrument to obtain exposure to a listed or other type of index.
Speculation: the use of an instrument to express macro-economic and other investment views.
Options Purchased and Written
A call option on a security gives the purchaser of the option the right to buy, and the writer of a call option the obligation to sell, the underlying security. The purchaser of a put option has the right to sell, and the writer of the put option the obligation to buy, the underlying security at any time during the option period. The risk associated with purchasing options is limited to the premium originally paid.
The following table represents the Fund’s use, and volume of call/put options purchased on a quarterly basis:
| Fund | Use | | Average Number
of Contracts | |
| Macro Opportunities Fund | Duration, Hedge, Index Exposure, Speculation | | | 23,864 | |
| Fund | Use | | Average
Notional* | |
| Macro Opportunities Fund | Duration, Hedge, Index Exposure, Speculation | | $ | 200,380,500 | |
| * | Average Notional relates to currency options. |
The risk in writing a call option is that a Fund may incur a loss if the market price of the underlying security increases and the option is exercised. The risk in writing a put option is that a Fund may incur a loss if the market price of the underlying security decreases and the option is exercised. In addition, there may be an imperfect correlation between the movement in prices of options and the underlying securities where a Fund may not be able to enter into a closing transaction because of an illiquid secondary market; or, for OTC options, a Fund may be at risk because of the counterparty’s inability to perform.
| | THE GUGGENHEIM FUNDS SEMI-ANNUAL REPORT | 63 |
NOTES TO CONSOLIDATED FINANCIAL STATEMENTS (Unaudited)(continued) |
The following tables represent the Fund’s use and activity of options written for the period ended March 31, 2017:
| Written Call Options | | | |
| | | Macro Opportunities Fund | |
| | | Number of
Contracts | | | Premium
Amount | |
| Balance at September 30, 2016 | | | 9,069 | | | $ | 2,711,631 | |
| Options Written | | | 57,976 | | | | 5,275,816 | |
| Options terminated in closing purchase transactions | | | (9,069 | ) | | | (2,711,631 | ) |
| Options expired | | | — | | | | — | |
| Options exercised | | | — | | | | — | |
| Balance at March 31, 2017 | | | 57,976 | | | $ | 5,275,816 | |
| Written Put Options | | | |
| | | Macro Opportunities Fund | |
| | | Number of
Contracts | | | Premium
Amount | |
| Balance at September 30, 2016 | | | — | | | $ | — | |
| Options Written | | | 8,995 | | | | 3,479,266 | |
| Options terminated in closing purchase transactions | | | — | | | | — | |
| Options expired | | | — | | | | — | |
| Options exercised | | | — | | | | — | |
| Balance at March 31, 2017 | | | 8,995 | | | $ | 3,479,266 | |
Swaps
A swap is an agreement that obligates two parties to exchange a series of cash flows at specified intervals based upon or calculated by reference to changes in specified prices or rates for a specified amount of an underlying asset. A Fund utilizing OTC swaps bears the risk of loss of the amount expected to be received under a swap agreement in the event of the default or bankruptcy of a swap agreement counterparty or if the underlying asset declines in value. Certain standardized swaps are subject to mandatory central clearing. Central clearing generally reduces counterparty credit risk and increases liquidity, but central clearing does not make swap transactions risk-free. For Funds utilizing interest rate swaps, the exchange bears the risk of loss. Additionally, there is no guarantee that a Fund or an underlying fund could eliminate its exposure under an outstanding swap agreement by entering into an offsetting swap agreement with the same or another party.
Equity swaps involve commitments where single or multiple cash flows are exchanged based on the price of an underlying reference asset (such as index or basket) or a fixed or variable interest rate. Index swaps will usually be computed based on the current index value as of the close of regular trading on the NYSE or other exchange, with the swap value being adjusted to include
| 64 | THE GUGGENHEIM FUNDS SEMI-ANNUAL REPORT | |
NOTES TO CONSOLIDATED FINANCIAL STATEMENTS (Unaudited)(continued) |
dividends accrued, financing charges and/or interest associated with the swap agreement. A fund utilizing a total return index swap bears the risk of loss of the amount expected to be received under a swap agreement in the event of the default or bankruptcy of a swap agreement counterparty or if the underlying index declines in value.
The following table represents the Fund’s use and volume of equity swaps on a quarterly basis:
| | | | Average Notional | |
| Fund | Use | | Long | | | Short | |
| Macro Opportunities Fund | Index exposure, Speculation | | $ | 189,041,658 | | | $ | 256,071,639 | |
Interest rate swaps involve the exchange by the Fund with another party for its respective commitment to pay or receive interest on a notional amount of principal. Interest rate swaps are generally valued using the closing price from the prior day, subject to an adjustment for the current day’s spreads. Interest rate swaps are generally subject to mandatory central clearing, but central clearing does not make interest rate swap transactions risk free.
The following table represents the Fund’s use and volume of interest rate swaps on a quarterly basis:
| | | | Average Notional | |
| Fund | Use | | Long | | | Short | |
| Macro Opportunities Fund | Duration, Hedge, Speculation | | $ | — | | | $ | 1,333,725,000 | |
Forward Foreign Currency Exchange Contracts
A forward foreign currency exchange contract is an agreement between two parties to exchange two designated currencies at a specific time in the future. Certain types of contracts may be cash settled, in an amount equal to the change in exchange rates during the term of the contract. The contracts can be used to hedge or manage exposure to foreign currency risks with portfolio investments or to gain exposure to foreign currencies.
The market value of a forward foreign currency exchange contract changes with fluctuations in foreign currency exchange rates. Furthermore, the Fund may be exposed to risk if the counterparties cannot meet the contract terms or if the currency value changes unfavorably as compared to the U.S. dollar.
The following table represents the Fund’s use, and volume of forward currency exchange contracts on a quarterly basis:
| | | | Average Settlement | |
| Fund | Use | | Purchased | | | Sold | |
| Macro Opportunities Fund | Hedge | | $ | 27,709,281 | | | $ | 2,342,140 | |
| | THE GUGGENHEIM FUNDS SEMI-ANNUAL REPORT | 65 |
NOTES TO CONSOLIDATED FINANCIAL STATEMENTS (Unaudited)(continued) |
Derivative Investment Holdings Categorized by Risk Exposure
The following is a summary of the location of derivative investments on the Fund’s Statement of Assets and Liabilities as of March 31, 2017:
| Derivative Investment Type | Asset Derivatives | Liability Derivatives |
| Equity/Interest Rate contracts | Unrealized appreciation on swap agreements | Unrealized appreciation on swap agreements |
| Currency contracts | Unrealized appreciation on forward foreign currency exchange contracts | Unrealized appreciation on foreign currency exchange contracts |
| Currency/Interest Rate contracts | Investments in unaffiliated issues, at value | Options written, at value |
The following table sets forth the fair value of the Fund’s derivative investments categorized by primary risk exposure at March 31, 2017:
| Asset Derivative Investments Value | |
| Fund | | Swaps
Equity
Contracts | | | Swaps
Interest Rate
Contracts | | | Options Purchased Currency Contracts | | | Options
Purchased Interest Rate
Contracts | | | Forward
Foreign Currency Exchange Contracts | | | Total Value at
March 31, 2017 | |
| Macro Opportunities Fund | | $ | 4,509,213 | | | $ | 29,393 | | | $ | 15,667,725 | | | $ | 15,537,568 | | | $ | 243,813 | | | $ | 35,987,712 | |
| Liability Derivative Investments Value | |
| Fund | | Swaps
Equity
Contracts | | | Swaps
Interest Rate
Contracts | | | Options Purchased Currency Contracts | | | Options
Written
Interest Rate
Contracts | | | Forward
Foreign Currency Exchange Contracts | | | Total Value at
March 31, 2017 | |
| Macro Opportunities Fund | | $ | 6,117,365 | | | $ | 833,159 | | | $ | 2,192,531 | | | $ | 8,406,520 | | | $ | 602,936 | | | $ | 18,152,511 | |
| 66 | THE GUGGENHEIM FUNDS SEMI-ANNUAL REPORT | |
NOTES TO CONSOLIDATED FINANCIAL STATEMENTS (Unaudited)(continued) |
The following is a summary of the location of derivative investments on the Fund’s Statement of Operations for the period ended March 31, 2017:
| Derivative Investment Type | Location of Gain (Loss) on Derivatives |
| Currency contracts | Net realized gain(loss) on forward foreign currency exchange contracts |
| | Net change in unrealized appreciation (depreciation) on forward foreign currency exchange contracts |
| Currency/Commodity/Equity/Interest Rate/Total Return contracts | Net realized gain (loss) on options purchased |
| | Net change in unrealized appreciation (depreciation) on options purchased |
| | Net realized gain (loss) on options written |
| | Net change in unrealized appreciation (depreciation) on options written |
| | Net realized gain (loss) on swap agrrements |
| | Net change in unrealized appreciation (depreciation) on swap agreements |
The following is a summary of the Fund’s realized gain (loss) and change in unrealized appreciation (depreciation) on derivative investments recognized on the Statement of Operations categorized by primary risk exposure for the period ended March 31, 2017:
| Realized Gain (Loss) on Derivative Investments Recognized on the Statement of Operations | |
| Fund | | Swaps
Interest
Rate Agreements | | | Swaps
Equity Agreements | | | Swaps Currency Agreements | | | Swaps
Total
Return Agreements | | | Options Written Interest Rate
Contracts | | | Options Written Commodities
Contracts | |
| Macro Opportunities Fund | | $ | 1,572,489 | | | $ | 359,377 | | | $ | 194,574 | | | $ | 8,112,639 | | | $ | — | | | $ | 2,321,664 | |
| Realized Gain (Loss) on Derivative Investments Recognized on the Statement of Operations | |
| Fund | | Options Purchased Foreign Currency
Contracts | | | Options Purchased Interest Rate Contracts | | | Options Purchased Commodities
Contracts | | | Options Purchased Foreign Currency
Contracts | | | Forward Exchange Contracts | | | Total | |
| Macro Opportunities Fund | | $ | — | | | $ | — | | | $ | — | | | $ | (5,940,195 | ) | | $ | 1,571,215 | | | $ | 8,191,763 | |
| | THE GUGGENHEIM FUNDS SEMI-ANNUAL REPORT | 67 |
NOTES TO CONSOLIDATED FINANCIAL STATEMENTS (Unaudited)(continued) |
| Change in Unrealized Appreciation (Depreciation) on Derivative Investments Recognized on the Statement of Operations | |
| Fund | | Swaps Interest
Rate Agreements | | | Swaps
Equity Agreements | | | Swaps Currency Agreements | | | Swaps
Total
Return Agreements | | | Options Written Interest Rate
Contracts | | | Options Written Commodities
Contracts | |
| Macro Opportunities Fund | | $ | 1,200,762 | | | $ | 7,591 | | | $ | — | | | $ | 1,423,193 | | | $ | (3,130,704 | ) | | $ | (2,117,612 | ) |
| Change in Unrealized Appreciation (Depreciation) on Derivative Investments Recognized on the Statement of Operations | |
| Fund | | Options Written Foreign Currency
Contracts | | | Options Purchased Interest Rate Contracts | | | Options Purchased Commodities
Contracts | | | Options Purchased Foreign Currency
Contracts | | | Forward Exchange Contracts | | | Total | |
| Macro Opportunities Fund | | $ | 1,286,735 | | | $ | 5,391,768 | | | $ | 3,899,670 | | | $ | (2,201,669 | ) | | $ | (673,766 | ) | | $ | 5,085,968 | |
In conjunction with the use short sales and of derivative instruments, the Fund is required to maintain collateral in various forms. The Fund uses, where appropriate, depending on the financial instrument utilized and the broker involved, margin deposits at the broker, cash and/or securities segregated at the custodian bank, discount notes or the repurchase agreements allocated to the Fund.
The Trust has established counterparty credit guidelines and enters into transactions only with financial institutions of investment grade or better. The Trust monitors the counterparty credit risk.
3. Fees and Other Transactions with Affiliates
At a meeting that occurred on November 16, 2016, the Board approved to add an advisory fee breakpoint (“breakpoint”) to the Fund.
Under the terms of an investment advisory contract, the Fund pays GI investment advisory fees calculated at an annualized rate of 0.89% of the average daily net assets of the Fund. Effective January 30, 2017, a breakpoint of 5 basis points (0.05%) on average daily net assets above $5 billion will apply to the Fund’s advisory fees.
GI has contractually agreed to waive the management fee it receives from the Subsidiary in an amount equal to the management fee paid to GI by the Subsidiary. This undertaking will continue in effect for so long as the Fund invests in the Subsidiary, and may not be terminated by GI unless GI obtains the prior approval of the Fund’s Board of Trustees for such termination. For the period ended March 31, 2017, the Fund waived $20,956 related to advisory fees in the Subsidiary.
| 68 | THE GUGGENHEIM FUNDS SEMI-ANNUAL REPORT | |
NOTES TO CONSOLIDATED FINANCIAL STATEMENTS (Unaudited)(continued) |
GI engages external service providers to perform other necessary services for the Trust, such as audit and accounting related services, legal services, custody, printing and mailing, etc., on a pass-through basis. Such expenses are allocated to various Funds within the complex based on relative net assets.
The Fund has adopted Distribution Plans related to the offering of A-Class, C-Class and P-Class shares pursuant to Rule 12b-1 under the 1940 Act. The plans provide for payments at an annual rate of 0.25% of the average daily net assets of the Fund’s A-Class and P-Class shares, and 1.00% of the average daily net assets of the Fund’s C-Class shares.
The investment advisory contracts for the following Fund provides that the total expenses be limited to a percentage of average net assets for each class of shares, exclusive of brokerage costs, dividends on securities sold short, expenses of other investment companies in which a Fund invests, interest, taxes, litigation, indemnification and extraordinary expenses. The limits are listed below:
| | | Limit | | Effective
Date | Contract
End Date |
| Macro Opportunities Fund - A-Class | | | 1.36 | % | 11/30/12 | 02/01/18 |
| Macro Opportunities Fund - C-Class | | | 2.11 | % | 11/30/12 | 02/01/18 |
| Macro Opportunities Fund - P-Class | | | 1.36 | % | 05/01/15 | 02/01/18 |
| Macro Opportunities Fund - Institutional Class | | | 0.95 | % | 11/30/12 | 02/01/18 |
GI is entitled to reimbursement by the Funds for fees waived or expenses reimbursed during any of the previous 36 months, beginning on the date of the expense limitation agreement, if on any day the estimated operating expenses are less than the indicated percentages. At March 31, 2017, the amount of fees waived or expenses reimbursed that are subject to recoupment are presented in the following table:
| Fund | | Expires
2017 | | | Expires
2018 | | | Expires
2019 | | | Expires
2020 | | | Total | |
| Macro Opportunities Fund | | | | | | | | | | | | | | | |
| A-Class | | $ | 269,842 | | | $ | 863,800 | | | $ | 990,093 | | | $ | 285,928 | | | $ | 2,409,663 | |
| C-Class | | | 122,942 | | | | 287,650 | | | | 353,801 | | | | 101,234 | | | | 865,627 | |
| P-Class | | | — | | | | 10,952 | | | | 61,438 | | | | 61,699 | | | | 134,089 | |
| Institutional Class | | | 520,051 | | | | 2,185,566 | | | | 3,487,376 | | | | 919,691 | | | | 7,112,684 | |
For the period ended March 31, 2017, no amounts were recouped by GI.
If a Fund invests in an affiliated fund, the investing Fund’s adviser has agreed to waive fees at the investing fund level. Fee waivers will be calculated at the investing Fund level without regard to any expense cap, if any, in effect for the investing Fund. Fees waived under this arrangement are not subject to reimbursement to GI. For the period March 31, 2017, the Fund waived $1,034,304 related to investments in affiliated funds.
| | THE GUGGENHEIM FUNDS SEMI-ANNUAL REPORT | 69 |
NOTES TO CONSOLIDATED FINANCIAL STATEMENTS (Unaudited)(continued) |
For the period ended March 31, 2017, GFD retained sales charges of $712,076 relating to sales of A-Class shares of the Trust.
Certain trustees and officers of the Trust are also officers of GI and GFD.
On October 4, 2016, Rydex Fund Services, LLC (“RFS”) was purchased by MUFG Investor Services and as of that date RFS ceased to be an affiliate of GI. In connection with its acquisition, RFS changed its name to MUFG Investor Services (US), LLC (“MUIS”). This change had no impact on the financial statements of the Trust.
MUIS acts as the Trust’s administrator, transfer agent and accounting agent. As administrator, transfer agent and accounting agent, MUIS is responsible for maintaining the books and records of the Trust’s securities and cash. For providing the aforementioned administrative and accounting services, MUIS is entitled to receive a monthly fee equal to a percentage of the Fund’s fees and out of pocket expenses. For providing the aforementioned transfer agent services, MUIS is entitled to receive a monthly fee based on the number of transactions during the month and the number of accounts under management subject to certain minimum monthly fees and out of pocket expenses.
4. Fair Value Measurement
In accordance with U.S. GAAP, fair value is defined as the price that the Fund would receive to sell an investment or pay to transfer a liability in an orderly transaction with an independent buyer in the principal market, or in the absence of a principal market, the most advantageous market for the investment or liability. U.S. GAAP establishes a three-tier fair value hierarchy based on the types of inputs used to value assets and liabilities and requires corresponding disclosure. The hierarchy and the corresponding inputs are summarized below:
| Level 1 — | quoted prices in active markets for identical assets or liabilities. |
| Level 2 — | significant other observable inputs (for example quoted prices for securities that are similar based on characteristics such as interest rates, prepayment speeds, credit risk, etc.). |
| Level 3 — | significant unobservable inputs based on the best information available under the circumstances, to the extent observable inputs are not available, which may include assumptions. |
The types of inputs available depend on a variety of factors, such as the type of security and the characteristics of the markets in which it trades, if any. Fair valuation determinations that rely on fewer or no observable inputs require greater judgment. Accordingly, fair value determinations for Level 3 securities require the greatest amount of judgment.
Independent pricing services are used to value a majority of the Fund’s investments. When values are not available from a pricing service, they may be computed by the Fund’s investment adviser or an affiliate. In any event, values may be determined using a variety of sources and techniques,
| 70 | THE GUGGENHEIM FUNDS SEMI-ANNUAL REPORT | |
NOTES TO CONSOLIDATED FINANCIAL STATEMENTS (Unaudited)(continued) |
including: market prices; broker quotes; and models which derive prices based on inputs such as prices of securities with comparable maturities and characteristics or based on inputs such as anticipated cash flows or collateral, spread over Treasuries, and other information and analysis. A significant portion of the Fund’s assets and liabilities are categorized as Level 2 or Level 3, as indicated in this report.
Indicative quotes from broker-dealers, adjusted for fluctuations in criteria such as credit spreads and interest rates, may be also used to value the Fund’s assets and liabilities, i.e. prices provided by a broker-dealer or other market participant who has not committed to trade at that price. Although indicative quotes are typically received from established market participants, the Fund may not have the transparency to view the underlying inputs which support the market quotations. Significant changes in an indicative quote would generally result in significant changes in the fair value of the security.
Certain fixed income securities are valued by obtaining a monthly indicative quote from a broker-dealer, adjusted for fluctuations in criteria such as credit spreads and interest rates.
The inputs or methodologies used for valuing securities are not necessarily an indication of the risk associated with investing in those securities. The suitability of the techniques and sources employed to determine fair valuation are regularly monitored and subject to change.
5. Offsetting
In the normal course of business, the Fund enters into transactions subject to enforceable master netting arrangements or other similar arrangements. Generally, the right to offset in those agreements allows the Fund to counteract the exposure to a specific counterparty with collateral received from or delivered to that counterparty based on the terms of the arrangements. These arrangements provide for the right to liquidate upon the occurrence of an event of default, credit event upon merger or additional termination event.
In order to better define their contractual rights and to secure rights that will help the Fund mitigate its counterparty risk, the Fund may enter into an International Swaps and Derivatives Association, Inc. Master Agreement (“ISDA Master Agreement”) or similar agreement with its derivative contract counterparties. An ISDA Master Agreement is a bilateral agreement between a Fund and a counterparty that governs OTC derivatives, including foreign exchange contracts, and typically contains, among other things, collateral posting terms and netting provisions in the event of a default and/or termination event. The provisions of the ISDA Master Agreement typically permit a single net payment in the event of a default (close-out netting) or similar event, including the bankruptcy or insolvency of the counterparty.
For derivatives traded under an ISDA Master Agreement, the collateral requirements are typically calculated by netting the mark-to-market amount for each transaction under such agreement and comparing that amount to the value of any collateral currently pledged by the Fund and the counterparty. For financial reporting purposes, cash collateral that has been pledged to cover
| | THE GUGGENHEIM FUNDS SEMI-ANNUAL REPORT | 71 |
NOTES TO CONSOLIDATED FINANCIAL STATEMENTS (Unaudited)(continued) |
obligations of the Fund and cash collateral received from the counterparty, if any, are reported separately on the Statement of Assets and Liabilities as segregated cash with broker/receivable for variation margin, or payable for swap settlement/variation margin. Generally, the amount of collateral due from or to a counterparty must exceed a minimum transfer amount threshold (e.g., $300,000) before a transfer is required to be made. To the extent amounts due to the Fund from its counterparties are not fully collateralized, contractually or otherwise, the Fund bears the risk of loss from counterparty nonperformance. The Fund attempts to mitigate counterparty risk by only entering into agreements with counterparties that they believe to be of good standing and by monitoring the financial stability of those counterparties.
For financial reporting purposes, the Fund does not offset derivative assets and derivative liabilities that are subject to netting arrangements in the Statement of Assets and Liabilities.
The following tables present derivative financial instruments and secured financing transactions that are subject to enforceable netting arrangements and offset in the Statement of Assets and Liabilities in conformity with U.S. GAAP:
| | | | | | | | | | | | | Gross Amounts Not Offset
in the Statement of
Assets and Liabilities | | | | |
| Fund | Instrument | | Gross Amounts of Recognized Assets1 | | | Gross Amounts Offset in the Statement of Assets and Liabilities | | | Net Amount of Assets Presented on the Statement of Assets and Liabilities | | | Financial
Instruments | | | Cash
Collateral
Received | | | Net
Amount | |
| Macro Opportunities Fund | Swap agreements | | $ | 4,509,213 | | | $ | — | | | $ | 4,509,213 | | | $ | 4,509,213 | | | $ | — | | | $ | — | |
Foreign forward currency exchange contracts | | | 243,813 | | | | — | | | | 243,813 | | | | 26,773 | | | | — | | | | 217,040 | |
| Option contracts | | | 31,205,293 | | | | — | | | | 31,205,293 | | | | 10,669,654 | | | | 6,620,000 | | | | 13,915,639 | |
| 72 | THE GUGGENHEIM FUNDS SEMI-ANNUAL REPORT | |
NOTES TO CONSOLIDATED FINANCIAL STATEMENTS (Unaudited)(continued) |
| | | | | | | | | | | | | Gross Amounts Not Offset
in the Statement of
Assets and Liabilities | | | | |
| Fund | Instrument | | Gross Amounts of Recognized Liabilities1 | | | Gross Amounts Offset in the Statement of Assets and Liabilities | | | Net Amount of Liabilities Presented on the Statement of Assets and Liabilities | | | Financial
Instruments | | | Cash
Collateral
Pledged | | | Net
Amount | |
| Macro Opportunities Fund | Swap agreements | | $ | 6,117,365 | | | $ | — | | | $ | 6,117,365 | | | $ | 4,535,986 | | | $ | 1,581,379 | | | $ | — | |
Foreign forward currency exchange contracts | | | 602,936 | | | | — | | | | 602,936 | | | | 70,603 | | | | — | | | | 532,333 | |
| Option contracts | | | 10,599,051 | | | | — | | | | 10,599,051 | | | | 10,599,051 | | | | — | | | | — | |
1 | Centrally cleared swaps are excluded from these reported amounts. |
6. Federal Income Tax Information
The Fund intends to comply with the provisions of Subchapter M of the Internal Revenue Code applicable to regulated investment companies and will distribute substantially all taxable net investment income and capital gains sufficient to relieve the Fund from all, or substantially all, federal income, excise and state income taxes. Therefore, no provision for federal or state income tax is required.
Tax positions taken or expected to be taken in the course of preparing the Fund’s tax returns are evaluated to determine whether the tax positions are “more-likely-than-not” of being sustained by the applicable tax authority. Tax positions not deemed to meet the more-likely-than-not threshold would be recorded as a tax benefit or expense in the current year. Management has analyzed the Fund’s tax positions taken, or to be taken, on federal income tax returns for all open tax years, and has concluded that no provision for income tax is required in the Fund’s financial statements. The Fund’s federal tax returns are subject to examination by the Internal Revenue Service for a period of three years after they are filed.
| | THE GUGGENHEIM FUNDS SEMI-ANNUAL REPORT | 73 |
NOTES TO CONSOLIDATED FINANCIAL STATEMENTS (Unaudited)(continued) |
At March 31, 2017, the cost of securities for federal income tax purposes, the aggregate gross unrealized gain for all securities for which there was an excess of value over tax cost, and the aggregate gross unrealized loss for all securities for which there was an excess of tax cost over value were as follows:
| Fund Name | | Tax
Cost | | | Tax
Unrealized
Gain | | | Tax
Unrealized
Loss | | | Net
Unrealized
Gain | |
| Macro Opportunities Fund | | $ | 5,316,221,903 | | | $ | 142,119,480 | | | $ | (90,325,802 | ) | | $ | 51,793,678 | |
7. Securities Transactions
For the period ended March 31, 2017, the cost of purchases and proceeds from sales of investment securities, excluding government securities, short-term investments and derivatives, were as follows:
| Fund | | Purchases | | | Sales | |
| Macro Opportunities Fund | | $ | 2,523,521,360 | | | $ | 980,578,940 | |
The Fund is permitted to purchase or sell securities from or to certain affiliated funds under specified conditions outlined in procedures adopted by the Board of the Trust. The procedures have been designed to ensure that any purchase or sale of securities by a Fund from or to another fund or portfolio that is or could be considered an affiliate by virtue of having a common investment adviser (or affiliated investment advisers), common Trustees and/or common officers complies with Rule 17a-7 of the 1940 Act. Further, as defined under these procedures, each transaction is effected at the current market price to save costs, where permissible. For the period ended March 31, 2017, the Fund engaged in purchases and sales of securities, pursuant to Rule 17a-7 of the 1940 Act, as follows:
| Fund | | Purchases | | | Sales | | | Realized
Gain | |
| Macro Opportunities Fund | | $ | 16,956,793 | | | $ | 41,832,709 | | | $ | 3,307,013 | |
8. Affiliated Transactions
Investments representing 5% or more of the outstanding voting shares of a portfolio company of a fund, or control of or by, or common control under GI, result in that portfolio company being considered an affiliated company of such fund, as defined in the 1940 Act.
The Fund may invest in the Guggenheim Strategy Funds Trust consisting of Guggenheim Strategy Fund I, Guggenheim Strategy Fund II, Guggenheim Strategy Fund III, and Guggenheim Variable Insurance Strategy Fund III (collectively, the “Cash Management Funds”), open-end management investment companies managed by GI. The Cash Management Funds, which launched on March 11, 2014, are offered as cash management options only to mutual funds,
| 74 | THE GUGGENHEIM FUNDS SEMI-ANNUAL REPORT | |
NOTES TO CONSOLIDATED FINANCIAL STATEMENTS (Unaudited)(continued) |
trusts, and other accounts managed by GI and/or its affiliates, and are not available to the public. The Cash Management Funds pay no investment management fees. The Cash Management Funds’ annual report on Form N-CSR dated September 30, 2016, is available publicly or upon request. This information is available from the EDGAR database on the SEC’s website at https://www.sec.gov/Archives/edgar/data/1601445/000089180416001923/gug65857-ncsr.htm.
Transactions during the period ended March 31, 2017, in which the portfolio company is an “affiliated person,” were as follows:
| Affiliated issuers by Fund | | Value
09/30/16 | | | Additions | | | Reductions | | | Value
03/31/17 | |
| Macro Opportunities Fund | |
| Guggenheim Alpha Opportunity Fund - Institutional Class | | $ | 50,457,164 | | | $ | 110,011,896 | | | $ | — | | | $ | 166,244,516 | |
| Guggenheim Floating Rate Strategies Fund - Institutional Class | | | 12,390,218 | | | | 236,756 | | | | — | | | | 12,694,154 | |
| Guggenheim High Yield Fund - Institutional Class | | | 13,357,046 | | | | 15,500,783 | | | | (29,124,796 | ) | | | — | |
| Guggenheim Limited Duration Fund - Institutional Class | | | 48,212,909 | | | | 273,064,183 | | | | — | | | | 161,235,498 | |
| Guggenheim Risk Managed Real Estate Fund - Institutional Class | | | 13,911,113 | | | | 509,992 | | | | — | | | | 14,221,264 | |
| Guggenheim Strategy Fund I | | | 81,343,779 | | | | 3,732,541 | | | | — | | | | 85,272,458 | |
| Guggenheim Strategy Fund II | | | — | | | | 31,458,929 | | | | — | | | | 31,494,837 | |
| | | $ | 219,672,229 | | | $ | 434,515,080 | | | $ | (29,124,796 | ) | | $ | 471,162,727 | |
| Affiliated issuers by Fund | | Shares
03/31/17 | | | Investment
Income | | | Realized
Gain (Loss) | | | Capital Gain Distributions | |
| Macro Opportunities Fund | | | | | | | | | | | | |
| Guggenheim Alpha Opportunity Fund - Institutional Class | | | 5,591,810 | | | $ | — | | | $ | — | | | $ | 11,896 | |
| Guggenheim Floating Rate Strategies Fund - Institutional Class | | | 486,739 | | | | 236,749 | | | | — | | | | — | |
| Guggenheim High Yield Fund - Institutional Class | | | — | | | | 551,270 | | | | 773,201 | | | | — | |
| Guggenheim Limited Duration Fund - Institutional Class | | | 6,519,834 | | | | 1,391,436 | | | | 11,979 | | | | — | |
| Guggenheim Risk Managed Real Estate Fund - Institutional Class | | | 494,825 | | | | 169,792 | | | | 306,926 | | | | 33,273 | |
| Guggenheim Strategy Fund I | | | 3,404,090 | | | | 729,746 | | | | — | | | | — | |
| Guggenheim Strategy Fund II | | | 1,259,793 | | | | 155,429 | | | | — | | | | — | |
| | | | | | | $ | 3,234,422 | | | $ | 1,092,106 | | | $ | 45,169 | |
| | THE GUGGENHEIM FUNDS SEMI-ANNUAL REPORT | 75 |
NOTES TO CONSOLIDATED FINANCIAL STATEMENTS (Unaudited)(continued) |
9. Loan Commitments
Pursuant to the terms of certain loan agreements, the Fund held unfunded loan commitments as of March 31, 2017. The Fund is obligated to fund these loan commitments at the borrower’s discretion.
The unfunded loan commitments as of March 31, 2017, were as follows:
| Borrower | Maturity
Date | | Face
Amount1 | | | Value | |
| Macro Opportunities Fund | | | | | | | |
| Acosta, Inc. | 09/26/19 | | $ | 5,066,667 | | | $ | 335,609 | |
| Acrisure LLC | 11/22/23 | | | 222,698 | | | | — | * |
| Advantage Sales & Marketing LLC | 07/25/19 | | | 900,000 | | | | 53,657 | |
| American Bath Group LLC | 09/30/23 | | | 47,170 | | | | — | * |
| American Stock Transfer & Trust | 06/26/18 | | | 400,000 | | | | 12,985 | |
| BBB Industries, LLC | 11/04/19 | | | 1,750,000 | | | | 125,537 | |
| CEVA Group Plc (United Kingdom) | 03/19/19 | | | 520,000 | | | | 63,700 | |
| CH Hold Corp. | 08/01/17 | | | 159,091 | | | | 262 | |
| Dubois Chemicals, Inc. | 03/15/24 | | | 600,000 | | | | — | * |
| Endries International Inc. | 06/29/17 | | | 2,000,000 | | | | — | * |
| Epicor Software | 06/01/20 | | | 2,000,000 | | | | 157,521 | |
| Eyemart Express | 12/18/19 | | | 500,000 | | | | 32,937 | |
| Go Daddy Operating Company LLC | 12/12/17 | | EUR | 4,000,000 | | | | — | * |
| Hillman Group, Inc. | 06/30/19 | | | 1,000,000 | | | | 48,889 | |
| Internet Brands | 07/08/21 | | | 790,588 | | | | — | * |
| IntraWest Holdings S.à r.l. | 12/10/18 | | | 750,000 | | | | 10,142 | |
| Learning Care Group (US), Inc. | 05/05/19 | | | 500,000 | | | | 35,747 | |
| Linn Energy LLC / Linn Energy Finance Corp. | 02/27/21 | | | 770,679 | | | | 57,801 | |
| National Technical Systems | 06/12/21 | | | 594,118 | | | | 24,432 | |
| Oberthur Technologies Group SAS | 01/10/24 | | EUR | 833,394 | | | | — | * |
| Oberthur Technologies of America Corp. | 01/10/24 | | | 1,422,368 | | | | — | * |
| Pro Mach Group, Inc. | 10/22/19 | | | 900,000 | | | | 55,514 | |
| Signode Industrial Group US, Inc. | 05/01/19 | | | 3,400,000 | | | | 176,615 | |
| Solera LLC | 03/03/21 | | | 1,620,000 | | | | 178,823 | |
| Wencor Group | 06/19/19 | | | 376,923 | | | | 19,582 | |
| | | | $ | 31,123,696 | | | $ | 1,389,753 | |
1 | The face amount is denominated in U.S. dollars unless otherwise indicated. |
| * | Security has a market value of $0. |
10. Line of Credit
The Trust, with the exception of Capital Stewardship Fund, and certain affiliated funds, secured a 364-day committed, $800,000,000 line of credit from Citibank, N.A., which was in place through October 6, 2016, at which time the line of credit was renewed, with an increased commitment amount to $1,000,000,000. A Fund may draw (borrow) from the line of credit as a temporary
| 76 | THE GUGGENHEIM FUNDS SEMI-ANNUAL REPORT | |
NOTES TO CONSOLIDATED FINANCIAL STATEMENTS (Unaudited)(continued) |
measure for emergency purposes, to facilitate redemption requests, or for other short-term liquidity purposes consistent with the Fund’s investment objective and program. For example, it may be advantageous for the Fund to borrow money rather than sell existing portfolio positions to meet redemption requests. Fees related to borrowings, if any, vary under this arrangement between the greater of Citibank’s “base rate”, LIBOR plus 1%, or the federal funds rate 0.82% at March 31, 2017, plus 1/2 of 1%. All affiliated funds that participate in the line of credit paid upfront costs totaling $2,032,388 to renew the line of credit.
The commitment fee that may be paid by the Funds is at an annualized rate of 0.15% of the average daily amount of their unused commitment amount. The Funds did not have any borrowings under this agreement as of and for the period ended March 31, 2017.
The allocated commitment fee amount for each Fund is referenced in the Statement of Operations under “Line of credit fees” and the effect on the expense ratio is included in the Financial Highlights.
11. Repurchase Agreements
In connection with transactions in repurchase agreements, it is the Fund’s policy that its custodian takes possession of the underlying collateral. For the following repurchase agreements, the collateral is in the possession of the Fund’s custodian and is evaluated to ensure that its market value exceeds, at a minimum, 102% of the original face amount of the repurchase agreements.
Counterparty and
Terms of Agreement | | Face
Value | | | Repurchase
Price | | | Collateral | | | Par
Value | | | Fair
Value | |
| Barclays | | | | | | | | Nature's Bounty Co/The | | | | | | | |
| 0.25% - 0.50% | | | | | | | | 7.63% | | | | | | | |
| Open Maturity | | $ | 1,628,438 | | | $ | 1,635,890 | | | 05/15/21 | | | $ | 1,300,000 | | | $ | 1,405,490 | |
| | | | | | | | | | | Envision Healthcare Corp. | | | | | | | | | |
| | | | | | | | | | | 5.13% | | | | | | | | | |
| | | | | | | | | | | 07/01/22 | | | | 250,000 | | | | 257,603 | |
| | | | | | | | | | | | | | | $ | 1,550,000 | | | $ | 1,663,093 | |
| | | | | | | | | | | | | | | | | | | | | |
| Jeffries | | | | | | | | | | Neuberger Berman CLO Ltd | | | | | | | | | |
| 3.95% - 4.01% | | | | | | | | | | 0.00% | | | | | | | | | |
| 04/10/17 - 04/18/17 | | | 4,641,000 | | | | 4,657,436 | | | 01/23/24 | | | | 14,779,050 | | | | 9,163,011 | |
| | | | | | | | | | | Venture CDO Ltd | | | | | | | | | |
| | | | | | | | | | | 0.00% | | | | | | | | | |
| | | | | | | | | | | 10/20/28 | | | | 1,831,521 | | | | 1,685,000 | |
| | | | | | | | | | | | | | | $ | 16,610,571 | | | $ | 10,848,011 | |
| * | The repurchase agreements were used as a means of borrowing securities to sell short. |
| | THE GUGGENHEIM FUNDS SEMI-ANNUAL REPORT | 77 |
NOTES TO CONSOLIDATED FINANCIAL STATEMENTS (Unaudited)(continued) |
In the event of counterparty default, the Fund has the right to collect the collateral to offset losses incurred. There is potential loss to the Fund in the event the Fund is delayed or prevented from exercising its right to dispose of the collateral securities, including the risk of a possible decline in the value of the underlying securities during the period while the Fund seeks to assert its rights. The Fund’s investment adviser, acting under the supervision of the Board of Trustees, reviews the value of the collateral and the creditworthiness of those banks and dealers with which the Fund enters into repurchase agreements to evaluate potential risks.
12. Reverse Repurchase Agreements
The Fund may enter into reverse repurchase agreements. Under a reverse repurchase agreement, a Fund sells securities and agrees to repurchase them at a particular price at a future date. In the event the buyer of securities under a reverse repurchase agreement files for bankruptcy or becomes insolvent, such buyer or its trustee or receiver may receive an extension of time to determine whether to enforce the Fund’s obligation to repurchase the securities, and the Fund’s use of the proceeds of the reverse repurchase agreement may effectively be restricted pending such decision. As of March 31, 2017, the Fund did not have any open reverse repurchase agreements.
| Fund | | Number of Days Outstanding | | | Balance at
March 31, 2017 | | | Average Balance outstanding | | | Average Interest Rate | |
| Macro Opportunities Fund | | | 89 | | | $ | — | | | $ | 2,059,850 | | | | -0.21 | % |
13. Restricted Securities
The securities below are considered illiquid and restricted under guidelines established by the Board of Trustees:
| Fund | Restricted
Securities | Acquisition
Date | | Cost | | | Value | |
| Macro Opportunities Fund | Airplanes Pass Through Trust | | | | | | | |
| | 2001-1A, 1.46% due 03/15/19 | 01/18/12 | | $ | 3,057,624 | | | $ | 1,175,212 | |
| | Banco Bradesco SA 2014-1, | | | | | | | | | |
| | 5.44% due 03/12/26 | 11/19/14 | | | 2,935,159 | | | | 2,959,810 | |
| | Capmark Military Housing Trust | | | | | | | | | |
| | 2007-AET2, 6.06% due 10/10/52 | 04/23/15 | | | 5,838,896 | | | | 6,028,106 | |
| | Copper River CLO Ltd. | | | | | | | | | |
| | 2007-1A, due 01/20/21 | 05/09/14 | | | 9,535,500 | | | | 1,145,829 | |
| | Customers Bank | | | | | | | | | |
| | 6.13% due 06/26/29 | 06/24/14 | | | 4,500,000 | | | | 4,601,250 | |
| | Fortress Credit Opportunities | | | | | | | | | |
| | 2005-1A, 0.94% due 07/15/19 | 02/16/12 | | | 264,934 | | | | 269,287 | |
| 78 | THE GUGGENHEIM FUNDS SEMI-ANNUAL REPORT | |
NOTES TO CONSOLIDATED FINANCIAL STATEMENTS (Unaudited)(concluded) |
| Fund | Restricted
Securities | Acquisition
Date | | Cost | | | Value | |
| | Great Lakes CLO Ltd. | | | | | | | |
| | 2012-1A, due 01/15/23 | 12/06/12 | | $ | 3,103,750 | | | $ | 1,377,576 | |
| | RFTI Issuer Ltd. | | | | | | | | | |
| | 2015-FL1, 4.79% due 08/15/30 | 10/14/15 | | | 22,787,609 | | | | 22,876,104 | |
| | Schahin II Finance Company SPV Ltd. | | | | | | | | | |
| | 5.88% due 09/25/22 | 03/21/12 | | | 4,838,890 | | | | 869,101 | |
| | Turbine Engines Securitization Ltd. | | | | | | | | | |
| | 2013-1A, 6.38% due 12/13/48 | 11/27/13 | | | 2,114,060 | | | | 2,009,096 | |
| | Turbine Engines Securitization Ltd. | | | | | | | | | |
| | 2013-1A, 5.13% due 12/13/48 | 11/27/13 | | | 3,036,287 | | | | 3,035,219 | |
| | | | | $ | 62,012,709 | | | $ | 46,346,590 | |
| | THE GUGGENHEIM FUNDS SEMI-ANNUAL REPORT | 79 |
OTHER INFORMATION (Unaudited) |
Proxy Voting Information
A description of the policies and procedures that the Trust uses to determine how to vote proxies relating to securities held in the Funds’ portfolios is available, without charge and upon request, by calling 800.820.0888. This information is also available from the EDGAR database on the SEC’s website at https://www.sec.gov.
Information regarding how the Funds voted proxies relating to portfolio securities during the most recent 12-month period ended June 30 is available without charge, upon request, by calling 800.820.0888. This information is also available from the EDGAR database on the SEC’s website at https://www.sec.gov.
Sector Classification
Information in the “Schedule of Investments” is categorized by sectors using sector-level Classifications defined by the Bloomberg Industry Classification System, a widely recognized industry classification system provider. Each Fund’s registration statement has investment policies relating to concentration in specific sectors/industries. For purposes of these investment policies, the Funds usually classify sectors/industries based on industry-level Classifications used by widely recognized industry classification system providers such as Bloomberg Industry Classification System, Global Industry Classification Standards and Barclays Global Classification Scheme.
Quarterly Portfolio Schedules Information
The Trust files its complete schedule of portfolio holdings with the SEC for the first and third quarters of each fiscal year on Form N-Q; which are available on the SEC’s website at https://www.sec.gov. The Funds’ Forms N-Q may be reviewed and copied at the SEC’s Public Reference Room in Washington, DC, and that information on the operation of the Public Reference Room may be obtained by calling 800-SEC-0330. Copies of the portfolio holdings are also available to shareholders, without charge and upon request, by calling 800.820.0888.
| 80 | THE GUGGENHEIM FUNDS SEMI-ANNUAL REPORT | |
INFORMATION ON BOARD OF TRUSTEES AND OFFICERS (Unaudited) |
| Name, Address* and Year of Birth | Position(s) Held with the Trust | Term of Office and Length of Time Served** | Principal Occupation(s) During Past Five Years | Number of Portfolios in Fund Complex Overseen | Other Directorships Held by Trustees |
| INDEPENDENT TRUSTEES | | | | |
Randall C. Barnes
(1951) | Trustee | Since 2014 | Current: Private Investor (2001-present). Former: Senior Vice President and Treasurer, PepsiCo, Inc. (1993-1997); President, Pizza Hut International (1991-1993); Senior Vice President, Strategic Planning and New Business Development, PepsiCo, Inc. (1987-1990). | 98 | Current: Trustee, Purpose Investments Inc. (2014-Present). |
Donald A.
Chubb, Jr.
(1946 ) | Trustee | Since 1994 | Current: Business broker and manager of commercial real estate, Griffith & Blair, Inc. (1997-present). | 95 | Former: Midland Care, Inc. (2011-2016). |
Jerry B. Farley
(1946) | Trustee | Since 2005 | Current: President, Washburn University (1997-present). | 95 | Current: Westar Energy, Inc. (2004-present); CoreFirst Bank & Trust (2000-present). |
Roman
Friedrich III
(1946) | Trustee and Chairman of the Contracts Review Committee | Since 2014 | Current: Founder and Managing Partner, Roman Friedrich & Company (1998-present). Former: Senior Managing Director, MLV & Co. LLC (2010-2011). | 95 | Current: Zincore Metals, Inc. (2009-present). Former: Axiom Gold and Silver Corp. (2011-2012). |
| | THE GUGGENHEIM FUNDS SEMI-ANNUAL REPORT | 81 |
INFORMATION ON BOARD OF TRUSTEES AND OFFICERS (Unaudited)(continued) |
| Name, Address* and Year of Birth | Position(s) Held with the Trust | Term of Office and Length of Time Served** | Principal Occupation(s) During Past Five Years | Number of Portfolios in Fund Complex Overseen | Other Directorships Held by Trustees |
| INDEPENDENT TRUSTEES - continued |
Robert B. Karn III
(1942) | Trustee and Chairman of the Audit Committee | Since 2014 | Current: Consultant (1998-present). Former: Arthur Andersen (1965-1997) and Managing Partner, Financial and Economic Consulting, St. Louis office (1987-1997). | 95 | Current: GP Natural Resource Partners, LLC (2002- present). Former: Peabody Energy Company (2003- Apr. 2017). |
Ronald A. Nyberg
(1953) | Trustee and Chairman of the Nominating and Governance Committee | Since 2014 | Current: Partner, Momkus McCluskey Roberts, LLC (2016-present). Former: Partner, Nyberg & Cassioppi, LLC (2000-2016); Executive Vice President, General Counsel, and Corporate Secretary, Van Kampen Investments (1982-1999). | 100 | Current: Edward-Elmhurst Healthcare System (2012-present). |
| 82 | THE GUGGENHEIM FUNDS SEMI-ANNUAL REPORT | |
INFORMATION ON BOARD OF TRUSTEES AND OFFICERS (Unaudited)(continued) |
| Name, Address* and Year of Birth | Position(s) Held with the Trust | Term of Office and Length of Time Served** | Principal Occupation(s) During Past Five Years | Number of Portfolios in Fund Complex Overseen | Other Directorships Held by Trustees |
| INDEPENDENT TRUSTEES - concluded |
Maynard F. Oliverius
(1943) | Trustee | Since 1998 | Current: Retired. Former: President and CEO, Stormont-Vail HealthCare (1996-2012). | 95 | Current: Robert J. Dole Institute of Politics (2016-present); Stormont-Vail Foundation (2013-present); University of Minnesota MHA Alumni Philanthropy Committee (2009-present); Fort Hays State University Foundation (1999-present). Former: Topeka Community Foundation (2009-2014). |
Ronald E.
Toupin, Jr.
(1958) | Trustee and Chairman of the Board | Since 2014 | Current: Portfolio Consultant (2010-present). Former: Vice President, Manager and Portfolio Manager, Nuveen Asset Management (1998-1999); Vice President, Nuveen Investment Advisory Corp. (1992-1999); Vice President and Manager, Nuveen Unit Investment Trusts (1991-1999); and Assistant Vice President and Portfolio Manager, Nuveen Unit Investment Trusts (1988-1999), each of John Nuveen & Co., Inc. (1982-1999). | 97 | Former: Bennett Group of Funds (2011-2013). |
| | THE GUGGENHEIM FUNDS SEMI-ANNUAL REPORT | 83 |
INFORMATION ON BOARD OF TRUSTEES AND OFFICERS (Unaudited)(continued) |
| Name, Address* and Year of Birth | Position(s) Held with the Trust | Term of Office and Length of Time Served** | Principal Occupation(s) During Past Five Years | Number of Portfolios in Fund Complex Overseen | Other Directorships Held by Trustees |
| INTERESTED TRUSTEE |
Donald C. Cacciapaglia***
(1951) | President, Chief Executive Officer and Trustee | Since 2012 | Current: President and CEO, certain other funds in the Fund Complex (2012-present); Vice Chairman, Guggenheim Investments (2010-present). Former: Chairman and CEO, Channel Capital Group, Inc. (2002-2010). | 230 | Current: Clear Spring Life Insurance Company (2015-present); Guggenheim Partners Japan, Ltd. (2014-present); Guggenheim Partners Investment Management Holdings, LLC (2014-present); Delaware Life (2013-present); Guggenheim Life and Annuity Company (2011-present); Paragon Life Insurance Company of Indiana (2011-present). |
| * | The business address of each Trustee is c/o Guggenheim Investments, 227 West Monroe Street, Chicago, Illinois 60606. |
| ** | Each Trustee serves an indefinite term, until his successor is elected and qualified. Time served includes time served in the respective position for the Predecessor Corporation. |
| *** | This Trustee is deemed to be an "interested person" of the Funds under the 1940 Act by reason of his position with the Funds' Investment Manager and/or the parent of the Investment Manager. |
| 84 | THE GUGGENHEIM FUNDS SEMI-ANNUAL REPORT | |
INFORMATION ON BOARD OF TRUSTEES AND OFFICERS (Unaudited)(continued) |
| Name, Address* and Year of Birth | Position(s) Held with the Trust | Term of Office and Length of Time Served** | Principal Occupations During Past Five Years |
| OFFICERS | | | |
William H.
Belden, III
(1965) | Vice President | Since 2014 | Current: Vice President, certain other funds in the Fund Complex (2006-present); Managing Director, Guggenheim Funds Investment Advisors, LLC (2005-present). Former: Vice President of Management, Northern Trust Global Investments (1999-2005). |
Joanna M. Catalucci
(1966) | AML Officer | Since 2016 | Current: Chief Compliance Officer, certain funds in the Fund Complex (2012-present); Senior Managing Director, Guggenheim Investments (2014-present); AML Officer, certain funds in the Fund Complex (2016-present). Former: Chief Compliance Officer and Secretary, certain other funds in the Fund Complex (2008-2012); Senior Vice President & Chief Compliance Officer, Security Investors, LLC and certain affiliates (2010-2012); Chief Compliance Officer and Senior Vice President, Rydex Advisors, LLC and certain affiliates (2010-2011). |
James M. Howley
(1972) | Assistant Treasurer | Since 2014 | Current: Managing Director, Guggenheim Investments (2004-present); Assistant Treasurer, certain other funds in the Fund Complex (2006-present). Former: Manager, Mutual Fund Administration of Van Kampen Investments, Inc. (1996-2004). |
Keith D. Kemp
(1960) | Assistant Treasurer | Since 2016 | Current: Treasurer and Assistant Treasurer, certain other funds in the Fund Complex (2010-present); Managing Director of Guggenheim Partners Investment Management, LLC (2015-present); Chief Financial Officer, Guggenheim Specialized Products, LLC (2016-present). Former: Managing Director and Director, Transparent Value, LLC (2010-2016); Director, Guggenheim Partners Investment Management, LLC (2010-2015); Chief Operating Officer, Macquarie Capital Investment Management (2007-2009). |
| | THE GUGGENHEIM FUNDS SEMI-ANNUAL REPORT | 85 |
INFORMATION ON BOARD OF TRUSTEES AND OFFICERS (Unaudited)(continued) |
| Name, Address* and Year of Birth | Position(s) Held with the Trust | Term of Office and Length of Time Served** | Principal Occupations
During Past Five Years |
| OFFICERS - continued | |
Amy J. Lee
(1961) | Vice President and Chief Legal Officer | Since 2007 (Vice President) Since 2014 (Chief Legal Officer) | Current: Chief Legal Officer, certain other funds in the Fund Complex (2013-present); Senior Managing Director, Guggenheim Investments (2012-present). Former: Vice President, Associate General Counsel and Assistant Secretary, Security Benefit Life Insurance Company and Security Benefit Corporation (2004-2012). |
Mark E. Mathiasen
(1978) | Secretary | Since 2014 | Current: Secretary, certain other funds in the Fund Complex (2007-present); Managing Director, Guggenheim Investments (2007-present). |
Glenn McWhinnie
(1969) | Assistant Treasurer | Since 2016 | Current: Vice President, Guggenheim Investments (2009-present). Former: Tax Compliance Manager, Ernst & Young LLP (1996-2009). |
Michael P. Megaris
(1984) | Assistant Secretary | Since 2014 | Current: Assistant Secretary, certain other funds in the Fund Complex (2014-present); Vice President, Guggenheim Investments (2012-present). Former: J.D., University of Kansas School of Law (2009-2012). |
Elisabeth Miller
(1968) | Chief Compliance Officer | Since 2012 | Current: CCO, certain other funds in the Fund Complex (2012-present); CCO, Security Investors, LLC (2012-present); CCO, Guggenheim Funds Investment Advisors, LLC (2012-present); Managing Director, Guggenheim Investments (2012-present); Vice President, Guggenheim Funds Distributors, LLC (March 2014-present). Former: CCO, Guggenheim Distributors, LLC (2009-March 2014); Senior Manager, Security Investors, LLC (2004-2009); Senior Manager, Guggenheim Distributors, LLC (2004-2009). |
| 86 | THE GUGGENHEIM FUNDS SEMI-ANNUAL REPORT | |
INFORMATION ON BOARD OF TRUSTEES AND OFFICERS (Unaudited)(concluded) |
| Name, Address* and Year of Birth | Position(s) Held with the Trust | Term of Office and Length of Time Served** | Principal Occupations
During Past Five Years |
| OFFICERS - concluded | |
Adam J. Nelson
(1979) | Assistant Treasurer | Since 2015 | Current: Vice President, Guggenheim Investments (2015-present); Assistant Treasurer, certain other funds in the Fund Complex (2015-present). Former: Assistant Vice President and Fund Administration Director, State Street Corporation (2013-2015); Fund Administration Assistant Director, State Street (2011-2013); Fund Administration Manager, State Street (2009-2011). |
Kimberly J. Scott
(1974) | Assistant Treasurer | Since 2014 | Current: Director, Guggenheim Investments (2012-present); Assistant Treasurer, certain other funds in the Fund Complex (2012-present). Former: Financial Reporting Manager, Invesco, Ltd. (2010-2011); Vice President/Assistant Treasurer, Mutual Fund Administration for Van Kampen Investments, Inc./Morgan Stanley Investment Management (2009-2010); Manager of Mutual Fund Administration, Van Kampen Investments, Inc./Morgan Stanley Investment Management (2005-2009). |
Bryan Stone
(1979) | Vice President | Since 2014 | Current: Vice President, certain other funds in the Fund Complex (2014-present); Director, Guggenheim Investments (2013-present). Former: Senior Vice President, Neuberger Berman Group LLC (2009-2013); Vice President, Morgan Stanley (2002-2009). |
John L. Sullivan
(1955) | Chief Financial Officer and Treasurer | Since 2014 | Current: CFO, Chief Accounting Officer and Treasurer, certain other funds in the Fund Complex (2010-present); Senior Managing Director, Guggenheim Investments (2010-present). Former: Managing Director and CCO, each of the funds in the Van Kampen Investments fund complex (2004-2010); Managing Director and Head of Fund Accounting and Administration, Morgan Stanley Investment Management (2002-2004); CFO and Treasurer, Van Kampen Funds (1996-2004). |
| * | The business address of each officer is c/o Guggenheim Investments, 227 West Monroe Street, Chicago, Illinois 60606. |
| ** | Each officer serves an indefinite term, until his or her successor is duly elected and qualified. Time served includes time served in the respective position for the Predecessor Corporation. |
| | THE GUGGENHEIM FUNDS SEMI-ANNUAL REPORT | 87 |
GUGGENHEIM INVESTMENTS PRIVACY POLICIES (Unaudited) |
Guggenheim Investments as used herein refers to Guggenheim Partners, LLC, Guggenheim Funds Investment Advisors, LLC, Guggenheim Partners Investment Management, LLC, Guggenheim Funds Distributors, LLC and Security Investors, LLC as well as the funds in the Guggenheim Funds complex (the “funds”).
Our Commitment to You
When you become a Guggenheim Investments investor, you entrust us with not only your hard-earned money but also with personal and financial information about you. We recognize that your relationship with us is based on trust and that you expect us to act responsibly and in your best interests. Because we have access to personal information about you, we hold ourselves to high standards in its safekeeping and use. This means, most importantly, that we do not sell client or account information to anyone—whether you are a current or former Guggenheim Investments client.
The Information We Collect About You and How We Collect It
In the course of doing business with shareholders and investors, we collect nonpublic personal information about you. You typically provide personal information when you complete a Guggenheim Investments account application or when you request a transaction that involves Rydex and Guggenheim Funds or one of the Guggenheim affiliated companies. “Nonpublic personal information” is personally identifiable information about you. For example it includes your name and address, Social Security or taxpayer identification number, assets, income, account balance, bank account information and investment activity (e.g. purchase and redemption history).
How We Share Your Personal Information
As a matter of policy, we do not disclose your nonpublic personal information to nonaffiliated third parties except as required or permitted by law. As emphasized above, we do not sell information about current or former clients or their accounts to third parties. Nor do we share such information, except when necessary to complete transactions at your request or to make you aware of related investment products and services that we offer. Additional details about how we handle your personal information are provided below.
To complete certain transactions or account changes that you direct, it may be necessary to provide your personal information to companies, individuals or groups that are not affiliated with Guggenheim Investments. For example if you ask to transfer assets from another financial institution to Guggenheim Investments, we will need to provide certain information about you to that company to complete the transaction. In connection with servicing your accounts or to alert you to other Guggenheim Investments investment products and services, we may share your information within the Guggenheim Investments family of affiliated companies. This would include, for example, sharing your information within Guggenheim Investments so we can make you aware of new funds or the services offered through another Guggenheim Investments
| 88 | THE GUGGENHEIM FUNDS SEMI-ANNUAL REPORT | |
GUGGENHEIM INVESTMENTS PRIVACY POLICIES (Unaudited)(concluded) |
affiliated company. In certain instances, we may contract with nonaffiliated companies to perform services for us. Where necessary, we will disclose information we have about you to these third parties. In all such cases, we provide the third party with only the information necessary to carry out its assigned responsibilities and only for that purpose. And we require these third parties to treat your personal information with the same high degree of confidentiality that we do. In certain instances, we may share information with other financial institutions regarding individuals and entities in response to the U.S.A. Patriot Act. Finally we will share personal information about you if we are compelled by law to do so, if you direct us to do so with your consent, or in other circumstances as permitted by law.
How We Safeguard Your Personal Information
We maintain physical, electronic and procedural safeguards to protect your personal information. Within Guggenheim Investments, access to such information is limited to those who need it to perform their jobs such as servicing your account, resolving problems or informing you of new products and services.
| | THE GUGGENHEIM FUNDS SEMI-ANNUAL REPORT | 89 |
3.31.2017
Guggenheim Funds Semi-Annual Report
| |
| Guggenheim Floating Rate Strategies Fund | | |
| GuggenheimInvestments.com | FR-SEMI-0317x0917 |
| DEAR SHAREHOLDER | 2 |
| ECONOMIC AND MARKET OVERVIEW | 3 |
| ABOUT SHAREHOLDERS’ FUND EXPENSES | 5 |
| FLOATING RATE STRATEGIES FUND | 8 |
| NOTES TO FINANCIAL STATEMENTS | 36 |
| OTHER INFORMATION | 52 |
| INFORMATION ON BOARD OF TRUSTEES AND OFFICERS | 53 |
| GUGGENHEIM INVESTMENTS PRIVACY POLICIES | 60 |
| | THE GUGGENHEIM FUNDS SEMI-ANNUAL REPORT | 1 |
Dear Shareholder:
Guggenheim Partners Investment Management, LLC (the “Investment Adviser”) is pleased to present the shareholder report for Guggenheim Floating Rate Strategies Fund (the “Fund”) for the six-month period ended March 31, 2017.
The Investment Adviser is part of Guggenheim Investments, which represents the investment management businesses of Guggenheim Partners, LLC (“Guggenheim”), a global, diversified financial services firm.
Guggenheim Funds Distributors, LLC is the distributor of the Funds. Guggenheim Funds Distributors, LLC is affiliated with Guggenheim and the Investment Adviser.
We encourage you to read the Economic and Market Overview section of the report, which follows this letter.
We are committed to providing innovative investment solutions and appreciate the trust you place in us.
Sincerely,
Donald C. Cacciapaglia
President and Chief Executive Officer
April 30, 2017
Read a prospectus and summary prospectus (if available) carefully before investing. It contains the investment objectives, risks, charges, expenses and other information, which should be considered carefully before investing. Obtain a prospectus and summary prospectus (if available) at guggenheiminvestments.com or call 800.820.0888.
There can be no assurance that any investment product will achieve its investment objective(s). There are risks associated with investing, including the entire loss of principal invested. Investing involves market risks. The investment return and principal value of any investment product will fluctuate with changes in market conditions.
| 2 | THE GUGGENHEIM FUNDS SEMI-ANNUAL REPORT | |
ECONOMIC AND MARKET OVERVIEW (Unaudited) | March 31, 2017 |
The market optimism that helped lift risk asset prices after the presidential election in November continued through the early part of 2017. The Standard & Poor’s 500® (“S&P 500”) Index* set a new record, high yield corporate bond spreads approached cycle lows, and the 10-year Treasury yield rose to 2.63%, the highest level since 2014. Risk appetite faded as the first quarter drew to a close, however, as investors grappled with the implications of an unsuccessful healthcare reform bill and growing geopolitical risks.
Much of the rise in asset valuations since Donald Trump’s victory has been based on anticipation of his pro-growth policies coming to fruition, an outcome that is far from certain. Asset valuations could be getting a bit ahead of themselves, and becoming more sensitive to a temporary growth scare or setback, especially since the rollout of Trump’s new policies will not be smooth or easy.
Nevertheless, the underlying economy remains on a good trajectory. Tracking estimates for first-quarter real U.S. Gross Domestic Product (“GDP”) growth have fallen in recent weeks despite strong gains in consumer and business sentiment since the election. In late April, after the period ended, the initial estimate of first-quarter GDP growth was 0.7%. However, we attribute a large portion of the apparent weakness to seasonal factors that have depressed as-reported first quarter GDP growth over the past several years. In keeping with this pattern, we would expect the final first-quarter GDP number to be revised higher. More importantly, the prospects for quarterly GDP growth appear stronger going forward.
Consumer spending should benefit from solid income and wealth gains, with household net worth sitting at an all-time high. Recent job gains have been strong, and we anticipate a further acceleration of wage growth as the labor market continues to tighten. Buoyant consumer sentiment and low household debt service outlays also support our positive outlook. On the business investment side, we expect various factors to be supportive, including the uptick in global industrial production growth, the ongoing rise in U.S. oil drilling activity, the surge in small-business optimism, and the recovery in corporate earnings.
On March 15, the Federal Open Market Committee (“FOMC”) raised the U.S. Federal Reserve (the “Fed”) funds target rate by 25 basis points to a range of 0.75–1.0%. The hike itself had little impact on markets because several FOMC members had indicated in the weeks leading up to the meeting that a hike was likely. Looking ahead, we believe that the market is underpricing the likely pace of Fed rate hikes in 2017 and 2018, particularly now that market optimism about fiscal stimulus is waning.
Importantly, Chair Yellen noted that the FOMC’s baseline forecast of two additional rate increases in 2017 and three more in 2018 was not conditioned on expectations for fiscal stimulus. Rather, it reflected a need to gradually remove accommodation due to the fact that the Fed has essentially achieved its dual mandate objectives for employment and inflation. Fiscal easing, she explained, could result in a faster pace of tightening, if it materializes. Markets are skeptical and are pricing in only 1.5 more rate hikes in 2017 and another 1.5 rate hikes in 2018, according to fed funds futures contracts. We expect that the Fed will deliver three more rate hikes in 2017 and another four in 2018.
| | THE GUGGENHEIM FUNDS SEMI-ANNUAL REPORT | 3 |
ECONOMIC AND MARKET OVERVIEW (Unaudited)(concluded) | March 31, 2017 |
We expect to see equity and credit investors take more chips off the table unless there is concrete progress on fiscal legislation in Washington, particularly as the Fed demonstrates its desire to tighten even without fiscal stimulus. While we are optimistic about the near-term U.S. economic outlook, current valuations and growing political risks warrant a more defensive stance.
For the six months ended March 31, 2017, the S&P 500 Index returned 10.12%. The MSCI Europe-Australasia-Far East (“EAFE”) Index* returned 6.48%. The return of the MSCI Emerging Markets Index* was 6.80%.
In the bond market, the Bloomberg Barclays U.S. Aggregate Bond Index* posted a -2.18% return for the period, while the Bloomberg Barclays U.S. Corporate High Yield Index* returned 4.50%. The return of the Bank of America (“BofA”) Merrill Lynch 3-Month U.S. Treasury Bill Index* was 0.19% for the 12-month period.
The opinions and forecasts expressed may not actually come to pass. This information is subject to change at any time, based on market and other conditions, and should not be construed as a recommendation of any specific security or strategy.
*Index Definitions:
The following indices are referenced throughout this report. Indices are unmanaged and not available for direct investment. Index performance does not reflect transaction costs, fees, or expenses.
Bloomberg Barclays U.S. Aggregate Bond Index is a broad-based flagship benchmark that measures the investment grade, U.S. dollar-denominated, fixed-rate taxable bond market, including U.S. Treasuries, government-related and corporate securities, mortgage-backed securities or “MBS” (agency fixed-rate and hybrid adjustable-rate mortgage, or “ARM”, pass-throughs), asset-backed securities (“ABS”), and commercial mortgage-backed securities (“CMBS”) (agency and non-agency).
Bloomberg Barclays U.S. Corporate High Yield Index measures the U.S. dollar-denominated, high yield, fixed-rate corporate bond market. Securities are classified as high yield if the middle rating of Moody’s, Fitch, and S&P is Ba1/BB +/BB + or below.
BofA Merrill Lynch 3-Month U.S. Treasury Bill Index is an unmanaged market index of U.S. Treasury securities maturing in 90 days that assumes reinvestment of all income.
MSCI EAFE Index is a free float-adjusted market capitalization index that is designed to measure the equity market performance of developed markets, excluding the U.S. & Canada.
MSCI Emerging Markets Index is a free float-adjusted market capitalization weighted index that is designed to measure equity market performance in the global emerging markets.
S&P 500® Index is a capitalization-weighted index of 500 stocks designed to measure the performance of the broad economy, representing all major industries and is considered a representation of the U.S. stock market.
| 4 | THE GUGGENHEIM FUNDS SEMI-ANNUAL REPORT | |
ABOUT SHAREHOLDERS’ FUND EXPENSES (Unaudited) |
All mutual funds have operating expenses, and it is important for our shareholders to understand the impact of costs on their investments. Shareholders of a fund incur two types of costs: (i) transaction costs, including sales charges (loads) on purchase payments, reinvested dividends, other distributions, and exchange fees, and (ii) ongoing costs, including management fees, administrative services, and shareholder reports, among others. These ongoing costs, or operating expenses, are deducted from a fund’s gross income and reduce the investment return of the fund.
A fund’s expenses are expressed as a percentage of its average net assets, which is known as the expense ratio. The following examples are intended to help investors understand the ongoing costs (in dollars) of investing in a fund and to compare these costs with the ongoing costs of investing in other mutual funds.
The examples are based on an investment of $1,000 made at the beginning of the period and held for the entire six-month period beginning September 30, 2016 and ending March 31, 2017.
The following tables illustrate the Fund’s costs in two ways:
Table 1. Based on actual Fund return: This section helps investors estimate the actual expenses paid over the period. The “Ending Account Value” shown is derived from the Fund’s actual return, and the fifth column shows the dollar amount that would have been paid by an investor who started with $1,000 in the Fund. Investors may use the information here, together with the amount invested, to estimate the expenses paid over the period. Simply divide the Fund’s account value by $1,000 (for example, an $8,600 account value divided by $1,000 = 8.6), then multiply the result by the number provided under the heading “Expenses Paid During Period.”
Table 2. Based on hypothetical 5% return: This section is intended to help investors compare a Fund’s cost with those of other mutual funds. The table provides information about hypothetical account values and hypothetical expenses based on the Fund’s actual expense ratio and an assumed rate of return of 5% per year before expenses, which is not the Fund’s actual return. The hypothetical account values and expenses may not be used to estimate the actual ending account balance or expenses paid during the period. The example is useful in making comparisons because the U.S. Securities and Exchange Commission (the “SEC”) requires all mutual funds to calculate expenses based on the 5% return. Investors can assess a Fund’s costs by comparing this hypothetical example with the hypothetical examples that appear in shareholder reports of other funds.
The calculations illustrated above assume no shares were bought or sold during the period. Actual costs may have been higher or lower, depending on the amount of investment and the timing of any purchases or redemptions.
| | THE GUGGENHEIM FUNDS SEMI-ANNUAL REPORT | 5 |
ABOUT SHAREHOLDERS’ FUND EXPENSES (Unaudited)(continued) |
Please note that the expenses shown in the table are meant to highlight your ongoing costs only and do not reflect any transactional costs, such as sales charges (loads) on purchase payments, and contingent deferred sales charges (“CDSC”) on redemptions, if any. Therefore, the second table is useful in comparing ongoing costs only, and will not help you determine the relative total costs of owning different funds. In addition, if these transactional costs were included, your costs would have been higher.
More information about the Fund’s expenses, including annual expense ratios for periods up to five years (subject to the Fund’s inception date), can be found in the Financial Highlights section of this report. For additional information on operating expenses and other shareholder costs, please refer to the Fund’s prospectus.
| 6 | THE GUGGENHEIM FUNDS SEMI-ANNUAL REPORT | |
ABOUT SHAREHOLDERS’ FUND EXPENSES (Unaudited)(concluded) |
| Expense
Ratio1 | Fund
Return | Beginning
Account Value
September 30,
2016 | Ending
Account Value
March 31,
2017 | Expenses
Paid During
Period2 |
Table 1. Based on actual Fund return3 |
| Floating Rate Strategies Fund |
| A-Class | 1.03% | 2.33% | $ 1,000.00 | $ 1,023.30 | $ 5.20 |
| C-Class | 1.78% | 1.95% | 1,000.00 | 1,019.50 | 8.96 |
| P-Class | 1.03% | 2.32% | 1,000.00 | 1,023.20 | 5.20 |
| Institutional Class | 0.78% | 2.45% | 1,000.00 | 1,024.50 | 3.94 |
|
| Table 2. Based on hypothetical 5% return (before expenses) |
| Floating Rate Strategies Fund |
| A-Class | 1.03% | 5.00% | $ 1,000.00 | $ 1,019.80 | $ 5.19 |
| C-Class | 1.78% | 5.00% | 1,000.00 | 1,016.06 | 8.95 |
| P-Class | 1.03% | 5.00% | 1,000.00 | 1,019.80 | 5.19 |
| Institutional Class | 0.78% | 5.00% | 1,000.00 | 1,021.04 | 3.93 |
1 | Annualized and excludes expenses of the underlying funds in which the Fund invests. |
2 | Expenses are equal to the Fund's annualized expense ratio, net of any applicable fee waivers, multiplied by the average account value over the period, multiplied by 182/365 (to reflect the one-half year period). |
3 | Actual cumulative return at net asset value for the period September 30, 2016 to March 31, 2017. |
| | THE GUGGENHEIM FUNDS SEMI-ANNUAL REPORT | 7 |
FUND PROFILE (Unaudited) | March 31, 2017 |
FLOATING RATE STRATEGIES FUND
OBJECTIVE: Seeks to provide a high level of current income while maximizing total return.
Holdings Diversification (Market Exposure as % of Net Assets)
“Holdings Diversification (Market Exposure as % of Net Assets)” excludes any temporary cash investments or investments in Guggenheim Strategy Funds Trust mutual funds. Investments in those Funds do not provide “market exposure” to meet the Fund’s investment objective, but will significantly increase the portfolio’s exposure to certain other asset categories (and their associated risks), which may cause the Fund to deviate from its principal investment strategy, including: (i) high yield, high risk debt securities rated below the top four long-term rating categories by a nationally recognized statistical rating organization (also known as “junk bonds”); (ii) securities issued by the U.S. government or its agencies and instrumentalities; (iii) CLOs and similar investments; and (iv) other short-term fixed income securities.
| Inception Dates: |
| A-Class | November 30, 2011 |
| C-Class | November 30, 2011 |
| P-Class | May 1, 2015 |
| Institutional Class | November 30, 2011 |
| Ten Largest Holdings (% of Total Net Assets) |
| Flex Acquisition Company, Inc. | 1.0% |
| LPL Holdings, Inc. | 1.0% |
| Equinox Holdings, Inc. | 1.0% |
| Univision Communications, Inc. | 1.0% |
| LANDesk Group, Inc. | 1.0% |
| VC GB Holdings, Inc. | 0.9% |
| Press Ganey Holdings, Inc. | 0.9% |
| Dynegy, Inc. | 0.9% |
| Leslie’s Poolmart, Inc. | 0.9% |
| Radiate HoldCo LLC | 0.9% |
| Top Ten Total | 9.5% |
| “Ten Largest Holdings” excludes any temporary cash or derivative investments. |
8 | THE GUGGENHEIM FUNDS SEMI-ANNUAL REPORT | |
FUND PROFILE (Unaudited)(concluded) | March 31, 2017 |
Portfolio Composition by Quality Rating1
| Rating | % of Total Investments |
| Fixed Income Instruments |
| AAA | 0.8% |
| AA | 0.8% |
| A | 3.1% |
| BBB | 11.5% |
| BB | 31.1% |
| B | 44.5% |
| CCC | 2.2% |
| CC | 0.1% |
NR2 | 3.4% |
| Other Instruments | 2.5% |
| Total Investments | 100.0% |
The chart above reflects percentages of the value of total investments.
1 | Source: BlackRock Solutions. Credit quality ratings are measured on a scale that generally ranges from AAA (highest) to D (lowest). All securities except for those labeled “NR” have been rated by a Nationally Recognized Statistical Rating Organization (“NRSRO”). For purposes of this presentation, when ratings are available from more than one agency, the highest rating is used. Guggenheim Investments converts ratings to the equivalent S&P rating. |
2 | NR securities do not necessarily indicate low credit quality. |
| | THE GUGGENHEIM FUNDS SEMI-ANNUAL REPORT | 9 |
SCHEDULE OF INVESTMENTS (Unaudited) | March 31, 2017 |
| FLOATING RATE STRATEGIES FUND | |
| | | Shares | | | Value | |
| | | | | | | |
COMMON STOCKS† - 0.0% | |
| | | | | | | |
| Energy - 0.0% | |
Titan Energy LLC*,1 | | | 10,110 | | | $ | 184,002 | |
| | | | | | | | | |
| Consumer, Non-cyclical - 0.0%16,231,796 | |
Targus Group International Equity, Inc*,†††,1 | | | 13,186 | | | | 19,252 | |
| | | | | | | | | |
| Basic Materials - 0.0% | |
Mirabela Nickel Ltd.*,†††,1 | | | 4,755,634 | | | | 363 | |
| | | | | | | | | |
| Total Common Stocks | | | | | | | | |
| (Cost $2,130,407) | | | | | | | 203,617 | |
| | | | | | | | | |
MUTUAL FUNDS† - 0.7% | |
Guggenheim Strategy Fund I2 | | | 742,332 | | | | 18,595,415 | |
Guggenheim Strategy Fund II2 | | | 290,542 | | | | 7,263,541 | |
| Total Mutual Funds | | | | | | | | |
| (Cost $25,699,164) | | | | | | | 25,858,956 | |
| | | | | | | | | |
SHORT-TERM INVESTMENTS† - 2.0% | |
Federated U.S. Treasury Cash Reserve Fund - Institutional Shares 0.48%3 | | | 69,808,981 | | | | 69,808,981 | |
| Total Short-Term Investments | | | | | |
| (Cost $69,808,981) | | | | | | | 69,808,981 | |
| | | Face
Amount9 | | | | |
| | | | | | | |
SENIOR FLOATING RATE INTERESTS†† - 80.5% | |
| Industrial - 15.7% | |
| Flex Acquisition Company, Inc. | | | | | | |
| 4.25% due 12/29/23 | | $ | 36,760,714 | | | | 36,955,913 | |
| VC GB Holdings, Inc. | | | | | | | | |
| 4.75% due 02/28/24 | | | 33,036,685 | | | | 33,201,867 | |
| Rexnord LLC/ RBS Global, Inc. | | | | | | |
| 3.84% due 08/21/23 | | | 29,986,725 | | | | 30,072,486 | |
| Quikrete Holdings, Inc. | | | | | | | | |
| 4.23% due 11/15/23 | | | 26,433,750 | | | | 26,650,771 | |
| USIC Holding, Inc. | | | | | | | | |
| 5.17% due 12/08/23 | | | 25,641,416 | | | | 25,769,623 | |
| Travelport Finance Luxembourg Sarl | | | | | | | | |
| 4.29% due 09/02/21 | | | 24,470,530 | | | | 24,633,749 | |
| BWAY Holding Co. | | | | | | | | |
| 3.25% due 04/03/24 | | | 24,700,000 | | | | 24,622,936 | |
| Transdigm, Inc. | | | | | | | | |
| 4.04% due 05/14/22 | | | 12,846,355 | | | | 12,789,061 | |
| 4.14% due 06/04/21 | | | 6,623,878 | | | | 6,601,423 | |
| 3.98% due 06/09/23 | | | 4,974,937 | | | | 4,949,267 | |
| Optiv, Inc. | | | | | | | | |
| 4.25% due 02/01/24 | | | 22,415,824 | | | | 22,514,006 | |
| Advanced Disposal Services, Inc. | | | | | | | | |
| 3.70% due 11/10/23 | | | 22,051,886 | | | | 22,166,777 | |
| Filtration Group Corp. | | | | | | | | |
| 4.30% due 11/23/20 | | | 18,204,396 | | | | 18,325,819 | |
| Berry Plastics Corp. | | | | | | | | |
| 3.52% due 01/19/24 | | | 9,500,000 | | | | 9,556,715 | |
| 3.50% due 10/01/22 | | | 8,525,003 | | | | 8,574,704 | |
| American Builders & Contractors Supply Co., Inc. | | | | | | | | |
| 3.73% due 10/31/23 | | | 17,933,712 | | | | 17,964,558 | |
| Cartrawler | | | | | | | | |
4.25% due 04/29/211 | | EUR | 16,231,796 | | | | 17,144,434 | |
| Reynolds Group Holdings, Inc. | | | | | | | | |
| 3.98% due 02/05/23 | | | 16,471,969 | | | | 16,528,633 | |
| Brickman Group Holdings, Inc. | | | | | | | | |
| 4.00% due 12/18/20 | | | 16,239,959 | | | | 16,271,302 | |
| Engility Corp. | | | | | | | | |
| 4.75% due 08/14/23 | | | 13,908,298 | | | | 13,964,766 | |
| Zodiac Pool Solutions LLC | | | | | | | | |
| 5.65% due 12/20/23 | | | 13,240,943 | | | | 13,318,137 | |
10 | THE GUGGENHEIM FUNDS SEMI-ANNUAL REPORT | SEE NOTES TO FINANCIAL STATEMENTS. |
SCHEDULE OF INVESTMENTS (Unaudited)(continued) | March 31, 2017 |
| FLOATING RATE STRATEGIES FUND | |
| | | Face
Amount9 | | | Value | |
| | | | | | | |
| Amber Bidco Ltd. | | | | | | |
5.35% due 06/30/21†††,1 | | $ | 10,480,000 | | | $ | 10,351,879 | |
4.76% due 06/30/21†††,1 | | GBP | 2,333,333 | | | | 2,887,868 | |
| CHI Overhead Doors, Inc. | | | | | | | | |
| 4.25% due 07/29/22 | | | 12,710,005 | | | | 12,688,779 | |
| TMF Group Holding BV | | | | | | | | |
| 4.00% due 10/16/23 | | EUR | 10,750,000 | | | | 11,568,207 | |
| American Bath Group LLC | | | | | | | | |
| 6.40% due 09/30/23 | | | 10,728,132 | | | | 10,799,976 | |
| DAE Aviation | | | | | | | | |
| 5.25% due 07/07/22 | | | 10,376,159 | | | | 10,415,069 | |
| CareCore National LLC | | | | | | | | |
| 5.50% due 03/05/21 | | | 9,540,494 | | | | 9,564,345 | |
| Crosby Worldwide | | | | | | | | |
| 4.05% due 11/23/20 | | | 6,505,457 | | | | 5,989,899 | |
| CPM Holdings, Inc. | | | | | | | | |
| 5.25% due 04/11/22 | | | 5,713,000 | | | | 5,784,413 | |
| Thermasys Corp. | | | | | | | | |
5.25% due 05/03/191 | | | 6,227,813 | | | | 5,573,892 | |
| Corialis Group Ltd. | | | | | | | | |
| 3.75% due 03/11/24 | | EUR | 5,075,000 | | | | 5,431,436 | |
| Kuehg Corp. | | | | | | | | |
| 5.40% due 08/12/22 | | | 5,386,466 | | | | 5,413,399 | |
| Hardware Holdings LLC | | | | | | | | |
7.68% due 03/30/20†††,1 | | | 5,484,375 | | | | 5,374,688 | |
| GYP Holdings III Corp. | | | | | | | | |
| 4.54% due 04/01/21 | | | 4,360,010 | | | | 4,374,529 | |
| NVA Holdings, Inc. | | | | | | | | |
| 4.65% due 08/14/21 | | | 4,287,344 | | | | 4,324,858 | |
| Generac Power Systems, Inc. | | | | | | | | |
| 3.75% due 05/31/23 | | | 4,050,000 | | | | 4,067,739 | |
| Power Borrower, LLC | | | | | | | | |
| 4.40% due 05/06/20 | | | 3,596,794 | | | | 3,594,564 | |
| Hillman Group, Inc. | | | | | | | | |
| 4.65% due 06/30/21 | | | 3,440,373 | | | | 3,464,731 | |
| Survitec | | | | | | | | |
| 4.00% due 03/12/22 | | EUR | 2,700,000 | | | | 2,873,413 | |
| SIG Onex Wizard Acquisition | | | | | | | | |
| 4.00% due 03/14/22 | | | 2,815,320 | | | | 2,831,649 | |
| Learning Care Group (US), Inc. | | | | | | | | |
| 5.06% due 05/05/21 | | | 2,632,852 | | | | 2,662,472 | |
| SI Organization | | | | | | | | |
| 5.65% due 11/22/19 | | | 2,404,944 | | | | 2,428,993 | |
| Signode Industrial Group US, Inc. | | | | | | | | |
| 4.06% due 05/01/21 | | | 2,406,250 | | | | 2,409,258 | |
| Berlin Packaging LLC | | | | | | | | |
| 4.50% due 10/01/21 | | | 2,351,611 | | | | 2,362,522 | |
| Thor Bidco (Morrison Utility) | | | | | | | | |
5.86% due 09/20/231 | | GBP | 1,850,000 | | | | 2,318,005 | |
| Doncasters Group Ltd. | | | | | | | | |
| 9.50% due 10/09/20 | | | 2,348,621 | | | | 2,256,625 | |
| Avis Budget Car Rental LLC | | | | | | | | |
| 3.15% due 03/15/22 | | | 1,995,000 | | | | 1,997,494 | |
| Constantia Lux Parent S.A. | | | | | | | | |
| 4.00% due 04/30/22 | | | 1,822,308 | | | | 1,823,456 | |
| Tank Holdings Corp. | | | | | | | | |
| 5.25% due 03/16/22 | | | 1,782,609 | | | | 1,781,129 | |
| Mast Global | | | | | | | | |
7.75% due 09/12/19†††,1 | | | 1,583,084 | | | | 1,576,552 | |
| Ceva Group Plc (United Kingdom) | | | | | | | | |
8.00% due 03/19/19†††,1 | | | 1,440,000 | | | | 1,263,600 | |
| NANA Development Corp. | | | | | | | | |
8.00% due 03/15/181 | | | 1,020,000 | | | | 994,500 | |
| Pro Mach Group, Inc. | | | | | | | | |
| 4.75% due 10/22/21 | | | 953,170 | | | | 954,066 | |
| Wencor Group | | | | | | | | |
4.48% due 06/19/191 | | | 701,538 | | | | 658,997 | |
| Atkore International, Inc. | | | | | | | | |
| 4.15% due 12/22/23 | | | 597,924 | | | | 601,476 | |
| Omnitracs, Inc. | | | | | | | | |
| 8.90% due 05/25/21 | | | 350,000 | | | | 351,096 | |
| SEE NOTES TO FINANCIAL STATEMENTS. | THE GUGGENHEIM FUNDS SEMI-ANNUAL REPORT | 11 |
SCHEDULE OF INVESTMENTS (Unaudited)(continued) | March 31, 2017 |
| FLOATING RATE STRATEGIES FUND | |
| | | Face
Amount9 | | | Value | |
| | | | | | | |
| Hunter Fan Co. | | | | | | |
6.50% due 12/20/171 | | $ | 150,743 | | | $ | 149,235 | |
| Total Industrial | | | | | | | 556,541,756 | |
| | | | | | | | | |
| Consumer, Cyclical - 15.2% | |
| AlixPartners, LLP | | | | | | | | |
| 4.00% due 03/28/24 | | | 26,500,000 | | | | 26,599,375 | |
| 4.00% due 07/28/22 | | | 16,033,426 | | | | 16,059,240 | |
| Gates Global, Inc. | | | | | | | | |
| 3.50% due 04/01/24 | | EUR | 20,275,000 | | | | 21,626,739 | |
| 4.40% due 07/05/21 | | | 14,871,692 | | | | 14,882,846 | |
| Equinox Holdings, Inc. | | | | | | | | |
| 4.25% due 03/08/24 | | | 34,000,000 | | | | 34,244,460 | |
| Leslie’s Poolmart, Inc. | | | | | | | | |
| 4.77% due 08/16/23 | | | 31,300,449 | | | | 31,394,350 | |
| Hilton Worldwide Finance LLC | | | | | | | | |
| 2.98% due 10/25/23 | | | 28,200,937 | | | | 28,416,110 | |
| Smart & Final Stores LLC | | | | | | | | |
| 4.58% due 11/15/22 | | | 28,140,447 | | | | 27,612,814 | |
| Fitness International LLC | | | | | | | | |
| 5.40% due 07/01/20 | | | 25,412,033 | | | | 25,697,918 | |
| Sears Holdings Corp. | | | | | | | | |
| 5.50% due 06/30/18 | | | 24,809,662 | | | | 24,476,220 | |
| Life Time Fitness, Inc. | | | | | | | | |
| 4.00% due 06/10/22 | | | 22,466,912 | | | | 22,506,229 | |
| PetSmart Inc | | | | | | | | |
| 4.02% due 03/11/22 | | | 22,355,416 | | | | 21,321,478 | |
| Eldorado Resorts, Inc. | | | | | | | | |
| 2.25% due 03/15/24 | | | 20,300,000 | | | | 20,249,250 | |
| Navistar Inc. | | | | | | | | |
| 5.00% due 08/07/20 | | | 19,756,875 | | | | 19,954,444 | |
| PC Intermediate Holdings, Inc. | | | | | | | | |
| 3.87% due 08/19/22 | | | 19,729,078 | | | | 19,669,101 | |
| Petco Animal Supplies, Inc. | | | | | | | | |
| 4.29% due 01/26/23 | | | 18,164,000 | | | | 17,078,701 | |
| Acosta, Inc. | | | | | | | | |
| 4.29% due 09/26/21 | | | 17,788,369 | | | | 16,632,125 | |
| Advantage Sales & Marketing LLC | | | | | | | | |
| 4.25% due 07/23/21 | | | 13,391,957 | | | | 13,241,298 | |
3.86% due 07/25/19†††,1 | | | 3,200,000 | | | | 3,008,730 | |
| BBB Industries, LLC | | | | | | | | |
| 6.00% due 11/03/21 | | | 15,576,050 | | | | 15,585,863 | |
| National Vision, Inc. | | | | | | | | |
| 4.00% due 03/12/21 | | | 14,161,937 | | | | 14,150,182 | |
| Greektown Holdings LLC | | | | | | | | |
| 3.75% due 03/20/24 | | | 12,950,000 | | | | 12,941,971 | |
| BJ’s Wholesale Club, Inc. | | | | | | | | |
| 4.75% due 02/03/24 | | | 12,367,000 | | | | 12,071,058 | |
| Burlington Coat Factory Warehouse Corp. | | | | | | | | |
| 3.70% due 08/13/21 | | | 10,100,000 | | | | 10,128,381 | |
| Trader Corp. | | | | | | | | |
| 4.25% due 09/28/23 | | | 9,877,456 | | | | 9,898,001 | |
| Deuce Acquisition | | | | | | | | |
6.50% due 12/08/221 | | GBP | 7,100,000 | | | | 8,811,615 | |
| PTL Acqusition, Inc. | | | | | | | | |
| 3.23% due 08/01/23 | | | 8,258,500 | | | | 8,315,318 | |
| Belk, Inc. | | | | | | | | |
| 5.76% due 12/12/22 | | | 8,051,645 | | | | 6,780,613 | |
| Prime Security Services Borrower LLC | | | | | | | | |
| 4.25% due 05/02/22 | | | 6,650,000 | | | | 6,713,707 | |
| Eyemart Express | | | | | | | | |
| 5.19% due 12/17/21 | | | 6,593,495 | | | | 6,659,430 | |
| Neiman Marcus Group, Inc. | | | | | | | | |
| 4.25% due 10/25/20 | | | 7,766,972 | | | | 6,230,199 | |
| YUM! Brands, Inc. | | | | | | | | |
| 2.98% due 06/16/23 | | | 5,174,000 | | | | 5,196,662 | |
| Men’s Wearhouse | | | | | | | | |
| 4.53% due 06/18/21 | | | 4,366,575 | | | | 4,140,954 | |
| Penn National Gaming, Inc. | | | | | | | | |
| 3.52% due 01/19/24 | | | 2,400,000 | | | | 2,412,600 | |
| CH Hold Corp. | | | | | | | | |
| 4.00% due 02/01/24 | | | 1,636,364 | | | | 1,646,591 | |
| NPC International, Inc. | | | | | | | | |
| 4.75% due 12/28/18 | | | 904,164 | | | | 907,555 | |
| Kate Spade & Co. | | | | | | | | |
| 4.00% due 04/09/21 | | | 575,318 | | | | 573,880 | |
12 | THE GUGGENHEIM FUNDS SEMI-ANNUAL REPORT | SEE NOTES TO FINANCIAL STATEMENTS. |
SCHEDULE OF INVESTMENTS (Unaudited)(continued) | March 31, 2017 |
| FLOATING RATE STRATEGIES FUND | |
| | | Face
Amount9 | | | Value | |
| | | | | | | |
| Rite Aid Corp. | | | | | | |
| 5.75% due 08/21/20 | | $ | 500,000 | | | $ | 500,625 | |
| Total Consumer, Cyclical | | | | 538,336,633 | |
| | | | | | | | | |
| Consumer, Non-cyclical - 13.5% | |
| Press Ganey Holdings, Inc. | | | | | | | | |
| 4.25% due 10/23/23 | | | 31,709,703 | | | | 31,769,318 | |
| Albertson’s LLC | | | | | | | | |
| 3.98% due 08/25/21 | | | 23,735,098 | | | | 23,832,175 | |
| 4.40% due 12/21/22 | | | 6,284,250 | | | | 6,320,384 | |
| Chobani LLC | | | | | | | | |
| 5.25% due 10/09/23 | | | 28,290,000 | | | | 28,525,657 | |
| CHG Healthcare Services, Inc. | | | | | | | | |
| 4.75% due 06/07/23 | | | 26,491,784 | | | | 26,796,440 | |
| Examworks Group, Inc. | | | | | | | | |
| 4.23% due 07/27/23 | | | 23,117,063 | | | | 23,218,315 | |
| DJO Finance LLC | | | | | | | | |
| 4.25% due 06/08/20 | | | 23,867,543 | | | | 23,057,001 | |
| Dole Food Company, Inc. | | | | | | | | |
| 4.00% due 03/23/24 | | | 17,755,000 | | | | 17,861,530 | |
| 4.58% due 11/01/18 | | | 4,699,164 | | | | 4,700,620 | |
| JBS USA Lux SA | | | | | | | | |
| 3.29% due 10/30/22 | | | 21,170,000 | | | | 21,236,262 | |
| Sterigenics-Norion Holdings | | | | | | | | |
| 4.00% due 05/16/22 | | | 15,715,100 | | | | 15,653,811 | |
| 4.40% due 05/15/22 | | | 4,925,000 | | | | 4,925,000 | |
| MPH Acquisition Holdings LLC | | | | | | | | |
| 4.90% due 06/07/23 | | | 18,783,285 | | | | 19,011,314 | |
| US Foods, Inc. | | | | | | | | |
| 3.73% due 06/27/23 | | | 16,367,750 | | | | 16,508,349 | |
| American Tire Distributors, Inc. | | | | | | | | |
| 5.25% due 09/01/21 | | | 16,403,574 | | | | 16,424,079 | |
| Hearthside Group Holdings LLC | | | | | | | | |
| 4.00% due 06/02/21 | | | 15,750,000 | | | | 15,868,125 | |
| Authentic Brands | | | | | | | | |
| 5.17% due 05/27/21 | | | 14,961,351 | | | | 15,073,561 | |
| Change Healthcare Holdings, Inc. | | | | | | | | |
| 3.75% due 03/01/24 | | | 14,860,000 | | | | 14,878,575 | |
| Pharmaceutical Product Development | | | | | | | | |
| 4.33% due 08/18/22 | | | 12,592,277 | | | | 12,623,757 | |
| Hostess Brands LLC | | | | | | | | |
| 4.00% due 08/03/22 | | | 12,383,262 | | | | 12,494,711 | |
| At Home Holding III Corp. | | | | | | | | |
| 4.54% due 06/03/22 | | | 12,281,250 | | | | 12,250,547 | |
| Endo Luxembourg Finance Co. | | | | | | | | |
| 4.00% due 09/25/22 | | | 11,257,500 | | | | 11,240,276 | |
| Grifols Worldwide Operations USA, Inc. | | | | | | | | |
| 3.19% due 01/31/25 | | | 11,000,000 | | | | 11,013,970 | |
| Advancepierre Foods, Inc. | | | | | | | | |
| 4.00% due 06/02/23 | | | 10,705,051 | | | | 10,825,483 | |
| Lineage Logistics LLC | | | | | | | | |
| 4.50% due 04/07/21 | | | 10,741,217 | | | | 10,734,557 | |
| CTI Foods Holding Co. LLC | | | | | | | | |
| 8.40% due 06/28/21 | | | 7,420,000 | | | | 6,678,000 | |
| 4.65% due 06/29/20 | | | 3,662,453 | | | | 3,625,829 | |
| CPI Holdco LLC | | | | | | | | |
| 5.15% due 03/21/24 | | | 9,150,000 | | | | 9,195,750 | |
| Prestige Brands, Inc. | | | | | | | | |
| 3.73% due 01/26/24 | | | 8,570,918 | | | | 8,642,314 | |
| Cotiviti Corp. | | | | | | | | |
| 3.90% due 09/28/23 | | | 8,457,224 | | | | 8,457,224 | |
| ADMI Corp. | | | | | | | | |
| 4.80% due 04/29/22 | | | 8,000,000 | | | | 8,065,040 | |
| Reddy Ice Holdings, Inc. | | | | | | | | |
| 6.75% due 05/01/19 | | | 4,706,406 | | | | 4,600,512 | |
10.75% due 10/01/191 | | | 2,000,000 | | | | 1,786,660 | |
| Valeant Pharmaceuticals International, Inc. | | | | | | | | |
| 5.57% due 04/01/22 | | | 4,685,683 | | | | 4,696,038 | |
| Grocery Outlet, Inc. | | | | | | | | |
| 5.15% due 10/21/21 | | | 3,930,109 | | | | 3,933,803 | |
| Nellson Nutraceutical (US) | | | | | | | | |
| 6.15% due 12/23/21 | | | 3,048,089 | | | | 3,025,228 | |
| R&R Ice Cream PLC | | | | | | | | |
| 3.00% due 09/29/23 | | EUR | 2,000,000 | | | | 2,147,615 | |
| SEE NOTES TO FINANCIAL STATEMENTS. | THE GUGGENHEIM FUNDS SEMI-ANNUAL REPORT | 13 |
SCHEDULE OF INVESTMENTS (Unaudited)(continued) | March 31, 2017 |
| FLOATING RATE STRATEGIES FUND | |
| | | Face
Amount9 | | | Value | |
| | | | | | | |
| Nellson Nutraceutical (CAD) | | | | | | |
| 6.15% due 12/23/21 | | $ | 1,893,219 | | | $ | 1,879,020 | |
| NES Global Talent | | | | | | | | |
6.54% due 10/03/191 | | | 1,592,361 | | | | 1,433,125 | |
| Acadia Healthcare Company, Inc. | | | | | | | | |
| 3.98% due 02/16/23 | | | 1,333,125 | | | | 1,340,351 | |
| Pinnacle Foods Finance LLC | | | | | | | | |
| 2.81% due 02/02/24 | | | 1,326,675 | | | | 1,331,345 | |
| Catalent Pharma Solutions, Inc. | | | | | | | | |
| 3.75% due 05/20/21 | | | 1,032,268 | | | | 1,042,807 | |
| Jacobs Douwe Egberts | | | | | | | | |
| 3.50% due 07/02/22 | | | 702,749 | | | | 707,141 | |
| Arctic Glacier Group Holdings, Inc. | | | | | | | | |
| 5.25% due 03/20/24 | | | 100,000 | | | | 100,875 | |
| Targus Group International, Inc. | | | | | | | | |
due 05/24/16†††,1,4 | | | 152,876 | | | | — | |
| Total Consumer, Non-cyclical | | | | 479,532,494 | |
| | | | | | | | | |
| Technology - 11.5% | |
| LANDesk Group, Inc. | | | | | | | | |
| 5.25% due 01/20/24 | | | 33,725,000 | | | | 33,872,715 | |
| Infor (US), Inc. | | | | | | | | |
| 3.75% due 02/01/22 | | EUR | 21,600,000 | | | | 23,188,946 | |
| 3.90% due 02/01/22 | | | 10,086,398 | | | | 10,046,759 | |
| Solera LLC | | | | | | | | |
| 4.25% due 03/03/23 | | | 26,514,625 | | | | 26,617,766 | |
| Verisure Cayman 2 | | | | | | | | |
| 3.75% due 10/21/22 | | EUR | 17,000,000 | | | | 18,242,942 | |
| 3.00% due 10/21/22 | | EUR | 7,250,000 | | | | 7,748,829 | |
| Applied Systems, Inc. | | | | | | | | |
| 4.40% due 01/25/21 | | | 23,340,563 | | | | 23,451,429 | |
| EIG Investors Corp. | | | | | | | | |
| 6.04% due 02/09/23 | | | 16,227,858 | | | | 16,336,098 | |
| 6.53% due 11/08/19 | | | 5,077,305 | �� | | | 5,096,345 | |
| Kronos, Inc. | | | | | | | | |
| 5.03% due 11/01/23 | | | 20,668,731 | | | | 20,774,348 | |
| Epicor Software | | | | | | | | |
| 4.75% due 06/01/22 | | | 18,252,609 | | | | 18,270,862 | |
| TIBCO Software, Inc. | | | | | | | | |
| 5.50% due 12/04/20 | | | 16,569,368 | | | | 16,731,583 | |
| First Data Corp. | | | | | | | | |
| 3.98% due 03/24/21 | | | 15,391,624 | | | | 15,504,291 | |
| 3.98% due 07/08/22 | | | 1,119,544 | | | | 1,127,706 | |
| Planview, Inc. (PHNTM Holdings, Inc.) | | | | | | | | |
6.25% due 01/27/23†††,1 | | | 16,000,000 | | | | 15,760,000 | |
| Diebold, Inc. | | | | | | | | |
| 5.38% due 11/06/23 | | | 13,534,875 | | | | 13,725,175 | |
| Cypress Intermediate Holdings III, Inc. | | | | | | | | |
| 4.00% due 03/31/24 | | | 13,300,000 | | | | 13,073,900 | |
| Cologix Holdings, Inc. | | | | | | | | |
| 4.00% due 03/20/24 | | | 8,575,000 | | | | 8,577,658 | |
| 8.00% due 03/20/25 | | | 1,900,000 | | | | 1,891,697 | |
| Advanced Computer Software | | | | | | | | |
| 6.56% due 03/18/22 | | | 6,370,000 | | | | 6,162,975 | |
10.56% due 01/31/231 | | | 4,490,000 | | | | 4,082,173 | |
| Informatica Corp. | | | | | | | | |
| 4.65% due 08/05/22 | | | 10,296,233 | | | | 10,228,690 | |
| Coherent Holding GmbH | | | | | | | | |
| 4.25% due 11/07/23 | | EUR | 8,837,082 | | | | 9,562,962 | |
| Banca Civica (UK) - Chambertin | | | | | | | | |
4.59% due 08/04/21†††,1 | | GBP | 3,800,000 | | | | 4,609,221 | |
4.59% due 05/29/20†††,1 | | GBP | 3,800,000 | | | | 4,582,759 | |
| Active Network LLC | | | | | | | | |
| 6.00% due 11/13/20 | | | 9,046,611 | | | | 9,057,920 | |
| Micro Focus International plc | | | | | | | | |
| 4.79% due 11/19/21 | | | 8,883,769 | | | | 8,944,090 | |
| Ipreo Holdings | | | | | | | | |
| 4.40% due 08/06/21 | | | 8,773,854 | | | | 8,708,050 | |
| GlobalLogic Holdings, Inc. | | | | | | | | |
| 5.65% due 06/20/22 | | | 7,633,543 | | | | 7,652,627 | |
| Go Daddy Operating Company LLC | | | | | | | | |
| 3.41% due 02/15/24 | | | 7,590,165 | | | | 7,596,845 | |
14 | THE GUGGENHEIM FUNDS SEMI-ANNUAL REPORT | SEE NOTES TO FINANCIAL STATEMENTS. |
SCHEDULE OF INVESTMENTS (Unaudited)(continued) | March 31, 2017 |
| FLOATING RATE STRATEGIES FUND | |
| | | Face
Amount9 | | | Value | |
| | | | | | | |
| Microsemi Corp. | | | | | | |
| 3.23% due 01/15/23 | | $ | 7,056,964 | | | $ | 7,088,932 | |
| Aspect Software, Inc. | | | | | | | | |
| 11.28% due 05/25/20 | | | 6,847,145 | | | | 6,838,586 | |
| Micron Technology, Inc. | | | | | | | | |
| 4.74% due 04/26/22 | | | 5,774,672 | | | | 5,794,537 | |
| Compucom Systems, Inc. | | | | | | | | |
| 4.25% due 05/11/20 | | | 4,196,260 | | | | 3,482,896 | |
| Ceridian Corp. | | | | | | | | |
| 4.54% due 09/15/20 | | | 3,393,424 | | | | 3,363,732 | |
| Cypress Holdings | | | | | | | | |
| 7.75% due 03/31/25 | | | 2,568,750 | | | | 2,515,166 | |
| Sabre GLBL, Inc. | | | | | | | | |
| 3.73% due 02/22/24 | | | 2,387,048 | | | | 2,404,092 | |
| Eze Castle Software, Inc. | | | | | | | | |
| 7.65% due 04/05/21 | | | 1,441,176 | | | | 1,428,566 | |
| Sparta Holding Corp. | | | | | | | | |
6.65% due 07/28/20†††,1 | | | 1,384,832 | | | | 1,377,156 | |
| Oberthur Technologies Group SAS | | | | | | | | |
| 3.75% due 01/10/24 | | EUR | 1,205,415 | | | | 1,285,575 | |
| Gartner, Inc. | | | | | | | | |
| 2.00% due 04/05/24 | | | 350,000 | | | | 352,625 | |
| Total Technology | | | | | | | 407,159,224 | |
| | | | | | | | | |
| Communications - 11.4% | |
| Univision Communications, Inc. | | | | | | | | |
| 3.75% due 03/15/24 | | | 34,201,660 | | | | 33,973,534 | |
| Altice US Finance I Corp. | | | | | | | | |
| 2.25% due 07/15/25 | | | 24,800,000 | | | | 24,761,312 | |
| 3.98% due 01/15/25 | | | 8,977,500 | | | | 8,960,712 | |
| SFR Group SA | | | | | | | | |
| 4.29% due 01/14/25 | | | 29,775,375 | | | | 29,775,375 | |
| 3.00% due 07/31/25 | | EUR | 3,000,000 | | | | 3,181,671 | |
| 2.75% due 07/31/25 | | | 501,438 | | | | 499,402 | |
| Radiate HoldCo LLC | | | | | | | | |
| 3.98% due 02/01/24 | | | 30,154,902 | | | | 30,272,203 | |
| Telenet Financing USD LLC | | | | | | | | |
| 3.91% due 01/31/25 | | | 29,450,000 | | | | 29,453,829 | |
| Virgin Media Bristol LLC | | | | | | | | |
| 3.66% due 01/31/25 | | | 28,185,935 | | | | 28,247,662 | |
| WMG Acquisition Corp. | | | | | | | | |
| 3.75% due 11/01/23 | | | 24,154,713 | | | | 24,222,588 | |
| Zayo Group LLC | | | | | | | | |
| 3.50% due 01/19/24 | | | 24,050,000 | | | | 24,133,454 | |
| Sprint Communications, Inc. | | | | | | | | |
| 3.50% due 02/02/24 | | | 24,125,000 | | | | 24,107,871 | |
| Cengage Learning Acquisitions, Inc. | | | | | | | | |
| 5.25% due 06/07/23 | | | 23,272,180 | | | | 22,144,876 | |
| Mcgraw-Hill Global Education Holdings LLC | | | | | | | | |
| 5.00% due 05/04/22 | | | 19,389,259 | | | | 19,152,322 | |
| Internet Brands | | | | | | | | |
| 4.75% due 07/08/21 | | | 17,364,824 | | | | 17,422,652 | |
| UPC Broadband Holding BV | | | | | | | | |
| 3.00% due 01/15/26 | | EUR | 13,200,000 | | | | 14,056,669 | |
| Light Tower Fiber LLC | | | | | | | | |
| 4.40% due 04/13/20 | | | 13,507,316 | | | | 13,557,969 | |
| Ziggo Secured Finance BV | | | | | | | | |
| 3.41% due 04/15/25 | | | 13,550,000 | | | | 13,527,372 | |
| CSC Holdings, LLC | | | | | | | | |
| 3.94% due 10/11/24 | | | 11,812,500 | | | | 11,779,307 | |
| 2.25% due 07/14/25 | | | 737,037 | | | | 735,931 | |
| Houghton Mifflin Co. | | | | | | | | |
| 4.00% due 05/31/21 | | | 10,711,731 | | | | 9,854,793 | |
| Outfront Media Capital LLC | | | | | | | | |
| 3.18% due 03/18/24 | | | 3,795,000 | | | | 3,814,924 | |
| AMC Entertainment Holdings, Inc. | | | | | | | | |
| 3.73% due 12/15/23 | | | 3,200,000 | | | | 3,226,016 | |
| Charter Communications Operating, LLC | | | | | | | | |
| 2.99% due 01/03/21 | | | 1,567,430 | | | | 1,570,565 | |
| 3.23% due 01/15/24 | | | 1,339,127 | | | | 1,344,899 | |
| Proquest LLC | | | | | | | | |
| 5.25% due 10/24/21 | | | 2,700,000 | | | | 2,737,125 | |
| Mediacom Illinois LLC | | | | | | | | |
| 3.20% due 02/15/24 | | | 2,650,000 | | | | 2,661,051 | |
| Match Group, Inc. | | | | | | | | |
| 4.10% due 11/16/22 | | | 2,471,875 | | | | 2,498,151 | |
| SEE NOTES TO FINANCIAL STATEMENTS. | THE GUGGENHEIM FUNDS SEMI-ANNUAL REPORT | 15 |
SCHEDULE OF INVESTMENTS (Unaudited)(continued) | March 31, 2017 |
| FLOATING RATE STRATEGIES FUND | |
| | | Face
Amount9 | | | Value | |
| | | | | | | |
| Anaren, Inc. | | | | | | |
5.65% due 02/18/211 | | $ | 1,489,690 | | | $ | 1,480,379 | |
9.40% due 08/18/211 | | | 275,000 | | | | 267,781 | |
| Level 3 Financing, Inc. | | | | | | | | |
| 3.23% due 02/22/24 | | | 1,000,000 | | | | 1,001,250 | |
| Total Communications | | | | | | | 404,423,645 | |
| | | | | | | | | |
| Financial - 7.5% | |
| LPL Holdings, Inc. | | | | | | | | |
| 3.77% due 03/11/24 | | | 34,400,000 | | | | 34,421,671 | |
| National Financial Partners Corp. | | | | | | | | |
| 4.65% due 01/08/24 | | | 26,733,000 | | | | 27,000,330 | |
| Amwins Group LLC | | | | | | | | |
| 4.32% due 01/25/24 | | | 25,760,438 | | | | 25,760,438 | |
| Avolon Luxembourg SARL | | | | | | | | |
| 3.73% due 03/21/22 | | | 24,200,000 | | | | 24,512,664 | |
| Americold Realty Operating Partnership, LP | | | | | | | | |
| 4.75% due 12/01/22 | | | 17,964,250 | | | | 18,132,755 | |
| Alliant Holdings I L.P. | | | | | | | | |
| 4.39% due 08/12/22 | | | 16,309,573 | | | | 16,379,541 | |
| Transunion Holding Co. | | | | | | | | |
| 3.48% due 04/09/23 | | | 16,136,565 | | | | 16,227,414 | |
| Hyperion Insurance | | | | | | | | |
| 5.50% due 04/29/22 | | | 12,587,533 | | | | 12,621,645 | |
| HUB International Ltd. | | | | | | | | |
| 4.03% due 10/02/20 | | | 12,380,898 | | | | 12,441,069 | |
| Acrisure LLC | | | | | | | | |
| 5.90% due 11/22/23 | | | 11,744,968 | | | | 11,921,143 | |
| Delos Finance S.A.R.L | | | | | | | | |
| 3.40% due 10/06/23 | | | 11,250,000 | | | | 11,365,313 | |
| York Risk Services | | | | | | | | |
4.90% due 10/01/211 | | | 11,406,249 | | | | 11,078,319 | |
| WEX, Inc. | | | | | | | | |
| 4.48% due 07/01/23 | | | 10,024,250 | | | | 10,133,414 | |
| Assured Partners, Inc. | | | | | | | | |
| 5.25% due 10/21/22 | | | 7,667,590 | | | | 7,717,429 | |
| Magic Newco, LLC | | | | | | | | |
| 5.00% due 12/12/18 | | | 7,328,783 | | | | 7,350,183 | |
| American Stock Transfer & Trust | | | | | | | | |
| 5.75% due 06/26/20 | | | 5,649,801 | | | | 5,635,676 | |
| Capital Automotive L.P. | | | | | | | | |
| 4.00% due 03/25/24 | | | 5,175,000 | | | | 5,226,750 | |
| Jefferies Finance LLC | | | | | | | | |
| 4.56% due 05/14/20 | | | 3,782,625 | | | | 3,763,712 | |
| Geo Group, Inc. | | | | | | | | |
| 3.00% due 03/15/24 | | | 2,550,000 | | | | 2,561,169 | |
| Fly Leasing Ltd. | | | | | | | | |
| 3.79% due 02/09/22 | | | 1,639,456 | | | | 1,643,555 | |
| USI Holdings Corp. | | | | | | | | |
| 4.40% due 12/27/19 | | | 1,328,998 | | | | 1,328,759 | |
| Total Financial | | | | | | | 267,222,949 | |
| | | | | | | | | |
| Utilities - 2.8% | |
| Dynegy, Inc. | | | | | | | | |
| 4.25% due 06/27/23 | | | 31,400,000 | | | | 31,460,602 | |
| Moss Creek Resources LLC | | | | | | | | |
9.00% due 03/29/221 | | | 12,862,500 | | | | 12,666,475 | |
| TPF II Power LLC | | | | | | | | |
due 10/02/234 | | | 11,143,402 | | | | 11,179,618 | |
| Helix Gen Funding LLC | | | | | | | | |
| 4.75% due 03/08/24 | | | 10,710,000 | | | | 10,857,263 | |
| EFS Cogen Holdings I LLC | | | | | | | | |
| 4.65% due 06/28/23 | | | 9,708,260 | | | | 9,786,315 | |
| Viva Alamo LLC | | | | | | | | |
| 5.30% due 02/22/21 | | | 7,821,277 | | | | 7,430,213 | |
| Stonewall | | | | | | | | |
| 6.65% due 11/15/21 | | | 5,950,000 | | | | 5,786,375 | |
| Lightstone HoldCo LLC | | | | | | | | |
| 5.54% due 01/30/24 | | | 4,530,000 | | | | 4,553,782 | |
| Panda Temple II Power | | | | | | | | |
| 7.25% due 04/03/19 | | | 4,443,750 | | | | 3,849,398 | |
| Total Utilities | | | | | | | 97,570,041 | |
| | | | | | | | | |
| Basic Materials - 2.3% | |
| Alpha 3 B.V. | | | | | | | | |
| 4.15% due 01/31/24 | | | 27,335,376 | | | | 27,386,768 | |
| PQ Corp. | | | | | | | | |
| 5.29% due 11/04/22 | | | 24,212,695 | | | | 24,459,180 | |
| Nexeo Solutions LLC | | | | | | | | |
| 4.81% due 06/09/23 | | | 10,477,858 | | | | 10,556,442 | |
| Platform Specialty Products | | | | | | | | |
| 4.25% due 06/07/20 | | EUR | 4,139,625 | | | | 4,431,028 | |
16 | THE GUGGENHEIM FUNDS SEMI-ANNUAL REPORT | SEE NOTES TO FINANCIAL STATEMENTS. |
SCHEDULE OF INVESTMENTS (Unaudited)(continued) | March 31, 2017 |
| FLOATING RATE STRATEGIES FUND | |
| | | Face
Amount9 | | | Value | |
| | | | | | | |
| 4.50% due 06/07/20 | | $ | 1,893,912 | | | $ | 1,911,506 | |
| Arch Coal, Inc. | | | | | | | | |
| 5.00% due 03/07/24 | | | 5,900,000 | | | | 5,887,079 | |
| Royal Holdings, Inc. | | | | | | | | |
| 4.40% due 06/20/22 | | | 4,750,000 | | | | 4,793,035 | |
| Zep, Inc. | | | | | | | | |
| 5.00% due 06/27/22 | | | 2,235,727 | | | | 2,263,673 | |
| Minerals Technologies, Inc. | | | | | | | | |
| 3.29% due 02/14/24 | | | 902,558 | | | | 905,942 | |
| Total Basic Materials | | | | | | | 82,594,653 | |
| | | | | | | | | |
| Energy - 0.6% | |
| Veresen Midstream LP | | | | | | | | |
| 4.50% due 03/31/22 | | | 15,547,528 | | | | 15,683,569 | |
| PSS Companies | | | | | | | | |
5.65% due 01/28/201 | | | 5,580,219 | | | | 4,464,175 | |
| Summit Midstream Partners, LP | | | | | | | | |
| 7.02% due 05/13/22 | | | 1,000,000 | | | | 1,017,500 | |
| Total Energy | | | | | | | 21,165,244 | |
| Total Senior Floating Rate Interests | | | | | |
| (Cost $2,867,778,684) | | | | | | | 2,854,546,639 | |
| | | | | | | | | |
CORPORATE BONDS†† - 6.4% | |
| Communications - 1.6% | |
| Sprint Communications, Inc. | | | | | | | | |
9.00% due 11/15/185 | | | 12,700,000 | | | | 13,827,125 | |
| DISH DBS Corp. | | | | | | | | |
| 7.75% due 07/01/26 | | | 10,700,000 | | | | 12,438,750 | |
| Ziggo Secured Finance BV | | | | | | | | |
5.50% due 01/15/275 | | | 5,000,000 | | | | 4,999,500 | |
| Midcontinent Communications / Midcontinent Finance Corp. | | | | | | | | |
6.88% due 08/15/235 | | | 4,000,000 | | | | 4,255,000 | |
| Level 3 Financing, Inc. | | | | | | | | |
4.76% due 01/15/186 | | | 4,210,000 | | | | 4,231,050 | |
| Inmarsat Finance plc | | | | | | | | |
4.88% due 05/15/225 | | | 3,500,000 | | | | 3,465,000 | |
| Anixter, Inc. | | | | | | | | |
| 5.50% due 03/01/23 | | | 3,000,000 | | | | 3,112,500 | |
| Zayo Group LLC / Zayo Capital, Inc. | | | | | | | | |
5.75% due 01/15/275 | | | 2,000,000 | | | | 2,109,600 | |
| CCO Holdings LLC / CCO Holdings Capital Corp. | | | | | | | | |
| 5.25% due 09/30/22 | | | 1,890,000 | | | | 1,960,875 | |
| MDC Partners, Inc. | | | | | | | | |
6.50% due 05/01/245 | | | 1,700,000 | | | | 1,621,375 | |
| Total Communications | | | | | | | 52,020,775 | |
| | | | | | | | | |
| Consumer, Non-cyclical - 1.2% | |
| Tenet Healthcare Corp. | | | | | | | | |
4.63% due 06/15/206 | | | 17,300,000 | | | | 17,386,500 | |
| 7.50% due 01/01/22 | | | 1,250,000 | | | | 1,350,000 | |
| HCA, Inc. | | | | | | | | |
| 6.50% due 02/15/20 | | | 13,914,000 | | | | 15,227,203 | |
| 4.50% due 02/15/27 | | | 1,500,000 | | | | 1,500,000 | |
| ServiceMaster Co. LLC | | | | | | | | |
5.13% due 11/15/245 | | | 4,000,000 | | | | 4,100,000 | |
| Bumble Bee Holdings, Inc. | | | | | | | | |
9.00% due 12/15/175 | | | 1,754,000 | | | | 1,710,150 | |
| Kinetic Concepts Incorporated / KCI USA Inc | | | | | | | | |
7.88% due 02/15/215 | | | 1,240,000 | | | | 1,314,400 | |
| AMN Healthcare, Inc. | | | | | | | | |
5.13% due 10/01/245 | | | 450,000 | | | | 454,500 | |
| Total Consumer, Non-cyclical | | | | 43,042,753 | |
| | | | | | | | | |
| Energy - 1.0% | |
| Sabine Pass Liquefaction LLC | | | | | | | | |
| 5.63% due 02/01/21 | | | 5,500,000 | | | | 5,926,029 | |
| 5.63% due 04/15/23 | | | 4,200,000 | | | | 4,556,588 | |
| CONSOL Energy, Inc. | | | | | | | | |
| 5.88% due 04/15/22 | | | 6,750,000 | | | | 6,674,063 | |
| Cheniere Corpus Christi Holdings LLC | | | | | | | | |
| 5.88% due 03/31/25 | | | 5,200,000 | | | | 5,421,000 | |
| Unit Corp. | | | | | | | | |
| 6.63% due 05/15/21 | | | 4,000,000 | | | | 3,940,000 | |
| FTS International, Inc. | | | | | | | | |
8.63% due 06/15/205,6 | | | 2,950,000 | | | | 2,990,563 | |
| SEE NOTES TO FINANCIAL STATEMENTS. | THE GUGGENHEIM FUNDS SEMI-ANNUAL REPORT | 17 |
SCHEDULE OF INVESTMENTS (Unaudited)(continued) | March 31, 2017 |
| FLOATING RATE STRATEGIES FUND | |
| | | Face
Amount9 | | | Value | |
| | | | | | | |
| Legacy Reserves Limited Partnership / Legacy Reserves Finance Corp. | | | | | | |
| 8.00% due 12/01/20 | | $ | 2,750,000 | | | $ | 2,090,000 | |
| American Midstream Partners Limited Partnership / American Midstream Finance Corp. | | | | | | | | |
| 8.50% due 12/15/21 | | | 1,428,000 | | | | 1,456,560 | |
| Gibson Energy, Inc. | | | | | | | | |
6.75% due 07/15/215 | | | 958,000 | | | | 1,001,110 | |
| BreitBurn Energy Partners Limited Partnership / BreitBurn Finance Corp. | | | | | | | | |
7.88% due 04/15/227 | | | 850,000 | | | | 510,000 | |
| Total Energy | | | | | | | 34,565,913 | |
| | | | | | | | | |
| Industrial - 0.8% | |
| Ardagh Packaging Finance plc / Ardagh Holdings USA, Inc. | | | | | | | | |
4.29% due 05/15/215,6 | | | 13,500,000 | | | | 13,820,625 | |
4.63% due 05/15/235 | | | 2,100,000 | | | | 2,115,750 | |
4.25% due 09/15/225 | | | 1,500,000 | | | | 1,515,000 | |
| Reynolds Group Issuer Incorporated / Reynolds Group Issuer LLC / Reynolds Group Issuer Lu | | | | | | | | |
4.52% due 07/15/215,6 | | | 7,500,000 | | | | 7,673,475 | |
| Novelis Corp. | | | | | | | | |
6.25% due 08/15/245 | | | 3,000,000 | | | | 3,127,500 | |
| Grinding Media Inc. / MC Grinding Media Canada Inc. | | | | | | | | |
7.38% due 12/15/235 | | | 750,000 | | | | 787,500 | |
| StandardAero Aviation Holdings, Inc. | | | | | | | | |
10.00% due 07/15/235 | | | 275,000 | | | | 294,938 | |
| Total Industrial | | | | | | | 29,334,788 | |
| | | | | | | | | |
| Financial - 0.6% | |
| Kennedy-Wilson, Inc. | | | | | | | | |
| 5.88% due 04/01/24 | | | 11,855,000 | | | | 12,151,375 | |
| Icahn Enterprises, LP / Icahn Enterprises Finance Corp. | | | | | | | | |
| 5.88% due 02/01/22 | | | 5,000,000 | | | | 5,075,000 | |
| 6.00% due 08/01/20 | | | 1,700,000 | | | | 1,759,500 | |
| Jefferies Finance LLC / JFIN Company-Issuer Corp. | | | | | | | | |
7.38% due 04/01/205 | | | 1,050,000 | | | | 1,060,500 | |
| NFP Corp. | | | | | | | | |
9.00% due 07/15/215 | | | 850,000 | | | | 898,323 | |
| Fidelity & Guaranty Life Holdings, Inc. | | | | | | | | |
6.38% due 04/01/215 | | | 450,000 | | | | 451,125 | |
| FBM Finance, Inc. | | | | | | | | |
8.25% due 08/15/215 | | | 200,000 | | | | 212,000 | |
| Total Financial | | | | | | | 21,607,823 | |
| | | | | | | | | |
| Consumer, Cyclical - 0.5% | |
| Nathan’s Famous, Inc. | | | | | | | | |
10.00% due 03/15/205 | | | 7,700,000 | | | | 8,277,500 | |
| Ferrellgas Limited Partnership / Ferrellgas Finance Corp. | | | | | | | | |
| 6.50% due 05/01/21 | | | 4,615,000 | | | | 4,384,250 | |
| WMG Acquisition Corp. | | | | | | | | |
6.75% due 04/15/225 | | | 2,280,000 | | | | 2,396,850 | |
| Lennar Corp. | | | | | | | | |
| 4.13% due 01/15/22 | | | 1,500,000 | | | | 1,510,785 | |
| Total Consumer, Cyclical | | | | 16,569,385 | |
| | | | | | | | | |
| Technology - 0.4% | |
| First Data Corp. | | | | | | | | |
5.00% due 01/15/245 | | | 6,250,000 | | | | 6,359,375 | |
5.75% due 01/15/245 | | | 5,200,000 | | | | 5,363,800 | |
| NCR Corp. | | | | | | | | |
| 5.88% due 12/15/21 | | | 2,250,000 | | | | 2,345,625 | |
| 6.38% due 12/15/23 | | | 800,000 | | | | 842,000 | |
| Micron Technology, Inc. | | | | | | | | |
| 5.25% due 08/01/23 | | | 450,000 | | | | 461,250 | |
| Total Technology | | | | | | | 15,372,050 | |
18 | THE GUGGENHEIM FUNDS SEMI-ANNUAL REPORT | SEE NOTES TO FINANCIAL STATEMENTS. |
SCHEDULE OF INVESTMENTS (Unaudited)(continued) | March 31, 2017 |
| FLOATING RATE STRATEGIES FUND | |
| | | Face
Amount9 | | | Value | |
| | | | | | | |
| Utilities - 0.3% | |
| AES Corp. | | | | | | |
4.05% due 06/01/196 | | $ | 2,608,000 | | | $ | 2,608,000 | |
| 6.00% due 05/15/26 | | | 2,000,000 | | | | 2,070,000 | |
| 5.50% due 04/15/25 | | | 1,150,000 | | | | 1,164,375 | |
| Terraform Global Operating LLC | | | | | | | | |
9.75% due 08/15/225 | | | 4,600,000 | | | | 5,157,750 | |
| LBC Tank Terminals Holding Netherlands BV | | | | | | | | |
6.88% due 05/15/235 | | | 630,000 | | | | 653,701 | |
| Total Utilities | | | | | | | 11,653,826 | |
| | | | | | | | | |
| Basic Materials - 0.0% | |
| Constellium N.V. | | | | | | | | |
7.88% due 04/01/215 | | | 1,000,000 | | | | 1,067,500 | |
| Eldorado Gold Corp. | | | | | | | | |
6.13% due 12/15/205 | | | 265,000 | | | | 271,625 | |
| Mirabela Nickel Ltd. | | | | | | | | |
2.38% due 06/24/191 | | | 1,279,819 | | | | 89,587 | |
1.00% due 09/10/44†††,1 | | | 25,570 | | | | — | |
| Total Basic Materials | | | | | | | 1,428,712 | |
| | | | | | | | | |
| Diversified - 0.0% | |
| HRG Group, Inc. | | | | | | | | |
| 7.88% due 07/15/19 | | | 490,000 | | | | 507,150 | |
| Total Corporate Bonds | | | | | | | | |
| (Cost $224,338,803) | | | | | | | 226,103,175 | |
| | | | | | | | | |
ASSET-BACKED SECURITIES†† - 4.5% | |
| Collateralized Loan Obligations - 3.5% | |
| Golub Capital Partners CLO Ltd. | | | | | | | | |
2016-33A, 3.37% due 11/21/285,6 | | | 12,500,000 | | | | 12,458,583 | |
2015-24A, 4.78% due 02/05/275,6 | | | 3,750,000 | | | | 3,732,847 | |
| TICP CLO II Ltd. | | | | | | | | |
2014-2A, 5.78% due 07/20/265,6 | | | 6,560,000 | | | | 6,266,924 | |
| OHA Credit Partners IX Ltd. | | | | | | | | |
2013-9A, due 10/20/255,8 | | | 6,000,000 | | | | 5,353,509 | |
| Octagon Loan Funding Ltd. | | | | | | | | |
, % due 11/18/268 | | | 5,600,000 | | | | 5,074,791 | |
| PFP Ltd. | | | | | | | | |
2015-2, 3.61% due 07/14/345,6 | | | 5,000,000 | | | | 5,008,191 | |
| Fortress Credit Opportunities V CLO Ltd. | | | | | | | | |
2017-5A, % due 10/15/265,6 | | | 2,500,000 | | | | 2,502,642 | |
2014-5A, 5.51% due 10/15/265,6 | | | 2,500,000 | | | | 2,495,005 | |
| Cerberus Loan Funding XVII Ltd. | | | | | | | | |
2016-3A, 3.48% due 01/15/285,6 | | | 5,000,000 | | | | 4,983,808 | |
| Fortress Credit Opportunities VII CLO Ltd. | | | | | | | | |
2016-7A, 3.88% due 12/15/285,6 | | | 5,000,000 | | | | 4,969,766 | |
| OCP CLO Ltd. | | | | | | | | |
2016-2A, 3.90% due 11/22/255,6 | | | 3,800,000 | | | | 3,804,230 | |
| ACIS CLO Ltd. | | | | | | | | |
2013-2A, 4.87% due 10/14/225,6 | | | 1,800,000 | | | | 1,793,357 | |
2015-6A, 4.40% due 05/01/275,6 | | | 1,000,000 | | | | 999,981 | |
2013-1A, 5.52% due 04/18/245,6 | | | 1,000,000 | | | | 999,968 | |
| Avery | | | | | | | | |
2013-3X COM, % due 01/18/258 | | | 4,300,020 | | | | 3,684,946 | |
| Jamestown CLO V Ltd. | | | | | | | | |
2014-5A, 6.12% due 01/17/275,6 | | | 4,000,000 | | | | 3,648,942 | |
| SEE NOTES TO FINANCIAL STATEMENTS. | THE GUGGENHEIM FUNDS SEMI-ANNUAL REPORT | 19 |
SCHEDULE OF INVESTMENTS (Unaudited)(continued) | March 31, 2017 |
| FLOATING RATE STRATEGIES FUND | |
| | | Face
Amount9 | | | Value | |
| | | | | | | |
| Fortress Credit Funding V, LP | | | | | | |
2015-5A, 4.69% due 08/15/225,6 | | $ | 3,500,000 | | | $ | 3,494,123 | |
| Fortress Credit Opportunities VI CLO Ltd. | | | | | | | | |
2015-6A, 4.76% due 10/10/265,6 | | | 3,500,000 | | | | 3,468,480 | |
| OHA Credit Partners VIII Ltd. | | | | | | | | |
2013-8A, 5.43% due 04/20/255,6 | | | 3,225,000 | | | | 3,038,884 | |
| Flagship CLO VIII Ltd. | | | | | | | | |
2017-8A, 3.54% due 01/16/265,6 | | | 3,000,000 | | | | 2,990,033 | |
| ABPCI Direct Lending Fund CLO I LLC | | | | | | | | |
2016-1A, 3.65% due 12/22/285,6 | | | 3,000,000 | | | | 2,984,207 | |
| Treman Park CLO Ltd. | | | | | | | | |
2015-1A, due 04/20/275,8 | | | 3,000,000 | | | | 2,691,001 | |
| ALM XIV Ltd. | | | | | | | | |
2014-14A, 4.49% due 07/28/265,6 | | | 2,650,000 | | | | 2,656,788 | |
| Halcyon Loan Advisors Funding Ltd. | | | | | | | | |
2012-1A, 4.04% due 08/15/235,6 | | | 2,600,000 | | | | 2,608,305 | |
| Ares XXXIII CLO Ltd. | | | | | | | | |
2016-1A, 3.90% due 12/05/255,6 | | | 2,500,000 | | | | 2,499,749 | |
| Catamaran CLO 2012-1 Ltd. | | | | | | | | |
2016-1A, 4.00% due 12/20/235,6 | | | 2,000,000 | | | | 2,000,201 | |
| Tralee CLO III Ltd. | | | | | | | | |
2016-3A, 3.93% due 07/20/265,6 | | | 2,000,000 | | | | 2,000,167 | |
| Duane Street CLO IV Ltd. | | | | | | | | |
2007-4A, 3.29% due 11/14/215,6 | | | 2,000,000 | | | | 2,000,064 | |
| KVK CLO 2014-1 Ltd. | | | | | | | | |
2017-1A, 3.44% due 05/15/265,6 | | | 2,000,000 | | | | 1,991,073 | |
| Galaxy XVI CLO Ltd. | | | | | | | | |
2013-16A, 4.39% due 11/16/255,6 | | | 2,000,000 | | | | 1,939,050 | |
| CIFC Funding Ltd. | | | | | | | | |
2014-1A, 5.52% due 04/18/255,6 | | | 2,000,000 | | | | 1,901,507 | |
| DIVCORE CLO Ltd. | | | | | | | | |
2013-1A, 4.81% due 11/15/325,6 | | | 1,600,000 | | | | 1,596,931 | |
| Dryden XXVIII Senior Loan Fund | | | | | | | | |
2013-28A, 3.74% due 08/15/255,6 | | | 1,500,000 | | | | 1,489,526 | |
| Cent CLO 22 Ltd. | | | | | | | | |
2014-22A, 6.33% due 11/07/265,6 | | | 1,500,000 | | | | 1,417,823 | |
| Grayson CLO Ltd. | | | | | | | | |
2006-1A, 1.44% due 11/01/215,6 | | | 1,200,000 | | | | 1,172,328 | |
| Cerberus Onshore II CLO LLC | | | | | | | | |
2014-1A, 5.02% due 10/15/235,6 | | | 600,000 | | | | 594,166 | |
2014-1A, 4.52% due 10/15/235,6 | | | 500,000 | | | | 498,615 | |
| Telos CLO Ltd. | | | | | | | | |
2013-3A, 5.27% due 01/17/245,6 | | | 1,050,000 | | | | 1,050,677 | |
| Cerberus Loan Funding XVI, LP | | | | | | | | |
2016-2A, 4.82% due 11/15/275,6 | | | 1,000,000 | | | | 1,011,994 | |
| Newstar Commercial Loan Funding 2017-1 LLC | | | | | | | | |
2017-1A, 4.54% due 03/20/275,6 | | | 1,000,000 | | | | 999,990 | |
| Shackleton VII CLO Ltd. | | | | | | | | |
2016-7A, 3.87% due 04/15/275,6 | | | 1,000,000 | | | | 999,388 | |
20 | THE GUGGENHEIM FUNDS SEMI-ANNUAL REPORT | SEE NOTES TO FINANCIAL STATEMENTS. |
SCHEDULE OF INVESTMENTS (Unaudited)(continued) | March 31, 2017 |
| FLOATING RATE STRATEGIES FUND | |
| | | Face
Amount9 | | | Value | |
| | | | | | | |
| Venture XI CLO Ltd. | | | | | | |
2015-11A, 3.99% due 11/14/225,6 | | $ | 1,000,000 | | | $ | 994,241 | |
| COA Summit CLO Limited | | | | | | | | |
2014-1A, 4.88% due 04/20/235,6 | | | 1,000,000 | | | | 989,796 | |
| WhiteHorse VII Ltd. | | | | | | | | |
2013-1A, 5.85% due 11/24/255,6 | | | 1,000,000 | | | | 935,218 | |
| Shackleton CLO | | | | | | | | |
2014-6A, 6.77% due 07/17/265,6 | | | 1,000,000 | | | | 841,720 | |
| Westchester CLO Ltd. | | | | | | | | |
2007-1A, 1.37% due 08/01/225,6 | | | 750,000 | | | | 747,625 | |
| NewStar Arlington Senior Loan Program LLC | | | | | | | | |
2014-1A, 4.34% due 07/25/255,6 | | | 600,000 | | | | 593,953 | |
| Ares XXVI CLO Ltd. | | | | | | | | |
2013-1A, due 04/15/255,8 | | | 1,250,000 | | | | 565,880 | |
| Kingsland IV Ltd. | | | | | | | | |
2007-4A, 2.47% due 04/16/215,6 | | | 500,000 | | | | 482,045 | |
| Eastland CLO Ltd. | | | | | | | | |
2007-1A, 1.43% due 05/01/225,6 | | | 350,000 | | | | 343,662 | |
| Newstar Commercial Loan Funding LLC | | | | | | | | |
2014-1A, 5.78% due 04/20/255,6 | | | 250,000 | | | | 244,794 | |
| Great Lakes CLO Ltd. | | | | | | | | |
2014-1A, 5.22% due 04/15/255,6 | | | 250,000 | | | | 242,180 | |
| Total Collateralized Loan Obligations | | | | 123,853,674 | |
| | | | | | | | | |
| Credit Card - 0.6% | |
| Capital One Multi-Asset Execution Trust | | | | | | | | |
2007-A5, 0.95% due 07/15/206 | | | 10,000,000 | | | | 9,998,091 | |
2015-A6, 1.28% due 06/15/206 | | | 9,000,000 | | | | 9,010,015 | |
| Chase Issuance Trust | | | | | | | | |
2007-A12, 0.96% due 08/15/196 | | | 4,000,000 | | | | 3,999,999 | |
| Credit Card Pass-Through Trust | | | | | | | | |
2012-BIZ, due 12/15/495,11 | | | 64,350 | | | | 48,019 | |
| Total Credit Card | | | | | | | 23,056,124 | |
| | | | | | | | | |
| Collateralized Debt Obligations - 0.2% | |
| Triaxx Prime CDO Ltd. | | | | | | | | |
2006-2A, 1.05% due 10/02/395,6 | | | 2,506,834 | | | | 2,442,997 | |
| N-Star REL CDO VIII Ltd. | | | | | | | | |
2006-8A, 1.15% due 02/01/415,6 | | | 1,733,536 | | | | 1,723,725 | |
| RAIT CRE CDO I Ltd. | | | | | | | | |
| 2006-1X A1B, 1.31% due 11/20/46 | | | 1,115,297 | | | | 1,109,035 | |
| SRERS Funding Ltd. | | | | | | | | |
2011-RS, 1.10% due 05/09/465,6 | | | 180,966 | | | | 178,780 | |
| Total Collateralized Debt Obligations | | | | 5,454,537 | |
| | | | | | | | | |
| Automotive - 0.1% | |
| AmeriCredit Automobile Receivables Trust | | | | | | | | |
2016-2, 1.55% due 10/08/196 | | | 4,255,710 | | | | 4,265,683 | |
| | | | | | | | | |
| Transport-Aircraft - 0.1% | |
| Castlelake Aircraft Securitization Trust | | | | | | | | |
| 2014-1, 5.25% due 02/15/29 | | | 1,550,548 | | | | 1,546,672 | |
| 2014-1, 7.50% due 02/15/29 | | | 1,132,696 | | | | 1,132,696 | |
| Airplanes Pass Through Trust | | | | | | | | |
2001-1A, 1.46% due 03/15/196,10 | | | 1,620,327 | | | | 502,301 | |
| Total Transport-Aircraft | | | | | | | 3,181,669 | |
| Total Asset-Backed Securities | | | | | |
| (Cost $156,166,941) | | | | | | | 159,811,687 | |
| SEE NOTES TO FINANCIAL STATEMENTS. | THE GUGGENHEIM FUNDS SEMI-ANNUAL REPORT | 21 |
SCHEDULE OF INVESTMENTS (Unaudited)(continued) | March 31, 2017 |
| FLOATING RATE STRATEGIES FUND | |
| | | Face
Amount9 | | | Value | |
| | | | | | | |
COLLATERALIZED MORTGAGE OBLIGATIONS†† - 4.1% | |
| Residential Mortgage Backed Securities - 3.3% | |
| LSTAR Commercial Mortgage Trust | | | | | | |
2016-7, 2.78% due 12/01/215,6 | | $ | 19,410,908 | | | $ | 19,241,064 | |
| LSTAR Securities Investment Trust | | | | | | | | |
2016-5, 2.78% due 11/01/215,6 | | | 10,308,991 | | | | 10,256,580 | |
2015-10, 2.78% due 11/02/205,6 | | | 1,526,560 | | | | 1,526,083 | |
| LSTAR Securities Investment Ltd. | | | | | | | | |
2016-4, 2.78% due 10/01/215,6 | | | 6,862,037 | | | | 6,807,271 | |
2017-1, 2.78% due 01/01/225,6 | | | 4,699,402 | | | | 4,687,653 | |
| RALI Series Trust | | | | | | | | |
2006-QO2, 1.20% due 02/25/466 | | | 8,895,441 | | | | 3,856,192 | |
2007-QO4, 1.17% due 05/25/476 | | | 3,531,257 | | | | 3,183,607 | |
2006-QO10, 1.14% due 01/25/376 | | | 3,370,069 | | | | 2,858,684 | |
| Lehman XS Trust Series | | | | | | | | |
2007-15N, 1.23% due 08/25/376 | | | 5,733,051 | | | | 4,903,304 | |
2006-16N, 1.17% due 11/25/466 | | | 3,045,683 | | | | 2,608,090 | |
| GSAA Home Equity Trust | | | | | | | | |
2006-14, 1.15% due 09/25/366 | | | 11,510,804 | | | | 5,984,152 | |
2007-7, 1.25% due 07/25/376 | | | 909,680 | | | | 826,587 | |
| Soundview Home Loan Trust | | | | | | | | |
2005-OPT3, 1.45% due 11/25/356 | | | 6,000,000 | | | | 5,412,123 | |
| American Home Mortgage Investment Trust | | | | | | | | |
2006-1, 1.38% due 03/25/466 | | | 6,184,243 | | | | 5,136,376 | |
| CIM Trust | | | | | | | | |
2017-2, 2.78% due 12/25/575,6 | | | 5,000,000 | | | | 4,962,643 | |
| IndyMac INDX Mortgage Loan Trust | | | | | | | | |
2006-AR4, 1.19% due 05/25/466 | | | 5,555,296 | | | | 4,851,995 | |
| WaMu Mortgage Pass-Through Certificates Series Trust | | | | | | | | |
2007-OA6, 1.42% due 07/25/476 | | | 5,433,528 | | | | 4,691,695 | |
| Structured Asset Securities Corporation Mortgage Loan Trust | | | | | | | | |
2006-OPT1, 1.24% due 04/25/366 | | | 3,473,270 | | | | 3,383,365 | |
2007-BC1, 1.11% due 02/25/376 | | | 789,710 | | | | 708,223 | |
| Nomura Resecuritization Trust | | | | | | | | |
2015-4R, 1.66% due 03/26/365,6 | | | 2,398,254 | | | | 2,287,694 | |
2012-1R, 1.22% due 08/27/475,6 | | | 955,233 | | | | 947,973 | |
| AJAX Mortgage Loan Trust | | | | | | | | |
2015-A, 3.88% due 11/25/545,6 | | | 3,221,657 | | | | 3,213,448 | |
| American Home Mortgage Assets Trust | | | | | | | | |
2006-4, 1.19% due 10/25/466 | | | 4,781,888 | | | | 3,159,328 | |
| Washington Mutual Mortgage Pass-Through Certificates WMALT Series Trust | | | | | | | | |
2006-AR9, 1.48% due 11/25/466 | | | 3,817,091 | | | | 3,061,459 | |
| Wachovia Asset Securitization Issuance II LLC Trust | | | | | | | | |
2007-HE1, 1.12% due 07/25/375,6 | | | 2,937,737 | | | | 2,689,956 | |
22 | THE GUGGENHEIM FUNDS SEMI-ANNUAL REPORT | SEE NOTES TO FINANCIAL STATEMENTS. |
SCHEDULE OF INVESTMENTS (Unaudited)(continued) | March 31, 2017 |
| FLOATING RATE STRATEGIES FUND | |
| | | Face
Amount9 | | | Value | |
| | | | | | | |
| Merrill Lynch Alternative Note Asset Trust Series | | | | | | |
2007-OAR3, 0.97% due 07/25/376 | | $ | 2,644,305 | | | $ | 2,139,135 | |
| GreenPoint Mortgage Funding Trust | | | | | | | | |
2005-HE4, 1.45% due 07/25/306 | | | 1,903,002 | | | | 1,870,507 | |
| Morgan Stanley Re-REMIC Trust | | | | | | | | |
2010-R5, 1.60% due 06/26/365 | | | 1,003,807 | | | | 735,167 | |
| Alliance Bancorp Trust | | | | | | | | |
2007-OA1, 1.22% due 07/25/376 | | | 782,061 | | | | 569,074 | |
| New Century Home Equity Loan Trust | | | | | | | | |
2004-4, 1.78% due 02/25/356 | | | 351,611 | | | | 311,685 | |
| Total Residential Mortgage Backed Securities | | | | 116,871,113 | |
| | | | | | | | | |
| Commercial Mortgage Backed Securities - 0.8% | |
| Cosmopolitan Hotel Trust | | | | | | | | |
2016-CSMO, 5.56% due 11/15/335,6 | | | 19,500,000 | | | | 19,829,702 | |
| GS Mortgage Securities Corporation Trust | | | | | | | | |
2016-ICE2, 9.41% due 02/15/335,6 | | | 10,000,000 | | | | 10,200,717 | |
| Total Commercial Mortgage Backed Securities | | | | 30,030,419 | |
| Total Collateralized Mortgage Obligations | | | | | |
| (Cost $144,759,623) | | | | | | | 146,901,532 | |
| | | | | | | | | |
SENIOR FIXED RATE INTERESTS†† - 0.1% | |
| Consumer, Cyclical - 0.1% | |
| Men’s Wearhouse, Inc. | | | | | | | | |
| 5.00% due 06/18/21 | | | 4,700,000 | | | | 4,418,000 | |
| | | | | | | | | |
| Financial - 0.0% | |
| Magic Newco, LLC | | | | | | | | |
| 12.00% due 06/12/19 | | | 500,000 | | | | 523,750 | |
| | | | | | | | | |
| Consumer, Non-cyclical - 0.0% | |
| Targus International LLC | | | | | | | | |
7.50% due 12/31/19†††,1 | | | 61,579 | | | | 86,106 | |
| Total Senior Fixed Rate Interests | | | | | |
| (Cost $5,272,896) | | | | | | | 5,027,856 | |
| | | | | | | | | |
COMMERCIAL PAPER†† - 9.4% | |
| CVS Health Corp | | | | | | | | |
| 1.22% due 04/17/17 | | | 55,000,000 | | | | 54,970,178 | |
| Mondelez International Inc | | | | | | | | |
| 1.30% due 06/13/17 | | | 30,000,000 | | | | 29,918,044 | |
| 1.04% due 04/26/17 | | | 25,000,000 | | | | 24,978,098 | |
| Marriott International Inc/MD | | | | | | | | |
| 1.23% due 04/18/17 | | | 39,000,000 | | | | 38,977,348 | |
| 1.25% due 04/24/17 | | | 10,000,000 | | | | 9,992,014 | |
| Clorox Co/The | | | | | | | | |
| 0.90% due 04/06/17 | | | 33,500,000 | | | | 33,495,813 | |
| Cox Enterprises Inc | | | | | | | | |
| 0.97% due 04/10/17 | | | 30,000,000 | | | | 29,991,225 | |
| Hyundai Capital America | | | | | | | | |
| 1.19% due 04/25/17 | | | 24,518,000 | | | | 24,497,732 | |
| Whirlpool Corp | | | | | | | | |
| 1.16% due 04/26/17 | | | 21,500,000 | | | | 21,482,083 | |
| VF Corp | | | | | | | | |
| 0.85% due 04/03/17 | | | 20,000,000 | | | | 19,999,056 | |
| Nissan Motor Acceptance Corp | | | | | | | | |
| 0.90% due 04/27/17 | | | 20,000,000 | | | | 19,987,000 | |
| Harley-Davidson Financial Services Inc | | | | | | | | |
| 0.88% due 04/06/17 | | | 16,000,000 | | | | 15,998,045 | |
| SEE NOTES TO FINANCIAL STATEMENTS. | THE GUGGENHEIM FUNDS SEMI-ANNUAL REPORT | 23 |
SCHEDULE OF INVESTMENTS (Unaudited)(continued) | March 31, 2017 |
| FLOATING RATE STRATEGIES FUND | |
| | | Face
Amount9 | | | Value | |
| | | | | | | |
| Ryder System Inc | | | | | | |
| 1.15% due 04/19/17 | | $ | 8,000,000 | | | $ | 7,995,400 | |
| Total Commercial Paper | | | | | | | | |
| (Cost $332,288,753) | | | | | | | 332,282,036 | |
| | | | | | | | | |
| Total Investments - 107.7% | | | | | |
| (Cost $3,828,244,252) | | | | | | $ | 3,820,544,479 | |
| Other Assets & Liabilities, net - (7.7)% | | | | (273,148,932 | ) |
| Total Net Assets - 100.0% | | | $ | 3,547,395,547 | |
FORWARD FOREIGN CURRENCY EXCHANGE CONTRACTS†† |
| Counterparty | | Contracts to Buy (Sell) | | Currency | Settlement Date | | Settlement Value | | | Value at
March 31,
2017 | | | Net Unrealized Appreciation/ (Depreciation) | |
| Morgan Stanley | | | (21,546,000 | ) | EUR | 04/11/17 | | $ | 23,258,631 | | | $ | 22,995,706 | | | $ | 262,925 | |
| J.P. Morgan | | | (7,250,000 | ) | EUR | 04/11/17 | | | 7,880,823 | | | | 7,737,811 | | | | 143,012 | |
| Citigroup | | | (2,670,000 | ) | EUR | 04/11/17 | | | 2,902,784 | | | | 2,849,649 | | | | 53,135 | |
| Morgan Stanley | | | 720,000 | | EUR | 04/11/17 | | | (768,729 | ) | | | (768,444 | ) | | | (285 | ) |
| Bank of America | | | (1,900,000 | ) | GBP | 04/11/17 | | | 2,358,613 | | | | 2,381,067 | | | | (22,454 | ) |
| Barclays | | | (16,883,000 | ) | GBP | 04/11/17 | | | 20,588,768 | | | | 21,157,661 | | | | (568,893 | ) |
| Bank of America | | | (76,045,000 | ) | EUR | 04/11/17 | | | 80,584,658 | | | | 81,161,630 | | | | (576,972 | ) |
| | | | | | | | | | | | | | | | | $ | (709,532 | ) |
24 | THE GUGGENHEIM FUNDS SEMI-ANNUAL REPORT | SEE NOTES TO FINANCIAL STATEMENTS. |
SCHEDULE OF INVESTMENTS (Unaudited)(continued) | March 31, 2017 |
| FLOATING RATE STRATEGIES FUND | |
| * | Non-income producing security. |
† | Value determined based on Level 1 inputs, unless otherwise noted — See Note 4. |
†† | Value determined based on Level 2 inputs, unless otherwise noted — See Note 4. |
††† | Value determined based on Level 3 inputs — See Note 4. |
1 | Illiquid security. |
2 | Affiliated issuer — See Note 7. |
3 | Rate indicated is the 7 day yield as of March 31, 2017. |
4 | Security with no rate was unsettled at March 31, 2017. |
5 | Security is a 144A or Section 4(a)(2) security. The total market value of 144A or Section 4(a)(2) securities is $318,915,379 (cost $312,259,244), or 9.0% of total net assets. These securities have been determined to be liquid under guidelines established by the Board of Trustees. |
6 | Variable rate security. Rate indicated is rate effective at March 31, 2017. |
7 | Security is in default of interest and/or principal obligations. |
8 | Security has no stated coupon. However, it is expected to receive residual cash flow payments on defined deal dates. |
9 | The face amount is denominated in U.S. dollars unless otherwise indicated. |
10 | Security is a 144A or Section 4(a)(2) security. These securities are considered illiquid and restricted under guidelines established by the Board of Trustees. The total market value of 144A or Section 4(a)(2) illiquid and restricted securities is $502,301 (cost $1,307,090), or less than 0.0% of total net assets — See Note 10. |
11 | Zero coupon rate security. |
| | plc — Public Limited Company |
| | REIT — Real Estate Investment Trust |
| | |
| | See Sector Classification in Other Information section. |
| SEE NOTES TO FINANCIAL STATEMENTS. | THE GUGGENHEIM FUNDS SEMI-ANNUAL REPORT | 25 |
SCHEDULE OF INVESTMENTS (Unaudited)(continued) | March 31, 2017 |
| FLOATING RATE STRATEGIES FUND | |
The following table summarizes the inputs used to value the Fund’s investments at March 31, 2017 (See Note 4 in the Notes to Financial Statements):
| Investments in Securities (Assets) | | Level 1 | | | Level 2 | | | Level 2 -
Other* | | | Level 3 | | | Total | |
| Asset-Backed Securities | | $ | — | | | $ | 159,811,687 | | | $ | — | | | $ | — | | | $ | 159,811,687 | |
| Collateralized Mortgage Obligations | | | — | | | | 146,901,532 | | | | — | | | | — | | | | 146,901,532 | |
| Commercial Paper | | | — | | | | 332,282,036 | | | | — | | | | — | | | | 332,282,036 | |
| Common Stocks | | | 184,002 | | | | — | | | | — | | | | 19,615 | | | | 203,617 | |
| Corporate Bonds | | | — | | | | 226,103,175 | | | | — | | | | — | ** | | | 226,103,175 | |
| Forward Foreign Currency Exchange Contracts | | | — | | | | — | | | | 459,072 | | | | — | | | | 459,072 | |
| Mutual Funds | | | 25,858,956 | | | | — | | | | — | | | | — | | | | 25,858,956 | |
| Senior Fixed Rate Interests | | | — | | | | 4,941,750 | | | | — | | | | 86,106 | | | | 5,027,856 | |
| Senior Floating Rate Interests | | | — | | | | 2,803,754,186 | | | | — | | | | 50,792,453 | | | | 2,854,546,639 | |
| Short-Term Investments | | | 69,808,981 | | | | — | | | | — | | | | — | | | | 69,808,981 | |
| Total | | $ | 95,851,939 | | | $ | 3,673,794,366 | | | $ | 459,072 | | | $ | 50,898,174 | | | $ | 3,821,003,551 | |
| | | | | | | | | | | | | | | | | | | | | |
| Investments in Securities (Liabilities) | | Level 1 | | | Level 2 | | | Level 2 -
Other* | | | Level 3 | | | Total | |
| Forward Foreign Currency Exchange Contracts | | $ | — | | | $ | — | | | $ | 1,168,604 | | | $ | — | | | $ | 1,168,604 | |
| Unfunded Loan Commitments | | | — | | | | 1,300,342 | | | | — | | | | — | | | | 1,300,342 | |
| Total | | $ | — | | | $ | 1,300,342 | | | $ | 1,168,604 | | | $ | — | | | $ | 2,468,946 | |
| * | Other financial instruments include forward foreign currency exchange contracts, which are reported as unrealized gain/loss at period end. |
| ** | Less than $1. |
The following is a summary of significant unobservable inputs used in the fair valuation of assets and liabilities categorized within Level 3 of the fair value hierarchy:
| Category | | Ending Balance at 03/31/17 | | Valuation
Technique | Unobservable
Inputs | | Input
Range | |
| Common Stocks | | $ | 19,252 | | Enterprise Value | Valuation Multiple | | | 6.4 | x |
| Common Stocks | | | 363 | | Model Price | Liquidation value | | | — | |
| Senior Fixed Rate Interests | | | 86,106 | | Enterprise Value | Valuation Multiple | | | 6.4 | x |
| Senior Floating Rate Interests | | | 19,202,185 | | Model Price | Purchase Price | | | — | |
| Senior Floating Rate Interests | | | 15,760,000 | | Model Price | Trade Price | | | — | |
| Senior Floating Rate Interests | | | 9,191,980 | | Enterprise Value | Valuation Multiple | | | 11.1 | x |
| Senior Floating Rate Interests | | | 6,638,288
| | Option Adjusted Spread off the prior month end broker mark over the 3 month LIBOR | Indicative Quote | | | — | |
| Total | | $ | 50,898,174 | | | | | | | |
Any remaining Level 3 securities held by the Fund and excluded from the tables above, were not considered material to the Fund.
26 | THE GUGGENHEIM FUNDS SEMI-ANNUAL REPORT | SEE NOTES TO FINANCIAL STATEMENTS. |
SCHEDULE OF INVESTMENTS (Unaudited)(concluded) | March 31, 2017 |
| FLOATING RATE STRATEGIES FUND | |
Transfers between investment levels may occur as the markets fluctuate and/or the availability of data used in an investment’s valuation changes. Transfers between valuation levels, if any, are in comparison to the valuation levels at the end of the previous fiscal year, and are effective using the fair value as of the end of the previous fiscal period.
As of March 31, 2017, the Fund had securities with a total value of $6,565,543 transfer into Level 3 from Level 2 and securities with a total value of $809,970 transfer out of Level 3 into Level 2 due to changes in the securities valuation method. There were no other securities that transferred between levels.
Summary of Fair Value Level 3 Activity
Following is a reconciliation of Level 3 assets for which significant unobservable inputs were used to determine fair value for the period ended March 31, 2017:
LEVEL 3 - Fair value measurement using significant unobservable inputs
| | | Senior Floating Rate Interests | | | Senior
Fixed Rate
Interests | | | Common Stocks | | | Corporate Bonds | | | Total | |
| Floating Rate Strategies Fund | | | | | | | | | | | | | | | |
| Assets: | | | | | | | | | | | | | | | |
| Beginning Balance | | $ | 43,247,269 | | | $ | 80,078 | | | $ | 19,616 | | | $ | 358,349 | | | $ | 43,705,312 | |
| Purchases | | | 24,730,000 | | | | 4,311 | | | | — | | | | — | | | | 24,734,311 | |
| Sales, maturities and paydowns | | | (23,081,669 | ) | | | — | | | | — | | | | — | | | | (23,081,669 | ) |
| Total realized gains or losses included in earnings | | | (3,736,569 | ) | | | — | | | | — | | | | — | | | | (3,736,569 | ) |
| Total change in unrealized gains or losses included in earnings | | | 3,519,500 | | | | 1,717 | | | | (1 | ) | | | — | | | | 3,521,216 | |
| Transfers into Level 3 | | | 6,565,543 | | | | — | | | | — | | | | — | | | | 6,565,543 | |
| Transfers out of Level 3 | | | (451,621 | ) | | | — | | | | — | | | | (358,349 | ) | | | (809,970 | ) |
| Ending Balance | | $ | 50,792,453 | | | $ | 86,106 | | | $ | 19,615 | | | $ | — | | | $ | 50,898,174 | |
| Net change in unrealized appreciation (depreciation) for investments in securities still held at March 31, 2017 | | $ | 285,832 | | | $ | (1,717 | ) | | $ | (1 | ) | | $ | — | | | $ | 287,548 | |
| SEE NOTES TO FINANCIAL STATEMENTS. | THE GUGGENHEIM FUNDS SEMI-ANNUAL REPORT | 27 |
STATEMENT OF ASSETS AND LIABILITIES (Unaudited) |
| FLOATING RATE STRATEGIES FUND |
March 31, 2017
| Assets: | |
| Investments in unaffiliated issuers, at value (cost $3,802,545,088) | | $ | 3,794,685,523 | |
| Investments in affiliated issuers, at value (cost $25,699,164) | | | 25,858,956 | |
| Total investments (cost $3,828,244,252) | | | 3,820,544,479 | |
| Foreign currency, at value (cost $564,418) | | | 564,418 | |
| Cash | | | 2,989,025 | |
| Segregated cash with broker | | | 1,840,000 | |
| Unrealized appreciation on forward foreign currency exchange contracts | | | 459,072 | |
| Prepaid expenses | | | 227,179 | |
| Receivables: | |
| Securities sold | | | 3,299,480 | |
| Fund shares sold | | | 23,874,217 | |
| Dividends | | | 44,455 | |
| Foreign taxes reclaim | | | 63,494 | |
| Interest | | | 11,644,680 | |
| Total assets | | | 3,865,550,499 | |
| | | | | |
| Liabilities: | |
| Unfunded loan commitments, at value (Note 8) (proceeds $2,935,523) | | | 1,300,342 | |
| Unrealized depreciation on forward foreign currency exchange contracts | | | 1,168,604 | |
| Payable for: | |
| Securities purchased | | | 300,984,401 | |
| Fund shares redeemed | | | 10,176,471 | |
| Management fees | | | 1,878,704 | |
| Transfer agent/maintenance fees | | | 353,198 | |
| Distribution and service fees | | | 353,110 | |
| Fund accounting/administration fees | | | 235,544 | |
| Trustees’ fees* | | | 45,622 | |
| Miscellaneous | | | 1,658,956 | |
| Total liabilities | | | 318,154,952 | |
| Net assets | | $ | 3,547,395,547 | |
| | | | | |
| Net assets consist of: | |
| Paid in capital | | $ | 3,568,874,532 | |
| Accumulated net investment loss | | | (1,573,723 | ) |
| Accumulated net realized loss on investments | | | (13,260,640 | ) |
| Net unrealized depreciation on investments | | | (6,644,622 | ) |
| Net assets | | $ | 3,547,395,547 | |
| | | | | |
| A-Class: | |
| Net assets | | $ | 558,518,710 | |
| Capital shares outstanding | | | 21,431,460 | |
| Net asset value per share | | $ | 26.06 | |
| Maximum offering price per share (Net asset value divided by 97.00%) | | $ | 26.87 | |
| | | | | |
| C-Class: | |
| Net assets | | $ | 221,361,072 | |
| Capital shares outstanding | | | 8,497,331 | |
| Net asset value per share | | $ | 26.05 | |
| | | | | |
| P-Class: | |
| Net assets | | $ | 237,789,758 | |
| Capital shares outstanding | | | 9,120,245 | |
| Net asset value per share | | $ | 26.07 | |
| | | | | |
| Institutional Class: | |
| Net assets | | $ | 2,529,726,007 | |
| Capital shares outstanding | | | 96,988,773 | |
| Net asset value per share | | $ | 26.08 | |
| * | Relates to Trustees not deemed “interested persons” within the meaning of Section 2(a)(19) of the 1940 Act. |
28 | THE GUGGENHEIM FUNDS SEMI-ANNUAL REPORT | SEE NOTES TO FINANCIAL STATEMENTS. |
STATEMENT OF OPERATIONS (Unaudited) |
| FLOATING RATE STRATEGIES FUND |
Period Ended March 31, 2017
| Investment Income: | |
| Interest | | $ | 65,078,700 | |
| Dividends from securities of affiliated issuers | | | 249,361 | |
| Total investment income | | | 65,328,061 | |
| | | | | |
| Expenses: | |
| Management fees | | | 9,493,986 | |
| Transfer agent/maintenance fees: | |
| A-Class | | | 262,119 | |
| C-Class | | | 80,262 | |
| P-Class | | | 118,874 | |
| Institutional Class | | | 299,904 | |
| Distribution and service fees: | |
| A-Class | | | 618,322 | |
| C-Class | | | 1,050,679 | |
| P-Class | | | 221,761 | |
| Fund accounting/administration fees | | | 1,172,479 | |
| Line of credit fees | | | 234,136 | |
| Trustees’ fees* | | | 36,844 | |
| Custodian fees | | | 28,440 | |
| Miscellaneous | | | 255,006 | |
| Total expenses | | | 13,872,812 | |
| Less: | |
| Expenses waived by Adviser | | | (12,840 | ) |
| Expenses reimbursed by Adviser: | | | | |
| A-Class | | | (212,103 | ) |
| C-Class | | | (59,208 | ) |
| P-Class | | | (100,652 | ) |
| Institutional Class | | | (144,295 | ) |
| Expenses waived by Distributor: | | | | |
| A-Class | | | (5,722 | ) |
| C-Class | | | (2,462 | ) |
| P-Class | | | (1,254 | ) |
| Total waived/reimbursed expenses | | | (538,536 | ) |
| Net expenses | | | 13,334,276 | |
| Net investment income | | | 51,993,785 | |
| Net Realized and Unrealized Gain (Loss): | |
| Net realized gain (loss) on: | |
| Investments | | | 679,057 | |
| Foreign currency | | | (4,219,396 | ) |
| Forward foreign currency exchange contracts | | | 6,049,002 | |
| Net realized gain | | | 2,508,663 | |
| Net change in unrealized appreciation (depreciation) on: | |
| Investments in unaffiliated issuers | | | 13,102,940 | |
| Investments in affiliated issuers | | | 61,672 | |
| Foreign currency | | | 206,006 | |
| Forward foreign currency exchange contracts | | | (1,193,914 | ) |
| Net change in unrealized appreciation (depreciation) | | | 12,176,704 | |
| Net realized and unrealized gain | | | 14,685,367 | |
| Net increase in net assets resulting from operations | | $ | 66,679,152 | |
| * | Relates to Trustees not deemed “interested persons” within the meaning of Section 2(a)(19) of the 1940 Act. |
| SEE NOTES TO FINANCIAL STATEMENTS. | THE GUGGENHEIM FUNDS SEMI-ANNUAL REPORT | 29 |
| STATEMENTS OF CHANGES IN NET ASSETS |
| FLOATING RATE STRATEGIES FUND | |
| | | Period Ended
March 31,
2017
(Unaudited) | | | Year Ended
September 30,
2016 | |
| Increase (Decrease) in Net Assets from Operations: | | | | | | |
| Net investment income | | $ | 51,993,785 | | | $ | 82,804,906 | |
| Net realized gain (loss) on investments | | | 2,508,663 | | | | (15,139,654 | ) |
| Net change in unrealized appreciation (depreciation) on investments | | | 12,176,704 | | | | 28,480,707 | |
| Net increase in net assets resulting from operations | | | 66,679,152 | | | | 96,145,959 | |
| | | | | | | | | |
| Distributions to shareholders from: | | | | | | | | |
| Net investment income | | | | | | | | |
| A-Class | | | (8,708,678 | ) | | | (17,533,970 | ) |
| C-Class | | | (2,922,283 | ) | | | (6,005,382 | ) |
| P-Class | | | (3,044,949 | ) | | | (3,269,505 | ) |
| Institutional Class | | | (38,147,940 | ) | | | (62,586,943 | ) |
| Total distributions to shareholders | | | (52,823,850 | ) | | | (89,395,800 | ) |
| | | | | | | | | |
| Capital share transactions: | | | | | | | | |
| Proceeds from sale of shares | | | | | | | | |
| A-Class | | | 216,646,483 | | | | 328,587,677 | |
| C-Class | | | 50,443,786 | | | | 93,383,014 | |
| P-Class | | | 142,132,969 | | | | 130,565,954 | |
| Institutional Class | | | 1,244,929,601 | | | | 1,293,714,252 | |
| Distributions reinvested | | | | | | | | |
| A-Class | | | 7,347,804 | | | | 15,307,772 | |
| C-Class | | | 2,265,659 | | | | 4,886,193 | |
| P-Class | | | 3,044,949 | | | | 3,269,505 | |
| Institutional Class | | | 30,044,130 | | | | 50,783,545 | |
| Cost of shares redeemed | | | | | | | | |
| A-Class | | | (120,604,981 | ) | | | (292,937,913 | ) |
| C-Class | | | (29,734,730 | ) | | | (47,794,125 | ) |
| P-Class | | | (33,107,184 | ) | | | (30,899,865 | ) |
| Institutional Class | | | (398,681,759 | ) | | | (934,769,638 | ) |
| Net increase from capital share transactions | | | 1,114,726,727 | | | | 614,096,371 | |
| Net increase in net assets | | | 1,128,582,029 | | | | 620,846,530 | |
| | | | | | | | | |
| Net assets: | | | | | | | | |
| Beginning of period | | | 2,418,813,518 | | | | 1,797,966,988 | |
| End of period | | $ | 3,547,395,547 | | | $ | 2,418,813,518 | |
| Accumulated net investment loss at end of period | | $ | (1,573,723 | ) | | $ | (743,658 | ) |
30 | THE GUGGENHEIM FUNDS SEMI-ANNUAL REPORT | SEE NOTES TO FINANCIAL STATEMENTS. |
STATEMENTS OF CHANGES IN NET ASSETS (concluded) |
| FLOATING RATE STRATEGIES FUND | |
| | | Period Ended
March 31,
2017
(Unaudited) | | | Year Ended
September 30,
2016 | |
| Capital share activity: | | | | | | |
| Shares sold | | | | | | |
| A-Class | | | 8,322,973 | | | | 12,898,402 | |
| C-Class | | | 1,939,053 | | | | 3,665,393 | |
| P-Class | | | 5,455,000 | | | | 5,115,313 | |
| Institutional Class | | | 47,776,057 | | | | 50,648,724 | |
| Shares issued from reinvestment of distributions | | | | | | | | |
| A-Class | | | 282,307 | | | | 600,582 | |
| C-Class | | | 87,089 | | | | 191,843 | |
| P-Class | | | 117,373 | | | | 128,540 | |
| Institutional Class | | | 1,153,200 | | | | 1,990,689 | |
| Shares redeemed | | | | | | | | |
| A-Class | | | (4,634,495 | ) | | | (11,505,029 | ) |
| C-Class | | | (1,142,952 | ) | | | (1,879,755 | ) |
| P-Class | | | (1,270,948 | ) | | | (1,218,323 | ) |
| Institutional Class | | | (15,305,007 | ) | | | (36,817,913 | ) |
| Net increase in shares | | | 42,779,650 | | | | 23,818,466 | |
| SEE NOTES TO FINANCIAL STATEMENTS. | THE GUGGENHEIM FUNDS SEMI-ANNUAL REPORT | 31 |
| FINANCIAL HIGHLIGHTS |
| FLOATING RATE STRATEGIES FUND | |
This table is presented to show selected data for a share outstanding throughout each period and to assist shareholders in evaluating a Fund’s performance for the periods presented.
| A-Class | | Period Ended
March 31,
2017a | | | Year Ended
Sept. 30,
2016 | | | Year Ended
Sept. 30,
2015 | | | Year Ended
Sept. 30,
2014 | | | Year Ended
Sept. 30,
2013 | | | Period Ended
Sept. 30,
2012b | |
| Per Share Data | | | | | | | | | | | | | | | | | | |
| Net asset value, beginning of period | | $ | 25.92 | | | $ | 25.88 | | | $ | 26.52 | | | $ | 26.62 | | | $ | 26.10 | | | $ | 25.00 | |
| Income (loss) from investment operations: | |
Net investment income (loss)c | | | .45 | | | | .99 | | | | 1.04 | | | | 1.10 | | | | 1.30 | | | | 1.09 | |
| Net gain (loss) on investments (realized and unrealized) | | | .15 | | | | .12 | | | | (.42 | ) | | | .05 | | | | .65 | | | | .97 | |
| Total from investment operations | | | .60 | | | | 1.11 | | | | .62 | | | | 1.15 | | | | 1.95 | | | | 2.06 | |
| Less distributions from: | |
| Net investment income | | | (.46 | ) | | | (1.07 | ) | | | (1.18 | ) | | | (1.20 | ) | | | (1.37 | ) | | | (.96 | ) |
| Net realized gains | | | — | | | | — | | | | (.08 | ) | | | (.05 | ) | | | (.06 | ) | | | — | |
| Total distributions | | | (.46 | ) | | | (1.07 | ) | | | (1.26 | ) | | | (1.25 | ) | | | (1.43 | ) | | | (.96 | ) |
| Net asset value, end of period | | $ | 26.06 | | | $ | 25.92 | | | $ | 25.88 | | | $ | 26.52 | | | $ | 26.62 | | | $ | 26.10 | |
| | |
Total Returng | | | 2.33 | % | | | 4.47 | % | | | 2.36 | % | | | 4.42 | % | | | 7.61 | % | | | 8.37 | % |
| Ratios/Supplemental Data | |
| Net assets, end of period (in thousands) | | $ | 558,519 | | | $ | 452,611 | | | $ | 400,270 | | | $ | 365,207 | | | $ | 378,324 | | | $ | 44,175 | |
| Ratios to average net assets: | |
| Net investment income (loss) | | | 3.46 | % | | | 3.88 | % | | | 3.97 | % | | | 4.10 | % | | | 4.90 | % | | | 5.13 | % |
Total expensesd | | | 1.12 | % | | | 1.20 | % | | | 1.19 | % | | | 1.18 | % | | | 1.19 | % | | | 1.39 | % |
Net expensese,h | | | 1.03 | % | | | 1.03 | % | | | 1.03 | % | | | 1.04 | % | | | 1.05 | % | | | 1.06 | % |
| Portfolio turnover rate | | | 23 | % | | | 35 | % | | | 44 | % | | | 58 | % | | | 50 | % | | | 61 | % |
32 | THE GUGGENHEIM FUNDS SEMI-ANNUAL REPORT | SEE NOTES TO FINANCIAL STATEMENTS. |
FINANCIAL HIGHLIGHTS (continued) |
| FLOATING RATE STRATEGIES FUND | |
This table is presented to show selected data for a share outstanding throughout each period and to assist shareholders in evaluating a Fund’s performance for the periods presented.
| C-Class | | Period Ended
March 31,
2017a | | | Year Ended
Sept. 30,
2016 | | | Year Ended
Sept. 30,
2015 | | | Year Ended
Sept. 30,
2014 | | | Year Ended
Sept. 30,
2013 | | | Period Ended
Sept. 30,
2012b | |
| Per Share Data | | | | | | | | | | | | | | | | | | |
| Net asset value, beginning of period | | $ | 25.91 | | | $ | 25.87 | | | $ | 26.51 | | | $ | 26.60 | | | $ | 26.09 | | | $ | 25.00 | |
| Income (loss) from investment operations: | |
Net investment income (loss)c | | | .35 | | | | .80 | | | | .85 | | | | .90 | | | | 1.11 | | | | .93 | |
| Net gain (loss) on investments (realized and unrealized) | | | .15 | | | | .12 | | | | (.43 | ) | | | .06 | | | | .63 | | | | .98 | |
| Total from investment operations | | | .50 | | | | .92 | | | | .42 | | | | .96 | | | | 1.74 | | | | 1.91 | |
| Less distributions from: | |
| Net investment income | | | (.36 | ) | | | (.88 | ) | | | (.98 | ) | | | (1.00 | ) | | | (1.17 | ) | | | (.82 | ) |
| Net realized gains | | | — | | | | — | | | | (.08 | ) | | | (.05 | ) | | | (.06 | ) | | | — | |
| Total distributions | | | (.36 | ) | | | (.88 | ) | | | (1.06 | ) | | | (1.05 | ) | | | (1.23 | ) | | | (.82 | ) |
| Net asset value, end of period | | $ | 26.05 | | | $ | 25.91 | | | $ | 25.87 | | | $ | 26.51 | | | $ | 26.60 | | | $ | 26.09 | |
| | |
Total Returng | | | 1.95 | % | | | 3.68 | % | | | 1.63 | % | | | 3.64 | % | | | 6.77 | % | | | 7.72 | % |
| Ratios/Supplemental Data | |
| Net assets, end of period (in thousands) | | $ | 221,361 | | | $ | 197,296 | | | $ | 145,808 | | | $ | 132,370 | | | $ | 120,606 | | | $ | 24,358 | |
| Ratios to average net assets: | |
| Net investment income (loss) | | | 2.72 | % | | | 3.13 | % | | | 3.23 | % | | | 3.35 | % | | | 4.19 | % | | | 4.36 | % |
Total expensesd | | | 1.84 | % | | | 1.93 | % | | | 1.91 | % | | | 1.89 | % | | | 1.93 | % | | | 2.06 | % |
Net expensese,h | | | 1.78 | % | | | 1.78 | % | | | 1.78 | % | | | 1.79 | % | | | 1.81 | % | | | 1.80 | % |
| Portfolio turnover rate | | | 23 | % | | | 35 | % | | | 44 | % | | | 58 | % | | | 50 | % | | | 61 | % |
| SEE NOTES TO FINANCIAL STATEMENTS. | THE GUGGENHEIM FUNDS SEMI-ANNUAL REPORT | 33 |
FINANCIAL HIGHLIGHTS (continued) |
| FLOATING RATE STRATEGIES FUND | |
This table is presented to show selected data for a share outstanding throughout each period and to assist shareholders in evaluating a Fund’s performance for the periods presented.
| P-Class | | Period Ended
March 31,
2017a | | | Year Ended
Sept. 30,
2016 | | | Period Ended
Sept. 30,
2015f | |
| Per Share Data | | | | | | | | | |
| Net asset value, beginning of period | | $ | 25.93 | | | $ | 25.89 | | | $ | 26.37 | |
| Income (loss) from investment operations: | |
Net investment income (loss)c | | | .44 | | | | .99 | | | | .40 | |
| Net gain (loss) on investments (realized and unrealized) | | | .16 | | | | .12 | | | | (.46 | ) |
| Total from investment operations | | | .60 | | | | 1.11 | | | | (.06 | ) |
| Less distributions from: | |
| Net investment income | | | (.46 | ) | | | (1.07 | ) | | | (.42 | ) |
| Total distributions | | | (.46 | ) | | | (1.07 | ) | | | (.42 | ) |
| Net asset value, end of period | | $ | 26.07 | | | $ | 25.93 | | | $ | 25.89 | |
| | |
Total Returng | | | 2.32 | % | | | 4.46 | % | | | (0.24 | %) |
| Ratios/Supplemental Data | |
| Net assets, end of period (in thousands) | | $ | 237,790 | | | $ | 124,974 | | | $ | 20,536 | |
| Ratios to average net assets: | |
| Net investment income (loss) | | | 3.38 | % | | | 3.86 | % | | | 3.68 | % |
Total expensesd | | | 1.15 | % | | | 1.06 | % | | | 1.04 | % |
Net expensese,h | | | 1.03 | % | | | 1.03 | % | | | 1.02 | % |
| Portfolio turnover rate | | | 23 | % | | | 35 | % | | | 44 | % |
34 | THE GUGGENHEIM FUNDS SEMI-ANNUAL REPORT | SEE NOTES TO FINANCIAL STATEMENTS. |
FINANCIAL HIGHLIGHTS (concluded) |
| FLOATING RATE STRATEGIES FUND |
This table is presented to show selected data for a share outstanding throughout each period and to assist shareholders in evaluating a Fund’s performance for the periods presented.
| Institutional Class | | Period Ended
March 31,
2017a | | | Year Ended
Sept. 30,
2016 | | | Year Ended
Sept. 30,
2015 | | | Year Ended
Sept. 30,
2014 | | | Year Ended
Sept. 30,
2013 | | | Period Ended
Sept. 30,
2012b | |
| Per Share Data | | | | | | | | | | | | | | | | | | |
| Net asset value, beginning of period | | $ | 25.94 | | | $ | 25.90 | | | $ | 26.54 | | | $ | 26.64 | | | $ | 26.12 | | | $ | 25.00 | |
| Income (loss) from investment operations: | |
Net investment income (loss)c | | | .48 | | | | 1.05 | | | | 1.10 | | | | 1.16 | | | | 1.36 | | | | 1.10 | |
| Net gain (loss) on investments (realized and unrealized) | | | .15 | | | | .12 | | | | (.42 | ) | | | .06 | | | | .65 | | | | 1.02 | |
| Total from investment operations | | | .63 | | | | 1.17 | | | | .68 | | | | 1.22 | | | | 2.01 | | | | 2.12 | |
| Less distributions from: | |
| Net investment income | | | (.49 | ) | | | (1.13 | ) | | | (1.24 | ) | | | (1.27 | ) | | | (1.43 | ) | | | (1.00 | ) |
| Net realized gains | | | — | | | | — | | | | (.08 | ) | | | (.05 | ) | | | (.06 | ) | | | — | |
| Total distributions | | | (.49 | ) | | | (1.13 | ) | | | (1.32 | ) | | | (1.32 | ) | | | (1.49 | ) | | | (1.00 | ) |
| Net asset value, end of period | | $ | 26.08 | | | $ | 25.94 | | | $ | 25.90 | | | $ | 26.54 | | | $ | 26.64 | | | $ | 26.12 | |
| | |
Total Returng | | | 2.45 | % | | | 4.71 | % | | | 2.59 | % | | | 4.67 | % | | | 7.86 | % | | | 8.59 | % |
| Ratios/Supplemental Data | |
| Net assets, end of period (in thousands) | | $ | 2,529,726 | | | $ | 1,643,932 | | | $ | 1,231,352 | | | $ | 753,476 | | | $ | 457,813 | | | $ | 72,197 | |
| Ratios to average net assets: | |
| Net investment income (loss) | | | 3.68 | % | | | 4.11 | % | | | 4.18 | % | | | 4.32 | % | | | 5.12 | % | | | 5.16 | % |
Total expensesd | | | 0.80 | % | | | 0.87 | % | | | 0.85 | % | | | 0.87 | % | | | 0.86 | % | | | 0.99 | % |
Net expensese,h | | | 0.78 | % | | | 0.79 | % | | | 0.79 | % | | | 0.80 | % | | | 0.81 | % | | | 0.80 | % |
| Portfolio turnover rate | | | 23 | % | | | 35 | % | | | 44 | % | | | 58 | % | | | 50 | % | | | 61 | % |
a | Unaudited figures for the period ended March 31, 2017. Percentage amounts for the period, except total return and portfolio turnover rate, have been annualized. |
b | Since commencement of operations: November 30, 2011. Percentage amounts for the period, except total return and portfolio turnover rate, have been annualized. |
c | Net investment income (loss) per share was computed using average shares outstanding throughout the period. |
d | Does not include expenses of the underlying funds in which the Fund invests. |
e | Net expense information reflects the expense ratios after expense waivers. |
f | Since commencement of operations: May 1, 2015. Percentage amounts for the period, except total return and portfolio turnover rate, have been annualized. |
g | Total return does not reflect the impact of any applicable sales charges and has not been annualized. |
h | Net expenses may include expenses that are excluded from the expense limitation agreement. Excluding these expenses the net expense ratios for the periods would be: |
| | | 03/31/17 | 09/30/16 | 09/30/15 | 09/30/14 | 09/30/13 | 09/30/12 |
| | A-Class | 1.02% | 1.02% | 1.02% | 1.02% | 1.03% | 1.01% |
| | C-Class | 1.77% | 1.77% | 1.77% | 1.77% | 1.78% | 1.76% |
| | P-Class | 1.02% | 1.02% | 1.01% | N/A | N/A | N/A |
| | Institutional Class | 0.78% | 0.78% | 0.78% | 0.78% | 0.79% | 0.77% |
| SEE NOTES TO FINANCIAL STATEMENTS. | THE GUGGENHEIM FUNDS SEMI-ANNUAL REPORT | 35 |
NOTES TO FINANCIAL STATEMENTS (Unaudited) |
1. Organization and Significant Accounting Policies
Organization
Guggenheim Funds Trust (the “Trust”), a Delaware statutory trust, is registered with the SEC under the Investment Company Act of 1940 (“1940 Act”), as an open-ended investment company of the series type. Each series, in effect, is representing a separate Fund. The Trust is authorized to issue an unlimited number of shares. The Trust accounts for the assets of each Fund separately.
The Trust offers a combination of five separate classes of shares, A-Class shares, C-Class shares, P-Class shares, R6-Class shares and Institutional Class shares. Sales of shares of each Class are made without a front-end sales charge at the net asset value per share (“NAV”), with the exception of A-Class shares. A-Class shares are sold at the NAV, plus the applicable front-end sales charge. The sales charge varies depending on the amount purchased. A-Class share purchases of $1 million or more are exempt from the front-end sales charge but have a 1% contingent deferred sales charge (“CDSC”), if shares are redeemed within 12 months of purchase. C-Class shares have a 1% CDSC if shares are redeemed within 12 months of purchase. Institutional Class shares are offered primarily for direct investment by institutions such as pension and profit sharing plans, endowments, foundations and corporations. Institutional Class shares require a minimum initial investment of $2 million and a minimum account balance of $1 million. At March 31, 2017, the Trust consisted of nineteen funds (the “Funds”).
This report covers the Floating Rate Strategies Fund (the “Fund”), a diversified investment company. Only A-Class, C-Class, P-Class and Institutional Class shares had been issued by the Fund.
Security Investors, LLC and Guggenheim Partners Investment Management, LLC, which operates under the name Guggenheim Investments (“GI”), provides advisory services. Guggenheim Funds Distributors, LLC (“GFD”) acts as principal underwriter for the Trust. GI and GFD are affiliated entities.
Significant Accounting Policies
The Fund operates as an investment company and, accordingly, follows the investment company accounting and reporting guidance of the Financial Accounting Standards Board (“FASB”) Accounting Standards Codification Topic 946 Financial Services – Investment Companies.
The following significant accounting policies are in conformity with U.S. generally accepted accounting principles (“U.S. GAAP”) and are consistently followed by the Trust. This requires management to make estimates and assumptions that affect the reported amount of assets and liabilities, contingent assets and liabilities at the date of the financial statements, and the reported amounts of revenues and expenses during the reporting period. Actual results could differ from these estimates. All time references are based on Eastern Time.
| 36 | THE GUGGENHEIM FUNDS SEMI-ANNUAL REPORT | |
NOTES TO FINANCIAL STATEMENTS (Unaudited)(continued) |
The NAV of each Class of the Fund is calculated by dividing the market value of the Fund’s securities and other assets, less all liabilities, attributable to the Class by the number of outstanding shares of the Class.
A. The Board of Trustees of the Fund (the “Board”) has adopted policies and procedures for the valuation of the Fund’s investments (the “Valuation Procedures”). Pursuant to the Valuation Procedures, the Board has delegated to a valuation committee, consisting of representatives from Guggenheim’s investment management, fund administration, legal and compliance departments (the “Valuation Committee”), the day-to-day responsibility for implementing the Valuation Procedures, including, under most circumstances, the responsibility for determining the fair value of the Fund’s securities and/or other assets.
Valuations of the Fund’s securities are supplied primarily by pricing services appointed pursuant to the processes set forth in the Valuation Procedures. The Valuation Committee convenes monthly, or more frequently as needed, to review the valuation of all assets which have been fair valued for reasonableness. The Fund’s officers, through the Valuation Committee and consistent with the monitoring and review responsibilities set forth in the Valuation Procedures, regularly review procedures used and valuations provided by the pricing services.
If the pricing service cannot or does not provide a valuation for a particular investment or such valuation is deemed unreliable, such investment is fair valued by the Valuation Committee.
Equity securities listed on an exchange (New York Stock Exchange (“NYSE”) or American Stock Exchange) are valued at the last quoted sales price as of the close of business on the NYSE, usually 4:00 p.m. on the valuation date. Equity securities listed on the NASDAQ market system are valued at the NASDAQ Official Closing Price on the valuation date, which may not necessarily represent the last sale price. If there has been no sale on such exchange or NASDAQ on a given day, the security is valued at the closing bid price on that day.
Generally, trading in foreign securities markets is substantially completed each day at various times prior to the close of the NYSE. The values of foreign securities are determined as of the close of such foreign markets or the close of the NYSE, if earlier. All investments quoted in foreign currencies are valued in U.S. dollars on the basis of the foreign currency exchange rates prevailing at the close of business. Investments in foreign securities may involve risks not present in domestic investments. The Valuation Committee will determine the current value of such foreign securities by taking into consideration certain factors which may include those discussed above, as well as the following factors, among others: the value of the securities traded on other foreign markets, ADR trading, closed-end fund trading, foreign currency exchange activity, and the trading prices of financial products that are tied to foreign securities. In addition, the Board has authorized the Valuation Committee and GI to use prices and other information supplied by a third party pricing vendor in valuing foreign securities.
| | THE GUGGENHEIM FUNDS SEMI-ANNUAL REPORT | 37 |
NOTES TO FINANCIAL STATEMENTS (Unaudited)(continued) |
Open-end investment companies (“mutual funds”) are valued at their NAV as of the close of business, on the valuation date. Exchange-traded funds (“ETFs”) and closed-end investment companies (“CEFs”) are valued at the last quoted sales price.
Debt securities with a maturity of greater than 60 days at acquisition are valued at prices that reflect broker-dealer supplied valuations or are obtained from independent pricing services, which may consider the trade activity, treasury spreads, yields or price of bonds of comparable quality, coupon, maturity, and type, as well as prices quoted by dealers who make markets in such securities. Short-term debt securities with a maturity of 60 days or less at acquisition are valued at amortized cost, provided such amount approximates market value.
Typically, loans are valued using information provided by an independent third party pricing service which uses broker quotes in a non-active market.
Investments for which market quotations are not readily available are fair- valued as determined in good faith by GI under the direction of the Board using methods established or ratified by the Board. Valuations in accordance with these methods are intended to reflect each security’s (or asset’s) “fair value.” Each such determination is based on a consideration of all relevant factors, which are likely to vary from one pricing context to another. Examples of such factors may include, but are not limited to market prices; sale prices; broker quotes; and models which derive prices based on inputs such as prices of securities with comparable maturities and characteristics, or based on inputs such as anticipated cash flows or collateral, spread over Treasuries, and other information analysis. In connection with futures contracts and other derivative investments, such factors may include obtaining information as to how (a) these contracts and other derivative investments trade in the futures or other derivative markets, respectively, and (b) the securities underlying these contracts and other derivative investments trade in the cash market.
B. Senior loans in which the Fund invests generally pay interest rates which are periodically adjusted by reference to a base short-term floating rate, plus a premium. These base lending rates are generally (i) the lending rate offered by one or more major European banks, such as the one-month or three-month London Inter-Bank Offered Rate (LIBOR), (ii) the prime rate offered by one or more major United States banks, or (iii) the bank’s certificate of deposit rate. Senior floating rate interests often require prepayments from excess cash flows or permit the borrower to repay at its election. The rate at which the borrower repays cannot be predicted with accuracy. As a result, the actual remaining maturity may be substantially less than the stated maturities shown. The interest rate indicated is the rate in effect at March 31, 2017.
C. The Fund may purchase and sell interests in securities on a when-issued and delayed delivery basis, with payment and delivery scheduled for a future date. No income accrues to the Fund on such interests or securities in connection with such transactions prior to the date the Fund actually take delivery of such interests or securities. These transactions are subject to market fluctuations and are subject to the risk that the value at delivery may be more or less than the trade date purchase price. Although the Fund will generally purchase these securities with the intention of acquiring such securities, they may sell such securities before the settlement date.
| 38 | THE GUGGENHEIM FUNDS SEMI-ANNUAL REPORT | |
NOTES TO FINANCIAL STATEMENTS (Unaudited)(continued) |
D. Forward foreign currency exchange contracts are valued daily based on the applicable exchange rate of the underlying currency. The change in value of the contract is recorded as unrealized appreciation or depreciation until the contract is closed. When the contract is closed, the Fund records a realized gain or loss equal to the difference between the value at the time the contract was opened and the value at the time it was closed.
E. Security transactions are recorded on the trade date for financial reporting purposes. Realized gains and losses from securities transactions are recorded using the identified cost basis. Proceeds from lawsuits related to investment holdings are recorded as realized gains in the Fund. Dividend income is recorded on the ex-dividend date, net of applicable taxes withheld by foreign countries. Taxable non-cash dividends are recorded as dividend income. Interest income, including amortization of premiums and accretion of discounts, is accrued on a daily basis. Interest income also includes paydown gains and losses on mortgage-backed and asset-backed securities and senior and subordinated loans. Amendment fees are earned as compensation for evaluating and accepting changes to the original loan agreement and are recognized when received. Dividend income from REITs is recorded based on the income included in the distributions received from the REIT investments using published REIT classifications, including some management estimates when actual amounts are not available. Distributions received in excess of this estimated amount are recorded as a reduction of the cost of investments or reclassified to capital gains. The actual amounts of income, return of capital, and capital gains are only determined by each REIT after its fiscal year-end, and may differ from the estimated amounts.
F. The Fund declares dividends from investment income daily. The Fund pays its shareholders from its net investment income monthly and distributes any net capital gains that it has realized, at least annually. Distributions to shareholders are recorded on the ex-dividend date. Dividends are reinvested in additional shares unless shareholders request payment in cash. The character of distributions made during the year from net investment income or net realized gains may differ from their ultimate characterization for federal income tax purposes.
G. Interest and dividend income, most expenses, all realized gains and losses, and all unrealized gains and losses are allocated to the classes based upon the value of the outstanding shares in each Class. Certain costs, such as distribution and service fees are charged directly to specific classes. In addition, certain expenses have been allocated to the individual Funds in the Trust on a pro rata basis upon the respective aggregate net assets of each Fund included in the Trust.
H. Under the fee arrangement with the custodian, the Fund may earn credits based on overnight custody cash balances. These credits are utilized to reduce related custodial expenses. The custodian fees disclosed in the Statement of Operations are before the reduction in expense from the related earnings credits, if any. For the period ended March 31, 2017, there were no earnings credits received.
| | THE GUGGENHEIM FUNDS SEMI-ANNUAL REPORT | 39 |
NOTES TO FINANCIAL STATEMENTS (Unaudited)(continued) |
I. The Fund may leave cash overnight in its cash account with the custodian. Periodically, the Fund may have cash due to the custodian bank as an overdraft balance. A fee is incurred on this overdraft, calculated by multiplying the overdraft by a rate based on the federal funds rate, which was 0.82% at March 31, 2017.
J. The accounting records of the Fund are maintained in U.S. dollars. All assets and liabilities initially expressed in foreign currencies are converted into U.S. dollars at prevailing exchange rates. Purchases and sales of investment securities, dividend and interest income, and certain expenses are translated at the rates of exchange prevailing on the respective dates of such transactions. Changes in the relationship of these foreign currencies to the U.S. dollar can significantly affect the value of the investments and earnings of the Funds. Foreign investments may also subject the Fund to foreign government exchange restrictions, expropriation, taxation or other political, social or economic developments, all of which could aff ect the market and/or credit risk of the investments.
The Fund does not isolate that portion of the results of operations resulting from changes in the foreign exchange rates on investments from the fluctuations arising from changes in the market prices of securities held. Such fluctuations are included with the net realized and unrealized gain or loss on investments.
Reported net realized foreign exchange gains and losses arise from sales of foreign currencies and currency gains or losses realized between the trade and settlement dates on investment transactions. Net unrealized exchange gains and losses arise from changes in the fair values of assets and liabilities other than investments in securities at the fiscal period end, resulting from changes in exchange rates.
K. Under the Fund’s organizational documents, its Trustees and Officers are indemnified against certain liabilities arising out of the performance of their duties to the Trust. In addition, throughout the normal course of business, the Fund enters into contracts that contain a variety of representations and warranties which provide general indemnifications. The Fund’s maximum exposure under these arrangements is unknown, as this would involve future claims that may be made against the Fund and/or its affiliates that have not yet occurred. However, based on experience, the Fund expects the risk of loss to be remote.
2. Financial Instruments and Derivatives
As part of its investment strategy, the Fund utilizes a variety of derivative instruments. These investments involve, to varying degrees, elements of market risk and risks in excess of the amounts recognized in the Statement of Assets and Liabilities. Valuation and accounting treatment of these instruments can be found under Significant Accounting Policies in Note 1 of these Notes to Financial Statements.
| 40 | THE GUGGENHEIM FUNDS SEMI-ANNUAL REPORT | |
NOTES TO FINANCIAL STATEMENTS (Unaudited)(continued) |
Derivatives
Derivatives are instruments whose values depend on, or are derived from, in whole or in part, the value of one or more other assets, such as securities, currencies, commodities or indices. Derivative instruments may be used to increase investment flexibility (including to maintain cash reserves while maintaining exposure to certain other assets), for risk management (hedging) purposes, to facilitate trading, to reduce transaction costs and to pursue higher investment returns. Derivative instruments may also be used to mitigate certain investment risks, such as foreign currency exchange rate risk, interest rate risk and credit risk. U.S. GAAP requires disclosures to enable investors to better understand how and why a Fund uses derivative instruments, how these derivative instruments are accounted for and their effects on the Fund’s financial position and results of operations.
The Fund may utilize derivatives for the following purposes:
Hedge: an investment made in order to reduce the risk of adverse price movements in a security, by taking an offsetting position to protect against broad market moves.
Forward Foreign Currency Exchange Contracts
A forward foreign currency exchange contract is an agreement between two parties to exchange two designated currencies at a specific time in the future. Certain types of contracts may be cash settled, in an amount equal to the change in exchange rates during the term of the contract. The contracts can be used to hedge or manage exposure to foreign currency risks with portfolio investments or to gain exposure to foreign currencies.
The market value of a forward foreign currency exchange contract changes with fluctuations in foreign currency exchange rates. Furthermore, the Fund may be exposed to risk if the counterparties cannot meet the contract terms or if the currency value changes unfavorably as compared to the U.S. dollar.
The following table represents the Fund’s use and volume of forward currency exchange contracts on a quarterly basis:
| | | | Average Settlement | |
| Fund | Use | | Purchased | | | Sold | |
| Floating Rate Strategies Fund | Hedge | | $ | 114,664,552 | | | $ | 2,252,135 | |
| | THE GUGGENHEIM FUNDS SEMI-ANNUAL REPORT | 41 |
NOTES TO FINANCIAL STATEMENTS (Unaudited)(continued) |
Derivative Investment Holdings Categorized by Risk Exposure
The following is a summary of the location of derivative investments on the Fund’s Statement of Assets and Liabilities as of March 31, 2017:
| Derivative Investment Type | Asset Derivatives | Liability Derivatives |
| Currency contracts | Unrealized appreciation on forward foreign currency exchange contracts | Unrealized depreciation on forward foreign currency exchange contracts |
The following table sets forth the fair value of the Fund’s derivative investments categorized by primary risk exposure at March 31, 2017:
| Asset Derivative Investments Value | |
| Fund | | Forward
Foreign Currency
Exchange Contracts | |
| Floating Rate Strategies Fund | | $ | 459,072 | |
| Liability Derivative Investments Value | |
| Fund | | Forward
Foreign Currency
Exchange Contracts | |
| Floating Rate Strategies Fund | | $ | 1,168,604 | |
The following is a summary of the location of derivative investments on the Fund’s Statement of Operations for the period ended March 31, 2017:
| Derivative Investment Type | Location of Gain (Loss) on Derivatives |
| Currency contracts | Net realized gain (loss) on forward foreign currency exchange contracts |
| | Net change in unrealized appreciation (depreciation) on forward foreign currency exchange contracts |
The following is a summary of the Fund’s realized gain (loss) and change in unrealized appreciation (depreciation) on derivative investments recognized on the Statement of Operations categorized by primary risk exposure for the period ended March 31, 2017:
| Realized Gain (Loss) on Derivative Investments Recognized on the Statement of Operations | |
| Fund | | Forward
Foreign Currency
Exchange Contracts | |
| Floating Rate Strategies Fund | | $ | 6,049,002 | |
| 42 | THE GUGGENHEIM FUNDS SEMI-ANNUAL REPORT | |
NOTES TO FINANCIAL STATEMENTS (Unaudited)(continued) |
Change in Unrealized Appreciation (Depreciation) on Derivative
Investments Recognized on the Statement of Operations | |
| Fund | | Forward
Foreign Currency
Exchange Contracts | |
| Floating Rate Strategies Fund | | $ | (1,193,914 | ) |
In conjunction with the use of derivative instruments, the Fund is required to maintain collateral in various forms. The Fund uses, where appropriate, depending on the financial instrument utilized and the broker involved, margin deposits at the broker, cash and/or securities segregated at the custodian bank, discount notes or the repurchase agreements allocated to the Fund.
The Trust has established counterparty credit guidelines and enters into transactions only with financial institutions of investment grade or better. The Trust monitors the counterparty credit risk.
3. Fees and Other Transactions with Affiliates
At a meeting that occurred on November 16, 2016, the Board approved to add an advisory fee breakpoint (“breakpoint”) to the Fund.
Under the terms of an investment advisory contract, the Fund pays GI investment advisory fees calculated at an annualized rate of 0.65% of the average daily net assets of the Fund. Effective January 30, 2017, a breakpoint of 5 basis points (0.05%) on average daily net assets above $5 billion will apply to the Fund’s advisory fees.
GI engages external service providers to perform other necessary services for the Trust, such as audit and accounting related services, legal services, custody, printing and mailing, etc., on a pass-through basis. Such expenses are allocated to various Funds within the complex based on relative net assets.
The Fund has adopted Distribution Plans related to the offering of A-Class, C-Class and P-Class shares pursuant to Rule 12b-1 under the 1940 Act. The plans provide for payments at an annual rate of 0.25% of the average daily net assets of the Fund’s A-Class and P-Class shares, and 1.00% of the average daily net assets of the Fund’s C-Class shares.
| | THE GUGGENHEIM FUNDS SEMI-ANNUAL REPORT | 43 |
NOTES TO FINANCIAL STATEMENTS (Unaudited)(continued) |
The investment advisory contracts for the following Fund provides that the total expenses be limited to a percentage of average net assets for each class of shares, exclusive of brokerage costs, dividends on securities sold short, expenses of other investment companies in which a Fund invests, interest, taxes, litigation, indemnification and extraordinary expenses. The limits are listed below:
| Limit | Effective
Date | Contract
End Date |
| Floating Rate Strategies Fund - A-Class | 1.02% | 11/30/12 | 02/01/18 |
| Floating Rate Strategies Fund - C-Class | 1.77% | 11/30/12 | 02/01/18 |
| Floating Rate Strategies Fund - P-Class | 1.02% | 05/01/15 | 02/01/18 |
| Floating Rate Strategies Fund - Institutional Class | 0.78% | 11/30/12 | 02/01/18 |
GI is entitled to reimbursement by the Fund for fees waived or expenses reimbursed during any of the previous 36 months, beginning on the date of the expense limitation agreement, if on any day the estimated operating expenses are less than the indicated percentages. At March 31, 2017, the amount of fees waived or expenses reimbursed that are subject to recoupment are presented in the following table:
| Fund | | Expires
2017 | | | Expires
2018 | | | Expires
2019 | | | Expires
2020 | | | Fund
Total | |
| Floating Rate Strategies Fund | | | | | | | | | | | | | | | |
| A-Class | | $ | 353,370 | | | $ | 521,200 | | | $ | 715,008 | | | $ | 219,899 | | | $ | 1,809,477 | |
| C-Class | | | 79,639 | | | | 164,290 | | | | 254,684 | | | | 62,500 | | | | 561,113 | |
| P-Class | | | — | | | | 609 | | | | 19,459 | | | | 102,748 | | | | 122,816 | |
| Institutional Class | | | 298,590 | | | | 538,037 | | | | 1,021,450 | | | | 153,389 | | | | 2,011,466 | |
For the period ended March 31, 2017, no amounts were recouped by GI.
If a Fund invests in an affiliated fund, the investing Fund’s adviser has agreed to waive fees at the investing fund level. Fee waivers will be calculated at the investing Fund level without regard to any expense cap, if any, in effect for the investing Fund. Fees waived under this arrangement are not subject to reimbursement to GI. For the period March 31, 2017, the Fund did not waive any fees related to investments in affiliated funds.
For the period ended March 31, 2017, GFD retained sales charges of $356,038 relating to sales of A-Class shares of the Trust.
Certain trustees and officers of the Trust are also officers of GI and GFD.
On October 4, 2016, Rydex Fund Services, LLC (“RFS”) was purchased by MUFG Investor Services and as of that date RFS ceased to be an affiliate of GI. In connection with its acquisition, RFS changed its name to MUFG Investor Services (US), LLC (“MUIS”). This change had no impact on the financial statements of the Trust.
| 44 | THE GUGGENHEIM FUNDS SEMI-ANNUAL REPORT | |
NOTES TO FINANCIAL STATEMENTS (Unaudited)(continued) |
MUIS acts as the Trust’s administrator, transfer agent and accounting agent. As administrator, transfer agent and accounting agent, MUIS is responsible for maintaining the books and records of the Trust’s securities and cash. For providing the aforementioned administrative and accounting services, MUIS is entitled to receive a monthly fee equal to a percentage of the Fund’s fees and out of pocket expenses. For providing the aforementioned transfer agent services, MUIS is entitled to receive a monthly fee based on the number of transactions during the month and the number of accounts under management subject to certain minimum monthly fees and out of pocket expenses.
4. Fair Value Measurement
In accordance with U.S. GAAP, fair value is defined as the price that the Fund would receive to sell an investment or pay to transfer a liability in an orderly transaction with an independent buyer in the principal market, or in the absence of a principal market, the most advantageous market for the investment or liability. U.S. GAAP establishes a three-tier fair value hierarchy based on the types of inputs used to value assets and liabilities and requires corresponding disclosure. The hierarchy and the corresponding inputs are summarized below:
| Level 1 — | quoted prices in active markets for identical assets or liabilities. |
| Level 2 — | significant other observable inputs (for example quoted prices for securities that are similar based on characteristics such as interest rates, prepayment speeds, credit risk, etc.). |
| Level 3 — | significant unobservable inputs based on the best information available under the circumstances, to the extent observable inputs are not available, which may include assumptions. |
The types of inputs available depend on a variety of factors, such as the type of security and the characteristics of the markets in which it trades, if any. Fair valuation determinations that rely on fewer or no observable inputs require greater judgment. Accordingly, fair value determinations for Level 3 securities require the greatest amount of judgment.
Independent pricing services are used to value a majority of the Fund’s investments. When values are not available from a pricing service, they may be computed by the Fund’s investment adviser or an affiliate. In any event, values may be determined using a variety of sources and techniques, including: market prices; broker quotes; and models which derive prices based on inputs such as prices of securities with comparable maturities and characteristics or based on inputs such as anticipated cash flows or collateral, spread over Treasuries, and other information and analysis. A significant portion of the Fund’s assets and liabilities are categorized as Level 2 or Level 3, as indicated in this report.
Indicative quotes from broker-dealers, adjusted for fluctuations in criteria such as credit spreads and interest rates, may be also used to value the Fund’s assets and liabilities, i.e. prices provided by a broker-dealer or other market participant who has not committed to trade at that price.
| | THE GUGGENHEIM FUNDS SEMI-ANNUAL REPORT | 45 |
NOTES TO FINANCIAL STATEMENTS (Unaudited)(continued) |
Although indicative quotes are typically received from established market participants, the Fund may not have the transparency to view the underlying inputs which support the market quotations. Significant changes in an indicative quote would generally result in significant changes in the fair value of the security.
Certain fixed income securities are valued by obtaining a monthly indicative quote from a broker-dealer, adjusted for fluctuations in criteria such as credit spreads and interest rates.
The inputs or methodologies used for valuing securities are not necessarily an indication of the risk associated with investing in those securities. The suitability of the techniques and sources employed to determine fair valuation are regularly monitored and subject to change.
5. Federal Income Tax Information
The Fund intends to comply with the provisions of Subchapter M of the Internal Revenue Code applicable to regulated investment companies and will distribute substantially all taxable net investment income and capital gains sufficient to relieve the Fund from all, or substantially all, federal income, excise and state income taxes. Therefore, no provision for federal or state income tax is required.
Tax positions taken or expected to be taken in the course of preparing the Fund’s tax returns are evaluated to determine whether the tax positions are “more-likely-than-not” of being sustained by the applicable tax authority. Tax positions not deemed to meet the more-likely-than-not threshold would be recorded as a tax benefit or expense in the current year. Management has analyzed the Fund’s tax positions taken, or to be taken, on federal income tax returns for all open tax years, and has concluded that no provision for income tax is required in the Fund’s financial statements. The Fund’s federal tax returns are subject to examination by the Internal Revenue Service for a period of three years after they are filed.
At March 31, 2017, the cost of securities for federal income tax purposes, the aggregate gross unrealized gain for all securities for which there was an excess of value over tax cost, and the aggregate gross unrealized loss for all securities for which there was an excess of tax cost over value were as follows:
| Fund | | Tax Cost | | | Tax
Unrealized
Gain | | | Tax
Unrealized
Loss | | | Net
Unrealized
Loss | |
| Floating Rate Strategies Fund | | $ | 3,828,320,527 | | | $ | 30,389,020 | | | $ | (38,165,068 | ) | | $ | (7,776,048 | ) |
| 46 | THE GUGGENHEIM FUNDS SEMI-ANNUAL REPORT | |
NOTES TO FINANCIAL STATEMENTS (Unaudited)(continued) |
6. Securities Transactions
For the period ended March 31, 2017, the cost of purchases and proceeds from sales of investment securities, excluding government securities, short-term investments and derivatives, were as follows:
| Fund | | Purchases | | | Sales | |
| Floating Rate Strategies Fund | | $ | 1,802,683,332 | | | $ | 606,506,970 | |
The Fund is permitted to purchase or sell securities from or to certain affiliated funds under specified conditions outlined in procedures adopted by the Board of the Trust. The procedures have been designed to ensure that any purchase or sale of securities by a Fund from or to another fund or portfolio that is or could be considered an affiliate by virtue of having a common investment adviser (or affiliated investment advisers), common Trustees and/or common officers complies with Rule 17a-7 of the 1940 Act. Further, as defined under these procedures, each transaction is effected at the current market price to save costs, where permissible. For the period ended March 31, 2017, the Fund engaged in purchases and sales of securities, pursuant to Rule 17a-7 of the 1940 Act, as follows:
| Fund | | Purchases | | | Sales | | | Realized
Gain | |
| Floating Rate Strategies Fund | | $ | 15,866,806 | | | $ | — | | | $ | — | |
7. Affiliated Transactions
Investments representing 5% or more of the outstanding voting shares of a portfolio company of a fund, or control of or by, or common control under GI, result in that portfolio company being considered an affiliated company of such fund, as defined in the 1940 Act.
The Fund may invest in the Guggenheim Strategy Funds Trust consisting of Guggenheim Strategy Fund I, Guggenheim Strategy Fund II, Guggenheim Strategy Fund III, and Guggenheim Variable Insurance Strategy Fund III (collectively, the “Cash Management Funds”), open-end management investment companies managed by GI. The Cash Management Funds, which launched on March 11, 2014, are offered as cash management options only to mutual funds, trusts, and other accounts managed by GI and/or its affiliates, and are not available to the public. The Cash Management Funds pay no investment management fees. The Cash Management Funds’ annual report on Form N-CSR dated September 30, 2016, is available publicly or upon request. This information is available from the EDGAR database on the SEC’s website at https://www.sec.gov/Archives/edgar/data/1601445/000089180416001923/gugg65857-ncsr.htm.
| | THE GUGGENHEIM FUNDS SEMI-ANNUAL REPORT | 47 |
NOTES TO FINANCIAL STATEMENTS (Unaudited)(continued) |
Transactions during the period ended March 31, 2017, in which the portfolio company is an “affiliated person,” were as follows:
| Affiliated issuers by Fund | | Value
09/30/16 | | | Additions | | | Reductions | | | Value
03/31/17 | | | Shares
03/31/17 | | | Investment
Income | |
| Floating Rate Strategies Fund | | | | | | | |
| Guggenheim Strategy Fund I | | $ | 18,386,427 | | | $ | 164,655 | | | $ | — | | | $ | 18,595,415 | | | | 742,332 | | | $ | 164,086 | |
| Guggenheim Strategy Fund II | | | 7,160,896 | | | | 85,306 | | | | — | | | | 7,263,541 | | | | 290,542 | | | | 85,275 | |
| | | $ | 25,547,323 | | | $ | 249,961 | | | $ | — | | | $ | 25,858,956 | | | | | | | $ | 249,361 | |
8. Loan Commitments
Pursuant to the terms of certain loan agreements, the Fund held unfunded loan commitments as of March 31, 2017. The Fund is obligated to fund these loan commitments at the borrower’s discretion.
The unfunded loan commitments as of March 31, 2017 were as follows:
| Borrower | Maturity Date | | Face Amount1 | | | Value | |
| Floating Rate Strategies Fund | | | | | | | |
| Acrisure LLC | 11/22/23 | | $ | 445,032 | | | $ | — | |
| Advantage Sales & Marketing LLC | 07/25/19 | | | 4,800,000 | | | | 286,170 | |
| AMC Entertainment Holdings, Inc. | 04/30/17 | | | 9,750,000 | | | | — | |
| American Bath Group LLC | 09/30/23 | | | 254,717 | | | | — | |
| American Stock Transfer & Trust | 06/26/18 | | | 800,000 | | | | 25,970 | |
| CEVA Group Plc (United Kingdom) | 03/19/19 | | | 1,560,000 | | | | 191,100 | |
| CH Hold Corp. | 08/01/17 | | | 163,636 | | | | — | |
| CSC Holdings, LLC | 07/14/25 | | | 9,212,963 | | | | — | |
| Go Daddy Operating Company LLC | 12/12/17 | | EUR | 15,900,000 | | | | — | |
| Go Daddy Operating Company LLC | 12/12/17 | | | 10,084,835 | | | | — | |
| Internet Brands | 07/08/21 | | | 6,850,588 | | | | — | |
| IntraWest Holdings S.à r.l. | 12/10/18 | | | 6,900,000 | | | | 93,307 | |
| Moss Creek Resources LLC | 03/29/22 | | | 4,287,500 | | | | — | |
| Oberthur Technologies Group SAS | 01/10/24 | | EUR | 1,944,585 | | | | — | |
| Signode Industrial Group US, Inc. | 05/01/19 | | | 11,400,000 | | | | 592,178 | |
| Wencor Group | 06/19/19 | | | 2,148,462 | | | | 111,617 | |
| | | | | | | | $ | 1,300,342 | |
1 | The face amount is denominated in U.S. dollars unless otherwise indicated. |
9. Line of Credit
The Trust, with the exception of Capital Stewardship Fund, and certain affiliated funds, secured a 364-day committed, $800,000,000 line of credit from Citibank, N.A., which was in place through October 6, 2016, at which time the line of credit was renewed, with an increased commitment
| 48 | THE GUGGENHEIM FUNDS SEMI-ANNUAL REPORT | |
NOTES TO FINANCIAL STATEMENTS (Unaudited)(continued) |
amount to $1,000,000,000. A Fund may draw (borrow) from the line of credit as a temporary measure for emergency purposes, to facilitate redemption requests, or for other short-term liquidity purposes consistent with the Fund’s investment objective and program. For example, it may be advantageous for the Fund to borrow money rather than sell existing portfolio positions to meet redemption requests. Fees related to borrowings, if any, vary under this arrangement between the greater of Citibank’s “base rate”, LIBOR plus 1%, or the federal funds rate 0.82% at March 31, 2017, plus 1/2 of 1%. All affiliated funds that participate in the line of credit paid upfront costs totaling $2,032,388 to renew the line of credit.
The commitment fee that may be paid by the Funds is at an annualized rate of 0.15% of the average daily amount of their unused commitment amount. The Funds did not have any borrowings under this agreement as of and for the period ended March 31, 2017.
The allocated commitment fee amount for each Fund is referenced in the Statement of Operations under “Line of credit fees” and the effect on the expense ratio is included in the Financial Highlights.
10. Restricted Securities
The securities below are considered illiquid and restricted under guidelines established by the Board:
| Fund | Restricted Securities | Acquisition
Date | | Amortized
Cost | | | Value | |
| Floating Rate Strategies Fund | Airplanes Pass Through Trust 2001-1A, 1.46%
due 03/15/19 | 12/27/11 | | $ | 1,307,090 | | | $ | 502,301 | |
11. Offsetting
In the normal course of business, the Fund enters into transactions subject to enforceable master netting arrangements or other similar arrangements. Generally, the right to offset in those agreements allows the Fund to counteract the exposure to a specific counterparty with collateral received or delivered to that counterparty based on the terms of the arrangements. These arrangements provide for the right to liquidate upon the occurrence of an event of default, credit event upon merger or additional termination event.
In order to better define their contractual rights and to secure rights that will help the Fund mitigate its counterparty risk, the Fund may enter into an International Swaps and Derivatives Association, Inc. Master Agreement (“ISDA Master Agreement”) or similar agreement with its derivative contract counterparties. An ISDA Master Agreement is a bilateral agreement between a Fund and a counterparty that governs OTC derivatives, including foreign exchange contracts, and typically contains, among other things, collateral posting terms and netting provisions in
| | THE GUGGENHEIM FUNDS SEMI-ANNUAL REPORT | 49 |
NOTES TO FINANCIAL STATEMENTS (Unaudited)(continued) |
the event of a default and/or termination event. The provisions of the ISDA Master Agreement typically permit a single net payment in the event of a default (close-out netting) or similar event, including the bankruptcy or insolvency of the counterparty.
For derivatives traded under an ISDA Master Agreement, the collateral requirements are typically calculated by netting the mark to market amount for each transaction under such agreement and comparing that amount to the value of any collateral currently pledged by the Fund and the counterparty. For financial reporting purposes, cash collateral that has been pledged to cover obligations of the Fund and cash collateral received from the counterparty, if any, is reported separately on the Statement of Assets and Liabilities as segregated cash with broker/receivable for variation margin, or payable for swap settlement/ variation margin. Generally, the amount of collateral due from or to a counterparty must exceed a minimum transfer amount threshold (e.g., $300,000) before a transfer is required to be made. To the extent amounts due to the Fund from its counterparties are not fully collateralized, contractually or otherwise, the Fund bears the risk of loss from counterparty nonperformance. The Fund attempts to mitigate counterparty risk by only entering into agreements with counterparties that they believe to be of good standing and by monitoring the financial stability of those counterparties.
For financial reporting purposes, the Fund does not offset derivative assets and derivative liabilities that are subject to netting arrangements in the Statement of Assets and Liabilities. The following tables present derivative financial instruments and secured financing transactions that are subject to enforceable netting arrangements and off set in the Statement of Assets and Liabilities in conformity with U.S. GAAP.
| | | | | | | | | | | | | Gross Amounts Not Offset in the Statement of Assets and Liabilities | | | | |
| Fund | Instrument | | Gross Amounts of Recognized Assets | | | Gross Amounts Offset in the Statement of Assets and Liabilities | | | Net Amount of Assets Presented on the Statement of Assets and Liabilities | | | Financial Instruments | | | Cash Collateral Received | | | Net Amount | |
| Floating Rate Strategies Fund | Forward foreign currency exchange contracts | | $ | 459,072 | | | $ | — | | | $ | 459,072 | | | $ | 459,072 | | | $ | — | | | $ | — | |
| 50 | THE GUGGENHEIM FUNDS SEMI-ANNUAL REPORT | |
NOTES TO FINANCIAL STATEMENTS (Unaudited)(concluded) |
| | | | | | | | | | | | | Gross Amounts Not Offset in the Statement of Assets and Liabilities | | | | |
| Fund | Instrument | | Gross Amounts of Recognized Liabilities | | | Gross Amounts Offset in the Statement of Assets and Liabilities | | | Net Amount of Liabilities Presented on the Statement of Assets and Liabilities | | | Financial Instruments | | | Cash Collateral Received | | | Net Amount | |
| Floating Rate Strategies Fund | Forward foreign currency exchange contracts | | $ | 1,168,604 | | | $ | — | | | $ | 1,168,604 | | | $ | 459,072 | | | $ | — | | | $ | 709,532 | |
| | THE GUGGENHEIM FUNDS SEMI-ANNUAL REPORT | 51 |
OTHER INFORMATION (Unaudited) |
Proxy Voting Information
A description of the policies and procedures that the Trust uses to determine how to vote proxies relating to securities held in the Funds’ portfolios is available, without charge and upon request, by calling 800.820.0888. This information is also available from the EDGAR database on the SEC’s website at https://www.sec.gov.
Information regarding how the Funds voted proxies relating to portfolio securities during the most recent 12-month period ended June 30 is available without charge, upon request, by calling 800.820.0888. This information is also available from the EDGAR database on the SEC’s website at https://www.sec.gov.
Sector Classification
Information in the “Schedule of Investments” is categorized by sectors using sector-level Classifications defined by the Bloomberg Industry Classification System, a widely recognized industry classification system provider. Each Fund’s registration statement has investment policies relating to concentration in specific sectors/industries. For purposes of these investment policies, the Funds usually classify sectors/industries based on industry-level Classifications used by widely recognized industry classification system providers such as Bloomberg Industry Classification System, Global Industry Classification Standards and Barclays Global Classification Scheme.
Quarterly Portfolio Schedules Information
The Trust files its complete schedule of portfolio holdings with the SEC for the first and third quarters of each fiscal year on Form N-Q; which are available on the SEC’s website at https://www.sec.gov. The Funds’ Forms N-Q may be reviewed and copied at the SEC’s Public Reference Room in Washington, DC, and that information on the operation of the Public Reference Room may be obtained by calling 800-SEC-0330. Copies of the portfolio holdings are also available to shareholders, without charge and upon request, by calling 800.820.0888.
| 52 | THE GUGGENHEIM FUNDS SEMI-ANNUAL REPORT | |
INFORMATION ON BOARD OF TRUSTEES AND OFFICERS (Unaudited) |
Name, Address* and Year of Birth | Position(s) Held with the Trust | Term of Office and Length of Time Served** | Principal Occupation(s) During Past Five Years | Number of Portfolios in Fund Complex Overseen | Other Directorships Held by Trustees |
| INDEPENDENT TRUSTEES | | | |
Randall C. Barnes
(1951) | Trustee | Since 2014 | Current: Private Investor (2001-present). Former: Senior Vice President and Treasurer, PepsiCo, Inc. (1993-1997); President, Pizza Hut International (1991-1993); Senior Vice President, Strategic Planning and New Business Development, PepsiCo, Inc. (1987-1990). | 98 | Current: Trustee, Purpose Investments Inc. (2014-Present). |
Donald A.
Chubb, Jr.
(1946 ) | Trustee | Since 1994 | Current: Business broker and manager of commercial real estate, Griffith & Blair, Inc. (1997-present). | 95 | Former: Midland Care, Inc. (2011-2016). |
Jerry B. Farley
(1946) | Trustee | Since 2005 | Current: President, Washburn University (1997-present). | 95 | Current: Westar Energy, Inc. (2004-present); CoreFirst Bank & Trust (2000-present). |
Roman
Friedrich III
(1946) | Trustee and Chairman of the Contracts Review Committee | Since 2014 | Current: Founder and Managing Partner, Roman Friedrich & Company (1998-present). Former: Senior Managing Director, MLV & Co. LLC (2010-2011). | 95 | Current: Zincore Metals, Inc. (2009-present). Former: Axiom Gold and Silver Corp. (2011-2012). |
| | THE GUGGENHEIM FUNDS SEMI-ANNUAL REPORT | 53 |
INFORMATION ON BOARD OF TRUSTEES AND OFFICERS (Unaudited)(continued) |
Name, Address* and Year of Birth | Position(s) Held with the Trust | Term of Office and Length of Time Served** | Principal Occupation(s) During Past Five Years | Number of Portfolios in Fund Complex Overseen | Other Directorships Held by Trustees |
| INDEPENDENT TRUSTEES - continued | | |
Robert B. Karn III
(1942) | Trustee and Chairman of the Audit Committee | Since 2014 | Current: Consultant (1998-present). Former: Arthur Andersen (1965-1997) and Managing Partner, Financial and Economic Consulting, St. Louis office (1987-1997). | 95 | Current: GP Natural Resource Partners, LLC (2002- present). Former: Peabody Energy Company (2003- Apr. 2017). |
Ronald A. Nyberg
(1953) | Trustee and Chairman of the Nominating and Governance Committee | Since 2014 | Current: Partner, Momkus McCluskey Roberts, LLC (2016-present). Former: Partner, Nyberg & Cassioppi, LLC (2000-2016); Executive Vice President, General Counsel, and Corporate Secretary, Van Kampen Investments (1982-1999). | 100 | Current: Edward-Elmhurst Healthcare System (2012-present). |
Maynard F. Oliverius
(1943) | Trustee | Since 1998 | Current: Retired. Former: President and CEO, Stormont-Vail HealthCare (1996-2012). | 95 | Current: Robert J. Dole Institute of Politics (2016-present); Stormont-Vail Foundation (2013-present); University of Minnesota MHA Alumni Philanthropy Committee (2009-present); Fort Hays State University Foundation (1999-present). Former: Topeka Community Foundation (2009-2014). |
| 54 | THE GUGGENHEIM FUNDS SEMI-ANNUAL REPORT | |
INFORMATION ON BOARD OF TRUSTEES AND OFFICERS (Unaudited)(continued) |
Name, Address* and Year of Birth | Position(s) Held with the Trust | Term of Office and Length of Time Served** | Principal Occupation(s) During Past Five Years | Number of Portfolios in Fund Complex Overseen | Other Directorships Held by Trustees |
| INDEPENDENT TRUSTEES - concluded | | |
Ronald E.
Toupin, Jr.
(1958) | Trustee and Chairman of the Board | Since 2014 | Current: Portfolio Consultant (2010-present). Former: Vice President, Manager and Portfolio Manager, Nuveen Asset Management (1998-1999); Vice President, Nuveen Investment Advisory Corp. (1992-1999); Vice President and Manager, Nuveen Unit Investment Trusts (1991-1999); and Assistant Vice President and Portfolio Manager, Nuveen Unit Investment Trusts (1988-1999), each of John Nuveen & Co., Inc. (1982-1999). | 97 | Former: Bennett Group of Funds (2011-2013). |
| | THE GUGGENHEIM FUNDS SEMI-ANNUAL REPORT | 55 |
INFORMATION ON BOARD OF TRUSTEES AND OFFICERS (Unaudited)(continued) |
Name, Address* and Year of Birth | Position(s) Held with the Trust | Term of Office and Length of Time Served** | Principal Occupation(s) During Past Five Years | Number of Portfolios in Fund Complex Overseen | Other Directorships Held by Trustees |
| INTERESTED TRUSTEE | |
Donald C. Cacciapaglia***
(1951) | President, Chief Executive Officer and Trustee | Since 2012 | Current: President and CEO, certain other funds in the Fund Complex (2012-present); Vice Chairman, Guggenheim Investments (2010-present). Former: Chairman and CEO, Channel Capital Group, Inc. (2002-2010). | 230 | Current: Clear Spring Life Insurance Company (2015-present); Guggenheim Partners Japan, Ltd. (2014-present); Guggenheim Partners Investment Management Holdings, LLC (2014-present); Delaware Life (2013-present); Guggenheim Life and Annuity Company (2011-present); Paragon Life Insurance Company of Indiana (2011-present). |
| * | The business address of each Trustee is c/o Guggenheim Investments, 227 West Monroe Street, Chicago, Illinois 60606. |
| ** | Each Trustee serves an indefinite term, until his successor is elected and qualified. Time served includes time served in the respective position for the Predecessor Corporation. |
| *** | This Trustee is deemed to be an “interested person” of the Funds under the 1940 Act by reason of his position with the Funds' Investment Manager and/or the parent of the Investment Manager. |
| 56 | THE GUGGENHEIM FUNDS SEMI-ANNUAL REPORT | |
INFORMATION ON BOARD OF TRUSTEES AND OFFICERS (Unaudited)(continued) |
Name, Address* and Year of Birth | Position(s) held with the Trust | Term of Office and Length of Time Served** | Principal Occupations
During Past Five Years |
| OFFICERS | | | |
William H.
Belden, III
(1965) | Vice President | Since 2014 | Current: Vice President, certain other funds in the Fund Complex (2006-present); Managing Director, Guggenheim Funds Investment Advisors, LLC (2005-present). Former: Vice President of Management, Northern Trust Global Investments (1999-2005). |
Joanna M. Catalucci
(1966) | AML Officer | Since 2016 | Current: Chief Compliance Officer, certain funds in the Fund Complex (2012-present); Senior Managing Director, Guggenheim Investments (2014-present); AML Officer, certain funds in the Fund Complex (2016-present). Former: Chief Compliance Officer and Secretary, certain other funds in the Fund Complex (2008-2012); Senior Vice President & Chief Compliance Officer, Security Investors, LLC and certain affiliates (2010-2012); Chief Compliance Officer and Senior Vice President, Rydex Advisors, LLC and certain affiliates (2010-2011). |
James M. Howley
(1972) | Assistant Treasurer | Since 2014 | Current: Managing Director, Guggenheim Investments (2004-present); Assistant Treasurer, certain other funds in the Fund Complex (2006-present). Former: Manager, Mutual Fund Administration of Van Kampen Investments, Inc. (1996-2004). |
Keith D. Kemp
(1960) | Assistant Treasurer | Since 2016 | Current: Treasurer and Assistant Treasurer, certain other funds in the Fund Complex (2010-present); Managing Director of Guggenheim Partners Investment Management, LLC (2015-present); Chief Financial Officer, Guggenheim Specialized Products, LLC (2016-present). Former: Managing Director and Director, Transparent Value, LLC (2010-2016); Director, Guggenheim Partners Investment Management, LLC (2010-2015); Chief Operating Officer, Macquarie Capital Investment Management (2007-2009). |
| | THE GUGGENHEIM FUNDS SEMI-ANNUAL REPORT | 57 |
INFORMATION ON BOARD OF TRUSTEES AND OFFICERS (Unaudited)(continued) |
Name, Address* and Year of Birth | Position(s) held with the Trust | Term of Office and Length of Time Served** | Principal Occupations
During Past Five Years |
| OFFICERS - continued | |
Amy J. Lee
(1961) | Vice President and Chief Legal Officer | Since 2007 (Vice President) Since 2014 (Chief Legal Officer) | Current: Chief Legal Officer, certain other funds in the Fund Complex (2013-present); Senior Managing Director, Guggenheim Investments (2012-present). Former: Vice President, Associate General Counsel and Assistant Secretary, Security Benefit Life Insurance Company and Security Benefit Corporation (2004-2012). |
Mark E. Mathiasen
(1978) | Secretary | Since 2014 | Current: Secretary, certain other funds in the Fund Complex (2007-present); Managing Director, Guggenheim Investments (2007-present). |
Glenn McWhinnie
(1969) | Assistant Treasurer | Since 2016 | Current: Vice President, Guggenheim Investments (2009-present). Former: Tax Compliance Manager, Ernst & Young LLP (1996-2009). |
Michael P. Megaris
(1984) | Assistant Secretary | Since 2014 | Current: Assistant Secretary, certain other funds in the Fund Complex (2014-present); Vice President, Guggenheim Investments (2012-present). Former: J.D., University of Kansas School of Law (2009-2012). |
Elisabeth Miller
(1968) | Chief Compliance Officer | Since 2012 | Current: CCO, certain other funds in the Fund Complex (2012-present); CCO, Security Investors, LLC (2012-present); CCO, Guggenheim Funds Investment Advisors, LLC (2012-present); Managing Director, Guggenheim Investments (2012-present); Vice President, Guggenheim Funds Distributors, LLC (March 2014-present). Former: CCO, Guggenheim Distributors, LLC (2009-March 2014); Senior Manager, Security Investors, LLC (2004-2009); Senior Manager, Guggenheim Distributors, LLC (2004-2009). |
| 58 | THE GUGGENHEIM FUNDS SEMI-ANNUAL REPORT | |
INFORMATION ON BOARD OF TRUSTEES AND OFFICERS (Unaudited)(concluded) |
Name, Address* and Year of Birth | Position(s) held with the Trust | Term of Office and Length of Time Served** | Principal Occupations
During Past Five Years |
| OFFICERS - concluded | |
Adam J. Nelson
(1979) | Assistant Treasurer | Since 2015 | Current: Vice President, Guggenheim Investments (2015-present); Assistant Treasurer, certain other funds in the Fund Complex (2015-present). Former: Assistant Vice President and Fund Administration Director, State Street Corporation (2013-2015); Fund Administration Assistant Director, State Street (2011-2013); Fund Administration Manager, State Street (2009-2011). |
Kimberly J. Scott
(1974) | Assistant Treasurer | Since 2014 | Current: Director, Guggenheim Investments (2012-present); Assistant Treasurer, certain other funds in the Fund Complex (2012-present). Former: Financial Reporting Manager, Invesco, Ltd. (2010-2011); Vice President/Assistant Treasurer, Mutual Fund Administration for Van Kampen Investments, Inc./Morgan Stanley Investment Management (2009-2010); Manager of Mutual Fund Administration, Van Kampen Investments, Inc./Morgan Stanley Investment Management (2005-2009). |
Bryan Stone
(1979) | Vice President | Since 2014 | Current: Vice President, certain other funds in the Fund Complex (2014-present); Director, Guggenheim Investments (2013-present). Former: Senior Vice President, Neuberger Berman Group LLC (2009-2013); Vice President, Morgan Stanley (2002-2009). |
John L. Sullivan
(1955) | Chief Financial Officer and Treasurer | Since 2014 | Current: CFO, Chief Accounting Officer and Treasurer, certain other funds in the Fund Complex (2010-present); Senior Managing Director, Guggenheim Investments (2010-present). Former: Managing Director and CCO, each of the funds in the Van Kampen Investments fund complex (2004-2010); Managing Director and Head of Fund Accounting and Administration, Morgan Stanley Investment Management (2002-2004); CFO and Treasurer, Van Kampen Funds (1996-2004). |
| * | The business address of each officer is c/o Guggenheim Investments, 227 West Monroe Street, Chicago, Illinois 60606. |
| ** | Each officer serves an indefinite term, until his or her successor is duly elected and qualified. Time served includes time served in the respective position for the Predecessor Corporation. |
| | THE GUGGENHEIM FUNDS SEMI-ANNUAL REPORT | 59 |
GUGGENHEIM INVESTMENTS PRIVACY POLICIES (Unaudited) |
Guggenheim Investments as used herein refers to Guggenheim Partners, LLC, Guggenheim Funds Investment Advisors, LLC, Guggenheim Partners Investment Management, LLC, Guggenheim Funds Distributors, LLC and Security Investors, LLC as well as the funds in the Guggenheim Funds complex (the “funds”).
Our Commitment to You
When you become a Guggenheim Investments investor, you entrust us with not only your hard-earned money but also with personal and financial information about you. We recognize that your relationship with us is based on trust and that you expect us to act responsibly and in your best interests. Because we have access to personal information about you, we hold ourselves to high standards in its safekeeping and use. This means, most importantly, that we do not sell client or account information to anyone—whether you are a current or former Guggenheim Investments client.
The Information We Collect About You and How We Collect It
In the course of doing business with shareholders and investors, we collect nonpublic personal information about you. You typically provide personal information when you complete a Guggenheim Investments account application or when you request a transaction that involves Rydex and Guggenheim Funds or one of the Guggenheim affiliated companies. “Nonpublic personal information” is personally identifiable information about you. For example it includes your name and address, Social Security or taxpayer identification number, assets, income, account balance, bank account information and investment activity (e.g. purchase and redemption history).
How We Share Your Personal Information
As a matter of policy, we do not disclose your nonpublic personal information to nonaffiliated third parties except as required or permitted by law. As emphasized above, we do not sell information about current or former clients or their accounts to third parties. Nor do we share such information, except when necessary to complete transactions at your request or to make you aware of related investment products and services that we offer. Additional details about how we handle your personal information are provided below.
To complete certain transactions or account changes that you direct, it may be necessary to provide your personal information to companies, individuals or groups that are not affiliated with Guggenheim Investments. For example if you ask to transfer assets from another financial institution to Guggenheim Investments, we will need to provide certain information about you to that company to complete the transaction. In connection with servicing your accounts or to alert you to other Guggenheim Investments investment products and services, we may share your information within the Guggenheim Investments family of affiliated companies. This would include, for example, sharing your information within Guggenheim Investments so we can make you aware of new funds or the services offered through another Guggenheim Investments
| 60 | THE GUGGENHEIM FUNDS SEMI-ANNUAL REPORT | |
GUGGENHEIM INVESTMENTS PRIVACY POLICIES (Unaudited)(concluded) |
affiliated company. In certain instances, we may contract with nonaffiliated companies to perform services for us. Where necessary, we will disclose information we have about you to these third parties. In all such cases, we provide the third party with only the information necessary to carry out its assigned responsibilities and only for that purpose. And we require these third parties to treat your personal information with the same high degree of confidentiality that we do. In certain instances, we may share information with other financial institutions regarding individuals and entities in response to the U.S.A. Patriot Act. Finally we will share personal information about you if we are compelled by law to do so, if you direct us to do so with your consent, or in other circumstances as permitted by law.
How We Safeguard Your Personal Information
We maintain physical, electronic and procedural safeguards to protect your personal information. Within Guggenheim Investments, access to such information is limited to those who need it to perform their jobs such as servicing your account, resolving problems or informing you of new products and services.
| | THE GUGGENHEIM FUNDS SEMI-ANNUAL REPORT | 61 |
This page intentionally left blank.
This page intentionally left blank.
This page intentionally left blank.
This page intentionally left blank.
3.31.2017
Guggenheim Funds Semi-Annual Report
| |
| Guggenheim Total Return Bond Fund | | |
| GuggenheimInvestments.com | TRB-SEMI-0317x0917 |
| DEAR SHAREHOLDER | 2 |
| ECONOMIC AND MARKET OVERVIEW | 3 |
| ABOUT SHAREHOLDERS’ FUND EXPENSES | 5 |
| TOTAL RETURN BOND FUND | 8 |
| NOTES TO FINANCIAL STATEMENTS | 51 |
| OTHER INFORMATION | 71 |
| INFORMATION ON BOARD OF TRUSTEES AND OFFICERS | 72 |
| GUGGENHEIM INVESTMENTS PRIVACY POLICIES | 79 |
| | THE GUGGENHEIM FUNDS SEMI-ANNUAL REPORT | 1 |
Dear Shareholder:
Guggenheim Partners Investment Management, LLC (the “Investment Adviser”) is pleased to present the shareholder report for Guggenheim Total Return Bond Fund (the “Fund”) for the six-month period ended March 31, 2017.
The Investment Adviser is part of Guggenheim Investments, which represents the investment management businesses of Guggenheim Partners, LLC (“Guggenheim”), a global, diversified financial services firm.
Guggenheim Funds Distributors, LLC is the distributor of the Funds. Guggenheim Funds Distributors, LLC is affiliated with Guggenheim and the Investment Adviser.
We encourage you to read the Economic and Market Overview section of the report, which follows this letter.
We are committed to providing innovative investment solutions and appreciate the trust you place in us.
Sincerely,
Donald C. Cacciapaglia
President and Chief Executive Officer
April 30, 2017
Read a prospectus and summary prospectus (if available) carefully before investing. It contains the investment objectives, risks, charges, expenses and other information, which should be considered carefully before investing. Obtain a prospectus and summary prospectus (if available) at guggenheiminvestments.com or call 800.820.0888.
There can be no assurance that any investment product will achieve its investment objective(s). There are risks associated with investing, including the entire loss of principal invested. Investing involves market risks. The investment return and principal value of any investment product will fluctuate with changes in market conditions.
| 2 | THE GUGGENHEIM FUNDS SEMI-ANNUAL REPORT | |
ECONOMIC AND MARKET OVERVIEW (Unaudited) | March 31, 2017 |
The market optimism that helped lift risk asset prices after the presidential election in November continued through the early part of 2017. The Standard & Poor’s 500® (“S&P 500®”) Index set a new record, high yield corporate bond spreads approached cycle lows, and the 10-year Treasury yield rose to 2.63%, the highest level since 2014. Risk appetite faded as the first quarter drew to a close, however, as investors grappled with the implications of an unsuccessful healthcare reform bill and growing geopolitical risks.
Much of the rise in asset valuations since Donald Trump’s victory has been based on anticipation of his pro-growth policies coming to fruition, an outcome that is far from certain. Asset valuations could be getting a bit ahead of themselves, and becoming more sensitive to a temporary growth scare or setback, especially since the rollout of Trump’s new policies will not be smooth or easy.
Nevertheless, the underlying economy remains on a good trajectory. Tracking estimates for first-quarter real U.S. Gross Domestic Product (“GDP”) growth have fallen in recent weeks despite strong gains in consumer and business sentiment since the election. In late April, after the period ended, the initial estimate of first-quarter GDP growth was 0.7%. However, we attribute a large portion of the apparent weakness to seasonal factors that have depressed as-reported first quarter GDP growth over the past several years. In keeping with this pattern, we would expect the final first-quarter GDP number to be revised higher. More importantly, the prospects for quarterly U.S. GDP growth appear stronger going forward.
Consumer spending should benefit from solid income and wealth gains, with household net worth sitting at an all-time high. Recent job gains have been strong, and we anticipate a further acceleration of wage growth as the labor market continues to tighten. Buoyant consumer sentiment and low household debt service outlays also support our positive outlook. On the business investment side, we expect various factors to be supportive, including the uptick in global industrial production growth, the ongoing rise in U.S. oil drilling activity, the surge in small-business optimism, and the recovery in corporate earnings.
On March 15, the Federal Open Market Committee (“FOMC”) raised the U.S. Federal Reserve (the “Fed”) funds target rate by 25 basis points to a range of 0.75–1.0%. The hike itself had little impact on markets because several FOMC members had indicated in the weeks leading up to the meeting that a hike was likely. Looking ahead, we believe that the market is underpricing the likely pace of Fed rate hikes in 2017 and 2018, particularly now that market optimism about fiscal stimulus is waning.
Importantly, Chair Yellen noted that the FOMC’s baseline forecast of two additional rate increases in 2017 and three more in 2018 was not conditioned on expectations for fiscal stimulus. Rather, it reflected a need to gradually remove accommodation due to the fact that the Fed has essentially achieved its dual mandate objectives for employment and inflation. Fiscal easing, she explained, could result in a faster pace of tightening, if it materializes. Markets are skeptical and are pricing in only 1.5 more rate hikes in 2017 and another 1.5 rate hikes in 2018, according to fed funds futures contracts. We expect that the Fed will deliver three more rate hikes in 2017 and another four in 2018.
| | THE GUGGENHEIM FUNDS SEMI-ANNUAL REPORT | 3 |
ECONOMIC AND MARKET OVERVIEW (Unaudited)(concluded) | March 31, 2017 |
We expect to see equity and credit investors take more chips off the table unless there is concrete progress on fiscal legislation in Washington, particularly as the Fed demonstrates its desire to tighten even without fiscal stimulus. While we are optimistic about the near-term U.S. economic outlook, current valuations and growing political risks warrant a more defensive stance.
For the six months ended March 31, 2017, the S&P 500 Index* returned 10.12%. The MSCI Europe-Australasia-Far East (“EAFE”) Index* returned 6.48%. The return of the MSCI Emerging Markets Index* was 6.80%.
In the bond market, the Bloomberg Barclays U.S. Aggregate Bond Index* posted a -2.18% return for the period, while the Bloomberg Barclays U.S. Corporate High Yield Index* returned 4.50%. The return of the Bank of America (“BofA”) Merrill Lynch 3-Month U.S. Treasury Bill Index* was 0.19% for the 12-month period.
The opinions and forecasts expressed may not actually come to pass. This information is subject to change at any time, based on market and other conditions, and should not be construed as a recommendation of any specific security or strategy.
*Index Definitions:
The following indices are referenced throughout this report. Indices are unmanaged and not available for direct investment. Index performance does not reflect transaction costs, fees, or expenses.
Bloomberg Barclays U.S. Aggregate Bond Index is a broad-based flagship benchmark that measures the investment grade, U.S. dollar-denominated, fixed-rate taxable bond market, including U.S. Treasuries, government-related and corporate securities, mortgage-backed securities or “MBS” (agency fixed-rate and hybrid adjustable-rate mortgage, or “ARM”, pass-throughs), asset-backed securities (“ABS”), and commercial mortgage-backed securities (“CMBS”) (agency and non-agency).
Bloomberg Barclays U.S. Corporate High Yield Index measures the U.S. dollar-denominated, high yield, fixed-rate corporate bond market. Securities are classified as high yield if the middle rating of Moody’s, Fitch, and S&P is Ba1/BB +/BB + or below.
BofA Merrill Lynch 3-Month U.S. Treasury Bill Index is an unmanaged market index of U.S. Treasury securities maturing in 90 days that assumes reinvestment of all income.
MSCI EAFE Index is a free float-adjusted market capitalization index that is designed to measure the equity market performance of developed markets, excluding the U.S. & Canada.
MSCI Emerging Markets Index is a free float-adjusted market capitalization weighted index that is designed to measure equity market performance in the global emerging markets.
S&P 500® Index is a capitalization-weighted index of 500 stocks designed to measure the performance of the broad economy, representing all major industries and is considered a representation of the U.S. stock market.
| 4 | THE GUGGENHEIM FUNDS SEMI-ANNUAL REPORT | |
ABOUT SHAREHOLDERS’ FUND EXPENSES (Unaudited) |
All mutual funds have operating expenses, and it is important for our shareholders to understand the impact of costs on their investments. Shareholders of a fund incur two types of costs: (i) transaction costs, including sales charges (loads) on purchase payments, reinvested dividends, other distributions, and exchange fees, and (ii) ongoing costs, including management fees, administrative services, and shareholder reports, among others. These ongoing costs, or operating expenses, are deducted from a fund’s gross income and reduce the investment return of the fund.
A fund’s expenses are expressed as a percentage of its average net assets, which is known as the expense ratio. The following examples are intended to help investors understand the ongoing costs (in dollars) of investing in a fund and to compare these costs with the ongoing costs of investing in other mutual funds.
The examples are based on an investment of $1,000 made at the beginning of the period and held for the entire six-month period beginning September 30, 2016 and ending March 31, 2017.
The following tables illustrate the Fund’s costs in two ways:
Table 1. Based on actual Fund return. This section helps investors estimate the actual expenses paid over the period. The “Ending Account Value” shown is derived from the Fund’s actual return, and the fifth column shows the dollar amount that would have been paid by an investor who started with $1,000 in the Fund. Investors may use the information here, together with the amount invested, to estimate the expenses paid over the period. Simply divide the Fund’s account value by $1,000 (for example, an $8,600 account value divided by $1,000 = 8.6), then multiply the result by the number provided under the heading “Expenses Paid During Period.”
Table 2. Based on hypothetical 5% return. This section is intended to help investors compare a Fund’s cost with those of other mutual funds. The table provides information about hypothetical account values and hypothetical expenses based on the Fund’s actual expense ratio and an assumed rate of return of 5% per year before expenses, which is not the Fund’s actual return. The hypothetical account values and expenses may not be used to estimate the actual ending account balance or expenses paid during the period. The example is useful in making comparisons because the U.S. Securities and Exchange Commission (the “SEC”) requires all mutual funds to calculate expenses based on the 5% return. Investors can assess a Fund’s costs by comparing this hypothetical example with the hypothetical examples that appear in shareholder reports of other funds.
The calculations illustrated above assume no shares were bought or sold during the period. Actual costs may have been higher or lower, depending on the amount of investment and the timing of any purchases or redemptions.
| | THE GUGGENHEIM FUNDS SEMI-ANNUAL REPORT | 5 |
ABOUT SHAREHOLDERS’ FUND EXPENSES (Unaudited)(continued) |
Please note that the expenses shown in the table are meant to highlight your ongoing costs only and do not reflect any transactional costs, such as sales charges (loads) on purchase payments, and contingent deferred sales charges (“CDSC”) on redemptions, if any. Therefore, the second table is useful in comparing ongoing costs only, and will not help you determine the relative total costs of owning different funds. In addition, if these transactional costs were included, your costs would have been higher.
More information about the Fund’s expenses, including annual expense ratios for periods up to five years (subject to the Fund’s inception date), can be found in the Financial Highlights section of this report. For additional information on operating expenses and other shareholder costs, please refer to the Fund’s prospectus.
| 6 | THE GUGGENHEIM FUNDS SEMI-ANNUAL REPORT | |
ABOUT SHAREHOLDERS’ FUND EXPENSES (Unaudited)(concluded) |
| | Expense
Ratio1 | Fund
Return | Beginning
Account Value
September 30,
2016 | Ending
Account Value
March 31,
2017 | Expenses
Paid During
Period2 |
Table 1. Based on actual Fund return3 |
| Total Return Bond Fund |
| A-Class | 0.88% | 0.22% | $ 1,000.00 | $ 1,002.20 | $ 4.39 |
| C-Class | 1.61% | (0.15%) | 1,000.00 | 998.50 | 8.02 |
| P-Class | 0.84% | 0.23% | 1,000.00 | 1,002.30 | 4.19 |
R6-Class4 | 0.50% | 0.63% | 1,000.00 | 1,006.30 | 2.25 |
| Institutional Class | 0.54% | 0.39% | 1,000.00 | 1,003.90 | 2.70 |
| |
| Table 2. Based on hypothetical 5% return (before expenses) |
| Total Return Bond Fund |
| A-Class | 0.88% | 5.00% | $ 1,000.00 | $ 1,020.54 | $ 4.43 |
| C-Class | 1.61% | 5.00% | 1,000.00 | 1,016.90 | 8.10 |
| P-Class | 0.84% | 5.00% | 1,000.00 | 1,020.74 | 4.23 |
R6-Class4 | 0.50% | 5.00% | 1,000.00 | 1,022.69 | 2.27 |
| Institutional Class | 0.54% | 5.00% | 1,000.00 | 1,022.24 | 2.72 |
1 | Annualized and excludes expenses of the underlying funds in which the Funds invest. |
2 | Expenses are equal to the Fund's annualized expense ratio, net of any applicable fee waivers, multiplied by the average account value over the period, multiplied by 182/365 (to reflect the one-half year period). |
3 | Actual cumulative return at net asset value for the period September 30, 2016 to March 31, 2017. |
4 | Since commencement of operations: October 19, 2016. Expenses paid based on hypothetical 5% return are calculated using 182 days. |
| | THE GUGGENHEIM FUNDS SEMI-ANNUAL REPORT | 7 |
FUND PROFILE (Unaudited) | March 31, 2017 |
TOTAL RETURN BOND FUND
OBJECTIVE: Seeks to provide total return, comprised of current income and capital appreciation.
Holdings Diversification (Market Exposure as % of Net Assets)
“Holdings Diversification (Market Exposure as % of Net Assets)” excludes any temporary cash investments or investments in Guggenheim Strategy Funds Trust mutual funds. Investments in those Funds do not provide “market exposure” to meet the Fund’s investment objective, but will significantly increase the portfolio’s exposure to certain other asset categories (and their associated risks), which may cause the Fund to deviate from its principal investment strategy, including: (i) high yield, high risk debt securities rated below the top four long-term rating categories by a nationally recognized statistical rating organization (also known as “junk bonds”); (ii) securities issued by the U.S. government or its agencies and instrumentalities; (iii) CLOs and similar investments; and (iv) other short-term fixed income securities.
8 | THE GUGGENHEIM FUNDS SEMI-ANNUAL REPORT | |
FUND PROFILE (Unaudited)(concluded) | March 31, 2017 |
| Inception Dates: |
| A-Class | November 30, 2011 |
| C-Class | November 30, 2011 |
| P-Class | May 1, 2015 |
| R6-Class | October 19, 2016 |
| Institutional Class | November 30, 2011 |
Portfolio Composition by Quality Rating1 |
| Rating | % of Total Investments |
| Fixed Income Instruments | |
| AAA | 24.3% |
| AA | 19.3% |
| A | 14.6% |
| BBB | 11.0% |
| BB | 4.6% |
| B | 5.4% |
| CCC | 4.6% |
| CC | 1.3% |
NR2 | 11.1% |
| Total | 96.2% |
| Other Instruments | 3.8% |
| Total Investments | 100.0% |
| The chart above reflects percentages of the value of total investments. |
| Ten Largest Holdings (% of Total Net Assets) |
| U.S. Treasury Bond | 8.4% |
| CIT Mortgage Loan Trust | 1.5% |
| FirstKey Master Funding | 1.3% |
| Anchorage Credit Funding Ltd. | 1.0% |
| FirstKey Master Funding | 0.9% |
| Capital Automotive REIT | 0.8% |
| Golub Capital Partners CLO Ltd. | 0.8% |
| Fortress Credit Opportunities VII CLO Ltd. | 0.7% |
| Fortress Credit BSL II Ltd. | 0.7% |
| American Home Mortgage Investment Trust | 0.7% |
| Top Ten Total | 16.8% |
| “Ten Largest Holdings” excludes any temporary cash or derivative investments. |
1 | Source: BlackRock Solutions. Credit quality ratings are measured on a scale that generally ranges from AAA (highest) to D (lowest). All securities except for those labeled “NR” have been rated by a Nationally Recognized Statistical Rating Organization (“NRSRO”). For purposes of this presentation, when ratings are available from more than one agency, the highest rating is used. Guggenheim Investments converts ratings to the equivalent S&P rating. |
2 | NR securities do not necessarily indicate low credit quality. |
| | THE GUGGENHEIM FUNDS SEMI-ANNUAL REPORT | 9 |
SCHEDULE OF INVESTMENTS (Unaudited) | March 31, 2017 |
| TOTAL RETURN BOND FUND | |
| | | Shares | | | Value | |
| | | | | | | |
COMMON STOCKS† - 0.0%** | |
| | | | | | | |
| Energy - 0.0%** | |
Titan Energy LLC*,1 | | | 6,740 | | | $ | 122,668 | |
| | | | | | | | | |
| Total Common Stocks | | | | | | | | |
| (Cost $200,000) | | | | | | | 122,668 | |
| | | | | | | | | |
PREFERRED STOCKS†† - 0.0%** | |
| Industrial - 0.0%** | |
Seaspan Corp. 6.38% due 04/30/191 | | | 44,000 | | | | 1,104,400 | |
| Total Preferred Stocks | | | | | | | | |
| (Cost $1,100,000) | | | | | | | 1,104,400 | |
| | | | | | | | | |
MUTUAL FUNDS† - 1.4% | |
Guggenheim Floating Rate Strategies Fund — Institutional Class2 | | | 1,369,251 | | | | 35,710,067 | |
Guggenheim Limited Duration Fund — Institutional Class2 | | | 634,963 | | | | 15,702,638 | |
Guggenheim Strategy Fund I2 | | | 486,545 | | | | 12,187,954 | |
Guggenheim Strategy Fund II2 | | | 475,628 | | | | 11,890,707 | |
Guggenheim Strategy Fund III2 | | | 257,614 | | | | 6,442,936 | |
| Total Mutual Funds | | | | | | | | |
| (Cost $81,240,039) | | | | | | | 81,934,302 | |
| | | | | | | | | |
CLOSED-END FUNDS† - 0.2% | |
Guggenheim Strategic Opportunities Fund2 | | | 481,691 | | | | 9,802,412 | |
| Total Closed-End Funds | | | | | | | | |
| (Cost $8,478,228) | | | | | | | 9,802,412 | |
| | | | | | | | | |
SHORT-TERM INVESTMENTS† - 2.4% | |
Federated U.S. Treasury Cash Reserve Fund — Institutional Shares 0.48%4 | | | 138,016,288 | | | | 138,016,288 | |
| Total Short-Term Investments | | | | | |
| (Cost $138,016,288) | | | | | | | 138,016,288 | |
| | | Face
Amount3 | | | | |
| | | | | | | |
ASSET-BACKED SECURITIES†† - 41.3% | |
| Collateralized Loan Obligations - 31.9% | |
| CIFC Funding Ltd. | | | | | | |
2017-3A, 2.06% due 10/24/255,6 | | $ | 24,700,000 | | | | 24,644,497 | |
2015-2A, 3.00% due 12/05/245,6 | | | 18,500,000 | | | | 18,495,428 | |
2017-3A, 2.54% due 10/24/255,6 | | | 11,500,000 | | | | 11,457,931 | |
2015-3A, 3.12% due 10/19/275,6 | | | 9,750,000 | | | | 9,740,118 | |
2016-1A, 2.99% due 01/22/275,6 | | | 7,500,000 | | | | 7,500,271 | |
2016-5A, 3.72% due 01/17/275,6 | | | 3,750,000 | | | | 3,751,720 | |
2015-2A, 3.12% due 04/15/275,6 | | | 2,000,000 | | | | 2,000,755 | |
2014-1A, 3.82% due 04/18/255,6 | | | 500,000 | | | | 499,990 | |
| Fortress Credit Opportunities III CLO, LP | | | | | | | | |
2017-3A, 2.82% due 04/28/265,6 | | | 64,150,000 | | | | 64,070,609 | |
2017-3A, 4.00% due 04/28/266 | | | 7,700,000 | | | | 7,680,271 | |
2014-3A, 2.91% due 04/28/265,6 | | | 5,000,000 | | | | 4,999,956 | |
2014-3A, 3.51% due 04/28/265,6 | | | 650,000 | | | | 647,797 | |
2014-3A, 4.26% due 04/28/265,6 | | | 400,000 | | | | 399,996 | |
| Golub Capital Partners CLO Ltd. | | | | | | | | |
2016-33A, 3.37% due 11/21/285,6 | | | 48,750,000 | | | | 48,588,477 | |
2015-25A, 2.83% due 08/05/275,6 | | | 16,500,000 | | | | 16,503,120 | |
2015-24A, 3.73% due 02/05/275,6 | | | 5,000,000 | | | | 5,004,245 | |
2013-17A, 3.44% due 10/25/255,6 | | | 3,250,000 | | | | 3,205,148 | |
2014-21A, 3.49% due 10/25/265,6 | | | 2,700,000 | | | | 2,661,214 | |
2014-18A, 4.54% due 04/25/265,6 | | | 500,000 | | | | 499,102 | |
10 | THE GUGGENHEIM FUNDS SEMI-ANNUAL REPORT | SEE NOTES TO FINANCIAL STATEMENTS. |
SCHEDULE OF INVESTMENTS (Unaudited)(continued) | March 31, 2017 |
| TOTAL RETURN BOND FUND | |
| | | Face
Amount3 | | | Value | |
| | | | | | | |
2013-17A, 4.87% due 10/25/255,6 | | $ | 400,000 | | | $ | 400,990 | |
| Fortress Credit BSL II Ltd. | | | | | | | | |
2017-2A, 2.80% due 10/19/255,6 | | | 41,850,000 | | | | 41,752,473 | |
2013-2A, 2.52% due 10/19/255,6 | | | 15,500,000 | | | | 15,508,470 | |
2013-2A, 3.27% due 10/19/255,6 | | | 4,000,000 | | | | 4,006,261 | |
| OCP CLO Ltd. | | | | | | | | |
2016-11A, 3.43% due 04/26/285,6 | | | 18,500,000 | | | | 18,498,935 | |
2014-6A, 5.97% due 07/17/265,6 | | | 7,700,000 | | | | 7,357,290 | |
2016-11A, 4.48% due 04/26/285,6 | | | 7,000,000 | | | | 6,999,371 | |
2016-2A, 3.90% due 11/22/255,6 | | | 6,500,000 | | | | 6,507,236 | |
2015-8A, 6.52% due 04/17/275,6 | | | 6,500,000 | | | | 6,250,510 | |
2014-6A, 4.12% due 07/17/265,6 | | | 5,500,000 | | | | 5,499,769 | |
2014-7A, 3.13% due 10/20/265,6 | | | 3,500,000 | | | | 3,499,959 | |
2013-4A, 3.79% due 10/24/255,6 | | | 2,250,000 | | | | 2,250,000 | |
2014-6A, 3.07% due 07/17/265,6 | | | 1,500,000 | | | | 1,500,003 | |
| Shackleton CLO Ltd. | | | | | | | | |
2016-7A, 2.97% due 04/15/275,6 | | | 20,250,000 | | | | 20,249,032 | |
2017-4A, 2.65% due 01/13/255,6 | | | 14,950,000 | | | | 14,963,889 | |
2015-8A, 3.98% due 10/20/275,6 | | | 7,600,000 | | | | 7,577,761 | |
2013-4A, 3.02% due 01/13/255,6 | | | 5,000,000 | | | | 5,003,478 | |
2016-2A, 3.68% due 10/20/235,6 | | | 4,000,000 | | | | 3,999,757 | |
2014-6A, 4.12% due 07/17/265,6 | | | 2,950,000 | | | | 2,957,550 | |
2013-3A, 6.52% due 04/15/255,6 | | | 2,250,000 | | | | 1,989,886 | |
| KVK CLO Ltd. | | | | | | | | |
2017-1A, 2.84% due 05/15/265,6 | | | 24,865,000 | | | | 24,847,258 | |
2017-2A, 2.80% due 01/15/265,6 | | | 19,200,000 | | | | 19,171,546 | |
2014-2A, 5.77% due 07/15/265,6 | | | 9,930,000 | | | | 8,544,418 | |
2013-1A, due 04/14/256,7 | | | 3,800,000 | | | | 1,721,241 | |
| Fortress Credit Opportunities V CLO Ltd. | | | | | | | | |
2017-5A, 2.94% due 10/15/265,6 | | | 29,450,000 | | | | 29,468,853 | |
2017-5A, 3.40% due 10/15/266 | | | 16,000,000 | | | | 16,016,589 | |
2014-5A, 4.56% due 10/15/265,6 | | | 1,750,000 | | | | 1,749,412 | |
2014-5A, 3.66% due 10/15/265,6 | | | 1,500,000 | | | | 1,499,251 | |
2017-5A, 3.75% due 10/15/266 | | | 1,000,000 | | | | 1,001,058 | |
| Fortress Credit Opportunities VII CLO Ltd. | | | | | | | | |
2016-7A, 2.98% due 12/15/285,6 | | | 42,200,000 | | | | 42,268,426 | |
2016-7A, 3.88% due 12/15/285,6 | | | 5,000,000 | | | | 4,969,766 | |
| PFP Ltd. | | | | | | | | |
2017-3, 1.83% due 01/14/355,6 | | | 28,500,000 | | | | 28,568,115 | |
2015-2, 2.93% due 07/14/345,6 | | | 16,500,000 | | | | 16,485,732 | |
2017-3, 2.53% due 01/14/355,6 | | | 2,000,000 | | | | 2,005,600 | |
| NXT Capital CLO LLC | | | | | | | | |
2017-1A, 2.86% due 04/20/295,6 | | | 32,000,000 | | | | 31,944,525 | |
2015-1A, 4.69% due 04/21/275,6 | | | 1,000,000 | | | | 979,787 | |
| Cerberus Loan Funding XVII Ltd. | | | | | | | | |
2016-3A, 3.48% due 01/15/285,6 | | | 31,500,000 | | | | 31,397,992 | |
| Flagship CLO VIII Ltd. | | | | | | | | |
2017-8A, 2.29% due 01/16/265,6 | | | 30,900,000 | | | | 30,825,789 | |
| SEE NOTES TO FINANCIAL STATEMENTS. | THE GUGGENHEIM FUNDS SEMI-ANNUAL REPORT | 11 |
SCHEDULE OF INVESTMENTS (Unaudited)(continued) | March 31, 2017 |
| TOTAL RETURN BOND FUND | |
| | | Face
Amount3 | | | Value | |
| | | | | | | |
| WhiteHorse VI Ltd. | | | | | | |
2016-1A, 2.93% due 02/03/255,6 | | $ | 22,100,000 | | | $ | 22,083,631 | |
2016-1A, 3.78% due 02/03/255,6 | | | 8,500,000 | | | | 8,502,249 | |
| Venture XIX CLO Ltd. | | | | | | | | |
2016-19A, 3.02% due 01/15/275,6 | | | 29,450,000 | | | | 29,448,586 | |
| Great Lakes CLO Ltd. | | | | | | | | |
2015-1A, 2.97% due 07/15/265,6 | | | 10,000,000 | | | | 10,031,986 | |
2014-1A, 2.87% due 04/15/255,6 | | | 9,500,000 | | | | 9,509,702 | |
2012-1A, 3.77% due 01/15/235,6 | | | 4,000,000 | | | | 3,995,308 | |
2015-1A, 3.72% due 07/15/265,6 | | | 4,000,000 | | | | 3,955,993 | |
2012-1A, 5.12% due 01/15/235,6 | | | 1,250,000 | | | | 1,249,924 | |
2012-1A, due 01/15/235,7,15 | | | 1,000,000 | | | | 423,870 | |
2014-1A, 4.72% due 04/15/255,6 | | | 250,000 | | | | 247,172 | |
| Cerberus Loan Funding XVI, LP | | | | | | | | |
2016-2A, 3.07% due 11/15/275,6 | | | 15,500,000 | | | | 15,684,760 | |
2016-2A, 3.37% due 11/15/275,6 | | | 9,350,000 | | | | 9,434,628 | |
| A Voce CLO Ltd. | | | | | | | | |
2017-1A, 2.70% due 07/15/265,6 | | | 23,200,000 | | | | 23,143,450 | |
| OZLM IX Ltd. | | | | | | | | |
2017-9A, 2.69% due 01/20/275,6 | | | 22,550,000 | | | | 22,480,440 | |
| Venture XII CLO Ltd. | | | | | | | | |
2017-12A, 2.67% due 02/28/265,6 | | | 22,300,000 | | | | 22,238,729 | |
| Galaxy XVIII CLO Ltd. | | | | | | | | |
2017-18A, 2.65% due 10/15/265,6 | | | 19,550,000 | | | | 19,549,101 | |
2014-18A, 4.02% due 10/15/265,6 | | | 2,500,000 | | | | 2,500,000 | |
| Tuolumne Grove CLO Limited | | | | | | | | |
2017-1A, 2.81% due 04/25/265,6 | | | 22,000,000 | | | | 21,917,848 | |
| Symphony CLO XIV Ltd. | | | | | | | | |
2017-14A, 2.86% due 07/14/265,6 | | | 21,275,000 | | | | 21,283,048 | |
| Regatta V Funding Ltd. | | | | | | | | |
2017-1A, 2.71% due 10/25/265,6 | | | 20,950,000 | | | | 20,986,724 | |
| Newstar Commercial Loan Funding LLC | | | | | | | | |
2017-1A, 3.54% due 03/20/275,6 | | | 12,750,000 | | | | 12,749,976 | |
2016-1A, 4.80% due 02/25/285,6 | | | 5,750,000 | | | | 5,761,775 | |
2015-1A, 3.83% due 01/20/275,6 | | | 1,000,000 | | | | 999,938 | |
2014-1A, 4.63% due 04/20/255,6 | | | 500,000 | | | | 498,033 | |
| Oaktree EIF II Series Ltd. | | | | | | | | |
2014-A2, 3.34% due 11/15/255,6 | | | 8,000,000 | | | | 7,999,352 | |
| 1.30% due 10/23/21 | | | 6,614,009 | | | | 6,611,915 | |
2014-A2, 4.24% due 11/17/255,6 | | | 5,300,000 | | | | 5,292,145 | |
| Catamaran CLO Ltd. | | | | | | | | |
2016-1A, 3.10% due 12/20/235,6 | | | 12,000,000 | | | | 12,003,329 | |
2012-1A, 6.77% due 12/20/235,6 | | | 3,000,000 | | | | 2,961,035 | |
2014-2A, 6.53% due 10/18/265,6 | | | 2,500,000 | | | | 2,141,301 | |
2016-2A, 3.07% due 10/18/265,6 | | | 1,750,000 | | | | 1,761,845 | |
2015-1A, 4.14% due 04/22/275,6 | | | 1,000,000 | | | | 1,007,612 | |
| TICP CLO II Ltd. | | | | | | | | |
2017-2A, 2.70% due 07/20/265,6 | | | 14,000,000 | | | | 14,013,979 | |
2014-2A, 4.03% due 07/20/265,6 | | | 3,000,000 | | | | 3,000,000 | |
2014-2A, 4.33% due 07/20/265,6 | | | 2,850,000 | | | | 2,819,533 | |
12 | THE GUGGENHEIM FUNDS SEMI-ANNUAL REPORT | SEE NOTES TO FINANCIAL STATEMENTS. |
SCHEDULE OF INVESTMENTS (Unaudited)(continued) | March 31, 2017 |
| TOTAL RETURN BOND FUND | |
| | | Face
Amount3 | | | Value | |
| | | | | | | |
| Flagship VII Ltd. | | | | | | |
2017-7A, 2.71%due 01/20/265,6 | | $ | 19,125,000 | | | $ | 19,075,140 | |
| Halcyon Loan Advisors Funding Ltd. | | | | | | | | |
2014-2A, 3.04% due 04/28/255,6 | | | 14,000,000 | | | | 14,027,115 | |
2012-2A, 4.00% due 12/20/245,6 | | | 4,000,000 | | | | 4,006,638 | |
2012-2A, 5.65% due 12/20/245,6 | | | 600,000 | | | | 600,182 | |
| Northwoods Capital XIV Ltd. | | | | | | | | |
2017-14A, 2.79% due 11/12/255,6 | | | 18,450,000 | | | | 18,470,986 | |
| Regatta IV Funding Ltd. | | | | | | | | |
2014-1A, 3.99% due 07/25/265,6 | | | 13,500,000 | | | | 13,499,216 | |
2014-1A, 5.99% due 07/25/265,6 | | | 4,621,000 | | | | 4,347,968 | |
| Venture XVI CLO Ltd. | | | | | | | | |
2017-16A, 2.65% due 04/15/265,6 | | | 14,500,000 | | | | 14,499,333 | |
2014-16A, 3.77% due 04/15/265,6 | | | 2,500,000 | | | | 2,500,000 | |
| ABPCI Direct Lending Fund CLO I LLC | | | | | | | | |
2016-1A, 3.65% due 12/22/285,6 | | | 17,000,000 | | | | 16,910,506 | |
| Steele Creek CLO Ltd. | | | | | | | | |
2017-1A, 2.89% due 08/21/265,6 | | | 16,800,000 | | | | 16,799,902 | |
| Northwoods Capital XI Ltd. | | | | | | | | |
2017-11A, 2.75% due 04/15/255,6 | | | 16,750,000 | | | | 16,750,521 | |
| Tralee CLO III Ltd. | | | | | | | | |
2016-3A, 3.03% due 07/20/265,6 | | | 8,300,000 | | | | 8,305,596 | |
2016-3A, 3.93% due 07/20/265,6 | | | 7,500,000 | | | | 7,500,626 | |
| WhiteHorse VIII Ltd. | | | | | | | | |
2014-1A, 3.08% due 05/01/265,6 | | | 15,750,000 | | | | 15,789,717 | |
| Garrison Funding Ltd. | | | | | | | | |
2016-2A, 3.26% due 09/29/275,6 | | | 7,000,000 | | | | 7,046,912 | |
2015-1A, 3.55% due 05/25/275,6 | | | 6,250,000 | | | | 6,250,630 | |
2016-2A, 4.20% due 09/29/275,6 | | | 2,250,000 | | | | 2,244,064 | |
| Fortress Credit Investments IV Ltd. | | | | | | | | |
2015-4A, 2.92% due 07/17/235,6 | | | 14,000,000 | | | | 14,015,512 | |
2015-4A, 3.92% due 07/17/235,6 | | | 1,000,000 | | | | 999,998 | |
| Atrium XI | | | | | | | | |
2014-11A, 4.24% due 10/23/255,6 | | | 11,500,000 | | | | 11,500,970 | |
2017-11A, 2.65% due 10/23/255,6 | | | 3,500,000 | | | | 3,491,579 | |
| MP CLO VI Ltd. | | | | | | | | |
2017-2A, 2.57% due 01/15/275,6 | | | 14,500,000 | | | | 14,522,913 | |
| Northwoods Capital X Ltd. | | | | | | | | |
2017-10A, 2.65% due 11/04/255,6 | | | 14,500,000 | | | | 14,512,390 | |
| Marea CLO Ltd. | | | | | | | | |
2015-1A, 2.82% due 10/15/235,6 | | | 14,393,000 | | | | 14,389,911 | |
| MP CLO V Ltd. | | | | | | | | |
2017-1A, 2.57% due 07/18/265,6 | | | 13,010,000 | | | | 13,011,304 | |
| Seneca Park CLO Limited | | | | | | | | |
2017-1A, 2.65% due 07/17/265,6 | | | 12,900,000 | | | | 12,907,446 | |
| Dryden XXXI Senior Loan Fund | | | | | | | | |
2017-31A, 2.66% due 04/18/265,6 | | | 12,850,000 | | | | 12,801,968 | |
| Vibrant CLO III Ltd. | | | | | | | | |
2016-3A, 3.08% due 04/20/265,6 | | | 12,000,000 | | | | 11,956,067 | |
| AMMC CLO XV Ltd. | | | | | | | | |
2016-15A, 3.01% due 12/09/265,6 | | | 11,600,000 | | | | 11,642,889 | |
| Treman Park CLO Ltd. | | | | | | | | |
2015-1A, due 04/20/276,7 | | | 13,600,000 | | | | 11,458,596 | |
| SEE NOTES TO FINANCIAL STATEMENTS. | THE GUGGENHEIM FUNDS SEMI-ANNUAL REPORT | 13 |
SCHEDULE OF INVESTMENTS (Unaudited)(continued) | March 31, 2017 |
| TOTAL RETURN BOND FUND | |
| | | Face
Amount3 | | | Value | |
| | | | | | | |
| Venture XI CLO Ltd. | | | | | | |
2015-11A, 2.99% due 11/14/225,6 | | $ | 11,500,000 | | | $ | 11,431,980 | |
| Resource Capital Corp. | | | | | | | | |
2015-CRE3, 3.34% due 03/15/325,6 | | | 4,500,000 | | | | 4,471,295 | |
2015-CRE3, 4.09% due 03/15/325,6 | | | 3,000,000 | | | | 2,974,692 | |
2015-CRE3, 4.94% due 03/15/325,6 | | | 2,000,000 | | | | 1,978,992 | |
2014-CRE2, 3.44% due 04/15/325,6 | | | 2,000,000 | | | | 1,970,032 | |
| Crown Point CLO II Ltd. | | | | | | | | |
2013-2A, 2.95% due 12/31/235,6 | | | 11,300,000 | | | | 11,283,592 | |
| TCP Waterman CLO LLC | | | | | | | | |
2016-1A, 3.18% due 12/15/285,6 | | | 7,150,000 | | | | 7,224,647 | |
2016-1A, 3.43% due 12/15/285,6 | | | 4,000,000 | | | | 3,999,824 | |
| Flatiron CLO Ltd. | | | | | | | | |
2017-1A, 2.64% due 07/17/265,6 | | | 7,600,000 | | | | 7,577,603 | |
2013-1A, 6.37% due 01/17/265,6 | | | 2,000,000 | | | | 1,780,684 | |
2016-1A, 3.54% due 10/25/215,6 | | | 1,750,000 | | | | 1,749,772 | |
| Black Diamond CLO Ltd. | | | | | | | | |
2012-1A, 2.43% due 02/01/235,6 | | | 8,171,449 | | | | 8,160,742 | |
2014-1A, 3.87% due 02/06/265,6 | | | 2,000,000 | | | | 2,001,935 | |
2013-1A, 4.28% due 02/01/235,6 | | | 650,000 | | | | 650,168 | |
| Nelder Grove CLO Ltd. | | | | | | | | |
2017-1A, 2.80% due 08/28/265,6 | | | 10,050,000 | | | | 10,048,453 | |
| Ares XXXIII CLO Ltd. | | | | | | | | |
2016-1A, 3.05% due 12/05/255,6 | | | 9,800,000 | | | | 9,824,506 | |
| ACIS CLO Ltd. | | | | | | | | |
2015-6A, 3.51% due 05/01/275,6 | | | 7,500,000 | | | | 7,529,504 | |
2013-1A, 3.97% due 04/18/245,6 | | | 1,650,000 | | | | 1,653,281 | |
2013-2A, 4.23% due 10/14/225,6 | | | 375,000 | | | | 374,547 | |
| Dryden 37 Senior Loan Fund | | | | | | | | |
2015-37A, due 04/15/276,7 | | | 10,000,000 | | | | 9,391,405 | |
| TICP CLO III Ltd. | | | | | | | | |
2014-3A, 3.38% due 01/20/275,6 | | | 7,000,000 | | | | 7,000,000 | |
2014-3A, 4.28% due 01/20/275,6 | | | 2,250,000 | | | | 2,250,000 | |
| Venture XVII CLO Ltd. | | | | | | | | |
2014-17A, 3.87% due 07/15/265,6 | | | 8,750,000 | | | | 8,754,916 | |
| Neuberger Berman CLO XVII Ltd. | | | | | | | | |
2014-17A, 3.79% due 08/04/255,6 | | | 8,500,000 | | | | 8,436,256 | |
| Madison Park Funding XVI Ltd. | | | | | | | | |
2016-16A, 2.93% due 04/20/265,6 | | | 8,250,000 | | | | 8,267,645 | |
| Betony CLO Ltd. | | | | | | | | |
2016-1A, 2.97% due 04/15/275,6 | | | 8,250,000 | | | | 8,240,836 | |
| Voya CLO Ltd. | | | | | | | | |
2013-1X, due 04/15/247 | | | 9,500,000 | | | | 5,904,868 | |
2015-3A, 3.97% due 10/15/225,6 | | | 2,250,000 | | | | 2,249,919 | |
| Fifth Street SLF II Ltd. | | | | | | | | |
2015-2A, 2.96% due 09/29/275,6 | | | 8,000,000 | | | | 8,007,084 | |
| KKR CLO Ltd. | | | | | | | | |
2015-12, 3.32% due 07/15/275,6 | | | 8,000,000 | | | | 7,990,538 | |
| Carlyle Global Market Strategies CLO Ltd. | | | | | | | | |
2012-3A, due 10/04/246,7 | | | 8,920,000 | | | | 7,229,225 | |
2014-2A, 4.93% due 07/20/235,6 | | | 750,000 | | | | 749,963 | |
| Vibrant CLO IV Ltd. | | | | | | | | |
2016-4A, 3.43% due 07/20/285,6 | | | 7,000,000 | | | | 7,111,921 | |
14 | THE GUGGENHEIM FUNDS SEMI-ANNUAL REPORT | SEE NOTES TO FINANCIAL STATEMENTS. |
SCHEDULE OF INVESTMENTS (Unaudited)(continued) | March 31, 2017 |
| TOTAL RETURN BOND FUND | |
| | | Face
Amount3 | | | Value | |
| | | | | | | |
| Vibrant CLO Limited | | | | | | |
2015-1A, 3.82% due 07/17/245,6 | | $ | 7,000,000 | | | $ | 6,995,333 | |
| Cent CLO 21 Ltd. | | | | | | | | |
2017-21A, 2.76% due 07/27/265,6 | | | 7,000,000 | | | | 6,994,044 | |
| Ares XXVI CLO Ltd. | | | | | | | | |
2013-1A, 3.77% due 04/15/255,6 | | | 5,000,000 | | | | 4,999,760 | |
2013-1A, due 04/15/256,7 | | | 4,300,000 | | | | 1,946,628 | |
| TICC CLO LLC | | | | | | | | |
2012-1A, 4.55% due 08/25/235,6 | | | 6,250,000 | | | | 6,252,032 | |
2012-1A, 5.68% due 08/25/235,6 | | | 350,000 | | | | 350,156 | |
| Marathon CLO VII Ltd. | | | | | | | | |
2014-7A, 4.54% due 10/28/255,6 | | | 4,000,000 | | | | 4,002,669 | |
2014-7A, 3.69% due 10/28/255,6 | | | 2,500,000 | | | | 2,499,854 | |
| Atlas Senior Loan Fund V Ltd. | | | | | | | | |
2016-1A, 3.53% due 07/16/265,6 | | | 6,500,000 | | | | 6,499,667 | |
| Avery Point II CLO Ltd. | | | | | | | | |
2013-3X COM, due 01/18/257 | | | 7,500,060 | | | | 6,427,252 | |
| Fifth Street Senior Loan Fund I LLC | | | | | | | | |
2015-1A, 3.03% due 01/20/275,6 | | | 5,000,000 | | | | 5,007,346 | |
2015-1A, 4.03% due 01/20/275,6 | | | 1,250,000 | | | | 1,252,101 | |
| Cereberus ICQ Levered LLC | | | | | | | | |
2015-1A, 3.07% due 11/06/255,6 | | | 4,000,000 | | | | 4,008,664 | |
2015-1A, 4.07% due 11/06/255,6 | | | 2,250,000 | | | | 2,249,870 | |
| Fortress Credit Funding V, LP | | | | | | | | |
2015-5A, 3.69% due 08/15/225,6 | | | 6,000,000 | | | | 5,993,920 | |
| Northwoods Capital IX Ltd. | | | | | | | | |
2012-9A, 3.27% due 01/18/245,6 | | | 5,815,000 | | | | 5,814,681 | |
| Ares CLO Ltd. | | | | | | | | |
2016-3A, 4.92% due 01/17/245,6 | | | 5,550,000 | | | | 5,550,232 | |
| TICP CLO I Ltd. | | | | | | | | |
2014-1A, 4.03% due 04/26/265,6 | | | 5,500,000 | | | | 5,500,497 | |
| OHA Credit Partners IX Ltd. | | | | | | | | |
2013-9A, due 10/20/256,7 | | | 6,000,000 | | | | 5,353,510 | |
| OHA Loan Funding Ltd. | | | | | | | | |
2017-1A, 3.09% due 07/23/255,6 | | | 5,300,000 | | | | 5,296,909 | |
| AIMCO CLO Series | | | | | | | | |
2015-AA, 3.32% due 01/15/285,6 | | | 5,000,000 | | | | 5,042,287 | |
| RFTI Issuer Ltd. | | | | | | | | |
2015-FL1, 4.79% due 08/15/305,15 | | | 5,000,000 | | | | 5,007,685 | |
| Mountain Hawk II CLO Ltd. | | | | | | | | |
2013-2A, 2.73% due 07/22/245,6 | | | 5,000,000 | | | | 4,993,792 | |
| Fortress Credit Opportunities VI CLO Ltd. | | | | | | | | |
2015-6A, 3.81% due 10/10/265,6 | | | 5,000,000 | | | | 4,979,282 | |
| Telos CLO Ltd. | | | | | | | | |
2013-3A, 4.02% due 01/17/245,6 | | | 2,000,000 | | | | 2,000,744 | |
2014-6A, 3.12% due 01/17/275,6 | | | 1,500,000 | | | | 1,500,779 | |
2007-2A, 3.22% due 04/15/225,6 | | | 1,100,000 | | | | 1,071,169 | |
| Benefit Street Partners CLO V Ltd. | | | | | | | | |
2017-VA, 2.53% due 10/20/265,6 | | | 4,500,000 | | | | 4,496,909 | |
| SEE NOTES TO FINANCIAL STATEMENTS. | THE GUGGENHEIM FUNDS SEMI-ANNUAL REPORT | 15 |
SCHEDULE OF INVESTMENTS (Unaudited)(continued) | March 31, 2017 |
| TOTAL RETURN BOND FUND | |
| | | Face
Amount3 | | | Value | |
| | | | | | | |
| Marathon CLO V Ltd. | | | | | | |
2013-5A, 3.40% due 02/21/255,6 | | $ | 4,500,000 | | | $ | 4,485,366 | |
| Jamestown CLO VI Ltd. | | | | | | | | |
2015-6A, 5.80% due 02/20/275,6 | | | 4,500,000 | | | | 4,268,106 | |
| Cavalry CLO II | | | | | | | | |
2013-2A, 2.37% due 01/17/245,6 | | | 4,000,000 | | | | 4,000,000 | |
| Regatta III Funding Ltd. | | | | | | | | |
2014-1A, 3.87% due 04/15/265,6 | | | 4,000,000 | | | | 3,979,412 | |
| Kingsland V Ltd. | | | | | | | | |
2007-5A, 1.82% due 07/14/215,6 | | | 4,000,000 | | | | 3,874,516 | |
| OZLM Funding II Ltd. | | | | | | | | |
2016-2A, 3.64% due 10/30/275,6 | | | 3,750,000 | | | | 3,739,559 | |
| Babson CLO Ltd. | | | | | | | | |
2012-2A, due 05/15/236,7 | | | 4,750,000 | | | | 2,825,307 | |
2014-IA, due 07/20/256,7 | | | 1,300,000 | | | | 805,452 | |
| Anchorage Capital CLO 4 Ltd. | | | | | | | | |
2014-4A, 3.20% due 07/28/265,6 | | | 3,600,000 | | | | 3,600,637 | |
| Greywolf CLO III Ltd. | | | | | | | | |
2014-1A, 3.89% due 04/22/265,6 | | | 2,000,000 | | | | 1,998,867 | |
2014-1A, 3.09% due 04/22/265,6 | | | 1,500,000 | | | | 1,506,159 | |
| Cent CLO | | | | | | | | |
2014-16A, 3.28% due 08/01/245,6 | | | 1,750,000 | | | | 1,750,150 | |
2014-16A, 4.23% due 08/01/245,6 | | | 1,750,000 | | | | 1,750,071 | |
| THL Credit Wind River CLO Ltd. | | | | | | | | |
2014-2A, 6.27% due 07/15/265,6 | | | 3,600,000 | | | | 3,456,609 | |
| CFIP CLO Ltd. | | | | | | | | |
2014-1A, 2.49% due 04/13/255,6 | | | 3,400,000 | | | | 3,410,480 | |
| Eaton Vance CLO Ltd. | | | | | | | | |
2017-1A, 2.62% due 07/15/265,6 | | | 3,400,000 | | | | 3,391,783 | |
| Recette CLO LLC | | | | | | | | |
2015-1A, 3.83% due 10/20/275,6 | | | 3,250,000 | | | | 3,269,563 | |
| Venture X CLO Ltd. | | | | | | | | |
2016-10A, 3.51% due 07/20/225,6 | | | 3,250,000 | | | | 3,257,371 | |
| Oaktree EIF I Series A1 Ltd. | | | | | | | | |
2016-A, 4.68% due 01/20/275,6 | | | 3,250,000 | | | | 3,254,767 | |
| Cerberus Onshore II CLO LLC | | | | | | | | |
2014-1A, 3.72% due 10/15/235,6 | | | 2,250,000 | | | | 2,251,151 | |
2014-1A, 3.02% due 10/15/235,6 | | | 970,732 | | | | 970,869 | |
| AMMC CLO XI Ltd. | | | | | | | | |
2016-11A, 3.89% due 10/30/235,6 | | | 3,000,000 | | | | 3,015,267 | |
| Crown Point CLO III Ltd. | | | | | | | | |
2015-3A, 4.07% due 12/31/275,6 | | | 3,000,000 | | | | 3,012,120 | |
| Madison Park Funding Ltd. | | | | | | | | |
2007-6A, 4.28% due 07/26/215,6 | | | 3,000,000 | | | | 3,004,824 | |
| Benefit Street Partners CLO Ltd. | | | | | | | | |
2015-IA, 4.12% due 10/15/255,6 | | | 3,000,000 | | | | 3,003,021 | |
| Atlas Senior Loan Fund VI Ltd. | | | | | | | | |
2017-6A, 3.38% due 10/15/265,6 | | | 3,000,000 | | | | 2,988,370 | |
| Ivy Hill Middle Market Credit Fund VII Ltd. | | | | | | | | |
2013-7A, 3.33% due 10/20/255,6 | | | 2,000,000 | | | | 1,952,694 | |
2013-7A, 4.48% due 10/20/255,6 | | | 1,000,000 | | | | 967,568 | |
| KKR CLO Trust | | | | | | | | |
2012-1A, 3.33% due 12/15/245,6 | | | 2,000,000 | | | | 2,000,503 | |
16 | THE GUGGENHEIM FUNDS SEMI-ANNUAL REPORT | SEE NOTES TO FINANCIAL STATEMENTS. |
SCHEDULE OF INVESTMENTS (Unaudited)(continued) | March 31, 2017 |
| TOTAL RETURN BOND FUND | |
| | | Face
Amount3 | | | Value | |
| | | | | | | |
2012-1A, 4.43% due 12/15/245,6 | | $ | 500,000 | | | $ | 500,268 | |
| FS Senior Funding Ltd. | | | | | | | | |
2015-1A, 2.82% due 05/28/255,6 | | | 2,500,000 | | | | 2,500,125 | |
| Marathon CLO IV Ltd. | | | | | | | | |
2012-4A, 4.06% due 05/20/235,6 | | | 2,500,000 | | | | 2,500,118 | |
| Oaktree EIF II Series B1 Ltd. | | | | | | | | |
2015-B1A, 3.34% due 02/15/265,6 | | | 2,205,000 | | | | 2,206,382 | |
| Rockwall CDO II Ltd. | | | | | | | | |
2007-1A, 1.58% due 08/01/245,6 | | | 2,100,000 | | | | 2,083,893 | |
| NewStar Arlington Senior Loan Program LLC | | | | | | | | |
2014-1A, 3.64% due 07/25/255,6 | | | 1,000,000 | | | | 980,666 | |
2014-1A, 4.76% due 07/25/256 | | | 700,000 | | | | 700,442 | |
2014-1A, 4.34% due 07/25/255,6 | | | 400,000 | | | | 395,968 | |
| Duane Street CLO IV Ltd. | | | | | | | | |
2007-4A, 3.29% due 11/14/215,6 | | | 2,000,000 | | | | 2,000,064 | |
| Mountain Hawk I CLO Ltd. | | | | | | | | |
2013-1A, 3.21% due 01/20/245,6 | | | 2,000,000 | | | | 2,000,060 | |
| Octagon Investment Partners XVI Ltd. | | | | | | | | |
2013-1A, 3.77% due 07/17/255,6 | | | 2,000,000 | | | | 1,999,930 | |
| NewStar Clarendon Fund CLO LLC | | | | | | | | |
2015-1A, 4.39% due 01/25/275,6 | | | 2,000,000 | | | | 1,989,951 | |
| Sound Point CLO IV Ltd. | | | | | | | | |
2013-3A, 3.39% due 01/21/265,6 | | | 2,000,000 | | | | 1,986,450 | |
| Madison Park Funding V Ltd. | | | | | | | | |
2007-5A, 2.50% due 02/26/215,6 | | | 2,000,000 | | | | 1,960,411 | |
| Ivy Hill Middle Market Credit Fund IX Ltd. | | | | | | | | |
2014-9A, 3.47% due 10/18/255,6 | | | 1,000,000 | | | | 996,232 | |
2014-9A, 4.32% due 10/18/255,6 | | | 1,000,000 | | | | 963,338 | |
| LMREC, Inc. | | | | | | | | |
2015-CRE1, 4.48% due 02/22/325,6 | | | 2,000,000 | | | | 1,957,186 | |
| Venture XIII CLO Ltd. | | | | | | | | |
2013-13A, due 06/10/256,7 | | | 3,700,000 | | | | 1,877,569 | |
| AMMC CLO XIII Ltd. | | | | | | | | |
2013-13A, 6.79% due 01/26/265,6 | | | 2,000,000 | | | | 1,840,910 | |
| Westchester CLO Ltd. | | | | | | | | |
2007-1A, 1.47% due 08/01/225,6 | | | 1,850,000 | | | | 1,804,511 | |
| Galaxy XIX CLO Ltd. | | | | | | | | |
2015-19A, due 01/24/276,7 | | | 2,000,000 | | | | 1,803,999 | |
| Newstar Trust | | | | | | | | |
2012-2A, 5.28% due 01/20/235,6 | | | 1,000,000 | | | | 1,000,053 | |
2012-2A, 4.28% due 01/20/235,6 | | | 750,000 | | | | 753,336 | |
| Adirondack Park CLO Ltd. | | | | | | | | |
2013-1A, 4.02% due 04/15/245,6 | | | 1,500,000 | | | | 1,501,196 | |
| ING Investment Management CLO Ltd. | | | | | | | | |
2007-4A, 3.24% due 06/14/225,6 | | | 1,500,000 | | | | 1,499,939 | |
| COA Summit CLO Limited | | | | | | | | |
2014-1A, 3.83% due 04/20/235,6 | | | 1,250,000 | | | | 1,249,887 | |
| Venture CLO Ltd. | | | | | | | | |
2013-14A, 3.80% due 08/28/255,6 | | | 1,250,000 | | | | 1,249,772 | |
| Oaktree CLO Ltd. | | | | | | | | |
2014-2A, 6.28% due 10/20/265,6 | | | 1,250,000 | | | | 1,202,124 | |
| ALM XIV Ltd. | | | | | | | | |
2014-14A, 3.99% due 07/28/265,6 | | | 750,000 | | | | 753,001 | |
| SEE NOTES TO FINANCIAL STATEMENTS. | THE GUGGENHEIM FUNDS SEMI-ANNUAL REPORT | 17 |
SCHEDULE OF INVESTMENTS (Unaudited)(continued) | March 31, 2017 |
| TOTAL RETURN BOND FUND | |
| | | Face
Amount3 | | | Value | |
| | | | | | | |
2014-14A, 4.49% due 07/28/265,6 | | $ | 300,000 | | | $ | 300,768 | |
| Highbridge Loan Management Ltd. | | | | | | | | |
2013-2A, 4.73% due 10/20/245,6 | | | 1,000,000 | | | | 1,002,415 | |
| Gallatin CLO VII Ltd. | | | | | | | | |
2014-1A, 3.92% due 07/15/235,6 | | | 1,000,000 | | | | 1,000,052 | |
| Lime Street CLO Ltd. | | | | | | | | |
2007-1A, 3.65% due 06/20/215,6 | | | 1,000,000 | | | | 986,809 | |
| WhiteHorse IV Ltd. | | | | | | | | |
2007-4A, 2.47% due 01/17/205,6 | | | 1,000,000 | | | | 985,260 | |
| Saranac CLO III Ltd. | | | | | | | | |
2014-3A, 6.31% due 06/22/255,6 | | | 1,000,000 | | | | 900,434 | |
| Atlas Senior Loan Fund II Ltd. | | | | | | | | |
2012-2A, due 01/30/246,7 | | | 1,200,000 | | | | 764,693 | |
| Grayson CLO Ltd. | | | | | | | | |
2006-1A, 1.44% due 11/01/215,6 | | | 750,000 | | | | 732,705 | |
| Keuka Park CLO Ltd. | | | | | | | | |
2013-1A, due 10/21/246,7 | | | 1,000,000 | | | | 505,943 | |
| GoldenTree Credit Opportunities Financing Ltd. | | | | | | | | |
2012-1A, 5.38% due 06/15/285,6 | | | 500,000 | | | | 503,905 | |
| AMMC CLO XIV Ltd. | | | | | | | | |
2014-14A, 3.84% due 07/27/265,6 | | | 500,000 | | | | 499,961 | |
| DIVCORE CLO Ltd. | | | | | | | | |
2013-1A, 4.81% due 11/15/325,6 | | | 500,000 | | | | 499,041 | |
| MCF CLO IV LLC | | | | | | | | |
2014-1A, 6.78% due 10/15/255,6 | | | 500,000 | | | | 454,498 | |
| Ares XXV CLO Ltd. | | | | | | | | |
2013-3A, due 01/17/246,7 | | | 750,000 | | | | 405,119 | |
| Rockwall CDO Ltd. | | | | | | | | |
2007-1A, 1.28% due 08/01/245,6 | | | 260,624 | | | | 259,973 | |
| Eastland CLO Ltd. | | | | | | | | |
2007-1A, 1.43% due 05/01/225,6 | | | 250,000 | | | | 245,473 | |
| Copper River CLO Ltd. | | | | | | | | |
2007-1A, due 01/20/215,7,15 | | | 1,500,000 | | | | 210,889 | |
| Global Leveraged Capital Credit Opportunity Fund | | | | | | | | |
2006-1A, 2.03% due 12/20/185,6 | | | 73,711 | | | | 73,656 | |
| Marathon CLO II Ltd. | | | | | | | | |
2005-2A, due 12/20/19†††,7 | | | 250,000 | | | | — | |
| Total Collateralized Loan Obligations | | | | | | | 1,833,452,669 | |
| | | | | | | | | |
| Collateralized Debt Obligations - 3.2% | |
| Anchorage Credit Funding Ltd. | | | | | | | | |
2016-4A, 3.50% due 02/15/356 | | | 55,600,000 | | | | 55,397,307 | |
2016-3A, 3.85% due 10/28/336 | | | 7,500,000 | | | | 7,609,395 | |
| Putnam Structured Product Funding Ltd. | | | | | | | | |
2003-1A, 1.91% due 10/15/385,6 | | | 29,424,187 | | | | 26,704,900 | |
| FDF II Ltd. | | | | | | | | |
2016-2A, 4.29% due 05/12/316 | | | 20,500,000 | | | | 20,598,443 | |
2016-2A, 5.29% due 05/12/316 | | | 5,000,000 | | | | 5,059,237 | |
| Triaxx Prime CDO Ltd. | | | | | | | | |
2006-2A, 1.05% due 10/02/395,6 | | | 17,220,718 | | | | 16,782,189 | |
| RB Commercial Trust | | | | | | | | |
2012-RS1, 5.35% due 01/26/226 | | | 15,792,231 | | | | 16,309,063 | |
| FDF I Ltd. | | | | | | | | |
2015-1A, 4.40% due 11/12/306 | | | 13,000,000 | | | | 12,813,533 | |
18 | THE GUGGENHEIM FUNDS SEMI-ANNUAL REPORT | SEE NOTES TO FINANCIAL STATEMENTS. |
SCHEDULE OF INVESTMENTS (Unaudited)(continued) | March 31, 2017 |
| TOTAL RETURN BOND FUND | |
| | | Face
Amount3 | | | Value | |
| | | | | | | |
| SRERS Funding Ltd. | | | | | | |
2011-RS, 1.10% due 05/09/465,6 | | $ | 12,110,238 | | | $ | 8,127,089 | |
| Highland Park CDO I Ltd. | | | | | | | | |
2006-1A, 1.45% due 11/25/515,6 | | | 4,026,789 | | | | 3,740,537 | |
| Anchorage Credit Funding 1 Ltd. | | | | | | | | |
2015-1A, 4.30% due 07/28/306 | | | 3,000,000 | | | | 3,099,156 | |
| JPMCC Re-REMIC Trust | | | | | | | | |
2014-FRR1, 3.24% due 04/27/445,6 | | | 3,000,000 | | | | 2,959,860 | |
| N-Star REL CDO VIII Ltd. | | | | | | | | |
2006-8A, 1.15% due 02/01/415,6 | | | 1,946,894 | | | | 1,935,876 | |
| Wrightwood Capital Real Estate CDO Ltd. | | | | | | | | |
2005-1A, 1.48% due 11/21/405,6 | | | 1,250,000 | | | | 1,226,329 | |
| RAIT CRE CDO I Ltd. | | | | | | | | |
| 2006-1X A1B, 1.31% due 11/20/46 | | | 557,649 | | | | 554,518 | |
| Total Collateralized Debt Obligations | | | | 182,917,432 | |
| | | | | | | | | |
| Transport-Aircraft - 3.2% | |
| Apollo Aviation Securitization Equity Trust | | | | | | | | |
| 2016-2, 4.21% due 11/15/41 | | | 34,618,290 | | | | 34,647,922 | |
2016-1A, 4.88% due 03/17/366 | | | 20,970,000 | | | | 21,074,850 | |
2014-1, 5.13% due 12/15/295 | | | 7,412,046 | | | | 7,402,781 | |
2014-1, 7.38% due 12/15/295 | | | 2,280,630 | | | | 2,277,779 | |
| AIM Aviation Finance Ltd. | | | | | | | | |
2015-1A, 4.21% due 02/15/406 | | | 28,089,286 | | | | 27,983,950 | |
2015-1A, 5.07% due 02/15/406 | | | 2,340,774 | | | | 2,293,958 | |
| Castlelake Aircraft Securitization Trust | | | | | | | | |
2015-1A, 4.70% due 12/15/406 | | | 18,756,450 | | | | 19,141,173 | |
| 2014-1, 5.25% due 02/15/29 | | | 1,181,888 | | | | 1,178,933 | |
| 2014-1, 7.50% due 02/15/29 | | | 582,583 | | | | 582,583 | |
| ECAF I Ltd. | | | | | | | | |
2015-1A, 4.95% due 06/15/406 | | | 15,828,514 | | | | 15,337,498 | |
2015-1A, 3.47% due 06/15/406 | | | 1,491,867 | | | | 1,476,949 | |
| Falcon Aerospace Ltd. | | | | | | | | |
| 2017-1, 4.58% due 02/15/42 | | | 16,507,040 | | | | 16,640,929 | |
| Harbour Aircraft Investments Ltd. | | | | | | | | |
| 2016-1A, 4.70% due 07/15/41 | | | 7,616,910 | | | | 7,632,784 | |
| Diamond Head Aviation Ltd. | | | | | | | | |
2015-1, 3.81% due 07/14/286 | | | 4,386,890 | | | | 4,389,052 | |
| Rise Ltd. | | | | | | | | |
| 4.75% due 02/12/39 | | | 3,995,539 | | | | 3,975,561 | |
| Atlas Ltd. | | | | | | | | |
| 2014-1 A, 4.88% due 12/15/39 | | | 3,458,400 | | | | 3,449,754 | |
| AABS Ltd. | | | | | | | | |
| 2013-1 A, 4.88% due 01/10/38 | | | 2,842,982 | | | | 2,835,874 | |
| Eagle I Ltd. | | | | | | | | |
2014-1A, 4.31% due 12/15/396 | | | 2,573,750 | | | | 2,575,686 | |
| Emerald Aviation Finance Ltd. | | | | | | | | |
2013-1, 4.65% due 10/15/386 | | | 1,548,922 | | | | 1,556,667 | |
2013-1, 6.35% due 10/15/386 | | | 331,912 | | | | 331,912 | |
| Stripes 2103 Aircraft 1 Ltd. | | | | | | | | |
2013-1 A1, 4.48% due 03/20/23†††,1 | | | 1,654,686 | | | | 1,615,754 | |
| SEE NOTES TO FINANCIAL STATEMENTS. | THE GUGGENHEIM FUNDS SEMI-ANNUAL REPORT | 19 |
SCHEDULE OF INVESTMENTS (Unaudited)(continued) | March 31, 2017 |
| TOTAL RETURN BOND FUND | |
| | | Face
Amount3 | | | Value | |
| | | | | | | |
| Turbine Engines Securitization Ltd. | | | | | | |
2013-1A, 5.13% due 12/13/4815 | | $ | 1,094,729 | | | $ | 1,084,378 | |
| Willis Engine Securitization Trust II | | | | | | | | |
2012-A, 5.50% due 09/15/376 | | | 1,055,642 | | | | 1,047,724 | |
| AASET | | | | | | | | |
| 2014-1 C, 10.41% due 12/15/29 | | | 991,889 | | | | 989,409 | |
| Airplanes Pass Through Trust | | | | | | | | |
2001-1A, 1.46% due 03/15/195,15 | | | 740,322 | | | | 229,500 | |
| Total Transport-Aircraft | | | | | | | 181,753,360 | |
| | | | | | | | | |
| Net Lease - 1.9% | |
| Capital Automotive REIT | | | | | | | | |
2017-1A, 3.87% due 04/15/476 | | | 49,950,000 | | | | 49,935,520 | |
2014-1A, 3.66% due 10/15/446 | | | 4,500,000 | | | | 4,385,043 | |
| Store Master Funding I-VII | | | | | | | | |
2016-1A, 3.96% due 10/20/466 | | | 30,973,729 | | | | 29,610,885 | |
2016-1A, 4.32% due 10/20/466 | | | 7,400,000 | | | | 7,429,422 | |
| Spirit Master Funding LLC | | | | | | | | |
2014-2A, 5.76% due 03/20/426 | | | 4,938,032 | | | | 5,172,588 | |
2014-4A, 4.63% due 01/20/456 | | | 4,250,000 | | | | 4,170,820 | |
| Store Master Funding I LLC | | | | | | | | |
2015-1A, 4.17% due 04/20/456 | | | 5,792,947 | | | | 5,704,147 | |
2015-1A, 3.75% due 04/20/456 | | | 1,485,625 | | | | 1,463,272 | |
| Store Master Funding LLC | | | | | | | | |
2012-1A, 5.77% due 08/20/426 | | | 1,770,251 | | | | 1,783,211 | |
2013-1A, 4.16% due 03/20/436 | | | 1,727,225 | | | | 1,713,486 | |
| Total Net Lease | | | | | | | 111,368,394 | |
| | | | | | | | | |
| Whole Business - 0.8% | |
| Taco Bell Funding LLC | | | | | | | | |
2016-1A, 4.97% due 05/25/466 | | | 27,462,000 | | | | 27,875,084 | |
2016-1A, 4.38% due 05/25/466 | | | 5,273,500 | | | | 5,341,855 | |
| Wendys Funding LLC | | | | | | | | |
2015-1A, 4.50% due 06/15/456 | | | 7,830,750 | | | | 7,623,016 | |
| Drug Royalty III Limited Partnership | | | | | | | | |
2016-1A, 3.98% due 04/15/276 | | | 3,824,269 | | | | 3,824,665 | |
| Sonic Capital LLC | | | | | | | | |
2016-1A, 4.47% due 05/20/466 | | | 2,485,417 | | | | 2,449,276 | |
| Total Whole Business | | | | | | | 47,113,896 | |
| | | | | | | | | |
| Industrial - 0.1% | |
| Agnico-Eagle Mines Ltd. | | | | | | | | |
4.84% due 06/30/26†††,1 | | | 6,000,000 | | | | 5,967,026 | |
| | | | | | | | | |
| Insurance - 0.1% | |
| Chesterfield Financial Holdings LLC | | | | | | | | |
2014-1A, 4.50% due 12/15/346 | | | 4,950,000 | | | | 4,927,181 | |
| | | | | | | | | |
| Financial - 0.1% | |
| Industrial DPR Funding Ltd. | | | | | | | | |
2016-1A, 5.24% due 04/15/26†††,6 | | | 4,000,000 | | | | 3,880,345 | |
| Hana Small Business Lending Loan Trust | | | | | | | | |
2014-2014, 3.68% due 01/25/405,6 | | | 905,181 | | | | 890,336 | |
| Total Financial | | | | | | | 4,770,681 | |
| | | | | | | | | |
| Transport-Container - 0.0%** | |
| CLI Funding V LLC | | | | | | | | |
2013-2A, 3.22% due 06/18/286 | | | 1,384,777 | | | | 1,335,424 | |
20 | THE GUGGENHEIM FUNDS SEMI-ANNUAL REPORT | SEE NOTES TO FINANCIAL STATEMENTS. |
SCHEDULE OF INVESTMENTS (Unaudited)(continued) | March 31, 2017 |
| TOTAL RETURN BOND FUND | |
| | | Face
Amount3 | | | Value | |
| | | | | | | |
| Diversified Payment Rights - 0.0%** | |
| CCR Incorporated MT100 Payment Rights Master Trust | | | | | | |
2012-CA, 4.75% due 07/10/226 | | $ | 723,810 | | | $ | 732,068 | |
| CCR, Inc. MT100 Payment Rights Master Trust | | | | | | | | |
2010-CX, 1.30% due 07/10/175 | | | 210,470 | | | | 210,053 | |
| Garanti Diversified Payment Rights Finance Co. | | | | | | | | |
2007-A, 1.20% due 07/09/175 | | | 208,000 | | | | 207,525 | |
| Total Diversified Payment Rights | | | | 1,149,646 | |
| | | | | | | | | |
| Total Asset-Backed Securities | | | | | |
| (Cost $2,354,851,264) | | | | | | | 2,374,755,709 | |
| | | | | | | | | |
COLLATERALIZED MORTGAGE OBLIGATIONS†† - 31.3% | |
| Residential Mortgage Backed Securities - 21.8% | |
| RALI Series Trust | | | | | | | | |
2006-QO5, 1.20% due 05/25/465 | | | 27,612,163 | | | | 24,522,754 | |
2006-QO10, 1.14% due 01/25/375 | | | 16,406,108 | | | | 13,916,592 | |
2007-QO4, 1.17% due 05/25/475 | | | 13,731,741 | | | | 12,379,863 | |
2006-QO2, 1.20% due 02/25/465 | | | 22,548,824 | | | | 9,774,963 | |
2007-QO2, 1.13% due 02/25/475 | | | 13,894,070 | | | | 8,238,881 | |
2007-QO4, 1.18% due 05/25/475 | | | 6,387,420 | | | | 5,764,406 | |
2005-QO1, 1.28% due 08/25/355 | | | 6,458,826 | | | | 5,147,630 | |
2005-QO1, 2.14% due 08/25/355 | | | 4,270,664 | | | | 3,704,008 | |
2006-QS8, 1.43% due 08/25/365 | | | 5,432,822 | | | | 3,495,335 | |
2006-QO2, 1.25% due 02/25/465 | | | 5,966,913 | | | | 2,645,896 | |
2007-QO3, 1.14% due 03/25/475 | | | 2,606,353 | | | | 2,120,450 | |
| CIT Mortgage Loan Trust | | | | | | | | |
2007-1, 2.33% due 10/25/375,6 | | | 84,382,335 | | | | 83,778,544 | |
2007-1, 2.43% due 10/25/375,6 | | | 7,086,943 | | | | 6,939,033 | |
| LSTAR Securities Investment Ltd. | | | | | | | | |
2016-4, 2.78% due 10/01/215,6 | | | 28,892,787 | | | | 28,662,194 | |
2017-1, 2.78% due 01/01/225,6 | | | 18,797,608 | | | | 18,750,614 | |
2016-5, 2.78% due 11/01/215,6 | | | 16,824,273 | | | | 16,738,738 | |
2016-3, 2.78% due 09/01/215,6 | | | 14,690,142 | | | | 14,505,122 | |
2015-6, 2.78% due 05/01/205,6 | | | 3,416,280 | | | | 3,403,469 | |
| FirstKey Master Funding | | | | | | | | |
2017-R1, 1.01% due 11/03/415,6 | | | 64,850,000 | | | | 63,712,148 | |
| American Home Mortgage Investment Trust | | | | | | | | |
2007-1, 2.08% due 05/25/478 | | | 225,682,858 | | | | 41,417,205 | |
2006-1, 1.26% due 03/25/465 | | | 8,433,059 | | | | 6,946,177 | |
2006-1, 1.38% due 03/25/465 | | | 3,783,164 | | | | 3,142,139 | |
| LSTAR Commercial Mortgage Trust | | | | | | | | |
2016-7, 2.78% due 12/01/215,6 | | | 41,733,452 | | | | 41,368,283 | |
| VOLT L LLC | | | | | | | | |
2016-NP10, 3.50% due 09/25/465,6 | | | 37,118,963 | | | | 37,351,271 | |
| CIM Trust | | | | | | | | |
2017-2, 2.78% due 12/25/575,6 | | | 37,500,000 | | | | 37,219,819 | |
| Bayview Opportunity Master Fund IIIa Trust | | | | | | | | |
2016-RN3, 3.60% due 09/29/315,6 | | | 35,469,618 | | | | 35,416,776 | |
| GCAT | | | | | | | | |
| A1, 3.38% due 03/25/47 | | | 34,000,000 | | | | 33,967,495 | |
| SEE NOTES TO FINANCIAL STATEMENTS. | THE GUGGENHEIM FUNDS SEMI-ANNUAL REPORT | 21 |
SCHEDULE OF INVESTMENTS (Unaudited)(continued) | March 31, 2017 |
| TOTAL RETURN BOND FUND | |
| | | Face
Amount3 | | | Value | |
| | | | | | | |
| Countrywide Asset-Backed Certificates | | | | | | |
2006-6, 1.15% due 09/25/365 | | $ | 33,691,563 | | | $ | 31,409,192 | |
2005-15, 1.43% due 03/25/365 | | | 1,500,000 | | | | 1,230,474 | |
| First NLC Trust | | | | | | | | |
2005-4, 1.37% due 02/25/365 | | | 30,550,000 | | | | 28,686,819 | |
2005-1, 1.44% due 05/25/355 | | | 3,440,397 | | | | 2,977,952 | |
| Stanwich Mortgage Loan Co. | | | | | | | | |
2016-NPA1, 3.84% due 10/16/465,6 | | | 29,609,826 | | | | 29,567,384 | |
| Bayview Opportunity Master Fund IVb Trust | | | | | | | | |
2017-NPL1, 3.60% due 01/28/326 | | | 18,749,061 | | | | 18,698,778 | |
2017-RN1, 3.60% due 02/28/325,6 | | | 9,442,842 | | | | 9,429,035 | |
| LSTAR Securities Investment Trust | | | | | | | | |
2016-2, 2.78% due 03/01/215,6 | | | 23,885,231 | | | | 23,765,805 | |
2015-10, 2.78% due 11/02/205,6 | | | 3,358,432 | | | | 3,357,382 | |
| Credit-Based Asset Servicing & Securitization LLC | | | | | | | | |
2006-CB2, 1.17% due 12/25/365 | | | 26,736,867 | | | | 24,826,072 | |
| VOLT XLI LLC | | | | | | | | |
2016-NPL1, 4.25% due 02/26/466,13 | | | 23,558,836 | | | | 23,671,174 | |
| VOLT LI LLC | | | | | | | | |
2016-NP11, 3.50% due 10/25/466 | | | 22,102,280 | | | | 22,264,520 | |
| VOLT LIV LLC | | | | | | | | |
2017-NPL1, 3.63% due 02/25/475,6 | | | 19,750,000 | | | | 19,680,697 | |
| VOLT LIII LLC | | | | | | | | |
2016-NP13, 3.88% due 12/26/466 | | | 19,618,754 | | | | 19,569,391 | |
| American Home Mortgage Assets Trust | | | | | | | | |
2006-4, 1.17% due 10/25/465 | | | 14,723,694 | | | | 9,698,697 | |
2007-1, 1.34% due 02/25/475 | | | 12,289,042 | | | | 7,126,700 | |
2006-5, 1.56% due 11/25/465 | | | 5,143,718 | | | | 2,627,561 | |
| WaMu Mortgage Pass-Through Certificates Series Trust | | | | | | | | |
2007-OA6, 1.42% due 07/25/475 | | | 10,850,341 | | | | 9,368,957 | |
2007-OA3, 1.41% due 04/25/475 | | | 7,034,709 | | | | 5,743,944 | |
2006-AR13, 1.52% due 10/25/465 | | | 2,492,158 | | | | 2,174,504 | |
2006-AR11, 1.56% due 09/25/465 | | | 1,998,134 | | | | 1,589,335 | |
| CSMC Series | | | | | | | | |
2015-12R, 1.27% due 11/30/375,6 | | | 19,537,079 | | | | 18,425,479 | |
| Washington Mutual Mortgage Pass-Through Certificates WMALT Series Trust | | | | | | | | |
2006-AR9, 1.47% due 11/25/465 | | | 20,952,928 | | | | 15,277,360 | |
| 2006-7, 4.41% due 09/25/36 | | | 3,087,170 | | | | 1,607,239 | |
2006-AR9, 1.48% due 11/25/465 | | | 1,285,679 | | | | 1,031,166 | |
| 2006-8, 4.56% due 10/25/36 | | | 533,368 | | | | 323,450 | |
| Deutsche Alt-A Securities Mortgage Loan Trust Series | | | | | | | | |
2006-AF1, 1.08% due 04/25/365 | | | 11,234,710 | | | | 9,824,989 | |
2007-OA2, 1.41% due 04/25/475 | | | 5,172,549 | | | | 4,389,392 | |
2006-OA1, 1.18% due 02/25/475 | | | 4,458,030 | | | | 3,994,553 | |
22 | THE GUGGENHEIM FUNDS SEMI-ANNUAL REPORT | SEE NOTES TO FINANCIAL STATEMENTS. |
SCHEDULE OF INVESTMENTS (Unaudited)(continued) | March 31, 2017 |
| TOTAL RETURN BOND FUND | |
| | | Face
Amount3 | | | Value | |
| | | | | | | |
| VOLT LII LLC | | | | | | |
2016-NP12, 3.63% due 11/26/466 | | $ | 18,037,502 | | | $ | 17,961,887 | |
| Lehman XS Trust Series | | | | | | | | |
2007-2N, 1.16% due 02/25/375 | | | 11,523,152 | | | | 7,969,082 | |
2007-15N, 1.23% due 08/25/375 | | | 6,077,034 | | | | 5,197,502 | |
2005-7N, 1.25% due 12/25/355 | | | 3,088,235 | | | | 2,911,586 | |
| Impac Secured Assets CMN Owner Trust | | | | | | | | |
2005-2, 1.23% due 03/25/365 | | | 17,692,619 | | | | 15,858,676 | |
| Wachovia Asset Securitization Issuance II LLC Trust | | | | | | | | |
2007-HE1, 1.12% due 07/25/375,6 | | | 9,042,685 | | | | 8,279,988 | |
2007-HE2A, 1.11% due 07/25/375,6 | | | 7,439,708 | | | | 6,654,334 | |
| VOLT XLVIII LLC | | | | | | | | |
2016-NPL8, 3.50% due 07/25/466 | | | 14,843,522 | | | | 14,923,673 | |
| GSMSC Resecuritization Trust | | | | | | | | |
2015-5R, 0.91% due 02/26/375,6 | | | 15,899,146 | | | | 14,139,610 | |
| Nomura Resecuritization Trust | | | | | | | | |
2016-1R, 3.78% due 01/28/38†††,5,6 | | | 9,630,973 | | | | 9,671,685 | |
2015-4R, 1.66% due 03/26/365,6 | | | 2,398,254 | | | | 2,287,694 | |
2015-4R, 1.49% due 12/26/365,6 | | | 1,755,054 | | | | 1,638,724 | |
2012-1R, 1.22% due 08/27/475,6 | | | 137,691 | | | | 136,645 | |
| VOLT XXXIX LLC | | | | | | | | |
2015-NP13, 4.13% due 10/25/456 | | | 12,386,445 | | | | 12,413,357 | |
| Citigroup Mortgage Loan Trust, Inc. | | | | | | | | |
2005-HE3, 1.72% due 09/25/355 | | | 11,687,000 | | | | 11,143,564 | |
| VOLT XL LLC | | | | | | | | |
2015-NP14, 4.38% due 11/27/456 | | | 10,517,368 | | | | 10,620,208 | |
| NRPL Trust | | | | | | | | |
2015-1A, 3.88% due 11/01/546 | | | 7,274,037 | | | | 7,227,344 | |
2014-2A, 3.75% due 10/25/575,6 | | | 3,111,357 | | | | 3,133,565 | |
| Banc of America Funding Trust | | | | | | | | |
2014-R7, 0.92% due 09/26/365,6 | | | 6,419,296 | | | | 6,159,314 | |
2015-R4, 0.95% due 01/27/355,6 | | | 3,984,346 | | | | 3,737,338 | |
| Alternative Loan Trust | | | | | | | | |
2007-OA7, 0.96% due 05/25/475 | | | 6,128,750 | | | | 5,198,075 | |
2005-38, 1.68% due 09/25/355 | | | 5,141,161 | | | | 4,500,942 | |
| First Franklin Mortgage Loan Trust | | | | | | | | |
2004-FF10, 2.26% due 07/25/345 | | | 9,970,558 | | | | 9,651,070 | |
| VOLT XXXVI LLC | | | | | | | | |
2015-NP10, 3.63% due 07/25/455,6 | | | 9,605,998 | | | | 9,629,226 | |
| VOLT XXXIII LLC | | | | | | | | |
2015-NPL5, 3.50% due 03/25/556 | | | 9,370,375 | | | | 9,405,271 | |
| HarborView Mortgage Loan Trust | | | | | | | | |
2006-14, 1.13% due 01/25/475 | | | 10,328,164 | | | | 8,810,625 | |
| Soundview Home Loan Trust | | | | | | | | |
2007-1, 1.15% due 03/25/375 | | | 5,105,871 | | | | 4,897,214 | |
2005-OPT3, 1.45% due 11/25/355 | | | 3,930,000 | | | | 3,544,941 | |
| Bayview Opportunity Master Fund Trust | | | | | | | | |
2016-LT1, 3.47% due 10/28/315,6 | | | 8,402,346 | | | | 8,360,566 | |
| SEE NOTES TO FINANCIAL STATEMENTS. | THE GUGGENHEIM FUNDS SEMI-ANNUAL REPORT | 23 |
SCHEDULE OF INVESTMENTS (Unaudited)(continued) | March 31, 2017 |
| TOTAL RETURN BOND FUND | |
| | | Face
Amount3 | | | Value | |
| | | | | | | |
| VOLT XXVII LLC | | | | | | |
2014-NPL7, 3.38% due 08/27/576 | | $ | 8,002,314 | | | $ | 7,993,190 | |
| Morgan Stanley ABS Capital I Incorporated Trust | | | | | | | | |
2006-NC1, 1.36% due 12/25/355 | | | 7,800,000 | | | | 7,273,139 | |
| Bear Stearns Asset Backed Securities I Trust | | | | | | | | |
2006-HE3, 1.34% due 04/25/365 | | | 7,600,000 | | | | 7,204,932 | |
| Morgan Stanley Resecuritization Trust | | | | | | | | |
2014-R9, 0.91% due 11/26/465,6 | | | 7,403,934 | | | | 6,976,727 | |
| Structured Asset Investment Loan Trust | | | | | | | | |
2005-11, 1.34% due 01/25/365 | | | 7,689,989 | | | | 6,952,767 | |
| IndyMac INDX Mortgage Loan Trust | | | | | | | | |
2005-AR18, 1.76% due 10/25/365 | | | 9,353,238 | | | | 6,721,842 | |
| JP Morgan Mortgage Acquisition Trust | | | | | | | | |
2006-HE2, 1.12% due 07/25/365 | | | 6,957,211 | | | | 6,688,067 | |
| ASG Resecuritization Trust | | | | | | | | |
2010-3, 1.07% due 12/28/455,6 | | | 7,448,451 | | | | 6,379,773 | |
| Vericrest Opportunity Loan Trust | | | | | | | | |
2015-NPL3, 3.38% due 10/25/586 | | | 6,389,314 | | | | 6,364,261 | |
| VOLT XXXIV LLC | | | | | | | | |
2015-NPL7, 3.25% due 02/25/555,6 | | | 5,033,961 | | | | 5,026,189 | |
| Park Place Securities Incorporated Asset-Backed Pass-Through Certificates Series | | | | | | | | |
2005-WCW2, 1.51% due 07/25/355 | | | 5,000,000 | | | | 4,728,089 | |
| BCAP LLC | | | | | | | | |
2014-RR2, 1.07% due 03/26/365,6 | | | 3,357,490 | | | | 3,294,075 | |
2014-RR3, 0.92% due 10/26/365,6 | | | 1,443,798 | | | | 1,409,159 | |
| VOLT XLII LLC | | | | | | | | |
2016-NPL2, 4.25% due 03/26/466 | | | 4,564,423 | | | | 4,598,744 | |
| AJAX Mortgage Loan Trust | | | | | | | | |
2015-A, 3.88% due 11/25/545,6 | | | 3,888,072 | | | | 3,878,166 | |
| Luminent Mortgage Trust | | | | | | | | |
2006-2, 1.18% due 02/25/465 | | | 5,101,828 | | | | 3,789,093 | |
| GSAA Home Equity Trust | | | | | | | | |
2006-14, 1.15% due 09/25/365 | | | 6,018,902 | | | | 3,129,063 | |
2007-7, 1.25% due 07/25/375 | | | 454,840 | | | | 413,293 | |
| CWABS Asset-Backed Certificates Trust | | | | | | | | |
2004-15, 2.33% due 04/25/355 | | | 3,490,000 | | | | 3,404,527 | |
| GSAA Trust | | | | | | | | |
2005-10, 1.96% due 06/25/355 | | | 3,312,000 | | | | 3,112,048 | |
| Nationstar HECM Loan Trust | | | | | | | | |
2016-1A, 2.98% due 02/25/266 | | | 2,250,958 | | | | 2,250,958 | |
| Impac Secured Assets Trust | | | | | | | | |
2006-2, 1.15% due 08/25/365 | | | 2,658,066 | | | | 2,152,606 | |
| RFMSI Series Trust | | | | | | | | |
| 2006-S11, 6.00% due 11/25/36 | | | 2,204,785 | | | | 1,933,726 | |
| GreenPoint Mortgage Funding Trust | | | | | | | | |
2005-HE4, 1.45% due 07/25/305 | | | 1,942,626 | | | | 1,909,455 | |
| GCAT LLC | | | | | | | | |
2015-1, 3.63% due 05/26/205,6 | | | 1,503,540 | | | | 1,503,691 | |
24 | THE GUGGENHEIM FUNDS SEMI-ANNUAL REPORT | SEE NOTES TO FINANCIAL STATEMENTS. |
SCHEDULE OF INVESTMENTS (Unaudited)(continued) | March 31, 2017 |
| TOTAL RETURN BOND FUND | |
| | | Face
Amount3 | | | Value | |
| | | | | | | |
| Structured Asset Securities Corporation Mortgage Loan Trust | | | | | | |
2006-BC6, 1.15% due 01/25/375 | | $ | 1,087,842 | | | $ | 1,024,590 | |
| Irwin Home Equity Loan Trust | | | | | | | | |
2007-1, 5.85% due 08/25/376 | | | 1,019,890 | | | | 996,366 | |
| UCFC Manufactured Housing Contract | | | | | | | | |
| 1997-2, 7.38% due 10/15/28 | | | 871,410 | | | | 898,849 | |
| Alliance Bancorp Trust | | | | | | | | |
2007-OA1, 1.22% due 07/25/375 | | | 1,173,092 | | | | 853,611 | |
| GSAMP Trust | | | | | | | | |
2005-HE6, 1.42% due 11/25/355 | | | 781,380 | | | | 768,456 | |
| Morgan Stanley Re-REMIC Trust | | | | | | | | |
2010-R5, 1.60% due 06/26/366 | | | 446,136 | | | | 326,741 | |
| Total Residential Mortgage Backed Securities | | | | 1,257,387,705 | |
| | | | | | | | | |
| Commercial Mortgage Backed Securities - 7.2% | |
| Citigroup Commercial Mortgage Trust | | | | | | | | |
2016-GC36, 4.76% due 02/10/495 | | | 23,800,000 | | | | 24,585,333 | |
2016-P5, 4.32% due 10/10/495 | | | 5,950,000 | | | | 5,663,631 | |
2016-C2, 1.80% due 08/10/495 | | | 34,480,088 | | | | 4,363,441 | |
2016-P4, 2.01% due 07/10/495 | | | 32,880,527 | | | | 4,265,019 | |
2016-P5, 1.56% due 10/10/495 | | | 31,891,407 | | | | 3,192,046 | |
2016-GC37, 1.81% due 04/10/495 | | | 19,283,447 | | | | 2,294,011 | |
2015-GC35, 0.90% due 11/10/485 | | | 34,235,261 | | | | 1,784,989 | |
2015-GC29, 1.16% due 04/10/485 | | | 24,795,430 | | | | 1,601,212 | |
2013-GC15, 4.37% due 09/10/465 | | | 380,000 | | | | 411,636 | |
| Chicago Skyscraper Trust | | | | | | | | |
2017-SKY, 1.71% due 04/15/305,6 | | | 38,500,000 | | | | 38,521,559 | |
| Cosmopolitan Hotel Trust | | | | | | | | |
2016-CSMO, 3.01% due 11/15/335,6 | | | 15,500,000 | | | | 15,664,478 | |
2016-CSMO, 3.56% due 11/15/335,6 | | | 13,100,000 | | | | 13,279,897 | |
2016-CSMO, 4.41% due 11/15/335,6 | | | 6,600,000 | | | | 6,707,107 | |
| JPMDB Commercial Mortgage Securities Trust | | | | | | | | |
2016-C2, 3.40% due 06/15/495 | | | 14,300,000 | | | | 13,430,248 | |
2017-C5, 1.18% due 03/15/505 | | | 134,710,000 | | | | 10,118,068 | |
2016-C2, 1.71% due 06/15/495 | | | 33,013,410 | | | | 3,320,406 | |
2016-C4, 3.10% due 12/15/495 | | | 3,500,000 | | | | 3,196,262 | |
2016-C4, 0.85% due 12/15/495 | | | 33,947,987 | | | | 2,140,757 | |
| Wells Fargo Commercial Mortgage Trust | | | | | | | | |
2016-C32, 1.36% due 01/15/595 | | | 125,213,536 | | | | 10,530,045 | |
2017-RB1, 1.45% due 03/15/505 | | | 40,025,513 | | | | 3,982,539 | |
2016-C35, 2.01% due 07/15/485 | | | 27,572,908 | | | | 3,614,342 | |
2016-NXS5, 1.57% due 01/15/595 | | | 30,717,142 | | | | 2,767,802 | |
2015-NXS4, 0.96% due 12/15/485 | | | 39,667,639 | | | | 2,354,703 | |
2017-RC1, 1.74% due 01/15/605 | | | 21,348,259 | | | | 2,339,669 | |
2015-P2, 1.03% due 12/15/485 | | | 34,791,168 | | | | 2,142,409 | |
2015-C30, 1.01% due 09/15/585 | | | 33,480,376 | | | | 2,095,453 | |
2016-C32, 4.72% due 01/15/595 | | | 1,400,000 | | | | 1,456,265 | |
| SEE NOTES TO FINANCIAL STATEMENTS. | THE GUGGENHEIM FUNDS SEMI-ANNUAL REPORT | 25 |
SCHEDULE OF INVESTMENTS (Unaudited)(continued) | March 31, 2017 |
| TOTAL RETURN BOND FUND | |
| | | Face
Amount3 | | | Value | |
| | | | | | | |
2015-NXS1, 1.19% due 05/15/485 | | $ | 11,813,640 | | | $ | 761,354 | |
2015-NXS4, 4.22% due 12/15/485 | | | 64,000 | | | | 65,973 | |
| COMM Mortgage Trust | | | | | | | | |
2015-CR27, 4.47% due 10/10/585 | | | 5,750,000 | | | | 5,813,464 | |
2015-CR26, 1.05% due 10/10/485 | | | 92,954,277 | | | | 5,796,127 | |
2013-CR13, 4.75% due 12/10/235 | | | 4,650,000 | | | | 4,790,376 | |
2015-CR26, 4.49% due 10/10/485 | | | 3,780,000 | | | | 3,618,458 | |
2015-CR24, 4.38% due 08/10/485 | | | 2,967,000 | | | | 3,012,913 | |
2015-CR23, 1.00% due 05/10/485 | | | 49,269,853 | | | | 2,639,120 | |
2015-CR27, 1.16% due 10/10/485 | | | 31,665,320 | | | | 2,042,556 | |
2013-CR13, 0.94% due 12/10/235 | | | 51,997,259 | | | | 1,996,892 | |
2014-LC15, 1.35% due 04/10/475 | | | 15,182,720 | | | | 878,199 | |
| 2015-CR23, 3.80% due 05/10/48 | | | 700,000 | | | | 720,252 | |
| JP Morgan Chase Commercial Mortgage Securities Trust | | | | | | | |
2016-WIKI, 4.01% due 10/05/315,6 | | | 17,000,000 | | | | 16,614,726 | |
2016-JP3, 1.52% due 08/15/495 | | | 74,764,368 | | | | 7,509,954 | |
2015-JP1, 4.74% due 01/15/495 | | | 2,800,000 | | | | 2,917,723 | |
2016-WSP, 3.06% due 08/15/335,6 | | | 5,000,000 | | | | 5,005,250 | |
| GAHR Commercial Mortgage Trust | | | | | | | | |
2015-NRF, 3.38% due 12/15/345,6 | | | 21,950,000 | | | | 21,115,966 | |
| GS Mortgage Securities Corporation Trust | | | | | | | | |
2016-ICE2, 5.16% due 02/15/335,6 | | | 18,000,000 | | | | 18,422,458 | |
| VSD | | | | | | | | |
| 2017-PLT1 A, 3.60% due 12/25/43 | | | 17,500,000 | | | | 17,455,760 | |
| JPMCC Commercial Mortgage Securities Trust | | | | | | | | |
2017-JP5, 1.28% due 03/15/505 | | | 215,016,000 | | | | 16,303,459 | |
| Motel 6 Trust | | | | | | | | |
2015-MTL6, 5.28% due 02/05/306 | | | 15,000,000 | | | | 15,076,679 | |
| Morgan Stanley Bank of America Merrill Lynch Trust | | | | | | | | |
2014-C19, 4.75% due 12/15/46†††,6 | | | 7,318,000 | | | | 7,310,592 | |
2015-C27, 1.04% due 12/15/475 | | | 41,492,193 | | | | 2,558,496 | |
| Morgan Stanley Capital I Trust | | | | | | | | |
2015-XLF1, 3.09% due 08/14/315,6 | | | 7,600,000 | | | | 7,610,929 | |
2016-UBS9, 4.55% due 03/15/495 | | | 275,000 | | | | 270,096 | |
| JPMBB Commercial Mortgage Securities Trust | | | | | | | | |
2015-C31, 4.62% due 08/15/485 | | | 3,253,000 | | | | 3,041,999 | |
2013-C17, 4.89% due 01/15/475 | | | 2,500,000 | | | | 2,560,481 | |
2013-C12, 0.70% due 07/15/455 | | | 50,177,352 | | | | 1,201,612 | |
| CSAIL Commercial Mortgage Trust | | | | | | | | |
2015-C1, 0.95% due 04/15/505 | | | 58,138,941 | | | | 3,161,119 | |
2016-C6, 4.75% due 01/15/495 | | | 3,000,000 | | | | 3,110,586 | |
| CDGJ Commercial Mortgage Trust | | | | | | | | |
2014-BXCH, 3.41% due 12/15/275,6 | | | 3,000,000 | | | | 3,012,639 | |
2014-BXCH, 5.16% due 12/15/275,6 | | | 1,798,536 | | | | 1,810,932 | |
26 | THE GUGGENHEIM FUNDS SEMI-ANNUAL REPORT | SEE NOTES TO FINANCIAL STATEMENTS. |
SCHEDULE OF INVESTMENTS (Unaudited)(continued) | March 31, 2017 |
| TOTAL RETURN BOND FUND | |
| | | Face
Amount3 | | | Value | |
| | | | | | | |
| BAMLL Commercial Mortgage Securities Trust | | | | | | |
2014-ICTS, 2.81% due 06/15/285,6 | | $ | 3,480,000 | | | $ | 3,360,400 | |
2014-ICTS, 3.86% due 06/15/285,6 | | | 1,500,000 | | | | 1,452,109 | |
| FREMF Mortgage Trust | | | | | | | | |
2013-K29, 0.13% due 05/25/466,9 | | | 820,388,451 | | | | 4,756,448 | |
| DBWF Mortgage Trust | | | | | | | | |
2015-LCM, 3.42% due 06/10/345,6 | | | 5,000,000 | | | | 4,330,097 | |
| DBJPM Mortgage Trust | | | | | | | | |
2016-C1, 3.35% due 05/10/495 | | | 4,450,000 | | | | 4,176,827 | |
| CD Mortgage Trust | | | | | | | | |
2016-CD1, 1.44% due 08/10/495 | | | 35,954,378 | | | | 3,487,923 | |
| CFCRE Commercial Mortgage Trust | | | | | | | | |
2016-C3, 1.09% due 01/10/485 | | | 40,620,578 | | | | 2,900,492 | |
| CD Commerical Mortgage Trust | | | | | | | | |
2017-CD3, 1.05% due 02/10/505 | | | 35,083,560 | | | | 2,780,021 | |
| BXHTL Mortgage Trust | | | | | | | | |
2015-JWRZ, 3.76% due 05/15/295,6 | | | 2,500,000 | | | | 2,511,764 | |
| Banc of America Commercial Mortgage Trust | | | | | | | | |
2017-BNK3, 1.15% due 02/15/505 | | | 24,585,220 | | | | 2,060,116 | |
| Hyatt Hotel Portfolio Trust | | | | | | | | |
2015-HYT, 3.96% due 11/15/295,6 | | | 2,000,000 | | | | 2,011,885 | |
| BLCP Hotel Trust | | | | | | | | |
2014-CLRN, 3.41% due 08/15/295,6 | | | 1,795,000 | | | | 1,800,073 | |
| CSMC Trust | | | | | | | | |
2015-SAND, 3.76% due 08/15/305,6 | | | 1,700,000 | | | | 1,703,701 | |
| Freddie Mac Multifamily Structured Pass Through Certificates | | | | | | | | |
2015-K043, 0.55% due 12/25/245 | | | 44,738,571 | | | | 1,602,348 | |
| GS Mortgage Securities Trust | | | | | | | | |
2015-GC28, 1.15% due 02/10/485 | | | 21,608,546 | | | | 1,273,469 | |
| WFRBS Commercial Mortgage Trust | | | | | | | | |
2013-C12, 1.38% due 03/15/485,6 | | | 13,906,313 | | | | 741,909 | |
| LSTAR Commercial Mortgage Trust | | | | | | | | |
2014-2, 4.91% due 01/20/415,6 | | | 500,000 | | | | 503,254 | |
| GS Mortgage Securities Corporation II | | | | | | | | |
| 2013-GC10, 2.94% due 02/10/46 | | | 225,000 | | | | 227,245 | |
| GreenPoint Mortgage Funding Trust | | | | | | | | |
2007-AR1, 1.06% due 02/25/475 | | | 24 | | | | 24 | |
| Total Commercial Mortgage Backed Securities | | | | 415,710,572 | |
| | | | | | | | | |
| Military Housing - 1.3% | |
| GMAC Commercial Mortgage Asset Corp. | | | | | | | | |
2007-HCKM, 6.11% due 08/10/52†††,15 | | | 22,832,105 | | | | 23,133,768 | |
2003-PRES, 6.24% due 10/10/416 | | | 10,957,451 | | | | 12,506,988 | |
2005-DRUM, 5.47% due 05/10/50†††,15 | | | 4,708,255 | | | | 4,585,494 | |
2005-BLIS, 5.25% due 07/10/50†††,15 | | | 2,500,000 | | | | 2,327,843 | |
| Capmark Military Housing Trust | | | | | | | | |
2008-AMCW, 6.90% due 07/10/55†††,15 | | | 8,433,488 | | | | 9,785,618 | |
2007-AETC, 5.75% due 02/10/5215 | | | 8,284,304 | | | | 8,097,410 | |
| SEE NOTES TO FINANCIAL STATEMENTS. | THE GUGGENHEIM FUNDS SEMI-ANNUAL REPORT | 27 |
SCHEDULE OF INVESTMENTS (Unaudited)(continued) | March 31, 2017 |
| TOTAL RETURN BOND FUND | |
| | | Face
Amount3 | | | Value | |
| | | | | | | |
2007-ROBS, 6.06% due 10/10/5215 | | $ | 4,805,985 | | | $ | 4,823,238 | |
2006-RILY, 1.23% due 07/10/51†††,5,6 | | | 7,203,608 | | | | 4,331,516 | |
2007-AET2, 6.06% due 10/10/5215 | | | 2,185,659 | | | | 2,260,540 | |
| Total Military Housing | | | | | | | 71,852,415 | |
| | | | | | | | | |
| Government Agency - 0.7% | |
| Fannie Mae | | | | | | | | |
| #BA1742, 3.50% due 12/01/45 | | | 8,376,195 | | | | 8,571,883 | |
| #AS6528, 4.00% due 01/01/46 | | | 4,043,775 | | | | 4,247,269 | |
| #AL6307, 4.50% due 02/01/45 | | | 2,283,861 | | | | 2,453,275 | |
| #AS7580, 3.00% due 07/01/46 | | | 2,283,901 | | | | 2,265,273 | |
| #AS2523, 5.00% due 05/01/44 | | | 1,272,139 | | | | 1,398,118 | |
| #AX3215, 4.50% due 09/01/44 | | | 1,276,442 | | | | 1,369,940 | |
| #AL4290, 4.50% due 10/01/43 | | | 1,003,302 | | | | 1,076,762 | |
| #AL6671, 5.00% due 12/01/44 | | | 847,603 | | | | 931,540 | |
| #MA1525, 3.50% due 08/01/43 | | | 836,608 | | | | 859,219 | |
| #AN3562, 3.63% due 01/01/37 | | | 748,645 | | | | 749,698 | |
| #AN3620, 2.75% due 11/01/31 | | | 676,508 | | | | 644,275 | |
| #AS7386, 3.50% due 06/01/46 | | | 99,113 | | | | 101,402 | |
| Freddie Mac | | | | | | | | |
| #G08694, 4.00% due 02/01/46 | | | 3,788,659 | | | | 3,979,024 | |
| #G60038, 3.50% due 01/01/44 | | | 3,307,281 | | | | 3,394,181 | |
| #G08677, 4.00% due 11/01/45 | | | 2,934,523 | | | | 3,081,117 | |
| #G08715, 3.00% due 08/01/46 | | | 2,310,558 | | | | 2,290,046 | |
| Freddie Mac Multifamily Structured Pass Through Certificates | | | | | | | | |
| 2014-K715, 2.86% due 01/25/21 | | | 450,000 | | | | 461,390 | |
| Total Government Agency | | | | | | | 37,874,412 | |
| | | | | | | | | |
| Financial - 0.3% | |
| Station Place Securitization Trust | | | | | | | | |
2017-1, 2.23% due 02/25/49���††,5,6 | | | 8,000,000 | | | | 7,991,573 | |
2017-1, 3.23% due 02/25/49†††,5,6 | | | 7,000,000 | | | | 6,992,746 | |
| Total Financial | | | | | | | 14,984,319 | |
| Total Collateralized Mortgage Obligations | | | | | |
| (Cost $1,790,452,163) | | | | | | | 1,797,809,423 | |
| | | | | | | | | |
CORPORATE BONDS†† - 10.1% | |
| Financial - 5.7% | |
| Bank of America Corp. | | | | | | | | |
6.10%5,10 | | | 30,749,000 | | | | 32,578,565 | |
6.30%5,10 | | | 18,615,000 | | | | 20,243,813 | |
6.50%5,10 | | | 6,450,000 | | | | 7,038,563 | |
| 2.15% due 11/09/20 | | | 1,600,000 | | | | 1,585,563 | |
| Citigroup, Inc. | | | | | | | | |
6.25%5,10 | | | 30,140,000 | | | | 32,513,524 | |
5.95%5,10 | | | 14,860,000 | | | | 15,473,124 | |
5.95%5,10 | | | 9,235,000 | | | | 9,639,031 | |
| Hospitality Properties Trust | | | | | | | | |
| 5.25% due 02/15/26 | | | 17,900,000 | | | | 18,757,087 | |
| 4.95% due 02/15/27 | | | 6,850,000 | | | | 7,033,676 | |
| Mid-Atlantic Military Family Communities LLC | | | | | | | | |
5.30% due 08/01/506 | | | 18,690,030 | | | | 17,585,824 | |
| Jefferies Group LLC | | | | | | | | |
| 4.85% due 01/15/27 | | | 13,750,000 | | | | 14,035,794 | |
| 5.13% due 01/20/23 | | | 1,500,000 | | | | 1,611,899 | |
| Voya Financial, Inc. | | | | | | | | |
5.65% due 05/15/535 | | | 14,145,000 | | | | 14,392,537 | |
28 | THE GUGGENHEIM FUNDS SEMI-ANNUAL REPORT | SEE NOTES TO FINANCIAL STATEMENTS. |
SCHEDULE OF INVESTMENTS (Unaudited)(continued) | March 31, 2017 |
| TOTAL RETURN BOND FUND | |
| | | Face
Amount3 | | | Value | |
| | | | | | | |
| Infinity Property & Casualty Corp. | | | | | | |
| 5.00% due 09/19/22 | | $ | 12,961,000 | | | $ | 13,688,566 | |
| Wells Fargo & Co. | | | | | | | | |
5.88%5,10 | | | 9,800,000 | | | | 10,563,832 | |
| KeyCorp | | | | | | | | |
5.00%5,10 | | | 9,350,000 | | | | 9,256,500 | |
| BBC Military Housing-Navy Northeast LLC | | | | | | | | |
6.30%†††,1,10 | | | 8,725,000 | | | | 8,737,179 | |
| JPMorgan Chase & Co. | | | | | | | | |
6.10%5,10 | | | 4,550,000 | | | | 4,808,213 | |
6.00%5,10 | | | 2,000,000 | | | | 2,085,600 | |
| Atlas Mara Ltd. | | | | | | | | |
8.00% due 12/31/201 | | | 6,600,000 | | | | 5,458,200 | |
| Fort Benning Family Communities LLC | | | | | | | | |
1.26% due 01/15/36†††,5,15 | | | 6,000,000 | | | | 4,885,444 | |
| Lincoln Finance Ltd. | | | | | | | | |
7.38% due 04/15/216 | | | 4,580,000 | | | | 4,854,800 | |
| GEO Group, Inc. | | | | | | | | |
| 5.88% due 10/15/24 | | | 3,615,000 | | | | 3,696,338 | |
| 6.00% due 04/15/26 | | | 1,036,000 | | | | 1,049,181 | |
| Northern Trust Corp. | | | | | | | | |
4.60%5,10 | | | 4,737,000 | | | | 4,642,260 | |
| Citizens Financial Group, Inc. | | | | | | | | |
5.50%5,10 | | | 4,500,000 | | | | 4,618,125 | |
| Navigators Group, Inc. | | | | | | | | |
| 5.75% due 10/15/23 | | | 4,050,000 | | | | 4,342,908 | |
| Kennedy-Wilson, Inc. | | | | | | | | |
| 5.88% due 04/01/24 | | | 4,113,000 | | | | 4,215,825 | |
| Greystar Real Estate Partners LLC | | | | | | | | |
8.25% due 12/01/226 | | | 3,445,000 | | | | 3,716,293 | |
| Fort Knox Military Housing Privatization Project | | | | | | | | |
5.82% due 02/15/526 | | | 1,965,613 | | | | 1,960,463 | |
1.25% due 02/15/52†††,5,15 | | | 1,761,916 | | | | 1,052,067 | |
| Atlantic Marine Corporations Communities LLC | | | | | | | | |
5.43% due 12/01/5015 | | | 1,426,658 | | | | 1,392,233 | |
5.37% due 12/01/506 | | | 807,741 | | | | 824,785 | |
| 5.38% due 02/15/48 | | | 549,505 | | | | 523,524 | |
| Fidelity National Financial, Inc. | | | | | | | | |
| 5.50% due 09/01/22 | | | 2,425,000 | | | | 2,560,899 | |
| Customers Bank | | | | | | | | |
6.13% due 06/26/295,15 | | | 2,000,000 | | | | 2,045,000 | |
| M&T Bank Corp. | | | | | | | | |
5.13%5,10 | | | 2,000,000 | | | | 1,990,000 | |
| Goldman Sachs Group, Inc. | | | | | | | | |
| 6.13% due 02/15/33 | | | 1,600,000 | | | | 1,931,682 | |
| US Bancorp | | | | | | | | |
5.30%5,10 | | | 1,800,000 | | | | 1,833,750 | |
| First American Financial Corp. | | | | | | | | |
| 4.30% due 02/01/23 | | | 1,680,000 | | | | 1,704,625 | |
| Prudential Financial, Inc. | | | | | | | | |
| 6.63% due 12/01/37 | | | 1,300,000 | | | | 1,683,963 | |
| Royal Bank of Scotland Group plc | | | | | | | | |
| 3.88% due 09/12/23 | | | 1,700,000 | | | | 1,675,452 | |
| Enstar Group Ltd. | | | | | | | | |
| 4.50% due 03/10/22 | | | 1,610,000 | | | | 1,630,260 | |
| Barclays plc | | | | | | | | |
| 4.38% due 01/12/26 | | | 1,600,000 | | | | 1,621,363 | |
| Compass Bank | | | | | | | | |
| 2.75% due 09/29/19 | | | 1,600,000 | | | | 1,609,763 | |
| CBRE Services, Inc. | | | | | | | | |
| 5.25% due 03/15/25 | | | 1,500,000 | | | | 1,591,914 | |
| International Lease Finance Corp. | | | | | | | | |
| 8.63% due 01/15/22 | | | 1,300,000 | | | | 1,590,698 | |
| Santander UK Group Holdings plc | | | | | | | | |
| 2.88% due 08/05/21 | | | 1,600,000 | | | | 1,579,178 | |
| AmTrust Financial Services, Inc. | | | | | | | | |
6.13% due 08/15/231 | | | 1,301,000 | | | | 1,365,197 | |
| SEE NOTES TO FINANCIAL STATEMENTS. | THE GUGGENHEIM FUNDS SEMI-ANNUAL REPORT | 29 |
SCHEDULE OF INVESTMENTS (Unaudited)(continued) | March 31, 2017 |
| TOTAL RETURN BOND FUND | |
| | | Face
Amount3 | | | Value | |
| | | | | | | |
| Cadence Bank North America | | | | | | |
6.25% due 06/28/295,15 | | $ | 1,200,000 | | | $ | 1,200,000 | |
| Morgan Stanley | | | | | | | | |
| 7.25% due 04/01/32 | | | 820,000 | | | | 1,112,976 | |
| Pacific Northwest Communities LLC | | | | | | | | |
5.91% due 06/15/5015 | | | 1,000,000 | | | | 1,081,030 | |
| Univest Corporation of Pennsylvania | | | | | | | | |
5.10% due 03/30/251,5 | | | 1,000,000 | | | | 1,017,500 | |
| Wilton Re Finance LLC | | | | | | | | |
5.88% due 03/30/335,6 | | | 925,000 | | | | 942,344 | |
| Nationwide Mutual Insurance Co. | | | | | | | | |
9.38% due 08/15/396 | | | 530,000 | | | | 849,320 | |
| ACC Group Housing LLC | | | | | | | | |
6.35% due 07/15/5415 | | | 625,000 | | | | 718,614 | |
| HSBC Holdings plc | | | | | | | | |
| 4.38% due 11/23/26 | | | 700,000 | | | | 705,434 | |
| Hanover Insurance Group, Inc. | | | | | | | | |
| 4.50% due 04/15/26 | | | 650,000 | | | | 674,881 | |
| Discover Bank/Greenwood DE | | | | | | | | |
| 4.20% due 08/08/23 | | | 610,000 | | | | 635,261 | |
| Lincoln National Corp. | | | | | | | | |
| 8.75% due 07/01/19 | | | 307,000 | | | | 350,435 | |
| 7.00% due 06/15/40 | | | 210,000 | | | | 271,286 | |
| Assurant, Inc. | | | | | | | | |
| 6.75% due 02/15/34 | | | 106,000 | | | | 127,941 | |
| Total Financial | | | | | | | 324,962,102 | |
| | | | | | | | | |
| Consumer, Non-cyclical - 1.3% | |
| Danone S.A. | | | | | | | | |
2.95% due 11/02/266 | | | 29,200,000 | | | | 27,913,974 | |
| Tenet Healthcare Corp. | | | | | | | | |
4.63% due 06/15/205 | | | 22,374,000 | | | | 22,485,870 | |
| Bumble Bee Holdings, Inc. | | | | | | | | |
9.00% due 12/15/176 | | | 10,801,000 | | | | 10,530,975 | |
| Offutt AFB America First Community LLC | | | | | | | | |
5.46% due 09/01/506 | | | 6,721,049 | | | | 6,401,127 | |
| United Communities LLC | | | | | | | | |
5.61% due 09/15/516 | | | 4,628,496 | | | | 4,888,757 | |
| Flowers Foods, Inc. | | | | | | | | |
| 3.50% due 10/01/26 | | | 1,750,000 | | | | 1,705,872 | |
| Actavis Funding SCS | | | | | | | | |
| 4.55% due 03/15/35 | | | 800,000 | | | | 802,174 | |
| Total Consumer, Non-cyclical | | | | 74,728,749 | |
| | | | | | | | | |
| Energy - 1.2% | |
| Sunoco Logistics Partners Operations, LP | | | | | | | | |
| 5.95% due 12/01/25 | | | 18,100,000 | | | | 20,152,884 | |
| 3.90% due 07/15/26 | | | 5,600,000 | | | | 5,410,698 | |
| Buckeye Partners, LP | | | | | | | | |
| 3.95% due 12/01/26 | | | 12,876,000 | | | | 12,610,651 | |
| 4.35% due 10/15/24 | | | 4,760,000 | | | | 4,836,603 | |
| ConocoPhillips | | | | | | | | |
| 6.50% due 02/01/39 | | | 10,495,000 | | | | 13,366,820 | |
| Hess Corp. | | | | | | | | |
| 4.30% due 04/01/27 | | | 3,650,000 | | | | 3,585,070 | |
| 7.88% due 10/01/29 | | | 897,000 | | | | 1,097,154 | |
| Sabine Pass Liquefaction LLC | | | | | | | | |
| 5.88% due 06/30/26 | | | 1,500,000 | | | | 1,653,881 | |
| ONEOK Partners, LP | | | | | | | | |
| 3.38% due 10/01/22 | | | 1,600,000 | | | | 1,601,474 | |
| MPLX, LP | | | | | | | | |
| 4.13% due 03/01/27 | | | 1,600,000 | | | | 1,593,064 | |
| Enterprise Products Operating LLC | | | | | | | | |
| 3.90% due 02/15/24 | | | 890,000 | | | | 910,897 | |
| 3.95% due 02/15/27 | | | 400,000 | | | | 407,864 | |
| Marathon Petroleum Corp. | | | | | | | | |
| 3.63% due 09/15/24 | | | 1,200,000 | | | | 1,181,430 | |
| QEP Resources, Inc. | | | | | | | | |
| 6.88% due 03/01/21 | | | 200,000 | | | | 212,500 | |
| Schahin II Finance Company SPV Ltd. | | | | | | | | |
5.88% due 09/25/2211,15 | | | 781,800 | | | | 89,907 | |
| Total Energy | | | | | | | 68,710,897 | |
| | | | | | | | | |
| Basic Materials - 1.0% | |
| Yamana Gold, Inc. | | | | | | | | |
| 4.95% due 07/15/24 | | | 21,020,000 | | | | 21,125,100 | |
| Newcrest Finance Pty Ltd. | | | | | | | | |
4.20% due 10/01/226 | | | 18,955,000 | | | | 19,470,614 | |
30 | THE GUGGENHEIM FUNDS SEMI-ANNUAL REPORT | SEE NOTES TO FINANCIAL STATEMENTS. |
SCHEDULE OF INVESTMENTS (Unaudited)(continued) | March 31, 2017 |
| TOTAL RETURN BOND FUND | |
| | | Face
Amount3 | | | Value | |
| | | | | | | |
| BHP Billiton Finance USA Ltd. | | | | | | |
6.75% due 10/19/755,6 | | $ | 13,000,000 | | | $ | 14,703,000 | |
| Eldorado Gold Corp. | | | | | | | | |
6.13% due 12/15/206 | | | 1,050,000 | | | | 1,076,250 | |
| Southern Copper Corp. | | | | | | | | |
| 5.25% due 11/08/42 | | | 430,000 | | | | 421,509 | |
| 7.50% due 07/27/35 | | | 260,000 | | | | 316,574 | |
| Total Basic Materials | | | | | | | 57,113,047 | |
| | | | | | | | | |
| Consumer, Cyclical - 0.3% | |
| HP Communities LLC | | | | | | | | |
5.78% due 03/15/4615 | | | 2,150,000 | | | | 2,296,500 | |
5.86% due 09/15/5315 | | | 1,420,000 | | | | 1,501,096 | |
5.62% due 09/15/3215 | | | 1,000,000 | | | | 1,090,610 | |
| Ferrellgas Limited Partnership / Ferrellgas Finance Corp. | | | | | | | | |
| 6.50% due 05/01/21 | | | 3,000,000 | | | | 2,850,000 | |
| Hasbro, Inc. | | | | | | | | |
| 6.35% due 03/15/40 | | | 1,500,000 | | | | 1,756,862 | |
| Wyndham Worldwide Corp. | | | | | | | | |
| 4.50% due 04/01/27 | | | 1,630,000 | | | | 1,642,095 | |
| Northern Group Housing LLC | | | | | | | | |
6.80% due 08/15/5315 | | | 1,200,000 | | | | 1,440,636 | |
| Suburban Propane Partners Limited Partnership/Suburban Energy Finance Corp. | | | | | | | | |
| 5.88% due 03/01/27 | | | 1,000,000 | | | | 985,000 | |
| Ford Motor Co. | | | | | | | | |
| 7.45% due 07/16/31 | | | 650,000 | | | | 819,857 | |
| Total Consumer, Cyclical | | | | | | | 14,382,656 | |
| | | | | | | | | |
| Industrial - 0.2% | |
| Princess Juliana International Airport Operating Company N.V. | | | | | | | | |
5.50% due 12/20/27†††,6 | | | 2,580,793 | | | | 2,578,194 | |
| Reynolds Group Issuer Inc. / Reynolds Group Issuer LLC / Reynolds Group Issuer | | | | | | | | |
| 6.88% due 02/15/21 | | | 2,009,220 | | | | 2,064,473 | |
| Reynolds Group Issuer Incorporated / Reynolds Group Issuer LLC / Reynolds Group Issuer Lu | | | | | | | | |
4.52% due 07/15/215,6 | | | 1,875,000 | | | | 1,918,369 | |
| Dynagas LNG Partners Limited Partnership / Dynagas Finance, Inc. | | | | | | | | |
6.25% due 10/30/191 | | | 1,700,000 | | | | 1,678,750 | |
| Eaton Corp. | | | | | | | | |
| 4.00% due 11/02/32 | | | 1,300,000 | | | | 1,317,533 | |
| L3 Technologies, Inc. | | | | | | | | |
| 5.20% due 10/15/19 | | | 760,000 | | | | 814,398 | |
| Total Industrial | | | | | | | 10,371,717 | |
| | | | | | | | | |
| Utilities - 0.2% | |
| LBC Tank Terminals Holding Netherlands BV | | | | | | | | |
6.88% due 05/15/236 | | | 5,590,000 | | | | 5,800,295 | |
| AES Corp. | | | | | | | | |
4.05% due 06/01/195 | | | 3,098,000 | | | | 3,098,000 | |
| Exelon Generation Company LLC | | | | | | | | |
| 6.25% due 10/01/39 | | | 670,000 | | | | 694,787 | |
| Total Utilities | | | | | | | 9,593,082 | |
| | | | | | | | | |
| Communications - 0.1% | |
| SFR Group S.A. | | | | | | | | |
6.25% due 05/15/246 | | | 3,150,000 | | | | 3,169,687 | |
| Charter Communications Operating LLC / Charter Communications Operating Capital | | | | | | | | |
| 6.38% due 10/23/35 | | | 1,400,000 | | | | 1,591,452 | |
| Time Warner Cable LLC | | | | | | | | |
| 4.00% due 09/01/21 | | | 1,500,000 | | | | 1,554,914 | |
| Qwest Corp. | | | | | | | | |
| 6.75% due 12/01/21 | | | 1,270,000 | | | | 1,392,235 | |
| SEE NOTES TO FINANCIAL STATEMENTS. | THE GUGGENHEIM FUNDS SEMI-ANNUAL REPORT | 31 |
SCHEDULE OF INVESTMENTS (Unaudited)(continued) | March 31, 2017 |
| TOTAL RETURN BOND FUND | |
| | | Face
Amount3 | | | Value | |
| | | | | | | |
| AT&T, Inc. | | | | | | |
| 6.30% due 01/15/38 | | $ | 500,000 | | | $ | 574,540 | |
| Total Communications | | | | | | | 8,282,828 | |
| | | | | | | | | |
| Diversified - 0.1% | |
| HRG Group, Inc. | | | | | | | | |
| 7.88% due 07/15/19 | | | 6,395,000 | | | | 6,618,825 | |
| Leucadia National Corp. | | | | | | | | |
| 5.50% due 10/18/23 | | | 1,500,000 | | | | 1,597,464 | |
| Total Diversified | | | | | | | 8,216,289 | |
| | | | | | | | | |
| Technology - 0.0%** | |
| CA, Inc. | | | | | | | | |
| 5.38% due 12/01/19 | | | 760,000 | | | | 821,119 | |
| | | | | | | | | |
| Diversified Payment Rights - 0.0%** | |
| CIC Receivables Master Trust | | | | | | | | |
4.89% due 10/07/21††† | | | 439,429 | | | | 452,340 | |
| Total Corporate Bonds | | | | | | | | |
| (Cost $568,304,660) | | | | | | | 577,634,826 | |
| | | | | | | | | |
U.S. GOVERNMENT SECURITIES†† - 9.6% | |
| U.S. Treasury Bond | | | | | | | | |
1.94% due 11/15/4412 | | | 1,143,025,000 | | | | 484,574,020 | |
| 8.75% due 05/15/20 | | | 9,030,000 | | | | 11,001,077 | |
| 2.88% due 11/15/46 | | | 10,379,000 | | | | 10,070,463 | |
| 8.75% due 08/15/20 | | | 6,500,000 | | | | 8,014,045 | |
| 4.38% due 05/15/40 | | | 6,150,000 | | | | 7,635,852 | |
| 7.88% due 02/15/21 | | | 5,500,000 | | | | 6,755,546 | |
| 8.13% due 08/15/21 | | | 4,400,000 | | | | 5,553,451 | |
| 8.13% due 08/15/19 | | | 3,000,000 | | | | 3,471,444 | |
| 8.00% due 11/15/21 | | | 2,600,000 | | | | 3,300,476 | |
| 2.75% due 11/15/42 | | | 2,580,000 | | | | 2,456,542 | |
| 4.75% due 02/15/41 | | | 1,500,000 | | | | 1,963,770 | |
| 2.88% due 08/15/45 | | | 1,800,000 | | | | 1,745,649 | |
| 2.13% due 05/15/25 | | | 1,200,000 | | | | 1,181,906 | |
| Total U.S. Treasury Bond | | | | | | | 547,724,241 | |
| U.S. Treasury Note | | | | | | | | |
| 3.13% due 05/15/19 | | | 2,500,000 | | | | 2,595,118 | |
| 2.88% due 03/31/18 | | | 1,000,000 | | | | 1,017,383 | |
| Total U.S. Treasury Note | | | | | | | 3,612,501 | |
| Total U.S. Government Securities | | | | | |
| (Cost $581,111,599) | | | | | | | 551,336,742 | |
| | | | | | | | | |
FEDERAL AGENCY NOTES†† - 3.5% | |
Fannie Mae Principal Strips14 | | | | | | | | |
due 05/15/3012 | | | 43,400,000 | | | | 28,123,547 | |
due 01/15/3012 | | | 35,825,000 | | | | 23,529,000 | |
due 05/15/2912 | | | 33,900,000 | | | | 22,360,610 | |
due 11/15/3012 | | | 17,570,000 | | | | 11,197,484 | |
| Total Fannie Mae Principal Strips | | | | 85,210,641 | |
Freddie Mac14 | | | | | | | | |
due 12/14/2912 | | | 45,850,000 | | | | 30,376,541 | |
| 1.25% due 10/02/19 | | | 2,500,000 | | | | 2,486,058 | |
| 2.38% due 01/13/22 | | | 2,000,000 | | | | 2,036,160 | |
| Total Freddie Mac | | | | | | | 34,898,759 | |
Freddie Mac Principal Strips14 | | | | | | | | |
due 03/15/3112 | | | 28,085,000 | | | | 17,563,966 | |
due 07/15/3212 | | | 28,600,000 | | | | 16,625,266 | |
| Total Freddie Mac Principal Strips | | | | 34,189,232 | |
| Tennessee Valley Authority | | | | | | | | |
| 5.38% due 04/01/56 | | | 8,360,000 | | | | 10,663,849 | |
| 4.25% due 09/15/65 | | | 9,900,000 | | | | 10,388,179 | |
| Total Tennessee Valley Authority | | | | 21,052,028 | |
Fannie Mae Interest Strips14 | | | | | | | | |
due 01/15/3212 | | | 8,833,000 | | | | 5,471,178 | |
due 01/15/3512 | | | 2,250,000 | | | | 1,193,645 | |
due 01/15/3312 | | | 1,450,000 | | | | 827,184 | |
due 07/15/3212 | | | 1,333,000 | | | | 776,410 | |
| Total Fannie Mae Interest Strips | | | | 8,268,417 | |
| Freddie Mac Interest Strips | | | | | |
due 03/15/3012 | | | 7,250,000 | | | | 4,698,326 | |
due 09/15/3012 | | | 2,906,000 | | | | 1,845,917 | |
| Total Freddie Mac Interest Strips | | | | 6,544,243 | |
Fannie Mae14 | | | | | | | | |
due 01/15/3012 | | | 5,900,000 | | | | 3,873,014 | |
| 0.88% due 02/08/18 | | | 1,500,000 | | | | 1,497,158 | |
due 02/06/3312 | | | 1,456,000 | | | | 827,596 | |
| Total Fannie Mae | | | | | | | 6,197,768 | |
32 | THE GUGGENHEIM FUNDS SEMI-ANNUAL REPORT | SEE NOTES TO FINANCIAL STATEMENTS. |
SCHEDULE OF INVESTMENTS (Unaudited)(continued) | March 31, 2017 |
| TOTAL RETURN BOND FUND | |
| | | Face
Amount3 | | | Value | |
| | | | | | | |
| Residual Funding Corporation Principal Strips | | | | | | |
due 01/15/3012 | | $ | 5,000,000 | | | $ | 3,331,590 | |
| Total Federal Agency Notes | | | | | |
| (Cost $207,762,425) | | | | | | | 199,692,678 | |
| | | | | | | | | |
SENIOR FLOATING RATE INTERESTS††,5 - 3.4% | |
| Technology - 0.9% | |
| Epicor Software | | | | | | | | |
| 4.75% due 06/01/22 | | | 18,076,258 | | | | 18,094,335 | |
| 5.00% due 06/01/22 | | | 3,293,630 | | | | 3,299,130 | |
| EIG Investors Corp. | | | | | | | | |
| 6.04% due 02/09/23 | | | 8,125,628 | | | | 8,179,827 | |
| 6.53% due 11/08/19 | | | 698,534 | | | | 701,154 | |
| Cypress Intermediate Holdings III, Inc. | | | | | | | | |
| 4.00% due 03/31/24 | | | 6,200,000 | | | | 6,094,600 | |
| Macom Technology Solutions Holdings, Inc. | | | | | | | | |
| 3.86% due 05/07/21 | | | 1,989,796 | | | | 2,018,409 | |
| TIBCO Software, Inc. | | | | | | | | |
| 5.50% due 12/04/20 | | | 1,960,000 | | | | 1,979,188 | |
| Advanced Computer Software | | | | | | | | |
10.56% due 01/31/231 | | | 2,000,000 | | | | 1,818,340 | |
| Cologix Holdings, Inc. | | | | | | | | |
| 4.00% due 03/20/24 | | | 1,000,000 | | | | 1,000,310 | |
| Microsemi Corp. | | | | | | | | |
| 3.23% due 01/15/23 | | | 868,192 | | | | 872,125 | |
| Micro Focus International plc | | | | | | | | |
| 4.79% due 11/19/21 | | | 845,513 | | | | 851,254 | |
| Compucom Systems, Inc. | | | | | | | | |
| 4.25% due 05/11/20 | | | 290,010 | | | | 240,708 | |
| Ceridian Corp. | | | | | | | | |
| 4.54% due 09/15/20 | | | 239,000 | | | | 236,909 | |
| Micron Technology, Inc. | | | | | | | | |
| 4.74% due 04/26/22 | | | 198,997 | | | | 199,682 | |
| Aspect Software, Inc. | | | | | | | | |
| 11.28% due 05/25/20 | | | 14,916 | | | | 14,897 | |
| Total Technology | | | | | | | 45,600,868 | |
| | | | | | | | | |
| Communications - 0.6% | |
| Cengage Learning Acquisitions, Inc. | | | | | | | | |
| 5.25% due 06/07/23 | | | 22,170,133 | | | | 21,096,212 | |
| SFR Group SA | | | | | | | | |
| 4.29% due 01/14/25 | | | 6,783,000 | | | | 6,783,000 | |
| 5.29% due 01/15/24 | | | 1,439,125 | | | | 1,440,147 | |
| Internet Brands | | | | | | | | |
| 4.75% due 07/08/21 | | | 3,151,620 | | | | 3,167,090 | |
| Proquest LLC | | | | | | | | |
| 5.25% due 10/24/21 | | | 1,349,770 | | | | 1,368,329 | |
| Altice US Finance I Corp. | | | | | | | | |
| 3.98% due 01/15/25 | | | 7798,000 | | | | 7796,508 | |
| Houghton Mifflin Co. | | | | | | | | |
| 4.00% due 05/31/21 | | | 42,443 | | | | 683,048 | |
| Telenet Financing USD LLC | | | | | | | | |
| 3.91% due 01/31/25 | | | 500,000 | | | | 500,065 | |
| Ziggo Secured Finance BV | | | | | | | | |
| Total Communications | | | | | | | 35,834,399 | |
| | | | | | | | | |
| Industrial - 0.6% | |
| Travelport Finance Luxembourg Sarl | | | | | | | | |
| 4.29% due 09/02/21 | | | 21,082,482 | | | | 21,223,101 | |
| Engility Corp. | | | | | | | | |
| 4.75% due 08/14/23 | | | 3,149,902 | | | | 3,162,691 | |
| TMF Group Holding BV | | | | | | | | |
| 4.00% due 10/16/23 | | EUR | 1,750,000 | | | | 1,883,196 | |
| VC GB Holdings, Inc. | | | | | | | | |
| 4.75% due 02/28/24 | | | 1,675,000 | | | | 1,683,375 | |
| Reynolds Group Holdings, Inc. | | | | | | | | |
| 3.98% due 02/05/23 | | | 1,493,258 | | | | 1,498,394 | |
| CareCore National LLC | | | | | | | | |
| 5.50% due 03/05/21 | | | 1,364,121 | | | | 1,367,532 | |
| Hillman Group, Inc. | | | | | | | | |
| 4.65% due 06/30/21 | | | 989,822 | | | | 996,830 | |
| Hardware Holdings LLC | | | | | | | | |
7.68% due 03/30/20†††,1 | | | 745,875 | | | | 730,958 | |
| NVA Holdings, Inc. | | | | | | | | |
| 4.65% due 08/14/21 | | | 575,000 | | | | 580,031 | |
| CHI Overhead Doors, Inc. | | | | | | | | |
| 4.25% due 07/29/22 | | | 498,738 | | | | 497,905 | |
| SEE NOTES TO FINANCIAL STATEMENTS. | THE GUGGENHEIM FUNDS SEMI-ANNUAL REPORT | 33 |
SCHEDULE OF INVESTMENTS (Unaudited)(continued) | March 31, 2017 |
| TOTAL RETURN BOND FUND | |
| | | Face
Amount3 | | | Value | |
| | | | | | | |
| Wencor Group | | | | | | |
| 4.65% due 06/18/21 | | $ | 292,710 | | | $ | 284,113 | |
| USIC Holding, Inc. | | | | | | | | |
| 5.17% due 12/08/23 | | | 149,625 | | | | 150,373 | |
| Thermasys Corp. | | | | | | | | |
5.25% due 05/03/191 | | | 91,250 | | | | 81,669 | |
| Total Industrial | | | | | | | 34,140,168 | |
| | | | | | | | | |
| Consumer, Non-cyclical - 0.6% | |
| Pharmaceutical Product Development | | | | | | | | |
| 4.33% due 08/18/22 | | | 8,498,784 | | | | 8,520,031 | |
| MPH Acquisition Holdings LLC | | | | | | | | |
| 4.90% due 06/07/23 | | | 3,890,166 | | | | 3,937,392 | |
| Examworks Group, Inc. | | | | | | | | |
| 4.23% due 07/27/23 | | | 3,815,438 | | | | 3,832,149 | |
| Press Ganey Holdings, Inc. | | | | | | | | |
| 4.25% due 10/23/23 | | | 3,192,000 | | | | 3,198,001 | |
| Packaging Coordinators Midco, Inc. | | | | | | | | |
| 5.00% due 06/30/23 | | | 3,184,000 | | | | 3,170,086 | |
| Albertson’s LLC | | | | | | | | |
| 4.40% due 12/21/22 | | | 2,756,045 | | | | 2,771,892 | |
| DJO Finance LLC | | | | | | | | |
| 4.25% due 06/08/20 | | | 2,366,783 | | | | 2,286,407 | |
| CHG Healthcare Services, Inc. | | | | | | | | |
| 4.75% due 06/07/23 | | | 1,887,745 | | | | 1,909,454 | |
| Grocery Outlet, Inc. | | | | | | | | |
| 5.15% due 10/21/21 | | | 1,741,271 | | | | 1,742,908 | |
| One Call Medical, Inc. | | | | | | | | |
| 5.09% due 11/27/20 | | | 1,658,912 | | | | 1,549,706 | |
| CTI Foods Holding Co. LLC | | | | | | | | |
| 4.65% due 06/29/20 | | | 200,000 | | | | 198,000 | |
| Total Consumer, Non-cyclical | | | | 33,116,026 | |
| | | | | | | | | |
| Consumer, Cyclical - 0.5% | |
| Equinox Holdings, Inc. | | | | | | | | |
| 4.25% due 03/08/24 | | | 8,050,000 | | | | 8,107,879 | |
| Leslie’s Poolmart, Inc. | | | | | | | | |
| 4.77% due 08/16/23 | | | 4,453,000 | | | | 4,466,359 | |
| Trader Corp. | | | | | | | | |
| 4.25% due 09/28/23 | | | 4,000,000 | | | | 4,008,320 | |
| PetSmart Inc | | | | | | | | |
| 4.02% due 03/11/22 | | | 4,160,690 | | | | 3,968,258 | |
| Life Time Fitness, Inc. | | | | | | | | |
| 4.00% due 06/10/22 | | | 1,703,954 | | | | 1,706,936 | |
| 1-800 Contacts | | | | | | | | |
| 4.28% due 01/22/23 | | | 1,584,030 | | | | 1,593,265 | |
| Eyemart Express | | | | | | | | |
| 5.19% due 12/17/21 | | | 1,325,000 | | | | 1,338,250 | |
| PTL Acqusition, Inc. | | | | | | | | |
| 3.23% due 08/01/23 | | | 1,243,750 | | | | 1,252,307 | |
| BBB Industries, LLC | | | | | | | | |
| 6.00% due 11/03/21 | | | 982,500 | | | | 983,119 | |
| Neiman Marcus Group, Inc. | | | | | | | | |
| 4.25% due 10/25/20 | | | 582,000 | | | | 466,845 | |
| Sears Holdings Corp. | | | | | | | | |
| 5.50% due 06/30/18 | | | 367,738 | | | | 362,796 | |
| Acosta, Inc. | | | | | | | | |
3.82% due 09/26/19†††,1 | | | 342,222 | | | | 319,554 | |
| Total Consumer, Cyclical | | | | | | | 28,573,888 | |
| | | | | | | | | |
| Financial - 0.1% | |
| Hyperion Insurance | | | | | | | | |
| 5.50% due 04/29/22 | | | 2,648,281 | | | | 2,655,458 | |
| National Financial Partners Corp. | | | | | | | | |
| 4.65% due 01/08/24 | | | 1,820,438 | | | | 1,838,642 | |
| Delos Finance S.A.R.L | | | | | | | | |
| 3.40% due 10/06/23 | | | 1,300,000 | | | | 1,313,325 | |
| HUB International Ltd. | | | | | | | | |
| 4.03% due 10/02/20 | | | 1,000,000 | | | | 1,004,860 | |
| American Stock Transfer & Trust | | | | | | | | |
| 5.75% due 06/26/20 | | | 235,408 | | | | 234,820 | |
| Total Financial | | | | | | | 7,047,105 | |
| | | | | | | | | |
| Basic Materials - 0.1% | |
| Road Infrastructure Investment | | | | | | | | |
| 4.50% due 06/13/23 | | | 4,439,250 | | | | 4,464,776 | |
| Nexeo Solutions LLC | | | | | | | | |
| 4.81% due 06/09/23 | | | 1,691,500 | | | | 1,704,186 | |
| Total Basic Materials | | | | | | | 6,168,962 | |
34 | THE GUGGENHEIM FUNDS SEMI-ANNUAL REPORT | SEE NOTES TO FINANCIAL STATEMENTS. |
SCHEDULE OF INVESTMENTS (Unaudited)(continued) | March 31, 2017 |
| TOTAL RETURN BOND FUND | |
| | | Face
Amount3 | | | Value | |
| | | | | | | |
| Utilities - 0.0%** | |
| Invenergy Thermal Operating I, LLC | | | | | | |
| 6.65% due 10/19/22 | | $ | 2,602,732 | | | $ | 2,498,622 | |
| Total Senior Floating Rate Interests | | | | | |
| (Cost $192,940,654) | | | | | | | 192,980,038 | |
| | | | | | | | | |
MUNICIPAL BONDS†† - 1.2% | |
| California - 0.5% | |
| San Mateo County Community College District General Obligation Unlimited | | | | | | | | |
due 09/01/3412 | | | 14,900,000 | | | | 7,801,193 | |
| Poway Unified School District General Obligation Unlimited | | | | | | | | |
due 08/01/4012 | | | 10,000,000 | | | | 3,751,100 | |
due 08/01/3812 | | | 8,460,000 | | | | 3,471,053 | |
| Foothill-De Anza Community College District General Obligation Unlimited | | | | | | | | |
due 08/01/3212 | | | 9,385,000 | | | | 5,446,866 | |
| San Diego Unified School District General Obligation Unlimited | | | | | | | | |
due 07/01/3912 | | | 7,150,000 | | | | 2,879,305 | |
due 07/01/4312 | | | 1,350,000 | | | | 456,908 | |
| Beverly Hills Unified School District California General Obligation Unlimited | | | | | | | | |
due 08/01/3412 | | | 5,295,000 | | | | 2,653,589 | |
| Total California | | | | | | | 26,460,014 | |
| | | | | | | | | |
| Ohio - 0.5% | |
| American Municipal Power, Inc. Revenue Bonds | | | | | | | | |
| 8.08% due 02/15/50 | | | 15,250,000 | | | | 23,511,535 | |
| 7.50% due 02/15/50 | | | 2,060,000 | | | | 2,807,883 | |
| Total Ohio | | | | | | | 26,319,418 | |
| | | | | | | | | |
| Michigan - 0.1% | |
| Detroit City School District General Obligation Unlimited | | | | | | | | |
| 7.75% due 05/01/39 | | | 4,900,000 | | | | 6,417,824 | |
| | | | | | | | | |
| Illinois - 0.1% | |
| State of Illinois General Obligation Unlimited | | | | | | | | |
| 5.65% due 12/01/38 | | | 5,350,000 | | | | 5,657,946 | |
| | | | | | | | | |
| Florida - 0.0%** | |
| County of Miami-Dade Florida Revenue Bonds | | | | | | | | |
due 10/01/4112 | | | 4,100,000 | | | | 1,342,258 | |
| | | | | | | | | |
| Texas - 0.0%** | |
| Harris County-Houston Sports Authority Revenue Bonds | | | | | | | | |
due 11/15/4512 | | | 2,850,000 | | | | 766,422 | |
due 11/15/4112 | | | 1,500,000 | | | | 494,415 | |
| Total Texas | | | | | | | 1,260,837 | |
| Total Municipal Bonds | | | | | | | | |
| (Cost $66,894,913) | | | | | | | 67,458,297 | |
| | | | | | | | | |
FOREIGN GOVERNMENT BONDS†† - 0.7% | |
| Czech Republic Government Bond | | | | | | | | |
due 11/09/1712 | | CSK | 455,000,000 | | | | 18,087,219 | |
| Dominican Republic International Bond | | | | | | | | |
6.85% due 01/27/456 | | | 10,755,000 | | | | 11,104,537 | |
| Kenya Government International Bond | | | | | | | | |
6.88% due 06/24/246 | | | 11,005,000 | | | | 10,951,296 | |
| Bahamas Government International Bond | | | | | | | | |
6.95% due 11/20/296 | | | 110,000 | | | | 117,425 | |
| Total Foreign Government Bonds | | | | | |
| (Cost $39,701,051) | | | | | | | 40,260,477 | |
| | | | | | | | | |
COMMERCIAL PAPER†† - 1.2% | |
| Hyundai Capital America | | | | | | | | |
1.20% due 04/18/176 | | | 32,000,000 | | | | 31,981,867 | |
| SEE NOTES TO FINANCIAL STATEMENTS. | THE GUGGENHEIM FUNDS SEMI-ANNUAL REPORT | 35 |
SCHEDULE OF INVESTMENTS (Unaudited)(continued) | March 31, 2017 |
| TOTAL RETURN BOND FUND | |
| | | Face
Amount3 | | | Value | |
| | | | | | | |
| CVS Health Corp | | | | | | |
| 1.22% due 04/17/17 | | $ | 25,000,000 | | | $ | 24,986,444 | |
| Mondelez International Inc | | | | | | | | |
| 1.18% due 04/24/17 | | | 710,000,000 | | | | 79,992,461 | |
| 0.92% due 04/10/17 | | | 750,000 | | | | 749,824 | |
| Total Mondelez International Inc | | | | 10,742,285 | |
| Unilever Capital Corp | | | | | | | | |
| 0.84% due 04/24/17 | | | 1,500,000 | | | | 1,499,195 | |
| Cargill Inc | | | | | | | | |
| 0.84% due 04/21/17 | | | 1,000,000 | | | | 999,533 | |
| Apple Inc | | | | | | | | |
| 0.77% due 05/10/17 | | | 1,000,000 | | | | 999,200 | |
| Total Commercial Paper | | | | | | | | |
| (Cost $71,208,490) | | | | | | | 71,208,524 | |
| | | Contracts | | | | |
| | | | | | | |
OPTIONS PURCHASED† - 0.2% | |
| Call options on: | | | | | | |
Bank of America Merrill
Lynch June 2017 iShares
20+ Year Treasury Bond
ETF, Expiring with
strike price of $120.00 | | | 33,392 | | | | 8,949,056 | |
| Total Call options | | | | | | | 8,949,056 | |
| Total Options Purchased | | | | | | | | |
| (Cost $5,843,600) | | | | | | | 8,949,056 | |
| | | | | | | | | |
| Total Investments - 106.5% | | | | | |
| (Cost $6,108,105,374) | | | | | | $ | 6,113,065,840 | |
| | | | | | | | | |
OPTIONS WRITTEN† - (0.1)% | |
| Call options on: | | | | | | | | |
Bank of America Merrill
Lynch June 2017 iShares
20+ Year Treasury Bond
ETF, Expiring with
strike price of $123.00 | | | 33,392 | | | | (4,841,840 | ) |
| Total Options Written | | | | | | | | |
| (Premiums received $3,038,672) | | | | (4,841,840 | ) |
| Other Assets & Liabilities, net - (6.4)% | | | | (367,703,740 | ) |
| Total Net Assets - 100.0% | | | | | | $ | 5,740,520,260 | |
CENTRALLY CLEARED INTEREST RATE SWAP AGREEMENTS†† | |
| Counterparty | Exchange | Floating
Rate | Floating
Rate Index | | Fixed
Rate | | Maturity
Date | | Notional
Amount | | | Market
Value | | | Unrealized
Appreciation | |
| Merrill Lynch | CME | Receive | 3-Month
USD-LIBOR | | | 2.16 | % | 02/13/24 | | $ | (108,330,000 | ) | | $ | 500,718 | | | $ | 500,718 | |
FORWARD FOREIGN CURRENCY EXCHANGE CONTRACTS†† | |
| Counterparty | | Contracts
to Sell | | Currency | Settlement
Date | | Settlement
Value | | | Value at
March 31,
2017 | | | Net
Unrealized Depreciation | |
| Bank of America | | | (1,786,000 | ) | CSK | 04/11/17 | | $ | 1,892,619 | | | $ | 1,906,170 | | | $ | (13,551 | ) |
| J.P. Morgan | | | (455,000,000 | ) | EUR | 11/09/17 | | | 18,215,301 | | | | 18,342,077 | | | | (126,776 | ) |
| | | | | | | | | | | | | | | | | $ | (140,327 | ) |
36 | THE GUGGENHEIM FUNDS SEMI-ANNUAL REPORT | SEE NOTES TO FINANCIAL STATEMENTS. |
SCHEDULE OF INVESTMENTS (Unaudited)(continued) | March 31, 2017 |
| TOTAL RETURN BOND FUND | |
| * | Non-income producing security. |
| ** | Less than 0.1% of net assets. |
† | Value determined based on Level 1 inputs — See Note 4. |
†† | Value determined based on Level 2 inputs, unless otherwise noted — See Note 4. |
††† | Value determined based on Level 3 inputs — See Note 4. |
1 | Illiquid security. |
2 | Affiliated issuer — See Note 7. |
3 | The face amount is denominated in U.S. dollars, unless otherwise noted. |
4 | Rate indicated is the 7 day yield as of March 31, 2017. |
5 | Variable rate security. Rate indicated is rate effective at March 31, 2017. |
6 | Security is a 144A or Section 4(a)(2) security. The total market value of 144A or Section 4(a)(2) securities is $3,442,482,047 (cost $3,411,816,348), or 60.0% of total net assets. These securities have been determined to be liquid under guidelines established by the Board of Trustees. |
7 | Security has no stated coupon. However, it is expected to receive residual cash flow payments on defined deal dates. |
8 | Security is an interest-only strip. Rate indicated is effective yield at March 31, 2017. |
9 | Maturity date indicated is next interest reset date. |
10 | Perpetual maturity. |
11 | Security is in default of interest and/or principal obligations. |
12 | Zero coupon rate security. |
13 | Security is a step up/step down security. The coupon increases or decreases at regular intervals until the security reaches full maturity. Rate indicated is rate effective as of March 31, 2017. |
14 | On September 7, 2008, the issuer was placed in conservatorship by the Federal Housing Finance Agency (FHFA). As conservator, the FHFA has full powers to control the assets and operations of the firm. |
15 | Security is a 144A or Section 4(a)(2) security. These securities have been determined to be illiquid and restricted under guidelines established by the Board of Trustees. The total market value of 144A or Section 4(a)(2) illiquid and restricted securities is $80,763,369 (cost $88,586,441), or 0.01% of total net assets — See Note 11. |
| | plc — Public Limited Company |
| | REIT — Real Estate Investment Trust |
| | CME — Chicago Mercantile Exchange |
| | CSK — Czech Koruna |
| | EUR — Euro |
| | |
| | See Sector Classification in Other Information section. |
| SEE NOTES TO FINANCIAL STATEMENTS. | THE GUGGENHEIM FUNDS SEMI-ANNUAL REPORT | 37 |
SCHEDULE OF INVESTMENTS (Unaudited)(continued) | March 31, 2017 |
| TOTAL RETURN BOND FUND | |
The following table summarizes the inputs used to value the Fund’s investments at March 31, 2017 (See Note 4 in the Notes to Financial Statements):
| Investments in Securities (Assets) | | Level 1 | | | Level 2 | | | Level 2 -
Other* | | | Level 3 | | | Total | |
| Asset Backed Securities | | $ | — | | | $ | 2,363,292,584 | | | $ | — | | | $ | 11,463,125 | | | $ | 2,374,755,709 | |
| Closed-End Funds | | | 9,802,412 | | | | — | | | | — | | | | — | | | | 9,802,412 | |
| Collateralized Mortgage Obligations | | | — | | | | 1,721,678,588 | | | | — | | | | 76,130,835 | | | | 1,797,809,423 | |
| Commercial Paper | | | — | | | | 71,208,524 | | | | — | | | | — | | | | 71,208,524 | |
| Common Stocks | | | 122,668 | | | | — | | | | — | | | | — | | | | 122,668 | |
| Corporate Bonds | | | — | | | | 559,929,602 | | | | — | | | | 17,705,224 | | | | 577,634,826 | |
| Federal Agency Notes | | | — | | | | 199,692,678 | | | | — | | | | — | | | | 199,692,678 | |
| Foreign Government Bonds | | | — | | | | 40,260,477 | | | | — | | | | — | | | | 40,260,477 | |
| Interest Rate Swap Agreements | | | — | | | | — | | | | 500,718 | | | | — | | | | 500,718 | |
| Municipal Bonds | | | — | | | | 67,458,297 | | | | — | | | | — | | | | 67,458,297 | |
| Mutual Funds | | | 81,934,302 | | | | — | | | | — | | | | — | | | | 81,934,302 | |
| Options Purchased | | | 8,949,056 | | | | — | | | | — | | | | — | | | | 8,949,056 | |
| Preferred Stocks | | | — | | | | 1,104,400 | | | | — | | | | — | | | | 1,104,400 | |
| Senior Floating Rate Interests | | | — | | | | 191,929,526 | | | | — | | | | 1,050,512 | | | | 192,980,038 | |
| Short Term Investments | | | 138,016,288 | | | | — | | | | — | | | | — | | | | 138,016,288 | |
| U.S. Government Securities | | | — | | | | 551,336,742 | | | | — | | | | — | | | | 551,336,742 | |
| Total | | $ | 238,824,726 | | | $ | 5,767,891,418 | | | $ | 500,718 | | | $ | 106,349,696 | | | $ | 6,113,566,558 | |
| | | | | | | | | | | | | | | | | | | | | |
| Investments in Securities (Liabilities) | | Level 1 | | | Level 2 | | | Level 2 -
Other* | | | Level 3 | | | Total | |
| Currency Contracts | | $ | — | | | $ | — | | | $ | 140,327 | | | $ | — | | | $ | 140,327 | |
| Options Written | | | 4,841,840 | | | | — | | | | — | | | | — | | | | 4,841,840 | |
| Unfunded Loan Commitments | | | — | | | | — | | | | 64,767 | | | | 58,290 | | | | 123,057 | |
| Total | | $ | 4,841,840 | | | $ | — | | | $ | 205,094 | | | $ | 58,290 | | | $ | 5,105,224 | |
| * | Other financial instruments include forward foreign currency exchange contracts and/or swaps, which are reported as unrealized gain/loss at period end. |
38 | THE GUGGENHEIM FUNDS SEMI-ANNUAL REPORT | SEE NOTES TO FINANCIAL STATEMENTS. |
SCHEDULE OF INVESTMENTS (Unaudited)(continued) | March 31, 2017 |
| TOTAL RETURN BOND FUND | |
The following is a summary of significant unobservable inputs used in the fair valuation of assets and liabilities categorized within Level 3 of the fair value hierarchy:
| Category | | Ending Balance
at 03/31/17 | | Valuation
Technique | Unobservable Inputs |
| Asset Backed Securities | | $ | 11,463,125 | | Option Adjusted Spread off the prior month end broker mark over the 3 month LIBOR | Indicative Quote |
| Collateralized Mortgage Obligations | | | 76,130,835 | | Option Adjusted Spread off the prior month end broker mark over the 3 month LIBOR | Indicative Quote |
| Corporate Bonds | | | 15,127,030 | | Option Adjusted Spread off the prior month end broker mark over the 3 month LIBOR | Indicative Quote |
| Corporate Bonds | | | 2,578,194 | | OAS off prior broker quote | Indicative Quote |
| Senior Floating Rate Interests | | | 730,958 | | Option Adjusted Spread off the prior month end broker mark over the 3 month LIBOR | Indicative Quote |
| Senior Floating Rate Interests | | | 319,554 | | Model Price | Purchase Price |
| Total | | $ | 106,349,696 | | | |
Transfers between investment levels may occur as the markets fluctuate and/or the availability of data used in an investment’s valuation changes. Transfers between valuation levels, if any, are in comparison to the valuation levels at the end of the previous fiscal year, and are effective using the fair value as of the end of the previous fiscal period.
As of March 31, 2017, Total Return Bond Fund had securities with a total value of $7,605,668 transfer out of level 3 into level 2 and securities with a total value of $5,965,295 transfer out of level 2 into level 3 due to changes in the securities valuation method using observable market inputs. There were no other securities that transferred between levels.
Any remaining Level 3 securities held by the Fund and excluded from the table above, were not considered material to the Fund.
| SEE NOTES TO FINANCIAL STATEMENTS. | THE GUGGENHEIM FUNDS SEMI-ANNUAL REPORT | 39 |
SCHEDULE OF INVESTMENTS (Unaudited)(concluded) | March 31, 2017 |
| TOTAL RETURN BOND FUND | |
Summary of Fair Value Level 3 Activity
Following is a reconciliation of Level 3 assets for which significant unobservable inputs were used to determine fair value for the period ended March 31, 2017:
LEVEL 3 - Fair value measurement using significant unobservable inputs
| |
| Senior Floating
Rate Interests | | | Collateralized
Mortgage
Obligations | | | Asset-Backed
Securities | | | Corporate
Bonds | | | Total | |
| TOTAL RETURN BOND | | | | | | | | | | | | | | | |
| Assets: | | | | | | | | | | | | | | | |
| Beginning Balance | | $ | — | | | $ | 26,276,741 | | | $ | 19,482,303 | | | $ | 18,329,648 | | | $ | 64,088,692 | |
| Purchases | | | 638,000 | | | | 53,009,505 | | | | — | | | | — | | | | 53,647,505 | |
| Sales, maturities and paydowns | | | (427,391 | ) | | | (3,236,004 | ) | | | (109,814 | ) | | | (134,726 | ) | | | (3,907,935 | ) |
| Total realized gains or losses included in earnings | | | (1,782 | ) | | | (18,615 | ) | | | — | | | | — | | | | (20,397 | ) |
| Total change in unrealized gains or losses included in earnings | | | 29,510 | | | | (5,053,912 | ) | | | (303,696 | ) | | | (489,698 | ) | | | (5,817,796 | ) |
| Transfers into Level 3 | | | 812,175 | | | | 5,153,120 | | | | — | | | | — | | | | 5,965,295 | |
| Transfers out of Level 3 | | | — | | | | — | | | | (7,605,668 | ) | | | — | | | | (7,605,668 | ) |
| Ending Balance | | $ | 1,050,512 | | | $ | 76,130,835 | | | $ | 11,463,125 | | | $ | 17,705,224 | | | $ | 106,349,696 | |
| Net Change in unrealized appreciation (depreciation) for investments in securities still held at March 31, 2017 | | $ | 21,444 | | | $ | (5,171,258 | ) | | $ | (305,167 | ) | | $ | (526,787 | ) | | $ | (5,981,768 | ) |
40 | THE GUGGENHEIM FUNDS SEMI-ANNUAL REPORT | SEE NOTES TO FINANCIAL STATEMENTS. |
STATEMENT OF ASSETS AND LIABILITIES (Unaudited) |
| TOTAL RETURN BOND FUND |
March 31, 2017
| Assets: | |
| Investments in unaffiliated issuers, at value (cost $6,018,387,107) | | $ | 6,021,329,126 | |
| Investments in affiliated issuers, at value(cost $89,718,267) | | | 91,736,714 | |
| Total investments (cost $6,108,105,374) | | | 6,113,065,840 | |
| Cash | | | 22,643,458 | |
| Segregated cash with broker | | | 2,675,000 | |
| Prepaid expenses | | | 519,815 | |
| Unrealized appreciation on swap agreements | | | 500,718 | |
| Receivables: | |
| Securities sold | | | 29,773,633 | |
| Fund shares sold | | | 34,226,583 | |
| Dividends | | | 208,447 | |
| Interest | | | 24,222,819 | |
| Total assets | | | 6,227,836,313 | |
| | | | | |
| Liabilities: | |
| Reverse Repurchase Agreements | | | 10,041,683 | |
| Options written, at value(premiums received $3,038,672) | | | 4,841,840 | |
| Segregated cash due to broker | | | 4,330,474 | |
| Unrealized depreciation on forward foreign currency exchange contracts | | | 140,327 | |
| Unfunded loan commitments, at value (Note 8)(proceeds $241,511) | | | 123,057 | |
| Payable for: | |
| Securities purchased | | | 452,162,458 | |
| Fund shares redeemed | | | 10,626,148 | |
| Management fees | | | 1,663,335 | |
| Distribution and service fees | | | 394,286 | |
| Fund accounting/administration fees | | | 368,259 | |
| Transfer agent/maintenance fees | | | 178,155 | |
| Swap settlement | | | 169,801 | |
| Interest from reverse repurchase agreements | | | 181 | |
| Trustees’ fees* | | | 6 | |
| Miscellaneous | | | 2,276,043 | |
| Total liabilities | | | 487,316,053 | |
| Net assets | | | 5,740,520,260 | |
| | | | | |
| Net assets consist of: | |
| Paid in capital | | $ | 5,751,074,153 | |
| Accumulated net investment loss | | | (12,111,638 | ) |
| Accumulated net realized loss on investments | | | (2,076,493 | ) |
| Net unrealized appreciation on investments | | | 3,634,238 | |
| Net assets | | $ | 5,740,520,260 | |
| | | | | |
| A-Class: | |
| Net assets | | $ | 634,448,691 | |
| Capital shares outstanding | | | 23,819,053 | |
| Net asset value per share | | $ | 26.64 | |
| Maximum offering price per share(Net asset value divided by 96.00%) | | $ | 27.75 | |
| | | | | |
| C-Class: | |
| Net assets | | $ | 226,292,899 | |
| Capital shares outstanding | | | 8,494,597 | |
| Net asset value per share | | $ | 26.64 | |
| | | | | |
| P-Class: | |
| Net assets | | $ | 372,994,527 | |
| Capital shares outstanding | | | 14,001,764 | |
| Net asset value per share | | $ | 26.64 | |
| | | | | |
| R6-Class:** | |
| Net assets | | $ | 2,681,207 | |
| Capital shares outstanding | | | 100,538 | |
| Net asset value per share | | $ | 26.67 | |
| | | | | |
| Institutional Class: | |
| Net assets | | $ | 4,504,102,936 | |
| Capital shares outstanding | | | 168,890,573 | |
| Net asset value per share | | $ | 26.67 | |
| * | Relates to Trustees not deemed “interested persons” within the meaning of Section 2(a)(19) of the 1940 Act. |
| ** | Since commencement of operations: October 19, 2016. |
| SEE NOTES TO FINANCIAL STATEMENTS. | THE GUGGENHEIM FUNDS SEMI-ANNUAL REPORT | 41 |
STATEMENT OF OPERATIONS (Unaudited) |
| TOTAL RETURN BOND FUND |
Period Ended March 31, 2017
| Investment Income: | |
| Interest | | $ | 90,826,953 | |
| Dividends from securities of affiliated issuers | | | 1,629,684 | |
| Dividends from securities of unaffiliated issuers | | | 36,245 | |
| Total investment income | | | 92,492,882 | |
| | | | | |
| Expenses: | |
| Management fees | | | 11,114,761 | |
| Transfer agent/maintenance fees | |
| A-Class | | | 362,091 | |
| C-Class | | | 80,008 | |
| P-Class | | | 118,389 | |
| R6-Class* | | | 152 | |
| Institutional Class | | | 435,480 | |
| Distribution and service fees: | |
| A-Class | | | 745,986 | |
| C-Class | | | 1,090,094 | |
| P-Class | | | 279,793 | |
| Fund accounting/administration fees | | | 1,787,969 | |
| Interest expense | | | 655,624 | |
| Line of credit fees | | | 377,539 | |
| Trustees’ fees** | | | 34,988 | |
| Custodian fees | | | 31,906 | |
| Miscellaneous | | | 496,306 | |
| Total expenses | | | 17,611,086 | |
| Less: | |
| Expenses waived by Adviser | | | (2,506,089 | ) |
| Expense reimbursed by Adviser | | | | |
| A-Class | | | (86,779 | ) |
| C-Class | | | (3,358 | ) |
| P-Class | | | (56,037 | ) |
| R6-Class | | | (482 | ) |
| Institutional Class | | | (438,509 | ) |
| Total waived/reimbursed expenses | | | (3,091,254 | ) |
| Net expenses | | | 14,519,832 | |
| Net investment income | | | 77,973,050 | |
| | | | |
| Net Realized and Unrealized Gain (Loss): | |
| Net realized gain (loss) on: | |
| Investments in unaffiliated issuers | | | 10,812,725 | |
| Investments in affiliated issuers | | | 2,715 | |
| Swap agreements | | | (111,540 | ) |
| Foreign currency | | | 260,037 | |
| Forward currency exchange contracts | | | (158,101 | ) |
| Securities sold short | | | 814 | |
| Net realized gain | | | 10,806,650 | |
| Net change in unrealized appreciation(depreciation) on: | |
| Investments in unaffiliated issuers | | | (63,379,610 | ) |
| Investments in affiliated issuers | | | 787,317 | |
| Swap agreements | | | 500,718 | |
| Options purchased | | | 3,105,456 | |
| Options written | | | (1,803,168 | ) |
| Foreign currency | | | 2,414 | |
| Forward foreign currency exchange contracts | | | (140,327 | ) |
| Net change in unrealized appreciation(depreciation) | | | (60,927,200 | ) |
| Net realized and unrealized loss | | | (50,120,550 | ) |
| Net increase in net assets resulting from operations | | $ | 27,852,500 | |
| * | Since commencement of operations: October 19, 2016. |
| ** | Relates to Trustees not deemed “interested persons” within the meaning of Section 2(a)(19) of the 1940 Act. |
42 | THE GUGGENHEIM FUNDS SEMI-ANNUAL REPORT | SEE NOTES TO FINANCIAL STATEMENTS. |
| STATEMENTS OF CHANGES IN NET ASSETS |
| TOTAL RETURN BOND FUND | |
| | | Period Ended
March 31,
2017
(Unaudited) | | | Year Ended
September 30,
2016 | |
| Increase (Decrease) in Net Assets from Operations: | | | | | | |
| Net investment income | | $ | 77,973,050 | | | $ | 106,270,675 | |
| Net realized gain on investments | | | 10,806,650 | | | | 25,179,563 | |
| Net change in unrealized appreciation (depreciation) on investments | | | (60,927,200 | ) | | | 82,855,164 | |
| Net increase in net assets resulting from operations | | | 27,852,500 | | | | 214,305,402 | |
| | | | | | | | | |
| Distributions to shareholders from: | | | | | | | | |
| Net investment income | | | | | | | | |
| A-Class | | | (11,901,713 | ) | | | (19,285,718 | ) |
| C-Class | | | (3,538,497 | ) | | | (4,414,562 | ) |
| P-Class | | | (4,352,728 | ) | | | (2,468,760 | ) |
| R6-Class* | | | (24,032 | ) | | | — | |
| Institutional Class | | | (72,719,263 | ) | | | (85,820,390 | ) |
| Net realized gains | | | | | | | | |
| A-Class | | | (2,595,729 | ) | | | — | |
| C-Class | | | (928,930 | ) | | | — | |
| P-Class | | | (771,149 | ) | | | — | |
| R6-Class* | | | (418 | ) | | | — | |
| Institutional Class | | | (13,065,720 | ) | | | — | |
| Total distributions to shareholders | | | (109,898,179 | ) | | | (111,989,430 | ) |
| | | | | | | | | |
| Capital share transactions: | | | | | | | | |
| Proceeds from sale of shares | | | | | | | | |
| A-Class | | | 268,089,666 | | | | 409,315,803 | |
| C-Class | | | 48,762,905 | | | | 142,276,966 | |
| P-Class | | | 259,955,914 | | | | 169,273,892 | |
| R6-Class* | | | 2,638,483 | | | | — | |
| Institutional Class | | | 2,234,472,266 | | | | 2,285,297,704 | |
| Distributions reinvested | | | | | | | | |
| A-Class | | | 12,680,342 | | | | 16,940,775 | |
| C-Class | | | 3,492,317 | | | | 3,370,562 | |
| P-Class | | | 5,123,877 | | | | 2,496,360 | |
| R6-Class* | | | 24,450 | | | | — | |
| Institutional Class | | | 69,478,650 | | | | 68,800,673 | |
| Cost of shares redeemed | | | | | | | | |
| A-Class | | | (182,622,321 | ) | | | (328,114,466 | ) |
| C-Class | | | (37,387,589 | ) | | | (24,573,068 | ) |
| P-Class | | | (50,925,014 | ) | | | (26,108,049 | ) |
| R6-Class* | | | (2,997 | ) | | | — | |
| Institutional Class | | | (762,539,367 | ) | | | (816,727,764 | ) |
| Net increase from capital share transactions | | | 1,871,241,582 | | | | 1,902,249,388 | |
| Net increase in net assets | | | 1,789,195,903 | | | | 2,004,565,360 | |
| | | | | | | | | |
| Net assets: | | | | | | | | |
| Beginning of period | | | 3,951,324,357 | | | | 1,946,758,997 | |
| End of period | | $ | 5,740,520,260 | | | $ | 3,951,324,357 | |
| Accumulated net investment loss/Undistributed net investment income at the end of period | | $ | (12,111,638 | ) | | $ | 2,451,545 | |
| SEE NOTES TO FINANCIAL STATEMENTS. | THE GUGGENHEIM FUNDS SEMI-ANNUAL REPORT | 43 |
STATEMENTS OF CHANGES IN NET ASSETS (concluded) |
| TOTAL RETURN BOND FUND | |
| | | Period Ended
March 31,
2017
(Unaudited) | | | Year Ended
September 30,
2016 | |
| Capital share activity: | | | | | | |
| Shares sold | | | | | | |
| A-Class | | | 10,073,264 | | | | 15,477,259 | |
| C-Class | | | 1,828,129 | | | | 5,370,784 | |
| P-Class | | | 9,778,000 | | | | 6,363,397 | |
| R6-Class* | | | 99,716 | | | | — | |
| Institutional Class | | | 83,982,272 | | | | 86,143,028 | |
| Shares issued from reinvestment of distributions | | | | | | | | |
| A-Class | | | 477,658 | | | | 639,848 | |
| C-Class | | | 131,556 | | | | 126,992 | |
| P-Class | | | 193,944 | | | | 93,411 | |
| R6-Class* | | | 935 | | | | — | |
| Institutional Class | | | 2,612,023 | | | | 2,587,333 | |
| Shares redeemed | | | | | | | | |
| A-Class | | | (6,867,400 | ) | | | (12,426,783 | ) |
| C-Class | | | (1,406,942 | ) | | | (926,958 | ) |
| P-Class | | | (1,917,051 | ) | | | (982,068 | ) |
| R6-Class* | | | (113 | ) | | | — | |
| Institutional Class | | | (28,671,857 | ) | | | (30,884,118 | ) |
| Net increase in shares | | | 70,314,134 | | | | 71,582,125 | |
| * | Since commencement of operations: October 19, 2016. |
44 | THE GUGGENHEIM FUNDS SEMI-ANNUAL REPORT | SEE NOTES TO FINANCIAL STATEMENTS. |
| FINANCIAL HIGHLIGHTS |
| TOTAL RETURN BOND FUND | |
This table is presented to show selected data for a share outstanding throughout each period and to assist shareholders in evaluating a Fund’s performance for the periods presented.
| A-Class | | Period Ended
March 31,
2017a | | | Year Ended
Sept. 30,
2016 | | | Year Ended
Sept. 30,
2015 | | | Year Ended
Sept. 30,
2014 | | | Year Ended
Sept. 30,
2013 | | | Period Ended
Sept. 30,
2012b | |
| Per Share Data | | | | | | | | | | | | | | | | | | |
| Net asset value, beginning of period | | $ | 27.23 | | | $ | 26.50 | | | $ | 26.94 | | | $ | 26.16 | | | $ | 26.51 | | | $ | 25.00 | |
| Income (loss) from investment operations: | |
Net investment income (loss)c | | | .45 | | | | .96 | | | | .94 | | | | 1.01 | | | | 1.20 | | | | 1.08 | |
| Net gain (loss) on investments (realized and unrealized) | | | (.40 | ) | | | .81 | | | | (.25 | ) | | | 1.13 | | | | (.28 | ) | | | 1.35 | |
| Total from investment operations | | | .05 | | | | 1.77 | | | | .69 | | | | 2.14 | | | | .92 | | | | 2.43 | |
| Less distributions from: | |
| Net investment income | | | (.53 | ) | | | (1.04 | ) | | | (1.09 | ) | | | (1.36 | ) | | | (1.23 | ) | | | (.92 | ) |
| Net realized gains | | | (.11 | ) | | | — | | | | (.04 | ) | | | ��� | | | | (.04 | ) | | | — | |
| Total distributions | | | (.64 | ) | | | (1.04 | ) | | | (1.13 | ) | | | (1.36 | ) | | | (1.27 | ) | | | (.92 | ) |
| Net asset value, end of period | | $ | 26.64 | | | $ | 27.23 | | | $ | 26.50 | | | $ | 26.94 | | | $ | 26.16 | | | $ | 26.51 | |
| | |
| Total Return | | | 0.22 | % | | | 6.88 | % | | | 2.56 | % | | | 8.34 | % | | | 3.53 | % | | | 9.78 | % |
| Ratios/Supplemental Data | |
| Net assets, end of period (in thousands) | | $ | 634,449 | | | $ | 548,223 | | | $ | 435,760 | | | $ | 90,805 | | | $ | 74,328 | | | $ | 30,689 | |
| Ratios to average net assets: | |
| Net investment income (loss) | | | 3.36 | % | | | 3.63 | % | | | 3.50 | % | | | 3.80 | % | | | 4.47 | % | | | 5.10 | % |
Total expensesd | | | 1.02 | % | | | 1.15 | % | | | 1.10 | % | | | 1.19 | % | | | 1.27 | % | | | 1.51 | % |
Net expensese,h | | | 0.88 | % | | | 0.97 | % | | | 0.91 | % | | | 0.94 | % | | | 0.98 | % | | | 0.85 | % |
| Portfolio turnover rate | | | 38 | % | | | 86 | % | | | 74 | % | | | 52 | % | | | 94 | % | | | 69 | % |
| SEE NOTES TO FINANCIAL STATEMENTS. | THE GUGGENHEIM FUNDS SEMI-ANNUAL REPORT | 45 |
FINANCIAL HIGHLIGHTS (continued) |
| TOTAL RETURN BOND FUND | |
This table is presented to show selected data for a share outstanding throughout each period and to assist shareholders in evaluating a Fund’s performance for the periods presented.
| C-Class | | Period Ended
March 31,
2017a | | | Year Ended
Sept. 30,
2016 | | | Year Ended
Sept. 30,
2015 | | | Year Ended
Sept. 30,
2014 | | | Year Ended
Sept. 30,
2013 | | | Period Ended
Sept. 30,
2012b | |
| Per Share Data | | | | | | | | | | | | | | | | | | |
| Net asset value, beginning of period | | $ | 27.23 | | | $ | 26.50 | | | $ | 26.94 | | | $ | 26.16 | | | $ | 26.50 | | | $ | 25.00 | |
| Income (loss) from investment operations: | |
Net investment income (loss)c | | | .35 | | | | .75 | | | | .74 | | | | .82 | | | | .99 | | | | .94 | |
| Net gain (loss) on investments (realized and unrealized) | | | (.39 | ) | | | .82 | | | | (.25 | ) | | | 1.12 | | | | (.27 | ) | | | 1.32 | |
| Total from investment operations | | | (.04 | ) | | | 1.57 | | | | .49 | | | | 1.94 | | | | .72 | | | | 2.26 | |
| Less distributions from: | |
| Net investment income | | | (.43 | ) | | | (.84 | ) | | | (.89 | ) | | | (1.16 | ) | | | (1.02 | ) | | | (.76 | ) |
| Net realized gains | | | (.11 | ) | | | — | | | | (.04 | ) | | | — | | | | (.04 | ) | | | — | |
| Total distributions | | | (.55 | ) | | | (.84 | ) | | | (.93 | ) | | | (1.16 | ) | | | (1.06 | ) | | | (.76 | ) |
| Net asset value, end of period | | $ | 26.64 | | | $ | 27.23 | | | $ | 26.50 | | | $ | 26.94 | | | $ | 26.16 | | | $ | 26.50 | |
| | |
| Total Return | | | (0.15 | %) | | | 6.08 | % | | | 1.82 | % | | | 7.58 | % | | | 2.77 | % | | | 9.09 | % |
| Ratios/Supplemental Data | |
| Net assets, end of period (in thousands) | | $ | 226,293 | | | $ | 216,255 | | | $ | 89,320 | | | $ | 25,107 | | | $ | 15,654 | | | $ | 6,607 | |
| Ratios to average net assets: | |
| Net investment income (loss) | | | 2.66 | % | | | 2.82 | % | | | 2.75 | % | | | 3.10 | % | | | 3.70 | % | | | 4.38 | % |
Total expensesd | | | 1.72 | % | | | 1.83 | % | | | 1.80 | % | | | 1.90 | % | | | 2.07 | % | | | 2.26 | % |
Net expensese,h | | | 1.61 | % | | | 1.69 | % | | | 1.63 | % | | | 1.66 | % | | | 1.77 | % | | | 1.63 | % |
| Portfolio turnover rate | | | 38 | % | | | 86 | % | | | 74 | % | | | 52 | % | | | 94 | % | | | 69 | % |
46 | THE GUGGENHEIM FUNDS SEMI-ANNUAL REPORT | SEE NOTES TO FINANCIAL STATEMENTS. |
FINANCIAL HIGHLIGHTS (continued) |
| TOTAL RETURN BOND FUND | |
This table is presented to show selected data for a share outstanding throughout each period and to assist shareholders in evaluating a Fund’s performance for the periods presented.
| P-Class | | Period Ended
March 31,
2017a | | | Year Ended
Sept. 30,
2016 | | | Period Ended
Sept. 30,
2015f | |
| Per Share Data | | | | | | | | | |
| Net asset value, beginning of period | | $ | 27.23 | | | $ | 26.49 | | | $ | 26.98 | |
| Income (loss) from investment operations: | |
Net investment income (loss)c | | | .42 | | | | .96 | | | | .36 | |
| Net gain (loss) on investments (realized and unrealized) | | | (.36 | ) | | | .84 | | | | (.43 | ) |
| Total from investment operations | | | .06 | | | | 1.80 | | | | (.07 | ) |
| Less distributions from: | |
| Net investment income | | | (.53 | ) | | | (1.06 | ) | | | (.42 | ) |
| Net realized gains | | | (.11 | ) | | | — | | | | — | |
| Total distributions | | | (.65 | ) | | | (1.06 | ) | | | (.42 | ) |
| Net asset value, end of period | | $ | 26.64 | | | $ | 27.23 | | | $ | 26.49 | |
| | |
| Total Return | | | 0.23 | % | | | 6.97 | % | | | (0.21 | %) |
| Ratios/Supplemental Data | |
| Net assets, end of period (in thousands) | | $ | 372,995 | | | $ | 161,928 | | | $ | 12,509 | |
| Ratios to average net assets: | |
| Net investment income (loss) | | | 3.13 | % | | | 3.58 | % | | | 3.20 | % |
Total expensesd | | | 1.00 | % | | | 0.96 | % | | | 1.02 | % |
Net expensese,h | | | 0.84 | % | | | 0.82 | % | | | 0.84 | % |
| Portfolio turnover rate | | | 38 | % | | | 86 | % | | | 74 | % |
| SEE NOTES TO FINANCIAL STATEMENTS. | THE GUGGENHEIM FUNDS SEMI-ANNUAL REPORT | 47 |
FINANCIAL HIGHLIGHTS (continued) |
| TOTAL RETURN BOND FUND | |
This table is presented to show selected data for a share outstanding throughout each period and to assist shareholders in evaluating a Fund’s performance for the periods presented.
| R6-Class | | Period Ended
March 31,
2017g | |
| Per Share Data | | | |
| Net asset value, beginning of period | | $ | 27.15 | |
| Income (loss) from investment operations: | |
Net investment income (loss)c | | | .37 | |
| Net gain (loss) on investments (realized and unrealized) | | | (.21 | ) |
| Total from investment operations | | | .16 | |
| Less distributions from: | |
| Net investment income | | | (.53 | ) |
| Net realized gains | | | (.11 | ) |
| Total distributions | | | (.64 | ) |
| Net asset value, end of period | | $ | 26.67 | |
| | | | | |
| Total Return | | | 0.63 | % |
| Ratios/Supplemental Data | |
| Net assets, end of period (in thousands) | | $ | 2,681 | |
| Ratios to average net assets: | |
| Net investment income (loss) | | | 3.09 | % |
Total expensesd | | | 0.69 | % |
Net expensese,h | | | 0.50 | % |
| Portfolio turnover rate | | | 38 | % |
48 | THE GUGGENHEIM FUNDS SEMI-ANNUAL REPORT | SEE NOTES TO FINANCIAL STATEMENTS. |
FINANCIAL HIGHLIGHTS (continued) |
| TOTAL RETURN BOND FUND | |
This table is presented to show selected data for a share outstanding throughout each period and to assist shareholders in evaluating a Fund’s performance for the periods presented.
| Institutional Class | | Period Ended
March 31,
2017a | | | Year Ended
Sept. 30,
2016 | | | Year Ended
Sept. 30,
2015 | | | Year Ended
Sept. 30,
2014 | | | Year Ended
Sept. 30,
2013 | | | Period Ended
Sept. 30,
2012b | |
| Per Share Data | | | | | | | | | | | | | | | | | | |
| Net asset value, beginning of period | | $ | 27.26 | | | $ | 26.53 | | | $ | 26.97 | | | $ | 26.19 | | | $ | 26.54 | | | $ | 25.00 | |
| Income (loss) from investment operations: | |
Net investment income (loss)c | | | .48 | | | | 1.05 | | | | 1.03 | | | | 1.09 | | | | 1.28 | | | | 1.06 | |
| Net gain (loss) on investments (realized and unrealized) | | | (.38 | ) | | | .82 | | | | (.25 | ) | | | 1.14 | | | | (.27 | ) | | | 1.44 | |
| Total from investment operations | | | .10 | | | | 1.87 | | | | .78 | | | | 2.23 | | | | 1.01 | | | | 2.50 | |
| Less distributions from: | |
| Net investment income | | | (.57 | ) | | | (1.14 | ) | | | (1.18 | ) | | | (1.45 | ) | | | (1.32 | ) | | | (.96 | ) |
| Net realized gains | | | (.11 | ) | | | — | | | | (.04 | ) | | | — | | | | (.04 | ) | | | — | |
| Total distributions | | | (.69 | ) | | | (1.14 | ) | | | (1.22 | ) | | | (1.45 | ) | | | (1.36 | ) | | | (.96 | ) |
| Net asset value, end of period | | $ | 26.67 | | | $ | 27.26 | | | $ | 26.53 | | | $ | 26.97 | | | $ | 26.19 | | | $ | 26.54 | |
| | |
| Total Return | | | 0.39 | % | | | 7.26 | % | | | 2.91 | % | | | 8.74 | % | | | 3.88 | % | | | 10.09 | % |
| Ratios/Supplemental Data | |
| Net assets, end of period (in thousands) | | $ | 4,504,103 | | | $ | 3,024,918 | | | $ | 1,409,171 | | | $ | 270,668 | | | $ | 78,318 | | | $ | 44,566 | |
| Ratios to average net assets: | |
| Net investment income (loss) | | | 3.60 | % | | | 3.94 | % | | | 3.83 | % | | | 4.09 | % | | | 4.78 | % | | | 4.91 | % |
Total expensesd | | | 0.68 | % | | | 0.79 | % | | | 0.76 | % | | | 0.81 | % | | | 0.89 | % | | | 0.99 | % |
Net expensese,h | | | 0.54 | % | | | 0.59 | % | | | 0.57 | % | | | 0.57 | % | | | 0.64 | % | | | 0.52 | % |
| Portfolio turnover rate | | | 38 | % | | | 86 | % | | | 74 | % | | | 52 | % | | | 94 | % | | | 69 | % |
| SEE NOTES TO FINANCIAL STATEMENTS. | THE GUGGENHEIM FUNDS SEMI-ANNUAL REPORT | 49 |
FINANCIAL HIGHLIGHTS (concluded) |
| TOTAL RETURN BOND FUND | |
a | Unaudited figures for the period ended March 31, 2017. Percentage amounts for the period, except total return and portfolio turnover rate, have been annualized. |
b | Since commencement of operations: November 30, 2011. Percentage amounts for the period, except total return and portfolio turnover rate, have been annualized. |
c | Net investment income (loss) per share was computed using average shares outstanding throughout the period. |
d | Does not include expenses of the underlying funds in which the Fund invests. |
e | Net expense information reflects the expense ratios after expense waivers. |
f | Since commencement of operations: May 1, 2015. Percentage amounts for the period, except total return and portfolio turnover rate, have been annualized. |
g | Since commencement of operations: October 19, 2016. Percentage amounts for the period, except total return and portfolio turnover rate, have been annualized. |
h | Net expenses may include expenses that are excluded from the expense limitation agreement. Excluding these expenses, the net expense ratio for the year would be: |
| | | 03/31/17 | 09/30/16 | 09/30/15 | 09/30/14 | 09/30/13 | 09/30/12 |
| | A-Class | 0.83% | 0.87% | 0.84% | 0.86% | 0.86% | 0.82% |
| | C-Class | 1.56% | 1.60% | 1.56% | 1.58% | 1.64% | 1.59% |
| | P-Class | 0.79% | 0.75% | 0.75% | N/A | N/A | N/A |
| | R6-Class | 0.44% | N/A | N/A | N/A | N/A | N/A |
| | Institutional Class | 0.49% | 0.49% | 0.50% | 0.50% | 0.52% | 0.50% |
50 | THE GUGGENHEIM FUNDS SEMI-ANNUAL REPORT | SEE NOTES TO FINANCIAL STATEMENTS. |
NOTES TO FINANCIAL STATEMENTS (Unaudited) |
1. Organization and Significant Accounting Policies
Organization
Guggenheim Funds Trust (the “Trust”), a Delaware statutory trust, is registered with the SEC under the Investment Company Act of 1940 (“1940 Act”), as an open-ended investment company of the series type. Each series, in effect, is representing a separate Fund. The Trust is authorized to issue an unlimited number of shares. The Trust accounts for the assets of each Fund separately.
The Trust offers a combination of five separate classes of shares, A-Class shares, C-Class shares, P-Class shares, R6-Class shares and Institutional Class shares. Sales of shares of each Class are made without a front-end sales charge at the net asset value per share (“NAV”), with the exception of A-Class shares. A-Class shares are sold at the NAV, plus the applicable front-end sales charge. The sales charge varies depending on the amount purchased. A-Class share purchases of $1 million or more are exempt from the front-end sales charge but have a 1% contingent deferred sales charge (“CDSC”), if shares are redeemed within 12 months of purchase. C-Class shares have a 1% CDSC if shares are redeemed within 12 months of purchase. Institutional Class shares are offered primarily for direct investment by institutions such as pension and profit sharing plans, endowments, foundations and corporations. Institutional Class shares require a minimum initial investment of $2 million and a minimum account balance of $1 million. At March 31, 2017, the Trust consisted of nineteen funds (the “Funds”).
This report covers the Total Return Bond Fund (the “Fund”), a diversified investment company.
Security Investors, LLC and Guggenheim Partners Investment Management, LLC, which operates under the name Guggenheim Investments (“GI”), provides advisory services. Guggenheim Funds Distributors, LLC (“GFD”) acts as principal underwriter for the Trust. GI and GFD are affiliated entities.
Significant Accounting Policies
The Fund operates as an investment company and, accordingly, follows the investment company accounting and reporting guidance of the Financial Accounting Standards Board (“FASB”) Accounting Standards Codification Topic 946 Financial Services – Investment Companies.
The following significant accounting policies are in conformity with U.S. generally accepted accounting principles (“U.S. GAAP”) and are consistently followed by the Trust. This requires management to make estimates and assumptions that affect the reported amount of assets and liabilities, contingent assets and liabilities at the date of the financial statements, and the reported amounts of revenues and expenses during the reporting period. Actual results could differ from these estimates. All time references are based on Eastern Time.
The NAV of each Class of the Fund is calculated by dividing the market value of the Fund’s securities and other assets, less all liabilities, attributable to the Class by the number of outstanding shares of the Class.
| | THE GUGGENHEIM FUNDS SEMI-ANNUAL REPORT | 51 |
NOTES TO FINANCIAL STATEMENTS (Unaudited)(continued) |
A. The Board of Trustees of the Fund (the “Board”) has adopted policies and procedures for the valuation of the Fund’s investments (the “Valuation Procedures”). Pursuant to the Valuation Procedures, the Board has delegated to a valuation committee, consisting of representatives from Guggenheim’s investment management, fund administration, legal and compliance departments (the “Valuation Committee”), the day-to-day responsibility for implementing the Valuation Procedures, including, under most circumstances, the responsibility for determining the fair value of the Fund’s securities and/or other assets.
Valuations of the Fund’s securities are supplied primarily by pricing services appointed pursuant to the processes set forth in the Valuation Procedures. The Valuation Committee convenes monthly, or more frequently as needed, to review the valuation of all assets which have been fair valued for reasonableness. The Fund’s officers, through the Valuation Committee and consistent with the monitoring and review responsibilities set forth in the Valuation Procedures, regularly review procedures used and valuations provided by the pricing services.
If the pricing service cannot or does not provide a valuation for a particular investment or such valuation is deemed unreliable, such investment is fair valued by the Valuation Committee.
Equity securities listed on an exchange (New York Stock Exchange (“NYSE”) or American Stock Exchange) are valued at the last quoted sales price as of the close of business on the NYSE, usually 4:00 p.m. on the valuation date. Equity securities listed on the NASDAQ market system are valued at the NASDAQ Official Closing Price on the valuation date, which may not necessarily represent the last sale price. If there has been no sale on such exchange or NASDAQ on a given day, the security is valued at the closing bid price on that day.
Generally, trading in foreign securities markets is substantially completed each day at various times prior to the close of the NYSE. The values of foreign securities are determined as of the close of such foreign markets or the close of the NYSE, if earlier. All investments quoted in foreign currencies are valued in U.S. dollars on the basis of the foreign currency exchange rates prevailing at the close of business. Investments in foreign securities may involve risks not present in domestic investments. The Valuation Committee will determine the current value of such foreign securities by taking into consideration certain factors which may include those discussed above, as well as the following factors, among others: the value of the securities traded on other foreign markets, ADR trading, closed-end fund trading, foreign currency exchange activity, and the trading prices of financial products that are tied to foreign securities. In addition, the Board has authorized the Valuation Committee and GI to use prices and other information supplied by a third party pricing vendor in valuing foreign securities.
Open-end investment companies (“mutual funds”) are valued at their NAV as of the close of business, on the valuation date. Exchange-traded funds (“ETFs”) and closed-end investment companies (“CEFs”) are valued at the last quoted sales price.
U.S. Government securities are valued by either independent pricing services, the last traded fill price, or at the reported bid price at the close of business.
| 52 | THE GUGGENHEIM FUNDS SEMI-ANNUAL REPORT | |
NOTES TO FINANCIAL STATEMENTS (Unaudited)(continued) |
Debt securities with a maturity of greater than 60 days at acquisition are valued at prices that reflect broker-dealer supplied valuations or are obtained from independent pricing services, which may consider the trade activity, treasury spreads, yields or price of bonds of comparable quality, coupon, maturity, and type, as well as prices quoted by dealers who make markets in such securities. Short-term debt securities with a maturity of 60 days or less at acquisition are valued at amortized cost, provided such amount approximates market value.
Repurchase agreements are valued at amortized cost, provided such amounts approximate market value.
Typically, loans are valued using information provided by an independent third party pricing service which uses broker quotes in a non-active market.
Listed options are valued at the Official Settlement Price listed by the exchange, usually as of 4:00 p.m. Long options are valued using the bid price and short options are valued using the ask price. In the event that a settlement price is not available, fair valuation is enacted. Over-the-counter (“OTC”) options are valued using the average bid price (for long options) or average ask price (for short options) obtained from one or more security dealers.
The value of interest rate swap agreements entered into by a Fund is accounted for using the unrealized gain or loss on the agreements that is determined using the spread priced off the previous day’s Chicago Mercantile Exchange (“CME”) price.
Forward foreign currency exchange contracts are valued daily based on the applicable exchange rate of the underlying currency. The change in value of the contract is recorded as unrealized appreciation or depreciation until the forward foreign currency contract is closed. When the forward foreign currency contract is closed, the Fund records a realized gain or loss equal to the difference between the value at the time the contract was opened and the value at the time it was closed.
Investments for which market quotations are not readily available are fair- valued as determined in good faith by GI under the direction of the Board using methods established or ratified by the Board. Valuations in accordance with these methods are intended to reflect each security’s (or asset’s) “fair value.” Each such determination is based on a consideration of all relevant factors, which are likely to vary from one pricing context to another. Examples of such factors may include, but are not limited to market prices; sale prices; broker quotes; and models which derive prices based on inputs such as prices of securities with comparable maturities and characteristics, or based on inputs such as anticipated cash flows or collateral, spread over Treasuries, and other information analysis.
In connection with futures contracts and other derivative investments, such factors may include obtaining information as to how (a) these contracts and other derivative investments trade in the futures or other derivative markets, respectively, and (b) the securities underlying these contracts and other derivative investments trade in the cash market.
| | THE GUGGENHEIM FUNDS SEMI-ANNUAL REPORT | 53 |
NOTES TO FINANCIAL STATEMENTS (Unaudited)(continued) |
B. Senior loans in which the Fund invests generally pay interest rates which are periodically adjusted by reference to a base short-term floating rate, plus a premium. These base lending rates are generally (i) the lending rate offered by one or more major European banks, such as the one-month or three-month London Inter-Bank Offered Rate (LIBOR), (ii) the prime rate offered by one or more major United States banks, or (iii) the bank’s certificate of deposit rate. Senior floating rate interests often require prepayments from excess cash flows or permit the borrower to repay at its election. The rate at which the borrower repays cannot be predicted with accuracy. As a result, the actual remaining maturity may be substantially less than the stated maturities shown. The interest rate indicated is the rate in effect at March 31, 2017.
C. The Fund may purchase and sell interests in securities on a when-issued and delayed delivery basis, with payment and delivery scheduled for a future date. No income accrues to the Fund on such interests or securities in connection with such transactions prior to the date the Fund actually take delivery of such interests or securities. These transactions are subject to market fluctuations and are subject to the risk that the value at delivery may be more or less than the trade date purchase price. Although the Fund will generally purchase these securities with the intention of acquiring such securities, they may sell such securities before the settlement date.
D. Upon the purchase of an option, the premium paid is recorded as an investment, the value of which is marked-to-market daily. If a purchased option expires, the Fund realizes a loss in the amount of the cost of the option. When the Fund enters into a closing sale transaction, it realizes a gain or loss depending on whether the proceeds from the closing sale transaction are greater or less than the cost of the option. If the Fund exercises a put option, it realizes a gain or loss from the sale of the underlying security and the proceeds from such sale will be decreased by the premium originally paid. When the Fund exercises a call option, the cost of the security purchased by the Fund upon exercise increases by the premium originally paid.
When the Fund writes (sells) an option, an amount equal to the premium received is entered in that Fund’s accounting records as an asset and equivalent liability. The amount of the liability is subsequently marked-to-market to reflect the current value of the option written. When a written option expires, or if the Fund enters into a closing purchase transaction, it realizes a gain (or loss if the cost of a closing purchase transaction exceeds the premium received when the option was sold).
E. Swap agreements are marked-to-marked daily and the change, if any, is recorded as unrealized gain or loss. Payments received or made as a result of an agreement or termination of the agreement are recognized as realized gains or losses.
F. The accounting records of the Fund are maintained in U.S. dollars. All assets and liabilities initially expressed in foreign currencies are converted into U.S. dollars at prevailing exchange rates. Purchases and sales of investment securities, dividend and interest income, and certain expenses are translated at the rates of exchange prevailing on the respective dates of such transactions. Changes in the relationship of these foreign currencies to the U.S. dollar can significantly affect the value of the investments and earnings of the Fund. Foreign investments
| 54 | THE GUGGENHEIM FUNDS SEMI-ANNUAL REPORT | |
NOTES TO FINANCIAL STATEMENTS (Unaudited)(continued) |
may also subject the Fund to foreign government exchange restrictions, expropriation, taxation, or other political, social or economic developments, all of which could affect the market and/or credit risk of the investments.
The Fund does not isolate that portion of the results of operations resulting from changes in the foreign exchange rates on investments from the fluctuations arising from changes in the market prices of securities held. Such fluctuations are included with the net realized and unrealized gain or loss on investments.
Reported net realized foreign exchange gains and losses arise from sales of foreign currencies and currency gains or losses realized between the trade and settlement dates on investment transactions. Net unrealized exchange gains and losses arise from changes in the fair values of assets and liabilities other than investments in securities at the fiscal period end, resulting from changes in exchange rates.
G. Security transactions are recorded on the trade date for financial reporting purposes. Realized gains and losses from securities transactions are recorded using the identified cost basis. Proceeds from lawsuits related to investment holdings are recorded as realized gains in the Fund. Dividend income is recorded on the ex-dividend date, net of applicable taxes withheld by foreign countries. Taxable non-cash dividends are recorded as dividend income. Interest income, including amortization of premiums and accretion of discounts, is accrued on a daily basis. Interest income also includes paydown gains and losses on mortgage-backed and asset-backed securities and senior and subordinated loans. Amendment fees are earned as compensation for evaluating and accepting changes to the original loan agreement and are recognized when received. Dividend income from REITs is recorded based on the income included in the distributions received from the REIT investments using published REIT classifications, including some management estimates when actual amounts are not available. Distributions received in excess of this estimated amount are recorded as a reduction of the cost of investments or reclassified to capital gains. The actual amounts of income, return of capital, and capital gains are only determined by each REIT after its fiscal year-end, and may differ from the estimated amounts.
H. The Fund declares dividends from investment income daily. The Fund pays its shareholders from its net investment income monthly and distributes any net capital gains that it has realized, at least annually. Distributions to shareholders are recorded on the ex-dividend date. Dividends are reinvested in additional shares unless shareholders request payment in cash. The character of distributions made during the year from net investment income or net realized gains may differ from their ultimate characterization for federal income tax purposes.
I. Interest and dividend income, most expenses, all realized gains and losses, and all unrealized gains and losses are allocated to the classes based upon the value of the outstanding shares in each Class. Certain costs, such as distribution and service fees are charged directly to specific classes. In addition, certain expenses have been allocated to the individual Funds in the Trust on a pro rata basis upon the respective aggregate net assets of each Fund included in the Trust.
| | THE GUGGENHEIM FUNDS SEMI-ANNUAL REPORT | 55 |
NOTES TO FINANCIAL STATEMENTS (Unaudited)(continued) |
J. Under the fee arrangement with the custodian, the Fund may earn credits based on overnight custody cash balances. These credits are utilized to reduce related custodial expenses. The custodian fees disclosed in the Statement of Operations are before the reduction in expense from the related earnings credits, if any. For the period ended March 31, 2017, there were no earnings credits received.
K. The Fund may leave cash overnight in its cash account with the custodian. Periodically, the Fund may have cash due to the custodian bank as an overdraft balance. A fee is incurred on this overdraft, calculated by multiplying the overdraft by a rate based on the federal funds rate, which was 0.82% at March 31, 2017.
L. Under the Fund’s organizational documents, its Trustees and Officers are indemnified against certain liabilities arising out of the performance of their duties to the Trust. In addition, throughout the normal course of business, the Fund enters into contracts that contain a variety of representations and warranties which provide general indemnifications. The Fund’s maximum exposure under these arrangements is unknown, as this would involve future claims that may be made against the Fund and/or its affiliates that have not yet occurred. However, based on experience, the Fund expects the risk of loss to be remote.
2. Financial Instruments and Derivatives
As part of its investment strategy, the Fund utilizes short sales and a variety of derivative instruments. These investments involve, to varying degrees, elements of market risk and risks in excess of the amounts recognized in the Statement of Assets and Liabilities. Valuation and accounting treatment of these instruments can be found under Significant Accounting Policies in Note 1 of these Notes to Financial Statements.
Derivatives
Derivatives are instruments whose values depend on, or are derived from, in whole or in part, the value of one or more other assets, such as securities, currencies, commodities or indices. Derivative instruments may be used to increase investment flexibility (including to maintain cash reserves while maintaining exposure to certain other assets), for risk management (hedging) purposes, to facilitate trading, to reduce transaction costs and to pursue higher investment returns. Derivative instruments may also be used to mitigate certain investment risks, such as foreign currency exchange rate risk, interest rate risk and credit risk. U.S. GAAP requires disclosures to enable investors to better understand how and why a Fund uses derivative instruments, how these derivative instruments are accounted for and their effects on the Fund’s financial position and results of operations. The Funds may utilize derivatives for the following purposes:
Duration: the use of an instrument to manage the interest rate risk of a portfolio.
Hedge: an investment made in order to reduce the risk of adverse price movements in a security, by taking an offsetting position to protect against broad market moves.
| 56 | THE GUGGENHEIM FUNDS SEMI-ANNUAL REPORT | |
NOTES TO FINANCIAL STATEMENTS (Unaudited)(continued) |
Options Purchased and Written
A call option on a security gives the purchaser of the option the right to buy, and the writer of a call option the obligation to sell, the underlying security. The purchaser of a put option has the right to sell, and the writer of the put option the obligation to buy, the underlying security at any time during the option period. The risk associated with purchasing options is limited to the premium originally paid.
The following table represents the Fund’s use, and volume of call/put options purchased on a quarterly basis:
| Fund | Use | | Average Number
of Contracts | |
| Total Return Bond Fund | Duration, Hedge | | | 8,348 | |
| Fund | Use | | Average
Notional | |
| Total Return Bond Fund | Duration, Hedge | | $ | 2,237,264 | |
The risk in writing a call option is that a Fund may incur a loss if the market price of the underlying security increases and the option is exercised. The risk in writing a put option is that a Fund may incur a loss if the market price of the underlying security decreases and the option is exercised. In addition, there may be an imperfect correlation between the movement in prices of options and the underlying securities where a Fund may not be able to enter into a closing transaction because of an illiquid secondary market; or, for OTC options, a Fund may be at risk because of the counterparty’s inability to perform.
The Fund used written options for Duration and Hedge. The following tables represent the Fund’s use and activity of options written for the year ended March 31, 2017:
Call Options Written
| Written Call Options | | | |
| | | Total Return Bond Fund | |
| | | Number of
Contracts | | | Premium
Amount | |
| Balance at September 30, 2016 | | | — | | | $ | — | |
| Options Written | | | 33,392 | | | | 3,038,672 | |
| Options terminated in closing purchase transactions | | | — | | | | — | |
| Options expired | | | — | | | | — | |
| Options exercised | | | — | | | | — | |
| Balance at March 31, 2017 | | | 33,392 | | | $ | 3,038,672 | |
| | THE GUGGENHEIM FUNDS SEMI-ANNUAL REPORT | 57 |
NOTES TO FINANCIAL STATEMENTS (Unaudited)(continued) |
Swaps
A swap is an agreement that obligates two parties to exchange a series of cash flows at specified intervals based upon or calculated by reference to changes in specified prices or rates for a specified amount of an underlying asset. A Fund utilizing OTC swaps bears the risk of loss of the amount expected to be received under a swap agreement in the event of the default or bankruptcy of a swap agreement counterparty or if the underlying asset declines in value. Certain standardized swaps are subject to mandatory central clearing. Central clearing generally reduces counterparty credit risk and increases liquidity, but central clearing does not make swap transactions risk-free. For Funds utilizing interest rate swaps, the exchange bears the risk of loss. Additionally, there is no guarantee that a Fund or an underlying fund could eliminate its exposure under an outstanding swap agreement by entering into an offsetting swap agreement with the same or another party.
Interest rate swaps involve the exchange by the Fund with another party for its respective commitment to pay or receive interest on a notional amount of principal. Interest rate swaps are generally valued using the closing price from the prior day, subject to an adjustment for the current day’s spreads. Interest rate swaps are generally subject to mandatory central clearing, but central clearing does not make interest rate swap transactions risk free.
The following table represents the Fund’s use and volume of interest rate swaps on a quarterly basis:
| | | | Average Notional | |
| Fund | Use | | Long | | | Short | |
| Total Return Bond Fund | Duration, Hedge | | $ | — | | | $ | 27,082,500 | |
Forward Foreign Currency Exchange Contracts
A forward foreign currency exchange contract is an agreement between two parties to exchange two designated currencies at a specific time in the future. Certain types of contracts may be cash settled, in an amount equal to the change in exchange rates during the term of the contract. The contracts can be used to hedge or manage exposure to foreign currency risks with portfolio investments or to gain exposure to foreign currencies.
The market value of a forward foreign currency exchange contract changes with fluctuations in foreign currency exchange rates. Furthermore, the Fund may be exposed to risk if the counterparties cannot meet the contract terms or if the currency value changes unfavorably as compared to the U.S. dollar.
| 58 | THE GUGGENHEIM FUNDS SEMI-ANNUAL REPORT | |
NOTES TO FINANCIAL STATEMENTS (Unaudited)(continued) |
The following table represents the Fund’s use, and volume of forward currency exchange contracts on a quarterly basis:
| | | | Average Settlement | |
| Fund | Use | | Purchased | | | Sold | |
| Total Return Bond Fund | Hedge, Income | | $ | 5,446,480 | | | $ | 384,418 | |
Derivative Investment Holdings Categorized by Risk Exposure
The following is a summary of the location of derivative investments on the Fund’s Statement of Assets and Liabilities as of March 31, 2017:
| Derivative Investment Type | Asset Derivatives | Liability Derivatives |
| Interest Rate contracts | Unrealized appreciation on swap agreements | |
| Currency contracts | | Unrealized depreciation on forward foreign currency exchange contracts |
| Equity contracts | Investments in unaffiliated issuers, at value | Options written, at value |
The following table sets forth the fair value of the Fund’s derivative investments categorized by primary risk exposure at March 31, 2017:
| Asset Derivative Investments Value | |
| Fund | | Swap
Interest
Rate
Contracts | | | Options
Written
Equity
Contracts | | | Options
Purchased
Equity
Contracts | | | Forward
Foreign
Currency
Exchange
Contracts | | | Total Value at
March 31, 2017 | |
| Total Return Bond Fund | | $ | 500,718 | | | $ | — | | | $ | 8,949,056 | | | $ | — | | | $ | 9,449,774 | |
| Liability Derivative Investments Value | |
| Fund | | Swap
Interest
Rate
Contracts | | | Options
Written
Equity
Contracts | | | Options
Purchased
Equity
Contracts | | | Forward
Foreign
Currency
Exchange
Contracts | | | Total Value at
March 31, 2017 | |
| Total Return Bond Fund | | $ | — | | | $ | (4,841,840 | ) | | $ | — | | | $ | (140,327 | ) | | $ | 4,982,167 | |
| | THE GUGGENHEIM FUNDS SEMI-ANNUAL REPORT | 59 |
NOTES TO FINANCIAL STATEMENTS (Unaudited)(continued) |
The following is a summary of the location of derivative investments on the Fund’s Statement of Operations for the period ended March 31, 2017:
| Derivative Investment Type | Location of Gain (Loss) on Derivatives |
| Currency contracts | Net realized gain (loss) on forward foreign currency exchange contracts |
| | Net change in unrealized appreciation (depreciation) on forward foreign currency exchange contracts |
| Equity/Interest rate contracts | Net realized gain (loss) on options purchased Net change in unrealized appreciation (depreciation) on options purchased |
| | Net realized gain (loss) on options written |
| | Net change in unrealized appreciation (depreciation) on options written |
| | Net realized gain (loss) on swap agreements |
| | Net change in unrealized appreciation (depreciation) on swap agreements |
The following is a summary of the Fund’s realized gain (loss) and change in unrealized appreciation (depreciation) on derivative investments recognized on the Statement of Operations categorized by primary risk exposure for the period ended March 31, 2017:
| Realized Gain (Loss) on Derivative Investments Recognized on the Statement of Operations | |
| Fund | | Swaps
Interest
Rate
Contracts | | | Options
Written
|Equity
Contracts | | | Options
Purchased
Equity
Contracts | | | Forward
Foreign
Currency
Exchange
Contracts | | | Total | |
| Total Return Bond Fund | | $ | (111,540 | ) | | $ | — | | | $ | — | | | $ | (158,101 | ) | | $ | (269,641 | ) |
| Change in Unrealized Appreciation (Depreciation) on Derivative Investments Recognized on the Statement of Operations | |
| Fund | | Swaps
Interest
Rate
Contracts | | | Options
Written
Equity
Contracts | | | Options
Purchased
Equity
Contracts | | | Forward
Foreign
Currency
Exchange
Contracts | | | Total | |
| Total Return Bond Fund | | $ | 500,718 | | | $ | (1,803,168 | ) | | $ | 3,105,456 | | | $ | (140,327 | ) | | $ | 1,662,679 | |
In conjunction with the use short sales and of derivative instruments, the Fund is required to maintain collateral in various forms. The Fund uses, where appropriate, depending on the financial instrument utilized and the broker involved, margin deposits at the broker, cash and/or securities segregated at the custodian bank, discount notes or the repurchase agreements allocated to the Fund.
| 60 | THE GUGGENHEIM FUNDS SEMI-ANNUAL REPORT | |
NOTES TO FINANCIAL STATEMENTS (Unaudited)(continued) |
The Trust has established counterparty credit guidelines and enters into transactions only with financial institutions of investment grade or better. The Trust monitors the counterparty credit risk.
3. Fees and Other Transactions with Affiliates
At a meeting that occurred on November 16, 2016, the Board approved to add an advisory fee breakpoint (“breakpoint”) to the Fund.
Under the terms of an investment advisory contract, the Fund pays GI investment advisory fees calculated at an annualized rate of 0.50% of the average daily net assets up to $5 billion; and 0.45% of the average daily net assets in excess of $5 billion of the Fund’s advisory fees.
GI engages external service providers to perform other necessary services for the Trust, such as audit and accounting related services, legal services, custody, printing and mailing, etc., on a pass-through basis. Such expenses are allocated to various Funds within the complex based on relative net assets.
The Fund has adopted Distribution Plans related to the offering of A-Class, C-Class and P-Class shares pursuant to Rule 12b-1 under the 1940 Act. The plans provide for payments at an annual rate of 0.25% of the average daily net assets of the Fund’s A-Class and P-Class shares, and 1.00% of the average daily net assets of the Fund’s C-Class shares.
The investment advisory contracts for the Fund provides that the total expenses be limited to a percentage of average net assets for each class of shares, exclusive of brokerage costs, dividends on securities sold short, expenses of other investment companies in which a Fund invests, interest, taxes, litigation, indemnification and extraordinary expenses. The limits are listed below:
| | | Limit | | Effective
Date | Contract
End Date |
| Total Return Bond Fund - A-Class | | | 0.90 | % | 11/30/12 | 02/01/18 |
| Total Return Bond Fund - C-Class | | | 1.65 | % | 11/30/12 | 02/01/18 |
| Total Return Bond Fund - P-Class* | | | 0.90 | % | 05/01/15 | 02/01/18 |
| Total Return Bond Fund - R6-Class** | | | 0.50 | % | 10/19/16 | 02/01/18 |
| Total Return Bond Fund - Institutional Class | | | 0.50 | % | 11/30/12 | 02/01/18 |
| * | Since the commencement of operations: May 1, 2015 |
| ** | Since the commencement of operations: October 19, 2016 |
| | THE GUGGENHEIM FUNDS SEMI-ANNUAL REPORT | 61 |
NOTES TO FINANCIAL STATEMENTS (Unaudited)(continued) |
GI is entitled to reimbursement by the Funds for fees waived or expenses reimbursed during any of the previous 36 months, beginning on the date of the expense limitation agreement, if on any day the estimated operating expenses are less than the indicated percentages. At March 31, 2017, the amount of fees waived or expenses reimbursed that are subject to recoupment are presented in the following table:
| Fund | | Expires
2017 | | | Expires
2018 | | | Expires
2019 | | | Expires
2020 | | | Total | |
| Total Return Fund | | | | | | | | | | | | | | | |
| A-Class | | $ | 105,941 | | | $ | 576,490 | | | $ | 886,912 | | | $ | 397,533 | | | $ | 1,966,876 | |
| C-Class | | | 20,537 | | | | 99,359 | | | | 201,092 | | | | 117,053 | | | | 438,041 | |
| P-Class | | | — | | | | 2,335 | | | | 91,216 | | | | 173,904 | | | | 267,455 | |
| Institutional Class | | | 197,372 | | | | 1,646,773 | | | | 4,174,107 | | | | 2,226,692 | | | | 8,244,944 | |
For the period ended March 31, 2017, no amounts were recouped by GI.
If a Fund invests in an affiliated fund, the investing Fund’s adviser has agreed to waive fees at the investing fund level. Fee waivers will be calculated at the investing Fund level without regard to any expense cap, if any, in effect for the investing Fund. Fees waived under this arrangement are not subject to reimbursement to GI. For the period March 31, 2017, the Fund waived $174,948 related to investments in affiliated funds.
For the period ended March 31, 2017, GFD retained sales charges of $712,076 relating to sales of A-Class shares of the Trust.
Certain trustees and officers of the Trust are also officers of GI and GFD.
4. Fair Value Measurement
In accordance with U.S. GAAP, fair value is defined as the price that the Fund would receive to sell an investment or pay to transfer a liability in an orderly transaction with an independent buyer in the principal market, or in the absence of a principal market, the most advantageous market for the investment or liability. U.S. GAAP establishes a three-tier fair value hierarchy based on the types of inputs used to value assets and liabilities and requires corresponding disclosure. The hierarchy and the corresponding inputs are summarized below:
| Level 1 — | quoted prices in active markets for identical assets or liabilities. |
| Level 2 — | significant other observable inputs (for example quoted prices for securities that are similar based on characteristics such as interest rates, prepayment speeds, credit risk, etc.). |
| Level 3 — | significant unobservable inputs based on the best information available under the circumstances, to the extent observable inputs are not available, which may include assumptions. |
| 62 | THE GUGGENHEIM FUNDS SEMI-ANNUAL REPORT | |
NOTES TO FINANCIAL STATEMENTS (Unaudited)(continued) |
The types of inputs available depend on a variety of factors, such as the type of security and the characteristics of the markets in which it trades, if any. Fair valuation determinations that rely on fewer or no observable inputs require greater judgment. Accordingly, fair value determinations for Level 3 securities require the greatest amount of judgment.
Independent pricing services are used to value a majority of the Fund’s investments. When values are not available from a pricing service, they may be computed by the Fund’s investment adviser or an affiliate. In any event, values may be determined using a variety of sources and techniques, including: market prices; broker quotes; and models which derive prices based on inputs such as prices of securities with comparable maturities and characteristics or based on inputs such as anticipated cash flows or collateral, spread over Treasuries, and other information and analysis. A significant portion of the Fund’s assets and liabilities are categorized as Level 2 or Level 3, as indicated in this report.
Indicative quotes from broker-dealers, adjusted for fluctuations in criteria such as credit spreads and interest rates, may be also used to value the Fund’s assets and liabilities, i.e. prices provided by a broker-dealer or other market participant who has not committed to trade at that price. Although indicative quotes are typically received from established market participants, the Fund may not have the transparency to view the underlying inputs which support the market quotations. Significant changes in an indicative quote would generally result in significant changes in the fair value of the security.
Certain fixed income securities are valued by obtaining a monthly indicative quote from a broker-dealer, adjusted for fluctuations in criteria such as credit spreads and interest rates.
The inputs or methodologies used for valuing securities are not necessarily an indication of the risk associated with investing in those securities. The suitability of the techniques and sources employed to determine fair valuation are regularly monitored and subject to change.
5. Federal Income Tax Information
The Fund intends to comply with the provisions of Subchapter M of the Internal Revenue Code applicable to regulated investment companies and will distribute substantially all taxable net investment income and capital gains sufficient to relieve the Fund from all, or substantially all, federal income, excise and state income taxes. Therefore, no provision for federal or state income tax is required.
Tax positions taken or expected to be taken in the course of preparing the Fund’s tax returns are evaluated to determine whether the tax positions are “more-likely-than-not” of being sustained by the applicable tax authority. Tax positions not deemed to meet the more-likely-than-not threshold would be recorded as a tax benefit or expense in the current year. Management has analyzed the Fund’s tax positions taken, or to be taken, on federal income tax returns for all open tax years, and
| | THE GUGGENHEIM FUNDS SEMI-ANNUAL REPORT | 63 |
NOTES TO FINANCIAL STATEMENTS (Unaudited)(continued) |
has concluded that no provision for income tax is required in the Fund’s financial statements. The Fund’s federal tax returns are subject to examination by the Internal Revenue Service for a period of three years after they are filed.
At March 31, 2017, the cost of securities for federal income tax purposes, the aggregate gross unrealized gain for all securities for which there was an excess of value over tax cost, and the aggregate gross unrealized loss for all securities for which there was an excess of tax cost over value were as follows:
| Fund | | Tax
Cost | | | Tax
Unrealized
Gain | | | Tax
Unrealized
Loss | | | Net
Unrealized
Gain | |
| Total Return Bond Fund | | $ | 6,109,337,835 | | | $ | 85,276,734 | | | $ | (81,548,729 | ) | | $ | 3,728,005 | |
6. Securities Transactions
For the period ended March 31, 2017, the cost of purchases and proceeds from sales of investment securities, excluding government securities, short-term investments and derivatives, were as follows:
| Fund | | Purchases | | | Sales | |
| Total Return Bond Fund | | $ | 3,226,279,918 | | | $ | 1,290,743,184 | |
For the year ended March 31, 2017, the cost of purchases and proceeds from sales of government securities were as follows:
| Fund | | Purchases | | | Sales | |
| Total Return Bond Fund | | $ | 725,923,358 | | | $ | 479,899,853 | |
The Fund is permitted to purchase or sell securities from or to certain affiliated funds under specified conditions outlined in procedures adopted by the Board of the Trust. The procedures have been designed to ensure that any purchase or sale of securities by a Fund from or to another fund or portfolio that is or could be considered an affiliate by virtue of having a common investment adviser (or affiliated investment advisers), common Trustees and/or common officers complies with Rule 17a-7 of the 1940 Act. Further, as defined under these procedures, each transaction is effected at the current market price to save costs, where permissible. For the period ended March 31, 2017, the Fund engaged in purchases and sales of securities, pursuant to Rule 17a-7 of the 1940 Act, as follows:
| Fund | | Purchases | | | Sales | | | Realized
Gain | |
| Total Return Bond Fund | | $ | 23,702,236 | | | $ | 6,154,416 | | | $ | 122,920 | |
| 64 | THE GUGGENHEIM FUNDS SEMI-ANNUAL REPORT | |
NOTES TO FINANCIAL STATEMENTS (Unaudited)(continued) |
7. Affiliated Transactions
Investments representing 5% or more of the outstanding voting shares of a portfolio company of a fund, or control of or by, or common control under GI, result in that portfolio company being considered an affiliated company of such fund, as defined in the 1940 Act.
The Fund may invest in the Guggenheim Strategy Funds Trust consisting of Guggenheim Strategy Fund I, Guggenheim Strategy Fund II, Guggenheim Strategy Fund III, and Guggenheim Variable Insurance Strategy Fund III (collectively, the “Cash Management Funds”), open-end management investment companies managed by GI. The Cash Management Funds, which launched on March 11, 2014, are offered as cash management options only to mutual funds, trusts, and other accounts managed by GI and/or its affiliates, and are not available to the public. The Cash Management Funds pay no investment management fees. The Cash Management Funds’ annual report on Form N-CSR dated September 30, 2016, is available publicly or upon request. This information is available from the EDGAR database on the SEC’s website at https://www.sec.gov/Archives/edgar/data/1601445/000089180416001923/gug65857-ncsr.htm.
Transactions during the period ended March 31, 2017, in which the portfolio company is an “affiliated person,” were as follows:
| Affiliated issuers by Fund | | Value
09/30/16 | | | Additions | | | Reductions | | | Value
03/31/17 | | | Shares
03/31/17 | | | Investment
Income | | | Realized
Gain | |
| Total Return Bond Fund | | | | | | | | | | |
| Guggenheim Floating Rate Strategies Fund - Institutional Class | | $ | 20,054,667 | | | $ | 15,540,977 | | | $ | — | | | $ | 35,710,067 | | | | 1,369,251 | | | $ | 538,310 | | | $ | — | |
| Guggenheim Limited Duration Fund - Institutional Class | | | 15,453,399 | | | | 15,644,174 | | | | — | | | | 15,662,584 | | | | 633,343 | | | | 233,793 | | | | 2,716 | |
| Guggenheim Strategic Opportunities Fund | | | 9,205,115 | | | | — | | | | — | | | | 9,802,412 | | | | 481,691 | | | | 526,296 | | | | — | |
| Guggenheim Strategy Fund I | | | 12,050,977 | | | | 107,920 | | | | — | | | | 12,187,954 | | | | 486,545 | | | | 107,545 | | | | — | |
| Guggenheim Strategy Fund II | | | 10,733,931 | | | | 1,130,786 | | | | — | | | | 11,890,707 | | | | 475,628 | | | | 130,625 | | | | — | |
| Guggenheim Strategy Fund III | | | 6,342,121 | | | | 93,111 | | | | — | | | | 6,442,936 | | | | 257,614 | | | | 93,115 | | | | — | |
| | | $ | 73,840,210 | | | $ | 32,516,968 | | | $ | — | | | $ | 91,696,600 | | | | | | | $ | 1,629,684 | | | $ | 2,716 | |
8. Loan Commitments
Pursuant to the terms of certain loan agreements, the Fund held unfunded loan commitments as of March 31, 2017. The Fund is obligated to fund these loan commitments at the borrower’s discretion.
| | THE GUGGENHEIM FUNDS SEMI-ANNUAL REPORT | 65 |
NOTES TO FINANCIAL STATEMENTS (Unaudited)(continued) |
The unfunded loan commitments as of March 31, 2017 were as follows:
| Borrower | Maturity
Date | | Face
Amount | | | Value | |
| Total Return Bond Fund | | | | | | | |
| Acosta, Inc. | 09/26/19 | | $ | 1,857,778 | | | $ | 123,057 | |
| Internet Brands | 07/08/21 | | | 338,824 | | | | — | |
| | | | $ | 2,196,601 | | | $ | 123,057 | |
9. Line of Credit
The Trust, with the exception of Capital Stewardship Fund, and certain affiliated funds, secured a 364-day committed, $800,000,000 line of credit from Citibank, N.A., which was in place through October 6, 2016, at which time the line of credit was renewed, with an increased commitment amount to $1,000,000,000. A Fund may draw (borrow) from the line of credit as a temporary measure for emergency purposes, to facilitate redemption requests, or for other short-term liquidity purposes consistent with the Fund’s investment objective and program. For example, it may be advantageous for the Fund to borrow money rather than sell existing portfolio positions to meet redemption requests. Fees related to borrowings, if any, vary under this arrangement between the greater of Citibank’s “base rate”, LIBOR plus 1%, or the federal funds rate 0.82% at March 31, 2017, plus 1/2 of 1%. All affiliated funds that participate in the line of credit paid upfront costs totaling $2,032,388 to renew the line of credit.
The commitment fee that may be paid by the Funds is at an annualized rate of 0.15% of the average daily amount of their unused commitment amount. The Funds did not have any borrowings under this agreement as of and for the period ended March 31, 2017.
The allocated commitment fee amount for each Fund is referenced in the Statement of Operations under “Line of credit fees” and the effect on the expense ratio is included in the Financial Highlights.
10. Reverse Repurchase Agreements
The Fund may enter into reverse repurchase agreements. Under a reverse repurchase agreement, a Fund sells securities and agrees to repurchase them at a particular price at a future date. In the event the buyer of securities under a reverse repurchase agreement files for bankruptcy or becomes insolvent, such buyer or its trustee or receiver may receive an extension of time to determine whether to enforce the Fund’s obligation to repurchase the securities, and the Fund’s use of the proceeds of the reverse repurchase agreement may effectively be restricted pending such decision.
| 66 | THE GUGGENHEIM FUNDS SEMI-ANNUAL REPORT | |
NOTES TO FINANCIAL STATEMENTS (Unaudited)(continued) |
For the period ended March 31, 2017, the Fund entered into reverse repurchase agreements:
| Fund | | Number of Days Outstanding | | | Balance at
March 31, 2017 | | | Average Balance Outstanding | | | Average Interest Rate | |
| Total Return Bond Fund | | | 182 | | | $ | 10,041,683 | | | $ | 378,546,324 | | | | 0.4 | % |
The following table presents reverse repurchase agreements that are subject to netting arrangements and offset in the Statement of Assets of Liabilities in conformity with U.S. GAAP:
| | | | | | | | | | | | | Gross Amounts Not Offset in the Statement of Assets and Liabilities | | | | |
| Fund | Instrument | | Gross Amounts of Recognized Liabilities | | | Gross Amounts Offset in the Statement of Assets and Liabilities | | | Net Amount of Liabilities Presented on the Statement of Assets and Liabilities | | | Financial
Instruments | | | Cash
Collateral
Received | | | Net
Amount | |
| Total Return Bond Fund | Reverse repurchase agreements | | $ | 10,041,683 | | | $ | — | | | $ | 10,041,683 | | | $ | 10,041,683 | | | $ | — | | | $ | — | |
The following is a summary of the remaining contractual maturities of the reverse repurchase agreements outstanding as of March 31, 2017, aggregated by asset class of the related collateral pledged by the Fund:
| Fund | | Up to
30 days | |
| Total Return Bond Fund | | | |
| U.S. Treasury Bond | | $ | 10,041,683.00 | |
11. Restricted Securities
The securities below are considered illiquid and restricted under guidelines established by the Board of Trustees.
| Fund | Restricted
Securities | Acquisition
Date | | Cost | | | Value | |
| Total Return Bond Fund | GMAC Commercial Mortgage Asset Corp. 2007-HCKM | | | | | | | |
| | 6.11% due 08/10/52 | 10/07/16 | | $ | 26,343,879 | | | $ | 23,133,768 | |
| | Capmark Military Housing Trust 2008-AMCW | | | | | | | | | |
| | 6.90% due 07/10/55 | 05/20/16 | | | 10,793,217 | | | | 9,785,618 | |
| | THE GUGGENHEIM FUNDS SEMI-ANNUAL REPORT | 67 |
NOTES TO FINANCIAL STATEMENTS (Unaudited)(continued) |
| Fund | Restricted
Securities | Acquisition
Date | | Cost | | | Value | |
| | Capmark Military Housing Trust 2007-AETC | | | | | | | |
| | 5.75% due 02/10/52 | 09/18/14 | | $ | 8,300,125 | | | $ | 8,097,410 | |
| | RFTI Issuer Ltd. 2015-FL1 | | | | | | | | | |
| | 4.79% due 08/15/30 | 10/14/15 | | | 4,988,313 | | | | 5,007,685 | |
| | Fort Benning Family Communities LLC | | | | | | | | | |
| | 1.26% due 01/15/36 | 03/27/15 | | | 4,765,774 | | | | 4,885,444 | |
| | Capmark Military Housing Trust 2007-ROBS | | | | | | | | | |
| | 6.06% due 10/10/52 | 04/23/15 | | | 4,721,939 | | | | 4,823,238 | |
| | GMAC Commercial Mortgage Asset Corp. 2005-DRUM | | | | | | | | | |
| | 5.47% due 05/10/50 | 05/20/16 | | | 5,036,729 | | | | 4,585,494 | |
| | GMAC Commercial Mortgage Asset Corp. 2005-BLIS | | | | | | | | | |
| | 5.25% due 07/10/50 | 05/20/16 | | | 2,595,215 | | | | 2,327,843 | |
| | HP Communities LLC | | | | | | | | | |
| | 5.78% due 03/15/46 | 08/23/16 | | | 2,553,362 | | | | 2,296,500 | |
| | Capmark Military Housing Trust 2007-AET2 | | | | | | | | | |
| | 6.06% due 10/10/52 | 10/16/15 | | | 2,157,960 | | | | 2,260,540 | |
| | Customers Bank | | | | | | | | | |
| | 6.13% due 06/26/29 | 06/24/14 | | | 2,000,000 | | | | 2,045,000 | |
| | HP Communities LLC | | | | | | | | | |
| | 5.86% due 09/15/53 | 10/06/16 | | | 1,617,025 | | | | 1,501,096 | |
| | Northern Group Housing LLC | | | | | | | | | |
| | 6.80% due 08/15/53 | 07/25/13 | | | 1,200,000 | | | | 1,440,636 | |
| | Atlantic Marine Corporations Communities LLC | | | | | | | | | |
| | 5.43% due 12/01/50 | 07/25/14 | | | 1,406,412 | | | | 1,392,233 | |
| | Cadence Bank North America | | | | | | | | | |
| | 6.25% due 06/28/29 | 06/06/14 | | | 1,200,000 | | | | 1,200,000 | |
| | HP Communities LLC | | | | | | | | | |
| | 5.62% due 09/15/32 | 06/09/14 | | | 1,011,240 | | | | 1,090,610 | |
| | Turbine Engines Securitization Ltd. 2013-1A | | | | | | | | | |
| | 5.13% due 12/13/48 | 11/27/13 | | | 1,084,759 | | | | 1,084,378 | |
| | Pacific Northwest Communities LLC | | | | | | | | | |
| | 5.91% due 06/15/50 | 05/22/14 | | | 1,000,000 | | | | 1,081,030 | |
| | Fort Knox Military Housing Privatization Project | | | | | | | | | |
| | 1.25% due 02/15/52 | 04/09/15 | | | 1,115,057 | | | | 1,052,067 | |
| | ACC Group Housing LLC | | | | | | | | | |
| | 6.35% due 07/15/54 | 06/03/14 | | | 625,000 | | | | 718,614 | |
| 68 | THE GUGGENHEIM FUNDS SEMI-ANNUAL REPORT | |
NOTES TO FINANCIAL STATEMENTS (Unaudited)(continued) |
| Fund | Restricted
Securities | Acquisition
Date | | Cost | | | Value | |
| | Great Lakes CLO Ltd. 2012-1A | | | | | | | |
| | due 01/15/23 | 12/06/12 | | $ | 955,000 | | | $ | 423,870 | |
| | Airplanes Pass Through Trust 2001-1A | | | | | | | | | |
| | 1.46% due 03/15/19 | 11/30/11 | | | 607,228 | | | | 229,500 | |
| | Copper River CLO Ltd. 2007-1A | | | | | | | | | |
| | due 01/20/21 | 05/09/14 | | | 1,755,000 | | | | 210,889 | |
| | Schahin II Finance Company SPV Ltd. | | | | | | | | | |
| | due 09/25/22 | 03/21/12 | | | 777,505 | | | | 89,907 | |
| | | | | $ | 88,610,739 | | | $ | 80,763,369 | |
12. Offsetting
In the normal course of business, the Fund enters into transactions subject to enforceable master netting arrangements or other similar arrangements. Generally, the right to offset in those agreements allows the Fund to counteract the exposure to a specific counterparty with collateral received or delivered to that counterparty based on the terms of the arrangements. These arrangements provide for the right to liquidate upon the occurrence of an event of default, credit event upon merger or additional termination event.
In order to better define their contractual rights and to secure rights that will help the Fund mitigate its counterparty risk, the Fund may enter into an International Swaps and Derivatives Association, Inc. Master Agreement (“ISDA Master Agreement”) or similar agreement with its derivative contract counterparties.
An ISDA Master Agreement is a bilateral agreement between a Fund and a counterparty that governs OTC derivatives, including foreign exchange contracts, and typically contains, among other things, collateral posting terms and netting provisions in the event of a default and/or termination event. The provisions of the ISDA Master Agreement typically permit a single net payment in the event of a default (close-out netting) or similar event, including the bankruptcy or insolvency of the counterparty.
For derivatives traded under an ISDA Master Agreement, the collateral requirements are typically calculated by netting the mark to market amount for each transaction under such agreement and comparing that amount to the value of any collateral currently pledged by the Fund and the counterparty. For financial reporting purposes, cash collateral that has been pledged to cover obligations of the Fund and cash collateral received from the counterparty, if any, is reported separately on the Statement of Assets and Liabilities as segregated cash with broker/receivable for variation margin, or payable for swap settlement/variation margin. Generally, the amount of collateral due from or to a counterparty must exceed a minimum transfer amount threshold (e.g., $300,000) before a transfer is required to be made. To the extent amounts due to the Fund from its counterparties are
| | THE GUGGENHEIM FUNDS SEMI-ANNUAL REPORT | 69 |
NOTES TO FINANCIAL STATEMENTS (Unaudited)(concluded) |
not fully collateralized, contractually or otherwise, the Fund bears the risk of loss from counterparty nonperformance. The Fund attempts to mitigate counterparty risk by only entering into agreements with counterparties that they believe to be of good standing and by monitoring the financial stability of those counterparties.
For financial reporting purposes, the Fund does not offset derivative assets and derivative liabilities that are subject to netting arrangements in the Statement of Assets and Liabilities.
The following table presents derivative financial instruments and secured financing transactions that are subject to enforceable netting arrangements and off set in the Statement of Assets and Liabilities in conformity with U.S. GAAP.
| | | | | | | | | | | | | Gross Amounts Not Offset
in the Statements of
Assets and Liabilities | | | | |
| Fund | Instrument | | Gross Amounts of Recognized Assets | | | Gross Amounts Offset in the Statements of Assets and Liabilities | | | Net Amount of Assets Presented
on the
Statements
of Assets and
Liabilities | | | Financial
Instruments | | | Cash
Collateral
Received | | | Net
Amount | |
| Total Return Bond Fund | Option
contracts | | $ | 8,949,056 | | | $ | — | | | $ | 8,949,056 | | | $ | 4,855,391 | | | $ | 3,865,000 | | | $ | 228,665 | |
| | | | | | | | | | | | | Gross Amounts Not Offset in the Statements of Assets and Liabilities | | | | |
| Fund | Instrument | | Gross Amounts of Recognized Liabilities | | | Gross Amounts Offset in the Statements of Assets and Liabilities | | | Net Amount of Liabilities Presented
on the
Statements
of Assets and
Liabilities | | | Financial
Instruments | | | Cash
Collateral
Pledged | | | Net
Amount | |
| Total Return Bond Fund | Option
contracts | | $ | 4,841,840 | | | $ | — | | | $ | 4,841,840 | | | $ | 4,841,840 | | | $ | — | | | $ | — | |
| | Foreign forward currency exchange contracts | | | 140,327 | | | | — | | | | 140,327 | | | | 13,551 | | | | — | | | | 126,776 | |
| 70 | THE GUGGENHEIM FUNDS SEMI-ANNUAL REPORT | |
OTHER INFORMATION (Unaudited) |
Proxy Voting Information
A description of the policies and procedures that the Trust uses to determine how to vote proxies relating to securities held in the Funds’ portfolios is available, without charge and upon request, by calling 800.820.0888. This information is also available from the EDGAR database on the SEC’s website at https://www.sec.gov.
Information regarding how the Funds voted proxies relating to portfolio securities during the most recent 12-month period ended June 30 is available without charge, upon request, by calling 800.820.0888. This information is also available from the EDGAR database on the SEC’s website at https://www.sec.gov.
Sector Classification
Information in the “Schedule of Investments” is categorized by sectors using sector-level Classifications defined by the Bloomberg Industry Classification System, a widely recognized industry classification system provider. Each Fund’s registration statement has investment policies relating to concentration in specific sectors/industries. For purposes of these investment policies, the Funds usually classify sectors/industries based on industry-level Classifications used by widely recognized industry classification system providers such as Bloomberg Industry Classification System, Global Industry Classification Standards and Barclays Global Classification Scheme.
Quarterly Portfolio Schedules Information
The Trust files its complete schedule of portfolio holdings with the SEC for the first and third quarters of each fiscal year on Form N-Q; which are available on the SEC’s website at https://www.sec.gov. The Funds’ Forms N-Q may be reviewed and copied at the SEC’s Public Reference Room in Washington, DC, and that information on the operation of the Public Reference Room may be obtained by calling 800-SEC-0330. Copies of the portfolio holdings are also available to shareholders, without charge and upon request, by calling 800.820.0888.
| | THE GUGGENHEIM FUNDS SEMI-ANNUAL REPORT | 71 |
INFORMATION ON BOARD OF TRUSTEES AND OFFICERS (Unaudited) |
Name, Address*
and Year of Birth | Position(s) Held
with the Trust | Term of Office
and Length of
Time Served** | Principal Occupation(s)
During Past Five Years | Number of
Portfolios in
Fund Complex
Overseen | Other Directorships
Held by Trustees |
| INDEPENDENT TRUSTEES | | | |
Randall C. Barnes
(1951) | Trustee | Since 2014 | Current: Private Investor (2001-present). Former: Senior Vice President and Treasurer, PepsiCo, Inc. (1993-1997); President, Pizza Hut International (1991-1993); Senior Vice President, Strategic Planning and New Business Development, PepsiCo, Inc. (1987-1990). | 98 | Current: Trustee, Purpose Investments Inc. (2014-Present). |
Donald A.
Chubb, Jr.
(1946 ) | Trustee | Since 1994 | Current: Business broker and manager of commercial real estate, Griffith & Blair, Inc. (1997-present). | 95 | Former: Midland Care, Inc. (2011-2016). |
Jerry B. Farley
(1946) | Trustee | Since 2005 | Current: President, Washburn University (1997-present). | 95 | Current: Westar Energy, Inc. (2004-present); CoreFirst Bank & Trust (2000-present). |
| 72 | THE GUGGENHEIM FUNDS SEMI-ANNUAL REPORT | |
INFORMATION ON BOARD OF TRUSTEES AND OFFICERS (Unaudited)(continued) |
Name, Address*
and Year of Birth | Position(s) Held
with the Trust | Term of Office
and Length of
Time Served** | Principal Occupation(s)
During Past Five Years | Number of
Portfolios in
Fund Complex
Overseen | Other Directorships
Held by Trustees |
| INDEPENDENT TRUSTEES - continued | | |
Roman
Friedrich III
(1946) | Trustee and Chairman of the Contracts Review Committee | Since 2014 | Current: Founder and Managing Partner, Roman Friedrich & Company (1998-present). Former: Senior Managing Director, MLV & Co. LLC (2010-2011). | 95 | Current: Zincore Metals, Inc. (2009-present). Former: Axiom Gold and Silver Corp. (2011-2012). |
Robert B. Karn III
(1942) | Trustee and Chairman of the Audit Committee | Since 2014 | Current: Consultant (1998-present). Former: Arthur Andersen (1965-1997) and Managing Partner, Financial and Economic Consulting, St. Louis office (1987-1997). | 95 | Current: GP Natural Resource Partners, LLC (2002- present). Former: Peabody Energy Company (2003- Apr. 2017). |
Ronald A. Nyberg
(1953) | Trustee and Chairman of the Nominating and Governance Committee | Since 2014 | Current: Partner, Momkus McCluskey Roberts, LLC (2016-present). Former: Partner, Nyberg & Cassioppi, LLC (2000-2016); Executive Vice President, General Counsel, and Corporate Secretary, Van Kampen Investments (1982-1999). | 100 | Current: Edward-Elmhurst Healthcare System (2012-present). |
| | THE GUGGENHEIM FUNDS SEMI-ANNUAL REPORT | 73 |
INFORMATION ON BOARD OF TRUSTEES AND OFFICERS (Unaudited)(continued) |
Name, Address*
and Year of Birth | Position(s) Held
with the Trust | Term of Office
and Length of
Time Served** | Principal Occupation(s)
During Past Five Years | Number of
Portfolios in
Fund Complex
Overseen | Other Directorships
Held by Trustees |
| INDEPENDENT TRUSTEES - concluded | | |
Maynard F. Oliverius
(1943) | Trustee | Since 1998 | Current: Retired. Former: President and CEO, Stormont-Vail HealthCare (1996-2012). | 95 | Current: Robert J. Dole Institute of Politics (2016-present); Stormont-Vail Foundation (2013-present); University of Minnesota MHA Alumni Philanthropy Committee (2009-present); Fort Hays State University Foundation (1999-present). Former: Topeka Community Foundation (2009-2014). |
Ronald E.
Toupin, Jr.
(1958) | Trustee and Chairman of the Board | Since 2014 | Current: Portfolio Consultant (2010-present). Former: Vice President, Manager and Portfolio Manager, Nuveen Asset Management (1998-1999); Vice President, Nuveen Investment Advisory Corp. (1992-1999); Vice President and Manager, Nuveen Unit Investment Trusts (1991-1999); and Assistant Vice President and Portfolio Manager, Nuveen Unit Investment Trusts (1988-1999), each of John Nuveen & Co., Inc. (1982-1999). | 97 | Former: Bennett Group of Funds (2011-2013). |
| 74 | THE GUGGENHEIM FUNDS SEMI-ANNUAL REPORT | |
INFORMATION ON BOARD OF TRUSTEES AND OFFICERS (Unaudited)(continued) |
Name, Address*
and Year of Birth | Position(s) Held
with the Trust | Term of Office
and Length of
Time Served** | Principal Occupation(s)
During Past Five Years | Number of
Portfolios in
Fund Complex
Overseen | Other Directorships
Held by Trustees |
| INTERESTED TRUSTEE | |
Donald C. Cacciapaglia***
(1951) | President, Chief Executive Officer and Trustee | Since 2012 | Current: President and CEO, certain other funds in the Fund Complex (2012-present); Vice Chairman, Guggenheim Investments (2010-present). Former: Chairman and CEO, Channel Capital Group, Inc. (2002-2010). | 230 | Current: Clear Spring Life Insurance Company (2015-present); Guggenheim Partners Japan, Ltd. (2014-present); Guggenheim Partners Investment Management Holdings, LLC (2014-present); Delaware Life (2013-present); Guggenheim Life and Annuity Company (2011-present); Paragon Life Insurance Company of Indiana (2011-present). |
| * | The business address of each Trustee is c/o Guggenheim Investments, 227 West Monroe Street, Chicago, Illinois 60606. |
| ** | Each Trustee serves an indefinite term, until his successor is elected and qualified. Time served includes time served in the respective position for the Predecessor Corporation. |
| *** | This Trustee is deemed to be an "interested person" of the Funds under the 1940 Act by reason of his position with the Funds' Investment Manager and/or the parent of the Investment Manager. |
| | THE GUGGENHEIM FUNDS SEMI-ANNUAL REPORT | 75 |
INFORMATION ON BOARD OF TRUSTEES AND OFFICERS (Unaudited)(continued) |
Name, Address*
and Year of Birth | Position(s) held
with the Trust | Term of Office
and Length of
Time Served** | Principal Occupations
During Past Five Years |
| OFFICERS | | | |
William H.
Belden, III
(1965) | Vice President | Since 2014 | Current: Vice President, certain other funds in the Fund Complex (2006-present); Managing Director, Guggenheim Funds Investment Advisors, LLC (2005-present). Former: Vice President of Management, Northern Trust Global Investments (1999-2005). |
Joanna M. Catalucci
(1966) | AML Officer | Since 2016 | Current: Chief Compliance Officer, certain funds in the Fund Complex (2012-present); Senior Managing Director, Guggenheim Investments (2014-present); AML Officer, certain funds in the Fund Complex (2016-present). Former: Chief Compliance Officer and Secretary, certain other funds in the Fund Complex (2008-2012); Senior Vice President & Chief Compliance Officer, Security Investors, LLC and certain affiliates (2010-2012); Chief Compliance Officer and Senior Vice President, Rydex Advisors, LLC and certain affiliates (2010-2011). |
James M. Howley
(1972) | Assistant Treasurer | Since 2014 | Current: Managing Director, Guggenheim Investments (2004-present); Assistant Treasurer, certain other funds in the Fund Complex (2006-present). Former: Manager, Mutual Fund Administration of Van Kampen Investments, Inc. (1996-2004). |
Keith D. Kemp
(1960) | Assistant Treasurer | Since 2016 | Current: Treasurer and Assistant Treasurer, certain other funds in the Fund Complex (2010-present); Managing Director of Guggenheim Partners Investment Management, LLC (2015-present); Chief Financial Officer, Guggenheim Specialized Products, LLC (2016-present). Former: Managing Director and Director, Transparent Value, LLC (2010-2016); Director, Guggenheim Partners Investment Management, LLC (2010-2015); Chief Operating Officer, Macquarie Capital Investment Management (2007-2009). |
| 76 | THE GUGGENHEIM FUNDS SEMI-ANNUAL REPORT | |
INFORMATION ON BOARD OF TRUSTEES AND OFFICERS (Unaudited)(continued) |
Name, Address*
and Year of Birth | Position(s) held
with the Trust | Term of Office
and Length of
Time Served** | Principal Occupations
During Past Five Years |
| OFFICERS - continued | |
Amy J. Lee
(1961) | Vice President and Chief Legal Officer | Since 2007 (Vice President) Since 2014 (Chief Legal Officer) | Current: Chief Legal Officer, certain other funds in the Fund Complex (2013-present); Senior Managing Director, Guggenheim Investments (2012-present). Former: Vice President, Associate General Counsel and Assistant Secretary, Security Benefit Life Insurance Company and Security Benefit Corporation (2004-2012). |
Mark E. Mathiasen
(1978) | Secretary | Since 2014 | Current: Secretary, certain other funds in the Fund Complex (2007-present); Managing Director, Guggenheim Investments (2007-present). |
Glenn McWhinnie
(1969) | Assistant Treasurer | Since 2016 | Current: Vice President, Guggenheim Investments (2009-present). Former: Tax Compliance Manager, Ernst & Young LLP (1996-2009). |
Michael P. Megaris
(1984) | Assistant Secretary | Since 2014 | Current: Assistant Secretary, certain other funds in the Fund Complex (2014-present); Vice President, Guggenheim Investments (2012-present). Former: J.D., University of Kansas School of Law (2009-2012). |
Elisabeth Miller
(1968) | Chief Compliance Officer | Since 2012 | Current: CCO, certain other funds in the Fund Complex (2012-present); CCO, Security Investors, LLC (2012-present); CCO, Guggenheim Funds Investment Advisors, LLC (2012-present); Managing Director, Guggenheim Investments (2012-present); Vice President, Guggenheim Funds Distributors, LLC (March 2014-present). Former: CCO, Guggenheim Distributors, LLC (2009-March 2014); Senior Manager, Security Investors, LLC (2004-2009); Senior Manager, Guggenheim Distributors, LLC (2004-2009). |
| | THE GUGGENHEIM FUNDS SEMI-ANNUAL REPORT | 77 |
INFORMATION ON BOARD OF TRUSTEES AND OFFICERS (Unaudited)(concluded) |
Name, Address*
and Year of Birth | Position(s) held
with the Trust | Term of Office
and Length of
Time Served** | Principal Occupations
During Past Five Years |
| OFFICERS - concluded | |
Adam J. Nelson
(1979) | Assistant Treasurer | Since 2015 | Current: Vice President, Guggenheim Investments (2015-present); Assistant Treasurer, certain other funds in the Fund Complex (2015-present). Former: Assistant Vice President and Fund Administration Director, State Street Corporation (2013-2015); Fund Administration Assistant Director, State Street (2011-2013); Fund Administration Manager, State Street (2009-2011). |
Kimberly J. Scott
(1974) | Assistant Treasurer | Since 2014 | Current: Director, Guggenheim Investments (2012-present); Assistant Treasurer, certain other funds in the Fund Complex (2012-present). Former: Financial Reporting Manager, Invesco, Ltd. (2010-2011); Vice President/Assistant Treasurer, Mutual Fund Administration for Van Kampen Investments, Inc./Morgan Stanley Investment Management (2009-2010); Manager of Mutual Fund Administration, Van Kampen Investments, Inc./Morgan Stanley Investment Management (2005-2009). |
Bryan Stone
(1979) | Vice President | Since 2014 | Current: Vice President, certain other funds in the Fund Complex (2014-present); Director, Guggenheim Investments (2013-present). Former: Senior Vice President, Neuberger Berman Group LLC (2009-2013); Vice President, Morgan Stanley (2002-2009). |
John L. Sullivan
(1955) | Chief Financial Officer and Treasurer | Since 2014 | Current: CFO, Chief Accounting Officer and Treasurer, certain other funds in the Fund Complex (2010-present); Senior Managing Director, Guggenheim Investments (2010-present). Former: Managing Director and CCO, each of the funds in the Van Kampen Investments fund complex (2004-2010); Managing Director and Head of Fund Accounting and Administration, Morgan Stanley Investment Management (2002-2004); CFO and Treasurer, Van Kampen Funds (1996-2004). |
| * | The business address of each officer is c/o Guggenheim Investments, 227 West Monroe Street, Chicago, Illinois 60606. |
| ** | Each officer serves an indefinite term, until his or her successor is duly elected and qualified. Time served includes time served in the respective position for the Predecessor Corporation. |
| 78 | THE GUGGENHEIM FUNDS SEMI-ANNUAL REPORT | |
GUGGENHEIM INVESTMENTS PRIVACY POLICIES (Unaudited) |
Guggenheim Investments as used herein refers to Guggenheim Partners, LLC, Guggenheim Funds Investment Advisors, LLC, Guggenheim Partners Investment Management, LLC, Guggenheim Funds Distributors, LLC and Security Investors, LLC as well as the funds in the Guggenheim Funds complex (the “funds”).
Our Commitment to You
When you become a Guggenheim Investments investor, you entrust us with not only your hard-earned money but also with personal and financial information about you. We recognize that your relationship with us is based on trust and that you expect us to act responsibly and in your best interests. Because we have access to personal information about you, we hold ourselves to high standards in its safekeeping and use. This means, most importantly, that we do not sell client or account information to anyone—whether you are a current or former Guggenheim Investments client.
The Information We Collect About You and How We Collect It
In the course of doing business with shareholders and investors, we collect nonpublic personal information about you. You typically provide personal information when you complete a Guggenheim Investments account application or when you request a transaction that involves Rydex and Guggenheim Funds or one of the Guggenheim affiliated companies. “Nonpublic personal information” is personally identifiable information about you. For example it includes your name and address, Social Security or taxpayer identification number, assets, income, account balance, bank account information and investment activity (e.g. purchase and redemption history).
How We Share Your Personal Information
As a matter of policy, we do not disclose your nonpublic personal information to nonaffiliated third parties except as required or permitted by law. As emphasized above, we do not sell information about current or former clients or their accounts to third parties. Nor do we share such information, except when necessary to complete transactions at your request or to make you aware of related investment products and services that we offer. Additional details about how we handle your personal information are provided below
To complete certain transactions or account changes that you direct, it may be necessary to provide your personal information to companies, individuals or groups that are not affiliated with Guggenheim Investments. For example if you ask to transfer assets from another financial institution to Guggenheim Investments, we will need to provide certain information about you to that company to complete the transaction. In connection with servicing your accounts or to alert you to other Guggenheim Investments investment products and services, we may share your information within the Guggenheim Investments family of affiliated companies. This would include, for example, sharing your information within Guggenheim Investments so we can make you aware of new funds or the services offered through another Guggenheim Investments
| | THE GUGGENHEIM FUNDS SEMI-ANNUAL REPORT | 79 |
GUGGENHEIM INVESTMENTS PRIVACY POLICIES (Unaudited)(concluded) |
affiliated company. In certain instances, we may contract with nonaffiliated companies to perform services for us. Where necessary, we will disclose information we have about you to these third parties. In all such cases, we provide the third party with only the information necessary to carry out its assigned responsibilities and only for that purpose. And we require these third parties to treat your personal information with the same high degree of confidentiality that we do. In certain instances, we may share information with other financial institutions regarding individuals and entities in response to the U.S.A. Patriot Act. Finally we will share personal information about you if we are compelled by law to do so, if you direct us to do so with your consent, or in other circumstances as permitted by law.
How We Safeguard Your Personal Information
We maintain physical, electronic and procedural safeguards to protect your personal information. Within Guggenheim Investments, access to such information is limited to those who need it to perform their jobs such as servicing your account, resolving problems or informing you of new products and services.
| 80 | THE GUGGENHEIM FUNDS SEMI-ANNUAL REPORT | |
This page intentionally left blank.
Not required at this time.
| Item 3. | Audit Committee Financial Expert. |
Not required at this time.
| Item 4. | Principal Accountant Fees and Services. |
Not required at this time.
| Item 5. | Audit Committee of Listed Registrants. |
Not applicable.
The Schedule of Investments is included under Item 1 of this form.
| Item 7. | Disclosure of Proxy Voting Policies and Procedures for Closed-End Management Investment Companies. |
Not applicable.
| Item 8. | Portfolio Mangers of Closed-end Management Investment Companies |
Not applicable
| Item 9. | Purchases of Equity Securities by Closed-End Management Investment Company and Affiliated Purchasers. |
Not applicable.
| Item 10. | Submission of Matters to a Vote of Security Holders. |
The registrant does not currently have in place procedures by which shareholders may recommend nominees to the registrant’s board.
There have been no changes to the procedures by which shareholders may recommend nominees to the registrant’s board.
| Item 11. | Controls and Procedures. |
| (a) | The registrant’s President (principal executive officer) and Treasurer (principal financial officer) have evaluated the registrant’s disclosure controls and procedures within 90 days of this filing and have concluded that the registrant’s disclosure controls and procedures were effective as of that date in ensuring that information required to be disclosed by the registrant in this Form N-CSR was recorded, processed, summarized, and reported timely. |
| (b) | The registrant’s principal executive officer and principal financial officer are aware of no change in the registrant’s internal control over financial reporting that occurred during the registrant’s second fiscal quarter covered by this report that has materially affected, or is reasonably likely to materially affect, the registrant’s internal control over financial reporting. |
| (a)(2) | Separate certifications by the President (principal executive officer) and Treasurer (principal financial officer) of the registrant as required by Rule 30a‑2(a) under the Act (17 CFR 270.30a-2(a)) are attached. |
| (b) | A certification by the registrant’s President (principal executive officer) and Treasurer (principal financial officer) as required by Rule 30a-2(b) under the Act (17 CFR 270.30a-2(b)) is attached. |
SIGNATURES
Pursuant to the requirements of the Securities Exchange Act of 1934 and the Investment Company Act of 1940, the registrant has duly caused this report to be signed on its behalf by the undersigned, thereunto duly authorized.
| (Registrant) | Guggenheim Funds Trust | |
| | | |
| By (Signature and Title)* | /s/ Donald C. Cacciapaglia | |
| | Donald C. Cacciapaglia, President and Chief Executive Officer | |
| | | |
| Date | June 9, 2017 | |
Pursuant to the requirements of the Securities Exchange Act of 1934 and the Investment Company Act of 1940, this report has been signed below by the following persons on behalf of the registrant and in the capacities and on the dates indicated.
| By (Signature and Title)* | /s/ Donald C. Cacciapaglia | |
| | Donald C. Cacciapaglia, President and Chief Executive Officer | |
| | | |
| Date | June 9, 2017 | |
| | | |
| By (Signature and Title)* | /s/ John L. Sullivan | |
| | John L. Sullivan, Chief Financial Officer, Chief Accounting Officer and Treasurer |
| | | |
| Date | June 9, 2017 | |
* | Print the name and title of each signing officer under his or her signature. |