UNITED STATES
SECURITIES AND EXCHANGE COMMISSION
Washington, D.C. 20549
FORM N-CSR
CERTIFIED SHAREHOLDER REPORT OF REGISTERED
MANAGEMENT INVESTMENT COMPANIES
Investment Company Act file number 811- 01136
Guggenheim Funds Trust
(Exact name of registrant as specified in charter)
805 King Farm Boulevard, Suite 600
Rockville, Maryland 20850
(Address of principal executive offices) (Zip code)
Amy J. Lee
Guggenheim Funds Trust
805 King Farm Boulevard, Suite 600
Rockville, Maryland 20850
(Name and address of agent for service)
Registrant's telephone number, including area code: 1-301-296-5100
Date of fiscal year end: September 30
Date of reporting period: March 31, 2016
Form N-CSR is to be used by management investment companies to file reports with the Commission not later than 10 days after the transmission to stockholders of any report that is required to be transmitted to stockholders under Rule 30e‑1 under the Investment Company Act of 1940 (17 CFR 270.30e‑1). The Commission may use the information provided on Form N‑CSR in its regulatory, disclosure review, inspection, and policymaking roles.
A registrant is required to disclose the information specified by Form N‑CSR, and the Commission will make this information public. A registrant is not required to respond to the collection of information contained in Form N‑CSR unless the Form displays a currently valid Office of Management and Budget (“OMB”) control number. Please direct comments concerning the accuracy of the information collection burden estimate and any suggestions for reducing the burden to Secretary, Securities and Exchange Commission, 450 Fifth Street, NW, Washington, DC 20549‑0609. The OMB has reviewed this collection of information under the clearance requirements of 44 U.S.C. §3507.
| Item 1. | Reports to Stockholders. |
The registrant’s semi-annual report transmitted to shareholders pursuant to Rule 30e-1 under the Investment Company Act of 1940, as amended (the “Investment Company Act”), is as follows:
3.31.2016
Guggenheim Funds Semi-Annual Report
Guggenheim Funds Trust-Equity |
Guggenheim Alpha Opportunity Fund | | |
Guggenheim Large Cap Value Fund | | |
Guggenheim Market Neutral Real Estate Fund | | |
Guggenheim Risk Managed Real Estate Fund | | |
Guggenheim Small Cap Value Fund | | |
Guggenheim StylePlus—Large Core Fund | | |
Guggenheim StylePlus—Mid Growth Fund | | |
Guggenheim World Equity Income Fund | | |
SBE-SEMI-0316x0916 | guggenheiminvestments.com |
DEAR SHAREHOLDER | 2 |
ECONOMIC AND MARKET OVERVIEW | 3 |
ABOUT SHAREHOLDERS’ FUND EXPENSES | 5 |
ALPHA OPPORTUNITY FUND | 8 |
LARGE CAP VALUE FUND | 22 |
MARKET NEUTRAL REAL ESTATE FUND | 31 |
RISK MANAGED REAL ESTATE FUND | 39 |
SMALL CAP VALUE FUND | 51 |
STYLEPLUS—LARGE CORE FUND | 60 |
STYLEPLUS—MID GROWTH FUND | 71 |
WORLD EQUITY INCOME FUND | 82 |
NOTES TO FINANCIAL STATEMENTS | 92 |
OTHER INFORMATION | 106 |
INFORMATION ON BOARD OF TRUSTEES AND OFFICERS | 110 |
GUGGENHEIM INVESTMENTS PRIVACY POLICIES | 114 |
| | THE GUGGENHEIM FUNDS SEMI-ANNUAL REPORT | 1 |
Dear Shareholder:
Security Investors, LLC and Guggenheim Partners Investment Management (the “Investment Advisers”) are pleased to present the semi-annual shareholder report for a selection of our Funds (the “Funds”) for the six-month period ended March 31, 2016.
The Investment Advisers is part of Guggenheim Investments, which represents the investment management businesses of Guggenheim Partners, LLC (“Guggenheim”), a global, diversified financial services firm.
Guggenheim Funds Distributors, LLC is the distributor of the Funds. Guggenheim Funds Distributors, LLC is affiliated with Guggenheim and the Investment Advisers.
We encourage you to read the Economic and Market Overview section of the report, which follows this letter.
We are committed to providing innovative investment solutions and appreciate the trust you place in us.
Sincerely,

Donald C. Cacciapaglia
President
April 30, 2016
Read a prospectus and summary prospectus (if available) carefully before investing. It contains the investment objectives, risks, charges, expenses and other information, which should be considered carefully before investing. Obtain a prospectus and summary prospectus (if available) at guggenheiminvestments.com or call 800.820.0888.
There can be no assurance that any investment product will achieve its investment objective(s). There are risks associated with investing, including the entire loss of principal invested. Investing involves market risks. The investment return and principal value of any investment product will fluctuate with changes in market conditions.
2 | THE GUGGENHEIM FUNDS SEMI-ANNUAL REPORT | |
ECONOMIC AND MARKET OVERVIEW (Unaudited) | March 31, 2016 |
Financial markets were buffeted by a variety of events over the past six months, including volatility in the oil market, weak growth in China, ongoing stimulus from global central banks, and a 25 basis point increase in the U.S. federal funds target rate in December. While the direct impact of the move was fairly insignificant, the decision to begin normalization of interest rates after seven years of unprecedented liquidity provision was not. Indeed, in 2015, risk assets posted their worst annual performance since the 2008 financial crisis, as market participants’ expectations for the start of rate hikes collided with concern about plunging commodity prices, and slowing economic growth in China and other emerging market economies.
As 2016 began, forecasts for U.S. and global economic growth were downgraded, and recession fears surged along with market volatility. Estimates for first quarter gross domestic product (“GDP”) in the U.S. were marked down, even though first quarter GDP has undershot full-year growth rates in six out of the last seven years. Risk assets rallied in the last half of the first quarter, led by a dovish pivot in the U.S. Federal Reserve’s (the “Fed”) communication that spurred a rally in crude oil and a reversal of dollar strength. The weaker dollar, along with optimism about a production freeze agreed to by a group of major oil producing countries, helped oil to rebound. After falling in the early weeks of the year to a cycle low of $26 per barrel on February 11, 2016 the front-month West Texas Intermediate (“WTI”) oil futures contract rallied as high as $40 per barrel before closing the quarter at $38 per barrel.
The outlook for economic growth outside the U.S. softened in the first quarter. A further deterioration in the euro zone inflation outlook prompted the European Central Bank (“ECB”) to announce an increase in the size of its monthly asset purchases and reduce its deposit rate to -40 basis points. European government bonds rallied following the announcement, with the 10-year German bond ending the first quarter with a yield of just 16 basis points.
Ongoing stimulus efforts in Asia also appeared likely to contribute to low U.S. rates. Chinese industrial production growth continued to slow in early 2016, prompting the People’s Bank of China (“PBOC”) to stimulate credit growth by allowing banks to hold fewer reserves against deposits. And after years of struggling with stagnant growth and low inflation, the Bank of Japan (“BOJ”) surprised markets by cutting its key interest rate to -10 basis points in January. The negative rates pushed a considerable amount of Japanese savings into foreign markets.
In an environment where global rates are moving lower and markets are already starved for yield, foreign investors began looking to the U.S. Guggenheim expects that U.S. Treasury yields will fall further as the gravitational pull of global yields gets stronger, and does not discount the possibility of 10-year U.S. Treasury yields declining to closer to 1 percent before the end of the year.
A stronger dollar has weighed on the U.S. economy, but consumer spending has been resilient. The labor market is now operating near full employment, and tight labor market conditions are beginning to spur faster wage growth. We believe the U.S. economy is fundamentally sound, and find little evidence to support the conclusion that the economy will fall into a recession in 2016.
Despite the relative health of the U.S. economy, markets are concerned that sluggish global growth will hold back the U.S. expansion, that inflation will remain below the Fed’s target for longer, and that tighter conditions in credit markets have raised recession risks. Our view is that the Fed remains focused on fulfilling its dual mandate objectives of maximum employment and price stability, and thus is biased toward normalizing policy. We expect further declines in the unemployment rate as job gains outstrip growth in the labor force. Meanwhile, core and headline inflation should move closer to the Fed’s target by year end, reflecting our forecasts for a tighter labor market and a modest rise in oil prices. Normally, this would result in at least two Fed rate hikes on the table for 2016, but the U.S. Fed is becoming more sensitive to global financial conditions and the extent of global money flows that occur as monetary policy in the U.S. diverges from Europe, Japan and China. As a result, we have reduced our expectations for a June rate hike, although it would normally be an easy call. We continue to believe a December rate hike is a near certainty. A solid macroeconomic backdrop and a rebalancing oil market should support an improving credit picture in the second half of 2016.
For the six months ended March 31, 2016, the Standard & Poor’s 500® (“S&P 500”) Index* returned 8.49%. The Morgan Stanley Capital International (“MSCI”) Europe-Australasia-Far East (“EAFE”) Index* returned 1.56%. The return of the MSCI Emerging Markets Index* was 6.41%.
| | THE GUGGENHEIM FUNDS SEMI-ANNUAL REPORT | 3 |
ECONOMIC AND MARKET OVERVIEW (Unaudited)(concluded) | March 31, 2016 |
In the bond market, the Barclays U.S. Aggregate Bond Index* posted a 2.44% return for the period, while the Barclays U.S. Corporate High Yield Index* returned 1.22%. The return of the Bank of America (“BofA”) Merrill Lynch 3-Month U.S. Treasury Bill Index* was 0.11% for the six-month period.
The opinions and forecasts expressed may not actually come to pass. This information is subject to change at any time, based on market and other conditions, and should not be construed as a recommendation of any specific security or strategy.
*Index Definitions:
The following indices are referenced throughout this report. Indices are unmanaged and not available for direct investment. Index performance does not reflect transaction costs, fees, or expenses.
Barclays U.S. Aggregate Bond Index is a broad-based benchmark that measures the investment grade, U.S. dollar denominated, fixed-rate taxable bond market, including U.S. Treasuries, government-related and corporate securities, MBS (agency fixed-rate and hybrid ARM pass-throughs), ABS, and CMBS.
Barclays U.S. Corporate High Yield Index measures the market of U.S. dollar denominated, non-investment grade, fixed-rate, taxable corporate bonds. Securities are classified as high yield if the middle rating of Moody’s, Fitch, and S&P is Ba1/BB+/BB+ or below.
BofA Merrill Lynch 3-Month U.S. Treasury Bill Index is an unmanaged market index of U.S. Treasury securities maturing in 90 days that assumes reinvestment of all income.
MSCI EAFE Index is a free float-adjusted market capitalization index that is designed to measure the equity market performance of developed markets, excluding the U.S. & Canada.
MSCI Emerging Markets Index is a free float-adjusted market capitalization weighted index that is designed to measure equity market performance in the global emerging markets.
S&P 500® Index is a capitalization-weighted index of 500 stocks designed to measure the performance of the broad economy, representing all major industries and is considered a representation of the U.S. stock market.
4 | THE GUGGENHEIM FUNDS SEMI-ANNUAL REPORT | |
ABOUT SHAREHOLDERS’ FUND EXPENSES (Unaudited) | |
All mutual funds have operating expenses and it is important for our shareholders to understand the impact of costs on their investments. Shareholders of a Fund incur two types of costs: (i) transaction costs, including sales charges (loads) on purchase payments, reinvested dividends, or other distributions; and exchange fees; and (ii) ongoing costs, including management fees, administrative services, and shareholder reports, among others. These ongoing costs, or operating expenses, are deducted from a fund’s gross income and reduce the investment return of the fund.
A fund’s expenses are expressed as a percentage of its average net assets, which is known as the expense ratio. The following examples are intended to help investors understand the ongoing costs (in dollars) of investing in a Fund and to compare these costs with the ongoing costs of investing in other mutual funds.
The examples are based on an investment of $1,000 made at the beginning of the period and held for the entire six-month period beginning September 30, 2015 and ending March 31, 2016.
The following tables illustrate a Fund’s costs in two ways:
Table 1. Based on actual Fund return. This section helps investors estimate the actual expenses paid over the period. The “Ending Account Value” shown is derived from the Fund’s actual return, and the fourth column shows the dollar amount that would have been paid by an investor who started with $1,000 in the Fund. Investors may use the information here, together with the amount invested, to estimate the expenses paid over the period. Simply divide the Fund’s account value by $1,000 (for example, an $8,600 account value divided by $1,000 = 8.6), then multiply the result by the number provided under the heading “Expenses Paid During Period.”
Table 2. Based on hypothetical 5% return. This section is intended to help investors compare a Fund’s cost with those of other mutual funds. The table provides information about hypothetical account values and hypothetical expenses based on the Fund’s actual expense ratio and an assumed rate of return of 5% per year before expenses, which is not the Fund’s actual return. The hypothetical account values and expenses may not be used to estimate the actual ending account balance or expenses paid during the period. The example is useful in making comparisons because the U.S. Securities and Exchange Commission (the “SEC”) requires all mutual funds to calculate expenses based on the 5% return. Investors can assess a Fund’s costs by comparing this hypothetical example with the hypothetical examples that appear in shareholder reports of other funds.
The calculations illustrated above assume no shares were bought or sold during the period. Actual costs may have been higher or lower, depending on the amount of investment and the timing of any purchases or redemptions.
Please note that the expenses shown in the table are meant to highlight your ongoing costs only and do not reflect any transactional costs, such as sales charges (loads) on purchase payments, and contingent deferred sales charges (“CDSC”) on redemptions, if any. Therefore, the second table is useful in comparing ongoing costs only, and will not help you determine the relative total costs of owning different funds. In addition, if these transactional costs were included, your costs would have been higher.
More information about a Fund’s expenses, including annual expense ratios for up to the past five years (subject to the Fund’s inception date), can be found in the Financial Highlights section of this report. For additional information on operating expenses and other shareholder costs, please refer to the appropriate Fund prospectus.
| | THE GUGGENHEIM FUNDS SEMI-ANNUAL REPORT | 5 |
ABOUT SHAREHOLDERS’ FUND EXPENSES (Unaudited)(continued) | |
| | Expense
Ratio1 | Fund Return | Beginning Account Value September 30, 2015 | Ending Account Value March 31, 2016 | Expenses Paid During Period2 |
Table 1. Based on actual Fund return3 | | | | | |
| Alpha Opportunity Fund | | | | | |
| A-Class | 2.88% | 5.82% | $ 1,000.00 | $ 1,058.20 | $ 14.82 |
| C-Class | 3.67% | 5.40% | 1,000.00 | 1,054.00 | 18.85 |
| P-Class | 3.28% | 5.82% | 1,000.00 | 1,058.20 | 16.88 |
| Institutional Class | 2.54% | 5.95% | 1,000.00 | 1,059.50 | 13.08 |
| Large Cap Value Fund | | | | | |
| A-Class | 1.17% | 5.95% | 1,000.00 | 1,059.50 | 6.02 |
| C-Class | 1.92% | 5.58% | 1,000.00 | 1,055.80 | 9.87 |
| P-Class | 1.17% | 6.03% | 1,000.00 | 1,060.30 | 6.03 |
| Institutional Class | 0.91% | 6.08% | 1,000.00 | 1,060.80 | 4.69 |
Market Neutral Real Estate Fund4 | | | | | |
| A-Class | 1.64% | (1.60%) | 1,000.00 | 984.00 | 1.42 |
| C-Class | 2.40% | (1.68%) | 1,000.00 | 983.20 | 2.08 |
| P-Class | 1.65% | (1.60%) | 1,000.00 | 984.00 | 1.43 |
| Institutional Class | 1.39% | (1.60%) | 1,000.00 | 984.00 | 1.21 |
| Risk Managed Real Estate Fund | | | | | |
| A-Class | 1.81% | 10.05% | 1,000.00 | 1,100.50 | 9.50 |
| C-Class | 2.54% | 9.62% | 1,000.00 | 1,096.20 | 13.31 |
| P-Class | 1.78% | 10.05% | 1,000.00 | 1,100.50 | 9.35 |
| Institutional Class | 1.54% | 10.20% | 1,000.00 | 1,102.00 | 8.09 |
| Small Cap Value Fund | | | | | |
| A-Class | 1.32% | 7.38% | 1,000.00 | 1,073.80 | 6.84 |
| C-Class | 2.07% | 7.12% | 1,000.00 | 1,071.20 | 10.72 |
| P-Class | 1.32% | 7.46% | 1,000.00 | 1,074.60 | 6.85 |
| Institutional Class | 1.07% | 7.55% | 1,000.00 | 1,075.50 | 5.55 |
| StylePlus—Large Core Fund | | | | | |
| A-Class | 1.35% | 7.84% | 1,000.00 | 1,078.40 | 7.01 |
| C-Class | 2.32% | 7.31% | 1,000.00 | 1,073.10 | 12.02 |
| P-Class | 1.22% | 7.75% | 1,000.00 | 1,077.50 | 6.34 |
| Institutional Class | 1.02% | 8.46% | 1,000.00 | 1,084.60 | 5.32 |
| StylePlus—Mid Growth Fund | | | | | |
| A-Class | 1.50% | 4.12% | 1,000.00 | 1,041.20 | 7.65 |
| C-Class | 2.39% | 3.68% | 1,000.00 | 1,036.80 | 12.17 |
| P-Class | 1.52% | 3.92% | 1,000.00 | 1,039.20 | 7.75 |
| Institutional Class | 1.52% | 4.14% | 1,000.00 | 1,041.40 | 7.76 |
| World Equity Income Fund | | | | | |
| A-Class | 1.48% | 8.15% | 1,000.00 | 1,081.50 | 7.70 |
| C-Class | 2.23% | 7.82% | 1,000.00 | 1,078.20 | 11.59 |
| P-Class | 1.48% | 8.38% | 1,000.00 | 1,083.80 | 7.71 |
| Institutional Class | 1.22% | 8.29% | 1,000.00 | 1,082.90 | 6.35 |
6 | THE GUGGENHEIM FUNDS SEMI-ANNUAL REPORT | |
ABOUT SHAREHOLDERS’ FUND EXPENSES (Unaudited)(concluded) | |
| | Expense
Ratio1 | Fund
Return | Beginning
Account Value
September 30, 2015 | Ending
Account Value
March 31, 2016 | Expenses
Paid During
Period2 |
Table 2. Based on hypothetical 5% return (before expenses) | | | | |
Alpha Opportunity Fund | | | | | |
A-Class | 2.88% | 5.00% | $ 1,000.00 | $ 1,010.60 | $ 14.48 |
C-Class | 3.67% | 5.00% | 1,000.00 | 1,006.65 | 18.41 |
P-Class | 3.28% | 5.00% | 1,000.00 | 1,008.60 | 16.47 |
Institutional Class | 2.54% | 5.00% | 1,000.00 | 1,012.30 | 12.78 |
Large Cap Value Fund | | | | | |
A-Class | 1.17% | 5.00% | 1,000.00 | 1,019.15 | 5.91 |
C-Class | 1.92% | 5.00% | 1,000.00 | 1,015.40 | 9.67 |
P-Class | 1.17% | 5.00% | 1,000.00 | 1,019.15 | 5.91 |
Institutional Class | 0.91% | 5.00% | 1,000.00 | 1,020.45 | 4.60 |
Market Neutral Real Estate Fund4 | | | | | |
A-Class | 1.64% | 5.00% | 1,000.00 | 1,016.80 | 8.27 |
C-Class | 2.40% | 5.00% | 1,000.00 | 1,013.00 | 12.08 |
P-Class | 1.65% | 5.00% | 1,000.00 | 1,016.75 | 8.32 |
Institutional Class | 1.39% | 5.00% | 1,000.00 | 1,018.05 | 7.01 |
Risk Managed Real Estate Fund | | | | | |
A-Class | 1.81% | 5.00% | 1,000.00 | 1,015.95 | 9.12 |
C-Class | 2.54% | 5.00% | 1,000.00 | 1,012.30 | 12.78 |
P-Class | 1.78% | 5.00% | 1,000.00 | 1,016.10 | 8.97 |
Institutional Class | 1.54% | 5.00% | 1,000.00 | 1,017.30 | 7.77 |
Small Cap Value Fund | | | | | |
A-Class | 1.32% | 5.00% | 1,000.00 | 1,018.40 | 6.66 |
C-Class | 2.07% | 5.00% | 1,000.00 | 1,014.65 | 10.43 |
P-Class | 1.32% | 5.00% | 1,000.00 | 1,018.40 | 6.66 |
Institutional Class | 1.07% | 5.00% | 1,000.00 | 1,019.65 | 5.40 |
StylePlus—Large Core Fund | | | | | |
A-Class | 1.35% | 5.00% | 1,000.00 | 1,018.25 | 6.81 |
C-Class | 2.32% | 5.00% | 1,000.00 | 1,013.40 | 11.68 |
P-Class | 1.22% | 5.00% | 1,000.00 | 1,018.90 | 6.16 |
Institutional Class | 1.02% | 5.00% | 1,000.00 | 1,019.90 | 5.15 |
StylePlus—Mid Growth Fund | | | | | |
A-Class | 1.50% | 5.00 | 1,000.00 | 1,017.50 | 7.57 |
C-Class | 2.39% | 5.00 | 1,000.00 | 1,013.05 | 12.03 |
P-Class | 1.52% | 5.00 | 1,000.00 | 1,017.40 | 7.67 |
Institutional Class | 1.52% | 5.00 | 1,000.00 | 1,017.40 | 7.67 |
World Equity Income Fund | | | | | |
A-Class | 1.48% | 5.00 | 1,000.00 | 1,017.60 | 7.47 |
C-Class | 2.23% | 5.00 | 1,000.00 | 1,013.85 | 11.23 |
P-Class | 1.48% | 5.00 | 1,000.00 | 1,017.60 | 7.47 |
Institutional Class | 1.22% | 5.00 | 1,000.00 | 1,018.90 | 6.16 |
1 | This ratio represents annualized net expenses, which may include short dividend and interest expenses. Excluding these expenses, the operating expense ratio for the Alpha Opportunity Fund would be 2.11%, 2.86%, 2.11% and 1.86% and the Risk Managed Real Estate Fund would be 1.30%, 2.03%, 1.27% and 1.03% for the A-Class, C-Class, P-Class and Institutional Class, respectively. Excludes expenses of the underlying funds in which the Funds invest. |
2 | Expenses are equal to the Fund's annualized expense ratio, net of any applicable fee waivers, multiplied by the average account value over the period, multiplied by 183/366 (to reflect the one-half year period). |
3 | Actual cumulative return at net asset value for the period September 30, 2015 to March 31, 2016. |
4 | Since commencement of operations: February 26, 2016. Due to the limited length of Class operations, current expense ratios may not be indicative of future expense ratios. Expenses paid based on actual fund returns are calculated using 32 days from the commencement of operations. Expenses paid based on the hypothetical 5% return are calculated using 183 days. |
| | THE GUGGENHEIM FUNDS SEMI-ANNUAL REPORT | 7 |
FUND PROFILE (Unaudited) | March 31, 2016 |
ALPHA OPPORTUNITY FUND
OBJECTIVE: Seeks long-term growth of capital.
Holdings Diversification (Market Exposure as % of Net Assets)
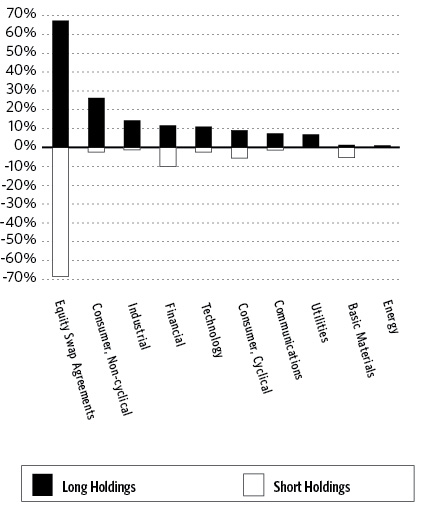
“Holdings Diversification (Market Exposure as % of Net Assets)” excludes any temporary cash investments.
Inception Dates: |
A-Class | July 7, 2003 |
C-Class | July 7, 2003 |
P-Class | May 1, 2015 |
Institutional Class | November 7, 2008 |
Ten Largest Long Holdings (% of Total Net Assets) |
Verizon Communications, Inc. | 1.2% |
Cal-Maine Foods, Inc. | 1.2% |
AbbVie, Inc. | 1.2% |
Prudential Financial, Inc. | 1.2% |
Wal-Mart Stores, Inc. | 1.1% |
UGI Corp. | 1.1% |
Tyson Foods, Inc. — Class A | 1.1% |
MetLife, Inc. | 1.1% |
HP, Inc. | 1.1% |
FirstEnergy Corp. | 1.1% |
Top Ten Total | 11.4% |
| | |
“Ten Largest Long Holdings” excludes any temporary cash or derivative investments. |
8 | THE GUGGENHEIM FUNDS SEMI-ANNUAL REPORT | |
SCHEDULE OF INVESTMENTS (Unaudited) | March 31, 2016 |
ALPHA OPPORTUNITY FUND | |
| | | Shares | | | Value | |
| | | | | | | |
COMMON STOCKS† - 86.6% | |
| | | | | | | |
Consumer, Non-cyclical - 26.2% | |
Cal-Maine Foods, Inc. | | | 19,261 | | | $ | 999,839 | |
AbbVie, Inc.1 | | | 16,728 | | | | 955,503 | |
Tyson Foods, Inc. — Class A1 | | | 13,580 | | | | 905,243 | |
Express Scripts Holding Co.*,1 | | | 12,614 | | | | 866,456 | |
Ingredion, Inc.1 | | | 7,736 | | | | 826,127 | |
Sanderson Farms, Inc. | | | 9,048 | | | | 815,949 | |
HCA Holdings, Inc.*,1 | | | 9,382 | | | | 732,265 | |
Flowers Foods, Inc.1 | | | 39,622 | | | | 731,422 | |
Laboratory Corporation of America Holdings* | | | 6,079 | | | | 712,033 | |
Quest Diagnostics, Inc.1 | | | 9,769 | | | | 697,995 | |
DaVita HealthCare Partners, Inc.* | | | 9,385 | | | | 688,671 | |
United Therapeutics Corp.*,1 | | | 5,502 | | | | 613,088 | |
United Rentals, Inc.* | | | 9,779 | | | | 608,156 | |
Merck & Company, Inc. | | | 11,493 | | | | 608,095 | |
MEDNAX, Inc.*,1 | | | 8,981 | | | | 580,352 | |
St. Jude Medical, Inc.1 | | | 10,455 | | | | 575,025 | |
Johnson & Johnson | | | 4,619 | | | | 499,776 | |
ManpowerGroup, Inc. | | | 5,882 | | | | 478,912 | |
Total System Services, Inc. | | | 10,015 | | | | 476,514 | |
JM Smucker Co. | | | 3,579 | | | | 464,697 | |
Robert Half International, Inc. | | | 9,765 | | | | 454,854 | |
Darling Ingredients, Inc.*,1 | | | 33,616 | | | | 442,723 | |
Varian Medical Systems, Inc.* | | | 5,268 | | | | 421,545 | |
Post Holdings, Inc.* | | | 5,923 | | | | 407,325 | |
Philip Morris International, Inc. | | | 4,033 | | | | 395,678 | |
Dean Foods Co.1 | | | 22,507 | | | | 389,821 | |
Charles River Laboratories International, Inc.* | | | 4,699 | | | | 356,842 | |
LifePoint Health, Inc.*,1 | | | 5,004 | | | | 346,527 | |
Dr Pepper Snapple Group, Inc.1 | | | 3,483 | | | | 311,450 | |
Whole Foods Market, Inc.1 | | | 9,788 | | | | 304,505 | |
SpartanNash Co.1 | | | 9,946 | | | | 301,463 | |
RR Donnelley & Sons Co. | | | 18,081 | | | | 296,529 | |
Cambrex Corp.* | | | 6,719 | | | | 295,636 | |
Mead Johnson Nutrition Co. — Class A | | | 3,478 | | | | 295,526 | |
Owens & Minor, Inc.1 | | | 7,056 | | | | 285,203 | |
Mondelez International, Inc. — Class A | | | 6,991 | | | | 280,479 | |
ResMed, Inc.1 | | | 4,820 | | | | 278,692 | |
Community Health Systems, Inc.*,1 | | | 14,529 | | | | 268,932 | |
Magellan Health, Inc.* | | | 3,887 | | | | 264,044 | |
VCA, Inc.* | | | 4,396 | | | | 253,605 | |
Cardtronics, Inc.* | | | 6,870 | | | | 247,251 | |
Deluxe Corp.1 | | | 3,862 | | | | 241,336 | |
Chemed Corp. | | | 1,729 | | | | 234,193 | |
Air Methods Corp.*,1 | | | 6,281 | | | | 227,498 | |
Total Consumer, Non-cyclical | | | | | | | 21,437,775 | |
| | | | | | | | | |
Industrial - 14.2% | |
Boeing Co.1 | | | 5,047 | | | | 640,666 | |
Huntington Ingalls Industries, Inc.1 | | | 3,679 | | | | 503,802 | |
Arrow Electronics, Inc.*,1 | | | 7,701 | | | | 496,021 | |
Tech Data Corp.*,1 | | | 5,998 | | | | 460,467 | |
Fluor Corp.1 | | | 8,298 | | | | 445,602 | |
Dycom Industries, Inc.* | | | 5,997 | | | | 387,826 | |
AECOM* | | | 12,213 | | | | 376,038 | |
Gentex Corp. | | | 23,721 | | | | 372,183 | |
Jabil Circuit, Inc.1 | | | 19,057 | | | | 367,228 | |
ITT Corp.1 | | | 9,648 | | | | 355,915 | |
Knight Transportation, Inc.1 | | | 13,186 | | | | 344,814 | |
CSX Corp. | | | 13,245 | | | | 341,059 | |
Dover Corp.1 | | | 4,977 | | | | 320,170 | |
Parker-Hannifin Corp.1 | | | 2,836 | | | | 315,023 | |
Avnet, Inc.1 | | | 7,036 | | | | 311,695 | |
Harris Corp. | | | 3,975 | | | | 309,494 | |
Vishay Intertechnology, Inc.1 | | | 24,879 | | | | 303,772 | |
Rockwell Automation, Inc. | | | 2,640 | | | | 300,300 | |
Waters Corp.* | | | 2,157 | | | | 284,551 | |
Union Pacific Corp. | | | 3,572 | | | | 284,152 | |
Crane Co.1 | | | 5,270 | | | | 283,842 | |
Barnes Group, Inc.1 | | | 7,955 | | | | 278,664 | |
Briggs & Stratton Corp.1 | | | 11,442 | | | | 273,693 | |
Sanmina Corp.* | | | 11,686 | | | | 273,219 | |
Saia, Inc.*,1 | | | 9,672 | | | | 272,267 | |
Clean Harbors, Inc.*,1 | | | 5,502 | | | | 271,469 | |
Federal Signal Corp.1 | | | 19,924 | | | | 264,192 | |
Timken Co.1 | | | 7,805 | | | | 261,390 | |
Werner Enterprises, Inc. | | | 9,487 | | | | 257,667 | |
Trinity Industries, Inc.1 | | | 14,009 | | | | 256,505 | |
Keysight Technologies, Inc.*,1 | | | 9,005 | | | | 249,799 | |
Jacobs Engineering Group, Inc.*,1 | | | 5,672 | | | | 247,016 | |
Applied Industrial Technologies, Inc.1 | | | 5,604 | | | | 243,214 | |
Mueller Industries, Inc.1 | | | 8,064 | | | | 237,243 | |
ArcBest Corp.1 | | | 10,806 | | | | 233,301 | |
Methode Electronics, Inc.1 | | | 7,908 | | | | 231,230 | |
Total Industrial | | | | | | | 11,655,489 | |
| | | | | | | | | |
Financial - 11.6% | |
Prudential Financial, Inc.1 | | | 13,167 | | | | 950,921 | |
MetLife, Inc.1 | | | 20,553 | | | | 903,099 | |
Unum Group | | | 22,129 | | | | 684,229 | |
Aflac, Inc.1 | | | 10,100 | | | | 637,714 | |
Affiliated Managers Group, Inc.* | | | 2,907 | | | | 472,097 | |
Interactive Brokers Group, Inc. — Class A | | | 11,920 | | | | 468,694 | |
Discover Financial Services1 | | | 9,113 | | | | 464,034 | |
American Express Co. | | | 7,003 | | | | 429,984 | |
Bank of America Corp. | | | 27,045 | | | | 365,648 | |
Ameriprise Financial, Inc. | | | 3,838 | | | | 360,810 | |
Selective Insurance Group, Inc.1 | | | 8,919 | | | | 326,525 | |
Old Republic International Corp. | | | 17,811 | | | | 325,585 | |
Aspen Insurance Holdings Ltd.1 | | | 6,658 | | | | 317,587 | |
Regions Financial Corp. | | | 40,442 | | | | 317,470 | |
Torchmark Corp. | | | 5,778 | | | | 312,936 | |
American Financial Group, Inc. | | | 4,362 | | | | 306,954 | |
Hanover Insurance Group, Inc. | | | 3,382 | | | | 305,124 | |
East West Bancorp, Inc.1 | | | 8,873 | | | | 288,195 | |
American Equity Investment Life Holding Co.1 | | | 15,500 | | | | 260,400 | |
SEE NOTES TO FINANCIAL STATEMENTS. | THE GUGGENHEIM FUNDS SEMI-ANNUAL REPORT | 9 |
SCHEDULE OF INVESTMENTS (Unaudited)(continued) | March 31, 2016 |
ALPHA OPPORTUNITY FUND | |
| | | Shares | | | Value | |
| | | | | | | |
Legg Mason, Inc. | | | 7,448 | | | $ | 258,297 | |
WP GLIMCHER, Inc. | | | 24,745 | | | | 234,830 | |
CNO Financial Group, Inc. | | | 12,028 | | | | 215,542 | |
Waddell & Reed Financial, Inc. — Class A1 | | | 9,137 | | | | 215,085 | |
City Office REIT, Inc. | | | 6,354 | | | | 72,436 | |
Total Financial | | | | | | | 9,494,196 | |
| | | | | | | | | |
Technology - 10.9% | |
HP, Inc. | | | 72,825 | | | | 897,204 | |
Apple, Inc.1 | | | 7,890 | | | | 859,931 | |
Hewlett Packard Enterprise Co.1 | | | 45,340 | | | | 803,878 | |
Intel Corp. | | | 22,547 | | | | 729,395 | |
International Business Machines Corp. | | | 3,998 | | | | 605,497 | |
Skyworks Solutions, Inc. | | | 6,209 | | | | 483,681 | |
Micron Technology, Inc.* | | | 45,301 | | | | 474,302 | |
Convergys Corp.1 | | | 15,599 | | | | 433,184 | |
Tessera Technologies, Inc. | | | 13,870 | | | | 429,970 | |
Cirrus Logic, Inc.*,1 | | | 10,733 | | | | 390,789 | |
Texas Instruments, Inc. | | | 6,354 | | | | 364,847 | |
CA, Inc.1 | | | 11,818 | | | | 363,876 | |
Nuance Communications, Inc.* | | | 17,039 | | | | 318,459 | |
CACI International, Inc. — Class A*,1 | | | 2,824 | | | | 301,321 | |
Oracle Corp.1 | | | 6,867 | | | | 280,929 | |
Sykes Enterprises, Inc.*,1 | | | 8,959 | | | | 270,383 | |
NetApp, Inc. | | | 8,666 | | | | 236,495 | |
Cabot Microelectronics Corp.1 | | | 5,722 | | | | 234,087 | |
Mentor Graphics Corp. | | | 11,507 | | | | 233,937 | |
Icad, Inc.*,1 | | | 40,332 | | | | 205,693 | |
Total Technology | | | | | | | 8,917,858 | |
| | | | | | | | | |
Consumer, Cyclical - 9.1% | |
Wal-Mart Stores, Inc.1 | | | 13,461 | | | | 921,944 | |
JetBlue Airways Corp.*,1 | | | 31,237 | | | | 659,725 | |
American Eagle Outfitters, Inc.1 | | | 38,785 | | | | 646,546 | |
CVS Health Corp.1 | | | 5,494 | | | | 569,893 | |
Foot Locker, Inc. | | | 8,060 | | | | 519,870 | |
DR Horton, Inc. | | | 16,924 | | | | 511,612 | |
UniFirst Corp. | | | 4,600 | | | | 501,952 | |
Walgreens Boots Alliance, Inc. | | | 5,796 | | | | 488,255 | |
Casey’s General Stores, Inc.1 | | | 3,612 | | | | 409,312 | |
Thor Industries, Inc.1 | | | 5,485 | | | | 349,778 | |
PACCAR, Inc.1 | | | 6,093 | | | | 333,226 | |
Children’s Place, Inc. | | | 3,845 | | | | 320,942 | |
Guess?, Inc.1 | | | 14,198 | | | | 266,496 | |
Dana Holding Corp.1 | | | 17,721 | | | | 249,689 | |
Spirit Airlines, Inc.*,1 | | | 5,173 | | | | 248,201 | |
Select Comfort Corp.*,1 | | | 12,284 | | | | 238,187 | |
Macy’s, Inc. | | | 5,104 | | | | 225,035 | |
Total Consumer, Cyclical | | | | | | | 7,460,663 | |
| | | | | | | | | |
Communications - 7.3% | |
Verizon Communications, Inc.1 | | | 18,644 | | | | 1,008,267 | |
AT&T, Inc.1 | | | 21,351 | | | | 836,319 | |
Viacom, Inc. — Class B1 | | | 14,970 | | | | 617,961 | |
Discovery Communications, Inc. — Class A*,1 | | | 21,079 | | | | 603,492 | |
Juniper Networks, Inc. | | | 20,017 | | | | 510,634 | |
Level 3 Communications, Inc.* | | | 9,092 | | | | 480,512 | |
Time Warner, Inc.1 | | | 6,356 | | | | 461,128 | |
Comcast Corp. — Class A | | | 6,311 | | | | 385,476 | |
AMC Networks, Inc. — Class A* | | | 4,768 | | | | 309,634 | |
eBay, Inc.* | | | 12,782 | | | | 304,978 | |
Polycom, Inc.*,1 | | | 20,214 | | | | 225,386 | |
General Communication, Inc. — Class A*,1 | | | 11,663 | | | | 213,666 | |
Total Communications | | | | | | | 5,957,453 | |
| | | | | | | | | |
Utilities - 6.8% | |
UGI Corp.1 | | | 22,554 | | | | 908,701 | |
FirstEnergy Corp. | | | 24,819 | | | | 892,739 | |
NextEra Energy, Inc.1 | | | 6,091 | | | | 720,809 | |
OGE Energy Corp.1 | | | 20,566 | | | | 588,805 | |
Pinnacle West Capital Corp.1 | | | 6,799 | | | | 510,401 | |
Southwest Gas Corp. | | | 7,224 | | | | 475,700 | |
Ameren Corp. | | | 8,574 | | | | 429,557 | |
American Electric Power Company, Inc.1 | | | 6,249 | | | | 414,934 | |
Vectren Corp.1 | | | 7,566 | | | | 382,537 | |
Edison International | | | 3,337 | | | | 239,897 | |
Total Utilities | | | | | | | 5,564,080 | |
| | | | | | | | | |
Basic Materials - 0.4% | |
Mosaic Co.1 | | | 12,432 | | | | 335,664 | |
| | | | | | | | | |
Energy - 0.1% | |
PBF Logistics, LP | | | 3,000 | | | | 56,520 | |
| | | | | | | | | |
Total Common Stocks | | | | | | | | |
(Cost $67,960,942) | | | | | | | 70,879,698 | |
| | | | | | | | | |
SHORT TERM INVESTMENTS† - 7.0% | |
Goldman Sachs Financial Square Treasury Instruments Fund Institutional Shares 0.19%2 | | | 5,760,593 | | | | 5,760,593 | |
Total Short Term Investments | | | | | | | | |
(Cost $5,760,593) | | | | | | | 5,760,593 | |
| | | | | | | | | |
Total Investments - 93.6% | | | | | | | | |
(Cost $73,721,535) | | | | | | $ | 76,640,291 | |
| | | | | | | | | |
COMMON STOCKS SOLD SHORT† - (29.0)% | |
Industrial - (1.3)% | |
EnPro Industries, Inc. | | | 4,970 | | | | (286,670 | ) |
Louisiana-Pacific Corp.* | | | 47,230 | | | | (808,578 | ) |
Total Industrial | | | | | | | (1,095,248 | ) |
| | | | | | | | | |
Communications - (1.4)% | |
Ruckus Wireless, Inc.* | | | 26,229 | | | | (257,306 | ) |
Facebook, Inc. — Class A* | | | 2,667 | | | | (304,305 | ) |
Amazon.com, Inc.* | | | 1,024 | | | | (607,887 | ) |
Total Communications | | | | | | | (1,169,498 | ) |
10 | THE GUGGENHEIM FUNDS SEMI-ANNUAL REPORT | SEE NOTES TO FINANCIAL STATEMENTS. |
SCHEDULE OF INVESTMENTS (Unaudited)(continued) | March 31, 2016 |
ALPHA OPPORTUNITY FUND | |
| | | Shares | | | Value | |
| | | | | | | |
Technology - (2.5)% | |
Red Hat, Inc.* | | | 3,229 | | | $ | (240,593 | ) |
Medidata Solutions, Inc.* | | | 6,449 | | | | (249,641 | ) |
Ultimate Software Group, Inc.* | | | 1,341 | | | | (259,483 | ) |
CommVault Systems, Inc.* | | | 6,075 | | | | (262,258 | ) |
Silicon Laboratories, Inc.* | | | 6,018 | | | | (270,569 | ) |
Electronics for Imaging, Inc.* | | | 7,099 | | | | (300,926 | ) |
Cypress Semiconductor Corp. | | | 49,671 | | | | (430,151 | ) |
Total Technology | | | | | | | (2,013,621 | ) |
| | | | | | | | | |
Consumer, Non-cyclical - (2.5)% | |
Acorda Therapeutics, Inc.* | | | 6,686 | | | | (176,845 | ) |
Cantel Medical Corp. | | | 3,485 | | | | (248,689 | ) |
Monro Muffler Brake, Inc. | | | 4,210 | | | | (300,889 | ) |
Live Nation Entertainment, Inc.* | | | 16,986 | | | | (378,958 | ) |
Alexion Pharmaceuticals, Inc.* | | | 3,138 | | | | (436,872 | ) |
Vertex Pharmaceuticals, Inc.* | | | 6,751 | | | | (536,637 | ) |
Total Consumer, Non-cyclical | | | | | | | (2,078,890 | ) |
| | | | | | | | | |
Basic Materials - (5.4)% | |
Compass Minerals International, Inc. | | | 3,251 | | | | (230,366 | ) |
PolyOne Corp. | | | 8,085 | | | | (244,571 | ) |
NewMarket Corp. | | | 630 | | | | (249,644 | ) |
Worthington Industries, Inc. | | | 7,567 | | | | (269,688 | ) |
RPM International, Inc. | | | 6,138 | | | | (290,512 | ) |
HB Fuller Co. | | | 9,127 | | | | (387,441 | ) |
Sensient Technologies Corp. | | | 6,855 | | | | (435,018 | ) |
Praxair, Inc. | | | 4,845 | | | | (554,510 | ) |
Ecolab, Inc. | | | 7,590 | | | | (846,437 | ) |
Royal Gold, Inc. | | | 17,445 | | | | (894,754 | ) |
Total Basic Materials | | | | | | | (4,402,941 | ) |
| | | | | | | | | |
Consumer, Cyclical - (5.7)% | |
Popeyes Louisiana Kitchen, Inc.* | | | 4,029 | | | | (209,750 | ) |
Callaway Golf Co. | | | 24,300 | | | | (221,616 | ) |
Starbucks Corp. | | | 3,747 | | | | (223,696 | ) |
Scotts Miracle-Gro Co. — Class A | | | 3,153 | | | | (229,444 | ) |
Regis Corp.* | | | 15,318 | | | | (232,680 | ) |
Sonic Automotive, Inc. — Class A | | | 12,910 | | | | (238,577 | ) |
Motorcar Parts of America, Inc.* | | | 6,387 | | | | (242,578 | ) |
Crocs, Inc.* | | | 25,329 | | | | (243,665 | ) |
Papa John’s International, Inc. | | | 4,622 | | | | (250,466 | ) |
Fred’s, Inc. — Class A | | | 17,188 | | | | (256,273 | ) |
Mobile Mini, Inc. | | | 7,936 | | | | (262,047 | ) |
Pool Corp. | | | 3,330 | | | | (292,174 | ) |
Wendy’s Co. | | | 27,113 | | | | (295,260 | ) |
LKQ Corp.* | | | 9,712 | | | | (310,104 | ) |
Lithia Motors, Inc. — Class A | | | 3,878 | | | | (338,666 | ) |
O’Reilly Automotive, Inc.* | | | 1,379 | | | | (377,377 | ) |
Signet Jewelers Ltd. | | | 3,634 | | | | (450,725 | ) |
Total Consumer, Cyclical | | | | | | | (4,675,098 | ) |
| | | | | | | | | |
Financial - (10.2)% | |
Community Bank System, Inc. | | | 5,688 | | | | (217,339 | ) |
Washington Federal, Inc. | | | 9,883 | | | | (223,850 | ) |
Safety Insurance Group, Inc. | | | 4,010 | | | | (228,811 | ) |
FNB Corp. | | | 17,607 | | | | (229,067 | ) |
Northfield Bancorp, Inc. | | | 14,052 | | | | (231,015 | ) |
American Assets Trust, Inc. | | | 5,970 | | | | (238,323 | ) |
Pennsylvania Real Estate Investment Trust | | | 11,154 | | | | (243,715 | ) |
Glacier Bancorp, Inc. | | | 9,762 | | | | (248,150 | ) |
Liberty Property Trust | | | 7,479 | | | | (250,247 | ) |
Webster Financial Corp. | | | 7,449 | | | | (267,419 | ) |
Sovran Self Storage, Inc. | | | 2,331 | | | | (274,941 | ) |
Associated Banc-Corp. | | | 16,602 | | | | (297,840 | ) |
Assurant, Inc. | | | 4,039 | | | | (311,609 | ) |
EastGroup Properties, Inc. | | | 5,224 | | | | (315,373 | ) |
Public Storage | | | 1,308 | | | | (360,786 | ) |
Alexandria Real Estate Equities, Inc. | | | 4,283 | | | | (389,282 | ) |
Highwoods Properties, Inc. | | | 8,206 | | | | (392,329 | ) |
Camden Property Trust | | | 4,764 | | | | (400,605 | ) |
Valley National Bancorp | | | 50,739 | | | | (484,050 | ) |
Retail Opportunity Investments Corp. | | | 25,747 | | | | (518,029 | ) |
Morgan Stanley | | | 20,911 | | | | (522,984 | ) |
Federal Realty Investment Trust | | | 3,478 | | | | (542,742 | ) |
Cousins Properties, Inc. | | | 53,316 | | | | (553,420 | ) |
Boston Properties, Inc. | | | 4,508 | | | | (572,876 | ) |
Total Financial | | | | | | | (8,314,802 | ) |
Total Common Stocks Sold Short | | | | | | | | |
(Proceeds $23,066,701) | | | | | | | (23,750,098 | ) |
Total Securities Sold Short - (29.0)% | | | | | | | | |
(Proceeds $23,066,701) | | | | | | $ | (23,750,098 | ) |
Other Assets & Liabilities, net - 35.4% | | | | | | | 29,026,511 | |
Total Net Assets - 100.0% | | | | | | $ | 81,916,704 | |
| | | | | | | Unrealized
Gain (Loss) | |
| | | | | | | | | |
OTC EQUITY SWAP AGREEMENTS†† | |
Morgan Stanley
February 2017 Alpha Opportunity Long
Custom Basket Swap 0.43%3,
Terminating 02/03/17
(Notional Value $54,948,876) | | | | | | $ | 3,561,738 | |
| | | | | | | | | |
OTC EQUITY SWAP AGREEMENTS Sold short†† | |
Morgan Stanley
February 2017 Alpha Opportunity Short
Custom Basket Swap 0.37%4,
Terminating 02/03/17
(Notional Value $55,947,792) | | | | | | $ | (4,086,030 | ) |
SEE NOTES TO FINANCIAL STATEMENTS. | THE GUGGENHEIM FUNDS SEMI-ANNUAL REPORT | 11 |
SCHEDULE OF INVESTMENTS (Unaudited)(continued) | March 31, 2016 |
ALPHA OPPORTUNITY FUND | |
| | | Shares | | | Unrealized
Gain (Loss) | |
| | | | | | | |
CUSTOM BASKET OF LONG SECURITIES3 | |
CenturyLink, Inc. | | | 28,732 | | | $ | 184,312 | |
Cisco Systems, Inc. | | | 24,980 | | | | 127,454 | |
Frontier Communications Corp. | | | 121,431 | | | | 117,939 | |
WellCare Health Plans, Inc.* | | | 7,414 | | | | 116,772 | |
United Continental Holdings, Inc.* | | | 9,199 | | | | 114,262 | |
Molina Healthcare, Inc.* | | | 11,069 | | | | 104,093 | |
Gilead Sciences, Inc. | | | 12,488 | | | | 97,684 | |
Hartford Financial Services Group, Inc. | | | 14,667 | | | | 94,115 | |
Xerox Corp. | | | 54,048 | | | | 91,993 | |
Southwest Airlines Co. | | | 13,118 | | | | 91,565 | |
Cummins, Inc. | | | 5,200 | | | | 90,949 | |
InterDigital, Inc. | | | 8,557 | | | | 90,366 | |
Consolidated Edison, Inc. | | | 13,287 | | | | 85,838 | |
Telephone & Data Systems, Inc. | | | 12,475 | | | | 83,390 | |
Computer Sciences Corp. | | | 21,557 | | | | 78,147 | |
Everest Re Group Ltd. | | | 4,546 | | | | 76,256 | |
UnitedHealth Group, Inc. | | | 5,816 | | | | 75,777 | |
Public Service Enterprise Group, Inc. | | | 13,111 | | | | 75,519 | |
Energizer Holdings, Inc. | | | 9,543 | | | | 74,536 | |
Entergy Corp. | | | 9,547 | | | | 73,321 | |
Raymond James Financial, Inc. | | | 13,137 | | | | 71,327 | |
QUALCOMM, Inc. | | | 14,810 | | | | 70,342 | |
Goodyear Tire & Rubber Co. | | | 15,454 | | | | 67,095 | |
Delphi Automotive plc | | | 5,506 | | | | 61,354 | |
LyondellBasell Industries N.V. — Class A | | | 5,602 | | | | 60,671 | |
Seagate Technology plc | | | 14,030 | | | | 60,405 | |
Principal Financial Group, Inc. | | | 20,488 | | | | 60,340 | |
IPG Photonics Corp.* | | | 3,959 | | | | 59,292 | |
CenterPoint Energy, Inc. | | | 25,485 | | | | 58,236 | |
Universal Health Services, Inc. — Class B | | | 5,618 | | | | 56,082 | |
Pitney Bowes, Inc. | | | 16,862 | | | | 49,060 | |
Alaska Air Group, Inc. | | | 3,743 | | | | 47,573 | |
Delta Air Lines, Inc. | | | 15,252 | | | | 44,539 | |
Corning, Inc. | | | 18,975 | | | | 44,022 | |
Travelers Companies, Inc. | | | 4,442 | | | | 43,695 | |
GameStop Corp. — Class A | | | 8,342 | | | | 41,043 | |
Dick's Sporting Goods, Inc. | | | 5,407 | | | | 40,511 | |
Scripps Networks Interactive, Inc. — Class A | | | 10,003 | | | | 39,534 | |
Textron, Inc. | | | 14,313 | | | | 38,825 | |
Western Union Co. | | | 23,851 | | | | 37,505 | |
Progressive Corp. | | | 7,471 | | | | 34,815 | |
SYNNEX Corp. | | | 4,816 | | | | 32,112 | |
Allstate Corp. | | | 4,117 | | | | 28,160 | |
Great Plains Energy, Inc. | | | 8,785 | | | | 28,096 | |
General Mills, Inc. | | | 4,289 | | | | 27,346 | |
WR Berkley Corp. | | | 4,236 | | | | 25,119 | |
Teradyne, Inc. | | | 12,490 | | | | 24,905 | |
Archer-Daniels-Midland Co. | | | 29,663 | | | | 24,522 | |
Albemarle Corp. | | | 4,476 | | | | 24,403 | |
Best Buy Company, Inc. | | | 6,785 | | | | 23,931 | |
SunTrust Banks, Inc. | | | 18,083 | | | | 22,278 | |
DST Systems, Inc. | | | 3,687 | | | | 20,542 | |
F5 Networks, Inc.* | | | 2,673 | | | | 20,010 | |
ConAgra Foods, Inc. | | | 7,503 | | | | 19,635 | |
Teradata Corp.* | | | 10,343 | | | | 18,947 | |
Carlisle Companies, Inc. | | | 2,413 | | | | 17,991 | |
Cognizant Technology Solutions Corp. — Class A* | | | 3,821 | | | | 17,960 | |
Cardinal Health, Inc. | | | 7,568 | | | | 17,785 | |
EMCOR Group, Inc. | | | 5,261 | | | | 16,107 | |
Mallinckrodt plc* | | | 11,964 | | | | 14,973 | |
JPMorgan Chase & Co. | | | 15,369 | | | | 14,540 | |
First Solar, Inc.* | | | 7,026 | | | | 14,489 | |
AGCO Corp. | | | 9,161 | | | | 14,128 | |
Snap-on, Inc. | | | 1,703 | | | | 13,858 | |
Synchrony Financial* | | | 9,897 | | | | 12,962 | |
Altria Group, Inc. | | | 6,049 | | | | 12,712 | |
Microsoft Corp. | | | 4,260 | | | | 12,136 | |
PepsiCo, Inc. | | | 3,397 | | | | 11,920 | |
Amsurg Corp. — Class A* | | | 5,671 | | | | 11,296 | |
Fifth Third Bancorp | | | 14,606 | | | | 8,983 | |
Lincoln National Corp. | | | 17,281 | | | | 8,756 | |
Ford Motor Co. | | | 18,261 | | | | 7,730 | |
Visa, Inc. — Class A | | | 2,990 | | | | 6,353 | |
Procter & Gamble Co. | | | 3,346 | | | | 4,064 | |
Atlantic Tele-Network, Inc. | | | 7,656 | | | | (1,519 | ) |
Citigroup, Inc. | | | 9,530 | | | | (2,011 | ) |
Michael Kors Holdings Ltd.* | | | 4,178 | | | | (2,513 | ) |
Amgen, Inc. | | | 5,077 | | | | (2,550 | ) |
McKesson Corp. | | | 3,036 | | | | (3,669 | ) |
Hologic, Inc.* | | | 12,144 | | | | (10,123 | ) |
Kroger Co. | | | 15,187 | | | | (26,679 | ) |
Biogen, Inc.* | | | 2,409 | | | | (29,672 | ) |
Total Custom Basket of Long Securities | | | | | | | 3,530,566 | |
| | | | | | | | | |
CUSTOM BASKET OF SHORT SECURITIES4 | | | | | | | | |
CF Industries Holdings, Inc. | | | (11,108 | ) | | | 53,421 | |
Hanesbrands, Inc. | | | (15,804 | ) | | | 43,169 | |
Intercontinental Exchange, Inc. | | | (1,607 | ) | | | 42,285 | |
AutoNation, Inc.* | | | (4,194 | ) | | | 26,129 | |
Cree, Inc.* | | | (6,876 | ) | | | 21,657 | |
Tangoe, Inc.* | | | (30,728 | ) | | | 14,523 | |
HCP, Inc. | | | (29,682 | ) | | | 14,450 | |
Celgene Corp.* | | | (3,852 | ) | | | 12,816 | |
International Flavors & Fragrances, Inc. | | | (2,916 | ) | | | 11,292 | |
Bank of the Ozarks, Inc. | | | (5,597 | ) | | | 9,842 | |
Goldman Sachs Group, Inc. | | | (3,925 | ) | | | 5,127 | |
NIKE, Inc. — Class B | | | (4,630 | ) | | | 5,072 | |
Domino's Pizza, Inc. | | | (1,822 | ) | | | 4,156 | |
Buffalo Wild Wings, Inc.* | | | (1,814 | ) | | | 3,751 | |
Boston Beer Company, Inc. — Class A* | | | (1,175 | ) | | | 3,086 | |
Crown Castle International Corp. | | | (6,185 | ) | | | 2,802 | |
TripAdvisor, Inc.* | | | (4,074 | ) | | | 2,672 | |
Macerich Co. | | | (2,826 | ) | | | 1,506 | |
Reynolds American, Inc. | | | (4,413 | ) | | | 338 | |
12 | THE GUGGENHEIM FUNDS SEMI-ANNUAL REPORT | SEE NOTES TO FINANCIAL STATEMENTS. |
SCHEDULE OF INVESTMENTS (Unaudited)(continued) | March 31, 2016 |
ALPHA OPPORTUNITY FUND | |
| | | Shares | | | Unrealized
Loss | |
| | | | | | | |
Expedia, Inc. | | | (2,346 | ) | | $ | (390 | ) |
Taubman Centers, Inc. | | | (3,068 | ) | | | (544 | ) |
Royal Caribbean Cruises Ltd. | | | (5,057 | ) | | | (1,407 | ) |
Hormel Foods Corp. | | | (5,164 | ) | | | (1,540 | ) |
Under Armour, Inc. — Class A* | | | (9,186 | ) | | | (2,102 | ) |
Edwards Lifesciences Corp.* | | | (4,252 | ) | | | (3,544 | ) |
WhiteWave Foods Co. — Class A* | | | (5,556 | ) | | | (4,851 | ) |
Signature Bank* | | | (2,618 | ) | | | (5,697 | ) |
Leucadia National Corp. | | | (23,811 | ) | | | (5,719 | ) |
Intersil Corp. — Class A | | | (16,687 | ) | | | (6,833 | ) |
Ross Stores, Inc. | | | (5,063 | ) | | | (6,913 | ) |
Deere & Co. | | | (7,554 | ) | | | (7,976 | ) |
Orbital ATK, Inc. | | | (4,556 | ) | | | (8,603 | ) |
Nasdaq, Inc. | | | (3,592 | ) | | | (8,605 | ) |
Dollar Tree, Inc.* | | | (11,963 | ) | | | (10,079 | ) |
Cheesecake Factory, Inc. | | | (4,381 | ) | | | (10,167 | ) |
PayPal Holdings, Inc.* | | | (7,012 | ) | | | (10,585 | ) |
Illumina, Inc.* | | | (2,210 | ) | | | (10,757 | ) |
Marsh & McLennan Companies, Inc. | | | (3,841 | ) | | | (11,010 | ) |
Core-Mark Holding Company, Inc. | | | (3,859 | ) | | | (11,205 | ) |
Tractor Supply Co. | | | (3,191 | ) | | | (11,802 | ) |
Automatic Data Processing, Inc. | | | (3,646 | ) | | | (11,906 | ) |
Douglas Emmett, Inc. | | | (11,034 | ) | | | (12,284 | ) |
Equity One, Inc. | | | (17,020 | ) | | | (12,297 | ) |
Regency Centers Corp. | | | (5,782 | ) | | | (12,714 | ) |
Weingarten Realty Investors | | | (7,403 | ) | | | (13,414 | ) |
Panera Bread Co. — Class A* | | | (1,553 | ) | | | (13,783 | ) |
VF Corp. | | | (8,787 | ) | | | (14,393 | ) |
Twenty-First Century Fox, Inc. — Class A | | | (9,111 | ) | | | (14,805 | ) |
Bristol-Myers Squibb Co. | | | (7,329 | ) | | | (15,172 | ) |
Stillwater Mining Co.* | | | (16,000 | ) | | | (15,410 | ) |
Apartment Investment & Management Co. — Class A | | | (5,924 | ) | | | (15,808 | ) |
Kite Realty Group Trust | | | (16,821 | ) | | | (16,036 | ) |
Host Hotels & Resorts, Inc. | | | (16,188 | ) | | | (16,136 | ) |
M&T Bank Corp. | | | (2,654 | ) | | | (16,206 | ) |
Group 1 Automotive, Inc. | | | (4,475 | ) | | | (16,567 | ) |
Mattel, Inc. | | | (12,536 | ) | | | (17,161 | ) |
Advance Auto Parts, Inc. | | | (1,922 | ) | | | (17,241 | ) |
Semtech Corp.* | | | (13,121 | ) | | | (18,165 | ) |
Post Properties, Inc. | | | (6,838 | ) | | | (18,360 | ) |
Carnival Corp. | | | (4,578 | ) | | | (18,465 | ) |
Eversource Energy | | | (4,269 | ) | | | (18,737 | ) |
MSCI, Inc. — Class A | | | (3,183 | ) | | | (19,276 | ) |
Urban Edge Properties | | | (10,183 | ) | | | (19,416 | ) |
Equity Residential | | | (7,874 | ) | | | (19,501 | ) |
Medical Properties Trust, Inc. | | | (19,161 | ) | | | (20,941 | ) |
National Retail Properties, Inc. | | | (8,325 | ) | | | (22,100 | ) |
Kaiser Aluminum Corp. | | | (3,425 | ) | | | (22,169 | ) |
Balchem Corp. | | | (4,629 | ) | | | (22,764 | ) |
Healthcare Realty Trust, Inc. | | | (13,618 | ) | | | (23,343 | ) |
Nielsen Holdings plc | | | (4,462 | ) | | | (23,477 | ) |
Alliant Energy Corp. | | | (3,755 | ) | | | (24,119 | ) |
BlackRock, Inc. — Class A | | | (1,316 | ) | | | (24,572 | ) |
UDR, Inc. | | | (10,102 | ) | | | (24,632 | ) |
MDU Resources Group, Inc. | | | (18,929 | ) | | | (25,045 | ) |
Woodward, Inc. | | | (4,450 | ) | | | (27,555 | ) |
Netflix, Inc.* | | | (4,032 | ) | | | (28,427 | ) |
Dominion Resources, Inc. | | | (5,735 | ) | | | (29,268 | ) |
Education Realty Trust, Inc. | | | (10,530 | ) | | | (29,996 | ) |
Garmin Ltd. | | | (10,014 | ) | | | (31,836 | ) |
Tanger Factory Outlet Centers, Inc. | | | (7,930 | ) | | | (32,459 | ) |
New York Community Bancorp, Inc. | | | (55,830 | ) | | | (32,908 | ) |
Aerovironment, Inc.* | | | (11,593 | ) | | | (32,952 | ) |
General Electric Co. | | | (9,701 | ) | | | (33,109 | ) |
Intuit, Inc. | | | (4,812 | ) | | | (33,407 | ) |
Welltower, Inc. | | | (5,472 | ) | | | (35,150 | ) |
People's United Financial, Inc. | | | (24,250 | ) | | | (35,212 | ) |
Xylem, Inc. | | | (5,862 | ) | | | (36,136 | ) |
Omega Healthcare Investors, Inc. | | | (10,093 | ) | | | (37,334 | ) |
South Jersey Industries, Inc. | | | (11,031 | ) | | | (37,617 | ) |
Kilroy Realty Corp. | | | (5,835 | ) | | | (38,019 | ) |
PulteGroup, Inc. | | | (17,990 | ) | | | (38,077 | ) |
DreamWorks Animation SKG, Inc. — Class A* | | | (36,270 | ) | | | (39,108 | ) |
Cooper Companies, Inc. | | | (1,926 | ) | | | (39,250 | ) |
Simon Property Group, Inc. | | | (1,972 | ) | | | (40,466 | ) |
McGraw Hill Financial, Inc. | | | (2,687 | ) | | | (41,120 | ) |
Extra Space Storage, Inc. | | | (6,653 | ) | | | (41,270 | ) |
Sealed Air Corp. | | | (8,720 | ) | | | (41,729 | ) |
Yum! Brands, Inc. | | | (4,813 | ) | | | (41,947 | ) |
SL Green Realty Corp. | | | (9,605 | ) | | | (42,167 | ) |
CME Group, Inc. — Class A | | | (7,332 | ) | | | (42,267 | ) |
Duke Realty Corp. | | | (17,869 | ) | | | (42,874 | ) |
Headwaters, Inc.* | | | (12,171 | ) | | | (45,010 | ) |
Vornado Realty Trust | | | (6,003 | ) | | | (46,471 | ) |
Corporate Office Properties Trust | | | (13,209 | ) | | | (47,154 | ) |
Air Products & Chemicals, Inc. | | | (4,333 | ) | | | (47,219 | ) |
Five Below, Inc.* | | | (8,621 | ) | | | (47,480 | ) |
AvalonBay Communities, Inc. | | | (2,480 | ) | | | (48,472 | ) |
Lennar Corp. — Class A | | | (6,984 | ) | | | (48,655 | ) |
KBR, Inc. | | | (29,056 | ) | | | (48,705 | ) |
PPG Industries, Inc. | | | (3,103 | ) | | | (49,338 | ) |
Mack-Cali Realty Corp. | | | (13,741 | ) | | | (50,821 | ) |
Ingersoll-Rand plc | | | (4,021 | ) | | | (52,987 | ) |
Itron, Inc.* | | | (6,433 | ) | | | (54,030 | ) |
Realty Income Corp. | | | (10,787 | ) | | | (55,249 | ) |
Sherwin-Williams Co. | | | (2,025 | ) | | | (56,120 | ) |
American Campus Communities, Inc. | | | (13,959 | ) | | | (57,022 | ) |
American Tower Corp. — Class A | | | (5,982 | ) | | | (60,885 | ) |
Rayonier, Inc. | | | (23,154 | ) | | | (62,495 | ) |
Dunkin' Brands Group, Inc. | | | (10,501 | ) | | | (62,890 | ) |
Eagle Materials, Inc. | | | (3,941 | ) | | | (62,906 | ) |
Essex Property Trust, Inc. | | | (3,210 | ) | | | (67,072 | ) |
Prologis, Inc. | | | (14,714 | ) | | | (69,843 | ) |
Ventas, Inc. | | | (8,488 | ) | | | (71,115 | ) |
Mercury General Corp. | | | (7,967 | ) | | | (72,775 | ) |
SEE NOTES TO FINANCIAL STATEMENTS. | THE GUGGENHEIM FUNDS SEMI-ANNUAL REPORT | 13 |
SCHEDULE OF INVESTMENTS (Unaudited)(concluded) | March 31, 2016 |
ALPHA OPPORTUNITY FUND | |
| | | Shares | | | Unrealized
Loss | |
| | | | | | | |
Kansas City Southern | | | (5,579 | ) | | $ | (73,531 | ) |
Autodesk, Inc.* | | | (7,536 | ) | | | (75,029 | ) |
Olin Corp. | | | (39,466 | ) | | | (82,823 | ) |
Ashland, Inc. | | | (5,953 | ) | | | (98,641 | ) |
FMC Corp. | | | (23,209 | ) | | | (102,750 | ) |
Wynn Resorts Ltd. | | | (4,073 | ) | | | (123,480 | ) |
Martin Marietta Materials, Inc. | | | (5,164 | ) | | | (131,695 | ) |
Vulcan Materials Co. | | | (8,858 | ) | | | (134,419 | ) |
CarMax, Inc.* | | | (19,202 | ) | | | (135,428 | ) |
J.C. Penney Company, Inc.* | | | (42,725 | ) | | | (149,800 | ) |
Kate Spade & Co.* | | | (20,280 | ) | | | (155,548 | ) |
Total Custom Basket of Short Securities | | | | | | | (4,008,170 | ) |
* | Non-income producing security. |
† | Value determined based on Level 1 inputs — See Note 4. |
†† | Value determined based on Level 2 inputs — See Note 4. |
1 | All or a portion of this security is pledged as short security collateral at March 31, 2016. |
2 | Rate indicated is the 7 day yield as of March 31, 2016. |
3 | Total Return is based on the return of the custom basket of long securities +/- financing at a variable rate. Rate indicated is the rate effective at March 31, 2016. |
4 | Total Return is based on the return of the custom basket of short securities +/- financing at a variable rate. Rate indicated is the rate effective at March 31, 2016. |
| | plc — Public Limited Company |
| | REIT — Real Estate Investment Trust |
| | |
| | See Sector Classification in Other Information section. |
The following table summarizes the inputs used to value the Fund’s investments at March 31, 2016 (See Note 4 in the Notes to Financial Statements):
Investments in Securities (Assets) | | Level 1 | | | Level 2 | | | Level 2 -
Other* | | | Level 3 | | | Total | |
Common Stocks | | $ | 70,879,698 | | | $ | — | | | $ | — | | | $ | — | | | $ | 70,879,698 | |
Equity Swap Agreements | | | — | | | | — | | | | 3,561,738 | | | | — | | | | 3,561,738 | |
Short Term Investments | | | 5,760,593 | | | | — | | | | — | | | | — | | | | 5,760,593 | |
Total | | $ | 76,640,291 | | | $ | — | | | $ | 3,561,738 | | | $ | — | | | $ | 80,202,029 | |
| | | | | | | | | | | | | | | | | | | | | |
Investments in Securities (Liabilities) | | Level 1 | | | Level 2 | | | Level 2 -
Other* | | | Level 3 | | | Total | |
Common Stocks | | $ | 23,750,098 | | | $ | — | | | $ | — | | | $ | — | | | $ | 23,750,098 | |
Equity Swap Agreements | | | — | | | | — | | | | 4,086,030 | | | | — | | | | 4,086,030 | |
Total | | $ | 23,750,098 | | | $ | — | | | $ | 4,086,030 | | | $ | — | | | $ | 27,836,128 | |
* | Other financial instruments include swaps, which are reported as unrealized gain/loss at period end. |
For the period ended March 31, 2016, there were no transfers between levels.
14 | THE GUGGENHEIM FUNDS SEMI-ANNUAL REPORT | SEE NOTES TO FINANCIAL STATEMENTS. |
STATEMENT OF ASSETS AND LIABILITIES (Unaudited) |
March 31, 2016 |
Assets: | |
Investments, at value (cost $73,721,535) | | $ | 76,640,291 | |
Segregated cash with broker | | | 27,166,732 | |
Unrealized appreciation on swap agreements | | | 3,561,738 | |
Prepaid expenses | | | 17,217 | |
Cash | | | 6,225 | |
Receivables: | |
Fund shares sold | | | 1,691,995 | |
Securities sold | | | 1,086,356 | |
Dividends | | | 74,887 | |
Other assets | | | 156 | |
Total assets | | | 110,245,597 | |
| | | | | |
Liabilities: | |
Securities sold short, at value (proceeds $23,066,701) | | | 23,750,098 | |
Unrealized depreciation on swap agreements | | | 4,086,030 | |
Payable for: | |
Securities purchased | | | 128,503 | |
Fund shares redeemed | | | 115,579 | |
Management fees | | | 93,903 | |
Swap settlement | | | 69,781 | |
Fund accounting/administration fees | | | 6,245 | |
Distribution and service fees | | | 5,832 | |
Transfer agent/maintenance fees | | | 4,805 | |
Trustees' fees* | | | 729 | |
Miscellaneous | | | 67,388 | |
Total liabilities | | | 28,328,893 | |
Net assets | | $ | 81,916,704 | |
| | | | | |
Net assets consist of: | |
Paid in capital | | $ | 83,593,129 | |
Accumulated net investment loss | | | (222,779 | ) |
Accumulated net realized loss on investments | | | (3,164,713 | ) |
Net unrealized appreciation on investments | | | 1,711,067 | |
Net assets | | $ | 81,916,704 | |
| | | | | |
A-Class: | |
Net assets | | $ | 20,101,488 | |
Capital shares outstanding | | | 1,033,013 | |
Net asset value per share | | $ | 19.46 | |
Maximum offering price per share (Net asset value divided by 95.25%) | | $ | 20.43 | |
| | | | | |
C-Class: | |
Net assets | | $ | 1,971,457 | |
Capital shares outstanding | | | 113,545 | |
Net asset value per share | | $ | 17.36 | |
| | | | | |
P-Class: | |
Net assets | | $ | 2,766,736 | |
Capital shares outstanding | | | 142,162 | |
Net asset value per share | | $ | 19.46 | |
| | | | | |
Institutional Class: | |
Net assets | | $ | 57,077,023 | |
Capital shares outstanding | | | 2,093,766 | |
Net asset value per share | | $ | 27.26 | |
* | Relates to Trustees not deemed “interested persons” within the meaning of Section 2(a)(19) of the 1940 Act. |
SEE NOTES TO FINANCIAL STATEMENTS. | THE GUGGENHEIM FUNDS SEMI-ANNUAL REPORT | 15 |
STATEMENT OF OPERATIONS (Unaudited) |
Period Ended March 31, 2016 |
Investment Income: | |
Dividends | | $ | 566,056 | |
Interest | | | 701 | |
Total investment income | | | 566,757 | |
| | | | | |
Expenses: | |
Management fees | | | 429,500 | |
Transfer agent/maintenance fees: | |
A-Class | | | 9,762 | |
C-Class | | | 1,412 | |
P-Class | | | 384 | |
Institutional Class | | | 6,042 | |
Distribution and service fees: | |
A-Class | | | 15,612 | |
C-Class | | | 7,133 | |
P-Class | | | 1,201 | |
Fund accounting/administration fees | | | 31,538 | |
Short sales dividend expense | | | 219,384 | |
Registration fees | | | 69,772 | |
Prime broker interest expense | | | 13,841 | |
Custodian fees | | | 9,248 | |
Trustees’ fees* | | | 2,225 | |
Miscellaneous | | | 57,692 | |
Total expenses | | | 874,746 | |
Net investment loss | | | (307,989 | ) |
Net Realized and Unrealized Gain (Loss): | |
Net realized gain (loss) on: | |
Investments | | $ | (1,255,788 | ) |
Swap agreements | | | 638,863 | |
Securities sold short | | | 1,363,293 | |
Net realized gain | | | 746,368 | |
Net change in unrealized appreciation (depreciation) on: | |
Investments | | | 5,749,092 | |
Securities sold short | | | (1,822,175 | ) |
Swap agreements | | | (439,082 | ) |
Net change in unrealized appreciation (depreciation) | | | 3,487,835 | |
Net realized and unrealized gain | | | 4,234,203 | |
Net increase in net assets resulting from operations | | $ | 3,926,214 | |
* | Relates to Trustees not deemed “interested persons” within the meaning of Section 2(a)(19) of the 1940 Act. |
16 | THE GUGGENHEIM FUNDS SEMI-ANNUAL REPORT | SEE NOTES TO FINANCIAL STATEMENTS. |
STATEMENTS OF CHANGES IN NET ASSETS |
| | | Period Ended
March 31,
2016
(Unaudited) | | | Year Ended
September 30,
2015 | |
Increase (Decrease) in Net Assets from Operations: | | | | | | |
Net investment loss | | $ | (307,989 | ) | | $ | (514,996 | ) |
Net realized gain on investments | | | 746,368 | | | | 666,067 | |
Net change in unrealized appreciation (depreciation) on investments | | | 3,487,835 | | | | (1,613,916 | ) |
Net increase (decrease) in net assets resulting from operations | | | 3,926,214 | | | | (1,462,845 | ) |
| | | | | | | | | |
Distributions to shareholders from: | | | | | | | | |
Net investment income | | | | | | | | |
A-Class | | | — | | | | (1,982 | ) |
C-Class | | | — | | | | (278 | ) |
Institutional Class | | | — | | | | (297 | ) |
Total distributions to shareholders | | | — | | | | (2,557 | ) |
| | | | | | | | | |
Capital share transactions: | | | | | | | | |
Proceeds from sale of shares | | | | | | | | |
A-Class | | | 9,475,404 | | | | 5,408,836 | |
B-Class | | | — | | | | 235 | |
C-Class | | | 847,431 | | | | 265,649 | |
P-Class | | | 2,702,456 | | | | 139,796 | * |
Institutional Class | | | 6,430,827 | | | | 50,445,467 | |
Distributions reinvested | | | | | | | | |
A-Class | | | — | | | | 1,956 | |
C-Class | | | — | | | | 273 | |
Institutional Class | | | — | | | | 297 | |
Cost of shares redeemed | | | | | | | | |
A-Class | | | (1,618,930 | ) | | | (2,010,069 | ) |
B-Class | | | — | | | | (93 | ) |
C-Class | | | (169,607 | ) | | | (182,978 | ) |
P-Class | | | (150,951 | ) | | | (4,920 | )* |
Institutional Class | | | (2,651,110 | ) | | | (225,328 | ) |
Net increase from capital share transactions | | | 14,865,520 | | | | 53,839,121 | |
Net increase in net assets | | | 18,791,734 | | | | 52,373,719 | |
| | | | | | | | | |
Net assets: | | | | | | | | |
Beginning of period | | | 63,124,970 | | | | 10,751,251 | |
End of period | | $ | 81,916,704 | | | $ | 63,124,970 | |
(Accumulated net investment loss)/Undistributed net investment income at end of period | | $ | (222,779 | ) | | $ | 85,210 | |
SEE NOTES TO FINANCIAL STATEMENTS. | THE GUGGENHEIM FUNDS SEMI-ANNUAL REPORT | 17 |
STATEMENTS OF CHANGES IN NET ASSETS (concluded) |
| | | Period Ended
March 31,
2016
(Unaudited) | | | Year Ended
September 30,
2015 | |
Capital share activity: | | | | | | |
Shares sold | | | | | | |
A-Class | | | 495,349 | | | | 288,180 | |
C-Class | | | 50,557 | | | | 15,608 | |
P-Class | | | 142,667 | | | | 7,535 | * |
Institutional Class | | | 241,798 | | | | 1,897,857 | |
Shares issued from reinvestment of distributions | | | | | | | | |
A-Class | | | — | | | | 103 | |
C-Class | | | — | | | | 16 | |
Institutional Class | | | — | | | | 11 | |
Shares redeemed | | | | | | | | |
A-Class | | | (86,840 | ) | | | (107,421 | ) |
C-Class | | | (10,053 | ) | | | (11,312 | ) |
P-Class | | | (7,771 | ) | | | (269 | )* |
Institutional Class | | | (103,112 | ) | | | (8,239 | ) |
Net increase in shares | | | 722,595 | | | | 2,082,069 | |
* | Since commencement of operations: May 1, 2015. |
18 | THE GUGGENHEIM FUNDS SEMI-ANNUAL REPORT | SEE NOTES TO FINANCIAL STATEMENTS. |
This table is presented to show selected data for a share outstanding throughout each period and to assist shareholders in evaluating a Fund’s performance for the periods presented.
A-Class | | Period Ended
March 31,
2016a | | | Year Ended
September 30,
2015 | | | Year Ended
September 30,
2014 | | | Year Ended
September 30,
2013 | | | Year Ended
September 30,
2012 | | | Year Ended
September 30,
2011 | |
Per Share Data | | | | | | | | | | | | | | | | | | |
Net asset value, beginning of period | | $ | 18.39 | | | $ | 18.01 | | | $ | 16.22 | | | $ | 13.33 | | | $ | 9.82 | | | $ | 9.70 | |
Income (loss) from investment operations: | |
Net investment income (loss)b | | | (.11 | ) | | | (.35 | ) | | | (.13 | ) | | | .03 | | | | (— | )c | | | (.04 | ) |
Net gain (loss) on investments (realized and unrealized) | | | 1.18 | | | | .73 | | | | 1.92 | | | | 2.86 | | | | 3.48 | | | | .16 | |
Payments by affiliates | | | — | | | | — | | | | — | | | | — | | | | .03 | e | | | — | |
Total from investment operations | | | 1.07 | | | | .38 | | | | 1.79 | | | | 2.89 | | | | 3.51 | | | | .12 | |
Less distributions from: | |
Net investment income | | | — | | | | (— | )d | | | — | | | | — | | | | — | | | | — | |
Total distributions | | | — | | | | (— | )d | | | — | | | | — | | | | — | | | | — | |
Net asset value, end of period | | $ | 19.46 | | | $ | 18.39 | | | $ | 18.01 | | | $ | 16.22 | | | $ | 13.33 | | | $ | 9.82 | |
| | |
Total Returnf | | | 5.82 | % | | | 2.13 | % | | | 11.04 | % | | | 21.38 | % | | | 35.74 | %e | | | 1.13 | % |
Ratios/Supplemental Data | |
Net assets, end of period (in thousands) | | $ | 20,101 | | | $ | 11,485 | | | $ | 7,989 | | | $ | 7,749 | | | $ | 7,250 | | | $ | 6,708 | |
Ratios to average net assets: | |
Net investment income (loss) | | | (1.17 | %) | | | (1.88 | %) | | | (0.73 | %) | | | 0.19 | % | | | (0.01 | %) | | | (0.33 | %) |
Total expensesh | | | 2.88 | % | | | 3.92 | % | | | 3.25 | % | | | 3.99 | % | | | 2.99 | % | | | 3.39 | % |
Net expensesi,j | | | 2.88 | % | | | 2.94 | % | | | 2.12 | % | | | 2.14 | % | | | 2.21 | % | | | 2.15 | % |
Portfolio turnover rate | | | 134 | % | | | 124 | % | | | — | | | | 488 | % | | | 707 | % | | | 868 | % |
C-Class | | Period Ended
March 31,
2016a | | | Year Ended
September 30,
2015 | | | Year Ended
September 30,
2014 | | | Year Ended
September 30,
2013 | | | Year Ended
September 30,
2012 | | | Year Ended
September 30,
2011 | |
Per Share Data | | | | | | | | | | | | | | | | | | |
Net asset value, beginning of period | | $ | 16.47 | | | $ | 16.25 | | | $ | 14.74 | | | $ | 12.21 | | | $ | 9.07 | | | $ | 9.03 | |
Income (loss) from investment operations: | |
Net investment income (loss)b | | | (.16 | ) | | | (.44 | ) | | | (.23 | ) | | | (.07 | ) | | | (.09 | ) | | | (.11 | ) |
Net gain (loss) on investments (realized and unrealized) | | | 1.05 | | | | .66 | | | | 1.74 | | | | 2.60 | | | | 3.21 | | | | .15 | |
Payments by affiliates | | | — | | | | — | | | | — | | | | — | | | | .02 | e | | | — | |
Total from investment operations | | | .89 | | | | .22 | | | | 1.51 | | | | 2.53 | | | | 3.14 | | | | .04 | |
Less distributions from: | |
Net investment income | | | — | | | | (— | )d | | | — | | | | — | | | | — | | | | — | |
Total distributions | | | — | | | | (— | )d | | | — | | | | — | | | | — | | | | — | |
Net asset value, end of period | | $ | 17.36 | | | $ | 16.47 | | | $ | 16.25 | | | $ | 14.74 | | | $ | 12.21 | | | $ | 9.07 | |
| | |
Total Returnf | | | 5.40 | % | | | 1.38 | % | | | 10.24 | % | | | 20.48 | % | | | 34.62 | %e | | | 0.44 | % |
Ratios/Supplemental Data | |
Net assets, end of period (in thousands) | | $ | 1,971 | | | $ | 1,203 | | | $ | 1,117 | | | $ | 1,206 | | | $ | 1,497 | | | $ | 1,292 | |
Ratios to average net assets: | |
Net investment income (loss) | | | (1.91 | %) | | | (2.64 | %) | | | (1.46 | %) | | | (0.56 | %) | | | (0.76 | %) | | | (1.08 | %) |
Total expensesh | | | 3.67 | % | | | 4.81 | % | | | 4.11 | % | | | 4.84 | % | | | 3.80 | % | | | 4.14 | % |
Net expensesi,j | | | 3.67 | % | | | 3.68 | % | | | 2.87 | % | | | 2.89 | % | | | 2.96 | % | | | 2.90 | % |
Portfolio turnover rate | | | 134 | % | | | 124 | % | | | — | | | | 488 | % | | | 707 | % | | | 868 | % |
SEE NOTES TO FINANCIAL STATEMENTS. | THE GUGGENHEIM FUNDS SEMI-ANNUAL REPORT | 19 |
FINANCIAL HIGHLIGHTS (continued) |
This table is presented to show selected data for a share outstanding throughout each period and to assist shareholders in evaluating a Fund’s performance for the periods presented.
P-Class | | Period Ended
March 31,
2016a | | | Period Ended
September 30,
2015g | |
Per Share Data | | | | | | |
Net asset value, beginning of period | | $ | 18.39 | | | $ | 19.11 | |
Income (loss) from investment operations: | |
Net investment income (loss)b | | | (.13 | ) | | | (.13 | ) |
Net gain (loss) on investments (realized and unrealized) | | | 1.20 | | | | (.59 | ) |
Total from investment operations | | | 1.07 | | | | (.72 | ) |
Net asset value, end of period | | $ | 19.46 | | | $ | 18.39 | |
| | |
Total Returnf | | | 5.82 | % | | | (3.77 | %) |
Ratios/Supplemental Data | |
Net assets, end of period (in thousands) | | $ | 2,767 | | | $ | 134 | |
Ratios to average net assets: | |
Net investment income (loss) | | | (1.41 | %) | | | (1.77 | %) |
Total expensesh | | | 3.28 | % | | | 3.31 | % |
Net expensesi,j | | | 3.28 | % | | | 2.87 | % |
Portfolio turnover rate | | | 134 | % | | | 124 | % |
20 | THE GUGGENHEIM FUNDS SEMI-ANNUAL REPORT | SEE NOTES TO FINANCIAL STATEMENTS. |
FINANCIAL HIGHLIGHTS (concluded) |
This table is presented to show selected data for a share outstanding throughout each period and to assist shareholders in evaluating a Fund’s performance for the periods presented.
Institutional Class | | Period Ended
March 31,
2016a | | | Year Ended
September 30,
2015 | | | Year Ended
September 30,
2014 | | | Year Ended
September 30,
2013 | | | Year Ended
September 30,
2012 | | | Year Ended
September 30,
2011 | |
Per Share Data | | | | | | | | | | | | | | | | | | |
Net asset value, beginning of period | | $ | 25.73 | | | $ | 25.13 | | | $ | 22.58 | | | $ | 18.52 | | | $ | 13.53 | | | $ | 13.33 | |
Income (loss) from investment operations: | |
Net investment income (loss)b | | | (.11 | ) | | | (.40 | ) | | | (.12 | ) | | | .09 | | | | .04 | | | | (.01 | ) |
Net gain (loss) on investments (realized and unrealized) | | | 1.64 | | | | 1.00 | | | | 2.67 | | | | 3.97 | | | | 4.82 | | | | .21 | |
Payments by affiliates | | | — | | | | — | | | | — | | | | — | | | | .13 | e | | | — | |
Total from investment operations | | | 1.53 | | | | .60 | | | | 2.55 | | | | 4.06 | | | | 4.99 | | | | .20 | |
Less distributions from: | |
Net investment income | | | — | | | | (— | )d | | | — | | | | — | | | | — | | | | — | |
Total distributions | | | — | | | | (— | )d | | | — | | | | — | | | | — | | | | — | |
Net asset value, end of period | | $ | 27.26 | | | $ | 25.73 | | | $ | 25.13 | | | $ | 22.58 | | | $ | 18.52 | | | $ | 13.53 | |
| | |
Total Returnf | | | 5.95 | % | | | 2.41 | % | | | 11.29 | % | | | 21.60 | % | | | 36.88 | %e | | | 1.50 | % |
Ratios/Supplemental Data | |
Net assets, end of period (in thousands) | | $ | 57,077 | | | $ | 50,304 | | | $ | 1,645 | | | $ | 1,740 | | | $ | 1,518 | | | $ | 1,326 | |
Ratios to average net assets: | |
Net investment income (loss) | | | (.83 | %) | | | (1.55 | %) | | | (0.48 | %) | | | 0.43 | % | | | 0.24 | % | | | (0.08 | %) |
Total expensesh | | | 2.54 | % | | | 2.80 | % | | | 2.90 | % | | | 3.67 | % | | | 2.68 | % | | | 3.12 | % |
Net expensesi,j | | | 2.54 | % | | | 2.80 | % | | | 1.87 | % | | | 1.90 | % | | | 1.96 | % | | | 1.90 | % |
Portfolio turnover rate | | | 134 | % | | | 124 | % | | | — | | | | 488 | % | | | 707 | % | | | 868 | % |
a | Unaudited figures for the period ended March 31, 2016. Percentage amounts for the period, except total return and portfolio turnover rate, have been annualized. |
b | Net investment income (loss) per share was computed using average shares outstanding throughout the period. |
c | Net investment income is less than $0.01 per share. |
d | Distributions from net investment income are less than $0.01 per share. |
e | For the year ended September 30, 2012, 0.30%, 0.22% and 0.96% of the Fund’s A-Class, C-Class and Institutional Class, respectively, total return consisted of a voluntary reimbursement by the Adviser for losses incurred during fund trading. Excluding this item, total return would have been 35.44%, 34.40% and 35.92% for the Fund’s A-Class, C-Class and Institutional Class, respectively. |
f | Total return does not reflect the impact of any applicable sales charges. |
g | Since commencement of operations: May 1, 2015. Percentage amounts for the period, except total return and portfolio turnover rate, have been annualized. |
h | Does not include expenses of the underlying funds in which the Fund invests. |
i | Net expense information reflects the expense ratios after expense waivers. |
j | Net expenses may include expenses that are excluded from the expense limitation agreement. Excluding these expenses, the operating expense ratios for the periods presented would be: |
| | 03/31/16 | 09/30/15 | 09/30/14 | 09/30/13 | 09/30/12 | 09/30/11 |
A-Class | 2.11% | 2.11% | 2.11% | 2.11% | 2.11% | 2.11% |
C-Class | 2.86% | 2.86% | 2.86% | 2.86% | 2.86% | 2.86% |
P-Class | 2.11% | 2.10% | — | — | — | — |
Institutional Class | 1.86% | 1.86% | 1.86% | 1.86% | 1.86% | 1.86% |
SEE NOTES TO FINANCIAL STATEMENTS. | THE GUGGENHEIM FUNDS SEMI-ANNUAL REPORT | 21 |
FUND PROFILE (Unaudited) | March 31, 2016 |
LARGE CAP VALUE FUND
OBJECTIVE: Seeks long-term growth of capital.
Holdings Diversification (Market Exposure as % of Net Assets)
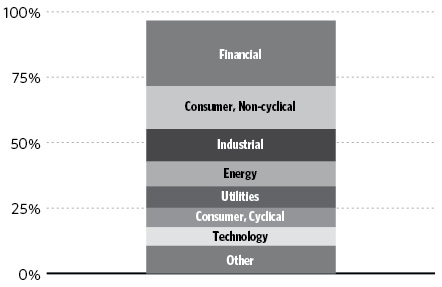
“Holdings Diversification (Market Exposure as % of Net Assets)” excludes any temporary cash investments.
Inception Dates: |
A-Class | August 7, 1944 |
C-Class | January 29, 1999 |
P-Class | May 1, 2015 |
Institutional Class | June 7, 2013 |
Ten Largest Holdings (% of Total Net Assets) |
JPMorgan Chase & Co. | 3.3% |
American International Group, Inc. | 3.1% |
Republic Services, Inc. — Class A | 3.1% |
Wells Fargo & Co. | 3.0% |
Johnson & Johnson | 2.8% |
Citigroup, Inc. | 2.6% |
Edison International | 2.6% |
Cisco Systems, Inc. | 2.4% |
Chevron Corp. | 2.4% |
Dow Chemical Co. | 2.3% |
Top Ten Total | 27.6% |
| | |
“Ten Largest Holdings” excludes any temporary cash investments. |
22 | THE GUGGENHEIM FUNDS SEMI-ANNUAL REPORT | |
SCHEDULE OF INVESTMENTS (Unaudited) | March 31, 2016 |
LARGE CAP VALUE FUND | |
| | | Shares | | | Value | |
| | | | | | | |
COMMON STOCKS† - 96.6% | |
| | | | | | | |
Financial - 25.0% | |
JPMorgan Chase & Co. | | | 31,787 | | | $ | 1,882,425 | |
American International Group, Inc. | | | 32,912 | | | | 1,778,893 | |
Wells Fargo & Co. | | | 35,209 | | | | 1,702,708 | |
Citigroup, Inc. | | | 35,846 | | | | 1,496,571 | |
Zions Bancorporation | | | 40,548 | | | | 981,667 | |
Allstate Corp. | | | 13,296 | | | | 895,752 | |
MasterCard, Inc. — Class A | | | 7,349 | | | | 694,481 | |
Assured Guaranty Ltd. | | | 24,484 | | | | 619,445 | |
Sun Communities, Inc. | | | 7,881 | | | | 564,358 | |
PNC Financial Services Group, Inc. | | | 6,348 | | | | 536,850 | |
BB&T Corp. | | | 16,038 | | | | 533,584 | |
Bank of America Corp. | | | 35,208 | | | | 476,012 | |
Charles Schwab Corp. | | | 13,649 | | | | 382,445 | |
Simon Property Group, Inc. | | | 1,795 | | | | 372,804 | |
Synchrony Financial* | | | 12,824 | | | | 367,536 | |
Equity Residential | | | 4,532 | | | | 340,036 | |
Unum Group | | | 9,051 | | | | 279,857 | |
KeyCorp | | | 25,002 | | | | 276,022 | |
Total Financial | | | | | | | 14,181,446 | |
| | | | | | | | | |
Consumer, Non-cyclical - 16.4% | |
Johnson & Johnson | | | 14,664 | | | | 1,586,644 | |
UnitedHealth Group, Inc. | | | 8,554 | | | | 1,102,611 | |
Pfizer, Inc. | | | 25,702 | | | | 761,807 | |
Bunge Ltd. | | | 12,386 | | | | 701,915 | |
Hershey Co. | | | 7,057 | | | | 649,879 | |
HCA Holdings, Inc.* | | | 8,260 | | | | 644,693 | |
Medtronic plc | | | 8,583 | | | | 643,725 | |
Quest Diagnostics, Inc. | | | 8,697 | | | | 621,401 | |
Zimmer Biomet Holdings, Inc. | | | 5,817 | | | | 620,267 | |
Sanderson Farms, Inc. | | | 5,985 | | | | 539,727 | |
Philip Morris International, Inc. | | | 4,633 | | | | 454,544 | |
Mondelez International, Inc. — Class A | | | 9,916 | | | | 397,830 | |
Henry Schein, Inc.* | | | 2,061 | | | | 355,790 | |
United Rentals, Inc.* | | | 3,581 | | | | 222,702 | |
Total Consumer, Non-cyclical | | | | | | | 9,303,535 | |
| | | | | | | | | |
Industrial - 12.5% | |
Republic Services, Inc. — Class A | | | 37,138 | | | | 1,769,625 | |
FLIR Systems, Inc. | | | 30,200 | | | | 995,090 | |
General Electric Co. | | | 26,811 | | | | 852,322 | |
CH Robinson Worldwide, Inc. | | | 8,453 | | | | 627,466 | |
Huntington Ingalls Industries, Inc. | | | 4,244 | | | | 581,173 | |
TE Connectivity Ltd. | | | 7,254 | | | | 449,168 | |
WestRock Co. | | | 10,855 | | | | 423,671 | |
Harris Corp. | | | 3,800 | | | | 295,868 | |
Eaton Corporation plc | | | 4,622 | | | | 289,152 | |
Honeywell International, Inc. | | | 2,534 | | | | 283,935 | |
CSX Corp. | | | 10,858 | | | | 279,594 | |
Jabil Circuit, Inc. | | | 14,381 | | | | 277,122 | |
Total Industrial | | | | | | | 7,124,186 | |
| | | | | | | | | |
Energy - 9.4% | |
Chevron Corp. | | | 14,386 | | | | 1,372,424 | |
Exxon Mobil Corp. | | | 15,608 | | | | 1,304,673 | |
Kinder Morgan, Inc. | | | 36,145 | | | | 645,550 | |
Marathon Oil Corp. | | | 49,723 | | | | 553,914 | |
Hess Corp. | | | 10,503 | | | | 552,983 | |
Whiting Petroleum Corp.* | | | 36,433 | | | | 290,735 | |
Rowan Companies plc — Class A | | | 14,757 | | | | 237,588 | |
Oasis Petroleum, Inc.* | | | 27,332 | | | | 198,977 | |
Superior Energy Services, Inc. | | | 12,674 | | | | 169,705 | |
Total Energy | | | | | | | 5,326,549 | |
| | | | | | | | | |
Utilities - 8.2% | |
Edison International | | | 20,690 | | | | 1,487,403 | |
Public Service Enterprise Group, Inc. | | | 21,804 | | | | 1,027,841 | |
Ameren Corp. | | | 12,863 | | | | 644,436 | |
OGE Energy Corp. | | | 22,213 | | | | 635,958 | |
Exelon Corp. | | | 9,831 | | | | 352,540 | |
UGI Corp. | | | 8,575 | | | | 345,487 | |
Duke Energy Corp. | | | 2,116 | | | | 170,719 | |
Total Utilities | | | | | | | 4,664,384 | |
| | | | | | | | | |
Consumer, Cyclical - 7.5% | |
CVS Health Corp. | | | 10,563 | | | | 1,095,700 | |
Lear Corp. | | | 7,911 | | | | 879,466 | |
Target Corp. | | | 7,523 | | | | 618,992 | |
Wal-Mart Stores, Inc. | | | 8,880 | | | | 608,191 | |
J.C. Penney Company, Inc.* | | | 31,110 | | | | 344,077 | |
PVH Corp. | | | 3,280 | | | | 324,917 | |
Goodyear Tire & Rubber Co. | | | 8,615 | | | | 284,123 | |
AutoNation, Inc.* | | | 2,602 | | | | 121,461 | |
Total Consumer, Cyclical | | | | | | | 4,276,927 | |
| | | | | | | | | |
Technology - 7.1% | |
Intel Corp. | | | 30,932 | | | | 1,000,649 | |
QUALCOMM, Inc. | | | 18,375 | | | | 939,698 | |
Lam Research Corp. | | | 7,312 | | | | 603,971 | |
Applied Materials, Inc. | | | 27,914 | | | | 591,219 | |
Microsoft Corp. | | | 10,381 | | | | 573,343 | |
Texas Instruments, Inc. | | | 5,207 | | | | 298,986 | |
Total Technology | | | | | | | 4,007,866 | |
| | | | | | | | | |
Communications - 6.2% | |
Cisco Systems, Inc. | | | 48,683 | | | | 1,386,005 | |
AT&T, Inc. | | | 20,254 | | | | 793,349 | |
DigitalGlobe, Inc.* | | | 29,741 | | | | 514,519 | |
Scripps Networks Interactive, Inc. — Class A | | | 7,345 | | | | 481,098 | |
Yahoo!, Inc.* | | | 9,052 | | | | 333,204 | |
Total Communications | | | | | | | 3,508,175 | |
SEE NOTES TO FINANCIAL STATEMENTS. | THE GUGGENHEIM FUNDS SEMI-ANNUAL REPORT | 23 |
SCHEDULE OF INVESTMENTS (Unaudited)(concluded) | March 31, 2016 |
LARGE CAP VALUE FUND | |
| | | Shares | | | Value | |
| | | | | | | |
Basic Materials - 4.3% | |
Dow Chemical Co. | | | 26,117 | | | $ | 1,328,310 | |
Reliance Steel & Aluminum Co. | | | 10,315 | | | | 713,695 | |
Olin Corp. | | | 16,753 | | | | 291,000 | |
Freeport-McMoRan, Inc. | | | 13,123 | | | | 135,692 | |
Total Basic Materials | | | | | | | 2,468,697 | |
| | | | | | | | | |
Total Common Stocks | | | | | | | | |
(Cost $52,021,050) | | | | | | | 54,861,765 | |
| | | | | | | | | |
SHORT TERM INVESTMENTS† - 3.8% | |
Dreyfus Treasury Prime Cash Management Institutional Shares 0.18%1 | | | 2,183,782 | | | | 2,183,782 | |
Total Short Term Investments | | | | | | | | |
(Cost $2,183,782) | | | | | | | 2,183,782 | |
| | | | | | | | | |
Total Investments - 100.4% | | | | | | | | |
(Cost $54,204,832) | | | | | | $ | 57,045,547 | |
Other Assets & Liabilities, net - (0.4)% | | | | | | | (223,369 | ) |
Total Net Assets - 100.0% | | | | | | $ | 56,822,178 | |
* | Non-income producing security. |
† | Value determined based on Level 1 inputs — See Note 4. |
1 | Rate indicated is the 7 day yield as of March 31, 2016. |
| | plc — Public Limited Company |
| | |
| | See Sector Classification in Other Information section. |
The following table summarizes the inputs used to value the Fund’s investments at March 31, 2016 (See Note 4 in the Notes to Financial Statements):
Investments in Securities (Assets) | | Level 1 | | | Level 2 | | | Level 3 | | | Total | |
Common Stocks | | $ | 54,861,765 | | | $ | — | | | $ | — | | | $ | 54,861,765 | |
Short Term Investments | | | 2,183,782 | | | | — | | | | — | | | | 2,183,782 | |
Total | | $ | 57,045,547 | | | $ | — | | | $ | — | | | $ | 57,045,547 | |
For the period ended March 31, 2016, there were no transfers between levels.
24 | THE GUGGENHEIM FUNDS SEMI-ANNUAL REPORT | SEE NOTES TO FINANCIAL STATEMENTS. |
STATEMENT OF ASSETS AND LIABILITIES (Unaudited) |
March 31, 2016 |
Assets: | |
Investments, at value (cost $54,204,832) | | $ | 57,045,547 | |
Prepaid expenses | | | 33,723 | |
Receivables: | |
Dividends | | | 70,819 | |
Fund shares sold | | | 6,915 | |
Foreign taxes reclaim | | | 1,288 | |
Total assets | | | 57,158,292 | |
| | | | | |
Liabilities: | |
Overdraft due to custodian bank | | | 376 | |
Payable for: | |
Securities purchased | | | 185,693 | |
Fund shares redeemed | | | 50,257 | |
Management fees | | | 25,662 | |
Transfer agent/maintenance fees | | | 21,988 | |
Direct shareholders expense | | | 20,733 | |
Distribution and service fees | | | 14,021 | |
Fund accounting/administration fees | | | 4,480 | |
Trustees’ fees* | | | 3,623 | |
Miscellaneous | | | 9,281 | |
Total liabilities | | | 336,114 | |
Net assets | | $ | 56,822,178 | |
| | | | | |
Net assets consist of: | |
Paid in capital | | $ | 53,224,084 | |
Undistributed net investment income | | | 514,199 | |
Accumulated net realized gain on investments | | | 243,180 | |
Net unrealized appreciation on investments | | | 2,840,715 | |
Net assets | | $ | 56,822,178 | |
| | | | | |
A-Class: | |
Net assets | | $ | 52,699,428 | |
Capital shares outstanding | | | 1,377,433 | |
Net asset value per share | | $ | 38.26 | |
Maximum offering price per share (Net asset value divided by 95.25%) | | $ | 40.17 | |
| | | | | |
C-Class: | |
Net assets | | $ | 3,582,254 | |
Capital shares outstanding | | | 100,768 | |
Net asset value per share | | $ | 35.55 | |
| | | | | |
P-Class: | |
Net assets | | $ | 512,062 | |
Capital shares outstanding | | | 13,400 | |
Net asset value per share | | $ | 38.21 | |
| | | | | |
Institutional Class: | |
Net assets | | $ | 28,434 | |
Capital shares outstanding | | | 743 | |
Net asset value per share | | $ | 38.27 | |
STATEMENT OF OPERATIONS (Unaudited) |
Period Ended March 31, 2016 |
Investment Income: | |
Dividends | | $ | 832,064 | |
Interest | | | 190 | |
Total investment income | | | 832,254 | |
| | | | | |
Expenses: | |
Management fees | | | 171,441 | |
Transfer agent/maintenance fees: | |
A-Class | | | 32,557 | |
C-Class | | | 3,980 | |
P-Class | | | 143 | |
Institutional Class | | | 203 | |
Distribution and service fees: | |
A-Class | | | 58,937 | |
C-Class | | | 17,805 | |
P-Class | | | 261 | |
Fund accounting/administration fees | | | 25,056 | |
Registration fees | | | 39,930 | |
Line of credit fees | | | 3,263 | |
Trustees’ fees* | | | 2,082 | |
Custodian fees | | | 73 | |
Tax expense | | | 6 | |
Miscellaneous | | | 19,941 | |
Total expenses | | | 375,678 | |
Less: | |
Expenses waived by Adviser | | | (57,623 | ) |
Net expenses | | | 318,055 | |
Net investment income | | | 514,199 | |
| | | | | |
Net Realized and Unrealized Gain (Loss): | |
Net realized gain (loss) on: | |
Investments | | | 346,422 | |
Net realized gain | | | 346,422 | |
Net change in unrealized appreciation (depreciation) on: | |
Investments | | | 2,383,509 | |
Net change in unrealized appreciation (depreciation) | | | 2,383,509 | |
Net realized and unrealized gain | | | 2,729,931 | |
Net increase in net assets resulting from operations | | $ | 3,244,130 | |
* | Relates to Trustees not deemed “interested persons” within the meaning of Section 2(a)(19) of the 1940 Act. |
SEE NOTES TO FINANCIAL STATEMENTS. | THE GUGGENHEIM FUNDS SEMI-ANNUAL REPORT | 25 |
STATEMENTS OF CHANGES IN NET ASSETS |
| | | Period Ended
March 31,
2016
(Unaudited) | | | Year Ended
September 30,
2015 | |
Increase (Decrease) in Net Assets from Operations: | | | | | | |
Net investment income | | $ | 514,199 | | | $ | 475,990 | |
Net realized gain on investments | | | 346,422 | | | | 8,151,325 | |
Net change in unrealized appreciation (depreciation) on investments | | | 2,383,509 | | | | (13,238,675 | ) |
Net increase (decrease) in net assets resulting from operations | | | 3,244,130 | | | | (4,611,360 | ) |
| | | | | | | | | |
Distributions to shareholders from: | | | | | | | | |
Net investment income | | | | | | | | |
A-Class | | | (433,473 | ) | | | (402,108 | ) |
B-Class | | | — | | | | (14,969 | ) |
C-Class | | | (6,564 | ) | | | (10,590 | ) |
P-Class | | | (6,451 | ) | | | — | * |
Institutional Class | | | (31,516 | ) | | | (35,334 | ) |
Net realized gains | | | | | | | | |
A-Class | | | (3,188,410 | ) | | | (1,529,881 | ) |
B-Class | | | — | | | | (41,043 | ) |
C-Class | | | (263,930 | ) | | | (138,586 | ) |
P-Class | | | (38,749 | ) | | | — | * |
Institutional Class | | | (178,457 | ) | | | (102,374 | ) |
Total distributions to shareholders | | | (4,147,550 | ) | | | (2,274,885 | ) |
| | | | | | | | | |
Capital share transactions: | | | | | | | | |
Proceeds from sale of shares | | | | | | | | |
A-Class | | | 9,166,685 | | | | 12,175,794 | |
B-Class | | | — | | | | 65,624 | |
C-Class | | | 488,913 | | | | 879,081 | |
P-Class | | | 3,957,241 | | | | 10,000 | * |
Institutional Class | | | 41,718 | | | | 264,341 | |
Distributions reinvested | | | | | | | | |
A-Class | | | 3,509,323 | | | | 1,855,957 | |
B-Class | | | — | | | | 55,872 | |
C-Class | | | 266,749 | | | | 146,562 | |
P-Class | | | 45,199 | | | | — | * |
Institutional Class | | | 209,973 | | | | 137,708 | |
Cost of shares redeemed | | | | | | | | |
A-Class | | | (4,802,171 | ) | | | (22,897,730 | ) |
B-Class | | | — | | | | (1,365,292 | ) |
C-Class | | | (414,704 | ) | | | (1,209,560 | ) |
P-Class | | | (3,501,789 | ) | | | — | * |
Institutional Class | | | (2,457,977 | ) | | | (887,546 | ) |
Net increase (decrease) from capital share transactions | | | 6,509,160 | | | | (10,769,189 | ) |
Net increase (decrease) in net assets | | | 5,605,740 | | | | (17,655,434 | ) |
| | | | | | | | | |
Net assets: | | | | | | | | |
Beginning of period | | | 51,216,438 | | | | 68,871,872 | |
End of period | | $ | 56,822,178 | | | $ | 51,216,438 | |
Undistributed net investment income at end of period | | $ | 514,199 | | | $ | 478,004 | |
26 | THE GUGGENHEIM FUNDS SEMI-ANNUAL REPORT | SEE NOTES TO FINANCIAL STATEMENTS. |
STATEMENTS OF CHANGES IN NET ASSETS (concluded) |
| | | Period Ended
March 31,
2016
(Unaudited) | | | Year Ended
September 30,
2015 | |
Capital share activity: | | | | | | |
Shares sold | | | | | | |
A-Class | | | 252,959 | | | | 283,554 | |
B-Class | | | — | | | | 1,656 | |
C-Class | | | 13,564 | | | | 21,744 | |
P-Class | | | 103,245 | | | | 229 | * |
Institutional Class | | | 1,060 | | | | 6,257 | |
Shares issued from reinvestment of distributions | | | | | | | | |
A-Class | | | 92,667 | | | | 43,212 | |
B-Class | | | — | | | | 1,419 | |
C-Class | | | 7,563 | | | | 3,646 | |
P-Class | | | 1,194 | | | | — | * |
Institutional Class | | | 5,548 | | | | 3,208 | |
Shares redeemed | | | | | | | | |
A-Class | | | (127,059 | ) | | | (544,300 | ) |
B-Class | | | — | | | | (34,996 | ) |
C-Class | | | (12,305 | ) | | | (30,302 | ) |
P-Class | | | (91,268 | ) | | | — | * |
Institutional Class | | | (70,811 | ) | | | (20,632 | ) |
Net increase (decrease) in shares | | | 176,357 | | | | (265,305 | ) |
* | Since commencement of operations: May 1, 2015. |
SEE NOTES TO FINANCIAL STATEMENTS. | THE GUGGENHEIM FUNDS SEMI-ANNUAL REPORT | 27 |
This table is presented to show selected data for a share outstanding throughout each period and to assist shareholders in evaluating a Fund’s performance for the periods presented.
A-Class | | Period Ended
March 31,
2016a | | | Year Ended
September 30,
2015 | | | Year Ended
September 30,
2014 | | | Year Ended
September 30,
2013 | | | Year Ended
September 30,
2012 | | | Year Ended
September 30,
2011f | |
Per Share Data | | | | | | | | | | | | | | | | | | |
Net asset value, beginning of period | | $ | 39.11 | | | $ | 43.80 | | | $ | 38.28 | | | $ | 31.25 | | | $ | 24.58 | | | $ | 26.08 | |
Income (loss) from investment operations: | |
Net investment income (loss)b | | | .38 | | | | .36 | | | | .30 | | | | .29 | | | | .25 | | | | .16 | |
Net gain (loss) on investments (realized and unrealized) | | | 1.91 | | | | (3.36 | ) | | | 5.51 | | | | 7.03 | | | | 6.58 | | | | (1.54 | ) |
Total from investment operations | | | 2.29 | | | | (3.00 | ) | | | 5.81 | | | | 7.32 | | | | 6.83 | | | | (1.38 | ) |
Less distributions from: | |
Net investment income | | | (.37 | ) | | | (.35 | ) | | | (.29 | ) | | | (.29 | ) | | | (.16 | ) | | | (.12 | ) |
Net realized gains | | | (2.77 | ) | | | (1.34 | ) | | | — | | | | — | | | | — | | | | — | |
Total distributions | | | (3.14 | ) | | | (1.69 | ) | | | (.29 | ) | | | (.29 | ) | | | (.16 | ) | | | (.12 | ) |
Net asset value, end of period | | $ | 38.26 | | | $ | 39.11 | | | $ | 43.80 | | | $ | 38.28 | | | $ | 31.25 | | | $ | 24.58 | |
| | |
Total Returnc | | | 5.95 | % | | | (7.19 | %) | | | 15.25 | % | | | 23.62 | % | | | 27.90 | % | | | (5.38 | %) |
Ratios/Supplemental Data | |
Net assets, end of period (in thousands) | | $ | 52,699 | | | $ | 45,318 | | | $ | 60,281 | | | $ | 47,307 | | | $ | 41,173 | | | $ | 41,036 | |
Ratios to average net assets: | |
Net investment income (loss) | | | 1.99 | % | | | 0.85 | % | | | 0.72 | % | | | 0.82 | % | | | 0.86 | % | | | 0.56 | % |
Total expensesd | | | 1.38 | % | | | 1.35 | % | | | 1.48 | % | | | 1.48 | % | | | 1.65 | % | | | 1.52 | % |
Net expensese | | | 1.17 | %i | | | 1.16 | %i | | | 1.17 | %i | | | 1.15 | % | | | 1.18 | % | | | 1.15 | % |
Portfolio turnover rate | | | 32 | % | | | 60 | % | | | 40 | % | | | 43 | % | | | 16 | % | | | 26 | % |
C-Class | | Period Ended
March 31,
2016a | | | Year Ended
September 30,
2015 | | | Year Ended
September 30,
2014 | | | Year Ended
September 30,
2013 | | | Year Ended
September 30,
2012 | | | Year Ended
September 30,
2011f | |
Per Share Data | | | | | | | | | | | | | | | | | | |
Net asset value, beginning of period | | $ | 36.38 | | | $ | 40.91 | | | $ | 35.86 | | | $ | 29.30 | | | $ | 23.08 | | | $ | 24.60 | |
Income (loss) from investment operations: | |
Net investment income (loss)b | | | .22 | | | | .04 | | | | (.02 | ) | | | .02 | | | | .03 | | | | (.05 | ) |
Net gain (loss) on investments (realized and unrealized) | | | 1.79 | | | | (3.13 | ) | | | 5.16 | | | | 6.62 | | | | 6.19 | | | | (1.47 | ) |
Total from investment operations | | | 2.01 | | | | (3.09 | ) | | | 5.14 | | | | 6.64 | | | | 6.22 | | | | (1.52 | ) |
Less distributions from: | |
Net investment income | | | (.07 | ) | | | (.10 | ) | | | (.09 | ) | | | (.08 | ) | | | — | | | | — | |
Net realized gains | | | (2.77 | ) | | | (1.34 | ) | | | — | | | | — | | | | — | | | | — | |
Total distributions | | | (2.84 | ) | | | (1.44 | ) | | | (.09 | ) | | | (.08 | ) | | | — | | | | — | |
Net asset value, end of period | | $ | 35.55 | | | $ | 36.38 | | | $ | 40.91 | | | $ | 35.86 | | | $ | 29.30 | | | $ | 23.08 | |
| | |
Total Returnc | | | 5.58 | % | | | (7.89 | %) | | | 14.35 | % | | | 22.73 | % | | | 26.95 | % | | | (6.18 | %) |
Ratios/Supplemental Data | |
Net assets, end of period (in thousands) | | $ | 3,582 | | | $ | 3,345 | | | $ | 3,963 | | | $ | 3,494 | | | $ | 2,257 | | | $ | 2,013 | |
Ratios to average net assets: | |
Net investment income (loss) | | | 1.23 | % | | | 0.10 | % | | | (0.04 | %) | | | 0.08 | % | | | 0.12 | % | | | (0.20 | %) |
Total expensesd | | | 2.22 | % | | | 2.16 | % | | | 2.33 | % | | | 2.47 | % | | | 2.45 | % | | | 2.27 | % |
Net expensese | | | 1.92 | %i | | | 1.91 | %i | | | 1.92 | %i | | | 1.90 | % | | | 1.93 | % | | | 1.90 | % |
Portfolio turnover rate | | | 32 | % | | | 60 | % | | | 40 | % | | | 43 | % | | | 16 | % | | | 26 | % |
28 | THE GUGGENHEIM FUNDS SEMI-ANNUAL REPORT | SEE NOTES TO FINANCIAL STATEMENTS. |
FINANCIAL HIGHLIGHTS (continued) |
This table is presented to show selected data for a share outstanding throughout each period and to assist shareholders in evaluating a Fund’s performance for the periods presented.
P-Class | | Period Ended
March 31,
2016a | | | Period Ended
September 30,
2015h | |
Per Share Data | | | | | | |
Net asset value, beginning of period | | $ | 39.13 | | | $ | 43.64 | |
Income (loss) from investment operations: | |
Net investment income (loss)b | | | .85 | | | | .22 | |
Net gain (loss) on investments (realized and unrealized) | | | 1.46 | | | | (4.73 | ) |
Total from investment operations | | | 2.31 | | | | (4.51 | ) |
Less distributions from: | |
Net investment income | | | (.46 | ) | | | — | |
Net realized gains | | | (2.77 | ) | | | — | |
Total distributions | | | (3.23 | ) | | | — | |
Net asset value, end of period | | $ | 38.21 | | | $ | 39.13 | |
| | |
Total Returnc | | | 6.03 | % | | | (10.38 | %) |
Ratios/Supplemental Data | |
Net assets, end of period (in thousands) | | $ | 512 | | | $ | 9 | |
Ratios to average net assets: | |
Net investment income (loss) | | | 4.41 | % | | | 1.21 | % |
Total expensesd | | | 1.38 | % | | | 3.29 | % |
Net expensese,i | | | 1.17 | % | | | 1.16 | % |
Portfolio turnover rate | | | 32 | % | | | 60 | % |
SEE NOTES TO FINANCIAL STATEMENTS. | THE GUGGENHEIM FUNDS SEMI-ANNUAL REPORT | 29 |
FINANCIAL HIGHLIGHTS (concluded) |
This table is presented to show selected data for a share outstanding throughout each period and to assist shareholders in evaluating a Fund’s performance for the periods presented.
Institutional Class | | Period Ended
March 31,
2016a | | | Year Ended
September 30,
2015 | | | Year Ended
September 30,
2014 | | | Period Ended
September 30,
2013g | |
Per Share Data | | | | | | | | | | | | |
Net asset value, beginning of period | | $ | 39.17 | | | $ | 43.87 | | | $ | 38.32 | | | $ | 36.84 | |
Income (loss) from investment operations: | |
Net investment income (loss)b | | | .43 | | | | .47 | | | | .40 | | | | .13 | |
Net gain (loss) on investments (realized and unrealized) | | | 1.93 | | | | (3.37 | ) | | | 5.51 | | | | 1.35 | |
Total from investment operations | | | 2.36 | | | | (2.90 | ) | | | 5.91 | | | | 1.48 | |
Less distributions from: | |
Net investment income | | | (.49 | ) | | | (.46 | ) | | | (.36 | ) | | | — | |
Net realized gains | | | (2.77 | ) | | | (1.34 | ) | | | — | | | | — | |
Total distributions | | | (3.26 | ) | | | (1.80 | ) | | | (.36 | ) | | | — | |
Net asset value, end of period | | $ | 38.27 | | | $ | 39.17 | | | $ | 43.87 | | | $ | 38.32 | |
| | |
Total Returnc | | | 6.08 | % | | | (6.97 | %) | | | 15.52 | % | | | 4.02 | % |
Ratios/Supplemental Data | |
Net assets, end of period (in thousands) | | $ | 28 | | | $ | 2,544 | | | $ | 3,339 | | | $ | 2,831 | |
Ratios to average net assets: | |
Net investment income (loss) | | | 2.21 | % | | | 1.09 | % | | | 0.96 | % | | | 1.12 | % |
Total expensesd | | | 1.02 | % | | | 0.98 | % | | | 1.08 | % | | | 1.12 | % |
Net expensese | | | 0.91 | %i | | | 0.91 | %i | | | 0.92 | %i | | | 0.89 | % |
Portfolio turnover rate | | | 32 | % | | | 60 | % | | | 40 | % | | | 43 | % |
a | Unaudited figures for the period ended March 31, 2016. Percentage amounts for the period, except total return and portfolio turnover rate, have been annualized. |
b | Net investment income (loss) per share was computed using average shares outstanding throughout the period. |
c | Total return does not reflect the impact of any applicable sales charges. |
d | Does not include expenses of the underlying funds in which the Fund invests. |
e | Net expense information reflects the expense ratios after expense waivers. |
f | Reverse share split — Per share amounts for the period presented through April 8, 2011 have been restated to reflect a 1:4 reverse share split effective April 8, 2011. |
g | Since commencement of operations: June 7, 2013. Percentage amounts for the period, except total return and portfolio turnover rate, have been annualized. |
h | Since commencement of operations: May 1, 2015. Percentage amounts for the period, except total return and portfolio turnover rate, have been annualized. |
i | Net expenses may include expenses that are excluded from the expense limitation agreement. Excluding these expenses, the operating expense ratios for the periods presented would be: |
| | 03/31/16 | 09/30/15 | 09/30/14 |
A-Class | 1.15% | 1.15% | 1.15% |
C-Class | 1.90% | 1.90% | 1.90% |
P-Class | 1.15% | 1.15% | — |
Institutional Class | 0.90% | 0.90% | 0.90% |
30 | THE GUGGENHEIM FUNDS SEMI-ANNUAL REPORT | SEE NOTES TO FINANCIAL STATEMENTS. |
FUND PROFILE (Unaudited) | March 31, 2016 |
MARKET NEUTRAL REAL ESTATE FUND
OBJECTIVE: Seeks to provide capital appreciation, while limiting exposure to general stock market risk.
Holdings Diversification (Market Exposure as % of Net Assets)
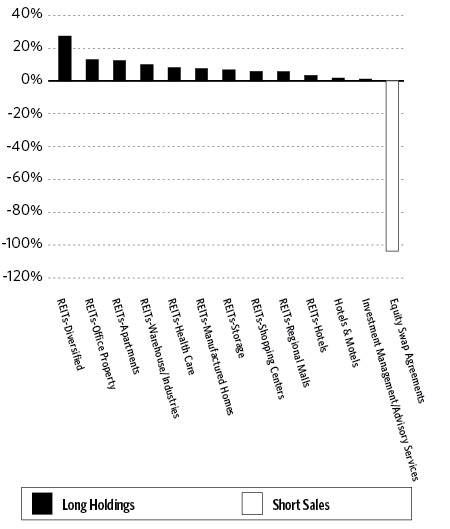
“Holdings Diversification (Market Exposure as % of Net Assets)” excludes any temporary cash investments.
Inception Dates: |
A-Class | February 26, 2016 |
C-Class | February 26, 2016 |
P-Class | February 26, 2016 |
Institutional Class | February 26, 2016 |
Ten Largest Holdings (% of Total Net Assets) |
Sun Communities, Inc. | 4.8% |
Extra Space Storage, Inc. | 4.7% |
Equinix, Inc. | 4.5% |
Monogram Residential Trust, Inc. | 4.4% |
Equity Commonwealth | 4.3% |
Gramercy Property Trust | 4.0% |
Duke Realty Corp. | 3.9% |
American Tower Corp. — Class A | 3.9% |
American Assets Trust, Inc. | 3.9% |
Federal Realty Investment Trust | 3.4% |
Top Ten Total | 41.8% |
| | |
“Ten Largest Holdings” excludes any temporary cash or derivative investments. |
| | THE GUGGENHEIM FUNDS SEMI-ANNUAL REPORT | 31 |
SCHEDULE OF INVESTMENTS (Unaudited) | March 31, 2016 |
MARKET NEUTRAL REAL ESTATE FUND | |
| | | Shares | | | Value | |
| | | | | | | |
COMMON STOCKS† - 102.9% | |
| | | | | | | |
REITs - 100.1% | |
REITs-Diversified - 27.4% | |
Equinix, Inc. | | | 676 | | | $ | 223,560 | |
Duke Realty Corp. | | | 8,536 | | | | 192,401 | |
American Tower Corp. — Class A | | | 1,877 | | | | 192,148 | |
American Assets Trust, Inc. | | | 4,784 | | | | 190,977 | |
NorthStar Realty Finance Corp. | | | 9,467 | | | | 124,207 | |
Cousins Properties, Inc. | | | 11,411 | | | | 118,446 | |
Retail Properties of America, Inc. — Class A | | | 7,330 | | | | 116,181 | |
STORE Capital Corp. | | | 4,033 | | | | 104,374 | |
NorthStar Realty Europe Corp. | | | 7,599 | | | | 88,148 | |
Total REITs-Diversified | | | | | | | 1,350,442 | |
| | | | | | | | | |
REITs-Office Property - 13.0% | |
Equity Commonwealth* | | | 7,571 | | | | 213,654 | |
Gramercy Property Trust | | | 23,211 | | | | 196,133 | |
New York REIT, Inc. | | | 11,451 | | | | 115,655 | |
Parkway Properties, Inc. | | | 7,323 | | | | 114,678 | |
Total REITs-Office Property | | | | | | | 640,120 | |
| | | | | | | | | |
REITs-Apartments - 12.4% | |
Monogram Residential Trust, Inc. | | | 21,849 | | | | 215,432 | |
American Campus Communities, Inc. | | | 3,477 | | | | 163,732 | |
Camden Property Trust | | | 1,481 | | | | 124,537 | |
Education Realty Trust, Inc. | | | 2,567 | | | | 106,787 | |
Total REITs-Apartments | | | | | | | 610,488 | |
| | | | | | | | | |
REITs-Warehouse/Industries - 10.0% | |
QTS Realty Trust, Inc. — Class A | | | 2,865 | | | | 135,744 | |
EastGroup Properties, Inc. | | | 2,189 | | | | 132,150 | |
CyrusOne, Inc. | | | 2,579 | | | | 117,731 | |
First Industrial Realty Trust, Inc. | | | 4,727 | | | | 107,492 | |
Total REITs-Warehouse/Industries | | | | | | | 493,117 | |
| | | | | | | | | |
REITs-Health Care - 8.1% | |
Healthcare Trust of America, Inc. — Class A | | | 5,500 | | | | 161,810 | |
Care Capital Properties, Inc. | | | 4,938 | | | | 132,536 | |
Omega Healthcare Investors, Inc. | | | 2,991 | | | | 105,582 | |
Total REITs-Health Care | | | | | | | 399,928 | |
| | | | | | | | | |
REITs-Manufactured Homes - 7.5% | |
Sun Communities, Inc. | | | 3,270 | | | | 234,164 | |
Equity LifeStyle Properties, Inc. | | | 1,879 | | | | 136,660 | |
Total REITs-Manufactured Homes | | | | | | | 370,824 | |
| | | | | | | | | |
REITs-Storage - 6.7% | |
Extra Space Storage, Inc. | | | 2,455 | | | | 229,445 | |
National Storage Affiliates Trust | | | 4,796 | | | | 101,675 | |
Total REITs-Storage | | | | | | | 331,120 | |
| | | | | | | | | |
REITs-Shopping Centers - 5.9% | |
Federal Realty Investment Trust | | | 1,078 | | | | 168,222 | |
Equity One, Inc. | | | 4,248 | | | | 121,748 | |
Total REITs-Shopping Centers | | | | | | | 289,970 | |
| | | | | | | | | |
REITs-Regional Malls - 5.7% | |
General Growth Properties, Inc. | | | 4,822 | | | | 143,358 | |
Simon Property Group, Inc. | | | 650 | | | | 134,999 | |
Total REITs-Regional Malls | | | | | | | 278,357 | |
| | | | | | | | | |
REITs-Hotels - 3.4% | |
Chatham Lodging Trust | | | 7,682 | | | | 164,625 | |
Total REITs | | | | | | | 4,928,991 | |
| | | | | | | | | |
Hotels & Motels - 1.7% | |
Starwood Hotels & Resorts Worldwide, Inc. | | | 1,001 | | | | 83,513 | |
| | | | | | | | | |
Investment Management/Advisory Services - 1.1% | |
NorthStar Asset Management Group, Inc. | | | 4,685 | | | | 53,175 | |
| | | | | | | | | |
Total Common Stocks | | | | | | | | |
(Cost $4,709,812) | | | | | | | 5,065,679 | |
| | | | | | | | | |
Total Investments - 102.9% | | | | | | | | |
(Cost $4,709,812) | | | | | | $ | 5,065,679 | |
Other Assets & Liabilities, net - (2.9)% | | | | | | | (144,059 | ) |
Total Net Assets - 100.0% | | | | | | $ | 4,921,620 | |
| | | | | | Unrealized
Loss | |
| | | | | | | | | |
OTC Equity SWAP AGREEMENTS sold short †† | |
Morgan Stanley
June 2017
Market Neutral Real Estate
Short Custom Basket Swap 0.37%1,
Terminating 06/15/17
(Notional Value $5,101,512) | | | | | | $ | (443,873 | ) |
| | | Shares | | | | | |
| | | | | | | | | |
CUSTOM BASKET OF SHORT SECURITIES1 | |
Annaly Mortgage Management | | | (12,975 | ) | | | (706 | ) |
LTC Properties, Inc. | | | (2,274 | ) | | | (2,002 | ) |
Lexington Realty Trust | | | (12,038 | ) | | | (2,368 | ) |
HCP, Inc. | | | (3,214 | ) | | | (3,180 | ) |
National Retail Properties, Inc. | | | (1,645 | ) | | | (3,809 | ) |
Realty Income Corp. | | | (1,220 | ) | | | (4,683 | ) |
DDR Corp. | | | (6,013 | ) | | | (6,695 | ) |
Piedmont Office Realty | | | (8,984 | ) | | | (8,119 | ) |
CBL & Associates Properties | | | (16,576 | ) | | | (8,243 | ) |
Weingarten Realty Investors | | | (4,290 | ) | | | (8,379 | ) |
WP Glimcher, Inc. | | | (8,990 | ) | | | (8,442 | ) |
FelCor Lodging Trust, Inc. | | | (13,493 | ) | | | (8,544 | ) |
32 | THE GUGGENHEIM FUNDS SEMI-ANNUAL REPORT | SEE NOTES TO FINANCIAL STATEMENTS. |
SCHEDULE OF INVESTMENTS (Unaudited)(concluded) | March 31, 2016 |
MARKET NEUTRAL REAL ESTATE FUND | |
| | | Shares | | | Unrealized
Loss | |
| | | | | | | |
Ryman Hospitality Properties | | | (2,251 | ) | | $ | (9,082 | ) |
Urban Edge Properties | | | (6,722 | ) | | | (9,578 | ) |
Entertainment Properties Trust | | | (2,341 | ) | | | (10,494 | ) |
Sunstone Hotel Investor,s Inc. | | | (11,077 | ) | | | (12,122 | ) |
DuPont Fabros Technology, Inc. | | | (2,509 | ) | | | (12,352 | ) |
UDR, INC. | | | (3,668 | ) | | | (14,949 | ) |
Host Hotels & Resorts, Inc. | | | (10,553 | ) | | | (14,987 | ) |
Kilroy Realty Corp. | | | (2,232 | ) | | | (15,245 | ) |
Healthcare Realty Trust, Inc. | | | (8,005 | ) | | | (15,782 | ) |
Lamar Advertising Co. | | | (3,154 | ) | | | (16,203 | ) |
Liberty Property Trust | | | (3,410 | ) | | | (16,296 | ) |
Mid-America Apartment Communities, Inc. | | | (1,667 | ) | | | (17,882 | ) |
Douglas Emmett, Inc. | | | (5,781 | ) | | | (18,645 | ) |
Apartment Investment & Management Co. | | | (3,774 | ) | | | (19,886 | ) |
STAG Industrial, Inc. | | | (9,332 | ) | | | (26,878 | ) |
Iron Mountain, Inc. | | | (6,440 | ) | | | (27,635 | ) |
Government Properties Income Trust | | | (13,784 | ) | | | (41,346 | ) |
iShares Dow Jones US Real Estate Index Fund | | | (9,886 | ) | | | (56,592 | ) |
Total Custom Backet of Short Securities | | | | | | | (421,124 | ) |
* | Non-income producing security. |
† | Value determined based on Level 1 inputs — See Note 4. |
†† | Value determined based on Level 2 inputs — See Note 4. |
1 | Total Return is based on the return of the custom basket of short securities +/- financing at a variable rate. Rate indicated is the rate effective at March 31, 2016. |
| | REIT — Real Estate Investment Trust |
| | |
| | See Sector Classification in Other Information section. |
The following table summarizes the inputs used to value the Fund’s investments at March 31, 2016 (See Note 4 in the Notes to Financial Statements):
Investments in Securities (Assets) | | Level 1 | | | Level 2 | | | Level 2 -
Other* | | | Level 3 | | | Total | |
Common Stocks | | $ | 5,065,679 | | | $ | — | | | $ | — | | | $ | — | | | $ | 5,065,679 | |
| | | | | | | | | | | | | | | | | | | | | |
Investments in Securities (Liabilities) | | Level 1 | | | Level 2 | | | Level 2 -
Other* | | | Level 3 | | | Total | |
Equity Swap Agreements | | $ | — | | | $ | — | | | $ | 443,873 | | | $ | — | | | $ | 443,873 | |
* | Other financial instruments include swaps, which are reported as unrealized gain/loss at period end. |
For the period ended March 31, 2016, there were no transfers between levels.
SEE NOTES TO FINANCIAL STATEMENTS. | THE GUGGENHEIM FUNDS SEMI-ANNUAL REPORT | 33 |
MARKET NEUTRAL REAL ESTATE FUND | |
STATEMENT OF ASSETS AND LIABILITIES (Unaudited) |
March 31, 2016 |
Assets: | |
Investments, at value (cost $4,709,812) | | $ | 5,065,679 | |
Cash | | | 398,834 | |
Receivables: | |
Securities sold | | | 89,697 | |
Dividends | | | 17,031 | |
Investment Adviser | | | 1,134 | |
Total assets | | | 5,572,375 | |
| | | | | |
LIABILITIES: | |
Unrealized depreciation on swap agreements | | | 443,873 | |
Payable for: | |
Securities purchased | | | 137,517 | |
Swap settlement | | | 62,126 | |
Transfer agent/maintenance fees | | | 80 | |
Trustees' fees* | | | 614 | |
Distribution and service fees | | | 126 | |
Miscellaneous | | | 6,419 | |
Total liabilities | | | 650,755 | |
Net assets | | $ | 4,921,620 | |
| | | | | |
Net assets consist of: | |
Paid in capital | | $ | 5,002,011 | |
Undistributed net investment income | | | 30,769 | |
Accumulated net realized loss on investments | | | (23,154 | ) |
Net unrealized depreciation on investments | | | (88,006 | ) |
Net assets | | $ | 4,921,620 | |
| | | | | |
A-Class: | |
Net assets | | $ | 100,383 | |
Capital shares outstanding | | | 4,082 | |
Net asset value per share | | $ | 24.59 | |
Maximum offering price per share (Net asset value divided by 95.25%) | | $ | 25.82 | |
| | | | | |
C-Class: | |
Net assets | | $ | 98,308 | |
Capital shares outstanding | | | 4,000 | |
Net asset value per share | | $ | 24.58 | |
| | | | | |
P-Class: | |
Net assets | | $ | 98,373 | |
Capital shares outstanding | | | 4,000 | |
Net asset value per share | | $ | 24.59 | |
| | | | | |
Institutional Class: | |
Net assets | | $ | 4,624,556 | |
Capital shares outstanding | | | 188,000 | |
Net asset value per share | | $ | 24.60 | |
STATEMENT OF OPERATIONS (Unaudited) |
Period Ended March 31, 2016** |
Investment Income: | |
Dividends | | $ | 36,888 | |
Interest | | | 25 | |
Total investment income | | | 36,913 | |
| | | | | |
Expenses: | |
Management fees | | | 4,755 | |
Transfer agent/maintenance fees: | |
A-Class | | | 17 | |
C-Class | | | 9 | |
P-Class | | | 6 | |
Institutional Class | | | 70 | |
Distribution and service fees: | |
A-Class | | | 22 | |
C-Class | | | 86 | |
P-Class | | | 22 | |
Fund accounting/administration fees | | | 2,192 | |
Professional fees | | | 1,928 | |
Custodian fees | | | 877 | |
Trustees’ fees* | | | 614 | |
Printing expenses | | | 614 | |
Miscellaneous | | | 877 | |
Total expenses | | | 12,089 | |
Less: | |
Expenses waived by Adviser | | | (5,945 | ) |
Net expenses | | | 6,144 | |
Net investment income | | | 30,769 | |
| | | | | |
Net Realized and Unrealized Gain (Loss): | |
Net realized gain (loss) on: | |
Investments | | | 38,972 | |
Swap agreements | | | (62,126 | ) |
Net realized loss | | | (23,154 | ) |
Net change in unrealized appreciation (depreciation) on: | |
Investments | | | 355,867 | |
Swap agreements | | | (443,873 | ) |
Net change in unrealized appreciation (depreciation) | | | (88,006 | ) |
Net realized and unrealized loss | | | (111,160 | ) |
Net decrease in net assets resulting from operations | | $ | (80,391 | ) |
* | Relates to Trustees not deemed “interested persons” within the meaning of Section 2(a)(19) of the 1940 Act. |
** | Since commencement of operations: February 26, 2016 |
34 | THE GUGGENHEIM FUNDS SEMI-ANNUAL REPORT | SEE NOTES TO FINANCIAL STATEMENTS. |
MARKET NEUTRAL REAL ESTATE FUND | |
STATEMENTS OF CHANGES IN NET ASSETS |
| | | Period Ended March 31,
2016a | |
Increase (Decrease) in Net Assets from Operations: | | | |
Net investment income | | $ | 30,769 | |
Net realized loss on investments | | | (23,154 | ) |
Net change in unrealized appreciation (depreciation) on investments | | | (88,006 | ) |
Net decrease in net assets resulting from operations | | | (80,391 | ) |
| | | | | |
Capital share transactions: | | | | |
Proceeds from sale of shares | | | | |
A-Class | | | 102,011 | |
C-Class | | | 100,000 | |
P-Class | | | 100,000 | |
Institutional Class | | | 4,700,000 | |
Net increase from capital share transactions | | | 5,002,011 | |
Net increase in net assets | | | 4,921,620 | |
| | | | | |
Net assets: | | | | |
Beginning of period | | | — | |
End of period | | $ | 4,921,620 | |
Undistributed net investment income at end of period | | $ | 30,769 | |
| | | | | |
Capital share activity: | | | | |
Shares sold | | | | |
A-Class | | | 4,082 | |
C-Class | | | 4,000 | |
P-Class | | | 4,000 | |
Institutional Class | | | 188,000 | |
Net increase in shares | | | 200,082 | |
a | Since commencement of operations: February 26, 2016 |
SEE NOTES TO FINANCIAL STATEMENTS. | THE GUGGENHEIM FUNDS SEMI-ANNUAL REPORT | 35 |
MARKET NEUTRAL REAL ESTATE FUND | |
This table is presented to show selected data for a share outstanding throughout each period and to assist shareholders in evaluating a Fund’s performance for the periods presented.
A-Class | | Period Ended
March 31,
2016a,b | |
Per Share Data | | | |
Net asset value, beginning of period | | $ | 25.00 | |
Income (loss) from investment operations: | | | | |
Net investment income (loss)c | | | .15 | |
Net gain (loss) on investments (realized and unrealized) | | | (.56 | ) |
Total from investment operations | | | (.41 | ) |
Net asset value, end of period | | $ | 24.59 | |
| | | | | |
Total Returnd | | | (1.60 | %) |
Ratios/Supplemental Data | |
Net assets, end of period (in thousands) | | $ | 100 | |
Ratios to average net assets: | | | | |
Net investment income (loss) | | | 6.89 | % |
Total expensese,f | | | 3.19 | % |
Net expensesg,h | | | 1.64 | % |
Portfolio turnover rate | | | 18 | % |
C-Class | | Period Ended
March 31,
2016a,b | |
Per Share Data | | | |
Net asset value, beginning of period | | $ | 25.00 | |
Income (loss) from investment operations: | | | | |
Net investment income (loss)c | | | .13 | |
Net gain (loss) on investments (realized and unrealized) | | | (.55 | ) |
Total from investment operations | | | (.42 | ) |
Net asset value, end of period | | $ | 24.58 | |
| | | | | |
Total Returnd | | | (1.68 | %) |
Ratios/Supplemental Data | |
Net assets, end of period (in thousands) | | $ | 98 | |
Ratios to average net assets: | | | | |
Net investment income (loss) | | | 6.14 | % |
Total expensese,f | | | 3.85 | % |
Net expensesg,h | | | 2.40 | % |
Portfolio turnover rate | | | 18 | % |
36 | THE GUGGENHEIM FUNDS SEMI-ANNUAL REPORT | SEE NOTES TO FINANCIAL STATEMENTS. |
MARKET NEUTRAL REAL ESTATE FUND | |
FINANCIAL HIGHLIGHTS (continued) |
This table is presented to show selected data for a share outstanding throughout each period and to assist shareholders in evaluating a Fund’s performance for the periods presented.
P-Class | | Period Ended
March 31,
2016a,b | |
Per Share Data | | | |
Net asset value, beginning of period | | $ | 25.00 | |
Income (loss) from investment operations: | | | | |
Net investment income (loss)c | | | .15 | |
Net gain (loss) on investments (realized and unrealized) | | | (.56 | ) |
Total from investment operations | | | (.41 | ) |
Net asset value, end of period | | $ | 24.59 | |
| | | | | |
Total Returnd | | | (1.60 | %) |
Ratios/Supplemental Data | |
Net assets, end of period (in thousands) | | $ | 98 | |
Ratios to average net assets: | | | | |
Net investment income (loss) | | | 6.89 | % |
Total expensese,f | | | 3.07 | % |
Net expensesg,h | | | 1.65 | % |
Portfolio turnover rate | | | 18 | % |
SEE NOTES TO FINANCIAL STATEMENTS. | THE GUGGENHEIM FUNDS SEMI-ANNUAL REPORT | 37 |
MARKET NEUTRAL REAL ESTATE FUND | |
FINANCIAL HIGHLIGHTS (concluded) |
This table is presented to show selected data for a share outstanding throughout each period and to assist shareholders in evaluating a Fund’s performance for the periods presented.
Institutional Class | | Period Ended
March 31,
2016a,b | |
Per Share Data | | | |
Net asset value, beginning of period | | $ | 25.00 | |
Income (loss) from investment operations: | | | | |
Net investment income (loss)c | | | .15 | |
Net gain (loss) on investments (realized and unrealized) | | | (.55 | ) |
Total from investment operations | | | (.40 | ) |
Net asset value, end of period | | $ | 24.60 | |
| | | | | |
Total Returnd | | | (1.60 | %) |
Ratios/Supplemental Data | |
Net assets, end of period (in thousands) | | $ | 4,625 | |
Ratios to average net assets: | | | | |
Net investment income (loss) | | | 7.15 | % |
Total expensese,f | | | 2.76 | % |
Net expensesg,h | | | 1.39 | % |
Portfolio turnover rate | | | 18 | % |
a | Unaudited figures for the period ended March 31, 2016. Percentage amounts for the period, except total return and portfolio turnover rate, have been annualized. |
b | Since commencement of operations: February 26, 2016. |
c | Net investment income (loss) per share was computed using average shares outstanding throughout the period. |
d | Total return does not reflect the impact of any applicable sales charges. |
e | Does not include expenses of the underlying funds in which the Fund invests. |
f | Due to limited length of Fund operations, ratios for this period are not indicative of future performance. |
g | Net expense information reflects the expense ratios after expense waivers. |
h | Net expenses may include expenses that are excluded from the expense limitation agreement. Excluding these expenses, the operating expense ratios for the period presented would be: |
| | 03/31/16 |
A-Class | 1.64% |
C-Class | 2.40% |
P-Class | 1.65% |
Institutional Class | 1.39% |
38 | THE GUGGENHEIM FUNDS SEMI-ANNUAL REPORT | SEE NOTES TO FINANCIAL STATEMENTS. |
FUND PROFILE (Unaudited) | March 31, 2016 |
RISK MANAGED REAL ESTATE FUND
OBJECTIVE: Seeks to provide total return, comprised of capital appreciation and current income.
Holdings Diversification (Market Exposure as % of Net Assets)
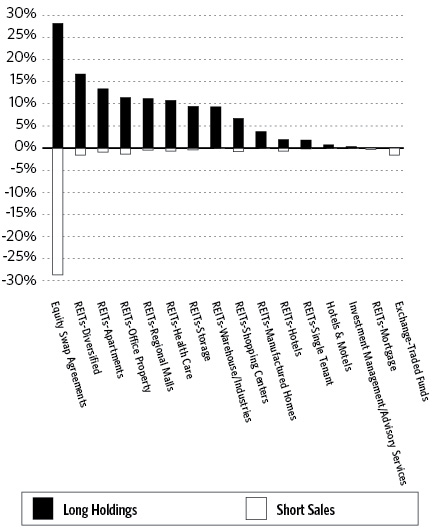
“Holdings Diversification (Market Exposure as % of Net Assets)” excludes any temporary cash investments.
Inception Dates: |
A-Class | March 28, 2014 |
C-Class | March 28, 2014 |
P-Class | May 1, 2015 |
Institutional Class | March 28, 2014 |
Ten Largest Long Holdings (% of Total Net Assets) |
Simon Property Group, Inc. | 8.1% |
Public Storage | 5.5% |
Equinix, Inc. | 4.4% |
Welltower, Inc. | 3.8% |
Extra Space Storage, Inc. | 2.9% |
General Growth Properties, Inc. | 2.9% |
Federal Realty Investment Trust | 2.8% |
Equity Residential | 2.7% |
AvalonBay Communities, Inc. | 2.6% |
Boston Properties, Inc. | 2.6% |
Top Ten Total | 38.3% |
| | |
“Ten Largest Long Holdings” excludes any temporary cash or derivative investments. |
| | THE GUGGENHEIM FUNDS SEMI-ANNUAL REPORT | 39 |
SCHEDULE OF INVESTMENTS (Unaudited) | March 31, 2016 |
RISK MANAGED REAL ESTATE FUND | |
| | | Shares | | | Value | |
| | | | | | | |
COMMON STOCKS† - 97.3% | |
| | | | | | | |
REITs - 96.3% | |
REITs-Diversified - 16.7% | |
Equinix, Inc. | | | 14,868 | | | $ | 4,916,997 | |
Duke Realty Corp. | | | 88,406 | | | | 1,992,672 | |
American Tower Corp. — Class A1 | | | 16,630 | | | | 1,702,413 | |
STORE Capital Corp. | | | 65,490 | | | | 1,694,881 | |
NorthStar Realty Finance Corp. | | | 119,051 | | | | 1,561,949 | |
American Assets Trust, Inc.1 | | | 33,296 | | | | 1,329,176 | |
Cousins Properties, Inc. | | | 101,993 | | | | 1,058,687 | |
Crown Castle International Corp.1 | | | 11,979 | | | | 1,036,184 | |
Digital Realty Trust, Inc. | | | 11,245 | | | | 995,070 | |
Vornado Realty Trust | | | 9,933 | | | | 937,973 | |
NorthStar Realty Europe Corp. | | | 70,539 | | | | 818,252 | |
Retail Properties of America, Inc. — Class A | | | 46,693 | | | | 740,084 | |
Total REITs-Diversified | | | | | | | 18,784,338 | |
| | | | | | | | | |
REITs-Apartments - 13.4% | |
Equity Residential | | | 40,205 | | | | 3,016,581 | |
AvalonBay Communities, Inc.1 | | | 15,487 | | | | 2,945,627 | |
American Campus Communities, Inc. | | | 43,634 | | | | 2,054,725 | |
Essex Property Trust, Inc. | | | 8,574 | | | | 2,005,116 | |
Monogram Residential Trust, Inc. | | | 194,563 | | | | 1,918,391 | |
Camden Property Trust1 | | | 18,846 | | | | 1,584,760 | |
Education Realty Trust, Inc. | | | 38,026 | | | | 1,581,882 | |
Total REITs-Apartments | | | | | | | 15,107,082 | |
| | | | | | | | | |
REITs-Office Property - 11.4% | |
Boston Properties, Inc.1 | | | 22,923 | | | | 2,913,056 | |
Gramercy Property Trust | | | 256,167 | | | | 2,164,611 | |
Equity Commonwealth* | | | 75,956 | | | | 2,143,478 | |
Highwoods Properties, Inc. | | | 32,826 | | | | 1,569,411 | |
New York REIT, Inc. | | | 152,367 | | | | 1,538,907 | |
Parkway Properties, Inc. | | | 75,328 | | | | 1,179,636 | |
Alexandria Real Estate Equities, Inc.1 | | | 6,563 | | | | 596,511 | |
Paramount Group, Inc. | | | 33,145 | | | | 528,663 | |
SL Green Realty Corp. | | | 1,925 | | | | 186,494 | |
Total REITs-Office Property | | | | | | | 12,820,767 | |
| | | | | | | | | |
REITs-Regional Malls - 11.2% | |
Simon Property Group, Inc. | | | 43,708 | | | | 9,077,715 | |
General Growth Properties, Inc. | | | 109,621 | | | | 3,259,032 | |
Macerich Co. | | | 2,714 | | | | 215,057 | |
Total REITs-Regional Malls | | | | | | | 12,551,804 | |
| | | | | | | | | |
REITs-Health Care - 10.8% | |
Welltower, Inc. | | | 62,566 | | | | 4,338,326 | |
Ventas, Inc. | | | 36,746 | | | | 2,313,528 | |
Healthcare Trust of America, Inc. — Class A | | | 64,385 | | | | 1,894,207 | |
Care Capital Properties, Inc. | | | 52,775 | | | | 1,416,481 | |
Omega Healthcare Investors, Inc. | | | 32,619 | | | | 1,151,451 | |
HCP, Inc. | | | 31,568 | | | | 1,028,485 | |
Total REITs-Health Care | | | | | | | 12,142,478 | |
| | | | | | | | | |
REITs-Storage - 9.4% | |
Public Storage | | | 22,635 | | | | 6,243,413 | |
Extra Space Storage, Inc. | | | 35,142 | | | | 3,284,371 | |
National Storage Affiliates Trust | | | 47,741 | | | | 1,012,109 | |
Total REITs-Storage | | | | | | | 10,539,893 | |
| | | | | | | | | |
REITs-Warehouse/Industries - 9.3% | |
Prologis, Inc. | | | 62,142 | | | | 2,745,434 | |
CyrusOne, Inc. | | | 42,985 | | | | 1,962,265 | |
First Industrial Realty Trust, Inc. | | | 68,545 | | | | 1,558,713 | |
QTS Realty Trust, Inc. — Class A | | | 32,598 | | | | 1,544,493 | |
DCT Industrial Trust, Inc.1 | | | 37,010 | | | | 1,460,785 | |
EastGroup Properties, Inc. | | | 20,260 | | | | 1,223,096 | |
Total REITs-Warehouse/Industries | | | | | | | 10,494,786 | |
| | | | | | | | | |
REITs-Shopping Centers - 6.7% | |
Federal Realty Investment Trust | | | 20,326 | | | | 3,171,871 | |
Kimco Realty Corp. | | | 61,488 | | | | 1,769,625 | |
Regency Centers Corp. | | | 19,256 | | | | 1,441,312 | |
Equity One, Inc. | | | 40,401 | | | | 1,157,893 | |
Total REITs-Shopping Centers | | | | | | | 7,540,701 | |
| | | | | | | | | |
REITs-Manufactured Homes - 3.7% | |
Sun Communities, Inc. | | | 32,114 | | | | 2,299,683 | |
Equity LifeStyle Properties, Inc. | | | 25,590 | | | | 1,861,161 | |
Total REITs-Manufactured Homes | | | | | | | 4,160,844 | |
| | | | | | | | | |
REITs-Hotels - 1.9% | |
Chatham Lodging Trust | | | 64,261 | | | | 1,377,113 | |
Summit Hotel Properties, Inc. | | | 62,881 | | | | 752,686 | |
Host Hotels & Resorts, Inc. | | | 2,724 | | | | 45,491 | |
Total REITs-Hotels | | | | | | | 2,175,290 | |
| | | | | | | | | |
REITs-Single Tenant - 1.8% | |
Realty Income Corp. | | | 18,111 | | | | 1,132,118 | |
Spirit Realty Capital, Inc. | | | 75,716 | | | | 851,805 | |
Total REITs-Single Tenant | | | | | | | 1,983,923 | |
Total REITs | | | | | | | 108,301,906 | |
| | | | | | | | | |
HOTELS & MOTELS – 0.7% | |
Starwood Hotels & Resorts Worldwide, Inc. | | | 8,813 | | | | 735,269 | |
| | | | | | | | | |
Investment Management/Advisory Services - 0.3% | |
NorthStar Asset Management Group, Inc. | | | 34,205 | | | | 388,227 | |
| | | | | | | | | |
Total Common Stocks | | | | | | | | |
(Cost $100,206,114) | | | | | | | 109,425,402 | |
| | | | | | | | | |
SHORT TERM INVESTMENTS† - 4.8% | |
Dreyfus Treasury Prime Cash Management Institutional Shares 0.18%2 | | | 5,434,202 | | | | 5,434,202 | |
Total Short Term Investments | | | | | | | | |
(Cost $5,434,202) | | | | | | | 5,434,202 | |
| | | | | | | | | |
Total Investments - 102.1% | | | | | | | | |
(Cost $105,640,316) | | | | | | $ | 114,859,604 | |
40 | THE GUGGENHEIM FUNDS SEMI-ANNUAL REPORT | SEE NOTES TO FINANCIAL STATEMENTS. |
SCHEDULE OF INVESTMENTS (Unaudited)(continued) | March 31, 2016 |
RISK MANAGED REAL ESTATE FUND | |
| | | Shares | | | Value | |
| | | | | | | |
| | | | | | | |
COMMON STOCKS SOLD SHORT† - (7.6)% | |
| | | | | | | |
REITs - 7.6% | |
REITs-Single Tenant – (0.2%) | |
National Retail Properties, Inc. | | | (3,662 | ) | | $ | (169,184 | ) |
| | | | | | | | | |
REITs-Mortgage – (0.3)% | |
Annaly Capital Management, Inc. | | | (27,776 | ) | | | (284,982 | ) |
| | | | | | | | | |
REITs-Storage – (0.4)% | |
Iron Mountain, Inc. | | | (13,169 | ) | | | (446,561 | ) |
| | | | | | | | | |
REITs-Regional Malls – (0.5)% | |
WP GLIMCHER, Inc. | | | (18,187 | ) | | | (172,595 | ) |
CBL & Associates Properties, Inc. | | | (37,178 | ) | | | (442,418 | ) |
Total REITs-Regional Malls | | | | | | | (615,013 | ) |
| | | | | | | | | |
REITs-Health Care – (0.7)% | |
LTC Properties, Inc. | | | (5,065 | ) | | | (229,141 | ) |
Healthcare Realty Trust, Inc. | | | (16,742 | ) | | | (517,160 | ) |
Total REITs-Health Care | | | | | | | (746,301 | ) |
| | | | | | | | | |
REITs-Hotels – (0.7)% | |
FelCor Lodging Trust, Inc. | | | (28,164 | ) | | | (228,692 | ) |
Ryman Hospitality Properties, Inc. | | | (4,547 | ) | | | (234,080 | ) |
Sunstone Hotel Investors, Inc. | | | (24,147 | ) | | | (338,058 | ) |
Total REITs-Hotels | | | | | | | (800,830 | ) |
| | | | | | | | | |
REITs-Shopping Centers – (0.8)% | |
DDR Corp. | | | (12,753 | ) | | | (226,876 | ) |
Weingarten Realty Investors | | | (9,195 | ) | | | (344,996 | ) |
Urban Edge Properties | | | (14,343 | ) | | | (370,623 | ) |
Total REITs-Shopping Centers | | | | | | | (942,495 | ) |
| | | | | | | | | |
REITs-Apartments – (0.9)% | |
UDR, Inc. | | | (7,488 | ) | | | (288,513 | ) |
Apartment Investment & Management Co. — Class A1 | | | (7,587 | ) | | | (317,288 | ) |
Mid-America Apartment Communities, Inc. | | | (3,445 | ) | | | (352,113 | ) |
Total REITs-Apartments | | | | | | | (957,914 | ) |
| | | | | | | | | |
REITs-Office Property – (1.4)% | |
Kilroy Realty Corp. | | | (4,925 | ) | | | (304,710 | ) |
Douglas Emmett, Inc. | | | (11,518 | ) | | | (346,807 | ) |
Piedmont Office Realty Trust, Inc. — Class A | | | (19,837 | ) | | | (402,889 | ) |
Government Properties Income Trust | | | (27,643 | ) | | | (493,428 | ) |
Total REITs-Office Property | | | | | | | (1,547,834 | ) |
| | | | | | | | | |
REITs-Diversified – (1.6)% | |
DuPont Fabros Technology, Inc. | | | (5,287 | ) | | | (214,282 | ) |
Liberty Property Trust | | | (6,695 | ) | | | (224,015 | ) |
Lexington Realty Trust | | | (26,804 | ) | | | (230,514 | ) |
EPR Properties | | | (5,220 | ) | | | (347,756 | ) |
STAG Industrial, Inc. | | | (18,457 | ) | | | (375,785 | ) |
Lamar Advertising Co. — Class A | | | (6,580 | ) | | | (404,670 | ) |
Total REITs-Diversified | | | | | | | (1,797,022 | ) |
Total REITs | | | | | | | (8,308,136 | ) |
| | | | | | | | | |
Total Common Stocks Sold Short | | | | | | | | |
(Cost $(7,789,017)) | | | | | | | (8,308,136 | ) |
| | | | | | | | | |
EXCHANGE-TRADED FUNDS SOLD SHORT† - (1.6)% | |
iShares U.S. Real Estate ETF | | | 22,434 | | | | (1,746,711 | ) |
Total Exchange-Traded Funds Sold Short | | | | | | | | |
(Proceeds $1,629,907) | | | | | | | (1,746,711 | ) |
Total Securities Sold Short- (9.1)% | | | | | | | | |
(Proceeds $9,418,924) | | | | | | $ | (10,054,847 | ) |
Other Assets & Liabilities, net - 7.0% | | | | | | | 7,887,910 | |
Total Net Assets - 100.0% | | | | | | $ | 112,692,667 | |
| | | | | | | Unrealized Gain (Loss) | |
| | | | | | | | | |
OTC Equity SWAP AGREEMENTS †† | |
Morgan Stanley
June 2017 Risk Managed Real Estate
Long Custom Basket Swap 0.43%3,
Terminating 06/15/17
(Notional Value $31,809,187) | | | | | | $ | 2,233,020 | |
| | | | | | | | | |
OTC Equity SWAP AGREEMENTS SOLD SHORT †† | |
Morgan Stanley
June 2017 Risk Managed Real Estate
Short Custom Basket Swap 0.37%4,
Terminating 06/15/17
(Notional Value $32,350,750) | | | | | | $ | (2,743,963 | ) |
SEE NOTES TO FINANCIAL STATEMENTS. | THE GUGGENHEIM FUNDS SEMI-ANNUAL REPORT | 41 |
SCHEDULE OF INVESTMENTS (Unaudited)(continued) | March 31, 2016 |
RISK MANAGED REAL ESTATE FUND | |
| | | Shares | | | Unrealized
Gain (Loss) | |
| | | | | | | |
CUSTOM BASKET OF LONG SECURITIES3 | |
Equinix, Inc. | | | 4,061 | | | $ | 232,076 | |
Equity LifeStyle Properties, Inc. | | | 11,826 | | | | 192,946 | |
Gramercy Property Trust | | | 146,196 | | | | 178,375 | |
Duke Realty Corp. | | | 53,462 | | | | 167,418 | |
Federal Realty Investment Trust | | | 6,826 | | | | 158,448 | |
Extra Space Storage, Inc. | | | 15,426 | | | | 146,308 | |
Sun Communities, Inc. | | | 20,704 | | | | 137,939 | |
Equity One, Inc. | | | 26,975 | | | | 107,932 | |
General Growth Properties, Inc. | | | 29,959 | | | | 106,173 | |
National Storage Affiliates Trust | | | 19,975 | | | | 101,650 | |
American Campus Communities, Inc. | | | 21,782 | | | | 100,624 | |
CyrusOne, Inc. | | | 16,271 | | | | 97,893 | |
American Tower Corp. — Class A | | | 11,839 | | | | 95,576 | |
Simon Property Group, Inc. | | | 3,881 | | | | 91,625 | |
Education Realty Trust, Inc. | | | 16,007 | | | | 89,855 | |
Starwood Hotels & Resorts Worldwide, Inc. | | | 6,022 | | | | 82,992 | |
Camden Property Trust | | | 9,086 | | | | 79,405 | |
Cousins Properties, Inc. | | | 70,447 | | | | 78,232 | |
Retail Properties of America, Inc. — Class A | | | 45,420 | | | | 77,382 | |
Monogram Residential Trust, Inc. | | | 138,474 | | | | 73,860 | |
Equity Commonwealth* | | | 48,006 | | | | 54,808 | |
NorthStar Realty Europe Corp. | | | 47,607 | | | | 31,685 | |
EastGroup Properties, Inc. | | | 13,707 | | | | 29,839 | |
STORE Capital Corp. | | | 24,979 | | | | 27,812 | |
Healthcare Trust of America, Inc. — Class A | | | 34,034 | | | | 25,815 | |
QTS Realty Trust, Inc. — Class A | | | 17,331 | | | | 22,500 | |
American Assets Trust, Inc. | | | 30,318 | | | | 6,579 | |
Omega Healthcare Investors, Inc. | | | 18,664 | | | | 4,074 | |
Chatham Lodging Trust | | | 47,655 | | | | 1,606 | |
First Industrial Realty Trust, Inc. | | | 28,202 | | | | (3,023 | ) |
New York REIT, Inc. | | | 71,466 | | | | (6,403 | ) |
Parkway Properties, Inc. | | | 45,690 | | | | (33,220 | ) |
NorthStar Asset Management Group, Inc. | | | 28,985 | | | | (66,306 | ) |
Care Capital Properties, Inc. | | | 30,643 | | | | (130,883 | ) |
NorthStar Realty Finance Corp. | | | 58,184 | | | | (235,378 | ) |
Total Custom Basket of Long Securities | | | | | | | 2,126,214 | |
| | | | | | | | | |
CUSTOM BASKET OF SHORT SECURITIES4 | | | | | | | | |
CBL & Associates Properties, Inc. | | | (107,729 | ) | | | 222,816 | |
WP GLIMCHER, Inc. | | | (52,561 | ) | | | 136,359 | |
Host Hotels & Resorts, Inc. | | | (65,864 | ) | | | 65,247 | |
Ryman Hospitality Properties, Inc. | | | (14,039 | ) | | | 27,422 | |
Kilroy Realty Corp. | | | (14,741 | ) | | | 4,658 | |
Lexington Realty Trust | | | (77,682 | ) | | | (15,280 | ) |
Douglas Emmett, Inc. | | | (35,561 | ) | | | (19,178 | ) |
HCP, Inc. | | | (20,718 | ) | | | (20,496 | ) |
Liberty Property Trust | | | (20,669 | ) | | | (31,441 | ) |
Annaly Capital Management, Inc. | | | (83,566 | ) | | | (37,870 | ) |
LTC Properties, Inc. | | | (14,678 | ) | | | (50,619 | ) |
Piedmont Office Realty Trust, Inc. — Class A | | | (58,380 | ) | | | (52,758 | ) |
DDR Corp. | | | (37,518 | ) | | | (56,386 | ) |
National Retail Properties, Inc. | | | (10,612 | ) | | | (58,050 | ) |
Weingarten Realty Investors | | | (26,947 | ) | | | (65,177 | ) |
Realty Income Corp. | | | (7,872 | ) | | | (74,804 | ) |
FelCor Lodging Trust, Inc. | | | (84,134 | ) | | | (91,549 | ) |
Apartment Investment & Management Co. — Class A | | | (23,104 | ) | | | (93,374 | ) |
STAG Industrial, Inc. | | | (56,984 | ) | | | (94,848 | ) |
Lamar Advertising Co. — Class A | | | (19,739 | ) | | | (98,239 | ) |
UDR, Inc. | | | (22,319 | ) | | | (109,668 | ) |
EPR Properties | | | (15,128 | ) | | | (175,868 | ) |
Iron Mountain, Inc. | | | (40,656 | ) | | | (176,167 | ) |
Urban Edge Properties | | | (42,196 | ) | | | (180,124 | ) |
Sunstone Hotel Investors, Inc. | | | (72,873 | ) | | | (192,973 | ) |
Government Properties Income Trust | | | (85,345 | ) | | | (193,847 | ) |
DuPont Fabros Technology, Inc. | | | (16,205 | ) | | | (200,970 | ) |
Mid-America Apartment Communities, Inc. | | | (10,272 | ) | | | (217,284 | ) |
Healthcare Realty Trust, Inc. | | | (49,850 | ) | | | (346,329 | ) |
iShares U.S. Real Estate ETF | | | (65,075 | ) | | | (402,444 | ) |
Total Custom Basket of Short Securities | | | | | | | (2,599,239 | ) |
* | Non-income producing security. |
† | Value determined based on Level 1 inputs — See Note 4. |
†† | Value determined based on Level 2 inputs — See Note 4. |
1 | All or a portion of this security is pledged as short security collateral at March 31, 2016. |
2 | Rate indicated is the 7 day yield as of March 31, 2016. |
3 | Total Return is based on the return of the custom basket of long securities +/ - financing at a variable rate. Rate indicated is the rate effective at March 31, 2016. |
4 | Total Return is based on the return of the custom basket of short securities +/- financing at a variable rate. Rate indicated is the rate effective at March 31, 2016. |
| | REIT — Real Estate Investment Trust |
| | |
| | See Sector Classification in Other Information section. |
42 | THE GUGGENHEIM FUNDS SEMI-ANNUAL REPORT | SEE NOTES TO FINANCIAL STATEMENTS. |
SCHEDULE OF INVESTMENTS (Unaudited)(concluded) | March 31, 2016 |
RISK MANAGED REAL ESTATE FUND | |
The following table summarizes the inputs used to value the Fund’s investments at March 31, 2016 (See Note 4 in the Notes to Financial Statements):
Investments in Securities (Assets) | | Level 1 | | | Level 2 | | | Level 2 -
Other* | | | Level 3 | | | Total | |
Common Stocks | | $ | 109,425,402 | | | $ | — | | | $ | — | | | $ | — | | | $ | 109,425,402 | |
Short Term Investments | | | 5,434,202 | | | | — | | | | — | | | | — | | | | 5,434,202 | |
Equity Swap Agreements | | | — | | | | — | | | | 2,233,020 | | | | — | | | | 2,233,020 | |
Total | | $ | 114,859,604 | | | $ | — | | | $ | 2,233,020 | | | $ | — | | | $ | 117,092,624 | |
| | | | | | | | | | | | | | | | | | | | | |
Investments in Securities (Liabilities) | | Level 1 | | | Level 2 | | | Level 2 -
Other* | | | Level 3 | | | Total | |
Common Stocks | | $ | 8,308,136 | | | $ | — | | | $ | — | | | $ | — | | | $ | 8,308,136 | |
Exchange-Traded Funds | | | 1,746,711 | | | | — | | | | — | | | | — | | | | 1,746,711 | |
Equity Swap Agreements | | | — | | | | — | | | | 2,743,963 | | | | — | | | | 2,743,963 | |
Total | | $ | 10,054,847 | | | $ | — | | | $ | 2,743,963 | | | $ | — | | | $ | 12,798,810 | |
* | Other financial instruments include swaps, which are reported as unrealized gain/loss at period end. |
For the period ended March 31, 2016, there were no transfers between levels.
SEE NOTES TO FINANCIAL STATEMENTS. | THE GUGGENHEIM FUNDS SEMI-ANNUAL REPORT | 43 |
RISK MANAGED REAL ESTATE FUND | |
STATEMENT OF ASSETS AND LIABILITIES (Unaudited) |
March 31, 2016 |
Assets: | |
Investments, at value (cost $105,640,316) | | $ | 114,859,604 | |
Segregated cash with broker | | | 9,796,869 | |
Unrealized appreciation on swap agreements | | | 2,233,020 | |
Prepaid expenses | | | 34,395 | |
Receivables: | |
Securities sold | | | 1,041,634 | |
Dividends | | | 264,111 | |
Swap settlement | | | 186,061 | |
Other assets | | | 3 | |
Total assets | | | 128,415,697 | |
| | | | | |
Liabilities: | |
Securities sold short, at value (proceeds $9,418,924) | | | 10,054,847 | |
Unrealized depreciation on swap agreements | | | 2,743,963 | |
Overdraft due to custodian bank | | | 710,032 | |
Payable for: | |
Securities purchased | | | 2,017,430 | |
Management fees | | | 64,937 | |
Fund accounting/administration fees | | | 8,738 | |
Transfer agent/maintenance fees | | | 4,451 | |
Trustees' fees* | | | 2,610 | |
Distribution and service fees | | | 331 | |
Fund shares redeemed | | | 216 | |
Miscellaneous | | | 115,475 | |
Total liabilities | | | 15,723,030 | |
Net assets | | $ | 112,692,667 | |
| | | | | |
Net assets consist of: | |
Paid in capital | | $ | 109,574,885 | |
Accumulated net investment loss | | | (134,331 | ) |
Accumulated net realized loss on investments | | | (4,820,309 | ) |
Net unrealized appreciation on investments | | | 8,072,422 | |
Net assets | | $ | 112,692,667 | |
| | | | | |
A-Class: | |
Net assets | | $ | 503,704 | |
Capital shares outstanding | | | 18,127 | |
Net asset value per share | | $ | 27.79 | |
Maximum offering price per share (Net asset value divided by 95.25%) | | $ | 29.18 | |
| | | | | |
C-Class: | |
Net assets | | $ | 265,680 | |
Capital shares outstanding | | | 9,590 | |
Net asset value per share | | $ | 27.70 | |
| | | | | |
P-Class: | |
Net assets | | $ | 44,170 | |
Capital shares outstanding | | | 1,582 | |
Net asset value per share | | $ | 27.92 | |
| | | | | |
Institutional Class: | |
Net assets | | $ | 111,879,113 | |
Capital shares outstanding | | | 3,985,327 | |
Net asset value per share | | $ | 28.07 | |
* | Relates to Trustees not deemed “interested persons” within the meaning of Section 2(a)(19) of the 1940 Act. |
44 | THE GUGGENHEIM FUNDS SEMI-ANNUAL REPORT | SEE NOTES TO FINANCIAL STATEMENTS. |
RISK MANAGED REAL ESTATE FUND | |
STATEMENT OF OPERATIONS (Unaudited) |
Period Ended March 31, 2016 |
Investment Income: | |
Dividends | | $ | 1,184,062 | |
Interest | | | 182 | |
Total investment income | | | 1,184,244 | |
| | | | | |
Expenses: | |
Management fees | | | 404,249 | |
Transfer agent/maintenance fees: | |
A-Class | | | 1,786 | |
C-Class | | | 1,053 | |
P-Class | | | 46 | |
Institutional Class | | | 11,736 | |
Distribution and service fees: | |
A-Class | | | 646 | |
C-Class | | | 1,166 | |
P-Class | | | 46 | |
Fund accounting/administration fees | | | 51,204 | |
Short sales dividend expense | | | 253,770 | |
Registration fees | | | 49,544 | |
Prime broker interest expense | | | 14,159 | |
Custodian fees | | | 10,510 | |
Line of credit fees | | | 6,270 | |
Trustees’ fees* | | | 4,998 | |
Miscellaneous | | | 23,620 | |
Total expenses | | | 834,803 | |
Less: | |
Expenses waived by Adviser | | | (4,160 | ) |
Net expenses | | | 830,643 | |
Net investment income | | | 353,601 | |
| | | | | |
Net Realized and Unrealized Gain (Loss): | |
Net realized gain (loss) on: | |
Investments | | $ | 23,965 | |
Swap agreements | | | (462,543 | ) |
Securities sold short | | | 144,097 | |
Net realized loss | | | (294,481 | ) |
Net change in unrealized appreciation (depreciation) on: | |
Investments | | | 12,104,353 | |
Securities sold short | | | (1,280,730 | ) |
Swap agreements | | | (337,039 | ) |
Net change in unrealized appreciation (depreciation) | | | 10,486,584 | |
Net realized and unrealized gain | | | 10,192,103 | |
Net increase in net assets resulting from operations | | $ | 10,545,704 | |
* | Relates to Trustees not deemed “interested persons” within the meaning of Section 2(a)(19) of the 1940 Act. |
SEE NOTES TO FINANCIAL STATEMENTS. | THE GUGGENHEIM FUNDS SEMI-ANNUAL REPORT | 45 |
RISK MANAGED REAL ESTATE FUND | |
STATEMENTS OF CHANGES IN NET ASSETS |
| | | Period Ended
March 31,
2016
(Unaudited) | | | Year Ended
September 30,
2015 | |
Increase (Decrease) in Net Assets from Operations: | | | | | | |
Net investment income (loss) | | $ | 353,601 | | | $ | (400,544 | ) |
Net realized gain (loss) on investments | | | (294,481 | ) | | | 13,509,189 | |
Net change in unrealized appreciation (depreciation) on investments | | | 10,486,584 | | | | (934,660 | ) |
Net increase in net assets resulting from operations | | | 10,545,704 | | | | 12,173,985 | |
| | | | | | | | | |
Distributions to shareholders from: | | | | | | | | |
Net investment income | | | | | | | | |
A-Class | | | (12,079 | ) | | | (2,130 | ) |
C-Class | | | (6,326 | ) | | | — | |
P-Class | | | (1,032 | ) | | | — | * |
Institutional Class | | | (3,147,751 | ) | | | (110,810 | ) |
Net realized gains | | | | | | | | |
A-Class | | | (43,834 | ) | | | (5,715 | ) |
C-Class | | | (32,752 | ) | | | (362 | ) |
P-Class | | | (4,335 | ) | | | — | * |
Institutional Class | | | (13,211,585 | ) | | | (534,120 | ) |
Total distributions to shareholders | | | (16,459,694 | ) | | | (653,137 | ) |
| | | | | | | | | |
Capital share transactions: | | | | | | | | |
Proceeds from sale of shares | | | | | | | | |
A-Class | | | 482,738 | | | | 1,724,691 | |
C-Class | | | 199,775 | | | | 205,333 | |
P-Class | | | 15,119 | | | | 30,035 | * |
Institutional Class | | | 3,253,082 | | | | 2,482,274 | |
Distributions reinvested | | | | | | | | |
A-Class | | | 51,563 | | | | 6,954 | |
C-Class | | | 38,858 | | | | 362 | |
P-Class | | | 5,367 | | | | — | * |
Institutional Class | | | 12,495,556 | | | | 488,786 | |
Cost of shares redeemed | | | | | | | | |
A-Class | | | (381,907 | ) | | | (1,496,971 | ) |
C-Class | | | (46,230 | ) | | | (164,753 | ) |
P-Class | | | (4,729 | ) | | | — | * |
Institutional Class | | | (3,874,957 | ) | | | (12,576,840 | ) |
Net increase (decrease) from capital share transactions | | | 12,234,235 | | | | (9,300,129 | ) |
Net increase in net assets | | | 6,320,245 | | | | 2,220,719 | |
| | | | | | | | | |
Net assets: | | | | | | | | |
Beginning of period | | | 106,372,422 | | | | 104,151,703 | |
End of period | | $ | 112,692,667 | | | $ | 106,372,422 | |
(Accumulated net investment loss)/Undistributed net investment income at end of period | | $ | (134,331 | ) | | $ | 2,679,256 | |
46 | THE GUGGENHEIM FUNDS SEMI-ANNUAL REPORT | SEE NOTES TO FINANCIAL STATEMENTS. |
RISK MANAGED REAL ESTATE FUND | |
STATEMENTS OF CHANGES IN NET ASSETS (concluded) |
| | | Period Ended
March 31,
2016
(Unaudited) | | | Year Ended
September 30,
2015 | |
Capital share activity: | | | | | | |
Shares sold | | | | | | |
A-Class | | | 16,512 | | | | 56,206 | |
C-Class | | | 6,730 | | | | 6,656 | |
P-Class | | | 559 | | | | 999 | * |
Institutional Class | | | 121,443 | | | | 79,259 | |
Shares issued from reinvestment of distributions | | | | | | | | |
A-Class | | | 1,918 | | | | 229 | |
C-Class | | | 1,451 | | | | 12 | |
P-Class | | | 199 | | | | ��� | * |
Institutional Class | | | 459,551 | | | | 16,219 | |
Shares redeemed | | | | | | | | |
A-Class | | | (12,582 | ) | | | (48,126 | ) |
C-Class | | | (1,813 | ) | | | (5,377 | ) |
P-Class | | | (175 | ) | | | — | * |
Institutional Class | | | (136,287 | ) | | | (406,035 | ) |
Net increase (decrease) in shares | | | 457,506 | | | | (299,958 | ) |
* | Since commencement of operations: May 1, 2015. |
SEE NOTES TO FINANCIAL STATEMENTS. | THE GUGGENHEIM FUNDS SEMI-ANNUAL REPORT | 47 |
RISK MANAGED REAL ESTATE FUND | |
This table is presented to show selected data for a share outstanding throughout each period and to assist shareholders in evaluating a Fund’s performance for the periods presented.
A-Class | | Period Ended
March 31,
2016a | | | Year Ended
September 30,
2015 | | | Period Ended
September 30,
2014b | |
Per Share Data | | | | | | | | | |
Net asset value, beginning of period | | $ | 29.77 | | | $ | 26.99 | | | $ | 25.00 | |
Income (loss) from investment operations: | |
Net investment income (loss)c | | | .05 | | | | (.21 | ) | | | .02 | |
Net gain (loss) on investments (realized and unrealized) | | | 2.76 | | | | 3.18 | | | | 2.06 | |
Total from investment operations | | | 2.81 | | | | 2.97 | | | | 2.08 | |
Less distributions from: | |
Net investment income | | | (.98 | ) | | | (.05 | ) | | | (.09 | ) |
Net realized gains | | | (3.81 | ) | | | (.14 | ) | | | — | |
Total distributions | | | (4.79 | ) | | | (.19 | ) | | | (.09 | ) |
Net asset value, end of period | | $ | 27.79 | | | $ | 29.77 | | | $ | 26.99 | |
| | |
Total Returnd | | | 10.05 | % | | | 10.97 | % | | | 8.35 | % |
Ratios/Supplemental Data | |
Net assets, end of period (in thousands) | | $ | 504 | | | $ | 366 | | | $ | 107 | |
Ratios to average net assets: | |
Net investment income (loss) | | | 0.37 | % | | | (0.67 | %) | | | 0.16 | % |
Total expensese | | | 2.47 | % | | | 3.41 | % | | | 4.22 | %h |
Net expensesf,i | | | 1.81 | % | | | 3.04 | % | | | 3.32 | % |
Portfolio turnover rate | | | 109 | % | | | 214 | % | | | 57 | % |
C-Class | | Period Ended
March 31,
2016a | | | Year Ended
September 30,
2015 | | | Period Ended
September 30,
2014b | |
Per Share Data | | | | | | | | | |
Net asset value, beginning of period | | $ | 29.56 | | | $ | 26.95 | | | $ | 25.00 | |
Income (loss) from investment operations: | |
Net investment income (loss)c | | | (.03 | ) | | | (.43 | ) | | | (.23 | ) |
Net gain (loss) on investments (realized and unrealized) | | | 2.71 | | | | 3.18 | | | | 2.19 | |
Total from investment operations | | | 2.68 | | | | 2.75 | | | | 1.96 | |
Less distributions from: | |
Net investment income | | | (.73 | ) | | | — | | | | (.01 | ) |
Net realized gains | | | (3.81 | ) | | | (.14 | ) | | | — | |
Total distributions | | | (4.54 | ) | | | (.14 | ) | | | (.01 | ) |
Net asset value, end of period | | $ | 27.70 | | | $ | 29.56 | | | $ | 26.95 | |
| | |
Total Returnd | | | 9.62 | % | | | 10.20 | % | | | 7.85 | % |
Ratios/Supplemental Data | |
Net assets, end of period (in thousands) | | $ | 266 | | | $ | 95 | | | $ | 52 | |
Ratios to average net assets: | |
Net investment income (loss) | | | (0.20 | %) | | | (1.42 | %) | | | (1.60 | %) |
Total expensese | | | 3.42 | % | | | 5.76 | % | | | 9.33 | %h |
Net expensesf,i | | | 2.54 | % | | | 3.76 | % | | | 2.67 | % |
Portfolio turnover rate | | | 109 | % | | | 214 | % | | | 57 | % |
48 | THE GUGGENHEIM FUNDS SEMI-ANNUAL REPORT | SEE NOTES TO FINANCIAL STATEMENTS. |
RISK MANAGED REAL ESTATE FUND | |
FINANCIAL HIGHLIGHTS (continued) |
This table is presented to show selected data for a share outstanding throughout each period and to assist shareholders in evaluating a Fund’s performance for the periods presented.
P-Class | | Period Ended
March 31,
2016a | | | Period Ended
September 30,
2015g | |
Per Share Data | | | | | | |
Net asset value, beginning of period | | $ | 29.77 | | | $ | 30.89 | |
Income (loss) from investment operations: | |
Net investment income (loss)c | | | .09 | | | | .04 | |
Net gain (loss) on investments (realized and unrealized) | | | 2.72 | | | | (1.16 | ) |
Total from investment operations | | | 2.81 | | | | (1.12 | ) |
Less distributions from: | |
Net investment income | | | (.85 | ) | | | — | |
Net realized gains | | | (3.81 | ) | | | — | |
Total distributions | | | (4.66 | ) | | | — | |
Net asset value, end of period | | $ | 27.92 | | | $ | 29.77 | |
| | |
Total Returnd | | | 10.05 | % | | | (3.63 | %) |
Ratios/Supplemental Data | |
Net assets, end of period (in thousands) | | $ | 44 | | | $ | 30 | |
Ratios to average net assets: | |
Net investment income (loss) | | | 0.66 | % | | | 0.30 | % |
Total expensese | | | 2.02 | % | | | 4.04 | %h |
Net expensesf,i | | | 1.78 | % | | | 2.94 | % |
Portfolio turnover rate | | | 109 | % | | | 214 | % |
SEE NOTES TO FINANCIAL STATEMENTS. | THE GUGGENHEIM FUNDS SEMI-ANNUAL REPORT | 49 |
RISK MANAGED REAL ESTATE FUND | |
FINANCIAL HIGHLIGHTS (concluded) |
This table is presented to show selected data for a share outstanding throughout each period and to assist shareholders in evaluating a Fund’s performance for the periods presented.
Institutional Class | | Period Ended
March 31,
2016a | | | Year Ended
September 30,
2015 | | | Period Ended
September 30,
2014b | |
Per Share Data | | | | | | | | | |
Net asset value, beginning of period | | $ | 29.90 | | | $ | 27.00 | | | $ | 25.00 | |
Income (loss) from investment operations: | |
Net investment income (loss)c | | | .09 | | | | (.11 | ) | | | .02 | |
Net gain (loss) on investments (realized and unrealized) | | | 2.78 | | | | 3.18 | | | | 2.09 | |
Total from investment operations | | | 2.87 | | | | 3.07 | | | | 2.11 | |
Less distributions from: | |
Net investment income | | | (.89 | ) | | | (.03 | ) | | | (.11 | ) |
Net realized gains | | | (3.81 | ) | | | (.14 | ) | | | — | |
Total distributions | | | (4.70 | ) | | | (.17 | ) | | | (.11 | ) |
Net asset value, end of period | | $ | 28.07 | | | $ | 29.90 | | | $ | 27.00 | |
| | |
Total Returnd | | | 10.20 | % | | | 11.36 | % | | | 8.44 | % |
Ratios/Supplemental Data | |
Net assets, end of period (in thousands) | | $ | 111,879 | | | $ | 105,882 | | | $ | 103,993 | |
Ratios to average net assets: | |
Net investment income (loss) | | | 0.66 | % | | | (0.35 | %) | | | 0.11 | % |
Total expensese | | | 1.54 | % | | | 2.70 | % | | | 2.69 | %h |
Net expensesf,i | | | 1.54 | % | | | 2.70 | % | | | 2.58 | % |
Portfolio turnover rate | | | 109 | % | | | 214 | % | | | 57 | % |
a | Unaudited figures for the period ended March 31, 2016. Percentage amounts for the period, except total return and portfolio turnover rate, have been annualized. |
b | Since commencement of operations: March 28, 2014. Percentage amounts for the period, except total return and portfolio turnover rate, have been annualized. |
c | Net investment income (loss) per share was computed using average shares outstanding throughout the period. |
d | Total return does not reflect the impact of any applicable sales charges and has not been annualized. |
e | Does not include expenses of the underlying funds in which the Fund invests. |
f | Net expense information reflects the expense ratios after expense waivers. |
g | Since commencement of operations: May 1, 2015. Percentage amounts for the period, except total return and portfolio turnover rate, have been annualized. |
h | Due to limited length of Fund operations, ratios for this period are not indicative of future performance. |
i | Net expenses may include expenses that are excluded from the expense limitation agreement and recouped amounts. Excluding these expenses, the operating expense ratios for the periods presented would be: |
| | 03/31/16 | 09/30/15 | 09/30/14 |
A-Class | 1.30% | 1.30% | 1.30% |
C-Class | 2.03% | 2.05% | 2.05% |
P-Class | 1.27% | 1.30% | — |
Institutional Class | 1.03% | 0.99% | 1.10% |
50 | THE GUGGENHEIM FUNDS SEMI-ANNUAL REPORT | SEE NOTES TO FINANCIAL STATEMENTS. |
FUND PROFILE (Unaudited) | March 31, 2016 |
SMALL CAP VALUE FUND
OBJECTIVE: Seeks long-term capital appreciation.
Holdings Diversification (Market Exposure as % of Net Assets)
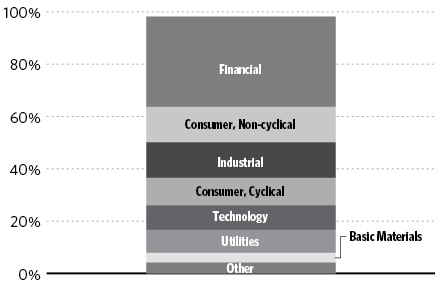
“Holdings Diversification (Market Exposure as % of Net Assets)” excludes any temporary cash investments.
Inception Dates: |
A-Class | July 11, 2008 |
C-Class | July 11, 2008 |
P-Class | May 1, 2015 |
Institutional Class | July 11, 2008 |
Ten Largest Holdings (% of Total Net Assets) |
CubeSmart | 3.2% |
Laclede Group, Inc. | 2.8% |
Emergent BioSolutions, Inc. | 2.7% |
FLIR Systems, Inc. | 2.4% |
Berkshire Hills Bancorp, Inc. | 2.4% |
Apartment Investment & Management Co. — Class A | 2.3% |
Navigators Group, Inc. | 2.2% |
Black Hills Corp. | 2.0% |
Camden Property Trust | 2.0% |
Sun Communities, Inc. | 1.9% |
Top Ten Total | 23.9% |
| | |
“Ten Largest Holdings” excludes any temporary cash investments. |
| | THE GUGGENHEIM FUNDS SEMI-ANNUAL REPORT | 51 |
SCHEDULE OF INVESTMENTS (Unaudited) | March 31, 2016 |
SMALL CAP VALUE FUND | |
| | | Shares | | | Value | |
| | | | | | | |
COMMON STOCKS† - 98.2% | |
| | | | | | | |
Financial - 34.5% | |
CubeSmart | | | 17,502 | | | $ | 582,817 | |
Berkshire Hills Bancorp, Inc. | | | 16,305 | | | | 438,441 | |
Apartment Investment & Management Co. — Class A | | | 10,302 | | | | 430,829 | |
Navigators Group, Inc.* | | | 4,908 | | | | 411,634 | |
Camden Property Trust | | | 4,303 | | | | 361,839 | |
Sun Communities, Inc. | | | 4,882 | | | | 349,600 | |
Hanover Insurance Group, Inc. | | | 3,560 | | | | 321,183 | |
Zions Bancorporation | | | 11,697 | | | | 283,184 | |
Fulton Financial Corp. | | | 20,015 | | | | 267,801 | |
Trustmark Corp. | | | 11,602 | | | | 267,194 | |
Cathay General Bancorp | | | 9,350 | | | | 264,886 | |
Endurance Specialty Holdings Ltd. | | | 4,041 | | | | 264,039 | |
1st Source Corp. | | | 8,171 | | | | 260,165 | |
Corrections Corporation of America | | | 7,997 | | | | 256,304 | |
Argo Group International Holdings Ltd. | | | 4,126 | | | | 236,791 | |
Wintrust Financial Corp. | | | 4,747 | | | | 210,482 | |
BancorpSouth, Inc. | | | 8,494 | | | | 181,007 | |
Horace Mann Educators Corp. | | | 5,460 | | | | 173,027 | |
Parkway Properties, Inc. | | | 8,706 | | | | 136,336 | |
Hanmi Financial Corp. | | | 6,122 | | | | 134,807 | |
TriCo Bancshares | | | 5,304 | | | | 134,297 | |
Prosperity Bancshares, Inc. | | | 2,870 | | | | 133,139 | |
Lexington Realty Trust | | | 11,180 | | | | 96,148 | |
Equity Commonwealth* | | | 3,241 | | | | 91,461 | |
Umpqua Holdings Corp. | | | 3,150 | | | | 49,959 | |
Monogram Residential Trust, Inc. | | | 4,460 | | | | 43,976 | |
Total Financial | | | | | | | 6,381,346 | |
| | | | | | | | | |
Consumer, Non-cyclical - 13.6% | |
Emergent BioSolutions, Inc.* | | | 13,735 | | | | 499,266 | |
Invacare Corp. | | | 15,923 | | | | 209,706 | |
Sanderson Farms, Inc. | | | 1,944 | | | | 175,310 | |
Darling Ingredients, Inc.* | | | 12,989 | | | | 171,065 | |
Navigant Consulting, Inc.* | | | 9,940 | | | | 157,151 | |
Surgical Care Affiliates, Inc.* | | | 3,069 | | | | 142,033 | |
Premier, Inc. — Class A* | | | 4,030 | | | | 134,441 | |
ICU Medical, Inc.* | | | 1,225 | | | | 127,523 | |
HealthSouth Corp. | | | 3,050 | | | | 114,772 | |
Patterson Companies, Inc. | | | 2,050 | | | | 95,387 | |
Kindred Healthcare, Inc. | | | 7,574 | | | | 93,539 | |
Carriage Services, Inc. — Class A | | | 4,310 | | | | 93,139 | |
WEX, Inc.* | | | 1,107 | | | | 92,280 | |
FTI Consulting, Inc.* | | | 2,544 | | | | 90,337 | |
Everi Holdings, Inc.* | | | 38,569 | | | | 88,323 | |
United Rentals, Inc.* | | | 1,155 | | | | 71,829 | |
Universal Corp. | | | 1,145 | | | | 65,047 | |
Community Health Systems, Inc.* | | | 2,809 | | | | 51,995 | |
ICF International, Inc.* | | | 1,391 | | | | 47,809 | |
Total Consumer, Non-cyclical | | | | | | | 2,520,952 | |
| | | | | | | | | |
Industrial - 13.6% | |
FLIR Systems, Inc. | | | 13,563 | | | | 446,901 | |
Marten Transport Ltd. | | | 11,600 | | | | 217,151 | |
Benchmark Electronics, Inc.* | | | 8,900 | | | | 205,145 | |
Knight Transportation, Inc. | | | 7,210 | | | | 188,542 | |
Oshkosh Corp. | | | 4,441 | | | | 181,504 | |
Ryder System, Inc. | | | 2,643 | | | | 171,214 | |
Argan, Inc. | | | 4,250 | | | | 149,430 | |
Werner Enterprises, Inc. | | | 5,298 | | | | 143,894 | |
Scorpio Tankers, Inc. | | | 22,984 | | | | 133,997 | |
Gentex Corp. | | | 8,126 | | | | 127,497 | |
Kirby Corp.* | | | 1,697 | | | | 102,312 | |
Celadon Group, Inc. | | | 9,380 | | | | 98,302 | |
Colfax Corp.* | | | 3,264 | | | | 93,318 | |
ITT Corp. | | | 2,480 | | | | 91,487 | |
LMI Aerospace, Inc.* | | | 8,686 | | | | 73,918 | |
Terex Corp. | | | 1,823 | | | | 45,356 | |
Rand Logistics, Inc.* | | | 34,819 | | | | 33,078 | |
Total Industrial | | | | | | | 2,503,046 | |
| | | | | | | | | |
Consumer, Cyclical - 10.5% | |
International Speedway Corp. — Class A | | | 8,456 | | | | 312,111 | |
J.C. Penney Company, Inc.* | | | 25,027 | | | | 276,799 | |
Century Communities, Inc.* | | | 10,190 | | | | 173,943 | |
Essendant, Inc. | | | 4,854 | | | | 154,987 | |
La-Z-Boy, Inc. | | | 5,790 | | | | 154,825 | |
UniFirst Corp. | | | 1,300 | | | | 141,856 | |
Tuesday Morning Corp.* | | | 14,740 | | | | 120,573 | |
ScanSource, Inc.* | | | 2,820 | | | | 113,872 | |
WESCO International, Inc.* | | | 1,919 | | | | 104,912 | |
CalAtlantic Group, Inc. | | | 2,819 | | | | 94,211 | |
Caleres, Inc. | | | 3,326 | | | | 94,093 | |
Unifi, Inc.* | | | 3,498 | | | | 80,139 | |
Sonic Automotive, Inc. — Class A | | | 2,990 | | | | 55,255 | |
Tenneco, Inc.* | | | 1,026 | | | | 52,849 | |
Total Consumer, Cyclical | | | | | | | 1,930,425 | |
| | | | | | | | | |
Technology - 9.4% | |
Maxwell Technologies, Inc.* | | | 48,100 | | | | 285,713 | |
Silicon Graphics International Corp.* | | | 40,028 | | | | 284,999 | |
ManTech International Corp. — Class A | | | 7,705 | | | | 246,483 | |
Mercury Systems, Inc.* | | | 8,690 | | | | 176,407 | |
IXYS Corp. | | | 14,972 | | | | 167,986 | |
Cree, Inc.* | | | 4,910 | | | | 142,881 | |
Super Micro Computer, Inc.* | | | 3,970 | | | | 135,298 | |
Brooks Automation, Inc. | | | 11,160 | | | | 116,064 | |
Photronics, Inc.* | | | 8,405 | | | | 87,496 | |
Diebold, Inc. | | | 1,726 | | | | 49,899 | |
MKS Instruments, Inc. | | | 1,240 | | | | 46,686 | |
Total Technology | | | | | | | 1,739,912 | |
| | | | | | | | | |
Utilities - 8.7% | |
Laclede Group, Inc. | | | 7,769 | | | | 526,350 | |
Black Hills Corp. | | | 6,030 | | | | 362,584 | |
52 | THE GUGGENHEIM FUNDS SEMI-ANNUAL REPORT | SEE NOTES TO FINANCIAL STATEMENTS. |
SCHEDULE OF INVESTMENTS (Unaudited)(concluded) | March 31, 2016 |
SMALL CAP VALUE FUND | |
| | | Shares | | | Value | |
| | | | | | | |
Avista Corp. | | | 7,683 | | | $ | 313,313 | |
Portland General Electric Co. | | | 7,660 | | | | 302,493 | |
ALLETE, Inc. | | | 1,800 | | | | 100,926 | |
Total Utilities | | | | | | | 1,605,666 | |
| | | | | | | | | |
Basic Materials - 3.8% | |
Calgon Carbon Corp. | | | 14,000 | | | | 196,281 | |
Reliance Steel & Aluminum Co. | | | 2,412 | | | | 166,886 | |
Stillwater Mining Co.* | | | 8,511 | | | | 90,642 | |
Olin Corp. | | | 5,027 | | | | 87,319 | |
Landec Corp.* | | | 7,636 | | | | 80,178 | |
Luxfer Holdings plc ADR | | | 7,099 | | | | 75,320 | |
Total Basic Materials | | | | | | | 696,626 | |
| | | | | | | | | |
Communications - 2.6% | |
DigitalGlobe, Inc.* | | | 14,908 | | | | 257,908 | |
Finisar Corp.* | | | 12,440 | | | | 226,906 | |
Total Communications | | | | | | | 484,814 | |
| | | | | | | | | |
Energy - 1.5% | |
Rowan Companies plc — Class A | | | 7,640 | | | | 123,004 | |
Oasis Petroleum, Inc.* | | | 15,580 | | | | 113,423 | |
Sanchez Energy Corp.* | | | 6,288 | | | | 34,521 | |
Total Energy | | | | | | | 270,948 | |
| | | | | | | | | |
Total Common Stocks | | | | | | | | |
(Cost $17,554,903) | | | | | | | 18,133,735 | |
| | | | | | | | | |
CONVERTIBLE PREFERRED STOCKS††† - 0.0% | |
Thermoenergy Corp.*,1 | | | 6,250 | | | | 13 | |
Total Convertible Preferred Stocks | | | | | | | | |
(Cost $5,968) | | | | | | | 13 | |
| | | | | | | | | |
SHORT TERM INVESTMENTS† - 1.7% | |
Dreyfus Treasury Prime Cash Management Institutional Shares 0.18%2 | | | 313,627 | | | | 313,627 | |
Total Short Term Investments | | | | | | | | |
(Cost $313,627) | | | | | | | 313,627 | |
| | | | | | | | | |
Total Investments - 99.9% | | | | | | | | |
(Cost $17,874,498) | | | | | | $ | 18,447,375 | |
Other Assets & Liabilities, net - 0.1% | | | | | | | 27,452 | |
Total Net Assets - 100.0% | | | | | | $ | 18,474,827 | |
* | Non-income producing security. |
† | Value determined based on Level 1 inputs — See Note 4 |
††† | Value determined based on Level 3 inputs — See Note 4. |
1 | PIPE (Private Investment in Public Equity) — Stock issued by a company in the secondary market as a means of raising capital more quickly and less expensively than through registration of a secondary public offering. |
2 | Rate indicated is the 7 day yield as of March 31, 2016. |
| | ADR — American Depositary Receipt |
| | plc — Public Limited Company |
| | |
| | See Sector Classification in Other Information section. |
The following table summarizes the inputs used to value the Fund’s investments at March 31, 2016 (See Note 4 in the Notes to Financial Statements):
Investments in Securities (Assets) | | Level 1 | | | Level 2 | | | Level 3 | | | Total | |
Common Stocks | | $ | 18,133,735 | | | $ | — | | | $ | — | | | $ | 18,133,735 | |
Convertible Preferred Stocks | | | — | | | | — | | | | 13 | | | | 13 | |
Short Term Investments | | | 313,627 | | | | — | | | | — | | | | 313,627 | |
Total | | $ | 18,447,362 | | | $ | — | | | $ | 13 | | | $ | 18,447,375 | |
For the period ended March 31, 2016, there were no transfers between levels.
SEE NOTES TO FINANCIAL STATEMENTS. | THE GUGGENHEIM FUNDS SEMI-ANNUAL REPORT | 53 |
STATEMENT OF ASSETS AND LIABILITIES (Unaudited) |
March 31, 2016 |
Assets: | |
Investments, at value (cost $17,874,498) | | $ | 18,447,375 | |
Prepaid expenses | | | 7,918 | |
Receivables: | |
Securities sold | | | 40,821 | |
Dividends | | | 28,697 | |
Fund shares sold | | | 13,106 | |
Total assets | | | 18,537,917 | |
| | | | | |
Liabilities: | |
Payable for: | |
Fund shares redeemed | | | 30,133 | |
Distribution and service fees | | | 6,915 | |
Management fees | | | 6,334 | |
Transfer agent/maintenance fees | | | 5,490 | |
Direct shareholders expense | | | 3,395 | |
Legal fees | | | 3,292 | |
Fund accounting/administration fees | | | 1,437 | |
Trustees’ fees* | | | 659 | |
Miscellaneous | | | 5,435 | |
Total liabilities | | | 63,090 | |
Net assets | | $ | 18,474,827 | |
| | | | | |
Net assets consist of: | |
Paid in capital | | $ | 18,539,056 | |
Accumulated net investment loss | | | (20,327 | ) |
Accumulated net realized loss on investments | | | (616,779 | ) |
Net unrealized appreciation on investments | | | 572,877 | |
Net assets | | $ | 18,474,827 | |
| | | | | |
A-Class: | |
Net assets | | $ | 12,835,981 | |
Capital shares outstanding | | | 1,008,759 | |
Net asset value per share | | $ | 12.72 | |
Maximum offering price per share (Net asset value divided by 95.25%) | | $ | 13.35 | |
| | | | | |
C-Class: | |
Net assets | | $ | 5,221,711 | |
Capital shares outstanding | | | 442,705 | |
Net asset value per share | | $ | 11.80 | |
| | | | | |
P-Class: | |
Net assets | | $ | 10,157 | |
Capital shares outstanding | | | 798 | |
Net asset value per share | | $ | 12.73 | |
| | | | | |
Institutional Class: | |
Net assets | | $ | 406,978 | |
Capital shares outstanding | | | 34,748 | |
Net asset value per share | | $ | 11.71 | |
STATEMENT OF OPERATIONS (Unaudited) | |
Period Ended March 31, 2016 | |
Investment Income: | |
Dividends (net of foreign withholding tax of $182) | | $ | 125,622 | |
Interest | | | 47 | |
Total investment income | | | 125,669 | |
| | | | | |
Expenses: | |
Management fees | | | 89,940 | |
Transfer agent/maintenance fees: | |
A-Class | | | 15,272 | |
C-Class | | | 6,098 | |
P-Class | | | 28 | |
Institutional Class | | | 473 | |
Distribution and service fees: | |
A-Class | | | 15,571 | |
C-Class | | | 25,251 | |
P-Class | | | 12 | |
Fund accounting/administration fees | | | 8,544 | |
Registration fees | | | 51,468 | |
Custodian fees | | | 2,363 | |
Line of credit fees | | | 1,302 | |
Trustees’ fees* | | | 920 | |
Miscellaneous | | | 21,848 | |
Total expenses | | | 239,090 | |
Less: | |
Expenses waived by Adviser | | | (102,474 | ) |
Net expenses | | | 136,616 | |
Net investment loss | | | (10,947 | ) |
| | | | | |
Net Realized and Unrealized Gain (Loss): | |
Net realized gain (loss) on: | |
Investments | | | (477,196 | ) |
Net realized loss | | | (477,196 | ) |
Net change in unrealized appreciation (depreciation) on: | |
Investments | | | 1,781,515 | |
Net change in unrealized appreciation (depreciation) | | | 1,781,515 | |
Net realized and unrealized gain | | | 1,304,319 | |
Net increase in net assets resulting from operations | | $ | 1,293,372 | |
* | Relates to Trustees not deemed “interested persons” within the meaning of Section 2(a)(19) of the 1940 Act. |
54 | THE GUGGENHEIM FUNDS SEMI-ANNUAL REPORT | SEE NOTES TO FINANCIAL STATEMENTS. |
STATEMENTS OF CHANGES IN NET ASSETS |
| | | Period Ended
March 31,
2016
(Unaudited) | | | Year Ended
September 30,
2015 | |
Increase (Decrease) in Net Assets from Operations: | | | | | | |
Net investment loss | | $ | (10,947 | ) | | $ | (21,279 | ) |
Net realized gain (loss) on investments | | | (477,196 | ) | | | 2,580,686 | |
Net change in unrealized appreciation (depreciation) on investments | | | 1,781,515 | | | | (3,368,440 | ) |
Net increase (decrease) in net assets resulting from operations | | | 1,293,372 | | | | (809,033 | ) |
| | | | | | | | | |
Distributions to shareholders from: | | | | | | | | |
Net investment income | | | | | | | | |
A-Class | | | — | | | | (85,715 | ) |
Institutional Class | | | — | | | | (60,526 | ) |
Net realized gains | | | | | | | | |
A-Class | | | (955,328 | ) | | | (3,174,844 | ) |
C-Class | | | (396,113 | ) | | | (1,734,594 | ) |
P-Class | | | (707 | ) | | | — | * |
Institutional Class | | | (41,348 | ) | | | (145,234 | ) |
Total distributions to shareholders | | | (1,393,496 | ) | | | (5,200,913 | ) |
| | | | | | | | | |
Capital share transactions: | | | | | | | | |
Proceeds from sale of shares | | | | | | | | |
A-Class | | | 1,516,458 | | | | 4,411,252 | |
C-Class | | | 644,807 | | | | 563,350 | |
P-Class | | | 425 | | | | 10,100 | * |
Institutional Class | | | 238,319 | | | | 415,494 | |
Distributions reinvested | | | | | | | | |
A-Class | | | 939,682 | | | | 3,225,514 | |
C-Class | | | 387,206 | | | | 1,687,462 | |
P-Class | | | 707 | | | | — | * |
Institutional Class | | | 31,740 | | | | 119,479 | |
Cost of shares redeemed | | | | | | | | |
A-Class | | | (2,444,138 | ) | | | (8,280,585 | ) |
C-Class | | | (940,543 | ) | | | (3,649,333 | ) |
P-Class | | | — | | | | — | * |
Institutional Class | | | (306,725 | ) | | | (608,113 | ) |
Net increase (decrease) from capital share transactions | | | 67,938 | | | | (2,105,380 | ) |
Net decrease in net assets | | | (32,186 | ) | | | (8,115,326 | ) |
| | | | | | | | | |
Net assets: | | | | | | | | |
Beginning of period | | | 18,507,013 | | | | 26,622,339 | |
End of period | | $ | 18,474,827 | | | $ | 18,507,013 | |
Accumulated net investment loss at end of period | | $ | (20,327 | ) | | $ | (9,380 | ) |
SEE NOTES TO FINANCIAL STATEMENTS. | THE GUGGENHEIM FUNDS SEMI-ANNUAL REPORT | 55 |
STATEMENTS OF CHANGES IN NET ASSETS (concluded) |
| | | Period Ended
March 31,
2016
(Unaudited) | | | Year Ended
September 30,
2015 | |
Capital share activity: | | | | | | |
Shares sold | | | | | | |
A-Class | | | 120,178 | | | | 298,616 | |
C-Class | | | 56,550 | | | | 41,676 | |
P-Class | | | 36 | | | | 706 | * |
Institutional Class | | | 20,797 | | | | 31,665 | |
Shares issued from reinvestment of distributions | | | | | | | | |
A-Class | | | 74,756 | | | | 230,223 | |
C-Class | | | 33,151 | | | | 127,935 | |
P-Class | | | 56 | | | | — | * |
Institutional Class | | | 2,743 | | | | 9,233 | |
Shares redeemed | | | | | | | | |
A-Class | | | (193,257 | ) | | | (552,933 | ) |
C-Class | | | (79,774 | ) | | | (271,052 | ) |
Institutional Class | | | (27,608 | ) | | | (46,285 | ) |
Net increase (decrease) in shares | | | 7,628 | | | | (130,216 | ) |
* | Since commencement of operations: May 1, 2015. |
56 | THE GUGGENHEIM FUNDS SEMI-ANNUAL REPORT | SEE NOTES TO FINANCIAL STATEMENTS. |
This table is presented to show selected data for a share outstanding throughout each period and to assist shareholders in evaluating a Fund’s performance for the periods presented.
A-Class | | Period Ended
March 31,
2016a | | | Year Ended
September 30,
2015 | | | Year Ended
September 30,
2014 | | | Year Ended
September 30,
2013 | | | Year Ended
September 30,
2012 | | | Year Ended
September 30,
2011 | |
Per Share Data | | | | | | | | | | | | | | | | | | |
Net asset value, beginning of period | | $ | 12.78 | | | $ | 16.82 | | | $ | 17.81 | | | $ | 15.04 | | | $ | 11.66 | | | $ | 14.35 | |
Income (loss) from investment operations: | |
Net investment income (loss)b | | | .01 | | | | .02 | | | | (.03 | ) | | | (— | )c | | | (.03 | ) | | | (.07 | ) |
Net gain (loss) on investments (realized and unrealized) | | | .92 | | | | (.60 | ) | | | .26 | | | | 4.05 | | | | 3.73 | | | | (.63 | ) |
Total from investment operations | | | .93 | | | | (.58 | ) | | | .23 | | | | 4.05 | | | | 3.70 | | | | (.70 | ) |
Less distributions from: | |
Net investment income | | | — | | | | (.09 | ) | | | (.03 | ) | | | (.01 | ) | | | — | | | | — | |
Net realized gains | | | (.99 | ) | | | (3.37 | ) | | | (1.19 | ) | | | (1.27 | ) | | | (.32 | ) | | | (1.99 | ) |
Total distributions | | | (.99 | ) | | | (3.46 | ) | | | (1.22 | ) | | | (1.28 | ) | | | (.32 | ) | | | (1.99 | ) |
Net asset value, end of period | | $ | 12.72 | | | $ | 12.78 | | | $ | 16.82 | | | $ | 17.81 | | | $ | 15.04 | | | $ | 11.66 | |
| | |
Total Returnd | | | 7.38 | % | | | (5.23 | %) | | | 1.07 | % | | | 29.39 | % | | | 32.19 | % | | | (7.31 | %) |
Ratios/Supplemental Data | |
Net assets, end of period (in thousands) | | $ | 12,836 | | | $ | 12,866 | | | $ | 17,342 | | | $ | 16,487 | | | $ | 12,294 | | | $ | 7,592 | |
Ratios to average net assets: | |
Net investment income (loss) | | | 0.08 | % | | | 0.13 | % | | | (0.14 | %) | | | (0.02 | %) | | | (0.24 | %) | | | (0.52 | %) |
Total expenses | | | 2.46 | % | | | 1.99 | % | | | 1.85 | % | | | 1.91 | % | | | 2.14 | % | | | 2.33 | % |
Net expensese | | | 1.32 | %g | | | 1.32 | %g | | | 1.32 | %g | | | 1.30 | % | | | 1.30 | % | | | 1.30 | % |
Portfolio turnover rate | | | 31 | % | | | 62 | % | | | 45 | % | | | 34 | % | | | 62 | % | | | 70 | % |
C-Class | | Period Ended
March 31,
2016a | | | Year Ended
September 30,
2015 | | | Year Ended
September 30,
2014 | | | Year Ended
September 30,
2013 | | | Year Ended
September 30,
2012 | | | Year Ended
September 30,
2011 | |
Per Share Data | | | | | | | | | | | | | | | | | | |
Net asset value, beginning of period | | $ | 11.95 | | | $ | 15.96 | | | $ | 17.05 | | | $ | 14.54 | | | $ | 11.36 | | | $ | 14.13 | |
Income (loss) from investment operations: | |
Net investment income (loss)b | | | (.04 | ) | | | (.09 | ) | | | (.15 | ) | | | (.12 | ) | | | (.14 | ) | | | (.18 | ) |
Net gain (loss) on investments (realized and unrealized) | | | .88 | | | | (.55 | ) | | | .25 | | | | 3.90 | | | | 3.64 | | | | (.60 | ) |
Total from investment operations | | | .84 | | | | (.64 | ) | | | .10 | | | | 3.78 | | | | 3.50 | | | | (.78 | ) |
Less distributions from: | |
Net realized gains | | | (.99 | ) | | | (3.37 | ) | | | (1.19 | ) | | | (1.27 | ) | | | (.32 | ) | | | (1.99 | ) |
Total distributions | | | (.99 | ) | | | (3.37 | ) | | | (1.19 | ) | | | (1.27 | ) | | | (.32 | ) | | | (1.99 | ) |
Net asset value, end of period | | $ | 11.80 | | | $ | 11.95 | | | $ | 15.96 | | | $ | 17.05 | | | $ | 14.54 | | | $ | 11.36 | |
| | |
Total Returnd | | | 7.12 | % | | | (5.97 | %) | | | 0.30 | % | | | 28.34 | % | | | 31.35 | % | | | (8.07 | %) |
Ratios/Supplemental Data | |
Net assets, end of period (in thousands) | | $ | 5,222 | | | $ | 5,173 | | | $ | 8,527 | | | $ | 5,885 | | | $ | 3,026 | | | $ | 2,305 | |
Ratios to average net assets: | |
Net investment income (loss) | | | (0.67 | %) | | | (0.65 | %) | | | (0.87 | %) | | | (0.75 | %) | | | (1.00 | %) | | | (1.26 | %) |
Total expenses | | | 3.20 | % | | | 2.72 | % | | | 2.51 | % | | | 2.58 | % | | | 2.70 | % | | | 3.07 | % |
Net expensese | | | 2.07 | %g | | | 2.08 | %g | | | 2.07 | %g | | | 2.05 | % | | | 2.05 | % | | | 2.05 | % |
Portfolio turnover rate | | | 31 | % | | | 62 | % | | | 45 | % | | | 34 | % | | | 62 | % | | | 70 | % |
SEE NOTES TO FINANCIAL STATEMENTS. | THE GUGGENHEIM FUNDS SEMI-ANNUAL REPORT | 57 |
FINANCIAL HIGHLIGHTS (continued) |
This table is presented to show selected data for a share outstanding throughout each period and to assist shareholders in evaluating a Fund’s performance for the periods presented.
P-Class | | Period Ended
March 31,
2016a | | | Period Ended
September 30,
2015f | |
Per Share Data | | | | | | |
Net asset value, beginning of period | | $ | 12.77 | | | $ | 14.33 | |
Income (loss) from investment operations: | |
Net investment income (loss)b | | | .01 | | | | .04 | |
Net gain (loss) on investments (realized and unrealized) | | | .94 | | | | (1.60 | ) |
Total from investment operations | | | .95 | | | | (1.56 | ) |
Less distributions from: | |
Net realized gains | | | (.99 | ) | | | — | |
Total distributions | | | (.99 | ) | | | — | |
Net asset value, end of period | | $ | 12.73 | | | $ | 12.77 | |
| | |
Total Returnd | | | 7.46 | % | | | (10.82 | %) |
Ratios/Supplemental Data | |
Net assets, end of period (in thousands) | | $ | 10 | | | $ | 9 | |
Ratios to average net assets: | |
Net investment income (loss) | | | 0.11 | % | | | 0.60 | % |
Total expenses | | | 2.81 | % | | | 4.04 | % |
Net expensese,g | | | 1.32 | % | | | 1.31 | % |
Portfolio turnover rate | | | 31 | % | | | 62 | % |
58 | THE GUGGENHEIM FUNDS SEMI-ANNUAL REPORT | SEE NOTES TO FINANCIAL STATEMENTS. |
FINANCIAL HIGHLIGHTS (concluded) |
This table is presented to show selected data for a share outstanding throughout each period and to assist shareholders in evaluating a Fund’s performance for the periods presented.
Institutional Class | | Period Ended
March 31,
2016a | | | Year Ended
September 30,
2015 | | | Year Ended
September 30,
2014 | | | Year Ended
September 30,
2013 | | | Year Ended
September 30,
2012 | | | Year Ended
September 30,
2011 | |
Per Share Data | | | | | | | | | | | | | | | | | | |
Net asset value, beginning of period | | $ | 11.82 | | | $ | 17.04 | | | $ | 18.04 | | | $ | 15.21 | | | $ | 11.76 | | | $ | 14.43 | |
Income (loss) from investment operations: | |
Net investment income (loss)b | | | .02 | | | | .05 | | | | .01 | | | | .04 | | | | — | c | | | (.04 | ) |
Net gain (loss) on investments (realized and unrealized) | | | .86 | | | | (.49 | ) | | | .25 | | | | 4.10 | | | | 3.77 | | | | (.64 | ) |
Total from investment operations | | | .88 | | | | (.44 | ) | | | .26 | | | | 4.14 | | | | 3.77 | | | | (.68 | ) |
Less distributions from: | |
Net investment income | | | — | | | | (1.41 | ) | | | (.07 | ) | | | (.04 | ) | | | — | | | | — | |
Net realized gains | | | (.99 | ) | | | (3.37 | ) | | | (1.19 | ) | | | (1.27 | ) | | | (.32 | ) | | | (1.99 | ) |
Total distributions | | | (.99 | ) | | | (4.78 | ) | | | (1.26 | ) | | | (1.31 | ) | | | (.32 | ) | | | (1.99 | ) |
Net asset value, end of period | | $ | 11.71 | | | $ | 11.82 | | | $ | 17.04 | | | $ | 18.04 | | | $ | 15.21 | | | $ | 11.76 | |
| | |
Total Returnd | | | 7.55 | % | | | (5.01 | %) | | | 1.21 | % | | | 29.74 | % | | | 32.51 | % | | | (7.11 | %) |
Ratios/Supplemental Data | |
Net assets, end of period (in thousands) | | $ | 407 | | | $ | 459 | | | $ | 753 | | | $ | 22,315 | | | $ | 18,591 | | | $ | 638 | |
Ratios to average net assets: | |
Net investment income (loss) | | | 0.27 | % | | | 0.33 | % | | | 0.05 | % | | | 0.23 | % | | | 0.02 | % | | | (0.30 | %) |
Total expenses | | | 2.20 | % | | | 1.70 | % | | | 1.33 | % | | | 1.34 | % | | | 1.44 | % | | | 2.09 | % |
Net expensese | | | 1.07 | %g | | | 1.07 | %g | | | 1.07 | %g | | | 1.05 | % | | | 1.05 | % | | | 1.05 | % |
Portfolio turnover rate | | | 31 | % | | | 62 | % | | | 45 | % | | | 34 | % | | | 62 | % | | | 70 | % |
a | Unaudited figures for the period ended March 31, 2016. Percentage amounts for the period, except total return and portfolio turnover rate, have been annualized. |
b | Net investment income (loss) per share was computed using average shares outstanding throughout the period. |
c | Net investment income is less than $0.01 per share. |
d | Total return does not reflect the impact of any applicable sales charges. |
e | Net expense information reflects the expense ratios after expense waivers. |
f | Since commencement of operations: May 1, 2015. Percentage amounts for the period, except total return and portfolio turnover rate, have been annualized. |
g | Net expenses may include expenses that are excluded from the expense limitation agreement. Excluding these expenses, the operation expense ratios for the periods presented would be: |
| | 03/31/16 | 09/30/15 | 09/30/14 |
A-Class | 1.30% | 1.30% | 1.30% |
C-Class | 2.05% | 2.05% | 2.05% |
P-Class | 1.30% | 1.30% | — |
Institutional Class | 1.05% | 1.05% | 1.05% |
SEE NOTES TO FINANCIAL STATEMENTS. | THE GUGGENHEIM FUNDS SEMI-ANNUAL REPORT | 59 |
FUND PROFILE (Unaudited) | March 31, 2016 |
STYLEPLUS—LARGE CORE FUND
OBJECTIVE: Seeks long-term growth of capital.
Holdings Diversification (Market Exposure as % of Net Assets)
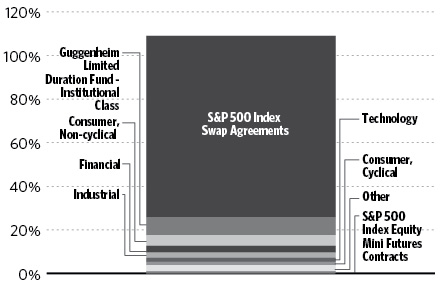
“Holdings Diversification (Market Exposure as % of Net Assets)” excludes any temporary cash investments or investments in Guggenheim Strategy Funds Trust mutual funds. Investments in those Funds do not provide “market exposure” to meet the Fund’s investment objective, but will significantly increase the portfolio’s exposure to certain other asset categories (and their associated risks), which may cause the Fund to deviate from its principal investment strategy, including: (i) high yield, high risk debt securities rated below the top four long-term rating categories by a nationally recognized statistical rating organization (also known as “junk bonds”); (ii) securities issued by the U.S. government or its agencies and instrumentalities; (iii) CLOs and similar investments; and (iv) other short-term fixed income securities.
Inception Dates: |
A-Class | September 10, 1962 |
C-Class | January 29, 1999 |
P-Class | May 1, 2015 |
Institutional Class | March 1, 2012 |
Ten Largest Holdings (% of Total Net Assets) |
Guggenheim Strategy Fund III | 35.1% |
Guggenheim Strategy Fund II | 25.1% |
Guggenheim Strategy Fund I | 11.0% |
Guggenheim Limited Duration Fund - Institutional Class | 8.2% |
Apple, Inc. | 0.7% |
General Electric Co. | 0.5% |
Procter & Gamble Co. | 0.4% |
JPMorgan Chase & Co. | 0.4% |
PepsiCo, Inc. | 0.3% |
Cisco Systems, Inc. | 0.3% |
Top Ten Total | 82.0% |
| | |
“Ten Largest Holdings” excludes any temporary cash or derivative investments. |
60 | THE GUGGENHEIM FUNDS SEMI-ANNUAL REPORT | |
SCHEDULE OF INVESTMENTS (Unaudited) | March 31, 2016 |
STYLEPLUS—LARGE CORE FUND | |
| | | Shares | | | Value | |
| | | | | | | |
COMMON STOCKS† - 16.6% | |
| | | | | | | |
Consumer, Non-cyclical - 4.9% | |
Procter & Gamble Co. | | | 8,627 | | | $ | 710,088 | |
PepsiCo, Inc. | | | 5,687 | | | | 582,804 | |
Merck & Company, Inc. | | | 10,811 | | | | 572,009 | |
Gilead Sciences, Inc. | | | 5,945 | | | | 546,108 | |
UnitedHealth Group, Inc. | | | 4,200 | | | | 541,380 | |
Medtronic plc | | | 6,776 | | | | 508,200 | |
Amgen, Inc. | | | 3,369 | | | | 505,114 | |
AbbVie, Inc. | | | 8,371 | | | | 478,152 | |
Danaher Corp. | | | 4,438 | | | | 420,989 | |
Biogen, Inc.* | | | 1,515 | | | | 394,385 | |
General Mills, Inc. | | | 6,223 | | | | 394,227 | |
HCA Holdings, Inc.* | | | 4,876 | | | | 380,572 | |
Express Scripts Holding Co.* | | | 5,444 | | | | 373,948 | |
Sysco Corp. | | | 7,851 | | | | 366,877 | |
Kroger Co. | | | 9,261 | | | | 354,233 | |
Pfizer, Inc. | | | 10,563 | | | | 313,087 | |
McKesson Corp. | | | 1,975 | | | | 310,569 | |
Cardinal Health, Inc. | | | 3,539 | | | | 290,021 | |
Johnson & Johnson | | | 2,619 | | | | 283,376 | |
Tyson Foods, Inc. — Class A | | | 3,326 | | | | 221,711 | |
Allergan plc* | | | 543 | | | | 145,540 | |
Kraft Heinz Co. | | | 1,262 | | | | 99,143 | |
Aetna, Inc. | | | 759 | | | | 85,274 | |
Anthem, Inc. | | | 564 | | | | 78,390 | |
Cigna Corp. | | | 546 | | | | 74,933 | |
Mondelez International, Inc. — Class A | | | 1,580 | | | | 63,390 | |
Total Consumer, Non-cyclical | | | | | | | 9,094,520 | |
| | | | | | | | | |
Financial - 3.2% | |
JPMorgan Chase & Co. | | | 11,496 | | | | 680,793 | |
Bank of America Corp. | | | 41,044 | | | | 554,915 | |
Citigroup, Inc. | | | 12,527 | | | | 523,002 | |
MetLife, Inc. | | | 9,247 | | | | 406,313 | |
Travelers Companies, Inc. | | | 3,331 | | | | 388,761 | |
Capital One Financial Corp. | | | 5,429 | | | | 376,284 | |
Bank of New York Mellon Corp. | | | 10,213 | | | | 376,145 | |
Prudential Financial, Inc. | | | 5,101 | | | | 368,394 | |
Allstate Corp. | | | 5,406 | | | | 364,202 | |
Aflac, Inc. | | | 5,761 | | | | 363,750 | |
American Express Co. | | | 5,789 | | | | 355,445 | |
Synchrony Financial* | | | 10,365 | | | | 297,061 | |
PNC Financial Services Group, Inc. | | | 2,962 | | | | 250,496 | |
Berkshire Hathaway, Inc. — Class B* | | | 1,083 | | | | 153,656 | |
Wells Fargo & Co. | | | 3,139 | | | | 151,802 | |
Charles Schwab Corp. | | | 3,908 | | | | 109,502 | |
Chubb Ltd. | | | 790 | | | | 94,129 | |
Visa, Inc. — Class A | | | 1,229 | | | | 93,994 | |
Total Financial | | | | | | | 5,908,644 | |
| | | | | | | | | |
Industrial - 2.3% | |
General Electric Co. | | | 26,877 | | | | 854,420 | |
Boeing Co. | | | 3,659 | | | | 464,474 | |
Union Pacific Corp. | | | 5,338 | | | | 424,638 | |
Caterpillar, Inc. | | | 5,459 | | | | 417,832 | |
Lockheed Martin Corp. | | | 1,866 | | | | 413,319 | |
Eaton Corporation plc | | | 6,086 | | | | 380,740 | |
Waste Management, Inc. | | | 6,097 | | | | 359,723 | |
CSX Corp. | | | 11,501 | | | | 296,151 | |
FedEx Corp. | | | 1,623 | | | | 264,094 | |
United Parcel Service, Inc. — Class B | | | 2,170 | | | | 228,870 | |
General Dynamics Corp. | | | 928 | | | | 121,911 | |
Honeywell International, Inc. | | | 866 | | | | 97,035 | |
Total Industrial | | | | | | | 4,323,207 | |
| | | | | | | | | |
Technology - 1.9% | |
Apple, Inc. | | | 11,823 | | | | 1,288,589 | |
Intel Corp. | | | 16,369 | | | | 529,537 | |
Microsoft Corp. | | | 9,317 | | | | 514,578 | |
Hewlett Packard Enterprise Co. | | | 26,241 | | | | 465,253 | |
International Business Machines Corp. | | | 2,016 | | | | 305,323 | |
QUALCOMM, Inc. | | | 4,808 | | | | 245,881 | |
Broadcom Ltd. | | | 662 | | | | 102,279 | |
Total Technology | | | | | | | 3,451,440 | |
| | | | | | | | | |
Consumer, Cyclical - 1.5% | |
CVS Health Corp. | | | 5,103 | | | | 529,334 | |
Wal-Mart Stores, Inc. | | | 7,470 | | | | 511,620 | |
Walgreens Boots Alliance, Inc. | | | 5,361 | | | | 451,611 | |
Ford Motor Co. | | | 30,106 | | | | 406,431 | |
Delta Air Lines, Inc. | | | 6,407 | | | | 311,893 | |
Southwest Airlines Co. | | | 6,119 | | | | 274,131 | |
American Airlines Group, Inc. | | | 5,505 | | | | 225,760 | |
Total Consumer, Cyclical | | | | | | | 2,710,780 | |
| | | | | | | | | |
Communications - 1.4% | |
Cisco Systems, Inc. | | | 20,356 | | | | 579,534 | |
Comcast Corp. — Class A | | | 9,469 | | | | 578,367 | |
Alphabet, Inc. — Class C* | | | 621 | | | | 462,614 | |
Time Warner, Inc. | | | 6,012 | | | | 436,171 | |
eBay, Inc.* | | | 8,344 | | | | 199,088 | |
Facebook, Inc. — Class A* | | | 1,209 | | | | 137,947 | |
AT&T, Inc. | | | 2,806 | | | | 109,912 | |
Verizon Communications, Inc. | | | 1,781 | | | | 96,316 | |
Amazon.com, Inc.* | | | 161 | | | | 95,576 | |
Total Communications | | | | | | | 2,695,525 | |
| | | | | | | | | |
Energy - 1.1% | |
Exxon Mobil Corp. | | | 6,932 | | | | 579,446 | |
Chevron Corp. | | | 2,841 | | | | 271,031 | |
Schlumberger Ltd. | | | 3,449 | | | | 254,364 | |
Valero Energy Corp. | | | 1,842 | | | | 118,146 | |
EOG Resources, Inc. | | | 1,573 | | | | 114,168 | |
ConocoPhillips | | | 2,662 | | | | 107,199 | |
SEE NOTES TO FINANCIAL STATEMENTS. | THE GUGGENHEIM FUNDS SEMI-ANNUAL REPORT | 61 |
SCHEDULE OF INVESTMENTS (Unaudited)(continued) | March 31, 2016 |
STYLEPLUS—LARGE CORE FUND | |
| | | Shares | | | Value | |
| | | | | | | |
Marathon Petroleum Corp. | | | 2,649 | | | $ | 98,490 | |
Apache Corp. | | | 1,980 | | | | 96,644 | |
Hess Corp. | | | 1,726 | | | | 90,874 | |
Occidental Petroleum Corp. | | | 1,302 | | | | 89,096 | |
Anadarko Petroleum Corp. | | | 1,906 | | | | 88,762 | |
Kinder Morgan, Inc. | | | 4,223 | | | | 75,423 | |
Halliburton Co. | | | 2,033 | | | | 72,619 | |
Williams Companies, Inc. | | | 3,964 | | | | 63,701 | |
Total Energy | | | | | | | 2,119,963 | |
| | | | | | | | | |
Basic Materials - 0.3% | |
LyondellBasell Industries N.V. — Class A | | | 4,426 | | | | 378,777 | |
Dow Chemical Co. | | | 1,832 | | | | 93,176 | |
Total Basic Materials | | | | | | | 471,953 | |
| | | | | | | | | |
Utilities - 0.0% | |
Southern Co. | | | 1,791 | | | | 92,648 | |
| | | | | | | | | |
Total Common Stocks | | | | | | | | |
(Cost $29,982,256) | | | | | | | 30,868,680 | |
| | | | | | | | | |
MUTUAL FUNDS† - 79.4% | |
Guggenheim Strategy Fund III1 | | | 2,650,720 | | | | 65,393,260 | |
Guggenheim Strategy Fund II1 | | | 1,891,287 | | | | 46,695,867 | |
Guggenheim Strategy Fund I1 | | | 827,971 | | | | 20,541,950 | |
Guggenheim Limited Duration Fund -
Institutional Class1 | | | 628,317 | | | | 15,236,692 | |
Total Mutual Funds | | | | | | | | |
(Cost $148,952,998) | | | | | | | 147,867,769 | |
| | | | | | | | | |
SHORT TERM INVESTMENTS† - 3.8% | |
Dreyfus Treasury Prime Cash Management Institutional Shares 0.18%2 | | | 7,064,509 | | | | 7,064,509 | |
Total Short Term Investments | | | | | | | | |
(Cost $7,064,509) | | | | | | | 7,064,509 | |
| | | | | | | | | |
Total Investments - 99.8% | | | | | | | | |
(Cost $185,999,763) | | | | | | $ | 185,800,958 | |
Other Assets & Liabilities, net - 0.2% | | | | | | | 427,607 | |
Total Net Assets - 100.0% | | | | | | $ | 186,228,565 | |
| | | Contracts | | | Unrealized
Gain (Loss) | |
| | | | | | | |
EQUITY FUTURES CONTRACTS PURCHASED† | |
June 2016 S&P 500 Index
Mini Futures Contracts
(Aggregate Value of
Contracts $1,845,450) | | | 18 | | | $ | 37,248 | |
| | | | | | | | | |
| | | Units | | | | | |
| | | | | | | | | |
OTC EQUITY INDEX SWAP AGREEMENTS†† | |
Bank of America
May 2016 S&P 500 Index Swap 0.62%3,
Terminating 05/02/16
(Notional Value $47,839,521) | | | 23,226 | | | $ | 3,815,360 | |
Goldman Sachs International
April 2016 S&P 500 Index Swap 0.44%3,
Terminating 04/01/16
(Notional Value $34,735,455) | | | 16,864 | | | | 1,280,628 | |
Morgan Stanley Capital Services, Inc.
July 2016 S&P 500 Total Return Swap 0.63%3,
Terminating 07/05/16
(Notional Value $72,441,395) | | | 18,703 | | | | (745,236 | ) |
(Total Notional Value $155,016,371) | | | | | | $ | 4,350,752 | |
* | Non-income producing security. |
† | Value determined based on Level 1 inputs — See Note 4. |
†† | Value determined based on Level 2 inputs — See Note 4. |
1 | Affiliated issuer — See Note 8. |
2 | Rate indicated is the 7 day yield as of March 31, 2016. |
3 | Total Return based on S&P 500 Index +/- financing at a variable rate. Rate indicated is the rate effective at March 31, 2016. |
| | plc — Public Limited Company |
| | |
| | See Sector Classification in Other Information section. |
62 | THE GUGGENHEIM FUNDS SEMI-ANNUAL REPORT | SEE NOTES TO FINANCIAL STATEMENTS. |
SCHEDULE OF INVESTMENTS (Unaudited)(concluded) | March 31, 2016 |
STYLEPLUS—LARGE CORE FUND | |
The following table summarizes the inputs used to value the Fund’s investments at March 31, 2016 (See Note 4 in the Notes to Financial Statements):
Investments in Securities (Assets) | | Level 1 | | | Level 1 -
Other* | | | Level 2 | | | Level 2 -
Other* | | | Level 3 | | | Total | |
Common Stocks | | $ | 30,868,680 | | | $ | — | | | $ | — | | | $ | — | | | $ | — | | | $ | 30,868,680 | |
Equity Futures Contracts | | | — | | | | 37,248 | | | | — | | | | — | | | | — | | | | 37,248 | |
Equity Index Swap Agreements | | | — | | | | — | | | | — | | | | 5,095,988 | | | | — | | | | 5,095,988 | |
Mutual Funds | | | 147,867,769 | | | | — | | | | — | | | | — | | | | — | | | | 147,867,769 | |
Short Term Investments | | | 7,064,509 | | | | — | | | | — | | | | — | | | | — | | | | 7,064,509 | |
Total | | $ | 185,800,958 | | | $ | 37,248 | | | $ | — | | | $ | 5,095,988 | | | $ | — | | | $ | 190,934,194 | |
| | | | | | | | | | | | | | | | | | | | | | | | | |
Investments in Securities (Liabilities) | | Level 1 | | | Level 1 -
Other* | | | Level 2 | | | Level 2 -
Other* | | | Level 3 | | | Total | |
Equity Index Swap Agreements | | $ | — | | | $ | — | | | $ | — | | | $ | 745,236 | | | $ | — | | | $ | 745,236 | |
* | Other financial instruments include futures contracts and/or swaps, which are reported as unrealized gain/loss at period end. |
For the period ended March 31, 2016, there were no transfers between levels.
SEE NOTES TO FINANCIAL STATEMENTS. | THE GUGGENHEIM FUNDS SEMI-ANNUAL REPORT | 63 |
STYLEPLUS—LARGE CORE FUND | |
STATEMENT OF ASSETS AND LIABILITIES (Unaudited) |
March 31, 2016 |
Assets: | |
Investments in unaffiliated issuers, at value (cost $37,046,765) | | $ | 37,933,189 | |
Investments in affiliated issuers, at value (cost $148,952,998) | | | 147,867,769 | |
Total investments (cost $185,999,763) | | | 185,800,958 | |
Unrealized appreciation on swap agreements | | | 5,095,988 | |
Segregated cash with broker | | | 2,463,035 | |
Prepaid expenses | | | 48,137 | |
Receivables: | |
Securities sold | | | 918,340 | |
Dividends | | | 315,739 | |
Fund shares sold | | | 48,047 | |
Total assets | | | 194,690,244 | |
| | | | | |
Liabilities: | |
Segregated cash from broker | | | 5,015,000 | |
Unrealized depreciation on swap agreements | | | 745,236 | |
Overdraft due to custodian bank | | | 266 | |
Payable for: | |
Swap settlement | | | 1,754,492 | |
Securities purchased | | | 532,165 | |
Fund shares redeemed | | | 160,661 | |
Management fees | | | 111,860 | |
Distribution and service fees | | | 40,773 | |
Transfer agent/maintenance fees | | | 17,600 | |
Fund accounting/administration fees | | | 14,733 | |
Trustees' fees* | | | 9,899 | |
Variation margin | | | 4,230 | |
Miscellaneous | | | 54,764 | |
Total liabilities | | | 8,461,679 | |
Net assets | | $ | 186,228,565 | |
| | | | | |
Net assets consist of: | |
Paid in capital | | $ | 187,253,643 | |
Undistributed net investment income | | | 173,415 | |
Accumulated net realized loss on investments | | | (5,387,688 | ) |
Net unrealized appreciation on investments | | | 4,189,195 | |
Net assets | | $ | 186,228,565 | |
| | | | | |
A-Class: | |
Net assets | | $ | 182,409,239 | |
Capital shares outstanding | | | 8,984,215 | |
Net asset value per share | | $ | 20.30 | |
Maximum offering price per share (Net asset value divided by 95.25%) | | $ | 21.31 | |
| | | | | |
C-Class: | |
Net assets | | $ | 3,289,804 | |
Capital shares outstanding | | | 204,846 | |
Net asset value per share | | $ | 16.06 | |
| | | | | |
P-Class: | |
Net assets | | $ | 384,201 | |
Capital shares outstanding | | | 19,028 | |
Net asset value per share | | $ | 20.19 | |
| | | | | |
Institutional Class: | |
Net assets | | $ | 145,321 | |
Capital shares outstanding | | | 7,197 | |
Net asset value per share | | $ | 20.19 | |
* | Relates to Trustees not deemed “interested persons” within the meaning of Section 2(a)(19) of the 1940 Act. |
64 | THE GUGGENHEIM FUNDS SEMI-ANNUAL REPORT | SEE NOTES TO FINANCIAL STATEMENTS. |
STYLEPLUS—LARGE CORE FUND | |
STATEMENT OF OPERATIONS (Unaudited) |
Period Ended March 31, 2016 |
Investment Income: | |
Dividends from securities of affiliated issuers | | $ | 1,423,367 | |
Dividends from securities of unaffiliated issuers | | | 356,589 | |
Interest | | | 11,979 | |
Total investment income | | | 1,791,935 | |
| | | | | |
Expenses: | |
Management fees | | | 698,445 | |
Transfer agent/maintenance fees: | |
A-Class | | | 119,316 | |
C-Class | | | 5,340 | |
P-Class | | | 28 | |
Institutional Class | | | 259 | |
Distribution and service fees: | |
A-Class | | | 227,064 | |
C-Class | | | 15,151 | |
P-Class | | | 264 | |
Fund accounting/administration fees | | | 88,469 | |
Line of credit fees | | | 21,987 | |
Trustees’ fees* | | | 8,471 | |
Custodian fees | | | 6,144 | |
Miscellaneous | | | 81,008 | |
Total expenses | | | 1,271,946 | |
Less: | |
Expenses waived by Adviser | | | (4,458 | ) |
Net expenses | | | 1,267,488 | |
Net investment income | | | 524,447 | |
| | | | | |
Net Realized and Unrealized Gain (Loss): | |
Net realized gain (loss) on: | |
Investments in unaffiliated issuers | | $ | 598,531 | |
Investments in affiliated issuers | | | (145,392 | ) |
Swap agreements | | | (5,171,515 | ) |
Futures contracts | | | 122,765 | |
Net realized loss | | | (4,595,611 | ) |
Net change in unrealized appreciation (depreciation) on: | |
Investments in unaffiliated issuers | | | 1,574,793 | |
Investments in affiliated issuers | | | (767,447 | ) |
Swap agreements | | | 17,130,731 | |
Futures contracts | | | 70,819 | |
Net change in unrealized appreciation (depreciation) | | | 18,008,896 | |
Net realized and unrealized gain | | | 13,413,285 | |
Net increase in net assets resulting from operations | | $ | 13,937,732 | |
* | Relates to Trustees not deemed “interested persons” within the meaning of Section 2(a)(19) of the 1940 Act. |
SEE NOTES TO FINANCIAL STATEMENTS. | THE GUGGENHEIM FUNDS SEMI-ANNUAL REPORT | 65 |
STYLEPLUS—LARGE CORE FUND | |
STATEMENTS OF CHANGES IN NET ASSETS |
| | | Period Ended
March 31,
2016
(Unaudited) | | | Year Ended
September 30,
2015 | |
Increase (Decrease) in Net Assets from Operations: | | | | | | |
Net investment income | | $ | 524,447 | | | $ | 916,462 | |
Net realized gain (loss) on investments | | | (4,595,611 | ) | | | 21,563,771 | |
Net change in unrealized appreciation (depreciation) on investments | | | 18,008,896 | | | | (23,122,031 | ) |
Net increase (decrease) in net assets resulting from operations | | | 13,937,732 | | | | (641,798 | ) |
| | | | | | | | | |
Distributions to shareholders from: | | | | | | | | |
Net investment income | | | | | | | | |
A-Class | | | (1,021,091 | ) | | | (1,732,889 | ) |
C-Class | | | — | | | | (12,770 | ) |
P-Class | | | (120 | ) | | | — | * |
Institutional Class | | | (18,603 | ) | | | (1,276 | ) |
Net realized gains | | | | | | | | |
A-Class | | | (19,593,831 | ) | | | (24,703,723 | ) |
B-Class | | | — | | | | (495,181 | ) |
C-Class | | | (390,350 | ) | | | (513,717 | ) |
P-Class | | | (1,552 | ) | | | — | * |
Institutional Class | | | (208,131 | ) | | | (14,534 | ) |
Total distributions to shareholders | | | (21,233,678 | ) | | | (27,474,090 | ) |
| | | | | | | | | |
Capital share transactions: | | | | | | | | |
Proceeds from sale of shares | | | | | | | | |
A-Class | | | 3,669,428 | | | | 9,389,928 | |
B-Class | | | — | | | | 73,635 | |
C-Class | | | 806,889 | | | | 1,219,839 | |
P-Class | | | 362,398 | | | | 15,200 | * |
Institutional Class | | | 1,651,205 | | | | 299,886 | |
Distributions reinvested | | | | | | | | |
A-Class | | | 19,338,091 | | | | 24,669,740 | |
B-Class | | | — | | | | 493,058 | |
C-Class | | | 381,661 | | | | 522,705 | |
P-Class | | | 1,672 | | | | — | * |
Institutional Class | | | 225,550 | | | | 11,270 | |
Cost of shares redeemed | | | | | | | | |
A-Class | | | (11,441,443 | ) | | | (21,983,556 | ) |
B-Class | | | — | | | | (3,242,342 | ) |
C-Class | | | (478,435 | ) | | | (1,457,727 | ) |
Institutional Class | | | (1,825,086 | ) | | | (67,861 | ) |
Net increase from capital share transactions | | | 12,691,930 | | | | 9,943,775 | |
Net increase (decrease) in net assets | | | 5,395,984 | | | | (18,172,113 | ) |
| | | | | | | | | |
Net assets: | | | | | | | | |
Beginning of period | | | 180,832,581 | | | | 199,004,694 | |
End of period | | $ | 186,228,565 | | | $ | 180,832,581 | |
Undistributed net investment income at end of period | | $ | 173,415 | | | $ | 688,782 | |
66 | THE GUGGENHEIM FUNDS SEMI-ANNUAL REPORT | SEE NOTES TO FINANCIAL STATEMENTS. |
STYLEPLUS—LARGE CORE FUND | |
STATEMENTS OF CHANGES IN NET ASSETS (concluded) |
| | | Period Ended
March 31,
2016
(Unaudited) | | | Year Ended
September 30,
2015 | |
Capital share activity: | | | | | | |
Shares sold | | | | | | |
A-Class | | | 180,808 | | | | 407,154 | |
B-Class | | | — | | | | 4,630 | |
C-Class | | | 49,513 | | | | 63,123 | |
P-Class | | | 18,285 | | | | 660 | * |
Institutional Class | | | 78,791 | | | | 13,800 | |
Shares issued from reinvestment of distributions | | | | | | | | |
A-Class | | | 960,661 | | | | 1,097,897 | |
B-Class | | | — | | | | 30,473 | |
C-Class | | | 23,881 | | | | 28,423 | |
P-Class | | | 83 | | | | — | * |
Institutional Class | | | 11,274 | | | | 505 | |
Shares redeemed | | | | | | | | |
A-Class | | | (565,058 | ) | | | (959,415 | ) |
B-Class | | | — | | | | (200,041 | ) |
C-Class | | | (29,748 | ) | | | (78,357 | ) |
Institutional Class | | | (97,307 | ) | | | (3,130 | ) |
Net increase in shares | | | 631,183 | | | | 405,722 | |
* | Since commencement of operations: May, 1, 2015. |
SEE NOTES TO FINANCIAL STATEMENTS. | THE GUGGENHEIM FUNDS SEMI-ANNUAL REPORT | 67 |
STYLEPLUS—LARGE CORE FUND | |
This table is presented to show selected data for a share outstanding throughout each period and to assist shareholders in evaluating a Fund’s performance for the periods presented.
A-Class | | Period Ended
March 31,
2016a | | | Year Ended
September 30,
2015 | | | Year Ended
September 30,
2014 | | | Year Ended
September 30,
2013 | | | Year Ended
September 30,
2012 | | | Year Ended
September 30,
2011h | |
Per Share Data | | | | | | | | | | | | | | | | | | |
Net asset value, beginning of period | | $ | 21.14 | | | $ | 24.53 | | | $ | 24.27 | | | $ | 21.25 | | | $ | 16.79 | | | $ | 17.56 | |
Income (loss) from investment operations: | |
Net investment income (loss)b | | | .06 | | | | .11 | | | | .20 | | | | .06 | | | | .06 | | | | .01 | |
Net gain (loss) on investments (realized and unrealized) | | | 1.58 | | | | (.12 | ) | | | 4.45 | | | | 3.04 | | | | 4.42 | | | | (.74 | ) |
Total from investment operations | | | 1.64 | | | | (.01 | ) | | | 4.65 | | | | 3.10 | | | | 4.48 | | | | (.73 | ) |
Less distributions from: | |
Net investment income | | | (.13 | ) | | | (.22 | ) | | | (.06 | ) | | | (.08 | ) | | | (.02 | ) | | | (.04 | ) |
Net realized gains | | | (2.35 | ) | | | (3.16 | ) | | | (4.33 | ) | | | — | | | | — | | | | — | |
Total distributions | | | (2.48 | ) | | | (3.38 | ) | | | (4.39 | ) | | | (.08 | ) | | | (.02 | ) | | | (.04 | ) |
Net asset value, end of period | | $ | 20.30 | | | $ | 21.14 | | | $ | 24.53 | | | $ | 24.27 | | | $ | 21.25 | | | $ | 16.79 | |
| | |
Total Returnc | | | 7.84 | % | | | (0.84 | %) | | | 21.59 | % | | | 14.64 | % | | | 26.71 | % | | | (4.11 | %) |
Ratios/Supplemental Data | |
Net assets, end of period (in thousands) | | $ | 182,409 | | | $ | 177,748 | | | $ | 192,850 | | | $ | 175,601 | | | $ | 171,907 | | | $ | 156,232 | |
Ratios to average net assets: | |
Net investment income (loss) | | | 0.58 | % | | | 0.48 | % | | | 0.86 | % | | | 0.26 | % | | | 0.32 | % | | | 0.06 | % |
Total expensesd | | | 1.35 | % | | | 1.32 | % | | | 1.41 | % | | | 1.37 | % | | | 1.36 | % | | | 1.35 | % |
Net expensese | | | 1.35 | % | | | 1.32 | % | | | 1.39 | % | | | 1.37 | % | | | 1.36 | % | | | 1.35 | % |
Portfolio turnover rate | | | 36 | % | | | 65 | % | | | 107 | % | | | 217 | % | | | 101 | % | | | 92 | % |
C-Class | | Period Ended
March 31,
2016a | | | Year Ended
September 30,
2015 | | | Year Ended
September 30,
2014 | | | Year Ended
September 30,
2013 | | | Year Ended
September 30,
2012 | | | Year Ended
September 30,
2011h | |
Per Share Data | | | | | | | | | | | | | | | | | | |
Net asset value, beginning of period | | $ | 17.17 | | | $ | 20.55 | | | $ | 21.12 | | | $ | 18.60 | | | $ | 14.81 | | | $ | 15.56 | |
Income (loss) from investment operations: | |
Net investment income (loss)b | | | (.03 | ) | | | (.08 | ) | | | (.02 | ) | | | (.15 | ) | | | (.10 | ) | | | (.12 | ) |
Net gain (loss) on investments (realized and unrealized) | | | 1.27 | | | | (.06 | ) | | | 3.78 | | | | 2.67 | | | | 3.89 | | | | (.63 | ) |
Total from investment operations | | | 1.24 | | | | (.14 | ) | | | 3.76 | | | | 2.52 | | | | 3.79 | | | | (.75 | ) |
Less distributions from: | |
Net investment income | | | — | | | | (.08 | ) | | | — | | | | — | | | | — | | | | — | |
Net realized gains | | | (2.35 | ) | | | (3.16 | ) | | | (4.33 | ) | | | — | | | | — | | | | — | |
Total distributions | | | (2.35 | ) | | | (3.24 | ) | | | (4.33 | ) | | | — | | | | — | | | | — | |
Net asset value, end of period | | $ | 16.06 | | | $ | 17.17 | | | $ | 20.55 | | | $ | 21.12 | | | $ | 18.60 | | | $ | 14.81 | |
| | |
Total Returnc | | | 7.31 | % | | | (1.72 | %) | | | 20.40 | % | | | 13.55 | % | | | 25.59 | % | | | (4.82 | %) |
Ratios/Supplemental Data | |
Net assets, end of period (in thousands) | | $ | 3,290 | | | $ | 2,767 | | | $ | 3,042 | | | $ | 2,275 | | | $ | 1,669 | | | $ | 1,600 | |
Ratios to average net assets: | |
Net investment income (loss) | | | (0.38 | %) | | | (0.44 | %) | | | (0.08 | %) | | | (0.77 | %) | | | (0.55 | %) | | | (0.70 | %) |
Total expensesd | | | 2.33 | % | | | 2.25 | % | | | 2.36 | % | | | 2.34 | % | | | 2.22 | % | | | 2.10 | % |
Net expensese | | | 2.32 | % | | | 2.25 | % | | | 2.34 | % | | | 2.34 | % | | | 2.22 | % | | | 2.10 | % |
Portfolio turnover rate | | | 36 | % | | | 65 | % | | | 107 | % | | | 217 | % | | | 101 | % | | | 92 | % |
68 | THE GUGGENHEIM FUNDS SEMI-ANNUAL REPORT | SEE NOTES TO FINANCIAL STATEMENTS. |
STYLEPLUS—LARGE CORE FUND | |
FINANCIAL HIGHLIGHTS (continued) |
This table is presented to show selected data for a share outstanding throughout each period and to assist shareholders in evaluating a Fund’s performance for the periods presented.
P-Class | | Period Ended
March 31,
2016a | | | Period Ended
September 30,
2015f | |
Per Share Data | | | | | | |
Net asset value, beginning of period | | $ | 21.11 | | | $ | 23.12 | |
Income (loss) from investment operations: | |
Net investment income (loss)b | | | .09 | | | | .03 | |
Net gain (loss) on investments (realized and unrealized) | | | 1.53 | | | | (2.04 | ) |
Total from investment operations | | | 1.62 | | | | (2.01 | ) |
Less distributions from: | |
Net investment income | | | (.19 | ) | | | — | |
Net realized gains | | | (2.35 | ) | | | — | |
Total distributions | | | (2.54 | ) | | | — | |
Net asset value, end of period | | $ | 20.19 | | | $ | 21.11 | |
| | |
Total Returnc | | | 7.75 | % | | | (8.69 | %) |
Ratios/Supplemental Data | |
Net assets, end of period (in thousands) | | $ | 384 | | | $ | 14 | |
Ratios to average net assets: | |
Net investment income (loss) | | | 0.89 | % | | | 0.31 | % |
Total expensesd | | | 1.23 | % | | | 1.38 | % |
Net expensese | | | 1.22 | % | | | 1.38 | % |
Portfolio turnover rate | | | 36 | % | | | 65 | % |
SEE NOTES TO FINANCIAL STATEMENTS. | THE GUGGENHEIM FUNDS SEMI-ANNUAL REPORT | 69 |
STYLEPLUS—LARGE CORE FUND | |
FINANCIAL HIGHLIGHTS (concluded) |
This table is presented to show selected data for a share outstanding throughout each period and to assist shareholders in evaluating a Fund’s performance for the periods presented.
Institutional Class | | Period Ended
March 31,
2016a | | | Year Ended
September 30,
2015 | | | Year Ended
September 30,
2014 | | | Year Ended
September 30,
2013 | | | Period Ended
September 30,
2012g | |
Per Share Data | | | | | | | | | | | | | | | |
Net asset value, beginning of period | | $ | 21.00 | | | $ | 24.42 | | | $ | 24.25 | | | $ | 21.28 | | | $ | 20.84 | |
Income (loss) from investment operations: | |
Net investment income (loss)b | | | .08 | | | | .12 | | | | .23 | | | | .06 | | | | .07 | |
Net gain (loss) on investments (realized and unrealized) | | | 1.67 | | | | (.10 | ) | | | 4.38 | | | | 3.06 | | | | .37 | |
Total from investment operations | | | 1.75 | | | | .02 | | | | 4.61 | | | | 3.12 | | | | .44 | |
Less distributions from: | |
Net investment income | | | (.21 | ) | | | (.28 | ) | | | (.11 | ) | | | (.15 | ) | | | — | |
Net realized gains | | | (2.35 | ) | | | (3.16 | ) | | | (4.33 | ) | | | — | | | | — | |
Total distributions | | | (2.56 | ) | | | (3.44 | ) | | | (4.44 | ) | | | (.15 | ) | | | — | |
Net asset value, end of period | | $ | 20.19 | | | $ | 21.00 | | | $ | 24.42 | | | $ | 24.25 | | | $ | 21.28 | |
| | |
Total Returnc | | | 8.46 | % | | | (0.75 | %) | | | 21.50 | % | | | 14.79 | % | | | 2.11 | % |
Ratios/Supplemental Data | |
Net assets, end of period (in thousands) | | $ | 145 | | | $ | 303 | | | $ | 80 | | | $ | 26 | | | $ | 10 | |
Ratios to average net assets: | |
Net investment income (loss) | | | 0.77 | % | | | 0.52 | % | | | 0.97 | % | | | 0.26 | % | | | 0.59 | % |
Total expensesd | | | 1.02 | % | | | 1.25 | % | | | 1.39 | % | | | 1.25 | % | | | 1.12 | % |
Net expensese | | | 1.02 | % | | | 1.25 | % | | | 1.37 | % | | | 1.25 | % | | | 1.12 | % |
Portfolio turnover rate | | | 36 | % | | | 65 | % | | | 107 | % | | | 217 | % | | | 101 | % |
a | Unaudited figures for the period ended March 31, 2016. Percentage amounts for the period, except total return and portfolio turnover rate, have been annualized. |
b | Net investment income (loss) per share was computed using average shares outstanding throughout the period. |
c | Total return does not reflect the impact of any applicable sales charges. |
d | Does not include expenses of the underlying funds in which the Fund invests. |
e | Net expense information reflects the expense ratios after expense waivers. |
f | Since commencement of operations: May 1, 2015. Percentage amounts for the period, except total return and portfolio turnover rate, have been annualized. |
g | Since commencement of operations: March 1, 2012. Percentage amounts for the period, except total return and portfolio turnover rate, have been annualized. |
h | Reverse share split — Per share amounts for the periods presented through April 8, 2011 have been restated to reflect a 1:4 reverse share split effect April 8, 2011. |
70 | THE GUGGENHEIM FUNDS SEMI-ANNUAL REPORT | SEE NOTES TO FINANCIAL STATEMENTS. |
FUND PROFILE (Unaudited) | March 31, 2016 |
STYLEPLUS—MID GROWTH FUND
OBJECTIVE: Seeks long-term growth of capital.
Holdings Diversification (Market Exposure as % of Net Assets)
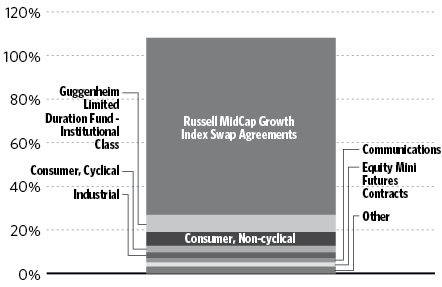
“Holdings Diversification (Market Exposure as % of Net Assets)” excludes any temporary cash investments or investments in Guggenheim Strategy Funds Trust mutual funds. Investments in those Funds do not provide “market exposure” to meet the Fund’s investment objective, but will significantly increase the portfolio’s exposure to certain other asset categories (and their associated risks), which may cause the Fund to deviate from its principal investment strategy, including: (i) high yield, high risk debt securities rated below the top four long-term rating categories by a nationally recognized statistical rating organization (also known as “junk bonds”); (ii) securities issued by the U.S. government or its agencies and instrumentalities; (iii) CLOs and similar investments; and (iv) other short-term fixed income securities.
Inception Dates: |
A-Class | September 17, 1969 |
C-Class | January 29, 1999 |
P-Class | May 1, 2015 |
Institutional Class | March 1, 2012 |
Ten Largest Holdings (% of Total Net Assets) |
Guggenheim Strategy Fund III | 33.7% |
Guggenheim Strategy Fund II | 25.9% |
Guggenheim Strategy Fund I | 10.2% |
Guggenheim Limited Duration Fund - Institutional Class | 7.9% |
United Continental Holdings, Inc. | 0.2% |
AmerisourceBergen Corp. — Class A | 0.2% |
Southwest Airlines Co. | 0.2% |
Constellation Brands, Inc. — Class A | 0.2% |
Omnicom Group, Inc. | 0.2% |
PACCAR, Inc. | 0.2% |
Top Ten Total | 78.9% |
| | |
“Ten Largest Holdings” excludes any temporary cash or derivative investments. |
| | THE GUGGENHEIM FUNDS SEMI-ANNUAL REPORT | 71 |
SCHEDULE OF INVESTMENTS (Unaudited) | March 31, 2016 |
STYLEPLUS—MID GROWTH FUND | |
| | | Shares | | | Value | |
| | | | | | | |
COMMON STOCKS† - 17.1% | |
| | | | | | | |
Consumer, Non-cyclical - 6.3% | |
AmerisourceBergen Corp. — Class A | | | 2,129 | | | $ | 184,265 | |
Constellation Brands, Inc. — Class A | | | 1,083 | | | | 163,630 | |
Dr Pepper Snapple Group, Inc. | | | 1,775 | | | | 158,721 | |
Monster Beverage Corp.* | | | 1,169 | | | | 155,921 | |
Spectrum Brands Holdings, Inc. | | | 1,406 | | | | 153,648 | |
Flowers Foods, Inc. | | | 8,322 | | | | 153,624 | |
Laboratory Corporation of America Holdings* | | | 1,309 | | | | 153,323 | |
ConAgra Foods, Inc. | | | 3,308 | | | | 147,604 | |
Avis Budget Group, Inc.* | | | 5,304 | | | | 145,117 | |
Zimmer Biomet Holdings, Inc. | | | 1,310 | | | | 139,686 | |
Kellogg Co. | | | 1,802 | | | | 137,943 | |
Mallinckrodt plc* | | | 2,136 | | | | 130,894 | |
Molina Healthcare, Inc.* | | | 2,028 | | | | 130,786 | |
DaVita HealthCare Partners, Inc.* | | | 1,682 | | | | 123,425 | |
Mead Johnson Nutrition Co. — Class A | | | 1,419 | | | | 120,572 | |
Ingredion, Inc. | | | 1,079 | | | | 115,226 | |
St. Jude Medical, Inc. | | | 2,089 | | | | 114,895 | |
WhiteWave Foods Co. — Class A* | | | 2,639 | | | | 107,249 | |
Sysco Corp. | | | 2,254 | | | | 105,329 | |
Cardinal Health, Inc. | | | 1,266 | | | | 103,749 | |
Hologic, Inc.* | | | 2,963 | | | | 102,224 | |
United Rentals, Inc.* | | | 1,630 | | | | 101,370 | |
General Mills, Inc. | | | 1,524 | | | | 96,545 | |
HCA Holdings, Inc.* | | | 1,170 | | | | 91,318 | |
Cal-Maine Foods, Inc. | | | 1,668 | | | | 86,586 | |
CR Bard, Inc. | | | 426 | | | | 86,337 | |
KAR Auction Services, Inc. | | | 2,248 | | | | 85,739 | |
HealthSouth Corp. | | | 2,254 | | | | 84,818 | |
RR Donnelley & Sons Co. | | | 5,136 | | | | 84,230 | |
Becton Dickinson and Co. | | | 554 | | | | 84,108 | |
Tyson Foods, Inc. — Class A | | | 1,251 | | | | 83,392 | |
Western Union Co. | | | 4,218 | | | | 81,365 | |
MEDNAX, Inc.* | | | 1,232 | | | | 79,612 | |
Robert Half International, Inc. | | | 1,606 | | | | 74,807 | |
Universal Health Services, Inc. — Class B | | | 558 | | | | 69,593 | |
Tenet Healthcare Corp.* | | | 2,320 | | | | 67,118 | |
Verisk Analytics, Inc. — Class A* | | | 759 | | | | 60,659 | |
Pilgrim’s Pride Corp.* | | | 2,097 | | | | 53,264 | |
Zoetis, Inc. | | | 1,172 | | | | 51,955 | |
Hershey Co. | | | 538 | | | | 49,544 | |
Hain Celestial Group, Inc.* | | | 1,202 | | | | 49,174 | |
LifePoint Health, Inc.* | | | 702 | | | | 48,614 | |
Coca-Cola Enterprises, Inc. | | | 938 | | | | 47,594 | |
Alexion Pharmaceuticals, Inc.* | | | 332 | | | | 46,221 | |
Quintiles Transnational Holdings, Inc.* | | | 708 | | | | 46,091 | |
DexCom, Inc.* | | | 630 | | | | 42,783 | |
Nielsen Holdings plc | | | 802 | | | | 42,233 | |
Amsurg Corp. — Class A* | | | 560 | | | | 41,776 | |
Alnylam Pharmaceuticals, Inc.* | | | 648 | | | | 40,675 | |
DENTSPLY SIRONA, Inc. | | | 641 | | | | 39,505 | |
BioMarin Pharmaceutical, Inc.* | | | 460 | | | | 37,941 | |
Global Payments, Inc. | | | 496 | | | | 32,389 | |
Centene Corp.* | | | 437 | | | | 26,906 | |
Total Consumer, Non-cyclical | | | | | | | 4,862,093 | |
| | | | | | | | | |
Consumer, Cyclical - 3.0% | |
United Continental Holdings, Inc.* | | | 3,155 | | | | 188,859 | |
Southwest Airlines Co. | | | 3,958 | | | | 177,319 | |
PACCAR, Inc. | | | 2,923 | | | | 159,859 | |
Delphi Automotive plc | | | 1,878 | | | | 140,888 | |
DR Horton, Inc. | | | 4,304 | | | | 130,110 | |
Liberty Interactive Corporation QVC Group — Class A* | | | 4,982 | | | | 125,796 | |
Lear Corp. | | | 1,128 | | | | 125,400 | |
WW Grainger, Inc. | | | 532 | | | | 124,185 | |
JetBlue Airways Corp.* | | | 5,120 | | | | 108,134 | |
Harley-Davidson, Inc. | | | 1,577 | | | | 80,947 | |
Alaska Air Group, Inc. | | | 893 | | | | 73,244 | |
Macy’s, Inc. | | | 1,641 | | | | 72,352 | |
AutoZone, Inc.* | | | 86 | | | | 68,515 | |
Toll Brothers, Inc.* | | | 2,281 | | | | 67,312 | |
Spirit Airlines, Inc.* | | | 1,278 | | | | 61,318 | |
Lions Gate Entertainment Corp. | | | 2,754 | | | | 60,175 | |
Dollar General Corp. | | | 679 | | | | 58,122 | |
Fastenal Co. | | | 1,069 | | | | 52,381 | |
Tiffany & Co. | | | 635 | | | | 46,596 | |
Ross Stores, Inc. | | | 804 | | | | 46,551 | |
L Brands, Inc. | | | 523 | | | | 45,925 | |
Dollar Tree, Inc.* | | | 550 | | | | 45,353 | |
Harman International Industries, Inc. | | | 507 | | | | 45,143 | |
American Eagle Outfitters, Inc. | | | 2,555 | | | | 42,592 | |
Marriott International, Inc. — Class A | | | 562 | | | | 40,003 | |
Under Armour, Inc. — Class A* | | | 456 | | | | 38,682 | |
Chipotle Mexican Grill, Inc. — Class A* | | | 76 | | | | 35,794 | |
Hilton Worldwide Holdings, Inc. | | | 1,459 | | | | 32,857 | |
Total Consumer, Cyclical | | | | | | | 2,294,412 | |
| | | | | | | | | |
Industrial - 2.7% | |
Spirit AeroSystems Holdings, Inc. — Class A* | | | 3,431 | | | | 155,630 | |
Harris Corp. | | | 1,723 | | | | 134,153 | |
Rockwell Automation, Inc. | | | 1,118 | | | | 127,173 | |
TransDigm Group, Inc.* | | | 551 | | | | 121,407 | |
Stericycle, Inc.* | | | 927 | | | | 116,978 | |
Regal Beloit Corp. | | | 1,817 | | | | 114,635 | |
Huntington Ingalls Industries, Inc. | | | 831 | | | | 113,797 | |
Textron, Inc. | | | 3,061 | | | | 111,604 | |
CSX Corp. | | | 3,754 | | | | 96,665 | |
WestRock Co. | | | 2,445 | | | | 95,428 | |
Carlisle Companies, Inc. | | | 955 | | | | 95,023 | |
Roper Technologies, Inc. | | | 442 | | | | 80,784 | |
Clean Harbors, Inc.* | | | 1,628 | | | | 80,326 | |
Jabil Circuit, Inc. | | | 4,149 | | | | 79,951 | |
AECOM* | | | 2,515 | | | | 77,437 | |
AMERCO | | | 200 | | | | 71,462 | |
Rockwell Collins, Inc. | | | 759 | | | | 69,987 | |
72 | THE GUGGENHEIM FUNDS SEMI-ANNUAL REPORT | SEE NOTES TO FINANCIAL STATEMENTS. |
SCHEDULE OF INVESTMENTS (Unaudited)(continued) | March 31, 2016 |
STYLEPLUS—MID GROWTH FUND | |
| | | Shares | | | Value | |
| | | | | | | |
Tyco International plc | | | 1,489 | | | $ | 54,661 | |
AMETEK, Inc. | | | 1,033 | | | | 51,629 | |
Genesee & Wyoming, Inc. — Class A* | | | 761 | | | | 47,715 | |
Stanley Black & Decker, Inc. | | | 419 | | | | 44,083 | |
Zebra Technologies Corp. — Class A* | | | 619 | | | | 42,711 | |
Cummins, Inc. | | | 386 | | | | 42,437 | |
Flowserve Corp. | | | 905 | | | | 40,191 | |
Total Industrial | | | | | | | 2,065,867 | |
| | | | | | | | | |
Communications - 2.0% | |
Omnicom Group, Inc. | | | 1,942 | | | | 161,632 | |
Scripps Networks Interactive, Inc. — Class A | | | 2,266 | | | | 148,422 | |
Palo Alto Networks, Inc.* | | | 878 | | | | 143,237 | |
IAC/InterActiveCorp | | | 2,864 | | | | 134,836 | |
Discovery Communications, Inc. — Class A* | | | 3,525 | | | | 100,921 | |
LinkedIn Corp. — Class A* | | | 859 | | | | 98,227 | |
DISH Network Corp. — Class A* | | | 1,902 | | | | 87,987 | |
Splunk, Inc.* | | | 1,561 | | | | 76,380 | |
CommScope Holding Company, Inc.* | | | 2,716 | | | | 75,831 | |
AMC Networks, Inc. — Class A* | | | 1,160 | | | | 75,330 | |
Viacom, Inc. — Class B | | | 1,684 | | | | 69,516 | |
Ciena Corp.* | | | 3,431 | | | | 65,258 | |
Charter Communications, Inc. — Class A* | | | 303 | | | | 61,336 | |
Expedia, Inc. | | | 562 | | | | 60,595 | |
Twitter, Inc.* | | | 3,498 | | | | 57,892 | |
VeriSign, Inc.* | | | 598 | | | | 52,947 | |
Zayo Group Holdings, Inc.* | | | 1,608 | | | | 38,978 | |
Total Communications | | | | | | | 1,509,325 | |
| | | | | | | | | |
Technology - 1.8% | |
Skyworks Solutions, Inc. | | | 1,712 | | | | 133,365 | |
Qorvo, Inc.* | | | 2,391 | | | | 120,530 | |
Microchip Technology, Inc. | | | 2,274 | | | | 109,607 | |
IHS, Inc. — Class A* | | | 806 | | | | 100,073 | |
Teradata Corp.* | | | 3,201 | | | | 83,994 | |
SS&C Technologies Holdings, Inc. | | | 1,264 | | | | 80,163 | |
ServiceNow, Inc.* | | | 1,232 | | | | 75,375 | |
Take-Two Interactive Software, Inc.* | | | 1,901 | | | | 71,611 | |
Cerner Corp.* | | | 1,293 | | | | 68,477 | |
Red Hat, Inc.* | | | 904 | | | | 67,357 | |
Nuance Communications, Inc.* | | | 3,365 | | | | 62,892 | |
Analog Devices, Inc. | | | 1,021 | | | | 60,433 | |
Fortinet, Inc.* | | | 1,950 | | | | 59,729 | |
Electronic Arts, Inc.* | | | 858 | | | | 56,722 | |
Lam Research Corp. | | | 604 | | | | 49,890 | |
Verint Systems, Inc.* | | | 1,458 | | | | 48,668 | |
NetSuite, Inc.* | | | 707 | | | | 48,422 | |
Rackspace Hosting, Inc.* | | | 2,036 | | | | 43,957 | |
Fidelity National Information Services, Inc. | | | 658 | | | | 41,658 | |
Tableau Software, Inc. — Class A* | | | 798 | | | | 36,604 | |
Total Technology | | | | | | | 1,419,527 | |
| | | | | | | | | |
Financial - 0.8% | |
Ameriprise Financial, Inc. | | | 1,664 | | | | 156,433 | |
Alliance Data Systems Corp.* | | | 661 | | | | 145,421 | |
CoreLogic, Inc.* | | | 1,679 | | | | 58,261 | |
Interactive Brokers Group, Inc. — Class A | | | 1,164 | | | | 45,768 | |
Jones Lang LaSalle, Inc. | | | 365 | | | | 42,821 | |
CBRE Group, Inc. — Class A* | | | 1,452 | | | | 41,847 | |
T. Rowe Price Group, Inc. | | | 543 | | | | 39,889 | |
Signature Bank* | | | 287 | | | | 39,066 | |
Equinix, Inc. | | | 118 | | | | 39,024 | |
Crown Castle International Corp. | | | 428 | | | | 37,022 | |
Total Financial | | | | | | | 645,552 | |
| | | | | | | | | |
Basic Materials - 0.3% | |
Steel Dynamics, Inc. | | | 2,343 | | | | 52,741 | |
International Paper Co. | | | 1,235 | | | | 50,684 | |
Celanese Corp. — Class A | | | 737 | | | | 48,274 | |
Huntsman Corp. | | | 3,463 | | | | 46,058 | |
Total Basic Materials | | | | | | | 197,757 | |
| | | | | | | | | |
Energy - 0.2% | |
Cabot Oil & Gas Corp. — Class A | | | 2,112 | | | | 47,964 | |
FMC Technologies, Inc.* | | | 1,544 | | | | 42,244 | |
ONEOK, Inc. | | | 1,068 | | | | 31,890 | |
Total Energy | | | | | | | 122,098 | |
| | | | | | | | | |
Total Common Stocks | | | | | | | | |
(Cost $13,112,514) | | | | | | | 13,116,631 | |
| | | | | | | | | |
MUTUAL FUNDS† - 77.7% | |
Guggenheim Strategy Fund III1 | | | 1,047,095 | | | | 25,831,830 | |
Guggenheim Strategy Fund II1 | | | 803,237 | | | | 19,831,924 | |
Guggenheim Strategy Fund I1 | | | 315,295 | | | | 7,822,469 | |
Guggenheim Limited Duration Fund -
Institutional Class1 | | | 249,889 | | | | 6,059,811 | |
Total Mutual Funds | | | | | | | | |
(Cost $59,994,211) | | | | | | | 59,546,034 | |
| | | | | | | | | |
SHORT TERM INVESTMENTS† - 4.5% | |
Dreyfus Treasury Prime Cash Management Institutional Shares 0.18%2 | | | 3,413,603 | | | | 3,413,603 | |
Total Short Term Investments | | | | | | | | |
(Cost $3,413,603) | | | | | | | 3,413,603 | |
| | | | | | | | | |
Total Investments - 99.3% | | | | | | | | |
(Cost $76,520,328) | | | | | | $ | 76,076,268 | |
Other Assets & Liabilities, net - 0.7% | | | | | | | 563,552 | |
Total Net Assets - 100.0% | | | | | | $ | 76,639,820 | |
SEE NOTES TO FINANCIAL STATEMENTS. | THE GUGGENHEIM FUNDS SEMI-ANNUAL REPORT | 73 |
SCHEDULE OF INVESTMENTS (Unaudited)(concluded) | March 31, 2016 |
STYLEPLUS—MID GROWTH FUND | |
| | | Contracts | | | Unrealized
Gain (Loss) | |
| | | | | | | |
EQUITY FUTURES CONTRACTS PURCHASED† | |
June 2016 S&P MidCap 400 Index
Mini Futures Contracts
(Aggregate Value of
Contracts $864,600) | | | 6 | | | $ | 26,111 | |
June 2016 NASDAQ-100 Index
Mini Futures Contracts
(Aggregate Value of
Contracts $268,515) | | | 3 | | | | 7,049 | |
June 2016 S&P 500 Index
Mini Futures Contracts
(Aggregate Value of
Contracts $307,575) | | | 3 | | | | 6,208 | |
(Total Aggregate Value of Contracts $1,440,690) | | | | | | $ | 39,368 | |
| | | Units | | | | |
| | | | | | | |
OTC EQUITY INDEX SWAP AGREEMENTS†† | |
Goldman Sachs International
May 2016 Russell MidCap
Growth Index Swap 0.62%3,
Terminating 05/04/16
(Notional Value $19,892,728) | | | 26,876 | | | | 1,933,290 | |
Goldman Sachs International
April 2016 Russell MidCap
Growth Index Swap 0.44%3,
Terminating 04/11/16
(Notional Value $13,569,482) | | | 18,333 | | | | 582,427 | |
Morgan Stanley Capital Services, Inc.
July 2016 Russell MidCap
Growth Total Return Index Swap 0.63%3,
Terminating 07/05/16
(Notional Value $28,802,837) | | | 13,589 | | | | (1,729,498 | ) |
(Total Notional Value $62,265,047) | | | | | | $ | 786,219 | |
* | Non-income producing security. |
† | Value determined based on Level 1 inputs — See Note 4. |
†† | Value determined based on Level 2 inputs — See Note 4. |
1 | Affiliated issuer — See Note 8. |
2 | Rate indicated is the 7 day yield as of March 31, 2016. |
3 | Total Return based on Russell MidCap Growth Index +/- financing at a variable rate. Rate indicated is the rate effective at March 31, 2016. |
| | plc — Public Limited Company |
| | |
| | See Sector Classification in Other Information section. |
The following table summarizes the inputs used to value the Fund’s investments at March 31, 2016 (See Note 4 in the Notes to Financial Statements):
Investments in Securities (Assets) | | Level 1 | | | Level 1 -
Other* | | | Level 2 | | | Level 2 -
Other* | | | Level 3 | | | Total | |
Common Stocks | | $ | 13,116,631 | | | $ | — | | | $ | — | | | $ | — | | | $ | — | | | $ | 13,116,631 | |
Equity Mini Futures Contracts | | | — | | | | 39,368 | | | | — | | | | — | | | | — | | | | 39,368 | |
Equity Index Swap Agreements | | | — | | | | — | | | | — | | | | 2,515,717 | | | | — | | | | 2,515,717 | |
Mutual Funds | | | 59,546,034 | | | | — | | | | — | | | | — | | | | — | | | | 59,546,034 | |
Short Term Investments | | | 3,413,603 | | | | — | | | | — | | | | — | | | | — | | | | 3,413,603 | |
Total | | $ | 76,076,268 | | | $ | 39,368 | | | $ | — | | | $ | 2,515,717 | | | $ | — | | | $ | 78,631,353 | |
| | | | | | | | | | | | | | | | | | | | | | | | | |
Investments in Securities (Liabilities) | | Level 1 | | | Level 1 -
Other* | | | Level 2 | | | Level 2 -
Other* | | | Level 3 | | | Total | |
Equity Index Swap Agreements | | $ | — | | | $ | — | | | $ | — | | | $ | 1,729,498 | | | $ | — | | | $ | 1,729,498 | |
* | Other financial instruments include futures contracts and/or swaps, which are reported as unrealized gain/loss at period end. |
For the period ended March 31, 2016, there were no transfers between levels.
74 | THE GUGGENHEIM FUNDS SEMI-ANNUAL REPORT | SEE NOTES TO FINANCIAL STATEMENTS. |
STYLEPLUS—MID GROWTH FUND | |
STATEMENT OF ASSETS AND LIABILITIES (Unaudited) |
March 31, 2016 |
Assets: | |
Investments in unaffiliated issuers, at value (cost $16,526,117) | | $ | 16,530,234 | |
Investments in affiliated issuers, at value (cost $59,994,211) | | | 59,546,034 | |
Total investments (cost $76,520,328) | | | 76,076,268 | |
Segregated cash with broker | | | 3,516,931 | |
Unrealized appreciation on swap agreements | | | 2,515,717 | |
Prepaid expenses | | | 31,445 | |
Cash | | | 14 | |
Receivables: | |
Securities sold | | | 644,506 | |
Dividends | | | 123,931 | |
Fund shares sold | | | 3,128 | |
Total assets | | | 82,911,940 | |
| | | | | |
Liabilities: | |
Segregated cash from broker | | | 2,380,000 | |
Unrealized depreciation on swap agreements | | | 1,729,498 | |
Payable for: | |
Swap settlement | | | 1,555,625 | |
Securities purchased | | | 438,168 | |
Management fees | | | 45,689 | |
Transfer agent/maintenance fees | | | 29,992 | |
Fund shares redeemed | | | 21,463 | |
Distribution and service fees | | | 18,621 | |
Fund accounting/administration fees | | | 6,014 | |
Trustees' fees* | | | 2,485 | |
Variation margin | | | 990 | |
Miscellaneous | | | 43,575 | |
Total liabilities | | | 6,272,120 | |
Net assets | | $ | 76,639,820 | |
| | | | | |
Net assets consist of: | |
Paid in capital | | $ | 81,075,434 | |
Undistributed net investment income | | | 72,019 | |
Accumulated net realized loss on investments | | | (4,889,160 | ) |
Net unrealized appreciation on investments | | | 381,527 | |
Net assets | | $ | 76,639,820 | |
| | | | | |
A-Class: | |
Net assets | | $ | 71,999,916 | |
Capital shares outstanding | | | 1,903,524 | |
Net asset value per share | | $ | 37.82 | |
Maximum offering price per share (Net asset value divided by 95.25%) | | $ | 39.71 | |
| | | | | |
C-Class: | |
Net assets | | $ | 4,521,190 | |
Capital shares outstanding | | | 157,708 | |
Net asset value per share | | $ | 28.67 | |
| | | | | |
P-Class: | |
Net assets | | $ | 60,008 | |
Capital shares outstanding | | | 1,597 | |
Net asset value per share | | $ | 37.58 | |
| | | | | |
Institutional Class: | |
Net assets | | $ | 58,706 | |
Capital shares outstanding | | | 1,549 | |
Net asset value per share | | $ | 37.90 | |
* | Relates to Trustees not deemed “interested persons” within the meaning of Section 2(a)(19) of the 1940 Act. |
SEE NOTES TO FINANCIAL STATEMENTS. | THE GUGGENHEIM FUNDS SEMI-ANNUAL REPORT | 75 |
STYLEPLUS—MID GROWTH FUND | |
STATEMENT OF OPERATIONS (Unaudited) |
Period Ended March 31, 2016 |
Investment Income: | |
Dividends from securities of affiliated issuers | | $ | 583,137 | |
Dividends from securities of unaffiliated issuers (net of foreign withholding tax of $26) | | | 80,164 | |
Interest | | | 5,038 | |
Total investment income | | | 668,339 | |
| | | | | |
Expenses: | |
Management fees | | | 288,458 | |
Transfer agent/maintenance fees: | |
A-Class | | | 68,678 | |
C-Class | | | 7,665 | |
P-Class | | | 30 | |
Institutional Class | | | 129 | |
Distribution and service fees: | |
A-Class | | | 90,250 | |
C-Class | | | 23,210 | |
P-Class | | | 30 | |
Fund accounting/administration fees | | | 36,538 | |
Registration fees | | | 42,721 | |
Line of credit fees | | | 6,297 | |
Trustees’ fees* | | | 4,061 | |
Custodian fees | | | 3,753 | |
Miscellaneous | | | 26,293 | |
Total expenses | | | 598,113 | |
Less: | |
Expenses waived by Adviser | | | (1,793 | ) |
Net expenses | | | 596,320 | |
Net investment income | | | 72,019 | |
| | | | | |
Net Realized and Unrealized Gain (Loss): | |
Net realized gain (loss) on: | |
Investments in unaffiliated issuers | | $ | (155,837 | ) |
Investments in affiliated issuers | | | (52,352 | ) |
Swap agreements | | | (4,531,983 | ) |
Futures contracts | | | (42,739 | ) |
Net realized loss | | | (4,782,911 | ) |
Net change in unrealized appreciation (depreciation) on: | |
Investments in unaffiliated issuers | | | 846,498 | |
Investments in affiliated issuers | | | (319,498 | ) |
Swap agreements | | | 7,193,567 | |
Futures contracts | | | 44,206 | |
Net change in unrealized appreciation (depreciation) | | | 7,764,773 | |
Net realized and unrealized gain | | | 2,981,862 | |
Net increase in net assets resulting from operations | | $ | 3,053,881 | |
* | Relates to Trustees not deemed “interested persons” within the meaning of Section 2(a)(19) of the 1940 Act. |
76 | THE GUGGENHEIM FUNDS SEMI-ANNUAL REPORT | SEE NOTES TO FINANCIAL STATEMENTS. |
STYLEPLUS—MID GROWTH FUND | |
STATEMENTS OF CHANGES IN NET ASSETS |
| | | Period Ended
March 31,
2016
(Unaudited) | | | Year Ended
September 30,
2015 | |
Increase (Decrease) in Net Assets from Operations: | | | | | | |
Net investment income | | $ | 72,019 | | | $ | 82,187 | |
Net realized gain (loss) on investments | | | (4,782,911 | ) | | | 11,053,603 | |
Net change in unrealized appreciation (depreciation) on investments | | | 7,764,773 | | | | (9,948,308 | ) |
Net increase in net assets resulting from operations | | | 3,053,881 | | | | 1,187,482 | |
| | | | | | | | | |
Distributions to shareholders from: | | | | | | | | |
Net investment income | | | | | | | | |
A-Class | | | (86,688 | ) | | | — | |
P-Class | | | (63 | ) | | | — | * |
Institutional Class | | | (170 | ) | | | — | |
Net realized gains | | | | | | | | |
A-Class | | | (9,333,165 | ) | | | (8,445,226 | ) |
B-Class | | | — | | | | (244,616 | ) |
C-Class | | | (773,702 | ) | | | (583,423 | ) |
P-Class | | | (1,713 | ) | | | — | * |
Institutional Class | | | (7,288 | ) | | | (5,903 | ) |
Total distributions to shareholders | | | (10,202,789 | ) | | | (9,279,168 | ) |
| | | | | | | | | |
Capital share transactions: | | | | | | | | |
Proceeds from sale of shares | | | | | | | | |
A-Class | | | 1,058,806 | | | | 7,359,683 | |
B-Class | | | — | | | | 450 | |
C-Class | | | 423,786 | | | | 1,397,441 | |
P-Class | | | 45,485 | | | | 12,000 | * |
Institutional Class | | | 10,103 | | | | 57,374 | |
Distributions reinvested | | | | | | | | |
A-Class | | | 9,015,453 | | | | 8,149,102 | |
B-Class | | | — | | | | 243,630 | |
C-Class | | | 758,694 | | | | 567,893 | |
P-Class | | | 1,776 | | | | — | * |
Institutional Class | | | 6,154 | | | | 3,831 | |
Cost of shares redeemed | | | | | | | | |
A-Class | | | (4,712,450 | ) | | | (12,353,481 | ) |
B-Class | | | — | | | | (1,780,631 | ) |
C-Class | | | (817,764 | ) | | | (913,759 | ) |
P-Class | | | (270 | ) | | | — | * |
Institutional Class | | | (5,904 | ) | | | (31,110 | ) |
Net increase from capital share transactions | | | 5,783,869 | | | | 2,712,423 | |
Net decrease in net assets | | | (1,365,039 | ) | | | (5,379,263 | ) |
| | | | | | | | | |
Net assets: | | | | | | | | |
Beginning of period | | | 78,004,859 | | | | 83,384,122 | |
End of period | | $ | 76,639,820 | | | $ | 78,004,859 | |
Undistributed net investment income at end of period | | $ | 72,019 | | | $ | 86,921 | |
SEE NOTES TO FINANCIAL STATEMENTS. | THE GUGGENHEIM FUNDS SEMI-ANNUAL REPORT | 77 |
STYLEPLUS—MID GROWTH FUND | |
STATEMENTS OF CHANGES IN NET ASSETS (concluded) |
| | | Period Ended
March 31,
2016
(Unaudited) | | | Year Ended
September 30,
2015 | |
Capital share activity: | | | | | | |
Shares sold | | | | | | |
A-Class | | | 27,520 | | | | 162,640 | |
B-Class | | | — | | | | 15 | |
C-Class | | | 13,973 | | | | 39,105 | |
P-Class | | | 1,295 | | | | 262 | * |
Institutional Class | | | 262 | | | | 1,231 | |
Shares issued from reinvestment of distributions | | | | | | | | |
A-Class | | | 236,875 | | | | 187,770 | |
B-Class | | | — | | | | 8,692 | |
C-Class | | | 26,225 | | | | 16,446 | |
P-Class | | | 47 | | | | — | * |
Institutional Class | | | 161 | | | | 88 | |
Shares redeemed | | | | | | | | |
A-Class | | | (124,717 | ) | | | (274,858 | ) |
B-Class | | | — | | | | (61,741 | ) |
C-Class | | | (27,770 | ) | | | (25,764 | ) |
P-Class | | | (7 | ) | | | — | * |
Institutional Class | | | (162 | ) | | | (683 | ) |
Net increase in shares | | | 153,702 | | | | 53,202 | |
* | Since commencement of operations: May 1, 2015. |
78 | THE GUGGENHEIM FUNDS SEMI-ANNUAL REPORT | SEE NOTES TO FINANCIAL STATEMENTS. |
STYLEPLUS—MID GROWTH FUND | |
This table is presented to show selected data for a share outstanding throughout each period and to assist shareholders in evaluating a Fund’s performance for the periods presented.
A-Class | | Period Ended
March 31,
2016a | | Year Ended
September 30,
2015 | | Year Ended
September 30,
2014 | | Year Ended
September 30,
2013 | | Year Ended
September 30,
2012 | | Year Ended
September 30,
2011i | |
Per Share Data | | | | | | | | | | | | | | | | | | |
Net asset value, beginning of period | | $ | 41.49 | | | $ | 45.82 | | | $ | 43.54 | | | $ | 36.40 | | | $ | 28.67 | | | $ | 29.44 | |
Income (loss) from investment operations: | |
Net investment income (loss)b | | | .05 | | | | .07 | | | | .16 | | | | (.16 | ) | | | (.25 | ) | | | (.24 | ) |
Net gain (loss) on investments (realized and unrealized) | | | 1.69 | | | | .63 | | | | 6.21 | | | | 7.30 | | | | 7.98 | | | | (.53 | ) |
Total from investment operations | | | 1.74 | | | | .70 | | | | 6.37 | | | | 7.14 | | | | 7.73 | | | | (.77 | ) |
Less distributions from: | |
Net investment income | | | (.05 | ) | | | — | | | | — | | | | — | | | | — | | | | — | |
Net realized gains | | | (5.36 | ) | | | (5.03 | ) | | | (4.09 | ) | | | — | | | | — | | | | — | |
Total distributions | | | (5.41 | ) | | | (5.03 | ) | | | (4.09 | ) | | | — | | | | — | | | | — | |
Net asset value, end of period | | $ | 37.82 | | | $ | 41.49 | | | $ | 45.82 | | | $ | 43.54 | | | $ | 36.40 | | | $ | 28.67 | |
| | |
Total Returnc | | | 4.12 | % | | | 1.04 | % | | | 15.61 | % | | | 19.62 | % | | | 26.96 | % | | | (2.62 | %) |
Ratios/Supplemental Data | |
Net assets, end of period (in thousands) | | $ | 72,000 | | | $ | 73,178 | | | $ | 77,363 | | | $ | 70,767 | | | $ | 65,767 | | | $ | 62,575 | |
Ratios to average net assets: | |
Net investment income (loss) | | | 0.24 | % | | | 0.16 | % | | | 0.36 | % | | | (0.40 | %) | | | (0.74 | %) | | | (0.72 | %) |
Total expensesd | | | 1.50 | % | | | 1.47 | % | | | 1.67 | % | | | 1.57 | % | | | 1.62 | % | | | 1.49 | % |
Net expensese | | | 1.50 | % | | | 1.47 | % | | | 1.65 | % | | | 1.57 | % | | | 1.62 | % | | | 1.49 | % |
Portfolio turnover rate | | | 36 | % | | | 75 | % | | | 112 | % | | | 214 | % | | | 149 | % | | | 157 | % |
C-Class | | Period Ended
March 31,
2016a | | Year Ended
September 30,
2015 | | Year Ended
September 30,
2014 | | Year Ended
September 30,
2013 | | Year Ended
September 30,
2012 | | Year Ended
September 30,
2011i | |
Per Share Data | | | | | | | | | | | | | | | | | | |
Net asset value, beginning of period | | $ | 32.78 | | | $ | 37.48 | | | $ | 36.63 | | | $ | 30.92 | | | $ | 24.55 | | | $ | 25.40 | |
Income (loss) from investment operations: | |
Net investment income (loss)b | | | (.10 | ) | | | (.25 | ) | | | (.20 | ) | | | (.45 | ) | | | (.46 | ) | | | (.42 | ) |
Net gain (loss) on investments (realized and unrealized) | | | 1.35 | | | | .58 | | | | 5.14 | | | | 6.16 | | | | 6.83 | | | | (.43 | ) |
Total from investment operations | | | 1.25 | | | | .33 | | | | 4.94 | | | | 5.71 | | | | 6.37 | | | | (.85 | ) |
Less distributions from: | |
Net investment income | | | — | | | | — | | | | — | | | | — | | | | — | | | | — | |
Net realized gains | | | (5.36 | ) | | | (5.03 | ) | | | (4.09 | ) | | | — | | | | — | | | | — | |
Total distributions | | | (5.36 | ) | | | (5.03 | ) | | | (4.09 | ) | | | — | | | | — | | | | — | |
Net asset value, end of period | | $ | 28.67 | | | $ | 32.78 | | | $ | 37.48 | | | $ | 36.63 | | | $ | 30.92 | | | $ | 24.55 | |
| | |
Total Returnc | | | 3.68 | % | | | 0.20 | % | | | 14.56 | % | | | 18.47 | % | | | 25.95 | % | | | (3.35 | %) |
Ratios/Supplemental Data | |
Net assets, end of period (in thousands) | | $ | 4,521 | | | $ | 4,762 | | | $ | 4,329 | | | $ | 4,103 | | | $ | 4,346 | | | $ | 4,162 | |
Ratios to average net assets: | |
Net investment income (loss) | | | (0.65 | %) | | | (0.68 | %) | | | (0.55 | %) | | | (1.36 | %) | | | (1.57 | %) | | | (1.48 | %) |
Total expensesd | | | 2.40 | % | | | 2.31 | % | | | 2.57 | % | | | 2.53 | % | | | 2.45 | % | | | 2.25 | % |
Net expensese | | | 2.39 | % | | | 2.31 | % | | | 2.55 | % | | | 2.53 | % | | | 2.45 | % | | | 2.25 | % |
Portfolio turnover rate | | | 36 | % | | | 75 | % | | | 112 | % | | | 214 | % | | | 149 | % | | | 157 | % |
SEE NOTES TO FINANCIAL STATEMENTS. | THE GUGGENHEIM FUNDS SEMI-ANNUAL REPORT | 79 |
STYLEPLUS—MID GROWTH FUND | |
FINANCIAL HIGHLIGHTS (continued) |
This table is presented to show selected data for a share outstanding throughout each period and to assist shareholders in evaluating a Fund’s performance for the periods presented.
P-Class | | Period Ended
March 31,
2016a | | | Period Ended
September 30,
2015f | |
Per Share Data | | | | | | |
Net asset value, beginning of period | | $ | 41.48 | | | $ | 45.96 | |
Income (loss) from investment operations: | |
Net investment income (loss)b | | | .07 | | | | — | g |
Net gain (loss) on investments (realized and unrealized) | | | 1.59 | | | | (4.48 | ) |
Total from investment operations | | | 1.66 | | | | (4.48 | ) |
Less distributions from: | |
Net investment income | | | (.20 | ) | | | — | |
Net realized gains | | | (5.36 | ) | | | — | |
Total distributions | | | (5.56 | ) | | | — | |
Net asset value, end of period | | $ | 37.58 | | | $ | 41.48 | |
| | |
Total Returnc | | | 3.92 | % | | | (9.75 | %) |
Ratios/Supplemental Data | |
Net assets, end of period (in thousands) | | $ | 60 | | | $ | 11 | |
Ratios to average net assets: | |
Net investment income (loss) | | | 0.37 | % | | | 0.00 | % |
Total expensesd | | | 1.57 | % | | | 1.49 | % |
Net expensese | | | 1.52 | % | | | 1.49 | % |
Portfolio turnover rate | | | 36 | % | | | 75 | % |
80 | THE GUGGENHEIM FUNDS SEMI-ANNUAL REPORT | SEE NOTES TO FINANCIAL STATEMENTS. |
STYLEPLUS—MID GROWTH FUND | |
FINANCIAL HIGHLIGHTS (concluded) |
This table is presented to show selected data for a share outstanding throughout each period and to assist shareholders in evaluating a Fund’s performance for the periods presented.
Institutional Class | | Period Ended
March 31,
2016a | | | Year Ended
September 30,
2015 | | | Year Ended
September 30,
2014 | | | Year Ended
September 30,
2013 | | | Period Ended
September 30,
2012h | |
Per Share Data | | | | | | | | | | | | | | | |
Net asset value, beginning of period | | $ | 41.64 | | | $ | 45.96 | | | $ | 43.72 | | | $ | 36.46 | | | $ | 36.16 | |
Income (loss) from investment operations: | |
Net investment income (loss)b | | | .04 | | | | .11 | | | | .11 | | | | (.07 | ) | | | (.08 | ) |
Net gain (loss) on investments (realized and unrealized) | | | 1.71 | | | | .60 | | | | 6.22 | | | | 7.33 | | | | .38 | |
Total from investment operations | | | 1.75 | | | | .71 | | | | 6.33 | | | | 7.26 | | | | .30 | |
Less distributions from: | |
Net investment income | | | (.13 | ) | | | — | | | | — | | | | — | | | | — | |
Net realized gains | | | (5.36 | ) | | | (5.03 | ) | | | (4.09 | ) | | | — | | | | — | |
Total distributions | | | (5.49 | ) | | | (5.03 | ) | | | (4.09 | ) | | | — | | | | — | |
Net asset value, end of period | | $ | 37.90 | | | $ | 41.64 | | | $ | 45.96 | | | $ | 43.72 | | | $ | 36.46 | |
| | |
Total Returnc | | | 4.14 | % | | | 1.08 | % | | | 15.42 | % | | | 19.91 | % | | | 0.83 | % |
Ratios/Supplemental Data | |
Net assets, end of period (in thousands) | | $ | 59 | | | $ | 54 | | | $ | 30 | | | $ | 21 | | | $ | 10 | |
Ratios to average net assets: | |
Net investment income (loss) | | | 0.22 | % | | | 0.23 | % | | | 0.24 | % | | | (0.17 | %) | | | (0.41 | %) |
Total expensesd | | | 1.53 | % | | | 1.41 | % | | | 1.81 | % | | | 1.33 | % | | | 1.37 | % |
Net expensese | | | 1.52 | % | | | 1.41 | % | | | 1.79 | % | | | 1.33 | % | | | 1.37 | % |
Portfolio turnover rate | | | 36 | % | | | 75 | % | | | 112 | % | | | 214 | % | | | 149 | % |
a | Unaudited figures for the period ended March 31, 2016. Percentage amounts for the period, except total return and portfolio turnover rate, have been annualized. |
b | Net investment income (loss) per share was computed using average shares outstanding throughout the period. |
c | Total return does not reflect the impact of any applicable sales charges. |
d | Does not include expenses of the underlying funds in which the Fund invests. |
e | Net expense information reflects the expense ratios after expense waivers. |
f | Since commencement of operations: May 1, 2015. Percentage amounts for the period, except total return and portfolio turnover rate, have been annualized. |
g | Net investment income is less than $0.01 per share. |
h | Since commencement of operations: March 1, 2012. Percentage amounts for the period, except total return and portfolio turnover rate, have been annualized. |
i | Reverse share split — Per share amounts for the periods presented through April 8, 2011 have been restated to reflect a 1:4 reverse share split effect April 8, 2011. |
SEE NOTES TO FINANCIAL STATEMENTS. | THE GUGGENHEIM FUNDS SEMI-ANNUAL REPORT | 81 |
FUND PROFILE (Unaudited) | March 31, 2016 |
WORLD EQUITY INCOME FUND
OBJECTIVE: Sees to provide total return comprised of capital appreciation and income.
Holdings Diversification (Market Exposure as % of Net Assets)
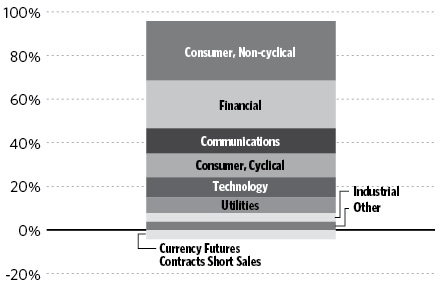
“Holdings Diversification (Market Exposure as % of Net Assets)” excludes any temporary cash investments.
COUNTRY DIVERSIFICATION
At March 31, 2016, the investment diversification of the Fund by country was as follows:
Country | % of Securities | Value |
United States | 55% | $48,343,444 |
Japan | 11% | 9,893,085 |
Canada | 7% | 6,212,650 |
Australia | 4% | 3,635,756 |
United Kingdom | 4% | 3,390,769 |
Sweden | 3% | 2,394,827 |
Singapore | 3% | 2,382,361 |
Other | 13% | 11,456,057 |
Total Securities | 100% | $87,708,949 |
| | | |
“Country Diversification” exclude any temporary cash or derivative investments. |
Inception Dates: |
A-Class | October 1, 1993 |
C-Class | January 29, 1999 |
P-Class | May 1, 2015 |
Institutional Class | May 2, 2011 |
Ten Largest Holdings (% of Total Net Assets) |
Johnson & Johnson | 1.6% |
AT&T, Inc. | 1.5% |
Verizon Communications, Inc. | 1.4% |
Wells Fargo & Co. | 1.4% |
Procter & Gamble Co. | 1.3% |
Home Depot, Inc. | 1.3% |
Apple, Inc. | 1.2% |
Merck & Company, Inc. | 1.2% |
Pfizer, Inc. | 1.2% |
International Business Machines Corp. | 1.2% |
Top Ten Total | 13.3% |
| | |
“Ten Largest Holdings” excludes any temporary cash or derivative investments. |
82 | THE GUGGENHEIM FUNDS SEMI-ANNUAL REPORT | |
SCHEDULE OF INVESTMENTS (Unaudited) | March 31, 2016 |
WORLD EQUITY INCOME FUND | |
| | | Shares | | | Value | |
| | | | | | | |
COMMON STOCKS† - 95.7% | |
| | | | | | | |
Consumer, Non-cyclical - 27.2% | |
Johnson & Johnson | | | 13,900 | | | | 1,503,979 | |
Procter & Gamble Co. | | | 14,282 | | | | 1,175,551 | |
Merck & Company, Inc. | | | 21,000 | | | | 1,111,110 | |
Pfizer, Inc. | | | 37,000 | | | | 1,096,680 | |
UnitedHealth Group, Inc. | | | 8,200 | | | | 1,056,980 | |
Altria Group, Inc. | | | 16,326 | | | | 1,022,987 | |
Roche Holding AG | | | 4,100 | | | | 1,009,277 | |
PepsiCo, Inc. | | | 9,761 | | | | 1,000,307 | |
Novartis AG | | | 13,000 | | | | 942,333 | |
GlaxoSmithKline plc | | | 46,400 | | | | 941,063 | |
Kimberly-Clark Corp. | | | 6,588 | | | | 886,152 | |
Automatic Data Processing, Inc. | | | 9,600 | | | | 861,216 | |
Dr Pepper Snapple Group, Inc. | | | 8,542 | | | | 763,826 | |
Eli Lilly & Co. | | | 10,400 | | | | 748,904 | |
Reynolds American, Inc. | | | 14,450 | | | | 726,980 | |
Anthem, Inc. | | | 5,100 | | | | 708,849 | |
Wesfarmers Ltd. | | | 22,000 | | | | 699,016 | |
Sysco Corp. | | | 14,516 | | | | 678,333 | |
Baxter International, Inc. | | | 16,400 | | | | 673,712 | |
Cardinal Health, Inc. | | | 8,200 | | | | 671,990 | |
Otsuka Holdings Company Ltd. | | | 18,300 | | | | 664,715 | |
Clorox Co. | | | 5,221 | | | | 658,159 | |
Transurban Group | | | 73,300 | | | | 637,733 | |
Woolworths Ltd. | | | 32,680 | | | | 553,622 | |
Philip Morris International, Inc. | | | 5,236 | | | | 513,704 | |
Wm Morrison Supermarkets plc | | | 176,995 | | | | 504,901 | |
Patterson Companies, Inc. | | | 10,000 | | | | 465,300 | |
Nissin Foods Holdings Company Ltd. | | | 9,718 | | | | 456,779 | |
Aetna, Inc. | | | 3,000 | | | | 337,050 | |
Asahi Group Holdings Ltd. | | | 10,667 | | | | 332,393 | |
Hutchison Port Holdings Trust — Class U | | | 616,900 | | | | 308,450 | |
Quest Diagnostics, Inc. | | | 4,000 | | | | 285,800 | |
Abbott Laboratories | | | 6,000 | | | | 250,980 | |
General Mills, Inc. | | | 3,827 | | | | 242,440 | |
Seven & i Holdings Company Ltd. | | | 4,780 | | | | 203,525 | |
Colgate-Palmolive Co. | | | 1,855 | | | | 131,056 | |
Gartner, Inc.* | | | 1,000 | | | | 89,350 | |
Henry Schein, Inc.* | | | 300 | | | | 51,789 | |
Total Consumer, Non-cyclical | | | | | | | 24,966,991 | |
| | | | | | | | | |
Financial - 21.9% | |
Wells Fargo & Co. | | | 25,600 | | | | 1,238,016 | |
Marsh & McLennan Companies, Inc. | | | 14,300 | | | | 869,297 | |
U.S. Bancorp | | | 21,000 | | | | 852,390 | |
CME Group, Inc. — Class A | | | 8,500 | | | | 816,425 | |
Swedbank AB — Class A | | | 37,600 | | | | 809,986 | |
Daito Trust Construction Company Ltd. | | | 4,900 | | | | 695,739 | |
Intact Financial Corp. | | | 9,900 | | | | 693,203 | |
Everest Re Group Ltd. | | | 3,500 | | | | 691,005 | |
Nordea Bank AB | | | 67,900 | | | | 652,326 | |
Cincinnati Financial Corp. | | | 9,600 | | | | 627,456 | |
Allianz AG | | | 3,800 | | | | 618,092 | |
Vicinity Centres | | | 252,058 | | | | 616,355 | |
Svenska Handelsbanken AB — Class A | | | 47,900 | | | | 609,447 | |
HSBC Holdings plc* | | | 96,700 | | | | 602,604 | |
M&T Bank Corp. | | | 5,400 | | | | 599,400 | |
Singapore Exchange Ltd. | | | 94,300 | | | | 556,216 | |
American Capital Agency Corp. REIT | | | 29,500 | | | | 549,585 | |
Simon Property Group, Inc. | | | 2,600 | | | | 539,994 | |
RenaissanceRe Holdings Ltd. | | | 4,300 | | | | 515,269 | |
Annaly Capital Management, Inc. | | | 49,700 | | | | 509,922 | |
People’s United Financial, Inc. | | | 31,600 | | | | 503,388 | |
Government Properties Trust, Inc.* | | | 129,600 | | | | 496,723 | |
Japan Retail Fund Investment Corp. | | | 200 | | | | 480,163 | |
T. Rowe Price Group, Inc. | | | 6,200 | | | | 455,452 | |
Axis Capital Holdings Ltd. | | | 8,100 | | | | 449,226 | |
First Capital Realty, Inc. | | | 28,200 | | | | 447,771 | |
CapitaLand Mall Trust | | | 283,900 | | | | 440,227 | |
H&R Real Estate Investment Trust | | | 25,800 | | | | 417,013 | |
Tryg A/S | | | 20,700 | | | | 401,767 | |
CI Financial Corp. | | | 16,000 | | | | 353,606 | |
Admiral Group plc | | | 11,500 | | | | 327,392 | |
Hannover Rueck SE | | | 2,600 | | | | 302,941 | |
Hang Seng Bank Ltd. | | | 15,000 | | | | 265,102 | |
Chubb Ltd. | | | 2,200 | | | | 262,130 | |
Suncorp Group Ltd. | | | 26,800 | | | | 244,673 | |
Bank of Montreal | | | 4,000 | | | | 242,935 | |
PNC Financial Services Group, Inc. | | | 2,400 | | | | 202,968 | |
JPMorgan Chase & Co. | | | 1,100 | | | | 65,142 | |
WR Berkley Corp. | | | 1,000 | | | | 56,200 | |
Total Financial | | | | | | | 20,077,546 | |
| | | | | | | | | |
Communications - 11.6% | |
AT&T, Inc. | | | 34,100 | | | | 1,335,697 | |
Verizon Communications, Inc. | | | 24,400 | | | | 1,319,552 | |
Comcast Corp. — Class A | | | 16,100 | | | | 983,388 | |
Vivendi S.A. | | | 32,700 | | | | 687,599 | |
Singapore Telecommunications Ltd. | | | 226,700 | | | | 642,510 | |
Telstra Corp., Ltd. | | | 155,900 | | | | 636,961 | |
Thomson Reuters Corp. | | | 15,300 | | | | 619,955 | |
Shaw Communications, Inc. — Class B | | | 31,800 | | | | 614,392 | |
Elisa Oyj | | | 15,000 | | | | 583,205 | |
Alphabet, Inc. — Class C* | | | 700 | | | | 521,465 | |
TELUS Corp. | | | 14,900 | | | | 485,109 | |
BCE, Inc. | | | 10,500 | | | | 478,581 | |
StarHub Ltd. | | | 175,000 | | | | 434,958 | |
Singapore Press Holdings Ltd.* | | | 128,200 | | | | 380,463 | |
TeliaSonera AB | | | 62,200 | | | | 323,068 | |
HKT Trust & HKT Ltd. | | | 170,100 | | | | 234,186 | |
Rogers Communications, Inc. — Class B | | | 4,700 | | | | 188,200 | |
TDC A/S | | | 35,000 | | | | 171,299 | |
Total Communications | | | | | | | 10,640,588 | |
SEE NOTES TO FINANCIAL STATEMENTS. | THE GUGGENHEIM FUNDS SEMI-ANNUAL REPORT | 83 |
SCHEDULE OF INVESTMENTS (Unaudited)(continued) | March 31, 2016 |
WORLD EQUITY INCOME FUND | |
| | | Shares | | | Value | |
| | | | | | | |
Consumer, Cyclical - 10.9% | |
Home Depot, Inc. | | | 8,700 | | | $ | 1,160,841 | |
Toyota Motor Corp. | | | 19,700 | | | | 1,041,845 | |
McDonald’s Corp. | | | 7,600 | | | | 955,168 | |
Wal-Mart Stores, Inc. | | | 13,375 | | | | 916,054 | |
Costco Wholesale Corp. | | | 4,945 | | | | 779,233 | |
Mitsui & Company Ltd. | | | 64,800 | | | | 745,621 | |
Sumitomo Corp. | | | 74,800 | | | | 743,381 | |
Marubeni Corp. | | | 141,000 | | | | 714,114 | |
ITOCHU Corp. | | | 50,600 | | | | 623,143 | |
Lawson, Inc. | | | 7,288 | | | | 610,005 | |
Sankyo Company Ltd. | | | 14,600 | | | | 543,551 | |
Persimmon plc | | | 16,600 | | | | 497,142 | |
Next plc* | | | 5,500 | | | | 426,207 | |
FamilyMart Company Ltd. | | | 4,456 | | | | 231,619 | |
Mitsubishi Corp. | | | 1,800 | | | | 30,484 | |
Total Consumer, Cyclical | | | | | | | 10,018,408 | |
| | | | | | | | | |
Technology - 9.2% | |
Apple, Inc. | | | 10,500 | | | | 1,144,395 | |
International Business Machines Corp. | | | 7,100 | | | | 1,075,295 | |
Accenture plc — Class A | | | 8,100 | | | | 934,740 | |
Canon, Inc. | | | 29,000 | | | | 864,499 | |
Paychex, Inc. | | | 15,700 | | | | 847,957 | |
CA, Inc. | | | 24,800 | | | | 763,592 | |
Fidelity National Information Services, Inc. | | | 10,300 | | | | 652,093 | |
Oracle Corporation Japan | | | 10,900 | | | | 612,093 | |
Microsoft Corp. | | | 10,900 | | | | 602,007 | |
SAP AG | | | 6,000 | | | | 485,407 | |
Fiserv, Inc.* | | | 4,000 | | | | 410,320 | |
Total Technology | | | | | | | 8,392,398 | |
| | | | | | | | | |
Utilities - 7.2% | |
PPL Corp. | | | 21,654 | | | | 824,368 | |
CLP Holdings Ltd. | | | 81,737 | | | | 739,148 | |
Southern Co. | | | 13,960 | | | | 722,151 | |
Duke Energy Corp. | | | 8,773 | | | | 707,806 | |
Dominion Resources, Inc. | | | 9,268 | | | | 696,212 | |
Terna Rete Elettrica Nazionale SpA | | | 115,600 | | | | 659,651 | |
Snam SpA | | | 104,500 | | | | 654,574 | |
DTE Energy Co. | | | 4,093 | | | | 371,071 | |
Osaka Gas Company Ltd. | | | 77,932 | | | | 299,416 | |
CenterPoint Energy, Inc. | | | 14,212 | | | | 297,315 | |
SCANA Corp. | | | 4,089 | | | | 286,843 | |
Sempra Energy | | | 2,299 | | | | 239,211 | |
Fortis, Inc. | | | 2,357 | | | | 73,889 | |
Total Utilities | | | | | | | 6,571,655 | |
| | | | | | | | | |
Industrial - 4.0% | |
Lockheed Martin Corp. | | | 4,000 | | | | 886,000 | |
Waste Management, Inc. | | | 12,200 | | | | 719,799 | |
MTR Corporation Ltd. | | | 111,000 | | | | 549,464 | |
Republic Services, Inc. — Class A | | | 11,000 | | | | 524,150 | |
Honeywell International, Inc. | | | 3,400 | | | | 380,970 | |
Aurizon Holdings Ltd. | | | 81,500 | | | | 247,396 | |
General Electric Co. | | | 6,000 | | | | 190,740 | |
CAE, Inc. | | | 14,200 | | | | 164,239 | |
Total Industrial | | | | | | | 3,662,758 | |
| | | | | | | | | |
Energy - 2.7% | |
Exxon Mobil Corp. | | | 10,100 | | | | 844,259 | |
TransCanada Corp. | | | 20,400 | | | | 802,101 | |
Royal Dutch Shell plc — Class B | | | 21,200 | | | | 517,667 | |
Eni SpA | | | 19,800 | | | | 299,642 | |
Total Energy | | | | | | | 2,463,669 | |
| | | | | | | | | |
Basic Materials - 1.0% | |
Potash Corporation of Saskatchewan, Inc. | | | 37,100 | | | | 631,656 | |
Airgas, Inc. | | | 2,000 | | | | 283,280 | |
Total Basic Materials | | | | | | | 914,936 | |
| | | | | | | | | |
Total Common Stocks | | | | | | | | |
(Cost $86,056,041) | | | | | | | 87,708,949 | |
| | | | | | | | | |
SHORT TERM INVESTMENTS† - 3.8% | |
Goldman Sachs Financial Square Treasury Instruments Fund Institutional Shares 0.19%1 | | | 3,444,654 | | | | 3,444,654 | |
Total Short Term Investments | | | | | | | | |
(Cost $3,444,654) | | | | | | | 3,444,654 | |
| | | | | | | | | |
Total Investments - 99.5% | | | | | | | | |
(Cost $89,500,695) | | | | | | $ | 91,153,603 | |
Other Assets & Liabilities, net - 0.5% | | | | | | | 485,499 | |
Total Net Assets - 100.0% | | | | | | $ | 91,639,102 | |
| | | Contracts | | | Unrealized
Loss | |
| | | | | | | | | |
CURRENCY FUTURES CONTRACTS SOLD SHORT† | |
June 2016 British Pound
Futures Contracts
(Aggregate Value of
Contracts $3,860,863) | | | 43 | | | $ | (39,337 | ) |
84 | THE GUGGENHEIM FUNDS SEMI-ANNUAL REPORT | SEE NOTES TO FINANCIAL STATEMENTS. |
SCHEDULE OF INVESTMENTS (Unaudited)(concluded) | March 31, 2016 |
WORLD EQUITY INCOME FUND | |
* | Non-income producing security. |
† | Value determined based on Level 1 inputs — See Note 4 |
1 | Rate indicated is the 7 day yield as of March 31, 2016. |
| | plc — Public Limited Company |
| | REIT — Real Estate Investment Trust |
| | |
| | See Sector Classification in Other Information section. |
The following table summarizes the inputs used to value the Fund’s investments at March 31, 2016 (See Note 4 in the Notes to Financial Statements):
Investments in Securities (Assets) | | Level 1 | | | Level 1 -
Other* | | | Level 2 | | | Level 3 | | | Total | |
Common Stocks | | $ | 87,708,949 | | | $ | — | | | $ | — | | | $ | — | | | $ | 87,708,949 | |
Short Term Investments | | | 3,444,654 | | | | — | | | | — | | | | — | | | | 3,444,654 | |
Total | | $ | 91,153,603 | | | $ | — | | | $ | — | | | $ | — | | | $ | 91,153,603 | |
| | | | | | | | | | | | | | | | | | | | | |
Investments in Securities (Liabilities) | | Level 1 | | | Level 1 -
Other* | | | Level 2 | | | Level 3 | | | Total | |
Currency Futures Contracts | | $ | — | | | $ | 39,337 | | | $ | — | | | $ | — | | | $ | 39,337 | |
* | Other financial instruments include futures contracts which are reported as unrealized gain/loss at period end. |
For the period ended March 31, 2016, there were no transfers between levels.
SEE NOTES TO FINANCIAL STATEMENTS. | THE GUGGENHEIM FUNDS SEMI-ANNUAL REPORT | 85 |
STATEMENT OF ASSETS AND LIABILITIES (Unaudited) | |
March 31, 2016 | |
Assets: | |
Investments, at value (cost $89,500,695) | | $ | 91,153,603 | |
Foreign currency, at value (cost $70,260) | | | 70,357 | |
Segregated cash with broker | | | 88,150 | |
Prepaid expenses | | | 38,325 | |
Receivables: | |
Dividends | | | 370,077 | |
Foreign taxes reclaim | | | 246,455 | |
Fund shares sold | | | 22,345 | |
Variation margin | | | 6,181 | |
Total assets | | | 91,995,493 | |
| | | | | |
LIABILITIES: | |
Overdraft due to custodian bank | | | 28,989 | |
Payable for: | | | | |
Fund shares redeemed | | | 167,400 | |
Management fees | | | 60,353 | |
Distributions to Shareholders | | | 38,350 | |
Distribution and service fees | | | 22,167 | |
Fund accounting/administration fees | | | 11,430 | |
Transfer agent/maintenance fees | | | 9,590 | |
Trustees' fees* | | | 2,520 | |
Miscellaneous | | | 15,592 | |
Total liabilities | | | 356,391 | |
Net assets | | $ | 91,639,102 | |
| | | | | |
Net assets consist of: | |
Paid in capital | | $ | 111,659,824 | |
Accumulated net investment loss | | | (284,277 | ) |
Accumulated net realized loss on investments | | | (21,349,191 | ) |
Net unrealized appreciation on investments | | | 1,612,746 | |
Net assets | | $ | 91,639,102 | |
| | | | | |
A-Class: | |
Net assets | | $ | 83,010,445 | |
Capital shares outstanding | | | 6,316,441 | |
Net asset value per share | | $ | 13.14 | |
Maximum offering price per share (Net asset value divided by 95.25%) | | $ | 13.80 | |
| | | | | |
C-Class: | |
Net assets | | $ | 5,886,044 | |
Capital shares outstanding | | | 521,498 | |
Net asset value per share | | $ | 11.29 | |
| | | | | |
P-Class: | |
Net assets | | $ | 104,039 | |
Capital shares outstanding | | | 7,855 | |
Net asset value per share | | $ | 13.24 | |
| | | | | |
Institutional Class: | |
Net assets | | $ | 2,638,574 | |
Capital shares outstanding | | | 202,162 | |
Net asset value per share | | $ | 13.05 | |
STATEMENT OF OPERATIONS (Unaudited) | |
Period Ended March 31, 2016 | |
Investment Income: | |
Dividends (net of foreign withholding tax of $104,470) | | $ | 1,608,232 | |
Other income | | | 245 | |
Total investment income | | | 1,608,477 | |
| | | | | |
Expenses: | |
Management fees | | | 319,132 | |
Transfer agent/maintenance fees: | |
A-Class | | | 40,528 | |
C-Class | | | 7,964 | |
P-Class | | | 41 | |
Institutional Class | | | 3,421 | |
Distribution and service fees: | |
A-Class | | | 94,721 | |
C-Class | | | 28,796 | |
P-Class | | | 686 | |
Fund accounting/administration fees | | | 64,262 | |
Custodian fees | | | 9,098 | |
Line of credit fees | | | 5,110 | |
Trustees’ fees* | | | 3,656 | |
Miscellaneous | | | 71,117 | |
Total expenses | | | 648,532 | |
Net investment income | | | 959,945 | |
| | | | | |
Net Realized and Unrealized Gain (Loss): | |
Net realized gain (loss) on: | |
Investments | | | (1,325,849 | ) |
Futures contracts | | | (74,645 | ) |
Foreign currency | | | (5,035 | ) |
Net realized loss | | | (1,405,529 | ) |
Net change in unrealized appreciation (depreciation) on: | |
Investments | | | 7,341,882 | |
Futures contracts | | | (39,337 | ) |
Foreign currency | | | 12,788 | |
Net change in unrealized appreciation (depreciation) | | | 7,315,333 | |
Net realized and unrealized gain | | | 5,909,804 | |
Net increase in net assets resulting from operations | | $ | 6,869,749 | |
* | Relates to Trustees not deemed “interested persons” within the meaning of Section 2(a)(19) of the 1940 Act. |
86 | THE GUGGENHEIM FUNDS SEMI-ANNUAL REPORT | SEE NOTES TO FINANCIAL STATEMENTS. |
STATEMENTS OF CHANGES IN NET ASSETS |
| | | Period Ended
March 31,
2016
(Unaudited) | | | Year Ended
September 30,
2015 | |
Increase (Decrease) in Net Assets from Operations: | | | | | | |
Net investment income | | $ | 959,945 | | | $ | 2,011,185 | |
Net realized loss on investments | | | (1,405,529 | ) | | | (1,277,947 | ) |
Net change in unrealized appreciation (depreciation) on investments | | | 7,315,333 | | | | (6,974,344 | ) |
Net increase (decrease) in net assets resulting from operations | | | 6,869,749 | | | | (6,241,106 | ) |
| | | | | | | | | |
Distributions to shareholders from: | | | | | | | | |
Net investment income | | | | | | | | |
A-Class | | | (868,526 | ) | | | (2,093,228 | ) |
B-Class | | | — | | | | (37,182 | ) |
C-Class | | | (43,846 | ) | | | (113,425 | ) |
P-Class | | | (2,609 | ) | | | (87 | )* |
Institutional Class | | | (40,396 | ) | | | (100,864 | ) |
Total distributions to shareholders | | | (955,377 | ) | | | (2,344,786 | ) |
| | | | | | | | | |
Capital share transactions: | | | | | | | | |
Proceeds from sale of shares | | | | | | | | |
A-Class | | | 11,910,193 | | | | 21,530,432 | |
B-Class | | | — | | | | 426 | |
C-Class | | | 720,297 | | | | 2,875,991 | |
P-Class | | | 1,162,169 | | | | 10,001 | * |
Institutional Class | | | 1,184,085 | | | | 5,710,071 | |
Distributions reinvested | | | | | | | | |
A-Class | | | 840,093 | | | | 2,035,374 | |
B-Class | | | — | | | | 37,174 | |
C-Class | | | 37,693 | | | | 89,045 | |
P-Class | | | 2,609 | | | | 87 | * |
Institutional Class | | | 19,458 | | | | 44,847 | |
Cost of shares redeemed | | | | | | | | |
A-Class | | | (8,582,513 | ) | | | (21,295,826 | ) |
B-Class | | | — | | | | (1,916,762 | ) |
C-Class | | | (1,203,898 | ) | | | (1,746,534 | ) |
P-Class | | | (1,056,779 | ) | | | — | * |
Institutional Class | | | (3,362,215 | ) | | | (1,698,989 | ) |
Net increase from capital share transactions | | | 1,671,192 | | | | 5,675,337 | |
Net increase (decrease) in net assets | | | 7,585,564 | | | | (2,910,555 | ) |
| | | | | | | | | |
Net assets: | | | | | | | | |
Beginning of period | | | 84,053,538 | | | | 86,964,093 | |
End of period | | $ | 91,639,102 | | | $ | 84,053,538 | |
Accumulated net investment loss at end of period | | $ | (284,277 | ) | | $ | (288,845 | ) |
SEE NOTES TO FINANCIAL STATEMENTS. | THE GUGGENHEIM FUNDS SEMI-ANNUAL REPORT | 87 |
STATEMENTS OF CHANGES IN NET ASSETS (concluded) |
| | | Period Ended
March 31,
2016
(Unaudited) | | | Year Ended
September 30,
2015 | |
Capital share activity: | | | | | | |
Shares sold | | | | | | |
A-Class | | | 938,910 | | | | 1,601,893 | |
B-Class | | | — | | | | 36 | |
C-Class | | | 65,920 | | | | 249,395 | |
P-Class | | | 90,134 | | | | 734 | * |
Institutional Class | | | 93,971 | | | | 430,264 | |
Shares issued from reinvestment of distributions | | | | | | | | |
A-Class | | | 64,359 | | | | 156,014 | |
B-Class | | | — | | | | 3,234 | |
C-Class | | | 3,351 | | | | 7,937 | |
P-Class | | | 201 | | | | 7 | * |
Institutional Class | | | 1,503 | | | | 3,463 | |
Shares redeemed | | | | | | | | |
A-Class | | | (677,615 | ) | | | (1,598,406 | ) |
B-Class | | | — | | | | (167,791 | ) |
C-Class | | | (110,337 | ) | | | (154,420 | ) |
P-Class | | | (83,221 | ) | | | — | * |
Institutional Class | | | (264,610 | ) | | | (130,120 | ) |
Net increase in shares | | | 122,566 | | | | 402,240 | |
* | Since commencement of operations: May 1, 2015. |
88 | THE GUGGENHEIM FUNDS SEMI-ANNUAL REPORT | SEE NOTES TO FINANCIAL STATEMENTS. |
This table is presented to show selected data for a share outstanding throughout each period and to assist shareholders in evaluating a Fund’s performance for the periods presented.
A-Class | | Period Ended
March 31,
2016a | | Year Ended
September 30,
2015 | | Year Ended
September 30,
2014 | | Year Ended
September 30,
2013 | | Year Ended
September 30,
2012 | | Year Ended
September 30,
2011 | |
Per Share Data | | | | | | | | | | | | | | | | | | |
Net asset value, beginning of period | | $ | 12.28 | | | $ | 13.51 | | | $ | 12.60 | | | $ | 10.55 | | | $ | 9.70 | | | $ | 10.52 | |
Income (loss) from investment operations: | |
Net investment income (loss)b | | | .15 | | | | .29 | | | | .38 | | | | .18 | | | | .15 | | | | .05 | |
Net gain (loss) on investments (realized and unrealized) | | | .85 | | | | (1.18 | ) | | | .95 | | | | 2.16 | | | | .70 | | | | (.81 | ) |
Total from investment operations | | | 1.00 | | | | (.89 | ) | | | 1.33 | | | | 2.34 | | | | .85 | | | | (.76 | ) |
Less distributions from: | |
Net investment income | | | (.14 | ) | | | (.34 | ) | | | (.42 | ) | | | (.29 | ) | | | (— | )c | | | (.06 | ) |
Total distributions | | | (.14 | ) | | | (.34 | ) | | | (.42 | ) | | | (.29 | ) | | | (— | )c | | | (.06 | ) |
Net asset value, end of period | | $ | 13.14 | | | $ | 12.28 | | | $ | 13.51 | | | $ | 12.60 | | | $ | 10.55 | | | $ | 9.70 | |
| | |
Total Returnd | | | 8.15 | % | | | (6.70 | %) | | | 10.62 | % | | | 22.58 | % | | | 8.82 | % | | | (7.32 | %) |
Ratios/Supplemental Data | |
Net assets, end of period (in thousands) | | $ | 83,010 | | | $ | 73,568 | | | $ | 78,783 | | | $ | 65,966 | | | $ | 61,838 | | | $ | 65,573 | |
Ratios to average net assets: | |
Net investment income (loss) | | | 2.30 | % | | | 2.21 | % | | | 2.81 | % | | | 1.59 | % | | | 1.45 | % | | | 0.04 | % |
Total expensese | | | 1.48 | % | | | 1.48 | % | | | 1.66 | % | | | 1.93 | % | | | 2.05 | % | | | 1.85 | % |
Net expensesf | | | 1.48 | %i | | | 1.43 | %i | | | 1.49 | %i | | | 1.59 | % | | | 1.63 | % | | | 1.82 | % |
Portfolio turnover rate | | | 25 | % | | | 131 | % | | | 131 | % | | | 154 | % | | | 41 | % | | | 206 | % |
C-Class | | Period Ended
March 31,
2016a | | Year Ended
September 30,
2015 | | Year Ended
September 30,
2014 | | Year Ended
September 30,
2013 | | Year Ended
September 30,
2012 | | Year Ended
September 30,
2011 | |
Per Share Data | | | | | | | | | | | | | | | | | | |
Net asset value, beginning of period | | $ | 10.55 | | | $ | 11.61 | | | $ | 10.79 | | | $ | 9.01 | | | $ | 8.33 | | | $ | 9.06 | |
Income (loss) from investment operations: | |
Net investment income (loss)b | | | .08 | | | | .17 | | | | .25 | | | | .08 | | | | .06 | | | | (.04 | ) |
Net gain (loss) on investments (realized and unrealized) | | | .74 | | | | (1.02 | ) | | | .81 | | | | 1.84 | | | | .62 | | | | (.69 | ) |
Total from investment operations | | | .82 | | | | (.85 | ) | | | 1.06 | | | | 1.92 | | | | .68 | | | | (.73 | ) |
Less distributions from: | |
Net investment income | | | (.08 | ) | | | (.21 | ) | | | (.24 | ) | | | (.14 | ) | | | — | | | | — | |
Total distributions | | | (.08 | ) | | | (.21 | ) | | | (.24 | ) | | | (.14 | ) | | | — | | | | — | |
Net asset value, end of period | | $ | 11.29 | | | $ | 10.55 | | | $ | 11.61 | | | $ | 10.79 | | | $ | 9.01 | | | $ | 8.33 | |
| | |
Total Returnd | | | 7.82 | % | | | (7.40 | %) | | | 9.79 | % | | | 21.57 | % | | | 8.16 | % | | | (8.06 | %) |
Ratios/Supplemental Data | |
Net assets, end of period (in thousands) | | $ | 5,886 | | | $ | 5,936 | | | $ | 5,337 | | | $ | 3,377 | | | $ | 3,015 | | | $ | 3,426 | |
Ratios to average net assets: | |
Net investment income (loss) | | | 1.52 | % | | | 1.50 | % | | | 2.13 | % | | | 0.80 | % | | | 0.68 | % | | | (0.37 | %) |
Total expensese | | | 2.23 | % | | | 2.28 | % | | | 2.62 | % | | | 2.89 | % | | | 2.88 | % | | | 2.60 | % |
Net expensesf | | | 2.23 | %i | | | 2.23 | %i | | | 2.24 | %i | | | 2.35 | % | | | 2.38 | % | | | 2.58 | % |
Portfolio turnover rate | | | 25 | % | | | 131 | % | | | 131 | % | | | 154 | % | | | 41 | % | | | 206 | % |
SEE NOTES TO FINANCIAL STATEMENTS. | THE GUGGENHEIM FUNDS SEMI-ANNUAL REPORT | 89 |
FINANCIAL HIGHLIGHTS (continued) |
This table is presented to show selected data for a share outstanding throughout each period and to assist shareholders in evaluating a Fund’s performance for the periods presented.
P-Class | | Period Ended
March 31,
2016a | | | Period Ended
September 30,
2015g | |
Per Share Data | | | | | | |
Net asset value, beginning of period | | $ | 12.33 | | | $ | 13.62 | |
Income (loss) from investment operations: | |
Net investment income (loss)b | | | .15 | | | | .12 | |
Net gain (loss) on investments (realized and unrealized) | | | .88 | | | | (1.29 | ) |
Total from investment operations | | | 1.03 | | | | (1.17 | ) |
Less distributions from: | |
Net investment income | | | (.12 | ) | | | (.12 | ) |
Total distributions | | | (.12 | ) | | | (.12 | ) |
Net asset value, end of period | | $ | 13.24 | | | $ | 12.33 | |
| | |
Total Returnd | | | 8.38 | % | | | (8.64 | %) |
Ratios/Supplemental Data | |
Net assets, end of period (in thousands) | | $ | 104 | | | $ | 9 | |
Ratios to average net assets: | |
Net investment income (loss) | | | 2.45 | % | | | 2.14 | % |
Total expensese | | | 1.48 | % | | | 3.54 | % |
Net expensesf,i | | | 1.48 | % | | | 1.48 | % |
Portfolio turnover rate | | | 25 | % | | | 131 | % |
90 | THE GUGGENHEIM FUNDS SEMI-ANNUAL REPORT | SEE NOTES TO FINANCIAL STATEMENTS. |
FINANCIAL HIGHLIGHTS (concluded) |
This table is presented to show selected data for a share outstanding throughout each period and to assist shareholders in evaluating a Fund’s performance for the periods presented.
Institutional Class | | Period Ended
March 31,
2016a | | Year Ended
September 30,
2015 | | Year Ended
September 30,
2014 | | Year Ended
September 30,
2013 | | Year Ended
September 30,
2012 | | Period Ended
September 30,
2011h | |
Per Share Data | | | | | | | | | | | | | | | | | | |
Net asset value, beginning of period | | $ | 12.23 | | | $ | 13.45 | | | $ | 12.53 | | | $ | 10.50 | | | $ | 9.70 | | | $ | 12.37 | |
Income (loss) from investment operations: | |
Net investment income (loss)b | | | .14 | | | | .36 | | | | .44 | | | | .28 | | | | .28 | | | | .13 | |
Net gain (loss) on investments (realized and unrealized) | | | .87 | | | | (1.21 | ) | | | .90 | | | | 2.10 | | | | .52 | | | | (2.80 | ) |
Total from investment operations | | | 1.01 | | | | (.85 | ) | | | 1.34 | | | | 2.38 | | | | .80 | | | | (2.67 | ) |
Less distributions from: | |
Net investment income | | | (.19 | ) | | | (.37 | ) | | | (.42 | ) | | | (.35 | ) | | | (— | )c | | | — | |
Total distributions | | | (.19 | ) | | | (.37 | ) | | | (.42 | ) | | | (.35 | ) | | | (— | )c | | | — | |
Net asset value, end of period | | $ | 13.05 | | | $ | 12.23 | | | $ | 13.45 | | | $ | 12.53 | | | $ | 10.50 | | | $ | 9.70 | |
| | |
Total Returnd | | | 8.29 | % | | | (6.42 | %) | | | 10.83 | % | | | 23.17 | % | | | 8.17 | % | | | (21.58 | %) |
Ratios/Supplemental Data | |
Net assets, end of period (in thousands) | | $ | 2,639 | | | $ | 4,541 | | | $ | 911 | | | $ | 252 | | | $ | 90 | | | $ | 285 | |
Ratios to average net assets: | |
Net investment income (loss) | | | 2.26 | % | | | 2.70 | % | | | 3.27 | % | | | 2.42 | % | | | 2.70 | % | | | 2.99 | % |
Total expensese | | | 1.22 | % | | | 1.23 | % | | | 1.33 | % | | | 1.73 | % | | | 1.90 | % | | | 2.27 | % |
Net expensesf | | | 1.22 | %i | | | 1.23 | %i | | | 1.23 | %i | | | 1.26 | % | | | 1.32 | % | | | 1.36 | % |
Portfolio turnover rate | | | 25 | % | | | 131 | % | | | 131 | % | | | 154 | % | | | 41 | % | | | 206 | % |
a | Unaudited figures for the period ended March 31, 2016. Percentage amounts for the period, except total return and portfolio turnover rate, have been annualized. |
b | Net investment income (loss) per share was computed using average shares outstanding throughout the period. |
c | Distributions from net investment income are less than $0.01 per share. |
d | Total return does not reflect the impact of any applicable sales charges. |
e | Does not include expenses of the underlying funds in which the Fund invests. |
f | Net expense information reflects the expense ratios after expense waivers and reimbursements, as applicable. |
g | Since commencement of operations: May 1, 2015. Percentage amounts for the period, except total return and portfolio turnover rate, have been annualized. |
h | Since commencement of operations: May 2, 2011. Percentage amounts for the period, except total return and portfolio turnover rate, have been annualized. |
i | Net expenses may include expenses that are excluded from the expense limitation agreement and recouped amounts. Excluding these expenses, the operating expense ratios for the periods presented would be: |
| | 03/31/16 | 09/30/15 | 09/30/14 |
A-Class | 1.46% | 1.46% | 1.46% |
C-Class | 2.21% | 2.21% | 2.21% |
P-Class | 1.46% | 1.46% | — |
Institutional Class | 1.21% | 1.21% | 1.21% |
SEE NOTES TO FINANCIAL STATEMENTS. | THE GUGGENHEIM FUNDS SEMI-ANNUAL REPORT | 91 |
NOTES TO FINANCIAL STATEMENTS (Unaudited) |
1. Organization and Significant Accounting Policies
Organization
Guggenheim Funds Trust (the “Trust”), a Delaware statutory trust, is registered with the SEC under the Investment Company Act of 1940 (“1940 Act”), as an open-ended investment company of the series type. Each series, in effect, is representing a separate Fund. The Trust is authorized to issue an unlimited number of shares. The Trust accounts for the assets of each Fund separately.
The Trust offers a combination of four separate classes of shares, A-Class shares, C-Class shares, P-Class shares and Institutional Class shares. Sales of shares of each Class are made without a front-end sales charge at the net asset value per share (“NAV”), with the exception of A-Class shares. A-Class shares are sold at the NAV, plus the applicable front-end sales charge. The sales charge varies depending on the amount purchased. A-Class share purchases of $1 million or more are exempt from the front-end sales charge but have a 1% contingent deferred sales charge (“CDSC”), if shares are redeemed within 12 months of purchase. B-Class shares previously offered have been converted to A-Class shares effective July 31, 2014 for the Alpha Opportunity Fund, and effective August 8, 2015 for the other funds in the Trust. C-Class shares have a 1% CDSC if shares are redeemed within 12 months of purchase. Institutional Class shares are offered primarily for direct investment by institutions such as pension and profit sharing plans, endowments, foundations and corporations. Institutional Class shares require a minimum initial investment of $2 million and a minimum account balance of $1 million. At March 31, 2016, the Trust consisted of nineteen funds.
This report covers the Alpha Opportunity Fund, Large Cap Value Fund, Market Neutral Real Estate Fund, Risk Managed Real Estate Fund, Small Cap Value Fund, StylePlus—Large Core Fund, StylePlus—Mid Growth Fund and World Equity Income Fund (the “Funds”), each a diversified investment company, with the exception of the Large Cap Value Fund, Market Neutral Real Estate Fund and Risk Managed Real Estate Fund, which are each a non-diversified investment company.
Guggenheim Investments (“GI”) provides advisory services, and Rydex Fund Services, LLC (“RFS”) provides transfer agent, administrative and accounting services to the Trust. Guggenheim Funds Distributors, LLC (“GFD”) acts as principal underwriter for the Trust. GI, RFS and GFD are affiliated entities.
Significant Accounting Policies
The Funds operate as investment companies and accordingly follow the investment company accounting and reporting guidance of the Financial Accounting Standards Board (“FASB”) Accounting Standards Codification Topic 946 Financial Services – Investment Companies.
The following significant accounting policies are in conformity with U.S. generally accepted accounting principles (“U.S. GAAP”) and are consistently followed by the Trust. This requires management to make estimates and assumptions that affect the reported amount of assets and liabilities and disclosure of contingent assets and liabilities at the date of the financial statements and the reported amounts of revenues and expenses during the reporting period. Actual results could differ from these estimates. All time references are based on Eastern Time.
The NAV of each Class of the Funds is calculated by dividing the market value of the Fund’s securities and other assets, less all liabilities, attributable to the Class by the number of outstanding shares of the Class.
A. The Board of Trustees of the Funds (the “Board”) has adopted policies and procedures for the valuation of the Funds’ investments (the “Valuation Procedures”). Pursuant to the Valuation Procedures, the Board has delegated to a valuation committee, consisting of representatives from Guggenheim’s investment management, fund administration, legal and compliance departments (the “Valuation Committee”), the day-to-day responsibility for implementing the Valuation Procedures, including, under most circumstances, the responsibility for determining the fair value of the Funds’ securities or other assets.
Valuations of the Funds’ securities are supplied primarily by pricing services appointed pursuant to the processes set forth in the Valuation Procedures. The Valuation Committee convenes monthly, or more frequently as needed, and will review the valuation of all assets which have been fair valued for reasonableness. The Funds’ officers, through the Valuation Committee and consistent with the monitoring and review responsibilities set forth in the Valuation Procedures, regularly review procedures used by, and valuations provided by, the pricing services.
If the pricing service cannot or does not provide a valuation for a particular investment or such valuation is deemed unreliable, such investment is fair valued by the Valuation Committee.
92 | THE GUGGENHEIM FUNDS SEMI-ANNUAL REPORT | |
NOTES TO FINANCIAL STATEMENTS (Unaudited)(continued) |
Equity securities listed on an exchange (New York Stock Exchange (“NYSE”) or American Stock Exchange) are valued at the last quoted sales price as of the close of business on the NYSE, usually 4:00 p.m. on the valuation date. Equity securities listed on the NASDAQ market system are valued at the NASDAQ Official Closing Price on the valuation date, which may not necessarily represent the last sale price. If there has been no sale on such exchange or NASDAQ on a given day, the security is valued at the closing bid price on that day.
Generally, trading in foreign securities markets is substantially completed each day at various times prior to the close of the NYSE. The values of foreign securities are determined as of the close of such foreign markets or the close of the NYSE, if earlier. All investments quoted in foreign currency are valued in U.S. dollars on the basis of the foreign currency exchange rates prevailing at the close of business. Investments in foreign securities may involve risks not present in domestic investments. The Valuation Committee will determine the current value of such foreign securities by taking into consideration certain factors which may include those discussed above, as well as the following factors, among others: the value of the securities traded on other foreign markets, ADR trading, closed-end fund trading, foreign currency exchange activity, and the trading prices of financial products that are tied to foreign securities. In addition, the Board of Trustees has authorized the Valuation Committee and GI to use prices and other information supplied by a third party pricing vendor in valuing foreign securities.
Open-end investment companies (“Mutual Funds”) are valued at their NAV as of the close of business, on the valuation date. Exchange-traded funds (“ETFs”) are valued at the last quoted sales price.
Debt securities with a maturity of greater than 60 days at acquisition are valued at prices that reflect broker/dealer supplied valuations or are obtained from independent pricing services, which may consider the trade activity, treasury spreads, yields or price of bonds of comparable quality, coupon, maturity, and type, as well as prices quoted by dealers who make markets in such securities. Short-term debt securities with a maturity of 60 days or less at acquisition are valued at amortized cost, provided such amount approximates market value.
The value of futures contracts is accounted for using the unrealized gain or loss on the contracts that is determined by marking the contracts to their current realized settlement prices. Financial futures contracts are valued at the 4:00 p.m. price on the valuation date. In the event that the exchange for a specific futures contract closes earlier than 4:00 p.m., the futures contract is valued at the Official Settlement Price of the exchange. However, the underlying securities from which the futures contract value is derived are monitored until 4:00 p.m. to determine if fair valuation would provide a more accurate valuation.
The value of OTC swap agreements entered into by a Fund is accounted for using the unrealized gain or loss on the agreements that is determined by marking the agreements to the last quoted value of the index that the swap pertains to at the close of the NYSE. The swap’s value is then adjusted to include dividends accrued, and financing charges and/or interest associated with the swap agreements.
Investments for which market quotations are not readily available are fair valued as determined in good faith by GI under the direction of the Board of Trustees using methods established or ratified by the Board of Trustees. Valuations in accordance with these methods are intended to reflect each security’s (or asset’s) “fair value.” Each such determination is based on a consideration of all relevant factors, which are likely to vary from one pricing context to another. Examples of such factors may include, but are not limited to: (i) the type of security, (ii) the initial cost of the security, (iii) the existence of any contractual restrictions on the security’s disposition, (iv) the price and extent of public trading in similar securities of the issuer or of comparable companies, (v) quotations or evaluated prices from broker-dealers and/or pricing services, (vi) information obtained from the issuer, analysts, and/or the appropriate stock exchange (for exchange-traded securities), (vii) an analysis of the company’s financial statements, and (viii) an evaluation of the forces that influence the issuer and the market(s) in which the security is purchased and sold (e.g. the existence of pending merger activity, public offerings or tender offers that might affect the value of the security).
In connection with futures contracts and other derivative investments, such factors may include obtaining information as to how (a) these contracts and other derivative investments trade in the futures or other derivative markets, respectively, and (b) the securities underlying these contracts and other derivative investments trade in the cash market.
| | THE GUGGENHEIM FUNDS SEMI-ANNUAL REPORT | 93 |
NOTES TO FINANCIAL STATEMENTS (Unaudited)(continued) |
B. The Funds may purchase and sell interests in securities on a when-issued and delayed delivery basis, with payment and delivery scheduled for a future date. No income accrues to the Fund on such interests or securities in connection with such transactions prior to the date the Funds actually take delivery of such interests or securities. These transactions are subject to market fluctuations and are subject to the risk that the value at delivery may be more or less than the trade date purchase price. Although the Funds will generally purchase these securities with the intention of acquiring such securities, they may sell such securities before the settlement date.
C. When a Fund engages in a short sale of a security, an amount equal to the proceeds is reflected as an asset and an equivalent liability. The amount of the liability is subsequently marked-to-market to reflect the market value of the short sale. The Fund maintains a segregated account of cash and/or securities as collateral for short sales.
Fees, if any, paid to brokers to borrow securities in connection with short sales are recorded as interest expense. In addition, the Fund must pay out the dividend rate of the equity or coupon rate of the obligation to the lender and record this as an expense. Short dividend or interest expense is a cost associated with the investment objective of short sales transactions, rather than an operational cost associated with the day-to-day management of any mutual fund. The Fund may also receive rebate income from the broker resulting from the investment of the proceeds from securities sold short.
D. Upon entering into a futures contract, a Fund deposits and maintains as collateral such initial margin as required by the exchange on which the transaction is affected. Pursuant to the contract, the Fund agrees to receive from or pay to the broker an amount of cash equal to the daily fluctuation in value of the contract. Such receipts or payments are known as variation margin and are recorded by the Fund as unrealized gains or losses. When the contract is closed, the Fund records a realized gain or loss equal to the difference between the value of the contract at the time it was opened and the value at the time it was closed.
E. Swap agreements are marked-to-market daily and the change, if any, is recorded as unrealized gain or loss. Payments received or made as a result of an agreement or termination of the agreement are recognized as realized gains or losses.
F. Security transactions are recorded on the trade date for financial reporting purposes. Realized gains and losses from securities transactions are recorded using the identified cost basis. Proceeds from lawsuits related to investment holdings are recorded as realized gains in the respective Fund. Dividend income is recorded on the ex-dividend date, net of applicable taxes withheld by foreign countries. Taxable non-cash dividends are recorded as dividend income. Interest income, including amortization of premiums and accretion of discounts, is accrued on a daily basis. Interest income also includes paydown gains and losses on mortgage-backed and asset-backed securities and senior and subordinated loans. Amendment fees are earned as compensation for evaluating and accepting changes to the original loan agreement and are recognized when received. Dividend income from REITs is recorded based on the income included in the distributions received from the REIT investments using published REIT classifications, including some management estimates when actual amounts are not available. Distributions received in excess of this estimated amount are recorded as a reduction of the cost of investments or reclassified to capital gains. The actual amounts of income, return of capital, and capital gains are only determined by each REIT after its fiscal year-end, and may differ from the estimated amounts.
G. Dividends from net investment income are declared quarterly in the World Equity Income Fund and Risk Managed Real Estate Fund. Dividends are reinvested in additional shares unless shareholders request payment in cash. Distributions of net investment income in the remaining Funds and distributions of net realized gains, if any, in all Funds are declared at least annually and recorded on the ex-dividend date and are determined in accordance with income tax regulations which may differ from U.S. GAAP.
H. Interest and dividend income, most expenses, all realized gains and losses, and all unrealized gains and losses are allocated to the classes based upon the value of the outstanding shares in each Class. Certain costs, such as distribution and service fees are charged directly to specific classes. In addition, certain expenses have been allocated to the individual Funds in the Trust on a pro rata basis upon the respective aggregate net assets of each Fund included in the Trust.
I. Under the fee arrangement with the custodian, the Funds may earn credits based on overnight custody cash balances. These credits are utilized to reduce related custodial expenses. The custodian fees disclosed in the Statement of Operations are before the reduction in
94 | THE GUGGENHEIM FUNDS SEMI-ANNUAL REPORT | |
NOTES TO FINANCIAL STATEMENTS (Unaudited)(continued) |
expense from the related earnings credits, if any. For the period ended March 31, 2016, there were no earnings credits received.
J. The Funds may leave cash overnight in their cash account with the custodian. Periodically, a Fund may have cash due to the custodian bank as an overdraft balance. A fee is incurred on this overdraft, calculated by multiplying the overdraft by a rate based on the federal funds rate, which was 0.25% at March 31, 2016.
K. The accounting records of the Fund are maintained in U.S. dollars. All assets and liabilities initially expressed in foreign currencies are converted into U.S. dollars at prevailing exchange rates. Purchases and sales of investment securities, dividend and interest income, and certain expenses are translated at the rates of exchange prevailing on the respective dates of such transactions. Changes in the relationship of these foreign currencies to the U.S. dollar can significantly affect the value of the investments and earnings of the Funds. Foreign investments may also subject the Funds to foreign government exchange restrictions, expropriation, taxation or other political, social or economic developments, all of which could affect the market and/ or credit risk of the investments.
The Funds do not isolate that portion of the results of operations resulting from changes in the foreign exchange rates on investments from the fluctuations arising from changes in the market prices of securities held. Such fluctuations are included with the net realized and unrealized gain or loss on investments.
Reported net realized foreign exchange gains and losses arise from sales of foreign currencies and currency gains or losses realized between the trade and settlement dates on investment transactions. Net unrealized exchange gains and losses arise from changes in the fair values of assets and liabilities other than investments in securities at the fiscal period end, resulting from changes in exchange rates.
L. Under the Funds’ organizational documents, their Trustees and Officers are indemnified against certain liabilities arising out of the performance of their duties to the Trust. In addition, throughout the normal course of business, the Funds enter into contracts that contain a variety of representations and warranties which provide general indemnifications. The Funds’ maximum exposure under these arrangements is unknown, as this would involve future claims that may be made against the Funds and/or their affiliates that have not yet occurred. However, based on experience, the Funds expect the risk of loss to be remote.
2. Financial Instruments and Derivatives
As part of their investment strategy, the Funds utilize short sales and a variety of derivative instruments. These investments involve, to varying degrees, elements of market risk and risks in excess of the amounts recognized in the Statements of Assets and Liabilities. Valuation and accounting treatment of these instruments can be found under Significant Accounting Policies in Note 1 of these Notes to Financial Statements.
Short Sales
A short sale is a transaction in which a Fund sells a security it does not own. If the security sold short decreases in price between the time the Fund sells the security and closes its short position, that Fund will realize a gain on the transaction. Conversely, if the security increases in price during the period, that Fund will realize a loss on the transaction. The risk of such price increases is the principal risk of engaging in short sales.
Derivatives
Derivatives are instruments whose values depend on, or are derived from, in whole or in part, the value of one or more other assets, such as securities, currencies, commodities or indices. Derivative instruments may be used to increase investment flexibility (including to maintain cash reserves while maintaining exposure to certain other assets), for risk management (hedging) purposes, to facilitate trading, to reduce transaction costs and to pursue higher investment returns. Derivative instruments may also be used to mitigate certain investment risks, such as foreign currency exchange rate risk, interest rate risk and credit risk. U.S. GAAP requires disclosures to enable investors to better understand how and why a Fund uses derivative instruments, how these derivative instruments are accounted for and their effects on the Fund’s financial position and results of operations.
The Funds may utilize derivatives for the following purposes:
Duration: the use of an instrument to manage the interest rate risk of a portfolio.
| | THE GUGGENHEIM FUNDS SEMI-ANNUAL REPORT | 95 |
NOTES TO FINANCIAL STATEMENTS (Unaudited)(continued) |
Hedge: an investment made in order to reduce the risk of adverse price movements in a security, by taking an offsetting position to protect against broad market moves.
Income: the use of any instrument that distributes cash flows typically based upon some rate of interest.
Index Exposure: the use of an instrument to obtain exposure to a listed or other type of index.
Leverage: gaining total exposure to equities or other assets on the long and short sides at greater than 100% of invested capital.
Speculation: the use of an instrument to express macro-economic and other investment views.
For any Fund whose investment strategy consistently involves applying leverage, the value of the Fund’s shares will tend to increase or decrease more than the value of any increase or decrease in the underlying index or other asset. In addition, because an investment in derivative instruments generally requires a small investment relative to the amount of investment exposure assumed, an opportunity for increased net income is created; but, at the same time, leverage risk will increase. The Fund’s use of leverage, through borrowings or instruments such as derivatives, may cause the Fund to be more volatile and riskier than if they had not been leveraged.
Futures
A futures contract is an agreement to purchase (long) or sell (short) an agreed amount of securities or other instruments at a set price for delivery at a future date. There are significant risks associated with a Fund’s use of futures contracts, including (i) there may be an imperfect or no correlation between the changes in market value of the underlying asset and the prices of futures contracts; (ii) there may not be a liquid secondary market for a futures contract; (iii) trading restrictions or limitations may be imposed by an exchange; and (iv) government regulations may restrict trading in futures contracts. When investing in futures, there is minimal counterparty credit risk to a Fund because futures are exchange-traded and the exchange’s clearinghouse, as counterparty to all exchange-traded futures, guarantees against default. Cash deposits are shown as segregated cash with broker on the Statements of Assets and Liabilities; securities held as collateral are noted on the Schedules of Investments.
The following table represents the Funds’ use and volume of futures on a quarterly basis:
| | | | Average Notional | |
Fund | Use | | Long | | | Short | |
StylePlus—Large Core Fund | Index exposure | | $ | 1,351,841 | | | $ | — | |
StylePlus—Mid Growth Fund | Index exposure | | | 631,986 | | | | — | |
World Equity Income Fund | Hedge | | | — | | | | 965,216 | |
Swaps
A swap is an agreement that obligates two parties to exchange a series of cash flows at specified intervals based upon or calculated by reference to changes in specified prices or rates for a specified amount of an underlying asset. A Fund utilizing OTC swaps bears the risk of loss of the amount expected to be received under a swap agreement in the event of the default or bankruptcy of a swap agreement counterparty or if the underlying asset declines in value. Certain standardized swaps are subject to mandatory central clearing. Central clearing generally reduces counterparty credit risk and increases liquidity, but central clearing does not make swap transactions risk-free. Additionally, there is no guarantee that a Fund or an underlying fund could eliminate its exposure under an outstanding swap agreement by entering into an offsetting swap agreement with the same or another party.
Total return swaps involve commitments where single or multiple cash flows are exchanged based on the price of an underlying reference asset (such as index or basket) or a fixed or variable interest rate. Index swaps will usually be computed based on the current index value as of the close of regular trading on the NYSE or other exchange, with the swap value being adjusted to include dividends accrued, financing charges and/or interest associated with the swap
96 | THE GUGGENHEIM FUNDS SEMI-ANNUAL REPORT | |
NOTES TO FINANCIAL STATEMENTS (Unaudited)(continued) |
agreement. A fund utilizing a total return index swap bears the risk of loss of the amount expected to be received under a swap agreement in the event of the default or bankruptcy of a swap agreement counterparty or if the underlying index declines in value.
The following table represents the Funds’ use and volume of total return swaps on a quarterly basis:
| | | | Average Notional | |
Fund | Use | | Long | | | Short | |
Alpha Opportunity Fund | Hedge, Leverage | | $ | 38,386,220 | | | $ | 39,682,050 | |
Market Neutral Real Estate Fund | Leverage | | | — | | | | 1,275,378 | |
Risk Managed Real Estate Fund | Income, Leverage | | | 31,327,663 | | | | 23,541,118 | |
StylePlus—Large Core Fund | Index exposure | | | 158,446,156 | | | | — | |
StylePlus—Mid Growth Fund | Index exposure | | | 66,789,117 | | | | — | |
Derivative Investment Holdings Categorized by Risk Exposure
The following is a summary of the location of derivative investments on the Funds’ Statements of Assets and Liabilities as of March 31, 2016:
Derivative Investment Type | Asset Derivatives | Liability Derivatives |
Equity contracts | Variation margin | Variation margin |
| Unrealized appreciation on swap agreements | Unrealized depreciation on swap agreements |
The following table sets forth the fair value of the Funds’ derivative investments categorized by primary risk exposure at March 31, 2016:
Asset Derivative Investments Value | |
Fund | | Futures
Equity
Contracts* | | | Swaps
Equity
Contracts | | | Futures
Currency
Contracts* | | | Total Value at
March 31,
2016 | |
Alpha Opportunity Fund | | $ | — | | | $ | 3,561,738 | | | $ | — | | | $ | 3,561,738 | |
Risk Managed Real Estate Fund | | | — | | | | 2,233,020 | | | | — | | | | 2,233,020 | |
StylePlus—Large Core Fund | | | 37,248 | | | | 5,095,988 | | | | — | | | | 5,133,236 | |
StylePlus—Mid Growth Fund | | | 39,368 | | | | 2,515,717 | | | | — | | | | 2,555,085 | |
Liability Derivative Investments Value | |
Fund | | Futures
Equity
Contracts* | | | Swaps
Equity
Contracts | | | Futures
Currency
Contracts* | | | Total Value at
March 31,
2016 | |
Alpha Opportunity Fund | | $ | — | | | $ | 4,086,030 | | | $ | — | | | $ | 4,086,030 | |
Market Neutral Real Estate Fund | | | — | | | | 443,873 | | | | — | | | | 443,873 | |
Risk Managed Real Estate Fund | | | — | | | | 2,743,963 | | | | — | | | | 2,743,963 | |
StylePlus—Large Core Fund | | | — | | | | 745,236 | | | | — | | | | 745,236 | |
StylePlus—Mid Growth Fund | | | — | | | | 1,729,498 | | | | — | | | | 1,729,498 | |
World Equity Income Fund | | | — | | | | — | | | | 39,337 | | | | 39,337 | |
* | Includes cumulative appreciation (depreciation) of futures contracts as reported on the Schedules of Investments. Only current day’s variation margin is reported within the Statements of Assets and Liabilities. |
The following is a summary of the location of derivative investments on the Funds’ Statements of Operations for the period ended March 31, 2016:
| | THE GUGGENHEIM FUNDS SEMI-ANNUAL REPORT | 97 |
NOTES TO FINANCIAL STATEMENTS (Unaudited)(continued) |
Derivative Investment Type | Location of Gain (Loss) on Derivatives |
Equity contracts | Net realized gain (loss) on futures contracts |
| | Net realized gain (loss) on swap agreements |
| Net change in unrealized appreciation (depreciation) on futures contracts |
| Net change in unrealized appreciation (depreciation) on swap agreements |
The following is a summary of the Funds’ realized gain (loss) and change in unrealized appreciation (depreciation) on derivative investments recognized on the Statements of Operations categorized by primary risk exposure for the period ended March 31, 2016:
Realized Gain (Loss) on Derivative Investments Recognized on the Statements of Operations | |
Fund | | Futures
Equity
Contracts | | | Swaps
Equity
Contracts | | | Futures
Currency
Contracts | | | Total | |
Alpha Opportunity Fund | | $ | — | | | $ | 638,863 | | | $ | �� | | | $ | 638,863 | |
Market Neutral Real Estate Fund | | | — | | | | (62,126 | ) | | | — | | | | (62,126 | ) |
Risk Managed Real Estate Fund | | | — | | | | (462,543 | ) | | | — | | | | (462,543 | ) |
StylePlus—Large Core Fund | | | 122,765 | | | | (5,171,515 | ) | | | — | | | | (5,048,750 | ) |
StylePlus—Mid Growth Fund | | | (42,739 | ) | | | (4,531,983 | ) | | | — | | | | (4,574,722 | ) |
World Equity Income Fund | | | — | | | | — | | | | (74,645 | ) | | | (74,645 | ) |
Change in Unrealized Appreciation (Depreciation) on Derivative Investments Recognized on the Statements of Operations | |
Fund | | Futures
Equity
Contracts | | | Swaps
Equity
Contracts | | | Futures
Currency
Contracts | | | Total | |
Alpha Opportunity Fund | | $ | — | | | $ | (439,082 | ) | | $ | — | | | $ | (439,082 | ) |
Market Neutral Real Estate Fund | | | — | | | | (443,873 | ) | | | — | | | | (443,873 | ) |
Risk Managed Real Estate Fund | | | — | | | | (337,039 | ) | | | — | | | | (337,039 | ) |
StylePlus—Large Core Fund | | | 70,819 | | | | 17,130,731 | | | | — | | | | 17,201,550 | |
StylePlus—Mid Growth Fund | | | 44,206 | | | | 7,193,567 | | | | — | | | | 7,237,773 | |
World Equity Income Fund | | | — | | | | — | | | | (39,337 | ) | | | (39,337 | ) |
In conjunction with the use of short sales and derivative instruments, the Funds are required to maintain collateral in various forms. The Funds use, where appropriate, depending on the financial instrument utilized and the broker involved, margin deposits at the broker, cash and/or securities segregated at the custodian bank, discount notes or the repurchase agreements allocated to the Funds.
There are several risks associated with exposure to foreign currencies, foreign issuers and emerging markets. A Fund’s indirect and direct exposure to foreign currencies subjects the Fund to the risk that those currencies will decline in value relative to the U.S. dollar, or, in the case of short positions, that the U.S. dollar will decline in value relative to the currency being hedged. Currency rates in foreign countries may fluctuate significantly over short periods of time for a number of reasons, including changes in interest rates and the imposition of currency controls or other political developments in the U.S. or abroad. In addition, the Fund may incur transaction costs in connection with conversions between various currencies. The Fund may, but is not obligated to, engage in currency hedging transactions, which generally involve buying currency forward, options or futures contracts. However, not all currency risk may be effectively hedged, and in some cases the costs of hedging techniques may outweigh expected benefits. In such instances, the value of securities denominated in foreign currencies can change significantly when foreign currencies strengthen or weaken relative to the U.S. dollar.
Certain Funds may invest in securities of foreign companies directly, or in financial instruments, such as ADRs and exchange-traded funds, which are indirectly linked to the performance of foreign issuers. Foreign markets can be more volatile than the U.S. market due to increased risks of adverse issuer, political, regulatory, market, or economic developments and can perform differently from the U.S. market. Investing in securities of foreign companies directly, or in financial instruments that are indirectly linked to the performance of foreign issuers, may involve risks not typically
98 | THE GUGGENHEIM FUNDS SEMI-ANNUAL REPORT | |
NOTES TO FINANCIAL STATEMENTS (Unaudited)(continued) |
associated with investing in U.S. issuers. The value of securities denominated in foreign currencies, and of dividends from such securities, can change significantly when foreign currencies strengthen or weaken relative to the U.S. dollar. Foreign securities markets generally have less trading volume and less liquidity than U.S. markets, and prices in some foreign markets may fluctuate more than those of securities traded on U.S. markets. Many foreign countries lack accounting and disclosure standards comparable to those that apply to U.S. companies, and it may be more difficult to obtain reliable information regarding a foreign issuer’s financial condition and operations. Transaction costs and costs associated with custody services are generally higher for foreign securities than they are for U.S. securities. Some foreign governments levy withholding taxes against dividend and interest income. Although in some countries portions of these taxes are recoverable, the non-recovered portion will reduce the income received by the Fund.
The Trust has established counterparty credit guidelines and enters into transactions only with financial institutions of investment grade or better. The Trust monitors the counterparty credit risk.
3. Fees and Other Transactions with Affiliates
Under the terms of an investment advisory contract, the Funds pay GI investment advisory fees calculated at their annualized rates below, based on the average daily net assets of the Funds:
Fund | Management Fees
(as a % of Net Assets) |
Alpha Opportunity Fund | 1.25% |
Large Cap Value Fund | 0.65% |
Market Neutral Real Estate Fund | 1.10% |
Risk Managed Real Estate Fund | 0.75% |
Small Cap Value Fund | 1.00% |
StylePlus—Large Core Fund | 0.75% |
StylePlus—Mid Growth Fund | 0.75% |
World Equity Income Fund | 0.70% |
RFS is paid the following for providing transfer agent services to the Funds. Transfer agent fees are assessed to the applicable class of each Fund.
Annual charge per account | $5.00 – $8.00 |
Transaction fee | $0.60 – $1.10 |
Minimum annual charge per Fund† | $25,000 |
Certain out-of-pocket charges | Varies |
† | Not subject to Funds during first twelve months of operations. |
RFS also acts as the administrative agent for the Funds, and as such performs administrative functions and the bookkeeping, accounting and pricing functions for each Fund. For these services, RFS receives the following:
Fund | Fund Accounting/
Administrative Fees
(as a % of Net Assets) |
Alpha Opportunity Fund | 0.095% |
Large Cap Value Fund | 0.095% |
Market Neutral Real Estate Fund | 0.095% |
Risk Managed Real Estate Fund | 0.095% |
Small Cap Value Fund | 0.095% |
StylePlus—Large Core Fund | 0.095% |
StylePlus—Mid Growth Fund | 0.095% |
World Equity Income Fund | greater of 0.150% or $60,000 |
Minimum annual charge per Fund | $25,000 |
Certain out-of-pocket charges | Varies |
| | THE GUGGENHEIM FUNDS SEMI-ANNUAL REPORT | 99 |
NOTES TO FINANCIAL STATEMENTS (Unaudited)(continued) |
RFS engages external service providers to perform other necessary services for the Trust, such as audit and accounting related services, legal services, custody, printing and mailing, etc., on a pass-through basis. Such expenses are allocated to various Funds within the complex based on relative net assets.
The Funds have adopted Distribution Plans related to the offering of A-Class, C-Class and P-Class shares pursuant to Rule 12b-1 under the 1940 Act. The plans provide for payments at an annual rate of 0.25% of the average daily net assets of each Fund’s A-Class and P-Class shares, and 1.00% of the average daily net assets of each Fund’s C-Class shares.
The investment advisory contracts for the following Funds provide that the total expenses be limited to a percentage of average net assets for each class of shares, exclusive of brokerage costs, dividends on securities sold short, expenses of other investment companies in which a Fund invests, interest, taxes, litigation, indemnification and extraordinary expenses. The limits are listed below:
| | Limit | Effective
Date | Contract
End Date |
Alpha Opportunity Fund – A-Class | 2.11% | 11/30/12 | 02/01/17 |
Alpha Opportunity Fund – C-Class | 2.86% | 11/30/12 | 02/01/17 |
Alpha Opportunity Fund – P-Class | 2.11% | 05/01/15 | 02/01/17 |
Alpha Opportunity Fund – Institutional Class | 1.86% | 11/30/12 | 02/01/17 |
Large Cap Value Fund – A-Class | 1.15% | 11/30/12 | 02/01/17 |
Large Cap Value Fund – C-Class | 1.90% | 11/30/12 | 02/01/17 |
Large Cap Value Fund – P-Class | 1.15% | 05/01/15 | 02/01/17 |
Large Cap Value Fund – Institutional Class | 0.90% | 06/05/13 | 02/01/17 |
Market Neutral Real Estate Fund – A-Class* | 1.65% | 02/26/16 | 02/01/18 |
Market Neutral Real Estate Fund – C-Class* | 2.40% | 02/26/16 | 02/01/18 |
Market Neutral Real Estate Fund – P-Class* | 1.65% | 02/26/16 | 02/01/18 |
Market Neutral Real Estate Fund – Institutional Class* | 1.40% | 02/26/16 | 02/01/18 |
Risk Managed Real Estate Fund – A-Class | 1.30% | 03/26/14 | 02/01/17 |
Risk Managed Real Estate Fund – C-Class | 2.05% | 03/26/14 | 02/01/17 |
Risk Managed Real Estate Fund – P-Class | 1.30% | 05/01/15 | 02/01/17 |
Risk Managed Real Estate Fund – Institutional Class | 1.10% | 03/26/14 | 02/01/17 |
Small Cap Value Fund – A-Class | 1.30% | 11/30/12 | 02/01/17 |
Small Cap Value Fund – C-Class | 2.05% | 11/30/12 | 02/01/17 |
Small Cap Value Fund – P-Class | 1.30% | 05/01/15 | 02/01/17 |
Small Cap Value Fund – Institutional Class | 1.05% | 11/30/12 | 02/01/17 |
World Equity Income Fund – A-Class | 1.46% | 08/15/13 | 02/01/17 |
World Equity Income Fund – C-Class | 2.21% | 08/15/13 | 02/01/17 |
World Equity Income Fund – P-Class | 1.46% | 05/01/15 | 02/01/17 |
World Equity Income Fund – Institutional Class | 1.21% | 08/15/13 | 02/01/17 |
* | Commencement of operations: February 26, 2016. |
GI is entitled to reimbursement by the Funds for fees waived or expenses reimbursed during any of the previous 36 months, beginning on the date of the expense limitation agreement, if on any day the estimated operating expenses are less than the indicated percentages. At March 31, 2016, the amount of fees waived or expenses reimbursed that are subject to recoupment are presented in the following table:
Fund | | Expires
2016 | | | Expires
2017 | | | Expires
2018 | | | Expires
2019 | | | Total | |
Alpha Opportunity Fund | | $ | 93,166 | | | $ | 126,237 | | | $ | 68,666 | | | $ | — | | | $ | 288,069 | |
Large Cap Value Fund | | | 117,895 | | | | 213,340 | | | | 117,091 | | | | 57,623 | | | | 505,949 | |
Market Neutral Real Estate Fund | | | — | | | | — | | | | — | | | | 5,945 | | | | 5,945 | |
Risk Managed Real Estate Fund | | | — | | | | 468 | | | | — | | | | 4,160 | | | | 4,628 | |
Small Cap Value Fund | | | 103,548 | | | | 199,545 | | | | 153,832 | | | | 102,474 | | | | 559,399 | |
World Equity Income Fund | | | 146,093 | | | | 167,150 | | | | — | | | | — | | | | 313,244 | |
100 | THE GUGGENHEIM FUNDS SEMI-ANNUAL REPORT | |
NOTES TO FINANCIAL STATEMENTS (Unaudited)(continued) |
During the period ended March 31, 2016, GI recouped $16,939 from the Alpha Opportunity Fund and $25,742 from World Equity Income Fund. These amounts are included in Management Fees in the Statement of Operations.
If a Fund invests in an affiliated fund, the investing Fund’s Adviser has agreed to waive fees at the investing fund level. Fee waivers will be calculated at the investing Fund level without regard to any expense cap, if any, in effect for the investing Fund. Fees waived under this arrangement are not subject to reimbursement to GI. For the period March 31, 2016, the following Funds waived advisory fees related to investments in affiliated funds.
Fund | | Amount | |
StylePlus—Large Core Fund | | $ | 4,458 | |
StylePlus—Mid Growth Fund | | | 1,793 | |
For the period ended March 31, 2016, GFD retained sales charges of $274,695 relating to sales of A-Class shares of the Trust.
Certain trustees and officers of the Trust are also officers of GI, RFS and GFD.
At March 31, 2016, GI and its affiliates owned 99.96% and 55.62% of the outstanding shares of the Alpha Opportunity Fund and Market Neutral Real Estate Fund, respectively.
4. Fair Value Measurement
In accordance with U.S. GAAP, fair value is defined as the price that the Funds would receive to sell an investment or pay to transfer a liability in an orderly transaction with an independent buyer in the principal market, or in the absence of a principal market, the most advantageous market for the investment or liability. U.S. GAAP establishes a three-tier fair value hierarchy based on the types of inputs used to value assets and liabilities and requires corresponding disclosure. The hierarchy and the corresponding inputs are summarized below:
Level 1 — | quoted prices in active markets for identical assets or liabilities. |
Level 2 — | significant other observable inputs (for example quoted prices for securities that are similar based on characteristics such as interest rates, prepayment speeds, credit risk, etc.). |
Level 3 — | significant unobservable inputs based on the best information available under the circumstances, to the extent observable inputs are not available, which may include assumptions. |
The types of inputs available depend on a variety of factors, such as the type of security and the characteristics of the markets in which it trades, if any. Fair valuation determinations that rely on fewer or no observable inputs require greater judgment. Accordingly, fair value determinations for Level 3 securities require the greatest amount of judgment.
The inputs or methodologies used for valuing securities are not necessarily an indication of the risk associated with investing in those securities. The suitability of the techniques and sources employed to determine fair valuation are regularly monitored and subject to change.
5. Offsetting
In the normal course of business, the Funds enter into transactions subject to enforceable master netting arrangements or other similar arrangements. Generally, the right to offset in those agreements allows the Funds to counteract the exposure to a specific counterparty with collateral received or delivered to that counterparty based on the terms of the arrangements. These arrangements provide for the right to liquidate upon the occurrence of an event of default, credit event upon merger or additional termination event.
In order to better define their contractual rights and to secure rights that will help the Funds mitigate their counterparty risk, the Funds may enter into an International Swaps and Derivatives Association, Inc. Master Agreement (“ISDA Master Agreement”) or similar agreement with their derivative contract counterparties. An ISDA Master Agreement is a bilateral
| | THE GUGGENHEIM FUNDS SEMI-ANNUAL REPORT | 101 |
NOTES TO FINANCIAL STATEMENTS (Unaudited)(continued) |
agreement between a Fund and a counterparty that governs OTC derivatives, including foreign exchange contracts, and typically contains, among other things, collateral posting terms and netting provisions in the event of a default and/or termination event. The provisions of the ISDA Master Agreement typically permit a single net payment in the event of a default (close-out netting) or similar event, including the bankruptcy or insolvency of the counterparty.
For derivatives traded under an ISDA Master Agreement, the collateral requirements are typically calculated by netting the mark to market amount for each transaction under such agreement and comparing that amount to the value of any collateral currently pledged by the Funds and the counterparty. For financial reporting purposes, cash collateral that has been pledged to cover obligations of the Funds and cash collateral received from the counterparty, if any, is reported separately on the Statements of Assets and Liabilities as segregated cash with broker/receivable for variation margin, or payable for swap settlement/variation margin. Generally, the amount of collateral due from or to a counterparty must exceed a minimum transfer amount threshold (e.g., $300,000) before a transfer is required to be made. To the extent amounts due to the Funds from their counterparties are not fully collateralized, contractually or otherwise, the Funds bear the risk of loss from counterparty nonperformance. The Funds attempt to mitigate counterparty risk by only entering into agreements with counterparties that they believe to be of good standing and by monitoring the financial stability of those counterparties.
For financial reporting purposes, the Funds do not offset derivative assets and derivative liabilities that are subject to netting arrangements in the Statements of Assets and Liabilities.
The following tables present derivative financial instruments and secured financing transactions that are subject to enforceable netting arrangements and offset in the Statements of Assets and Liabilities in conformity with U.S. GAAP.
| | | | | | | | | | | | | Gross Amounts Not Offset
in the Statements of
Assets and Liabilities | | | | |
Fund | Instrument | | Gross
Amounts of
Recognized Assets1 | | | Gross Amounts Offset In the Statements of Assets and Liabilities | | | Net Amount of Assets Presented on the Statements of Assets and Liabilities | | | Financial
Instruments | | | Cash
Collateral
Received | | | Net
Amount | |
Alpha Opportunity Fund | Swap equity contracts | | $ | 3,561,738 | | | $ | — | | | $ | 3,561,738 | | | $ | 3,561,738 | | | $ | — | | | $ | — | |
Risk Managed Real Estate Fund | Swap equity contracts | | | 2,233,020 | | | | — | | | | 2,233,020 | | | | 2,233,020 | | | | — | | | | — | |
StylePlus—Large Core Fund | Swap equity contracts | | | 5,095,988 | | | | — | | | | 5,095,988 | | | | — | | | | 4,345,000 | | | | 750,988 | |
StylePlus—Mid Growth Fund | Swap equity contracts | | | 2,515,717 | | | | — | | | | 2,515,717 | | | | — | | | | 2,060,000 | | | | 455,717 | |
| | | | | | | | | | | | | Gross Amounts Not Offset
in the Statements of
Assets and Liabilities | | | | |
Fund | Instrument | | Gross
Amounts of
Recognized Liabilities1 | | | Gross Amounts Offset In the Statements of Assets and Liabilities | | | Net Amount of Liabilities Presented on the Statements of Assets and Liabilities | | | Financial
Instruments | | | Cash
Collateral
Pledged | | | Net
Amount | |
Alpha Opportunity Fund | Swap equity contracts | | $ | 4,086,030 | | | $ | — | | | $ | 4,086,030 | | | $ | 3,561,738 | | | $ | 524,292 | | | $ | — | |
Market Neutral Real Estate Fund | Swap equity contracts | | | 443,873 | | | | — | | | | 443,873 | | | | — | | | | 443,873 | | | | — | |
Risk Managed Real Estate Fund | Swap equity contracts | | | 2,743,963 | | | | — | | | | 2,743,963 | | | | 2,233,020 | | | | 510,943 | | | | — | |
StylePlus—Large Core Fund | Swap equity contracts | | | 745,236 | | | | — | | | | 745,236 | | | | — | | | | 745,236 | | | | — | |
StylePlus—Mid Growth Fund | Swap equity contracts | | | 1,729,498 | | | | — | | | | 1,729,498 | | | | — | | | | 1,729,498 | | | | — | |
1 | Exchange-traded futures are excluded from these reported amounts. |
102 | THE GUGGENHEIM FUNDS SEMI-ANNUAL REPORT | |
NOTES TO FINANCIAL STATEMENTS (Unaudited)(continued) |
6. Federal Income Tax Information
The Funds intend to comply with the provisions of Subchapter M of the Internal Revenue Code applicable to regulated investment companies and will distribute substantially all taxable net investment income and capital gains sufficient to relieve the Funds from all, or substantially all, federal income, excise and state income taxes. Therefore, no provision for federal or state income tax is required.
Tax positions taken or expected to be taken in the course of preparing the Funds’ tax returns are evaluated to determine whether the tax positions are “more-likely-than-not” of being sustained by the applicable tax authority. Tax positions not deemed to meet the more-likely-than-not threshold would be recorded as a tax benefit or expense in the current year. Management has analyzed the Funds’ tax positions taken, or to be taken, on Federal income tax returns for all open tax years, and has concluded that no provision for income tax is required in the Funds’ financial statements. The Funds’ federal tax returns are subject to examination by the Internal Revenue Service for a period of three years after they are filed.
At March 31, 2016, the cost of securities for Federal income tax purposes, the aggregate gross unrealized gain for all securities for which there was an excess of value over tax cost and the aggregate gross unrealized loss for all securities for which there was an excess of tax cost over value, were as follows:
Fund | | Tax
Cost | | | Tax
Unrealized
Gain | | | Tax
Unrealized
Loss | | | Net
Unrealized
Gain (Loss) | |
Alpha Opportunity Fund | | $ | 77,611,889 | | | $ | 2,789,578 | | | $ | (3,761,176 | ) | | $ | (971,598 | ) |
Large Cap Value Fund | | | 54,303,435 | | | | 6,587,367 | | | | (3,845,254 | ) | | | 2,742,113 | |
Market Neutral Real Estate Fund | | | 4,709,812 | | | | 356,319 | | | | (452 | ) | | | 355,867 | |
Risk Managed Real Estate Fund | | | 109,216,891 | | | | 7,721,766 | | | | (2,079,053 | ) | | | 5,642,713 | |
Small Cap Value Fund | | | 17,929,029 | | | | 2,190,860 | | | | (1,672,514 | ) | | | 518,346 | |
StylePlus—Large Core Fund | | | 186,383,293 | | | | 1,914,365 | | | | (2,496,700 | ) | | | (582,335 | ) |
StylePlus—Mid Growth Fund | | | 76,645,611 | | | | 805,925 | | | | (1,375,268 | ) | | | (569,343 | ) |
World Equity Income Fund | | | 89,792,242 | | | | 6,141,390 | | | | (4,780,029 | ) | | | 1,361,361 | |
7. Securities Transactions
For the period ended March 31, 2016, the cost of purchases and proceeds from sales of investment securities, excluding government securities, short-term investments and derivatives, were as follows:
Fund | | Purchases | | | Sales | |
Alpha Opportunity Fund | | $ | 114,920,241 | | | $ | 106,149,582 | |
Large Cap Value Fund | | | 18,306,807 | | | | 16,407,753 | |
Market Neutral Real Estate Fund | | | 5,606,902 | | | | 936,062 | |
Risk Managed Real Estate Fund | | | 67,660,591 | | | | 69,776,159 | |
Small Cap Value Fund | | | 5,542,266 | | | | 6,450,207 | |
StylePlus—Large Core Fund | | | 65,483,723 | | | | 63,366,252 | |
StylePlus—Mid Growth Fund | | | 27,055,433 | | | | 30,505,120 | |
World Equity Income Fund | | | 21,431,428 | | | | 22,284,391 | |
The Funds are permitted to purchase or sell securities from or to certain affiliated funds under specified conditions outlined in procedures adopted by the Board of Trustees of the Trust. The procedures have been designed to ensure that any purchase or sale of securities by a Fund from or to another fund or portfolio that is or could be considered an affiliate by virtue of having a common investment adviser (or affiliated investment advisers), common Trustees and/or common officers complies with Rule 17a-7 of the 1940 Act. Further, as defined under these procedures, each transaction is effected at the current market price to save costs, where permissible. For the period ended March 31, 2016, the Funds did not engage in purchases and sales of securities pursuant to Rule 17a-7 of the 1940 Act.
| | THE GUGGENHEIM FUNDS SEMI-ANNUAL REPORT | 103 |
NOTES TO FINANCIAL STATEMENTS (Unaudited)(continued) |
8. Affiliated Transactions
Investments representing 5% or more of the outstanding voting shares of a portfolio company of a fund, or control of or by, or common control under GI, result in that portfolio company being considered an affiliated company of such fund, as defined in the 1940 Act.
The Funds may invest in the Guggenheim Strategy Funds Trust consisting of Guggenheim Strategy Fund I, Guggenheim Strategy Fund II, Guggenheim Strategy Fund III, and Guggenheim Variable Insurance Strategy Fund III (collectively, the “Cash Management Funds”), open-end management investment companies managed by GI. The Cash Management Funds, which launched on March 11, 2014, are offered as cash management options only to mutual funds, trusts, and other accounts managed by GI and/or its affiliates, and are not available to the public. The Cash Management Funds pay no investment management fees. The Cash Management Funds’ annual report on Form N-CSR dated September 30, 2015 is available publicly or upon request. This information is available from the EDGAR database on the SEC’s website at http://www.sec.gov/Archives/edgar/data/1601445/000089180415000857/gug63224-ncsr.htm.
Transactions during the period ended March 31, 2016, in which the portfolio company is an “affiliated person”, were as follows:
Affiliated issuers by Fund | | Value
09/30/15 | | | Additions | | | Reductions | | | Value
03/31/16 | | | Shares
03/31/16 | | | Investment
Income | | �� | Realized
Gain (Loss) | |
StylePlus—Large Core Fund | | | | | | | | | | | | | | | | | | | | | |
Guggenheim Limited Duration Fund -
Institutional Class | | $ | — | | | $ | 15,180,483 | | | $ | — | | | $ | 15,236,692 | | | | 628,317 | | | $ | 30,483 | | | $ | — | |
Guggenheim Strategy Fund I | | | 42,522,683 | | | | 197,381 | | | | (22,090,300 | ) | | | 20,541,950 | | | | 827,971 | | | | 197,250 | | | | (27,232 | ) |
Guggenheim Strategy Fund II | | | 50,215,775 | | | | 5,768,185 | | | | (8,950,000 | ) | | | 46,695,867 | | | | 1,891,287 | | | | 468,375 | | | | (118,160 | ) |
Guggenheim Strategy Fund III | | | 50,309,143 | | | | 15,627,258 | | | | — | | | | 65,393,260 | | | | 2,650,720 | | | | 727,259 | | | | — | |
| | | $ | 143,047,601 | | | $ | 36,773,307 | | | $ | (31,040,300 | ) | | $ | 147,867,769 | | | | | | | $ | 1,423,367 | | | $ | (145,392 | ) |
| | | | | | | | | | | | | | | | | | | | | | | | | | | | | |
StylePlus—Mid Growth Fund | | | | | | | | | | | | | | | | | | | | | | | | | | | | |
Guggenheim Limited Duration Fund -
Institutional Class | | $ | — | | | $ | 6,037,254 | | | $ | — | | | $ | 6,059,811 | | | | 249,889 | | | $ | 12,254 | | | $ | — | |
Guggenheim Strategy Fund I | | | 17,393,825 | | | | 1,725,810 | | | | (11,268,541 | ) | | | 7,822,469 | | | | 315,295 | | | | 75,810 | | | | (4,077 | ) |
Guggenheim Strategy Fund II | | | 22,101,923 | | | | 1,504,662 | | | | (3,625,000 | ) | | | 19,831,924 | | | | 803,237 | | | | 204,662 | | | | (48,275 | ) |
Guggenheim Strategy Fund III | | | 22,457,513 | | | | 3,590,438 | | | | — | | | | 25,831,830 | | | | 1,047,095 | | | | 290,411 | | | | — | |
| | | $ | 61,953,261 | | | $ | 12,858,164 | | | $ | (14,893,541 | ) | | $ | 59,546,034 | | | | | | | $ | 583,137 | | | $ | (52,352 | ) |
9. Line of Credit
The Funds, with the exception of Alpha Opportunity Fund, Capital Stewardship Fund, Diversified Income Fund and Market Neutral Real Estate Fund, secured a committed $800,000,000 line of credit from Citibank, N.A., good through October 7, 2016, at which time the line of credit may be renewed. This line of credit is reserved for emergency or temporary purposes. Fees related to borrowings, if any, vary under this arrangement between the greater of Citibank’s “base rate”, LIBOR plus 1%, or the federal funds rate (0.25% at March 31, 2016), plus 1/2 of 1%. The Funds also pay a commitment fee at an annualized rate of 0.15% of the average daily amount of their unused commitment amount. The Funds did not have any borrowings under this agreement as of and for the period ended March 31, 2016.
10. Other Liabilities
StylePlus—Large Core Fund wrote put option contracts through Lehman Brothers Inc., (“LBI”) that were exercised prior to the option contracts’ expiration and prior to the bankruptcy filing by LBI, during September, 2008. However, these transactions have not settled and the securities have not been delivered to the Fund as of March 31, 2016.
Although the ultimate resolution of these transactions is uncertain, the Fund has recorded a liability equal to the difference between the strike price on the put options and the market price of the underlying security on the exercise date. The amount of the liability recorded in miscellaneous payables by the Fund as of March 31, 2016, was $18,615.
104 | THE GUGGENHEIM FUNDS SEMI-ANNUAL REPORT | |
NOTES TO FINANCIAL STATEMENTS (Unaudited)(concluded) |
11. Large Shareholder Risk
As of March 31, 2016, 55.6% of the Alpha Opportunity Fund (the “Fund”) was held by Macro Opportunities Fund. The Fund may experience adverse effects if a large number of shares of the Fund are held by a single shareholder (e.g., an institutional investor, financial intermediary or another GI Fund). The Fund is subject to the risk that a redemption by those shareholders of all or a large portion of the Fund could cause the Fund to liquidate its assets at inopportune times, or at a loss or depressed value, which could adversely impact the Fund’s performance and cause the value of a shareholder’s investment to decline. Redemptions of a large number of shares also may increase transaction costs or, by necessitating a sale of portfolio securities, have adverse tax consequences for shareholders. They also potentially limit the use of any capital loss carryforwards and certain other losses to offset future realized capital gains (if any) and may limit or prevent a Fund’s use of tax equalization.
| | THE GUGGENHEIM FUNDS SEMI-ANNUAL REPORT | 105 |
OTHER INFORMATION (Unaudited) |
Proxy Voting Information
A description of the policies and procedures that the Trust uses to determine how to vote proxies relating to securities held in the Funds’ portfolios is available, without charge and upon request, by calling 800.820.0888. This information is also available from the EDGAR database on the SEC’s website at http://www.sec.gov.
Information regarding how the Funds voted proxies relating to portfolio securities during the most recent 12-month period ended June 30 is available without charge, upon request, by calling 800.820.0888. This information is also available from the EDGAR database on the SEC’s website at http://www.sec.gov.
Sector Classification
Information in the “Schedule of Investments” is categorized by sectors using sector-level Classifications defined by the Bloomberg Industry Classification System, a widely recognized industry classification system provider. Each Fund’s registration statement has investment policies relating to concentration in specific sectors/industries. For purposes of these investment policies, the Funds usually classify sectors/industries based on industry-level Classifications used by widely recognized industry classification system providers such as Bloomberg Industry Classification System, Global Industry Classification Standards and Barclays Global Classification Scheme.
Quarterly Portfolio Schedules Information
The Trust files its complete schedule of portfolio holdings with the SEC for the first and third quarters of each fiscal year on Form N-Q; which are available on the SEC’s website at http://www.sec.gov. The Funds’ Forms N-Q may be reviewed and copied at the SEC’s Public Reference Room in Washington, DC, and that information on the operation of the Public Reference Room may be obtained by calling 800-SEC-0330. Copies of the portfolio holdings are also available to shareholders, without charge and upon request, by calling 800.820.0888.
Board Considerations Regarding Approval of Investment Advisory Agreement - Guggenheim Market Neutral Real Estate Fund
Guggenheim Funds Trust (the “Trust”) was organized as a Delaware statutory trust on November 8, 2013, and is registered as an open-end management investment company under the Investment Company Act of 1940, as amended (the “1940 Act”). The Trust is authorized to issue an unlimited number of shares of beneficial interest in separate series, with each such series representing interests in a portfolio of securities and other assets (each, a “Fund” and collectively, the “Funds”). On November 10, 2015, Guggenheim Partners Investment Management, LLC (“GPIM” or the “Investment Adviser”), an indirect subsidiary of Guggenheim Partners, LLC, a global diversified financial services firm (“Guggenheim Partners”), was approved to serve as the investment adviser to the Guggenheim Market Neutral Real Estate Fund (the “New Fund”), a new series of the Trust, pursuant to an investment advisory agreement between the Trust and GPIM, with respect to the New Fund (the “Advisory Agreement”). (Guggenheim Partners, GPIM and its affiliates may be referred to herein together as “Guggenheim.”) Under the supervision of the Board of Trustees of the Trust (the “Board,” with the members of the Board referred to individually as the “Trustees”), GPIM regularly provides (or oversees the provision of) investment research, advice and supervision, a continuous investment program and the purchase and sale of securities and other investments for various Funds’ portfolios. GPIM will provide those same services to the New Fund under the Advisory Agreement.
The 1940 Act, provides, in substance, that an investment advisory agreement between a fund and its investment adviser may be entered into only if it is approved by the fund’s board of trustees, including by a vote of a majority of the trustees who are not “interested persons,” as defined by the 1940 Act, of the fund, cast in person at a meeting called for the purpose of considering such approval. At a meeting held in person on November 10, 2015 (the “November Meeting”), the Trustees who are not “interested persons” (collectively, the “Independent Trustees”) met separately from Guggenheim to consider the approval of the proposed Advisory Agreement. As part of its review process, the Independent Trustees were represented by independent legal counsel (“Independent Legal Counsel”). Independent Legal Counsel reviewed and discussed with the Independent Trustees various factors relevant to the consideration of the Advisory Agreement and the legal responsibilities of the Trustees related to such consideration and assisted the Independent Trustees in their deliberations.
106 | THE GUGGENHEIM FUNDS SEMI-ANNUAL REPORT | |
OTHER INFORMATION (Unaudited)(continued) |
The Trustees, including the Independent Trustees, discussed the Advisory Agreement in light of the regulatory requirements and criteria and assessed information concerning the New Fund’s proposed investment advisory fee, investment objective and policies, investment strategies and portfolio construction process, market opportunity, fund positioning and portfolio management team (including biographies), among other things. GPIM provided peer group comparisons of the proposed contractual advisory fee and total net expense ratio, as set forth in a report prepared by an independent, third party research provider, FUSE Research Networks LLC (“FUSE”).
The Independent Trustees also considered the variety of written materials, reports and oral presentations it received during the year with respect to the other series of the Trust and in connection with the Independent Trustees’ service on the boards of trustees of other registered investment companies or series thereof for which GPIM or an affiliate serves as investment adviser or sub-adviser (“Guggenheim Funds”). Thus, in connection with their consideration of the proposed Advisory Agreement, the Independent Trustees also took into account relevant material provided by Guggenheim relating to the annual contract renewal proposals for the Guggenheim Funds considered at the May 19-20, 2015 Board meeting (“Contract Renewal”), including information concerning Guggenheim’s resources and financial information, as updated at the November Meeting.
The Board considered the foregoing materials in the context of its substantial accumulated experience in governing the other Guggenheim Funds and weighed the factors and standards discussed with Independent Legal Counsel. Following an analysis and discussion of the factors identified below and in the exercise of its business judgment, the Board concluded that it was in the best interests of the New Fund to approve the Advisory Agreement for an initial term of two years.
Nature, Extent and Quality of Services to Be Provided by the Investment Adviser: With respect to the nature, extent and quality of services to be provided by the Investment Adviser for the New Fund, the Independent Trustees considered the functions to be performed by the Investment Adviser for the New Fund and the nature and quality of services provided by GPIM in the past, including the firm’s management capabilities demonstrated with respect to other Guggenheim Funds. The Independent Trustees also considered the Investment Adviser’s attention to relevant developments in the mutual fund industry and its observance of compliance and regulatory requirements and noted that on a regular basis the Board receives and reviews information from the Trust’s Chief Compliance Officer regarding compliance policies and procedures established pursuant to Rule 38a-1 under the 1940 Act. The Board took into consideration the recent settlement of a regulatory matter and remedial steps taken in response by the Investment Adviser to enhance its compliance structure. In addition, the Independent Trustees took into account the various compliance and risk management initiatives undertaken by Guggenheim, including, among other things, the hiring of additional staff to support the firm’s Chief Risk Officer, initiatives related to the risks associated with the investment process and risk at the enterprise level, the organization’s risk management infrastructure and critical activities. The Independent Trustees also considered other initiatives intended to achieve greater enhancements and efficiencies in the organization’s ability to provide services to all Guggenheim Funds, including the New Fund, such as efforts to consolidate compliance manuals and align processes of the Funds with those of other funds managed by the Investment Adviser or another Guggenheim affiliate. Moreover, in connection with the Board’s evaluation of the overall package of services to be provided by the Investment Adviser, the Board considered the Investment Adviser’s administrative capabilities, including its role in monitoring and coordinating compliance responsibilities with the fund administrator, transfer agent, distributor, custodian and other service providers to the New Fund.
With respect to Guggenheim’s resources and the ability of the Investment Adviser to carry out its responsibilities under the Advisory Agreement, the Trustees considered the presentation by the Chief Financial Officer of Guggenheim Investments (the investment management business of Guggenheim Partners) in connection with Contract Renewal and his review of the audited financial statements of Guggenheim Partners Investment Management Holdings, LLC (“GPIMH”), the holding company of the investment advisers (including GPIM), broker/dealers and other entities that comprise Guggenheim Investments. In this connection, the Board took into account management’s statements set forth in a memorandum to the Board that: (i) there have been no material adverse changes to the previously provided information in connection with Contract Renewal that would affect the Trustees’ ability to fulfill their obligations under Section 15(c) of the 1940 Act; and (ii) GPIM is aware of no additional information, other than certain supplemental information provided to the Board for the November Meeting, that it believes would be relevant to the Trustees’ considerations.
| | THE GUGGENHEIM FUNDS SEMI-ANNUAL REPORT | 107 |
OTHER INFORMATION (Unaudited)(continued) |
The Board also considered the acceptability of the terms of the Advisory Agreement (including the scope of services required to be performed by the Adviser), noting that the terms were consistent with the terms of the investment advisory agreements of other open-end Guggenheim Funds. Based on the foregoing, and based on other information received (both oral and written) at the November Meeting and in connection with Contract Renewal, as well as other considerations, including the Board’s knowledge of the Investment Adviser’s quality of performance of its duties for other Guggenheim Funds through Board meetings, discussions and reports during the year, the Board concluded that the Investment Adviser and its personnel were qualified to serve the New Fund in such capacity.
Investment Performance: With respect to investment performance, the Board noted that the New Fund has no operating history. As a result, the Board considered that the New Fund’s investment objective is to provide capital appreciation, while limiting exposure to general stock market risk. The Board noted that the New Fund will employ a fundamental long/short real estate equity strategy focusing on publicly-traded real estate investment trusts (or REITs) and other real estate operating companies based in the U.S. In addition, the Board noted that Guggenheim has managed the investment strategy to be employed for the New Fund in institutional accounts since September 2010 and has managed a sleeve within another Fund, the Guggenheim Risk Managed Real Estate Fund (the “Similar Fund”), in a similar manner as the proposed strategy. In this connection, Guggenheim provided performance information for an institutional composite investment strategy as compared to the Morningstar Market Neutral Category Average (institutional share class only). The Board also considered GPIM’s investment expertise generally, and the portfolio managers’ expertise and experience with this type of investment process, and determined that GPIM’s performance was expected to be acceptable.
Comparative Fees, Costs of Services to be Provided and the Profits to be Realized by GPIM from its Relationship with the New Fund: The Board compared the New Fund’s proposed contractual advisory fee and total net expense ratio to a smaller peer group and larger universe, as set forth in the FUSE report. The Board also reviewed the median and average advisory fees and expense ratios, including certain expense ratio components (e.g., distribution fees, administration fees, transfer agency fees and fee waivers/reimbursements) of the peer group of funds. The Board reviewed the proposed advisory fee and total net expense ratio for each of Class A, C, I, R6 and P, noting that in each case the advisory fee was equal to the peer group median, ranging from 25th to 33rd percentile, and the total net expense ratio (after fee caps and waivers) was below the peer group median, ranging from the 29th to 44th percentile. The Board also noted that although the proposed contractual advisory fee for the New Fund is higher than the advisory fee for the Comparable Fund, management stated that the New Fund plans to allocate a larger portion of its assets to a long-short equity strategy, which requires more extensive research and active portfolio management than is needed for the Similar Fund.
As a part of its considerations, the Board noted that GPIM proposed a fee waiver/expense limitation agreement with respect to the New Fund, limiting ordinary operating expenses to 1.65% for Class A and Class P shares, 2.40% for Class C shares and 1.40% for Class I and Class R6 shares through February 1, 2017. In addition, the Board took into account the proposed Affiliated Fund Waiver Agreement under which Guggenheim agreed, through February 1, 2017, to waive the amount of the advisory fee to the extent necessary to offset the proportionate share of any advisory fee paid by the New Fund with respect to investment in an affiliated underlying fund.
With respect to the costs of advisory services to be provided and estimated level of profitability, the Trustees noted the start-up nature of the New Fund, and that they would have the opportunity in the future to periodically reexamine this matter.
The Board considered other benefits to be available to GPIM because of its relationship with the New Fund and noted that GPIM may be deemed to benefit from arrangements whereby an affiliate, Rydex Fund Services, LLC, will receive fees for: (i) performing certain administrative functions and bookkeeping, accounting and pricing functions for the New Fund pursuant to a Fund Accounting and Administration Agreement; and (ii) acting as transfer agent for the New Fund and performing all shareholder servicing functions, including transferring record ownership, processing purchase and redemption transactions, answering inquiries, mailing shareholder communications, and acting as the dividend disbursing agent pursuant to a Transfer Agency Agreement. In this connection, the Trustees considered its prior review of the compensation arrangements for the provision of the foregoing services.
108 | THE GUGGENHEIM FUNDS SEMI-ANNUAL REPORT | |
OTHER INFORMATION (Unaudited)(concluded) |
Economies of Scale to Be Realized: With respect to economies of scale, the Board considered that the New Fund was in its start-up phase. The Trustees also noted that they would have the opportunity in the future to periodically re-examine whether the New Fund had achieved economies of scale and the appropriateness of the advisory fees payable by the New Fund to GPIM.
Overall Conclusions
Based on the foregoing, the Trustees determined that the proposed investment advisory fees for the New Fund are fair and reasonable in light of the extent and quality of the services to be provided and other benefits to be received and that the approval of the Advisory Agreement is in the best interests of the New Fund. In reaching this conclusion, no single factor was determinative or conclusive and each Trustee, in the exercise of his business judgment, may attribute different weights to different factors. At the November Meeting, the Board, including all of the Independent Trustees, approved the Advisory Agreement for an initial term of two years.
| | THE GUGGENHEIM FUNDS SEMI-ANNUAL REPORT | 109 |
INFORMATION ON BOARD OF TRUSTEES AND OFFICERS (Unaudited) |
A Board of Trustees oversees the Trust, as well as other trusts of GI, in which its members have no stated term of service, and continue to serve after election until resignation. The Statement of Additional Information includes further information about Fund Trustees and Officers, and can be obtained without charge by visiting guggenheiminvestments.com or by calling 800.820.0888.
Name, Address* and Year of Birth | Position(s)
Held with
the Trust | Term of Office and Length of Time Served** | Principal Occupation(s) During Past Five Years | Number of Portfolios in Fund Complex Overseen | Other
Directorships
Held by Trustees |
INDEPENDENT TRUSTEES | | | |
Randall C. Barnes (1951) | Trustee | Since 2014 | Current: Private Investor (2001-present). Former: Senior Vice President and Treasurer, PepsiCo, Inc. (1993-1997); President, Pizza Hut International (1991-1993); Senior Vice President, Strategic Planning and New Business Development, PepsiCo, Inc. (1987-1990). | 105 | Current: Trustee, Purpose Investments Inc. (2014-Present). |
Donald A. Chubb, Jr. (1946) | Trustee | Since 1994 | Current: Business broker and manager of commercial real estate, Griffith & Blair, Inc. (1997-present). | 101 | Current: Midland Care, Inc. (2011-present). |
Jerry B. Farley (1946) | Trustee | Since 2005 | Current: President, Washburn University (1997-present). | 101 | Current: Westar Energy, Inc. (2004-present); CoreFirst Bank & Trust (2000-present). |
Roman Friedrich III (1946) | Trustee and Chairman of the Contracts Review Committee | Since 2014 | Current: Founder and Managing Partner, Roman Friedrich & Company (1998-present). Former: Senior Managing Director, MLV & Co. LLC (2010-2011). | 101 | Current: Zincore Metals, Inc. (2009-present). Former: Axiom Gold and Silver Corp. (2011-2012). |
Robert B. Karn III (1942) | Trustee and Chairman of the Audit Committee | Since 2014 | Current: Consultant (1998-present). Former: Arthur Andersen (1965-1997) and Managing Partner, Financial and Economic Consulting, St. Louis office (1987-1997). | 101 | Current: Peabody Energy Company (2003-present); GP Natural Resource Partners, LLC (2002- present). |
Ronald A. Nyberg (1953) | Trustee and Chairman of the Nominating and Governance Committee | Since 2014 | Current: Partner, Nyberg & Cassioppi, LLC (2000-present). Former: Executive Vice President, General Counsel, and Corporate Secretary, Van Kampen Investments (1982-1999). | 107 | Current: Edward-Elmhurst Healthcare System (2012-present). |
110 | THE GUGGENHEIM FUNDS SEMI-ANNUAL REPORT | |
INFORMATION ON BOARD OF TRUSTEES AND OFFICERS (Unaudited)(continued) |
Name, Address* and Year of Birth | Position(s)
Held with
the Trust | Term of Office and Length of Time Served** | Principal Occupation(s) During Past Five Years | Number of Portfolios in Fund Complex Overseen | Other
Directorships Held by Trustees |
INDEPENDENT TRUSTEES - concluded | | |
Maynard F. Oliverius (1943) | Trustee | Since 1998 | Current: Retired. Former: President and CEO, Stormont-Vail HealthCare (1996-2012). | 101 | Current: Fort Hays State University Foundation (1999-present); Stormont-Vail Foundation (2013-present); University of Minnesota HealthCare Alumni Association Foundation (2009-present). |
Ronald E. Toupin, Jr. (1958) | Trustee and Chairman of the Board | Since 2014 | Current: Portfolio Consultant (2010-present). Former: Vice President, Manager and Portfolio Manager, Nuveen Asset Management (1998-1999); Vice President, Nuveen Investment Advisory Corp. (1992-1999); Vice President and Manager, Nuveen Unit Investment Trusts (1991-1999); and Assistant Vice President and Portfolio Manager, Nuveen Unit Investment Trusts (1988-1999), each of John Nuveen & Co., Inc. (1982-1999). | 104 | Former: Bennett Group of Funds (2011-2013). |
INTERESTED TRUSTEE | |
Donald C. Cacciapaglia*** (1951) | President, Chief Executive Officer and Trustee | Since 2012 | Current: President and CEO, certain other funds in the Fund Complex (2012-present); Vice Chairman, Guggenheim Investments (2010-present). Former: Chairman and CEO, Channel Capital Group, Inc. (2002-2010). | 236 | Current: Clear Spring Life Insurance Company (2015-present); Guggenheim Partners Japan, Ltd. (2014-present); Delaware Life (2013-present); Guggenheim Life and Annuity Company (2011-present); Paragon Life Insurance Company of Indiana (2011-present). |
* | The business address of each Trustee is c/o Guggenheim Investments, 805 King Farm Boulevard, Suite 600, Rockville, Maryland 20850. |
** | Each Trustee serves an indefinite term, until his successor is elected and qualified. Time served includes time served in the respective position for the Predecessor Corporation. |
*** | This Trustee is deemed to be an "interested person" of the Funds under the 1940 Act by reason of his position with the Funds' Investment Manager and/or the parent of the Investment Manager. |
| | THE GUGGENHEIM FUNDS SEMI-ANNUAL REPORT | 111 |
INFORMATION ON BOARD OF TRUSTEES AND OFFICERS (Unaudited)(continued) |
Name, Address* and Year of Birth | Position(s)
Held with
the Trust | Term of Office and Length of Time Served** | Principal Occupations
During Past Five Years |
OFFICERS | | | |
Joseph M. Arruda (1966) | Assistant Treasurer | Since 2010 | Current: Assistant Treasurer, certain other funds in the Fund Complex (2006-present); Vice President, Security Investors, LLC (2010-present); CFO and Manager, Guggenheim Specialized Products, LLC (2009-present). Former: Vice President, Security Global Investors, LLC (2010-2011); Vice President, Rydex Advisors, LLC (2010); Vice President, Rydex Advisors II, LLC (2010). |
William H. Belden, III (1965) | Vice President | Since 2014 | Current: Vice President, certain other funds in the Fund Complex (2006-present); Managing Director, Guggenheim Funds Investment Advisors, LLC (2005-present). Former: Vice President of Management, Northern Trust Global Investments (1999-2005). |
James Howley (1972) | Assistant Treasurer | Since 2014 | Current: Director, Guggenheim Investments (2004-present) ; Assistant Treasurer, certain other funds in the Fund Complex (2006-present). Former: Manager, Mutual Fund Administration of Van Kampen Investments, Inc. (1996-2004). |
Amy J. Lee (1961) | Vice President and Chief Legal Officer | Since 2007 (Vice President) Since 2014 (Chief Legal Officer) | Current: Chief Legal Officer, certain other funds in the Fund Complex (2013-present); Senior Managing Director, Guggenheim Investments (2012-present). Former: Vice President, Associate General Counsel and Assistant Secretary, Security Benefit Life Insurance Company and Security Benefit Corporation (2004-2012). |
Mark E. Mathiasen (1978) | Secretary | Since 2014 | Current: Secretary, certain other funds in the Fund Complex (2007-present); Managing Director, Guggenheim Investments (2007-present). |
Michael P. Megaris (1984) | Assistant Secretary | Since 2014 | Current: Assistant Secretary, certain other funds in the Fund Complex (2014-present); Senior Associate, Guggenheim Investments (2012-present). Former: J.D., University of Kansas School of Law (2009-2012). |
Elisabeth Miller (1968) | Chief Compliance Officer | Since 2012 | Current: CCO, certain other funds in the Fund Complex (2012-present); CCO, Security Investors, LLC (2012-present); CCO, Guggenheim Funds Investment Advisors, LLC (2012-present); Managing Director, Guggenheim Investments (2012-present); Vice President, Guggenheim Funds Distributors, LLC (March 2014-present). Former: CCO, Guggenheim Distributors, LLC (2009-March 2014); Senior Manager, Security Investors, LLC (2004-2009); Senior Manager, Guggenheim Distributors, LLC (2004-2009). |
112 | THE GUGGENHEIM FUNDS SEMI-ANNUAL REPORT | |
INFORMATION ON BOARD OF TRUSTEES AND OFFICERS (Unaudited)(concluded) |
Name, Address* and Year of Birth | Position(s)
Held with
the Trust | Term of Office and Length of Time Served** | Principal Occupations
During Past Five Years |
OFFICERS - concluded | |
Adam Nelson (1979) | Assistant Treasurer | Since 2015 | Current: Vice President, Guggenheim Investments (2015-present); Assistant Treasurer, certain other funds in the Fund Complex (2015-present). Former: Assistant Vice President and Fund Administration Director, State Street Corporation (2013-2015); Fund Administration Assistant Director, State Street (2011-2013); Fund Administration Manager, State Street (2009-2011). |
Alison Santay (1974) | AML Officer | Since 2013 | Current: AML Officer, certain other funds in the Fund Complex (2010-present); Director and AML Officer, Rydex Fund Services, LLC (2010-present); AML Officer, Security Investors, LLC (2010-present); Director, Shareholder Risk and Compliance, Rydex Fund Services, LLC (2004-present). Former: AML Officer, Guggenheim Distributors, LLC (2013-2014). |
Kimberly Scott (1974) | Assistant Treasurer | Since 2014 | Current: Vice President, Guggenheim Investments (2012-present) ; Assistant Treasurer, certain other funds in the Fund Complex (2012-present). Former: Financial Reporting Manager, Invesco, Ltd. (2010-2011); Vice President/Assistant Treasurer, Mutual Fund Administration for Van Kampen Investments, Inc./Morgan Stanley Investment Management (2009-2010); Manager of Mutual Fund Administration, Van Kampen Investments, Inc./Morgan Stanley Investment Management (2005-2009). |
Bryan Stone (1979) | Vice President | Since 2014 | Current: Vice President, certain other funds in the Fund Complex (2014-present); Director, Guggenheim Investments (2013-present). Former: Senior Vice President, Neuberger Berman Group LLC (2009-2013); Vice President, Morgan Stanley (2002-2009). |
John L. Sullivan (1955) | Chief Financial Officer and Treasurer | Since 2014 | Current: CFO, Chief Accounting Officer and Treasurer, certain other funds in the Fund Complex (2010-present); Senior Managing Director, Guggenheim Investments (2010-present). Former: Managing Director and CCO, each of the funds in the Van Kampen Investments fund complex (2004-2010); Managing Director and Head of Fund Accounting and Administration, Morgan Stanley Investment Management (2002-2004); CFO and Treasurer, Van Kampen Funds (1996-2004). |
* | The business address of each officer is c/o Guggenheim Investments, 805 King Farm Boulevard, Suite 600, Rockville, Maryland 20850. |
** | Each officer serves an indefinite term, until his or her successor is duly elected and qualified. Time served includes time served in the respective position for the Predecessor Corporation. |
| | THE GUGGENHEIM FUNDS SEMI-ANNUAL REPORT | 113 |
GUGGENHEIM INVESTMENTS PRIVACY POLICIES (Unaudited) |
Rydex Funds, Guggenheim Funds, Rydex Investments, Guggenheim Funds Distributors, LLC, Security Investors, LLC, Security Distributors, Inc., Guggenheim Partners Investment Managers, LLC, and Rydex Advisory Services (Collectively “Guggenheim Investments”).
Our Commitment to You
When you become a Guggenheim Investments investor, you entrust us with not only your hard-earned money but also with personal and financial information about you. We recognize that your relationship with us is based on trust and that you expect us to act responsibly and in your best interests. Because we have access to this private information about you, we hold ourselves to the highest standards in its safekeeping and use. This means, most importantly, that we do not sell client information to anyone—whether it is your personal information or if you are a current or former Guggenheim Investments client.
The Information We Collect About You
In the course of doing business with shareholders and investors, we collect nonpublic personal information about you. You typically provide personal information when you complete a Guggenheim Investments account application or when you request a transaction that involves Rydex and Guggenheim Investments funds or one of the Guggenheim Investments affiliated companies. “Nonpublic personal information” is personally identifiable private information about you. For example, it includes information regarding your name and address, Social Security or taxpayer identification number, assets, income, account balance, bank account information and investment activity (e.g., purchase and redemption history).
How We Handle Your Personal Information
As emphasized above, we do not sell information about current or former clients or their accounts to third parties. Nor do we share such information, except when necessary to complete transactions at your request or to make you aware of related investment products and services that we offer. Additional details about how we handle your personal information are provided below. To complete certain transactions or account changes that you direct, it may be necessary to provide identifying information to companies, individuals or groups that are not affiliated with Guggenheim Investments. For example, if you ask to transfer assets from another financial institution to Guggenheim Investments, we will need to provide certain information about you to that company to complete the transaction. To alert you to other Guggenheim Investments investment products and services, we may share your information within the Guggenheim Investments family of affiliated companies. This would include, for example, sharing your information within Guggenheim Investments so we can make you aware of new Rydex and Guggenheim Investments funds or the services offered through another Guggenheim Investments affiliated company. In certain instances, we may contract with nonaffiliated companies to perform services for us. Where necessary, we will disclose information we have about you to these third parties. In all such cases, we provide the third party with only the information necessary to carry out its assigned responsibilities and only for that purpose. And we require these third parties to treat your private information with the same high degree of confidentiality that we do. In certain instances, we may share information with other financial institutions regarding individuals and entities in response to the U.S.A. Patriot Act. Finally, we will release information about you if you direct us to do so, if we are compelled by law to do so or in other circumstances permitted by law.
Opt Out Provisions
We do not sell your personal information to anyone. The law allows you to “opt out” of only certain kinds of information sharing with third parties. The firm does not share personal information about you with any third parties that triggers this opt-out right. This means YOU ARE ALREADY OPTED OUT.
114 | THE GUGGENHEIM FUNDS SEMI-ANNUAL REPORT | |
GUGGENHEIM INVESTMENTS PRIVACY POLICIES (Unaudited)(concluded) |
How We Protect Privacy Online
Our concern for the privacy of our shareholders also extends to those who use our web site, guggenheiminvestments.com. Our web site uses some of the most secure forms of online communication available, including encryption technology, Secure Socket Layer (SSL) protocol, firewalls and user names and passwords. These technologies provide a high level of security and privacy when you access your account information or initiate online transactions. The Guggenheim Investments web site offers customized features that require our use of “http cookies”—tiny pieces of information that we ask your browser to store. However, we make very limited use of these cookies. We only use cookies for session management and security features on the Guggenheim Investments web site. We do not use them to pull data from your hard drive, to learn your email address, or to view data in cookies created by other web sites. We will not share the information in our cookies or give others access to it. See the legal information area on our web site for more details about web site security and privacy features.
How We Safeguard Your Personal Information
We restrict access to nonpublic personal information about shareholders to our employees and in some cases to third parties (for example, the service providers described above) as permitted by law. We maintain strict physical, electronic and procedural safeguards that comply with federal standards to guard your nonpublic personal information.
We’ll Keep You Informed
As required by federal law, we will notify shareholders of our privacy policy annually. We reserve the right to modify this policy at any time, but rest assured that if we do change it, we will tell you promptly. You will also be able to access our privacy policy from our web site at guggenheiminvestments.com. Should you have any questions regarding our privacy policy, contact us at 800.820.0888 or 301.296.5100.
| | THE GUGGENHEIM FUNDS SEMI-ANNUAL REPORT | 115 |
This page intentionally left blank.
This page intentionally left blank.
3.31.2016
Guggenheim Funds Semi-Annual Report
| |
Guggenheim Diversified Income Fund | | |
Guggenheim High Yield Fund | | |
Guggenheim Investment Grade Bond Fund | | |
Guggenheim Limited Duration Fund | | |
Guggenheim Municipal Income Fund | | |
SBINC-SEMI-0316x0916 | guggenheiminvestments.com |
DEAR SHAREHOLDER | 2 |
ECONOMIC AND MARKET OVERVIEW | 3 |
ABOUT SHAREHOLDERS’ FUND EXPENSES | 5 |
DIVERSIFIED INCOME FUND | 8 |
HIGH YIELD FUND | 16 |
INVESTMENT GRADE BOND FUND | 32 |
LIMITED DURATION FUND | 46 |
MUNICIPAL INCOME FUND | 63 |
NOTES TO FINANCIAL STATEMENTS | 74 |
OTHER INFORMATION | 94 |
INFORMATION ON BOARD OF TRUSTEES AND OFFICERS | 98 |
GUGGENHEIM INVESTMENTS PRIVACY POLICIES | 102 |
| | THE GUGGENHEIM FUNDS SEMI-ANNUAL REPORT | 1 |
Dear Shareholder:
Security Investors, LLC and Guggenheim Partners Investment Management (the “Investment Advisers”) are pleased to present the semi-annual shareholder report for a selection of our Funds (the “Funds”) for the six-month period ended March 31, 2016.
The Investment Advisers are part of Guggenheim Investments, which represents the investment management businesses of Guggenheim Partners, LLC (“Guggenheim”), a global, diversified financial services firm.
Guggenheim Funds Distributors, LLC is the distributor of the Funds. Guggenheim Funds Distributors, LLC is affiliated with Guggenheim and the Investment Advisers.
We encourage you to read the Economic and Market Overview section of the report, which follows this letter.
We are committed to providing innovative investment solutions and appreciate the trust you place in us.
Sincerely,
Donald C. Cacciapaglia
President
April 30, 2016
Read a prospectus and summary prospectus (if available) carefully before investing. It contains the investment objectives, risks, charges, expenses and other information, which should be considered carefully before investing. Obtain a prospectus and summary prospectus (if available) at guggenheiminvestments.com or call 800.820.0888.
There can be no assurance that any investment product will achieve its investment objective(s). There are risks associated with investing, including the entire loss of principal invested. Investing involves market risks. The investment return and principal value of any investment product will fluctuate with changes in market conditions.
2 | THE GUGGENHEIM FUNDS SEMI-ANNUAL REPORT | |
ECONOMIC AND MARKET OVERVIEW (Unaudited) | March 31, 2016 |
Financial markets were buffeted by a variety of events over the past six months, including volatility in the oil market, weak growth in China, ongoing stimulus from global central banks, and a 25 basis point increase in the U.S. federal funds target rate in December. While the direct impact of the move was fairly insignificant, the decision to begin normalization of interest rates after seven years of unprecedented liquidity provision was not. Indeed, in 2015, risk assets posted their worst annual performance since the 2008 financial crisis, as market participants’ expectations for the start of rate hikes collided with concern about plunging commodity prices, and slowing economic growth in China and other emerging market economies.
As 2016 began, forecasts for U.S. and global economic growth were downgraded, and recession fears surged along with market volatility. Estimates for first quarter gross domestic product (“GDP”) in the U.S. were marked down, even though first quarter GDP has undershot full-year growth rates in six out of the last seven years. Risk assets rallied in the last half of the first quarter, led by a dovish pivot in the U.S. Federal Reserve’s (the “Fed”) communication that spurred a rally in crude oil and a reversal of dollar strength. The weaker dollar, along with optimism about a production freeze agreed to by a group of major oil producing countries, helped oil to rebound. After falling in the early weeks of the year to a cycle low of $26 per barrel on February 11, 2016, the front-month West Texas Intermediate (“WTI”) oil futures contract rallied as high as $40 per barrel before closing the quarter at $38 per barrel.
The outlook for economic growth outside the U.S. softened in the first quarter. A further deterioration in the euro zone inflation outlook prompted the European Central Bank (“ECB”) to announce an increase in the size of its monthly asset purchases and reduce its deposit rate to -40 basis points. European government bonds rallied following the announcement, with the 10-year German bund ending the first quarter with a yield of just 16 basis points.
Ongoing stimulus efforts in Asia also appeared likely to contribute to low U.S. rates. Chinese industrial production growth continued to slow in early 2016, prompting the People’s Bank of China (“PBOC”) to stimulate credit growth by allowing banks to hold fewer reserves against deposits. And after years of struggling with stagnant growth and low inflation, the Bank of Japan (“BOJ”) surprised markets by cutting its key interest rate to -10 basis points in January. The negative rates pushed a considerable amount of Japanese savings into foreign markets.
In an environment where global rates are moving lower and markets are already starved for yield, foreign investors began looking to the U.S. Guggenheim expects that U.S. Treasury yields will fall further as the gravitational pull of global yields gets stronger, and does not discount the possibility of 10-year U.S. Treasury yields declining to closer to 1 percent before the end of the year.
A stronger dollar has weighed on the U.S. economy, but consumer spending has been resilient. The labor market is now operating near full employment, and tight labor market conditions are beginning to spur faster wage growth. We believe the U.S. economy is fundamentally sound, and find little evidence to support the conclusion that the economy will fall into a recession in 2016.
Despite the relative health of the U.S. economy, markets are concerned that sluggish global growth will hold back the U.S. expansion, that inflation will remain below the Fed’s target for longer, and that tighter conditions in credit markets have raised recession risks. Our view is that the Fed remains focused on fulfilling its dual mandate objectives of maximum employment and price stability, and thus is biased toward normalizing policy. We expect further declines in the unemployment rate as job gains outstrip growth in the labor force. Meanwhile, core and headline inflation should move closer to the Fed’s target by year end, reflecting our forecasts for a tighter labor market and a modest rise in oil prices. Normally, this would result in at least two Fed rate hikes on the table for 2016, but the U.S. Fed is becoming more sensitive to global financial conditions and the extent of global money flows that occur as monetary policy in the U.S. diverges from Europe, Japan and China. As a result, we have reduced our expectations for a June rate hike, although it would normally be an easy call. We continue to believe a December rate hike is a near certainty. A solid macroeconomic backdrop and a rebalancing oil market should support an improving credit picture in the second half of 2016.
For the six months ended March 31, 2016, the Standard & Poor’s 500® (“S&P 500”) Index* returned 8.49%. The Morgan Stanley Capital International (“MSCI”) Europe-Australasia-Far East (“EAFE”) Index* returned 1.56%. The return of the MSCI Emerging Markets Index* was 6.41%.
| | THE GUGGENHEIM FUNDS SEMI-ANNUAL REPORT | 3 |
ECONOMIC AND MARKET OVERVIEW (Unaudited)(concluded) | March 31, 2016 |
In the bond market, the Barclays U.S. Aggregate Bond Index* posted a 2.44% return for the period, while the Barclays U.S. Corporate High Yield Index* returned 1.22%. The return of the Bank of America (“BofA”) Merrill Lynch 3-Month U.S. Treasury Bill Index* was 0.11% for the six-month period.
The opinions and forecasts expressed may not actually come to pass. This information is subject to change at any time, based on market and other conditions, and should not be construed as a recommendation of any specific security or strategy.
*Index Definitions:
The following indices are referenced throughout this report. Indices are unmanaged and not available for direct investment. Index performance does not reflect transaction costs, fees, or expenses.
Barclays U.S. Aggregate Bond Index is a broad-based benchmark that measures the investment grade, U.S. dollar denominated, fixed-rate taxable bond market, including U.S. Treasuries, government-related and corporate securities, MBS (agency fixed-rate and hybrid ARM pass-throughs), ABS, and CMBS.
Barclays U.S. Corporate High Yield Index measures the market of U.S. dollar denominated, non-investment grade, fixed-rate, taxable corporate bonds. Securities are classified as high yield if the middle rating of Moody’s, Fitch, and S&P is Ba1/BB+/BB+ or below.
BofA Merrill Lynch 3-Month U.S. Treasury Bill Index is an unmanaged market index of U.S. Treasury securities maturing in 90 days that assumes reinvestment of all income.
MSCI EAFE Index is a free float-adjusted market capitalization index that is designed to measure the equity market performance of developed markets, excluding the U.S. & Canada.
MSCI Emerging Markets Index is a free float-adjusted market capitalization weighted index that is designed to measure equity market performance in the global emerging markets.
S&P 500® Index is a capitalization-weighted index of 500 stocks designed to measure the performance of the broad economy, representing all major industries and is considered a representation of the U.S. stock market.
4 | THE GUGGENHEIM FUNDS SEMI-ANNUAL REPORT | |
ABOUT SHAREHOLDERS’ FUND EXPENSES (Unaudited) | |
All mutual funds have operating expenses and it is important for our shareholders to understand the impact of costs on their investments. Shareholders of a Fund incur two types of costs: (i) transaction costs, including sales charges (loads) on purchase payments, reinvested dividends, or other distributions; and exchange fees; and (ii) ongoing costs, including management fees, administrative services, and shareholder reports, among others. These ongoing costs, or operating expenses, are deducted from a fund’s gross income and reduce the investment return of the fund.
A fund’s expenses are expressed as a percentage of its average net assets, which is known as the expense ratio. The following examples are intended to help investors understand the ongoing costs (in dollars) of investing in a Fund and to compare these costs with the ongoing costs of investing in other mutual funds.
The examples are based on an investment of $1,000 made at the beginning of the period and held for the entire six-month period beginning September 30, 2015 and ending March 31, 2016.
The following tables illustrate a Fund’s costs in two ways:
Table 1.Based on actual Fund return. This section helps investors estimate the actual expenses paid over the period. The “Ending Account Value” shown is derived from the Fund’s actual return, and the fourth column shows the dollar amount that would have been paid by an investor who started with $1,000 in the Fund. Investors may use the information here, together with the amount invested, to estimate the expenses paid over the period. Simply divide the Fund’s account value by $1,000 (for example, an $8,600 account value divided by $1,000 = 8.6), then multiply the result by the number provided under the heading “Expenses Paid During Period.”
Table 2.Based on hypothetical 5% return. This section is intended to help investors compare a Fund’s cost with those of other mutual funds. The table provides information about hypothetical account values and hypothetical expenses based on the Fund’s actual expense ratio and an assumed rate of return of 5% per year before expenses, which is not the Fund’s actual return. The hypothetical account values and expenses may not be used to estimate the actual ending account balance or expenses paid during the period. The example is useful in making comparisons because the U.S. Securities and Exchange Commission (the “SEC”) requires all mutual funds to calculate expenses based on the 5% return. Investors can assess a Fund’s costs by comparing this hypothetical example with the hypothetical examples that appear in shareholder reports of other funds.
The calculations illustrated above assume no shares were bought or sold during the period. Actual costs may have been higher or lower, depending on the amount of investment and the timing of any purchases or redemptions.
Please note that the expenses shown in the table are meant to highlight your ongoing costs only and do not reflect any transactional costs, such as sales charges (loads) on purchase payments, and contingent deferred sales charges (“CDSC”) on redemptions, if any. Therefore, the second table is useful in comparing ongoing costs only, and will not help you determine the relative total costs of owning different funds. In addition, if these transactional costs were included, your costs would have been higher.
More information about a Fund’s expenses, including annual expense ratios for up to the past five years (subject to the Fund’s inception date), can be found in the Financial Highlights section of this report. For additional information on operating expenses and other shareholder costs, please refer to the appropriate Fund prospectus.
| | THE GUGGENHEIM FUNDS SEMI-ANNUAL REPORT | 5 |
ABOUT SHAREHOLDERS’ FUND EXPENSES (Unaudited)(continued) | |
| | Expense
Ratio1 | Fund
Return | Beginning
Account Value
September 30, 2015 | Ending
Account Value
March 31, 2016 | Expenses
Paid During
Period2 |
Table 1. Based on actual Fund return3 | | | | |
Diversified Income Fund4 | | | | | |
A-Class | 0.78% | 2.63% | $ 1,000.00 | $ 1,026.30 | $ 1.30 |
C-Class | 1.52% | 2.51% | 1,000.00 | 1,025.10 | 2.52 |
P-Class | 0.78% | 2.62% | 1,000.00 | 1,026.20 | 1.30 |
Institutional Class | 0.57% | 2.70% | 1,000.00 | 1,027.00 | 0.95 |
High Yield Fund | | | | | |
A-Class | 1.24% | (0.52%) | 1,000.00 | 994.80 | 6.18 |
C-Class | 1.99% | (0.96%) | 1,000.00 | 990.40 | 9.90 |
P-Class | 1.24% | (0.57%) | 1,000.00 | 994.30 | 6.18 |
Institutional Class | 0.99% | (0.47%) | 1,000.00 | 995.30 | 4.94 |
Investment Grade Bond Fund | | | | | |
A-Class | 1.06% | 1.25% | 1,000.00 | 1,012.50 | 5.33 |
C-Class | 1.81% | 0.88% | 1,000.00 | 1,008.80 | 9.09 |
P-Class | 1.05% | 1.22% | 1,000.00 | 1,012.20 | 5.28 |
Institutional Class | 0.80% | 1.43% | 1,000.00 | 1,014.30 | 4.03 |
Limited Duration Fund | | | | | |
A-Class | 0.85% | (0.19%) | 1,000.00 | 998.10 | 4.25 |
C-Class | 1.60% | (0.57%) | 1,000.00 | 994.30 | 7.98 |
P-Class | 0.86% | (0.18%) | 1,000.00 | 998.20 | 4.30 |
Institutional Class | 0.60% | (0.06%) | 1,000.00 | 999.40 | 3.00 |
Municipal Income Fund | | | | | |
A-Class | 0.81% | 2.93% | 1,000.00 | 1,029.30 | 4.11 |
C-Class | 1.56% | 2.46% | 1,000.00 | 1,024.60 | 7.90 |
P-Class | 0.82% | 2.85% | 1,000.00 | 1,028.50 | 4.16 |
Institutional Class | 0.56% | 2.97% | 1,000.00 | 1,029.70 | 2.84 |
6 | THE GUGGENHEIM FUNDS SEMI-ANNUAL REPORT | |
ABOUT SHAREHOLDERS’ FUND EXPENSES (Unaudited)(concluded) | |
| | Expense
Ratio1 | Fund
Return | Beginning
Account Value
September 30, 2015 | Ending
Account Value
March 31, 2016 | Expenses
Paid During
Period2 |
Table 2. Based on hypothetical 5% return (before expenses) | | | |
Diversified Income Fund4 | | | | | |
A-Class | 0.78% | 5.00% | $ 1,000.00 | $ 1,021.10 | $ 3.94 |
C-Class | 1.52% | 5.00% | 1,000.00 | 1,017.40 | 7.67 |
P-Class | 0.78% | 5.00% | 1,000.00 | 1,021.10 | 3.94 |
Institutional Class | 0.57% | 5.00% | 1,000.00 | 1,022.15 | 2.88 |
High Yield Fund | | | | | |
A-Class | 1.24% | 5.00% | 1,000.00 | 1,018.80 | 6.26 |
C-Class | 1.99% | 5.00% | 1,000.00 | 1,015.05 | 10.02 |
P-Class | 1.24% | 5.00% | 1,000.00 | 1,018.80 | 6.26 |
Institutional Class | 0.99% | 5.00% | 1,000.00 | 1,020.05 | 5.00 |
Investment Grade Bond Fund | | | | �� | |
A-Class | 1.06% | 5.00% | 1,000.00 | 1,019.70 | 5.35 |
C-Class | 1.81% | 5.00% | 1,000.00 | 1,015.95 | 9.12 |
P-Class | 1.05% | 5.00% | 1,000.00 | 1,019.75 | 5.30 |
Institutional Class | 0.80% | 5.00% | 1,000.00 | 1,021.00 | 4.04 |
Limited Duration Fund | | | | | |
A-Class | 0.85% | 5.00% | 1,000.00 | 1,020.75 | 4.29 |
C-Class | 1.60% | 5.00% | 1,000.00 | 1,017.00 | 8.07 |
P-Class | 0.86% | 5.00% | 1,000.00 | 1,020.70 | 4.34 |
Institutional Class | 0.60% | 5.00% | 1,000.00 | 1,022.00 | 3.03 |
Municipal Income Fund | | | | | |
A-Class | 0.81% | 5.00% | 1,000.00 | 1,020.95 | 4.09 |
C-Class | 1.56% | 5.00% | 1,000.00 | 1,017.20 | 7.87 |
P-Class | 0.82% | 5.00% | 1,000.00 | 1,020.90 | 4.14 |
Institutional Class | 0.56% | 5.00% | 1,000.00 | 1,022.20 | 2.83 |
1 | Annualized and excludes expenses of the underlying funds in which the Funds invest. |
2 | Expenses are equal to the Fund's annualized expense ratio, net of any applicable fee waivers, multiplied by the average account value over the period, multiplied by 183/366 (to reflect the one-half year period). |
3 | Actual cumulative return at net asset value for the period September 30, 2015 to March 31, 2016. |
4 | Since commencement of operations: January 29, 2016. Expenses paid based on actual fund return are calculated using 60 days from the commencement of operations. Expenses paid based on hypothetical 5% return are calculated using 183 days. |
| | THE GUGGENHEIM FUNDS SEMI-ANNUAL REPORT | 7 |
FUND PROFILE (Unaudited) | March 31, 2016 |
DIVERSIFIED INCOME FUND
OBJECTIVE: Seeks to achieve high current income with consideration for capital appreciation.
Holdings Diversification (Market Exposure as % of Net Assets)
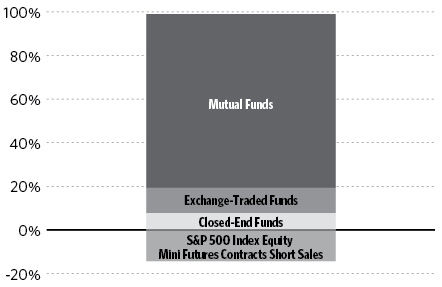
“Holdings Diversification (Market Exposure as % of Net Assets)” excludes any temporary cash investments.
Inception Dates: |
A-Class | January 29, 2016 |
C-Class | January 29, 2016 |
P-Class | January 29, 2016 |
Institutional Class | January 29, 2016 |
Ten Largest Holdings (% of Total Net Assets) |
Guggenheim High Yield Fund - Institutional Class | 24.7% |
Guggenheim Floating Rate Strategies Fund - Institutional Class | 20.5% |
Guggenheim Limited Duration Fund - Institutional Class | 13.5% |
Guggenheim S&P High Income Infrastructure ETF | 10.6% |
Guggenheim Investment Grade Bond Fund - Institutional Class | 9.7% |
Guggenheim World Equity Income Fund - Institutional Class | 7.1% |
Guggenheim Risk Managed Real Estate Fund - Institutional Class | 4.2% |
Eaton Vance Tax-Managed Buy-Write Income Fund | 0.2% |
Voya Global Equity Dividend and Premium Opportunity Fund | 0.2% |
Cohen & Steers REIT and Preferred Income Fund, Inc. | 0.2% |
Top Ten Total | 90.9% |
| | |
“Ten Largest Holdings” excludes any temporary cash or derivative investments. |
8 | THE GUGGENHEIM FUNDS SEMI-ANNUAL REPORT | |
SCHEDULE OF INVESTMENTS (Unaudited) | March 31, 2016 |
DIVERSIFIED INCOME FUND | |
| | | Shares | | | Value | |
| | | | | | | |
EXCHANGE-TRADED FUNDS† - 10.6% | |
Guggenheim S&P High Income Infrastructure ETF1 | | | 23,785 | | | $ | 546,579 | |
Total Exchange-Traded Funds | | | | | | | | |
(Cost $499,952) | | | | | | | 546,579 | |
| | | | | | | | | |
MUTUAL FUNDS† - 79.7% | |
Guggenheim High Yield Fund - Insitutional Class1 | | | 150,392 | | | | 1,267,801 | |
Guggenheim Floating Rate Strategies Fund - Institutional Class1 | | | 41,665 | | | | 1,053,695 | |
Guggenheim Limited Duration Fund - Institutional Class1 | | | 28,533 | | | | 691,937 | |
Guggenheim Investment Grade Bond Fund - Institutional Class1 | | | 27,835 | | | | 498,803 | |
Guggenheim World Equity Income Fund - Institutional Class1 | | | 27,987 | | | | 365,229 | |
Guggenheim Risk Managed Real Estate Fund - Institutional Class1 | | | 7,640 | | | | 214,457 | |
Total Mutual Funds | | | | | | | | |
(Cost $4,032,423) | | | | | | | 4,091,922 | |
| | | | | | | | | |
CLOSED-END FUNDS† - 8.7% | | | | | | | | |
Eaton Vance Tax-Managed Buy-Write Income Fund | | | 771 | | | | 12,506 | |
Voya Global Equity Dividend and Premium Opportunity Fund | | | 1,760 | | | | 12,479 | |
Cohen & Steers REIT and Preferred Income Fund, Inc. | | | 659 | | | | 12,468 | |
Avenue Income Credit Strategies Fund | | | 1,134 | | | | 12,429 | |
Calamos Convertible and High Income Fund | | | 1,195 | | | | 12,416 | |
John Hancock Investors Trust | | | 798 | | | | 12,321 | |
LMP Capital and Income Fund, Inc. | | | 995 | | | | 12,308 | |
John Hancock Preferred Income Fund II | | | 578 | | | | 12,288 | |
Legg Mason BW Global Income Opportunities Fund, Inc. | | | 995 | | | | 12,288 | |
Eaton Vance Tax-Managed Diversified Equity Income Fund | | | 1,151 | | | | 12,281 | |
Western Asset High Income Fund II, Inc. | | | 1,857 | | | | 12,275 | |
Cohen & Steers Quality Income Realty Fund, Inc. | | | 988 | | | | 12,261 | |
Eaton Vance Enhanced Equity Income Fund II | | | 946 | | | | 12,251 | |
New America High Income Fund, Inc. | | | 1,517 | | | | 12,242 | |
John Hancock Premium Dividend Fund | | | 807 | | | | 12,202 | |
Wells Fargo Global Dividend Opportunity Fund | | | 2,043 | | | | 12,197 | |
Neuberger Berman High Yield Strategies Fund, Inc. | | | 1,146 | | | | 12,159 | |
Eaton Vance Floating-Rate Income Trust | | | 923 | | | | 12,147 | |
Pioneer High Income Trust | | | 1,206 | | | | 12,108 | |
BlackRock Multi-Sector Income Trust | | | 761 | | | | 12,031 | |
Nuveen S&P 500 Dynamic Overwrite Fund | | | 902 | | | | 12,015 | |
Western Asset Worldwide Income Fund, Inc. | | | 1,153 | | | | 11,980 | |
ClearBridge Energy MLP Opportunity Fund, Inc. | | | 1,061 | | | | 11,957 | |
Western Asset Premier Bond Fund | | | 951 | | | | 11,935 | |
PIMCO Income Strategy Fund II | | | 1,364 | | | | 11,935 | |
Cohen & Steers Select Preferred and Income Fund, Inc. | | | 469 | | | | 11,856 | |
BlackRock Enhanced Capital and Income Fund, Inc. | | | 875 | | | | 11,848 | |
Nuveen Tax-Advantaged Dividend Growth Fund | | | 863 | | | | 11,823 | |
Eaton Vance Tax-Advantaged Dividend Income Fund | | | 616 | | | | 11,821 | |
Invesco High Income Trust II | | | 892 | | | | 11,810 | |
Alpine Total Dynamic Dividend Fund | | | 1,572 | | | | 11,790 | |
Nuveen Credit Strategies Income Fund | | | 1,488 | | | | 11,770 | |
Western Asset High Yield Defined Opportunity Fund, Inc. | | | 834 | | | | 11,626 | |
PIMCO Corporate & Income Strategy Fund | | | 835 | | | | 11,481 | |
PIMCO Income Opportunity Fund | | | 551 | | | | 11,433 | |
Ivy High Income Opportunities Fund | | | 890 | | | | 11,330 | |
PIMCO Dynamic Income Fund | | | 421 | | | | 10,967 | |
Total Closed-End Funds | | | | | | | | |
(Cost $424,467) | | | | | | | 445,034 | |
| | | | | | | | | |
Total Investments - 99.0% | | | | | | | | |
(Cost $4,956,842) | | | | | | $ | 5,083,535 | |
Other Assets & Liabilities, net - 1.0% | | | | | | | 50,290 | |
Total Net Assets - 100.0% | | | | | | $ | 5,133,825 | |
| | | Contracts | | | Unrealized
Loss | |
| | | | | | | | | |
EQUITY FUTURES CONTRACTS SOLD SHORT† | |
June 2016 S&P 500 Index
Mini Futures Contracts
(Aggregate Value of
Contracts $717,675) | | | 7 | | | $ | (18,638 | ) |
† | Value determined based on Level 1 inputs — See Note 4. |
1 | Affiliated issuer — See Note 7. |
| | REIT — Real Estate Investment Trust |
| | |
| | See Sector Classification in Other Information section. |
SEE NOTES TO FINANCIAL STATEMENTS. | THE GUGGENHEIM FUNDS SEMI-ANNUAL REPORT | 9 |
SCHEDULE OF INVESTMENTS (Unaudited)(concluded) | March 31, 2016 |
DIVERSIFIED INCOME FUND | |
The following table summarizes the inputs used to value the Fund’s investments at March 31, 2016 (See Note 4 in the Notes to Financial Statements):
Investments in Securities (Assets) | | Level 1 | | | Level 1 -
Other* | | | Level 2 | | | Level 3 | | | Total | |
Exchange-Traded Funds | | $ | 546,579 | | | $ | — | | | $ | — | | | $ | — | | | $ | 546,579 | |
Closed-End Funds | | | 445,034 | | | | — | | | | — | | | | — | | | | 445,034 | |
Mutual Funds | | | 4,091,922 | | | | — | | | | — | | | | — | | | | 4,091,922 | |
Total | | $ | 5,083,535 | | | $ | — | | | $ | — | | | $ | — | | | $ | 5,083,535 | |
Investments in Securities (Liabilities) | | Level 1 | | | Level 1 -
Other* | | | Level 2 | | | Level 3 | | | Total | |
Equity Futures Contracts | | $ | — | | | $ | 18,638 | | | $ | — | | | $ | — | | | $ | 18,638 | |
Total | | $ | — | | | $ | 18,638 | | | $ | — | | | $ | — | | | $ | 18,638 | |
* | Other financial instruments include futures contracts, which are reported as unrealized gain/loss at period end. |
For the period ended March 31, 2016, there were no transfers between levels.
10 | THE GUGGENHEIM FUNDS SEMI-ANNUAL REPORT | SEE NOTES TO FINANCIAL STATEMENTS. |
STATEMENT OF ASSETS AND LIABILITIES (Unaudited) |
March 31, 2016 |
Assets: | |
Investments in unaffiliated issuers, at value (cost $424,467) | | $ | 445,034 | |
Investments in affiliated issuers, at value (cost $4,532,375) | | | 4,638,501 | |
Total investments (cost $4,956,842) | | | 5,083,535 | |
Segregated cash with broker | | | 33,250 | |
Cash | | | 20,985 | |
Receivables: | |
Dividends | | | 19,695 | |
Management fees | | | 4,537 | |
Variation margin | | | 1,645 | |
Interest | | | 109 | |
Total assets | | | 5,163,756 | |
| | | | | |
Liabilities: | |
Payable for: | |
Securities purchased | | | 18,592 | |
Professional fees | | | 3,616 | |
Transfer agent/maintenance fees | | | 2,264 | |
Legal fees | | | 1,644 | |
Trustees' fees* | | | 1,151 | |
Distribution and service fees | | | 132 | |
Miscellaneous | | | 2,532 | |
Total liabilities | | | 29,931 | |
NET ASSETS | | $ | 5,133,825 | |
| | | | | |
Net assets consist of: | |
Paid in capital | | $ | 5,034,465 | |
Undistributed net investment income | | | 5,313 | |
Accumulated net realized loss on investments | | | (14,008 | ) |
Net unrealized appreciation on investments | | | 108,055 | |
Net assets | | $ | 5,133,825 | |
| | | | | |
A-Class: | |
Net assets | | $ | 102,706 | |
Capital shares outstanding | | | 4,029 | |
Net asset value per share | | $ | 25.49 | |
Maximum offering price per share (Net asset value divided by 96.00%) | | $ | 26.55 | |
| | | | | |
C-Class: | |
Net assets | | $ | 102,521 | |
Capital shares outstanding | | | 4,021 | |
Net asset value per share | | $ | 25.49 | |
| | | | | |
P-Class: | |
Net assets | | $ | 102,644 | |
Capital shares outstanding | | | 4,026 | |
Net asset value per share | | $ | 25.49 | |
| | | | | |
Institutional Class: | |
Net assets | | $ | 4,825,954 | |
Capital shares outstanding | | | 189,290 | |
Net asset value per share | | $ | 25.50 | |
STATEMENT OF OPERATIONS (Unaudited) | |
Period Ended March 31, 2016** | |
Investment Income: | |
Dividends from securities of affiliated issuers | | $ | 36,786 | |
Dividends from securities of unaffiliated issuers (net of foreign withholding tax of $34) | | | 7,800 | |
Interest | | | 38 | |
Total investment income | | | 44,624 | |
| | | | | |
Expenses: | |
Management fees | | | 6,164 | |
Transfer agent/maintenance fees: | |
A-Class | | | 27 | |
C-Class | | | 17 | |
P-Class | | | 5 | |
Institutional Class | | | 251 | |
Distribution and service fees: | |
A-Class | | | 41 | |
C-Class | | | 164 | |
P-Class | | | 41 | |
Fund accounting/administration fees | | | 4,109 | |
Professional fees | | | 3,616 | |
Legal fees | | | 1,644 | |
Trustees’ fees* | | | 1,151 | |
Printing expenses | | | 1,151 | |
Custodian fees | | | 559 | |
Miscellaneous | | | 822 | |
Total expenses | | | 19,762 | |
Less: | |
Expenses waived by Adviser due to expense limit | | | (10,661 | ) |
Expenses waived by Adviser due to affiliated issuers | | | (4,193 | ) |
Total waived expenses | | | (14,854 | ) |
Net expenses | | | 4,908 | |
Net investment income | | | 39,716 | |
| | | | | |
Net Realized and Unrealized Gain (Loss): | |
Net realized gain (loss) on: | |
Investments in unaffiliated issuers | | | 4,781 | |
Investments in affiliated issuers | | | (144 | ) |
Futures contracts | | | (18,645 | ) |
Net realized loss | | | (14,008 | ) |
Net change in unrealized appreciation (depreciation) on: | |
Investments in unaffiliated issuers | | | 20,567 | |
Investments in affiliated issuers | | | 106,126 | |
Futures contracts | | | (18,638 | ) |
Net change in unrealized appreciation (depreciation) | | | 108,055 | |
Net realized and unrealized gain | | | 94,047 | |
Net increase in net assets resulting from operations | | $ | 133,763 | |
* | Relates to Trustees not deemed “interested persons” within the meaning of Section 2(a)(19) of the 1940 Act. |
** | Since commencement of operations: January 29, 2016. |
SEE NOTES TO FINANCIAL STATEMENTS. | THE GUGGENHEIM FUNDS SEMI-ANNUAL REPORT | 11 |
STATEMENTS OF CHANGES IN NET ASSETS |
| | | Period Ended
March 31,
2016a | |
Increase (Decrease) in Net Assets from Operations: | | | |
Net investment income | | $ | 39,716 | |
Net realized loss on investments | | | (14,008 | ) |
Net change in unrealized appreciation (depreciation) on investments | | | 108,055 | |
Net increase in net assets resulting from operations | | | 133,763 | |
| | | | | |
Distributions to shareholders from: | | | | |
Net investment income | | | | |
A-Class | | | (660 | ) |
C-Class | | | (541 | ) |
P-Class | | | (658 | ) |
Institutional Class | | | (32,544 | ) |
Total distributions to shareholders | | | (34,403 | ) |
| | | | | |
Capital share transactions: | | | | |
Proceeds from sale of shares | | | | |
A-Class | | | 100,153 | |
C-Class | | | 100,000 | |
P-Class | | | 100,000 | |
Institutional Class | | | 4,700,000 | |
Distributions reinvested | | | | |
A-Class | | | 660 | |
C-Class | | | 541 | |
P-Class | | | 658 | |
Institutional Class | | | 32,544 | |
Cost of shares redeemed | | | | |
A-Class | | | (91 | ) |
C-Class | | | — | |
P-Class | | | — | |
Institutional Class | | | — | |
Net increase from capital share transactions | | | 5,034,465 | |
Net increase in net assets | | | 5,133,825 | |
| | | | | |
Net assets: | | | | |
Beginning of period | | | — | |
End of period | | $ | 5,133,825 | |
Undistributed net investment income at end of period | | $ | 5,313 | |
| | | | | |
Capital share activity: | | | | |
Shares sold | | | | |
A-Class | | | 4,007 | |
C-Class | | | 4,000 | |
P-Class | | | 4,000 | |
Institutional Class | | | 188,000 | |
Shares issued from reinvestment of distributions | | | | |
A-Class | | | 26 | |
C-Class | | | 21 | |
P-Class | | | 26 | |
Institutional Class | | | 1,290 | |
Shares redeemed | | | | |
A-Class | | | (4 | ) |
C-Class | | | — | |
P-Class | | | — | |
Institutional Class | | | — | |
Net increase in shares | | | 201,366 | |
a | Since commencement of operations: January 29, 2016. |
12 | THE GUGGENHEIM FUNDS SEMI-ANNUAL REPORT | SEE NOTES TO FINANCIAL STATEMENTS. |
This table is presented to show selected data for a share outstanding throughout each period and to assist shareholders in evaluating a Fund’s performance for the periods presented.
A-Class | | Period Ended
March 31,
2016a | |
Per Share Data | | | |
Net asset value, beginning of period | | $ | 25.00 | |
Income (loss) from investment operations: | |
Net investment income (loss)b | | | .19 | |
Net gain (loss) on investments (realized and unrealized) | | | .46 | |
Total from investment operations | | | .65 | |
Less distributions from: | |
Net investment income | | | (.16 | ) |
Total distributions | | | (.16 | ) |
Net asset value, end of period | | $ | 25.49 | |
| | | | | |
Total Returnd | | | 2.63 | % |
Ratios/Supplemental Data | |
Net assets, end of period (in thousands) | | $ | 103 | |
Ratios to average net assets: | |
Net investment income (loss) | | | 4.65 | % |
Total expensesc | | | 2.75 | % |
Net expensese | | | 0.78 | % |
Portfolio turnover rate | | | 6 | % |
C-Class | | Period Ended
March 31,
2016a | |
Per Share Data | | | |
Net asset value, beginning of period | | $ | 25.00 | |
Income (loss) from investment operations: | |
Net investment income (loss)b | | | .16 | |
Net gain (loss) on investments (realized and unrealized) | | | .49 | |
Total from investment operations | | | .65 | |
Less distributions from: | |
Net investment income | | | (.16 | ) |
Total distributions | | | (.16 | ) |
Net asset value, end of period | | $ | 25.49 | |
| | | | | |
Total Returnd | | | 2.51 | % |
Ratios/Supplemental Data | |
Net assets, end of period (in thousands) | | $ | 103 | |
Ratios to average net assets: | |
Net investment income (loss) | | | 3.91 | % |
Total expensesc | | | 3.44 | % |
Net expensese | | | 1.52 | % |
Portfolio turnover rate | | | 6 | % |
SEE NOTES TO FINANCIAL STATEMENTS. | THE GUGGENHEIM FUNDS SEMI-ANNUAL REPORT | 13 |
FINANCIAL HIGHLIGHTS (continued) |
This table is presented to show selected data for a share outstanding throughout each period and to assist shareholders in evaluating a Fund’s performance for the periods presented.
P-Class | | Period Ended
March 31,
2016a | |
Per Share Data | | | |
Net asset value, beginning of period | | $ | 25.00 | |
Income (loss) from investment operations: | |
Net investment income (loss)b | | | .19 | |
Net gain (loss) on investments (realized and unrealized) | | | .44 | |
Total from investment operations | | | .63 | |
Less distributions from: | |
Net investment income | | | (.14 | ) |
Total distributions | | | (.14 | ) |
Net asset value, end of period | | $ | 25.49 | |
| | | | | |
Total Returnd | | | 2.62 | % |
Ratios/Supplemental Data | |
Net assets, end of period (in thousands) | | $ | 103 | |
Ratios to average net assets: | |
Net investment income (loss) | | | 4.65 | % |
Total expensesc | | | 2.62 | % |
Net expensese | | | 0.78 | % |
Portfolio turnover rate | | | 6 | % |
14 | THE GUGGENHEIM FUNDS SEMI-ANNUAL REPORT | SEE NOTES TO FINANCIAL STATEMENTS. |
FINANCIAL HIGHLIGHTS (concluded) |
This table is presented to show selected data for a share outstanding throughout each period and to assist shareholders in evaluating a Fund’s performance for the periods presented.
Institutional Class | | Period Ended
March 31,
2016a | |
Per Share Data | | | |
Net asset value, beginning of period | | $ | 25.00 | |
Income (loss) from investment operations: | |
Net investment income (loss)b | | | .20 | |
Net gain (loss) on investments (realized and unrealized) | | | .47 | |
Total from investment operations | | | .67 | |
Less distributions from: | |
Net investment income | | | (.17 | ) |
Total distributions | | | (.17 | ) |
Net asset value, end of period | | $ | 25.50 | |
| | | | | |
Total Returnd | | | 2.70 | % |
Ratios/Supplemental Data | |
Net assets, end of period (in thousands) | | $ | 4,826 | |
Ratios to average net assets: | |
Net investment income (loss) | | | 4.86 | % |
Total expensesc | | | 2.37 | % |
Net expensese | | | 0.57 | % |
Portfolio turnover rate | | | 6 | % |
a | Since commencement of operations: January 29, 2016. Percentage amounts for the period, except total return and portfolio turnover rate, have been annualized. |
b | Net investment income (loss) per share was computed using average shares outstanding throughout the period. |
c | Does not include expenses of the underlying funds in which the Fund invests. |
d | Total return does not reflect the impact of any applicable sales charges and has not been annualized. |
e | Net expense information reflects the expense ratios after expense waivers. |
SEE NOTES TO FINANCIAL STATEMENTS. | THE GUGGENHEIM FUNDS SEMI-ANNUAL REPORT | 15 |
FUND PROFILE (Unaudited) | March 31, 2016 |
HIGH YIELD FUND
OBJECTIVE: Seeks high current income. Capital appreciation is a secondary objective.
Holdings Diversification (Market Exposure as % of Net Assets)
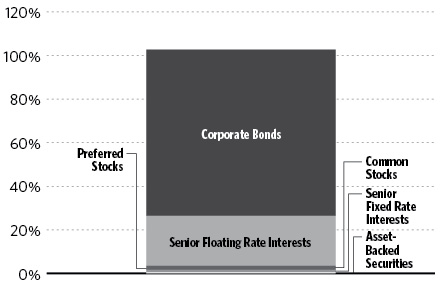
“Holdings Diversification (Market Exposure as % of Net Assets)” excludes any temporary cash investments.
Portfolio Composition by Quality Rating1 |
Rating | |
Fixed Income Instruments | |
AAA | 0.2% |
A | 0.2% |
BBB | 6.1% |
BB | 45.0% |
B | 34.0% |
CCC | 9.1% |
C | 0.1% |
D | 0.4% |
NR2 | 0.9% |
Other Instruments | 4.0% |
Total Investments | 100.0% |
| | |
The chart above reflects percentages of the value of total investments. |
Inception Dates: |
A-Class | August 5, 1996 |
C-Class | May 1, 2000 |
P-Class | May 1, 2015 |
Institutional Class | July 11, 2008 |
Ten Largest Holdings (% of Total Net Assets) |
Vector Group Ltd. | 1.7% |
ContourGlobal Power Holdings S.A. | 1.4% |
WMG Acquisition Corp. | 1.3% |
Infor US, Inc. | 1.3% |
Kennedy-Wilson, Inc. | 1.3% |
Open Text Corp. | 1.2% |
First Data Corp. | 1.1% |
ADT Corp. | 1.1% |
LBC Tank Terminals Holding Netherlands BV | 1.0% |
Eldorado Gold Corp. | 1.0% |
Top Ten Total | 12.4% |
| | |
“Ten Largest Holdings” excludes any temporary cash or derivative investments. |
1 | Source: BlackRock Solutions. Credit quality ratings are measured on a scale that generally ranges from AAA (highest) to D (lowest). All securities except for those labeled “NR” have been rated by a Nationally Recognized Statistical Rating Organization (“NRSRO”). For purposes of this presentation, when ratings are available from more than one agency, the highest rating is used. Guggenheim Investments converts ratings to the equivalent S&P rating. |
2 | NR securities do not necessarily indicate low credit quality. |
16 | THE GUGGENHEIM FUNDS SEMI-ANNUAL REPORT | |
SCHEDULE OF INVESTMENTS (Unaudited) | March 31, 2016 |
HIGH YIELD FUND | |
| | | Shares | | | Value | |
| | | | | | | |
COMMON STOCKS† - 0.2% | |
| | | | | | | |
Consumer, Cyclical - 0.2% | |
Metro-Goldwyn-Mayer, Inc.*,†† | | | 7,040 | | | $ | 494,560 | |
| | | | | | | | | |
Communications - 0.0% | |
Cengage Learning Acquisitions, Inc.*,†† | | | 2,107 | | | | 39,243 | |
| | | | | | | | | |
Industrial - 0.0% | |
Targus Group International, Inc.*,†††,1 | | | 13,240 | | | | 20,257 | |
| | | | | | | | | |
Energy - 0.0% | |
Stallion Oilfield Holdings Ltd.*,†† | | | 8,257 | | | | 2,890 | |
| | | | | | | | | |
Diversified - 0.0% | |
Leucadia National Corp. | | | 81 | | | | 1,310 | |
| | | | | | | | | |
Basic Materials - 0.0% | |
Mirabela Nickel Ltd.*,†††,1 | | | 1,044,540 | | | | 80 | |
| | | | | | | | | |
Consumer, Non-cyclical - 0.0% | |
Crimson Wine Group Ltd.* | | | 8 | | | | 67 | |
| | | | | | | | | |
Total Common Stocks | | | | | | | | |
(Cost $775,580) | | | | | | | 558,407 | |
| | | | | | | | | |
PREFERRED STOCKS†† - 1.9% | |
Industrial - 1.0% | |
Seaspan Corp. 6.38% due 04/30/191 | | | 80,000 | | | | 1,980,800 | |
U.S. Shipping Corp.*,1 | | | 14,718 | | | | 27,596 | |
Total Industrial | | | | | | | 2,008,396 | |
| | | | | | | | | |
Financial - 0.8% | |
Morgan Stanley 6.38%2,3 | | | 46,000 | | | | 1,199,220 | |
Aspen Insurance Holdings Ltd. 5.95%1,2,3 | | | 19,965 | | | | 528,074 | |
Total Financial | | | | | | | 1,727,294 | |
| | | | | | | | | |
Communications - 0.1% | |
Medianews Group, Inc.* | | | 11,074 | | | | 323,915 | |
Total Preferred Stocks | | | | | | | | |
(Cost $4,192,221) | | | | | | | 4,059,605 | |
| | | | | | | | | |
EXCHANGE-TRADED FUNDS† - 0.8% | |
SPDR Barclays High Yield Bond ETF | | | 50,000 | | | | 1,712,500 | |
Total Exchange-Traded Funds | | | | | | | | |
(Cost $1,726,695) | | | | | | | 1,712,500 | |
| | | | | | | | | |
SHORT TERM INVESTMENTS† - 1.2% | |
Dreyfus Treasury Prime Cash Management Institutional Shares 0.18%4 | | | 2,670,677 | | | | 2,670,677 | |
Total Short Term Investments | | | | | | | | |
(Cost $2,670,677) | | | | | | | 2,670,677 | |
| | | Face
Amount9 | | | Value | |
| | | | | | | |
CORPORATE BONDS†† - 76.4% | |
Communications - 16.3% | |
T-Mobile USA, Inc. | | | | | | |
6.50% due 01/15/26 | | | 2,050,000 | | | | 2,129,437 | |
6.00% due 04/15/24 | | | 1,300,000 | | | | 1,316,250 | |
MDC Partners, Inc. | | | | | | | | |
6.75% due 04/01/205,6 | | | 2,000,000 | | | | 2,067,500 | |
6.50% due 05/01/246 | | | 1,200,000 | | | | 1,225,500 | |
Sprint Communications, Inc. | | | | | | | | |
9.00% due 11/15/186 | | | 1,750,000 | | | | 1,833,125 | |
7.00% due 03/01/206 | | | 1,000,000 | | | | 1,000,000 | |
6.00% due 11/15/22 | | | 150,000 | | | | 109,688 | |
DISH DBS Corp. | | | | | | | | |
5.88% due 11/15/24 | | | 2,300,000 | | | | 2,110,249 | |
5.88% due 07/15/22 | | | 750,000 | | | | 710,625 | |
McGraw-Hill Global Education Holdings LLC / McGraw-Hill Global Education Finance | | | | | | | | |
9.75% due 04/01/21 | | | 2,050,000 | | | | 2,224,250 | |
CSC Holdings LLC | | | | | | | | |
5.25% due 06/01/24 | | | 1,100,000 | | | | 980,375 | |
6.75% due 11/15/21 | | | 850,000 | | | | 872,950 | |
Neptune Finco Corp. | | | | | | | | |
6.63% due 10/15/256 | | | 1,400,000 | | | | 1,513,610 | |
Zayo Group LLC / Zayo Capital, Inc. | | | | | | | | |
6.38% due 05/15/25 | | | 1,400,000 | | | | 1,368,525 | |
Numericable-SFR S.A. | | | | | | | | |
6.00% due 05/15/226 | | | 1,350,000 | | | | 1,316,250 | |
Interoute Finco plc | | | | | | | | |
7.38% due 10/15/20 | | EUR | 1,000,000 | | | | 1,234,568 | |
Sirius XM Radio, Inc. | | | | | | | | |
5.38% due 04/15/256 | | | 900,000 | | | | 915,750 | |
6.00% due 07/15/246 | | | 250,000 | | | | 263,125 | |
Virgin Media Secured Finance plc | | | | | | | | |
5.25% due 01/15/266 | | | 1,050,000 | | | | 1,050,000 | |
CCO Holdings LLC / CCO Holdings Capital Corp. | | | | | | | | |
5.88% due 04/01/24 | | | 1,000,000 | | | | 1,047,500 | |
CCOH Safari LLC | | | | | | | | |
5.75% due 02/15/266 | | | 1,000,000 | | | | 1,035,000 | |
TIBCO Software, Inc. | | | | | | | | |
11.38% due 12/01/216 | | | 1,100,000 | | | | 962,500 | |
Altice US Finance I Corp. | | | | | | | | |
5.38% due 07/15/236 | | | 900,000 | | | | 924,188 | |
Sprint Corp. | | | | | | | | |
7.88% due 09/15/23 | | | 1,000,000 | | | | 764,790 | |
7.63% due 02/15/25 | | | 100,000 | | | | 74,250 | |
Discovery Communications LLC | | | | | | | | |
4.90% due 03/11/26 | | | 800,000 | | | | 824,819 | |
UPCB Finance IV Ltd. | | | | | | | | |
5.38% due 01/15/256 | | | 700,000 | | | | 708,750 | |
Avaya, Inc. | | | | | | | | |
7.00% due 04/01/196 | | | 1,050,000 | | | | 708,750 | |
SEE NOTES TO FINANCIAL STATEMENTS. | THE GUGGENHEIM FUNDS SEMI-ANNUAL REPORT | 17 |
SCHEDULE OF INVESTMENTS (Unaudited)(continued) | March 31, 2016 |
HIGH YIELD FUND | |
| | | Face
Amount9 | | | Value | |
| | | | | | | |
Midcontinent Communications & Midcontinent Finance Corp. | | | | | | |
6.88% due 08/15/236 | | $ | 650,000 | | | $ | 672,750 | |
CCO Safari II LLC | | | | | | | | |
4.46% due 07/23/22 | | | 600,000 | | | | 627,161 | |
CCO Holdings LLC/CCO Holdings Capital Corp. | | | | | | | | |
6.50% due 04/30/21 | | | 600,000 | | | | 621,306 | |
Level 3 Financing, Inc. | | | | | | | | |
5.25% due 03/15/26 | | | 550,000 | | | | 554,125 | |
Cogent Communications Group, Inc. | | | | | | | | |
5.38% due 03/01/226 | | | 400,000 | | | | 393,000 | |
Sirius XM Canada Holdings, Inc. | | | | | | | | |
5.63% due 04/23/216 | | CAD | 500,000 | | | | 371,549 | |
Inmarsat Finance plc | | | | | | | | |
4.88% due 05/15/226 | | | 350,000 | | | | 329,656 | |
CenturyLink, Inc. | | | | | | | | |
5.63% due 04/01/25 | | | 350,000 | | | | 313,250 | |
Total Communications | | | | | | | 35,175,121 | |
| | | | | | | | | |
Consumer, Non-cyclical - 11.5% | |
Vector Group Ltd. | | | | | | | | |
7.75% due 02/15/21 | | | 3,480,000 | | | | 3,654,000 | |
ADT Corp. | | | | | | | | |
6.25% due 10/15/215 | | | 2,300,000 | | | | 2,311,500 | |
3.50% due 07/15/22 | | | 850,000 | | | | 735,250 | |
HCA, Inc. | | | | | | | | |
5.88% due 02/15/26 | | | 1,350,000 | | | | 1,390,500 | |
5.25% due 06/15/26 | | | 500,000 | | | | 512,500 | |
Midas Intermediate Holdco II LLC / Midas Intermediate Holdco II Finance, Inc. | | | | | | | | |
7.88% due 10/01/226 | | | 1,950,000 | | | | 1,813,500 | |
Tenet Healthcare Corp. | | | | | | | | |
4.13% due 06/15/202,6 | | | 1,700,000 | | | | 1,687,249 | |
Opal Acquisition, Inc. | | | | | | | | |
8.88% due 12/15/216 | | | 2,300,000 | | | | 1,604,250 | |
Central Garden & Pet Co. | | | | | | | | |
6.13% due 11/15/23 | | | 1,500,000 | | | | 1,560,000 | |
US Foods, Inc. | | | | | | | | |
8.50% due 06/30/19 | | | 1,450,000 | | | | 1,489,875 | |
Bumble Bee Holdco SCA | | | | | | | | |
9.62% due 03/15/186 | | | 1,424,000 | | | | 1,402,640 | |
WEX, Inc. | | | | | | | | |
4.75% due 02/01/236 | | | 1,500,000 | | | | 1,320,000 | |
Bumble Bee Holdings, Inc. | | | | | | | | |
9.00% due 12/15/176 | | | 1,250,000 | | | | 1,253,125 | |
KeHE Distributors LLC / KeHE Finance Corp. | | | | | | | | |
7.63% due 08/15/216 | | | 845,000 | | | | 809,088 | |
Kinetic Concepts Incorporated / KCI USA Inc | | | | | | | | |
7.88% due 02/15/216 | | | 700,000 | | | | 740,250 | |
Halyard Health, Inc. | | | | | | | | |
6.25% due 10/15/22 | | | 550,000 | | | | 547,938 | |
CHS/Community Health Systems, Inc. | | | | | | | | |
5.13% due 08/15/18 | | | 500,000 | | | | 503,750 | |
DaVita HealthCare Partners, Inc. | | | | | | | | |
5.00% due 05/01/25 | | | 450,000 | | | | 445,500 | |
Acadia Healthcare Company, Inc. | | | | | | | | |
6.50% due 03/01/24 | | | 400,000 | | | | 416,000 | |
Jaguar Holding Company II / Pharmaceutical Product Development LLC | | | | | | | | |
6.37% due 08/01/236 | | | 400,000 | | | | 410,720 | |
R&R Ice Cream plc | | | | | | | | |
8.25% due 05/15/2010 | | AUD | 200,000 | | | | 158,018 | |
MEDNAX, Inc. | | | | | | | | |
5.25% due 12/01/236 | | | 100,000 | | | | 104,000 | |
Total Consumer, Non-cyclical | | | | | | | 24,869,653 | |
| | | | | | | | | |
Financial - 9.2% | |
Kennedy-Wilson, Inc. | | | | | | | | |
5.87% due 04/01/24 | | | 2,850,000 | | | | 2,785,875 | |
Jefferies Finance LLC / JFIN Company-Issuer Corp. | | | | | | | | |
7.38% due 04/01/206 | | | 2,150,000 | | | | 1,859,751 | |
7.50% due 04/15/216 | | | 1,000,000 | | | | 860,000 | |
Lincoln Finance Ltd. | | | | | | | | |
6.87% due 04/15/21 | | EUR | 1,600,000 | | | | 1,893,383 | |
National Financial Partners Corp. | | | | | | | | |
9.00% due 07/15/216 | | | 1,500,000 | | | | 1,440,000 | |
Icahn Enterprises Limited Partnership / Icahn Enterprises Finance Corp. | | | | | | | | |
5.88% due 02/01/22 | | | 800,000 | | | | 759,200 | |
6.00% due 08/01/20 | | | 650,000 | | | | 632,125 | |
American Equity Investment Life Holding Co. | | | | | | | | |
6.63% due 07/15/21 | | | 1,350,000 | | | | 1,387,125 | |
Iron Mountain, Inc. | | | | | | | | |
6.12% due 09/15/22 | | GBP | 850,000 | | | | 1,236,175 | |
Citigroup, Inc. | | | | | | | | |
6.30% due 12/29/492,3 | | | 700,000 | | | | 672,338 | |
5.95% due 12/31/492,3 | | | 450,000 | | | | 433,125 | |
GEO Group, Inc. | | | | | | | | |
5.88% due 01/15/22 | | | 900,000 | | | | 911,250 | |
Greystar Real Estate Partners LLC | | | | | | | | |
8.25% due 12/01/226 | | | 710,000 | | | | 733,075 | |
NewStar Financial, Inc. | | | | | | | | |
7.25% due 05/01/20 | | | 800,000 | | | | 720,000 | |
Wilton Re Finance LLC | | | | | | | | |
5.87% due 03/30/332,6 | | | 650,000 | | | | 705,854 | |
Bank of America Corp. | | | | | | | | |
6.10% due 03/12/492,3 | | | 700,000 | | | | 689,500 | |
EPR Properties | | | | | | | | |
5.75% due 08/15/22 | | | 450,000 | | | | 485,169 | |
Lock AS | | | | | | | | |
7.00% due 08/15/21 | | EUR | 400,000 | | | | 480,173 | |
HUB International Ltd. | | | | | | | | |
9.25% due 02/15/216 | | | 450,000 | | | | 466,875 | |
Compass Bank | | | | | | | | |
3.88% due 04/10/25 | | | 450,000 | | | | 422,060 | |
Majid AL Futtaim Holding | | | | | | | | |
7.12% due 12/31/49 | | | 300,000 | | | | 315,000 | |
18 | THE GUGGENHEIM FUNDS SEMI-ANNUAL REPORT | SEE NOTES TO FINANCIAL STATEMENTS. |
SCHEDULE OF INVESTMENTS (Unaudited)(continued) | March 31, 2016 |
HIGH YIELD FUND | |
| | | Face
Amount9 | | | Value | |
| | | | | | | |
Quicken Loans, Inc. | | | | | | |
5.75% due 05/01/256 | | $ | 250,000 | | | $ | 242,500 | |
Total Financial | | | | | | | 20,130,553 | |
| | | | | | | | | |
Industrial - 9.1% | |
Novelis, Inc. | | | | | | | | |
8.75% due 12/15/20 | | | 1,750,000 | | | | 1,766,275 | |
8.38% due 12/15/17 | | | 1,250,000 | | | | 1,271,250 | |
Reynolds Group Issuer Inc. / Reynolds Group Issuer LLC / Reynolds Group Issuer | | | | | | | | |
7.13% due 04/15/19 | | | 1,300,000 | | | | 1,322,750 | |
6.88% due 02/15/21 | | | 400,000 | | | | 414,000 | |
Amsted Industries, Inc. | | | | | | | | |
5.38% due 09/15/246 | | | 1,650,000 | | | | 1,586,063 | |
StandardAero Aviation Holdings, Inc. | | | | | | | | |
10.00% due 07/15/236 | | | 1,650,000 | | | | 1,575,750 | |
Reynolds Group Issuer Incorporated / Reynolds Group Issuer LLC / Reynolds Group Issuer | | | | | | | | |
7.88% due 08/15/19 | | | 1,500,000 | | | | 1,552,500 | |
CNH Industrial Capital LLC | | | | | | | | |
4.38% due 11/06/205 | | | 800,000 | | | | 786,000 | |
4.88% due 04/01/21 | | | 600,000 | | | | 597,750 | |
Summit Materials LLC / Summit Materials Finance Corp. | | | | | | | | |
8.50% due 04/15/22 | | | 1,050,000 | | | | 1,084,125 | |
CEVA Group plc | | | | | | | | |
7.00% due 03/01/216 | | | 1,300,000 | | | | 1,036,750 | |
Moto Finance plc | | | | | | | | |
6.37% due 09/01/20 | | GBP | 650,000 | | | | 952,555 | |
Reliance Intermediate Holdings, LP | | | | | | | | |
6.50% due 04/01/236 | | | 825,000 | | | | 848,719 | |
Standard Industries, Inc. | | | | | | | | |
5.50% due 02/15/236 | | | 700,000 | | | | 715,750 | |
LMI Aerospace, Inc. | | | | | | | | |
7.38% due 07/15/19 | | | 761,000 | | | | 715,340 | |
Anixter, Inc. | | | | | | | | |
5.50% due 03/01/236 | | | 650,000 | | | | 658,125 | |
GCP Applied Technologies, Inc. | | | | | | | | |
9.50% due 02/01/236 | | | 580,000 | | | | 629,300 | |
BMBG Bond Finance SCA | | | | | | | | |
4.86% due 10/15/202,6 | | EUR | 550,000 | | | | 625,818 | |
Actuant Corp. | | | | | | | | |
5.63% due 06/15/22 | | | 600,000 | | | | 609,000 | |
Coveris Holdings S.A. | | | | | | | | |
7.88% due 11/01/196 | | | 550,000 | | | | 492,250 | |
Hexcel Corp. | | | | | | | | |
4.70% due 08/15/25 | | | 400,000 | | | | 402,485 | |
Moog, Inc. | | | | | | | | |
5.25% due 12/01/226 | | | 200,000 | | | | 200,250 | |
Total Industrial | | | | | | | 19,842,805 | |
| | | | | | | | | |
Energy - 8.2% | |
Sabine Pass Liquefaction LLC | | | | | | | | |
6.25% due 03/15/22 | | | 1,911,000 | | | | 1,870,391 | |
5.63% due 02/01/21 | | | 1,100,000 | | | | 1,057,375 | |
5.63% due 04/15/23 | | | 250,000 | | | | 237,500 | |
ContourGlobal Power Holdings S.A. | | | | | | | | |
7.13% due 06/01/195,6 | | | 3,200,000 | | | | 3,108,000 | |
Antero Resources Corp. | | | | | | | | |
5.63% due 06/01/23 | | | 800,000 | | | | 736,000 | |
6.00% due 12/01/20 | | | 750,000 | | | | 712,500 | |
5.13% due 12/01/22 | | | 300,000 | | | | 272,250 | |
5.38% due 11/01/21 | | | 250,000 | | | | 231,250 | |
CONSOL Energy, Inc. | | | | | | | | |
8.00% due 04/01/23 | | | 1,300,000 | | | | 971,360 | |
5.88% due 04/15/22 | | | 950,000 | | | | 684,589 | |
Comstock Resources, Inc. | | | | | | | | |
10.00% due 03/15/206 | | | 2,150,000 | | | | 1,058,875 | |
Crestwood Midstream Partners Limited Partnership / Crestwood Midstream Finance Corp. | | | | | | | | |
6.00% due 12/15/20 | | | 980,000 | | | | 769,300 | |
Keane Group Holdings LLC | | | | | | | | |
8.50% due 08/08/19†††,1 | | | 968,750 | | | | 661,172 | |
Unit Corp. | | | | | | | | |
6.63% due 05/15/21 | | | 1,300,000 | | | | 653,250 | |
EP Energy LLC / Everest Acquisition Finance, Inc. | | | | | | | | |
9.38% due 05/01/20 | | | 650,000 | | | | 327,844 | |
6.38% due 06/15/23 | | | 650,000 | | | | 299,000 | |
FTS International, Inc. | | | | | | | | |
8.13% due 06/15/202,6 | | | 700,000 | | | | 472,142 | |
6.25% due 05/01/22 | | | 700,000 | | | | 77,000 | |
QEP Resources, Inc. | | | | | | | | |
6.88% due 03/01/21 | | | 550,000 | | | | 504,625 | |
TerraForm Power Operating LLC | | | | | | | | |
5.88% due 02/01/236 | | | 400,000 | | | | 324,000 | |
6.13% due 06/15/255,6 | | | 225,000 | | | | 175,500 | |
SandRidge Energy, Inc. | | | | | | | | |
8.75% due 06/01/206 | | | 1,850,000 | | | | 448,625 | |
7.50% due 03/15/21 | | | 250,000 | | | | 14,375 | |
Gibson Energy, Inc. | | | | | | | | |
6.75% due 07/15/216 | | | 500,000 | | | | 460,000 | |
Legacy Reserves Limited Partnership / Legacy Reserves Finance Corp. | | | | | | | | |
6.63% due 12/01/21 | | | 1,090,000 | | | | 207,100 | |
8.00% due 12/01/20 | | | 965,000 | | | | 185,763 | |
Atlas Energy Holdings Operating Company LLC / Atlas Resource Finance Corp. | | | | | | | | |
7.75% due 01/15/211 | | | 1,450,000 | | | | 210,250 | |
9.25% due 08/15/211 | | | 1,100,000 | | | | 170,500 | |
Whiting Petroleum Corp. | | | | | | | | |
5.75% due 03/15/21 | | | 500,000 | | | | 332,500 | |
Summit Midstream Holdings LLC / Summit Midstream Finance Corp. | | | | | | | | |
7.50% due 07/01/21 | | | 300,000 | | | | 235,500 | |
SEE NOTES TO FINANCIAL STATEMENTS. | THE GUGGENHEIM FUNDS SEMI-ANNUAL REPORT | 19 |
SCHEDULE OF INVESTMENTS (Unaudited)(continued) | March 31, 2016 |
HIGH YIELD FUND | |
| | | Face
Amount9 | | | Value | |
| | | | | | | |
BreitBurn Energy Partners Limited Partnership / BreitBurn Finance Corp. | | | | | | |
7.88% due 04/15/22 | | $ | 1,750,000 | | | $ | 175,000 | |
DCP Midstream LLC | | | | | | | | |
5.35% due 03/15/206 | | | 150,000 | | | | 129,080 | |
Ultra Petroleum Corp. | | | | | | | | |
5.75% due 12/15/18 | | | 500,000 | | | | 35,000 | |
Schahin II Finance Company SPV Ltd. | | | | | | | | |
5.88% due 09/25/227,10 | | | 217,167 | | | | 31,598 | |
SemGroup, LP | | | | | | | | |
8.75% due 11/15/15†††,1 | | | 1,300,000 | | | | 1 | |
Total Energy | | | | | | | 17,839,215 | |
| | | | | | | | | |
Consumer, Cyclical - 8.2% | |
WMG Acquisition Corp. | | | | | | | | |
6.75% due 04/15/225,6 | | | 2,950,000 | | | | 2,920,500 | |
6.00% due 01/15/216 | | | 350,000 | | | | 357,875 | |
5.63% due 04/15/226 | | | 350,000 | | | | 355,250 | |
Ferrellgas Limited Partnership / Ferrellgas Finance Corp. | | | | | | | | |
6.75% due 06/15/23 | | | 1,300,000 | | | | 1,140,750 | |
6.50% due 05/01/21 | | | 650,000 | | | | 576,875 | |
6.75% due 01/15/22 | | | 450,000 | | | | 399,375 | |
AmeriGas Finance LLC / AmeriGas Finance Corp. | | | | | | | | |
7.00% due 05/20/22 | | | 1,500,000 | | | | 1,537,500 | |
Wynn Las Vegas LLC / Wynn Las Vegas Capital Corp. | | | | | | | | |
5.50% due 03/01/256 | | | 1,400,000 | | | | 1,319,500 | |
Hanesbrands, Inc. | | | | | | | | |
6.38% due 12/15/20 | | | 1,200,000 | | | | 1,242,000 | |
Nathan’s Famous, Inc. | | | | | | | | |
10.00% due 03/15/206 | | | 1,000,000 | | | | 1,052,500 | |
NPC International Incorporated / NPC Operating Company A Inc / NPC Operating Co B Inc | | | | | | | | |
10.50% due 01/15/20 | | | 900,000 | | | | 929,250 | |
Hyatt Hotels Corp. | | | | | | | | |
4.85% due 03/15/26 | | | 700,000 | | | | 730,423 | |
Suburban Propane Partners Limited Partnership/Suburban Energy Finance Corp. | | | | | | | | |
5.50% due 06/01/24 | | | 650,000 | | | | 627,250 | |
5.75% due 03/01/25 | | | 100,000 | | | | 95,500 | |
Lennar Corp. | | | | | | | | |
4.75% due 04/01/21 | | | 700,000 | | | | 708,750 | |
Wyndham Worldwide Corp. | | | | | | | | |
5.10% due 10/01/25 | | | 650,000 | | | | 682,950 | |
Interval Acquisition Corp. | | | | | | | | |
5.63% due 04/15/23 | | | 600,000 | | | | 601,500 | |
Group 1 Automotive, Inc. | | | | | | | | |
5.25% due 12/15/236 | | | 550,000 | | | | 543,125 | |
Seminole Hard Rock Entertainment Inc. / Seminole Hard Rock International LLC | | | | | | | | |
5.88% due 05/15/216 | | | 500,000 | | | | 501,250 | |
Carrols Restaurant Group, Inc. | | | | | | | | |
8.00% due 05/01/22 | | | 400,000 | | | | 429,000 | |
QVC, Inc. | | | | | | | | |
4.85% due 04/01/24 | | | 400,000 | | | | 397,632 | |
Men’s Wearhouse, Inc. | | | | | | | | |
7.00% due 07/01/22 | | | 450,000 | | | | 381,375 | |
L Brands, Inc. | | | | | | | | |
6.88% due 11/01/35 | | | 250,000 | | | | 271,300 | |
Total Consumer, Cyclical | | | | | | | 17,801,430 | |
| | | | | | | | | |
Technology - 7.9% | |
First Data Corp. | | | | | | | | |
5.75% due 01/15/246 | | | 2,350,000 | | | | 2,349,765 | |
5.00% due 01/15/246 | | | 1,600,000 | | | | 1,602,000 | |
7.00% due 12/01/236 | | | 350,000 | | | | 353,500 | |
Infor US, Inc. | | | | | | | | |
6.50% due 05/15/225 | | | 3,100,000 | | | | 2,820,999 | |
NCR Corp. | | | | | | | | |
6.38% due 12/15/23 | | | 1,500,000 | | | | 1,545,000 | |
5.88% due 12/15/21 | | | 1,000,000 | | | | 1,022,500 | |
Open Text Corp. | | | | | | | | |
5.63% due 01/15/236 | | | 2,500,000 | | | | 2,550,000 | |
Epicor Software | | | | | | | | |
9.24% due 06/21/23††† | | | 2,000,000 | | | | 1,831,000 | |
Micron Technology, Inc. | | | | | | | | |
5.25% due 08/01/236 | | | 2,050,000 | | | | 1,675,875 | |
Aspect Software, Inc. | | | | | | | | |
10.63% due 05/15/17†††,1,7 | | | 1,235,000 | | | | 494,000 | |
Microsoft Corp. | | | | | | | | |
4.20% due 11/03/35 | | | 450,000 | | | | 482,350 | |
Applied Materials, Inc. | | | | | | | | |
3.90% due 10/01/25 | | | 450,000 | | | | 477,384 | |
Total Technology | | | | | | | 17,204,373 | |
| | | | | | | | | |
Utilities - 2.8% | |
AES Corp. | | | | | | | | |
7.38% due 07/01/21 | | | 1,250,000 | | | | 1,400,000 | |
5.50% due 03/15/24 | | | 1,000,000 | | | | 977,500 | |
4.88% due 05/15/23 | | | 350,000 | | | | 336,875 | |
3.64% due 06/01/192 | | | 300,000 | | | | 289,500 | |
LBC Tank Terminals Holding Netherlands BV | | | | | | | | |
6.88% due 05/15/236 | | | 2,405,000 | | | | 2,236,650 | |
Terraform Global Operating LLC | | | | | | | | |
9.75% due 08/15/226 | | | 1,200,000 | | | | 900,000 | |
Total Utilities | | | | | | | 6,140,525 | |
| | | | | | | | | |
Basic Materials - 2.3% | |
Eldorado Gold Corp. | | | | | | | | |
6.13% due 12/15/206 | | | 2,450,000 | | | | 2,235,625 | |
TPC Group, Inc. | | | | | | | | |
8.75% due 12/15/206 | | | 1,585,000 | | | | 1,109,500 | |
Constellium N.V. | | | | | | | | |
7.88% due 04/01/216 | | | 700,000 | | | | 699,391 | |
20 | THE GUGGENHEIM FUNDS SEMI-ANNUAL REPORT | SEE NOTES TO FINANCIAL STATEMENTS. |
SCHEDULE OF INVESTMENTS (Unaudited)(continued) | March 31, 2016 |
HIGH YIELD FUND | |
| | | Face
Amount9 | | | Value | |
| | | | | | | |
Yamana Gold, Inc. | | | | | | |
4.95% due 07/15/24 | | $ | 625,000 | | | $ | 528,125 | |
Cascades, Inc. | | | | | | | | |
5.75% due 07/15/236 | | | 350,000 | | | | 330,313 | |
Unifrax I LLC / Unifrax Holding Co. | | | | | | | | |
7.50% due 02/15/196 | | | 140,000 | | | | 86,450 | |
Mirabela Nickel Ltd. | | | | | | | | |
9.50% due 06/24/19†††,1 | | | 265,505 | | | | 69,031 | |
1.00% due 09/10/44†††,1 | | | 5,561 | | | | — | |
Total Basic Materials | | | | | | | 5,058,435 | |
| | | | | | | | | |
Diversified - 0.9% | |
HRG Group, Inc. | | | | | | | | |
7.88% due 07/15/19 | | | 1,885,000 | | | | 1,987,921 | |
Total Corporate Bonds | | | | | | | | |
(Cost $181,725,649) | | | | | | | 166,050,031 | |
| | | | | | | | | |
SENIOR FLOATING RATE INTERESTS†† - 22.9% | |
Consumer, Cyclical - 5.0% | |
Sky Bet | | | | | | | | |
6.50% due 02/25/22 | | GBP | 950,000 | | | | 1,361,629 | |
PETCO Animal Supplies, Inc. | | | | | | | | |
5.75% due 01/26/23 | | | 900,000 | | | | 898,623 | |
5.62% due 01/26/23 | | | 300,000 | | | | 299,550 | |
Belk, Inc. | | | | | | | | |
5.75% due 12/12/22 | | | 1,300,000 | | | | 1,146,171 | |
Fitness International LLC | | | | | | | | |
5.50% due 07/01/20 | | | 1,180,108 | | | | 1,135,854 | |
Talbots, Inc. | | | | | | | | |
5.50% due 03/19/20 | | | 1,015,651 | | | | 946,252 | |
Mavis Tire | | | | | | | | |
6.25% due 11/02/20†††,1 | | | 945,250 | | | | 924,738 | |
DLK Acquisitions BV | | | | | | | | |
8.50% due 08/28/19 | | EUR | 700,000 | | | | 795,301 | |
Navistar, Inc. | | | | | | | | |
6.50% due 08/07/20 | | | 798,000 | | | | 726,180 | |
BBB Industries, LLC | | | | | | | | |
4.43% due 11/04/191 | | | 657,143 | | | | 591,501 | |
Sears Holdings Corp. | | | | | | | | |
5.50% due 06/30/18 | | | 546,324 | | | | 519,008 | |
Alexander Mann Solutions Ltd. | | | | | | | | |
5.75% due 12/20/19 | | | 450,091 | | | | 441,089 | |
National Vision, Inc. | | | | | | | | |
6.75% due 03/11/22 | | | 450,000 | | | | 403,875 | |
PF Chang’s | | | | | | | | |
4.25% due 07/02/19 | | | 397,896 | | | | 378,001 | |
Men’s Wearhouse | | | | | | | | |
4.50% due 06/18/21 | | | 200,000 | | | | 192,126 | |
Advantage Sales & Marketing LLC | | | | | | | | |
3.39% due 07/25/191 | | | 110,000 | | | | 100,599 | |
Total Consumer, Cyclical | | | | | | | 10,860,497 | |
| | | | | | | | | |
Industrial - 4.6% | |
Flakt Woods | | | | | | | | |
2.63% due 03/20/17†††,1 | | EUR | 1,617,056 | | | | 1,822,505 | |
KC Merger Sub, Inc. | | | | | | | | |
6.00% due 08/12/22 | | | 1,145,247 | | | | 1,129,499 | |
CareCore National LLC | | | | | | | | |
5.50% due 03/05/21 | | | 1,196,119 | | | | 1,112,391 | |
Mitchell International, Inc. | | | | | | | | |
8.50% due 10/11/21 | | | 973,000 | | | | 853,808 | |
Hardware Holdings LLC | | | | | | | | |
6.75% due 03/30/20†††,1 | | | 592,500 | | | | 577,688 | |
Hillman Group, Inc. | | | | | | | | |
3.81% due 06/28/191 | | | 614,286 | | | | 570,620 | |
API Technologies Corp. | | | | | | | | |
10.00% due 02/06/18†††,1 | | | 550,045 | | | | 553,896 | |
CPM Holdings, Inc. | | | | | | | | |
6.00% due 04/11/22 | | | 496,250 | | | | 488,186 | |
LSF9 Cypress Holdings LLC | | | | | | | | |
7.25% due 10/09/22 | | | 500,000 | | | | 473,335 | |
Hunter Defense Technologies | | | | | | | | |
due 08/05/191,8 | | | 468,750 | | | | 375,000 | |
Panda Power | | | | | | | | |
7.50% due 08/21/20 | | | 400,000 | | | | 362,000 | |
SIRVA Worldwide, Inc. | | | | | | | | |
7.50% due 03/27/191 | | | 379,651 | | | | 358,770 | |
Transdigm, Inc. | | | | | | | | |
3.50% due 05/14/22 | | | 346,668 | | | | 341,035 | |
Quanex Building Products Corp. | | | | | | | | |
6.25% due 11/02/22 | | | 300,000 | | | | 299,250 | |
Wencor Group | | | | | | | | |
3.94% due 06/19/19 | | | 321,538 | | | | 297,307 | |
Mast Global | | | | | | | | |
7.75% due 09/12/19†††,1 | | | 271,017 | | | | 267,873 | |
CEVA Logistics US Holdings | | | | | | | | |
6.50% due 03/19/21 | | | 90,705 | | | | 74,530 | |
CEVA Logistics Holdings BV (Dutch) | | | | | | | | |
6.50% due 03/19/21 | | | 65,929 | | | | 54,172 | |
CEVA Group Plc (United Kingdom) | | | | | | | | |
6.50% due 03/19/21 | | | 63,633 | | | | 52,285 | |
NANA Development Corp. | | | | | | | | |
8.00% due 03/15/181 | | | 44,444 | | | | 38,889 | |
CEVA Logistics Canada, ULC | | | | | | | | |
6.50% due 03/19/21 | | | 11,338 | | | | 9,316 | |
Total Industrial | | | | | | | 10,112,355 | |
| | | | | | | | | |
Technology - 3.8% | |
Solera LLC | | | | | | | | |
5.75% due 03/03/23 | | | 1,300,000 | | | | 1,297,453 | |
TIBCO Software, Inc. | | | | | | | | |
6.50% due 12/04/20 | | | 1,240,117 | | | | 1,111,765 | |
Avago Technologies Ltd. | | | | | | | | |
4.25% due 02/01/23 | | | 1,000,000 | | | | 994,430 | |
Sparta Holding Corp. | | | | | | | | |
6.50% due 07/28/20††† | | | 859,551 | | | | 853,355 | |
SEE NOTES TO FINANCIAL STATEMENTS. | THE GUGGENHEIM FUNDS SEMI-ANNUAL REPORT | 21 |
SCHEDULE OF INVESTMENTS (Unaudited)(continued) | March 31, 2016 |
HIGH YIELD FUND | |
| | | Face
Amount9 | | | Value | |
| | | | | | | |
Advanced Computer Software | | | | | | |
6.50% due 03/18/22 | | $ | 544,500 | | | $ | 522,720 | |
10.50% due 01/31/23 | | | 300,000 | | | | 275,250 | |
Greenway Medical Technologies | | | | | | | | |
9.25% due 11/04/211 | | | 550,000 | | | | 423,500 | |
6.00% due 11/04/201 | | | 342,125 | | | | 294,228 | |
Verisure Cayman 2 | | | | | | | | |
5.25% due 10/10/22 | | EUR | 500,000 | | | | 569,568 | |
Aspect Software, Inc. | | | | | | | | |
9.50% due 09/30/16 | | | 459,009 | | | | 454,419 | |
SolarWinds Holdings, Inc. | | | | | | | | |
6.50% due 02/03/23 | | | 425,000 | | | | 420,040 | |
GlobalLogic Holdings, Inc. | | | | | | | | |
6.25% due 05/31/19 | | | 346,000 | | | | 338,215 | |
Flexera Software LLC | | | | | | | | |
8.00% due 04/02/21 | | | 250,000 | | | | 231,250 | |
Quorum Business Solutions | | | | | | | | |
5.75% due 08/06/211 | | | 217,800 | | | | 214,533 | |
Avaya, Inc. | | | | | | | | |
6.50% due 03/30/18 | | | 292,040 | | | | 213,919 | |
The Active Network, Inc. | | | | | | | | |
5.50% due 11/13/20 | | | 146,994 | | | | 139,276 | |
Total Technology | | | | | | | 8,353,921 | |
| | | | | | | | | |
Communications - 2.8% | |
Cengage Learning Acquisitions, Inc. | | | | | | | | |
7.00% due 03/31/20 | | | 1,405,938 | | | | 1,397,910 | |
Match Group, Inc. | | | | | | | | |
5.50% due 11/16/22 | | | 1,036,875 | | | | 1,036,232 | |
Mitel Networks Corp. | | | | | | | | |
5.50% due 04/29/22 | | | 1,010,955 | | | | 1,009,377 | |
Cartrawler | | | | | | | | |
4.25% due 04/29/211 | | EUR | 650,000 | | | | 717,415 | |
Neptune Finco Corp. | | | | | | | | |
5.00% due 10/10/22 | | | 500,000 | | | | 499,920 | |
Anaren, Inc. | | | | | | | | |
9.25% due 08/18/211 | | | 500,000 | | | | 455,835 | |
Gogo LLC | | | | | | | | |
7.50% due 03/21/181 | | | 413,656 | | | | 397,110 | |
MergerMarket Ltd. | | | | | | | | |
4.50% due 02/04/21 | | | 294,000 | | | | 285,180 | |
Cablevision Systems | | | | | | | | |
2.93% due 04/17/20 | | | 211,819 | | | | 211,555 | |
Total Communications | | | | | | | 6,010,534 | |
| | | | | | | | | |
Consumer, Non-cyclical - 2.7% | |
Albertson’s (Safeway) Holdings LLC | | | | | | | | |
5.50% due 08/25/21 | | | 1,245,177 | | | | 1,245,800 | |
IHC Holding Corp. | | | | | | | | |
7.00% due 04/30/21†††,1 | | | 845,750 | | | | 824,860 | |
CTI Foods Holding Co. LLC | | | | | | | | |
8.25% due 06/28/21 | | | 590,000 | | | | 533,950 | |
Americold Realty Operating Partnership, LP | | | | | | | | |
6.50% due 12/01/22 | | | 498,750 | | | | 497,503 | |
Reddy Ice Holdings, Inc. | | | | | | | | |
6.75% due 05/01/19 | | | 582,000 | | | | 484,998 | |
AdvancePierre Foods, Inc. | | | | | | | | |
9.50% due 10/10/17 | | | 461,000 | | | | 457,160 | |
NES Global Talent | | | | | | | | |
6.50% due 10/03/19 | | | 504,622 | | | | 454,159 | |
Affordable Care Holdings Corp. | | | | | | | | |
5.75% due 10/24/22 | | | 448,875 | | | | 441,581 | |
American Seafoods | | | | | | | | |
6.00% due 08/19/211 | | | 444,375 | | | | 431,044 | |
Pelican Products, Inc. | | | | | | | | |
9.25% due 04/09/21 | | | 300,000 | | | | 250,500 | |
Arctic Glacier Holdings, Inc. | | | | | | | | |
6.00% due 05/10/19 | | | 138,104 | | | | 131,199 | |
Performance Food Group | | | | | | | | |
7.21% due 11/14/19 | | | 102,125 | | | | 102,125 | |
Targus Group International, Inc. | | | | | | | | |
7.37% due 05/24/16†††,1 | | | 153,133 | | | | — | |
Total Consumer, Non-cyclical | | | | | | | 5,854,879 | |
| | | | | | | | | |
Financial - 2.0% | |
Lineage Logistics LLC | | | | | | | | |
4.50% due 04/07/21 | | | 840,100 | | | | 703,584 | |
Acrisure LLC | | | | | | | | |
6.50% due 05/19/22 | | | 694,753 | | | | 680,859 | |
York Risk Services | | | | | | | | |
4.75% due 10/01/21 | | | 740,625 | | | | 628,605 | |
Trademonster | | | | | | | | |
7.25% due 08/29/19†††,1 | | | 544,250 | | | | 541,529 | |
Expert Global Solutions | | | | | | | | |
8.50% due 04/03/18 | | | 477,734 | | | | 468,179 | |
Integro Parent, Inc. | | | | | | | | |
6.75% due 10/31/22 | | | 450,000 | | | | 427,992 | |
Safe-Guard | | | | | | | | |
6.25% due 08/19/21 | | | 370,393 | | | | 362,985 | |
Cunningham Lindsey U.S., Inc. | | | | | | | | |
9.25% due 06/10/201 | | | 623,636 | | | | 309,741 | |
LPL Financial Holdings, Inc. | | | | | | | | |
4.75% due 11/21/22 | | | 300,000 | | | | 294,000 | |
Total Financial | | | | | | | 4,417,474 | |
| | | | | | | | | |
Basic Materials - 0.8% | |
Zep, Inc. | | | | | | | | |
5.50% due 06/27/22 | | | 995,000 | | | | 992,513 | |
Atkore International, Inc. | | | | | | | | |
7.75% due 10/09/21 | | | 450,000 | | | | 409,500 | |
Azelis Finance S.A. | | | | | | | | |
6.50% due 12/16/22 | | | 249,375 | | | | 248,128 | |
Arch Coal, Inc. | | | | | | | | |
7.50% due 05/16/18 | | | 198,461 | | | | 70,041 | |
Total Basic Materials | | | | | | | 1,720,182 | |
22 | THE GUGGENHEIM FUNDS SEMI-ANNUAL REPORT | SEE NOTES TO FINANCIAL STATEMENTS. |
SCHEDULE OF INVESTMENTS (Unaudited)(continued) | March 31, 2016 |
HIGH YIELD FUND | |
| | | Face
Amount9 | | | Value | |
| | | | | | | |
Utilities - 0.6% | |
Invenergy Thermal Operating I, LLC | | | | | | |
6.50% due 10/19/22 | | $ | 1,047,750 | | | $ | 984,885 | |
Stonewall (Green Energy) | | | | | | | | |
6.50% due 11/12/21 | | | 400,000 | | | | 372,000 | |
Total Utilities | | | | | | | 1,356,885 | |
| | | | | | | | | |
Energy - 0.6% | |
Veresen Midstream LP | | | | | | | | |
5.25% due 03/31/22 | | | 744,375 | | | | 687,617 | |
PSS Companies | | | | | | | | |
5.50% due 01/28/201 | | | 536,945 | | | | 349,014 | |
Cactus Wellhead | | | | | | | | |
7.00% due 07/31/20 | | | 444,375 | | | | 155,531 | |
FTS International | | | | | | | | |
5.75% due 04/16/21 | | | 241,818 | | | | 28,414 | |
Total Energy | | | | | | | 1,220,576 | |
Total Senior Floating Rate Interests | | | | | | | | |
(Cost $53,190,317) | | | | | | | 49,907,303 | |
| | | | | | | | | |
SENIOR FIXED RATE INTERESTS†† - 0.5% | |
Communications - 0.3% | |
Lions Gate Entertainment Corp. | | | | | | | | |
5.00% due 03/17/22 | | | 610,000 | | | | 593,225 | |
| | | | | | | | | |
Financial - 0.2% | |
Magic Newco, LLC | | | | | | | | |
12.00% due 06/12/19 | | | 500,000 | | | | 512,815 | |
| | | | | | | | | |
Consumer, Non-cyclical - 0.0% | |
Targus Group International, Inc. | | | | | | | | |
7.50% due 12/31/19†††,1 | | | 53,283 | | | | 78,197 | |
Total Consumer, Non-cyclical | | | | | | | 78,197 | |
Total Senior Fixed Rate Interests | | | | | | | | |
(Cost $1,211,409) | | | | | | | 1,184,237 | |
| | | | | | | | | |
ASSET-BACKED SECURITIES†† - 0.1% | |
Collateralized Debt Obligations - 0.1% | |
SRERS Funding Ltd. | | | | | | | | |
2011-RS A1B1, 0.69% due 05/09/462,6 | | | 209,815 | | | | 200,729 | |
Total Asset-Backed Securities | | | | | | | | |
(Cost $200,634) | | | | | | | 200,729 | |
| | | | | | | | | |
Total Investments - 104.0% | | | | | | | | |
(Cost $245,693,182) | | | | | | $ | 226,343,489 | |
Other Assets & Liabilities, net - (4.0)% | | | | | | | (8,652,726 | ) |
Total Net Assets - 100.0% | | | | | | $ | 217,690,763 | |
FORWARD FOREIGN CURRENCY EXCHANGE CONTRACTS†† | |
Counterparty | | Contracts to Buy (Sell) | | Currency | Settlement
Date | | Settlement
Value | | | Value at
March 31,
2016 | | | Net Unrealized
Appreciation/
(Depreciation) | |
BNY Mellon | | | 343,000 | | EUR | 04/11/16 | | $ | (381,359 | ) | | $ | (390,391 | ) | | $ | 9,031 | |
BNY Mellon | | | (209,000 | ) | AUD | 04/11/16 | | | 155,120 | | | | 160,165 | | | | (5,045 | ) |
BNY Mellon | | | (488,000 | ) | CAD | 04/11/16 | | | 366,372 | | | | 375,823 | | | | (9,450 | ) |
BNY Mellon | | | (2,506,000 | ) | GBP | 04/11/16 | | | 3,561,703 | | | | 3,599,622 | | | | (37,920 | ) |
BNY Mellon | | | (7,587,000 | ) | EUR | 04/11/16 | | | 8,380,547 | | | | 8,635,262 | | | | (254,713 | ) |
| | | | | | | | | | | | | | | | | $ | (298,097 | ) |
SEE NOTES TO FINANCIAL STATEMENTS. | THE GUGGENHEIM FUNDS SEMI-ANNUAL REPORT | 23 |
SCHEDULE OF INVESTMENTS (Unaudited)(concluded) | March 31, 2016 |
HIGH YIELD FUND | |
* | Non-income producing security. |
† | Value determined based on Level 1 inputs, unless otherwise noted — See Note 4. |
†† | Value determined based on Level 2 inputs, unless otherwise noted — See Note 4. |
††† | Value determined based on Level 3 inputs — See Note 4. |
1 | Illiquid security. |
2 | Variable rate security. Rate indicated is rate effective at March 31, 2016. |
3 | Perpetual maturity. |
4 | Rate indicated is the 7 day yield as of March 31, 2016. |
5 | Security or a portion thereof is held as collateral for reverse repurchase agreements — See Note 11. |
6 | Security is a 144A or Section 4(a)(2) security. The total market value of 144A or Section 4(a)(2) securities is $78,332,786 (cost $83,643,910), or 36.0% of total net assets. These securities have been determined to be liquid under guidelines established by the Board of Trustees. |
7 | Security is in default of interest and/or principal obligations. |
8 | Security with no rate was unsettled at March 31, 2016. |
9 | The face amount is denominated in U.S. Dollars unless otherwise indicated. |
10 | Security is a 144A or Section 4(a)(2) security. These securities are considered illiquid and restricted under guidelines established by the Board of Trustees. The total market value of 144A or Section 4(a)(2) securities is $276,066 (cost $471,883), or 0.1% of total net assets — See Note 14. |
| | plc — Public Limited Company |
| | REIT — Real Estate Investment Trust |
| | |
| | See Sector Classification in Other Information section. |
The following table summarizes the inputs used to value the Fund’s investments at March 31, 2016 (See Note 4 in the Notes to Financial Statements):
Investments in Securities (Assets) | | Level 1 | | | Level 2 | | | Level 2 -
Other* | | | Level 3 | | | Total | |
Asset-Backed Securities | | $ | — | | | $ | 200,729 | | | $ | — | | | $ | — | | | $ | 200,729 | |
Exchange-Traded Funds | | | 1,712,500 | | | | — | | | | — | | | | — | | | | 1,712,500 | |
Common Stocks | | | 1,377 | | | | 536,693 | | | | — | | | | 20,337 | | | | 558,407 | |
Corporate Bonds | | | — | | | | 162,994,827 | | | | — | | | | 3,055,204 | | | | 166,050,031 | |
Forward Foreign Currency Exchange Contracts | | | — | | | | — | | | | 9,031 | | | | — | | | | 9,031 | |
Preferred Stocks | | | — | | | | 4,059,605 | | | | — | | | | — | | | | 4,059,605 | |
Senior Fixed Rate Interests | | | — | | | | 1,106,040 | | | | — | | | | 78,197 | | | | 1,184,237 | |
Senior Floating Rate Interests | | | — | | | | 43,540,859 | | | | — | | | | 6,366,444 | | | | 49,907,303 | |
Short Term Investments | | | 2,670,677 | | | | — | | | | — | | | | — | | | | 2,670,677 | |
Total | | $ | 4,384,554 | | | $ | 212,438,753 | | | $ | 9,031 | | | $ | 9,520,182 | | | $ | 226,352,520 | |
Investments in Securities (Liabilities) | | Level 1 | | | Level 2 | | | Level 2 -
Other* | | | Level 3 | | | Total | |
Forward Foreign Currency Exchange Contracts | | $ | — | | | $ | — | | | $ | 307,128 | | | $ | — | | | $ | 307,128 | |
Total | | $ | — | | | $ | — | | | $ | 307,128 | | | $ | — | | | $ | 307,128 | |
* | Other financial instruments include forward foreign currency exchange contracts, which are reported as unrealized gain/loss at period end. |
Transfers between investment levels may occur as the markets fluctuate and/or the availability of data used in an investment’s valuation changes. The Fund recognized transfers between the levels as of the beginning of the period. As of March 31, 2016, High Yield Fund had securities with a total value of $465,869 transfer out of Level 3 into Level 2 and a total value of $1,185,186 transfer into Level 3 from Level 2 due to changes in the securities valuation method. There were no other securities that transferred between levels.
24 | THE GUGGENHEIM FUNDS SEMI-ANNUAL REPORT | SEE NOTES TO FINANCIAL STATEMENTS. |
STATEMENT OF ASSETS AND LIABILITIES (Unaudited) |
March 31, 2016 |
Assets: | |
Investments, at value (cost $245,693,182) | | $ | 226,343,489 | |
Foreign currency, at value (cost $81,327) | | | 81,571 | |
Cash | | | 120,455 | |
Prepaid expenses | | | 42,614 | |
Unrealized appreciation on forward foreign currency exchange contracts | | | 9,031 | |
Receivables: | |
Interest | | | 3,752,267 | |
Securities sold | | | 1,345,104 | |
Fund shares sold | | | 774,247 | |
Foreign taxes reclaim | | | 7,445 | |
Dividends | | | 7,425 | |
Total assets | | | 232,483,648 | |
| | | | | |
Liabilities: | |
Reverse Repurchase Agreements | | | 8,911,433 | |
Unfunded loan commitments, at value (Note 8) (proceeds $1,370,277) | | | 949,282 | |
Unrealized depreciation on forward foreign currency exchange contracts | | | 307,128 | |
Payable for: | |
Securities purchased | | | 3,889,025 | |
Fund shares redeemed | | | 352,721 | |
Management fees | | | 113,275 | |
Distribution and service fees | | | 28,421 | |
Transfer agent/maintenance fees | | | 20,496 | |
Fund accounting/administration fees | | | 16,808 | |
Trustees' fees* | | | 4,001 | |
Miscellaneous | | | 200,295 | |
Total liabilities | | | 14,792,885 | |
Commitments and contingent liabilities (Note 13) | | | — | |
NET ASSETS | | $ | 217,690,763 | |
| | | | | |
Net assets consist of: | |
Paid in capital | | $ | 239,705,461 | |
Accumulated net investment loss | | | (380,449 | ) |
Accumulated net realized loss on investments | | | (2,412,286 | ) |
Net unrealized depreciation on investments | | | (19,221,963 | ) |
Net assets | | $ | 217,690,763 | |
| | | | | |
A-Class: | |
Net assets | | $ | 70,302,629 | |
Capital shares outstanding | | | 6,799,114 | |
Net asset value per share | | $ | 10.34 | |
Maximum offering price per share (Net asset value divided by 96.00%) | | $ | 10.77 | |
| | | | | |
C-Class: | |
Net assets | | $ | 17,104,926 | |
Capital shares outstanding | | | 1,641,197 | |
Net asset value per share | | $ | 10.42 | |
| | | | | |
P-Class: | |
Net assets | | $ | 1,417,342 | |
Capital shares outstanding | | | 137,057 | |
Net asset value per share | | $ | 10.34 | |
| | | | | |
Institutional Class: | |
Net assets | | $ | 128,865,866 | |
Capital shares outstanding | | | 15,280,997 | |
Net asset value per share | | $ | 8.43 | |
* | Relates to Trustees not deemed “interested persons” within the meaning of Section 2(a)(19) of the 1940 Act. |
SEE NOTES TO FINANCIAL STATEMENTS. | THE GUGGENHEIM FUNDS SEMI-ANNUAL REPORT | 25 |
STATEMENT OF OPERATIONS (Unaudited) |
Period Ended March 31, 2016 |
Investment Income: | |
Interest | | $ | 6,911,102 | |
Dividends | | | 97,926 | |
Total investment income | | | 7,009,028 | |
| | | | | |
Expenses: | |
Management fees | | | 537,168 | |
Transfer agent/maintenance fees: | |
A-Class | | | 44,090 | |
C-Class | | | 9,050 | |
P-Class | | | 82 | |
Institutional Class | | | 20,685 | |
Distribution and service fees: | |
A-Class | | | 87,569 | |
C-Class | | | 69,579 | |
P-Class | | | 522 | |
Fund accounting/administration fees | | | 85,051 | |
Interest expense | | | 56,961 | |
Line of credit fees | | | 11,283 | |
Custodian fees | | | 7,980 | |
Trustees’ fees* | | | 4,392 | |
Miscellaneous | | | 118,133 | |
Total expenses | | | 1,052,545 | |
Less: | |
Expenses waived by Adviser | | | (10,299 | ) |
Net expenses | | | 1,042,246 | |
Net investment income | | | 5,966,782 | |
| | | | | |
Net Realized and Unrealized Gain (Loss): | |
Net realized gain (loss) on: | |
Investments | | $ | (1,808,546 | ) |
Foreign currency | | | 5,905 | |
Forward foreign currency exchange contracts | | | 304,469 | |
Net realized loss | | | (1,498,172 | ) |
Net change in unrealized appreciation (depreciation) on: | |
Investments | | | (4,628,631 | ) |
Foreign currency | | | 3,068 | |
Forward foreign currency exchange contracts | | | (277,161 | ) |
Net change in unrealized appreciation (depreciation) | | | (4,902,724 | ) |
Net realized and unrealized loss | | | (6,400,896 | ) |
Net decrease in net assets resulting from operations | | $ | (434,114 | ) |
* | Relates to Trustees not deemed “interested persons” within the meaning of Section 2(a)(19) of the 1940 Act. |
26 | THE GUGGENHEIM FUNDS SEMI-ANNUAL REPORT | SEE NOTES TO FINANCIAL STATEMENTS. |
STATEMENTS OF CHANGES IN NET ASSETS |
| | | Period Ended
March 31,
2016
(Unaudited) | | | Year Ended
September 30,
2015 | |
Increase (Decrease) in Net Assets from Operations: | | | | | | |
Net investment income | | $ | 5,966,782 | | | $ | 8,972,189 | |
Net realized gain (loss) on investments | | | (1,498,172 | ) | | | 405,135 | |
Net change in unrealized appreciation (depreciation) on investments | | | (4,902,724 | ) | | | (13,898,198 | ) |
Net decrease in net assets resulting from operations | | | (434,114 | ) | | | (4,520,874 | ) |
| | | | | | | | | |
Distributions to shareholders from: | | | | | | | | |
Net investment income | | | | | | | | |
A-Class | | | (2,626,104 | ) | | | (4,807,748 | ) |
B-Class | | | — | | | | (52,842 | ) |
C-Class | | | (464,296 | ) | | | (802,666 | ) |
P-Class | | | (13,677 | ) | | | (235 | )* |
Institutional Class | | | (3,725,163 | ) | | | (3,966,454 | ) |
Net realized gains | | | | | | | | |
A-Class | | | — | | | | (1,532,517 | ) |
B-Class | | | — | | | | (20,686 | ) |
C-Class | | | — | | | | (263,521 | ) |
P-Class | | | — | | | | — | * |
Institutional Class | | | — | | | | (944,650 | ) |
Total distributions to shareholders | | | (6,829,240 | ) | | | (12,391,319 | ) |
| | | | | | | | | |
Capital share transactions: | | | | | | | | |
Proceeds from sale of shares | | | | | | | | |
A-Class | | | 21,279,940 | | | | 33,036,938 | |
B-Class | | | — | | | | 7,076 | |
C-Class | | | 6,041,823 | | | | 5,046,504 | |
P-Class | | | 1,369,210 | | | | 10,001 | * |
Institutional Class | | | 86,919,176 | | | | 74,875,388 | |
Redemption fees collected | | | | | | | | |
A-Class | | | 40,152 | | | | 41,648 | |
B-Class | | | — | | | | 490 | |
C-Class | | | 9,906 | | | | 8,074 | |
P-Class | | | 752 | | | | 1 | * |
Institutional Class | | | 72,686 | | | | 33,446 | |
Distributions reinvested | | | | | | | | |
A-Class | | | 2,410,327 | | | | 5,856,839 | |
B-Class | | | — | | | | 66,438 | |
C-Class | | | 367,526 | | | | 824,962 | |
P-Class | | | 13,677 | | | | 235 | * |
Institutional Class | | | 3,148,832 | | | | 3,711,027 | |
Cost of shares redeemed | | | | | | | | |
A-Class | | | (23,334,950 | ) | | | (40,000,821 | ) |
B-Class | | | — | | | | (1,185,413 | ) |
C-Class | | | (2,489,754 | ) | | | (5,333,911 | ) |
P-Class | | | (3,953 | ) | | | — | * |
Institutional Class | | | (32,975,483 | ) | | | (33,586,946 | ) |
Net increase from capital share transactions | | | 62,869,867 | | | | 43,411,976 | |
Net increase in net assets | | | 55,606,513 | | | | 26,499,783 | |
| | | | | | | | | |
Net assets: | | | | | | | | |
Beginning of period | | | 162,084,250 | | | | 135,584,467 | |
End of period | | $ | 217,690,763 | | | $ | 162,084,250 | |
Accumulated net investment loss/Undistributed net investment income at end of period | | $ | (380,449 | ) | | $ | 482,009 | |
SEE NOTES TO FINANCIAL STATEMENTS. | THE GUGGENHEIM FUNDS SEMI-ANNUAL REPORT | 27 |
STATEMENTS OF CHANGES IN NET ASSETS (concluded) |
| | | Period Ended
March 31,
2016
(Unaudited) | | | Year Ended
September 30,
2015 | |
Capital share activity: | | | | | | |
Shares sold | | | | | | |
A-Class | | | 2,073,011 | | | | 2,907,297 | |
B-Class | | | — | | | | 574 | |
C-Class | | | 588,259 | | | | 437,537 | |
P-Class | | | 135,215 | | | | 867 | * |
Institutional Class | | | 10,243,931 | | | | 8,020,780 | |
Shares issued from reinvestment of distributions | | | | | | | | |
A-Class | | | 230,643 | | | | 512,078 | |
B-Class | | | — | | | | 5,810 | |
C-Class | | | 34,910 | | | | 71,624 | |
P-Class | | | 1,338 | | | | 21 | * |
Institutional Class | | | 370,565 | | | | 399,647 | |
Shares redeemed | | | | | | | | |
A-Class | | | (2,289,369 | ) | | | (3,526,055 | ) |
B-Class | | | — | | | | (104,833 | ) |
C-Class | | | (238,601 | ) | | | (463,316 | ) |
P-Class | | | (384 | ) | | | — | * |
Institutional Class | | | (3,864,688 | ) | | | (3,627,052 | ) |
Net increase in shares | | | 7,284,830 | | | | 4,634,979 | |
* | Since commencement of operations: May 1, 2015. |
28 | THE GUGGENHEIM FUNDS SEMI-ANNUAL REPORT | SEE NOTES TO FINANCIAL STATEMENTS. |
This table is presented to show selected data for a share outstanding throughout each period and to assist shareholders in evaluating a Fund’s performance for the periods presented.
A-Class | | Period Ended
March 31,
2016a | | Year Ended
September 30,
2015 | | Year Ended
September 30,
2014 | | Year Ended
September 30,
2013 | | Period Ended
September 30,
2012b | | Year Ended
December 31,
2011 | |
Per Share Data | | | | | | | | | | | | | | | | | | |
Net asset value, beginning of period | | $ | 10.79 | | | $ | 12.02 | | | $ | 11.85 | | | $ | 11.95 | | | $ | 11.12 | | | $ | 12.89 | |
Income (loss) from investment operations: | |
Net investment income (loss)c | | | .34 | | | | .69 | | | | .72 | | | | .81 | | | | .58 | | | | .87 | |
Net gain (loss) on investments (realized and unrealized) | | | (.41 | ) | | | (.97 | ) | | | .27 | | | | .27 | | | | .84 | | | | (1.30 | ) |
Total from investment operations | | | (.07 | ) | | | (.28 | ) | | | .99 | | | | 1.08 | | | | 1.42 | | | | (.43 | ) |
Less distributions from: | |
Net investment income | | | (.39 | ) | | | (.74 | ) | | | (.83 | ) | | | (.90 | ) | | | (.59 | ) | | | (1.07 | ) |
Net realized gains | | | — | | | | (.22 | ) | | | — | | | | (.29 | ) | | | — | | | | (.27 | ) |
Total distributions | | | (.39 | ) | | | (.96 | ) | | | (.83 | ) | | | (1.19 | ) | | | (.59 | ) | | | (1.34 | ) |
Redemption fees collected | | | .01 | | | | .01 | | | | .01 | | | | .01 | | | | — | d | | | — | |
Net asset value, end of period | | $ | 10.34 | | | $ | 10.79 | | | $ | 12.02 | | | $ | 11.85 | | | $ | 11.95 | | | $ | 11.12 | |
| | |
Total Returnh | | | (0.52 | %) | | | (2.40 | %) | | | 9.18 | % | | | 9.54 | % | | | 12.93 | % | | | (3.50 | %) |
Ratios/Supplemental Data | |
Net assets, end of period (in thousands) | | $ | 70,303 | | | $ | 73,236 | | | $ | 82,854 | | | $ | 70,451 | | | $ | 64,174 | | | $ | 86,041 | |
Ratios to average net assets: | |
Net investment income (loss) | | | 6.59 | % | | | 6.01 | % | | | 5.91 | % | | | 6.84 | % | | | 7.19 | % | | | 6.92 | % |
Total expensese | | | 1.26 | % | | | 1.27 | % | | | 1.32 | % | | | 1.41 | % | | | 1.44 | % | | | 1.34 | % |
Net expensesf,i | | | 1.24 | % | | | 1.20 | % | | | 1.26 | % | | | 1.18 | % | | | 1.17 | % | | | 1.18 | % |
Portfolio turnover rate | | | 35 | % | | | 72 | % | | | 97 | % | | | 101 | % | | | 55 | % | | | 102 | % |
C-Class | | Period Ended
March 31,
2016a | | Year Ended
September 30,
2015 | | Year Ended
September 30,
2014 | | Year Ended
September 30,
2013 | | Period Ended
September 30,
2012b | | Year Ended
December 31,
2011 | |
Per Share Data | | | | | | | | | | | | | | | | | | |
Net asset value, beginning of period | | $ | 10.88 | | | $ | 12.12 | | | $ | 11.95 | | | $ | 12.03 | | | $ | 11.20 | | | $ | 12.97 | |
Income (loss) from investment operations: | |
Net investment income (loss)c | | | .31 | | | | .61 | | | | .63 | | | | .73 | | | | .56 | | | | .79 | |
Net gain (loss) on investments (realized and unrealized) | | | (.43 | ) | | | (.98 | ) | | | .27 | | | | .27 | | | | .80 | | | | (1.32 | ) |
Total from investment operations | | | (.12 | ) | | | (.37 | ) | | | .90 | | | | 1.00 | | | | 1.36 | | | | (.53 | ) |
Less distributions from: | |
Net investment income | | | (.35 | ) | | | (.66 | ) | | | (.74 | ) | | | (.80 | ) | | | (.53 | ) | | | (.97 | ) |
Net realized gains | | | — | | | | (.22 | ) | | | — | | | | (.29 | ) | | | — | | | | (.27 | ) |
Total distributions | | | (.35 | ) | | | (.88 | ) | | | (.74 | ) | | | (1.09 | ) | | | (.53 | ) | | | (1.24 | ) |
Redemption fees collected | | | .01 | | | | .01 | | | | .01 | | | | .01 | | | | — | d | | | — | |
Net asset value, end of period | | $ | 10.42 | | | $ | 10.88 | | | $ | 12.12 | | | $ | 11.95 | | | $ | 12.03 | | | $ | 11.20 | |
| | |
Total Returnh | | | (0.96 | %) | | | (3.14 | %) | | | 8.46 | % | | | 8.69 | % | | | 12.33 | % | | | (4.30 | %) |
Ratios/Supplemental Data | |
Net assets, end of period (in thousands) | | $ | 17,105 | | | $ | 13,671 | | | $ | 14,674 | | | $ | 9,463 | | | $ | 9,054 | | | $ | 7,991 | |
Ratios to average net assets: | |
Net investment income (loss) | | | 5.84 | % | | | 5.25 | % | | | 5.14 | % | | | 6.10 | % | | | 6.37 | % | | | 6.32 | % |
Total expensese | | | 2.02 | % | | | 2.01 | % | | | 2.09 | % | | | 2.17 | % | | | 2.19 | % | | | 2.08 | % |
Net expensesf,i | | | 1.99 | % | | | 1.95 | % | | | 2.01 | % | | | 1.93 | % | | | 1.92 | % | | | 1.94 | % |
Portfolio turnover rate | | | 35 | % | | | 72 | % | | | 97 | % | | | 101 | % | | | 55 | % | | | 102 | % |
SEE NOTES TO FINANCIAL STATEMENTS. | THE GUGGENHEIM FUNDS SEMI-ANNUAL REPORT | 29 |
FINANCIAL HIGHLIGHTS (continued) |
This table is presented to show selected data for a share outstanding throughout each period and to assist shareholders in evaluating a Fund’s performance for the periods presented.
P-Class | | Period Ended
March 31,
2016a | | | Period Ended
September 30,
2015g | |
Per Share Data | | | | | | |
Net asset value, beginning of period | | $ | 10.80 | | | $ | 11.53 | |
Income (loss) from investment operations: | |
Net investment income (loss)c | | | .34 | | | | .27 | |
Net gain (loss) on investments (realized and unrealized) | | | (.42 | ) | | | (.73 | ) |
Total from investment operations | | | (.08 | ) | | | (.46 | ) |
Less distributions from: | |
Net investment income | | | (.40 | ) | | | (.27 | ) |
Total distributions | | | (.40 | ) | | | (.27 | ) |
Redemption fees collected | | | .02 | | | | — | d |
Net asset value, end of period | | $ | 10.34 | | | $ | 10.80 | |
| | |
Total Returnh | | | (0.57 | %) | | | (4.06 | %) |
Ratios/Supplemental Data | |
Net assets, end of period (in thousands) | | $ | 1,417 | | | $ | 10 | |
Ratios to average net assets: | |
Net investment income (loss) | | | 6.67 | % | | | 5.76 | % |
Total expensese | | | 1.24 | % | | | 3.36 | % |
Net expensesf,i | | | 1.24 | % | | | 1.19 | % |
Portfolio turnover rate | | | 35 | % | | | 72 | % |
30 | THE GUGGENHEIM FUNDS SEMI-ANNUAL REPORT | SEE NOTES TO FINANCIAL STATEMENTS. |
FINANCIAL HIGHLIGHTS (concluded) |
This table is presented to show selected data for a share outstanding throughout each period and to assist shareholders in evaluating a Fund’s performance for the periods presented.
Institutional Class | | Period Ended
March 31,
2016a | | Year Ended
September 30,
2015 | | Year Ended
September 30,
2014 | | Year Ended
September 30,
2013 | | Period Ended
September 30,
2012b | | Year Ended
December 31,
2011 | |
Per Share Data | | | | | | | | | | | | | | | | | | |
Net asset value, beginning of period | | $ | 8.81 | | | $ | 9.87 | | | $ | 9.74 | | | $ | 9.90 | | | $ | 9.26 | | | $ | 10.96 | |
Income (loss) from investment operations: | |
Net investment income (loss)c | | | .29 | | | | .58 | | | | .61 | | | | .70 | | | | .55 | | | | .79 | |
Net gain (loss) on investments (realized and unrealized) | | | (.34 | ) | | | (.79 | ) | | | .23 | | | | .22 | | | | .64 | | | | (1.12 | ) |
Total from investment operations | | | (.05 | ) | | | (.21 | ) | | | .84 | | | | .92 | | | | 1.19 | | | | (.33 | ) |
Less distributions from: | |
Net investment income | | | (.34 | ) | | | (.64 | ) | | | (.72 | ) | | | (.80 | ) | | | (.55 | ) | | | (1.10 | ) |
Net realized gains | | | — | | | | (.22 | ) | | | — | | | | (.29 | ) | | | — | | | | (.27 | ) |
Total distributions | | | (.34 | ) | | | (.86 | ) | | | (.72 | ) | | | (1.09 | ) | | | (.55 | ) | | | (1.37 | ) |
Redemption fees collected | | | .01 | | | | .01 | | | | .01 | | | | .01 | | | | — | d | | | — | |
Net asset value, end of period | | $ | 8.43 | | | $ | 8.81 | | | $ | 9.87 | | | $ | 9.74 | | | $ | 9.90 | | | $ | 9.26 | |
| | |
Total Returnh | | | (0.47 | %) | | | (2.21 | %) | | | 9.50 | % | | | 9.97 | % | | | 13.17 | % | | | (3.30 | %) |
Ratios/Supplemental Data | |
Net assets, end of period (in thousands) | | $ | 128,866 | | | $ | 75,167 | | | $ | 36,880 | | | $ | 18,755 | | | $ | 9,974 | | | $ | 7,900 | |
Ratios to average net assets: | |
Net investment income (loss) | | | 6.86 | % | | | 6.21 | % | | | 6.12 | % | | | 7.12 | % | | | 7.42 | % | | | 7.61 | % |
Total expensese | | | 0.99 | % | | | 0.94 | % | | | 1.01 | % | | | 1.01 | % | | | 1.11 | % | | | 1.08 | % |
Net expensesf,i | | | 0.99 | % | | | 0.94 | % | | | 1.01 | % | | | 0.93 | % | | | 0.92 | % | | | 0.95 | % |
Portfolio turnover rate | | | 35 | % | | | 72 | % | | | 97 | % | | | 101 | % | | | 55 | % | | | 102 | % |
a | Unaudited figures for the period ended March 31, 2016. Percentage amounts for the period, except total return and portfolio turnover rate, have been annualized. |
b | The Fund changed its fiscal year end from December 31 to September 30 in 2012. |
c | Net investment income (loss) per share was computed using average shares outstanding throughout the period. |
d | Redemption fees collected are less than $0.01 per share. |
e | Does not include expenses of the underlying funds in which the Fund invests. |
f | Net expense information reflects the expense ratios after expense waivers. |
g | Since commencement of operations: May 1, 2015. Percentage amounts for the period, except total return and portfolio turnover rate, have been annualized. |
h | Total return does not reflect the impact of any applicable sales charges and has not been annualized. |
i | Net expenses may include expenses that are excluded from the expense limitation agreement and recouped amounts. Excluding these expenses, the operating expense ratios for the years would be: |
| | 03/31/16 | 09/30/15 | 09/30/14 |
A-Class | 1.16% | 1.16% | 1.16% |
C-Class | 1.91% | 1.91% | 1.91% |
P-Class | 1.16% | 1.16% | — |
Institutional Class | 0.91% | 0.91% | 0.91% |
SEE NOTES TO FINANCIAL STATEMENTS. | THE GUGGENHEIM FUNDS SEMI-ANNUAL REPORT | 31 |
FUND PROFILE (Unaudited) | March 31, 2016 |
INVESTMENT GRADE BOND FUND
OBJECTIVE: Seeks to provide current income.
Holdings Diversification (Market Exposure as % of Net Assets)
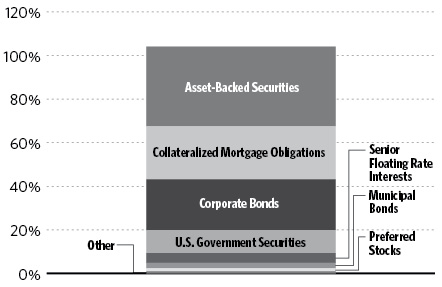
“Holdings Diversification (Market Exposure as % of Net Assets)” excludes any temporary cash investments.
Portfolio Composition by Quality Rating1 |
Rating | |
Fixed Income Instruments | |
AAA | 18.9% |
AA | 13.9% |
A | 21.1% |
BBB | 17.1% |
BB | 8.3% |
B | 3.9% |
CCC | 3.2% |
CC | 0.2% |
A+ | 0.2% |
NR2 | 11.8% |
Other Instruments | 1.4% |
Total Investments | 100.0% |
| | |
The chart above reflects percentages of the value of total investments. |
Inception Dates: |
A-Class | August 15, 1985 |
C-Class | May 1, 2000 |
P-Class | May 1, 2015 |
Institutional Class | January 29, 2013 |
Ten Largest Holdings (% of Total Net Assets) |
U.S. Treasury Notes | 6.8% |
U.S. Treasury Bonds | 3.8% |
Freddie Mac | 1.4% |
GCAT 2014-2 LLC | 1.2% |
Willis Engine Securitization Trust II | 1.1% |
Citigroup, Inc. | 1.1% |
LSTAR Securities Investment Trust 2015-2 | 1.1% |
LSTAR Securities Investment Trust 2014-1 | 1.1% |
LSTAR Securities Investment Trust 2015-4 | 1.0% |
LSTAR Securities Investment Trust 2016-2 | 1.0% |
Top Ten Total | 19.6% |
| | |
“Ten Largest Holdings” excludes any temporary cash investments. |
1 | Source: BlackRock Solutions. Credit quality ratings are measured on a scale that generally ranges from AAA (highest) to D (lowest). All securities except for those labeled “NR” have been rated by a Nationally Recognized Statistical Rating Organization (“NRSRO”). For purposes of this presentation, when ratings are available from more than one agency, the highest rating is used. Guggenheim Investments converts ratings to the equivalent S&P rating. |
2 | NR securities do not necessarily indicate low credit quality. |
32 | THE GUGGENHEIM FUNDS SEMI-ANNUAL REPORT | |
SCHEDULE OF INVESTMENTS (Unaudited) | March 31, 2016 |
INVESTMENT GRADE BOND FUND | |
| | | Shares | | | Value | |
| | | | | | | |
COMMON STOCKS† - 0.0% | |
| | | | | | | |
Financial - 0.0% | |
Rescap Liquidating Trust* | | | 5,199 | | | $ | 40,292 | |
| | | | | | | | | |
Industrial - 0.0% | |
Constar International Holdings LLC*,†††,9 | | | 68 | | | | — | |
| | | | | | | | | |
Total Common Stocks | | | | | | | | |
(Cost $262,501) | | | | | | | 40,292 | |
| | | | | | | | | |
PREFERRED STOCKS†† - 1.4% | |
Financial - 1.1% | |
Woodbourne Capital Trust II 0.03%*,†††,1,2,11 | | | 950,000 | | | | 488,281 | |
Woodbourne Capital Trust I 0.03%*,†††,1,2,11 | | | 950,000 | | | | 488,281 | |
Woodbourne Capital Trust III 0.03%*,†††,1,2,11 | | | 950,000 | | | | 488,281 | |
Woodbourne Capital Trust IV 0.03%*,†††,1,2,11 | | | 950,000 | | | | 488,281 | |
Total Financial | | | | | | | 1,953,124 | |
| | | | | | | | | |
Industrial - 0.3% | |
Seaspan Corp. 6.38% due 04/30/199 | | | 22,000 | | | | 544,720 | |
Constar International Holdings LLC*,†††,9 | | | 7 | | | | — | |
Total Industrial | | | | | | | 544,720 | |
Total Preferred Stocks | | | | | | | | |
(Cost $4,368,354) | | | | | | | 2,497,844 | |
| | | | | | | | | |
SHORT TERM INVESTMENTS† - 0.0% | |
Dreyfus Treasury Prime Cash Management Institutional Shares 0.18%4 | | | 29,473 | | | | 29,473 | |
Total Short Term Investments | | | | | | | | |
(Cost $29,473) | | | | | | | 29,473 | |
| | | Face
Amount | | | | | |
| | | | | | | | | |
ASSET-BACKED SECURITIES†† - 36.6% | |
Collateralized Loan Obligations - 24.6% | |
Golub Capital Partners CLO Ltd. | | | | | | | | |
2015-25A, 2.42% due 08/05/271,3 | | $ | 1,500,000 | | | | 1,467,601 | |
2014-21A, 3.07% due 10/25/261,3 | | | 600,000 | | | | 580,830 | |
2013-17A, 4.45% due 10/25/251,3 | | | 250,000 | | | | 243,080 | |
Telos CLO Ltd. | | | | | | | | |
2013-3A, 3.62% due 01/17/241,3 | | | 1,250,000 | | | | 1,206,846 | |
2007-2A, 2.82% due 04/15/221,3 | | | 1,100,000 | | | | 1,055,395 | |
Great Lakes CLO Ltd. | | | | | | | | |
2012-1A, 4.72% due 01/15/231,3 | | | 1,000,000 | | | | 992,459 | |
2015-1A, 2.57% due 07/15/261,3 | | | 1,000,000 | | | | 991,617 | |
2014-1A, 4.32% due 04/15/251,3 | | | 250,000 | | | | 240,839 | |
CIFC Funding Ltd. | | | | | | | | |
2015-2A, 2.54% due 12/05/241,3 | | | 1,500,000 | | | | 1,475,487 | |
2014-3X due 07/22/265 | | | 500,000 | | | | 227,522 | |
Ivy Hill Middle Market Credit Fund VII Ltd. | | | | | | |
2013-7A, 2.92% due 10/20/251,3 | | | 1,000,000 | | | | 960,978 | |
2013-7A, 4.07% due 10/20/251,3 | | | 600,000 | | | | 553,730 | |
Oaktree EIF I Series A Ltd. | | | | | | | | |
2015-A1, 3.25% due 10/18/271,3 | | | 1,500,000 | | | | 1,488,031 | |
Grayson CLO Ltd. | | | | | | | | |
2006-1A A2, 1.03% due 11/01/211,3 | | | 1,400,000 | | | | 1,257,132 | |
Flagship CLO VI | | | | | | | | |
2007-1A, 3.04% due 06/10/211,3 | | | 1,250,000 | | | | 1,171,470 | |
Rockwall CDO Ltd. | | | | | | | | |
2007-1A, 1.17% due 08/01/241,3 | | | 1,100,000 | | | | 1,029,942 | |
WhiteHorse VIII Ltd. | | | | | | | | |
2014-1A, 2.67% due 05/01/261,3 | | | 1,100,000 | | | | 996,712 | |
ALM VII R Ltd. | | | | | | | | |
2013-7RA, 3.22% due 04/24/241,3 | | | 1,000,000 | | | | 995,840 | |
Atrium XI | | | | | | | | |
2014-11A, 3.82% due 10/23/251,3 | | | 1,000,000 | | | | 994,309 | |
Fortress Credit Investments IV Ltd. | | | | | | | | |
2015-4A, 2.52% due 07/17/231,3 | | | 1,000,000 | | | | 987,330 | |
PFP Ltd. | | | | | | | | |
2015-2, 2.44% due 07/14/341,3 | | | 1,000,000 | | | | 985,812 | |
Rampart CLO Ltd. | | | | | | | | |
2007-1A, 2.49% due 10/25/211,3 | | | 1,000,000 | | | | 980,107 | |
Fortress Credit Opportunities V CLO Ltd. | | | | | | | | |
2014-5A, 3.27% due 10/15/261,3 | | | 1,000,000 | | | | 975,246 | |
Vibrant CLO Limited | | | | | | | | |
2015-1A, 2.72% due 07/17/241,3 | | | 1,000,000 | | | | 973,183 | |
Fortress Credit BSL II Ltd. | | | | | | | | |
2013-2A, 2.87% due 10/19/251,3 | | | 1,000,000 | | | | 972,779 | |
Marea CLO Ltd. | | | | | | | | |
2015-1A, 2.42% due 10/15/231,3 | | | 1,000,000 | | | | 963,068 | |
Venture CLO Ltd. | | | | | | | | |
2013-14A, 3.39% due 08/28/251,3 | | | 1,000,000 | | | | 962,986 | |
Figueroa CLO Ltd. | | | | | | | | |
2013-1A, 3.37% due 03/21/241,3 | | | 1,000,000 | | | | 960,023 | |
Northwoods Capital XIV Ltd. | | | | | | | | |
2014-14A, 3.08% due 11/12/251,3 | | | 1,000,000 | | | | 957,400 | |
KKR CLO 12 Ltd. | | | | | | | | |
2015-12, 2.56% due 07/15/271,3 | | | 1,000,000 | | | | 950,305 | |
Black Diamond CLO Ltd. | | | | | | | | |
2013-1A, 3.87% due 02/01/231,3 | | | 950,000 | | | | 923,512 | |
Dryden 37 Senior Loan Fund | | | | | | | | |
2015-37A, due 04/15/273,5 | | | 1,000,000 | | | | 895,290 | |
MT Wilson Clo II Ltd. | | | | | | | | |
2007-2A, 3.37% due 07/11/201,3 | | | 1,000,000 | | | | 888,084 | |
MCF CLO I LLC | | | | | | | | |
2013-1A, 4.17% due 04/20/231,3 | | | 900,000 | | | | 874,237 | |
COA Summit CLO Limited | | | | | | | | |
2014-1A, 3.42% due 04/20/231,3 | | | 800,000 | | | | 753,599 | |
OZLM Funding Ltd. | | | | | | | | |
2012-2A, 3.87% due 10/30/231,3 | | | 750,000 | | | | 750,061 | |
Newstar Trust | | | | | | | | |
2012-2A, 3.87% due 01/20/231,3 | | | 750,000 | | | | 745,520 | |
SEE NOTES TO FINANCIAL STATEMENTS. | THE GUGGENHEIM FUNDS SEMI-ANNUAL REPORT | 33 |
SCHEDULE OF INVESTMENTS (Unaudited)(continued) | March 31, 2016 |
INVESTMENT GRADE BOND FUND | |
| | | Face
Amount | | | Value | |
| | | | | | | |
Ares XII CLO Ltd. | | | | | | |
2007-12A, 3.88% due 11/25/201,3 | | $ | 750,000 | | | $ | 737,458 | |
ACIS CLO Ltd. | | | | | | | | |
2013-1A, 3.57% due 04/18/241,3 | | | 500,000 | | | | 429,010 | |
2013-2A, 3.83% due 10/14/221,3 | | | 250,000 | | | | 247,993 | |
Fortress Credit Opportunities III CLO, LP | | | | | | | | |
2014-3A, 3.12% due 04/28/261,3 | | | 300,000 | | | | 292,419 | |
2014-3A, 3.87% due 04/28/261,3 | | | 300,000 | | | | 285,398 | |
Cent CLO | | | | | | | | |
2014-16A, 2.87% due 08/01/241,3 | | | 500,000 | | | | 495,118 | |
Cerberus Onshore II CLO-2 LLC | | | | | | | | |
2014-1A, 2.98% due 10/15/231,3 | | | 500,000 | | | | 492,059 | |
KKR Financial CLO Ltd. | | | | | | | | |
2012-1A, 3.93% due 12/15/241,3 | | | 500,000 | | | | 488,996 | |
MCF CLO III LLC | | | | | | | | |
2014-3A, 3.17% due 01/20/241,3 | | | 500,000 | | | | 472,802 | |
Treman Park CLO Ltd. | | | | | | | | |
2015-1A COM, due 04/20/273,5 | | | 500,000 | | | | 453,236 | |
Eastland CLO Ltd. | | | | | | | | |
2007-1A A3, 1.02% due 05/01/221,3 | | | 450,000 | | | | 424,293 | |
Westwood CDO I Ltd. | | | | | | | | |
2006-1A B, 1.27% due 03/25/211,3 | | | 400,000 | | | | 373,271 | |
Babson CLO Limited | | | | | | | | |
2012-2A, due 05/15/233,5 | | | 1,000,000 | | | | 371,570 | |
KVK CLO Ltd. | | | | | | | | |
2013-1A, due 04/14/253,5 | | | 1,000,000 | | | | 335,345 | |
Newstar Commercial Loan Funding LLC | | | | | | | | |
2013-1A D, 5.17% due 09/20/231,3 | | | 350,000 | | | | 323,514 | |
Halcyon Loan Advisors Funding Ltd. | | | | | | | | |
2012-2A, 5.12% due 12/20/241,3 | | | 350,000 | | | | 295,669 | |
DIVCORE CLO Ltd. | | | | | | | | |
2013-1A B, 4.33% due 11/15/321,3 | | | 300,000 | | | | 295,403 | |
TICC CLO LLC | | | | | | | | |
2012-1A, 5.37% due 08/25/231,3 | | | 250,000 | | | | 254,060 | |
Cerberus Onshore II CLO LLC | | | | | | | | |
2014-1A, 3.32% due 10/15/231,3 | | | 250,000 | | | | 249,023 | |
Gallatin CLO VII Ltd. | | | | | | | | |
2014-1A, 3.52% due 07/15/231,3 | | | 250,000 | | | | 245,944 | |
ICE EM CLO | | | | | | | | |
2007-1A, 1.46% due 08/15/221,3 | | | 248,819 | | | | 243,998 | |
ALM XIV Ltd. | | | | | | | | |
2014-14A, 3.57% due 07/28/261,3 | | | 250,000 | | | | 241,665 | |
Dryden XXIII Senior Loan Fund | | | | | | | | |
2014-23A, 3.57% due 07/17/231,3 | | | 250,000 | | | | 241,342 | |
Garrison Funding Ltd. | | | | | | | | |
2013-2A, 4.02% due 09/25/231,3 | | | 250,000 | | | | 240,967 | |
Babson CLO Ltd. | | | | | | | | |
2014-IA, due 07/20/253,5 | | | 650,000 | | | | 237,891 | |
NewStar Arlington Senior Loan Program LLC | | | | | | | | |
2014-1A C1, 3.92% due 07/25/251,3 | | | 250,000 | | | | 236,168 | |
Neuberger Berman CLO Ltd. | | | | | | | | |
2012-12A, 0.00% due 07/25/233,5 | | | 450,000 | | | | 178,724 | |
Copper River CLO Ltd. | | | | | | | | |
2007-1A, due 01/20/211,3,5 | | | 700,000 | | | | 131,528 | |
Carlyle Global Market Strategies CLO Ltd. | | | | | | | | |
2012-3A, due 10/04/243,5 | | | 250,000 | | | | 123,588 | |
Keuka Park CLO Ltd. | | | | | | | | |
2013-1A, due 10/21/243,5 | | | 250,000 | | | | 103,927 | |
Total Collateralized Loan Obligations | | | | | | | 43,970,741 | |
| | | | | | | | | |
Transport-Aircraft - 7.9% | |
Castlelake Aircraft Securitization Trust | | | | | | | | |
2015-1A, 4.70% due 12/15/403 | | | 1,462,500 | | | | 1,433,543 | |
2014-1 A1, 5.25% due 02/15/293 | | | 845,179 | | | | 837,995 | |
2014-1 B, 7.50% due 02/15/293 | | | 336,903 | | | | 332,355 | |
Willis Engine Securitization Trust II | | | | | | | | |
2012-A, 5.50% due 09/15/373 | | | 2,075,454 | | | | 2,019,416 | |
Apollo Aviation Securitization Equity Trust | | | | | | | | |
2014-1, 5.12% due 12/15/291 | | | 1,355,769 | | | | 1,304,928 | |
2014-1, 7.38% due 12/15/291 | | | 677,885 | | | | 671,784 | |
Apollo Aviation Securitization Equity Trust | | | | | | | | |
2016-1A, 4.88% due 03/17/363 | | | 1,500,000 | | | | 1,478,617 | |
Emerald Aviation Finance Ltd. | | | | | | | | |
2013-1, 4.65% due 10/15/383 | | | 995,247 | | | | 992,059 | |
2013-1, 6.35% due 10/15/383 | | | 199,049 | | | | 201,786 | |
Rise Ltd. | | | | | | | | |
2014-1, 4.74% due 02/12/39 | | | 1,088,583 | | | | 1,069,533 | |
ECAF I Ltd. | | | | | | | | |
2015-1A, 4.95% due 06/15/403 | | | 991,172 | | | | 960,793 | |
AIM Aviation Finance Ltd. | | | | | | | | |
2015-1A, 4.21% due 02/15/403 | | | 922,619 | | | | 893,963 | |
Diamond Head Aviation Ltd. | | | | | | | | |
2015-1, 3.81% due 07/14/283 | | | 884,112 | | | | 873,614 | |
Turbine Engines Securitization Ltd. | | | | | | | | |
2013-1A, 5.13% due 12/13/483 | | | 815,652 | | | | 790,736 | |
AABS Ltd. | | | | | | | | |
2013-1, 4.87% due 01/15/38 | | | 381,689 | | | | 376,536 | |
Total Transport-Aircraft | | | | | | | 14,237,658 | |
| | | | | | | | | |
Collateralized Debt Obligations - 3.2% | |
Gramercy Real Estate CDO Ltd. | | | | | | | | |
2007-1A A1, 0.90% due 08/15/561,3 | | | 1,242,766 | | | | 1,093,634 | |
Triaxx Prime CDO Ltd. | | | | | | | | |
2006-2A A1A, 0.70% due 10/02/391,3 | | | 1,145,177 | | | | 1,076,774 | |
Banco Bradesco SA | | | | | | | | |
2014-1A, 4.21% due 03/12/26†††,9 | | | 913,459 | | | | 920,053 | |
RAIT CRE CDO I Ltd. | | | | | | | | |
2006-1X A1B, 0.75% due 11/20/46 | | | 768,599 | | | | 715,221 | |
Gramercy Real Estate CDO 2006-1 Ltd. | | | | | | | | |
2006-1A, 0.99% due 07/25/411,3 | | | 716,848 | | | | 697,135 | |
SRERS Funding Ltd. | | | | | | | | |
2011-RS A1B1, 0.69% due 05/09/461,3 | | | 545,519 | | | | 521,897 | |
N-Star REL CDO VIII Ltd. | | | | | | | | |
2006-8A A2, 0.79% due 02/01/411,3 | | | 500,000 | | | | 481,258 | |
34 | THE GUGGENHEIM FUNDS SEMI-ANNUAL REPORT | SEE NOTES TO FINANCIAL STATEMENTS. |
SCHEDULE OF INVESTMENTS (Unaudited)(continued) | March 31, 2016 |
INVESTMENT GRADE BOND FUND | |
| | | Face
Amount | | | Value | |
| | | | | | | |
N-Star Real Estate CDO IX Ltd., | | | | | | |
0.75% due 02/01/419 | | $ | 272,789 | | | $ | 267,883 | |
Total Collateralized Debt Obligations | | | | | | | 5,773,855 | |
| | | | | | | | | |
Financial - 0.5% | |
Garanti Diversified Payment Rights Finance Co. | | | | | | | | |
2007-A, 0.81% due 07/09/171 | | | 624,000 | | | | 611,282 | |
CIC Receivables Master Trust | | | | | | | | |
REGD, 4.89% due 10/07/21†††,9 | | | 300,000 | | | | 299,265 | |
Total Financial | | | | | | | 910,547 | |
| | | | | | | | | |
Insurance - 0.4% | |
Chesterfield Financial Holdings LLC | | | | | | | | |
2014-1A, 4.50% due 12/15/343 | | | 705,750 | | | | 709,236 | |
Total Asset-Backed Securities | | | | | | | | |
(Cost $67,715,427) | | | | | | | 65,602,037 | |
| | | | | | | | | |
COLLATERALIZED MORTGAGE OBLIGATIONS†† - 24.3% | |
Residential Mortgage-Backed Securities - 19.1% | |
LSTAR Securities Investment Trust | | | | | | | | |
2015-2, 2.43% due 01/01/201,3 | | | 1,913,110 | | | | 1,899,954 | |
2014-1 NOTE, 3.54% due 09/01/211,3 | | | 1,916,324 | | | | 1,897,159 | |
2015-4 A1, 2.43% due 04/01/201,3 | | | 1,942,082 | | | | 1,883,820 | |
2016-2, 2.44% due 03/01/213 | | | 1,850,000 | | | | 1,793,261 | |
2015-6, 2.44% due 05/01/201,3 | | | 1,733,537 | | | | 1,694,533 | |
2015-10 A1, 2.43% due 11/01/201,3 | | | 1,412,082 | | | | 1,376,780 | |
2015-3, 2.44% due 03/01/201,3 | | | 1,398,827 | | | | 1,367,941 | |
2015-1 A, 2.43% due 01/01/201,3 | | | 1,307,858 | | | | 1,281,653 | |
2015-5 A1, 2.44% due 04/01/201,3 | | | 1,025,571 | | | | 1,002,558 | |
GCAT 2014-2 LLC | | | | | | | | |
2014-2, 3.72% due 10/25/193,6 | | | 2,193,641 | | | | 2,177,032 | |
Banc of America Funding Trust | | | | | | | | |
2015-R4 8A1, 0.61% due 01/27/35†††,1,3 | | | 1,106,583 | | | | 991,742 | |
2014-R7, 0.58% due 09/26/361,3 | | | 926,528 | | | | 858,328 | |
NRPL Trust | | | | | | | | |
2014-2A, 3.75% due 10/25/571,3 | | | 933,603 | | | | 924,878 | |
2015-1A, 3.88% due 11/01/543 | | | 640,104 | | | | 638,578 | |
American Home Mortgage Assets Trust | | | | | | | | |
2006-4, 0.62% due 10/25/461 | | | 1,380,453 | | | | 855,723 | |
2007-1, 1.05% due 02/25/471 | | | 1,088,884 | | | | 596,928 | |
Banc of America Funding Ltd. | | | | | | | | |
2013-R1 A5, 0.65% due 11/03/411,3 | | | 1,518,806 | | | | 1,405,434 | |
CIT Mortgage Loan Trust | | | | | | | | |
2007-1, 1.88% due 10/25/371,3 | | | 1,247,538 | | | | 1,168,187 | |
CSMC Series | | | | | | | | |
2015-12R, 0.93% due 11/30/371,3 | | | 1,300,000 | | | | 1,131,979 | |
American Home Mortgage Investment Trust | | | | | | | | |
2006-1 12A1, 0.83% due 03/25/461 | | | 1,280,672 | | | | 1,018,759 | |
VOLT XLII LLC | | | | | | | | |
2016-NPL2, 4.25% due 03/26/463 | | | 1,000,000 | | | | 1,003,230 | |
New Century Home Equity Loan Trust | | | | | | | | |
2005-3, 0.94% due 07/25/351 | | | 1,100,000 | | | | 990,756 | |
VOLT XLI LLC | | | | | | | | |
2016-NPL1, 4.25% due 02/26/463,6 | | | 988,786 | | | | 987,618 | |
Nationstar HECM Loan Trust | | | | | | | | |
2016-1A, 2.98% due 02/25/263 | | | 951,043 | | | | 951,661 | |
Luminent Mortgage Trust | | | | | | | | |
2006-2, 0.63% due 02/25/461 | | | 1,463,726 | | | | 945,098 | |
Deutsche Alt-A Securities Mortgage Loan Trust Series | | | | | | | | |
2007-OA2, 1.12% due 04/25/471 | | | 957,754 | | | | 804,655 | |
MASTR Adjustable Rate Mortgages Trust | | | | | | | | |
2003-5, 2.13% due 11/25/331 | | | 770,202 | | | | 695,797 | |
HarborView Mortgage Loan Trust | | | | | | | | |
2006-14, 0.58% due 01/25/471 | | | 865,326 | | | | 639,617 | |
Washington Mutual Mortgage Pass-Through Certificates WMALT Series Trust | | | | | | | | |
2006-AR9 2A, 1.16% due 11/25/461 | | | 658,560 | | | | 443,965 | |
UCFC Manufactured Housing Contract | | | | | | | | |
1997-2, 7.38% due 10/15/28 | | | 249,580 | | | | 254,344 | |
Nomura Resecuritization Trust | | | | | | | | |
2012-1R A, 0.87% due 08/27/471,3 | | | 189,975 | | | | 180,700 | |
GreenPoint Mortgage Funding Trust | | | | | | | | |
2005-HE4 M1, 0.90% due 07/25/301 | | | 155,514 | | | | 150,173 | |
GreenPoint Mortgage Funding Trust Series | | | | | | | | |
2007-AR1, 0.51% due 02/25/471 | | | 57,800 | | | | 56,615 | |
First Franklin Mortgage Loan Trust | | | | | | | | |
2006-FF1, 0.77% due 01/25/361 | | | 50,000 | | | | 44,025 | |
JPMorgan Mortgage Trust | | | | | | | | |
2006-A3, 2.63% due 04/25/361 | | | 27,420 | | | | 22,892 | |
Total Residential Mortgage-Backed Securities | | | | | | | 34,136,373 | |
| | | | | | | | | |
Commercial Mortgage-Backed Securities - 4.5% | |
Hilton USA Trust | | | | | | | | |
2013-HLT, 4.41% due 11/05/303 | | | 1,100,000 | | | | 1,101,396 | |
2013-HLF, 4.19% due 11/05/301,3 | | | 997,386 | | | | 992,435 | |
Citigroup Commercial Mortgage Trust | | | | | | | | |
2016-GC36, 4.76% due 02/10/49 | | | 1,400,000 | | | | 1,296,677 | |
GS Mortgage Securities Corporation Trust | | | | | | | | |
2016-ICE2, 4.69% due 02/15/331,3 | | | 1,200,000 | | | | 1,200,378 | |
Wells Fargo Commercial Mortgage Trust | | | | | | | | |
2016-C32, 1.37% due 01/15/591 | | | 6,445,384 | | | | 597,299 | |
2016-NXS5, 1.58% due 01/15/591 | | | 4,996,091 | | | | 499,850 | |
Boca Hotel Portfolio Trust | | | | | | | | |
2013-BOCA, 3.49% due 08/15/261,3 | | | 1,000,000 | | | | 996,545 | |
LSTAR Commercial Mortgage Trust | | | | | | | | |
2014-2, 4.97% due 01/20/411,3 | | | 500,000 | | | | 502,946 | |
COMM Mortgage Trust | | | | | | | | |
2015-CR26, 1.07% due 09/10/251 | | | 6,682,638 | | | | 474,467 | |
CFCRE Commercial Mortgage Trust | | | | | | | | |
2016-C3, 1.10% due 12/10/251 | | | 5,992,131 | | | | 467,909 | |
Total Commercial Mortgage-Backed Securities | | | | | | | 8,129,902 | |
| | | | | | | | | |
SEE NOTES TO FINANCIAL STATEMENTS. | THE GUGGENHEIM FUNDS SEMI-ANNUAL REPORT | 35 |
SCHEDULE OF INVESTMENTS (Unaudited)(continued) | March 31, 2016 |
INVESTMENT GRADE BOND FUND | |
| | | Face
Amount | | | Value | |
| | | | | | | |
Military Housing - 0.7% | |
Capmark Military Housing Trust | | | | | | |
2007-ROBS, 6.06% due 10/10/523 | | $ | 484,154 | | | $ | 477,352 | |
2007-AETC, 5.74% due 02/10/52†††,3 | | | 338,014 | | | | 338,193 | |
GMAC Commercial Mortgage Asset Corp. | | | | | | | | |
2003-PRES, 6.24% due 10/10/41†††,3 | | | 473,459 | | | | 485,479 | |
Total Military Housing | | | | | | | 1,301,024 | |
| | | | | | | | | |
Government Agency - 0.0% | |
Ginnie Mae | | | | | | | | |
#518436, 7.25% due 09/15/299 | | | 8,695 | | | | 9,140 | |
#1849, 8.50% due 08/20/249 | | | 827 | | | | 867 | |
Fannie Mae | | | | | | | | |
1990-108, 7.00% due 09/25/209 | | | 4,975 | | | | 5,260 | |
Total Government Agency | | | | | | | 15,267 | |
Total Collateralized Mortgage Obligations | | | | | | | | |
(Cost $44,279,653) | | | | | | | 43,582,566 | |
| | | | | | | | | |
CORPORATE BONDS†† - 23.2% | |
Financial - 8.1% | |
Citigroup, Inc. | | | | | | | | |
5.87% due 12/31/491,2 | | | 2,000,000 | | | | 1,932,500 | |
Teachers Insurance & Annuity Association of America | | | | | | | | |
4.90% due 09/15/443 | | | 1,000,000 | | | | 1,071,548 | |
4.38% due 09/15/541,3 | | | 500,000 | | | | 503,506 | |
Hospitality Properties Trust | | | | | | | | |
5.25% due 02/15/26 | | | 1,050,000 | | | | 1,054,719 | |
AmTrust Financial Services, Inc. | | | | | | | | |
6.12% due 08/15/239 | | | 960,000 | | | | 1,030,380 | |
Aurora Military Housing LLC | | | | | | | | |
6.89% due 01/15/47†††,3 | | | 750,000 | | | | 874,230 | |
Fifth Third Bancorp | | | | | | | | |
5.10% due 06/30/231,2 | | | 961,000 | | | | 872,108 | |
Icahn Enterprises Limited Partnership / Icahn Enterprises Finance Corp. | | | | | | | | |
5.88% due 02/01/22 | | | 900,000 | | | | 854,100 | |
SunTrust Banks, Inc. | | | | | | | | |
5.63% due 12/31/491,2,10 | | | 830,000 | | | | 821,700 | |
Corporation Financiera de Desarrollo S.A. | | | | | | | | |
5.25% due 07/15/291,3 | | | 600,000 | | | | 604,500 | |
Banco Nacional de Comercio Exterior SNC | | | | | | | | |
4.38% due 10/14/253 | | | 600,000 | | | | 604,200 | |
Wilton Re Finance LLC | | | | | | | | |
5.87% due 03/30/331,3 | | | 475,000 | | | | 515,816 | |
Manulife Financial Corp. | | | | | | | | |
4.15% due 03/04/26 | | | 500,000 | | | | 510,816 | |
GMH Military Housing-Navy Northeast LLC | | | | | | | | |
6.30% due 10/15/49††† | | | 485,000 | | | | 509,478 | |
Customers Bank | | | | | | | | |
6.12% due 06/26/291,11 | | | 500,000 | | | | 500,000 | |
Kennedy-Wilson, Inc. | | | | | | | | |
5.87% due 04/01/24 | | | 500,000 | | | | 488,750 | |
Pacific Northwest Communities LLC | | | | | | | | |
5.91% due 06/15/503 | | | 400,000 | | | | 445,168 | |
Atlantic Marine Corporations Communities LLC | | | | | | | | |
5.43% due 12/01/503 | | | 384,184 | | | | 389,916 | |
Bank of America Corp. | | | | | | | | |
6.30% due 12/31/491,2 | | | 350,000 | | | | 360,500 | |
ACC Group Housing LLC | | | | | | | | |
6.35% due 07/15/54†††,3 | | | 300,000 | | | | 318,588 | |
Cadence Bank North America | | | | | | | | |
6.25% due 06/28/291,11 | | | 200,000 | | | | 172,500 | |
Prosight Global Inc. | | | | | | | | |
7.50% due 11/26/20†††,9 | | | 100,000 | | | | 103,704 | |
TIG Holdings, Inc. | | | | | | | | |
8.60% due 01/15/2711 | | | 34,000 | | | | 27,710 | |
Total Financial | | | | | | | 14,566,437 | |
| | | | | | | | | |
Government - 4.0% | |
Freddie Mac | | | | | | | | |
6.75% due 03/15/31 | | | 1,627,000 | | | | 2,456,292 | |
0.00% due 12/14/297 | | | 1,150,000 | | | | 767,052 | |
Tennessee Valley Authority | | | | | | | | |
4.25% due 09/15/65 | | | 700,000 | | | | 738,358 | |
5.38% due 04/01/56 | | | 500,000 | | | | 643,553 | |
Freddie Mac Strips | | | | | | | | |
0.00% due 03/15/317 | | | 1,250,000 | | | | 795,927 | |
Federal Home Loan Bank | | | | | | | | |
5.50% due 07/15/36 | | | 500,000 | | | | 688,827 | |
Fannie Mae Principal | | | | | | | | |
0.00% due 01/15/307 | | | 600,000 | | | | 397,105 | |
0.00% due 05/15/307 | | | 250,000 | | | | 163,041 | |
Freddie Mac. | | | | | | | | |
0.00% due 01/02/347 | | | 850,000 | | | | 480,604 | |
Total Government | | | | | | | 7,130,759 | |
| | | | | | | | | |
Communications - 3.0% | |
CCOH Safari LLC | | | | | | | | |
5.75% due 02/15/263 | | | 1,150,000 | | | | 1,190,250 | |
Sprint Communications, Inc. | | | | | | | | |
7.00% due 03/01/203 | | | 975,000 | | | | 975,000 | |
DISH DBS Corp. | | | | | | | | |
5.88% due 07/15/22 | | | 500,000 | | | | 473,750 | |
5.88% due 11/15/24 | | | 200,000 | | | | 183,500 | |
Altice US Finance I Corp. | | | | | | | | |
5.38% due 07/15/233 | | | 600,000 | | | | 616,125 | |
CSC Holdings LLC | | | | | | | | |
6.75% due 11/15/2110 | | | 550,000 | | | | 564,850 | |
Avaya, Inc. | | | | | | | | |
7.00% due 04/01/193,10 | | | 650,000 | | | | 438,750 | |
Neptune Finco Corp. | | | | | | | | |
6.63% due 10/15/253 | | | 350,000 | | | | 378,403 | |
T-Mobile USA, Inc. | | | | | | | | |
6.00% due 04/15/24 | | | 250,000 | | | | 253,125 | |
36 | THE GUGGENHEIM FUNDS SEMI-ANNUAL REPORT | SEE NOTES TO FINANCIAL STATEMENTS. |
SCHEDULE OF INVESTMENTS (Unaudited)(continued) | March 31, 2016 |
INVESTMENT GRADE BOND FUND | |
| | | Face
Amount | | | Value | |
| | | | | | | |
McGraw-Hill Global Education Holdings LLC / McGraw-Hill Global Education Finance | | | | | | |
9.75% due 04/01/21 | | $ | 175,000 | | | $ | 189,875 | |
Inmarsat Finance plc | | | | | | | | |
4.88% due 05/15/223 | | | 200,000 | | | | 188,375 | |
Nortel Networks Ltd. | | | | | | | | |
6.88% due 09/01/238 | | | 31,000 | | | | 11,160 | |
Total Communications | | | | | | | 5,463,163 | |
| | | | | | | | | |
Consumer, Non-cyclical - 1.9% | |
Bumble Bee Holdings, Inc. | | | | | | | | |
9.00% due 12/15/173 | | | 1,100,000 | | | | 1,102,750 | |
Vector Group Ltd. | | | | | | | | |
7.75% due 02/15/21 | | | 650,000 | | | | 682,500 | |
ADT Corp. | | | | | | | | |
4.13% due 06/15/2310 | | | 525,000 | | | | 457,406 | |
6.25% due 10/15/2110 | | | 150,000 | | | | 150,750 | |
Central Garden & Pet Co. | | | | | | | | |
6.13% due 11/15/23 | | | 350,000 | | | | 364,000 | |
HCA, Inc. | | | | | | | | |
5.88% due 02/15/26 | | | 350,000 | | | | 360,500 | |
Tenet Healthcare Corp. | | | | | | | | |
4.13% due 06/15/201,3 | | | 300,000 | | | | 297,750 | |
Total Consumer, Non-cyclical | | | | | | | 3,415,656 | |
| | | | | | | | | |
Consumer, Cyclical - 1.8% | |
Interval Acquisition Corp. | | | | | | | | |
5.63% due 04/15/23 | | | 813,000 | | | | 815,033 | |
Hyatt Hotels Corp. | | | | | | | | |
4.85% due 03/15/26 | | | 700,000 | | | | 730,423 | |
Northern Group Housing LLC | | | | | | | | |
6.80% due 08/15/533 | | | 600,000 | | | | 720,924 | |
Wyndham Worldwide Corp. | | | | | | | | |
5.10% due 10/01/25 | | | 550,000 | | | | 577,881 | |
Wynn Las Vegas LLC / Wynn Las Vegas Capital Corp. | | | | | | | | |
5.50% due 03/01/253 | | | 400,000 | | | | 377,000 | |
Total Consumer, Cyclical | | | | | | | 3,221,261 | |
| | | | | | | | | |
Energy - 1.5% | |
Sunoco Logistics Partners Operations, LP | | | | | | | | |
5.95% due 12/01/25 | | | 1,050,000 | | | | 1,054,925 | |
4.25% due 04/01/24 | | | 200,000 | | | | 183,592 | |
Equities Corp. | | | | | | | | |
4.88% due 11/15/21 | | | 425,000 | | | | 406,721 | |
Gulfstream Natural Gas System LLC | | | | | | | | |
4.60% due 09/15/253 | | | 360,000 | | | | 352,340 | |
Husky Energy, Inc. | | | | | | | | |
3.95% due 04/15/22 | | | 300,000 | | | | 298,890 | |
Hess Corp. | | | | | | | | |
8.13% due 02/15/19 | | | 200,000 | | | | 219,739 | |
Magellan Midstream Partners, LP | | | | | | | | |
5.00% due 03/01/26 | | | 150,000 | | | | 162,215 | |
Total Energy | | | | | | | 2,678,422 | |
| | | | | | | | | |
Basic Materials - 1.1% | |
Yamana Gold, Inc. | | | | | | | | |
4.95% due 07/15/2410 | | | 985,000 | | | | 832,325 | |
Newcrest Finance Pty Ltd. | | | | | | | | |
4.20% due 10/01/223 | | | 740,000 | | | | 701,261 | |
BHP Billiton Finance USA Ltd. | | | | | | | | |
6.75% due 10/19/751,3 | | | 400,000 | | | | 400,000 | |
Mosaic Global Holdings, Inc. | | | | | | | | |
7.38% due 08/01/189 | | | 18,000 | | | | 19,162 | |
Total Basic Materials | | | | | | | 1,952,748 | |
| | | | | | | | | |
Industrial - 1.0% | |
Molex Electronic Technologies LLC | | | | | | | | |
3.90% due 04/15/253 | | | 1,200,000 | | | | 1,165,582 | |
Reynolds Group Issuer Inc. / Reynolds Group Issuer LLC / Reynolds Group Issuer | | | | | | | | |
7.13% due 04/15/19 | | | 300,000 | | | | 305,250 | |
Reynolds Group Issuer Incorporated / Reynolds Group Issuer LLC / Reynolds Group Issuer | | | | | | | | |
7.88% due 08/15/19 | | | 200,000 | | | | 207,000 | |
SBM Baleia Azul | | | | | | | | |
5.50% due 09/15/27†††,9 | | | 252,870 | | | | 176,202 | |
Constar International, Inc | | | | | | | | |
11.00% due 12/31/17†††,9 | | | 4,091 | | | | — | |
Total Industrial | | | | | | | 1,854,034 | |
| | | | | | | | | |
Diversified - 0.4% | |
HRG Group, Inc. | | | | | | | | |
7.88% due 07/15/19 | | | 750,000 | | | | 790,950 | |
| | | | | | | | | |
Technology - 0.4% | |
Open Text Corp. | | | | | | | | |
5.63% due 01/15/233 | | | 325,000 | | | | 331,500 | |
CDK Global, Inc. | | | | | | | | |
4.50% due 10/15/2410 | | | 305,000 | | | | 302,099 | |
Total Technology | | | | | | | 633,599 | |
Total Corporate Bonds | | | | | | | | |
(Cost $41,548,370) | | | | | | | 41,707,029 | |
| | | | | | | | | |
U.S. GOVERNMENT SECURITIES†† - 10.6% | |
U.S. Treasury Notes | | | | | | | | |
1.63% due 02/15/2610 | | | 12,346,000 | | | | 12,166,600 | |
U.S. Treasury Bonds | | | | | | | | |
0.00% due 11/15/447 | | | 15,119,000 | | | | 6,887,234 | |
Total U.S. Government Securities | | | | | | | | |
(Cost $18,755,577) | | | | | | | 19,053,834 | |
SEE NOTES TO FINANCIAL STATEMENTS. | THE GUGGENHEIM FUNDS SEMI-ANNUAL REPORT | 37 |
SCHEDULE OF INVESTMENTS (Unaudited)(continued) | March 31, 2016 |
INVESTMENT GRADE BOND FUND | |
| | | Face
Amount | | | Value | |
| | | | | | | |
SENIOR FLOATING RATE INTERESTS†† - 4.5% | |
Technology - 1.1% | |
Avago Technologies Ltd. | | | | | | |
4.25% due 02/01/23 | | $ | 1,300,000 | | | $ | 1,292,759 | |
Solera LLC | | | | | | | | |
5.75% due 03/03/23 | | | 400,000 | | | | 399,216 | |
Greenway Medical Technologies | | | | | | | | |
6.00% due 11/04/209 | | | 342,125 | | | | 294,228 | |
Total Technology | | | | | | | 1,986,203 | |
| | | | | | | | | |
Financial - 1.1% | |
Fly Leasing Ltd. | | | | | | | | |
3.50% due 08/09/19 | | | 972,603 | | | | 964,093 | |
Global Payments, Inc. | | | | | | | | |
6.75% due 03/21/23 | | | 600,000 | | | | 602,502 | |
Magic Newco, LLC | | | | | | | | |
5.00% due 12/12/18 | | | 243,081 | | | | 242,837 | |
American Stock Transfer & Trust | | | | | | | | |
5.75% due 06/26/20 | | | 95,158 | | | | 92,065 | |
Total Financial | | | | | | | 1,901,497 | |
| | | | | | | | | |
Communications - 0.9% | |
MergerMarket Ltd. | | | | | | | | |
4.50% due 02/04/21 | | | 588,000 | | | | 570,359 | |
Light Tower Fiber LLC | | | | | | | | |
4.00% due 04/13/20 | | | 496,173 | | | | 489,971 | |
Proquest LLC | | | | | | | | |
5.75% due 10/24/21 | | | 498,738 | | | | 481,283 | |
Asurion Corp. | | | | | | | | |
5.00% due 08/04/22 | | | 133,730 | | | | 130,806 | |
Total Communications | | | | | | | 1,672,419 | |
| | | | | | | | | |
Consumer, Cyclical - 0.9% | |
La Quinta Intermediate Holdings | | | | | | | | |
3.75% due 04/14/21 | | | 598,492 | | | | 587,019 | |
Compucom Systems, Inc. | | | | | | | | |
4.25% due 05/11/20 | | | 713,944 | | | | 499,761 | |
Warner Music Group | | | | | | | | |
3.75% due 07/01/20 | | | 497,455 | | | | 489,785 | |
Total Consumer, Cyclical | | | | | | | 1,576,565 | |
| | | | | | | | | |
Consumer, Non-cyclical - 0.4% | |
Albertson’s (Safeway) Holdings LLC | | | | | | | | |
5.50% due 08/25/21 | | | 397,000 | | | | 397,199 | |
5.50% due 12/21/22 | | | 250,000 | | | | 250,135 | |
NES Global Talent | | | | | | | | |
6.50% due 10/03/19 | | | 125,672 | | | | 113,104 | |
Performance Food Group | | | | | | | | |
7.21% due 11/14/19 | | | 41,055 | | | | 41,055 | |
Total Consumer, Non-cyclical | | | | | | | 801,493 | |
| | | | | | | | | |
Industrial - 0.1% | |
CareCore National LLC | | | | | | | | |
5.50% due 03/05/21 | | | 126,524 | | | | 117,668 | |
Total Senior Floating Rate Interests | | | | | | | | |
(Cost $8,339,970) | | | | | | | 8,055,845 | |
| | | | | | | | | |
MUNICIPAL BONDS†† - 2.5% | |
California - 1.2% | |
State of California General Obligation Unlimited | | | | | | | | |
7.60% due 11/01/4010 | | | 1,000,000 | | | | 1,554,810 | |
Inland Valley Development Agency Tax Allocation | | | | | | | | |
5.50% due 03/01/33 | | | 500,000 | | | | 545,635 | |
Total California | | | | | | | 2,100,445 | |
| | | | | | | | | |
Illinois - 0.7% | |
State of Illinois General Obligation Unlimited | | | | | | | | |
6.90% due 03/01/3510 | | | 500,000 | | | | 558,935 | |
5.65% due 12/01/38 | | | 500,000 | | | | 502,855 | |
City of Chicago Illinois General Obligation Unlimited | | | | | | | | |
5.43% due 01/01/42 | | | 300,000 | | | | 249,369 | |
Total Illinois | | | | | | | 1,311,159 | |
| | | | | | | | | |
Michigan - 0.6% | |
Detroit City School District General Obligation Unlimited | | | | | | | | |
7.75% due 05/01/39 | | | 850,000 | | | | 1,059,364 | |
Total Municipal Bonds | | | | | | | | |
(Cost $4,355,945) | | | | | | | 4,470,968 | |
| | | | | | | | | |
FOREIGN GOVERNMENT BONDS†† - 0.8% | |
Kenya Government International Bond | | | | | | | | |
6.87% due 06/24/243 | | | 850,000 | | | | 801,125 | |
Dominican Republic International Bond | | | | | | | | |
6.85% due 01/27/453,10 | | | 700,000 | | | | 693,000 | |
Total Foreign Government Bonds | | | | | | | | |
(Cost $1,605,479) | | | | | | | 1,494,125 | |
| | | | | | | | | |
COMMERCIAL PAPER†† - 1.7% | |
Ryder System, Inc. | | | | | | | | |
0.65% due 04/05/16 | | | 1,500,000 | | | | 1,499,891 | |
Harley-Davidson Financial Services, Inc. | | | | | | | | |
0.57% due 04/07/16 | | | 1,500,000 | | | | 1,499,858 | |
Total Commercial Paper | | | | | | | | |
(Cost $2,999,749) | | | | | | | 2,999,749 | |
| | | | | | | | | |
Total Investments - 105.6% | | | | | | | | |
(Cost $194,260,498) | | | | | | $ | 189,533,762 | |
Other Assets & Liabilities, net - (5.6)% | | | | | | | (10,113,444 | ) |
Total Net Assets - 100.0% | | | | | | $ | 179,420,318 | |
38 | THE GUGGENHEIM FUNDS SEMI-ANNUAL REPORT | SEE NOTES TO FINANCIAL STATEMENTS. |
SCHEDULE OF INVESTMENTS (Unaudited)(concluded) | March 31, 2016 |
INVESTMENT GRADE BOND FUND | |
* | Non-income producing security. |
† | Value determined based on Level 1 inputs — See Note 4. |
†† | Value determined based on Level 2 inputs, unless otherwise noted — See Note 4. |
††† | Value determined based on Level 3 inputs — See Note 4. |
1 | Variable rate security. Rate indicated is rate effective at March 31, 2016. |
2 | Perpetual maturity. |
3 | Security is a 144A or Section 4(a)(2) security. The total market value of 144A or Section 4(a)(2) securities is $108,722,420 (cost $110,745,912), or 60.6% of total net assets. These securities have been determined to be liquid under guidelines established by the Board of Trustees. |
4 | Rate indicated is the 7 day yield as of March 31, 2016. |
5 | Residual interest. |
6 | Security is a step up/step down bond. The coupon increases or decreases at regular intervals until the bond reaches full maturity. |
7 | Zero coupon rate security. |
8 | Security is in default of interest and/or principal obligations. |
9 | Illiquid security. |
10 | Security or a portion thereof is held as collateral for reverse repurchase agreements — See Note 11. |
11 | Security is a 144A or Section 4(a)(2) security. These securities are considered illiquid and restricted under guidelines established by the Board of Trustees. The total market value of 144A or Section 4(a)(2) securities is $2,653,334 (cost $4,547,451), or 1.5% of total net assets — See Note 14. |
| | plc — Public Limited Company |
| | |
| | See Sector Classification in Other Information section. |
The following table summarizes the inputs used to value the Fund’s investments at March 31, 2016 (See Note 4 in the Notes to Financial Statements):
Investments in Securities (Assets) | | Level 1 | | | Level 2 | | | Level 3 | | | Total | |
Asset-Backed Securities | | $ | — | | | $ | 64,382,719 | | | $ | 1,219,318 | | | $ | 65,602,037 | |
Collateralized Mortgage Obligations | | | — | | | | 41,767,152 | | | | 1,815,414 | | | | 43,582,566 | |
Commercial Paper | | | — | | | | 2,999,749 | | | | — | | | | 2,999,749 | |
Common Stocks | | | 40,292 | | | | — | | | | — | | | | 40,292 | |
Corporate Bonds | | | — | | | | 39,724,827 | | | | 1,982,202 | | | | 41,707,029 | |
Foreign Government Bonds | | | — | | | | 1,494,125 | | | | — | | | | 1,494,125 | |
Municipal Bonds | | | — | | | | 4,470,968 | | | | — | | | | 4,470,968 | |
Preferred Stocks | | | — | | | | 544,720 | | | | 1,953,124 | | | | 2,497,844 | |
Senior Floating Rate Interests | | | — | | | | 8,055,845 | | | | — | | | | 8,055,845 | |
Short Term Investments | | | 29,473 | | | | — | | | | — | | | | 29,473 | |
U.S. Government Securities | | | — | | | | 19,053,834 | | | | — | | | | 19,053,834 | |
Total | | $ | 69,765 | | | $ | 182,493,939 | | | $ | 6,970,058 | | | $ | 189,533,762 | |
For the period ended March 31, 2016, there were no transfers between levels.
SEE NOTES TO FINANCIAL STATEMENTS. | THE GUGGENHEIM FUNDS SEMI-ANNUAL REPORT | 39 |
INVESTMENT GRADE BOND FUND | |
STATEMENT OF ASSETS AND LIABILITIES (Unaudited) | |
March 31, 2016 | |
Assets: | |
Investments, at value (cost $194,260,498) | | $ | 189,533,762 | |
Prepaid expenses | | | 58,190 | |
Receivables: | |
Interest | | | 1,037,300 | |
Fund shares sold | | | 754,840 | |
Securities sold | | | 263,271 | |
Total assets | | | 191,647,363 | |
| | | | | |
Liabilities: | |
Reverse Repurchase Agreements | | | 8,275,180 | |
Overdraft due to custodian bank | | | 6,945 | |
Payable for: | |
Securities purchased | | | 2,574,992 | |
Fund shares redeemed | | | 1,102,220 | |
Management fees | | | 73,007 | |
Distribution and service fees | | | 50,666 | |
Transfer agent/maintenance fees | | | 27,837 | |
Fund accounting/administration fees | | | 14,208 | |
Trustees’ fees* | | | 5,634 | |
Miscellaneous | | | 96,356 | |
Total liabilities | | | 12,227,045 | |
Net assets | | $ | 179,420,318 | |
| | | | | |
Net assets consist of: | |
Paid in capital | | $ | 214,961,010 | |
Accumulated net investment loss | | | (602,054 | ) |
Accumulated net realized loss on investments | | | (30,211,902 | ) |
Net unrealized depreciation on investments | | | (4,726,736 | ) |
Net assets | | $ | 179,420,318 | |
| | | | | |
A-Class: | |
Net assets | | $ | 130,413,734 | |
Capital shares outstanding | | | 7,269,625 | |
Net asset value per share | | $ | 17.94 | |
Maximum offering price per share (Net asset value divided by 96.00%) | | $ | 18.69 | |
| | | | | |
C-Class: | |
Net assets | | $ | 28,173,994 | |
Capital shares outstanding | | | 1,577,213 | |
Net asset value per share | | $ | 17.86 | |
| | | | | |
P-Class: | |
Net assets | | $ | 1,743,115 | |
Capital shares outstanding | | | 97,092 | |
Net asset value per share | | $ | 17.95 | |
| | | | | |
Institutional Class: | |
Net assets | | $ | 19,089,475 | |
Capital shares outstanding | | | 1,065,561 | |
Net asset value per share | | $ | 17.91 | |
STATEMENT OF OPERATIONS (Unaudited) | |
Period Ended March 31, 2016 | |
Investment Income: | |
Interest | | $ | 3,845,551 | |
Dividends | | | 88,770 | |
Total investment income | | | 3,934,321 | |
| | | | | |
Expenses: | |
Management fees | | | 396,539 | |
Transfer agent/maintenance fees: | |
A-Class | | | 56,509 | |
C-Class | | | 21,912 | |
P-Class | | | 149 | |
Institutional Class | | | 6,022 | |
Distribution and service fees: | |
A-Class | | | 149,892 | |
C-Class | | | 128,283 | |
P-Class | | | 1,088 | |
Fund accounting/administration fees | | | 75,342 | |
Interest expense | | | 34,408 | |
Line of credit fees | | | 10,028 | |
Custodian fees | | | 5,983 | |
Trustees’ fees* | | | 3,756 | |
Miscellaneous | | | 83,498 | |
Total expenses | | | 973,409 | |
Less: | |
Expenses waived by Adviser | | | (54,683 | ) |
Net expenses | | | 918,726 | |
Net investment income | | | 3,015,595 | |
| | | | | |
Net Realized and Unrealized Gain (Loss): | |
Net realized gain (loss) on: | |
Investments | | | 869,062 | |
Foreign currency | | | 12 | |
Options purchased | | | (57,363 | ) |
Options written | | | 15,664 | |
Net realized gain | | | 827,375 | |
Net change in unrealized appreciation (depreciation) on: | |
Investments in unaffiliated issuers | | | (1,718,395 | ) |
Investments in affiliated issuers | | | 1,620 | |
Options purchased | | | (42,971 | ) |
Options written | | | 7,577 | |
Net change in unrealized appreciation (depreciation) | | | (1,752,169 | ) |
Net realized and unrealized loss | | | (924,794 | ) |
Net increase in net assets resulting from operations | | $ | 2,090,801 | |
* | Relates to Trustees not deemed “interested persons” within the meaning of Section 2(a)(19) of the 1940 Act. |
40 | THE GUGGENHEIM FUNDS SEMI-ANNUAL REPORT | SEE NOTES TO FINANCIAL STATEMENTS. |
INVESTMENT GRADE BOND FUND | |
STATEMENTS OF CHANGES IN NET ASSETS |
| | | Period Ended
March 31,
2016
(Unaudited) | | | Year Ended
September 30,
2015 | |
Increase (Decrease) in Net Assets from Operations: | | | | | | |
Net investment income | | $ | 3,015,595 | | | $ | 5,043,465 | |
Net realized gain (loss) on investments | | | 827,375 | | | | (2,824,809 | ) |
Net change in unrealized appreciation (depreciation) on investments | | | (1,752,169 | ) | | | 509,808 | |
Net increase in net assets resulting from operations | | | 2,090,801 | | | | 2,728,464 | |
| | | | | | | | | |
Distributions to shareholders from: | | | | | | | | |
Net investment income | | | | | | | | |
A-Class | | | (2,545,738 | ) | | | (4,661,405 | ) |
B-Class | | | — | | | | (47,942 | ) |
C-Class | | | (451,611 | ) | | | (851,092 | ) |
P-Class | | | (16,678 | ) | | | (186 | )* |
Institutional Class | | | (264,871 | ) | | | (271,114 | ) |
Total distributions to shareholders | | | (3,278,898 | ) | | | (5,831,739 | ) |
| | | | | | | | | |
Capital share transactions: | | | | | | | | |
Proceeds from sale of shares | | | | | | | | |
A-Class | | | 27,217,522 | | | | 46,869,449 | |
B-Class | | | — | | | | 52,221 | |
C-Class | | | 8,346,918 | | | | 10,722,431 | |
P-Class | | | 1,962,206 | | | | 47,999 | * |
Institutional Class | | | 14,737,597 | | | | 10,634,690 | |
Distributions reinvested | | | | | | | | |
A-Class | | | 2,428,594 | | | | 4,442,417 | |
B-Class | | | — | | | | 47,722 | |
C-Class | | | 392,744 | | | | 740,294 | |
P-Class | | | 16,606 | | | | 186 | * |
Institutional Class | | | 160,320 | | | | 226,521 | |
Cost of shares redeemed | | | | | | | | |
A-Class | | | (13,289,340 | ) | | | (33,418,832 | ) |
B-Class | | | — | | | | (2,196,898 | ) |
C-Class | | | (4,472,560 | ) | | | (7,495,634 | ) |
P-Class | | | (249,738 | ) | | | (37,888 | )* |
Institutional Class | | | (2,692,377 | ) | | | (9,741,384 | ) |
Net increase from capital share transactions | | | 34,558,492 | | | | 20,893,294 | |
Net increase in net assets | | | 33,370,395 | | | | 17,790,019 | |
| | | | | | | | | |
Net assets: | | | | | | | | |
Beginning of period | | | 146,049,923 | | | | 128,259,904 | |
End of period | | $ | 179,420,318 | | | $ | 146,049,923 | |
Accumulated net investment loss at end of period | | $ | (602,054 | ) | | $ | (338,751 | ) |
SEE NOTES TO FINANCIAL STATEMENTS. | THE GUGGENHEIM FUNDS SEMI-ANNUAL REPORT | 41 |
INVESTMENT GRADE BOND FUND | |
STATEMENTS OF CHANGES IN NET ASSETS (concluded) |
| | | Period Ended
March 31,
2016
(Unaudited) | | | Year Ended
September 30,
2015 | |
Capital share activity: | | | | | | |
Shares sold | | | | | | |
A-Class | | | 1,520,266 | | | | 2,543,649 | |
B-Class | | | — | | | | 2,821 | |
C-Class | | | 467,634 | | | | 584,251 | |
P-Class | | | 109,581 | | | | 2,628 | * |
Institutional Class | | | 824,577 | | | | 577,777 | |
Shares issued from reinvestment of distributions | | | | | | | | |
A-Class | | | 135,497 | | | | 241,345 | |
B-Class | | | — | | | | 2,590 | |
C-Class | | | 22,004 | | | | 40,376 | |
P-Class | | | 928 | | | | 10 | * |
Institutional Class | | | 8,961 | | | | 12,321 | |
Shares redeemed | | | | | | | | |
A-Class | | | (741,541 | ) | | | (1,812,612 | ) |
B-Class | | | — | | | | (120,112 | ) |
C-Class | | | (250,412 | ) | | | (409,164 | ) |
P-Class | | | (13,977 | ) | | | (2,078 | )* |
Institutional Class | | | (150,308 | ) | | | (527,752 | ) |
Net increase in shares | | | 1,933,210 | | | | 1,136,050 | |
* | Since the commencement of operations: May 1, 2015. |
42 | THE GUGGENHEIM FUNDS SEMI-ANNUAL REPORT | SEE NOTES TO FINANCIAL STATEMENTS. |
INVESTMENT GRADE BOND FUND | |
This table is presented to show selected data for a share outstanding throughout each period and to assist shareholders in evaluating a Fund’s performance for the periods presented.
A-Class | | Period Ended
March 31,
2016a | | Year Ended
September 30,
2015 | | Year Ended
September 30,
2014 | | Year Ended
September 30,
2013 | | Period Ended
September 30,
2012b | | Year Ended
December 31,
2011 g | |
Per Share Data | | | | | | | | | | | | | | | | | | |
Net asset value, beginning of period | | $ | 18.10 | | | $ | 18.50 | | | $ | 17.81 | | | $ | 17.92 | | | $ | 17.41 | | | $ | 16.71 | |
Income (loss) from investment operations: | |
Net investment income (loss)c | | | .35 | | | | .69 | | | | .65 | | | | .61 | | | | .27 | | | | .42 | |
Net gain (loss) on investments (realized and unrealized) | | | (.13 | ) | | | (.30 | ) | | | .83 | | | | (.04 | ) | | | .51 | | | | .74 | |
Total from investment operations | | | .22 | | | | .39 | | | | 1.48 | | | | .57 | | | | .78 | | | | 1.16 | |
Less distributions from: | |
Net investment income | | | (.38 | ) | | | (.79 | ) | | | (.79 | ) | | | (.68 | ) | | | (.27 | ) | | | (.46 | ) |
Total distributions | | | (.38 | ) | | | (.79 | ) | | | (.79 | ) | | | (.68 | ) | | | (.27 | ) | | | (.46 | ) |
Net asset value, end of period | | $ | 17.94 | | | $ | 18.10 | | | $ | 18.50 | | | $ | 17.81 | | | $ | 17.92 | | | $ | 17.41 | |
| | |
Total Returni | | | 1.25 | % | | | 2.12 | % | | | 8.47 | % | | | 3.21 | % | | | 4.51 | % | | | 6.94 | % |
Ratios/Supplemental Data | |
Net assets, end of period (in thousands) | | $ | 130,414 | | | $ | 115,019 | | | $ | 99,565 | | | $ | 83,642 | | | $ | 98,063 | | | $ | 108,999 | |
Ratios to average net assets: | |
Net investment income (loss) | | | 3.92 | % | | | 3.72 | % | | | 3.55 | % | | | 3.40 | % | | | 2.04 | % | | | 2.43 | % |
Total expenses | | | 1.11 | % | | | 1.17 | % | | | 1.19 | % | | | 1.21 | % | | | 1.15 | % | | | 1.15 | % |
Net expensesd,h | | | 1.06 | % | | | 1.07 | % | | | 1.05 | % | | | 1.04 | % | | | 1.00 | % | | | 1.00 | % |
Portfolio turnover rate | | | 53 | % | | | 57 | % | | | 61 | % | | | 119 | % | | | 52 | % | | | 43 | % |
C-Class | | Period Ended
March 31,
2016a | | Year Ended
September 30,
2015 | | Year Ended
September 30,
2014 | | Year Ended
September 30,
2013 | | Period Ended
September 30,
2012b | | Year Ended
December 31,
2011 g | |
Per Share Data | | | | | | | | | | | | | | | | | | |
Net asset value, beginning of period | | $ | 18.02 | | | $ | 18.42 | | | $ | 17.73 | | | $ | 17.82 | | | $ | 17.31 | | | $ | 16.62 | |
Income (loss) from investment operations: | |
Net investment income (loss)c | | | .29 | | | | .55 | | | | .51 | | | | .48 | | | | .17 | | | | .29 | |
Net gain (loss) on investments (realized and unrealized) | | | (.13 | ) | | | (.30 | ) | | | .83 | | | | (.05 | ) | | | .51 | | | | .73 | |
Total from investment operations | | | .16 | | | | .25 | | | | 1.34 | | | | .43 | | | | .68 | | | | 1.02 | |
Less distributions from: | |
Net investment income | | | (.32 | ) | | | (.65 | ) | | | (.65 | ) | | | (.52 | ) | | | (.17 | ) | | | (.33 | ) |
Total distributions | | | (.32 | ) | | | (.65 | ) | | | (.65 | ) | | | (.52 | ) | | | (.17 | ) | | | (.33 | ) |
Net asset value, end of period | | $ | 17.86 | | | $ | 18.02 | | | $ | 18.42 | | | $ | 17.73 | | | $ | 17.82 | | | $ | 17.31 | |
| | |
Total Returni | | | 0.88 | % | | | 1.36 | % | | | 7.69 | % | | | 2.42 | % | | | 3.95 | % | | | 6.32 | % |
Ratios/Supplemental Data | |
Net assets, end of period (in thousands) | | $ | 28,174 | | | $ | 24,111 | | | $ | 20,673 | | | $ | 17,876 | | | $ | 20,929 | | | $ | 22,035 | |
Ratios to average net assets: | |
Net investment income (loss) | | | 3.20 | % | | | 3.00 | % | | | 2.80 | % | | | 2.65 | % | | | 1.29 | % | | | 1.68 | % |
Total expenses | | | 1.95 | % | | | 1.99 | % | | | 1.99 | % | | | 2.03 | % | | | 1.92 | % | | | 1.90 | % |
Net expensesd,h | | | 1.81 | % | | | 1.82 | % | | | 1.80 | % | | | 1.79 | % | | | 1.75 | % | | | 1.75 | % |
Portfolio turnover rate | | | 53 | % | | | 57 | % | | | 61 | % | | | 119 | % | | | 52 | % | | | 43 | % |
SEE NOTES TO FINANCIAL STATEMENTS. | THE GUGGENHEIM FUNDS SEMI-ANNUAL REPORT | 43 |
INVESTMENT GRADE BOND FUND | |
FINANCIAL HIGHLIGHTS (continued) |
This table is presented to show selected data for a share outstanding throughout each period and to assist shareholders in evaluating a Fund’s performance for the periods presented.
P-Class | | Period Ended
March 31,
2016a | | | Period Ended
September 30,
2015e | |
Per Share Data | | | | | | |
Net asset value, beginning of period | | $ | 18.12 | | | $ | 18.45 | |
Income (loss) from investment operations: | |
Net investment income (loss)c | | | .31 | | | | .25 | |
Net gain (loss) on investments (realized and unrealized) | | | (.10 | ) | | | (.26 | ) |
Total from investment operations | | | .21 | | | | (.01 | ) |
Less distributions from: | |
Net investment income | | | (.38 | ) | | | (.32 | ) |
Total distributions | | | (.38 | ) | | | (.32 | ) |
Net asset value, end of period | | $ | 17.95 | | | $ | 18.12 | |
| | |
Total Returni | | | 1.22 | % | | | (0.11 | %) |
Ratios/Supplemental Data | |
Net assets, end of period (in thousands) | | $ | 1,743 | | | $ | 10 | |
Ratios to average net assets: | |
Net investment income (loss) | | | 3.47 | % | | | 3.25 | % |
Total expenses | | | 1.05 | % | | | 3.29 | % |
Net expensesd,h | | | 1.05 | % | | | 1.09 | % |
Portfolio turnover rate | | | 53 | % | | | 57 | % |
44 | THE GUGGENHEIM FUNDS SEMI-ANNUAL REPORT | SEE NOTES TO FINANCIAL STATEMENTS. |
INVESTMENT GRADE BOND FUND | |
FINANCIAL HIGHLIGHTS (concluded) |
This table is presented to show selected data for a share outstanding throughout each period and to assist shareholders in evaluating a Fund’s performance for the periods presented.
Institutional Class | | Period Ended
March 31,
2016a | | | Year Ended
September 30,
2015 | | | Year Ended
September 30,
2014 | | | Period Ended
September 30,
2013f | |
Per Share Data | | | | | | | | | | | | |
Net asset value, beginning of period | | $ | 18.07 | | | $ | 18.47 | | | $ | 17.80 | | | $ | 18.00 | |
Income (loss) from investment operations: | |
Net investment income (loss)c | | | .36 | | | | .74 | | | | .68 | | | | .46 | |
Net gain (loss) on investments (realized and unrealized) | | | (.12 | ) | | | (.31 | ) | | | .83 | | | | (.21 | ) |
Total from investment operations | | | .24 | | | | .43 | | | | 1.51 | | | | .25 | |
Less distributions from: | |
Net investment income | | | (.40 | ) | | | (.83 | ) | | | (.84 | ) | | | (.45 | ) |
Total distributions | | | (.40 | ) | | | (.83 | ) | | | (.84 | ) | | | (.45 | ) |
Net asset value, end of period | | $ | 17.91 | | | $ | 18.07 | | | $ | 18.47 | | | $ | 17.80 | |
| | |
Total Returni | | | 1.43 | % | | | 2.37 | % | | | 8.64 | % | | | 1.35 | % |
Ratios/Supplemental Data | |
Net assets, end of period (in thousands) | | $ | 19,089 | | | $ | 6,910 | | | $ | 5,909 | | | $ | 174 | |
Ratios to average net assets: | |
Net investment income (loss) | | | 4.00 | % | | | 4.01 | % | | | 3.72 | % | | | 3.85 | % |
Total expenses | | | 0.86 | % | | | 0.94 | % | | | 0.88 | % | | | 1.17 | % |
Net expensesd,h | | | 0.80 | % | | | 0.82 | % | | | 0.78 | % | | | 0.82 | % |
Portfolio turnover rate | | | 53 | % | | | 57 | % | | | 61 | % | | | 119 | % |
a | Unaudited figures for the period ended March 31, 2016. Percentage amounts for the period, except total return and portfolio turnover rate, have been annualized. |
b | The Fund changed its fiscal year end from December 31 to September 30 in 2012. |
c | Net investment income (loss) per share was computed using average shares outstanding throughout the period. |
d | Net expense information reflects the expense ratios after expense waivers. |
e | Since commencement of operations: May 1, 2015. Percentage amounts for the period, except total return and portfolio turnover rate, have been annualized. |
f | Since commencement of operations: January 29, 2013. Percentage amounts for the period, except total return and portfolio turnover rate, have been annualized. |
g | Per share amounts for the periods presented through April 8, 2011 have been restated to reflect a 1:4 reverse share split effective April 8, 2011. |
h | Net expenses may include expenses that are excluded from the expense limitation agreement. Excluding these expenses, the operating expense ratios for the years would be: |
| | 03/31/16 | 09/30/15 | 09/30/14 | 09/30/13 |
A-Class | 1.00% | 1.00% | 1.00% | 1.02% |
C-Class | 1.75% | 1.75% | 1.75% | 1.77% |
P-Class | 1.00% | 1.00% | — | — |
Institutional Class | 0.75% | 0.75% | 0.75% | 0.77% |
i | Total return does not reflect the impact of any applicable sales charges and has not been annualized. |
SEE NOTES TO FINANCIAL STATEMENTS. | THE GUGGENHEIM FUNDS SEMI-ANNUAL REPORT | 45 |
FUND PROFILE (Unaudited) | March 31, 2016 |
LIMITED DURATION FUND
OBJECTIVE: Seeks to provide a high level of income consistent with preservation of capital.
Holdings Diversification (Market Exposure as % of Net Assets)
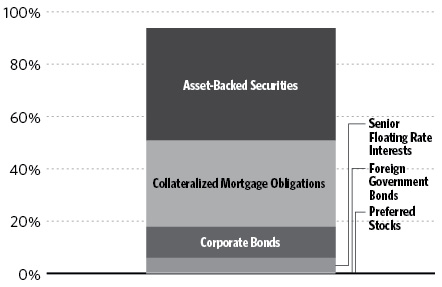
“Holdings Diversification (Market Exposure as % of Net Assets)” excludes any temporary cash investments or investments in Guggenheim Strategy Funds Trust mutual funds. Investments in those Funds do not provide “market exposure” to meet the fund’s investment objective, but will significantly increase the portfolio’s exposure to certain other asset categories (and their associated risks), which may cause the Fund to deviate from its principal investment strategy, including: (i) high yield, high risk debt securities rated below the top four long-term rating categories by a nationally recognized statistical rating organization (also known as “junk bonds”); (ii) securities issued by the U.S. government or its agencies and instrumentalities; (iii) CLOs and similar investments; and (iv) other short-term fixed income securities.
Inception Dates: |
A-Class | December 16, 2013 |
C-Class | December 16, 2013 |
P-Class | May 1, 2015 |
Institutional Class | December 16, 2013 |
Ten Largest Holdings (% of Total Net Assets) |
Guggenheim Strategy Fund I | 2.4% |
Nationstar HECM Loan Trust | 2.1% |
Station Place Securitization Trust | 1.8% |
LSTAR Securities Investment Trust 2015-10 | 1.3% |
LSTAR Securities Investment Trust 2015-1 | 1.2% |
GS Mortgage Securities Corporation Trust | 1.2% |
LSTAR Securities Investment Trust 2015-4 | 1.1% |
LSTAR Securities Investment Trust 2015-6 | 1.1% |
LSTAR Securities Investment Trust 2016-2 | 1.1% |
VOLT XLI LLC | 1.1% |
Top Ten Total | 14.4% |
| | |
“Ten Largest Holdings” excludes any temporary cash investments. |
46 | THE GUGGENHEIM FUNDS SEMI-ANNUAL REPORT | |
FUND PROFILE (Unaudited)(concluded) | March 31, 2016 |
Portfolio Composition by Quality Rating1 |
Rating | |
Fixed Income Instruments | |
AAA | 18.9% |
AA | 11.8% |
A | 18.4% |
BBB | 13.4% |
BB | 7.4% |
B | 3.2% |
CCC | 0.8% |
D | 0.0% |
A+ | 0.1% |
NR2 | 18.0% |
Other Instruments | 8.0% |
Total Investments | 100.0% |
| | |
The chart above reflects percentages of the value of total investments. |
1 | Source: BlackRock Solutions. Credit quality ratings are measured on a scale that generally ranges from AAA (highest) to D (lowest). All securities except for those labeled “NR” have been rated by a Nationally Recognized Statistical Rating Organization (“NRSRO”). For purposes of this presentation, when ratings are available from more than one agency, the highest rating is used. Guggenheim Investments converts ratings to the equivalent S&P rating. |
2 | NR securities do not necessarily indicate low credit quality. |
| | THE GUGGENHEIM FUNDS SEMI-ANNUAL REPORT | 47 |
SCHEDULE OF INVESTMENTS (Unaudited) | March 31, 2016 |
LIMITED DURATION FUND | |
| | | Shares | | | Value | |
| | | | | | | |
PREFERRED STOCKS†† - 0.1% | |
| | | | | | | |
Industrial - 0.1% | |
Seaspan Corp. 6.38% due 04/30/1910 | | | 20,000 | | | $ | 495,200 | |
Total Preferred Stocks | | | | | | | | |
(Cost $503,824) | | | | | | | 495,200 | |
| | | | | | | | | |
MUTUAL FUNDS† - 2.4% | |
Guggenheim Strategy Fund I1 | | | 534,890 | | | | 13,270,617 | |
Total Mutual Funds | | | | | | | | |
(Cost $13,292,135) | | | | | | | 13,270,617 | |
| | | | | | | | | |
SHORT TERM INVESTMENTS† - 1.8% | |
Dreyfus Treasury Prime Cash Management Institutional Shares 0.18%2 | | | 9,936,722 | | | | 9,936,722 | |
Total Short Term Investments | | | | | | | | |
(Cost $9,936,722) | | | | | | | 9,936,722 | |
| | | Face
Amount | | | | | |
| | | | | | | | | |
ASSET-BACKED SECURITIES†† - 43.1% | |
Collateralized Loan Obligations - 35.5% | |
CIFC Funding Ltd. | | | | | | | | |
2015-2A, 2.54% due 12/05/243,4,11 | | $ | 2,000,000 | | | | 1,967,316 | |
2015-2A, 3.34% due 12/05/243,4 | | | 1,990,000 | | | | 1,922,812 | |
2013-3A, 4.87% due 01/29/253,4 | | | 1,400,000 | | | | 1,266,259 | |
2007-1A, 2.12% due 05/10/213,4 | | | 1,000,000 | | | | 937,572 | |
2014-3X, due 07/22/265 | | | 2,000,000 | | | | 910,088 | |
2013-3A, 3.62% due 01/29/253,4 | | | 600,000 | | | | 584,090 | |
Fortress Credit BSL II Ltd. | | | | | | | | |
2013-2A, 2.12% due 10/19/253,4,11 | | | 5,000,000 | | | | 4,933,184 | |
2013-2A, 2.87% due 10/19/253,4 | | | 1,500,000 | | | | 1,459,169 | |
Golub Capital Partners CLO Ltd. | | | | | | | | |
2015-25A, 2.42% due 08/05/273,4 | | | 5,000,000 | | | | 4,892,003 | |
2014-10A, 3.57% due 10/20/213,4 | | | 700,000 | | | | 686,909 | |
2014-21A, 3.07% due 10/25/263,4 | | | 500,000 | | | | 484,025 | |
2014-18A, 4.12% due 04/25/263,4 | | | 250,000 | | | | 239,554 | |
Acis CLO Ltd. | | | | | | | | |
2013-1A, 1.49% due 04/18/243,4 | | | 5,500,000 | | | | 5,343,787 | |
Cent CDO 14 Ltd. | | | | | | | | |
2007-14A, 1.32% due 04/15/213,4 | | | 6,000,000 | | | | 5,279,547 | |
MT Wilson Clo II Ltd. | | | | | | | | |
2007-2A, 1.62% due 07/11/203,4 | | | 4,500,000 | | | | 4,313,165 | |
2007-2A, 3.37% due 07/11/203,4 | | | 1,000,000 | | | | 888,084 | |
Great Lakes CLO Ltd. | | | | | | | | |
2015-1A, 2.57% due 07/15/263,4 | | | 5,000,000 | | | | 4,958,085 | |
2014-1A, 4.32% due 04/15/253,4 | | | 250,000 | | | | 240,839 | |
Rampart CLO Ltd. | | | | | | | | |
2007-1A, 2.49% due 10/25/213,4 | | | 5,000,000 | | | | 4,900,535 | |
Black Diamond CLO Ltd. | | | | | | | | |
2013-1A, 2.02% due 02/01/233,4 | | | 5,000,000 | | | | 4,882,945 | |
GoldenTree Loan Opportunities VII Ltd. | | | | | | |
2013-7A, 1.77% due 04/25/253,4 | | | 5,000,000 | | | | 4,879,003 | |
Ares XII CLO Ltd. | | | | | | | | |
2007-12A, 2.63% due 11/25/203,4 | | | 5,000,000 | | | | 4,850,627 | |
Oaktree EIF I Series A Ltd. | | | | | | | | |
2015-A1, 3.25% due 10/18/273,4 | | | 4,500,000 | | | | 4,464,089 | |
RFTI Issuer Ltd. | | | | | | | | |
2015-FL1, 2.19% due 08/15/303,12 | | | 4,000,000 | | | | 3,991,574 | |
Resource Capital Corporation Ltd. | | | | | | | | |
2015-CRE4, 1.84% due 08/15/323,4 | | | 2,000,000 | | | | 1,963,566 | |
2014-CRE2, 2.94% due 04/15/323,4 | | | 2,000,000 | | | | 1,793,788 | |
WhiteHorse VIII Ltd. | | | | | | | | |
2014-1A, 2.12% due 05/01/263,4 | | | 3,450,000 | | | | 3,375,871 | |
Voya CLO Ltd. | | | | | | | | |
2013-1A, 3.52% due 04/15/243,4 | | | 2,300,000 | | | | 2,286,360 | |
2015-3A, 3.57% due 10/15/223,4 | | | 1,000,000 | | | | 995,447 | |
PFP Ltd. | | | | | | | | |
2015-2, 2.44% due 07/14/343,4 | | | 3,000,000 | | | | 2,957,437 | |
Cavalry CLO II | | | | | | | | |
2013-2A, 1.97% due 01/17/243,4 | | | 3,000,000 | | | | 2,946,881 | |
Fifth Street SLF II Ltd. | | | | | | | | |
2015-2A, 2.25% due 09/29/273,4 | | | 3,000,000 | | | | 2,932,508 | |
Oak Hill Credit Partners X Ltd. | | | | | | | | |
2014-10A, 2.72% due 07/20/263,4 | | | 2,950,000 | | | | 2,833,406 | |
Venture VI CDO Ltd. | | | | | | | | |
2006-1A, 2.10% due 08/03/203,4 | | | 2,850,000 | | | | 2,596,083 | |
Catamaran CLO Ltd. | | | | | | | | |
2014-1A, 3.27% due 04/20/263,4 | | | 2,750,000 | | | | 2,586,303 | |
Atrium XI | | | | | | | | |
2014-11A, 3.82% due 10/23/253,4 | | | 2,500,000 | | | | 2,485,772 | |
Ares XXVI CLO Ltd. | | | | | | | | |
2013-1A, 3.37% due 04/15/253,4 | | | 2,500,000 | | | | 2,386,990 | |
KKR CLO 12 Ltd. | | | | | | | | |
2015-12, 2.56% due 07/15/273,4 | | | 2,500,000 | | | | 2,375,763 | |
Highbridge Loan Management Ltd. | | | | | | | | |
2014-2014, 2.67% due 07/28/253,4 | | | 1,250,000 | | | | 1,198,325 | |
2014-1A, 2.87% due 09/20/223,4 | | | 1,000,000 | | | | 999,872 | |
Northwoods Capital X Ltd. | | | | | | | | |
2013-10A, 2.52% due 11/04/253,4 | | | 2,250,000 | | | | 2,150,273 | |
Babson CLO Ltd. | | | | | | | | |
2013-IIA, 3.27% due 01/18/253,4 | | | 2,250,000 | | | | 2,136,158 | |
Cent CLO Ltd. | | | | | | | | |
2014-20A, 2.10% due 01/25/263,4 | | | 2,100,000 | | | | 2,077,952 | |
Fortress Credit Funding V, LP | | | | | | | | |
2015-5A, 3.27% due 08/15/223,4 | | | 2,000,000 | | | | 1,980,817 | |
Carlyle Global Market Strategies CLO Ltd. | | | | | | | | |
2013-4A, 2.09% due 10/15/253,4 | | | 2,000,000 | | | | 1,971,150 | |
Dryden XXIV Senior Loan Fund | | | | | | | | |
2015-24RA, 3.32% due 11/15/233,4,11 | | | 2,000,000 | | | | 1,967,847 | |
Steele Creek CLO Ltd. | | | | | | | | |
2014-1A, 2.87% due 08/21/263,4 | | | 2,000,000 | | | | 1,964,966 | |
Venture CLO Ltd. | | | | | | | | |
2015-11A, 2.57% due 11/14/223,4,11 | | | 2,000,000 | | | | 1,957,500 | |
48 | THE GUGGENHEIM FUNDS SEMI-ANNUAL REPORT | SEE NOTES TO FINANCIAL STATEMENTS. |
SCHEDULE OF INVESTMENTS (Unaudited)(continued) | March 31, 2016 |
LIMITED DURATION FUND | |
| | | Face
Amount | | | Value | |
| | | | | | | |
KKR CLO Trust | | | | | | |
2012-1A, 2.83% due 12/15/243,4 | | $ | 2,000,000 | | | $ | 1,949,898 | |
Vibrant CLO Limited | | | | | | | | |
2015-1A, 2.72% due 07/17/243,4 | | | 2,000,000 | | | | 1,946,366 | |
Marea CLO Ltd. | | | | | | | | |
2015-1A, 3.37% due 10/15/233,4 | | | 1,000,000 | | | | 974,477 | |
2015-1A, 2.42% due 10/15/233,4 | | | 1,000,000 | | | | 963,068 | |
Fortress Credit Opportunities V CLO Ltd. | | | | | | | | |
2014-5A, 3.27% due 10/15/263,4 | | | 1,000,000 | | | | 975,246 | |
2014-5A, 4.17% due 10/15/263,4 | | | 1,000,000 | | | | 938,631 | |
OCP CLO Ltd. | | | | | | | | |
2013-4A, 3.37% due 10/24/253,4 | | | 2,000,000 | | | | 1,905,235 | |
Garrison Funding Ltd. | | | | | | | | |
2015-1A, 3.13% due 05/25/273,4 | | | 2,000,000 | | | | 1,900,344 | |
FS Senior Funding Ltd. | | | | | | | | |
2015-1A, 3.27% due 05/28/253,4 | | | 2,000,000 | | | | 1,885,850 | |
Airlie CLO Ltd. | | | | | | | | |
2006-2A, 2.07% due 12/20/203,4 | | | 2,000,000 | | | | 1,832,900 | |
Golub Capital Partners CLO 10 Ltd. | | | | | | | | |
2014-10A, 2.37% due 10/20/213,4 | | | 1,500,000 | | | | 1,467,720 | |
Flagship CLO VI | | | | | | | | |
2007-1A, 3.04% due 06/10/213,4 | | | 1,500,000 | | | | 1,405,764 | |
Shackleton I CLO Ltd. | | | | | | | | |
2012-1A, 2.15% due 08/14/233,4 | | | 1,400,000 | | | | 1,398,037 | |
Tuolumne Grove CLO Limited | | | | | | | | |
2014-1A, 2.72% due 04/25/263,4 | | | 1,500,000 | | | | 1,390,412 | |
Dryden 37 Senior Loan Fund | | | | | | | | |
2015-37A, due 04/15/274,5 | | | 1,500,000 | | | | 1,342,935 | |
OFSI Fund V Ltd. | | | | | | | | |
2013-5A, 3.82% due 04/17/253,4 | | | 1,500,000 | | | | 1,327,877 | |
Dryden 30 Senior Loan Fund | | | | | | | | |
2013-30A, 3.47% due 11/15/253,4 | | | 1,330,000 | | | | 1,297,921 | |
Venture VII CDO Ltd. | | | | | | | | |
2006-7A, 0.85% due 01/20/223,4 | | | 1,318,816 | | | | 1,291,536 | |
Atlas Senior Loan Fund VI Ltd. | | | | | | | | |
2014-6A, 3.02% due 10/15/263,4 | | | 1,272,000 | | | | 1,249,235 | |
Venture XVI CLO Ltd. | | | | | | | | |
2014-16A, 2.12% due 04/15/263,4 | | | 1,200,000 | | | | 1,183,677 | |
Symphony CLO IX, LP | | | | | | | | |
2012-9A, 4.87% due 04/16/223,4 | | | 600,000 | | | | 576,458 | |
2012-9A, 3.87% due 04/16/223,4 | | | 500,000 | | | | 503,555 | |
Ares XXIII CLO Ltd. | | | | | | | | |
2014-1A, 3.82% due 04/19/233,4 | | | 1,000,000 | | | | 1,003,901 | |
Benefit Street Partners CLO Ltd. | | | | | | | | |
2015-IA, 3.72% due 10/15/253,4 | | | 1,000,000 | | | | 999,989 | |
ACAS CLO Ltd. | | | | | | | | |
2014-1A, 2.94% due 09/20/233,4 | | | 1,000,000 | | | | 999,015 | |
Cent CLO | | | | | | | | |
2014-16A, 3.82% due 08/01/243,4 | | | 500,000 | | | | 499,947 | |
2014-16A, 2.87% due 08/01/243,4 | | | 500,000 | | | | 495,118 | |
Newstar Commercial Loan Funding 2016-1 LLC | | | | | | | | |
2016-1A, 4.37% due 02/25/283,4 | | | 1,000,000 | | | | 995,001 | |
Symphony CLO X Ltd. | | | | | | | | |
2015-10A, 3.47% due 07/23/233,4 | | | 1,000,000 | | | | 992,935 | |
Madison Park Funding VIII Ltd. | | | | | | | | |
2014-8A, 3.42% due 04/22/223,4 | | | 500,000 | | | | 499,945 | |
2014-8A, 2.82% due 04/22/223,4 | | | 500,000 | | | | 491,868 | |
Fortress Credit Investments IV Ltd. | | | | | | | | |
2015-4A, 2.52% due 07/17/233,4 | | | 1,000,000 | | | | 987,330 | |
Kingsland V Ltd. | | | | | | | | |
2007-5A, 1.42% due 07/14/213,4 | | | 1,070,000 | | | | 985,613 | |
Adirondack Park CLO Ltd. | | | | | | | | |
2013-1A, 3.62% due 04/15/243,4 | | | 1,000,000 | | | | 983,139 | |
Fortress Credit Opportunities III CLO, LP | | | | | | | | |
2014-3A, 3.12% due 04/28/263,4 | | | 1,000,000 | | | | 974,730 | |
Resource Capital Corporation | | | | | | | | |
2015-CRE3, 3.59% due 03/15/323,4 | | | 1,000,000 | | | | 971,350 | |
Fortress Credit Opportunities VI CLO Ltd. | | | | | | | | |
2015-6A, 3.34% due 10/10/263,4 | | | 1,000,000 | | | | 965,721 | |
CFIP CLO Ltd. | | | | | | | | |
2014-1A, 2.09% due 04/13/253,4 | | | 1,000,000 | | | | 964,814 | |
Oaktree EIF II Series Ltd. | | | | | | | | |
2014-A2, 2.92% due 11/15/253,4,11 | | | 1,000,000 | | | | 964,364 | |
Ivy Hill Middle Market Credit Fund VII Ltd. | | | | | | | | |
2013-7A, 2.92% due 10/20/253,4 | | | 1,000,000 | | | | 960,978 | |
Northwoods Capital XIV Ltd. | | | | | | | | |
2014-14A, 3.08% due 11/12/253,4,11 | | | 1,000,000 | | | | 957,400 | |
San Gabriel CLO Ltd. | | | | | | | | |
2007-1A, 2.89% due 09/10/213,4 | | | 1,000,000 | | | | 955,016 | |
Golub Capital Partners Clo 23M Ltd. | | | | | | | | |
2015-23A, 2.77% due 05/05/273,4 | | | 1,000,000 | | | | 954,522 | |
Black Diamond CLO Delaware Corp. | | | | | | | | |
2005-2A, 2.42% due 01/07/183,4 | | | 1,000,000 | | | | 951,173 | |
Golub Capital Partners Clo 24M Ltd. | | | | | | | | |
2015-24A C, 4.37% due 02/05/273,4 | | | 1,000,000 | | | | 949,967 | |
Battalion CLO Ltd. | | | | | | | | |
2007-1A, 2.77% due 07/14/223,4 | | | 1,000,000 | | | | 946,246 | |
Anchorage Capital CLO 4 Ltd. | | | | | | | | |
2014-4A, 2.78% due 07/28/263,4 | | | 1,000,000 | | | | 946,147 | |
Rockwall CDO Ltd. | | | | | | | | |
2007-1A, 1.17% due 08/01/243,4 | | | 1,000,000 | | | | 936,310 | |
Shackleton II CLO Ltd. | | | | | | | | |
2012-2A D, 4.67% due 10/20/233,4 | | | 1,000,000 | | | | 926,301 | |
Westbrook CLO Ltd. | | | | | | | | |
2006-1A, 2.32% due 12/20/203,4 | | | 1,000,000 | | | | 922,266 | |
Duane Street CLO IV Ltd. | | | | | | | | |
2007-4A D, 2.87% due 11/14/213,4 | | | 1,000,000 | | | | 906,480 | |
Treman Park CLO Ltd. | | | | | | | | |
2015-1A COM, due 04/20/274,5 | | | 1,000,000 | | | | 906,472 | |
Madison Park Funding V Ltd. | | | | | | | | |
2007-5A, 2.08% due 02/26/213,4 | | | 1,000,000 | | | | 904,129 | |
Cerberus Onshore II CLO LLC | | | | | | | | |
2014-1A, 2.62% due 10/15/233,4 | | | 593,802 | | | | 591,972 | |
2014-1A, 3.32% due 10/15/233,4 | | | 250,000 | | | | 249,023 | |
SEE NOTES TO FINANCIAL STATEMENTS. | THE GUGGENHEIM FUNDS SEMI-ANNUAL REPORT | 49 |
SCHEDULE OF INVESTMENTS (Unaudited)(continued) | March 31, 2016 |
LIMITED DURATION FUND | |
| | | Face
Amount | | | Value | |
| | | | | | | |
OHA Credit Partners IX Ltd. | | | | | | |
2013-9A ACOM, due 10/20/254,5 | | $ | 1,000,000 | | | $ | 817,860 | |
Race Point V CLO Ltd. | | | | | | | | |
2014-5A, 4.38% due 12/15/223,4 | | | 750,000 | | | | 717,742 | |
KVK CLO Ltd. | | | | | | | | |
2014-2A, 3.62% due 07/15/263,4 | | | 500,000 | | | | 457,280 | |
2013-1A, due 04/14/254,5 | | | 750,000 | | | | 251,509 | |
Gramercy Park CLO Ltd. | | | | | | | | |
2014-1A, 3.57% due 07/17/233,4 | | | 700,000 | | | | 690,641 | |
Madison Park Funding III Ltd. | | | | | | | | |
2006-3A, 2.04% due 10/25/203,4 | | | 750,000 | | | | 685,406 | |
OZLM Funding Ltd. | | | | | | | | |
2012-2A, 3.87% due 10/30/233,4 | | | 500,000 | | | | 500,041 | |
ALM VII R-2 Ltd. | | | | | | | | |
2013-7R2A, 3.22% due 04/24/243,4 | | | 500,000 | | | | 497,923 | |
BlueMountain CLO Ltd. | | | | | | | | |
2012-2A, 3.37% due 11/20/243,4 | | | 500,000 | | | | 493,523 | |
LCM X, LP | | | | | | | | |
2014-10A, 3.47% due 04/15/223,4 | | | 500,000 | | | | 492,964 | |
Cerberus Onshore II CLO-2 LLC | | | | | | | | |
2014-1A, 2.98% due 10/15/233,4 | | | 500,000 | | | | 492,059 | |
Gallatin CLO VII Ltd. | | | | | | | | |
2014-1A, 3.52% due 07/15/233,4 | | | 500,000 | | | | 491,888 | |
Gale Force 4 CLO Ltd. | | | | | | | | |
2007-4A, 4.12% due 08/20/213,4 | | | 500,000 | | | | 487,906 | |
NZCG Funding Ltd. | | | | | | | | |
2015-2A, 2.97% due 04/27/273,4 | | | 500,000 | | | | 485,080 | |
Halcyon Loan Advisors Funding Ltd. | | | | | | | | |
2012-1A B, 3.62% due 08/15/233,4 | | | 500,000 | | | | 483,597 | |
Figueroa CLO Ltd. | | | | | | | | |
2013-1A, 3.37% due 03/21/243,4 | | | 500,000 | | | | 480,011 | |
Telos CLO Ltd. | | | | | | | | |
2013-4A, 3.37% due 07/17/243,4 | | | 500,000 | | | | 468,419 | |
WhiteHorse IV Ltd. | | | | | | | | |
2007-4A, 2.07% due 01/17/203,4 | | | 500,000 | | | | 466,117 | |
Shasta CLO Ltd. | | | | | | | | |
2007-1A, 2.02% due 04/20/213,4 | | | 500,000 | | | | 457,381 | |
NewStar Arlington Senior Loan Program LLC | | | | | | | | |
2014-1A C1, 3.92% due 07/25/253,4 | | | 250,000 | | | | 236,168 | |
2014-1A, 4.87% due 07/25/253,4 | | | 250,000 | | | | 213,122 | |
COA Summit CLO Limited | | | | | | | | |
2014-1A C, 4.47% due 04/20/233,4 | | | 500,000 | | | | 445,075 | |
ALM XIV Ltd. | | | | | | | | |
2014-14A C, 4.07% due 07/28/263,4 | | | 500,000 | | | | 437,657 | |
Babson CLO Limited | | | | | | | | |
2012-2A, 0.00% due 05/15/234,5 | | | 750,000 | | | | 278,677 | |
Golub Capital Partners CLO 18 Ltd. | | | | | | | | |
2014-18A, 4.62% due 04/25/263,4 | | | 250,000 | | | | 225,233 | |
Kingsland IV Ltd. | | | | | | | | |
2007-4A D, 2.07% due 04/16/213,4 | | | 250,000 | | | | 218,987 | |
Keuka Park CLO Ltd. | | | | | | | | |
2013-1A, 0.00% due 10/21/244,5 | | | 500,000 | | | | 207,854 | |
Neuberger Berman CLO Ltd. | | | | | | | | |
2012-12A, due 07/25/234,5 | | | 350,000 | | | | 139,007 | |
Copper River CLO Ltd. | | | | | | | | |
2007-1A, due 01/20/213,4,5 | | | 500,000 | | | | 93,948 | |
Connecticut Valley Structured Credit CDO III Ltd. | | | | | | | | |
2006-3A, 6.67% due 03/23/234 | | | 34,977 | | | | 34,900 | |
Total Collateralized Loan Obligations | | | | | | | 193,090,595 | |
| | | | | | | | | |
Transport-Aircraft - 3.7% | |
Castlelake Aircraft Securitization Trust | | | | | | | | |
2015-1A, 4.70% due 12/15/404 | | | 5,850,000 | | | | 5,734,169 | |
2014-1 A1, 5.25% due 02/15/294 | | | 338,072 | | | | 335,198 | |
2014-1 B, 7.50% due 02/15/294 | | | 336,903 | | | | 332,355 | |
Apollo Aviation Securitization Equity Trust 16-1 | | | | | | | | |
2016-1A, 4.88% due 03/17/364 | | | 4,500,000 | | | | 4,435,852 | |
ECAF I Ltd. | | | | | | | | |
2015-1A, 3.47% due 06/15/404 | | | 1,789,573 | | | | 1,714,912 | |
2015-1A, 5.80% due 06/15/404 | | | 949,287 | | | | 925,555 | |
AIM Aviation Finance Ltd. | | | | | | | | |
2015-1A, 4.21% due 02/15/404 | | | 1,845,238 | | | | 1,787,924 | |
Diamond Head Aviation Ltd. | | | | | | | | |
2015-1, 3.81% due 07/14/284 | | | 1,768,224 | | | | 1,747,228 | |
Apollo Aviation Securitization Equity Trust | | | | | | | | |
2014-1, 5.12% due 12/15/293 | | | 1,129,808 | | | | 1,087,440 | |
2014-1, 7.38% due 12/15/293 | | | 451,923 | | | | 447,856 | |
Atlas Ltd. | | | | | | | | |
2014-1, 4.87% due 12/15/39††† | | | 927,100 | | | | 913,203 | |
Rise Ltd. | | | | | | | | |
2014-1, 4.74% due 02/12/39 | | | 435,433 | | | | 427,813 | |
AABS Ltd. | | | | | | | | |
2013-1, 4.87% due 01/15/38 | | | 381,689 | | | | 376,536 | |
Total Transport-Aircraft | | | | | | | 20,266,041 | |
| | | | | | | | | |
Collateralized Debt Obligations - 2.9% | |
Triaxx Prime CDO Ltd. | | | | | | | | |
2006-2A, 0.70% due 10/02/393,4 | | | 3,944,798 | | | | 3,727,066 | |
2006-2A A1A, 0.70% due 10/02/393,4 | | | 875,723 | | | | 823,415 | |
FDF I Ltd. | | | | | | | | |
2015-1A, 4.40% due 11/12/30†††,4 | | | 3,000,000 | | | | 3,046,890 | |
Gramercy Real Estate CDO 2006-1 Ltd. | | | | | | | | |
2006-1A, 0.99% due 07/25/413,4 | | | 2,335,538 | | | | 2,271,310 | |
SRERS Funding Ltd. | | | | | | | | |
2011-RS A1B1, 0.69% due 05/09/463,4 | | | 1,804,409 | | | | 1,726,274 | |
Highland Park CDO I Ltd. | | | | | | | | |
2006-1A A1, 0.96% due 11/25/513,4 | | | 1,782,631 | | | | 1,684,931 | |
H2 Asset Funding Ltd. | | | | | | | | |
2014-1A, 2.33% due 03/19/37 | | | 1,000,000 | | | | 960,951 | |
Wrightwood Capital Real Estate CDO Ltd. | | | | | | | | |
2005-1A, 1.05% due 11/21/403,4 | | | 700,000 | | | | 664,303 | |
Helios Series I Multi Asset CBO Ltd. | | | | | | | | |
2001-1A, 1.59% due 12/13/363,4 | | | 442,944 | | | | 434,402 | |
50 | THE GUGGENHEIM FUNDS SEMI-ANNUAL REPORT | SEE NOTES TO FINANCIAL STATEMENTS. |
SCHEDULE OF INVESTMENTS (Unaudited)(continued) | March 31, 2016 |
LIMITED DURATION FUND | |
| | | Face
Amount | | | Value | |
| | | | | | | |
Gramercy Real Estate CDO Ltd. | | | | | | |
2007-1A A1, 0.90% due 08/15/563,4 | | $ | 426,091 | | | $ | 374,960 | |
Total Collateralized Debt Obligations | | | | | | | 15,714,502 | |
| | | | | | | | | |
Net Lease - 0.7% | |
STORE Master Funding LLC | | | | | | | | |
2012-1A, 5.77% due 08/20/424 | | | 3,792,429 | | | | 3,920,318 | |
| | | | | | | | | |
Communications - 0.1% | |
Miramax LLC | | | | | | | | |
2014-1A, 3.34% due 07/20/264 | | | 742,800 | | | | 746,385 | |
| | | | | | | | | |
Insurance - 0.1% | |
Chesterfield Financial Holdings LLC | | | | | | | | |
2014-1A, 4.50% due 12/15/344 | | | 705,750 | | | | 709,236 | |
| | | | | | | | | |
Financial - 0.1% | |
CCR Incorporated MT100 Payment Rights Master Trust | | | | | | | | |
2010-CX, 0.88% due 07/10/173 | | | 499,581 | | | | 493,070 | |
Total Asset-Backed Securities | | | | | | | | |
(Cost $240,087,599) | | | | | | | 234,940,147 | |
| | | | | | | | | |
COLLATERALIZED MORTGAGE OBLIGATIONS†† - 33.0% | |
Residential Mortgage-Backed Securities - 27.4% | |
LSTAR Securities Investment Trust | | | | | | | | |
2015-10 A1, 2.44% due 11/01/203,4 | | | 7,531,106 | | | | 7,342,828 | |
2015-1 A, 2.43% due 01/01/203,4 | | | 6,764,781 | | | | 6,629,243 | |
2015-4 A1, 2.44% due 04/01/203,4 | | | 6,355,905 | | | | 6,165,229 | |
2015-6, 2.44% due 05/01/203,4 | | | 6,210,397 | | | | 6,070,663 | |
2016-2, 2.43% due 03/01/214 | | | 6,200,000 | | | | 6,009,846 | |
2014-1 NOTE, 3.53% due 09/01/213,4 | | | 5,901,406 | | | | 5,842,392 | |
2015-2, 2.43% due 01/01/203,4 | | | 4,894,001 | | | | 4,860,350 | |
2015-3, 2.43% due 03/01/203,4 | | | 4,331,853 | | | | 4,236,205 | |
2015-5 A1, 2.44% due 04/01/203,4 | | | 3,429,253 | | | | 3,352,304 | |
Nationstar HECM Loan Trust | | | | | | | | |
2016-1A, 2.98% due 02/25/264 | | | 11,374,476 | | | | 11,381,869 | |
2015-2A, 2.88% due 11/25/254 | | | 3,788,076 | | | | 3,781,564 | |
2015-1A, 3.84% due 05/25/184 | | | 2,127,993 | | | | 2,126,929 | |
CSMC Series | | | | | | | | |
2015-12R, 0.93% due 11/30/373,4 | | | 6,800,000 | | | | 5,921,122 | |
2014-6R, 0.62% due 09/27/363,4 | | | 4,399,729 | | | | 4,105,646 | |
2014-2R, 0.64% due 02/27/463,4 | | | 450,227 | | | | 411,939 | |
GCAT LLC | | | | | | | | |
2015-1, 3.63% due 05/26/204 | | | 4,853,774 | | | | 4,814,405 | |
2014-2, 3.72% due 10/25/194,6 | | | 1,720,503 | | | | 1,707,476 | |
VOLT XLI LLC | | | | | | | | |
2016-NPL1, 4.25% due 02/26/464,6 | | | 5,932,718 | | | | 5,925,711 | |
VOLT XXXIX LLC | | | | | | | | |
2015-NP13, 4.13% due 10/25/454 | | | 5,784,528 | | | | 5,754,953 | |
Banc of America Funding Ltd. | | | | | | | | |
2013-R1 A5, 0.65% due 11/03/413,4 | | | 6,075,226 | | | | 5,621,735 | |
Banc of America Funding Trust | | | | | | | | |
2015-R4 8A1, 0.61% due 01/27/35†††,3,4 | | | 6,196,867 | | | | 5,553,756 | |
VOLT XL LLC | | | | | | | | |
2015-NP14, 4.38% due 11/27/454,6 | | | 4,784,848 | | | | 4,776,006 | |
VOLT XXXVI LLC | | | | | | | | |
2015-NP10, 3.63% due 07/25/454 | | | 3,701,827 | | | | 3,675,510 | |
NRPL Trust | | | | | | | | |
2014-2A, 3.75% due 10/25/573,4 | | | 1,782,332 | | | | 1,765,676 | |
2015-1A, 3.88% due 11/01/544 | | | 1,706,945 | | | | 1,702,874 | |
GSMSC Resecuritization Trust | | | | | | | | |
2015-7R, 0.59% due 09/26/37†††,3,4 | | | 3,581,530 | | | | 3,199,811 | |
VOLT XXXIII LLC | | | | | | | | |
2015-NPL5, 3.50% due 03/25/554 | | | 3,033,824 | | | | 2,979,718 | |
Oak Hill Advisors Residential Loan Trust | | | | | | | | |
2015-NPL2, 3.72% due 07/25/554 | | | 2,113,605 | | | | 2,099,966 | |
2015-NPL1, 3.47% due 01/25/554 | | | 618,672 | | | | 615,001 | |
VOLT XXVII LLC | | | | | | | | |
2014-NPL7, 3.38% due 08/27/574 | | | 2,104,607 | | | | 2,072,356 | |
Nomura Resecuritization Trust | | | | | | | | |
2015-4R 5A1, 0.86% due 03/26/363,4 | | | 1,882,500 | | | | 1,672,851 | |
2012-1R A, 0.87% due 08/27/473,4 | | | 284,963 | | | | 271,050 | |
CIT Mortgage Loan Trust | | | | | | | | |
2007-1, 1.88% due 10/25/373,4 | | | 2,005,524 | | | | 1,877,962 | |
Vericrest Opportunity Loan Trust | | | | | | | | |
2015-NPL3, 3.38% due 10/25/584 | | | 1,863,379 | | | | 1,837,540 | |
AJAX Mortgage Loan Trust | | | | | | | | |
2015-A A, 3.88% due 11/25/544 | | | 1,846,233 | | | | 1,825,520 | |
VOLT XXXIV LLC | | | | | | | | |
2015-NPL7, 3.25% due 02/25/554 | | | 1,743,206 | | | | 1,709,772 | |
BCAP LLC Trust | | | | | | | | |
2014-RR3, 0.58% due 10/26/363,4 | | | 1,756,634 | | | | 1,671,399 | |
Structured Asset Investment Loan Trust | | | | | | | | |
2005-2, 1.17% due 03/25/353 | | | 1,000,000 | | | | 931,216 | |
2005-1, 1.15% due 02/25/353,4 | | | 550,000 | | | | 514,730 | |
VOLT XLII LLC | | | | | | | | |
2016-NPL2, 4.25% due 03/26/464 | | | 1,400,000 | | | | 1,404,522 | |
Encore Credit Receivables Trust | | | | | | | | |
2005-4, 0.87% due 01/25/363 | | | 1,077,390 | | | | 990,767 | |
Ocwen Master Advance Receivables Trust | | | | | | | | |
2015-T3, 3.21% due 11/15/474 | | | 1,000,000 | | | | 973,091 | |
First Frankin Mortgage Loan Trust | | | | | | | | |
2006-FF4, 0.63% due 03/25/363 | | | 704,956 | | | | 654,895 | |
UCFC Manufactured Housing Contract | | | | | | | | |
1997-2, 7.38% due 10/15/28 | | | 638,925 | | | | 651,119 | |
GreenPoint Mortgage Funding Trust | | | | | | | | |
2005-HE4 M1, 0.90% due 07/25/303 | | | 570,217 | | | | 550,633 | |
Structured Asset Securities Corporation Mortgage Loan Trust | | | | | | | | |
2007-BC1 A4, 0.56% due 02/25/373 | | | 600,000 | | | | 521,335 | |
GSAMP Trust | | | | | | | | |
2005-HE6, 0.87% due 11/25/353 | | | 450,000 | | | | 423,714 | |
Accredited Mortgage Loan Trust | | | | | | | | |
2007-1, 0.56% due 02/25/373 | | | 323,591 | | | | 306,961 | |
Soundview Home Loan Trust | | | | | | | | |
2003-1, 3.81% due 08/25/313 | | | 186,122 | | | | 182,172 | |
SEE NOTES TO FINANCIAL STATEMENTS. | THE GUGGENHEIM FUNDS SEMI-ANNUAL REPORT | 51 |
SCHEDULE OF INVESTMENTS (Unaudited)(continued) | March 31, 2016 |
LIMITED DURATION FUND | |
| | | Face
Amount | | | Value | |
| | | | | | | |
Morgan Stanley Re-REMIC Trust | | | | | | |
2010-R5 4B, 0.93% due 06/26/363,4 | | $ | 216,344 | | | $ | 156,751 | |
GreenPoint Mortgage Funding Trust Series | | | | | | | | |
2007-AR1, 0.51% due 02/25/473 | | | 83,232 | | | | 81,525 | |
Total Residential Mortgage-Backed Securities | | | | | | | 149,712,608 | |
| | | | | | | | | |
Commercial Mortgage-Backed Securities - 5.0% | |
GS Mortgage Securities Corporation Trust | | | | | | | | |
2016-ICE2, 3.69% due 02/15/333,4 | | | 6,400,000 | | | | 6,402,000 | |
Hilton USA Trust | | | | | | | | |
2013-HLT, 4.60% due 11/05/303,4 | | | 1,800,000 | | | | 1,810,591 | |
2013-HLF, 4.19% due 11/05/303,4 | | | 1,541,414 | | | | 1,533,763 | |
2013-HLF, 3.19% due 11/05/303,4 | | | 1,360,072 | | | | 1,353,112 | |
2013-HLT, 4.41% due 11/05/304 | | | 1,300,000 | | | | 1,301,650 | |
Wells Fargo Commercial Mortgage Trust | | | | | | | | |
2016-C32, 1.37% due 01/15/593 | | | 20,335,436 | | | | 1,884,501 | |
2016-NXS5, 1.58% due 01/15/593 | | | 6,994,527 | | | | 699,790 | |
GAHR Commercial Mortgage Trust | | | | | | | | |
2015-NRF, 1.74% due 12/15/163,4 | | | 1,981,671 | | | | 1,964,624 | |
JP Morgan Chase Commercial Mortgage Securities Trust | | | | | | | | |
2014-FL5, 2.44% due 07/15/313,4 | | | 1,000,000 | | | | 977,530 | |
2015-CSMO, 3.74% due 01/15/323,4 | | | 1,000,000 | | | | 973,642 | |
BXHTL Mortgage Trust | | | | | | | | |
2015-JWRZ, 3.29% due 05/15/293,4 | | | 1,775,000 | | | | 1,679,244 | |
COMM Mortgage Trust | | | | | | | | |
2014-KYO, 2.79% due 06/11/273,4 | | | 1,500,000 | | | | 1,468,062 | |
Americold 2010 LLC Trust | | | | | | | | |
2010-ARTA, 6.03% due 01/14/294 | | | 1,100,000 | | | | 1,210,005 | |
Morgan Stanley Capital I Trust | | | | | | | | |
2015-XLF1, 2.64% due 08/13/193,4 | | | 1,000,000 | | | | 987,209 | |
CDGJ Commercial Mortgage Trust | | | | | | | | |
2014-BXCH, 2.94% due 12/15/273,4 | | | 1,000,000 | | | | 970,779 | |
Motel 6 Trust | | | | | | | | |
2015-MTL6, 5.27% due 02/05/304 | | | 1,000,000 | | | | 967,881 | |
Hyatt Hotel Portfolio Trust | | | | | | | | |
2015-HYT, 3.49% due 11/15/293,4 | | | 1,000,000 | | | | 962,333 | |
Total Commercial Mortgage-Backed Securities | | | | | | | 27,146,716 | |
| | | | | | | | | |
Mortgage Securities - 0.6% | |
JPMBB Commercial Mortgage Securities Trust | | | | | | | | |
2013-C17, 1.05% due 12/15/233 | | | 34,269,271 | | | | 1,754,151 | |
Wells Fargo Commercial Mortgage Trust | | | | | | | | |
2015-LC22, 0.93% due 09/15/583 | | | 24,883,104 | | | | 1,520,492 | |
Total Mortgage Securities | | | | | | | 3,274,643 | |
Total Collateralized Mortgage Obligations | | | | | | | | |
(Cost $181,377,765) | | | | | | | 180,133,967 | |
| | | | | | | | | |
CORPORATE BONDS†† - 11.9% | |
Financial - 5.3% | |
Station Place Securitization Trust | | | | | | | | |
1.43% due 02/25/17 | | | 9,600,000 | | | | 9,603,360 | |
Abbey National Treasury Services plc/United Kingdom | | | | | | | | |
2.11% due 03/14/193 | | | 5,700,000 | | | | 5,728,717 | |
Citigroup, Inc. | | | | | | | | |
5.87% due 12/31/493,7 | | | 1,995,000 | | | | 1,927,669 | |
5.95% due 12/31/493,7 | | | 995,000 | | | | 954,140 | |
Berkshire Hathaway Finance Corp. | | | | | | | | |
1.32% due 03/15/193 | | | 2,600,000 | | | | 2,617,204 | |
Icahn Enterprises Limited Partnership / Icahn Enterprises Finance Corp. | | | | | | | | |
4.88% due 03/15/19 | | | 2,200,000 | | | | 2,112,000 | |
5.88% due 02/01/22 | | | 500,000 | | | | 474,500 | |
SunTrust Banks, Inc. | | | | | | | | |
5.63% due 12/31/493,7 | | | 1,660,000 | | | | 1,643,400 | |
Bank of America Corp. | | | | | | | | |
6.30% due 12/31/493,7 | | | 1,200,000 | | | | 1,236,000 | |
Citizens Financial Group, Inc. | | | | | | | | |
5.50% due 12/31/493,4,7 | | | 1,000,000 | | | | 950,000 | |
Fifth Third Bancorp | | | | | | | | |
4.90% due 12/31/493,7 | | | 1,000,000 | | | | 872,500 | |
Corporation Financiera de Desarrollo S.A. | | | | | | | | |
5.25% due 07/15/293,4 | | | 350,000 | | | | 352,625 | |
Total Financial | | | | | | | 28,472,115 | |
| | | | | | | | | |
Consumer, Non-cyclical - 2.4% | |
HCA, Inc. | | | | | | | | |
4.25% due 10/15/19 | | | 1,625,000 | | | | 1,674,766 | |
3.75% due 03/15/19 | | | 950,000 | | | | 973,180 | |
Vector Group Ltd. | | | | | | | | |
7.75% due 02/15/21 | | | 2,324,000 | | | | 2,440,200 | |
Tenet Healthcare Corp. | | | | | | | | |
4.13% due 06/15/203,4 | | | 2,300,000 | | | | 2,282,749 | |
FTI Consulting, Inc. | | | | | | | | |
6.00% due 11/15/22 | | | 2,050,000 | | | | 2,147,375 | |
Bumble Bee Holdings, Inc. | | | | | | | | |
9.00% due 12/15/174 | | | 2,016,000 | | | | 2,021,040 | |
Central Garden & Pet Co. | | | | | | | | |
6.13% due 11/15/23 | | | 1,650,000 | | | | 1,716,000 | |
Fresenius Medical Care US Finance II, Inc. | | | | | | | | |
5.63% due 07/31/194 | | | 100,000 | | | | 109,094 | |
Total Consumer, Non-cyclical | | | | | | | 13,364,404 | |
| | | | | | | | | |
Industrial - 1.1% | |
Reynolds Group Issuer Incorporated / Reynolds Group Issuer LLC / Reynolds Group Issuer | | | | | | | | |
7.88% due 08/15/19 | | | 3,178,000 | | | | 3,289,230 | |
CNH Industrial Capital LLC | | | | | | | | |
4.88% due 04/01/21 | | | 2,000,000 | | | | 1,992,500 | |
3.88% due 07/16/18 | | | 600,000 | | | | 595,800 | |
52 | THE GUGGENHEIM FUNDS SEMI-ANNUAL REPORT | SEE NOTES TO FINANCIAL STATEMENTS. |
SCHEDULE OF INVESTMENTS (Unaudited)(continued) | March 31, 2016 |
LIMITED DURATION FUND | |
| | | Face
Amount | | | Value | |
| | | | | | | |
Dynagas LNG Partners Limited Partnership / Dynagas Finance, Inc. | | | | | | |
6.25% due 10/30/1910 | | $ | 600,000 | | | $ | 402,000 | |
Total Industrial | | | | | | | 6,279,530 | |
| | | | | | | | | |
Energy - 0.9% | |
Pioneer Natural Resources Co. | | | | | | | | |
7.50% due 01/15/20 | | | 1,700,000 | | | | 1,921,800 | |
Equities Corp. | | | | | | | | |
4.88% due 11/15/21 | | | 1,300,000 | | | | 1,244,086 | |
Husky Energy, Inc. | | | | | | | | |
3.95% due 04/15/22 | | | 1,050,000 | | | | 1,046,116 | |
Magellan Midstream Partners, LP | | | | | | | | |
5.00% due 03/01/26 | | | 600,000 | | | | 648,858 | |
Schahin II Finance Company SPV Ltd. | | | | | | | | |
5.88% due 09/25/228,12 | | | 390,900 | | | | 56,876 | |
Total Energy | | | | | | | 4,917,736 | |
| | | | | | | | | |
Communications - 0.7% | |
Sprint Communications, Inc. | | | | | | | | |
9.00% due 11/15/184 | | | 2,600,000 | | | | 2,723,500 | |
7.00% due 03/01/204 | | | 575,000 | | | | 575,000 | |
McGraw-Hill Global Education Holdings LLC / McGraw-Hill Global Education Finance | | | | | | | | |
9.75% due 04/01/21 | | | 400,000 | | | | 434,000 | |
Total Communications | | | | | | | 3,732,500 | |
| | | | | | | | | |
Consumer, Cyclical - 0.6% | |
eBay, Inc. | | | | | | | | |
2.50% due 03/09/18 | | | 1,300,000 | | | | 1,321,085 | |
L Brands, Inc. | | | | | | | | |
8.50% due 06/15/19 | | | 825,000 | | | | 965,333 | |
Lennar Corp. | | | | | | | | |
4.50% due 06/15/19 | | | 725,000 | | | | 748,563 | |
AmeriGas Finance LLC / AmeriGas Finance Corp. | | | | | | | | |
6.75% due 05/20/20 | | | 250,000 | | | | 256,250 | |
Total Consumer, Cyclical | | | | | | | 3,291,231 | |
| | | | | | | | | |
Diversified - 0.5% | |
HRG Group, Inc. | | | | | | | | |
7.88% due 07/15/19 | | | 2,375,000 | | | | 2,504,675 | |
| | | | | | | | | |
Utilities - 0.3% | |
AES Corp. | | | | | | | | |
3.64% due 06/01/193 | | | 1,700,000 | | | | 1,640,500 | |
| | | | | | | | | |
Basic Materials - 0.1% | |
Yamana Gold, Inc. | | | | | | | | |
4.95% due 07/15/24 | | | 750,000 | | | | 633,750 | |
| | | | | | | | | |
Technology - 0.0% | |
Infor US, Inc. | | | | | | | | |
5.75% due 08/15/204 | | | 100,000 | | | | 103,000 | |
Total Corporate Bonds | | | | | | | | |
(Cost $65,530,381) | | | | | | | 64,939,441 | |
| | | | | | | | | |
SENIOR FLOATING RATE INTERESTS†† - 5.6% | |
Technology - 1.3% | |
Avago Technologies Ltd. | | | | | | | | |
4.25% due 02/01/23 | | | 4,500,000 | | | | 4,474,936 | |
First Data Corp. | | | | | | | | |
7.25% due 03/24/21 | | | 1,200,000 | | | | 1,196,064 | |
3.93% due 03/23/18 | | | 1,045,827 | | | | 1,042,951 | |
Avaya, Inc. | | | | | | | | |
6.25% due 05/29/20 | | | 492,618 | | | | 327,768 | |
Deltek, Inc. | | | | | | | | |
5.00% due 06/25/22 | | | 290,163 | | | | 288,350 | |
Sabre, Inc. | | | | | | | | |
4.00% due 02/19/19 | | | 195,455 | | | | 195,333 | |
Total Technology | | | | | | | 7,525,402 | |
| | | | | | | | | |
Consumer, Cyclical - 1.2% | |
Advantage Sales & Marketing LLC | | | | | | | | |
4.25% due 07/23/21 | | | 1,550,000 | | | | 1,520,457 | |
Smart & Final Stores LLC | | | | | | | | |
4.00% due 11/15/19 | | | 1,020,796 | | | | 1,011,098 | |
La Quinta Intermediate Holdings | | | | | | | | |
3.75% due 04/14/21 | | | 997,487 | | | | 978,366 | |
BJ’s Wholesale Club, Inc. | | | | | | | | |
4.50% due 09/26/19 | | | 842,125 | | | | 818,613 | |
Petsmart, Inc. | | | | | | | | |
4.25% due 03/11/22 | | | 800,000 | | | | 796,200 | |
Acosta, Inc. | | | | | | | | |
4.25% due 09/26/21 | | | 800,000 | | | | 779,568 | |
NPC International, Inc. | | | | | | | | |
4.75% due 12/28/18 | | | 248,708 | | | | 247,464 | |
Fitness International LLC | | | | | | | | |
5.50% due 07/01/20 | | | 245,625 | | | | 236,414 | |
Total Consumer, Cyclical | | | | | | | 6,388,180 | |
| | | | | | | | | |
Communications - 0.9% | |
Univision Communications, Inc. | | | | | | | | |
4.00% due 03/01/20 | | | 1,985,416 | | | | 1,963,497 | |
4.00% due 02/28/20 | | | 1,717,799 | | | | 1,699,006 | |
T-Mobile US, Inc. | | | | | | | | |
3.50% due 11/09/22 | | | 997,500 | | | | 1,000,931 | |
Asurion Corp. | | | | | | | | |
4.25% due 07/08/20 | | | 313,086 | | | | 301,346 | |
5.00% due 08/04/22 | | | 57,695 | | | | 56,433 | |
Total Communications | | | | | | | 5,021,213 | |
| | | | | | | | | |
Industrial - 0.7% | |
Travelport Holdings LLC | | | | | | | | |
5.75% due 09/02/21 | | | 2,629,549 | | | | 2,624,948 | |
Quikrete Holdings, Inc. | | | | | | | | |
4.00% due 09/28/20 | | | 500,000 | | | | 498,750 | |
Filtration Group Corp. | | | | | | | | |
4.25% due 11/23/20 | | | 497,729 | | | | 495,031 | |
SEE NOTES TO FINANCIAL STATEMENTS. | THE GUGGENHEIM FUNDS SEMI-ANNUAL REPORT | 53 |
SCHEDULE OF INVESTMENTS (Unaudited)(continued) | March 31, 2016 |
LIMITED DURATION FUND | |
| | | Face
Amount | | | Value | |
| | | | | | | |
Dematic S.A. | | | | | | |
4.25% due 12/27/19 | | $ | 244,375 | | | $ | 241,829 | |
Total Industrial | | | | | | | 3,860,558 | |
| | | | | | | | | |
Financial - 0.6% | |
Fly Leasing Ltd. | | | | | | | | |
3.50% due 08/09/19 | | | 2,666,348 | | | | 2,643,017 | |
USI Holdings Corp. | | | | | | | | |
4.25% due 12/27/19 | | | 369,332 | | | | 363,176 | |
Magic Newco, LLC | | | | | | | | |
5.00% due 12/12/18 | | | 200,000 | | | | 199,800 | |
Total Financial | | | | | | | 3,205,993 | |
| | | | | | | | | |
Consumer, Non-cyclical - 0.6% | |
Albertson’s (Safeway) Holdings LLC | | | | | | | | |
5.50% due 12/21/22 | | | 1,246,875 | | | | 1,247,548 | |
5.50% due 08/25/21 | | | 694,750 | | | | 695,097 | |
American Tire Distributors, Inc. | | | | | | | | |
5.25% due 09/01/21 | | | 693,501 | | | | 690,034 | |
Grocery Outlet, Inc. | | | | | | | | |
4.75% due 10/21/21 | | | 400,000 | | | | 390,500 | |
Total Consumer, Non-cyclical | | | | | | | 3,023,179 | |
| | | | | | | | | |
Utilities - 0.2% | |
Texas Competitive Electric Holdings Company LLC | | | | | | | | |
3.75% due 11/07/16 | | | 1,000,000 | | | | 995,000 | |
| | | | | | | | | |
Basic Materials - 0.1% | |
Chromaflo Technologies | | | | | | | | |
4.50% due 12/02/19 | | | 394,792 | | | | 376,039 | |
Total Senior Floating Rate Interests | | | | | | | | |
(Cost $30,515,292) | | | | | | | 30,395,564 | |
| | | | | | | | | |
FOREIGN GOVERNMENT BONDS†† - 0.1% | |
Kenya Government International Bond | | | | | | | | |
6.87% due 06/24/244 | | | 850,000 | | | | 801,125 | |
Total Foreign Government Bonds | | | | | | | | |
(Cost $859,181) | | | | | | | 801,125 | |
| | | | | | | | | |
COMMERCIAL PAPER†† - 1.8% | |
Bacardi USA, Inc. | | | | | | | | |
0.68% due 04/06/16 | | | 5,000,000 | | | | 4,999,527 | |
VF Corp. | | | | | | | | |
0.65% due 04/13/16 | | | 5,000,000 | | | | 4,998,917 | |
Total Commercial Paper | | | | | | | | |
(Cost $9,998,444) | | | | | | | 9,998,444 | |
| | | | | | | | | |
REPURCHASE AGREEMENTS††,9 - 4.0% | |
Jefferies & Company, Inc.
issued 03/22/16 at 3.44%
due 04/01/16 | | | 5,079,000 | | | | 5,079,000 | |
Jefferies & Company, Inc.
issued 03/09/16 at 2.94%
due 04/11/16 | | | 3,366,000 | | | | 3,366,000 | |
Jefferies & Company, Inc.
issued 03/15/16 at 3.44%
due 04/15/16 | | | 3,284,000 | | | | 3,284,000 | |
Jefferies & Company, Inc.
issued 03/18/16 at 3.44%
due 04/18/16 | | | 2,874,000 | | | | 2,874,000 | |
Jefferies & Company, Inc.
issued 03/11/16 at 3.44%
due 04/14/16 | | | 1,592,000 | | | | 1,592,000 | |
Jefferies & Company, Inc.
issued 03/28/16 at 2.94%
due 04/28/16 | | | 1,432,000 | | | | 1,432,000 | |
Jefferies & Company, Inc.
issued 03/11/16 at 2.94%
due 04/08/16 | | | 1,414,000 | | | | 1,414,000 | |
Jefferies & Company, Inc.
issued 03/02/16 at 3.44%
due 04/04/16 | | | 857,000 | | | | 857,000 | |
Jefferies & Company, Inc.
issued 03/23/16 at 3.43%
due 04/22/16 | | | 842,000 | | | | 842,000 | |
Jefferies & Company, Inc.
issued 03/08/16 at 3.44%
due 04/08/16 | | | 675,000 | | | | 675,000 | |
Jefferies & Company, Inc.
issued 03/28/16 at 3.44%
due 04/28/16 | | | 333,000 | | | | 333,000 | |
Total Repurchase Agreements | | | | | | | | |
(Cost $21,748,000) | | | | | | | 21,748,000 | |
| | | | | | | | | |
Total Investments - 103.8% | | | | | | | | |
(Cost $573,849,343) | | | | | | $ | 566,659,227 | |
Other Assets & Liabilities, net - (3.8)% | | | | | | | (20,572,783 | ) |
Total Net Assets - 100.0% | | | | | | $ | 546,086,444 | |
54 | THE GUGGENHEIM FUNDS SEMI-ANNUAL REPORT | SEE NOTES TO FINANCIAL STATEMENTS. |
SCHEDULE OF INVESTMENTS (Unaudited)(concluded) | March 31, 2016 |
LIMITED DURATION FUND | |
† | Value determined based on Level 1 inputs — See Note 4. |
†† | Value determined based on Level 2 inputs, unless otherwise noted — See Note 4. |
††† | Value determined based on Level 3 inputs — See Note 4. |
1 | Affiliated issuer — See Note 7. |
2 | Rate indicated is the 7 day yield as of March 31, 2016. |
3 | Variable rate security. Rate indicated is rate effective at March 31, 2016. |
4 | Security is a 144A or Section 4(a)(2) security. The total market value of 144A or Section 4(a)(2) securities is $404,230,445 (cost $410,468,582), or 74.0% of total net assets. These securities have been determined to be liquid under guidelines established by the Board of Trustees. |
5 | Residual interest. |
6 | Security is a step up/step down bond. The coupon increases or decreases at regular intervals until the bond reaches full maturity. |
7 | Perpetual maturity. |
8 | Security is in default of interest and/or principal obligations. |
9 | Repurchase Agreement — See Note 10. |
10 | Illiquid security. |
11 | Security or a portion thereof is held as collateral for reverse repurchase agreements — See Note 11. |
12 | Security is a 144A or Section 4(a)(2) security. These securities are considered illiquid and restricted under guidelines established by the Board of Trustees. The total market value of 144A or Section 4(a)(2) securities is $4,048,450 (cost $4,355,020), or 0.7% of total net assets — See Note 14. |
| | plc — Public Limited Company |
| | |
| | See Sector Classification in Other Information section. |
The following table summarizes the inputs used to value the Fund’s investments at March 31, 2016 (See Note 4 in the Notes to Financial Statements):
Investments in Securities (Assets) | | Level 1 | | | Level 2 | | | Level 3 | | | Total | |
Asset-Backed Securities | | $ | — | | | $ | 230,980,054 | | | $ | 3,960,093 | | | $ | 234,940,147 | |
Collateralized Mortgage Obligations | | | — | | | | 171,380,400 | | | | 8,753,567 | | | | 180,133,967 | |
Commercial Paper | | | — | | | | 9,998,444 | | | | — | | | | 9,998,444 | |
Corporate Bonds | | | — | | | | 64,939,441 | | | | — | | | | 64,939,441 | |
Foreign Government Bonds | | | — | | | | 801,125 | | | | — | | | | 801,125 | |
Mutual Funds | | | 13,270,617 | | | | — | | | | — | | | | 13,270,617 | |
Preferred Stocks | | | — | | | | 495,200 | | | | — | | | | 495,200 | |
Repurchase Agreements | | | — | | | | 21,748,000 | | | | — | | | | 21,748,000 | |
Senior Floating Rate Interests | | | — | | | | 30,395,564 | | | | — | | | | 30,395,564 | |
Short Term Investments | | | 9,936,722 | | | | — | | | | — | | | | 9,936,722 | |
Total | | $ | 23,207,339 | | | $ | 530,738,228 | | | $ | 12,713,660 | | | $ | 566,659,227 | |
For the period ended March 31, 2016, there were no transfers between levels.
SEE NOTES TO FINANCIAL STATEMENTS. | THE GUGGENHEIM FUNDS SEMI-ANNUAL REPORT | 55 |
STATEMENT OF ASSETS AND LIABILITIES (Unaudited) |
March 31, 2016 |
Assets: | |
Investments in unaffiliated issuers, at value (cost $538,809,208) | | $ | 531,640,610 | |
Investments in affiliated issuers, at value (cost $13,292,135) | | | 13,270,617 | |
Repurchase agreements, at value (cost $21,748,000) | | | 21,748,000 | |
Total investments (cost $573,849,343) | | | 566,659,227 | |
Prepaid expenses | | | 66,646 | |
Receivables: | |
Interest | | | 2,051,142 | |
Fund shares sold | | | 1,278,330 | |
Securities sold | | | 402,788 | |
Dividends | | | 16,905 | |
Transfer agent/maintenance fees | | | 8,312 | |
Trustees’ fees* | | | 384 | |
Total assets | | | 570,483,734 | |
| | | | | |
Liabilities: | |
Reverse Repurchase Agreements | | | 7,595,000 | |
Overdraft due to custodian bank | | | 11,134 | |
Payable for: | |
Securities purchased | | | 14,523,777 | |
Fund shares redeemed | | | 1,707,674 | |
Management fees | | | 173,868 | |
Distribution and service fees | | | 57,715 | |
Fund accounting/administration fees | | | 42,665 | |
Miscellaneous | | | 285,457 | |
Total liabilities | | | 24,397,290 | |
Net assets | | $ | 546,086,444 | |
| | | | | |
Net assets consist of: | |
Paid in capital | | $ | 555,079,387 | |
Accumulated net investment loss | | | (815,164 | ) |
Accumulated net realized loss on investments | | | (987,663 | ) |
Net unrealized depreciation on investments | | | (7,190,116 | ) |
Net assets | | $ | 546,086,444 | |
| | | | | |
A-Class: | |
Net assets | | $ | 184,386,882 | |
Capital shares outstanding | | | 7,601,818 | |
Net asset value per share | | $ | 24.26 | |
Maximum offering price per share (Net asset value divided by 97.75%) | | $ | 24.82 | |
| | | | | |
C-Class: | |
Net assets | | $ | 22,758,719 | |
Capital shares outstanding | | | 938,859 | |
Net asset value per share | | $ | 24.24 | |
| | | | | |
P-Class: | |
Net assets | | $ | 1,613,311 | |
Capital shares outstanding | | | 66,504 | |
Net asset value per share | | $ | 24.26 | |
| | | | | |
Institutional Class: | |
Net assets | | $ | 337,327,532 | |
Capital shares outstanding | | | 13,910,811 | |
Net asset value per share | | $ | 24.25 | |
* | Relates to Trustees not deemed “interested persons” within the meaning of Section 2(a)(19) of the 1940 Act. |
56 | THE GUGGENHEIM FUNDS SEMI-ANNUAL REPORT | SEE NOTES TO FINANCIAL STATEMENTS. |
STATEMENT OF OPERATIONS (Unaudited) |
Period Ended March 31, 2016 |
Investment Income: | |
Interest | | $ | 7,269,925 | |
Dividends from securities of affiliated issuers | | | 58,353 | |
Dividends from securities of unaffiliated issuers | | | 15,937 | |
Other income | | | 106,748 | |
Total investment income | | | 7,450,963 | |
| | | | | |
Expenses: | |
Management fees | | | 957,277 | |
Transfer agent/maintenance fees: | |
A-Class | | | 32,120 | |
C-Class | | | 5,012 | |
P-Class | | | 253 | |
Institutional Class | | | 20,507 | |
Distribution and service fees: | |
A-Class | | | 199,064 | |
C-Class | | | 88,105 | |
P-Class | | | 3,203 | |
Fund accounting/administration fees | | | 202,089 | |
Interest expense | | | 88,764 | |
Line of credit fees | | | 14,728 | |
Trustees’ fees* | | | 7,072 | |
Custodian fees | | | 6,429 | |
Miscellaneous | | | 117,904 | |
Total expenses | | | 1,742,527 | |
Less: | |
Expenses waived by Adviser | | | (179,159 | ) |
Net expenses | | | 1,563,368 | |
Net investment income | | | 5,887,595 | |
| | | | | |
Net Realized and Unrealized Gain (Loss): | |
Net realized gain (loss) on: | |
Investments in unaffiliated issuers | | $ | (573,828 | ) |
Investments in affiliated issuers | | | (10,789 | ) |
Options purchased | | | (104,173 | ) |
Options written | | | 28,511 | |
Net realized loss | | | (660,279 | ) |
Net change in unrealized appreciation (depreciation) on: | |
Investments in unaffiliated issuers | | | (5,328,567 | ) |
Investments in affiliated issuers | | | (16,982 | ) |
Options purchased | | | (78,144 | ) |
Options written | | | 13,729 | |
Net change in unrealized appreciation (depreciation) | | | (5,409,964 | ) |
Net realized and unrealized loss | | | (6,070,243 | ) |
Net decrease in net assets resulting from operations | | $ | (182,648 | ) |
* | Relates to Trustees not deemed “interested persons” within the meaning of Section 2(a)(19) of the 1940 Act. |
SEE NOTES TO FINANCIAL STATEMENTS. | THE GUGGENHEIM FUNDS SEMI-ANNUAL REPORT | 57 |
STATEMENTS OF CHANGES IN NET ASSETS |
| | | Period Ended
March 31,
2016
(Unaudited) | | | Year Ended
September 30,
2015 | |
Increase (Decrease) in Net Assets from Operations: | | | | | | |
Net investment income | | $ | 5,887,595 | | | $ | 4,956,701 | |
Net realized loss on investments | | | (660,279 | ) | | | (272,435 | ) |
Net change in unrealized appreciation (depreciation) on investments | | | (5,409,964 | ) | | | (1,527,852 | ) |
Net increase (decrease) in net assets resulting from operations | | | (182,648 | ) | | | 3,156,414 | |
| | | | | | | | | |
Distributions to shareholders from: | | | | | | | | |
Net investment income | | | | | | | | |
A-Class | | | (2,226,271 | ) | | | (1,877,597 | ) |
C-Class | | | (179,957 | ) | | | (92,400 | ) |
P-Class | | | (36,461 | ) | | | (14,688 | )* |
Institutional Class | | | (3,756,688 | ) | | | (3,607,196 | ) |
Net realized gains | | | | | | | | |
A-Class | | | — | | | | (10,524 | ) |
C-Class | | | — | | | | (358 | ) |
P-Class | | | — | | | | — | * |
Institutional Class | | | — | | | | (24,979 | ) |
Total distributions to shareholders | | | (6,199,377 | ) | | | (5,627,742 | ) |
| | | | | | | | | |
Capital share transactions: | | | | | | | | |
Proceeds from sale of shares | | | | | | | | |
A-Class | | | 122,511,840 | | | | 123,676,382 | |
C-Class | | | 15,955,466 | | | | 10,713,529 | |
P-Class | | | 1,418,775 | | | | 2,751,295 | * |
Institutional Class | | | 290,232,902 | | | | 144,227,876 | |
Distributions reinvested | | | | | | | | |
A-Class | | | 1,905,016 | | | | 1,735,098 | |
C-Class | | | 131,965 | | | | 77,547 | |
P-Class | | | 36,461 | | | | 14,688 | * |
Institutional Class | | | 2,932,688 | | | | 3,470,791 | |
Cost of shares redeemed | | | | | | | | |
A-Class | | | (55,152,559 | ) | | | (23,872,067 | ) |
C-Class | | | (3,375,974 | ) | | | (1,041,909 | ) |
P-Class | | | (2,533,636 | ) | | | (14,275 | )* |
Institutional Class | | | (128,603,261 | ) | | | (39,087,053 | ) |
Net increase from capital share transactions | | | 245,459,683 | | | | 222,651,902 | |
Net increase in net assets | | | 239,077,658 | | | | 220,180,574 | |
| | | | | | | | | |
Net assets: | | | | | | | | |
Beginning of period | | | 307,008,786 | | | | 86,828,212 | |
End of period | | $ | 546,086,444 | | | $ | 307,008,786 | |
Accumulated net investment loss at end of period | | $ | (815,164 | ) | | $ | (503,382 | ) |
58 | THE GUGGENHEIM FUNDS SEMI-ANNUAL REPORT | SEE NOTES TO FINANCIAL STATEMENTS. |
STATEMENTS OF CHANGES IN NET ASSETS (concluded) |
| | | Period Ended
March 31,
2016
(Unaudited) | | | Year Ended
September 30,
2015 | |
Capital share activity: | | | | | | |
Shares sold | | | | | | |
A-Class | | | 5,010,417 | | | | 4,981,438 | |
C-Class | | | 652,909 | | | | 432,133 | |
P-Class | | | 58,089 | | | | 110,968 | * |
Institutional Class | | | 11,918,047 | | | | 5,820,359 | |
Shares issued from reinvestment of distributions | | | | | | | | |
A-Class | | | 78,146 | | | | 69,980 | |
C-Class | | | 5,421 | | | | 3,131 | |
P-Class | | | 1,493 | | | | 594 | * |
Institutional Class | | | 120,359 | | | | 139,945 | |
Shares redeemed | | | | | | | | |
A-Class | | | (2,258,594 | ) | | | (961,747 | ) |
C-Class | | | (138,511 | ) | | | (42,003 | ) |
P-Class | | | (104,063 | ) | | | (577 | )* |
Institutional Class | | | (5,282,577 | ) | | | (1,575,206 | ) |
Net increase in shares | | | 10,061,136 | | | | 8,979,015 | |
* | Since commencement of operations: May 1, 2015. |
SEE NOTES TO FINANCIAL STATEMENTS. | THE GUGGENHEIM FUNDS SEMI-ANNUAL REPORT | 59 |
This table is presented to show selected data for a share outstanding throughout each period and to assist shareholders in evaluating a Fund’s performance for the periods presented.
A-Class | | Period Ended
March 31,
2016a | | | Year Ended
September 30,
2015 | | | Period Ended
September 30,
2014b | |
Per Share Data | | | | | | | | | |
Net asset value, beginning of period | | $ | 24.65 | | | $ | 24.97 | | | $ | 25.00 | |
Income (loss) from investment operations: | |
Net investment income (loss)c | | | .32 | | | | .69 | | | | .52 | |
Net gain (loss) on investments (realized and unrealized) | | | (.37 | ) | | | (.16 | ) | | | (.08 | ) |
Total from investment operations | | | (.05 | ) | | | .53 | | | | .44 | |
Less distributions from: | |
Net investment income | | | (.34 | ) | | | (.84 | ) | | | (.47 | ) |
Net realized gains | | | — | | | | (.01 | ) | | | — | |
Total distributions | | | (.34 | ) | | | (.85 | ) | | | (.47 | ) |
Net asset value, end of period | | $ | 24.26 | | | $ | 24.65 | | | $ | 24.97 | |
| | |
Total Returnd | | | (0.19 | %) | | | 2.15 | % | | | 1.75 | % |
Ratios/Supplemental Data | |
Net assets, end of period (in thousands) | | $ | 184,387 | | | $ | 117,628 | | | $ | 17,035 | |
Ratios to average net assets: | |
Net investment income (loss) | | | 2.65 | % | | | 2.79 | % | | | 2.67 | % |
Total expensese | | | 0.95 | % | | | 0.99 | % | | | 1.14 | % |
Net expensesf,h | | | 0.85 | % | | | 0.87 | % | | | 0.83 | % |
Portfolio turnover rate | | | 15 | % | | | 26 | % | | | 40 | % |
C-Class | | Period Ended
March 31,
2016a | | | Year Ended
September 30,
2015 | | | Period Ended
September 30,
2014b | |
Per Share Data | | | | | | | | | |
Net asset value, beginning of period | | $ | 24.63 | | | $ | 24.96 | | | $ | 25.00 | |
Income (loss) from investment operations: | |
Net investment income (loss)c | | | .23 | | | | .49 | | | | .38 | |
Net gain (loss) on investments (realized and unrealized) | | | (.37 | ) | | | (.16 | ) | | | (.09 | ) |
Total from investment operations | | | (.14 | ) | | | .33 | | | | .29 | |
Less distributions from: | |
Net investment income | | | (.25 | ) | | | (.65 | ) | | | (.33 | ) |
Net realized gains | | | — | | | | (.01 | ) | | | — | |
Total distributions | | | (.25 | ) | | | (.66 | ) | | | (.33 | ) |
Net asset value, end of period | | $ | 24.24 | | | $ | 24.63 | | | $ | 24.96 | |
| | |
Total Returnd | | | (0.57 | %) | | | 1.37 | % | | | 1.13 | % |
Ratios/Supplemental Data | |
Net assets, end of period (in thousands) | | $ | 22,759 | | | $ | 10,323 | | | $ | 643 | |
Ratios to average net assets: | |
Net investment income (loss) | | | 1.90 | % | | | 1.96 | % | | | 1.93 | % |
Total expensese | | | 1.71 | % | | | 1.76 | % | | | 2.14 | % |
Net expensesf,h | | | 1.60 | % | | | 1.62 | % | | | 1.56 | % |
Portfolio turnover rate | | | 15 | % | | | 26 | % | | | 40 | % |
60 | THE GUGGENHEIM FUNDS SEMI-ANNUAL REPORT | SEE NOTES TO FINANCIAL STATEMENTS. |
FINANCIAL HIGHLIGHTS (continued) |
This table is presented to show selected data for a share outstanding throughout each period and to assist shareholders in evaluating a Fund’s performance for the periods presented.
P-Class | | Period Ended
March 31,
2016a | | | Period Ended
September 30,
2015g | |
Per Share Data | | | | | | |
Net asset value, beginning of period | | $ | 24.65 | | | $ | 24.86 | |
Income (loss) from investment operations: | |
Net investment income (loss)c | | | .33 | | | | .25 | |
Net gain (loss) on investments (realized and unrealized) | | | (.38 | ) | | | (.17 | ) |
Total from investment operations | | | (.05 | ) | | | .08 | |
Less distributions from: | |
Net investment income | | | (.34 | ) | | | (.29 | ) |
Total distributions | | | (.34 | ) | | | (.29 | ) |
Net asset value, end of period | | $ | 24.26 | | | $ | 24.65 | |
| | |
Total Returnd | | | (0.18 | %) | | | 0.32 | % |
Ratios/Supplemental Data | |
Net assets, end of period (in thousands) | | $ | 1,613 | | | $ | 2,736 | |
Ratios to average net assets: | |
Net investment income (loss) | | | 2.72 | % | | | 2.39 | % |
Total expensese | | | 0.95 | % | | | 0.94 | % |
Net expensesf,h | | | 0.86 | % | | | 0.88 | % |
Portfolio turnover rate | | | 15 | % | | | 26 | % |
SEE NOTES TO FINANCIAL STATEMENTS. | THE GUGGENHEIM FUNDS SEMI-ANNUAL REPORT | 61 |
FINANCIAL HIGHLIGHTS (concluded) |
This table is presented to show selected data for a share outstanding throughout each period and to assist shareholders in evaluating a Fund’s performance for the periods presented.
Institutional Class | | Period Ended
March 31,
2016a | | | Year Ended
September 30,
2015 | | | Period Ended
September 30,
2014b | |
Per Share Data | | | | | | | | | |
Net asset value, beginning of period | | $ | 24.64 | | | $ | 24.96 | | | $ | 25.00 | |
Income (loss) from investment operations: | |
Net investment income (loss)c | | | .35 | | | | .78 | | | | .57 | |
Net gain (loss) on investments (realized and unrealized) | | | (.37 | ) | | | (.19 | ) | | | (.08 | ) |
Total from investment operations | | | (.02 | ) | | | .59 | | | | .49 | |
Less distributions from: | |
Net investment income | | | (.37 | ) | | | (.90 | ) | | | (.53 | ) |
Net realized gains | | | — | | | | (.01 | ) | | | — | |
Total distributions | | | (.37 | ) | | | (.91 | ) | | | (.53 | ) |
Net asset value, end of period | | $ | 24.25 | | | $ | 24.64 | | | $ | 24.96 | |
| | |
Total Returnd | | | (0.06 | %) | | | 2.41 | % | | | 1.98 | % |
Ratios/Supplemental Data | |
Net assets, end of period (in thousands) | | $ | 337,328 | | | $ | 176,322 | | | $ | 69,150 | |
Ratios to average net assets: | |
Net investment income (loss) | | | 2.91 | % | | | 3.14 | % | | | 2.90 | % |
Total expensese | | | 0.67 | % | | | 0.73 | % | | | 0.96 | % |
Net expensesf,h | | | 0.60 | % | | | 0.62 | % | | | 0.57 | % |
Portfolio turnover rate | | | 15 | % | | | 26 | % | | | 40 | % |
a | Unaudited figures for the period ended March 31, 2016. Percentage amounts for the period, except total return and portfolio turnover rate, have been annualized. |
b | Since commencement of operations: December 16, 2013. Percentage amounts for the period, except total return and portfolio turnover rate, have been annualized. |
c | Net investment income (loss) per share was computed using average shares outstanding throughout the period. |
d | Total return does not reflect the impact of any applicable sales charges and has not been annualized. |
e | Does not include expenses of the underlying funds in which the Fund invests. |
f | Net expense information reflects the expense ratios after expense waivers. |
g | Since commencement of operations: May 1, 2015. Percentage amounts for the period, except total return and portfolio turnover rate, have been annualized. |
h | Net expenses may include expenses that are excluded from the expense limitation agreement. Excluding these expenses, the operating expense ratios for the years would be: |
| | 03/31/16 | 09/30/15 | 09/30/14 |
A-Class | 0.80% | 0.80% | 0.79% |
C-Class | 1.55% | 1.55% | 1.52% |
P-Class | 0.80% | 0.80% | — |
Institutional Class | 0.55% | 0.55% | 0.54% |
62 | THE GUGGENHEIM FUNDS SEMI-ANNUAL REPORT | SEE NOTES TO FINANCIAL STATEMENTS. |
FUND PROFILE (Unaudited) | March 31, 2016 |
MUNICIPAL INCOME FUND
OBJECTIVE: Seeks to provide current income with an emphasis on income exempt from federal income tax, while also considering capital appreciation.
Holdings Diversification (Market Exposure as % of Net Assets)
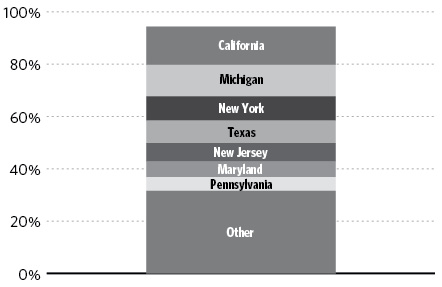
“Holdings Diversification (Market Exposure as % of Net Assets)” excludes any temporary cash investments.
Portfolio Composition by Quality Rating1 |
Rating | |
Fixed Income Instruments | |
AAA | 13.2% |
AA | 64.5% |
A | 12.7% |
BBB | 3.3% |
BB | 1.6% |
Other Instruments | 4.7% |
Total Investments | 100.0% |
| | |
The chart above reflects percentages of the value of total investments. |
Inception Dates: |
A-Class | April 28, 2004 |
C-Class | January 13, 2012 |
P-Class | May 1, 2015 |
Institutional Class | January 13, 2012 |
Ten Largest Holdings (% of Total Net Assets) |
City of Detroit Michigan Water Supply System Revenue Bonds | 3.8% |
Tustin Unified School District General Obligation Unlimited | 3.0% |
State of California General Obligation Unlimited | 2.8% |
City of Detroit Michigan Sewage Disposal System Revenue Bonds | 2.7% |
Arizona Health Facilities Authority Revenue Bonds | 2.6% |
Regents of the University of California Medical Center Pooled Revenue Bonds | 2.6% |
Hudson County Improvement Authority Revenue Bonds | 2.5% |
Detroit Wayne County Stadium Authority Revenue Bonds | 2.5% |
North Texas Tollway Authority Revenue Bonds | 2.1% |
Puerto Rico Electric Power Authority Revenue Bonds | 2.0% |
Top Ten Total | 26.6% |
| | |
“Ten Largest Holdings” excludes any temporary cash investments. |
1 | Source: BlackRock Solutions. Credit quality ratings are measured on a scale that generally ranges from AAA (highest) to D (lowest). All securities except for those labeled “NR” have been rated by a Nationally Recognized Statistical Rating Organization (“NRSRO”). For purposes of this presentation, when ratings are available from more than one agency, the highest rating is used. Guggenheim Investments converts ratings to the equivalent S&P rating. |
| | THE GUGGENHEIM FUNDS SEMI-ANNUAL REPORT | 63 |
SCHEDULE OF INVESTMENTS (Unaudited) | March 31, 2016 |
MUNICIPAL INCOME FUND | |
| | | Shares | | | Value | |
| | | | | | | |
SHORT TERM INVESTMENTS† - 4.7% | |
Dreyfus Tax Exempt Cash Management Institutional Shares 0.06%1 | | | 3,144,447 | | | $ | 3,144,447 | |
Total Short Term Investments | | | | | | | | |
(Cost $3,144,447) | | | | | | | 3,144,447 | |
| | | Face
Amount | | | | | |
| | | | | | | | | |
MUNICIPAL BONDS†† - 94.2% | |
| | | | | | | | | |
California - 14.6% | |
Tustin Unified School District General Obligation Unlimited | | | | | | | | |
6.00% due 08/01/21 | | $ | 1,600,000 | | | | 2,005,295 | |
State of California General Obligation Unlimited | | | | | | | | |
5.00% due 03/01/26 | | | 1,500,000 | | | | 1,883,280 | |
Regents of the University of California Medical Center Pooled Revenue Bonds | | | | | | | | |
1.15% due 05/15/432 | | | 2,000,000 | | | | 1,726,080 | |
Stockton Public Financing Authority Revenue Bonds | | | | | | | | |
6.25% due 10/01/38 | | | 1,000,000 | | | | 1,244,180 | |
6.25% due 10/01/40 | | | 250,000 | | | | 311,045 | |
San Diego Unified School District General Obligation Unlimited | | | | | | | | |
0.00% due 07/01/393 | | | 2,500,000 | | | | 1,005,825 | |
College of the Sequoias Tulare Area Improvement District No. 3 General Obligation Unlimited | | | | | | | | |
6.85% due 08/01/424 | | | 1,000,000 | | | | 605,270 | |
Kings Canyon Unified School District General Obligation Unlimited | | | | | | | | |
5.00% due 08/01/28 | | | 445,000 | | | | 548,120 | |
Oakland Unified School District/Alameda County General Obligation Unlimited | | | | | | | | |
5.00% due 08/01/22 | | | 300,000 | | | | 349,737 | |
Culver Redevelopment Agency Tax Allocation | | | | | | | | |
0.00% due 11/01/233 | | | 195,000 | | | | 150,669 | |
Total California | | | | | | | 9,829,501 | |
| | | | | | | | | |
Michigan - 12.1% | |
City of Detroit Michigan Water Supply System Revenue Bonds | | | | | | | | |
5.00% due 07/01/33 | | | 2,530,000 | | | | 2,545,601 | |
4.75% due 07/01/29 | | | 230,000 | | | | 244,207 | |
5.00% due 07/01/41 | | | 200,000 | | | | 217,060 | |
4.25% due 07/01/16 | | | 125,000 | | | | 126,089 | |
5.00% due 07/01/34 | | | 55,000 | | | | 55,322 | |
City of Detroit Michigan Sewage Disposal System Revenue Bonds | | | | | | | | |
1.02% due 07/01/322 | | | 2,000,000 | | | | 1,797,880 | |
Detroit Wayne County Stadium Authority Revenue Bonds | | | | | | |
5.00% due 10/01/26 | | | 1,490,000 | | | | 1,663,868 | |
Detroit City School District General Obligation Unlimited | | | | | | | | |
5.00% due 05/01/32 | | | 1,000,000 | | | | 1,119,870 | |
5.00% due 05/01/30 | | | 300,000 | | | | 338,166 | |
Total Michigan | | | | | | | 8,108,063 | |
| | | | | | | | | |
New York - 9.2% | |
New York City Transitional Finance Authority Future Tax Secured Revenue Bonds | | | | | | | | |
5.00% due 11/01/29 | | | 1,000,000 | | | | 1,241,370 | |
City of New York New York General Obligation Unlimited | | | | | | | | |
5.00% due 08/01/28 | | | 1,000,000 | | | | 1,232,680 | |
New York City Water & Sewer System Revenue Bonds | | | | | | | | |
5.00% due 06/15/39 | | | 1,000,000 | | | | 1,180,070 | |
Metropolitan Transportation Authority Revenue Bonds | | | | | | | | |
0.59% due 11/01/322 | | | 1,000,000 | | | | 980,240 | |
Triborough Bridge & Tunnel Authority Revenue Bonds | | | | | | | | |
0.79% due 11/15/272 | | | 1,000,000 | | | | 969,510 | |
New York State Dormitory Authority Revenue Bonds | | | | | | | | |
5.00% due 10/01/41 | | | 350,000 | | | | 404,324 | |
New York State Urban Development Corp. Revenue Bonds | | | | | | | | |
5.00% due 03/15/35 | | | 250,000 | | | | 293,653 | |
Total New York | | | | | | | 6,301,847 | |
| | | | | | | | | |
Texas - 8.6% | |
North Texas Tollway Authority Revenue Bonds | | | | | | | | |
5.75% due 01/01/40 | | | 1,295,000 | | | | 1,399,066 | |
5.75% due 01/01/18 | | | 1,205,000 | | | | 1,308,871 | |
Texas Tech University Revenue Bonds | | | | | | | | |
5.00% due 08/15/32 | | | 735,000 | | | | 855,430 | |
Harris County-Houston Sports Authority Revenue Bonds | | | | | | | | |
0.00% due 11/15/533 | | | 4,000,000 | | | | 706,480 | |
County of Harris Texas Revenue Bonds | | | | | | | | |
1.08% due 08/15/352 | | | 500,000 | | | | 445,240 | |
Birdville Independent School District General Obligation Unlimited | | | | | | | | |
5.00% due 02/15/27 | | | 305,000 | | | | 378,868 | |
Clint Independent School District General Obligation Unlimited | | | | | | | | |
5.00% due 08/15/31 | | | 300,000 | | | | 365,391 | |
State of Texas General Obligation Unlimited | | | | | | | | |
5.00% due 10/01/29 | | | 250,000 | | | | 313,245 | |
Total Texas | | �� | | | | | 5,772,591 | |
64 | THE GUGGENHEIM FUNDS SEMI-ANNUAL REPORT | SEE NOTES TO FINANCIAL STATEMENTS. |
SCHEDULE OF INVESTMENTS (Unaudited)(continued) | March 31, 2016 |
MUNICIPAL INCOME FUND | |
| | | Face
Amount | | | Value | |
| | | | | | | |
New Jersey - 7.1% | |
Hudson County Improvement Authority Revenue Bonds | | | | | | |
6.00% due 01/01/40 | | $ | 1,500,000 | | | $ | 1,698,255 | |
State of New Jersey General Obligation Unlimited | | | | | | | | |
5.00% due 06/01/23 | | | 1,000,000 | | | | 1,174,550 | |
New Jersey Turnpike Authority Revenue Bonds | | | | | | | | |
0.86% due 01/01/242 | | | 1,000,000 | | | | 998,390 | |
New Jersey Transportation Trust Fund Authority Revenue Bonds | | | | | | | | |
1.60% due 06/15/342 | | | 1,000,000 | | | | 951,850 | |
Total New Jersey | | | | | | | 4,823,045 | |
| | | | | | | | | |
Maryland - 5.9% | |
County of Baltimore Maryland General Obligation Unlimited | | | | | | | | |
5.00% due 08/01/18 | | | 1,000,000 | | | | 1,098,310 | |
5.00% due 02/01/17 | | | 500,000 | | | | 518,540 | |
County of Montgomery Maryland General Obligation Unlimited | | | | | | | | |
5.00% due 11/01/26 | | | 1,000,000 | | | | 1,261,120 | |
Maryland State Transportation Authority Revenue Bonds | | | | | | | | |
5.00% due 07/01/35 | | | 1,000,000 | | | | 1,080,140 | |
Total Maryland | | | | | | | 3,958,110 | |
| | | | | | | | | |
Pennsylvania - 5.1% | |
Pennsylvania Economic Development Financing Authority Revenue Bonds | | | | | | | | |
5.00% due 02/01/27 | | | 1,000,000 | | | | 1,206,600 | |
Pennsylvania Turnpike Commission Revenue Bonds | | | | | | | | |
1.67% due 12/01/202 | | | 500,000 | | | | 504,570 | |
1.38% due 12/01/212 | | | 500,000 | | | | 496,470 | |
County of Allegheny Pennsylvania General Obligation Unlimited | | | | | | | | |
0.96% due 11/01/262 | | | 1,000,000 | | | | 965,480 | |
Reading School District General Obligation Unlimited | | | | | | | | |
5.00% due 02/01/27 | | | 300,000 | | | | 353,247 | |
Total Pennsylvania | | | | | | | 3,526,367 | |
| | | | | | | | | |
Illinois - 4.9% | |
Will County Township High School District No. 204 Joliet General Obligation Limited | | | | | | | | |
6.25% due 01/01/31 | | | 1,000,000 | | | | 1,190,130 | |
Southern Illinois University Revenue Bonds | | | | | | | | |
5.00% due 04/01/32 | | | 1,000,000 | | | | 1,119,820 | |
City of Chicago Illinois General Obligation Unlimited | | | | | | | | |
4.75% due 01/01/28 | | | 500,000 | | | | 500,630 | |
5.00% due 01/01/23 | | | 70,000 | | | | 73,086 | |
5.00% due 01/01/22 | | | 5,000 | | | | 5,045 | |
University of Illinois Revenue Bonds | | | | | | | | |
6.00% due 10/01/29 | | | 200,000 | | | | 238,992 | |
Metropolitan Pier & Exposition Authority Revenue Bonds | | | | | | | | |
0.00% due 06/15/453 | | | 500,000 | | | | 141,465 | |
Total Illinois | | | | | | | 3,269,168 | |
| | | | | | | | | |
Puerto Rico - 4.6% | |
Puerto Rico Electric Power Authority Revenue Bonds | | | | | | | | |
0.94% due 07/01/292,5 | | | 1,845,000 | | | | 1,366,758 | |
5.00% due 07/01/245 | | | 1,170,000 | | | | 1,174,232 | |
5.00% due 07/01/225 | | | 620,000 | | | | 628,438 | |
Total Puerto Rico | | | | | | | 3,169,428 | |
| | | | | | | | | |
Washington - 4.1% | |
King County Public Hospital District No. 1 General Obligation Limited | | | | | | | | |
5.00% due 12/01/37 | | | 1,000,000 | | | | 1,073,540 | |
Greater Wenatchee Regional Events Center Public Facilities Dist Revenue Bonds | | | | | | | | |
5.00% due 09/01/275 | | | 500,000 | | | | 535,190 | |
5.25% due 09/01/325 | | | 500,000 | | | | 527,660 | |
King County School District No. 409 Tahoma General Obligation Unlimited | | | | | | | | |
5.00% due 12/01/27 | | | 325,000 | | | | 407,813 | |
State of Washington General Obligation Unlimited | | | | | | | | |
5.00% due 06/01/41 | | | 195,000 | | | | 223,421 | |
Total Washington | | | | | | | 2,767,624 | |
| | | | | | | | | |
Massachusetts - 3.1% | |
Massachusetts Development Finance Agency Revenue Bonds | | | | | | | | |
6.88% due 01/01/41 | | | 1,000,000 | | | | 1,180,980 | |
Commonwealth of Massachusetts General Obligation Unlimited | | | | | | | | |
0.98% due 05/01/372 | | | 1,000,000 | | | | 931,120 | |
Total Massachusetts | | | | | | | 2,112,100 | |
| | | | | | | | | |
Colorado - 3.0% | |
City & County of Denver Colorado General Obligation Unlimited | | | | | | | | |
5.00% due 08/01/16 | | | 1,210,000 | | | | 1,228,150 | |
Auraria Higher Education Center Revenue Bonds | | | | | | | | |
5.00% due 04/01/28 | | | 390,000 | | | | 480,246 | |
University of Colorado Revenue Bonds | | | | | | | | |
5.00% due 06/01/37 | | | 285,000 | | | | 329,175 | |
Total Colorado | | | | | | | 2,037,571 | |
| | | | | | | | | |
Florida - 2.8% | |
School Board of Miami-Dade County Certificate Of Participation | | | | | | | | |
5.00% due 05/01/27 | | | 500,000 | | | | 610,250 | |
County of Miami-Dade Florida Revenue Bonds | | | | | | | | |
0.00% due 10/01/453 | | | 2,000,000 | | | | 558,260 | |
SEE NOTES TO FINANCIAL STATEMENTS. | THE GUGGENHEIM FUNDS SEMI-ANNUAL REPORT | 65 |
SCHEDULE OF INVESTMENTS (Unaudited)(continued) | March 31, 2016 |
MUNICIPAL INCOME FUND | |
| | | Face
Amount | | | Value | |
| | | | | | | |
City of Jacksonville Florida Revenue Bonds | | | | | | |
5.00% due 10/01/29 | | $ | 300,000 | | | $ | 353,250 | |
Miami Beach Redevelopment Agency Tax Allocation | | | | | | | | |
5.00% due 02/01/40 | | | 300,000 | | | | 340,923 | |
State of Florida Lottery Revenue Bonds | | | | | | | | |
5.00% due 07/01/16 | | | 100,000 | | | | 101,148 | |
Total Florida | | | | | | | 1,963,831 | |
| | | | | | | | | |
Arizona - 2.6% | |
Arizona Health Facilities Authority Revenue Bonds | | | | | | | | |
1.23% due 01/01/372 | | | 2,000,000 | | | | 1,760,940 | |
| | | | | | | | | |
Mississippi - 1.3% | |
Mississippi Development Bank Revenue Bonds | | | | | | | | |
6.50% due 10/01/31 | | | 500,000 | | | | 591,180 | |
6.25% due 10/01/26 | | | 230,000 | | | | 273,544 | |
Total Mississippi | | | | | | | 864,724 | |
| | | | | | | | | |
Louisiana - 1.0% | |
Louisiana Local Government Environmental Facilities & Community Development Auth Revenue Bonds | | | | | | | | |
5.00% due 10/01/37 | | | 620,000 | | | | 708,617 | |
| | | | | | | | | |
Virginia - 1.1% | |
County of Fairfax Virginia General Obligation Unlimited | | | | | | | | |
5.00% due 10/01/32 | | | 300,000 | | | | 375,339 | |
Virginia College Building Authority Revenue Bonds | | | | | | | | |
5.00% due 02/01/28 | | | 250,000 | | | | 308,130 | |
Total Virginia | | | | | | | 683,469 | |
| | | | | | | | | |
West Virginia - 0.9% | |
West Virginia Higher Education Policy Commission Revenue Bonds | | | | | | | | |
5.00% due 04/01/29 | | | 500,000 | | | | 580,430 | |
| | | | | | | | | |
South Carolina - 0.6% | |
Anderson County School District No. 5 General Obligation Unlimited | | | | | | | | |
5.00% due 03/01/27 | | | 300,000 | | | | 380,079 | |
| | | | | | | | | |
District of Columbia - 0.5% | |
District of Columbia General Obligation Unlimited | | | | | | | | |
5.00% due 06/01/32 | | | 275,000 | | | | 330,668 | |
| | | | | | | | | |
Nevada - 0.4% | |
Las Vegas Valley Water District General Obligation Limited | | | | | | | | |
5.00% due 06/01/27 | | | 230,000 | | | | 286,072 | |
| | | | | | | | | |
Georgia - 0.4% | |
Savannah Economic Development Authority Revenue Bonds | | | | | | | | |
5.00% due 12/01/28 | | | 200,000 | | | | 242,772 | |
| | | | | | | | | |
North Carolina - 0.3% | |
State of North Carolina General Obligation Unlimited | | | | | | | | |
5.00% due 06/01/17 | | | 200,000 | | | | 210,246 | |
Total Municipal Bonds | | | | | | | | |
(Cost $61,094,971) | | | | | | | 63,687,263 | |
| | | | | | | | | |
Total Investments - 98.9% | | | | | | | | |
(Cost $64,239,418) | | | | | | $ | 66,831,710 | |
Other Assets & Liabilities, net - 1.1% | | | | | | | 713,129 | |
Total Net Assets - 100.0% | | | | | | $ | 67,544,839 | |
† | Value determined based on Level 1 inputs — See Note 4. |
†† | Value determined based on Level 2 inputs — See Note 4. |
1 | Rate indicated is the 7 day yield as of March 31, 2016. |
2 | Variable rate security. Rate indicated is rate effective at March 31, 2016. |
3 | Zero coupon rate security. |
4 | Security is a step up/step down bond. The coupon increases or decreases at regular intervals until the bond reaches full maturity. |
5 | Illiquid security. |
| | |
| | See Sector Classification in Other Information section. |
66 | THE GUGGENHEIM FUNDS SEMI-ANNUAL REPORT | SEE NOTES TO FINANCIAL STATEMENTS. |
SCHEDULE OF INVESTMENTS (Unaudited)(concluded) | March 31, 2016 |
MUNICIPAL INCOME FUND | |
The following table summarizes the inputs used to value the Fund’s investments at March 31, 2016 (See Note 4 in the Notes to Financial Statements):
Investments in Securities (Assets) | | Level 1 | | | Level 2 | | | Level 3 | | | Total | |
Municipal Bonds | | $ | — | | | $ | 63,687,263 | | | $ | — | | | $ | 63,687,263 | |
Short Term Investments | | | 3,144,447 | | | | — | | | | — | | | | 3,144,447 | |
Total | | $ | 3,144,447 | | | $ | 63,687,263 | | | $ | — | | | $ | 66,831,710 | |
For the period ended March 31, 2016, there were no transfers between levels.
SEE NOTES TO FINANCIAL STATEMENTS. | THE GUGGENHEIM FUNDS SEMI-ANNUAL REPORT | 67 |
STATEMENT OF ASSETS AND LIABILITIES (Unaudited) | |
March 31, 2016 | |
Assets: | |
Investments, at value (cost $64,239,418) | | $ | 66,831,710 | |
Prepaid expenses | | | 26,928 | |
Cash | | | 2 | |
Receivables: | |
Interest | | | 608,365 | |
Fund shares sold | | | 220,884 | |
Transfer agent/maintenance fees | | | 4,826 | |
Total assets | | | 67,692,715 | |
| | | | | |
Liabilities: | |
Payable for: | |
Distributions to Shareholders | | | 42,849 | |
Fund shares redeemed | | | 25,861 | |
Direct shareholders expense | | | 22,357 | |
Distribution and service fees | | | 15,319 | |
Management fees | | | 13,576 | |
Custodian fees | | | 8,607 | |
Legal fees | | | 7,419 | |
Fund accounting/administration fees | | | 5,509 | |
Trustees’ fees* | | | 4,622 | |
Miscellaneous | | | 1,757 | |
Total liabilities | | | 147,876 | |
Net assets | | $ | 67,544,839 | |
| | | | | |
Net assets consist of: | |
Paid in capital | | $ | 92,760,914 | |
Undistributed net investment income | | | — | |
Accumulated net realized loss on investments | | | (27,808,367 | ) |
Net unrealized appreciation on investments | | | 2,592,292 | |
Net assets | | $ | 67,544,839 | |
| | | | | |
A-Class: | |
Net assets | | $ | 49,501,860 | |
Capital shares outstanding | | | 3,883,499 | |
Net asset value per share | | $ | 12.75 | |
Maximum offering price per share (Net asset value divided by 96.00%) | | $ | 13.28 | |
| | | | | |
C-Class: | |
Net assets | | $ | 4,930,444 | |
Capital shares outstanding | | | 387,051 | |
Net asset value per share | | $ | 12.74 | |
| | | | | |
P-Class: | |
Net assets | | $ | 28,839 | |
Capital shares outstanding | | | 2,263 | |
Net asset value per share | | $ | 12.74 | |
| | | | | |
Institutional Class: | |
Net assets | | $ | 13,083,696 | |
Capital shares outstanding | | | 1,026,008 | |
Net asset value per share | | $ | 12.75 | |
STATEMENT OF OPERATIONS (Unaudited) | |
Period Ended March 31, 2016 | |
Investment Income: | |
Interest | | $ | 974,162 | |
Total investment income | | | 974,162 | |
| | | | | |
Expenses: | |
Management fees | | | 165,822 | |
Transfer agent/maintenance fees: | |
A-Class | | | 25,134 | |
C-Class | | | 2,430 | |
P-Class | | | 43 | |
Institutional Class | | | 4,117 | |
Distribution and service fees: | |
A-Class | | | 66,425 | |
C-Class | | | 18,687 | |
P-Class | | | 27 | |
Fund accounting/administration fees | | | 31,506 | |
Registration fees | | | 53,532 | |
Line of credit fees | | | 4,260 | |
Trustees’ fees* | | | 728 | |
Custodian fees | | | 27 | |
Miscellaneous | | | 13,734 | |
Total expenses | | | 386,472 | |
Less: | |
Expenses waived by Adviser | | | (114,629 | ) |
Net expenses | | | 271,843 | |
Net investment income | | | 702,319 | |
| | | | | |
Net Realized and Unrealized Gain (Loss): | |
Net realized gain (loss) on: | |
Investments | | | 334,269 | |
Net realized gain | | | 334,269 | |
Net change in unrealized appreciation (depreciation) on: | |
Investments | | | 794,225 | |
Net change in unrealized appreciation (depreciation) | | | 794,225 | |
Net realized and unrealized gain | | | 1,128,494 | |
Net increase in net assets resulting from operations | | $ | 1,830,813 | |
* | Relates to Trustees not deemed “interested persons” within the meaning of Section 2(a)(19) of the 1940 Act. |
68 | THE GUGGENHEIM FUNDS SEMI-ANNUAL REPORT | SEE NOTES TO FINANCIAL STATEMENTS. |
STATEMENTS OF CHANGES IN NET ASSETS |
| | | Period Ended
March 31,
2016
(Unaudited) | | | Year Ended
September 30,
2015 | |
Increase (Decrease) in Net Assets from Operations: | | | | | | |
Net investment income | | $ | 702,319 | | | $ | 1,376,249 | |
Net realized gain on investments | | | 334,269 | | | | 266,390 | |
Net change in unrealized appreciation (depreciation) on investments | | | 794,225 | | | | (419,085 | ) |
Net increase in net assets resulting from operations | | | 1,830,813 | | | | 1,223,554 | |
| | | | | | | | | |
Distributions to shareholders from: | | | | | | | | |
Net investment income | | | | | | | | |
A-Class | | | (565,324 | ) | | | (1,146,185 | ) |
C-Class | | | (24,906 | ) | | | (30,351 | ) |
P-Class | | | (228 | ) | | | (100 | )* |
Institutional Class | | | (111,861 | ) | | | (199,613 | ) |
Total distributions to shareholders | | | (702,319 | ) | | | (1,376,249 | ) |
| | | | | | | | | |
Capital share transactions: | | | | | | | | |
Proceeds from sale of shares | | | | | | | | |
A-Class | | | 16,384,624 | | | | 21,002,499 | |
C-Class | | | 3,878,017 | | | | 2,084,724 | |
P-Class | | | 18,250 | | | | 10,000 | * |
Institutional Class | | | 5,753,017 | | | | 4,945,093 | |
Distributions reinvested | | | | | | | | |
A-Class | | | 351,112 | | | | 704,334 | |
C-Class | | | 17,389 | | | | 21,242 | |
P-Class | | | 228 | | | | 100 | * |
Institutional Class | | | 73,492 | | | | 116,901 | |
Cost of shares redeemed | | | | | | | | |
A-Class | | | (17,221,776 | ) | | | (16,588,738 | ) |
C-Class | | | (1,485,139 | ) | | | (700,489 | ) |
P-Class | | | — | | | | — | * |
Institutional Class | | | (1,484,770 | ) | | | (2,933,434 | ) |
Net increase from capital share transactions | | | 6,284,444 | | | | 8,662,232 | |
Net increase in net assets | | | 7,412,938 | | | | 8,509,537 | |
| | | | | | | | | |
Net assets: | | | | | | | | |
Beginning of period | | | 60,131,901 | | | | 51,622,364 | |
End of period | | $ | 67,544,839 | | | $ | 60,131,901 | |
Undistributed net investment income at end of period | | $ | — | | | $ | — | |
SEE NOTES TO FINANCIAL STATEMENTS. | THE GUGGENHEIM FUNDS SEMI-ANNUAL REPORT | 69 |
STATEMENTS OF CHANGES IN NET ASSETS (concluded) |
| | | Period Ended
March 31,
2016
(Unaudited) | | | Year Ended
September 30,
2015 | |
Capital share activity: | | | | | | |
Shares sold | | | | | | |
A-Class | | | 1,294,312 | | | | 1,657,982 | |
C-Class | | | 305,430 | | | | 165,051 | |
P-Class | | | 1,446 | | | | 791 | * |
Institutional Class | | | 453,962 | | | | 391,788 | |
Shares issued from reinvestment of distributions | | | | | | | | |
A-Class | | | 27,731 | | | | 55,887 | |
C-Class | | | 1,373 | | | | 1,686 | |
P-Class | | | 18 | | | | 8 | * |
Institutional Class | | | 5,803 | | | | 9,270 | |
Shares redeemed | | | | | | | | |
A-Class | | | (1,358,024 | ) | | | (1,319,843 | ) |
C-Class | | | (117,236 | ) | | | (55,776 | ) |
P-Class | | | — | | | | — | * |
Institutional Class | | | (117,327 | ) | | | (233,057 | ) |
Net increase in shares | | | 497,488 | | | | 673,787 | |
* | Since commencement of operations: May 1, 2015. |
70 | THE GUGGENHEIM FUNDS SEMI-ANNUAL REPORT | SEE NOTES TO FINANCIAL STATEMENTS. |
This table is presented to show selected data for a share outstanding throughout each period and to assist shareholders in evaluating a Fund’s performance for the periods presented.
A-Class† | | Period Ended
March 31,
2016a | | Year Ended
September 30,
2015 | | Year Ended
September 30,
2014 | | Year Ended
September 30,
2013 | | Period Ended
September 30,
2012b | | Year Ended
December 31,
2011 | |
Per Share Data | | | | | | | | | | | | | | | | | | |
Net asset value, beginning of period | | $ | 12.52 | | | $ | 12.51 | | | $ | 11.59 | | | $ | 12.59 | | | $ | 11.82 | | | $ | 11.54 | |
Income (loss) from investment operations: | |
Net investment income (loss)c | | | .13 | | | | .29 | | | | .36 | | | | .38 | | | | .26 | | | | .64 | |
Distributions to preferred shareholders from: | |
Net investment income | | | — | | | | — | | | | — | | | | — | | | | (.01 | ) | | | (.10 | ) |
Net gain (loss) on investments (realized and unrealized) | | | .24 | | | | .01 | | | | .92 | | | | (1.00 | ) | | | .78 | | | | .54 | |
Total from investment operations | | | .37 | | | | .30 | | | | 1.28 | | | | (.62 | ) | | | 1.03 | | | | 1.08 | |
Less distributions from: | |
Net investment income | | | (.14 | ) | | | (.29 | ) | | | (.36 | ) | | | (.38 | ) | | | (.26 | ) | | | (.80 | ) |
Total distributions | | | (.14 | ) | | | (.29 | ) | | | (.36 | ) | | | (.38 | ) | | | (.26 | ) | | | (.80 | ) |
Net asset value, end of period | | $ | 12.75 | | | $ | 12.52 | | | $ | 12.51 | | | $ | 11.59 | | | $ | 12.59 | | | $ | 11.82 | |
| | |
Total Returng | | | 2.93 | % | | | 2.39 | % | | | 11.20 | % | | | (5.09 | %) | | | 8.91 | % | | | 9.64 | % |
Ratios/Supplemental Data | |
Net assets, end of period (in thousands) | | $ | 49,502 | | | $ | 49,086 | | | $ | 44,090 | | | $ | 50,463 | | | $ | 77,609 | | | $ | 182,150 | |
Ratios to average net assets: | |
Net investment income (loss) | | | 2.13 | % | | | 2.28 | % | | | 3.00 | % | | | 3.04 | % | | | 2.78 | % | | | 4.60 | % |
Total expenses | | | 1.16 | % | | | 1.17 | % | | | 1.29 | % | | | 1.14 | % | | | 1.15 | % | | | 2.09 | % |
Net expensesd,h | | | 0.81 | % | | | 0.81 | % | | | 0.83 | % | | | 0.82 | % | | | 0.87 | % | | | 2.09 | % |
Portfolio turnover rate | | | 38 | % | | | 80 | % | | | 173 | % | | | 91 | % | | | 121 | % | | | 104 | % |
C-Class | | Period Ended
March 31,
2016a | | Year Ended
September 30,
2015 | | Year Ended
September 30,
2014 | | Year Ended
September 30,
2013 | | Period Ended
September 30,
2012e | |
Per Share Data | | | | | | | | | | | | | | | |
Net asset value, beginning of period | | $ | 12.52 | | | $ | 12.50 | | | $ | 11.59 | | | $ | 12.58 | | | $ | 11.98 | |
Income (loss) from investment operations: | |
Net investment income (loss)c | | | .08 | | | | .19 | | | | .27 | | | | .28 | | | | .20 | |
Net gain (loss) on investments (realized and unrealized) | | | .23 | | | | .02 | | | | .91 | | | | (.98 | ) | | | .62 | |
Total from investment operations | | | .31 | | | | .21 | | | | 1.18 | | | | (.70 | ) | | | .82 | |
Less distributions from: | |
Net investment income | | | (.09 | ) | | | (.19 | ) | | | (.27 | ) | | | (.29 | ) | | | (.22 | ) |
Total distributions | | | (.09 | ) | | | (.19 | ) | | | (.27 | ) | | | (.29 | ) | | | (.22 | ) |
Net asset value, end of period | | $ | 12.74 | | | $ | 12.52 | | | $ | 12.50 | | | $ | 11.59 | | | $ | 12.58 | |
| | |
Total Returng | | | 2.46 | % | | | 1.71 | % | | | 10.28 | % | | | (5.70 | %) | | | 7.04 | % |
Ratios/Supplemental Data | |
Net assets, end of period (in thousands) | | $ | 4,930 | | | $ | 2,472 | | | $ | 1,082 | | | $ | 1,495 | | | $ | 1,176 | |
Ratios to average net assets: | |
Net investment income (loss) | | | 1.33 | % | | | 1.54 | % | | | 2.24 | % | | | 2.30 | % | | | 2.36 | % |
Total expenses | | | 1.93 | % | | | 1.87 | % | | | 2.08 | % | | | 1.93 | % | | | 1.94 | % |
Net expensesd,h | | | 1.56 | % | | | 1.56 | % | | | 1.58 | % | | | 1.57 | % | | | 1.55 | % |
Portfolio turnover rate | | | 38 | % | | | 80 | % | | | 173 | % | | | 91 | % | | | 121 | % |
SEE NOTES TO FINANCIAL STATEMENTS. | THE GUGGENHEIM FUNDS SEMI-ANNUAL REPORT | 71 |
FINANCIAL HIGHLIGHTS (continued) |
This table is presented to show selected data for a share outstanding throughout each period and to assist shareholders in evaluating a Fund’s performance for the periods presented.
P-Class | | Period Ended
March 31,
2016a | | | Period Ended
September 30,
2015f | |
Per Share Data | | | | | | |
Net asset value, beginning of period | | $ | 12.52 | | | $ | 12.64 | |
Income (loss) from investment operations: | |
Net investment income (loss)c | | | .13 | | | | .13 | |
Net gain (loss) on investments (realized and unrealized) | | | .22 | | | | (.12 | ) |
Total from investment operations | | | .35 | | | | .01 | |
Less distributions from: | |
Net investment income | | | (.13 | ) | | | (.13 | ) |
Total distributions | | | (.13 | ) | | | (.13 | ) |
Net asset value, end of period | | $ | 12.74 | | | $ | 12.52 | |
| | |
Total Returng | | | 2.85 | % | | | 0.06 | % |
Ratios/Supplemental Data | |
Net assets, end of period (in thousands) | | $ | 29 | | | $ | 10 | |
Ratios to average net assets: | |
Net investment income (loss) | | | 2.10 | % | | | 2.46 | % |
Total expenses | | | 1.45 | % | | | 3.17 | % |
Net expensesd,h | | | 0.82 | % | | | 0.81 | % |
Portfolio turnover rate | | | 38 | % | | | 80 | % |
72 | THE GUGGENHEIM FUNDS SEMI-ANNUAL REPORT | SEE NOTES TO FINANCIAL STATEMENTS. |
FINANCIAL HIGHLIGHTS (concluded) |
This table is presented to show selected data for a share outstanding throughout each period and to assist shareholders in evaluating a Fund’s performance for the periods presented.
Institutional Class | | Period Ended
March 31,
2016a | | | Year Ended
September 30,
2015 | | | Year Ended
September 30,
2014 | | | Year Ended
September 30,
2013 | | | Period Ended
September 30,
2012e | |
Per Share Data | | | | | | | | | | | | | | | |
Net asset value, beginning of period | | $ | 12.53 | | | $ | 12.51 | | | $ | 11.60 | | | $ | 12.59 | | | $ | 11.98 | |
Income (loss) from investment operations: | |
Net investment income (loss)c | | | .15 | | | | .32 | | | | .39 | | | | .40 | | | | .29 | |
Net gain (loss) on investments (realized and unrealized) | | | .22 | | | | .02 | | | | .91 | | | | (.98 | ) | | | .62 | |
Total from investment operations | | | .37 | | | | .34 | | | | 1.30 | | | | (.58 | ) | | | .91 | |
Less distributions from: | |
Net investment income | | | (.15 | ) | | | (.32 | ) | | | (.39 | ) | | | (.41 | ) | | | (.30 | ) |
Total distributions | | | (.15 | ) | | | (.32 | ) | | | (.39 | ) | | | (.41 | ) | | | (.30 | ) |
Net asset value, end of period | | $ | 12.75 | | | $ | 12.53 | | | $ | 12.51 | | | $ | 11.60 | | | $ | 12.59 | |
| | |
Total Returng | | | 2.97 | % | | | 2.73 | % | | | 11.38 | % | | | (4.76 | %) | | | 7.76 | % |
Ratios/Supplemental Data | |
Net assets, end of period (in thousands) | | $ | 13,084 | | | $ | 8,564 | | | $ | 6,451 | | | $ | 6,343 | | | $ | 1,051 | |
Ratios to average net assets: | |
Net investment income (loss) | | | 2.38 | % | | | 2.53 | % | | | 3.23 | % | | | 3.35 | % | | | 3.37 | % |
Total expenses | | | 0.90 | % | | | 0.89 | % | | | 0.97 | % | | | 0.93 | % | | | 0.86 | % |
Net expensesd,h | | | 0.56 | % | | | 0.56 | % | | | 0.58 | % | | | 0.57 | % | | | 0.55 | % |
Portfolio turnover rate | | | 38 | % | | | 80 | % | | | 173 | % | | | 91 | % | | | 121 | % |
† | Effective January 13, 2012, the Fund acquired all of the assets and liabilities of the TS&W/Claymore Tax-Advantage Balanced Fund (“TYW”), a registered closed-end management investment company. The A-Class financial highlights for the periods prior to that date reflect performance of TYW. |
a | Unaudited figures for the period ended March 31, 2016. Percentage amounts for the period, except total return and portfolio turnover rate, have been annualized. |
b | Prior to January 13, 2012, the Fund’s fiscal year end was December 31. Percentage amounts for the period, except total return and portfolio turnover rate, have been annualized. |
c | Net investment income (loss) per share was computed using average shares outstanding throughout the period. |
d | Net expense information reflects the expense ratios after expense waivers. |
e | Since commencement of operations: January 13, 2012. Percentage amounts for the period, except total return and portfolio turnover rate, have been annualized. |
f | Since commencement of operations: May 1, 2015. Percentage amounts for the period, except total return and portfolio turnover rate, have been annualized. |
g | Total return does not reflect the impact of any applicable sales charges and has not been annualized. |
h | Net expenses may include expenses that are excluded from the expense limitation agreement. Excluding these expenses, the operating expense ratios for the years would be: |
| | 03/31/16 | 09/30/15 | 09/30/14 |
A-Class | 0.80% | 0.80% | 0.80% |
C-Class | 1.55% | 1.55% | 1.54% |
P-Class | 0.80% | 0.81% | — |
Institutional Class | 0.55% | 0.55% | 0.55% |
SEE NOTES TO FINANCIAL STATEMENTS. | THE GUGGENHEIM FUNDS SEMI-ANNUAL REPORT | 73 |
NOTES TO FINANCIAL STATEMENTS (Unaudited) |
1. Organization and Significant Accounting Policies
Organization
Guggenheim Funds Trust (the “Trust”), a Delaware statutory trust, is registered with the SEC under the Investment Company Act of 1940 (“1940 Act”), as an open-ended investment company of the series type. Each series, in effect, is representing a separate Fund. The Trust is authorized to issue an unlimited number of shares. The Trust accounts for the assets of each Fund separately.
The Trust offers a combination of four separate classes of shares, A-Class shares, C-Class shares, P-Class shares and Institutional Class shares. Sales of shares of each Class are made without a front-end sales charge at the net asset value per share (“NAV”), with the exception of A-Class shares. A-Class shares are sold at the NAV, plus the applicable front-end sales charge. The sales charge varies depending on the amount purchased. A-Class share purchases of $1 million or more are exempt from the front-end sales charge but have a 1% contingent deferred sales charge (“CDSC”), if shares are redeemed within 12 months of purchase. B-Class shares previously offered have been converted to A-Class shares effective August 8, 2015 for the funds in the Trust. C-Class shares have a 1% CDSC if shares are redeemed within 12 months of purchase. Institutional Class shares are offered primarily for direct investment by institutions such as pension and profit sharing plans, endowments, foundations and corporations. Institutional Class shares require a minimum initial investment of $2 million and a minimum account balance of $1 million. At March 31, 2016, the Trust consisted of nineteen funds.
As of January 1, 2012, A-Class, C-Class, P-Class and Institutional Class shares of High Yield Fund are subject to a 2% redemption fee when shares are redeemed or exchanged within 90 days of purchase.
This report covers the Diversified Income Fund, High Yield Fund, Investment Grade Bond Fund, Limited Duration Fund, and Municipal Income Fund (the “Funds”), each a diversified investment company.
Guggenheim Investments (“GI”) provides advisory services, and Rydex Fund Services, LLC (“RFS”) provides transfer agent, administrative and accounting services to the Trust. Guggenheim Funds Distributors, LLC (“GFD”) acts as principal underwriter for the Trust. GI, RFS and GFD are affiliated entities.
Guggenheim Partners Investment Management (“GPIM”), an affiliate of GI, serves as investment sub-adviser (the “Sub-Adviser”) to the Municipal Income Fund and is responsible for the day-to-day management of the Fund’s portfolio.
Significant Accounting Policies
The Funds operate as investment companies and accordingly follow the investment company accounting and reporting guidance of the Financial Accounting Standards Board (“FASB”) Accounting Standards Codification Topic 946 Financial Services – Investment Companies.
The following significant accounting policies are in conformity with U.S. generally accepted accounting principles (“U.S. GAAP”) and are consistently followed by the Trust. This requires management to make estimates and assumptions that affect the reported amount of assets and liabilities and disclosure of contingent assets and liabilities at the date of the financial statements and the reported amounts of revenues and expenses during the reporting period. Actual results could differ from these estimates. All time references are based on Eastern Time.
The NAV of each Class of the Funds is calculated by dividing the market value of the Fund’s securities and other assets, less all liabilities, attributable to the Class by the number of outstanding shares of the Class.
A. The Board of Trustees of the Funds (the “Board”) has adopted policies and procedures for the valuation of the Funds’ investments (the “Valuation Procedures”). Pursuant to the Valuation Procedures, the Board has delegated to a valuation committee, consisting of representatives from Guggenheim’s investment management, fund administration, legal and compliance departments (the “Valuation Committee”), the day-to-day responsibility for implementing the Valuation Procedures, including, under most circumstances, the responsibility for determining the fair value of the Funds’ securities or other assets.
Valuations of the Funds’ securities are supplied primarily by pricing services appointed pursuant to the processes set forth in the Valuation Procedures. The Valuation Committee convenes monthly, or more frequently as needed and will review the valuation of all assets which have been fair valued for reasonableness. The Funds’ officers, through the Valuation Committee and consistent with the monitoring and review
74 | THE GUGGENHEIM FUNDS SEMI-ANNUAL REPORT | |
NOTES TO FINANCIAL STATEMENTS (Unaudited)(continued) |
responsibilities set forth in the Valuation Procedures, regularly review procedures used by, and valuations provided by, the pricing services.
If the pricing service cannot or does not provide a valuation for a particular investment or such valuation is deemed unreliable, such investment is fair valued by the Valuation Committee.
Equity securities listed on an exchange (New York Stock Exchange (“NYSE”) or American Stock Exchange) are valued at the last quoted sales price as of the close of business on the NYSE, usually 4:00 p.m. on the valuation date. Equity securities listed on the NASDAQ market system are valued at the NASDAQ Official Closing Price on the valuation date, which may not necessarily represent the last sale price. If there has been no sale on such exchange or NASDAQ on a given day, the security is valued at the closing bid price on that day.
Generally, trading in foreign securities markets is substantially completed each day at various times prior to the close of the NYSE. The values of foreign securities are determined as of the close of such foreign markets or the close of the NYSE, if earlier. All investments quoted in foreign currency are valued in U.S. dollars on the basis of the foreign currency exchange rates prevailing at the close of business. Investments in foreign securities may involve risks not present in domestic investments. The Valuation Committee will determine the current value of such foreign securities by taking into consideration certain factors which may include those discussed above, as well as the following factors, among others: the value of the securities traded on other foreign markets, ADR trading, closed-end fund trading, foreign currency exchange activity, and the trading prices of financial products that are tied to foreign securities. In addition, the Board of Trustees has authorized the Valuation Committee and GI to use prices and other information supplied by a third party pricing vendor in valuing foreign securities.
Open-end investment companies (“Mutual Funds”) are valued at their NAV as of the close of business, on the valuation date. Exchange-traded funds (“ETFs”) and closed-end investment companies (“CEFs”) are valued at the last quoted sales price.
U.S. government securities are valued by either independent pricing services, the last traded fill price, or at the reported bid price at the close of business.
Debt securities with a maturity of greater than 60 days at acquisition are valued at prices that reflect broker/dealer supplied valuations or are obtained from independent pricing services, which may consider the trade activity, treasury spreads, yields or price of bonds of comparable quality, coupon, maturity, and type, as well as prices quoted by dealers who make markets in such securities. Short-term debt securities with a maturity of 60 days or less at acquisition are valued at amortized cost, provided such amount approximates market value.
Repurchase agreements are valued at amortized cost, provided such amounts approximate market value.
Typically loans are valued using information provided by an independent third party pricing service which uses broker quotes in a non-active market.
The value of futures contracts is accounted for using the unrealized gain or loss on the contracts that is determined by marking the contracts to their current realized settlement prices. Financial futures contracts are valued at the 4:00 p.m. price on the valuation date. In the event that the exchange for a specific futures contract closes earlier than 4:00 p.m., the futures contract is valued at the Official Settlement Price of the exchange. However, the underlying securities from which the futures contract value is derived are monitored until 4:00 p.m. to determine if fair valuation would provide a more accurate valuation.
Investments for which market quotations are not readily available are fair valued as determined in good faith by GI under the direction of the Board of Trustees using methods established or ratified by the Board of Trustees. Valuations in accordance with these methods are intended to reflect each security’s (or asset’s) “fair value.” Each such determination is based on a consideration of all relevant factors, which are likely to vary from one pricing context to another. Examples of such factors may include, but are not limited to: (i) the type of security, (ii) the initial cost of the security, (iii) the existence of any contractual restrictions on the security’s disposition, (iv) the price and extent of public trading in similar securities of the issuer or of comparable companies, (v) quotations or evaluated prices from broker-dealers and/or pricing services, (vi) information obtained from the issuer, analysts, and/or the appropriate stock exchange (for exchange-traded securities), (vii) an analysis of the company’s financial statements, and (viii) an evaluation of the forces that influence the issuer and the market(s) in which the
| | THE GUGGENHEIM FUNDS SEMI-ANNUAL REPORT | 75 |
NOTES TO FINANCIAL STATEMENTS (Unaudited)(continued) |
security is purchased and sold (e.g. the existence of pending merger activity, public offerings or tender offers that might affect the value of the security).
In connection with futures contracts and other derivative investments, such factors may include obtaining information as to how (a) these contracts and other derivative investments trade in the futures or other derivative markets, respectively, and (b) the securities underlying these contracts and other derivative investments trade in the cash market.
B. Certain U.S. Government and Agency Obligations are traded on a discount basis; the interest rates shown on the Schedules of Investments reflect the effective rates paid at the time of purchase by the Funds. Other securities bear interest at the rates shown, payable at fixed dates through maturity.
C. Senior loans in which the Funds invest generally pay interest rates which are periodically adjusted by reference to a base short-term, floating rate plus a premium. These base lending rates are generally (i) the lending rate offered by one or more major European banks, such as the one-month or three-month London Inter-Bank Offered Rate (LIBOR), (ii) the prime rate offered by one or more major United States banks, or (iii) the bank’s certificate of deposit rate. Senior floating rate interests often require prepayments from excess cash flows or permit the borrower to repay at its election. The rate at which the borrower repays cannot be predicted with accuracy. As a result, the actual remaining maturity may be substantially less than the stated maturities shown. The interest rate indicated is the rate in effect at March 31, 2016.
D. The Funds may purchase and sell interests in securities on a when-issued and delayed delivery basis, with payment and delivery scheduled for a future date. No income accrues to the Fund on such interests or securities in connection with such transactions prior to the date the Funds actually take delivery of such interests or securities. These transactions are subject to market fluctuations and are subject to the risk that the value at delivery may be more or less than the trade date purchase price. Although the Funds will generally purchase these securities with the intention of acquiring such securities, they may sell such securities before the settlement date.
E. Upon entering into a futures contract, a Fund deposits and maintains as collateral such initial margin as required by the exchange on which the transaction is affected. Pursuant to the contract, the Fund agrees to receive from or pay to the broker an amount of cash equal to the daily fluctuation in value of the contract. Such receipts or payments are known as variation margin and are recorded by the Fund as unrealized gains or losses. When the contract is closed, the Fund records a realized gain or loss equal to the difference between the value of the contract at the time it was opened and the value at the time it was closed.
F. Forward foreign currency exchange contracts are valued daily based on the applicable exchange rate of the underlying currency. The change in value of the contract is recorded as unrealized appreciation or depreciation until the forward foreign currency contract is closed. When the forward foreign currency contract is closed, the Funds record a realized gain or loss equal to the difference between the value at the time the contract was opened and the value at the time it was closed.
G. Security transactions are recorded on the trade date for financial reporting purposes. Realized gains and losses from securities transactions are recorded using the identified cost basis. Proceeds from lawsuits related to investment holdings are recorded as realized gains in the respective Fund. Dividend income is recorded on the ex-dividend date, net of applicable taxes withheld by foreign countries. Taxable non-cash dividends are recorded as dividend income. Interest income, including amortization of premiums and accretion of discounts, is accrued on a daily basis. Interest income also includes paydown gains and losses on mortgage-backed and asset-backed securities and senior and subordinated loans. Amendment fees are earned as compensation for evaluating and accepting changes to the original loan agreement and are recognized when received. Dividend income from REITs is recorded based on the income included in the distributions received from the REIT investments using published REIT classifications, including some management estimates when actual amounts are not available. Distributions received in excess of this estimated amount are recorded as a reduction of the cost of investments or reclassified to capital gains. The actual amounts of income, return of capital, and capital gains are only determined by each REIT after its fiscal year-end, and may differ from the estimated amounts.
H. The Funds declare dividends from investment income daily, except the Diversified Income Fund, which declares monthly. Each Fund pays its shareholders from its net investment income monthly and distributes any net capital gains that it has realized, at least annually. Distributions to shareholders are recorded on the ex-dividend date. Dividends are reinvested in additional
76 | THE GUGGENHEIM FUNDS SEMI-ANNUAL REPORT | |
NOTES TO FINANCIAL STATEMENTS (Unaudited)(continued) |
shares unless shareholders request payment in cash. The character of distributions made during the year from net investment income or net realized gains may differ from their ultimate characterization for federal income tax purposes.
I. Interest and dividend income, most expenses, all realized gains and losses, and all unrealized gains and losses are allocated to the classes based upon the value of the outstanding shares in each Class. Certain costs, such as distribution and service fees are charged directly to specific classes. In addition, certain expenses have been allocated to the individual Funds in the Trust on a pro rata basis upon the respective aggregate net assets of each Fund included in the Trust.
J. Under the fee arrangement with the custodian, the Funds may earn credits based on overnight custody cash balances. These credits are utilized to reduce related custodial expenses. The custodian fees disclosed in the Statement of Operations are before the reduction in expense from the related earnings credits, if any. For the period ended March 31, 2016, there were no earnings credits received.
K. The Funds may leave cash overnight in their cash account with the custodian. Periodically, a Fund may have cash due to the custodian bank as an overdraft balance. A fee is incurred on this overdraft, calculated by multiplying the overdraft by a rate based on the federal funds rate, which was 0.25% at March 31, 2016.
L. The accounting records of the Funds are maintained in U.S. dollars. All assets and liabilities initially expressed in foreign currencies are converted into U.S. dollars at prevailing exchange rates. Purchases and sales of investment securities, dividend and interest income, and certain expenses are translated at the rates of exchange prevailing on the respective dates of such transactions. Changes in the relationship of these foreign currencies to the U.S. dollar can significantly affect the value of the investments and earnings of the Funds. Foreign investments may also subject the Funds to foreign government exchange restrictions, expropriation, taxation or other political, social or economic developments, all of which could affect the market and/or credit risk of the investments. The Funds do not isolate that portion of the results of operations resulting from changes in the foreign exchange rates on investments from the fluctuations arising from changes in the market prices of securities held. Such fluctuations are included with the net realized and unrealized gain or loss on investments. Reported net realized foreign exchange gains and losses arise from sales of foreign currencies and currency gains or losses realized between the trade and settlement dates on investment transactions. Net unrealized exchange gains and losses arise from changes in the fair values of assets and liabilities other than investments in securities at the fiscal period end, resulting from changes in exchange rates.
M. Under the Funds’ organizational documents, their Trustees and Officers are indemnified against certain liabilities arising out of the performance of their duties to the Trust. In addition, throughout the normal course of business, the Funds enter into contracts that contain a variety of representations and warranties which provide general indemnifications. The Funds’ maximum exposure under these arrangements is unknown, as this would involve future claims that may be made against the Funds and/or their affiliates that have not yet occurred. However, based on experience, the Funds expect the risk of loss to be remote.
2. Financial Instruments and Derivatives
As part of their investment strategy, the Funds utilize a variety of derivative instruments. These investments involve, to varying degrees, elements of market risk and risks in excess of the amounts recognized in the Statements of Assets and Liabilities. Valuation and accounting treatment of these instruments can be found under Significant Accounting Policies in Note 1 of these Notes to Financial Statements.
Derivatives
Derivatives are instruments whose values depend on, or are derived from, in whole or in part, the value of one or more other assets, such as securities, currencies, commodities or indices. Derivative instruments may be used to increase investment flexibility (including to maintain cash reserves while maintaining exposure to certain other assets), for risk management (hedging) purposes, to facilitate trading, to reduce transaction costs and to pursue higher investment returns. Derivative instruments may also be used to mitigate certain investment risks, such as foreign currency exchange rate risk, interest rate risk and credit risk. U.S. GAAP requires disclosures to enable investors to better understand how and why a Fund uses derivative instruments, how these derivative instruments are accounted for and their effects on the Fund’s financial position and results of operations. The Funds may utilize derivatives for the following purposes:
Duration: the use of an instrument to manage the interest rate risk of a portfolio.
| | THE GUGGENHEIM FUNDS SEMI-ANNUAL REPORT | 77 |
NOTES TO FINANCIAL STATEMENTS (Unaudited)(continued) |
Hedge: an investment made in order to reduce the risk of adverse price movements in a security, by taking an offsetting position to protect against broad market moves.
Options Purchased and Written
A call option on a security gives the purchaser of the option the right to buy, and the writer of a call option the obligation to sell, the underlying security. The purchaser of a put option has the right to sell, and the writer of the put option the obligation to buy, the underlying security at any time during the option period. The risk associated with purchasing options is limited to the premium originally paid.
The following table represents the Funds’ use, and volume of call/put options purchased on a quarterly basis:
Fund | Use | Average Number of Contracts |
Investment Grade Bond Fund | Duration, Hedge | 714 |
Limited Duration Fund | Duration, Hedge | 264 |
The risk in writing a call option is that a Fund may incur a loss if the market price of the underlying security increases and the option is exercised. The risk in writing a put option is that a Fund may incur a loss if the market price of the underlying security decreases and the option is exercised. In addition, there may be an imperfect correlation between the movement in prices of options and the underlying securities where a Fund may not be able to enter into a closing transaction because of an illiquid secondary market; or, for OTC options, the Fund may be at risk because of the counterparty’s inability to perform.
The following tables represent the Funds’ use and activity of options written for the period ended March 31, 2016:
Fund | Use |
Investment Grade Bond Fund | Duration, Hedge |
Limited Duration Fund | Duration, Hedge |
| | | | Limited Duration Fund | | | | Investment Grade Bond Fund | |
| | | Number of
Contracts | | | Premium
Amount | | | Number of
Contracts | | | Premium
Amount | |
Balance at September 30, 2015 | | | 1,056 | | | $ | 28,511 | | | | 581 | | | $ | 15,663 | |
Options Written | | | — | | | | — | | | | — | | | | — | |
Options terminated in closing purchase transactions | | | — | | | | — | | | | — | | | | — | |
Options expired | | | (1,056 | ) | | | (28,511 | ) | | | (581 | ) | | | (15,663 | ) |
Options exercised | | | — | | | | — | | | | — | | | | — | |
Balance at March 31, 2016 | | | — | | | $ | — | | | | — | | | $ | — | |
Futures
A futures contract is an agreement to purchase (long) or sell (short) an agreed amount of securities or other instruments at a set price for delivery at a future date. There are significant risks associated with a Fund’s use of futures contracts, including (i) there may be an imperfect or no correlation between the changes in market value of the underlying asset and the prices of futures contracts; (ii) there may not be a liquid secondary market for a futures contract; (iii) trading restrictions or limitations may be imposed by an exchange; and (iv) government regulations may restrict trading in futures contracts. When investing in futures, there is minimal counterparty credit risk to a Fund because futures are exchange-traded and the exchange’s clearinghouse, as counterparty to all exchange-traded futures, guarantees against default. Cash deposits are shown as segregated cash with broker on the Statements of Assets and Liabilities; securities held as collateral are noted on the Schedules of Investments.
78 | THE GUGGENHEIM FUNDS SEMI-ANNUAL REPORT | |
NOTES TO FINANCIAL STATEMENTS (Unaudited)(continued) |
The following table represents the Funds’ use and volume of futures:
| | | | Average Notional | |
Fund | Use | | Long | | | Short | |
Diversified Income Fund | Hedge | | $ | — | | | $ | 717,675 | |
Forward Foreign Currency Exchange Contracts
A forward foreign currency exchange contract is an agreement between two parties to exchange two designated currencies at a specific time in the future. Certain types of forward foreign currency exchange contracts may be cash settled, in an amount equal to the change in exchange rates during the term of the contract. The contracts can be used to hedge or manage exposure to foreign currency risks with portfolio investments or to gain exposure to foreign currencies.
The market value of a forward foreign currency exchange contract changes with fluctuations in foreign currency exchange rates. Furthermore, the Fund may be exposed to risk if the counterparties cannot meet the contract terms or if the currency value changes unfavorably as compared to the U.S. dollar.
The following table represents the Funds’ use, and volume of forward currency exchange contracts on a quarterly basis:
| | | | Average Settlement | |
Fund | Use | | Purchased | | | Sold | |
High Yield Fund | Hedge | | $ | 10,348,464 | | | $ | 112,506 | |
Derivative Investment Holdings Categorized by Risk Exposure
The following is a summary of the location of derivative investments on the Funds’ Statements of Assets and Liabilities as of March 31, 2016:
Derivative Investment Type | Asset Derivatives | Liability Derivatives |
Equity/Currency contracts | Unrealized appreciation on forward foreign currency exchange contracts | Unrealized depreciation on forward foreign currency exchange contracts |
| | Variation margin |
The following table sets forth the fair value of the Funds’ derivative investments categorized by primary risk exposure at March 31, 2016:
Asset Derivative Investments Value | |
Fund | | Forward
Foreign
Currency
Exchange
Contracts | | | Total Value
at March 31,
2016 | |
High Yield Fund | | $ | 9,031 | | | $ | 9,031 | |
| | THE GUGGENHEIM FUNDS SEMI-ANNUAL REPORT | 79 |
NOTES TO FINANCIAL STATEMENTS (Unaudited)(continued) |
Liability Derivative Investments Value | |
Fund | | Futures
Equity
Contracts* | | | Forward
Foreign
Currency
Exchange
Contracts | | | Total Value
at March 31,
2016 | |
Diversified Income | | $ | (18,638 | ) | | $ | — | | | $ | (18,638 | ) |
High Yield Fund | | | — | | | | (307,128 | ) | | | (307,128 | ) |
* | Includes cumulative appreciation (depreciation) of futures contracts as reported on the Schedules of Investments. Only current day’s variation margin is reported within the Statements of Assets and Liabilities. |
The following is a summary of the location of derivative investments on the Funds’ Statements of Operations for the period ended March 31, 2016:
Derivative Investment Type | Location of Gain (Loss) on Derivatives |
Equity/Currency contracts | Net realized gain (loss) on forward foreign currency exchange contracts |
| Net change in unrealized appreciation (depreciation) on forward foreign currency exchange contracts |
| | Net realized gain (loss) on options purchased |
| Net change in unrealized appreciation (depreciation) on options purchased |
| | Net realized gain (loss) on options written |
| Net change in unrealized appreciation (deprecation) on options written |
| Net realized gain (loss) on futures contracts |
| Net change in unrealized appreciation (depreciation) on futures contracts |
The following is a summary of the Funds’ realized gain (loss) and change in unrealized appreciation (depreciation) on derivative investments recognized on the Statements of Operations categorized by primary risk exposure for the period ended March 31, 2016:
Realized Gain (Loss) on Derivative Investments Recognized on the Statements of Operations | |
Fund | | Futures
Equity
Contracts | | | Options
Written
Interest
Rate
Contracts | | | Options
Purchased
Interest
Rate
Contracts | | | Forward
Foreign
Currency
Exchange Contracts | | | Total | |
Diversified Income | | $ | (18,645 | ) | | $ | — | | | $ | — | | | $ | — | | | $ | (18,645 | ) |
High Yield Fund | | | — | | | | — | | | | — | | | | 304,469 | | | | 304,469 | |
Investment Grade Bond Fund | | | — | | | | 15,664 | | | | (57,363 | ) | | | — | | | | (41,699 | ) |
Limited Duration Fund | | | — | | | | 28,511 | | | | (104,173 | ) | | | — | | | | (75,662 | ) |
Change in Unrealized Appreciation (Depreciation) on Derivative Investments Recognized on the Statements of Operations | |
Fund | | Futures
Equity
Contracts | | | Options
Written
Interest
Rate
Contracts | | | Options
Purchased
Interest
Rate
Contracts | | | Forward
Foreign
Currency
Exchange Contracts | | | Total | |
Diversified Income | | $ | (18,638 | ) | | $ | — | | | $ | — | | | $ | — | | | $ | (18,638 | ) |
High Yield Fund | | | — | | | | — | | | | — | | | | (277,161 | ) | | | (277,161 | ) |
Investment Grade Bond Fund | | | — | | | | 7,577 | | | | (42,971 | ) | | | — | | | | (35,394 | ) |
Limited Duration Fund | | | — | | | | 13,729 | | | | (78,144 | ) | | | — | | | | (64,415 | ) |
80 | THE GUGGENHEIM FUNDS SEMI-ANNUAL REPORT | |
NOTES TO FINANCIAL STATEMENTS (Unaudited)(continued) |
In conjunction with the use short sales and of derivative instruments, the Funds are required to maintain collateral in various forms. The Funds use, where appropriate, depending on the financial instrument utilized and the broker involved, margin deposits at the broker, cash and/or securities segregated at the custodian bank, discount notes or the repurchase agreements allocated to the Funds.
The Trust has established counterparty credit guidelines and enters into transactions only with financial institutions of investment grade or better. The Trust monitors the counterparty credit risk.
3. Fees and Other Transactions with Affiliates
Under the terms of an investment advisory contract, the Funds pay GI investment advisory fees calculated at their annualized rates below, based on the average daily net assets of the Funds:
Fund | Management Fees
(as a % of Net Assets) |
Diversified Income Fund | 0.75% |
High Yield Fund | 0.60% |
Investment Grade Bond Fund | 0.50% |
Limited Duration Fund | 0.45% |
Municipal Income Fund | 0.50% |
RFS is paid the following for providing transfer agent services to the Funds. Transfer agent fees are assessed to the applicable class of each Fund.
Annual charge per account | $5.00 – $8.00 |
Transaction fee | $0.60 – $1.10 |
Minimum annual charge per Fund† | $25,000 |
Certain out-of-pocket charges | Varies |
† | Not subject to Funds during first twelve months of operations. |
RFS also acts as the administrative agent for the Funds, and as such performs administrative functions and the bookkeeping, accounting and pricing functions for each Fund. For these services, RFS receives the following:
Fund | Fund Accounting/
Administrative Fees
(as a % of Net Assets) |
Diversified Income Fund | 0.095% |
High Yield Fund | 0.095% |
Investment Grade Bond Fund | 0.095% |
Limited Duration Fund | 0.095% |
Municipal Income Fund | 0.095% |
| | |
Minimum annual charge per Fund | $25,000 |
Certain out-of-pocket charges | Varies |
RFS engages external service providers to perform other necessary services for the Trust, such as audit and accounting related services, legal services, custody, printing and mailing, etc., on a pass-through basis. Such expenses are allocated to various Funds within the complex based on relative net assets.
The Funds have adopted Distribution Plans related to the offering of A-Class, C-Class and P-Class shares pursuant to Rule 12b-1 under the 1940 Act. The plans provide for payments at an annual rate of 0.25% of the average daily net assets of each Fund’s A-Class and P-Class shares, and 1.00% of the average daily net assets of each Fund’s C-Class shares.
| | THE GUGGENHEIM FUNDS SEMI-ANNUAL REPORT | 81 |
NOTES TO FINANCIAL STATEMENTS (Unaudited)(continued) |
The investment advisory contracts for the following Funds provide that the total expenses be limited to a percentage of average net assets for each class of shares, exclusive of brokerage costs, dividends on securities sold short, expenses of other investment companies in which a Fund invests, interest, taxes, litigation, indemnification and extraordinary expenses. The limits are listed below:
| | Limit | Effective
Date | Contract
End Date |
Diversified Income Fund — A-Class** | 1.30% | 01/29/16 | 02/01/17 |
Diversified Income Fund — C-Class** | 2.05% | 01/29/16 | 02/01/17 |
Diversified Income Fund — P-Class** | 1.30% | 01/29/16 | 02/01/17 |
Diversified Income Fund — Institutional Class** | 1.05% | 01/29/16 | 02/01/17 |
High Yield Fund — A-Class | 1.16% | 11/30/12 | 02/01/17 |
High Yield Fund — C-Class | 1.91% | 11/30/12 | 02/01/17 |
High Yield Fund — P-Class* | 1.16% | 05/01/15 | 02/01/17 |
High Yield Fund — Institutional Class | 0.91% | 11/30/12 | 02/01/17 |
Investment Grade Bond Fund — A-Class | 1.00% | 11/30/12 | 02/01/17 |
Investment Grade Bond Fund — C-Class | 1.75% | 11/30/12 | 02/01/17 |
Investment Grade Bond Fund — P-Class* | 1.00% | 05/01/15 | 02/01/17 |
Investment Grade Bond Fund — Institutional Class | 0.75% | 11/30/12 | 02/01/17 |
Limited Duration Fund — A-Class | 0.80% | 12/01/13 | 02/01/17 |
Limited Duration Fund — C-Class | 1.55% | 12/01/13 | 02/01/17 |
Limited Duration Fund — P-Class* | 0.80% | 05/01/15 | 02/01/17 |
Limited Duration Fund — Institutional Class | 0.55% | 12/01/13 | 02/01/17 |
Municipal Income Fund — A-Class | 0.80% | 11/30/12 | 02/01/17 |
Municipal Income Fund — C-Class | 1.55% | 11/30/12 | 02/01/17 |
Municipal Income Fund — P-Class* | 0.80% | 05/01/15 | 02/01/17 |
Municipal Income Fund — Institutional Class | 0.55% | 11/30/12 | 02/01/17 |
* | Since the commencement of operations: May 1, 2015 |
** | Since the commencement of operations: January 29, 2016 |
GI is entitled to reimbursement by the Funds for fees waived or expenses reimbursed during any of the previous 36 months, beginning on the date of the expense limitation agreement, if on any day the estimated operating expenses are less than the indicated percentages. At March 31, 2016, the amount of fees waived or expenses reimbursed that are subject to recoupment are presented in the following table:
Fund | | Expires
2016 | | | Expires
2017 | | | Expires
2018 | | | Expires
2019 | | | Fund
Total | |
Diversified Income Fund | | $ | — | | | $ | — | | | $ | — | | | $ | 10,661 | | | $ | 10,661 | |
High Yield Fund | | | 109,693 | | | | 81,112 | | | | 53,603 | | | | — | | | | 244,408 | |
Investment Grade Bond Fund | | | 149,682 | | | | 183,531 | | | | 171,425 | | | | 54,448 | | | | 559,086 | |
Limited Duration Fund | | | — | | | | 142,224 | | | | 180,387 | | | | 179,159 | | | | 501,770 | |
Municipal Income Fund | | | 129,927 | | | | 242,274 | | | | 214,145 | | | | 114,629 | | | | 700,976 | |
For the period ended March 31, 2016, GI recouped $17,209 from the High Yield Fund.
If a Fund invests in an affiliated fund, the investing Fund’s Adviser has agreed to waive fees at the investing fund level. Fee waivers will be calculated at the investing Fund level without regard to any expense cap, if any, in effect for the investing Fund. Fees waived under this arrangement are not subject to reimbursement to GI. For the period March 31, 2016, the Diversified Income Fund waived $4,193 related to investments in affiliated funds.
For the period ended March 31, 2016, GFD retained sales charges of $274,695 relating to sales of A-Class shares of the Trust.
Certain trustees and officers of the Trust are also officers of GI, RFS and GFD.
At March 31, 2016, GI and its affiliates owned 100% of the outstanding owned shares of the Diversified Income Fund.
82 | THE GUGGENHEIM FUNDS SEMI-ANNUAL REPORT | |
NOTES TO FINANCIAL STATEMENTS (Unaudited)(continued) |
4. Fair Value Measurement
In accordance with U.S. GAAP, fair value is defined as the price that the Funds would receive to sell an investment or pay to transfer a liability in an orderly transaction with an independent buyer in the principal market, or in the absence of a principal market, the most advantageous market for the investment or liability. U.S. GAAP establishes a three-tier fair value hierarchy based on the types of inputs used to value assets and liabilities and requires corresponding disclosure. The hierarchy and the corresponding inputs are summarized below:
Level 1 — | quoted prices in active markets for identical assets or liabilities. |
Level 2 — | significant other observable inputs (for example quoted prices for securities that are similar based on characteristics such as interest rates, prepayment speeds, credit risk, etc.). |
Level 3 — | significant unobservable inputs based on the best information available under the circumstances, to the extent observable inputs are not available, which may include assumptions. |
The types of inputs available depend on a variety of factors, such as the type of security and the characteristics of the markets in which it trades, if any. Fair valuation determinations that rely on fewer or no observable inputs require greater judgment. Accordingly, fair value determinations for Level 3 securities require the greatest amount of judgment.
Independent pricing services are used to value a majority of the Funds’ investments. When values are not available from a pricing service, they may be computed by the Funds’ investment adviser or an affiliate. In any event, values may be determined using a variety of sources and techniques, including: market prices; broker quotes; and models which derive prices based on inputs such as prices of securities with comparable maturities and characteristics or based on inputs such as anticipated cash flows or collateral, spread over Treasuries, and other information and analysis. A significant portion of the Funds’ assets and liabilities are categorized as Level 2 or Level 3, as indicated in this report.
Indicative quotes from broker-dealers, adjusted for fluctuations in criteria such as credit spreads and interest rates, may be also used to value the Funds’ assets and liabilities, i.e. prices provided by a broker-dealer or other market participant who has not committed to trade at that price. Although indicative quotes are typically received from established market participants, the Funds may not have the transparency to view the underlying inputs which support the market quotations. Significant changes in an indicative quote would generally result in significant changes in the fair value of the security.
Certain fixed income securities are valued by obtaining a monthly indicative quote from a broker-dealer, adjusted for fluctuations in criteria such as credit spreads and interest rates.
The inputs or methodologies used for valuing securities are not necessarily an indication of the risk associated with investing in those securities. The suitability of the techniques and sources employed to determine fair valuation are regularly monitored and subject to change.
| | THE GUGGENHEIM FUNDS SEMI-ANNUAL REPORT | 83 |
NOTES TO FINANCIAL STATEMENTS (Unaudited)(continued) |
The following is a summary of significant unobservable inputs used in the fair valuation of assets and liabilities categorized within Level 3 of the fair value hierarchy:
Fund | Category and
Subcategory | | Ending Balance at 03/31/16 | | Valuation
Technique | Unobservable Inputs |
High Yield Fund | Senior Floating Rate Interests | | $ | 5,788,756 | | Monthly Model Priced | Purchase Price |
| | | | | 577,688 | | Option Adjusted Spread off the prior month end broker mark over the 3 month LIBOR | Indicative Quote |
| | Total Senior Floating Rate Interests | | | 6,366,444 | | | |
Corporate Bonds | | | 2,325,001 | | Monthly Model Priced | Purchase Price |
| | | | | 730,203 | | Monthly Model Priced | Average Comparative Yield* |
| | Total Corporate Bonds | | | 3,055,204 | | | |
Senior Fixed Rate Interests | | | 78,197 | | Monthly Model Priced | Purchase Price |
Preferred Stocks | | | 27,596 | | Option Adjusted Spread off the prior month end broker mark over the 3 month LIBOR | Indicative Quote |
Common Stocks | | | 20,337 | | Monthly Model Priced | Purchase Price |
| | | | | | | |
Investment Grade Bond Fund | Corporate Bonds | | | 1,982,202 | | Option Adjusted Spread off the prior month end broker mark over the 3 month LIBOR | Indicative Quote |
Preferred Stocks | | | 1,953,124 | | Option Adjusted Spread off the prior month end broker mark over the 3 month LIBOR | Indicative Quote |
Collateralized Mortgage Obligations | | | 1,815,414 | | Option Adjusted Spread off the prior month end broker mark over the 3 month LIBOR | Indicative Quote |
Asset-Backed Securities | | | 1,219,318 | | Option Adjusted Spread off the prior month end broker mark over the 3 month LIBOR | Indicative Quote |
| | | | | | | |
Limited Duration Fund | Collateralized Mortgage Obligations | | | 8,753,567 | | Option Adjusted Spread off the prior month end broker mark over the 3 month LIBOR | Indicative Quote |
Asset-Backed Securities | | | 3,960,093 | | Option Adjusted Spread off the prior month end broker mark over the 3 month LIBOR | Indicative Quote |
* | Average comparative yields used ranged between 24.06%-29.28%. |
Any remaining Level 3 securities held by the Funds and excluded from the tables above, were not considered material to the Funds.
84 | THE GUGGENHEIM FUNDS SEMI-ANNUAL REPORT | |
NOTES TO FINANCIAL STATEMENTS (Unaudited)(continued) |
Summary of Fair Value Level 3 Activity
Following is a reconciliation of Level 3 assets and liabilities for which significant unobservable inputs were used to determine fair value for the period ended March 31, 2016:
LEVEL 3 – Fair value measurement using significant unobservable inputs
| | | Senior Floating
Rate Interests | | | Senior Fixed Rate Interests | | | Common
Stocks | | | Preferred
Stocks | | | Corporate
Bonds | | | Total | |
High Yield Fund | | | | | | | | | | | | | | | | | | |
Assets: | | | | | | | | | | | | | | | | | | |
Beginning Balance | | $ | 7,202,981 | | | $ | — | | | $ | 73 | | | $ | 11,039 | | | $ | 3,256,186 | | | $ | 10,470,279 | |
Purchases | | | 1,179,723 | | | | 62,855 | | | | 17,181 | | | | — | | | | 12,039 | | | | 1,271,798 | |
Sales, maturities and paydowns | | | (601,068 | ) | | | — | | | | — | | | | — | | | | (354,500 | ) | | | (955,568 | ) |
Total realized gains or losses included in earnings | | | 10,078 | | | | — | | | | — | | | | — | | | | (231,429 | ) | | | (221,351 | ) |
Total change in unrealized gains or losses included in earnings | | | (1,101,012 | ) | | | 15,342 | | | | 3,083 | | | | — | | | | (670,667 | ) | | | (1,753,254 | ) |
Transfers into Level 3 | | | 141,611 | | | | — | | | | — | | | | — | | | | 1,043,575 | | | | 1,185,186 | |
Transfers out of Level 3 | | | (465,869 | ) | | | — | | | | — | | | | (11,039 | ) | | | — | | | | (476,908 | ) |
Ending Balance | | $ | 6,366,444 | | | $ | 78,197 | | | $ | 20,337 | | | $ | — | | | $ | 3,055,204 | | | $ | 9,520,182 | |
Net Change in unrealized appreciation (depreciation) for investments in securities still held at March 31, 2016 | | $ | (92,971 | ) | | $ | 19,411 | | | $ | 3,083 | | | $ | — | | | $ | (672,278 | ) | | $ | (742,755 | ) |
| | | Asset-Backed
Securities | | | Collateralized
Mortgage
Obligations | | | Preferred
Stocks | | | Corporate
Bonds | | | Total | |
Investment Grade Bond Fund | | | | | | | | | | | | | | | |
Assets: | | | | | | | | | | | | | | | |
Beginning Balance | | $ | 1,260,209 | | | $ | 862,693 | | | $ | 1,742,414 | | | $ | 1,140,016 | | | $ | 5,005,332 | |
Purchases | | | — | | | | 1,060,491 | | | | — | | | | 835,508 | | | | 1,895,999 | |
Sales, maturities and paydowns | | | (35,519 | ) | | | (70,395 | ) | | | — | | | | (7,680 | ) | | | (113,594 | ) |
Total realized gains or losses included in earnings | | | — | | | | — | | | | — | | | | (1,888 | ) | | | (1,888 | ) |
Total change in unrealized gains or losses included in earnings | | | (5,372 | ) | | | (37,375 | ) | | | 210,710 | | | | 16,246 | | | | 184,209 | |
Transfers into Level 3 | | | — | | | | — | | | | — | | | | — | | | | — | |
Transfers out of Level 3 | | | — | | | | — | | | | — | | | | — | | | | — | |
Ending Balance | | $ | 1,219,318 | | | $ | 1,815,414 | | | $ | 1,953,124 | | | $ | 1,982,202 | | | $ | 6,970,058 | |
Net Change in unrealized appreciation (depreciation) for investments in securities still held at March 31, 2016 | | $ | (5,372 | ) | | $ | (50,115 | ) | | $ | 210,710 | | | $ | 16,779 | | | $ | 172,002 | |
| | | Asset-Backed
Securities | | | Collateralized
Mortgage
Obligations | | | Total | |
Limited Duration Fund | | | | | | | | | |
Assets: | | | | | | | | | |
Beginning Balance | | $ | 971,372 | | | $ | — | | | $ | 971,372 | |
Purchases | | | 2,989,652 | | | | 9,340,724 | | | | 12,330,376 | |
Sales, maturities and paydowns | | | (26,000 | ) | | | (582,697 | ) | | | (608,697 | ) |
Total realized gains or losses included in earnings | | | — | | | | — | | | | — | |
Total change in unrealized gains or losses included in earnings | | | 25,069 | | | | (4,460 | ) | | | 20,609 | |
Transfers into Level 3 | | | — | | | | — | | | | — | |
Transfers out of Level 3 | | | — | | | | — | | | | — | |
Ending Balance | | $ | 3,960,093 | | | $ | 8,753,567 | | | $ | 12,713,660 | |
Net Change in unrealized appreciation (depreciation) for investments
in securities still held at March 31, 2016 | | $ | 24,583 | | | $ | (116,248 | ) | | $ | (91,665 | ) |
| | THE GUGGENHEIM FUNDS SEMI-ANNUAL REPORT | 85 |
NOTES TO FINANCIAL STATEMENTS (Unaudited)(continued) |
5. Federal Income Tax Information
The Funds intend to comply with the provisions of Subchapter M of the Internal Revenue Code applicable to regulated investment companies and will distribute substantially all taxable net investment income and capital gains sufficient to relieve the Funds from all, or substantially all, federal income, excise and state income taxes. Therefore, no provision for federal or state income tax is required.
Tax positions taken or expected to be taken in the course of preparing the Funds’ tax returns are evaluated to determine whether the tax positions are “more-likely-than-not” of being sustained by the applicable tax authority. Tax positions not deemed to meet the more-likely-than-not threshold would be recorded as a tax benefit or expense in the current year. Management has analyzed the Funds’ tax positions taken, or to be taken, on Federal income tax returns for all open tax years, and has concluded that no provision for income tax is required in the Funds’ financial statements. The Funds’ federal tax returns are subject to examination by the Internal Revenue Service for a period of three years after they are filed.
At March 31, 2016, the cost of securities for Federal income tax purposes, the aggregate gross unrealized gain for all securities for which there was an excess of value over tax cost and the aggregate gross unrealized loss for all securities for which there was an excess of tax cost over value, were as follows:
Fund | | Tax
Cost | | | Tax
Unrealized
Gain | | | Tax
Unrealized
Loss | | | Net
Unrealized
Gain (Loss) | |
Diversified Income Fund | | $ | 4,956,879 | | | $ | 129,681 | | | $ | (3,025 | ) | | $ | 126,656 | |
High Yield Fund | | | 245,707,938 | | | | 3,243,284 | | | | (22,607,733 | ) | | | (19,364,449 | ) |
Investment Grade Bond Fund | | | 194,261,738 | | | | 3,129,028 | | | | (7,857,004 | ) | | | (4,727,976 | ) |
Limited Duration Fund | | | 573,861,888 | | | | 1,979,885 | | | | (9,182,545 | ) | | | (7,202,660 | ) |
Municipal Income Fund | | | 64,239,418 | | | | 2,786,335 | | | | (194,043 | ) | | | 2,592,292 | |
6. Securities Transactions
For the period ended March 31, 2016, the cost of purchases and proceeds from sales of investment securities, excluding government securities, short-term investments and derivatives, were as follows:
Fund | | Purchases | | | Sales | |
Diversified Income Fund | | $ | 5,256,499 | | | $ | 322,887 | |
High Yield Fund | | | 100,352,385 | | | | 41,067,373 | |
Investment Grade Bond Fund | | | 86,739,844 | | | | 61,374,778 | |
Limited Duration Fund | | | 307,111,415 | | | | 60,234,625 | |
Municipal Income Fund | | | 27,991,067 | | | | 22,622,142 | |
For the period ended March 31, 2016, the cost of purchases and proceeds from sales of government securities were as follows:
Fund | | Purchases | | | Sales | |
Investment Grade Bond Fund | | $ | 31,678,319 | | | $ | 24,157,760 | |
86 | THE GUGGENHEIM FUNDS SEMI-ANNUAL REPORT | |
NOTES TO FINANCIAL STATEMENTS (Unaudited)(continued) |
The Funds are permitted to purchase or sell securities from or to certain affiliated funds under specified conditions outlined in procedures adopted by the Board of Trustees of the Trust. The procedures have been designed to ensure that any purchase or sale of securities by a Fund from or to another fund or portfolio that is or could be considered an affiliate by virtue of having a common investment adviser (or affiliated investment advisers), common Trustees and/or common officers complies with Rule 17a-7 of the 1940 Act. Further, as defined under these procedures, each transaction is effected at the current market price to save costs, where permissible. For the period ended March 31, 2016, the Funds engaged in purchases and sales of securities, pursuant to Rule 17a-7 of the 1940 Act, as follows:
Fund | | Purchase | | | Sales | | | Realized
Gain (Loss) | |
High Yield Fund | | $ | 3,852,970 | | | $ | — | | | $ | — | |
Investment Grade Bond Fund | | | 149,625 | | | | — | | | | — | |
Limited Duration Fund | | | 1,396,500 | | | | — | | | | — | |
7. Affiliated Transactions
Investments representing 5% or more of the outstanding voting shares of a portfolio company of a fund, or control of or by, or common control under GI, result in that portfolio company being considered an affiliated company of such fund, as defined in the 1940 Act.
The Funds may invest in the Guggenheim Strategy Funds Trust consisting of Guggenheim Strategy Fund I, Guggenheim Strategy Fund II, Guggenheim Strategy Fund III, and Guggenheim Variable Insurance Strategy Fund III (collectively, the “Cash Management Funds”), open-end management investment companies managed by GI. The Cash Management Funds, which launched on March 11, 2014, are offered as cash management options only to mutual funds, trusts, and other accounts managed by GI and/or its affiliates, and are not available to the public. The Cash Management Funds pay no investment management fees. The Cash Management Funds’ annual report on Form N-CSR dated September 30, 2015 is available publicly or upon request. This information is available from the EDGAR database on the SEC’s website at http://www.sec.gov/Archives/edgar/data/1601445/000089180415000857/gug63224-ncsr.htm.
Transactions during the period ended March 31, 2016, in which the portfolio company is an “affiliated person”, were as follows:
Affiliated issuers by Fund | | Value
09/30/15 | | | Additions | | | Reductions | | | Value
03/31/16 | | | Shares
03/31/16 | | | Investment Income | | | Realized Gain (Loss) | |
Diversified Income Fund | | | | | | | | | | | | | | | | | | | | | |
Guggenheim Floating Rate Strategies Fund - Institutional Class | | $ | — | | | $ | 1,057,498 | | | $ | (12,963 | ) | | $ | 1,053,695 | | | | 41,665 | | | $ | 7,498 | | | $ | (10 | ) |
Guggenheim World Equity Income Fund - Institutional Class | | | — | | | | 353,516 | | | | (4,321 | ) | | | 365,229 | | | | 27,987 | | | | 3,516 | | | | (42 | ) |
Guggenheim Investment Grade Bond Fund - Institutional Class | | | — | | | | 503,295 | | | | (6,173 | ) | | | 498,803 | | | | 27,835 | | | | 3,295 | | | | 7 | |
Guggenheim High Yield Fund -Insitutional Class | | | — | | | | 1,263,786 | | | | (15,432 | ) | | | 1,267,801 | | | | 150,392 | | | | 13,786 | | | | (75 | ) |
Guggenheim Limited Duration Fund - Institutional Class | | | — | | | | 703,418 | | | | (8,642 | ) | | | 691,937 | | | | 28,533 | | | | 3,418 | | | | (7 | ) |
Guggenheim Risk Managed Real Estate Fund - Institutional Class | | | — | | | | 201,054 | | | | (2,469 | ) | | | 214,457 | | | | 7,640 | | | | 1,054 | | | | (17 | ) |
Guggenheim S&P High Income Infrastructure ETF | | | — | | | | 499,951 | | | | — | | | | 546,579 | | | | 23,785 | | | | 4,219 | | | | — | |
| | | $ | — | | | $ | 4,582,518 | | | $ | (50,000 | ) | | $ | 4,638,501 | | | | | | | $ | 36,786 | | | $ | (144 | ) |
Limited Duration Fund | | | | | | | | | | | | | | | | | | | | | | | | | | | | |
Guggenheim Strategy Fund I | | $ | 7,269,053 | | | $ | 14,308,353 | | | $ | (8,279,019 | ) | | $ | 13,270,617 | | | | 534,890 | | | $ | 58,353 | | | $ | (10,789 | ) |
8. Loan Commitments
Pursuant to the terms of certain loan agreements, certain Funds held unfunded loan commitments as of March 31, 2016. The Funds are obligated to fund these loan commitments at the borrower’s discretion.
| | THE GUGGENHEIM FUNDS SEMI-ANNUAL REPORT | 87 |
NOTES TO FINANCIAL STATEMENTS (Unaudited)(continued) |
The unfunded loan commitments as of March 31, 2016 were as follows:
Borrower | Maturity Date | | Face Amount | | | Value | |
High Yield Fund | | | | | | | |
Acosta, Inc. | 9/26/2019 | | $ | 1,000,000 | | | $ | 92,837 | |
Advantage Sales & Marketing LLC | 7/25/2019 | | | 990,000 | | | | 84,608 | |
Arch Coal, Inc. | 1/31/2017 | | | 44,825 | | | | 1,793 | |
Aspect Software, Inc. | 9/30/2016 | | | 43,831 | | | | — | |
BBB Industries, LLC | 11/4/2019 | | | 342,857 | | | | 34,248 | |
Deltek, Inc. | 6/25/2020 | | | 800,000 | | | | 84,346 | |
Epicor Software | 6/1/2020 | | | 1,000,000 | | | | 103,764 | |
Eyemart Express | 12/18/2019 | | | 600,000 | | | | 54,096 | |
Hillman Group, Inc. | 6/28/2019 | | | 385,714 | | | | 27,418 | |
Learning Care Group (US), Inc. | 5/5/2019 | | | 500,000 | | | | 44,468 | |
McGraw-Hill Global Education Holdings LLC | 3/22/2018 | | | 1,000,000 | | | | 47,742 | |
National Technical Systems | 6/12/2021 | | | 250,000 | | | | 27,071 | |
Phillips-Medsize Corp. | 6/14/2019 | | | 1,100,000 | | | | 83,996 | |
Pro Mach Group, Inc. | 10/22/2019 | | | 900,000 | | | | 77,185 | |
Signode Industrial Group US, Inc. | 5/1/2019 | | | 1,800,000 | | | | 138,348 | |
Wencor Group | 6/19/2019 | | | 628,462 | | | | 47,362 | |
| | | | $ | 11,385,689 | | | $ | 949,282 | |
9. Line of Credit
The Funds, with the exception of Alpha Opportunity Fund, Capital Stewardship Fund, Diversified Income Fund and Market Neutral Real Estate Fund, secured a committed $800,000,000 line of credit from Citibank, N.A., good through October 7, 2016, at which time the line of credit may be renewed. This line of credit is reserved for emergency or temporary purposes. Fees related to borrowings, if any, vary under this arrangement between the greater of Citibank’s “base rate”, LIBOR plus 1%, or the Federal Funds Rate (0.25% at March 31, 2016), plus 1/2 of 1%. The Funds also pay a commitment fee at an annualized rate of 0.15% of the average daily amount of their unused commitment amount. The Funds did not have any borrowings under this agreement as of and for the period ended March 31, 2016.
10. Repurchase Agreements
In connection with transactions in repurchase agreements, it is the Funds’ policy that their custodian takes possession of the underlying collateral. The collateral is in the possession of the Funds’ custodian and is evaluated to ensure that its market value exceeds, at a minimum, 102% of the original face amount of the repurchase agreements.
| Fund | Counterparty and Terms of Agreement | | | Face
Value | | | Repurchase
Price | | Collateral | | | Par
Value | | | Fair
Value |
| Limited Duration Fund | Jefferies & Company, Inc. | | | | | | Neuberger Berman CLO Ltd. | | | | | |
| | 2.94% - 3.44% | | | | | | | | 01/23/24 - 07/15/27* | | $ | 25,602,000 | | $ | 16,388,940 |
| | Due 04/01/16 -04/28/16 | | $ | 21,748,000 | | $ | 21,801,155 | | American Money Management Corp. | | | | | | |
| | | | | | | | | | 04/14/27* | | | 7,600,000 | | | 7,764,312 |
| | | | | | | | | | Whitehorse Ltd. | | | | | | |
| | | | | | | | | | 02/03/25* | | | 18,050,000 | | | 5,529,442 |
| | | | | | | | | | Ares CLO Ltd. | | | | | | |
| | | | | | | | | | 11/25/20* | | | 4,750,000 | | | 5,181,300 |
| | | | | | | | | | JP Morgan Chase Commercial Mortgage Securities Trust | | | | | | |
| | | | | | | | | | 1.69% | | | | | | |
| | | | | | | | | | 12/15/16 | | | 4,007,000 | | | 3,991,533 |
| | | | | | | | | | Cathedral Lake Ltd. | | | | | | |
| | | | | | | | | | 07/15/27* | | | 10,450,000 | | | 2,874,000 |
88 | THE GUGGENHEIM FUNDS SEMI-ANNUAL REPORT | |
NOTES TO FINANCIAL STATEMENTS (Unaudited)(continued) |
| Fund | Counterparty and
Terms of Agreement | | | Face
Value | | | Repurchase
Price | | Collateral | | | Par
Value | | | Fair
Value |
| | | | | | | | | | Banc of America Commercial Mortgage Trust | | | | | | |
| | | | | | | | | | 4.77% | | | | | | |
| | | | | | | | | | 07/10/43 | | $ | 2,364,000 | | $ | 2,401,848 |
| | | | | | | | | | Mohegan Tribal Finance Authority | | | | | | |
| | | | | | | | | | 7.00% | | | | | | |
| | | | | | | | | | 02/01/45 | | | 2,375,000 | | | 2,372,032 |
| | | | | | | | | | GCCFC Commercial Mortgage Trust | | | | | | |
| | | | | | | | | | 5.50% | | | | | | |
| | | | | | | | | | 10/10/15 | | | 2,325,000 | | | 2,323,210 |
| | | | | | | | | | GS Mortgage Securities Trust | | | | | | |
| | | | | | | | | | 5.79% | | | | | | |
| | | | | | | | | | 08/10/45 | | | 1,897,000 | | | 1,814,177 |
| | | | | | | | | | Puerto Rico Commonwealth Aqueduct & Sewer Authority | | | | | | |
| | | | | | | | | | 3.92% | | | | | | |
| | | | | | | | | | 07/01/16 | | | 1,895,000 | | | 1,491,630 |
| | | | | | | | | | WF-RBS Commercial Mortgage Trust | | | | | | |
| | | | | | | | | | 3.91% | | | | | | |
| | | | | | | | | | 09/15/57 | | | 2,000,000 | | | 1,470,660 |
| | | | | | | | | | Nelder Grove CLO Ltd. | | | | | | |
| | | | | | | | | | 08/28/26* | | | 4,100,000 | | | 820,000 |
| | | | | | | | | | State of California | | | | | | |
| | | | | | | | | | 4.00% | | | | | | |
| | | | | | | | | | 09/01/35 | | | 640,000 | | | 702,893 |
| | | | | | | | | | Acis CLO Ltd. | | | | | | |
| | | | | | | | | | 0.00% | | | | | | |
| | | | | | | | | | 05/01/27 | | | 7,500,000 | | | 675,000 |
| | | | | | | | | | Hilton USA Trust | | | | | | |
| | | | | | | | | | 3.69% | | | | | | |
| | | | | | | | | | 07/15/16 | | | 385,000 | | | 384,965 |
| | | | | | | | | | | | $ | $95,940,000 | | $ | $56,185,942 |
In the event of counterparty default, the Funds have the right to collect the collateral to offset losses incurred. There is potential loss to the Funds in the event the Funds are delayed or prevented from exercising their rights to dispose of the collateral securities, including the risk of a possible decline in the value of the underlying securities during the period while the Funds seek to assert their rights. The Funds’ investment adviser, acting under the supervision of the Board of Trustees, reviews the value of the collateral and the creditworthiness of those banks and dealers with which the Funds enter into repurchase agreements to evaluate potential risks.
| | THE GUGGENHEIM FUNDS SEMI-ANNUAL REPORT | 89 |
NOTES TO FINANCIAL STATEMENTS (Unaudited)(continued) |
11. Reverse Repurchase Agreements
Each of the Funds may enter into reverse repurchase agreements. Under a reverse repurchase agreement, a Fund sells securities and agrees to repurchase them at a particular price at a future date. In the event the buyer of securities under a reverse repurchase agreement files for bankruptcy or becomes insolvent, such buyer or its trustee or receiver may receive an extension of time to determine whether to enforce the Fund’s obligation to repurchase the securities, and the Fund’s use of the proceeds of the reverse repurchase agreement may effectively be restricted pending such decision.
For the period ended March 31, 2016, the following Funds entered into reverse repurchase agreements as follows:
Fund | | Number
of Days
Outstanding | | | Balance at
March 31,
2016 | | | Average
Balance
Outstanding | | | Average
Interest
Rate | |
High Yield Fund | | | 183 | | | $ | 8,911,433 | | | $ | 14,712,034 | | | | 0.77 | % |
Investment Grade Bond Fund | | | 183 | | | | 8,275,180 | | | | 12,463,002 | | | | 0.55 | % |
Limited Duration Fund | | | 183 | | | | 7,595,000 | | | | 11,998,407 | | | | 1.48 | % |
The following table presents reverse repurchase agreements that are subject to netting arrangements and offset in the Statements of Assets and Liabilities in conformity with U.S. GAAP.
| | | | | | | | | | | | | Gross Amounts Not Offset
in the Statements of
Assets and Liabilities | | | | |
Fund | Instrument | | Gross Amounts of Recognized Liabilities | | | Gross Amounts Offset In the Statements of Assets and Liabilities | | | Net Amount of Liabilities Presented on the Statements of Assets and Liabilities | | | Financial
Instruments | | | Cash
Collateral
Pledged | | | Net
Amount | |
High Yield Fund | Reverse repurchase agreements | | $ | 8,911,433 | | | $ | — | | | $ | 8,911,433 | | | $ | 8,911,433 | | | $ | — | | | $ | — | |
Investment Grade Bond Fund | Reverse repurchase agreements | | | 8,275,180 | | | | — | | | | 8,275,180 | | | | 8,275,180 | | | | — | | | | — | |
Limited Duration Fund | Reverse repurchase agreements | | | 7,595,000 | | | | — | | | | 7,595,000 | | | | 7,595,000 | | | | — | | | | — | |
In June 2014, the FASB issued Accounting Standards Update 2014-11, Repurchase-to-Maturity Transactions, Repurchase Financings, and Disclosures (ASU 2014-11) that expanded secured borrowing accounting for certain repurchase agreements. The ASU also sets forth additional disclosure requirements for certain transactions accounted for as secured borrowings, which applies to the reverse repurchase agreements held by the Funds. The ASU became effective prospectively for annual periods beginning after December 15, 2014, and for interim periods beginning after March 15, 2015. The Funds have adopted the ASU.
90 | THE GUGGENHEIM FUNDS SEMI-ANNUAL REPORT | |
NOTES TO FINANCIAL STATEMENTS (Unaudited)(continued) |
The following is a summary of the remaining contractual maturities of the reverse repurchase agreements outstanding as of year-end, aggregated by asset class of the related collateral pledged by the Funds:
| | | Overnight and Continuous | | | Up to
30 days | | | 31-90
days | | | Greater than 90 days | | | Total | |
High Yield Fund | | | | | | | | | | | | | | | |
Corporate Bonds | | $ | 4,134,050 | | | $ | — | | | $ | 1,652,383 | | | $ | 3,125,000 | | | $ | 8,911,433 | |
Gross amount of recognized liabilities for reverse repurchase agreements | | | 4,134,050 | | | | — | | | | 1,652,383 | | | | 3,125,000 | | | | 8,911,433 | |
| | | | | | | | | | | | | | | | | | | | | |
Investment Grade Bond Fund | | | | | | | | | | | | | | | | | | | | |
Corporate Bonds | | | 612,188 | | | | 5,697,992 | | | | — | | | | — | | | | 6,310,180 | |
Municipal Bonds | | | — | | | | 1,965,000 | | | | — | | | | — | | | | 1,965,000 | |
Gross amount of recognized liabilities for reverse repurchase agreements | | | 612,188 | | | | 7,662,992 | | | | — | | | | — | | | | 8,275,180 | |
| | | | | | | | | | | | | | | | | | | | | |
Limited Duration Fund | | | | | | | | | | | | | | | | | | | | |
Asset Backed Securities | | | — | | | | — | | | | 7,595,000 | | | | — | | | | 7,595,000 | |
Gross amount of recognized liabilities for reverse repurchase agreements | | | — | | | | — | | | | 7,595,000 | | | | — | | | | 7,595,000 | |
12. P-Class Shares
Effective May 1, 2015, the Funds started to offer P-Class shares. P-Class shares of the Funds are offered primarily through broker/dealers and other financial intermediaries with which GFD has an agreement for the use of P-Class shares of the Funds in investment products, programs or accounts. P-Class shares do not have a minimum initial investment amount, subsequent investment amount or a minimum account balance.
13. Legal Proceedings
Motors Liquidation Company
In June 2015, High Yield Fund became aware that it was named as a defendant in the case entitled Official Committee of Unsecured Creditors of Motors Liquidation Company v. JPMorgan Chase Bank, N.A., et al., Adversary Proceeding No. 09-00504 (Bankr. S.D.N.Y.). The lawsuit was initially filed in the United States Bankruptcy Court for the Southern District of New York on July 31, 2009 by the Official Committee of Unsecured Creditors of Motors Liquidation Company (f/k/a General Motors) against the former holders of an approximately $1.5 billion term loan issued pursuant to a term loan agreement, dated as of November 29, 2006, between General Motors, as borrower, JPMorgan Chase Bank, N.A., as administrative agent (“JPMorgan”), and various institutions as lenders, including High Yield Fund (f/k/a Security Income Fund – High Yield Series). The term loan lenders received a full repayment of the term loan pursuant to a court order issued in connection with the General Motors chapter 11 bankruptcy filing on June 1, 2009. The plaintiffs are seeking a court order that the lenders return the proceeds received in 2009 based on the contention that the security interest held by the lenders was not properly perfected, and as a result the lenders were unsecured creditors at the time General Motors filed for bankruptcy.
This lawsuit does not allege any wrongdoing on the part of the High Yield Fund and the Fund intends to vigorously defend the matter. If the plaintiffs are successful, it is reasonably possible that the High Yield Fund will be required to make payments in some amount (but not likely to exceed approximately $1,000,000), although the Fund may file or otherwise be a party to a cross-claim against a codefendant. At this stage of the proceedings, the High Yield Fund is unable to make a reliable predication as to the outcome of this lawsuit or the effect, if any, on the Fund’s net asset value. The High Yield Fund was not previously aware that it had been named as a defendant in this case because, in 2009, the Bankruptcy Court allowed the plaintiffs to refrain from serving any of the defendants other than JPMorgan with notice of the filing of the lawsuit.
| | THE GUGGENHEIM FUNDS SEMI-ANNUAL REPORT | 91 |
NOTES TO FINANCIAL STATEMENTS (Unaudited)(continued) |
14. Restricted Securities
The securities below are considered illiquid and restricted under guidelines established by the Board:
Fund | | Restricted Securities | | Acquisition Date | | Cost | | | Value | |
High Yield Fund | | Schahin II Finance Company SPV Ltd. | | | | | | | | |
| | | 5.88% due 09/25/22 | | 03/12/15 | | $ | 139,296 | | | $ | 31,598 | |
| | | Unifrax I LLC / Unifrax Holding Co. | | | | | | | | | | |
| | | 7.50% due 02/15/19 | | 01/17/14 | | | 144,661 | | | | 86,450 | |
| | | R&R Ice Cream plc | | | | | | | | | | |
| | | 8.25% due 05/15/20 | | 06/19/14 | | | 187,926 | | | | 158,018 | |
| | | | | | | | 471,883 | | | | 276,066 | |
| | | | | | | | | | | | | |
Investment Grade Bond Fund | | Cadence Bank North America | | | | | | | | | | |
| | | 6.25% due 06/28/29 | | 06/06/14 | | | 200,000 | | | | 172,500 | |
| | | Customers Bank | | | | | | | | | | |
| | | 6.12% due 06/26/29 | | 06/24/14 | | | 500,000 | | | | 500,000 | |
| | | TIG Holdings, Inc. | | | | | | | | | | |
| | | 8.60% due 01/15/27 | | 06/29/05 | | | 29,097 | | | | 27,710 | |
| | | Woodbourne Capital Trust I | | | | | | | | | | |
| | | 0.03% | | 01/20/06 | | | 954,589 | | | | 488,281 | |
| | | Woodbourne Capital Trust II | | | | | | | | | | |
| | | 0.03% | | 01/20/06 | | | 954,589 | | | | 488,281 | |
| | | Woodbourne Capital Trust III | | | | | | | | | | |
| | | 0.03% | | 01/20/06 | | | 954,589 | | | | 488,281 | |
| | | Woodbourne Capital Trust IV | | | | | | | | | | |
| | | 0.03% | | 01/20/06 | | | 954,589 | | | | 488,281 | |
| | | | | | | | 4,547,451 | | | | 2,653,334 | |
| | | | | | | | | | | | | |
Limited Duration Fund | | RFTI Issuer Ltd. | | | | | | | | | | |
| | | 2.19% due 08/15/30 | | 10/14/15 | | | 3,979,984 | | | | 3,991,574 | |
| | | Schahin II Finance Company SPV Ltd. | | | | | | | | | | |
| | | 5.88% due 09/25/22 | | 01/08/14 | | | 375,036 | | | | 56,876 | |
| | | | | | | | 4,355,020 | | | | 4,048,450 | |
15. Offsetting
In the normal course of business, the Funds enter into transactions subject to enforceable master netting arrangements or other similar arrangements. Generally, the right to offset in those agreements allows the Funds to counteract the exposure to a specific counterparty with collateral received or delivered to that counterparty based on the terms of the arrangements. These arrangements provide for the right to liquidate upon the occurrence of an event of default, credit event upon merger or additional termination event.
In order to better define their contractual rights and to secure rights that will help the Funds mitigate their counterparty risk, the Funds may enter into an International Swaps and Derivatives Association, Inc. Master Agreement (“ISDA Master Agreement”) or similar agreement with their derivative contract counterparties. An ISDA Master Agreement is a bilateral agreement between a Fund and a counterparty that governs OTC derivatives, including foreign exchange contracts, and typically contains, among other things, collateral posting terms and netting provisions in the event of a default and/or termination event. The provisions of the ISDA Master Agreement typically permit a single net payment in the event of a default (close-out netting) or similar event, including the bankruptcy or insolvency of the counterparty.
For derivatives traded under an ISDA Master Agreement, the collateral requirements are typically calculated by netting the mark to market amount for each transaction under such agreement and comparing that amount to the value of any collateral currently pledged by the Funds and the counterparty. For financial reporting purposes, cash collateral that has been pledged to cover obligations of the Funds and cash collateral received from the counterparty, if any, is reported separately on the Statements of Assets and Liabilities as segregated cash with broker/receivable for variation margin, or payable for swap settlement/variation margin. Generally, the amount of collateral due from or to a counterparty must
92 | THE GUGGENHEIM FUNDS SEMI-ANNUAL REPORT | |
NOTES TO FINANCIAL STATEMENTS (Unaudited)(concluded) |
exceed a minimum transfer amount threshold (e.g., $300,000) before a transfer is required to be made. To the extent amounts due to the Funds from their counterparties are not fully collateralized, contractually or otherwise, the Funds bear the risk of loss from counterparty nonperformance. The Funds attempt to mitigate counterparty risk by only entering into agreements with counterparties that they believe to be of good standing and by monitoring the financial stability of those counterparties.
For financial reporting purposes, the Funds do not offset derivative assets and derivative liabilities that are subject to netting arrangements in the Statements of Assets and Liabilities.
The following tables present derivative financial instruments and secured financing transactions that are subject to enforceable netting arrangements and offset in the Statements of Assets and Liabilities in conformity with U.S. GAAP.
| | | | | | | | | | | | | Gross Amounts Not Offset
in the Statements of
Assets and Liabilities | | | | |
Fund | Instrument | | Gross Amounts of Recognized Assets1 | | | Gross Amounts Offset in the Statements of Assets and Liabilities | | | Net Amount of Assets Presented on the Statements of Assets and Liabilities | | | Financial Instruments | | | Cash Collateral Received | | | Net
Amount | |
High Yield Fund | Forward foreign currency exchange contracts | | $ | 9,031 | | | $ | — | | | $ | 9,031 | | | $ | 9,031 | | | $ | — | | | $ | — | |
| | | | | | | | | | | | | Gross Amounts Not Offset
in the Statements of
Assets and Liabilities | | | | |
Fund | Instrument | | Gross Amounts of
Recognized Liabilities1 | | | Gross Amounts Offset In the Statements
of Assets and Liabilities | | | Net Amount
of Liabilities
Presented on the Statements of Assets and Liabilities | | | Financial Instruments | | | Cash
Collateral
Received | | | Net
Amount | |
High Yield Fund | Forward foreign currency exchange contracts | | $ | 307,128 | | | $ | — | | | $ | 307,128 | | | $ | 9,031 | | | $ | — | | | $ | 298,097 | |
1 | Exchange-traded futures are excluded from these reported amounts. |
| | THE GUGGENHEIM FUNDS SEMI-ANNUAL REPORT | 93 |
OTHER INFORMATION (Unaudited) |
Proxy Voting Information
A description of the policies and procedures that the Trust uses to determine how to vote proxies relating to securities held in the Funds’ portfolios is available, without charge and upon request, by calling 800.820.0888. This information is also available from the EDGAR database on the SEC’s website at http://www.sec.gov.
Information regarding how the Funds voted proxies relating to portfolio securities during the most recent 12-month period ended June 30 is available without charge, upon request, by calling 800.820.0888. This information is also available from the EDGAR database on the SEC’s website at http://www.sec.gov.
Sector Classification
Information in the “Schedule of Investments” is categorized by sectors using sector-level Classifications defined by the Bloomberg Industry Classification System, a widely recognized industry classification system provider. Each Fund’s registration statement has investment policies relating to concentration in specific sectors/industries. For purposes of these investment policies, the Funds usually classify sectors/industries based on industry-level Classifications used by widely recognized industry classification system providers such as Bloomberg Industry Classification System, Global Industry Classification Standards and Barclays Global Classification Scheme.
Quarterly Portfolio Schedules Information
The Trust files its complete schedule of portfolio holdings with the SEC for the first and third quarters of each fiscal year on Form N-Q; which are available on the SEC’s website at http://www.sec.gov. The Funds’ Forms N-Q may be reviewed and copied at the SEC’s Public Reference Room in Washington, DC, and that information on the operation of the Public Reference Room may be obtained by calling 800-SEC-0330. Copies of the portfolio holdings are also available to shareholders, without charge and upon request, by calling 800.820.0888.
Board Considerations Regarding Approval of Investment Management Agreement - Guggenheim Diversified Income Fund
Guggenheim Funds Trust (the “Trust”) was organized as a Delaware statutory trust on November 8, 2013, and is registered as an open-end management investment company under the Investment Company Act of 1940, as amended (the “1940 Act”). The Trust is authorized to issue an unlimited number of shares of beneficial interest in separate series, with each such series representing interests in a portfolio of securities and other assets (each, a “Fund” and collectively, the “Funds”). On August 20, 2015, Guggenheim Partners Investment Management, LLC (“GPIM” or the “Investment Adviser”), an indirect subsidiary of Guggenheim Partners, LLC, a global diversified financial services firm (“Guggenheim Partners”), was approved to serve as the investment adviser to the Guggenheim Diversified Income Fund (the “New Fund”), a new series of the Trust, pursuant to an investment advisory agreement between the Trust and GPIM, with respect to the New Fund (the “Investment Advisory Agreement”). (Guggenheim Partners, GPIM and its affiliates may be referred to herein together as “Guggenheim.”) Under the supervision of the Board of Trustees of the Trust (the “Board,” with the members of the Board referred to individually as the “Trustees”), GPIM regularly provides (or oversees the provision of) investment research, advice and supervision, a continuous investment program and the purchase and sale of securities and other investments for various Funds’ portfolios. GPIM will provide those same services to the New Fund.
The 1940 Act, provides, in substance, that an investment advisory agreement between a fund and its investment adviser may be entered into only if it is approved, and may continue in effect from year to year after an initial two-year period only if its continuance is approved at least annually, by the fund’s board of trustees, including by a vote of a majority of the trustees who are not “interested persons,” as defined by the 1940 Act, of the fund, cast in person at a meeting called for the purpose of considering such approval. At a meeting held in person on August 20, 2015 (the “August Meeting”), the Trustees who are not “interested persons” (collectively, the “Independent Trustees”) met separately from Guggenheim to consider the approval of the proposed Investment Advisory Agreement. As part of its review process, the Independent Trustees were represented by independent legal counsel (“Independent Legal Counsel”). Independent Legal Counsel reviewed and discussed with the Independent Trustees various factors relevant to the consideration of the Investment Advisory Agreement and the legal responsibilities of the Trustees related to such consideration and assisted the Independent Trustees in their deliberations.
94 | THE GUGGENHEIM FUNDS SEMI-ANNUAL REPORT | |
OTHER INFORMATION (Unaudited)(continued) |
The Trustees, including the Independent Trustees, discussed the Investment Advisory Agreement in light of the regulatory requirements and criteria and assessed information concerning the New Fund’s proposed investment advisory fee, investment objective and policies, investment strategies and expected strategy allocation weights, market opportunity and portfolio management team (including biographies), among other things. GPIM provided peer group comparisons of the proposed advisory fee and total operating expenses, as set forth in a report prepared by an independent, third party research provider, FUSE Research Networks LLC (“FUSE”).
The Independent Trustees also considered the variety of written materials, reports and oral presentations it received during the year with respect to the other series of the Trust and in connection with the Independent Trustees’ service on the boards of trustees of other registered investment companies or series thereof for which GPIM or an affiliate serves as investment adviser or sub-adviser (“Guggenheim Funds”). Thus, in connection with their consideration of the proposed Investment Advisory Agreement, the Independent Trustees also took into account relevant material provided by Guggenheim relating to the annual contract renewal proposals for the Guggenheim Funds considered at the May 19-20, 2015 Board meeting (“Contract Renewal”), including information concerning Guggenheim’s resources and financial information, as updated at the August Meeting.
The Board considered the foregoing materials in the context of its substantial accumulated experience in governing the other Guggenheim Funds and weighed the factors and standards discussed with Independent Legal Counsel. Following an analysis and discussion of the factors identified below and in the exercise of its business judgment, the Board concluded that it was in the best interests of the New Fund to approve the Investment Advisory Agreement for an initial term of two years.
Nature, Extent and Quality of Services to Be Provided by the Investment Adviser: With respect to the nature, extent and quality of services to be provided by the Investment Adviser for the New Fund, the Independent Trustees considered the functions to be performed by the Investment Adviser for the New Fund and the nature and quality of services provided by GPIM in the past, including the firm’s management capabilities demonstrated with respect to other Guggenheim Funds. The Independent Trustees also considered the Investment Adviser’s attention to relevant developments in the mutual fund industry and its observance of compliance and regulatory requirements and noted that on a regular basis the Board receives and reviews information from the Trust’s Chief Compliance Officer regarding compliance policies and procedures established pursuant to Rule 38a-1 under the 1940 Act. The Board took into consideration the recent settlement of a regulatory matter and remedial steps taken in response by the Investment Adviser to enhance its compliance structure. In addition, the Independent Trustees took into account the various compliance and risk management initiatives undertaken by Guggenheim, including, among other things, the hiring of additional staff to support the firm’s Chief Risk Officer, initiatives related to the risks associated with the investment process and risk at the enterprise level, the organization’s risk management infrastructure and critical activities. The Independent Trustees also considered other initiatives intended to achieve greater enhancements and efficiencies in the organization’s ability to provide services to all Guggenheim Funds, including the New Fund, such as efforts to consolidate compliance manuals and align processes of the Funds with those of other funds managed by the Investment Manager or another Guggenheim affiliate. Moreover, in connection with the Board’s evaluation of the overall package of services to be provided by the Investment Adviser, the Board considered the Investment Adviser’s administrative capabilities, including its role in monitoring and coordinating compliance responsibilities with the fund administrator, transfer agent, distributor, custodian and other service providers to the New Fund.
With respect to Guggenheim’s resources and the ability of the Investment Adviser to carry out its responsibilities under the Investment Advisory Agreement, the Trustees considered the presentation by the Chief Financial Officer of Guggenheim Investments (the investment management business of Guggenheim Partners) in connection with Contract Renewal and his review of the audited financial statements of Guggenheim Partners Investment Management Holdings, LLC (“GPIMH”), the holding company of the investment advisers/managers (including GPIM), broker/dealers and other entities that comprise Guggenheim Investments. In this connection, the Board took into account management’s statement at the August Meeting that there have been no material adverse changes to the previously provided Contract Renewal materials, including the financial information, that would affect the Investment Adviser’s ability to carry out its responsibilities under the Investment Advisory Agreement or the Trustees’ ability to fulfill their obligations under Section 15(c) of the 1940 Act.
| | THE GUGGENHEIM FUNDS SEMI-ANNUAL REPORT | 95 |
OTHER INFORMATION (Unaudited)(continued) |
The Board also considered the acceptability of the terms of the Investment Advisory Agreement (including the scope of services required to be performed by the Investment Adviser), noting that the terms were consistent with the terms of the investment advisory agreements of other open-end Guggenheim Funds. Based on the foregoing, and based on other information received (both oral and written) at the August Meeting and in connection with Contract Renewal, as well as other considerations, including the Board’s knowledge of the Investment Adviser’s quality of performance of its duties for other Guggenheim Funds through Board meetings, discussions and reports during the year, the Board concluded that the Investment Adviser and its personnel were qualified to serve the New Fund in such capacity.
Investment Performance: With respect to investment performance, the Board noted that the New Fund has no operating history. As a result, the Board considered that the New Fund’s investment objective is to seek to achieve high current income with consideration for capital appreciation and reviewed historical back-tested results. The Board also noted management’s explanation that until the New Fund reaches significant scale it will operate as a “fund of funds” that will seek to deliver a reliable source of income by diversifying the portfolio across multiple high income asset classes while incorporating elements of both strategic and tactical asset allocation. In this connection, the Board considered management’s target strategy weightings and description of the process for adjusting strategy exposures. The Board also considered GPIM’s investment expertise generally, and the portfolio managers’ expertise and experience with this type of investment process, and determined that GPIM’s performance was expected to be acceptable.
Comparative Fees, Costs of Services to be Provided and the Profits to be Realized by GPIM from its Relationship with the New Fund: The Board compared the New Fund’s proposed advisory fee and total operating expenses to a smaller peer group and larger universe, as set forth in the FUSE report. The Board also reviewed the median and average advisory fees and expense ratios, including certain expense ratio components (e.g., distribution fees, administration fees, transfer agency fees and fee waivers/reimbursements) of the peer group of funds and the percentile rankings. The Board noted the proposed advisory fee of 0.75% of average daily net asset and reviewed the projected total operating expense ratio for each of Class A, C, I and P, noting that in each case the advisory fee and expense ratio (after fee caps and waivers) was above the peer group median, ranging from the 64th to 73rd percentile as to the advisory fee, and from the 77th to 86th percentile as to the total expense ratio. In this regard, the Board took into account management’s statements regarding the expected categorization of the New Fund, the dispersion of fees in such category of funds and that strategies that take a more dynamic approach while still maintaining a conservative, fixed income-oriented portfolio tend to feature a management fee and expense ratio at the higher end of the pricing spectrum. As a part of its considerations, the Board noted that GPIM proposed a fee waiver/expense limitation agreement with respect to the New Fund, limiting ordinary operating expenses to 1.30% for Class A and Class P shares, 2.05% for Class C shares and 1.05% for Class I shares through February 1, 2017. In addition, the Board took into account the proposed Affiliated Fund Waiver Agreement under which Guggenheim agreed, through February 1, 2017, that it would waive the amount of the management fee to the extent necessary to offset the proportionate share of any management fee paid by the New Fund with respect to investment in an affiliated underlying fund.
With respect to the costs of advisory services to be provided and estimated level of profitability, the Trustees noted the start-up nature of the New Fund, and that they would have the opportunity in the future to periodically reexamine this matter.
The Board considered other benefits to be available to GPIM because of its relationship with the New Fund and noted that GPIM may be deemed to benefit from arrangements whereby an affiliate, Rydex Fund Services, LLC, will receive fees for: (i) performing certain administrative functions and bookkeeping, accounting and pricing functions for the New Fund pursuant to a Fund Accounting and Administration Agreement; and (ii) acting as transfer agent for the New Fund and performing all shareholder servicing functions, including transferring record ownership, processing purchase and redemption transactions, answering inquiries, mailing shareholder communications, and acting as the dividend disbursing agent pursuant to a Transfer Agency Agreement. In this connection, the Trustees considered its prior review of the compensation arrangements for the provision of the foregoing services.
Economies of Scale to Be Realized: With respect to economies of scale, the Board considered that the New Fund was in its start-up phase. The Trustees also noted that they would have the opportunity in the future to periodically re-examine whether the New Fund had achieved economies of scale and the appropriateness of the advisory fees payable by the New Fund to GPIM.
96 | THE GUGGENHEIM FUNDS SEMI-ANNUAL REPORT | |
OTHER INFORMATION (Unaudited)(concluded) |
Overall Conclusions
Based on the foregoing, the Trustees determined that the proposed investment advisory fee for the New Fund is fair and reasonable in light of the extent and quality of the services to be provided and other benefits to be received and that the approval of the Investment Advisory Agreement is in the best interests of the New Fund. In reaching this conclusion, no single factor was determinative or conclusive and each Trustee, in the exercise of his business judgment, may attribute different weights to different factors. At the August Meeting, the Board, including all of the Independent Trustees, approved the Investment Advisory Agreement for an initial term of two years.
| | THE GUGGENHEIM FUNDS SEMI-ANNUAL REPORT | 97 |
INFORMATION ON BOARD OF TRUSTEES AND OFFICERS (Unaudited) |
Name, Address* and Year of Birth | Position(s) Held with the Trust | Term of Office and Length of Time Served** | Principal Occupation(s)
During Past Five Years | Number of Portfolios in Fund Complex Overseen | Other Directorships
Held by Trustees |
INDEPENDENT TRUSTEES | | | | |
Randall C. Barnes
(1951) | Trustee | Since 2014 | Current: Private Investor (2001-present).
Former: Senior Vice President and Treasurer, PepsiCo, Inc. (1993-1997); President, Pizza Hut International (1991-1993); Senior Vice President, Strategic Planning and New Business Development, PepsiCo, Inc. (1987-1990). | 105 | Current: Trustee, Purpose Investments Inc. (2014-Present). |
Donald A. Chubb, Jr.
(1946 ) | Trustee | Since 1994 | Current: Business broker and manager of commercial real estate, Griffith & Blair, Inc. (1997-present). | 101 | Current: Midland Care, Inc. (2011-present). |
Jerry B. Farley
(1946) | Trustee | Since 2005 | Current: President, Washburn University (1997-present). | 101 | Current: Westar Energy, Inc. (2004-present); CoreFirst Bank & Trust (2000-present). |
Roman Friedrich III
(1946) | Trustee and Chairman of the Contracts Review Committee | Since 2014 | Current: Founder and Managing Partner, Roman Friedrich & Company (1998-present).
Former: Senior Managing Director, MLV & Co. LLC (2010-2011). | 101 | Current: Zincore Metals, Inc. (2009-present).
Former: Axiom Gold and Silver Corp. (2011-2012). |
Robert B. Karn III
(1942) | Trustee and Chairman of the Audit Committee | Since 2014 | Current: Consultant (1998-present).
Former: Arthur Andersen (1965-1997) and Managing Partner, Financial and Economic Consulting, St. Louis office (1987-1997). | 101 | Current: Peabody Energy Company (2003-present); GP Natural Resource Partners, LLC (2002- present). |
Ronald A. Nyberg
(1953) | Trustee and Chairman of the Nominating and Governance Committee | Since 2014 | Current: Partner, Nyberg & Cassioppi, LLC (2000-present).
Former: Executive Vice President, General Counsel, and Corporate Secretary, Van Kampen Investments (1982-1999). | 107 | Current: Edward-Elmhurst Healthcare System (2012-present). |
98 | THE GUGGENHEIM FUNDS SEMI-ANNUAL REPORT | |
INFORMATION ON BOARD OF TRUSTEES AND OFFICERS (Unaudited)(continued) |
Name, Address* and Year of Birth | Position(s) Held with the Trust | Term of Office and Length of Time Served** | Principal Occupation(s)
During Past Five Years | Number of Portfolios in Fund Complex Overseen | Other Directorships
Held by Trustees |
INDEPENDENT TRUSTEES - concluded | | |
Maynard F. Oliverius
(1943) | Trustee | Since 1998 | Current: Retired.
Former: President and CEO, Stormont-Vail HealthCare (1996-2012). | 101 | Current: Fort Hays State University Foundation (1999-present); Stormont-Vail Foundation (2013-present); University of Minnesota HealthCare Alumni Association Foundation (2009-present). |
Ronald E. Toupin, Jr.
(1958) | Trustee and Chairman of the Board | Since 2014 | Current: Portfolio Consultant (2010-present).
Former: Vice President, Manager and Portfolio Manager, Nuveen Asset Management (1998-1999); Vice President, Nuveen Investment Advisory Corp. (1992-1999); Vice President and Manager, Nuveen Unit Investment Trusts (1991-1999); and Assistant Vice President and Portfolio Manager, Nuveen Unit Investment Trusts (1988-1999), each of John Nuveen & Co., Inc. (1982-1999). | 104 | Former: Bennett Group of Funds (2011-2013). |
INTERESTED TRUSTEES | | | | |
Donald C. Cacciapaglia***
(1951) | President, Chief Executive Officer and Trustee | Since 2012 | Current: President and CEO, certain other funds in the Fund Complex (2012-present); Vice Chairman, Guggenheim Investments (2010-present).
Former: Chairman and CEO, Channel Capital Group, Inc. (2002-2010). | 236 | Current: Clear Spring Life Insurance Company (2015-present); Guggenheim Partners Japan, Ltd. (2014-present); Delaware Life (2013-present); Guggenheim Life and Annuity Company (2011-present); Paragon Life Insurance Company of Indiana (2011-present). |
* | The business address of each Trustee is c/o Guggenheim Investments, 805 King Farm Boulevard, Suite 600, Rockville, Maryland 20850. |
** | Each Trustee serves an indefinite term, until his successor is elected and qualified. Time served includes time served in the respective position for the Predecessor Corporation. |
*** | This Trustee is deemed to be an "interested person" of the Funds under the 1940 Act by reason of his position with the Funds' Investment Manager and/or the parent of the Investment Manager. |
| | THE GUGGENHEIM FUNDS SEMI-ANNUAL REPORT | 99 |
INFORMATION ON BOARD OF TRUSTEES AND OFFICERS (Unaudited)(continued) |
Name, Address* and Year of Birth | Position(s)
Held with
the Trust | Term of Office and Length of Time Served** | Principal Occupations
During Past Five Years |
OFFICERS | | | |
Joseph M. Arruda
(1966) | Assistant Treasurer | Since 2010 | Current: Assistant Treasurer, certain other funds in the Fund Complex (2006-present); Vice President, Security Investors, LLC (2010-present); CFO and Manager, Guggenheim Specialized Products, LLC (2009-present).
Former: Vice President, Security Global Investors, LLC (2010-2011); Vice President, Rydex Advisors, LLC (2010); Vice President, Rydex Advisors II, LLC (2010). |
William H. Belden, III
(1965) | Vice President | Since 2014 | Current: Vice President, certain other funds in the Fund Complex (2006-present); Managing Director, Guggenheim Funds Investment Advisors, LLC (2005-present).
Former: Vice President of Management, Northern Trust Global Investments (1999-2005). |
James Howley
(1972) | Assistant Treasurer | Since 2014 | Current: Director, Guggenheim Investments (2004-present) ; Assistant Treasurer, certain other funds in the Fund Complex (2006-present).
Former: Manager, Mutual Fund Administration of Van Kampen Investments, Inc. (1996-2004). |
Amy J. Lee
(1961) | Vice President and Chief Legal Officer | Since 2007 (Vice President) Since 2014 (Chief Legal Officer) | Current: Chief Legal Officer, certain other funds in the Fund Complex (2013-present); Senior Managing Director, Guggenheim Investments (2012-present).
Former: Vice President, Associate General Counsel and Assistant Secretary, Security Benefit Life Insurance Company and Security Benefit Corporation (2004-2012). |
Mark E. Mathiasen
(1978) | Secretary | Since 2014 | Current: Secretary, certain other funds in the Fund Complex (2007-present); Managing Director, Guggenheim Investments (2007-present). |
Michael P. Megaris
(1984) | Assistant Secretary | Since 2014 | Current: Assistant Secretary, certain other funds in the Fund Complex (2014-present); Senior Associate, Guggenheim Investments (2012-present).
Former: J.D., University of Kansas School of Law (2009-2012). |
Elisabeth Miller
(1968) | Chief Compliance Officer | Since 2012 | Current: CCO, certain other funds in the Fund Complex (2012-present); CCO, Security Investors, LLC (2012-present); CCO, Guggenheim Funds Investment Advisors, LLC (2012-present); Managing Director, Guggenheim Investments (2012-present); Vice President, Guggenheim Funds Distributors, LLC (March 2014-present).
Former: CCO, Guggenheim Distributors, LLC (2009-March 2014); Senior Manager, Security Investors, LLC (2004-2009); Senior Manager, Guggenheim Distributors, LLC (2004-2009). |
100 | THE GUGGENHEIM FUNDS SEMI-ANNUAL REPORT | |
INFORMATION ON BOARD OF TRUSTEES AND OFFICERS (Unaudited)(concluded) |
Name, Address* and Year of Birth | Position(s)
Held with
the Trust | Term of Office and Length of Time Served** | Principal Occupations
During Past Five Years |
OFFICERS - concluded | |
Adam Nelson
(1979) | Assistant Treasurer | Since 2015 | Current: Vice President, Guggenheim Investments (2015-present); Assistant Treasurer, certain other funds in the Fund Complex (2015-present).
Former: Assistant Vice President and Fund Administration Director, State Street Corporation (2013-2015); Fund Administration Assistant Director, State Street (2011-2013); Fund Administration Manager, State Street (2009-2011). |
Alison Santay
(1974) | AML Officer | Since 2013 | Current: AML Officer, certain other funds in the Fund Complex (2010-present); Director and AML Officer, Rydex Fund Services, LLC (2010-present); AML Officer, Security Investors, LLC (2010-present); Director, Shareholder Risk and Compliance, Rydex Fund Services, LLC (2004-present). Former: AML Officer, Guggenheim Distributors, LLC (2013-2014). |
Kimberly Scott
(1974) | Assistant Treasurer | Since 2014 | Current: Vice President, Guggenheim Investments (2012-present) ; Assistant Treasurer, certain other funds in the Fund Complex (2012-present).
Former: Financial Reporting Manager, Invesco, Ltd. (2010-2011); Vice President/Assistant Treasurer, Mutual Fund Administration for Van Kampen Investments, Inc./Morgan Stanley Investment Management (2009-2010); Manager of Mutual Fund Administration, Van Kampen Investments, Inc./Morgan Stanley Investment Management (2005-2009). |
Bryan Stone
(1979) | Vice President | Since 2014 | Current: Vice President, certain other funds in the Fund Complex (2014-present); Director, Guggenheim Investments (2013-present).
Former: Senior Vice President, Neuberger Berman Group LLC (2009-2013); Vice President, Morgan Stanley (2002-2009). |
John L. Sullivan
(1955) | Chief Financial Officer and Treasurer | Since 2014 | Current: CFO, Chief Accounting Officer and Treasurer, certain other funds in the Fund Complex (2010-present); Senior Managing Director, Guggenheim Investments (2010-present).
Former: Managing Director and CCO, each of the funds in the Van Kampen Investments fund complex (2004-2010); Managing Director and Head of Fund Accounting and Administration, Morgan Stanley Investment Management (2002-2004); CFO and Treasurer, Van Kampen Funds (1996-2004). |
* | The business address of each officer is c/o Guggenheim Investments, 805 King Farm Boulevard, Suite 600, Rockville, Maryland 20850. |
** | Each officer serves an indefinite term, until his or her successor is duly elected and qualified. Time served includes time served in the respective position for the Predecessor Corporation. |
| | THE GUGGENHEIM FUNDS SEMI-ANNUAL REPORT | 101 |
GUGGENHEIM INVESTMENTS PRIVACY POLICIES (Unaudited) |
Rydex Funds, Guggenheim Funds, Rydex Investments, Guggenheim Funds Distributors, LLC, Security Investors, LLC, Security Distributors, Inc., Guggenheim Partners Investment Managers, LLC, and Rydex Advisory Services (Collectively “Guggenheim Investments”).
Our Commitment to You
When you become a Guggenheim Investments investor, you entrust us with not only your hard-earned money but also with personal and financial information about you. We recognize that your relationship with us is based on trust and that you expect us to act responsibly and in your best interests. Because we have access to this private information about you, we hold ourselves to the highest standards in its safekeeping and use. This means, most importantly, that we do not sell client information to anyone—whether it is your personal information or if you are a current or former Guggenheim Investments client.
The Information We Collect About You
In the course of doing business with shareholders and investors, we collect nonpublic personal information about you. You typically provide personal information when you complete a Guggenheim Investments account application or when you request a transaction that involves Rydex and Guggenheim Investments funds or one of the Guggenheim Investments affiliated companies. “Nonpublic personal information” is personally identifiable private information about you. For example, it includes information regarding your name and address, Social Security or taxpayer identification number, assets, income, account balance, bank account information and investment activity (e.g., purchase and redemption history).
How We Handle Your Personal Information
As emphasized above, we do not sell information about current or former clients or their accounts to third parties. Nor do we share such information, except when necessary to complete transactions at your request or to make you aware of related investment products and services that we offer. Additional details about how we handle your personal information are provided below. To complete certain transactions or account changes that you direct, it may be necessary to provide identifying information to companies, individuals or groups that are not affiliated with Guggenheim Investments. For example, if you ask to transfer assets from another financial institution to Guggenheim Investments, we will need to provide certain information about you to that company to complete the transaction. To alert you to other Guggenheim Investments investment products and services, we may share your information within the Guggenheim Investments family of affiliated companies. This would include, for example, sharing your information within Guggenheim Investments so we can make you aware of new Rydex and Guggenheim Investments funds or the services offered through another Guggenheim Investments affiliated company. In certain instances, we may contract with nonaffiliated companies to perform services for us. Where necessary, we will disclose information we have about you to these third parties. In all such cases, we provide the third party with only the information necessary to carry out its assigned responsibilities and only for that purpose. And we require these third parties to treat your private information with the same high degree of confidentiality that we do. In certain instances, we may share information with other financial institutions regarding individuals and entities in response to the U.S.A. Patriot Act. Finally, we will release information about you if you direct us to do so, if we are compelled by law to do so or in other circumstances permitted by law.
102 | THE GUGGENHEIM FUNDS SEMI-ANNUAL REPORT | |
GUGGENHEIM INVESTMENTS PRIVACY POLICIES (Unaudited)(concluded) |
Opt Out Provisions
We do not sell your personal information to anyone. The law allows you to “opt out” of only certain kinds of information sharing with third parties. The firm does not share personal information about you with any third parties that triggers this opt-out right. This means YOU ARE ALREADY OPTED OUT.
How We Protect Privacy Online
Our concern for the privacy of our shareholders also extends to those who use our web site, guggenheiminvestments.com. Our web site uses some of the most secure forms of online communication available, including encryption technology, Secure Socket Layer (SSL) protocol, firewalls and user names and passwords. These technologies provide a high level of security and privacy when you access your account information or initiate online transactions. The Guggenheim Investments web site offers customized features that require our use of “http cookies”—tiny pieces of information that we ask your browser to store. However, we make very limited use of these cookies. We only use cookies for session management and security features on the Guggenheim Investments web site. We do not use them to pull data from your hard drive, to learn your email address, or to view data in cookies created by other web sites. We will not share the information in our cookies or give others access to it. See the legal information area on our web site for more details about web site security and privacy features.
How We Safeguard Your Personal Information
We restrict access to nonpublic personal information about shareholders to our employees and in some cases to third parties (for example, the service providers described above) as permitted by law. We maintain strict physical, electronic and procedural safeguards that comply with federal standards to guard your nonpublic personal information.
We’ll Keep You Informed
As required by federal law, we will notify shareholders of our privacy policy annually. We reserve the right to modify this policy at any time, but rest assured that if we do change it, we will tell you promptly. You will also be able to access our privacy policy from our web site at guggenheiminvestments.com. Should you have any questions regarding our privacy policy, contact us at 800.820.0888 or 301.296.5100.
| | THE GUGGENHEIM FUNDS SEMI-ANNUAL REPORT | 103 |
This page intentionally left blank.
This page intentionally left blank.
This page intentionally left blank.
This page intentionally left blank.
This page intentionally left blank.
This page intentionally left blank.
3.31.2016
Guggenheim Funds Semi-Annual Report
Fundamental Alpha |
Guggenheim Mid Cap Value Fund | | |
MCV-SEMI-0316x0916 | guggenheiminvestments.com |

DEAR SHAREHOLDER | 2 |
ECONOMIC AND MARKET OVERVIEW | 3 |
ABOUT SHAREHOLDERS’ FUND EXPENSES | 6 |
MID CAP VALUE FUND | 9 |
NOTES TO FINANCIAL STATEMENTS | 20 |
OTHER INFORMATION | 27 |
INFORMATION ON BOARD OF TRUSTEES AND OFFICERS | 28 |
GUGGENHEIM INVESTMENTS PRIVACY POLICIES | 35 |
| | THE GUGGENHEIM FUNDS SEMI-ANNUAL REPORT | 1 |
Dear Shareholder:
Security Investors, LLC (the “Investment Adviser”) is pleased to present the semi-annual shareholder report for the Guggenheim Mid Cap Value Fund (the “Fund”) for the six-month period ended March 31, 2016.
The Investment Adviser is part of Guggenheim Investments, which represents the investment management businesses of Guggenheim Partners, LLC (“Guggenheim”), a global, diversified financial services firm.
Guggenheim Funds Distributors, LLC is the distributor of the Funds. Guggenheim Funds Distributors, LLC is affiliated with Guggenheim and the Investment Adviser.
We encourage you to read the Economic and Market Overview section of the report, which follows this letter.
We are committed to providing innovative investment solutions and appreciate the trust you place in us.
Sincerely,

Donald C. Cacciapaglia
President
April 30, 2016
Read a prospectus and summary prospectus (if available) carefully before investing. It contains the investment objectives, risks, charges, expenses and other information, which should be considered carefully before investing. Obtain a prospectus and summary prospectus (if available) at guggenheiminvestments.com or call 800.820.0888.
There can be no assurance that any investment product will achieve its investment objective(s). There are risks associated with investing, including the entire loss of principal invested. Investing involves market risks. The investment return and principal value of any investment product will fluctuate with changes in market conditions.
2 | THE GUGGENHEIM FUNDS SEMI-ANNUAL REPORT | |
ECONOMIC AND MARKET OVERVIEW (Unaudited) | March 31, 2016 |
Financial markets were buffeted by a variety of events over the past six months, including volatility in the oil market, weak growth in China, ongoing stimulus from global central banks, and a 25 basis point increase in the U.S. federal funds target rate in December. While the direct impact of the move was fairly insignificant, the decision to begin normalization of interest rates after seven years of unprecedented liquidity provision was not. Indeed, in 2015, risk assets posted their worst annual performance since the 2008 financial crisis, as market participants’ expectations for the start of rate hikes collided with concern about plunging commodity prices, and slowing economic growth in China and other emerging market economies.
As 2016 began, forecasts for U.S. and global economic growth were downgraded, and recession fears surged along with market volatility. Estimates for first quarter gross domestic product (“GDP”) in the U.S. were marked down, even though first quarter GDP has undershot full-year growth rates in six out of the last seven years. Risk assets rallied in the last half of the first quarter, led by a dovish pivot in the U.S. Federal Reserve’s (the “Fed”) communication that spurred a rally in crude oil and a reversal of dollar strength. The weaker dollar, along with optimism about a production freeze agreed to by a group of major oil producing countries, helped oil to rebound. After falling in the early weeks of the year to a cycle low of $26 per barrel on February 11, 2016, the front-month West Texas Intermediate (“WTI”) oil futures contract rallied as high as $40 per barrel before closing the quarter at $38 per barrel.
The outlook for economic growth outside the U.S. softened in the first quarter. A further deterioration in the euro zone inflation outlook prompted the European Central Bank (“ECB”) to announce an increase in the size of its monthly asset purchases and reduce its deposit rate to -40 basis points. European government bonds rallied following the announcement, with the 10-year German bund ending the first quarter with a yield of just 16 basis points.
Ongoing stimulus efforts in Asia also appeared likely to contribute to low U.S. rates. Chinese industrial production growth continued to slow in early 2016, prompting the People’s Bank of China (“PBOC”) to stimulate credit growth by allowing banks to hold fewer reserves against deposits. And after years of struggling with stagnant growth and low inflation, the Bank of Japan (“BOJ”) surprised markets by cutting its key interest rate to -10 basis points in January. The negative rates pushed a considerable amount of Japanese savings into foreign markets.
In an environment where global rates are moving lower and markets are already starved for yield, foreign investors began looking to the U.S. Guggenheim expects that U.S. Treasury yields will fall further as the gravitational pull of global yields gets stronger, and does not discount the possibility of 10-year U.S. Treasury yields declining to closer to 1 percent before the end of the year.
| | THE GUGGENHEIM FUNDS SEMI-ANNUAL REPORT | 3 |
ECONOMIC AND MARKET OVERVIEW (Unaudited)(continued) | March 31, 2016 |
A stronger dollar has weighed on the U.S. economy, but consumer spending has been resilient. The labor market is now operating near full employment, and tight labor market conditions are beginning to spur faster wage growth. We believe the U.S. economy is fundamentally sound, and find little evidence to support the conclusion that the economy will fall into a recession in 2016.
Despite the relative health of the U.S. economy, markets are concerned that sluggish global growth will hold back the U.S. expansion, that inflation will remain below the Fed’s target for longer, and that tighter conditions in credit markets have raised recession risks. Our view is that the Fed remains focused on fulfilling its dual mandate objectives of maximum employment and price stability, and thus is biased toward normalizing policy. We expect further declines in the unemployment rate as job gains outstrip growth in the labor force. Meanwhile, core and headline inflation should move closer to the Fed’s target by year end, reflecting our forecasts for a tighter labor market and a modest rise in oil prices. Normally, this would result in at least two Fed rate hikes on the table for 2016, but the U.S. Fed is becoming more sensitive to global financial conditions and the extent of global money flows that occur as monetary policy in the U.S. diverges from Europe, Japan and China. As a result, we have reduced our expectations for a June rate hike, although it would normally be an easy call. We continue to believe a December rate hike is a near certainty. A solid macroeconomic backdrop and a rebalancing oil market should support an improving credit picture in the second half of 2016.
For the six months ended March 31, 2016, the Standard & Poor’s 500® (“S&P 500”) Index* returned 8.49%. The Morgan Stanley Capital International (“MSCI”) Europe-Australasia-Far East (“EAFE”) Index* returned 1.56%. The return of the MSCI Emerging Markets Index* was 6.41%.
In the bond market, the Barclays U.S. Aggregate Bond Index* posted a 2.44% return for the period, while the Barclays U.S. Corporate High Yield Index* returned 1.22%. The return of the Bank of America (“BofA”) Merrill Lynch 3-Month U.S. Treasury Bill Index* was 0.11% for the six-month period.
The opinions and forecasts expressed may not actually come to pass. This information is subject to change at any time, based on market and other conditions, and should not be construed as a recommendation of any specific security or strategy.
4 | THE GUGGENHEIM FUNDS SEMI-ANNUAL REPORT | |
ECONOMIC AND MARKET OVERVIEW (Unaudited)(concluded) | March 31, 2016 |
*Index Definitions:
The following indices are referenced throughout this report. Indices are unmanaged and not available for direct investment. Index performance does not reflect transaction costs, fees, or expenses.
Barclays U.S. Aggregate Bond Index is a broad-based benchmark that measures the investment grade, U.S. dollar (“USD”) denominated, fixed-rate taxable bond market, including U.S. Treasuries, government-related and corporate securities, MBS (agency fixed-rate and hybrid ARM pass-throughs), ABS, and CMBS.
Barclays U.S. Corporate High Yield Index measures the market of U.S. dollar denominated, non-investment grade, fixed-rate, taxable corporate bonds. Securities are classified as high yield if the middle rating of Moody’s, Fitch, and S&P is Ba1/BB+/BB+ or below.
BofA Merrill Lynch 3-Month U.S. Treasury Bill Index is an unmanaged market index of U.S. Treasury securities maturing in 90 days that assumes reinvestment of all income.
MSCI EAFE Index is a free float-adjusted market capitalization index that is designed to measure the equity market performance of developed markets, excluding the U.S. & Canada.
MSCI Emerging Markets Index is a free float-adjusted market capitalization weighted index that is designed to measure equity market performance in the global emerging markets.
S&P 500® Index is a capitalization-weighted index of 500 stocks designed to measure the performance of the broad economy, representing all major industries and is considered a representation of the U.S. stock market.
| | THE GUGGENHEIM FUNDS SEMI-ANNUAL REPORT | 5 |
ABOUT SHAREHOLDERS’ FUND EXPENSES (Unaudited) |
All mutual funds have operating expenses and it is important for our shareholders to understand the impact of costs on their investments. Shareholders of a Fund incur two types of costs: (i) transaction costs, including sales charges (loads) on purchase payments, reinvested dividends, or other distributions; and exchange fees; and (ii) ongoing costs, including management fees, administrative services, and shareholder reports, among others. These ongoing costs, or operating expenses, are deducted from a fund’s gross income and reduce the investment return of the fund.
A fund’s expenses are expressed as a percentage of its average net assets, which is known as the expense ratio. The following examples are intended to help investors understand the ongoing costs (in dollars) of investing in a Fund and to compare these costs with the ongoing costs of investing in other mutual funds.
The examples are based on an investment of $1,000 made at the beginning of the period and held for the entire six-month period beginning September 30, 2015 and ending March 31, 2016.
The following tables illustrate a Fund’s costs in two ways:
Table 1. Based on actual Fund return. This section helps investors estimate the actual expenses paid over the period. The “Ending Account Value” shown is derived from the Fund’s actual return, and the fourth column shows the dollar amount that would have been paid by an investor who started with $1,000 in the Fund. Investors may use the information here, together with the amount invested, to estimate the expenses paid over the period. Simply divide the Fund’s account value by $1,000 (for example, an $8,600 account value divided by $1,000 = 8.6), then multiply the result by the number provided under the heading “Expenses Paid During Period.”
Table 2. Based on hypothetical 5% return. This section is intended to help investors compare a Fund’s cost with those of other mutual funds. The table provides information about hypothetical account values and hypothetical expenses based on the Fund’s actual expense ratio and an assumed rate of return of 5% per year before expenses, which is not the Fund’s actual return. The hypothetical account values and expenses may not be used to estimate the actual ending account balance or expenses paid during the period. The example is useful in making comparisons because the U.S. Securities and Exchange Commission (the “SEC”) requires all mutual funds to calculate expenses based on the 5% return. Investors can assess a Fund’s costs by comparing this hypothetical example with the hypothetical examples that appear in shareholder reports of other funds.
6 | THE GUGGENHEIM FUNDS SEMI-ANNUAL REPORT | |
ABOUT SHAREHOLDERS’ FUND EXPENSES (Unaudited)(continued) |
The calculations illustrated above assume no shares were bought or sold during the period. Actual costs may have been higher or lower, depending on the amount of investment and the timing of any purchases or redemptions.
Please note that the expenses shown in the table are meant to highlight your ongoing costs only and do not reflect any transactional costs, such as sales charges (loads) on purchase payments, and contingent deferred sales charges (“CDSC”) on redemptions, if any. Therefore, the second table is useful in comparing ongoing costs only, and will not help you determine the relative total costs of owning different funds. In addition, if these transactional costs were included, your costs would have been higher.
More information about a Fund’s expenses, including annual expense ratios for up to the past five years (subject to the Fund’s inception date), can be found in the Financial Highlights section of this report. For additional information on operating expenses and other shareholder costs, please refer to the appropriate Fund prospectus.
| | THE GUGGENHEIM FUNDS SEMI-ANNUAL REPORT | 7 |
ABOUT SHAREHOLDERS’ FUND EXPENSES (Unaudited)(concluded) |
| | Expense
Ratio1 | Fund
Return | Beginning
Account Value
September 30,
2015 | Ending
Account Value
March 31,
2016 | Expenses
Paid During
Period2 |
Table 1. Based on actual Fund return3 |
Mid Cap Value Fund |
A-Class | 1.47% | 6.54% | $ 1,000.00 | $ 1,065.40 | $ 7.59 |
C-Class | 2.24% | 6.13% | 1,000.00 | 1,061.30 | 11.54 |
P-Class | 1.32% | 6.53% | 1,000.00 | 1,065.30 | 6.82 |
| |
Table 2. Based on hypothetical 5% return (before expenses) |
Mid Cap Value Fund |
A-Class | 1.47% | 5.00% | $ 1,000.00 | $ 1,017.65 | $ 7.41 |
C-Class | 2.24% | 5.00% | 1,000.00 | 1,013.80 | 11.28 |
P-Class | 1.32% | 5.00% | 1,000.00 | 1,018.40 | 6.66 |
1 | Annualized and excludes expenses of the underlying funds in which the Fund invests. |
2 | Expenses are equal to the Fund's annualized expense ratio, net of any applicable fee waivers, multiplied by the average account value over the period, multiplied by 183/366 (to reflect the one-half year period). |
3 | Actual cumulative return at net asset value for the period September 30, 2015 to March 31, 2016. |
8 | THE GUGGENHEIM FUNDS SEMI-ANNUAL REPORT | |
FUND PROFILE (Unaudited) | March 31, 2016 |
MID CAP VALUE FUND
OBJECTIVE: Seeks long-term growth of capital.
Holdings Diversification (Market Exposure as % of Net Assets)

“Holdings Diversification (Market Exposure as % of Net Assets)” excludes any temporary cash investments.
Inception Dates: |
A-Class | May 1, 1997 |
C-Class | January 29, 1999 |
P-Class | May 1, 2015 |
Ten Largest Holdings (% of Total Net Assets) |
FLIR Systems, Inc. | 2.8% |
Ameren Corp. | 2.4% |
Pinnacle West Capital Corp. | 2.1% |
Alleghany Corp. | 2.0% |
Zions Bancorporation | 1.8% |
Sonoco Products Co. | 1.8% |
Hanover Insurance Group, Inc. | 1.7% |
Camden Property Trust | 1.7% |
CubeSmart | 1.7% |
DigitalGlobe, Inc. | 1.6% |
Top Ten Total | 19.6% |
| | |
“Ten Largest Holdings” excludes any temporary cash investments. |
| | THE GUGGENHEIM FUNDS SEMI-ANNUAL REPORT | 9 |
SCHEDULE OF INVESTMENTS (Unaudited) | March 31, 2016 |
MID CAP VALUE FUND | |
| | | Shares | | | Value | |
| | | | | | | |
COMMON STOCKS† - 99.0% | |
| | | | | | | |
Financial - 28.4% | |
Alleghany Corp.* | | | 21,095 | | | $ | 10,467,338 | |
Zions Bancorporation | | | 391,600 | | | | 9,480,636 | |
Hanover Insurance Group, Inc. | | | 102,539 | | | | 9,251,069 | |
Camden Property Trust | | | 107,330 | | | | 9,025,379 | |
CubeSmart | | | 266,180 | | | | 8,863,794 | |
FirstMerit Corp. | | | 390,600 | | | | 8,222,130 | |
Corrections Corporation of America | | | 254,692 | | | | 8,162,879 | |
Popular, Inc. | | | 273,540 | | | | 7,825,979 | |
Endurance Specialty Holdings Ltd. | | | 109,931 | | | | 7,182,892 | |
Sun Communities, Inc. | | | 98,283 | | | | 7,038,046 | |
Assured Guaranty Ltd. | | | 259,169 | | | | 6,556,976 | |
Wintrust Financial Corp. | | | 143,310 | | | | 6,354,365 | |
Apartment Investment & Management Co. — Class A | | | 150,277 | | | | 6,284,584 | |
Fulton Financial Corp. | | | 456,532 | | | | 6,108,398 | |
Trustmark Corp. | | | 244,500 | | | | 5,630,835 | |
Alexandria Real Estate Equities, Inc. | | | 56,412 | | | | 5,127,287 | |
E*TRADE Financial Corp.* | | | 205,449 | | | | 5,031,446 | |
Parkway Properties, Inc. | | | 294,149 | | | | 4,606,373 | |
Prosperity Bancshares, Inc. | | | 85,330 | | | | 3,958,459 | |
Lexington Realty Trust | | | 330,030 | | | | 2,838,258 | |
Equity Commonwealth* | | | 94,614 | | | | 2,670,007 | |
Unum Group | | | 83,906 | | | | 2,594,374 | |
KeyCorp | | | 231,413 | | | | 2,554,800 | |
BancorpSouth, Inc. | | | 89,664 | | | | 1,910,740 | |
Umpqua Holdings Corp. | | | 85,868 | | | | 1,361,866 | |
Monogram Residential Trust, Inc. | | | 130,475 | | | | 1,286,484 | |
Total Financial | | | | | | | 150,395,394 | |
| | | | | | | | | |
Industrial - 16.6% | |
FLIR Systems, Inc. | | | 444,600 | | | | 14,649,570 | |
Sonoco Products Co. | | | 193,130 | | | | 9,380,324 | |
Gentex Corp. | | | 462,953 | | | | 7,263,733 | |
Huntington Ingalls Industries, Inc. | | | 45,765 | | | | 6,267,059 | |
Knight Transportation, Inc. | | | 237,090 | | | | 6,199,904 | |
Oshkosh Corp. | | | 135,159 | | | | 5,523,948 | |
Ryder System, Inc. | | | 77,589 | | | | 5,026,215 | |
WestRock Co. | | | 125,959 | | | | 4,916,180 | |
Werner Enterprises, Inc. | | | 166,265 | | | | 4,515,757 | |
Owens Corning | | | 86,960 | | | | 4,111,469 | |
Scorpio Tankers, Inc. | | | 668,711 | | | | 3,898,585 | |
Owens-Illinois, Inc.* | | | 218,696 | | | | 3,490,388 | |
Kirby Corp.* | | | 49,524 | | | | 2,985,802 | |
Harris Corp. | | | 35,380 | | | | 2,754,687 | |
Colfax Corp.* | | | 95,731 | | | | 2,736,949 | |
ITT Corp. | | | 72,728 | | | | 2,682,936 | |
Terex Corp. | | | 53,076 | | | | 1,320,531 | |
Total Industrial | | | | | | | 87,724,037 | |
| | | | | | | | | |
Consumer, Non-cyclical - 14.6% | |
MEDNAX, Inc.* | | | 106,118 | | | | 6,857,345 | |
Bunge Ltd. | | | 120,759 | | | | 6,843,413 | |
Quest Diagnostics, Inc. | | | 78,106 | | | | 5,580,674 | |
Emergent BioSolutions, Inc.* | | | 148,838 | | | | 5,410,261 | |
Navigant Consulting, Inc.* | | | 336,652 | | | | 5,322,467 | |
Sanderson Farms, Inc. | | | 57,020 | | | | 5,142,064 | |
Darling Ingredients, Inc.* | | | 381,289 | | | | 5,021,576 | |
ICF International, Inc.* | | | 138,124 | | | | 4,747,322 | |
HealthSouth Corp. | | | 123,569 | | | | 4,649,901 | |
Surgical Care Affiliates, Inc.* | | | 90,009 | | | | 4,165,617 | |
Premier, Inc. — Class A* | | | 124,090 | | | | 4,139,642 | |
Kindred Healthcare, Inc. | | | 231,523 | | | | 2,859,309 | |
Patterson Companies, Inc. | | | 59,976 | | | | 2,790,683 | |
WEX, Inc.* | | | 32,430 | | | | 2,703,365 | |
FTI Consulting, Inc.* | | | 74,145 | | | | 2,632,889 | |
Universal Corp. | | | 39,860 | | | | 2,264,447 | |
Ingredion, Inc. | | | 20,287 | | | | 2,166,449 | |
United Rentals, Inc.* | | | 33,714 | | | | 2,096,674 | |
Community Health Systems, Inc.* | | | 81,577 | | | | 1,509,990 | |
Everi Holdings, Inc.* | | | 233,280 | | | | 534,211 | |
Total Consumer, Non-cyclical | | | | 77,438,299 | |
10 | THE GUGGENHEIM FUNDS SEMI-ANNUAL REPORT | SEE NOTES TO FINANCIAL STATEMENTS. |
SCHEDULE OF INVESTMENTS (Unaudited)(continued) | March 31, 2016 |
MID CAP VALUE FUND | |
| | | Shares | | | Value | |
| | | | | | | |
Utilities - 11.4% | |
Ameren Corp. | | | 253,760 | | | $ | 12,713,375 | |
Pinnacle West Capital Corp. | | | 145,306 | | | | 10,908,121 | |
Westar Energy, Inc. | | | 146,354 | | | | 7,260,622 | |
Black Hills Corp. | | | 119,721 | | | | 7,198,824 | |
Great Plains Energy, Inc. | | | 209,562 | | | | 6,758,375 | |
Avista Corp. | | | 146,910 | | | | 5,990,990 | |
Portland General Electric Co. | | | 151,325 | | | | 5,975,824 | |
OGE Energy Corp. | | | 118,420 | | | | 3,390,365 | |
Total Utilities | | | | | | | 60,196,496 | |
| | | | | | | | | |
Consumer, Cyclical – 11.0% | |
J.C. Penney Company, Inc.* | | | 728,985 | | | | 8,062,574 | |
DR Horton, Inc. | | | 201,457 | | | | 6,090,045 | |
Visteon Corp. | | | 75,655 | | | | 6,021,382 | |
Caleres, Inc. | | | 194,838 | | | | 5,511,968 | |
PVH Corp. | | | 53,085 | | | | 5,258,600 | |
Essendant, Inc. | | | 161,442 | | | | 5,154,843 | |
UniFirst Corp. | | | 39,320 | | | | 4,290,598 | |
iRobot Corp.* | | | 88,738 | | | | 3,132,451 | |
WESCO International, Inc.* | | | 56,286 | | | | 3,077,156 | |
CalAtlantic Group, Inc. | | | 84,934 | | | | 2,838,494 | |
Goodyear Tire & Rubber Co. | | | 80,514 | | | | 2,655,352 | |
Sonic Automotive, Inc. — Class A | | | 89,542 | | | | 1,654,736 | |
Tenneco, Inc.* | | | 30,155 | | | | 1,553,284 | |
La-Z-Boy, Inc. | | | 57,330 | | | | 1,533,004 | |
AutoNation, Inc.* | | | 24,812 | | | | 1,158,224 | |
Total Consumer, Cyclical | | | | | | | 57,992,711 | |
| | | | | | | | | |
Technology - 6.6% | |
CSRA, Inc. | | | 287,864 | | | | 7,743,542 | |
IXYS Corp. | | | 669,917 | | | | 7,516,469 | |
Maxwell Technologies, Inc.* | | | 1,187,841 | | | | 7,055,775 | |
Cree, Inc.* | | | 151,780 | | | | 4,416,798 | |
Super Micro Computer, Inc.* | | | 116,111 | | | | 3,957,063 | |
ManTech International Corp. — Class A | | | 49,690 | | | | 1,589,583 | |
Diebold, Inc. | | | 50,426 | | | | 1,457,816 | |
MKS Instruments, Inc. | | | 36,800 | | | | 1,385,520 | |
Total Technology | | | | | | | 35,122,566 | |
| | | | | | | | | |
Energy - 3.7% | |
Marathon Oil Corp. | | | 441,900 | | | | 4,922,766 | |
Whiting Petroleum Corp.* | | | 616,012 | | | | 4,915,776 | |
Oasis Petroleum, Inc.* | | | 511,760 | | | | 3,725,613 | |
Rowan Companies plc — Class A | | | 224,330 | | | | 3,611,713 | |
Sanchez Energy Corp.* | | | 438,780 | | | | 2,408,902 | |
Total Energy | | | | | | | 19,584,770 | |
| | | | | | | | | |
Communications - 3.6% | |
DigitalGlobe, Inc.* | | | 477,884 | | | | 8,267,393 | |
Finisar Corp.* | | | 365,178 | | | | 6,660,847 | |
Scripps Networks Interactive, Inc. — Class A | | | 66,734 | | | | 4,371,077 | |
Total Communications | | | | | | | 19,299,317 | |
| | | | | | | | | |
Basic Materials - 3.1% | |
Reliance Steel & Aluminum Co. | | | 74,070 | | | | 5,124,902 | |
Olin Corp. | | | 164,862 | | | | 2,863,653 | |
Stillwater Mining Co.* | | | 248,650 | | | | 2,648,123 | |
Landec Corp.* | | | 228,143 | | | | 2,395,502 | |
Calgon Carbon Corp. | | | 166,180 | | | | 2,329,844 | |
Freeport-McMoRan, Inc. | | | 122,807 | | | | 1,269,824 | |
Total Basic Materials | | | | | | | 16,631,848 | |
| | | | | | | | | |
Total Common Stocks | | | | | | | | |
(Cost $494,103,860) | | | | | | | 524,385,438 | |
| | | | | | | | | |
CONVERTIBLE PREFERRED STOCKS††† - 0.0% | |
Thermoenergy Corp. due *,1,3 | | | 858,334 | | | | 1,754 | |
Total Convertible Preferred Stocks | | | | | |
(Cost $819,654) | | | | | | | 1,754 | |
SEE NOTES TO FINANCIAL STATEMENTS. | THE GUGGENHEIM FUNDS SEMI-ANNUAL REPORT | 11 |
SCHEDULE OF INVESTMENTS (Unaudited)(concluded) | March 31, 2016 |
MID CAP VALUE FUND | |
| | | Shares | | | Value | |
| | | | | | | |
SHORT TERM INVESTMENTS† - 0.5% | |
Dreyfus Treasury Prime Cash Management Institutional Shares 0.18%2 | | | 2,800,117 | | | $ | 2,800,117 | |
Total Short Term Investments | | | | | |
(Cost $2,800,117) | | | | | | | 2,800,117 | |
| | | | | | | | | |
Total Investments - 99.5% | | | | | |
(Cost $497,723,631) | | | | | | $ | 527,187,309 | |
Other Assets & Liabilities, net - 0.5% | | | | 2,651,760 | |
Total Net Assets - 100.0% | | | $ | 529,839,069 | |
* | Non-income producing security. |
† | Value determined based on Level 1 inputs — See Note 4. |
††† | Value determined based on Level 3 inputs — See Note 4. |
1 | PIPE (Private Investment in Public Equity) — Stock issued by a company in the secondary market as a means of raising capital more quickly and less expensively than through registration of a secondary public offering. |
2 | Rate indicated is the 7 day yield as of March 31, 2016. |
3 | Illiquid security. |
| | plc — Public Limited Company |
| | |
| | See Sector Classification in Other Information section. |
The following table summarizes the inputs used to value the Fund’s investments at March 31, 2016 (See Note 4 in the Notes to Financial Statements):
Investments in Securities (Assets) | | Level 1 | | | Level 2 | | | Level 3 | | | Total | |
Common Stocks | | $ | 524,385,438 | | | $ | — | | | $ | — | | | $ | 524,385,438 | |
Convertible Preferred Stocks | | | — | | | | — | | | | 1,754 | | | | 1,754 | |
Short Term Investments | | | 2,800,117 | | | | — | | | | — | | | | 2,800,117 | |
Total | | $ | 527,185,555 | | | $ | — | | | $ | 1,754 | | | $ | 527,187,309 | |
For the period ended March 31, 2016, there were no transfers between levels.
12 | THE GUGGENHEIM FUNDS SEMI-ANNUAL REPORT | SEE NOTES TO FINANCIAL STATEMENTS. |
STATEMENT OF ASSETS AND LIABILITIES (Unaudited) |
MID CAP VALUE FUND |
March 31, 2016
Assets: | |
Investments, at value (cost $497,723,631) | | $ | 527,187,309 | |
Prepaid expenses | | | 72,793 | |
Cash | | | 11,428 | |
Receivables: | |
Securities sold | | | 4,720,558 | |
Dividends | | | 823,247 | |
Fund shares sold | | | 69,190 | |
Foreign taxes reclaim | | | 13,049 | |
Total assets | | | 532,897,574 | |
| | | | | |
Liabilities: | |
Payable for: | |
Fund shares redeemed | | | 1,273,972 | |
Securities purchased | | | 589,977 | |
Management fees | | | 373,189 | |
Distribution and service fees | | | 178,279 | |
Fund accounting/administration fees | | | 41,906 | |
Trustees’ fees* | | | 35,745 | |
Miscellaneous | | | 565,437 | |
Total liabilities | | | 3,058,505 | |
Net assets | | $ | 529,839,069 | |
| | | | | |
Net assets consist of: | |
Paid in capital | | $ | 489,198,919 | |
Undistributed net investment income | | | 5,044,636 | |
Accumulated net realized gain on investments | | | 6,131,836 | |
Net unrealized appreciation on investments | | | 29,463,678 | |
Net assets | | $ | 529,839,069 | |
| | | | | |
A-Class: | |
Net assets | | $ | 420,613,040 | |
Capital shares outstanding | | | 15,068,427 | |
Net asset value per share | | $ | 27.91 | |
Maximum offering price per share (Net asset value divided by 95.25%) | | $ | 29.30 | |
| | | | | |
C-Class: | |
Net assets | | $ | 108,142,556 | |
Capital shares outstanding | | | 5,126,763 | |
Net asset value per share | | $ | 21.09 | |
| | | | | |
P-Class: | |
Net assets | | $ | 1,083,473 | |
Capital shares outstanding | | | 38,954 | |
Net asset value per share | | $ | 27.81 | |
* | Relates to Trustees not deemed “interested persons” within the meaning of Section 2(a)(19) of the 1940 Act. |
SEE NOTES TO FINANCIAL STATEMENTS. | THE GUGGENHEIM FUNDS SEMI-ANNUAL REPORT | 13 |
STATEMENT OF OPERATIONS (Unaudited) |
MID CAP VALUE FUND |
Period Ended March 31, 2016
Investment Income: | |
Dividends (net of foreign withholding tax of $8,537) | | $ | 9,547,130 | |
Interest | | | 374 | |
Other income | | | 248 | |
Total investment income | | | 9,547,752 | |
| | | | | |
Expenses: | |
Management fees | | | 2,325,684 | |
Transfer agent/maintenance fees | |
A-Class | | | 334,755 | |
C-Class | | | 97,333 | |
P-Class | | | 65 | |
Distribution and service fees: | |
A-Class | | | 548,116 | |
C-Class | | | 573,278 | |
P-Class | | | 341 | |
Fund accounting/administration fees | | | 262,872 | |
Line of credit fees | | | 44,393 | |
Trustees’ fees* | | | 40,260 | |
Custodian fees | | | 17,502 | |
Miscellaneous | | | 258,517 | |
Total expenses | | | 4,503,116 | |
Net investment income | | | 5,044,636 | |
| | | | | |
Net Realized and Unrealized Gain (Loss): | |
Net realized gain (loss) on: | |
Investments | | $ | 8,588,254 | |
Net realized gain | | | 8,588,254 | |
Net change in unrealized appreciation (depreciation) on: | |
Investments | | | 20,029,525 | |
Net change in unrealized appreciation (depreciation) | | | 20,029,525 | |
Net realized and unrealized gain | | | 28,617,779 | |
Net increase in net assets resulting from operations | | $ | 33,662,415 | |
* | Relates to Trustees not deemed “interested persons” within the meaning of Section 2(a)(19) of the 1940 Act. |
14 | THE GUGGENHEIM FUNDS SEMI-ANNUAL REPORT | SEE NOTES TO FINANCIAL STATEMENTS. |
STATEMENTS OF CHANGES IN NET ASSETS |
MID CAP VALUE FUND | |
| | | Period Ended
March 31,
2016
(Unaudited) | | | Year Ended
September 30,
2015 | |
Increase (Decrease) in Net Assets from Operations: | | | | | | |
Net investment income | | $ | 5,044,636 | | | $ | 430,814 | |
Net realized gain on investments | | | 8,588,254 | | | | 148,539,157 | |
Net change in unrealized appreciation (depreciation) on investments | | | 20,029,525 | | | | (179,558,088 | ) |
Net increase (decrease) in net assets resulting from operations | | | 33,662,415 | | | | (30,588,117 | ) |
| | | | | | | | | |
Distributions to shareholders from: | | | | | | | | |
Net realized gains | | | | | | | | |
A-Class | | | (71,175,868 | ) | | | (123,882,978 | ) |
B-Class | | | — | | | | (1,863,094 | ) |
C-Class | | | (23,558,203 | ) | | | (28,169,528 | ) |
P-Class | | | (15,730 | ) | | | — | |
Total distributions to shareholders | | | (94,749,801 | ) | | | (153,915,600 | ) |
| | | | | | | | | |
Capital share transactions: | | | | | | | | |
Proceeds from sale of shares | | | | | | | | |
A-Class | | | 17,582,818 | | | | 95,234,863 | |
B-Class | | | — | | | | 61,226 | |
C-Class | | | 3,804,146 | | | | 9,969,782 | |
P-Class | | | 1,183,325 | | | | 62,301 | * |
Distributions reinvested | | | | | | | | |
A-Class | | | 65,228,180 | | | | 114,025,165 | |
B-Class | | | — | | | | 1,753,261 | |
C-Class | | | 20,922,534 | | | | 24,118,771 | |
P-Class | | | 15,730 | | | | — | * |
Cost of shares redeemed | | | | | | | | |
A-Class | | | (94,876,703 | ) | | | (604,909,941 | ) |
B-Class | | | — | | | | (12,817,123 | ) |
C-Class | | | (25,639,464 | ) | | | (63,102,815 | ) |
P-Class | | | (190,614 | ) | | | — | * |
Net decrease from capital share transactions | | | (11,970,048 | ) | | | (435,604,510 | ) |
Net decrease in net assets | | | (73,057,434 | ) | | | (620,108,227 | ) |
| | | | | | | | | |
Net assets: | | | | | | | | |
Beginning of period | | | 602,896,503 | | | | 1,223,004,730 | |
End of period | | $ | 529,839,069 | | | $ | 602,896,503 | |
Undistributed net investment income at end of period | | $ | 5,044,636 | | | $ | — | |
SEE NOTES TO FINANCIAL STATEMENTS. | THE GUGGENHEIM FUNDS SEMI-ANNUAL REPORT | 15 |
STATEMENTS OF CHANGES IN NET ASSETS(concluded) |
MID CAP VALUE FUND | |
| | | Period Ended
March 31,
2016
(Unaudited) | | | Year Ended
September 30,
2015 | |
Capital share activity: | | | | | | |
Shares sold | | | | | | |
A-Class | | | 656,372 | | | | 2,752,607 | |
B-Class | | | — | | | | 2,355 | |
C-Class | | | 182,844 | | | | 363,138 | |
P-Class | | | 43,626 | | | | 1,862 | * |
Shares issued from reinvestment of distributions | | | | | | | | |
A-Class | | | 2,398,977 | | | | 3,380,581 | |
B-Class | | | — | | | | 68,273 | |
C-Class | | | 1,015,657 | | | | 893,949 | |
P-Class | | | 581 | | | | — | * |
Shares redeemed | | | | | | | | |
A-Class | | | (3,438,061 | ) | | | (17,642,149 | ) |
B-Class | | | — | | | | (501,001 | ) |
C-Class | | | (1,208,142 | ) | | | (2,316,755 | ) |
P-Class | | | (7,115 | ) | | | — | * |
Net decrease in shares | | | (355,261 | ) | | | (12,997,140 | ) |
* | Since the commencement of operations: May 1, 2015. |
16 | THE GUGGENHEIM FUNDS SEMI-ANNUAL REPORT | SEE NOTES TO FINANCIAL STATEMENTS. |
FINANCIAL HIGHLIGHTS |
MID CAP VALUE FUND | |
This table is presented to show selected data for a share outstanding throughout each period and to assist shareholders in evaluating a Fund’s performance for the periods presented.
A-Class | | Period Ended
March 31,
2016a | | | Year Ended
Sept. 30,
2015 | | | Year Ended
Sept. 30,
2014 | | | Year Ended
Sept. 30,
2013 | | | Year Ended
Sept. 30,
2012 | | | Year Ended
Sept. 30,
2011 | |
Per Share Data | | | | | | | | | | | | | | | | | | |
Net asset value, beginning of period | | $ | 30.86 | | | $ | 37.73 | | | $ | 38.15 | | | $ | 33.05 | | | $ | 27.13 | | | $ | 29.55 | |
Income (loss) from investment operations: | |
Net investment income (loss)b | | | .28 | | | | .06 | | | | .03 | | | | .04 | | | | (.07 | ) | | | (.03 | ) |
Net gain (loss) on investments (realized and unrealized) | | | 1.61 | | | | (2.24 | ) | | | 2.04 | | | | 8.59 | | | | 6.54 | | | | (2.31 | ) |
Total from investment operations | | | 1.89 | | | | (2.18 | ) | | | 2.07 | | | | 8.63 | | | | 6.47 | | | | (2.34 | ) |
Less distributions from: | |
Net investment income | | | — | | | | — | | | | — | | | | — | | | | — | | | | (.08 | ) |
Net realized gains | | | (4.84 | ) | | | (4.69 | ) | | | (2.49 | ) | | | (3.53 | ) | | | (.55 | ) | | | — | |
Total distributions | | | (4.84 | ) | | | (4.69 | ) | | | (2.49 | ) | | | (3.53 | ) | | | (.55 | ) | | | (.08 | ) |
Net asset value, end of period | | $ | 27.91 | | | $ | 30.86 | | | $ | 37.73 | | | $ | 38.15 | | | $ | 33.05 | | | $ | 27.13 | |
| | |
Total Returnc | | | 6.54 | % | | | (6.83 | %) | | | 5.52 | % | | | 28.93 | % | | | 24.13 | % | | | (7.98 | %) |
Ratios/Supplemental Data | |
Net assets, end of period (in thousands) | | $ | 420,613 | | | $ | 476,792 | | | $ | 1,017,208 | | | $ | 1,038,762 | | | $ | 903,221 | | | $ | 973,467 | |
Ratios to average net assets: | |
Net investment income (loss) | | | 1.99 | % | | | 0.18 | % | | | 0.08 | % | | | 0.11 | % | | | (0.22 | %) | | | (0.10 | %) |
Total expensese | | | 1.47 | % | | | 1.42 | % | | | 1.39 | % | | | 1.39 | % | | | 1.46 | % | | | 1.32 | % |
Portfolio turnover rate | | | 27 | % | | | 84 | % | | | 35 | % | | | 23 | % | | | 19 | % | | | 28 | % |
SEE NOTES TO FINANCIAL STATEMENTS. | THE GUGGENHEIM FUNDS SEMI-ANNUAL REPORT | 17 |
FINANCIAL HIGHLIGHTS (continued) |
MID CAP VALUE FUND | |
This table is presented to show selected data for a share outstanding throughout each period and to assist shareholders in evaluating a Fund’s performance for the periods presented.
C-Class | | Period Ended
March 31,
2016a | | | Year Ended
Sept. 30,
2015 | | | Year Ended
Sept. 30,
2014 | | | Year Ended
Sept. 30,
2013 | | | Year Ended
Sept. 30,
2012 | | | Year Ended
Sept. 30,
2011 | |
Per Share Data | | | | | | | | | | | | | | | | | | |
Net asset value, beginning of period | | $ | 24.54 | | | $ | 31.14 | | | $ | 32.13 | | | $ | 28.57 | | | $ | 23.68 | | | $ | 25.93 | |
Income (loss) from investment operations: | |
Net investment income (loss)b | | | .13 | | | | (.15 | ) | | | (.21 | ) | | | (.18 | ) | | | (.25 | ) | | | (.24 | ) |
Net gain (loss) on investments (realized and unrealized) | | | 1.26 | | | | (1.76 | ) | | | 1.71 | | | | 7.27 | | | | 5.69 | | | | (2.01 | ) |
Total from investment operations | | | 1.39 | | | | (1.91 | ) | | | 1.50 | | | | 7.09 | | | | 5.44 | | | | (2.25 | ) |
Less distributions from: | |
Net realized gains | | | (4.84 | ) | | | (4.69 | ) | | | (2.49 | ) | | | (3.53 | ) | | | (.55 | ) | | | — | |
Total distributions | | | (4.84 | ) | | | (4.69 | ) | | | (2.49 | ) | | | (3.53 | ) | | | (.55 | ) | | | — | |
Net asset value, end of period | | $ | 21.09 | | | $ | 24.54 | | | $ | 31.14 | | | $ | 32.13 | | | $ | 28.57 | | | $ | 23.68 | |
| | |
Total Returnc | | | 6.13 | % | | | (7.49 | %) | | | 4.74 | % | | | 27.98 | % | | | 23.28 | % | | | (8.68 | %) |
Ratios/Supplemental Data | |
Net assets, end of period (in thousands) | | $ | 108,143 | | | $ | 126,047 | | | $ | 192,942 | | | $ | 219,695 | | | $ | 191,249 | | | $ | 188,745 | |
Ratios to average net assets: | |
Net investment income (loss) | | | 1.20 | % | | | (0.53 | %) | | | (0.65 | %) | | | (0.62 | %) | | | (0.92 | %) | | | (0.85 | %) |
Total expensese | | | 2.24 | % | | | 2.12 | % | | | 2.12 | % | | | 2.12 | % | | | 2.17 | % | | | 2.07 | % |
Portfolio turnover rate | | | 27 | % | | | 84 | % | | | 35 | % | | | 23 | % | | | 19 | % | | | 28 | % |
18 | THE GUGGENHEIM FUNDS SEMI-ANNUAL REPORT | SEE NOTES TO FINANCIAL STATEMENTS. |
FINANCIAL HIGHLIGHTS (concluded) |
MID CAP VALUE FUND |
This table is presented to show selected data for a share outstanding throughout each period and to assist shareholders in evaluating a Fund’s performance for the periods presented.
P-Class | | Period Ended
March 31,
2016a | | | Period Ended
Sept. 30,
2015d | |
Per Share Data | | | | | | |
Net asset value, beginning of period | | $ | 30.77 | | | $ | 33.91 | |
Income (loss) from investment operations: | |
Net investment income (loss)b | | | .33 | | | | .10 | |
Net gain (loss) on investments (realized and unrealized) | | | 1.55 | | | | (3.24 | ) |
Total from investment operations | | | 1.88 | | | | (3.14 | ) |
Less distributions from: | |
Net realized gains | | | (4.84 | ) | | | — | |
Total distributions | | | (4.84 | ) | | | — | |
Net asset value, end of period | | $ | 27.81 | | | $ | 30.77 | |
| | |
Total Returnc | | | 6.53 | % | | | (9.26 | %) |
Ratios/Supplemental Data | |
Net assets, end of period (in thousands) | | $ | 1,083 | | | $ | 57 | |
Ratios to average net assets: | |
Net investment income (loss) | | | 2.56 | % | | | 0.71 | % |
Total expensese | | | 1.32 | % | | | 1.32 | % |
Portfolio turnover rate | | | 27 | % | | | 84 | % |
a | Unaudited figures for the period ended March 31, 2016. Percentage amounts for the period, except total return and portfolio turnover rate, have been annualized. |
b | Net investment income (loss) per share was computed using average shares outstanding throughout the period. |
c | Total return does not reflect the impact of any applicable sales charges. |
d | Since commencement of operations: May 1, 2015. Percentage amounts for the period, except total return and portfolio turnover rate, have been annualized. |
e | Does not include expenses of the underlying funds in which the Fund invests. |
SEE NOTES TO FINANCIAL STATEMENTS. | THE GUGGENHEIM FUNDS SEMI-ANNUAL REPORT | 19 |
NOTES TO FINANCIAL STATEMENTS (Unaudited) |
1. Organization and Significant Accounting Policies
Organization
Guggenheim Funds Trust (the “Trust”), a Delaware statutory trust, is registered with the SEC under the Investment Company Act of 1940 (“1940 Act”), as an open-ended investment company of the series type. Each series, in effect, is representing a separate Fund. The Trust is authorized to issue an unlimited number of shares. The Trust accounts for the assets of each Fund separately.
The Trust offers a combination of four separate classes of shares, A-Class shares, C-Class shares, P-Class shares and Institutional Class shares. Sales of shares of each Class are made without a front-end sales charge at the net asset value per share (“NAV”), with the exception of A-Class shares. A-Class shares are sold at the NAV, plus the applicable front-end sales charge. The sales charge varies depending on the amount purchased. A-Class share purchases of $1 million or more are exempt from the front-end sales charge but have a 1% contingent deferred sales charge (“CDSC”), if shares are redeemed within 12 months of purchase. B-Class shares previously offered have been converted to A-Class shares effective July 31, 2014 for the Alpha Opportunity Fund, and effective August 8, 2015 for the other funds in the Trust. C-Class shares have a 1% CDSC if shares are redeemed within 12 months of purchase. Institutional Class shares are offered primarily for direct investment by institutions such as pension and profit sharing plans, endowments, foundations and corporations. Institutional Class shares require a minimum initial investment of $2 million and a minimum account balance of $1 million. At March 31, 2016, the Trust consisted of nineteen funds (the “Funds”).
This report covers the Mid Cap Value Fund (the “Fund”), a diversified investment company. Only A-Class, C-Class and P-Class shares had been issued by the Fund.
Guggenheim Investments (“GI”) provides advisory services, and Rydex Fund Services, LLC (“RFS”) provides transfer agent, administrative and accounting services to the Trust. Guggenheim Funds Distributors, LLC (“GFD”) acts as principal underwriter for the Trust. GI, RFS and GFD are affiliated entities.
Significant Accounting Policies
The Fund operates as an investment company and accordingly follows the investment company accounting and reporting guidance of the Financial Accounting Standards Board (“FASB”) Accounting Standards Codification Topic 946 Financial Services – Investment Companies.
The following significant accounting policies are in conformity with U.S. generally accepted accounting principles (“U.S. GAAP”) and are consistently followed by the Trust. This requires management to make estimates and assumptions that affect
20 | THE GUGGENHEIM FUNDS SEMI-ANNUAL REPORT | |
NOTES TO FINANCIAL STATEMENTS (Unaudited)(continued) |
the reported amount of assets and liabilities and disclosure of contingent assets and liabilities at the date of the financial statements and the reported amounts of revenues and expenses during the reporting period. Actual results could differ from these estimates. All time references are based on Eastern Time.
The NAV of each Class of the Fund is calculated by dividing the market value of the Fund’s securities and other assets, less all liabilities, attributable to the Class by the number of outstanding shares of the Class.
A. The Board of Trustees of the Fund (the “Board”) has adopted policies and procedures for the valuation of the Fund’s investments (the “Valuation Procedures”). Pursuant to the Valuation Procedures, the Board has delegated to a valuation committee, consisting of representatives from Guggenheim’s investment management, fund administration, legal and compliance departments (the “Valuation Committee”), the day-to-day responsibility for implementing the Valuation Procedures, including, under most circumstances, the responsibility for determining the fair value of the Fund’s securities or other assets.
Valuations of the Fund’s securities are supplied primarily by pricing services appointed pursuant to the processes set forth in the Valuation Procedures. The Valuation Committee convenes monthly, or more frequently as needed, and will review the valuation of all assets which have been fair valued for reasonableness. The Fund’s officers, through the Valuation Committee and consistent with the monitoring and review responsibilities set forth in the Valuation Procedures, regularly review procedures used by, and valuations provided by, the pricing services.
If the pricing service cannot or does not provide a valuation for a particular investment or such valuation is deemed unreliable, such investment is fair valued by the Valuation Committee.
Equity securities listed on an exchange (New York Stock Exchange (“NYSE”) or American Stock Exchange) are valued at the last quoted sales price as of the close of business on the NYSE, usually 4:00 p.m. on the valuation date. Equity securities listed on the NASDAQ market system are valued at the NASDAQ Official Closing Price on the valuation date, which may not necessarily represent the last sale price. If there has been no sale on such exchange or NASDAQ on a given day, the security is valued at the closing bid price on that day.
Open-end investment companies (“Mutual Funds”) are valued at their NAV as of the close of business on the valuation date.
| | THE GUGGENHEIM FUNDS SEMI-ANNUAL REPORT | 21 |
NOTES TO FINANCIAL STATEMENTS (Unaudited)(continued) |
Investments for which market quotations are not readily available are fair valued as determined in good faith by GI under the direction of the Board of Trustees using methods established or ratified by the Board of Trustees. These methods include but are not limited to: (i) obtaining general information as to how these securities and assets trade; and (ii) obtaining other information and considerations, including current values in related markets.
B. Security transactions are recorded on the trade date for financial reporting purposes. Realized gains and losses from securities transactions are recorded using the identified cost basis. Proceeds from lawsuits related to investment holdings are recorded as realized gains in the Fund. Dividend income is recorded on the ex-dividend date, net of applicable taxes withheld by foreign countries. Taxable non-cash dividends are recorded as dividend income. Interest income, including amortization of premiums and accretion of discounts, is accrued on a daily basis. Interest income also includes paydown gains and losses on mortgage-backed and asset-backed securities and senior and subordinated loans. Amendment fees are earned as compensation for evaluating and accepting changes to the original loan agreement and are recognized when received. Dividend income from REITs is recorded based on the income included in the distributions received from the REIT investments using published REIT classifications, including some management estimates when actual amounts are not available. Distributions received in excess of this estimated amount are recorded as a reduction of the cost of investments or reclassified to capital gains. The actual amounts of income, return of capital, and capital gains are only determined by each REIT after its fiscal year-end, and may differ from the estimated amounts.
C. Distributions of net investment income and net realized gains, if any, are declared and paid at least annually. Dividends are reinvested in additional shares unless shareholders request payment in cash. Distributions are recorded on the ex-dividend date and are determined in accordance with income tax regulations which may differ from U.S. GAAP.
D. Interest and dividend income, most expenses, all realized gains and losses, and all unrealized gains and losses are allocated to the classes based upon the value of the outstanding shares in each Class. Certain costs, such as distribution and service fees are charged directly to specific classes. In addition, certain expenses have been allocated to the individual Funds in the Trust on a pro rata basis upon the respective aggregate net assets of each Fund included in the Trust.
22 | THE GUGGENHEIM FUNDS SEMI-ANNUAL REPORT | |
NOTES TO FINANCIAL STATEMENTS (Unaudited)(continued) |
E. Under the fee arrangement with the custodian, the Fund may earn credits based on overnight custody cash balances. These credits are utilized to reduce related custodial expenses. The custodian fees disclosed in the Statement of Operations are before the reduction in expense from the related earnings credits, if any. For the period ended March 31, 2016, there were no earnings credits received.
F. The Fund may leave cash overnight in its cash account with the custodian. Periodically, the Fund may have cash due to the custodian bank as an overdraft balance. A fee is incurred on this overdraft, calculated by multiplying the overdraft by a rate based on the federal funds rate, which was 0.25% at March 31, 2016.
G. Under the Fund’s organizational documents, its Trustees and Officers are indemnified against certain liabilities arising out of the performance of their duties to the Trust. In addition, throughout the normal course of business, the Fund enters into contracts that contain a variety of representations and warranties which provide general indemnifications. The Fund’s maximum exposure under these arrangements is unknown, as this would involve future claims that may be made against the Fund and/or its affiliates that have not yet occurred. However, based on experience, the Fund expects the risk of loss to be remote.
2. Federal Income Tax Information
The Fund intends to comply with the provisions of Subchapter M of the Internal Revenue Code applicable to regulated investment companies and will distribute substantially all taxable net investment income and capital gains sufficient to relieve the Fund from all, or substantially all, federal income, excise and state income taxes. Therefore, no provision for federal or state income tax is required.
Tax positions taken or expected to be taken in the course of preparing the Fund’s tax returns are evaluated to determine whether the tax positions are “more-likely-than-not” of being sustained by the applicable tax authority. Tax positions not deemed to meet the more-likely-than-not threshold would be recorded as a tax benefit or expense in the current year. Management has analyzed the Fund’s tax positions taken, or to be taken, on Federal income tax returns for all open tax years, and has concluded that no provision for income tax is required in the Fund’s financial statements. The Fund’s federal tax returns are subject to examination by the Internal Revenue Service for a period of three years after they are filed.
| | THE GUGGENHEIM FUNDS SEMI-ANNUAL REPORT | 23 |
NOTES TO FINANCIAL STATEMENTS (Unaudited)(continued) |
At March 31, 2016, the cost of securities for Federal income tax purposes, the aggregate gross unrealized gain for all securities for which there was an excess of value over tax cost and the aggregate gross unrealized loss for all securities for which there was an excess of tax cost over value, were as follows:
Fund Name | | Tax
Cost | | | Tax
Unrealized
Gain | | | Tax
Unrealized
Loss | | | Net
Unrealized
Gain (Loss) | |
Mid Cap Value Fund | | $ | 499,113,110 | | | $ | 71,732,788 | | | $ | (43,658,589 | ) | | $ | 28,074,199 | |
3. Fees and Other Transactions with Affiliates
Under the terms of an investment advisory contract, the Fund pays GI investment advisory fees calculated at 1.00% of the average daily net assets of $200 million or less and 0.75% of the average daily net assets of the Fund in excess of $200 millon.
RFS provides transfer agent services to the Fund for fees calculated at the rate below, which are assessed to the applicable classes of the Fund. For these services, RFS receives the following:
Annual charge per account | $5.00 – $8.00 |
Transaction fee | $0.60 – $1.10 |
Minimum annual charge per Fund† | $25,000 |
Certain out-of-pocket charges | Varies |
† | Not subject to Fund during first twelve months of operations. |
RFS also acts as the administrative agent for the Fund, and as such performs administrative functions and the bookkeeping, accounting and pricing functions for the Fund. For these services, RFS receives 0.095% of the average daily net assets of the Fund. The minimum annual charge for administrative fees is $25,000.
RFS engages external service providers to perform other necessary services for the Trust, such as audit and accounting related services, legal services, custody, printing and mailing, etc., on a pass-through basis. Such expenses are allocated to various Funds within the complex based on relative net assets.
The Fund has adopted Distribution Plans related to the offering of A-Class, C-Class and P-Class shares pursuant to Rule 12b-1 under the 1940 Act. The plans provide for payments at an annual rate of 0.25% of the average daily net assets of the Fund’s A-Class and P-Class shares, and 1.00% of the average daily net assets of the Fund’s C-Class shares.
24 | THE GUGGENHEIM FUNDS SEMI-ANNUAL REPORT | |
NOTES TO FINANCIAL STATEMENTS (Unaudited)(continued) |
For the period ended March 31, 2016, GFD retained sales charges of $274,695 relating to sales of A-Class shares of the Trust.
Certain trustees and officers of the Trust are also officers of GI, RFS and GFD.
4. Fair Value Measurement
In accordance with U.S. GAAP, fair value is defined as the price that the Fund would receive to sell an investment or pay to transfer a liability in an orderly transaction with an independent buyer in the principal market, or in the absence of a principal market, the most advantageous market for the investment or liability. U.S. GAAP establishes a three-tier fair value hierarchy based on the types of inputs used to value assets and liabilities and requires corresponding disclosure. The hierarchy and the corresponding inputs are summarized below:
Level 1 — | quoted prices in active markets for identical assets or liabilities. |
Level 2 — | significant other observable inputs (for example quoted prices for securities that are similar based on characteristics such as interest rates, prepayment speeds, credit risk, etc.). |
Level 3 — | significant unobservable inputs based on the best information available under the circumstances, to the extent observable inputs are not available, which may include assumptions. |
The types of inputs available depend on a variety of factors, such as the type of security and the characteristics of the markets in which it trades, if any. Fair valuation determinations that rely on fewer or no observable inputs require greater judgment. Accordingly, fair value determinations for Level 3 securities require the greatest amount of judgment.
The inputs or methodologies used for valuing securities are not necessarily an indication of the risk associated with investing in those securities. The suitability of the techniques and sources employed to determine fair valuation are regularly monitored and subject to change.
5. Securities Transactions
For the period ended March 31, 2016, the cost of purchases and proceeds from sales of investment securities, excluding government securities, short-term investments and derivatives, were as follows:
Fund | | Purchases | | | Sales | |
Mid Cap Value Fund | | $ | 148,993,027 | | | $ | 232,327,056 | |
| | THE GUGGENHEIM FUNDS SEMI-ANNUAL REPORT | 25 |
NOTES TO FINANCIAL STATEMENTS (Unaudited)(concluded) |
The Fund is permitted to purchase or sell securities from or to certain affiliated funds under specified conditions outlined in procedures adopted by the Board of Trustees of the Trust. The procedures have been designed to ensure that any purchase or sale of securities by a Fund from or to another fund or portfolio that is or could be considered an affiliate by virtue of having a common investment adviser (or affiliated investment advisers), common Trustees and/or common officers complies with Rule 17a-7 of the 1940 Act. Further, as defined under these procedures, each transaction is effected at the current market price to save costs, where permissible. For the period ended March 31, 2016, the Fund did not engage in purchases and sales of securities, pursuant to Rule 17a-7 of the 1940 Act.
6. Line of Credit
The Funds, with the exception of Alpha Opportunity Fund, Capital Stewardship Fund, Diversified Income Fund and Market Neutral Real Estate Fund, secured a committed $800,000,000 line of credit from Citibank, N.A., good through October 7, 2016, at which time the line of credit may be renewed. This line of credit is reserved for emergency or temporary purposes. Fees related to borrowings, if any, vary under this arrangement between the greater of Citibank’s “base rate”, LIBOR plus 1%, or the federal funds rate (0.25% at March 31, 2016), plus 1/2 of 1%. The Funds also pay a commitment fee at an annualized rate of 0.15% of the average daily amount of their unused commitment amount. The Funds did not have any borrowings under this agreement as of and for the period-ended March 31, 2016.
7. Other Liabilities
The Fund wrote put option contracts through Lehman Brothers Inc., (“LBI”) that were exercised prior to the option contracts’ expiration and prior to the bankruptcy filing by LBI, during September, 2008. However, these transactions have not settled and the securities have not been delivered to the Fund as of March 31, 2016.
Although the ultimate resolution of these transactions is uncertain, the Fund has recorded a liability on its books equal to the difference between the strike price on the put options and the market price of the underlying security on the exercise date. The amount of the liability recorded in miscellaneous payables by the Fund as of March 31, 2016, was $473,594.
26 | THE GUGGENHEIM FUNDS SEMI-ANNUAL REPORT | |
OTHER INFORMATION (Unaudited) |
Proxy Voting Information
A description of the policies and procedures that the Trust uses to determine how to vote proxies relating to securities held in the Funds’ portfolios is available, without charge and upon request, by calling 800.820.0888. This information is also available from the EDGAR database on the SEC’s website at http://www.sec.gov.
Information regarding how the Funds voted proxies relating to portfolio securities during the most recent 12-month period ended June 30 is available without charge, upon request, by calling 800.820.0888. This information is also available from the EDGAR database on the SEC’s website at http://www.sec.gov.
Sector Classification
Information in the “Schedule of Investments” is categorized by sectors using sector-level Classifications defined by the Bloomberg Industry Classification System, a widely recognized industry classification system provider. Each Fund’s registration statement has investment policies relating to concentration in specific sectors/industries. For purposes of these investment policies, the Funds usually classify sectors/industries based on industry-level Classifications used by widely recognized industry classification system providers such as Bloomberg Industry Classification System, Global Industry Classification Standards and Barclays Global Classification Scheme.
Quarterly Portfolio Schedules Information
The Trust files its complete schedule of portfolio holdings with the SEC for the first and third quarters of each fiscal year on Form N-Q; which are available on the SEC’s website at http://www.sec.gov. The Funds’ Forms N-Q may be reviewed and copied at the SEC’s Public Reference Room in Washington, DC, and that information on the operation of the Public Reference Room may be obtained by calling 800-SEC-0330. Copies of the portfolio holdings are also available to shareholders, without charge and upon request, by calling 800.820.0888.
| | THE GUGGENHEIM FUNDS SEMI-ANNUAL REPORT | 27 |
INFORMATION ON BOARD OF TRUSTEES AND OFFICERS (Unaudited) |
Name, Address* and Year of Birth | Position(s) Held with the Trust | Term of Office and Length of Time Served** | Principal Occupation(s) During Past Five Years | Number of Portfolios in Fund Complex Overseen | Other Directorships Held by Trustees |
INDEPENDENT TRUSTEES | | | |
Randall C. Barnes (1951) | Trustee | Since 2014 | Current: Private Investor (2001-present). Former: Senior Vice President and Treasurer, PepsiCo, Inc. (1993-1997); President, Pizza Hut International (1991-1993); Senior Vice President, Strategic Planning and New Business Development, PepsiCo, Inc. (1987-1990). | 105 | Current: Trustee, Purpose Investments Inc. (2014-Present). |
Donald A. Chubb, Jr. (1946) | Trustee | Since 1994 | Current: Business broker and manager of commercial real estate, Griffith & Blair, Inc. (1997-present). | 101 | Current: Midland Care, Inc. (2011-present). |
Jerry B. Farley (1946) | Trustee | Since 2005 | Current: President, Washburn University (1997-present). | 101 | Current: Westar Energy, Inc. (2004-present); CoreFirst Bank & Trust (2000-present). |
28 | THE GUGGENHEIM FUNDS SEMI-ANNUAL REPORT | |
INFORMATION ON BOARD OF TRUSTEES AND OFFICERS (Unaudited)(continued) |
Name, Address* and Year of Birth | Position(s) Held with the Trust | Term of Office and Length of Time Served** | Principal Occupation(s) During Past Five Years | Number of Portfolios in Fund Complex Overseen | Other Directorships Held by Trustees |
INDEPENDENT TRUSTEES - continued | | |
Roman Friedrich III (1946) | Trustee and Chairman of the Contracts Review Committee | Since 2014 | Current: Founder and Managing Partner, Roman Friedrich & Company (1998-present). Former: Senior Managing Director, MLV & Co. LLC (2010-2011). | 101 | Current: Zincore Metals, Inc. (2009-present). Former: Axiom Gold and Silver Corp. (2011-2012). |
Robert B. Karn III (1942) | Trustee and Chairman of the Audit Committee | Since 2014 | Current: Consultant (1998-present). Former: Arthur Andersen (1965-1997) and Managing Partner, Financial and Economic Consulting, St. Louis office (1987-1997). | 101 | Current: Peabody Energy Company (2003-present); GP Natural Resource Partners, LLC (2002- present). |
Ronald A. Nyberg (1953) | Trustee and Chairman of the Nominating and Governance Committee | Since 2014 | Current: Partner, Nyberg & Cassioppi, LLC (2000-present). Former: Executive Vice President, General Counsel, and Corporate Secretary, Van Kampen Investments (1982-1999). | 107 | Current: Edward-Elmhurst Healthcare System (2012-present). |
| | THE GUGGENHEIM FUNDS SEMI-ANNUAL REPORT | 29 |
INFORMATION ON BOARD OF TRUSTEES AND OFFICERS (Unaudited)(continued) |
Name, Address* and Year of Birth | Position(s) Held with the Trust | Term of Office and Length of Time Served** | Principal Occupation(s) During Past Five Years | Number of Portfolios in Fund Complex Overseen | Other Directorships Held by Trustees |
INDEPENDENT TRUSTEES - concluded | | |
Maynard F. Oliverius (1943) | Trustee | Since 1998 | Current: Retired. Former: President and CEO, Stormont-Vail HealthCare (1996-2012). | 101 | Current: Fort Hays State University Foundation (1999-present); Stormont-Vail Foundation (2013-present); University of Minnesota HealthCare Alumni Association Foundation (2009-present). |
Ronald E. Toupin, Jr. (1958) | Trustee and Chairman of the Board | Since 2014 | Current: Portfolio Consultant (2010-present). Former: Vice President, Manager and Portfolio Manager, Nuveen Asset Management (1998-1999); Vice President, Nuveen Investment Advisory Corp. (1992-1999); Vice President and Manager, Nuveen Unit Investment Trusts (1991-1999); and Assistant Vice President and Portfolio Manager, Nuveen Unit Investment Trusts (1988-1999), each of John Nuveen & Co., Inc. (1982-1999). | 104 | Former: Bennett Group of Funds (2011-2013). |
30 | THE GUGGENHEIM FUNDS SEMI-ANNUAL REPORT | |
INFORMATION ON BOARD OF TRUSTEES AND OFFICERS (Unaudited)(continued) |
Name, Address* and Year of Birth | Position(s) Held with the Trust | Term of Office and Length of Time Served** | Principal Occupation(s) During Past Five Years | Number of Portfolios in Fund Complex Overseen | Other Directorships Held by Trustees |
INTERESTED TRUSTEE | |
Donald C. Cacciapaglia*** (1951) | President, Chief Executive Officer and Trustee | Since 2012 | Current: President and CEO, certain other funds in the Fund Complex (2012-present); Vice Chairman, Guggenheim Investments (2010-present). Former: Chairman and CEO, Channel Capital Group, Inc. (2002-2010). | 236 | Current: Clear Spring Life Insurance Company (2015-present); Guggenheim Partners Japan, Ltd. (2014-present); Delaware Life (2013-present); Guggenheim Life and Annuity Company (2011-present); Paragon Life Insurance Company of Indiana (2011-present). |
* | The business address of each Trustee is c/o Guggenheim Investments, 805 King Farm Boulevard, Suite 600, Rockville, Maryland 20850. |
** | Each Trustee serves an indefinite term, until his successor is elected and qualified. Time served includes time served in the respective position for the Predecessor Corporation. |
*** | This Trustee is deemed to be an "interested person" of the Funds under the 1940 Act by reason of his position with the Funds' Investment Manager and/or the parent of the Investment Manager. |
| | THE GUGGENHEIM FUNDS SEMI-ANNUAL REPORT | 31 |
INFORMATION ON BOARD OF TRUSTEES AND OFFICERS (Unaudited)(continued) |
Name, Address* and Year of Birth | Position(s) Held with the Trust | Term of Office and Length of Time Served** | Principal Occupations
During Past Five Years |
OFFICERS | | | |
Joseph M. Arruda (1966) | Assistant Treasurer | Since 2010 | Current: Assistant Treasurer, certain other funds in the Fund Complex (2006-present); Vice President, Security Investors, LLC (2010-present); CFO and Manager, Guggenheim Specialized Products, LLC (2009-present). Former: Vice President, Security Global Investors, LLC (2010-2011); Vice President, Rydex Advisors, LLC (2010); Vice President, Rydex Advisors II, LLC (2010). |
William H. Belden, III (1965) | Vice President | Since 2014 | Current: Vice President, certain other funds in the Fund Complex (2006-present); Managing Director, Guggenheim Funds Investment Advisors, LLC (2005-present). Former: Vice President of Management, Northern Trust Global Investments (1999-2005). |
James Howley (1972) | Assistant Treasurer | Since 2014 | Current: Director, Guggenheim Investments (2004-present) ; Assistant Treasurer, certain other funds in the Fund Complex (2006-present). Former: Manager, Mutual Fund Administration of Van Kampen Investments, Inc. (1996-2004). |
Amy J. Lee (1961) | Vice President and Chief Legal Officer | Since 2007 (Vice President) Since 2014 (Chief Legal Officer) | Current: Chief Legal Officer, certain other funds in the Fund Complex (2013-present); Senior Managing Director, Guggenheim Investments (2012-present). Former: Vice President, Associate General Counsel and Assistant Secretary, Security Benefit Life Insurance Company and Security Benefit Corporation (2004-2012). |
Mark E. Mathiasen (1978) | Secretary | Since 2014 | Current: Secretary, certain other funds in the Fund Complex (2007-present); Managing Director, Guggenheim Investments (2007-present). |
32 | THE GUGGENHEIM FUNDS SEMI-ANNUAL REPORT | |
INFORMATION ON BOARD OF TRUSTEES AND OFFICERS (Unaudited)(continued) |
Name, Address* and Year of Birth | Position(s) Held with the Trust | Term of Office and Length of Time Served** | Principal Occupations
During Past Five Years |
OFFICERS - continued | |
Michael P. Megaris (1984) | Assistant Secretary | Since 2014 | Current: Assistant Secretary, certain other funds in the Fund Complex (2014-present); Senior Associate, Guggenheim Investments (2012-present). Former: J.D., University of Kansas School of Law (2009-2012). |
Elisabeth Miller (1968) | Chief Compliance Officer | Since 2012 | Current: CCO, certain other funds in the Fund Complex (2012-present); CCO, Security Investors, LLC (2012-present); CCO, Guggenheim Funds Investment Advisors, LLC (2012-present); Managing Director, Guggenheim Investments (2012-present); Vice President, Guggenheim Funds Distributors, LLC (March 2014-present). Former: CCO, Guggenheim Distributors, LLC (2009-March 2014); Senior Manager, Security Investors, LLC (2004-2009); Senior Manager, Guggenheim Distributors, LLC (2004-2009). |
Adam Nelson (1979) | Assistant Treasurer | Since 2015 | Current: Vice President, Guggenheim Investments (2015-present); Assistant Treasurer, certain other funds in the Fund Complex (2015-present). Former: Assistant Vice President and Fund Administration Director, State Street Corporation (2013-2015); Fund Administration Assistant Director, State Street (2011-2013); Fund Administration Manager, State Street (2009-2011). |
Alison Santay (1974) | AML Officer | Since 2013 | Current: AML Officer, certain other funds in the Fund Complex (2010-present); Director and AML Officer, Rydex Fund Services, LLC (2010-present); AML Officer, Security Investors, LLC (2010-present); Director, Shareholder Risk and Compliance, Rydex Fund Services, LLC (2004-present). Former: AML Officer, Guggenheim Distributors, LLC (2013-2014). |
| 4 | THE GUGGENHEIM FUNDS SEMI-ANNUAL REPORT | 33 |
INFORMATION ON BOARD OF TRUSTEES AND OFFICERS (Unaudited)(concluded) |
Name, Address* and Year of Birth | Position(s) Held with the Trust | Term of Office and Length of Time Served** | Principal Occupations
During Past Five Years |
OFFICERS - continued | |
Kimberly Scott (1974) | Assistant Treasurer | Since 2014 | Current: Vice President, Guggenheim Investments (2012-present) ; Assistant Treasurer, certain other funds in the Fund Complex (2012-present). Former: Financial Reporting Manager, Invesco, Ltd. (2010-2011); Vice President/Assistant Treasurer, Mutual Fund Administration for Van Kampen Investments, Inc./Morgan Stanley Investment Management (2009-2010); Manager of Mutual Fund Administration, Van Kampen Investments, Inc./Morgan Stanley Investment Management (2005-2009). |
Bryan Stone (1979) | Vice President | Since 2014 | Current: Vice President, certain other funds in the Fund Complex (2014-present); Director, Guggenheim Investments (2013-present). Former: Senior Vice President, Neuberger Berman Group LLC (2009-2013); Vice President, Morgan Stanley (2002-2009). |
John L. Sullivan (1955) | Chief Financial Officer and Treasurer | Since 2014 | Current: CFO, Chief Accounting Officer and Treasurer, certain other funds in the Fund Complex (2010-present); Senior Managing Director, Guggenheim Investments (2010-present). Former: Managing Director and CCO, each of the funds in the Van Kampen Investments fund complex (2004-2010); Managing Director and Head of Fund Accounting and Administration, Morgan Stanley Investment Management (2002-2004); CFO and Treasurer, Van Kampen Funds (1996-2004). |
* | The business address of each officer is c/o Guggenheim Investments, 805 King Farm Boulevard, Suite 600, Rockville, Maryland 20850. |
** | Each officer serves an indefinite term, until his or her successor is duly elected and qualified. Time served includes time served in the respective position for the Predecessor Corporation. |
34 | THE GUGGENHEIM FUNDS SEMI-ANNUAL REPORT | |
GUGGENHEIM INVESTMENTS PRIVACY POLICIES (Unaudited) |
Rydex Funds, Guggenheim Funds, Rydex Investments, Guggenheim Funds Distributors, LLC, Security Investors, LLC, Security Distributors, Inc., Guggenheim Partners Investment Managers, LLC, and Rydex Advisory Services (Collectively “Guggenheim Investments”).
Our Commitment to You
When you become a Guggenheim Investments investor, you entrust us with not only your hard-earned money but also with personal and financial information about you. We recognize that your relationship with us is based on trust and that you expect us to act responsibly and in your best interests. Because we have access to this private information about you, we hold ourselves to the highest standards in its safekeeping and use. This means, most importantly, that we do not sell client information to anyone—whether it is your personal information or if you are a current or former Guggenheim Investments client.
The Information We Collect About You
In the course of doing business with shareholders and investors, we collect nonpublic personal information about you. You typically provide personal information when you complete a Guggenheim Investments account application or when you request a transaction that involves Rydex and Guggenheim Investments funds or one of the Guggenheim Investments affiliated companies. “Nonpublic personal information” is personally identifiable private information about you. For example, it includes information regarding your name and address, Social Security or taxpayer identification number, assets, income, account balance, bank account information and investment activity (e.g., purchase and redemption history).
How We Handle Your Personal Information
As emphasized above, we do not sell information about current or former clients or their accounts to third parties. Nor do we share such information, except when necessary to complete transactions at your request or to make you aware of related investment products and services that we offer. Additional details about how we handle your personal information are provided below. To complete certain transactions or account changes that you direct, it may be necessary to provide identifying information to companies, individuals or groups that are not affiliated with Guggenheim Investments. For example, if you ask to transfer assets from another financial institution to Guggenheim Investments, we will need to provide certain information about you to that company to complete the transaction. To alert you to other Guggenheim Investments investment products and services, we may share your information within the Guggenheim Investments family of affiliated companies. This would include, for example, sharing your information within Guggenheim Investments so we can make you aware of
| | THE GUGGENHEIM FUNDS SEMI-ANNUAL REPORT | 35 |
GUGGENHEIM INVESTMENTS PRIVACY POLICIES (Unaudited)(continued) |
new Rydex and Guggenheim Investments funds or the services offered through another Guggenheim Investments affiliated company. In certain instances, we may contract with nonaffiliated companies to perform services for us. Where necessary, we will disclose information we have about you to these third parties. In all such cases, we provide the third party with only the information necessary to carry out its assigned responsibilities and only for that purpose. And we require these third parties to treat your private information with the same high degree of confidentiality that we do. In certain instances, we may share information with other financial institutions regarding individuals and entities in response to the U.S.A. Patriot Act. Finally, we will release information about you if you direct us to do so, if we are compelled by law to do so or in other circumstances permitted by law.
Opt Out Provisions
We do not sell your personal information to anyone. The law allows you to “opt out” of only certain kinds of information sharing with third parties. The firm does not share personal information about you with any third parties that triggers this opt-out right. This means YOU ARE ALREADY OPTED OUT.
How We Protect Privacy Online
Our concern for the privacy of our shareholders also extends to those who use our web site, guggenheiminvestments.com. Our web site uses some of the most secure forms of online communication available, including encryption technology, Secure Socket Layer (SSL) protocol, firewalls and user names and passwords. These technologies provide a high level of security and privacy when you access your account information or initiate online transactions. The Guggenheim Investments web site offers customized features that require our use of “http cookies”—tiny pieces of information that we ask your browser to store. However, we make very limited use of these cookies. We only use cookies for session management and security features on the Guggenheim Investments web site. We do not use them to pull data from your hard drive, to learn your email address, or to view data in cookies created by other web sites. We will not share the information in our cookies or give others access to it. See the legal information area on our web site for more details about web site security and privacy features.
36 | THE GUGGENHEIM FUNDS SEMI-ANNUAL REPORT | |
GUGGENHEIM INVESTMENTS PRIVACY POLICIES (Unaudited)(concluded) |
How We Safeguard Your Personal Information
We restrict access to nonpublic personal information about shareholders to our employees and in some cases to third parties (for example, the service providers described above) as permitted by law. We maintain strict physical, electronic and procedural safeguards that comply with federal standards to guard your nonpublic personal information.
We’ll Keep You Informed
As required by federal law, we will notify shareholders of our privacy policy annually. We reserve the right to modify this policy at any time, but rest assured that if we do change it, we will tell you promptly. You will also be able to access our privacy policy from our web site at guggenheiminvestments.com. Should you have any questions regarding our privacy policy, contact us at 800.820.0888 or 301.296.5100.
| | THE GUGGENHEIM FUNDS SEMI-ANNUAL REPORT | 37 |
This page intentionally left blank.
This page intentionally left blank.
This page intentionally left blank.
This page intentionally left blank.
3.31.2016
Guggenheim Funds Semi-Annual Report
Fundamental Alpha |
Guggenheim Mid Cap Value Institutional Fund | | |
MCVI-SEMI-0316x0916 | guggenheiminvestments.com |
DEAR SHAREHOLDER | 2 |
ECONOMIC AND MARKET OVERVIEW | 3 |
ABOUT SHAREHOLDERS’ FUND EXPENSES | 6 |
MID CAP VALUE INSTITUTIONAL FUND | 9 |
NOTES TO FINANCIAL STATEMENTS | 17 |
OTHER INFORMATION | 24 |
INFORMATION ON BOARD OF TRUSTEES AND OFFICERS | 25 |
GUGGENHEIM INVESTMENTS PRIVACY POLICIES | 32 |
| | THE GUGGENHEIM FUNDS SEMI-ANNUAL REPORT | 1 |
Dear Shareholder:
Security Investors, LLC (the “Investment Adviser”) is pleased to present the semi-annual shareholder report for the Guggenheim Mid Cap Value Institutional Fund (the “Fund”) for the six-month period ended March 31, 2016.
The Investment Adviser is part of Guggenheim Investments, which represents the investment management businesses of Guggenheim Partners, LLC (“Guggenheim”), a global, diversified financial services firm.
Guggenheim Funds Distributors, LLC is the distributor of the Funds. Guggenheim Funds Distributors, LLC is affiliated with Guggenheim and the Investment Adviser.
We encourage you to read the Economic and Market Overview section of the report, which follows this letter.
We are committed to providing innovative investment solutions and appreciate the trust you place in us.
Sincerely,

Donald C. Cacciapaglia
President
April 30, 2016
Read a prospectus and summary prospectus (if available) carefully before investing. It contains the investment objectives, risks, charges, expenses and other information, which should be considered carefully before investing. Obtain a prospectus and summary prospectus (if available) at guggenheiminvestments.com or call 800.820.0888.
There can be no assurance that any investment product will achieve its investment objective(s). There are risks associated with investing, including the entire loss of principal invested. Investing involves market risks. The investment return and principal value of any investment product will fluctuate with changes in market conditions.
2 | THE GUGGENHEIM FUNDS SEMI-ANNUAL REPORT | |
ECONOMIC AND MARKET OVERVIEW (Unaudited) | March 31, 2016 |
Financial markets were buffeted by a variety of events over the past six months, including volatility in the oil market, weak growth in China, ongoing stimulus from global central banks, and a 25 basis point increase in the U.S. federal funds target rate in December. While the direct impact of the move was fairly insignificant, the decision to begin normalization of interest rates after seven years of unprecedented liquidity provision was not. Indeed, in 2015, risk assets posted their worst annual performance since the 2008 financial crisis, as market participants’ expectations for the start of rate hikes collided with concern about plunging commodity prices, and slowing economic growth in China and other emerging market economies.
As 2016 began, forecasts for U.S. and global economic growth were downgraded, and recession fears surged along with market volatility. Estimates for first quarter gross domestic product (“GDP”) in the U.S. were marked down, even though first quarter GDP has undershot full-year growth rates in six out of the last seven years. Risk assets rallied in the last half of the first quarter, led by a dovish pivot in the U.S. Federal Reserve’s (the “Fed”) communication that spurred a rally in crude oil and a reversal of dollar strength. The weaker dollar, along with optimism about a production freeze agreed to by a group of major oil producing countries, helped oil to rebound. After falling in the early weeks of the year to a cycle low of $26 per barrel on February 11, 2016, the front-month West Texas Intermediate (“WTI”) oil futures contract rallied as high as $40 per barrel before closing the quarter at $38 per barrel.
The outlook for economic growth outside the U.S. softened in the first quarter. A further deterioration in the euro zone inflation outlook prompted the European Central Bank (“ECB”) to announce an increase in the size of its monthly asset purchases and reduce its deposit rate to -40 basis points. European government bonds rallied following the announcement, with the 10-year German bund ending the first quarter with a yield of just 16 basis points.
Ongoing stimulus efforts in Asia also appeared likely to contribute to low U.S. rates. Chinese industrial production growth continued to slow in early 2016, prompting the People’s Bank of China (“PBOC”) to stimulate credit growth by allowing banks to hold fewer reserves against deposits. And after years of struggling with stagnant growth and low inflation, the Bank of Japan (“BOJ”) surprised markets by cutting its key interest rate to -10 basis points in January. The negative rates pushed a considerable amount of Japanese savings into foreign markets.
| | THE GUGGENHEIM FUNDS SEMI-ANNUAL REPORT | 3 |
ECONOMIC AND MARKET OVERVIEW (Unaudited)(continued) | March 31, 2016 |
In an environment where global rates are moving lower and markets are already starved for yield, foreign investors began looking to the U.S. Guggenheim expects that U.S. Treasury yields will fall further as the gravitational pull of global yields gets stronger, and does not discount the possibility of 10-year U.S. Treasury yields declining to closer to 1 percent before the end of the year.
A stronger dollar has weighed on the U.S. economy, but consumer spending has been resilient. The labor market is now operating near full employment, and tight labor market conditions are beginning to spur faster wage growth. We believe the U.S. economy is fundamentally sound, and find little evidence to support the conclusion that the economy will fall into a recession in 2016.
Despite the relative health of the U.S. economy, markets are concerned that sluggish global growth will hold back the U.S. expansion, that inflation will remain below the Fed’s target for longer, and that tighter conditions in credit markets have raised recession risks. Our view is that the Fed remains focused on fulfilling its dual mandate objectives of maximum employment and price stability, and thus is biased toward normalizing policy. We expect further declines in the unemployment rate as job gains outstrip growth in the labor force. Meanwhile, core and headline inflation should move closer to the Fed’s target by year end, reflecting our forecasts for a tighter labor market and a modest rise in oil prices. Normally, this would result in at least two Fed rate hikes on the table for 2016, but the U.S. Fed is becoming more sensitive to global financial conditions and the extent of global money flows that occur as monetary policy in the U.S. diverges from Europe, Japan and China. As a result, we have reduced our expectations for a June rate hike, although it would normally be an easy call. We continue to believe a December rate hike is a near certainty. A solid macroeconomic backdrop and a rebalancing oil market should support an improving credit picture in the second half of 2016.
For the six months ended March 31, 2016, the Standard & Poor’s 500® (“S&P 500”) Index* returned 8.49%. The Morgan Stanley Capital International (“MSCI”) Europe-Australasia-Far East (“EAFE”) Index* returned 1.56%. The return of the MSCI Emerging Markets Index* was 6.41%.
In the bond market, the Barclays U.S. Aggregate Bond Index* posted a 2.44% return for the period, while the Barclays U.S. Corporate High Yield Index* returned 1.22%. The return of the Bank of America (“BofA”) Merrill Lynch 3-Month U.S. Treasury Bill Index* was 0.11% for the six-month period.
The opinions and forecasts expressed may not actually come to pass. This information is subject to change at any time, based on market and other conditions, and should not be construed as a recommendation of any specific security or strategy.
4 | THE GUGGENHEIM FUNDS SEMI-ANNUAL REPORT | |
ECONOMIC AND MARKET OVERVIEW (Unaudited)(concluded) | March 31, 2016 |
*Index Definitions:
The following indices are referenced throughout this report. Indices are unmanaged and not available for direct investment. Index performance does not reflect transaction costs, fees, or expenses.
Barclays U.S. Aggregate Bond Index is a broad-based benchmark that measures the investment grade, U.S. dollar denominated, fixed-rate taxable bond market, including U.S. Treasuries, government-related and corporate securities, MBS (agency fixed-rate and hybrid ARM pass-throughs), ABS, and CMBS.
Barclays U.S. Corporate High Yield Index measures the market of U.S. dollar denominated, non-investment grade, fixed-rate, taxable corporate bonds. Securities are classified as high yield if the middle rating of Moody’s, Fitch, and S&P is Ba1/BB+/BB+ or below.
BofA Merrill Lynch 3-Month U.S. Treasury Bill Index is an unmanaged market index of U.S. Treasury securities maturing in 90 days that assumes reinvestment of all income.
MSCI EAFE Index is a free float-adjusted market capitalization index that is designed to measure the equity market performance of developed markets, excluding the U.S. & Canada.
MSCI Emerging Markets Index is a free float-adjusted market capitalization weighted index that is designed to measure equity market performance in the global emerging markets.
S&P 500® Index is a capitalization-weighted index of 500 stocks designed to measure the performance of the broad economy, representing all major industries and is considered a representation of the U.S. stock market.
| | THE GUGGENHEIM FUNDS SEMI-ANNUAL REPORT | 5 |
ABOUT SHAREHOLDERS’ FUND EXPENSES (Unaudited) |
All mutual funds have operating expenses and it is important for our shareholders to understand the impact of costs on their investments. Shareholders of a Fund incur two types of costs: (i) transaction costs, including sales charges (loads) on purchase payments, reinvested dividends, or other distributions; and exchange fees; and (ii) ongoing costs, including management fees, administrative services, and shareholder reports, among others. These ongoing costs, or operating expenses, are deducted from a fund’s gross income and reduce the investment return of the fund.
A fund’s expenses are expressed as a percentage of its average net assets, which is known as the expense ratio. The following examples are intended to help investors understand the ongoing costs (in dollars) of investing in a Fund and to compare these costs with the ongoing costs of investing in other mutual funds.
The examples are based on an investment of $1,000 made at the beginning of the period and held for the entire six-month period beginning September 30, 2015 and ending March 31, 2016.
The following tables illustrate a Fund’s costs in two ways:
Table 1. Based on actual Fund return. This section helps investors estimate the actual expenses paid over the period. The “Ending Account Value” shown is derived from the Fund’s actual return, and the fourth column shows the dollar amount that would have been paid by an investor who started with $1,000 in the Fund. Investors may use the information here, together with the amount invested, to estimate the expenses paid over the period. Simply divide the Fund’s account value by $1,000 (for example, an $8,600 account value divided by $1,000 = 8.6), then multiply the result by the number provided under the heading “Expenses Paid During Period.”
Table 2. Based on hypothetical 5% return. This section is intended to help investors compare a Fund’s cost with those of other mutual funds. The table provides information about hypothetical account values and hypothetical expenses based on the Fund’s actual expense ratio and an assumed rate of return of 5% per year before expenses, which is not the Fund’s actual return. The hypothetical account values and expenses may not be used to estimate the actual ending account balance or expenses paid during the period. The example is useful in making comparisons because the U.S. Securities and Exchange Commission (the “SEC”) requires all mutual funds to calculate expenses based on the 5% return. Investors can assess a Fund’s costs by comparing this hypothetical example with the hypothetical examples that appear in shareholder reports of other funds.
6 | THE GUGGENHEIM FUNDS SEMI-ANNUAL REPORT | |
ABOUT SHAREHOLDERS’ FUND EXPENSES (Unaudited)(continued) |
The calculations illustrated above assume no shares were bought or sold during the period. Actual costs may have been higher or lower, depending on the amount of investment and the timing of any purchases or redemptions.
Please note that the expenses shown in the table are meant to highlight your ongoing costs only and do not reflect any transactional costs, such as sales charges (loads) on purchase payments, and contingent deferred sales charges (“CDSC”) on redemptions, if any. Therefore, the second table is useful in comparing ongoing costs only, and will not help you determine the relative total costs of owning different funds. In addition, if these transactional costs were included, your costs would have been higher.
More information about a Fund’s expenses, including annual expense ratios for up to the past five years (subject to the Fund’s inception date), can be found in the Financial Highlights section of this report. For additional information on operating expenses and other shareholder costs, please refer to the appropriate Fund prospectus.
| | THE GUGGENHEIM FUNDS SEMI-ANNUAL REPORT | 7 |
ABOUT SHAREHOLDERS’ FUND EXPENSES (Unaudited)(concluded) |
| | Expense
Ratio1 | Fund
Return | Beginning
Account Value
September 30,
2015 | Ending
Account Value
March 31,
2016 | Expenses
Paid During
Period2 |
Table 1. Based on actual Fund return3 |
Mid Cap Value Institutional Fund | 1.07% | 6.99% | $ 1,000.00 | $ 1,069.90 | $ 5.54 |
| |
Table 2. Based on hypothetical 5% return (before expenses) |
Mid Cap Value Institutional Fund | 1.07% | 5.00% | $ 1,000.00 | $ 1,019.65 | $ 5.40 |
1 | Annualized and excludes expenses of the underlying funds in which the Fund invests. |
2 | Expenses are equal to the Fund's annualized expense ratio, net of any applicable fee waivers, multiplied by the average account value over the period, multiplied by 183/366 (to reflect the one-half year period). |
3 | Actual cumulative return at net asset value for the period September 30, 2015 to March 31, 2016. |
8 | THE GUGGENHEIM FUNDS SEMI-ANNUAL REPORT | |
FUND PROFILE (Unaudited) | March 31, 2016 |
MID CAP VALUE INSTITUTIONAL FUND
OBJECTIVE: Seeks long-term growth of capital.
Holdings Diversification (Market Exposure as % of Net Assets)

“Holdings Diversification (Market Exposure as % of Net Assets)” excludes any temporary cash investments.
Inception Date: July 11, 2008 |
Ten Largest Holdings (% of Total Net Assets) |
FLIR Systems, Inc. | 2.8% |
Ameren Corp. | 2.4% |
Pinnacle West Capital Corp. | 2.0% |
Alleghany Corp. | 2.0% |
Sonoco Products Co. | 1.8% |
Zions Bancorporation | 1.8% |
Hanover Insurance Group, Inc. | 1.7% |
Camden Property Trust | 1.7% |
CubeSmart | 1.7% |
DigitalGlobe, Inc. | 1.6% |
Top Ten Total | 19.5% |
| | |
“Ten Largest Holdings” excludes any temporary cash investments. |
| | THE GUGGENHEIM FUNDS SEMI-ANNUAL REPORT | 9 |
SCHEDULE OF INVESTMENTS (Unaudited) | March 31, 2016 |
MID CAP VALUE INSTITUTIONAL FUND | |
| | | Shares | | | Value | |
| | | | | | | |
COMMON STOCKS† - 98.1% | |
| | | | | | | |
Financial - 28.3% | |
Alleghany Corp.* | | | 10,728 | | | $ | 5,323,233 | |
Zions Bancorporation | | | 197,560 | | | | 4,782,928 | |
Hanover Insurance Group, Inc. | | | 52,526 | | | | 4,738,895 | |
Camden Property Trust | | | 54,075 | | | | 4,547,167 | |
CubeSmart | | | 135,738 | | | | 4,520,075 | |
Corrections Corporation of America | | | 129,879 | | | | 4,162,622 | |
FirstMerit Corp. | | | 196,880 | | | | 4,144,324 | |
Popular, Inc. | | | 136,763 | | | | 3,912,790 | |
Endurance Specialty Holdings Ltd. | | | 55,606 | | | | 3,633,296 | |
Sun Communities, Inc. | | | 49,540 | | | | 3,547,559 | |
Assured Guaranty Ltd. | | | 131,095 | | | | 3,316,704 | |
Wintrust Financial Corp. | | | 73,080 | | | | 3,240,367 | |
Apartment Investment & Management Co. — Class A | | | 75,678 | | | | 3,164,854 | |
Fulton Financial Corp. | | | 236,020 | | | | 3,157,948 | |
Trustmark Corp. | | | 128,070 | | | | 2,949,452 | |
Alexandria Real Estate Equities, Inc. | | | 28,767 | | | | 2,614,633 | |
E*TRADE Financial Corp.* | | | 104,768 | | | | 2,565,768 | |
Parkway Properties, Inc. | | | 155,132 | | | | 2,429,367 | |
Prosperity Bancshares, Inc. | | | 41,650 | | | | 1,932,144 | |
Lexington Realty Trust | | | 181,060 | | | | 1,557,116 | |
Equity Commonwealth* | | | 48,359 | | | | 1,364,691 | |
Unum Group | | | 42,802 | | | | 1,323,438 | |
KeyCorp | | | 117,795 | | | | 1,300,457 | |
BancorpSouth, Inc. | | | 45,881 | | | | 977,724 | |
Umpqua Holdings Corp. | | | 49,670 | | | | 787,766 | |
Monogram Residential Trust, Inc. | | | 66,661 | | | | 657,277 | |
Total Financial | | | | | | | 76,652,595 | |
| | | | | | | | | |
Industrial - 16.4% | |
FLIR Systems, Inc. | | | 231,600 | | | | 7,631,221 | |
Sonoco Products Co. | | | 98,771 | | | | 4,797,308 | |
Gentex Corp. | | | 229,187 | | | | 3,595,944 | |
Huntington Ingalls Industries, Inc. | | | 23,149 | | | | 3,170,024 | |
Knight Transportation, Inc. | | | 114,360 | | | | 2,990,514 | |
Oshkosh Corp. | | | 68,367 | | | | 2,794,159 | |
Ryder System, Inc. | | | 39,566 | | | | 2,563,085 | |
WestRock Co. | | | 63,747 | | | | 2,488,045 | |
Werner Enterprises, Inc. | | | 86,120 | | | | 2,339,019 | |
Owens Corning | | | 43,480 | | | | 2,055,734 | |
Scorpio Tankers, Inc. | | | 338,415 | | | | 1,972,960 | |
Owens-Illinois, Inc.* | | | 110,569 | | | | 1,764,681 | |
Kirby Corp.* | | | 25,942 | | | | 1,564,043 | |
Colfax Corp.* | | | 48,684 | | | | 1,391,876 | |
ITT Corp. | | | 36,986 | | | | 1,364,414 | |
Harris Corp. | | | 17,470 | | | | 1,360,214 | |
Terex Corp. | | | 26,991 | | | | 671,536 | |
Total Industrial | | | | | | | 44,514,777 | |
| | | | | | | | | |
Consumer, Non-cyclical - 14.5% | |
Bunge Ltd. | | | 61,280 | | | | 3,472,738 | |
MEDNAX, Inc.* | | | 53,476 | | | | 3,455,619 | |
Quest Diagnostics, Inc. | | | 39,830 | | | | 2,845,854 | |
Emergent BioSolutions, Inc.* | | | 75,899 | | | | 2,758,929 | |
Sanderson Farms, Inc. | | | 28,998 | | | | 2,615,040 | |
Navigant Consulting, Inc.* | | | 162,760 | | | | 2,573,235 | |
Darling Ingredients, Inc.* | | | 191,290 | | | | 2,519,289 | |
ICF International, Inc.* | | | 71,707 | | | | 2,464,570 | |
HealthSouth Corp. | | | 63,013 | | | | 2,371,179 | |
Premier, Inc. — Class A* | | | 66,800 | | | | 2,228,448 | |
Surgical Care Affiliates, Inc.* | | | 45,775 | | | | 2,118,467 | |
Kindred Healthcare, Inc. | | | 120,419 | | | | 1,487,175 | |
Patterson Companies, Inc. | | | 30,613 | | | | 1,424,423 | |
WEX, Inc.* | | | 16,593 | | | | 1,383,192 | |
FTI Consulting, Inc.* | | | 38,844 | | | | 1,379,350 | |
Universal Corp. | | | 19,310 | | | | 1,097,001 | |
Ingredion, Inc. | | | 10,262 | | | | 1,095,879 | |
United Rentals, Inc.* | | | 17,105 | | | | 1,063,760 | |
Community Health Systems, Inc.* | | | 41,722 | | | | 772,274 | |
Everi Holdings, Inc.* | | | 112,220 | | | | 256,984 | |
Total Consumer, Non-cyclical | | | | 39,383,406 | |
10 | THE GUGGENHEIM FUNDS SEMI-ANNUAL REPORT | SEE NOTES TO FINANCIAL STATEMENTS. |
SCHEDULE OF INVESTMENTS (Unaudited)(continued) | March 31, 2016 |
MID CAP VALUE INSTITUTIONAL FUND | |
| | | Shares | | | Value | |
| | | | | | | |
Utilities - 11.2% | |
Ameren Corp. | | | 129,404 | | | $ | 6,483,140 | |
Pinnacle West Capital Corp. | | | 73,535 | | | | 5,520,272 | |
Westar Energy, Inc. | | | 74,657 | | | | 3,703,734 | |
Black Hills Corp. | | | 60,346 | | | | 3,628,605 | |
Great Plains Energy, Inc. | | | 106,577 | | | | 3,437,108 | |
Portland General Electric Co. | | | 76,070 | | | | 3,004,004 | |
Avista Corp. | | | 72,697 | | | | 2,964,584 | |
OGE Energy Corp. | | | 57,350 | | | | 1,641,931 | |
Total Utilities | | | | | | | 30,383,378 | |
| | | | | | | | | |
Consumer, Cyclical - 10.8% | |
J.C. Penney Company, Inc.* | | | 368,742 | | | | 4,078,287 | |
DR Horton, Inc. | | | 101,452 | | | | 3,066,894 | |
Visteon Corp. | | | 37,600 | | | | 2,992,584 | |
Caleres, Inc. | | | 99,718 | | | | 2,821,022 | |
Essendant, Inc. | | | 84,436 | | | | 2,696,041 | |
PVH Corp. | | | 26,852 | | | | 2,659,959 | |
UniFirst Corp. | | | 19,240 | | | | 2,099,469 | |
iRobot Corp.* | | | 45,239 | | | | 1,596,937 | |
WESCO International, Inc.* | | | 28,625 | | | | 1,564,929 | |
CalAtlantic Group, Inc. | | | 41,922 | | | | 1,401,033 | |
Goodyear Tire & Rubber Co. | | | 41,152 | | | | 1,357,193 | |
Sonic Automotive, Inc. — Class A | | | 47,550 | | | | 878,724 | |
Tenneco, Inc.* | | | 15,186 | | | | 782,231 | |
La-Z-Boy, Inc. | | | 28,650 | | | | 766,101 | |
AutoNation, Inc.* | | | 12,556 | | | | 586,114 | |
Total Consumer, Cyclical | | | | | | | 29,347,518 | |
| | | | | | | | | |
Technology - 6.5% | |
CSRA, Inc. | | | 146,795 | | | | 3,948,785 | |
IXYS Corp. | | | 339,098 | | | | 3,804,680 | |
Maxwell Technologies, Inc.* | | | 574,291 | | | | 3,411,288 | |
Cree, Inc.* | | | 79,730 | | | | 2,320,143 | |
Super Micro Computer, Inc.* | | | 58,810 | | | | 2,004,245 | |
ManTech International Corp. — Class A | | | 25,339 | | | | 810,595 | |
Diebold, Inc. | | | 25,643 | | | | 741,339 | |
MKS Instruments, Inc. | | | 18,340 | | | | 690,501 | |
Total Technology | | | | | | | 17,731,576 | |
| | | | | | | | | |
Energy - 3.7% | |
Marathon Oil Corp. | | | 234,420 | | | | 2,611,439 | |
Whiting Petroleum Corp.* | | | 307,911 | | | | 2,457,130 | |
Oasis Petroleum, Inc.* | | | 268,000 | | | | 1,951,040 | |
Rowan Companies plc — Class A | | | 109,510 | | | | 1,763,111 | |
Sanchez Energy Corp.* | | | 227,247 | | | | 1,247,586 | |
HydroGen Corp.*,†††,1 | | | 1,265,700 | | | | 1 | |
Total Energy | | | | | | | 10,030,307 | |
| | | | | | | | | |
Communications - 3.6% | |
DigitalGlobe, Inc.* | | | 245,776 | | | | 4,251,924 | |
Finisar Corp.* | | | 186,221 | | | | 3,396,671 | |
Scripps Networks Interactive, Inc. — Class A | | | 34,031 | | | | 2,229,031 | |
Total Communications | | | | | | | 9,877,626 | |
| | | | | | | | | |
Basic Materials - 3.1% | |
Reliance Steel & Aluminum Co. | | | 37,700 | | | | 2,608,463 | |
Stillwater Mining Co.* | | | 130,154 | | | | 1,386,140 | |
Olin Corp. | | | 78,092 | | | | 1,356,458 | |
Landec Corp.* | | | 111,854 | | | | 1,174,467 | |
Calgon Carbon Corp. | | | 83,000 | | | | 1,163,660 | |
Freeport-McMoRan, Inc. | | | 62,844 | | | | 649,807 | |
Total Basic Materials | | | | | | | 8,338,995 | |
| | | | | | | | | |
Total Common Stocks | | | | | | | | |
(Cost $255,080,887) | | | | | | | 266,260,178 | |
| | | | | | | | | |
CONVERTIBLE PREFERRED STOCKS††† - 0.0% | |
Thermoenergy Corp.*,2,3 | | | 793,750 | | | | 1,622 | |
Total Convertible Preferred Stocks | | | | | |
(Cost $757,980) | | | | | | | 1,622 | |
SEE NOTES TO FINANCIAL STATEMENTS. | THE GUGGENHEIM FUNDS SEMI-ANNUAL REPORT | 11 |
SCHEDULE OF INVESTMENTS (Unaudited)(concluded) | March 31, 2016 |
MID CAP VALUE INSTITUTIONAL FUND | |
| | | Shares | | | Value | |
| | | | | | | |
SHORT TERM INVESTMENTS† - 1.2% | |
Dreyfus Treasury Prime Cash Management Institutional Shares 0.18%4 | | | 3,233,045 | | | $ | 3,233,045 | |
Total Short Term Investments | | | | | |
(Cost $3,233,045) | | | | | | | 3,233,045 | |
| | | | | | | | | |
Total Investments - 99.3% | | | | | |
(Cost $259,071,912) | | | | | | $ | 269,494,845 | |
Other Assets & Liabilities, net - 0.7% | | | | 2,025,235 | |
Total Net Assets - 100.0% | | | $ | 271,520,080 | |
* | Non-income producing security. |
† | Value determined based on Level 1 inputs, unless otherwise noted — See Note 4. |
††† | Value determined based on Level 3 inputs — See Note 4. |
1 | Affiliated issuer — See Note 6. |
2 | PIPE (Private Investment in Public Equity) — Stock issued by a company in the secondary market as a means of raising capital more quickly and less expensively than through registration of a secondary public offering. |
3 | Illiquid security. |
4 | Rate indicated is the 7 day yield as of March 31, 2016. |
| | plc — Public Limited Company |
| | |
| | See Sector Classification in Other Information section. |
The following table summarizes the inputs used to value the Fund’s investments at March 31, 2016 (See Note 4 in the Notes to Financial Statements):
Investments in Securities (Assets) | | Level 1 | | | Level 2 | | | Level 3 | | | Total | |
Common Stocks | | $ | 266,260,177 | | | $ | — | | | $ | 1 | | | $ | 266,260,178 | |
Convertible Preferred Stocks | | | — | | | | — | | | | 1,622 | | | | 1,622 | |
Short Term Investments | | | 3,233,045 | | | | — | | | | — | | | | 3,233,045 | |
Total | | $ | 269,493,222 | | | $ | — | | | $ | 1,623 | | | $ | 269,494,845 | |
For the period ended March 31, 2016, there were no transfers between levels.
12 | THE GUGGENHEIM FUNDS SEMI-ANNUAL REPORT | SEE NOTES TO FINANCIAL STATEMENTS. |
STATEMENT OF ASSETS AND LIABILITIES (Unaudited) |
MID CAP VALUE INSTITUTIONAL FUND |
March 31, 2016
Assets: | |
Investments in unaffiliated issuers, at value (cost $259,069,381) | | $ | 269,494,844 | |
Investments in affiliated issuers, at value (cost $2,531) | | | 1 | |
Total investments (cost $259,071,912) | | | 269,494,845 | |
Prepaid expenses | | | 26,320 | |
Receivables: | |
Securities sold | | | 2,290,434 | |
Dividends | | | 420,951 | |
Fund shares sold | | | 210,801 | |
Foreign taxes reclaim | | | 10,107 | |
Total assets | | | 272,453,458 | |
| | | | | |
Liabilities: | |
Overdraft due to custodian bank | | | 612 | |
Payable for: | |
Fund shares redeemed | | | 345,881 | |
Securities purchased | | | 301,990 | |
Management fees | | | 169,004 | |
Fund accounting/administration fees | | | 21,407 | |
Trustees' fees* | | | 10,577 | |
Miscellaneous | | | 83,907 | |
Total liabilities | | | 933,378 | |
Net assets | | $ | 271,520,080 | |
| | | | | |
Net assets consist of: | |
Paid in capital | | $ | 256,544,662 | |
Undistributed net investment income | | | 2,441,372 | |
Accumulated net realized gain on investments | | | 2,111,113 | |
Net unrealized appreciation on investments | | | 10,422,933 | |
Net assets | | $ | 271,520,080 | |
Capital shares outstanding | | | 27,105,653 | |
Net asset value per share | | $ | 10.02 | |
* | Relates to Trustees not deemed “interested persons” within the meaning of Section 2(a)(19) of the 1940 Act. |
SEE NOTES TO FINANCIAL STATEMENTS. | THE GUGGENHEIM FUNDS SEMI-ANNUAL REPORT | 13 |
STATEMENT OF OPERATIONS (Unaudited) |
MID CAP VALUE INSTITUTIONAL FUND |
Period Ended March 31, 2016
Investment Income: | |
Dividends (net of foreign withholding tax of $4,388) from unaffiliated issuers | | $ | 4,640,729 | |
Interest | | | 782 | |
Total investment income | | | 4,641,511 | |
| | | | | |
Expenses: | |
Management fees | | | 1,025,254 | |
Transfer agent/maintenance fees | | | 168,603 | |
Fund accounting/administration fees | | | 129,864 | |
Line of credit fees | | | 21,651 | |
Trustees’ fees* | | | 15,555 | |
Custodian fees | | | 10,530 | |
Miscellaneous | | | 93,774 | |
Total expenses | | | 1,465,231 | |
Net investment income | | | 3,176,280 | |
| | | | | |
Net Realized and Unrealized Gain (Loss): | |
Net realized gain (loss) on: | |
Investments in unaffiliated issuers | | $ | 4,193,009 | |
Net realized gain | | | 4,193,009 | |
Net change in unrealized appreciation (depreciation) on: | |
Investments in unaffiliated issuers | | | 11,198,627 | |
Net change in unrealized appreciation (depreciation) | | | 11,198,627 | |
Net realized and unrealized gain | | | 15,391,636 | |
Net increase in net assets resulting from operations | | $ | 18,567,916 | |
* | Relates to Trustees not deemed “interested persons” within the meaning of Section 2(a)(19) of the 1940 Act. |
14 | THE GUGGENHEIM FUNDS SEMI-ANNUAL REPORT | SEE NOTES TO FINANCIAL STATEMENTS. |
STATEMENTS OF CHANGES IN NET ASSETS |
MID CAP VALUE INSTITUTIONAL FUND | |
| | | Period Ended
March 31,
2016
(Unaudited) | | | Year Ended
September 30,
2015 | |
Increase (Decrease) in Net Assets from Operations: | | | | | | |
Net investment income | | $ | 3,176,280 | | | $ | 2,586,231 | |
Net realized gain on investments | | | 4,193,009 | | | | 60,951,511 | |
Net change in unrealized appreciation (depreciation) on investments | | | 11,198,627 | | | | (81,449,262 | ) |
Net increase (decrease) in net assets resulting from operations | | | 18,567,916 | | | | (17,911,520 | ) |
| | | | | | | | | |
Distributions to shareholders from: | | | | | | | | |
Net investment income | | | (3,255,047 | ) | | | (2,549,762 | ) |
Net realized gains | | | (25,619,255 | ) | | | (71,890,688 | ) |
Total distributions to shareholders | | | (28,874,302 | ) | | | (74,440,450 | ) |
| | | | | | | | | |
Capital share transactions: | | | | | | | | |
Proceeds from sale of shares | | | 55,570,749 | | | | 180,989,626 | |
Distributions reinvested | | | 5,764,338 | | | | 40,920,075 | |
Cost of shares redeemed | | | (66,878,462 | ) | | | (440,288,527 | ) |
Net decrease from capital share transactions | | | (5,543,375 | ) | | | (218,378,826 | ) |
Net decrease in net assets | | | (15,849,761 | ) | | | (310,730,796 | ) |
| | | | | | | | | |
Net assets: | | | | | | | | |
Beginning of period | | | 287,369,841 | | | | 598,100,637 | |
End of period | | $ | 271,520,080 | | | $ | 287,369,841 | |
Undistributed net investment income at end of period | | $ | 2,441,372 | | | $ | 2,520,139 | |
| | | | | | | | | |
Capital share activity: | | | | | | | | |
Shares sold | | | 5,832,631 | | | | 15,865,670 | |
Shares issued from reinvestment of distributions | | | 592,429 | | | | 3,627,667 | |
Shares redeemed | | | (6,917,428 | ) | | | (38,179,646 | ) |
Net decrease in shares | | | (492,368 | ) | | | (18,686,309 | ) |
SEE NOTES TO FINANCIAL STATEMENTS. | THE GUGGENHEIM FUNDS SEMI-ANNUAL REPORT | 15 |
FINANCIAL HIGHLIGHTS |
MID CAP VALUE INSTITUTIONAL FUND | |
This table is presented to show selected data for a share outstanding throughout each period and to assist shareholders in evaluating a Fund’s performance for the periods presented.
Institutional Class | | Period Ended
March 31,
2016a | | | Year Ended
Sept. 30,
2015 | | | Year Ended
Sept. 30,
2014 | | | Year Ended
Sept. 30,
2013 | | | Year Ended
Sept. 30,
2012 | | | Year Ended
Sept. 30,
2011 | |
Per Share Data | | | | | | | | | | | | | | | | | | |
Net asset value, beginning of period | | $ | 10.41 | | | $ | 12.92 | | | $ | 13.09 | | | $ | 11.29 | | | $ | 9.97 | | | $ | 11.34 | |
Income (loss) from investment operations: | |
Net investment income (loss)b | | | .11 | | | | .06 | | | | .06 | | | | .06 | | | | .03 | | | | .04 | |
Net gain (loss) on investments (realized and unrealized) | | | .59 | | | | (.66 | ) | | | .65 | | | | 2.90 | | | | 2.30 | | | | (.87 | ) |
Total from investment operations | | | .70 | | | | (.60 | ) | | | .71 | | | | 2.96 | | | | 2.33 | | | | (.83 | ) |
Less distributions from: | |
Net investment income | | | (.12 | ) | | | (.07 | ) | | | (.07 | ) | | | (.04 | ) | | | (.04 | ) | | | (.06 | ) |
Net realized gains | | | (.97 | ) | | | (1.84 | ) | | | (.81 | ) | | | (1.12 | ) | | | (.97 | ) | | | (.48 | ) |
Total distributions | | | (1.09 | ) | | | (1.91 | ) | | | (.88 | ) | | | (1.16 | ) | | | (1.01 | ) | | | (.54 | ) |
Net asset value, end of period | | $ | 10.02 | | | $ | 10.41 | | | $ | 12.92 | | | $ | 13.09 | | | $ | 11.29 | | | $ | 9.97 | |
| | |
Total Returnc | | | 6.99 | % | | | (5.85 | %) | | | 5.53 | % | | | 28.89 | % | | | 24.96 | % | | | (8.05 | %) |
Ratios/Supplemental Data | |
Net assets, end of period (in thousands) | | $ | 271,520 | | | $ | 287,370 | | | $ | 598,101 | | | $ | 571,465 | | | $ | 490,741 | | | $ | 472,266 | |
Ratios to average net assets: | |
Net investment income (loss) | | | 2.33 | % | | | 0.52 | % | | | 0.42 | % | | | 0.51 | % | | | 0.30 | % | | | 0.34 | % |
Total expensesd | | | 1.07 | % | | | 1.05 | % | | | 1.05 | % | | | 1.01 | % | | | 1.01 | % | | | 0.98 | % |
Net expenses | | | 1.07 | % | | | 1.05 | % | | | 1.05 | % | | | 1.01 | % | | | 0.98 | %e | | | 0.90 | %e |
Portfolio turnover rate | | | 31 | % | | | 95 | % | | | 41 | % | | | 24 | % | | | 33 | % | | | 38 | % |
a | Unaudited figures for the period ended March 31, 2016. Percentage amounts for the period, except total return and portfolio turnover rate, have been annualized. |
b | Net investment income (loss) per share was computed using average shares outstanding throughout the period. |
c | Total return does not reflect the impact of any applicable sales charges. |
d | Does not include expenses of the underlying funds in which the Fund invests. |
e | Net expense information reflects the expense ratios after expense waivers and reimbursements, as applicable. |
16 | THE GUGGENHEIM FUNDS SEMI-ANNUAL REPORT | SEE NOTES TO FINANCIAL STATEMENTS. |
NOTES TO FINANCIAL STATEMENTS (Unaudited) |
1. Organization and Significant Accounting Policies
Organization
Guggenheim Funds Trust (the “Trust”), a Delaware statutory trust, is registered with the SEC under the Investment Company Act of 1940 (“1940 Act”), as an open-ended investment company of the series type. Each series, in effect, is representing a separate Fund. The Trust is authorized to issue an unlimited number of shares. The Trust accounts for the assets of each Fund separately.
The Trust offers a combination of four separate classes of shares, A-Class shares, C-Class shares, P-Class shares and Institutional Class shares. Sales of shares of each Class are made without a front-end sales charge at the net asset value per share (“NAV”), with the exception of A-Class shares. A-Class shares are sold at the NAV, plus the applicable front-end sales charge. The sales charge varies depending on the amount purchased. A-Class share purchases of $1 million or more are exempt from the front-end sales charge but have a 1% contingent deferred sales charge (“CDSC”), if shares are redeemed within 12 months of purchase. C-Class shares have a 1% CDSC if shares are redeemed within 12 months of purchase. Institutional Class shares are offered primarily for direct investment by institutions such as pension and profit sharing plans, endowments, foundations and corporations. Institutional Class shares require a minimum initial investment of $2 million and a minimum account balance of $1 million. At March 31, 2016, the Trust consisted of nineteen funds (the “Funds”).
This report covers the Mid Cap Value Institutional Fund (the “Fund”), a diversified investment company.
Guggenheim Investments (“GI”) provides advisory services, and Rydex Fund Services, LLC (“RFS”) provides transfer agent, administrative and accounting services to the Trust. Guggenheim Funds Distributors, LLC (“GFD”) acts as principal underwriter for the Trust. GI, RFS and GFD are affiliated entities.
Significant Accounting Policies
The Fund operates as an investment company and accordingly follows the investment company accounting and reporting guidance of the Financial Accounting Standards Board (“FASB”) Accounting Standards Codification Topic 946 Financial Services – Investment Companies.
The following significant accounting policies are in conformity with U.S. generally accepted accounting principles (“U.S. GAAP”) and are consistently followed by the Trust. This requires management to make estimates and assumptions that affect the reported amount of assets and liabilities and disclosure of contingent assets
| | THE GUGGENHEIM FUNDS SEMI-ANNUAL REPORT | 17 |
NOTES TO FINANCIAL STATEMENTS (Unaudited)(continued) |
and liabilities at the date of the financial statements and the reported amounts of revenues and expenses during the reporting period. Actual results could differ from these estimates. All time references are based on Eastern Time.
The NAV of the Fund is calculated by dividing the market value of the Fund’s securities and other assets, less all liabilities, by the number of outstanding shares of the Fund.
A. The Board of Trustees of the Fund (the “Board”) has adopted policies and procedures for the valuation of the Fund’s investments (the “Valuation Procedures”). Pursuant to the Valuation Procedures, the Board has delegated to a valuation committee, consisting of representatives from Guggenheim’s investment management, fund administration, legal and compliance departments (the “Valuation Committee”), the day-to-day responsibility for implementing the Valuation Procedures, including, under most circumstances, the responsibility for determining the fair value of the Fund’s securities or other assets.
Valuations of the Fund’s securities are supplied primarily by pricing services appointed pursuant to the processes set forth in the Valuation Procedures. The Valuation Committee convenes monthly, or more frequently as needed, and will review the valuation of all assets which have been fair valued for reasonableness. The Fund’s officers, through the Valuation Committee and consistent with the monitoring and review responsibilities set forth in the Valuation Procedures, regularly review procedures used by, and valuations provided by, the pricing services.
If the pricing service cannot or does not provide a valuation for a particular investment or such valuation is deemed unreliable, such investment is fair valued by the Valuation Committee.
Equity securities listed on an exchange (New York Stock Exchange (“NYSE”) or American Stock Exchange) are valued at the last quoted sales price as of the close of business on the NYSE, usually 4:00 p.m. on the valuation date. Equity securities listed on the NASDAQ market system are valued at the NASDAQ Official Closing Price on the valuation date, which may not necessarily represent the last sale price. If there has been no sale on such exchange or NASDAQ on a given day, the security is valued at the closing bid price on that day.
Open-end investment companies (“Mutual Funds”) are valued at their NAV as of the close of business, on the valuation date.
Investments for which market quotations are not readily available are fair valued as determined in good faith by GI under the direction of the Board of Trustees using methods established or ratified by the Board of Trustees. These methods include
18 | THE GUGGENHEIM FUNDS SEMI-ANNUAL REPORT | |
NOTES TO FINANCIAL STATEMENTS (Unaudited)(continued) |
but are not limited to: (i) obtaining general information as to how these securities and assets trade; and (ii) obtaining other information and considerations, including current values in related markets.
B. Security transactions are recorded on the trade date for financial reporting purposes. Realized gains and losses from securities transactions are recorded using the identified cost basis. Proceeds from lawsuits related to investment holdings are recorded as realized gains in the Fund. Dividend income is recorded on the ex-dividend date, net of applicable taxes withheld by foreign countries. Taxable non-cash dividends are recorded as dividend income. Interest income, including amortization of premiums and accretion of discounts, is accrued on a daily basis. Dividend income from REITs is recorded based on the income included in the distributions received from the REIT investments using published REIT classifications, including some management estimates when actual amounts are not available. Distributions received in excess of this estimated amount are recorded as a reduction of the cost of investments or reclassified to capital gains. The actual amounts of income, return of capital, and capital gains are only determined by each REIT after its fiscal year-end, and may differ from the estimated amounts.
C. Distributions of net investment income and net realized gains, if any, are declared and paid at least annually. Dividends are reinvested in additional shares unless shareholders request payment in cash. Distributions are recorded on the ex-dividend date and are determined in accordance with income tax regulations which may differ from U.S. GAAP.
D. Certain expenses have been allocated to the individual Funds in the Trust on a pro rata basis upon the respective aggregate net assets of each Fund included in the Trust.
E. Under the fee arrangement with the custodian, the Fund may earn credits based on overnight custody cash balances. These credits are utilized to reduce related custodial expenses. The custodian fees disclosed in the Statement of Operations are before the reduction in expense from the related earnings credits, if any. For the period ended March 31, 2016, there were no earnings credits received, which was 0.25% at March 31, 2016..
The Fund may leave cash overnight in its cash account with the custodian. Periodically, the Fund may have cash due to the custodian bank as an overdraft balance. A fee is incurred on this overdraft, calculated by multiplying the overdraft by a rate based on the federal funds rate.
| | THE GUGGENHEIM FUNDS SEMI-ANNUAL REPORT | 19 |
NOTES TO FINANCIAL STATEMENTS (Unaudited)(continued) |
F. Under the Fund’s organizational documents, its Trustees and Officers are indemnified against certain liabilities arising out of the performance of their duties to the Trust. In addition, throughout the normal course of business, the Fund enters into contracts that contain a variety of representations and warranties which provide general indemnifications. The Fund’s maximum exposure under these arrangements is unknown, as this would involve future claims that may be made against the Fund and/or its affiliates that have not yet occurred. However, based on experience, the Fund expects the risk of loss to be remote.
2. Federal Income Tax Information
The Fund intends to comply with the provisions of Subchapter M of the Internal Revenue Code applicable to regulated investment companies and will distribute substantially all taxable net investment income and capital gains sufficient to relieve the Fund from all, or substantially all, federal income, excise and state income taxes. Therefore, no provision for federal or state income tax is required.
Tax positions taken or expected to be taken in the course of preparing the Fund’s tax returns are evaluated to determine whether the tax positions are “more-likely-than-not” of being sustained by the applicable tax authority. Tax positions not deemed to meet the more-likely-than-not threshold would be recorded as a tax benefit or expense in the current year. Management has analyzed the Fund’s tax positions taken, or to be taken, on Federal income tax returns for all open tax years, and has concluded that no provision for income tax is required in the Fund’s financial statements. The Fund’s federal tax returns are subject to examination by the Internal Revenue Service for a period of three years after they are filed.
At March 31, 2016, the cost of securities for Federal income tax purposes, the aggregate gross unrealized gain for all securities for which there was an excess of value over tax cost and the aggregate gross unrealized loss for all securities for which there was an excess of tax cost over value, were as follows:
Fund | | Tax
Cost | | | Tax
Unrealized
Gain | | | Tax
Unrealized
Loss | | | Net
Unrealized
Gain (Loss) | |
Mid Cap Value Institutional Fund | | $ | 260,426,124 | | | $ | 31,437,897 | | | $ | (22,369,175 | ) | | $ | 9,068,722 | |
3. Fees and Other Transactions with Affiliates
Under the terms of an investment advisory contract, the Fund pays GI investment advisory fees calculated at an annualized rate of 0.75% of the average daily net assets of the Fund.
20 | THE GUGGENHEIM FUNDS SEMI-ANNUAL REPORT | |
NOTES TO FINANCIAL STATEMENTS (Unaudited)(continued) |
RFS is paid the following for providing transfer agent services to the Fund. Transfer agent fees are assessed to the applicable class of the Fund.
Annual charge per account | $5.00 – $8.00 |
Transaction fee | $0.60 – $1.10 |
Minimum annual charge per Fund† | $25,000 |
Certain out-of-pocket charges | Varies |
† | Not subject to Fund during first twelve months of operations. |
RFS also acts as the administrative agent for the Fund, and as such performs administrative functions and the bookkeeping, accounting and pricing functions for the Fund. For these services, RFS receives 0.095% of the average daily net assets of the Fund. The minimum annual charge for fund accounting/administrative fees is $25,000.
RFS engages external service providers to perform other necessary services for the Trust, such as audit and accounting related services, legal services, custody, printing and mailing, etc., on a pass-through basis. Such expenses are allocated to various Funds within the complex based on relative net assets.
Certain trustees and officers of the Trust are also officers of GI, RFS and GFD.
4. Fair Value Measurement
In accordance with U.S. GAAP, fair value is defined as the price that the Fund would receive to sell an investment or pay to transfer a liability in an orderly transaction with an independent buyer in the principal market, or in the absence of a principal market, the most advantageous market for the investment or liability. U.S. GAAP establishes a three-tier fair value hierarchy based on the types of inputs used to value assets and liabilities and requires corresponding disclosure. The hierarchy and the corresponding inputs are summarized below:
Level 1 — | quoted prices in active markets for identical assets or liabilities. |
Level 2 — | significant other observable inputs (for example quoted prices for securities that are similar based on characteristics such as interest rates, prepayment speeds, credit risk, etc.). |
Level 3 — | significant unobservable inputs based on the best information available under the circumstances, to the extent observable inputs are not available, which may include assumptions. |
| | THE GUGGENHEIM FUNDS SEMI-ANNUAL REPORT | 21 |
NOTES TO FINANCIAL STATEMENTS (Unaudited)(continued) |
The types of inputs available depend on a variety of factors, such as the type of security and the characteristics of the markets in which it trades, if any. Fair valuation determinations that rely on fewer or no observable inputs require greater judgment. Accordingly, fair value determinations for Level 3 securities require the greatest amount of judgment.
The inputs or methodologies used for valuing securities are not necessarily an indication of the risk associated with investing in those securities. The suitability of the techniques and sources employed to determine fair valuation are regularly monitored and subject to change.
5. Securities Transactions
For the period ended March 31, 2016, the cost of purchases and proceeds from sales of investment securities, excluding government securities, short-term investments and derivatives, were as follows:
Fund | | Purchases | | | Sales | |
Mid Cap Value Institutional Fund | | $ | 82,985,912 | | | $ | 110,092,303 | |
The Fund is permitted to purchase or sell securities from or to certain affiliated funds under specified conditions outlined in procedures adopted by the Board of Trustees of the Trust. The procedures have been designed to ensure that any purchase or sale of securities by a Fund from or to another fund or portfolio that is or could be considered an affiliate by virtue of having a common investment adviser (or affiliated investment advisers), common Trustees and/or common officers complies with Rule 17a-7 of the 1940 Act. Further, as defined under these procedures, each transaction is effected at the current market price to save costs, where permissible. For the period ended March 31, 2016, the Fund did not engage in purchases and sales of securities, pursuant to Rule 17a-7 of the 1940 Act.
6. Affiliated Transactions
Investments representing 5% or more of the outstanding voting shares of a portfolio company of a fund, or control of or by, or common control under GI, result in that portfolio company being considered an affiliated company of such fund, as defined in the 1940 Act.
Transactions during the period ended March 31, 2016, in which the portfolio company is an “affiliated person”, were as follows:
Affiliated issuers | | Value
09/30/15 | | | Additions | | | Reductions | | | Value
03/31/16 | | | Shares
03/31/16 | | | Investment
Income | |
HydroGen Corp. | | $ | 1 | | | $ | — | | | $ | — | | | $ | 1 | | | | 1,265,700 | | | $ | — | |
22 | THE GUGGENHEIM FUNDS SEMI-ANNUAL REPORT | |
NOTES TO FINANCIAL STATEMENTS (Unaudited)(concluded) |
7. Line of Credit
The Funds, with the exception of Alpha Opportunity Fund, Capital Stewardship Fund, Diversified Income Fund and Market Neutral Real Estate Fund, secured a committed $800,000,000 line of credit from Citibank, N.A., good through October 7, 2016, at which time the line of credit may be renewed. This line of credit is reserved for emergency or temporary purposes. Fees related to borrowings, if any, vary under this arrangement between the greater of Citibank’s “base rate”, LIBOR plus 1%, or the federal funds rate (0.25% at March 31, 2016), plus 1/2 of 1%. The Funds also pays a commitment fee at an annualized rate of 0.15% of the average daily amount of their unused commitment amount. The Fund did not have any borrowings under this agreement as of and for the period-ended March 31, 2016.
8. Other Liabilities
The Fund wrote put option contracts through Lehman Brothers Inc., (“LBI”) that were exercised prior to the option contracts’ expiration and prior to the bankruptcy filing by LBI, during September 2008. However, these transactions have not settled and the securities have not been delivered to the Fund as of March 31, 2016.
Although the ultimate resolution of these transactions is uncertain, the Fund has recorded a liability on its books equal to the difference between the strike price on the put options and the market price of the underlying security on the exercise date. The amount of the liability recorded in miscellaneous payables by the Fund as of March 31, 2016 was $15,940.
| | THE GUGGENHEIM FUNDS SEMI-ANNUAL REPORT | 23 |
OTHER INFORMATION (Unaudited) |
Proxy Voting Information
A description of the policies and procedures that the Trust uses to determine how to vote proxies relating to securities held in the Funds’ portfolios is available, without charge and upon request, by calling 800.820.0888. This information is also available from the EDGAR database on the SEC’s website at http://www.sec.gov.
Information regarding how the Funds voted proxies relating to portfolio securities during the most recent 12-month period ended June 30 is available without charge, upon request, by calling 800.820.0888. This information is also available from the EDGAR database on the SEC’s website at http://www.sec.gov.
Sector Classification
Information in the “Schedule of Investments” is categorized by sectors using sector-level Classifications defined by the Bloomberg Industry Classification System, a widely recognized industry classification system provider. Each Fund’s registration statement has investment policies relating to concentration in specific sectors/industries. For purposes of these investment policies, the Funds usually classify sectors/industries based on industry-level Classifications used by widely recognized industry classification system providers such as Bloomberg Industry Classification System, Global Industry Classification Standards and Barclays Global Classification Scheme.
Quarterly Portfolio Schedules Information
The Trust files its complete schedule of portfolio holdings with the SEC for the first and third quarters of each fiscal year on Form N-Q; which are available on the SEC’s website at http://www.sec.gov. The Funds’ Forms N-Q may be reviewed and copied at the SEC’s Public Reference Room in Washington, DC, and that information on the operation of the Public Reference Room may be obtained by calling 800-SEC-0330. Copies of the portfolio holdings are also available to shareholders, without charge and upon request, by calling 800.820.0888.
24 | THE GUGGENHEIM FUNDS SEMI-ANNUAL REPORT | |
INFORMATION ON BOARD OF TRUSTEES AND OFFICERS (Unaudited) |
A Board of Trustees oversees the Trust, as well as other trusts of GI, in which its members have no stated term of service, and continue to serve after election until resignation. The Statement of Additional Information includes further information about Fund Trustees and Officers, and can be obtained without charge by calling 800.820.0888.
Name, Address* and Year of Birth | Position(s) Held with the Trust | Term of Office and Length of Time Served** | Principal Occupation(s) During Past Five Years | Number of Portfolios in Fund Complex Overseen | Other Directorships Held by Trustees |
INDEPENDENT TRUSTEES | | | |
Randall C. Barnes (1951) | Trustee | Since 2014 | Current: Private Investor (2001-present). Former: Senior Vice President and Treasurer, PepsiCo, Inc. (1993-1997); President, Pizza Hut International (1991-1993); Senior Vice President, Strategic Planning and New Business Development, PepsiCo, Inc. (1987-1990). | 105 | Current: Trustee, Purpose Investments Inc. (2014-Present). |
Donald A. Chubb, Jr. (1946) | Trustee | Since 1994 | Current: Business broker and manager of commercial real estate, Griffith & Blair, Inc. (1997-present). | 101 | Current: Midland Care, Inc. (2011-present). |
Jerry B. Farley (1946) | Trustee | Since 2005 | Current: President, Washburn University (1997-present). | 101 | Current: Westar Energy, Inc. (2004-present); CoreFirst Bank & Trust (2000-present). |
| | THE GUGGENHEIM FUNDS SEMI-ANNUAL REPORT | 25 |
INFORMATION ON BOARD OF TRUSTEES AND OFFICERS (Unaudited)(continued) |
Name, Address* and Year of Birth | Position(s) Held with the Trust | Term of Office and Length of Time Served** | Principal Occupation(s) During Past Five Years | Number of Portfolios in Fund Complex Overseen | Other Directorships Held by Trustees |
INDEPENDENT TRUSTEES - continued | | |
Roman Friedrich III (1946) | Trustee and Chairman of the Contracts Review Committee | Since 2014 | Current: Founder and Managing Partner, Roman Friedrich & Company (1998-present). Former: Senior Managing Director, MLV & Co. LLC (2010-2011). | 101 | Current: Zincore Metals, Inc. (2009-present). Former: Axiom Gold and Silver Corp. (2011-2012). |
Robert B. Karn III (1942) | Trustee and Chairman of the Audit Committee | Since 2014 | Current: Consultant (1998-present). Former: Arthur Andersen (1965-1997) and Managing Partner, Financial and Economic Consulting, St. Louis office (1987-1997). | 101 | Current: Peabody Energy Company (2003-present); GP Natural Resource Partners, LLC (2002- present). |
Ronald A. Nyberg (1953) | Trustee and Chairman of the Nominating and Governance Committee | Since 2014 | Current: Partner, Nyberg & Cassioppi, LLC (2000-present). Former: Executive Vice President, General Counsel, and Corporate Secretary, Van Kampen Investments (1982-1999). | 107 | Current: Edward-Elmhurst Healthcare System (2012-present). |
26 | THE GUGGENHEIM FUNDS SEMI-ANNUAL REPORT | |
INFORMATION ON BOARD OF TRUSTEES AND OFFICERS (Unaudited)(continued) |
Name, Address* and Year of Birth | Position(s) Held with the Trust | Term of Office and Length of Time Served** | Principal Occupation(s) During Past Five Years | Number of Portfolios in Fund Complex Overseen | Other Directorships Held by Trustees |
INDEPENDENT TRUSTEES - concluded | | |
Maynard F. Oliverius (1943) | Trustee | Since 1998 | Current: Retired. Former: President and CEO, Stormont-Vail HealthCare (1996-2012). | 101 | Current: Fort Hays State University Foundation (1999-present); Stormont-Vail Foundation (2013-present); University of Minnesota HealthCare Alumni Association Foundation (2009-present). |
Ronald E. Toupin, Jr. (1958) | Trustee and Chairman of the Board | Since 2014 | Current: Portfolio Consultant (2010-present). Former: Vice President, Manager and Portfolio Manager, Nuveen Asset Management (1998-1999); Vice President, Nuveen Investment Advisory Corp. (1992-1999); Vice President and Manager, Nuveen Unit Investment Trusts (1991-1999); and Assistant Vice President and Portfolio Manager, Nuveen Unit Investment Trusts (1988-1999), each of John Nuveen & Co., Inc. (1982-1999). | 104 | Former: Bennett Group of Funds (2011-2013). |
| | THE GUGGENHEIM FUNDS SEMI-ANNUAL REPORT | 27 |
INFORMATION ON BOARD OF TRUSTEES AND OFFICERS (Unaudited)(continued) |
Name, Address* and Year of Birth | Position(s) Held with the Trust | Term of Office and Length of Time Served** | Principal Occupation(s) During Past Five Years | Number of Portfolios in Fund Complex Overseen | Other Directorships Held by Trustees |
INTERESTED TRUSTEE | |
Donald C. Cacciapaglia*** (1951) | President, Chief Executive Officer and Trustee | Since 2012 | Current: President and CEO, certain other funds in the Fund Complex (2012-present); Vice Chairman, Guggenheim Investments (2010-present). Former: Chairman and CEO, Channel Capital Group, Inc. (2002-2010). | 236 | Current: Clear Spring Life Insurance Company (2015-present); Guggenheim Partners Japan, Ltd. (2014-present); Delaware Life (2013-present); Guggenheim Life and Annuity Company (2011-present); Paragon Life Insurance Company of Indiana (2011-present). |
* | The business address of each Trustee is c/o Guggenheim Investments, 805 King Farm Boulevard, Suite 600, Rockville, Maryland 20850. |
** | Each Trustee serves an indefinite term, until his successor is elected and qualified. Time served includes time served in the respective position for the Predecessor Corporation. |
*** | This Trustee is deemed to be an "interested person" of the Funds under the 1940 Act by reason of his position with the Funds' Investment Manager and/or the parent of the Investment Manager. |
28 | THE GUGGENHEIM FUNDS SEMI-ANNUAL REPORT | |
INFORMATION ON BOARD OF TRUSTEES AND OFFICERS (Unaudited)(continued) |
Name, Address* and Year of Birth | Position(s) Held with the Trust | Term of Office and Length of Time Served** | Principal Occupations
During Past Five Years |
OFFICERS | | | |
Joseph M. Arruda (1966) | Assistant Treasurer | Since 2010 | Current: Assistant Treasurer, certain other funds in the Fund Complex (2006-present); Vice President, Security Investors, LLC (2010-present); CFO and Manager, Guggenheim Specialized Products, LLC (2009-present). Former: Vice President, Security Global Investors, LLC (2010-2011); Vice President, Rydex Advisors, LLC (2010); Vice President, Rydex Advisors II, LLC (2010). |
William H. Belden, III (1965) | Vice President | Since 2014 | Current: Vice President, certain other funds in the Fund Complex (2006-present); Managing Director, Guggenheim Funds Investment Advisors, LLC (2005-present). Former: Vice President of Management, Northern Trust Global Investments (1999-2005). |
James Howley (1972) | Assistant Treasurer | Since 2014 | Current: Director, Guggenheim Investments (2004-present) ; Assistant Treasurer, certain other funds in the Fund Complex (2006-present). Former: Manager, Mutual Fund Administration of Van Kampen Investments, Inc. (1996-2004). |
Amy J. Lee (1961) | Vice President and Chief Legal Officer | Since 2007 (Vice President) Since 2014 (Chief Legal Officer) | Current: Chief Legal Officer, certain other funds in the Fund Complex (2013-present); Senior Managing Director, Guggenheim Investments (2012-present). Former: Vice President, Associate General Counsel and Assistant Secretary, Security Benefit Life Insurance Company and Security Benefit Corporation (2004-2012). |
Mark E. Mathiasen (1978) | Secretary | Since 2014 | Current: Secretary, certain other funds in the Fund Complex (2007-present); Managing Director, Guggenheim Investments (2007-present). |
| | THE GUGGENHEIM FUNDS SEMI-ANNUAL REPORT | 29 |
INFORMATION ON BOARD OF TRUSTEES AND OFFICERS (Unaudited)(continued) |
Name, Address* and Year of Birth | Position(s) Held with the Trust | Term of Office and Length of Time Served** | Principal Occupations
During Past Five Years |
OFFICERS - continued | |
Michael P. Megaris (1984) | Assistant Secretary | Since 2014 | Current: Assistant Secretary, certain other funds in the Fund Complex (2014-present); Senior Associate, Guggenheim Investments (2012-present). Former: J.D., University of Kansas School of Law (2009-2012). |
Elisabeth Miller (1968) | Chief Compliance Officer | Since 2012 | Current: CCO, certain other funds in the Fund Complex (2012-present); CCO, Security Investors, LLC (2012-present); CCO, Guggenheim Funds Investment Advisors, LLC (2012-present); Managing Director, Guggenheim Investments (2012-present); Vice President, Guggenheim Funds Distributors, LLC (March 2014-present). Former: CCO, Guggenheim Distributors, LLC (2009-March 2014); Senior Manager, Security Investors, LLC (2004-2009); Senior Manager, Guggenheim Distributors, LLC (2004-2009). |
Adam Nelson (1979) | Assistant Treasurer | Since 2015 | Current: Vice President, Guggenheim Investments (2015-present); Assistant Treasurer, certain other funds in the Fund Complex (2015-present). Former: Assistant Vice President and Fund Administration Director, State Street Corporation (2013-2015); Fund Administration Assistant Director, State Street (2011-2013); Fund Administration Manager, State Street (2009-2011). |
Alison Santay (1974) | AML Officer | Since 2013 | Current: AML Officer, certain other funds in the Fund Complex (2010-present); Director and AML Officer, Rydex Fund Services, LLC (2010-present); AML Officer, Security Investors, LLC (2010-present); Director, Shareholder Risk and Compliance, Rydex Fund Services, LLC (2004-present). Former: AML Officer, Guggenheim Distributors, LLC (2013-2014). |
30 | THE GUGGENHEIM FUNDS SEMI-ANNUAL REPORT | |
INFORMATION ON BOARD OF TRUSTEES AND OFFICERS (Unaudited)(concluded) |
Name, Address* and Year of Birth | Position(s) Held with the Trust | Term of Office and Length of Time Served** | Principal Occupations
During Past Five Years |
OFFICERS - concluded | |
Kimberly Scott (1974) | Assistant Treasurer | Since 2014 | Current: Vice President, Guggenheim Investments (2012-present) ; Assistant Treasurer, certain other funds in the Fund Complex (2012-present). Former: Financial Reporting Manager, Invesco, Ltd. (2010-2011); Vice President/Assistant Treasurer, Mutual Fund Administration for Van Kampen Investments, Inc./Morgan Stanley Investment Management (2009-2010); Manager of Mutual Fund Administration, Van Kampen Investments, Inc./Morgan Stanley Investment Management (2005-2009). |
Bryan Stone (1979) | Vice President | Since 2014 | Current: Vice President, certain other funds in the Fund Complex (2014-present); Director, Guggenheim Investments (2013-present). Former: Senior Vice President, Neuberger Berman Group LLC (2009-2013); Vice President, Morgan Stanley (2002-2009). |
John L. Sullivan (1955) | Chief Financial Officer and Treasurer | Since 2014 | Current: CFO, Chief Accounting Officer and Treasurer, certain other funds in the Fund Complex (2010-present); Senior Managing Director, Guggenheim Investments (2010-present). Former: Managing Director and CCO, each of the funds in the Van Kampen Investments fund complex (2004-2010); Managing Director and Head of Fund Accounting and Administration, Morgan Stanley Investment Management (2002-2004); CFO and Treasurer, Van Kampen Funds (1996-2004). |
* | The business address of each officer is c/o Guggenheim Investments, 805 King Farm Boulevard, Suite 600, Rockville, Maryland 20850. |
** | Each officer serves an indefinite term, until his or her successor is duly elected and qualified. Time served includes time served in the respective position for the Predecessor Corporation. |
| | THE GUGGENHEIM FUNDS SEMI-ANNUAL REPORT | 31 |
GUGGENHEIM INVESTMENTS PRIVACY POLICIES (Unaudited) |
Rydex Funds, Guggenheim Funds, Rydex Investments, Guggenheim Funds Distributors, LLC, Security Investors, LLC, Security Distributors, Inc., Guggenheim Partners Investment Managers, LLC, and Rydex Advisory Services (Collectively “Guggenheim Investments”).
Our Commitment to You
When you become a Guggenheim Investments investor, you entrust us with not only your hard-earned money but also with personal and financial information about you. We recognize that your relationship with us is based on trust and that you expect us to act responsibly and in your best interests. Because we have access to this private information about you, we hold ourselves to the highest standards in its safekeeping and use. This means, most importantly, that we do not sell client information to anyone—whether it is your personal information or if you are a current or former Guggenheim Investments client.
The Information We Collect About You
In the course of doing business with shareholders and investors, we collect nonpublic personal information about you. You typically provide personal information when you complete a Guggenheim Investments account application or when you request a transaction that involves Rydex and Guggenheim Investments funds or one of the Guggenheim Investments affiliated companies. “Nonpublic personal information” is personally identifiable private information about you. For example, it includes information regarding your name and address, Social Security or taxpayer identification number, assets, income, account balance, bank account information and investment activity (e.g., purchase and redemption history).
How We Handle Your Personal Information
As emphasized above, we do not sell information about current or former clients or their accounts to third parties. Nor do we share such information, except when necessary to complete transactions at your request or to make you aware of related investment products and services that we offer. Additional details about how we handle your personal information are provided below. To complete certain transactions or account changes that you direct, it may be necessary to provide identifying information to companies, individuals or groups that are not affiliated with Guggenheim Investments. For example, if you ask to transfer assets from another financial institution to Guggenheim Investments, we will need to provide certain information about you to that company to complete the transaction. To alert you to other Guggenheim Investments investment products and services, we may share your information within the Guggenheim Investments family of affiliated companies. This would include, for example, sharing your information within Guggenheim Investments so we can make you aware of
32 | THE GUGGENHEIM FUNDS SEMI-ANNUAL REPORT | |
GUGGENHEIM INVESTMENTS PRIVACY POLICIES (Unaudited)(continued) |
new Rydex and Guggenheim Investments funds or the services offered through another Guggenheim Investments affiliated company. In certain instances, we may contract with nonaffiliated companies to perform services for us. Where necessary, we will disclose information we have about you to these third parties. In all such cases, we provide the third party with only the information necessary to carry out its assigned responsibilities and only for that purpose. And we require these third parties to treat your private information with the same high degree of confidentiality that we do. In certain instances, we may share information with other financial institutions regarding individuals and entities in response to the U.S.A. Patriot Act. Finally, we will release information about you if you direct us to do so, if we are compelled by law to do so or in other circumstances permitted by law.
Opt Out Provisions
We do not sell your personal information to anyone. The law allows you to “opt out” of only certain kinds of information sharing with third parties. The firm does not share personal information about you with any third parties that triggers this opt-out right. This means YOU ARE ALREADY OPTED OUT.
How We Protect Privacy Online
Our concern for the privacy of our shareholders also extends to those who use our web site, guggenheiminvestments.com. Our web site uses some of the most secure forms of online communication available, including encryption technology, Secure Socket Layer (SSL) protocol, firewalls and user names and passwords. These technologies provide a high level of security and privacy when you access your account information or initiate online transactions. The Guggenheim Investments web site offers customized features that require our use of “http cookies”—tiny pieces of information that we ask your browser to store. However, we make very limited use of these cookies. We only use cookies for session management and security features on the Guggenheim Investments web site. We do not use them to pull data from your hard drive, to learn your email address, or to view data in cookies created by other web sites. We will not share the information in our cookies or give others access to it. See the legal information area on our web site for more details about web site security and privacy features.
How We Safeguard Your Personal Information
We restrict access to nonpublic personal information about shareholders to our employees and in some cases to third parties (for example, the service providers described above) as permitted by law. We maintain strict physical, electronic and procedural safeguards that comply with federal standards to guard your nonpublic personal information.
| | THE GUGGENHEIM FUNDS SEMI-ANNUAL REPORT | 33 |
GUGGENHEIM INVESTMENTS PRIVACY POLICIES (Unaudited)(concluded) |
We’ll Keep You Informed
As required by federal law, we will notify shareholders of our privacy policy annually. We reserve the right to modify this policy at any time, but rest assured that if we do change it, we will tell you promptly. You will also be able to access our privacy policy from our web site at guggenheiminvestments.com. Should you have any questions regarding our privacy policy, contact us at 800.820.0888 or 301.296.5100.
34 | THE GUGGENHEIM FUNDS SEMI-ANNUAL REPORT | |
This page intentionally left blank.
This page intentionally left blank.
This page intentionally left blank.
This page intentionally left blank.
This page intentionally left blank.
This page intentionally left blank.
This page intentionally left blank.
3.31.2016
Guggenheim Funds Semi-Annual Report
| |
Guggenheim Capital Stewardship Fund | | |
CSF-SEMI-0316x0916 | guggenheiminvestments.com |
DEAR SHAREHOLDER | 2 |
ECONOMIC AND MARKET OVERVIEW | 3 |
ABOUT SHAREHOLDERS’ FUND EXPENSES | 5 |
CAPITAL STEWARDSHIP FUND | 7 |
NOTES TO FINANCIAL STATEMENTS | 13 |
OTHER INFORMATION | 17 |
INFORMATION ON BOARD OF TRUSTEES AND OFFICERS | 18 |
GUGGENHEIM INVESTMENTS PRIVACY POLICIES | 22 |
| | THE GUGGENHEIM FUNDS SEMI-ANNUAL REPORT | 1 |
Dear Shareholder:
Guggenheim Partners Investment Management (the “Investment Adviser”) and Concinnity Advisors, LP, the Fund’s sub-adviser (the “Sub-Adviser”) are pleased to present the semiannual shareholder report for the Guggenheim Capital Stewardship Fund (the “Fund”) for the six-month period ended March 31, 2016.
The Investment Adviser is part of Guggenheim Investments, which represents the investment management businesses of Guggenheim Partners, LLC (“Guggenheim”), a global, diversified financial services firm. The Sub-Adviser is unaffiliated with Guggenheim.
Guggenheim Funds Distributors, LLC is the distributor of the Funds. Guggenheim Funds Distributors, LLC is affiliated with Guggenheim and the Investment Adviser.
We encourage you to read the Economic and Market Overview section of the report, which follows this letter.
We are committed to providing innovative investment solutions and appreciate the trust you place in us.
Sincerely,

Donald C. Cacciapaglia
President
April 30, 2016
Read a prospectus and summary prospectus (if available) carefully before investing. It contains the investment objectives, risks, charges, expenses and other information, which should be considered carefully before investing. Obtain a prospectus and summary prospectus (if available) at guggenheiminvestments.com or call 800.820.0888.
There can be no assurance that any investment product will achieve its investment objective(s). There are risks associated with investing, including the entire loss of principal invested. Investing involves market risks. The investment return and principal value of any investment product will fluctuate with changes in market conditions.
2 | THE GUGGENHEIM FUNDS SEMI-ANNUAL REPORT | |
ECONOMIC AND MARKET OVERVIEW (Unaudited) | March 31, 2016 |
Financial markets were buffeted by a variety of events over the past six months, including volatility in the oil market, weak growth in China, ongoing stimulus from global central banks, and a 25-basis-point increase in the U.S. federal funds target rate in December. While the direct impact of the move was fairly insignificant, the decision to begin normalization of interest rates after seven years of unprecedented liquidity provision was not. Indeed, in 2015, risk assets posted their worst annual performance since the 2008 financial crisis, as market participants’ expectations for the start of rate hikes collided with concern about plunging commodity prices, and slowing economic growth in China and other emerging market economies.
As 2016 began, forecasts for U.S. and global economic growth were downgraded, and recession fears surged along with market volatility. Estimates for first quarter gross domestic product (“GDP”) in the U.S. were marked down, even though first quarter GDP has undershot full-year growth rates in six out of the last seven years. Risk assets rallied in the last half of the first quarter, led by a dovish pivot in the U.S. Federal Reserve (the “Fed”) Fed’s communication that spurred a rally in crude oil and a reversal of dollar strength. The weaker dollar, along with optimism about a production freeze agreed to by a group of major oil producing countries, helped oil to rebound. After falling in the early weeks of the year to a cycle low of $26 per barrel on February 11, 2016, the front-month West Texas Intermediate (“WTI”) oil futures contract rallied as high as $40 per barrel before closing the quarter at $38 per barrel.
The outlook for economic growth outside the U.S. softened in the first quarter. A further deterioration in the euro zone inflation outlook prompted the European Central Bank (“ECB”) to announce an increase in the size of its monthly asset purchases and reduce its deposit rate to -40 basis points. European government bonds rallied following the announcement, with the 10-year German bund ending the first quarter with a yield of just 16 basis points.
Ongoing stimulus efforts in Asia also appeared likely to contribute to low U.S. rates. Chinese industrial production growth continued to slow in early 2016, prompting the People’s Bank of China (“PBOC”) to stimulate credit growth by allowing banks to hold fewer reserves against deposits. And after years of struggling with stagnant growth and low inflation, the Bank of Japan (“BOJ”) surprised markets by cutting its key interest rate to -10 basis points in January. The negative rates pushed a considerable amount of Japanese savings into foreign markets.
In an environment where global rates are moving lower and markets are already starved for yield, foreign investors began looking to the U.S. Guggenheim expects that U.S. Treasury yields will fall further as the gravitational pull of global yields gets stronger, and does not discount the possibility of 10-year U.S. Treasury yields declining to closer to 1 percent before the end of the year.
A stronger dollar has weighed on the U.S. economy, but consumer spending has been resilient. The labor market is now operating near full employment, and tight labor market conditions are beginning to spur faster wage growth. We believe the U.S. economy is fundamentally sound, and find little evidence to support the conclusion that the economy will fall into a recession in 2016.
Despite the relative health of the U.S. economy, markets are concerned that sluggish global growth will hold back the U.S. expansion, that inflation will remain below the Fed’s target for longer, and that tighter conditions in credit markets have raised recession risks. Our view is that the Fed remains focused on fulfilling its dual mandate objectives of maximum employment and price stability, and thus is biased toward normalizing policy. We expect further declines in the unemployment rate as job gains outstrip growth in the labor force. Meanwhile, core and headline inflation should move closer to the Fed’s target by year end, reflecting our forecasts for a tighter labor market and a modest rise in oil prices. Normally, this would result in at least two Fed rate hikes on the table for 2016, but the U.S. Fed is becoming more sensitive to global financial conditions and the extent of global money flows that occur as monetary policy in the US diverges from Europe, Japan and China. As a result, we have reduced our expectations for a June rate hike, although it would normally be an easy call. We continue to believe a December rate hike is a near certainty. A solid macroeconomic backdrop and a rebalancing oil market should support an improving credit picture in the second half of 2016.
For the six months ended February 29, 2016, the Standard & Poor’s 500® (“S&P 500”) Index* returned 8.49%. The Morgan Stanley Capital International (“MSCI”) Europe-Australasia-Far East (“EAFE”) Index* returned 1.56%. The return of the MSCI Emerging Markets Index* was 6.41%.
| | THE GUGGENHEIM FUNDS SEMI-ANNUAL REPORT | 3 |
ECONOMIC AND MARKET OVERVIEW (Unaudited)(concluded) | March 31, 2016 |
In the bond market, the Barclays U.S. Aggregate Bond Index* posted a 2.44% return for the period, while the Barclays U.S. Corporate High Yield Index* returned 1.22%. The return of the Bank of America (BofA) Merrill Lynch 3-Month U.S. Treasury Bill Index* was 0.11% for the six-month period.
The opinions and forecasts expressed may not actually come to pass. This information is subject to change at any time, based on market and other conditions, and should not be construed as a recommendation of any specific security or strategy.
*Index Definitions:
The following indices are referenced throughout this report. Indices are unmanaged and not available for direct investment. Index performance does not reflect transaction costs, fees, or expenses.
Barclays U.S. Aggregate Bond Index is a broad-based benchmark that measures the investment grade, U.S. dollar (“USD”)-denominated, fixed-rate taxable bond market, including U.S. Treasuries, government-related and corporate securities, MBS (agency fixed-rate and hybrid ARM pass-throughs), ABS, and CMBS.
Barclays U.S. Corporate High Yield Index measures the market of USD-denominated, non-investment grade, fixed-rate, taxable corporate bonds. Securities are classified as high yield if the middle rating of Moody’s, Fitch, and S&P is Ba1/BB+/BB+ or below.
BofA Merrill Lynch 3-Month U.S. Treasury Bill Index is an unmanaged market index of U.S. Treasury securities maturing in 90 days that assumes reinvestment of all income.
MSCI EAFE Index is a free float-adjusted market capitalization index that is designed to measure the equity market performance of developed markets, excluding the U.S. & Canada.
MSCI Emerging Markets Index is a free float-adjusted market capitalization weighted index that is designed to measure equity market performance in the global emerging markets.
S&P 500® Index is a capitalization-weighted index of 500 stocks designed to measure the performance of the broad economy, representing all major industries and is considered a representation of the U.S. stock market.
4 | THE GUGGENHEIM FUNDS SEMI-ANNUAL REPORT | |
ABOUT SHAREHOLDERS’ FUND EXPENSES (Unaudited) | |
All mutual funds have operating expenses and it is important for our shareholders to understand the impact of costs on their investments. Shareholders of a Fund incur two types of costs: (i) transaction costs, including sales charges (loads) on purchase payments, reinvested dividends, or other distributions; and exchange fees; and (ii) ongoing costs, including management fees, administrative services, and shareholder reports, among others. These ongoing costs, or operating expenses, are deducted from a fund’s gross income and reduce the investment return of the fund.
A fund’s expenses are expressed as a percentage of its average net assets, which is known as the expense ratio. The following examples are intended to help investors understand the ongoing costs (in dollars) of investing in a Fund and to compare these costs with the ongoing costs of investing in other mutual funds.
The examples are based on an investment of $1,000 made at the beginning of the period and held for the entire six-month period beginning September 30, 2015 and ending March 31, 2016.
The following tables illustrate a Fund’s costs in two ways:
Table 1. Based on actual Fund return. This section helps investors estimate the actual expenses paid over the period. The “Ending Account Value” shown is derived from the Fund’s actual return, and the fourth column shows the dollar amount that would have been paid by an investor who started with $1,000 in the Fund. Investors may use the information here, together with the amount invested, to estimate the expenses paid over the period. Simply divide the Fund’s account value by $1,000 (for example, an $8,600 account value divided by $1,000 = 8.6), then multiply the result by the number provided under the heading “Expenses Paid During Period.”
Table 2. Based on hypothetical 5% return. This section is intended to help investors compare a Fund’s cost with those of other mutual funds. The table provides information about hypothetical account values and hypothetical expenses based on the Fund’s actual expense ratio and an assumed rate of return of 5% per year before expenses, which is not the Fund’s actual return. The hypothetical account values and expenses may not be used to estimate the actual ending account balance or expenses paid during the period. The example is useful in making comparisons because the U.S. Securities and Exchange Commission (the “SEC”) requires all mutual funds to calculate expenses based on the 5% return. Investors can assess a Fund’s costs by comparing this hypothetical example with the hypothetical examples that appear in shareholder reports of other funds.
The calculations illustrated above assume no shares were bought or sold during the period. Actual costs may have been higher or lower, depending on the amount of investment and the timing of any purchases or redemptions.
Please note that the expenses shown in the table are meant to highlight your ongoing costs only and do not reflect any transactional costs, such as sales charges (loads) on purchase payments, and contingent deferred sales charges (“CDSC”) on redemptions, if any. Therefore, the second table is useful in comparing ongoing costs only, and will not help you determine the relative total costs of owning different funds. In addition, if these transactional costs were included, your costs would have been higher.
More information about a Fund’s expenses, including annual expense ratios for up to the past five years (subject to the Fund’s inception date), can be found in the Financial Highlights section of this report. For additional information on operating expenses and other shareholder costs, please refer to the appropriate Fund prospectus.
| | THE GUGGENHEIM FUNDS SEMI-ANNUAL REPORT | 5 |
ABOUT SHAREHOLDERS’ FUND EXPENSES (Unaudited)(concluded) | |
| | Expense
Ratio1 | Fund
Return | Beginning
Account Value
September 30, 2015 | Ending
Account Value
March 31, 2016 | Expenses
Paid During
Period2 |
Table 1. Based on actual Fund return3 | | | | | |
Capital Stewardship Fund | | | | | |
Institutional Class | 1.08% | 10.78% | $ 1,000.00 | $ 1,107.80 | $ 5.69 |
| |
Table 2. Based on hypothetical 5% return (before expenses) | | | | |
Capital Stewardship Fund | | | | | |
Institutional Class | 1.08% | 5.00% | $ 1,000.00 | $ 1,019.60 | $ 5.45 |
1 | Annualized and excludes expenses of the underlying funds in which the Fund invests. |
2 | Expenses are equal to the Fund's annualized expense ratio, net of any applicable fee waivers, multiplied by the average account value over the period, multiplied by 183/366 (to reflect the one-half year period). |
3 | Actual cumulative return at net asset value for the period September 30, 2015 to March 31, 2016. |
6 | THE GUGGENHEIM FUNDS SEMI-ANNUAL REPORT | |
FUND PROFILE (Unaudited) | March 31, 2016 |
CAPITAL STEWARDSHIP FUND
OBJECTIVE: Seeks long-term capital appreciation.
Holdings Diversification (Market Exposure as % of Net Assets)
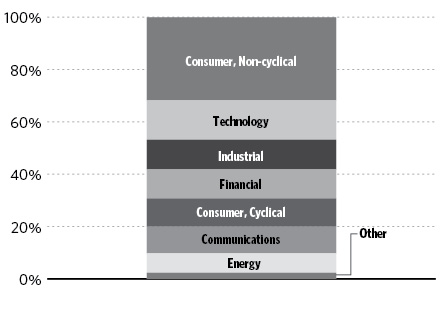
“Holdings Diversification (Market Exposure as % of Net Assets)” excludes any temporary cash investments.
Inception Date: |
Institutional Class | September 26, 2014 |
Ten Largest Holdings (% of Total Net Assets) |
Apple, Inc. | 4.4% |
JPMorgan Chase & Co. | 2.7% |
AT&T, Inc. | 2.5% |
Microsoft Corp. | 2.4% |
Intel Corp. | 2.2% |
PepsiCo, Inc. | 2.2% |
Gilead Sciences, Inc. | 2.2% |
CVS Health Corp. | 2.2% |
Procter & Gamble Co. | 2.2% |
Chevron Corp. | 2.1% |
Top Ten Total | 25.1% |
| | |
“Ten Largest Holdings” excludes any temporary cash investments. |
| | THE GUGGENHEIM FUNDS SEMI-ANNUAL REPORT | 7 |
SCHEDULE OF INVESTMENTS (Unaudited) | March 31, 2016 |
CAPITAL STEWARDSHIP FUND | |
| | | Shares | | | Value | |
| | | | | | | |
COMMON STOCKS† - 99.8% | |
| | | | | | | |
Consumer, Non-cyclical - 31.7% | |
PepsiCo, Inc. | | | 44,468 | | | $ | 4,557,080 | |
Gilead Sciences, Inc. | | | 49,502 | | | | 4,547,253 | |
Procter & Gamble Co. | | | 54,028 | | | | 4,447,045 | |
Kroger Co. | | | 92,097 | | | | 3,522,710 | |
JM Smucker Co. | | | 25,055 | | | | 3,253,141 | |
DaVita HealthCare Partners, Inc.* | | | 44,224 | | | | 3,245,157 | |
AbbVie, Inc. | | | 55,635 | | | | 3,177,871 | |
ManpowerGroup, Inc. | | | 37,537 | | | | 3,056,263 | |
Cardinal Health, Inc. | | | 36,433 | | | | 2,985,684 | |
Medtronic plc | | | 39,534 | | | | 2,965,050 | |
Becton Dickinson and Co. | | | 17,075 | | | | 2,592,327 | |
RR Donnelley & Sons Co. | | | 149,947 | | | | 2,459,131 | |
Amgen, Inc. | | | 16,376 | | | | 2,455,254 | |
Merck & Company, Inc. | | | 46,200 | | | | 2,444,442 | |
Pfizer, Inc. | | | 73,660 | | | | 2,183,282 | |
General Mills, Inc. | | | 33,598 | | | | 2,128,433 | |
Johnson & Johnson | | | 18,172 | | | | 1,966,210 | |
Quest Diagnostics, Inc. | | | 24,202 | | | | 1,729,233 | |
Biogen, Inc.* | | | 5,924 | | | | 1,542,136 | |
Danaher Corp. | | | 15,985 | | | | 1,516,337 | |
St. Jude Medical, Inc. | | | 26,687 | | | | 1,467,785 | |
Allergan plc* | | | 4,851 | | | | 1,300,214 | |
CR Bard, Inc. | | | 6,289 | | | | 1,274,592 | |
Owens & Minor, Inc. | | | 27,084 | | | | 1,094,735 | |
Coca-Cola Co. | | | 21,648 | | | | 1,004,251 | |
Dr Pepper Snapple Group, Inc. | | | 10,892 | | | | 973,963 | |
Kellogg Co. | | | 12,574 | | | | 962,540 | |
Anthem, Inc. | | | 3,678 | | | | 511,205 | |
Total Consumer, Non-cyclical | | | | | | | 65,363,324 | |
| | | | | | | | | |
Technology - 15.1% | |
Apple, Inc. | | | 83,675 | | | | 9,119,739 | |
Microsoft Corp. | | | 89,130 | | | | 4,922,650 | |
Intel Corp. | | | 141,577 | | | | 4,580,016 | |
QUALCOMM, Inc. | | | 55,586 | | | | 2,842,668 | |
salesforce.com, Inc.* | | | 31,041 | | | | 2,291,757 | |
Teradata Corp.* | | | 79,639 | | | | 2,089,727 | |
International Business Machines Corp. | | | 7,378 | | | | 1,117,398 | |
Oracle Corp. | | | 25,343 | | | | 1,036,782 | |
Rackspace Hosting, Inc.* | | | 42,939 | | | | 927,053 | |
Teradyne, Inc. | | | 40,422 | | | | 872,711 | |
Ultimate Software Group, Inc.* | | | 3,384 | | | | 654,804 | |
Autodesk, Inc.* | | | 10,322 | | | | 601,876 | |
Total Technology | | | | | | | 31,057,181 | |
| | | | | | | | | |
Industrial - 11.3% | |
Boeing Co. | | | 31,516 | | | | 4,000,640 | |
Caterpillar, Inc. | | | 46,636 | | | | 3,569,519 | |
CSX Corp. | | | 109,654 | | | | 2,823,591 | |
Cummins, Inc. | | | 24,407 | | | | 2,683,306 | |
Fluor Corp. | | | 47,946 | | | | 2,574,700 | |
General Electric Co. | | | 75,335 | | | | 2,394,900 | |
FedEx Corp. | | | 9,672 | | | | 1,573,828 | |
United Parcel Service, Inc. — Class B | | | 9,174 | | | | 967,582 | |
Waste Management, Inc. | | | 14,977 | | | | 883,643 | |
Union Pacific Corp. | | | 8,004 | | | | 636,718 | |
Honeywell International, Inc. | | | 5,587 | | | | 626,023 | |
United Technologies Corp. | | | 5,996 | | | | 600,200 | |
Total Industrial | | | | | | | 23,334,650 | |
| | | | | | | | | |
Financial - 11.1% | |
JPMorgan Chase & Co. | | | 92,664 | | | | 5,487,562 | |
Principal Financial Group, Inc. | | | 79,094 | | | | 3,120,259 | |
American Financial Group, Inc. | | | 33,626 | | | | 2,366,262 | |
Visa, Inc. — Class A | | | 23,765 | | | | 1,817,547 | |
Travelers Companies, Inc. | | | 11,306 | | | | 1,319,523 | |
Aflac, Inc. | | | 19,253 | | | | 1,215,634 | |
Capital One Financial Corp. | | | 12,687 | | | | 879,335 | |
Progressive Corp. | | | 24,022 | | | | 844,133 | |
Fifth Third Bancorp | | | 48,656 | | | | 812,069 | |
T. Rowe Price Group, Inc. | | | 11,033 | | | | 810,484 | |
American Express Co. | | | 13,029 | | | | 799,981 | |
PNC Financial Services Group, Inc. | | | 9,189 | | | | 777,114 | |
Discover Financial Services | | | 13,297 | | | | 677,083 | |
AvalonBay Communities, Inc. | | | 3,375 | | | | 641,925 | |
Wells Fargo & Co. | | | 13,236 | | | | 640,093 | |
Charles Schwab Corp. | | | 21,810 | | | | 611,116 | |
Total Financial | | | | | | | 22,820,120 | |
| | | | | | | | | |
Consumer, Cyclical - 10.7% | |
CVS Health Corp. | | | 43,263 | | | | 4,487,671 | |
Wal-Mart Stores, Inc. | | | 61,851 | | | | 4,236,175 | |
Walgreens Boots Alliance, Inc. | | | 47,918 | | | | 4,036,612 | |
Ford Motor Co. | | | 184,487 | | | | 2,490,575 | |
Delta Air Lines, Inc. | | | 50,400 | | | | 2,453,471 | |
Southwest Airlines Co. | | | 49,597 | | | | 2,221,946 | |
Alaska Air Group, Inc. | | | 25,928 | | | | 2,126,615 | |
Total Consumer, Cyclical | | | | | | | 22,053,065 | |
| | | | | | | | | |
Communications - 10.2% | |
AT&T, Inc. | | | 132,045 | | | | 5,172,203 | |
Verizon Communications, Inc. | | | 67,574 | | | | 3,654,402 | |
Cisco Systems, Inc. | | | 105,707 | | | | 3,009,478 | |
Alphabet, Inc. — Class A* | | | 3,351 | | | | 2,556,478 | |
Discovery Communications, Inc. — Class A* | | | 54,509 | | | | 1,560,593 | |
Facebook, Inc. — Class A* | | | 12,273 | | | | 1,400,349 | |
eBay, Inc.* | | | 53,632 | | | | 1,279,659 | |
News Corp. — Class A | | | 96,166 | | | | 1,228,040 | |
Telephone & Data Systems, Inc. | | | 21,614 | | | | 650,365 | |
Amazon.com, Inc.* | | | 1,067 | | | | 633,414 | |
Total Communications | | | | | | | 21,144,981 | |
| | | | | | | | | |
Energy - 7.4% | |
Chevron Corp. | | | 45,259 | | | | 4,317,709 | |
Occidental Petroleum Corp. | | | 25,322 | | | | 1,732,784 | |
8 | THE GUGGENHEIM FUNDS SEMI-ANNUAL REPORT | SEE NOTES TO FINANCIAL STATEMENTS. |
SCHEDULE OF INVESTMENTS (Unaudited)(concluded) | March 31, 2016 |
CAPITAL STEWARDSHIP FUND | |
| | | Shares | | | Value | |
| | | | | | | |
First Solar, Inc.* | | | 23,633 | | | $ | 1,618,152 | |
Schlumberger Ltd. | | | 14,718 | | | | 1,085,452 | |
Spectra Energy Corp. | | | 28,591 | | | | 874,885 | |
Devon Energy Corp. | | | 24,821 | | | | 681,088 | |
Hess Corp. | | | 12,591 | | | | 662,916 | |
Valero Energy Corp. | | | 10,126 | | | | 649,482 | |
Oceaneering International, Inc. | | | 19,232 | | | | 639,272 | |
EOG Resources, Inc. | | | 8,752 | | | | 635,220 | |
Anadarko Petroleum Corp. | | | 13,313 | | | | 619,986 | |
FMC Technologies, Inc.* | | | 22,539 | | | | 616,667 | |
Phillips 66 | | | 6,868 | | | | 594,700 | |
ConocoPhillips | | | 14,503 | | | | 584,036 | |
Total Energy | | | | | | | 15,312,349 | |
| | | | | | | | | |
Basic Materials - 1.6% | |
International Paper Co. | | | 30,860 | | | | 1,266,494 | |
Westlake Chemical Corp. | | | 17,573 | | | | 813,631 | |
Mosaic Co. | | | 23,070 | | | | 622,890 | |
Dow Chemical Co. | | | 12,062 | | | | 613,473 | |
Total Basic Materials | | | | | | | 3,316,488 | |
| | | | | | | | | |
Utilities - 0.7% | |
Entergy Corp. | | | 10,890 | | | | 863,359 | |
Southern Co. | | | 12,383 | | | | 640,573 | |
Total Utilities | | | | | | | 1,503,932 | |
| | | | | | | | | |
Total Common Stocks | | | | | | | | |
(Cost $199,224,869) | | | | | | | 205,906,090 | |
| | | | | | | | | |
SHORT TERM INVESTMENTS† - 0.5% | |
Dreyfus Treasury Prime Cash Management Institutional Shares 0.00%1 | | | 976,109 | | | | 976,109 | |
Total Short Term Investments | | | | | | | | |
(Cost $976,109) | | | | | | | 976,109 | |
| | | | | | | | | |
Total Investments - 100.3% | | | | | | | | |
(Cost $200,200,978) | | | | | | $ | 206,882,199 | |
Other Assets & Liabilities, net - (0.3)% | | | | | | | (561,857 | ) |
Total Net Assets - 100.0% | | | | | | $ | 206,320,342 | |
* | Non-income producing security. |
† | Value determined based on Level 1 inputs — See Note 3. |
1 | Rate indicated is the 7 day yield as of March 31, 2016. |
| | plc — Public Limited Company |
| | |
| | See Sector Classification in Other Information section. |
The following table summarizes the inputs used to value the Fund’s investments at March 31, 2016 (See Note 3 in the Notes to Financial Statements):
Investments in Securities (Assets) | | Level 1 | | | Level 2 | | | Level 3 | | | Total | |
Common Stocks | | $ | 205,906,090 | | | $ | — | | | $ | — | | | $ | 205,906,090 | |
Short Term Investments | | | 976,109 | | | | — | | | | — | | | | 976,109 | |
Total | | $ | 206,882,199 | | | $ | — | | | $ | — | | | $ | 206,882,199 | |
For the period ended March 31, 2016, there were no transfers between levels.
SEE NOTES TO FINANCIAL STATEMENTS. | THE GUGGENHEIM FUNDS SEMI-ANNUAL REPORT | 9 |
STATEMENT OF ASSETS AND LIABILITIES (Unaudited) |
March 31, 2016 |
Assets: | |
Investments, at value (cost $200,200,978) | | $ | 206,882,199 | |
Prepaid expenses | | | 2,244 | |
Cash | | | 12 | |
Receivables: | |
Dividends | | | 183,957 | |
Total assets | | | 207,068,412 | |
| | | | | |
Liabilities: | |
Payable for: | |
Fund shares redeemed | | | 512,464 | |
Management fees | | | 154,524 | |
Fund accounting/administration fees | | | 16,311 | |
Trustees’ fees* | | | 13,721 | |
Transfer agent/maintenance fees | | | 2,899 | |
Miscellaneous | | | 48,151 | |
Total liabilities | | | 748,070 | |
Net assets | | $ | 206,320,342 | |
| | | | | |
Net assets consist of: | |
Paid in capital | | $ | 202,582,202 | |
Undistributed net investment income | | | 726,263 | |
Accumulated net realized loss on investments | | | (3,669,344 | ) |
Net unrealized appreciation on investments | | | 6,681,221 | |
Net assets | | $ | 206,320,342 | |
Capital shares outstanding | | | 8,089,074 | |
Net asset value per share | | $ | 25.51 | |
STATEMENT OF OPERATIONS (Unaudited) |
Period Ended March 31, 2016 |
Investment Income: | |
Dividends | | $ | 2,462,501 | |
Interest | | | 94 | |
Total investment income | | | 2,462,595 | |
| | | | | |
Expenses: | |
Management fees | | | 895,562 | |
Transfer agent/maintenance fees | | | 12,673 | |
Fund accounting/administration fees | | | 94,530 | |
Trustees’ fees* | | | 7,605 | |
Custodian fees | | | 7,323 | |
Miscellaneous | | | 58,780 | |
Total expenses | | | 1,076,473 | |
Net investment income | | | 1,386,122 | |
| | | | | |
Net Realized and Unrealized Gain (Loss): | |
Net realized gain (loss) on: | |
Investments | | | (598,805 | ) |
Net realized loss | | | (598,805 | ) |
Net change in unrealized appreciation (depreciation) on: | |
Investments | | | 19,491,888 | |
Net change in unrealized appreciation (depreciation) | | | 19,491,888 | |
Net realized and unrealized gain | | | 18,893,083 | |
Net increase in net assets resulting from operations | | $ | 20,279,205 | |
* | Relates to Trustees not deemed “interested persons” within the meaning of Section 2(a)(19) of the 1940 Act. |
10 | THE GUGGENHEIM FUNDS SEMI-ANNUAL REPORT | SEE NOTES TO FINANCIAL STATEMENTS. |
STATEMENTS OF CHANGES IN NET ASSETS |
| | | Period Ended
March 31,
2016
(Unaudited) | | | Year Ended
September 30,
2015 | |
Increase (Decrease) in Net Assets from Operations: | | | | | | |
Net investment income | | $ | 1,386,122 | | | $ | 2,559,178 | |
Net realized gain (loss) on investments | | | (598,805 | ) | | | 506,679 | |
Net change in unrealized appreciation (depreciation) on investments | | | 19,491,888 | | | | (11,027,250 | ) |
Net increase (decrease) in net assets resulting from operations | | | 20,279,205 | | | | (7,961,393 | ) |
| | | | | | | | | |
Distributions to shareholders from: | | | | | | | | |
Net investment income | | | (2,583,368 | ) | | | (637,133 | ) |
Net realized gains | | | (3,078,358 | ) | | | — | |
Total distributions to shareholders | | | (5,661,726 | ) | | | (637,133 | ) |
| | | | | | | | | |
Capital share transactions: | | | | | | | | |
Proceeds from sale of shares | | | 40,409,661 | | | | 38,908,526 | |
Distributions reinvested | | | 5,389,571 | | | | 476,495 | |
Cost of shares redeemed | | | (43,764,564 | ) | | | (50,132,804 | ) |
Net increase (decrease) from capital share transactions | | | 2,034,668 | | | | (10,747,783 | ) |
Net increase (decrease) in net assets | | | 16,652,147 | | | | (19,346,309 | ) |
| | | | | | | | | |
Net assets: | | | | | | | | |
Beginning of period | | | 189,668,195 | | | | 209,014,504 | |
End of period | | $ | 206,320,342 | | | $ | 189,668,195 | |
Undistributed net investment income at end of period | | $ | 726,263 | | | $ | 1,923,509 | |
| | | | | | | | | |
Capital share activity: | | | | | | | | |
Shares sold | | | 1,615,108 | | | | 1,485,730 | |
Shares issued from reinvestment of distributions | | | 218,644 | | | | 18,671 | |
Shares redeemed | | | (1,750,725 | ) | | | (1,929,837 | ) |
Net increase (decrease) in shares | | | 83,027 | | | | (425,436 | ) |
SEE NOTES TO FINANCIAL STATEMENTS. | THE GUGGENHEIM FUNDS SEMI-ANNUAL REPORT | 11 |
This table is presented to show selected data for a share outstanding throughout each period and to assist shareholders in evaluating a Fund’s performance for the periods presented.
Institutional Class | | Period Ended
March 31,
2016a | | | Year Ended
September 30,
2015 | | | Period Ended
September 30,
2014b | |
Per Share Data | | | | | | | | | |
Net asset value, beginning of period | | $ | 23.69 | | | $ | 24.79 | | | $ | 25.00 | |
Income (loss) from investment operations: | |
Net investment income (loss)c | | | .17 | | | | .31 | | | | — | d |
Net gain (loss) on investments (realized and unrealized) | | | 2.36 | | | | (1.33 | ) | | | (.21 | ) |
Total from investment operations | | | 2.53 | | | | (1.02 | ) | | | (.21 | ) |
Less distributions from: | |
Net investment income | | | (.32 | ) | | | (.08 | ) | | | — | |
Net realized gains | | | (.39 | ) | | | — | | | | — | |
Total distributions | | | (.71 | ) | | | (.08 | ) | | | — | |
Net asset value, end of period | | $ | 25.51 | | | $ | 23.69 | | | $ | 24.79 | |
| | |
Total Return f | | | 10.78 | % | | | (4.15 | %) | | | (0.84 | %) |
Ratios/Supplemental Data | |
Net assets, end of period (in thousands) | | $ | 206,320 | | | $ | 189,668 | | | $ | 209,015 | |
Ratios to average net assets: | |
Net investment income (loss) | | | 1.40 | % | | | 1.22 | % | | | 0.13 | % |
Total expensese | | | 1.08 | % | | | 1.15 | % | | | 1.24 | % |
Portfolio turnover rate | | | 104 | % | | | 221 | % | | | — | |
a | Unaudited figures for the period ended March 31, 2016. Percentage amounts for the period, except total return and portfolio turnover rate, have been annualized. |
b | Since commencement of operations: September 26, 2014. Percentage amounts for the period, except total return and portfolio turnover rate, have been annualized. |
c | Net investment income (loss) per share was computed using average shares outstanding throughout the period. |
d | Net investment income is less than $0.01 per share. |
e | Does not include expenses of the underlying funds in which the Fund invests. |
f | Total Return does not reflect the impact of any applicable sales charge and has not been annualized. |
12 | THE GUGGENHEIM FUNDS SEMI-ANNUAL REPORT | SEE NOTES TO FINANCIAL STATEMENTS. |
NOTES TO FINANCIAL STATEMENTS (Unaudited) |
1. Organization and Significant Accounting Policies
Organization
Guggenheim Funds Trust (the “Trust”), a Delaware statutory trust, is registered with the SEC under the Investment Company Act of 1940 (“1940 Act”), as an open-ended investment company of the series type. Each series, in effect, is representing a separate Fund. The Trust is authorized to issue an unlimited number of shares. The Trust accounts for the assets of each Fund separately.
The Trust offers a combination of four separate classes of shares, A-Class shares, C-Class shares, P-Class shares and Institutional Class shares. Sales of shares of each Class are made without a front-end sales charge at the net asset value per share (“NAV”), with the exception of A-Class shares. A-Class shares are sold at the NAV, plus the applicable front-end sales charge. The sales charge varies depending on the amount purchased. A-Class share purchases of $1 million or more are exempt from the front-end sales charge but have a 1% contingent deferred sales charge (“CDSC”), if shares are redeemed within 12 months of purchase. C-Class shares have a 1% CDSC if shares are redeemed within 12 months of purchase. Institutional Class shares are offered primarily for direct investment by institutions such as pension and profit sharing plans, endowments, foundations and corporations. Institutional Class shares require a minimum initial investment of $2 million and a minimum account balance of $1 million. Institutional Class shares are offered without a front-end sales charge or a CDSC. At March 31, 2016, the Trust consisted of nineteen funds (the “Funds”).
This report covers the Guggenheim Capital Stewardship Fund (the “Fund”), a diversified investment company. As of March 31, 2016, only Institutional Class shares of the Fund were offered for subscription.
Guggenheim Investments (“GI”) provides advisory services, and Rydex Fund Services, LLC (“RFS”) provides transfer agent, administrative and accounting services to the Trust. Guggenheim Funds Distributors, LLC (“GFD”) acts as principal underwriter for the Trust. GI, RFS and GFD are affiliated entities.
Concinnity Advisors, LP (the “Sub-Adviser”) serves as the sub-adviser to the Fund and is responsible for the day-to-day management of the Fund’s portfolio.
Significant Accounting Policies
The Fund operates as an investment company and accordingly follows the investment company accounting and reporting guidance of the Financial Accounting Standards Board (“FASB”) Accounting Standards Codification Topic 946 Financial Services – Investment Companies.
The following significant accounting policies are in conformity with U.S. generally accepted accounting principles (“U.S. GAAP”) and are consistently followed by the Trust. This requires management to make estimates and assumptions that affect the reported amount of assets and liabilities and disclosure of contingent assets and liabilities at the date of the financial statements and the reported amounts of revenues and expenses during the reporting period. Actual results could differ from these estimates. All time references are based on Eastern Time.
The NAV of the Fund is calculated by dividing the market value of the Fund’s securities and other assets, less all liabilities, attributable to the Class by the number of outstanding shares of the Fund.
A. The Board of Trustees of the Fund (the “Board”) has adopted policies and procedures for the valuation of the Fund’s investments (the “Valuation Procedures”). Pursuant to the Valuation Procedures, the Board has delegated to a valuation committee, consisting of representatives from Guggenheim’s investment management, fund administration, legal and compliance departments (the “Valuation Committee”), the day-to-day responsibility for implementing the Valuation Procedures, including, under most circumstances, the responsibility for determining the fair value of the Fund’s securities or other assets.
Valuations of the Fund’s securities are supplied primarily by pricing services appointed pursuant to the processes set forth in the Valuation Procedures. The Valuation Committee convenes monthly, or more frequently as needed, and will review the valuation of all assets which have been fair valued for reasonableness. The Fund’s officers, through the Valuation Committee and consistent with the monitoring and review responsibilities set forth in the Valuation Procedures, regularly review procedures used by, and valuations provided by, the pricing services.
If the pricing service cannot or does not provide a valuation for a particular investment or such valuation is deemed unreliable, such investment is fair valued by the Valuation Committee.
| | THE GUGGENHEIM FUNDS SEMI-ANNUAL REPORT | 13 |
NOTES TO FINANCIAL STATEMENTS (Unaudited)(continued) |
Equity securities listed on an exchange (New York Stock Exchange (“NYSE”) or American Stock Exchange) are valued at the last quoted sales price as of the close of business on the NYSE, usually 4:00 p.m. on the valuation date. Equity securities listed on the NASDAQ market system are valued at the NASDAQ Official Closing Price on the valuation date, which may not necessarily represent the last sale price. If there has been no sale on such exchange or NASDAQ on a given day, the security is valued at the closing bid price on that day.
Open-end investment companies (“Mutual Funds”) are valued at their NAV as of the close of business, on the valuation date.
Investments for which market quotations are not readily available are fair valued as determined in good faith by GI under the direction of the Board of Trustees using methods established or ratified by the Board of Trustees. Valuations in accordance with these methods are intended to reflect each security’s (or asset’s) “fair value.” Each such determination is based on a consideration of all relevant factors, which are likely to vary from one pricing context to another. Examples of such factors may include, but are not limited to: (i) the type of security, (ii) the initial cost of the security, (iii) the existence of any contractual restrictions on the security’s disposition, (iv) the price and extent of public trading in similar securities of the issuer or of comparable companies, (v) quotations or evaluated prices from broker-dealers and/or pricing services, (vi) information obtained from the issuer, analysts, and/or the appropriate stock exchange (for exchange-traded securities), (vii) an analysis of the company’s financial statements, and (viii) an evaluation of the forces that influence the issuer and the market(s) in which the security is purchased and sold (e.g. the existence of pending merger activity, public offerings or tender offers that might affect the value of the security).
B. Security transactions are recorded on the trade date for financial reporting purposes. Realized gains and losses from securities transactions are recorded using the identified cost basis. Proceeds from lawsuits related to investment holdings are recorded as realized gains in the Fund. Dividend income is recorded on the ex-dividend date, net of applicable taxes withheld by foreign countries. Taxable non-cash dividends are recorded as dividend income. Interest income, including amortization of premiums and accretion of discounts, is accrued on a daily basis. Dividend income from REITs is recorded based on the income included in the distributions received from the REIT investments using published REIT classifications, including some management estimates when actual amounts are not available. Distributions received in excess of this estimated amount are recorded as a reduction of the cost of investments or reclassified to capital gains. The actual amounts of income, return of capital, and capital gains are only determined by each REIT after its fiscal year-end, and may differ from the estimated amounts.
C. Distributions of net investment income and net realized gains, if any, are declared and paid at least annually. Dividends are reinvested in additional shares unless shareholders request payment in cash. Distributions are recorded on the ex-dividend date and are determined in accordance with income tax regulations which may differ from U.S. GAAP.
D. Certain expenses have been allocated to the individual Funds in the Trust on a pro rata basis upon the respective aggregate net assets of each Fund included in the Trust.
E. Under the fee arrangement with the custodian, the Fund may earn credits based on overnight custody cash balances. These credits are utilized to reduce related custodial expenses. The custodian fees disclosed in the Statement of Operations are before the reduction in expense from the related earnings credits, if any. For the period ended March 31, 2016, there were no earnings credits received.
The Fund may leave cash overnight in its cash account with the custodian. Periodically, the Fund may have cash due to the custodian bank as an overdraft balance. A fee is incurred on this overdraft, calculated by multiplying the overdraft by a rate based on the federal funds rate, which was 0.25% at March 31, 2016.
F. Under the Fund’s organizational documents, its Trustees and Officers are indemnified against certain liabilities arising out of the performance of their duties to the Trust. In addition, throughout the normal course of business, the Fund enters into contracts that contain a variety of representations and warranties which provide general indemnifications. The Fund’s maximum exposure under these arrangements is unknown, as this would involve future claims that may be made against the Fund and/or its affiliates that have not yet occurred. However, based on experience, the Fund expects the risk of loss to be remote.
14 | THE GUGGENHEIM FUNDS SEMI-ANNUAL REPORT | |
NOTES TO FINANCIAL STATEMENTS (Unaudited)(continued) |
2. Fees and Other Transactions with Affiliates
Under the terms of an investment advisory contract, the Fund pays GI investment advisory fees calculated at an annualized rate of 0.90% of the average daily net assets of the Fund.
RFS is paid the following for providing transfer agent services to the Fund. Transfer agent fees are assessed to the applicable class of the Fund.
Annual charge per account | $5.00 – $8.00 |
Transaction fee | $0.60 – $1.10 |
Minimum annual charge per Fund† | $25,000 |
Certain out-of-pocket charges | Varies |
† | Not subject to Fund during first twelve months of operations. |
RFS also acts as the administrative agent for the Fund, and as such performs administrative functions and the bookkeeping, accounting and pricing functions for the Fund. For these services, RFS receives 0.095% of the average daily net assets of the Fund. The minimum annual charge for administrative fees is $25,000.
RFS engages external service providers to perform other necessary services for the Trust, such as audit and accounting related services, legal services, custody, printing and mailing, etc., on a pass-through basis. Such expenses are allocated to various Funds within the complex based on relative net assets.
Certain trustees and officers of the Trust are also officers of GI, RFS and GFD.
3. Fair Value Measurement
In accordance with U.S. GAAP, fair value is defined as the price that the Fund would receive to sell an investment or pay to transfer a liability in an orderly transaction with an independent buyer in the principal market, or in the absence of a principal market, the most advantageous market for the investment or liability. U.S. GAAP establishes a three-tier fair value hierarchy based on the types of inputs used to value assets and liabilities and requires corresponding disclosure. The hierarchy and the corresponding inputs are summarized below:
| Level 1 — | quoted prices in active markets for identical assets or liabilities. |
| Level 2 — | significant other observable inputs (for example quoted prices for securities that are similar based on characteristics such as interest rates, prepayment speeds, credit risk, etc.). |
| Level 3 — | significant unobservable inputs based on the best information available under the circumstances, to the extent observable inputs are not available, which may include assumptions. |
The types of inputs available depend on a variety of factors, such as the type of security and the characteristics of the markets in which it trades, if any. Fair valuation determinations that rely on fewer or no observable inputs require greater judgement. Accordingly, fair value determinations for Level 3 securities require the greatest amount of judgement.
The inputs or methodologies used for valuing securities are not necessarily an indication of the risk associated with investing in those securities. The suitability of the techniques and sources employed to determine fair valuation are regularly monitored and subject to change.
4. Federal Income Tax Information
The Fund intends to comply with the provisions of Subchapter M of the Internal Revenue Code applicable to regulated investment companies and will distribute substantially all taxable net investment income and capital gains sufficient to relieve the Fund from all, or substantially all, federal income, excise and state income taxes. Therefore, no provision for federal or state income tax is required.
Tax positions taken or expected to be taken in the course of preparing the Fund’s tax returns are evaluated to determine whether the tax positions are “more-likely-than-not” of being sustained by the applicable tax authority. Tax positions not deemed to meet the more-likely-than-not threshold would be recorded as a tax benefit or expense in the current year. Management has analyzed the Fund’s tax positions taken, or to be taken, on Federal income tax returns for all open tax years, and has concluded that no provision for income tax is required in the Fund’s financial statements. The Fund’s federal tax returns are subject to examination by the Internal Revenue Service for a period of three years after they are filed.
| | THE GUGGENHEIM FUNDS SEMI-ANNUAL REPORT | 15 |
NOTES TO FINANCIAL STATEMENTS (Unaudited)(concluded) |
At March 31, 2016, the cost of securities for Federal income tax purposes, the aggregate gross unrealized gain for all securities for which there was an excess of value over tax cost and the aggregate gross unrealized loss for all securities for which there was an excess of tax cost over value, were as follows:
Fund | | Tax
Cost | | | Tax
Unrealized
Gain | �� | | Tax
Unrealized
Loss | | | Net
Unrealized
Gain | |
Capital Stewardship Fund | | $ | 201,357,464 | | | $ | 11,375,049 | | | $ | (5,850,314 | ) | | $ | 5,524,735 | |
5. Securities Transactions
For the period ended March 31, 2016, the cost of purchases and proceeds from sales of investment securities, excluding government securities, short-term investments and derivatives, were as follows:
Fund | | Purchases | | | Sales | |
Capital Stewardship Fund | | $ | 206,161,701 | | | $ | 208,686,616 | |
The Funds are permitted to purchase or sell securities from or to certain affiliated funds under specified conditions outlined in procedures adopted by the Board of Trustees of the Trust. The procedures have been designed to ensure that any purchase or sale of securities by a Fund from or to another fund or portfolio that is or could be considered an affiliate by virtue of having a common investment adviser (or affiliated investment advisers), common Trustees and/or common officers complies with Rule 17a-7 of the 1940 Act. Further, as defined under these procedures, each transaction is effected at the current market price to save costs, where permissible. For the period ended March 31, 2016, the Fund did not engage in purchases and sales of securities, pursuant to Rule 17a-7 of the 1940 Act.
16 | THE GUGGENHEIM FUNDS SEMI-ANNUAL REPORT | |
OTHER INFORMATION (Unaudited) |
Proxy Voting Information
A description of the policies and procedures that the Trust uses to determine how to vote proxies relating to securities held in the Funds’ portfolios is available, without charge and upon request, by calling 800.820.0888. This information is also available from the EDGAR database on the SEC’s website at http://www.sec.gov.
Information regarding how the Funds voted proxies relating to portfolio securities during the most recent 12-month period ended June 30 is available without charge, upon request, by calling 800.820.0888. This information is also available from the EDGAR database on the SEC’s website at http://www.sec.gov.
Sector Classification
Information in the “Schedule of Investments” is categorized by sectors using sector-level Classifications defined by the Bloomberg Industry Classification System, a widely recognized industry classification system provider. Each Fund’s registration statement has investment policies relating to concentration in specific sectors/industries. For purposes of these investment policies, the Funds usually classify sectors/industries based on industry-level Classifications used by widely recognized industry classification system providers such as Bloomberg Industry Classification System, Global Industry Classification Standards and Barclays Global Classification Scheme.
Quarterly Portfolio Schedules Information
The Trust files its complete schedule of portfolio holdings with the SEC for the first and third quarters of each fiscal year on Form N-Q; which are available on the SEC’s website at http://www.sec.gov. The Funds’ Forms N-Q may be reviewed and copied at the SEC’s Public Reference Room in Washington, DC, and that information on the operation of the Public Reference Room may be obtained by calling 800-SEC-0330. Copies of the portfolio holdings are also available to shareholders, without charge and upon request, by calling 800.820.0888.
| | THE GUGGENHEIM FUNDS SEMI-ANNUAL REPORT | 17 |
INFORMATION ON BOARD OF TRUSTEES AND OFFICERS (Unaudited) |
A Board of Trustees oversees the Trust, as well as other trusts of GI, in which its members have no stated term of service, and continue to serve after election until resignation. The Statement of Additional Information includes further information about Fund Trustees and Officers, and can be obtained without charge by visiting guggenheiminvestments.com or by calling 800.820.0888.
Name, Address* and Year of Birth | Position(s)
Held with
the Trust | Term of Office and Length of Time Served** | Principal Occupation(s) During Past Five Years | Number of Portfolios in Fund Complex Overseen | Other
Directorships
Held by Trustees |
INDEPENDENT TRUSTEES | | | |
Randall C. Barnes
(1951) | Trustee | Since 2014 | Current: Private Investor (2001-present).
Former: Senior Vice President and Treasurer, PepsiCo, Inc. (1993-1997); President, Pizza Hut International (1991-1993); Senior Vice President, Strategic Planning and New Business Development, PepsiCo, Inc. (1987-1990). | 105 | Current: Trustee, Purpose Investments Inc. (2014-Present). |
Donald A. Chubb, Jr.
(1946 ) | Trustee | Since 1994 | Current: Business broker and manager of commercial real estate, Griffith & Blair, Inc. (1997-present). | 101 | Current: Midland Care, Inc. (2011-present). |
Jerry B. Farley
(1946) | Trustee | Since 2005 | Current: President, Washburn University (1997-present). | 101 | Current: Westar Energy, Inc. (2004-present); CoreFirst Bank & Trust (2000-present). |
Roman Friedrich III
(1946) | Trustee and Chairman of the Contracts Review Committee | Since 2014 | Current: Founder and Managing Partner, Roman Friedrich & Company (1998-present).
Former: Senior Managing Director, MLV & Co. LLC (2010-2011). | 101 | Current: Zincore Metals, Inc. (2009-present).
Former: Axiom Gold and Silver Corp. (2011-2012). |
Robert B. Karn III
(1942) | Trustee and Chairman of the Audit Committee | Since 2014 | Current: Consultant (1998-present).
Former: Arthur Andersen (1965-1997) and Managing Partner, Financial and Economic Consulting, St. Louis office (1987-1997). | 101 | Current: Peabody Energy Company (2003-present); GP Natural Resource Partners, LLC (2002- present). |
Ronald A. Nyberg
(1953) | Trustee and Chairman of the Nominating and Governance Committee | Since 2014 | Current: Partner, Nyberg & Cassioppi, LLC (2000-present).
Former: Executive Vice President, General Counsel, and Corporate Secretary, Van Kampen Investments (1982-1999). | 107 | Current: Edward-Elmhurst Healthcare System (2012-present). |
18 | THE GUGGENHEIM FUNDS SEMI-ANNUAL REPORT | |
INFORMATION ON BOARD OF TRUSTEES AND OFFICERS (Unaudited)(continued) |
Name, Address* and Year of Birth | Position(s)
Held with
the Trust | Term of Office and Length of Time Served** | Principal Occupation(s) During Past Five Years | Number of Portfolios in Fund Complex Overseen | Other
Directorships Held by Trustees |
INDEPENDENT TRUSTEES - continued | | |
Maynard F. Oliverius
(1943) | Trustee | Since 1998 | Current: Retired.
Former: President and CEO, Stormont-Vail HealthCare (1996-2012). | 101 | Current: Fort Hays State University Foundation (1999-present); Stormont-Vail Foundation (2013-present); University of Minnesota HealthCare Alumni Association Foundation (2009-present). |
Ronald E. Toupin, Jr.
(1958) | Trustee and Chairman of the Board | Since 2014 | Current: Portfolio Consultant (2010-present).
Former: Vice President, Manager and Portfolio Manager, Nuveen Asset Management (1998-1999); Vice President, Nuveen Investment Advisory Corp. (1992-1999); Vice President and Manager, Nuveen Unit Investment Trusts (1991-1999); and Assistant Vice President and Portfolio Manager, Nuveen Unit Investment Trusts (1988-1999), each of John Nuveen & Co., Inc. (1982-1999). | 104 | Former: Bennett Group of Funds (2011-2013). |
INTERESTED TRUSTEE | |
Donald C. Cacciapaglia***
(1951) | President, Chief Executive Officer and Trustee | Since 2012 | Current: President and CEO, certain other funds in the Fund Complex (2012-present); Vice Chairman, Guggenheim Investments (2010-present).
Former: Chairman and CEO, Channel Capital Group, Inc. (2002-2010). | 236 | Current: Clear Spring Life Insurance Company (2015-present); Guggenheim Partners Japan, Ltd. (2014-present); Delaware Life (2013-present); Guggenheim Life and Annuity Company (2011-present); Paragon Life Insurance Company of Indiana (2011-present). |
* | The business address of each Trustee is c/o Guggenheim Investments, 805 King Farm Boulevard, Suite 600, Rockville, Maryland 20850. |
** | Each Trustee serves an indefinite term, until his successor is elected and qualified. Time served includes time served in the respective position for the Predecessor Corporation. |
*** | This Trustee is deemed to be an "interested person" of the Funds under the 1940 Act by reason of his position with the Funds' Investment Manager and/or the parent of the Investment Manager. |
| | THE GUGGENHEIM FUNDS SEMI-ANNUAL REPORT | 19 |
INFORMATION ON BOARD OF TRUSTEES AND OFFICERS (Unaudited)(continued) |
Name, Address* and Year of Birth | Position(s)
Held with
the Trust | Term of Office and Length of Time Served** | Principal Occupations
During Past Five Years |
OFFICERS | | | |
Joseph M. Arruda
(1966) | Assistant Treasurer | Since 2010 | Current: Assistant Treasurer, certain other funds in the Fund Complex (2006-present); Vice President, Security Investors, LLC (2010-present); CFO and Manager, Guggenheim Specialized Products, LLC (2009-present).
Former: Vice President, Security Global Investors, LLC (2010-2011); Vice President, Rydex Advisors, LLC (2010); Vice President, Rydex Advisors II, LLC (2010). |
William H. Belden, III
(1965) | Vice President | Since 2014 | Current: Vice President, certain other funds in the Fund Complex (2006-present); Managing Director, Guggenheim Funds Investment Advisors, LLC (2005-present).
Former: Vice President of Management, Northern Trust Global Investments (1999-2005). |
James Howley
(1972) | Assistant Treasurer | Since 2014 | Current: Director, Guggenheim Investments (2004-present) ; Assistant Treasurer, certain other funds in the Fund Complex (2006-present).
Former: Manager, Mutual Fund Administration of Van Kampen Investments, Inc. (1996-2004). |
Amy J. Lee
(1961) | Vice President and Chief Legal Officer | Since 2007 (Vice President) Since 2014 (Chief Legal Officer) | Current: Chief Legal Officer, certain other funds in the Fund Complex (2013-present); Senior Managing Director, Guggenheim Investments (2012-present).
Former: Vice President, Associate General Counsel and Assistant Secretary, Security Benefit Life Insurance Company and Security Benefit Corporation (2004-2012). |
Mark E. Mathiasen
(1978) | Secretary | Since 2014 | Current: Secretary, certain other funds in the Fund Complex (2007-present); Managing Director, Guggenheim Investments (2007-present). |
Michael P. Megaris
(1984) | Assistant Secretary | Since 2014 | Current: Assistant Secretary, certain other funds in the Fund Complex (2014-present); Senior Associate, Guggenheim Investments (2012-present).
Former: J.D., University of Kansas School of Law (2009-2012). |
Elisabeth Miller
(1968) | Chief Compliance Officer | Since 2012 | Current: CCO, certain other funds in the Fund Complex (2012-present); CCO, Security Investors, LLC (2012-present); CCO, Guggenheim Funds Investment Advisors, LLC (2012-present); Managing Director, Guggenheim Investments (2012-present); Vice President, Guggenheim Funds Distributors, LLC (March 2014-present).
Former: CCO, Guggenheim Distributors, LLC (2009-March 2014); Senior Manager, Security Investors, LLC (2004-2009); Senior Manager, Guggenheim Distributors, LLC (2004-2009). |
Adam Nelson
(1979) | Assistant Treasurer | Since 2015 | Current: Vice President, Guggenheim Investments (2015-present); Assistant Treasurer, certain other funds in the Fund Complex (2015-present).
Former: Assistant Vice President and Fund Administration Director, State Street Corporation (2013-2015); Fund Administration Assistant Director, State Street (2011-2013); Fund Administration Manager, State Street (2009-2011). |
20 | THE GUGGENHEIM FUNDS SEMI-ANNUAL REPORT | |
INFORMATION ON BOARD OF TRUSTEES AND OFFICERS (Unaudited)(concluded) |
Name, Address* and Year of Birth | Position(s) Held with the Trust | Term of Office and Length of Time Served** | Principal Occupations
During Past Five Years |
OFFICERS - continued | |
Alison Santay
(1974) | AML Officer | Since 2013 | Current: AML Officer, certain other funds in the Fund Complex (2010-present); Director and AML Officer, Rydex Fund Services, LLC (2010-present); AML Officer, Security Investors, LLC (2010-present); Director, Shareholder Risk and Compliance, Rydex Fund Services, LLC (2004-present).
Former: AML Officer, Guggenheim Distributors, LLC (2013-2014). |
Kimberly Scott
(1974) | Assistant Treasurer | Since 2014 | Current: Vice President, Guggenheim Investments (2012-present) ; Assistant Treasurer, certain other funds in the Fund Complex (2012-present).
Former: Financial Reporting Manager, Invesco, Ltd. (2010-2011); Vice President/Assistant Treasurer, Mutual Fund Administration for Van Kampen Investments, Inc./Morgan Stanley Investment Management (2009-2010); Manager of Mutual Fund Administration, Van Kampen Investments, Inc./Morgan Stanley Investment Management (2005-2009). |
Bryan Stone
(1979) | Vice President | Since 2014 | Current: Vice President, certain other funds in the Fund Complex (2014-present); Director, Guggenheim Investments (2013-present).
Former: Senior Vice President, Neuberger Berman Group LLC (2009-2013); Vice President, Morgan Stanley (2002-2009). |
John L. Sullivan
(1955) | Chief Financial Officer and Treasurer | Since 2014 | Current: CFO, Chief Accounting Officer and Treasurer, certain other funds in the Fund Complex (2010-present); Senior Managing Director, Guggenheim Investments (2010-present).
Former: Managing Director and CCO, each of the funds in the Van Kampen Investments fund complex (2004-2010); Managing Director and Head of Fund Accounting and Administration, Morgan Stanley Investment Management (2002-2004); CFO and Treasurer, Van Kampen Funds (1996-2004). |
* | The business address of each officer is c/o Guggenheim Investments, 805 King Farm Boulevard, Suite 600, Rockville, Maryland 20850. |
** | Each officer serves an indefinite term, until his or her successor is duly elected and qualified. Time served includes time served in the respective position for the Predecessor Corporation. |
| | THE GUGGENHEIM FUNDS SEMI-ANNUAL REPORT | 21 |
GUGGENHEIM INVESTMENTS PRIVACY POLICIES (Unaudited) |
Rydex Funds, Guggenheim Funds, Rydex Investments, Guggenheim Funds Distributors, LLC, Security Investors, LLC, Security Distributors, Inc., Guggenheim Partners Investment Managers, LLC, and Rydex Advisory Services (Collectively “Guggenheim Investments”).
Our Commitment to You
When you become a Guggenheim Investments investor, you entrust us with not only your hard-earned money but also with personal and financial information about you. We recognize that your relationship with us is based on trust and that you expect us to act responsibly and in your best interests. Because we have access to this private information about you, we hold ourselves to the highest standards in its safekeeping and use. This means, most importantly, that we do not sell client information to anyone—whether it is your personal information or if you are a current or former Guggenheim Investments client.
The Information We Collect About You
In the course of doing business with shareholders and investors, we collect nonpublic personal information about you. You typically provide personal information when you complete a Guggenheim Investments account application or when you request a transaction that involves Rydex and Guggenheim Investments funds or one of the Guggenheim Investments affiliated companies. “Nonpublic personal information” is personally identifiable private information about you. For example, it includes information regarding your name and address, Social Security or taxpayer identification number, assets, income, account balance, bank account information and investment activity (e.g., purchase and redemption history).
How We Handle Your Personal Information
As emphasized above, we do not sell information about current or former clients or their accounts to third parties. Nor do we share such information, except when necessary to complete transactions at your request or to make you aware of related investment products and services that we offer. Additional details about how we handle your personal information are provided below. To complete certain transactions or account changes that you direct, it may be necessary to provide identifying information to companies, individuals or groups that are not affiliated with Guggenheim Investments. For example, if you ask to transfer assets from another financial institution to Guggenheim Investments, we will need to provide certain information about you to that company to complete the transaction. To alert you to other Guggenheim Investments investment products and services, we may share your information within the Guggenheim Investments family of affiliated companies. This would include, for example, sharing your information within Guggenheim Investments so we can make you aware of new Rydex and Guggenheim Investments funds or the services offered through another Guggenheim Investments affiliated company. In certain instances, we may contract with nonaffiliated companies to perform services for us. Where necessary, we will disclose information we have about you to these third parties. In all such cases, we provide the third party with only the information necessary to carry out its assigned responsibilities and only for that purpose. And we require these third parties to treat your private information with the same high degree of confidentiality that we do. In certain instances, we may share information with other financial institutions regarding individuals and entities in response to the U.S.A. Patriot Act. Finally, we will release information about you if you direct us to do so, if we are compelled by law to do so or in other circumstances permitted by law.
Opt Out Provisions
We do not sell your personal information to anyone. The law allows you to “opt out” of only certain kinds of information sharing with third parties. The firm does not share personal information about you with any third parties that triggers this opt-out right. This means YOU ARE ALREADY OPTED OUT.
22 | THE GUGGENHEIM FUNDS SEMI-ANNUAL REPORT | |
GUGGENHEIM INVESTMENTS PRIVACY POLICIES (Unaudited)(concluded) |
How We Protect Privacy Online
Our concern for the privacy of our shareholders also extends to those who use our web site, guggenheiminvestments.com. Our web site uses some of the most secure forms of online communication available, including encryption technology, Secure Socket Layer (SSL) protocol, firewalls and user names and passwords. These technologies provide a high level of security and privacy when you access your account information or initiate online transactions. The Guggenheim Investments web site offers customized features that require our use of “http cookies”—tiny pieces of information that we ask your browser to store. However, we make very limited use of these cookies. We only use cookies for session management and security features on the Guggenheim Investments web site. We do not use them to pull data from your hard drive, to learn your email address, or to view data in cookies created by other web sites. We will not share the information in our cookies or give others access to it. See the legal information area on our web site for more details about web site security and privacy features.
How We Safeguard Your Personal Information
We restrict access to nonpublic personal information about shareholders to our employees and in some cases to third parties (for example, the service providers described above) as permitted by law. We maintain strict physical, electronic and procedural safeguards that comply with federal standards to guard your nonpublic personal information.
We’ll Keep You Informed
As required by federal law, we will notify shareholders of our privacy policy annually. We reserve the right to modify this policy at any time, but rest assured that if we do change it, we will tell you promptly. You will also be able to access our privacy policy from our web site at guggenheiminvestments.com. Should you have any questions regarding our privacy policy, contact us at 800.820.0888 or 301.296.5100.
| | THE GUGGENHEIM FUNDS SEMI-ANNUAL REPORT | 23 |
This page intentionally left blank.
This page intentionally left blank.
This page intentionally left blank.
This page intentionally left blank.
This page intentionally left blank.
This page intentionally left blank.
3.31.2016
Guggenheim Funds Semi-Annual Report
| |
Guggenheim Macro Opportunities Fund | | |
MO-SEMI-0316x0916 | guggenheiminvestments.com |
DEAR SHAREHOLDER | 2 |
ECONOMIC AND MARKET OVERVIEW | 3 |
ABOUT SHAREHOLDERS’ FUND EXPENSES | 6 |
MACRO OPPORTUNITIES FUND | 9 |
NOTES TO CONSOLIDATED FINANCIAL STATEMENTS | 57 |
OTHER INFORMATION | 86 |
INFORMATION ON BOARD OF TRUSTEES AND OFFICERS | 87 |
GUGGENHEIM INVESTMENTS PRIVACY POLICIES | 95 |
| | THE GUGGENHEIM FUNDS SEMI-ANNUAL REPORT | 1 |
Dear Shareholder:
Guggenheim Partners Investment Management, LLC (the “Investment Adviser”) is pleased to present the semi-annual shareholder report for Guggenheim Macro Opportunities (the “Fund”) for the six-month period ended March 31, 2016.
The Investment Adviser is part of Guggenheim Investments, which represents the investment management businesses of Guggenheim Partners, LLC (“Guggenheim”), a global diversified financial services firm.
Guggenheim Funds Distributors, LLC is the distributor of the Fund. Guggenheim Funds Distributors, LLC is affiliated with Guggenheim and the Investment Adviser.
We encourage you to read the Economic and Market Overview section of the report, which follows this letter.
We are committed to providing innovative investment solutions and appreciate the trust you place in us.
Sincerely,

Donald C. Cacciapaglia
President
April 30, 2016
Read a prospectus and summary prospectus (if available) carefully before investing. It contains the investment objectives, risks, charges, expenses and other information, which should be considered carefully before investing. Obtain a prospectus and summary prospectus (if available) at guggenheiminvestments.com or call 800.820.0888.
There can be no assurance that any investment product will achieve its investment objective(s). There are risks associated with investing, including the entire loss of principal invested. Investing involves market risks. The investment return and principal value of any investment product will fluctuate with changes in market conditions.
2 | THE GUGGENHEIM FUNDS SEMI-ANNUAL REPORT | |
ECONOMIC AND MARKET OVERVIEW (Unaudited) | March 31, 2016 |
Financial markets were buffeted by a variety of events over the past six months, including volatility in the oil market, weak growth in China, ongoing stimulus from global central banks, and a 25 basis point increase in the U.S. federal funds target rate in December. While the direct impact of the move was fairly insignificant, the decision to begin normalization of interest rates after seven years of unprecedented liquidity provision was not. Indeed, in 2015, risk assets posted their worst annual performance since the 2008 financial crisis, as market participants’ expectations for the start of rate hikes collided with concern about plunging commodity prices, and slowing economic growth in China and other emerging market economies.
As 2016 began, forecasts for U.S. and global economic growth were downgraded, and recession fears surged along with market volatility. Estimates for first quarter gross domestic product (“GDP”) in the U.S. were marked down, even though first quarter GDP has undershot full-year growth rates in six out of the last seven years. Risk assets rallied in the last half of the first quarter, led by a dovish pivot in the U.S. Federal Reserve’s (the “Fed”) communication that spurred a rally in crude oil and a reversal of dollar strength. The weaker dollar, along with optimism about a production freeze agreed to by a group of major oil producing countries, helped oil to rebound. After falling in the early weeks of the year to a cycle low of $26 per barrel on February 11, 2016, the front-month West Texas Intermediate (“WTI”) oil futures contract rallied as high as $40 per barrel before closing the quarter at $38 per barrel.
The outlook for economic growth outside the U.S. softened in the first quarter. A further deterioration in the euro zone inflation outlook prompted the European Central Bank (“ECB”) to announce an increase in the size of its monthly asset purchases and reduce its deposit rate to -40 basis points. European government bonds rallied following the announcement, with the 10-year German bund ending the first quarter with a yield of just 16 basis points.
Ongoing stimulus efforts in Asia also appeared likely to contribute to low U.S. rates. Chinese industrial production growth continued to slow in early 2016, prompting the People’s Bank of China (“PBOC”) to stimulate credit growth by allowing banks to hold fewer reserves against deposits. And after years of struggling with stagnant growth and low inflation, the Bank of Japan (“BOJ”) surprised markets by cutting its key interest rate to -10 basis points in January. The negative rates pushed a considerable amount of Japanese savings into foreign markets.
| | THE GUGGENHEIM FUNDS SEMI-ANNUAL REPORT | 3 |
ECONOMIC AND MARKET OVERVIEW (Unaudited)(continued) | March 31, 2016 |
In an environment where global rates are moving lower and markets are already starved for yield, foreign investors began looking to the U.S. Guggenheim expects that U.S. Treasury yields will fall further as the gravitational pull of global yields gets stronger, and does not discount the possibility of 10-year U.S. Treasury yields declining to closer to 1 percent before the end of the year.
A stronger dollar has weighed on the U.S. economy, but consumer spending has been resilient. The labor market is now operating near full employment, and tight labor market conditions are beginning to spur faster wage growth. We believe the U.S. economy is fundamentally sound, and find little evidence to support the conclusion that the economy will fall into a recession in 2016.
Despite the relative health of the U.S. economy, markets are concerned that sluggish global growth will hold back the U.S. expansion, that inflation will remain below the Fed’s target for longer, and that tighter conditions in credit markets have raised recession risks. Our view is that the Fed remains focused on fulfilling its dual mandate objectives of maximum employment and price stability, and thus is biased toward normalizing policy. We expect further declines in the unemployment rate as job gains outstrip growth in the labor force. Meanwhile, core and headline inflation should move closer to the Fed’s target by year end, reflecting our forecasts for a tighter labor market and a modest rise in oil prices. Normally, this would result in at least two Fed rate hikes on the table for 2016, but the U.S. Fed is becoming more sensitive to global financial conditions and the extent of global money flows that occur as monetary policy in the U.S. diverges from Europe, Japan and China. As a result, we have reduced our expectations for a June rate hike, although it would normally be an easy call. We continue to believe a December rate hike is a near certainty. A solid macroeconomic backdrop and a rebalancing oil market should support an improving credit picture in the second half of 2016.
For the six months ended March 31, 2016, the Standard & Poor’s 500® Index* (“S&P 500”) returned 8.49%. The Morgan Stanley Capital International (“MSCI”) Europe-Australasia-Far East (“EAFE”) Index* returned 1.56%. The return of the MSCI Emerging Markets Index* was 6.41%.
In the bond market, the Barclays U.S. Aggregate Bond Index* posted a 2.44% return for the period, while the Barclays U.S. Corporate High Yield Index* returned 1.22%. The return of the Bank of America (“BofA”) Merrill Lynch 3-Month U.S. Treasury Bill Index* was 0.11% for the six-month period.
The opinions and forecasts expressed may not actually come to pass. This information is subject to change at any time, based on market and other conditions, and should not be construed as a recommendation of any specific security or strategy.
4 | THE GUGGENHEIM FUNDS SEMI-ANNUAL REPORT | |
ECONOMIC AND MARKET OVERVIEW (Unaudited)(concluded) | March 31, 2016 |
*Index Definitions:
The following indices are referenced throughout this report. Indices are unmanaged and not available for direct investment. Index performance does not reflect transaction costs, fees, or expenses.
Barclays U.S. Aggregate Bond Index is a broad-based benchmark that measures the investment grade, U.S. dollar (“USD”)-denominated, fixed-rate taxable bond market, including U.S. Treasuries, government-related and corporate securities, MBS (agency fixed-rate and hybrid ARM pass-throughs), ABS, and CMBS.
Barclays U.S. Corporate High Yield Index measures the market of USD-denominated, non-investment grade, fixed-rate, taxable corporate bonds. Securities are classified as high yield if the middle rating of Moody’s, Fitch, and S&P is Ba1/BB+/BB+ or below.
BofA Merrill Lynch 3-Month U.S. Treasury Bill Index is an unmanaged market index of U.S. Treasury securities maturing in 90 days that assumes reinvestment of all income.
MSCI EAFE Index is a free float-adjusted market capitalization index that is designed to measure the equity market performance of developed markets, excluding the U.S. & Canada.
MSCI Emerging Markets Index is a free float-adjusted market capitalization weighted index that is designed to measure equity market performance in the global emerging markets.
S&P 500® Index is a capitalization-weighted index of 500 stocks designed to measure the performance of the broad economy, representing all major industries and is considered a representation of the U.S. stock market.
| | THE GUGGENHEIM FUNDS SEMI-ANNUAL REPORT | 5 |
ABOUT SHAREHOLDERS’ FUND EXPENSES (Unaudited) |
All mutual funds have operating expenses and it is important for our shareholders to understand the impact of costs on their investments. Shareholders of a Fund incur two types of costs: (i) transaction costs, including sales charges (loads) on purchase payments, reinvested dividends, or other distributions; and exchange fees; and (ii) ongoing costs, including management fees, administrative services, and shareholder reports, among others. These ongoing costs, or operating expenses, are deducted from a fund’s gross income and reduce the investment return of the fund.
A fund’s expenses are expressed as a percentage of its average net assets, which is known as the expense ratio. The following examples are intended to help investors understand the ongoing costs (in dollars) of investing in a Fund and to compare these costs with the ongoing costs of investing in other mutual funds.
The examples are based on an investment of $1,000 made at the beginning of the period and held for the entire six-month period beginning September 30, 2015 and ending March 31, 2016.
The following tables illustrate a Fund’s costs in two ways:
Table 1. Based on actual Fund return. This section helps investors estimate the actual expenses paid over the period. The “Ending Account Value” shown is derived from the Fund’s actual return, and the fourth column shows the dollar amount that would have been paid by an investor who started with $1,000 in the Fund. Investors may use the information here, together with the amount invested, to estimate the expenses paid over the period. Simply divide the Fund’s account value by $1,000 (for example, an $8,600 account value divided by $1,000 = 8.6), then multiply the result by the number provided under the heading “Expenses Paid During Period.”
Table 2. Based on hypothetical 5% return. This section is intended to help investors compare a Fund’s cost with those of other mutual funds. The table provides information about hypothetical account values and hypothetical expenses based on the Fund’s actual expense ratio and an assumed rate of return of 5% per year before expenses, which is not the Fund’s actual return. The hypothetical account values and expenses may not be used to estimate the actual ending account balance or expenses paid during the period. The example is useful in making comparisons because the U.S. Securities and Exchange Commission (the “SEC”) requires all mutual funds to calculate expenses based on the 5% return. Investors can assess a Fund’s costs by comparing this hypothetical example with the hypothetical examples that appear in shareholder reports of other funds.
6 | THE GUGGENHEIM FUNDS SEMI-ANNUAL REPORT | |
ABOUT SHAREHOLDERS’ FUND EXPENSES (Unaudited)(continued) |
The calculations illustrated above assume no shares were bought or sold during the period. Actual costs may have been higher or lower, depending on the amount of investment and the timing of any purchases or redemptions.
Please note that the expenses shown in the table are meant to highlight your ongoing costs only and do not reflect any transactional costs, such as sales charges (loads) on purchase payments, and contingent deferred sales charges (“CDSC”) on redemptions, if any. Therefore, the second table is useful in comparing ongoing costs only, and will not help you determine the relative total costs of owning different funds. In addition, if these transactional costs were included, your costs would have been higher.
More information about a Fund’s expenses, including annual expense ratios for up to the past five years (subject to the Fund’s inception date), can be found in the Financial Highlights section of this report. For additional information on operating expenses and other shareholder costs, please refer to the appropriate Fund prospectus.
| | THE GUGGENHEIM FUNDS SEMI-ANNUAL REPORT | 7 |
ABOUT SHAREHOLDERS’ FUND EXPENSES (Unaudited)(concluded) |
| | Expense
Ratio1 | Fund
Return | Beginning
Account Value
September 30,
2015 | Ending
Account Value
March 31,
2016 | Expenses
Paid During
Period2 |
Table 1. Based on actual Fund return3 |
Macro Opportunities Fund |
A-Class | 1.45% | (1.70%) | $ 1,000.00 | $ 983.00 | $ 7.19 |
C-Class | 2.18% | (2.06%) | 1,000.00 | 979.40 | 10.79 |
P-Class | 1.34% | (1.66%) | 1,000.00 | 983.40 | 6.64 |
Institutional Class | 1.09% | (1.53%) | 1,000.00 | 984.70 | 5.41 |
| |
Table 2. Based on hypothetical 5% return (before expenses) |
Macro Opportunities Fund |
A-Class | 1.45% | 5.00% | $ 1,000.00 | $ 1,017.75 | $ 7.31 |
C-Class | 2.18% | 5.00% | 1,000.00 | 1,014.10 | 10.98 |
P-Class | 1.34% | 5.00% | 1,000.00 | 1,018.30 | 6.76 |
Institutional Class | 1.09% | 5.00% | 1,000.00 | 1,019.55 | 5.50 |
1 | Annualized and excludes expenses of the underlying funds in which the Fund invests. |
2 | Expenses are equal to the Fund's annualized expense ratio, net of any applicable fee waivers, multiplied by the average account value over the period, multiplied by 183/366 (to reflect the one-half year period). |
3 | Actual cumulative return at net asset value for the period September 30, 2015 to March 31, 2016. |
8 | THE GUGGENHEIM FUNDS SEMI-ANNUAL REPORT | |
FUND PROFILE (Unaudited) | March 31, 2016 |
MACRO OPPORTUNITIES FUND
OBJECTIVE: Seeks to provide total return, comprised of current income and capital appreciation.
Consolidated Holdings Diversification (Market Exposure as % of Net Assets)
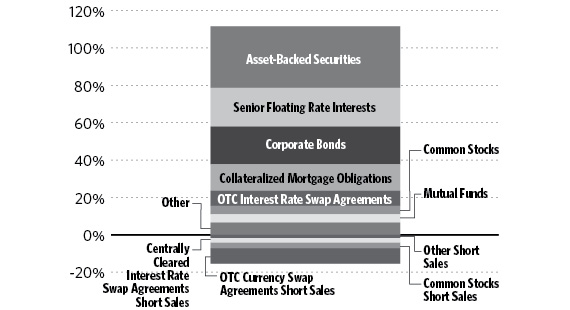
“Consolidated Holdings Diversification (Market Exposure as % of Net Assets)” excludes any temporary cash investments or investments in Guggenheim Strategy Funds Trust mutual funds. Investments in those Funds do not provide “market exposure” to meet the fund’s investment objective, but will significantly increase the portfolio’s exposure to certain other asset categories (and their associated risks), which may cause the Fund to deviate from its principal investment strategy, including: (i) high yield, high risk debt securities rated below the top four long-term rating categories by a nationally recognized statistical rating organization (also known as “junk bonds”); (ii) securities issued by the U.S. government or its agencies and instrumentalities; (iii) CLOs and similar investments; and (iv) other short-term fixed income securities.
| | THE GUGGENHEIM FUNDS SEMI-ANNUAL REPORT | 9 |
FUND PROFILE (Unaudited)(concluded) | March 31, 2016 |
Inception Dates: |
A-Class | November 30, 2011 |
C-Class | November 30, 2011 |
P-Class | May 1, 2015 |
Institutional Class | November 30, 2011 |
Ten Largest Long Holdings (% of Total Net Assets) |
Guggenheim Strategy Fund I | 2.6% |
Guggenheim Floating Rate Strategies Fund - Institutional Class | 1.7% |
Guggenheim Alpha Opportunity Fund - Institutional Class | 1.7% |
Triaxx Prime CDO Ltd. | 1.2% |
Banc of America Funding Ltd. | 1.1% |
Kenya Government International Bond | 1.1% |
Motel 6 Trust | 1.1% |
Dominican Republic International Bond | 1.0% |
Guggenheim BulletShares 2018 High Yield Corporate Bond ETF | 0.9% |
Travelport Holdings LLC | 0.9% |
Top Ten Total | 13.3% |
| | |
“Ten Largest Long Holdings” excludes any temporary cash or derivative investments |
Portfolio Composition by Quality Rating1 |
Rating | % of Total Investments |
Fixed Income Instruments | |
AAA | 0.2% |
AA | 2.3% |
A | 12.6% |
BBB | 15.2% |
BB | 17.5% |
B | 21.3% |
CCC | 9.0% |
CC | 0.2% |
D | 0.1% |
NR2 | 7.8% |
Other Instruments | 13.8% |
Total Investments | 100.0% |
| | |
The chart above reflects percentages of the value of total investments. |
1 | Source: BlackRock Solutions. Credit quality ratings are measured on a scale that generally ranges from AAA (highest) to D (lowest). All securities except for those labeled “NR” have been rated by a Nationally Recognized Statistical Rating Organization (“NRSRO”). For purposes of this presentation, when ratings are available from more than one agency, the highest rating is used. Guggenheim Investments converts ratings to the equivalent S&P rating. |
2 | NR securities do not necessarily indicate low credit quality. |
10 | THE GUGGENHEIM FUNDS SEMI-ANNUAL REPORT | |
CONSOLIDATED SCHEDULE OF INVESTMENTS (Unaudited) | March 31, 2016 |
MACRO OPPORTUNITIES FUND | |
| | | Shares | | | Value | |
| | | | | | | |
COMMON STOCKS† - 4.6% | |
| | | | | | | |
Consumer, Non-cyclical - 1.4% | |
Gilead Sciences, Inc. | | | 21,189 | | | $ | 1,946,423 | |
Archer-Daniels-Midland Co.1 | | | 50,331 | | | | 1,827,519 | |
Cal-Maine Foods, Inc.1 | | | 32,681 | | | | 1,696,470 | |
AbbVie, Inc. | | | 28,382 | | | | 1,621,180 | |
Tyson Foods, Inc. — Class A1 | | | 23,042 | | | | 1,535,980 | |
Express Scripts Holding Co.*,1 | | | 21,402 | | | | 1,470,103 | |
Ingredion, Inc.1 | | | 13,126 | | | | 1,401,726 | |
Sanderson Farms, Inc. | | | 15,353 | | | | 1,384,534 | |
UnitedHealth Group, Inc. | | | 9,868 | | | | 1,271,985 | |
HCA Holdings, Inc.*,1 | | | 15,919 | | | | 1,242,478 | |
Molina Healthcare, Inc.* | | | 18,781 | | | | 1,211,187 | |
Laboratory Corporation of America Holdings* | | | 10,314 | | | | 1,208,079 | |
Universal Health Services, Inc. — Class B1 | | | 9,532 | | | | 1,188,831 | |
Quest Diagnostics, Inc.1 | | | 16,576 | | | | 1,184,355 | |
WellCare Health Plans, Inc.* | | | 12,579 | | | | 1,166,702 | |
Biogen, Inc.*,1 | | | 4,088 | | | | 1,064,188 | |
Cardinal Health, Inc.1 | | | 12,925 | | | | 1,059,204 | |
United Therapeutics Corp.*,1 | | | 9,336 | | | | 1,040,310 | |
Kroger Co.1 | | | 25,769 | | | | 985,664 | |
MEDNAX, Inc.*,1 | | | 15,239 | | | | 984,744 | |
St. Jude Medical, Inc. | | | 17,780 | | | | 977,900 | |
Johnson & Johnson1 | | | 7,863 | | | | 850,777 | |
McKesson Corp. | | | 5,152 | | | | 810,152 | |
JM Smucker Co. | | | 6,072 | | | | 788,388 | |
Western Union Co.1 | | | 40,469 | | | | 780,647 | |
Darling Ingredients, Inc.*,1 | | | 58,591 | | | | 771,643 | |
Amsurg Corp. — Class A* | | | 9,622 | | | | 717,801 | |
Varian Medical Systems, Inc.* | | | 8,938 | | | | 715,219 | |
Hologic, Inc.* | | | 20,605 | | | | 710,873 | |
Dean Foods Co.1 | | | 38,734 | | | | 670,873 | |
Altria Group, Inc.1 | | | 10,263 | | | | 643,080 | |
Charles River Laboratories International, Inc.*,1 | | | 8,084 | | | | 613,899 | |
LifePoint Health, Inc.*,1 | | | 8,544 | | | | 591,672 | |
ConAgra Foods, Inc.1 | | | 12,731 | | | | 568,057 | |
Dr Pepper Snapple Group, Inc.1 | | | 6,020 | | | | 538,308 | |
Whole Foods Market, Inc.1 | | | 16,607 | | | | 516,644 | |
SpartanNash Co.1 | | | 16,875 | | | | 511,481 | |
Owens & Minor, Inc.1 | | | 11,972 | | | | 483,908 | |
ResMed, Inc.1 | | | 8,179 | | | | 472,910 | |
Procter & Gamble Co.1 | | | 5,677 | | | | 467,274 | |
Mondelez International, Inc. — Class A | | | 11,583 | | | | 464,710 | |
Magellan Health, Inc.*,1 | | | 6,755 | | | | 458,867 | |
Community Health Systems, Inc.*,1 | | | 24,651 | | | | 456,290 | |
General Mills, Inc.1 | | | 7,180 | | | | 454,853 | |
VCA, Inc.* | | | 7,651 | | | | 441,386 | |
Cardtronics, Inc.*,1 | | | 11,939 | | | | 429,685 | |
Deluxe Corp.1 | | | 6,554 | | | | 409,559 | |
Chemed Corp.1 | | | 2,933 | | | | 397,275 | |
Air Methods Corp.* | | | 10,658 | | | | 386,033 | |
Total Consumer, Non-cyclical | | | | 43,591,826 | |
| | | | | | | | | |
Financial - 0.7% | |
California Republic Bancorp*,2 | | | 166,500 | | | | 4,188,641 | |
Prudential Financial, Inc. | | | 22,340 | | | | 1,613,396 | |
JPMorgan Chase & Co.1 | | | 26,077 | | | | 1,544,280 | |
MetLife, Inc.1 | | | 34,873 | | | | 1,532,320 | |
Everest Re Group Ltd. | | | 7,713 | | | | 1,522,778 | |
Principal Financial Group, Inc. | | | 34,763 | | | | 1,371,400 | |
Hartford Financial Services Group, Inc. | | | 24,886 | | | | 1,146,747 | |
Aflac, Inc.1 | | | 17,137 | | | | 1,082,030 | |
Travelers Companies, Inc.1 | | | 7,537 | | | | 879,643 | |
Interactive Brokers Group, Inc. — Class A1 | | | 20,226 | | | | 795,286 | |
American Express Co. | | | 11,882 | | | | 729,555 | |
Selective Insurance Group, Inc.1 | | | 15,439 | | | | 565,222 | |
SEE NOTES TO FINANCIAL STATEMENTS. | THE GUGGENHEIM FUNDS SEMI-ANNUAL REPORT | 11 |
CONSOLIDATED SCHEDULE OF INVESTMENTS (Unaudited)(continued) | March 31, 2016 |
MACRO OPPORTUNITIES FUND | |
| | | Shares | | | Value | |
| | | | | | | |
Aspen Insurance Holdings Ltd. | | | 11,476 | | | $ | 547,405 | |
Regions Financial Corp.1 | | | 68,620 | | | | 538,667 | |
American Financial Group, Inc. | | | 7,401 | | | | 520,808 | |
Hanover Insurance Group, Inc. | | | 5,739 | | | | 517,773 | |
East West Bancorp, Inc.1 | | | 15,055 | | | | 488,987 | |
Allstate Corp.1 | | | 6,985 | | | | 470,579 | |
American Equity Investment Life Holding Co.1 | | | 26,299 | | | | 441,823 | |
WR Berkley Corp.1 | | | 7,187 | | | | 403,909 | |
WP GLIMCHER, Inc. | | | 41,985 | | | | 398,438 | |
Waddell & Reed Financial, Inc. — Class A1 | | | 15,671 | | | | 368,895 | |
City Office REIT, Inc. | | | 10,316 | | | | 117,602 | |
Total Financial | | | | | | | 21,786,184 | |
| | | | | | | | | |
Industrial - 0.7% | |
Boeing Co.1 | | | 8,564 | | | | 1,087,114 | |
Cummins, Inc.1 | | | 8,824 | | | | 970,110 | |
Textron, Inc.1 | | | 24,285 | | | | 885,432 | |
Huntington Ingalls Industries, Inc.1 | | | 6,276 | | | | 859,435 | |
Arrow Electronics, Inc.* | | | 13,067 | | | | 841,645 | |
Tech Data Corp.* | | | 10,177 | | | | 781,288 | |
AGCO Corp. | | | 15,544 | | | | 772,537 | |
Fluor Corp. | | | 14,079 | | | | 756,043 | |
Corning, Inc.1 | | | 32,195 | | | | 672,554 | |
Jabil Circuit, Inc.1 | | | 32,335 | | | | 623,095 | |
ITT Corp.1 | | | 16,371 | | | | 603,925 | |
Knight Transportation, Inc.1 | | | 22,373 | | | | 585,053 | |
Dover Corp.1 | | | 8,445 | | | | 543,267 | |
Parker-Hannifin Corp.1 | | | 4,813 | | | | 534,628 | |
Avnet, Inc. | | | 11,939 | | | | 528,898 | |
Vishay Intertechnology, Inc.1 | | | 42,213 | | | | 515,421 | |
Rockwell Automation, Inc. | | | 4,480 | | | | 509,600 | |
Union Pacific Corp. | | | 6,196 | | | | 492,892 | |
Crane Co.1 | | | 8,941 | | | | 481,562 | |
Barnes Group, Inc.1 | | | 13,720 | | | | 480,612 | |
Clean Harbors, Inc.*,1 | | | 9,471 | | | | 467,299 | |
Briggs & Stratton Corp.1 | | | 19,415 | | | | 464,407 | |
Sanmina Corp.*,1 | | | 19,828 | | | | 463,579 | |
Saia, Inc.*,1 | | | 16,411 | | | | 461,970 | |
Federal Signal Corp.1 | | | 33,807 | | | | 448,281 | |
Timken Co.1 | | | 13,243 | | | | 443,508 | |
Werner Enterprises, Inc.1 | | | 16,097 | | | | 437,195 | |
Trinity Industries, Inc.1 | | | 23,770 | | | | 435,229 | |
EMCOR Group, Inc.1 | | | 8,927 | | | | 433,852 | |
Keysight Technologies, Inc.*,1 | | | 15,279 | | | | 423,839 | |
Jacobs Engineering Group, Inc.*,1 | | | 9,624 | | | | 419,125 | |
Applied Industrial Technologies, Inc.1 | | | 9,640 | | | | 418,376 | |
Mueller Industries, Inc.1 | | | 13,683 | | | | 402,554 | |
ArcBest Corp.1 | | | 18,334 | | | | 395,831 | |
Methode Electronics, Inc.1 | | | 13,418 | | | | 392,342 | |
Targus Group International, Inc.*,†††,2 | | | 13,186 | | | | 20,175 | |
Total Industrial | | | | | | | 20,052,673 | |
| | | | | | | | | |
Technology - 0.6% | |
HP, Inc.1 | | | 123,566 | | | | 1,522,334 | |
Apple, Inc.1 | | | 13,387 | | | | 1,459,049 | |
Hewlett Packard Enterprise Co.1 | | | 76,931 | | | | 1,363,988 | |
International Business Machines Corp. | | | 6,784 | | | | 1,027,437 | |
Xerox Corp.1 | | | 91,707 | | | | 1,023,450 | |
Skyworks Solutions, Inc. | | | 10,536 | | | | 820,754 | |
Seagate Technology plc1 | | | 23,805 | | | | 820,082 | |
Micron Technology, Inc.*,1 | | | 76,864 | | | | 804,766 | |
SYNNEX Corp.1 | | | 8,171 | | | | 756,553 | |
Convergys Corp.1 | | | 26,468 | | | | 735,016 | |
Tessera Technologies, Inc.1 | | | 23,533 | | | | 729,523 | |
DST Systems, Inc. | | | 6,256 | | | | 705,489 | |
Cirrus Logic, Inc.*,1 | | | 18,212 | | | | 663,099 | |
IPG Photonics Corp.*,1 | | | 6,717 | | | | 645,369 | |
Texas Instruments, Inc. | | | 10,781 | | | | 619,045 | |
CA, Inc.1 | | | 20,053 | | | | 617,432 | |
Nuance Communications, Inc.* | | | 28,313 | | | | 529,170 | |
12 | THE GUGGENHEIM FUNDS SEMI-ANNUAL REPORT | SEE NOTES TO FINANCIAL STATEMENTS. |
CONSOLIDATED SCHEDULE OF INVESTMENTS (Unaudited)(continued) | March 31, 2016 |
MACRO OPPORTUNITIES FUND | |
| | | Shares | | | Value | |
| | | | | | | |
CACI International, Inc. — Class A*,1 | | | 4,791 | | | $ | 511,200 | |
Oracle Corp.1 | | | 11,652 | | | | 476,683 | |
Teradata Corp.*,1 | | | 17,549 | | | | 460,486 | |
Sykes Enterprises, Inc.*,1 | | | 15,201 | | | | 458,766 | |
NetApp, Inc.1 | | | 14,704 | | | | 401,272 | |
Cabot Microelectronics Corp.1 | | | 9,708 | | | | 397,154 | |
Mentor Graphics Corp.1 | | | 19,524 | | | | 396,923 | |
Icad, Inc.*,1 | | | 65,113 | | | | 332,076 | |
Total Technology | | | | | | | 18,277,116 | |
| | | | | | | | | |
Consumer, Cyclical - 0.5% | |
Wal-Mart Stores, Inc.1 | | | 22,839 | | | | 1,564,243 | |
Delta Air Lines, Inc. | | | 25,878 | | | | 1,259,741 | |
JetBlue Airways Corp.*,1 | | | 53,001 | | | | 1,119,381 | |
American Eagle Outfitters, Inc.1 | | | 66,461 | | | | 1,107,905 | |
Southwest Airlines Co. | | | 21,621 | | | | 968,621 | |
CVS Health Corp.1 | | | 9,322 | | | | 966,971 | |
Goodyear Tire & Rubber Co.1 | | | 26,222 | | | | 864,802 | |
UniFirst Corp.1 | | | 7,885 | | | | 860,411 | |
Walgreens Boots Alliance, Inc.1 | | | 9,834 | | | | 828,416 | |
Casey’s General Stores, Inc.1 | | | 6,128 | | | | 694,425 | |
Thor Industries, Inc. | | | 9,485 | | | | 604,858 | |
PACCAR, Inc. | | | 10,338 | | | | 565,385 | |
Children’s Place, Inc.1 | | | 6,632 | | | | 553,573 | |
Guess?, Inc.1 | | | 24,090 | | | | 452,169 | |
Dana Holding Corp.1 | | | 30,068 | | | | 423,658 | |
Spirit Airlines, Inc.* | | | 8,778 | | | | 421,168 | |
Select Comfort Corp.*,1 | | | 20,842 | | | | 404,126 | |
Macy’s, Inc.1 | | | 8,830 | | | | 389,315 | |
Best Buy Company, Inc.1 | | | 11,764 | | | | 381,624 | |
Total Consumer, Cyclical | | | | | | | 14,430,792 | |
| | | | | | | | | |
Communications - 0.4% | |
Verizon Communications, Inc.1 | | | 31,635 | | | | 1,710,820 | |
CenturyLink, Inc.1 | | | 48,033 | | | | 1,535,134 | |
AT&T, Inc.1 | | | 36,227 | | | | 1,419,012 | |
Cisco Systems, Inc.1 | | | 42,384 | | | | 1,206,673 | |
Frontier Communications Corp.1 | | | 206,037 | | | | 1,151,747 | |
Viacom, Inc. — Class B | | | 25,400 | | | | 1,048,511 | |
Atlantic Tele-Network, Inc.1 | | | 12,990 | | | | 985,032 | |
InterDigital, Inc. | | | 14,520 | | | | 808,038 | |
Time Warner, Inc. | | | 10,784 | | | | 782,379 | |
Telephone & Data Systems, Inc.1 | | | 21,167 | | | | 636,915 | |
AMC Networks, Inc. — Class A* | | | 8,091 | | | | 525,430 | |
Cengage Learning Acquisitions, Inc.*,†† | | | 21,660 | | | | 403,418 | |
Polycom, Inc.*,1 | | | 34,298 | | | | 382,423 | |
General Communication, Inc. — Class A*,1 | | | 20,169 | | | | 369,496 | |
Total Communications | | | | | | | 12,965,028 | |
| | | | | | | | | |
Utilities - 0.3% | |
Consolidated Edison, Inc.1 | | | 22,544 | | | | 1,727,322 | |
Entergy Corp.1 | | | 16,198 | | | | 1,284,177 | |
NextEra Energy, Inc.1 | | | 10,335 | | | | 1,223,044 | |
Public Service Enterprise Group, Inc.1 | | | 22,246 | | | | 1,048,676 | |
OGE Energy Corp.1 | | | 34,895 | | | | 999,044 | |
CenterPoint Energy, Inc.1 | | | 43,241 | | | | 904,602 | |
Pinnacle West Capital Corp.1 | | | 11,637 | | | | 873,590 | |
Southwest Gas Corp.1 | | | 12,258 | | | | 807,189 | |
American Electric Power Company, Inc.1 | | | 10,603 | | | | 704,039 | |
Vectren Corp.1 | | | 13,020 | | | | 658,291 | |
Edison International1 | | | 5,764 | | | | 414,374 | |
Total Utilities | | | | | | | 10,644,348 | |
| | | | | | | | | |
Energy - 0.0% | |
First Solar, Inc.*,1 | | | 11,921 | | | | 816,231 | |
PBF Logistics, LP | | | 5,000 | | | | 94,200 | |
Total Energy | | | | | | | 910,431 | |
| | | | | | | | | |
SEE NOTES TO FINANCIAL STATEMENTS. | THE GUGGENHEIM FUNDS SEMI-ANNUAL REPORT | 13 |
CONSOLIDATED SCHEDULE OF INVESTMENTS (Unaudited)(continued) | March 31, 2016 |
MACRO OPPORTUNITIES FUND | |
| | | Shares | | | Value | |
| | | | | | | |
Basic Materials - 0.0% | |
Mosaic Co.1 | | | 21,483 | | | $ | 580,041 | |
Mirabela Nickel Ltd.*,†††,2 | | | 7,057,522 | | | | 541 | |
Total Basic Materials | | | | | | | 580,582 | |
| | | | | | | | | |
Total Common Stocks | | | | | | | | |
(Cost $142,511,360) | | | | | | | 143,238,980 | |
| | | | | | | | | |
PREFERRED STOCKS†† - 0.6% | |
Industrial - 0.5% | |
Seaspan Corp. 6.38% due 04/30/192 | | | 572,000 | | | | 14,162,720 | |
| | | | | | | | | |
Financial - 0.1% | |
Cent CLO 16, LP due 08/1/24*,3,4 | | | 7,000 | | | | 2,106,105 | |
ALM Loan Funding Ltd. due 06/20/23*,4 | | | 1,373 | | | | 919,794 | |
BreitBurn Energy Partners 8.00% due 12/31/49*,†††,2 | | | 389,684 | | | | 831,254 | |
GSC Partners CDO Fund V Ltd. due 11/20/16*,†††,4,6 | | | 5,200 | | | | 1 | |
Total Financial | | | | | | | 3,857,154 | |
Total Preferred Stocks | | | | | | | | |
(Cost $20,857,434) | | | | | | | 18,019,874 | |
| | | | | | | | | |
EXCHANGE-TRADED FUNDS† - 1.7% | |
Guggenheim BulletShares 2018 High Yield Corporate Bond ETF7 | | | 1,220,000 | | | | 29,438,600 | |
Guggenheim BulletShares 2019 High Yield Corporate Bond ETF7 | | | 1,059,096 | | | | 24,475,709 | |
Total Exchange-Traded Funds | | | | | |
(Cost $55,002,093) | | | | | | | 53,914,309 | |
| | | | | | | | | |
MUTUAL FUNDS† - 7.0% | |
Guggenheim Strategy Fund I7 | | | 3,227,983 | | | | 80,086,248 | |
Guggenheim Floating Rate Strategies Fund - Institutional Class7 | | | 2,148,806 | | | | 54,343,297 | |
Guggenheim Alpha Opportunity Fund - Institutional Class7 | | | 1,881,326 | | | | 51,284,947 | |
Guggenheim High Yield Fund - Insitutional Class7 | | | 2,340,238 | | | | 19,728,204 | |
Guggenheim Risk Managed Real Estate Fund - Institutional Class7 | | | 474,102 | | | | 13,308,030 | |
Total Mutual Funds | | | | | | | | |
(Cost $217,743,081) | | | | | | | 218,750,726 | |
| | | | | | | | | |
SHORT TERM INVESTMENTS† - 3.4% | |
Federated U.S. Treasury Cash Reserve Fund - Institutional Shares 0.16%8 | | | 99,729,757 | | | | 99,729,757 | |
Western Asset Institutional U.S. Treasury Reserves - Institutional Shares 0.19%8 | | | 5,416,126 | | | | 5,416,126 | |
Total Short Term Investments | | | | | |
(Cost $105,145,883) | | | | | | | 105,145,883 | |
| | | Face
Amount15 | | | | | |
| | | | | | | | | |
ASSET-BACKED SECURITIES†† - 32.9% | |
Collateralized Loan Obligations - 22.4% | |
CIFC Funding Ltd. | | | | | | | | |
2014-2A, 5.22% due 05/24/265,6 | | $ | 10,000,000 | | | | 7,579,943 | |
2014-3X INC, due 07/22/264 | | | 15,400,000 | | | | 7,007,678 | |
2015-2A, 4.29% due 12/05/245,6,9 | | | 6,250,000 | | | | 5,710,122 | |
2012-1X, 8.44% due 08/14/24 | | | 4,850,000 | | | | 3,713,462 | |
2013-2A, 4.22% due 04/21/255,6 | | | 4,250,000 | | | | 3,672,684 | |
14 | THE GUGGENHEIM FUNDS SEMI-ANNUAL REPORT | SEE NOTES TO FINANCIAL STATEMENTS. |
CONSOLIDATED SCHEDULE OF INVESTMENTS (Unaudited)(continued) | March 31, 2016 |
MACRO OPPORTUNITIES FUND | |
| | | Face
Amount15 | | | Value | |
| | | | | | | |
2012-1AR A3R, 3.69% due 08/14/245,6 | | $ | 3,250,000 | | | $ | 3,167,676 | |
2014-1A C, 3.42% due 04/18/255,6 | | | 1,750,000 | | | | 1,660,176 | |
2014-1A, 5.87% due 04/18/255,6 | | | 2,500,000 | | | | 1,390,625 | |
2013-4A, 4.14% due 11/27/245,6 | | | 1,000,000 | | | | 858,801 | |
Treman Park CLO Ltd. | | | | | | | | |
2015-1A COM due 04/20/274,6 | | | 20,000,000 | | | | 18,129,434 | |
2015-1A SUB due 04/20/274,6 | | | 8,400,000 | | | | 5,357,009 | |
KVK CLO Ltd. | | | | | | | | |
2014-2A, 3.62% due 07/15/265,6,9 | | | 8,250,000 | | | | 7,545,122 | |
2014-1A, 3.52% due 05/15/265,6 | | | 5,000,000 | | | | 4,184,756 | |
2013-1A SUB due 04/14/254,6 | | | 11,900,000 | | | | 3,990,604 | |
2014-3A, due 10/15/264,6 | | | 2,500,000 | | | | 974,341 | |
Shackleton CLO Ltd. | | | | | | | | |
2014-5A, 3.32% due 05/07/265,6,9 | | | 10,750,000 | | | | 9,882,284 | |
2013-4A, 3.62% due 01/13/255,6,9 | | | 7,250,000 | | | | 6,675,548 | |
Voya CLO Ltd. | | | | | | | | |
2013-1X INC due 04/15/244 | | | 20,000,000 | | | | 10,067,491 | |
2015-3A, 4.57% due 10/15/225,6 | | | 4,000,000 | | | | 3,749,437 | |
2014-2A, 3.57% due 07/17/265,6 | | | 2,000,000 | | | | 1,955,316 | |
Avery | | | | | | | | |
2013-3X COM due 01/18/254 | | | 19,800,000 | | | | 15,531,456 | |
Dryden 37 Senior Loan Fund | | | | | | | | |
2015-37A Q due 04/15/274,6 | | | 9,500,000 | | | | 8,505,252 | |
2015-37A due 04/15/274,6 | | | 6,500,000 | | | | 4,125,580 | |
Fortress Credit Opportunities VI CLO Ltd. | | | | | | | | |
2015-6A, 5.89% due 10/10/265,6 | | | 5,400,000 | | | | 5,055,091 | |
2015-6A B, 3.34% due 10/10/265,6 | | | 4,000,000 | | | | 3,862,884 | |
2015-6A C, 4.29% due 10/10/265,6 | | | 3,000,000 | | | | 2,833,024 | |
OHA Credit Partners IX Ltd. | | | | | | | | |
2013-9A ACOM due 10/20/254,6 | | | 14,000,000 | | | | 11,450,043 | |
KKR Financial CLO Ltd. | | | | | | | | |
2007-1A E, 5.62% due 05/15/215,6,9 | | | 6,000,000 | | | | 5,976,629 | |
2015-12, 3.26% due 07/15/275,6 | | | 5,000,000 | | | | 4,542,767 | |
5.61% due 05/15/21 | | | 800,000 | | | | 796,884 | |
Northwoods Capital XIV Ltd. | | | | | | | | |
2014-14A, 3.97% due 11/12/255,6 | | | 6,000,000 | | | | 5,577,370 | |
2014-14A B, 3.08% due 11/12/255,6 | | | 5,750,000 | | | | 5,505,052 | |
NewStar Clarendon Fund CLO LLC | | | | | | | | |
2015-1A, 3.32% due 01/25/275,6 | | | 7,000,000 | | | | 6,759,316 | |
2015-1A C, 3.97% due 01/25/275,6 | | | 4,000,000 | | | | 3,718,770 | |
Neuberger Berman CLO Ltd. | | | | | | | | |
2014-12A, 3.72% due 07/25/235,6 | | | 5,300,000 | | | | 5,199,862 | |
2012-12X SUB due 07/25/234 | | | 7,000,000 | | | | 2,780,150 | |
2012-12A SUB due 07/25/234,6 | | | 5,900,000 | | | | 2,343,269 | |
Highbridge Loan Management Ltd. | | | | | | | | |
2014-1A, 3.87% due 09/20/225,6,9 | | | 6,500,000 | | | | 6,488,741 | |
2014-1A, 4.87% due 09/20/225,6 | | | 3,500,000 | | | | 3,312,846 | |
SEE NOTES TO FINANCIAL STATEMENTS. | THE GUGGENHEIM FUNDS SEMI-ANNUAL REPORT | 15 |
CONSOLIDATED SCHEDULE OF INVESTMENTS (Unaudited)(continued) | March 31, 2016 |
MACRO OPPORTUNITIES FUND | |
| | | Face
Amount15 | | | Value | |
| | | | | | | |
Newstar Commercial Loan Funding LLC | | | | | | |
2015-1A, 4.47% due 01/20/275,6 | | $ | 5,000,000 | | | $ | 4,768,140 | |
2013-1A D, 5.17% due 09/20/235,6 | | | 3,250,000 | | | | 3,004,061 | |
2014-1A D, 5.37% due 04/20/255,6 | | | 1,250,000 | | | | 1,151,058 | |
2013-1A E, 5.92% due 09/20/235,6 | | | 750,000 | | | | 713,488 | |
Telos CLO Ltd. | | | | | | | | |
2014-6A, 3.62% due 01/17/275,6 | | | 5,000,000 | | | | 4,675,011 | |
2013-3A C, 3.62% due 01/17/245,6 | | | 2,750,000 | | | | 2,655,060 | |
2013-3A D, 4.87% due 01/17/245,6 | | | 2,550,000 | | | | 2,236,599 | |
Great Lakes CLO Ltd. | | | | | | | | |
2015-1A, 4.37% due 07/15/265,6 | | | 4,250,000 | | | | 3,922,739 | |
2014-1A C, 4.32% due 04/15/255,6 | | | 3,000,000 | | | | 2,890,067 | |
2012-1A SUB due 01/15/234,6 | | | 3,250,000 | | | | 1,369,469 | |
2014-1A D, 4.82% due 04/15/255,6 | | | 1,500,000 | | | | 1,355,110 | |
Dryden XXIII Senior Loan Fund | | | | | | | | |
2014-23RA BR, 3.57% due 07/17/235,6,9 | | | 6,000,000 | | | | 5,792,203 | |
2012-23A CR, 4.52% due 07/17/235,6 | | | 3,425,000 | | | | 3,165,328 | |
Galaxy XIX CLO Ltd. | | | | | | | | |
2015-19A COMB due 01/24/274,6 | | | 5,500,000 | | | | 4,825,781 | |
2015-19A, 4.02% due 01/24/275,6 | | | 3,000,000 | | | | 3,008,751 | |
Golub Capital Partners CLO Ltd. | | | | | | | | |
2015-25A, 3.27% due 08/05/275,6 | | | 6,000,000 | | | | 5,646,127 | |
2014-18A C, 4.12% due 04/25/265,6 | | | 2,200,000 | | | | 2,108,074 | |
Atlas Senior Loan Fund V Ltd. | | | | | | | | |
2014-1A, 3.62% due 07/16/265,6,9 | | | 8,000,000 | | | | 7,696,688 | |
Ares XXVI CLO Ltd. | | | | | | | | |
2013-26A SUB due 04/15/254,6 | | | 9,500,000 | | | | 4,513,756 | |
2013-1A C, 3.37% due 04/15/255,6 | | | 2,000,000 | | | | 1,909,592 | |
2013-1A, 4.37% due 04/15/255,6 | | | 1,500,000 | | | | 1,266,936 | |
Resource Capital Corp. CRE | | | | | | | | |
2015-CRE4, 3.44% due 08/15/325,6 | | | 7,750,000 | | | | 7,645,891 | |
Cent CLO | | | | | | | | |
2014-16AR BR, 3.82% due 08/01/245,6,9 | | | 7,250,000 | | | | 7,249,231 | |
Atlas Senior Loan Fund IV Ltd. | | | | | | | | |
2014-2A, 3.32% due 02/17/265,6 | | | 3,900,000 | | | | 3,714,634 | |
2014-2A, 4.07% due 02/17/265,6 | | | 3,990,000 | | | | 3,431,295 | |
Dryden 41 Senior Loan Fund | | | | | | | | |
2015-41A, due 01/15/283,6 | | | 10,500,000 | | | | 6,952,494 | |
Shackleton I CLO Ltd. | | | | | | | | |
2012-1A, 5.37% due 08/14/235,6,9 | | | 7,500,000 | | | | 6,949,995 | |
Babson CLO Ltd. | | | | | | | | |
2012-2A SUB due 05/15/234,6 | | | 11,850,000 | | | | 4,403,100 | |
2014-IA SUB due 07/20/254,6 | | | 6,400,000 | | | | 2,342,313 | |
Resource Capital Corporation | | | | | | | | |
2015-CRE3 D, 4.44% due 03/15/325,6 | | | 7,000,000 | | | | 6,671,488 | |
OCP CLO Ltd. | | | | | | | | |
2014-7A, 3.62% due 10/20/265,6,9 | | | 5,000,000 | | | | 4,742,139 | |
2014-6A, 3.72% due 07/17/265,6 | | | 2,000,000 | | | | 1,927,719 | |
16 | THE GUGGENHEIM FUNDS SEMI-ANNUAL REPORT | SEE NOTES TO FINANCIAL STATEMENTS. |
CONSOLIDATED SCHEDULE OF INVESTMENTS (Unaudited)(continued) | March 31, 2016 |
MACRO OPPORTUNITIES FUND | |
| | | Face
Amount15 | | | Value | |
| | | | | | | |
Benefit Street Partners CLO Ltd. | | | | | | |
2015-IA BR, 3.72% due 10/15/255,6,9 | | $ | 6,500,000 | | | $ | 6,499,928 | |
ACIS CLO Ltd. | | | | | | | | |
2015-6A C, 3.99% due 05/01/275,6 | | | 3,000,000 | | | | 2,981,261 | |
2013-1A D, 5.12% due 04/18/245,6 | | | 2,100,000 | | | | 1,773,415 | |
2013-2A, 4.47% due 10/14/225,6 | | | 1,800,000 | | | | 1,709,752 | |
TICP CLO III Ltd. | | | | | | | | |
2014-3A, 4.37% due 01/20/275,6 | | | 8,000,000 | | | | 6,328,283 | |
ALM VII Ltd. | | | | | | | | |
2012-7A, 5.12% due 10/19/245,6,9 | | | 6,500,000 | | | | 6,312,623 | |
Venture XI CLO Ltd. | | | | | | | | |
2015-11AR CR, 3.57% due 11/14/225,6 | | | 4,000,000 | | | | 3,892,339 | |
2015-11A, 4.57% due 11/14/225,6 | | | 2,500,000 | | | | 2,250,307 | |
Golub Capital Partners CLO 18 Ltd. | | | | | | | | |
2014-18A, 3.12% due 04/25/265,6 | | | 5,000,000 | | | | 4,893,541 | |
2014-18A, 4.62% due 04/25/265,6 | | | 1,200,000 | | | | 1,081,117 | |
Fortress Credit Opportunities V CLO Ltd. | | | | | | | | |
2014-5A D, 5.12% due 10/15/265,6 | | | 3,500,000 | | | | 3,093,904 | |
2014-5A C, 4.17% due 10/15/265,6 | | | 3,000,000 | | | | 2,815,892 | |
Fortress Credit Investments IV Ltd. | | | | | | | | |
2015-4A, 4.12% due 07/17/235,6,9 | | | 5,800,000 | | | | 5,403,462 | |
Fortress Credit Opportunities III CLO, LP | | | | | | | | |
2014-3A C, 3.87% due 04/28/265,6 | | | 5,500,000 | | | | 5,232,288 | |
ALM XIV Ltd. | | | | | | | | |
2014-14A B, 3.57% due 07/28/265,6 | | | 3,100,000 | | | | 2,996,647 | |
2014-14A C, 4.07% due 07/28/265,6 | | | 2,500,000 | | | | 2,188,283 | |
Fortress Credit Funding V, LP | | | | | | | | |
2015-5AR BR, 4.27% due 08/15/225,6 | | | 5,000,000 | | | | 4,906,256 | |
Cerberus Onshore II CLO-2 LLC | | | | | | | | |
2014-1A, 3.63% due 10/15/235,6 | | | 2,500,000 | | | | 2,463,050 | |
2014-1A, 4.43% due 10/15/235,6 | | | 2,500,000 | | | | 2,325,436 | |
Fifth Street SLF II Ltd. | | | | | | | | |
2015-2A, 3.14% due 09/29/275,6 | | | 5,000,000 | | | | 4,657,817 | |
Babson CLO Limited | | | | | | | | |
2013-IIA, 3.87% due 01/18/255,6 | | | 3,500,000 | | | | 2,966,250 | |
2014-3A, 5.72% due 01/15/265,6 | | | 2,500,000 | | | | 1,665,018 | |
Carlyle Global Market Strategies CLO Ltd. | | | | | | | | |
2012-2AR DR, 4.52% due 07/20/235,6 | | | 3,000,000 | | | | 2,767,682 | |
2015-1A, 4.37% due 04/20/225,6 | | | 1,000,000 | | | | 935,038 | |
2012-3A SUB, due 10/04/244,6 | | | 1,800,000 | | | | 889,836 | |
Hull Street CLO Ltd. | | | | | | | | |
2014-1A, 4.22% due 10/18/265,6 | | | 5,785,000 | | | | 4,545,399 | |
NewStar Commercial Loan Trust | | | | | | | | |
2007-1A D, 2.94% due 09/30/225,6 | | | 4,000,000 | | | | 3,583,377 | |
2007-1A C, 1.94% due 09/30/225,6 | | | 1,000,000 | | | | 924,176 | |
Madison Park Funding XIII Ltd. | | | | | | | | |
2014-13A, 6.47% due 01/19/255,6 | | | 6,750,000 | | | | 4,502,798 | |
SEE NOTES TO FINANCIAL STATEMENTS. | THE GUGGENHEIM FUNDS SEMI-ANNUAL REPORT | 17 |
CONSOLIDATED SCHEDULE OF INVESTMENTS (Unaudited)(continued) | March 31, 2016 |
MACRO OPPORTUNITIES FUND | |
| | | Face
Amount15 | | | Value | |
| | | | | | | |
Mountain Hawk II CLO Ltd. | | | | | | |
2013-2A, 3.77% due 07/22/245,6 | | $ | 2,750,000 | | | $ | 2,276,937 | |
2013-2A, 3.22% due 07/22/245,6 | | | 2,500,000 | | | | 2,160,321 | |
Golub Capital Partners CLO 24M Ltd. | | | | | | | | |
2015-24A, 4.87% due 02/05/275,6 | | | 5,000,000 | | | | 4,430,371 | |
Figueroa CLO Ltd. | | | | | | | | |
2013-2A, 4.37% due 12/18/255,6 | | | 5,000,000 | | | | 4,345,048 | |
ALM VII R Ltd. | | | | | | | | |
2013-7RA, 4.07% due 04/24/245,6,9 | | | 4,750,000 | | | | 4,338,982 | |
NewStar Arlington Senior Loan Program LLC | | | | | | | | |
2014-1A, 4.87% due 07/25/255,6 | | | 2,750,000 | | | | 2,344,347 | |
2014-1A C1, 3.92% due 07/25/255,6 | | | 2,000,000 | | | | 1,889,340 | |
Atlas Senior Loan Fund II Ltd. | | | | | | | | |
2012-2A SUB due 01/30/246 | | | 9,600,000 | | | | 4,195,005 | |
AIMCO CLO Series | | | | | | | | |
2015-AA, due 01/15/284,6 | | | 5,400,000 | | | | 4,081,108 | |
Golub Capital Partners CLO 21M Ltd. | | | | | | | | |
2014-21A, 3.92% due 10/25/265,6 | | | 4,300,000 | | | | 4,065,254 | |
Dryden XXVIII Senior Loan Fund | | | | | | | | |
2013-28A, 4.52% due 08/15/255,6 | | | 6,000,000 | | | | 4,023,646 | |
Symphony Clo V Ltd. | | | | | | | | |
2007-5A, 4.87% due 01/15/245,6 | | | 4,000,000 | | | | 3,920,096 | |
Catamaran CLO Ltd. | | | | | | | | |
2015-1A C1, 3.72% due 04/22/275,6 | | | 4,000,000 | | | | 3,868,316 | |
BlueMountain CLO Ltd. | | | | | | | | |
2012-2A, 4.72% due 11/20/245,6 | | | 4,100,000 | | | | 3,860,979 | |
Halcyon Loan Advisors Funding Ltd. | | | | | | | | |
2012-2A C, 3.47% due 12/20/245,6 | | | 3,250,000 | | | | 2,801,702 | |
2012-1A B, 3.62% due 08/15/235,6 | | | 1,000,000 | | | | 967,194 | |
Golub Capital Partners CLO 25M Ltd. | | | | | | | | |
2015-25A, 4.27% due 08/05/275,6 | | | 4,000,000 | | | | 3,767,507 | |
Gramercy Park CLO Ltd. | | | | | | | | |
2014-1AR CR, 4.67% due 07/17/235,6 | | | 1,750,000 | | | | 1,645,651 | |
2012-1A, due 07/17/234,6 | | | 2,650,000 | | | | 1,418,903 | |
2012-1X, due 07/17/234 | | | 1,250,000 | | | | 669,294 | |
JFIN CLO Ltd. | | | | | | | | |
2007-1A, 3.41% due 07/20/215,6 | | | 4,000,000 | | | | 3,733,652 | |
Oaktree EIF II Series Ltd. | | | | | | | | |
2014-A2 C, 3.82% due 11/15/255,6 | | | 4,000,000 | | | | 3,719,626 | |
ALM VIII Ltd. | | | | | | | | |
2013-8A, 4.74% due 01/20/265,6 | | | 5,000,000 | | | | 3,699,110 | |
Franklin CLO VI Ltd. | | | | | | | | |
2007-6A, 2.87% due 08/09/195,6 | | | 4,165,000 | | | | 3,678,869 | |
Airlie CLO Ltd. | | | | | | | | |
2006-2A, 2.07% due 12/20/205,6 | | | 4,000,000 | | | | 3,665,800 | |
Longfellow Place CLO Ltd. | | | | | | | | |
2013-1A, 6.37% due 01/15/245,6 | | | 5,250,000 | | | | 3,660,113 | |
ACAS CLO Ltd. | | | | | | | | |
2013-1A, 6.72% due 04/20/255,6 | | | 4,000,000 | | | | 2,600,441 | |
2013-1A, 3.37% due 04/20/255,6 | | | 1,000,000 | | | | 947,899 | |
Adirondack Park CLO Ltd. | | | | | | | | |
2013-1A, 4.27% due 04/15/245,6 | | | 4,000,000 | | | | 3,540,212 | |
18 | THE GUGGENHEIM FUNDS SEMI-ANNUAL REPORT | SEE NOTES TO FINANCIAL STATEMENTS. |
CONSOLIDATED SCHEDULE OF INVESTMENTS (Unaudited)(continued) | March 31, 2016 |
MACRO OPPORTUNITIES FUND | |
| | | Face
Amount15 | | | Value | |
| | | | | | | |
Fifth Street Senior Loan Fund I LLC | | | | | | |
2015-1A, 4.37% due 01/20/275,6 | | $ | 3,500,000 | | | $ | 3,325,005 | |
Grayson CLO Ltd. | | | | | | | | |
2006-1A A2, 1.03% due 11/01/215,6 | | | 3,700,000 | | | | 3,322,421 | |
Ivy Hill Middle Market Credit Fund IX Ltd. | | | | | | | | |
9A C, 3.92% due 10/18/255,6 | | | 3,500,000 | | | | 3,256,689 | |
Marea CLO Ltd. | | | | | | | | |
2015-1A, 4.37% due 10/15/235,6 | | | 3,500,000 | | | | 3,213,340 | |
DIVCORE CLO Ltd. | | | | | | | | |
2013-1A B, 4.33% due 11/15/325,6 | | | 3,250,000 | | | | 3,200,199 | |
Primus Clo II Ltd. | | | | | | | | |
2007-2A, 1.57% due 07/15/215,6 | | | 3,500,000 | | | | 3,183,813 | |
Mountain Hawk I CLO Ltd. | | | | | | | | |
2013-1A, 3.34% due 01/20/245,6 | | | 3,400,000 | | | | 3,041,825 | |
Oaktree EIF II Series B1 Ltd. | | | | | | | | |
2015-B1A, 3.72% due 02/15/265,6 | | | 3,250,000 | | | | 2,988,448 | |
Rampart CLO Ltd. | | | | | | | | |
2007-1A, 4.11% due 10/25/215,6 | | | 3,000,000 | | | | 2,952,207 | |
NewMark Capital Funding CLO Ltd. | | | | | | | | |
2014-2A, 4.13% due 06/30/265,6 | | | 3,500,000 | | | | 2,927,009 | |
Neuberger Berman CLO XVIII Ltd. | | | | | | | | |
2014-18A B, 3.77% due 11/14/255,6 | | | 3,000,000 | | | | 2,913,831 | |
Vibrant CLO II Ltd. | | | | | | | | |
2013-2A, 3.37% due 07/24/245,6 | | | 3,000,000 | | | | 2,810,647 | |
Flatiron CLO Ltd. | | | | | | | | |
2013-1A, 4.21% due 01/17/265,6 | | | 3,200,000 | | | | 2,783,011 | |
Race Point V CLO Ltd. | | | | | | | | |
2014-5AR DR, 4.38% due 12/15/225,6 | | | 2,900,000 | | | | 2,775,270 | |
Marathon CLO VII Ltd. | | | | | | | | |
2014-7A B, 4.12% due 10/28/255,6 | | | 3,000,000 | | | | 2,726,250 | |
TICP CLO I Ltd. | | | | | | | | |
2014-1A, 5.12% due 04/26/265,6 | | | 4,200,000 | | | | 2,706,757 | |
Silvermore CLO Ltd. | | | | | | | | |
2014-1A, 3.62% due 05/15/265,6 | | | 3,000,000 | | | | 2,678,724 | |
Sound Point CLO I Ltd. | | | | | | | | |
2012-1A, 5.20% due 10/20/235,6 | | | 2,750,000 | | | | 2,646,826 | |
Mountain Hawk III CLO Ltd. | | | | | | | | |
2014-3A, 3.42% due 04/18/255,6 | | | 3,000,000 | | | | 2,636,880 | |
Fortress Credit BSL Ltd. | | | | | | | | |
2013-1A, 3.52% due 01/19/255,6 | | | 2,750,000 | | | | 2,628,712 | |
Vibrant CLO Ltd. | | | | | | | | |
2015-1A, 4.52% due 07/17/245,6 | | | 3,000,000 | | | | 2,615,826 | |
Steele Creek CLO Ltd. | | | | | | | | |
2014-1A C, 3.82% due 08/21/265,6 | | | 1,500,000 | | | | 1,385,573 | |
2015-1A, 4.62% due 02/21/275,6 | | | 1,350,000 | | | | 1,185,312 | |
Symphony CLO IX, LP | | | | | | | | |
2012-9A, 4.87% due 04/16/225,6 | | | 2,600,000 | | | | 2,497,984 | |
Apidos CLO XX | | | | | | | | |
2015-20A, 3.82% due 01/16/275,6 | | | 2,500,000 | | | | 2,455,930 | |
Galaxy XVIII CLO Ltd. | | | | | | | | |
2014-18A, 3.62% due 10/15/265,6 | | | 2,500,000 | | | | 2,450,094 | |
LCM X, LP | | | | | | | | |
2014-10A, 4.37% due 04/15/225,6 | | | 2,500,000 | | | | 2,425,000 | |
SEE NOTES TO FINANCIAL STATEMENTS. | THE GUGGENHEIM FUNDS SEMI-ANNUAL REPORT | 19 |
CONSOLIDATED SCHEDULE OF INVESTMENTS (Unaudited)(continued) | March 31, 2016 |
MACRO OPPORTUNITIES FUND | |
| | | Face
Amount15 | | | Value | |
| | | | | | | |
ALM VII R-2 Ltd. | | | | | | |
2013-7R2A, 4.07% due 04/24/245,6 | | $ | 2,500,000 | | | $ | 2,390,612 | |
Symphony CLO XII Ltd. | | | | | | | | |
2013-12A, 4.12% due 10/15/255,6 | | | 2,700,000 | | | | 2,377,080 | |
Marathon CLO VI Ltd. | | | | | | | | |
2014-6A, 3.47% due 05/13/255,6 | | | 2,750,000 | | | | 2,360,815 | |
Gallatin CLO VII Ltd. | | | | | | | | |
2014-1A, 4.38% due 07/15/235,6 | | | 2,500,000 | | | | 2,342,570 | |
Westwood CDO II Ltd. | | | | | | | | |
2007-2X, 2.41% due 04/25/22 | | | 1,550,000 | | | | 1,400,011 | |
2007-2A, 2.42% due 04/25/225,6 | | | 1,000,000 | | | | 903,233 | |
Symphony CLO XI Ltd. | | | | | | | | |
2013-11A, 4.62% due 01/17/255,6 | | | 2,500,000 | | | | 2,283,965 | |
West CLO Ltd. | | | | | | | | |
2013-1A, due 11/07/254,6 | | | 5,300,000 | | | | 1,357,911 | |
2013-1A, 3.52% due 11/07/255,6 | | | 1,000,000 | | | | 795,484 | |
Venture XVI CLO Ltd. | | | | | | | | |
2014-16A, 3.37% due 04/15/265,6 | | | 2,250,000 | | | | 2,034,275 | |
Venture XII CLO Ltd. | | | | | | | | |
2013-12A, 4.29% due 02/28/245,6 | | | 2,250,000 | | | | 1,994,162 | |
Callidus Debt Partners Clo Fund VI Ltd. | | | | | | | | |
2007-6A, 3.62% due 10/23/215,6 | | | 2,100,000 | | | | 1,956,429 | |
AMMC CLO XI Ltd. | | | | | | | | |
2012-11A, due 10/30/234,6 | | | 5,650,000 | | | | 1,952,193 | |
Gale Force 4 CLO Ltd. | | | | | | | | |
2007-4A, 4.12% due 08/20/215,6 | | | 2,000,000 | | | | 1,951,624 | |
Blue Hill CLO Ltd. | | | | | | | | |
2013-1A, 3.62% due 01/15/265,6 | | | 2,000,000 | | | | 1,946,702 | |
Cerberus Onshore II CLO LLC | | | | | | | | |
2014-1A C, 4.12% due 10/15/235,6 | | | 1,000,000 | | | | 993,750 | |
2014-1A D, 4.62% due 10/15/235,6 | | | 1,000,000 | | | | 925,369 | |
Limerock CLO II Ltd. | | | | | | | | |
2014-2A C1, 3.47% due 04/18/265,6 | | | 2,000,000 | | | | 1,916,847 | |
AMMC CLO XIV Ltd. | | | | | | | | |
2014-14A A3L, 3.42% due 07/27/265,6 | | | 2,000,000 | | | | 1,888,803 | |
OHA Credit Partners VII Ltd. | | | | | | | | |
2012-7A, 4.62% due 11/20/235,6 | | | 2,000,000 | | | | 1,863,429 | |
Venture XIII CLO Ltd. | | | | | | | | |
2013-13A SUB, due 06/10/254,6 | | | 4,790,000 | | | | 1,805,583 | |
Kingsland III Ltd. | | | | | | | | |
2006-3A C1, 2.22% due 08/24/215,6 | | | 1,890,000 | | | | 1,789,124 | |
Marathon CLO V Ltd. | | | | | | | | |
2013-5A, due 02/21/254,6 | | | 5,500,000 | | | | 1,751,886 | |
Regatta Funding Ltd. | | | | | | | | |
2007-1X, 3.93% due 06/15/205 | | | 1,800,000 | | | | 1,741,216 | |
Symphony CLO XV Ltd. | | | | | | | | |
2014-15A C, 3.82% due 10/17/265,6 | | | 1,750,000 | | | | 1,734,846 | |
OHA Credit Partners VI Ltd. | | | | | | | | |
2015-6A, 4.12% due 05/15/235,6 | | | 1,750,000 | | | | 1,715,556 | |
NXT Capital CLO LLC | | | | | | | | |
2015-1A, 4.77% due 04/21/275,6 | | | 2,000,000 | | | | 1,694,277 | |
Shackleton CLO | | | | | | | | |
2014-6A, 4.22% due 07/17/265,6 | | | 2,068,000 | | | | 1,688,555 | |
Octagon Investment Partners XV Ltd. | | | | | | | | |
2013-1A, 3.47% due 01/19/255,6 | | | 1,750,000 | | | | 1,687,719 | |
20 | THE GUGGENHEIM FUNDS SEMI-ANNUAL REPORT | SEE NOTES TO FINANCIAL STATEMENTS. |
CONSOLIDATED SCHEDULE OF INVESTMENTS (Unaudited)(continued) | March 31, 2016 |
MACRO OPPORTUNITIES FUND | |
| | | Face
Amount15 | | | Value | |
| | | | | | | |
Lime Street CLO Ltd. | | | | | | |
2007-1A D, 3.12% due 06/20/215,6 | | $ | 2,000,000 | | | $ | 1,652,180 | |
Canyon Capital CLO Ltd. | | | | | | | | |
2013-1A, 3.42% due 01/15/245,6 | | | 1,750,000 | | | | 1,649,697 | |
Shackleton II CLO Ltd. | | | | | | | | |
2012-2A D, 4.67% due 10/20/235,6 | | | 1,750,000 | | | | 1,621,027 | |
Carlyle Global Market Strategies | | | | | | | | |
2013-3X SUB, due 07/15/254 | | | 4,000,000 | | | | 1,588,985 | |
Jamestown CLO VI Ltd. | | | | | | | | |
2015-6A, 3.87% due 02/20/275,6 | | | 2,000,000 | | | | 1,565,484 | |
Octagon Investment Partners XIV Ltd. | | | | | | | | |
2012-1A, 7.12% due 01/15/245,6 | | | 2,550,000 | | | | 1,564,076 | |
Rockwall CDO Ltd. | | | | | | | | |
2007-1A A1LA, 0.87% due 08/01/245,6 | | | 1,610,353 | | | | 1,563,164 | |
Octagon Loan Funding Ltd. | | | | | | | | |
2014-1A, due 11/18/264,6 | | | 3,000,000 | | | | 1,543,400 | |
MCF CLO III LLC | | | | | | | | |
2014-3A, 3.42% due 01/20/245,6 | | | 1,750,000 | | | | 1,532,734 | |
Copper River CLO Ltd. | | | | | | | | |
2007-1A INC, due 01/20/214,5,6 | | | 8,150,000 | | | | 1,531,360 | |
Landmark VIII CLO Ltd. | | | | | | | | |
2006-8A, 2.07% due 10/19/205,6 | | | 1,650,000 | | | | 1,511,432 | |
Madison Park Funding XI Ltd. | | | | | | | | |
2013-11A, 4.12% due 10/23/255,6 | | | 1,750,000 | | | | 1,491,876 | |
OZLM Funding V Ltd. | | | | | | | | |
2013-5A B, 3.62% due 01/17/265,6 | | | 1,500,000 | | | | 1,460,663 | |
MCF CLO I LLC | | | | | | | | |
2013-1A C, 4.17% due 04/20/235,6 | | | 1,500,000 | | | | 1,457,062 | |
Greywolf CLO III Ltd. | | | | | | | | |
2014-1A B, 3.47% due 04/22/265,6 | | | 1,500,000 | | | | 1,443,573 | |
Symphony CLO X Ltd. | | | | | | | | |
2015-10A, 4.47% due 07/23/235,6 | | | 1,500,000 | | | | 1,421,401 | |
MCF CLO IV LLC | | | | | | | | |
2014-1A E, 6.22% due 10/15/255,6 | | | 1,750,000 | | | | 1,414,857 | |
Avalon IV Capital Ltd. | | | | | | | | |
2014-1A, 4.47% due 04/17/235,6 | | | 1,500,000 | | | | 1,412,004 | |
Kingsland IV Ltd. | | | | | | | | |
2007-4A D, 2.07% due 04/16/215,6 | | | 1,500,000 | | | | 1,313,921 | |
Covenant Credit Partners CLO I Ltd. | | | | | | | | |
2014-1A C, 3.54% due 07/20/265,6 | | | 1,500,000 | | | | 1,292,910 | |
LCM XI, LP | | | | | | | | |
2012-11A, 5.77% due 04/19/225,6 | | | 1,500,000 | | | | 1,276,868 | |
Duane Street CLO IV Ltd. | | | | | | | | |
2007-4A D, 2.87% due 11/14/215,6 | | | 1,400,000 | | | | 1,269,072 | |
OHA Park Avenue CLO I Ltd. | | | | | | | | |
2007-1A, 3.88% due 03/14/225,6 | | | 1,413,497 | | | | 1,255,041 | |
Keuka Park CLO Ltd. | | | | | | | | |
2013-1A, due 10/21/244,6 | | | 3,000,000 | | | | 1,247,122 | |
TICP CLO II Ltd. | | | | | | | | |
2014-2A B, 3.62% due 07/20/265,6 | | | 1,300,000 | | | | 1,201,298 | |
ICE EM CLO | | | | | | | | |
2007-1A, 1.71% due 08/15/225,6 | | | 1,250,000 | | | | 1,197,790 | |
Finn Square CLO Ltd. | | | | | | | | |
2012-1A SUB, due 12/24/234,6 | | | 3,250,000 | | | | 1,137,814 | |
GoldenTree Loan Opportunities III Ltd. | | | | | | | | |
2007-3A, 3.82% due 05/01/225,6 | | | 1,250,000 | | | | 1,126,465 | |
SEE NOTES TO FINANCIAL STATEMENTS. | THE GUGGENHEIM FUNDS SEMI-ANNUAL REPORT | 21 |
CONSOLIDATED SCHEDULE OF INVESTMENTS (Unaudited)(continued) | March 31, 2016 |
MACRO OPPORTUNITIES FUND | |
| | | Face
Amount15 | | | Value | |
| | | | | | | |
COA Summit CLO Limited | | | | | | |
2014-1A C, 4.47% due 04/20/235,6 | | $ | 1,250,000 | | | $ | 1,112,688 | |
ALM VI Ltd. | | | | | | | | |
2012-6A, due 07/15/264,6 | | | 1,600,000 | | | | 1,071,865 | |
Black Diamond CLO Luxembourg S.A. | | | | | | | | |
2007-1A, 1.31% due 04/29/195,6 | | | 1,100,000 | | | | 1,025,251 | |
Resource Capital Corporation CRE Notes Ltd. | | | | | | | | |
2013-CRE1, 3.94% due 12/15/285,6 | | | 1,000,000 | | | | 991,202 | |
Gleneagles CLO Ltd. | | | | | | | | |
2005-1A, 1.52% due 11/01/175,6 | | | 1,000,000 | | | | 988,083 | |
Palmer Square CLO Ltd. | | | | | | | | |
2014-1A, 3.17% due 10/17/225,6 | | | 1,000,000 | | | | 963,480 | |
Eastland CLO Ltd. | | | | | | | | |
2007-1A A3, 1.02% due 05/01/225,6 | | | 1,000,000 | | | | 942,874 | |
Halcyon Loan Investors CLO II, Inc. | | | | | | | | |
2007-2A, 2.02% due 04/24/215,6 | | | 1,000,000 | | | | 904,414 | |
OHA Loan Funding Ltd. | | | | | | | | |
2013-1A, 4.22% due 07/23/255,6 | | | 1,000,000 | | | | 891,336 | |
WhiteHorse VIII Ltd. | | | | | | | | |
2014-1A, 3.37% due 05/01/265,6 | | | 1,000,000 | | | | 889,950 | |
Cavalry CLO II | | | | | | | | |
2013-2A, 4.62% due 01/17/245,6 | | | 1,000,000 | | | | 874,868 | |
Halcyon Loan Investors CLO I, Inc. | | | | | | | | |
2006-1A, 4.12% due 11/20/205,6 | | | 1,000,000 | | | | 868,603 | |
Ares CLO Ltd. | | | | | | | | |
2013-1X, due 04/15/254 | | | 1,660,000 | | | | 788,720 | |
Garrison Funding Ltd. | | | | | | | | |
2013-2A B, 5.27% due 09/25/235,6 | | | 750,000 | | | | 736,911 | |
Venture CLO Ltd. | | | | | | | | |
2013-14A C, 3.39% due 08/28/255,6 | | | 750,000 | | | | 722,239 | |
Venture XV CLO Ltd. | | | | | | | | |
2013-15A, 3.72% due 07/15/255,6 | | | 750,000 | | | | 715,908 | |
Ares XXV CLO Ltd. | | | | | | | | |
2012-25A SUB, due 01/17/246 | | | 2,000,000 | | | | 655,469 | |
Westwood CDO I Ltd. | | | | | | | | |
2006-1A B, 1.27% due 03/25/215,6 | | | 700,000 | | | | 653,224 | |
Fortress Credit Opportunities | | | | | | | | |
2005-1A, 0.86% due 07/15/195,18 | | | 501,315 | | | | 474,628 | |
Marathon CLO Ltd. | | | | | | | | |
due 02/21/254 | | | 1,000,000 | | | | 318,525 | |
Connecticut Valley Structured Credit CDO III Ltd. | | | | | | | | |
2006-3A, 6.67% due 03/23/236 | | | 34,977 | | | | 34,900 | |
BlackRock Senior Income Series Corp. | | | | | | | | |
2004-1X NOTE due 09/15/16†††,4 | | | 2,382,940 | | | | 2 | |
Marathon CLO II Ltd. | | | | | | | | |
2005-2A INC due 12/20/19†††,4,5,6 | | | 2,250,000 | | | | 2 | |
Total Collateralized Loan Obligations | | | | 704,588,757 | |
| | | | | | | | | |
Transport-Aircraft - 5.3% | |
Apollo Aviation Securitization Equity Trust | | | | | | | | |
2014-1 B, 7.38% due 12/15/295 | | | 17,850,962 | | | | 17,690,302 | |
2014-1 A, 5.12% due 12/15/295 | | | 16,947,115 | | | | 16,311,599 | |
ECAF I Ltd. | | | | | | | | |
2015-1A, 5.80% due 06/15/406 | | | 28,241,291 | | | | 27,535,258 | |
22 | THE GUGGENHEIM FUNDS SEMI-ANNUAL REPORT | SEE NOTES TO FINANCIAL STATEMENTS. |
CONSOLIDATED SCHEDULE OF INVESTMENTS (Unaudited)(continued) | March 31, 2016 |
MACRO OPPORTUNITIES FUND | |
| | | Face
Amount15 | | | Value | |
| | | | | | | |
Castlelake Aircraft Securitization Trust | | | | | | |
2014-1 B, 7.50% due 02/15/296 | | $ | 12,719,569 | | | $ | 12,547,855 | |
2014-1 A1, 5.25% due 02/15/296 | | | 6,951,393 | | | | 6,892,306 | |
AIM Aviation Finance Ltd. | | | | | | | | |
2015-1A B1, 5.07% due 02/15/406 | | | 17,022,321 | | | | 16,870,653 | |
Castle Aircraft SecuritizationTrust | | | | | | | | |
2015-1A, 5.75% due 12/15/406 | | | 12,216,250 | | | | 11,910,844 | |
Stripes | | | | | | | | |
2013-1 A1, 3.93% due 03/20/23†††,2 | | | 9,108,771 | | | | 8,888,248 | |
AASET | | | | | | | | |
2014-1 C, 10.00% due 08/15/30††† | | | 6,771,574 | | | | 6,675,147 | |
Atlas Ltd. | | | | | | | | |
2014-1 A, 4.87% due 12/15/39††† | | | 6,721,475 | | | | 6,620,720 | |
Turbine Engines Securitization Ltd. | | | | | | | | |
2013-1A A, 5.13% due 12/13/486 | | | 3,806,374 | | | | 3,690,101 | |
2013-1A, 6.38% due 12/13/4818 | | | 2,542,646 | | | | 2,497,781 | |
Rise Ltd. | | | | | | | | |
2014-1, 4.74% due 02/12/39 | | | 6,096,067 | | | | 5,989,386 | |
Apollo Aviation Securitization Equity Trust 16-1 | | | | | | | | |
2016-1A, 6.50% due 03/17/366 | | | 6,000,000 | | | | 5,877,943 | |
Emerald Aviation Finance Ltd. | | | | | | | | |
2013-1 B, 6.35% due 10/15/386 | | | 5,573,384 | | | | 5,650,018 | |
Eagle I Ltd. | | | | | | | | |
2014-1A, 5.29% due 12/15/396 | | | 4,839,844 | | | | 4,694,648 | |
Willis Engine Securitization Trust II | | | | | | | | |
2012-A, 5.50% due 09/15/376 | | | 4,528,264 | | | | 4,406,001 | |
AABS Ltd. | | | | | | | | |
2013-1, 4.87% due 01/15/38 | | | 3,015,341 | | | | 2,974,634 | |
Airplanes Pass Through Trust | | | | | | | | |
2001-1A A9, 0.99% due 03/15/195,18 | | | 3,791,006 | | | | 947,752 | |
Total Transport-Aircraft | | | | | | | 168,671,196 | |
| | | | | | | | | |
Collateralized Debt Obligations - 4.8% | |
Triaxx Prime CDO Ltd. | | | | | | | | |
2006-2A A1A, 0.70% due 10/02/395,6 | | | 40,308,205 | | | | 37,900,546 | |
RFTI Issuer Ltd. | | | | | | | | |
2015-FL1 B, 4.31% due 08/15/30†††,5,18 | | | 27,841,000 | | | | 27,450,391 | |
Gramercy Real Estate CDO Ltd. | | | | | | | | |
2007-1A A1, 0.90% due 08/15/565,6 | | | 13,918,978 | | | | 12,248,701 | |
FDF I Ltd. | | | | | | | | |
2015-1A, 5.50% due 11/12/30†††,6 | | | 12,000,000 | | | | 12,122,280 | |
RAIT CRE CDO I Ltd. | | | | | | | | |
2006-1X A1B, 0.75% due 11/20/46 | | | 9,459,680 | | | | 8,802,714 | |
Highland Park CDO I Ltd. | | | | | | | | |
2006-1A, 1.03% due 11/25/515,6 | | | 8,250,000 | | | | 6,220,087 | |
2006-1A A1, 0.96% due 11/25/515,6 | | | 2,525,074 | | | | 2,386,683 | |
N-Star REL CDO VIII Ltd. | | | | | | | | |
2006-8A A2, 0.79% due 02/01/415,6 | | | 8,100,000 | | | | 7,796,380 | |
2006-8A A1, 0.72% due 02/01/415,6 | | | 756,369 | | | | 742,730 | |
SRERS Funding Ltd. | | | | | | | | |
2011-RS A1B1, 0.69% due 05/09/465,6 | | | 8,252,725 | | | | 7,895,360 | |
SEE NOTES TO FINANCIAL STATEMENTS. | THE GUGGENHEIM FUNDS SEMI-ANNUAL REPORT | 23 |
CONSOLIDATED SCHEDULE OF INVESTMENTS (Unaudited)(continued) | March 31, 2016 |
MACRO OPPORTUNITIES FUND | |
| | | Face
Amount15 | | | Value | |
| | | | | | | |
Static Repackaging Trust Ltd. | | | | | | |
2004-1A, 1.67% due 05/10/395,6 | | $ | 7,348,472 | | | $ | 6,950,949 | |
Wrightwood Capital Real Estate CDO Ltd. | | | | | | | | |
2005-1A B, 1.05% due 11/21/405,6 | | | 5,000,000 | | | | 4,745,023 | |
N-Star Real Estate CDO IX Ltd. | | | | | | | | |
0.75% due 02/01/412 | | | 3,967,835 | | | | 3,896,486 | |
Putnam Structured Product CDO Ltd. | | | | | | | | |
2002-1A A2, 1.12% due 01/10/385,6 | | | 3,641,911 | | | | 3,488,160 | |
Banco Bradesco SA | | | | | | | | |
2014-1B, 5.43% due 03/12/26†††,2 | | | 3,197,105 | | | | 3,228,341 | |
Helios Series I Multi Asset CBO Ltd. | | | | | | | | |
2001-1A, 1.59% due 12/13/365,6 | | | 2,657,663 | | | | 2,606,414 | |
Pasadena CDO Ltd. | | | | | | | | |
2002-1A, 1.42% due 06/19/375,6 | | | 1,282,760 | | | | 1,245,311 | |
Total Collateralized Debt Obligations | | | | 149,726,556 | |
| | | | | | | | | |
Financial - 0.4% | |
CIC Receivables Master Trust | | | | | | | | |
4.89% due 10/07/21†††,2 | | | 6,500,000 | | | | 6,484,075 | |
CCR Incorporated MT100 Payment Rights Master Trust | | | | | | | | |
2010-CX C, 0.88% due 07/10/175 | | | 4,544,577 | | | | 4,485,343 | |
Garanti Diversified Payment Rights Finance Co. | | | | | | | | |
2007-A A1, 0.81% due 07/09/175 | | | 156,000 | | | | 152,820 | |
Total Financial | | | | | | | 11,122,238 | |
| | | Face
Amount15 | | | Value | |
| | | | | | | |
Credit Card - 0.0% | |
Credit Card Pass-Through Trust | | | | | | |
2012-BIZ A, 0.00% due 12/15/496 | | | 281,909 | | | | 222,990 | |
Total Asset-Backed Securities | | | | | |
(Cost $1,106,437,577) | | | | | | | 1,034,331,737 | |
| | | | | | | | | |
SENIOR FLOATING RATE INTERESTS†† - 20.7% | |
Consumer, Cyclical - 4.8% | |
PETCO Animal Supplies, Inc. | | | | | | | | |
5.75% due 01/26/23 | | | 10,350,000 | | | | 10,334,164 | |
5.62% due 01/26/23 | | | 5,000,000 | | | | 4,992,500 | |
Belk, Inc. | | | | | | | | |
5.75% due 12/12/22 | | | 12,050,000 | | | | 10,624,123 | |
Mavis Tire | | | | | | | | |
6.25% due 11/02/20†††,2 | | | 9,353,000 | | | | 9,150,039 | |
Party City Holdings, Inc. | | | | | | | | |
4.25% due 08/19/22 | | | 8,467,097 | | | | 8,389,454 | |
Advantage Sales & Marketing LLC | | | | | | | | |
4.25% due 07/23/21 | | | 8,230,569 | | | | 8,073,694 | |
3.39% due 07/25/192 | | | 150,000 | | | | 137,181 | |
Sears Holdings Corp. | | | | | | | | |
5.50% due 06/30/18 | | | 7,591,439 | | | | 7,211,867 | |
Life Time Fitness | | | | | | | | |
4.25% due 06/10/22 | | | 6,861,197 | | | | 6,768,571 | |
Navistar, Inc. | | | | | | | | |
6.50% due 08/07/20 | | | 6,483,750 | | | | 5,900,213 | |
Thame & London Ltd. | | | | | | | | |
6.00% due 06/19/17 | | GBP | 4,000,000 | | | | 5,688,021 | |
Sky Bet | | | | | | | | |
6.50% due 02/25/22 | | GBP | 3,700,000 | | | | 5,303,192 | |
National Vision, Inc. | | | | | | | | |
4.00% due 03/12/21 | | | 4,727,727 | | | | 4,582,964 | |
6.75% due 03/11/22 | | | 650,000 | | | | 583,375 | |
Ceridian Corp. | | | | | | | | |
4.50% due 09/15/20 | | | 4,678,196 | | | | 4,502,764 | |
Eyemart Express | | | | | | | | |
5.00% due 12/17/21 | | | 4,441,250 | | | | 4,363,528 | |
Neiman Marcus Group, Inc. | | | | | | | | |
4.25% due 10/25/20 | | | 4,696,408 | | | | 4,293,691 | |
24 | THE GUGGENHEIM FUNDS SEMI-ANNUAL REPORT | SEE NOTES TO FINANCIAL STATEMENTS. |
CONSOLIDATED SCHEDULE OF INVESTMENTS (Unaudited)(continued) | March 31, 2016 |
MACRO OPPORTUNITIES FUND | |
| | | Face
Amount15 | | | Value | |
| | | | | | | |
BJ’s Wholesale Club, Inc. | | | | | | |
4.50% due 09/26/19 | | $ | 3,250,648 | | | $ | 3,159,890 | |
Ipreo Holdings | | | | | | | | |
4.00% due 08/06/21 | | | 3,255,748 | | | | 3,088,891 | |
Mattress Firm | | | | | | | | |
6.25% due 10/20/21 | | | 2,745,142 | | | | 2,710,827 | |
Equinox Fitness | | | | | | | | |
5.00% due 01/31/20 | | | 2,639,416 | | | | 2,624,900 | |
BBB Industries, LLC | | | | | | | | |
6.00% due 11/03/21 | | | 1,463,114 | | | | 1,442,382 | |
4.43% due 11/04/192 | | | 1,150,000 | | | | 1,035,127 | |
Petsmart, Inc. | | | | | | | | |
4.25% due 03/11/22 | | | 2,290,471 | | | | 2,279,591 | |
Fitness International LLC | | | | | | | | |
5.50% due 07/01/20 | | | 2,358,739 | | | | 2,270,286 | |
Acosta, Inc. | | | | | | | | |
4.25% due 09/26/21 | | | 2,294,833 | | | | 2,236,223 | |
PF Chang’s | | | | | | | | |
4.25% due 07/02/19 | | | 2,210,688 | | | | 2,100,153 | |
CHG Healthcare Services, Inc. | | | | | | | | |
4.25% due 11/19/19 | | | 2,058,813 | | | | 2,043,886 | |
Men’s Wearhouse | | | | | | | | |
4.50% due 06/18/21 | | | 2,075,470 | | | | 1,993,759 | |
Dealer Tire LLC | | | | | | | | |
5.50% due 12/22/21 | | | 1,980,000 | | | | 1,975,050 | |
Packers Holdings | | | | | | | | |
5.00% due 12/02/21 | | | 1,805,195 | | | | 1,798,426 | |
Capital Automotive LP | | | | | | | | |
6.00% due 04/30/20 | | | 1,770,000 | | | | 1,763,363 | |
Kate Spade & Co. | | | | | | | | |
4.00% due 04/09/21 | | | 1,629,323 | | | | 1,604,883 | |
Med Finance Merger Sub LLC | | | | | | | | |
7.25% due 08/16/21†††,2 | | | 1,281,366 | | | | 1,253,176 | |
7.25% due 08/14/21†††,2 | | | 312,047 | | | | 309,254 | |
Southern Graphics, Inc. | | | | | | | | |
4.25% due 10/17/19 | | | 1,475,063 | | | | 1,458,468 | |
Compucom Systems, Inc. | | | | | | | | |
4.25% due 05/11/20 | | | 1,895,648 | | | | 1,326,953 | |
1-800 Contacts | | | | | | | | |
5.25% due 01/22/23 | | | 1,300,000 | | | | 1,300,000 | |
NPC International, Inc. | | | | | | | | |
4.75% due 12/28/18 | | | 1,290,205 | | | | 1,283,754 | |
Alexander Mann Solutions Ltd. | | | | | | |
5.75% due 12/20/19 | | | 1,166,986 | | | | 1,143,646 | |
Jacobs Entertainment, Inc. | | | | | | | | |
5.25% due 10/29/18 | | | 1,175,162 | | | | 1,139,907 | |
AlixPartners, LLP | | | | | | | | |
4.50% due 07/28/22 | | | 1,096,000 | | | | 1,092,986 | |
California Pizza Kitchen, Inc. | | | | | | | | |
5.25% due 03/29/18 | | | 927,421 | | | | 789,857 | |
Sterling Intermidiate Corp. | | | | | | | | |
5.75% due 06/20/22 | | | 521,034 | | | | 508,879 | |
Container Store, Inc. | | | | | | | | |
4.25% due 04/06/19 | | | 325,516 | | | | 246,848 | |
Rite Aid Corp. | | | | | | | | |
5.75% due 08/21/20 | | | 100,000 | | | | 100,208 | |
Total Consumer, Cyclical | | | | | | | 146,980,914 | |
| | | | | | | | | |
Industrial - 4.2% | |
Travelport Holdings LLC | | | | | | | | |
5.75% due 09/02/21 | | | 28,495,400 | | | | 28,445,532 | |
Gates Global, Inc. | | | | | | | | |
4.25% due 07/05/21 | | | 8,712,247 | | | | 8,205,890 | |
DAE Aviation | | | | | | | | |
5.25% due 07/07/22 | | | 6,584,625 | | | | 6,555,849 | |
LSF9 Cypress Holdings LLC | | | | | | | | |
7.25% due 10/09/22 | | | 5,486,250 | | | | 5,193,668 | |
Springs Industries, Inc. | | | | | | | | |
7.50% due 06/01/21†††,2 | | | 5,100,000 | | | | 4,980,120 | |
CareCore National LLC | | | | | | | | |
5.50% due 03/05/21 | | | 5,091,923 | | | | 4,735,489 | |
Connolly Corp. | | | | | | | | |
4.50% due 05/14/21 | | | 3,951,427 | | | | 3,882,277 | |
NVA Holdings, Inc. | | | | | | | | |
4.75% due 08/14/21 | | | 2,834,294 | | | | 2,805,951 | |
8.00% due 08/12/22 | | | 750,000 | | | | 727,500 | |
SIRVA Worldwide, Inc. | | | | | | | | |
7.50% due 03/27/192 | | | 3,701,595 | | | | 3,498,007 | |
GYP Holdings III Corp. | | | | | | | | |
4.75% due 04/01/21 | | | 3,693,921 | | | | 3,480,376 | |
Hardware Holdings LLC | | | | | | | | |
6.75% due 03/30/20†††,2 | | | 3,456,250 | | | | 3,369,844 | |
Flakt Woods | | | | | | | | |
2.63% due 03/20/17†††,2 | | EUR | 2,678,249 | | | | 3,018,525 | |
SEE NOTES TO FINANCIAL STATEMENTS. | THE GUGGENHEIM FUNDS SEMI-ANNUAL REPORT | 25 |
CONSOLIDATED SCHEDULE OF INVESTMENTS (Unaudited)(continued) | March 31, 2016 |
MACRO OPPORTUNITIES FUND | |
| | | Face
Amount15 | | | Value | |
| | | | | | | |
Pro Mach Group, Inc. | | | | | | |
4.75% due 10/22/21 | | $ | 2,773,492 | | | $ | 2,708,787 | |
Berlin Packaging LLC | | | | | | | | |
4.50% due 10/01/21 | | | 2,663,604 | | | | 2,634,757 | |
AlliedBarton Security Services LLC | | | | | | | | |
4.25% due 02/12/21 | | | 2,685,844 | | | | 2,618,698 | |
Nord Anglia Education Finance LLC | | | | | | | | |
5.00% due 03/31/21 | | | 2,584,607 | | | | 2,541,004 | |
KC Merger Sub, Inc. | | | | | | | | |
6.00% due 08/12/22 | | | 2,388,997 | | | | 2,356,149 | |
V.Group Ltd. | | | | | | | | |
4.75% due 06/25/21 | | | 2,258,833 | | | | 2,202,363 | |
Power Borrower, LLC | | | | | | | | |
4.25% due 05/06/20 | | | 1,762,707 | | | | 1,727,453 | |
8.25% due 11/06/20 | | | 275,000 | | | | 254,375 | |
Mast Global | | | | | | | | |
7.75% due 09/12/19†††,2 | | | 1,842,916 | | | | 1,821,539 | |
CHI Overhead Doors, Inc. | | | | | | | | |
4.75% due 07/29/22 | | | 1,840,750 | | | | 1,813,139 | |
National Technical Systems | | | | | | | | |
7.00% due 06/12/21†††,2 | | | 1,896,353 | | | | 1,803,432 | |
Thermasys Corp. | | | | | | | | |
5.26% due 05/03/19 | | | 2,259,375 | | | | 1,793,379 | |
CPM Holdings, Inc. | | | | | | | | |
6.00% due 04/11/22 | | | 1,687,250 | | | | 1,659,832 | |
Survitec | | | | | | | | |
5.34% due 02/24/222 | | GBP | 1,125,000 | | | | 1,565,418 | |
Milacron | | | | | | | | |
4.50% due 09/28/20 | | | 1,584,658 | | | | 1,564,849 | |
CEVA Logistics US Holdings | | | | | | | | |
6.50% due 03/19/21 | | | 1,850,389 | | | | 1,520,409 | |
Swissport Investments S.A. | | | | | | | | |
6.25% due 01/20/22 | | EUR | 1,250,000 | | | | 1,413,196 | |
Dematic S.A. | | | | | | | | |
4.25% due 12/27/19 | | | 1,403,686 | | | | 1,389,060 | |
Capstone Logistics | | | | | | | | |
5.50% due 10/07/21 | | | 1,405,327 | | | | 1,375,463 | |
Goodpack Ltd. | | | | | | | | |
4.75% due 09/09/21 | | | 1,469,269 | | | | 1,355,401 | |
Hillman Group, Inc. | | | | | | | | |
4.50% due 06/30/21 | | | 786,000 | | | | 764,715 | |
3.81% due 06/28/192 | | | 614,286 | | | | 570,620 | |
CEVA Group Plc (United Kingdom) | | | | | | | | |
6.50% due 03/19/21 | | | 1,298,105 | | | | 1,066,614 | |
due 03/19/1910 | | | 220,000 | | | | 193,394 | |
Data Device Corp. | | | | | | | | |
7.00% due 07/15/202 | | | 1,261,163 | | | | 1,251,704 | |
ProAmpac | | | | | | | | |
5.75% due 08/18/22 | | | 1,271,813 | | | | 1,242,408 | |
API Technologies Corp. | | | | | | | | |
10.00% due 02/06/18†††,2 | | | 1,123,009 | | | | 1,130,870 | |
CEVA Logistics Holdings BV (Dutch) | | | | | | | | |
6.50% due 03/19/21 | | | 1,344,954 | | | | 1,105,109 | |
USIC Holding, Inc. | | | | | | | | |
4.00% due 07/10/20 | | | 1,066,495 | | | | 1,045,165 | |
SI Organization | | | | | | | | |
5.75% due 11/22/19 | | | 1,050,693 | | | | 1,040,186 | |
Constantinople Acquisition GmbH | | | | | | | | |
4.75% due 04/30/22 | | | 990,000 | | | | 985,050 | |
Exopack Holdings SA | | | | | | | | |
4.50% due 05/08/19 | | | 789,350 | | | | 768,629 | |
Mitchell International, Inc. | | | | | | | | |
8.50% due 10/11/21 | | | 701,000 | | | | 615,128 | |
Hunter Defense Technologies | | | | | | | | |
due 08/05/192,10 | | | 750,000 | | | | 600,000 | |
Headwaters, Inc. | | | | | | | | |
4.50% due 03/24/22 | | | 496,250 | | | | 497,491 | |
Douglas Dynamics, LLC | | | | | | | | |
5.25% due 12/31/21 | | | 493,750 | | | | 492,516 | |
Hunter Fan Co. | | | | | | | | |
6.50% due 12/20/172 | | | 486,450 | | | | 481,585 | |
NANA Development Corp. | | | | | | | | |
8.00% due 03/15/182 | | | 520,000 | | | | 455,000 | |
Tank Holdings Corp. | | | | | | | | |
5.25% due 03/16/22 | | | 470,652 | | | | 449,670 | |
Doncasters Group Ltd. | | | | | | | | |
9.50% due 10/09/20 | | | 456,207 | | | | 410,586 | |
CEVA Logistics Canada, ULC | | | | | | | | |
6.50% due 03/19/21 | | | 231,299 | | | | 190,051 | |
Wencor Group | | | | | | | | |
3.94% due 06/19/19 | | | 169,231 | | | | 156,477 | |
26 | THE GUGGENHEIM FUNDS SEMI-ANNUAL REPORT | SEE NOTES TO FINANCIAL STATEMENTS. |
CONSOLIDATED SCHEDULE OF INVESTMENTS (Unaudited)(continued) | March 31, 2016 |
MACRO OPPORTUNITIES FUND | |
| | | Face
Amount15 | | | Value | |
| | | | | | | |
Camp Systems International | | | | | | |
8.25% due 11/29/19 | | $ | 120,000 | | | $ | 108,000 | |
Total Industrial | | | | | | | 130,638,699 | |
| | | | | | | | | |
Technology - 3.9% | |
Avaya, Inc. | | | | | | | | |
6.25% due 05/29/20 | | | 14,195,682 | | | | 9,445,239 | |
6.50% due 03/30/18 | | | 6,119,644 | | | | 4,482,639 | |
Epicor Software | | | | | | | | |
4.75% due 06/01/22 | | | 11,413,750 | | | | 10,795,467 | |
TIBCO Software, Inc. | | | | | | | | |
6.50% due 12/04/20 | | | 11,691,707 | | | | 10,481,615 | |
Deltek, Inc. | | | | | | | | |
5.00% due 06/25/22 | | | 8,261,586 | | | | 8,209,952 | |
Solera LLC | | | | | | | | |
5.75% due 03/03/23 | | | 7,850,000 | | | | 7,834,614 | |
Advanced Computer Software | | | | | | | | |
10.50% due 01/31/23 | | | 4,750,000 | | | | 4,358,125 | |
6.50% due 03/18/22 | | | 3,465,000 | | | | 3,326,400 | |
Nimbus Acquisition Bidco Ltd. | | | | | | | | |
7.25% due 07/15/21†††,2 | | GBP | 5,050,000 | | | | 7,005,590 | |
EIG Investors Corp. | | | | | | | | |
6.00% due 02/09/232 | | | 4,600,000 | | | | 4,255,000 | |
6.23% due 11/09/19 | | | 2,693,272 | | | | 2,568,708 | |
Informatica Corp. | | | | | | | | |
4.50% due 08/05/22 | | | 6,368,000 | | | | 6,240,640 | |
Severin Acquisition LLC | | | | | | | | |
5.88% due 07/30/21†††,2 | | | 3,482,500 | | | | 3,428,870 | |
6.00% due 07/30/21†††,2 | | | 2,057,000 | | | | 2,037,047 | |
Micro Focus International plc | | | | | | | | |
5.25% due 11/19/21 | | | 4,973,539 | | | | 4,957,375 | |
Microsemi Corp. | | | | | | | | |
5.25% due 01/15/23 | | | 4,246,885 | | | | 4,263,490 | |
Greenway Medical Technologies | | | | | | | | |
6.00% due 11/04/202 | | | 3,567,875 | | | | 3,068,373 | |
9.25% due 11/04/212 | | | 550,000 | | | | 423,500 | |
Verisure Cayman 2 | | | | | | | | |
5.25% due 10/10/22 | | EUR | 2,450,000 | | | | 2,790,884 | |
CPI Acquisition, Inc. | | | | | | | | |
5.50% due 08/17/22 | | | 2,502,372 | | | | 2,474,221 | |
LANDesk Group, Inc. | | | | | | | | |
5.00% due 02/25/20 | | | 2,390,960 | | | | 2,331,186 | |
Mirion Technologies | | | | | | | | |
5.75% due 03/31/22 | | | 2,233,125 | | | | 2,199,628 | |
The Active Network, Inc. | | | | | | | | |
5.50% due 11/13/20 | | | 2,041,497 | | | | 1,934,318 | |
Sparta Holding Corp. | | | | | | | | |
6.50% due 07/28/20††† | | | 1,814,608 | | | | 1,801,528 | |
Wall Street Systems | | | | | | | | |
4.25% due 04/30/21 | | | 1,786,405 | | | | 1,766,308 | |
Infor, Inc. | | | | | | | | |
3.75% due 06/03/20 | | | 1,448,309 | | | | 1,402,369 | |
SolarWinds Holdings, Inc. | | | | | | | | |
6.50% due 02/03/23 | | EUR | 1,200,000 | | | | 1,354,839 | |
GlobalLogic Holdings, Inc. | | | | | | | | |
6.25% due 05/31/19 | | | 1,176,000 | | | | 1,149,540 | |
Flexera Software LLC | | | | | | | | |
4.50% due 04/02/20 | | | 819,873 | | | | 815,265 | |
8.00% due 04/02/21 | | | 350,000 | | | | 323,750 | |
Aspect Software, Inc. | | | | | | | | |
9.50% due 09/30/16 | | | 1,125,432 | | | | 1,114,178 | |
Eze Castle Software, Inc. | | | | | | | | |
4.00% due 04/06/20 | | | 693,004 | | | | 686,074 | |
7.25% due 04/05/21 | | | 400,000 | | | | 376,000 | |
MRI Software LLC | | | | | | | | |
5.25% due 06/23/21 | | | 995,000 | | | | 980,075 | |
CCC Information Services, Inc. | | | | | | | | |
4.00% due 12/20/19 | | | 989,012 | | | | 970,468 | |
Hyland Software, Inc. | | | | | | | | |
4.75% due 07/01/22 | | | 724,296 | | | | 719,769 | |
Quorum Business Solutions | | | | | | | | |
5.75% due 08/06/212 | | | 663,300 | | | | 653,351 | |
First Data Corp. | | | | | | | | |
7.25% due 03/24/21 | | | 178,213 | | | | 177,628 | |
Total Technology | | | | | | | 123,204,023 | |
| | | | | | | | | |
Consumer, Non-cyclical - 3.3% | |
Albertson’s (Safeway) Holdings LLC | | | | | | | | |
5.50% due 08/25/21 | | | 28,286,250 | | | | 28,300,393 | |
IHC Holding Corp. | | | | | | | | |
7.00% due 04/30/21†††,2 | | | 7,462,500 | | | | 7,278,176 | |
SEE NOTES TO FINANCIAL STATEMENTS. | THE GUGGENHEIM FUNDS SEMI-ANNUAL REPORT | 27 |
CONSOLIDATED SCHEDULE OF INVESTMENTS (Unaudited)(continued) | March 31, 2016 |
MACRO OPPORTUNITIES FUND | |
| | | Face
Amount15 | | | Value | |
| | | | | | | |
Affordable Care Holdings Corp. | | | | | | |
5.75% due 10/24/22 | | $ | 7,231,875 | | | $ | 7,114,357 | |
American Seafoods | | | | | | | | |
6.00% due 08/19/212 | | | 5,925,000 | | | | 5,747,250 | |
One Call Medical, Inc. | | | | | | | | |
5.00% due 11/27/20 | | | 6,102,769 | | | | 5,355,180 | |
Americold Realty Operating Partnership, LP | | | | | | | | |
6.50% due 12/01/22 | | | 5,236,875 | | | | 5,223,783 | |
At Home Holding III Corp. | | | | | | | | |
5.00% due 06/03/22 | | | 4,962,500 | | | | 4,764,000 | |
Grocery Outlet, Inc. | | | | | | | | |
4.75% due 10/21/21 | | | 4,406,591 | | | | 4,301,934 | |
Hearthside Foods | | | | | | | | |
4.50% due 06/02/21 | | | 3,267,146 | | | | 3,177,299 | |
Authentic Brands | | | | | | | | |
5.50% due 05/27/21 | | | 3,282,951 | | | | 3,165,322 | |
SHO Holding I Corp. | | | | | | | | |
6.00% due 10/27/222 | | | 3,000,000 | | | | 2,970,000 | |
American Tire Distributors, Inc. | | | | | | | | |
5.25% due 09/01/21 | | | 2,735,549 | | | | 2,721,871 | |
Dole Food Company, Inc. | | | | | | | | |
4.50% due 11/01/18 | | | 2,511,949 | | | | 2,498,862 | |
AdvancePierre Foods, Inc. | | | | | | | | |
9.50% due 10/10/17 | | | 1,006,000 | | | | 997,620 | |
5.75% due 07/10/17 | | | 723,205 | | | | 724,109 | |
AMAG Pharmaceuticals | | | | | | | | |
4.75% due 08/17/21 | | | 1,735,000 | | | | 1,704,638 | |
Performance Food Group | | | | | | | | |
7.21% due 11/14/19 | | | 1,685,106 | | | | 1,685,106 | |
Reddy Ice Holdings, Inc. | | | | | | | | |
6.75% due 05/01/19 | | | 1,067,486 | | | | 889,568 | |
10.75% due 10/01/192 | | | 1,125,000 | | | | 742,500 | |
Physio-Control International, Inc. | | | | | | | | |
5.50% due 06/06/22 | | | 1,556,100 | | | | 1,554,155 | |
Hostess Brands | | | | | | | | |
4.50% due 08/03/22 | | | 1,492,500 | | | | 1,492,500 | |
Phillips-Medsize Corp. | | | | | | | | |
4.75% due 06/16/21 | | | 1,474,242 | | | | 1,448,443 | |
Nellson Nutraceutical (US) | | | | | | | | |
6.00% due 12/23/21 | | | 1,466,274 | | | | 1,447,946 | |
Arctic Glacier Holdings, Inc. | | | | | | | | |
6.00% due 05/10/19 | | | 1,522,448 | | | | 1,446,326 | |
DJO Finance LLC | | | | | | | | |
4.25% due 06/08/20 | | | 1,215,921 | | | | 1,187,554 | |
Valeo Foods Group Ltd. | | | | | | | | |
4.25% due 05/06/22 | | EUR | 1,100,000 | | | | 1,187,489 | |
NES Global Talent | | | | | | | | |
6.50% due 10/03/19 | | | 1,093,347 | | | | 984,012 | |
CTI Foods Holding Co. LLC | | | | | | | | |
8.25% due 06/28/21 | | | 1,035,000 | | | | 936,675 | |
Pharmaceutical Product Development | | | | | | | | |
4.25% due 08/18/22 | | | 914,630 | | | | 905,868 | |
Winebow, Inc. | | | | | | | | |
4.75% due 07/01/21 | | | 982,500 | | | | 901,444 | |
Nellson Nutraceutical (CAD) | | | | | | | | |
6.00% due 12/23/21 | | | 910,727 | | | | 899,343 | |
Fender Musical Instruments Corp. | | | | | | | | |
5.75% due 04/03/19 | | | 474,750 | | | | 468,816 | |
Targus Group International, Inc. | | | | | | | | |
7.37% due 05/24/16†††,2 | | | 152,522 | | | | — | |
Total Consumer, Non-cyclical | | | | 104,222,539 | |
| | | | | | | | | |
Financial - 1.5% | |
LPL Financial Holdings, Inc. | | | | | | | | |
4.75% due 11/21/22 | | | 5,700,000 | | | | 5,586,000 | |
Lineage Logistics LLC | | | | | | | | |
4.50% due 04/07/21 | | | 6,431,880 | | | | 5,386,699 | |
USI Holdings Corp. | | | | | | | | |
4.25% due 12/27/19 | | | 4,404,204 | | | | 4,330,786 | |
National Financial Partners Corp. | | | | | | | | |
4.50% due 07/01/20 | | | 4,197,396 | | | | 4,094,560 | |
Alliant Holdings I L.P. | | | | | | | | |
4.50% due 08/12/22 | | | 3,522,128 | | | | 3,475,460 | |
Assured Partners, Inc. | | | | | | | | |
5.75% due 10/21/22 | | | 3,491,250 | | | | 3,465,066 | |
Magic Newco, LLC | | | | | | | | |
5.00% due 12/12/18 | | | 3,354,512 | | | | 3,351,157 | |
28 | THE GUGGENHEIM FUNDS SEMI-ANNUAL REPORT | SEE NOTES TO FINANCIAL STATEMENTS. |
CONSOLIDATED SCHEDULE OF INVESTMENTS (Unaudited)(continued) | March 31, 2016 |
MACRO OPPORTUNITIES FUND | |
| | | Face
Amount15 | | | Value | |
| | | | | | | |
Hyperion Insurance | | | | | | |
5.50% due 04/29/22 | | $ | 3,267,000 | | | $ | 3,107,734 | |
York Risk Services | | | | | | | | |
4.75% due 10/01/21 | | | 3,064,469 | | | | 2,600,968 | |
Integro Parent, Inc. | | | | | | | | |
6.75% due 10/31/22 | | | 2,250,000 | | | | 2,139,963 | |
Expert Global Solutions | | | | | | | | |
8.50% due 04/03/18 | | | 2,152,660 | | | | 2,109,607 | |
Acrisure LLC | | | | | | | | |
6.50% due 05/19/22 | | | 2,088,247 | | | | 2,046,482 | |
Ryan LLC | | | | | | | | |
6.75% due 08/07/20 | | | 1,684,375 | | | | 1,631,738 | |
American Stock Transfer & Trust | | | | | | | | |
5.75% due 06/26/20 | | | 1,570,104 | | | | 1,519,075 | |
Genex Services, Inc. | | | | | | | | |
5.25% due 05/28/21 | | | 907,985 | | | | 889,825 | |
HUB International Ltd. | | | | | | | | |
4.00% due 10/02/20 | | | 791,940 | | | | 770,161 | |
Cunningham Lindsey U.S., Inc. | | | | | | | | |
5.00% due 12/10/19 | | | 663,531 | | | | 447,884 | |
9.25% due 06/10/202 | | | 116,932 | | | | 58,077 | |
Total Financial | | | | | | | 47,011,242 | |
| | | | | | | | | |
Communications - 1.4% | |
Cengage Learning Acquisitions, Inc. | | | | | | | | |
7.00% due 03/31/20 | | | 11,249,893 | | | | 11,185,656 | |
Match Group, Inc. | | | | | | | | |
5.50% due 11/16/22 | | | 6,517,500 | | | | 6,513,459 | |
Numericable US LLC | | | | | | | | |
4.75% due 02/10/23 | | | 5,850,000 | | | | 5,796,999 | |
Anaren, Inc. | | | | | | | | |
5.50% due 02/18/212 | | | 1,891,210 | | | | 1,702,089 | |
9.25% due 08/18/212 | | | 1,500,000 | | | | 1,367,505 | |
Neptune Finco Corp. | | | | | | | | |
5.00% due 10/10/22 | | | 3,000,000 | | | | 2,999,520 | |
Gogo LLC | | | | | | | | |
11.25% due 03/21/182 | | | 2,113,354 | | | | 2,123,921 | |
7.50% due 03/21/182 | | | 802,555 | | | | 770,452 | |
Proquest LLC | | | | | | | | |
5.75% due 10/24/21 | | | 2,734,240 | | | | 2,638,542 | |
Asurion Corp. | | | | | | | | |
4.25% due 07/08/20 | | | 1,176,242 | | | | 1,132,133 | |
5.00% due 08/04/22 | | | 772,198 | | | | 755,310 | |
Mitel Networks Corp. | | | | | | | | |
5.50% due 04/29/22 | | | 1,263,545 | | | | 1,261,574 | |
MergerMarket Ltd. | | | | | | | | |
4.50% due 02/04/21 | | | 1,176,985 | | | | 1,141,675 | |
Bureau van Dijk Electronic Publishing BV | | | | | | | | |
5.09% due 09/20/212 | | GBP | 800,834 | | | | 1,122,733 | |
First Data Corp. | | | | | | | | |
4.18% due 07/10/22 | | | 1,000,000 | | | | 993,000 | |
Liberty Cablevision of Puerto Rico LLC | | | | | | | | |
4.50% due 01/07/22 | | | 600,000 | | | | 571,500 | |
Internet Brands | | | | | | | | |
4.75% due 07/08/21 | | | 267,465 | | | | 265,293 | |
Total Communications | | | | | | | 42,341,361 | |
| | | | | | | | | |
Utilities - 0.8% | |
Invenergy Thermal Operating I, LLC | | | | | | | | |
6.50% due 10/19/22 | | | 12,319,125 | | | | 11,579,977 | |
Texas Competitive Electric Holdings Company LLC | | | | | | | | |
3.75% due 11/07/16 | | | 5,883,663 | | | | 5,854,245 | |
Panda Hummel | | | | | | | | |
7.00% due 10/27/22 | | | 3,000,000 | | | | 2,760,000 | |
Terraform AP Acquisition Holdings LLC | | | | | | | | |
5.00% due 06/26/22 | | | 2,875,925 | | | | 2,588,332 | |
Osmose Utility Services, Inc. | | | | | | | | |
4.75% due 08/22/22 | | | 1,645,875 | | | | 1,612,958 | |
Panda Temple II Power | | | | | | | | |
7.25% due 04/03/19 | | | 997,500 | | | | 832,913 | |
Stonewall (Green Energy) | | | | | | | | |
6.50% due 11/12/21 | | | 500,000 | | | | 465,000 | |
Total Utilities | | | | | | | 25,693,425 | |
| | | | | | | | | |
Basic Materials - 0.7% | |
Atkore International, Inc. | | | | | | | | |
4.50% due 04/09/21 | | | 3,637,596 | | | | 3,537,561 | |
7.75% due 10/09/21 | | | 850,000 | | | | 773,500 | |
SEE NOTES TO FINANCIAL STATEMENTS. | THE GUGGENHEIM FUNDS SEMI-ANNUAL REPORT | 29 |
CONSOLIDATED SCHEDULE OF INVESTMENTS (Unaudited)(continued) | March 31, 2016 |
MACRO OPPORTUNITIES FUND | |
| | | Face
Amount15 | | | Value | |
| | | | | | | |
Ennis-Flint | | | | | | |
4.25% due 03/31/212 | | $ | 1,960,000 | | | $ | 1,911,000 | |
7.75% due 09/30/212 | | | 550,000 | | | | 522,500 | |
Platform Specialty Products | | | | | | | | |
5.50% due 06/07/20 | | | 2,414,750 | | | | 2,419,471 | |
Azelis Finance S.A. | | | | | | | | |
6.50% due 12/16/22 | | | 2,294,250 | | | | 2,282,779 | |
Orica Chemicals | | | | | | | | |
7.25% due 02/28/22 | | | 2,289,987 | | | | 2,221,288 | |
Zep, Inc. | | | | | | | | |
5.50% due 06/27/22 | | | 1,990,000 | | | | 1,985,025 | |
Plaskolite LLC | | | | | | | | |
5.75% due 11/03/22 | | | 1,700,000 | | | | 1,685,125 | |
Noranda Aluminum Acquisition Corp. | | | | | | | | |
5.75% due 02/28/19 | | | 3,356,210 | | | | 973,301 | |
12.00% due 11/08/16†††,2 | | | 698,324 | | | | 670,391 | |
Trinseo Materials Operating S.C.A. | | | | | | | | |
4.25% due 11/05/21 | | | 1,141,375 | | | | 1,133,888 | |
Chromaflo Technologies | | | | | | | | |
4.50% due 12/02/19 | | | 1,064,650 | | | | 1,014,079 | |
Royal Adhesives And Sealants | | | | | | | | |
4.50% due 06/19/22 | | | 794,000 | | | | 768,695 | |
Hoffmaster Group, Inc. | | | | | | | | |
5.25% due 05/08/20 | | | 494,975 | | | | 486,724 | |
Total Basic Materials | | | | | | | 22,385,327 | |
| | | | | | | | | |
Energy - 0.1% | |
Veresen Midstream LP | | | | | | | | |
5.25% due 03/31/22 | | | 3,051,937 | | | | 2,819,227 | |
PSS Companies | | | | | | | | |
5.50% due 01/28/202 | | | 859,309 | | | | 558,551 | |
Cactus Wellhead | | | | | | | | |
7.00% due 07/31/20 | | | 1,481,250 | | | | 518,438 | |
FTS International | | | | | | | | |
5.75% due 04/16/21 | | | 2,382,727 | | | | 279,970 | |
Total Energy | | | | | | | 4,176,186 | |
Total Senior Floating Rate Interests | | | | | |
(Cost $675,024,735) | | | | | | | 646,653,716 | |
| | | | | | | | | |
CORPORATE BONDS†† - 20.2% | |
Financial - 4.3% | |
Citigroup, Inc. | | | | | | | | |
5.95% due 12/31/495,11 | | | 18,009,000 | | | | 17,290,383 | |
5.87% due 12/31/495,9,11 | | | 9,280,000 | | | | 8,966,800 | |
5.95% due 12/29/495,11 | | | 8,300,000 | | | | 7,996,527 | |
Bank of America Corp. | | | | | | | | |
6.10% due 03/12/495,11 | | | 17,000,000 | | | | 16,744,999 | |
6.30% due 12/31/495,11 | | | 6,100,000 | | | | 6,283,000 | |
Fifth Third Bancorp | | | | | | | | |
5.10% due 06/30/235,11 | | | 11,244,000 | | | | 10,203,930 | |
4.90% due 12/31/495,11 | | | 7,700,000 | | | | 6,718,250 | |
Jefferies Finance LLC / JFIN Company-Issuer Corp. | | | | | | | | |
7.38% due 04/01/206,9 | | | 10,274,000 | | | | 8,887,010 | |
7.50% due 04/15/216 | | | 4,751,000 | | | | 4,085,860 | |
6.88% due 04/15/226 | | | 1,100,000 | | | | 932,250 | |
Atlas Mara Ltd. | | | | | | | | |
8.00% due 12/31/202 | | | 13,400,000 | | | | 11,081,800 | |
Oxford Finance LLC / Oxford Finance Company-Issuer, Inc. | | | | | | | | |
7.25% due 01/15/186 | | | 7,926,000 | | | | 7,846,740 | |
Customers Bank | | | | | | | | |
6.13% due 06/26/295,18 | | | 6,000,000 | | | | 6,000,000 | |
Kennedy-Wilson, Inc. | | | | | | | | |
5.87% due 04/01/24 | | | 5,400,000 | | | | 5,278,500 | |
Greystar Real Estate Partners LLC | | | | | | | | |
8.25% due 12/01/226 | | | 3,325,000 | | | | 3,433,063 | |
Univest Corporation of Pennsylvania | | | | | | | | |
5.10% due 03/30/252,5 | | | 2,500,000 | | | | 2,487,500 | |
SunTrust Banks, Inc. | | | | | | | | |
5.63% due 12/31/495,11 | | | 2,490,000 | | | | 2,465,100 | |
National Financial Partners Corp. | | | | | | | | |
9.00% due 07/15/216,9 | | | 2,351,000 | | | | 2,256,960 | |
GEO Group, Inc. | | | | | | | | |
5.88% due 01/15/22 | | | 1,600,000 | | | | 1,620,000 | |
Jefferies LoanCore LLC / JLC Finance Corp. | | | | | | | | |
6.87% due 06/01/206 | | | 1,700,000 | | | | 1,449,250 | |
30 | THE GUGGENHEIM FUNDS SEMI-ANNUAL REPORT | SEE NOTES TO FINANCIAL STATEMENTS. |
CONSOLIDATED SCHEDULE OF INVESTMENTS (Unaudited)(continued) | March 31, 2016 |
MACRO OPPORTUNITIES FUND | |
| | | Face
Amount15 | | | Value | |
| | | | | | | |
NewStar Financial, Inc. | | | | | | |
7.25% due 05/01/20 | | $ | 1,225,000 | | | $ | 1,102,500 | |
Prosight Global Inc. | | | | | | | | |
7.50% due 11/26/20†††,2 | | | 850,000 | | | | 881,484 | |
Total Financial | | | | | | | 134,011,906 | |
| | | | | | | | | |
Communications - 4.0% | |
Sprint Communications, Inc. | | | | | | | | |
9.00% due 11/15/186 | | | 17,125,000 | | | | 17,938,437 | |
7.00% due 03/01/206 | | | 5,497,000 | | | | 5,497,000 | |
DISH DBS Corp. | | | | | | | | |
5.88% due 11/15/24 | | | 16,900,000 | | | | 15,505,749 | |
5.88% due 07/15/22 | | | 2,170,000 | | | | 2,056,075 | |
Zayo Group LLC / Zayo Capital, Inc. | | | | | | | | |
6.00% due 04/01/23 | | | 12,350,000 | | | | 12,326,782 | |
6.38% due 05/15/25 | | | 1,200,000 | | | | 1,173,000 | |
MDC Partners, Inc. | | | | | | | | |
6.75% due 04/01/206 | | | 9,200,000 | | | | 9,510,500 | |
6.50% due 05/01/246 | | | 2,350,000 | | | | 2,399,938 | |
Numericable-SFR S.A. | | | | | | | | |
6.00% due 05/15/226 | | | 8,300,000 | | | | 8,092,500 | |
T-Mobile USA, Inc. | | | | | | | | |
6.50% due 01/15/26 | | | 6,500,000 | | | | 6,751,874 | |
Numericable-SFR SAS | | | | | | | | |
6.25% due 05/15/246 | | | 6,622,000 | | | | 6,420,029 | |
Avaya, Inc. | | | | | | | | |
7.00% due 04/01/196 | | | 9,505,000 | | | | 6,415,875 | |
McGraw-Hill Global Education Holdings LLC / McGraw-Hill Global Education Finance | | | | | | | | |
9.75% due 04/01/219 | | | 5,550,000 | | | | 6,021,750 | |
Neptune Finco Corp. | | | | | | | | |
6.63% due 10/15/256 | | | 5,050,000 | | | | 5,459,808 | |
Interoute Finco plc | | | | | | | | |
7.38% due 10/15/20 | | EUR | 4,250,000 | | | | 5,246,914 | |
CCOH Safari LLC | | | | | | | | |
5.75% due 02/15/266,9 | | | 4,500,000 | | | | 4,657,500 | |
Sprint Corp. | | | | | | | | |
7.88% due 09/15/23 | | | 4,550,000 | | | | 3,479,795 | |
Midcontinent Communications & Midcontinent Finance Corp. | | | | | | | | |
6.88% due 08/15/236 | | | 2,410,000 | | | | 2,494,350 | |
TIBCO Software, Inc. | | | | | | | | |
11.38% due 12/01/216 | | | 2,750,000 | | | | 2,406,250 | |
CenturyLink, Inc. | | | | | | | | |
5.63% due 04/01/25 | | | 1,150,000 | | | | 1,029,250 | |
CSC Holdings LLC | | | | | | | | |
6.75% due 11/15/21 | | | 500,000 | | | | 513,500 | |
Total Communications | | | | | | | 125,396,876 | |
| | | | | | | | | |
Energy - 2.5% | |
ContourGlobal Power Holdings S.A. | | | | | | | | |
7.13% due 06/01/196 | | | 11,775,000 | | | | 11,436,469 | |
Sunoco Logistics Partners Operations, LP | | | | | | | | |
5.95% due 12/01/25 | | | 10,000,000 | | | | 10,046,900 | |
Buckeye Partners, LP | | | | | | | | |
4.35% due 10/15/24 | | | 9,701,000 | | | | 8,712,846 | |
Husky Energy, Inc. | | | | | | | | |
4.00% due 04/15/24 | | | 5,350,000 | | | | 5,061,399 | |
3.95% due 04/15/22 | | | 3,600,000 | | | | 3,586,684 | |
Halcon Resources Corp. | | | | | | | | |
8.63% due 02/01/206,9 | | | 9,150,000 | | | | 6,496,500 | |
EQT Corp. | | | | | | | | |
8.13% due 06/01/19 | | | 5,550,000 | | | | 5,980,651 | |
Comstock Resources, Inc. | | | | | | | | |
10.00% due 03/15/206 | | | 9,775,000 | | | | 4,814,188 | |
CONSOL Energy, Inc. | | | | | | | | |
8.00% due 04/01/23 | | | 5,950,000 | | | | 4,445,840 | |
Gibson Energy, Inc. | | | | | | | | |
6.75% due 07/15/216,9 | | | 4,590,000 | | | | 4,222,800 | |
Approach Resources, Inc. | | | | | | | | |
7.00% due 06/15/21 | | | 7,343,000 | | | | 3,506,283 | |
BreitBurn Energy Partners Limited Partnership / BreitBurn Finance Corp. | | | | | | | | |
9.25% due 05/18/20†††,2 | | | 5,037,000 | | | | 2,518,903 | |
SandRidge Energy, Inc. | | | | | | | | |
8.75% due 06/01/206 | | | 8,404,000 | | | | 2,037,970 | |
SEE NOTES TO FINANCIAL STATEMENTS. | THE GUGGENHEIM FUNDS SEMI-ANNUAL REPORT | 31 |
CONSOLIDATED SCHEDULE OF INVESTMENTS (Unaudited)(continued) | March 31, 2016 |
MACRO OPPORTUNITIES FUND | |
| | | Face
Amount15 | | | Value | |
| | | | | | | |
EP Energy LLC / Everest Acquisition Finance, Inc. | | | | | | |
9.38% due 05/01/20 | | $ | 3,725,000 | | | $ | 1,878,797 | |
Schahin II Finance Company SPV Ltd. | | | | | | | | |
5.88% due 09/25/2212,18 | | | 7,557,400 | | | | 1,099,602 | |
Unit Corp. | | | | | | | | |
6.63% due 05/15/21 | | | 2,100,000 | | | | 1,055,250 | |
Atlas Energy Holdings Operating Company LLC / Atlas Resource Finance Corp. | | | | | | | | |
9.25% due 08/15/212,9 | | | 3,860,000 | | | | 598,300 | |
7.75% due 01/15/212,9 | | | 1,350,000 | | | | 195,750 | |
Total Energy | | | | | | | 77,695,132 | |
| | | | | | | | | |
Consumer, Non-cyclical - 2.1% | |
Vector Group Ltd. | | | | | | | | |
7.75% due 02/15/219 | | | 18,410,000 | | | | 19,330,499 | |
Bumble Bee Holdings, Inc. | | | | | | | | |
9.00% due 12/15/176,9 | | | 18,709,000 | | | | 18,755,773 | |
Central Garden & Pet Co. | | | | | | | | |
6.13% due 11/15/23 | | | 10,400,000 | | | | 10,816,000 | |
Midas Intermediate Holdco II LLC / Midas Intermediate Holdco II Finance, Inc. | | | | | | | | |
7.88% due 10/01/226,9 | | | 5,840,000 | | | | 5,431,200 | |
Opal Acquisition, Inc. | | | | | | | | |
8.88% due 12/15/216 | | | 7,730,000 | | | | 5,391,675 | |
US Foods, Inc. | | | | | | | | |
8.50% due 06/30/19 | | | 4,000,000 | | | | 4,110,000 | |
KeHE Distributors LLC / KeHE Finance Corp. | | | | | | | | |
7.63% due 08/15/216 | | | 1,125,000 | | | | 1,077,188 | |
Bumble Bee Holdco SCA | | | | | | | | |
9.62% due 03/15/186 | | | 1,076,000 | | | | 1,059,860 | |
Total Consumer, Non-cyclical | | | | 65,972,195 | |
| | | | | | | | | |
Technology - 1.7% | |
First Data Corp. | | | | | | | | |
5.75% due 01/15/246 | | | 26,800,000 | | | | 26,797,324 | |
7.00% due 12/01/236 | | | 1,000,000 | | | | 1,010,000 | |
NCR Corp. | | | | | | | | |
6.38% due 12/15/23 | | | 5,000,000 | | | | 5,150,000 | |
5.88% due 12/15/219 | | | 4,467,000 | | | | 4,567,508 | |
Micron Technology, Inc. | | | | | | | | |
5.25% due 08/01/236 | | | 11,200,000 | | | | 9,156,000 | |
Infor US, Inc. | | | | | | | | |
6.50% due 05/15/229 | | | 5,520,000 | | | | 5,023,200 | |
5.75% due 08/15/206 | | | 1,250,000 | | | | 1,287,500 | |
Epicor Software | | | | | | | | |
9.24% due 06/21/23††† | | | 1,850,000 | | | | 1,693,675 | |
Total Technology | | | | | | | 54,685,207 | |
| | | | | | | | | |
Basic Materials - 1.7% | |
BHP Billiton Finance USA Ltd. | | | | | | | | |
6.75% due 10/19/755,6 | | | 18,850,000 | | | | 18,850,000 | |
Newcrest Finance Pty Ltd. | | | | | | | | |
4.20% due 10/01/226,9 | | | 13,100,000 | | | | 12,414,214 | |
Yamana Gold, Inc. | | | | | | | | |
4.95% due 07/15/24 | | | 12,000,000 | | | | 10,140,000 | |
Eldorado Gold Corp. | | | | | | | | |
6.13% due 12/15/206 | | | 6,295,000 | | | | 5,744,188 | |
TPC Group, Inc. | | | | | | | | |
8.75% due 12/15/206,9 | | | 5,190,000 | | | | 3,633,000 | |
Constellium N.V. | | | | | | | | |
7.88% due 04/01/216 | | | 550,000 | | | | 549,522 | |
Mirabela Nickel Ltd. | | | | | | | | |
9.50% due 06/24/19†††,2 | | | 1,799,922 | | | | 467,980 | |
Unifrax I LLC / Unifrax Holding Co. | | | | | | | | |
7.50% due 02/15/1918 | | | 220,000 | | | | 135,850 | |
Total Basic Materials | | | | | | | 51,934,754 | |
| | | | | | | | | |
Consumer, Cyclical - 1.2% | |
WMG Acquisition Corp. | | | | | | | | |
6.75% due 04/15/226,9 | | | 13,700,000 | | | | 13,563,000 | |
5.63% due 04/15/226 | | | 1,800,000 | | | | 1,827,000 | |
Wynn Las Vegas LLC / Wynn Las Vegas Capital Corp. | | | | | | | | |
5.50% due 03/01/256 | | | 10,400,000 | | | | 9,802,000 | |
32 | THE GUGGENHEIM FUNDS SEMI-ANNUAL REPORT | SEE NOTES TO FINANCIAL STATEMENTS. |
CONSOLIDATED SCHEDULE OF INVESTMENTS (Unaudited)(continued) | March 31, 2016 |
MACRO OPPORTUNITIES FUND | |
| | | Face
Amount15 | | | Value | |
| | | | | | | |
Ferrellgas Limited Partnership / Ferrellgas Finance Corp. | | | | | | |
6.75% due 06/15/239 | | $ | 5,500,000 | | | $ | 4,826,250 | |
Carrols Restaurant Group, Inc. | | | | | | | | |
8.00% due 05/01/22 | | | 2,500,000 | | | | 2,681,250 | |
Nathan’s Famous, Inc. | | | | | | | | |
10.00% due 03/15/206 | | | 2,150,000 | | | | 2,262,875 | |
Seminole Hard Rock Entertainment Inc. / Seminole Hard Rock International LLC | | | | | | | | |
5.88% due 05/15/216 | | | 1,550,000 | | | | 1,553,875 | |
AmeriGas Finance LLC / AmeriGas Finance Corp. | | | | | | | | |
6.75% due 05/20/20 | | | 750,000 | | | | 768,750 | |
Total Consumer, Cyclical | | | | | | | 37,285,000 | |
| | | | | | | | | |
Industrial - 1.1% | |
Reynolds Group Issuer Inc. / Reynolds Group Issuer LLC / Reynolds Group Issuer | | | | | | | | |
7.13% due 04/15/19 | | | 9,650,000 | | | | 9,818,874 | |
Reynolds Group Issuer Incorporated / Reynolds Group Issuer LLC / Reynolds Group Issuer | | | | | | | | |
7.88% due 08/15/199 | | | 5,600,000 | | | | 5,796,000 | |
StandardAero Aviation Holdings, Inc. | | | | | | | | |
10.00% due 07/15/236 | | | 5,800,000 | | | | 5,539,000 | |
Novelis, Inc. | | | | | | | | |
8.75% due 12/15/20 | | | 4,325,000 | | | | 4,365,223 | |
8.38% due 12/15/17 | | | 450,000 | | | | 457,650 | |
Dynagas LNG Partners Limited Partnership / Dynagas Finance, Inc. | | | | | | | | |
6.25% due 10/30/192 | | | 5,950,000 | | | | 3,986,500 | |
CEVA Group plc | | | | | | | | |
7.00% due 03/01/216 | | | 2,325,000 | | | | 1,854,188 | |
Princess Juliana International Airport Operating Company N.V. | | | | | | | | |
5.50% due 12/20/27†††,6 | | | 1,820,888 | | | | 1,796,124 | |
LMI Aerospace, Inc. | | | | | | | | |
7.38% due 07/15/19 | | | 1,550,000 | | | | 1,457,000 | |
SBM Baleia Azul | | | | | | | | |
5.50% due 09/15/27†††,2 | | | 927,190 | | | | 646,075 | |
Total Industrial | | | | | | | 35,716,634 | |
| | | | | | | | | |
Utilities - 0.9% | |
AES Corp. | | | | | | | | |
3.64% due 06/01/195 | | | 13,832,000 | | | | 13,347,880 | |
7.38% due 07/01/21 | | | 3,450,000 | | | | 3,864,000 | |
4.88% due 05/15/23 | | | 3,000,000 | | | | 2,887,500 | |
5.50% due 03/15/24 | | | 800,000 | | | | 782,000 | |
AmeriGas Partners LP / AmeriGas Finance Corp. | | | | | | | | |
6.50% due 05/20/21 | | | 2,830,000 | | | | 2,872,450 | |
LBC Tank Terminals Holding Netherlands BV | | | | | | | | |
6.88% due 05/15/236 | | | 2,765,000 | | | | 2,571,450 | |
Terraform Global Operating LLC | | | | | | | | |
9.75% due 08/15/226 | | | 2,700,000 | | | | 2,025,000 | |
FPL Energy National Wind LLC | | | | | | | | |
5.61% due 03/10/2418 | | | 42,908 | | | | 42,908 | |
Total Utilities | | | | | | | 28,393,188 | |
| | | | | | | | | |
Diversified - 0.7% | |
HRG Group, Inc. | | | | | | | | |
7.88% due 07/15/199 | | | 20,871,000 | | | | 22,010,557 | |
Total Corporate Bonds | | | | | | | | |
(Cost $659,028,622) | | | | | | | 633,101,449 | |
| | | | | | | | | |
COLLATERALIZED MORTGAGE OBLIGATIONS†† - 14.2% | |
Residential Mortgage-Backed Securities - 11.4% | |
Banc of America Funding Ltd. | | | | | | | | |
2013-R1 A5, 0.65% due 11/03/415,6 | | | 37,970,162 | | | | 35,135,840 | |
SEE NOTES TO FINANCIAL STATEMENTS. | THE GUGGENHEIM FUNDS SEMI-ANNUAL REPORT | 33 |
CONSOLIDATED SCHEDULE OF INVESTMENTS (Unaudited)(continued) | March 31, 2016 |
MACRO OPPORTUNITIES FUND | |
| | | Face
Amount15 | | | Value | |
| | | | | | | |
American Home Mortgage Assets Trust | | | | | | |
2007-1 A1, 1.05% due 02/25/475,9 | | $ | 35,530,946 | | | $ | 19,478,125 | |
2006-4 1A11, 0.62% due 10/25/465 | | | 15,579,449 | | | | 9,657,481 | |
RALI Series Trust | | | | | | | | |
2006-QO10 A1, 0.59% due 01/25/375 | | | 12,142,260 | | | | 8,787,445 | |
2007-QO2 A1, 0.58% due 02/25/475 | | | 13,591,825 | | | | 7,069,970 | |
2006-QO2 A2, 0.70% due 02/25/465,9 | | | 14,605,431 | | | | 6,006,187 | |
2007-QO3 A1, 0.59% due 03/25/475 | | | 6,614,027 | | | | 5,129,292 | |
2006-QO2 A1, 0.65% due 02/25/465 | | | 4,217,436 | | | | 1,702,821 | |
HarborView Mortgage Loan Trust | | | | | | | | |
2006-14 2A1A, 0.58% due 01/25/475,9 | | | 38,467,212 | | | | 28,433,546 | |
NRPL Trust | | | | | | | | |
2015-1 A1, 3.88% due 11/01/546,9 | | | 21,493,727 | | | | 21,442,464 | |
2014-2A A1, 3.75% due 10/25/575,6 | | | 6,450,346 | | | | 6,390,065 | |
Lehman XS Trust Series | | | | | | | | |
2007-15N 2A1, 0.69% due 08/25/375 | | | 13,815,066 | | | | 10,482,322 | |
2006-16N A4A, 0.62% due 11/25/465 | | | 12,554,103 | | | | 9,673,218 | |
2006-10N, 0.64% due 07/25/465 | | | 9,267,980 | | | | 7,137,550 | |
GCAT LLC | | | | | | | | |
2014-2 A1, 3.72% due 10/25/196,13 | | | 15,075,906 | | | | 14,961,754 | |
2015-6 A, 3.63% due 05/26/206 | | | 5,893,868 | | | | 5,846,063 | |
Nomura Resecuritization Trust | | | | | | | | |
2012-1R A, 0.87% due 08/27/475,6 | | | 8,510,893 | | | | 8,095,366 | |
2015-4R 5A1, 0.86% due 03/26/365,6 | | | 7,269,872 | | | | 6,460,248 | |
2015-4R 6A1, 0.96% due 12/26/365,6 | | | 4,875,353 | | | | 4,670,813 | |
GSAA Home Equity Trust | | | | | | | | |
2006-14 A2, 0.60% due 09/25/365 | | | 18,338,649 | | | | 9,055,288 | |
2006-3, 0.73% due 03/25/365 | | | 5,988,281 | | | | 3,959,782 | |
2007-7 A4, 0.70% due 07/25/375 | | | 4,069,380 | | | | 3,494,270 | |
2006-14, 0.68% due 09/25/365 | | | 4,807,275 | | | | 2,668,363 | |
GreenPoint Mortgage Funding Trust | | | | | | | | |
2006-AR1 A1A, 0.72% due 02/25/365,9 | | | 11,084,497 | | | | 8,536,837 | |
2005-HE4 M1, 0.90% due 07/25/305 | | | 4,483,976 | | | | 4,329,980 | |
2007-AR1 1A1A, 0.51% due 02/25/475 | | | 1,396,908 | | | | 1,368,266 | |
Oak Hill Advisors Residential Loan Trust | | | | | | | | |
2015-NPL2 A1, 3.72% due 07/25/556 | | | 13,738,436 | | | | 13,649,776 | |
American Home Mortgage Investment Trust | | | | | | | | |
2006-1 11A1, 0.71% due 03/25/465 | | | 10,245,378 | | | | 8,077,090 | |
2006-1 12A1, 0.83% due 03/25/465 | | | 6,217,664 | | | | 4,946,073 | |
AJAX Mortgage Loan Trust | | | | | | | | |
2015-A A, 3.88% due 11/25/546 | | | 12,000,517 | | | | 11,865,883 | |
GSAA Trust | | | | | | | | |
2006-9, 0.67% due 06/25/365 | | | 15,569,496 | | | | 8,371,626 | |
2005-10 M4, 1.40% due 06/25/355 | | | 2,462,000 | | | | 2,252,891 | |
Merrill Lynch Alternative Note Asset Trust Series | | | | | | | | |
2007-OAR3 A1, 0.62% due 07/25/375 | | | 12,843,121 | | | | 9,303,427 | |
34 | THE GUGGENHEIM FUNDS SEMI-ANNUAL REPORT | SEE NOTES TO FINANCIAL STATEMENTS. |
CONSOLIDATED SCHEDULE OF INVESTMENTS (Unaudited)(continued) | March 31, 2016 |
MACRO OPPORTUNITIES FUND | |
| | | Face
Amount15 | | | Value | |
| | | | | | | |
Washington Mutual Mortgage Pass-Through Certificates WMALT Series Trust | | | | | | |
2006-AR9 2A, 1.16% due 11/25/465 | | $ | 10,339,390 | | | $ | 6,970,255 | |
2006-8 A6, 4.66% due 10/25/36 | | | 3,906,631 | | | | 2,300,084 | |
Luminent Mortgage Trust | | | | | | | | |
2006-2 A1A, 0.63% due 02/25/465 | | | 12,690,255 | | | | 8,193,835 | |
Banc of America Funding Trust | | | | | | | | |
2015-R4 8A1, 0.61% due 01/27/35†††,5,6 | | | 8,289,638 | | | | 7,429,339 | |
HSI Asset Securitization Corporation Trust | | | | | | | | |
2005-OPT1, 0.85% due 11/25/355 | | | 7,320,000 | | | | 6,008,468 | |
Soundview Home Loan Trust | | | | | | | | |
2007-1 2A3, 0.60% due 03/25/375 | | | 4,087,770 | | | | 3,652,433 | |
First Franklin Mortgage Loan Trust | | | | | | | | |
2006-FF1 2A4, 0.77% due 01/25/365 | | | 2,750,000 | | | | 2,421,360 | |
2006-FF1, 0.87% due 01/25/365 | | | 1,225,000 | | | | 882,693 | |
Alliance Bancorp Trust | | | | | | | | |
2007-OA1 A1, 0.67% due 07/25/375 | | | 4,682,756 | | | | 2,903,116 | |
Wachovia Asset Securitization Issuance II LLC Trust | | | | | | | | |
2007-HE1 A, 0.57% due 07/25/375,6 | | | 2,635,558 | | | | 2,208,964 | |
Morgan Stanley Re-REMIC Trust | | | | | | | | |
2010-R5 4B, 0.93% due 06/26/365,6 | | | 2,352,743 | | | | 1,704,671 | |
Bear Stearns Mortgage Funding Trust | | | | | | | | |
2007-AR5 1A1A, 0.60% due 06/25/475 | | | 1,642,930 | | | | 1,235,225 | |
Asset Backed Securities Corporation Home Equity Loan Trust | | | | | | | | |
2006-HE5, 0.57% due 07/25/365 | | | 1,311,763 | | | | 1,069,559 | |
New Century Home Equity Loan Trust | | | | | | | | |
2004-4 M2, 1.23% due 02/25/355 | | | 1,051,622 | | | | 822,894 | |
Total Residential Mortgage-Backed Securities | | | | 356,243,018 | |
| | | | | | | | | |
Commercial Mortgage-Backed Securities - 2.6% | |
Motel 6 Trust | | | | | | | | |
2015-MTL6 E, 5.27% due 02/05/306,9 | | | 34,450,000 | | | | 33,343,497 | |
GS Mortgage Securities Corporation Trust | | | | | | | | |
2016-ICE2 E, 8.94% due 02/15/335,6 | | | 28,300,000 | | | | 28,308,878 | |
CDGJ Commercial Mortgage Trust | | | | | | | | |
2014-BXCH EPA, 4.69% due 12/15/275,6 | | | 12,500,000 | | | | 12,419,468 | |
BXHTL Mortgage Trust | | | | | | | | |
2015-JWRZ, 4.13% due 05/15/295,6 | | | 5,000,000 | | | | 4,794,281 | |
GE Business Loan Trust | | | | | | | | |
2007-1A, 0.89% due 04/16/355,6 | | | 4,572,967 | | | | 3,994,902 | |
Total Commercial Mortgage-Backed Securities | | | | 82,861,026 | |
| | | | | | | | | |
Military Housing - 0.2% | |
Capmark Military Housing Trust | | | | | | | | |
2007-AET2 A, 6.06% due 10/10/526 | | | 5,871,504 | | | | 5,928,047 | |
Total Collateralized Mortgage Obligations | | | | | |
(Cost $466,757,168) | | | | | | | 445,032,091 | |
SEE NOTES TO FINANCIAL STATEMENTS. | THE GUGGENHEIM FUNDS SEMI-ANNUAL REPORT | 35 |
CONSOLIDATED SCHEDULE OF INVESTMENTS (Unaudited)(continued) | March 31, 2016 |
MACRO OPPORTUNITIES FUND | |
| | | Face
Amount15 | | | Value | |
| | | | | | | |
FOREIGN GOVERNMENT BONDS†† - 2.1% | |
Kenya Government International Bond | | | | | | |
6.87% due 06/24/246 | | $ | 36,210,000 | | | $ | 34,127,925 | |
Dominican Republic International Bond | | | | | | | | |
6.85% due 01/27/456,9 | | | 30,400,000 | | | | 30,096,000 | |
Total Foreign Government Bonds | | | | | |
(Cost $68,177,557) | | | | | | | 64,223,925 | |
| | | | | | | | | |
COMMERCIAL PAPER†† - 0.2% | |
AirGas, Inc. | | | | | | | | |
0.70% due 04/12/166 | | | 6,000,000 | | | | 5,998,717 | |
Total Commercial Paper | | | | | | | | |
(Cost $5,998,717) | | | | | | | 5,998,717 | |
| | | | | | | | | |
REPURCHASE AGREEMENTS††,14 - 0.1% | |
Jefferies & Company, Inc.
issued 03/15/16 at 2.95%
due 04/04/16 | | | 2,404,000 | | | | 2,404,000 | |
Barclays
issued 03/24/16 at 0.00%
open maturity | | | 510,625 | | | | 510,625 | |
issued 12/17/15 at (0.15)%
open maturity | | | 489,375 | | | | 489,375 | |
Total Repurchase Agreements | | | | | |
(Cost $3,404,000) | | | | | | | 3,404,000 | |
| | | | | | | | | |
SENIOR FIXED RATE INTERESTS†† - 0.1% | |
Communications - 0.1% | |
Lions Gate Entertainment Corp. | | | | | | | | |
5.00% due 03/17/22 | | | 2,110,000 | | | | 2,051,976 | |
| | | | | | | | | |
Financial - 0.0% | |
Magic Newco, LLC | | | | | | | | |
12.00% due 06/12/19 | | | 1,075,000 | | | | 1,102,552 | |
| | | | | | | | | |
Consumer, Non-cyclical - 0.0% | |
Targus Group International, Inc. | | | | | | | | |
7.50% due 12/31/19†††,2 | | | 53,069 | | | | 77,884 | |
Total Senior Fixed Rate Interests | | | | | |
(Cost $3,379,762) | | | | | | | 3,232,412 | |
| | | Contracts | | | | |
| | | | | | | |
OPTIONS PURCHASED† - 0.2% | |
Put options on: | | | | | | |
Bank of America Merrill Lynch
September 2016 SPDR
Gold Shares Expiring with
strike price of $128.00 | | | 10,345 | | | | 2,379,350 | |
BNP
June 2016 S&P 500 Index
Expiring with strike
price of $1,800.00 | | | 544 | | | | 489,600 | |
| | | Notional | | | | |
| | | | | | | |
Bank of America Merrill Lynch
September 2016 EUR
/ DKK Expiring with
strike price of $7.44††† | | $ | 118,700,000 | | | | 404,767 | |
Total Put options | | | | | | | 3,273,717 | |
| | | | | | | | | |
Call options on: | | | | | | | | |
JPMorgan
August 2016 USD / CNH
Expiring with strike
price of $6.66††† | | | 78,400,000 | | | | 763,381 | |
Bank of America Merrill Lynch
September 2016 USD /
TWD Expiring with strike
price of $32.48††† | | | 39,400,000 | | | | 604,435 | |
36 | THE GUGGENHEIM FUNDS SEMI-ANNUAL REPORT | SEE NOTES TO FINANCIAL STATEMENTS. |
CONSOLIDATED SCHEDULE OF INVESTMENTS (Unaudited)(continued) | March 31, 2016 |
MACRO OPPORTUNITIES FUND | |
| | | Notional | | | Value | |
| | | | | | | |
Bank of America Merrill Lynch
August 2016 USD / SAR
Expiring with strike
price of $3.78††† | | $ | 78,400,000 | | | $ | 368,245 | |
Total Call options | | | | 1,736,061 | |
Total Options Purchased | | | | | |
(Cost $14,115,746) | | | | | | | 5,009,778 | |
Total Investments - 108.0% | | | | | |
(Cost $3,543,583,735) | | | | | | $ | 3,380,057,597 | |
| | | Shares | | | | |
| | | | | | | |
COMMON STOCKS SOLD SHORT† - (3.1)% | |
Utilities - (0.0)% | |
South Jersey Industries, Inc. | | | 18,716 | | | | (532,470 | ) |
| | | | | | | | | |
Communications - (0.1)% | |
Twenty-First Century Fox, Inc. — Class A | | | 15,459 | | | | (430,997 | ) |
Ruckus Wireless, Inc.* | | | 45,650 | | | | (447,827 | ) |
TripAdvisor, Inc.* | | | 6,912 | | | | (459,648 | ) |
Facebook, Inc. — Class A* | | | 4,526 | | | | (516,417 | ) |
Netflix, Inc.* | | | 6,841 | | | | (699,355 | ) |
Amazon.com, Inc.* | | | 1,738 | | | | (1,031,746 | ) |
Total Communications | | | | | | | (3,585,990 | ) |
| | | | | | | | | |
Consumer, Non-cyclical - (0.1)% | |
Acorda Therapeutics, Inc.* | | | 11,344 | | | | (300,049 | ) |
Cantel Medical Corp. | | | 5,914 | | | | (422,023 | ) |
Monro Muffler Brake, Inc. | | | 7,234 | | | | (517,014 | ) |
Live Nation Entertainment, Inc.* | | | 28,822 | | | | (643,019 | ) |
Alexion Pharmaceuticals, Inc.* | | | 5,325 | | | | (741,347 | ) |
Bristol-Myers Squibb Co. | | | 12,436 | | | | (794,412 | ) |
Vertex Pharmaceuticals, Inc.* | | | 11,455 | | | | (910,558 | ) |
Total Consumer, Non-cyclical | | | | (4,328,422 | ) |
| | |
Technology - (0.2)% | |
Intersil Corp. — Class A | | | 29,163 | | | | (389,909 | ) |
Red Hat, Inc.* | | | 5,491 | | | | (409,134 | ) |
Tangoe, Inc.* | | | 52,314 | | | | (412,757 | ) |
Medidata Solutions, Inc.* | | | 10,942 | | | | (423,565 | ) |
Ultimate Software Group, Inc.* | | | 2,276 | | | | (440,406 | ) |
CommVault Systems, Inc.* | | | 10,591 | | | | (457,213 | ) |
Silicon Laboratories, Inc.* | | | 10,210 | | | | (459,042 | ) |
Semtech Corp.* | | | 22,263 | | | | (489,563 | ) |
Electronics for Imaging, Inc.* | | | 12,046 | | | | (510,630 | ) |
Cypress Semiconductor Corp.* | | | 84,278 | | | | (729,848 | ) |
Autodesk, Inc.* | | | 12,787 | | | | (745,610 | ) |
Intuit, Inc. | | | 8,165 | | | | (849,243 | ) |
Total Technology | | | | | | | (6,316,920 | ) |
| | | | | | | | | |
Industrial - (0.3)% | |
Headwaters, Inc.* | | | 20,652 | | | | (409,736 | ) |
Itron, Inc.* | | | 11,016 | | | | (459,588 | ) |
Eagle Materials, Inc. | | | 6,858 | | | | (480,814 | ) |
EnPro Industries, Inc. | | | 8,433 | | | | (486,415 | ) |
Aerovironment, Inc.* | | | 19,951 | | | | (565,012 | ) |
Sealed Air Corp. | | | 14,796 | | | | (710,356 | ) |
KBR, Inc. | | | 49,333 | | | | (763,675 | ) |
Louisiana-Pacific Corp.* | | | 80,138 | | | | (1,371,963 | ) |
Martin Marietta Materials, Inc. | | | 8,763 | | | | (1,397,786 | ) |
Vulcan Materials Co. | | | 15,030 | | | | (1,586,717 | ) |
Total Industrial | | | | | | | (8,232,062 | ) |
| | | | | | | | | |
Basic Materials - (0.4)% | |
Compass Minerals International, Inc. | | | 5,516 | | | | (390,864 | ) |
NewMarket Corp. | | | 1,069 | | | | (423,602 | ) |
PolyOne Corp. | | | 14,026 | | | | (424,287 | ) |
Worthington Industries, Inc. | | | 12,840 | | | | (457,618 | ) |
RPM International, Inc. | | | 10,414 | | | | (492,895 | ) |
Balchem Corp. | | | 8,018 | | | | (497,276 | ) |
International Flavors & Fragrances, Inc. | | | 4,948 | | | | (562,934 | ) |
SEE NOTES TO FINANCIAL STATEMENTS. | THE GUGGENHEIM FUNDS SEMI-ANNUAL REPORT | 37 |
CONSOLIDATED SCHEDULE OF INVESTMENTS (Unaudited)(continued) | March 31, 2016 |
MACRO OPPORTUNITIES FUND | |
| | | Shares | | | Value | |
| | | | | | | |
PPG Industries, Inc. | | | 5,265 | | | $ | (586,995 | ) |
HB Fuller Co. | | | 15,487 | | | | (657,423 | ) |
Sensient Technologies Corp. | | | 11,632 | | | | (738,167 | ) |
Praxair, Inc. | | | 8,221 | | | | (940,893 | ) |
Sherwin-Williams Co. | | | 3,436 | | | | (978,126 | ) |
Air Products & Chemicals, Inc. | | | 7,351 | | | | (1,058,912 | ) |
Ashland, Inc. | | | 10,102 | | | | (1,110,816 | ) |
Ecolab, Inc. | | | 12,879 | | | | (1,436,265 | ) |
Royal Gold, Inc. | | | 28,140 | | | | (1,443,301 | ) |
FMC Corp. | | | 39,380 | | | | (1,589,770 | ) |
Total Basic Materials | | | | | | | (13,790,144 | ) |
| | | | | | | | | |
Consumer, Cyclical - (0.6)% | |
Popeyes Louisiana Kitchen, Inc.* | | | 6,837 | | | | (355,934 | ) |
Starbucks Corp. | | | 6,358 | | | | (379,573 | ) |
Callaway Golf Co. | | | 41,759 | | | | (380,842 | ) |
Regis Corp.* | | | 25,992 | | | | (394,818 | ) |
Scotts Miracle-Gro Co. — Class A | | | 5,490 | | | | (399,507 | ) |
Sonic Automotive, Inc. — Class A | | | 21,911 | | | | (404,915 | ) |
Motorcar Parts of America, Inc.* | | | 10,837 | | | | (411,589 | ) |
Crocs, Inc.* | | | 42,976 | | | | (413,429 | ) |
Papa John’s International, Inc. | | | 7,842 | | | | (424,958 | ) |
Fred’s, Inc. — Class A | | | 29,163 | | | | (434,820 | ) |
Mobile Mini, Inc. | | | 13,465 | | | | (444,614 | ) |
Group 1 Automotive, Inc. | | | 7,724 | | | | (453,322 | ) |
Tractor Supply Co. | | | 5,414 | | | | (489,750 | ) |
Pool Corp. | | | 5,700 | | | | (500,118 | ) |
Wendy’s Co. | | | 46,003 | | | | (500,972 | ) |
LKQ Corp.* | | | 16,479 | | | | (526,174 | ) |
Core-Mark Holding Company, Inc. | | | 6,547 | | | | (533,974 | ) |
Lithia Motors, Inc. — Class A | | | 6,581 | | | | (574,719 | ) |
O’Reilly Automotive, Inc.* | | | 2,339 | | | | (640,091 | ) |
Wynn Resorts Ltd. | | | 6,911 | | | | (645,695 | ) |
Royal Caribbean Cruises Ltd. | | | 8,581 | | | | (704,929 | ) |
Hanesbrands, Inc. | | | 26,815 | | | | (759,937 | ) |
Signet Jewelers Ltd. | | | 6,166 | | | | (764,769 | ) |
J.C. Penney Company, Inc.* | | | 72,493 | | | | (801,773 | ) |
Kate Spade & Co.* | | | 34,411 | | | | (878,169 | ) |
Under Armour, Inc. — Class A* | | | 15,586 | | | | (1,322,160 | ) |
DreamWorks Animation SKG, Inc. — Class A* | | | 61,542 | | | | (1,535,473 | ) |
CarMax, Inc.* | | | 32,580 | | | | (1,664,838 | ) |
Total Consumer, Cyclical | | | | | | | (17,741,862 | ) |
| | | | | | | | | |
Financial - (1.4)% | |
Taubman Centers, Inc. | | | 5,205 | | | | (370,752 | ) |
Community Bank System, Inc. | | | 9,878 | | | | (377,438 | ) |
Safety Insurance Group, Inc. | | | 6,803 | | | | (388,179 | ) |
Washington Federal, Inc. | | | 17,213 | | | | (389,874 | ) |
Northfield Bancorp, Inc. | | | 23,842 | | | | (391,962 | ) |
FNB Corp. | | | 30,493 | | | | (396,714 | ) |
Bank of the Ozarks, Inc. | | | 9,496 | | | | (398,547 | ) |
American Assets Trust, Inc. | | | 10,341 | | | | (412,813 | ) |
Pennsylvania Real Estate Investment Trust | | | 19,030 | | | | (415,806 | ) |
Glacier Bancorp, Inc. | | | 16,564 | | | | (421,057 | ) |
Liberty Property Trust | | | 12,690 | | | | (424,607 | ) |
Webster Financial Corp. | | | 12,638 | | | | (453,704 | ) |
Sovran Self Storage, Inc. | | | 4,017 | | | | (473,805 | ) |
Tanger Factory Outlet Centers, Inc. | | | 13,456 | | | | (489,664 | ) |
Associated Banc-Corp. | | | 28,170 | | | | (505,370 | ) |
Assurant, Inc. | | | 6,853 | | | | (528,709 | ) |
EastGroup Properties, Inc. | | | 8,864 | | | | (535,120 | ) |
Douglas Emmett, Inc. | | | 18,722 | | | | (563,719 | ) |
Corporate Office Properties Trust | | | 22,413 | | | | (588,117 | ) |
Public Storage | | | 2,243 | | | | (618,687 | ) |
Kilroy Realty Corp. | | | 10,101 | | | | (624,949 | ) |
Intercontinental Exchange, Inc. | | | 2,726 | | | | (640,992 | ) |
38 | THE GUGGENHEIM FUNDS SEMI-ANNUAL REPORT | SEE NOTES TO FINANCIAL STATEMENTS. |
CONSOLIDATED SCHEDULE OF INVESTMENTS (Unaudited)(continued) | March 31, 2016 |
MACRO OPPORTUNITIES FUND | |
| | | Shares | | | Value | |
| | | | | | | |
Welltower, Inc. | | | 9,285 | | | $ | (643,822 | ) |
National Retail Properties, Inc. | | | 14,125 | | | | (652,575 | ) |
People’s United Financial, Inc. | | | 41,146 | | | | (655,456 | ) |
Alexandria Real Estate Equities, Inc. | | | 7,267 | | | | (660,498 | ) |
Highwoods Properties, Inc. | | | 13,924 | | | | (665,706 | ) |
Camden Property Trust | | | 8,083 | | | | (679,699 | ) |
Duke Realty Corp. | | | 30,320 | | | | (683,413 | ) |
Simon Property Group, Inc. | | | 3,347 | | | | (695,138 | ) |
Healthcare Realty Trust, Inc. | | | 23,107 | | | | (713,775 | ) |
Regency Centers Corp. | | | 9,811 | | | | (734,353 | ) |
Mercury General Corp. | | | 13,657 | | | | (757,964 | ) |
Kite Realty Group Trust | | | 28,541 | | | | (790,871 | ) |
AvalonBay Communities, Inc. | | | 4,209 | | | | (800,552 | ) |
Valley National Bancorp | | | 86,092 | | | | (821,318 | ) |
Equity One, Inc. | | | 28,879 | | | | (827,672 | ) |
Retail Opportunity Investments Corp. | | | 43,686 | | | | (878,962 | ) |
Morgan Stanley | | | 35,480 | | | | (887,355 | ) |
Crown Castle International Corp. | | | 10,495 | | | | (907,818 | ) |
Federal Realty Investment Trust | | | 5,902 | | | | (921,008 | ) |
Cousins Properties, Inc. | | | 90,463 | | | | (939,006 | ) |
Vornado Realty Trust | | | 10,186 | | | | (961,864 | ) |
Boston Properties, Inc. | | | 7,649 | | | | (972,036 | ) |
Equity Residential | | | 13,359 | | | | (1,002,326 | ) |
American Tower Corp. — Class A | | | 10,149 | | | | (1,038,952 | ) |
Goldman Sachs Group, Inc. | | | 6,659 | | | | (1,045,330 | ) |
Extra Space Storage, Inc. | | | 11,288 | | | | (1,054,976 | ) |
Prologis, Inc. | | | 24,965 | | | | (1,102,953 | ) |
American Campus Communities, Inc. | | | 23,685 | | | | (1,115,327 | ) |
Realty Income Corp. | | | 18,303 | | | | (1,144,121 | ) |
Essex Property Trust, Inc. | | | 5,446 | | | | (1,273,601 | ) |
SL Green Realty Corp. | | | 16,297 | | | | (1,578,854 | ) |
HCP, Inc. | | | 50,364 | | | | (1,640,859 | ) |
Total Financial | | | | | | | (39,658,745 | ) |
| | | | | | | | | |
Total Common Stocks Sold Short | | | | | |
(Proceeds $90,289,875) | | | | | | | (94,186,615 | ) |
| | | Face
Amount | | | | |
| | | | | | | |
CORPORATE BONDS SOLD SHORT†† - (0.0)% | |
Envision Healthcare Corp. | | | | | | |
5.13% due 07/01/226 | | $ | 1,000,000 | | | | (1,015,000 | ) |
Total Corporate Bonds Sold Short | | | | | |
(Cost $984,518) | | | | | | | (1,015,000 | ) |
| | | | | | | | | |
Total Securities Sold Short - (3.1)% | | | | | |
(Proceeds $91,274,393) | | | | | | | (95,201,615 | ) |
| | | Contracts | | | | |
| | | | | | | |
OPTIONS WRITTEN† - (0.0)% | |
Call options on: | | | | | | |
Bank of America Merrill Lynch
September 2016 SPDR
Gold Shares Expiring with
strike price of $142.00 | | | 10,345 | | | | (868,980 | ) |
Put options on: | | | | | | | | |
BNP
June 2016 S&P 500 Index
Expiring with strike
price of $1,600.00 | | | 544 | | | | (139,264 | ) |
Total Options Written | | | | | | | | |
(Premiums received $4,061,040) | | | | | | | (1,008,244 | ) |
| | | | | | | | | |
Other Assets & Liabilities, net - (4.9)% | | | | (152,868,358 | ) |
Total Net Assets - 100.0% | | | $ | 3,130,979,380 | |
SEE NOTES TO FINANCIAL STATEMENTS. | THE GUGGENHEIM FUNDS SEMI-ANNUAL REPORT | 39 |
CONSOLIDATED SCHEDULE OF INVESTMENTS (Unaudited)(continued) | March 31, 2016 |
MACRO OPPORTUNITIES FUND | |
| | | Units | | | Unrealized
Gain (Loss) | |
| | | | | | | |
OTC CURRENCY SWAP AGREEMENT SOLD SHORT†† | |
Bank of America
June 2016 Euro -
Bund Swap,
Terminating 06/06/16
(Aggregate Value of
Contracts $258,454,992) | | | 1,389 | | | $ | (1,454,397 | ) |
| | | | | | | | | |
OTC EQUITY SWAP AGREEMENTS†† | |
Morgan Stanley
June 2017 Macro
Opportunities Long Custom
Basket Swap 0.43%16
Terminating 06/15/17
(Notional Value
$51,889,508) | | | | | | $ | 3,337,357 | |
| | | | | | | | | |
OTC INTEREST RATE SWAP AGREEMENT†† | |
Bank of America
April 2016 U.S. Treasury
Note 2.25% due 11/15/25
Swap 0.40%19,
Terminating 04/12/16
(Notional Value
$251,707,616) | | | 241,854,000 | | | | 9,847,591 | |
| | | | | | | | | |
OTC EQUITY SWAP AGREEMENTS SOLD SHORT†† | |
Morgan Stanley
June 2017 Macro
Opportunities Short Custom
Basket Swap 0.37%17
Terminating 06/15/17
(Notional Value
$52,254,172) | | | | | | $ | (1,874,059 | ) |
CENTRALLY CLEARED INTEREST RATE SWAP AGREEMENTS†† | |
| | |
Counterparty | Floating Rate | Floating Rate Index | | Fixed Rate | | Maturity Date | | Notional Amount | | | Market Value | | | Unrealized Depreciation | |
Merrill Lynch | Receive | 3-Month USD-LIBOR | | 2.27 | % | 8/17/25 | | $ | (3,600,000 | ) | | $ | (212,580 | ) | | $ | (212,580 | ) |
Merrill Lynch | Receive | 3-Month USD-LIBOR | | 2.27 | % | 8/17/25 | | | (3,850,000 | ) | | | (228,497 | ) | | | (228,497 | ) |
Merrill Lynch | Receive | 3-Month USD-LIBOR | | 2.23 | % | 11/16/25 | | | (8,750,000 | ) | | | (487,375 | ) | | | (487,375 | ) |
Merrill Lynch | Receive | 3-Month USD-LIBOR | | 1.59 | % | 7/2/18 | | | (34,550,000 | ) | | | (552,454 | ) | | | (552,454 | ) |
Merrill Lynch | Receive | 3-Month USD-LIBOR | | 2.73 | % | 7/2/23 | | | (23,800,000 | ) | | | (2,176,034 | ) | | | (2,176,034 | ) |
| | | | | | | | | | | | | | | | | $ | (3,656,940 | ) |
OTC FORWARD FOREIGN CURRENCY EXCHANGE CONTRACTS†† | |
| | |
Counterparty | | Contracts
Sell | | Currency | Settlement Date | | Settlement Value | | | Value at
March 31,
2016 | | | Net
Unrealized Depreciation | |
Bank of America | | | (14,700,000 | ) | GBP | 04/11/16 | | $ | 20,834,192 | | | $ | 21,115,104 | | | $ | (280,911 | ) |
BNY Mellon | | | (14,926,000 | ) | EUR | 04/11/16 | | | 16,384,934 | | | | 16,988,257 | | | | (603,324 | ) |
| | | | | | | | | | | | | | | | | $ | (884,235 | ) |
40 | THE GUGGENHEIM FUNDS SEMI-ANNUAL REPORT | SEE NOTES TO FINANCIAL STATEMENTS. |
CONSOLIDATED SCHEDULE OF INVESTMENTS (Unaudited)(continued) | March 31, 2016 |
MACRO OPPORTUNITIES FUND | |
| | | Shares | | | Unrealized
Gain (Loss) | |
| | | | | | | |
Custom Basket of Long Securities16 | |
United Continental Holdings, Inc.* | | | 15,608 | | | $ | 203,759 | |
Affiliated Managers Group, Inc.* | | | 4,932 | | | | 194,402 | |
UGI Corp. | | | 38,269 | | | | 183,817 | |
United Rentals, Inc.* | | | 16,592 | | | | 162,993 | |
Total System Services, Inc. | | | 16,993 | | | | 143,978 | |
Computer Sciences Corp. | | | 36,576 | | | | 128,979 | |
Raymond James Financial, Inc. | | | 22,290 | | | | 123,482 | |
Scripps Networks Interactive, Inc. — Class A | | | 16,973 | | | | 120,028 | |
Post Holdings, Inc.* | | | 10,183 | | | | 115,430 | |
Cambrex Corp.* | | | 11,401 | | | | 111,362 | |
Delphi Automotive plc | | | 9,343 | | | | 104,111 | |
Energizer Holdings, Inc. | | | 16,192 | | | | 103,609 | |
FirstEnergy Corp. | | | 40,781 | | | | 103,559 | |
LyondellBasell Industries N.V. — Class A | | | 9,506 | | | | 102,952 | |
AECOM* | | | 20,723 | | | | 99,147 | |
Robert Half International, Inc. | | | 16,568 | | | | 94,148 | |
DaVita HealthCare Partners, Inc.* | | | 15,925 | | | | 89,811 | |
Alaska Air Group, Inc. | | | 6,313 | | | | 85,981 | |
Legg Mason, Inc. | | | 12,926 | | | | 84,025 | |
Pitney Bowes, Inc. | | | 28,611 | | | | 83,244 | |
Ameren Corp. | | | 14,549 | | | | 81,958 | |
Gentex Corp. | | | 40,249 | | | | 80,228 | |
Dick's Sporting Goods, Inc. | | | 9,214 | | | | 78,191 | |
Intel Corp. | | | 38,256 | | | | 76,864 | |
Level 3 Communications, Inc.* | | | 15,427 | | | | 72,401 | |
Mead Johnson Nutrition Co. — Class A | | | 5,857 | | | | 69,292 | |
Dycom Industries, Inc.* | | | 10,176 | | | | 66,300 | |
Philip Morris International, Inc. | | | 6,924 | | | | 63,541 | |
Progressive Corp. | | | 12,676 | | | | 52,529 | |
DR Horton, Inc. | | | 28,716 | | | | 49,767 | |
Waters Corp.* | | | 3,660 | | | | 49,223 | |
Great Plains Energy, Inc. | | | 14,905 | | | | 47,669 | |
Teradyne, Inc. | | | 21,192 | | | | 42,257 | |
Albemarle Corp. | | | 7,594 | | | | 41,402 | |
Ameriprise Financial, Inc. | | | 6,512 | | | | 40,940 | |
RR Donnelley & Sons Co. | | | 30,679 | | | | 38,142 | |
SunTrust Banks, Inc. | | | 30,683 | | | | 37,801 | |
Discovery Communications, Inc. — Class A* | | | 35,766 | | | | 35,675 | |
F5 Networks, Inc.* | | | 4,536 | | | | 33,956 | |
Unum Group | | | 37,546 | | | | 32,939 | |
Carlisle Companies, Inc. | | | 4,095 | | | | 30,532 | |
Cognizant Technology Solutions Corp. — Class A* | | | 6,483 | | | | 30,472 | |
Merck & Company, Inc. | | | 19,500 | | | | 26,171 | |
ManpowerGroup, Inc. | | | 9,980 | | | | 24,757 | |
QUALCOMM, Inc. | | | 25,128 | | | | 23,923 | |
Snap-on, Inc. | | | 2,889 | | | | 23,509 | |
Synchrony Financial* | | | 16,792 | | | | 21,992 | |
Microsoft Corp. | | | 7,228 | | | | 20,592 | |
CSX Corp. | | | 22,473 | | | | 20,432 | |
Juniper Networks, Inc. | | | 33,964 | | | | 20,327 | |
Comcast Corp. — Class A | | | 10,709 | | | | 19,591 | |
Bank of America Corp. | | | 45,888 | | | | 17,713 | |
Fifth Third Bancorp | | | 24,782 | | | | 15,241 | |
CNO Financial Group, Inc. | | | 21,041 | | | | 14,129 | |
Ford Motor Co. | | | 30,985 | | | | 13,116 | |
Torchmark Corp. | | | 9,803 | | | | 12,636 | |
eBay, Inc.* | | | 21,687 | | | | 11,459 | |
Visa, Inc. — Class A | | | 5,073 | | | | 10,779 | |
PepsiCo, Inc. | | | 5,868 | | | | 8,440 | |
Old Republic International Corp. | | | 30,669 | | | | 7,940 | |
California Resources Corp. | | | 931 | | | | 694 | |
Michael Kors Holdings Ltd.* | | | 7,089 | | | | (4,265 | ) |
SEE NOTES TO FINANCIAL STATEMENTS. | THE GUGGENHEIM FUNDS SEMI-ANNUAL REPORT | 41 |
CONSOLIDATED SCHEDULE OF INVESTMENTS (Unaudited)(continued) | March 31, 2016 |
MACRO OPPORTUNITIES FUND | |
| | | Shares | | | Unrealized
Gain (Loss) | |
| | | | | | | |
Discover Financial Services | | | 15,463 | | | $ | (5,776 | ) |
Harris Corp. | | | 6,744 | | | | (5,860 | ) |
Mallinckrodt plc* | | | 20,314 | | | | (12,787 | ) |
GameStop Corp. — Class A | | | 14,155 | | | | (13,226 | ) |
Flowers Foods, Inc. | | | 67,229 | | | | (25,463 | ) |
Amgen, Inc. | | | 8,615 | | | | (39,778 | ) |
PTC Therapeutics, Inc.* | | | 8,726 | | | | (137,237 | ) |
Citigroup, Inc. | | | 16,170 | | | | (142,102 | ) |
Lincoln National Corp. | | | 29,321 | | | | (238,002 | ) |
Total Custom Basket of Long Securities | | | | 3,293,550 | |
| | | | | | | | | |
Custom Basket of Short Securities17 | |
PTC Therapeutics, Inc.* | | | (8,726 | ) | | | 178,551 | |
CF Industries Holdings, Inc. | | | (18,847 | ) | | | 90,639 | |
AutoNation, Inc.* | | | (7,116 | ) | | | 44,333 | |
Cree, Inc.* | | | (11,667 | ) | | | 36,748 | |
Celgene Corp.* | | | (6,535 | ) | | | 21,742 | |
PulteGroup, Inc. | | | (31,121 | ) | | | 12,119 | |
NIKE, Inc. — Class B | | | (7,855 | ) | | | 8,605 | |
Domino's Pizza, Inc. | | | (3,092 | ) | | | 7,053 | |
Boston Beer Company, Inc. — Class A* | | | (1,994 | ) | | | 5,237 | |
Buffalo Wild Wings, Inc.* | | | (3,078 | ) | | | 4,052 | |
Macerich Co. | | | (4,795 | ) | | | 2,556 | |
Reynolds American, Inc. | | | (7,487 | ) | | | 574 | |
Expedia, Inc. | | | (3,981 | ) | | | (662 | ) |
California Resources Corp. | | | (931 | ) | | | (676 | ) |
Hormel Foods Corp. | | | (8,761 | ) | | | (2,613 | ) |
Deere & Co. | | | (12,817 | ) | | | (5,421 | ) |
Edwards Lifesciences Corp.* | | | (7,215 | ) | | | (6,014 | ) |
WhiteWave Foods Co. — Class A* | | | (9,427 | ) | | | (8,231 | ) |
Orbital ATK, Inc. | | | (7,730 | ) | | | (8,466 | ) |
Signature Bank* | | | (4,441 | ) | | | (9,663 | ) |
Leucadia National Corp. | | | (40,401 | ) | | | (9,704 | ) |
Nasdaq, Inc. | | | (6,095 | ) | | | (14,601 | ) |
Lennar Corp. — Class A | | | (11,850 | ) | | | (15,179 | ) |
Woodward, Inc. | | | (7,551 | ) | | | (16,604 | ) |
MSCI, Inc. — Class A | | | (5,403 | ) | | | (17,047 | ) |
Dollar Tree, Inc.* | | | (20,299 | ) | | | (17,093 | ) |
Cheesecake Factory, Inc. | | | (7,434 | ) | | | (17,252 | ) |
Illumina, Inc.* | | | (3,750 | ) | | | (18,252 | ) |
Marsh & McLennan Companies, Inc. | | | (6,518 | ) | | | (18,684 | ) |
PayPal Holdings, Inc.* | | | (11,898 | ) | | | (18,983 | ) |
Automatic Data Processing, Inc. | | | (6,187 | ) | | | (20,203 | ) |
Weingarten Realty Investors | | | (12,562 | ) | | | (22,761 | ) |
McGraw Hill Financial, Inc. | | | (4,559 | ) | | | (23,445 | ) |
VF Corp. | | | (14,909 | ) | | | (23,875 | ) |
Stillwater Mining Co.* | | | (26,050 | ) | | | (25,089 | ) |
Panera Bread Co. — Class A* | | | (2,635 | ) | | | (26,137 | ) |
Apartment Investment & Management Co. — Class A | | | (10,052 | ) | | | (26,824 | ) |
Host Hotels & Resorts, Inc. | | | (27,468 | ) | | | (27,380 | ) |
M&T Bank Corp. | | | (4,503 | ) | | | (27,497 | ) |
Mattel, Inc. | | | (21,270 | ) | | | (29,117 | ) |
Advance Auto Parts, Inc. | | | (3,261 | ) | | | (29,253 | ) |
Post Properties, Inc. | | | (11,603 | ) | | | (30,662 | ) |
Carnival Corp. | | | (7,768 | ) | | | (31,332 | ) |
Eversource Energy | | | (7,244 | ) | | | (31,794 | ) |
CME Group, Inc. — Class A | | | (12,441 | ) | | | (31,990 | ) |
UDR, Inc. | | | (17,140 | ) | | | (33,618 | ) |
Urban Edge Properties | | | (17,277 | ) | | | (34,070 | ) |
Kansas City Southern | | | (9,466 | ) | | | (34,235 | ) |
Ross Stores, Inc. | | | (8,590 | ) | | | (34,398 | ) |
Medical Properties Trust, Inc. | | | (32,511 | ) | | | (35,531 | ) |
Kaiser Aluminum Corp. | | | (5,811 | ) | | | (37,613 | ) |
Nielsen Holdings plc | | | (7,572 | ) | | | (39,840 | ) |
Alliant Energy Corp. | | | (6,371 | ) | | | (40,923 | ) |
BlackRock, Inc. — Class A | | | (2,233 | ) | | | (41,695 | ) |
42 | THE GUGGENHEIM FUNDS SEMI-ANNUAL REPORT | SEE NOTES TO FINANCIAL STATEMENTS. |
CONSOLIDATED SCHEDULE OF INVESTMENTS (Unaudited)(continued) | March 31, 2016 |
MACRO OPPORTUNITIES FUND | |
| | | Shares | | | Unrealized
Loss | |
| | | | | | | |
MDU Resources Group, Inc. | | | (32,117 | ) | | $ | (42,494 | ) |
Mack-Cali Realty Corp. | | | (23,315 | ) | | | (42,869 | ) |
General Electric Co. | | | (16,461 | ) | | | (44,404 | ) |
Education Realty Trust, Inc. | | | (17,868 | ) | | | (52,700 | ) |
New York Community Bancorp, Inc. | | | (94,729 | ) | | | (58,658 | ) |
Xylem, Inc. | | | (9,946 | ) | | | (61,312 | ) |
Garmin Ltd. | | | (16,991 | ) | | | (63,172 | ) |
Yum! Brands, Inc. | | | (8,166 | ) | | | (63,542 | ) |
Omega Healthcare Investors, Inc. | | | (17,126 | ) | | | (64,462 | ) |
Cooper Companies, Inc. | | | (3,295 | ) | | | (70,604 | ) |
Dominion Resources, Inc. | | | (9,843 | ) | | | (75,468 | ) |
Five Below, Inc.* | | | (14,627 | ) | | | (83,397 | ) |
Ingersoll-Rand plc | | | (6,823 | ) | | | (89,911 | ) |
Rayonier, Inc. | | | (39,286 | ) | | | (106,037 | ) |
Dunkin' Brands Group, Inc. | | | (18,033 | ) | | | (110,683 | ) |
Ventas, Inc. | | | (14,402 | ) | | | (120,664 | ) |
Olin Corp. | | | (66,964 | ) | | | (140,531 | ) |
Total Custom Basket of Short Securities | | | | (1,823,126 | ) |
SEE NOTES TO FINANCIAL STATEMENTS. | THE GUGGENHEIM FUNDS SEMI-ANNUAL REPORT | 43 |
CONSOLIDATED SCHEDULE OF INVESTMENTS (Unaudited)(continued) | March 31, 2016 |
MACRO OPPORTUNITIES FUND | |
* | Non-income producing security. |
† | Value determined based on Level 1 inputs, unless otherwise noted — See Note 4. |
†† | Value determined based on Level 2 inputs, unless otherwise noted — See Note 4. |
††† | Value determined based on Level 3 inputs — See Note 4. |
1 | All or a portion of this security is pledged as short security collateral at March 31, 2016. |
2 | Illiquid security. |
3 | Zero coupon rate security. |
4 | Residual interest. |
5 | Variable rate security. Rate indicated is rate effective at March 31, 2016. |
6 | Security is a 144A or Section 4(a)(2) security. The total market value of 144A or Section 4(a)(2) securities is $1,450,184,911 (cost $1,522,226,592), or 47.6% of total net assets. These securities have been determined to be liquid under guidelines established by the Board of Trustees. |
7 | Affiliated issuer — See Note 8. |
8 | Rate indicated is the 7 day yield as of March 31, 2016. |
9 | Security or a portion thereof is held as collateral for reverse repurhase agreements — See Note 12. |
10 | Security with no rate was unsettled at March 31, 2016. |
11 | Perpetual maturity. |
12 | Security is in default of interest and/or principal obligations. |
13 | Security is a step up/step down bond. The coupon increases or decreases at regular intervals until the bond reaches full maturity. |
14 | Repurchase Agreements — See Note 11. |
15 | The face amount is denominated in U.S. Dollars unless otherwise indicated. |
16 | Total Return is based on the return of long basket of securities +/- financing at a variable rate. Rate indicated is rate effective at March 31, 2016. |
17 | Total Return is based on the return of short basket of securities +/- financing at a variable rate. Rate indicated is rate effective at March 31, 2016. |
18 | Security is a 144A or Section 4(a)(2) security. These securities are considered illiquid and restricted under guidelines established by the Board of Trustees. The total market value of 144A or Section 4(a)(2) securities is $38,648,912 (cost $44,778,766), or 1.2% of total net assets — See Note 13. |
19 | Total return is based on U.S. Treasury Note +/- financing at a fixed rate. Rate indicated is rate effective at March 31, 2016. |
| | plc — Public Limited Company |
| | REIT — Real Estate Investment Trust |
| | |
| | See Sector Classification in Other Information section. |
44 | THE GUGGENHEIM FUNDS SEMI-ANNUAL REPORT | SEE NOTES TO FINANCIAL STATEMENTS. |
CONSOLIDATED SCHEDULE OF INVESTMENTS (Unaudited)(continued) | March 31, 2016 |
MACRO OPPORTUNITIES FUND | |
The following table summarizes the inputs used to value the Fund’s investments at March 31, 2016 (See Note 4 in the Notes to Consolidated Financial Statements):
Investments in Securities (Assets) | | Level 1 | | | Level 1 - Other* | | | Level 2 | | | Level 2 - Other* | | | Level 3 | | | Total | |
Asset-Backed Securities | | $ | — | | | $ | — | | | $ | 962,862,531 | | | $ | — | | | $ | 71,469,206 | | | $ | 1,034,331,737 | |
Collateralized Mortgage Obligations | | | — | | | | — | | | | 437,602,752 | | | | — | | | | 7,429,339 | | | | 445,032,091 | |
Commercial Paper | | | — | | | | — | | | | 5,998,717 | | | | — | | | | — | | | | 5,998,717 | |
Common Stocks | | | 142,814,846 | | | | — | | | | 403,418 | | | | — | | | | 20,716 | | | | 143,238,980 | |
Exchange-Traded Funds | | | 53,914,309 | | | | — | | | | — | | | | — | | | | — | | | | 53,914,309 | |
Corporate Bonds | | | — | | | | — | | | | 625,097,208 | | | | — | | | | 8,004,241 | | | | 633,101,449 | |
Equity Swap Agreements | | | — | | | | — | | | | — | | | | 3,337,357 | | | | — | | | | 3,337,357 | |
Foreign Government Bonds | | | — | | | | — | | | | 64,223,925 | | | | — | | | | — | | | | 64,223,925 | |
Interest Rate Swap Agreements | | | — | | | | — | | | | — | | | | 9,847,591 | | | | — | | | | 9,847,591 | |
Mutual Funds | | | 218,750,726 | | | | — | | | | — | | | | — | | | | — | | | | 218,750,726 | |
Options Purchased | | | 2,868,950 | | | | — | | | | — | | | | — | | | | 2,140,828 | | | | 5,009,778 | |
Preferred Stocks | | | — | | | | — | | | | 17,188,619 | | | | — | | | | 831,255 | | | | 18,019,874 | |
Repurchase Agreements | | | — | | | | — | | | | 3,404,000 | | | | — | | | | — | | | | 3,404,000 | |
Senior Fixed Rate Interests | | | — | | | | — | | | | 3,154,528 | | | | — | | | | 77,884 | | | | 3,232,412 | |
Senior Floating Rate Interests | | | — | | | | — | | �� | | 597,595,315 | | | | — | | | | 49,058,401 | | | | 646,653,716 | |
Short Term Investments | | | 105,145,883 | | | | — | | | | — | | | | — | | | | — | | | | 105,145,883 | |
Total | | $ | 523,494,714 | | | $ | — | | | $ | 2,717,531,013 | | | $ | 13,184,948 | | | $ | 139,031,870 | | | $ | 3,393,242,545 | |
SEE NOTES TO FINANCIAL STATEMENTS. | THE GUGGENHEIM FUNDS SEMI-ANNUAL REPORT | 45 |
CONSOLIDATED SCHEDULE OF INVESTMENTS (Unaudited)(concluded) | March 31, 2016 |
MACRO OPPORTUNITIES FUND | |
Investments in Securities (Liabilities) | | Level 1 | | | Level 1 - Other* | | | Level 2 | | | Level 2 - Other* | | | Level 3 | | | Total | |
Common Stocks | | $ | 94,186,615 | | | $ | — | | | $ | — | | | $ | — | | | $ | — | | | $ | 94,186,615 | |
Corporate Bonds | | | — | | | | — | | | | 1,015,000 | | | | — | | | | — | | | | 1,015,000 | |
Currency Swap Agreements | | | — | | | | — | | | | — | | | | 1,454,397 | | | | — | | | | 1,454,397 | |
Forward Foreign Currency Exchange Contracts | | | — | | | | — | | | | — | | | | 884,235 | | | | — | | | | 884,235 | |
Equity Index Swap Agreements | | | — | | | | — | | | | — | | | | 1,874,059 | | | | — | | | | 1,874,059 | |
Interest Rate Swap Agreements | | | — | | | | — | | | | — | | | | 3,656,940 | | | | — | | | | 3,656,940 | |
Options Written | | | 1,008,244 | | | | — | | | | — | | | | — | | | | — | | | | 1,008,244 | |
Total | | $ | 95,194,859 | | | $ | — | | | $ | 1,015,000 | | | $ | 7,869,631 | | | $ | — | | | $ | 104,079,490 | |
* | Other financial instruments include forward foreign currency exchange contracts or swaps, which are reported as unrealized gain/loss at period end. |
Transfers between investment levels may occur as the markets fluctuate and/or the availability of data used in an investment’s valuation changes. The Fund recognized transfers between the levels as of the beginning of the period. As of March 31, 2016, the Fund had transfers in/out of Level 3 due to changes in securities valuation method. See the Summary of Fair Value Level 3 Activity in Note 4 for changes to and from Level 2 and Level 3. There were no other securities that transferred between levels.
46 | THE GUGGENHEIM FUNDS SEMI-ANNUAL REPORT | SEE NOTES TO FINANCIAL STATEMENTS. |
CONSOLIDATED STATEMENT OF ASSETS AND LIABILITIES (Unaudited) |
MACRO OPPORTUNITIES FUND |
March 31, 2016
Assets: | |
Investments in unaffiliated issuers, at value (cost $3,267,434,561) | | $ | 3,103,988,562 | |
Investments in affiliated issuers, at value(cost $272,745,174) | | | 272,665,035 | |
Repurchase agreements, at value (cost $3,404,000) | | | 3,404,000 | |
Total investments (cost $3,543,583,735) | | | 3,380,057,597 | |
Foreign currency, at value (cost $131,070) | | | 133,499 | |
Segregated cash with broker | | | 51,705,293 | |
Cash | | | 26,223,237 | |
Unrealized appreciation on swap agreements | | | 13,184,948 | |
Prepaid expenses | | | 284,061 | |
Receivables: | |
Securities sold | | | 37,024,763 | |
Interest | | | 24,401,945 | |
Fund shares sold | | | 6,692,788 | |
Dividends | | | 416,028 | |
Foreign taxes reclaim | | | 38,794 | |
Total assets | | | 3,540,162,953 | |
| | | | | |
Liabilities: | |
Reverse Repurchase Agreements | | | 253,502,419 | |
Securities sold short, at value (proceeds $91,274,393) | | | 95,201,615 | |
Unrealized depreciation on swap agreements | | | 6,985,396 | |
Segregated cash from broker | | | 4,542,000 | |
Unfunded loan commitments, at value (Note 9) (proceeds $2,891,546) | | | 1,923,036 | |
Options written, at value (premiums received $4,061,040) | | | 1,008,244 | |
Unrealized depreciation on forward foreign currency exchange contracts | | | 884,235 | |
Payable for: | |
Securities purchased | | | 25,196,292 | |
Fund shares redeemed | | | 13,953,519 | |
Management fees | | $ | 1,753,097 | |
Swap settlement | | | 580,238 | |
Distribution and service fees | | | 456,495 | |
Fund accounting/administration fees | | | 251,583 | |
Trustees’ fees* | | | 22,667 | |
Miscellaneous | | | 2,922,737 | |
Total liabilities | | | 409,183,573 | |
Net assets | | $ | 3,130,979,380 | |
| | | | | |
Net assets consist of: | |
Paid in capital | | | 3,428,399,465 | |
Accumulated net investment loss | | | (36,677,253 | ) |
Accumulated net realized loss on investments | | | (102,688,318 | ) |
Net unrealized depreciation on investments | | | (158,054,514 | ) |
Net assets | | $ | 3,130,979,380 | |
| | | | | |
A-Class: | |
Net assets | | $ | 738,283,805 | |
Capital shares outstanding | | | 29,688,025 | |
Net asset value per share | | $ | 24.87 | |
Maximum offering price per share (Net asset value divided by 96.00%) | | $ | 25.91 | |
| | | | | |
C-Class: | |
Net assets | | $ | 340,522,168 | |
Capital shares outstanding | | | 13,704,028 | |
Net asset value per share | | $ | 24.85 | |
| | | | | |
P-Class: | |
Net assets | | $ | 59,369,819 | |
Capital shares outstanding | | | 2,387,322 | |
Net asset value per share | | $ | 24.87 | |
| | | | | |
Institutional Class: | |
Net assets | | $ | 1,992,803,588 | |
Capital shares outstanding | | | 80,040,999 | |
Net asset value per share | | $ | 24.90 | |
* | Relates to Trustees not deemed ”interested persons” within the meaning of Section 2(a)(19) of the 1940 Act. |
SEE NOTES TO FINANCIAL STATEMENTS. | THE GUGGENHEIM FUNDS SEMI-ANNUAL REPORT | 47 |
CONSOLIDATED STATEMENT OF OPERATIONS (Unaudited) |
MACRO OPPORTUNITIES FUND |
Period Ended March 31, 2016
Investment Income: | |
Interest | | $ | 96,103,342 | |
Dividends from securities of affiliated issuers | | | 4,368,852 | |
Dividends from securities of unaffiliated issuers | | | 1,530,651 | |
Other income | | | 107,110 | |
Total investment income | | | 102,109,955 | |
| | | | | |
Expenses: | |
Management fees | | | 15,220,711 | |
Transfer agent/maintenance fees | |
A-Class | | | 542,955 | |
C-Class | | | 158,064 | |
P-Class | | | 763 | |
Institutional Class | | | 589,134 | |
Distribution and service fees: | |
A-Class | | | 982,922 | |
C-Class | | | 1,808,632 | |
P-Class | | | 75,419 | |
Fund accounting/administration fees | | | 1,623,254 | |
Interest expense | | | 2,857,893 | |
Prime broker interest expense | | | 222,600 | |
Line of credit fees | | | 216,979 | |
Trustees’ fees* | | | 108,542 | |
Custodian fees | | | 56,543 | |
Tax expense | | | 8 | |
Miscellaneous | | | 797,600 | |
Total expenses | | | 25,262,019 | |
Less: | |
Expenses waived by Adviser | | | (3,019,238 | ) |
Expenses waived by Transfer Agent | |
A-Class | | | (4,683 | ) |
Institutional Class | | | (249,640 | ) |
Total waived expenses | | | (3,273,561 | ) |
Net expenses | | | 21,988,458 | |
Net investment income | | | 80,121,497 | |
| | | | | |
Net Realized and Unrealized Gain (Loss): | |
Net realized gain (loss) on: | |
Investments in unaffiliated issuers | | $ | (21,634,338 | ) |
Investments in affiliated issuers | | | (1,956,431 | ) |
Swap agreements | | | (54,541,488 | ) |
Foreign currency | | | (58,506 | ) |
Forward currency exchange contracts | | | 3,033,070 | |
Securities sold short | | | 6,044,958 | |
Options purchased | | | 119,590 | |
Options written | | | 905,081 | |
Net realized loss | | | (68,088,064 | ) |
Net change in unrealized appreciation (depreciation) on: | |
Investments in unaffiliated issuers | | | (81,147,818 | ) |
Investments in affiliated issuers | | | 1,033,328 | |
Securities sold short | | | (7,851,806 | ) |
Swap agreements | | | 18,019,843 | |
Options purchased | | | (8,244,157 | ) |
Options written | | | 3,458,141 | |
Foreign currency | | | (31,246 | ) |
Forward foreign currency exchange contracts | | | (857,765 | ) |
Net change in unrealized appreciation (depreciation) | | | (75,621,480 | ) |
Net realized and unrealized loss | | | (143,709,544 | ) |
Net decrease in net assets resulting from operations | | $ | (63,588,047 | ) |
* | Relates to Trustees not deemed ”interested persons” within the meaning of Section 2(a)(19) of the 1940 Act. |
48 | THE GUGGENHEIM FUNDS SEMI-ANNUAL REPORT | SEE NOTES TO FINANCIAL STATEMENTS. |
CONSOLIDATED STATEMENTS OF CHANGES IN NET ASSETS |
MACRO OPPORTUNITIES FUND | |
| | | Period Ended
March 31,
2016
(Unaudited) | | | Year Ended
September 30,
2015 | |
Increase (Decrease) in Net Assets from Operations: | | | | | | |
Net investment income | | $ | 80,121,497 | | | $ | 106,179,902 | |
Net realized loss on investments | | | (68,088,064 | ) | | | (9,260,115 | ) |
Net change in unrealized appreciation (depreciation) on investments | | | (75,621,480 | ) | | | (75,857,361 | ) |
Net increase (decrease) in net assets resulting from operations | | | (63,588,047 | ) | | | 21,062,426 | |
| | | | | | | | | |
Distributions to shareholders from: | | | | | | | | |
Net investment income | | | | | | | | |
A-Class | | | (23,562,426 | ) | | | (32,220,860 | ) |
C-Class | | | (9,531,042 | ) | | | (11,680,427 | ) |
P-Class | | | (1,850,623 | ) | | | (440,186 | )* |
Institutional Class | | | (70,278,033 | ) | | | (82,260,910 | ) |
Total distributions to shareholders | | | (105,222,124 | ) | | | (126,602,383 | ) |
| | | | | | | | | |
Capital share transactions: | | | | | | | | |
Proceeds from sale of shares | | | | | | | | |
A-Class | | | 174,819,734 | | | | 850,080,101 | |
C-Class | | | 44,957,693 | | | | 190,338,315 | |
P-Class | | | 18,825,064 | | | | 65,730,196 | * |
Institutional Class | | | 551,683,057 | | | | 2,043,569,550 | |
Distributions reinvested | | | | | | | | |
A-Class | | | 18,433,690 | | | | 24,525,980 | |
C-Class | | | 7,939,394 | | | | 9,454,336 | |
P-Class | | | 1,850,494 | | | | 440,175 | * |
Institutional Class | | | 59,859,879 | | | | 70,225,372 | |
Cost of shares redeemed | | | | | | | | |
A-Class | | | (261,190,531 | ) | | | (361,979,619 | ) |
C-Class | | | (69,397,204 | ) | | | (62,646,748 | ) |
P-Class | | | (22,196,821 | ) | | | (1,207,063 | )* |
Institutional Class | | | (905,391,929 | ) | | | (563,882,643 | ) |
Net increase (decrease) from capital share transactions | | | (379,807,480 | ) | | | 2,264,647,952 | |
Net increase (decrease) in net assets | | | (548,617,651 | ) | | | 2,159,107,995 | |
| | | | | | | | | |
Net assets: | | | | | | | | |
Beginning of period | | | 3,679,597,031 | | | | 1,520,489,036 | |
End of period | | $ | 3,130,979,380 | | | $ | 3,679,597,031 | |
Accumulated net investment loss at end of period | | $ | (36,677,253 | ) | | $ | (11,576,626 | ) |
SEE NOTES TO FINANCIAL STATEMENTS. | THE GUGGENHEIM FUNDS SEMI-ANNUAL REPORT | 49 |
CONSOLIDATED STATEMENTS OF CHANGES IN NET ASSETS(concluded) |
MACRO OPPORTUNITIES FUND | |
| | | Period Ended
March 31,
2016
(Unaudited) | | | Year Ended
September 30,
2015 | |
Capital share activity: | | | | | | |
Shares sold | | | | | | |
A-Class | | | 6,893,432 | | | | 31,696,780 | |
C-Class | | | 1,771,375 | | | | 7,105,425 | |
P-Class | | | 745,337 | | | | 2,477,290 | * |
Institutional Class | | | 21,798,419 | | | | 76,252,160 | |
Shares issued from reinvestment of distributions | | | | | | | | |
A-Class | | | 732,293 | | | | 919,487 | |
C-Class | | | 315,691 | | | | 353,874 | |
P-Class | | | 73,463 | | | | 16,755 | * |
Institutional Class | | | 2,375,094 | | | | 2,628,280 | |
Shares redeemed | | | | | | | | |
A-Class | | | (10,335,927 | ) | | | (13,561,866 | ) |
C-Class | | | (2,766,527 | ) | | | (2,346,202 | ) |
P-Class | | | (879,664 | ) | | | (45,859 | )* |
Institutional Class | | | (35,965,323 | ) | | | (21,112,108 | ) |
Net increase (decrease) in shares | | | (15,242,337 | ) | | | 84,384,016 | |
* | Since commencement of operations May 1, 2015. |
50 | THE GUGGENHEIM FUNDS SEMI-ANNUAL REPORT | SEE NOTES TO FINANCIAL STATEMENTS. |
CONSOLIDATED STATEMENT OF CASH FLOWS |
MACRO OPPORTUNITIES FUND | |
Period Ended March 31, 2016
Cash Flows from Operating Activities: | | | |
Net decrease in net assets resulting from operations | | $ | (63,588,047 | ) |
| | | | | |
Adjustments to Reconcile Net Increase in Net Assets Resulting from Operations to
Net Cash Provided by Operating and Investing Activities: | | | | |
Net change in unrealized depreciation on investments | | | 87,966,296 | |
Net change in unrealized depreciation on options | | | 4,786,016 | |
Net change in unrealized appreciation on swaps | | | (18,019,843 | ) |
Net realized loss on swap agreements | | | 54,541,488 | |
Net realized gain on options | | | (1,024,671 | ) |
Net realized gain on investments | | | 17,545,811 | |
Net accretion of bond discount and amortization of bond premium | | | (14,722,998 | ) |
Paydowns received on mortgage and asset-backed securities | | | 182,967,600 | |
Purchase of long-term investments | | | (1,923,939,386 | ) |
Proceeds from sale of long-term investments | | | 2,036,585,290 | |
Net purchases of short-term investments | | | (11,660,422 | ) |
Increase in interest receivable | | | (6,691,719 | ) |
Increase in dividends receivable | | | (17,441 | ) |
Increase in prepaid expenses | | | (45,432 | ) |
Increase in foreign tax reclaims | | | (18,210 | ) |
Decrease in fair value of unfunded loans | | | (318,205 | ) |
Increase in trustees' fee payable | | | 18,087 | |
Decrease in transfer agent fee payable | | | (53,276 | ) |
Decrease in administration fee payable | | | (33,908 | ) |
Decrease in distribution fee payable | | | (37,763 | ) |
Decrease in management fee payable | | | (10,853 | ) |
Increase in accrued expenses and other liabilities | | | 2,528,037 | |
Net Cash Used in Operating and Investing Activities | | $ | 346,756,451 | |
| | | | | |
Cash Flows From Financing Activities: | | | | |
Proceeds from sales of shares | | | 795,554,774 | |
Cost of shares redeemed | | | (1,254,639,270 | ) |
Distributions paid out | | | (16,958,467 | ) |
Proceeds from reverse repurchase agreements | | | 1,490,371,374 | |
Payments made on reverse repurchase agreements | | | (1,393,359,755 | ) |
Net Cash Used in Financing Activities | | | (379,031,344 | ) |
Net decrease in cash | | | (32,274,893 | ) |
| | | | | |
Cash at Beginning of Period (including foreign cash) | | $ | 58,631,629 | |
Cash at End of Period (including foreign cash) | | $ | 26,356,736 | |
Supplemental Disclosure of Cash Flow Information: | | | | |
Cash paid during the year for interest | | $ | 2,330,763 | |
Dividend reinvestment | | $ | 88,083,457 | |
SEE NOTES TO FINANCIAL STATEMENTS. | THE GUGGENHEIM FUNDS SEMI-ANNUAL REPORT | 51 |
FINANCIAL HIGHLIGHTS |
MACRO OPPORTUNITIES FUND | |
This table is presented to show selected data for a share outstanding throughout each period and to assist shareholders in evaluating a Fund’s performance for the periods presented.
A-Class | | Period Ended
March 31,
2016a,h | | | Year Ended
Sept. 30,
2015h | | | Year Ended
Sept. 30,
2014 | | | Year Ended
Sept. 30,
2013 | | | Period Ended
Sept. 30,
2012b | |
Per Share Data | | | | | | | | | | | | | | | |
Net asset value, beginning of period | | $ | 26.07 | | | $ | 26.81 | | | $ | 26.31 | | | $ | 26.53 | | | $ | 25.00 | |
Income (loss) from investment operations: | |
Net investment income (loss)c | | | .57 | | | | .98 | | | | 1.10 | | | | 1.37 | | | | .99 | |
Net gain (loss) on investments (realized and unrealized) | | | (1.01 | ) | | | (.55 | ) | | | .69 | | | | (.04 | ) | | | 1.52 | |
Total from investment operations | | | (.44 | ) | | | .43 | | | | 1.79 | | | | 1.33 | | | | 2.51 | |
Less distributions from: | |
Net investment income | | | (.76 | ) | | | (1.17 | ) | | | (1.27 | ) | | | (1.43 | ) | | | (.98 | ) |
Net realized gains | | | — | | | | — | | | | — | | | | (.12 | ) | | | — | |
Return of capital | | | — | | | | — | | | | (.02 | ) | | | — | | | | — | |
Total distributions | | | (.76 | ) | | | (1.17 | ) | | | (1.29 | ) | | | (1.55 | ) | | | (.98 | ) |
Net asset value, end of period | | $ | 24.87 | | | $ | 26.07 | | | $ | 26.81 | | | $ | 26.31 | | | $ | 26.53 | |
| | |
Total Returni | | | (1.70 | %) | | | 1.59 | % | | | 6.88 | % | | | 5.01 | % | | | 10.19 | % |
Ratios/Supplemental Data | |
Net assets, end of period (in thousands) | | $ | 738,284 | | | $ | 844,523 | | | $ | 357,765 | | | $ | 334,751 | | | $ | 83,081 | |
Ratios to average net assets: | |
Net investment income (loss) | | | 4.54 | % | | | 3.67 | % | | | 4.08 | % | | | 5.11 | % | | | 4.61 | % |
Total expensesd | | | 1.62 | % | | | 1.52 | % | | | 1.51 | % | | | 1.56 | % | | | 1.61 | % |
Net expensese,g | | | 1.45 | % | | | 1.38 | % | | | 1.36 | % | | | 1.41 | % | | | 1.37 | % |
Portfolio turnover rate | | | 46 | % | | | 40 | % | | | 54 | % | | | 84 | % | | | 46 | % |
52 | THE GUGGENHEIM FUNDS SEMI-ANNUAL REPORT | SEE NOTES TO FINANCIAL STATEMENTS. |
FINANCIAL HIGHLIGHTS (continued) |
MACRO OPPORTUNITIES FUND | |
This table is presented to show selected data for a share outstanding throughout each period and to assist shareholders in evaluating a Fund’s performance for the periods presented.
C-Class | | Period Ended
March 31,
2016a,h | | | Year Ended
Sept. 30,
2015h | | | Year Ended
Sept. 30,
2014 | | | Year Ended
Sept. 30,
2013 | | | Period Ended
Sept. 30,
2012b | |
Per Share Data | | | | | | | | | | | | | | | |
Net asset value, beginning of period | | $ | 26.05 | | | $ | 26.79 | | | $ | 26.29 | | | $ | 26.51 | | | $ | 25.00 | |
Income (loss) from investment operations: | |
Net investment income (loss)c | | | .48 | | | | .78 | | | | .90 | | | | 1.17 | | | | .82 | |
Net gain (loss) on investments (realized and unrealized) | | | (1.02 | ) | | | (.55 | ) | | | .69 | | | | (.03 | ) | | | 1.53 | |
Total from investment operations | | | (.54 | ) | | | .23 | | | | 1.59 | | | | 1.14 | | | | 2.35 | |
Less distributions from: | |
Net investment income | | | (.66 | ) | | | (.97 | ) | | | (1.07 | ) | | | (1.24 | ) | | | (.84 | ) |
Net realized gains | | | — | | | | — | | | | — | | | | (.12 | ) | | | — | |
Return of capital | | | — | | | | — | | | | (.02 | ) | | | — | | | | — | |
Total distributions | | | (.66 | ) | | | (.97 | ) | | | (1.09 | ) | | | (1.36 | ) | | | (.84 | ) |
Net asset value, end of period | | $ | 24.85 | | | $ | 26.05 | | | $ | 26.79 | | | $ | 26.29 | | | $ | 26.51 | |
| | |
Total Returni | | | (2.06 | %) | | | 0.84 | % | | | 6.10 | % | | | 4.26 | % | | | 9.54 | % |
Ratios/Supplemental Data | |
Net assets, end of period (in thousands) | | $ | 340,522 | | | $ | 374,633 | | | $ | 248,359 | | | $ | 163,129 | | | $ | 32,711 | |
Ratios to average net assets: | |
Net investment income (loss) | | | 3.83 | % | | | 2.90 | % | | | 3.34 | % | | | 4.36 | % | | | 3.83 | % |
Total expensesd | | | 2.33 | % | | | 2.24 | % | | | 2.22 | % | | | 2.29 | % | | | 2.31 | % |
Net expensese,g | | | 2.18 | % | | | 2.13 | % | | | 2.10 | % | | | 2.15 | % | | | 2.11 | % |
Portfolio turnover rate | | | 46 | % | | | 40 | % | | | 54 | % | | | 84 | % | | | 46 | % |
SEE NOTES TO FINANCIAL STATEMENTS. | THE GUGGENHEIM FUNDS SEMI-ANNUAL REPORT | 53 |
FINANCIAL HIGHLIGHTS (continued) |
MACRO OPPORTUNITIES FUND | |
This table is presented to show selected data for a share outstanding throughout each period and to assist shareholders in evaluating a Fund’s performance for the periods presented.
P-Class | | Period Ended
March 31,
2016a,h | | | Period Ended
Sept. 30,
2015f,h | |
Per Share Data | | | | | | |
Net asset value, beginning of period | | $ | 26.07 | | | $ | 26.78 | |
Income (loss) from investment operations: | |
Net investment income (loss)c | | | .58 | | | | .37 | |
Net gain (loss) on investments (realized and unrealized) | | | (1.01 | ) | | | (.62 | ) |
Total from investment operations | | | (.43 | ) | | | (.25 | ) |
Less distributions from: | |
Net investment income | | | (.77 | ) | | | (.46 | ) |
Total distributions | | | (.77 | ) | | | (.46 | ) |
Net asset value, end of period | | $ | 24.87 | | | $ | 26.07 | |
| | |
Total Returni | | | (1.66 | %) | | | (0.95 | %) |
Ratios/Supplemental Data | |
Net assets, end of period (in thousands) | | $ | 59,370 | | | $ | 63,819 | |
Ratios to average net assets: | |
Net investment income (loss) | | | 4.63 | % | | | 3.36 | % |
Total expensesd | | | 1.48 | % | | | 1.43 | % |
Net expensese,g | | | 1.34 | % | | | 1.30 | % |
Portfolio turnover rate | | | 46 | % | | | 40 | % |
54 | THE GUGGENHEIM FUNDS SEMI-ANNUAL REPORT | SEE NOTES TO FINANCIAL STATEMENTS. |
FINANCIAL HIGHLIGHTS (continued) |
MACRO OPPORTUNITIES FUND | |
This table is presented to show selected data for a share outstanding throughout each period and to assist shareholders in evaluating a Fund’s performance for the periods presented.
Institutional Class | | Period Ended
March 31,
2016a,h | | | Year Ended
Sept. 30,
2015h | | | Year Ended
Sept. 30,
2014 | | | Year Ended
Sept. 30,
2013 | | | Period Ended
Sept. 30,
2012b | |
Per Share Data | | | | | | | | | | | | | | | |
Net asset value, beginning of period | | $ | 26.10 | | | $ | 26.84 | | | $ | 26.34 | | | $ | 26.56 | | | $ | 25.00 | |
Income (loss) from investment operations: | |
Net investment income (loss)c | | | .62 | | | | 1.06 | | | | 1.18 | | | | 1.46 | | | | 1.12 | |
Net gain (loss) on investments (realized and unrealized) | | | (1.02 | ) | | | (.54 | ) | | | .70 | | | | (.04 | ) | | | 1.47 | |
Total from investment operations | | | (.40 | ) | | | (.52 | ) | | | 1.88 | | | | 1.42 | | | | 2.59 | |
Less distributions from: | |
Net investment income | | | (.80 | ) | | | (1.26 | ) | | | (1.36 | ) | | | (1.52 | ) | | | (1.03 | ) |
Net realized gains | | | — | | | | — | | | | — | | | | (.12 | ) | | | — | |
Return of capital | | | — | | | | — | | | | (.02 | ) | | | — | | | | — | |
Total distributions | | | (.80 | ) | | | (1.26 | ) | | | (1.38 | ) | | | (1.64 | ) | | | (1.03 | ) |
Net asset value, end of period | | $ | 24.90 | | | $ | 26.10 | | | $ | 26.84 | | | $ | 26.34 | | | $ | 26.56 | |
| | |
Total Returni | | | (1.53 | %) | | | 1.92 | % | | | 7.23 | % | | | 5.35 | % | | | 10.55 | % |
Ratios/Supplemental Data | |
Net assets, end of period (in thousands) | | $ | 1,992,804 | | | $ | 2,396,622 | | | $ | 914,366 | | | $ | 416,727 | | | $ | 106,716 | |
Ratios to average net assets: | |
Net investment income (loss) | | | 4.89 | % | | | 3.97 | % | | | 4.37 | % | | | 5.43 | % | | | 5.22 | % |
Total expensesd | | | 1.29 | % | | | 1.20 | % | | | 1.18 | % | | | 1.23 | % | | | 1.31 | % |
Net expensese,g | | | 1.09 | % | | | 1.05 | % | | | 1.02 | % | | | 1.09 | % | | | 1.06 | % |
Portfolio turnover rate | | | 46 | % | | | 40 | % | | | 54 | % | | | 84 | % | | | 46 | % |
SEE NOTES TO FINANCIAL STATEMENTS. | THE GUGGENHEIM FUNDS SEMI-ANNUAL REPORT | 55 |
FINANCIAL HIGHLIGHTS (concluded) |
MACRO OPPORTUNITIES FUND | |
a | Unaudited figures for the period ended March 31, 2016. Percentage amounts for the period, except total return and portfolio turnover rate, have been annualized. |
b | Since commencement of operations: November 30, 2011. Percentage amounts for the period, except total return and portfolio turnover rate, have been annualized. |
c | Net investment income (loss) per share was computed using average shares outstanding throughout the period. |
d | Does not include expenses of the underlying funds in which the Fund invests. |
e | Net expense information reflects the expense ratios after expense waivers. |
f | Since commencement of operations: May 1, 2015. Percentage amounts for the period, except total return and portfolio turnover rate, have been annualized. |
g | Net expenses may include expenses that are excluded from the expense limitation agreement. Excluding these expenses, the operating expense ratios for the periods would be: |
| | 03/31/16 | 09/30/15 | 09/30/14 | 09/30/13 | 09/30/12 |
A-Class | 1.25% | 1.30% | 1.27% | 1.29% | 1.29% |
C-Class | 1.98% | 2.05% | 2.01% | 2.01% | 2.02% |
P-Class | 1.15% | 1.21% | N/A | N/A | N/A |
Institutional Class | 0.89% | 0.97% | 0.94% | 0.96% | 0.96% |
h | Consolidated. |
i | Total return does not reflect the impact of any applicable sales charges and has not been annualized. |
56 | THE GUGGENHEIM FUNDS SEMI-ANNUAL REPORT | SEE NOTES TO FINANCIAL STATEMENTS. |
NOTES TO CONSOLIDATED FINANCIAL STATEMENTS (Unaudited) |
1. Organization, Consolidation of Subsidiary and Significant Accounting Policies
Organization
Guggenheim Funds Trust (the “Trust”), a Delaware statutory trust, is registered with the SEC under the Investment Company Act of 1940 (“1940 Act”), as an open-ended investment company of the series type. Each series, in effect, is representing a separate Fund. The Trust is authorized to issue an unlimited number of shares. The Trust accounts for the assets of each Fund separately.
The Trust offers a combination of four separate classes of shares, A-Class shares, C-Class shares, P-Class shares and Institutional Class shares. Sales of shares of each Class are made without a front-end sales charge at the net asset value per share (“NAV”), with the exception of A-Class shares. A-Class shares are sold at the NAV, plus the applicable front-end sales charge. The sales charge varies depending on the amount purchased. A-Class share purchases of $1 million or more are exempt from the front-end sales charge but have a 1% contingent deferred sales charge (“CDSC”), if shares are redeemed within 12 months of purchase. C-Class shares have a 1% CDSC if shares are redeemed within 12 months of purchase. Institutional Class shares are offered primarily for direct investment by institutions such as pension and profit sharing plans, endowments, foundations and corporations. Institutional Class shares have a minimum initial investment of $2 million and a minimum account balance of $1 million. At March 31, 2016, the Trust consisted of nineteen funds (the “Funds”).
This report covers the Macro Opportunities Fund (the “Fund”), a diversified investment company.
Guggenheim Investments (“GI”) provides advisory services, and Rydex Fund Services, LLC (“RFS”) provides transfer agent, administrative and accounting services to the Trust. Guggenheim Funds Distributors, LLC (“GFD”) acts as principal underwriter for the Trust. GI, RFS and GFD are affiliated entities.
Consolidation of Subsidiary
The consolidated financial statements of the Fund includes the accounts of a wholly-owned and controlled Cayman Islands subsidiary (the “Subsidiary”).Significant inter-company accounts and transactions have been eliminated in consolidation for the Fund.
The Fund may invest up to 25% of its total assets in its Subsidiary which acts as an investment vehicle in order to effect certain investments consistent with the Fund’s investment objective and policies.
A summary of the Fund’s investment in its Subsidiary is as follows:
| | THE GUGGENHEIM FUNDS SEMI-ANNUAL REPORT | 57 |
NOTES TO CONSOLIDATED FINANCIAL STATEMENTS (Unaudited)(continued) |
Fund | Commencement
Date of
Subsidiary | | Subsidiary
Net Assets at
March 31,
2016 | | | % of Net Assets
of the Fund at
March 31,
2016 | |
Macro Opportunities Fund | 01/08/15 | | $ | 5,158,639 | | | | 0.16 | % |
Significant Accounting Policies
The Fund operates as an investment company and accordingly follows the investment company accounting and reporting guidance of the Financial Accounting Standards Board (“FASB”) Accounting Standards Codification Topic 946 Financial Services – Investment Companies.
The following significant accounting policies are in conformity with U.S. generally accepted accounting principles (“U.S. GAAP”) and are consistently followed by the Trust. This requires management to make estimates and assumptions that affect the reported amount of assets and liabilities and disclosure of contingent assets and liabilities at the date of the financial statements and the reported amounts of revenues and expenses during the reporting period. Actual results could differ from these estimates. All time references are based on Eastern Time.
The NAV of each Class of the Fund is calculated by dividing the market value of the Fund’s securities and other assets, less all liabilities, attributable to the Class by the number of outstanding shares of the Class.
A. The Board of Trustees of the Fund (the “Board”) has adopted policies and procedures for the valuation of the Fund’s investments (the “Valuation Procedures”). Pursuant to the Valuation Procedures, the Board has delegated to a valuation committee, consisting of representatives from Guggenheim’s investment management, fund administration, legal and compliance departments (the “Valuation Committee”), the day-to-day responsibility for implementing the Valuation Procedures, including, under most circumstances, the responsibility for determining the fair value of the Fund’s securities or other assets.
Valuations of the Fund’s securities are supplied primarily by pricing services appointed pursuant to the processes set forth in the Valuation Procedures. The Valuation Committee convenes monthly, or more frequently as needed and will review the valuation of all assets which have been fair valued for reasonableness. The Fund’s officers, through the Valuation Committee and consistent with the monitoring and review responsibilities set forth in the Valuation Procedures, regularly review procedures used by, and valuations provided by, the pricing services.
58 | THE GUGGENHEIM FUNDS SEMI-ANNUAL REPORT | |
NOTES TO CONSOLIDATED FINANCIAL STATEMENTS (Unaudited)(continued) |
If the pricing service cannot or does not provide a valuation for a particular investment or such valuation is deemed unreliable, such investment is fair valued by the Valuation Committee.
Equity securities listed on an exchange (New York Stock Exchange (“NYSE”) or American Stock Exchange) are valued at the last quoted sales price as of the close of business on the NYSE, usually 4:00 p.m. on the valuation date. Equity securities listed on the NASDAQ market system are valued at the NASDAQ Official Closing Price on the valuation date, which may not necessarily represent the last sale price. If there has been no sale on such exchange or NASDAQ on a given day, the security is valued at the closing bid price on that day.
Generally, trading in foreign securities markets is substantially completed each day at various times prior to the close of the NYSE. The values of foreign securities are determined as of the close of such foreign markets or the close of the NYSE, if earlier. All investments quoted in foreign currency are valued in U.S. dollars on the basis of the foreign currency exchange rates prevailing at the close of business. Investments in foreign securities may involve risks not present in domestic investments. The Valuation Committee will determine the current value of such foreign securities by taking into consideration certain factors which may include those discussed above, as well as the following factors, among others: the value of the securities traded on other foreign markets, ADR trading, closed-end fund trading, foreign currency exchange activity, and the trading prices of financial products that are tied to foreign securities. In addition, the Board of Trustees has authorized the Valuation Committee and GI to use prices and other information supplied by a third party pricing vendor in valuing foreign securities.
Open-end investment companies (“Mutual Funds”) are valued at their NAV as of the close of business, on the valuation date. Exchange-traded funds (“ETFs”) and closed-end investment companies (“CEFs”) are valued at the last quoted sales price.
Debt securities with a maturity of greater than 60 days at acquisition are valued at prices that reflect broker/dealer supplied valuations or are obtained from independent pricing services, which may consider the trade activity, treasury spreads, yields or price of bonds of comparable quality, coupon, maturity, and type, as well as prices quoted by dealers who make markets in such securities. Short-term debt securities with a maturity of 60 days or less at acquisition are valued at amortized cost, provided such amount approximates market value.
Repurchase agreements are valued at amortized cost, provided such amounts approximate market value.
| | THE GUGGENHEIM FUNDS SEMI-ANNUAL REPORT | 59 |
NOTES TO CONSOLIDATED FINANCIAL STATEMENTS (Unaudited)(continued) |
Typically loans are valued using information provided by an independent third party pricing service which uses broker quotes in a non-active market.
Listed options are valued at the Official Settlement Price listed by the exchange, usually as of 4:00 p.m. Long options are valued using the bid price and short options are valued using the ask price. In the event that a settlement price is not available, fair valuation is enacted. Over-the-counter options are valued using the average bid price (for long options), or average ask price (for short options) obtained from one or more security dealers.
The value of OTC swap agreements entered into by a Fund is accounted for using the unrealized gain or loss on the agreements that is determined by marking the agreements to the last quoted value of the index that the swap pertains to at the close of the NYSE. The swap’s value is then adjusted to include dividends accrued, and financing charges and/or interest associated with the swap agreements.
The value of interest rate swap agreements entered into by a Fund are accounted for using the unrealized gain or loss on the agreements that is determined using the spread priced off the previous day’s Chicago Mercantile Exchange (“CME”) price.
Investments for which market quotations are not readily available are fair valued as determined in good faith by GI under the direction of the Board of Trustees using methods established or ratified by the Board of Trustees. Valuations in accordance with these methods are intended to reflect each security’s (or asset’s) “fair value.” Each such determination is based on a consideration of all relevant factors, which are likely to vary from one pricing context to another. Examples of such factors may include, but are not limited to: (i) the type of security, (ii) the initial cost of the security, (iii) the existence of any contractual restrictions on the security’s disposition, (iv) the price and extent of public trading in similar securities of the issuer or of comparable companies, (v) quotations or evaluated prices from broker-dealers and/or pricing services, (vi) information obtained from the issuer, analysts, and/or the appropriate stock exchange (for exchange-traded securities), (vii) an analysis of the company’s financial statements, and (viii) an evaluation of the forces that influence the issuer and the market(s) in which the security is purchased and sold (e.g. the existence of pending merger activity, public offerings or tender offers that might affect the value of the security).
In connection with futures contracts and other derivative investments, such factors may include obtaining information as to how (a) these contracts and other derivative investments trade in the futures or other derivative markets, respectively, and (b) the securities underlying these contracts and other derivative investments trade in the cash market.
60 | THE GUGGENHEIM FUNDS SEMI-ANNUAL REPORT | |
NOTES TO CONSOLIDATED FINANCIAL STATEMENTS (Unaudited)(continued) |
B. Senior loans in which the Fund invests generally pay interest rates which are periodically adjusted by reference to a base short-term, floating rate plus a premium. These base lending rates are generally (i) the lending rate offered by one or more major European banks, such as the one-month or three-month London Inter-Bank Offered Rate (LIBOR), (ii) the prime rate offered by one or more major United States banks, or (iii) the bank’s certificate of deposit rate. Senior floating rate interests often require prepayments from excess cash flows or permit the borrower to repay at its election. The rate at which the borrower repays cannot be predicted with accuracy. As a result, the actual remaining maturity may be substantially less than the stated maturities shown. The interest rate indicated is the rate in effect at March 31, 2016.
C. The Fund may purchase and sell interests in securities on a when-issued and delayed delivery basis, with payment and delivery scheduled for a future date. No income accrues to the Fund on such interests or securities in connection with such transactions prior to the date the Fund actually take delivery of such interests or securities. These transactions are subject to market fluctuations and are subject to the risk that the value at delivery may be more or less than the trade date purchase price. Although the Fund will generally purchase these securities with the intention of acquiring such securities, they may sell such securities before the settlement date.
D. When the Fund engages in a short sale of a security, an amount equal to the proceeds is reflected as an asset and an equivalent liability. The amount of the liability is subsequently marked-to-market to reflect the market value of the short sale. The Fund maintains a segregated account of cash and/or securities as collateral for short sales.
Fees, if any, paid to brokers to borrow securities in connection with short sales are recorded as interest expense. In addition, the Fund must pay out the dividend rate of the equity or coupon rate of the obligation to the lender and record this as an expense. Short dividend or interest expense is a cost associated with the investment objective of short sales transactions, rather than an operational cost associated with the day-to-day management of any mutual fund. The Fund may also receive rebate income from the broker resulting from the investment of the proceeds from securities sold short.
E. Upon the purchase of an option, the premium paid is recorded as an investment, the value of which is marked-to-market daily. If a purchased option expires, the Fund realizes a loss in the amount of the cost of the option. When the Fund enters into a closing sale transaction, it realizes a gain or loss depending on whether the proceeds from the closing sale transaction are greater or less than the cost of the option. If the Fund exercises a put option, it realizes a gain or loss
| | THE GUGGENHEIM FUNDS SEMI-ANNUAL REPORT | 61 |
NOTES TO CONSOLIDATED FINANCIAL STATEMENTS (Unaudited)(continued) |
from the sale of the underlying security and the proceeds from such sale will be decreased by the premium originally paid. When the Fund exercises a call option, the cost of the security purchased by the Fund upon exercise increases by the premium originally paid.
When the Fund writes (sells) an option, an amount equal to the premium received is entered in that Fund’s accounting records as an asset and equivalent liability. The amount of the liability is subsequently marked-to-market to reflect the current value of the option written. When a written option expires, or if the Fund enters into a closing purchase transaction, it realizes a gain (or loss if the cost of a closing purchase transaction exceeds the premium received when the option was sold).
F. Swap agreements are marked-to-market daily and the change, if any, is recorded as unrealized gain or loss. Payments received or made as a result of an agreement or termination of the agreement are recognized as realized gains or losses.
G. Forward foreign currency exchange contracts are valued daily based on the applicable exchange rate of the underlying currency. The change in value of the contract is recorded as unrealized appreciation or depreciation until the forward foreign currency contract is closed. When the forward foreign currency contract is closed, the Fund records a realized gain or loss equal to the difference between the value at the time the contract was opened and the value at the time it was closed.
H. Security transactions are recorded on the trade date for financial reporting purposes. Realized gains and losses from securities transactions are recorded using the identified cost basis. Proceeds from lawsuits related to investment holdings are recorded as realized gains in the Fund. Dividend income is recorded on the ex-dividend date, net of applicable taxes withheld by foreign countries. Taxable non-cash dividends are recorded as dividend income. Interest income, including amortization of premiums and accretion of discounts, is accrued on a daily basis. Interest income also includes paydown gains and losses on mortgage-backed and asset-backed securities and senior and subordinated loans. Amendment fees are earned as compensation for evaluating and accepting changes to the original loan agreement and are recognized when received. Dividend income from REITs is recorded based on the income included in the distributions received from the REIT investments using published REIT classifications, including some management estimates when actual amounts are not available. Distributions received in excess of this estimated amount are recorded as a reduction of the cost of investments or reclassified to capital gains. The actual amounts of income, return of capital, and capital gains are only determined by each REIT after its fiscal year-end, and may differ from the estimated amounts.
62 | THE GUGGENHEIM FUNDS SEMI-ANNUAL REPORT | |
NOTES TO CONSOLIDATED FINANCIAL STATEMENTS (Unaudited)(continued) |
I. The Fund declares dividends from investment income daily. The Fund pays its shareholders from its net investment income monthly and distributes any net capital gains that it has realized, at least annually. Distributions to shareholders are recorded on the ex-dividend date. Dividends are reinvested in additional shares unless shareholders request payment in cash. The character of distributions made during the year from net investment income or net realized gains may differ from their ultimate characterization for federal income tax purposes.
J. Interest and dividend income, most expenses, all realized gains and losses, and all unrealized gains and losses are allocated to the classes based upon the value of the outstanding shares in each Class. Certain costs, such as distribution and service fees are charged directly to specific classes. In addition, certain expenses have been allocated to the individual Funds in the Trust on a pro rata basis upon the respective aggregate net assets of each Fund included in the Trust.
K. Under the fee arrangement with the custodian, the Fund may earn credits based on overnight custody cash balances. These credits are utilized to reduce related custodial expenses. The custodian fees disclosed in the Statement of Operations are before the reduction in expense from the related earnings credits, if any. For the period ended March 31, 2016, there were no earnings credits received.
L. The Fund may leave cash overnight in its cash account with the custodian. Periodically, the Fund may have cash due to the custodian bank as an overdraft balance. A fee is incurred on this overdraft, calculated by multiplying the overdraft by a rate based on the federal funds rate which was 0.25% at March 31, 2016.
M. The accounting records of the Fund are maintained in U.S. dollars. All assets and liabilities initially expressed in foreign currencies are converted into U.S. dollars at prevailing exchange rates. Purchases and sales of investment securities, dividend and interest income, and certain expenses are translated at the rates of exchange prevailing on the respective dates of such transactions. Changes in the relationship of these foreign currencies to the U.S. dollar can significantly affect the value of the investments and earnings of the Funds. Foreign investments may also subject the Funds to foreign government exchange restrictions, expropriation, taxation or other political, social or economic developments, all of which could affect the market and/or credit risk of the investments.
The Funds do not isolate that portion of the results of operations resulting from changes in the foreign exchange rates on investments from the fluctuations arising from changes in the market prices of securities held. Such fluctuations are included with the net realized and unrealized gain or loss on investments.
| | THE GUGGENHEIM FUNDS SEMI-ANNUAL REPORT | 63 |
NOTES TO CONSOLIDATED FINANCIAL STATEMENTS (Unaudited)(continued) |
Reported net realized foreign exchange gains and losses arise from sales of foreign currencies and currency gains or losses realized between the trade and settlement dates on investment transactions. Net unrealized exchange gains and losses arise from changes in the fair values of assets and liabilities other than investments in securities at the fiscal period end, resulting from changes in exchange rates.
N. Under the Fund’s organizational documents, its Trustees and Officers are indemnified against certain liabilities arising out of the performance of their duties to the Trust. In addition, throughout the normal course of business, the Fund enters into contracts that contain a variety of representations and warranties which provide general indemnifications. The Fund’s maximum exposure under these arrangements is unknown, as this would involve future claims that may be made against the Fund and/or its affiliates that have not yet occurred. However, based on experience, the Fund expects the risk of loss to be remote.
2. Financial Instruments and Derivatives
As part of its investment strategy, the Fund utilizes short sales and a variety of derivative instruments. These investments involve, to varying degrees, elements of market risk and risks in excess of the amounts recognized in the Statement of Assets and Liabilities. Valuation and accounting treatment of these instruments can be found under Significant Accounting Policies in Note 1 of these Notes to Financial Statements.
Short Sales
A short sale is a transaction in which a Fund sells a security it does not own. If the security sold short decreases in price between the time the Fund sells the security and closes its short position, that Fund will realize a gain on the transaction. Conversely, if the security increases in price during the period, that Fund will realize a loss on the transaction. The risk of such price increases is the principal risk of engaging in short sales.
Derivatives
Derivatives are instruments whose values depend on, or are derived from, in whole or in part, the value of one or more other assets, such as securities, currencies, commodities or indices. Derivative instruments may be used to increase investment flexibility (including to maintain cash reserves while maintaining exposure to certain other assets), for risk management (hedging) purposes, to facilitate trading, to reduce transaction costs and to pursue higher investment returns. Derivative instruments may also be used to mitigate certain investment risks, such as foreign currency exchange rate risk, interest rate risk and credit risk. U.S. GAAP requires disclosures to enable investors to better understand how
64 | THE GUGGENHEIM FUNDS SEMI-ANNUAL REPORT | |
NOTES TO CONSOLIDATED FINANCIAL STATEMENTS (Unaudited)(continued) |
and why a Fund uses derivative instruments, how these derivative instruments are accounted for and their effects on the Fund’s financial position and results of operations.
The Fund may utilize derivatives for the following purposes:
Duration - the use of an instrument to manage the interest rate risk of a portfolio.
Hedge - an investment made in order to reduce the risk of adverse price movements in a security, by taking an offsetting position to protect against broad market moves.
Index Exposure - the use of an instrument to obtain exposure to a listed or other type of index.
Speculation - the use of an instrument to express macro-economic and other investment views.
Options Purchased and Written
A call option on a security gives the purchaser of the option the right to buy, and the writer of a call option the obligation to sell, the underlying security. The purchaser of a put option has the right to sell, and the writer of the put option the obligation to buy, the underlying security at any time during the option period. The risk associated with purchasing options is limited to the premium originally paid.
The following table represents the Fund’s use, and volume of call/put options purchased on a quarterly basis:
Fund | Use | | Average Number of Contracts | |
Macro Opportunities Fund | Duration, Hedge | | | 25,718 | |
Fund | Use | | Average Notional* | |
Macro Opportunities Fund | Duration, Hedge | | $ | 524,862,500 | |
* | Average Notional relates to currency options. |
The risk in writing a call option is that a Fund may incur a loss if the market price of the underlying security increases and the option is exercised. The risk in writing a put option is that a Fund may incur a loss if the market price of the underlying security decreases and the option is exercised. In addition, there may be an imperfect correlation between the movement in prices of options and
| | THE GUGGENHEIM FUNDS SEMI-ANNUAL REPORT | 65 |
NOTES TO CONSOLIDATED FINANCIAL STATEMENTS (Unaudited)(continued) |
the underlying securities where a Fund may not be able to enter into a closing transaction because of an illiquid secondary market; or, for OTC options, the Fund may be at risk because of the counterparty’s inability to perform.
The Fund used written options for Duration, Hedge, and Index exposure. The following table represents the Fund’s volume of options written for the period ended March 31, 2016:
Written Call Options | | | |
| | | Macro Opportunities Fund | |
| | | Number of
contracts | | | Premium
amount | |
Balance at September 30, 2015 | | | 25,858 | | | $ | 2,787,228 | |
Options Written | | | 10,345 | | | | 2,037,965 | |
Options terminated in closing purchase transactions | | | (10,345 | ) | | | (2,369,005 | ) |
Options expired | | | (15,513 | ) | | | (418,222 | ) |
Options exercised | | | — | | | | — | |
Balance at March 31, 2016 | | | 10,345 | | | $ | 2,037,966 | |
Written Put Options | | | |
| | | Macro Opportunities Fund | |
| | | Number of
contracts | | | Premium
amount | |
Balance at September 30, 2015 | | | 594 | | | $ | 1,899,577 | |
Options Written | | | 544 | | | | 2,023,075 | |
Options terminated in closing purchase transactions | | | (594 | ) | | | (1,899,577 | ) |
Options expired | | | — | | | | — | |
Options exercised | | | — | | | | — | |
Balance at March 31, 2016 | | | 544 | | | $ | 2,023,075 | |
Swaps
A swap is an agreement that obligates two parties to exchange a series of cash flows at specified intervals based upon or calculated by reference to changes in specified prices or rates for a specified amount of an underlying asset. A Fund utilizing OTC swaps bears the risk of loss of the amount expected to be received under a swap agreement in the event of the default or bankruptcy of a swap agreement counterparty or if the underlying asset declines in value. Certain standardized swaps are subject to mandatory central clearing. Central clearing generally reduces counterparty credit risk and increases liquidity, but central clearing does not make swap transactions risk-free. For Funds utilizing interest rate swaps, the exchange bears the risk of loss. Additionally, there is no guarantee that
66 | THE GUGGENHEIM FUNDS SEMI-ANNUAL REPORT | |
NOTES TO CONSOLIDATED FINANCIAL STATEMENTS (Unaudited)(continued) |
a Fund or an underlying fund could eliminate its exposure under an outstanding swap agreement by entering into an offsetting swap agreement with the same or another party.
Total return swaps involve commitments where single or multiple cash flows are exchanged based on the price of an underlying reference asset (such as index or basket) or a fixed or variable interest rate. Index swaps will usually be computed based on the current index value as of the close of regular trading on the NYSE or other exchange, with the swap value being adjusted to include dividends accrued, financing charges and/or interest associated with the swap agreement. A fund utilizing a total return index swap bears the risk of loss of the amount expected to be received under a swap agreement in the event of the default or bankruptcy of a swap agreement counterparty or if the underlying index declines in value.
The following table represents the Fund’s use and volume of total return swaps on a quarterly basis:
| | | | Average Notional | |
Fund | Use | | Long | | | Short | |
Macro Opportunities Fund | Index exposure, Speculation | | $ | 152,187,632 | | | $ | 17,774,373 | |
Interest rate swaps involve the exchange by the Fund with another party for its respective commitment to pay or receive interest on a notional amount of principal. Interest rate swaps are generally valued using the closing price from the prior day, subject to an adjustment for the current day’s spreads. Interest rate swaps are generally subject to mandatory central clearing, but central clearing does not make interest rate swap transactions risk free.
The following table represents the Fund’s use and volume of interest rate swaps on a quarterly basis:
| | | | Average Notional | |
Fund | Use | | Long | | | Short | |
Macro Opportunities Fund | Duration, Hedge | | $ | 224,000,000 | | | $ | 255,570,223 | |
Currency swaps enable the Fund to gain exposure to currencies in a market without actually possessing a given currency, or to hedge a position. Currency swaps involve the exchange of the principal and interest in one currency for the principal and interest in another currency. As in other types of OTC swaps, the Fund may be at risk due to the counterparty’s inability to perform.
| | THE GUGGENHEIM FUNDS SEMI-ANNUAL REPORT | 67 |
NOTES TO CONSOLIDATED FINANCIAL STATEMENTS (Unaudited)(continued) |
The following table represents the Fund’s use, and volume of currency swaps on a quarterly basis:
| | | | Average Notional | |
Fund | Use | | Long | | | Short | |
Macro Opportunities Fund | Hedge | | $ | 53,728,071 | | | $ | 64,613,748 | |
Forward Foreign Currency Exchange Contracts
A forward foreign currency exchange contract is an agreement between two parties to exchange two designated currencies at a specific time in the future. Certain types of forward foreign currency exchange contracts may be cash settled, in an amount equal to the change in exchange rates during the term of the contract. The contracts can be used to hedge or manage exposure to foreign currency risks with portfolio investments or to gain exposure to foreign currencies.
The market value of a forward foreign currency exchange contract changes with fluctuations in foreign currency exchange rates. Furthermore, the Fund may be exposed to risk if the counterparties cannot meet the contract terms or if the currency value changes unfavorably as compared to the U.S. dollar.
The following table represents the Fund’s use, and volume of forward currency exchange contracts on a quarterly basis:
| | | | Average Settlement | |
Fund | Use | | Purchased | | | Sold | |
Macro Opportunities Fund | Hedge, Speculation | | $ | 73,262,314 | | | $ | 1,542,286 | |
Derivative Investment Holdings Categorized by Risk Exposure
The following is a summary of the location of derivative investments on the Fund’s Statement of Assets and Liabilities as of March 31, 2016:
Derivative Investment Type | Asset Derivatives | Liability Derivatives |
Equity/Currency/Interest Rate contracts | Unrealized appreciation on swap agreements | Unrealized depreciation on swap agreements |
Currency contracts | | Unrealized depreciation on forward foreign currency
exchange contracts |
| | Investments in unaffiliated issuers, at value | Options written, at value |
68 | THE GUGGENHEIM FUNDS SEMI-ANNUAL REPORT | |
NOTES TO CONSOLIDATED FINANCIAL STATEMENTS (Unaudited)(continued) |
The following table sets forth the fair value of the Fund’s derivative investments categorized by primary risk exposure at March 31, 2016:
Asset Derivative Investments Value | |
Fund | | Swaps
Equity
Contracts | | | Swaps
Interest Rate
Contracts | | | Swaps
Currency
Contracts | | | Options
Purchased Equity
Contracts | | | Options
Purchased Commodities
Contracts | | | Options
Purchased Foreign Currency
Contracts | | | Forward Foreign
Currency
Exchange
Contracts | | | Total
Value at
March 31, 2016 | |
Macro Opportunities Fund | | $ | 3,337,357 | | | $ | 9,847,591 | | | $ | — | | | $ | 489,600 | | | $ | 2,379,350 | | | $ | 2,140,828 | | | $ | — | | | $ | 18,194,726 | |
Liability Derivative Investments Value | |
Fund | | Swaps
Equity
Contracts | | | Swaps
Interest Rate
Contracts | | | Swaps
Currency
Contracts | | | Options
Written Equity
Contracts | | | Options
Written Commodities
Contracts | | | Options
Written Foreign Currency
Contracts | | | Forward Foreign
Currency
Exchange
Contracts | | | Total
Value at
March 31, 2016 | |
Macro Opportunities Fund | | $ | 1,874,059 | | | $ | 3,656,940 | | | $ | 1,454,397 | | | $ | 139,264 | | | $ | 868,980 | | | $ | — | | | $ | 884,235 | | | $ | 8,877,875 | |
The following is a summary of the location of derivative investments on the Fund’s Statement of Operations for the period ended March 31, 2016:
Derivative Investment Type | Location of Gain (Loss) on Derivatives |
Currency contracts | Net realized gain(loss) on forward foreign currency exchange contracts |
| | Net change in unrealized appreciation (depreciation) on forward foreign currency
exchange contracts |
Equity/Currency/Interest Rate/Commodity contracts | Net realized gain (loss) on options purchased |
| Net change in unrealized appreciation (depreciation) on options purchased |
| Net realized gain (loss) on options written |
| Net change in unrealized appreciation (depreciation) on options written |
| | Net realized gain (loss) on swap agreements |
| | Net change in unrealized appreciation (depreciation) on swap agreements |
| | THE GUGGENHEIM FUNDS SEMI-ANNUAL REPORT | 69 |
NOTES TO CONSOLIDATED FINANCIAL STATEMENTS (Unaudited)(continued) |
The following is a summary of the Fund’s realized gain (loss) and change in unrealized appreciation (depreciation) on derivative investments recognized on the Statement of Operations categorized by primary risk exposure for the period ended March 31, 2016:
Realized Gain (Loss) on Derivative Investments Recognized on the Statement of Operations | |
Fund | | Swaps
Equity Contracts | | | Swaps
Currency
Contracts | | | Swaps
Interest
Rate
Contracts | | | Options
Written
Equity
Contracts | | | Options
Written
Interest Rate
Contracts | | | Options
Written
Commodities
Contracts | |
Macro Opportunities Fund | | $ | (38,876,491 | ) | | $ | (10,217,324 | ) | | $ | (5,447,673 | ) | | $ | 1,738,604 | | | $ | 418,222 | | | $ | (1,251,745 | ) |
Realized Gain (Loss) on Derivative Investments Recognized on the Statement of Operations | |
Fund | | Options
Purchased
Equity
Contracts | | | Options
Purchased
Interest Rate
Contracts | | | Options
Purchased
Commodities
Contracts | | | Options
Purchased
Foreign Currency
Contracts | | | Forward
Foreign
Currency
Exchange
Contracts | | | Total
Value at
March 31, 2016 | |
Macro Opportunities Fund | | $ | (656,903 | ) | | $ | (1,531,613 | ) | | $ | 3,796,616 | | | $ | (1,488,510 | ) | | $ | 3,472,240 | | | $ | (50,044,577 | ) |
Change in Unrealized Appreciation (Depreciation) on Derivative Investments Recognized on the Statement of Operations | |
Fund | | Swaps
Equity Contracts | | | Swaps
Currency
Contracts | | | Swaps
Interest
Rate
Contracts | | | Options
Written
Equity
Contracts | | | Options
Written
Interest Rate
Contracts | | | Options
Written
Commodities
Contracts | |
Macro Opportunities Fund | | $ | 14,027,663 | | | $ | (1,604,118 | ) | | $ | 5,596,298 | | | $ | 2,366,173 | | | $ | 202,298 | | | $ | 889,670 | |
Change in Unrealized Appreciation (Depreciation) on Derivative Investments Recognized on the Statement of Operations | |
Fund | | Options
Purchased
Equity
Contracts | | | Options
Purchased
Interest Rate
Contracts | | | Options
Purchased
Commodities
Contracts | | | Options
Purchased
Foreign Currency
Contracts | | | Forward
Foreign
Currency
Exchange
Contracts | | | Total
Value at
March 31, 2016 | |
Macro Opportunities Fund | | $ | (4,872,518 | ) | | $ | (1,147,341 | ) | | $ | (920,705 | ) | | $ | (1,303,593 | ) | | $ | (857,765 | ) | | $ | 12,376,062 | |
70 | THE GUGGENHEIM FUNDS SEMI-ANNUAL REPORT | |
NOTES TO CONSOLIDATED FINANCIAL STATEMENTS (Unaudited)(continued) |
In conjunction with the use short sales and of derivative instruments, the Fund is required to maintain collateral in various forms. The Fund uses, where appropriate, depending on the financial instrument utilized and the broker involved, margin deposits at the broker, cash and/or securities segregated at the custodian bank, discount notes or the repurchase agreements allocated to the Fund.
The Trust has established counterparty credit guidelines and enters into transactions only with financial institutions of investment grade or better. The Trust monitors the counterparty credit risk.
3. Fees and Other Transactions with Affiliates
Under the terms of an investment advisory contract, the Fund pays GI investment advisory fees calculated at an annualized rate of 0.89% of the average daily net assets of the Fund.
GI has contractually agreed to waive the management fee it receives from the Subsidiary in an amount equal to the management fee paid to GI by the Subsidiary. This undertaking will continue in effect for so long as the Fund invests in the Subsidiary, and may not be terminated by GI unless GI obtains the prior approval of the Fund’s Board of Trustees for such termination.
RFS is paid the following for providing transfer agent services to the Fund. Transfer agent fees are assessed to the applicable class of the Fund.
Annual charge per account | $5.00 – $8.00 |
Transaction fee | $0.60 – $1.10 |
Minimum annual charge per Fund† | $25,000 |
Certain out-of-pocket charges | Varies |
† | Not subject to Fund during first twelve months of operations. |
RFS also acts as the administrative agent for the Fund, and as such performs administrative functions and the bookkeeping, accounting and pricing functions for the Fund. For these services, RFS receives 0.095% of the average daily net assets of the Fund. The minimum annual charge for fund accounting/administrative fees is $25,000.
RFS engages external service providers to perform other necessary services for the Trust, such as audit and accounting related services, legal services, custody, printing and mailing, etc., on a pass-through basis. Such expenses are allocated to various Funds within the complex based on relative net assets.
| | THE GUGGENHEIM FUNDS SEMI-ANNUAL REPORT | 71 |
NOTES TO CONSOLIDATED FINANCIAL STATEMENTS (Unaudited)(continued) |
The Fund has adopted Distribution Plans related to the offering of A-Class, C-Class and P-Class shares pursuant to Rule 12b-1 under the 1940 Act. The plans provide for payments at an annual rate of 0.25% of the average daily net assets of the Fund’s A-Class and P-Class shares, and 1.00% of the average daily net assets of the Fund’s C-Class shares.
The investment advisory contracts for the following Fund provides that the total expenses be limited to a percentage of average net assets for each class of shares, exclusive of brokerage costs, dividends on securities sold short, expenses of other investment companies in which a Fund invests, interest, taxes, litigation, indemnification and extraordinary expenses. The limits are listed below:
| | Limit | Effective
Date | Contract
End Date |
Macro Opportunities Fund - A-Class | 1.36% | 11/30/12 | 02/01/17 |
Macro Opportunities Fund - C-Class | 2.11% | 11/30/12 | 02/01/17 |
Macro Opportunities Fund - P-Class | 1.36% | 05/01/15 | 02/01/17 |
Macro Opportunities Fund - Institutional Class | 0.95% | 11/30/12 | 02/01/17 |
GI is entitled to reimbursement by the Fund for fees waived or expenses reimbursed during any of the previous 36 months, beginning on the date of the expense limitation agreement, if on any day the estimated operating expenses are less than the indicated percentages. At March 31, 2016, the amount of fees waived or expenses reimbursed that are subject to recoupment are presented in the following table:
Fund | | Expires
2016 | | | Expires
2017 | | | Expires
2018 | | | Expires
2019 | | | Total | |
Macro Opportunities Fund | | $ | 646,270 | | | $ | 1,567,567 | | | $ | 3,347,967 | | | $ | 2,254,088 | | | $ | 7,815,892 | |
For the period ended March 31, 2016, no amounts were recouped by GI.
If a Fund invests in an affiliated fund, the investing Fund’s Adviser has agreed to waive fees at the investing fund level. Fee waivers will be calculated at the investing Fund level without regard to any expense cap, if any, in effect for the investing Fund. Fees waived under this arrangement are not subject to reimbursement to GI. For the period March 31, 2016, the Fund waived $1,006,458 related to investments in affiliated funds.
For the period ended March 31, 2016, GFD retained sales charges of $274,695 relating to sales of A-Class shares of the Trust.
Certain trustees and officers of the Trust are also officers of GI, RFS and GFD.
72 | THE GUGGENHEIM FUNDS SEMI-ANNUAL REPORT | |
NOTES TO CONSOLIDATED FINANCIAL STATEMENTS (Unaudited)(continued) |
4. Fair Value Measurement
In accordance with U.S. GAAP, fair value is defined as the price that the Fund would receive to sell an investment or pay to transfer a liability in an orderly transaction with an independent buyer in the principal market, or in the absence of a principal market, the most advantageous market for the investment or liability. U.S. GAAP establishes a three-tier fair value hierarchy based on the types of inputs used to value assets and liabilities and requires corresponding disclosure. The hierarchy and the corresponding inputs are summarized below:
Level 1 — | quoted prices in active markets for identical assets or liabilities. |
Level 2 — | significant other observable inputs (for example quoted prices for securities that are similar based on characteristics such as interest rates, prepayment speeds, credit risk, etc.). |
Level 3 — | significant unobservable inputs based on the best information available under the circumstances, to the extent observable inputs are not available, which may include assumptions. |
The types of inputs available depend on a variety of factors, such as the type of security and the characteristics of the markets in which it trades, if any. Fair valuation determinations that rely on fewer or no observable inputs require greater judgment. Accordingly, fair value determinations for Level 3 securities require the greatest amount of judgment.
Independent pricing services are used to value a majority of the Fund’s investments. When values are not available from a pricing service, they may be computed by the Fund’s investment adviser or an affiliate. In any event, values may be determined using a variety of sources and techniques, including: market prices; broker quotes; and models which derive prices based on inputs such as prices of securities with comparable maturities and characteristics or based on inputs such as anticipated cash flows or collateral, spread over Treasuries, and other information and analysis. A significant portion of the Fund’s assets and liabilities are categorized as Level 2 or Level 3, as indicated in this report.
Indicative quotes from broker-dealers, adjusted for fluctuations in criteria such as credit spreads and interest rates, may be also used to value the Fund’s assets and liabilities, i.e. prices provided by a broker-dealer or other market participant who has not committed to trade at that price. Although indicative quotes are typically received from established market participants, the Fund may not have the transparency to view the underlying inputs which support the market quotations. Significant changes in an indicative quote would generally result in significant changes in the fair value of the security.
| | THE GUGGENHEIM FUNDS SEMI-ANNUAL REPORT | 73 |
NOTES TO CONSOLIDATED FINANCIAL STATEMENTS (Unaudited)(continued) |
Certain fixed income securities are valued by obtaining a monthly indicative quote from a broker-dealer, adjusted for fluctuations in criteria such as credit spreads and interest rates.
The inputs or methodologies used for valuing securities are not necessarily an indication of the risk associated with investing in those securities. The suitability of the techniques and sources employed to determine fair valuation are regularly monitored and subject to change.
The following is a summary of significant unobservable inputs used in the fair valuation of assets and liabilities categorized within Level 3 of the fair value hierarchy:
Fund | Category and Subcategory | | Ending Balance at 03/31/16 | | Valuation Technique | Unobservable Inputs |
Macro Opportunities Fund | Asset-Backed Securities | | $ | 71,469,206 | | Option Adjusted Spread off the prior month end broker mark over the 3 month LIBOR | Indicative Quote |
| | Senior Floating Rate Interests | | | 45,688,557 | | Monthly Model Priced | Purchase Price |
| | | | | 3,369,844 | | Option Adjusted Spread off the prior month end broker mark over the 3 month LIBOR | Indicative Quote |
| | Total Senior Floating Rate Interests | | | 49,058,401 | | | |
| | Corporate Bonds | | | 5,842,586 | | Option Adjusted Spread off the prior month end broker mark over the 3 month LIBOR | Indicative Quote |
| | | | | 467,980 | | Monthly Model Priced | Average Comparative Yield* |
| | | | | 1,693,675 | | Monthly Model Priced | Purchase Price |
| | Total Corporate Bonds | | | 8,004,241 | | | |
74 | THE GUGGENHEIM FUNDS SEMI-ANNUAL REPORT | |
NOTES TO CONSOLIDATED FINANCIAL STATEMENTS (Unaudited)(continued) |
Fund | Category and Subcategory | | Ending Balance at 03/31/16 | | Valuation Technique | Unobservable Inputs |
| Macro Opportunities Fund | Collateralized Mortgage Obligations | | $ | 7,429,339 | | Option Adjusted Spread off the prior month end broker mark over the 3 month LIBOR | Indicative Quote |
| | Options Purchased | | | 2,140,828 | | Monthly Model Priced | Purchase Price |
| | Preferred Stocks | | | 831,255 | | Option Adjusted Spread off the prior month end broker mark over the 3 month LIBOR | Indicative Quote |
| | Senior Fixed Rate Interests | | | 77,884 | | Option Adjusted Spread off the prior month end broker mark over the 3 month LIBOR | Indicative Quote |
| | Common Stocks | | | 20,716 | | Monthly Model Priced | Purchase Price |
* | Average comparative yield used at period end was 29.8%. |
Any remaining Level 3 securities held by the Funds and excluded from the tables above, were not considered material to the Funds.
| | THE GUGGENHEIM FUNDS SEMI-ANNUAL REPORT | 75 |
NOTES TO CONSOLIDATED FINANCIAL STATEMENTS (Unaudited)(continued) |
Summary of Fair Value Level 3 Activity
Following is a reconciliation of Level 3 assets and liabilities for which significant unobservable inputs were used to determine fair value for the period ended March 31, 2016:
LEVEL 3 – Fair value measurement using significant unobservable inputs
| | | Senior Floating/
Fixed Rate Interests | | | Asset-Backed Securities/ Collateralized Mortgage Obligations | | | Options Purchased | | | Common/ Preferred Stocks | | | Corporate Bonds | | | Total | |
Macro Opportunities Fund | | | | | | | | | | | | | | | | | | |
Assets: | | | | | | | | | | | | | | | | | | |
Beginning Balance | | $ | 47,150,842 | | | $ | 26,538,479 | | | $ | 4,932,931 | | | $ | 1,955,376 | | | $ | 9,632,885 | | | $ | 90,210,513 | |
Purchases | | | 22,376,417 | | | | 47,570,112 | | | | — | | | | 33,046 | | | | 81,619 | | | | 70,061,194 | |
Sales, maturities and paydowns | | | (3,733,528 | ) | | | (1,958,577 | ) | | | — | | | | — | | | | (937,672 | ) | | | (6,629,777 | ) |
Total realized gains or losses included in earnings | | | 40,661 | | | | — | | | | (1,488,510 | ) | | | (971,250 | ) | | | (578,573 | ) | | | (2,997,672 | ) |
Total change in unrealized gains or losses included in earnings | | | (16,093,761 | ) | | | (678,246 | ) | | | (1,303,593 | ) | | | (165,202 | ) | | | (2,060,041 | ) | | | (20,300,843 | ) |
Transfers in Level 3 | | | 141,046 | | | | 7,426,777 | | | | — | | | | — | | | | 1,866,023 | | | | 9,433,846 | |
Transfers out of Level 3 | | | (745,391 | ) | | | — | | | | — | | | | — | | | | — | | | | (745,391 | ) |
Ending Balance | | $ | 49,136,286 | | | $ | 78,898,545 | | | $ | 2,140,828 | | | $ | 851,970 | | | $ | 8,004,241 | | | $ | 139,031,870 | |
Net Change in unrealized appreciation (depreciation) for investments in securities still held at March 31, 2016 | | $ | (508,320 | ) | | $ | (805,423 | ) | | $ | (1,303,593 | ) | | $ | 1,734,069 | | | $ | (2,097,123 | ) | | $ | (2,998,102 | ) |
5. Offsetting
In the normal course of business, the Fund enters into transactions subject to enforceable master netting arrangements or other similar arrangements. Generally, the right to offset in those agreements allows the Fund to counteract the exposure to a specific counterparty with collateral received or delivered to that counterparty based on the terms of the arrangements. These arrangements provide for the right to liquidate upon the occurrence of an event of default, credit event upon merger or additional termination event.
76 | THE GUGGENHEIM FUNDS SEMI-ANNUAL REPORT | |
NOTES TO CONSOLIDATED FINANCIAL STATEMENTS (Unaudited)(continued) |
In order to better define their contractual rights and to secure rights that will help the Fund mitigate its counterparty risk, the Fund may enter into an International Swaps and Derivatives Association, Inc. Master Agreement (“ISDA Master Agreement”) or similar agreement with its derivative contract counterparties. An ISDA Master Agreement is a bilateral agreement between a Fund and a counterparty that governs OTC derivatives, including foreign exchange contracts, and typically contains, among other things, collateral posting terms and netting provisions in the event of a default and/or termination event. The provisions of the ISDA Master Agreement typically permit a single net payment in the event of a default (close-out netting) or similar event, including the bankruptcy or insolvency of the counterparty.
For derivatives traded under an ISDA Master Agreement, the collateral requirements are typically calculated by netting the mark to market amount for each transaction under such agreement and comparing that amount to the value of any collateral currently pledged by the Fund and the counterparty. For financial reporting purposes, cash collateral that has been pledged to cover obligations of the Fund and cash collateral received from the counterparty, if any, is reported separately on the Statement of Assets and Liabilities as segregated cash with broker/receivable for variation margin, or payable for swap settlement/variation margin. Generally, the amount of collateral due from or to a counterparty must exceed a minimum transfer amount threshold (e.g., $300,000) before a transfer is required to be made. To the extent amounts due to the Fund from its counterparties are not fully collateralized, contractually or otherwise, the Fund bears the risk of loss from counterparty nonperformance. The Fund attempts to mitigate counterparty risk by only entering into agreements with counterparties that they believe to be of good standing and by monitoring the financial stability of those counterparties.
For financial reporting purposes, the Fund does not offset derivative assets and derivative liabilities that are subject to netting arrangements in the Statement of Assets and Liabilities.
| | THE GUGGENHEIM FUNDS SEMI-ANNUAL REPORT | 77 |
NOTES TO CONSOLIDATED FINANCIAL STATEMENTS (Unaudited)(continued) |
The following tables present derivative financial instruments and secured financing transactions that are subject to enforceable netting arrangements and offset in the Statement of Assets and Liabilities in conformity with U.S. GAAP.
| | | | | | | | | | | | | Gross Amounts Not Offset
in the Statement of
Assets and Liabilities | | | | |
Fund | Instrument | | Gross Amounts of Recognized Assets1 | | | Gross Amounts Offset In the Statement of Assets and Liabilities | | | Net Amount of Assets Presented on
the Statement of Assets and Liabilities | | | Financial Instruments | | | Cash Collateral Received | | | Net
Amount | |
Macro Opportunities Fund | Swap agreements | | $ | 13,184,948 | | | $ | — | | | $ | 13,184,948 | | | $ | — | | | $ | — | | | $ | 13,184,948 | |
Option contracts | | | 5,009,778 | | | | — | | | | 5,009,778 | | | | 3,756,797 | | | | — | | | | 1,252,981 | |
| | | | | | | | | | | | | Gross Amounts Not Offset in the Statement of
Assets and Liabilities | | | | |
Fund | Instrument | | Gross Amounts of Recognized Liabilities1 | | | Gross Amounts Offset In the Statement of Assets and Liabilities | | | Net Amount of Liabilities Presented on the Statement of Assets and Liabilities | | | Financial Instruments | | | Cash Collateral Pledged | | | Net Amount | |
Macro Opportunities Fund | Swap agreements | | $ | 3,328,456 | | | $ | — | | | $ | 3,328,456 | | | $ | — | | | $ | — | | | $ | 3,328,456 | |
Forward foreign currency exchange contracts | | | 884,235 | | | | — | | | | 884,235 | | | | — | | | | — | | | | 884,235 | |
Option contracts | | | 1,008,244 | | | | — | | | | 1,008,244 | | | | 1,008,244 | | | | — | | | | — | |
1 | Centrally cleared swaps are excluded from these reported amounts. |
78 | THE GUGGENHEIM FUNDS SEMI-ANNUAL REPORT | |
NOTES TO CONSOLIDATED FINANCIAL STATEMENTS (Unaudited)(continued) |
6. Federal Income Tax Information
The Fund intends to comply with the provisions of Subchapter M of the Internal Revenue Code applicable to regulated investment companies and will distribute substantially all taxable net investment income and capital gains sufficient to relieve the Fund from all, or substantially all, federal income, excise and state income taxes. Therefore, no provision for federal or state income tax is required.
Tax positions taken or expected to be taken in the course of preparing the Fund’s tax returns are evaluated to determine whether the tax positions are “more-likely-than-not” of being sustained by the applicable tax authority. Tax positions not deemed to meet the more-likely-than-not threshold would be recorded as a tax benefit or expense in the current year. Management has analyzed the Fund’s tax positions taken, or to be taken, on Federal income tax returns for all open tax years, and has concluded that no provision for income tax is required in the Fund’s financial statements. The Fund’s federal tax returns are subject to examination by the Internal Revenue Service for a period of three years after they are filed.
The Fund intends to invest up to 25% of their assets in the Subsidiary which is expected to provide the Funds with exposure to the commodities markets within the limitations of the federal tax requirements under Subchapter M of the Internal Revenue Code. The Subsidiary will be classified as a corporation for U.S. federal income tax purposes. A foreign corporation, such as the Subsidiary, will generally not be subject to U.S. federal income taxation unless it is deemed to be engaged in a U.S. trade or business.
At March 31, 2016, the cost of securities for Federal income tax purposes, the aggregate gross unrealized gain for all securities for which there was an excess of value over tax cost and the aggregate gross unrealized loss for all securities for which there was an excess of tax cost over value, were as follows:
Fund | | Tax
Cost | | | Tax
Unrealized
Gain | | | Tax
Unrealized
Loss | | | Net
Unrealized
Loss | |
Macro Opportunities Fund | | $ | 3,546,933,176 | | | $ | 73,304,663 | | | $ | (240,180,242 | ) | | $ | (166,875,579 | ) |
| | THE GUGGENHEIM FUNDS SEMI-ANNUAL REPORT | 79 |
NOTES TO CONSOLIDATED FINANCIAL STATEMENTS (Unaudited)(continued) |
7. Securities Transactions
For the period ended March 31, 2016, the cost of purchases and proceeds from sales of investment securities, excluding government securities, short-term investments and derivatives, were as follows:
Fund | | Purchases | | | Sales | |
Macro Opportunities Fund | | $ | 1,487,324,438 | | | $ | 1,612,233,566 | |
For the period ended March 31, 2016, the cost of purchases and proceeds from the sales of government securities were as follows:
Fund | Purchases | | Sales | |
Macro Opportunities Fund | | $ | 3,093,219 | | | $ | 3,021,506 | |
The Fund is permitted to purchase or sell securities from or to certain affiliated funds under specified conditions outlined in procedures adopted by the Board of Trustees of the Trust. The procedures have been designed to ensure that any purchase or sale of securities by a Fund from or to another fund or portfolio that is or could be considered an affiliate by virtue of having a common investment adviser (or affiliated investment advisers), common Trustees and/or common officers complies with Rule 17a-7 of the 1940 Act. Further, as defined under these procedures, each transaction is effected at the current market price to save costs, where permissible. For the period ended March 31, 2016, the Fund engaged in purchases and sales of securities, pursuant to Rule 17a-7 of the 1940 Act, as follows:
Fund | | Purchases | | | Sales | | | Realized Loss | |
Macro Opportunities Fund | | $ | 3,590,563 | | | $ | 10,247,379 | | | $ | (733,883 | ) |
8. Affiliated Transactions
Investments representing 5% or more of the outstanding voting shares of a portfolio company of a fund, or control of or by, or common control under GI, result in that portfolio company being considered an affiliated company of such fund, as defined in the 1940 Act.
The Fund may invest in the Guggenheim Strategy Funds Trust consisting of Guggenheim Strategy Fund I, Guggenheim Strategy Fund II, Guggenheim Strategy Fund III, and Guggenheim Variable Insurance Strategy Fund III (collectively, the “Cash Management Funds”), open-end management investment companies managed by GI. The Cash Management Funds, which launched on March 11, 2014, are offered as cash management options only to mutual funds, trusts, and other accounts managed by GI and/or its affiliates, and are not available to the
80 | THE GUGGENHEIM FUNDS SEMI-ANNUAL REPORT | |
NOTES TO CONSOLIDATED FINANCIAL STATEMENTS (Unaudited)(continued) |
public. The Cash Management Funds pay no investment management fees. The Cash Management Funds’ annual report on Form N-CSR dated September 30, 2015 is available publicly or upon request. This information is available from the EDGAR database on the SEC’s website at http://www.sec.gov/Archives/edgar/data/1601445/000089180415000857/gug63224-ncsr.htm.
Transactions during the period ended March 31, 2016, in which the portfolio company is an “affiliated person”, were as follows:
Affiliated issuers
by Fund | | Value
09/30/15 | | | Additions | | | Reductions | | | Value
03/31/16 | | | Shares
03/31/16 | | | Investment
Income | | | Realized
Gain (Loss) | |
Macro Opportunities Fund | | | | | | | | | | |
Guggenheim Floating Rate Strategies Fund Institutional Class | | $ | — | | | $ | 168,331,711 | | | $ | (110,000,000 | ) | | $ | 54,343,297 | | | | 2,148,806 | | | $ | 2,331,712 | | | $ | (3,273,898 | ) |
Guggenheim Alpha Opportunity Fund - Institutional Class | | | 48,406,518 | | | | — | | | | — | | | | 51,284,947 | | | | 1,881,326 | | | | — | | | | — | |
Guggenheim BulletShares 2018 High Yield Corporate Bond ETF | | | — | | | | 30,005,464 | | | | — | | | | 29,438,600 | | | | 1,220,000 | | | | 469,334 | | | | — | |
Guggenheim BulletShares 2019 High Yield Corporate Bond ETF | | | — | | | | 24,996,630 | | | | — | | | | 24,475,709 | | | | 1,059,096 | | | | 380,738 | | | | — | |
Guggenheim High Yield Fund - Insitutional Class | | | — | | | | 20,611,911 | | | | — | | | | 19,728,204 | | | | 2,340,238 | | | | 611,911 | | | | — | |
Guggenheim Risk Managed Real Estate Fund - Institutional Class | | | 12,075,709 | | | | 1,906,896 | | | | — | | | | 13,308,030 | | | | 474,102 | | | | 367,957 | | | | 1,538,939 | |
Guggenheim Strategy Fund I | | | 177,382,768 | | | | 80,207,200 | | | | (177,497,627 | ) | | | 80,086,248 | | | | 3,227,983 | | | | 207,200 | | | | (221,472 | ) |
| | | $ | 237,864,995 | | | $ | 326,059,812 | | | $ | (287,497,627 | ) | | $ | 272,665,035 | | | | | | | $ | 4,368,852 | | | $ | (1,956,431 | ) |
| | THE GUGGENHEIM FUNDS SEMI-ANNUAL REPORT | 81 |
NOTES TO CONSOLIDATED FINANCIAL STATEMENTS (Unaudited)(continued) |
9. Loan Commitments
Pursuant to the terms of certain loan agreements, the Fund held unfunded loan commitments as of March 31, 2016. The Fund is obligated to fund these loan commitments at the borrower’s discretion.
The unfunded loan commitments as of March 31, 2016 were as follows:
Borrower | Maturity
Date | | Face
Amount | | | Value | |
Macro Opportunities Fund | | | | | | | |
Acosta, Inc. | 9/26/2019 | | $ | 6,000,000 | | | $ | 557,017 | |
Advantage Sales & Marketing LLC | 7/25/2019 | | | 1,350,000 | | | | 115,375 | |
American Stock Transfer & Trust | 6/26/2018 | | | 400,000 | | | | 23,831 | |
Aspect Software, Inc. | 9/30/2016 | | | 89,557 | | | | — | |
BBB Industries, LLC | 11/4/2019 | | | 600,000 | | | | 59,934 | |
CEVA Group Plc (United Kingdom) | 3/19/2019 | | | 780,000 | | | | 94,332 | |
Epicor Software | 6/1/2020 | | | 2,000,000 | | | | 207,528 | |
Eyemart Express | 12/18/2019 | | | 500,000 | | | | 45,080 | |
Hillman Group, Inc. | 6/28/2019 | | | 385,714 | | | | 27,418 | |
Hoffmaster Group, Inc. | 5/9/2019 | | | 500,000 | | | | 36,181 | |
IntraWest Holdings S.à r.l. | 12/10/2018 | | | 750,000 | | | | 16,122 | |
Learning Care Group (US), Inc. | 5/5/2019 | | | 500,000 | | | | 44,468 | |
Lincoln Finance Ltd. | 12/31/2015 | | | 15,000,000 | | | | — | |
McGraw-Hill Global Education Holdings LLC | 3/22/2018 | | | 3,050,000 | | | | 145,612 | |
National Financial Partners Corp. | 7/1/2018 | | | 1,000,000 | | | | 63,303 | |
National Technical Systems | 6/12/2021 | | | 594,118 | | | | 30,249 | |
Noranda Aluminum Acquisition Corp. | 11/8/2016 | | | 279,330 | | | | 9,153 | |
Phillips-Medsize Corp. | 6/14/2019 | | | 1,100,000 | | | | 83,996 | |
Pro Mach Group, Inc. | 10/22/2019 | | | 900,000 | | | | 77,185 | |
Signode Industrial Group US, Inc. | 5/1/2019 | | | 3,400,000 | | | | 261,324 | |
Wencor Group | 6/19/2019 | | | 330,769 | | | | 24,928 | |
| | | | $ | 39,509,488 | | | $ | 1,923,036 | |
10. Line of Credit
The Funds, with the exception of Alpha Opportunity Fund, Capital Stewardship Fund, Diversified Income Fund and Market Neutral Real Estate Fund secured a committed, $800,000,000 line of credit from Citibank, N.A., good through October 7, 2016, at which time the line of credit may be renewed. This line of credit is reserved for emergency or temporary purposes. Fees related to borrowings, if any, vary under this arrangement between the greater of Citibank’s “base rate”, LIBOR plus 1%, or the federal funds rate (0.25% at March 31, 2016), plus 1/2 of 1%. The Funds also pay a commitment fee at an annualized rate of 0.15% of the
82 | THE GUGGENHEIM FUNDS SEMI-ANNUAL REPORT | |
NOTES TO CONSOLIDATED FINANCIAL STATEMENTS (Unaudited)(continued) |
average daily amount of their unused commitment amount. The Funds did not have any borrowings outstanding under this agreement at or during the period ended March 31, 2016.
11. Repurchase Agreements
In connection with transactions in repurchase agreements, it is the Fund’s policy that its custodian takes possession of the underlying collateral. For the following repurchase agreements, the collateral is in the possession of the Fund’s custodian and is evaluated to ensure that its market value exceeds, at a minimum, 102% of the original face amount of the repurchase agreements.
Counterparty and
Terms of Agreement | | | Face
Value | | | Repurchase
Price | | Collateral | | | Par
Value | | | Fair
Value |
Jefferies & Company, Inc. | | | | | | | | Puerto Rico Commonwealth Aqueduct and Sewer Authority | | | | | |
2.95% | | | | | | | | 6.10% | | | | | | |
Due 04/04/16 | | $ | 2,404,000 | | $ | 2,475,706 | | 07/01/34 | | $ | 6,425,000 | | $ | 3,511,276 |
| | | | | | | | | Puerto Rico Public Buildings Authority | | | | | | |
| | | | | | | | | 5.75% | | | | | | |
| | | | | | | | | 07/01/34 | | | 560,000 | | | 344,943 |
| | | | | | | | | | | $ | 6,985,000 | | $ | 3,856,219 |
In the event of counterparty default, the Fund has the right to collect the collateral to offset losses incurred. There is potential loss to the Fund in the event the Fund is delayed or prevented from exercising its right to dispose of the collateral securities, including the risk of a possible decline in the value of the underlying securities during the period while the Fund seeks to assert its rights. The Fund’s investment adviser, acting under the supervision of the Board of Trustees, reviews the value of the collateral and the creditworthiness of those banks and dealers with which the Fund enters into repurchase agreements to evaluate potential risks.
The following repurchase agreements were used as a means of borrowing securities to sell short.
Counterparty and
Terms of Agreement | | | Face
Value | | | Repurchase
Price | | Collateral | | | Par
Value | | | Fair
Value |
Barclays | | | | | | | | Envision Healthcare Corp. | | | | | | |
(0.15)% - 0.00% | | | | | | | | 5.13% | | | | | | |
Open Maturity | | $ | 1,000,000 | | $ | 1,000,000 | | 07/01/22 | | $ | 1,000,000 | | $ | 1,015,000 |
| | THE GUGGENHEIM FUNDS SEMI-ANNUAL REPORT | 83 |
NOTES TO CONSOLIDATED FINANCIAL STATEMENTS (Unaudited)(continued) |
12. Reverse Repurchase Agreements
The Fund may enter into reverse repurchase agreements. Under a reverse repurchase agreement, a Fund sells securities and agrees to repurchase them at a particular price at a future date. In the event the buyer of securities under a reverse repurchase agreement files for bankruptcy or becomes insolvent, such buyer or its trustee or receiver may receive an extension of time to determine whether to enforce the Fund’s obligation to repurchase the securities, and the Fund’s use of the proceeds of the reverse repurchase agreement may effectively be restricted pending such decision.
For the period ended March 31, 2016, the Fund entered into reverse repurchase agreements as follows:
Fund | | Number
of Days
Outstanding | | | Balance at
March 31,
2016 | | | Average
Balance Outstanding | | | Average
Interest
Rate | |
Macro Opportunities Fund | | | 183 | | | $ | 253,502,419 | | | $ | 412,104,506 | | | | 1.38 | % |
The following table presents reverse repurchase agreements that are subject to netting arrangements and offset in the Statement of Assets and Liabilities in conformity with U.S. GAAP.
| | | | | | | | | | | | | Gross Amounts Not Offset in the Statement of
Assets and Liabilities | | | | |
Fund | Instrument | | Gross Amounts of Recognized Liabilities | | | Gross Amounts Offset In the Statement of Assets and Liabilities | | | Net Amount of Liabilities Presented on the Statement of Assets and Liabilities | | | Financial Instruments | | | Cash Collateral Pledged | | | Net Amount | |
Macro Opportunities Fund | Reverse repurchase agreements | | $ | 253,502,419 | | | $ | — | | | $ | 253,502,419 | | | $ | 253,502,419 | | | $ | — | | | $ | — | |
In June 2014, the FASB issued Accounting Standards Update 2014-11, Repurchase-to-Maturity Transactions, Repurchase Financings, and Disclosures (ASU 2014-11) that expanded secured borrowing accounting for certain repurchase agreements. The ASU also sets forth additional disclosure requirements for certain transactions accounted for as secured borrowings, which applies to the reverse repurchase agreements held by the Fund. The ASU became effective prospectively for annual periods beginning after December 15, 2014, and for interim periods beginning after March 15, 2015. The Fund has adopted the ASU.
84 | THE GUGGENHEIM FUNDS SEMI-ANNUAL REPORT | |
NOTES TO CONSOLIDATED FINANCIAL STATEMENTS (Unaudited)(concluded) |
The following is a summary of the remaining contractual maturities of the reverse repurchase agreements outstanding as of year-end, aggregated by asset class of the related collateral pledged by the Fund:
Fund | | Overnight and Continuous | | | Up to
30 days | | | 31-90
days | | | Greater than 90 days | | | Total | |
Macro Opportunities Fund | | | | | | | | | | | | | | | |
Corporate Bonds | | $ | 18,553,217 | | | $ | 22,468,325 | | | $ | 46,239,434 | | | $ | 7,347,938 | | | $ | 94,608,913 | |
Collateralized Mortgage Obligations | | | — | | | | 85,195,506 | | | | — | | | | — | | | | 85,195,506 | |
Asset Backed Securities | | | — | | | | 45,805,000 | | | | 27,893,000 | | | | — | | | | 73,698,000 | |
Gross amount of recognized liabilities for reverse repurchase agreements | | $ | 18,553,217 | | | $ | 153,468,831 | | | $ | 74,132,434 | | | $ | 7,347,938 | | | $ | 253,502,419 | |
13. Restricted Securities
The securities below are considered illiquid and restricted under guidelines established by the Board:
Restricted Securities | Acquisition
Date | | Cost | | | Value | |
Macro Opportunities Fund | | | | | | | |
Airplanes Pass Through Trust | | | | | | | |
0.99% due 03/15/19 | 07/11/12 | | $ | 2,985,686 | | | $ | 947,752 | |
Customers Bank | | | | | | | | | |
6.13% due 06/26/29 | 06/24/14 | | | 6,000,000 | | | | 6,000,000 | |
FPL Energy National Wind LLC | | | | | | | | | |
5.61% due 03/10/24 | 08/31/12 | | | 41,176 | | | | 42,908 | |
Fortress Credit Opportunities | | | | | | | | | |
0.86% due 07/15/19 | 02/16/12 | | | 471,090 | | | | 474,628 | |
RFTI Issuer Ltd. | | | | | | | | | |
4.31% due 08/15/30 | 10/14/15 | | | 27,724,367 | | | | 27,450,391 | |
Schahin II Finance Company SPV Ltd. | | | | | | | | | |
5.88% due 09/25/22 | 03/21/12 | | | 4,838,890 | | | | 1,099,602 | |
Turbine Engines Securitization Ltd. | | | | | | | | | |
6.38% due 12/13/48 | 11/27/13 | | | 2,497,557 | | | | 2,497,781 | |
Unifrax I LLC / Unifrax Holding Co. | | | | | | | | | |
7.50% due 02/15/19 | 01/31/13 | | | 220,000 | | | | 135,850 | |
| | | | $ | 44,778,766 | | | $ | 38,648,912 | |
| | THE GUGGENHEIM FUNDS SEMI-ANNUAL REPORT | 85 |
OTHER INFORMATION (Unaudited) |
Proxy Voting Information
A description of the policies and procedures that the Trust uses to determine how to vote proxies relating to securities held in the Funds’ portfolios is available, without charge and upon request, by calling 800.820.0888. This information is also available from the EDGAR database on the SEC’s website at http://www.sec.gov.
Information regarding how the Funds voted proxies relating to portfolio securities during the most recent 12-month period ended June 30 is available without charge, upon request, by calling 800.820.0888. This information is also available from the EDGAR database on the SEC’s website at http://www.sec.gov.
Sector Classification
Information in the “Schedule of Investments” is categorized by sectors using sector-level Classifications defined by the Bloomberg Industry Classification System, a widely recognized industry classification system provider. Each Fund’s registration statement has investment policies relating to concentration in specific sectors/industries. For purposes of these investment policies, the Funds usually classify sectors/industries based on industry-level Classifications used by widely recognized industry classification system providers such as Bloomberg Industry Classification System, Global Industry Classification Standards and Barclays Global Classification Scheme.
Quarterly Portfolio Schedules Information
The Trust files its complete schedule of portfolio holdings with the SEC for the first and third quarters of each fiscal year on Form N-Q; which are available on the SEC’s website at http://www.sec.gov. The Funds’ Forms N-Q may be reviewed and copied at the SEC’s Public Reference Room in Washington, DC, and that information on the operation of the Public Reference Room may be obtained by calling 800-SEC-0330. Copies of the portfolio holdings are also available to shareholders, without charge and upon request, by calling 800.820.0888.
86 | THE GUGGENHEIM FUNDS SEMI-ANNUAL REPORT | |
INFORMATION ON BOARD OF TRUSTEES AND OFFICERS (Unaudited) |
A Board of Trustees oversees the Trust, as well as other trusts of GI, in which its members have no stated term of service, and continue to serve after election until resignation. The Statement of Additional Information includes further information about Fund Trustees and Officers, and can be obtained without charge by calling 800.820.0888.
Name, Address* and Year of Birth | Position(s) Held with the Trust | Term of Office and Length of Time Served** | Principal Occupation(s) During Past Five Years | Number of Portfolios in Fund Complex Overseen | Other Directorships Held by Trustees |
INDEPENDENT TRUSTEES | | | |
Randall C. Barnes (1951) | Trustee | Since 2014 | Current: Private Investor (2001-present). Former: Senior Vice President and Treasurer, PepsiCo, Inc. (1993-1997); President, Pizza Hut International (1991-1993); Senior Vice President, Strategic Planning and New Business Development, PepsiCo, Inc. (1987-1990). | 105 | Current: Trustee, Purpose Investments Inc. (2014-Present). |
Donald A. Chubb, Jr. (1946) | Trustee | Since 1994 | Current: Business broker and manager of commercial real estate, Griffith & Blair, Inc. (1997-present). | 101 | Current: Midland Care, Inc. (2011-present). |
Jerry B. Farley (1946) | Trustee | Since 2005 | Current: President, Washburn University (1997-present). | 101 | Current: Westar Energy, Inc. (2004-present); CoreFirst Bank & Trust (2000-present). |
| | THE GUGGENHEIM FUNDS SEMI-ANNUAL REPORT | 87 |
INFORMATION ON BOARD OF TRUSTEES AND OFFICERS (Unaudited)(continued) |
Name, Address* and Year of Birth | Position(s) Held with the Trust | Term of Office and Length of Time Served** | Principal Occupation(s) During Past Five Years | Number of Portfolios in Fund Complex Overseen | Other Directorships Held by Trustees |
INDEPENDENT TRUSTEES - continued | | |
Roman Friedrich III (1946) | Trustee and Chairman of the Contracts Review Committee | Since 2014 | Current: Founder and Managing Partner, Roman Friedrich & Company (1998-present). Former: Senior Managing Director, MLV & Co. LLC (2010-2011). | 101 | Current: Zincore Metals, Inc. (2009-present). Former: Axiom Gold and Silver Corp. (2011-2012). |
Robert B. Karn III (1942) | Trustee and Chairman of the Audit Committee | Since 2014 | Current: Consultant (1998-present). Former: Arthur Andersen (1965-1997) and Managing Partner, Financial and Economic Consulting, St. Louis office (1987-1997). | 101 | Current: Peabody Energy Company (2003-present); GP Natural Resource Partners, LLC (2002- present). |
Ronald A. Nyberg (1953) | Trustee and Chairman of the Nominating and Governance Committee | Since 2014 | Current: Partner, Nyberg & Cassioppi, LLC (2000-present). Former: Executive Vice President, General Counsel, and Corporate Secretary, Van Kampen Investments (1982-1999). | 107 | Current: Edward-Elmhurst Healthcare System (2012-present). |
88 | THE GUGGENHEIM FUNDS SEMI-ANNUAL REPORT | |
INFORMATION ON BOARD OF TRUSTEES AND OFFICERS (Unaudited)(continued) |
Name, Address* and Year of Birth | Position(s) Held with the Trust | Term of Office and Length of Time Served** | Principal Occupation(s) During Past Five Years | Number of Portfolios in Fund Complex Overseen | Other Directorships Held by Trustees |
INDEPENDENT TRUSTEES - concluded | | |
Maynard F. Oliverius (1943) | Trustee | Since 1998 | Current: Retired. Former: President and CEO, Stormont-Vail HealthCare (1996-2012). | 101 | Current: Fort Hays State University Foundation (1999-present); Stormont-Vail Foundation (2013-present); University of Minnesota HealthCare Alumni Association Foundation (2009-present). |
Ronald E. Toupin, Jr. (1958) | Trustee and Chairman of the Board | Since 2014 | Current: Portfolio Consultant (2010-present). Former: Vice President, Manager and Portfolio Manager, Nuveen Asset Management (1998-1999); Vice President, Nuveen Investment Advisory Corp. (1992-1999); Vice President and Manager, Nuveen Unit Investment Trusts (1991-1999); and Assistant Vice President and Portfolio Manager, Nuveen Unit Investment Trusts (1988-1999), each of John Nuveen & Co., Inc. (1982-1999). | 104 | Former: Bennett Group of Funds (2011-2013). |
| | THE GUGGENHEIM FUNDS SEMI-ANNUAL REPORT | 89 |
INFORMATION ON BOARD OF TRUSTEES AND OFFICERS (Unaudited)(continued) |
Name, Address* and Year of Birth | Position(s) Held with the Trust | Term of Office and Length of Time Served** | Principal Occupation(s) During Past Five Years | Number of Portfolios in Fund Complex Overseen | Other Directorships Held by Trustees |
INTERESTED TRUSTEE | |
Donald C. Cacciapaglia*** (1951) | President, Chief Executive Officer and Trustee | Since 2012 | Current: President and CEO, certain other funds in the Fund Complex (2012-present); Vice Chairman, Guggenheim Investments (2010-present). Former: Chairman and CEO, Channel Capital Group, Inc. (2002-2010). | 236 | Current: Clear Spring Life Insurance Company (2015-present); Guggenheim Partners Japan, Ltd. (2014-present); Delaware Life (2013-present); Guggenheim Life and Annuity Company (2011-present); Paragon Life Insurance Company of Indiana (2011-present). |
* | The business address of each Trustee is c/o Guggenheim Investments, 805 King Farm Boulevard, Suite 600, Rockville, Maryland 20850. |
** | Each Trustee serves an indefinite term, until his successor is elected and qualified. Time served includes time served in the respective position for the Predecessor Corporation. |
*** | This Trustee is deemed to be an “interested person” of the Funds under the 1940 Act by reason of his position with the Funds' Investment Manager and/or the parent of the Investment Manager. |
90 | THE GUGGENHEIM FUNDS SEMI-ANNUAL REPORT | |
INFORMATION ON BOARD OF TRUSTEES AND OFFICERS (Unaudited)(continued) |
Name, Address* and Year of Birth | Position(s) Held with the Trust | Term of Office and Length of Time Served** | Principal Occupations
During Past Five Years |
OFFICERS | | | |
Joseph M. Arruda (1966) | Assistant Treasurer | Since 2010 | Current: Assistant Treasurer, certain other funds in the Fund Complex (2006-present); Vice President, Security Investors, LLC (2010-present); CFO and Manager, Guggenheim Specialized Products, LLC (2009-present). Former: Vice President, Security Global Investors, LLC (2010-2011); Vice President, Rydex Advisors, LLC (2010); Vice President, Rydex Advisors II, LLC (2010). |
William H. Belden, III (1965) | Vice President | Since 2014 | Current: Vice President, certain other funds in the Fund Complex (2006-present); Managing Director, Guggenheim Funds Investment Advisors, LLC (2005-present). Former: Vice President of Management, Northern Trust Global Investments (1999-2005). |
James Howley (1972) | Assistant Treasurer | Since 2014 | Current: Director, Guggenheim Investments (2004-present) ; Assistant Treasurer, certain other funds in the Fund Complex (2006-present). Former: Manager, Mutual Fund Administration of Van Kampen Investments, Inc. (1996-2004). |
Amy J. Lee (1961) | Vice President and Chief Legal Officer | Since 2007 (Vice President) Since 2014 (Chief Legal Officer) | Current: Chief Legal Officer, certain other funds in the Fund Complex (2013-present); Senior Managing Director, Guggenheim Investments (2012-present). Former: Vice President, Associate General Counsel and Assistant Secretary, Security Benefit Life Insurance Company and Security Benefit Corporation (2004-2012). |
| | THE GUGGENHEIM FUNDS SEMI-ANNUAL REPORT | 91 |
INFORMATION ON BOARD OF TRUSTEES AND OFFICERS (Unaudited)(continued) |
Name, Address* and Year of Birth | Position(s) Held with the Trust | Term of Office and Length of Time Served** | Principal Occupations
During Past Five Years |
OFFICERS - continued | |
Mark E. Mathiasen (1978) | Secretary | Since 2014 | Current: Secretary, certain other funds in the Fund Complex (2007-present); Managing Director, Guggenheim Investments (2007-present). |
Michael P. Megaris (1984) | Assistant Secretary | Since 2014 | Current: Assistant Secretary, certain other funds in the Fund Complex (2014-present); Senior Associate, Guggenheim Investments (2012-present). Former: J.D., University of Kansas School of Law (2009-2012). |
Elisabeth Miller (1968) | Chief Compliance Officer | Since 2012 | Current: CCO, certain other funds in the Fund Complex (2012-present); CCO, Security Investors, LLC (2012-present); CCO, Guggenheim Funds Investment Advisors, LLC (2012-present); Managing Director, Guggenheim Investments (2012-present); Vice President, Guggenheim Funds Distributors, LLC (March 2014-present). Former: CCO, Guggenheim Distributors, LLC (2009-March 2014); Senior Manager, Security Investors, LLC (2004-2009); Senior Manager, Guggenheim Distributors, LLC (2004-2009). |
Adam Nelson (1979) | Assistant Treasurer | Since 2015 | Current: Vice President, Guggenheim Investments (2015-present); Assistant Treasurer, certain other funds in the Fund Complex (2015-present). Former: Assistant Vice President and Fund Administration Director, State Street Corporation (2013-2015); Fund Administration Assistant Director, State Street (2011-2013); Fund Administration Manager, State Street (2009-2011). |
92 | THE GUGGENHEIM FUNDS SEMI-ANNUAL REPORT | |
INFORMATION ON BOARD OF TRUSTEES AND OFFICERS (Unaudited)(continued) |
Name, Address* and Year of Birth | Position(s) Held with the Trust | Term of Office and Length of Time Served** | Principal Occupations
During Past Five Years |
OFFICERS - continued | |
Alison Santay (1974) | AML Officer | Since 2013 | Current: AML Officer, certain other funds in the Fund Complex (2010-present); Director and AML Officer, Rydex Fund Services, LLC (2010-present); AML Officer, Security Investors, LLC (2010-present); Director, Shareholder Risk and Compliance, Rydex Fund Services, LLC (2004-present). Former: AML Officer, Guggenheim Distributors, LLC (2013-2014). |
Kimberly Scott (1974) | Assistant Treasurer | Since 2014 | Current: Vice President, Guggenheim Investments (2012-present) ; Assistant Treasurer, certain other funds in the Fund Complex (2012-present). Former: Financial Reporting Manager, Invesco, Ltd. (2010-2011); Vice President/Assistant Treasurer, Mutual Fund Administration for Van Kampen Investments, Inc./Morgan Stanley Investment Management (2009-2010); Manager of Mutual Fund Administration, Van Kampen Investments, Inc./Morgan Stanley Investment Management (2005-2009). |
Bryan Stone (1979) | Vice President | Since 2014 | Current: Vice President, certain other funds in the Fund Complex (2014-present); Director, Guggenheim Investments (2013-present). Former: Senior Vice President, Neuberger Berman Group LLC (2009-2013); Vice President, Morgan Stanley (2002-2009). |
| | THE GUGGENHEIM FUNDS SEMI-ANNUAL REPORT | 93 |
INFORMATION ON BOARD OF TRUSTEES AND OFFICERS (Unaudited)(concluded) |
Name, Address* and Year of Birth | Position(s) Held with the Trust | Term of Office and Length of Time Served** | Principal Occupations
During Past Five Years |
OFFICERS - concluded | |
John L. Sullivan (1955) | Chief Financial Officer and Treasurer | Since 2014 | Current: CFO, Chief Accounting Officer and Treasurer, certain other funds in the Fund Complex (2010-present); Senior Managing Director, Guggenheim Investments (2010-present). Former: Managing Director and CCO, each of the funds in the Van Kampen Investments fund complex (2004-2010); Managing Director and Head of Fund Accounting and Administration, Morgan Stanley Investment Management (2002-2004); CFO and Treasurer, Van Kampen Funds (1996-2004). |
* | The business address of each officer is c/o Guggenheim Investments, 805 King Farm Boulevard, Suite 600, Rockville, Maryland 20850. |
** | Each officer serves an indefinite term, until his or her successor is duly elected and qualified. Time served includes time served in the respective position for the Predecessor Corporation. |
94 | THE GUGGENHEIM FUNDS SEMI-ANNUAL REPORT | |
GUGGENHEIM INVESTMENTS PRIVACY POLICIES (Unaudited) |
Rydex Funds, Guggenheim Funds, Rydex Investments, Guggenheim Funds Distributors, LLC, Security Investors, LLC, Security Distributors, Inc., Guggenheim Partners Investment Managers, LLC, and Rydex Advisory Services (Collectively “Guggenheim Investments”).
Our Commitment to You
When you become a Guggenheim Investments investor, you entrust us with not only your hard-earned money but also with personal and financial information about you. We recognize that your relationship with us is based on trust and that you expect us to act responsibly and in your best interests. Because we have access to this private information about you, we hold ourselves to the highest standards in its safekeeping and use. This means, most importantly, that we do not sell client information to anyone—whether it is your personal information or if you are a current or former Guggenheim Investments client.
The Information We Collect About You
In the course of doing business with shareholders and investors, we collect nonpublic personal information about you. You typically provide personal information when you complete a Guggenheim Investments account application or when you request a transaction that involves Rydex and Guggenheim Investments funds or one of the Guggenheim Investments affiliated companies. “Nonpublic personal information” is personally identifiable private information about you. For example, it includes information regarding your name and address, Social Security or taxpayer identification number, assets, income, account balance, bank account information and investment activity (e.g., purchase and redemption history).
How We Handle Your Personal Information
As emphasized above, we do not sell information about current or former clients or their accounts to third parties. Nor do we share such information, except when necessary to complete transactions at your request or to make you aware of related investment products and services that we offer. Additional details about how we handle your personal information are provided below. To complete certain transactions or account changes that you direct, it may be necessary to provide identifying information to companies, individuals or groups that are not affiliated with Guggenheim Investments. For example, if you ask to transfer assets from another financial institution to Guggenheim Investments, we will need to provide certain information about you to that company to complete the transaction. To alert you to other Guggenheim Investments investment products and services, we may share your information within the Guggenheim Investments family of affiliated companies. This would include, for example, sharing your information within Guggenheim Investments so we can make you aware of
| | THE GUGGENHEIM FUNDS SEMI-ANNUAL REPORT | 95 |
GUGGENHEIM INVESTMENTS PRIVACY POLICIES (Unaudited)(continued) |
new Rydex and Guggenheim Investments funds or the services offered through another Guggenheim Investments affiliated company. In certain instances, we may contract with nonaffiliated companies to perform services for us. Where necessary, we will disclose information we have about you to these third parties. In all such cases, we provide the third party with only the information necessary to carry out its assigned responsibilities and only for that purpose. And we require these third parties to treat your private information with the same high degree of confidentiality that we do. In certain instances, we may share information with other financial institutions regarding individuals and entities in response to the U.S.A. Patriot Act. Finally, we will release information about you if you direct us to do so, if we are compelled by law to do so or in other circumstances permitted by law.
Opt Out Provisions
We do not sell your personal information to anyone. The law allows you to “opt out” of only certain kinds of information sharing with third parties. The firm does not share personal information about you with any third parties that triggers this opt-out right. This means YOU ARE ALREADY OPTED OUT.
How We Protect Privacy Online
Our concern for the privacy of our shareholders also extends to those who use our web site, guggenheiminvestments.com. Our web site uses some of the most secure forms of online communication available, including encryption technology, Secure Socket Layer (SSL) protocol, firewalls and user names and passwords. These technologies provide a high level of security and privacy when you access your account information or initiate online transactions. The Guggenheim Investments web site offers customized features that require our use of “http cookies”—tiny pieces of information that we ask your browser to store. However, we make very limited use of these cookies. We only use cookies for session management and security features on the Guggenheim Investments web site. We do not use them to pull data from your hard drive, to learn your email address, or to view data in cookies created by other web sites. We will not share the information in our cookies or give others access to it. See the legal information area on our web site for more details about web site security and privacy features.
How We Safeguard Your Personal Information
We restrict access to nonpublic personal information about shareholders to our employees and in some cases to third parties (for example, the service providers described above) as permitted by law. We maintain strict physical, electronic and procedural safeguards that comply with federal standards to guard your nonpublic personal information.
96 | THE GUGGENHEIM FUNDS SEMI-ANNUAL REPORT | |
GUGGENHEIM INVESTMENTS PRIVACY POLICIES (Unaudited)(concluded) |
We’ll Keep You Informed
As required by federal law, we will notify shareholders of our privacy policy annually. We reserve the right to modify this policy at any time, but rest assured that if we do change it, we will tell you promptly. You will also be able to access our privacy policy from our web site at guggenheiminvestments.com. Should you have any questions regarding our privacy policy, contact us at 800.820.0888 or 301.296.5100.
| | THE GUGGENHEIM FUNDS SEMI-ANNUAL REPORT | 97 |
This page intentionally left blank.
This page intentionally left blank.
This page intentionally left blank.
This page intentionally left blank.
This page intentionally left blank.
This page intentionally left blank.
This page intentionally left blank.
This page intentionally left blank.
3.31.2016
Guggenheim Funds Semi-Annual Report
| |
Guggenheim Floating Rate Strategies Fund | | |
FR-SEMI-0316x0916 | guggenheiminvestments.com |
DEAR SHAREHOLDER | 2 |
ECONOMIC AND MARKET OVERVIEW | 3 |
ABOUT SHAREHOLDERS’ FUND EXPENSES | 6 |
FLOATING RATE STRATEGIES FUND | 9 |
NOTES TO FINANCIAL STATEMENTS | 36 |
OTHER INFORMATION | 55 |
INFORMATION ON BOARD OF TRUSTEES AND OFFICERS | 56 |
GUGGENHEIM INVESTMENTS PRIVACY POLICIES | 63 |
| | THE GUGGENHEIM FUNDS SEMI-ANNUAL REPORT | 1 |
Dear Shareholder:
Guggenheim Partners Investment Management (the “Investment Adviser”) is pleased to present the semiannual shareholder report for a one of our Funds (the “Fund”) for the six-month period ended March 31, 2016.
The Investment Adviser is part of Guggenheim Investments, which represents the investment management businesses of Guggenheim Partners, LLC (“Guggenheim”), a global, diversified financial services firm.
Guggenheim Funds Distributors, LLC is the distributor of the Funds. Guggenheim Funds Distributors, LLC is affiliated with Guggenheim and the Investment Adviser.
We encourage you to read the Economic and Market Overview section of the report, which follows this letter.
We are committed to providing innovative investment solutions and appreciate the trust you place in us.
Sincerely,

Donald C. Cacciapaglia
President
April 30, 2016
Read a prospectus and summary prospectus (if available) carefully before investing. It contains the investment objectives, risks, charges, expenses and other information, which should be considered carefully before investing. Obtain a prospectus and summary prospectus (if available) at guggenheiminvestments.com or call 800.820.0888.
There can be no assurance that any investment product will achieve its investment objective(s). There are risks associated with investing, including the entire loss of principal invested. Investing involves market risks. The investment return and principal value of any investment product will fluctuate with changes in market conditions.
2 | THE GUGGENHEIM FUNDS SEMI-ANNUAL REPORT | |
ECONOMIC AND MARKET OVERVIEW (Unaudited) | March 31, 2016 |
Financial markets were buffeted by a variety of events over the past six months, including volatility in the oil market, weak growth in China, ongoing stimulus from global central banks, and a 25 basis point increase in the U.S. federal funds target rate in December. While the direct impact of the move was fairly insignificant, the decision to begin normalization of interest rates after seven years of unprecedented liquidity provision was not. Indeed, in 2015, risk assets posted their worst annual performance since the 2008 financial crisis, as market participants’ expectations for the start of rate hikes collided with concern about plunging commodity prices, and slowing economic growth in China and other emerging market economies.
As 2016 began, forecasts for U.S. and global economic growth were downgraded, and recession fears surged along with market volatility. Estimates for first quarter gross domestic product (“GDP”) in the U.S. were marked down, even though first quarter GDP has undershot full-year growth rates in six out of the last seven years. Risk assets rallied in the last half of the first quarter, led by a dovish pivot in the U.S. Federal Reserve’s (the “Fed”) communication that spurred a rally in crude oil and a reversal of dollar strength. The weaker dollar, along with optimism about a production freeze agreed to by a group of major oil producing countries, helped oil to rebound. After falling in the early weeks of the year to a cycle low of $26 per barrel on February 11, 2016, the front-month West Texas Intermediate (“WTI”) oil futures contract rallied as high as $40 per barrel before closing the quarter at $38 per barrel.
The outlook for economic growth outside the U.S. softened in the first quarter. A further deterioration in the euro zone inflation outlook prompted the European Central Bank (“ECB”) to announce an increase in the size of its monthly asset purchases and reduce its deposit rate to -40 basis points. European government bonds rallied following the announcement, with the 10-year German bund ending the first quarter with a yield of just 16 basis points.
Ongoing stimulus efforts in Asia also appeared likely to contribute to low U.S. rates. Chinese industrial production growth continued to slow in early 2016, prompting the People’s Bank of China (“PBOC”) to stimulate credit growth by allowing banks to hold fewer reserves against deposits. And after years of struggling with stagnant growth and low inflation, the Bank of Japan (“BOJ”) surprised markets by cutting its key interest rate to -10 basis points in January. The negative rates pushed a considerable amount of Japanese savings into foreign markets.
| | THE GUGGENHEIM FUNDS SEMI-ANNUAL REPORT | 3 |
ECONOMIC AND MARKET OVERVIEW (Unaudited)(continued) | March 31, 2016 |
In an environment where global rates are moving lower and markets are already starved for yield, foreign investors began looking to the U.S. Guggenheim expects that U.S. Treasury yields will fall further as the gravitational pull of global yields gets stronger, and does not discount the possibility of 10-year U.S. Treasury yields declining to closer to 1 percent before the end of the year.
A stronger dollar has weighed on the U.S. economy, but consumer spending has been resilient. The labor market is now operating near full employment, and tight labor market conditions are beginning to spur faster wage growth. We believe the U.S. economy is fundamentally sound, and find little evidence to support the conclusion that the economy will fall into a recession in 2016.
Despite the relative health of the U.S. economy, markets are concerned that sluggish global growth will hold back the U.S. expansion, that inflation will remain below the Fed’s target for longer, and that tighter conditions in credit markets have raised recession risks. Our view is that the Fed remains focused on fulfilling its dual mandate objectives of maximum employment and price stability, and thus is biased toward normalizing policy. We expect further declines in the unemployment rate as job gains outstrip growth in the labor force. Meanwhile, core and headline inflation should move closer to the Fed’s target by year end, reflecting our forecasts for a tighter labor market and a modest rise in oil prices. Normally, this would result in at least two Fed rate hikes on the table for 2016, but the U.S. Fed is becoming more sensitive to global financial conditions and the extent of global money flows that occur as monetary policy in the U.S. diverges from Europe, Japan and China. As a result, we have reduced our expectations for a June rate hike, although it would normally be an easy call. We continue to believe a December rate hike is a near certainty. A solid macroeconomic backdrop and a rebalancing oil market should support an improving credit picture in the second half of 2016.
For the six months ended March 31, 2016, the Standard & Poor’s 500® (“S&P 500”) Index* returned 8.49%. The Morgan Stanley Capital International (“MSCI”) Europe-Australasia-Far East (“EAFE”) Index* returned 1.56%. The return of the MSCI Emerging Markets Index* was 6.41%.
In the bond market, the Barclays U.S. Aggregate Bond Index* posted a 2.44% return for the period, while the Barclays U.S. Corporate High Yield Index* returned 1.22%. The return of the Bank of America (“BofA”) Merrill Lynch 3-Month U.S. Treasury Bill Index* was 0.11% for the six-month period.
The opinions and forecasts expressed may not actually come to pass. This information is subject to change at any time, based on market and other conditions, and should not be construed as a recommendation of any specific security or strategy.
4 | THE GUGGENHEIM FUNDS SEMI-ANNUAL REPORT | |
ECONOMIC AND MARKET OVERVIEW (Unaudited)(concluded) | March 31, 2016 |
*Index Definitions:
The following indices are referenced throughout this report. Indices are unmanaged and not available for direct investment. Index performance does not reflect transaction costs, fees, or expenses.
Barclays U.S. Aggregate Bond Index is a broad-based benchmark that measures the investment grade, U.S. dollar denominated, fixed-rate taxable bond market, including U.S. Treasuries, government-related and corporate securities, MBS (agency fixed-rate and hybrid ARM pass-throughs), ABS, and CMBS.
Barclays U.S. Corporate High Yield Index measures the market of U.S. dollar denominated, non-investment grade, fixed-rate, taxable corporate bonds. Securities are classified as high yield if the middle rating of Moody’s, Fitch, and S&P is Ba1/BB+/BB+ or below.
BofA Merrill Lynch 3-Month U.S. Treasury Bill Index is an unmanaged market index of U.S. Treasury securities maturing in 90 days that assumes reinvestment of all income.
MSCI EAFE Index is a free float-adjusted market capitalization index that is designed to measure the equity market performance of developed markets, excluding the U.S. & Canada.
MSCI Emerging Markets Index is a free float-adjusted market capitalization weighted index that is designed to measure equity market performance in the global emerging markets.
S&P 500® Index is a capitalization-weighted index of 500 stocks designed to measure the performance of the broad economy, representing all major industries and is considered a representation of the U.S. stock market.
| | THE GUGGENHEIM FUNDS SEMI-ANNUAL REPORT | 5 |
ABOUT SHAREHOLDERS’ FUND EXPENSES (Unaudited) |
All mutual funds have operating expenses and it is important for our shareholders to understand the impact of costs on their investments. Shareholders of a Fund incur two types of costs: (i) transaction costs, including sales charges (loads) on purchase payments, reinvested dividends, or other distributions; and exchange fees; and (ii) ongoing costs, including management fees, administrative services, and shareholder reports, among others. These ongoing costs, or operating expenses, are deducted from a fund’s gross income and reduce the investment return of the fund.
A fund’s expenses are expressed as a percentage of its average net assets, which is known as the expense ratio. The following examples are intended to help investors understand the ongoing costs (in dollars) of investing in a Fund and to compare these costs with the ongoing costs of investing in other mutual funds.
The examples are based on an investment of $1,000 made at the beginning of the period and held for the entire six-month period beginning September 30, 2015 and ending March 31, 2016.
The following tables illustrate a Fund’s costs in two ways:
Table 1. Based on actual Fund return. This section helps investors estimate the actual expenses paid over the period. The “Ending Account Value” shown is derived from the Fund’s actual return, and the fourth column shows the dollar amount that would have been paid by an investor who started with $1,000 in the Fund. Investors may use the information here, together with the amount invested, to estimate the expenses paid over the period. Simply divide the Fund’s account value by $1,000 (for example, an $8,600 account value divided by $1,000 = 8.6), then multiply the result by the number provided under the heading “Expenses Paid During Period.”
Table 2. Based on hypothetical 5% return. This section is intended to help investors compare a Fund’s cost with those of other mutual funds. The table provides information about hypothetical account values and hypothetical expenses based on the Fund’s actual expense ratio and an assumed rate of return of 5% per year before expenses, which is not the Fund’s actual return. The hypothetical account values and expenses may not be used to estimate the actual ending account balance or expenses paid during the period. The example is useful in making comparisons because the U.S. Securities and Exchange Commission (the “SEC”) requires all mutual funds to calculate expenses based on the 5% return. Investors can assess a Fund’s costs by comparing this hypothetical example with the hypothetical examples that appear in shareholder reports of other funds.
6 | THE GUGGENHEIM FUNDS SEMI-ANNUAL REPORT | |
ABOUT SHAREHOLDERS’ FUND EXPENSES (Unaudited)(continued) |
The calculations illustrated above assume no shares were bought or sold during the period. Actual costs may have been higher or lower, depending on the amount of investment and the timing of any purchases or redemptions.
Please note that the expenses shown in the table are meant to highlight your ongoing costs only and do not reflect any transactional costs, such as sales charges (loads) on purchase payments, and contingent deferred sales charges (“CDSC”) on redemptions, if any. Therefore, the second table is useful in comparing ongoing costs only, and will not help you determine the relative total costs of owning different funds. In addition, if these transactional costs were included, your costs would have been higher.
More information about a Fund’s expenses, including annual expense ratios for up to the past five years (subject to the Fund’s inception date), can be found in the Financial Highlights section of this report. For additional information on operating expenses and other shareholder costs, please refer to the appropriate Fund prospectus.
| | THE GUGGENHEIM FUNDS SEMI-ANNUAL REPORT | 7 |
ABOUT SHAREHOLDERS’ FUND EXPENSES (Unaudited)(concluded) |
| | Expense
Ratio1 | Fund
Return | Beginning
Account Value
September 30,
2015 | Ending
Account Value
March 31,
2016 | Expenses
Paid During
Period2 |
Table 1. Based on actual Fund return3 |
Floating Rate Strategies Fund |
A-Class | 1.03% | (0.12%) | $ 1,000.00 | $ 998.80 | $ 5.15 |
C-Class | 1.78% | (0.54%) | 1,000.00 | 994.60 | 8.88 |
P-Class | 1.03% | (0.13%) | 1,000.00 | 998.70 | 5.15 |
Institutional Class | 0.79% | 0.00% | 1,000.00 | 1,000.00 | 3.95 |
| |
Table 2. Based on hypothetical 5% return (before expenses) |
Floating Rate Strategies Fund |
A-Class | 1.03% | 5.00% | $ 1,000.00 | $ 1,019.85 | $ 5.20 |
C-Class | 1.78% | 5.00% | 1,000.00 | 1,016.10 | 8.97 |
P-Class | 1.03% | 5.00% | 1,000.00 | 1,019.85 | 5.20 |
Institutional Class | 0.79% | 5.00% | 1,000.00 | 1,021.05 | 3.99 |
1 | Annualized and excludes expenses of the underlying funds in which the Fund invests. |
2 | Expenses are equal to the Fund's annualized expense ratio, net of any applicable fee waivers, multiplied by the average account value over the period, multiplied by 183/366 (to reflect the one-half year period). |
3 | Actual cumulative return at net asset value for the period September 30, 2015 to March 31, 2016. |
8 | THE GUGGENHEIM FUNDS SEMI-ANNUAL REPORT | |
FUND PROFILE (Unaudited) | March 31, 2016 |
FLOATING RATE STRATEGIES FUND
OBJECTIVE: Seeks to provide a high level of current income while maximizing total return.
Holdings Diversification (Market Exposure as % of Net Assets)
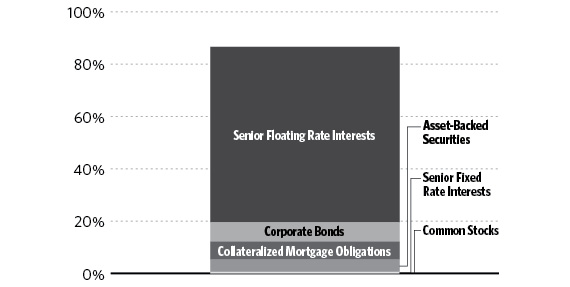
“Holdings Diversification (Market Exposure as % of Net Assets)” excludes any temporary cash investments or investments in Guggenheim Strategy Funds Trust mutual funds. Investments in those Funds do not provide “market exposure” to meet the fund’s investment objective, but will significantly increase the portfolio’s exposure to certain other asset categories (and their associated risks), which may cause the Fund to deviate from its principal investment strategy, including: (i) high yield, high risk debt securities rated below the top four long-term rating categories by a nationally recognized statistical rating organization (also known as “junk bonds”); (ii) securities issued by the U.S. government or its agencies and instrumentalities; (iii) CLOs and similar investments; and (iv) other short-term fixed income securities.
| | THE GUGGENHEIM FUNDS SEMI-ANNUAL REPORT | 9 |
FUND PROFILE (Unaudited)(continued) | March 31, 2016 |
Inception Dates: |
A-Class | November 30, 2011 |
C-Class | November 30, 2011 |
P-Class | May 1, 2015 |
Institutional Class | November 30, 2011 |
Ten Largest Holdings (% of Total Net Assets) |
Avago Technologies Ltd. | 1.1% |
Petsmart, Inc. | 1.1% |
Cartrawler | 1.0% |
Life Time Fitness | 1.0% |
Cengage Learning Acquisitions, Inc. | 1.0% |
Verisure Cayman 2 | 1.0% |
Guggenheim Strategy Fund I | 0.9% |
Neptune Finco Corp. | 0.9% |
Albertson’s (Safeway) Holdings LLC | 0.9% |
Epicor Software | 0.9% |
Top Ten Total | 9.8% |
| | |
“Ten Largest Holdings” excludes any temporary cash or derivative investments. |
10 | THE GUGGENHEIM FUNDS SEMI-ANNUAL REPORT | |
FUND PROFILE (Unaudited)(concluded) | March 31, 2016 |
Portfolio Composition by Quality Rating1
Rating | % of Total Investments |
Fixed Income Instruments |
AAA | 0.1% |
AA | 0.6% |
A | 3.5% |
BBB | 10.9% |
BB | 29.9% |
B | 42.3% |
CCC | 4.4% |
CC | 0.2% |
C | 0.0% |
D | 0.4% |
NR2 | 2.7% |
Other Instruments | 5.0% |
Total Investments | 100.0% |
| | |
The chart above reflects percentages of the value of total investments. |
1 | Source: BlackRock Solutions. Credit quality ratings are measured on a scale that generally ranges from AAA (highest) to D (lowest). All securities except for those labeled “NR” have been rated by a Nationally Recognized Statistical Rating Organization (“NRSRO”). For purposes of this presentation, when ratings are available from more than one agency, the highest rating is used. Guggenheim Investments converts ratings to the equivalent S&P rating. |
2 | NR securities do not necessarily indicate low credit quality. |
| | THE GUGGENHEIM FUNDS SEMI-ANNUAL REPORT | 11 |
SCHEDULE OF INVESTMENTS (Unaudited) | March 31, 2016 |
FLOATING RATE STRATEGIES FUND | |
| | | Shares | | | Value | |
| | | | | | | |
COMMON STOCKS††† - 0.0% | |
| | | | | | | |
Industrial - 0.0% | |
Targus Group International, Inc.* | | | 13,186 | | | $ | 20,174 | |
| | | | | | | | | |
Basic Materials - 0.0% | |
Mirabela Nickel Ltd.*,8 | | | 4,755,634 | | | | 365 | |
| | | | | | | | | |
Total Common Stocks | | | | | | | | |
(Cost $1,830,407) | | | | | | | 20,539 | |
| | | | | | | | | |
MUTUAL FUNDS† - 1.3% | |
Guggenheim Strategy Fund I1 | | | 729,632 | | | | 18,102,182 | |
Guggenheim Strategy Fund II1 | | | 284,034 | | | | 7,012,803 | |
Total Mutual Funds | | | | | | | | |
(Cost $25,219,865) | | | | | | | 25,114,985 | |
| | | | | | | | | |
SHORT TERM INVESTMENTS† - 3.6% | |
Federated U.S. Treasury Cash Reserve Fund Institutional Shares 0.16%2 | | | 72,145,446 | | | | 72,145,446 | |
Total Short Term Investments | | | | | |
(Cost $72,145,446) | | | | | | | 72,145,446 | |
| | | Face
Amount7 | | | | |
| | | | | | | |
SENIOR FLOATING RATE INTERESTS††,5 - 67.1% | |
Consumer, Cyclical - 15.1% | |
PETCO Animal Supplies, Inc. | | | | | | |
5.75% due 01/26/23 | | $ | 16,350,000 | | | | 16,324,984 | |
5.62% due 01/26/23 | | | 5,450,000 | | | | 5,441,825 | |
Petsmart, Inc. | | | | | | | | |
4.25% due 03/11/22 | | | 21,125,610 | | | | 21,025,263 | |
Life Time Fitness | | | | | | | | |
4.25% due 06/10/22 | | | 19,772,391 | | | | 19,505,463 | |
Warner Music Group | | | | | | | | |
3.75% due 07/01/20 | | | 17,786,808 | | | | 17,512,535 | |
BJ’s Wholesale Club, Inc. | | | | | | |
4.50% due 09/26/19 | | | 16,771,741 | | | | 16,303,473 | |
Party City Holdings, Inc. | | | | | | | | |
4.25% due 08/19/22 | | | 16,137,291 | | | | 15,989,313 | |
Acosta, Inc. | | | | | | | | |
4.25% due 09/26/21 | | | 16,064,668 | | | | 15,654,376 | |
Smart & Final Stores LLC | | | | | | | | |
4.00% due 11/15/19 | | | 15,210,342 | | | | 15,065,844 | |
Sears Holdings Corp. | | | | | | | | |
5.50% due 06/30/18 | | | 15,599,158 | | | | 14,819,200 | |
Navistar, Inc. | | | | | | | | |
6.50% due 08/07/20 | | | 15,411,375 | | | | 14,024,351 | |
Belk, Inc. | | | | | | | | |
5.75% due 12/12/22 | | | 13,350,000 | | | | 11,770,295 | |
La Quinta Intermediate Holdings | | | | | | | | |
3.75% due 04/14/21 | | | 10,745,865 | | | | 10,539,866 | |
Deuce Acquisition | | | | | | | | |
6.50% due 12/08/228 | | GBP | 7,100,000 | | | | 9,713,804 | |
Advantage Sales & Marketing LLC | | | | | | | | |
4.25% due 07/23/21 | | | 9,117,792 | | | | 8,944,007 | |
3.39% due 07/25/19 | | | 800,000 | | | | 731,630 | |
Ipreo Holdings | | | | | | | | |
4.00% due 08/06/21 | | | 8,863,155 | | | | 8,408,919 | |
Dollar Tree, Inc. | | | | | | | | |
3.50% due 07/06/22 | | | 7,830,318 | | | | 7,853,809 | |
National Vision, Inc. | | | | | | | | |
4.00% due 03/12/21 | | | 8,069,759 | | | | 7,822,663 | |
Neiman Marcus Group, Inc. | | | | | | | | |
4.25% due 10/25/20 | | | 7,847,044 | | | | 7,174,160 | |
Eyemart Express | | | | | | | | |
5.00% due 12/17/21 | | | 6,979,152 | | | | 6,857,017 | |
Burlington Coat Factory Warehouse Corp. | | | | | | | | |
4.25% due 08/13/21 | | | 6,000,000 | | | | 5,998,920 | |
Ceridian Corp. | | | | | | | | |
4.50% due 09/15/20 | | | 6,032,444 | | | | 5,806,228 | |
Mattress Firm | | | | | | | | |
6.25% due 10/20/21 | | | 5,245,603 | | | | 5,180,033 | |
Equinox Fitness | | | | | | | | |
5.00% due 01/31/20 | | | 5,189,988 | | | | 5,161,443 | |
12 | THE GUGGENHEIM FUNDS SEMI-ANNUAL REPORT | SEE NOTES TO FINANCIAL STATEMENTS. |
SCHEDULE OF INVESTMENTS (Unaudited)(continued) | March 31, 2016 |
FLOATING RATE STRATEGIES FUND | |
| | | Face
Amount7 | | | Value | |
| | | | | | | |
Sterling Intermidiate Corp. | | | | | | |
5.75% due 06/20/22 | | $ | 4,292,331 | | | $ | 4,192,191 | |
Nassa Midco AS | | | | | | | | |
3.75% due 07/09/21 | | EUR | 3,300,000 | | | | 3,694,415 | |
Fitness International LLC | | | | | | | | |
5.50% due 07/01/20 | | | 3,438,750 | | | | 3,309,797 | |
Compucom Systems, Inc. | | | | | | | | |
4.25% due 05/11/20 | | | 4,263,543 | | | | 2,984,480 | |
Capital Automotive LP | | | | | | | | |
6.00% due 04/30/20 | | | 2,830,000 | | | | 2,819,388 | |
Digital Cinema | | | | | | | | |
3.25% due 05/17/21 | | | 2,504,118 | | | | 2,476,998 | |
California Pizza Kitchen, Inc. | | | | | | | | |
5.25% due 03/29/18 | | | 2,898,191 | | | | 2,468,302 | |
NPC International, Inc. | | | | | | | | |
4.75% due 12/28/18 | | | 913,657 | | | | 909,089 | |
Pinnacle Entertainment, Inc. | | | | | | | | |
3.75% due 08/13/20 | | | 769,640 | | | | 768,201 | |
Container Store, Inc. | | | | | | | | |
4.25% due 04/06/19 | | | 875,580 | | | | 663,978 | |
Kate Spade & Co. | | | | | | | | |
4.00% due 04/09/21 | | | 581,219 | | | | 572,501 | |
Rite Aid Corp. | | | | | | | | |
5.75% due 08/21/20 | | | 500,000 | | | | 501,040 | |
Jacobs Entertainment, Inc. | | | | | | | | |
5.25% due 10/29/18 | | | 470,065 | | | | 455,963 | |
Total Consumer, Cyclical | | | | | | | 299,445,764 | |
| | | | | | | | | |
Industrial - 12.1% | |
Transdigm, Inc. | | | | | | | | |
3.50% due 05/14/22 | | | 12,971,016 | | | | 12,760,237 | |
3.75% due 06/04/21 | | | 6,691,990 | | | | 6,589,201 | |
Brickman Group Holdings, Inc. | | | | | | | | |
4.00% due 12/18/20 | | | 16,365,205 | | | | 16,086,996 | |
Amber Bidco Ltd. | | | | | | | | |
4.62% due 06/30/21†††,8 | | | 10,480,000 | | | | 10,321,747 | |
4.59% due 06/30/21†††,8 | | GBP | 3,500,000 | | | | 4,951,377 | |
Gates Global, Inc. | | | | | | | | |
4.25% due 07/05/21 | | | 15,065,166 | | | | 14,189,579 | |
Flakt Woods | | | | | | | | |
2.63% due 03/20/17†††,8 | | EUR | 12,244,976 | | | | 13,800,721 | |
Travelport Holdings LLC | | | | | | | | |
5.75% due 09/02/21 | | | 13,760,765 | | | | 13,736,683 | |
Quikrete Holdings, Inc. | | | | | | | | |
4.00% due 09/28/20 | | | 13,400,000 | | | | 13,366,500 | |
USIC Holding, Inc. | | | | | | | | |
4.00% due 07/10/20 | | | 12,014,577 | | | | 11,774,285 | |
DAE Aviation | | | | | | | | |
5.25% due 07/07/22 | | | 10,507,836 | | | | 10,461,917 | |
Rexnord LLC/RBS Global, Inc. | | | | | | | | |
4.00% due 08/21/20 | | | 8,190,000 | | | | 8,055,602 | |
Hardware Holdings LLC | | | | | | | | |
6.75% due 03/30/20†††,8 | | | 6,171,875 | | | | 6,017,578 | |
CPM Holdings, Inc. | | | | | | | | |
6.00% due 04/11/22 | | | 5,756,500 | | | | 5,662,957 | |
Multiplan, Inc. | | | | | | | | |
3.75% due 03/31/21 | | | 5,678,544 | | | | 5,618,919 | |
SIRVA Worldwide, Inc. | | | | | | | | |
7.50% due 03/27/198 | | | 5,694,761 | | | | 5,381,549 | |
Crosby Worldwide | | | | | | | | |
4.00% due 11/23/20 | | | 6,589,507 | | | | 5,366,362 | |
Power Borrower, LLC | | | | | | | | |
4.25% due 05/06/20 | | | 3,632,227 | | | | 3,559,582 | |
8.25% due 11/06/20 | | | 1,670,000 | | | | 1,544,750 | |
Thermasys Corp. | | | | | | | | |
5.26% due 05/03/19 | | | 6,398,438 | | | | 5,078,760 | |
Mitchell International, Inc. | | | | | | | | |
4.50% due 10/13/20 | | | 2,729,346 | | | | 2,626,996 | |
8.50% due 10/11/21 | | | 2,374,000 | | | | 2,083,185 | |
CHI Overhead Doors, Inc. | | | | | | | | |
4.75% due 07/29/22 | | | 4,577,000 | | | | 4,508,345 | |
Connolly Corp. | | | | | | | | |
4.50% due 05/14/21 | | | 4,412,811 | | | | 4,335,586 | |
NVA Holdings, Inc. | | | | | | | | |
4.75% due 08/14/21 | | | 3,983,847 | | | | 3,944,009 | |
CareCore National LLC | | | | | | | | |
5.50% due 03/05/21 | | | 4,102,908 | | | | 3,815,704 | |
SEE NOTES TO FINANCIAL STATEMENTS. | THE GUGGENHEIM FUNDS SEMI-ANNUAL REPORT | 13 |
SCHEDULE OF INVESTMENTS (Unaudited)(continued) | March 31, 2016 |
FLOATING RATE STRATEGIES FUND | |
| | | Face
Amount7 | | | Value | |
| | | | | | | |
Reynolds Group Holdings | | | | | | |
4.50% due 12/03/18 | | $ | 3,109,251 | | | $ | 3,109,251 | |
Mast Global | | | | | | | | |
7.75% due 09/12/19†††,8 | | | 2,981,188 | | | | 2,946,606 | |
SIG Onex Wizard Acquisition | | | | | | | | |
4.25% due 03/11/22 | | | 2,929,455 | | | | 2,916,653 | |
CEVA Logistics US Holdings | | | | | | | | |
6.50% due 03/19/21 | | | 3,483,865 | | | | 2,862,587 | |
Learning Care Group (US), Inc. | | | | | | | | |
5.00% due 05/05/21 | | | 2,703,360 | | | | 2,692,384 | |
GYP Holdings III Corp. | | | | | | | | |
4.75% due 04/01/21 | | | 2,751,000 | | | | 2,591,965 | |
CEVA Group Plc (United Kingdom) | | | | | | | | |
6.50% due 03/19/21 | | | 2,444,038 | | | | 2,008,192 | |
due 03/19/193 | | | 660,000 | | | | 580,181 | |
SI Organization | | | | | | | | |
5.75% due 11/22/19 | | | 2,276,501 | | | | 2,253,736 | |
Doncasters Group Ltd. | | | | | | | | |
9.50% due 10/09/20 | | | 2,348,621 | | | | 2,113,759 | |
CEVA Logistics Holdings BV (Dutch) | | | | | | | | |
6.50% due 03/19/21 | | | 2,532,245 | | | | 2,080,670 | |
Berry Plastics Corp. | | | | | | | | |
3.50% due 02/07/20 | | | 1,072,362 | | | | 1,067,000 | |
3.75% due 01/06/21 | | | 815,500 | | | | 812,165 | |
Berlin Packaging LLC | | | | | | | | |
4.50% due 10/01/21 | | | 1,897,983 | | | | 1,877,428 | |
Goodpack Ltd. | | | | | | | | |
4.75% due 09/09/21 | | | 1,992,898 | | | | 1,838,448 | |
Constantinople Acquisition GmbH | | | | | | | | |
4.75% due 04/30/22 | | | 1,831,500 | | | | 1,822,343 | |
Tank Holdings Corp. | | | | | | | | |
5.25% due 03/16/22 | | | 1,882,609 | | | | 1,798,682 | |
NANA Development Corp. | | | | | | | | |
8.00% due 03/15/188 | | | 2,040,000 | | | | 1,785,000 | |
Braas Monier Buildings Group | | | | | | | | |
3.69% due 10/15/20 | | EUR | 1,216,837 | | | | 1,378,238 | |
Dematic S.A. | | | | | | | | |
4.25% due 12/27/19 | | | 1,334,379 | | | | 1,320,475 | |
Camp Systems International | | | | | | | | |
8.25% due 11/29/19 | | | 1,150,000 | | | | 1,035,000 | |
Nord Anglia Education Finance LLC | | | | | | | | |
5.00% due 03/31/21 | | | 1,031,676 | | | | 1,014,272 | |
Wencor Group | | | | | | | | |
3.94% due 06/19/19 | | | 964,615 | | | | 891,920 | |
AlliedBarton Security Services LLC | | | | | | | | |
4.25% due 02/12/21 | | | 691,614 | | | | 674,323 | |
Pro Mach Group, Inc. | | | | | | | | |
4.75% due 10/22/21 | | | 620,301 | | | | 605,829 | |
CEVA Logistics Canada, ULC | | | | | | | | |
6.50% due 03/19/21 | | | 435,483 | | | | 357,823 | |
Omnitracs, Inc. | | | | | | | | |
8.75% due 05/25/21 | | | 350,000 | | | | 322,585 | |
Hunter Fan Co. | | | | | | | | |
6.50% due 12/20/178 | | | 187,096 | | | | 185,225 | |
Total Industrial | | | | | | | 240,581,867 | |
| | | | | | | | | |
Technology - 11.9% | |
Avago Technologies Ltd. | | | | | | | | |
4.25% due 02/01/23 | | | 21,450,000 | | | | 21,330,525 | |
Verisure Cayman 2 | | | | | | | | |
5.25% due 10/10/22 | | EUR | 17,000,000 | | | | 19,365,318 | |
Epicor Software | | | | | | | | |
4.75% due 06/01/22 | | | 18,659,000 | | | | 17,648,242 | |
Solera LLC | | | | | | | | |
5.75% due 03/03/23 | | | 16,050,000 | | | | 16,018,542 | |
Deltek, Inc. | | | | | | | | |
5.00% due 06/25/22 | | | 15,438,596 | | | | 15,342,105 | |
TIBCO Software, Inc. | | | | | | | | |
6.50% due 12/04/20 | | | 16,738,444 | | | | 15,006,015 | |
The Active Network, Inc. | | | | | | | | |
5.50% due 11/13/20 | | | 12,017,711 | | | | 11,386,781 | |
Informatica Corp. | | | | | | | | |
4.50% due 08/05/22 | | | 10,547,000 | | | | 10,336,060 | |
Infor, Inc. | | | | | | | | |
3.75% due 06/03/20 | | | 10,425,351 | | | | 10,094,755 | |
14 | THE GUGGENHEIM FUNDS SEMI-ANNUAL REPORT | SEE NOTES TO FINANCIAL STATEMENTS. |
SCHEDULE OF INVESTMENTS (Unaudited)(continued) | March 31, 2016 |
FLOATING RATE STRATEGIES FUND | |
| | | Face
Amount7 | | | Value | |
| | | | | | | |
GlobalLogic Holdings, Inc. | | | | | | |
6.25% due 05/31/19 | | $ | 9,555,000 | | | $ | 9,340,013 | |
Micro Focus International plc | | | | | | | | |
5.25% due 11/19/21 | | | 8,986,489 | | | | 8,957,283 | |
First Data Corp. | | | | | | | | |
3.93% due 03/23/18 | | | 6,619,723 | | | | 6,601,519 | |
7.25% due 03/24/21 | | | 1,600,000 | | | | 1,594,752 | |
3.93% due 09/24/18 | | | 400,000 | | | | 399,168 | |
Greenway Medical Technologies | | | | | | | | |
6.00% due 11/04/208 | | | 9,775,000 | | | | 8,406,500 | |
Advanced Computer Software | | | | | | | | |
6.50% due 03/18/22 | | | 6,435,000 | | | | 6,177,600 | |
10.50% due 01/31/23 | | | 2,200,000 | | | | 2,018,500 | |
LANDesk Group, Inc. | | | | | | | | |
5.00% due 02/25/20 | | | 8,288,350 | | | | 8,081,141 | |
Aspect Software, Inc. | | | | | | | | |
9.50% due 09/30/16 | | | 7,323,563 | | | | 7,250,327 | |
Avaya, Inc. | | | | | | | | |
6.25% due 05/29/20 | | | 7,308,729 | | | | 4,862,936 | |
6.50% due 03/30/18 | | | 3,223,269 | | | | 2,361,044 | |
Banca Civica (UK) - Chambertin | | | | | | | | |
5.09% due 05/29/20†††,8 | | GBP | 3,800,000 | | | | 5,226,228 | |
4.88% due 08/04/21†††,8 | | GBP | 503,500 | | | | 692,475 | |
EIG Investors Corp. | | | | | | | | |
6.23% due 11/09/198 | | | 5,286,999 | | | | 5,042,475 | |
Go Daddy Operating Company, LLC | | | | | | | | |
4.25% due 05/13/21 | | | 3,826,425 | | | | 3,817,394 | |
American Builders & Contractors Supply Co., Inc. | | | | | | | | |
3.50% due 04/16/20 | | | 3,361,188 | | | | 3,356,146 | |
Linxens | | | | | | | | |
5.00% due 10/16/22 | | | 3,400,000 | | | | 3,344,750 | |
SolarWinds Holdings, Inc. | | | | | | | | |
6.50% due 02/03/23 | | | 3,000,000 | | | | 2,964,990 | |
Sabre, Inc. | | | | | | | | |
4.00% due 02/19/19 | | | 2,892,247 | | | | 2,890,454 | |
CDW LLC | | | | | | | | |
3.25% due 04/29/20 | | | 2,855,182 | | | | 2,844,704 | |
Wall Street Systems | | | | | | | | |
4.25% due 04/30/21 | | | 1,888,011 | | | | 1,866,771 | |
Sparta Holding Corp. | | | | | | | | |
6.50% due 07/28/20††† | | | 1,384,832 | | | | 1,374,850 | |
Eze Castle Software, Inc. | | | | | | | | |
7.25% due 04/05/21 | | | 1,441,176 | | | | 1,354,706 | |
Applied Systems, Inc. | | | | | | | | |
4.31% due 01/25/21 | | | 1,263,756 | | | | 1,249,273 | |
Total Technology | | | | | | | 238,604,342 | |
| | | | | | | | | |
Communications - 9.4% | |
Numericable US LLC | | | | | | | | |
4.75% due 02/10/23 | | | 17,650,000 | | | | 17,490,091 | |
4.56% due 07/31/22 | | | 3,291,750 | | | | 3,248,562 | |
Cartrawler | | | | | | | | |
4.25% due 04/29/21 | | EUR | 17,700,000 | | | | 19,535,758 | |
Cengage Learning Acquisitions, Inc. | | | | | | | | |
7.00% due 03/31/20 | | | 19,533,166 | | | | 19,421,632 | |
Neptune Finco Corp. | | | | | | | | |
5.00% due 10/10/22 | | | 18,000,000 | | | | 17,997,120 | |
Univision Communications, Inc. | | | | | | | | |
4.00% due 02/28/20 | | | 13,318,165 | | | | 13,172,465 | |
4.00% due 03/01/20 | | | 1,278,572 | | | | 1,264,456 | |
Ziggo B.V. | | | | | | | | |
3.75% due 01/15/22 | | EUR | 12,300,000 | | | | 13,842,870 | |
T-Mobile US, Inc. | | | | | | | | |
3.50% due 11/09/22 | | | 11,970,000 | | | | 12,011,177 | |
Light Tower Fiber LLC | | | | | | | | |
4.00% due 04/13/20 | | | 11,717,730 | | | | 11,571,258 | |
Asurion Corp. | | | | | | | | |
4.25% due 07/08/20 | | | 5,956,920 | | | | 5,733,536 | |
5.00% due 08/04/22 | | | 2,971,454 | | | | 2,906,468 | |
Zayo Group LLC | | | | | | | | |
3.75% due 05/06/21 | | | 8,138,194 | | | | 8,090,749 | |
Houghton Mifflin Co. | | | | | | | | |
4.00% due 05/31/21 | | | 6,252,750 | | | | 6,104,247 | |
SEE NOTES TO FINANCIAL STATEMENTS. | THE GUGGENHEIM FUNDS SEMI-ANNUAL REPORT | 15 |
SCHEDULE OF INVESTMENTS (Unaudited)(continued) | March 31, 2016 |
FLOATING RATE STRATEGIES FUND | |
| | | Face
Amount7 | | | Value | |
| | | | | | | |
Virgin Media Bristol LLC | | | | | | |
3.50% due 06/30/23 | | $ | 5,857,895 | | | $ | 5,804,471 | |
Match Group, Inc. | | | | | | | | |
5.50% due 11/16/22 | | | 5,579,375 | | | | 5,575,916 | |
Gogo LLC | | | | | | | | |
11.25% due 03/21/188 | | | 3,939,999 | | | | 3,959,699 | |
7.50% due 03/21/188 | | | 1,299,950 | | | | 1,247,952 | |
CBS Outdoor Americas Capital LLC | | | | | | | | |
3.00% due 02/01/21 | | | 4,312,500 | | | | 4,285,547 | |
Live Nation Worldwide, Inc. | | | | | | | | |
3.50% due 08/14/20 | | | 2,925,000 | | | | 2,921,344 | |
EMI Music Publishing | | | | | | | | |
4.00% due 08/19/22 | | | 2,564,956 | | | | 2,557,902 | |
Internet Brands | | | | | | | | |
4.75% due 07/08/21 | | | 2,150,478 | | | | 2,133,016 | |
Scout24 AG | | | | | | | | |
3.75% due 02/12/21 | | EUR | 1,818,050 | | | | 2,051,726 | |
Anaren, Inc. | | | | | | | | |
5.50% due 02/18/21 | | | 1,512,968 | | | | 1,361,671 | |
9.25% due 08/18/21 | | | 275,000 | | | | 250,709 | |
Charter Communications Operating, LLC | | | | | | | | |
3.00% due 01/03/21 | | | 1,583,715 | | | | 1,576,082 | |
Level 3 Communications, Inc. | | | | | | | | |
4.00% due 08/01/19 | | | 750,000 | | | | 750,780 | |
Total Communications | | | | | | | 186,867,204 | |
| | | | | | | | | |
Consumer, Non-cyclical - 8.4% | |
Albertson’s (Safeway) Holdings LLC | | | | | | | | |
5.50% due 08/25/21 | | | 17,884,403 | | | | 17,893,344 | |
5.50% due 03/21/19 | | | 1,246,629 | | | | 1,245,931 | |
Authentic Brands | | | | | | | | |
5.50% due 05/27/21 | | | 14,003,209 | | | | 13,501,473 | |
Valeant Pharmaceuticals International, Inc. | | | | | | | | |
4.00% due 04/01/22 | | | 9,405,000 | | | | 8,868,163 | |
3.75% due 08/05/20 | | | 4,000,000 | | | | 3,765,000 | |
At Home Holding III Corp. | | | | | | | | |
5.00% due 06/03/22 | | | 12,406,250 | | | | 11,910,000 | |
Hostess Brands | | | | | | | | |
4.50% due 08/03/22 | | | 11,442,500 | | | | 11,442,500 | |
Endo Luxembourg Finance Co. | | | | | | | | |
3.75% due 09/25/22 | | | 11,400,000 | | | | 11,214,750 | |
Pinnacle Foods Corp. | | | | | | | | |
3.00% due 04/29/20 | | | 8,947,661 | | | | 8,933,923 | |
Dole Food Company, Inc. | | | | | | | | |
4.50% due 11/01/18 | | | 8,407,220 | | | | 8,363,418 | |
CTI Foods Holding Co. LLC | | | | | | | | |
8.25% due 06/28/21 | | | 7,420,000 | | | | 6,715,100 | |
4.50% due 06/29/20 | | | 1,316,250 | | | | 1,263,600 | |
Pharmaceutical Product Development | | | | | | | | |
4.25% due 08/18/22 | | | 5,639,713 | | | | 5,585,685 | |
Reddy Ice Holdings, Inc. | | | | | | | | |
6.75% due 05/01/198 | | | 4,755,431 | | | | 3,962,843 | |
10.75% due 10/01/198 | | | 2,000,000 | | | | 1,320,000 | |
American Tire Distributors, Inc. | | | | | | | | |
5.25% due 09/01/21 | | | 4,999,546 | | | | 4,974,549 | |
Sterigenics Norion Holdings | | | | | | | | |
4.25% due 05/16/22 | | | 4,987,500 | | | | 4,937,625 | |
Physio-Control International, Inc. | | | | | | | | |
5.50% due 06/06/22 | | | 4,788,000 | | | | 4,782,015 | |
Arctic Glacier Holdings, Inc. | | | | | | | | |
6.00% due 05/10/19 | | | 4,600,067 | | | | 4,370,064 | |
Hill-Rom Holdings, Inc. | | | | | | | | |
3.50% due 09/08/22 | | | 4,237,822 | | | | 4,242,611 | |
Alere, Inc. | | | | | | | | |
4.25% due 06/20/22 | | | 3,245,429 | | | | 3,222,094 | |
Nellson Nutraceutical (US) | | | | | | | | |
6.00% due 12/23/21 | | | 3,079,176 | | | | 3,040,686 | |
Hearthside Foods | | | | | | | | |
4.50% due 06/02/21 | | | 3,122,715 | | | | 3,036,840 | |
Serta Simmons Holdings LLC | | | | | | | | |
4.25% due 10/01/19 | | | 2,602,371 | | | | 2,597,504 | |
DJO Finance LLC | | | | | | | | |
4.25% due 06/08/20 | | | 2,657,490 | | | | 2,595,490 | |
Genoa Healthcare | | | | | | | | |
4.50% due 05/02/22 | | | 2,580,500 | | | | 2,548,244 | |
16 | THE GUGGENHEIM FUNDS SEMI-ANNUAL REPORT | SEE NOTES TO FINANCIAL STATEMENTS. |
SCHEDULE OF INVESTMENTS (Unaudited)(continued) | March 31, 2016 |
FLOATING RATE STRATEGIES FUND | |
| | | Face
Amount7 | | | Value | |
| | | | | | | |
Grocery Outlet, Inc. | | | | | | |
4.75% due 10/21/21 | | $ | 2,078,947 | | | $ | 2,029,572 | |
AdvancePierre Foods, Inc. | | | | | | | | |
5.75% due 07/10/17 | | | 1,436,662 | | | | 1,438,458 | |
9.50% due 10/10/17 | | | 461,000 | | | | 457,160 | |
Nellson Nutraceutical (CAD) | | | | | | | | |
6.00% due 12/23/21 | | | 1,912,528 | | | | 1,888,621 | |
NES Global Talent | | | | | | | | |
6.50% due 10/03/19 | | | 1,682,072 | | | | 1,513,865 | |
Acadia Healthcare Company, Inc. | | | | | | | | |
4.50% due 02/13/19 | | | 1,346,625 | | | | 1,349,426 | |
Catalent Pharma Solutions, Inc. | | | | | | | | |
4.25% due 05/20/21 | | | 1,197,241 | | | | 1,195,577 | |
Aramark Corp. | | | | | | | | |
3.25% due 02/24/21 | | | 1,195,600 | | | | 1,190,614 | |
Fender Musical Instruments Corp. | | | | | | | | |
5.75% due 04/03/19 | | | 792,732 | | | | 782,823 | |
Targus Group International, Inc. | | | | | | | | |
7.37% due 05/24/16†††,8 | | | 152,522 | | | | — | |
Total Consumer, Non-cyclical | | | | 168,179,568 | |
| | | | | | | | | |
Financial - 6.8% | |
Alliant Holdings I L.P. | | | | | | | | |
4.50% due 08/12/22 | | | 16,475,500 | | | | 16,257,201 | |
Transunion Holding Co. | | | | | | | | |
3.50% due 04/09/21 | | | 16,302,671 | | | | 16,131,493 | |
National Financial Partners Corp. | | | | | | | | |
4.50% due 07/01/20 | | | 14,187,965 | | | | 13,840,360 | |
HUB International Ltd. | | | | | | | | |
4.00% due 10/02/20 | | | 12,508,208 | | | | 12,164,232 | |
Hyperion Insurance | | | | | | | | |
5.50% due 04/29/22 | | | 11,711,500 | | | | 11,140,564 | |
Assured Partners, Inc. | | | | | | | | |
5.75% due 10/21/22 | | | 11,122,125 | | | | 11,038,709 | |
York Risk Services | | | | | | | | |
4.75% due 10/01/21 | | | 11,522,937 | | | | 9,780,093 | |
Lineage Logistics LLC | | | | | | | | |
4.50% due 04/07/21 | | | 8,874,533 | | | | 7,432,421 | |
Magic Newco, LLC | | | | | | | | |
5.00% due 12/12/18 | | | 7,405,428 | | | | 7,398,023 | |
American Stock Transfer & Trust | | | | | | | | |
5.75% due 06/26/20 | | | 5,709,467 | | | | 5,523,910 | |
Expert Global Solutions | | | | | | | | |
8.50% due 04/03/18 | | | 4,174,422 | | | | 4,090,934 | |
7.67% due 04/02/17†††,8 | | | 654,167 | | | | 633,095 | |
WTG Holdings | | | | | | | | |
4.75% due 01/15/21 | | | 4,135,908 | | | | 4,042,850 | |
Jefferies Finance LLC | | | | | | | | |
4.50% due 05/14/20 | | | 3,821,125 | | | | 3,754,255 | |
LPL Financial Holdings, Inc. | | | | | | | | |
4.75% due 11/21/22 | | | 3,825,000 | | | | 3,748,500 | |
Genex Services, Inc. | | | | | | | | |
5.25% due 05/28/21 | | | 2,538,000 | | | | 2,487,240 | |
Fly Leasing Ltd. | | | | | | | | |
3.50% due 08/09/19 | | | 2,390,703 | | | | 2,369,784 | |
USI Holdings Corp. | | | | | | | | |
4.25% due 12/27/19 | | | 1,378,413 | | | | 1,355,435 | |
Cunningham Lindsey U.S., Inc. | | | | | | | | |
5.00% due 12/10/198 | | | 1,566,176 | | | | 1,057,169 | |
9.25% due 06/10/208 | | | 194,886 | | | | 96,794 | |
AmWINS Group, LLC | | | | | | | | |
5.25% due 09/06/19 | | | 1,086,226 | | | | 1,087,453 | |
Total Financial | | | | | | | 135,430,515 | |
| | | | | | | | | |
Basic Materials - 1.8% | |
Chromaflo Technologies | | | | | | | | |
4.50% due 12/02/19 | | | 9,180,818 | | | | 8,744,728 | |
Univar, Inc. | | | | | | | | |
4.25% due 07/01/22 | | | 8,557,000 | | | | 8,423,340 | |
Zep, Inc. | | | | | | | | |
5.50% due 06/27/22 | | | 6,268,500 | | | | 6,252,829 | |
INEOS US Finance LLC | | | | | | | | |
4.25% due 03/31/22 | | | 4,454,977 | | | | 4,385,390 | |
Platform Specialty Products | | | | | | | | |
5.50% due 06/07/20 | | | 4,031,250 | | | | 3,889,673 | |
SEE NOTES TO FINANCIAL STATEMENTS. | THE GUGGENHEIM FUNDS SEMI-ANNUAL REPORT | 17 |
SCHEDULE OF INVESTMENTS (Unaudited)(continued) | March 31, 2016 |
FLOATING RATE STRATEGIES FUND | |
| | | Face
Amount7 | | | Value | |
| | | | | | | |
Ennis-Flint | | | | | | |
4.25% due 03/31/218 | | $ | 2,058,000 | | | $ | 2,006,550 | |
7.75% due 09/30/218 | | | 270,000 | | | | 256,500 | |
Minerals Technologies, Inc. | | | | | | | | |
3.75% due 05/10/21 | | | 1,106,888 | | | | 1,101,354 | |
Hoffmaster Group, Inc. | | | | | | | | |
5.25% due 05/08/20 | | | 940,452 | | | | 924,775 | |
Atkore International, Inc. | | | | | | | | |
7.75% due 10/09/218 | | | 400,000 | | | | 364,000 | |
Total Basic Materials | | | | | | | 36,349,139 | |
| | | | | | | | | |
Utilities - 0.9% | |
Texas Competitive Electric Holdings Company LLC | | | | | | | | |
3.75% due 11/07/16 | | | 9,000,000 | | | | 8,955,000 | |
Stonewall (Green Energy) | | | | | | | | |
6.50% due 11/12/21 | | | 5,950,000 | | | | 5,533,500 | |
Panda Temple II Power | | | | | | | | |
7.25% due 04/03/19 | | | 4,488,750 | | | | 3,748,106 | |
Total Utilities | | | | | | | 18,236,606 | |
| | | | | | | | | |
Energy - 0.7% | |
Veresen Midstream LP | | | | | | | | |
5.25% due 03/31/22 | | | 11,286,000 | | | | 10,425,443 | |
PSS Companies | | | | | | | | |
5.50% due 01/28/20 | | | 5,653,580 | | | | 3,674,827 | |
Total Energy | | | | | | | 14,100,270 | |
Total Senior Floating Rate Interests | | | | | |
(Cost $1,387,469,904) | | | | | | | 1,337,795,275 | |
| | | | | | | | | |
CORPORATE BONDS†† - 7.3% | |
Energy - 1.6% | |
Sabine Pass Liquefaction LLC | | | | | | | | |
5.63% due 02/01/21 | | | 5,500,000 | | | | 5,286,874 | |
5.63% due 04/15/23 | | | 4,200,000 | | | | 3,990,000 | |
Crestwood Midstream Partners Limited Partnership / Crestwood Midstream Finance Corp. | | | | | | | | |
6.00% due 12/15/20 | | | 6,300,000 | | | | 4,945,500 | |
CONSOL Energy, Inc. | | | | | | | | |
5.88% due 04/15/22 | | | 6,750,000 | | | | 4,864,185 | |
ContourGlobal Power Holdings S.A. | | | | | | | | |
7.13% due 06/01/194 | | | 3,500,000 | | | | 3,399,375 | |
Gibson Energy, Inc. | | | | | | | | |
6.75% due 07/15/214 | | | 2,905,000 | | | | 2,672,600 | |
FTS International, Inc. | | | | | | | | |
8.13% due 06/15/204,5 | | | 2,950,000 | | | | 1,989,743 | |
6.25% due 05/01/22 | | | 1,250,000 | | | | 137,500 | |
Unit Corp. | | | | | | | | |
6.63% due 05/15/21 | | | 4,000,000 | | | | 2,010,000 | |
Legacy Reserves Limited Partnership / Legacy Reserves Finance Corp. | | | | | | | | |
8.00% due 12/01/20 | | | 2,750,000 | | | | 529,375 | |
Ultra Petroleum Corp. | | | | | | | | |
5.75% due 12/15/18 | | | 4,680,000 | | | | 327,600 | |
Atlas Energy Holdings Operating Company LLC / Atlas Resource Finance Corp. | | | | | | | | |
9.25% due 08/15/218 | | | 1,375,000 | | | | 213,125 | |
7.75% due 01/15/218 | | | 125,000 | | | | 18,125 | |
BreitBurn Energy Partners Limited Partnership / BreitBurn Finance Corp. | | | | | | | | |
7.88% due 04/15/22 | | | 850,000 | | | | 85,000 | |
Total Energy | | | | | | | 30,469,002 | |
| | | | | | | | | |
Consumer, Non-cyclical - 1.4% | |
Tenet Healthcare Corp. | | | | | | | | |
4.13% due 06/15/204,5 | | | 17,000,000 | | | | 16,872,500 | |
Vector Group Ltd. | | | | | | | | |
7.75% due 02/15/21 | | | 6,890,000 | | | | 7,234,500 | |
Opal Acquisition, Inc. | | | | | | | | |
8.88% due 12/15/214 | | | 3,195,000 | | | | 2,228,513 | |
Bumble Bee Holdings, Inc. | | | | | | | | |
9.00% due 12/15/174 | | | 1,754,000 | | | | 1,758,385 | |
Total Consumer, Non-cyclical | | | | 28,093,898 | |
| | | | | | | | | |
Communications - 1.0% | |
Interoute Finco plc | | | | | | | | |
6.24% due 10/15/20 | | EUR | 7,250,000 | | | | 8,319,536 | |
18 | THE GUGGENHEIM FUNDS SEMI-ANNUAL REPORT | SEE NOTES TO FINANCIAL STATEMENTS. |
SCHEDULE OF INVESTMENTS (Unaudited)(continued) | March 31, 2016 |
FLOATING RATE STRATEGIES FUND | |
| | | Face
Amount7 | | | Value | |
| | | | | | | |
Level 3 Financing, Inc. | | | | | | |
4.10% due 01/15/185 | | $ | 4,210,000 | | | $ | 4,225,788 | |
Midcontinent Communications & Midcontinent Finance Corp. | | | | | | | | |
6.88% due 08/15/234 | | | 4,000,000 | | | | 4,140,000 | |
MDC Partners, Inc. | | | | | | | | |
6.75% due 04/01/204 | | | 1,000,000 | | | | 1,033,750 | |
CyrusOne Limited Partnership / CyrusOne Finance Corp. | | | | | | | | |
6.38% due 11/15/22 | | | 600,000 | | | | 622,500 | |
UPCB Finance VI Ltd. | | | | | | | | |
6.88% due 01/15/224 | | | 477,000 | | | | 504,428 | |
TIBCO Software, Inc. | | | | | | | | |
11.38% due 12/01/214 | | | 550,000 | | | | 481,250 | |
Avaya, Inc. | | | | | | | | |
7.00% due 04/01/194 | | | 610,000 | | | | 411,750 | |
Total Communications | | | | | | | 19,739,002 | |
| | | | | | | | | |
Financial - 0.8% | |
Kennedy-Wilson, Inc. | | | | | | | | |
5.87% due 04/01/24 | | | 6,705,000 | | | | 6,554,138 | |
Icahn Enterprises Limited Partnership / Icahn Enterprises Finance Corp. | | | | | | | | |
5.88% due 02/01/22 | | | 5,000,000 | | | | 4,745,000 | |
6.00% due 08/01/20 | | | 1,700,000 | | | | 1,653,250 | |
Jefferies Finance LLC / JFIN Company-Issuer Corp. | | | | | | | | |
7.38% due 04/01/204 | | | 1,050,000 | | | | 908,250 | |
National Financial Partners Corp. | | | | | | | | |
9.00% due 07/15/214 | | | 850,000 | | | | 816,000 | |
Oxford Finance LLC / Oxford Finance Company-Issuer, Inc. | | | | | | | | |
7.25% due 01/15/184 | | | 650,000 | | | | 643,500 | |
Fidelity & Guaranty Life Holdings, Inc. | | | | | | | | |
6.38% due 04/01/214 | | | 450,000 | | | | 452,250 | |
Total Financial | | | | | | | 15,772,388 | |
| | | | | | | | | |
Technology - 0.8% | |
First Data Corp. | | | | | | | | |
5.00% due 01/15/244 | | | 6,250,000 | | | | 6,257,813 | |
5.75% due 01/15/244 | | | 5,200,000 | | | | 5,199,480 | |
Infor US, Inc. | | | | | | | | |
5.75% due 08/15/204 | | | 3,250,000 | | | | 3,347,500 | |
NCR Corp. | | | | | | | | |
6.38% due 12/15/23 | | | 800,000 | | | | 824,000 | |
Total Technology | | | | | | | 15,628,793 | |
| | | | | | | | | |
Utilities - 0.6% | |
AES Corp. | | | | | | | | |
3.64% due 06/01/195 | | | 8,000,000 | | | | 7,720,000 | |
5.50% due 04/15/25 | | | 1,150,000 | | | | 1,109,750 | |
Terraform Global Operating LLC | | | | | | | | |
9.75% due 08/15/224 | | | 4,600,000 | | | | 3,450,000 | |
LBC Tank Terminals Holding Netherlands BV | | | | | | | | |
6.88% due 05/15/234 | | | 630,000 | | | | 585,900 | |
Total Utilities | | | | | | | 12,865,650 | |
| | | | | | | | | |
Industrial - 0.6% | |
CEVA Group plc | | | | | | | | |
7.00% due 03/01/214 | | | 5,800,000 | | | | 4,625,500 | |
BMBG Bond Finance SCA | | | | | | | | |
4.86% due 10/15/204,5 | | EUR | 4,000,000 | | | | 4,551,402 | |
Anixter, Inc. | | | | | | | | |
5.50% due 03/01/234 | | | 3,000,000 | | | | 3,037,500 | |
Total Industrial | | | | | | | 12,214,402 | |
| | | | | | | | | |
Consumer, Cyclical - 0.3% | |
Ferrellgas Limited Partnership / Ferrellgas Finance Corp. | | | | | | | | |
6.50% due 05/01/21 | | | 4,615,000 | | | | 4,095,812 | |
WMG Acquisition Corp. | | | | | | | | |
6.75% due 04/15/224 | | | 2,280,000 | | | | 2,257,200 | |
SEE NOTES TO FINANCIAL STATEMENTS. | THE GUGGENHEIM FUNDS SEMI-ANNUAL REPORT | 19 |
SCHEDULE OF INVESTMENTS (Unaudited)(continued) | March 31, 2016 |
FLOATING RATE STRATEGIES FUND | |
| | | Face
Amount7 | | | Value | |
| | | | | | | |
Men’s Wearhouse, Inc. | | | | | | |
7.00% due 07/01/22 | | $ | 525,000 | | | $ | 444,938 | |
Total Consumer, Cyclical | | | | | | | 6,797,950 | |
| | | | | | | | | |
Basic Materials - 0.2% | |
Kaiser Aluminum Corp. | | | | | | | | |
8.25% due 06/01/20 | | | 1,300,000 | | | | 1,351,999 | |
TPC Group, Inc. | | | | | | | | |
8.75% due 12/15/204 | | | 1,455,000 | | | | 1,018,500 | |
Unifrax I LLC / Unifrax Holding Co. | | | | | | | | |
7.50% due 02/15/199 | | | 665,000 | | | | 410,638 | |
Mirabela Nickel Ltd. | | | | | | | | |
9.50% due 06/24/19†††,8 | | | 1,221,786 | | | | 317,664 | |
1.00% due 09/10/44†††,8 | | | 25,570 | | | | — | |
Eldorado Gold Corp. | | | | | | | | |
6.13% due 12/15/204 | | | 265,000 | | | | 241,813 | |
Total Basic Materials | | | | | | | 3,340,614 | |
| | | | | | | | | |
Diversified - 0.0% | |
HRG Group, Inc. | | | | | | | | |
7.88% due 07/15/19 | | | 490,000 | | | | 516,754 | |
Total Corporate Bonds | | | | | | | | |
(Cost $169,115,074) | | | | | | | 145,438,453 | |
| | | | | | | | | |
COLLATERALIZED MORTGAGE OBLIGATIONS†† - 6.9% | |
Residential Mortgage-Backed Securities - 6.4% | |
LSTAR Securities Investment Trust | | | | | | | | |
2015-4 A1, 2.44% due 04/01/204,5 | | | 11,696,631 | | | | 11,345,731 | |
2014-1 NOTE, 3.53% due 09/01/214,5 | | | 7,534,636 | | | | 7,459,290 | |
2015-5 A1, 2.44% due 04/01/204,5 | | | 6,313,671 | | | | 6,171,999 | |
2015-10 A1, 2.44% due 11/01/204,5 | | | 4,706,941 | | | | 4,589,267 | |
2015-1 A, 2.43% due 01/01/204,5 | | | 4,509,854 | | | | 4,419,495 | |
Lehman XS Trust Series | | | | | | | | |
2007-15N 2A1, 0.69% due 08/25/375 | | | 6,475,812 | | | | 4,913,588 | |
2005-9N 1A1, 0.70% due 02/25/365 | | | 3,556,791 | | | | 2,780,571 | |
2006-16N A4A, 0.62% due 11/25/465 | | | 3,518,565 | | | | 2,711,133 | |
RALI Series Trust | | | | | | | | |
2006-QO2 A1, 0.65% due 02/25/465 | | | 9,603,481 | | | | 3,877,476 | |
2007-QO4 A1A, 0.62% due 05/25/475 | | | 4,001,231 | | | | 3,088,697 | |
2006-QO10 A1, 0.59% due 01/25/375 | | | 3,947,293 | | | | 2,856,685 | |
Home Equity Asset Trust | | | | | | | | |
2005-9 M1, 0.84% due 04/25/365 | | | 10,000,000 | | | | 8,018,442 | |
Banc of America Funding Ltd. | | | | | | | | |
2013-R1 A5, 0.65% due 11/03/414,5 | | | 8,606,570 | | | | 7,964,124 | |
GSAA Home Equity Trust | | | | | | | | |
2006-14 A2, 0.60% due 09/25/365 | | | 12,899,219 | | | | 6,369,398 | |
2007-7 A4, 0.70% due 07/25/375 | | | 1,077,981 | | | | 925,634 | |
GreenPoint Mortgage Funding Trust | | | | | | | | |
2005-HE4 M1, 0.90% due 07/25/305 | | | 3,784,165 | | | | 3,654,203 | |
2006-AR1 A1A, 0.72% due 02/25/365 | | | 2,718,298 | | | | 2,093,525 | |
American Home Mortgage Investment Trust | | | | | | | | |
2006-1 12A1, 0.83% due 03/25/465 | | | 6,761,950 | | | | 5,379,045 | |
IndyMac INDX Mortgage Loan Trust | | | | | | | | |
2006-AR4 A1A, 0.64% due 05/25/465 | | | 6,404,354 | | | | 5,075,691 | |
20 | THE GUGGENHEIM FUNDS SEMI-ANNUAL REPORT | SEE NOTES TO FINANCIAL STATEMENTS. |
SCHEDULE OF INVESTMENTS (Unaudited)(continued) | March 31, 2016 |
FLOATING RATE STRATEGIES FUND | |
| | | Face
Amount7 | | | Value | |
| | | | | | | |
Structured Asset Securities Corporation Mortgage Loan Trust | | | | | | |
2006-OPT1 A5, 0.69% due 04/25/365 | | $ | 4,271,348 | | | $ | 3,984,208 | |
2007-BC1 A4, 0.56% due 02/25/375 | | | 900,000 | | | | 782,002 | |
Banc of America Funding Trust | | | | | | | | |
2015-R4 8A1, 0.61% due 01/27/35†††,4,5 | | | 5,311,601 | | | | 4,760,363 | |
WaMu Mortgage Pass-Through Certificates Series Trust | | | | | | | | |
2007-OA6 1A, 1.13% due 07/25/475 | | | 5,903,724 | | | | 4,680,412 | |
Nomura Resecuritization Trust | | | | | | | | |
2015-4R 5A1, 0.86% due 03/26/364,5 | | | 2,823,750 | | | | 2,509,277 | |
2012-1R A, 0.87% due 08/27/474,5 | | | 2,108,726 | | | | 2,005,771 | |
AJAX Mortgage Loan Trust | | | | | | | | |
2015-A A, 3.88% due 11/25/544 | | | 3,824,472 | | | | 3,781,566 | |
American Home Mortgage Assets Trust | | | | | | | | |
2006-4 1A12, 0.64% due 10/25/465 | | | 5,245,760 | | | | 3,260,706 | |
Washington Mutual Mortgage Pass-Through Certificates WMALT Series Trust | | | | | | | | |
2006-AR9 2A, 1.16% due 11/25/465 | | | 4,247,711 | | | | 2,863,576 | |
Merrill Lynch Alternative Note Asset Trust Series | | | | | | | | |
2007-OAR3 A1, 0.62% due 07/25/375 | | | 2,852,126 | | | | 2,066,052 | |
Wachovia Asset Securitization Issuance II LLC Trust | | | | | | | | |
2007-HE1 A, 0.57% due 07/25/374,5 | | | 2,218,539 | | | | 1,859,444 | |
Morgan Stanley Re-REMIC Trust | | | | | | | | |
2010-R5 4B, 0.93% due 06/26/364,5 | | | 1,216,936 | | | | 881,726 | |
Bear Stearns Mortgage Funding Trust | | | | | | | | |
2007-AR5 1A1A, 0.60% due 06/25/475 | | | 864,700 | | | | 650,119 | |
Alliance Bancorp Trust | | | | | | | | |
2007-OA1 A1, 0.67% due 07/25/375 | | | 851,410 | | | | 527,839 | |
New Century Home Equity Loan Trust | | | | | | | | |
2004-4 M2, 1.23% due 02/25/355 | | | 417,310 | | | | 326,545 | |
Total Residential Mortgage- Backed Securities | | | | 128,633,600 | |
| | | | | | | | | |
Commercial Mortgage-Backed Securities - 0.5% | |
GS Mortgage Securities Corporation Trust | | | | | | | | |
2016-ICE2 E, 8.94% due 02/15/334,5 | | | 10,000,000 | | | | 10,003,137 | |
Total Collateralized Mortgage Obligations | |
(Cost $142,939,201) | | | | | | | 138,636,737 | |
| | | | | | | | | |
ASSET-BACKED SECURITIES†† - 4.7% | |
Collateralized Loan Obligations - 3.2% | |
PFP Ltd. | | | | | | | | |
2015-2 B, 3.14% due 07/14/344,5 | | | 5,000,000 | | | | 4,951,136 | |
OHA Credit Partners IX Ltd. | | | | | | | | |
2013-9A ACOM, due 10/20/254,6 | | | 6,000,000 | | | | 4,907,160 | |
Golub Capital Partners Clo 24M Ltd. | | | | | | | | |
2015-24A C, 4.37% due 02/05/274,5 | | | 3,750,000 | | | | 3,562,378 | |
SEE NOTES TO FINANCIAL STATEMENTS. | THE GUGGENHEIM FUNDS SEMI-ANNUAL REPORT | 21 |
SCHEDULE OF INVESTMENTS (Unaudited)(continued) | March 31, 2016 |
FLOATING RATE STRATEGIES FUND | |
| | | Face
Amount7 | | | Value | |
| | | | | | | |
ACIS CLO Ltd. | | | | | | |
2013-2A, 4.47% due 10/14/224,5 | | $ | 1,800,000 | | | $ | 1,709,752 | |
2015-6A C, 3.99% due 05/01/274,5 | | | 1,000,000 | | | | 993,754 | |
2013-1A D, 5.12% due 04/18/244,5 | | | 1,000,000 | | | | 844,483 | |
Fortress Credit Funding V, LP | | | | | | | | |
2015-5AR BR, 4.27% due 08/15/224,5 | | | 3,500,000 | | | | 3,434,379 | |
Avery | | | | | | | | |
2013-3X COM, due 01/18/256 | | | 4,300,020 | | | | 3,373,009 | |
Fortress Credit Opportunities VI CLO Ltd. | | | | | | | | |
2015-6A C, 4.29% due 10/10/264,5 | | | 3,500,000 | | | | 3,305,194 | |
Newstar Commercial Loan Funding LLC | | | | | | | | |
2013-1A D, 5.17% due 09/20/234,5 | | | 2,750,000 | | | | 2,541,898 | |
2013-1A E, 5.92% due 09/20/234,5 | | | 250,000 | | | | 237,829 | |
2014-1A D, 5.37% due 04/20/254,5 | | | 250,000 | | | | 230,212 | |
Treman Park CLO Ltd. | | | | | | | | |
2015-1A COM, due 04/20/274,6 | | | 3,000,000 | | | | 2,719,415 | |
Halcyon Loan Advisors Funding Ltd. | | | | | | | | |
2012-1A B, 3.62% due 08/15/234,5 | | | 2,600,000 | | | | 2,514,703 | |
ALM XIV Ltd. | | | | | | | | |
2014-14A C, 4.07% due 07/28/264,5 | | | 2,650,000 | | | | 2,319,580 | |
Fortress Credit Opportunities V CLO Ltd. | | | | | | | | |
2014-5A D, 5.12% due 10/15/264,5 | | | 2,500,000 | | | | 2,209,932 | |
Shackleton I CLO Ltd. | | | | | | | | |
2012-1A C, 3.92% due 08/14/234,5 | | | 2,000,000 | | | | 1,959,573 | |
Duane Street CLO IV Ltd. | | | | | | | | |
2007-4A D, 2.87% due 11/14/214,5 | | | 2,000,000 | | | | 1,812,959 | |
Galaxy XVI CLO Ltd. | | | | | | | | |
2013-16A D, 3.97% due 11/16/254,5 | | | 2,000,000 | | | | 1,675,166 | |
DIVCORE CLO Ltd. | | | | | | | | |
2013-1A B, 4.33% due 11/15/324,5 | | | 1,600,000 | | | | 1,575,483 | |
CIFC Funding Ltd. | | | | | | | | |
2014-1A E, 5.12% due 04/18/254,5 | | | 2,000,000 | | | | 1,490,000 | |
MCF CLO I LLC | | | | | | | | |
2013-1A, 4.17% due 04/20/234,5 | | | 1,500,000 | | | | 1,457,062 | |
Dryden XXVIII Senior Loan Fund | | | | | | | | |
2013-28A A3L, 3.32% due 08/15/254,5 | | | 1,500,000 | | | | 1,450,682 | |
Grayson CLO Ltd. | | | | | | | | |
2006-1A A2, 1.03% due 11/01/214,5 | | | 1,200,000 | | | | 1,077,542 | |
Cerberus Onshore II CLO LLC | | | | | | | | |
2014-1A D, 4.62% due 10/15/234,5 | | | 600,000 | | | | 555,221 | |
2014-1A C, 4.12% due 10/15/234,5 | | | 500,000 | | | | 496,875 | |
Venture XI CLO Ltd. | | | | | | | | |
2015-11AR CR, 3.57% due 11/14/224,5 | | | 1,000,000 | | | | 973,085 | |
Gramercy Park CLO Ltd. | | | | | | | | |
2014-1AR CR, 4.67% due 07/17/234,5 | | | 1,000,000 | | | | 940,372 | |
Telos CLO Ltd. | | | | | | | | |
2013-3A D, 4.87% due 01/17/244,5 | | | 1,050,000 | | | | 920,953 | |
NewStar Commercial Loan Trust | | | | | | | | |
2007-1A C, 1.94% due 09/30/224,5 | | | 500,000 | | | | 462,088 | |
2007-1A D, 2.94% due 09/30/224,5 | | | 500,000 | | | | 447,922 | |
22 | THE GUGGENHEIM FUNDS SEMI-ANNUAL REPORT | SEE NOTES TO FINANCIAL STATEMENTS. |
SCHEDULE OF INVESTMENTS (Unaudited)(continued) | March 31, 2016 |
FLOATING RATE STRATEGIES FUND | |
| | | Face
Amount7 | | | Value | |
| | | | | | | |
COA Summit CLO Limited | | | | | | |
2014-1A C, 4.47% due 04/20/234,5 | | $ | 1,000,000 | | | $ | 890,150 | |
Garrison Funding Ltd. | | | | | | | | |
2013-2A B, 5.27% due 09/25/234,5 | | | 750,000 | | | | 736,911 | |
Westchester CLO Ltd. | | | | | | | | |
2007-1A A1B, 0.96% due 08/01/224,5 | | | 750,000 | | | | 711,133 | |
Shackleton II CLO Ltd. | | | | | | | | |
2012-2A D, 4.67% due 10/20/234,5 | | | 750,000 | | | | 694,726 | |
KKR Financial CLO Ltd. | | | | | | | | |
5.61% due 05/15/21 | | | 650,000 | | | | 647,468 | |
Ares XXVI CLO Ltd. | | | | | | | | |
2013-26A SUB, due 04/15/254,6 | | | 1,250,000 | | | | 593,915 | |
NewStar Arlington Senior Loan Program LLC | | | | | | | | |
2014-1A C1, 3.92% due 07/25/254,5 | | | 600,000 | | | | 566,802 | |
Kingsland III Ltd. | | | | | | | | |
2006-3A C1, 2.22% due 08/24/214,5 | | | 500,000 | | | | 473,313 | |
Westwood CDO I Ltd. | | | | | | | | |
2006-1A B, 1.27% due 03/25/214,5 | | | 500,000 | | | | 466,588 | |
Kingsland IV Ltd. | | | | | | | | |
2007-4A D, 2.07% due 04/16/214,5 | | | 500,000 | | | | 437,974 | |
MCF CLO III LLC | | | | | | | | |
2014-3A, 3.42% due 01/20/244,5 | | | 500,000 | | | | 437,924 | |
Eastland CLO Ltd. | | | | | | | | |
2007-1A A3, 1.02% due 05/01/224,5 | | | 350,000 | | | | 330,006 | |
Great Lakes CLO Ltd. | | | | | | | | |
2014-1A D, 4.82% due 04/15/254,5 | | | 250,000 | | | | 225,852 | |
Total Collateralized Loan Obligations | | | | 64,362,559 | |
| | | | | | | | | |
Collateralized Debt Obligations - 1.2% | |
Gramercy Real Estate CDO Ltd. | | | | | | | | |
2007-1A A1, 0.90% due 08/15/564,5 | | | 10,119,665 | | | | 8,905,306 | |
RAIT CRE CDO I Ltd. | | | | | | | | |
2006-1X A1B, 0.75% due 11/20/46 | | | 4,729,840 | | | | 4,401,357 | |
Triaxx Prime CDO Ltd. | | | | | | | | |
2006-2A A1A, 0.70% due 10/02/394,5 | | | 4,109,164 | | | | 3,863,719 | |
N-Star REL CDO VIII Ltd. | | | | | | | | |
2006-8A A2, 0.79% due 02/01/414,5 | | | 3,250,000 | | | | 3,128,177 | |
2006-8A A1, 0.72% due 02/01/414,5 | | | 495,979 | | | | 487,036 | |
N-Star Real Estate CDO IX Ltd. | | | | | | | | |
0.75% due 02/01/418 | | | 1,339,144 | | | | 1,315,064 | |
Putnam Structured Product CDO Ltd. | | | | | | | | |
2002-1A A2, 1.12% due 01/10/384,5 | | | 910,478 | | | | 872,040 | |
Highland Park CDO I Ltd. | | | | | | | | |
2006-1A A1, 0.96% due 11/25/514,5 | | | 646,665 | | | | 611,224 | |
SRERS Funding Ltd. | | | | | | | | |
2011-RS A1B1, 0.69% due 05/09/464,5 | | | 629,445 | | | | 602,188 | |
Total Collateralized Debt Obligations | | | | 24,186,111 | |
| | | | | | | | | |
Transport-Aircraft - 0.3% | |
Castlelake Aircraft Securitization Trust | | | | | | | | |
2014-1 A1, 5.25% due 02/15/294 | | | 3,211,679 | | | | 3,184,379 | |
2014-1 B, 7.50% due 02/15/294 | | | 2,358,319 | | | | 2,326,482 | |
Airplanes Pass Through Trust | | | | | | | | |
2001-1A A9, 0.99% due 03/15/195,9 | | | 1,620,327 | | | | 405,082 | |
Total Transport-Aircraft | | | | | | | 5,915,943 | |
SEE NOTES TO FINANCIAL STATEMENTS. | THE GUGGENHEIM FUNDS SEMI-ANNUAL REPORT | 23 |
SCHEDULE OF INVESTMENTS (Unaudited)(continued) | March 31, 2016 |
FLOATING RATE STRATEGIES FUND | |
| | | Face
Amount7 | | | Value | |
| | | | | | | |
Credit Card - 0.0% | |
Credit Card Pass-Through Trust | | | | | | |
2012-BIZ A, due 12/15/494 | | $ | 126,859 | | | $ | 100,346 | |
Total Asset-Backed Securities | | | | | |
(Cost $97,882,141) | | | | | | | 94,564,959 | |
| | | | | | | | | |
SENIOR FIXED RATE INTERESTS†† - 0.6% | |
Communications - 0.4% | |
Lions Gate Entertainment Corp. | | | | | | | | |
5.00% due 03/17/22 | | | 7,780,000 | | | | 7,566,050 | |
| | | | | | | | | |
Consumer, Cyclical - 0.2% | |
Men’s Wearhouse, Inc. | | | | | | | | |
5.00% due 06/18/21 | | | 4,700,000 | | | | 4,441,500 | |
| | | | | | | | | |
Financial - 0.0% | |
Magic Newco, LLC | | | | | | | | |
12.00% due 06/12/19 | | | 500,000 | | | | 512,815 | |
| | | | | | | | | |
Consumer, Non-cyclical - 0.0% | |
Targus Group International, Inc. | | | | | | | | |
7.50% due 12/31/19††† | | | 53,069 | | | | 77,884 | |
Total Senior Fixed Rate Interests | | | | | |
(Cost $13,044,288) | | | | | | | 12,598,249 | |
| | | | | | | | | |
COMMERCIAL PAPER†† - 7.2% | |
Bayer Corp. | | | | | | | | |
0.76% due 04/25/16 | | | 20,000,000 | | | | 19,989,866 | |
0.63% due 04/05/16 | | | 15,000,000 | | | | 14,998,950 | |
Total Bayer Corp. | | | | | | | 34,988,816 | |
Campbell Soup Co. | | | | | | | | |
0.63% due 04/20/16 | | | 12,000,000 | | | | 11,996,010 | |
0.65% due 04/11/16 | | | 8,600,000 | | | | 8,598,447 | |
Total Campbell Soup Co. | | | | | | | 20,594,457 | |
Ryder System, Inc. | | | | | | | | |
0.65% due 04/05/16 | | | 10,000,000 | | | | 9,999,278 | |
0.67% due 04/05/16 | | | 10,000,000 | | | | 9,999,256 | |
Total Ryder System, Inc. | | | | | | | 19,998,534 | |
Harley-Davidson Financial Services, Inc. | | | | | | | | |
0.57% due 04/07/16 | | | 18,500,000 | | | | 18,498,243 | |
Bemis Company, Inc. | | | | | | | | |
0.65% due 04/11/16 | | | 15,500,000 | | | | 15,497,201 | |
Nissan Motor Acceptance Corp. | | | | | | | | |
0.71% due 04/05/16 | | | 15,000,000 | | | | 14,998,817 | |
Bacardi USA, Inc. | | | | | | | | |
0.71% due 04/20/16 | | | 10,000,000 | | | | 9,996,253 | |
VF Corp. | | | | | | | | |
0.70% due 05/11/16 | | | 10,000,000 | | | | 9,992,222 | |
Total Commercial Paper | | | | | | | | |
(Cost $144,564,543) | | | | | | | 144,564,543 | |
| | | | | | | | | |
Total Investments - 98.7% | | | | | |
(Cost $2,054,210,869) | | | | | | $ | 1,970,879,186 | |
Other Assets & Liabilities, net - 1.3% | | | | 26,116,530 | |
Total Net Assets - 100.0% | | | $ | 1,996,995,716 | |
24 | THE GUGGENHEIM FUNDS SEMI-ANNUAL REPORT | SEE NOTES TO FINANCIAL STATEMENTS. |
SCHEDULE OF INVESTMENTS (Unaudited)(continued) | March 31, 2016 |
FLOATING RATE STRATEGIES FUND | |
FORWARD FOREIGN CURRENCY EXCHANGE CONTRACTS†† | |
Counterparty | | Contracts to Buy (Sell) | | Currency | Settlement
Date | | Settlement
Value | | | Value at March 31,
2016 | | | Net Unrealized Depreciation | |
BNY Mellon | | | (14,620,000 | ) | GBP | 04/11/16 | | $ | 20,727,797 | | | $ | 21,000,191 | | | $ | (272,394 | ) |
BNY Mellon | | | (76,824,000 | ) | EUR | 04/11/16 | | | 84,294,832 | | | | 87,438,424 | | | | (3,143,592 | ) |
| | | | | | | | | | | | | | | | | $ | (3,415,986 | ) |
* | Non-income producing security. |
† | Value determined based on Level 1 inputs — See Note 4. |
†† | Value determined based on Level 2 inputs, unless otherwise noted — See Note 4. |
††† | Value determined based on Level 3 inputs — See Note 4. |
1 | Affiliated issuer — See Note 7. |
2 | Rate indicated is the 7 day yield as of March 31, 2016. |
3 | Security with no rate was unsettled at March 31, 2016. |
4 | Security is a 144A or Section 4(a)(2) security. The total market value of 144A or Section 4(a)(2) securities is $225,386,668 (cost $239,268,837), or 11.3% of total net assets. These securities have been determined to be liquid under guidelines established by the Board of Trustees. |
5 | Variable rate security. Rate indicated is rate effective at March 31, 2016. |
6 | Residual interest. |
7 | The face amount is denominated in U.S. dollars unless otherwise indicated. |
8 | Illiquid security. |
9 | Security is a 144A or Section 4(a)(2) security. These securities are considered illiquid and restricted under guidelines established by the Board of Trustees. The total market value of 144A or Section 4(a)(2) securities is $815,720 (cost $1,941,362), or 0.0% of total net assets — See Note 11. |
| | plc — Public Limited Company |
| | REIT — Real Estate Investment Trust |
| | |
| | See Sector Classification in Other Information Section |
SEE NOTES TO FINANCIAL STATEMENTS. | THE GUGGENHEIM FUNDS SEMI-ANNUAL REPORT | 25 |
SCHEDULE OF INVESTMENTS (Unaudited)(concluded) | March 31, 2016 |
FLOATING RATE STRATEGIES FUND | |
The following table summarizes the inputs used to value the Fund’s investments at March 31, 2016 (See Note 4 in the Notes to Financial Statements):
Investments in Securities (Assets) | | Level 1 | | | Level 1 - Other* | | | Level 2 | | | Level 2 - Other* | | | Level 3 | | | Total | |
Asset-Backed Securities | | $ | — | | | $ | — | | | $ | 94,564,959 | | | $ | — | | | $ | — | | | $ | 94,564,959 | |
Collateralized Mortgage Obligations | | | — | | | | — | | | | 133,876,374 | | | | — | | | | 4,760,363 | | | | 138,636,737 | |
Commercial Paper | | | — | | | | — | | | | 144,564,543 | | | | — | | | | — | | | | 144,564,543 | |
Common Stocks | | | — | | | | — | | | | — | | | | — | | | | 20,539 | | | | 20,539 | |
Corporate Bonds | | | — | | | | — | | | | 145,120,789 | | | | — | | | | 317,664 | | | | 145,438,453 | |
Mutual Funds | | | 25,114,985 | | | | — | | | | — | | | | — | | | | — | | | | 25,114,985 | |
Senior Fixed Rate Interests | | | — | | | | — | | | | 12,520,365 | | | | — | | | | 77,884 | | | | 12,598,249 | |
Senior Floating Rate Interests | | | — | | | | — | | | | 1,291,830,598 | | | | — | | | | 45,964,677 | | | | 1,337,795,275 | |
Short Term Investments | | | 72,145,446 | | | | — | | | | — | | | | — | | | | — | | | | 72,145,446 | |
Total | | $ | 97,260,431 | | | $ | — | | | $ | 1,822,477,628 | | | $ | — | | | $ | 51,141,127 | | | $ | 1,970,879,186 | |
Investments in Securities (Liabilities) | | Level 1 | | | Level 1 - Other* | | | Level 2 | | | Level 2 - Other* | | | Level 3 | | | Total | |
Currency Contracts | | $ | — | | | $ | — | | | $ | — | | | $ | 3,415,986 | | | $ | — | | | $ | 3,415,986 | |
* | Other financial instruments include futures contracts and/or swaps, which are reported as unrealized gain/loss at period end. |
Transfers between investment levels may occur as the markets fluctuate and/or the availability of data used in the investment’s valuation changes. The Fund recognizes transfers between the levels as of the beginning of the period. As of March 31, 2016, the Fund had securities with a total value of $141,046 transfer into Level 3 from Level 2 due to changes in the securities valuation method. There were no other securities that transferred between levels.
26 | THE GUGGENHEIM FUNDS SEMI-ANNUAL REPORT | SEE NOTES TO FINANCIAL STATEMENTS. |
STATEMENT OF ASSETS AND LIABILITIES (Unaudited) |
FLOATING RATE STRATEGIES FUND |
March 31, 2016
Assets: | |
Investments in unaffiliated issuers, at value (cost $2,028,991,004) | | $ | 1,945,764,201 | |
Investments in affiliated issuers, at value (cost $25,219,865) | | | 25,114,985 | |
Total investments (cost $2,054,210,869) | | | 1,970,879,186 | |
Foreign currency, at value (cost $247,679) | | | 247,679 | |
Prepaid expenses | | | 194,111 | |
Cash | | | 5,188 | |
Receivables: | |
Fund shares sold | | | 22,624,088 | |
Securities sold | | | 15,636,889 | |
Interest | | | 10,722,519 | |
Foreign taxes reclaim | | | 58,984 | |
Dividends | | | 36,591 | |
Total assets | | | 2,020,405,235 | |
| | | | | |
Liabilities: | |
Unrealized depreciation on forward foreign currency exchange contracts | | | 3,415,986 | |
Unfunded loan commitments, at value (Note 8) (proceeds $4,596,781) | | | 2,729,629 | |
Payable for: | |
Securities purchased | | | 8,932,609 | |
Fund shares redeemed | | | 5,800,791 | |
Distributions to Shareholders | | | 1,193,211 | |
Management fees | | | 892,142 | |
Distribution and service fees | | | 246,473 | |
Fund accounting/administration fees | | | 156,381 | |
Trustees’ fees* | | | 12,425 | |
Miscellaneous | | | 29,872 | |
Total liabilities | | | 23,409,519 | |
Net assets | | $ | 1,996,995,716 | |
| | | | | |
Net assets consist of: | |
Paid in capital | | $ | 2,087,981,246 | |
Accumulated net investment loss | | | (1,574,180 | ) |
Accumulated net realized loss on investments | | | (4,555,914 | ) |
Net unrealized depreciation on investments | | | (84,855,436 | ) |
Net assets | | $ | 1,996,995,716 | |
| | | | | |
A-Class: | |
Net assets | | $ | 408,673,646 | |
Capital shares outstanding | | | 16,175,072 | |
Net asset value per share | | $ | 25.27 | |
Maximum offering price per share (Net asset value divided by 97.00%) | | $ | 26.05 | |
| | | | | |
C-Class: | |
Net assets | | $ | 175,383,784 | |
Capital shares outstanding | | | 6,944,737 | |
Net asset value per share | | $ | 25.25 | |
| | | | | |
P-Class: | |
Net assets | | $ | 80,188,719 | |
Capital shares outstanding | | | 3,172,513 | |
Net asset value per share | | $ | 25.28 | |
| | | | | |
Institutional Class: | |
Net assets | | $ | 1,332,749,567 | |
Capital shares outstanding | | | 52,706,455 | |
Net asset value per share | | $ | 25.29 | |
* | Relates to Trustees not deemed “interested persons” within the meaning of Section 2(a)(19) of the 1940 Act. |
SEE NOTES TO FINANCIAL STATEMENTS. | THE GUGGENHEIM FUNDS SEMI-ANNUAL REPORT | 27 |
STATEMENT OF OPERATIONS (Unaudited) |
FLOATING RATE STRATEGIES FUND |
Period Ended March 31, 2016
Investment Income: | |
Interest | | $ | 47,701,560 | |
Dividends from securities of affiliated issuers | | | 194,102 | |
Dividends from securities of unaffiliated issuers | | | 8,392 | |
Total investment income | | | 47,904,054 | |
| | | | | |
Expenses: | |
Management fees | | | 6,356,462 | |
Transfer agent/maintenance fees: | |
A-Class | | | 249,736 | |
C-Class | | | 106,673 | |
P-Class | | | 1,360 | |
Institutional Class | | | 272,678 | |
Distribution and service fees: | |
A-Class | | | 493,186 | |
C-Class | | | 820,154 | |
P-Class | | | 72,162 | |
Fund accounting/administration fees | | | 929,009 | |
Line of credit fees | | | 114,457 | |
Trustees’ fees* | | | 56,842 | |
Custodian fees | | | 19,471 | |
Tax expense | | | 95 | |
Miscellaneous | | | 435,505 | |
Total expenses | | | 9,927,790 | |
Less: | |
Expenses waived by Adviser | | | (829,499 | ) |
Net expenses | | | 9,098,291 | |
Net investment income | | | 38,805,763 | |
| | | | | |
Net Realized and Unrealized Gain (Loss): | |
Net realized gain (loss) on: | |
Investments in unaffiliated issuers | | $ | (7,524,184 | ) |
Investments in affiliated issuers | | | (25,744 | ) |
Foreign currency | | | 513,969 | |
Forward currency exchange contracts | | | 2,264,698 | |
Net realized loss | | | (4,771,261 | ) |
Net change in unrealized appreciation (depreciation) on: | |
Investments in unaffiliated issuers | | | (34,465,024 | ) |
Investments in affiliated issuers | | | (76,745 | ) |
Foreign currency | | | (2,132 | ) |
Forward foreign currency exchange contracts | | | (3,009,502 | ) |
Net change in unrealized appreciation (depreciation) | | | (37,553,403 | ) |
Net realized and unrealized loss | | | (42,324,664 | ) |
Net decrease in net assets resulting from operations | | $ | (3,518,901 | ) |
* | Relates to Trustees not deemed “interested persons” within the meaning of Section 2(a)(19) of the 1940 Act. |
28 | THE GUGGENHEIM FUNDS SEMI-ANNUAL REPORT | SEE NOTES TO FINANCIAL STATEMENTS. |
STATEMENTS OF CHANGES IN NET ASSETS |
FLOATING RATE STRATEGIES FUND | |
| | | Period Ended
March 31,
2016
(Unaudited) | | | Year Ended
September 30,
2015 | |
Increase (Decrease) in Net Assets from Operations: | | | | | | |
Net investment income | | $ | 38,805,763 | | | $ | 57,257,242 | |
Net realized gain (loss) on investments | | | (4,771,261 | ) | | | 12,472,163 | |
Net change in unrealized appreciation (depreciation) on investments | | | (37,553,403 | ) | | | (41,312,890 | ) |
Net increase (decrease) in net assets resulting from operations | | | (3,518,901 | ) | | | 28,416,515 | |
| | | | | | | | | |
Distributions to shareholders from: | | | | | | | | |
Net investment income | | | | | | | | |
A-Class | | | (8,931,841 | ) | | | (14,747,792 | ) |
C-Class | | | (3,077,120 | ) | | | (4,776,563 | ) |
P-Class | | | (1,278,495 | ) | | | (100,000 | )* |
Institutional Class | | | (32,094,729 | ) | | | (43,675,370 | ) |
Net realized gains | | | | | | | | |
A-Class | | | — | | | | (968,588 | ) |
C-Class | | | — | | | | (397,766 | ) |
Institutional Class | | | — | | | | (2,326,328 | ) |
Total distributions to shareholders | | | (45,382,185 | ) | | | (66,992,407 | ) |
| | | | | | | | | |
Capital share transactions: | | | | | | | | |
Proceeds from sale of shares | | | | | | | | |
A-Class | | | 179,692,083 | | | | 269,729,701 | |
C-Class | | | 58,400,781 | | | | 61,495,860 | |
P-Class | | | 72,119,391 | | | | 21,013,826 | * |
Institutional Class | | | 737,485,413 | | | | 920,575,822 | |
Distributions reinvested | | | | | | | | |
A-Class | | | 7,789,160 | | | | 12,878,840 | |
C-Class | | | 2,529,350 | | | | 4,256,809 | |
P-Class | | | 1,278,214 | | | | 99,953 | * |
Institutional Class | | | 26,716,669 | | | | 37,311,662 | |
Cost of shares redeemed | | | | | | | | |
A-Class | | | (169,426,093 | ) | | | (238,118,241 | ) |
C-Class | | | (27,622,124 | ) | | | (48,812,351 | ) |
P-Class | | | (12,729,071 | ) | | | (368,247 | )* |
Institutional Class | | | (628,303,959 | ) | | | (454,573,514 | ) |
Net increase from capital share transactions | | | 247,929,814 | | | | 585,490,120 | |
Net increase in net assets | | | 199,028,728 | | | | 546,914,228 | |
| | | | | | | | | |
Net assets: | | | | | | | | |
Beginning of period | | | 1,797,966,988 | | | | 1,251,052,760 | |
End of period | | $ | 1,996,995,716 | | | $ | 1,797,966,988 | |
Accumulated net investment loss at end of period | | $ | (1,574,180 | ) | | $ | (5,002,242 | ) |
SEE NOTES TO FINANCIAL STATEMENTS. | THE GUGGENHEIM FUNDS SEMI-ANNUAL REPORT | 29 |
STATEMENTS OF CHANGES IN NET ASSETS (concluded) |
FLOATING RATE STRATEGIES FUND | |
| | | Period Ended
March 31,
2016
(Unaudited) | | | Year Ended
September 30,
2015 | |
Capital share activity: | | | | | | |
Shares sold | | | | | | |
A-Class | | | 7,081,028 | | | | 10,278,287 | |
C-Class | | | 2,301,462 | | | | 2,343,633 | |
P-Class | | | 2,839,503 | | | | 803,544 | * |
Institutional Class | | | 28,973,983 | | | | 35,050,422 | |
Shares issued from reinvestment of distributions | | | | | | | | |
A-Class | | | 307,950 | | | | 491,118 | |
C-Class | | | 100,082 | | | | 162,389 | |
P-Class | | | 50,666 | | | | 3,839 | * |
Institutional Class | | | 1,054,412 | | | | 1,421,995 | |
Shares redeemed | | | | | | | | |
A-Class | | | (6,680,626 | ) | | | (9,071,267 | ) |
C-Class | | | (1,093,467 | ) | | | (1,862,040 | ) |
P-Class | | | (510,946 | ) | | | (14,093 | )* |
Institutional Class | | | (24,864,963 | ) | | | (17,315,843 | ) |
Net increase in shares | | | 9,559,084 | | | | 22,291,984 | |
* | Since the commencement of operations: May 1, 2015. |
30 | THE GUGGENHEIM FUNDS SEMI-ANNUAL REPORT | SEE NOTES TO FINANCIAL STATEMENTS. |
FINANCIAL HIGHLIGHTS |
FLOATING RATE STRATEGIES FUND | |
This table is presented to show selected data for a share outstanding throughout each period and to assist shareholders in evaluating a Fund’s performance for the periods presented.
A-Class | | Period Ended
March 31,
2016a | | | Year Ended
Sept. 30,
2015 | | | Year Ended
Sept. 30,
2014 | | | Year Ended
Sept. 30,
2013 | | | Period Ended
Sept. 30,
2012b | |
Per Share Data | | | | | | | | | | | | | | | |
Net asset value, beginning of period | | $ | 25.88 | | | $ | 26.52 | | | $ | 26.62 | | | $ | 26.10 | | | $ | 25.00 | |
Income (loss) from investment operations: | |
Net investment income (loss)c | | | .49 | | | | 1.04 | | | | 1.10 | | | | 1.30 | | | | 1.09 | |
Net gain (loss) on investments (realized and unrealized) | | | (.53 | ) | | | (.42 | ) | | | .05 | | | | .65 | | | | .97 | |
Total from investment operations | | | (.04 | ) | | | .62 | | | | 1.15 | | | | 1.95 | | | | 2.06 | |
Less distributions from: | |
Net investment income | | | (.57 | ) | | | (1.18 | ) | | | (1.20 | ) | | | (1.37 | ) | | | (.96 | ) |
Net realized gains | | | — | | | | (.08 | ) | | | (.05 | ) | | | (.06 | ) | | | — | |
Total distributions | | | (.57 | ) | | | (1.26 | ) | | | (1.25 | ) | | | (1.43 | ) | | | (.96 | ) |
Net asset value, end of period | | $ | 25.27 | | | $ | 25.88 | | | $ | 26.52 | | | $ | 26.62 | | | $ | 26.10 | |
| | |
Total Returng | | | (0.12 | %) | | | 2.36 | % | | | 4.42 | % | | | 7.61 | % | | | 8.37 | % |
Ratios/Supplemental Data | |
Net assets, end of period (in thousands) | | $ | 408,674 | | | $ | 400,270 | | | $ | 365,207 | | | $ | 378,324 | | | $ | 44,175 | |
Ratios to average net assets: | |
Net investment income (loss) | | | 3.88 | % | | | 3.97 | % | | | 4.10 | % | | | 4.90 | % | | | 5.13 | % |
Total expensesd | | | 1.19 | % | | | 1.19 | % | | | 1.18 | % | | | 1.19 | % | | | 1.39 | % |
Net expensese,h | | | 1.03 | % | | | 1.03 | % | | | 1.04 | % | | | 1.05 | % | | | 1.06 | % |
Portfolio turnover rate | | | 20 | % | | | 44 | % | | | 58 | % | | | 50 | % | | | 61 | % |
SEE NOTES TO FINANCIAL STATEMENTS. | THE GUGGENHEIM FUNDS SEMI-ANNUAL REPORT | 31 |
FINANCIAL HIGHLIGHTS (continued) |
FLOATING RATE STRATEGIES FUND | |
This table is presented to show selected data for a share outstanding throughout each period and to assist shareholders in evaluating a Fund’s performance for the periods presented.
C-Class | | Period Ended
March 31,
2016a | | | Year Ended
Sept. 30,
2015 | | | Year Ended
Sept. 30,
2014 | | | Year Ended
Sept. 30,
2013 | | | Period Ended
Sept. 30,
2012b | |
Per Share Data | | | | | | | | | | | | | | | |
Net asset value, beginning of period | | $ | 25.87 | | | $ | 26.51 | | | $ | 26.60 | | | $ | 26.09 | | | $ | 25.00 | |
Income (loss) from investment operations: | |
Net investment income (loss)c | | | .40 | | | | .85 | | | | .90 | | | | 1.11 | | | | .93 | |
Net gain (loss) on investments (realized and unrealized) | | | (.54 | ) | | | (.43 | ) | | | .06 | | | | .63 | | | | .98 | |
Total from investment operations | | | (.14 | ) | | | .42 | | | | .96 | | | | 1.74 | | | | 1.91 | |
Less distributions from: | |
Net investment income | | | (.48 | ) | | | (.98 | ) | | | (1.00 | ) | | | (1.17 | ) | | | (.82 | ) |
Net realized gains | | | — | | | | (.08 | ) | | | (.05 | ) | | | (.06 | ) | | | — | |
Total distributions | | | (.48 | ) | | | (1.06 | ) | | | (1.05 | ) | | | (1.23 | ) | | | (.82 | ) |
Net asset value, end of period | | $ | 25.25 | | | $ | 25.87 | | | $ | 26.51 | | | $ | 26.60 | | | $ | 26.09 | |
| | |
Total Returng | | | (0.54 | %) | | | 1.63 | % | | | 3.64 | % | | | 6.77 | % | | | 7.72 | % |
Ratios/Supplemental Data | |
Net assets, end of period (in thousands) | | $ | 175,384 | | | $ | 145,808 | | | $ | 132,370 | | | $ | 120,606 | | | $ | 24,358 | |
Ratios to average net assets: | |
Net investment income (loss) | | | 3.13 | % | | | 3.23 | % | | | 3.35 | % | | | 4.19 | % | | | 4.36 | % |
Total expensesd | | | 1.94 | % | | | 1.91 | % | | | 1.89 | % | | | 1.93 | % | | | 2.06 | % |
Net expensese,h | | | 1.78 | % | | | 1.78 | % | | | 1.79 | % | | | 1.81 | % | | | 1.80 | % |
Portfolio turnover rate | | | 20 | % | | | 44 | % | | | 58 | % | | | 50 | % | | | 61 | % |
32 | THE GUGGENHEIM FUNDS SEMI-ANNUAL REPORT | SEE NOTES TO FINANCIAL STATEMENTS. |
FINANCIAL HIGHLIGHTS (continued) |
FLOATING RATE STRATEGIES FUND |
This table is presented to show selected data for a share outstanding throughout each period and to assist shareholders in evaluating a Fund’s performance for the periods presented.
P-Class | | Period Ended
March 31,
2016a | | | Period Ended
Sept. 30,
2015f | |
Per Share Data | | | | | | |
Net asset value, beginning of period | | $ | 25.89 | | | $ | 26.37 | |
Income (loss) from investment operations: | |
Net investment income (loss)c | | | .49 | | | | .40 | |
Net gain (loss) on investments (realized and unrealized) | | | (.53 | ) | | | (.46 | ) |
Total from investment operations | | | (.04 | ) | | | (.06 | ) |
Less distributions from: | |
Net investment income | | | (.57 | ) | | | (.42 | ) |
Total distributions | | | (.57 | ) | | | (.42 | ) |
Net asset value, end of period | | $ | 25.28 | | | $ | 25.89 | |
| | |
Total Returng | | | (0.13 | %) | | | (0.24 | %) |
Ratios/Supplemental Data | |
Net assets, end of period (in thousands) | | $ | 80,189 | | | $ | 20,536 | |
Ratios to average net assets: | |
Net investment income (loss) | | | 3.90 | % | | | 3.68 | % |
Total expensesd | | | 1.06 | % | | | 1.04 | % |
Net expensese,h | | | 1.03 | % | | | 1.02 | % |
Portfolio turnover rate | | | 20 | % | | | 44 | % |
SEE NOTES TO FINANCIAL STATEMENTS. | THE GUGGENHEIM FUNDS SEMI-ANNUAL REPORT | 33 |
FINANCIAL HIGHLIGHTS (continued) |
FLOATING RATE STRATEGIES FUND |
This table is presented to show selected data for a share outstanding throughout each period and to assist shareholders in evaluating a Fund’s performance for the periods presented.
Institutional Class | | Period Ended
March 31,
2016a | | | Year Ended
Sept. 30,
2015 | | | Year Ended
Sept. 30,
2014 | | | Year Ended
Sept. 30,
2013 | | | Period Ended
Sept. 30,
2012b | |
Per Share Data | | | | | | | | | | | | | | | |
Net asset value, beginning of period | | $ | 25.90 | | | $ | 26.54 | | | $ | 26.64 | | | $ | 26.12 | | | $ | 25.00 | |
Income (loss) from investment operations: | |
Net investment income (loss)c | | | .52 | | | | 1.10 | | | | 1.16 | | | | 1.36 | | | | 1.10 | |
Net gain (loss) on investments (realized and unrealized) | | | (.53 | ) | | | (.42 | ) | | | .06 | | | | .65 | | | | 1.02 | |
Total from investment operations | | | (.01 | ) | | | .68 | | | | 1.22 | | | | 2.01 | | | | 2.12 | |
Less distributions from: | |
Net investment income | | | (.60 | ) | | | (1.24 | ) | | | (1.27 | ) | | | (1.43 | ) | | | (1.00 | ) |
Net realized gains | | | — | | | | (.08 | ) | | | (.05 | ) | | | (.06 | ) | | | — | |
Total distributions | | | (.60 | ) | | | (1.32 | ) | | | (1.32 | ) | | | (1.49 | ) | | | (1.00 | ) |
Net asset value, end of period | | $ | 25.29 | | | $ | 25.90 | | | $ | 26.54 | | | $ | 26.64 | | | $ | 26.12 | |
| | |
Total Returng | | | 0.00 | % | | | 2.59 | % | | | 4.67 | % | | | 7.86 | % | | | 8.59 | % |
Ratios/Supplemental Data | |
Net assets, end of period (in thousands) | | $ | 1,332,750 | | | $ | 1,231,352 | | | $ | 753,476 | | | $ | 457,813 | | | $ | 72,197 | |
Ratios to average net assets: | |
Net investment income (loss) | | | 4.11 | % | | | 4.18 | % | | | 4.32 | % | | | 5.12 | % | | | 5.16 | % |
Total expensesd | | | 0.85 | % | | | 0.85 | % | | | 0.87 | % | | | 0.86 | % | | | 0.99 | % |
Net expensese,h | | | 0.79 | % | | | 0.79 | % | | | 0.80 | % | | | 0.81 | % | | | 0.80 | % |
Portfolio turnover rate | | | 20 | % | | | 44 | % | | | 58 | % | | | 50 | % | | | 61 | % |
34 | THE GUGGENHEIM FUNDS SEMI-ANNUAL REPORT | SEE NOTES TO FINANCIAL STATEMENTS. |
FINANCIAL HIGHLIGHTS (concluded) |
FLOATING RATE STRATEGIES FUND |
a | Unaudited figures for the period ended March 31, 2016. Percentage amounts for the period, except total return and portfolio turnover rate, have been annualized. |
b | Since commencement of operations: November 30, 2011. Percentage amounts for the period, except total return and portfolio turnover rate, have been annualized. |
c | Net investment income (loss) per share was computed using average shares outstanding throughout the period. |
d | Does not include expenses of the underlying funds in which the Fund invests. |
e | Net expense information reflects the expense ratios after expense waivers. |
f | Since commencement of operations: May 1, 2015. Percentage amounts for the period, except total return and portfolio turnover rate, have been annualized. |
g | Total return does not reflect the impact of any applicable sales charges and has not been annualized. |
h | Net expenses may include expenses that are excluded from the expense limitation agreement. Excluding these expenses, the operating ratios for the periods would be: |
| | 03/31/16 | 09/30/15 | 09/30/14 | 09/30/13 | 09/30/12 |
A-Class | 1.02% | 1.02% | 1.02% | 1.03% | 1.01% |
C-Class | 1.77% | 1.77% | 1.77% | 1.78% | 1.76% |
P-Class | 1.02% | 1.01% | N/A | N/A | N/A |
Institutional Class | 0.78% | 0.78% | 0.78% | 0.79% | 0.77% |
SEE NOTES TO FINANCIAL STATEMENTS. | THE GUGGENHEIM FUNDS SEMI-ANNUAL REPORT | 35 |
NOTES TO FINANCIAL STATEMENTS (Unaudited) |
1. Organization and Significant Accounting Policies
Organization
Guggenheim Funds Trust (the “Trust”), a Delaware statutory trust, is registered with the SEC under the Investment Company Act of 1940 (“1940 Act”), as an open-ended investment company of the series type. Each series, in effect, is representing a separate Fund. The Trust is authorized to issue an unlimited number of shares. The Trust accounts for the assets of each Fund separately.
The Trust offers a combination of four separate classes of shares, A-Class shares, C-Class shares, P-Class shares and Institutional Class shares. Sales of shares of each Class are made without a front-end sales charge at the net asset value per share (“NAV”), with the exception of A-Class shares. A-Class shares are sold at the NAV, plus the applicable front-end sales charge. The sales charge varies depending on the amount purchased. A-Class share purchases of $1 million or more are exempt from the front-end sales charge but have a 1% contingent deferred sales charge (“CDSC”), if shares are redeemed within 12 months of purchase. C-Class shares have a 1% CDSC if shares are redeemed within 12 months of purchase. Institutional Class shares are offered primarily for direct investment by institutions such as pension and profit sharing plans, endowments, foundations and corporations. Institutional Class shares have a minimum initial investment of $2 million and a minimum account balance of $1 million. At March 31, 2016, the Trust consisted of nineteen funds (the “Funds”).
This report covers the Floating Rate Strategies Fund (the “Fund”), a non-diversified investment company.
Guggenheim Investments (“GI”) provides advisory services, and Rydex Fund Services, LLC (“RFS”) provides transfer agent, administrative and accounting services to the Trust. Guggenheim Funds Distributors, LLC (“GFD”) acts as principal underwriter for the Trust. GI, RFS and GFD are affiliated entities.
Significant Accounting Policies
The Fund operates as an investment company and accordingly follows the investment company accounting and reporting guidance of the Financial Accounting Standards Board (“FASB”) Accounting Standards Codification Topic 946 Financial Services – Investment Companies.
36 | THE GUGGENHEIM FUNDS SEMI-ANNUAL REPORT | |
NOTES TO FINANCIAL STATEMENTS (Unaudited)(continued) |
The following significant accounting policies are in conformity with U.S. generally accepted accounting principles (“U.S. GAAP”) and are consistently followed by the Trust. This requires management to make estimates and assumptions that affect the reported amount of assets and liabilities and disclosure of contingent assets and liabilities at the date of the financial statements and the reported amounts of revenues and expenses during the reporting period. Actual results could differ from these estimates. All time references are based on Eastern Time.
The NAV of each Class of the Fund is calculated by dividing the market value of the Fund’s securities and other assets, less all liabilities, attributable to the Class by the number of outstanding shares of the Class.
A. The Board of Trustees of the Fund (the “Board”) has adopted policies and procedures for the valuation of the Fund’s investments (the “Valuation Procedures”). Pursuant to the Valuation Procedures, the Board has delegated to a valuation committee, consisting of representatives from Guggenheim’s investment management, fund administration, legal and compliance departments (the “Valuation Committee”), the day-to-day responsibility for implementing the Valuation Procedures, including, under most circumstances, the responsibility for determining the fair value of the Fund’s securities or other assets.
Valuations of the Fund’s securities are supplied primarily by pricing services appointed pursuant to the processes set forth in the Valuation Procedures. The Valuation Committee convenes monthly, or more frequently as needed and will review the valuation of all assets which have been fair valued for reasonableness. The Fund’s officers, through the Valuation Committee and consistent with the monitoring and review responsibilities set forth in the Valuation Procedures, regularly review procedures used by, and valuations provided by, the pricing services.
If the pricing service cannot or does not provide a valuation for a particular investment or such valuation is deemed unreliable, such investment is fair valued by the Valuation Committee.
Equity securities listed on an exchange (New York Stock Exchange (“NYSE”) or American Stock Exchange) are valued at the last quoted sales price as of the close of business on the NYSE, usually 4:00 p.m. on the valuation date. Equity securities listed on the NASDAQ market system are valued at the NASDAQ Official Closing Price on the valuation date, which may not necessarily represent the last sale price. If there has been no sale on such exchange or NASDAQ on a given day, the security is valued at the closing bid price on that day.
| | THE GUGGENHEIM FUNDS SEMI-ANNUAL REPORT | 37 |
NOTES TO FINANCIAL STATEMENTS (Unaudited)(continued) |
Generally, trading in foreign securities markets is substantially completed each day at various times prior to the close of the NYSE. The values of foreign securities are determined as of the close of such foreign markets or the close of the NYSE, if earlier. All investments quoted in foreign currency are valued in U.S. dollars on the basis of the foreign currency exchange rates prevailing at the close of business. Investments in foreign securities may involve risks not present in domestic investments. The Valuation Committee will determine the current value of such foreign securities by taking into consideration certain factors which may include those discussed above, as well as the following factors, among others: the value of the securities traded on other foreign markets, ADR trading, closed-end fund trading, foreign currency exchange activity, and the trading prices of financial products that are tied to foreign securities. In addition, the Board of Trustees has authorized the Valuation Committee and GI to use prices and other information supplied by a third party pricing vendor in valuing foreign securities.
Open-end investment companies (“Mutual Funds”) are valued at their NAV as of the close of business, on the valuation date. Exchange-traded funds (“ETFs”) and closed-end investment companies (“CEFs”) are valued at the last quoted sales price.
Debt securities with a maturity of greater than 60 days at acquisition are valued at prices that reflect broker/dealer supplied valuations or are obtained from independent pricing services, which may consider the trade activity, treasury spreads, yields or price of bonds of comparable quality, coupon, maturity, and type, as well as prices quoted by dealers who make markets in such securities. Short-term debt securities with a maturity of 60 days or less at acquisition are valued at amortized cost, provided such amount approximates market value.
Typically loans are valued using information provided by an independent third party pricing service which uses broker quotes in a non-active market.
Investments for which market quotations are not readily available are fair valued as determined in good faith by GI under the direction of the Board of Trustees using methods established or ratified by the Board of Trustees. Valuations in accordance with these methods are intended to reflect each security’s (or asset’s) “fair value.” Each such determination is based on a consideration of all relevant factors, which are likely to vary from one pricing context to another. Examples of such factors may include, but are not limited to: (i) the type of security, (ii) the initial cost of the security, (iii) the existence of any contractual restrictions on the security’s disposition, (iv) the price and extent of public trading in similar securities of the issuer or of comparable companies, (v) quotations or evaluated prices from
38 | THE GUGGENHEIM FUNDS SEMI-ANNUAL REPORT | |
NOTES TO FINANCIAL STATEMENTS (Unaudited)(continued) |
broker-dealers and/or pricing services, (vi) information obtained from the issuer, analysts, and/or the appropriate stock exchange (for exchange-traded securities), (vii) an analysis of the company’s financial statements, and (viii) an evaluation of the forces that influence the issuer and the market(s) in which the security is purchased and sold (e.g. the existence of pending merger activity, public offerings or tender offers that might affect the value of the security).
B. Senior loans in which the Fund invests generally pay interest rates which are periodically adjusted by reference to a base short-term, floating rate plus a premium. These base lending rates are generally (I) the lending rate offered by one or more major European banks, such as the one-month or three-month London Inter-Bank Offered Rate (LIBOR), (ii) the prime rate offered by one or more major United States banks, or (iii) the bank’s certificate of deposit rate. Senior floating rate interests often require prepayments from excess cash flows or permit the borrower to repay at its election. The rate at which the borrower repays cannot be predicted with accuracy. As a result, the actual remaining maturity may be substantially less than the stated maturities shown. The interest rate indicated is the rate in effect at March 31, 2016.
C. The Fund may purchase and sell interests in securities on a when-issued and delayed delivery basis, with payment and delivery scheduled for a future date. No income accrues to the Fund on such interests or securities in connection with such transactions prior to the date the Fund actually take delivery of such interests or securities. These transactions are subject to market fluctuations and are subject to the risk that the value at delivery may be more or less than the trade date purchase price. Although the Fund will generally purchase these securities with the intention of acquiring such securities, they may sell such securities before the settlement date.
D. Forward foreign currency exchange contracts are valued daily based on the applicable exchange rate of the underlying currency. The change in value of the contract is recorded as unrealized appreciation or depreciation until the forward foreign currency contract is closed. When the forward foreign currency contract is closed, the Fund records a realized gain or loss equal to the difference between the value at the time the contract was opened and the value at the time it was closed.
E. Security transactions are recorded on the trade date for financial reporting purposes. Realized gains and losses from securities transactions are recorded using the identified cost basis. Proceeds from lawsuits related to investment holdings are recorded as realized gains in the Fund. Dividend income is recorded on the ex-dividend date, net of applicable taxes withheld by foreign countries. Taxable non-cash dividends are recorded as dividend income. Interest income, including
| | THE GUGGENHEIM FUNDS SEMI-ANNUAL REPORT | 39 |
NOTES TO FINANCIAL STATEMENTS (Unaudited)(continued) |
amortization of premiums and accretion of discounts, is accrued on a daily basis. Interest income also includes paydown gains and losses on mortgage-backed and asset-backed securities and senior and subordinated loans. Amendment fees are earned as compensation for evaluating and accepting changes to the original loan agreement and are recognized when received. Dividend income from REITs is recorded based on the income included in the distributions received from the REIT investments using published REIT classifications, including some management estimates when actual amounts are not available. Distributions received in excess of this estimated amount are recorded as a reduction of the cost of investments or reclassified to capital gains. The actual amounts of income, return of capital, and capital gains are only determined by each REIT after its fiscal year-end, and may differ from the estimated amounts.
F. The Fund declares dividends from investment income daily. The Fund pays its shareholders from its net investment income monthly and distributes any net capital gains that it has realized, at least annually. Distributions to shareholders are recorded on the ex-dividend date. Dividends are reinvested in additional shares unless shareholders request payment in cash. The character of distributions made during the year from net investment income or net realized gains may differ from their ultimate characterization for federal income tax purposes.
G. Interest and dividend income, most expenses, all realized gains and losses, and all unrealized gains and losses are allocated to the classes based upon the value of the outstanding shares in each Class. Certain costs, such as distribution and service fees are charged directly to specific classes. In addition, certain expenses have been allocated to the individual Funds in the Trust on a pro rata basis upon the respective aggregate net assets of each Fund included in the Trust.
H. Under the fee arrangement with the custodian, the Fund may earn credits based on overnight custody cash balances. These credits are utilized to reduce related custodial expenses. The custodian fees disclosed in the Statement of Operations are before the reduction in expense from the related earnings credits, if any. For the period ended March 31, 2016, there were no earnings credits received.
I. The Fund may leave cash overnight in its cash account with the custodian. Periodically, the Fund may have cash due to the custodian bank as an overdraft balance. A fee is incurred on this overdraft, calculated by multiplying the overdraft by a rate based on the federal funds rate, which was 0.25% at March 31, 2016.
J. Under the Fund’s organizational documents, its Trustees and Officers are indemnified against certain liabilities arising out of the performance of their duties to the Trust. In addition, throughout the normal course of business, the Fund enters into contracts that contain a variety of representations and warranties which
40 | THE GUGGENHEIM FUNDS SEMI-ANNUAL REPORT | |
NOTES TO FINANCIAL STATEMENTS (Unaudited)(continued) |
provide general indemnifications. The Fund’s maximum exposure under these arrangements is unknown, as this would involve future claims that may be made against the Fund and/or its affiliates that have not yet occurred. However, based on experience, the Fund expects the risk of loss to be remote.
K. The accounting records of the Fund are maintained in U.S. dollars. All assets and liabilities initially expressed in foreign currencies are converted into U.S. dollars at prevailing exchange rates. Purchases and sales of investment securities, dividend and interest income, and certain expenses are translated at the rates of exchange prevailing on the respective dates of such transactions. Changes in the relationship of these foreign currencies to the U.S. dollar can significantly affect the value of the investments and earnings of the Funds. Foreign investments may also subject the Fund to foreign government exchange restrictions, expropriation, taxation or other political, social or economic developments, all of which could affect the market and/or credit risk of the investments.
The Fund does not isolate that portion of the results of operations resulting from changes in the foreign exchange rates on investments from the fluctuations arising from changes in the market prices of securities held. Such fluctuations are included with the net realized and unrealized gain or loss on investments.
Reported net realized foreign exchange gains and losses arise from sales of foreign currencies and currency gains or losses realized between the trade and settlement dates on investment transactions. Net unrealized exchange gains and losses arise from changes in the fair values of assets and liabilities other than investments in securities at the fiscal period end, resulting from changes in exchange rates.
2. Financial Instruments and Derivatives
As part of its investment strategy, the Fund utilizes a variety of derivative instruments. These investments involve, to varying degrees, elements of market risk and risks in excess of the amounts recognized in the Statement of Assets and Liabilities. Valuation and accounting treatment of these instruments can be found under Significant Accounting Policies in Note 1 of these Notes to Financial Statements.
Derivatives
Derivatives are instruments whose values depend on, or are derived from, in whole or in part, the value of one or more other assets, such as securities, currencies, commodities or indices. Derivative instruments may be used to increase investment flexibility (including to maintain cash reserves while maintaining exposure to certain other assets), for risk management (hedging) purposes, to facilitate trading, to reduce transaction costs and to pursue higher investment
| | THE GUGGENHEIM FUNDS SEMI-ANNUAL REPORT | 41 |
NOTES TO FINANCIAL STATEMENTS (Unaudited)(continued) |
returns. Derivative instruments may also be used to mitigate certain investment risks, such as foreign currency exchange rate risk, interest rate risk and credit risk. U.S. GAAP requires disclosures to enable investors to better understand how and why a Fund uses derivative instruments, how these derivative instruments are accounted for and their effects on the Fund’s financial position and results of operations.
The Fund may utilize derivatives for the following purposes:
Hedge: an investment made in order to reduce the risk of adverse price movements in a security, by taking an offsetting position to protect against broad market moves.
Forward Foreign Currency Exchange Contracts
A forward foreign currency exchange contract is an agreement between two parties to exchange two designated currencies at a specific time in the future. Certain types of forward foreign currency exchange contracts may be cash settled, in an amount equal to the change in exchange rates during the term of the contract. The contracts can be used to hedge or manage exposure to foreign currency risks with portfolio investments or to gain exposure to foreign currencies.
The market value of a forward foreign currency exchange contract changes with fluctuations in foreign currency exchange rates. Furthermore, the Fund may be exposed to risk if the counterparties cannot meet the contract terms or if the currency value changes unfavorably as compared to the U.S. dollar.
The following table represents the Fund’s use, and volume of forward currency exchange contracts on a quarterly basis:
| | | | Average Settlement | |
Fund | Use | | Purchased | | | Sold | |
Floating Rate Strategies Fund | Hedge | | $ | 95,664,337 | | | $ | 730,313 | |
Derivative Investment Holdings Categorized by Risk Exposure
The following is a summary of the location of derivative investments on the Fund’s Statement of Assets and Liabilities as of March 31, 2016:
Derivative Investment Type | Asset Derivatives | Liability Derivatives |
Currency contracts | — | Unrealized depreciation on forward foreign currency exchange contracts |
42 | THE GUGGENHEIM FUNDS SEMI-ANNUAL REPORT | |
NOTES TO FINANCIAL STATEMENTS (Unaudited)(continued) |
The following table sets forth the fair value of the Fund’s derivative investments categorized by primary risk exposure at March 31, 2016:
Liability Derivative Investments Value | |
Fund | Forward
Foreign Currency
Exchange Contracts | |
Floating Rate Strategies Fund | | $ | 3,415,986 | |
The following is a summary of the location of derivative investments on the Fund’s Statement of Operations for the period ended March 31, 2016:
Derivative Investment Type | Location of Gain (Loss) on Derivatives |
Currency contracts | Net realized gain (loss) on forward foreign currency exchange contracts |
| Net change in unrealized appreciation (depreciation) on forward foreign currency exchange contracts |
The following is a summary of the Fund’s realized gain (loss) and change in unrealized appreciation (depreciation) on derivative investments recognized on the Statement of Operations categorized by primary risk exposure for the period ended March 31, 2016:
Realized Gain(Loss) on Derivative Investments Recognized on the Statement of Operations | |
Fund | Forward
Foreign Currency
Exchange Contracts | |
Floating Rate Strategies Fund | | $ | 2,264,698 | |
Change in Unrealized Appreciation(Depreciation) on Derivative
Investments Recognized on the Statement of Operations | |
Fund | Forward
Foreign Currency
Exchange Contracts | |
Floating Rate Strategies Fund | | $ | (3,009,502 | ) |
In conjunction with the use of derivative instruments, the Fund is required to maintain collateral in various forms. The Fund uses, where appropriate, depending on the financial instrument utilized and the broker involved, margin deposits at the broker, cash and/or securities segregated at the custodian bank, discount notes or the repurchase agreements allocated to the Fund.
| | THE GUGGENHEIM FUNDS SEMI-ANNUAL REPORT | 43 |
NOTES TO FINANCIAL STATEMENTS (Unaudited)(continued) |
The Trust has established counterparty credit guidelines and enters into transactions only with financial institutions of investment grade or better. The Trust monitors the counterparty credit risk.
3. Fees and Other Transactions with Affiliates
Under the terms of an investment advisory contract, the Fund pays GI investment advisory fees calculated at an annualized rate of 0.65% of the average daily net assets of the Fund.
RFS is paid the following for providing transfer agent services to the Fund. Transfer agent fees are assessed to the applicable class of the Fund.
Annual charge per account | $5.00 – $8.00 |
Transaction fee | $0.60 – $1.10 |
Minimum annual charge per Fund† | $25,000 |
Certain out-of-pocket charges | Varies |
† | Not subject to Fund during first twelve months of operations. |
RFS also acts as the administrative agent for the Fund, and as such performs administrative functions and the bookkeeping, accounting and pricing functions for the Fund. For these services, RFS receives 0.095% of the average daily net assets of the Fund. The minimum annual charge for fund accounting/administrative fees is $25,000.
RFS engages external service providers to perform other necessary services for the Trust, such as audit and accounting related services, legal services, custody, printing and mailing, etc., on a pass-through basis. Such expenses are allocated to various Funds within the complex based on relative net assets.
The Fund has adopted Distribution Plans related to the offering of A-Class, C-Class and P-Class shares pursuant to Rule 12b-1 under the 1940 Act. The plans provide for payments at an annual rate of 0.25% of the average daily net assets of the Fund’s A-Class and P-Class shares, and 1.00% of the average daily net assets of the Fund’s C-Class shares.
44 | THE GUGGENHEIM FUNDS SEMI-ANNUAL REPORT | |
NOTES TO FINANCIAL STATEMENTS (Unaudited)(continued) |
The investment advisory contracts for the following Fund provides that the total expenses be limited to a percentage of average net assets for each class of shares, exclusive of brokerage costs, dividends on securities sold short, expenses of other investment companies in which a Fund invests, interest, taxes, litigation, indemnification and extraordinary expenses. The limits are listed below:
| | Limit | Effective
Date | Contract
End Date |
Floating Rate Strategies Fund - A-Class | 1.02% | 11/30/12 | 02/01/17 |
Floating Rate Strategies Fund - C-Class | 1.77% | 11/30/12 | 02/01/17 |
Floating Rate Strategies Fund - P-Class* | 1.02% | 05/01/15 | 02/01/17 |
Floating Rate Strategies Fund - Institutional Class | 0.78% | 11/30/12 | 02/01/17 |
* | Since the commencement of operations: May 1, 2015 |
GI is entitled to reimbursement by the Fund for fees waived or expenses reimbursed during any of the previous 36 months, beginning on the date of the expense limitation agreement, if on any day the estimated operating expenses are less than the indicated percentages. At March 31, 2016, the amount of fees waived or expenses reimbursed that are subject to recoupment are presented in the following table:
Fund | | Expires
2016 | | | Expires
2017 | | | Expires
2018 | | | Expires
2019 | | | Total | |
Floating Rate Strategies Fund | | $ | 288,732 | | | $ | 1,206,044 | | | $ | 1,224,136 | | | $ | 829,499 | | | $ | 3,548,411 | |
For the period ended March 31, 2016, no amounts were recouped by GI.
For the period ended March 31, 2016, GFD retained sales charges of $274,695 relating to sales of A-Class shares of the Trust.
Certain trustees and officers of the Trust are also officers of GI, RFS and GFD.
4. Fair Value Measurement
In accordance with U.S. GAAP, fair value is defined as the price that the Fund would receive to sell an investment or pay to transfer a liability in an orderly transaction with an independent buyer in the principal market, or in the absence of a principal market, the most advantageous market for the investment or liability. U.S. GAAP establishes a three-tier fair value hierarchy based on the types of inputs used to value assets and liabilities and requires corresponding disclosure. The hierarchy and the corresponding inputs are summarized below:
Level 1 — | quoted prices in active markets for identical assets or liabilities. |
| | THE GUGGENHEIM FUNDS SEMI-ANNUAL REPORT | 45 |
NOTES TO FINANCIAL STATEMENTS (Unaudited)(continued) |
Level 2 — | significant other observable inputs (for example quoted prices for securities that are similar based on characteristics such as interest rates, prepayment speeds, credit risk, etc.). |
Level 3 — | significant unobservable inputs based on the best information available under the circumstances, to the extent observable inputs are not available, which may include assumptions. |
The types of inputs available depend on a variety of factors, such as the type of security and the characteristics of the markets in which it trades, if any. Fair valuation determinations that rely on fewer or no observable inputs require greater judgment. Accordingly, fair value determinations for Level 3 securities require the greatest amount of judgment.
Independent pricing services are used to value a majority of the Fund’s investments. When values are not available from a pricing service, they may be computed by the Fund’s investment adviser or an affiliate. In any event, values may be determined using a variety of sources and techniques, including: market prices; broker quotes; and models which derive prices based on inputs such as prices of securities with comparable maturities and characteristics or based on inputs such as anticipated cash flows or collateral, spread over Treasuries, and other information and analysis. A significant portion of the Fund’s assets and liabilities are categorized as Level 2 or Level 3, as indicated in this report.
Indicative quotes from broker-dealers, adjusted for fluctuations in criteria such as credit spreads and interest rates, may be also used to value the Fund’s assets and liabilities, i.e. prices provided by a broker-dealer or other market participant who has not committed to trade at that price. Although indicative quotes are typically received from established market participants, the Fund may not have the transparency to view the underlying inputs which support the market quotations. Significant changes in an indicative quote would generally result in significant changes in the fair value of the security.
Certain fixed income securities are valued by obtaining a monthly indicative quote from a broker-dealer, adjusted for fluctuations in criteria such as credit spreads and interest rates.
The inputs or methodologies used for valuing securities are not necessarily an indication of the risk associated with investing in those securities. The suitability of the techniques and sources employed to determine fair valuation are regularly monitored and subject to change.
46 | THE GUGGENHEIM FUNDS SEMI-ANNUAL REPORT | |
NOTES TO FINANCIAL STATEMENTS (Unaudited)(continued) |
The following is a summary of significant unobservable inputs used in the fair value valuation of assets and liabilities categorizes within Level 3 of the fair value hierarchy.
Fund | Category and
Subcategory | | Ending Balance
at 03/31/16 | | Valuation
Technique | Unobservable
Inputs |
Floating Rate Strategies Fund | Senior Floating Rate Interests | | $ | 39,947,100 | | Monthly Model Priced | Purchase Price |
| | | | | 6,017,577 | | Option Adjusted Spread off the prior month end broker mark over the 3 month LIBOR | Indicative Quote |
| Total Senior Floating Rate Interests | | | 45,964,677 | | | |
Collateralized Mortgage Obligations | | | 4,760,363 | | Option Adjusted Spread off the prior month end broker mark over the 3 month LIBOR | Indicative Quote |
Corporate Bonds | | | 317,664 | | Monthly Model Priced | Average Comparative Yield |
Senior Fixed Rate Interests | | | 77,884 | | Option Adjusted Spread off the prior month end broker mark over the 3 month LIBOR | Indicative Quote |
Common Stocks | | | 20,539 | | Monthly Model Priced | Purchase Price |
* | Average comparative yield used at period end was 29.28% |
Any remaining Level 3 securities held by the Fund and excluded from the table above, were not considered material to the Fund.
Transfers between investment levels may occur as the markets fluctuate and/ or the availability of data used in an investment’s valuation changes. The Fund recognized transfers between the levels as of the beginning of the period. As of March 31, 2016, the Fund had transfers in/out of Level 3 due to changes in securities valuation method. See the table below for changes to and from Level 2 and Level 3. There were no other securities that transferred between levels.
| | THE GUGGENHEIM FUNDS SEMI-ANNUAL REPORT | 47 |
NOTES TO FINANCIAL STATEMENTS (Unaudited)(continued) |
Summary of Fair Value Level 3 Activity
Following is a reconciliation of Level 3 assets for which significant unobservable inputs were used to determine fair value for the period ended March 31, 2016:
LEVEL 3 - Fair value measurement using significant unobservable inputs
| | | Senior
Floating Rate
Interests | | | Collateralized
Mortgage
Obligations | | | Common
Stocks | | | Corporate
Bonds | | | Senior
Fixed Rate
Interests | | | Total | |
Floating Rate Strategies Fund | | | | | | | | | | | | | | | | | | |
Assets: | | | | | | | | | | | | | | | | | | |
Beginning Balance | | $ | 52,904,389 | | | $ | — | | | $ | 334 | | | $ | 1,543,530 | | | $ | 67,103 | | | $ | 54,515,356 | |
Purchases | | | 725,597 | | | | 5,090,358 | | | | 17,820 | | | | 55,403 | | | | 64,645 | | | | 5,953,823 | |
Sales, maturities and paydowns | | | (6,823,922 | ) | | | (315,047 | ) | | | — | | | | (1,026,000 | ) | | | (78,773 | ) | | | (8,243,742 | ) |
Total realized gains or losses included in earnings | | | 112,963 | | | | — | | | | — | | | | (636,812 | ) | | | (62,389 | ) | | | (586,238 | ) |
Total change in unrealized gains or losses included in earnings | | | (1,095,396 | ) | | | (14,948 | ) | | | 2,385 | | | | 381,543 | | | | 87,298 | | | | (639,118 | ) |
Transfers in Level 3 | | | 141,046 | | | | — | | | | — | | | | — | | | | — | | | | 141,046 | |
Transfers out of Level 3 | | | — | | | | — | | | | — | | | | — | | | | — | | | | — | |
Ending Balance | | $ | 45,964,677 | | | $ | 4,760,363 | | | $ | 20,539 | | | $ | 317,664 | | | $ | 77,884 | | | $ | 51,141,127 | |
Net Change in unrealized appreciation (depreciation) for investments in securities still held at March 31, 2016 | | $ | (270,491 | ) | | $ | (74,430 | ) | | $ | 2,385 | | | $ | 362,471 | | | $ | 80,216 | | | $ | 100,151 | |
5. Federal Income Tax Information
The Fund intends to comply with the provisions of Subchapter M of the Internal Revenue Code applicable to regulated investment companies and will distribute substantially all taxable net investment income and capital gains sufficient to relieve the Fund from all, or substantially all, federal income, excise and state income taxes. Therefore, no provision for federal or state income tax is required.
Tax positions taken or expected to be taken in the course of preparing the Fund’s tax returns are evaluated to determine whether the tax positions are “more-likely-than-not” of being sustained by the applicable tax authority. Tax positions not deemed to meet the more-likely-than-not threshold would be recorded as a tax benefit or expense in the current year. Management has analyzed the Fund’s tax positions taken, or to be taken, on Federal income tax returns for all open tax
48 | THE GUGGENHEIM FUNDS SEMI-ANNUAL REPORT | |
NOTES TO FINANCIAL STATEMENTS (Unaudited)(continued) |
years, and has concluded that no provision for income tax is required in the Fund’s financial statements. The Fund’s federal tax returns are subject to examination by the Internal Revenue Service for a period of three years after they are filed.
At March 31, 2016, the cost of securities for Federal income tax purposes, the aggregate gross unrealized gain for all securities for which there was an excess of value over tax cost and the aggregate gross unrealized loss for all securities for which there was an excess of tax cost over value, were as follows:
Fund | | Tax
Cost | | | Tax
Unrealized
Gain | | | Tax
Unrealized
Loss | | | Net
Unrealized
Loss | |
Floating Rate Strategies Fund | | $ | 2,054,210,869 | | | $ | 7,190,811 | | | $ | (90,522,494 | ) | | $ | (83,331,683 | ) |
6. Securities Transactions
For the period ended March 31, 2016, the cost of purchases and proceeds from sales of investment securities, excluding government securities, short-term investments and derivatives, were as follows:
Fund | | Purchases | | | Sales | |
Floating Rate Strategies Fund | | $ | 494,099,693 | | | $ | 350,438,203 | |
The Fund is permitted to purchase or sell securities from or to certain affiliated funds under specified conditions outlined in procedures adopted by the Board of Trustees of the Trust. The procedures have been designed to ensure that any purchase or sale of securities by a Fund from or to another fund or portfolio that is or could be considered an affiliate by virtue of having a common investment adviser (or affiliated investment advisers), common Trustees and/or common officers complies with Rule 17a-7 of the 1940 Act. Further, as defined under these procedures, each transaction is effected at the current market price to save costs, where permissible. For the period ended March 31, 2016, the Fund did not engage in purchases and sales of securities, pursuant to Rule 17a-7 of the 1940 Act.
7. Affiliated Transactions
Investments representing 5% or more of the outstanding voting shares of a portfolio company of a fund, or control of or by, or common control under GI, result in that portfolio company being considered an affiliated company of such fund, as defined in the 1940 Act.
| | THE GUGGENHEIM FUNDS SEMI-ANNUAL REPORT | 49 |
NOTES TO FINANCIAL STATEMENTS (Unaudited)(continued) |
The Fund may invest in the Guggenheim Strategy Funds Trust consisting of Guggenheim Strategy Fund I, Guggenheim Strategy Fund II, Guggenheim Strategy Fund III, and Guggenheim Variable Insurance Strategy Fund III (collectively, the “Cash Management Funds”), open-end management investment companies managed by GI. The Cash Management Funds, which launched on March 11, 2014, are offered as cash management options only to mutual funds, trusts, and other accounts managed by GI and/or its affiliates, and are not available to the public. The Cash Management Funds pay no investment management fees. The Cash Management Funds’ annual report on Form N-CSR dated September 30, 2015 is available publicly or upon request. This information is available from the EDGAR database on the SEC’s website at http://www.sec.gov/Archives/edgar/data/1601445/000089180415000857/gug63224-ncsr.htm.
Transactions during the period ended March 31, 2016, in which the portfolio company is an “affiliated person”, were as follows:
Affiliated
issuers by Fund | | Value
09/30/15 | | | Additions | | | Reductions | | | Value
03/31/16 | | | Shares
03/31/16 | | | Investment
Income | | | Realized
Gain (Loss) | |
Floating Rate Strategies Fund | | | | | | | | | | |
Guggenheim Strategy Fund I | $ | 35,022,618 | | | $ | 140,078 | | | $ | (17,000,000 | ) | | $ | 18,102,182 | | | | 729,632 | | | $ | 139,324 | | | $ | (23,326 | ) |
Guggenheim Strategy Fund II | | — | | | | 10,054,779 | | | | (3,000,000 | ) | | | 7,012,803 | | | | 284,034 | | | | 54,778 | | | | (2,418 | ) |
| | | $ | 35,022,618 | | | $ | 10,194,857 | | | $ | (20,000,000 | ) | | $ | 25,114,985 | | | | | | | $ | 194,102 | | | $ | (25,744 | ) |
8. Loan Commitments
Pursuant to the terms of certain loan agreements, the Fund held unfunded loan commitments as of March 31, 2016. The Fund is obligated to fund these loan commitments at the borrower’s discretion.
50 | THE GUGGENHEIM FUNDS SEMI-ANNUAL REPORT | |
NOTES TO FINANCIAL STATEMENTS (Unaudited)(continued) |
The unfunded loan commitments as of March 31, 2016, were as follows:
Borrower | Maturity
Date | | Face
Amount | | | Value | |
Floating Rate Strategies Fund | | | | | | | |
Advantage Sales & Marketing LLC | 7/25/2019 | | $ | 7,200,000 | | | $ | 615,334 | |
American Stock Transfer & Trust | 6/26/2018 | | | 800,000 | | | | 47,662 | |
Aspect Software, Inc. | 9/30/2016 | | | 613,826 | | | | — | |
Banca Civica (UK) - Chambertin | 8/4/2021 | | | 3,296,500 | | | | 103,173 | |
CEVA Group Plc (United Kingdom) | 3/19/2019 | | | 3,000,000 | | | | 282,995 | |
Expert Global Solutions | 4/2/2017 | | | 202,155 | | | | 6,633 | |
Hoffmaster Group, Inc. | 5/9/2019 | | | 1,750,000 | | | | 126,634 | |
IntraWest Holdings S.à r.l. | 12/10/2018 | | | 6,900,000 | | | | 148,326 | |
Kronos Incorporated | 10/30/2017 | | | 500,000 | | | | 23,576 | |
Lincoln Finance Ltd. | 12/31/2015 | | | 14,000,000 | | | | — | |
McGraw-Hill Global Education Holdings LLC | 3/22/2018 | | | 3,500,000 | | | | 167,095 | |
National Financial Partners Corp. | 7/1/2018 | | | 3,000,000 | | | | 189,909 | |
Signode Industrial Group US, Inc. | 5/1/2019 | | | 11,400,000 | | | | 876,205 | |
Wencor Group | 6/19/2019 | | | 1,885,385 | | | | 142,087 | |
| | | | $ | 58,047,866 | | | $ | 2,729,629 | |
9. Line of Credit
The Funds, with the exception of Alpha Opportunity Fund, Capital Stewardship Fund, Diversified Income Fund and Market Neutral Real Estate Fund, secured a committed $800,000,000 line of credit from Citibank, N.A., good through October 7, 2016, at which time the line of credit may be renewed. This line of credit is reserved for emergency or temporary purposes. Fees related to borrowings, if any, vary under this arrangement between the greater of Citibank’s “base rate”, LIBOR plus 1%, or the federal funds rate (0.25% at March 31, 2016), plus 1/2 of 1%. The Funds also pay a commitment fee at an annualized rate of 0.15% of the average daily amount of their unused commitment amount. The Funds did not have any borrowings under this agreement as of and for the period-ended March 31, 2016.
10. Reverse Repurchase Agreements
The Fund may enter into reverse repurchase agreements. Under a reverse repurchase agreement, a Fund sells securities and agrees to repurchase them at a particular price at a future date. In the event the buyer of securities under a reverse repurchase agreement files for bankruptcy or becomes insolvent, such buyer or its trustee or receiver may receive an extension of time to determine whether to enforce the Fund’s obligation to repurchase the securities, and the Fund’s use of the proceeds of the reverse repurchase agreement may effectively be restricted pending such decision.
| | THE GUGGENHEIM FUNDS SEMI-ANNUAL REPORT | 51 |
NOTES TO FINANCIAL STATEMENTS (Unaudited)(continued) |
For the period ended March 31, 2016, the Fund entered into reverse repurchase agreements as follows:
Fund | | Number
of Days
Outstanding | | | Balance at
March 31,
2016 | | | Average
Balance
Outstanding | | | Average
Interest
Rate | |
Floating Rate Strategies Fund | | | 116 | | | $ | — | | | $ | 398,091 | | | | (1.70 | %) |
In June 2014, the FASB issued Accounting Standards Update 2014-11, Repurchase-to-Maturity Transactions, Repurchase Financings, and Disclosures (ASU 2014-11) that expanded secured borrowing accounting for certain repurchase agreements.
The ASU also sets forth additional disclosure requirements for certain transactions accounted for as secured borrowings, which applies to the reverse repurchase agreements held by the Fund. The ASU became effective prospectively for annual periods beginning after December 15, 2014, and for interim periods beginning after March 15, 2015. The Fund has adopted the ASU.
There were no outstanding reverse repurchase agreements at March 31, 2016.
11. Restricted Securities
The securities below are considered illiquid and restricted under guidelines established by the Board:
Fund | Restricted
Securities | Acquisition
Date | | | Amortized
Cost | | | Value |
Floating Rate Strategies Fund | Unifrax I LLC/Unifrax | | | | | | | |
| | Holding Co. | | | | | | | |
| | 7.50% due 02/15/19 | 1/31/13 | | $ | 665,000 | | $ | 410,638 |
| | | | | | | | | |
| | Airplanes Pass Through | | | | | | | |
| | Trust 2001-1A A9, 0.99% | | | | | | | |
| | due 03/15/19 | 12/27/11 | | | 1,276,362 | | | 405,082 |
12. Offsetting
In the normal course of business, the Fund enters into transactions subject to enforceable master netting arrangements or other similar arrangements. Generally, the right to offset in those agreements allows the Fund to counteract the exposure to a specific counterparty with collateral received or delivered to that counterparty based on the terms of the arrangements. These arrangements provide for the right to liquidate upon the occurrence of an event of default, credit event upon merger or additional termination event.
52 | THE GUGGENHEIM FUNDS SEMI-ANNUAL REPORT | |
NOTES TO FINANCIAL STATEMENTS (Unaudited)(continued) |
In order to better define their contractual rights and to secure rights that will help the Fund mitigate its counterparty risk, the Fund may enter into an International Swaps and Derivatives Association, Inc. Master Agreement (“ISDA Master Agreement”) or similar agreement with its derivative contract counterparties. An ISDA Master Agreement is a bilateral agreement between a Fund and a counterparty that governs OTC derivatives, including foreign exchange contracts, and typically contains, among other things, collateral posting terms and netting provisions in the event of a default and/or termination event. The provisions of the ISDA Master Agreement typically permit a single net payment in the event of a default (close-out netting) or similar event, including the bankruptcy or insolvency of the counterparty.
For derivatives traded under an ISDA Master Agreement, the collateral requirements are typically calculated by netting the mark to market amount for each transaction under such agreement and comparing that amount to the value of any collateral currently pledged by the Fund and the counterparty. For financial reporting purposes, cash collateral that has been pledged to cover obligations of the Fund and cash collateral received from the counterparty, if any, is reported separately on the Statement of Assets and Liabilities as segregated cash with broker/receivable for variation margin, or payable for swap settlement/ variation margin. Generally, the amount of collateral due from or to a counterparty must exceed a minimum transfer amount threshold (e.g., $300,000) before a transfer is required to be made. To the extent amounts due to the Fund from its counterparties are not fully collateralized, contractually or otherwise, the Fund bears the risk of loss from counterparty nonperformance. The Fund attempts to mitigate counterparty risk by only entering into agreements with counterparties that they believe to be of good standing and by monitoring the financial stability of those counterparties.
For financial reporting purposes, the Fund does not offset derivative assets and derivative liabilities that are subject to netting arrangements in the Statement of Assets and Liabilities.
| | THE GUGGENHEIM FUNDS SEMI-ANNUAL REPORT | 53 |
NOTES TO FINANCIAL STATEMENTS (Unaudited)(concluded) |
The following table presents derivative financial instruments and secured financing transactions that are subject to enforceable netting arrangements and offset in the Statement of Assets and Liabilities in conformity with U.S. GAAP.
| | | | | | | | | | | | | Gross Amounts Not Offset in the Statement of Assets and Liabilities | | | | |
Fund | Instrument | | Gross Amounts of Recognized Liabilities | | | Gross Amounts Offset in the Statement of Assets and Liabilities | | | Net Amount of Liabilities Presented on the Statement of Assets and Liabilities | | | Financial Instruments | | | Cash Collateral Received | | | Net Amount | |
Floating Rate Strategies Fund | Forward foreign currency exchange contracts | | $ | 3,415,986 | | | $ | — | | | $ | 3,415,986 | | | $ | — | | | $ | — | | | $ | 3,415,986 | |
54 | THE GUGGENHEIM FUNDS SEMI-ANNUAL REPORT | |
OTHER INFORMATION (Unaudited) |
Proxy Voting Information
A description of the policies and procedures that the Trust uses to determine how to vote proxies relating to securities held in the Funds’ portfolios is available, without charge and upon request, by calling 800.820.0888. This information is also available from the EDGAR database on the SEC’s website at http://www.sec.gov.
Information regarding how the Funds voted proxies relating to portfolio securities during the most recent 12-month period ended June 30 is available without charge, upon request, by calling 800.820.0888. This information is also available from the EDGAR database on the SEC’s website at http://www.sec.gov.
Sector Classification
Information in the “Schedule of Investments” is categorized by sectors using sector-level Classifications defined by the Bloomberg Industry Classification System, a widely recognized industry classification system provider. Each Fund’s registration statement has investment policies relating to concentration in specific sectors/industries. For purposes of these investment policies, the Funds usually classify sectors/industries based on industry-level Classifications used by widely recognized industry classification system providers such as Bloomberg Industry Classification System, Global Industry Classification Standards and Barclays Global Classification Scheme.
Quarterly Portfolio Schedules Information
The Trust files its complete schedule of portfolio holdings with the SEC for the first and third quarters of each fiscal year on Form N-Q; which are available on the SEC’s website at http://www.sec.gov. The Funds’ Forms N-Q may be reviewed and copied at the SEC’s Public Reference Room in Washington, DC, and that information on the operation of the Public Reference Room may be obtained by calling 800-SEC-0330. Copies of the portfolio holdings are also available to shareholders, without charge and upon request, by calling 800.820.0888.
| | THE GUGGENHEIM FUNDS SEMI-ANNUAL REPORT | 55 |
INFORMATION ON BOARD OF TRUSTEES AND OFFICERS (Unaudited) |
Name, Address* and Year of Birth | Position(s) Held with the Trust | Term of Office and Length of Time Served** | Principal Occupation(s) During Past Five Years | Number of Portfolios in Fund Complex Overseen | Other Directorships Held by Trustees |
INDEPENDENT TRUSTEES | | | |
Randall C. Barnes
(1951) | Trustee | Since 2014 | Current: Private Investor (2001-present).
Former: Senior Vice President and Treasurer, PepsiCo, Inc. (1993-1997); President, Pizza Hut International (1991-1993); Senior Vice President, Strategic Planning and New Business Development, PepsiCo, Inc. (1987-1990). | 105 | Current: Trustee, Purpose Investments Inc. (2014-Present). |
Donald A. Chubb, Jr.
(1946 ) | Trustee | Since 1994 | Current: Business broker and manager of commercial real estate, Griffith & Blair, Inc. (1997-present). | 101 | Current: Midland Care, Inc. (2011-present). |
Jerry B. Farley
(1946) | Trustee | Since 2005 | Current: President, Washburn University (1997-present). | 101 | Current: Westar Energy, Inc. (2004-present); CoreFirst Bank & Trust (2000-present). |
56 | THE GUGGENHEIM FUNDS SEMI-ANNUAL REPORT | |
INFORMATION ON BOARD OF TRUSTEES AND OFFICERS (Unaudited)(continued) |
Name, Address* and Year of Birth | Position(s) Held with the Trust | Term of Office and Length of Time Served** | Principal Occupation(s) During Past Five Years | Number of Portfolios in Fund Complex Overseen | Other Directorships Held by Trustees |
INDEPENDENT TRUSTEES - continued | | |
Roman Friedrich III
(1946) | Trustee and Chairman of the Contracts Review Committee | Since 2014 | Current: Founder and Managing Partner, Roman Friedrich & Company (1998-present).
Former: Senior Managing Director, MLV & Co. LLC (2010-2011). | 101 | Current: Zincore Metals, Inc. (2009-present).
Former: Axiom Gold and Silver Corp. (2011-2012). |
Robert B. Karn III
(1942) | Trustee and Chairman of the Audit Committee | Since 2014 | Current: Consultant (1998-present).
Former: Arthur Andersen (1965-1997) and Managing Partner, Financial and Economic Consulting, St. Louis office (1987-1997). | 101 | Current: Peabody Energy Company (2003-present); GP Natural Resource Partners, LLC (2002- present). |
Ronald A. Nyberg
(1953) | Trustee and Chairman of the Nominating and Governance Committee | Since 2014 | Current: Partner, Nyberg & Cassioppi, LLC (2000-present).
Former: Executive Vice President, General Counsel, and Corporate Secretary, Van Kampen Investments (1982-1999). | 107 | Current: Edward-Elmhurst Healthcare System (2012-present). |
| | THE GUGGENHEIM FUNDS SEMI-ANNUAL REPORT | 57 |
INFORMATION ON BOARD OF TRUSTEES AND OFFICERS (Unaudited)(continued) |
Name, Address* and Year of Birth | Position(s) Held with the Trust | Term of Office and Length of Time Served** | Principal Occupation(s) During Past Five Years | Number of Portfolios in Fund Complex Overseen | Other Directorships Held by Trustees |
INDEPENDENT TRUSTEES - concluded | | |
Maynard F. Oliverius
(1943) | Trustee | Since 1998 | Current: Retired.
Former: President and CEO, Stormont-Vail HealthCare (1996-2012). | 101 | Current: Fort Hays State University Foundation (1999-present); Stormont-Vail Foundation (2013-present); University of Minnesota HealthCare Alumni Association Foundation (2009-present). |
Ronald E. Toupin, Jr. (1958) | Trustee and Chairman of the Board | Since 2014 | Current: Portfolio Consultant (2010-present).
Former: Vice President, Manager and Portfolio Manager, Nuveen Asset Management (1998-1999); Vice President, Nuveen Investment Advisory Corp. (1992-1999); Vice President and Manager, Nuveen Unit Investment Trusts (1991-1999); and Assistant Vice President and Portfolio Manager, Nuveen Unit Investment Trusts (1988-1999), each of John Nuveen & Co., Inc. (1982-1999). | 104 | Former: Bennett Group of Funds (2011-2013). |
58 | THE GUGGENHEIM FUNDS SEMI-ANNUAL REPORT | |
INFORMATION ON BOARD OF TRUSTEES AND OFFICERS (Unaudited)(continued) |
Name, Address* and Year of Birth | Position(s) Held with the Trust | Term of Office and Length of Time Served** | Principal Occupation(s) During Past Five Years | Number of Portfolios in Fund Complex Overseen | Other Directorships Held by Trustees |
INTERESTED TRUSTEE | |
Donald C. Cacciapaglia***
(1951) | President, Chief Executive Officer and Trustee | Since 2012 | Current: President and CEO, certain other funds in the Fund Complex (2012-present); Vice Chairman, Guggenheim Investments (2010-present).
Former: Chairman and CEO, Channel Capital Group, Inc. (2002-2010). | 236 | Current: Clear Spring Life Insurance Company (2015-present); Guggenheim Partners Japan, Ltd. (2014-present); Delaware Life (2013-present); Guggenheim Life and Annuity Company (2011-present); Paragon Life Insurance Company of Indiana (2011-present). |
* | The business address of each Trustee is c/o Guggenheim Investments, 805 King Farm Boulevard, Suite 600, Rockville, Maryland 20850 |
** | Each Trustee serves an indefinite term, until his successor is elected and qualified. Time served includes time served in the respective position for the Predecessor Corporation. |
*** | This Trustee is deemed to be an "interested person" of the Funds under the 1940 Act by reason of his position with the Funds' Investment Manager and/or the parent of the Investment Manager. |
| | THE GUGGENHEIM FUNDS SEMI-ANNUAL REPORT | 59 |
INFORMATION ON BOARD OF TRUSTEES AND OFFICERS (Unaudited)(continued) |
Name, Address* and Year of Birth | Position(s) Held with the Trust | Term of Office and Length of Time Served** | Principal Occupations
During Past Five Years |
OFFICERS | | | |
Joseph M. Arruda
(1966) | Assistant Treasurer | Since 2010 | Current: Assistant Treasurer, certain other funds in the Fund Complex (2006-present); Vice President, Security Investors, LLC (2010-present); CFO and Manager, Guggenheim Specialized Products, LLC (2009-present).
Former: Vice President, Security Global Investors, LLC (2010-2011); Vice President, Rydex Advisors, LLC (2010); Vice President, Rydex Advisors II, LLC (2010). |
William H. Belden, III (1965) | Vice President | Since 2014 | Current: Vice President, certain other funds in the Fund Complex (2006-present); Managing Director, Guggenheim Funds Investment Advisors, LLC (2005-present).
Former: Vice President of Management, Northern Trust Global Investments (1999-2005). |
James Howley (1972) | Assistant Treasurer | Since 2014 | Current: Director, Guggenheim Investments (2004-present) ; Assistant Treasurer, certain other funds in the Fund Complex (2006-present).
Former: Manager, Mutual Fund Administration of Van Kampen Investments, Inc. (1996-2004). |
Amy J. Lee (1961) | Vice President and Chief Legal Officer | Since 2007 (Vice President) Since 2014 (Chief Legal Officer) | Current: Chief Legal Officer, certain other funds in the Fund Complex (2013-present); Senior Managing Director, Guggenheim Investments (2012-present).
Former: Vice President, Associate General Counsel and Assistant Secretary, Security Benefit Life Insurance Company and Security Benefit Corporation (2004-2012). |
Mark E. Mathiasen (1978) | Secretary | Since 2014 | Current: Secretary, certain other funds in the Fund Complex (2007-present); Managing Director, Guggenheim Investments (2007-present). |
60 | THE GUGGENHEIM FUNDS SEMI-ANNUAL REPORT | |
INFORMATION ON BOARD OF TRUSTEES AND OFFICERS (Unaudited)(continued) |
Name, Address* and Year of Birth | Position(s) Held with the Trust | Term of Office and Length of Time Served** | Principal Occupations
During Past Five Years |
OFFICERS - continued | |
Michael P. Megaris
(1984) | Assistant Secretary | Since 2014 | Current: Assistant Secretary, certain other funds in the Fund Complex (2014-present); Senior Associate, Guggenheim Investments (2012-present).
Former: J.D., University of Kansas School of Law (2009-2012). |
Elisabeth Miller
(1968) | Chief Compliance Officer | Since 2012 | Current: CCO, certain other funds in the Fund Complex (2012-present); CCO, Security Investors, LLC (2012-present); CCO, Guggenheim Funds Investment Advisors, LLC (2012-present); Managing Director, Guggenheim Investments (2012-present); Vice President, Guggenheim Funds Distributors, LLC (March 2014-present).
Former: CCO, Guggenheim Distributors, LLC (2009-March 2014); Senior Manager, Security Investors, LLC (2004-2009); Senior Manager, Guggenheim Distributors, LLC (2004-2009). |
Adam Nelson
(1979) | Assistant Treasurer | Since 2015 | Current: Vice President, Guggenheim Investments (2015-present); Assistant Treasurer, certain other funds in the Fund Complex (2015-present).
Former: Assistant Vice President and Fund Administration Director, State Street Corporation (2013-2015); Fund Administration Assistant Director, State Street (2011-2013); Fund Administration Manager, State Street (2009-2011). |
Alison Santay
(1974) | AML Officer | Since 2013 | Current: AML Officer, certain other funds in the Fund Complex (2010-present); Director and AML Officer, Rydex Fund Services, LLC (2010-present); AML Officer, Security Investors, LLC (2010-present); Director, Shareholder Risk and Compliance, Rydex Fund Services, LLC (2004-present).
Former: AML Officer, Guggenheim Distributors, LLC (2013-2014). |
| | THE GUGGENHEIM FUNDS SEMI-ANNUAL REPORT | 61 |
INFORMATION ON BOARD OF TRUSTEES AND OFFICERS (Unaudited)(concluded) |
Name, Address* and Year of Birth | Position(s) Held with the Trust | Term of Office and Length of Time Served** | Principal Occupations
During Past Five Years |
OFFICERS - concluded | |
Kimberly Scott
(1974) | Assistant Treasurer | Since 2014 | Current: Vice President, Guggenheim Investments (2012-present) ; Assistant Treasurer, certain other funds in the Fund Complex (2012-present).
Former: Financial Reporting Manager, Invesco, Ltd. (2010-2011); Vice President/Assistant Treasurer, Mutual Fund Administration for Van Kampen Investments, Inc./Morgan Stanley Investment Management (2009-2010); Manager of Mutual Fund Administration, Van Kampen Investments, Inc./Morgan Stanley Investment Management (2005-2009). |
Bryan Stone
(1979) | Vice President | Since 2014 | Current: Vice President, certain other funds in the Fund Complex (2014-present); Director, Guggenheim Investments (2013-present).
Former: Senior Vice President, Neuberger Berman Group LLC (2009-2013); Vice President, Morgan Stanley (2002-2009). |
John L. Sullivan
(1955) | Chief Financial Officer and Treasurer | Since 2014 | Current: CFO, Chief Accounting Officer and Treasurer, certain other funds in the Fund Complex (2010-present); Senior Managing Director, Guggenheim Investments (2010-present).
Former: Managing Director and CCO, each of the funds in the Van Kampen Investments fund complex (2004-2010); Managing Director and Head of Fund Accounting and Administration, Morgan Stanley Investment Management (2002-2004); CFO and Treasurer, Van Kampen Funds (1996-2004). |
* | The business address of each officer is c/o Guggenheim Investments, 805 King Farm Boulevard, Suite 600, Rockville, Maryland 20850. |
** | Each officer serves an indefinite term, until his or her successor is duly elected and qualified. Time served includes time served in the respective position for the Predecessor Corporation. |
62 | THE GUGGENHEIM FUNDS SEMI-ANNUAL REPORT | |
GUGGENHEIM INVESTMENTS PRIVACY POLICIES (Unaudited) |
Rydex Funds, Guggenheim Funds, Rydex Investments, Guggenheim Funds Distributors, LLC, Security Investors, LLC, Security Distributors, Inc., Guggenheim Partners Investment Managers, LLC, and Rydex Advisory Services (Collectively “Guggenheim Investments”).
Our Commitment to You
When you become a Guggenheim Investments investor, you entrust us with not only your hard-earned money but also with personal and financial information about you. We recognize that your relationship with us is based on trust and that you expect us to act responsibly and in your best interests. Because we have access to this private information about you, we hold ourselves to the highest standards in its safekeeping and use. This means, most importantly, that we do not sell client information to anyone—whether it is your personal information or if you are a current or former Guggenheim Investments client.
The Information We Collect About You
In the course of doing business with shareholders and investors, we collect nonpublic personal information about you. You typically provide personal information when you complete a Guggenheim Investments account application or when you request a transaction that involves Rydex and Guggenheim Investments funds or one of the Guggenheim Investments affiliated companies. “Nonpublic personal information” is personally identifiable private information about you. For example, it includes information regarding your name and address, Social Security or taxpayer identification number, assets, income, account balance, bank account information and investment activity (e.g., purchase and redemption history).
How We Handle Your Personal Information
As emphasized above, we do not sell information about current or former clients or their accounts to third parties. Nor do we share such information, except when necessary to complete transactions at your request or to make you aware of related investment products and services that we offer. Additional details about how we handle your personal information are provided below. To complete certain transactions or account changes that you direct, it may be necessary to provide identifying information to companies, individuals or groups that are not affiliated with Guggenheim Investments. For example, if you ask to transfer assets from another financial institution to Guggenheim Investments, we will need to provide certain information about you to that company to complete the transaction. To alert you to other Guggenheim Investments investment products and services, we may share your information within the Guggenheim Investments family of affiliated companies. This would include, for example, sharing your information within Guggenheim Investments so we can make you aware of
| | THE GUGGENHEIM FUNDS SEMI-ANNUAL REPORT | 63 |
GUGGENHEIM INVESTMENTS PRIVACY POLICIES (Unaudited)(continued) |
new Rydex and Guggenheim Investments funds or the services offered through another Guggenheim Investments affiliated company. In certain instances, we may contract with nonaffiliated companies to perform services for us. Where necessary, we will disclose information we have about you to these third parties. In all such cases, we provide the third party with only the information necessary to carry out its assigned responsibilities and only for that purpose. And we require these third parties to treat your private information with the same high degree of confidentiality that we do. In certain instances, we may share information with other financial institutions regarding individuals and entities in response to the U.S.A. Patriot Act. Finally, we will release information about you if you direct us to do so, if we are compelled by law to do so or in other circumstances permitted by law.
Opt Out Provisions
We do not sell your personal information to anyone. The law allows you to “opt out” of only certain kinds of information sharing with third parties. The firm does not share personal information about you with any third parties that triggers this opt-out right. This means YOU ARE ALREADY OPTED OUT.
How We Protect Privacy Online
Our concern for the privacy of our shareholders also extends to those who use our web site, guggenheiminvestments.com. Our web site uses some of the most secure forms of online communication available, including encryption technology, Secure Socket Layer (SSL) protocol, firewalls and user names and passwords. These technologies provide a high level of security and privacy when you access your account information or initiate online transactions. The Guggenheim Investments web site offers customized features that require our use of “http cookies”—tiny pieces of information that we ask your browser to store. However, we make very limited use of these cookies. We only use cookies for session management and security features on the Guggenheim Investments web site. We do not use them to pull data from your hard drive, to learn your email address, or to view data in cookies created by other web sites. We will not share the information in our cookies or give others access to it. See the legal information area on our web site for more details about web site security and privacy features.
How We Safeguard Your Personal Information
We restrict access to nonpublic personal information about shareholders to our employees and in some cases to third parties (for example, the service providers described above) as permitted by law. We maintain strict physical, electronic and procedural safeguards that comply with federal standards to guard your nonpublic personal information.
64 | THE GUGGENHEIM FUNDS SEMI-ANNUAL REPORT | |
GUGGENHEIM INVESTMENTS PRIVACY POLICIES (Unaudited)(concluded) |
We’ll Keep You Informed
As required by federal law, we will notify shareholders of our privacy policy annually. We reserve the right to modify this policy at any time, but rest assured that if we do change it, we will tell you promptly. You will also be able to access our privacy policy from our web site at guggenheiminvestments.com. Should you have any questions regarding our privacy policy, contact us at 800.820.0888 or 301.296.5100.
| | THE GUGGENHEIM FUNDS SEMI-ANNUAL REPORT | 65 |
3.31.2016
Guggenheim Funds Semi-Annual Report
| |
Guggenheim Total Return Bond Fund | | |
TRB-SEMI-0316x0916 | guggenheiminvestments.com |
DEAR SHAREHOLDER | 2 |
ECONOMIC AND MARKET OVERVIEW | 3 |
ABOUT SHAREHOLDERS’ FUND EXPENSES | 6 |
TOTAL RETURN BOND FUND | 9 |
NOTES TO FINANCIAL STATEMENTS | 45 |
OTHER INFORMATION | 68 |
INFORMATION ON BOARD OF TRUSTEES AND OFFICERS | 69 |
GUGGENHEIM INVESTMENTS PRIVACY POLICIES | 77 |
| | THE GUGGENHEIM FUNDS SEMI-ANNUAL REPORT | 1 |
Dear Shareholder:
Guggenheim Partners Investment Management (the “Investment Adviser”) is pleased to present the semi-annual shareholder report for a one of our Funds (the “Fund”) for the six-month period ended March 31, 2016.
The Investment Adviser is part of Guggenheim Investments, which represents the investment management businesses of Guggenheim Partners, LLC (“Guggenheim”), a global, diversified financial services firm.
Guggenheim Funds Distributors, LLC is the distributor of the Funds. Guggenheim Funds Distributors, LLC is affiliated with Guggenheim and the Investment Adviser.
We encourage you to read the Economic and Market Overview section of the report, which follows this letter.
We are committed to providing innovative investment solutions and appreciate the trust you place in us.
Sincerely,

Donald C. Cacciapaglia
President
April 30, 2016
Read a prospectus and summary prospectus (if available) carefully before investing. It contains the investment objectives, risks, charges, expenses and other information, which should be considered carefully before investing. Obtain a prospectus and summary prospectus (if available) at guggenheiminvestments.com or call 800.820.0888.
There can be no assurance that any investment product will achieve its investment objective(s). There are risks associated with investing, including the entire loss of principal invested. Investing involves market risks. The investment return and principal value of any investment product will fluctuate with changes in market conditions.
2 | THE GUGGENHEIM FUNDS SEMI-ANNUAL REPORT | |
ECONOMIC AND MARKET OVERVIEW (Unaudited) | March 31, 2016 |
Financial markets were buffeted by a variety of events over the past six months, including volatility in the oil market, weak growth in China, ongoing stimulus from global central banks, and a 25 basis point increase in the U.S. federal funds target rate in December. While the direct impact of the move was fairly insignificant, the decision to begin normalization of interest rates after seven years of unprecedented liquidity provision was not. Indeed, in 2015, risk assets posted their worst annual performance since the 2008 financial crisis, as market participants’ expectations for the start of rate hikes collided with concern about plunging commodity prices, and slowing economic growth in China and other emerging market economies.
As 2016 began, forecasts for U.S. and global economic growth were downgraded, and recession fears surged along with market volatility. Estimates for first quarter gross domestic product (“GDP”) in the U.S. were marked down, even though first quarter GDP has undershot full-year growth rates in six out of the last seven years. Risk assets rallied in the last half of the first quarter, led by a dovish pivot in the U.S. Federal Reserve’s (the “Fed”) communication that spurred a rally in crude oil and a reversal of dollar strength. The weaker dollar, along with optimism about a production freeze agreed to by a group of major oil producing countries, helped oil to rebound. After falling in the early weeks of the year to a cycle low of $26 per barrel on February 11, 2016, the front-month West Texas Intermediate (“WTI”) oil futures contract rallied as high as $40 per barrel before closing the quarter at $38 per barrel.
The outlook for economic growth outside the U.S. softened in the first quarter. A further deterioration in the euro zone inflation outlook prompted the European Central Bank (“ECB”) to announce an increase in the size of its monthly asset purchases and reduce its deposit rate to -40 basis points. European government bonds rallied following the announcement, with the 10-year German bund ending the first quarter with a yield of just 16 basis points.
Ongoing stimulus efforts in Asia also appeared likely to contribute to low U.S. rates. Chinese industrial production growth continued to slow in early 2016, prompting the People’s Bank of China (“PBOC”) to stimulate credit growth by allowing banks to hold fewer reserves against deposits. And after years of struggling with stagnant growth and low inflation, the Bank of Japan (“BOJ”) surprised markets by cutting its key interest rate to -10 basis points in January. The negative rates pushed a considerable amount of Japanese savings into foreign markets.
In an environment where global rates are moving lower and markets are already starved for yield, foreign investors began looking to the U.S. Guggenheim expects that U.S. Treasury yields will fall further as the gravitational pull of global yields gets stronger, and does not discount the possibility of 10-year U.S. Treasury yields declining to closer to 1 percent before the end of the year.
| | THE GUGGENHEIM FUNDS SEMI-ANNUAL REPORT | 3 |
ECONOMIC AND MARKET OVERVIEW (Unaudited)(continued) | March 31, 2016 |
A stronger dollar has weighed on the U.S. economy, but consumer spending has been resilient. The labor market is now operating near full employment, and tight labor market conditions are beginning to spur faster wage growth. We believe the U.S. economy is fundamentally sound, and find little evidence to support the conclusion that the economy will fall into a recession in 2016.
Despite the relative health of the U.S. economy, markets are concerned that sluggish global growth will hold back the U.S. expansion, that inflation will remain below the Fed’s target for longer, and that tighter conditions in credit markets have raised recession risks. Our view is that the Fed remains focused on fulfilling its dual mandate objectives of maximum employment and price stability, and thus is biased toward normalizing policy. We expect further declines in the unemployment rate as job gains outstrip growth in the labor force. Meanwhile, core and headline inflation should move closer to the Fed’s target by year end, reflecting our forecasts for a tighter labor market and a modest rise in oil prices. Normally, this would result in at least two Fed rate hikes on the table for 2016, but the U.S. Fed is becoming more sensitive to global financial conditions and the extent of global money flows that occur as monetary policy in the U.S. diverges from Europe, Japan and China. As a result, we have reduced our expectations for a June rate hike, although it would normally be an easy call. We continue to believe a December rate hike is a near certainty. A solid macroeconomic backdrop and a rebalancing oil market should support an improving credit picture in the second half of 2016.
For the six months ended March 31, 2016, the Standard & Poor’s 500® (“S&P 500”) Index* returned 8.49%. The Morgan Stanley Capital International (“MSCI”) Europe-Australasia-Far East (“EAFE”) Index* returned 1.56%. The return of the MSCI Emerging Markets Index* was 6.41%.
In the bond market, the Barclays U.S. Aggregate Bond Index* posted a 2.44% return for the period, while the Barclays U.S. Corporate High Yield Index* returned 1.22%. The return of the Bank of America (“BofA”) Merrill Lynch 3-Month U.S. Treasury Bill Index* was 0.11% for the six-month period.
The opinions and forecasts expressed may not actually come to pass. This information is subject to change at any time, based on market and other conditions, and should not be construed as a recommendation of any specific security or strategy.
4 | THE GUGGENHEIM FUNDS SEMI-ANNUAL REPORT | |
ECONOMIC AND MARKET OVERVIEW (Unaudited)(concluded) | March 31, 2016 |
*Index Definitions:
The following indices are referenced throughout this report. Indices are unmanaged and not available for direct investment. Index performance does not reflect transaction costs, fees, or expenses.
Barclays U.S. Aggregate Bond Index is a broad-based benchmark that measures the investment grade, U.S. dollar denominated, fixed-rate taxable bond market, including U.S. Treasuries, government-related and corporate securities, MBS (agency fixed-rate and hybrid ARM pass-throughs), ABS, and CMBS.
Barclays U.S. Corporate High Yield Index measures the market of U.S. dollar denominated, non-investment grade, fixed-rate, taxable corporate bonds. Securities are classified as high yield if the middle rating of Moody’s, Fitch, and S&P is Ba1/BB+/BB+ or below.
BofA Merrill Lynch 3-Month U.S. Treasury Bill Index is an unmanaged market index of U.S. Treasury securities maturing in 90 days that assumes reinvestment of all income.
MSCI EAFE Index is a free float-adjusted market capitalization index that is designed to measure the equity market performance of developed markets, excluding the U.S. & Canada.
MSCI Emerging Markets Index is a free float-adjusted market capitalization weighted index that is designed to measure equity market performance in the global emerging markets.
S&P 500® Index is a capitalization-weighted index of 500 stocks designed to measure the performance of the broad economy, representing all major industries and is considered a representation of the U.S. stock market.
| | THE GUGGENHEIM FUNDS SEMI-ANNUAL REPORT | 5 |
ABOUT SHAREHOLDERS’ FUND EXPENSES (Unaudited) |
All mutual funds have operating expenses and it is important for our shareholders to understand the impact of costs on their investments. Shareholders of a Fund incur two types of costs: (i) transaction costs, including sales charges (loads) on purchase payments, reinvested dividends, or other distributions; and exchange fees; and (ii) ongoing costs, including management fees, administrative services, and shareholder reports, among others. These ongoing costs, or operating expenses, are deducted from a fund’s gross income and reduce the investment return of the fund.
A fund’s expenses are expressed as a percentage of its average net assets, which is known as the expense ratio. The following examples are intended to help investors understand the ongoing costs (in dollars) of investing in a Fund and to compare these costs with the ongoing costs of investing in other mutual funds.
The examples are based on an investment of $1,000 made at the beginning of the period and held for the entire six-month period beginning September 30, 2015 and ending March 31, 2016.
The following tables illustrate a Fund’s costs in two ways:
Table 1. Based on actual Fund return. This section helps investors estimate the actual expenses paid over the period. The “Ending Account Value” shown is derived from the Fund’s actual return, and the fourth column shows the dollar amount that would have been paid by an investor who started with $1,000 in the Fund. Investors may use the information here, together with the amount invested, to estimate the expenses paid over the period. Simply divide the Fund’s account value by $1,000 (for example, an $8,600 account value divided by $1,000 = 8.6), then multiply the result by the number provided under the heading “Expenses Paid During Period.”
Table 2. Based on hypothetical 5% return. This section is intended to help investors compare a Fund’s cost with those of other mutual funds. The table provides information about hypothetical account values and hypothetical expenses based on the Fund’s actual expense ratio and an assumed rate of return of 5% per year before expenses, which is not the Fund’s actual return. The hypothetical account values and expenses may not be used to estimate the actual ending account balance or expenses paid during the period. The example is useful in making comparisons because the U.S. Securities and Exchange Commission (the “SEC”) requires all mutual funds to calculate expenses based on the 5% return. Investors can assess a Fund’s costs by comparing this hypothetical example with the hypothetical examples that appear in shareholder reports of other funds.
6 | THE GUGGENHEIM FUNDS SEMI-ANNUAL REPORT | |
ABOUT SHAREHOLDERS’ FUND EXPENSES (Unaudited)(continued) |
The calculations illustrated above assume no shares were bought or sold during the period. Actual costs may have been higher or lower, depending on the amount of investment and the timing of any purchases or redemptions.
Please note that the expenses shown in the table are meant to highlight your ongoing costs only and do not reflect any transactional costs, such as sales charges (loads) on purchase payments, and contingent deferred sales charges (“CDSC”) on redemptions, if any. Therefore, the second table is useful in comparing ongoing costs only, and will not help you determine the relative total costs of owning different funds. In addition, if these transactional costs were included, your costs would have been higher.
More information about a Fund’s expenses, including annual expense ratios for up to the past five years (subject to the Fund’s inception date), can be found in the Financial Highlights section of this report. For additional information on operating expenses and other shareholder costs, please refer to the appropriate Fund prospectus.
| | THE GUGGENHEIM FUNDS SEMI-ANNUAL REPORT | 7 |
ABOUT SHAREHOLDERS’ FUND EXPENSES (Unaudited)(concluded) |
| | Expense
Ratio1 | Fund
Return | Beginning
Account Value
September 30,
2015 | Ending
Account Value
March 31,
2016 | Expenses
Paid During
Period2 |
Table 1. Based on actual Fund return3 |
Total Return Bond Fund |
A-Class | 0.97% | 0.96% | $ 1,000.00 | $ 1,009.60 | $ 4.87 |
C-Class | 1.69% | 0.59% | 1,000.00 | 1,005.90 | 8.47 |
P-Class | 0.87% | 1.00% | 1,000.00 | 1,010.00 | 4.37 |
Institutional Class | 0.61% | 1.14% | 1,000.00 | 1,011.40 | 3.07 |
| |
Table 2. Based on hypothetical 5% return (before expenses) |
Total Return Bond Fund |
A-Class | 0.97% | 5.00% | $ 1,000.00 | $ 1,020.15 | $ 4.90 |
C-Class | 1.69% | 5.00% | 1,000.00 | 1,016.55 | 8.52 |
P-Class | 0.87% | 5.00% | 1,000.00 | 1,020.65 | 4.39 |
Institutional Class | 0.61% | 5.00% | 1,000.00 | 1,021.95 | 3.08 |
1 | Annualized and excludes expenses of the underlying funds in which the Fund invests. |
2 | Expenses are equal to the Fund's annualized expense ratio, net of any applicable fee waivers, multiplied by the average account value over the period, multiplied by 183/366 (to reflect the one-half year period). |
3 | Actual cumulative return at net asset value for the period September 30, 2015 to March 31, 2016. |
8 | THE GUGGENHEIM FUNDS SEMI-ANNUAL REPORT | |
FUND PROFILE (Unaudited) | March 31, 2016 |
TOTAL RETURN BOND FUND
OBJECTIVE: Seeks to provide total return, comprised of current income and capital appreciation.
Holdings Diversification (Market Exposure as % of Net Assets)

“Holdings Diversification (Market Exposure as % of Net Assets)” excludes any temporary cash investments or investments in Guggenheim Strategy Funds Trust mutual funds. Investments in those Funds do not provide “market exposure” to meet the fund’s investment objective, but will significantly increase the portfolio’s exposure to certain other asset categories (and their associated risks), which may cause the Fund to deviate from its principal investment strategy, including: (i) high yield, high risk debt securities rated below the top four long-term rating categories by a nationally recognized statistical rating organization (also known as “junk bonds”); (ii) securities issued by the U.S. government or its agencies and instrumentalities; (iii) CLOs and similar investments; and (iv) other short-term fixed income securities.
| | THE GUGGENHEIM FUNDS SEMI-ANNUAL REPORT | 9 |
FUND PROFILE (Unaudited)(concluded) | March 31, 2016 |
Inception Dates: |
A-Class | November 30, 2011 |
C-Class | November 30, 2011 |
P-Class | May 1, 2015 |
Institutional Class | November 30, 2011 |
Portfolio Composition by Quality Rating1 |
Rating | % of Total Investments |
Fixed Income Instruments | |
AAA | 21.6% |
AA | 10.9% |
A | 15.7% |
BBB | 11.5% |
BB | 9.2% |
B | 4.3% |
CCC | 6.4% |
CC | 1.1% |
D | 0.1% |
A+ | 0.0% |
NR2 | 14.6% |
Other Instruments | 4.6% |
Total Investments | 100.0% |
| | |
The chart above reflects percentages of the value of total investments. |
Ten Largest Holdings (% of Total Net Assets) |
U.S. Treasury Notes 1.63% due 02/15/26 | 5.3% |
U.S. Treasury Bonds due 11/15/44 | 4.0% |
Freddie Mac 6.75% due 03/15/31 | 1.7% |
VOLT XLI LLC 2016-NPL1 A1, 4.25% due 02/26/46 | 1.2% |
LSTAR Securities Investment Trust
2015-1A, 2.43% due 01/01/20 | 1.1% |
AIM Aviation Finance Ltd.
2015-1A A1, 4.21% due 02/15/40 | 1.1% |
LSTAR Securities Investment Trust 2015-4 A1, 2.44% due 04/01/20 | 1.0% |
LSTAR Securities Investment Trust 2016-2A, 2.43% due 03/01/21 | 1.0% |
LSTAR Securities Investment Trust
2014-1 NOTE, 3.53% due 09/01/21 | 0.9% |
State of California General Obligation Unlimited | 0.8% |
Top Ten Total | 18.1% |
| | |
“Ten Largest Holdings” excludes any temporary cash or derivative investments. |
1 | Source: BlackRock Solutions. Credit quality ratings are measured on a scale that generally ranges from AAA (highest) to D (lowest). All securities except for those labeled “NR” have been rated by a Nationally Recognized Statistical Rating Organization (“NRSRO”). For purposes of this presentation, when ratings are available from more than one agency, the highest rating is used. Guggenheim Investments converts ratings to the equivalent S&P rating. |
2 | NR securities do not necessarily indicate low credit quality. |
10 | THE GUGGENHEIM FUNDS SEMI-ANNUAL REPORT | |
SCHEDULE OF INVESTMENTS (Unaudited) | March 31, 2016 |
TOTAL RETURN BOND FUND | |
| | | Shares | | | Value | |
| | | | | | | |
PREFERRED STOCKS†† - 0.0% | |
| | | | | | | |
Industrial - 0.0% | |
Seaspan Corp.
6.38% due 04/30/191 | | | 44,000 | | | $ | 1,089,440 | |
| | | | | | | | | |
Financial – 0.0% | |
GSC Partners CDO Fund V Ltd. due 11/20/16*,†††,3,4 | | | 1,325 | | | | — | |
Total Preferred Stocks | | | | | | | | |
(Cost $2,238,513) | | | | | | | 1,089,440 | |
| | | | | | | | | |
MUTUAL FUNDS† - 1.0% | |
Guggenheim Strategy Fund I5 | | | 688,558 | | | | 17,083,133 | |
Guggenheim Strategy Fund II5 | | | 405,708 | | | | 10,016,928 | |
Total Mutual Funds | | | | | | | | |
(Cost $27,117,838) | | | | | | | 27,100,061 | |
| | | | | | | | | |
CLOSED-END FUNDS† - 0.3% | |
Guggenheim Strategic Opportunities Fund5 | | | 481,691 | | | | 8,183,930 | |
Total Closed-End Funds | | | | | | | | |
(Cost $8,478,228) | | | | | | | 8,183,930 | |
| | | | | | | | | |
SHORT TERM INVESTMENTS† - 3.4% | |
Federated U.S. Treasury Cash Reserve Fund Institutional Shares 0.16%6 | | | 92,920,815 | | | | 92,920,815 | |
Total Short Term Investments | | | | | |
(Cost $92,920,815) | | | | | | | 92,920,815 | |
| | | Face
Amount15 | | | Value | |
| | | | | | | |
COLLATERALIZED MORTGAGE OBLIGATIONS†† - 31.7% | |
Residential Mortgage-Backed Securities - 24.1% | |
LSTAR Securities Investment Trust | | | | | | |
2015-1 A, 2.43% due 01/01/202,3 | | $ | 30,441,515 | | | | 29,831,588 | |
2015-4 A1, 2.44% due 04/01/202,3 | | | 28,954,679 | | | | 28,086,038 | |
2016-2 A, 2.43% due 03/01/213 | | | 28,150,000 | | | | 27,286,640 | |
2014-1 NOTE, 3.53% due 09/01/212,3 | | | 24,258,915 | | | | 24,016,326 | |
2015-2 A, 2.43% due 01/01/202,3 | | | 21,044,205 | | | | 20,899,505 | |
2015-3 A, 2.43% due 03/01/202,3 | | | 19,899,448 | | | | 19,460,068 | |
2015-5 A1, 2.44% due 04/01/202,3 | | | 15,127,171 | | | | 14,787,733 | |
2015-10 A1, 2.44% due 11/01/202,3 | | | 10,355,270 | | | | 10,096,388 | |
2015-6 A, 2.44% due 05/01/202,3 | | | 4,767,227 | | | | 4,659,965 | |
RALI Series Trust | | | | | | | | |
2006-QO10 A1, 0.59% due 01/25/372 | | | 19,216,139 | | | | 13,906,864 | |
2007-QO2 A1, 0.58% due 02/25/472 | | | 15,355,911 | | | | 7,987,583 | |
2006-QO2 A1, 0.65% due 02/25/462 | | | 15,825,179 | | | | 6,389,532 | |
2007-QO4 A1A, 0.62% due 05/25/472 | | | 7,415,615 | | | | 5,724,385 | |
2005-QO1 A2, 1.85% due 08/25/352 | | | 4,843,246 | | | | 4,044,462 | |
2006-QS8 A4, 0.88% due 08/25/362 | | | 6,600,753 | | | | 3,778,165 | |
2006-QO2 A2, 0.70% due 02/25/462 | | | 6,441,855 | | | | 2,649,082 | |
2007-QO3 A1, 0.59% due 03/25/472 | | | 3,131,547 | | | | 2,428,569 | |
VOLT XLI LLC | | | | | | | | |
2016-NPL1 A1, 4.25% due 02/26/463,7 | | | 34,113,129 | | | | 34,072,837 | |
SEE NOTES TO FINANCIAL STATEMENTS. | THE GUGGENHEIM FUNDS SEMI-ANNUAL REPORT | 11 |
SCHEDULE OF INVESTMENTS (Unaudited)(continued) | March 31, 2016 |
TOTAL RETURN BOND FUND | |
| | | Face
Amount15 | | | Value | |
| | | | | | | |
Lehman XS Trust Series | | | | | | |
2005-9N 1A1, 0.70% due 02/25/362 | | $ | 12,480,781 | | | $ | 9,757,022 | |
2007-2N 2A, 0.61% due 02/25/372 | | | 12,937,787 | | | | 8,690,098 | |
2007-15N 2A1, 0.69% due 08/25/372 | | | 6,864,361 | | | | 5,208,404 | |
2005-7N 1A1A, 0.70% due 12/25/352 | | | 3,614,960 | | | | 3,012,910 | |
Washington Mutual Mortgage Pass-Through Certificates WMALT Series Trust | | | | | | | | |
2006-AR9, 1.15% due 11/25/462 | | | 23,953,722 | | | | 16,255,769 | |
2006-7 A5, 4.50% due 09/25/36 | | | 3,391,742 | | | | 1,721,978 | |
2006-AR9 2A, 1.16% due 11/25/462 | | | 1,284,192 | | | | 865,732 | |
2006-8 A6, 4.66% due 10/25/36 | | | 585,995 | | | | 345,013 | |
VOLT XXXIX LLC | | | | | | | | |
2015-NPL13 A1, 4.13% due 10/25/453 | | | 19,281,759 | | | | 19,183,177 | |
CSMC Series | | | | | | | | |
2015-12R 2A1, 0.93% due 11/30/372,3 | | | 19,970,000 | | | | 17,388,943 | |
2014-6R 11A1, 0.62% due 09/27/362,3 | | | 1,126,331 | | | | 1,051,045 | |
VOLT XXXVI LLC | | | | | | | | |
2015-NP10 A1, 3.63% due 07/25/453 | | | 17,955,987 | | | | 17,828,338 | |
VOLT XL LLC | | | | | | | | |
2015-NP14 A1, 4.38% due 11/27/453,7 | | | 17,703,936 | | | | 17,671,222 | |
American Home Mortgage Assets Trust | | | | | | | | |
2006-4 1A11, 0.62% due 10/25/462 | | | 16,151,982 | | | | 10,012,386 | |
2007-1 A1, 1.05% due 02/25/472 | | | 13,208,827 | | | | 7,241,102 | |
WaMu Mortgage Pass-Through Certificates Series Trust | | | | | | | | |
2007-OA6 1A, 1.13% due 07/25/472 | | | 11,789,286 | | | | 9,346,427 | |
2007-OA3 2A, 1.12% due 04/25/472 | | | 8,155,243 | | | | 5,977,629 | |
2006-AR11 3A1A, 1.27% due 09/25/462 | | | 2,240,800 | | | | 1,602,297 | |
Banc of America Funding Ltd. | | | | | | | | |
2013-R1 A5, 0.65% due 11/03/412,3 | | | 18,225,678 | | | | 16,865,204 | |
Impac Secured Assets CMN Owner Trust | | | | | | | | |
2005-2 A1W, 0.68% due 03/25/362 | | | 20,261,109 | | | | 15,454,088 | |
VOLT XXXIII LLC | | | | | | | | |
2015-NPL5 A1, 3.50% due 03/25/553 | | | 15,108,844 | | | | 14,839,390 | |
NRPL Trust | | | | | | | | |
2015-1 A1, 3.88% due 11/01/543 | | | 9,388,199 | | | | 9,365,808 | |
2014-2A A1, 3.75% due 10/25/572,3 | | | 3,732,713 | | | | 3,697,830 | |
Vericrest Opportunity Loan Trust | | | | | | | | |
2015-NPL3 A1, 3.38% due 10/25/583 | | | 12,422,525 | | | | 12,250,264 | |
Banc of America Funding Trust | | | | | | | | |
2014-R7 2A1, 0.58% due 09/26/362,3 | | | 7,940,346 | | | | 7,355,873 | |
2015-R4 8A1, 0.61% due 01/27/35†††,2,3 | | | 4,868,967 | | | | 4,363,666 | |
VOLT XXVII LLC | | | | | | | | |
2014-NPL7 A1, 3.38% due 08/27/573 | | | 11,201,939 | | | | 11,030,282 | |
American Home Mortgage Investment Trust | | | | | | | | |
2006-1 11A1, 0.71% due 03/25/462 | | | 9,220,840 | | | | 7,269,381 | |
2006-1 12A1, 0.83% due 03/25/462 | | | 4,136,571 | | | | 3,290,590 | |
12 | THE GUGGENHEIM FUNDS SEMI-ANNUAL REPORT | SEE NOTES TO FINANCIAL STATEMENTS. |
SCHEDULE OF INVESTMENTS (Unaudited)(continued) | March 31, 2016 |
TOTAL RETURN BOND FUND | |
| | | Face
Amount15 | | | Value | |
| | | | | | | |
GCAT LLC | | | | | | |
2014-2 A1, 3.72% due 10/25/193,7 | | $ | 7,742,263 | | | $ | 7,683,640 | |
2015-6 A, 3.63% due 05/26/203 | | | 2,773,585 | | | | 2,751,089 | |
Oak Hill Advisors Residential Loan Trust | | | | | | | | |
2015-NPL2 A1, 3.72% due 07/25/553 | | | 6,693,084 | | | | 6,649,891 | |
2015-NPL1 A1, 3.47% due 01/25/553 | | | 3,505,805 | | | | 3,485,004 | |
CIT Mortgage Loan Trust | | | | | | | | |
2007-1 2A3, 1.88% due 10/25/372,3 | | | 9,360,835 | | | | 8,765,433 | |
HarborView Mortgage Loan Trust | | | | | | | | |
2006-14 2A1A, 0.58% due 01/25/472 | | | 11,406,199 | | | | 8,431,043 | |
Nationstar HECM Loan Trust | | | | | | | | |
2016-1A A, 2.98% due 02/25/263 | | | 4,660,112 | | | | 4,663,141 | |
2015-1A A, 3.84% due 05/25/183 | | | 3,723,988 | | | | 3,722,126 | |
Deutsche Alt-A Securities Mortgage Loan Trust Series | | | | | | | | |
2007-OA2 A1, 1.12% due 04/25/472 | | | 5,287,599 | | | | 4,442,364 | |
2006-OA1 A1, 0.63% due 02/25/472 | | | 4,765,967 | | | | 3,608,194 | |
Morgan Stanley Resecuritization Trust | | | | | | | | |
2014-R9 1A, 0.57% due 11/26/462,3 | | | 8,546,422 | | | | 7,732,110 | |
BCAP LLC | | | | | | | | |
2014-RR2 1A1, 0.71% due 03/26/362,3 | | | 4,894,223 | | | | 4,643,289 | |
2014-RR3 5A1, 0.58% due 10/26/362,3 | | | 2,983,288 | | | | 2,838,533 | |
IndyMac INDX Mortgage Loan Trust | | | | | | | | |
2005-AR18 2A1B, 1.21% due 10/25/362 | | | 10,631,535 | | | | 7,253,470 | |
VOLT XXXIV LLC | | | | | | | | |
2015-NPL7 A1, 3.25% due 02/25/553 | | | 6,972,823 | | | | 6,839,086 | |
VOLT XLII LLC | | | | | | | | |
2016-NPL2 A1, 4.25% due 03/26/463 | | | 6,350,000 | | | | 6,370,511 | |
Soundview Home Loan Trust | | | | | | | | |
2007-1 2A3, 0.60% due 03/25/372 | | | 6,881,080 | | | | 6,148,262 | |
Nomura Resecuritization Trust | | | | | | | | |
2015-4R 5A1, 0.86% due 03/26/362,3 | | | 2,823,750 | | | | 2,509,277 | |
2015-4R 6A1, 0.96% due 12/26/362,3 | | | 2,187,012 | | | | 2,095,258 | |
2012-1R A, 0.87% due 08/27/472,3 | | | 303,960 | | | | 289,120 | |
AJAX Mortgage Loan Trust | | | | | | | | |
2015-A A, 3.88% due 11/25/543 | | | 4,615,583 | | | | 4,563,801 | |
Park Place Securities Incorporated Asset-Backed Pass-Through Certificates Series | | | | | | | | |
2005-WCW2 M2, 0.96% due 07/25/352 | | | 5,000,000 | | | | 4,393,778 | |
GreenPoint Mortgage Funding Trust | | | | | | | | |
2005-HE4 M1, 0.90% due 07/25/302 | | | 3,862,958 | | | | 3,730,290 | |
2007-AR1 1A1A, 0.51% due 02/25/472 | | | 124,848 | | | | 122,288 | |
Luminent Mortgage Trust | | | | | | | | |
2006-2 A1A, 0.63% due 02/25/462 | | | 5,944,169 | | | | 3,838,027 | |
GSAA Home Equity Trust | | | | | | | | |
2006-14 A2, 0.60% due 09/25/362 | | | 6,744,893 | | | | 3,330,505 | |
2007-7 A4, 0.70% due 07/25/372 | | | 538,991 | | | | 462,817 | |
First NLC Trust | | | | | | | | |
2005-1 A, 0.90% due 05/25/352 | | | 3,794,867 | | | | 3,116,754 | |
SEE NOTES TO FINANCIAL STATEMENTS. | THE GUGGENHEIM FUNDS SEMI-ANNUAL REPORT | 13 |
SCHEDULE OF INVESTMENTS (Unaudited)(continued) | March 31, 2016 |
TOTAL RETURN BOND FUND | |
| | | Face
Amount15 | | | Value | |
| | | | | | | |
GSAA Trust | | | | | | |
2005-10 M4, 1.40% due 06/25/352 | | $ | 3,312,000 | | | $ | 3,030,697 | |
RFMSI Series Trust | | | | | | | | |
2006-S11 A4, 6.00% due 11/25/36 | | | 2,810,174 | | | | 2,472,777 | |
Irwin Home Equity Loan Trust | | | | | | | | |
2007-1 2A4, 5.85% due 08/25/373 | | | 1,672,553 | | | | 1,615,386 | |
UCFC Manufactured Housing Contract | | | | | | | | |
1997-2 M, 7.38% due 10/15/28 | | | 1,078,185 | | | | 1,098,764 | |
Structured Asset Securities Corporation Mortgage Loan Trust | | | | | | | | |
2006-BC6 A4, 0.60% due 01/25/372 | | | 1,237,322 | | | | 1,039,964 | |
Alliance Bancorp Trust | | | | | | | | |
2007-OA1 A1, 0.67% due 07/25/372 | | | 1,277,115 | | | | 791,759 | |
GSAMP Trust | | | | | | | | |
2005-HE6 M1, 0.87% due 11/25/352 | | | 800,000 | | | | 753,270 | |
Morgan Stanley Re-REMIC Trust | | | | | | | | |
2010-R5 4B, 0.93% due 06/26/362,3 | | | 540,861 | | | | 391,878 | |
First Franklin Mortgage Loan Trust | | | | | | | | |
2006-FF1 2A4, 0.77% due 01/25/362 | | | 150,000 | | | | 132,074 | |
Total Residential Mortgage-Backed Securities | | | | 654,853,268 | |
| | | | | | | | | |
Commercial Mortgage-Backed Securities - 6.3% | |
Hilton USA Trust | | | | | | | | |
2013-HLT EFX, 4.60% due 11/05/302,3 | | | 11,700,000 | | | | 11,768,844 | |
2013-HLF EFL, 4.19% due 11/05/302,3 | | | 7,208,379 | | | | 7,172,600 | |
2013-HLF DFL, 3.19% due 11/05/302,3 | | | 6,256,329 | | | | 6,224,314 | |
2013-HLT DFX, 4.41% due 11/05/303 | | | 1,850,000 | | | | 1,852,349 | |
Citigroup Commercial Mortgage Trust | | | | | | | | |
2016-GC36 C, 4.76% due 02/10/49 | | | 22,400,000 | | | | 20,746,830 | |
2015-GC35 XA, 0.91% due 11/10/482 | | | 34,449,404 | | | | 1,999,623 | |
2015-GC29 XA, 1.17% due 04/10/482 | | | 24,915,480 | | | | 1,799,137 | |
2013-GC15 A4, 4.37% due 09/10/462 | | | 380,000 | | | | 424,552 | |
COMM Mortgage Trust | | | | | | | | |
2015-CR26 XA, 1.07% due 09/10/252 | | | 89,567,304 | | | | 6,359,279 | |
2014-KYO E, 2.79% due 06/11/272,3 | | | 6,000,000 | | | | 5,872,246 | |
2015-CR23 XA, 1.01% due 05/10/482 | | | 49,715,194 | | | | 2,948,504 | |
2015-CR26 C, 4.50% due 10/10/482 | | | 3,000,000 | | | | 2,698,271 | |
2013-CR13 XA, 1.14% due 12/10/232 | | | 52,659,252 | | | | 2,458,044 | |
2015-CR27 XA, 1.18% due 10/10/482 | | | 31,906,084 | | | | 2,334,661 | |
2015-CR27 C, 4.47% due 10/10/482 | | | 1,500,000 | | | | 1,424,771 | |
Wells Fargo Commercial Mortgage Trust | | | | | | | | |
2016-C32 XA, 1.37% due 01/15/592 | | | 109,221,776 | | | | 10,121,668 | |
2016-NXS5 XA, 1.58% due 01/15/592 | | | 30,975,764 | | | | 3,099,069 | |
2015-NXS4 XA, 0.97% due 12/15/482 | | | 39,934,702 | | | | 2,631,813 | |
2015-P2 XA, 1.04% due 12/15/482 | | | 34,958,941 | | | | 2,446,035 | |
2015-NXS1 XA, 1.20% due 05/15/482 | | | 11,916,239 | | | | 873,209 | |
2015-NXS4 B, 4.22% due 12/15/48†††,2 | | | 64,000 | | | | 65,705 | |
14 | THE GUGGENHEIM FUNDS SEMI-ANNUAL REPORT | SEE NOTES TO FINANCIAL STATEMENTS. |
SCHEDULE OF INVESTMENTS (Unaudited)(continued) | March 31, 2016 |
TOTAL RETURN BOND FUND | |
| | | Face
Amount15 | | | Value | |
| | | | | | | |
GS Mortgage Securities Corporation Trust | | | | | | |
2016-ICE2 C, 4.69% due 02/15/332,3 | | $ | 18,000,000 | | | $ | 18,005,667 | |
Motel 6 Trust | | | | | | | | |
2015-MTL6 E, 5.27% due 02/05/303 | | | 15,000,000 | | | | 14,518,214 | |
Morgan Stanley Capital I Trust | | | | | | | | |
2015-XLF1 C, 2.64% due 08/13/192,3 | | | 7,600,000 | | | | 7,502,791 | |
2016-UBS9 C, 4.70% due 03/15/492 | | | 275,000 | | | | 257,323 | |
CDGJ Commercial Mortgage Trust | | | | | | | | |
2014-BXCH C, 2.94% due 12/15/272,3 | | | 3,000,000 | | | | 2,912,337 | |
2014-BXCH EPA, 4.69% due 12/15/272,3 | | | 2,000,000 | | | | 1,987,115 | |
DBJPM Mortgage Trust | | | | | | | | |
2016-C1 C, 3.35% due 05/10/492 | | | 4,450,000 | | | | 3,895,841 | |
CSAIL Commercial Mortgage Trust | | | | | | | | |
2015-C1 XA, 0.97% due 04/15/502 | | | 58,598,738 | | | | 3,482,418 | |
CFCRE Commercial Mortgage Trust | | | | | | | | |
2016-C3 XA, 1.10% due 12/10/252 | | | 40,946,230 | | | | 3,197,376 | |
Morgan Stanley Bank of America Merrill Lynch Trust | | | | | | | | |
2015-C27 XA, 1.06% due 12/15/472 | | | 42,006,004 | | | | 2,879,583 | |
JP Morgan Chase Commercial Mortgage Securities Trust | | | | | | | | |
2015-CSMO D, 3.74% due 01/15/322,3 | | | 2,500,000 | | | | 2,434,104 | |
BXHTL Mortgage Trust | | | | | | | | |
2015-JWRZ GL1, 3.29% due 05/15/292,3 | | | 2,500,000 | | | | 2,365,132 | |
Freddie Mac Multifamily Structured Pass Through Certificates | | | | | | | | |
K043 X1, 0.55% due 12/25/242 | | | 44,877,114 | | | | 1,803,329 | |
K715 A2, 2.86% due 01/25/21 | | | 450,000 | | | | 474,396 | |
Hyatt Hotel Portfolio Trust | | | | | | | | |
2015-HYT D, 3.49% due 11/15/292,3 | | | 2,000,000 | | | | 1,924,666 | |
Boca Hotel Portfolio Trust | | | | | | | | |
2013-BOCA D, 3.49% due 08/15/262,3 | | | 1,700,000 | | | | 1,694,126 | |
JPMBB Commercial Mortgage Securities Trust | | | | | | | | |
2013-C12 XA, 0.85% due 07/15/452 | | | 54,456,652 | | | | 1,683,391 | |
GS Mortgage Securities Trust | | | | | | | | |
2015-GC28 XA, 1.17% due 02/10/482 | | | 21,811,285 | | | | 1,465,803 | |
BLCP Hotel Trust | | | | | | | | |
2014-CLRN D, 2.94% due 08/15/292,3 | | | 1,500,000 | | | | 1,400,204 | |
BAMLL Commercial Mortgage Securities Trust | | | | | | | | |
2014-ICTS E, 3.39% due 06/15/282,3 | | | 1,500,000 | | | | 1,398,035 | |
WFRBS Commercial Mortgage Trust | | | | | | | | |
2013-C12 XA, 1.41% due 03/15/482,3 | | | 14,143,190 | | | | 907,399 | |
LSTAR Commercial Mortgage Trust | | | | | | | | |
2014-2 C, 4.97% due 01/20/412,3 | | | 500,000 | | | | 502,946 | |
GS Mortgage Securities Corporation II | | | | | | | | |
2013-GC10 A5, 2.94% due 02/10/46 | | | 225,000 | | | | 230,803 | |
SEE NOTES TO FINANCIAL STATEMENTS. | THE GUGGENHEIM FUNDS SEMI-ANNUAL REPORT | 15 |
SCHEDULE OF INVESTMENTS (Unaudited)(continued) | March 31, 2016 |
TOTAL RETURN BOND FUND | |
| | | Face
Amount15 | | | Value | |
| | | | | | | |
BAMLL-DB Trust | | | | | | |
2012-OSI C, 5.81% due 04/13/293 | | $ | 200,000 | | | $ | 204,294 | |
Total Commercial Mortgage- Backed Securities | | | | 172,448,817 | |
| | | | | | | | | |
Government Agency - 0.7% | |
Fannie Mae | | | | | | | | |
#AS6404, 3.50% due 12/01/45 | | | 4,368,719 | | | | 4,588,410 | |
#AL6671, 5.00% due 12/01/44 | | | 3,075,140 | | | | 3,405,441 | |
#AL6307, 4.50% due 02/01/45 | | | 2,336,861 | | | | 2,542,127 | |
#AZ4788, 4.00% due 10/01/45 | | | 1,131,294 | | | | 1,212,382 | |
Freddie Mac | | | | | | | | |
#G60038, 3.50% due 01/01/44 | | | 3,982,595 | | | | 4,172,425 | |
#G08677, 4.00% due 11/01/45 | | | 3,877,624 | | | | 4,142,472 | |
Total Government Agency | | | | 20,063,257 | |
| | | | | | | | | |
Military Housing - 0.6% | |
Capmark Military Housing Trust | | | | | | | | |
2007-AETC A1, 5.74% due 02/10/52†††,3 | | | 8,353,767 | | | | 8,358,196 | |
2007-ROBS A, 6.06% due 10/10/523 | | | 4,841,540 | | | | 4,773,516 | |
2007-AET2 A, 6.06% due 10/10/523 | | | 2,201,814 | | | | 2,223,017 | |
GMAC Commercial Mortgage Asset Corp. | | | | | | | | |
2003-PRES A, 6.24% due 10/10/41†††,3 | | | 946,917 | | | | 970,959 | |
Total Military Housing | | | | | | | 16,325,688 | |
Total Collateralized Mortgage Obligations | | | | | |
(Cost $875,515,954) | | | | | | | 863,691,030 | |
| | | | | | | | | |
ASSET-BACKED SECURITIES†† - 31.6% | |
Collateralized Loan Obligations - 23.1% | |
CIFC Funding Ltd. | | | | | | | | |
2012-2A A2RL, 2.54% due 12/05/242,3 | | | 18,500,000 | | | | 18,197,671 | |
2014-3X INC, due 07/22/264 | | | 9,500,000 | | | | 4,322,919 | |
2007-I 2, 2.12% due 05/10/212,3 | | | 3,250,000 | | | | 3,047,107 | |
2015-1A B, 2.82% due 01/22/272,3 | | | 3,000,000 | | | | 2,896,620 | |
2015-2A B, 2.72% due 04/15/272,3 | | | 2,000,000 | | | | 1,902,317 | |
2012-1AR A3R, 3.69% due 08/14/242,3 | | | 1,250,000 | | | | 1,218,337 | |
2014-1A C, 3.42% due 04/18/252,3 | | | 500,000 | | | | 474,336 | |
Golub Capital Partners CLO Ltd. | | | | | | | | |
2015-25A A1, 2.42% due 08/05/272,3 | | | 16,500,000 | | | | 16,143,610 | |
2015-24A B, 3.32% due 02/05/272,3 | | | 5,000,000 | | | | 4,830,011 | |
2014-21A B, 3.07% due 10/25/262,3 | | | 2,700,000 | | | | 2,613,735 | |
2011-10AR CR, 3.57% due 10/20/212,3 | | | 1,000,000 | | | | 981,299 | |
2014-18A C, 4.12% due 04/25/262,3 | | | 500,000 | | | | 479,108 | |
2013-17A B, 4.45% due 10/25/252,3 | | | 400,000 | | | | 388,928 | |
LMREC, Inc. | | | | | | | | |
2015-CRE1, 2.18% due 02/22/322,3 | | | 20,000,000 | | | | 19,593,972 | |
2015-CRE1 B, 3.93% due 02/22/322,3 | | | 2,000,000 | | | | 1,916,808 | |
Fortress Credit BSL II Ltd. | | | | | | | | |
2013-2A A1F, 2.12% due 10/19/252,3 | | | 15,500,000 | | | | 15,292,871 | |
2013-2A B1, 2.87% due 10/19/252,3 | | | 4,000,000 | | | | 3,891,118 | |
Black Diamond CLO Ltd. | | | | | | | | |
2012-1X A1, 2.02% due 02/01/232,3 | | | 16,000,000 | | | | 15,625,425 | |
16 | THE GUGGENHEIM FUNDS SEMI-ANNUAL REPORT | SEE NOTES TO FINANCIAL STATEMENTS. |
SCHEDULE OF INVESTMENTS (Unaudited)(continued) | March 31, 2016 |
TOTAL RETURN BOND FUND | |
| | | Face
Amount15 | | | Value | |
| | | | | | | |
2013-1A B, 3.47% due 02/06/262,3 | | $ | 2,000,000 | | | $ | 1,783,481 | |
2012-1A B, 3.87% due 02/01/232,3 | | | 650,000 | | | | 631,877 | |
PFP Ltd. | | | | | | | | |
2015-2 AS, 2.44% due 07/14/342,3 | | | 16,500,000 | | | | 16,265,903 | |
Great Lakes CLO Ltd. | | | | | | | | |
2015-1A A1, 2.57% due 07/15/262,3 | | | 10,000,000 | | | | 9,916,169 | |
2015-1A B, 3.32% due 07/15/262,3 | | | 4,000,000 | | | | 3,859,342 | |
2012-1A C, 4.72% due 01/15/232,3 | | | 1,250,000 | | | | 1,240,573 | |
2012-1A SUB, due 01/15/233,4 | | | 1,000,000 | | | | 421,375 | |
2014-1A C, 4.32% due 04/15/252,3 | | | 250,000 | | | | 240,839 | |
Fortress Credit Investments IV Ltd. | | | | | | | | |
2015-4A B, 2.52% due 07/17/232,3 | | | 14,000,000 | | | | 13,822,626 | |
2015-4A C, 3.52% due 07/17/232,3 | | | 1,000,000 | | | | 949,870 | |
WhiteHorse VIII Ltd. | | | | | | | | |
2014-1A B, 2.67% due 05/01/262,3 | | | 15,750,000 | | | | 14,271,097 | |
Marea CLO Ltd. | | | | | | | | |
2012-1A BR, 2.42% due 10/15/232,3 | | | 14,393,000 | | | | 13,861,434 | |
Oaktree EIF II Series Ltd. | | | | | | | | |
2014-A2 B, 2.92% due 11/15/252,3 | | | 8,000,000 | | | | 7,714,913 | |
2014-A2 C, 3.82% due 11/15/252,3 | | | 5,300,000 | | | | 4,928,504 | |
Venture CLO Ltd. | | | | | | | | |
2012-11AR BR, 2.57% due 11/14/222,3 | | | 11,500,000 | | | | 11,255,622 | |
2013-14A C, 3.39% due 08/28/252,3 | | | 1,250,000 | | | | 1,203,732 | |
Regatta IV Funding Ltd. | | | | | | | | |
2014-1A C, 3.57% due 07/25/262,3 | | | 13,000,000 | | | | 11,892,859 | |
Atrium XI | | | | | | | | |
11A C, 3.82% due 10/23/252,3 | | | 11,500,000 | | | | 11,434,551 | |
Treman Park CLO Ltd. | | | | | | | | |
2015-1A COM, due 04/20/273,4 | | | 10,000,000 | | | | 9,064,717 | |
2015-1A SUB, due 04/20/273,4 | | | 3,600,000 | | | | 2,295,861 | |
Resource Capital Corporation | | | | | | | | |
2015-CRE3 B, 2.84% due 03/15/322,3 | | | 4,500,000 | | | | 4,372,821 | |
2015-CRE3 C, 3.59% due 03/15/322,3 | | | 3,000,000 | | | | 2,914,050 | |
2015-CRE3 D, 4.44% due 03/15/322,3 | | | 2,000,000 | | | | 1,906,139 | |
2014-CRE2 B, 2.94% due 04/15/322,3 | | | 2,000,000 | | | | 1,793,788 | |
RFTI Issuer Ltd. | | | | | | | | |
2015-FL1 A, 2.19% due 08/15/302,14 | | | 10,000,000 | | | | 9,978,936 | |
ACIS CLO Ltd. | | | | | | | | |
2015-6A B1, 3.10% due 05/01/272,3 | | | 7,500,000 | | | | 7,203,144 | |
2013-1A C, 3.57% due 04/18/242,3 | | | 1,650,000 | | | | 1,415,734 | |
2013-2A, 3.83% due 10/14/222,3 | | | 375,000 | | | | 371,990 | |
Dryden 37 Senior Loan Fund | | | | | | | | |
2015-37A Q, due 04/15/273,4 | | | 10,000,000 | | | | 8,952,897 | |
Neuberger Berman CLO XVII Ltd. | | | | | | | | |
2014-17A C, 3.38% due 08/04/252,3 | | | 8,500,000 | | | | 7,969,130 | |
Venture XVII CLO Ltd. | | | | | | | | |
2014-17A C, 3.47% due 07/15/262,3 | | | 8,750,000 | | | | 7,938,699 | |
Fifth Street SLF II Ltd. | | | | | | | | |
2015-2A A1T, 2.25% due 09/29/272,3 | | | 8,000,000 | | | | 7,820,022 | |
Babson CLO Ltd. | | | | | | | | |
2014-3A C1, 3.62% due 01/15/262,3 | | | 6,000,000 | | | | 5,551,705 | |
SEE NOTES TO FINANCIAL STATEMENTS. | THE GUGGENHEIM FUNDS SEMI-ANNUAL REPORT | 17 |
SCHEDULE OF INVESTMENTS (Unaudited)(continued) | March 31, 2016 |
TOTAL RETURN BOND FUND | |
| | | Face
Amount15 | | | Value | |
| | | | | | | |
2012-2A SUB, due 05/15/233,4 | | $ | 4,750,000 | | | $ | 1,764,956 | |
2014-IA SUB, due 07/20/253,4 | | | 1,300,000 | | | | 475,782 | |
Newstar Commercial Loan Funding LLC | | | | | | | | |
2016-1A B, 4.37% due 02/25/282,3 | | | 5,750,000 | | | | 5,721,257 | |
2015-1A B, 3.42% due 01/20/272,3 | | | 1,000,000 | | | | 940,830 | |
2013-1A D, 5.17% due 09/20/232,3 | | | 700,000 | | | | 647,029 | |
2014-1A C, 4.22% due 04/20/252,3 | | | 500,000 | | | | 479,067 | |
KKR CLO 12 Ltd. | | | | | | | | |
12 B1, 2.56% due 07/15/272,3 | | | 8,000,000 | | | | 7,602,442 | |
Voya CLO Ltd. | | | | | | | | |
2013-1X INC, due 04/15/244 | | | 9,500,000 | | | | 4,782,058 | |
2015-3AR CR, 3.57% due 10/15/222,3 | | | 2,250,000 | | | | 2,239,757 | |
OCP CLO Ltd. | | | | | | | | |
2014-7A A2A, 2.72% due 10/20/262,3 | | | 3,500,000 | | | | 3,313,986 | |
2013-4, 3.37% due 10/24/252,3 | | | 2,250,000 | | | | 2,143,390 | |
2014-6A A2A, 2.67% due 07/17/262,3 | | | 1,500,000 | | | | 1,449,780 | |
Ares XXVI CLO Ltd. | | | | | | | | |
2013-1A C, 3.37% due 04/15/252,3 | | | 5,000,000 | | | | 4,773,980 | |
2013-26A SUB, due 04/15/253,4 | | | 4,300,000 | | | | 2,043,069 | |
Vibrant CLO Limited | | | | | | | | |
2012-1A BR, 3.42% due 07/17/242,3 | | | 7,000,000 | | | | 6,733,865 | |
TICC CLO LLC | | | | | | | | |
2012-1A B1, 4.12% due 08/25/232,3 | | | 6,250,000 | | | | 6,303,495 | |
2012-1A C1, 5.37% due 08/25/232,3 | | | 350,000 | | | | 355,685 | |
Garrison Funding Ltd. | | | | | | | | |
2015-1A A2, 3.13% due 05/25/272,3 | | | 6,250,000 | | | | 5,938,575 | |
2013-2A A2, 4.02% due 09/25/232,3 | | | 500,000 | | | | 481,933 | |
Covenant Credit Partners CLO I Ltd. | | | | | | | | |
2014-1A C, 3.54% due 07/20/262,3 | | | 7,300,000 | | | | 6,292,161 | |
Fifth Street Senior Loan Fund I LLC | | | | | | | | |
2015-1A A, 2.62% due 01/20/272,3 | | | 5,000,000 | | | | 4,932,054 | |
2015-1A B, 3.62% due 01/20/272,3 | | | 1,250,000 | | | | 1,228,333 | |
Marathon CLO VII Ltd. | | | | | | | | |
2014-7A B, 4.12% due 10/28/252,3 | | | 4,000,000 | | | | 3,635,000 | |
2014-7A A2, 3.27% due 10/28/252,3 | | | 2,500,000 | | | | 2,403,590 | |
Fortress Credit Opportunities III CLO, LP | | | | | | | | |
2014-3A A1T, 2.52% due 04/28/262,3 | | | 5,000,000 | | | | 4,941,700 | |
2014-3A B1, 3.12% due 04/28/262,3 | | | 650,000 | | | | 633,574 | |
2014-3A C, 3.87% due 04/28/262,3 | | | 400,000 | | | | 380,530 | |
Fortress Credit Funding V, LP | | | | | | | | |
2012-5AR A2R, 3.27% due 08/15/222,3 | | | 6,000,000 | | | | 5,942,451 | |
Avery | | | | | | | | |
2013-3X COM, due 01/18/254 | | | 7,500,060 | | | | 5,883,174 | |
Northwoods Capital XIV Ltd. | | | | | | | | |
2014-14A B, 3.08% due 11/12/252,3 | | | 6,000,000 | | | | 5,744,402 | |
Muir Woods CLO Ltd. | | | | | | | | |
2012-1A B, 3.23% due 09/14/232,3 | | | 5,500,000 | | | | 5,480,663 | |
TICP CLO I Ltd. | | | | | | | | |
2014-1A B, 3.62% due 04/26/262,3 | | | 5,500,000 | | | | 5,206,169 | |
18 | THE GUGGENHEIM FUNDS SEMI-ANNUAL REPORT | SEE NOTES TO FINANCIAL STATEMENTS. |
SCHEDULE OF INVESTMENTS (Unaudited)(continued) | March 31, 2016 |
TOTAL RETURN BOND FUND | |
| | | Face
Amount15 | | | Value | |
| | | | | | | |
OHA Credit Partners IX Ltd. | | | | | | |
2013-9A ACOM, due 10/20/253,4 | | $ | 6,000,000 | | | $ | 4,907,161 | |
Fortress Credit Opportunities VI CLO Ltd. | | | | | | | | |
2015-6A B, 3.34% due 10/10/262,3 | | | 5,000,000 | | | | 4,828,605 | |
SHACKLETON CLO Ltd. | | | | | | | | |
2013-4A B1, 2.62% due 01/13/252,3 | | | 5,000,000 | | | | 4,720,672 | |
Mountain Hawk II CLO Ltd. | | | | | | | | |
2013-2A B, 2.32% due 07/22/242,3 | | | 5,000,000 | | | | 4,509,192 | |
Telos CLO Ltd. | | | | | | | | |
2013-3A C, 3.62% due 01/17/242,3 | | | 2,000,000 | | | | 1,930,953 | |
2014-6A B1, 2.72% due 01/17/272,3 | | | 1,500,000 | | | | 1,407,987 | |
2007-2A D, 2.82% due 04/15/222,3 | | | 1,100,000 | | | | 1,055,395 | |
Cerberus Onshore II CLO LLC | | | | | | | | |
2013-1A A1, 2.62% due 10/15/232,3 | | | 4,156,613 | | | | 4,143,803 | |
ACAS CLO Ltd. | | | | | | | | |
2012-1AR BR, 2.94% due 09/20/232,3 | | | 4,000,000 | | | | 3,996,059 | |
Halcyon Loan Advisors Funding Ltd. | | | | | | | | |
2012-2A C, 3.47% due 12/20/242,3 | | | 4,000,000 | | | | 3,448,249 | |
2012-2A D, 5.12% due 12/20/242,3 | | | 600,000 | | | | 506,861 | |
Cavalry CLO II | | | | | | | | |
2A A, 1.97% due 01/17/242,3 | | | 4,000,000 | | | | 3,929,174 | |
Canyon Capital CLO Ltd. | | | | | | | | |
2012-1A B1, 2.57% due 01/15/242,3 | | | 4,000,000 | | | | 3,832,960 | |
TICP CLO II Ltd. | | | | | | | | |
2014-2A C, 3.92% due 07/20/262,3 | | | 2,850,000 | | | | 2,348,185 | |
2014-2A B, 3.62% due 07/20/262,3 | | | 1,500,000 | | | | 1,386,113 | |
Kingsland V Ltd. | | | | | | | | |
2007-5A C, 1.42% due 07/14/212,3 | | | 4,000,000 | | | | 3,684,534 | |
Regatta III Funding Ltd. | | | | | | | | |
2014-1A B, 3.47% due 04/15/262,3 | | | 4,000,000 | | | | 3,629,534 | |
ACRE Commercial Mortgage Trust | | | | | | | | |
2014-FL2 C, 2.94% due 08/15/312,3 | | | 3,500,000 | | | | 3,564,496 | |
MT Wilson CLO II Ltd. | | | | | | | | |
2007-2A D, 3.37% due 07/11/202,3 | | | 4,000,000 | | | | 3,552,338 | |
Cent CLO | | | | | | | | |
2014-16AR BR, 3.82% due 08/01/242,3 | | | 1,750,000 | | | | 1,749,814 | |
2014-16AR A2R, 2.87% due 08/01/242,3 | | | 1,750,000 | | | | 1,732,912 | |
Madison Park Funding VIII Ltd. | | | | | | | | |
2012-8AR CR, 3.42% due 04/22/222,3 | | | 2,000,000 | | | | 1,999,778 | |
2012-8AR BR, 2.82% due 04/22/222,3 | | | 1,500,000 | | | | 1,475,605 | |
Steele Creek CLO Ltd. | | | | | | | | |
2014-1A B, 2.87% due 08/21/262,3 | | | 3,300,000 | | | | 3,242,194 | |
2014-1A C, 3.82% due 08/21/262,3 | | | 250,000 | | | | 230,929 | |
Anchorage Capital CLO 4 Ltd. | | | | | | | | |
2014-4A A2, 2.78% due 07/28/262,3 | | | 3,600,000 | | | | 3,406,131 | |
Greywolf CLO III Ltd. | | | | | | | | |
2014-1A B, 3.47% due 04/22/262,3 | | | 2,000,000 | | | | 1,924,764 | |
2014-1A A2, 2.67% due 04/22/262,3 | | | 1,500,000 | | | | 1,436,979 | |
CFIP CLO Ltd. | | | | | | | | |
2014-1A A2, 2.09% due 04/13/252,3 | | | 3,400,000 | | | | 3,280,368 | |
Carlyle Global Market Strategies CLO Ltd. | | | | | | | | |
2014-1A C, 3.62% due 04/17/252,3 | | | 2,500,000 | | | | 2,451,943 | |
SEE NOTES TO FINANCIAL STATEMENTS. | THE GUGGENHEIM FUNDS SEMI-ANNUAL REPORT | 19 |
SCHEDULE OF INVESTMENTS (Unaudited)(continued) | March 31, 2016 |
TOTAL RETURN BOND FUND | |
| | | Face
Amount15 | | | Value | |
| | | | | | | |
2012-2AR DR, 4.52% due 07/20/232,3 | | $ | 750,000 | | | $ | 691,921 | |
2012-3A SUB, due 10/04/243,4 | | | 250,000 | | | | 123,588 | |
Oaktree EIF I Series A Ltd. | | | | | | | | |
2016-A C1, 4.39% due 01/20/272,3 | | | 3,250,000 | | | | 3,262,648 | |
Fortress Credit Opportunities V CLO Ltd. | | | | | | | | |
2014-5A C, 4.17% due 10/15/262,3 | | | 1,750,000 | | | | 1,642,603 | |
2014-5A B, 3.27% due 10/15/262,3 | | | 1,500,000 | | | | 1,462,869 | |
Dryden XXIII Senior Loan Fund | | | | | | | | |
2012-23A CR, 4.52% due 07/17/232,3 | | | 2,000,000 | | | | 1,848,366 | |
2014-23RA BR, 3.57% due 07/17/232,3 | | | 1,250,000 | | | | 1,206,709 | |
Rockwall CDO Ltd. | | | | | | | | |
2007-1A A1LB, 1.17% due 08/01/242,3 | | | 2,100,000 | | | | 1,966,252 | |
2007-1A A1LA, 0.87% due 08/01/242,3 | | | 1,080,998 | | | | 1,049,321 | |
Benefit Street Partners CLO Ltd. | | | | | | | | |
2015-IA BR, 3.72% due 10/15/252,3 | | | 3,000,000 | | | | 2,999,967 | |
KKR Financial CLO Ltd. | | | | | | | | |
2007-1A E, 5.62% due 05/15/212,3 | | | 2,500,000 | | | | 2,490,262 | |
2012-1A B, 3.93% due 12/15/242,3 | | | 500,000 | | | | 488,996 | |
Venture X CLO Ltd. | | | | | | | | |
2012-10A C, 3.87% due 07/20/222,3 | | | 3,000,000 | | | | 2,963,486 | |
Octagon Investment Partners XIX Ltd. | | | | | | | | |
2014-1A C, 3.47% due 04/15/262,3 | | | 3,000,000 | | | | 2,891,483 | |
Madison Park Funding Ltd. | | | | | | | | |
2007-6A D, 3.87% due 07/26/212,3 | | | 3,000,000 | | | | 2,885,712 | |
Atlas Senior Loan Fund VI Ltd. | | | | | | | | |
2014-6A C, 3.62% due 10/15/262,3 | | | 3,000,000 | | | | 2,873,809 | |
Ivy Hill Middle Market Credit Fund VII Ltd. | | | | | | | | |
7A B, 2.92% due 10/20/252,3 | | | 2,000,000 | | | | 1,921,957 | |
7A C, 4.07% due 10/20/252,3 | | | 1,000,000 | | | | 922,883 | |
Crown Point CLO III Ltd. | | | | | | | | |
2015-3A B, 3.67% due 12/31/272,3 | | | 3,000,000 | | | | 2,659,994 | |
OHA Credit Partners VI Ltd. | | | | | | | | |
2015-6A C1R, 3.12% due 05/15/232,3 | | | 2,500,000 | | | | 2,494,953 | |
Eaton Vance CLO 2013-1 Ltd. | | | | | | | | |
2013-1A A2, 2.42% due 11/13/242,3 | | | 2,500,000 | | | | 2,364,276 | |
Cerberus Onshore II CLO-2 LLC | | | | | | | | |
2014-1A B, 2.98% due 10/15/232,3 | | | 2,250,000 | | | | 2,214,266 | |
TICP CLO III Ltd. | | | | | | | | |
2014-3A C, 3.87% due 01/20/272,3 | | | 2,250,000 | | | | 2,159,957 | |
Oaktree EIF II Series B1 Ltd. | | | | | | | | |
2015-B1A B, 2.92% due 02/15/262,3 | | | 2,205,000 | | | | 2,121,103 | |
St. James River CLO Ltd. | | | | | | | | |
2007-1A D, 2.93% due 06/11/212,3 | | | 2,250,000 | | | | 2,107,692 | |
ALM VII R Ltd. | | | | | | | | |
2013-7RA B, 3.22% due 04/24/242,3 | | | 2,000,000 | | | | 1,991,681 | |
NewStar Arlington Senior Loan Program LLC | | | | | | | | |
2014-1A B1, 3.22% due 07/25/252,3 | | | 1,000,000 | | | | 928,748 | |
2014-1A B2, 4.76% due 07/25/253 | | | 700,000 | | | | 680,142 | |
2014-1A C1, 3.92% due 07/25/252,3 | | | 400,000 | | | | 377,868 | |
20 | THE GUGGENHEIM FUNDS SEMI-ANNUAL REPORT | SEE NOTES TO FINANCIAL STATEMENTS. |
SCHEDULE OF INVESTMENTS (Unaudited)(continued) | March 31, 2016 |
TOTAL RETURN BOND FUND | |
| | | Face
Amount15 | | | Value | |
| | | | | | | |
Symphony CLO X Ltd. | | | | | | |
2012-10AR CR, 3.47% due 07/23/232,3 | | $ | 2,000,000 | | | $ | 1,985,870 | |
KKR CLO Trust | | | | | | | | |
2012-1A A2, 2.83% due 12/15/242,3 | | | 2,000,000 | | | | 1,949,898 | |
Ivy Hill Middle Market Credit Fund IX Ltd. | | | | | | | | |
9A B1, 3.07% due 10/18/252,3 | | | 1,000,000 | | | | 968,739 | |
9A C, 3.92% due 10/18/252,3 | | | 1,000,000 | | | | 930,483 | |
Anchorage Capital CLO 2012-1 Ltd. | | | | | | | | |
2012-1A B, 3.42% due 01/13/252,3 | | | 2,000,000 | | | | 1,882,211 | |
Sound Point CLO IV Ltd. | | | | | | | | |
2013-3A C, 2.97% due 01/21/262,3 | | | 2,000,000 | | | | 1,860,343 | |
NewStar Clarendon Fund CLO LLC | | | | | | | | |
2015-1A C, 3.97% due 01/25/272,3 | | | 2,000,000 | | | | 1,859,385 | |
Duane Street CLO IV Ltd. | | | | | | | | |
2007-4A D, 2.87% due 11/14/212,3 | | | 2,000,000 | | | | 1,812,959 | |
Madison Park Funding V Ltd. | | | | | | | | |
2007-5A C, 2.08% due 02/26/212,3 | | | 2,000,000 | | | | 1,808,257 | |
Neuberger Berman CLO Ltd. | | | | | | | | |
2012-12X SUB, due 07/25/234 | | | 3,000,000 | | | | 1,191,493 | |
2012-12A SUB, due 07/25/233,4 | | | 1,500,000 | | | | 595,746 | |
Galaxy XIX CLO Ltd. | | | | | | | | |
2015-19A COMB, due 01/24/273,4 | | | 2,000,000 | | | | 1,754,830 | |
Newstar Trust | | | | | | | | |
2012-2A C, 4.87% due 01/20/232,3 | | | 1,000,000 | | | | 965,987 | |
2012-2A B, 3.87% due 01/20/232,3 | | | 750,000 | | | | 745,520 | |
Westchester CLO Ltd. | | | | | | | | |
2007-1A B, 1.06% due 08/01/222,3 | | | 1,850,000 | | | | 1,693,438 | |
KVK CLO 2013-2 Ltd. | | | | | | | | |
2013-2A B, 2.62% due 01/15/262,3 | | | 1,750,000 | | | | 1,585,126 | |
Race Point V CLO Ltd. | | | | | | | | |
2014-5AR CR, 3.48% due 12/15/222,3 | | | 1,100,000 | | | | 1,103,730 | |
2014-5AR DR, 4.38% due 12/15/222,3 | | | 500,000 | | | | 478,495 | |
Gramercy Park CLO Ltd. | | | | | | | | |
2012-1AR BR, 3.57% due 07/17/232,3 | | | 1,600,000 | | | | 1,578,607 | |
Adirondack Park CLO Ltd. | | | | | | | | |
2013-1A C, 3.62% due 04/15/242,3 | | | 1,500,000 | | | | 1,474,708 | |
ACA CLO Ltd. | | | | | | | | |
2007-1A C, 1.57% due 06/15/222,3 | | | 1,575,000 | | | | 1,461,094 | |
MCF CLO I LLC | | | | | | | | |
2013-1A C, 4.17% due 04/20/232,3 | | | 1,500,000 | | | | 1,457,062 | |
ING Investment Management CLO Ltd. | | | | | | | | |
2007-4A C, 2.82% due 06/14/222,3 | | | 1,500,000 | | | | 1,400,625 | |
NYLIM Flatiron CLO Ltd. | | | | | | | | |
2006-1A C, 2.09% due 08/08/202,3 | | | 1,500,000 | | | | 1,399,854 | |
Venture XIII CLO Ltd. | | | | | | | | |
2013-13A SUB, due 06/10/253,4 | | | 3,700,000 | | | | 1,394,709 | |
Flatiron CLO 2013-1 Ltd. | | | | | | | | |
2013-1A B, 3.37% due 01/17/262,3 | | | 1,450,000 | | | | 1,338,709 | |
KVK CLO Ltd. | | | | | | | | |
2013-1A SUB, due 04/14/253,4 | | | 3,800,000 | | | | 1,274,310 | |
Galaxy XI CLO Ltd. | | | | | | | | |
2011-11A D, 4.27% due 08/20/222,3 | | | 1,250,000 | | | | 1,186,276 | |
SEE NOTES TO FINANCIAL STATEMENTS. | THE GUGGENHEIM FUNDS SEMI-ANNUAL REPORT | 21 |
SCHEDULE OF INVESTMENTS (Unaudited)(continued) | March 31, 2016 |
TOTAL RETURN BOND FUND | |
| | | Face
Amount15 | | | Value | |
| | | | | | | |
COA Summit CLO Limited | | | | | | |
2014-1A B, 3.42% due 04/20/232,3 | | $ | 1,250,000 | | | $ | 1,177,499 | |
Global Leveraged Capital Credit Opportunity Fund | | | | | | | | |
2006-1A C, 1.62% due 12/20/182,3 | | | 1,036,000 | | | | 1,017,221 | |
Ares XXIII CLO Ltd. | | | | | | | | |
2014-1AR CR, 3.82% due 04/19/232,3 | | | 1,000,000 | | | | 1,003,901 | |
Symphony CLO XV Ltd. | | | | | | | | |
2014-15A C, 3.82% due 10/17/262,3 | | | 1,000,000 | | | | 991,341 | |
ALM XIV Ltd. | | | | | | | | |
2014-14A B, 3.57% due 07/28/262,3 | | | 750,000 | | | | 724,995 | |
2014-14A C, 4.07% due 07/28/262,3 | | | 300,000 | | | | 262,594 | |
Gallatin CLO VII Ltd. | | | | | | | | |
2014-1A C, 3.52% due 07/15/232,3 | | | 1,000,000 | | | | 983,777 | |
Churchill Financial Cayman Ltd. | | | | | | | | |
2007-1A D1, 3.22% due 07/10/192,3 | | | 1,000,000 | | | | 983,489 | |
Neuberger Berman CLO XVIII Ltd. | | | | | | | | |
2014-18A B, 3.77% due 11/14/252,3 | | | 1,000,000 | | | | 971,277 | |
Catamaran CLO Ltd. | | | | | | | | |
2015-1A C1, 3.72% due 04/22/272,3 | | | 1,000,000 | | | | 967,079 | |
Limerock CLO II Ltd. | | | | | | | | |
2014-2A C1, 3.47% due 04/18/262,3 | | | 1,000,000 | | | | 958,424 | |
San Gabriel CLO Ltd. | | | | | | | | |
2007-1A B1L, 2.89% due 09/10/212,3 | | | 1,000,000 | | | | 955,016 | |
Flagship CLO VI | | | | | | | | |
2007-1A D, 3.04% due 06/10/212,3 | | | 1,000,000 | | | | 937,176 | |
WhiteHorse IV Ltd. | | | | | | | | |
2006-4A C, 2.07% due 01/17/202,3 | | | 1,000,000 | | | | 932,234 | |
NXT Capital CLO LLC | | | | | | | | |
2015-1A C, 4.27% due 04/21/272,3 | | | 1,000,000 | | | | 922,213 | |
Highbridge Loan Management Ltd. | | | | | | | | |
2013-2A C, 4.32% due 10/20/242,3 | | | 1,000,000 | | | | 891,393 | |
Lime Street CLO Ltd. | | | | | | | | |
2007-1A D, 3.12% due 06/20/212,3 | | | 1,000,000 | | | | 826,090 | |
Ares XII CLO Ltd. | | | | | | | | |
2007-12A D, 3.88% due 11/25/202,3 | | | 750,000 | | | | 737,458 | |
Venture XII CLO Ltd. | | | | | | | | |
2012-12A C1, 3.49% due 02/28/242,3 | | | 750,000 | | | | 716,408 | |
Grayson CLO Ltd. | | | | | | | | |
2006-1A A2, 1.03% due 11/01/212,3 | | | 750,000 | | | | 673,464 | |
Atlas Senior Loan Fund II Ltd. | | | | | | | | |
2012-2A SUB, due 01/30/243,4 | | | 1,200,000 | | | | 524,376 | |
GoldenTree Credit Opportunities Financing Ltd. | | | | | | | | |
2012-1A B2, 4.63% due 09/15/242,3 | | | 500,000 | | | | 497,875 | |
DIVCORE CLO Ltd. | | | | | | | | |
2013-1A B, 4.33% due 11/15/322,3 | | | 500,000 | | | | 492,338 | |
OZLM Funding V Ltd. | | | | | | | | |
2013-5A B, 3.62% due 01/17/262,3 | | | 500,000 | | | | 486,888 | |
AMMC CLO XIV Ltd. | | | | | | | | |
2014-14A A3L, 3.42% due 07/27/262,3 | | | 500,000 | | | | 472,201 | |
Westwood CDO I Ltd. | | | | | | | | |
2006-1A B, 1.27% due 03/25/212,3 | | | 500,000 | | | | 466,588 | |
NewStar Commercial Loan Trust | | | | | | | | |
2007-1A C, 1.94% due 09/30/222,3 | | | 500,000 | | | | 462,088 | |
22 | THE GUGGENHEIM FUNDS SEMI-ANNUAL REPORT | SEE NOTES TO FINANCIAL STATEMENTS. |
SCHEDULE OF INVESTMENTS (Unaudited)(continued) | March 31, 2016 |
TOTAL RETURN BOND FUND | |
| | | Face
Amount15 | | | Value | |
| | | | | | | |
Keuka Park CLO Ltd. | | | | | | |
2013-1A, due 10/21/243,4 | | $ | 1,000,000 | | | $ | 415,707 | |
MCF CLO IV LLC | | | | | | | | |
2014-1A E, 6.22% due 10/15/252,3 | | | 500,000 | | | | 404,245 | |
Finn Square CLO Ltd. | | | | | | | | |
2012-1A SUB, due 12/24/233,4 | | | 1,000,000 | | | | 350,096 | |
Copper River CLO Ltd. | | | | | | | | |
2007-1A INC, due 01/20/213,4 | | | 1,500,000 | | | | 281,845 | |
Ares XXV CLO Ltd. | | | | | | | | |
2012-25A SUB, due 01/17/243,4 | | | 750,000 | | | | 245,801 | |
Eastland CLO Ltd. | | | | | | | | |
2007-1A A3, 1.02% due 05/01/222,3 | | | 250,000 | | | | 235,719 | |
ICE EM CLO | | | | | | | | |
2007-1A A2, 1.46% due 08/15/222,3 | | | 146,364 | | | | 143,528 | |
BlackRock Senior Income Series Corp. | | | | | | | | |
2004-1X NOTE, due 09/15/16†††,1,4 | | | 496,446 | | | | — | |
Marathon CLO II Ltd. | | | | | | | | |
2005-2A INC, due 12/20/19†††,2,3,4 | | | 250,000 | | | | — | |
Total Collateralized Loan Obligations | | | | 630,313,337 | |
| | | | | | | | | |
Transport-Aircraft - 4.8% | |
Apollo Aviation Securitization Equity Trust | | | | | | | | |
2016-1A A, 4.88% due 03/17/363 | | | 22,250,000 | | | | 21,932,822 | |
2014-1 A, 5.12% due 12/15/292 | | | 8,812,500 | | | | 8,482,031 | |
2014-1 B, 7.38% due 12/15/292 | | | 2,711,538 | | | | 2,687,135 | |
AIM Aviation Finance Ltd. | | | | | | | | |
2015-1A A1, 4.21% due 02/15/403 | | | 30,446,429 | | | | 29,500,763 | |
2015-1A B1, 5.07% due 02/15/403 | | | 2,537,202 | | | | 2,514,596 | |
Castlelake Aircraft Securitization Trust | | | | | | | | |
2015-1A A, 4.70% due 12/15/403 | | | 21,450,000 | | | | 21,025,290 | |
2014-1 A1, 5.25% due 02/15/293 | | | 2,448,066 | | | | 2,427,258 | |
2014-1 B, 7.50% due 02/15/293 | | | 1,212,960 | | | | 1,196,585 | |
ECAF I Ltd. | | | | | | | | |
2015-1A A2, 4.95% due 06/15/403 | | | 16,106,543 | | | | 15,612,894 | |
2015-1A A1, 3.47% due 06/15/403 | | | 1,789,573 | | | | 1,714,912 | |
Diamond Head Aviation Ltd. | | | | | | | | |
2015-1 A, 3.81% due 07/14/283 | | | 5,746,727 | | | | 5,678,490 | |
Rise Ltd. | | | | | | | | |
2014-1, 4.74% due 02/12/39 | | | 4,833,310 | | | | 4,748,727 | |
Atlas Ltd. | | | | | | | | |
2014-1 A, 4.87% due 12/15/39††† | | | 3,708,400 | | | | 3,652,811 | |
AASET | | | | | | | | |
2014-1 C, 10.00% due 08/15/30††† | | | 2,708,630 | | | | 2,670,059 | |
Emerald Aviation Finance Ltd. | | | | | | | | |
2013-1 A, 4.65% due 10/15/383 | | | 1,672,015 | | | | 1,666,660 | |
2013-1 B, 6.35% due 10/15/383 | | | 358,289 | | | | 363,215 | |
Stripes | | | | | | | | |
2013-1 A1, 3.93% due 03/20/23†††,1 | | | 1,905,088 | | | | 1,858,966 | |
Turbine Engines Securitization Ltd. | | | | | | | | |
2013-1A A, 5.13% due 12/13/483 | | | 1,359,419 | | | | 1,317,893 | |
Willis Engine Securitization Trust II | | | | | | | | |
2012-A, 5.50% due 09/15/373 | | | 1,132,066 | | | | 1,101,500 | |
AABS Ltd. | | | | | | | | |
2013-1, 4.87% due 01/15/38 | | | 381,689 | | | | 376,536 | |
SEE NOTES TO FINANCIAL STATEMENTS. | THE GUGGENHEIM FUNDS SEMI-ANNUAL REPORT | 23 |
SCHEDULE OF INVESTMENTS (Unaudited)(continued) | March 31, 2016 |
TOTAL RETURN BOND FUND | |
| | | Face
Amount15 | | | Value | |
| | | | | | | |
Airplanes Pass Through Trust | | | | | | |
2001-1A A9, 0.99% due 03/15/192,14 | | $ | 740,322 | | | $ | 185,080 | |
Total Transport-Aircraft | | | | | | | 130,714,223 | |
| | | | | | | | | |
Collateralized Debt Obligations - 2.8% | |
Triaxx Prime CDO Ltd. | | | | | | | | |
2006-2A A1A, 0.70% due 10/02/392,3 | | | 22,903,538 | | | | 21,535,481 | |
2006-2A A1B2, 0.70% due 10/02/392,3 | | | 5,324,399 | | | | 5,030,520 | |
FDF I Ltd. | | | | | | | | |
2015-1A A, 4.40% due 11/12/30†††,3 | | | 13,000,000 | | | | 13,203,190 | |
Gramercy Real Estate CDO 2006-1 Ltd. | | | | | | | | |
2006-1A B, 0.99% due 07/25/412,3 | | | 10,220,867 | | | | 9,939,793 | |
RFTI Issuer Ltd. | | | | | | | | |
2015-FL1 B, 4.32% due 08/15/30†††,2,14 | | | 5,000,000 | | | | 4,929,850 | |
SRERS Funding Ltd. | | | | | | | | |
2011-RS A1B1, 0.69% due 05/09/462,3 | | | 4,905,156 | | | | 4,692,749 | |
N-Star REL CDO VIII Ltd. | | | | | | | | |
2006-8A A2, 0.79% due 02/01/412,3 | | | 3,650,000 | | | | 3,513,184 | |
Banco Bradesco SA | | | | | | | | |
2014-1 A, 4.21% due 03/12/26†††,1 | | | 3,105,759 | | | | 3,128,182 | |
Anchorage Credit Funding 1 Ltd. | | | | | | | | |
2015-1A A, 4.30% due 07/28/301,3,14 | | | 3,000,000 | | | | 3,114,209 | |
RAIT CRE CDO I Ltd. | | | | | | | | |
2006-1X A1B, 0.75% due 11/20/46 | | | 2,364,920 | | | | 2,200,679 | |
Gramercy Real Estate CDO Ltd. | | | | | | | | |
2007-1A A1, 0.90% due 08/15/562,3 | | | 1,562,334 | | | | 1,374,854 | |
Wrightwood Capital Real Estate CDO Ltd. | | | | | | | | |
2005-1A B, 1.05% due 11/21/402,3 | | | 1,250,000 | | | | 1,186,256 | |
Highland Park CDO I Ltd. | | | | | | | | |
2006-1A A1, 0.96% due 11/25/512,3 | | | 1,247,140 | | | | 1,178,789 | |
N-Star Real Estate CDO IX Ltd. | | | | | | | | |
0.75% due 02/01/411 | | | 793,567 | | | | 779,297 | |
Total Collateralized Debt Obligations | | | | 75,807,033 | |
| | | | | | | | | |
Net Lease - 0.5% | |
Spirit Master Funding LLC | | | | | | | | |
2014-2A A, 5.76% due 03/20/423 | | | 5,013,416 | | | | 5,221,002 | |
2014-4A A2, 4.63% due 01/20/453 | | | 2,000,000 | | | | 1,902,894 | |
Store Master Funding I LLC | | | | | | | | |
2015-1A A2, 4.17% due 04/20/453 | | | 5,822,192 | | | | 5,385,528 | |
Store Master Funding LLC | | | | | | | | |
2012-1A A, 5.77% due 08/20/423 | | | 1,801,404 | | | | 1,862,151 | |
Total Net Lease | | | | | | | 14,371,575 | |
| | | | | | | | | |
Insurance - 0.2% | |
Chesterfield Financial Holdings LLC | | | | | | | | |
2014-1A A, 4.50% due 12/15/343 | | | 5,881,250 | | | | 5,910,303 | |
| | | | | | | | | |
Financial - 0.1% | |
CCR Incorporated MT100 Payment Rights Master Trust | | | | | | | | |
2012-CA C, 4.75% due 07/10/223 | | | 859,524 | | | | 865,243 | |
2010-CX C, 0.88% due 07/10/172 | | | 757,429 | | | | 747,557 | |
Garanti Diversified Payment Rights Finance Co. | | | | | | | | |
2007-A A1, 0.81% due 07/09/172 | | | 624,000 | | | | 611,282 | |
24 | THE GUGGENHEIM FUNDS SEMI-ANNUAL REPORT | SEE NOTES TO FINANCIAL STATEMENTS. |
SCHEDULE OF INVESTMENTS (Unaudited)(continued) | March 31, 2016 |
TOTAL RETURN BOND FUND | |
| | | Face
Amount15 | | | Value | |
| | | | | | | |
CIC Receivables Master Trust | | | | | | |
4.89% due 10/07/21†††,1 | | $ | 500,000 | | | $ | 498,775 | |
Total Financial | | | | | | | 2,722,857 | |
| | | | | | | | | |
Communications - 0.1% | |
Hana Small Business Lending Loan Trust | | | | | | | | |
2014 A, 3.34% due 01/25/402,3 | | | 1,615,537 | | | | 1,594,050 | |
Total Asset-Backed Securities | | | | | |
(Cost $886,125,712) | | | | | | | 861,433,378 | |
| | | | | | | | | |
CORPORATE BONDS†† - 21.1% | |
Financial - 5.6% | |
Citigroup, Inc. | | | | | | | | |
5.95%2,9 | | | 11,090,000 | | | | 10,650,833 | |
5.87%2,9,10 | | | 5,685,000 | | | | 5,493,131 | |
5.95%2,9 | | | 5,000,000 | | | | 4,817,185 | |
Bank of America Corp. | | | | | | | | |
6.10%2,9,10 | | | 10,500,000 | | | | 10,342,500 | |
6.30%2,9 | | | 5,450,000 | | | | 5,613,500 | |
6.10% due 06/15/17 | | | 760,000 | | | | 794,873 | |
Hospitality Properties Trust | | | | | | | | |
5.25% due 02/15/26 | | | 16,200,000 | | | | 16,272,802 | |
Teachers Insurance & Annuity Association of America | | | | | | | | |
4.90% due 09/15/443,10 | | | 11,050,000 | | | | 11,840,616 | |
4.38% due 09/15/542,3,10 | | | 3,000,000 | | | | 3,021,036 | |
SunTrust Banks, Inc. | | | | | | | | |
5.63%2,9,10 | | | 9,878,000 | | | | 9,779,219 | |
GMH Military Housing-Navy Northeast LLC | | | | | | | | |
6.30% due 10/15/49††† | | | 8,725,000 | | | | 9,165,351 | |
Banco Nacional de Comercio Exterior SNC | | | | | | | | |
4.38% due 10/14/253 | | | 7,900,000 | | | | 7,955,300 | |
Corporation Financiera de Desarrollo S.A. | | | | | | | | |
5.25% due 07/15/292,3 | | | 6,650,000 | | | | 6,699,875 | |
Fifth Third Bancorp | | | | | | | | |
4.90%2,9,10 | | | 3,800,000 | | | | 3,315,500 | |
5.10%2,9 | | | 3,142,000 | | | | 2,851,365 | |
Icahn Enterprises Limited Partnership / Icahn Enterprises Finance Corp. | | | | | | | | |
6.00% due 08/01/2010 | | | 5,000,000 | | | | 4,862,500 | |
5.88% due 02/01/22 | | | 1,000,000 | | | | 949,000 | |
Fort Benning Family Communities LLC | | | | | | | | |
0.79% due 01/15/36†††,2,3 | | | 6,000,000 | | | | 4,594,020 | |
Citizens Financial Group, Inc. | | | | | | | | |
5.50%2,3,9,10 | | | 4,500,000 | | | | 4,275,000 | |
Mid-Atlantic Military Family Communities LLC | | | | | | | | |
5.30% due 08/01/503 | | | 3,338,261 | | | | 3,041,790 | |
Kennedy-Wilson, Inc. | | | | | | | | |
5.87% due 04/01/24 | | | 2,275,000 | | | | 2,223,813 | |
Manulife Financial Corp. | | | | | | | | |
4.15% due 03/04/26 | | | 2,100,000 | | | | 2,145,427 | |
AmTrust Financial Services, Inc. | | | | | | | | |
6.12% due 08/15/231 | | | 1,910,000 | | | | 2,050,028 | |
Customers Bank | | | | | | | | |
6.12% due 06/26/292,14 | | | 2,000,000 | | | | 2,000,000 | |
Atlas Mara Ltd. | | | | | | | | |
8.00% due 12/31/201 | | | 2,400,000 | | | | 1,984,800 | |
Atlantic Marine Corporations Communities LLC | | | | | | | | |
5.43% due 12/01/503 | | | 1,056,505 | | | | 1,072,269 | |
5.38% due 02/15/48 | | | 556,076 | | | | 562,632 | |
Pacific Northwest Communities LLC | | | | | | | | |
5.91% due 06/15/503 | | | 1,000,000 | | | | 1,112,920 | |
Fort Knox Military Housing Privatization Project | | | | | | | | |
0.78% due 02/15/52†††,2,3 | | | 1,775,845 | | | | 1,093,796 | |
Cadence Bank North America | | | | | | | | |
6.25% due 06/28/292,14 | | | 1,200,000 | | | | 1,035,000 | |
Wilton Re Finance LLC | | | | | | | | |
5.87% due 03/30/332,3 | | | 925,000 | | | | 1,004,484 | |
Univest Corporation of Pennsylvania | | | | | | | | |
5.10% due 03/30/251,2 | | | 1,000,000 | | | | 995,000 | |
SEE NOTES TO FINANCIAL STATEMENTS. | THE GUGGENHEIM FUNDS SEMI-ANNUAL REPORT | 25 |
SCHEDULE OF INVESTMENTS (Unaudited)(continued) | March 31, 2016 |
TOTAL RETURN BOND FUND | |
| | | Face
Amount15 | | | Value | |
| | | | | | | |
Oxford Finance LLC / Oxford Finance Company-Issuer, Inc. | | | | | | |
7.25% due 01/15/183 | | $ | 1,000,000 | | | $ | 990,000 | |
International Lease Finance Corp. | | | | | | | | |
7.13% due 09/01/18 | | | 730,000 | | | | 795,700 | |
Nasdaq, Inc. | | | | | | | | |
5.55% due 01/15/20 | | | 720,000 | | | | 794,728 | |
First Niagara Financial Group, Inc. | | | | | | | | |
6.75% due 03/19/20 | | | 700,000 | | | | 792,434 | |
EPR Properties | | | | | | | | |
4.50% due 04/01/2510 | | | 785,000 | | | | 761,563 | |
ACC Group Housing LLC | | | | | | | | |
6.35% due 07/15/54†††,3 | | | 625,000 | | | | 663,725 | |
American Tower Corp. | | | | | | | | |
3.50% due 01/31/23 | | | 420,000 | | | | 423,982 | |
Jackson National Life Insurance Co. | | | | | | | | |
8.15% due 03/15/273 | | | 125,000 | | | | 166,270 | |
Prosight Global Inc. | | | | | | | | |
7.50% due 11/26/20†††,1 | | | 100,000 | | | | 103,704 | |
Total Financial | | | | | | | 149,107,671 | |
| | | | | | | | | |
Government - 4.5% | |
Freddie Mac | | | | | | | | |
6.75% due 03/15/31 | | | 30,646,000 | | | | 46,266,480 | |
due 12/14/2911 | | | 16,600,000 | | | | 11,072,233 | |
Tennessee Valley Authority | | | | | | | | |
4.25% due 09/15/65 | | | 9,900,000 | | | | 10,442,490 | |
5.38% due 04/01/56 | | | 7,210,000 | | | | 9,280,027 | |
Fannie Mae Principal | | | | | | | | |
due 01/15/3011 | | | 22,000,000 | | | | 14,560,524 | |
due 05/15/3011 | | | 2,250,000 | | | | 1,467,367 | |
Federal Home Loan Bank | | | | | | | | |
5.50% due 07/15/36 | | | 11,000,000 | | | | 15,154,183 | |
Freddie Mac Strips | | | | | | | | |
due 07/15/3211 | | | 8,000,000 | | | | 4,888,480 | |
due 03/15/3111 | | | 6,525,000 | | | | 4,154,742 | |
Fannie Mae | | | | | | | | |
due 01/15/3011 | | | 4,000,000 | | | | 2,640,220 | |
due 01/15/3511 | | | 2,250,000 | | | | 1,216,352 | |
due 02/06/3311 | | | 1,456,000 | | | | 848,812 | |
due 01/15/3311 | | | 1,450,000 | | | | 847,207 | |
due 07/15/3211 | | | 1,333,000 | | | | 793,782 | |
Total Government | | | | | | | 123,632,899 | |
| | | | | | | | | |
Communications - 2.6% | |
CCOH Safari LLC | | | | | | | | |
5.75% due 02/15/263 | | | 17,200,000 | | | | 17,801,999 | |
Sprint Communications, Inc. | | | | | | | | |
7.00% due 03/01/203,10 | | | 14,500,000 | | | | 14,500,000 | |
9.00% due 11/15/183 | | | 750,000 | | | | 785,625 | |
DISH DBS Corp. | | | | | | | | |
5.88% due 11/15/2410 | | | 8,100,000 | | | | 7,431,749 | |
Neptune Finco Corp. | | | | | | | | |
6.63% due 10/15/253 | | | 5,997,000 | | | | 6,483,657 | |
T-Mobile USA, Inc. | | | | | | | | |
6.00% due 04/15/24 | | | 4,250,000 | | | | 4,303,125 | |
Numericable-SFR SAS | | | | | | | | |
6.25% due 05/15/243 | | | 2,950,000 | | | | 2,860,025 | |
CCO Holdings LLC / CCO Holdings Capital Corp. | | | | | | | | |
5.88% due 04/01/24 | | | 2,500,000 | | | | 2,618,750 | |
McGraw-Hill Global Education Holdings LLC / McGraw-Hill Global Education Finance | | | | | | | | |
9.75% due 04/01/21 | | | 2,150,000 | | | | 2,332,750 | |
Virgin Media Finance plc | | | | | | | | |
6.38% due 04/15/233 | | | 1,620,000 | | | | 1,684,800 | |
Altice US Finance I Corp. | | | | | | | | |
5.38% due 07/15/233 | | | 1,356,000 | | | | 1,392,443 | |
Avaya, Inc. | | | | | | | | |
7.00% due 04/01/193,10 | | | 1,700,000 | | | | 1,147,500 | |
Verizon Communications, Inc. | | | | | | | | |
5.15% due 09/15/23 | | | 750,000 | | | | 865,660 | |
CC Holdings GS V LLC / Crown Castle GS III Corp. | | | | | | | | |
3.85% due 04/15/23 | | | 800,000 | | | | 824,761 | |
AT&T, Inc. | | | | | | | | |
6.15% due 09/15/34 | | | 730,000 | | | | 824,435 | |
26 | THE GUGGENHEIM FUNDS SEMI-ANNUAL REPORT | SEE NOTES TO FINANCIAL STATEMENTS. |
SCHEDULE OF INVESTMENTS (Unaudited)(continued) | March 31, 2016 |
TOTAL RETURN BOND FUND | |
| | | Face
Amount15 | | | Value | |
| | | | | | | |
Discovery Communications LLC | | | | | | |
4.38% due 06/15/21 | | $ | 770,000 | | | $ | 807,118 | |
Telefonica Emisiones SAU | | | | | | | | |
5.46% due 02/16/21 | | | 710,000 | | | | 806,599 | |
Koninklijke KPN N.V. | | | | | | | | |
8.38% due 10/01/30 | | | 600,000 | | | | 800,609 | |
Qwest Corp. | | | | | | | | |
6.75% due 12/01/21 | | | 740,000 | | | | 795,500 | |
Vodafone Group plc | | | | | | | | |
5.45% due 06/10/19 | | | 350,000 | | | | 385,824 | |
7.88% due 02/15/30 | | | 300,000 | | | | 379,418 | |
CSC Holdings LLC | | | | | | | | |
6.75% due 11/15/21 | | | 700,000 | | | | 718,900 | |
Time Warner, Inc. | | | | | | | | |
6.50% due 11/15/36 | | | 500,000 | | | | 580,033 | |
Symantec Corp. | | | | | | | | |
4.20% due 09/15/20 | | | 500,000 | | | | 517,107 | |
Total Communications | | | | | | | 71,648,387 | |
| | | | | | | | | |
Energy - 1.8% | |
Sunoco Logistics Partners Operations, LP | | | | | | | | |
5.95% due 12/01/2510 | | | 14,050,000 | | | | 14,115,895 | |
4.25% due 04/01/24 | | | 3,700,000 | | | | 3,396,459 | |
Equities Corp. | | | | | | | | |
4.88% due 11/15/21 | | | 6,905,000 | | | | 6,608,010 | |
Husky Energy, Inc. | | | | | | | | |
3.95% due 04/15/22 | | | 5,500,000 | | | | 5,479,655 | |
4.00% due 04/15/24 | | | 800,000 | | | | 756,845 | |
Gulfstream Natural Gas System LLC | | | | | | | | |
4.60% due 09/15/253,10 | | | 5,190,000 | | | | 5,079,572 | |
Hess Corp. | | | | | | | | |
8.13% due 02/15/1910 | | | 3,650,000 | | | | 4,010,240 | |
7.13% due 03/15/33 | | | 720,000 | | | | 724,190 | |
ContourGlobal Power Holdings S.A. | | | | | | | | |
7.13% due 06/01/193,10 | | | 3,100,000 | | | | 3,010,875 | |
Magellan Midstream Partners, LP | | | | | | | | |
5.00% due 03/01/26 | | | 2,550,000 | | | | 2,757,647 | |
Valero Energy Corp. | | | | | | | | |
7.50% due 04/15/32 | | | 630,000 | | | | 722,267 | |
Tosco Corp. | | | | | | | | |
8.13% due 02/15/30 | | | 560,000 | | | | 689,578 | |
Buckeye Partners, LP | | | | | | | | |
4.88% due 02/01/21 | | | 400,000 | | | | 403,970 | |
Unit Corp. | | | | | | | | |
6.63% due 05/15/21 | | | 700,000 | | | | 351,750 | |
Atlas Energy Holdings Operating Company LLC / Atlas Resource Finance Corp. | | | | | | | | |
9.25% due 08/15/211 | | | 1,000,000 | | | | 155,000 | |
Schahin II Finance Company SPV Ltd. | | | | | | | | |
5.88% due 09/25/2212,14 | | | 781,800 | | | | 113,752 | |
Total Energy | | | | | | | 48,375,705 | |
| | | | | | | | | |
Consumer, Non-cyclical - 1.7% | |
Bumble Bee Holdings, Inc. | | | | | | | | |
9.00% due 12/15/173 | | | 10,801,000 | | | | 10,828,003 | |
Vector Group Ltd. | | | | | | | | |
7.75% due 02/15/2110 | | | 10,287,000 | | | | 10,801,350 | |
Bon Secours Charity Health System, Inc. | | | | | | | | |
6.25% due 11/01/3510 | | | 6,000,000 | | | | 6,246,936 | |
Tenet Healthcare Corp. | | | | | | | | |
4.13% due 06/15/202,3 | | | 4,275,000 | | | | 4,242,938 | |
HCA, Inc. | | | | | | | | |
5.88% due 02/15/26 | | | 3,400,000 | | | | 3,502,000 | |
ADT Corp. | | | | | | | | |
6.25% due 10/15/2110 | | | 2,600,000 | | | | 2,613,000 | |
Central Garden & Pet Co. | | | | | | | | |
6.13% due 11/15/23 | | | 2,415,000 | | | | 2,511,600 | |
Opal Acquisition, Inc. | | | | | | | | |
8.88% due 12/15/213 | | | 1,895,000 | | | | 1,321,763 | |
Molson Coors Brewing Co. | | | | | | | | |
5.00% due 05/01/42 | | | 870,000 | | | | 905,111 | |
Reynolds American, Inc. | | | | | | | | |
6.15% due 09/15/43 | | | 730,000 | | | | 898,045 | |
Altria Group, Inc. | | | | | | | | |
4.00% due 01/31/24 | | | 780,000 | | | | 858,556 | |
SEE NOTES TO FINANCIAL STATEMENTS. | THE GUGGENHEIM FUNDS SEMI-ANNUAL REPORT | 27 |
SCHEDULE OF INVESTMENTS (Unaudited)(continued) | March 31, 2016 |
TOTAL RETURN BOND FUND | |
| | | Face
Amount15 | | | Value | |
| | | | | | | |
Coca-Cola Femsa SAB de CV | | | | | | |
2.38% due 11/26/18 | | $ | 790,000 | | | $ | 801,995 | |
Kraft Heinz Foods Co. | | | | | | | | |
6.88% due 01/26/39 | | | 320,000 | | | | 408,816 | |
Boston Scientific Corp. | | | | | | | | |
2.85% due 05/15/20 | | | 400,000 | | | | 406,239 | |
Total Consumer, Non-cyclical | | | | 46,346,352 | |
| | | | | | | | | |
Industrial - 1.4% | |
Molex Electronic Technologies LLC | | | | | | | | |
3.90% due 04/15/253,10 | | | 18,100,000 | | | | 17,580,856 | |
Reynolds Group Issuer Inc. / Reynolds Group Issuer LLC / Reynolds Group Issuer | | | | | | | | |
7.13% due 04/15/19 | | | 4,100,000 | | | | 4,171,750 | |
6.88% due 02/15/21 | | | 3,100,000 | | | | 3,208,500 | |
Reynolds Group Issuer Incorporated / Reynolds Group Issuer LLC / Reynolds Group Issuer | | | | | | | | |
7.88% due 08/15/1910 | | | 6,995,000 | | | | 7,239,825 | |
Princess Juliana International Airport Operating Company N.V. | | | | | | | | |
5.50% due 12/20/27†††,3 | | | 2,752,505 | | | | 2,715,071 | |
Dynagas LNG Partners Limited Partnership / Dynagas Finance, Inc. | | | | | | | | |
6.25% due 10/30/191 | | | 1,700,000 | | | | 1,139,000 | |
Standard Industries, Inc. | | | | | | | | |
6.00% due 10/15/253 | | | 1,000,000 | | | | 1,057,500 | |
L-3 Communications Corp. | | | | | | | | |
5.20% due 10/15/19 | | | 760,000 | | | | 809,222 | |
Amsted Industries, Inc. | | | | | | | | |
5.38% due 09/15/243 | | | 500,000 | | | | 480,625 | |
SBM Baleia Azul | | | | | | | | |
5.50% due 09/15/27†††,1 | | | 421,450 | | | | 293,671 | |
CEVA Group plc | | | | | | | | |
7.00% due 03/01/213 | | | 350,000 | | | | 279,125 | |
Total Industrial | | | | | | | 38,975,145 | |
| | | | | | | | | |
Consumer, Cyclical - 1.2% | |
Hyatt Hotels Corp. | | | | | | | | |
4.85% due 03/15/26 | | | 11,400,000 | | | | 11,895,467 | |
Wyndham Worldwide Corp. | | | | | | | | |
5.10% due 10/01/2510 | | | 8,950,000 | | | | 9,403,693 | |
Wynn Las Vegas LLC / Wynn Las Vegas Capital Corp. | | | | | | | | |
5.50% due 03/01/253,10 | | | 6,600,000 | | | | 6,220,500 | |
Northern Group Housing LLC | | | | | | | | |
6.80% due 08/15/533 | | | 1,200,000 | | | | 1,441,848 | |
Lennar Corp. | | | | | | | | |
4.88% due 12/15/2310 | | | 1,200,000 | | | | 1,200,000 | |
HP Communities LLC | | | | | | | | |
5.62% due 09/15/323 | | | 1,000,000 | | | | 1,104,490 | |
General Motors Co. | | | | | | | | |
4.88% due 10/02/23 | | | 770,000 | | | | 806,875 | |
Hasbro, Inc. | | | | | | | | |
6.35% due 03/15/40 | | | 400,000 | | | | 469,135 | |
WMG Acquisition Corp. | | | | | | | | |
5.63% due 04/15/223 | | | 300,000 | | | | 304,500 | |
Total Consumer, Cyclical | | | | | | | 32,846,508 | |
| | | | | | | | | |
Basic Materials - 1.0% | |
Yamana Gold, Inc. | | | | | | | | |
4.95% due 07/15/2410 | | | 18,870,000 | | | | 15,945,150 | |
BHP Billiton Finance USA Ltd. | | | | | | | | |
6.75% due 10/19/752,3,10 | | | 6,000,000 | | | | 6,000,000 | |
Newcrest Finance Pty Ltd. | | | | | | | | |
4.20% due 10/01/223,10 | | | 2,550,000 | | | | 2,416,508 | |
4.45% due 11/15/213 | | | 625,000 | | | | 608,463 | |
Southern Copper Corp. | | | | | | | | |
7.50% due 07/27/35 | | | 440,000 | | | | 459,860 | |
5.25% due 11/08/42 | | | 430,000 | | | | 353,180 | |
Barrick North America Finance LLC | | | | | | | | |
4.40% due 05/30/21 | | | 566,000 | | | | 578,625 | |
Eldorado Gold Corp. | | | | | | | | |
6.13% due 12/15/203 | | | 550,000 | | | | 501,875 | |
TPC Group, Inc. | | | | | | | | |
8.75% due 12/15/203 | | | 696,000 | | | | 487,200 | |
Total Basic Materials | | | | | | | 27,350,861 | |
28 | THE GUGGENHEIM FUNDS SEMI-ANNUAL REPORT | SEE NOTES TO FINANCIAL STATEMENTS. |
SCHEDULE OF INVESTMENTS (Unaudited)(continued) | March 31, 2016 |
TOTAL RETURN BOND FUND | |
| | | Face
Amount15 | | | Value | |
| | | | | | | |
Technology - 0.5% | |
First Data Corp. | | | | | | |
5.75% due 01/15/243 | | $ | 5,500,000 | | | $ | 5,499,450 | |
Micron Technology, Inc. | | | | | | | | |
5.25% due 08/01/233 | | | 5,450,000 | | | | 4,455,375 | |
CDK Global, Inc. | | | | | | | | |
4.50% due 10/15/2410 | | | 1,150,000 | | | | 1,139,061 | |
Open Text Corp. | | | | | | | | |
5.63% due 01/15/233 | | | 975,000 | | | | 994,500 | |
Xerox Corp. | | | | | | | | |
5.63% due 12/15/19 | | | 730,000 | | | | 754,481 | |
Total Technology | | | | | | | 12,842,867 | |
| | | | | | | | | |
Utilities - 0.4% | |
AES Corp. | | | | | | | | |
3.64% due 06/01/192,10 | | | 8,990,000 | | | | 8,675,350 | |
4.88% due 05/15/23 | | | 1,000,000 | | | | 962,500 | |
LBC Tank Terminals Holding Netherlands BV | | | | | | | | |
6.88% due 05/15/233 | | | 850,000 | | | | 790,500 | |
Progress Energy, Inc. | | | | | | | | |
6.00% due 12/01/39 | | | 650,000 | | | | 771,800 | |
Sempra Energy | | | | | | | | |
9.80% due 02/15/19 | | | 540,000 | | | | 649,545 | |
Exelon Generation Company LLC | | | | | | | | |
6.25% due 10/01/39 | | | 190,000 | | | | 196,212 | |
Total Utilities | | | | | | | 12,045,907 | |
| | | | | | | | | |
Diversified - 0.4% | |
HRG Group, Inc. | | | | | | | | |
7.88% due 07/15/1910 | | | 10,950,000 | | | | 11,547,870 | |
Total Corporate Bonds | | | | | | | | |
(Cost $574,204,478) | | | | | | | 574,720,172 | |
| | | | | | | | | |
U.S. GOVERNMENT SECURITIES†† - 10.1% | |
U.S. Treasury Notes | | | | | | | | |
1.63% due 02/15/2610 | | | 146,214,000 | | | | 144,089,363 | |
3.13% due 05/15/19 | | | 1,000,000 | | | | 1,068,867 | |
2.88% due 03/31/18 | | | 1,000,000 | | | | 1,041,836 | |
2.38% due 06/30/18 | | | 800,000 | | | | 828,562 | |
2.75% due 02/28/18 | | | 500,000 | | | | 519,102 | |
2.38% due 05/31/18 | | | 500,000 | | | | 517,207 | |
1.38% due 09/30/18 | | | 500,000 | | | | 507,071 | |
1.25% due 10/31/18 | | | 400,000 | | | | 404,344 | |
Total U.S. Treasury Notes | | | | | | | 148,976,352 | |
U.S. Treasury Bonds | | | | | | | | |
due 11/15/4411 | | | 240,756,000 | | | | 109,672,783 | |
4.75% due 02/15/41 | | | 2,250,000 | | | | 3,195,879 | |
6.13% due 11/15/27 | | | 2,000,000 | | | | 2,882,344 | |
4.38% due 05/15/40 | | | 2,070,000 | | | | 2,785,202 | |
8.00% due 11/15/21 | | | 1,500,000 | | | | 2,041,230 | |
8.75% due 05/15/20 | | | 1,350,000 | | | | 1,762,752 | |
2.75% due 11/15/42 | | | 1,700,000 | | | | 1,752,661 | |
9.13% due 05/15/18 | | | 1,000,000 | | | | 1,177,148 | |
8.13% due 08/15/21 | | | 500,000 | | | | 676,016 | |
8.75% due 08/15/20 | | | 500,000 | | | | 661,270 | |
7.88% due 02/15/21 | | | 500,000 | | | | 656,114 | |
Total U.S. Treasury Bonds | | | | | | | 127,263,399 | |
Total U.S. Government Securities | | | | | |
(Cost $270,663,814) | | | | | | | 276,239,751 | |
| | | | | | | | | |
SENIOR FLOATING RATE INTERESTS††,2 - 5.5% | |
Technology - 1.7% | |
Avago Technologies Ltd. | | | | | | | | |
4.25% due 02/01/23 | | | 20,300,000 | | | | 20,186,929 | |
Solera LLC | | | | | | | | |
5.75% due 03/03/23 | | | 6,000,000 | | | | 5,988,240 | |
Avaya, Inc. | | | | | | | | |
6.25% due 05/29/20 | | | 4,751,323 | | | | 3,161,340 | |
6.50% due 03/30/18 | | | 922,377 | | | | 675,641 | |
Epicor Software | | | | | | | | |
4.75% due 06/01/22 | | | 3,773,490 | | | | 3,569,080 | |
Informatica Corp. | | | | | | | | |
4.50% due 08/05/22 | | | 3,582,000 | | | | 3,510,360 | |
Advanced Computer Software | | | | | | | | |
10.50% due 01/31/23 | | | 2,000,000 | | | | 1,835,000 | |
TIBCO Software, Inc. | | | | | | | | |
6.50% due 12/04/20 | | | 1,980,000 | | | | 1,775,070 | |
Deltek, Inc. | | | | | | | | |
5.00% due 06/25/22 | | | 1,613,879 | | | | 1,603,792 | |
Verisure Cayman 2 | | | | | | | | |
5.25% due 10/10/22 | | EUR | 1,350,000 | | | | 1,537,834 | |
SEE NOTES TO FINANCIAL STATEMENTS. | THE GUGGENHEIM FUNDS SEMI-ANNUAL REPORT | 29 |
SCHEDULE OF INVESTMENTS (Unaudited)(continued) | March 31, 2016 |
TOTAL RETURN BOND FUND | |
| | | Face
Amount15 | | | Value | |
| | | | | | | |
Micro Focus International plc | | | | | | |
5.25% due 11/19/21 | | $ | 855,290 | | | $ | 852,510 | |
EIG Investors Corp. | | | | | | | | |
6.23% due 11/09/191 | | | 627,384 | | | | 598,368 | |
Blue Coat Systems, Inc. | | | | | | | | |
4.50% due 05/20/22 | | | 423,938 | | | | 416,519 | |
Aspect Software, Inc. | | | | | | | | |
9.50% due 09/30/16 | | | 15,954 | | | | 15,794 | |
Total Technology | | | | | | | 45,726,477 | |
| | | | | | | | | |
Communications - 1.2% | |
Univision Communications, Inc. | | | | | | | | |
4.00% due 02/28/20 | | | 12,626,182 | | | | 12,488,052 | |
4.00% due 03/01/20 | | | 7,241,533 | | | | 7,161,587 | |
Numericable US LLC | | | | | | | | |
4.75% due 02/10/23 | | | 4,300,000 | | | | 4,261,042 | |
EMI Music Publishing | | | | | | | | |
4.00% due 08/19/22 | | | 2,985,000 | | | | 2,976,791 | |
Light Tower Fiber LLC | | | | | | | | |
4.00% due 04/13/20 | | | 2,863,823 | | | | 2,828,025 | |
Internet Brands | | | | | | | | |
4.75% due 07/08/21 | | | 2,562,948 | | | | 2,542,136 | |
Proquest LLC | | | | | | | | |
5.75% due 10/24/21 | | | 1,367,120 | | | | 1,319,271 | |
Neptune Finco Corp. | | | | | | | | |
5.00% due 10/10/22 | | | 450,000 | | | | 449,928 | |
Total Communications | | | | | | | 34,026,832 | |
| | | | | | | | | |
Consumer, Non-cyclical - 0.9% | |
Albertson’s (Safeway) Holdings LLC | | | | | | | | |
5.50% due 08/25/21 | | | 9,947,125 | | | | 9,952,099 | |
5.50% due 12/21/22 | | | 2,344,125 | | | | 2,345,391 | |
Pharmaceutical Product Development | | | | | | | | |
4.25% due 08/18/22 | | | 4,320,000 | | | | 4,278,614 | |
JBS USA, Inc. | | | | | | | | |
4.00% due 10/30/22 | | | 3,918,262 | | | | 3,893,773 | |
Grocery Outlet, Inc. | | | | | | | | |
4.75% due 10/21/21 | | | 1,760,239 | | | | 1,718,433 | |
Acadia Healthcare Company, Inc. | | | | | | | | |
4.50% due 02/13/19 | | | 1,645,875 | | | | 1,649,298 | |
One Call Medical, Inc. | | | | | | | | |
5.00% due 11/27/201 | | | 1,676,058 | | | | 1,470,741 | |
Performance Food Group | | | | | | | | |
7.21% due 11/14/19 | | | 144,473 | | | | 144,473 | |
Arctic Glacier Holdings, Inc. | | | | | | | | |
6.00% due 05/10/19 | | | 119,634 | | | | 113,652 | |
Total Consumer, Non-cyclical | | | | 25,566,474 | |
| | | | | | | | | |
Consumer, Cyclical - 0.8% | |
La Quinta Intermediate Holdings | | | | | | | | |
3.75% due 04/14/21 | | | 4,987,437 | | | | 4,891,828 | |
Petsmart, Inc. | | | | | | | | |
4.25% due 03/11/22 | | | 3,600,000 | | | | 3,582,900 | |
Equinox Fitness | | | | | | | | |
5.00% due 01/31/20 | | | 2,378,643 | | | | 2,365,560 | |
Life Time Fitness | | | | | | | | |
4.25% due 06/10/22 | | | 1,500,000 | | | | 1,479,750 | |
Mattress Firm | | | | | | | | |
6.25% due 10/20/21 | | | 1,451,300 | | | | 1,433,159 | |
Warner Music Group | | | | | | | | |
3.75% due 07/01/20 | | | 1,445,922 | | | | 1,423,625 | |
Eyemart Express | | | | | | | | |
5.00% due 12/17/21 | | | 1,402,500 | | | | 1,377,956 | |
1-800 Contacts | | | | | | | | |
5.25% due 01/22/23 | | | 1,200,000 | | | | 1,200,000 | |
BBB Industries, LLC | | | | | | | | |
6.00% due 11/03/21 | | | 990,000 | | | | 975,972 | |
Burlington Coat Factory Warehouse Corp. | | | | | | | | |
4.25% due 08/13/21 | | | 650,000 | | | | 649,883 | |
Neiman Marcus Group, Inc. | | | | | | | | |
4.25% due 10/25/20 | | | 588,000 | | | | 537,579 | |
Sears Holdings Corp. | | | | | | | | |
5.50% due 06/30/18 | | | 492,941 | | | | 468,294 | |
Compucom Systems, Inc. | | | | | | | | |
4.25% due 05/11/20 | | | 294,660 | | | | 206,262 | |
Container Store, Inc. | | | | | | | | |
4.25% due 04/06/19 | | | 256,975 | | | | 194,872 | |
30 | THE GUGGENHEIM FUNDS SEMI-ANNUAL REPORT | SEE NOTES TO FINANCIAL STATEMENTS. |
SCHEDULE OF INVESTMENTS (Unaudited)(continued) | March 31, 2016 |
TOTAL RETURN BOND FUND | |
| | | Face
Amount15 | | | Value | |
| | | | | | | |
Capital Automotive LP | | | | | | |
6.00% due 04/30/20 | | $ | 140,000 | | �� | $ | 139,475 | |
Total Consumer, Cyclical | | | | | | | 20,927,115 | |
| | | | | | | | | |
Industrial - 0.6% | |
Travelport Holdings LLC | | | | | | | | |
5.75% due 09/02/21 | | | 12,825,470 | | | | 12,803,025 | |
Quikrete Holdings, Inc. | | | | | | | | |
4.00% due 09/28/20 | | | 1,150,000 | | | | 1,147,125 | |
Hardware Holdings LLC | | | | | | | | |
6.75% due 03/30/20†††,1 | | | 839,375 | | | | 818,391 | |
CareCore National LLC | | | | | | | | |
5.50% due 03/05/21 | | | 380,565 | | | | 353,926 | |
Wencor Group | | | | | | | | |
4.50% due 06/18/21 | | | 296,355 | | | | 262,644 | |
Thermasys Corp. | | | | | | | | |
5.26% due 05/03/19 | | | 93,750 | | | | 74,414 | |
Total Industrial | | | | | | | 15,459,525 | |
| | | | | | | | | |
Basic Materials - 0.1% | |
Univar, Inc. | | | | | | | | |
4.25% due 07/01/22 | | | 3,611,315 | | | | 3,554,906 | |
Platform Specialty Products | | | | | | | | |
5.50% due 06/07/20 | | | 495,000 | | | | 477,368 | |
Total Basic Materials | | | | | | | 4,032,274 | |
| | | | | | | | | |
Financial - 0.1% | |
National Financial Partners Corp. | | | | | | | | |
4.50% due 07/01/20 | | | 1,205,290 | | | | 1,175,760 | |
Hyperion Insurance | | | | | | | | |
5.50% due 04/29/22 | | | 990,000 | | | | 941,738 | |
USI Holdings Corp. | | | | | | | | |
4.25% due 12/27/19 | | | 497,455 | | | | 489,163 | |
American Stock Transfer & Trust | | | | | | | | |
5.75% due 06/26/20 | | | 237,894 | | | | 230,163 | |
Total Financial | | | | | | | 2,836,824 | |
| | | | | | | | | |
Utilities - 0.1% | |
Invenergy Thermal Operating I, LLC | | | | | | | | |
6.50% due 10/19/22 | | | 2,693,250 | | | | 2,531,655 | |
Total Senior Floating Rate Interests | | | | | |
(Cost $153,591,084) | | | | | | | 151,107,176 | |
| | | | | | | | | |
MUNICIPAL BONDS†† - 2.1% | |
California - 1.1% | |
State of California General Obligation Unlimited | | | | | | | | |
7.60% due 11/01/4010 | | | 14,360,000 | | | | 22,327,072 | |
San Diego Unified School District General Obligation Unlimited | | | | | | | | |
due 07/01/3810,11 | | | 7,000,000 | | | | 2,951,200 | |
Antelope Valley Community College District General Obligation Unlimited | | | | | | | | |
due 08/01/3410,11 | | | 5,600,000 | | | | 2,704,912 | |
City of Industry California Revenue Bonds | | | | | | | | |
4.63% due 01/01/34 | | | 1,000,000 | | | | 1,050,680 | |
Inland Valley Development Agency Tax Allocation | | | | | | | | |
5.50% due 03/01/33 | | | 400,000 | | | | 436,508 | |
Total California | | | | | | | 29,470,372 | |
| | | | | | | | | |
Illinois - 0.5% | |
State of Illinois General Obligation Unlimited | | | | | | | | |
5.65% due 12/01/38 | | | 5,350,000 | | | | 5,380,548 | |
6.90% due 03/01/35 | | | 1,600,000 | | | | 1,788,592 | |
City of Chicago Illinois General Obligation Unlimited | | | | | | | | |
5.43% due 01/01/4210 | | | 3,230,000 | | | | 2,684,873 | |
County of Cook Illinois General Obligation Unlimited | | | | | | | | |
6.23% due 11/15/34 | | | 2,300,000 | | | | 2,568,847 | |
SEE NOTES TO FINANCIAL STATEMENTS. | THE GUGGENHEIM FUNDS SEMI-ANNUAL REPORT | 31 |
SCHEDULE OF INVESTMENTS (Unaudited)(continued) | March 31, 2016 |
TOTAL RETURN BOND FUND | |
| | | Face
Amount15 | | | Value | |
| | | | | | | |
Chicago Transit Authority Revenue Bonds | | | | | | |
6.20% due 12/01/40 | | $ | 1,000,000 | | | $ | 1,110,610 | |
Total Illinois | | | | | | | 13,533,470 | |
| | | | | | | | | |
New Jersey - 0.3% | |
New Jersey Economic Development Authority Revenue Bonds | | | | | | | | |
7.43% due 02/15/2910 | | | 6,475,000 | | | | 7,843,168 | |
| | | | | | | | | |
Michigan - 0.2% | |
Detroit City School District General Obligation Unlimited | | | | | | | | |
7.75% due 05/01/3910 | | | 4,900,000 | | | | 6,106,919 | |
Total Municipal Bonds | | | | | | | | |
(Cost $56,588,154) | | | | | | | 56,953,929 | |
| | | | | | | | | |
FOREIGN GOVERNMENT BONDS†† - 0.8% | |
Kenya Government International Bond | | | | | | | | |
6.87% due 06/24/243,10 | | | 12,250,000 | | | | 11,545,625 | |
Dominican Republic International Bond | | | | | | | | |
6.85% due 01/27/453 | | | 9,700,000 | | | | 9,603,000 | |
Bahamas Government International Bond | | | | | | | | |
6.95% due 11/20/293 | | | 110,000 | | | | 124,410 | |
Total Foreign Government Bonds | | | | | |
(Cost $22,763,282) | | | | | | | 21,273,035 | |
| | | | | | | | | |
COMMERCIAL PAPER†† - 0.3% | |
Bayer Corp. | | | | | | | | |
0.63% due 04/05/16 | | | 1,200,000 | | | | 1,199,916 | |
VF Corp. | | | | | | | | |
0.74% due 04/28/16 | | | 1,100,000 | | | | 1,099,390 | |
John Deere Capital Corp. | | | | | | | | |
0.39% due 04/21/16 | | | 1,050,000 | | | | 1,049,773 | |
Nissan Motor Acceptance Corp. | | | | | | | | |
0.80% due 05/09/16 | | | 1,050,000 | | | | 1,049,113 | |
PACCAR Financial Corp. | | | | | | | | |
0.35% due 04/07/16 | | | 1,000,000 | | | | 999,942 | |
Hershey Co. | | | | | | | | |
0.37% due 04/11/16 | | | 1,000,000 | | | | 999,897 | |
PepsiCo, Inc. | | | | | | | | |
0.34% due 04/21/16 | | | 1,000,000 | | | | 999,811 | |
Ryder System, Inc. | | | | | | | | |
0.67% due 04/05/16 | | | 800,000 | | | | 799,940 | |
Total Commercial Paper | | | | | | | | |
(Cost $8,197,782) | | | | | | | 8,197,782 | |
| | | | | | | | | |
REPURCHASE AGREEMENT††,8 - 0.2% | |
Jefferies & Company, Inc.
issued 03/15/16 at 2.95%
due 04/04/16 | | | 4,609,000 | | | | 4,609,000 | |
Total Repurchase Agreement | | | | | |
(Cost $4,609,000) | | | | | | | 4,609,000 | |
| | | | | | | | | |
Total Investments - 108.1% | | | | | |
(Cost $2,983,014,654) | | | | | | $ | 2,947,519,499 | |
Other Assets & Liabilities, net - (8.1)% | | | | (220,640,864 | ) |
Total Net Assets - 100.0% | | | $ | 2,726,878,635 | |
32 | THE GUGGENHEIM FUNDS SEMI-ANNUAL REPORT | SEE NOTES TO FINANCIAL STATEMENTS. |
SCHEDULE OF INVESTMENTS (Unaudited)(continued) | March 31, 2016 |
TOTAL RETURN BOND FUND | |
FORWARD FOREIGN CURRENCY EXCHANGE CONTRACTS†† | |
Counterparty | | Contracts to Buy (Sell) | | Currency | Settlement Date | | Settlement Value | | | Value at March 31, 2016 | | | Net Unrealized Depreciation | |
MorganStanley | | (1,348,000) | | EUR | 04/11/16 | | $ | 1,466,552 | | | $ | 1,534,247 | | | $ | (67,695 | ) |
| | | | | | | | | | | | | | | | $ | (67,695 | ) |
* | Non-income producing security. |
† | Value determined based on Level 1 inputs — See Note 4. |
†† | Value determined based on Level 2 inputs, unless otherwise noted — See Note 4. |
††† | Value determined based on Level 3 inputs — See Note 4. |
1 | Illiquid security. |
2 | Variable rate security. Rate indicated is rate effective at March 31, 2016. |
3 | Security is a 144A or Section 4(a)(2) security. The total market value of 144A or Section 4(a)(2) securities is $1,544,683,775 (cost $1,561,320,807), or 56.6% of total net assets. These securities have been determined to be liquid under guidelines established by the Board of Trustees. |
4 | Residual interest. |
5 | Affiliated issuer — See Note 7. |
6 | Rate indicated is the 7 day yield as of March 31, 2016. |
7 | Security is a step up/step down bond. The coupon increases or decreases at regular intervals until the bond reaches full maturity. |
8 | Repurchase Agreement — See Note 10. |
9 | Perpetual maturity. |
10 | Securities or a portion thereof are held as collateral for reverse repurchase agreements at March 31, 2016 — See Note 11. |
11 | Zero coupon rate security. |
12 | Security is in default of interest and/or principal obligations. |
14 | Security is a 144A or Section 4(a)(2) security. These securities are considered illiquid and restricted under guidelines established by the Board of Trustees. The total market value of 144A or Section 4(a)(2) securities is $18,242,618 (cost $19,500,569) or 0.7% of total net assets — See Note 12. |
15 | The face amount is denominated in U.S. dollars, unless otherwise indicated. |
| | plc — Public Limited Company |
| | |
| | See Sector Classification in Other Information section. |
SEE NOTES TO FINANCIAL STATEMENTS. | THE GUGGENHEIM FUNDS SEMI-ANNUAL REPORT | 33 |
SCHEDULE OF INVESTMENTS (Unaudited)(concluded) | March 31, 2016 |
TOTAL RETURN BOND FUND | |
The following table summarizes the inputs used to value the Fund’s investments at March 31, 2016 (See Note 4 in the Notes to Financial Statements):
Investments in Securities (Assets) | | Level 1 | | | Level 1 - Other* | | | Level 2 | | | Level 2 - Other* | | | Level 3 | | | Total | |
Asset-Backed Securities | | $ | — | | | $ | — | | | $ | 831,491,545 | | | $ | — | | | $ | 29,941,833 | | | $ | 861,433,378 | |
Collateralized Mortgage Obligations | | | — | | | | — | | | | 849,932,504 | | | | — | | | | 13,758,526 | | | | 863,691,030 | |
Commercial Paper | | | — | | | | — | | | | 8,197,782 | | | | — | | | | — | | | | 8,197,782 | |
Closed-end Funds | | | 8,183,930 | | | | — | | | | — | | | | — | | | | — | | | | 8,183,930 | |
Corporate Bonds | | | — | | | | — | | | | 556,090,834 | | | | — | | | | 18,629,338 | | | | 574,720,172 | |
Foreign Government Bonds | | | — | | | | — | | | | 21,273,035 | | | | — | | | | — | | | | 21,273,035 | |
Municipal Bonds | | | — | | | | — | | | | 56,953,929 | | | | — | | | | — | | | | 56,953,929 | |
Mutual Funds | | | 27,100,061 | | | | — | | | | — | | | | — | | | | — | | | | 27,100,061 | |
Preferred Stocks | | | — | | | | — | | | | 1,089,440 | | | | — | | | | — | | | | 1,089,440 | |
Repurchase Agreement | | | — | | | | — | | | | 4,609,000 | | | | — | | | | — | | | | 4,609,000 | |
Senior Floating Rate Interests | | | — | | | | — | | | | 150,288,785 | | | | — | | | | 818,391 | | | | 151,107,176 | |
Short Term Investments | | | 92,920,815 | | | | — | | | | — | | | | — | | | | — | | | | 92,920,815 | |
U.S. Government Securities | | | — | | | | — | | | | 276,239,751 | | | | — | | | | — | | | | 276,239,751 | |
Total | | $ | 128,204,806 | | | $ | — | | | $ | 2,756,166,605 | | | $ | — | | | $ | 63,148,088 | | | $ | 2,947,519,499 | |
Investments in Securities (Liabilities) | | Level 1 | | | Level 1 - Other* | | | Level 2 | | | Level 2 - Other* | | | Level 3 | | | Total | |
Currency Contracts | | $ | — | | | $ | — | | | $ | — | | | $ | 67,695 | | | $ | — | | | $ | — | |
* | Other financial instruments include futures contracts and/or swaps, which are reported as unrealized gain/loss at period end. |
Transfers between investment levels may occur as the markets fluctuate and/or the availability of data used in the investment’s valuation changes. The Fund recognizes transfers between the levels as of the beginning of the period. As of March 31, 2016, the Fund had securities with a total value of $5,768,250 transfer into Level 3 from Level 2 due to changes in the securities valuation method. There were no other securities that transferred between levels.
34 | THE GUGGENHEIM FUNDS SEMI-ANNUAL REPORT | SEE NOTES TO FINANCIAL STATEMENTS. |
STATEMENT OF ASSETS AND LIABILITIES (Unaudited) |
TOTAL RETURN BOND FUND |
March 31, 2016
Assets: | |
Investments in unaffiliated issuers, at value (cost $2,942,809,588) | | $ | 2,907,626,508 | |
Investments in affiliated issuers, at value (cost $35,596,066) | | | 35,283,991 | |
Repurchase agreements, at value (cost $4,609,000) | | | 4,609,000 | |
Total investments (cost $2,983,014,654) | | | 2,947,519,499 | |
Prepaid expenses | | | 242,172 | |
Receivables: | |
Fund shares sold | | | 19,766,521 | |
Interest | | | 14,726,818 | |
Securities sold | | | 8,449,340 | |
Dividends | | | 62,353 | |
Total assets | | | 2,990,766,703 | |
| | | | | |
Liabilities: | |
Reverse Repurchase Agreements | | | 210,297,721 | |
Overdraft due to custodian bank | | | 238,924 | |
Unfunded loan commitments, at value (Note 8) (proceeds $286,000) | | | 204,240 | |
Unrealized depreciation on forward foreign currency exchange contracts | | | 67,695 | |
Payable for: | |
Securities purchased | | | 43,888,579 | |
Fund shares redeemed | | | 6,101,709 | |
Management fees | | | 650,339 | |
Distribution and service fees | | | 226,349 | |
Fund accounting/administration fees | | | 208,405 | |
Miscellaneous | | | 2,004,107 | |
Total liabilities | | | 263,888,068 | |
Net assets | | $ | 2,726,878,635 | |
| | | | | |
Net assets consist of: | |
Paid in capital | | $ | 2,781,753,359 | |
Accumulated net investment loss | | | (21,238,245 | ) |
Accumulated net realized gain on investments | | | 1,844,352 | |
Net unrealized depreciation on investments | | | (35,480,831 | ) |
Net assets | | $ | 2,726,878,635 | |
| | | | | |
A-Class: | |
Net assets | | $ | 495,720,031 | |
Capital shares outstanding | | | 18,948,898 | |
Net asset value per share | | $ | 26.16 | |
Maximum offering price per share (Net asset value divided by 96.00%) | | $ | 27.25 | |
| | | | | |
C-Class: | |
Net assets | | $ | 144,181,900 | |
Capital shares outstanding | | | 5,511,507 | |
Net asset value per share | | $ | 26.16 | |
| | | | | |
P-Class: | |
Net assets | | $ | 60,447,815 | |
Capital shares outstanding | | | 2,310,715 | |
Net asset value per share | | $ | 26.16 | |
| | | | | |
Institutional Class: | |
Net assets | | $ | 2,026,528,889 | |
Capital shares outstanding | | | 77,376,240 | |
Net asset value per share | | $ | 26.19 | |
SEE NOTES TO FINANCIAL STATEMENTS. | THE GUGGENHEIM FUNDS SEMI-ANNUAL REPORT 35 |
STATEMENT OF OPERATIONS (Unaudited) |
TOTAL RETURN BOND FUND |
Period Ended March 31, 2016
Investment Income: | |
Interest | | $ | 44,087,587 | |
Dividends from securities of affiliated issuers | | | 1,124,367 | |
Dividends from securities of unaffiliated issuers | | | 65,043 | |
Other income | | | 355,825 | |
Total investment income | | | 45,632,822 | |
| | | | | |
Expenses: | |
Management fees | | | 5,659,347 | |
Transfer agent/maintenance fees | |
A-Class | | | 341,738 | |
C-Class | | | 49,330 | |
P-Class | | | 1,500 | |
Institutional Class | | | 425,990 | |
Distribution and service fees: | |
A-Class | | | 590,991 | |
C-Class | | | 569,027 | |
P-Class | | | 37,200 | |
Fund accounting/administration fees | | | 1,075,265 | |
Interest expense | | | 1,281,298 | |
Line of credit fees | | | 103,132 | |
Trustees’ fees* | | | 44,536 | |
Custodian fees | | | 18,868 | |
Miscellaneous | | | 369,464 | |
Total expenses | | | 10,567,686 | |
Less: | |
Expenses waived by Adviser | | | (2,132,354 | ) |
Net expenses | | | 8,435,332 | |
Net investment income | | | 37,197,490 | |
| | | | | |
Net Realized and Unrealized Gain (Loss): | |
Net realized gain (loss) on: | |
Investments in unaffiliated issuers | | $ | 8,827,966 | |
Investments in affiliated issuers | | | (1,592,995 | ) |
Swap agreements | | | 78,707 | |
Foreign currency | | | 28,560 | |
Forward currency exchange contracts | | | (15,994 | ) |
Options purchased | | | (724,488 | ) |
Options written | | | 197,829 | |
Net realized gain | | | 6,799,585 | |
Net change in unrealized appreciation (depreciation) on: | |
Investments in unaffiliated issuers | | | (15,029,173 | ) |
Investments in affiliated issuers | | | (44,606 | ) |
Swap agreements | | | (233,580 | ) |
Options purchased | | | (542,718 | ) |
Options written | | | 95,691 | |
Foreign currency | | | 259 | |
Forward foreign currency exchange contracts | | | (59,503 | ) |
Net change in unrealized appreciation (depreciation) | | | (15,813,630 | ) |
Net realized and unrealized loss | | | (9,014,045 | ) |
Net increase in net assets resulting from operations | | $ | 28,183,445 | |
* | Relates to Trustees not deemed "interested persons" within the meaning of Section 2(a)(19) of the 1940 Act. |
36 | THE GUGGENHEIM FUNDS SEMI-ANNUAL REPORT | SEE NOTES TO FINANCIAL STATEMENTS. |
STATEMENTS OF CHANGES IN NET ASSETS |
TOTAL RETURN BOND FUND | |
| | | Period Ended
March 31,
2016
(Unaudited) | | | Year Ended
September 30,
2015 | |
Increase (Decrease) in Net Assets from Operations: | | | | | | |
Net investment income | | $ | 37,197,490 | | | $ | 45,275,578 | |
Net realized gain (loss) on investments | | | 6,799,585 | | | | (1,184,115 | ) |
Net change in unrealized appreciation (depreciation) on investments | | | (15,813,630 | ) | | | (23,680,352 | ) |
Net increase in net assets resulting from operations | | | 28,183,445 | | | | 20,411,111 | |
| | | | | | | | | |
Distributions to shareholders from: | | | | | | | | |
Net investment income | | | | | | | | |
A-Class | | | (10,634,633 | ) | | | (12,143,821 | ) |
C-Class | | | (2,100,882 | ) | | | (1,931,992 | ) |
P-Class | | | (653,491 | ) | | | (50,783 | )* |
Institutional Class | | | (39,477,916 | ) | | | (37,951,737 | ) |
Net realized gains | | | | | | | | |
A-Class | | | — | | | | (151,030 | ) |
C-Class | | | — | | | | (42,876 | ) |
Institutional Class | | | — | | | | (494,795 | ) |
Total distributions to shareholders | | | (52,866,922 | ) | | | (52,767,034 | ) |
| | | | | | | | | |
Capital share transactions: | | | | | | | | |
Proceeds from sale of shares | | | | | | | | |
A-Class | | | 235,675,162 | | | | 458,924,613 | |
C-Class | | | 65,225,991 | | | | 71,678,491 | |
P-Class | | | 56,841,791 | | | | 12,910,094 | * |
Institutional Class | | | 1,030,214,839 | | | | 1,454,555,055 | |
Distributions reinvested | | | | | | | | |
A-Class | | | 9,351,211 | | | | 11,204,598 | |
C-Class | | | 1,574,420 | | | | 1,494,334 | |
P-Class | | | 653,480 | | | | 50,783 | * |
Institutional Class | | | 30,909,788 | | | | 30,228,500 | |
Cost of shares redeemed | | | | | | | | |
A-Class | | | (178,959,925 | ) | | | (117,493,593 | ) |
C-Class | | | (10,824,047 | ) | | | (7,519,876 | ) |
P-Class | | | (9,467,125 | ) | | | (407,473 | )* |
Institutional Class | | | (426,392,470 | ) | | | (323,091,282 | ) |
Net increase from capital share transactions | | | 804,803,115 | | | | 1,592,534,244 | |
Net increase in net assets | | | 780,119,638 | | | | 1,560,178,321 | |
| | | | | | | | | |
Net assets: | | | | | | | | |
Beginning of period | | | 1,946,758,997 | | | | 386,580,676 | |
End of period | | $ | 2,726,878,635 | | | $ | 1,946,758,997 | |
Accumulated net investment loss at end of period | | $ | (21,238,245 | ) | | $ | (5,568,813 | ) |
SEE NOTES TO FINANCIAL STATEMENTS. | THE GUGGENHEIM FUNDS SEMI-ANNUAL REPORT | 37 |
STATEMENTS OF CHANGES IN NET ASSETS (concluded) |
TOTAL RETURN BOND FUND | |
| | | Period Ended
March 31,
2016
(Unaudited) | | | Year Ended
September 30,
2015 | |
Capital share activity: | | | | | | |
Shares sold | | | | | | |
A-Class | | | 9,001,282 | | | | 17,036,418 | |
C-Class | | | 2,494,868 | | | | 2,663,981 | |
P-Class | | | 2,176,785 | | | | 485,553 | * |
Institutional Class | | | 39,381,543 | | | | 53,995,281 | |
Shares issued from reinvestment of distributions | | | | | | | | |
A-Class | | | 357,351 | | | | 417,283 | |
C-Class | | | 60,200 | | | | 55,663 | |
P-Class | | | 25,014 | | | | 1,915 | * |
Institutional Class | | | 1,180,274 | | | | 1,125,242 | |
Shares redeemed | | | | | | | | |
A-Class | | | (6,854,942 | ) | | | (4,379,242 | ) |
C-Class | | | (414,597 | ) | | | (280,709 | ) |
P-Class | | | (363,215 | ) | | | (15,337 | )* |
Institutional Class | | | (16,307,469 | ) | | | (12,035,818 | ) |
Net increase in shares | | | 30,737,094 | | | | 59,070,230 | |
* | Since the commencement of operations: May 1, 2015. |
38 | THE GUGGENHEIM FUNDS SEMI-ANNUAL REPORT | SEE NOTES TO FINANCIAL STATEMENTS. |
STATEMENT OF CASH FLOWS (Unaudited) |
TOTAL RETURN BOND FUND | |
Period Ended March 31, 2016
Cash Flows from Operating Activities: | | | |
Net Increase in net assets resulting from operations | | $ | 28,183,445 | |
| | | | | |
Adjustments to Reconcile Net Increase in Net Assets Resulting from Operations to | | | | |
Net Cash Provided by Operating and Investing Activities: | | | | |
Net change in unrealized depreciation on investments | | | 15,073,779 | |
Net change in unrealized depreciation on options | | | 447,027 | |
Net change in unrealized appreciation on swaps | | | 233,580 | |
Net realized gain on swap agreements | | | (78,707 | ) |
Net realized loss on options | | | 526,659 | |
Net realized gain on investments | | | (7,234,971 | ) |
Net accretion of bond discount and amortization of bond premium | | | (1,169,435 | ) |
Paydowns received on mortgage and asset-backed securities | | | 104,045,116 | |
Purchase of long-term investments | | | (2,314,025,720 | ) |
Purchase of long-term investments foreign | | | (1,471,673 | ) |
Proceeds from sale of long-term investments | | | 1,464,096,731 | |
Net purchases of short-term investments | | | (17,014,774 | ) |
Increase in interest receivable | | | (5,890,260 | ) |
Decrease in dividends receivable | | | 23,921 | |
Increase in prepaid expenses | | | (133,753 | ) |
Decrease in other assets | | | 24,040 | |
Decrease in trustees' fee payable | | | (4,660 | ) |
Decrease in transfer agent fee payable | | | (104,716 | ) |
Increase in administration fee payable | | | 60,390 | |
Increase in distribution fee payable | | | 65,750 | |
Increase in advisory fee payable | | | 390,210 | |
Decrease in accrued expenses and other liabilities | | | (53,408 | ) |
Net Cash Used in Operating and Investing Activities | | $ | (734,011,429 | ) |
| | | | | |
Cash Flows From Financing Activities: | | | | |
Proceeds from sales of shares | | | 1,377,267,442 | |
Cost of shares redeemed | | | (623,031,883 | ) |
Distributions paid out | | | (9,827,047 | ) |
Proceeds from reverse repurchase agreements | | | 7,013,758,952 | |
Payments made on reverse repurchase agreements | | | (7,045,872,227 | ) |
Net Cash Used in Financing Activities | | | 712,295,237 | |
Net decrease in cash | | | (21,716,192 | ) |
| | | | | |
Cash at Beginning of Period (including foreign and restricted cash) | | $ | 21,477,268 | |
Cash at End of Period (including foreign cash) | | $ | (238,924 | ) |
| | | | | |
Supplemental Disclosure of Cash Flow Information: | | | | |
Cash paid during the year for interest | | $ | 1,134,778 | |
Dividend reinvestment | | $ | 42,488,899 | |
SEE NOTES TO FINANCIAL STATEMENTS. | THE GUGGENHEIM FUNDS SEMI-ANNUAL REPORT | 39 |
FINANCIAL HIGHLIGHTS |
TOTAL RETURN BOND FUND | |
This table is presented to show selected data for a share outstanding throughout each period and to assist shareholders in evaluating a Fund’s performance for the periods presented.
A-Class | | Period Ended
March 31,
2016a | | | Year Ended
Sept. 30,
2015 | | | Year Ended
Sept. 30,
2014 | | | Year Ended
Sept. 30,
2013 | | | Period Ended
Sept. 30,
2012b | |
Per Share Data | | | | | | | | | | | | | | | |
Net asset value, beginning of period | | $ | 26.50 | | | $ | 26.94 | | | $ | 26.16 | | | $ | 26.51 | | | $ | 25.00 | |
Income (loss) from investment operations: | |
Net investment income (loss)c | | | .41 | | | | .94 | | | | 1.01 | | | | 1.20 | | | | 1.08 | |
Net gain (loss) on investments (realized and unrealized) | | | (.16 | ) | | | (.25 | ) | | | 1.13 | | | | (.28 | ) | | | 1.35 | |
Total from investment operations | | | .25 | | | | .69 | | | | 2.14 | | | | .92 | | | | 2.43 | |
Less distributions from: | |
Net investment income | | | (.59 | ) | | | (1.09 | ) | | | (1.36 | ) | | | (1.23 | ) | | | (.92 | ) |
Net realized gains | | | — | | | | (.04 | ) | | | — | | | | (.04 | ) | | | — | |
Total distributions | | | (.59 | ) | | | (1.13 | ) | | | (1.36 | ) | | | (1.27 | ) | | | (.92 | ) |
Net asset value, end of period | | $ | 26.16 | | | $ | 26.50 | | | $ | 26.94 | | | $ | 26.16 | | | $ | 26.51 | |
| | |
Total Returng | | | 0.96 | % | | | 2.56 | % | | | 8.34 | % | | | 3.53 | % | | | 9.78 | % |
Ratios/Supplemental Data | |
Net assets, end of period (in thousands) | | $ | 495,720 | | | $ | 435,760 | | | $ | 90,805 | | | $ | 74,328 | | | $ | 30,689 | |
Ratios to average net assets: | |
Net investment income (loss) | | | 3.14 | % | | | 3.50 | % | | | 3.80 | % | | | 4.47 | % | | | 5.10 | % |
Total expensesd | | | 1.16 | % | | | 1.10 | % | | | 1.19 | % | | | 1.27 | % | | | 1.51 | % |
Net expensese,h | | | 0.97 | % | | | 0.91 | % | | | 0.94 | % | | | 0.98 | % | | | 0.85 | % |
Portfolio turnover rate | | | 56 | % | | | 74 | % | | | 52 | % | | | 94 | % | | | 69 | % |
40 | THE GUGGENHEIM FUNDS SEMI-ANNUAL REPORT | SEE NOTES TO FINANCIAL STATEMENTS. |
FINANCIAL HIGHLIGHTS (continued) |
TOTAL RETURN BOND FUND | |
This table is presented to show selected data for a share outstanding throughout each period and to assist shareholders in evaluating a Fund’s performance for the periods presented.
C-Class | | Period Ended
March 31,
2016a | | | Year Ended
Sept. 30,
2015 | | | Year Ended
Sept. 30,
2014 | | | Year Ended
Sept. 30,
2013 | | | Period Ended
Sept. 30,
2012b | |
Per Share Data | | | | | | | | | | | | | | | |
Net asset value, beginning of period | | $ | 26.50 | | | $ | 26.94 | | | $ | 26.16 | | | $ | 26.50 | | | $ | 25.00 | |
Income (loss) from investment operations: | |
Net investment income (loss)c | | | .30 | | | | .74 | | | | .82 | | | | .99 | | | | .94 | |
Net gain (loss) on investments (realized and unrealized) | | | (.15 | ) | | | (.25 | ) | | | 1.12 | | | | (.27 | ) | | | 1.32 | |
Total from investment operations | | | .15 | | | | .49 | | | | 1.94 | | | | .72 | | | | 2.26 | |
Less distributions from: | |
Net investment income | | | (.49 | ) | | | (.89 | ) | | | (1.16 | ) | | | (1.02 | ) | | | (.76 | ) |
Net realized gains | | | — | | | | (.04 | ) | | | — | | | | (.04 | ) | | | — | |
Total distributions | | | (.49 | ) | | | (.93 | ) | | | (1.16 | ) | | | (1.06 | ) | | | (.76 | ) |
Net asset value, end of period | | $ | 26.16 | | | $ | 26.50 | | | $ | 26.94 | | | $ | 26.16 | | | $ | 26.50 | |
| | |
Total Returng | | | 0.59 | % | | | 1.82 | % | | | 7.58 | % | | | 2.77 | % | | | 9.09 | % |
Ratios/Supplemental Data | |
Net assets, end of period (in thousands) | | $ | 144,182 | | | $ | 89,320 | | | $ | 25,107 | | | $ | 15,654 | | | $ | 6,607 | |
Ratios to average net assets: | |
Net investment income (loss) | | | 2.30 | % | | | 2.75 | % | | | 3.10 | % | | | 3.70 | % | | | 4.38 | % |
Total expensesd | | | 1.84 | % | | | 1.80 | % | | | 1.90 | % | | | 2.07 | % | | | 2.26 | % |
Net expensese,h | | | 1.69 | % | | | 1.63 | % | | | 1.66 | % | | | 1.77 | % | | | 1.63 | % |
Portfolio turnover rate | | | 56 | % | | | 74 | % | | | 52 | % | | | 94 | % | | | 69 | % |
SEE NOTES TO FINANCIAL STATEMENTS. | THE GUGGENHEIM FUNDS SEMI-ANNUAL REPORT 41 |
FINANCIAL HIGHLIGHTS (continued) |
TOTAL RETURN BOND FUND |
This table is presented to show selected data for a share outstanding throughout each period and to assist shareholders in evaluating a Fund’s performance for the periods presented.
P-Class | | Period Ended
March 31,
2016a | | | Period Ended
Sept. 30,
2015f | |
Per Share Data | | | | | | |
Net asset value, beginning of period | | $ | 26.49 | | | $ | 26.98 | |
Income (loss) from investment operations: | |
Net investment income (loss)c | | | .39 | | | | .36 | |
Net gain (loss) on investments (realized and unrealized) | | | (.12 | ) | | | (.43 | ) |
Total from investment operations | | | .27 | | | | (.07 | ) |
Less distributions from: | |
Net investment income | | | (.60 | ) | | | (.42 | ) |
Total distributions | | | (.60 | ) | | | (.42 | ) |
Net asset value, end of period | | $ | 26.16 | | | $ | 26.49 | |
| | |
Total Returng | | | 1.00 | % | | | (0.21 | %) |
Ratios/Supplemental Data | |
Net assets, end of period (in thousands) | | $ | 60,448 | | | $ | 12,509 | |
Ratios to average net assets: | |
Net investment income (loss) | | | 2.97 | % | | | 3.20 | % |
Total expensesd | | | 1.00 | % | | | 1.02 | % |
Net expensese,h | | | 0.87 | % | | | 0.84 | % |
Portfolio turnover rate | | | 56 | % | | | 74 | % |
42 | THE GUGGENHEIM FUNDS SEMI-ANNUAL REPORT | SEE NOTES TO FINANCIAL STATEMENTS. |
FINANCIAL HIGHLIGHTS (continued) |
TOTAL RETURN BOND FUND |
This table is presented to show selected data for a share outstanding throughout each period and to assist shareholders in evaluating a Fund’s performance for the periods presented.
Institutional Class | | Period Ended
March 31,
2016a | | | Year Ended
Sept. 30,
2015 | | | Year Ended
Sept. 30,
2014 | | | Year Ended
Sept. 30,
2013 | | | Period Ended
Sept. 30,
2012b | |
Per Share Data | | | | | | | | | | | | | | | |
Net asset value, beginning of period | | $ | 26.53 | | | $ | 26.97 | | | $ | 26.19 | | | $ | 26.54 | | | $ | 25.00 | |
Income (loss) from investment operations: | |
Net investment income (loss)c | | | .45 | | | | 1.03 | | | | 1.09 | | | | 1.28 | | | | 1.06 | |
Net gain (loss) on investments (realized and unrealized) | | | (.16 | ) | | | (.25 | ) | | | 1.14 | | | | (.27 | ) | | | 1.44 | |
Total from investment operations | | | .29 | | | | .78 | | | | 2.23 | | | | 1.01 | | | | 2.50 | |
Less distributions from: | |
Net investment income | | | (.63 | ) | | | (1.18 | ) | | | (1.45 | ) | | | (1.32 | ) | | | (.96 | ) |
Net realized gains | | | — | | | | (.04 | ) | | | — | | | | (.04 | ) | | | — | |
Total distributions | | | (.63 | ) | | | (1.22 | ) | | | (1.45 | ) | | | (1.36 | ) | | | (.96 | ) |
Net asset value, end of period | | $ | 26.19 | | | $ | 26.53 | | | $ | 26.97 | | | $ | 26.19 | | | $ | 26.54 | |
| | |
Total Returng | | | 1.14 | % | | | 2.91 | % | | | 8.74 | % | | | 3.88 | % | | | 10.09 | % |
Ratios/Supplemental Data | |
Net assets, end of period (in thousands) | | $ | 2,026,529 | | | $ | 1,409,171 | | | $ | 270,668 | | | $ | 78,318 | | | $ | 44,566 | |
Ratios to average net assets: | |
Net investment income (loss) | | | 3.41 | % | | | 3.83 | % | | | 4.09 | % | | | 4.78 | % | | | 4.91 | % |
Total expensesd | | | 0.81 | % | | | 0.76 | % | | | 0.81 | % | | | 0.89 | % | | | 0.99 | % |
Net expensese,h | | | 0.61 | % | | | 0.57 | % | | | 0.57 | % | | | 0.64 | % | | | 0.52 | % |
Portfolio turnover rate | | | 56 | % | | | 74 | % | | | 52 | % | | | 94 | % | | | 69 | % |
SEE NOTES TO FINANCIAL STATEMENTS. | THE GUGGENHEIM FUNDS SEMI-ANNUAL REPORT 43 |
FINANCIAL HIGHLIGHTS (concluded) |
TOTAL RETURN BOND FUND |
a | Unaudited figures for the period ended March 31, 2016. Percentage amounts for the period, except total return and portfolio turnover rate, have been annualized. |
b | Since commencement of operations: November 30, 2011. Percentage amounts for the period, except total return and portfolio turnover rate, have been annualized. |
c | Net investment income (loss) per share was computed using average shares outstanding throughout the period. |
d | Does not include expenses of the underlying funds in which the Fund invests. |
e | Net expense information reflects the expense ratios after expense waivers. |
f | Since commencement of operations: May 1, 2015. Percentage amounts for the period, except total return and portfolio turnover rate, have been annualized. |
g | Total return does not reflect the impact of any applicable sales charges and has not been annualized. |
h | Net expenses may include expenses that are excluded from the expense limitation agreement. Excluding these expenses, the operating expense ratios for the periods would be: |
| | 03/31/16 | 09/30/15 | 09/30/14 | 09/30/13 | 09/30/12 |
A-Class | 0.85% | 0.84% | 0.86% | 0.86% | 0.82% |
C-Class | 1.57% | 1.56% | 1.58% | 1.64% | 1.59% |
P-Class | 0.75% | 0.75% | N/A | N/A | N/A |
Institutional Class | 0.49% | 0.50% | 0.50% | 0.52% | 0.50% |
44 | THE GUGGENHEIM FUNDS SEMI-ANNUAL REPORT | SEE NOTES TO FINANCIAL STATEMENTS. |
NOTES TO FINANCIAL STATEMENTS (Unaudited) |
1. Organization and Significant Accounting Policies
Organization
Guggenheim Funds Trust (the “Trust”), a Delaware statutory trust, is registered with the SEC under the Investment Company Act of 1940 (“1940 Act”), as an open-ended investment company of the series type. Each series, in effect, is representing a separate Fund. The Trust is authorized to issue an unlimited number of shares. The Trust accounts for the assets of each Fund separately.
The Trust offers a combination of four separate classes of shares, A-Class shares, C-Class shares, P-Class shares and Institutional Class shares. Sales of shares of each Class are made without a front-end sales charge at the net asset value per share (“NAV”), with the exception of A-Class shares. A-Class shares are sold at the NAV, plus the applicable front-end sales charge. The sales charge varies depending on the amount purchased. A-Class share purchases of $1 million or more are exempt from the front-end sales charge but have a 1% contingent deferred sales charge (“CDSC”), if shares are redeemed within 12 months of purchase. C-Class shares have a 1% CDSC if shares are redeemed within 12 months of purchase. Institutional Class shares are offered primarily for direct investment by institutions such as pension and profit sharing plans, endowments, foundations and corporations. Institutional Class shares have a minimum initial investment of $2 million and a minimum account balance of $1 million. At March 31, 2016, the Trust consisted of nineteen funds (the “Funds”).
This report covers the Total Return Bond Fund (the “Fund”), a non-diversified investment company.
Guggenheim Investments (“GI”) provides advisory services, and Rydex Fund Services, LLC (“RFS”) provides transfer agent, administrative and accounting services to the Trust. Guggenheim Funds Distributors, LLC (“GFD”) acts as principal underwriter for the Trust. GI, RFS and GFD are affiliated entities.
Significant Accounting Policies
The Fund operates as an investment company and accordingly follows the investment company accounting and reporting guidance of the Financial Accounting Standards Board (“FASB”) Accounting Standards Codification Topic 946 Financial Services – Investment Companies.
The following significant accounting policies are in conformity with U.S. generally accepted accounting principles (“U.S. GAAP”) and are consistently followed by the Trust. This requires management to make estimates and assumptions that affect the reported amount of assets and liabilities and disclosure of contingent assets
| | THE GUGGENHEIM FUNDS SEMI-ANNUAL REPORT | 45 |
NOTES TO FINANCIAL STATEMENTS (Unaudited)(continued) |
and liabilities at the date of the financial statements and the reported amounts of revenues and expenses during the reporting period. Actual results could differ from these estimates. All time references are based on Eastern Time.
The NAV of each Class of the Fund is calculated by dividing the market value of the Fund’s securities and other assets, less all liabilities, attributable to the Class by the number of outstanding shares of the Class.
A. The Board of Trustees of the Fund (the “Board”) has adopted policies and procedures for the valuation of the Fund’s investments (the “Valuation Procedures”). Pursuant to the Valuation Procedures, the Board has delegated to a valuation committee, consisting of representatives from Guggenheim’s investment management, fund administration, legal and compliance departments (the “Valuation Committee”), the day-to-day responsibility for implementing the Valuation Procedures, including, under most circumstances, the responsibility for determining the fair value of the Fund’s securities or other assets.
Valuations of the Fund’s securities are supplied primarily by pricing services appointed pursuant to the processes set forth in the Valuation Procedures. The Valuation Committee convenes monthly, or more frequently as needed and will review the valuation of all assets which have been fair valued for reasonableness. The Fund’s officers, through the Valuation Committee and consistent with the monitoring and review responsibilities set forth in the Valuation Procedures, regularly review procedures used by, and valuations provided by, the pricing services.
If the pricing service cannot or does not provide a valuation for a particular investment or such valuation is deemed unreliable, such investment is fair valued by the Valuation Committee.
Equity securities listed on an exchange (New York Stock Exchange (“NYSE”) or American Stock Exchange) are valued at the last quoted sales price as of the close of business on the NYSE, usually 4:00 p.m. on the valuation date. Equity securities listed on the NASDAQ market system are valued at the NASDAQ Official Closing Price on the valuation date, which may not necessarily represent the last sale price. If there has been no sale on such exchange or NASDAQ on a given day, the security is valued at the closing bid price on that day.
Generally, trading in foreign securities markets is substantially completed each day at various times prior to the close of the NYSE. The values of foreign securities are determined as of the close of such foreign markets or the close of the NYSE, if earlier. All investments quoted in foreign currency are valued in U.S. dollars on the basis of the foreign currency exchange rates prevailing at the close of business. Investments in foreign securities may involve risks not present in domestic
46 | THE GUGGENHEIM FUNDS SEMI-ANNUAL REPORT | |
NOTES TO FINANCIAL STATEMENTS (Unaudited)(continued) |
investments. The Valuation Committee will determine the current value of such foreign securities by taking into consideration certain factors which may include those discussed above, as well as the following factors, among others: the value of the securities traded on other foreign markets, ADR trading, closed-end fund trading, foreign currency exchange activity, and the trading prices of financial products that are tied to foreign securities. In addition, the Board of Trustees has authorized the Valuation Committee and GI to use prices and other information supplied by a third party pricing vendor in valuing foreign securities.
Open-end investment companies (“Mutual Funds”) are valued at their NAV as of the close of business, on the valuation date. Exchange-traded funds (“ETFs”) and closed-end investment companies (“CEFs”) are valued at the last quoted sales price.
U.S. government securities are valued by either independent pricing services, the last traded fill price, or at the reported bid price at the close of business.
Debt securities with a maturity of greater than 60 days at acquisition are valued at prices that reflect broker/dealer supplied valuations or are obtained from independent pricing services, which may consider the trade activity, treasury spreads, yields or price of bonds of comparable quality, coupon, maturity, and type, as well as prices quoted by dealers who make markets in such securities. Short-term debt securities with a maturity of 60 days or less at acquisition are valued at amortized cost, provided such amount approximates market value.
Repurchase agreements are valued at amortized cost, provided such amounts approximate market value.
Typically loans are valued using information provided by an independent third party pricing service which uses broker quotes in a non-active market.
Listed options are valued at the Official Settlement Price listed by the exchange, usually as of 4:00 p.m. Long options are valued using the bid price and short options are valued using the ask price. In the event that a settlement price is not available, fair valuation is enacted. Over-the-counter options are valued using the average bid price (for long options), or average ask price (for short options) obtained from one or more security dealers.
The value of interest rate swap agreements entered into by a Fund are accounted for using the unrealized gain or loss on the agreements that is determined using the spread priced off the previous day’s Chicago Mercantile Exchange (“CME”) price.
| | THE GUGGENHEIM FUNDS SEMI-ANNUAL REPORT | 47 |
NOTES TO FINANCIAL STATEMENTS (Unaudited)(continued) |
Forward foreign currency exchange contracts are valued daily based on the applicable exchange rate of the underlying currency. The change in value of the contract is recorded as unrealized appreciation or depreciation until the forward foreign currency contract is closed. When the forward foreign currency contract is closed, the Fund records a realized gain or loss equal to the difference between the value at the time the contract was opened and the value at the time it was closed.
Investments for which market quotations are not readily available are fair valued as determined in good faith by GI under the direction of the Board of Trustees using methods established or ratified by the Board of Trustees. Valuations in accordance with these methods are intended to reflect each security’s (or asset’s) “fair value.” Each such determination is based on a consideration of all relevant factors, which are likely to vary from one pricing context to another. Examples of such factors may include, but are not limited to: (i) the type of security, (ii) the initial cost of the security, (iii) the existence of any contractual restrictions on the security’s disposition, (iv) the price and extent of public trading in similar securities of the issuer or of comparable companies, (v) quotations or evaluated prices from broker-dealers and/or pricing services, (vi) information obtained from the issuer, analysts, and/or the appropriate stock exchange (for exchange-traded securities), (vii) an analysis of the company’s financial statements, and (viii) an evaluation of the forces that influence the issuer and the market(s) in which the security is purchased and sold (e.g. the existence of pending merger activity, public offerings or tender offers that might affect the value of the security).
In connection with futures contracts and other derivative investments, such factors may include obtaining information as to how (a) these contracts and other derivative investments trade in the futures or other derivative markets, respectively, and (b) the securities underlying these contracts and other derivative investments trade in the cash market.
B. Senior loans in which the Fund invests generally pay interest rates which are periodically adjusted by reference to a base short-term, floating rate plus a premium. These base lending rates are generally (I) the lending rate offered by one or more major European banks, such as the one-month or three-month London Inter-Bank Offered Rate (LIBOR), (ii) the prime rate offered by one or more major United States banks, or (iii) the bank’s certificate of deposit rate. Senior floating rate interests often require prepayments from excess cash flows or permit the borrower to repay at its election. The rate at which the borrower repays cannot be predicted with accuracy. As a result, the actual remaining maturity may be substantially less than the stated maturities shown. The interest rate indicated is the rate in effect at March 31, 2016.
48 | THE GUGGENHEIM FUNDS SEMI-ANNUAL REPORT | |
NOTES TO FINANCIAL STATEMENTS (Unaudited)(continued) |
C. The Fund may purchase and sell interests in securities on a when-issued and delayed delivery basis, with payment and delivery scheduled for a future date. No income accrues to the Fund on such interests or securities in connection with such transactions prior to the date the Fund actually take delivery of such interests or securities. These transactions are subject to market fluctuations and are subject to the risk that the value at delivery may be more or less than the trade date purchase price. Although the Fund will generally purchase these securities with the intention of acquiring such securities, they may sell such securities before the settlement date.
D. Upon the purchase of an option, the premium paid is recorded as an investment, the value of which is marked-to-market daily. If a purchased option expires, the Fund realizes a loss in the amount of the cost of the option. When the Fund enters into a closing sale transaction, it realizes a gain or loss depending on whether the proceeds from the closing sale transaction are greater or less than the cost of the option. If the Fund exercises a put option, it realizes a gain or loss from the sale of the underlying security and the proceeds from such sale will be decreased by the premium originally paid. When the Fund exercises a call option, the cost of the security purchased by the Fund upon exercise increases by the premium originally paid.
When the Fund writes (sells) an option, an amount equal to the premium received is entered in that Fund’s accounting records as an asset and equivalent liability. The amount of the liability is subsequently marked-to-market to reflect the current value of the option written. When a written option expires, or if the Fund enters into a closing purchase transaction, it realizes a gain (or loss if the cost of a closing purchase transaction exceeds the premium received when the option was sold).
E. Swap agreements are marked-to-market daily and the change, if any, is recorded as unrealized gain or loss. Payments received or made as a result of an agreement or termination of the agreement are recognized as realized gains or losses.
F. Security transactions are recorded on the trade date for financial reporting purposes. Realized gains and losses from securities transactions are recorded using the identified cost basis. Proceeds from lawsuits related to investment holdings are recorded as realized gains in the Fund. Dividend income is recorded on the ex-dividend date, net of applicable taxes withheld by foreign countries. Taxable non-cash dividends are recorded as dividend income. Interest income, including amortization of premiums and accretion of discounts, is accrued on a daily basis. Interest income also includes paydown gains and losses on mortgage-backed and asset-backed securities and senior and subordinated loans. Amendment fees are earned as compensation for evaluating and accepting changes to the original
| | THE GUGGENHEIM FUNDS SEMI-ANNUAL REPORT | 49 |
NOTES TO FINANCIAL STATEMENTS (Unaudited)(continued) |
loan agreement and are recognized when received. Dividend income from REITs is recorded based on the income included in the distributions received from the REIT investments using published REIT classifications, including some management estimates when actual amounts are not available. Distributions received in excess of this estimated amount are recorded as a reduction of the cost of investments or reclassified to capital gains. The actual amounts of income, return of capital, and capital gains are only determined by each REIT after its fiscal year-end, and may differ from the estimated amounts.
G. The Fund declares dividends from investment income daily. The Fund pays its shareholders from its net investment income monthly and distributes any net capital gains that it has realized, at least annually. Distributions to shareholders are recorded on the ex-dividend date. Dividends are reinvested in additional shares unless shareholders request payment in cash. The character of distributions made during the year from net investment income or net realized gains may differ from their ultimate characterization for federal income tax purposes.
H. Interest and dividend income, most expenses, all realized gains and losses, and all unrealized gains and losses are allocated to the classes based upon the value of the outstanding shares in each Class. Certain costs, such as distribution and service fees are charged directly to specific classes. In addition, certain expenses have been allocated to the individual Funds in the Trust on a pro rata basis upon the respective aggregate net assets of each Fund included in the Trust.
I. Under the fee arrangement with the custodian, the Fund may earn credits based on overnight custody cash balances. These credits are utilized to reduce related custodial expenses. The custodian fees disclosed in the Statement of Operations are before the reduction in expense from the related earnings credits, if any. For the period ended March 31, 2016, there were no earnings credits received.
J. The Fund may leave cash overnight in its cash account with the custodian. Periodically, the Fund may have cash due to the custodian bank as an overdraft balance. A fee is incurred on this overdraft, calculated by multiplying the overdraft by a rate based on the federal funds rate, which was 0.25% at March 31, 2016.
K. Under the Fund’s organizational documents, its Trustees and Officers are indemnified against certain liabilities arising out of the performance of their duties to the Trust. In addition, throughout the normal course of business, the Fund enters into contracts that contain a variety of representations and warranties which provide general indemnifications. The Fund’s maximum exposure under these arrangements is unknown, as this would involve future claims that may be made against the Fund and/or its affiliates that have not yet occurred. However, based on experience, the Fund expects the risk of loss to be remote.
50 | THE GUGGENHEIM FUNDS SEMI-ANNUAL REPORT | |
NOTES TO FINANCIAL STATEMENTS (Unaudited)(continued) |
L. The accounting records of the Fund are maintained in U.S. dollars. All assets and liabilities initially expressed in foreign currencies are converted into U.S. dollars at prevailing exchange rates. Purchases and sales of investment securities, dividend and interest income, and certain expenses are translated at the rates of exchange prevailing on the respective dates of such transactions. Changes in the relationship of these foreign currencies to the U.S. dollar can significantly affect the value of the investments and earnings of the Funds. Foreign investments may also subject the Funds to foreign government exchange restrictions, expropriation, taxation or other political, social or economic developments, all of which could affect the market and/or credit risk of the investments
The Funds do not isolate that portion of the results of operations resulting from changes in the foreign exchange rates on investments from the fluctuations arising from changes in the market prices of securities held.
Such fluctuations are included with the net realized and unrealized gain or loss on investments.
2. Financial Instruments and Derivatives
As part of its investment strategy, the Fund utilizes a variety of derivative instruments. These investments involve, to varying degrees, elements of market risk and risks in excess of the amounts recognized in the Statement of Assets and Liabilities. Valuation and accounting treatment of these instruments can be found under Significant Accounting Policies in Note 1 of these Notes to Financial Statements.
Derivatives
Derivatives are instruments whose values depend on, or are derived from, in whole or in part, the value of one or more other assets, such as securities, currencies, commodities or indices. Derivative instruments may be used to increase investment flexibility (including to maintain cash reserves while maintaining exposure to certain other assets), for risk management (hedging) purposes, to facilitate trading, to reduce transaction costs and to pursue higher investment returns. Derivative instruments may also be used to mitigate certain investment risks, such as foreign currency exchange rate risk, interest rate risk and credit risk. U.S. GAAP requires disclosures to enable investors to better understand how and why a Fund uses derivative instruments, how these derivative instruments are accounted for and their effects on the Fund’s financial position and results of operations.
The Funds may utilize derivatives for the following purposes:
Duration: the use of an instrument to manage the interest rate risk of a portfolio.
| | THE GUGGENHEIM FUNDS SEMI-ANNUAL REPORT | 51 |
NOTES TO FINANCIAL STATEMENTS (Unaudited)(continued) |
Hedge: an investment made in order to reduce the risk of adverse price movements in a security, by taking an offsetting position to protect against broad market moves.
Options Purchased and Written
A call option on a security gives the purchaser of the option the right to buy, and the writer of a call option the obligation to sell, the underlying security. The purchaser of a put option has the right to sell, and the writer of the put option the obligation to buy, the underlying security at any time during the option period. The risk associated with purchasing options is limited to the premium originally paid.
The following table represents the Fund’s use, and volume of call/put options purchased on a quarterly basis:
Fund | Use | | Average Number of Contracts | |
Total Return Bond Fund | Duration, Hedge | | | 8,182 | |
The risk in writing a call option is that a Fund may incur a loss if the market price of the underlying security increases and the option is exercised. The risk in writing a put option is that a Fund may incur a loss if the market price of the underlying security decreases and the option is exercised. In addition, there may be an imperfect correlation between the movement in prices of options and the underlying securities where a Fund may not be able to enter into a closing transaction because of an illiquid secondary market; or, for OTC options, a Fund may be at risk because of the counterparty’s inability to perform.
The Fund used written options for Duration and Hedge. The following table represents the Fund’s use and activity of options written for the year ended March 31, 2016:
Call Options Written
Written Call Options | | | |
| | | Total Return Bond Fund | |
| | | Number of
Contracts | | | Premium
Amount | |
Balance at September 30, 2015 | | | 7,338 | | | $ | 197,829 | |
Options Written | | | — | | | | — | |
Options terminated in closing purchase transactions | | | — | | | | — | |
Options expired | | | (7,338 | ) | | | (197,829 | ) |
Options exercised | | | — | | | | — | |
Balance at March 31, 2016 | | | — | | | $ | — | |
52 | THE GUGGENHEIM FUNDS SEMI-ANNUAL REPORT | |
NOTES TO FINANCIAL STATEMENTS (Unaudited)(continued) |
Swaps
A swap is an agreement that obligates two parties to exchange a series of cash flows at specified intervals based upon or calculated by reference to changes in specified prices or rates for a specified amount of an underlying asset. A Fund utilizing OTC swaps bears the risk of loss of the amount expected to be received under a swap agreement in the event of the default or bankruptcy of a swap agreement counterparty or if the underlying asset declines in value. Certain standardized swaps are subject to mandatory central clearing. Central clearing generally reduces counterparty credit risk and increases liquidity, but central clearing does not make swap transactions risk-free. Additionally, there is no guarantee that a Fund or an underlying fund could eliminate its exposure under an outstanding swap agreement by entering into an offsetting swap agreement with the same or another party.
Total return swaps involve commitments where single or multiple cash flows are exchanged based on the price of an underlying reference asset (such as index or basket) or a fixed or variable interest rate. Index swaps will usually be computed based on the current index value as of the close of regular trading on the NYSE or other exchange, with the swap value being adjusted to include dividends accrued, financing charges and/or interest associated with the swap agreement. Custom basket swaps are computed in a similar manner, but the composition of the custom basket swap is not tied directly to a publicly available index. As such, the constituents of the basket are available on the respective Fund’s Schedule of Investments. A Fund utilizing a total return index swap bears the risk of loss of the amount expected to be received under a swap agreement in the event of the default or bankruptcy of a swap agreement counterparty or if the underlying index declines in value.
Interest rate swaps involve the exchange by the Fund with another party for its respective commitment to pay or receive interest on a notional amount of principal. Interest rate swaps are generally valued using the closing price from the prior day, subject to an adjustment for the current day’s spreads. Interest rate swaps are generally subject to mandatory central clearing, but central clearing does not make interest rate swap transactions risk free.
The following table represents the Fund’s use and volume of interest rate swaps on a quarterly basis:
Fund | Use | | Average Notional | |
Total Return Bond Fund | Duration, Hedge | | $ | 10,250,000 | |
| | THE GUGGENHEIM FUNDS SEMI-ANNUAL REPORT | 53 |
NOTES TO FINANCIAL STATEMENTS (Unaudited)(continued) |
Forward Foreign Currency Exchange Contracts
A forward foreign currency exchange contract is an agreement between two parties to exchange two designated currencies at a specific time in the future. Certain types of forward foreign currency exchange contracts may be cash settled, in an amount equal to the change in exchange rates during the term of the contract. The contracts can be used to hedge or manage exposure to foreign currency risks with portfolio investments or to gain exposure to foreign currencies.
The market value of a forward foreign currency exchange contract changes with fluctuations in foreign currency exchange rates. Furthermore, the Fund may be exposed to risk if the counterparties cannot meet the contract terms or if the currency value changes unfavorably as compared to the U.S. dollar.
The following table represents the Fund’s use, and volume of forward currency exchange contracts on a quarterly basis:
| | | | Average Settlement | |
Fund | Use | | Purchased | | | Sold | |
Total Return Bond Fund | Hedge | | $ | 983,692 | | | $ | 126,663 | |
Derivative Investment Holdings Categorized by Risk Exposure
The following is a summary of the location of derivative investments on the Fund’s Statement of Assets and Liabilities as of March 31, 2016:
Derivative Investment Type | Asset Derivatives | Liability Derivatives |
Currency contracts | | Unrealized depreciation on forward foreign currency exchange contracts |
The following table sets forth the fair value of the Fund’s derivative investments categorized by primary risk exposure at March 31, 2016:
Liability Derivative Investments Value |
Fund | | Forward
Foreign
Currency
Exchange
Contracts | |
Total Return Bond Fund | | $ | (67,695 | ) |
54 | THE GUGGENHEIM FUNDS SEMI-ANNUAL REPORT | |
NOTES TO FINANCIAL STATEMENTS (Unaudited)(continued) |
The following is a summary of the location of derivative investments on the Fund’s Statement of Operation for the period ended March 31, 2016:
Derivative Investment Type | Location of Gain (Loss) on Derivatives |
Currency contracts | Net realized gain (loss) on forward foreign currency exchange contracts |
| Net change in unrealized appreciation (depreciation) on forward foreign currency exchange contracts |
The following is a summary of the Fund’s realized gain (loss) and change in unrealized appreciation (depreciation) on derivative investments recognized on the Statement of Operation categorized by primary risk exposure for the period ended March 31, 2016:
Realized Gain (Loss) on Derivative Investments Recognized on the Statement of Operations |
Fund | | Swaps Interest
Rate Contracts | | | Options Written
Equity Contracts | | | Options Purchased Equity Contracts | | | Forward
Foreign
Currency Exchange Contracts | | | Total | |
Total Return Bond Fund | | $ | 78,707 | | | $ | 197,829 | | | $ | (724,488 | ) | | $ | (15,994 | ) | | $ | (463,946 | ) |
Change in Unrealized Appreciation (Depreciation) on Derivative Investments Recognized on the Statement of Operations |
Fund | | Swaps Interest
Rate Contracts | | | Options Written
Equity Contracts | | | Options Purchased Equity Contracts | | | Forward
Foreign Currency Exchange Contracts | | | Total | |
Total Return Bond Fund | | $ | (233,580 | ) | | $ | 95,691 | | | $ | (542,718 | ) | | $ | (59,503 | ) | | $ | (740,110 | ) |
In conjunction with the use of derivative instruments, the Fund is required to maintain collateral in various forms. The Fund uses, where appropriate, depending on the financial instrument utilized and the broker involved, margin deposits at the broker, cash and/or securities segregated at the custodian bank, discount notes or the repurchase agreements allocated to the Fund.
The Trust has established counterparty credit guidelines and enters into transactions only with financial institutions of investment grade or better. The Trust monitors the counterparty credit risk.
| | THE GUGGENHEIM FUNDS SEMI-ANNUAL REPORT | 55 |
NOTES TO FINANCIAL STATEMENTS (Unaudited)(continued) |
3. Fees and Other Transactions with Affiliates
Under the terms of an investment advisory contract, the Fund pays GI investment advisory fees calculated at an annualized rate of 0.50% of the average daily net assets of the Fund.
RFS is paid the following for providing transfer agent services to the Fund. Transfer agent fees are assessed to the applicable class of the Fund.
Annual charge per account | $5.00 – $8.00 |
Transaction fee | $0.60 – $1.10 |
Minimum annual charge per Fund† | $25,000 |
Certain out-of-pocket charges | Varies |
† | Not subject to Fund during first twelve months of operations. |
RFS also acts as the administrative agent for the Fund, and as such performs administrative functions and the bookkeeping, accounting and pricing functions for the Fund. For these services, RFS receives 0.095% of the average daily net assets of the Fund. The minimum annual charge for fund accounting/administrative fees is $25,000.
RFS engages external service providers to perform other necessary services for the Trust, such as audit and accounting related services, legal services, custody, printing and mailing, etc., on a pass-through basis. Such expenses are allocated to various Funds within the complex based on relative net assets.
The Fund has adopted Distribution Plans related to the offering of A-Class, C-Class and P-Class shares pursuant to Rule 12b-1 under the 1940 Act. The plans provide for payments at an annual rate of 0.25% of the average daily net assets of the Fund’s A-Class and P-Class shares, and 1.00% of the average daily net assets of the Fund’s C-Class shares.
The investment advisory contracts for the following Fund provides that the total expenses be limited to a percentage of average net assets for each class of shares, exclusive of brokerage costs, dividends on securities sold short, expenses of other investment companies in which a Fund invests, interest, taxes, litigation, indemnification and extraordinary expenses. The limits are listed below:
| | Limit | Effective
Date | Contract
End Date |
Total Return Bond Fund - A-Class | 0.90% | 11/30/12 | 02/01/17 |
Total Return Bond Fund - C-Class | 1.65% | 11/30/12 | 02/01/17 |
Total Return Bond Fund - P-Class* | 0.90% | 05/01/15 | 02/01/17 |
Total Return Bond Fund - Institutional Class | 0.50% | 11/30/12 | 02/01/17 |
* | Since the commencement of operations: May 1, 2015 |
56 | THE GUGGENHEIM FUNDS SEMI-ANNUAL REPORT | |
NOTES TO FINANCIAL STATEMENTS (Unaudited)(continued) |
GI is entitled to reimbursement by the Fund for fees waived or expenses reimbursed during any of the previous 36 months, beginning on the date of the expense limitation agreement, if on any day the estimated operating expenses are less than the indicated percentages. At March 31, 2016, the amount of fees waived or expenses reimbursed that are subject to recoupment are presented in the following table:
Fund | | Expires
2016 | | | Expires
2017 | | | Expires
2018 | | | Expires
2019 | | | Fund
Total | |
Total Return Bond Fund | | $ | 267,000 | | | $ | 550,932 | | | $ | 2,324,957 | | | $ | 2,037,070 | | | $ | 5,179,959 | |
For the period ended March 31, 2016, no amounts were recouped by GI.
If a Fund invests in an affiliated fund, the investing Fund’s Adviser has agreed to waive fees at the investing fund level. Fee waivers will be calculated at the investing Fund level without regard to any expense cap, if any, in effect for the investing Fund. Fees waived under this arrangement are not subject to reimbursement to GI. For the period March 31, 2016, the Fund waived $95,284 related to investments in affiliated funds.
For the period ended March 31, 2016, GFD retained sales charges of $274,695 relating to sales of A-Class shares of the Trust.
Certain trustees and officers of the Trust are also officers of GI, RFS and GFD.
4. Fair Value Measurement
In accordance with U.S. GAAP, fair value is defined as the price that the Fund would receive to sell an investment or pay to transfer a liability in an orderly transaction with an independent buyer in the principal market, or in the absence of a principal market, the most advantageous market for the investment or liability. U.S. GAAP establishes a three-tier fair value hierarchy based on the types of inputs used to value assets and liabilities and requires corresponding disclosure. The hierarchy and the corresponding inputs are summarized below:
Level 1 — | quoted prices in active markets for identical assets or liabilities. |
Level 2 — | significant other observable inputs (for example quoted prices for securities that are similar based on characteristics such as interest rates, prepayment speeds, credit risk, etc.). |
Level 3 — | significant unobservable inputs based on the best information available under the circumstances, to the extent observable inputs are not available, which may include assumptions. |
| | THE GUGGENHEIM FUNDS SEMI-ANNUAL REPORT | 57 |
NOTES TO FINANCIAL STATEMENTS (Unaudited)(continued) |
The types of inputs available depend on a variety of factors, such as the type of security and the characteristics of the markets in which it trades, if any. Fair valuation determinations that rely on fewer or no observable inputs require greater judgment. Accordingly, fair value determinations for Level 3 securities require the greatest amount of judgment.
Independent pricing services are used to value a majority of the Fund’s investments. When values are not available from a pricing service, they may be computed by the Fund’s investment adviser or an affiliate. In any event, values may be determined using a variety of sources and techniques, including: market prices; broker quotes; and models which derive prices based on inputs such as prices of securities with comparable maturities and characteristics or based on inputs such as anticipated cash flows or collateral, spread over Treasuries, and other information and analysis. A significant portion of the Fund’s assets and liabilities are categorized as Level 2 or Level 3, as indicated in this report.
Indicative quotes from broker-dealers, adjusted for fluctuations in criteria such as credit spreads and interest rates, may be also used to value the Fund’s assets and liabilities, i.e. prices provided by a broker-dealer or other market participant who has not committed to trade at that price. Although indicative quotes are typically received from established market participants, the Fund may not have the transparency to view the underlying inputs which support the market quotations. Significant changes in an indicative quote would generally result in significant changes in the fair value of the security.
Certain fixed income securities are valued by obtaining a monthly indicative quote from a broker-dealer, adjusted for fluctuations in criteria such as credit spreads and interest rates.
The inputs or methodologies used for valuing securities are not necessarily an indication of the risk associated with investing in those securities. The suitability of the techniques and sources employed to determine fair valuation are regularly monitored and subject to change.
58 | THE GUGGENHEIM FUNDS SEMI-ANNUAL REPORT | |
NOTES TO FINANCIAL STATEMENTS (Unaudited)(continued) |
The following is a summary of significant unobservable inputs used in the fair value valuation of assets and liabilities categorizes within Level 3 of the fair value hierarchy.
Fund | Category and
Subcategory | | Ending Balance at 03/31/16 | | Valuation
Technique | Unobservable Inputs |
Total Return Bond Fund | Asset-Backed Securities | | $ | 29,941,833 | | Option Adjusted Spread off the prior month end broker mark over the 3 month LIBOR | Indicative Quote |
| | Corporate Bonds | | | 18,629,338 | | Option Adjusted Spread off the prior month end broker mark over the 3 month LIBOR | Indicative Quote |
| | Collateralized Mortgage Obligations | | | 13,692,821 | | Option Adjusted Spread off the prior month end broker mark over the 3 month LIBOR | Indicative Quote |
| | | | | 65,705 | | Option Adjusted Spread off multiple prior month end broker marks over the 3 month LIBOR | Indicative Quote |
| | Total Collateralized Mortgage Obligations | | | 13,758,526 | | | |
| | Senior Floating Rate Interests | | | 818,391 | | Option Adjusted Spread off the prior month end broker mark over the 3 month LIBOR | Indicative Quote |
Any remaining Level 3 securities held by the Fund and excluded from the table above, were not considered material to the Fund.
Transfers between investment levels may occur as the markets fluctuate and/ or the availability of data used in an investment’s valuation changes. The Fund recognized transfers between the levels as of the beginning of the period. As of March 31, 2016, the Fund had transfers in/out of Level 3 due to changes in securities valuation method. See the table below for changes to and from Level 2 and Level 3. There were no other securities that transferred between levels.
| | THE GUGGENHEIM FUNDS SEMI-ANNUAL REPORT | 59 |
NOTES TO FINANCIAL STATEMENTS (Unaudited)(continued) |
Summary of Fair Value Level 3 Activity
Following is a reconciliation of Level 3 assets for which significant unobservable inputs were used to determine fair value for the period ended March 31, 2016:
LEVEL 3 - Fair value measurement using significant unobservable inputs
| | | Senior
Floating Rate
Interests | | | Collateralized
Mortgage
Obligations | | | Asset-
Backed
Security | | | Corporate
Bonds | | | Senior
Fixed Rate
Interests | | | Total | |
TOTAL RETURN BOND | | | | | | | | | | | | | | | | | | |
Assets: | | | | | | | | | | | | | | | | | | |
Beginning Balance | | $ | 820,463 | | | $ | 9,315,497 | | | $ | 9,617,821 | | | $ | 16,122,382 | | | $ | 45 | | | $ | 35,876,208 | |
Purchases | | | — | | | | 4,728,377 | | | | 17,933,338 | | | | — | | | | — | | | | 22,661,715 | |
Sales, maturities and paydowns | | | (2,125 | ) | | | (328,850 | ) | | | (539,069 | ) | | | (101,852 | ) | | | — | | | | (971,896 | ) |
Total realized gains or losses included in earnings | | | — | | | | (64 | ) | | | — | | | | — | | | | (208,125 | ) | | | (208,189 | ) |
Total change in unrealized gains or losses included in earnings | | | 53 | | | | 43,566 | | | | (17,774 | ) | | | (211,925 | ) | | | 208,080 | | | | 22,000 | |
Transfers in Level 3 | | | — | | | | — | | | | 2,947,517 | | | | 2,820,733 | | | | — | | | | 5,768,250 | |
Transfers out of Level 3 | | | — | | | | — | | | | — | | | | — | | | | — | | | | — | |
Ending Balance | | $ | 818,391 | | | $ | 13,758,526 | | | $ | 29,941,833 | | | $ | 18,629,338 | | | $ | — | | | $ | 63,148,088 | |
Net Change in unrealized appreciation (depreciation) for investments in securities still held at March 31, 2016 | | $ | (2,289 | ) | | $ | (11,661 | ) | | $ | (25,215 | ) | | $ | (248,428 | ) | | $ | 208,080 | | | $ | (79,512 | ) |
5. Federal Income Tax Information
The Fund intends to comply with the provisions of Subchapter M of the Internal Revenue Code applicable to regulated investment companies and will distribute substantially all taxable net investment income and capital gains sufficient to relieve the Fund from all, or substantially all, federal income, excise and state income taxes. Therefore, no provision for federal or state income tax is required.
Tax positions taken or expected to be taken in the course of preparing the Fund’s tax returns are evaluated to determine whether the tax positions are “more-likely-than-not” of being sustained by the applicable tax authority. Tax positions not deemed to meet the more-likely-than-not threshold would be recorded as a tax benefit or expense in the current year. Management has analyzed the Fund’s tax positions taken, or to be taken, on Federal income tax returns for all open tax
60 | THE GUGGENHEIM FUNDS SEMI-ANNUAL REPORT | |
NOTES TO FINANCIAL STATEMENTS (Unaudited)(continued) |
years, and has concluded that no provision for income tax is required in the Fund’s financial statements. The Fund’s federal tax returns are subject to examination by the Internal Revenue Service for a period of three years after they are filed.
At March 31, 2016, the cost of securities for Federal income tax purposes, the aggregate gross unrealized gain for all securities for which there was an excess of value over tax cost and the aggregate gross unrealized loss for all securities for which there was an excess of tax cost over value, were as follows:
Fund | | Tax
Cost | | | Tax
Unrealized
Gain | | | Tax
Unrealized
Loss | | | Net
Unrealized
Loss | |
Total Return Bond Fund | | $ | 2,982,128,042 | | | $ | 41,520,974 | | | $ | (76,129,516 | ) | | $ | (34,608,542 | ) |
6. Securities Transactions
For the period ended March 31, 2016, the cost of purchases and proceeds from sales of investment securities, excluding government securities, short-term investments and derivatives, were as follows:
Fund | | Purchases | | | Sales | |
Total Return Bond Fund | | $ | 1,684,123,589 | | | $ | 978,439,846 | |
For the period ended March 31, 2016, the cost of purchases and proceeds from sales of government securities were as follows:
Fund | | Purchases | | | Sales | |
Total Return Bond Fund | | $ | 417,070,683 | | | $ | 359,754,824 | |
The Fund is permitted to purchase or sell securities from or to certain affiliated funds under specified conditions outlined in procedures adopted by the Board of Trustees of the Trust. The procedures have been designed to ensure that any purchase or sale of securities by a Fund from or to another fund or portfolio that is or could be considered an affiliate by virtue of having a common investment adviser (or affiliated investment advisers), common Trustees and/or common officers complies with Rule 17a-7 of the 1940 Act. Further, as defined under these procedures, each transaction is effected at the current market price to save costs, where permissible. For the period ended March 31, 2016, the Fund engaged in purchases and sales of securities, pursuant to Rule 17a-7 of the 1940 Act, as follows:
Fund | | Purchases | | | Sales | | | Realized
Gain (Loss) | |
Total Return Bond Fund | | $ | 14,179,737 | | | $ | — | | | $ | — | |
| | THE GUGGENHEIM FUNDS SEMI-ANNUAL REPORT | 61 |
NOTES TO FINANCIAL STATEMENTS (Unaudited)(continued) |
7. Affiliated Transactions
Investments representing 5% or more of the outstanding voting shares of a portfolio company of a fund, or control of or by, or common control under GI, result in that portfolio company being considered an affiliated company of such fund, as defined in the 1940 Act.
The Fund may invest in the Guggenheim Strategy Funds Trust consisting of Guggenheim Strategy Fund I, Guggenheim Strategy Fund II, Guggenheim Strategy Fund III, and Guggenheim Variable Insurance Strategy Fund III (collectively, the “Cash Management Funds”), open-end management investment companies managed by GI. The Cash Management Funds, which launched on March 11, 2014, are offered as cash management options only to mutual funds, trusts, and other accounts managed by GI and/or its affiliates, and are not available to the public. The Cash Management Funds pay no investment management fees. The Cash Management Funds’ annual report on Form N-CSR dated September 30, 2015 is available publicly or upon request. This information is available from the EDGAR database on the SEC’s website at http://www.sec.gov/Archives/edgar/data/1601445/000089180415000857/gug63224-ncsr.htm.
Transactions during the period ended March 31, 2016, in which the portfolio company is an “affiliated person”, were as follows:
Affiliated issuers by Fund | | Value
09/30/15 | | | Additions | | | Reductions | | | Value
03/31/16 | | | Shares
03/31/16 | | | Investment
Income | | | Realized
Gain (Loss) | |
Total Return Bond Fund | | | | | | | | | | |
Guggenheim Floating Rate Strategies Fund -
Institutional Class | | $ | — | | | $ | 64,630,776 | | | $ | (63,318,973 | ) | | $ | — | | | | — | | | $ | 630,833 | | | $ | (1,311,803 | ) |
Guggenheim High Yield Fund - Insitutional Class | | | — | | | | 3,516,850 | | | | (3,438,323 | ) | | | — | | | | — | | | | 16,850 | | | | (78,526 | ) |
Guggenheim Strategic Opportunities Fund | | | 2,968,259 | | | | 5,309,754 | | | | — | | | | 8,183,930 | | | | 481,691 | | | | 181,383 | | | | — | |
Guggenheim Strategy Fund I | | 95,705,888 | | | | 39,038,541 | | | | (117,500,000 | ) | | | 17,083,133 | | | | 688,558 | | | | 286,480 | | | | (202,666 | ) |
Guggenheim Strategy Fund II | | — | | | | 10,008,821 | | | | — | | | | 10,016,928 | | | | 405,708 | | | | 8,821 | | | | — | |
| | | $ | 98,674,147 | | | $ | 122,504,742 | | | $ | (184,257,296 | ) | | $ | 35,283,991 | | | | | | | $ | 1,124,367 | | | $ | (1,592,995 | ) |
8. Loan Commitments
Pursuant to the terms of certain loan agreements, the Fund held unfunded loan commitments as of March 31, 2016. The Fund is obligated to fund these loan commitments at the borrower’s discretion.
62 | THE GUGGENHEIM FUNDS SEMI-ANNUAL REPORT | |
NOTES TO FINANCIAL STATEMENTS (Unaudited)(continued) |
The unfunded loan commitments as of March 31, 2016, were as follows:
Borrower | Maturity
Date | | Face
Amount | | | Value | |
Total Return Bond Fund | | | | | | | |
Acosta, Inc. | 9/26/2019 | | $ | 2,200,000 | | | $ | 204,240 | |
Aspect Software, Inc. | 9/30/2016 | | | 1,270 | | | | — | |
| | | | $ | 7,201,270 | | | $ | 204,240 | |
9. Line of Credit
The Funds, with the exception of Alpha Opportunity Fund, Capital Stewardship Fund, Diversified Income Fund and Market Neutral Real Estate Fund, secured a committed $800,000,000 line of credit from Citibank, N.A., good through October 7, 2016, at which time the line of credit may be renewed. This line of credit is reserved for emergency or temporary purposes. Fees related to borrowings, if any, vary under this arrangement between the greater of Citibank’s “base rate”, LIBOR plus 1%, or the federal funds rate (0.25% at March 31, 2016), plus 1/2 of 1%. The Funds also pay a commitment fee at an annualized rate of 0.15% of the average daily amount of their unused commitment amount. The Funds did not have any borrowings under this agreement as of and for the period-ended March 31, 2016.
10. Repurchase Agreements
In connection with transactions in repurchase agreements, it is the Fund’s policy that its custodian takes possession of the underlying collateral. The collateral is in the possession of the Fund’s custodian and is evaluated to ensure that its market value exceeds, at a minimum, 102% of the original face amount of the repurchase agreements.
Counterparty and
Terms of Agreement | | | Face
Value | | | Repurchase
Price | | Collateral | | | Par
Value | | | Fair
Value |
Jeffries & Company, Inc. | | | | | | | | | | | | | | |
2.95% | | | | | | | | | | | | | | |
Due 04/04/16 | | $ | 4,609,000 | | $ | 4,746,476 | | Puerto Rico Public
Buildings Authority | | | |
| | | | | | | | | 5.75% | | | | | | |
| | | | | | | | | 07/01/34 | | $ | 13,250,000 | | $ | 8,161,603 |
| | THE GUGGENHEIM FUNDS SEMI-ANNUAL REPORT | 63 |
NOTES TO FINANCIAL STATEMENTS (Unaudited)(continued) |
11. Reverse Repurchase Agreements
The Fund may enter into reverse repurchase agreements. Under a reverse repurchase agreement, a Fund sells securities and agrees to repurchase them at a particular price at a future date. In the event the buyer of securities under a reverse repurchase agreement files for bankruptcy or becomes insolvent, such buyer or its trustee or receiver may receive an extension of time to determine whether to enforce the Fund’s obligation to repurchase the securities, and the Fund’s use of the proceeds of the reverse repurchase agreement may effectively be restricted pending such decision.
For the period ended March 31, 2016, the Fund entered into reverse repurchase agreements:
Fund | | Number
of Days
Outstanding | | | Balance at
March 31,
2016 | | | Average
Balance Outstanding | | | Average
interest
Rate | |
Total Return Bond Fund | | | 183 | | | $ | 210,297,721 | | | $ | 299,244,347 | | | | 0.86 | % |
The following table presents reverse repurchase agreements that are subject to netting arrangements and offset in the Statement of Assets and Liabilities in conformity with U.S. GAAP.
| | | | | | | | | | | | | Gross Amounts Not Offset in the Statement of Assets and Liabilities | | | | |
Fund | Instrument | | Gross Amounts of Recognized Liabilities | | | Gross Amounts Offset in the Statement of Assets and Liabilities | | | Net Amount of Liabilities Presented on the Statement of Assets and Liabilities | | | Financial Instruments | | | Cash Collateral Received | | | Net
Amount | |
Total Return
Bond Fund | Reverse repurchase agreements | | $ | 210,297,721 | | | $ | — | | | $ | 210,297,721 | | | $ | 210,297,721 | | | $ | — | | | $ | — | |
In June 2014, the FASB issued Accounting Standards Update 2014-11, Repurchase-to- Maturity Transactions, Repurchase Financings, and Disclosures (ASU 2014-11) that expanded secured borrowing accounting for certain repurchase agreements. The ASU also sets forth additional disclosure requirements for certain transactions accounted for as secured borrowings, which applies to the reverse repurchase agreements held by the Funds. The ASU became effective prospectively for annual periods beginning after December 15, 2014, and for interim periods beginning after March 15, 2015. The Funds have adopted the ASU.
64 | THE GUGGENHEIM FUNDS SEMI-ANNUAL REPORT | |
NOTES TO FINANCIAL STATEMENTS (Unaudited)(continued) |
The following is a summary of the remaining contractual maturities of the reverse repurchase agreements outstanding as of March 31, 2016, aggregated by asset class of the related collateral pledged by the Fund:
Fund | | Overnight and Continuous | | | Up to
30 days | | | 31-90
days | | | Greater than 90 days | | | Total | |
Total Return Bond Fund | | | | | | | | | | | | | | | |
Corporate Bonds | | $ | 8,955,250 | | | $ | 92,197,913 | | | $ | 83,797,033 | | | $ | 5,500,000 | | | $ | 190,450,196 | |
Municipal Bonds | | | — | | | | 9,807,713 | | | | 10,039,813 | | | | — | | | | 19,847,525 | |
Gross amount of recognized liabilities for reverse repurchase agreements | | $ | 8,955,250 | | | $ | 102,005,625 | | | $ | 93,836,845 | | | $ | 5,500,000 | | | $ | 210,297,721 | |
12. Restricted Securities
The securities below are considered illiquid and restricted under guidelines established by the Board:
Fund | Restricted
Securities | Acquisition
Date | | | Amortized
Cost | | | Value |
Total Return Bond Fund | RFTI Issuer Ltd. | | | | | | | |
| | 2015-FL1 A, 2.19% | | | | | | | |
| | due 08/15/30 | 10/14/15 | | $ | 9,949,960 | | $ | 9,978,936 |
| | | | | | | | | |
| | RFTI Issuer Ltd. | | | | | | | |
| | 2015-FL1 B, 4.32% | | | | | | | |
| | due 08/15/30 | 10/14/15 | | | 4,979,054 | | | 4,929,850 |
| | | | | | | | | |
| | Customers Bank | | | | | | | |
| | 6.12% due 06/26/29 | 6/24/14 | | | 2,000,000 | | | 2,000,000 |
| | | | | | | | | |
| | Cadence Bank North America | | | | | | | |
| | 6.25% due 06/28/29 | 6/6/14 | | | 1,200,000 | | | 1,035,000 |
| | | | | | | | | |
| | Airplanes Pass Through | | | | | | | |
| | Trust 2001-1A A9, 0.99% | | | | | | | |
| | due 03/15/19 | 11/30/11 | | | 594,050 | | | 185,080 |
| | | | | | | | | |
| | Schahin II Finance | | | | | | | |
| | Company SPV Ltd. | | | | | | | |
| | 5.88% due 09/25/22 | 3/31/12 | | | 777,505 | | | 113,752 |
| | THE GUGGENHEIM FUNDS SEMI-ANNUAL REPORT | 65 |
NOTES TO FINANCIAL STATEMENTS (Unaudited)(continued) |
13. Offsetting
In the normal course of business, the Fund enters into transactions subject to enforceable master netting arrangements or other similar arrangements. Generally, the right to offset in those agreements allows the Fund to counteract the exposure to a specific counterparty with collateral received or delivered to that counterparty based on the terms of the arrangements. These arrangements provide for the right to liquidate upon the occurrence of an event of default, credit event upon merger or additional termination event.
In order to better define their contractual rights and to secure rights that will help the Fund mitigate its counterparty risk, the Fund may enter into an International Swaps and Derivatives Association, Inc. Master Agreement (“ISDA Master
Agreement”) or similar agreement with its derivative contract counterparties. An ISDA Master Agreement is a bilateral agreement between a Fund and a counterparty that governs OTC derivatives, including foreign exchange contracts, and typically contains, among other things, collateral posting terms and netting provisions in the event of a default and/or termination event. The provisions of the ISDA Master Agreement typically permit a single net payment in the event of a default (close-out netting) or similar event, including the bankruptcy or insolvency of the counterparty.
For derivatives traded under an ISDA Master Agreement, the collateral requirements are typically calculated by netting the mark to market amount for each transaction under such agreement and comparing that amount to the value of any collateral currently pledged by the Fund and the counterparty. For financial reporting purposes, cash collateral that has been pledged to cover obligations of the Fund and cash collateral received from the counterparty, if any, is reported separately on the Statement of Assets and Liabilities as segregated cash with broker/receivable for variation margin, or payable for swap settlement/variation margin. Generally, the amount of collateral due from or to a counterparty must exceed a minimum transfer amount threshold (e.g., $300,000) before a transfer is required to be made. To the extent amounts due to the Fund from its counterparties are not fully collateralized, contractually or otherwise, the Fund bears the risk of loss from counterparty nonperformance. The Fund attempts to mitigate counterparty risk by only entering into agreements with counterparties that they believe to be of good standing and by monitoring the financial stability of those counterparties.
For financial reporting purposes, the Fund does not offset derivative assets and derivative liabilities that are subject to netting arrangements in the Statement of Assets and Liabilities.
66 | THE GUGGENHEIM FUNDS SEMI-ANNUAL REPORT | |
NOTES TO FINANCIAL STATEMENTS (Unaudited)(concluded) |
The following table presents derivative financial instruments and secured financing transactions that are subject to enforceable netting arrangements and off set in the Statement of Assets and Liabilities in conformity with U.S. GAAP.
| | | | | | | | | | | | | Gross Amounts Not Offset in the Statement of Assets and Liabilities | | | | |
Fund | Instrument | | Gross
Amounts of Recognized Liabilities | | | Gross Amounts Offset in the Statement of Assets and Liabilities | | | Net Amount of Liabilities Presented on the Statement of Assets and Liabilities | | | Financial Instruments | | | Cash Collateral Received | | | Net
Amount | |
Total Return Bond Fund | Forward foreign currency exchange contracts | | $ | 67,695 | | | $ | — | | | $ | 67,695 | | | $ | — | | | $ | — | | | $ | 67,695 | |
| | THE GUGGENHEIM FUNDS SEMI-ANNUAL REPORT | 67 |
OTHER INFORMATION (Unaudited) |
Proxy Voting Information
A description of the policies and procedures that the Trust uses to determine how to vote proxies relating to securities held in the Funds’ portfolios is available, without charge and upon request, by calling 800.820.0888. This information is also available from the EDGAR database on the SEC’s website at http://www.sec.gov.
Information regarding how the Funds voted proxies relating to portfolio securities during the most recent 12-month period ended June 30 is available without charge, upon request, by calling 800.820.0888. This information is also available from the EDGAR database on the SEC’s website at http://www.sec.gov.
Sector Classification
Information in the “Schedule of Investments” is categorized by sectors using sector-level Classifications defined by the Bloomberg Industry Classification System, a widely recognized industry classification system provider. Each Fund’s registration statement has investment policies relating to concentration in specific sectors/industries. For purposes of these investment policies, the Funds usually classify sectors/industries based on industry-level Classifications used by widely recognized industry classification system providers such as Bloomberg Industry Classification System, Global Industry Classification Standards and Barclays Global Classification Scheme.
Quarterly Portfolio Schedules Information
The Trust files its complete schedule of portfolio holdings with the SEC for the first and third quarters of each fiscal year on Form N-Q; which are available on the SEC’s website at http://www.sec.gov. The Funds’ Forms N-Q may be reviewed and copied at the SEC’s Public Reference Room in Washington, DC, and that information on the operation of the Public Reference Room may be obtained by calling 800-SEC-0330. Copies of the portfolio holdings are also available to shareholders, without charge and upon request, by calling 800.820.0888.
68 | THE GUGGENHEIM FUNDS SEMI-ANNUAL REPORT | |
INFORMATION ON BOARD OF TRUSTEES AND OFFICERS (Unaudited) |
A Board of Trustees oversees the Trust, as well as other trusts of GI, in which its members have no stated term of service, and continue to serve after election until resignation. The Statement of Additional Information includes further information about Fund Trustees and Officers, and can be obtained without charge by calling 800.820.0888.
Name, Address* and Year of Birth | Position(s) Held with the Trust | Term of Office and Length of Time Served** | Principal Occupation(s) During Past Five Years | Number of Portfolios in Fund Complex Overseen | Other Directorships Held by Trustees |
INDEPENDENT TRUSTEES | | | |
Randall C. Barnes (1951) | Trustee | Since 2014 | Current: Private Investor (2001-present). Former: Senior Vice President and Treasurer, PepsiCo, Inc. (1993-1997); President, Pizza Hut International (1991-1993); Senior Vice President, Strategic Planning and New Business Development, PepsiCo, Inc. (1987-1990). | 105 | Current: Trustee, Purpose Investments Inc. (2014-Present). |
Donald A. Chubb, Jr. (1946) | Trustee | Since 1994 | Current: Business broker and manager of commercial real estate, Griffith & Blair, Inc. (1997-present). | 101 | Current: Midland Care, Inc. (2011-present). |
Jerry B. Farley (1946) | Trustee | Since 2005 | Current: President, Washburn University (1997-present). | 101 | Current: Westar Energy, Inc. (2004-present); CoreFirst Bank & Trust (2000-present). |
| | THE GUGGENHEIM FUNDS SEMI-ANNUAL REPORT | 69 |
INFORMATION ON BOARD OF TRUSTEES AND OFFICERS (Unaudited)(continued) |
Name, Address* and Year of Birth | Position(s) Held with the Trust | Term of Office and Length of Time Served** | Principal Occupation(s) During Past Five Years | Number of Portfolios in Fund Complex Overseen | Other Directorships Held by Trustees |
INDEPENDENT TRUSTEES - continued | | |
Roman Friedrich III (1946) | Trustee and Chairman of the Contracts Review Committee | Since 2014 | Current: Founder and Managing Partner, Roman Friedrich & Company (1998-present). Former: Senior Managing Director, MLV & Co. LLC (2010-2011). | 101 | Current: Zincore Metals, Inc. (2009-present). Former: Axiom Gold and Silver Corp. (2011-2012). |
Robert B. Karn III (1942) | Trustee and Chairman of the Audit Committee | Since 2014 | Current: Consultant (1998-present). Former: Arthur Andersen (1965-1997) and Managing Partner, Financial and Economic Consulting, St. Louis office (1987-1997). | 101 | Current: Peabody Energy Company (2003-present); GP Natural Resource Partners, LLC (2002-present). |
Ronald A. Nyberg (1953) | Trustee and Chairman of the Nominating and Governance Committee | Since 2014 | Current: Partner, Nyberg & Cassioppi, LLC (2000-present). Former: Executive Vice President, General Counsel, and Corporate Secretary, Van Kampen Investments (1982-1999). | 107 | Current: Edward-Elmhurst Healthcare System (2012-present). |
70 | THE GUGGENHEIM FUNDS SEMI-ANNUAL REPORT | |
INFORMATION ON BOARD OF TRUSTEES AND OFFICERS (Unaudited)(continued) |
Name, Address* and Year of Birth | Position(s) Held with the Trust | Term of Office and Length of Time Served** | Principal Occupation(s) During Past Five Years | Number of Portfolios in Fund Complex Overseen | Other Directorships Held by Trustees |
INDEPENDENT TRUSTEES - concluded | | |
Maynard F. Oliverius (1943) | Trustee | Since 1998 | Current: Retired. Former: President and CEO, Stormont-Vail HealthCare (1996-2012). | 101 | Current: Fort Hays State University Foundation (1999-present); Stormont-Vail Foundation (2013-present); University of Minnesota HealthCare Alumni Association Foundation (2009-present). |
Ronald E. Toupin, Jr. (1958) | Trustee and Chairman of the Board | Since 2014 | Current: Portfolio Consultant (2010-present). Former: Vice President, Manager and Portfolio Manager, Nuveen Asset Management (1998-1999); Vice President, Nuveen Investment Advisory Corp. (1992-1999); Vice President and Manager, Nuveen Unit Investment Trusts (1991-1999); and Assistant Vice President and Portfolio Manager, Nuveen Unit Investment Trusts (1988-1999), each of John Nuveen & Co., Inc. (1982-1999). | 104 | Former: Bennett Group of Funds (2011-2013). |
| | THE GUGGENHEIM FUNDS SEMI-ANNUAL REPORT | 71 |
INFORMATION ON BOARD OF TRUSTEES AND OFFICERS (Unaudited)(continued) |
Name, Address* and Year of Birth | Position(s) Held with the Trust | Term of Office and Length of Time Served** | Principal Occupation(s) During Past Five Years | Number of Portfolios in Fund Complex Overseen | Other Directorships Held by Trustees |
INTERESTED TRUSTEE | |
Donald C. Cacciapaglia*** (1951) | President, Chief Executive Officer and Trustee | Since 2012 | Current: President and CEO, certain other funds in the Fund Complex (2012-present); Vice Chairman, Guggenheim Investments (2010-present). Former: Chairman and CEO, Channel Capital Group, Inc. (2002-2010). | 236 | Current: Clear Spring Life Insurance Company (2015-present); Guggenheim Partners Japan, Ltd. (2014-present); Delaware Life (2013-present); Guggenheim Life and Annuity Company (2011-present); Paragon Life Insurance Company of Indiana (2011-present). |
* | The business address of each Trustee is c/o Guggenheim Investments, 805 King Farm Boulevard, Suite 600, Rockville, Maryland 20850. |
** | Each Trustee serves an indefinite term, until his successor is elected and qualified. Time served includes time served in the respective position for the Predecessor Corporation. |
*** | This Trustee is deemed to be an "interested person" of the Funds under the 1940 Act by reason of his position with the Funds' Investment Manager and/or the parent of the Investment Manager. |
72 | THE GUGGENHEIM FUNDS SEMI-ANNUAL REPORT | |
INFORMATION ON BOARD OF TRUSTEES AND OFFICERS (Unaudited)(continued) |
Name, Address* and Year of Birth | Position(s) Held with the Trust | Term of Office and Length of Time Served** | Principal Occupations
During Past Five Years |
OFFICERS | | | |
Joseph M. Arruda (1966) | Assistant Treasurer | Since 2010 | Current: Assistant Treasurer, certain other funds in the Fund Complex (2006-present); Vice President, Security Investors, LLC (2010-present); CFO and Manager, Guggenheim Specialized Products, LLC (2009-present). Former: Vice President, Security Global Investors, LLC (2010-2011); Vice President, Rydex Advisors, LLC (2010); Vice President, Rydex Advisors II, LLC (2010). |
William H. Belden, III (1965) | Vice President | Since 2014 | Current: Vice President, certain other funds in the Fund Complex (2006-present); Managing Director, Guggenheim Funds Investment Advisors, LLC (2005-present). Former: Vice President of Management, Northern Trust Global Investments (1999-2005). |
James Howley (1972) | Assistant Treasurer | Since 2014 | Current: Director, Guggenheim Investments (2004-present) ; Assistant Treasurer, certain other funds in the Fund Complex (2006-present). Former: Manager, Mutual Fund Administration of Van Kampen Investments, Inc. (1996-2004). |
Amy J. Lee (1961) | Vice President and Chief Legal Officer | Since 2007 (Vice President) Since 2014 (Chief Legal Officer) | Current: Chief Legal Officer, certain other funds in the Fund Complex (2013-present); Senior Managing Director, Guggenheim Investments (2012-present). Former: Vice President, Associate General Counsel and Assistant Secretary, Security Benefit Life Insurance Company and Security Benefit Corporation (2004-2012). |
| | THE GUGGENHEIM FUNDS SEMI-ANNUAL REPORT | 73 |
INFORMATION ON BOARD OF TRUSTEES AND OFFICERS (Unaudited)(continued) |
Name, Address* and Year of Birth | Position(s) Held with the Trust | Term of Office and Length of Time Served** | Principal Occupations
During Past Five Years |
OFFICERS - continued | |
Mark E. Mathiasen (1978) | Secretary | Since 2014 | Current: Secretary, certain other funds in the Fund Complex (2007-present); Managing Director, Guggenheim Investments (2007-present). |
Michael P. Megaris (1984) | Assistant Secretary | Since 2014 | Current: Assistant Secretary, certain other funds in the Fund Complex (2014-present); Senior Associate, Guggenheim Investments (2012-present). Former: J.D., University of Kansas School of Law (2009-2012). |
Elisabeth Miller (1968) | Chief Compliance Officer | Since 2012 | Current: CCO, certain other funds in the Fund Complex (2012-present); CCO, Security Investors, LLC (2012-present); CCO, Guggenheim Funds Investment Advisors, LLC (2012-present); Managing Director, Guggenheim Investments (2012-present); Vice President, Guggenheim Funds Distributors, LLC (March 2014-present). Former: CCO, Guggenheim Distributors, LLC (2009-March 2014); Senior Manager, Security Investors, LLC (2004-2009); Senior Manager, Guggenheim Distributors, LLC (2004-2009). |
Adam Nelson (1979) | Assistant Treasurer | Since 2015 | Current: Vice President, Guggenheim Investments (2015-present); Assistant Treasurer, certain other funds in the Fund Complex (2015-present). Former: Assistant Vice President and Fund Administration Director, State Street Corporation (2013-2015); Fund Administration Assistant Director, State Street (2011-2013); Fund Administration Manager, State Street (2009-2011). |
74 | THE GUGGENHEIM FUNDS SEMI-ANNUAL REPORT | |
INFORMATION ON BOARD OF TRUSTEES AND OFFICERS (Unaudited)(continued) |
Name, Address* and Year of Birth | Position(s) Held with the Trust | Term of Office and Length of Time Served** | Principal Occupations
During Past Five Years |
OFFICERS - continued | |
Alison Santay (1974) | AML Officer | Since 2013 | Current: AML Officer, certain other funds in the Fund Complex (2010-present); Director and AML Officer, Rydex Fund Services, LLC (2010-present); AML Officer, Security Investors, LLC (2010-present); Director, Shareholder Risk and Compliance, Rydex Fund Services, LLC (2004-present). Former: AML Officer, Guggenheim Distributors, LLC (2013-2014). |
Kimberly Scott (1974) | Assistant Treasurer | Since 2014 | Current: Vice President, Guggenheim Investments (2012-present) ; Assistant Treasurer, certain other funds in the Fund Complex (2012-present). Former: Financial Reporting Manager, Invesco, Ltd. (2010-2011); Vice President/Assistant Treasurer, Mutual Fund Administration for Van Kampen Investments, Inc./Morgan Stanley Investment Management (2009-2010); Manager of Mutual Fund Administration, Van Kampen Investments, Inc./Morgan Stanley Investment Management (2005-2009). |
Bryan Stone (1979) | Vice President | Since 2014 | Current: Vice President, certain other funds in the Fund Complex (2014-present); Director, Guggenheim Investments (2013-present). Former: Senior Vice President, Neuberger Berman Group LLC (2009-2013); Vice President, Morgan Stanley (2002-2009). |
| | THE GUGGENHEIM FUNDS SEMI-ANNUAL REPORT | 75 |
INFORMATION ON BOARD OF TRUSTEES AND OFFICERS (Unaudited)(concluded) |
Name, Address* and Year of Birth | Position(s) Held with the Trust | Term of Office and Length of Time Served** | Principal Occupations
During Past Five Years |
OFFICERS - concluded | |
John L. Sullivan (1955) | Chief Financial Officer and Treasurer | Since 2014 | Current: CFO, Chief Accounting Officer and Treasurer, certain other funds in the Fund Complex (2010-present); Senior Managing Director, Guggenheim Investments (2010-present). Former: Managing Director and CCO, each of the funds in the Van Kampen Investments fund complex (2004-2010); Managing Director and Head of Fund Accounting and Administration, Morgan Stanley Investment Management (2002-2004); CFO and Treasurer, Van Kampen Funds (1996-2004). |
* | The business address of each officer is c/o Guggenheim Investments, 805 King Farm Boulevard, Suite 600, Rockville, Maryland 20850. |
** | Each officer serves an indefinite term, until his or her successor is duly elected and qualified. Time served includes time served in the respective position for the Predecessor Corporation. |
76 | THE GUGGENHEIM FUNDS SEMI-ANNUAL REPORT | |
GUGGENHEIM INVESTMENTS PRIVACY POLICIES (Unaudited) |
Rydex Funds, Guggenheim Funds, Rydex Investments, Guggenheim Funds Distributors, LLC, Security Investors, LLC, Security Distributors, Inc., Guggenheim Partners Investment Managers, LLC, and Rydex Advisory Services (Collectively “Guggenheim Investments”).
Our Commitment to You
When you become a Guggenheim Investments investor, you entrust us with not only your hard-earned money but also with personal and financial information about you. We recognize that your relationship with us is based on trust and that you expect us to act responsibly and in your best interests. Because we have access to this private information about you, we hold ourselves to the highest standards in its safekeeping and use. This means, most importantly, that we do not sell client information to anyone—whether it is your personal information or if you are a current or former Guggenheim Investments client.
The Information We Collect About You
In the course of doing business with shareholders and investors, we collect nonpublic personal information about you. You typically provide personal information when you complete a Guggenheim Investments account application or when you request a transaction that involves Rydex and Guggenheim Investments funds or one of the Guggenheim Investments affiliated companies. “Nonpublic personal information” is personally identifiable private information about you. For example, it includes information regarding your name and address, Social Security or taxpayer identification number, assets, income, account balance, bank account information and investment activity (e.g., purchase and redemption history).
How We Handle Your Personal Information
As emphasized above, we do not sell information about current or former clients or their accounts to third parties. Nor do we share such information, except when necessary to complete transactions at your request or to make you aware of related investment products and services that we offer. Additional details about how we handle your personal information are provided below. To complete certain transactions or account changes that you direct, it may be necessary to provide identifying information to companies, individuals or groups that are not affiliated with Guggenheim Investments. For example, if you ask to transfer assets from another financial institution to Guggenheim Investments, we will need to provide certain information about you to that company to complete the transaction. To alert you to other Guggenheim Investments investment products and services, we may share your information within the Guggenheim Investments family of affiliated companies. This would include, for example, sharing your information within Guggenheim Investments so we can make you aware of
| | THE GUGGENHEIM FUNDS SEMI-ANNUAL REPORT | 77 |
GUGGENHEIM INVESTMENTS PRIVACY POLICIES (Unaudited)(continued) |
new Rydex and Guggenheim Investments funds or the services offered through another Guggenheim Investments affiliated company. In certain instances, we may contract with nonaffiliated companies to perform services for us. Where necessary, we will disclose information we have about you to these third parties. In all such cases, we provide the third party with only the information necessary to carry out its assigned responsibilities and only for that purpose. And we require these third parties to treat your private information with the same high degree of confidentiality that we do. In certain instances, we may share information with other financial institutions regarding individuals and entities in response to the U.S.A. Patriot Act. Finally, we will release information about you if you direct us to do so, if we are compelled by law to do so or in other circumstances permitted by law.
Opt Out Provisions
We do not sell your personal information to anyone. The law allows you to “opt out” of only certain kinds of information sharing with third parties. The firm does not share personal information about you with any third parties that triggers this opt-out right. This means YOU ARE ALREADY OPTED OUT.
How We Protect Privacy Online
Our concern for the privacy of our shareholders also extends to those who use our web site, guggenheiminvestments.com. Our web site uses some of the most secure forms of online communication available, including encryption technology, Secure Socket Layer (SSL) protocol, firewalls and user names and passwords. These technologies provide a high level of security and privacy when you access your account information or initiate online transactions. The Guggenheim Investments web site offers customized features that require our use of “http cookies”—tiny pieces of information that we ask your browser to store. However, we make very limited use of these cookies. We only use cookies for session management and security features on the Guggenheim Investments web site. We do not use them to pull data from your hard drive, to learn your email address, or to view data in cookies created by other web sites. We will not share the information in our cookies or give others access to it. See the legal information area on our web site for more details about web site security and privacy features.
How We Safeguard Your Personal Information
We restrict access to nonpublic personal information about shareholders to our employees and in some cases to third parties (for example, the service providers described above) as permitted by law. We maintain strict physical, electronic and procedural safeguards that comply with federal standards to guard your nonpublic personal information.
78 | THE GUGGENHEIM FUNDS SEMI-ANNUAL REPORT | |
GUGGENHEIM INVESTMENTS PRIVACY POLICIES (Unaudited)(concluded) |
We’ll Keep You Informed
As required by federal law, we will notify shareholders of our privacy policy annually. We reserve the right to modify this policy at any time, but rest assured that if we do change it, we will tell you promptly. You will also be able to access our privacy policy from our web site at guggenheiminvestments.com. Should you have any questions regarding our privacy policy, contact us at 800.820.0888 or 301.296.5100.
| | THE GUGGENHEIM FUNDS SEMI-ANNUAL REPORT | 79 |
This page intentionally left blank.
This page intentionally left blank.
Not required at this time.
| Item 3. | Audit Committee Financial Expert. |
Not required at this time.
| Item 4. | Principal Accountant Fees and Services. |
Not required at this time.
| Item 5. | Audit Committee of Listed Registrants. |
Not applicable.
The Schedule of Investments is included under Item 1 of this form.
| Item 7. | Disclosure of Proxy Voting Policies and Procedures for Closed-End Management Investment Companies. |
Not applicable.
Item 8. Portfolio Mangers of Closed-end Management Investment Companies
Not applicable
| Item 9. | Purchases of Equity Securities by Closed-End Management Investment Company and Affiliated Purchasers. |
Not applicable.
| Item 10. | Submission of Matters to a Vote of Security Holders. |
The registrant does not currently have in place procedures by which shareholders may recommend nominees to the registrant’s board.
There have been no changes to the procedures by which shareholders may recommend nominees to the registrant’s board.
| Item 11. | Controls and Procedures. |
| (a) | The registrant’s President (principal executive officer) and Treasurer (principal financial officer) have evaluated the registrant’s disclosure controls and procedures within 90 days of this filing and have concluded that the registrant’s disclosure controls and procedures were effective as of that date in ensuring that information required to be disclosed by the registrant in this Form N-CSR was recorded, processed, summarized, and reported timely. |
| (b) | The registrant’s principal executive officer and principal financial officer are aware of no change in the registrant’s internal control over financial reporting that occurred during the registrant’s second fiscal quarter covered by this report that has materially affected, or is reasonably likely to materially affect, the registrant’s internal control over financial reporting. |
Item 12. Exhibits.
| (a)(2) | Separate certifications by the President (principal executive officer) and Treasurer (principal financial officer) of the registrant as required by Rule 30a‑2(a) under the Act (17 CFR 270.30a-2(a)) are attached. |
| (b) | A certification by the registrant’s President (principal executive officer) and Treasurer (principal financial officer) as required by Rule 30a-2(b) under the Act (17 CFR 270.30a-2(b)) is attached. |
SIGNATURES
Pursuant to the requirements of the Securities Exchange Act of 1934 and the Investment Company Act of 1940, the registrant has duly caused this report to be signed on its behalf by the undersigned, thereunto duly authorized.
| (Registrant) | Guggenheim Funds Trust | |
| | | |
By (Signature and Title)* | /s/ Donald C. Cacciapaglia | |
| | Donald C. Cacciapaglia, | |
| | President and Chief Executive Officer | |
| | | |
| Date | June 9, 2016 | |
| | | |
| Pursuant to the requirements of the Securities Exchange Act of 1934 and the Investment Company Act of 1940, this report has been signed below by the following persons on behalf of the registrant and in the capacities and on the dates indicated. |
| | | |
| By (Signature and Title)* | /s/ Donald C. Cacciapaglia | |
| | Donald C. Cacciapaglia, President and Chief Executive Officer | |
| | | |
| Date | June 9, 2016 | |
| | | |
| By (Signature and Title)* | /s/ John L. Sullivan | |
| | John L. Sullivan, Chief Financial Officer, Chief Accounting Officer and Treasurer | |
| | | |
| Date | June 9, 2016 | |
* Print the name and title of each signing officer under his or her signature.

