UNITED STATES
SECURITIES AND EXCHANGE COMMISSION
Washington, D.C. 20549
FORM N-CSR
CERTIFIED SHAREHOLDER REPORT OF REGISTERED
MANAGEMENT INVESTMENT COMPANIES
Investment Company Act file number 811- 01136
(Exact name of registrant as specified in charter)
805 King Farm Boulevard, Suite 600
Rockville, Maryland 20850
(Address of principal executive offices) (Zip code)
Donald C. Cacciapaglia, President
Guggenheim Funds Trust
805 King Farm Boulevard, Suite 600
Rockville, Maryland 20850
(Name and address of agent for service)
Registrant's telephone number, including area code:1-301-296-5100
Date of fiscal year end: September 30
Date of reporting period: March 31, 2014
Form N-CSR is to be used by management investment companies to file reports with the Commission not later than 10 days after the transmission to stockholders of any report that is required to be transmitted to stockholders under Rule 30e-1 under the Investment Company Act of 1940 (17 CFR 270.30e-1). The Commission may use the information provided on Form N-CSR in its regulatory, disclosure review, inspection, and policymaking roles.
A registrant is required to disclose the information specified by Form N-CSR, and the Commission will make this information public. A registrant is not required to respond to the collection of information contained in Form N-CSR unless the Form displays a currently valid Office of Management and Budget (“OMB”) control number. Please direct comments concerning the accuracy of the information collection burden estimate and any suggestions for reducing the burden to Secretary, Securities and Exchange Commission, 450 Fifth Street, NW, Washington, DC 20549-0609. The OMB has reviewed this collection of information under the clearance requirements of 44 U.S.C. §3507.
| Item 1. | Reports to Stockholders. |

03.31.2014
Guggenheim Funds Semi-Annual Report
| Fundamental Alpha |
| Guggenheim Mid Cap Value Fund |
| SBMCV-SEMI-0314x0914 | guggenheiminvestments.com |
| DEAR SHAREHOLDER | 2 |
| ECONOMIC AND MARKET OVERVIEW | 3 |
| ABOUT SHAREHOLDERS’ FUND EXPENSES | 4 |
| MID CAP VALUE FUND | 6 |
| NOTES TO FINANCIAL STATEMENTS | 13 |
| OTHER INFORMATION | 20 |
| INFORMATION ON BOARD OF TRUSTEES AND OFFICERS | 23 |
| GUGGENHEIM INVESTMENTS PRIVACY POLICIES | 27 |
| | GUGGENHEIM MID CAP VALUE FUND SEMI-ANNUAL REPORT | 1 |
Dear Shareholder:
Security Investors, LLC (the “Investment Adviser”) is pleased to present the semi-annual shareholder report for one Fund in our Guggenheim Funds Trust (the “Fund”) for the six-month period ended March 31, 2014.
The Investment Adviser is part of Guggenheim Investments, which represents the investment management businesses of Guggenheim Partners, LLC (“Guggenheim”), a global, diversified financial services firm.
Guggenheim Funds Distributors, LLC is the distributor of the Funds. Guggenheim Funds Distributors, LLC is affiliated with Guggenheim and the Investment Adviser.
We encourage you to read the Economic and Market Overview section of the report, which follows this letter, and then the Fund Profile for each Fund.
We are committed to providing innovative investment solutions and appreciate the trust you place in us.
Sincerely,
Donald C. Cacciapaglia
President
April 30, 2014
Read a prospectus and summary prospectus (if available) carefully before investing. It contains the investment objectives, risks, charges, expenses and other information, which should be considered carefully before investing. Obtain a prospectus and summary prospectus (if available) at guggenheiminvestments.com or call 800.820.0888.
There can be no assurance that any investment product will achieve its investment objective(s). There are risks associated with investing, including the entire loss of principal invested. Investing involves market risks. The investment return and principal value of any investment product will fluctuate with changes in market conditions.
| 2 | GUGGENHEIM MID CAP VALUE FUND SEMI-ANNUAL REPORT | |
ECONOMIC AND MARKET OVERVIEW | |
Investment markets continued to rally through the six months ended March 31, 2014, thanks to a steadily improving U.S. economy and ongoing U.S. central bank easing. Contributing to performance of equities were growing confidence in the sustainability of the U.S. economic recovery, favorable corporate profit growth, supportive valuations, interest rates below their long-run level, and positive inflows, as investors concerned about the end of quantitative easing and its impact on interest rates rotated out of fixed-income investments into equities.
In January 2014, based on positive economic data and a better jobs picture, the U.S. Federal Reserve (the “Fed”) began its long-expected tapering program, reducing monthly purchases by $10 billion. The Fed continued to taper even after acknowledging in March that the economy had slowed during the winter months, which were unusually harsh for much of the U.S. By April, it was buying only $55 billion a month, down from $85 billion in December 2013.
In March 2014, while noting that the U.S. economy has not yet reached full employment, the Fed also unlinked attainment of a 6.5% unemployment level with a potential rate hike, since the unemployment rate in February was approaching that level. Revised guidance from new Fed Chair Janet Yellen seemed to indicate that a rise might not be considered until mid-2015, at the earliest, although she stressed that it would depend on labor market conditions and the inflation rate. Still, the date was earlier than many market participants had expected, which knocked the market off record highs reached earlier in the six-month period.
Even though upcoming economic reports may reflect the impacts from the severe winter weather, and international tensions remain high, the arrival of spring was expected to return the U.S. economy to its improving trend. Pent-up demand resulting from the huge gap in household formation over the prior several years continues to buoy the housing market, while a pickup in global demand bodes well for the U.S. manufacturing sector. Consumption is rising due to an increase in net worth, resulting from the rebound in housing and asset prices, which has boosted retail sales, and consumer sentiment measures. The consensus expectation for 2014 growth stands at 3.0%, compared with 1.9% for 2013.
Momentum driven by the favorable macro environment is supporting equities and moving spreads tighter, helping perpetuate the risk-on mode that has prevailed in the U.S. since 2008. Investors who want income will have to keep investing, but buying cheap securities may be a thing of the past. Recent volatility indicates that investors must guard against becoming complacent about the quality of investments they make and their inherent risks. The Fed continues pumping enormous amounts of liquidity into the system but, with little expectation that it will raise interest rates before 2015, the expansion is likely to continue. Even when the Fed does hike, it typically takes another two years before a recession threatens growth. While the economy may be entering a new era where interest rates head higher over the long term, there is likely a ceiling on how high rates can rise in advance of eventual monetary tightening.
For the six months ended March 31, 2014, the Standard & Poor’s 500® (“S&P 500”) Index* returned 12.51%. The Morgan Stanley Capital International (“MSCI”) Europe-Australasia-Far East (“EAFE”) Index* returned 6.41%. The return of the MSCI Emerging Markets Index* was 1.39%.
In the bond market, the Barclays U.S. Aggregate Bond Index* posted a 1.70% return for the period, while the Barclays U.S. Corporate High Yield Index* returned 6.67%. The return of the BofA Merrill Lynch 3-Month U.S. Treasury Bill Index* was 0.03% for the six-month period.
The opinions and forecasts expressed may not actually come to pass. This information is subject to change at any time, based on market and other conditions, and should not be construed as a recommendation of any specific security or strategy.
* Index Definitions:
The following indices are referenced throughout this report. Indices are unmanaged and not available for direct investment. Index performance does not reflect transaction costs, fees, or expenses.
Barclays U.S. Aggregate Bond Index is a broad-based benchmark that measures the investment grade, U.S. dollar denominated, fixed-rate taxable bond market, including U.S. Treasuries, government-related and corporate securities, MBS (agency fixed-rate and hybrid ARM pass-throughs), ABS, and CMBS.
Barclays U.S. Corporate High Yield Index measures the market of USD-denominated, non-investment grade, fixed-rate, taxable corporate bonds. Securities are classified as high yield if the middle rating of Moody’s, Fitch, and S&P is Ba1/BB+/BB+ or below.
BofA Merrill Lynch 3-Month U.S. Treasury Bill Index is an unmanaged market index of U.S. Treasury securities maturing in 90 days that assumes reinvestment of all income.
MSCI EAFE Index is a free float-adjusted market capitalization index that is designed to measure the equity market performance of developed markets, excluding the U.S. & Canada.
MSCI Emerging Markets Index is a free float-adjusted market capitalization weighted index that is designed to measure equity market performance in the global emerging markets.
S&P 500® Index is a capitalization-weighted index of 500 stocks designed to measure the performance of the broad economy, representing all major industries and is considered a representation of the U.S. stock market.
| | GUGGENHEIM MID CAP VALUE FUND SEMI-ANNUAL REPORT | 3 |
ABOUT SHAREHOLDERS’ FUND EXPENSES (Unaudited)
All mutual funds have operating expenses and it is important for our shareholders to understand the impact of costs on their investments. Shareholders of a Fund incur two types of costs: (i) transaction costs, including sales charges (loads) on purchase payments, reinvested dividends, or other distributions; and exchange fees; and (ii) ongoing costs, including management fees, administrative services, and shareholder reports, among others. These ongoing costs, or operating expenses, are deducted from a fund’s gross income and reduce the investment return of the fund.
A fund’s expenses are expressed as a percentage of its average net assets, which is known as the expense ratio. The following examples are intended to help investors understand the ongoing costs (in dollars) of investing in a Fund and to compare these costs with the ongoing costs of investing in other mutual funds.
The examples are based on an investment of $1,000 made at the beginning of the period and held for the entire six-month period beginning September 30, 2013 and ending March 31, 2014.
The following tables illustrate a Fund’s costs in two ways:
| Table 1. | Based on actual Fund return. This section helps investors estimate the actual expenses paid over the period. The “Ending Account Value” shown is derived from the Fund’s actual return, and the fourth column shows the dollar amount that would have been paid by an investor who started with $1,000 in the Fund. Investors may use the information here, together with the amount invested, to estimate the expenses paid over the period. Simply divide the Fund’s account value by $1,000 (for example, an $8,600 account value divided by $1,000 = 8.6), then multiply the result by the number provided under the heading “Expenses Paid During Period.” |
| Table 2. | Based on hypothetical 5% return. This section is intended to help investors compare a Fund’s cost with those of other mutual funds. The table provides information about hypothetical account values and hypothetical expenses based on the Fund’s actual expense ratio and an assumed rate of return of 5% per year before expenses, which is not the Fund’s actual return. The hypothetical account values and expenses may not be used to estimate the actual ending account balance or expenses paid during the period. The example is useful in making comparisons because the U.S. Securities and Exchange Commission (the “SEC”) requires all mutual funds to calculate expenses based on the 5% return. Investors can assess a Fund’s costs by comparing this hypothetical example with the hypothetical examples that appear in shareholder reports of other funds. |
The calculations illustrated above assume no shares were bought or sold during the period. Actual costs may have been higher or lower, depending on the amount of investment and the timing of any purchases or redemptions.
Please note that the expenses shown in the table are meant to highlight your ongoing costs only and do not reflect any transactional costs, such as sales charges (loads) on purchase payments, and contingent deferred sales charges (“CDSC”) on redemptions, if any. Therefore, the second table is useful in comparing ongoing costs only, and will not help you determine the relative total costs of owning different funds. In addition, if these transactional costs were included, your costs would have been higher.
More information about a Fund’s expenses, including annual expense ratios for the past five years, can be found in the Financial Highlights section of this report. For additional information on operating expenses and other shareholder costs, please refer to the appropriate Fund prospectus.
| 4 | GUGGENHEIM MID CAP VALUE FUND SEMI-ANNUAL REPORT | |
ABOUT SHAREHOLDERS’ FUND EXPENSES (Unaudited) (concluded)
| | | Beginning Account Value September 30, 2013 | Ending Account Value March 31, 2014 | Expenses Paid During Period2 |
Table 1. Based on actual Fund return3 | | | |
| Mid Cap Value Fund | | | | | |
| A-Class | 1.39% | 10.53% | $1,000.00 | $1,105.30 | $7.30 |
| B-Class | 2.22% | 10.05% | 1,000.00 | 1,100.50 | 11.63 |
| C-Class | 2.10% | 10.12% | 1,000.00 | 1,101.20 | 11.11 |
|
Table 2. Based on hypothetical 5% return (before expenses) |
| Mid Cap Value Fund | | | | | |
| A-Class | 1.39% | 5.00% | $1,000.00 | $1,018.00 | $6.99 |
| B-Class | 2.22% | 5.00% | 1,000.00 | 1,013.86 | 11.15 |
| C-Class | 2.10% | 5.00% | 1,000.00 | 1,014.46 | 10.55 |
| 1 | Annualized and excludes expenses of the underlying funds in which the Funds invest. |
| 2 | Expenses are equal to the Fund’s annualized expense ratio multiplied by the average account value over the period, multiplied by 182/365 (to reflect the one-half year period). |
| 3 | Actual cumulative return at net asset value for the period September 30, 2013 to March 31, 2014. |
| | GUGGENHEIM MID CAP VALUE FUND SEMI-ANNUAL REPORT | 5 |
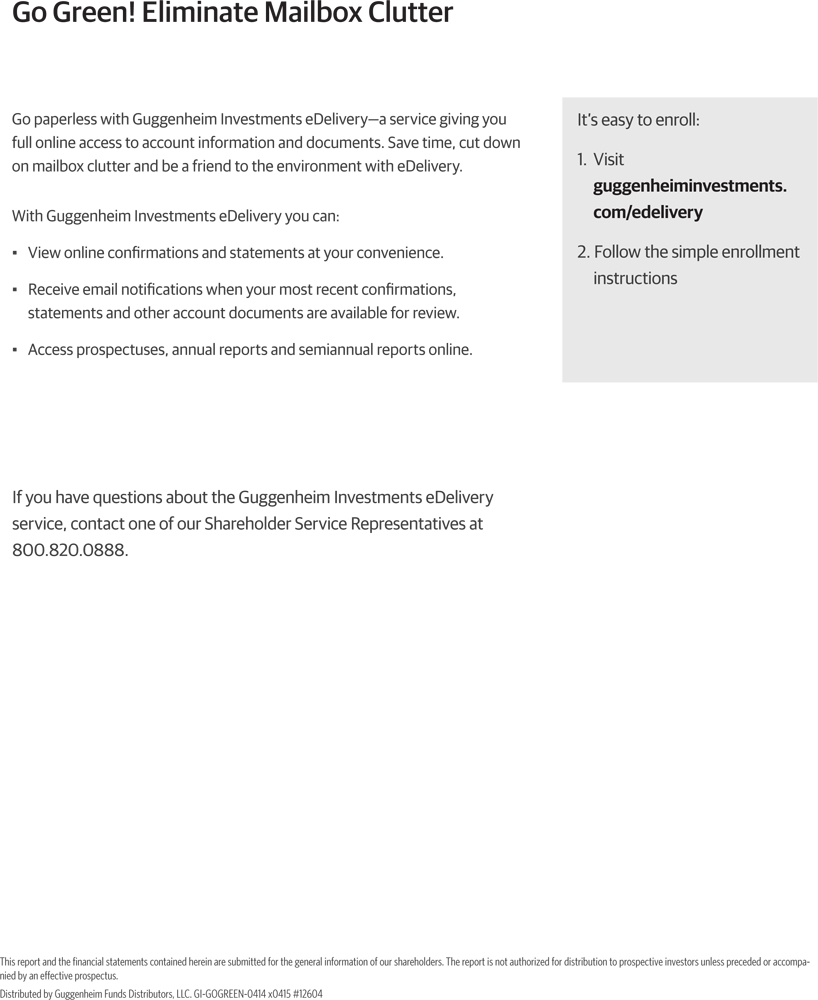
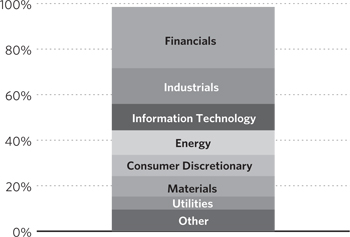
MID CAP VALUE FUND
OBJECTIVE: Seeks long-term growth of capital.
| | Holdings Diversification (Market Exposure as % of Net Assets) | |
| | | |
| | “Holdings Diversification (Market Exposure as % of Net Assets)” excludes any temporary cash investments. | |
|
| A-Class | May 1, 1997 |
| B-Class | May 1, 1997 |
| C-Class | January 29, 1999 |
| |
Ten Largest Holdings (% of Total Net Assets) |
| Hanover Insurance Group, Inc. | 4.6% |
| Computer Sciences Corp. | 3.5% |
| Owens-Illinois, Inc. | 2.8% |
| Covanta Holding Corp. | 2.8% |
| Reinsurance Group of America, Inc. — Class A | 2.7% |
| Cameco Corp. | 2.4% |
| American Financial Group, Inc. | 2.3% |
| Bunge Ltd. | 2.2% |
| Orbital Sciences Corp. | 2.0% |
| |
| |
| 6 | GUGGENHEIM MID CAP VALUE FUND SEMI-ANNUAL REPORT | |
SCHEDULE OF INVESTMENTS (Unaudited) | |
| MID CAP VALUE FUND | |
| | | | | | |
| | | | | | | |
COMMON STOCKS† - 98.5% | | | | | | |
| | | | | | | |
| FINANCIALS - 26.9% | | | | | | |
| Hanover Insurance Group, Inc. | | | 985,520 | | | $ | 60,550,348 | |
| Reinsurance Group of America, Inc. — Class A | | | 454,574 | | | | 36,197,728 | |
| American Financial Group, Inc. | | | 526,320 | | | | 30,373,927 | |
| Northern Trust Corp. | | | 344,430 | | | | 22,580,831 | |
| WR Berkley Corp. | | | 461,500 | | | | 19,207,629 | |
| Endurance Specialty Holdings Ltd. | | | 309,400 | | | | 16,655,002 | |
| Huntington Bancshares, Inc. | | | 1,539,620 | | | | 15,350,010 | |
| Alexandria Real Estate Equities, Inc. | | | 205,230 | | | | 14,891,489 | |
| BioMed Realty Trust, Inc. | | | 688,600 | | | | 14,109,414 | |
| SVB Financial Group* | | | 94,420 | | | | 12,159,407 | |
| Wintrust Financial Corp. | | | 231,110 | | | | 11,245,813 | |
| Lexington Realty Trust | | | 1,019,270 | | | | 11,120,236 | |
| Popular, Inc.* | | | 347,330 | | | | 10,763,757 | |
| First Niagara Financial Group, Inc. | | | 1,064,300 | | | | 10,057,635 | |
| Home Loan Servicing Solutions Ltd. | | | 423,227 | | | | 9,141,703 | |
| Ocwen Financial Corp.* | | | 230,694 | | | | 9,038,591 | |
| Zions Bancorporation | | | 288,250 | | | | 8,929,985 | |
| City National Corp. | | | 111,290 | | | | 8,760,749 | |
| Employers Holdings, Inc. | | | 391,750 | | | | 7,925,103 | |
| FirstMerit Corp. | | | 372,872 | | | | 7,766,924 | |
| First Midwest Bancorp, Inc. | | | 412,938 | | | | 7,052,981 | |
| Redwood Trust, Inc. | | | 263,753 | | | | 5,348,911 | |
| Investors Real Estate Trust | | | 562,530 | | | | 5,051,519 | |
| Campus Crest Communities, Inc. | | | 261,320 | | | | 2,268,258 | |
| Hancock Holding Co. | | | 3,432 | | | | 125,783 | |
| Total Financials | | | | | | | 356,673,733 | |
| | | | | | | | | |
| INDUSTRIALS - 15.7% | | | | | | | | |
| Covanta Holding Corp. | | | 2,056,570 | | | | 37,121,089 | |
| Orbital Sciences Corp.* | | | 963,140 | | | | 26,871,606 | |
| Navigant Consulting, Inc.* | | | 1,279,350 | | | | 23,872,671 | |
| Aegion Corp. — Class A* | | | 915,096 | | | | 23,161,079 | |
| Quanta Services, Inc.* | | | 561,970 | | | | 20,736,693 | |
| URS Corp. | | | 358,670 | | | | 16,879,010 | |
| ICF International, Inc.* | | | 358,960 | | | | 14,290,198 | |
| General Cable Corp. | | | 554,125 | | | | 14,191,141 | |
| DigitalGlobe, Inc.* | | | 450,460 | | | | 13,067,845 | |
| Towers Watson & Co. — Class A | | | 59,231 | | | | 6,755,296 | |
| United Stationers, Inc. | | | 150,582 | | | | 6,184,403 | |
| AZZ, Inc. | | | 85,650 | | | | 3,826,842 | |
| Saia, Inc.* | | | 34,988 | | | | 1,336,891 | |
| Thermoenergy Corp.* | | | 2,701,839 | | | | 64,844 | |
| Total Industrials | | | | | | | 208,359,608 | |
| | | | | | | | | |
| INFORMATION TECHNOLOGY - 11.6% | | | | | | | | |
| Computer Sciences Corp. | | | 771,420 | | | | 46,917,765 | |
IXYS Corp.2 | | | 2,012,549 | | | | 22,842,431 | |
Maxwell Technologies, Inc.*,2 | | | 1,704,971 | | | | 22,028,225 | |
| | | | | | |
| | | | | | | |
| Global Payments, Inc. | | | 257,220 | | | $ | 18,290,914 | |
| FLIR Systems, Inc. | | | 333,298 | | | | 11,998,728 | |
| Semtech Corp.* | | | 426,190 | | | | 10,799,655 | |
| RF Micro Devices, Inc.* | | | 1,358,340 | | | | 10,703,719 | |
| Liquidity Services, Inc.* | | | 281,560 | | | | 7,334,638 | |
| Integrated Device Technology, Inc.* | | | 240,441 | | | | 2,940,593 | |
| Total Information Technology | | | | | | | 153,856,668 | |
| | | | | | | | | |
| ENERGY - 10.8% | | | | | | | | |
| Cameco Corp. | | | 1,415,860 | | | | 32,423,194 | |
| Whiting Petroleum Corp.* | | | 370,012 | | | | 25,675,132 | |
| Superior Energy Services, Inc. | | | 756,590 | | | | 23,272,709 | |
| Oasis Petroleum, Inc.* | | | 318,610 | | | | 13,295,595 | |
| Patterson-UTI Energy, Inc. | | | 383,270 | | | | 12,141,994 | |
| Resolute Energy Corp.* | | | 1,507,360 | | | | 10,852,992 | |
| Sanchez Energy Corp.* | | | 334,524 | | | | 9,911,946 | |
| C&J Energy Services, Inc.* | | | 319,620 | | | | 9,320,119 | |
| Energy XXI Bermuda Ltd. | | | 262,780 | | | | 6,193,725 | |
| Total Energy | | | | | | | 143,087,406 | |
| | | | | | | | | |
| CONSUMER DISCRETIONARY - 9.3% | | | | | | | | |
| Brown Shoe Company, Inc. | | | 771,195 | | | | 20,467,514 | |
| DR Horton, Inc. | | | 883,250 | | | | 19,122,362 | |
| DeVry Education Group, Inc. | | | 394,150 | | | | 16,708,019 | |
| Cabela's, Inc.* | | | 211,150 | | | | 13,832,437 | |
| Scholastic Corp. | | | 353,560 | | | | 12,190,749 | |
| Jones Group, Inc. | | | 797,811 | | | | 11,943,231 | |
| Gentex Corp. | | | 313,640 | | | | 9,889,069 | |
| Guess?, Inc. | | | 343,808 | | | | 9,489,101 | |
| Chico's FAS, Inc. | | | 589,500 | | | | 9,449,685 | |
| Total Consumer Discretionary | | | | | | | 123,092,167 | |
| | | | | | | | | |
| MATERIALS - 9.0% | | | | | | | | |
| Owens-Illinois, Inc.* | | | 1,097,700 | | | | 37,135,192 | |
| Sonoco Products Co. | | | 561,950 | | | | 23,051,189 | |
| Royal Gold, Inc. | | | 241,838 | | | | 15,143,896 | |
| Landec Corp.* | | | 946,613 | | | | 10,564,201 | |
| Coeur Mining, Inc.* | | | 1,084,798 | | | | 10,077,773 | |
| Olin Corp. | | | 341,109 | | | | 9,418,019 | |
| Allied Nevada Gold Corp.* | | | 1,616,510 | | | | 6,967,158 | |
| Berry Plastics Group, Inc.* | | | 275,240 | | | | 6,371,806 | |
| Total Materials | | | | | | | 118,729,234 | |
| | | | | | | | | |
| UTILITIES - 5.7% | | | | | | | | |
| Black Hills Corp. | | | 355,140 | | | | 20,473,822 | |
| UGI Corp. | | | 337,838 | | | | 15,408,791 | |
| Pepco Holdings, Inc. | | | 580,020 | | | | 11,878,809 | |
| Great Plains Energy, Inc. | | | 406,127 | | | | 10,981,674 | |
| MDU Resources Group, Inc. | | | 283,058 | | | | 9,711,720 | |
| Westar Energy, Inc. | | | 205,380 | | | | 7,221,161 | |
| Total Utilities | | | | | | | 75,675,977 | |
| SEE NOTES TO FINANCIAL STATEMENTS. | GUGGENHEIM MID CAP VALUE FUND SEMI-ANNUAL REPORT | 7 |
SCHEDULE OF INVESTMENTS (Unaudited) (concluded) | |
| MID CAP VALUE FUND | |
| | | | | | |
| | | | | | | |
| HEALTH CARE - 5.1% | | | | | | |
| Kindred Healthcare, Inc. | | | 782,716 | | | $ | 18,331,209 | |
| MEDNAX, Inc.* | | | 268,542 | | | | 16,644,233 | |
| Hologic, Inc.* | | | 577,511 | | | | 12,416,487 | |
| Alere, Inc.* | | | 271,274 | | | | 9,318,262 | |
| Edwards Lifesciences Corp.* | | | 102,190 | | | | 7,579,432 | |
| Universal Health Services, Inc. — Class B | | | 39,990 | | | | 3,281,979 | |
| Total Health Care | | | | | | | 67,571,602 | |
| | | | | | | | | |
| CONSUMER STAPLES - 4.4% | | | | | | | | |
| Bunge Ltd. | | | 373,270 | | | | 29,678,698 | |
| Hormel Foods Corp. | | | 392,400 | | | | 19,333,548 | |
| Ingredion, Inc. | | | 144,250 | | | | 9,820,540 | |
| Total Consumer Staples | | | | | | | 58,832,786 | |
| Total Common Stocks | | | | | | | | |
| (Cost $974,090,319) | | | | | | | 1,305,879,181 | |
| | | | | | | | | |
CONVERTIBLE PREFERRED STOCKS††† - 0.0% | | | | | |
Thermoenergy Corp. *,1,3 | | | 858,334 | | | | 60,152 | |
| Total Convertible Preferred Stocks | | | | | | | | |
| (Cost $819,654) | | | | | | | 60,152 | |
| | | | | | |
| | | | | | | |
SHORT TERM INVESTMENTS† - 1.0% | | | | | | |
| Dreyfus Treasury Prime Cash Management Fund | | | 12,977,255 | | | $ | 12,977,255 | |
| Total Short Term Investments | | | | | | | | |
| (Cost $12,977,255) | | | | | | | 12,977,255 | |
| | | | | | | | | |
| | | | | | | | |
| | | | | | | | | |
CONVERTIBLE BONDS†† - 0.6% | | | | | | | | |
| INDUSTRIALS - 0.6% | | | | | | | | |
| DryShips, Inc. | | | | | | | | |
| 5.00% due 12/01/14 | | $ | 7,525,000 | | | | 7,440,344 | |
| Total Convertible Bonds | | | | | | | | |
| (Cost $7,010,865) | | | | | | | 7,440,344 | |
| | | | | | | | | |
| Total Investments - 100.1% | | | | | | | | |
| (Cost $994,898,093) | | | | | | $ | 1,326,356,932 | |
| Other Assets & Liabilities, net - (0.1)% | | | | | | | (830,610 | ) |
| Total Net Assets - 100.0% | | | | | | $ | 1,325,526,322 | |
| * | Non-income producing security. |
| † | Value determined based on Level 1 inputs — See Note 4. |
| †† | Value determined based on Level 2 inputs — See Note 4. |
| ††† | Value determined based on Level 3 inputs — See Note 4. |
| 1 | PIPE (Private Investment in Public Equity) — Stock issued by a company in the secondary market as a means of raising capital more quickly and less expensively than through registration of a secondary public offering. |
| 2 | Affiliated issuers — See Note 10. |
| 3 | Illiquid security. |
| 8 | GUGGENHEIM MID CAP VALUE FUND SEMI-ANNUAL REPORT | SEE NOTES TO FINANCIAL STATEMENTS. |
STATEMENT OF ASSETS AND LIABILITIES (Unaudited)
| March 31, 2014 | | | |
| | | | |
| Assets: | | | |
| Investments in unaffiliated issuers, at value (cost $958,309,244) | | $ | 1,281,486,276 | |
| Investments in affiliated issuers, at value (cost $36,588,849) | | | 44,870,656 | |
| Total investments (cost $994,898,093) | | | 1,326,356,932 | |
| Prepaid expenses | | | 68,440 | |
| Cash | | | 9,998 | |
| Receivables: | | | | |
| Dividends | | | 2,073,603 | |
| Securities sold | | | 1,776,882 | |
| Fund shares sold | | | 1,263,270 | |
| Interest | | | 125,072 | |
| Foreign taxes reclaim | | | 13,049 | |
| Total assets | | | 1,331,687,246 | |
| | | | | |
| Liabilities: | | | | |
| Payable for: | | | | |
| Securities purchased | | | 2,135,106 | |
| Fund shares redeemed | | | 1,959,254 | |
| Management fees | | | 886,928 | |
| Distribution and service fees | | | 432,660 | |
| Fund accounting/administration fees | | | 106,964 | |
| Transfer agent/maintenance fees | | | 51,617 | |
| Trustees' fees* | | | 10,513 | |
| Miscellaneous | | | 577,882 | |
| Total liabilities | | | 6,160,924 | |
| Net assets | | $ | 1,325,526,322 | |
| | | | | |
| Net assets consist of: | | | | |
| Paid in capital | | $ | 919,235,959 | |
| Accumulated net investment loss | | | (295,453 | ) |
| Accumulated net realized gain on investments | | | 75,126,977 | |
| Net unrealized appreciation on investments | | | 331,458,839 | |
| Net assets | | $ | 1,325,526,322 | |
| A-Class: | | | | |
| Net assets | | $ | 1,088,858,215 | |
| Capital shares outstanding | | | 27,552,665 | |
| Net asset value per share | | $ | 39.52 | |
| Maximum offering price per share (Net asset value divided by 95.25%) | | $ | 41.49 | |
| B-Class: | | | | |
| Net assets | | $ | 17,662,201 | |
| Capital shares outstanding | | | 562,144 | |
| Net asset value per share | | $ | 31.42 | |
| C-Class: | | | | |
| Net assets | | $ | 219,005,906 | |
| Capital shares outstanding | | | 6,689,682 | |
| Net asset value per share | | $ | 32.74 | |
STATEMENT OF OPERATIONS (Unaudited)
| Period Ended March 31, 2014 | | | |
| | | | |
| Investment Income: | | | |
| Dividends (net of foreign withholding tax of $43,088) | | $ | 9,767,120 | |
| Interest | | | 538,357 | |
| Total investment income | | | 10,305,477 | |
| | | | | |
| Expenses: | | | | |
| Management fees | | | 5,100,211 | |
| Transfer agent/maintenance fees: | | | | |
| A-Class | | | 798,936 | |
| B-Class | | | 22,515 | |
| C-Class | | | 125,431 | |
| Distribution and service fees: | | | | |
| A-Class | | | 1,318,813 | |
| B-Class | | | 95,252 | |
| C-Class | | | 1,097,356 | |
| Fund accounting/administration fees | | | 614,438 | |
| Trustees' fees* | | | 52,955 | |
| Custodian fees | | | 13,440 | |
| Tax expense | | | 32 | |
| Miscellaneous | | | 609,371 | |
| Total expenses | | | 9,848,750 | |
| Net investment income | | | 456,727 | |
| | | | | |
| Net Realized and Unrealized Gain (Loss): | | | | |
| Net realized gain (loss) on: | | | | |
| Investments in unaffiliated issuers | | | 96,505,923 | |
| Investments in affiliated issuers | | | 656,350 | |
| Options written | | | 997,471 | |
| Net realized gain | | | 98,159,744 | |
| Net change in unrealized appreciation (depreciation) on: | | | | |
| Investments in unaffiliated issuers | | | 28,288,111 | |
| Investments in affiliated issuers | | | 1,605,671 | |
| Options written | | | (84,247 | ) |
| Net change in unrealized appreciation (depreciation) | | | 29,809,535 | |
| Net realized and unrealized gain | | | 127,969,279 | |
| Net increase in net assets resulting from operations | | $ | 128,426,006 | |
| * | Relates to Trustees not deemed “interested persons” within the meaning of Section 2(a)(19) of the 1940 Act. |
| SEE NOTES TO FINANCIAL STATEMENTS. | GUGGENHEIM MID CAP VALUE FUND SEMI-ANNUAL REPORT | 9 |
STATEMENTS OF CHANGES IN NET ASSETS
| | Period Ended March 31, 2014 (Unaudited) | | | Year Ended September 30, 2013 | |
| Increase (Decrease) in Net Assets From Operations: | | | | | | |
| Net investment income (loss) | | $ | 456,727 | | | $ | (331,094 | ) |
| Net realized gain on investments | | | 98,159,744 | | | | 97,541,779 | |
Net change in unrealized appreciation (depreciation) on investments | | | 29,809,535 | | | | 197,430,576 | |
Net increase in net assets resulting from operations | | | 128,426,006 | | | | 294,641,261 | |
| | | | | | | | | |
| Distributions to shareholders from: | | | | | | | | |
| Net realized gains | | | | | | | | |
| A-Class | | | (66,154,623 | ) | | | (92,674,750 | ) |
| B-Class | | | (1,531,403 | ) | | | (2,844,203 | ) |
| | | (16,551,729 | ) | | | (22,741,115 | ) |
Total distributions to shareholders | | | (84,237,755 | ) | | | (118,260,068 | ) |
| | | | | | | | | |
| Capital share transactions: | | | | | | | | |
| Proceeds from sale of shares | | | | | | | | |
| A-Class | | | 94,439,619 | | | | 196,756,789 | |
| B-Class | | | 80,453 | | | | 437,407 | |
| C-Class | | | 18,141,171 | | | | 29,825,646 | |
| Distributions reinvested | | | | | | | | |
| A-Class | | | 60,093,834 | | | | 83,496,316 | |
| B-Class | | | 1,462,878 | | | | 2,720,726 | |
| C-Class | | | 12,947,243 | | | | 16,692,864 | |
| Cost of shares redeemed | | | | | | | | |
| A-Class | | | (143,635,916 | ) | | | (292,306,316 | ) |
| B-Class | | | (4,769,044 | ) | | | (8,971,838 | ) |
| | | (36,463,759 | ) | | | (44,208,482 | ) |
Net increase (decrease) from capital share transactions | | | 2,296,479 | | | | (15,556,888 | ) |
| Net increase in net assets | | | 46,484,730 | | | | 160,824,305 | |
| | | | | | | | | |
| Net assets: | | | | | | | | |
| | | 1,279,041,592 | | | | 1,118,217,287 | |
| | $ | 1,325,526,322 | | | $ | 1,279,041,592 | |
Accumulated net investment loss at end of period | | $ | (295,453 | ) | | $ | (752,180 | ) |
| | | | | | | | | |
| Capital share activity: | | | | | | | | |
| Shares sold | | | | | | | | |
| A-Class | | | 2,448,906 | | | | 5,636,342 | |
| B-Class | | | 2,589 | | | | 15,688 | |
| C-Class | | | 565,742 | | | | 1,023,309 | |
| Shares issued from reinvestment of distributions | | | | | | | | |
| A-Class | | | 1,617,164 | | | | 2,764,774 | |
| B-Class | | | 49,371 | | | | 110,419 | |
| C-Class | | | 419,548 | | | | 652,575 | |
| Shares redeemed | | | | | | | | |
| A-Class | | | (3,738,902 | ) | | | (8,501,344 | ) |
| B-Class | | | (154,934 | ) | | | (319,547 | ) |
| | | (1,134,203 | ) | | | (1,532,165 | ) |
Net increase (decrease) in shares | | | 75,281 | | | | (149,949 | ) |
| 10 | GUGGENHEIM MID CAP VALUE FUND SEMI-ANNUAL REPORT | SEE NOTES TO FINANCIAL STATEMENTS. |
This table is presented to show selected data for a share outstanding throughout each period and to assist shareholders in evaluating a Fund’s performance for the periods presented.
| | Period Ended March 31, 2014a | | | Year Ended September 30, 2013 | | | Year Ended September 30, 2012 | | | Year Ended September 30, 2011 | | | Year Ended September 30, 2010 | | | Year Ended September 30, 2009 | |
| Per Share Data | | | | | | | | | | | | | | | | | | |
Net asset value, beginning
of period | | $ | 38.15 | | | $ | 33.05 | | | $ | 27.13 | | | $ | 29.55 | | | $ | 26.58 | | | $ | 28.41 | |
| Income (loss) from investment operations: | | | | | | | | | | | | | | | | | | | | | | | | |
Net investment income (loss)b | | | .04 | | | | .04 | | | | (.07 | ) | | | (.03 | ) | | | .11 | | | | .08 | |
Net gain (loss) on investments
(realized and unrealized) | | | 3.82 | | | | 8.59 | | | | 6.54 | | | | (2.31 | ) | | | 2.90 | | | | .82 | |
Total from investment operations | | | 3.86 | | | | 8.63 | | | | 6.47 | | | | (2.34 | ) | | | 3.01 | | | | .90 | |
| Less distributions from: | | | | | | | | | | | | | | | | | | | | | | | | |
| Net investment income | | | — | | | | — | | | | — | | | | (.08 | ) | | | (.04 | ) | | | (.14 | ) |
| Net realized gains | | | (2.49 | ) | | | (3.53 | ) | | | (.55 | ) | | | — | | | | — | | | | (2.59 | ) |
| | | (2.49 | ) | | | (3.53 | ) | | | (.55 | ) | | | (.08 | ) | | | (.04 | ) | | | (2.73 | ) |
| Net asset value, end of period | | $ | 39.52 | | | $ | 38.15 | | | $ | 33.05 | | | $ | 27.13 | | | $ | 29.55 | | | $ | 26.58 | |
| | | | | | | | | | | | | | | | | | | | | | | | |
| | | 10.53 | % | | | 28.93 | % | | | 24.13 | % | | | (7.98 | %) | | | 11.32 | % | | | 6.90 | % |
| Ratios/Supplemental Data | | | | | | | | | | | | | | | | | | | | | | | | |
Net assets, end of period
(in thousands) | | $ | 1,088,858 | | | $ | 1,038,762 | | | $ | 903,221 | | | $ | 973,467 | | | $ | 1,056,655 | | | $ | 781,883 | |
| Ratios to average net assets: | | | | | | | | | | | | | | | | | | | | | | | | |
| Net investment income (loss) | | | 0.21 | % | | | 0.11 | % | | | (0.22 | %) | | | (0.10 | %) | | | 0.38 | % | | | 0.40 | % |
| | | 1.39 | % | | | 1.39 | % | | | 1.46 | % | | | 1.32 | % | | | 1.37 | % | | | 1.48 | % |
| Portfolio turnover rate | | | 13 | % | | | 23 | % | | | 19 | % | | | 28 | % | | | 23 | % | | | 31 | % |
| | Period Ended March 31, 2014a | | | Year Ended September 30, 2013 | | | Year Ended September 30, 2012 | | | Year Ended September 30, 2011 | | | Year Ended September 30, 2010 | | | Year Ended September 30, 2009 | |
| Per Share Data | | | | | | | | | | | | | | | | | | |
Net asset value, beginning
of period | | $ | 30.95 | | | $ | 27.66 | | | $ | 22.99 | | | $ | 25.17 | | | $ | 22.78 | | | $ | 24.83 | |
| Income (loss) from investment operations: | | | | | | | | | | | | | | | | | | | | | | | | |
Net investment income (loss)b | | | (.10 | ) | | | (.19 | ) | | | (.29 | ) | | | (.24 | ) | | | (.09 | ) | | | (.06 | ) |
Net gain (loss) on investments
(realized and unrealized) | | | 3.06 | | | | 7.01 | | | | 5.51 | | | | (1.94 | ) | | | 2.48 | | | | .60 | |
Total from investment operations | | | 2.96 | | | | 6.82 | | | | 5.22 | | | | (2.18 | ) | | | 2.39 | | | | .54 | |
| Less distributions from: | | | | | | | | | | | | | | | | | | | | | | | | |
| Net realized gains | | | (2.49 | ) | | | (3.53 | ) | | | (.55 | ) | | | — | | | | — | | | | (2.59 | ) |
| | | (2.49 | ) | | | (3.53 | ) | | | (.55 | ) | | | — | | | | — | | | | (2.59 | ) |
| Net asset value, end of period | | $ | 31.42 | | | $ | 30.95 | | | $ | 27.66 | | | $ | 22.99 | | | $ | 25.17 | | | $ | 22.78 | |
| | | | | | | | | | | | | | | | | | | | | | | | |
| | | 10.05 | % | | | 27.93 | % | | | 23.02 | % | | | (8.66 | %) | | | 10.49 | % | | | 6.17 | % |
| Ratios/Supplemental Data | | | | | | | | | | | | | | | | | | | | | | | | |
Net assets, end of period
(in thousands) | | $ | 17,662 | | | $ | 20,584 | | | $ | 23,747 | | | $ | 27,960 | | | $ | 42,321 | | | $ | 58,221 | |
| Ratios to average net assets: | | | | | | | | | | | | | | | | | | | | | | | | |
| Net investment loss | | | (0.66 | %) | | | (0.67 | %) | | | (1.09 | %) | | | (0.86 | %) | | | (0.40 | %) | | | (0.34 | %) |
| | | 2.22 | % | | | 2.16 | % | | | 2.33 | % | | | 2.07 | % | | | 2.12 | % | | | 2.23 | % |
| Portfolio turnover rate | | | 13 | % | | | 23 | % | | | 19 | % | | | 28 | % | | | 23 | % | | | 31 | % |
| SEE NOTES TO FINANCIAL STATEMENTS. | GUGGENHEIM MID CAP VALUE FUND SEMI-ANNUAL REPORT | 11 |
FINANCIAL HIGHLIGHTS (concluded)
This table is presented to show selected data for a share outstanding throughout each period and to assist shareholders in evaluating a Fund’s performance for the periods presented.
| | Period Ended March 31, 2014a | | | Year Ended September 30, 2013 | | | Year Ended September 30, 2012 | | | Year Ended September 30, 2011 | | | Year Ended September 30, 2010 | | | Year Ended September 30, 2009 | |
| Per Share Data | | | | | | | | | | | | | | | | | | |
Net asset value, beginning
of period | | $ | 32.13 | | | $ | 28.57 | | | $ | 23.68 | | | $ | 25.93 | | | $ | 23.47 | | | $ | 25.49 | |
| Income (loss) from investment operations: | | | | | | | | | | | | | | | | | | | | | | | | |
Net investment income (loss)b | | | (.08 | ) | | | (.18 | ) | | | (.25 | ) | | | (.24 | ) | | | (.09 | ) | | | (.07 | ) |
| Net gain (loss) on investments (realized and unrealized) | | | 3.18 | | | | 7.27 | | | | 5.69 | | | | (2.01 | ) | | | 2.55 | | | | .64 | |
Total from investment operations | | | 3.10 | | | | 7.09 | | | | 5.44 | | | | (2.25 | ) | | | 2.46 | | | | .57 | |
| Less distributions from: | | | | | | | | | | | | | | | | | | | | | | | | |
| Net realized gains | | | (2.49 | ) | | | (3.53 | ) | | | (.55 | ) | | | — | | | | — | | | | (2.59 | ) |
| | | (2.49 | ) | | | (3.53 | ) | | | (.55 | ) | | | — | | | | — | | | | (2.59 | ) |
| Net asset value, end of period | | $ | 32.74 | | | $ | 32.13 | | | $ | 28.57 | | | $ | 23.68 | | | $ | 25.93 | | | $ | 23.47 | |
| | | | | | | | | | | | | | | | | | | | | | | | |
| | | 10.12 | % | | | 27.98 | % | | | 23.28 | % | | | (8.68 | %) | | | 10.48 | % | | | 6.13 | % |
| Ratios/Supplemental Data | | | | | | | | | | | | | | | | | | | | | | | | |
Net assets, end of period
(in thousands) | | $ | 219,006 | | | $ | 219,696 | | | $ | 191,249 | | | $ | 188,745 | | | $ | 193,986 | | | $ | 139,121 | |
| Ratios to average net assets: | | | | | | | | | | | | | | | | | | | | | | | | |
| Net investment loss | | | (0.52 | %) | | | (0.62 | %) | | | (0.92 | %) | | | (0.85 | %) | | | (0.37 | %) | | | (0.35 | %) |
| | | 2.10 | % | | | 2.12 | % | | | 2.16 | % | | | 2.07 | % | | | 2.12 | % | | | 2.22 | % |
| Portfolio turnover rate | | | 13 | % | | | 23 | % | | | 19 | % | | | 28 | % | | | 23 | % | | | 31 | % |
| a | Unaudited figures for the period ended March 31, 2014. Percentage amounts for the period, except total return and portfolio turnover rate, have been annualized. |
| b | Net investment income (loss) per share was computed using average shares outstanding throughout the period. |
| c | Total return does not reflect the impact of any applicable sales charges and has not been annualized. |
| 12 | GUGGENHEIM MID CAP VALUE FUND SEMI-ANNUAL REPORT | SEE NOTES TO FINANCIAL STATEMENTS. |
NOTES TO FINANCIAL STATEMENTS (Unaudited)
1. Organization and Significant Accounting Policies
Organization
Guggenheim Funds Trust (the “Trust”), a Delaware statutory trust, is registered with the SEC under the Investment Company Act of 1940 (“1940 Act”), as a non-diversified, open-ended investment company of the series type. Each series, in effect, is representing a separate Fund (collectively the “Funds”). The Trust is authorized to issue an unlimited number of shares. The Trust accounts for the assets of each Fund separately.
The Trust offers a combination of four separate classes of shares, A-Class shares, B-Class shares, C-Class shares and Institutional Class shares. Sales of shares of each Class are made without a front-end sales charge at the net asset value per share (“NAV”), with the exception of A-Class shares. A-Class shares are sold at the NAV, plus the applicable front-end sales charge. The sales charge varies depending on the amount purchased, but will not exceed 4.75%. Prior to February 22, 2011, the maximum sales charge was 5.75%. A-Class share purchases of $1 million or more are exempt from the front-end sales charge but have a 1% contingent deferred sales charge (“CDSC”), if shares are redeemed within 12 months of purchase. B-Class shares were offered without a front-end sales charge, but were subject to a CDSC of up to 5% for five years and convert to A-Class shares after eight years. Effective January 4, 2010, subscriptions for B-Class shares are no longer accepted. C-Class shares have a 1% CDSC if shares are redeemed within 12 months of purchase. Institutional Class shares are offered primarily for direct investment by institutions such as pension and profit sharing plans, endowments, foundations and corporations. Institutional Class shares have a minimum initial investment of $2 million and a minimum account balance of $1 million. Institutional Class shares are offered without a front-end sales charge or a CDSC.
At March 31, 2014, the Trust consisted of sixteen separate funds. This report covers the Mid Cap Value Fund ( the “Fund”) while the other funds are contained in separate reports.
Guggenheim Investments (“GI”) provides advisory services to the Funds. Rydex Fund Services, LLC (“RFS”) acts as the transfer agent and provides administrative and accounting services to the Fund. Guggenheim Funds Distributors, LLC (“GFD”) acts as principal underwriter to the Fund. GI, RFS and GFD are affiliated entities.
Significant Accounting Policies
The following significant accounting policies are in conformity with U.S. generally accepted accounting principles (“U.S. GAAP”) and are consistently followed by the Fund. This requires management to make estimates and assumptions that affect the reported amount of assets and liabilities and disclosure of contingent assets and liabilities at the date of the financial statements and the reported amounts of revenues and expenses during the reporting period. Actual results could differ from these estimates. All time references are based on Eastern Time.
A. Valuations of the Fund’s securities are supplied primarily by pricing services approved by the Board of Trustees. A Valuation Committee (“Valuation Committee”) is responsible for the oversight of the valuation process of the Fund and convenes monthly, or more frequently as needed. The Valuation Committee will review the valuation of all assets which have been fair valued for reasonableness. The Trust’s officers, through the Valuation Committee under the general supervision of the Board of Trustees, regularly review procedures used by, and valuations provided by, the pricing services.
Equity securities listed on an exchange (New York Stock Exchange (“NYSE”) or American Stock Exchange) are valued at the last quoted sales price as of the close of business on the NYSE, usually 4:00 p.m. on the valuation date. Equity securities listed on the NASDAQ market system are valued at the NASDAQ Official Closing Price on the valuation date, which may not necessarily represent the last sale price. If there has been no sale on such exchange or NASDAQ on such day, the security is valued at the closing bid price on such day.
Open-end investment companies (“Mutual Funds”) are valued at their NAV as of the close of business on the valuation date.
Debt securities with a maturity of greater than 60 days at acquisition are valued at prices that reflect broker/dealer supplied valuations or are obtained from independent pricing services, which may consider the trade activity, treasury spreads, yields or price of bonds of comparable quality, coupon, maturity, and type, as well as prices quoted by dealers who make markets in such securities. Short-term debt securities with a maturity of 60 days or less at acquisition and repurchase agreements are valued at amortized cost, which approximates market value.
Listed options are valued at the Official Settlement Price listed by the exchange, usually as of 4:00 p.m. Long options are valued using the bid price and short options are valued using the ask price. In the event that a settlement price is not
| | GUGGENHEIM MID CAP VALUE FUND SEMI-ANNUAL REPORT | 13 |
NOTES TO FINANCIAL STATEMENTS (Unaudited) (continued)
available, fair valuation is enacted. Over-the-counter options are valued using the average bid price (for long options), or average ask price (for short options) obtained from one or more security dealers.
Premiums received from options written are entered in the Fund’s accounting records as an asset and equivalent liability. The amount of the liability is subsequently marked-to-market to reflect the current value of the option written. When an option written expires, or if a Fund enters into a closing purchase transaction, it realizes a gain (or loss if the cost of a closing purchase transaction exceeds the premium received when the option was sold).
Investments for which market quotations are not readily available are fair valued as determined in good faith by GI under the direction of the Board of Trustees using methods established or ratified by the Board of Trustees. These methods include, but are not limited to: (i) obtaining general information as to how these securities and assets trade; (ii) in connection with options thereupon obtaining information as to how (a) these contracts and other derivative investments trade in other derivative markets, respectively, and (b) the securities underlying these contracts and other derivative investments trade in the cash market; and (iii) obtaining other information and considerations, including current values in related markets.
B. Senior loans in which the Fund invests generally pay interest rates which are periodically adjusted by reference to a base short-term, floating rate plus a premium. These base lending rates are generally (I) the lending rate offered by one or more major European banks, such as the London Inter-Bank Offered Rate (LIBOR), (ii) the prime rate offered by one or more major United States banks, or (iii) the bank’s certificate of deposit rate. Senior floating rate interests often require prepayments from excess cash flows or permit the borrower to repay at its election. The rate at which the borrower repays cannot be predicted with accuracy. As a result, the actual remaining maturity may be substantially less than the stated maturities shown. The interest rate indicated is the rate in effect at March 31, 2014.
C. Security transactions are recorded on the trade date for financial reporting purposes. Realized gains and losses from securities transactions are recorded using the identified cost basis. Proceeds from lawsuits related to investment holdings are recorded as realized gains in the respective Fund. Dividend income is recorded on the ex-dividend date, net of applicable taxes withheld by foreign countries. Taxable non-cash dividends are recorded as dividend income. Interest income, including amortization of premiums and accretion of discounts, is accrued on a daily basis. Interest income also includes paydown gains and losses on mortgage-backed and asset-backed securities and senior and subordinated loans. Amendment fees are earned as compensation for evaluating and accepting changes to the original loan agreement and are recognized when received.
D. The Fund may purchase and sell interests in securities on a when-issued and delayed delivery basis, with payment and delivery scheduled for a future date. No income accrues to the Fund on such interests or securities in connection with such transactions prior to the date the Fund actually takes delivery of such interests or securities. These transactions are subject to market fluctuations and are subject to the risk that the value at delivery may be more or less than the trade date purchase price. Although the Fund will generally purchase these securities with the intention of acquiring such securities, they may sell such securities before the settlement date.
E. The accounting records of the Fund are maintained in U.S. dollars. All assets and liabilities initially expressed in foreign currencies are converted into U.S. dollars at prevailing exchange rates. Purchases and sales of investment securities, dividend and interest income, and certain expenses are translated at the rates of exchange prevailing on the respective dates of such transactions. Changes in the relationship of these foreign currencies to the U.S. dollar can significantly affect the value of the investments and earnings of the Fund. Foreign investments may also subject the Fund to foreign government exchange restrictions, expropriation, taxation or other political, social or economic developments, all of which could affect the market and/or credit risk of the investments.
The Fund does not isolate that portion of the results of operations resulting from changes in the foreign exchange rates on investments from the fluctuations arising from changes in the market prices of securities held. Such fluctuations are included with the net realized and unrealized gain or loss on investments.
Reported net realized foreign exchange gains and losses arise from sales of foreign currencies and currency gains or losses realized between the trade and settlement dates on investment transactions. Net unrealized exchange gains and losses arise from changes in the fair values of assets and liabilities other than investments in securities at the fiscal period end, resulting from changes in exchange rates.
| 14 | GUGGENHEIM MID CAP VALUE FUND SEMI-ANNUAL REPORT | |
NOTES TO FINANCIAL STATEMENTS (Unaudited) (continued)
F. Distributions of net investment income in the Fund and distributions of net realized gains, if any, are declared at least annually and recorded on the ex-dividend date and are determined in accordance with income tax regulations which may differ from U.S. GAAP.
G. When a Fund engages in a short sale of a security, an amount equal to the proceeds is reflected as an asset and an equivalent liability. The amount of the liability is subsequently marked-to-market to reflect the market value of the short sale. The Fund maintains a segregated account of cash and/or securities as collateral for short sales.
Fees, if any, paid to brokers to borrow securities in connection with short sales are recorded as interest expense. In addition, the Fund must pay out the dividend rate of the equity or coupon rate of the treasury obligation to the lender and record this as an expense. Short dividend or interest expense is a cost associated with the investment objective of short sales transactions, rather than an operational cost associated with the day-to-day management of any mutual fund. The Fund may also receive rebate income from the broker resulting from the investment of the proceeds from securities sold short.
H. Interest and dividend income, most expenses, all realized gains and losses, and all unrealized gains and losses are allocated to the classes based upon the value of the outstanding shares in each class. Certain costs, such as distribution and service fees relating to A-Class shares, B-Class shares and C-Class shares and transfer agent fees related to each class, are charged directly to specific classes. In addition, other expenses common to various funds within the fund complex are generally allocated amongst such funds on the basis of average net assets.
I. Under the fee arrangement with the custodian, the Fund may earn credits based on overnight custody cash balances. These credits are utilized to reduce related custodial expenses. The custodian fees disclosed in the Statement of Operations are before the reduction in expense from the related earnings credits, if any. For the period ended March 31, 2014, there were no earnings credits received.
J. The Fund may leave cash overnight in their cash account with the custodian, Bank of New York Mellon Corp. Periodically, a Fund may have cash due to the custodian bank as an overdraft balance. A fee is incurred on this overdraft, calculated by multiplying the overdraft by a rate based on the federal funds rate. Segregated cash with the broker is held as collateral for investments in derivative instruments such as futures contracts or swap agreements.
K. Under the Fund’s organizational documents, its Officers and Trustees are indemnified against certain liabilities arising out of the performance of their duties to the Trust. In addition, throughout the normal course of business, the Fund enters into contracts that contain a variety of representations and warranties which provide general indemnifications. The Fund’s maximum exposure under these arrangements is unknown, as this would involve future claims that may be made against the Fund and/or its affiliates that have not yet occurred. However, based on experience, the Fund expects the risk of loss to be remote.
2. Financial Instruments
The Fund may write call options on a covered basis and put options on securities that are traded on recognized securities exchanges and over-the-counter markets. Call and put options on securities give the writer the obligation to sell or purchase a security at a specified price, until a certain date. Options were used minimally to hedge the Fund’s portfolio, to increase returns, to maintain exposure to the equity markets, and create liquidity. The risk in writing a covered call option is that a fund may forego the opportunity for profit if the market price of the underlying security increases and the option is exercised. The risk in writing a covered put option is that a Fund may incur a loss if the market price of the underlying security decreases and the option is exercised. In addition, there is the risk that a fund may not be able to enter into a closing transaction because of an illiquid secondary market or, for over-the-counter options, because of the counterparty’s inability to perform.
The Trust has established counterparty credit guidelines and enters into transactions only with financial institutions of investment grade or better. The Trust monitors the counterparty credit risk.
The Fund utilized derivatives to achieve leveraged exposure. The use of derivative instruments by a Fund to achieve leveraged exposure to the underlying index creates leveraging risk. The more a Fund invests in leveraged instruments, the more this leverage will magnify any losses on those investments. A Fund’s investment in these instruments generally requires a small investment relative to the amount of investment exposure assumed. As a result, such investments may give rise to losses that exceed the amount invested in those instruments. Since a Fund’s investment strategy involves consistently applied leverage, the value of the Fund’s shares will tend to increase or decrease more than the value of any increase or decrease in the underlying index.
| | GUGGENHEIM MID CAP VALUE FUND SEMI-ANNUAL REPORT | 15 |
NOTES TO FINANCIAL STATEMENTS (Unaudited) (continued)
3. Fees and Other Transactions with Affiliates
Management fees are paid monthly to GI, based on the following annual rate:
| Management Fees (as a % of net assets) |
| Mid Cap Value Fund | 0.79%1 |
| 1 | Management fees are payable at an annual rate of 1.00% of the average daily net assets of $200 million or less, and 0.75% of the average daily net assets of the Fund in excess of $200 million. |
RFS also acts as the administrative agent for the Fund, and as such performs administrative functions and the bookkeeping, accounting and pricing functions. For these services, RFS receives the following:
| Fund Accounting/ Administrative Fees (as a % of net assets) |
| Mid Cap Value Fund | 0.095% |
| | |
| Minimum charge per Fund | $25,000 |
| Certain out-of-pocket charges | Varies |
RFS is paid the following for providing transfer agent services to the Fund. The transfer agent fees are assessed to the applicable class of the Fund in which they were incurred.
| Annual charge per account | $5.00 – $8.00 |
| Transaction fee | $0.60 – $1.10 |
| Minimum annual charge per Fund | $25,000 |
| Certain out-of-pocket charges | Varies |
The Fund has adopted Distribution Plans related to the offering of A-Class, B-Class and C-Class shares pursuant to Rule 12b-1 under the 1940 Act. The plans provide for payments at an annual rate of 0.25% of the average daily net assets of the Fund’s A-Class shares and 1.00% of the average daily net assets of the Fund’s B-Class and C-Class shares.
During the period ended March 31, 2014, GDL retained sales charges of $63,729 relating to sales of A-Class shares of the Fund.
Certain officers and trustees of the Trust are also officers of GI, RFS and GFD.
4. Fair Value Measurement
In accordance with U.S. GAAP, fair value is defined as the price that the Funds would receive to sell an investment or pay to transfer a liability in an orderly transaction with an independent buyer in the principal market, or in the absence of a principal market, the most advantageous market for the investment or liability. U.S. GAAP establishes a three-tier fair value hierarchy based on the types of inputs used to value assets and liabilities and requires corresponding disclosure. The hierarchy and the corresponding inputs are summarized below:
| Level 1 | — | quoted prices in active markets for identical assets or liabilities. |
| Level 2 | — | significant other observable inputs (for example quoted prices for securities that are similar based on characteristics such as interest rates, prepayment speeds, credit risk, etc.). |
| Level 3 | — | significant unobservable inputs based on the best information available under the circumstances, to the extent observable inputs are not available, which may include assumptions. |
The types of inputs available depend on a variety of factors, such as the type of security and the characteristics of the markets in which it trades, if any. Fair valuation determinations that rely on fewer or no observable inputs require greater judgment. Accordingly, fair value determinations for Level 3 securities require the greatest amount of judgment.
| 16 | GUGGENHEIM MID CAP VALUE FUND SEMI-ANNUAL REPORT | |
NOTES TO FINANCIAL STATEMENTS (Unaudited) (continued)
The following table summarizes the inputs used to value the Funds’ net assets at March 31, 2014:
| | Level 1 Investments In Securities | | | Level 2 Investments In Securities | | | Level 3 Investments In Securities | | | | |
| Assets | | | | | | | | | | | | |
| Mid Cap Value Fund | | $ | 1,318,856,436 | | | $ | 7,440,344 | | | $ | 60,152 | | | $ | 1,326,356,932 | |
Financial assets and liabilities categorized as Level 2 consist of fixed income investments. Independent pricing services are used to value a majority of the Fund’s investments. When values are not available from a pricing service, they may be computed by the Fund’s investment adviser or an affiliate. In any event, values may be determined using a variety of sources and techniques, including: market prices; broker quotes; and models which derive prices based on inputs such as prices of securities with comparable maturities and characteristics or based on inputs such as anticipated cash flows or collateral, spread over Treasuries, and other information and analysis.
Transfers between investment levels may occur as the markets fluctuate and/or the availability of data used in the investment’s valuation changes. The Fund recognizes transfers between the levels as of the beginning of the period.
For the period ended March 31, 2014, there were no transfers between levels.
The inputs or methodologies used for valuing securities are not necessarily an indication of the risk associated with investing in those securities. The suitability of the techniques and sources employed to determine fair valuation are regularly monitored and subject to change.
5. Derivative Investment Holdings Categorized by Risk Exposure
U.S. GAAP requires disclosures to enable investors to better understand how and why the Fund uses derivative instruments, how these derivative instruments are accounted for and their effects on the Fund’s financial position and results of operations.
The following is a summary of the location of derivative investments on the Fund’s Statements of Operations for the period ended March 31, 2014:
Derivative Investment Type | Location of Gain (Loss) on Derivatives |
| Equity contracts | Net realized gain (loss) on options written |
| | Net change in unrealized appreciation (depreciation) on options written |
The following is a summary of the Fund’s realized gain (loss) and change in unrealized appreciation (depreciation) on derivative investments recognized on the Statements of Operations categorized by primary risk exposure for the period ended March 31, 2014:
Realized Gain(Loss) on Derivative Investments Recognized on the Statement of Operations |
| | | | | | | | Options Written Equity Contracts | | | | |
| Mid Cap Value Fund | | $ | — | | | $ | — | | | $ | 997,471 | | | $ | 997,471 | |
Change in Unrealized Appreciation(Depreciation) on Derivative Investments Recognized on the Statement of Operations |
| | | | | | | | Options Written Equity Contracts | | | | |
| Mid Cap Value Fund | | $ | — | | | $ | — | | | $ | 84,247 | | | $ | 84,247 | |
| | GUGGENHEIM MID CAP VALUE FUND SEMI-ANNUAL REPORT | 17 |
NOTES TO FINANCIAL STATEMENTS (Unaudited) (continued)
7. Options Written
Transactions in options written during the period ended March 31, 2014 were as follows:
Call Options Written
| | | | |
| | | | | | |
| Balance at September 30, 2013 | | | 1,154 | | | $ | 390,057 | |
| Options Written | | | 1,597 | | | | 391,534 | |
| Options terminated in closing purchase transactions | | | — | | | | — | |
| Options expired | | | (2,751 | ) | | | (781,591 | ) |
| | | — | | | | — | |
Balance at March 31, 2014 | | | — | | | $ | — | |
Put Options Written
| | | | |
| | | | | | |
| Balance at September 30, 2013 | | | — | | | $ | — | |
| Options Written | | | 1,609 | | | | 215,880 | |
| Options terminated in closing purchase transactions | | | — | | | | — | |
| Options expired | | | (1,609 | ) | | | (215,880 | ) |
| | | — | | | | — | |
Balance at March 31, 2014 | | | — | | | $ | — | |
8. Federal Income Tax Information
The Fund intends to comply with the provisions of Subchapter M of the Internal Revenue Code applicable to regulated investment companies and will distribute substantially all taxable net investment income and capital gains sufficient to relieve the Fund from all, or substantially all, federal income, excise and state income taxes. Therefore, no provision for federal or state income tax is required.
Tax positions taken or expected to be taken in the course of preparing the Fund’s tax returns are evaluated to determine whether the tax positions are “more-likely-than-not” of being sustained by the applicable tax authority. Tax positions not deemed to meet the more-likely-than-not threshold would be recorded as a tax benefit or expense in the current year. Management has analyzed the Fund’s tax positions taken, or to be taken, on Federal income tax returns for all open tax years, and has concluded that no provision for income tax is required in the Fund’s financial statements. The Fund’s federal tax returns are subject to examination by the Internal Revenue Service for a period of three fiscal years after they are filed.
The RIC Modernization Act of 2010 was signed into law on December 22, 2010 and simplified some of the tax provisions applicable to regulated investment companies, the tax reporting to their shareholders improved and the tax efficiency of certain fund structures. The greatest impact to the disclosure in the financial reports for the Fund was on the treatment of net capital losses, effective for tax years beginning after December 22, 2010.
One of the more prominent changes addresses capital loss carryforwards. The Fund is permitted to carry forward capital losses incurred in taxable years beginning after December 22, 2010 for an unlimited period. However, any losses incurred during those future taxable years will be required to be utilized prior to the losses incurred in pre-enactment taxable years. Under pre-enactment law, capital losses could be carried forward for eight years, and carried forward as short-term capital, irrespective of the character of the original loss. As a result of this ordering rule, pre-enactment capital carryforwards may potentially expire unused. Additionally, post-enactment capital losses that are carried forward will retain their character as either short-term or long-term capital losses rather than being considered all short-term as under previous law.
| 18 | GUGGENHEIM MID CAP VALUE FUND SEMI-ANNUAL REPORT | |
NOTES TO FINANCIAL STATEMENTS (Unaudited) (concluded)
At March 31, 2014, the cost of securities for Federal income tax purposes, the aggregate gross unrealized gain for all securities for which there was an excess of value over tax cost and the aggregate gross unrealized loss for all securities for which there was an excess of tax cost over value, were as follows:
| | | | | | | | | | | | |
| Mid Cap Value Fund | | $ | 995,436,245 | | | $ | 384,968,273 | | | $ | (54,047,586 | ) | | $ | 330,920,687 | |
9. Securities Transactions
For the period ended March 31, 2014, the cost of purchases and proceeds from sales of investment securities, excluding government securities and short-term investments, were as follows:
| | | | | | |
| Mid Cap Value Fund | | $ | 161,726,373 | | | $ | 234,307,157 | |
10. Affiliated Transactions
Investments representing 5% or more of the outstanding voting shares of a portfolio company of a fund, or control of or by, or common control under GI, result in that portfolio company being considered an affiliated company of such fund, as defined in the 1940 Act. Transactions during the period ended March 31, 2014 in which the portfolio company is an “affiliated person” are as follows:
| | | | | | | | | | | | | | | | | | | |
| Mid Cap Value Fund | Common Stock: | | | | | | | | | | | | | | | | | | |
| | IXYS Corp. | | $ | 20,615,574 | | | $ | — | | | $ | — | | | $ | 20,615,574 | | | | 2,012,549 | | | $ | — | |
| Maxwell Technologies, Inc. | | | 15,481,137 | | | | — | | | | — | | | | 15,481,137 | | | | 1,704,971 | | | | — | |
| | Total | | $ | 36,096,711 | | | $ | — | | | $ | — | | | $ | 36,096,711 | | | | 3,717,520 | | | $ | — | |
11. Other Liabilities
Mid Cap Value Fund wrote put option contracts through LBI that were exercised prior to the option contracts’ expiration and prior to the bankruptcy filing by LBI, during September, 2008. However, these transactions have not settled and the securities have not been delivered to the Fund as of March 31, 2014.
Although the ultimate resolution of these transactions is uncertain, the Fund has recorded a liability on its respective book equal to the difference between the strike price on the put options and the market price of the underlying security on the exercise date. The amount of the liability recorded by the Fund as of March 31, 2014, was $473,594.
| | GUGGENHEIM MID CAP VALUE FUND SEMI-ANNUAL REPORT | 19 |
OTHER INFORMATION (Unaudited)
Proxy Voting Information
A description of the policies and procedures that the Trust uses to determine how to vote proxies relating to securities held in the Funds’ portfolios is available, without charge and upon request, by calling 800.820.0888. This information is also available from the EDGAR database on the SEC’s website at http://www.sec.gov.
Information regarding how the Funds voted proxies relating to portfolio securities during the most recent 12-month period ended June 30 is available without charge, upon request, by calling 800.820.0888. This information is also available from the EDGAR database on the SEC’s website at http://www.sec.gov.
At a special meeting of shareholders held on January 8, 2014, the shareholders of the Funds voted on whether to approve the election of nominees to the Board of Directors of each corporation. A description of the number of shares voted is as follows:
| | | |
| Randall C. Barnes | 25,511,441 | 844,276 | 26,355,717 |
| Roman Friedrich III | 26,062,314 | 293,403 | 26,355,717 |
| Robert B. Karn III | 26,042,598 | 313,119 | 26,355,717 |
| Ronald A. Nyberg | 26,091,609 | 264,108 | 26,355,717 |
| Ronald E. Toupin, Jr. | 26,075,975 | 279,742 | 26,355,717 |
At a special meeting of shareholders held on January 8, 2014, the shareholders of the Funds also voted on whether to approve the Funds from Kansas Corporations into Delaware Statutory Trusts. A description of the number of shares voted is as follows:
| | | |
| Mid Cap Value Fund | 17,448,012 | 129,654 | 201,198 |
At a special meeting of shareholders held on January 8, 2014, the shareholders of the Funds also voted on whether to approve changes to the fundamental investment policies. A description of the number of shares voted is as follows:
Diversification
| | | |
| Mid Cap Value Fund | 17,387,294 | 180,960 | 210,610 |
Underwriting
| | | |
| Mid Cap Value Fund | 17,386,271 | 179,562 | 213,031 |
Industry Concentration
| | | |
| Mid Cap Value Fund | 17,381,371 | 173,594 | 223,899 |
Real Estate
| | | |
| Mid Cap Value Fund | 17,371,867 | 182,914 | 224,083 |
| 20 | GUGGENHEIM MID CAP VALUE FUND SEMI-ANNUAL REPORT | |
OTHER INFORMATION (Unaudited) (continued)
Commodities
| | | |
| Mid Cap Value Fund | 17,361,909 | 174,755 | 242,200 |
Loans
| | | |
| Mid Cap Value Fund | 17,333,554 | 214,085 | 231,225 |
Borrowing
| | | |
| Mid Cap Value Fund | 17,331,610 | 208,297 | 238,957 |
Senior Securities
| | | |
| Mid Cap Value Fund | 17,365,617 | 179,218 | 234,029 |
Quarterly Portfolio Schedules Information
The Trust files its complete schedule of portfolio holdings with the SEC for the first and third quarters of each fiscal year on Form N-Q; which are available on the SEC’s website at http://www.sec.gov. The Funds’ Forms N-Q may be reviewed and copied at the SEC’s Public Reference Room in Washington, DC, and that information on the operation of the Public Reference Room may be obtained by calling 1-800-SEC-0330. Copies of the portfolio holdings are also available to shareholders, without charge and upon request, by calling 800.820.0888.
Office Locations
The offices of Guggenheim Investments can be found in the following locations:
330 Madison Avenue
10th Floor
New York, NY 10017
(Headquarters)
Four Irvington Centre
805 King Farm Boulevard
Suite 600
Rockville, MD 20850
9401 Indian Creek Parkway
40 Corporate Woods
Suite 850
Overland Park, KS 66210
| | GUGGENHEIM MID CAP VALUE FUND SEMI-ANNUAL REPORT | 21 |
OTHER INFORMATION (Unaudited) (concluded)
Board Considerations in Approving the Investment Advisory Agreements
At a meeting held on November 11, 2013, in connection with other actions taken to consider whether to approve the reorganization of the funds from series of Kansas corporations (the “Predecessor Funds”) into series of a Delaware statutory trust, Guggenheim Funds Trust (the “Trust” and its series, the “New Series”), the members of the Boards of Directors of the Kansas corporations (collectively, the “Predecessor Board” and the members individually, “Directors”), including the Directors who are not “interested persons,” as defined by the Investment Company Act of 1940, as amended (the “1940 Act”), of the corporations (the “Independent Directors”) appointed the then-investment advisers and sub-advisers of the Predecessor Funds, to serve in the same capacity to the corresponding New Series. The Predecessor Board also approved corresponding advisory and sub-advisory agreements, subject, for each Predecessor Fund, to approval of the reorganization of that fund by its shareholders and approval of the new agreements by the initial sole shareholder of the corresponding New Series. The Directors based their approval on a variety of factors, including: the findings they had made during their May, June and August 2013 meetings at which the advisory and sub-advisory agreements of the Predecessor Funds had the most recently been approved, which are discussed in the Annual Report of the Predecessor Funds for the fiscal year ended September 30, 2013; the fact that new agreements are the same as the agreements then in place for the Predecessor Funds except for the name of the signatory, the applicable state law and the term of the agreements; and the intention that the new agreements would be subject to re-consideration after the reorganizations at meetings scheduled to be held for these purposes in April and May 2014.
Distributor Change
Effective March 3, 2014, Guggenheim Distributors, LLC (“GD”), the distributor for shares of the Fund was consolidated into and with Guggenheim Funds Distributors, LLC (“GFD”). Following the consolidation, GFD serves as the Fund’s distributor.
GD and GFD are both indirect, wholly-owned subsidiaries of Guggenheim Capital, LLC and, therefore, the consolidation will not result in a change of actual control of the Fund’s distributor. The primary goal of the consolidation is to achieve greater operational efficiencies and allow all of the Guggenheim funds, including funds that are not series of the Trusts, to be distributed by a single distributor.
The consolidation is not expected to affect the day-to-day management of the Fund or result in any material changes to the distribution of the Fund, including any changes to the distribution fees paid by the Fund.
Guggenheim Funds Trust
Guggenheim Funds Trust (the “Trust”), which was organized as a Delaware statutory trust on November 8, 2013, is registered with the Securities and Exchange Commission (“SEC”) as an investment company. The Trust is an open-end management investment company that, upon the demand of the investor, must redeem its shares and pay the investor the next calculated NAV. The Guggenheim Enhanced World Equity Fund (“Enhanced World Equity Fund”), Guggenheim Large Cap Value Fund (“Large Cap Value Fund”), Guggenheim Mid Cap Value Fund (“Mid Cap Value Fund”), Guggenheim Mid Cap Value Institutional Fund (“Mid Cap Value Institutional Fund”), Guggenheim Small Cap Value Fund (“Small Cap Value Fund”), Guggenheim StylePlus—Large Core Fund (“StylePlus—Large Core Fund”), Guggenheim StylePlus—Mid Growth Fund (“StylePlus—Mid Growth Fund”) and Guggenheim World Equity Income Fund (“World Equity Income Fund”) (collectively, the “Funds”) were previously series (the “Predecessor Funds”) of Security Equity Fund, Security Large Cap Value Fund and Security Mid Cap Growth Fund (the “Predecessor Corporations”), different registered open-end investment companies, which were organized as Kansas corporations. In January 2014, at special meetings of shareholders, the shareholders of each Predecessor Fund approved the reorganization of each Predecessor Fund with and into a corresponding “shell” series of the Trust. The shell series of the Trust succeeded to the accounting and performance histories of the Predecessor Funds. Any such historical information provided for a series of the Trust that relates to periods prior to January 28, 2014, therefore, is that of the corresponding Predecessor Fund.
| 22 | GUGGENHEIM MID CAP VALUE FUND SEMI-ANNUAL REPORT | |
INFORMATION ON BOARD OF TRUSTEES AND OFFICERS (Unaudited)
| INDEPENDENT TRUSTEES |
Name, Address* and Year of Birth | Position(s) Held with the Trust | Term of Office and Length of Time Served** | Principal Occupation(s) During Past Five Years | Number of Portfolios in Fund Complex Overseen | Other Directorships Held by Trustees |
Randall C. Barnes (1951) | Trustee | Since 2014 | Current: Private Investor (2001-present). Former: Senior Vice President and Treasurer, PepsiCo, Inc. (1993-1997); President, Pizza Hut International (1991-1993); Senior Vice President, Strategic Planning and New Business Development, PepsiCo, Inc. (1987-1990). | 86 | None. |
Donald A. Chubb, Jr. (1946) | Trustee and Vice Chairman of the Board | Since 1994 | Current: Business broker and manager of commercial real estate, Griffith & Blair, Inc. (1997-present). | 82 | None. |
Jerry B. Farley (1946) | Trustee and Vice Chairman of the Audit Committee | Since 2005 | Current: President, Washburn University (1997-present). | 82 | Current: Westar Energy, Inc. (2004-present); CoreFirst Bank & Trust (2000-present). |
Roman Friedrich III (1946) | Trustee and Chairman of the Contracts Review Committee | Since 2014 | Current: Founder and President, Roman Friedrich & Company (1998-present). Former: Senior Managing Director, MLV & Co. LLC (2010-2011). | 82 | Current: Mercator Minerals Ltd. (2013-present); First Americas Gold Corp. (2012-present); Zincore Metals, Inc. (2009-present). Former: Blue Sky Uranium Corp. (2011-2012); Axiom Gold and Silver Corp. (2011-2012); Stratagold Corp. (2003-2009); GFM Resources Ltd. (2005-2010). |
Robert B. Karn III (1942) | Trustee and Chairman of the Audit Committee | Since 2014 | Current: Consultant (1998-present). Former: Arthur Andersen (1965-1997) and Managing Partner, Financial and Economic Consulting, St. Louis office (1987-1997). | 82 | Current: Peabody Energy Company (2003-present); GP Natural Resource Partners, LLC (2002- present). |
Ronald A. Nyberg (1953) | Trustee and Chairman of the Nominating and Governance Committee | Since 2014 | Current: Partner, Nyberg & Cassioppi, LLC (2000-present). Former: Executive Vice President, General Counsel, and Corporate Secretary, Van Kampen Investments (1982-1999). | 88 | None. |
| | GUGGENHEIM MID CAP VALUE FUND SEMI-ANNUAL REPORT | 23 |
INFORMATION ON BOARD OF TRUSTEES AND OFFICERS (Unaudited) (continued)
| INDEPENDENT TRUSTEES (concluded) | |
Name, Address* and Year of Birth | Position(s) Held with the Trust | Term of Office and Length of Time Served** | Principal Occupation(s) During Past Five Years | Number of Portfolios in Fund Complex Overseen | Other Directorships Held by Trustees |
Maynard F. Oliverius (1943) | Trustee and Vice Chairman of the Contracts Review Committee | Since 1998 | Retired. Former: President and CEO, Stormont-Vail HealthCare (1996-2012). | 82 | None. |
Ronald E. Toupin, Jr. (1958) | Trustee and Chairman of the Board | Since 2014 | Current: Portfolio Consultant (2010-present). Former: Vice President, Manager and Portfolio Manager, Nuveen Asset Management (1998-1999); Vice President, Nuveen Investment Advisory Corp. (1992-1999); Vice President and Manager, Nuveen Unit Investment Trusts (1991-1999); and Assistant Vice President and Portfolio Manager, Nuveen Unit Investment Trusts (1988-1999), each of John Nuveen & Co., Inc. (1982-1999). | 85 | Former: Bennett Group of Funds (2011-2013). |
| INTERESTED TRUSTEE | | | | | |
Donald C. Cacciapaglia*** (1951) | President, Chief Executive Officer and Trustee | Since 2012 | Current: President and CEO, certain other funds in the Fund Complex (2012-present); Vice Chairman, Guggenheim Investments (2010-present). Former: Chairman and CEO, Channel Capital Group, Inc. (2002-2010). | 214 | Current: Delaware Life (2013-present); Guggenheim Life and Annuity Company (2011-present); Paragon Life Insurance Company of Indiana (2011-present). |
| * | The business address of each Trustee is c/o Guggenheim Investments, 805 King Farm Boulevard, Suite 600, Rockville, Maryland 20850. |
| ** | Each Trustee serves an indefinite term, until his successor is elected and qualified. Time served includes time served in the respective position for the Predecessor Corporation. |
| *** | This Trustee is deemed to be an "interested person" of the Funds under the 1940 Act by reason of his position with the Funds' Investment Manager and/or the parent of the Investment Manager. |
| 24 | GUGGENHEIM MID CAP VALUE FUND SEMI-ANNUAL REPORT | |
INFORMATION ON BOARD OF TRUSTEES AND OFFICERS (Unaudited) (continued)
| OFFICERS | | | |
Name, Address* and Year of Birth | Position(s) Held with the Trust | Term of Office and Length of Time Served** | Principal Occupations During Past Five Years |
Joseph M. Arruda (1966) | Assistant Treasurer | Since 2010 | Current: Assistant Treasurer, certain other funds in the Fund Complex (2006-present); Vice President, Security Investors, LLC (2010-present); CFO and Manager, Guggenheim Specialized Products, LLC (2009-present). Former: Vice President, Security Global Investors, LLC (2010-2011); Vice President, Rydex Advisors, LLC (2010); Vice President, Rydex Advisors II, LLC (2010). |
William H. Belden, III (1965) | Vice President | Since 2014 | Current: Vice President, certain other funds in the Fund Complex (2006-present); Managing Director, Guggenheim Funds Investment Advisors, LLC (2005-present). Former: Vice President of Management, Northern Trust Global Investments (1999-2005). |
Mark J. Furjanic (1959) | Assistant Treasurer | Since 2014 | Current: Vice President, Guggenheim Investments (2005-present); Assistant Treasurer, certain other funds in the Fund Complex (2008-present). Former: Senior Manager, Ernst & Young LLP (1999-2005). |
James Howley (1972) | Assistant Treasurer | Since 2014 | Current: Director, Guggenheim Investments (2004-present); Assistant Treasurer, certain other funds in the Fund Complex (2006-present). Former: Manager, Mutual Fund Administration of Van Kampen Investments, Inc. (1996-2004). |
Amy J. Lee (1961) | Vice President and Chief Legal Officer | Since 1987 (Secretary) Since 2007 (Vice President) | Current: Chief Legal Officer, certain other funds in the Fund Complex (2013-present); Senior Managing Director, Guggenheim Investments (2012-present). Former: Vice President, Associate General Counsel and Assistant Secretary, Security Benefit Life Insurance Company and Security Benefit Corporation (2004-2012). |
Derek Maltbie (1972) | Assistant Treasurer | Since 2014 | Current: Vice President, Guggenheim Investments (2012-present); Assistant Treasurer, certain other funds in the Fund Complex (2011-present). Former: Assistant Vice President, Guggenheim Funds Investment Advisors, LLC (2005-2011); Supervisor, Mutual Fund Administration, Van Kampen Investments, Inc. (1995-2005). |
Mark E. Mathiasen (1978) | Secretary | Since 2013 | Current: Secretary, certain other funds in the Fund Complex (2007-present); Managing Director and Associate General Counsel, Guggenheim Funds Services, LLC, and affiliates (2007-present). |
Michael P. Megaris (1984) | Assistant Secretary | Since 2014 | Current: Assistant Secretary, certain other funds in the Fund Complex (April 2014-present); Associate, Guggenheim Investments (2012-present). Former: J.D., University of Kansas School of Law (2009-2012). |
| | GUGGENHEIM MID CAP VALUE FUND SEMI-ANNUAL REPORT | 25 |
INFORMATION ON BOARD OF TRUSTEES AND OFFICERS (Unaudited) (concluded)
| OFFICERS (concluded) | | | |
Name, Address* and Year of Birth | Position(s) Held with the Trust | Term of Office and Length of Time Served** | Principal Occupations During Past Five Years |
Elisabeth Miller (1968) | Chief Compliance Officer | Since 2012 | Current: CCO, certain other funds in the Fund Complex (2012-present); CCO, Security Investors, LLC (2012-present); CCO, Guggenheim Funds Investment Advisors, LLC (2012-present); Vice President, Guggenheim Funds Distributors, LLC (March 2014-present). Former: CCO, Guggenheim Distributors, LLC (2009-March 2014); Senior Manager, Security Investors, LLC (2004-2009); Senior Manager, Guggenheim Distributors, LLC (2004-2009). |
Alison Santay (1974) | AML Officer | Since 2013 | Current: AML Officer, certain other funds in the Fund Complex (2010-present); Director and AML Officer, Rydex Fund Services, LLC (2010-present); AML Officer, Security Investors, LLC (2010-present); Director, Shareholder Risk and Compliance, Rydex Fund Services, LLC (2004-present). Former: AML Officer, Guggenheim Distributors, LLC (2013-March 2014). |
Kimberly Scott (1974) | Assistant Treasurer | Since 2014 | Current: Vice President, Guggenheim Investments (2012-present); Assistant Treasurer, certain other funds in the Fund Complex (2012-present). Former: Financial Reporting Manager, Invesco, Ltd. (2010-2011); Vice President/Assistant Treasurer, Mutual Fund Administration for Van Kampen Investments, Inc./Morgan Stanley Investment Management (2009-2010); Manager of Mutual Fund Administration, Van Kampen Investments, Inc./Morgan Stanley Investment Management (2005-2009). |
Bryan Stone (1979) | Vice President | Since 2014 | Current: Vice President, certain other funds in the Fund Complex (April 2014-present); Director, Guggenheim Investments (2013-present). Former: Senior Vice President, Neuberger Berman Group LLC (2009-2013); Vice President, Morgan Stanley (2002-2009). |
John L. Sullivan (1955) | Chief Financial Officer and Treasurer | Since 2014 | Current: CFO, Chief Accounting Officer and Treasurer, certain other funds in the Fund Complex (2010-present); Senior Managing Director, Guggenheim Investments (2010-present). Former: Managing Director and CCO, each of the funds in the Van Kampen Investments fund complex (2004-2010); Managing Director and Head of Fund Accounting and Administration, Morgan Stanley Investment Management (2002-2004); CFO and Treasurer, Van Kampen Funds (1996-2004). |
| * | The business address of each officer is c/o Guggenheim Investments, 805 King Farm Boulevard, Suite 600, Rockville, Maryland 20850. |
| ** | Each officer serves an indefinite term, until his or her successor is duly elected and qualified. Time served includes time served in the respective position for the Predecessor Corporation. |
| 26 | GUGGENHEIM MID CAP VALUE FUND SEMI-ANNUAL REPORT | |
GUGGENHEIM INVESTMENTS PRIVACY POLICIES
Rydex Funds, Guggenheim Funds, Rydex Investments, Guggenheim Funds Distributors, LLC, Security Investors, LLC, Security Distributors, Inc., Guggenheim Partners Investment Managers, LLC, and Rydex Advisory Services (Collectively “Guggenheim Investments”).
Our Commitment to You
When you become a Guggenheim Investments investor, you entrust us with not only your hard-earned money but also with personal and financial information about you. We recognize that your relationship with us is based on trust and that you expect us to act responsibly and in your best interests. Because we have access to this private information about you, we hold ourselves to the highest standards in its safekeeping and use. This means, most importantly, that we do not sell client information to anyone—whether it is your personal information or if you are a current or former Guggenheim Investments client.
The Information We Collect About You
In the course of doing business with shareholders and investors, we collect nonpublic personal information about you. You typically provide personal information when you complete a Guggenheim Investments account application or when you request a transaction that involves Rydex and Guggenheim Investments funds or one of the Guggenheim Investments affiliated companies. “Nonpublic personal information” is personally identifiable private information about you. For example, it includes information regarding your name and address, Social Security or taxpayer identification number, assets, income, account balance, bank account information and investment activity (e.g., purchase and redemption history).
How We Handle Your Personal Information
As emphasized above, we do not sell information about current or former clients or their accounts to third parties. Nor do we share such information, except when necessary to complete transactions at your request or to make you aware of related investment products and services that we offer. Additional details about how we handle your personal information are provided below. To complete certain transactions or account changes that you direct, it may be necessary to provide identifying information to companies, individuals or groups that are not affiliated with Guggenheim Investments. For example, if you ask to transfer assets from another financial institution to Guggenheim Investments, we will need to provide certain information about you to that company to complete the transaction. To alert you to other Guggenheim Investments investment products and services, we may share your information within the Guggenheim Investments family of affiliated companies. This would include, for example, sharing your information within Guggenheim Investments so we can make you aware of new Rydex and Guggenheim Investments funds or the services offered through another Guggenheim Investments affiliated company. In certain instances, we may contract with nonaffiliated companies to perform services for us. Where necessary, we will disclose information we have about you to these third parties. In all such cases, we provide the third party with only the information necessary to carry out its assigned responsibilities and only for that purpose. And we require these third parties to treat your private information with the same high degree of confidentiality that we do. In certain instances, we may share information with other financial institutions regarding individuals and entities in response to the U.S.A. Patriot Act. Finally, we will release information about you if you direct us to do so, if we are compelled by law to do so or in other circumstances permitted by law.
Opt Out Provisions
We do not sell your personal information to anyone. The law allows you to “opt out” of only certain kinds of information sharing with third parties. The firm does not share personal information about you with any third parties that triggers this opt-out right. This means YOU ARE ALREADY OPTED OUT.
How We Protect Privacy Online
Our concern for the privacy of our shareholders also extends to those who use our web site, guggenheiminvestments.com. Our web site uses some of the most secure forms of online communication available, including encryption technology, Secure Socket Layer (SSL) protocol, firewalls and user names and passwords. These technologies provide a high level of security and privacy when you access your account information or initiate online transactions. The Guggenheim Investments web site offers customized features that require our use of “http cookies”—tiny pieces of information that we ask your browser to store. However, we make very limited use of these cookies. We only use cookies for session management and security features on the Guggenheim Investments web site. We do not use them to pull data from your hard drive, to learn your email address, or to view data in cookies created by other web sites. We will not share the information in our cookies or give others access to it. See the legal information area on our web site for more details about web site security and privacy features.
| | GUGGENHEIM MID CAP VALUE FUND SEMI-ANNUAL REPORT | 27 |
GUGGENHEIM INVESTMENTS PRIVACY POLICIES (concluded)
How We Safeguard Your Personal Information
We restrict access to nonpublic personal information about shareholders to our employees and in some cases to third parties (for example, the service providers described above) as permitted by law. We maintain strict physical, electronic and procedural safeguards that comply with federal standards to guard your nonpublic personal information.
We’ll Keep You Informed
As required by federal law, we will notify shareholders of our privacy policy annually. We reserve the right to modify this policy at any time, but rest assured that if we do change it, we will tell you promptly. You will also be able to access our privacy policy from our web site at guggenheiminvestments.com. Should you have any questions regarding our privacy policy, contact us at 800.820.0888 or 301.296.5100.
| 28 | GUGGENHEIM MID CAP VALUE FUND SEMI-ANNUAL REPORT | |
This page intentionally left blank.
03.31.2014
Guggenheim Funds Semi-Annual Report
| Fundamental Alpha |
| Guggenheim Mid Cap Value Institutional Fund |
| guggenheiminvestments.com |
| DEAR SHAREHOLDER | 2 |
| ECONOMIC AND MARKET OVERVIEW | 3 |
| ABOUT SHAREHOLDERS’ FUND EXPENSES | 4 |
| MID CAP VALUE INSTITUTIONAL FUND | 6 |
| NOTES TO FINANCIAL STATEMENTS | 12 |
| OTHER INFORMATION | 19 |
| INFORMATION ON BOARD OF TRUSTEES AND OFFICERS | 22 |
| GUGGENHEIM INVESTMENTS PRIVACY POLICIES | 26 |
| | GUGGENHEIM MID CAP VALUE INSTITUTIONAL FUND SEMI-ANNUAL REPORT | 1 |
Dear Shareholder:
Security Investors, LLC (the “Investment Adviser”) is pleased to present the semi-annual shareholder report for one Fund in our Guggenheim Funds Trust (the “Fund”) for the six-month period ended March 31, 2014.
The Investment Adviser is part of Guggenheim Investments, which represents the investment management businesses of Guggenheim Partners, LLC (“Guggenheim”), a global, diversified financial services firm.
Guggenheim Funds Distributors, LLC is the distributor of the Funds. Guggenheim Funds Distributors, LLC is affiliated with Guggenheim and the Investment Adviser.
We encourage you to read the Economic and Market Overview section of the report, which follows this letter, and then the Fund Profile for each Fund.
We are committed to providing innovative investment solutions and appreciate the trust you place in us.
Sincerely,
Donald C. Cacciapaglia
President
April 30, 2014
Read a prospectus and summary prospectus (if available) carefully before investing. It contains the investment objectives, risks, charges, expenses and other information, which should be considered carefully before investing. Obtain a prospectus and summary prospectus (if available) at guggenheiminvestments.com or call 800.820.0888.
There can be no assurance that any investment product will achieve its investment objective(s). There are risks associated with investing, including the entire loss of principal invested. Investing involves market risks. The investment return and principal value of any investment product will fluctuate with changes in market conditions.
| 2 | GUGGENHEIM MID CAP VALUE INSTITUTIONAL FUND SEMI-ANNUAL REPORT | |
ECONOMIC AND MARKET OVERVIEW | |
Investment markets continued to rally through the six months ended March 31, 2014, thanks to a steadily improving U.S. economy and ongoing U.S. central bank easing. Contributing to performance of equities were growing confidence in the sustainability of the U.S. economic recovery, favorable corporate profit growth, supportive valuations, interest rates below their long-run level, and positive inflows, as investors concerned about the end of quantitative easing and its impact on interest rates rotated out of fixed-income investments into equities.
In January 2014, based on positive economic data and a better jobs picture, the U.S. Federal Reserve (the “Fed”) began its long-expected tapering program, reducing monthly purchases by $10 billion. The Fed continued to taper even after acknowledging in March that the economy had slowed during the winter months, which were unusually harsh for much of the U.S. By April, it was buying only $55 billion a month, down from $85 billion in December 2013.
In March 2014, while noting that the U.S. economy has not yet reached full employment, the Fed also unlinked attainment of a 6.5% unemployment level with a potential rate hike, since the unemployment rate in February was approaching that level. Revised guidance from new Fed Chair Janet Yellen seemed to indicate that a rise might not be considered until mid-2015, at the earliest, although she stressed that it would depend on labor market conditions and the inflation rate. Still, the date was earlier than many market participants had expected, which knocked the market off record highs reached earlier in the six-month period.
Even though upcoming economic reports may reflect the impacts from the severe winter weather, and international tensions remain high, the arrival of spring was expected to return the U.S. economy to its improving trend. Pent-up demand resulting from the huge gap in household formation over the prior several years continues to buoy the housing market, while a pickup in global demand bodes well for the U.S. manufacturing sector. Consumption is rising due to an increase in net worth, resulting from the rebound in housing and asset prices, which has boosted retail sales, and consumer sentiment measures. The consensus expectation for 2014 growth stands at 3.0%, compared with 1.9% for 2013.
Momentum driven by the favorable macro environment is supporting equities and moving spreads tighter, helping perpetuate the risk-on mode that has prevailed in the U.S. since 2008. Investors who want income will have to keep investing, but buying cheap securities may be a thing of the past. Recent volatility indicates that investors must guard against becoming complacent about the quality of investments they make and their inherent risks. The Fed continues pumping enormous amounts of liquidity into the system, but with little expectation that it will raise interest rates before 2015, the expansion is likely to continue. Even when the Fed does hike, it typically takes another two years before a recession threatens growth. While the economy may be entering a new era where interest rates head higher over the long term, there is likely a ceiling on how high rates can rise in advance of eventual monetary tightening.
For the six months ended March 31, 2014, the Standard & Poor’s 500® (“S&P 500”) Index* returned 12.51%. The Morgan Stanley Capital International (“MSCI”) Europe-Australasia-Far East (“EAFE”) Index* returned 6.41%. The return of the MSCI Emerging Markets Index* was 1.39%.
In the bond market, the Barclays U.S. Aggregate Bond Index* posted a 1.70% return for the period, while the Barclays U.S. Corporate High Yield Index* returned 6.67%. The return of the BofA Merrill Lynch 3-Month U.S. Treasury Bill Index* was 0.03% for the six-month period.
The opinions and forecasts expressed may not actually come to pass. This information is subject to change at any time, based on market and other conditions, and should not be construed as a recommendation of any specific security or strategy.
* Index Definitions:
The following indices are referenced throughout this report. Indices are unmanaged and not available for direct investment. Index performance does not reflect transaction costs, fees, or expenses.
Barclays U.S. Aggregate Bond Index is a broad-based benchmark that measures the investment grade, U.S. dollar denominated, fixed-rate taxable bond market, including U.S. Treasuries, government-related and corporate securities, MBS (agency fixed-rate and hybrid ARM pass-throughs), ABS, and CMBS.
Barclays U.S. Corporate High Yield Index measures the market of USD-denominated, non-investment grade, fixed-rate, taxable corporate bonds. Securities are classified as high yield if the middle rating of Moody’s, Fitch, and S&P is Ba1/BB+/BB+ or below.
BofA Merrill Lynch 3-Month U.S. Treasury Bill Index is an unmanaged market index of U.S. Treasury securities maturing in 90 days that assumes reinvestment of all income.
MSCI EAFE Index is a free float-adjusted market capitalization index that is designed to measure the equity market performance of developed markets, excluding the U.S. & Canada.
MSCI Emerging Markets Index is a free float-adjusted market capitalization weighted index that is designed to measure equity market performance in the global emerging markets.
S&P 500® Index is a capitalization-weighted index of 500 stocks designed to measure the performance of the broad economy, representing all major industries and is considered a representation of the U.S. stock market.
| | GUGGENHEIM MID CAP VALUE INSTITUTIONAL FUND SEMI-ANNUAL REPORT | 3 |
ABOUT SHAREHOLDERS’ FUND EXPENSES (Unaudited)
All mutual funds have operating expenses and it is important for our shareholders to understand the impact of costs on their investments. Shareholders of a Fund incur two types of costs: (i) transaction costs, including sales charges (loads) on purchase payments, reinvested dividends, or other distributions; and exchange fees; and (ii) ongoing costs, including management fees, administrative services, and shareholder reports, among others. These ongoing costs, or operating expenses, are deducted from a fund’s gross income and reduce the investment return of the fund.
A fund’s expenses are expressed as a percentage of its average net assets, which is known as the expense ratio. The following examples are intended to help investors understand the ongoing costs (in dollars) of investing in a Fund and to compare these costs with the ongoing costs of investing in other mutual funds.
The examples are based on an investment of $1,000 made at the beginning of the period and held for the entire six-month period beginning September 30, 2013 and ending March 31, 2014.
The following tables illustrate a Fund’s costs in two ways:
| Table 1. | Based on actual Fund return. This section helps investors estimate the actual expenses paid over the period. The “Ending Account Value” shown is derived from the Fund’s actual return, and the fourth column shows the dollar amount that would have been paid by an investor who started with $1,000 in the Fund. Investors may use the information here, together with the amount invested, to estimate the expenses paid over the period. Simply divide the Fund’s account value by $1,000 (for example, an $8,600 account value divided by $1,000 = 8.6), then multiply the result by the number provided under the heading “Expenses Paid During Period.” |
| Table 2. | Based on hypothetical 5% return. This section is intended to help investors compare a Fund’s cost with those of other mutual funds. The table provides information about hypothetical account values and hypothetical expenses based on the Fund’s actual expense ratio and an assumed rate of return of 5% per year before expenses, which is not the Fund’s actual return. The hypothetical account values and expenses may not be used to estimate the actual ending account balance or expenses paid during the period. The example is useful in making comparisons because the U.S. Securities and Exchange Commission (the “SEC”) requires all mutual funds to calculate expenses based on the 5% return. Investors can assess a Fund’s costs by comparing this hypothetical example with the hypothetical examples that appear in shareholder reports of other funds. |
The calculations illustrated above assume no shares were bought or sold during the period. Actual costs may have been higher or lower, depending on the amount of investment and the timing of any purchases or redemptions.
Please note that the expenses shown in the table are meant to highlight your ongoing costs only and do not reflect any transactional costs, such as sales charges (loads) on purchase payments, and contingent deferred sales charges (“CDSC”) on redemptions, if any. Therefore, the second table is useful in comparing ongoing costs only, and will not help you determine the relative total costs of owning different funds. In addition, if these transactional costs were included, your costs would have been higher.
More information about a Fund’s expenses, including annual expense ratios for the past five years, can be found in the Financial Highlights section of this report. For additional information on operating expenses and other shareholder costs, please refer to the appropriate Fund prospectus.
| 4 | GUGGENHEIM MID CAP VALUE INSTITUTIONAL FUND SEMI-ANNUAL REPORT | |
ABOUT SHAREHOLDERS’ FUND EXPENSES (Unaudited) (concluded)
| | | Beginning Account Value September 30, 2013 | Ending Account Value March 31, 2014 | Expenses Paid During Period2 |
Table 1. Based on actual Fund return3 | | | |
| Mid Cap Value Institutional Fund | 1.05% | 10.35% | $1,000.00 | $1,103.50 | $5.51 |
|
Table 2. Based on hypothetical 5% return (before expenses) |
| Mid Cap Value Institutional Fund | 1.05% | 5.00% | $1,000.00 | $1,019.70 | $5.29 |
| 1 | Annualized and excludes expenses of the underlying funds in which the Fund invests. |
| 2 | Expenses are equal to the Fund’s annualized expense ratio multiplied by the average account value over the period, multiplied by 182/365 (to reflect the one-half year period). |
| 3 | Actual cumulative return at net asset value for the period September 30, 2013 to March 31, 2014. |
| | GUGGENHEIM MID CAP VALUE INSTITUTIONAL FUND SEMI-ANNUAL REPORT | 5 |
MID CAP VALUE INSTITUTIONAL FUND
OBJECTIVE: Seeks long-term growth of capital.
| | Holdings Diversification (Market Exposure as % of Net Assets) | |
| | | |
| | “Holdings Diversification (Market Exposure as % of Net Assets)” excludes any temporary cash investments. | |
|
| July 11, 2008 | |
| |
Ten Largest Holdings (% of Total Net Assets) |
| Hanover Insurance Group, Inc. | 4.4% |
| Computer Sciences Corp. | 3.4% |
| Owens-Illinois, Inc. | 2.7% |
| Covanta Holding Corp. | 2.7% |
| Reinsurance Group of America, Inc. — Class A | 2.5% |
| Cameco Corp. | 2.4% |
| American Financial Group, Inc. | 2.2% |
| Bunge Ltd. | 2.2% |
| Orbital Sciences Corp. | 1.9% |
| |
| |
| 6 | GUGGENHEIM MID CAP VALUE INSTITUTIONAL FUND SEMI-ANNUAL REPORT | |
SCHEDULE OF INVESTMENTS (Unaudited) | |
| MID CAP VALUE INSTITUTIONAL FUND | |
| | | | | | |
| | | | | | | |
COMMON STOCKS† - 95.0% | | | | | | |
| | | | | | | |
| FINANCIALS - 25.5% | | | | | | |
| Hanover Insurance Group, Inc. | | | 463,753 | | | $ | 28,492,984 | |
| Reinsurance Group of America, Inc. — Class A | | | 201,193 | | | | 16,020,999 | |
| American Financial Group, Inc. | | | 245,510 | | | | 14,168,382 | |
| Northern Trust Corp. | | | 162,820 | | | | 10,674,479 | |
| WR Berkley Corp. | | | 214,380 | | | | 8,922,496 | |
| Endurance Specialty Holdings Ltd. | | | 156,170 | | | | 8,406,631 | |
| Huntington Bancshares, Inc. | | | 704,090 | | | | 7,019,778 | |
| Alexandria Real Estate Equities, Inc. | | | 91,900 | | | | 6,668,264 | |
| BioMed Realty Trust, Inc. | | | 308,370 | | | | 6,318,501 | |
| Lexington Realty Trust | | | 493,740 | | | | 5,386,703 | |
| SVB Financial Group* | | | 41,590 | | | | 5,355,961 | |
| Popular, Inc.* | | | 161,360 | | | | 5,000,546 | |
| Wintrust Financial Corp. | | | 102,750 | | | | 4,999,815 | |
| First Niagara Financial Group, Inc. | | | 510,000 | | | | 4,819,500 | |
| Home Loan Servicing Solutions Ltd. | | | 189,120 | | | | 4,084,992 | |
| Ocwen Financial Corp.* | | | 103,478 | | | | 4,054,268 | |
| Zions Bancorporation | | | 126,980 | | | | 3,933,840 | |
| City National Corp. | | | 49,030 | | | | 3,859,642 | |
| First Midwest Bancorp, Inc. | | | 202,729 | | | | 3,462,611 | |
| FirstMerit Corp. | | | 164,235 | | | | 3,421,015 | |
| Employers Holdings, Inc. | | | 165,394 | | | | 3,345,921 | |
| Investors Real Estate Trust | | | 238,110 | | | | 2,138,228 | |
| Redwood Trust, Inc. | | | 103,436 | | | | 2,097,682 | |
| Campus Crest Communities, Inc. | | | 115,900 | | | | 1,006,012 | |
| Hancock Holding Co. | | | 1,639 | | | | 60,069 | |
| Total Financials | | | | | | | 163,719,319 | |
| | | | | | | | | |
| INDUSTRIALS - 15.1% | | | | | | | | |
| Covanta Holding Corp. | | | 953,650 | | | | 17,213,383 | |
| Orbital Sciences Corp.* | | | 446,898 | | | | 12,468,454 | |
| Navigant Consulting, Inc.* | | | 611,180 | | | | 11,404,618 | |
| Aegion Corp. — Class A* | | | 410,115 | | | | 10,380,010 | |
| Quanta Services, Inc.* | | | 268,780 | | | | 9,917,982 | |
| URS Corp. | | | 171,827 | | | | 8,086,179 | |
| ICF International, Inc.* | | | 171,165 | | | | 6,814,079 | |
| General Cable Corp. | | | 252,161 | | | | 6,457,843 | |
| DigitalGlobe, Inc.* | | | 216,058 | | | | 6,267,843 | |
| Towers Watson & Co. — Class A | | | 27,931 | | | | 3,185,531 | |
| United Stationers, Inc. | | | 68,416 | | | | 2,809,845 | |
| AZZ, Inc. | | | 38,080 | | | | 1,701,414 | |
| Saia, Inc.* | | | 14,156 | | | | 540,901 | |
| Total Industrials | | | | | | | 97,248,082 | |
| | | | | | | | | |
| INFORMATION TECHNOLOGY - 11.1% | | | | | | | | |
| Computer Sciences Corp. | | | 361,940 | | | | 22,013,190 | |
| IXYS Corp.* | | | 938,399 | | | | 10,650,830 | |
| Maxwell Technologies, Inc.* | | | 769,411 | | | | 9,940,790 | |
| Global Payments, Inc. | | | 111,700 | | | | 7,942,987 | |
| | | | | | |
| | | | | | | |
| FLIR Systems, Inc. | | | 158,756 | | | $ | 5,715,216 | |
| RF Micro Devices, Inc.* | | | 650,980 | | | | 5,129,722 | |
| Semtech Corp.* | | | 194,660 | | | | 4,932,684 | |
| Liquidity Services, Inc.* | | | 131,530 | | | | 3,426,357 | |
| Integrated Device Technology, Inc.* | | | 111,688 | | | | 1,365,944 | |
| Total Information Technology | | | | | | | 71,117,720 | |
| | | | | | | | | |
| ENERGY - 10.4% | | | | | | | | |
| Cameco Corp. | | | 681,530 | | | | 15,607,037 | |
| Whiting Petroleum Corp.* | | | 172,101 | | | | 11,942,089 | |
| Superior Energy Services, Inc. | | | 337,940 | | | | 10,395,034 | |
| Oasis Petroleum, Inc.* | | | 152,640 | | | | 6,369,667 | |
| Patterson-UTI Energy, Inc. | | | 179,370 | | | | 5,682,442 | |
| Resolute Energy Corp.* | | | 694,660 | | | | 5,001,552 | |
| C&J Energy Services, Inc.* | | | 159,450 | | | | 4,649,562 | |
| Sanchez Energy Corp.* | | | 147,367 | | | | 4,366,484 | |
| Energy XXI Bermuda Ltd. | | | 120,020 | | | | 2,828,871 | |
| Total Energy | | | | | | | 66,842,738 | |
| | | | | | | | | |
| CONSUMER DISCRETIONARY - 8.9% | | | | | | | | |
| Brown Shoe Company, Inc. | | | 357,568 | | | | 9,489,854 | |
| DR Horton, Inc. | | | 421,650 | | | | 9,128,723 | |
| DeVry Education Group, Inc. | | | 196,873 | | | | 8,345,446 | |
| Cabela's, Inc.* | | | 94,040 | | | | 6,160,560 | |
| Scholastic Corp. | | | 160,870 | | | | 5,546,798 | |
| Jones Group, Inc. | | | 353,062 | | | | 5,285,338 | |
| Chico's FAS, Inc. | | | 282,420 | | | | 4,527,193 | |
| Gentex Corp. | | | 139,130 | | | | 4,386,769 | |
| Guess?, Inc. | | | 150,891 | | | | 4,164,592 | |
HydroGen Corp.*,1 | | | 1,265,700 | | | | 1 | |
| Total Consumer Discretionary | | | | | | | 57,035,274 | |
| | | | | | | | | |
| MATERIALS - 8.7% | | | | | | | | |
| Owens-Illinois, Inc.* | | | 509,260 | | | | 17,228,265 | |
| Sonoco Products Co. | | | 271,176 | | | | 11,123,640 | |
| Royal Gold, Inc. | | | 112,238 | | | | 7,028,344 | |
| Landec Corp.* | | | 432,610 | | | | 4,827,928 | |
| Coeur Mining, Inc.* | | | 500,231 | | | | 4,647,146 | |
| Olin Corp. | | | 158,954 | | | | 4,388,720 | |
| Allied Nevada Gold Corp.* | | | 728,630 | | | | 3,140,395 | |
| Berry Plastics Group, Inc.* | | | 131,660 | | | | 3,047,929 | |
| Total Materials | | | | | | | 55,432,367 | |
| | | | | | | | | |
| UTILITIES - 6.0% | | | | | | | | |
| Black Hills Corp. | | | 170,769 | | | | 9,844,833 | |
| Great Plains Energy, Inc. | | | 291,565 | | | | 7,883,918 | |
| UGI Corp. | | | 161,889 | | | | 7,383,757 | |
| Pepco Holdings, Inc. | | | 271,690 | | | | 5,564,211 | |
| MDU Resources Group, Inc. | | | 124,307 | | | | 4,264,973 | |
| Westar Energy, Inc. | | | 95,020 | | | | 3,340,903 | |
| Total Utilities | | | | | | | 38,282,595 | |
| SEE NOTES TO FINANCIAL STATEMENTS. | GUGGENHEIM MID CAP VALUE INSTITUTIONAL FUND SEMI-ANNUAL REPORT | 7 |
SCHEDULE OF INVESTMENTS (Unaudited) (concluded) | |
| MID CAP VALUE INSTITUTIONAL FUND | |
| | | | | | |
| | | | | | | |
| HEALTH CARE - 4.8% | | | | | | |
| Kindred Healthcare, Inc. | | | 343,812 | | | $ | 8,052,077 | |
| MEDNAX, Inc.* | | | 121,666 | | | | 7,540,859 | |
| Hologic, Inc.* | | | 259,402 | | | | 5,577,143 | |
| Alere, Inc.* | | | 127,939 | | | | 4,394,705 | |
| Edwards Lifesciences Corp.* | | | 46,690 | | | | 3,462,997 | |
| Universal Health Services, Inc. — Class B | | | 18,290 | | | | 1,501,060 | |
| Total Health Care | | | | | | | 30,528,841 | |
| | | | | | | | | |
| CONSUMER STAPLES - 4.5% | | | | | | | | |
| Bunge Ltd. | | | 175,950 | | | | 13,989,785 | |
| Hormel Foods Corp. | | | 208,720 | | | | 10,283,634 | |
| Ingredion, Inc. | | | 66,610 | | | | 4,534,809 | |
| Total Consumer Staples | | | | | | | 28,808,228 | |
| Total Common Stocks | | | | | | | | |
| (Cost $462,319,641) | | | | | | | 609,015,164 | |
| | | | | | | | | |
PREFERRED STOCKS††† - 0.0% | | | | | | | | |
Thermoenergy Corp.*,2,3 | | | 793,750 | | | | 55,626 | |
| Total Preferred Stocks | | | | | | | | |
| (Cost $757,980) | | | | | | | 55,626 | |
| | | | | | |
| | | | | | | |
SHORT TERM INVESTMENTS† - 4.3% | | | | | | |
| Dreyfus Treasury Prime Cash Management Fund | | | 27,574,225 | | | $ | 27,574,225 | |
| Total Short Term Investments | | | | | | | | |
| (Cost $27,574,225) | | | | | | | 27,574,225 | |
| | | | | | | | | |
| | | | | | | | |
| | | | | | | | | |
CONVERTIBLE BONDS†† - 0.7% | | | | | | | | |
| INDUSTRIALS - 0.7% | | | | | | | | |
| DryShips, Inc. | | | | | | | | |
| 5.00% due 12/01/14 | | $ | 4,225,000 | | | | 4,177,469 | |
| Total Convertible Bonds | | | | | | | | |
| (Cost $3,921,169) | | | | | | | 4,177,469 | |
| | | | | | | | | |
| Total Investments - 100.0% | | | | | | | | |
| (Cost $494,573,015) | | | | | | $ | 640,822,484 | |
| Other Assets & Liabilities, net - 0.0% | | | | | | | (200,689 | ) |
| Total Net Assets - 100.0% | | | | | | $ | 640,621,795 | |
| * | Non-income producing security. |
| † | Value determined based on Level 1 inputs — See Note 4. |
| †† | Value determined based on Level 2 inputs — See Note 4. |
| ††† | Value determined based on Level 3 inputs — See Note 4. |
| 1 | Affiliated issuers — See Note 10. |
| 2 | PIPE (Private Investment in Public Equity) — Stock issued by a company in the secondary market as a means of raising capital more quickly and less expensively than through registration of a secondary public offering. |
| 8 | GUGGENHEIM MID CAP VALUE INSTITUTIONAL FUND SEMI-ANNUAL REPORT | SEE NOTES TO FINANCIAL STATEMENTS. |
| MID CAP VALUE INSTITUTIONAL FUND | |
STATEMENT OF ASSETS AND LIABILITIES (Unaudited)
| March 31, 2014 | | | |
| | | | |
| Assets: | | | |
| Investments, at value (cost $494,573,015) | | $ | 640,822,484 | |
| Prepaid expenses | | | 28,168 | |
| Cash | | | 4,414 | |
| Receivables: | | | | |
| Dividends | | | 958,378 | |
| Securities sold | | | 848,086 | |
| Fund shares sold | | | 816,987 | |
| Interest | | | 70,223 | |
| Foreign taxes reclaim | | | 5,835 | |
| Total assets | | | 643,554,575 | |
| | | | | |
| Liabilities: | | | | |
| Payable for: | | | | |
| Fund shares redeemed | | | 1,330,895 | |
| Securities purchased | | | 1,053,592 | |
| Management fees | | | 404,440 | |
| Fund accounting/administration fees | | | 51,228 | |
| Transfer agent/maintenance fees | | | 10,037 | |
| Trustees' fees* | | | 2,336 | |
| Miscellaneous | | | 80,252 | |
| Total liabilities | | | 2,932,780 | |
| Net assets | | $ | 640,621,795 | |
| | | | | |
| Net assets consist of: | | | | |
| Paid in capital | | $ | 465,323,844 | |
| Undistributed net investment income | | | 1,593,999 | |
| Accumulated net realized gain on investments | | | 27,454,483 | |
| Net unrealized appreciation on investments | | | 146,249,469 | |
| Net assets | | $ | 640,621,795 | |
| Capital shares outstanding | | | 47,433,631 | |
| Net asset value per share | | $ | 13.51 | |
STATEMENT OF OPERATIONS (Unaudited)
| Period Ended March 31, 2014 | | | |
| | | | |
| Investment Income: | | | |
| Dividends (net of foreign withholding tax of $20,105) | | $ | 4,472,558 | |
| Interest | | | 311,728 | |
| Total investment income | | | 4,784,286 | |
| | | | | |
| Expenses: | | | | |
| Management fees | | | 2,255,272 | |
| Transfer agent/maintenance fees | | | 272,228 | |
| Fund accounting/administration fees | | | 285,664 | |
| Trustees' fees* | | | 27,564 | |
| Custodian fees | | | 4,776 | |
| Tax expense | | | 661 | |
| Miscellaneous | | | 309,831 | |
| Total expenses | | | 3,155,996 | |
| Net investment income | | | 1,628,290 | |
| | | | | |
| Net Realized and Unrealized Gain (Loss): | | | | |
| Net realized gain (loss) on: | | | | |
| Investments | | | 35,654,390 | |
| Options written | | | 449,897 | |
| Net realized gain | | | 36,104,287 | |
| | | | | |
| Net change in unrealized appreciation (depreciation) on: | | | | |
| Investments in unaffiliated issuers | | | 21,787,478 | |
| Investments in affiliated issuers | | | (6,329 | ) |
| Options written | | | (37,743 | ) |
| Net change in unrealized appreciation (depreciation) | | | 21,743,406 | |
| Net realized and unrealized gain | | | 57,847,693 | |
| Net increase in net assets resulting from operations | | $ | 59,475,983 | |
| * | Relates to Trustees not deemed “interested persons” within the meaning of Section 2(a)(19) of the 1940 Act. |
| SEE NOTES TO FINANCIAL STATEMENTS. | GUGGENHEIM MID CAP VALUE INSTITUTIONAL FUND SEMI-ANNUAL REPORT | 9 |
| MID CAP VALUE INSTITUTIONAL FUND | |
STATEMENTS OF CHANGES IN NET ASSETS
| | Period Ended March 31, 2014 (Unaudited) | | | Year Ended September 30, 2013 | |
| Increase (Decrease) in Net Assets From Operations: | | | | | | |
| Net investment income | | $ | 1,628,290 | | | $ | 2,693,163 | |
| Net realized gain on investments | | | 36,104,287 | | | | 41,121,749 | |
Net change in unrealized appreciation (depreciation) on investments | | | 21,743,406 | | | | 88,465,578 | |
Net increase in net assets resulting from operations | | | 59,475,983 | | | | 132,280,490 | |
| | | | | | | | | |
| Distributions to shareholders from: | | | | | | | | |
| Net investment income | | | (3,106,999 | ) | | | (1,542,680 | ) |
| | | (35,348,105 | ) | | | (46,688,296 | ) |
Total distributions to shareholders | | | (38,455,104 | ) | | | (48,230,976 | ) |
| | | | | | | | | |
| Capital share transactions: | | | | | | | | |
| Proceeds from sale of shares | | | 82,261,613 | | | | 136,201,875 | |
| Distributions reinvested | | | 23,335,832 | | | | 27,245,300 | |
| | | (57,461,572 | ) | | | (166,772,360 | ) |
Net increase (decrease) from capital share transactions | | | 48,135,873 | | | | (3,325,185 | ) |
| Net increase in net assets | | | 69,156,752 | | | | 80,724,329 | |
| | | | | | | | | |
| Net assets: | | | | | | | | |
| | | 571,465,043 | | | | 490,740,714 | |
| | $ | 640,621,795 | | | $ | 571,465,043 | |
Undistributed net investment income at end of period | | $ | 1,593,999 | | | $ | 3,072,708 | |
| | | | | | | | | |
| Capital share activity: | | | | | | | | |
| Shares sold | | | 6,301,715 | | | | 11,673,620 | |
| Shares issued from reinvestment of distributions | | | 1,834,578 | | | | 2,629,855 | |
| | | (4,357,682 | ) | | | (14,131,954 | ) |
| | | 3,778,611 | | | | 171,521 | |
| 10 | GUGGENHEIM MID CAP VALUE INSTITUTIONAL FUND SEMI-ANNUAL REPORT | SEE NOTES TO FINANCIAL STATEMENTS. |
| MID CAP VALUE INSTITUTIONAL FUND | |
This table is presented to show selected data for a share outstanding throughout each period and to assist shareholders in evaluating a Fund’s performance for the periods presented.
| | Period Ended March 31, 2014a | | | Year Ended September 30, 2013 | | | Year Ended September 30, 2012 | | | Year Ended September 30, 2011 | | | Year Ended September 30, 2010 | | | Year Ended September 30, 2009 | |
| Per Share Data | | | | | | | | | | | | | | | | | | |
Net asset value, beginning
of period | | $ | 13.09 | | | $ | 11.29 | | | $ | 9.97 | | | $ | 11.34 | | | $ | 10.49 | | | $ | 10.68 | |
| Income (loss) from investment operations: | | | | | | | | | | | | | | | | | | | | | | | | |
Net investment income (loss)b | | | .04 | | | | .06 | | | | .03 | | | | .04 | | | | .08 | | | | .08 | |
| Net gain (loss) on investments (realized and unrealized) | | | 1.26 | | | | 2.90 | | | | 2.30 | | | | (.87 | ) | | | 1.13 | | | | .27 | |
Total from investment operations | | | 1.30 | | | | 2.96 | | | | 2.33 | | | | (.83 | ) | | | 1.21 | | | | .35 | |
| Less distributions from: | | | | | | | | | | | | | | | | | | | | | | | | |
| Net investment income | | | (.07 | ) | | | (.04 | ) | | | (.04 | ) | | | (.06 | ) | | | (.01 | ) | | | (.06 | ) |
| Net realized gains | | | (.81 | ) | | | (1.12 | ) | | | (.97 | ) | | | (.48 | ) | | | (.35 | ) | | | (.48 | ) |
| | | (.88 | ) | | | (1.16 | ) | | | (1.01 | ) | | | (.54 | ) | | | (.36 | ) | | | (.54 | ) |
| Net asset value, end of period | | $ | 13.51 | | | $ | 13.09 | | | $ | 11.29 | | | $ | 9.97 | | | $ | 11.34 | | | $ | 10.49 | |
| | | | | | | | | | | | | | | | | | | | | | | | |
| | | 10.35 | % | | | 28.89 | % | | | 24.96 | % | | | (8.05 | %) | | | 11.76 | % | | | 5.30 | % |
| Ratios/Supplemental Data | | | | | | | | | | | | | | | | | | | | | | | | |
Net assets, end of period
(in thousands) | | $ | 640,622 | | | $ | 571,465 | | | $ | 490,741 | | | $ | 472,266 | | | $ | 514,447 | | | $ | 317,455 | |
| Ratios to average net assets: | | | | | | | | | | | | | | | | | | | | | | | | |
| Net investment income | | | 0.54 | % | | | 0.51 | % | | | 0.30 | % | | | 0.34 | % | | | 0.78 | % | | | 0.82 | % |
| Total expenses | | | 1.05 | % | | | 1.01 | % | | | 1.01 | % | | | 0.98 | % | | | 0.95 | % | | | 0.98 | % |
| | | 1.05 | % | | | 1.01 | % | | | 0.98 | %d | | | 0.90 | %d | | | 0.90 | %d | | | 0.91 | %d |
| Portfolio turnover rate | | | 16 | % | | | 24 | % | | | 33 | % | | | 38 | % | | | 20 | % | | | 76 | % |
| a | Unaudited figures for the period ended March 31, 2014. Percentage amounts for the period, except total return and portfolio turnover rate, have been annualized. |
| b | Net investment income per share was computed using average shares outstanding throughout the period. |
| c | Total return does not reflect the impact of any applicable sales charges and has not been annualized. |
| d | Net expense information reflects the expense ratios after expense waivers and reimbursements, as applicable. |
| SEE NOTES TO FINANCIAL STATEMENTS. | GUGGENHEIM MID CAP VALUE INSTITUTIONAL FUND SEMI-ANNUAL REPORT | 11 |
NOTES TO FINANCIAL STATEMENTS (Unaudited)
1. Organization and Significant Accounting Policies
Organization
Guggenheim Funds Trust (the “Trust”), a Delaware statutory trust, is registered with the SEC under the Investment Company Act of 1940 (“1940 Act”), as a non-diversified, open-ended investment company of the series type. Each series, in effect, is representing a separate Fund (collectively the “Funds”). The Trust is authorized to issue an unlimited number of shares. The Trust accounts for the assets of each Fund separately.
The Trust offers a combination of four separate classes of shares, A-Class shares, B-Class shares, C-Class shares and Institutional Class shares. Sales of shares of each Class are made without a front-end sales charge at the net asset value per share (“NAV”), with the exception of A-Class shares. A-Class shares are sold at the NAV, plus the applicable front-end sales charge. The sales charge varies depending on the amount purchased, but will not exceed 4.75%. Prior to February 22, 2011, the maximum sales charge was 5.75%. A-Class share purchases of $1 million or more are exempt from the front-end sales charge but have a 1% contingent deferred sales charge (“CDSC”), if shares are redeemed within 12 months of purchase. B-Class shares were offered without a front-end sales charge, but were subject to a CDSC of up to 5% for five years and convert to A-Class shares after eight years. Effective January 4, 2010, subscriptions for B-Class shares are no longer accepted. C-Class shares have a 1% CDSC if shares are redeemed within 12 months of purchase. Institutional Class shares are offered primarily for direct investment by institutions such as pension and profit sharing plans, endowments, foundations and corporations. Institutional Class shares have a minimum initial investment of $2 million and a minimum account balance of $1 million. Institutional Class shares are offered without a front-end sales charge or a CDSC.
At March 31, 2014, the Trust consisted of sixteen separate funds. This report covers the Mid Cap Value Institutional Fund (the “Fund”) while the other funds are contained in separate reports.
Guggenheim Investments (“GI”) provides advisory services to the Fund. Rydex Fund Services, LLC (“RFS”) acts as the transfer agent and provides administrative and accounting services to the Fund. Guggenheim Funds Distributors, LLC (“GFD”) acts as principal underwriter to the Fund. GI, RFS and GFD are affiliated entities.
Significant Accounting Policies
The following significant accounting policies are in conformity with U.S. generally accepted accounting principles (“U.S. GAAP”) and are consistently followed by the Fund. This requires management to make estimates and assumptions that affect the reported amount of assets and liabilities and disclosure of contingent assets and liabilities at the date of the financial statements and the reported amounts of revenues and expenses during the reporting period. Actual results could differ from these estimates. All time references are based on Eastern Time.
A. Valuations of the Fund’s securities are supplied primarily by pricing services approved by the Board of Trustees. A Valuation Committee (“Valuation Committee”) is responsible for the oversight of the valuation process of the Fund and convenes monthly, or more frequently as needed. The Valuation Committee will review the valuation of all assets which have been fair valued for reasonableness. The Trust’s officers, through the Valuation Committee under the general supervision of the Board of Trustees, regularly review procedures used by, and valuations provided by, the pricing services.
Equity securities listed on an exchange (New York Stock Exchange (“NYSE”) or American Stock Exchange) are valued at the last quoted sales price as of the close of business on the NYSE, usually 4:00 p.m. on the valuation date. Equity securities listed on the NASDAQ market system are valued at the NASDAQ Official Closing Price on the valuation date, which may not necessarily represent the last sale price. If there has been no sale on such exchange or NASDAQ on such day, the security is valued at the closing bid price on such day.
Open-end investment companies (“Mutual Funds”) are valued at their NAV as of the close of business on the valuation date.
Debt securities with a maturity of greater than 60 days at acquisition are valued at prices that reflect broker/dealer supplied valuations or are obtained from independent pricing services, which may consider the trade activity, treasury spreads, yields or price of bonds of comparable quality, coupon, maturity, and type, as well as prices quoted by dealers who make markets in such securities. Short-term debt securities with a maturity of 60 days or less at acquisition and repurchase agreements are valued at amortized cost, which approximates market value.
Listed options are valued at the Official Settlement Price listed by the exchange, usually as of 4:00 p.m. Long options are valued using the bid price and short options are valued using the ask price. In the event that a settlement price is not
| 12 | GUGGENHEIM MID CAP VALUE INSTITUTIONAL FUND SEMI-ANNUAL REPORT | |
NOTES TO FINANCIAL STATEMENTS (Unaudited) (continued)
available, fair valuation is enacted. Over-the-counter options are valued using the average bid price (for long options), or average ask price (for short options) obtained from one or more security dealers.
Premiums received from options written are entered in the Fund’s accounting records as an asset and equivalent liability. The amount of the liability is subsequently marked-to-market to reflect the current value of the option written. When an option written expires, or if a fund enters into a closing purchase transaction, it realizes a gain (or loss if the cost of a closing purchase transaction exceeds the premium received when the option was sold).
Investments for which market quotations are not readily available are fair valued as determined in good faith by GI under the direction of the Board of Trustees using methods established or ratified by the Board of Trustees. These methods include, but are not limited to: (i) obtaining general information as to how these securities and assets trade; (ii) in connection with options thereupon, obtaining information as to how (a) these contracts and other derivative investments trade in other derivative markets, respectively, and (b) the securities underlying these contracts and other derivative investments trade in the cash market; and (iii) obtaining other information and considerations, including current values in related markets.
B. Senior loans in which the Fund invests generally pay interest rates which are periodically adjusted by reference to a base short-term, floating rate plus a premium. These base lending rates are generally (I) the lending rate offered by one or more major European banks, such as the London Inter-Bank Offered Rate (LIBOR), (ii) the prime rate offered by one or more major United States banks, or (iii) the bank’s certificate of deposit rate. Senior floating rate interests often require prepayments from excess cash flows or permit the borrower to repay at its election. The rate at which the borrower repays cannot be predicted with accuracy. As a result, the actual remaining maturity may be substantially less than the stated maturities shown. The interest rate indicated is the rate in effect at March 31, 2014.
C. Security transactions are recorded on the trade date for financial reporting purposes. Realized gains and losses from securities transactions are recorded using the identified cost basis. Proceeds from lawsuits related to investment holdings are recorded as realized gains in the respective Fund. Dividend income is recorded on the ex-dividend date, net of applicable taxes withheld by foreign countries. Taxable non-cash dividends are recorded as dividend income. Interest income, including amortization of premiums and accretion of discounts, is accrued on a daily basis. Interest income also includes paydown gains and losses on mortgage-backed and asset-backed securities and senior and subordinated loans. Amendment fees are earned as compensation for evaluating and accepting changes to the original loan agreement and are recognized when received.
D. The Fund may purchase and sell interests in securities on a when-issued and delayed delivery basis, with payment and delivery scheduled for a future date. No income accrues to the Fund on such interests or securities in connection with such transactions prior to the date the Fund actually takes delivery of such interests or securities. These transactions are subject to market fluctuations and are subject to the risk that the value at delivery may be more or less than the trade date purchase price. Although the Fund will generally purchase these securities with the intention of acquiring such securities, they may sell such securities before the settlement date.
E. The accounting records of the Fund are maintained in U.S. dollars. All assets and liabilities initially expressed in foreign currencies are converted into U.S. dollars at prevailing exchange rates. Purchases and sales of investment securities, dividend and interest income, and certain expenses are translated at the rates of exchange prevailing on the respective dates of such transactions. Changes in the relationship of these foreign currencies to the U.S. dollar can significantly affect the value of the investments and earnings of the Fund. Foreign investments may also subject the Fund to foreign government exchange restrictions, expropriation, taxation or other political, social or economic developments, all of which could affect the market and/or credit risk of the investments.
The Fund does not isolate that portion of the results of operations resulting from changes in the foreign exchange rates on investments from the fluctuations arising from changes in the market prices of securities held. Such fluctuations are included with the net realized and unrealized gain or loss on investments.
Reported net realized foreign exchange gains and losses arise from sales of foreign currencies and currency gains or losses realized between the trade and settlement dates on investment transactions. Net unrealized exchange gains and losses arise from changes in the fair values of assets and liabilities other than investments in securities at the fiscal period end, resulting from changes in exchange rates.
| | GUGGENHEIM MID CAP VALUE INSTITUTIONAL FUND SEMI-ANNUAL REPORT | 13 |
NOTES TO FINANCIAL STATEMENTS (Unaudited) (continued)
F. Distributions of net investment income in the Fund and distributions of net realized gains, if any, are declared at least annually and recorded on the ex-dividend date and are determined in accordance with income tax regulations which may differ from U.S. GAAP.
G. When a fund engages in a short sale of a security, an amount equal to the proceeds is reflected as an asset and an equivalent liability. The amount of the liability is subsequently marked-to-market to reflect the market value of the short sale. The Fund maintains a segregated account of cash and/or securities as collateral for short sales.
Fees, if any, paid to brokers to borrow securities in connection with short sales are recorded as interest expense. In addition, the Fund must pay out the dividend rate of the equity or coupon rate of the treasury obligation to the lender and record this as an expense. Short dividend or interest expense is a cost associated with the investment objective of short sales transactions, rather than an operational cost associated with the day-to-day management of any mutual fund. The Fund may also receive rebate income from the broker resulting from the investment of the proceeds from securities sold short.
H. Interest and dividend income, most expenses, all realized gains and losses, and all unrealized gains and losses are allocated to the classes based upon the value of the outstanding shares in each class.
I. Under the fee arrangement with the custodian, the Fund may earn credits based on overnight custody cash balances. These credits are utilized to reduce related custodial expenses. The custodian fees disclosed in the Statement of Operations are before the reduction in expense from the related earnings credits, if any. For the period ended March 31, 2014, there were no earnings credits received.
J. The Fund may leave cash overnight in their cash account with the custodian, Bank of New York Mellon Corp. Periodically, a Fund may have cash due to the custodian bank as an overdraft balance. A fee is incurred on this overdraft, calculated by multiplying the overdraft by a rate based on the federal funds rate. Segregated cash with the broker is held as collateral for investments in derivative instruments such as futures contracts or swap agreements.
K. Under the Fund’s organizational documents, its Officers and Trustees are indemnified against certain liabilities arising out of the performance of their duties to the Trust. In addition, throughout the normal course of business, the Fund enters into contracts that contain a
variety of representations and warranties which provide general indemnifications. The Fund’s maximum exposure under these arrangements is unknown, as this would involve future claims that may be made against the Fund and/or its affiliates that have not yet occurred. However, based on experience, the Fund expects the risk of loss to be remote.
2. Financial Instruments
The Fund may write call options on a covered basis and put options on securities that are traded on recognized securities exchanges and over-the-counter markets. Call and put options on securities give the writer the obligation to sell or purchase a security at a specified price, until a certain date. Options were used minimally to hedge the Fund’s portfolio, to increase returns, to maintain exposure to the equity markets, and create liquidity. The risk in writing a covered call option is that a fund may forego the opportunity for profit if the market price of the underlying security increases and the option is exercised. The risk in writing a covered put option is that a fund may incur a loss if the market price of the underlying security decreases and the option is exercised. In addition, there is the risk that a fund may not be able to enter into a closing transaction because of an illiquid secondary market or, for over-the-counter options, because of the counterparty’s inability to perform.
The Trust has established counterparty credit guidelines and enters into transactions only with financial institutions of investment grade or better. The Trust monitors the counterparty credit risk.
The Fund utilized derivatives to achieve leveraged exposure. The use of derivative instruments by a Fund to achieve leveraged exposure to the underlying index creates leveraging risk. The more a Fund invests in leveraged instruments, the more this leverage will magnify any losses on those investments. A Fund’s investment in these instruments generally requires a small investment relative to the amount of investment exposure assumed. As a result, such investments may give rise to losses that exceed the amount invested in those instruments. Since a Fund’s investment strategy involves consistently applied leverage, the value of the Fund’s shares will tend to increase or decrease more than the value of any increase or decrease in the underlying index.
| 14 | GUGGENHEIM MID CAP VALUE INSTITUTIONAL FUND SEMI-ANNUAL REPORT | |
NOTES TO FINANCIAL STATEMENTS (Unaudited) (continued)
3. Fees and Other Transactions with Affiliates
Management fees are paid monthly to GI, based on the following annual rate:
| Management Fees (as a % of net assets) |
| Mid Cap Value Institutional Fund | 0.75% |
RFS acts as the administrative agent for the Fund, and as such performs administrative functions and the bookkeeping, accounting and pricing functions. For these services, RFS receives the following:
| Fund Accounting/ Administrative Fees (as a % of net assets) |
| Mid Cap Value Institutional Fund | 0.095% |
| | |
| Minimum charge per Fund | $25,000 |
| Certain out-of-pocket charges | Varies |
RFS is paid the following for providing transfer agent services to the Fund.
| Annual charge per account | $5.00 – $8.00 |
| Transaction fee | $0.60 – $1.10 |
| Minimum annual charge per Fund | $25,000 |
| Certain out-of-pocket charges | Varies |
Certain officers and trustees of the Trust are also officers of GI, RFS and GFD.
4. Fair Value Measurement
In accordance with U.S. GAAP, fair value is defined as the price that the Funds would receive to sell an investment or pay to transfer
a liability in an orderly transaction with an independent buyer in the principal market, or in the absence of a principal market, the most advantageous market for the investment or liability. U.S. GAAP establishes a three-tier fair value hierarchy based on the types of inputs used to value assets and liabilities and requires corresponding disclosure. The hierarchy and the corresponding inputs are summarized below:
| Level 1 | — | quoted prices in active markets for identical assets or liabilities. |
| Level 2 | — | significant other observable inputs (for example quoted prices for securities that are similar based on characteristics such as interest rates, prepayment speeds, credit risk, etc.). |
| Level 3 | — | significant unobservable inputs based on the best information available under the circumstances, to the extent observable inputs are not available, which may include assumptions. |
The types of inputs available depend on a variety of factors, such as the type of security and the characteristics of the markets in which it trades, if any. Fair valuation determinations that rely on fewer or no observable inputs require greater judgment. Accordingly, fair value determinations for Level 3 securities require the greatest amount of judgment.
| | GUGGENHEIM MID CAP VALUE INSTITUTIONAL FUND SEMI-ANNUAL REPORT | 15 |
NOTES TO FINANCIAL STATEMENTS (Unaudited) (continued)
The following table summarizes the inputs used to value the Funds’ net assets at March 31, 2014:
| | Level 1 Investments In Securities | | | Level 2 Investments In Securities | | | Level 3 Investments In Securities | | | | |
| Assets | | | | | | | | | | | | |
| Mid Cap Value Institutional Fund | | $ | 636,589,389 | | | $ | 4,177,469 | | | $ | 55,626 | | | $ | 640,822,484 | |
Financial assets and liabilities categorized as Level 2 consist of fixed income investments. Independent pricing services are used to value a majority of the Fund’s investments. When values are not available from a pricing service, they may be computed by the Fund’s investment adviser or an affiliate. In any event, values may be determined using a variety of sources and techniques, including: market prices; broker quotes; and models which derive prices based on inputs such as prices of securities with comparable maturities and characteristics or based on inputs such as anticipated cash flows or collateral, spread over Treasuries, and other information and analysis.
Transfers between investment levels may occur as the markets fluctuate and/or the availability of data used in the investment’s valuation changes. The Fund recognizes transfers between the levels as of the beginning of the period.
For the period ended March 31, 2014, there were no transfers between levels.
The inputs or methodologies used for valuing securities are not necessarily an indication of the risk associated with investing in those securities. The suitability of the techniques and sources employed to determine fair valuation are regularly monitored and subject to change.
5. Derivative Investment Holdings Categorized by Risk Exposure
U.S. GAAP requires disclosures to enable investors to better understand how and why the Fund uses derivative instruments, how these derivative instruments are accounted for and their effects on the Fund’s financial position and results of operations.
The Fund utilized options to minimally hedge the Fund’s portfolio to increase returns, to maintain exposure to the equity markets, create liquidity and to achieve leveraged exposure.
The following is a summary of the location of derivative investments on the Fund’s Statements of Operations for the period ended March 31, 2014:
Derivative Investment Type | Location of Gain (Loss) on Derivatives |
| Equity contracts | Net realized gain (loss) on options written |
| | Net change in unrealized appreciation (depreciation) on options written |
The following is a summary of the Fund’s realized gain (loss) and change in unrealized appreciation (depreciation) on derivative investments recognized on the Statements of Operations categorized by primary risk exposure for the period ended March 31, 2014:
Realized Gain(Loss) on Derivative Investments Recognized on the Statement of Operations |
| | | | | | | | Options Written Equity Contracts | | | | |
| Mid Cap Value Institutional Fund | | $ | — | | | $ | — | | | $ | 449,897 | | | $ | 449,897 | |
Change in Unrealized Appreciation(Depreciation) on Derivative Investments Recognized on the Statement of Operations |
| | | | | | | | Options Written Equity Contracts | | | | |
| Mid Cap Value Institutional Fund | | $ | — | | | $ | — | | | $ | (37,743 | ) | | $ | (37,743 | ) |
| 16 | GUGGENHEIM MID CAP VALUE INSTITUTIONAL FUND SEMI-ANNUAL REPORT | |
NOTES TO FINANCIAL STATEMENTS (Unaudited) (continued)
7. Options Written
Transactions in options written during the period ended March 31, 2014 were as follows:
Written Call Options
| | | Mid Cap Value Institutional Fund | |
| | | | | | |
| Balance at September 30, 2013 | | | 517 | | | $ | 174,748 | |
| Options Written | | | 731 | | | | 179,216 | |
| Options terminated in closing purchase transactions | | | — | | | | — | |
| Options expired | | | (1,248 | ) | | | (353,964 | ) |
| | | — | | | | — | |
Balance at March 31, 2014 | | | — | | | $ | — | |
Written Put Options
| | | Mid Cap Value Institutional Fund | |
| | | | | | |
| Balance at September 30, 2013 | | | — | | | $ | — | |
| Options Written | | | 715 | | | | 95,933 | |
| Options terminated in closing purchase transactions | | | — | | | | — | |
| Options expired | | | (715 | ) | | | (95,933 | ) |
| | | — | | | | — | |
Balance at March 31, 2014 | | | — | | | $ | — | |
8. Federal Income Tax Information
The Fund intends to comply with the provisions of Subchapter M of the Internal Revenue Code applicable to regulated investment companies and will distribute substantially all taxable net investment income and capital gains sufficient to relieve the Fund from all, or substantially all, federal income, excise and state income taxes. Therefore, no provision for federal or state income tax is required.
Tax positions taken or expected to be taken in the course of preparing the Fund’s tax returns are evaluated to determine whether the tax positions are “more-likely-than-not” of being sustained by the applicable tax authority. Tax positions not deemed to meet the more-likely-than-not threshold would be recorded as a tax benefit or expense in the current year. Management has analyzed the Fund’s tax positions taken, or to be taken, on Federal income tax returns for all open tax years, and has concluded that no provision for income tax is required in the Fund’s financial statements. The Fund’s federal tax returns are subject to examination by the Internal Revenue Service for a period of three fiscal years after they are filed.
The RIC Modernization Act of 2010 was signed into law on December 22, 2010 and simplified some of the tax provisions applicable to regulated investment companies, the tax reporting to their shareholders and improved the tax efficiency of certain fund structures. The greatest impact to the disclosure in the financial reports for the Fund was on the treatment of net capital losses, effective for tax years beginning after December 22, 2010.
One of the more prominent changes addresses capital loss carryforwards. The Fund is permitted to carry forward capital losses incurred in taxable years beginning after December 22, 2010 for an unlimited period. However, any losses incurred during those future taxable years will be required to be utilized prior to the losses incurred in pre-enactment taxable years. Under pre-enactment law, capital losses could be carried forward for eight years, and carried forward as short-term capital, irrespective of the character of the original loss. As a result of this ordering rule, pre-enactment capital carryforwards may potentially expire unused. Additionally, post-enactment capital losses that are carried forward will retain their character as either short-term or long-term capital losses rather than being considered all short-term as under previous law.
| | GUGGENHEIM MID CAP VALUE INSTITUTIONAL FUND SEMI-ANNUAL REPORT | 17 |
NOTES TO FINANCIAL STATEMENTS (Unaudited) (concluded)
At March 31, 2014, the cost of securities for Federal income tax purposes, the aggregate gross unrealized gain for all securities for which there was an excess of value over tax cost and the aggregate gross unrealized loss for all securities for which there was an excess of tax cost over value, were as follows:
| | | | | | | | | | | | |
| Mid Cap Value Institutional Fund | | $ | 494,717,061 | | | $ | 169,357,864 | | | $ | (23,252,441 | ) | | $ | 146,105,423 | |
9. Securities Transactions
For the period ended March 31, 2014, the cost of purchases and proceeds from sales of investment securities, excluding government securities and short-term investments, were as follows:
| | | | | | |
| Mid Cap Value Institutional Fund | | $ | 92,886,308 | | | $ | 98,368,719 | |
10. Affiliated Transactions
Investments representing 5% or more of the outstanding voting shares of a portfolio company of a fund, or control of or by, or common control under GI, result in that portfolio company being considered an affiliated company of such fund, as defined in the 1940 Act. Transactions during the period ended March 31, 2014 in which the portfolio company is an “affiliated person” are as follows:
| | | | | | | | | | | | | | | | | | | |
| Mid Cap Value Institutional Fund | Common Stock: | | | | | | | | | | | | | | | | | | |
| | | $ | 8,860 | | | $ | — | | | $ | — | | | $ | 1 | | | | 1,265,700 | | | $ | — | |
| | Total | | $ | 8,860 | | | $ | — | | | $ | — | | | $ | 1 | | | | 1,265,700 | | | $ | — | |
11. Other Liabilities
The Fund wrote put option contracts through Lehman Brothers Inc., (“Lehman”) that were exercised prior to the option contracts’ expiration and prior to the bankruptcy filing by Lehman, during September, 2008. However, these transactions have not settled and the securities have not been delivered to the Fund as of March 31, 2014.
Although the ultimate resolution of these transactions is uncertain, the Fund has recorded a liability on its books equal to the difference between the strike price on the put options and the market price of the underlying security on the exercise date. The amount of the liability recorded by the Fund as of March 31, 2014 was $15,940.
| 18 | GUGGENHEIM MID CAP VALUE INSTITUTIONAL FUND SEMI-ANNUAL REPORT | |
OTHER INFORMATION (Unaudited)
Proxy Voting Information
A description of the policies and procedures that the Trust uses to determine how to vote proxies relating to securities held in the Funds’ portfolios is available, without charge and upon request, by calling 800.820.0888. This information is also available from the EDGAR database on the SEC’s website at http://www.sec.gov.
Information regarding how the Funds voted proxies relating to portfolio securities during the most recent 12-month period ended June 30 is available without charge, upon request, by calling 800.820.0888. This information is also available from the EDGAR database on the SEC’s website at http://www.sec.gov.
At a special meeting of shareholders held on January 8, 2014, the shareholders of the Funds voted on whether to approve the election of nominees to the Board of Directors of each corporation. A description of the number of shares voted is as follows:
| | | |
| Randall C. Barnes | 26,507,318 | 108,992 | 26,616,310 |
| Roman Friedrich III | 26,507,440 | 108,870 | 26,616,310 |
| Robert B. Karn III | 26,502,500 | 113,810 | 26,616,310 |
| Ronald A. Nyberg | 26,510,110 | 106,200 | 26,616,310 |
| Ronald E. Toupin, Jr. | 26,507,278 | 109,032 | 26,616,310 |
At a special meeting of shareholders held on January 8, 2014, the shareholders of the Funds also voted on whether to approve the Funds from Kansas Corporations into Delaware Statutory Trusts. A description of the number of shares voted is as follows:
| | | |
| Mid Cap Value Institutional Fund | 21,850,294 | 78,770 | 80,572 |
At a special meeting of shareholders held on January 8, 2014, the shareholders of the Funds also voted on whether to approve changes to the fundamental investment policies. A description of the number of shares voted is as follows:
Diversification
| | | |
| Mid Cap Value Institutional Fund | 21,817,386 | 108,173 | 84,077 |
Underwriting
| | | |
| Mid Cap Value Institutional Fund | 21,810,959 | 109,089 | 89,588 |
Industry Concentration
| | | |
| Mid Cap Value Institutional Fund | 21,810,758 | 111,916 | 86,962 |
Real Estate
| | | |
| Mid Cap Value Institutional Fund | 21,814,400 | 107,763 | 87,473 |
| | GUGGENHEIM MID CAP VALUE INSTITUTIONAL FUND SEMI-ANNUAL REPORT | 19 |
OTHER INFORMATION (Unaudited) (continued)
Commodities
| | | |
| Mid Cap Value Institutional Fund | 21,808,283 | 109,859 | 91,494 |
Loans
| | | |
| Mid Cap Value Institutional Fund | 21,790,366 | 119,339 | 99,931 |
Borrowing
| | | |
| Mid Cap Value Institutional Fund | 21,783,595 | 124,918 | 101,123 |
Senior Securities
| | | |
| Mid Cap Value Institutional Fund | 21,808,391 | 110,042 | 91,203 |
Quarterly Portfolio Schedules Information
The Trust files its complete schedule of portfolio holdings with the SEC for the first and third quarters of each fiscal year on Form N-Q; which are available on the SEC’s website at http://www.sec.gov. The Funds’ Forms N-Q may be reviewed and copied at the SEC’s Public Reference Room in Washington, DC, and that information on the operation of the Public Reference Room may be obtained by calling 1-800-SEC-0330. Copies of the portfolio holdings are also available to shareholders, without charge and upon request, by calling 800.820.0888.
Office Locations
The offices of Guggenheim Investments can be found in the following locations:
330 Madison Avenue
10th Floor
New York, NY 10017
(Headquarters)
Four Irvington Centre
805 King Farm Boulevard
Suite 600
Rockville, MD 20850
9401 Indian Creek Parkway
40 Corporate Woods
Suite 850
Overland Park, KS 66210
| 20 | GUGGENHEIM MID CAP VALUE INSTITUTIONAL FUND SEMI-ANNUAL REPORT | |
OTHER INFORMATION (Unaudited) (concluded)
Board Considerations in Approving the Investment Advisory Agreements
At a meeting held on November 11, 2013, in connection with other actions taken to consider whether to approve the reorganization of the funds from series of Kansas corporations (the “Predecessor Funds”) into series of a Delaware statutory trust, Guggenheim Funds Trust (the “Trust” and its series, the “New Series”), the members of the Boards of Directors of the Kansas corporations (collectively, the “Predecessor Board” and the members individually, “Directors”), including the Directors who are not “interested persons,” as defined by the Investment Company Act of 1940, as amended (the “1940 Act”), of the corporations (the “Independent Directors”) appointed the then-investment advisers and sub-advisers of the Predecessor Funds, to serve in the same capacity to the corresponding New Series. The Predecessor Board also approved corresponding advisory and sub-advisory agreements, subject, for each Predecessor Fund, to approval of the reorganization of that fund by its shareholders and approval of the new agreements by the initial sole shareholder of the corresponding New Series. The Directors based their approval on a variety of factors, including: the findings they had made during their May, June and August 2013 meetings at which the advisory and sub-advisory agreements of the Predecessor Funds had the most recently been approved, which are discussed in the Annual Report of the Predecessor Funds for the fiscal year ended September 30, 2013; the fact that new agreements are the same as the agreements then in place for the Predecessor Funds except for the name of the signatory, the applicable state law and the term of the agreements; and the intention that the new agreements would be subject to re-consideration after the reorganizations at meetings scheduled to be held for these purposes in April and May 2014.
Distributor change
Effective March 3, 2014, Guggenheim Distributors, LLC (“GD”), the distributor for shares of the Fund was consolidated into and with Guggenheim Funds Distributors, LLC (“GFD”). Following the consolidation, GFD serves as the Fund’s distributor.
GD and GFD are both indirect, wholly-owned subsidiaries of Guggenheim Capital, LLC and, therefore, the consolidation will not result in a change of actual control of the Fund’s distributor. The primary goal of the consolidation is to achieve greater operational efficiencies and allow all of the Guggenheim funds, including funds that are not series of the Trusts, to be distributed by a single distributor.
The consolidation is not expected to affect the day-to-day management of the Fund or result in any material changes to the distribution of the Fund, including any changes to the distribution fees paid by the Fund.
Guggenheim Funds Trust
Guggenheim Funds Trust (the “Trust”), which was organized as a Delaware statutory trust on November 8, 2013, is registered with the Securities and Exchange Commission (“SEC”) as an investment company. The Trust is an open-end management investment company that, upon the demand of the investor, must redeem its shares and pay the investor the next calculated NAV. The Guggenheim Enhanced World Equity Fund (“Enhanced World Equity Fund”), Guggenheim Large Cap Value Fund (“Large Cap Value Fund”), Guggenheim Mid Cap Value Fund (“Mid Cap Value Fund”), Guggenheim Mid Cap Value Institutional Fund (“Mid Cap Value Institutional Fund”), Guggenheim Small Cap Value Fund (“Small Cap Value Fund”), Guggenheim StylePlus—Large Core Fund (“StylePlus—Large Core Fund”), Guggenheim StylePlus—Mid Growth Fund (“StylePlus—Mid Growth Fund”) and Guggenheim World Equity Income Fund (“World Equity Income Fund”) (collectively, the “Funds”) were previously series (the “Predecessor Funds”) of Security Equity Fund, Security Large Cap Value Fund and Security Mid Cap Growth Fund (the “Predecessor Corporations”), different registered open-end investment companies, which were organized as Kansas corporations. In January 2014, at special meetings of shareholders, the shareholders of each Predecessor Fund approved the reorganization of each Predecessor Fund with and into a corresponding “shell” series of the Trust. The shell series of the Trust succeeded to the accounting and performance histories of the Predecessor Funds. Any such historical information provided for a series of the Trust that relates to periods prior to January 28, 2014, therefore, is that of the corresponding Predecessor Fund.
| | GUGGENHEIM MID CAP VALUE INSTITUTIONAL FUND SEMI-ANNUAL REPORT | 21 |
INFORMATION ON BOARD OF TRUSTEES AND OFFICERS (Unaudited)
| INDEPENDENT TRUSTEES | |
Name, Address* and Year of Birth | Position(s) Held with the Trust | Term of Office and Length of Time Served** | Principal Occupation(s) During Past Five Years | Number of Portfolios in Fund Complex Overseen | Other Directorships Held by Trustees |
Randall C. Barnes (1951) | Trustee | Since 2014 | Current: Private Investor (2001-present). Former: Senior Vice President and Treasurer, PepsiCo, Inc. (1993-1997); President, Pizza Hut International (1991-1993); Senior Vice President, Strategic Planning and New Business Development, PepsiCo, Inc. (1987-1990). | 86 | None. |
Donald A. Chubb, Jr. (1946) | Trustee and Vice Chairman of the Board | Since 1994 | Current: Business broker and manager of commercial real estate, Griffith & Blair, Inc. (1997-present). | 82 | None. |
Jerry B. Farley (1946) | Trustee and Vice Chairman of the Audit Committee | Since 2005 | Current: President, Washburn University (1997-present). | 82 | Current: Westar Energy, Inc. (2004-present); CoreFirst Bank & Trust (2000-present). |
Roman Friedrich III (1946) | Trustee and Chairman of the Contracts Review Committee | Since 2014 | Current: Founder and President, Roman Friedrich & Company (1998-present). Former: Senior Managing Director, MLV & Co. LLC (2010-2011). | 82 | Current: Mercator Minerals Ltd. (2013-present); First Americas Gold Corp. (2012-present); Zincore Metals, Inc. (2009-present). Former: Blue Sky Uranium Corp. (2011-2012); Axiom Gold and Silver Corp. (2011-2012); Stratagold Corp. (2003-2009); GFM Resources Ltd. (2005-2010). |
Robert B. Karn III (1942) | Trustee and Chairman of the Audit Committee | Since 2014 | Current: Consultant (1998-present). Former: Arthur Andersen (1965-1997) and Managing Partner, Financial and Economic Consulting, St. Louis office (1987-1997). | 82 | Current: Peabody Energy Company (2003-present); GP Natural Resource Partners, LLC (2002- present). |
Ronald A. Nyberg (1953) | Trustee and Chairman of the Nominating and Governance Committee | Since 2014 | Current: Partner, Nyberg & Cassioppi, LLC (2000-present). Former: Executive Vice President, General Counsel, and Corporate Secretary, Van Kampen Investments (1982-1999). | 88 | None. |
| 22 | GUGGENHEIM MID CAP VALUE INSTITUTIONAL FUND SEMI-ANNUAL REPORT | |
INFORMATION ON BOARD OF TRUSTEES AND OFFICERS (Unaudited) (continued)
| INDEPENDENT TRUSTEES (concluded) | | |
Name, Address* and Year of Birth | Position(s) Held with the Trust | Term of Office and Length of Time Served** | Principal Occupation(s) During Past Five Years | Number of Portfolios in Fund Complex Overseen | Other Directorships Held by Trustees |
Maynard F. Oliverius (1943) | Trustee and Vice Chairman of the Contracts Review Committee | Since 1998 | Retired. Former: President and CEO, Stormont-Vail HealthCare (1996-2012). | 82 | None. |
Ronald E. Toupin, Jr. (1958) | Trustee and Chairman of the Board | Since 2014 | Current: Portfolio Consultant (2010-present). Former: Vice President, Manager and Portfolio Manager, Nuveen Asset Management (1998-1999); Vice President, Nuveen Investment Advisory Corp. (1992-1999); Vice President and Manager, Nuveen Unit Investment Trusts (1991-1999); and Assistant Vice President and Portfolio Manager, Nuveen Unit Investment Trusts (1988-1999), each of John Nuveen & Co., Inc. (1982-1999). | 85 | Former: Bennett Group of Funds (2011-2013). |
| INTERESTED TRUSTEE | | | | | |
Donald C. Cacciapaglia*** (1951) | President, Chief Executive Officer and Trustee | Since 2012 | Current: President and CEO, certain other funds in the Fund Complex (2012-present); Vice Chairman, Guggenheim Investments (2010-present). Former: Chairman and CEO, Channel Capital Group, Inc. (2002-2010). | 214 | Current: Delaware Life (2013-present); Guggenheim Life and Annuity Company (2011-present); Paragon Life Insurance Company of Indiana (2011-present). |
| * | The business address of each Trustee is c/o Guggenheim Investments, 805 King Farm Boulevard, Suite 600, Rockville, Maryland 20850. |
| ** | Each Trustee serves an indefinite term, until his successor is elected and qualified. Time served includes time served in the respective position for the Predecessor Corporation. |
| *** | This Trustee is deemed to be an "interested person" of the Funds under the 1940 Act by reason of his position with the Funds' Investment Manager and/or the parent of the Investment Manager. |
| | GUGGENHEIM MID CAP VALUE INSTITUTIONAL FUND SEMI-ANNUAL REPORT | 23 |
INFORMATION ON BOARD OF TRUSTEES AND OFFICERS (Unaudited) (continued)
| OFFICERS | | | |
Name, Address* and Year of Birth | Position(s) Held with the Trust | Term of Office and Length of Time Served** | Principal Occupations During Past Five Years |
Joseph M. Arruda (1966) | Assistant Treasurer | Since 2010 | Current: Assistant Treasurer, certain other funds in the Fund Complex (2006-present); Vice President, Security Investors, LLC (2010-present); CFO and Manager, Guggenheim Specialized Products, LLC (2009-present). Former: Vice President, Security Global Investors, LLC (2010-2011); Vice President, Rydex Advisors, LLC (2010); Vice President, Rydex Advisors II, LLC (2010). |
William H. Belden, III (1965) | Vice President | Since 2014 | Current: Vice President, certain other funds in the Fund Complex (2006-present); Managing Director, Guggenheim Funds Investment Advisors, LLC (2005-present). Former: Vice President of Management, Northern Trust Global Investments (1999-2005). |
Mark J. Furjanic (1959) | Assistant Treasurer | Since 2014 | Current: Vice President, Guggenheim Investments (2005-present); Assistant Treasurer, certain other funds in the Fund Complex (2008-present). Former: Senior Manager, Ernst & Young LLP (1999-2005). |
James Howley (1972) | Assistant Treasurer | Since 2014 | Current: Director, Guggenheim Investments (2004-present); Assistant Treasurer, certain other funds in the Fund Complex (2006-present). Former: Manager, Mutual Fund Administration of Van Kampen Investments, Inc. (1996-2004). |
Amy J. Lee (1961) | Vice President and Chief Legal Officer | Since 1987 (Secretary) Since 2007 (Vice President) | Current: Chief Legal Officer, certain other funds in the Fund Complex (2013-present); Senior Managing Director, Guggenheim Investments (2012-present). Former: Vice President, Associate General Counsel and Assistant Secretary, Security Benefit Life Insurance Company and Security Benefit Corporation (2004-2012). |
Derek Maltbie (1972) | Assistant Treasurer | Since 2014 | Current: Vice President, Guggenheim Investments (2012-present); Assistant Treasurer, certain other funds in the Fund Complex (2011-present). Former: Assistant Vice President, Guggenheim Funds Investment Advisors, LLC (2005-2011); Supervisor, Mutual Fund Administration, Van Kampen Investments, Inc. (1995-2005). |
Mark E. Mathiasen (1978) | Secretary | Since 2013 | Current: Secretary, certain other funds in the Fund Complex (2007-present); Managing Director and Associate General Counsel, Guggenheim Funds Services, LLC, and affiliates (2007-present). |
Michael P. Megaris (1984) | Assistant Secretary | Since 2014 | Current: Assistant Secretary, certain other funds in the Fund Complex (April 2014-present); Associate, Guggenheim Investments (2012-present). Former: J.D., University of Kansas School of Law (2009-2012). |
| 24 | GUGGENHEIM MID CAP VALUE INSTITUTIONAL FUND SEMI-ANNUAL REPORT | |
INFORMATION ON BOARD OF TRUSTEES AND OFFICERS (Unaudited) (concluded)
| OFFICERS (concluded) | | | |
Name, Address* and Year of Birth | Position(s) Held with the Trust | Term of Office and Length of Time Served** | Principal Occupations During Past Five Years |
Elisabeth Miller (1968) | Chief Compliance Officer | Since 2012 | Current: CCO, certain other funds in the Fund Complex (2012-present); CCO, Security Investors, LLC (2012-present); CCO, Guggenheim Funds Investment Advisors, LLC (2012-present); Vice President, Guggenheim Funds Distributors, LLC (March 2014-present). Former: CCO, Guggenheim Distributors, LLC (2009-March 2014); Senior Manager, Security Investors, LLC (2004-2009); Senior Manager, Guggenheim Distributors, LLC (2004-2009). |
Alison Santay (1974) | AML Officer | Since 2013 | Current: AML Officer, certain other funds in the Fund Complex (2010-present); Director and AML Officer, Rydex Fund Services, LLC (2010-present); AML Officer, Security Investors, LLC (2010-present); Director, Shareholder Risk and Compliance, Rydex Fund Services, LLC (2004-present). Former: AML Officer, Guggenheim Distributors, LLC (2013-March 2014). |
Kimberly Scott (1974) | Assistant Treasurer | Since 2014 | Current: Vice President, Guggenheim Investments (2012-present); Assistant Treasurer, certain other funds in the Fund Complex (2012-present). Former: Financial Reporting Manager, Invesco, Ltd. (2010-2011); Vice President/Assistant Treasurer, Mutual Fund Administration for Van Kampen Investments, Inc./Morgan Stanley Investment Management (2009-2010); Manager of Mutual Fund Administration, Van Kampen Investments, Inc./Morgan Stanley Investment Management (2005-2009). |
Bryan Stone (1979) | Vice President | Since 2014 | Current: Vice President, certain other funds in the Fund Complex (April 2014-present); Director, Guggenheim Investments (2013-present). Former: Senior Vice President, Neuberger Berman Group LLC (2009-2013); Vice President, Morgan Stanley (2002-2009). |
John L. Sullivan (1955) | Chief Financial Officer and Treasurer | Since 2014 | Current: CFO, Chief Accounting Officer and Treasurer, certain other funds in the Fund Complex (2010-present); Senior Managing Director, Guggenheim Investments (2010-present). Former: Managing Director and CCO, each of the funds in the Van Kampen Investments fund complex (2004-2010); Managing Director and Head of Fund Accounting and Administration, Morgan Stanley Investment Management (2002-2004); CFO and Treasurer, Van Kampen Funds (1996-2004). |
| * | The business address of each officer is c/o Guggenheim Investments, 805 King Farm Boulevard, Suite 600, Rockville, Maryland 20850. |
| ** | Each officer serves an indefinite term, until his or her successor is duly elected and qualified. Time served includes time served in the respective position for the Predecessor Corporation. |
| | GUGGENHEIM MID CAP VALUE INSTITUTIONAL FUND SEMI-ANNUAL REPORT | 25 |
GUGGENHEIM INVESTMENTS PRIVACY POLICIES
Rydex Funds, Guggenheim Funds, Rydex Investments, Guggenheim Funds Distributors, LLC, Security Investors, LLC, Security Distributors, Inc., Guggenheim Partners Investment Managers, LLC, and Rydex Advisory Services (Collectively “Guggenheim Investments”).
Our Commitment to You
When you become a Guggenheim Investments investor, you entrust us with not only your hard-earned money but also with personal and financial information about you. We recognize that your relationship with us is based on trust and that you expect us to act responsibly and in your best interests. Because we have access to this private information about you, we hold ourselves to the highest standards in its safekeeping and use. This means, most importantly, that we do not sell client information to anyone—whether it is your personal information or if you are a current or former Guggenheim Investments client.
The Information We Collect About You
In the course of doing business with shareholders and investors, we collect nonpublic personal information about you. You typically provide personal information when you complete a Guggenheim Investments account application or when you request a transaction that involves Rydex and Guggenheim Investments funds or one of the Guggenheim Investments affiliated companies. “Nonpublic personal information” is personally identifiable private information about you. For example, it includes information regarding your name and address, Social Security or taxpayer identification number, assets, income, account balance, bank account information and investment activity (e.g., purchase and redemption history).
How We Handle Your Personal Information
As emphasized above, we do not sell information about current or former clients or their accounts to third parties. Nor do we share such information, except when necessary to complete transactions at your request or to make you aware of related investment products and services that we offer. Additional details about how we handle your personal information are provided below. To complete certain transactions or account changes that you direct, it may be necessary to provide identifying information to companies, individuals or groups that are not affiliated with Guggenheim Investments. For example, if you ask to transfer assets from another financial institution to Guggenheim Investments, we will need to provide certain information about you to that company to complete the transaction. To alert you to other Guggenheim Investments investment products and services, we may share your information within the Guggenheim Investments family of affiliated companies. This would include, for example, sharing your information within Guggenheim Investments so we can make you aware of new Rydex and Guggenheim Investments funds or the services offered through another Guggenheim Investments affiliated company. In certain instances, we may contract with nonaffiliated companies to perform services for us. Where necessary, we will disclose information we have about you to these third parties. In all such cases, we provide the third party with only the information necessary to carry out its assigned responsibilities and only for that purpose. And we require these third parties to treat your private information with the same high degree of confidentiality that we do. In certain instances, we may share information with other financial institutions regarding individuals and entities in response to the U.S.A. Patriot Act. Finally, we will release information about you if you direct us to do so, if we are compelled by law to do so or in other circumstances permitted by law.
Opt Out Provisions
We do not sell your personal information to anyone. The law allows you to “opt out” of only certain kinds of information sharing with third parties. The firm does not share personal information about you with any third parties that triggers this opt-out right. This means YOU ARE ALREADY OPTED OUT.
How We Protect Privacy Online
Our concern for the privacy of our shareholders also extends to those who use our web site, guggenheiminvestments.com. Our web site uses some of the most secure forms of online communication available, including encryption technology, Secure Socket Layer (SSL) protocol, firewalls and user names and passwords. These technologies provide a high level of security and privacy when you access your account information or initiate online transactions. The Guggenheim Investments web site offers customized features that require our use of “http cookies”—tiny pieces of information that we ask your browser to store. However, we make very limited use of these cookies. We only use cookies for session management and security features on the Guggenheim Investments web site. We do not use them to pull data from your hard drive, to learn your email address, or to view data in cookies created by other web sites. We will not share the information in our cookies or give others access to it. See the legal information area on our web site for more details about web site security and privacy features.
| 26 | GUGGENHEIM MID CAP VALUE INSTITUTIONAL FUND SEMI-ANNUAL REPORT | |
GUGGENHEIM INVESTMENTS PRIVACY POLICIES (concluded)
How We Safeguard Your Personal Information
We restrict access to nonpublic personal information about shareholders to our employees and in some cases to third parties (for example, the service providers described above) as permitted by law. We maintain strict physical, electronic and procedural safeguards that comply with federal standards to guard your nonpublic personal information.
We’ll Keep You Informed
As required by federal law, we will notify shareholders of our privacy policy annually. We reserve the right to modify this policy at any time, but rest assured that if we do change it, we will tell you promptly. You will also be able to access our privacy policy from our web site at guggenheiminvestments.com. Should you have any questions regarding our privacy policy, contact us at 800.820.0888 or 301.296.5100.
| | GUGGENHEIM MID CAP VALUE INSTITUTIONAL FUND SEMI-ANNUAL REPORT | 27 |
This page intentionally left blank.
This page intentionally left blank.
Not required at this time.
| Item 3. | Audit Committee Financial Expert. |
Not required at this time.
| Item 4. | Principal Accountant Fees and Services. |
Not required at this time.
| Item 5. | Audit Committee of Listed Registrants. |
Not applicable.
The Schedule of Investments is included under Item 1 of this form.
| Item 7. | Disclosure of Proxy Voting Policies and Procedures for Closed-End Management Investment Companies. |
Not applicable.
| Item 8. Portfolio Mangers of Closed-end Management Investment Companies |
Not applicable
| Item 9. | Purchases of Equity Securities by Closed-End Management Investment Company and Affiliated Purchasers. |
Not applicable.
| Item 10. | Submission of Matters to a Vote of Security Holders. |
The registrant does not currently have in place procedures by which shareholders may recommend nominees to the registrant’s board.
There have been no changes to the procedures by which shareholders may recommend nominees to the registrant’s board.
| Item 11. | Controls and Procedures. |
| | (a) | The registrant’s President (principal executive officer) and Treasurer (principal financial officer) have evaluated the registrant’s disclosure controls and procedures within 90 days of this filing and have concluded that the registrant’s disclosure controls and procedures were effective as of that date in ensuring that information required to be disclosed by the registrant in this Form N-CSR was recorded, processed, summarized, and reported timely. |
| | (b) | The registrant’s principal executive officer and principal financial officer are aware of no change in the registrant’s internal control over financial reporting that occurred during the registrant’s second fiscal quarter covered by this report that has materially affected, or is reasonably likely to materially affect, the registrant’s internal control over financial reporting. |
| | (a)(2) | Separate certifications by the President (principal executive officer) and Treasurer (principal financial officer) of the registrant as required by Rule 30a-2(a) under the Act (17 CFR 270.30a-2(a)) are attached. |
| | (b) | A certification by the registrant’s President (principal executive officer) and Treasurer (principal financial officer) as required by Rule 30a-2(b) under the Act (17 CFR 270.30a-2(b)) is attached. |
SIGNATURES
Pursuant to the requirements of the Securities Exchange Act of 1934 and the Investment Company Act of 1940, the registrant has duly caused this report to be signed on its behalf by the undersigned, thereunto duly authorized.
| (Registrant) | | Guggenheim Funds Trust | |
| | | | |
| By (Signature and Title)* | | /s/ Donald C. Cacciapaglia | |
| | | Donald C. Cacciapaglia, President | |
| | | | |
| Date | June 6, 2014 | | | |
| | | | |
| Pursuant to the requirements of the Securities Exchange Act of 1934 and the Investment Company Act of 1940, this report has been signed below by the following persons on behalf of the registrant and in the capacities and on the dates indicated. |
| | | | |
| By (Signature and Title)* | | /s/ Donald C. Cacciapaglia | |
| | | Donald C. Cacciapaglia, President | |
| | | | |
| Date | June 6, 2014 | | | |
| | | | |
| By (Signature and Title)* | | /s/ John L. Sullivan | |
| | | John L. Sullivan, Chief Financial Officer, Chief Accounting Officer and Treasurer |
| | | | |
| Date | June 6, 2014 | | | |
* Print the name and title of each signing officer under his or her signature.