Amy J. Lee
Form N-CSR is to be used by management investment companies to file reports with the Commission not later than 10 days after the transmission to stockholders of any report that is required to be transmitted to stockholders under Rule 30e‑1 under the Investment Company Act of 1940 (17 CFR 270.30e‑1). The Commission may use the information provided on Form N‑CSR in its regulatory, disclosure review, inspection, and policymaking roles.
A registrant is required to disclose the information specified by Form N‑CSR, and the Commission will make this information public. A registrant is not required to respond to the collection of information contained in Form N‑CSR unless the Form displays a currently valid Office of Management and Budget (“OMB”) control number. Please direct comments concerning the accuracy of the information collection burden estimate and any suggestions for reducing the burden to Secretary, Securities and Exchange Commission, 450 Fifth Street, NW, Washington, DC 20549‑0609. The OMB has reviewed this collection of information under the clearance requirements of 44 U.S.C. §3507.
The registrant’s semi-annual report transmitted to shareholders pursuant to Rule 30e-1 under the Investment Company Act of 1940, as amended (the “Investment Company Act”), is as follows:
3.31.2015
Guggenheim Funds Semi-Annual Report
| Guggenheim Funds Trust-Equity |
| Guggenheim Alpha Opportunity Fund | | |
| Guggenheim Enhanced World Equity Fund | | |
| Guggenheim Large Cap Value Fund | | |
| Guggenheim Risk Managed Real Estate Fund | | |
| Guggenheim Small Cap Value Fund | | |
| Guggenheim StylePlus—Large Core Fund | | |
| Guggenheim StylePlus—Mid Growth Fund | | |
| Guggenheim World Equity Income Fund | | |
| SBE-SEMI-0315x0915 | guggenheiminvestments.com |
TABLE OF CONTENTS
| DEAR SHAREHOLDER | 2 |
| ECONOMIC AND MARKET OVERVIEW | 3 |
| ABOUT SHAREHOLDERS’ FUND EXPENSES | 5 |
| ALPHA OPPORTUNITY FUND | 8 |
| ENHANCED WORLD EQUITY FUND | 19 |
| LARGE CAP VALUE FUND | 25 |
| RISK MANAGED REAL ESTATE FUND | 34 |
| SMALL CAP VALUE FUND | 42 |
| STYLEPLUS—LARGE CORE FUND | 49 |
| STYLEPLUS—MID GROWTH FUND | 59 |
| WORLD EQUITY INCOME FUND | 68 |
| NOTES TO FINANCIAL STATEMENTS | 76 |
| OTHER INFORMATION | 91 |
| INFORMATION ON BOARD OF TRUSTEES AND OFFICERS | 92 |
| GUGGENHEIM INVESTMENTS PRIVACY POLICIES | 96 |
| | THE GUGGENHEIM FUNDS SEMI-ANNUAL REPORT | 1 |
March 31, 2015
Dear Shareholder:
Security Investors, LLC and Guggenheim Partners Investment Management (the “Investment Advisers”) are pleased to present the semi-annual shareholder report for a selection of our Funds (the “Funds”) for the six-month period ended March 31, 2015.
The Investment Advisers are part of Guggenheim Investments, which represents the investment management businesses of Guggenheim Partners, LLC (“Guggenheim”), a global, diversified financial services firm.
Guggenheim Funds Distributors, LLC is the distributor of the Funds. Guggenheim Funds Distributors, LLC is affiliated with Guggenheim and the Investment Advisers.
We encourage you to read the Economic and Market Overview section of the report, which follows this letter.
We are committed to providing innovative investment solutions and appreciate the trust you place in us.
Sincerely,
Donald C. Cacciapaglia
President
April 30, 2015
Read a prospectus and summary prospectus (if available) carefully before investing. It contains the investment objectives, risks, charges, expenses and other information, which should be considered carefully before investing. Obtain a prospectus and summary prospectus (if available) at guggenheiminvestments.com or call 800.820.0888.
There can be no assurance that any investment product will achieve its investment objective(s). There are risks associated with investing, including the entire loss of principal invested. Investing involves market risks. The investment return and principal value of any investment product will fluctuate with changes in market conditions.
| 2 | THE GUGGENHEIM FUNDS SEMI-ANNUAL REPORT | |
ECONOMIC AND MARKET OVERVIEW (Unaudited) | March 31, 2015 |
The U.S. continued to enjoy a self-sustaining economic expansion for the six-month period ended March 31, 2015, although winter weather was likely to distort first-quarter economic data. In addition, U.S. companies scaled back hiring in the last month of the period, adding to evidence that the domestic economy has lost some momentum since the turn of the year. The March increase in payrolls was the smallest since December 2013 and broke a 12-month run of gains above 200,000.
Despite this short-term dislocation, the economy remains on track. Indeed, many other labor market indicators, such as initial jobless claims and the job openings rate, suggest that the U.S. labor market remains quite strong, supporting the conclusion that March’s payroll report was just a temporary blip, similar to the one witnessed last winter. As soon as temporary seasonal factors have dissipated, economic data is likely to bounce back. The labor market has improved over the past year, as subdued mortgage rates and tight housing inventory continue to point to fairly stable appreciation in the housing market, which is key to the ongoing recovery. Consumers are also being helped by lower fuel prices, which are acting as a tax cut for U.S. consumers, freeing up discretionary spending in other areas and acting as a support for consumption.
In Europe, economic data has been surprisingly good and should continue along that path on the back of the European Central Bank’s program of quantitative easing and depreciation of the euro. Japan’s economy remains weak and, without more structural reform, continued monetary accommodation could lead to stagflation. China’s policymakers appear likely to continue the supply of credit and do whatever else is necessary to maintain growth there at an acceptable pace for the near term.
Given weakness overseas and the effect of a stronger U.S. dollar on international earnings, some stocks could face a more challenging environment in the near term, but our research shows that equity markets tend to perform quite well in the periods leading up to a U.S. Federal Reserve (the “Fed”) rate increase. The yield on the 10-year Treasury note declined in January by more than 50 basis points before rebounding in February, echoing the pattern since 2009—Treasury yields decline and a sell-off ensues, driving rates higher. Then conditions stabilize, and rates test their previous lows. Liquidity from foreign central banks and comparatively attractive U.S. yields continue to push global investors to U.S. Treasuries, which should hold down U.S. interest rates in the near term.
Against this backdrop, the U.S. central bank feels pressure to raise its key rate above zero, but insists the decision will be data-dependent and not occur prematurely. With a secular inflation increase unlikely in the near term, slack in the economy, and disinflation being imported from abroad, the Fed may not hike rates until later in the year. The Fed for now appears to be focused on wage growth, which is key for sustaining the expansion but also an indicator of inflationary pressure. The lack of sustained wage growth has been a topic that has confounded the Fed lately. Given the strengthening employment numbers and the apparent reduction in labor market slack, wages should start to increase more steadily across the board. This is one of the most important data points at the moment for the Fed.
The underlying U.S. economy remains strong and investors should avoid being panicked by seasonal setbacks. Indeed, considering the strength of the economy and the wave of liquidity emanating from various central banks around the world, the general investment environment should remain attractive.
For the six months ended March 31, 2015, the Standard & Poor’s 500® (“S&P 500”) Index* returned 5.93%. The Morgan Stanley Capital International (“MSCI”) Europe-Australasia-Far East (“EAFE”) Index* returned 1.13%. The return of the MSCI Emerging Markets Index* was -2.37%.
In the bond market, the Barclays U.S. Aggregate Bond Index* posted a 3.43% return for the period, while the Barclays U.S. Corporate High Yield Index* returned 1.49%. The return of the Bank of America Merrill Lynch 3-Month U.S. Treasury Bill Index* was 0.01% for the six-month period.
The opinions and forecasts expressed may not actually come to pass. This information is subject to change at any time, based on market and other conditions, and should not be construed as a recommendation of any specific security or strategy.
| | THE GUGGENHEIM FUNDS SEMI-ANNUAL REPORT | 3 |
ECONOMIC AND MARKET OVERVIEW (Unaudited)(concluded) | March 31, 2015 |
*Index Definitions:
The following indices are referenced throughout this report. Indices are unmanaged and not available for direct investment. Index performance does not reflect transaction costs, fees, or expenses.
Barclays U.S. Aggregate Bond Index is a broad-based benchmark that measures the investment grade, U.S. dollar-denominated, fixed-rate taxable bond market, including U.S. Treasuries, government-related and corporate securities, MBS (agency fixed-rate and hybrid ARM pass-throughs), ABS, and CMBS.
Barclays U.S. Corporate High Yield Index measures the market of U.S. dollar-denominated, non-investment grade, fixed-rate, taxable corporate bonds. Securities are classified as high yield if the middle rating of Moody’s, Fitch, and S&P is Ba1/BB+/BB+ or below.
Bank of America (“BofA”) Merrill Lynch 3-Month U.S. Treasury Bill Index is an unmanaged market index of U.S. Treasury securities maturing in 90 days that assumes reinvestment of all income.
MSCI EAFE Index is a free float-adjusted market capitalization index that is designed to measure the equity market performance of developed markets, excluding the U.S. & Canada.
MSCI Emerging Markets Index is a free float-adjusted market capitalization weighted index that is designed to measure equity market performance in the global emerging markets.
S&P 500® Index is a capitalization-weighted index of 500 stocks designed to measure the performance of the broad economy, representing all major industries and is considered a representation of the U.S. stock market.
| 4 | THE GUGGENHEIM FUNDS SEMI-ANNUAL REPORT | |
ABOUT SHAREHOLDERS’ FUND EXPENSES (Unaudited)
All mutual funds have operating expenses and it is important for our shareholders to understand the impact of costs on their investments. Shareholders of a Fund incur two types of costs: (i) transaction costs, including sales charges (loads) on purchase payments, reinvested dividends, or other distributions; and exchange fees; and (ii) ongoing costs, including management fees, administrative services, and shareholder reports, among others. These ongoing costs, or operating expenses, are deducted from a fund’s gross income and reduce the investment return of the fund.
A fund’s expenses are expressed as a percentage of its average net assets, which is known as the expense ratio. The following examples are intended to help investors understand the ongoing costs (in dollars) of investing in a Fund and to compare these costs with the ongoing costs of investing in other mutual funds.
The examples are based on an investment of $1,000 made at the beginning of the period and held for the entire six-month period beginning September 30, 2014 and ending March 31, 2015.
The following tables illustrate a Fund’s costs in two ways:
Table 1. Based on actual Fund return. This section helps investors estimate the actual expenses paid over the period. The “Ending Account Value” shown is derived from the Fund’s actual return, and the fourth column shows the dollar amount that would have been paid by an investor who started with $1,000 in the Fund. Investors may use the information here, together with the amount invested, to estimate the expenses paid over the period. Simply divide the Fund’s account value by $1,000 (for example, an $8,600 account value divided by $1,000 = 8.6), then multiply the result by the number provided under the heading “Expenses Paid During Period.”
Table 2. Based on hypothetical 5% return. This section is intended to help investors compare a Fund’s cost with those of other mutual funds. The table provides information about hypothetical account values and hypothetical expenses based on the Fund’s actual expense ratio and an assumed rate of return of 5% per year before expenses, which is not the Fund’s actual return. The hypothetical account values and expenses may not be used to estimate the actual ending account balance or expenses paid during the period. The example is useful in making comparisons because the U.S. Securities and Exchange Commission (the “SEC”) requires all mutual funds to calculate expenses based on the 5% return. Investors can assess a Fund’s costs by comparing this hypothetical example with the hypothetical examples that appear in shareholder reports of other funds.
The calculations illustrated above assume no shares were bought or sold during the period. Actual costs may have been higher or lower, depending on the amount of investment and the timing of any purchases or redemptions.
Please note that the expenses shown in the table are meant to highlight your ongoing costs only and do not reflect any transactional costs, such as sales charges (loads) on purchase payments, and contingent deferred sales charges ("CDSC") on redemptions, if any. Therefore, the second table is useful in comparing ongoing costs only, and will not help you determine the relative total costs of owning different funds. In addition, if these transactional costs were included, your costs would have been higher.
More information about a Fund’s expenses, including annual expense ratios for the past five years, can be found in the Financial Highlights section of this report. For additional information on operating expenses and other shareholder costs, please refer to the appropriate Fund prospectus.
| | THE GUGGENHEIM FUNDS SEMI-ANNUAL REPORT | 5 |
ABOUT SHAREHOLDERS’ FUND EXPENSES (Unaudited)(continued)
| | Expense Ratio1 | Fund Return | Beginning Account Value September 30, 2014 | Ending Account Value March 31, 2015 | Expenses Paid During Period2 |
Table 1. Based on actual Fund return3 | | | | | |
| | | | | | |
| Alpha Opportunity Fund | | | | | |
| A-Class | 2.66% | 4.04% | $1,000.00 | $1,040.40 | $13.53 |
| C-Class | 3.39% | 3.67% | 1,000.00 | 1,036.70 | 17.21 |
| Institutional Class | 2.42% | 4.17% | 1,000.00 | 1,041.70 | 12.32 |
| Enhanced World Equity Fund | | | | | |
| A-Class | 1.26% | (0.84%) | 1,000.00 | 991.60 | 6.26 |
| C-Class | 2.01% | (1.25%) | 1,000.00 | 987.50 | 9.96 |
| Institutional Class | 1.01% | (0.74%) | 1,000.00 | 992.60 | 5.02 |
| Large Cap Value Fund | | | | | |
| A-Class | 1.16% | 2.18% | 1,000.00 | 1,021.80 | 5.85 |
B-Class4 | 0.91% | 2.34% | 1,000.00 | 1,023.40 | 4.59 |
| C-Class | 1.91% | 1.84% | 1,000.00 | 1,018.40 | 9.61 |
| Institutional Class | 0.91% | 2.34% | 1,000.00 | 1,023.40 | 4.59 |
| Risk Managed Real Estate Fund | | | | | |
| A-Class | 1.53% | 19.35% | 1,000.00 | 1,193.50 | 8.37 |
| C-Class | 2.27% | 18.96% | 1,000.00 | 1,189.60 | 12.39 |
| Institutional Class | 1.24% | 19.56% | 1,000.00 | 1,195.60 | 6.79 |
| Small Cap Value Fund | | | | | |
| A-Class | 1.34% | 7.68% | 1,000.00 | 1,076.80 | 6.94 |
| C-Class | 2.09% | 7.33% | 1,000.00 | 1,073.30 | 10.80 |
| Institutional Class | 1.09% | 7.85% | 1,000.00 | 1,078.50 | 5.65 |
| StylePlus—Large Core Fund | | | | | |
| A-Class | 1.33% | 6.15% | 1,000.00 | 1,061.50 | 6.84 |
| B-Class | 2.61% | 5.44% | 1,000.00 | 1,054.40 | 13.37 |
| C-Class | 2.25% | 5.66% | 1,000.00 | 1,056.60 | 11.54 |
| Institutional Class | 1.21% | 6.25% | 1,000.00 | 1,062.50 | 6.22 |
| StylePlus—Mid Growth Fund | | | | | |
| A-Class | 1.48% | 11.54% | 1,000.00 | 1,115.40 | 7.81 |
| B-Class | 2.86% | 10.76% | 1,000.00 | 1,107.60 | 15.03 |
| C-Class | 2.34% | 11.05% | 1,000.00 | 1,110.50 | 12.31 |
| Institutional Class | 1.34% | 11.60% | 1,000.00 | 1,116.00 | 7.07 |
| World Equity Income Fund | | | | | |
| A-Class | 1.48% | 0.43% | 1,000.00 | 1,004.30 | 7.40 |
B-Class4 | 1.23% | 0.52% | 1,000.00 | 1,005.20 | 6.15 |
| C-Class | 2.23% | 0.04% | 1,000.00 | 1,000.40 | 11.12 |
| Institutional Class | 1.22% | 0.56% | 1,000.00 | 1,005.60 | 6.10 |
| 6 | THE GUGGENHEIM FUNDS SEMI-ANNUAL REPORT | |
ABOUT SHAREHOLDERS’ FUND EXPENSES (Unaudited)(concluded)
| | Expense Ratio1 | Fund Return | Beginning Account Value September 30, 2014 | Ending Account Value March 31, 2015 | Expenses Paid During Period2 |
| Table 2. Based on hypothetical 5% return (before expenses) | | | | |
| | | | | |
| Alpha Opportunity Fund | | | | | |
| A-Class | 2.66% | 5.00% | $1,000.00 | $1,011.67 | $13.34 |
| C-Class | 3.39% | 5.00% | 1,000.00 | 1,008.03 | 16.97 |
| Institutional Class | 2.42% | 5.00% | 1,000.00 | 1,012.86 | 12.14 |
| Enhanced World Equity Fund | | | | | |
| A-Class | 1.26% | 5.00% | 1,000.00 | 1,018.65 | 6.34 |
| C-Class | 2.01% | 5.00% | 1,000.00 | 1,014.91 | 10.10 |
| Institutional Class | 1.01% | 5.00% | 1,000.00 | 1,019.90 | 5.09 |
| Large Cap Value Fund | | | | | |
| A-Class | 1.16% | 5.00% | 1,000.00 | 1,019.15 | 5.84 |
B-Class4 | 0.91% | 5.00% | 1,000.00 | 1,020.39 | 4.58 |
| C-Class | 1.91% | 5.00% | 1,000.00 | 1,015.41 | 9.60 |
| Institutional Class | 0.91% | 5.00% | 1,000.00 | 1,020.39 | 4.58 |
| Risk Managed Real Estate Fund | | | | | |
| A-Class | 1.53% | 5.00% | 1,000.00 | 1,017.30 | 7.70 |
| C-Class | 2.27% | 5.00% | 1,000.00 | 1,013.61 | 11.40 |
| Institutional Class | 1.24% | 5.00% | 1,000.00 | 1,018.75 | 6.24 |
| Small Cap Value Fund | | | | | |
| A-Class | 1.34% | 5.00% | 1,000.00 | 1,018.25 | 6.74 |
| C-Class | 2.09% | 5.00% | 1,000.00 | 1,014.51 | 10.50 |
| Institutional Class | 1.09% | 5.00% | 1,000.00 | 1,019.50 | 5.49 |
| StylePlus—Large Core Fund | | | | | |
| A-Class | 1.33% | 5.00% | 1,000.00 | 1,018.30 | 6.69 |
| B-Class | 2.61% | 5.00% | 1,000.00 | 1,011.92 | 13.09 |
| C-Class | 2.25% | 5.00% | 1,000.00 | 1,013.71 | 11.30 |
| Institutional Class | 1.21% | 5.00% | 1,000.00 | 1,018.90 | 6.09 |
| StylePlus—Mid Growth Fund | | | | | |
| A-Class | 1.48% | 5.00% | 1,000.00 | 1,017.55 | 7.44 |
| B-Class | 2.86% | 5.00% | 1,000.00 | 1,010.67 | 14.34 |
| C-Class | 2.34% | 5.00% | 1,000.00 | 1,013.26 | 11.75 |
| Institutional Class | 1.34% | 5.00% | 1,000.00 | 1,018.25 | 6.74 |
| World Equity Income Fund | | | | | |
| A-Class | 1.48% | 5.00% | 1,000.00 | 1,017.55 | 7.44 |
B-Class4 | 1.23% | 5.00% | 1,000.00 | 1,018.80 | 6.19 |
| C-Class | 2.23% | 5.00% | 1,000.00 | 1,013.81 | 11.20 |
| Institutional Class | 1.22% | 5.00% | 1,000.00 | 1,018.85 | 6.14 |
1 | This ratio represents annualized net expenses, which may include short dividend and interest expenses. Excluding these expenses, the operating expense ratio for the Alpha Opportunity Fund would be 1.79%, 2.54% and 1.54% and the Risk Managed Real Estate Fund would be 1.29%, 2.05% and 1.01% for the A-Class, C-Class and Institutional Class, respectively. Excludes expenses of the underlying funds in which the Funds invest. |
2 | Expenses are equal to the Fund's annualized expense ratio, net of any applicable fee waivers, multiplied by the average account value over the period, multiplied by 182/365 (to reflect the one-half year period). |
3 | Actual cumulative return at net asset value for the period September 30, 2014 to March 31, 2015. |
4 | B-Class shares did not charge 12b-1 fees during the period. |
| | THE GUGGENHEIM FUNDS SEMI-ANNUAL REPORT | 7 |
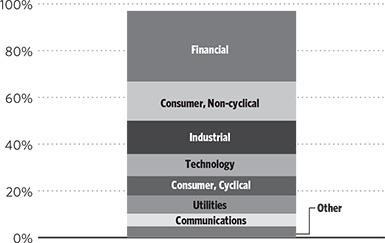
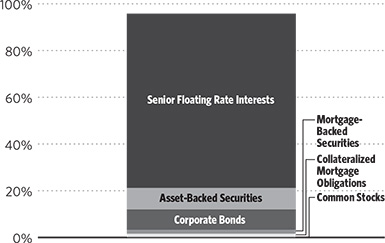
FUND PROFILE (Unaudited) | March 31, 2015 |
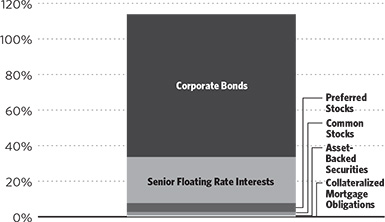
ALPHA OPPORTUNITY FUND
OBJECTIVE: Seeks long-term growth of capital.
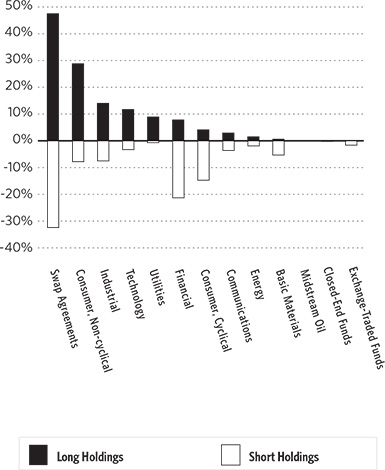
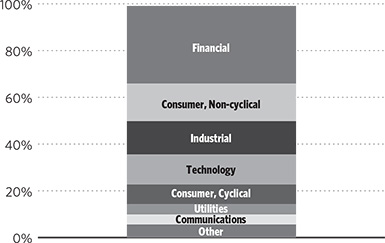
Holdings Diversification (Market Exposure as % of Net Assets)
“Holdings Diversification (Market Exposure as % of Net Assets)” excludes any temporary cash investments.
| Inception Dates: |
| A-Class | July 7, 2003 |
| C-Class | July 7, 2003 |
| Institutional Class | November 7, 2008 |
| Ten Largest Holdings (% of Total Net Assets) |
| Wal-Mart Stores, Inc. | 1.4% |
| ConAgra Foods, Inc. | 1.4% |
| Merck & Company, Inc. | 1.2% |
| Intel Corp. | 1.0% |
| DaVita HealthCare Partners, Inc. | 1.0% |
| International Business Machines Corp. | 1.0% |
| Brixmor Property Group, Inc. | 1.0% |
| Quest Diagnostics, Inc. | 1.0% |
| Ingredion, Inc. | 1.0% |
| Anthem, Inc. | 0.9% |
| Top Ten Total | 10.9% |
| | |
| “Ten Largest Holdings” exclude any temporary cash or derivative investments. |
| 8 | THE GUGGENHEIM FUNDS SEMI-ANNUAL REPORT | |
SCHEDULE OF INVESTMENTS (Unaudited) | March 31, 2015 |
| ALPHA OPPORTUNITY FUND | |
| | |
Shares | | | Value | |
| | | | | | | | |
COMMON STOCKS† - 80.3% | |
| | | | | | | | |
| CONSUMER, NON-CYCLICAL - 28.8% | |
| ConAgra Foods, Inc. | | | 4,683 | | | $ | 171,065 | |
| Merck & Company, Inc. | | | 2,578 | | | | 148,184 | |
| DaVita HealthCare Partners, Inc.* | | | 1,588 | | | | 129,073 | |
| Quest Diagnostics, Inc. | | | 1,589 | | | | 122,115 | |
| Ingredion, Inc. | | | 1,566 | | | | 121,866 | |
| Anthem, Inc. | | | 768 | | | | 118,586 | |
| Molson Coors Brewing Co. — Class B | | | 1,508 | | | | 112,271 | |
| Coca-Cola Enterprises, Inc. | | | 2,490 | | | | 110,058 | |
| Baxter International, Inc. | | | 1,602 | | | | 109,737 | |
| UnitedHealth Group, Inc. | | | 856 | | | | 101,256 | |
| HCA Holdings, Inc.* | | | 1,298 | | | | 97,649 | |
| Aetna, Inc. | | | 886 | | | | 94,386 | |
| Gilead Sciences, Inc. | | | 949 | | | | 93,124 | |
| Pfizer, Inc. | | | 2,658 | | | | 92,473 | |
| PepsiCo, Inc. | | | 949 | | | | 90,743 | |
| Cigna Corp. | | | 696 | | | | 90,090 | |
| Campbell Soup Co. | | | 1,848 | | | | 86,024 | |
| Humana, Inc. | | | 463 | | | | 82,423 | |
| Omnicare, Inc. | | | 1,030 | | | | 79,372 | |
| Epizyme, Inc.* | | | 4,077 | | | | 76,567 | |
| Universal Health Services, Inc. — Class B | | | 614 | | | | 72,274 | |
| ManpowerGroup, Inc. | | | 801 | | | | 69,007 | |
| United Rentals, Inc.* | | | 679 | | | | 61,898 | |
| Dr Pepper Snapple Group, Inc. | | | 758 | | | | 59,488 | |
| SUPERVALU, Inc.* | | | 4,980 | | | | 57,917 | |
| Magellan Health, Inc.* | | | 761 | | | | 53,894 | |
| Eli Lilly & Co. | | | 733 | | | | 53,252 | |
| JM Smucker Co. | | | 446 | | | | 51,615 | |
| Tekmira Pharmaceuticals Corp.* | | | 2,951 | | | | 51,524 | |
| Molina Healthcare, Inc.* | | | 727 | | | | 48,920 | |
| Amgen, Inc. | | | 300 | | | | 47,955 | |
| MEDNAX, Inc.* | | | 643 | | | | 46,624 | |
| Cardinal Health, Inc. | | | 511 | | | | 46,128 | |
| Coca-Cola Co. | | | 1,137 | | | | 46,105 | |
| Varian Medical Systems, Inc.* | | | 480 | | | | 45,163 | |
| H&R Block, Inc. | | | 1,400 | | | | 44,898 | |
| Darling Ingredients, Inc.* | | | 3,056 | | | | 42,815 | |
| Hershey Co. | | | 413 | | | | 41,676 | |
| Centene Corp.* | | | 587 | | | | 41,495 | |
| Select Medical Holdings Corp. | | | 2,727 | | | | 40,441 | |
| United Therapeutics Corp.* | | | 232 | | | | 40,005 | |
| Halyard Health, Inc.* | | | 811 | | | | 39,901 | |
| Health Net, Inc.* | | | 647 | | | | 39,137 | |
| Andersons, Inc. | | | 923 | | | | 38,185 | |
| Cal-Maine Foods, Inc. | | | 976 | | | | 38,123 | |
| LifePoint Hospitals, Inc.* | | | 509 | | | | 37,386 | |
| Sanderson Farms, Inc. | | | 467 | | | | 37,197 | |
| Hill-Rom Holdings, Inc. | | | 758 | | | | 37,142 | |
| Chemed Corp. | | | 306 | | | | 36,536 | |
| Total System Services, Inc. | | | 953 | | | | 36,357 | |
| Stryker Corp. | | | 385 | | | | 35,516 | |
| Patterson Companies, Inc. | | | 725 | | | | 35,373 | |
| Medifast, Inc.* | | | 1,142 | | | | 34,226 | |
| Total Consumer, Non-cyclical | | | | | | | 3,635,235 | |
| | | | | | | | |
| INDUSTRIAL - 14.0% | |
| Emerson Electric Co. | | | 2,042 | | | | 115,618 | |
| Fluor Corp. | | | 2,008 | | | | 114,778 | |
| Joy Global, Inc. | | | 2,164 | | | | 84,786 | |
| Energizer Holdings, Inc. | | | 529 | | | | 73,028 | |
| AGCO Corp. | | | 1,489 | | | | 70,936 | |
| Parker-Hannifin Corp. | | | 589 | | | | 69,961 | |
| CSX Corp. | | | 1,977 | | | | 65,479 | |
| Oshkosh Corp. | | | 1,322 | | | | 64,500 | |
| Norfolk Southern Corp. | | | 613 | | | | 63,090 | |
| Terex Corp. | | | 2,359 | | | | 62,726 | |
| Jacobs Engineering Group, Inc.* | | | 1,315 | | | | 59,386 | |
| ITT Corp. | | | 1,462 | | | | 58,349 | |
| Timken Co. | | | 1,341 | | | | 56,510 | |
| Kirby Corp.* | | | 752 | | | | 56,438 | |
| Kennametal, Inc. | | | 1,637 | | | | 55,150 | |
| Jabil Circuit, Inc. | | | 2,247 | | | | 52,534 | |
| Con-way, Inc. | | | 1,138 | | | | 50,220 | |
| Avnet, Inc. | | | 1,113 | | | | 49,528 | |
| Triumph Group, Inc. | | | 800 | | | | 47,776 | |
| Stanley Black & Decker, Inc. | | | 484 | | | | 46,154 | |
| Deere & Co. | | | 505 | | | | 44,283 | |
| Arrow Electronics, Inc.* | | | 666 | | | | 40,726 | |
| Trinity Industries, Inc. | | | 1,132 | | | | 40,197 | |
| Sanmina Corp.* | | | 1,601 | | | | 38,728 | |
| Tech Data Corp.* | | | 659 | | | | 38,070 | |
| Waters Corp.* | | | 304 | | | | 37,793 | |
| Raytheon Co. | | | 336 | | | | 36,708 | |
| TE Connectivity Ltd. | | | 501 | | | | 35,882 | |
| Actuant Corp. — Class A | | | 1,488 | | | | 35,325 | |
| Valmont Industries, Inc. | | | 283 | | | | 34,775 | |
| Lincoln Electric Holdings, Inc. | | | 525 | | | | 34,330 | |
| Union Pacific Corp. | | | 310 | | | | 33,576 | |
| Total Industrial | | | | | | | 1,767,340 | |
| | | | | | | | |
| TECHNOLOGY - 11.7% | |
| Intel Corp. | | | 4,221 | | | | 131,990 | |
| International Business Machines Corp. | | | 801 | | | | 128,561 | |
| Micron Technology, Inc.* | | | 4,317 | | | | 117,120 | |
| NetApp, Inc. | | | 3,226 | | | | 114,394 | |
| SanDisk Corp. | | | 1,678 | | | | 106,754 | |
| EMC Corp. | | | 3,394 | | | | 86,751 | |
| Seagate Technology plc | | | 1,607 | | | | 83,612 | |
| Hewlett-Packard Co. | | | 2,595 | | | | 80,860 | |
| Microsoft Corp. | | | 1,946 | | | | 79,115 | |
| Pitney Bowes, Inc. | | | 3,137 | | | | 73,155 | |
| Oracle Corp. | | | 1,674 | | | | 72,233 | |
| Xilinx, Inc. | | | 1,425 | | | | 60,278 | |
| Accenture plc — Class A | | | 631 | | | | 59,118 | |
| QUALCOMM, Inc. | | | 748 | | | | 51,866 | |
| SEE NOTES TO FINANCIAL STATEMENTS. | THE GUGGENHEIM FUNDS SEMI-ANNUAL REPORT | 9 |
SCHEDULE OF INVESTMENTS (Unaudited)(continued) | March 31, 2015 |
| ALPHA OPPORTUNITY FUND | |
| | |
Shares | | | Value | |
| | | | | | | | | |
| Apple, Inc. | | | 348 | | | $ | 43,302 | |
| KLA-Tencor Corp. | | | 740 | | | | 43,135 | |
| Lexmark International, Inc. — Class A | | | 956 | | | | 40,477 | |
| CACI International, Inc. — Class A* | | | 410 | | | | 36,867 | |
| Texas Instruments, Inc. | | | 626 | | | | 35,798 | |
| MKS Instruments, Inc. | | | 1,021 | | | | 34,520 | |
| Total Technology | | | | | | | 1,479,906 | |
| | | | | | | | |
| UTILITIES - 8.9% | |
| Edison International | | | 1,824 | | | | 113,946 | |
| DTE Energy Co. | | | 1,285 | | | | 103,687 | |
| PPL Corp. | | | 2,696 | | | | 90,747 | |
| American Electric Power Company, Inc. | | | 1,604 | | | | 90,225 | |
| PG&E Corp. | | | 1,643 | | | | 87,194 | |
| AGL Resources, Inc. | | | 1,641 | | | | 81,477 | |
| National Fuel Gas Co. | | | 1,156 | | | | 69,741 | |
| OGE Energy Corp. | | | 2,038 | | | | 64,421 | |
| Global Partners, LP | | | 1,648 | | | | 57,350 | |
| Questar Corp. | | | 2,268 | | | | 54,114 | |
| Vectren Corp. | | | 1,221 | | | | 53,895 | |
| MDU Resources Group, Inc. | | | 2,351 | | | | 50,170 | |
| UGI Corp. | | | 1,511 | | | | 49,243 | |
| Great Plains Energy, Inc. | | | 1,585 | | | | 42,288 | |
| PNM Resources, Inc. | | | 1,304 | | | | 38,077 | |
| NextEra Energy, Inc. | | | 358 | | | | 37,250 | |
| Westar Energy, Inc. | | | 952 | | | | 36,900 | |
| Total Utilities | | | | | | | 1,120,725 | |
| | | | | | | | |
| FINANCIAL - 7.8% | |
| Brixmor Property Group, Inc. | | | 4,694 | | | | 124,626 | |
| Hartford Financial Services Group, Inc. | | | 2,540 | | | | 106,224 | |
| Aflac, Inc. | | | 1,500 | | | | 96,015 | |
| Prudential Financial, Inc. | | | 1,034 | | | | 83,041 | |
| American International Group, Inc. | | | 1,401 | | | | 76,762 | |
| MetLife, Inc. | | | 1,317 | | | | 66,574 | |
| Nationstar Mortgage Holdings, Inc.* | | | 2,282 | | | | 56,526 | |
| Principal Financial Group, Inc. | | | 957 | | | | 49,161 | |
| Assurant, Inc. | | | 723 | | | | 44,399 | |
| Berkshire Hathaway, Inc. — Class B* | | | 297 | | | | 42,863 | |
| Regions Financial Corp. | | | 4,464 | | | | 42,185 | |
| Loews Corp. | | | 1,033 | | | | 42,177 | |
| TCF Financial Corp. | | | 2,504 | | | | 39,363 | |
| ProAssurance Corp. | | | 850 | | | | 39,024 | |
| Charles Schwab Corp. | | | 1,221 | | | | 37,167 | |
| Northern Trust Corp. | | | 525 | | | | 36,566 | |
| Total Financial | | | | | | | 982,673 | |
| | | | | | | | |
| CONSUMER, CYCLICAL - 4.1% | |
| Wal-Mart Stores, Inc. | | | 2,202 | | | | 181,115 | |
| CVS Health Corp. | | | 785 | | | | 81,020 | |
| PACCAR, Inc. | | | 1,139 | | | | 71,916 | |
| Ingram Micro, Inc. — Class A* | | | 2,067 | | | | 51,923 | |
| Dana Holding Corp. | | | 2,200 | | | | 46,552 | |
| Costco Wholesale Corp. | | | 275 | | | | 41,661 | |
| WW Grainger, Inc. | | | 155 | | | | 36,551 | |
| Total Consumer, Cyclical | | | | | | | 510,738 | |
| | | | | | | | |
| COMMUNICATIONS - 2.9% | |
| Time Warner, Inc. | | | 1,007 | | | | 85,032 | |
| Scripps Networks Interactive, Inc. — Class A | | | 854 | | | | 58,550 | |
| General Communication, Inc. — Class A* | | | 3,438 | | | | 54,183 | |
| VeriSign, Inc.* | | | 786 | | | | 52,638 | |
| Viacom, Inc. — Class B | | | 728 | | | | 49,722 | |
| NETGEAR, Inc.* | | | 1,131 | | | | 37,187 | |
| Cablevision Systems Corp. — Class A | | | 1,849 | | | | 33,837 | |
| Total Communications | | | | | | | 371,149 | |
| | | | | | | | |
| ENERGY - 1.5% | |
| ConocoPhillips | | | 837 | | | | 52,111 | |
| Chevron Corp. | | | 489 | | | | 51,335 | |
| Marathon Oil Corp. | | | 1,641 | | | | 42,847 | |
| Anadarko Petroleum Corp. | | | 517 | | | | 42,813 | |
| Total Energy | | | | | | | 189,106 | |
| | | | | | | | |
| BASIC MATERIALS - 0.6% | |
| United States Steel Corp. | | | 1,621 | | | | 39,552 | |
| Nucor Corp. | | | 775 | | | | 36,836 | |
| Total Basic Materials | | | | | | | 76,388 | |
| | | | | | | | |
| Total Common Stocks | | | | | | | | |
| (Cost $10,118,180) | | | | | | | 10,133,260 | |
| | | | | | | | |
SHORT TERM INVESTMENTS† - 8.0% | |
| Goldman Sachs Financial Square Funds - Treasury Instruments Fund 0.00% | | | 1,002,886 | | | | 1,002,886 | |
| Total Short Term Investments | | | | | | | | |
| (Cost $1,002,886) | | | | | | | 1,002,886 | |
| | | | | | | | |
| Total Investments - 88.3% | | | | | | | | |
| (Cost $11,121,066) | | | | | | | 11,136,146 | |
| | | | | | | | |
COMMON STOCKS SOLD SHORT† - (66.1)% | |
| MIDSTREAM OIL – (0.0)% | |
| Magellan Midstream Partners, LP | | | 36 | | | | (2,762 | ) |
| | | | | | | | |
| UTILITIES - (0.7)% | |
| NiSource, Inc. | | | 1,006 | | | | (44,425 | ) |
| Dominion Resources, Inc. | | | 633 | | | | (44,861 | ) |
| Total Utilities | | | | | | | (89,286 | ) |
| | | | | | | | |
| ENERGY - (1.9)% | |
| Crestwood Equity Partners, LP | | | 230 | | | | (1,380 | ) |
| Rose Rock Midstream, LP | | | 51 | | | | (2,423 | ) |
| Holly Energy Partners, LP | | | 79 | | | | (2,484 | ) |
| NuStar GP Holdings LLC | | | 106 | | | | (3,752 | ) |
| Tesoro Logistics, LP | | | 97 | | | | (5,219 | ) |
| Genesis Energy, LP | | | 150 | | | | (7,050 | ) |
| ONEOK, Inc. | | | 261 | | | | (12,591 | ) |
| SemGroup Corp. — Class A | | | 156 | | | | (12,689 | ) |
| 10 | THE GUGGENHEIM FUNDS SEMI-ANNUAL REPORT | SEE NOTES TO FINANCIAL STATEMENTS. |
SCHEDULE OF INVESTMENTS (Unaudited)(continued) | March 31, 2015 |
| ALPHA OPPORTUNITY FUND | |
| | |
Shares | | | Value | |
| | | | | | | | | |
| Williams Companies, Inc. | | | 260 | | | $ | (13,153 | ) |
| Gulfport Energy Corp.* | | | 887 | | | | (40,722 | ) |
| Exterran Holdings, Inc. | | | 1,246 | | | | (41,828 | ) |
| Marathon Petroleum Corp. | | | 429 | | | | (43,925 | ) |
| Spectra Energy Corp. | | | 1,351 | | | | (48,866 | ) |
| Total Energy | | | | | | | (236,082 | ) |
| | | | | | | | |
| TECHNOLOGY - (3.3)% | |
| CommVault Systems, Inc.* | | | 757 | | | | (33,081 | ) |
| Intuit, Inc. | | | 373 | | | | (36,166 | ) |
| Allscripts Healthcare Solutions, Inc.* | | | 3,051 | | | | (36,490 | ) |
| Akamai Technologies, Inc.* | | | 521 | | | | (37,014 | ) |
| Ultimate Software Group, Inc.* | | | 222 | | | | (37,730 | ) |
| Cognizant Technology Solutions Corp. — Class A* | | | 675 | | | | (42,113 | ) |
| Bottomline Technologies de, Inc.* | | | 1,578 | | | | (43,190 | ) |
| Cerner Corp.* | | | 641 | | | | (46,960 | ) |
| Solera Holdings, Inc. | | | 920 | | | | (47,527 | ) |
| Adobe Systems, Inc.* | | | 786 | | | | (58,117 | ) |
| Total Technology | | | | | | | (418,388 | ) |
| | | | | | | | |
| COMMUNICATIONS - (3.6)% | |
| Walt Disney Co. | | | 345 | | | | (36,187 | ) |
| ViaSat, Inc.* | | | 713 | | | | (42,502 | ) |
| Nielsen N.V. | | | 1,173 | | | | (52,281 | ) |
| Fortinet, Inc.* | | | 1,601 | | | | (55,955 | ) |
| Priceline Group, Inc.* | | | 51 | | | | (59,372 | ) |
| Facebook, Inc. — Class A* | | | 975 | | | | (80,160 | ) |
| Amazon.com, Inc.* | | | 329 | | | | (122,420 | ) |
| Total Communications | | | | | | | (448,877 | ) |
| | | | | | | | |
| BASIC MATERIALS - (5.3)% | |
| HB Fuller Co. | | | 824 | | | | (35,325 | ) |
| Dow Chemical Co. | | | 756 | | | | (36,273 | ) |
| RPM International, Inc. | | | 944 | | | | (45,303 | ) |
| Allegheny Technologies, Inc. | | | 1,661 | | | | (49,847 | ) |
| Eastman Chemical Co. | | | 730 | | | | (50,560 | ) |
| Minerals Technologies, Inc. | | | 712 | | | | (52,047 | ) |
| Cytec Industries, Inc. | | | 1,023 | | | | (55,283 | ) |
| Valspar Corp. | | | 660 | | | | (55,459 | ) |
| Praxair, Inc. | | | 487 | | | | (58,800 | ) |
| Ashland, Inc. | | | 523 | | | | (66,583 | ) |
| Ecolab, Inc. | | | 616 | | | | (70,458 | ) |
| Compass Minerals International, Inc. | | | 1,006 | | | | (93,769 | ) |
| Total Basic Materials | | | | | | | (669,707 | ) |
| | | | | | | | |
| INDUSTRIAL - (7.5)% | |
| Martin Midstream Partners, LP | | | 20 | | | | (709 | ) |
| Greif, Inc. — Class A | | | 878 | | | | (34,479 | ) |
| Graco, Inc. | | | 478 | | | | (34,492 | ) |
| CH Robinson Worldwide, Inc. | | | 492 | | | | (36,024 | ) |
| Allegion plc | | | 622 | | | | (38,048 | ) |
| Kansas City Southern | | | 384 | | | | (39,199 | ) |
| Knight Transportation, Inc. | | | 1,244 | | | | (40,119 | ) |
| B/E Aerospace, Inc. | | | 646 | | | | (41,099 | ) |
| UTI Worldwide, Inc.* | | | 3,665 | | | | (45,080 | ) |
| TimkenSteel Corp. | | | 1,764 | | | | (46,693 | ) |
| Lennox International, Inc. | | | 419 | | | | (46,798 | ) |
| Pall Corp. | | | 467 | | | | (46,882 | ) |
| Packaging Corporation of America | | | 687 | | | | (53,717 | ) |
| AMETEK, Inc. | | | 1,050 | | | | (55,167 | ) |
| Roper Industries, Inc. | | | 322 | | | | (55,384 | ) |
| Louisiana-Pacific Corp.* | | | 3,537 | | | | (58,396 | ) |
| Bemis Company, Inc. | | | 1,305 | | | | (60,434 | ) |
| General Electric Co. | | | 2,573 | | | | (63,836 | ) |
| Stericycle, Inc.* | | | 456 | | | | (64,036 | ) |
| Sealed Air Corp. | | | 1,754 | | | | (79,911 | ) |
| Total Industrial | | | | | | | (940,503 | ) |
| | | | | | | | |
| CONSUMER, NON-CYCLICAL - (7.8)% | |
| Alkermes plc* | | | 340 | | | | (20,730 | ) |
| ACADIA Pharmaceuticals, Inc.* | | | 640 | | | | (20,858 | ) |
| Repligen Corp.* | | | 765 | | | | (23,225 | ) |
| Halozyme Therapeutics, Inc.* | | | 1,655 | | | | (23,633 | ) |
| Neurocrine Biosciences, Inc.* | | | 597 | | | | (23,707 | ) |
| Alnylam Pharmaceuticals, Inc.* | | | 229 | | | | (23,912 | ) |
| Ultragenyx Pharmaceutical, Inc.* | | | 389 | | | | (24,153 | ) |
| Biogen, Inc.* | | | 59 | | | | (24,912 | ) |
| Incyte Corp.* | | | 276 | | | | (25,298 | ) |
| Medivation, Inc.* | | | 201 | | | | (25,943 | ) |
| NewLink Genetics Corp.* | | | 491 | | | | (26,863 | ) |
| Anacor Pharmaceuticals, Inc.* | | | 486 | | | | (28,115 | ) |
| Insmed, Inc.* | | | 1,444 | | | | (30,035 | ) |
| Bluebird Bio, Inc.* | | | 249 | | | | (30,072 | ) |
| Receptos, Inc.* | | | 195 | | | | (32,154 | ) |
| Brown-Forman Corp. — Class B | | | 400 | | | | (36,140 | ) |
| Avery Dennison Corp. | | | 686 | | | | (36,296 | ) |
| Church & Dwight Company, Inc. | | | 427 | | | | (36,474 | ) |
| Monro Muffler Brake, Inc. | | | 579 | | | | (37,664 | ) |
| WhiteWave Foods Co. — Class A* | | | 871 | | | | (38,620 | ) |
| Perrigo Company plc | | | 265 | | | | (43,871 | ) |
| Robert Half International, Inc. | | | 780 | | | | (47,206 | ) |
| Cooper Companies, Inc. | | | 260 | | | | (48,729 | ) |
| Akorn, Inc.* | | | 1,061 | | | | (50,408 | ) |
| Equifax, Inc. | | | 556 | | | | (51,708 | ) |
| Endo International plc* | | | 600 | | | | (53,820 | ) |
| Edwards Lifesciences Corp.* | | | 392 | | | | (55,844 | ) |
| McGraw Hill Financial, Inc. | | | 655 | | | | (67,727 | ) |
| Total Consumer, Non-cyclical | | | | | | | (988,117 | ) |
| | | | | | | | |
| CONSUMER, CYCLICAL - (14.7)% | |
| Polaris Industries, Inc. | | | 236 | | | | (33,300 | ) |
| Home Depot, Inc. | | | 316 | | | | (35,901 | ) |
| Johnson Controls, Inc. | | | 718 | | | | (36,216 | ) |
| Ross Stores, Inc. | | | 346 | | | | (36,455 | ) |
| Domino’s Pizza, Inc. | | | 368 | | | | (37,002 | ) |
| Texas Roadhouse, Inc. — Class A | | | 1,019 | | | | (37,122 | ) |
| Leggett & Platt, Inc. | | | 808 | | | | (37,241 | ) |
| SEE NOTES TO FINANCIAL STATEMENTS. | THE GUGGENHEIM FUNDS SEMI-ANNUAL REPORT | 11 |
SCHEDULE OF INVESTMENTS (Unaudited)(continued) | March 31, 2015 |
| ALPHA OPPORTUNITY FUND | |
| | |
Shares | | | Value | |
| | | | | | | | | |
| Fastenal Co. | | | 910 | | | $ | (37,706 | ) |
| L Brands, Inc. | | | 412 | | | | (38,847 | ) |
| Cinemark Holdings, Inc. | | | 868 | | | | (39,121 | ) |
| G-III Apparel Group Ltd.* | | | 349 | | | | (39,315 | ) |
| World Fuel Services Corp. | | | 694 | | | | (39,891 | ) |
| Carter’s, Inc. | | | 448 | | | | (41,427 | ) |
| Meritage Homes Corp.* | | | 853 | | | | (41,490 | ) |
| Marriott International, Inc. — Class A | | | 523 | | | | (42,007 | ) |
| Standard Pacific Corp.* | | | 4,751 | | | | (42,759 | ) |
| American Eagle Outfitters, Inc. | | | 2,505 | | | | (42,785 | ) |
| Whirlpool Corp. | | | 212 | | | | (42,837 | ) |
| Mohawk Industries, Inc.* | | | 234 | | | | (43,466 | ) |
| VF Corp. | | | 581 | | | | (43,755 | ) |
| Tractor Supply Co. | | | 518 | | | | (44,061 | ) |
| Signet Jewelers Ltd. | | | 319 | | | | (44,274 | ) |
| Buffalo Wild Wings, Inc.* | | | 251 | | | | (45,491 | ) |
| Lithia Motors, Inc. — Class A | | | 462 | | | | (45,927 | ) |
| Carnival Corp. | | | 985 | | | | (47,122 | ) |
| Thor Industries, Inc. | | | 754 | | | | (47,660 | ) |
| Kate Spade & Co.* | | | 1,566 | | | | (52,289 | ) |
| O’Reilly Automotive, Inc.* | | | 259 | | | | (56,006 | ) |
| Harman International Industries, Inc. | | | 425 | | | | (56,793 | ) |
| Pinnacle Entertainment, Inc.* | | | 1,628 | | | | (58,755 | ) |
| NIKE, Inc. — Class B | | | 616 | | | | (61,803 | ) |
| Skechers U.S.A., Inc. — Class A* | | | 875 | | | | (62,921 | ) |
| DR Horton, Inc. | | | 2,280 | | | | (64,934 | ) |
| Yum! Brands, Inc. | | | 843 | | | | (66,362 | ) |
| Jarden Corp.* | | | 1,330 | | | | (70,357 | ) |
| Hanesbrands, Inc. | | | 2,326 | | | | (77,944 | ) |
| Royal Caribbean Cruises Ltd. | | | 965 | | | | (78,986 | ) |
| Cabela’s, Inc.* | | | 1,439 | | | | (80,555 | ) |
| Total Consumer, Cyclical | | | | | | | (1,850,883 | ) |
| | | | | | | | |
| FINANCIAL - (21.3)% | |
| PennyMac Financial Services, Inc. — Class A* | | | 216 | | | | (3,666 | ) |
| Dime Community Bancshares, Inc. | | | 386 | | | | (6,215 | ) |
| Essent Group Ltd.* | | | 471 | | | | (11,262 | ) |
| Capitol Federal Financial, Inc. | | | 903 | | | | (11,288 | ) |
| MGIC Investment Corp.* | | | 1,364 | | | | (13,135 | ) |
| Equity One, Inc. | | | 912 | | | | (24,341 | ) |
| Boston Private Financial Holdings, Inc. | | | 2,913 | | | | (35,393 | ) |
| Iron Mountain, Inc. | | | 984 | | | | (35,896 | ) |
| Education Realty Trust, Inc. | | | 1,028 | | | | (36,371 | ) |
| First Niagara Financial Group, Inc. | | | 4,130 | | | | (36,509 | ) |
| United Bankshares, Inc. | | | 979 | | | | (36,791 | ) |
| PNC Financial Services Group, Inc. | | | 395 | | | | (36,830 | ) |
| Boston Properties, Inc. | | | 264 | | | | (37,087 | ) |
| First Horizon National Corp. | | | 2,611 | | | | (37,311 | ) |
| Parkway Properties, Inc. | | | 2,196 | | | | (38,101 | ) |
| Navient Corp. | | | 1,876 | | | | (38,139 | ) |
| American Campus Communities, Inc. | | | 936 | | | | (40,126 | ) |
| Financial Engines, Inc. | | | 996 | | | | (41,663 | ) |
| National Retail Properties, Inc. | | | 1,031 | | | | (42,240 | ) |
| Public Storage | | | 217 | | | | (42,779 | ) |
| E*TRADE Financial Corp.* | | | 1,517 | | | | (43,318 | ) |
| Medical Properties Trust, Inc. | | | 2,979 | | | | (43,910 | ) |
| PrivateBancorp, Inc. — Class A | | | 1,251 | | | | (43,998 | ) |
| Simon Property Group, Inc. | | | 227 | | | | (44,410 | ) |
| SVB Financial Group* | | | 353 | | | | (44,845 | ) |
| Alexandria Real Estate Equities, Inc. | | | 458 | | | | (44,902 | ) |
| HCP, Inc. | | | 1,093 | | | | (47,229 | ) |
| Kilroy Realty Corp. | | | 623 | | | | (47,454 | ) |
| Cousins Properties, Inc. | | | 4,538 | | | | (48,103 | ) |
| Invesco Ltd. | | | 1,229 | | | | (48,779 | ) |
| Citigroup, Inc. | | | 969 | | | | (49,923 | ) |
| Equity Residential | | | 653 | | | | (50,843 | ) |
| Sovran Self Storage, Inc. | | | 544 | | | | (51,104 | ) |
| Valley National Bancorp | | | 5,465 | | | | (51,590 | ) |
| Vornado Realty Trust | | | 461 | | | | (51,632 | ) |
| Sabra Health Care REIT, Inc. | | | 1,601 | | | | (53,073 | ) |
| Senior Housing Properties Trust | | | 2,397 | | | | (53,189 | ) |
| Plum Creek Timber Company, Inc. | | | 1,230 | | | | (53,444 | ) |
| FNB Corp. | | | 4,159 | | | | (54,649 | ) |
| UDR, Inc. | | | 1,612 | | | | (54,856 | ) |
| Goldman Sachs Group, Inc. | | | 297 | | | | (55,827 | ) |
| AvalonBay Communities, Inc. | | | 322 | | | | (56,109 | ) |
| EPR Properties | | | 947 | | | | (56,848 | ) |
| BB&T Corp. | | | 1,472 | | | | (57,393 | ) |
| U.S. Bancorp | | | 1,373 | | | | (59,959 | ) |
| Crown Castle International Corp. | | | 735 | | | | (60,667 | ) |
| Ventas, Inc. | | | 832 | | | | (60,753 | ) |
| Taubman Centers, Inc. | | | 807 | | | | (62,244 | ) |
| Federal Realty Investment Trust | | | 461 | | | | (67,864 | ) |
| General Growth Properties, Inc. | | | 2,393 | | | | (70,713 | ) |
| Regency Centers Corp. | | | 1,094 | | | | (74,436 | ) |
| Health Care REIT, Inc. | | | 1,000 | | | | (77,359 | ) |
| Kite Realty Group Trust | | | 2,876 | | | | (81,017 | ) |
| Morgan Stanley | | | 2,340 | | | | (83,515 | ) |
| Kimco Realty Corp. | | | 3,160 | | | | (84,846 | ) |
| Realty Income Corp. | | | 1,782 | | | | (91,948 | ) |
| Total Financial | | | | | | | (2,687,892 | ) |
| | | | | | | | |
| Total Common Stocks Sold Short | | | | | | | | |
| (Proceeds $8,205,135) | | | | | | | (8,332,497 | ) |
| | | | | | | | |
EXCHANGE-TRADED FUNDS SOLD SHORT† - (1.6)% | |
| SPDR S&P Biotech ETF | | | 881 | | | | (198,666 | ) |
| Total Exchange-Traded Funds Sold Short | | | | | | | | |
| (Proceeds $201,023) | | | | | | | (198,666 | ) |
| 12 | THE GUGGENHEIM FUNDS SEMI-ANNUAL REPORT | SEE NOTES TO FINANCIAL STATEMENTS. |
SCHEDULE OF INVESTMENTS (Unaudited)(continued) | March 31, 2015 |
| ALPHA OPPORTUNITY FUND | |
| | | | | | | | | |
| | |
Shares | | | Value | |
| | | | | | | | |
CLOSED-END FUNDS SOLD SHORT† - (0.2)% | |
| Herzfeld Caribbean Basin Fund, Inc. | | | 3,390 | | | $ | (31,358 | ) |
| Total Closed-End Funds Sold Short | | | | | | | | |
| (Proceeds $36,671) | | | | | | | (31,358 | ) |
| Total Securities Sold Short - (67.9)% | | | | | | | | |
| (Proceeds $8,442,829) | | | | | | $ | (8,562,521 | ) |
| Other Assets & Liabilities, net - 79.6% | | | | | | | 10,038,846 | |
| Total Net Assets - 100.0% | | | | | | $ | 12,612,471 | |
| | | | | | | | | |
| |
| | | Units | | | Unrealized Gain (Loss) | |
| |
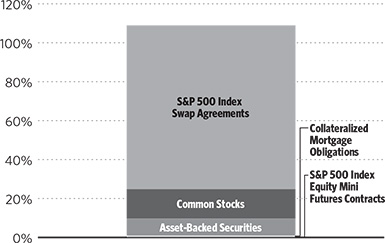
OTC TOTAL RETURN SWAP AGREEMENTS†† | |
Morgan Stanley
February 2016 Alpha Opportunity Short
Custom Basket Swap,
Terminating 02/03/161
(Notional Value $4,091,459) | | | 74,791 | | | $ | (92,111 | ) |
Morgan Stanley
February 2016 Alpha Opportunity Long
Custom Basket Swap,
Terminating 02/03/162
(Notional Value $5,987,766) | | | 155,568 | | | $ | (125,698 | ) |
| | | | | | | | |
| | | Shares | | | | |
| |
CUSTOM BASKET OF LONG SECURITIES2 | |
| Kroger Co. | | | 1,704 | | | | 12,100 | |
| Agilent Technologies, Inc. | | | 2,662 | | | | 8,412 | |
| Express Scripts Holding Co.* | | | 1,591 | | | | 7,145 | |
| Telephone & Data Systems, Inc. | | | 4,447 | | | | 6,896 | |
| Valero Energy Corp. | | | 1,390 | | | | 6,259 | |
| AES Corp. | | | 9,417 | | | | 5,218 | |
| General Mills, Inc. | | | 1,431 | | | | 4,869 | |
| PAREXEL International Corp.* | | | 882 | | | | 3,812 | |
| Western Union Co. | | | 2,777 | | | | 3,125 | |
| The Gap, Inc. | | | 2,178 | | | | 2,742 | |
| Allstate Corp. | | | 1,893 | | | | 2,725 | |
| Southwest Gas Corp. | | | 1,011 | | | | 2,709 | |
| CA, Inc. | | | 3,614 | | | | 2,607 | |
| DST Systems, Inc. | | | 569 | | | | 2,485 | |
| Macy’s, Inc. | | | 1,234 | | | | 2,407 | |
| NRG Energy, Inc. | | | 3,619 | | | | 2,391 | |
| Progressive Corp. | | | 2,342 | | | | 1,772 | |
| Atlantic Tele-Network, Inc. | | | 1,245 | | | | 1,580 | |
| Bank of New York Mellon Corp. | | | 1,505 | | | | 1,236 | |
| Clean Harbors, Inc.* | | | 1,281 | | | | 1,163 | |
| Travelers Companies, Inc. | | | 993 | | | | 1,145 | |
| Chubb Corp. | | | 538 | | | | 520 | |
| Alaska Air Group, Inc. | | | 1,068 | | | | 498 | |
| WR Berkley Corp. | | | 1,080 | | | | 487 | |
| Caterpillar, Inc. | | | 1,532 | | | | 355 | |
| DENTSPLY International, Inc. | | | 727 | | | | 184 | |
| Quanta Services, Inc.* | | | 1,915 | | | | (144 | ) |
| CR Bard, Inc. | | | 384 | | | | (227 | ) |
| Medtronic plc | | | 1,111 | | | | (241 | ) |
| Delta Air Lines, Inc. | | | 1,246 | | | | (326 | ) |
| AT&T, Inc. | | | 1,096 | | | | (365 | ) |
| General Dynamics Corp. | | | 404 | | | | (469 | ) |
| Comerica, Inc. | | | 1,431 | | | | (670 | ) |
| Teradata Corp.* | | | 1,806 | | | | (958 | ) |
| Northrop Grumman Corp. | | | 333 | | | | (990 | ) |
| First Solar, Inc.* | | | 925 | | | | (1,103 | ) |
| Everest Re Group Ltd. | | | 342 | | | | (1,326 | ) |
| JPMorgan Chase & Co. | | | 1,018 | | | | (1,358 | ) |
| State Street Corp. | | | 902 | | | | (1,394 | ) |
| Johnson & Johnson | | | 949 | | | | (1,514 | ) |
| Archer-Daniels-Midland Co. | | | 3,864 | | | | (1,573 | ) |
| Fossil Group, Inc.* | | | 618 | | | | (1,598 | ) |
| Dover Corp. | | | 1,623 | | | | (1,611 | ) |
| Franklin Resources, Inc. | | | 1,036 | | | | (2,117 | ) |
| Cummins, Inc. | | | 464 | | | | (2,278 | ) |
| Symantec Corp. | | | 2,619 | | | | (2,386 | ) |
| St. Jude Medical, Inc. | | | 1,443 | | | | (2,716 | ) |
| Juniper Networks, Inc. | | | 4,058 | | | | (3,023 | ) |
| Computer Sciences Corp. | | | 767 | | | | (3,695 | ) |
| Kimberly-Clark Corp. | | | 1,270 | | | | (3,833 | ) |
| Procter & Gamble Co. | | | 1,090 | | | | (4,086 | ) |
| Murphy Oil Corp. | | | 1,331 | | | | (4,178 | ) |
| AbbVie, Inc. | | | 974 | | | | (4,509 | ) |
| Apache Corp. | | | 879 | | | | (5,120 | ) |
| Public Service Enterprise Group, Inc. | | | 3,011 | | | | (5,266 | ) |
| Chesapeake Energy Corp. | | | 3,880 | | | | (5,406 | ) |
| Cisco Systems, Inc. | | | 3,054 | | | | (5,481 | ) |
| FedEx Corp. | | | 617 | | | | (5,738 | ) |
| Hess Corp. | | | 881 | | | | (5,787 | ) |
| Xerox Corp. | | | 11,404 | | | | (5,887 | ) |
| Windstream Holdings, Inc. | | | 9,585 | | | | (7,050 | ) |
| Avon Products, Inc. | | | 10,789 | | | | (7,476 | ) |
| Consolidated Edison, Inc. | | | 836 | | | | (8,661 | ) |
| Philip Morris International, Inc. | | | 1,516 | | | | (9,047 | ) |
| Ameren Corp. | | | 2,239 | | | | (9,584 | ) |
| Pinnacle West Capital Corp. | | | 1,443 | | | | (11,110 | ) |
| Corning, Inc. | | | 5,524 | | | | (11,499 | ) |
| CenturyLink, Inc. | | | 4,067 | | | | (11,844 | ) |
| Western Digital Corp. | | | 987 | | | | (13,853 | ) |
| CenterPoint Energy, Inc. | | | 5,549 | | | | (16,496 | ) |
| Entergy Corp. | | | 1,558 | | | | (16,547 | ) |
| Total Long Swap Holdings | | | | | | | (125,698 | ) |
| | | | | | | | |
CUSTOM BASKET OF SHORT SECURITIES1 | |
| SunCoke Energy, Inc. | | | 3,569 | | | | 9,425 | |
| TripAdvisor, Inc.* | | | 1,168 | | | | 7,616 | |
| SEE NOTES TO FINANCIAL STATEMENTS. | THE GUGGENHEIM FUNDS SEMI-ANNUAL REPORT | 13 |
SCHEDULE OF INVESTMENTS (Unaudited)(concluded) | March 31, 2015 |
| ALPHA OPPORTUNITY FUND | |
| | | Shares | | | Unrealized
Gain (Loss) | |
| | | | | | | | | |
| Freeport-McMoRan, Inc. | | | 3,992 | | | $ | 6,721 | |
| Autodesk, Inc.* | | | 1,503 | | | | 5,613 | |
| Discovery Communications, Inc. — Class C* | | | 2,009 | | | | 5,231 | |
| CF Industries Holdings, Inc. | | | 172 | | | | 3,803 | |
| Airgas, Inc. | | | 547 | | | | 3,773 | |
| Vertex Pharmaceuticals, Inc.* | | | 745 | | | | 2,218 | |
| American Tower Corp. — Class A | | | 520 | | | | 2,216 | |
| Mosaic Co. | | | 994 | | | | 2,083 | |
| Air Products & Chemicals, Inc. | | | 448 | | | | 1,846 | |
| Monsanto Co. | | | 304 | | | | 1,797 | |
| Ball Corp. | | | 1,253 | | | | 1,023 | |
| EI du Pont de Nemours & Co. | | | 818 | | | | 945 | |
| Danaher Corp. | | | 751 | | | | 908 | |
| HollyFrontier Corp. | | | 1,928 | | | | 825 | |
| Rayonier, Inc. | | | 2,385 | | | | 719 | |
| BlackRock, Inc. — Class A | | | 171 | | | | 558 | |
| SL Green Realty Corp. | | | 894 | | | | 295 | |
| PPG Industries, Inc. | | | 376 | | | | 252 | |
| Newell Rubbermaid, Inc. | | | 2,002 | | | | 104 | |
| SunTrust Banks, Inc. | | | 2,223 | | | | (219 | ) |
| FMC Corp. | | | 1,526 | | | | (298 | ) |
| Intercontinental Exchange, Inc. | | | 412 | | | | (363 | ) |
| People’s United Financial, Inc. | | | 5,436 | | | | (533 | ) |
| Essex Property Trust, Inc. | | | 350 | | | | (577 | ) |
| Associated Banc-Corp. | | | 4,162 | | | | (715 | ) |
| Extra Space Storage, Inc. | | | 1,066 | | | | (835 | ) |
| Wabtec Corp. | | | 675 | | | | (903 | ) |
| New York Community Bancorp, Inc. | | | 6,565 | | | | (924 | ) |
| Bank of the Ozarks, Inc. | | | 2,007 | | | | (1,159 | ) |
| Tesoro Corp. | | | 1,152 | | | | (1,564 | ) |
| salesforce.com, Inc.* | | | 1,328 | | | | (2,176 | ) |
| Sherwin-Williams Co. | | | 227 | | | | (2,197 | ) |
| Eagle Materials, Inc. | | | 782 | | | | (2,300 | ) |
| Mobile Mini, Inc. | | | 1,666 | | | | (2,461 | ) |
| Starwood Hotels & Resorts Worldwide, Inc. | | | 1,001 | | | | (2,511 | ) |
| Signature Bank* | | | 526 | | | | (2,742 | ) |
| Williams Companies, Inc. | | | 1,868 | | | | (3,635 | ) |
| Men’s Wearhouse, Inc. | | | 749 | | | | (3,781 | ) |
| Toll Brothers, Inc.* | | | 979 | | | | (4,320 | ) |
| Starbucks Corp. | | | 768 | | | | (4,381 | ) |
| Webster Financial Corp. | | | 1,979 | | | | (4,492 | ) |
| International Flavors & Fragrances, Inc. | | | 515 | | | | (5,530 | ) |
| AmerisourceBergen Corp. — Class A | | | 670 | | | | (6,905 | ) |
| CME Group, Inc. — Class A | | | 1,087 | | | | (7,212 | ) |
| CarMax, Inc.* | | | 1,836 | | | | (7,781 | ) |
| Skyworks Solutions, Inc. | | | 563 | | | | (7,988 | ) |
| Lennar Corp. — Class A | | | 1,429 | | | | (8,132 | ) |
| Avago Technologies Ltd. | | | 423 | | | | (8,874 | ) |
| Red Hat, Inc.* | | | 1,084 | | | | (9,269 | ) |
| Under Armour, Inc. — Class A* | | | 1,430 | | | | (10,847 | ) |
| Vulcan Materials Co. | | | 1,070 | | | | (13,936 | ) |
| Martin Marietta Materials, Inc. | | | 688 | | | | (20,522 | ) |
| Total Short Swap Holdings | | | | | | | (92,111 | ) |
| * | Non-income producing security. |
| † | Value determined based on Level 1 inputs — See Note 4. |
| †† | Value determined based on Level 2 inputs — See Note 4. |
| 1 | Total Return is based on the return of the basket of short securities +/- financing at a variable rate. |
| 2 | Total Return is based on the return of the basket of long securities +/- financing at a variable rate. |
| plc — Public Limited Company |
| REIT— Real Estate Investment Trust |
| |
| See Sector Classification in Other Information section. |
| 14 | THE GUGGENHEIM FUNDS SEMI-ANNUAL REPORT | SEE NOTES TO FINANCIAL STATEMENTS. |
STATEMENT OF ASSETS AND LIABILITIES (Unaudited)
March 31, 2015
| Assets: | |
| Investments, at value (cost $11,121,066) | | $ | 11,136,146 | |
| Segregated cash with broker | | | 10,039,753 | |
| Cash | | | 124,249 | |
| Prepaid expenses | | | 49,251 | |
| Receivables: | |
| Securities sold | | | 446,925 | |
| Fund shares sold | | | 28,347 | |
| Investment adviser | | | 17,303 | |
| Dividends | | | 14,940 | |
| Total assets | | | 21,856,914 | |
| | | | | |
| Liabilities: | |
| Securities sold short, at value (proceeds $8,442,829) | | | 8,562,521 | |
| Unrealized depreciation on swap agreements | | | 217,809 | |
| Payable for: | |
| Securities purchased | | | 385,804 | |
| Swap settlement | | | 23,337 | |
| Management fees | | | 13,043 | |
| Distribution and service fees | | | 2,939 | |
| Transfer agent/maintenance fees | | | 2,381 | |
| Fund accounting/administration fees | | | 2,123 | |
| Trustees’ fees* | | | 245 | |
| Fund shares redeemed | | | 117 | |
| Miscellaneous | | | 34,124 | |
| Total liabilities | | | 9,244,443 | |
| Net assets | | $ | 12,612,471 | |
| | | | | |
| Net assets consist of: | |
| Paid in capital | | $ | 18,034,229 | |
| Accumulated net investment loss | | | (109,665 | ) |
| Accumulated net realized loss on investments | | | (4,989,672 | ) |
| Net unrealized depreciation on investments | | | (322,421 | ) |
| Net assets | | $ | 12,612,471 | |
| | | | | |
| A-Class: | |
| Net assets | | $ | 9,516,901 | |
| Capital shares outstanding | | | 509,455 | |
| Net asset value per share | | $ | 18.68 | |
| Maximum offering price per share (Net asset value divided by 95.25%) | | $ | 19.61 | |
| | | | | |
| C-Class: | |
| Net assets | | $ | 1,178,650 | |
| Capital shares outstanding | | | 70,191 | |
| Net asset value per share | | $ | 16.79 | |
| | | | | |
| Institutional Class: | |
| Net assets | | $ | 1,916,920 | |
| Capital shares outstanding | | | 73,431 | |
| Net asset value per share | | $ | 26.11 | |
STATEMENT OF OPERATIONS (Unaudited)
Period Ended March 31, 2015
| Investment Income: | |
| Dividends (net of foreign withholding tax of $13) | | $ | 43,071 | |
| Interest | | | 11 | |
| Total investment income | | | 43,082 | |
| | | | | |
| Expenses: | |
| Management fees | | | 69,724 | |
| Transfer agent/maintenance fees: | |
| A-Class | | | 10,214 | |
| C-Class | | | 1,943 | |
| Institutional Class | | | 1,404 | |
| Distribution and service fees: | |
| A-Class | | | 10,439 | |
| C-Class | | | 5,306 | |
| Fund accounting/administration fees | | | 12,465 | |
| Legal fees | | | 53,585 | |
| Short sales dividend expense | | | 24,968 | |
| Custodian fees | | | 24,256 | |
| Professional fees | | | 15,613 | |
| Prime broker interest expense | | | 5,718 | |
| Trustees’ fees* | | | 566 | |
| Tax expense | | | 1 | |
| Miscellaneous | | | 23,811 | |
| Total expenses | | | 260,013 | |
| Less: | |
| Expenses waived by Adviser | | | (109,823 | ) |
| Net expenses | | | 150,190 | |
| Net investment loss | | | (107,108 | ) |
| | | | | |
| Net Realized and Unrealized Gain (Loss): | |
| Net realized gain (loss) on: | |
| Investments | | | 151,962 | |
| Swap agreements | | | 546,794 | |
| Securities sold short | | | (74,304 | ) |
| Net realized gain | | | 624,452 | |
| Net change in unrealized appreciation (depreciation) on: | |
| Investments | | | 15,080 | |
| Securities sold short | | | (119,692 | ) |
| Swap agreements | | | (87,609 | ) |
| Futures contracts | | | 32,652 | |
| Net change in unrealized appreciation (depreciation) | | | (159,569 | ) |
| Net realized and unrealized gain | | | 464,883 | |
| Net increase in net assets resulting from operations | | $ | 357,775 | |
| * | Relates to Trustees not deemed “interested persons” within the meaning of Section 2(a)(19) of the 1940 Act. |
| SEE NOTES TO FINANCIAL STATEMENTS. | THE GUGGENHEIM FUNDS SEMI-ANNUAL REPORT | 15 |
STATEMENTS OF CHANGES IN NET ASSETS
| | | Period Ended March 31, 2015 (Unaudited) | | | Year Ended September 30, 2014 | |
| Increase (Decrease) in Net Assets from Operations: | | | | | | |
| Net investment loss | | $ | (107,108 | ) | | $ | (88,149 | ) |
| Net realized gain on investments | | | 624,452 | | | | 4,542,329 | |
| Net change in unrealized appreciation (depreciation) on investments | | | (159,569 | ) | | | (3,297,136 | ) |
| Net increase in net assets resulting from operations | | | 357,775 | | | | 1,157,044 | |
| | | | | | | | | |
| Distributions to shareholders from: | | | | | | | | |
| Net investment income | | | | | | | | |
| A-Class | | | (1,982 | ) | | | — | |
| C-Class | | | (278 | ) | | | — | |
| Institutional Class | | | (297 | ) | | | — | |
| Total distributions to shareholders | | | (2,557 | ) | | | — | |
| | | | | | | | | |
| Capital share transactions: | | | | | | | | |
| Proceeds from sale of shares | | | | | | | | |
| A-Class | | | 1,827,219 | | | | 2,752,898 | |
| C-Class | | | 173,372 | | | | — | |
| Institutional Class | | | 278,496 | | | | — | |
| Distributions reinvested | | | | | | | | |
| A-Class | | | 1,955 | | | | — | |
| C-Class | | | 273 | | | | — | |
| Institutional Class | | | 297 | | | | — | |
| Cost of shares redeemed | | | | | | | | |
| A-Class | | | (571,211 | ) | | | (3,326,323 | ) |
| B-Class | | | — | | | | (628,571 | ) |
| C-Class | | | (138,447 | ) | | | (203,390 | ) |
| Institutional Class | | | (65,952 | ) | | | (270,604 | ) |
| Net increase (decrease) from capital share transactions | | | 1,506,002 | | | | (1,675,990 | ) |
| Net increase (decrease) in net assets | | | 1,861,220 | | | | (518,946 | ) |
| | | | | | | | | |
| Net assets: | | | | | | | | |
| Beginning of period | | | 10,751,251 | | | | 11,270,197 | |
| End of period | | $ | 12,612,471 | | | $ | 10,751,251 | |
| Accumulated net investment loss at end of period | | $ | (109,665 | ) | | $ | — | |
| | | | | | | | | |
| Capital share activity: | | | | | | | | |
| Shares sold | | | | | | | | |
| A-Class | | | 96,038 | | | | 151,642 | |
| C-Class | | | 10,099 | | | | — | |
| Institutional Class | | | 10,169 | | | | — | |
| Shares issued from reinvestment of distributions | | | | | | | | |
| A-Class | | | 103 | | | | — | |
| C-Class | | | 16 | | | | — | |
| Institutional Class | | | 11 | | | | — | |
| Shares redeemed | | | | | | | | |
| A-Class | | | (30,328 | ) | | | (185,854 | ) |
| B-Class | | | — | | | | (39,060 | ) |
| C-Class | | | (8,653 | ) | | | (13,056 | ) |
| Institutional Class | | | (2,200 | ) | | | (11,612 | ) |
| Net increase (decrease) in shares | | | 75,255 | | | | (97,940 | ) |
| 16 | THE GUGGENHEIM FUNDS SEMI-ANNUAL REPORT | SEE NOTES TO FINANCIAL STATEMENTS. |
This table is presented to show selected data for a share outstanding throughout each period and to assist shareholders in evaluating a Fund’s performance for the periods presented.
| A-Class | | Period Ended March 31, 2015a | | | Year Ended September 30, 2014 | | | Year Ended September 30, 2013 | | | Year Ended September 30, 2012 | | | Year Ended September 30, 2011 | | | Year Ended September 30, 2010 | |
| Per Share Data | | | | | | | | | | | | | | | | | | |
| Net asset value, beginning of period | | $ | 18.01 | | | $ | 16.22 | | | $ | 13.33 | | | $ | 9.82 | | | $ | 9.70 | | | $ | 8.56 | |
| Income (loss) from investment operations: | |
Net investment income (loss)b | | | (.18 | ) | | | (.13 | ) | | | .03 | | | | (— | )c | | | (.04 | ) | | | (.06 | ) |
| Net gain (loss) on investments (realized and unrealized) | | | .85 | | | | 1.92 | | | | 2.86 | | | | 3.48 | | | | .16 | | | | 1.20 | |
| Net increase from payments by affiliates | | | — | | | | — | | | | — | | | | .03 | d | | | — | | | | — | |
| Total from investment operations | | | .67 | | | | 1.79 | | | | 2.89 | | | | 3.51 | | | | .12 | | | | 1.14 | |
| Less distributions from: | |
| Net investment income | | | (— | )f | | | — | | | | — | | | | — | | | | — | | | | — | |
| Total distributions | | | (— | )f | | | — | | | | — | | | | — | | | | — | | | | — | |
| Net asset value, end of period | | $ | 18.68 | | | $ | 18.01 | | | $ | 16.22 | | | $ | 13.33 | | | $ | 9.82 | | | $ | 9.70 | |
| | |
Total Returne | | | 4.04 | % | | | 11.04 | % | | | 21.38 | % | | | 35.74 | %d | | | 1.13 | % | | | 13.43 | % |
| Ratios/Supplemental Data | |
| Net assets, end of period (in thousands) | | $ | 9,517 | | | $ | 7,989 | | | $ | 7,749 | | | $ | 7,250 | | | $ | 6,708 | | | $ | 8,138 | |
| Ratios to average net assets: | |
| Net investment income (loss) | | | (1.89 | %) | | | (0.73 | %) | | | 0.19 | % | | | (0.01 | %) | | | (0.33 | %) | | | (0.71 | %) |
| Total expenses | | | 4.63 | % | | | 3.25 | % | | | 3.99 | % | | | 2.99 | % | | | 3.39 | % | | | 3.51 | % |
Net expensesg,h | | | 2.66 | % | | | 2.12 | % | | | 2.14 | % | | | 2.21 | % | | | 2.15 | % | | | 2.21 | % |
| Portfolio turnover rate | | | 149 | % | | | — | | | | 488 | % | | | 707 | % | | | 868 | % | | | 954 | % |
| C-Class | | Period Ended March 31, 2015a | | | Year Ended September 30, 2014 | | | Year Ended September 30, 2013 | | | Year Ended September 30, 2012 | | | Year Ended September 30, 2011 | | | Year Ended September 30, 2010 | |
| Per Share Data | | | | | | | | | | | | | | | | | | |
| Net asset value, beginning of period | | $ | 16.25 | | | $ | 14.74 | | | $ | 12.21 | | | $ | 9.07 | | | $ | 9.03 | | | $ | 8.02 | |
| Income (loss) from investment operations: | |
Net investment income (loss)b | | | (.22 | ) | | | (.23 | ) | | | (.07 | ) | | | (.09 | ) | | | (.11 | ) | | | (.12 | ) |
| Net gain (loss) on investments (realized and unrealized) | | | .76 | | | | 1.74 | | | | 2.60 | | | | 3.21 | | | | .15 | | | | 1.13 | |
| Net increase from payments by affiliates | | | — | | | | — | | | | — | | | | .02 | d | | | — | | | | — | |
| Total from investment operations | | | .54 | | | | 1.51 | | | | 2.53 | | | | 3.14 | | | | .04 | | | | 1.01 | |
| Less distributions from: | |
| Net investment income | | | (— | )f | | | — | | | | — | | | | — | | | | — | | | | — | |
| Total distributions | | | (— | )f | | | — | | | | — | | | | — | | | | — | | | | — | |
| Net asset value, end of period | | $ | 16.79 | | | $ | 16.25 | | | $ | 14.74 | | | $ | 12.21 | | | $ | 9.07 | | | $ | 9.03 | |
| | |
Total Returne | | | 3.67 | % | | | 10.24 | % | | | 20.48 | % | | | 34.62 | %d | | | 0.44 | % | | | 12.59 | % |
| Ratios/Supplemental Data | |
| Net assets, end of period (in thousands) | | $ | 1,179 | | | $ | 1,117 | | | $ | 1,206 | | | $ | 1,497 | | | $ | 1,292 | | | $ | 1,490 | |
| Ratios to average net assets: | |
| Net investment income (loss) | | | (2.64 | %) | | | (1.46 | %) | | | (0.56 | %) | | | (0.76 | %) | | | (1.08 | %) | | | (1.46 | %) |
| Total expenses | | | 5.48 | % | | | 4.11 | % | | | 4.84 | % | | | 3.80 | % | | | 4.14 | % | | | 4.28 | % |
Net expensesg,h | | | 3.39 | % | | | 2.87 | % | | | 2.89 | % | | | 2.96 | % | | | 2.90 | % | | | 2.95 | % |
| Portfolio turnover rate | | | 149 | % | | | — | | | | 488 | % | | | 707 | % | | | 868 | % | | | 954 | % |
| SEE NOTES TO FINANCIAL STATEMENTS. | THE GUGGENHEIM FUNDS SEMI-ANNUAL REPORT | 17 |
FINANCIAL HIGHLIGHTS (concluded)
This table is presented to show selected data for a share outstanding throughout each period and to assist shareholders in evaluating a Fund’s performance for the periods presented.
| Institutional Class | | Period Ended March 31, 2015a | | | Year Ended September 30, 2014 | | | Year Ended September 30, 2013 | | | Year Ended September 30, 2012 | | | Year Ended September 30, 2011 | | | Year Ended September 30, 2010 | |
| Per Share Data | | | | | | | | | | | | | | | | | | |
| Net asset value, beginning of period | | $ | 25.13 | | | $ | 22.58 | | | $ | 18.52 | | | $ | 13.53 | | | $ | 13.33 | | | $ | 11.73 | |
| Income (loss) from investment operations: | |
Net investment income (loss)b | | | (.21 | ) | | | (.12 | ) | | | .09 | | | | .04 | | | | (.01 | ) | | | (.06 | ) |
| Net gain (loss) on investments (realized and unrealized) | | | 1.19 | | | | 2.67 | | | | 3.97 | | | | 4.82 | | | | .21 | | | | 1.66 | |
| Net increase from payments by affiliates | | | — | | | | — | | | | — | | | | .13 | d | | | — | | | | — | |
| Total from investment operations | | | .98 | | | | 2.55 | | | | 4.06 | | | | 4.99 | | | | .20 | | | | 1.60 | |
| Less distributions from: | |
| Net investment income | | | (— | )f | | | — | | | | — | | | | — | | | | — | | | | — | |
| Total distributions | | | (— | )f | | | — | | | | — | | | | — | | | | — | | | | — | |
| Net asset value, end of period | | $ | 26.11 | | | $ | 25.13 | | | $ | 22.58 | | | $ | 18.52 | | | $ | 13.53 | | | $ | 13.33 | |
| |
Total Returne | | | 4.17 | % | | | 11.29 | % | | | 21.60 | % | | | 36.88 | %d | | | 1.50 | % | | | 13.64 | % |
| Ratios/Supplemental Data | |
| Net assets, end of period (in thousands) | | $ | 1,917 | | | $ | 1,645 | | | $ | 1,740 | | | $ | 1,518 | | | $ | 1,326 | | | $ | 1,444 | |
| Ratios to average net assets: | |
| Net investment income (loss) | | | (1.64 | %) | | | (0.48 | %) | | | 0.43 | % | | | 0.24 | % | | | (0.08 | %) | | | (0.48 | %) |
| Total expenses | | | 4.30 | % | | | 2.90 | % | | | 3.67 | % | | | 2.68 | % | | | 3.12 | % | | | 3.28 | % |
Net expensesg,h | | | 2.42 | % | | | 1.87 | % | | | 1.90 | % | | | 1.96 | % | | | 1.90 | % | | | 1.96 | % |
| Portfolio turnover rate | | | 149 | % | | | — | | | | 488 | % | | | 707 | % | | | 868 | % | | | 954 | % |
a | Unaudited figures for the period ended March 31, 2015. Percentage amounts for the period, except total return and portfolio turnover rate, have been annualized. |
b | Net investment income (loss) per share was computed using average shares outstanding throughout the period. |
c | Net investment income (loss) is less than $0.01 per share. |
d | For the year ended September 30, 2012, 0.30%, 0.22% and 0.96% of the Fund’s A-Class, C-Class and Institutional Class, respectively, total return consisted of a voluntary reimbursement by the Adviser for losses incurred during fund trading. Excluding this item, total return would have been 35.44%, 34.40% and 35.92% for the Fund’s A-Class, C-Class and Institutional Class, respectively. |
e | Total return does not reflect the impact of any applicable sales charges and has not been annualized. |
f | Distributions from net investment income are less than $0.01 per share. |
g | Net expense information reflects the expense ratios after expense waivers. |
h | Net expenses may include expenses that are excluded from the expense limitation agreement. Excluding these expenses, the operating expense ratios for the periods presented would be: |
| | 03/31/15 | 09/30/14 | 09/30/13 | 09/30/12 | 09/30/11 | 09/30/10 |
| A-Class | 1.79% | 2.11% | 2.11% | 2.11% | 2.11% | 2.05% |
| C-Class | 2.54% | 2.86% | 2.86% | 2.86% | 2.86% | 2.80% |
| Institutional Class | 1.54% | 1.86% | 1.86% | 1.86% | 1.86% | 1.80% |
| 18 | THE GUGGENHEIM FUNDS SEMI-ANNUAL REPORT | SEE NOTES TO FINANCIAL STATEMENTS. |
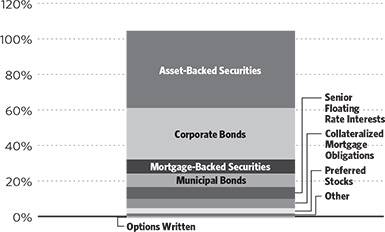
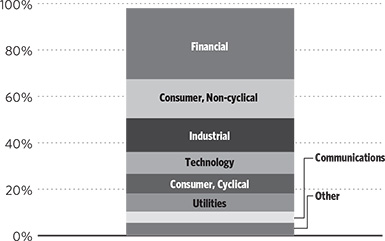
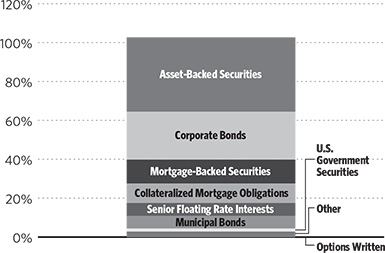
FUND PROFILE (Unaudited) | March 31, 2015 |
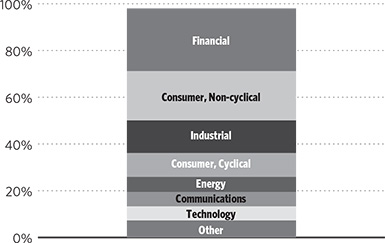
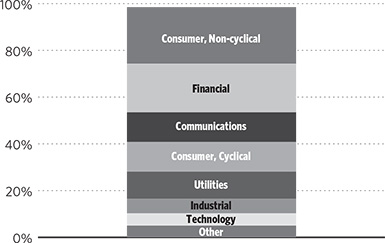
ENHANCED WORLD EQUITY FUND
OBJECTIVE: Seeks to achieve total return, comprised of capital appreciation and current income.
Holdings Diversification (Market Exposure as % of Net Assets)
“Holdings Diversification (Market Exposure as % of Net Assets)” excludes any temporary cash investments.
| Inception Dates: |
| A-Class | June 18, 2013 |
| C-Class | June 18, 2013 |
| Institutional Class | June 18, 2013 |
| Ten Largest Holdings (% of Total Net Assets) |
| SPDR S&P 500 ETF Trust | 29.9% |
| iShares MSCI EAFE ETF | 26.5% |
| Vanguard FTSE Emerging Markets ETF | 12.3% |
| iShares Russell 2000 ETF | 9.4% |
| Powershares QQQ Trust Series 1 | 8.0% |
| Materials Select Sector SPDR Fund | 3.0% |
| iShares MSCI United Kingdom ETF | 3.0% |
| iShares MSCI Japan ETF | 2.1% |
| iShares MSCI Brazil Capped ETF | 1.9% |
| Energy Select Sector SPDR Fund | 1.9% |
| Top Ten Total | 98.0% |
| |
| “Ten Largest Holdings” exclude any temporary cash or derivative investments. |
| | THE GUGGENHEIM FUNDS SEMI-ANNUAL REPORT | 19 |
SCHEDULE OF INVESTMENTS (Unaudited) | March 31, 2015 |
| ENHANCED WORLD EQUITY FUND | |
| | |
Shares | | | Value | |
| | | | | | | | |
EXCHANGE-TRADED FUNDS† - 98.9% | |
SPDR S&P 500 ETF Trust2 | | | 8,400 | | | $ | 1,734,012 | |
iShares MSCI EAFE ETF3 | | | 23,900 | | | | 1,533,663 | |
| Vanguard FTSE Emerging Markets ETF | | | 17,400 | | | | 711,138 | |
| iShares Russell 2000 ETF | | | 4,400 | | | | 547,140 | |
| Powershares QQQ Trust Series 1 | | | 4,400 | | | | 464,640 | |
| Materials Select Sector SPDR Fund | | | 3,600 | | | | 175,608 | |
| iShares MSCI United Kingdom ETF | | | 9,600 | | | | 172,896 | |
| iShares MSCI Japan ETF | | | 9,500 | | | | 119,035 | |
| iShares MSCI Brazil Capped ETF | | | 3,600 | | | | 112,932 | |
Energy Select Sector SPDR Fund1 | | | 1,400 | | | | 108,612 | |
| iShares MSCI Mexico Capped ETF | | | 900 | | | | 52,164 | |
| Total Exchange-Traded Funds | | | | | | | | |
| (Cost $5,790,443) | | | | | | | 5,731,840 | |
| | | | | | | | |
SHORT TERM INVESTMENTS† - 1.2% | |
| Dreyfus Treasury Prime Cash Management Fund 0.00% | | | 68,207 | | | | 68,207 | |
| Total Short Term Investments | | | | | | | | |
| (Cost $68,207) | | | | | | | 68,207 | |
| | | | | | | | |
| Total Investments - 100.1% | | | | | | | | |
| (Cost $5,858,650) | | | | | | $ | 5,800,047 | |
| | | Contracts | | | | |
| | | | | | | | |
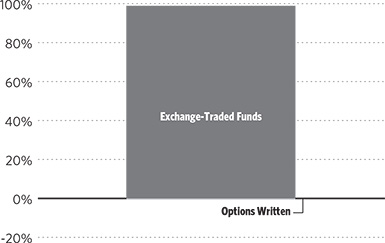
OPTIONS WRITTEN† - (0.2)% | |
| Call options on: | | | | | | | | |
iShares MSCI Mexico Capped ETF
Expiring April 2015 with strike price of $61.00 | | | 6 | | | | (36 | ) |
iShares MSCI Japan ETF
Expiring April 2015 with strike price of $13.00 | | | 71 | | | | (213 | ) |
SPDR S&P 500 ETF Trust
Expiring April 2015 with strike price of $215.00 | | | 63 | | | | (378 | ) |
Powershares QQQ Trust Series 1
Expiring April 2015 with strike price of $109.00 | | | 33 | | | | (594 | ) |
iShares MSCI United Kingdom ETF
Expiring April 2015 with strike price of $19.00 | | | 72 | | | | (720 | ) |
iShares MSCI EAFE ETF
Expiring April 2015 with strike price of $67.00 | | | 179 | | | | (1,253 | ) |
Energy Select Sector SPDR Fund
Expiring April 2015 with strike price of $77.00 | | | 10 | | | | (1,610 | ) |
Materials Select Sector SPDR Fund
Expiring April 2015 with strike price of $49.00 | | | 27 | | | | (1,620 | ) |
iShares MSCI Brazil Capped ETF
Expiring April 2015 with strike price of $32.00 | | | 27 | | | | (1,701 | ) |
Vanguard FTSE Emerging Markets ETF
Expiring April 2015 with strike price of $42.00 | | | 130 | | | | (2,600 | ) |
iShares Russell 2000 ETF
Expiring April 2015 with strike price of $126.00 | | | 33 | | | | (2,772 | ) |
| Total Options Written | | | | | | | | |
| (Premiums received $30,883) | | | | | | | (13,497 | ) |
| Other Assets & Liabilities, net - 0.1% | | | | | | | 5,426 | |
| Total Net Assets - 100.0% | | | | | | $ | 5,791,976 | |
| † | Value determined based on Level 1 inputs — See Note 4. |
| 1 | All or a portion of this security is pledged as collateral for open call options written contracts at March 31, 2015. |
| 2 | More information regarding the SPDR S&P 500 ETF Trust can be found at www.spdrs.com. |
| 3 | More information regarding the iShares MSCI EAFE ETF can be found at www.iShares.com. |
| |
| See Sector Classification in Other Information section. |
| 20 | THE GUGGENHEIM FUNDS SEMI-ANNUAL REPORT | SEE NOTES TO FINANCIAL STATEMENTS. |
| ENHANCED WORLD EQUITY FUND | |
STATEMENT OF ASSETS AND LIABILITIES (Unaudited)
March 31, 2015
| Assets: | |
| Investments, at value (cost $5,858,650) | | $ | 5,800,047 | |
| Prepaid expenses | | | 17,790 | |
| Cash | | | 3,459 | |
| Receivables: | |
| Investment adviser | | | 10,118 | |
| Dividends | | | 10,110 | |
| Total assets | | | 5,841,524 | |
| | | | | |
| Liabilities: | |
| Options written, at value (premiums received $30,883) | | | 13,497 | |
| Payable for: | |
| Professional fees | | | 11,460 | |
| Legal fees | | | 9,026 | |
| Direct shareholders expense | | | 6,048 | |
| Management fees | | | 3,445 | |
| Transfer agent/maintenance fees | | | 2,200 | |
| Fund accounting/administration fees | | | 2,123 | |
| Distribution and service fees | | | 65 | |
| Trustees’ fees* | | | 12 | |
| Miscellaneous | | | 1,672 | |
| Total liabilities | | | 49,548 | |
| Net assets | | $ | 5,791,976 | |
| | | | | |
| Net assets consist of: | |
| Paid in capital | | $ | 5,961,480 | |
| Undistributed net investment income | | | 25,975 | |
| Accumulated net realized loss on investments | | | (154,262 | ) |
| Net unrealized depreciation on investments | | | (41,217 | ) |
| Net assets | | $ | 5,791,976 | |
| | | | | |
| A-Class: | |
| Net assets | | $ | 139,822 | |
| Capital shares outstanding | | | 5,324 | |
| Net asset value per share | | $ | 26.26 | |
| Maximum offering price per share (Net asset value divided by 95.25%) | | $ | 27.57 | |
| | | | | |
| C-Class: | |
| Net assets | | $ | 44,841 | |
| Capital shares outstanding | | | 1,848 | |
| Net asset value per share | | $ | 24.26 | |
| | | | | |
| Institutional Class: | |
| Net assets | | $ | 5,607,313 | |
| Capital shares outstanding | | | 213,347 | |
| Net asset value per share | | $ | 26.28 | |
STATEMENT OF OPERATIONS (Unaudited)
Period Ended March 31, 2015
| Investment Income: | |
| Dividends | | $ | 55,256 | |
| Total investment income | | | 55,256 | |
| | | | | |
| Expenses: | |
| Management fees | | | 20,037 | |
| Transfer agent/maintenance fees: | |
| A-Class | | | 448 | |
| C-Class | | | 339 | |
| Institutional Class | | | 11,812 | |
| Distribution and service fees: | |
| A-Class | | | 140 | |
| C-Class | | | 330 | |
| Fund accounting/administration fees | | | 12,465 | |
| Registration fees | | | 21,556 | |
| Professional fees | | | 10,790 | |
| Custodian fees | | | 1,809 | |
| Line of credit fees | | | 186 | |
| Trustees’ fees* | | | 124 | |
| Miscellaneous | | | 3,091 | |
| Total expenses | | | 83,127 | |
| Less: | |
| Expenses waived by Adviser | | | (53,846 | ) |
| Net expenses | | | 29,281 | |
| Net investment income | | | 25,975 | |
| | | | | |
| Net Realized and Unrealized Gain (Loss): | |
| Net realized gain (loss) on: | |
| Investments | | | 52,615 | |
| Options written | | | (188,893 | ) |
| Net realized loss | | | (136,278 | ) |
| Net change in unrealized appreciation (depreciation) on: | |
| Investments | | | 71,333 | |
| Options written | | | (3,691 | ) |
| Net change in unrealized appreciation (depreciation) | | | 67,642 | |
| Net realized and unrealized loss | | | (68,636 | ) |
| Net decrease in net assets resulting from operations | | $ | (42,661 | ) |
| * | Relates to Trustees not deemed “interested persons” within the meaning of Section 2(a)(19) of the 1940 Act. |
| SEE NOTES TO FINANCIAL STATEMENTS. | THE GUGGENHEIM FUNDS SEMI-ANNUAL REPORT | 21 |
| ENHANCED WORLD EQUITY FUND | |
STATEMENTS OF CHANGES IN NET ASSETS
| | | Period Ended March 31, 2015 (Unaudited) | | | Year Ended September 30, 2014 | |
| Increase (Decrease) in Net Assets from Operations: | | | | | | |
| Net investment income | | $ | 25,975 | | | $ | 20,211 | |
| Net realized gain (loss) on investments | | | (136,278 | ) | | | 482,698 | |
| Net change in unrealized appreciation (depreciation) on investments | | | 67,642 | | | | (46,589 | ) |
| Net increase (decrease) in net assets resulting from operations | | | (42,661 | ) | | | 456,320 | |
| | | | | | | | | |
| Distributions to shareholders from: | | | | | | | | |
| Net investment income | | | | | | | | |
| A-Class | | | (495 | ) | | | — | |
| C-Class | | | (2,456 | ) | | | — | |
| Institutional Class | | | (17,623 | ) | | | (28,029 | ) |
| Net realized gains | | | | | | | | |
| A-Class | | | (1,012 | ) | | | (7,329 | ) |
| C-Class | | | (331 | ) | | | (19,881 | ) |
| Institutional Class | | | (54,436 | ) | | | (245,722 | ) |
| Total distributions to shareholders | | | (76,353 | ) | | | (300,961 | ) |
| | | | | | | | | |
| Capital share transactions: | | | | | | | | |
| Proceeds from sale of shares | | | | | | | | |
| A-Class | | | 44,034 | | | | 181,525 | |
| C-Class | | | 12,230 | | | | 1,289,731 | |
| Institutional Class | | | — | | | | 5,799,760 | |
| Distributions reinvested | | | | | | | | |
| A-Class | | | 1,486 | | | | 7,324 | |
| C-Class | | | 2,787 | | | | 19,881 | |
| Institutional Class | | | 72,059 | | | | 273,751 | |
| Cost of shares redeemed | | | | | | | | |
| A-Class | | | (9,750 | ) | | | (184,029 | ) |
| C-Class | | | (90,597 | ) | | | (1,556,501 | ) |
| Institutional Class | | | (421 | ) | | | (5,806,807 | ) |
| Net increase from capital share transactions | | | 31,828 | | | | 24,635 | |
| Net increase (decrease) in net assets | | | (87,186 | ) | | | 179,994 | |
| | | | | | | | | |
| Net assets: | | | | | | | | |
| Beginning of period | | | 5,879,162 | | | | 5,699,168 | |
| End of period | | $ | 5,791,976 | | | $ | 5,879,162 | |
| Undistributed net investment income at end of period | | $ | 25,975 | | | $ | 20,574 | |
| | | | | | | | | |
| Capital share activity: | | | | | | | | |
| Shares sold | | | | | | | | |
| A-Class | | | 1,701 | | | | 6,829 | |
| C-Class | | | 496 | | | | 48,882 | |
| Institutional Class | | | — | | | | 210,833 | |
| Shares issued from reinvestment of distributions | | | | | | | | |
| A-Class | | | 57 | | | | 283 | |
| C-Class | | | 114 | | | | 773 | |
| Institutional Class | | | 2,739 | | | | 10,631 | |
| Shares redeemed | | | | | | | | |
| A-Class | | | (369 | ) | | | (7,193 | ) |
| C-Class | | | (3,423 | ) | | | (59,526 | ) |
| Institutional Class | | | (16 | ) | | | (211,086 | ) |
| Net increase in shares | | | 1,299 | | | | 426 | |
| 22 | THE GUGGENHEIM FUNDS SEMI-ANNUAL REPORT | SEE NOTES TO FINANCIAL STATEMENTS. |
| ENHANCED WORLD EQUITY FUND | |
This table is presented to show selected data for a share outstanding throughout each period and to assist shareholders in evaluating a Fund’s performance for the periods presented.
| A-Class | | Period Ended March 31, 2015a | | | Year Ended September 30, 2014 | | | Period Ended September 30, 2013b | |
| Per Share Data | | | | | | | | | |
| Net asset value, beginning of period | | $ | 26.87 | | | $ | 26.03 | | | $ | 25.00 | |
| Income (loss) from investment operations: | |
Net investment income (loss)c | | | .09 | | | | .02 | | | | (.03 | ) |
| Net gain (loss) on investments (realized and unrealized) | | | (.32 | ) | | | 2.05 | | | | 1.06 | |
| Total from investment operations | | | (.23 | ) | | | 2.07 | | | | 1.03 | |
| Less distributions from: | |
| Net investment income | | | (.12 | ) | | | — | | | | — | |
| Net realized gains | | | (.26 | ) | | | (1.23 | ) | | | — | |
| Total distributions | | | (.38 | ) | | | (1.23 | ) | | | — | |
| Net asset value, end of period | | $ | 26.26 | | | $ | 26.87 | | | $ | 26.03 | |
| | |
Total Returnd | | | (0.84 | %) | | | 8.12 | % | | | 4.32 | % |
| Ratios/Supplemental Data | |
| Net assets, end of period (in thousands) | | $ | 140 | | | $ | 106 | | | $ | 105 | |
| Ratios to average net assets: | |
| Net investment income (loss) | | | 0.68 | % | | | 0.07 | % | | | (0.36 | %) |
Total expensese | | | 3.51 | % | | | 4.04 | % | | | 7.21 | %g |
Net expensesf | | | 1.26 | %h | | | 1.26 | %h | | | 1.25 | % |
| Portfolio turnover rate | | | 246 | % | | | 633 | % | | | 174 | % |
| C-Class | | Period Ended March 31, 2015a | | | Year Ended September 30, 2014 | | | Period Ended September 30, 2013b | |
| Per Share Data | | | | | | | | | |
| Net asset value, beginning of period | | $ | 26.76 | | | $ | 25.96 | | | $ | 25.00 | |
| Income (loss) from investment operations: | |
Net investment income (loss)c | | | (.12 | ) | | | (.24 | ) | | | (.03 | ) |
| Net gain (loss) on investments (realized and unrealized) | | | (.20 | ) | | | 2.27 | | | | .99 | |
| Total from investment operations | | | (.32 | ) | | | 2.03 | | | | .96 | |
| Less distributions from: | |
| Net investment income | | | (1.92 | ) | | | — | | | | — | |
| Net realized gains | | | (.26 | ) | | | (1.23 | ) | | | — | |
| Total distributions | | | (2.18 | ) | | | (1.23 | ) | | | — | |
| Net asset value, end of period | | $ | 24.26 | | | $ | 26.76 | | | $ | 25.96 | |
| | |
Total Returnd | | | (1.25 | %) | | | 8.00 | % | | | 4.00 | % |
| Ratios/Supplemental Data | |
| Net assets, end of period (in thousands) | | $ | 45 | | | $ | 125 | | | $ | 377 | |
| Ratios to average net assets: | |
| Net investment income (loss) | | | (0.94 | %) | | | (0.88 | %) | | | (0.43 | %) |
Total expensese | | | 4.37 | % | | | 4.57 | % | | | 9.26 | %g |
Net expensesf | | | 2.01 | %h | | | 2.00 | %h | | | 2.00 | % |
| Portfolio turnover rate | | | 246 | % | | | 633 | % | | | 174 | % |
| SEE NOTES TO FINANCIAL STATEMENTS. | THE GUGGENHEIM FUNDS SEMI-ANNUAL REPORT | 23 |
| ENHANCED WORLD EQUITY FUND | |
FINANCIAL HIGHLIGHTS (concluded)
This table is presented to show selected data for a share outstanding throughout each period and to assist shareholders in evaluating a Fund’s performance for the periods presented.
| Institutional Class | | Period Ended March 31, 2015a | | | Year Ended September 30, 2014 | | | Period Ended September 30, 2013b | |
| Per Share Data | | | | | | | | | |
| Net asset value, beginning of period | | $ | 26.82 | | | $ | 26.05 | | | $ | 25.00 | |
| Income (loss) from investment operations: | |
Net investment income (loss)c | | | .12 | | | | .11 | | | | .14 | |
| Net gain (loss) on investments (realized and unrealized) | | | (.32 | ) | | | 2.03 | | | | .91 | |
| Total from investment operations | | | (.20 | ) | | | 2.14 | | | | 1.05 | |
| Less distributions from: | |
| Net investment income | | | (.08 | ) | | | (.14 | ) | | | — | |
| Net realized gains | | | (.26 | ) | | | (1.23 | ) | | | — | |
| Total distributions | | | (.34 | ) | | | (1.37 | ) | | | — | |
| Net asset value, end of period | | $ | 26.28 | | | $ | 26.82 | | | $ | 26.05 | |
| | |
Total Returnd | | | (0.74 | %) | | | 8.42 | % | | | 4.40 | % |
| Ratios/Supplemental Data | |
| Net assets, end of period (in thousands) | | $ | 5,607 | | | $ | 5,649 | | | $ | 5,217 | |
| Ratios to average net assets: | |
| Net investment income (loss) | | | 0.93 | % | | | 0.40 | % | | | 1.96 | % |
Total expensese | | | 2.87 | % | | | 3.59 | % | | | 5.11 | %g |
Net expensesf | | | 1.01 | %h | | | 1.01 | %h | | | 1.00 | % |
| Portfolio turnover rate | | | 246 | % | | | 633 | % | | | 174 | % |
a | Unaudited figures for the period ended March 31, 2015. Percentage amounts for the period, except total return and portfolio turnover rate, have been annualized. |
b | Since commencement of operations: June 18, 2013. Percentage amounts for the period, except total return and portfolio turnover rate, have been annualized. |
c | Net investment income (loss) per share was computed using average shares outstanding throughout the period. |
d | Total return does not reflect the impact of any applicable sales charges and has not been annualized. |
e | Does not include expenses of the underlying funds in which the Fund invests. |
f | Net expense information reflects the expense ratios after expense waivers. |
g | Due to limited length of Fund operations, ratios for this period are not indicative of future performance. |
h | Net expenses may include expenses that are excluded from the expense limitation agreement. Excluding these expenses, the operating expense ratios for the periods presented would be: |
| | 03/31/15 | 09/30/14 |
| A-Class | 1.25% | 1.25% |
| C-Class | 2.00% | 2.00% |
| Institutional Class | 1.00% | 1.00% |
| 24 | THE GUGGENHEIM FUNDS SEMI-ANNUAL REPORT | SEE NOTES TO FINANCIAL STATEMENTS. |
FUND PROFILE (Unaudited) | March 31, 2015 |
LARGE CAP VALUE FUND
OBJECTIVE: Seeks long-term growth of capital.
Holdings Diversification (Market Exposure as % of Net Assets)
“Holdings Diversification (Market Exposure as % of Net Assets)” excludes any temporary cash investments.
| Inception Dates: |
| A-Class | August 7, 1944 |
| B-Class | October 19, 1993 |
| C-Class | January 29, 1999 |
| Institutional Class | June 7, 2013 |
| Ten Largest Holdings (% of Total Net Assets) |
| Wells Fargo & Co. | 3.8% |
| American International Group, Inc. | 3.3% |
| JPMorgan Chase & Co. | 3.0% |
| Citigroup, Inc. | 2.9% |
| Teva Pharmaceutical Industries Ltd. ADR | 2.8% |
| Wal-Mart Stores, Inc. | 2.4% |
| Dow Chemical Co. | 2.3% |
| Cisco Systems, Inc. | 2.3% |
| Chevron Corp. | 2.3% |
| Republic Services, Inc. — Class A | 2.2% |
| Top Ten Total | 27.3% |
| | |
| “Ten Largest Holdings” exclude any temporary cash or derivative investments. |
| | THE GUGGENHEIM FUNDS SEMI-ANNUAL REPORT | 25 |
SCHEDULE OF INVESTMENTS (Unaudited) | March 31, 2015 |
| LARGE CAP VALUE FUND | |
| | |
Shares | | | Value | |
| | | | | | | | |
COMMON STOCKS† - 96.5% | |
| | | | | | | | |
| FINANCIAL - 26.8% | |
| Wells Fargo & Co. | | | 42,110 | | | $ | 2,290,784 | |
| American International Group, Inc. | | | 36,092 | | | | 1,977,481 | |
| JPMorgan Chase & Co. | | | 29,990 | | | | 1,816,795 | |
| Citigroup, Inc. | | | 33,410 | | | | 1,721,283 | |
| Bank of New York Mellon Corp. | | | 32,570 | | | | 1,310,617 | |
| Reinsurance Group of America, Inc. — Class A | | | 12,165 | | | | 1,133,656 | |
| Allstate Corp. | | | 12,905 | | | | 918,449 | |
| Zions Bancorporation | | | 33,460 | | | | 903,420 | |
| Legg Mason, Inc. | | | 13,420 | | | | 740,784 | |
| NASDAQ OMX Group, Inc. | | | 12,419 | | | | 632,624 | |
| BB&T Corp. | | | 15,700 | | | | 612,143 | |
| Unum Group | | | 17,245 | | | | 581,674 | |
| Assured Guaranty Ltd. | | | 17,540 | | | | 462,881 | |
| Equity Residential | | | 4,090 | | | | 318,447 | |
| Simon Property Group, Inc. | | | 1,620 | | | | 316,937 | |
| Bank of America Corp. | | | 18,990 | | | | 292,256 | |
| Total Financial | | | | | | | 16,030,231 | |
| | | | | | | | |
| CONSUMER, NON-CYCLICAL - 21.1% | |
| Teva Pharmaceutical Industries Ltd. ADR | | | 26,565 | | | | 1,655,000 | |
| Johnson & Johnson | | | 13,180 | | | | 1,325,908 | |
| UnitedHealth Group, Inc. | | | 8,105 | | | | 958,740 | |
| Mondelez International, Inc. — Class A | | | 25,660 | | | | 926,069 | |
| Pfizer, Inc. | | | 24,680 | | | | 858,617 | |
| Kellogg Co. | | | 12,790 | | | | 843,501 | |
| Archer-Daniels-Midland Co. | | | 15,490 | | | | 734,226 | |
| ADT Corp. | | | 17,180 | | | | 713,314 | |
| Philip Morris International, Inc. | | | 8,740 | | | | 658,384 | |
| Quanta Services, Inc.* | | | 23,040 | | | | 657,331 | |
| Medtronic plc | | | 8,030 | | | | 626,260 | |
| Zimmer Holdings, Inc. | | | 5,250 | | | | 616,980 | |
| MasterCard, Inc. — Class A | | | 7,010 | | | | 605,594 | |
| Kraft Foods Group, Inc. | | | 6,741 | | | | 587,242 | |
| DeVry Education Group, Inc. | | | 13,990 | | | | 466,706 | |
| Tenet Healthcare Corp.* | | | 8,760 | | | | 433,708 | |
| Total Consumer, Non-cyclical | | | | | | | 12,667,580 | |
| | | | | | | | |
| INDUSTRIAL - 14.0% | |
| Republic Services, Inc. — Class A | | | 32,860 | | | | 1,332,801 | |
| United Technologies Corp. | | | 9,820 | | | | 1,150,904 | |
| Parker-Hannifin Corp. | | | 8,685 | | | | 1,031,604 | |
| General Electric Co. | | | 35,220 | | | | 873,808 | |
| FLIR Systems, Inc. | | | 27,260 | | | | 852,693 | |
| Covanta Holding Corp. | | | 37,070 | | | | 831,480 | |
| TE Connectivity Ltd. | | | 9,877 | | | | 707,391 | |
| Oshkosh Corp. | | | 14,230 | | | | 694,282 | |
| Rock-Tenn Co. — Class A | | | 9,798 | | | | 631,971 | |
| Huntington Ingalls Industries, Inc. | | | 1,180 | | | | 165,377 | |
| Owens-Illinois, Inc.* | | | 6,450 | | | | 150,414 | |
| Total Industrial | | | | | | | 8,422,725 | |
| | | | | | | | |
| CONSUMER, CYCLICAL - 10.2% | |
| Wal-Mart Stores, Inc. | | | 17,265 | | | | 1,420,046 | |
| CVS Health Corp. | | | 12,230 | | | | 1,262,258 | |
| Kohl’s Corp. | | | 12,370 | | | | 967,953 | |
| PulteGroup, Inc. | | | 42,700 | | | | 949,221 | |
| Lear Corp. | | | 7,470 | | | | 827,825 | |
| WESCO International, Inc.* | | | 9,610 | | | | 671,643 | |
| Total Consumer, Cyclical | | | | | | | 6,098,946 | |
| | | | | | | | |
| ENERGY - 6.4% | |
| Chevron Corp. | | | 12,985 | | | | 1,363,165 | |
| Exxon Mobil Corp. | | | 12,400 | | | | 1,054,000 | |
| Whiting Petroleum Corp.* | | | 15,605 | | | | 482,195 | |
| Patterson-UTI Energy, Inc. | | | 18,410 | | | | 345,648 | |
| Marathon Oil Corp. | | | 10,730 | | | | 280,160 | |
| Superior Energy Services, Inc. | | | 11,440 | | | | 255,570 | |
| Oasis Petroleum, Inc.* | | | 6,310 | | | | 89,728 | |
| Total Energy | | | | | | | 3,870,466 | |
| | | | | | | | |
| COMMUNICATIONS - 6.2% | |
| Cisco Systems, Inc. | | | 50,360 | | | | 1,386,159 | |
| Time Warner, Inc. | | | 10,615 | | | | 896,331 | |
| AT&T, Inc. | | | 19,800 | | | | 646,470 | |
| DigitalGlobe, Inc.* | | | 14,605 | | | | 497,592 | |
| Scripps Networks Interactive, Inc. — Class A | | | 4,290 | | | | 294,122 | |
| Total Communications | | | | | | | 3,720,674 | |
| | | | | | | | |
| TECHNOLOGY - 6.0% | |
| Computer Sciences Corp. | | | 18,845 | | | | 1,230,202 | |
| QUALCOMM, Inc. | | | 12,310 | | | | 853,575 | |
| Microsoft Corp. | | | 19,050 | | | | 774,478 | |
| NetApp, Inc. | | | 14,155 | | | | 501,936 | |
| Stratasys Ltd.* | | | 5,160 | | | | 272,345 | |
| Total Technology | | | | | | | 3,632,536 | |
| | | | | | | | |
| UTILITIES - 3.5% | |
| Edison International | | | 18,675 | | | | 1,166,627 | |
| AGL Resources, Inc. | | | 18,580 | | | | 922,497 | |
| Total Utilities | | | | | | | 2,089,124 | |
| | | | | | | | |
| BASIC MATERIALS - 2.3% | |
| Dow Chemical Co. | | | 29,280 | | | | 1,404,854 | |
| | | | | | | | |
| Total Common Stocks | | | | | | | | |
| (Cost $50,571,942) | | | | | | | 57,937,136 | |
| | | | | | | | |
WARRANTS† - 0.3% | |
| American International Group, Inc. | | | | | | | | |
| $45.00, 01/19/21 | | | 8,920 | | | | 194,813 | |
| Total Warrants | | | | | | | | |
| (Cost $167,892) | | | | | | | 194,813 | |
| 26 | THE GUGGENHEIM FUNDS SEMI-ANNUAL REPORT | SEE NOTES TO FINANCIAL STATEMENTS. |
SCHEDULE OF INVESTMENTS (Unaudited)(concluded) | March 31, 2015 |
| LARGE CAP VALUE FUND | |
| | |
Shares | | | Value | |
| | | | | | | | | |
EXCHANGE-TRADED FUNDS† - 1.2% | |
| iShares Russell 1000 Value ETF | | | 7,010 | | | $ | 722,591 | |
| Total Exchange-Traded Funds | | | | | | | | |
| (Cost $712,826) | | | | | | | 722,591 | |
| | | | | | | | |
SHORT TERM INVESTMENTS† - 1.7% | |
| Dreyfus Treasury Prime Cash Management Fund 0.00% | | | 1,009,562 | | | | 1,009,562 | |
| Total Short Term Investments | | | | | | | | |
| (Cost $1,009,562) | | | | | | | 1,009,562 | |
| | | | | | | | |
| Total Investments - 99.7% | | | | | | | | |
| (Cost $52,462,222) | | | | | | $ | 59,864,102 | |
| Other Assets & Liabilities, net - 0.3% | | | | | | | 184,650 | |
| Total Net Assets - 100.0% | | | | | | $ | 60,048,752 | |
| * | Non-income producing security. |
| † | Value determined based on Level 1 inputs — See Note 4. |
| ADR — American Depositary Receipt |
| plc — Public Limited Company |
| |
| See Sector Classification in Other Information section. |
| SEE NOTES TO FINANCIAL STATEMENTS. | THE GUGGENHEIM FUNDS SEMI-ANNUAL REPORT | 27 |
STATEMENT OF ASSETS AND LIABILITIES (Unaudited)
March 31, 2015
| Assets: | |
| Investments, at value (cost $52,462,222) | | $ | 59,864,102 | |
| Prepaid expenses | | | 28,816 | |
| Cash | | | 729 | |
| Receivables: | |
| Securities sold | | | 206,593 | |
| Dividends | | | 94,006 | |
| Investment adviser | | | 7,920 | |
| Fund shares sold | | | 2,868 | |
| Foreign taxes reclaim | | | 1,461 | |
| Total assets | | | 60,206,495 | |
| | | | | |
| Liabilities: | |
| Payable for: | |
| Direct shareholders expense | | | 37,582 | |
| Management fees | | | 33,315 | |
| Fund shares redeemed | | | 29,006 | |
| Distribution and service fees | | | 14,512 | |
| Transfer agent/maintenance fees | | | 14,175 | |
| Fund accounting/administration fees | | | 4,869 | |
| Trustees’ fees* | | | 776 | |
| Miscellaneous | | | 23,508 | |
| Total liabilities | | | 157,743 | |
| Net assets | | $ | 60,048,752 | |
| | | | | |
| Net assets consist of: | |
| Paid in capital | | $ | 49,176,804 | |
| Undistributed net investment income | | | 237,882 | |
| Accumulated net realized gain on investments | | | 3,232,186 | |
| Net unrealized appreciation on investments | | | 7,401,880 | |
| Net assets | | $ | 60,048,752 | |
| | | | | |
| A-Class: | |
| Net assets | | $ | 51,754,187 | |
| Capital shares outstanding | | | 1,201,774 | |
| Net asset value per share | | $ | 43.06 | |
| Maximum offering price per share (Net asset value divided by 95.25%) | | $ | 45.21 | |
| | | | | |
| B-Class: | |
| Net assets | | $ | 1,059,445 | |
| Capital shares outstanding | | | 26,818 | |
| Net asset value per share | | $ | 39.50 | |
| | | | | |
| C-Class: | |
| Net assets | | $ | 3,940,528 | |
| Capital shares outstanding | | | 97,979 | |
| Net asset value per share | | $ | 40.22 | |
| | | | | |
| Institutional Class: | |
| Net assets | | $ | 3,294,592 | |
| Capital shares outstanding | | | 76,467 | |
| Net asset value per share | | $ | 43.09 | |
STATEMENT OF OPERATIONS (Unaudited)
Period Ended March 31, 2015
| Investment Income: | |
| Dividends (net of foreign withholding tax of $306) | | $ | 592,847 | |
| Total investment income | | | 592,847 | |
| | | | | |
| Expenses: | |
| Management fees | | | 193,589 | |
| Transfer agent/maintenance fees: | |
| A-Class | | | 34,926 | |
| B-Class | | | 6,147 | |
| C-Class | | | 4,115 | |
| Institutional Class | | | 149 | |
| Distribution and service fees: | |
| A-Class | | | 63,620 | |
| C-Class | | | 20,736 | |
| Fund accounting/administration fees | | | 28,293 | |
| Registration fees | | | 34,386 | |
| Trustees’ fees* | | | 3,672 | |
| Line of credit fees | | | 2,384 | |
| Tax expense | | | 90 | |
| Custodian fees | | | 73 | |
| Miscellaneous | | | 31,115 | |
| Total expenses | | | 423,295 | |
| Less: | |
| Expenses waived by Adviser | | | (68,330 | ) |
| Net expenses | | | 354,965 | |
| Net investment income | | | 237,882 | |
| | | | | |
| Net Realized and Unrealized Gain (Loss): | |
| Net realized gain (loss) on: | |
| Investments | | | 6,724,148 | |
| Net realized gain | | | 6,724,148 | |
| Net change in unrealized appreciation (depreciation) on: | |
| Investments | | | (6,294,001 | ) |
| Net change in unrealized appreciation (depreciation) | | | (6,294,001 | ) |
| Net realized and unrealized gain | | | 430,147 | |
| Net increase in net assets resulting from operations | | $ | 668,029 | |
| * | Relates to Trustees not deemed “interested persons” within the meaning of Section 2(a)(19) of the 1940 Act. |
| 28 | THE GUGGENHEIM FUNDS SEMI-ANNUAL REPORT | SEE NOTES TO FINANCIAL STATEMENTS. |
STATEMENTS OF CHANGES IN NET ASSETS
| | | Period Ended March 31, 2015 (Unaudited) | | | Year Ended September 30, 2014 | |
| Increase (Decrease) in Net Assets from Operations: | | | | | | |
| Net investment income | | $ | 237,882 | | | $ | 462,954 | |
| Net realized gain on investments | | | 6,724,148 | | | | 6,780,018 | |
| Net change in unrealized appreciation (depreciation) on investments | | | (6,294,001 | ) | | | 1,707,332 | |
| Net increase in net assets resulting from operations | | | 668,029 | | | | 8,950,304 | |
| | | | | | | | | |
| Distributions to shareholders from: | | | | | | | | |
| Net investment income | | | | | | | | |
| A-Class | | | (402,108 | ) | | | (360,085 | ) |
| B-Class | | | (14,969 | ) | | | (19,432 | ) |
| C-Class | | | (10,590 | ) | | | (8,265 | ) |
| Institutional Class | | | (35,334 | ) | | | (26,519 | ) |
| Net realized gains | | | | | | | | |
| A-Class | | | (1,529,881 | ) | | | — | |
| B-Class | | | (41,043 | ) | | | — | |
| C-Class | | | (138,586 | ) | | | — | |
| Institutional Class | | | (102,374 | ) | | | — | |
| Total distributions to shareholders | | | (2,274,885 | ) | | | (414,301 | ) |
| | | | | | | | | |
| Capital share transactions: | | | | | | | | |
| Proceeds from sale of shares | | | | | | | | |
| A-Class | | | 7,399,378 | | | | 27,638,398 | |
| B-Class | | | 61,945 | | | | 59,007 | |
| C-Class | | | 805,840 | | | | 1,719,770 | |
| Institutional Class | | | 161,561 | | | | 448,328 | |
| Distributions reinvested | | | | | | | | |
| A-Class | | | 1,855,957 | | | | 345,368 | |
| B-Class | | | 55,872 | | | | 19,404 | |
| C-Class | | | 146,562 | | | | 8,202 | |
| Institutional Class | | | 137,708 | | | | 26,518 | |
| Cost of shares redeemed | | | | | | | | |
| A-Class | | | (16,339,183 | ) | | | (22,442,543 | ) |
| B-Class | | | (315,913 | ) | | | (973,891 | ) |
| C-Class | | | (900,895 | ) | | | (1,715,189 | ) |
| Institutional Class | | | (285,096 | ) | | | (374,679 | ) |
| Net increase (decrease) from capital share transactions | | | (7,216,264 | ) | | | 4,758,693 | |
| Net increase (decrease) in net assets | | | (8,823,120 | ) | | | 13,294,696 | |
| | | | | | | | | |
| Net assets: | | | | | | | | |
| Beginning of period | | | 68,871,872 | | | | 55,577,176 | |
| End of period | | $ | 60,048,752 | | | $ | 68,871,872 | |
| Undistributed net investment income at end of period | | $ | 237,882 | | | $ | 463,001 | |
| SEE NOTES TO FINANCIAL STATEMENTS. | THE GUGGENHEIM FUNDS SEMI-ANNUAL REPORT | 29 |
STATEMENTS OF CHANGES IN NET ASSETS (concluded)
| | | Period Ended March 31, 2015 (Unaudited) | | | Year Ended September 30, 2014 | |
| Capital share activity: | | | | | | | | |
| Shares sold | | | | | | | | |
| A-Class | | | 171,681 | | | | 660,974 | |
| B-Class | | | 1,563 | | | | 1,550 | |
| C-Class | | | 19,862 | | | | 42,907 | |
| Institutional Class | | | 3,810 | | | | 10,680 | |
| Shares issued from reinvestment of distributions | | | | | | | | |
| A-Class | | | 43,212 | | | | 8,728 | |
| B-Class | | | 1,419 | | | | 533 | |
| C-Class | | | 3,646 | | | | 220 | |
| Institutional Class | | | 3,208 | | | | 670 | |
| Shares redeemed | | | | | | | | |
| A-Class | | | (389,519 | ) | | | (529,031 | ) |
| B-Class | | | (8,085 | ) | | | (25,223 | ) |
| C-Class | | | (22,387 | ) | | | (43,704 | ) |
| Institutional Class | | | (6,664 | ) | | | (9,126 | ) |
| Net increase (decrease) in shares | | | (178,254 | ) | | | 119,178 | |
| 30 | THE GUGGENHEIM FUNDS SEMI-ANNUAL REPORT | SEE NOTES TO FINANCIAL STATEMENTS. |
This table is presented to show selected data for a share outstanding throughout each period and to assist shareholders in evaluating a Fund’s performance for the periods presented.
| A-Class | | Period Ended March 31, 2015a | | | Year Ended September 30, 2014 | | | Year Ended September 30, 2013 | | | Year Ended September 30, 2012 | | | Year Ended September 30, 2011g | | | Year Ended September 30, 2010g | |
| Per Share Data | | | | | | | | | | | | | | | | | | |
| Net asset value, beginning of period | | $ | 43.80 | | | $ | 38.28 | | | $ | 31.25 | | | $ | 24.58 | | | $ | 26.08 | | | $ | 24.92 | |
| Income (loss) from investment operations: | |
Net investment income (loss)b | | | .18 | | | | .30 | | | | .29 | | | | .25 | | | | .16 | | | | .12 | |
| Net gain (loss) on investments (realized and unrealized) | | | .77 | | | | 5.51 | | | | 7.03 | | | | 6.58 | | | | (1.54 | ) | | | 1.24 | |
| Total from investment operations | | | .95 | | | | 5.81 | | | | 7.32 | | | | 6.83 | | | | (1.38 | ) | | | 1.36 | |
| Less distributions from: | |
| Net investment income | | | (.35 | ) | | | (.29 | ) | | | (.29 | ) | | | (.16 | ) | | | (.12 | ) | | | (.20 | ) |
| Net realized gains | | | (1.34 | ) | | | — | | | | — | | | | — | | | | — | | | | — | |
| Total distributions | | | (1.69 | ) | | | (.29 | ) | | | (.29 | ) | | | (.16 | ) | | | (.12 | ) | | | (.20 | ) |
| Net asset value, end of period | | $ | 43.06 | | | $ | 43.80 | | | $ | 38.28 | | | $ | 31.25 | | | $ | 24.58 | | | $ | 26.08 | |
| | |
Total Returnc | | | 2.18 | % | | | 15.25 | % | | | 23.62 | % | | | 27.90 | % | | | (5.38 | %) | | | 5.46 | % |
| Ratios/Supplemental Data | |
| Net assets, end of period (in thousands) | | $ | 51,754 | | | $ | 60,281 | | | $ | 47,307 | | | $ | 41,173 | | | $ | 41,036 | | | $ | 47,718 | |
| Ratios to average net assets: | |
| Net investment income (loss) | | | 0.83 | % | | | 0.72 | % | | | 0.82 | % | | | 0.86 | % | | | 0.56 | % | | | 0.46 | % |
Total expensesd | | | 1.37 | % | | | 1.48 | % | | | 1.48 | % | | | 1.65 | % | | | 1.52 | % | | | 1.59 | % |
Net expensese | | | 1.16 | %i | | | 1.17 | %i | | | 1.15 | % | | | 1.18 | % | | | 1.15 | % | | | 1.18 | % |
| Portfolio turnover rate | | | 42 | % | | | 40 | % | | | 43 | % | | | 16 | % | | | 26 | % | | | 29 | % |
| B-Class | | Period Ended March 31, 2015a,f | | | Year Ended September 30, 2014f | | | Year Ended September 30, 2013f | | | Year Ended September 30, 2012f | | | Year Ended September 30, 2011f,g | | | Year Ended September 30, 2010f,g | |
| Per Share Data | | | | | | | | | | | | | | | | | | |
| Net asset value, beginning of period | | $ | 40.40 | | | $ | 35.34 | | | $ | 28.89 | | | $ | 22.75 | | | $ | 24.16 | | | $ | 23.12 | |
| Income (loss) from investment operations: | |
Net investment income (loss)b | | | .21 | | | | .36 | | | | .34 | | | | .29 | | | | .21 | | | | .16 | |
| Net gain (loss) on investments (realized and unrealized) | | | .72 | | | | 5.08 | | | | 6.49 | | | | 6.09 | | | | (1.46 | ) | | | 1.16 | |
| Total from investment operations | | | .93 | | | | 5.44 | | | | 6.83 | | | | 6.38 | | | | (1.25 | ) | | | 1.32 | |
| Less distributions from: | |
| Net investment income | | | (.49 | ) | | | (.38 | ) | | | (.38 | ) | | | (.24 | ) | | | (.16 | ) | | | (.28 | ) |
| Net realized gains | | | (1.34 | ) | | | — | | | | — | | | | — | | | | — | | | | — | |
| Total distributions | | | (1.83 | ) | | | (.38 | ) | | | (.38 | ) | | | (.24 | ) | | | (.16 | ) | | | (.28 | ) |
| Net asset value, end of period | | $ | 39.50 | | | $ | 40.40 | | | $ | 35.34 | | | $ | 28.89 | | | $ | 22.75 | | | $ | 24.16 | |
| | |
Total Returnc | | | 2.34 | % | | | 15.52 | % | | | 23.94 | % | | | 28.23 | % | | | (5.22 | %) | | | 5.78 | % |
| Ratios/Supplemental Data | |
| Net assets, end of period (in thousands) | | $ | 1,059 | | | $ | 1,289 | | | $ | 1,946 | | | $ | 2,226 | | | $ | 2,682 | | | $ | 4,132 | |
| Ratios to average net assets: | |
| Net investment income (loss) | | | 1.07 | % | | | 0.95 | % | | | 1.07 | % | | | 1.10 | % | | | 0.78 | % | | | 0.68 | % |
Total expensesd | | | 2.02 | % | | | 1.78 | % | | | 1.74 | % | | | 1.93 | % | | | 1.29 | % | | | 1.33 | % |
Net expensese | | | 0.91 | %i | | | 0.92 | %i | | | 0.90 | % | | | 0.93 | % | | | 0.90 | % | | | 0.94 | % |
| Portfolio turnover rate | | | 42 | % | | | 40 | % | | | 43 | % | | | 16 | % | | | 26 | % | | | 29 | % |
| SEE NOTES TO FINANCIAL STATEMENTS. | THE GUGGENHEIM FUNDS SEMI-ANNUAL REPORT | 31 |
FINANCIAL HIGHLIGHTS (continued)
This table is presented to show selected data for a share outstanding throughout each period and to assist shareholders in evaluating a Fund’s performance for the periods presented.
| C-Class | | Period Ended March 31, 2015a | | | Year Ended September 30, 2014 | | | Year Ended September 30, 2013 | | | Year Ended September 30, 2012 | | | Year Ended September 30, 2011g | | | Year Ended September 30, 2010g | |
| Per Share Data | | | | | | | | | | | | | | | | | | |
| Net asset value, beginning of period | | $ | 40.91 | | | $ | 35.86 | | | $ | 29.30 | | | $ | 23.08 | | | $ | 24.60 | | | $ | 23.48 | |
| Income (loss) from investment operations: | |
Net investment income (loss)b | | | .02 | | | | (.02 | ) | | | .02 | | | | .03 | | | | (.05 | ) | | | (.08 | ) |
| Net gain (loss) on investments (realized and unrealized) | | | .73 | | | | 5.16 | | | | 6.62 | | | | 6.19 | | | | (1.47 | ) | | | 1.20 | |
| Total from investment operations | | | .75 | | | | 5.14 | | | | 6.64 | | | | 6.22 | | | | (1.52 | ) | | | 1.12 | |
| Less distributions from: | |
| Net investment income | | | (.10 | ) | | | (.09 | ) | | | (.08 | ) | | | — | | | | — | | | | — | |
| Net realized gains | | | (1.34 | ) | | | — | | | | — | | | | — | | | | — | | | | — | |
| Total distributions | | | (1.44 | ) | | | (.09 | ) | | | (.08 | ) | | | — | | | | — | | | | — | |
| Net asset value, end of period | | $ | 40.22 | | | $ | 40.91 | | | $ | 35.86 | | | $ | 29.30 | | | $ | 23.08 | | | $ | 24.60 | |
| | |
Total Returnc | | | 1.84 | % | | | 14.35 | % | | | 22.73 | % | | | 26.95 | % | | | (6.18 | %) | | | 4.77 | % |
| Ratios/Supplemental Data | |
| Net assets, end of period (in thousands) | | $ | 3,941 | | | $ | 3,963 | | | $ | 3,494 | | | $ | 2,257 | | | $ | 2,013 | | | $ | 2,493 | |
| Ratios to average net assets: | |
| Net investment income (loss) | | | 0.09 | % | | | (0.04 | %) | | | 0.08 | % | | | 0.12 | % | | | (0.20 | %) | | | (0.31 | %) |
Total expensesd | | | 2.19 | % | | | 2.33 | % | | | 2.47 | % | | | 2.45 | % | | | 2.27 | % | | | 2.33 | % |
Net expensese | | | 1.91 | %i | | | 1.92 | %i | | | 1.90 | % | | | 1.93 | % | | | 1.90 | % | | | 1.94 | % |
| Portfolio turnover rate | | | 42 | % | | | 40 | % | | | 43 | % | | | 16 | % | | | 26 | % | | | 29 | % |
| 32 | THE GUGGENHEIM FUNDS SEMI-ANNUAL REPORT | SEE NOTES TO FINANCIAL STATEMENTS. |
FINANCIAL HIGHLIGHTS (concluded)
This table is presented to show selected data for a share outstanding throughout each period and to assist shareholders in evaluating a Fund’s performance for the periods presented.
| Institutional Class | | Period Ended March 31, 2015a | | | Year Ended September 30, 2014 | | | Period Ended September 30, 2013h | |
| Per Share Data | | | | | | | | | |
| Net asset value, beginning of period | | $ | 43.87 | | | $ | 38.32 | | | $ | 36.84 | |
| Income (loss) from investment operations: | |
Net investment income (loss)b | | | .23 | | | | .40 | | | | .13 | |
| Net gain (loss) on investments (realized and unrealized) | | | .79 | | | | 5.51 | | | | 1.35 | |
| Total from investment operations | | | 1.02 | | | | 5.91 | | | | 1.48 | |
| Less distributions from: | |
| Net investment income | | | (.46 | ) | | | (.36 | ) | | | — | |
| Net realized gains | | | (1.34 | ) | | | — | | | | — | |
| Total distributions | | | (1.80 | ) | | | (.36 | ) | | | — | |
| Net asset value, end of period | | $ | 43.09 | | | $ | 43.87 | | | $ | 38.32 | |
| | |
Total Returnc | | | 2.34 | % | | | 15.52 | % | | | 4.02 | % |
| Ratios/Supplemental Data | |
| Net assets, end of period (in thousands) | | $ | 3,295 | | | $ | 3,339 | | | $ | 2,831 | |
| Ratios to average net assets: | |
| Net investment income (loss) | | | 1.08 | % | | | 0.96 | % | | | 1.12 | % |
Total expensesd | | | 1.00 | % | | | 1.08 | % | | | 1.12 | % |
Net expensese | | | 0.91 | %i | | | 0.92 | %i | | | 0.89 | % |
| Portfolio turnover rate | | | 42 | % | | | 40 | % | | | 43 | % |
a | Unaudited figures for the period ended March 31, 2015. Percentage amounts for the period, except total return and portfolio turnover rate, have been annualized. |
b | Net investment income (loss) per share was computed using average shares outstanding throughout the period. |
c | Total return does not reflect the impact of any applicable sales charges and has not been annualized. |
d | Does not include expenses of the underlying funds in which the Fund invests. |
e | Net expense information reflects the expense ratios after expense waivers. |
f | Effective August 1, 2007 — B-Class shares ceased charging 12b-1 fees in accordance with FINRA sales cap regulations. Per share information reflects this change. This fee will be reinstated when sales exceed the sales cap limits. |
g | Reverse share split — Per share amounts for the periods presented through April 8, 2011 have been restated to reflect a 1:4 reverse share split effective April 8, 2011. |
h | Since commencement of operations: June 7, 2013. Percentage amounts for the period, except total return and portfolio turnover rate, have been annualized. |
i | Net expenses may include expenses that are excluded from the expense limitation agreement. Excluding these expenses, the operating expense ratios for the periods presented would be: |
| | 03/31/15 | 09/30/14 |
| A-Class | 1.15% | 1.15% |
| B-Class | 0.90% | 0.90% |
| C-Class | 1.90% | 1.90% |
| Institutional Class | 0.90% | 0.90% |
| SEE NOTES TO FINANCIAL STATEMENTS. | THE GUGGENHEIM FUNDS SEMI-ANNUAL REPORT | 33 |
FUND PROFILE (Unaudited) | March 31, 2015 |
RISK MANAGED REAL ESTATE FUND
OBJECTIVE: Seeks to provide total return, comprised of capital appreciation and current income.
Holdings Diversification (Market Exposure as % of Net Assets)
“Holdings Diversification (Market Exposure as % of Net Assets)” excludes any temporary cash investments.
| Inception Dates: |
| A-Class | March 28, 2014 |
| C-Class | March 28, 2014 |
| Institutional Class | March 28, 2014 |
| Ten Largest Holdings (% of Total Net Assets) |
| Simon Property Group, Inc. | 6.9% |
| Equity Residential | 4.0% |
| Prologis, Inc. | 3.9% |
| Health Care REIT, Inc. | 3.8% |
| General Growth Properties, Inc. | 3.0% |
| NorthStar Realty Finance Corp. | 2.9% |
| Ventas, Inc. | 2.9% |
| Federal Realty Investment Trust | 2.8% |
| Forest City Enterprises, Inc. — Class A | 2.8% |
| Apartment Investment & Management Co. — Class A | 2.6% |
| Top Ten Total | 35.6% |
| | |
| “Ten Largest Holdings” exclude any temporary cash or derivative investments. |
| 34 | THE GUGGENHEIM FUNDS SEMI-ANNUAL REPORT | |
SCHEDULE OF INVESTMENTS (Unaudited) | March 31, 2015 |
| RISK MANAGED REAL ESTATE FUND | |
| | |
Shares | | | Value | |
| | | | | | | | |
COMMON STOCKS† - 96.3% | |
| | | | | | | | |
| REITs - 84.4% | |
| REITs-REGIONAL MALLS - 13.8% | |
| Simon Property Group, Inc. | | | 41,979 | | | $ | 8,212,771 | |
| General Growth Properties, Inc. | | | 120,795 | | | | 3,569,492 | |
| Pennsylvania Real Estate Investment Trust | | | 88,449 | | | | 2,054,670 | |
| Macerich Co. | | | 23,508 | | | | 1,982,430 | |
| Taubman Centers, Inc. | | | 6,457 | | | | 498,028 | |
| Total REITs-Regional Malls | | | | | | | 16,317,391 | |
| | | | | | | | |
| REITs-APARTMENTS - 12.5% | |
| Equity Residential | | | 60,852 | | | | 4,737,938 | |
| Apartment Investment & Management Co. — Class A | | | 77,590 | | | | 3,053,942 | |
| AvalonBay Communities, Inc. | | | 14,392 | | | | 2,507,806 | |
| Essex Property Trust, Inc. | | | 9,091 | | | | 2,090,021 | |
| Camden Property Trust | | | 24,190 | | | | 1,889,965 | |
| UDR, Inc. | | | 14,812 | | | | 504,052 | |
| Total REITs-Apartments | | | | | | | 14,783,724 | |
| | | | | | | | |
| REITs-OFFICE PROPERTY - 11.7% | |
| Boston Properties, Inc. | | | 18,814 | | | | 2,642,990 | |
| BioMed Realty Trust, Inc. | | | 111,152 | | | | 2,518,703 | |
| Hudson Pacific Properties, Inc. | | | 68,982 | | | | 2,289,512 | |
| New York REIT, Inc. | | | 179,320 | | | | 1,879,274 | |
| Paramount Group, Inc. | | | 91,265 | | | | 1,761,415 | |
| SL Green Realty Corp. | | | 8,241 | | | | 1,057,980 | |
| Alexandria Real Estate Equities, Inc. | | | 9,417 | | | | 923,243 | |
| American Realty Capital Properties, Inc. | | | 53,803 | | | | 529,960 | |
| Douglas Emmett, Inc. | | | 11,298 | | | | 336,793 | |
| Total REITs-Office Property | | | | | | | 13,939,870 | |
| | | | | | | | |
| REITs-DIVERSIFIED - 9.2% | |
| Gramercy Property Trust, Inc. | | | 88,639 | | | | 2,488,104 | |
| American Tower Corp. — Class A | | | 26,380 | | | | 2,483,677 | |
| Crown Castle International Corp. | | | 26,083 | | | | 2,152,891 | |
| Vornado Realty Trust | | | 15,225 | | | | 1,705,200 | |
| American Assets Trust, Inc. | | | 37,668 | | | | 1,630,271 | |
| Digital Realty Trust, Inc. | | | 8,778 | | | | 578,997 | |
| Total REITs-Diversified | | | | | | | 11,039,140 | |
| | | | | | | | |
| REITs-WAREHOUSE/INDUSTRIES - 9.1% | |
| Prologis, Inc. | | | 106,628 | | | | 4,644,715 | |
| QTS Realty Trust, Inc. — Class A | | | 55,208 | | | | 2,010,123 | |
| First Industrial Realty Trust, Inc. | | | 87,550 | | | | 1,876,197 | |
| DCT Industrial Trust, Inc. | | | 45,900 | | | | 1,590,894 | |
| Rexford Industrial Realty, Inc. | | | 37,213 | | | | 588,338 | |
| Total REITs-Warehouse/Industries | | | | | | | 10,710,267 | |
| | | | | | | | |
| REITs-HEALTH CARE - 6.8% | |
| Health Care REIT, Inc. | | | 58,867 | | | | 4,553,952 | |
| Ventas, Inc. | | | 47,119 | | | | 3,440,629 | |
| HCP, Inc. | | | 715 | | | | 30,895 | |
| Total REITs-Health Care | | | | | | | 8,025,476 | |
| | | | | | | | |
| REITs-SHOPPING CENTERS - 6.5% | |
| Federal Realty Investment Trust | | | 22,711 | | | | 3,343,286 | |
| Regency Centers Corp. | | | 29,319 | | | | 1,994,865 | |
| Kimco Realty Corp. | | | 68,882 | | | | 1,849,482 | |
| DDR Corp. | | | 30,082 | | | | 560,127 | |
| Total REITs-Shopping Centers | | | | | | | 7,747,760 | |
| | | | | | | | |
| REITs-STORAGE - 4.5% | |
| Sovran Self Storage, Inc. | | | 23,748 | | | | 2,230,888 | |
| CubeSmart | | | 73,596 | | | | 1,777,343 | |
| Extra Space Storage, Inc. | | | 10,809 | | | | 730,364 | |
| Public Storage | | | 2,974 | | | | 586,294 | |
| Total REITs-Storage | | | | | | | 5,324,889 | |
| | | | | | | | |
| REITs-HOTELS - 3.7% | |
| Chatham Lodging Trust | | | 68,703 | | | | 2,020,555 | |
| Host Hotels & Resorts, Inc. | | | 79,293 | | | | 1,600,133 | |
| Strategic Hotels & Resorts, Inc.* | | | 55,153 | | | | 685,552 | |
| Total REITs-Hotels | | | | | | | 4,306,240 | |
| | | | | | | | |
| REITs-MANUFACTURED HOMES - 3.5% | |
| Sun Communities, Inc. | | | 36,421 | | | | 2,430,009 | |
| Equity LifeStyle Properties, Inc. | | | 31,687 | | | | 1,741,201 | |
| Total REITs-Manufactured Homes | | | | | | | 4,171,210 | |
| | | | | | | | |
| REITs-MORTGAGE - 2.9% | |
| NorthStar Realty Finance Corp. | | | 190,061 | | | | 3,443,906 | |
| | | | | | | | |
| OFFICE REITs - 0.2% | |
| Columbia Property Trust, Inc. | | | 10,129 | | | | 273,686 | |
| Total REITs | | | | | | | 100,083,559 | |
| | | | | | | | |
| LODGING - 4.2% | |
| HOTELS & MOTELS - 4.2% | |
| Starwood Hotels & Resorts Worldwide, Inc. | | | 24,357 | | | | 2,033,809 | |
| Hyatt Hotels Corp. — Class A* | | | 25,495 | | | | 1,509,814 | |
| Wyndham Worldwide Corp. | | | 15,610 | | | | 1,412,237 | |
| Total Hotels & Motels | | | | | | | 4,955,860 | |
| Total Lodging | | | | | | | 4,955,860 | |
| | | | | | | | |
| REAL ESTATE - 3.3% | |
| REAL ESTATE OPERATIONS/DEVELOPMENT - 2.8% | |
| Forest City Enterprises, Inc. — Class A* | | | 127,989 | | | | 3,266,279 | |
| | | | | | | | |
| REAL ESTATE MANAGEMENT/SERVICES - 0.5% | |
| WP Carey, Inc. | | | 8,484 | | | | 576,912 | |
| Total Real Estate | | | | | | | 3,843,191 | |
| | | | | | | | |
| SEE NOTES TO FINANCIAL STATEMENTS. | THE GUGGENHEIM FUNDS SEMI-ANNUAL REPORT | 35 |
SCHEDULE OF INVESTMENTS (Unaudited)(continued) | March 31, 2015 |
| RISK MANAGED REAL ESTATE FUND | |
| | |
Shares | | | Value | |
| | | | | | | | | |
| HEALTHCARE-SERVICES - 2.5% | |
| RETIREMENT/AGED CARE - 1.4% | |
| Brookdale Senior Living, Inc. — Class A* | | | 45,230 | | | $ | 1,707,885 | |
| | | | | | | | |
| MEDICAL-HOSPITALS - 1.1% | |
| HCA Holdings, Inc.* | | | 16,806 | | | | 1,264,315 | |
| Total Healthcare-Services | | | | | | | 2,972,200 | |
| | | | | | | | |
| DIVERSIFIED FINANCIAL SERVICES - 1.9% | |
| INVESTMENT MANAGEMENT/ADVISORY SERVICES - 1.9% | |
| NorthStar Asset Management Group, Inc. | | | 95,530 | | | | 2,229,670 | |
| Total Diversified Financial Services | | | | | | | 2,229,670 | |
| | | | | | | | |
| Total Common Stocks | | | | | | | | |
| (Cost $107,062,690) | | | | | | | 114,084,480 | |
| | | | | | | | |
SHORT TERM INVESTMENTS† - 6.6% | |
| Dreyfus Treasury Prime Cash Management Fund 0.00% | | | 7,776,694 | | | | 7,776,694 | |
| Total Short Term Investments | | | | | | | | |
| (Cost $7,776,694) | | | | | | | 7,776,694 | |
| Total Investments - 102.9% | | | | | | | | |
| (Cost $114,839,384) | | | | | | $ | 121,861,174 | |
| | | | | | | | |
COMMON STOCKS SOLD SHORT† - (28.9)% | |
| |
| REITs – (28.9)% | |
| REITs-MORTGAGE – (1.0)% | |
| Annaly Capital Management, Inc. | | | (113,719 | ) | | | (1,182,678 | ) |
| | | | | | | | |
| OFFICE REITs – (1.1)% | |
| Piedmont Office Realty Trust, Inc. — Class A | | | (71,813 | ) | | | (1,336,440 | ) |
| | | | | | | | |
| REITs-APARTMENTS – (1.2)% | |
| Mid-America Apartment Communities, Inc. | | | (17,854 | ) | | | (1,379,579 | ) |
| | | | | | | | |
| REITs-STORAGE – (1.2)% | |
| Iron Mountain, Inc. | | | (38,220 | ) | | | (1,394,266 | ) |
| | | | | | | | |
| RESIDENTIAL REITs – (1.4)% | |
| American Homes 4 Rent — Class A | | | (98,479 | ) | | | (1,629,827 | ) |
| | | | | | | | |
| REITs-REGIONAL MALLS – (2.0)% | |
| CBL & Associates Properties, Inc. | | | (54,248 | ) | | | (1,074,110 | ) |
| Rouse Properties, Inc. | | | (67,617 | ) | | | (1,282,018 | ) |
| Total REITs-Regional Malls | | | | | | | (2,356,128 | ) |
| | | | | | | | |
| REITs-HOTELS – (2.8)% | |
| Ryman Hospitality Properties, Inc. | | | (15,277 | ) | | | (930,522 | ) |
| Summit Hotel Properties, Inc. | | | (82,394 | ) | | | (1,159,284 | ) |
| Chesapeake Lodging Trust | | | (35,400 | ) | | | (1,197,582 | ) |
| Total REITs-Hotels | | | | | | | (3,287,388 | ) |
| | | | | | | | |
| REITs-SINGLE TENANT – (3.3)% | |
| National Retail Properties, Inc. | | | (45,029 | ) | | | (1,844,838 | ) |
| Realty Income Corp. | | | (39,535 | ) | | | (2,040,006 | ) |
| Total REITs-Single Tenant | | | | | | | (3,884,844 | ) |
| | | | | | | | |
| REITs-OFFICE PROPERTY – (3.5)% | |
| Equity Commonwealth* | | | (46,386 | ) | | | (1,231,548 | ) |
| Corporate Office Properties Trust | | | (45,501 | ) | | | (1,336,819 | ) |
| Government Properties Income Trust | | | (71,168 | ) | | | (1,626,189 | ) |
| Total REITs-Office Property | | | | | | | (4,194,556 | ) |
| | | | | | | | |
| REITs-DIVERSIFIED – (3.7)% | |
| EPR Properties | | | (21,933 | ) | | | (1,316,638 | ) |
| Duke Realty Corp. | | | (66,979 | ) | | | (1,458,133 | ) |
| Washington Real Estate Investment Trust | | | (61,759 | ) | | | (1,706,401 | ) |
| Total REITs-Diversified | | | | | | | (4,481,172 | ) |
| | | | | | | | |
| REITs-HEALTH CARE – (3.8)% | |
| Omega Healthcare Investors, Inc. | | | (34,219 | ) | | | (1,388,265 | ) |
| Healthcare Realty Trust, Inc. | | | (51,637 | ) | | | (1,434,476 | ) |
| Medical Properties Trust, Inc. | | | (112,992 | ) | | | (1,665,502 | ) |
| Total REITs-Health Care | | | | | | | (4,488,243 | ) |
| | | | | | | | |
| REITs-SHOPPING CENTERS – (3.9)% | |
| Weingarten Realty Investors | | | (40,417 | ) | | | (1,454,204 | ) |
| Brixmor Property Group, Inc. | | | (55,234 | ) | | | (1,466,463 | ) |
| WP GLIMCHER, Inc. | | | (107,932 | ) | | | (1,794,909 | ) |
| Total REITs-Shopping Centers | | | | | | | (4,715,576 | ) |
| Total REITs | | | | | | | (34,330,697 | ) |
| | | | | | | | |
| Total Common Stocks Sold Short | | | | | | | | |
| (Proceeds $33,566,598) | | | | | | | (34,330,697 | ) |
| | | | | | | | |
EXCHANGE-TRADED FUNDS SOLD SHORT† - (6.1)% | |
| iShares US Real Estate ETF | | | 91,051 | | | | (7,222,165 | ) |
| Total Exchange-Traded Funds Sold Short | | | | | | | | |
| (Proceeds $7,302,963) | | | | | | | (7,222,165 | ) |
| Total Securities Sold Short - (35.0)% | | | | | | | | |
| (Proceeds $40,869,561) | | | | | | $ | (41,552,862 | ) |
| Other Assets & Liabilities, net - 32.1% | | | | | | | 37,997,324 | |
| Total Net Assets - 100.0% | | | | | | $ | 118,305,636 | |
| | | | | | | | | |
| 36 | THE GUGGENHEIM FUNDS SEMI-ANNUAL REPORT | SEE NOTES TO FINANCIAL STATEMENTS. |
SCHEDULE OF INVESTMENTS (Unaudited)(concluded) | March 31, 2015 |
| RISK MANAGED REAL ESTATE FUND | |
| | | | | | | | | |
| | | Units | | | Unrealized
Gain | |
| | | | | | | | |
OTC EQUITY INDEX SWAP AGREEMENTS†† | |
Bank of America Merrill Lynch
April 2015 Guggenheim Real Estate
Investment Trust Basket
Total Return Index Swap,
Terminating 04/30/151
(Notional Value $35,527,028) | | | 313,483 | | | $ | 375,381 | |
Bank of America Merrill Lynch Real Estate Investment Trust Index Swap
| Sector | % of Index |
| REITs-Regional Malls | 15.9% |
| REITs-Apartments | 15.1% |
| REITs-Office Property | 12.6% |
| REITs-Health Care | 9.3% |
| REITs-Diversified | 8.9% |
| REITs-Warehouse/Industries | 8.5% |
| REITs-Shopping Centers | 7.2% |
| REITs-Storage | 6.3% |
| REITs-Hotels | 4.5% |
| Hotels & Motels | 2.6% |
| REITs-Manufactured Homes | 2.6% |
| REITs-Mortgage | 2.5% |
| Real Estate Operations/Development | 1.6% |
| Investment Management/Advisory Services | 1.3% |
| Medical-Hospitals | 0.6% |
| Retirement/Aged Care | 0.5% |
| Total | 100.0% |
| * | Non-income producing security. |
| † | Value determined based on Level 1 inputs — See Note 4. |
| †† | Value determined based on Level 2 inputs — See Note 4. |
| 1 | Customized basket of 57 exchange-traded equity securities. Total Return based on Bank of America Merrill Lynch Guggenheim Real Estate Investment Trust Basket Index +/- financing at a variable rate. |
| REIT — Real Estate Investment Trust |
| |
| See Sector Classification in Other Information section. |
| SEE NOTES TO FINANCIAL STATEMENTS. | THE GUGGENHEIM FUNDS SEMI-ANNUAL REPORT | 37 |
| RISK MANAGED REAL ESTATE FUND | |
STATEMENT OF ASSETS AND LIABILITIES (Unaudited)
March 31, 2015
| Assets: | |
| Investments, at value (cost $114,839,384) | | $ | 121,861,174 | |
| Segregated cash with broker | | | 37,603,910 | |
| Unrealized appreciation on swap agreements | | | 375,381 | |
| Prepaid expenses | | | 42,625 | |
| Cash | | | 22,879 | |
| Receivables: | |
| Securities sold | | | 3,695,759 | |
| Dividends | | | 170,270 | |
| Investment adviser | | | 2,568 | |
| Fund shares sold | | | 250 | |
| Total assets | | | 163,774,816 | |
| | | | | |
| Liabilities: | |
| Securities sold short, at value (proceeds $40,869,561) | | | 41,552,862 | |
| Payable for: | |
| Securities purchased | | | 3,790,166 | |
| Management fees | | | 74,818 | |
| Fund accounting/administration fees | | | 9,477 | |
| Trustees’ fees* | | | 428 | |
| Distribution and service fees | | | 399 | |
| Transfer agent/maintenance fees | | | 290 | |
| Miscellaneous | | | 40,740 | |
| Total liabilities | | | 45,469,180 | |
| Net assets | | $ | 118,305,636 | |
| | | | | |
| Net assets consist of: | |
| Paid in capital | | $ | 100,246,054 | |
| Accumulated net investment loss | | | (510,545 | ) |
| Accumulated net realized gain on investments | | | 11,856,257 | |
| Net unrealized appreciation on investments | | | 6,713,870 | |
| Net assets | | $ | 118,305,636 | |
| | | | | |
| A-Class: | |
| Net assets | | $ | 1,373,274 | |
| Capital shares outstanding | | | 42,889 | |
| Net asset value per share | | $ | 32.02 | |
| Maximum offering price per share (Net asset value divided by 95.25%) | | $ | 33.62 | |
| | | | | |
| C-Class: | |
| Net assets | | $ | 164,381 | |
| Capital shares outstanding | | | 5,152 | |
| Net asset value per share | | $ | 31.91 | |
| | | | | |
| Institutional Class: | |
| Net assets | | $ | 116,767,981 | |
| Capital shares outstanding | | | 3,637,156 | |
| Net asset value per share | | $ | 32.10 | |
STATEMENT OF OPERATIONS (Unaudited)
Period Ended March 31, 2015
| Investment Income: | |
| Dividends | | $ | 347,506 | |
| Interest | | | 24 | |
| Total investment income | | | 347,530 | |
| | | | | |
| Expenses: | |
| Management fees | | | 453,994 | |
| Transfer agent/maintenance fees: | |
| A-Class | | | 1,064 | |
| C-Class | | | 1,617 | |
| Institutional Class | | | 461 | |
| Distribution and service fees: | |
| A-Class | | | 1,031 | |
| C-Class | | | 397 | |
| Fund accounting/administration fees | | | 54,580 | |
| Prime broker interest expense | | | 126,592 | |
| Registration fees | | | 35,539 | |
| Trustees’ fees* | | | 5,189 | |
| Line of credit fees | | | 3,614 | |
| Custodian fees | | | 2,680 | |
| Miscellaneous | | | 27,243 | |
| Total expenses | | | 714,001 | |
| Net investment loss | | | (366,471 | ) |
| | | | | |
| Net Realized and Unrealized Gain (Loss): | |
| Net realized gain (loss) on: | |
| Investments | | | 8,718,125 | |
| Swap agreements | | | 5,721,412 | |
| Securities sold short | | | (2,120,421 | ) |
| Net realized gain | | | 12,319,116 | |
| Net change in unrealized appreciation (depreciation) on: | |
| Investments | | | 10,175,779 | |
| Securities sold short | | | (2,357,788 | ) |
| Swap agreements | | | 375,381 | |
| Net change in unrealized appreciation (depreciation) | | | 8,193,372 | |
| Net realized and unrealized gain | | | 20,512,488 | |
| Net increase in net assets resulting from operations | | $ | 20,146,017 | |
| * | Relates to Trustees not deemed “interested persons” within the meaning of Section 2(a)(19) of the 1940 Act. |
| 38 | THE GUGGENHEIM FUNDS SEMI-ANNUAL REPORT | SEE NOTES TO FINANCIAL STATEMENTS. |
| RISK MANAGED REAL ESTATE FUND | |
STATEMENTS OF CHANGES IN NET ASSETS
| | | Period Ended March 31, 2015 (Unaudited) | | | Period Ended September 30, 2014a | |
| Increase (Decrease) in Net Assets from Operations: | | | | | | |
| Net investment income (loss) | | $ | (366,471 | ) | | $ | 22,934 | |
| Net realized gain on investments | | | 12,319,116 | | | | 214,971 | |
| Net change in unrealized appreciation (depreciation) on investments | | | 8,193,372 | | | | (1,479,502 | ) |
| Net increase (decrease) in net assets resulting from operations | | | 20,146,017 | | | | (1,241,597 | ) |
| | | | | | | | | |
| Distributions to shareholders from: | | | | | | | | |
| Net investment income | | | | | | | | |
| A-Class | | | (2,130 | ) | | | (156 | ) |
| C-Class | | | — | | | | (6 | ) |
| Institutional Class | | | (110,810 | ) | | | (191,573 | ) |
| Net realized gains | | | | | | | | |
| A-Class | | | (5,715 | ) | | | — | |
| C-Class | | | (362 | ) | | | — | |
| Institutional Class | | | (534,120 | ) | | | — | |
| Total distributions to shareholders | | | (653,137 | ) | | | (191,735 | ) |
| | | | | | | | | |
| Capital share transactions: | | | | | | | | |
| Proceeds from sale of shares | | | | | | | | |
| A-Class | | | 1,421,263 | | | | 110,130 | |
| C-Class | | | 169,440 | | | | 309,239 | |
| Institutional Class | | | 192,498 | | | | 105,276,555 | |
| Distributions reinvested | | | | | | | | |
| A-Class | | | 6,954 | | | | 73 | |
| C-Class | | | 362 | | | | — | |
| Institutional Class | | | 488,786 | | | | 160,496 | |
| Cost of shares redeemed | | | | | | | | |
| A-Class | | | (234,897 | ) | | | (105 | ) |
| C-Class | | | (70,592 | ) | | | (260,047 | ) |
| Institutional Class | | | (7,312,761 | ) | | | (11,306 | ) |
| Net increase (decrease) from capital share transactions | | | (5,338,947 | ) | | | 105,585,035 | |
| Net increase in net assets | | | 14,153,933 | | | | 104,151,703 | |
| | | | | | | | | |
| Net assets: | | | | | | | | |
| Beginning of period | | | 104,151,703 | | | | — | |
| End of period | | $ | 118,305,636 | | | $ | 104,151,703 | |
| Accumulated net investment loss at end of period | | $ | (510,545 | ) | | $ | (31,134 | ) |
| | | | | | | | | |
| Capital share activity: | | | | | | | | |
| Shares sold | | | | | | | | |
| A-Class | | | 46,531 | | | | 3,971 | |
| C-Class | | | 5,497 | | | | 11,307 | |
| Institutional Class | | | 6,259 | | | | 3,845,861 | |
| Shares issued from reinvestment of distributions | | | | | | | | |
| A-Class | | | 229 | | | | 3 | |
| C-Class | | | 12 | | | | — | |
| Institutional Class | | | 16,219 | | | | 5,733 | |
| Shares redeemed | | | | | | | | |
| A-Class | | | (7,841 | ) | | | (4 | ) |
| C-Class | | | (2,288 | ) | | | (9,376 | ) |
| Institutional Class | | | (236,499 | ) | | | (417 | ) |
| Net increase (decrease) in shares | | | (171,881 | ) | | | 3,857,078 | |
a | Since commencement of operations: March 28, 2014 |
| SEE NOTES TO FINANCIAL STATEMENTS. | THE GUGGENHEIM FUNDS SEMI-ANNUAL REPORT | 39 |
| RISK MANAGED REAL ESTATE FUND | |
This table is presented to show selected data for a share outstanding throughout each period and to assist shareholders in evaluating a Fund’s performance for the periods presented.
| A-Class | | Period Ended March 31, 2015a | | | Period Ended September 30, 2014b | |
| Per Share Data | | | | | | |
| Net asset value, beginning of period | | $ | 26.99 | | | $ | 25.00 | |
| Income (loss) from investment operations: | |
Net investment income (loss)c | | | (.11 | ) | | | .02 | |
| Net gain (loss) on investments (realized and unrealized) | | | 5.33 | | | | 2.06 | |
| Total from investment operations | | | 5.22 | | | | 2.08 | |
| Less distributions from: | |
| Net investment income | | | (.05 | ) | | | (.09 | ) |
| Net realized gains | | | (.14 | ) | | | — | |
| Total distributions | | | (.19 | ) | | | (.09 | ) |
| Net asset value, end of period | | $ | 32.02 | | | $ | 26.99 | |
| | |
Total Returnd | | | 19.35 | % | | | 8.35 | % |
| Ratios/Supplemental Data | |
| Net assets, end of period (in thousands) | | $ | 1,373 | | | $ | 107 | |
| Ratios to average net assets: | |
| Net investment income (loss) | | | (0.69 | %) | | | 0.16 | % |
Total expensese | | | 1.53 | % | | | 4.22 | %g |
Net expensesf,h | | | 1.53 | % | | | 3.32 | % |
| Portfolio turnover rate | | | 107 | % | | | 57 | % |
| C-Class | | Period Ended March 31, 2015a | | | Period Ended September 30, 2014b | |
| Per Share Data | | | | | | |
| Net asset value, beginning of period | | $ | 26.95 | | | $ | 25.00 | |
| Income (loss) from investment operations: | |
Net investment income (loss)c | | | (.22 | ) | | | (.23 | ) |
| Net gain (loss) on investments (realized and unrealized) | | | 5.32 | | | | 2.19 | |
| Total from investment operations | | | 5.10 | | | | 1.96 | |
| Less distributions from: | |
| Net investment income | | | — | | | | (.01 | ) |
| Net realized gains | | | (.14 | ) | | | — | |
| Total distributions | | | (.14 | ) | | | (.01 | ) |
| Net asset value, end of period | | $ | 31.91 | | | $ | 26.95 | |
| | |
Total Returnd | | | 18.96 | % | | | 7.85 | % |
| Ratios/Supplemental Data | |
| Net assets, end of period (in thousands) | | $ | 164 | | | $ | 52 | |
| Ratios to average net assets: | |
| Net investment income (loss) | | | (1.45 | %) | | | (1.60 | %) |
Total expensese | | | 2.27 | % | | | 9.33 | %g |
Net expensesf,h | | | 2.27 | % | | | 2.67 | % |
| Portfolio turnover rate | | | 107 | % | | | 57 | % |
| 40 | THE GUGGENHEIM FUNDS SEMI-ANNUAL REPORT | SEE NOTES TO FINANCIAL STATEMENTS. |
| RISK MANAGED REAL ESTATE FUND | |
FINANCIAL HIGHLIGHTS (concluded)
This table is presented to show selected data for a share outstanding throughout each period and to assist shareholders in evaluating a Fund’s performance for the periods presented.
| Institutional Class | | Period Ended March 31, 2015a | | | Period Ended September 30, 2014b | |
| Per Share Data | | | | | | |
| Net asset value, beginning of period | | $ | 27.00 | | | $ | 25.00 | |
| Income (loss) from investment operations: | |
Net investment income (loss)c | | | (.10 | ) | | | .02 | |
| Net gain (loss) on investments (realized and unrealized) | | | 5.37 | | | | 2.09 | |
| Total from investment operations | | | 5.27 | | | | 2.11 | |
| Less distributions from: | |
| Net investment income | | | (.03 | ) | | | (.11 | ) |
| Net realized gains | | | (.14 | ) | | | — | |
| Total distributions | | | (.17 | ) | | | (.11 | ) |
| Net asset value, end of period | | $ | 32.10 | | | $ | 27.00 | |
| | |
Total Returnd | | | 19.56 | % | | | 8.44 | % |
| Ratios/Supplemental Data | |
| Net assets, end of period (in thousands) | | $ | 116,768 | | | $ | 103,993 | |
| Ratios to average net assets: | |
| Net investment income (loss) | | | (0.64 | %) | | | 0.11 | % |
Total expensese | | | 1.24 | % | | | 2.69 | %g |
Net expensesf,h | | | 1.24 | % | | | 2.58 | % |
| Portfolio turnover rate | | | 107 | % | | | 57 | % |
a | Unaudited figures for the period ended March 31, 2015. Percentage amounts for the period, except total return and portfolio turnover rate, have been annualized. |
b | Since commencement of operations: March 28, 2014. Percentage amounts for the period, except total return and portfolio turnover rate, have been annualized. |
c | Net investment income (loss) per share was computed using average shares outstanding throughout the period. |
d | Total return does not reflect the impact of any applicable sales charges and has not been annualized. |
e | Does not include expenses of the underlying funds in which the Fund invests. |
f | Net expense information reflects the expense ratios after expense waivers and reimbursements, as applicable. |
g | Due to limited length of Fund operations, ratios for this period are not indicative of future performance. |
h | Net expenses may include expenses that are excluded from the expense limitation agreement. Excluding these expenses, the operating expense ratios for the periods presented would be: |
| | 03/31/15 | 09/30/14 |
| A-Class | 1.29% | 1.30% |
| C-Class | 2.05% | 2.05% |
| Institutional Class | 1.01% | 1.10% |
| SEE NOTES TO FINANCIAL STATEMENTS. | THE GUGGENHEIM FUNDS SEMI-ANNUAL REPORT | 41 |
FUND PROFILE (Unaudited) | March 31, 2015 |
SMALL CAP VALUE FUND
OBJECTIVE: Seeks long-term capital appreciation.
Holdings Diversification (Market Exposure as % of Net Assets)
“Holdings Diversification (Market Exposure as % of Net Assets)” excludes any temporary cash investments.
| Inception Dates: |
| A-Class | July 11, 2008 |
| C-Class | July 11, 2008 |
| Institutional Class | July 11, 2008 |
| Ten Largest Holdings (% of Total Net Assets) |
| Endurance Specialty Holdings Ltd. | 3.0% |
| Hanover Insurance Group, Inc. | 3.0% |
| Diebold, Inc. | 2.6% |
| Covanta Holding Corp. | 2.4% |
| Emergent Biosolutions, Inc. | 2.2% |
| Papa Murphy’s Holdings, Inc. | 2.2% |
| Berkshire Hills Bancorp, Inc. | 2.1% |
| Apartment Investment & Management Co. — Class A | 2.1% |
| Laclede Group, Inc. | 2.0% |
| CubeSmart | 2.0% |
| Top Ten Total | 23.6% |
| | |
| “Ten Largest Holdings” exclude any temporary cash or derivative investments. |
| 42 | THE GUGGENHEIM FUNDS SEMI-ANNUAL REPORT | |
SCHEDULE OF INVESTMENTS (Unaudited) | March 31, 2015 |
| SMALL CAP VALUE FUND | |
| | |
Shares | | | Value | |
| | | | | | | | |
COMMON STOCKS† - 99.1% | |
| | | | | | | | |
| FINANCIAL - 33.2% | |
| Endurance Specialty Holdings Ltd. | | | 11,844 | | | $ | 724,142 | |
| Hanover Insurance Group, Inc. | | | 9,849 | | | | 714,840 | |
| Berkshire Hills Bancorp, Inc. | | | 18,510 | | | | 512,727 | |
| Apartment Investment & Management Co. — Class A | | | 12,970 | | | | 510,499 | |
| CubeSmart | | | 19,874 | | | | 479,957 | |
| Reinsurance Group of America, Inc. — Class A | | | 5,120 | | | | 477,133 | |
| Navigators Group, Inc.* | | | 5,440 | | | | 423,450 | |
| NorthStar Realty Finance Corp. | | | 21,350 | | | | 386,862 | |
| Sun Communities, Inc. | | | 5,624 | | | | 375,233 | |
| Horace Mann Educators Corp. | | | 10,820 | | | | 370,044 | |
| Camden Property Trust | | | 4,700 | | | | 367,211 | |
| Chatham Lodging Trust | | | 12,230 | | | | 359,684 | |
| OFG Bancorp | | | 21,728 | | | | 354,601 | |
| Symetra Financial Corp. | | | 13,930 | | | | 326,798 | |
| Wintrust Financial Corp. | | | 5,620 | | | | 267,962 | |
| Cathay General Bancorp | | | 7,540 | | | | 214,513 | |
| Argo Group International Holdings Ltd. | | | 4,241 | | | | 212,686 | |
| Acacia Research Corp. | | | 18,150 | | | | 194,205 | |
| 1st Source Corp. | | | 5,878 | | | | 188,860 | |
| Ocwen Financial Corp.* | | | 17,170 | | | | 141,653 | |
| BioMed Realty Trust, Inc. | | | 4,740 | | | | 107,408 | |
| Fulton Financial Corp. | | | 6,670 | | | | 82,308 | |
| Trustmark Corp. | | | 2,830 | | | | 68,712 | |
| Radian Group, Inc. | | | 3,720 | | | | 62,459 | |
| Total Financial | | | | | | | 7,923,947 | |
| | | | | | | | |
| CONSUMER, NON-CYCLICAL - 16.1% | |
| Emergent Biosolutions, Inc.* | | | 18,290 | | | | 526,020 | |
| ABM Industries, Inc. | | | 14,190 | | | | 452,093 | |
| Invacare Corp. | | | 18,340 | | | | 355,980 | |
| Global Cash Access Holdings, Inc.* | | | 44,660 | | | | 340,309 | |
| Kindred Healthcare, Inc. | | | 13,454 | | | | 320,071 | |
| Aegerion Pharmaceuticals, Inc.* | | | 7,460 | | | | 195,228 | |
| Darling Ingredients, Inc.* | | | 12,160 | | | | 170,362 | |
| Great Lakes Dredge & Dock Corp.* | | | 28,048 | | | | 168,568 | |
| Navigant Consulting, Inc.* | | | 12,770 | | | | 165,499 | |
| Omega Protein Corp.* | | | 11,330 | | | | 155,108 | |
| Globus Medical, Inc. — Class A* | | | 5,970 | | | | 150,683 | |
| HealthSouth Corp. | | | 3,310 | | | | 146,832 | |
| Greatbatch, Inc.* | | | 2,358 | | | | 136,410 | |
| Depomed, Inc.* | | | 6,022 | | | | 134,953 | |
| ICU Medical, Inc.* | | | 1,415 | | | | 131,793 | |
| DeVry Education Group, Inc. | | | 3,310 | | | | 110,422 | |
| ICF International, Inc.* | | | 1,753 | | | | 71,610 | |
| IPC Healthcare, Inc.* | | | 1,330 | | | | 62,031 | |
| Grand Canyon Education, Inc.* | | | 1,310 | | | | 56,723 | |
| Total Consumer, Non-cyclical | | | | | | | 3,850,695 | |
| | | | | | | | |
| INDUSTRIAL - 14.2% | |
| Covanta Holding Corp. | | | 25,150 | | | | 564,115 | |
| Orbital ATK, Inc. | | | 5,550 | | | | 425,296 | |
| Celadon Group, Inc. | | | 15,000 | | | | 408,299 | |
| PMFG, Inc.* | | | 72,189 | | | | 335,679 | |
| FLIR Systems, Inc. | | | 8,310 | | | | 259,937 | |
| Rofin-Sinar Technologies, Inc.* | | | 9,920 | | | | 240,362 | |
| Marten Transport Ltd. | | | 10,270 | | | | 238,264 | |
| Oshkosh Corp. | | | 3,613 | | | | 176,278 | |
| Gentex Corp. | | | 8,020 | | | | 146,766 | |
| LMI Aerospace, Inc.* | | | 9,970 | | | | 121,734 | |
| Sterling Construction Company, Inc.* | | | 26,248 | | | | 118,641 | |
| Aegion Corp. — Class A* | | | 6,533 | | | | 117,921 | |
| Rand Logistics, Inc.* | | | 34,819 | | | | 113,161 | |
| UTI Worldwide, Inc.* | | | 5,710 | | | | 70,233 | |
| Kirby Corp.* | | | 770 | | | | 57,789 | |
| Total Industrial | | | | | | | 3,394,475 | |
| | | | | | | | |
| TECHNOLOGY - 12.9% | |
| Diebold, Inc. | | | 17,450 | | | | 618,777 | |
| Maxwell Technologies, Inc.* | | | 49,238 | | | | 396,858 | |
| Silicon Graphics International Corp.* | | | 41,420 | | | | 359,940 | |
| ManTech International Corp. — Class A | | | 8,850 | | | | 300,369 | |
| KEYW Holding Corp.* | | | 32,908 | | | | 270,832 | |
| IXYS Corp. | | | 21,765 | | | | 268,145 | |
| Brooks Automation, Inc. | | | 13,660 | | | | 158,865 | |
| Diodes, Inc.* | | | 5,530 | | | | 157,937 | |
| Mercury Systems, Inc.* | | | 10,040 | | | | 156,122 | |
| Cree, Inc.* | | | 3,780 | | | | 134,152 | |
| IGATE Corp.* | | | 1,710 | | | | 72,949 | |
| IPG Photonics Corp.* | | | 770 | | | | 71,379 | |
| Teradyne, Inc. | | | 3,130 | | | | 59,001 | |
| Stratasys Ltd.* | | | 1,020 | | | | 53,836 | |
| Total Technology | | | | | | | 3,079,162 | |
| | | | | | | | |
| CONSUMER, CYCLICAL - 8.4% | |
| Papa Murphy’s Holdings, Inc.* | | | 28,630 | | | | 519,349 | |
| International Speedway Corp. — Class A | | | 10,381 | | | | 338,524 | |
| Chico’s FAS, Inc. | | | 13,150 | | | | 232,623 | |
| Ryland Group, Inc. | | | 3,250 | | | | 158,405 | |
| ScanSource, Inc.* | | | 3,250 | | | | 132,112 | |
| Wendy’s Co. | | | 11,080 | | | | 120,772 | |
| United Stationers, Inc. | | | 2,900 | | | | 118,871 | |
| Iconix Brand Group, Inc.* | | | 3,460 | | | | 116,498 | |
| Crocs, Inc.* | | | 9,010 | | | | 106,408 | |
| Abercrombie & Fitch Co. — Class A | | | 4,570 | | | | 100,723 | |
| WESCO International, Inc.* | | | 1,002 | | | | 70,030 | |
| Total Consumer, Cyclical | | | | | | | 2,014,315 | |
| SEE NOTES TO FINANCIAL STATEMENTS. | THE GUGGENHEIM FUNDS SEMI-ANNUAL REPORT | 43 |
SCHEDULE OF INVESTMENTS (Unaudited)(concluded) | March 31, 2015 |
| SMALL CAP VALUE FUND | |
| | |
Shares | | | Value | |
| | | | | | | | | |
| UTILITIES - 4.4% | |
| Laclede Group, Inc. | | | 9,556 | | | $ | 489,458 | |
| PICO Holdings, Inc.* | | | 16,532 | | | | 267,984 | |
| Avista Corp. | | | 4,350 | | | | 148,683 | |
| EnerNOC, Inc.* | | | 7,340 | | | | 83,676 | |
| Portland General Electric Co. | | | 1,630 | | | | 60,457 | |
| Total Utilities | | | | | | | 1,050,258 | |
| | | | | | | | |
| COMMUNICATIONS - 4.3% | |
| DigitalGlobe, Inc.* | | | 13,908 | | | | 473,845 | |
| Finisar Corp.* | | | 12,890 | | | | 275,073 | |
| Scholastic Corp. | | | 3,422 | | | | 140,097 | |
| Liquidity Services, Inc.* | | | 8,935 | | | | 88,278 | |
| NETGEAR, Inc.* | | | 1,690 | | | | 55,567 | |
| Total Communications | | | | | | | 1,032,860 | |
| | | | | | | | |
| ENERGY - 3.2% | |
| Patterson-UTI Energy, Inc. | | | 14,160 | | | | 265,854 | |
| Superior Energy Services, Inc. | | | 8,870 | | | | 198,156 | |
| Oasis Petroleum, Inc.* | | | 13,760 | | | | 195,667 | |
| Sanchez Energy Corp.* | | | 6,288 | | | | 81,807 | |
| Resolute Energy Corp.* | | | 47,930 | | | | 27,004 | |
| Total Energy | | | | | | | 768,488 | |
| | | | | | | | |
| BASIC MATERIALS - 2.4% | |
| Olin Corp. | | | 6,772 | | | | 216,975 | |
| Landec Corp.* | | | 8,836 | | | | 123,262 | |
| Intrepid Potash, Inc.* | | | 10,560 | | | | 121,968 | |
| Luxfer Holdings plc ADR | | | 8,370 | | | | 111,907 | |
| Total Basic Materials | | | | | | | 574,112 | |
| | | | | | | | |
| Total Common Stocks | | | | | | | | |
| (Cost $22,193,683) | | | | | | | 23,688,312 | |
| | | | | | | | |
CONVERTIBLE PREFERRED STOCKS††† - 0.0% | |
Thermoenergy Corp.*,1,2 | | | 6,250 | | | | 18 | |
| Total Convertible Preferred Stocks | | | | | | | | |
| (Cost $5,968) | | | | | | | 18 | |
| | | | | | | | |
SHORT TERM INVESTMENTS† - 0.2% | |
| Dreyfus Treasury Prime Cash Management Fund 0.00% | | | 50,348 | | | | 50,348 | |
| Total Short Term Investments | | | | | | | | |
| (Cost $50,348) | | | | | | | 50,348 | |
| | | | | | | | |
| Total Investments - 99.3% | | | | | | | | |
| (Cost $22,249,999) | | | | | | $ | 23,738,678 | |
| Other Assets & Liabilities, net - 0.7% | | | | | | | 169,993 | |
| Total Net Assets - 100.0% | | | | | | $ | 23,908,671 | |
| * | Non-income producing security. |
| † | Value determined based on Level 1 inputs — See Note 4. |
| ††† | Value determined based on Level 3 inputs — See Note 4. |
| 1 | PIPE (Private Investment in Public Equity) — Stock issued by a company in the secondary market as a means of raising capital more quickly and less expensively than through registration of a secondary public offering. |
| 2 | Illiquid security. |
| ADR — American Depositary Receipt |
| plc — Public Limited Company |
| |
| See Sector Classification in Other Information section. |
| 44 | THE GUGGENHEIM FUNDS SEMI-ANNUAL REPORT | SEE NOTES TO FINANCIAL STATEMENTS. |
STATEMENT OF ASSETS AND LIABILITIES (Unaudited)
March 31, 2015
| Assets: | |
| Investments, at value (cost $22,249,999) | | $ | 23,738,678 | |
| Prepaid expenses | | | 20,967 | |
| Receivables: | |
| Securities sold | | | 350,743 | |
| Dividends | | | 32,162 | |
| Investment adviser | | | 14,679 | |
| Fund shares sold | | | 8,637 | |
| Total assets | | | 24,165,866 | |
| | | | | |
| Liabilities: | |
| Payable for: | |
| Securities purchased | | | 159,434 | |
| Fund shares redeemed | | | 48,504 | |
| Management fees | | | 20,245 | |
| Distribution and service fees | | | 9,313 | |
| Transfer agent/maintenance fees | | | 2,172 | |
| Fund accounting/administration fees | | | 1,923 | |
| Trustees’ fees* | | | 486 | |
| Miscellaneous | | | 15,118 | |
| Total liabilities | | | 257,195 | |
| Net assets | | $ | 23,908,671 | |
| | | | | |
| Net assets consist of: | |
| Paid in capital | | $ | 20,407,492 | |
| Distributions in excess of net investment loss | | | (292,083 | ) |
| Accumulated net realized gain on investments | | | 2,304,583 | |
| Net unrealized appreciation on investments | | | 1,488,679 | |
| Net assets | | $ | 23,908,671 | |
| | | | | |
| A-Class: | |
| Net assets | | $ | 16,369,158 | |
| Capital shares outstanding | | | 1,127,361 | |
| Net asset value per share | | $ | 14.52 | |
| Maximum offering price per share (Net asset value divided by 95.25%) | | $ | 15.24 | |
| | | | | |
| C-Class: | |
| Net assets | | $ | 6,840,511 | |
| Capital shares outstanding | | | 501,614 | |
| Net asset value per share | | $ | 13.64 | |
| | | | | |
| Institutional Class: | |
| Net assets | | $ | 699,002 | |
| Capital shares outstanding | | | 52,088 | |
| Net asset value per share | | $ | 13.42 | |
STATEMENT OF OPERATIONS (Unaudited)
Period Ended March 31, 2015
| Investment Income: | |
| Dividends (net of foreign withholding tax of $412) | | $ | 195,523 | |
| Total investment income | | | 195,523 | |
| | | | | |
| Expenses: | |
| Management fees | | | 124,702 | |
| Transfer agent/maintenance fees: | |
| A-Class | | | 15,952 | |
| C-Class | | | 6,429 | |
| Institutional Class | | | 587 | |
| Distribution and service fees: | |
| A-Class | | | 20,727 | |
| C-Class | | | 38,263 | |
| Fund accounting/administration fees | | | 11,847 | |
| Registration fees | | | 26,709 | |
| Custodian fees | | | 3,173 | |
| Tax expense | | | 3,075 | |
| Trustees’ fees* | | | 2,207 | |
| Line of credit fees | | | 1,341 | |
| Miscellaneous | | | 18,266 | |
| Total expenses | | | 273,278 | |
| Less: | |
| Expenses waived by Adviser | | | (78,883 | ) |
| Net expenses | | | 194,395 | |
| Net investment income | | | 1,128 | |
| | | | | |
| Net Realized and Unrealized Gain (Loss): | |
| Net realized gain (loss) on: | |
| Investments | | | 2,509,891 | |
| Net realized gain | | | 2,509,891 | |
| Net change in unrealized appreciation (depreciation) on: | |
| Investments | | | (671,123 | ) |
| Net change in unrealized appreciation (depreciation) | | | (671,123 | ) |
| Net realized and unrealized gain | | | 1,838,768 | |
| Net increase in net assets resulting from operations | | $ | 1,839,896 | |
| * | Relates to Trustees not deemed “interested persons” within the meaning of Section 2(a)(19) of the 1940 Act. |
| SEE NOTES TO FINANCIAL STATEMENTS. | THE GUGGENHEIM FUNDS SEMI-ANNUAL REPORT | 45 |
STATEMENTS OF CHANGES IN NET ASSETS
| | | Period Ended March 31, 2015 (Unaudited) | | | Year Ended September 30, 2014 | |
| Increase (Decrease) in Net Assets from Operations: | | | | | | |
| Net investment income (loss) | | $ | 1,128 | | | $ | (90,719 | ) |
| Net realized gain on investments | | | 2,509,891 | | | | 8,751,257 | |
| Net change in unrealized appreciation (depreciation) on investments | | | (671,123 | ) | | | (7,309,504 | ) |
| Net increase in net assets resulting from operations | | | 1,839,896 | | | | 1,351,034 | |
| | | | | | | | | |
| Distributions to shareholders from: | | | | | | | | |
| Net investment income | | | | | | | | |
| A-Class | | | (85,715 | ) | | | (33,808 | ) |
| Institutional Class | | | (60,526 | ) | | | (89,016 | ) |
| Net realized gains | | | | | | | | |
| A-Class | | | (3,174,844 | ) | | | (1,236,307 | ) |
| C-Class | | | (1,734,594 | ) | | | (508,183 | ) |
| Institutional Class | | | (145,234 | ) | | | (1,474,064 | ) |
| Total distributions to shareholders | | | (5,200,913 | ) | | | (3,341,378 | ) |
| | | | | | | | | |
| Capital share transactions: | | | | | | | | |
| Proceeds from sale of shares | | | | | | | | |
| A-Class | | | 3,013,452 | | | | 9,171,920 | |
| C-Class | | | 325,629 | | | | 4,179,080 | |
| Institutional Class | | | 369,388 | | | | 559,915 | |
| Distributions reinvested | | | | | | | | |
| A-Class | | | 3,225,514 | | | | 1,239,655 | |
| C-Class | | | 1,687,462 | | | | 485,717 | |
| Institutional Class | | | 119,479 | | | | 25,070 | |
| Cost of shares redeemed | | | | | | | | |
| A-Class | | | (5,211,313 | ) | | | (8,482,138 | ) |
| C-Class | | | (2,494,065 | ) | | | (1,429,909 | ) |
| Institutional Class | | | (388,197 | ) | | | (21,823,574 | ) |
| Net increase (decrease) from capital share transactions | | | 647,349 | | | | (16,074,264 | ) |
| Net decrease in net assets | | | (2,713,668 | ) | | | (18,064,608 | ) |
| | | | | | | | | |
| Net assets: | | | | | | | | |
| Beginning of period | | | 26,622,339 | | | | 44,686,947 | |
| End of period | | $ | 23,908,671 | | | $ | 26,622,339 | |
| Distributions in excess of net investment loss at end of period | | $ | (292,083 | ) | | $ | (146,970 | ) |
| | | | | | | | | |
| Capital share activity: | | | | | | | | |
| Shares sold | | | | | | | | |
| A-Class | | | 200,053 | | | | 506,970 | |
| C-Class | | | 23,065 | | | | 242,648 | |
| Institutional Class | | | 28,127 | | | | 30,658 | |
| Shares issued from reinvestment of distributions | | | | | | | | |
| A-Class | | | 230,223 | | | | 71,163 | |
| C-Class | | | 127,935 | | | | 29,190 | |
| Institutional Class | | | 9,233 | | | | 1,422 | |
| Shares redeemed | | | | | | | | |
| A-Class | | | (334,091 | ) | | | (472,674 | ) |
| C-Class | | | (183,605 | ) | | | (82,761 | ) |
| Institutional Class | | | (29,475 | ) | | | (1,224,766 | ) |
| Net increase (decrease) in shares | | | 71,465 | | | | (898,150 | ) |
| 46 | THE GUGGENHEIM FUNDS SEMI-ANNUAL REPORT | SEE NOTES TO FINANCIAL STATEMENTS. |
This table is presented to show selected data for a share outstanding throughout each period and to assist shareholders in evaluating a Fund’s performance for the periods presented.
| A-Class | | Period Ended March 31, 2015a | | | Year Ended September 30, 2014 | | | Year Ended September 30, 2013 | | | Year Ended September 30, 2012 | | | Year Ended September 30, 2011 | | | Year Ended September 30, 2010 | |
| Per Share Data | | | | | | | | | | | | | | | | | | |
| Net asset value, beginning of period | | $ | 16.82 | | | $ | 17.81 | | | $ | 15.04 | | | $ | 11.66 | | | $ | 14.35 | | | $ | 13.24 | |
| Income (loss) from investment operations: | |
Net investment income (loss)b | | | .02 | | | | (.03 | ) | | | (— | )c | | | (.03 | ) | | | (.07 | ) | | | (.05 | ) |
| Net gain (loss) on investments (realized and unrealized) | | | 1.14 | | | | .26 | | | | 4.05 | | | | 3.73 | | | | (.63 | ) | | | 1.54 | |
| Total from investment operations | | | 1.16 | | | | .23 | | | | 4.05 | | | | 3.70 | | | | (.70 | ) | | | 1.49 | |
| Less distributions from: | |
| Net investment income | | | (.09 | ) | | | (.03 | ) | | | (.01 | ) | | | — | | | | — | | | | — | |
| Net realized gains | | | (3.37 | ) | | | (1.19 | ) | | | (1.27 | ) | | | (.32 | ) | | | (1.99 | ) | | | (.38 | ) |
| Total distributions | | | (3.46 | ) | | | (1.22 | ) | | | (1.28 | ) | | | (.32 | ) | | | (1.99 | ) | | | (.38 | ) |
| Net asset value, end of period | | $ | 14.52 | | | $ | 16.82 | | | $ | 17.81 | | | $ | 15.04 | | | $ | 11.66 | | | $ | 14.35 | |
| | |
Total Returnd | | | 7.68 | % | | | 1.07 | % | | | 29.39 | % | | | 32.19 | % | | | (7.31 | %) | | | 11.53 | % |
| Ratios/Supplemental Data | |
| Net assets, end of period (in thousands) | | $ | 16,369 | | | $ | 17,342 | | | $ | 16,487 | | | $ | 12,294 | | | $ | 7,592 | | | $ | 6,209 | |
| Ratios to average net assets: | |
| Net investment income (loss) | | | 0.24 | % | | | (0.14 | %) | | | (0.02 | %) | | | (0.24 | %) | | | (0.52 | %) | | | (0.34 | %) |
| Total expenses | | | 1.98 | % | | | 1.85 | % | | | 1.91 | % | | | 2.14 | % | | | 2.33 | % | | | 2.45 | % |
Net expensese | | | 1.34 | %f | | | 1.32 | %f | | | 1.30 | % | | | 1.30 | % | | | 1.30 | % | | | 1.30 | % |
| Portfolio turnover rate | | | 39 | % | | | 45 | % | | | 34 | % | | | 62 | % | | | 70 | % | | | 140 | % |
| C-Class | | Period Ended March 31, 2015a | | | Year Ended September 30, 2014 | | | Year Ended September 30, 2013 | | | Year Ended September 30, 2012 | | | Year Ended September 30, 2011 | | | Year Ended September 30, 2010 | |
| Per Share Data | | | | | | | | | | | | | | | | | | |
| Net asset value, beginning of period | | $ | 15.96 | | | $ | 17.05 | | | $ | 14.54 | | | $ | 11.36 | | | $ | 14.13 | | | $ | 13.11 | |
| Income (loss) from investment operations: | |
Net investment income (loss)b | | | (.04 | ) | | | (.15 | ) | | | (.12 | ) | | | (.14 | ) | | | (.18 | ) | | | (.15 | ) |
| Net gain (loss) on investments (realized and unrealized) | | | 1.09 | | | | .25 | | | | 3.90 | | | | 3.64 | | | | (.60 | ) | | | 1.55 | |
| Total from investment operations | | | 1.05 | | | | .10 | | | | 3.78 | | | | 3.50 | | | | (.78 | ) | | | 1.40 | |
| Less distributions from: | |
| Net realized gains | | | (3.37 | ) | | | (1.19 | ) | | | (1.27 | ) | | | (.32 | ) | | | (1.99 | ) | | | (.38 | ) |
| Total distributions | | | (3.37 | ) | | | (1.19 | ) | | | (1.27 | ) | | | (.32 | ) | | | (1.99 | ) | | | (.38 | ) |
| Net asset value, end of period | | $ | 13.64 | | | $ | 15.96 | | | $ | 17.05 | | | $ | 14.54 | | | $ | 11.36 | | | $ | 14.13 | |
| | |
Total Returnd | | | 7.33 | % | | | 0.30 | % | | | 28.34 | % | | | 31.35 | % | | | (8.07 | %) | | | 10.94 | % |
| Ratios/Supplemental Data | |
| Net assets, end of period (in thousands) | | $ | 6,841 | | | $ | 8,527 | | | $ | 5,885 | | | $ | 3,026 | | | $ | 2,305 | | | $ | 1,353 | |
| Ratios to average net assets: | |
| Net investment income (loss) | | | (0.53 | %) | | | (0.87 | %) | | | (0.75 | %) | | | (1.00 | %) | | | (1.26 | %) | | | (1.09 | %) |
| Total expenses | | | 2.70 | % | | | 2.51 | % | | | 2.58 | % | | | 2.70 | % | | | 3.07 | % | | | 3.22 | % |
Net expensese | | | 2.09 | %f | | | 2.07 | %f | | | 2.05 | % | | | 2.05 | % | | | 2.05 | % | | | 2.05 | % |
| Portfolio turnover rate | | | 39 | % | | | 45 | % | | | 34 | % | | | 62 | % | | | 70 | % | | | 140 | % |
| SEE NOTES TO FINANCIAL STATEMENTS. | THE GUGGENHEIM FUNDS SEMI-ANNUAL REPORT | 47 |
FINANCIAL HIGHLIGHTS (concluded)
This table is presented to show selected data for a share outstanding throughout each period and to assist shareholders in evaluating a Fund’s performance for the periods presented.
| Institutional Class | | Period Ended March 31, 2015a | | | Year Ended September 30, 2014 | | | Year Ended September 30, 2013 | | | Year Ended September 30, 2012 | | | Year Ended September 30, 2011 | | | Year Ended September 30, 2010 | |
| Per Share Data | | | | | | | | | | | | | | | | | | |
| Net asset value, beginning of period | | $ | 17.04 | | | $ | 18.04 | | | $ | 15.21 | | | $ | 11.76 | | | $ | 14.43 | | | $ | 13.28 | |
| Income (loss) from investment operations: | |
Net investment income (loss)b | | | .03 | | | | .01 | | | | .04 | | | | — | c | | | (.04 | ) | | | (.01 | ) |
| Net gain (loss) on investments (realized and unrealized) | | | 1.13 | | | | .25 | | | | 4.10 | | | | 3.77 | | | | (.64 | ) | | | 1.54 | |
| Total from investment operations | | | 1.16 | | | | .26 | | | | 4.14 | | | | 3.77 | | | | (.68 | ) | | | 1.53 | |
| Less distributions from: | |
| Net investment income | | | (1.41 | ) | | | (.07 | ) | | | (.04 | ) | | | — | | | | — | | | | — | |
| Net realized gains | | | (3.37 | ) | | | (1.19 | ) | | | (1.27 | ) | | | (.32 | ) | | | (1.99 | ) | | | (.38 | ) |
| Total distributions | | | (4.78 | ) | | | (1.26 | ) | | | (1.31 | ) | | | (.32 | ) | | | (1.99 | ) | | | (.38 | ) |
| Net asset value, end of period | | $ | 13.42 | | | $ | 17.04 | | | $ | 18.04 | | | $ | 15.21 | | | $ | 11.76 | | | $ | 14.43 | |
| | |
Total Returnd | | | 7.85 | % | | | 1.21 | % | | | 29.74 | % | | | 32.51 | % | | | (7.11 | %) | | | 11.80 | % |
| Ratios/Supplemental Data | |
| Net assets, end of period (in thousands) | | $ | 699 | | | $ | 753 | | | $ | 22,315 | | | $ | 18,591 | | | $ | 638 | | | $ | 734 | |
| Ratios to average net assets: | |
| Net investment income (loss) | | | 0.45 | % | | | 0.05 | % | | | 0.23 | % | | | 0.02 | % | | | (0.30 | %) | | | (0.08 | %) |
| Total expenses | | | 1.70 | % | | | 1.33 | % | | | 1.34 | % | | | 1.44 | % | | | 2.09 | % | | | 2.21 | % |
Net expensese | | | 1.09 | %f | | | 1.07 | %f | | | 1.05 | % | | | 1.05 | % | | | 1.05 | % | | | 1.05 | % |
| Portfolio turnover rate | | | 39 | % | | | 45 | % | | | 34 | % | | | 62 | % | | | 70 | % | | | 140 | % |
a | Unaudited figures for the period ended March 31, 2015. Percentage amounts for the period, except total return and portfolio turnover rate, have been annualized. |
b | Net investment income (loss) per share was computed using average shares outstanding throughout the period. |
c | Net investment income (loss) is less than $0.01 per share. |
d | Total return does not reflect the impact of any applicable sales charges and has not been annualized. |
e | Net expense information reflects the expense ratios after expense waivers. |
f | Net expenses may include expenses that are excluded from the expense limitation agreement. Excluding these expenses, the operating expense ratios for the periods presented would be: |
| | 03/31/15 | 09/30/14 |
| A-Class | 1.30% | 1.30% |
| C-Class | 2.05% | 2.05% |
| Institutional Class | 1.05% | 1.05% |
| 48 | THE GUGGENHEIM FUNDS SEMI-ANNUAL REPORT | SEE NOTES TO FINANCIAL STATEMENTS. |
FUND PROFILE (Unaudited) | March 31, 2015 |
STYLEPLUS—LARGE CORE FUND
OBJECTIVE: Seeks long-term growth of capital.
Holdings Diversification (Market Exposure as % of Net Assets)
| Portfolio Composition by Quality Rating* |
| Rating | |
| Fixed Income Instruments | |
| AAA | 3.6% |
| AA | 1.6% |
| A | 3.0% |
| BBB | 1.3% |
| B | 0.1% |
| Other Instruments | |
| Mutual Funds | 72.1% |
| Common Stocks | 15.4% |
| Short Term Investments | 2.9% |
| Total Investments | 100.0% |
| | |
| The chart above reflects percentages of the value of total investments. |
“Holdings Diversification (Market Exposure as % of Net Assets)” excludes any temporary cash investments or investments in Guggenheim Strategy Funds Trust mutual funds. Investments in those Funds do not provide “market exposure” to meet the fund’s investment objective, but will significantly increase the portfolio’s exposure to certain other asset categories (and their associated risks), which may cause the Fund to deviate from its principal investment strategy, including: (i) high yield, high risk debt securities rated below the top four long-term rating categories by a nationally recognized statistical rating organization (also known as “junk bonds”); (ii) securities issued by the U.S. government or its agencies and instrumentalities; (iii) CLOs and similar investments; and (iv) other short-term fixed income securities.
| Inception Dates: |
| A-Class | September 10, 1962 |
| B-Class | October 19, 1993 |
| C-Class | January 29, 1999 |
| Institutional Class | March 1, 2012 |
| Ten Largest Holdings (% of Total Net Assets) |
| Guggenheim Strategy Fund III | 24.7% |
| Guggenheim Strategy Fund I | 24.1% |
| Guggenheim Strategy Fund II | 22.0% |
| Duane Street CLO IV Ltd. — Class A1T | 0.8% |
| Goldman Sachs Asset Management CLO plc — Class D | 0.7% |
| Salus CLO Ltd. — Class A2N | 0.7% |
| Black Diamond CLO 2005-1 Delaware Corp. — Class D1 | 0.6% |
| Apple, Inc. | 0.6% |
| Cornerstone CLO Ltd. — Class A1S | 0.6% |
| KKR Financial CLO 2007-1 Ltd. — Class D | 0.6% |
| Top Ten Total | 75.4% |
| | |
| “Ten Largest Holdings” exclude any temporary cash or derivative investments. |
| * | Source: BlackRock Solutions. Credit quality ratings are measured on a scale that generally ranges from AAA (highest) to D (lowest). All securities have been rated by Moody’s, Standard & Poor’s (“S&P”), or Fitch, which are all a Nationally Recognized Statistical Rating Organization (“NRSRO”). For purposes of this presentation, when ratings are available from more than one agency, the highest rating is used. Guggenheim Investments has converted Moody’s and Fitch ratings to the equivalent S&P rating. Security ratings are determined at the time of purchase and may change thereafter. |
| | THE GUGGENHEIM FUNDS SEMI-ANNUAL REPORT | 49 |
SCHEDULE OF INVESTMENTS (Unaudited) | March 31, 2015 |
| STYLEPLUS—LARGE CORE FUND | |
| | |
Shares | | | Value | |
| | | | | | | | |
COMMON STOCKS† - 15.1% | |
| | | | | | | | |
| CONSUMER, NON-CYCLICAL - 5.1% | |
| Pfizer, Inc. | | | 19,742 | | | $ | 686,823 | |
| Procter & Gamble Co. | | | 7,689 | | | | 630,037 | |
| UnitedHealth Group, Inc. | | | 4,293 | | | | 507,818 | |
| PepsiCo, Inc. | | | 5,097 | | | | 487,375 | |
| Express Scripts Holding Co.* | | | 5,014 | | | | 435,065 | |
| Johnson & Johnson | | | 4,233 | | | | 425,840 | |
| Mondelez International, Inc. — Class A | | | 11,581 | | | | 417,958 | |
| Anthem, Inc. | | | 2,565 | | | | 396,061 | |
| Aetna, Inc. | | | 3,645 | | | | 388,302 | |
| Cigna Corp. | | | 2,979 | | | | 385,602 | |
| General Mills, Inc. | | | 6,745 | | | | 381,767 | |
| Merck & Company, Inc. | | | 6,617 | | | | 380,345 | |
| Kimberly-Clark Corp. | | | 3,527 | | | | 377,777 | |
| Archer-Daniels-Midland Co. | | | 7,772 | | | | 368,393 | |
| Stryker Corp. | | | 3,908 | | | | 360,513 | |
| Coca-Cola Co. | | | 8,492 | | | | 344,351 | |
| Kroger Co. | | | 3,907 | | | | 299,511 | |
| Kraft Foods Group, Inc. | | | 3,421 | | | | 298,020 | |
| Abbott Laboratories | | | 6,314 | | | | 292,528 | |
| Cardinal Health, Inc. | | | 3,157 | | | | 284,982 | |
| AbbVie, Inc. | | | 4,604 | | | | 269,518 | |
| Humana, Inc. | | | 1,490 | | | | 265,250 | |
| Philip Morris International, Inc. | | | 3,126 | | | | 235,482 | |
| Eli Lilly & Co. | | | 3,148 | | | | 228,702 | |
| McKesson Corp. | | | 994 | | | | 224,843 | |
| Amgen, Inc. | | | 1,396 | | | | 223,150 | |
| HCA Holdings, Inc.* | | | 2,716 | | | | 204,325 | |
| Baxter International, Inc. | | | 2,773 | | | | 189,951 | |
| Medtronic plc | | | 2,399 | | | | 187,098 | |
| Gilead Sciences, Inc.* | | | 1,820 | | | | 178,597 | |
| Actavis plc* | | | 438 | | | | 130,358 | |
| Total Consumer, Non-cyclical | | | | | | | 10,486,342 | |
| | | | | | | | |
| TECHNOLOGY - 2.4% | |
| Apple, Inc. | | | 9,466 | | | | 1,177,855 | |
| Microsoft Corp. | | | 19,492 | | | | 792,447 | |
| International Business Machines Corp. | | | 3,462 | | | | 555,651 | |
| Intel Corp. | | | 17,317 | | | | 541,503 | |
| Hewlett-Packard Co. | | | 12,591 | | | | 392,336 | |
| Oracle Corp. | | | 8,709 | | | | 375,793 | |
| EMC Corp. | | | 14,563 | | | | 372,230 | |
| Micron Technology, Inc.* | | | 11,757 | | | | 318,967 | |
| Western Digital Corp. | | | 3,393 | | | | 308,797 | |
| Total Technology | | | | | | | 4,835,579 | |
| | | | | | | | |
| INDUSTRIAL - 2.4% | |
| General Electric Co. | | | 22,868 | | | | 567,355 | |
| Caterpillar, Inc. | | | 4,841 | | | | 387,425 | |
| Eaton Corporation plc | | | 5,327 | | | | 361,916 | |
| FedEx Corp. | | | 2,157 | | | | 356,876 | |
| Corning, Inc. | | | 15,248 | | | | 345,825 | |
| CSX Corp. | | | 9,843 | | | | 326,000 | |
| Boeing Co. | | | 2,114 | | | | 317,268 | |
| Deere & Co. | | | 3,494 | | | | 306,389 | |
| Waste Management, Inc. | | | 5,542 | | | | 300,543 | |
| Norfolk Southern Corp. | | | 2,793 | | | | 287,456 | |
| General Dynamics Corp. | | | 2,038 | | | | 276,617 | |
| Raytheon Co. | | | 2,438 | | | | 266,352 | |
| Northrop Grumman Corp. | | | 1,608 | | | | 258,824 | |
| Emerson Electric Co. | | | 4,023 | | | | 227,782 | |
| United Technologies Corp. | | | 1,583 | | | | 185,528 | |
| Total Industrial | | | | | | | 4,772,156 | |
| | | | | | | | |
| FINANCIAL - 1.4% | |
| JPMorgan Chase & Co. | | | 7,994 | | | | 484,277 | |
| MetLife, Inc. | | | 7,859 | | | | 397,272 | |
| Bank of New York Mellon Corp. | | | 7,972 | | | | 320,793 | |
| Bank of America Corp. | | | 18,177 | | | | 279,744 | |
| Prudential Financial, Inc. | | | 3,285 | | | | 263,818 | |
| Citigroup, Inc. | | | 4,780 | | | | 246,266 | |
| Wells Fargo & Co. | | | 3,487 | | | | 189,693 | |
| State Street Corp. | | | 2,134 | | | | 156,913 | |
| Berkshire Hathaway, Inc. — Class B* | | | 938 | | | | 135,372 | |
| Allstate Corp. | | | 1,735 | | | | 123,480 | |
| Aflac, Inc. | | | 1,761 | | | | 112,722 | |
| Ameriprise Financial, Inc. | | | 714 | | | | 93,420 | |
| Total Financial | | | | | | | 2,803,770 | |
| | | | | | | | |
| ENERGY - 1.2% | |
| ConocoPhillips | | | 6,733 | | | | 419,196 | |
| Exxon Mobil Corp. | | | 4,892 | | | | 415,820 | |
| Anadarko Petroleum Corp. | | | 4,707 | | | | 389,786 | |
| Occidental Petroleum Corp. | | | 4,854 | | | | 354,342 | |
| Apache Corp. | | | 5,706 | | | | 344,243 | |
| Chevron Corp. | | | 2,491 | | | | 261,505 | |
| Kinder Morgan, Inc. | | | 2,909 | | | | 122,353 | |
| Valero Energy Corp. | | | 1,588 | | | | 101,029 | |
| Devon Energy Corp. | | | 1,603 | | | | 96,677 | |
| Total Energy | | | | | | | 2,504,951 | |
| | | | | | | | |
| COMMUNICATIONS - 1.1% | |
| Cisco Systems, Inc. | | | 19,078 | | | | 525,122 | |
| eBay, Inc.* | | | 6,983 | | | | 402,779 | |
| Comcast Corp. — Class A | | | 6,226 | | | | 351,582 | |
| AT&T, Inc. | | | 7,341 | | | | 239,684 | |
| Google, Inc. — Class C* | | | 419 | | | | 229,612 | |
| Walt Disney Co. | | | 1,768 | | | | 185,446 | |
| Time Warner, Inc. | | | 2,173 | | | | 183,488 | |
| Verizon Communications, Inc. | | | 1,972 | | | | 95,898 | |
| Total Communications | | | | | | | 2,213,611 | |
| | | | | | | | |
| CONSUMER, CYCLICAL - 1.1% | |
| Wal-Mart Stores, Inc. | | | 6,402 | | | | 526,565 | |
| CVS Health Corp. | | | 4,952 | | | | 511,095 | |
| Delta Air Lines, Inc. | | | 6,262 | | | | 281,540 | |
| 50 | THE GUGGENHEIM FUNDS SEMI-ANNUAL REPORT | SEE NOTES TO FINANCIAL STATEMENTS. |
SCHEDULE OF INVESTMENTS (Unaudited)(continued) | March 31, 2015 |
| STYLEPLUS—LARGE CORE FUND | |
| | |
Shares | | | Value | |
| | | | | | | | | |
| Southwest Airlines Co. | | | 5,624 | | | $ | 249,143 | |
| Ford Motor Co. | | | 13,235 | | | | 213,613 | |
| General Motors Co. | | | 4,978 | | | | 186,675 | |
| Walgreens Boots Alliance, Inc. | | | 2,123 | | | | 179,776 | |
| Total Consumer, Cyclical | | | | | | | 2,148,407 | |
| | | | | | | | |
| UTILITIES - 0.4% | |
| Duke Energy Corp. | | | 5,273 | | | | 404,861 | |
| American Electric Power Company, Inc. | | | 4,136 | | | | 232,650 | |
| PG&E Corp. | | | 3,798 | | | | 201,560 | |
| Total Utilities | | | | | | | 839,071 | |
| | | | | | | | |
| Total Common Stocks | | | | | | | | |
| (Cost $28,347,061) | | | | | | | 30,603,887 | |
| | | | | | | | |
MUTUAL FUNDS†,1 - 70.8% | |
| Guggenheim Strategy Fund III | | | 2,002,207 | | | | 49,955,057 | |
| Guggenheim Strategy Fund I | | | 1,957,710 | | | | 48,746,970 | |
| Guggenheim Strategy Fund II | | | 1,785,349 | | | | 44,473,050 | |
| Total Mutual Funds | | | | | | | | |
| (Cost $143,241,259) | | | | | | | 143,175,077 | |
| | | | | | | | |
SHORT TERM INVESTMENTS† - 2.9% | |
| Dreyfus Treasury Prime Cash Management Fund 0.00% | | | 5,820,719 | | | | 5,820,719 | |
| Total Short Term Investments | | | | | | | | |
| (Cost $5,820,719) | | | | | | | 5,820,719 | |
| | | | | | | | |
| | | Face
Amount | | | | |
| | | | | | | | |
ASSET-BACKED SECURITIES†† - 8.8% | |
| Duane Street CLO IV Ltd. | | | | | | | | |
2007-4A, 0.49% due 11/14/212,3 | | $ | 1,658,526 | | | | 1,645,092 | |
| Goldman Sachs Asset Management CLO plc | | | | | | | | |
2007-1A, 3.00% due 08/01/222,3 | | | 1,500,000 | | | | 1,502,250 | |
| Brentwood CLO Corp. | | | | | | | | |
2006-1A, 0.52% due 02/01/222,3 | | | 995,529 | | | | 981,393 | |
2006-1A, 1.07% due 02/01/222,3 | | | 500,000 | | | | 474,650 | |
| Salus CLO Ltd. | | | | | | | | |
2013-1AN, 2.48% due 03/05/212,3 | | | 1,400,000 | | | | 1,401,680 | |
| Black Diamond CLO 2005-1 Delaware Corp. | | | | | | | | |
2005-1A, 2.17% due 06/20/172,3 | | | 1,250,000 | | | | 1,223,625 | |
| Symphony CLO IX, LP | | | | | | | | |
2012-9A, 2.75% due 04/16/222,3 | | | 700,000 | | | | 702,590 | |
2012-9A, 3.50% due 04/16/222,3 | | | 500,000 | | | | 501,700 | |
| Cornerstone CLO Ltd. | | | | | | | | |
2007-1A, 0.47% due 07/15/212,3 | | | 1,176,825 | | | | 1,166,705 | |
| KKR Financial CLO 2007-1 Ltd. | | | | | | | | |
2007-1A, 2.51% due 05/15/212,3 | | | 1,150,000 | | | | 1,145,515 | |
| Symphony CLO VII Ltd. | | | | | | | | |
2011-7A, 3.46% due 07/28/212,3 | | | 1,000,000 | | | | 998,800 | |
| GSC Group CDO Fund VIII Ltd. | | | | | | | | |
2007-8A, 0.64% due 04/17/212,3 | | | 1,000,000 | | | | 987,100 | |
| N-Star REL CDO VIII Ltd. | | | | | | | | |
2006-8A, 0.47% due 02/01/412,3 | | | 966,089 | | | | 948,023 | |
| Black Diamond CLO 2006-1 Luxembourg S.A. | | | | | | | | |
2007-1A, 0.64% due 04/29/192,3 | | | 900,000 | | | | 864,180 | |
| OFSI Fund V Ltd. | | | | | | | | |
2013-5A, 3.46% due 04/17/252,3 | | | 750,000 | | | | 740,775 | |
| Foothill CLO Ltd. | | | | | | | | |
2007-1A, 0.51% due 02/22/212,3 | | | 683,593 | | | | 678,603 | |
| Halcyon Loan Advisors Funding 2012-1 Ltd. | | | | | | | | |
2012-1A, 3.26% due 08/15/232,3 | | | 500,000 | | | | 488,250 | |
| NewStar Commercial Loan Trust 2007-1 | | | | | | | | |
2007-1A, 1.56% due 09/30/222,3 | | | 500,000 | | | | 475,650 | |
| Race Point IV CLO Ltd. | | | | | | | | |
2007-4A, 1.00% due 08/01/212,3 | | | 450,000 | | | | 437,670 | |
| Tricadia CDO 2006-6 Ltd. | | | | | | | | |
2006-6A, 0.81% due 11/05/412,3 | | | 184,525 | | | | 183,639 | |
| Global Leveraged Capital Credit Opportunity Fund | | | | | | | | |
2006-1A, 0.56% due 12/20/182,3 | | | 111,923 | | | | 111,621 | |
| West Coast Funding Ltd. | | | | | | | | |
2006-1A, 0.40% due 11/02/412,3 | | | 94,283 | | | | 93,708 | |
| Golub Capital Partners Fundings Ltd. | | | | | | | | |
2007-1A, 0.52% due 03/15/222,3 | | | 90,492 | | | | 90,084 | |
| Total Asset-Backed Securities | | | | | | | | |
| (Cost $17,580,127) | | | | | | | 17,843,303 | |
| | | | | | | | |
COLLATERALIZED MORTGAGE OBLIGATIONS†† - 0.5% | |
| SRERS-2011 Funding Ltd. | | | | | | | | |
2011-RS, 0.43% due 05/09/462,3 | | | 1,123,357 | | | | 1,068,088 | |
| Total Collateralized Mortgage Obligations | | | | | | | | |
| (Cost $998,385) | | | | | | | 1,068,088 | |
| | | | | | | | |
| Total Investments - 98.1% | | | | | | | | |
| (Cost $195,987,551) | | | | | | $ | 198,511,074 | |
| Other Assets & Liabilities, net - 1.9% | | | | | | | 3,944,257 | |
| Total Net Assets - 100.0% | | | | | | $ | 202,455,331 | |
| | | | | | | | | |
| SEE NOTES TO FINANCIAL STATEMENTS. | THE GUGGENHEIM FUNDS SEMI-ANNUAL REPORT | 51 |
SCHEDULE OF INVESTMENTS (Unaudited)(concluded) | March 31, 2015 |
| STYLEPLUS—LARGE CORE FUND | |
| | | | | | | | | |
| | | Contracts | | | Unrealized
Gain | |
| | | | | | | | |
EQUITY FUTURES CONTRACTS PURCHASED† | |
June 2015 S&P 500 Index
Mini Futures Contracts
(Aggregate Value of
Contracts $720,825) | | | 7 | | | $ | 9,603 | |
| | | | | | | | |
| | | Units | | | | |
| | | | | | | | |
OTC EQUITY INDEX SWAP AGREEMENTS†† | |
Morgan Stanley Capital Services, Inc.
June 2015 S&P 500
Total Return Index Swap,
Terminating 06/03/154
(Notional Value $108,880,219) | | | 28,613 | | | $ | 11,116,008 | |
Bank of America
August 2015 S&P 500
Total Return Index Swap,
Terminating 08/05/154
(Notional Value $42,851,168) | | | 11,261 | | | | 2,709,977 | |
Goldman Sachs International
May 2015 S&P 500
Index Swap,
Terminating 05/05/154
(Notional Value $18,499,344) | | | 8,946 | | | | — | |
| (Total Notional Value $170,230,731) | | | | | | $ | 13,825,985 | |
| * | Non-income producing security. |
| † | Value determined based on Level 1 inputs — See Note 4. |
| †† | Value determined based on Level 2 inputs — See Note 4. |
| 1 | Affiliated issuer — See Note 10. |
| 2 | Variable rate security. Rate indicated is rate effective at March 31, 2015. |
| 3 | Security is a 144A or Section 4(a)(2) security. The total market value of 144A or Section 4(a)(2) securities is $18,911,392 (cost $18,578,513), or 9.3% of total net assets. These securities have been determined to be liquid under guidelines established by the Board of Trustees. |
| 4 | Total Return based on S&P 500 Index +/- financing at a variable rate. |
| plc — Public Limited Company |
| |
| See Sector Classification in Other Information section. |
| 52 | THE GUGGENHEIM FUNDS SEMI-ANNUAL REPORT | SEE NOTES TO FINANCIAL STATEMENTS. |
| STYLEPLUS—LARGE CORE FUND | |
STATEMENT OF ASSETS AND LIABILITIES (Unaudited)
March 31, 2015
| Assets: | |
| Investments in unaffiliated issuers, at value (cost $52,746,292) | | $ | 55,335,997 | |
| Investments in affiliated issuers, at value (cost $143,241,259) | | | 143,175,077 | |
| Total investments (cost $195,987,551) | | | 198,511,074 | |
| Unrealized appreciation on swap agreements | | | 13,825,985 | |
| Cash | | | 1,345,808 | |
| Segregated cash with broker | | | 332,200 | |
| Prepaid expenses | | | 38,963 | |
| Receivables: | |
| Securities sold | | | 1,197,060 | |
| Dividends | | | 231,188 | |
| Interest | | | 34,218 | |
| Fund shares sold | | | 7,538 | |
| Total assets | | | 215,524,034 | |
| | | | | |
| Liabilities: | |
| Segregated cash from broker | | | 12,084,000 | |
| Payable for: | |
| Swap settlement | | | 483,222 | |
| Securities purchased | | | 187,197 | |
| Management fees | | | 130,091 | |
| Distribution and service fees | | | 47,242 | |
| Fund shares redeemed | | | 38,973 | |
| Fund accounting/administration fees | | | 16,478 | |
| Transfer agent/maintenance fees | | | 13,918 | |
| Variation margin | | | 5,635 | |
| Trustees’ fees* | | | 3,466 | |
| Miscellaneous | | | 58,481 | |
| Total liabilities | | | 13,068,703 | |
| Net assets | | $ | 202,455,331 | |
| | | | | |
| Net assets consist of: | |
| Paid in capital | | $ | 181,836,496 | |
| Undistributed net investment income | | | 370,126 | |
| Accumulated net realized gain on investments | | | 3,889,598 | |
| Net unrealized appreciation on investments | | | 16,359,111 | |
| Net assets | | $ | 202,455,331 | |
| | | | | |
| A-Class: | |
| Net assets | | $ | 196,397,388 | |
| Capital shares outstanding | | | 8,679,328 | |
| Net asset value per share | | $ | 22.63 | |
| Maximum offering price per share (Net asset value divided by 95.25%) | | $ | 23.76 | |
| | | | | |
| B-Class: | |
| Net assets | | $ | 2,621,732 | |
| Capital shares outstanding | | | 161,593 | |
| Net asset value per share | | $ | 16.22 | |
| | | | | |
| C-Class: | |
| Net assets | | $ | 3,351,388 | |
| Capital shares outstanding | | | 181,528 | |
| Net asset value per share | | $ | 18.46 | |
| | | | | |
| Institutional Class: | |
| Net assets | | $ | 84,823 | |
| Capital shares outstanding | | | 3,774 | |
| Net asset value per share | | $ | 22.48 | |
STATEMENT OF OPERATIONS (Unaudited)
Period Ended March 31, 2015
| Investment Income: | |
| Dividends from securities of affiliated issuers | | $ | 932,994 | |
| Interest | | | 637,592 | |
| Dividends from securities of unaffiliated issuers | | | 408,045 | |
| Total investment income | | | 1,978,631 | |
| | | | | |
| Expenses: | |
| Management fees | | | 757,980 | |
| Transfer agent/maintenance fees: | |
| A-Class | | | 123,100 | |
| B-Class | | | 9,505 | |
| C-Class | | | 5,027 | |
| Institutional Class | | | 123 | |
| Distribution and service fees: | |
| A-Class | | | 244,651 | |
| B-Class | | | 14,381 | |
| C-Class | | | 17,177 | |
| Fund accounting/administration fees | | | 96,009 | |
| Line of credit fees | | | 14,624 | |
| Custodian fees | | | 10,728 | |
| Trustees’ fees* | | | 10,039 | |
| Tax expense | | | 9 | |
| Miscellaneous | | | 74,482 | |
| Total expenses | | | 1,377,835 | |
| Net investment income | | | 600,796 | |
| | | | | |
| Net Realized and Unrealized Gain (Loss): | |
| Net realized gain (loss) on: | |
| Investments in unaffiliated issuers | | | 3,342,609 | |
| Investments in affiliated issuers | | | (13,996 | ) |
| Swap agreements | | | 1,051,251 | |
| Futures contracts | | | 58,473 | |
| Net realized gain | | | 4,438,337 | |
| Net change in unrealized appreciation (depreciation) on: | |
| Investments in unaffiliated issuers | | | (1,286,412 | ) |
| Investments in affiliated issuers | | | 180,124 | |
| Swap agreements | | | 8,144,756 | |
| Futures contracts | | | 18,313 | |
| Net change in unrealized appreciation (depreciation) | | | 7,056,781 | |
| Net realized and unrealized gain | | | 11,495,118 | |
| Net increase in net assets resulting from operations | | $ | 12,095,914 | |
| * | Relates to Trustees not deemed “interested persons” within the meaning of Section 2(a)(19) of the 1940 Act. |
| SEE NOTES TO FINANCIAL STATEMENTS. | THE GUGGENHEIM FUNDS SEMI-ANNUAL REPORT | 53 |
| STYLEPLUS—LARGE CORE FUND | |
STATEMENTS OF CHANGES IN NET ASSETS
| | | Period Ended March 31, 2015 (Unaudited) | | | Year Ended September 30, 2014 | |
| Increase (Decrease) in Net Assets from Operations: | | | | | | |
| Net investment income | | $ | 600,796 | | | $ | 1,594,339 | |
| Net realized gain on investments | | | 4,438,337 | | | | 32,337,769 | |
| Net change in unrealized appreciation (depreciation) on investments | | | 7,056,781 | | | | 3,604,720 | |
| Net increase in net assets resulting from operations | | | 12,095,914 | | | | 37,536,828 | |
| | | | | | | | | |
| Distributions to shareholders from: | | | | | | | | |
| Net investment income | | | | | | | | |
| A-Class | | | (1,732,889 | ) | | | (394,204 | ) |
| C-Class | | | (12,770 | ) | | | — | |
| Institutional Class | | | (1,276 | ) | | | (125 | ) |
| Net realized gains | | | | | | | | |
| A-Class | | | (24,703,723 | ) | | | (30,898,467 | ) |
| B-Class | | | (495,180 | ) | | | (755,687 | ) |
| C-Class | | | (513,717 | ) | | | (490,315 | ) |
| Institutional Class | | | (14,534 | ) | | | (4,758 | ) |
| Total distributions to shareholders | | | (27,474,089 | ) | | | (32,543,556 | ) |
| | | | | | | | | |
| Capital share transactions: | | | | | | | | |
| Proceeds from sale of shares | | | | | | | | |
| A-Class | | | 5,001,924 | | | | 5,232,403 | |
| B-Class | | | 73,203 | | | | 139,271 | |
| C-Class | | | 1,065,945 | | | | 926,456 | |
| Institutional Class | | | 34,411 | | | | 60,516 | |
| Distributions reinvested | | | | | | | | |
| A-Class | | | 24,669,737 | | | | 29,159,068 | |
| B-Class | | | 493,058 | | | | 750,686 | |
| C-Class | | | 522,705 | | | | 483,096 | |
| Institutional Class | | | 11,270 | | | | 4,883 | |
| Cost of shares redeemed | | | | | | | | |
| A-Class | | | (11,444,337 | ) | | | (22,280,678 | ) |
| B-Class | | | (636,719 | ) | | | (1,341,102 | ) |
| C-Class | | | (932,608 | ) | | | (628,059 | ) |
| Institutional Class | | | (29,777 | ) | | | (13,481 | ) |
| Net increase from capital share transactions | | | 18,828,812 | | | | 12,493,059 | |
| Net increase in net assets | | | 3,450,637 | | | | 17,486,331 | |
| | | | | | | | | |
| Net assets: | | | | | | | | |
| Beginning of period | | | 199,004,694 | | | | 181,518,363 | |
| End of period | | $ | 202,455,331 | | | $ | 199,004,694 | |
| Undistributed net investment income at end of period | | $ | 370,126 | | | $ | 1,516,265 | |
| 54 | THE GUGGENHEIM FUNDS SEMI-ANNUAL REPORT | SEE NOTES TO FINANCIAL STATEMENTS. |
| STYLEPLUS—LARGE CORE FUND | |
STATEMENTS OF CHANGES IN NET ASSETS (concluded)
| | | Period Ended March 31, 2015 (Unaudited) | | | Year Ended September 30, 2014 | |
| Capital share activity: | | | | | | | | |
| Shares sold | | | | | | | | |
| A-Class | | | 213,125 | | | | 221,145 | |
| B-Class | | | 4,604 | | | | 7,794 | |
| C-Class | | | 54,673 | | | | 45,606 | |
| Institutional Class | | | 1,353 | | | | 2,509 | |
| Shares issued from reinvestment of distributions | | | | | | | | |
| A-Class | | | 1,097,897 | | | | 1,349,957 | |
| B-Class | | | 30,473 | | | | 45,857 | |
| C-Class | | | 28,423 | | | | 26,486 | |
| Institutional Class | | | 505 | | | | 227 | |
| Shares redeemed | | | | | | | | |
| A-Class | | | (493,862 | ) | | | (944,947 | ) |
| B-Class | | | (38,422 | ) | | | (75,228 | ) |
| C-Class | | | (49,579 | ) | | | (31,801 | ) |
| Institutional Class | | | (1,348 | ) | | | (548 | ) |
| Net increase in shares | | | 847,842 | | | | 647,057 | |
| SEE NOTES TO FINANCIAL STATEMENTS. | THE GUGGENHEIM FUNDS SEMI-ANNUAL REPORT | 55 |
| STYLEPLUS—LARGE CORE FUND | |
This table is presented to show selected data for a share outstanding throughout each period and to assist shareholders in evaluating a Fund’s performance for the periods presented.
| A-Class | | Period Ended March 31, 2015a | | | Year Ended September 30, 2014 | | | Year Ended September 30, 2013 | | | Year Ended September 30, 2012 | | | Year Ended September 30, 2011f | | | Year Ended September 30, 2010f | |
| Per Share Data | | | | | | | | | | | | | | | | | | |
| Net asset value, beginning of period | | $ | 24.53 | | | $ | 24.27 | | | $ | 21.25 | | | $ | 16.79 | | | $ | 17.56 | | | $ | 16.20 | |
| Income (loss) from investment operations: | |
Net investment income (loss)b | | | .07 | | | | .20 | | | | .06 | | | | .06 | | | | .01 | | | | .04 | |
| Net gain (loss) on investments (realized and unrealized) | | | 1.41 | | | | 4.45 | | | | 3.04 | | | | 4.42 | | | | (.74 | ) | | | 1.32 | |
| Total from investment operations | | | 1.48 | | | | 4.65 | | | | 3.10 | | | | 4.48 | | | | (.73 | ) | | | 1.36 | |
| Less distributions from: | |
| Net investment income | | | (.22 | ) | | | (.06 | ) | | | (.08 | ) | | | (.02 | ) | | | (.04 | ) | | | — | |
| Net realized gains | | | (3.16 | ) | | | (4.33 | ) | | | — | | | | — | | | | — | | | | — | |
| Total distributions | | | (3.38 | ) | | | (4.39 | ) | | | (.08 | ) | | | (.02 | ) | | | (.04 | ) | | | — | |
| Net asset value, end of period | | $ | 22.63 | | | $ | 24.53 | | | $ | 24.27 | | | $ | 21.25 | | | $ | 16.79 | | | $ | 17.56 | |
| | |
Total Returnc | | | 6.15 | % | | | 21.59 | % | | | 14.64 | % | | | 26.71 | % | | | (4.11 | %) | | | 8.40 | % |
| Ratios/Supplemental Data | |
| Net assets, end of period (in thousands) | | $ | 196,397 | | | $ | 192,850 | | | $ | 175,601 | | | $ | 171,907 | | | $ | 156,232 | | | $ | 174,371 | |
| Ratios to average net assets: | |
| Net investment income (loss) | | | 0.63 | % | | | 0.86 | % | | | 0.26 | % | | | 0.32 | % | | | 0.06 | % | | | 0.31 | % |
Total expensesd | | | 1.33 | % | | | 1.41 | % | | | 1.37 | % | | | 1.36 | % | | | 1.35 | % | | | 1.43 | % |
Net expensese | | | 1.33 | % | | | 1.39 | % | | | 1.37 | % | | | 1.36 | % | | | 1.35 | % | | | 1.43 | % |
| Portfolio turnover rate | | | 42 | % | | | 107 | % | | | 217 | % | | | 101 | % | | | 92 | % | | | 100 | % |
| B-Class | | Period Ended March 31, 2015a | | | Year Ended September 30, 2014 | | | Year Ended September 30, 2013 | | | Year Ended September 30, 2012 | | | Year Ended September 30, 2011f | | | Year Ended September 30, 2010f | |
| Per Share Data | | | | | | | | | | | | | | | | | | |
| Net asset value, beginning of period | | $ | 18.39 | | | $ | 19.39 | | | $ | 17.13 | | | $ | 13.69 | | | $ | 14.40 | | | $ | 13.36 | |
| Income (loss) from investment operations: | |
Net investment income (loss)b | | | (.06 | ) | | | (.10 | ) | | | (.17 | ) | | | (.15 | ) | | | (.11 | ) | | | (.08 | ) |
| Net gain (loss) on investments (realized and unrealized) | | | 1.05 | | | | 3.43 | | | | 2.43 | | | | 3.59 | | | | (.60 | ) | | | 1.12 | |
| Total from investment operations | | | .99 | | | | 3.33 | | | | 2.26 | | | | 3.44 | | | | (.71 | ) | | | 1.04 | |
| Less distributions from: | |
| Net realized gains | | | (3.16 | ) | | | (4.33 | ) | | | — | | | | — | | | | — | | | | — | |
| Total distributions | | | (3.16 | ) | | | (4.33 | ) | | | — | | | | — | | | | — | | | | — | |
| Net asset value, end of period | | $ | 16.22 | | | $ | 18.39 | | | $ | 19.39 | | | $ | 17.13 | | | $ | 13.69 | | | $ | 14.40 | |
| | |
Total Returnc | | | 5.44 | % | | | 19.93 | % | | | 13.19 | % | | | 25.13 | % | | | (4.93 | %) | | | 7.78 | % |
| Ratios/Supplemental Data | |
| Net assets, end of period (in thousands) | | $ | 2,622 | | | $ | 3,033 | | | $ | 3,617 | | | $ | 4,714 | | | $ | 5,121 | | | $ | 6,817 | |
| Ratios to average net assets: | |
| Net investment income (loss) | | | (0.66 | %) | | | (0.56 | %) | | | (0.94 | %) | | | (0.92 | %) | | | (0.70 | %) | | | (0.48 | %) |
Total expensesd | | | 2.61 | % | | | 2.81 | % | | | 2.59 | % | | | 2.59 | % | | | 2.10 | % | | | 2.17 | % |
Net expensese | | | 2.61 | % | | | 2.80 | % | | | 2.59 | % | | | 2.59 | % | | | 2.10 | % | | | 2.17 | % |
| Portfolio turnover rate | | | 42 | % | | | 107 | % | | | 217 | % | | | 101 | % | | | 92 | % | | | 100 | % |
| 56 | THE GUGGENHEIM FUNDS SEMI-ANNUAL REPORT | SEE NOTES TO FINANCIAL STATEMENTS. |
| STYLEPLUS—LARGE CORE FUND | |
FINANCIAL HIGHLIGHTS (continued)
This table is presented to show selected data for a share outstanding throughout each period and to assist shareholders in evaluating a Fund’s performance for the periods presented.
| C-Class | | Period Ended March 31, 2015a | | | Year Ended September 30, 2014 | | | Year Ended September 30, 2013 | | | Year Ended September 30, 2012 | | | Year Ended September 30, 2011f | | | Year Ended September 30, 2010f | |
| Per Share Data | | | | | | | | | | | | | | | | | | |
| Net asset value, beginning of period | | $ | 20.55 | | | $ | 21.12 | | | $ | 18.60 | | | $ | 14.81 | | | $ | 15.56 | | | $ | 14.48 | |
| Income (loss) from investment operations: | |
Net investment income (loss)b | | | (.03 | ) | | | (.02 | ) | | | (.15 | ) | | | (.10 | ) | | | (.12 | ) | | | (.08 | ) |
| Net gain (loss) on investments (realized and unrealized) | | | 1.18 | | | | 3.78 | | | | 2.67 | | | | 3.89 | | | | (.63 | ) | | | 1.16 | |
| Total from investment operations | | | 1.15 | | | | 3.76 | | | | 2.52 | | | | 3.79 | | | | (.75 | ) | | | 1.08 | |
| Less distributions from: | |
| Net investment income | | | (.08 | ) | | | — | | | | — | | | | — | | | | — | | | | — | |
| Net realized gains | | | (3.16 | ) | | | (4.33 | ) | | | — | | | | — | | | | — | | | | — | |
| Total distributions | | | (3.24 | ) | | | (4.33 | ) | | | — | | | | — | | | | — | | | | — | |
| Net asset value, end of period | | $ | 18.46 | | | $ | 20.55 | | | $ | 21.12 | | | $ | 18.60 | | | $ | 14.81 | | | $ | 15.56 | |
| | |
Total Returnc | | | 5.66 | % | | | 20.40 | % | | | 13.55 | % | | | 25.59 | % | | | (4.82 | %) | | | 7.46 | % |
| Ratios/Supplemental Data | |
| Net assets, end of period (in thousands) | | $ | 3,351 | | | $ | 3,042 | | | $ | 2,275 | | | $ | 1,669 | | | $ | 1,600 | | | $ | 2,158 | |
| Ratios to average net assets: | |
| Net investment income (loss) | | | (0.28 | %) | | | (0.08 | %) | | | (0.77 | %) | | | (0.55 | %) | | | (0.70 | %) | | | (0.44 | %) |
Total expensesd | | | 2.25 | % | | | 2.36 | % | | | 2.34 | % | | | 2.22 | % | | | 2.10 | % | | | 2.18 | % |
Net expensese | | | 2.25 | % | | | 2.34 | % | | | 2.34 | % | | | 2.22 | % | | | 2.10 | % | | | 2.18 | % |
| Portfolio turnover rate | | | 42 | % | | | 107 | % | | | 217 | % | | | 101 | % | | | 92 | % | | | 100 | % |
| SEE NOTES TO FINANCIAL STATEMENTS. | THE GUGGENHEIM FUNDS SEMI-ANNUAL REPORT | 57 |
| STYLEPLUS—LARGE CORE FUND | |
FINANCIAL HIGHLIGHTS (concluded)
This table is presented to show selected data for a share outstanding throughout each period and to assist shareholders in evaluating a Fund’s performance for the periods presented.
| Institutional Class | | Period Ended March 31, 2015a | | | Year Ended September 30, 2014 | | | Year Ended September 30, 2013 | | | Period Ended September 30, 2012g | |
| Per Share Data | | | | | | | | | | | | |
| Net asset value, beginning of period | | $ | 24.42 | | | $ | 24.25 | | | $ | 21.28 | | | $ | 20.84 | |
| Income (loss) from investment operations: | |
Net investment income (loss)b | | | .09 | | | | .23 | | | | .06 | | | | .07 | |
| Net gain (loss) on investments (realized and unrealized) | | | 1.41 | | | | 4.38 | | | | 3.06 | | | | .37 | |
| Total from investment operations | | | 1.50 | | | | 4.61 | | | | 3.12 | | | | .44 | |
| Less distributions from: | |
| Net investment income | | | (.28 | ) | | | (.11 | ) | | | (.15 | ) | | | — | |
| Net realized gains | | | (3.16 | ) | | | (4.33 | ) | | | — | | | | — | |
| Total distributions | | | (3.44 | ) | | | (4.44 | ) | | | (.15 | ) | | | — | |
| Net asset value, end of period | | $ | 22.48 | | | $ | 24.42 | | | $ | 24.25 | | | $ | 21.28 | |
| | |
Total Returnc | | | 6.25 | % | | | 21.50 | % | | | 14.79 | % | | | 2.11 | % |
| Ratios/Supplemental Data | |
| Net assets, end of period (in thousands) | | $ | 85 | | | $ | 80 | | | $ | 26 | | | $ | 10 | |
| Ratios to average net assets: | |
| Net investment income (loss) | | | 0.75 | % | | | 0.97 | % | | | 0.26 | % | | | 0.59 | % |
Total expensesd | | | 1.21 | % | | | 1.39 | % | | | 1.25 | % | | | 1.12 | % |
Net expensese | | | 1.21 | % | | | 1.37 | % | | | 1.25 | % | | | 1.12 | % |
| Portfolio turnover rate | | | 42 | % | | | 107 | % | | | 217 | % | | | 101 | % |
a | Unaudited figures for the period ended March 31, 2015. Percentage amounts for the period, except total return and portfolio turnover rate, have been annualized. |
b | Net investment income (loss) per share was computed using average shares outstanding throughout the period. |
c | Total return does not reflect the impact of any applicable sales charges and has not been annualized. |
d | Does not include expenses of the underlying funds in which the Fund invests. |
e | Net expense information reflects the expense ratios after expense waivers. |
f | Reverse share split — Per share amounts for the periods presented through April 8, 2011 have been restated to reflect a 1:4 reverse share split effective April 8, 2011. |
g | Since commencement of operations: March 1, 2012. Percentage amounts for the period, except total return and portfolio turnover rate, have been annualized. |
| 58 | THE GUGGENHEIM FUNDS SEMI-ANNUAL REPORT | SEE NOTES TO FINANCIAL STATEMENTS. |
FUND PROFILE (Unaudited) | March 31, 2015 |
STYLEPLUS—MID GROWTH FUND
OBJECTIVE: Seeks long-term growth of capital.
Holdings Diversification (Market Exposure as % of Net Assets)
| Portfolio Composition by Quality Rating* |
| Rating | |
| Fixed Income Instruments | |
| AAA | 3.4% |
| AA | 1.3% |
| A | 3.6% |
| BBB | 1.1% |
| B | 0.2% |
| Other Instruments | |
| Mutual Funds | 71.4% |
| Common Stocks | 15.5% |
| Short Term Investments | 3.5% |
| Total Investments | 100.0% |
| | |
| The chart above reflects percentages of the value of total investments. |
“Holdings Diversification (Market Exposure as % of Net Assets)” excludes any temporary cash investments or investments in Guggenheim Strategy Funds Trust mutual funds. Investments in those Funds do not provide “market exposure” to meet the fund’s investment objective, but will significantly increase the portfolio’s exposure to certain other asset categories (and their associated risks), which may cause the Fund to deviate from its principal investment strategy, including: (i) high yield, high risk debt securities rated below the top four long-term rating categories by a nationally recognized statistical rating organization (also known as “junk bonds”); (ii) securities issued by the U.S. government or its agencies and instrumentalities; (iii) CLOs and similar investments; and (iv) other short-term fixed income securities.
| Inception Dates: |
| A-Class | September 17, 1969 |
| B-Class | October 19, 1993 |
| C-Class | January 29, 1999 |
| Institutional Class | March 1, 2012 |
| Ten Largest Holdings (% of Total Net Assets) |
| Guggenheim Strategy Fund III | 24.1% |
| Guggenheim Strategy Fund I | 23.1% |
| Guggenheim Strategy Fund II | 22.3% |
| Duane Street CLO IV Ltd. — Class A1T | 0.8% |
| N-Star REL CDO VIII Ltd. — Class A1 | 0.7% |
| Salus CLO Ltd. — Class A2N | 0.7% |
| Symphony CLO IX, LP — Class C | 0.6% |
| Goldman Sachs Asset Management CLO plc — Class D | 0.6% |
| Symphony CLO VII Ltd. — Class D | 0.6% |
| KKR Financial CLO 2007-1 Ltd. — Class D | 0.6% |
| Top Ten Total | 74.1% |
| | |
| “Ten Largest Holdings” exclude any temporary cash or derivative investments. |
| * | Source: BlackRock Solutions. Credit quality ratings are measured on a scale that generally ranges from AAA (highest) to D (lowest). All securities have been rated by Moody’s, Standard & Poor’s (“S&P”), or Fitch, which are all a Nationally Recognized Statistical Rating Organization (“NRSRO”). For purposes of this presentation, when ratings are available from more than one agency, the highest rating is used. Guggenheim Investments has converted Moody’s and Fitch ratings to the equivalent S&P rating. Security ratings are determined at the time of purchase and may change thereafter. |
| | THE GUGGENHEIM FUNDS SEMI-ANNUAL REPORT | 59 |
SCHEDULE OF INVESTMENTS (Unaudited) | March 31, 2015 |
| STYLEPLUS—MID GROWTH FUND | |
| | |
Shares | | | Value | |
| | | | | | | | |
COMMON STOCKS† - 15.1% | |
| | | | | | | | |
| CONSUMER, NON-CYCLICAL - 5.7% | |
| Kroger Co. | | | 3,181 | | | $ | 243,856 | |
| Catamaran Corp.* | | | 3,276 | | | | 195,053 | |
| AmerisourceBergen Corp. — Class A | | | 1,674 | | | | 190,283 | |
| Mylan N.V.* | | | 3,058 | | | | 181,492 | |
| Cigna Corp. | | | 1,210 | | | | 156,622 | |
| Constellation Brands, Inc. — Class A* | | | 1,284 | | | | 149,213 | |
| Vertex Pharmaceuticals, Inc.* | | | 1,221 | | | | 144,041 | |
| Archer-Daniels-Midland Co. | | | 2,965 | | | | 140,541 | |
| Hertz Global Holdings, Inc.* | | | 6,294 | | | | 136,454 | |
| Dr Pepper Snapple Group, Inc. | | | 1,695 | | | | 133,024 | |
| Coca-Cola Enterprises, Inc. | | | 2,870 | | | | 126,854 | |
| CR Bard, Inc. | | | 758 | | | | 126,851 | |
| Western Union Co. | | | 5,884 | | | | 122,446 | |
| Boston Scientific Corp.* | | | 6,725 | | | | 119,369 | |
| United Rentals, Inc.* | | | 1,276 | | | | 116,320 | |
| St. Jude Medical, Inc. | | | 1,755 | | | | 114,777 | |
| DaVita HealthCare Partners, Inc.* | | | 1,344 | | | | 109,240 | |
| Kellogg Co. | | | 1,648 | | | | 108,686 | |
| Zoetis, Inc. | | | 2,260 | | | | 104,615 | |
| Mead Johnson Nutrition Co. — Class A | | | 1,035 | | | | 104,049 | |
| Brown-Forman Corp. — Class B | | | 1,116 | | | | 100,831 | |
| Universal Health Services, Inc. — Class B | | | 750 | | | | 88,283 | |
| Cardinal Health, Inc. | | | 976 | | | | 88,104 | |
| Hershey Co. | | | 857 | | | | 86,480 | |
| Illumina, Inc.* | | | 445 | | | | 82,610 | |
| RR Donnelley & Sons Co. | | | 4,275 | | | | 82,037 | |
| Darling Ingredients, Inc.* | | | 5,816 | | | | 81,482 | |
| Henry Schein, Inc.* | | | 578 | | | | 80,700 | |
| HCA Holdings, Inc.* | | | 1,070 | | | | 80,496 | |
| Monster Beverage Corp.* | | | 570 | | | | 78,885 | |
| Ingredion, Inc. | | | 999 | | | | 77,742 | |
| BioMarin Pharmaceutical, Inc.* | | | 620 | | | | 77,264 | |
| Campbell Soup Co. | | | 1,645 | | | | 76,575 | |
| McGraw Hill Financial, Inc. | | | 724 | | | | 74,862 | |
| Quanta Services, Inc.* | | | 2,589 | | | | 73,864 | |
| Clorox Co. | | | 654 | | | | 72,195 | |
| Spectrum Brands Holdings, Inc. | | | 794 | | | | 71,111 | |
| Endo International plc* | | | 785 | | | | 70,415 | |
| Perrigo Company plc | | | 423 | | | | 70,028 | |
| Avis Budget Group, Inc.* | | | 1,132 | | | | 66,805 | |
| Whole Foods Market, Inc. | | | 1,153 | | | | 60,048 | |
| Jazz Pharmaceuticals plc* | | | 338 | | | | 58,403 | |
| Total System Services, Inc. | | | 1,486 | | | | 56,691 | |
| Hologic, Inc.* | | | 1,697 | | | | 56,043 | |
| DENTSPLY International, Inc. | | | 1,100 | | | | 55,979 | |
| Booz Allen Hamilton Holding Corp. | | | 1,913 | | | | 55,362 | |
| Keurig Green Mountain, Inc. | | | 462 | | | | 51,619 | |
| KAR Auction Services, Inc. | | | 1,280 | | | | 48,550 | |
| Vantiv, Inc. — Class A* | | | 1,275 | | | | 48,068 | |
| Incyte Corp.* | | | 503 | | | | 46,105 | |
| Alkermes plc* | | | 708 | | | | 43,167 | |
| Mallinckrodt plc* | | | 337 | | | | 42,681 | |
| Intuitive Surgical, Inc.* | | | 80 | | | | 40,402 | |
| Total Consumer, Non-cyclical | | | | | | | 5,067,673 | |
| | | | | | | | |
| INDUSTRIAL - 2.3% | |
| Parker-Hannifin Corp. | | | 1,400 | | | | 166,293 | |
| Dover Corp. | | | 2,036 | | | | 140,728 | |
| Corning, Inc. | | | 5,789 | | | | 131,295 | |
| Stanley Black & Decker, Inc. | | | 1,366 | | | | 130,262 | |
| Tyco International plc | | | 2,952 | | | | 127,113 | |
| Rockwell Automation, Inc. | | | 1,087 | | | | 126,081 | |
| Pentair plc | | | 1,588 | | | | 99,869 | |
| Huntington Ingalls Industries, Inc. | | | 702 | | | | 98,385 | |
| Fluor Corp. | | | 1,468 | | | | 83,911 | |
| Agilent Technologies, Inc. | | | 1,849 | | | | 76,826 | |
| Triumph Group, Inc. | | | 1,270 | | | | 75,844 | |
| Waste Management, Inc. | | | 1,304 | | | | 70,716 | |
| Trimble Navigation Ltd.* | | | 2,707 | | | | 68,216 | |
| Ingersoll-Rand plc | | | 985 | | | | 67,059 | |
| Roper Industries, Inc. | | | 382 | | | | 65,704 | |
| TransDigm Group, Inc. | | | 292 | | | | 63,866 | |
| Timken Co. | | | 1,420 | | | | 59,839 | |
| Lincoln Electric Holdings, Inc. | | | 889 | | | | 58,132 | |
| Kansas City Southern | | | 568 | | | | 57,981 | |
| Avnet, Inc. | | | 1,294 | | | | 57,583 | |
| Waste Connections, Inc. | | | 1,174 | | | | 56,516 | |
| Xylem, Inc. | | | 1,452 | | | | 50,849 | |
| Clean Harbors, Inc.* | | | 855 | | | | 48,547 | |
| Moog, Inc. — Class A* | | | 584 | | | | 43,829 | |
| B/E Aerospace, Inc. | | | 671 | | | | 42,689 | |
| Total Industrial | | | | | | | 2,068,133 | |
| | | | | | | | |
| CONSUMER, CYCLICAL - 2.2% | |
| United Continental Holdings, Inc.* | | | 3,157 | | | | 212,309 | |
| PACCAR, Inc. | | | 3,066 | | | | 193,587 | |
| Southwest Airlines Co. | | | 4,158 | | | | 184,199 | |
| Macy’s, Inc. | | | 2,207 | | | | 143,257 | |
| WW Grainger, Inc. | | | 521 | | | | 122,857 | |
| PVH Corp. | | | 1,053 | | | | 112,208 | |
| The Gap, Inc. | | | 2,282 | | | | 98,879 | |
| Allison Transmission Holdings, Inc. | | | 2,907 | | | | 92,850 | |
| Harley-Davidson, Inc. | | | 1,512 | | | | 91,839 | |
| Tesla Motors, Inc.* | | | 411 | | | | 77,584 | |
| Kohl’s Corp. | | | 929 | | | | 72,694 | |
| Genuine Parts Co. | | | 770 | | | | 71,756 | |
| Dollar General Corp.* | | | 943 | | | | 71,083 | |
| Dollar Tree, Inc.* | | | 833 | | | | 67,594 | |
| Whirlpool Corp. | | | 315 | | | | 63,649 | |
| Best Buy Company, Inc. | | | 1,635 | | | | 61,787 | |
| O’Reilly Automotive, Inc.* | | | 272 | | | | 58,817 | |
| Hilton Worldwide Holdings, Inc.* | | | 1,459 | | | | 43,216 | |
| Wyndham Worldwide Corp. | | | 454 | | | | 41,073 | |
| 60 | THE GUGGENHEIM FUNDS SEMI-ANNUAL REPORT | SEE NOTES TO FINANCIAL STATEMENTS. |
SCHEDULE OF INVESTMENTS (Unaudited)(continued) | March 31, 2015 |
| STYLEPLUS—MID GROWTH FUND | |
| | |
Shares | | | Value | |
| | | | | | | | | |
| Restaurant Brands International, Inc. | | | 1,018 | | | $ | 39,101 | |
| Total Consumer, Cyclical | | | | | | | 1,920,339 | |
| | | | | | | | |
| TECHNOLOGY - 2.1% | |
| Applied Materials, Inc. | | | 5,591 | | | | 126,132 | |
| NetApp, Inc. | | | 3,411 | | | | 120,954 | |
| Avago Technologies Ltd. | | | 888 | | | | 112,758 | |
| IHS, Inc. — Class A* | | | 963 | | | | 109,551 | |
| Citrix Systems, Inc.* | | | 1,687 | | | | 107,748 | |
| Computer Sciences Corp. | | | 1,629 | | | | 106,341 | |
| SanDisk Corp. | | | 1,508 | | | | 95,939 | |
| Fiserv, Inc.* | | | 1,195 | | | | 94,883 | |
| Activision Blizzard, Inc. | | | 4,104 | | | | 93,263 | |
| Intuit, Inc. | | | 927 | | | | 89,882 | |
| Pitney Bowes, Inc. | | | 3,852 | | | | 89,829 | |
| Xilinx, Inc. | | | 2,109 | | | | 89,211 | |
| KLA-Tencor Corp. | | | 1,426 | | | | 83,122 | |
| Teradyne, Inc. | | | 4,103 | | | | 77,342 | |
| Cerner Corp.* | | | 976 | | | | 71,502 | |
| DST Systems, Inc. | | | 570 | | | | 63,105 | |
| Maxim Integrated Products, Inc. | | | 1,750 | | | | 60,918 | |
| Riverbed Technology, Inc.* | | | 2,798 | | | | 58,506 | |
| Workday, Inc. — Class A* | | | 667 | | | | 56,301 | |
| ServiceNow, Inc.* | | | 670 | | | | 52,783 | |
| PTC, Inc.* | | | 1,388 | | | | 50,204 | |
| VeriFone Systems, Inc.* | | | 1,402 | | | | 48,916 | |
| NCR Corp.* | | | 1,616 | | | | 47,688 | |
| Total Technology | | | | | | | 1,906,878 | |
| | | | | | | | |
| COMMUNICATIONS - 1.9% | |
| Omnicom Group, Inc. | | | 2,013 | | | | 156,974 | |
| Twitter, Inc.* | | | 2,909 | | | | 145,683 | |
| LinkedIn Corp. — Class A* | | | 549 | | | | 137,173 | |
| Juniper Networks, Inc. | | | 5,631 | | | | 127,147 | |
| Liberty Interactive Corp. — Class A* | | | 3,599 | | | | 105,055 | |
| Netflix, Inc.* | | | 238 | | | | 99,172 | |
| Alliance Data Systems Corp.* | | | 324 | | | | 95,985 | |
| CenturyLink, Inc. | | | 2,602 | | | | 89,899 | |
| ARRIS Group, Inc.* | | | 2,681 | | | | 77,468 | |
| Harris Corp. | | | 899 | | | | 70,805 | |
| Nielsen N.V. | | | 1,264 | | | | 56,336 | |
| Level 3 Communications, Inc.* | | | 1,020 | | | | 54,917 | |
| Charter Communications, Inc. — Class A* | | | 276 | | | | 53,298 | |
| Interpublic Group of Companies, Inc. | | | 2,407 | | | | 53,243 | |
| Viacom, Inc. — Class B | | | 769 | | | | 52,523 | |
| Discovery Communications, Inc. — Class A* | | | 1,696 | | | | 52,169 | |
| CommScope Holding Company, Inc.* | | | 1,714 | | | | 48,918 | |
| Cablevision Systems Corp. — Class A | | | 2,539 | | | | 46,464 | |
| DISH Network Corp. — Class A* | | | 660 | | | | 46,240 | |
| EchoStar Corp. — Class A* | | | 889 | | | | 45,979 | |
| Sirius XM Holdings, Inc.* | | | 11,177 | | | | 42,696 | |
| Total Communications | | | | | | | 1,658,144 | |
| | | | | | | | |
| ENERGY - 0.7% | |
| Cheniere Energy, Inc.* | | | 1,410 | | | | 109,134 | |
| Valero Energy Corp. | | | 1,560 | | | | 99,247 | |
| Chesapeake Energy Corp. | | | 6,251 | | | | 88,514 | |
| HollyFrontier Corp. | | | 1,727 | | | | 69,546 | |
| Cameron International Corp.* | | | 1,121 | | | | 50,580 | |
| Concho Resources, Inc.* | | | 435 | | | | 50,425 | |
| Nabors Industries Ltd. | | | 3,452 | | | | 47,120 | |
| Superior Energy Services, Inc. | | | 2,093 | | | | 46,758 | |
| ONEOK, Inc. | | | 917 | | | | 44,236 | |
| Southwestern Energy Co.* | | | 1,851 | | | | 42,925 | |
| Total Energy | | | | | | | 648,485 | |
| | | | | | | | |
| FINANCIAL - 0.2% | |
| Ameriprise Financial, Inc. | | | 723 | | | | 94,598 | |
| Crown Castle International Corp. | | | 997 | | | | 82,292 | |
| T. Rowe Price Group, Inc. | | | 498 | | | | 40,328 | |
| Total Financial | | | | | | | 217,218 | |
| | | | | | | | |
| Total Common Stocks | | | | | | | | |
| (Cost $12,515,704) | | | | | | | 13,486,870 | |
| | | | | | | | |
MUTUAL FUNDS†,1 - 69.6% | |
| Guggenheim Strategy Fund III | | | 863,871 | | | | 21,553,581 | |
| Guggenheim Strategy Fund I | | | 828,162 | | | | 20,621,242 | |
| Guggenheim Strategy Fund II | | | 798,656 | | | | 19,894,512 | |
| Total Mutual Funds | | | | | | | | |
| (Cost $62,076,029) | | | | | | | 62,069,335 | |
| | | | | | | | |
SHORT TERM INVESTMENTS† - 3.4% | |
| Dreyfus Treasury Prime Cash Management Fund 0.00% | | | 3,079,435 | | | | 3,079,435 | |
| Total Short Term Investments | | | | | | | | |
| (Cost $3,079,435) | | | | | | | 3,079,435 | |
| | | | | | | | |
| | | Face
Amount | | | | |
| | | | | | | | |
ASSET-BACKED SECURITIES†† - 8.7% | |
| Duane Street CLO IV Ltd. | | | | | | | | |
2007-4A, 0.49% due 11/14/212,3 | | $ | 688,445 | | | | 682,869 | |
| N-Star REL CDO VIII Ltd. | | | | | | | | |
2006-8A, 0.47% due 02/01/412,3 | | | 666,268 | | | | 653,809 | |
| Brentwood CLO Corp. | | | | | | | | |
2006-1A, 0.52% due 02/01/222,3 | | | 408,878 | | | | 403,072 | |
2006-1A, 1.07% due 02/01/222,3 | | | 250,000 | | | | 237,325 | |
| Salus CLO Ltd. | | | | | | | | |
2013-1AN, 2.48% due 03/05/212,3 | | | 600,000 | | | | 600,720 | |
| Symphony CLO IX, LP | | | | | | | | |
2012-9A, 3.50% due 04/16/222,3 | | | 500,000 | | | | 501,700 | |
| Goldman Sachs Asset Management CLO plc | | | | | | | | |
2007-1A, 3.00% due 08/01/222,3 | | | 500,000 | | | | 500,750 | |
| SEE NOTES TO FINANCIAL STATEMENTS. | THE GUGGENHEIM FUNDS SEMI-ANNUAL REPORT | 61 |
SCHEDULE OF INVESTMENTS (Unaudited)(concluded) | March 31, 2015 |
| STYLEPLUS—MID GROWTH FUND | |
| | | | | | | | | |
| | | Face
Amount | | | Value | |
| | | | | | | | |
| Symphony CLO VII Ltd. | | | | | | | | |
2011-7A, 3.46% due 07/28/212,3 | | $ | 500,000 | | | $ | 499,400 | |
| KKR Financial CLO 2007-1 Ltd. | | | | | | | | |
2007-1A, 2.51% due 05/15/212,3 | | | 500,000 | | | | 498,050 | |
| Black Diamond CLO 2005-1 Delaware Corp. | | | | | | | | |
2005-1A, 2.17% due 06/20/172,3 | | | 500,000 | | | | 489,450 | |
| NewStar Commercial Loan Trust 2007-1 | | | | | | | | |
2007-1A, 1.56% due 09/30/222,3 | | | 500,000 | | | | 475,650 | |
| Cornerstone CLO Ltd. | | | | | | | | |
2007-1A, 0.47% due 07/15/212,3 | | | 441,309 | | | | 437,514 | |
| GSC Group CDO Fund VIII Ltd. | | | | | | | | |
2007-8A, 0.64% due 04/17/212,3 | | | 400,000 | | | | 394,840 | |
| Black Diamond CLO 2006-1 Luxembourg S.A. | | | | | | | | |
2007-1A, 0.64% due 04/29/192,3 | | | 400,000 | | | | 384,080 | |
| OFSI Fund V Ltd. | | | | | | | | |
2013-5A, 3.46% due 04/17/252,3 | | | 300,000 | | | | 296,310 | |
| Foothill CLO Ltd. | | | | | | | | |
2007-1A, 0.51% due 02/22/212,3 | | | 287,370 | | | | 285,273 | |
| Race Point IV CLO Ltd. | | | | | | | | |
2007-4A, 1.00% due 08/01/212,3 | | | 250,000 | | | | 243,150 | |
| Tricadia CDO 2006-6 Ltd. | | | | | | | | |
2006-6A, 0.81% due 11/05/412,3 | | | 76,885 | | | | 76,516 | |
| Global Leveraged Capital Credit Opportunity Fund | | | | | | | | |
2006-1A, 0.56% due 12/20/182,3 | | | 44,769 | | | | 44,648 | |
| West Coast Funding Ltd. | | | | | | | | |
2006-1A, 0.40% due 11/02/412,3 | | | 39,889 | | | | 39,646 | |
| Golub Capital Partners Fundings Ltd. | | | | | | | | |
2007-1A, 0.52% due 03/15/222,3 | | | 39,590 | | | | 39,412 | |
| Total Asset-Backed Securities | | | | | | | | |
| (Cost $7,652,106) | | | | | | | 7,784,184 | |
| | | | | | | | |
COLLATERALIZED MORTGAGE OBLIGATIONS†† - 0.5% | |
| SRERS-2011 Funding Ltd. | | | | | | | | |
2011-RS, 0.43% due 05/09/462,3 | | | 495,599 | | | | 471,215 | |
| Total Collateralized Mortgage Obligations | | | | | | | | |
| (Cost $436,487) | | | | | | | 471,215 | |
| | | | | | | | |
| Total Investments - 97.3% | | | | | | | | |
| (Cost $85,759,761) | | | | | | $ | 86,891,039 | |
| Other Assets & Liabilities, net - 2.7% | | | | | | | 2,399,933 | |
| Total Net Assets - 100.0% | | | | | | $ | 89,290,972 | |
| | | | | | | | | |
| | | Contracts | | | Unrealized
Gain | |
| | | | | | | | |
EQUITY FUTURES CONTRACTS PURCHASED† | |
June 2015 S&P MidCap 400 Index
Mini Futures Contracts
(Aggregate Value of
Contracts $760,100) | | | 5 | | | $ | 20,959 | |
June 2015 S&P 500 Index
Mini Futures Contracts
(Aggregate Value of
Contracts $205,950) | | | 2 | | | | 2,744 | |
June 2015 NASDAQ-100 Index
Mini Futures Contracts
(Aggregate Value of
Contracts $259,695) | | | 3 | | | | 1,589 | |
| (Total Aggregate Value of Contracts $1,225,745) | | | | | | $ | 25,292 | |
| | | | | | | | |
| | | Units | | | | |
| | | | | | | | |
OTC EQUITY INDEX SWAP AGREEMENTS†† | |
Morgan Stanley Capital Services, Inc.
June 2015 Russell MidCap Growth
Total Return Index Swap,
Terminating 06/03/154
(Notional Value $48,670,426) | | | 21,873 | | | $ | 6,998,418 | |
Bank of America
August 2015 Russell MidCap Growth
Total Return Index Swap,
Terminating 08/05/154
(Notional Value $20,826,812) | | | 9,454 | | | | 1,971,037 | |
Deutsche Bank
May 2015 Russell MidCap Growth
Index Swap,
Terminating 05/05/154
(Notional Value $3,981,328) | | | 5,089 | | | | — | |
| (Total Notional Value $73,478,566) | | | | | | $ | 8,969,455 | |
| * | Non-income producing security. |
| † | Value determined based on Level 1 inputs — See Note 4. |
| †† | Value determined based on Level 2 inputs — See Note 4. |
| 1 | Affiliated issuer — See Note 10. |
| 2 | Variable rate security. Rate indicated is rate effective at March 31, 2015. |
| 3 | Security is a 144A or Section 4(a)(2) security. The total market value of 144A or Section 4(a)(2) securities is $8,255,399 (cost $8,088,592), or 9.2% of total net assets. These securities have been determined to be liquid under guidelines established by the Board of Trustees. |
| 4 | Total Return based on Russell MidCap Growth Index +/- financing at a variable rate. |
| plc — Public Limited Company |
| |
| See Sector Classification in Other Information section. |
| 62 | THE GUGGENHEIM FUNDS SEMI-ANNUAL REPORT | SEE NOTES TO FINANCIAL STATEMENTS. |
| STYLEPLUS—MID GROWTH FUND | |
STATEMENT OF ASSETS AND LIABILITIES (Unaudited)
March 31, 2015
| Assets: | |
| Investments in unaffiliated issuers, at value (cost $23,683,732) | | $ | 24,821,704 | |
| Investments in affiliated issuers, at value (cost $62,076,029) | | | 62,069,335 | |
| Total investments (cost $85,759,761) | | | 86,891,039 | |
| Unrealized appreciation on swap agreements | | | 8,969,455 | |
| Cash | | | 566,760 | |
| Segregated cash with broker | | | 53,500 | |
| Prepaid expenses | | | 33,252 | |
| Receivables: | |
| Securities sold | | | 337,113 | |
| Dividends | | | 91,415 | |
| Fund shares sold | | | 84,190 | |
| Interest | | | 14,922 | |
| Total assets | | | 97,041,646 | |
| | | | | |
| Liabilities: | |
| Segregated cash from broker | | | 7,326,010 | |
| Payable for: | |
| Fund shares redeemed | | | 123,072 | |
| Securities purchased | | | 81,206 | |
| Management fees | | | 57,453 | |
| Swap settlement | | | 50,913 | |
| Distribution and service fees | | | 23,295 | |
| Transfer agent/maintenance fees | | | 14,629 | |
| Fund accounting/administration fees | | | 7,277 | |
| Variation margin | | | 6,415 | |
| Trustees’ fees* | | | 142 | |
| Miscellaneous | | | 60,262 | |
| Total liabilities | | | 7,750,674 | |
| Net assets | | $ | 89,290,972 | |
| | | | | |
| Net assets consist of: | |
| Paid in capital | | $ | 77,438,334 | |
| Undistributed net investment income | | | 108,665 | |
| Accumulated net realized gain on investments | | | 1,617,948 | |
| Net unrealized appreciation on investments | | | 10,126,025 | |
| Net assets | | $ | 89,290,972 | |
| | | | | |
| A-Class: | |
| Net assets | | $ | 82,625,550 | |
| Capital shares outstanding | | | 1,804,238 | |
| Net asset value per share | | $ | 45.80 | |
| Maximum offering price per share (Net asset value divided by 95.25%) | | $ | 48.08 | |
| | | | | |
| B-Class: | |
| Net assets | | $ | 1,378,479 | |
| Capital shares outstanding | | | 46,818 | |
| Net asset value per share | | $ | 29.44 | |
| | | | | |
| C-Class: | |
| Net assets | | $ | 5,231,881 | |
| Capital shares outstanding | | | 144,012 | |
| Net asset value per share | | $ | 36.33 | |
| | | | | |
| Institutional Class: | |
| Net assets | | $ | 55,062 | |
| Capital shares outstanding | | | 1,198 | |
| Net asset value per share | | $ | 45.96 | |
STATEMENT OF OPERATIONS (Unaudited)
Period Ended March 31, 2015
| Investment Income: | |
| Dividends from securities of affiliated issuers | | $ | 393,936 | |
| Interest | | | 275,598 | |
| Dividends from securities of unaffiliated issuers | | | 109,608 | |
| Total investment income | | | 779,142 | |
| | | | | |
| Expenses: | |
| Management fees | | | 323,476 | |
| Transfer agent/maintenance fees: | |
| A-Class | | | 66,984 | |
| B-Class | | | 6,056 | |
| C-Class | | | 6,461 | |
| Institutional Class | | | 69 | |
| Distribution and service fees: | |
| A-Class | | | 99,944 | |
| B-Class | | | 7,608 | |
| C-Class | | | 23,669 | |
| Fund accounting/administration fees | | | 40,973 | |
| Registration fees | | | 35,367 | |
| Custodian fees | | | 10,194 | |
| Line of credit fees | | | 6,174 | |
| Trustees’ fees* | | | 2,319 | |
| Tax expense | | | 90 | |
| Miscellaneous | | | 41,093 | |
| Total expenses | | | 670,477 | |
| Net investment income | | | 108,665 | |
| | | | | |
| Net Realized and Unrealized Gain (Loss): | |
| Net realized gain (loss) on: | |
| Investments in unaffiliated issuers | | | 1,256,145 | |
| Investments in affiliated issuers | | | (11,124 | ) |
| Swap agreements | | | 461,455 | |
| Futures contracts | | | 14,414 | |
| Net realized gain | | | 1,720,890 | |
| Net change in unrealized appreciation (depreciation) on: | |
| Investments in unaffiliated issuers | | | 360,225 | |
| Investments in affiliated issuers | | | 89,660 | |
| Swap agreements | | | 7,065,996 | |
| Futures contracts | | | 45,082 | |
| Net change in unrealized appreciation (depreciation) | | | 7,560,963 | |
| Net realized and unrealized gain | | | 9,281,853 | |
| Net increase in net assets resulting from operations | | $ | 9,390,518 | |
| * | Relates to Trustees not deemed “interested persons” within the meaning of Section 2(a)(19) of the 1940 Act. |
| SEE NOTES TO FINANCIAL STATEMENTS. | THE GUGGENHEIM FUNDS SEMI-ANNUAL REPORT | 63 |
| STYLEPLUS—MID GROWTH FUND | |
STATEMENTS OF CHANGES IN NET ASSETS
| | | Period Ended March 31, 2015 (Unaudited) | | | Year Ended September 30, 2014 | |
| Increase (Decrease) in Net Assets from Operations: | | | | | | |
| Net investment income | | $ | 108,665 | | | $ | 230,175 | |
| Net realized gain on investments | | | 1,720,890 | | | | 12,705,930 | |
| Net change in unrealized appreciation (depreciation) on investments | | | 7,560,963 | | | | (1,180,565 | ) |
| Net increase in net assets resulting from operations | | | 9,390,518 | | | | 11,755,540 | |
| | | | | | | | | |
| Distributions to shareholders from: | | | | | | | | |
| Net realized gains | | | | | | | | |
| A-Class | | | (8,445,226 | ) | | | (6,590,240 | ) |
| B-Class | | | (244,616 | ) | | | (268,820 | ) |
| C-Class | | | (583,423 | ) | | | (456,906 | ) |
| Institutional Class | | | (5,903 | ) | | | (2,003 | ) |
| Total distributions to shareholders | | | (9,279,168 | ) | | | (7,317,969 | ) |
| | | | | | | | | |
| Capital share transactions: | | | | | | | | |
| Proceeds from sale of shares | | | | | | | | |
| A-Class | | | 3,543,565 | | | | 4,986,267 | |
| B-Class | | | 450 | | | | 13,919 | |
| C-Class | | | 847,090 | | | | 321,841 | |
| Institutional Class | | | 25,396 | | | | 5,279 | |
| Distributions reinvested | | | | | | | | |
| A-Class | | | 8,149,102 | | | | 6,337,566 | |
| B-Class | | | 243,630 | | | | 267,782 | |
| C-Class | | | 567,893 | | | | 436,749 | |
| Institutional Class | | | 3,831 | | | | 2,003 | |
| Cost of shares redeemed | | | | | | | | |
| A-Class | | | (6,723,858 | ) | | | (9,031,518 | ) |
| B-Class | | | (435,520 | ) | | | (801,755 | ) |
| C-Class | | | (422,527 | ) | | | (663,153 | ) |
| Institutional Class | | | (3,552 | ) | | | — | |
| Net increase from capital share transactions | | | 5,795,500 | | | | 1,874,980 | |
| Net increase in net assets | | | 5,906,850 | | | | 6,312,551 | |
| | | | | | | | | |
| Net assets: | | | | | | | | |
| Beginning of period | | | 83,384,122 | | | | 77,071,571 | |
| End of period | | $ | 89,290,972 | | | $ | 83,384,122 | |
| Undistributed net investment income at end of period | | $ | 108,665 | | | $ | — | |
| | | | | | | | | |
| Capital share activity: | | | | | | | | |
| Shares sold | | | | | | | | |
| A-Class | | | 78,432 | | | | 112,690 | |
| B-Class | | | 15 | | | | 438 | |
| C-Class | | | 23,949 | | | | 8,737 | |
| Institutional Class | | | 539 | | | | 114 | |
| Shares issued from reinvestment of distributions | | | | | | | | |
| A-Class | | | 187,770 | | | | 152,676 | |
| B-Class | | | 8,692 | | | | 9,321 | |
| C-Class | | | 16,446 | | | | 12,770 | |
| Institutional Class | | | 88 | | | | 48 | |
| Shares redeemed | | | | | | | | |
| A-Class | | | (150,259 | ) | | | (202,301 | ) |
| B-Class | | | (14,923 | ) | | | (26,103 | ) |
| C-Class | | | (11,876 | ) | | | (18,028 | ) |
| Institutional Class | | | (81 | ) | | | — | |
| Net increase in shares | | | 138,792 | | | | 50,362 | |
| 64 | THE GUGGENHEIM FUNDS SEMI-ANNUAL REPORT | SEE NOTES TO FINANCIAL STATEMENTS. |
| STYLEPLUS—MID GROWTH FUND | |
This table is presented to show selected data for a share outstanding throughout each period and to assist shareholders in evaluating a Fund’s performance for the periods presented.
| A-Class | | Period Ended March 31, 2015a | | | Year Ended September 30, 2014 | | | Year Ended September 30, 2013 | | | Year Ended September 30, 2012 | | | Year Ended September 30, 2011f | | | Year Ended September 30, 2010f | |
| Per Share Data | | | | | | | | | | | | | | | | | | |
| Net asset value, beginning of period | | $ | 45.82 | | | $ | 43.54 | | | $ | 36.40 | | | $ | 28.67 | | | $ | 29.44 | | | $ | 26.16 | |
| Income (loss) from investment operations: | |
Net investment income (loss)b | | | .07 | | | | .16 | | | | (.16 | ) | | | (.25 | ) | | | (.24 | ) | | | (.24 | ) |
| Net gain (loss) on investments (realized and unrealized) | | | 4.94 | | | | 6.21 | | | | 7.30 | | | | 7.98 | | | | (.53 | ) | | | 3.52 | |
| Total from investment operations | | | 5.01 | | | | 6.37 | | | | 7.14 | | | | 7.73 | | | | (.77 | ) | | | 3.28 | |
| Less distributions from: | |
| Net realized gains | | | (5.03 | ) | | | (4.09 | ) | | | — | | | | — | | | | — | | | | — | |
| Total distributions | | | (5.03 | ) | | | (4.09 | ) | | | — | | | | — | | | | — | | | | — | |
| Net asset value, end of period | | $ | 45.80 | | | $ | 45.82 | | | $ | 43.54 | | | $ | 36.40 | | | $ | 28.67 | | | $ | 29.44 | |
| | |
Total Returnc | | | 11.54 | % | | | 15.61 | % | | | 19.62 | % | | | 26.96 | % | | | (2.62 | %) | | | 12.54 | % |
| Ratios/Supplemental Data | |
| Net assets, end of period (in thousands) | | $ | 82,626 | | | $ | 77,363 | | | $ | 70,767 | | | $ | 65,767 | | | $ | 62,575 | | | $ | 71,858 | |
| Ratios to average net assets: | |
| Net investment income (loss) | | | 0.32 | % | | | 0.36 | % | | | (0.40 | %) | | | (0.74 | %) | | | (0.72 | %) | | | (0.85 | %) |
Total expensesd | | | 1.48 | % | | | 1.67 | % | | | 1.57 | % | | | 1.62 | % | | | 1.49 | % | | | 1.67 | % |
Net expensese | | | 1.48 | % | | | 1.65 | % | | | 1.57 | % | | | 1.62 | % | | | 1.49 | % | | | 1.67 | % |
| Portfolio turnover rate | | | 49 | % | | | 112 | % | | | 214 | % | | | 149 | % | | | 157 | % | | | 133 | % |
| B-Class | | Period Ended March 31, 2015a | | | Year Ended September 30, 2014 | | | Year Ended September 30, 2013 | | | Year Ended September 30, 2012 | | | Year Ended September 30, 2011f | | | Year Ended September 30, 2010f | |
| Per Share Data | | | | | | | | | | | | | | | | | | |
| Net asset value, beginning of period | | $ | 31.35 | | | $ | 31.43 | | | $ | 26.68 | | | $ | 21.30 | | | $ | 22.04 | | | $ | 19.72 | |
| Income (loss) from investment operations: | |
Net investment income (loss)b | | | (.16 | ) | | | (.35 | ) | | | (.54 | ) | | | (.52 | ) | | | (.37 | ) | | | (.32 | ) |
| Net gain (loss) on investments (realized and unrealized) | | | 3.28 | | | | 4.36 | | | | 5.29 | | | | 5.90 | | | | (.37 | ) | | | 2.64 | |
| Total from investment operations | | | 3.12 | | | | 4.01 | | | | 4.75 | | | | 5.38 | | | | (.74 | ) | | | 2.32 | |
| Less distributions from: | |
| Net realized gains | | | (5.03 | ) | | | (4.09 | ) | | | — | | | | — | | | | — | | | | — | |
| Total distributions | | | (5.03 | ) | | | (4.09 | ) | | | — | | | | — | | | | — | | | | — | |
| Net asset value, end of period | | $ | 29.44 | | | $ | 31.35 | | | $ | 31.43 | | | $ | 26.68 | | | $ | 21.30 | | | $ | 22.04 | |
| | |
Total Returnc | | | 10.76 | % | | | 13.95 | % | | | 17.80 | % | | | 25.26 | % | | | (3.36 | %) | | | 11.76 | % |
| Ratios/Supplemental Data | |
| Net assets, end of period (in thousands) | | $ | 1,378 | | | $ | 1,663 | | | $ | 2,181 | | | $ | 2,710 | | | $ | 3,197 | | | $ | 4,537 | |
| Ratios to average net assets: | |
| Net investment income (loss) | | | (1.05 | %) | | | (1.13 | %) | | | (1.90 | %) | | | (2.08 | %) | | | (1.50 | %) | | | (1.60 | %) |
Total expensesd | | | 2.86 | % | | | 3.13 | % | | | 3.07 | % | | | 2.95 | % | | | 2.26 | % | | | 2.42 | % |
Net expensese | | | 2.86 | % | | | 3.11 | % | | | 3.07 | % | | | 2.95 | % | | | 2.26 | % | | | 2.42 | % |
| Portfolio turnover rate | | | 49 | % | | | 112 | % | | | 214 | % | | | 149 | % | | | 157 | % | | | 133 | % |
| SEE NOTES TO FINANCIAL STATEMENTS. | THE GUGGENHEIM FUNDS SEMI-ANNUAL REPORT | 65 |
| STYLEPLUS—MID GROWTH FUND | |
FINANCIAL HIGHLIGHTS (continued)
This table is presented to show selected data for a share outstanding throughout each period and to assist shareholders in evaluating a Fund’s performance for the periods presented.
| C-Class | | Period Ended March 31, 2015a | | | Year Ended September 30, 2014 | | | Year Ended September 30, 2013 | | | Year Ended September 30, 2012 | | | Year Ended September 30, 2011f | | | Year Ended September 30, 2010f | |
| Per Share Data | | | | | | | | | | | | | | | | | | |
| Net asset value, beginning of period | | $ | 37.48 | | | $ | 36.63 | | | $ | 30.92 | | | $ | 24.55 | | | $ | 25.40 | | | $ | 22.76 | |
| Income (loss) from investment operations: | |
Net investment income (loss)b | | | (.10 | ) | | | (.20 | ) | | | (.45 | ) | | | (.46 | ) | | | (.42 | ) | | | (.40 | ) |
| Net gain (loss) on investments (realized and unrealized) | | | 3.98 | | | | 5.14 | | | | 6.16 | | | | 6.83 | | | | (.43 | ) | | | 3.04 | |
| Total from investment operations | | | 3.88 | | | | 4.94 | | | | 5.71 | | | | 6.37 | | | | (.85 | ) | | | 2.64 | |
| Less distributions from: | |
| Net realized gains | | | (5.03 | ) | | | (4.09 | ) | | | — | | | | — | | | | — | | | | — | |
| Total distributions | | | (5.03 | ) | | | (4.09 | ) | | | — | | | | — | | | | — | | | | — | |
| Net asset value, end of period | | $ | 36.33 | | | $ | 37.48 | | | $ | 36.63 | | | $ | 30.92 | | | $ | 24.55 | | | $ | 25.40 | |
| | |
Total Returnc | | | 11.05 | % | | | 14.56 | % | | | 18.47 | % | | | 25.95 | % | | | (3.35 | %) | | | 11.60 | % |
| Ratios/Supplemental Data | |
| Net assets, end of period (in thousands) | | $ | 5,232 | | | $ | 4,329 | | | $ | 4,103 | | | $ | 4,346 | | | $ | 4,162 | | | $ | 5,339 | |
| Ratios to average net assets: | |
| Net investment income (loss) | | | (0.53 | %) | | | (0.55 | %) | | | (1.36 | %) | | | (1.57 | %) | | | (1.48 | %) | | | (1.60 | %) |
Total expensesd | | | 2.34 | % | | | 2.57 | % | | | 2.53 | % | | | 2.45 | % | | | 2.25 | % | | | 2.43 | % |
Net expensese | | | 2.34 | % | | | 2.55 | % | | | 2.53 | % | | | 2.45 | % | | | 2.25 | % | | | 2.43 | % |
| Portfolio turnover rate | | | 49 | % | | | 112 | % | | | 214 | % | | | 149 | % | | | 157 | % | | | 133 | % |
| 66 | THE GUGGENHEIM FUNDS SEMI-ANNUAL REPORT | SEE NOTES TO FINANCIAL STATEMENTS. |
| STYLEPLUS—MID GROWTH FUND | |
FINANCIAL HIGHLIGHTS (concluded)
This table is presented to show selected data for a share outstanding throughout each period and to assist shareholders in evaluating a Fund’s performance for the periods presented.
| Institutional Class | | Period Ended March 31, 2015a | | | Year Ended September 30, 2014 | | | Year Ended September 30, 2013 | | | Period Ended September 30, 2012g | |
| Per Share Data | | | | | | | | | | | | |
| Net asset value, beginning of period | | $ | 45.96 | | | $ | 43.72 | | | $ | 36.46 | | | $ | 36.16 | |
| Income (loss) from investment operations: | |
Net investment income (loss)b | | | .11 | | | | .11 | | | | (.07 | ) | | | (.08 | ) |
| Net gain (loss) on investments (realized and unrealized) | | | 4.92 | | | | 6.22 | | | | 7.33 | | | | .38 | |
| Total from investment operations | | | 5.03 | | | | 6.33 | | | | 7.26 | | | | .30 | |
| Less distributions from: | |
| Net realized gains | | | (5.03 | ) | | | (4.09 | ) | | | — | | | | — | |
| Total distributions | | | (5.03 | ) | | | (4.09 | ) | | | — | | | | — | |
| Net asset value, end of period | | $ | 45.96 | | | $ | 45.96 | | | $ | 43.72 | | | $ | 36.46 | |
| | |
Total Returnc | | | 11.60 | % | | | 15.42 | % | | | 19.91 | % | | | 0.83 | % |
| Ratios/Supplemental Data | |
| Net assets, end of period (in thousands) | | $ | 55 | | | $ | 30 | | | $ | 21 | | | $ | 10 | |
| Ratios to average net assets: | |
| Net investment income (loss) | | | 0.48 | % | | | 0.24 | % | | | (0.17 | %) | | | (0.41 | %) |
Total expensesd | | | 1.34 | % | | | 1.81 | % | | | 1.33 | % | | | 1.37 | % |
Net expensese | | | 1.34 | % | | | 1.79 | % | | | 1.33 | % | | | 1.37 | % |
| Portfolio turnover rate | | | 49 | % | | | 112 | % | | | 214 | % | | | 149 | % |
a | Unaudited figures for the period ended March 31, 2015. Percentage amounts for the period, except total return and portfolio turnover rate, have been annualized. |
b | Net investment income (loss) per share was computed using average shares outstanding throughout the period. |
c | Total return does not reflect the impact of any applicable sales charges and has not been annualized. |
d | Does not include expenses of the underlying funds in which the Fund invests. |
e | Net expense information reflects the expense ratios after expense waivers. |
f | Reverse share split — Per share amounts for the periods presented through April 8, 2011 have been restated to reflect a 1:4 reverse share split effective April 8, 2011. |
g | Since commencement of operations: March 1, 2012. Percentage amounts for the period, except total return and portfolio turnover rate, have been annualized. |
| SEE NOTES TO FINANCIAL STATEMENTS. | THE GUGGENHEIM FUNDS SEMI-ANNUAL REPORT | 67 |
FUND PROFILE (Unaudited) | March 31, 2015 |
WORLD EQUITY INCOME FUND
OBJECTIVE: Seeks to provide total return, comprised of capital appreciation and income.
Holdings Diversification (Market Exposure as % of Net Assets)
“Holdings Diversification (Market Exposure as % of Net Assets)” excludes any temporary cash investments.
COUNTRY DIVERSIFICATION
At March 31, 2015, the investment diversification of the Fund by country was as follows:
| Country | % of Common Stocks | Value |
| United States | 55.6% | $51,844,721 |
| Japan | 6.7% | 6,265,236 |
| Switzerland | 6.5% | 6,097,335 |
| Australia | 5.8% | 5,414,180 |
| United Kingdom | 5.8% | 5,361,607 |
| Hong Kong | 2.8% | 2,610,275 |
| Canada | 2.6% | 2,462,107 |
| Other | 14.2% | 13,267,730 |
| Total Investments | 100.0% | $93,323,191 |
| Inception Dates: |
| A-Class | October 1, 1993 |
| B-Class | October 19, 1993 |
| C-Class | January 29, 1999 |
| Institutional Class | May 2, 2011 |
| Ten Largest Holdings (% of Total Net Assets) |
| Pfizer, Inc. | 1.7% |
| Verizon Communications, Inc. | 1.6% |
| Roche Holding AG | 1.4% |
| AT&T, Inc. | 1.4% |
| Merck & Company, Inc. | 1.4% |
| Johnson & Johnson | 1.3% |
| International Business Machines Corp. | 1.3% |
| McDonald’s Corp. | 1.3% |
| Altria Group, Inc. | 1.2% |
| Apple, Inc. | 1.2% |
| Top Ten Total | 13.8% |
| | |
| “Ten Largest Holdings” exclude any temporary cash or derivative investments. |
| 68 | THE GUGGENHEIM FUNDS SEMI-ANNUAL REPORT | |
SCHEDULE OF INVESTMENTS (Unaudited) | March 31, 2015 |
| WORLD EQUITY INCOME FUND | |
| | |
Shares | | | Value | |
| | | | | | | | |
COMMON STOCKS† - 98.4% | |
| | | | | | | | |
| CONSUMER, NON-CYCLICAL - 24.1% | |
| Pfizer, Inc. | | | 45,000 | | | $ | 1,565,550 | |
Roche Holding AG†† | | | 5,000 | | | | 1,373,975 | |
| Merck & Company, Inc. | | | 22,600 | | | | 1,299,048 | |
| Johnson & Johnson | | | 12,700 | | | | 1,277,620 | |
| Altria Group, Inc. | | | 23,200 | | | | 1,160,464 | |
| Cardinal Health, Inc. | | | 12,800 | | | | 1,155,456 | |
| Procter & Gamble Co. | | | 13,800 | | | | 1,130,772 | |
| Eli Lilly & Co. | | | 15,500 | | | | 1,126,075 | |
Koninklijke Ahold N.V.†† | | | 53,800 | | | | 1,059,910 | |
| Reynolds American, Inc. | | | 15,000 | | | | 1,033,650 | |
| Dr Pepper Snapple Group, Inc. | | | 12,600 | | | | 988,848 | |
Nestle S.A.†† | | | 12,300 | | | | 926,230 | |
| Baxter International, Inc. | | | 13,400 | | | | 917,900 | |
| Kimberly-Clark Corp. | | | 8,500 | | | | 910,435 | |
| Automatic Data Processing, Inc. | | | 9,800 | | | | 839,272 | |
| Philip Morris International, Inc. | | | 10,300 | | | | 775,899 | |
| Clorox Co. | | | 6,900 | | | | 761,691 | |
| Anthem, Inc. | | | 4,800 | | | | 741,168 | |
Wesfarmers Ltd.†† | | | 21,000 | | | | 701,266 | |
Novartis AG†† | | | 6,600 | | | | 651,430 | |
Hutchison Port Holdings Trust — Class U†† | | | 730,100 | | | | 506,803 | |
| AmerisourceBergen Corp. — Class A | | | 4,200 | | | | 477,414 | |
Singapore Press Holdings Ltd.†† | | | 147,900 | | | | 451,463 | |
| Vertex Pharmaceuticals, Inc.* | | | 2,500 | | | | 294,925 | |
GlaxoSmithKline plc†† | | | 12,100 | | | | 278,500 | |
| PepsiCo, Inc. | | | 2,500 | | | | 239,050 | |
| Sysco Corp. | | | 6,100 | | | | 230,153 | |
| Total Consumer, Non-cyclical | | | | | | | 22,874,967 | |
| | | | | | | | |
| FINANCIAL - 20.7% | |
| Boston Properties, Inc. | | | 7,100 | | | | 997,408 | |
Swiss Re AG†† | | | 9,700 | | | | 935,652 | |
| Wells Fargo & Co. | | | 16,000 | | | | 870,400 | |
| Annaly Capital Management, Inc. | | | 79,200 | | | | 823,680 | |
| Simon Property Group, Inc. | | | 3,800 | | | | 743,432 | |
| Host Hotels & Resorts, Inc. | | | 35,600 | | | | 718,408 | |
Zurich Insurance Group AG*,†† | | | 2,000 | | | | 676,011 | |
| American Capital Agency Corp. | | | 29,400 | | | | 627,102 | |
National Australia Bank Ltd.†† | | | 21,200 | | | | 620,610 | |
Friends Life Group Ltd.†† | | | 100,700 | | | | 616,595 | |
| New York Community Bancorp, Inc. | | | 36,200 | | | | 605,626 | |
ASX Ltd.†† | | | 19,200 | | | | 604,054 | |
Stockland†† | | | 174,800 | | | | 597,215 | |
Hang Seng Bank Ltd.†† | | | 32,200 | | | | 582,783 | |
Insurance Australia Group Ltd.†† | | | 125,300 | | | | 580,008 | |
Lend Lease Group*,†† | | | 45,100 | | | | 569,635 | |
| Iron Mountain, Inc. | | | 15,100 | | | | 550,848 | |
| U.S. Bancorp | | | 11,700 | | | | 510,939 | |
Novion Property Group†† | | | 257,700 | | | | 490,906 | |
Admiral Group plc†† | | | 21,300 | | | | 482,057 | |
| People’s United Financial, Inc. | | | 31,600 | | | | 480,320 | |
Government Properties Trust, Inc.*,†† | | | 138,100 | | | | 479,666 | |
Gjensidige Forsikring ASA†† | | | 27,400 | | | | 472,685 | |
First Capital Realty, Inc.†† | | | 29,600 | | | | 461,098 | |
CK Hutchison Holdings Ltd.†† | | | 21,300 | | | | 435,170 | |
Hannover Rueck SE†† | | | 3,800 | | | | 392,573 | |
H&R Real Estate Investment Trust†† | | | 20,700 | | | | 381,293 | |
| CME Group, Inc. — Class A | | | 4,000 | | | | 378,840 | |
Bendigo & Adelaide Bank Ltd.†† | | | 38,700 | | | | 368,764 | |
| ACE Ltd. | | | 3,000 | | | | 334,470 | |
| Digital Realty Trust, Inc. | | | 4,900 | | | | 323,204 | |
Suncorp Group Ltd.†† | | | 30,100 | | | | 308,661 | |
| JPMorgan Chase & Co. | | | 4,900 | | | | 296,842 | |
Credit Suisse Group AG*,†† | | | 10,100 | | | | 271,733 | |
| Bank of America Corp. | | | 17,300 | | | | 266,247 | |
| Bank of New York Mellon Corp. | | | 6,000 | | | | 241,440 | |
Muenchener Rueckversicherungs-Gesellschaft AG in Muenchen†† | | | 1,100 | | | | 236,311 | |
| Marsh & McLennan Companies, Inc. | | | 4,000 | | | | 224,360 | |
Deutsche Boerse AG†† | | | 900 | | | | 73,430 | |
| Total Financial | | | | | | | 19,630,476 | |
| | | | | | | | |
| COMMUNICATIONS - 12.7% | |
| Verizon Communications, Inc. | | | 30,500 | | | | 1,483,214 | |
| AT&T, Inc. | | | 40,400 | | | | 1,319,060 | |
Vivendi S.A.†† | | | 40,000 | | | | 992,863 | |
Swisscom AG†† | | | 1,600 | | | | 927,834 | |
Lagardere SCA†† | | | 18,400 | | | | 552,880 | |
| Windstream Holdings, Inc. | | | 74,600 | | | | 552,040 | |
| Time Warner Cable, Inc. | | | 3,600 | | | | 539,568 | |
PCCW Ltd.†† | | | 859,600 | | | | 525,279 | |
BCE, Inc.†† | | | 12,000 | | | | 508,022 | |
Bezeq The Israeli Telecommunication Corporation Ltd.†† | | | 271,100 | | | | 504,827 | |
TDC A/S†† | | | 69,600 | | | | 498,591 | |
StarHub Ltd.†† | | | 153,200 | | | | 485,672 | |
| CenturyLink, Inc. | | | 13,000 | | | | 449,150 | |
NTT DOCOMO, Inc.†† | | | 25,600 | | | | 447,368 | |
Belgacom S.A.†† | | | 12,512 | | | | 437,664 | |
Spark New Zealand Ltd.†† | | | 191,300 | | | | 425,431 | |
Elisa Oyj†† | | | 16,800 | | | | 421,802 | |
Singapore Telecommunications Ltd.†† | | | 112,600 | | | | 359,303 | |
| Motorola Solutions, Inc. | | | 4,600 | | | | 306,682 | |
SES S.A.†† | | | 7,100 | | | | 251,633 | |
| Total Communications | | | | | | | 11,988,883 | |
| | | | | | | | |
| CONSUMER, CYCLICAL - 12.6% | |
| McDonald’s Corp. | | | 12,300 | | | | 1,198,512 | |
| Wal-Mart Stores, Inc. | | | 14,000 | | | | 1,151,500 | |
Compass Group plc†† | | | 58,700 | | | | 1,018,296 | |
Sumitomo Corp.†† | | | 95,400 | | | | 1,017,967 | |
LVMH Moet Hennessy Louis Vuitton SE†† | | | 5,000 | | | | 879,694 | |
| Costco Wholesale Corp. | | | 5,500 | | | | 833,223 | |
ITOCHU Corp.†† | | | 72,400 | | | | 783,471 | |
Marubeni Corp.†† | | | 130,800 | | | | 756,188 | |
| SEE NOTES TO FINANCIAL STATEMENTS. | THE GUGGENHEIM FUNDS SEMI-ANNUAL REPORT | 69 |
SCHEDULE OF INVESTMENTS (Unaudited)(concluded) | March 31, 2015 |
| WORLD EQUITY INCOME FUND | |
| | |
Shares | | | Value | |
| | | | | | | | | |
InterContinental Hotels Group plc†† | | | 19,300 | | | $ | 752,616 | |
Mitsui & Company Ltd.†† | | | 54,000 | | | | 723,148 | |
Persimmon plc*,†† | | | 25,200 | | | | 620,749 | |
Mitsubishi Corp.†† | | | 30,500 | | | | 612,836 | |
| Home Depot, Inc. | | | 4,900 | | | | 556,689 | |
Lawson, Inc.†† | | | 6,700 | | | | 464,424 | |
Toyota Motor Corp.†† | | | 5,100 | | | | 355,984 | |
Fiat Chrysler Automobiles N.V.*,†† | | | 15,200 | | | | 246,696 | |
Persimmon plc*,†† | | | 25,200 | | | | — | |
| Total Consumer, Cyclical | | | | | | | 11,971,993 | |
| | | | | | | | |
| UTILITIES - 11.6% | |
| Southern Co. | | | 21,800 | | | | 965,304 | |
CLP Holdings Ltd.†† | | | 110,200 | | | | 963,162 | |
| Duke Energy Corp. | | | 12,500 | | | | 959,750 | |
| PPL Corp. | | | 27,700 | | | | 932,382 | |
| Dominion Resources, Inc. | | | 11,900 | | | | 843,353 | |
Power Assets Holdings Ltd.†† | | | 59,700 | | | | 609,408 | |
| CenterPoint Energy, Inc. | | | 28,500 | | | | 581,685 | |
AGL Energy Ltd.†† | | | 49,500 | | | | 573,061 | |
SSE plc†† | | | 23,300 | | | | 516,840 | |
TransAlta Corp.†† | | | 52,000 | | | | 482,409 | |
Snam SpA†† | | | 84,300 | | | | 409,101 | |
Enagas S.A.†† | | | 14,000 | | | | 400,227 | |
| Entergy Corp. | | | 5,100 | | | | 395,199 | |
| Consolidated Edison, Inc. | | | 6,100 | | | | 372,100 | |
| American Electric Power Company, Inc. | | | 6,100 | | | | 343,125 | |
| Ameren Corp. | | | 8,100 | | | | 341,820 | |
| SCANA Corp. | | | 6,100 | | | | 335,439 | |
| Sempra Energy | | | 2,500 | | | | 272,550 | |
| NiSource, Inc. | | | 6,100 | | | | 269,376 | |
| DTE Energy Co. | | | 3,000 | | | | 242,070 | |
| NextEra Energy, Inc. | | | 2,000 | | | | 208,100 | |
| Total Utilities | | | | | | | 11,016,461 | |
| | | | | | | | |
| INDUSTRIAL - 6.2% | |
| Lockheed Martin Corp. | | | 5,300 | | | | 1,075,689 | |
| TransDigm Group, Inc. | | | 4,700 | | | | 1,027,984 | |
| Waste Management, Inc. | | | 14,000 | | | | 759,220 | |
AP Moeller - Maersk A/S — Class A†† | | | 350 | | | | 710,597 | |
| Northrop Grumman Corp. | | | 4,100 | | | | 659,936 | |
| United Parcel Service, Inc. — Class B | | | 5,200 | | | | 504,088 | |
IMI plc†† | | | 22,800 | | | | 429,979 | |
Melrose Industries plc†† | | | 103,442 | | | | 424,769 | |
Cheung Kong Infrastructure Holdings Ltd.†† | | | 33,800 | | | | 290,301 | |
| Total Industrial | | | | | | | 5,882,563 | |
| | | | | | | | |
| TECHNOLOGY - 5.4% | |
| International Business Machines Corp. | | | 7,900 | | | | 1,267,950 | |
| Apple, Inc. | | | 9,300 | | | | 1,157,199 | |
Canon, Inc.†† | | | 31,200 | | | | 1,103,850 | |
| Accenture plc — Class A | | | 7,700 | | | | 721,413 | |
| Microsoft Corp. | | | 11,600 | | | | 471,598 | |
| Paychex, Inc. | | | 7,000 | | | | 347,305 | |
| Total Technology | | | | | | | 5,069,315 | |
| | | | | | | | |
| ENERGY - 2.1% | |
| ConocoPhillips | | | 8,200 | | | | 510,532 | |
| Exxon Mobil Corp. | | | 4,300 | | | | 365,500 | |
Pembina Pipeline Corp.†† | | | 11,400 | | | | 360,210 | |
Vermilion Energy, Inc.†† | | | 6,400 | | | | 269,075 | |
Royal Dutch Shell plc — Class B†† | | | 7,100 | | | | 221,206 | |
| Schlumberger Ltd. | | | 2,600 | | | | 216,944 | |
| Total Energy | | | | | | | 1,943,467 | |
| | | | | | | | |
| BASIC MATERIALS - 2.0% | |
| Dow Chemical Co. | | | 19,300 | | | | 926,014 | |
Israel Chemicals Ltd.†† | | | 60,200 | | | | 427,557 | |
| International Paper Co. | | | 7,000 | | | | 388,430 | |
ArcelorMittal†† | | | 19,700 | | | | 184,791 | |
| Total Basic Materials | | | | | | | 1,926,792 | |
| | | | | | | | |
| DIVERSIFIED - 0.6% | |
Hutchison Whampoa Ltd.†† | | | 43,468 | | | | 602,504 | |
| | | | | | | | |
| CONSUMER DISCRETIONARY - 0.4% | |
Next plc*,†† | | | 4,000 | | | | 415,770 | |
| | | | | | | | |
| Total Common Stocks | | | | | | | | |
| (Cost $92,346,331) | | | | | | | 93,323,191 | |
| | | | | | | | |
SHORT TERM INVESTMENTS† - 1.0% | |
| Goldman Sachs Financial Square Funds - Treasury Instruments Fund 0.00% | | | 898,350 | | | | 898,350 | |
| Total Short Term Investments | | | | | | | | |
| (Cost $898,350) | | | | | | | 898,350 | |
| | | | | | | | |
| Total Investments - 99.4% | | | | | | | | |
| (Cost $93,244,681) | | | | | | $ | 94,221,541 | |
| Other Assets & Liabilities, net - 0.6% | | | | | | | 600,027 | |
| Total Net Assets - 100.0% | | | | | | $ | 94,821,568 | |
| * | Non-income producing security. |
| † | Value determined based on Level 1 inputs, unless otherwise noted — See Note 4. |
| †† | Value determined based on Level 2 inputs — See Note 4. |
| plc — Public Limited Company |
| |
| See Sector Classification in Other Information section. |
| 70 | THE GUGGENHEIM FUNDS SEMI-ANNUAL REPORT | SEE NOTES TO FINANCIAL STATEMENTS. |
STATEMENT OF ASSETS AND LIABILITIES (Unaudited)
March 31, 2015
| Assets: | |
| Investments, at value (cost $93,244,681) | | $ | 94,221,541 | |
| Foreign currency, at value (cost $58,666) | | | 58,428 | |
| Prepaid expenses | | | 30,329 | |
| Receivables: | |
| Dividends | | | 448,397 | |
| Fund shares sold | | | 182,140 | |
| Foreign taxes reclaim | | | 122,436 | |
| Investment adviser | | | 977 | |
| Total assets | | | 95,064,248 | |
| | | | | |
| Liabilities: | |
| Overdraft due to custodian bank | | | 20,995 | |
| Payable for: | |
| Management fees | | | 56,285 | |
| Fund shares redeemed | | | 43,677 | |
| Distributions | | | 34,926 | |
| Distribution and service fees | | | 23,006 | |
| Fund accounting/administration fees | | | 12,061 | |
| Transfer agent/maintenance fees | | | 11,175 | |
| Investment adviser | | | 2,991 | |
| Trustees’ fees* | | | 665 | |
| Miscellaneous | | | 36,899 | |
| Total liabilities | | | 242,680 | |
| Net assets | | $ | 94,821,568 | |
| | | | | |
| Net assets consist of: | |
| Paid in capital | | $ | 113,050,550 | |
| Distributions in excess of net investment income | | | (179,718 | ) |
| Accumulated net realized loss on investments | | | (19,008,634 | ) |
| Net unrealized appreciation on investments | | | 959,370 | |
| Net assets | | $ | 94,821,568 | |
| | | | | |
| A-Class: | |
| Net assets | | $ | 83,252,128 | |
| Capital shares outstanding | | | 6,218,210 | |
| Net asset value per share | | $ | 13.39 | |
| Maximum offering price per share (Net asset value divided by 95.25%) | | $ | 14.06 | |
| | | | | |
| B-Class: | |
| Net assets | | $ | 1,518,393 | |
| Capital shares outstanding | | | 130,532 | |
| Net asset value per share | | $ | 11.63 | |
| | | | | |
| C-Class: | |
| Net assets | | $ | 6,394,241 | |
| Capital shares outstanding | | | 555,989 | |
| Net asset value per share | | $ | 11.50 | |
| | | | | |
| Institutional Class: | |
| Net assets | | $ | 3,656,806 | |
| Capital shares outstanding | | | 274,289 | |
| Net asset value per share | | $ | 13.33 | |
STATEMENT OF OPERATIONS (Unaudited)
Period Ended March 31, 2015
| Investment Income: | |
| Dividends (net of foreign withholding tax of $135,278) | | $ | 1,615,801 | |
| Other income | | | 99 | |
| Total investment income | | | 1,615,900 | |
| | | | | |
| Expenses: | |
| Management fees | | | 311,669 | |
| Transfer agent/maintenance fees: | |
| A-Class | | | 56,575 | |
| B-Class | | | 9,011 | |
| C-Class | | | 5,465 | |
| Institutional Class | | | 848 | |
| Distribution and service fees: | |
| A-Class | | | 99,177 | |
| C-Class | | | 27,573 | |
| Fund accounting/administration fees | | | 66,786 | |
| Tax expense | | | 4,720 | |
| Trustees’ fees* | | | 4,184 | |
| Custodian fees | | | 4,075 | |
| Line of credit fees | | | 3,017 | |
| Miscellaneous | | | 81,213 | |
| Total expenses | | | 674,313 | |
| Less: | |
| Expenses waived by Adviser | | | (979 | ) |
| Net expenses | | | 673,334 | |
| Net investment income | | | 942,566 | |
| | | | | |
| Net Realized and Unrealized Gain (Loss): | |
| Net realized gain (loss) on: | |
| Investments | | | (265,120 | ) |
| Foreign currency | | | (22,632 | ) |
| Net realized loss | | | (287,752 | ) |
| Net change in unrealized appreciation (depreciation) on: | |
| Investments | | | (307,589 | ) |
| Foreign currency | | | (4,798 | ) |
| Net change in unrealized appreciation (depreciation) | | | (312,387 | ) |
| Net realized and unrealized loss | | | (600,139 | ) |
| Net increase in net assets resulting from operations | | $ | 342,427 | |
| * | Relates to Trustees not deemed “interested persons” within the meaning of Section 2(a)(19) of the 1940 Act. |
| SEE NOTES TO FINANCIAL STATEMENTS. | THE GUGGENHEIM FUNDS SEMI-ANNUAL REPORT | 71 |
STATEMENTS OF CHANGES IN NET ASSETS
| | | Period Ended March 31, 2015 (Unaudited) | | | Year Ended September 30, 2014 | |
| Increase (Decrease) in Net Assets from Operations: | | | | | | |
| Net investment income | | $ | 942,566 | | | $ | 2,231,596 | |
| Net realized gain (loss) on investments | | | (287,752 | ) | | | 5,032,043 | |
| Net change in unrealized appreciation (depreciation) on investments | | | (312,387 | ) | | | 112,540 | |
| Net increase in net assets resulting from operations | | | 342,427 | | | | 7,376,179 | |
| | | | | | | | | |
| Distributions to shareholders from: | | | | | | | | |
| Net investment income | | | | | | | | |
| A-Class | | | (1,061,542 | ) | | | (2,342,975 | ) |
| B-Class | | | (25,096 | ) | | | (82,131 | ) |
| C-Class | | | (57,592 | ) | | | (87,065 | ) |
| Institutional Class | | | (42,670 | ) | | | (17,450 | ) |
| Total distributions to shareholders | | | (1,186,900 | ) | | | (2,529,621 | ) |
| | | | | | | | | |
| Capital share transactions: | | | | | | | | |
| Proceeds from sale of shares | | | | | | | | |
| A-Class | | | 12,694,196 | | | | 19,667,007 | |
| B-Class | | | 383 | | | | 316,980 | |
| C-Class | | | 2,087,813 | | | | 2,381,875 | |
| Institutional Class | | | 3,146,217 | | | | 729,944 | |
| Distributions reinvested | | | | | | | | |
| A-Class | | | 1,039,082 | | | | 2,327,878 | |
| B-Class | | | 25,091 | | | | 81,697 | |
| C-Class | | | 45,060 | | | | 81,979 | |
| Institutional Class | | | 21,259 | | | | 17,450 | |
| Cost of shares redeemed | | | | | | | | |
| A-Class | | | (8,513,219 | ) | | | (13,679,896 | ) |
| B-Class | | | (421,394 | ) | | | (985,303 | ) |
| C-Class | | | (1,011,408 | ) | | | (707,859 | ) |
| Institutional Class | | | (411,132 | ) | | | (87,320 | ) |
| Net increase from capital share transactions | | | 8,701,948 | | | | 10,144,432 | |
| Net increase in net assets | | | 7,857,475 | | | | 14,990,990 | |
| | | | | | | | | |
| Net assets: | | | | | | | | |
| Beginning of period | | | 86,964,093 | | | | 71,973,103 | |
| End of period | | $ | 94,821,568 | | | $ | 86,964,093 | |
| Distributions in excess of net investment income/Undistributed net investment income at end of period | | $ | (179,718 | ) | | $ | 64,616 | |
| | | | | | | | | |
| Capital share activity: | | | | | | | | |
| Shares sold | | | | | | | | |
| A-Class | | | 945,094 | | | | 1,436,425 | |
| B-Class | | | 33 | | | | 26,018 | |
| C-Class | | | 180,776 | | | | 202,224 | |
| Institutional Class | | | 236,266 | | | | 52,741 | |
| Shares issued from reinvestment of distributions | | | | | | | | |
| A-Class | | | 78,045 | | | | 172,998 | |
| B-Class | | | 2,170 | | | | 7,052 | |
| C-Class | | | 3,941 | | | | 7,031 | |
| Institutional Class | | | 1,601 | | | | 1,301 | |
| Shares redeemed | | | | | | | | |
| A-Class | | | (636,215 | ) | | | (1,012,114 | ) |
| B-Class | | | (36,192 | ) | | | (84,436 | ) |
| C-Class | | | (88,380 | ) | | | (62,524 | ) |
| Institutional Class | | | (31,269 | ) | | | (6,471 | ) |
| Net increase in shares | | | 655,870 | | | | 740,245 | |
| 72 | THE GUGGENHEIM FUNDS SEMI-ANNUAL REPORT | SEE NOTES TO FINANCIAL STATEMENTS. |
This table is presented to show selected data for a share outstanding throughout each period and to assist shareholders in evaluating a Fund’s performance for the periods presented.
| A-Class | | Period Ended March 31, 2015a | | | Year Ended September 30, 2014 | | | Year Ended September 30, 2013 | | | Year Ended September 30, 2012 | | | Year Ended September 30, 2011 | | | Year Ended September 30, 2010 | |
| Per Share Data | | | | | | | | | | | | | | | | | | |
| Net asset value, beginning of period | | $ | 13.51 | | | $ | 12.60 | | | $ | 10.55 | | | $ | 9.70 | | | $ | 10.52 | | | $ | 9.97 | |
| Income (loss) from investment operations: | |
Net investment income (loss)b | | | .14 | | | | .38 | | | | .18 | | | | .15 | | | | .05 | | | | .02 | |
| Net gain (loss) on investments (realized and unrealized) | | | (.08 | ) | | | .95 | | | | 2.16 | | | | .70 | | | | (.81 | ) | | | .53 | |
| Total from investment operations | | | .06 | | | | 1.33 | | | | 2.34 | | | | .85 | | | | (.76 | ) | | | .55 | |
| Less distributions from: | |
| Net investment income | | | (.18 | ) | | | (.42 | ) | | | (.29 | ) | | | (— | )f | | | (.06 | ) | | | — | |
| Total distributions | | | (.18 | ) | | | (.42 | ) | | | (.29 | ) | | | (— | )f | | | (.06 | ) | | | — | |
| Net asset value, end of period | | $ | 13.39 | | | $ | 13.51 | | | $ | 12.60 | | | $ | 10.55 | | | $ | 9.70 | | | $ | 10.52 | |
| |
Total Returnc | | | 0.43 | % | | | 10.62 | % | | | 22.58 | % | | | 8.82 | % | | | (7.32 | %) | | | 5.52 | % |
| Ratios/Supplemental Data | |
| Net assets, end of period (in thousands) | | $ | 83,252 | | | $ | 78,783 | | | $ | 65,966 | | | $ | 61,838 | | | $ | 65,573 | | | $ | 78,201 | |
| Ratios to average net assets: | |
| Net investment income (loss) | | | 2.13 | % | | | 2.81 | % | | | 1.59 | % | | | 1.45 | % | | | 0.04 | % | | | 0.24 | % |
Total expensesd | | | 1.48 | % | | | 1.66 | % | | | 1.93 | % | | | 2.05 | % | | | 1.85 | % | | | 1.86 | % |
Net expensese | | | 1.48 | %i | | | 1.49 | %i | | | 1.59 | % | | | 1.63 | % | | | 1.82 | % | | | 1.86 | % |
| Portfolio turnover rate | | | 65 | % | | | 131 | % | | | 154 | % | | | 41 | % | | | 206 | % | | | 288 | % |
| B-Class | | Period Ended March 31, 2015a,g | | | Year Ended September 30, 2014g | | | Year Ended September 30, 2013g | | | Year Ended September 30, 2012g | | | Year Ended September 30, 2011g | | | Year Ended September 30, 2010g | |
| Per Share Data | | | | | | | | | | | | | | | | | | |
| Net asset value, beginning of period | | $ | 11.75 | | | $ | 11.01 | | | $ | 9.22 | | | $ | 8.46 | | | $ | 9.19 | | | $ | 8.69 | |
| Income (loss) from investment operations: | |
Net investment income (loss)b | | | .13 | | | | .35 | | | | .18 | | | | .14 | | | | .05 | | | | .04 | |
| Net gain (loss) on investments (realized and unrealized) | | | (.07 | ) | | | .84 | | | | 1.90 | | | | .63 | | | | (.69 | ) | | | .46 | |
| Total from investment operations | | | .06 | | | | 1.19 | | | | 2.08 | | | | .77 | | | | (.64 | ) | | | .50 | |
| Less distributions from: | |
| Net investment income | | | (.18 | ) | | | (.45 | ) | | | (.29 | ) | | | (.01 | ) | | | (.09 | ) | | | — | |
| Total distributions | | | (.18 | ) | | | (.45 | ) | | | (.29 | ) | | | (.01 | ) | | | (.09 | ) | | | — | |
| Net asset value, end of period | | $ | 11.63 | | | $ | 11.75 | | | $ | 11.01 | | | $ | 9.22 | | | $ | 8.46 | | | $ | 9.19 | |
| | |
Total Returnc | | | 0.52 | % | | | 10.91 | % | | | 22.95 | % | | | 9.07 | % | | | (7.13 | %) | | | 5.75 | % |
| Ratios/Supplemental Data | |
| Net assets, end of period (in thousands) | | $ | 1,518 | | | $ | 1,933 | | | $ | 2,378 | | | $ | 2,820 | | | $ | 4,148 | | | $ | 6,769 | |
| Ratios to average net assets: | |
| Net investment income (loss) | | | 2.22 | % | | | 2.96 | % | | | 1.77 | % | | | 1.60 | % | | | 0.53 | % | | | 0.45 | % |
Total expensesd | | | 2.11 | % | | | 2.24 | % | | | 2.43 | % | | | 2.34 | % | | | 1.61 | % | | | 1.61 | % |
Net expensese | | | 1.23 | %i | | | 1.24 | %i | | | 1.31 | % | | | 1.38 | % | | | 1.59 | % | | | 1.61 | % |
| Portfolio turnover rate | | | 65 | % | | | 131 | % | | | 154 | % | | | 41 | % | | | 206 | % | | | 288 | % |
| SEE NOTES TO FINANCIAL STATEMENTS. | THE GUGGENHEIM FUNDS SEMI-ANNUAL REPORT | 73 |
FINANCIAL HIGHLIGHTS (continued)
This table is presented to show selected data for a share outstanding throughout each period and to assist shareholders in evaluating a Fund’s performance for the periods presented.
| C-Class | | Period Ended March 31, 2015a | | | Year Ended September 30, 2014 | | | Year Ended September 30, 2013 | | | Year Ended September 30, 2012 | | | Year Ended September 30, 2011 | | | Year Ended September 30, 2010 | |
| Per Share Data | | | | | | | | | | | | | | | | | | |
| Net asset value, beginning of period | | $ | 11.61 | | | $ | 10.79 | | | $ | 9.01 | | | $ | 8.33 | | | $ | 9.06 | | | $ | 8.66 | |
| Income (loss) from investment operations: | |
Net investment income (loss)b | | | .08 | | | | .25 | | | | .08 | | | | .06 | | | | (.04 | ) | | | (.04 | ) |
| Net gain (loss) on investments (realized and unrealized) | | | (.08 | ) | | | .81 | | | | 1.84 | | | | .62 | | | | (.69 | ) | | | .44 | |
| Total from investment operations | | | — | | | | 1.06 | | | | 1.92 | | | | .68 | | | | (.73 | ) | | | .40 | |
| Less distributions from: | |
| Net investment income | | | (.11 | ) | | | (.24 | ) | | | (.14 | ) | | | — | | | | — | | | | — | |
| Total distributions | | | (.11 | ) | | | (.24 | ) | | | (.14 | ) | | | — | | | | — | | | | — | |
| Net asset value, end of period | | $ | 11.50 | | | $ | 11.61 | | | $ | 10.79 | | | $ | 9.01 | | | $ | 8.33 | | | $ | 9.06 | |
| | |
Total Returnc | | | 0.04 | % | | | 9.79 | % | | | 21.57 | % | | | 8.16 | % | | | (8.06 | %) | | | 4.62 | % |
| Ratios/Supplemental Data | |
| Net assets, end of period (in thousands) | | $ | 6,394 | | | $ | 5,337 | | | $ | 3,377 | | | $ | 3,015 | | | $ | 3,426 | | | $ | 4,295 | |
| Ratios to average net assets: | |
| Net investment income (loss) | | | 1.46 | % | | | 2.13 | % | | | 0.80 | % | | | 0.68 | % | | | (0.37 | %) | | | (0.50 | %) |
Total expensesd | | | 2.27 | % | | | 2.62 | % | | | 2.89 | % | | | 2.88 | % | | | 2.60 | % | | | 2.62 | % |
Net expensese | | | 2.23 | %i | | | 2.24 | %i | | | 2.35 | % | | | 2.38 | % | | | 2.58 | % | | | 2.62 | % |
| Portfolio turnover rate | | | 65 | % | | | 131 | % | | | 154 | % | | | 41 | % | | | 206 | % | | | 288 | % |
| 74 | THE GUGGENHEIM FUNDS SEMI-ANNUAL REPORT | SEE NOTES TO FINANCIAL STATEMENTS. |
FINANCIAL HIGHLIGHTS (concluded)
This table is presented to show selected data for a share outstanding throughout each period and to assist shareholders in evaluating a Fund’s performance for the periods presented.
| Institutional Class | | Period Ended March 31, 2015a | | | Year Ended September 30, 2014 | | | Year Ended September 30, 2013 | | | Year Ended September 30, 2012 | | | Period Ended September 30, 2011h | |
| Per Share Data | | | | | | | | | | | | | | | |
| Net asset value, beginning of period | | $ | 13.45 | | | $ | 12.53 | | | $ | 10.50 | | | $ | 9.70 | | | $ | 12.37 | |
| Income (loss) from investment operations: | |
Net investment income (loss)b | | | .20 | | | | .44 | | | | .28 | | | | .28 | | | | .13 | |
| Net gain (loss) on investments (realized and unrealized) | | | (.13 | ) | | | .90 | | | | 2.10 | | | | .52 | | | | (2.80 | ) |
| Total from investment operations | | | .07 | | | | 1.34 | | | | 2.38 | | | | .80 | | | | (2.67 | ) |
| Less distributions from: | |
| Net investment income | | | (.19 | ) | | | (.42 | ) | | | (.35 | ) | | | (— | )f | | | — | |
| Total distributions | | | (.19 | ) | | | (.42 | ) | | | (.35 | ) | | | (— | )f | | | — | |
| Net asset value, end of period | | $ | 13.33 | | | $ | 13.45 | | | $ | 12.53 | | | $ | 10.50 | | | $ | 9.70 | |
| | |
Total Returnc | | | 0.56 | % | | | 10.83 | % | | | 23.17 | % | | | 8.17 | % | | | (21.58 | %) |
| Ratios/Supplemental Data | |
| Net assets, end of period (in thousands) | | $ | 3,657 | | | $ | 911 | | | $ | 252 | | | $ | 90 | | | $ | 285 | |
| Ratios to average net assets: | |
| Net investment income (loss) | | | 3.01 | % | | | 3.27 | % | | | 2.42 | % | | | 2.70 | % | | �� | 2.99 | % |
Total expensesd | | | 1.22 | % | | | 1.33 | % | | | 1.73 | % | | | 1.90 | % | | | 2.27 | % |
Net expensese | | | 1.22 | %i | | | 1.23 | %i | | | 1.26 | % | | | 1.32 | % | | | 1.36 | % |
| Portfolio turnover rate | | | 65 | % | | | 131 | % | | | 154 | % | | | 41 | % | | | 206 | % |
a | Unaudited figures for the period ended March 31, 2015. Percentage amounts for the period, except total return and portfolio turnover rate, have been annualized. |
b | Net investment income (loss) per share was computed using average shares outstanding throughout the period. |
c | Total return does not reflect the impact of any applicable sales charges and has not been annualized. |
d | Does not include expenses of the underlying funds in which the Fund invests. |
e | Net expense information reflects the expense ratios after expense waivers and reimbursements, as applicable. |
f | Distributions from net investment income are less than $0.01 per share. |
g | Effective August 1, 2007 — B-Class shares ceased charging 12b-1 fees in accordance with FINRA sales cap regulations. Per share information reflects this change. This fee will be reinstated when sales exceed the sales cap limits. |
h | Since commencement of operations: May 2, 2011. Percentage amounts for the period, except total return and portfolio turnover rate, have been annualized. |
i | Net expenses may include expenses that are excluded from the expense limitation agreement. Excluding these expenses, the operating expense ratios for the periods presented would be: |
| | 03/31/15 | 09/30/14 |
| A-Class | 1.46% | 1.46% |
| B-Class | 1.21% | 1.21% |
| C-Class | 2.21% | 2.21% |
| Institutional Class | 1.21% | 1.21% |
| SEE NOTES TO FINANCIAL STATEMENTS. | THE GUGGENHEIM FUNDS SEMI-ANNUAL REPORT | 75 |
NOTES TO FINANCIAL STATEMENTS (Unaudited)
1. Organization and Significant Accounting Policies
Organization
Guggenheim Funds Trust (the “Trust”), a Delaware statutory trust, is registered with the SEC under the Investment Company Act of 1940 (“1940 Act”), as a non-diversified, open-ended investment company of the series type. Each series, in effect, is representing a separate Fund. The Trust is authorized to issue an unlimited number of shares. The Trust accounts for the assets of each Fund separately.
The Trust offers a combination of four separate classes of shares, A-Class shares, B-Class shares, C-Class shares and Institutional Class shares. Sales of shares of each Class are made without a front-end sales charge at the net asset value per share (“NAV”), with the exception of A-Class shares. A-Class shares are sold at the NAV, plus the applicable front-end sales charge. The sales charge varies depending on the amount purchased, but will not exceed 4.75%. Prior to February 22, 2011, the maximum sales charge was 5.75%. A-Class share purchases of $1 million or more are exempt from the front-end sales charge but have a 1% contingent deferred sales charge (“CDSC”), if shares are redeemed within 12 months of purchase. B-Class shares were offered without a front-end sales charge, but were subject to a CDSC of up to 5% for five years and convert to A-Class shares after eight years. Effective January 4, 2010, subscriptions for B-Class shares are no longer accepted. C-Class shares have a 1% CDSC if shares are redeemed within 12 months of purchase. Institutional Class shares are offered primarily for direct investment by institutions such as pension and profit sharing plans, endowments, foundations and corporations. Institutional Class shares have a minimum initial investment of $2 million and a minimum account balance of $1 million. Institutional Class shares are offered without a front-end sales charge or a CDSC. At March 31, 2015, the Trust consisted of eighteen funds.
This report covers the Alpha Opportunity Fund, Enhanced World Equity Fund, Large Cap Value Fund, Risk Managed Real Estate Fund, Small Cap Value Fund, StylePlus—Large Core Fund, StylePlus—Mid Growth Fund and World Equity Income Fund (the “Funds”).
The Guggenheim Alpha Opportunity Fund, Guggenheim Enhanced World Equity Fund, Guggenheim Large Cap Value Fund, Guggenheim Small Cap Value Fund, Guggenheim StylePlus—Large Core Fund, Guggenheim StylePlus—Mid Growth Fund, and Guggenheim World Equity Income Fund were previously series (the “Predecessor Funds”) of Security Equity Fund, Security Large Cap Value Fund and Security Mid Cap Growth Fund, different registered open-end investment companies, which were organized as Kansas corporations. In January 2014, at a special meeting of shareholders, the shareholders of the Predecessor Funds approved the reorganization of each Predecessor Fund with and into the Funds, a corresponding “shell” series of the Trust. The Funds succeeded to the accounting and performance history of the Predecessor Funds. Any such historical information provided for the Funds that relates to periods prior to January 28, 2014 (September 23, 2014 for the Guggenheim Alpha Opportunity Fund), therefore, is that of the Predecessor Fund.
Guggenheim Investments (“GI”) provides advisory services, and Rydex Fund Services, LLC (“RFS”) provides transfer agent, administrative and accounting services to the Trust. Guggenheim Funds Distributors, LLC (“GFD”) acts as principal underwriter for the Trust. GI, RFS and GFD are affiliated entities.
Significant Accounting Policies
The Funds operate as investment companies and accordingly follow the investment company accounting and reporting guidance of the Financial Accounting Standards Board (“FASB”) Accounting Standards Codification Topic 946 Financial Services – Investment Companies.
The following significant accounting policies are in conformity with U.S. generally accepted accounting principles (“U.S. GAAP”) and are consistently followed by the Trust. This requires management to make estimates and assumptions that affect the reported amount of assets and liabilities and disclosure of contingent assets and liabilities at the date of the financial statements and the reported amounts of revenues and expenses during the reporting period. Actual results could differ from these estimates. All time references are based on Eastern Time.
The NAV of each Class of the Funds is calculated by dividing the market value of the Fund’s securities and other assets, less all liabilities, attributable to the Class by the number of outstanding shares of the Class.
A. The Board of Trustees of the Funds (the “Board”) has adopted policies and procedures for the valuation of the Funds’ investments (the “Valuation Procedures”). Pursuant to the Valuation Procedures, the Board has delegated to a valuation committee, consisting of representatives from Guggenheim’s investment management, fund administration, legal and compliance
| 76 | THE GUGGENHEIM FUNDS SEMI-ANNUAL REPORT | |
NOTES TO FINANCIAL STATEMENTS (Unaudited)(continued)
departments (the “Valuation Committee”), the day-to-day responsibility for implementing the Valuation Procedures, including, under most circumstances, the responsibility for determining the fair value of the Funds' securities or other assets.
Valuations of the Funds’ securities are supplied primarily by pricing services appointed pursuant to the processes set forth in the Valuation Procedures. The Valuation Committee convenes monthly, or more frequently as needed and will review the valuation of all assets which have been fair valued for reasonableness. The Funds’ officers, through the Valuation Committee and consistent with the monitoring and review responsibilities set forth in the Valuation Procedures, regularly review procedures used by, and valuations provided by, the pricing services.
If the pricing service cannot or does not provide a valuation for a particular investment or such valuation is deemed unreliable, such investment is fair valued by the Valuation Committee.
Equity securities listed on an exchange (New York Stock Exchange (“NYSE”) or American Stock Exchange) are valued at the last quoted sales price as of the close of business on the NYSE, usually 4:00 p.m. on the valuation date. Equity securities listed on the NASDAQ market system are valued at the NASDAQ Official Closing Price on the valuation date, which may not necessarily represent the last sale price. If there has been no sale on such exchange or NASDAQ on a given day, the security is valued at the closing bid price on that day.
Generally, trading in foreign securities markets is substantially completed each day at various times prior to the close of the NYSE. The values of foreign securities are determined as of the close of such foreign markets or the close of the NYSE, if earlier. All investments quoted in foreign currency are valued in U.S. dollars on the basis of the foreign currency exchange rates prevailing at the close of business. Investments in foreign securities may involve risks not present in domestic investments. The Valuation Committee will determine the current value of such foreign securities by taking into consideration certain factors which may include those discussed above, as well as the following factors, among others: the value of the securities traded on other foreign markets, ADR trading, closed-end fund trading, foreign currency exchange activity, and the trading prices of financial products that are tied to foreign securities such as World Equity Benchmark Securities. In addition, the Board of Trustees has authorized the Valuation Committee and GI to use prices and other information supplied by a third party pricing vendor in valuing foreign securities.
Open-end investment companies (“Mutual Funds”) are valued at their NAV as of the close of business, on the valuation date. Exchange-traded funds (“ETFs”) and closed-end investment companies (“CEFs”) are valued at the last quoted sales price.
Debt securities with a maturity of greater than 60 days at acquisition are valued at prices that reflect broker/dealer supplied valuations or are obtained from independent pricing services, which may consider the trade activity, treasury spreads, yields or price of bonds of comparable quality, coupon, maturity, and type, as well as prices quoted by dealers who make markets in such securities. Short-term debt securities with a maturity of 60 days or less at acquisition are valued at amortized cost, provided such amount approximates market value.
Listed options are valued at the Official Settlement Price listed by the exchange, usually as of 4:00 p.m. Long options are valued using the bid price and short options are valued using the ask price. In the event that a settlement price is not available, fair valuation is enacted. Over-the-counter options are valued using the average bid price (for long options), or average ask price (for short options) obtained from one or more security dealers.
The value of futures contracts is accounted for using the unrealized gain or loss on the contracts that is determined by marking the contracts to their current realized settlement prices. Financial futures contracts are valued at the 4:00 p.m. price on the valuation date. In the event that the exchange for a specific futures contract closes earlier than 4:00 p.m., the futures contract is valued at the Official Settlement Price of the exchange. However, the underlying securities from which the futures contract value is derived are monitored until 4:00 p.m. to determine if fair valuation would provide a more accurate valuation.
The value of OTC swap agreements entered into by a Fund is accounted for using the unrealized gain or loss on the agreements that is determined by marking the agreements to the last quoted value of the index that the swap pertains to at the close of the NYSE. The swap's value is then adjusted to include dividends accrued, and financing charges and/or interest associated with the swap agreements.
| | THE GUGGENHEIM FUNDS SEMI-ANNUAL REPORT | 77 |
NOTES TO FINANCIAL STATEMENTS (Unaudited)(continued)
Investments for which market quotations are not readily available are fair valued as determined in good faith by GI under the direction of the Board of Trustees using methods established or ratified by the Board of Trustees. Valuations in accordance with these methods are intended to reflect each security’s (or asset’s) “fair value.” Each such determination is based on a consideration of all relevant factors, which are likely to vary from one pricing context to another. Examples of such factors may include, but are not limited to: (i) the type of security, (ii) the initial cost of the security, (iii) the existence of any contractual restrictions on the security’s disposition, (iv) the price and extent of public trading in similar securities of the issuer or of comparable companies, (v) quotations or evaluated prices from broker-dealers and/or pricing services, (vi) information obtained from the issuer, analysts, and/or the appropriate stock exchange (for exchange-traded securities), (vii) an analysis of the company’s financial statements, and (viii) an evaluation of the forces that influence the issuer and the market(s) in which the security is purchased and sold (e.g. the existence of pending merger activity, public offerings or tender offers that might affect the value of the security). In connection with futures contracts and other derivative investments such factors may include obtaining information as to how (a) these contracts and other derivative investments trade in the futures or other derivative markets, respectively, and (b) the securities underlying these contracts and other derivative investments trade in the cash market.
B. The Funds may purchase and sell interests in securities on a when-issued and delayed delivery basis, with payment and delivery scheduled for a future date. No income accrues to the Fund on such interests or securities in connection with such transactions prior to the date the Funds actually take delivery of such interests or securities. These transactions are subject to market fluctuations and are subject to the risk that the value at delivery may be more or less than the trade date purchase price. Although the Funds will generally purchase these securities with the intention of acquiring such securities, they may sell such securities before the settlement date.
C. When a Fund engages in a short sale of a security, an amount equal to the proceeds is reflected as an asset and an equivalent liability. The amount of the liability is subsequently marked-to-market to reflect the market value of the short sale. The Fund maintains a segregated account of cash and/or securities as collateral for short sales.
Fees, if any, paid to brokers to borrow securities in connection with short sales are recorded as interest expense. In addition, the Fund must pay out the dividend rate of the equity or coupon rate of the obligation to the lender and record this as an expense. Short dividend or interest expense is a cost associated with the investment objective of short sales transactions, rather than an operational cost associated with the day-to-day management of any mutual fund. The Funds may also receive rebate income from the broker resulting from the investment of the proceeds from securities sold short.
D. Upon the purchase of an option, the premium paid is recorded as an investment, the value of which is marked-to-market daily. If a purchased option expires, the Fund realizes a loss in the amount of the cost of the option. When the Fund enters into a closing sale transaction, it realizes a gain or loss depending on whether the proceeds from the closing sale transaction are greater or less than the cost of the option. If the Fund exercises a put option, it realizes a gain or loss from the sale of the underlying security and the proceeds from such sale will be decreased by the premium originally paid. When the Fund exercises a call option, the cost of the security purchased by the Fund upon exercise increases by the premium originally paid.
When the Fund writes (sells) an option, an amount equal to the premium received is entered in that Fund’s accounting records as an asset and equivalent liability. The amount of the liability is subsequently marked-to-market to reflect the current value of the option written. When a written option expires, or if the Fund enters into a closing purchase transaction, it realizes a gain (or loss if the cost of a closing purchase transaction exceeds the premium received when the option was sold).
E. Upon entering into a futures contract, a Fund deposits and maintains as collateral such initial margin as required by the exchange on which the transaction is affected. Pursuant to the contract, the Fund agrees to receive from or pay to the broker an amount of cash equal to the daily fluctuation in value of the contract. Such receipts or payments are known as variation margin and are recorded by the Fund as unrealized gains or losses. When the contract is closed, the Fund records a realized gain or loss equal to the difference between the value of the contract at the time it was opened and the value at the time it was closed.
| 78 | THE GUGGENHEIM FUNDS SEMI-ANNUAL REPORT | |
NOTES TO FINANCIAL STATEMENTS (Unaudited)(continued)
F. Swap agreements are marked-to-market daily and the change, if any, is recorded as unrealized gain or loss. Payments received or made as a result of an agreement or termination of the agreement are recognized as realized gains or losses.
G. Security transactions are recorded on the trade date for financial reporting purposes. Realized gains and losses from securities transactions are recorded using the identified cost basis. Proceeds from lawsuits related to investment holdings are recorded as realized gains in the respective Fund. Dividend income is recorded on the ex-dividend date, net of applicable taxes withheld by foreign countries. Taxable non-cash dividends are recorded as dividend income. Interest income, including amortization of premiums and accretion of discounts, is accrued on a daily basis. Interest income also includes paydown gains and losses on mortgage-backed and asset-backed securities and senior and subordinated loans. Amendment fees are earned as compensation for evaluating and accepting changes to the original loan agreement and are recognized when received. Dividend income from REITs is recorded based on the income included in the distributions received from the REIT investments using published REIT classifications, including some management estimates when actual amounts are not available. Distributions received in excess of this estimated amount are recorded as a reduction of the cost of investments or reclassified to capital gains. The actual amounts of income, return of capital, and capital gains are only determined by each REIT after its fiscal year-end, and may differ from the estimated amounts.
H. Dividends from net investment income are declared quarterly in the World Equity Income Fund and Risk Managed Real Estate Fund. Dividends are reinvested in additional shares unless shareholders request payment in cash. Distributions of net investment income in the remaining Funds and distributions of net realized gains, if any, in all Funds are declared at least annually and recorded on the ex-dividend date and are determined in accordance with income tax regulations which may differ from U.S. GAAP.
I. Interest and dividend income, most expenses, all realized gains and losses, and all unrealized gains and losses are allocated to the classes based upon the value of the outstanding shares in each Class. Certain costs, such as distribution and service fees are charged directly to specific classes. In addition, certain expenses have been allocated to the individual Funds in the Trust on a pro rata basis upon the respective aggregate net assets of each Fund included in the Trust.
J. Under the fee arrangement with the custodian, the Funds may earn credits based on overnight custody cash balances. These credits are utilized to reduce related custodial expenses. The custodian fees disclosed in the Statement of Operations are before the reduction in expense from the related earnings credits, if any. For the period ended March 31, 2015, there were no earnings credits received.
The Funds may leave cash overnight in their cash account with the custodian. Periodically, a Fund may have cash due to the custodian bank as an overdraft balance. A fee is incurred on this overdraft, calculated by multiplying the overdraft by a rate based on the federal funds rate.
K. The accounting records of the Fund are maintained in U.S. dollars. All assets and liabilities initially expressed in foreign currencies are converted into U.S. dollars at prevailing exchange rates. Purchases and sales of investment securities, dividend and interest income, and certain expenses are translated at the rates of exchange prevailing on the respective dates of such transactions. Changes in the relationship of these foreign currencies to the U.S. dollar can significantly affect the value of the investments and earnings of the Funds. Foreign investments may also subject the Funds to foreign government exchange restrictions, expropriation, taxation or other political, social or economic developments, all of which could affect the market and/ or credit risk of the investments.
The Funds do not isolate that portion of the results of operations resulting from changes in the foreign exchange rates on investments from the fluctuations arising from changes in the market prices of securities held. Such fluctuations are included with the net realized and unrealized gain or loss on investments.
Reported net realized foreign exchange gains and losses arise from sales of foreign currencies and currency gains or losses realized between the trade and settlement dates on investment transactions. Net unrealized exchange gains and losses arise from changes in the fair values of assets and liabilities other than investments in securities at the fiscal period end, resulting from changes in exchange rates.
L. Under the Funds’ organizational documents, their Trustees and Officers are indemnified against certain liabilities arising out of the performance of their duties to the Trust. In addition, throughout the normal course of business, the Funds enter into contracts that contain a variety of representations and warranties which
| | THE GUGGENHEIM FUNDS SEMI-ANNUAL REPORT | 79 |
NOTES TO FINANCIAL STATEMENTS (Unaudited)(continued)
provide general indemnifications. The Funds’ maximum exposure under these arrangements is unknown, as this would involve future claims that may be made against the Funds and/or their affiliates that have not yet occurred. However, based on experience, the Funds expect the risk of loss to be remote.
2. Financial Instruments
As part of their investment strategy, the Funds utilize short sales and a variety of derivative instruments. These investments involve, to varying degrees, elements of market risk and risks in excess of the amounts recognized in the Statements of Assets and Liabilities.
A short sale is a transaction in which a Fund sells a security it does not own. If the security sold short decreases in price between the time the Fund sells the security and closes its short position, that Fund will realize a gain on the transaction. Conversely, if the security increases in price during the period, that Fund will realize a loss on the transaction. The risk of such price increases is the principal risk of engaging in short sales.
An option on a security gives the purchaser of the option the right to sell, and the writer of the option the obligation to buy, the underlying security (put option) or the purchaser of the option the right to buy, and the writer of the option the obligation to sell, the underlying security (call option) at any time during the option period. The risk associated with purchasing options is limited to the premium originally paid. The risk in writing a call option is that a Fund may incur a loss if the market price of the underlying security increases and the option is exercised. The risk in writing a put option is that a Fund may incur a loss if the market price of the underlying security decreases and the option is exercised. In addition, there may be an imperfect correlation between the movement in prices of options and the underlying securities and a Fund may not be able to enter into a closing transaction because of an illiquid secondary market or, for over-the-counter options, because of the counterparty’s inability to perform.
A futures contract is an agreement to purchase (long) or sell (short) an agreed amount of securities or other instruments at a set price for delivery at a future date. There are significant risks associated with a Fund’s use of futures contracts, including (i) there may be an imperfect or no correlation between the changes in market value of the underlying asset and the prices of futures contracts; (ii) there may not be a liquid secondary market for a futures contract; (iii) trading restrictions or limitations may be imposed by an exchange; and (iv) government regulations may restrict trading in futures contracts. When investing in futures, there is minimal counterparty credit risk to the Fund because futures are exchange-traded and the exchange’s clearinghouse, as counterparty to all exchange-traded futures, guarantees against default. Cash deposits are shown as segregated cash with the broker on the Statement of Assets and Liabilities; securities held as collateral are noted on the Schedule of Investments.
A swap is an agreement that obligates two parties to exchange a series of cash flows at specified intervals based upon or calculated by reference to changes in specified prices or rates for a specified amount of an underlying asset. A Fund utilizing OTC swaps bears the risk of loss of the amount expected to be received under a swap agreement in the event of the default or bankruptcy of a swap agreement counterparty. Additionally, there is no guarantee that a Fund or an underlying fund could eliminate its exposure under an outstanding swap agreement by entering into an offsetting swap agreement with the same or another party.
Certain Funds use derivative instruments to achieve leveraged exposure to their respective underlying indices. Since these Funds’ investment strategies involve consistently applied leverage, the value of the Fund’s shares will tend to increase or decrease more than the value of any increase or decrease in the underlying index. In addition, as investment in derivative instruments generally requires a small investment relative to the amount of investment exposure assumed, this creates an opportunity for increased net income but, at the same time, additional leverage risk. The Funds’ use of leverage, through borrowings or instruments such as derivatives, may cause the Funds to be more volatile and riskier than if they had not been leveraged.
In conjunction with the use of short sales and derivative instruments, the Funds are required to maintain collateral in various forms. The Funds use, where appropriate, depending on the financial instrument utilized and the broker involved, margin deposits at the broker, cash and/or securities segregated at the custodian bank, discount notes or the repurchase agreements allocated to each Fund.
There are several risks associated with exposure to foreign currencies, foreign issuers and emerging markets. A Fund’s indirect and direct exposure to foreign currencies subjects the Fund to the risk that
| 80 | THE GUGGENHEIM FUNDS SEMI-ANNUAL REPORT | |
NOTES TO FINANCIAL STATEMENTS (Unaudited)(continued)
those currencies will decline in value relative to the U.S. dollar, or, in the case of short positions, that the U.S. dollar will decline in value relative to the currency being hedged. Currency rates in foreign countries may fluctuate significantly over short periods of time for a number of reasons, including changes in interest rates and the imposition of currency controls or other political developments in the U.S. or abroad. In addition, the Fund may incur transaction costs in connection with conversions between various currencies. The Fund may, but is not obligated to, engage in currency hedging transactions, which generally involve buying currency forward, options or futures contracts. However, not all currency risk may be effectively hedged, and in some cases the costs of hedging techniques may outweigh expected benefits. In such instances, the value of securities denominated in foreign currencies can change significantly when foreign currencies strengthen or weaken relative to the U.S. dollar.
Certain Funds may invest in securities of foreign companies directly, or in financial instruments, such as ADRs and exchange-traded funds, which are indirectly linked to the performance of foreign issuers. Foreign markets can be more volatile than the U.S. market due to increased risks of adverse issuer, political, regulatory, market, or economic developments and can perform differently from the U.S. market. Investing in securities of foreign companies directly, or in financial instruments that are indirectly linked to the performance of foreign issuers, may involve risks not typically associated with investing in U.S. issuers. The value of securities denominated in foreign currencies, and of dividends from such securities, can change significantly when foreign currencies strengthen or weaken relative to the U.S. dollar. Foreign securities markets generally have less trading volume and less liquidity than U.S. markets, and prices in some foreign markets may fluctuate more than those of securities traded on U.S. markets. Many foreign countries lack accounting and disclosure standards comparable to those that apply to U.S. companies, and it may be more difficult to obtain reliable information regarding a foreign issuer’s financial condition and operations. Transaction costs and costs associated with custody services are generally higher for foreign securities than they are for U.S. securities. Some foreign governments levy withholding taxes against dividend and interest income. Although in some countries portions of these taxes are recoverable, the non-recovered portion will reduce the income received by the Fund.
The Trust has established counterparty credit guidelines and enters into transactions only with financial institutions of investment grade or better. The Trust monitors the counterparty credit risk.
3. Fees and Other Transactions with Affiliates
Under the terms of an investment advisory contract, the Funds pay GI investment advisory fees calculated at their annualized rates below, based on the average daily net assets of the Funds:
| Fund | Management Fees (as a % of Net Assets) |
| Alpha Opportunity Fund | 1.25% |
| Enhanced World Equity Fund | 0.70% |
| Large Cap Value Fund | 0.65% |
| Risk Managed Real Estate Fund | 0.75% |
| Small Cap Value Fund | 1.00% |
| StylePlus—Large Core Fund | 0.75% |
| StylePlus—Mid Growth Fund | 0.75% |
| World Equity Income Fund | 0.70% |
RFS is paid the following for providing transfer agent services to the Funds. Transfer agent fees are assessed to the applicable class of each Fund.
| Annual charge per account | $5.00 – $8.00 |
| Transaction fee | $0.60 – $1.10 |
Minimum annual charge per Fund† | $25,000 |
| Certain out-of-pocket charges | Varies |
† | Not subject to Funds during first twelve months of operations. |
RFS also acts as the administrative agent for the Funds, and as such performs administrative functions and the bookkeeping, accounting and pricing functions for each Fund. For these services, RFS receives the following:
| Fund | Fund Accounting/ Administrative Fees (as a % of Net Assets) |
Alpha Opportunity Fund† | 0.095% |
| Enhanced World Equity Fund | 0.095% |
| Large Cap Value Fund | 0.095% |
| Risk Managed Real Estate Fund | 0.095% |
| Small Cap Value Fund | 0.095% |
| StylePlus—Large Core Fund | 0.095% |
| StylePlus—Mid Growth Fund | 0.095% |
| World Equity Income Fund | greater of 0.150% or $60,000 |
| | |
| Minimum annual charge per Fund | $25,000 |
| Certain out-of-pocket charges | Varies |
† | Effective January 28, 2015, the Fund’s fees were reduced from 0.150% to 0.095%. |
| | THE GUGGENHEIM FUNDS SEMI-ANNUAL REPORT | 81 |
NOTES TO FINANCIAL STATEMENTS (Unaudited)(continued)
RFS engages external service providers to perform other necessary services for the Trust, such as audit and accounting related services, legal services, custody, printing and mailing, etc., on a pass-through basis. Such expenses are allocated to various Funds within the complex based on relative net assets.
The investment advisory contracts for the following Funds provide that the total expenses be limited to a percentage of average net assets for each class of shares, exclusive of brokerage costs, dividends on securities sold short, expenses of other investment companies in which a Fund invests, interest, taxes, litigation, indemnification and extraordinary expenses. The limits are listed below:
| | Limit | Effective Date | Contract End Date |
| Alpha Opportunity Fund – A-Class | 2.11% | 11/30/12 | 02/01/16 |
| Alpha Opportunity Fund – C-Class | 2.86% | 11/30/12 | 02/01/16 |
| Alpha Opportunity Fund – Institutional Class | 1.86% | 11/30/12 | 02/01/16 |
| Enhanced World Equity Fund – A-Class | 1.25% | 06/05/13 | 02/01/16 |
| Enhanced World Equity Fund – C-Class | 2.00% | 06/05/13 | 02/01/16 |
| Enhanced World Equity Fund – Institutional Class | 1.00% | 06/05/13 | 02/01/16 |
| Large Cap Value Fund – A-Class | 1.15% | 11/30/12 | 02/01/16 |
| Large Cap Value Fund – B-Class | 1.90% | 11/30/12 | 02/01/16 |
| Large Cap Value Fund – C-Class | 1.90% | 11/30/12 | 02/01/16 |
| Large Cap Value Fund – Institutional Class | 0.90% | 06/05/13 | 02/01/16 |
| Risk Managed Real Estate Fund – A-Class* | 1.30% | 03/26/14 | 02/01/16 |
| Risk Managed Real Estate Fund – C-Class* | 2.05% | 03/26/14 | 02/01/16 |
| Risk Managed Real Estate Fund – Institutional Class* | 1.10% | 03/26/14 | 02/01/16 |
| Small Cap Value Fund – A-Class | 1.30% | 11/30/12 | 02/01/16 |
| Small Cap Value Fund – C-Class | 2.05% | 11/30/12 | 02/01/16 |
| Small Cap Value Fund – Institutional Class | 1.05% | 11/30/12 | 02/01/16 |
| World Equity Income Fund – A-Class | 1.46% | 08/15/13 | 02/01/16 |
| World Equity Income Fund – B-Class | 2.21% | 08/15/13 | 02/01/16 |
| World Equity Income Fund – C-Class | 2.21% | 08/15/13 | 02/01/16 |
| World Equity Income Fund – Institutional Class | 1.21% | 08/15/13 | 02/01/16 |
| * | Commencement of operations: March 28, 2014. |
GI is entitled to reimbursement by the Funds for fees waived or expenses reimbursed during any of the previous 36 months, beginning on the date of the expense limitation agreement, if on any day the estimated operating expenses are less than the indicated percentages. At March 31, 2015, the amount of fees waived or expenses reimbursed that are subject to recoupment are presented in the following table:
| Fund | | Expires 2015 | | | Expires 2016 | | | Expires 2017 | | | Expires 2018 | | | Total | |
| Alpha Opportunity Fund | | $ | 48,448 | | | $ | 204,142 | | | $ | 126,237 | | | $ | 109,822 | | | $ | 488,649 | |
| Enhanced World Equity Fund | | | — | | | | 61,313 | | | | 154,250 | | | | 53,846 | | | | 269,409 | |
| Large Cap Value Fund | | | 111,306 | | | | 189,178 | | | | 213,340 | | | | 68,330 | | | | 582,154 | |
| Risk Managed Real Estate Fund | | | — | | | | — | | | | 3,015 | | | | — | | | | 3,015 | |
| Small Cap Value Fund | | | 81,002 | | | | 175,376 | | | | 199,545 | | | | 78,883 | | | | 534,806 | |
| World Equity Income Fund | | | 114,061 | | | | 269,453 | | | | 167,150 | | | | 979 | | | | 551,643 | |
For the period ended March 31, 2015, GI recouped $22,132 from the Risk Managed Real Estate Fund.
If a Fund invests in an affiliated fund, the investing Fund’s Adviser will determine whether to waive fees at the investing fund level through February 1, 2016. Fee waivers will be calculated at the investing Fund level without regard to any expense cap, if any, in effect for the investing fund. Fees waived under this arrangement are not subject to reimbursement to GI.
| 82 | THE GUGGENHEIM FUNDS SEMI-ANNUAL REPORT | |
NOTES TO FINANCIAL STATEMENTS (Unaudited)(continued)
The Trust has adopted Distribution Plans related to the offering of A-Class, B-Class and C-Class shares pursuant to Rule 12b-1 under the 1940 Act. The plans provide for payments at an annual rate of 0.25% of the average daily net assets of each Fund’s A-Class shares and 1.00% of the average daily net assets of each Fund’s B-Class and C-Class shares. Effective August 1, 2007, the Large Cap Value Fund ceased charging 12b-1 fees on B-Class shares in accordance with the FINRA sales cap regulations. These fees may be reinstated at any time. Effective August 25, 2005, the World Equity Income Fund ceased charging 12b-1 fees on B-Class shares in accordance with the FINRA sales cap regulations. These fees may be reinstated at any time.
For the period ended March 31, 2015, GFD retained sales charges of $42,585 relating to sales of A-Class shares of the Trust.
Certain trustees and officers of the Trust are also officers of GI, RFS and GFD.
4. Fair Value Measurement
In accordance with U.S. GAAP, fair value is defined as the price that the Funds would receive to sell an investment or pay to transfer a liability in an orderly transaction with an independent buyer in the principal market, or in the absence of a principal market, the most advantageous market for the investment or liability. U.S. GAAP establishes a three-tier fair value hierarchy based on the types of inputs used to value assets and liabilities and requires corresponding disclosure. The hierarchy and the corresponding inputs are summarized below:
| Level 1 — | quoted prices in active markets for identical assets or liabilities. |
| Level 2 — | significant other observable inputs (for example quoted prices for securities that are similar based on characteristics such as interest rates, prepayment speeds, credit risk, etc.). |
| Level 3 — | significant unobservable inputs based on the best information available under the circumstances, to the extent observable inputs are not available, which may include assumptions. |
The types of inputs available depend on a variety of factors, such as the type of security and the characteristics of the markets in which it trades, if any. Fair valuation determinations that rely on fewer or no observable inputs require greater judgment. Accordingly, fair value determinations for Level 3 securities require the greatest amount of judgment.
The following table summarizes the inputs used to value the Funds’ investments at March 31, 2015:
| | | Level 1 Investments In Securities | | | Level 1 Other Financial Instruments* | | | Level 2 Investments In Securities | | | Level 2 Other Financial Instruments* | | | Level 3 Investments In Securities | | | Total | |
| Assets | | | | | | | | | | | | | | | | | | |
| Alpha Opportunity Fund | | $ | 11,136,146 | | | $ | — | | | $ | — | | | $ | — | | | $ | — | | | $ | 11,136,146 | |
| Enhanced World Equity Fund | | | 5,800,047 | | | | — | | | | — | | | | — | | | | — | | | | 5,800,047 | |
| Large Cap Value Fund | | | 59,864,102 | | | | — | | | | — | | | | — | | | | — | | | | 59,864,102 | |
| Risk Managed Real Estate Fund | | | 121,861,174 | | | | — | | | | — | | | | 375,381 | | | | — | | | | 122,236,555 | |
| Small Cap Value Fund | | | 23,738,660 | | | | — | | | | — | | | | — | | | | 18 | | | | 23,738,678 | |
| StylePlus—Large Core Fund | | | 179,599,683 | | | | 9,603 | | | | 18,911,391 | | | | 13,825,985 | | | | — | | | | 212,346,662 | |
| StylePlus—Mid Growth Fund | | | 78,635,640 | | | | 25,292 | | | | 8,255,399 | | | | 8,969,455 | | | | — | | | | 95,885,786 | |
| World Equity Income Fund | | | 52,668,999 | | | | — | | | | 41,552,542 | | | | — | | | | — | | | | 94,221,541 | |
| | |
| Liabilities | | | | | | | | | | | | | | | | | | | | | | | | |
| Alpha Opportunity Fund | | $ | 8,562,521 | | | $ | — | | | $ | — | | | $ | 217,809 | | | $ | — | | | $ | 8,780,330 | |
| Enhanced World Equity Fund | | | 13,497 | | | | — | | | | — | | | | — | | | | — | | | | 13,497 | |
| Risk Managed Real Estate Fund | | | 41,552,862 | | | | — | | | | — | | | | — | | | | — | | | | 41,552,862 | |
| * | Other financial instruments may include futures contracts and/or swaps, which are reported as unrealized gain/loss at period end. |
| | THE GUGGENHEIM FUNDS SEMI-ANNUAL REPORT | 83 |
NOTES TO FINANCIAL STATEMENTS (Unaudited)(continued)
Independent pricing services are used to value a majority of the Funds’ investments. When values are not available from a pricing service, they may be computed by the Funds’ investment adviser or an affiliate. In any event, values may be determined using a variety of sources and techniques, including: market prices; broker quotes; and models which derive prices based on inputs such as prices of securities with comparable maturities and characteristics or based on inputs such as anticipated cash flows or collateral, spread over Treasuries, and other information and analysis. A significant portion of the Funds’ assets and liabilities are categorized as Level 2 or Level 3, as indicated in this report.
Indicative quotes from broker-dealers, adjusted for fluctuations in criteria such as credit spreads and interest rates, may be also used to value the Funds’ assets and liabilities, i.e. prices provided by a broker-dealer or other market participant who has not committed to trade at that price. Although indicative quotes are typically received from established market participants, the Funds may not have the transparency to view the underlying inputs which support the market quotations. Significant changes in an indicative quote would generally result in significant changes in the fair value of the security.
Certain fixed income securities are valued by obtaining a monthly indicative quote from a broker-dealer, adjusted for fluctuations in criteria such as credit spreads and interest rates. The Funds’ fair valuation guidelines were recently revised to transition such monthly indicative quoted securities from Level 2 to Level 3.
The inputs or methodologies used for valuing securities are not necessarily an indication of the risk associated with investing in those securities. The suitability of the techniques and sources employed to determine fair valuation are regularly monitored and subject to change.
Transfers between investment levels may occur as the markets fluctuate and/or the availability of data used in an investment’s valuation changes. The Funds recognized transfers between the levels as of the beginning of the period. As of March 31, 2015, the World Equity Income Fund had transfers between Level 1 and Level 2 due to utilizing international fair value pricing during the period. There were no other securities that transferred between levels.
5. Derivative Investment Holdings Categorized by Risk Exposure
U.S. GAAP requires disclosures to enable investors to better understand how and why the Funds use derivative instruments, how these derivative instruments are accounted for and their effects on the Funds’ financial position and results of operations.
The Enhanced World Equity Fund utilized options to minimally hedge the Fund’s portfolio to increase returns, to maintain exposure to equity markets and create liquidity.
The following Funds utilized derivatives for the following purposes:
| Fund | Index Exposure | Hedge | Leverage | Income | Speculation |
| Alpha Opportunity Fund | x | x | x | x | x |
| Risk Managed Real Estate Fund | — | — | x | — | — |
| StylePlus—Large Core Fund | x | — | — | — | — |
| StylePlus—Mid Growth Fund | x | — | x | — | — |
The following table represents the notional amount of derivative instruments outstanding as an approximate percentage of the Funds’ net assets on a daily basis.
| | Approximate percentage of Fund's Net Assets on a quarterly basis |
| Fund | Long | Short |
| Alpha Opportunity Fund | 70% | 25% |
| Risk Managed Real Estate Fund | 30% | — |
| StylePlus—Large Core Fund | 80% | — |
| StylePlus—Mid Growth Fund | 80% | — |
| 84 | THE GUGGENHEIM FUNDS SEMI-ANNUAL REPORT | |
NOTES TO FINANCIAL STATEMENTS (Unaudited)(continued)
The following is a summary of the location of derivative investments on the Funds’ Statements of Assets and Liabilities as of March 31, 2015:
| Derivative Investment Type | Asset Derivatives | Liability Derivatives |
| Equity contracts | Variation margin | Variation margin |
| | Unrealized appreciation on swap agreements | Unrealized depreciation on swap agreements |
| | | Options written, at value |
The following table sets forth the fair value of the Funds’ derivative investments categorized by primary risk exposure at March 31, 2015:
| Asset Derivative Investments Value | |
| Fund | | Futures Equity Contracts* | | | Swaps Equity Contracts | | | Options Written Equity Contracts | | | Total Value at March 31, 2015 | |
| Risk Managed Real Estate Fund | | $ | — | | | $ | 375,381 | | | $ | — | | | $ | 375,381 | |
| StylePlus—Large Core Fund | | | 9,603 | | | | 13,825,985 | | | | — | | | | 13,835,588 | |
| StylePlus—Mid Growth Fund | | | 25,292 | | | | 8,969,455 | | | | — | | | | 8,994,747 | |
| Liability Derivative Investments Value | |
| Fund | | Futures Equity Contracts* | | | Swaps Equity Contracts | | | Options Written Equity Contracts | | | Total Value at March 31, 2015 | |
| Alpha Opportunity Fund | | $ | — | | | $ | 217,809 | | | $ | — | | | $ | 217,809 | |
| Enhanced World Equity Fund | | | — | | | | — | | | | 13,497 | | | | 13,497 | |
| * | Includes cumulative appreciation (depreciation) of futures contracts as reported on the Schedules of Investments. Only current day’s variation margin is reported within the Statements of Assets and Liabilities. |
The following is a summary of the location of derivative investments on the Funds' Statements of Operations for the period ended March 31, 2015:
| Derivative Investment Type | Location of Gain (Loss) on Derivatives |
| Equity contracts | Net realized gain (loss) on futures contracts |
| | Net realized gain (loss) on swap agreements |
| | Net realized gain (loss) on options written |
| | Net change in unrealized appreciation (depreciation) on futures contracts |
| | Net change in unrealized appreciation (depreciation) on swap agreements |
| | Net change in unrealized appreciation (depreciation) on options written |
| | THE GUGGENHEIM FUNDS SEMI-ANNUAL REPORT | 85 |
NOTES TO FINANCIAL STATEMENTS (Unaudited)(continued)
The following is a summary of the Funds’ realized gain (loss) and change in unrealized appreciation (depreciation) on derivative investments recognized on the Statements of Operations categorized by primary risk exposure for the period ended March 31, 2015:
| Realized Gain (Loss) on Derivative Investments Recognized on the Statements of Operations | |
| Fund | | Futures Equity Contracts | | | Swaps Equity Contracts | | | Options Written Equity Contracts | | | Total | |
| Alpha Opportunity Fund | | $ | — | | | $ | 546,794 | | | $ | — | | | $ | 546,794 | |
| Enhanced World Equity Fund | | | — | | | | — | | | | (188,893 | ) | | | (188,893 | ) |
| Risk Managed Real Estate Fund | | | — | | | | 5,721,412 | | | | — | | | | 5,721,412 | |
| StylePlus—Large Core Fund | | | 58,473 | | | | 1,051,251 | | | | — | | | | 1,109,724 | |
| StylePlus—Mid Growth Fund | | | 14,414 | | | | 461,455 | | | | — | | | | 475,869 | |
Change in Unrealized Appreciation (Depreciation) on Derivative Investments Recognized on the Statements of Operations | |
| Fund | | Futures Equity Contracts | | | Swaps Equity Contracts | | | Options Written Equity Contracts | | | Total | |
| Alpha Opportunity Fund | | $ | 32,652 | | | $ | (87,609 | ) | | $ | — | | | $ | (54,957 | ) |
| Enhanced World Equity Fund | | | — | | | | — | | | | (3,691 | ) | | | (3,691 | ) |
| Risk Managed Real Estate Fund | | | — | | | | 375,381 | | | | — | | | | 375,381 | |
| StylePlus—Large Core Fund | | | 18,313 | | | | 8,144,756 | | | | — | | | | 8,163,069 | |
| StylePlus—Mid Growth Fund | | | 45,082 | | | | 7,065,996 | | | | — | | | | 7,111,078 | |
6. Offsetting
In the normal course of business, the Funds enter into transactions subject to enforceable master netting arrangements or other similar arrangements. Generally, the right to offset in those agreements allows the Funds to counteract the exposure to a specific counterparty with collateral received or delivered to that counterparty based on the terms of the arrangements. These arrangements provide for the right to liquidate upon the occurrence of an event of default, credit event upon merger or additional termination event.
In order to better define their contractual rights and to secure rights that will help the Funds mitigate their counterparty risk, the Funds may enter into an International Swaps and Derivatives Association, Inc. Master Agreement (“ISDA Master Agreement”) or similar agreement with their derivative contract counterparties. An ISDA Master Agreement is a bilateral agreement between a Fund and a counterparty that governs OTC derivatives, including foreign exchange contracts, and typically contains, among other things, collateral posting terms and netting provisions in the event of a default and/or termination event. The provisions of the ISDA Master Agreement typically permit a single net payment in the event of a default (close-out netting) or similar event, including the bankruptcy or insolvency of the counterparty.
For derivatives traded under an ISDA Master Agreement, the collateral requirements are typically calculated by netting the mark to market amount for each transaction under such agreement and comparing that amount to the value of any collateral currently pledged by the Funds and the counterparty. For financial reporting purposes, cash collateral that has been pledged to cover obligations of the Funds and cash collateral received from the counterparty, if any, is reported separately on the Statement of Assets and Liabilities as segregated cash with broker/receivable for variation margin, or payable for swap settlement/variation margin. Generally, the amount of collateral due from or to a counterparty must exceed a minimum transfer amount threshold (e.g., $300,000) before a transfer is required to be made. To the extent amounts due to the Funds from their counterparties are not fully collateralized, contractually or otherwise, the Funds bear the risk of loss from counterparty nonperformance. The Funds attempt to mitigate counterparty risk by only entering into agreements with counterparties that they believe to be of good standing and by monitoring the financial stability of those counterparties.
| 86 | THE GUGGENHEIM FUNDS SEMI-ANNUAL REPORT | |
NOTES TO FINANCIAL STATEMENTS (Unaudited)(continued)
For financial reporting purposes, the Funds do not offset derivative assets and derivative liabilities that are subject to netting arrangements in the Statements of Assets and Liabilities.
The following tables present derivative financial instruments and secured financing transactions that are subject to enforceable netting arrangements and offset in the Statements of Assets and Liabilities in conformity with U.S. GAAP.
| | | | | | | | | | | | | Gross Amounts Not Offset In the Statements of Assets and Liabilities | | | | |
| Fund | Instrument | | Gross Amounts of Recognized Assets | | | Gross Amounts Offset In the Statements of Assets and Liabilities | | | Net Amount of Assets Presented on the Statements of Assets and Liabilities | | | Financial Instruments | | | Cash Collateral Received1 | | | Net Amount | |
| Risk Managed Real Estate Fund | Swap equity contracts | | $ | 375,381 | | | $ | — | | | $ | 375,381 | | | $ | — | | | $ | — | | | $ | 375,381 | |
| StylePlus—Large Core Fund | Swap equity contracts | | | 13,825,985 | | | | — | | | | 13,825,985 | | | | — | | | | 12,051,800 | | | | 1,774,185 | |
| StylePlus—Mid Growth Fund | Swap equity contracts | | | 8,969,455 | | | | — | | | | 8,969,455 | | | | — | | | | 7,272,510 | | | | 1,696,945 | |
1 | Excludes maintenance margin deposits held at the broker related to derivatives. These amounts are reflected as segregated cash with broker on the Statements of Assets and Liabilities. |
7. Federal Income Tax Information
The Funds intend to comply with the provisions of Subchapter M of the Internal Revenue Code applicable to regulated investment companies and will distribute substantially all taxable net investment income and capital gains sufficient to relieve the Funds from all, or substantially all, federal income, excise and state income taxes. Therefore, no provision for federal or state income tax is required.
Tax positions taken or expected to be taken in the course of preparing the Funds’ tax returns are evaluated to determine whether the tax positions are “more-likely-than-not” of being sustained by the applicable tax authority. Tax positions not deemed to meet the more-likely-than-not threshold would be recorded as a tax benefit or expense in the current year. Management has analyzed the Funds’ tax positions taken, or to be taken, on Federal income tax returns for all open tax years, and has concluded that no provision for income tax is required in the Funds’ financial statements. The Funds’ federal tax returns are subject to examination by the Internal Revenue Service for a period of three years after they are filed.
At March 31, 2015, the cost of securities for Federal income tax purposes, the aggregate gross unrealized gain for all securities for which there was an excess of value over tax cost and the aggregate gross unrealized loss for all securities for which there was an excess of tax cost over value, were as follows:
| Fund | | Tax Cost | | | Tax Unrealized Gain | | | Tax Unrealized Loss | | | Net Unrealized Gain (Loss) | |
| Alpha Opportunity Fund | | $ | 17,243,473 | | | $ | 385,594 | | | $ | (505,152 | ) | | $ | (119,558 | ) |
| Enhanced World Equity Fund | | | 5,880,609 | | | | 23,772 | | | | (104,334 | ) | | | (80,562 | ) |
| Large Cap Value Fund | | | 52,588,213 | | | | 9,291,527 | | | | (2,015,638 | ) | | | 7,275,889 | |
| Risk Managed Real Estate Fund | | | 115,214,073 | | | | 7,543,060 | | | | (895,959 | ) | | | 6,647,101 | |
| Small Cap Value Fund | | | 22,336,721 | | | | 3,317,870 | | | | (1,915,913 | ) | | | 1,401,957 | |
| StylePlus—Large Core Fund | | | 196,025,898 | | | | 3,296,034 | | | | (810,858 | ) | | | 2,485,176 | |
| StylePlus—Mid Growth Fund | | | 85,788,948 | | | | 1,462,952 | | | | (360,861 | ) | | | 1,102,091 | |
| World Equity Income Fund | | | 93,526,017 | | | | 4,554,779 | | | | (3,859,255 | ) | | | 695,524 | |
| | THE GUGGENHEIM FUNDS SEMI-ANNUAL REPORT | 87 |
NOTES TO FINANCIAL STATEMENTS (Unaudited)(continued)
8. Securities Transactions
For the period ended March 31, 2015, the cost of purchases and proceeds from sales of investment securities, excluding government securities, short-term investments and derivatives, were as follows:
| Fund | | Purchases | | | Sales | |
| Alpha Opportunity Fund | | $ | 3,555,253 | | | $ | 1,983,271 | |
| Enhanced World Equity Fund | | | 14,158,200 | | | | 14,353,507 | |
| Large Cap Value Fund | | | 24,664,303 | | | | 33,104,898 | |
| Risk Managed Real Estate Fund | | | 70,897,209 | | | | 80,499,333 | |
| Small Cap Value Fund | | | 9,520,953 | | | | 13,304,936 | |
| StylePlus—Large Core Fund | | | 80,018,152 | | | | 83,834,620 | |
| StylePlus—Mid Growth Fund | | | 40,602,301 | | | | 39,547,685 | |
| World Equity Income Fund | | | 66,987,231 | | | | 57,457,732 | |
9. Options Written
Information as to options written by the Funds during the period ended March 31, 2015, and options outstanding at period end is provided below:
| Call Options Written | | | |
| | | Enhanced World Equity Fund | |
| | | Number of contracts | | | Premium amount | |
| Balance at September 30, 2014 | | | 503 | | | $ | 25,930 | |
| Options Written | | | 3,998 | | | | 293,694 | |
| Options terminated in closing purchase transactions | | | (3,094 | ) | | | (249,772 | ) |
| Options expired | | | (660 | ) | | | (29,005 | ) |
| Options exercised | | | (96 | ) | | | (9,964 | ) |
| Balance at March 31, 2015 | | | 651 | | | $ | 30,883 | |
10. Affiliated and/or Related Transactions
Investments representing 5% or more of the outstanding voting shares of a portfolio company of a fund, or control of or by, or common control under GI, result in that portfolio company being considered an affiliated company of such fund, as defined in the 1940 Act.
The Funds may invest in the Guggenheim Strategy Funds Trust consisting of Guggenheim Strategy Fund I, Guggenheim Strategy Fund II, Guggenheim Strategy Fund III and Guggenheim Variable Insurance Strategy Fund III (collectively, the “Cash Management Funds”), open-end management investment companies managed by GI. The Cash Management Funds, which launched on March 11, 2014, are offered as cash management options only to mutual funds, trusts, and other accounts managed by GI and/or its affiliates, and are not available to the public. The Cash Management Funds pay no investment management fees. The Cash Management Funds’ annual report on Form N-CSR dated September 30, 2014 is available publicly or upon request. This information is also available from the EDGAR database on the SEC’s website at http://www.sec.gov.
| 88 | THE GUGGENHEIM FUNDS SEMI-ANNUAL REPORT | |
NOTES TO FINANCIAL STATEMENTS (Unaudited)(continued)
Transactions during the period ended March 31, 2015 in which the portfolio company is an “affiliated person” are as follows:
| Affiliated issuers by Fund | | Value 09/30/14 | | | Additions | | | Reductions | | | Value 03/31/15 | | | Shares 03/31/15 | | | Investment Income | | | Realized Gain (Loss) | | | Capital Gain Distributions | |
| StylePlus—Large Core Fund | | | | | | | | | | | | | | | | | | | | | | | |
| Guggenheim Strategy Fund I | | $ | 23,036,746 | | | $ | 29,165,634 | | | $ | (3,550,000 | ) | | $ | 48,746,970 | | | | 1,957,710 | | | $ | 219,513 | | | $ | (13,996 | ) | | $ | — | |
| Guggenheim Strategy Fund II | | | 30,278,579 | | | | 14,107,487 | | | | — | | | | 44,473,050 | | | | 1,785,349 | | | | 259,134 | | | | — | | | | — | |
| Guggenheim Strategy Fund III | | | 43,398,278 | | | | 6,385,028 | | | | — | | | | 49,955,057 | | | | 2,002,207 | | | | 454,347 | | | | — | | | | — | |
| | | $ | 96,713,603 | | | $ | 49,658,149 | | | $ | (3,550,000 | ) | | $ | 143,175,077 | | | | | | | $ | 932,994 | | | $ | (13,996 | ) | | $ | — | |
| StylePlus—Mid Growth Fund | | | | | | | | | | | | | | | | | | | | | | | | | | | | | | | |
| Guggenheim Strategy Fund I | | $ | 8,517,668 | | | $ | 14,858,038 | | | $ | (2,800,000 | ) | | $ | 20,621,242 | | | | 828,162 | | | $ | 80,857 | | | $ | (11,124 | ) | | $ | — | |
| Guggenheim Strategy Fund II | | | 13,261,482 | | | | 6,593,872 | | | | — | | | | 19,894,512 | | | | 798,656 | | | | 117,002 | | | | — | | | | — | |
| Guggenheim Strategy Fund III | | | 17,812,592 | | | | 3,665,941 | | | | — | | | | 21,553,581 | | | | 863,871 | | | | 196,077 | | | | — | | | | — | |
| | | $ | 39,591,742 | | | $ | 25,117,851 | | | $ | (2,800,000 | ) | | $ | 62,069,335 | | | | | | | $ | 393,936 | | | $ | (11,124 | ) | | $ | — | |
11. Line of Credit
The Trust, with the exception of Alpha Opportunity Fund and Capital Stewardship Fund, secured a committed, $625,000,000 line of credit from Citibank, N.A., good through October 9, 2015, at which time the line of credit may be renewed. This line of credit is reserved for emergency or temporary purposes. Fees related to borrowings, if any, vary under this arrangement between the greater of Citibank’s “base rate”, LIBOR plus 1.0%, and the Fed Funds rate, plus 0.50%. The Trust did not have any borrowings under this agreement as of and for the period-ended March 31, 2015. The Trust also pays a commitment fee at an annualized rate of 0.07% of the average daily amount of their unused commitment amount.
12. Other Liabilities
StylePlus—Large Core Fund wrote put option contracts through Lehman Brothers Inc., (“LBI”) that were exercised prior to the option contracts’ expiration and prior to the bankruptcy filing by LBI, during September, 2008. However, these transactions have not settled and the securities have not been delivered to the Fund as of March 31, 2015.
Although the ultimate resolution of these transactions is uncertain, the Fund has recorded a liability on its respective book equal to the difference between the strike price on the put options and the market price of the underlying security on the exercise date. The amount of the liability recorded by the Fund as of March 31, 2015, was $18,615.
13. Alpha Opportunity Fund
As noted in the Fund’s prior shareholder report, the Fund resolved certain outstanding short sale transactions with Lehman Brothers International Europe (“LBIE”) and its administrator in June 2014.
Effective January 28, 2015, the Fund, which had not accepted subscriptions since October 3, 2008, is once again accepting subscriptions for shares from new and existing shareholders.
14. Subsequent Event
P-Class Shares to be Offered
Effective following the close of business on April 30, 2015, or such later date as may be determined appropriate by management, Alpha Opportunity Fund, Large Cap Value fund, Risk Managed Real Estate Fund, Small Cap Value Fund, StylePlus—Large Core Fund, StylePlus—Mid Growth Fund and World Equity Income Fund (collectively, the “Funds”), each of which is a separate series of Guggenheim Funds Trust, will offer P-Class shares.
| | THE GUGGENHEIM FUNDS SEMI-ANNUAL REPORT | 89 |
NOTES TO FINANCIAL STATEMENTS (Unaudited)(concluded)
P-Class shares of the Funds are offered primarily through broker/dealers and other financial intermediaries with which Guggenheim Funds Distributors, LLC has an agreement for the use of P-Class shares of the Funds in investment products, programs or accounts. P-Class shares do not have a minimum initial investment amount, subsequent investment amount or a minimum account balance. The Funds reserves the right to modify their minimum investment amount and account balance requirements at any time, with or without prior notice to you.
Shareholders who currently have accounts held directly at Guggenheim Investments will not be permitted to purchase P-Class shares.
For more information, or to request copies of the Fund’s prospectuses, call Client Services at 800.820.0888 or visiting guggenheiminvestments.com.
| 90 | THE GUGGENHEIM FUNDS SEMI-ANNUAL REPORT | |
OTHER INFORMATION (Unaudited)
Proxy Voting Information
A description of the policies and procedures that the Trust uses to determine how to vote proxies relating to securities held in the Funds’ portfolios is available, without charge and upon request, by calling 800.820.0888. This information is also available from the EDGAR database on the SEC’s website at http://www.sec.gov.
Information regarding how the Funds voted proxies relating to portfolio securities during the most recent 12-month period ended June 30 is available without charge, upon request, by calling 800.820.0888. This information is also available from the EDGAR database on the SEC’s website at http://www.sec.gov.
Sector Classification
Information in the “Schedule of Investments” is categorized by sectors using sector-level classifications used by Bloomberg Industry Classification System, a widely recognized industry classification system provider. In each Fund’s registration statement, the Funds have investment policies relating to concentration in specific industries. For purposes of these investment policies, the Funds usually classify industries based on industry-level classifications used by widely recognized industry classification system providers such as Bloomberg Industry Classification System, Global Industry Classification Standards and Barclays Global Classification Scheme.
Quarterly Portfolio Schedules Information
The Trust files its complete schedule of portfolio holdings with the SEC for the first and third quarters of each fiscal year on Form N-Q; which are available on the SEC’s website at http://www.sec.gov. The Funds’ Forms N-Q may be reviewed and copied at the SEC’s Public Reference Room in Washington, DC, and that information on the operation of the Public Reference Room may be obtained by calling 800-SEC-0330. Copies of the portfolio holdings are also available to shareholders, without charge and upon request, by calling 800.820.0888.
| | THE GUGGENHEIM FUNDS SEMI-ANNUAL REPORT | 91 |
INFORMATION ON BOARD OF TRUSTEES AND OFFICERS (Unaudited)
Name, Address* and Year of Birth | Position(s) Held with the Trust | Term of Office and Length of Time Served** | Principal Occupation(s) During Past Five Years | Number of Portfolios in Fund Complex Overseen | Other Directorships Held by Trustees |
| INDEPENDENT TRUSTEES | | | |
Randall C. Barnes (1951) | Trustee | Since 2014 | Current: Private Investor (2001-present). Former: Senior Vice President and Treasurer, PepsiCo, Inc. (1993-1997); President, Pizza Hut International (1991-1993); Senior Vice President, Strategic Planning and New Business Development, PepsiCo, Inc. (1987-1990). | 91 | Current: Trustee, Purpose Investments Inc. (2014-Present). |
Donald A. Chubb, Jr. (1946 ) | Trustee and Vice Chairman of the Board | Since 1994 | Current: Business broker and manager of commercial real estate, Griffith & Blair, Inc. (1997-present). | 87 | None. |
Jerry B. Farley (1946) | Trustee and Vice Chairman of the Audit Committee | Since 2005 | Current: President, Washburn University (1997-present). | 87 | Current: Westar Energy, Inc. (2004-present); CoreFirst Bank & Trust (2000-present). |
Roman Friedrich III (1946) | Trustee and Chairman of the Contracts Review Committee | Since 2014 | Current: Founder and President, Roman Friedrich & Company (1998-present). Former: Senior Managing Director, MLV & Co. LLC (2010-2011). | 87 | Current: Zincore Metals, Inc. (2009-present). Former: Mercator Minerals Ltd. (2013-2014); First Americas Gold Corp. (2012-2014); Blue Sky Uranium Corp. (2011-2012); Axiom Gold and Silver Corp. (2011-2012); Stratagold Corp. (2003-2009); GFM Resources Ltd. (2005-2010). |
Robert B. Karn III (1942) | Trustee and Chairman of the Audit Committee | Since 2014 | Current: Consultant (1998-present). Former: Arthur Andersen (1965-1997) and Managing Partner, Financial and Economic Consulting, St. Louis office (1987-1997). | 87 | Current: Peabody Energy Company (2003-present); GP Natural Resource Partners, LLC (2002- present). |
Ronald A. Nyberg (1953) | Trustee and Chairman of the Nominating and Governance Committee | Since 2014 | Current: Partner, Nyberg & Cassioppi, LLC (2000-present). Former: Executive Vice President, General Counsel, and Corporate Secretary, Van Kampen Investments (1982-1999). | 93 | Current: Edward-Elmhurst Healthcare System (2012-present). |
| 92 | THE GUGGENHEIM FUNDS SEMI-ANNUAL REPORT | |
INFORMATION ON BOARD OF TRUSTEES AND OFFICERS (Unaudited)(continued)
Name, Address* and Year of Birth | Position(s) Held with the Trust | Term of Office and Length of Time Served** | Principal Occupation(s) During Past Five Years | Number of Portfolios in Fund Complex Overseen | Other Directorships Held by Trustees |
| INDEPENDENT TRUSTEES - concluded | | |
Maynard F. Oliverius (1943) | Trustee and Vice Chairman of the Contracts Review Committee | Since 1998 | Current: Retired. Former: President and CEO, Stormont-Vail HealthCare (1996-2012). | 87 | Current: Fort Hays State University Foundation (1999-present); Stormont-Vail Foundation (2013-present); University of Minnesota HealthCare Alumni Association Foundation (2009-present). |
Ronald E. Toupin, Jr. (1958) | Trustee and Chairman of the Board | Since 2014 | Current: Portfolio Consultant (2010-present). Former: Vice President, Manager and Portfolio Manager, Nuveen Asset Management (1998-1999); Vice President, Nuveen Investment Advisory Corp. (1992-1999); Vice President and Manager, Nuveen Unit Investment Trusts (1991-1999); and Assistant Vice President and Portfolio Manager, Nuveen Unit Investment Trusts (1988-1999), each of John Nuveen & Co., Inc. (1982-1999). | 90 | Former: Bennett Group of Funds (2011-2013). |
| INTERESTED TRUSTEE | |
Donald C. Cacciapaglia*** (1951) | President, Chief Executive Officer and Trustee | Since 2012 | Current: President and CEO, certain other funds in the Fund Complex (2012-present); Vice Chairman, Guggenheim Investments (2010-present). Former: Chairman and CEO, Channel Capital Group, Inc. (2002-2010). | 221 | Current: Clear Spring Life Insurance Company (2015-present); Guggenheim Partners Japan, Ltd. (2014-present); Delaware Life (2013-present); Guggenheim Life and Annuity Company (2011-present); Paragon Life Insurance Company of Indiana (2011-present). |
| * | The business address of each Trustee is c/o Guggenheim Investments, 805 King Farm Boulevard, Suite 600, Rockville, Maryland 20850. |
| ** | Each Trustee serves an indefinite term, until his successor is elected and qualified. Time served includes time served in the respective position for the Predecessor Corporation. |
| *** | This Trustee is deemed to be an "interested person" of the Funds under the 1940 Act by reason of his position with the Funds' Investment Manager and/or the parent of the Investment Manager. |
| | THE GUGGENHEIM FUNDS SEMI-ANNUAL REPORT | 93 |
INFORMATION ON BOARD OF TRUSTEES AND OFFICERS (Unaudited)(continued)
Name, Address* and Year of Birth | Position(s) Held with the Trust | Term of Office and Length of Time Served** | Principal Occupations During Past Five Years |
| OFFICERS | | | |
Joseph M. Arruda (1966) | Assistant Treasurer | Since 2010 | Current: Assistant Treasurer, certain other funds in the Fund Complex (2006-present); Vice President, Security Investors, LLC (2010-present); CFO and Manager, Guggenheim Specialized Products, LLC (2009-present). Former: Vice President, Security Global Investors, LLC (2010-2011); Vice President, Rydex Advisors, LLC (2010); Vice President, Rydex Advisors II, LLC (2010). |
William H. Belden, III (1965) | Vice President | Since 2014 | Current: Vice President, certain other funds in the Fund Complex (2006-present); Managing Director, Guggenheim Funds Investment Advisors, LLC (2005-present). Former: Vice President of Management, Northern Trust Global Investments (1999-2005). |
Mark J. Furjanic (1959) | Assistant Treasurer | Since 2014 | Current: Vice President, Guggenheim Investments (2005-present); Assistant Treasurer, certain other funds in the Fund Complex (2008-present). Former: Senior Manager, Ernst & Young LLP (1999-2005). |
James M. Howley (1972) | Assistant Treasurer | Since 2014 | Current: Director, Guggenheim Investments (2004-present) ; Assistant Treasurer, certain other funds in the Fund Complex (2006-present). Former: Manager, Mutual Fund Administration of Van Kampen Investments, Inc. (1996-2004). |
Amy J. Lee (1961) | Vice President and Chief Legal Officer | Since 2007 (Vice President) Since 2014 (Chief Legal Officer) | Current: Chief Legal Officer, certain other funds in the Fund Complex (2013-present); Senior Managing Director, Guggenheim Investments (2012-present). Former: Vice President, Associate General Counsel and Assistant Secretary, Security Benefit Life Insurance Company and Security Benefit Corporation (2004-2012). |
Mark E. Mathiasen (1978) | Secretary | Since 2014 | Current: Secretary, certain other funds in the Fund Complex (2007-present); Managing Director, Guggenheim Investments (2007-present). |
Michael P. Megaris (1984) | Assistant Secretary | Since 2014 | Current: Assistant Secretary, certain other funds in the Fund Complex (2014-present); Associate, Guggenheim Investments (2012-present). Former: J.D., University of Kansas School of Law (2009-2012). |
Elisabeth Miller (1968) | Chief Compliance Officer | Since 2012 | Current: CCO, certain other funds in the Fund Complex (2012-present); CCO, Security Investors, LLC (2012-present); CCO, Guggenheim Funds Investment Advisors, LLC (2012-present); Managing Director, Guggenheim Investments (2012-present); Vice President, Guggenheim Funds Distributors, LLC (March 2014-present). Former: CCO, Guggenheim Distributors, LLC (2009-March 2014); Senior Manager, Security Investors, LLC (2004-2009); Senior Manager, Guggenheim Distributors, LLC (2004-2009). |
| 94 | THE GUGGENHEIM FUNDS SEMI-ANNUAL REPORT | |
INFORMATION ON BOARD OF TRUSTEES AND OFFICERS (Unaudited)(concluded)
Name, Address* and Year of Birth | Position(s) Held with the Trust | Term of Office and Length of Time Served** | Principal Occupations During Past Five Years |
| OFFICERS - concluded | |
Alison Santay (1974) | AML Officer | Since 2013 | Current: AML Officer, certain other funds in the Fund Complex (2010-present); Director and AML Officer, Rydex Fund Services, LLC (2010-present); AML Officer, Security Investors, LLC (2010-present); Director, Shareholder Risk and Compliance, Rydex Fund Services, LLC (2004-present). Former: AML Officer, Guggenheim Distributors, LLC (2013-2014). |
Kimberly Scott (1974) | Assistant Treasurer | Since 2014 | Current: Vice President, Guggenheim Investments (2012-present) ; Assistant Treasurer, certain other funds in the Fund Complex (2012-present). Former: Financial Reporting Manager, Invesco, Ltd. (2010-2011); Vice President/Assistant Treasurer, Mutual Fund Administration for Van Kampen Investments, Inc./Morgan Stanley Investment Management (2009-2010); Manager of Mutual Fund Administration, Van Kampen Investments, Inc./Morgan Stanley Investment Management (2005-2009). |
Bryan Stone (1979) | Vice President | Since 2014 | Current: Vice President, certain other funds in the Fund Complex (2014-present); Director, Guggenheim Investments (2013-present). Former: Senior Vice President, Neuberger Berman Group LLC (2009-2013); Vice President, Morgan Stanley (2002-2009). |
John L. Sullivan (1955) | Chief Financial Officer and Treasurer | Since 2014 | Current: CFO, Chief Accounting Officer and Treasurer, certain other funds in the Fund Complex (2010-present); Senior Managing Director, Guggenheim Investments (2010-present). Former: Managing Director and CCO, each of the funds in the Van Kampen Investments fund complex (2004-2010); Managing Director and Head of Fund Accounting and Administration, Morgan Stanley Investment Management (2002-2004); CFO and Treasurer, Van Kampen Funds (1996-2004). |
| * | The business address of each officer is c/o Guggenheim Investments, 805 King Farm Boulevard, Suite 600, Rockville, Maryland 20850. |
| ** | Each officer serves an indefinite term, until his or her successor is duly elected and qualified. Time served includes time served in the respective position for the Predecessor Corporation. |
| | THE GUGGENHEIM FUNDS SEMI-ANNUAL REPORT | 95 |
GUGGENHEIM INVESTMENTS PRIVACY POLICIES (Unaudited)
Rydex Funds, Guggenheim Funds, Rydex Investments, Guggenheim Funds Distributors, LLC, Security Investors, LLC, Security Distributors, Inc., Guggenheim Partners Investment Managers, LLC, and Rydex Advisory Services (Collectively “Guggenheim Investments”).
Our Commitment to You
When you become a Guggenheim Investments investor, you entrust us with not only your hard-earned money but also with personal and financial information about you. We recognize that your relationship with us is based on trust and that you expect us to act responsibly and in your best interests. Because we have access to this private information about you, we hold ourselves to the highest standards in its safekeeping and use. This means, most importantly, that we do not sell client information to anyone—whether it is your personal information or if you are a current or former Guggenheim Investments client.
The Information We Collect About You
In the course of doing business with shareholders and investors, we collect nonpublic personal information about you. You typically provide personal information when you complete a Guggenheim Investments account application or when you request a transaction that involves Rydex and Guggenheim Investments funds or one of the Guggenheim Investments affiliated companies. “Nonpublic personal information” is personally identifiable private information about you. For example, it includes information regarding your name and address, Social Security or taxpayer identification number, assets, income, account balance, bank account information and investment activity (e.g., purchase and redemption history).
How We Handle Your Personal Information
As emphasized above, we do not sell information about current or former clients or their accounts to third parties. Nor do we share such information, except when necessary to complete transactions at your request or to make you aware of related investment products and services that we offer. Additional details about how we handle your personal information are provided below. To complete certain transactions or account changes that you direct, it may be necessary to provide identifying information to companies, individuals or groups that are not affiliated with Guggenheim Investments. For example, if you ask to transfer assets from another financial institution to Guggenheim Investments, we will need to provide certain information about you to that company to complete the transaction. To alert you to other Guggenheim Investments investment products and services, we may share your information within the Guggenheim Investments family of affiliated companies. This would include, for example, sharing your information within Guggenheim Investments so we can make you aware of new Rydex and Guggenheim Investments funds or the services offered through another Guggenheim Investments affiliated company. In certain instances, we may contract with nonaffiliated companies to perform services for us. Where necessary, we will disclose information we have about you to these third parties. In all such cases, we provide the third party with only the information necessary to carry out its assigned responsibilities and only for that purpose. And we require these third parties to treat your private information with the same high degree of confidentiality that we do. In certain instances, we may share information with other financial institutions regarding individuals and entities in response to the U.S.A. Patriot Act. Finally, we will release information about you if you direct us to do so, if we are compelled by law to do so or in other circumstances permitted by law.
Opt Out Provisions
We do not sell your personal information to anyone. The law allows you to “opt out” of only certain kinds of information sharing with third parties. The firm does not share personal information about you with any third parties that triggers this opt-out right. This means YOU ARE ALREADY OPTED OUT.
| 96 | THE GUGGENHEIM FUNDS SEMI-ANNUAL REPORT | |
GUGGENHEIM INVESTMENTS PRIVACY POLICIES (Unaudited)(concluded)
How We Protect Privacy Online
Our concern for the privacy of our shareholders also extends to those who use our web site, guggenheiminvestments.com. Our web site uses some of the most secure forms of online communication available, including encryption technology, Secure Socket Layer (SSL) protocol, firewalls and user names and passwords. These technologies provide a high level of security and privacy when you access your account information or initiate online transactions. The Guggenheim Investments web site offers customized features that require our use of “http cookies”—tiny pieces of information that we ask your browser to store. However, we make very limited use of these cookies. We only use cookies for session management and security features on the Guggenheim Investments web site. We do not use them to pull data from your hard drive, to learn your email address, or to view data in cookies created by other web sites. We will not share the information in our cookies or give others access to it. See the legal information area on our web site for more details about web site security and privacy features.
How We Safeguard Your Personal Information
We restrict access to nonpublic personal information about shareholders to our employees and in some cases to third parties (for example, the service providers described above) as permitted by law. We maintain strict physical, electronic and procedural safeguards that comply with federal standards to guard your nonpublic personal information.
We’ll Keep You Informed
As required by federal law, we will notify shareholders of our privacy policy annually. We reserve the right to modify this policy at any time, but rest assured that if we do change it, we will tell you promptly. You will also be able to access our privacy policy from our web site at guggenheiminvestments.com. Should you have any questions regarding our privacy policy, contact us at 800.820.0888 or 301.296.5100.
| | THE GUGGENHEIM FUNDS SEMI-ANNUAL REPORT | 97 |
This page intentionally left blank.
This page intentionally left blank.
This page intentionally left blank.
This page intentionally left blank.
3.31.2015
Guggenheim Funds Semi-Annual Report
| Guggenheim High Yield Fund | | |
| Guggenheim Investment Grade Bond Fund | | |
| Guggenheim Limited Duration Fund | | |
| Guggenheim Municipal Income Fund | | |
| SBINC-SEMI-0315x0915 | guggenheiminvestments.com |
| DEAR SHAREHOLDER | 2 |
| ECONOMIC AND MARKET OVERVIEW | 3 |
| ABOUT SHAREHOLDERS’ FUND EXPENSES | 5 |
| HIGH YIELD FUND | 8 |
| INVESTMENT GRADE BOND FUND | 22 |
| LIMITED DURATION FUND | 36 |
| MUNICIPAL INCOME FUND | 46 |
| NOTES TO FINANCIAL STATEMENTS | 53 |
| OTHER INFORMATION | 69 |
| INFORMATION ON BOARD OF TRUSTEES AND OFFICERS | 70 |
| GUGGENHEIM INVESTMENTS PRIVACY POLICIES | 74 |
| | THE GUGGENHEIM FUNDS SEMI-ANNUAL REPORT | 1 |
March 31, 2015
Dear Shareholder:
Security Investors, LLC and Guggenheim Partners Investment Management (the “Investment Advisers”) are pleased to present the semi-annual shareholder report for a selection of our Funds (the “Funds”) for the six-month period ended March 31, 2015.
The Investment Advisers are part of Guggenheim Investments, which represents the investment management businesses of Guggenheim Partners, LLC (“Guggenheim”), a global, diversified financial services firm.
Guggenheim Funds Distributors, LLC is the distributor of the Funds. Guggenheim Funds Distributors, LLC is affiliated with Guggenheim and the Investment Advisers.
We encourage you to read the Economic and Market Overview section of the report, which follows this letter.
We are committed to providing innovative investment solutions and appreciate the trust you place in us.
Sincerely,
Donald C. Cacciapaglia
President
April 30, 2015
Read a prospectus and summary prospectus (if available) carefully before investing. It contains the investment objectives, risks, charges, expenses and other information, which should be considered carefully before investing. Obtain a prospectus and summary prospectus (if available) at guggenheiminvestments.com or call 800.820.0888.
There can be no assurance that any investment product will achieve its investment objective(s). There are risks associated with investing, including the entire loss of principal invested. Investing involves market risks. The investment return and principal value of any investment product will fluctuate with changes in market conditions.
| 2 | THE GUGGENHEIM FUNDS SEMI-ANNUAL REPORT | |
ECONOMIC AND MARKET OVERVIEW (Unaudited) | March 31, 2015 |
The U.S. continued to enjoy a self-sustaining economic expansion for the six-month period ended March 31, 2015, although winter weather was likely to distort first-quarter economic data. In addition, U.S. companies scaled back hiring in the last month of the period, adding to evidence that the domestic economy has lost some momentum since the turn of the year. The March increase in payrolls was the smallest since December 2013 and broke a 12-month run of gains above 200,000.
Despite this short-term dislocation, the economy remains on track. Indeed, many other labor market indicators, such as initial jobless claims and the job openings rate, suggest that the U.S. labor market remains quite strong, supporting the conclusion that March’s payroll report was just a temporary blip, similar to the one witnessed last winter. As soon as temporary seasonal factors have dissipated, economic data is likely to bounce back. The labor market has improved over the past year, as subdued mortgage rates and tight housing inventory continue to point to fairly stable appreciation in the housing market, which is key to the ongoing recovery. Consumers are also being helped by lower fuel prices, which are acting as a tax cut for U.S. consumers, freeing up discretionary spending in other areas and acting as a support for consumption.
In Europe, economic data has been surprisingly good and should continue along that path on the back of the European Central Bank’s program of quantitative easing and depreciation of the euro. Japan’s economy remains weak and, without more structural reform, continued monetary accommodation could lead to stagflation. China’s policymakers appear likely to continue the supply of credit and do whatever else is necessary to maintain growth there at an acceptable pace for the near term.
Given weakness overseas and the effect of a stronger U.S. dollar on international earnings, some stocks could face a more challenging environment in the near term, but our research shows that equity markets tend to perform quite well in the periods leading up to a U.S. Federal Reserve (the “Fed”) rate increase. The yield on the 10-year Treasury note declined in January by more than 50 basis points before rebounding in February, echoing the pattern since 2009—Treasury yields decline and a sell-off ensues, driving rates higher. Then conditions stabilize, and rates test their previous lows. Liquidity from foreign central banks and comparatively attractive U.S. yields continue to push global investors to U.S. Treasuries, which should hold down U.S. interest rates in the near term.
Against this backdrop, the U.S. central bank feels pressure to raise its key rate above zero, but insists the decision will be data-dependent and not occur prematurely. With a secular inflation increase unlikely in the near term, slack in the economy, and disinflation being imported from abroad, the Fed may not hike rates until later in the year. The Fed for now appears to be focused on wage growth, which is key for sustaining the expansion but also an indicator of inflationary pressure. The lack of sustained wage growth has been a topic that has confounded the Fed lately. Given the strengthening employment numbers and the apparent reduction in labor market slack, wages should start to increase more steadily across the board. This is one of the most important data points at the moment for the Fed.
The underlying U.S. economy remains strong and investors should avoid being panicked by seasonal setbacks. Indeed, considering the strength of the economy and the wave of liquidity emanating from various central banks around the world, the general investment environment should remain attractive.
For the six months ended March 31, 2015, the Standard & Poor’s 500® (“S&P 500”) Index* returned 5.93%. The Morgan Stanley Capital International (“MSCI”) Europe-Australasia-Far East (“EAFE”) Index* returned 1.13%. The return of the MSCI Emerging Markets Index* was -2.37%.
In the bond market, the Barclays U.S. Aggregate Bond Index* posted a 3.43% return for the period, while the Barclays U.S. Corporate High Yield Index* returned 1.49%. The return of the Bank of America Merrill Lynch 3-Month U.S. Treasury Bill Index* was 0.01% for the six-month period.
The opinions and forecasts expressed may not actually come to pass. This information is subject to change at any time, based on market and other conditions, and should not be construed as a recommendation of any specific security or strategy.
| | THE GUGGENHEIM FUNDS SEMI-ANNUAL REPORT | 3 |
ECONOMIC AND MARKET OVERVIEW (Unaudited)(concluded) | March 31, 2015 |
*Index Definitions:
The following indices are referenced throughout this report. Indices are unmanaged and not available for direct investment. Index performance does not reflect transaction costs, fees, or expenses.
Barclays U.S. Aggregate Bond Index is a broad-based benchmark that measures the investment grade, U.S. dollar-denominated, fixed-rate taxable bond market, including U.S. Treasuries, government-related and corporate securities, MBS (agency fixed-rate and hybrid ARM pass-throughs), ABS, and CMBS.
Barclays U.S. Corporate High Yield Index measures the market of U.S. dollar-denominated, non-investment grade, fixed-rate, taxable corporate bonds. Securities are classified as high yield if the middle rating of Moody’s, Fitch, and S&P is Ba1/BB+/BB+ or below.
Bank of America (“BofA”) Merrill Lynch 3-Month U.S. Treasury Bill Index is an unmanaged market index of U.S. Treasury securities maturing in 90 days that assumes reinvestment of all income.
MSCI EAFE Index is a free float-adjusted market capitalization index that is designed to measure the equity market performance of developed markets, excluding the U.S. & Canada.
MSCI Emerging Markets Index is a free float-adjusted market capitalization weighted index that is designed to measure equity market performance in the global emerging markets.
S&P 500® Index is a capitalization-weighted index of 500 stocks designed to measure the performance of the broad economy, representing all major industries and is considered a representation of the U.S. stock market.
| 4 | THE GUGGENHEIM FUNDS SEMI-ANNUAL REPORT | |
ABOUT SHAREHOLDERS’ FUND EXPENSES (Unaudited)
All mutual funds have operating expenses and it is important for our shareholders to understand the impact of costs on their investments. Shareholders of a Fund incur two types of costs: (i) transaction costs, including sales charges (loads) on purchase payments, reinvested dividends, or other distributions; and exchange fees; and (ii) ongoing costs, including management fees, administrative services, and shareholder reports, among others. These ongoing costs, or operating expenses, are deducted from a fund’s gross income and reduce the investment return of the fund.
A fund’s expenses are expressed as a percentage of its average net assets, which is known as the expense ratio. The following examples are intended to help investors understand the ongoing costs (in dollars) of investing in a Fund and to compare these costs with the ongoing costs of investing in other mutual funds.
The examples are based on an investment of $1,000 made at the beginning of the period and held for the entire six-month period beginning September 30, 2014 and ending March 31, 2015.
The following tables illustrate a Fund’s costs in two ways:
Table 1. Based on actual Fund return. This section helps investors estimate the actual expenses paid over the period. The “Ending Account Value” shown is derived from the Fund’s actual return, and the fourth column shows the dollar amount that would have been paid by an investor who started with $1,000 in the Fund. Investors may use the information here, together with the amount invested, to estimate the expenses paid over the period. Simply divide the Fund’s account value by $1,000 (for example, an $8,600 account value divided by $1,000 = 8.6), then multiply the result by the number provided under the heading “Expenses Paid During Period.”
Table 2. Based on hypothetical 5% return. This section is intended to help investors compare a Fund’s cost with those of other mutual funds. The table provides information about hypothetical account values and hypothetical expenses based on the Fund’s actual expense ratio and an assumed rate of return of 5% per year before expenses, which is not the Fund’s actual return. The hypothetical account values and expenses may not be used to estimate the actual ending account balance or expenses paid during the period. The example is useful in making comparisons because the U.S. Securities and Exchange Commission (the “SEC”) requires all mutual funds to calculate expenses based on the 5% return. Investors can assess a Fund’s costs by comparing this hypothetical example with the hypothetical examples that appear in shareholder reports of other funds.
The calculations illustrated above assume no shares were bought or sold during the period. Actual costs may have been higher or lower, depending on the amount of investment and the timing of any purchases or redemptions.
Please note that the expenses shown in the table are meant to highlight your ongoing costs only and do not reflect any transactional costs, such as sales charges (loads) on purchase payments, and contingent deferred sales charges ("CDSC") on redemptions, if any. Therefore, the second table is useful in comparing ongoing costs only, and will not help you determine the relative total costs of owning different funds. In addition, if these transactional costs were included, your costs would have been higher.
More information about a Fund’s expenses, including annual expense ratios for the past five years, can be found in the Financial Highlights section of this report. For additional information on operating expenses and other shareholder costs, please refer to the appropriate Fund prospectus.
| | THE GUGGENHEIM FUNDS SEMI-ANNUAL REPORT | 5 |
ABOUT SHAREHOLDERS’ FUND EXPENSES (Unaudited)(continued)
| | Expense Ratio1 | Fund Return | Beginning Account Value September 30, 2014 | Ending Account Value March 31, 2015 | Expenses Paid During Period2 |
Table 1. Based on actual Fund return3 | | | | | |
| High Yield Fund | | | | | |
| A-Class | 1.21% | 0.27% | $1,000.00 | $1,002.70 | $6.04 |
| B-Class | 0.96% | 0.37% | 1,000.00 | 1,003.70 | 4.80 |
| C-Class | 1.96% | (0.17%) | 1,000.00 | 998.30 | 9.76 |
| Institutional Class | 0.96% | 0.30% | 1,000.00 | 1,003.00 | 4.79 |
| Investment Grade Bond Fund | | | | | |
| A-Class | 1.04% | 2.40% | 1,000.00 | 1,024.00 | 5.25 |
| B-Class | 1.79% | 2.08% | 1,000.00 | 1,020.80 | 9.02 |
| C-Class | 1.79% | 2.03% | 1,000.00 | 1,020.30 | 9.02 |
| Institutional Class | 0.79% | 2.58% | 1,000.00 | 1,025.80 | 3.99 |
| Limited Duration Fund | | | | | |
| A-Class | 0.85% | 1.51% | 1,000.00 | 1,015.10 | 4.27 |
| C-Class | 1.60% | 1.12% | 1,000.00 | 1,011.20 | 8.02 |
| Institutional Class | 0.60% | 1.63% | 1,000.00 | 1,016.30 | 3.02 |
| Municipal Income Fund | | | | | |
| A-Class | 0.81% | 2.87% | 1,000.00 | 1,028.70 | 4.10 |
| C-Class | 1.56% | 2.57% | 1,000.00 | 1,025.70 | 7.88 |
| Institutional Class | 0.56% | 3.08% | 1,000.00 | 1,030.80 | 2.84 |
| 6 | THE GUGGENHEIM FUNDS SEMI-ANNUAL REPORT | |
ABOUT SHAREHOLDERS’ FUND EXPENSES (Unaudited)(concluded)
| | Expense Ratio1 | Fund Return | Beginning Account Value September 30, 2014 | Ending Account Value March 31, 2015 | Expenses Paid During Period2 |
| Table 2. Based on hypothetical 5% return (before expenses) | | | | |
| High Yield Fund | | | | | |
| A-Class | 1.21% | 5.00% | $1,000.00 | $1,018.90 | $6.09 |
| B-Class | 0.96% | 5.00% | 1,000.00 | 1,020.14 | 4.84 |
| C-Class | 1.96% | 5.00% | 1,000.00 | 1,015.16 | 9.85 |
| Institutional Class | 0.96% | 5.00% | 1,000.00 | 1,020.14 | 4.84 |
| Investment Grade Bond Fund | | | | | |
| A-Class | 1.04% | 5.00% | 1,000.00 | 1,019.75 | 5.24 |
| B-Class | 1.79% | 5.00% | 1,000.00 | 1,016.01 | 9.00 |
| C-Class | 1.79% | 5.00% | 1,000.00 | 1,016.01 | 9.00 |
| Institutional Class | 0.79% | 5.00% | 1,000.00 | 1,020.99 | 3.98 |
| Limited Duration Fund | | | | | |
| A-Class | 0.85% | 5.00% | 1,000.00 | 1,020.69 | 4.28 |
| C-Class | 1.60% | 5.00% | 1,000.00 | 1,016.95 | 8.05 |
| Institutional Class | 0.60% | 5.00% | 1,000.00 | 1,021.94 | 3.02 |
| Municipal Income Fund | | | | | |
| A-Class | 0.81% | 5.00% | 1,000.00 | 1,020.89 | 4.08 |
| C-Class | 1.56% | 5.00% | 1,000.00 | 1,017.15 | 7.85 |
| Institutional Class | 0.56% | 5.00% | 1,000.00 | 1,022.14 | 2.82 |
1 | Annualized and excludes expenses of the underlying funds in which the Funds invest. |
2 | Expenses are equal to the Fund's annualized expense ratio, net of any applicable fee waivers, multiplied by the average account value over the period, multiplied by 182/365 (to reflect the one-half year period). |
3 | Actual cumulative return at net asset value for the period September 30, 2014 to March 31, 2015. |
| | THE GUGGENHEIM FUNDS SEMI-ANNUAL REPORT | 7 |
FUND PROFILE (Unaudited) | March 31, 2015 |
HIGH YIELD FUND
OBJECTIVE: Seeks high current income. Capital appreciation is a secondary objective.
Holdings Diversification (Market Exposure as % of Net Assets)
“Holdings Diversification (Market Exposure as % of Net Assets)” excludes any temporary cash investments.
| Portfolio Composition by Quality Rating* |
| Rating | % of Total Investments |
| Fixed Income Instruments | |
| BBB | 7.1% |
| BB | 32.4% |
| B | 40.1% |
| CCC | 9.1% |
| NR** | 5.3% |
| Other Instruments | |
| Preferred Stocks | 4.4% |
| Common Stocks | 1.6% |
| Total Investments | 100.0% |
| | |
| The chart above reflects percentages of the value of total investments. |
| Inception Dates: |
| A-Class | August 5, 1996 |
| B-Class | August 5, 1996 |
| C-Class | May 1, 2000 |
| Institutional Class | July 11, 2008 |
| Ten Largest Holdings (% of Total Net Assets) |
| GRD Holdings III Corp. | 1.7% |
| Vector Group Ltd. | 1.7% |
| Central Garden & Pet Co. | 1.6% |
| Crestwood Midstream Partners Limited Partnership / Crestwood Midstream Finance Corp. | 1.5% |
| MDC Partners, Inc. | 1.5% |
| Opal Acquisition, Inc. | 1.5% |
| Ineos Finance plc | 1.4% |
| Seaspan Corp. | 1.4% |
| CareCore National LLC | 1.3% |
| ContourGlobal Power Holdings S.A. | 1.2% |
| Top Ten Total | 14.8% |
| | |
| “Ten Largest Holdings” exclude any temporary cash or derivative instruments. |
| * | Source: BlackRock Solutions. Credit quality ratings are measured on a scale that generally ranges from AAA (highest) to D (lowest). All securities except for those labeled “NR” have been rated by Moody’s, Standard & Poor’s (“S&P”), or Fitch, which are all a Nationally Recognized Statistical Rating Organization (“NRSRO”). For purposes of this presentation, when ratings are available from more than one agency, the highest rating is used. Guggenheim Investments has converted Moody’s and Fitch ratings to the equivalent S&P rating. Security ratings are determined at the time of purchase and may change thereafter. |
| ** | NR securities do not necessarily indicate low credit quality. |
| 8 | THE GUGGENHEIM FUNDS SEMI-ANNUAL REPORT | |
SCHEDULE OF INVESTMENTS (Unaudited) | March 31, 2015 |
| HIGH YIELD FUND | |
| | |
Shares | | | Value | |
| | | | | | | | |
COMMON STOCKS† - 1.8% | |
| | | | | | | | |
| CONSUMER DISCRETIONARY - 1.7% | |
| Travelport, LLC* | | | 107,757 | | | $ | 1,799,543 | |
Metro-Goldwyn-Mayer, Inc.*,†† | | | 7,040 | | | | 527,472 | |
| Total Consumer Discretionary | | | | | | | 2,327,015 | |
| | | | | | | | |
| BASIC MATERIALS - 0.1% | |
Mirabela Nickel Ltd.*,†† | | | 1,044,540 | | | | 111,379 | |
| | | | | | | | |
| COMMUNICATIONS - 0.0% | |
Cengage Learning Acquisitions, Inc.*,†† | | | 2,107 | | | | 47,209 | |
| | | | | | | | |
| ENERGY - 0.0% | |
Stallion Oilfield Holdings Ltd.*,†† | | | 8,257 | | | | 34,407 | |
| | | | | | | | |
| DIVERSIFIED - 0.0% | |
| Leucadia National Corp. | | | 81 | | | | 1,805 | |
| | | | | | | | |
| CONSUMER, NON-CYCLICAL - 0.0% | |
| Crimson Wine Group Ltd.* | | | 8 | | | | 73 | |
| | | | | | | | |
| Total Common Stocks | | | | | | | | |
| (Cost $2,800,999) | | | | | | | 2,521,888 | |
| | | | | | | | |
PREFERRED STOCKS† - 5.1% | |
| FINANCIAL - 3.4% | |
Goldman Sachs Group, Inc.
5.50%1,2 | | | 62,240 | | | | 1,567,203 | |
Morgan Stanley
6.38%1,2 | | | 46,000 | | | | 1,197,840 | |
Aspen Insurance Holdings Ltd.
5.95% 1,2 | | | 40,000 | | | | 1,027,200 | |
Kemper Corp.
7.38% due 02/27/54 | | | 39,000 | | | | 1,023,750 | |
| Total Financial | | | | | | | 4,815,993 | |
| | | | | | | | |
| INDUSTRIAL - 1.4% | |
Seaspan Corp.
6.38% due 04/30/19 | | | 80,000 | | | | 2,014,400 | |
U.S. Shipping Corp.*,†††,3 | | | 14,718 | | | | 16,484 | |
| Total Industrial | | | | | | | 2,030,884 | |
| | | | | | | | |
| CONSUMER DISCRETIONARY - 0.3% | |
Medianews Group, Inc.*,†† | | | 11,074 | | | | 382,053 | |
| Total Preferred Stocks | | | | | | | | |
| (Cost $7,170,957) | | | | | | | 7,228,930 | |
| | | | | | | | |
| | | Face
Amount | | | | |
| | | | | | | | |
CORPORATE BONDS††,7 - 80.3% | |
| ENERGY - 14.9% | |
| Crestwood Midstream Partners Limited Partnership / Crestwood Midstream Finance Corp. | | | | | | | | |
7.75% due 04/01/194 | | $ | 2,050,000 | | | | 2,130,154 | |
6.00% due 12/15/204 | | | 500,000 | | | | 502,500 | |
| 6.25% due 04/01/23 | | | 200,000 | | | | 202,000 | |
| Sabine Pass Liquefaction LLC | | | | | | | | |
| 6.25% due 03/15/22 | | | 1,250,000 | | | | 1,292,188 | |
5.62% due 03/01/255 | | | 900,000 | | | | 889,875 | |
| ContourGlobal Power Holdings S.A. | | | | | | | | |
7.12% due 06/01/195 | | | 1,750,000 | | | | 1,785,000 | |
| Atlas Energy Holdings Operating Company LLC / Atlas Resource Finance Corp. | | | | | | | | |
| 7.75% due 01/15/21 | | | 1,450,000 | | | | 986,000 | |
| 9.25% due 08/15/21 | | | 1,100,000 | | | | 759,000 | |
| CONSOL Energy, Inc. | | | | | | | | |
| 5.87% due 04/15/22 | | | 950,000 | | | | 859,750 | |
| 8.00% due 04/01/23 | | | 850,000 | | | | 838,313 | |
Legacy Reserves Limited Partnership /
Legacy Reserves Finance Corp. | | | | | | | | |
| 6.62% due 12/01/21 | | | 1,090,000 | | | | 861,100 | |
| 8.00% due 12/01/20 | | | 965,000 | | | | 791,300 | |
| BreitBurn Energy Partners Limited Partnership / BreitBurn Finance Corp. | | | | | | | | |
| 7.87% due 04/15/22 | | | 2,050,000 | | | | 1,475,999 | |
| Unit Corp. | | | | | | | | |
| 6.62% due 05/15/21 | | | 1,350,000 | | | | 1,269,000 | |
| Comstock Resources, Inc. | | | | | | | | |
10.00% due 03/15/205 | | | 1,150,000 | | | | 1,112,625 | |
| Antero Resources Corp. | | | | | | | | |
| 5.63% due 06/01/23 | | | 800,000 | | | | 792,000 | |
| 5.13% due 12/01/22 | | | 300,000 | | | | 288,000 | |
| Keane Group Holdings LLC | | | | | | | | |
8.50% due 08/08/19†††,3 | | | 993,750 | | | | 939,094 | |
| FTS International, Inc. | | | | | | | | |
6.25% due 05/01/225 | | | 1,000,000 | | | | 735,000 | |
| SandRidge Energy, Inc. | | | | | | | | |
| 8.12% due 10/15/22 | | | 900,000 | | | | 552,150 | |
| 7.50% due 03/15/21 | | | 250,000 | | | | 155,000 | |
| Odebrecht Offshore Drilling Finance Ltd. | | | | | | | | |
6.62% due 10/01/228 | | | 664,300 | | | | 508,190 | |
| TerraForm Power Operating LLC | | | | | | | | |
5.87% due 02/01/235 | | | 400,000 | | | | 415,000 | |
| Newfield Exploration Co. | | | | | | | | |
| 5.38% due 01/01/26 | | | 350,000 | | | | 353,544 | |
| Endeavor Energy Resources. LP / EER Finance, Inc. | | | | | | | | |
7.00% due 08/15/215 | | | 350,000 | | | | 337,750 | |
| Ultra Petroleum Corp. | | | | | | | | |
| 5.75% due 12/15/18 | | | 350,000 | | | | 315,875 | |
| Schahin II Finance Company SPV Ltd. | | | | | | | | |
5.87% due 09/25/225 | | | 217,167 | | | | 131,277 | |
| IronGate Energy Services LLC | | | | | | | | |
11.00% due 07/01/188 | | | 120,000 | | | | 79,200 | |
| SemGroup, LP | | | | | | | | |
8.75% due 11/15/15†††,3,6 | | | 1,300,000 | | | | — | |
| Total Energy | | | | | | | 21,356,884 | |
| | | | | | | | |
| SEE NOTES TO FINANCIAL STATEMENTS. | THE GUGGENHEIM FUNDS SEMI-ANNUAL REPORT | 9 |
SCHEDULE OF INVESTMENTS (Unaudited)(continued) | March 31, 2015 |
| HIGH YIELD FUND | |
| | | Face
Amount | | | Value | |
| | | | | | | | | |
| CONSUMER, NON-CYCLICAL - 12.2% | |
| Vector Group Ltd. | | | | | | | | |
7.75% due 02/15/214 | | $ | 2,230,000 | | | $ | 2,372,163 | |
| Central Garden & Pet Co. | | | | | | | | |
8.25% due 03/01/184 | | | 2,184,000 | | | | 2,234,516 | |
| Opal Acquisition, Inc. | | | | | | | | |
8.87% due 12/15/214,5 | | | 2,050,000 | | | | 2,085,875 | |
| VRX Escrow Corp. | | | | | | | | |
5.88% due 05/15/235 | | | 950,000 | | | | 973,750 | |
5.38% due 03/15/205 | | | 300,000 | | | | 302,625 | |
| Bumble Bee Holdco SCA | | | | | | | | |
9.63% due 03/15/184,5 | | | 1,100,000 | | | | 1,135,750 | |
| ADT Corp. | | | | | | | | |
6.25% due 10/15/214 | | | 1,050,000 | | | | 1,118,250 | |
| FTI Consulting, Inc. | | | | | | | | |
| 6.00% due 11/15/22 | | | 1,000,000 | | | | 1,051,270 | |
| KeHE Distributors LLC / KeHE Finance Corp. | | | | | | | | |
7.62% due 08/15/215 | | | 945,000 | | | | 1,002,881 | |
| Midas Intermediate Holdco II LLC / Midas Intermediate Holdco II Finance, Inc. | | | | | | | | |
7.87% due 10/01/225 | | | 950,000 | | | | 933,375 | |
| WEX, Inc. | | | | | | | | |
4.75% due 02/01/235 | | | 800,000 | | | | 794,000 | |
| Physio-Control International, Inc. | | | | | | | | |
9.87% due 01/15/195 | | | 700,000 | | | | 743,750 | |
| Halyard Health, Inc. | | | | | | | | |
| 6.25% due 10/15/22 | | | 550,000 | | | | 576,125 | |
| Valeant Pharmaceuticals International, Inc. | | | | | | | | |
5.50% due 03/01/235 | | | 550,000 | | | | 554,125 | |
| American Seafoods Group LLC / American Seafoods Finance, Inc. | | | | | | | | |
10.75% due 05/15/164,8 | | | 500,000 | | | | 468,750 | |
| US Foods, Inc. | | | | | | | | |
| 8.50% due 06/30/19 | | | 395,000 | | | | 414,750 | |
| Surgical Care Affiliates, Inc. | | | | | | | | |
6.00% due 04/01/235 | | | 400,000 | | | | 403,000 | |
| Nathan’s Famous, Inc. | | | | | | | | |
10.00% due 03/15/208 | | | 250,000 | | | | 262,500 | |
| Total Consumer, Non-cyclical | | | | | | | 17,427,455 | |
| | | | | | | | |
| FINANCIAL - 11.8% | |
| Jefferies Finance LLC / JFIN Company-Issuer Corp. | | | | | | | | |
7.50% due 04/15/215 | | | 1,450,000 | | | | 1,399,250 | |
7.37% due 04/01/205 | | | 800,000 | | | | 776,000 | |
| Bank of America Corp. | | | | | | | | |
| 4.20% due 08/26/24 | | | 750,000 | | | | 775,924 | |
6.10%1,2 | | | 700,000 | | | | 710,063 | |
| American Equity Investment Life Holding Co. | | | | | | | | |
6.62% due 07/15/214 | | | 1,350,000 | | | | 1,447,875 | |
| Icahn Enterprises Limited Partnership / Icahn Enterprises Finance Corp. | | | | | | | | |
5.88% due 02/01/224 | | | 1,400,000 | | | | 1,442,000 | |
| Credit Acceptance Corp. | | | | | | | | |
| 6.12% due 02/15/21 | | | 1,400,000 | | | | 1,340,500 | |
| Pacific Premier Bancorp, Inc. | | | | | | | | |
5.75% due 09/03/248 | | | 1,250,000 | | | | 1,287,500 | |
| HRG Group, Inc. | | | | | | | | |
| 7.88% due 07/15/19 | | | 585,000 | | | | 615,713 | |
7.75% due 01/15/225 | | | 400,000 | | | | 398,000 | |
| Kennedy-Wilson, Inc. | | | | | | | | |
| 5.88% due 04/01/24 | | | 1,000,000 | | | | 1,002,500 | |
| Citigroup, Inc. | | | | | | | | |
6.30%1,2 | | | 700,000 | | | | 714,874 | |
| Wilton Re Finance LLC | | | | | | | | |
5.88% due 03/30/331,5 | | | 650,000 | | | | 702,196 | |
| Ally Financial, Inc. | | | | | | | | |
| 4.63% due 03/30/25 | | | 650,000 | | | | 640,250 | |
| HSBC Holdings plc | | | | | | | | |
6.38%1,2 | | | 500,000 | | | | 511,250 | |
| EPR Properties | | | | | | | | |
| 5.75% due 08/15/22 | | | 450,000 | | | | 495,405 | |
| Lancashire Holdings Ltd. | | | | | | | | |
5.70% due 10/01/225 | | | 450,000 | | | | 493,146 | |
| Lock AS | | | | | | | | |
| 7.00% due 08/15/21 | | | EUR 400,000 | | | | 463,278 | |
| WP Carey, Inc. | | | | | | | | |
| 4.00% due 02/01/25 | | | 450,000 | | | | 451,264 | |
| Fidelity & Guaranty Life Holdings, Inc. | | | | | | | | |
6.37% due 04/01/215 | | | 350,000 | | | | 367,500 | |
| Majid AL Futtaim Holding | | | | | | | | |
| 7.12% due 12/31/49 | | | 300,000 | | | | 319,935 | |
| Cabot Financial Luxembourg S.A. | | | | | | | | |
6.50% due 04/01/215 | | | GBP 200,000 | | | | 279,521 | |
| Greystar Real Estate Partners LLC | | | | | | | | |
8.25% due 12/01/225 | | | 260,000 | | | | 272,350 | |
| Total Financial | | | | | | | 16,906,294 | |
| | | | | | | | |
| COMMUNICATIONS - 11.5% | |
| MDC Partners, Inc. | | | | | | | | |
6.75% due 04/01/204,5 | | | 2,000,000 | | | | 2,107,500 | |
| SITEL LLC / Sitel Finance Corp. | | | | | | | | |
11.00% due 08/01/175 | | | 1,557,000 | | | | 1,611,495 | |
| McGraw-Hill Global Education Holdings LLC / McGraw-Hill Global Education Finance | | | | | | | | |
| 9.75% due 04/01/21 | | | 1,300,000 | | | | 1,436,500 | |
| Sirius XM Radio, Inc. | | | | | | | | |
5.38% due 04/15/255 | | | 1,400,000 | | | | 1,407,000 | |
| WMG Acquisition Corp. | | | | | | | | |
6.75% due 04/15/224,5 | | | 1,450,000 | | | | 1,373,875 | |
| Unitymedia Hessen GmbH & Company KG / Unitymedia NRW GmbH | | | | | | | | |
5.00% due 01/15/255 | | | 1,100,000 | | | | 1,110,999 | |
| Avaya, Inc. | | | | | | | | |
7.00% due 04/01/195 | | | 950,000 | | | | 942,875 | |
| DISH DBS Corp. | | | | | | | | |
| 5.88% due 11/15/24 | | | 550,000 | | | | 550,688 | |
| 5.87% due 07/15/22 | | | 350,000 | | | | 355,688 | |
| 10 | THE GUGGENHEIM FUNDS SEMI-ANNUAL REPORT | SEE NOTES TO FINANCIAL STATEMENTS. |
SCHEDULE OF INVESTMENTS (Unaudited)(continued) | March 31, 2015 |
| HIGH YIELD FUND | |
| | | Face
Amount | | | Value | |
| | | | | | | | | |
| CSC Holdings LLC | | | | | | | | |
| 5.25% due 06/01/24 | | $ | 700,000 | | | $ | 713,999 | |
| IAC / InterActive Corp. | | | | | | | | |
| 4.75% due 12/15/22 | | | 600,000 | | | | 595,500 | |
| Sprint Corp. | | | | | | | | |
| 7.62% due 02/15/25 | | | 500,000 | | | | 497,500 | |
| Inmarsat Finance plc | | | | | | | | |
4.88% due 05/15/225 | | | 450,000 | | | | 450,000 | |
| Sprint Communications, Inc. | | | | | | | | |
7.00% due 03/01/204,5 | | | 400,000 | | | | 441,000 | |
| Level 3 Financing, Inc. | | | | | | | | |
| 9.38% due 04/01/19 | | | 400,000 | | | | 418,752 | |
| UPCB Finance IV Ltd. | | | | | | | | |
5.38% due 01/15/255 | | | 400,000 | | | | 400,000 | |
| Cogent Communications Group, Inc. | | | | | | | | |
5.37% due 03/01/225 | | | 400,000 | | | | 399,000 | |
| Sirius XM Canada Holdings, Inc. | | | | | | | | |
5.63% due 04/23/215 | | | CAD 500,000 | | | | 397,810 | |
| Alcatel-Lucent USA, Inc. | | | | | | | | |
8.87% due 01/01/205 | | | 350,000 | | | | 381,500 | |
| CenturyLink, Inc. | | | | | | | | |
| 5.63% due 04/01/25 | | | 350,000 | | | | 351,313 | |
| GCI, Inc. | | | | | | | | |
| 6.88% due 04/15/25 | | | 250,000 | | | | 251,875 | |
| VeriSign, Inc. | | | | | | | | |
| 5.25% due 04/01/25 | | | 200,000 | | | | 204,000 | |
| Expo Event Transco, Inc. | | | | | | | | |
9.00% due 06/15/215 | | | 85,000 | | | | 86,913 | |
| Total Communications | | | | | | | 16,485,782 | |
| | | | | | | | |
| CONSUMER, CYCLICAL - 10.1% | |
| GRD Holdings III Corp. | | | | | | | | |
10.75% due 06/01/194,5 | | | 2,250,000 | | | | 2,446,874 | |
| AmeriGas Finance LLC / AmeriGas Finance Corp. | | | | | | | | |
| 7.00% due 05/20/22 | | | 1,320,000 | | | | 1,415,699 | |
| 6.75% due 05/20/20 | | | 400,000 | | | | 421,000 | |
| Checkers Drive-In Restaurants, Inc. | | | | | | | | |
11.00% due 12/01/175 | | | 1,500,000 | | | | 1,632,180 | |
| Iron Mountain, Inc. | | | | | | | | |
| 6.12% due 09/15/22 | | | GBP 850,000 | | | | 1,328,200 | |
| Wynn Las Vegas LLC / Wynn Las Vegas Capital Corp. | | | | | | | | |
5.50% due 03/01/255 | | | 1,200,000 | | | | 1,215,000 | |
| Suburban Propane Partners Limited Partnership/Suburban Energy Finance Corp. | | | | | | | | |
| 5.50% due 06/01/24 | | | 650,000 | | | | 666,250 | |
| 7.37% due 08/01/21 | | | 149,000 | | | | 160,175 | |
| 5.75% due 03/01/25 | | | 100,000 | | | | 102,000 | |
| Rite Aid Corp. | | | | | | | | |
| 6.13% due 04/01/23 | | | 900,000 | | | | 922,500 | |
| WMG Acquisition Corp. | | | | | | | | |
6.00% due 01/15/215 | | | 600,000 | | | | 612,000 | |
5.62% due 04/15/225 | | | 150,000 | | | | 150,563 | |
| Petco Animal Supplies, Inc. | | | | | | | | |
9.25% due 12/01/185 | | | 550,000 | | | | 577,500 | |
| Ferrellgas Limited Partnership / Ferrellgas Finance Corp. | | | | | | | | |
| 6.75% due 01/15/22 | | | 450,000 | | | | 457,830 | |
| 6.50% due 05/01/21 | | | 100,000 | | | | 101,000 | |
| Men’s Wearhouse, Inc. | | | | | | | | |
7.00% due 07/01/224,5 | | | 400,000 | | | | 421,000 | |
| QVC, Inc. | | | | | | | | |
| 4.85% due 04/01/24 | | | 400,000 | | | | 415,822 | |
| Bumble Bee Holdings, Inc. | | | | | | | | |
9.00% due 12/15/175 | | | 324,000 | | | | 340,200 | |
| Seminole Hard Rock Entertainment Incorporated / Seminole Hard Rock International LLC | | | | | | | | |
5.88% due 05/15/215 | | | 250,000 | | | | 250,938 | |
| DreamWorks Animation SKG, Inc. | | | | | | | | |
6.87% due 08/15/205 | | | 245,000 | | | | 238,875 | |
| Family Tree Escrow LLC | | | | | | | | |
5.75% due 03/01/235 | | | 225,000 | | | | 236,813 | |
| Argos Merger Sub, Inc. | | | | | | | | |
7.12% due 03/15/235 | | | 150,000 | | | | 155,438 | |
| R&R Ice Cream plc | | | | | | | | |
8.25% due 05/15/208 | | | AUD 200,000 | | | | 149,690 | |
| Guitar Center, Inc. | | | | | | | | |
6.50% due 04/15/195 | | | 100,000 | | | | 87,250 | |
| Total Consumer, Cyclical | | | | | | | 14,504,797 | |
| | | | | | | | |
| TECHNOLOGY - 6.7% | |
| NCR Corp. | | | | | | | | |
6.38% due 12/15/234 | | | 1,050,000 | | | | 1,118,250 | |
| 5.87% due 12/15/21 | | | 400,000 | | | | 417,000 | |
| Audatex North America, Inc. | | | | | | | | |
6.13% due 11/01/234,5 | | | 1,400,000 | | | | 1,480,500 | |
| Micron Technology, Inc. | | | | | | | | |
| 5.25% due 08/01/23 | | | 1,400,000 | | | | 1,424,500 | |
| Eagle Midco, Inc. | | | | | | | | |
9.00% due 06/15/185 | | | 1,300,000 | | | | 1,324,375 | |
| Open Text Corp. | | | | | | | | |
5.63% due 01/15/235 | | | 1,050,000 | | | | 1,089,375 | |
| Aspect Software, Inc. | | | | | | | | |
10.62% due 05/15/173 | | | 1,235,000 | | | | 1,074,450 | |
| Infor US, Inc. | | | | | | | | |
| 6.50% due 05/15/22 | | | 1,000,000 | | | | 1,025,000 | |
| Epicor Software Corp. | | | | | | | | |
| 8.62% due 05/01/19 | | | 600,000 | | | | 627,000 | |
| Total Technology | | | | | | | 9,580,450 | |
| | | | | | | | |
| INDUSTRIAL - 6.0% | |
| CEVA Group plc | | | | | | | | |
7.00% due 03/01/215 | | | 1,450,000 | | | | 1,406,500 | |
| Amsted Industries, Inc. | | | | | | | | |
5.38% due 09/15/245 | | | 1,200,000 | | | | 1,199,999 | |
5.00% due 03/15/225 | | | 100,000 | | | | 100,625 | |
| SEE NOTES TO FINANCIAL STATEMENTS. | THE GUGGENHEIM FUNDS SEMI-ANNUAL REPORT | 11 |
SCHEDULE OF INVESTMENTS (Unaudited)(continued) | March 31, 2015 |
| HIGH YIELD FUND | |
| | | Face
Amount | | | Value | |
| | | | | | | | | |
| Marquette Transportation Company LLC / Marquette Transportation Finance Corp. | | | | | | | | |
| 10.87% due 01/15/17 | | $ | 755,000 | | | $ | 778,594 | |
| Reliance Intermediate Holdings, LP | | | | | | | | |
6.50% due 04/01/235 | | | 650,000 | | | | 664,625 | |
| BMBG Bond Finance SCA | | | | | | | | |
5.07% due 10/15/201,5 | | | EUR 550,000 | | | | 596,743 | |
| Ultra Resources, Inc. | | | | | | | | |
4.51% due 10/12/20†††,3 | | | 600,000 | | | | 549,720 | |
| LMI Aerospace, Inc. | | | | | | | | |
7.37% due 07/15/195 | | | 511,000 | | | | 514,833 | |
| VWR Funding, Inc. | | | | | | | | |
| 4.62% due 04/15/22 | | | EUR 450,000 | | | | 475,880 | |
| Actuant Corp. | | | | | | | | |
| 5.62% due 06/15/22 | | | 400,000 | | | | 414,500 | |
| Moto Finance plc | | | | | | | | |
| 6.37% due 09/01/20 | | | GBP 250,000 | | | | 374,624 | |
| Unifrax I LLC / Unifrax Holding Co. | | | | | | | | |
7.50% due 02/15/195 | | | 350,000 | | | | 351,750 | |
| Penske Truck Leasing Company Lp / PTL Finance Corp. | | | | | | | | |
3.38% due 02/01/225 | | | 350,000 | | | | 349,892 | |
| Vulcan Materials Co. | | | | | | | | |
| 4.50% due 04/01/25 | | | 300,000 | | | | 304,500 | |
| Novelis, Inc. | | | | | | | | |
| 8.38% due 12/15/17 | | | 250,000 | | | | 261,250 | |
| Moog, Inc. | | | | | | | | |
5.25% due 12/01/225 | | | 200,000 | | | | 206,000 | |
| Total Industrial | | | | | | | 8,550,035 | |
| | | | | | | | |
| BASIC MATERIALS - 4.4% | |
| Ineos Finance plc | | | | | | | | |
8.38% due 02/15/195 | | | 1,950,000 | | | | 2,073,240 | |
| KGHM International Ltd. | | | | | | | | |
7.75% due 06/15/194,5 | | | 1,600,000 | | | | 1,648,000 | |
| TPC Group, Inc. | | | | | | | | |
8.75% due 12/15/205 | | | 1,505,000 | | | | 1,377,075 | |
| Eldorado Gold Corp. | | | | | | | | |
6.12% due 12/15/205 | | | 975,000 | | | | 948,188 | |
| Mirabela Nickel Ltd. | | | | | | | | |
9.50% due 06/24/19†††,3 | | | 241,972 | | | | 241,972 | |
1.00% due 07/31/44†††,3 | | | 5,506 | | | | — | |
| Total Basic Materials | | | | | | | 6,288,475 | |
| | | | | | | | |
| UTILITIES - 1.8% | |
| LBC Tank Terminals Holding Netherlands BV | | | | | | | | |
6.88% due 05/15/235 | | | 1,250,000 | | | | 1,278,125 | |
| AES Corp. | | | | | | | | |
| 5.50% due 03/15/24 | | | 650,000 | | | | 648,375 | |
| 7.38% due 07/01/21 | | | 300,000 | | | | 333,000 | |
| 4.88% due 05/15/23 | | | 250,000 | | | | 243,750 | |
| Total Utilities | | | | | | | 2,503,250 | |
| | | | | | | | |
| DIVERSIFIED - 0.9% | |
| HRG Group, Inc. | | | | | | | | |
| 7.75% due 01/15/22 | �� | | 1,336,000 | | | | 1,329,320 | |
| Total Corporate Bonds | | | | | | | | |
| (Cost $118,202,053) | | | | | | | 114,932,742 | |
| | | | | | | | |
SENIOR FLOATING RATE INTERESTS††,1,7 - 25.9% | |
| INDUSTRIAL - 6.1% | |
| CareCore National LLC | | | | | | | | |
| 5.50% due 03/05/21 | | | 1,878,015 | | | | 1,887,405 | |
| Flakt Woods | | | | | | | | |
2.63% due 03/20/17†††,3 | | | EUR 1,608,900 | | | | 1,694,771 | |
| Mitchell International, Inc. | | | | | | | | |
| 8.50% due 10/11/21 | | | 1,250,000 | | | | 1,237,238 | |
| API Technologies Corp. | | | | | | | | |
9.00% due 02/06/18†††,3 | | | 587,511 | | | | 583,046 | |
| Hardware Holdings LLC | | | | | | | | |
6.75% due 03/30/203 | | | 597,000 | | | | 579,090 | |
| Hunter Defense Technologies | | | | | | | | |
| 6.50% due 08/05/19 | | | 487,500 | | | | 487,500 | |
| Mast Global | | | | | | | | |
8.75% due 09/12/19†††,3 | | | 428,705 | | | | 425,463 | |
| SIRVA Worldwide, Inc. | | | | | | | | |
| 7.50% due 03/27/19 | | | 392,000 | | | | 390,040 | |
| Hillman Group, Inc. | | | | | | | | |
3.48% due 06/13/193 | | | 414,286 | | | | 375,617 | |
| Connolly Corp. | | | | | | | | |
| 5.00% due 05/14/21 | | | 299,246 | | | | 300,557 | |
| Knowledge Learning Corp. | | | | | | | | |
| 5.25% due 03/18/21 | | | 297,000 | | | | 299,474 | |
| OneSky | | | | | | | | |
7.50% due 06/03/193 | | | 150,000 | | | | 154,500 | |
| Ceva Logistics US Holdings | | | | | | | | |
| 6.50% due 03/19/21 | | | 97,537 | | | | 91,156 | |
| Ceva Logistics Holdings BV (Dutch) | | | | | | | | |
| 6.50% due 03/19/21 | | | 70,714 | | | | 66,088 | |
| NANA Development Corp. | | | | | | | | |
8.00% due 03/15/183 | | | 66,667 | | | | 63,833 | |
| Ceva Group plc (United Kingdom) | | | | | | | | |
| 6.50% due 03/19/21 | | | 67,734 | | | | 63,303 | |
| Ceva Logistics Canada, ULC | | | | | | | | |
| 6.50% due 03/19/21 | | | 12,192 | | | | 11,395 | |
| Total Industrial | | | | | | | 8,710,476 | |
| | | | | | | | |
| CONSUMER, CYCLICAL - 5.4% | |
| Sky Bet | | | | | | | | |
| 6.50% due 02/25/22 | | | GBP 950,000 | | | | 1,404,188 | |
| Fitness International LLC | | | | | | | | |
| 5.50% due 07/01/20 | | | 1,192,119 | | | | 1,108,671 | |
| GCA Services Group, Inc. | | | | | | | | |
| 9.25% due 11/01/20 | | | 800,000 | | | | 792,000 | |
| Eyemart Express | | | | | | | | |
| 5.00% due 12/18/21 | | | 700,000 | | | | 703,500 | |
| 12 | THE GUGGENHEIM FUNDS SEMI-ANNUAL REPORT | SEE NOTES TO FINANCIAL STATEMENTS. |
SCHEDULE OF INVESTMENTS (Unaudited)(continued) | March 31, 2015 |
| HIGH YIELD FUND | |
| | | Face
Amount | | | Value | |
| | | | | | | | | |
| IntraWest Holdings S.à r.l. | | | | | | | | |
| 5.50% due 12/09/20 | | $ | 661,972 | | | $ | 665,904 | |
| DLK Acquisitions BV | | | | | | | | |
8.50% due 08/28/19†††,3 | | | EUR 700,000 | | | | 664,897 | |
| Ipreo Holdings | | | | | | | | |
| 4.25% due 08/06/21 | | | 598,875 | | | | 593,635 | |
| Talbots, Inc. | | | | | | | | |
| 4.75% due 03/19/20 | | | 526,015 | | | | 514,180 | |
| Alexander Mann Solutions Ltd. | | | | | | | | |
| 5.75% due 12/20/19 | | | 493,750 | | | | 488,813 | |
| National Vision, Inc. | | | | | | | | |
| 6.75% due 03/11/22 | | | 450,000 | | | | 437,625 | |
| Warner Music Group | | | | | | | | |
| 3.75% due 07/01/20 | | | 200,000 | | | | 195,000 | |
| BBB Industries, LLC | | | | | | | | |
4.18% due 10/17/193 | | | 121,429 | | | | 105,871 | |
| Total Consumer, Cyclical | | | | | | | 7,674,284 | |
| | | | | | | | |
| TECHNOLOGY - 4.4% | |
| Sparta Holding Corp. | | | | | | | | |
7.50% due 07/28/20††† | | | 897,750 | | | | 889,670 | |
| Greenway Medical Technologies | | | | | | | | |
9.25% due 11/04/213 | | | 550,000 | | | | 536,250 | |
6.00% due 11/04/203 | | | 345,625 | | | | 345,625 | |
| Advanced Computer Software | | | | | | | | |
| 6.50% due 01/31/22 | | | 550,000 | | | | 542,438 | |
| 10.50% due 01/31/23 | | | 300,000 | | | | 288,000 | |
| TIBCO Software, Inc. | | | | | | | | |
| 6.50% due 12/04/20 | | | 800,000 | | | | 799,248 | |
| Infor, Inc. | | | | | | | | |
| 3.75% due 06/03/20 | | | 600,000 | | | | 594,096 | |
| Micro Focus International plc | | | | | | | | |
| 5.25% due 11/19/21 | | | 400,000 | | | | 400,600 | |
| EIG Investors Corp. | | | | | | | | |
| 5.00% due 11/09/19 | | | 394,000 | | | | 395,233 | |
| Evergreen Skill | | | | | | | | |
| 5.75% due 04/28/21 | | | 396,850 | | | | 391,889 | |
| Telx Group | | | | | | | | |
| 7.50% due 04/09/21 | | | 300,000 | | | | 295,875 | |
| Flexera Software LLC | | | | | | | | |
| 8.00% due 04/02/21 | | | 250,000 | | | | 243,750 | |
| Quorum Business Solutions | | | | | | | | |
| 5.75% due 08/07/21 | | | 219,450 | | | | 214,512 | |
| GlobalLogic Holdings, Inc. | | | | | | | | |
| 6.25% due 05/31/19 | | | 197,500 | | | | 196,019 | |
| Active Network, Inc., The | | | | | | | | |
| 5.50% due 11/13/20 | | | 148,497 | | | | 147,817 | |
| Total Technology | | | | | | | 6,281,022 | |
| | | | | | | | |
| FINANCIAL - 3.5% | |
| York Risk Services | | | | | | | | |
| 4.75% due 10/01/21 | | | 746,250 | | | | 743,137 | |
| Cunningham Lindsey U.S., Inc. | | | | | | | | |
| 9.25% due 06/10/20 | | | 623,636 | | | | 603,368 | |
| Magic Newco, LLC | | | | | | | | |
| 12.00% due 06/12/19 | | | 500,000 | | | | 543,750 | |
| Intertrust Group | | | | | | | | |
| 7.28% due 04/11/22 | | | 500,000 | | | | 497,710 | |
| Expert Global Solutions | | | | | | | | |
| 8.50% due 04/03/18 | | | 477,734 | | | | 476,339 | |
| Lineage Logistics LLC | | | | | | | | |
| 4.50% due 04/07/21 | | | 445,500 | | | | 441,326 | |
| Safe-Guard | | | | | | | | |
| 6.25% due 08/19/21 | | | 441,321 | | | | 439,115 | |
| Transunion Holding Co. | | | | | | | | |
| 4.00% due 04/09/21 | | | 350,000 | | | | 349,783 | |
| Trademonster | | | | | | | | |
7.25% due 08/29/19††† | | | 349,125 | | | | 347,554 | |
| National Financial Partners Corp. | | | | | | | | |
| 4.50% due 07/01/20 | | | 246,263 | | | | 245,392 | |
| STG-Fairway Acquisitions, Inc. | | | | | | | | |
| 6.25% due 02/28/19 | | | 245,003 | | | | 243,471 | |
| Total Financial | | | | | | | 4,930,945 | |
| | | | | | | | |
| CONSUMER, NON-CYCLICAL - 2.7% | |
| Dollar Tree, Inc. | | | | | | | | |
| 4.25% due 03/09/22 | | | 950,000 | | | | 959,633 | |
| Reddy Ice Holdings, Inc. | | | | | | | | |
6.75% due 04/01/193 | | | 588,000 | | | | 514,500 | |
| NES Global Talent | | | | | | | | |
| 6.50% due 10/03/19 | | | 521,442 | | | | 495,370 | |
| AdvancePierre Foods, Inc. | | | | | | | | |
| 9.50% due 10/10/17 | | | 461,000 | | | | 461,576 | |
| CTI Foods Holding Co. LLC | | | | | | | | |
| 8.25% due 06/28/21 | | | 340,000 | | | | 334,050 | |
| Pelican Products, Inc. | | | | | | | | |
| 9.25% due 04/09/21 | | | 300,000 | | | | 297,000 | |
| Performance Food Group | | | | | | | | |
| 6.25% due 11/14/19 | | | 245,625 | | | | 245,829 | |
| Valeant Pharmaceuticals International, Inc. | | | | | | | | |
| 4.00% due 03/11/22 | | | 198,193 | | | | 199,025 | |
| Targus Group International, Inc. | | | | | | | | |
14.75% due 05/24/163 | | | 224,526 | | | | 177,937 | |
| Arctic Glacier Holdings, Inc. | | | | | | | | |
| 6.00% due 05/10/19 | | | 169,519 | | | | 168,248 | |
| Total Consumer, Non-cyclical | | | | | | | 3,853,168 | |
| | | | | | | | |
| COMMUNICATIONS - 2.3% | |
| Cartrawler | | | | | | | | |
| 4.25% due 04/29/21 | | | EUR 650,000 | | | | 696,116 | |
| Lions Gate Entertainment Corp. | | | | | | | | |
| 5.00% due 03/11/22 | | | 550,000 | | | | 550,457 | |
| Anaren, Inc. | | | | | | | | |
| 9.25% due 08/18/21 | | | 500,000 | | | | 495,000 | |
| Cengage Learning Acquisitions, Inc. | | | | | | | | |
| 7.00% due 03/31/20 | | | 456,597 | | | | 457,903 | |
| Avaya, Inc. | | | | | | | | |
| 6.50% due 03/31/18 | | | 441,769 | | | | 440,360 | |
| SEE NOTES TO FINANCIAL STATEMENTS. | THE GUGGENHEIM FUNDS SEMI-ANNUAL REPORT | 13 |
SCHEDULE OF INVESTMENTS (Unaudited)(concluded) | March 31, 2015 |
| HIGH YIELD FUND | |
| | | Face
Amount | | | Value | |
| | | | | | | | | |
| Gogo LLC | | | | | | | | |
| 7.50% due 03/21/18 | | $ | 435,463 | | | $ | 418,045 | |
| MergerMarket Ltd. | | | | | | | | |
| 4.50% due 02/04/21 | | | 297,000 | | | | 288,090 | |
| Total Communications | | | | | | | 3,345,971 | |
| | | | | | | | |
| ENERGY - 0.7% | |
| PSS Companies | | | | | | | | |
| 5.50% due 01/28/20 | | | 542,534 | | | | 425,889 | |
| Cactus Wellhead | | | | | | | | |
| 7.00% due 07/31/20 | | | 447,750 | | | | 273,128 | |
| FTS International | | | | | | | | |
| 5.75% due 04/16/21 | | | 261,818 | | | | 202,092 | |
| Magnum Hunter Resources | | | | | | | | |
| 8.50% due 10/22/19 | | | 158,751 | | | | 156,303 | |
| Total Energy | | | | | | | 1,057,412 | |
| | | | | | | | |
| UTILITIES - 0.5% | |
| Veresen Midstream LP | | | | | | | | |
| 6.00% due 04/01/22 | | | 750,000 | | | | 748,688 | |
| | | | | | | | |
| BASIC MATERIALS - 0.3% | |
| Atkore International, Inc. | | | | | | | | |
| 7.75% due 10/09/21 | | | 450,000 | | | | 434,250 | |
| Total Senior Floating Rate Interests | | | | | | | | |
| (Cost $38,317,368) | | | | | | | 37,036,216 | |
| | | | | | | | |
ASSET-BACKED SECURITIES†† - 0.5% | |
| ALM XIV Ltd. | | | | | | | | |
2014-14A, 3.71% due 07/28/261,5 | | | 800,000 | | | | 759,680 | |
| Total Asset-Backed Securities | | | | | | | | |
| (Cost $762,607) | | | | | | | 759,680 | |
| | | | | | | | |
COLLATERALIZED MORTGAGE OBLIGATIONS†† - 0.3% | |
| SRERS Funding Ltd. | | | | | | | | |
2011-RS, 0.43% due 05/09/461,5 | | | 495,599 | | | | 471,215 | |
| Total Collateralized Mortgage Obligations | | | | | | | | |
| (Cost $459,230) | | | | | | | 471,215 | |
| | | | | | | | |
| Total Investments - 113.9% | | | | | | | | |
| (Cost $167,713,214) | | | | | | $ | 162,950,671 | |
| Other Assets & Liabilities, net - (13.9)% | | | | | | | (19,829,265 | ) |
| Total Net Assets - 100.0% | | | | | | $ | 143,121,406 | |
| | | | | | | | | |
FORWARD FOREIGN CURRENCY EXCHANGE CONTRACTS†† | |
| Counterparty | | Contracts to Sell | | Currency | Settlement Date | | Settlement Value | | | Value at
March 31, 2015 | | | Net Unrealized Appreciation | |
| BNY Mellon | | | 4,570,000 | | EUR | 04/07/15 | | $ | 5,035,500 | | | $ | 4,913,459 | | | $ | 122,041 | |
| BNY Mellon | | | 2,850,000 | | GBP | 04/07/15 | | | 4,301,972 | | | | 4,228,586 | | | | 73,387 | |
| BNY Mellon | | | 500,000 | | CAD | 04/07/15 | | | 400,590 | | | | 394,774 | | | | 5,816 | |
| BNY Mellon | | | 290,000 | | AUD | 04/07/15 | | | 225,350 | | | | 220,792 | | | | 4,558 | |
| | | | | | | | | | | | | | | | | $ | 205,802 | |
| * | Non-income producing security. |
| † | Value determined based on Level 1 inputs, unless otherwise noted — See Note 4. |
| †† | Value determined based on Level 2 inputs, unless otherwise noted — See Note 4. |
| ††† | Value determined based on Level 3 inputs — See Note 4. |
| 1 | Variable rate security. Rate indicated is rate effective at March 31, 2015. |
| 2 | Perpetual maturity. |
| 3 | Illiquid security. |
| 4 | Security or a portion thereof is held as collateral for reverse repurchase agreements — See Note 12. |
| 5 | Security is a 144A or Section 4(a)(2) security. The total market value of 144A or Section 4(a)(2) securities is $63,956,460 (cost $64,305,720), or 44.7% of total net assets. These securities have been determined to be liquid under guidelines established by the Board of Trustees. |
| 6 | Security is in default of interest and/or principal obligations. |
| 7 | The face amount is denominated in U.S. Dollars unless otherwise indicated. |
| 8 | Security is a 144A or Section 4(a)(2) security. These securities are considered illiquid and restricted under guidelines established by the Board of Trustees. The total market value of 144A or Section 4(a)(2) securities is $2,755,829 (cost $2,970,974), or 1.9% of total net assets — See Note 14. |
| plc — Public Limited Company |
| REIT — Real Estate Investment Trust |
| |
| See Sector Classification in Other Information section. |
| 14 | THE GUGGENHEIM FUNDS SEMI-ANNUAL REPORT | SEE NOTES TO FINANCIAL STATEMENTS. |
STATEMENT OF ASSETS AND LIABILITIES (Unaudited)
March 31, 2015
| Assets: | |
| Investments, at value (cost $167,713,214) | | $ | 162,950,671 | |
| Foreign currency, at value (cost $1,239,226) | | | 1,238,199 | |
| Cash | | | 956,531 | |
| Unrealized appreciation on forward foreign currency exchange contracts | | | 205,802 | |
| Prepaid expenses | | | 28,930 | |
| Receivables: | |
| Securities sold | | | 2,440,608 | |
| Interest | | | 2,353,995 | |
| Fund shares sold | | | 627,475 | |
| Dividends | | | 14,876 | |
| Foreign taxes reclaim | | | 2,954 | |
| Total assets | | | 170,820,041 | |
| | | | | |
| Liabilities: | |
| Reverse Repurchase Agreements | | | 20,355,264 | |
| Unfunded loan commitments, at value (Note 10) (proceeds $1,070,063) | | | 925,676 | |
| Payable for: | |
| Securities purchased | | | 5,771,389 | |
| Fund shares redeemed | | | 335,147 | |
| Management fees | | | 60,804 | |
| Distribution and service fees | | | 26,567 | |
| Fund accounting/administration fees | | | 11,387 | |
| Transfer agent/maintenance fees | | | 10,594 | |
| Trustees’ fees* | | | 4,835 | |
| Miscellaneous | | | 196,972 | |
| Total liabilities | | | 27,698,635 | |
| Net assets | | $ | 143,121,406 | |
| | | | | |
| Net assets consist of: | |
| Paid in capital | | $ | 148,228,052 | |
| Distributions in excess of net investment income | | | (884,880 | ) |
| Accumulated net realized gain on investments | | | 192,365 | |
| Net unrealized depreciation on investments | | | (4,414,131 | ) |
| Net assets | | $ | 143,121,406 | |
| | | | | |
| A-Class: | |
| Net assets | | $ | 70,523,690 | |
| Capital shares outstanding | | | 6,176,841 | |
| Net asset value per share | | $ | 11.42 | |
| Maximum offering price per share (Net asset value divided by 95.25%) | | $ | 11.99 | |
| | | | | |
| B-Class: | |
| Net assets | | $ | 904,054 | |
| Capital shares outstanding | | | 79,751 | |
| Net asset value per share | | $ | 11.34 | |
| | | | | |
| C-Class: | |
| Net assets | | $ | 13,969,261 | |
| Capital shares outstanding | | | 1,213,885 | |
| Net asset value per share | | $ | 11.51 | |
| | | | | |
| Institutional Class: | |
| Net assets | | $ | 57,724,401 | |
| Capital shares outstanding | | | 6,194,656 | |
| Net asset value per share | | $ | 9.32 | |
STATEMENT OF OPERATIONS (Unaudited)
Period Ended March 31, 2015
| Investment Income: | |
| Interest (net of foreign withholding tax of $2,887) | | $ | 4,799,701 | |
| Dividends | | | 197,206 | |
| Total investment income | | | 4,996,907 | |
| | | | | |
| Expenses: | |
| Management fees | | | 407,296 | |
| Transfer agent/maintenance fees: | |
| A-Class | | | 63,139 | |
| B-Class | | | 8,251 | |
| C-Class | | | 11,840 | |
| Institutional Class | | | 13,479 | |
| Distribution and service fees: | |
| A-Class | | | 93,418 | |
| C-Class | | | 69,123 | |
| Fund accounting/administration fees | | | 64,487 | |
| Registration fees | | | 44,946 | |
| Interest expense | | | 22,407 | |
| Line of credit fees | | | 8,693 | |
| Trustees’ fees* | | | 8,453 | |
| Custodian fees | | | 910 | |
| Tax expense | | | 88 | |
| Miscellaneous | | | 55,257 | |
| Total expenses | | | 871,787 | |
| Less: | |
| Expenses waived by Adviser | | | (60,245 | ) |
| Net expenses | | | 811,542 | |
| Net investment income | | | 4,185,365 | |
| | | | | |
| Net Realized and Unrealized Gain (Loss): | |
| Net realized gain (loss) on: | |
| Investments | | | (986,423 | ) |
| Foreign currency | | | (530,860 | ) |
| Forward foreign currency exchange contracts | | | 1,625,653 | |
| Net realized gain | | | 108,370 | |
| Net change in unrealized appreciation (depreciation) on: | |
| Investments | | | (3,764,270 | ) |
| Foreign currency | | | 37,685 | |
| Forward foreign currency exchange contracts | | | (266,505 | ) |
| Net change in unrealized appreciation (depreciation) | | | (3,993,090 | ) |
| Net realized and unrealized loss | | | (3,884,720 | ) |
| Net increase in net assets resulting from operations | | $ | 300,645 | |
| * | Relates to Trustees not deemed “interested persons” within the meaning of Section 2(a)(19) of the 1940 Act. |
| SEE NOTES TO FINANCIAL STATEMENTS. | THE GUGGENHEIM FUNDS SEMI-ANNUAL REPORT | 15 |
STATEMENTS OF CHANGES IN NET ASSETS
| | | Period Ended March 31, 2015 (Unaudited) | | | Year Ended September 30, 2014 | |
| Increase (Decrease) in Net Assets from Operations: | | | | | | |
| Net investment income | | $ | 4,185,365 | | | $ | 7,512,555 | |
| Net realized gain on investments | | | 108,370 | | | | 4,836,256 | |
| Net change in unrealized appreciation (depreciation) on investments | | | (3,993,090 | ) | | | (2,985,500 | ) |
| Net increase in net assets resulting from operations | | | 300,645 | | | | 9,363,311 | |
| | | | | | | | | |
| Distributions to shareholders from: | | | | | | | | |
| Net investment income | | | | | | | | |
| A-Class | | | (2,640,671 | ) | | | (5,820,148 | ) |
| B-Class | | | (37,946 | ) | | | (99,790 | ) |
| C-Class | | | (432,399 | ) | | | (738,796 | ) |
| Institutional Class | | | (1,695,750 | ) | | | (1,911,261 | ) |
| Net realized gains | | | | | | | | |
| A-Class | | | (1,532,517 | ) | | | — | |
| B-Class | | | (20,686 | ) | | | — | |
| C-Class | | | (263,520 | ) | | | — | |
| Institutional Class | | | (944,650 | ) | | | — | |
| Total distributions to shareholders | | | (7,568,139 | ) | | | (8,569,995 | ) |
| | | | | | | | | |
| Capital share transactions: | | | | | | | | |
| Proceeds from sale of shares | | | | | | | | |
| A-Class | | | 11,084,739 | | | | 62,904,723 | |
| B-Class | | | 6,837 | | | | 142,328 | |
| C-Class | | | 2,203,161 | | | | 7,344,432 | |
| Institutional Class | | | 37,006,994 | | | | 28,060,805 | |
| Redemption fees collected | | | | | | | | |
| A-Class | | | 26,352 | | | | 66,165 | |
| B-Class | | | 364 | | | | 1,013 | |
| C-Class | | | 5,050 | | | | 9,220 | |
| Institutional Class | | | 18,453 | | | | 19,942 | |
| Distributions reinvested | | | | | | | | |
| A-Class | | | 3,845,833 | | | | 5,125,824 | |
| B-Class | | | 53,716 | | | | 93,097 | |
| C-Class | | | 534,768 | | | | 552,770 | |
| Institutional Class | | | 1,822,951 | | | | 1,189,371 | |
| Cost of shares redeemed | | | | | | | | |
| A-Class | | | (22,926,563 | ) | | | (56,529,637 | ) |
| B-Class | | | (273,840 | ) | | | (782,961 | ) |
| C-Class | | | (2,705,903 | ) | | | (2,735,624 | ) |
| Institutional Class | | | (15,898,479 | ) | | | (11,032,316 | ) |
| Net increase from capital share transactions | | | 14,804,433 | | | | 34,429,152 | |
| Net increase in net assets | | | 7,536,939 | | | | 35,222,468 | |
| | | | | | | | | |
| Net assets: | | | | | | | | |
| Beginning of period | | | 135,584,467 | | | | 100,361,999 | |
| End of period | | $ | 143,121,406 | | | $ | 135,584,467 | |
| Distributions in excess of net investment income at end of period | | $ | (884,880 | ) | | $ | (263,479 | ) |
| 16 | THE GUGGENHEIM FUNDS SEMI-ANNUAL REPORT | SEE NOTES TO FINANCIAL STATEMENTS. |
STATEMENTS OF CHANGES IN NET ASSETS (concluded)
| | | Period Ended March 31, 2015 (Unaudited) | | | Year Ended September 30, 2014 | |
| Capital share activity: | | | | | | |
| Shares sold | | | | | | |
| A-Class | | | 958,798 | | | | 5,157,454 | |
| B-Class | | | 572 | | | | 11,694 | |
| C-Class | | | 189,934 | | | | 596,582 | |
| Institutional Class | | | 3,948,738 | | | | 2,794,173 | |
| Shares issued from reinvestment of distributions | | | | | | | | |
| A-Class | | | 333,717 | | | | 420,028 | |
| B-Class | | | 4,693 | | | | 7,688 | |
| C-Class | | | 46,074 | | | | 44,965 | |
| Institutional Class | | | 194,137 | | | | 118,766 | |
| Shares redeemed | | | | | | | | |
| A-Class | | | (2,007,183 | ) | | | (4,630,360 | ) |
| B-Class | | | (23,963 | ) | | | (64,801 | ) |
| C-Class | | | (232,907 | ) | | | (222,849 | ) |
| Institutional Class | | | (1,686,033 | ) | | | (1,101,374 | ) |
| Net increase in shares | | | 1,726,577 | | | | 3,131,966 | |
| SEE NOTES TO FINANCIAL STATEMENTS. | THE GUGGENHEIM FUNDS SEMI-ANNUAL REPORT | 17 |
This table is presented to show selected data for a share outstanding throughout each period and to assist shareholders in evaluating a Fund’s performance for the periods presented.
| A-Class | | Period Ended March 31, 2015a | | | Year Ended September 30, 2014 | | | Year Ended September 30, 2013 | | | Period Ended September 30, 2012f | | | Year Ended December 31, 2011 | | | Year Ended December 31, 2010 | | | Year Ended December 31, 2009 | |
| Per Share Data | | | | | | | | | | | | | | | | | | | | | |
| Net asset value, beginning of period | | $ | 12.02 | | | $ | 11.85 | | | $ | 11.95 | | | $ | 11.12 | | | $ | 12.89 | | | $ | 12.07 | | | $ | 7.70 | |
| Income (loss) from investment operations: | |
Net investment income (loss)c | | | .36 | | | | .72 | | | | .81 | | | | .58 | | | | .87 | | | | .96 | | | | .90 | |
| Net gain (loss) on investments (realized and unrealized) | | | (.34 | ) | | | .27 | | | | .27 | | | | .84 | | | | (1.30 | ) | | | .78 | | | | 4.30 | |
| Total from investment operations | | | .02 | | | | .99 | | | | 1.08 | | | | 1.42 | | | | (.43 | ) | | | 1.74 | | | | 5.20 | |
| Less distributions from: | |
| Net investment income | | | (.40 | ) | | | (.83 | ) | | | (.90 | ) | | | (.59 | ) | | | (1.07 | ) | | | (.92 | ) | | | (.83 | ) |
| Net realized gains | | | (.22 | ) | | | — | | | | (.29 | ) | | | — | | | | (.27 | ) | | | — | | | | — | |
| Return of capital | | | — | | | | — | | | | — | | | | — | | | | — | | | | — | | | | (— | )h |
| Total distributions | | | (.62 | ) | | | (.83 | ) | | | (1.19 | ) | | | (.59 | ) | | | (1.34 | ) | | | (.92 | ) | | | (.83 | ) |
| Redemption fees collected | | | — | d | | | .01 | | | | .01 | | | | — | d | | | — | | | | — | | | | — | |
| Net asset value, end of period | | $ | 11.42 | | | $ | 12.02 | | | $ | 11.85 | | | $ | 11.95 | | | $ | 11.12 | | | $ | 12.89 | | | $ | 12.07 | |
| | |
Total Returng | | | 0.27 | % | | | 9.18 | % | | | 9.54 | % | | | 12.93 | % | | | (3.50 | %) | | | 14.92 | % | | | 70.53 | % |
| Ratios/Supplemental Data | |
| Net assets, end of period (in thousands) | | $ | 70,524 | | | $ | 82,854 | | | $ | 70,451 | | | $ | 64,174 | | | $ | 86,041 | | | $ | 172,443 | | | $ | 155,899 | |
| Ratios to average net assets: | |
| Net investment income (loss) | | | 6.16 | % | | | 5.91 | % | | | 6.84 | % | | | 7.19 | % | | | 6.92 | % | | | 7.69 | % | | | 8.49 | % |
| Total expenses | | | 1.32 | % | | | 1.32 | % | | | 1.41 | % | | | 1.44 | % | | | 1.34 | % | | | 1.28 | % | | | 1.41 | % |
Net expensese,i | | | 1.21 | % | | | 1.26 | % | | | 1.18 | % | | | 1.17 | % | | | 1.18 | % | | | 1.14 | % | | | 1.10 | % |
| Portfolio turnover rate | | | 32 | % | | | 97 | % | | | 101 | % | | | 55 | % | | | 102 | % | | | 77 | % | | | 53 | % |
| 18 | THE GUGGENHEIM FUNDS SEMI-ANNUAL REPORT | SEE NOTES TO FINANCIAL STATEMENTS. |
FINANCIAL HIGHLIGHTS (continued)
This table is presented to show selected data for a share outstanding throughout each period and to assist shareholders in evaluating a Fund’s performance for the periods presented.
| B-Class | | Period Ended March 31, 2015a,b | | | Year Ended September 30, 2014b | | | Year Ended September 30, 2013b | | | Period Ended September 30, 2012b,f | | | Year Ended December 31, 2011b | | | Year Ended December 31, 2010b | | | Year Ended December 31, 2009b | |
| Per Share Data | | | | | | | | | | | | | | | | | | | | | |
| Net asset value, beginning of period | | $ | 11.94 | | | $ | 11.77 | | | $ | 11.89 | | | $ | 11.07 | | | $ | 12.84 | | | $ | 12.05 | | | $ | 7.67 | |
| Income (loss) from investment operations: | |
Net investment income (loss)c | | | .37 | | | | .75 | | | | .84 | | | | .62 | | | | .92 | | | | 1.00 | | | | .92 | |
| Net gain (loss) on investments (realized and unrealized) | | | (.33 | ) | | | .26 | | | | .26 | | | | .81 | | | | (1.32 | ) | | | .78 | | | | 4.30 | |
| Total from investment operations | | | .04 | | | | 1.01 | | | | 1.10 | | | | 1.43 | | | | (.40 | ) | | | 1.78 | | | | 5.22 | |
| Less distributions from: | |
| Net investment income | | | (.42 | ) | | | (.85 | ) | | | (.94 | ) | | | (.61 | ) | | | (1.10 | ) | | | (.99 | ) | | | (.84 | ) |
| Net realized gains | | | (.22 | ) | | | — | | | | (.29 | ) | | | — | | | | (.27 | ) | | | — | | | | — | |
| Return of capital | | | — | | | | — | | | | — | | | | — | | | | — | | | | — | | | | (— | )h |
| Total distributions | | | (.64 | ) | | | (.85 | ) | | | (1.23 | ) | | | (.61 | ) | | | (1.37 | ) | | | (.99 | ) | | | (.84 | ) |
| Redemption fees collected | | | — | d | | | .01 | | | | .01 | | | | — | d | | | — | | | | — | | | | — | |
| Net asset value, end of period | | $ | 11.34 | | | $ | 11.94 | | | $ | 11.77 | | | $ | 11.89 | | | $ | 11.07 | | | $ | 12.84 | | | $ | 12.05 | |
| | |
Total Returng | | | 0.37 | % | | | 9.46 | % | | | 9.79 | % | | | 13.20 | % | | | (3.32 | %) | | | 15.28 | % | | | 71.07 | % |
| Ratios/Supplemental Data | |
| Net assets, end of period (in thousands) | | $ | 904 | | | $ | 1,176 | | | $ | 1,693 | | | $ | 2,162 | | | $ | 2,777 | | | $ | 4,872 | | | $ | 6,996 | |
| Ratios to average net assets: | |
| Net investment income (loss) | | | 6.40 | % | | | 6.17 | % | | | 7.10 | % | | | 7.43 | % | | | 7.38 | % | | | 8.01 | % | | | 9.08 | % |
| Total expenses | | | 2.48 | % | | | 1.87 | % | | | 1.89 | % | | | 1.62 | % | | | 1.10 | % | | | 1.04 | % | | | 1.19 | % |
Net expensese,i | | | 0.96 | % | | | 1.00 | % | | | 0.93 | % | | | 0.92 | % | | | 0.94 | % | | | 0.89 | % | | | 0.85 | % |
| Portfolio turnover rate | | | 32 | % | | | 97 | % | | | 101 | % | | | 55 | % | | | 102 | % | | | 77 | % | | | 53 | % |
| SEE NOTES TO FINANCIAL STATEMENTS. | THE GUGGENHEIM FUNDS SEMI-ANNUAL REPORT | 19 |
FINANCIAL HIGHLIGHTS (continued)
This table is presented to show selected data for a share outstanding throughout each period and to assist shareholders in evaluating a Fund’s performance for the periods presented.
| C-Class | | Period Ended March 31, 2015a | | | Year Ended September 30, 2014 | | | Year Ended September 30, 2013 | | | Period Ended September 30, 2012f | | | Year Ended December 31, 2011 | | | Year Ended December 31, 2010 | | | Year Ended December 31, 2009 | |
| Per Share Data | | | | | | | | | | | | | | | | | | | | | |
| Net asset value, beginning of period | | $ | 12.12 | | | $ | 11.95 | | | $ | 12.03 | | | $ | 11.20 | | | $ | 12.97 | | | $ | 12.14 | | | $ | 7.73 | |
| Income (loss) from investment operations: | |
Net investment income (loss)c | | | .31 | | | | .63 | | | | .73 | | | | .56 | | | | .79 | | | | .87 | | | | .83 | |
| Net gain (loss) on investments (realized and unrealized) | | | (.34 | ) | | | .27 | | | | .27 | | | | .80 | | | | (1.32 | ) | | | .79 | | | | 4.33 | |
| Total from investment operations | | | (.03 | ) | | | .90 | | | | 1.00 | | | | 1.36 | | | | (.53 | ) | | | 1.66 | | | | 5.16 | |
| Less distributions from: | |
| Net investment income | | | (.36 | ) | | | (.74 | ) | | | (.80 | ) | | | (.53 | ) | | | (.97 | ) | | | (.83 | ) | | | (.75 | ) |
| Net realized gains | | | (.22 | ) | | | — | | | | (.29 | ) | | | — | | | | (.27 | ) | | | — | | | | — | |
| Return of capital | | | — | | | | — | | | | — | | | | — | | | | — | | | | — | | | | (— | )h |
| Total distributions | | | (.58 | ) | | | (.74 | ) | | | (1.09 | ) | | | (.53 | ) | | | (1.24 | ) | | | (.83 | ) | | | (.75 | ) |
| Redemption fees collected | | | — | d | | | .01 | | | | .01 | | | | — | d | | | — | | | | — | | | | — | |
| Net asset value, end of period | | $ | 11.51 | | | $ | 12.12 | | | $ | 11.95 | | | $ | 12.03 | | | $ | 11.20 | | | $ | 12.97 | | | $ | 12.14 | |
| | |
Total Returng | | | (0.17 | %) | | | 8.46 | % | | | 8.69 | % | | | 12.33 | % | | | (4.30 | %) | | | 14.07 | % | | | 69.42 | % |
| Ratios/Supplemental Data | |
| Net assets, end of period (in thousands) | | $ | 13,969 | | | $ | 14,674 | | | $ | 9,463 | | | $ | 9,054 | | | $ | 7,991 | | | $ | 10,264 | | | $ | 8,048 | |
| Ratios to average net assets: | |
| Net investment income (loss) | | | 5.40 | % | | | 5.14 | % | | | 6.10 | % | | | 6.37 | % | | | 6.32 | % | | | 6.92 | % | | | 8.11 | % |
| Total expenses | | | 2.07 | % | | | 2.09 | % | | | 2.17 | % | | | 2.19 | % | | | 2.08 | % | | | 2.04 | % | | | 2.19 | % |
Net expensese,i | | | 1.96 | % | | | 2.01 | % | | | 1.93 | % | | | 1.92 | % | | | 1.94 | % | | | 1.89 | % | | | 1.85 | % |
| Portfolio turnover rate | | | 32 | % | | | 97 | % | | | 101 | % | | | 55 | % | | | 102 | % | | | 77 | % | | | 53 | % |
| 20 | THE GUGGENHEIM FUNDS SEMI-ANNUAL REPORT | SEE NOTES TO FINANCIAL STATEMENTS. |
FINANCIAL HIGHLIGHTS (concluded)
This table is presented to show selected data for a share outstanding throughout each period and to assist shareholders in evaluating a Fund’s performance for the periods presented.
| Institutional Class | | Period Ended March 31, 2015a | | | Year Ended September 30, 2014 | | | Year Ended September 30, 2013 | | | Period Ended September 30, 2012f | | | Year Ended December 31, 2011 | | | Year Ended December 31, 2010 | | | Year Ended December 31, 2009 | |
| Per Share Data | | | | | | | | | | | | | | | | | | | | | |
| Net asset value, beginning of period | | $ | 9.87 | | | $ | 9.74 | | | $ | 9.90 | | | $ | 9.26 | | | $ | 10.96 | | | $ | 10.47 | | | $ | 6.74 | |
| Income (loss) from investment operations: | |
Net investment income (loss)c | | | .30 | | | | .61 | | | | .70 | | | | .55 | | | | .79 | | | | .86 | | | | .81 | |
| Net gain (loss) on investments (realized and unrealized) | | | (.28 | ) | | | .23 | | | | .22 | | | | .64 | | | | (1.12 | ) | | | .68 | | | | 3.76 | |
| Total from investment operations | | | .02 | | | | .84 | | | | .92 | | | | 1.19 | | | | (.33 | ) | | | 1.54 | | | | 4.57 | |
| Less distributions from: | |
| Net investment income | | | (.35 | ) | | | (.72 | ) | | | (.80 | ) | | | (.55 | ) | | | (1.10 | ) | | | (1.05 | ) | | | (.84 | ) |
| Net realized gains | | | (.22 | ) | | | — | | | | (.29 | ) | | | — | | | | (.27 | ) | | | — | | | | — | |
| Return of capital | | | — | | | | — | | | | — | | | | — | | | | — | | | | — | | | | (— | )h |
| Total distributions | | | (.57 | ) | | | (.72 | ) | | | (1.09 | ) | | | (.55 | ) | | | (1.37 | ) | | | (1.05 | ) | | | (.84 | ) |
| Redemption fees collected | | | — | d | | | .01 | | | | .01 | | | | — | d | | | — | | | | — | | | | — | |
| Net asset value, end of period | | $ | 9.32 | | | $ | 9.87 | | | $ | 9.74 | | | $ | 9.90 | | | $ | 9.26 | | | $ | 10.96 | | | $ | 10.47 | |
| | |
Total Returng | | | 0.30 | % | | | 9.50 | % | | | 9.97 | % | | | 13.17 | % | | | (3.30 | %) | | | 15.33 | % | | | 71.18 | % |
| Ratios/Supplemental Data | |
| Net assets, end of period (in thousands) | | $ | 57,724 | | | $ | 36,880 | | | $ | 18,755 | | | $ | 9,974 | | | $ | 7,900 | | | $ | 2,785 | | | $ | 2,649 | |
| Ratios to average net assets: | |
| Net investment income (loss) | | | 6.40 | % | | | 6.12 | % | | | 7.12 | % | | | 7.42 | % | | | 7.61 | % | | | 7.99 | % | | | 8.79 | % |
| Total expenses | | | 0.96 | % | | | 1.01 | % | | | 1.01 | % | | | 1.11 | % | | | 1.08 | % | | | 1.02 | % | | | 1.16 | % |
Net expensese,i | | | 0.96 | % | | | 1.01 | % | | | 0.93 | % | | | 0.92 | % | | | 0.95 | % | | | 0.89 | % | | | 0.85 | % |
| Portfolio turnover rate | | | 32 | % | | | 97 | % | | | 101 | % | | | 55 | % | | | 102 | % | | | 77 | % | | | 53 | % |
a | Unaudited figures for the period ended March 31, 2015. Percentage amounts for the period, except total return and portfolio turnover rate, have been annualized. |
b | Effective December 31, 2006, B-Class shares ceased charging 12b-1 fees in accordance with FINRA (formerly NASD) sales cap regulations. Per share information reflects this change. This fee will be reinstated when sales reach above the sales cap limit. |
c | Net investment income (loss) per share was computed using average shares outstanding throughout the period. |
d | Redemption fees collected are less than $0.01 per share. |
e | Net expense information reflects the expense ratios after expense waivers. |
f | The Fund changed its fiscal year end from December 31 to September 30 in 2012. |
g | Total return does not reflect the impact of any applicable sales charges and has not been annualized. |
h | Distributions from return of capital are less than $0.01 per share. |
i | Net expenses may include expenses that are excluded from the expense limitation agreement. Excluding these expenses, the operating expense ratio for the periods would be: |
| | 03/31/15 | 09/30/14 |
| A-Class | 1.16% | 1.16% |
| B-Class | 0.91% | 0.91% |
| C-Class | 1.91% | 1.91% |
| Institutional Class | 0.91% | 0.91% |
| SEE NOTES TO FINANCIAL STATEMENTS. | THE GUGGENHEIM FUNDS SEMI-ANNUAL REPORT | 21 |
FUND PROFILE (Unaudited) | March 31, 2015 |
INVESTMENT GRADE BOND FUND
OBJECTIVE: Seeks to provide current income.
Holdings Diversification (Market Exposure as % of Net Assets)
| Portfolio Composition by Quality Rating* |
| Rating | % of Total Investments |
| Fixed Income Instruments | |
| AAA | 4.2% |
| AA | 16.2% |
| A | 21.8% |
| BBB | 36.2% |
| BB | 4.2% |
| B | 5.7% |
| CCC | 4.0% |
| CC | 0.3% |
| D | 0.2% |
| NR** | 1.8% |
| Other Instruments | |
| Preferred Stocks | 2.7% |
| Mutual Funds | 1.3% |
| Short Term Investments | 0.7% |
| U.S. Government Securities | 0.6% |
| Options Purchased | 0.2% |
| Common Stocks | 0.0% |
| Options Written | -0.1% |
| Total Investments | 100.0% |
| | |
| The chart above reflects percentages of the value of total investments. |
“Holdings Diversification (Market Exposure as % of Net Assets)” excludes any temporary cash investments or investments in Guggenheim Strategy Funds Trust mutual funds. Investments in those Funds do not provide “market exposure” to meet the fund’s investment objective, but will significantly increase the portfolio’s exposure to certain other asset categories (and their associated risks), which may cause the Fund to deviate from its principal investment strategy, including: (i) high yield, high risk debt securities rated below the top four long-term rating categories by a nationally recognized statistical rating organization (also known as “junk bonds”); (ii) securities issued by the U.S. government or its agencies and instrumentalities; (iii) CLOs and similar investments; and (iv) other short-term fixed income securities.
| Inception Dates: |
| A-Class | August 15, 1985 |
| B-Class | October 19, 1993 |
| C-Class | May 1, 2000 |
| Institutional Class | January 29, 2013 |
| Ten Largest Holdings (% of Total Net Assets) |
| Willis Engine Securitization Trust II — 2012-A | 1.7% |
| GCAT LLC — 2014-2 | 1.7% |
| LSTAR Securities Investment Trust 2014-1 | 1.5% |
| Citigroup, Inc. | 1.4% |
| Guggenheim Strategy Fund I | 1.4% |
| Northwoods Capital VIII Ltd. — 2007-8A | 1.4% |
| Fifth Third Bancorp | 1.2% |
| New Jersey Transportation Trust Fund Authority Revenue Bonds | 1.1% |
| AASET — 2014-1 | 1.0% |
| JPMorgan Chase & Co. | 1.0% |
| Top Ten Total | 13.4% |
| | |
| “Ten Largest Holdings” exclude any temporary cash or derivative instruments. |
| * | Source: BlackRock Solutions. Credit quality ratings are measured on a scale that generally ranges from AAA (highest) to D (lowest). All securities except for those labeled “NR” have been rated by Moody’s, Standard & Poor’s (“S&P”), or Fitch, which are all a Nationally Recognized Statistical Rating Organization (“NRSRO”). For purposes of this presentation, when ratings are available from more than one agency, the highest rating is used. Guggenheim Investments has converted Moody’s and Fitch ratings to the equivalent S&P rating. Security ratings are determined at the time of purchase and may change thereafter. |
| ** | NR securities do not necessarily indicate low credit quality. |
| 22 | THE GUGGENHEIM FUNDS SEMI-ANNUAL REPORT | |
SCHEDULE OF INVESTMENTS (Unaudited) | March 31, 2015 |
| INVESTMENT GRADE BOND FUND | |
| | |
Shares | | | Value | |
| | | | | | | | |
COMMON STOCKS† - 0.0% | |
| | | | | | | | |
| FINANCIAL - 0.0% | |
| Rescap Liquidating Trust | | | 5,199 | | | $ | 54,590 | |
| | | | | | | | |
| MATERIALS - 0.0% | |
Constar International Holdings LLC*,†††,1 | | | 68 | | | | — | |
| | | | | | | | |
| Total Common Stocks | | | | | | | | |
| (Cost $262,501) | | | | | | | 54,590 | |
| | | | | | | | |
PREFERRED STOCKS† - 2.9% | |
| FINANCIAL - 2.5% | |
Aspen Insurance Holdings Ltd. 5.95% 2,3 | | | 48,000 | | | | 1,232,640 | |
Woodbourne Capital Trust III 0.01%†††,2,3,4 | | | 950,000 | | | | 451,630 | |
Woodbourne Capital Trust II 0.01%†††,2,3,4 | | | 950,000 | | | | 451,630 | |
Woodbourne Capital Trust I 0.01%†††,2,3,4 | | | 950,000 | | | | 451,630 | |
Woodbourne Capital Trust IV 0.01%†††,2,3,4 | | | 950,000 | | | | 451,630 | |
CoBank ACB 6.20% 2,3 | | | 3,000 | | | | 306,469 | |
AgriBank FCB 6.88% 2,3 | | | 1,500 | | | | 156,000 | |
City National Corp. 6.75% 2,3 | | | 4,000 | | | | 116,520 | |
| Total Financial | | | | | | | 3,618,149 | |
| | | | | | | | |
| INDUSTRIAL - 0.4% | |
| Seaspan Corp. 6.38% due 04/30/19 | | | 22,000 | | | | 553,960 | |
| | | | | | | | |
| MATERIALS – 0.0% | |
Constar International Holdings LLC*,†††,1 | | | 7 | | | | — | |
| Total Preferred Stocks | | | | | | | | |
| (Cost $6,120,328) | | | | | | | 4,172,109 | |
| | | | | | | | |
MUTUAL FUNDS† - 1.4% | |
Guggenheim Strategy Fund I5 | | | 80,413 | | | | 2,002,284 | |
| Total Mutual Funds | | | | | | | | |
| (Cost $2,000,676) | | | | | | | 2,002,284 | |
| | | | | | | | |
SHORT TERM INVESTMENTS† - 0.7% | |
| Dreyfus Treasury Prime Cash Management Fund 0.00% | | | 1,028,486 | | | | 1,028,486 | |
| Total Short Term Investments | | | | | | | | |
| (Cost $1,028,486) | | | | | | | 1,028,486 | |
| | | | | | | | |
| | | Face
Amount | | | | |
| | | | | | | | |
ASSET-BACKED SECURITIES†† - 43.5% | |
| Willis Engine Securitization Trust II | | | | | | | | |
2012-A, 5.50% due 09/15/374 | | $ | 2,446,009 | | | | 2,452,125 | |
| GCAT LLC | | | | | | | | |
2014-2, 3.72% due 10/25/194 | | | 2,438,188 | | | | 2,432,519 | |
| AASET | | | | | | | | |
2014-1, 5.13% due 12/15/292 | | | 1,471,154 | | | | 1,474,832 | |
2014-1, 7.37% due 12/15/292 | | | 735,577 | | | | 737,416 | |
| Telos CLO Ltd. | | | | | | | | |
2013-3A, 3.26% due 01/17/242,4 | | | 1,250,000 | | | | 1,223,625 | |
2007-2A, 2.45% due 04/15/222,4 | | | 1,100,000 | | | | 1,061,390 | |
| Northwoods Capital VIII Ltd. | | | | | | | | |
2007-8A, 2.26% due 07/28/222,4 | | | 1,950,000 | | | | 1,944,930 | |
| Castlelake Aircraft Securitization Trust | | | | | | | | |
| 2014-1, 5.25% due 02/15/29 | | | 1,048,748 | | | | 1,040,883 | |
| 2014-1, 7.50% due 02/15/29 | | | 419,499 | | | | 418,451 | |
| Emerald Aviation Finance Ltd. | | | | | | | | |
2013-1, 4.65% due 10/15/384 | | | 1,139,323 | | | | 1,170,654 | |
2013-1, 6.35% due 10/15/384,6 | | | 227,865 | | | | 231,283 | |
| CIT Mortgage Loan Trust | | | | | | | | |
2007-1, 1.62% due 10/25/372,4 | | | 1,450,000 | | | | 1,377,680 | |
| Grayson CLO Ltd. | | | | | | | | |
2006-1A, 0.66% due 11/01/212,4 | | | 1,400,000 | | | | 1,325,100 | |
| Babson CLO Limited | | | | | | | | |
2012-2A, due 05/15/234,14 | | | 1,000,000 | | | | 714,400 | |
2014-IA, due 07/20/254,14 | | | 650,000 | | | | 515,060 | |
| Flagship CLO VI | | | | | | | | |
2007-1A, 2.66% due 06/10/212,4 | | | 1,250,000 | | | | 1,226,000 | |
| Gramercy Real Estate CDO Ltd. | | | | | | | | |
2007-1A, 0.54% due 08/15/562,4 | | | 1,357,668 | | | | 1,223,259 | |
| CKE Restaurant Holdings, Inc. | | | | | | | | |
2013-1A, 4.47% due 03/20/434 | | | 1,115,500 | | | | 1,151,675 | |
| Rockwall CDO II Ltd. | | | | | | | | |
2007-1A, 0.80% due 08/01/242,4 | | | 1,100,000 | | | | 1,025,750 | |
| Garanti Diversified Payment Rights Finance Co. | | | | | | | | |
2007-A, 0.44% due 07/09/172 | | | 1,040,000 | | | | 1,009,944 | |
| Great Lakes CLO Ltd. | | | | | | | | |
2012-1A, 4.35% due 01/15/232,4 | | | 1,000,000 | | | | 1,000,000 | |
| Northwoods Capital XIV Ltd. | | | | | | | | |
2014-14A, 2.72% due 11/12/252,4 | | | 1,000,000 | | | | 1,000,000 | |
| AIM Aviation Finance Ltd. | | | | | | | | |
2015-1A, 4.21% due 02/15/404 | | | 994,048 | | | | 996,632 | |
| KKR Financial CLO Ltd. | | | | | | | | |
2007-1A, 2.51% due 05/15/212,4 | | | 1,000,000 | | | | 996,100 | |
| Banco Bradesco SA | | | | | | | | |
4.21% due 03/12/26†††,1 | | | 983,287 | | | | 989,973 | |
| ALM VII R Ltd. | | | | | | | | |
2013-7RA, 2.86% due 04/24/242,4 | | | 1,000,000 | | | | 986,800 | |
| Fortress Credit Opportunities V CLO Ltd. | | | | | | | | |
2014-5A, 2.88% due 10/15/262,4 | | | 1,000,000 | | | | 982,300 | |
| Figueroa CLO Ltd. | | | | | | | | |
2013-1A, 3.01% due 03/21/242,4 | | | 1,000,000 | | | | 976,100 | |
| New Century Home Equity Loan Trust | | | | | | | | |
2005-3, 0.68% due 07/25/352 | | | 1,100,000 | | | | 973,066 | |
| Dryden Senior Loan Fund | | | | | | | | |
2015-37A, due 04/15/27†††,4,14 | | | 1,000,000 | | | | 971,500 | |
| Venture XIV CLO Ltd. | | | | | | | | |
2013-14A, 3.01% due 08/28/252,4 | | | 1,000,000 | | | | 969,400 | |
| RAIT CRE CDO I Ltd. | | | | | | | | |
| 2006-1X, 0.49% due 11/20/46 | | | 1,005,997 | | | | 925,920 | |
| MCF CLO I LLC | | | | | | | | |
2013-1A, 3.81% due 04/20/232,4 | | | 900,000 | | | | 881,730 | |
| SEE NOTES TO FINANCIAL STATEMENTS. | THE GUGGENHEIM FUNDS SEMI-ANNUAL REPORT | 23 |
SCHEDULE OF INVESTMENTS (Unaudited)(continued) | March 31, 2015 |
| INVESTMENT GRADE BOND FUND | |
| | | Face
Amount | | | Value | |
| | | | | | | | | |
| Turbine Engines Securitization Ltd. | | | | | | | | |
2013-1A, 5.13% due 12/13/484 | | $ | 852,067 | | | $ | 862,973 | |
| COA Summit CLO Limited | | | | | | | | |
2014-1A, 3.06% due 04/20/232,4 | | | 800,000 | | | | 792,720 | |
| Acis CLO Ltd. | | | | | | | | |
2013-1A, 3.21% due 04/18/242,4 | | | 500,000 | | | | 490,250 | |
2013-2A, 3.46% due 10/14/222,4 | | | 250,000 | | | | 250,100 | |
| ICE EM CLO | | | | | | | | |
2007-1A, 0.98% due 08/15/222,4 | | | 791,108 | | | | 769,194 | |
| ARES XII CLO Ltd. | | | | | | | | |
2007-12A, 3.51% due 11/25/202,4 | | | 750,000 | | | | 750,000 | |
| OZLM Funding Ltd. | | | | | | | | |
2012-2A, 3.50% due 10/30/232,4 | | | 750,000 | | | | 750,000 | |
| Newstar Trust | | | | | | | | |
2012-2A, 3.51% due 01/20/232,4 | | | 750,000 | | | | 748,725 | |
| KVK CLO Ltd. | | | | | | | | |
2013-1A, due 04/14/254,14 | | | 1,000,000 | | | | 739,000 | |
| NRPL Trust | | | | | | | | |
2015-1A, 3.88% due 11/01/544 | | | 744,595 | | | | 738,191 | |
| Chesterfield Financial Holdings LLC | | | | | | | | |
2014-1A, 4.50% due 12/15/344 | | | 732,000 | | | | 733,976 | |
| N-Star Real Estate CDO IX Ltd. | | | | | | | | |
0.49% due 02/01/411 | | | 732,895 | | | | 700,354 | |
| Icon Brand Holdings LLC | | | | | | | | |
2013-1A, 4.35% due 01/25/434 | | | 620,630 | | | | 626,650 | |
| Golub Capital Partners CLO 21M Ltd. | | | | | | | | |
2014-21A, 2.68% due 10/25/262,4 | | | 600,000 | | | | 584,760 | |
| Fortress Credit Opportunities III CLO, LP | | | | | | | | |
2014-3A, 2.75% due 04/28/262,4 | | | 300,000 | | | | 294,990 | |
2014-3A, 3.50% due 04/28/262,4 | | | 300,000 | | | | 289,740 | |
| Ivy Hill Middle Market Credit Fund VII Ltd. | | | | | | | | |
2013-7A, 3.71% due 10/20/252,4 | | | 600,000 | | | | 580,200 | |
| Black Diamond CLO 2012-1 Ltd. | | | | | | | | |
2013-1A, 3.50% due 02/01/232,4 | �� | | 550,000 | | | | 546,040 | |
| Structured Asset Securities Corporation Mortgage Loan Trust | | | | | | | | |
2006-OPT1, 0.43% due 04/25/362 | | | 600,000 | | | | 544,483 | |
| Nationstar HECM Loan Trust | | | | | | | | |
2014-1A, 4.50% due 11/25/174 | | | 528,611 | | | | 531,413 | |
| Cent CLO 16, LP | | | | | | | | |
2014-16AR, 2.50% due 08/01/242,4 | | | 500,000 | | | | 502,300 | |
| Oxford Finance Funding Trust | | | | | | | | |
2014-1A, 3.48% due 12/15/224 | | | 500,000 | | | | 500,200 | |
| Apidos CLO IX | | | | | | | | |
2012-9A, 4.00% due 07/15/232,4 | | | 500,000 | | | | 500,050 | |
| KKR CLO Trust | | | | | | | | |
2012-1A, 3.57% due 12/15/242,4 | | | 500,000 | | | | 498,700 | |
| Cerberus Onshore II CLO-2 LLC | | | | | | | | |
2014-1A, 2.98% due 10/15/232,4 | | | 500,000 | | | | 498,700 | |
| Apidos CDO III Ltd. | | | | | | | | |
2006-3A, 2.02% due 06/12/202,4 | | | 500,000 | | | | 492,800 | |
| Golub Capital Partners Fundings Ltd. | | | | | | | | |
2007-1A, 1.02% due 03/15/222,4 | | | 500,000 | | | | 485,300 | |
| Treman Park CLO LLC | | | | | | | | |
2015-1A, 0.00% due 04/20/274,7 | | | 500,000 | | | | 480,050 | |
| MCF CLO III LLC | | | | | | | | |
2014-3A, 3.21% due 01/20/242,4 | | | 500,000 | | | | 476,100 | |
| N-Star REL CDO VIII Ltd. | | | | | | | | |
2006-8A, 0.54% due 02/01/412,4 | | | 500,000 | | | | 451,000 | |
| Eastland CLO Ltd. | | | | | | | | |
2007-1A, 0.65% due 05/01/222,4 | | | 450,000 | | | | 423,090 | |
| Westwood CDO I Ltd. | | | | | | | | |
2007-1A, 0.94% due 03/25/212,4 | | | 400,000 | | | | 377,200 | |
| Copper River CLO Ltd. | | | | | | | | |
2007-1A, due 01/20/212,4,14 | | | 700,000 | | | | 359,590 | |
| Halcyon Loan Advisors Funding Ltd. | | | | | | | | |
2012-2A, 4.77% due 12/20/242,4 | | | 350,000 | | | | 347,165 | |
| Saxon Asset Securities Trust | | | | | | | | |
2005-4, 0.61% due 11/25/372 | | | 400,000 | | | | 344,751 | |
| NewStar Commercial Loan Funding LLC | | | | | | | | |
2013-1A, 4.80% due 09/20/232,4 | | | 350,000 | | | | 340,270 | |
| UCFC Manufactured Housing Contract | | | | | | | | |
| 1997-2, 7.38% due 10/15/28 | | | 307,108 | | | | 332,212 | |
| DIVCORE CLO Ltd. | | | | | | | | |
| 2013-1A B, 4.07% due 11/15/32 | | | 300,000 | | | | 301,500 | |
| Salus CLO Ltd. | | | | | | | | |
2013-1AN, 3.98% due 03/05/212,4 | | | 300,000 | | | | 300,990 | |
| CIFC Funding Ltd. | | | | | | | | |
2012-2A, 4.52% due 12/05/242,4 | | | 300,000 | | | | 300,000 | |
| ALM VII R-2 Ltd. | | | | | | | | |
2013-7R2A, 2.86% due 04/24/242,4 | | | 300,000 | | | | 296,040 | |
| Neuberger Berman CLO Ltd. | | | | | | | | |
2012-12A, due 07/25/234,14 | | | 450,000 | | | | 289,035 | |
| GreenPoint Mortgage Funding Trust | | | | | | | | |
2005-HE4, 0.88% due 07/25/302 | | | 264,532 | | | | 252,835 | |
| TICC CLO LLC | | | | | | | | |
2012-1A, 5.01% due 08/25/232,4 | | | 250,000 | | | | 250,025 | |
| Dryden XXIII Senior Loan Fund | | | | | | | | |
2014-23RA, 3.20% due 07/17/232,4 | | | 250,000 | | | | 250,000 | |
| Cerberus Onshore II CLO LLC | | | | | | | | |
2014-1A, 2.95% due 10/15/232,4 | | | 250,000 | | | | 249,500 | |
| Garrison Funding Ltd. | | | | | | | | |
2013-2A, 3.63% due 09/25/232,4 | | | 250,000 | | | | 247,800 | |
| Gallatin CLO VII Ltd. | | | | | | | | |
2014-1A, 3.15% due 07/15/232,4 | | | 250,000 | | | | 247,600 | |
| ALM XIV Ltd. | | | | | | | | |
2014-14A, 3.21% due 07/28/262,4 | | | 250,000 | | | | 247,525 | |
| Golub Capital Partners CLO 17 Ltd. | | | | | | | | |
2013-17A, 4.09% due 10/25/252,4 | | | 250,000 | | | | 246,775 | |
| Great Lakes CLO Ltd. | | | | | | | | |
2014-1A, 3.95% due 04/15/252,4 | | | 250,000 | | | | 244,850 | |
| Race Point IV CLO Ltd. | | | | | | | | |
2007-4A, 2.25% due 08/01/212,4 | | | 250,000 | | | | 243,775 | |
| NewStar Arlington Senior Loan Program LLC | | | | | | | | |
2014-1A, 3.56% due 07/25/252,4 | | | 250,000 | | | | 239,550 | |
| Drug Royalty II Limited Partnership 2 | | | | | | | | |
2014-1, 3.08% due 07/15/232,4 | | | 234,058 | | | | 237,684 | |
| 24 | THE GUGGENHEIM FUNDS SEMI-ANNUAL REPORT | SEE NOTES TO FINANCIAL STATEMENTS. |
SCHEDULE OF INVESTMENTS (Unaudited)(continued) | March 31, 2015 |
| INVESTMENT GRADE BOND FUND | |
| | | Face
Amount | | | Value | |
| | | | | | | | | |
| Carlyle Global Market Strategies CLO Ltd. | | | | | | | | |
2012-3A, due 10/04/244,14 | | $ | 250,000 | | | $ | 207,500 | |
| Keuka Park CLO Limited | | | | | | | | |
2013-1A, due 10/21/244,14 | | | 250,000 | | | | 197,675 | |
| GSAA Home Equity Trust | | | | | | | | |
2007-7, 0.44% due 07/25/372 | | | 192,940 | | | | 162,914 | |
| Cerberus Offshore Levered I, LP | | | | | | | | |
2012-1A, 5.02% due 11/30/182,4 | | | 125,233 | | | | 125,221 | |
| New Century Home Equity Loan Trust | | | | | | | | |
2005-1, 0.89% due 03/25/352 | | | 124,067 | | | | 107,818 | |
| West Coast Funding Ltd. | | | | | | | | |
2006-1A, 0.40% due 11/02/412,4 | | | 101,536 | | | | 100,916 | |
| First Franklin Mortgage Loan Trust | | | | | | | | |
2006-FF1, 0.51% due 01/25/362 | | | 50,000 | | | | 44,079 | |
| Credit-Based Asset Servicing and Securitization LLC | | | | | | | | |
2005-CB5, 0.43% due 08/25/352 | | | 28,519 | | | | 28,470 | |
| Total Asset-Backed Securities | | | | | | | | |
| (Cost $60,626,013) | | | | | | | 61,559,811 | |
| | | | | | | | |
CORPORATE BONDS†† - 29.0% | |
| FINANCIAL - 20.1% | |
| Bank of America Corp. | | | | | | | | |
6.10%2,3 | | | 1,100,000 | | | | 1,115,813 | |
5.13%2,3 | | | 650,000 | | | | 638,560 | |
6.25%2,3 | | | 400,000 | | | | 407,500 | |
| JPMorgan Chase & Co. | | | | | | | | |
5.00%2,3,8 | | | 1,500,000 | | | | 1,473,675 | |
5.15%2,3 | | | 700,000 | | | | 683,375 | |
| Citigroup, Inc. | | | | | | | | |
5.88%2,3 | | | 2,000,000 | | | | 2,020,000 | |
| Fifth Third Bancorp | | | | | | | | |
5.10%2,3 | | | 1,820,000 | | | | 1,729,000 | |
| Teachers Insurance & Annuity Association of America | | | | | | | | |
4.90% due 09/15/444,8 | | | 1,000,000 | | | | 1,128,919 | |
4.38% due 09/15/542,4 | | | 500,000 | | | | 520,483 | |
| EPR Properties | | | | | | | | |
5.25% due 07/15/238 | | | 1,000,000 | | | | 1,079,426 | |
5.75% due 08/15/228 | | | 500,000 | | | | 550,451 | |
| Susquehanna Bancshares, Inc. | | | | | | | | |
5.38% due 08/15/228 | | | 1,200,000 | | | | 1,337,113 | |
| Icahn Enterprises Limited Partnership / Icahn Enterprises Finance Corp. | | | | | | | | |
6.00% due 08/01/208 | | | 800,000 | | | | 831,040 | |
| 4.87% due 03/15/19 | | | 450,000 | | | | 458,438 | |
| Deutsche Bank AG | | | | | | | | |
| 4.50% due 04/01/25 | | | 1,250,000 | | | | 1,248,988 | |
| AmTrust Financial Services, Inc. | | | | | | | | |
| 6.13% due 08/15/23 | | | 1,000,000 | | | | 1,066,619 | |
| SunTrust Banks, Inc. | | | | | | | | |
5.63%2,3,8 | | | 1,000,000 | | | | 1,019,375 | |
| Lancashire Holdings Ltd. | | | | | | | | |
5.70% due 10/01/224 | | | 900,000 | | | | 986,292 | |
| Ironshore Holdings US, Inc. | | | | | | | | |
8.50% due 05/15/204 | | | 750,000 | | | | 910,769 | |
| WP Carey, Inc. | | | | | | | | |
4.00% due 02/01/258 | | | 750,000 | | | | 752,106 | |
| Assured Guaranty US Holdings, Inc. | | | | | | | | |
5.00% due 07/01/248 | | | 700,000 | | | | 749,146 | |
| Farmers Exchange Capital III | | | | | | | | |
5.45% due 10/15/542,4,8 | | | 750,000 | | | | 741,695 | |
| Nordea Bank AB | | | | | | | | |
6.13%2,3,4 | | | 400,000 | | | | 412,752 | |
5.50%2,3,4 | | | 300,000 | | | | 304,875 | |
| Corporation Financiera de Desarrollo S.A. | | | | | | | | |
5.25% due 07/15/292,4 | | | 600,000 | | | | 623,910 | |
| First American Financial Corp. | | | | | | | | |
| 4.60% due 11/15/24 | | | 500,000 | | | | 522,531 | |
| Customers Bank | | | | | | | | |
6.13% due 06/26/292,4 | | | 500,000 | | | | 513,750 | |
| Wilton Re Finance LLC | | | | | | | | |
5.88% due 03/30/332,4 | | | 475,000 | | | | 513,143 | |
| Kemper Corp. | | | | | | | | |
| 4.35% due 02/15/25 | | | 500,000 | | | | 511,677 | |
| American Express Co. | | | | | | | | |
5.20%2,3 | | | 500,000 | | | | 507,500 | |
| Morgan Stanley | | | | | | | | |
5.55%2,3 | | | 500,000 | | | | 505,000 | |
| Pacific Northwest Communities LLC | | | | | | | | |
5.91% due 06/15/504 | | | 400,000 | | | | 448,472 | |
| Atlantic Marine Corporations Communities LLC | | | | | | | | |
5.43% due 12/01/504 | | | 387,755 | | | | 403,234 | |
| Royal Bank of Scotland Group plc | | | | | | | | |
| 5.12% due 05/28/24 | | | 350,000 | | | | 367,189 | |
| ACC Group Housing LLC | | | | | | | | |
6.35% due 07/15/54†††,4 | | | 300,000 | | | | 313,350 | |
| CIC Receivables Master Trust | | | | | | | | |
4.89% due 10/07/21††† | | | 300,000 | | | | 306,990 | |
| Cadence Bank North America | | | | | | | | |
6.25% due 06/28/292,11 | | | 200,000 | | | | 205,000 | |
| HSBC Holdings plc | | | | | | | | |
6.37%2,3 | | | 200,000 | | | | 204,250 | |
| Cadence Financial Corp. | | | | | | | | |
4.88% due 06/28/1911 | | | 150,000 | | | | 151,434 | |
| Prosight Global Inc. | | | | | | | | |
7.50% due 11/26/20†††,1 | | | 100,000 | | | | 104,810 | |
| TIG Holdings, Inc. | | | | | | | | |
8.60% due 01/15/274 | | | 34,000 | | | | 29,198 | |
| Total Financial | | | | | | | 28,397,848 | |
| | | | | | | | |
| CONSUMER, CYCLICAL - 2.2% | |
| United Airlines 2014-2 Class B Pass Through Trust | | | | | | | | |
| 4.63% due 09/03/22 | | | 745,000 | | | | 749,656 | |
| Northern Group Housing LLC | | | | | | | | |
6.80% due 08/15/534 | | | 600,000 | | | | 731,934 | |
| Sabre GLBL, Inc. | | | | | | | | |
8.50% due 05/15/194,8 | | | 680,000 | | | | 726,546 | |
| SEE NOTES TO FINANCIAL STATEMENTS. | THE GUGGENHEIM FUNDS SEMI-ANNUAL REPORT | 25 |
SCHEDULE OF INVESTMENTS (Unaudited)(continued) | March 31, 2015 |
| INVESTMENT GRADE BOND FUND | |
| | | Face
Amount | | | Value | |
| | | | | | | | | |
| Continental Airlines 2012-2 Class B Pass Through Trust | | | | | | | | |
| 5.50% due 10/29/20 | | $ | 362,393 | | | $ | 385,042 | |
| GRD Holdings III Corp. | | | | | | | | |
10.75% due 06/01/194 | | | 250,000 | | | | 271,875 | |
| QVC, Inc. | | | | | | | | |
7.38% due 10/15/204 | | | 200,000 | | | | 207,500 | |
| Total Consumer, Cyclical | | | | | | | 3,072,553 | |
| | | | | | | | |
| BASIC MATERIALS - 2.1% | |
| Newcrest Finance Pty Ltd. | | | | | | | | |
4.20% due 10/01/224,8 | | | 1,200,000 | | | | 1,129,256 | |
4.45% due 11/15/214 | | | 500,000 | | | | 491,507 | |
| Yamana Gold, Inc. | | | | | | | | |
| 4.95% due 07/15/24 | | | 1,150,000 | | | | 1,130,693 | |
| AngloGold Ashanti Holdings plc | | | | | | | | |
| 5.13% due 08/01/22 | | | 240,000 | | | | 226,204 | |
| Mosaic Global Holdings, Inc. | | | | | | | | |
| 7.38% due 08/01/18 | | | 18,000 | | | | 20,604 | |
| Total Basic Materials | | | | | | | 2,998,264 | |
| | | | | | | | |
| COMMUNICATIONS - 1.3% | |
| Avaya, Inc. | | | | | | | | |
7.00% due 04/01/194 | | | 650,000 | | | | 645,125 | |
| CBS Corp. | | | | | | | | |
| 4.60% due 01/15/45 | | | 600,000 | | | | 610,816 | |
| Juniper Networks, Inc. | | | | | | | | |
| 4.35% due 06/15/25 | | | 500,000 | | | | 506,919 | |
| Nortel Networks Ltd. | | | | | | | | |
6.88% due 09/01/239 | | | 31,000 | | | | 10,850 | |
| Total Communications | | | | | | | 1,773,710 | |
| | | | | | | | |
| CONSUMER, NON-CYCLICAL - 1.2% | |
| CDK Global, Inc. | | | | | | | | |
4.50% due 10/15/248 | | | 1,000,000 | | | | 1,030,693 | |
| Actavis Funding SCS | | | | | | | | |
| 4.75% due 03/15/45 | | | 500,000 | | | | 531,428 | |
| ADT Corp. | | | | | | | | |
6.25% due 10/15/218 | | | 150,000 | | | | 159,750 | |
| Total Consumer, Non-cyclical | | | | | | | 1,721,871 | |
| | | | | | | | |
| INDUSTRIAL - 1.1% | |
| Chicago Bridge & Iron Co. | | | | | | | | |
5.15% due 12/27/22†††,1 | | | 750,000 | | | | 767,926 | |
| SBM Baleia Azul | | | | | | | | |
5.50% due 09/15/27†††,1 | | | 447,600 | | | | 336,729 | |
| Trimble Navigation Ltd. | | | | | | | | |
| 4.75% due 12/01/24 | | | 300,000 | | | | 316,300 | |
| Skyway Concession Company LLC | | | | | | | | |
0.65% due 06/30/262,4,8 | | | 250,000 | | | | 207,500 | |
| Total Industrial | | | | | | | 1,628,455 | |
| | | | | | | | |
| ENERGY - 0.6% | |
| BreitBurn Energy Partners Limited Partnership / BreitBurn Finance Corp. | | | | | | | | |
7.87% due 04/15/228 | | | 600,000 | | | | 432,000 | |
| Crestwood Midstream Partners Limited Partnership / Crestwood Midstream Finance Corp. | | | | | | | | |
| 7.75% due 04/01/19 | | | 350,000 | | | | 363,685 | |
| Williams Companies, Inc. | | | | | | | | |
| 8.75% due 03/15/32 | | | 12,000 | | | | 14,361 | |
| Total Energy | | | | | | | 810,046 | |
| | | | | | | | |
| DIVERSIFIED - 0.4% | |
| Leucadia National Corp. | | | | | | | | |
5.50% due 10/18/238 | | | 600,000 | | | | 618,971 | |
| | | | | | | | |
| MATERIALS - 0.0% | |
| Constar International, Inc | | | | | | | | |
11.00% due 12/31/17†††,1 | | | 5,747 | | | | — | |
| Total Corporate Bonds | | | | | | | | |
| (Cost $40,221,825) | | | | | | | 41,021,718 | |
| | | | | | | | |
MORTGAGE-BACKED SECURITIES†† - 8.0% | |
| Luminent Mortgage Trust | | | | | | | | |
2006-2, 0.37% due 02/25/462 | | | 1,581,650 | | | | 1,183,124 | |
| American Home Mortgage Investment Trust | | | | | | | | |
2006-1, 0.57% due 03/25/462 | | | 1,391,976 | | | | 1,156,753 | |
| Hilton USA Trust | | | | | | | | |
2013-HLT, 4.41% due 11/05/304 | | | 1,100,000 | | | | 1,132,151 | |
| Boca Hotel Portfolio Trust | | | | | | | | |
2013-BOCA, 3.22% due 08/15/262,4 | | | 1,000,000 | | | | 998,818 | |
| Banc of America Funding Trust | | | | | | | | |
2014-R7, 0.31% due 09/26/362 | | | 1,045,649 | | | | 964,402 | |
| Alternative Loan Trust | | | | | | | | |
| 2003-18CB, 5.25% due 09/25/33 | | | 922,928 | | | | 958,758 | |
| Washington Mutual Mortgage Pass-Through Certificates WMALT Series Trust | | | | | | | | |
2006-AR9, 0.97% due 11/25/462 | | | 720,673 | | | | 502,329 | |
| 2006-8, 4.82% due 10/25/36 | | | 440,760 | | | | 350,340 | |
| MASTR Adjustable Rate Mortgages Trust | | | | | | | | |
2003-5, 2.13% due 11/25/332 | | | 903,639 | | | | 823,396 | |
| American Home Mortgage Assets Trust | | | | | | | | |
2007-1, 0.83% due 02/25/472 | | | 1,192,201 | | | | 758,206 | |
| GMAC Commercial Mortgage Asset Corp. | | | | | | | | |
2003-PRES, 6.24% due 10/10/41†††,4 | | | 480,176 | | | | 542,838 | |
| LSTAR Commercial Mortgage Trust | | | | | | | | |
2014-2, 5.14% due 01/20/412,4 | | | 500,000 | | | | 515,488 | |
| Chase Mortgage Finance Trust Series | | | | | | | | |
| 2006-S3, 6.00% due 11/25/36 | | | 484,519 | | | | 423,078 | |
| Capmark Military Housing Trust | | | | | | | | |
2007-AETC, 5.75% due 02/10/52†††,4 | | | 340,664 | | | | 340,834 | |
| Residential Asset Securitization Trust | | | | | | | | |
| 2006-A12, 6.25% due 11/25/36 | | | 476,716 | | | | 339,402 | |
| 26 | THE GUGGENHEIM FUNDS SEMI-ANNUAL REPORT | SEE NOTES TO FINANCIAL STATEMENTS. |
SCHEDULE OF INVESTMENTS (Unaudited)(continued) | March 31, 2015 |
| INVESTMENT GRADE BOND FUND | |
| | | Face
Amount | | | Value | |
| | | | | | | | | |
| GreenPoint Mortgage Funding Trust Series | | | | | | | | |
2007-AR1, 0.25% due 02/25/472 | | $ | 233,460 | | | $ | 218,056 | |
| JP Morgan Mortgage Trust | | | | | | | | |
2006-A3, 2.63% due 04/25/362 | | | 32,974 | | | | 28,394 | |
| Ginnie Mae | | | | | | | | |
| #518436, 7.25% due 09/15/29 | | | 9,261 | | | | 9,826 | |
| #1849, 8.50% due 08/20/24 | | | 923 | | | | 974 | |
Fannie Mae13 | | | | | | | | |
| 1990-108, 7.00% due 09/25/20 | | | 6,841 | | | | 7,506 | |
| Total Mortgage-Backed Securities | | | | | | | | |
| (Cost $11,233,302) | | | | | | | 11,254,673 | |
| | | | | | | | |
MUNICIPAL BONDS†† - 7.5% | |
| ILLINOIS - 1.5% | |
| State of Illinois General Obligation Unlimited | | | | | | | | |
| 6.90% due 03/01/35 | | | 500,000 | | | | 591,110 | |
| 5.65% due 12/01/38 | | | 500,000 | | | | 531,735 | |
| Chicago, Illinois, Second Lien Water Revenue Bonds, Taxable Build America Bonds | | | | | | | | |
| 6.74% due 11/01/40 | | | 550,000 | | | | 714,852 | |
| City of Chicago Illinois General Obligation Unlimited | | | | | | | | |
| 5.00% due 01/01/27 | | | 150,000 | | | | 160,982 | |
0.00% due 01/01/307 | | | 150,000 | | | | 78,825 | |
| Total Illinois | | | | | | | 2,077,504 | |
| | | | | | | | |
| FLORIDA - 1.4% | |
| County of Miami-Dade Florida Revenue Bonds | | | | | | | | |
0.00% due 10/01/457,8 | | | 5,100,000 | | | | 1,254,089 | |
0.00% due 10/01/427 | | | 2,500,000 | | | | 706,900 | |
| Total Florida | | | | | | | 1,960,989 | |
| | | | | | | | |
| NEW JERSEY - 1.1% | |
| New Jersey Transportation Trust Fund Authority Revenue Bonds | | | | | | | | |
0.00% due 12/15/327,8 | | | 3,500,000 | | | | 1,575,314 | |
| | | | | | | | |
| CALIFORNIA - 1.1% | |
| Stockton Unified School District General Obligation Unlimited | | | | | | | | |
0.00% due 08/01/367 | | | 875,000 | | | | 375,463 | |
0.00% due 08/01/357 | | | 565,000 | | | | 252,730 | |
| Inland Valley Development Agency Tax Allocation | | | | | | | | |
| 5.50% due 03/01/33 | | | 500,000 | | | | 548,595 | |
| San Marcos Unified School District General Obligation Unlimited | | | | | | | | |
0.00% due 08/01/477 | | | 1,400,000 | | | | 351,526 | |
| Total California | | | | | | | 1,528,314 | |
| | | | | | | | |
| PUERTO RICO - 0.9% | |
| Commonwealth of Puerto Rico General Obligation Unlimited | | | | | | | | |
| 5.00% due 07/01/31 | | | 500,000 | | | | 504,185 | |
| Puerto Rico Commonwealth Aqueduct & Sewer Authority Revenue Bonds | | | | | | | | |
| 5.13% due 07/01/47 | | | 500,000 | | | | 498,005 | |
| Puerto Rico Highways & Transportation Authority Revenue Bonds | | | | | | | | |
| 5.50% due 07/01/28 | | | 250,000 | | | | 264,473 | |
| Total Puerto Rico | | | | | | | 1,266,663 | |
| | | | | | | | |
| MICHIGAN - 0.7% | |
| Detroit City School District General Obligation Unlimited | | | | | | | | |
| 7.75% due 05/01/39 | | | 850,000 | | | | 1,040,977 | |
| | | | | | | | |
| ALABAMA - 0.6% | |
| County of Jefferson Alabama Sewer Revenue Revenue Bonds | | | | | | | | |
0.00% due 10/01/347 | | | 775,000 | | | | 265,035 | |
0.00% due 10/01/367 | | | 800,000 | | | | 240,152 | |
0.00% due 10/01/357 | | | 475,000 | | | | 152,190 | |
0.00% due 10/01/327 | | | 300,000 | | | | 118,158 | |
0.00% due 10/01/317 | | | 250,000 | | | | 105,990 | |
| Total Alabama | | | | | | | 881,525 | |
| | | | | | | | |
| NEW YORK - 0.2% | |
| Port Authority NY & NJ-182 | | | | | | | | |
| 5.31% due 08/01/46 | | | 310,000 | | | | 343,251 | |
| Total Municipal Bonds | | | | | | | | |
| (Cost $10,131,782) | | | | | | | 10,674,537 | |
| | | | | | | | |
SENIOR FLOATING RATE INTERESTS††,2,10 - 6.7% | |
| CONSUMER, CYCLICAL - 1.4% | |
| Landry’s, Inc. | | | | | | | | |
| 4.00% due 04/24/18 | | | 689,660 | | | | 690,523 | |
| Compucom Systems, Inc. | | | | | | | | |
| 4.25% due 05/07/20 | | | 726,882 | | | | 676,000 | |
| Ollies Bargain Outlet | | | | | | | | |
| 4.75% due 09/28/19 | | | 385,937 | | | | 382,078 | |
| Arby’s | | | | | | | | |
| 4.75% due 11/15/20 | | | 345,625 | | | | 346,489 | |
| Total Consumer, Cyclical | | | | | | | 2,095,090 | |
| | | | | | | | |
| INDUSTRIAL - 1.5% | |
| Rise Ltd. | | | | | | | | |
| 4.74% due 02/12/39 | | | 1,165,365 | | | | 1,174,105 | |
| AABS Ltd. | | | | | | | | |
| 4.87% due 01/15/38 | | | 433,988 | | | | 441,583 | |
| VAT Holding AG | | | | | | | | |
| 4.75% due 02/11/21 | | | 247,500 | | | | 246,468 | |
| CareCore National LLC | | | | | | | | |
| 5.50% due 03/05/21 | | | 198,995 | | | | 199,990 | |
| Total Industrial | | | | | | | 2,062,146 | |
| | | | | | | | |
| TECHNOLOGY - 1.1% | |
| Avago Technologies Ltd. | | | | | | | | |
| 3.75% due 05/06/21 | | | 863,517 | | | | 864,760 | |
| SEE NOTES TO FINANCIAL STATEMENTS. | THE GUGGENHEIM FUNDS SEMI-ANNUAL REPORT | 27 |
SCHEDULE OF INVESTMENTS (Unaudited)(continued) | March 31, 2015 |
| INVESTMENT GRADE BOND FUND | |
| | | Face
Amount | | | Value | |
| | | | | | | | | |
| Greenway Medical Technologies | | | | | | | | |
6.00% due 11/04/201 | | $ | 345,625 | | | $ | 345,625 | |
| P2 Energy Solutions | | | | | | | | |
| 5.00% due 10/30/20 | | | 295,877 | | | | 286,631 | |
| Total Technology | | | | | | | 1,497,016 | |
| | | | | | | | |
| BASIC MATERIALS - 0.8% | |
| Fortescue Metals Group Ltd. | | | | | | | | |
| 3.75% due 06/30/19 | | | 1,242,324 | | | | 1,119,930 | |
| | | | | | | | |
| CONSUMER, NON-CYCLICAL - 0.7% | |
| Hanesbrands, Inc. | | | | | | | | |
| 3.50% due 07/30/21 | | | EUR 397,000 | | | | 428,473 | |
| Albertson’s (Safeway) Holdings LLC | | | | | | | | |
| 5.50% due 08/25/21 | | | 400,000 | | | | 403,168 | |
| NES Global Talent | | | | | | | | |
| 6.50% due 10/03/19 | | | 129,861 | | | | 123,368 | |
| Performance Food Group | | | | | | | | |
| 6.25% due 11/14/19 | | | 98,744 | | | | 98,826 | |
| Total Consumer, Non-cyclical | | | | | | | 1,053,835 | |
| | | | | | | | |
| COMMUNICATIONS - 0.7% | |
| MergerMarket Ltd. | | | | | | | | |
| 4.50% due 02/04/21 | | | 594,000 | | | | 576,180 | |
| Asurion Corp. | | | | | | | | |
| 5.00% due 05/24/19 | | | 453,080 | | | | 454,086 | |
| Total Communications | | | | | | | 1,030,266 | |
| | | | | | | | |
| FINANCIAL - 0.5% | |
| Corporate Capital Trust | | | | | | | | |
| 4.00% due 05/20/19 | | | 347,375 | | | | 347,375 | |
| Magic Newco, LLC | | | | | | | | |
| 5.00% due 12/12/18 | | | 245,596 | | | | 245,771 | |
| American Stock Transfer & Trust | | | | | | | | |
| 5.75% due 06/26/20 | | | 96,152 | | | | 95,671 | |
| Total Financial | | | | | | | 688,817 | |
| Total Senior Floating Rate Interests | | | | | | | | |
| (Cost $9,767,292) | | | | | | | 9,547,100 | |
| | | | | | | | |
COLLATERALIZED MORTGAGE OBLIGATIONS†† - 5.3% | |
| LSTAR Securities Investment Trust | | | | | | | | |
2014-1, 3.28% due 09/01/212,4 | | | 2,103,044 | | | | 2,122,602 | |
2015-2, 2.17% due 01/01/202,4 | | | 740,609 | | | | 736,906 | |
2015-1, 2.18% due 01/01/202,4 | | | 741,133 | | | | 730,980 | |
| SRERS Funding Ltd. | | | | | | | | |
2011-RS, 0.43% due 05/09/462,4 | | | 1,288,557 | | | | 1,225,160 | |
| Motel 6 Trust | | | | | | | | |
2015-MTL6, 4.53% due 02/05/304 | | | 1,000,000 | | | | 1,010,584 | |
| HarborView Mortgage Loan Trust | | | | | | | | |
2006-14, 0.33% due 01/25/472 | | | 927,379 | | | | 711,013 | |
2006-12, 0.37% due 01/19/382 | | | 431,251 | | | | 364,281 | |
| Hilton USA Trust | | | | | | | | |
2013-HLT, 5.22% due 11/05/182,4 | | | 350,000 | | | | 359,505 | |
| Nomura Resecuritization Trust | | | | | | | | |
2012-1R, 0.62% due 08/27/472,4 | | | 282,295 | | | | 261,123 | |
| Total Collateralized Mortgage Obligations | | | | | | | | |
| (Cost $7,489,503) | | | | | | | 7,522,154 | |
| | | | | | | | |
FEDERAL AGENCY DISCOUNT NOTES†† - 2.8% | |
Federal Home Loan Bank12 | | | | | | | | |
| 0.04% due 04/15/15 | | | 3,000,000 | | | | 2,999,959 | |
| 0.03% due 04/02/15 | | | 1,000,000 | | | | 999,999 | |
| Total Federal Home Loan Bank | | | | | | | 3,999,958 | |
| Total Federal Agency Discount Notes | | | | | | | | |
| (Cost $3,999,958) | | | | | | | 3,999,958 | |
| | | | | | | | |
U.S. GOVERNMENT SECURITIES†† - 1.4% | |
| U.S. Treasury Bill | | | | | | | | |
0.00% due 04/09/157 | | | 1,000,000 | | | | 999,996 | |
| U.S. Treasury Notes | | | | | | | | |
| 2.25% due 11/15/24 | | | 551,000 | | | | 566,454 | |
| U.S. Treasury Bonds | | | | | | | | |
0.00% due 11/15/447 | | | 765,000 | | | | 353,215 | |
| Total U.S. Government Securities | | | | | | | | |
| (Cost $1,894,602) | | | | | | | 1,919,665 | |
| | | | | | | | |
FOREIGN GOVERNMENT BONDS†† - 0.7% | |
| Kenya Government International Bond | | | | | | | | |
6.88% due 06/24/244 | | | 550,000 | | | | 574,338 | |
| Mexico Government International Bond | | | | | | | | |
| 4.60% due 01/23/46 | | | 400,000 | | | | 409,000 | |
| Total Foreign Government Bonds | | | | | | | | |
| (Cost $970,932) | | | | | | | 983,338 | |
| | | | | | | | |
| | | Contracts | | | | |
| | | | | | | | |
OPTIONS PURCHASED† - 0.2% | |
| Call options on: | | | | | | | | |
| iShares 7-10 Year Treasury Bond ETF Expiring September 2015 with strike price of $109.00 | | | 1,429 | | | | 171,480 | |
| iShares 20+ Year Treasury Bond ETF Expiring September 2015 with strike price of $134.00 | | | 555 | | | | 111,555 | |
| Total Options Purchased | | | | | | | | |
| (Cost $321,675) | | | | | | | 283,035 | |
| | | | | | | | |
| Total Investments - 110.1% | | | | | | | | |
| (Cost $156,068,875) | | | | | | $ | 156,023,458 | |
| 28 | THE GUGGENHEIM FUNDS SEMI-ANNUAL REPORT | SEE NOTES TO FINANCIAL STATEMENTS. |
SCHEDULE OF INVESTMENTS (Unaudited)(concluded) | March 31, 2015 |
| INVESTMENT GRADE BOND FUND | |
| | | | | | | | | |
| | Contracts | | | Value | |
| | | | | | | | |
OPTIONS WRITTEN† - (0.1)% | |
| Call options on: | | | | | | | | |
| iShares 20+ Year Treasury Bond ETF Expiring September 2015 with strike price of $139.00 | | | 555 | | | $ | (52,170 | ) |
| iShares 7-10 Year Treasury Bond ETF Expiring September 2015 with strike price of $111.00 | | | 1,429 | | | | (121,465 | ) |
| Total Options Written | | | | | | | | |
| (Premiums received $150,605) | | | | | | | (173,635 | ) |
| Other Assets & Liabilities, net - (10.0)% | | | | | | | (14,130,155 | ) |
| Total Net Assets - 100.0% | | | | | | $ | 141,719,668 | |
| | | | | | | | | |
CENTRALLY CLEARED INTEREST RATE SWAP AGREEMENTS†† | | | | |
| Counterparty | Floating Rate | Floating Rate Index | | Fixed Rate | | Maturity Date | | Notional Amount | | | Market Value | | | Unrealized
Appreciation | |
| Merrill Lynch | Pay | 3-Month USD-LIBOR | | | 3.65 | % | 09/26/43 | | $ | 450,000 | | | $ | 122,760 | | | $ | 122,760 | |
FORWARD FOREIGN CURRENCY EXCHANGE CONTRACTS†† | |
| Counterparty | | Contracts to Sell | | Currency | Settlement Date | | Settlement Value | | | Value at March 31, 2015 | | | Net Unrealized Appreciation | |
| BNY Mellon | | | 400,000 | | EUR | 04/07/15 | | $ | 441,088 | | | $ | 430,062 | | | $ | 11,026 | |
| * | Non-income producing security. |
| † | Value determined based on Level 1 inputs, unless otherwise noted — See Note 4. |
| †† | Value determined based on Level 2 inputs, unless otherwise noted — See Note 4. |
| ††† | Value determined based on Level 3 inputs — See Note 4. |
| 1 | Illiquid security. |
| 2 | Variable rate security. Rate indicated is rate effective at March 31, 2015. |
| 3 | Perpetual maturity. |
| 4 | Security is a 144A or Section 4(a)(2) security. The total market value of 144A or Section 4(a)(2) securities is $76,820,535 (cost $77,369,602), or 54.2% of total net assets. These securities have been determined to be liquid under guidelines established by the Board of Trustees. |
| 5 | Affiliated issuer — See Note 13. |
| 6 | Security is a step up/step down bond. The coupon increases or decreases at regular intervals until the bond reaches full maturity. |
| 7 | Zero coupon rate security. |
| 8 | Security or a portion thereof is held as collateral for reverse repurchase agreements — See Note 12. |
| 9 | Security is in default of interest and/or principal obligations. |
| 10 | The face amount is denominated in U.S. Dollars unless otherwise indicated. |
| 11 | Security is a 144A or Section 4(a)(2) security. These securities are considered illiquid and restricted under guidelines established by the Board of Trustees. The total market value of 144A or Section 4(a)(2) securities is $356,434 (cost $350,000), or 0.3% of total net assets — See Note 14. |
| 12 | The issuer operates under a Congressional charter; its securities are neither issued nor guaranteed by the U.S. Government. |
| 13 | On September 7, 2008, the issuer was placed in conservatorship by the Federal Housing Finance Agency (FHFA). As conservator, the FHFA has full powers to control the assets and operations of the firm. |
| 14 | Residual interest. |
| plc — Public Limited Company |
| REIT — Real Estate Investment Trust |
| |
| See Sector Classification in Other Information section. |
| SEE NOTES TO FINANCIAL STATEMENTS. | THE GUGGENHEIM FUNDS SEMI-ANNUAL REPORT | 29 |
| INVESTMENT GRADE BOND FUND | |
STATEMENT OF ASSETS AND LIABILITIES (Unaudited)
March 31, 2015
| Assets: | |
| Investments in unaffiliated issuers, at value (cost $154,068,199) | | $ | 154,021,174 | |
| Investments in affiliated issuers, at value (cost $2,000,676) | | | 2,002,284 | |
| Total investments (cost $156,068,875) | | | 156,023,458 | |
| Foreign currency, at value (cost $2,406) | | | 2,406 | |
| Cash | | | 904,298 | |
| Unrealized appreciation on swap agreements | | | 122,760 | |
| Prepaid expenses | | | 45,056 | |
| Segregated cash with broker | | | 43,770 | |
| Unrealized appreciation on forward foreign currency exchange contracts | | | 11,026 | |
| Receivables: | |
| Interest | | | 893,456 | |
| Fund shares sold | | | 710,854 | |
| Securities sold | | | 407,499 | |
| Dividends | | | 21,241 | |
| Swap settlement | | | 248 | |
| Total assets | | | 159,186,072 | |
| | | | | |
| Liabilities: | |
| Reverse Repurchase Agreements | | | 14,195,563 | |
| Options written, at value (premiums received $150,605) | | | 173,635 | |
| Segregated cash from broker | | | 125,569 | |
| Payable for: | |
| Securities purchased | | | 1,718,556 | |
| Fund shares redeemed | | | 1,037,360 | |
| Management fees | | | 40,547 | |
| Distribution and service fees | | | 45,282 | |
| Fund accounting/administration fees | | | 11,443 | |
| Transfer agent/maintenance fees | | | 10,750 | |
| Trustees’ fees* | | | 2,556 | |
| Miscellaneous | | | 105,143 | |
| Total liabilities | | | 17,466,404 | |
| Net assets | | $ | 141,719,668 | |
| | | | | |
| Net assets consist of: | |
| Paid in capital | | $ | 172,552,253 | |
| Distributions in excess of net investment income | | | (1,062,291 | ) |
| Accumulated net realized loss on investments | | | (29,835,633 | ) |
| Net unrealized appreciation on investments | | | 65,339 | |
| Net assets | | $ | 141,719,668 | |
| | | | | |
| A-Class: | |
| Net assets | | $ | 108,182,989 | |
| Capital shares outstanding | | | 5,831,300 | |
| Net asset value per share | | $ | 18.55 | |
| Maximum offering price per share (Net asset value divided by 95.25%) | | $ | 19.48 | |
| | | | | |
| B-Class: | |
| Net assets | | $ | 1,658,530 | |
| Capital shares outstanding | | | 89,771 | |
| Net asset value per share | | $ | 18.48 | |
| | | | | |
| C-Class: | |
| Net assets | | $ | 24,664,492 | |
| Capital shares outstanding | | | 1,335,162 | |
| Net asset value per share | | $ | 18.47 | |
| | | | | |
| Institutional Class: | |
| Net assets | | $ | 7,213,657 | |
| Capital shares outstanding | | | 389,397 | |
| Net asset value per share | | $ | 18.53 | |
| * | Relates to Trustees not deemed “interested persons” within the meaning of Section 2(a)(19) of the 1940 Act. |
| 30 | THE GUGGENHEIM FUNDS SEMI-ANNUAL REPORT | SEE NOTES TO FINANCIAL STATEMENTS. |
| INVESTMENT GRADE BOND FUND | |
STATEMENT OF OPERATIONS (Unaudited)
Period Ended March 31, 2015
| Investment Income: | |
| Interest | | $ | 3,089,205 | |
| Dividends from securities of unaffiliated issuers | | | 131,232 | |
| Dividends from securities of affiliated issuers | | | 811 | |
| Total investment income | | | 3,221,248 | |
| | | | | |
| Expenses: | |
| Management fees | | | 344,566 | |
| Transfer agent/maintenance fees: | |
| A-Class | | | 50,459 | |
| B-Class | | | 10,821 | |
| C-Class | | | 18,014 | |
| Institutional Class | | | 1,723 | |
| Distribution and service fees: | |
| A-Class | | | 133,471 | |
| B-Class | | | 9,504 | |
| C-Class | | | 118,460 | |
| Fund accounting/administration fees | | | 65,467 | |
| Interest expense | | | 18,790 | |
| Custodian fees | | | 8,299 | |
| Line of credit fees | | | 8,075 | |
| Trustees’ fees* | | | 5,939 | |
| Tax expense | | | 3 | |
| Miscellaneous | | | 79,757 | |
| Total expenses | | | 873,348 | |
| Less: | |
| Expenses waived by Adviser | | | (68,099 | ) |
| Net expenses | | | 805,249 | |
| Net investment income | | | 2,415,999 | |
| | | | | |
| Net Realized and Unrealized Gain (Loss): | |
| Net realized gain (loss) on: | |
| Investments in unaffiliated issuers | | $ | (3,689,890 | ) |
| Swap agreements | | | 892,432 | |
| Foreign currency | | | 21,863 | |
| Forward foreign currency exchange contracts | | | 73,194 | |
| Net realized loss | | | (2,702,401 | ) |
| Net change in unrealized appreciation (depreciation) on: | |
| Investments in unaffiliated issuers | | | 4,031,655 | |
| Investments in affiliated issuers | | | 1,608 | |
| Swap agreements | | | (432,905 | ) |
| Options purchased | | | (38,640 | ) |
| Options written | | | (23,030 | ) |
| Forward foreign currency exchange contracts | | | 11,026 | |
| Net change in unrealized appreciation (depreciation) | | | 3,549,714 | |
| Net realized and unrealized gain | | | 847,313 | |
| Net increase in net assets resulting from operations | | $ | 3,263,312 | |
| * | Relates to Trustees not deemed “interested persons” within the meaning of Section 2(a)(19) of the 1940 Act. |
| SEE NOTES TO FINANCIAL STATEMENTS. | THE GUGGENHEIM FUNDS SEMI-ANNUAL REPORT | 31 |
| INVESTMENT GRADE BOND FUND | |
STATEMENTS OF CHANGES IN NET ASSETS
| | | Period Ended March 31, 2015 (Unaudited) | | | Year Ended September 30, 2014 | |
| Increase (Decrease) in Net Assets from Operations: | | | | | | |
| Net investment income | | $ | 2,415,999 | | | $ | 3,843,638 | |
| Net realized gain (loss) on investments | | | (2,702,401 | ) | | | 1,203,726 | |
| Net change in unrealized appreciation (depreciation) on investments | | | 3,549,714 | | | | 3,816,359 | |
| Net increase in net assets resulting from operations | | | 3,263,312 | | | | 8,863,723 | |
| | | | | | | | | |
| Distributions to shareholders from: | | | | | | | | |
| Net investment income | | | | | | | | |
| A-Class | | | (2,272,331 | ) | | | (3,901,798 | ) |
| B-Class | | | (32,848 | ) | | | (90,367 | ) |
| C-Class | | | (416,861 | ) | | | (663,466 | ) |
| Institutional Class | | | (124,537 | ) | | | (43,335 | ) |
| Total distributions to shareholders | | | (2,846,577 | ) | | | (4,698,966 | ) |
| | | | | | | | | |
| Capital share transactions: | | | | | | | | |
| Proceeds from sale of shares | | | | | | | | |
| A-Class | | | 26,302,587 | | | | 34,856,715 | |
| B-Class | | | 52,142 | | | | 113,376 | |
| C-Class | | | 7,402,134 | | | | 7,556,050 | |
| Institutional Class | | | 7,256,165 | | | | 6,598,753 | |
| Distributions reinvested | | | | | | | | |
| A-Class | | | 2,138,356 | | | | 3,669,266 | |
| B-Class | | | 32,712 | | | | 90,089 | |
| C-Class | | | 361,363 | | | | 598,003 | |
| Institutional Class | | | 104,844 | | | | 43,339 | |
| Cost of shares redeemed | | | | | | | | |
| A-Class | | | (20,126,348 | ) | | | (25,960,887 | ) |
| B-Class | | | (544,109 | ) | | | (1,240,203 | ) |
| C-Class | | | (3,839,501 | ) | | | (6,049,767 | ) |
| Institutional Class | | | (6,097,316 | ) | | | (925,391 | ) |
| Net increase from capital share transactions | | | 13,043,029 | | | | 19,349,343 | |
| Net increase in net assets | | | 13,459,764 | | | | 23,514,100 | |
| | | | | | | | | |
| Net assets: | | | | | | | | |
| Beginning of period | | | 128,259,904 | | | | 104,745,804 | |
| End of period | | $ | 141,719,668 | | | $ | 128,259,904 | |
| Distributions in excess of net investment income at end of period | | $ | (1,062,291 | ) | | $ | (620,132 | ) |
| | | | | | | | | |
| Capital share activity: | | | | | | | | |
| Shares sold | | | | | | | | |
| A-Class | | | 1,419,404 | | | | 1,908,779 | |
| B-Class | | | 2,817 | | | | 6,183 | |
| C-Class | | | 401,284 | | | | 414,295 | |
| Institutional Class | | | 392,605 | | | | 357,987 | |
| Shares issued from reinvestment of distributions | | | | | | | | |
| A-Class | | | 115,301 | | | | 201,435 | |
| B-Class | | | 1,771 | | | | 4,978 | |
| C-Class | | | 19,566 | | | | 33,009 | |
| Institutional Class | | | 5,661 | | | | 2,362 | |
| Shares redeemed | | | | | | | | |
| A-Class | | | (1,086,426 | ) | | | (1,424,258 | ) |
| B-Class | | | (29,518 | ) | | | (68,669 | ) |
| C-Class | | | (208,212 | ) | | | (333,003 | ) |
| Institutional Class | | | (328,854 | ) | | | (50,139 | ) |
| Net increase in shares | | | 705,399 | | | | 1,052,959 | |
| 32 | THE GUGGENHEIM FUNDS SEMI-ANNUAL REPORT | SEE NOTES TO FINANCIAL STATEMENTS. |
| INVESTMENT GRADE BOND FUND | |
This table is presented to show selected data for a share outstanding throughout each period and to assist shareholders in evaluating a Fund’s performance for the periods presented.
| A-Class | | Period Ended March 31, 2015a | | | Year Ended September 30, 2014 | | | Year Ended September 30, 2013 | | | Period Ended September 30, 2012b | | | Year Ended December 31, 2011g | | | Year Ended December 31, 2010g | | | Year Ended December 31, 2009g | |
| Per Share Data | | | | | | | | | | | | | | | | | | | | | |
| Net asset value, beginning of period | | $ | 18.50 | | | $ | 17.81 | | | $ | 17.92 | | | $ | 17.41 | | | $ | 16.71 | | | $ | 16.20 | | | $ | 15.12 | |
| Income (loss) from investment operations: | |
Net investment income (loss)c | | | .33 | | | | .65 | | | | .61 | | | | .27 | | | | .42 | | | | .40 | | | | .48 | |
| Net gain (loss) on investments (realized and unrealized) | | | .11 | | | | .83 | | | | (.04 | ) | | | .51 | | | | .74 | | | | .59 | | | | 1.12 | |
| Total from investment operations | | | .44 | | | | 1.48 | | | | .57 | | | | .78 | | | | 1.16 | | | | .99 | | | | 1.60 | |
| Less distributions from: | |
| Net investment income | | | (.39 | ) | | | (.79 | ) | | | (.68 | ) | | | (.27 | ) | | | (.46 | ) | | | (.48 | ) | | | (.52 | ) |
| Total distributions | | | (.39 | ) | | | (.79 | ) | | | (.68 | ) | | | (.27 | ) | | | (.46 | ) | | | (.48 | ) | | | (.52 | ) |
| Net asset value, end of period | | $ | 18.55 | | | $ | 18.50 | | | $ | 17.81 | | | $ | 17.92 | | | $ | 17.41 | | | $ | 16.71 | | | $ | 16.20 | |
| | |
Total Returnh | | | 2.40 | % | | | 8.47 | % | | | 3.21 | % | | | 4.51 | % | | | 6.94 | % | | | 6.11 | % | | | 10.63 | % |
| Ratios/Supplemental Data | |
| Net assets, end of period (in thousands) | | $ | 108,183 | | | $ | 99,565 | | | $ | 83,642 | | | $ | 98,063 | | | $ | 108,999 | | | $ | 101,971 | | | $ | 104,972 | |
| Ratios to average net assets: | |
| Net investment income (loss) | | | 3.63 | % | | | 3.55 | % | | | 3.40 | % | | | 2.04 | % | | | 2.43 | % | | | 2.51 | % | | | 3.04 | % |
Total expensesd | | | 1.11 | % | | | 1.19 | % | | | 1.21 | % | | | 1.15 | % | | | 1.15 | % | | | 1.21 | % | | | 1.31 | % |
Net expensese,i | | | 1.04 | % | | | 1.05 | % | | | 1.04 | % | | | 1.00 | % | | | 1.00 | % | | | 0.98 | % | | | 0.95 | % |
| Portfolio turnover rate | | | 19 | % | | | 61 | % | | | 119 | % | | | 52 | % | | | 43 | % | | | 39 | % | | | 89 | % |
| SEE NOTES TO FINANCIAL STATEMENTS. | THE GUGGENHEIM FUNDS SEMI-ANNUAL REPORT | 33 |
| INVESTMENT GRADE BOND FUND | |
FINANCIAL HIGHLIGHTS (continued)
This table is presented to show selected data for a share outstanding throughout each period and to assist shareholders in evaluating a Fund’s performance for the periods presented.
| B-Class | | Period Ended March 31, 2015a | | | Year Ended September 30, 2014 | | | Year Ended September 30, 2013 | | | Period Ended September 30, 2012b | | | Year Ended December 31, 2011g | | | Year Ended December 31, 2010g | | | Year Ended December 31, 2009g | |
| Per Share Data | | | | | | | | | | | | | | | | | | | | | |
| Net asset value, beginning of period | | $ | 18.42 | | | $ | 17.73 | | | $ | 17.82 | | | $ | 17.32 | | | $ | 16.62 | | | $ | 16.12 | | | $ | 15.04 | |
| Income (loss) from investment operations: | |
Net investment income (loss)c | | | .26 | | | | .51 | | | | .47 | | | | .16 | | | | .29 | | | | .28 | | | | .36 | |
| Net gain (loss) on investments (realized and unrealized) | | | .12 | | | | .83 | | | | (.04 | ) | | | .51 | | | | .74 | | | | .54 | | | | 1.12 | |
| Total from investment operations | | | .38 | | | | 1.34 | | | | .43 | | | | .67 | | | | 1.03 | | | | .82 | | | | 1.48 | |
| Less distributions from: | |
| Net investment income | | | (.32 | ) | | | (.65 | ) | | | (.52 | ) | | | (.17 | ) | | | (.33 | ) | | | (.32 | ) | | | (.40 | ) |
| Total distributions | | | (.32 | ) | | | (.65 | ) | | | (.52 | ) | | | (.17 | ) | | | (.33 | ) | | | (.32 | ) | | | (.40 | ) |
| Net asset value, end of period | | $ | 18.48 | | | $ | 18.42 | | | $ | 17.73 | | | $ | 17.82 | | | $ | 17.32 | | | $ | 16.62 | | | $ | 16.12 | |
| | |
Total Returnh | | | 2.08 | % | | | 7.68 | % | | | 2.42 | % | | | 3.91 | % | | | 6.35 | % | | | 5.08 | % | | | 9.87 | % |
| Ratios/Supplemental Data | |
| Net assets, end of period (in thousands) | | $ | 1,659 | | | $ | 2,113 | | | $ | 3,054 | | | $ | 5,168 | | | $ | 6,993 | | | $ | 11,619 | | | $ | 16,249 | |
| Ratios to average net assets: | |
| Net investment income (loss) | | | 2.84 | % | | | 2.82 | % | | | 2.64 | % | | | 1.29 | % | | | 1.72 | % | | | 1.76 | % | | | 2.31 | % |
Total expensesd | | | 2.91 | % | | | 2.53 | % | | | 2.67 | % | | | 2.12 | % | | | 1.92 | % | | | 1.95 | % | | | 2.06 | % |
Net expensese,i | | | 1.79 | % | | | 1.80 | % | | | 1.79 | % | | | 1.75 | % | | | 1.75 | % | | | 1.73 | % | | | 1.70 | % |
| Portfolio turnover rate | | | 19 | % | | | 61 | % | | | 119 | % | | | 52 | % | | | 43 | % | | | 39 | % | | | 89 | % |
| C-Class | | Period Ended March 31, 2015a | | | Year Ended September 30, 2014 | | | Year Ended September 30, 2013 | | | Period Ended September 30, 2012b | | | Year Ended December 31, 2011g | | | Year Ended December 31, 2010g | | | Year Ended December 31, 2009g | |
| Per Share Data | | | | | | | | | | | | | | | | | | | | | |
| Net asset value, beginning of period | | $ | 18.42 | | | $ | 17.73 | | | $ | 17.82 | | | $ | 17.31 | | | $ | 16.62 | | | $ | 16.12 | | | $ | 15.04 | |
| Income (loss) from investment operations: | |
Net investment income (loss)c | | | .27 | | | | .51 | | | | .48 | | | | .17 | | | | .29 | | | | .28 | | | | .36 | |
| Net gain (loss) on investments (realized and unrealized) | | | .10 | | | | .83 | | | | (.05 | ) | | | .51 | | | | .73 | | | | .54 | | | | 1.12 | |
| Total from investment operations | | | .37 | | | | 1.34 | | | | .43 | | | | .68 | | | | 1.02 | | | | .82 | | | | 1.48 | |
| Less distributions from: | |
| Net investment income | | | (.32 | ) | | | (.65 | ) | | | (.52 | ) | | | (.17 | ) | | | (.33 | ) | | | (.32 | ) | | | (.40 | ) |
| Total distributions | | | (.32 | ) | | | (.65 | ) | | | (.52 | ) | | | (.17 | ) | | | (.33 | ) | | | (.32 | ) | | | (.40 | ) |
| Net asset value, end of period | | $ | 18.47 | | | $ | 18.42 | | | $ | 17.73 | | | $ | 17.82 | | | $ | 17.31 | | | $ | 16.62 | | | $ | 16.12 | |
| | |
Total Returnh | | | 2.03 | % | | | 7.69 | % | | | 2.42 | % | | | 3.95 | % | | | 6.32 | % | | | 5.05 | % | | | 9.85 | % |
| Ratios/Supplemental Data | |
| Net assets, end of period (in thousands) | | $ | 24,664 | | | $ | 20,673 | | | $ | 17,876 | | | $ | 20,929 | | | $ | 22,035 | | | $ | 19,284 | | | $ | 20,843 | |
| Ratios to average net assets: | |
| Net investment income (loss) | | | 2.90 | % | | | 2.80 | % | | | 2.65 | % | | | 1.29 | % | | | 1.68 | % | | | 1.76 | % | | | 2.28 | % |
Total expensesd | | | 1.92 | % | | | 1.99 | % | | | 2.03 | % | | | 1.92 | % | | | 1.90 | % | | | 1.96 | % | | | 2.05 | % |
Net expensese,i | | | 1.79 | % | | | 1.80 | % | | | 1.79 | % | | | 1.75 | % | | | 1.75 | % | | | 1.73 | % | | | 1.70 | % |
| Portfolio turnover rate | | | 19 | % | | | 61 | % | | | 119 | % | | | 52 | % | | | 43 | % | | | 39 | % | | | 89 | % |
| 34 | THE GUGGENHEIM FUNDS SEMI-ANNUAL REPORT | SEE NOTES TO FINANCIAL STATEMENTS. |
| INVESTMENT GRADE BOND FUND | |
FINANCIAL HIGHLIGHTS (concluded)
This table is presented to show selected data for a share outstanding throughout each period and to assist shareholders in evaluating a Fund’s performance for the periods presented.
| Institutional Class | | Period Ended March 31, 2015a | | | Year Ended September 30, 2014 | | | Period Ended September 30, 2013f | |
| Per Share Data | | | | | | | | | |
| Net asset value, beginning of period | | $ | 18.47 | | | $ | 17.80 | | | $ | 18.00 | |
| Income (loss) from investment operations: | |
Net investment income (loss)c | | | .36 | | | | .68 | | | | .46 | |
| Net gain (loss) on investments (realized and unrealized) | | | .11 | | | | .83 | | | | (.21 | ) |
| Total from investment operations | | | .47 | | | | 1.51 | | | | .25 | |
| Less distributions from: | |
| Net investment income | | | (.41 | ) | | | (.84 | ) | | | (.45 | ) |
| Total distributions | | | (.41 | ) | | | (.84 | ) | | | (.45 | ) |
| Net asset value, end of period | | $ | 18.53 | | | $ | 18.47 | | | $ | 17.80 | |
| | |
Total Returnh | | | 2.58 | % | | | 8.64 | % | | | 1.35 | % |
| Ratios/Supplemental Data | |
| Net assets, end of period (in thousands) | | $ | 7,214 | | | $ | 5,909 | | | $ | 174 | |
| Ratios to average net assets: | |
| Net investment income (loss) | | | 3.94 | % | | | 3.72 | % | | | 3.85 | % |
Total expensesd | | | 0.84 | % | | | 0.88 | % | | | 1.17 | % |
Net expensese,i | | | 0.79 | % | | | 0.78 | % | | | 0.82 | % |
| Portfolio turnover rate | | | 19 | % | | | 61 | % | | | 119 | % |
a | Unaudited figures for the period ended March 31, 2015. Percentage amounts for the period, except total return and portfolio turnover rate, have been annualized. |
b | The Fund changed its fiscal year end from December 31 to September 30 in 2012. |
c | Net investment income (loss) per share was computed using average shares outstanding throughout the period. |
d | Does not include expenses of the underlying funds in which the Fund invests. |
e | Net expense information reflects the expense ratios after expense waivers. |
f | Since commencement of operations: January 29, 2013. Percentage amounts for the period, except total return and portfolio turnover rate, have been annualized. |
g | Per share amounts for the periods presented through April 8, 2011 have been restated to reflect a 1:4 reverse share split effective April 8, 2011. |
h | Total return does not reflect the impact of any applicable sales charges and has not been annualized. |
i | Net expenses may include expenses that are excluded from the expense limitation agreement. Excluding these expenses, the operating expense ratios for the periods would be: |
| | 03/31/15 | 09/30/14 | 09/30/13 |
| A-Class | 1.00% | 1.00% | 1.02% |
| B-Class | 1.75% | 1.75% | 1.77% |
| C-Class | 1.75% | 1.75% | 1.77% |
| Institutional Class | 0.75% | 0.75% | 0.77% |
| SEE NOTES TO FINANCIAL STATEMENTS. | THE GUGGENHEIM FUNDS SEMI-ANNUAL REPORT | 35 |
FUND PROFILE (Unaudited) | March 31, 2015 |
LIMITED DURATION FUND
OBJECTIVE: Seeks to provide a high level of income consistent with preservation of capital.
Holdings Diversification (Market Exposure as % of Net Assets)
| Portfolio Composition by Quality Rating* |
| Rating | % of Total Investments |
| Fixed Income Instruments | |
| AAA | 2.0% |
| AA | 7.0% |
| A | 21.1% |
| BBB | 31.2% |
| BB | 10.4% |
| B | 8.4% |
| CCC | 1.6% |
| D | 0.3% |
| NR** | 6.3% |
| Other Instruments | |
| Short Term Investments | 5.1% |
| Repurchase Agreements | 4.3% |
| Mutual Funds | 1.8% |
| Preferred Stocks | 0.5% |
| Total Investments | 100.0% |
| | |
| The chart above reflects percentages of the value of total investments. |
“Holdings Diversification (Market Exposure as % of Net Assets)” excludes any temporary cash investments or investments in Guggenheim Strategy Funds Trust mutual funds. Investments in those Funds do not provide “market exposure” to meet the fund’s investment objective, but will significantly increase the portfolio’s exposure to certain other asset categories (and their associated risks), which may cause the Fund to deviate from its principal investment strategy, including: (i) high yield, high risk debt securities rated below the top four long-term rating categories by a nationally recognized statistical rating organization (also known as “junk bonds”); (ii) securities issued by the U.S. government or its agencies and instrumentalities; (iii) CLOs and similar investments; and (iv) other short-term fixed income securities.
| Inception Dates: |
| A-Class | December 16, 2013 |
| C-Class | December 16, 2013 |
| Institutional Class | December 16, 2013 |
| Ten Largest Holdings (% of Total Net Assets) |
| Guggenheim Strategy Fund I | 1.9% |
| LSTAR Securities Investment Trust — 2015-2 | 1.9% |
| LSTAR Securities Investment Trust — 2015-1 | 1.9% |
| SRERS-2011 Funding Ltd. — 2011-RS | 1.4% |
| Odyssey Re Holdings Corp. | 1.3% |
| AIM Aviation Finance Ltd. — 2015-1A | 1.3% |
| Nomura Resecuritization Trust 2015-4R | 1.3% |
| Vericrest Opportunity Loan Trust 2015-NPL3 | 1.3% |
| NRPL Trust 2015-1A | 1.3% |
| LSTAR Securities Investment Trust – 2014-1 | 1.2% |
| Top Ten Total | 14.8% |
| | |
| “Ten Largest Holdings” exclude any temporary cash or derivative instruments. |
| * | Source: BlackRock Solutions. Credit quality ratings are measured on a scale that generally ranges from AAA (highest) to D (lowest). All securities except for those labeled “NR” have been rated by Moody’s, Standard & Poor’s (“S&P”), or Fitch, which are all a Nationally Recognized Statistical Rating Organization (“NRSRO”). For purposes of this presentation, when ratings are available from more than one agency, the highest rating is used. Guggenheim Investments has converted Moody’s and Fitch ratings to the equivalent S&P rating. Security ratings are determined at the time of purchase and may change thereafter. |
| ** | NR securities do not necessarily indicate low credit quality. |
| 36 | THE GUGGENHEIM FUNDS SEMI-ANNUAL REPORT | |
SCHEDULE OF INVESTMENTS (Unaudited) | March 31, 2015 |
| LIMITED DURATION FUND | |
| | |
Shares | | | Value | |
| | | | | | | | |
PREFERRED STOCKS† - 0.5% | |
| | | | | | | | |
| INDUSTRIAL - 0.3% | |
| Seaspan Corp. 6.38% due 04/30/19 | | | 20,000 | | | $ | 503,600 | |
| | | | | | | | |
| FINANCIAL - 0.2% | |
Goldman Sachs Group, Inc. 5.50% 1,2 | | | 13,540 | | | | 340,937 | |
| Total Preferred Stocks | | | | | | | | |
| (Cost $829,774) | | | | | | | 844,537 | |
| | | | | | | | |
MUTUAL FUNDS† - 2.0% | |
Guggenheim Strategy Fund I3 | | | 120,620 | | | | 3,003,426 | |
| Total Mutual Funds | | | | | | | | |
| (Cost $3,001,014) | | | | | | | 3,003,426 | |
| | | | | | | | |
SHORT TERM INVESTMENTS† - 5.7% | |
| Dreyfus Treasury Prime Cash Management Fund 0.00% | | | 8,750,486 | | | | 8,750,486 | |
| Total Short Term Investments | | | | | | | | |
| (Cost $8,750,486) | | | | | | | 8,750,486 | |
| | | | | | | | |
| | | Face
Amount | | | | |
| | | | | | | | |
ASSET-BACKED SECURITIES†† - 54.7% | |
| AIM Aviation Finance Ltd. | | | | | | | | |
2015-1A, 4.21% due 02/15/404 | | $ | 1,988,095 | | | | 1,993,265 | |
| Vericrest Opportunity Loan Trust | | | | | | | | |
2015-NPL3, 3.38% due 10/25/584 | | | 1,980,830 | | | | 1,977,067 | |
| NRPL Trust | | | | | | | | |
2015-1A, 3.88% due 11/01/544 | | | 1,985,586 | | | | 1,968,510 | |
| Fortress Credit Opportunities V CLO Ltd. | | | | | | | | |
2014-5A, 2.88% due 10/15/261,4 | | | 1,000,000 | | | | 982,300 | |
2014-5A, 3.78% due 10/15/261,4 | | | 1,000,000 | | | | 971,100 | |
| GCAT LLC | | | | | | | | |
2014-2, 3.72% due 10/25/194 | | | 1,912,304 | | | | 1,907,858 | |
| Nationstar HECM Loan Trust | | | | | | | | |
2014-1A, 4.50% due 11/25/174 | | | 1,806,088 | | | | 1,815,660 | |
| AASET | | | | | | | | |
2014-1, 5.13% due 12/15/291 | | | 1,225,962 | | | | 1,229,026 | |
2014-1, 7.37% due 12/15/291 | | | 490,385 | | | | 491,611 | |
| Oak Hill Advisors Residential Loan Trust | | | | | | | | |
2015-NPL1, 3.47% due 01/25/554 | | | 1,500,000 | | | | 1,499,895 | |
| VOLT XXXIII LLC | | | | | | | | |
2015-NPL5, 3.50% due 03/25/554 | | | 1,500,000 | | | | 1,498,341 | |
| OFSI Fund V Ltd. | | | | | | | | |
2013-5A, 3.46% due 04/17/251,4 | | | 1,500,000 | | | | 1,481,550 | |
| Flagship CLO VI | | | | | | | | |
2007-1A, 2.66% due 06/10/211,4 | | | 1,500,000 | | | | 1,471,200 | |
| Dryden 37 Senior Loan Fund | | | | | | | | |
2015-37A, due 04/15/27†††,4,11 | | | 1,500,000 | | | | 1,457,250 | |
| Cerberus Onshore II CLO LLC | | | | | | | | |
2014-1A, 2.25% due 10/15/231,4 | | | 1,000,000 | | | | 998,200 | |
2014-1A, 2.95% due 10/15/231,4 | | | 250,000 | | | | 249,500 | |
| CIT Mortgage Loan Trust | | | | | | | | |
2007-1, 1.62% due 10/25/371,4 | | | 1,300,000 | | | | 1,235,161 | |
| Symphony CLO IX, LP | | | | | | | | |
2012-9A, 4.50% due 04/16/221,4 | | | 600,000 | | | | 601,380 | |
2012-9A, 3.50% due 04/16/221,4 | | | 500,000 | | | | 501,700 | |
| ACAS CLO Ltd. | | | | | | | | |
2014-1AR, 2.57% due 09/20/231,4 | | | 1,000,000 | | | | 1,004,100 | |
| Cent CLO 16, LP | | | | | | | | |
2014-16AR, 2.50% due 08/01/241,4 | | | 500,000 | | | | 502,300 | |
2014-16AR, 3.50% due 08/01/241,4 | | | 500,000 | | | | 500,050 | |
| Encore Credit Receivables Trust | | | | | | | | |
2005-4, 0.61% due 01/25/361 | | | 1,077,390 | | | | 1,001,902 | |
| Madison Park Funding VIII Ltd. | | | | | | | | |
2014-8AR, 2.46% due 04/22/221,4 | | | 500,000 | | | | 500,500 | |
2014-8AR, 3.06% due 04/22/221,4 | | | 500,000 | | | | 500,000 | |
| Voya CLO Ltd. | | | | | | | | |
2015-3AR, 3.21% due 10/15/221,4 | | | 1,000,000 | | | | 1,000,500 | |
| Oxford Finance Funding Trust | | | | | | | | |
2014-1A, 3.48% due 12/15/224 | | | 1,000,000 | | | | 1,000,400 | |
| Highbridge Loan Management Ltd. | | | | | | | | |
2014-1AR, 2.50% due 09/20/221,4 | | | 1,000,000 | | | | 1,000,200 | |
| Ares XXIII CLO Ltd. | | | | | | | | |
2014-1AR, 3.46% due 04/19/231,4 | | | 1,000,000 | | | | 1,000,100 | |
| Northwoods Capital XIV Ltd. | | | | | | | | |
2014-14A, 2.72% due 11/12/251,4 | | | 1,000,000 | | | | 1,000,000 | |
| Golub Capital Partners CLO 24M Ltd. | | | | | | | | |
2015-24A, 4.02% due 02/05/271,4 | | | 1,000,000 | | | | 1,000,000 | |
| Adirondack Park CLO Limited | | | | | | | | |
2013-1A, 3.25% due 04/15/241,4 | | | 1,000,000 | | | | 1,000,000 | |
| Oaktree EIF II Series A2 Ltd. | | | | | | | | |
2014-A2, 2.60% due 11/15/251,4 | | | 1,000,000 | | | | 999,900 | |
| CIFC Funding 2012-III Ltd. | | | | | | | | |
2013-3A, 3.25% due 01/29/251,4 | | | 600,000 | | | | 596,760 | |
2013-3A, 4.50% due 01/29/251,4 | | | 400,000 | | | | 400,000 | |
| Fortress Credit BSL II Ltd. | | | | | | | | |
2013-2A, 1.76% due 10/19/251,4 | | | 1,000,000 | | | | 991,300 | |
| Fortress Credit Opportunities VI CLO Ltd. | | | | | | | | |
2015-6A, 2.97% due 10/10/261,4 | | | 1,000,000 | | | | 987,000 | |
| H2 Asset Funding Ltd. | | | | | | | | |
| 2.07% due 03/19/37 | | | 1,000,000 | | | | 985,700 | |
| Fortress Credit Opportunities III CLO, LP | | | | | | | | |
2014-3A, 2.75% due 04/28/261,4 | | | 1,000,000 | | | | 983,300 | |
| San Gabriel CLO Ltd. | | | | | | | | |
2007-1A, 2.51% due 09/10/211,4 | | | 1,000,000 | | | | 978,000 | |
| Battalion CLO Ltd. | | | | | | | | |
2007-1A, 2.40% due 07/14/221,4 | | | 1,000,000 | | | | 976,100 | |
| Duane Street CLO IV Ltd. | | | | | | | | |
2007-4A, 2.51% due 11/14/211,4 | | | 1,000,000 | | | | 973,900 | |
| Black Diamond CLO Delaware Corp. | | | | | | | | |
2005-2A, 2.07% due 01/07/181,4 | | | 1,000,000 | | | | 972,100 | |
| Westbrook CLO Ltd. | | | | | | | | |
2006-1A, 1.97% due 12/20/201,4 | | | 1,000,000 | | | | 964,800 | |
| CIFC Funding Ltd. | | | | | | | | |
2007-1A, 1.76% due 05/10/211,4 | | | 1,000,000 | | | | 963,600 | |
| SEE NOTES TO FINANCIAL STATEMENTS. | THE GUGGENHEIM FUNDS SEMI-ANNUAL REPORT | 37 |
SCHEDULE OF INVESTMENTS (Unaudited)(continued) | March 31, 2015 |
| LIMITED DURATION FUND | |
| | | Face
Amount | | | Value | |
| | | | | | | | | |
| Treman Park CLO LLC | | | | | | | | |
2015-1A, 0.00% due 04/20/274,5 | | $ | 1,000,000 | | | $ | 960,100 | |
| Drug Royalty II Limited Partnership 2 | | | | | | | | |
2014-1, 3.48% due 07/15/234 | | | 468,116 | | | | 475,655 | |
2014-1, 3.08% due 07/15/231,4 | | | 468,116 | | | | 475,368 | |
| OHA Credit Partners IX Ltd. | | | | | | | | |
2013-9A, 0.00% due 10/20/254,5 | | | 1,000,000 | | | | 946,800 | |
| Rockwall CDO II Ltd. | | | | | | | | |
2007-1A, 0.80% due 08/01/241,4 | | | 1,000,000 | | | | 932,500 | |
| Structured Asset Investment Loan Trust | | | | | | | | |
2005-2, 0.91% due 03/25/351 | | | 1,000,000 | | | | 929,278 | |
| GreenPoint Mortgage Funding Trust | | | | | | | | |
2005-HE4, 0.88% due 07/25/301 | | | 969,950 | | | | 927,062 | |
| Connecticut Valley Structured Credit CDO III Ltd. | | | | | | | | |
2006-3A, 0.91% due 03/23/231,4 | | | 500,000 | | | | 484,000 | |
2006-3A, 6.68% due 03/23/234 | | | 441,767 | | | | 439,116 | |
| Miramax LLC | | | | | | | | |
2014-1A, 3.34% due 07/20/264 | | | 906,000 | | | | 916,436 | |
| First Frankin Mortgage Loan Trust | | | | | | | | |
2006-FF4, 0.36% due 03/25/361 | | | 928,558 | | | | 893,164 | |
| UCFC Manufactured Housing Contract | | | | | | | | |
| 1997-2, 7.38% due 10/15/28 | | | 786,196 | | | | 850,464 | |
| Castlelake Aircraft Securitization Trust | | | | | | | | |
| 2014-1, 7.50% due 02/15/29 | | | 419,499 | | | | 418,451 | |
| 2014-1, 5.25% due 02/15/29 | | | 419,499 | | | | 416,353 | |
| Venture VI CDO Ltd. | | | | | | | | |
2006-1A, 1.73% due 08/03/201,4 | | | 850,000 | | | | 815,235 | |
| CCR Incorporated MT100 Payment Rights Master Trust | | | | | | | | |
2010-CX, 0.62% due 07/10/17†††,1 | | | 789,676 | | | | 772,461 | |
| CKE Restaurant Holdings, Inc. | | | | | | | | |
2013-1A, 4.47% due 03/20/434 | | | 727,500 | | | | 751,092 | |
| Race Point V CLO Ltd. | | | | | | | | |
2014-5AR, 3.99% due 12/15/221,4 | | | 750,000 | | | | 748,425 | |
| Chesterfield Financial Holdings LLC | | | | | | | | |
2014-1A, 4.50% due 12/15/344 | | | 732,000 | | | | 733,976 | |
| Gramercy Park CLO Ltd. | | | | | | | | |
2014-1AR, 3.21% due 07/17/231,4 | | | 700,000 | | | | 700,000 | |
| Golub Capital Partners CLO 10 Ltd. | | | | | | | | |
2014-10AR, 3.21% due 10/20/211,4 | | | 700,000 | | | | 697,340 | |
| Wrightwood Capital Real Estate CDO Ltd. | | | | | | | | |
2005-1A, 0.69% due 11/21/401,4 | | | 700,000 | | | | 664,020 | |
| KVK CLO Ltd. | | | | | | | | |
2013-1A, due 04/14/254,11 | | | 750,000 | | | | 554,250 | |
| Babson CLO Limited | | | | | | | | |
2012-2A, due 05/15/234,11 | | | 750,000 | | | | 535,800 | |
| Structured Asset Securities Corporation Mortgage Loan Trust | | | | | | | | |
2007-BC1, 0.30% due 02/25/371 | | | 600,000 | | | | 521,988 | |
| Structured Asset Investment Loan Trust | | | | | | | | |
2005-1, 0.89% due 02/25/351,4 | | | 550,000 | | | | 514,059 | |
| LCM X, LP | | | | | | | | |
2014-10AR, 3.10% due 04/15/221,4 | | | 500,000 | | | | 501,050 | |
| Gale Force 4 CLO Ltd. | | | | | | | | |
2007-4A, 3.76% due 08/20/211,4 | | | 500,000 | | | | 500,150 | |
| Marine Park CLO Ltd. | | | | | | | | |
2012-1A, 4.76% due 05/18/231,4 | | | 500,000 | | | | 500,100 | |
| OZLM Funding Ltd. | | | | | | | | |
2012-2A, 3.50% due 10/30/231,4 | | | 500,000 | | | | 500,000 | |
| Cerberus Onshore II CLO-2 LLC | | | | | | | | |
2014-1A, 2.98% due 10/15/231,4 | | | 500,000 | | | | 498,700 | |
| COA Summit CLO Limited | | | | | | | | |
2014-1A, 4.10% due 04/20/231,4 | | | 500,000 | | | | 496,350 | |
| CIFC Funding B Ltd. | | | | | | | | |
2006-1BA, 4.26% due 12/22/201,4 | | | 500,000 | | | | 496,000 | |
| Anchorage Capital CLO 4 Ltd. | | | | | | | | |
2014-4A, 2.42% due 07/28/261,4 | | | 500,000 | | | | 495,850 | |
| Gallatin CLO VII Ltd. | | | | | | | | |
2014-1A, 3.15% due 07/15/231,4 | | | 500,000 | | | | 495,200 | |
| Katonah Ltd. | | | | | | | | |
2007-10A, 2.26% due 04/17/201,4 | | | 500,000 | | | | 493,800 | |
| ALM VII R-2 Ltd. | | | | | | | | |
2013-7R2A, 2.86% due 04/24/241,4 | | | 500,000 | | | | 493,400 | |
| Apidos CDO III Ltd. | | | | | | | | |
2006-3A, 2.02% due 06/12/201,4 | | | 500,000 | | | | 492,800 | |
| BlueMountain CLO Ltd. | | | | | | | | |
2012-2A, 3.01% due 11/20/241,4 | | | 500,000 | | | | 492,250 | |
| Shackleton II CLO Ltd. | | | | | | | | |
2012-2A, 4.31% due 10/20/231,4 | | | 500,000 | | | | 490,800 | |
| Halcyon Loan Advisors Funding Ltd. | | | | | | | | |
2012-1A, 3.26% due 08/15/231,4 | | | 500,000 | | | | 488,250 | |
| Figueroa CLO Ltd. | | | | | | | | |
2013-1A, 3.01% due 03/21/241,4 | | | 500,000 | | | | 488,050 | |
| Race Point IV CLO Ltd. | | | | | | | | |
2007-4A, 2.25% due 08/01/211,4 | | | 500,000 | | | | 487,550 | |
| Babson Mid-Market CLO Inc. | | | | | | | | |
2007-2A, 1.95% due 04/15/211,4 | | | 500,000 | | | | 487,400 | |
| Golub Capital Partners CLO 21M Ltd. | | | | | | | | |
2014-21A, 2.68% due 10/25/261,4 | | | 500,000 | | | | 487,300 | |
| KVK CLO Ltd. | | | | | | | | |
2014-2A, 3.25% due 07/15/261,4 | | | 500,000 | | | | 485,150 | |
| ColumbusNova CLO Ltd. | | | | | | | | |
2007-1A, 1.61% due 05/16/191,4 | | | 500,000 | | | | 485,000 | |
| Telos CLO Ltd. | | | | | | | | |
2013-4A, 3.00% due 07/17/241,4 | | | 500,000 | | | | 481,950 | |
| Madison Park Funding III Ltd. | | | | | | | | |
2006-3A, 1.68% due 10/25/201,4 | | | 500,000 | | | | 481,300 | |
| WhiteHorse IV Ltd. | | | | | | | | |
2007-4A, 1.71% due 01/17/201,4 | | | 500,000 | | | | 481,150 | |
| Helios Series I Multi Asset CBO Ltd. | | | | | | | | |
2001-1A, 1.19% due 12/13/361,4 | | | 512,580 | | | | 480,903 | |
| Shasta CLO Ltd. | | | | | | | | |
2007-1A, 1.66% due 04/20/211,4 | | | 500,000 | | | | 479,700 | |
| Katonah IX CLO Ltd. | | | | | | | | |
2006-9A, 1.66% due 01/25/191,4 | | | 500,000 | | | | 478,600 | |
| ALM XIV Ltd. | | | | | | | | |
2014-14A, 3.71% due 07/28/261,4 | | | 500,000 | | | | 474,800 | |
| 38 | THE GUGGENHEIM FUNDS SEMI-ANNUAL REPORT | SEE NOTES TO FINANCIAL STATEMENTS. |
SCHEDULE OF INVESTMENTS (Unaudited)(continued) | March 31, 2015 |
| LIMITED DURATION FUND | |
| | | Face
Amount | | | Value | |
| | | | | | | | | |
| Golub Capital Partners CLO 18 Ltd. | | | | | | | | |
2014-18A, 3.76% due 04/25/261,4 | | $ | 250,000 | | | $ | 242,750 | |
2014-18A, 4.26% due 04/25/261,4 | | | 250,000 | | | | 231,100 | |
| NewStar Arlington Senior Loan Program LLC | | | | | | | | |
2014-1A, 3.56% due 07/25/251,4 | | | 250,000 | | | | 239,550 | |
2014-1A, 4.51% due 07/25/251,4 | | | 250,000 | | | | 232,750 | |
| Icon Brand Holdings LLC | | | | | | | | |
2013-1A, 4.35% due 01/25/434 | | | 443,307 | | | | 447,607 | |
| GSAA Home Equity Trust | | | | | | | | |
2006-18, 6.00% due 11/25/366 | | | 637,514 | | | | 426,535 | |
| Gramercy Real Estate CDO Ltd. | | | | | | | | |
2007-1A, 0.54% due 08/15/561,4 | | | 465,486 | | | | 419,403 | |
| GSAMP Trust 2005-HE6 | | | | | | | | |
2005-HE6, 0.61% due 11/25/351 | | | 450,000 | | | | 417,365 | |
| Accredited Mortgage Loan Trust | | | | | | | | |
2007-1, 0.30% due 02/25/371 | | | 437,821 | | | | 415,917 | |
| Keuka Park CLO Ltd. | | | | | | | | |
2013-1A, due 10/21/244,11 | | | 500,000 | | | | 395,350 | |
| Soundview Home Loan Trust | | | | | | | | |
2003-1, 2.42% due 08/25/311 | | | 269,972 | | | | 274,928 | |
| Copper River CLO Ltd. | | | | | | | | |
2007-1A, due 01/20/211,4,11 | | | 500,000 | | | | 256,850 | |
| ALM IV Ltd. | | | | | | | | |
2011-4A, 3.00% due 07/18/221,4 | | | 250,000 | | | | 250,000 | |
| Hewett’s Island CDO Ltd. | | | | | | | | |
2007-6A, 2.51% due 06/09/191,4 | | | 250,000 | | | | 249,950 | |
| Great Lakes CLO Ltd. | | | | | | | | |
2014-1A, 3.95% due 04/15/251,4 | | | 250,000 | | | | 244,850 | |
| Kingsland IV Ltd. | | | | | | | | |
2007-4A, 1.70% due 04/16/211,4 | | | 250,000 | | | | 233,375 | |
| Neuberger Berman CLO Ltd. | | | | | | | | |
2012-12A, due 07/25/234,11 | | | 350,000 | | | | 224,805 | |
| West Coast Funding Ltd. | | | | | | | | |
2006-1A, 0.40% due 11/02/411,4 | | | 224,829 | | | | 223,458 | |
| Tricadia CDO Ltd. | | | | | | | | |
2006-6A, 0.81% due 11/05/411,4 | | | 153,771 | | | | 153,033 | |
| Total Asset-Backed Securities | | | | | | | | |
| (Cost $84,734,248) | | | | | | | 84,479,608 | |
| | | | | | | | |
COLLATERALIZED MORTGAGE OBLIGATIONS†† - 17.5% | |
| LSTAR Securities Investment Trust | | | | | | | | |
2015-2, 2.17% due 01/01/201,4,7 | | | 2,962,438 | | | | 2,947,624 | |
2015-1, 2.18% due 01/01/201,4 | | | 2,964,533 | | | | 2,923,919 | |
2014-1, 3.28% due 09/01/211,4,7 | | | 1,911,858 | | | | 1,929,639 | |
2015-3, 2.18% due 03/01/201,4 | | | 1,500,000 | | | | 1,492,500 | |
| CSMC Series | | | | | | | | |
2014-ICE, 2.32% due 04/15/271,4 | | | 1,500,000 | | | | 1,495,526 | |
2014-6R, 0.35% due 09/27/361,4 | | | 907,596 | | | | 861,967 | |
2014-2R, 0.37% due 02/27/461,4 | | | 503,942 | | | | 468,760 | |
| SRERS Funding Ltd. | | | | | | | | |
2011-RS, 0.43% due 05/09/461,4,7 | | | 2,213,675 | | | | 2,104,762 | |
| Motel 6 Trust | | | | | | | | |
2015-MTL6, 4.53% due 02/05/304 | | | 1,000,000 | | | | 1,010,584 | |
2015-MTL6, 5.28% due 02/05/304 | | | 1,000,000 | | | | 1,001,532 | |
| Nomura Resecuritization Trust | | | | | | | | |
2015-4R, 0.61% due 03/26/361,4 | | | 2,200,000 | | | | 1,989,625 | |
2012-1R, 0.62% due 08/27/471,4 | | | 423,442 | | | | 391,684 | |
| COMM Mortgage Trust | | | | | | | | |
2014-KYO, 2.53% due 06/11/271,4,7 | | | 1,500,000 | | | | 1,498,522 | |
| Hilton USA Trust | | | | | | | | |
2013-HLT, 5.22% due 11/05/181,4 | | | 1,000,000 | | | | 1,027,157 | |
| Morgan Stanley Capital I Trust | | | | | | | | |
2015-XLF1, 2.35% due 08/13/161,4 | | | 1,000,000 | | | | 1,000,123 | |
| Resource Capital Corporation | | | | | | | | |
2015-CRE3, 3.32% due 03/15/321,4 | | | 1,000,000 | | | | 999,998 | |
| CSMC Trust | | | | | | | | |
2014-SURF, 2.43% due 02/15/291,4 | | | 1,000,000 | | | | 997,002 | |
| JP Morgan Chase Commercial Mortgage Securities Trust | | | | | | | | |
2014-FL5, 2.27% due 07/15/311,4 | | | 1,000,000 | | | | 995,237 | |
| LSTAR Commercial Mortgage Trust | | | | | | | | |
2011-1, 5.42% due 06/25/431,4 | | | 750,000 | | | | 761,099 | |
| Resource Capital Corporation Ltd. | | | | | | | | |
2014-CRE2, 2.68% due 04/15/321,4 | | | 500,000 | | | | 493,548 | |
| HarborView Mortgage Loan Trust | | | | | | | | |
2006-12, 0.37% due 01/19/381 | | | 536,668 | | | | 453,327 | |
| Morgan Stanley Re-REMIC Trust | | | | | | | | |
2010-R5, 0.48% due 06/26/361,4 | | | 251,918 | | | | 181,036 | |
| Total Collateralized Mortgage Obligations | | | | | | | | |
| (Cost $26,931,889) | | | | | | | 27,025,171 | |
| | | | | | | | |
CORPORATE BONDS†† - 14.0% | |
| FINANCIAL - 11.2% | |
| Citigroup, Inc. | | | | | | | | |
5.80%1,2,7 | | | 1,400,000 | | | | 1,403,500 | |
5.88%1,2 | | | 495,000 | | | | 499,950 | |
5.35%1,2 | | | 345,000 | | | | 333,788 | |
6.30%1,2 | | | 30,000 | | | | 30,638 | |
| Odyssey Re Holdings Corp. | | | | | | | | |
6.88% due 05/01/157 | | | 2,000,000 | | | | 2,007,662 | |
| Bank of America Corp. | | | | | | | | |
5.13%1,2 | | | 1,900,000 | | | | 1,866,559 | |
| SunTrust Banks, Inc. | | | | | | | | |
5.63%1,2 | | | 1,500,000 | | | | 1,529,063 | |
| Morgan Stanley | | | | | | | | |
5.55%1,2 | | | 1,500,000 | | | | 1,514,999 | |
| JPMorgan Chase & Co. | | | | | | | | |
5.00%1,2 | | | 1,280,000 | | | | 1,257,536 | |
| EPR Properties | | | | | | | | |
5.75% due 08/15/227 | | | 1,000,000 | | | | 1,100,901 | |
| Nordea Bank AB | | | | | | | | |
5.50% due 09/29/491,2,4,7 | | | 1,000,000 | | | | 1,016,250 | |
| Corporation Financiera de Desarrollo S.A. | | | | | | | | |
3.25% due 07/15/194,7 | | | 500,000 | | | | 507,500 | |
5.25% due 07/15/291,4,7 | | | 350,000 | | | | 363,948 | |
| SEE NOTES TO FINANCIAL STATEMENTS. | THE GUGGENHEIM FUNDS SEMI-ANNUAL REPORT | 39 |
SCHEDULE OF INVESTMENTS (Unaudited)(continued) | March 31, 2015 |
| LIMITED DURATION FUND | |
| | | Face
Amount | | | Value | |
| | | | | | | | | |
| HRG Group, Inc. | | | | | | | | |
7.88% due 07/15/197 | | $ | 800,000 | | | $ | 842,000 | |
| Icahn Enterprises Limited Partnership / Icahn Enterprises Finance Corp. | | | | | | | | |
6.00% due 08/01/207 | | | 400,000 | | | | 415,520 | |
3.50% due 03/15/177 | | | 350,000 | | | | 352,625 | |
| HSBC Holdings plc | | | | | | | | |
5.63%1,2,7 | | | 750,000 | | | | 757,031 | |
| Ironshore Holdings US, Inc. | | | | | | | | |
8.50% due 05/15/204 | | | 500,000 | | | | 607,180 | |
| Cadence Financial Corp. | | | | | | | | |
4.88% due 06/28/1910 | | | 500,000 | | | | 504,780 | |
| Assured Guaranty US Holdings, Inc. | | | | | | | | |
5.00% due 07/01/247 | | | 300,000 | | | | 321,063 | |
| Total Financial | | | | | | | 17,232,493 | |
| | | | | | | | |
| CONSUMER, CYCLICAL - 0.9% | |
| Bumble Bee Holdings, Inc. | | | | | | | | |
9.00% due 12/15/174 | | | 566,000 | | | | 594,300 | |
| United Airlines 2014-2 Class B Pass Through Trust | | | | | | | | |
| 4.63% due 09/03/22 | | | 500,000 | | | | 503,125 | |
| AmeriGas Finance LLC / AmeriGas Finance Corp. | | | | | | | | |
6.75% due 05/20/207 | | | 250,000 | | | | 263,125 | |
| Total Consumer, Cyclical | | | | | | | 1,360,550 | |
| | | | | | | | |
| INDUSTRIAL - 0.8% | |
| Quality Distribution LLC / QD Capital Corp. | | | | | | | | |
| 9.88% due 11/01/18 | | | 708,000 | | | | 741,630 | |
| Dynagas LNG Partners Limited Partnership / Dynagas Finance, Inc. | | | | | | | | |
| 6.25% due 10/30/19 | | | 600,000 | | | | 516,000 | |
| Total Industrial | | | | | | | 1,257,630 | |
| | | | | | | | |
| BASIC MATERIALS - 0.6% | |
| Yamana Gold, Inc. | | | | | | | | |
| 4.95% due 07/15/24 | | | 750,000 | | | | 737,409 | |
| KGHM International Ltd. | | | | | | | | |
7.75% due 06/15/194,7 | | | 200,000 | | | | 206,000 | |
| Total Basic Materials | | | | | | | 943,409 | |
| | | | | | | | |
| ENERGY - 0.5% | |
| Crestwood Midstream Partners Limited Partnership / Crestwood Midstream Finance Corp. | | | | | | | | |
7.75% due 04/01/197 | | | 500,000 | | | | 519,550 | |
| Schahin II Finance Company SPV Ltd. | | | | | | | | |
5.87% due 09/25/224,7 | | | 390,900 | | | | 236,299 | |
| Total Energy | | | | | | | 755,849 | |
| Total Corporate Bonds | | | | | | | | |
| (Cost $21,702,194) | | | | | | | 21,549,931 | |
| | | | | | | | |
SENIOR FLOATING RATE INTERESTS††,1 - 8.7% | |
| CONSUMER, CYCLICAL - 2.3% | |
| Party City Holdings, Inc. | | | | | | | | |
| 4.00% due 07/27/19 | | | 695,183 | | | | 694,021 | |
| American Tire Distributors, Inc. | | | | | | | | |
| 5.25% due 09/24/21 | | | 298,496 | | | | 299,616 | |
| 7.00% due 06/01/18 | | | 297,744 | | | | 297,744 | |
| BJ’s Wholesale Club, Inc. | | | | | | | | |
| 4.50% due 09/26/19 | | | 496,731 | | | | 496,508 | |
| Hilton Worldwide Holdings, Inc. | | | | | | | | |
| 3.50% due 10/26/20 | | | 475,490 | | | | 475,923 | |
| Hoyts Group Holdings LLC | | | | | | | | |
| 4.00% due 05/29/20 | | | 349,112 | | | | 347,366 | |
| Smart & Final Stores LLC | | | | | | | | |
| 4.75% due 11/15/19 | | | 270,796 | | | | 271,644 | |
| Fitness International LLC | | | | | | | | |
| 5.50% due 07/01/20 | | | 248,125 | | | | 230,756 | |
| Michaels Stores, Inc. | | | | | | | | |
| 4.00% due 01/28/20 | | | 199,000 | | | | 199,533 | |
| Arby’s | | | | | | | | |
| 4.75% due 11/15/20 | | | 197,500 | | | | 197,994 | |
| Total Consumer, Cyclical | | | | | | | 3,511,105 | |
| | | | | | | | |
| INDUSTRIAL - 1.6% | |
| Travelport Holdings LLC | | | | | | | | |
| 5.75% due 09/02/21 | | | 1,097,250 | | | | 1,106,258 | |
| Rise Ltd. | | | | | | | | |
| 4.74% due 02/12/39 | | | 466,146 | | | | 469,642 | |
| AABS Ltd. | | | | | | | | |
| 4.87% due 01/15/38 | | | 433,988 | | | | 441,583 | |
| Dematic S.A. | | | | | | | | |
| 4.25% due 12/28/19 | | | 246,875 | | | | 246,053 | |
| Doncasters Group Ltd. | | | | | | | | |
| 4.50% due 04/09/20 | | | 241,754 | | | | 241,955 | |
| Total Industrial | | | | | | | 2,505,491 | |
| | | | | | | | |
| TECHNOLOGY - 1.2% | |
| Avago Technologies Ltd. | | | | | | | | |
| 3.75% due 05/06/21 | | | 604,462 | | | | 605,333 | |
| Deltek, Inc. | | | | | | | | |
| 4.50% due 10/10/18 | | | 298,473 | | | | 298,939 | |
| Blue Coat Systems, Inc. | | | | | | | | |
| 4.00% due 05/31/19 | | | 297,738 | | | | 297,490 | |
| MSC Software Corp. | | | | | | | | |
| 5.00% due 05/29/20 | | | 266,250 | | | | 267,581 | |
| Sabre, Inc. | | | | | | | | |
| 4.00% due 02/19/19 | | | 197,475 | | | | 197,475 | |
| Epicor Software | | | | | | | | |
| 4.00% due 05/16/18 | | | 96,869 | | | | 96,772 | |
| Total Technology | | | | | | | 1,763,590 | |
| | | | | | | | |
| BASIC MATERIALS - 1.1% | |
| Fortescue Metals Group Ltd. | | | | | | | | |
| 3.75% due 06/30/19 | | | 1,390,336 | | | | 1,253,360 | |
| 40 | THE GUGGENHEIM FUNDS SEMI-ANNUAL REPORT | SEE NOTES TO FINANCIAL STATEMENTS. |
SCHEDULE OF INVESTMENTS (Unaudited)(concluded) | March 31, 2015 |
| LIMITED DURATION FUND | |
| | | Face
Amount | | | Value | |
| | | | | | | | | |
| Chromaflo Technologies | | | | | | | | |
| 4.50% due 12/02/19 | | $ | 398,990 | | | $ | 395,000 | |
| Total Basic Materials | | | | | | | 1,648,360 | |
| | | | | | | | |
| COMMUNICATIONS - 1.0% | |
| Asurion Corp. | | | | | | | | |
| 4.25% due 07/08/20 | | | 349,112 | | | | 347,935 | |
| 5.00% due 05/24/19 | | | 195,976 | | | | 196,411 | |
| Univision Communications, Inc. | | | | | | | | |
| 4.00% due 03/01/20 | | | 498,680 | | | | 497,433 | |
| Avaya, Inc. | | | | | | | | |
| 4.68% due 10/26/17 | | | 498,524 | | | | 490,253 | |
| Total Communications | | | | | | | 1,532,032 | |
| | | | | | | | |
| FINANCIAL - 0.9% | |
| First Data Corp. | | | | | | | | |
| 3.67% due 03/23/18 | | | 800,000 | | | | 799,200 | |
| 4.17% due 03/24/21 | | | 150,000 | | | | 150,375 | |
| USI Holdings Corp. | | | | | | | | |
| 4.25% due 12/27/19 | | | 372,166 | | | | 372,323 | |
| Total Financial | | | | | | | 1,321,898 | |
| | | | | | | | |
| CONSUMER, NON-CYCLICAL - 0.8% | |
| Albertson’s (Safeway) Holdings LLC | | | | | | | | |
| 5.50% due 08/25/21 | | | 700,000 | | | | 705,544 | |
| Diamond Foods, Inc. | | | | | | | | |
| 4.25% due 08/20/18 | | | 495,620 | | | | 494,847 | |
| Total Consumer, Non-cyclical | | | | | | | 1,200,391 | |
| Total Senior Floating Rate Interests | | | | | | | | |
| (Cost $13,482,180) | | | | | | | 13,482,867 | |
| | | | | | | | |
MORTGAGE-BACKED SECURITIES†† - 2.3% | |
| Hyatt Hotel Portfolio Trust | | | | | | | | |
2015-HYT, 3.22% due 11/15/291,4 | | | 1,000,000 | | | | 1,003,087 | |
| CDGJ Commercial Mortgage Trust | | | | | | | | |
2014-BXCH, 0.67% due 12/15/271,4 | | | 1,000,000 | | | | 1,001,399 | |
| Structured Asset Mortgage Investments II Trust | | | | | | | | |
2006-AR1, 0.40% due 02/25/361 | | | 538,417 | | | | 448,576 | |
| Residential Asset Securitization Trust | | | | | | | | |
| 2006-A12, 6.25% due 11/25/36 | | | 592,673 | | | | 421,959 | |
| First Horizon Alternative Mortgage Securities Trust | | | | | | | | |
| 2006-FA1, 5.75% due 04/25/36 | | | 481,449 | | | | 393,057 | |
| GreenPoint Mortgage Funding Trust Series | | | | | | | | |
2007-AR1, 0.25% due 02/25/471 | | | 336,183 | | | | 314,000 | |
| Total Mortgage-Backed Securities | | | | | | | | |
| (Cost $3,666,599) | | | | | | | 3,582,078 | |
| | | | | | | | |
REPURCHASE AGREEMENTS††,8,9 - 4.8% | |
| Jefferies & Company, Inc. | | | | | | | | |
issued 03/30/15 at 3.18%
due 04/24/15 | | | 2,719,000 | | | | 2,719,000 | |
issued 03/30/15 at 3.18%
due 05/07/15 | | | 1,339,000 | | | | 1,339,000 | |
issued 03/27/15 at 3.18%
due 05/01/15 | | | 1,250,000 | | | | 1,250,000 | |
issued 03/30/15 at 2.68%
due 05/07/15 | | | 973,000 | | | | 973,000 | |
issued 03/09/15 at 2.43%
due 04/05/15 | | | 549,000 | | | | 549,000 | |
issued 03/30/15 at 2.68%
due 04/24/15 | | | 509,000 | | | | 509,000 | |
| Total Repurchase Agreements | | | | | | | | |
| (Cost $7,339,000) | | | | | | | 7,339,000 | |
| | | | | | | | |
| Total Investments - 110.2% | | | | | | | | |
| (Cost $170,437,384) | | | | | | $ | 170,057,104 | |
| Other Assets & Liabilities, net - (10.2)% | | | | | | | (15,671,458 | ) |
| Total Net Assets - 100.0% | | | | | | $ | 154,385,646 | |
| † | Value determined based on Level 1 inputs — See Note 4. |
| †† | Value determined based on Level 2 inputs, unless otherwise noted — See Note 4. |
| ††† | Value determined based on Level 3 inputs — See Note 4. |
| 1 | Variable rate security. Rate indicated is rate effective at March 31, 2015. |
| 2 | Perpetual maturity. |
| 3 | Affiliated issuer — See Note 13. |
| 4 | Security is a 144A or Section 4(a)(2) security. The total market value of 144A or Section 4(a)(2) securities is $105,615,210 (cost $105,872,770), or 68.4% of total net assets. These securities have been determined to be liquid under guidelines established by the Board of Trustees. |
| 5 | Zero coupon rate security. |
| 6 | Security is a step up/step down bond. The coupon increases or decreases at regular intervals until the bond reaches full maturity. |
| 7 | Security or a portion thereof is held as collateral for reverse repurchase agreements — See Note 12. |
| 8 | Illiquid security. |
| 9 | Repurchase Agreements — See Note 11. |
| 10 | Security is a 144A or Section 4(a)(2) security. These securities are considered illiquid and restricted under guidelines established by the Board of Trustees. The total market value of 144A or Section 4(a)(2) securities is $504,780 (cost $500,000), or 0.3% of total net assets — See Note 14. |
| 11 | Residual interest. |
| plc — Public Limited Company |
| |
| See Sector Classification in Other Information section. |
| SEE NOTES TO FINANCIAL STATEMENTS. | THE GUGGENHEIM FUNDS SEMI-ANNUAL REPORT | 41 |
STATEMENT OF ASSETS AND LIABILITIES (Unaudited)
March 31, 2015
| Assets: | |
| Investments in unaffiliated issuers, at value (cost $160,097,370) | | $ | 159,714,678 | |
| Investments in affiliated issuers, at value (cost $3,001,014) | | | 3,003,426 | |
| Repurchase agreements, at value (cost $7,339,000) | | | 7,339,000 | |
| Total investments (cost $170,437,384) | | | 170,057,104 | |
| Cash | | | 759,949 | |
| Prepaid expenses | | | 21,605 | |
| Segregated cash with broker | | | 11,000 | |
| Receivables: | |
| Fund shares sold | | | 2,782,606 | |
| Interest | | | 704,734 | |
| Securities sold | | | 231,825 | |
| Dividends | | | 1,217 | |
| Total assets | | | 174,570,040 | |
| | | | | |
| Liabilities: | |
| Reverse Repurchase Agreements | | | 14,438,576 | |
| Payable for: | |
| Securities purchased | | | 5,470,909 | |
| Fund shares redeemed | | | 172,254 | |
| Management fees | | | 36,068 | |
| Fund accounting/administration fees | | | 11,615 | |
| Distribution and service fees | | | 11,427 | |
| Transfer agent/maintenance fees | | | 682 | |
| Trustees’ fees* | | | 172 | |
| Miscellaneous | | | 42,691 | |
| Total liabilities | | | 20,184,394 | |
| Net assets | | $ | 154,385,646 | |
| | | | | |
| Net assets consist of: | |
| Paid in capital | | $ | 154,834,331 | |
| Undistributed net investment income | | | 31,196 | |
| Accumulated net realized loss on investments | | | (99,601 | ) |
| Net unrealized depreciation on investments | | | (380,280 | ) |
| Net assets | | $ | 154,385,646 | |
| | | | | |
| A-Class: | |
| Net assets | | $ | 49,373,389 | |
| Capital shares outstanding | | | 1,985,544 | |
| Net asset value per share | | $ | 24.87 | |
| Maximum offering price per share (Net asset value divided by 97.75%) | | $ | 25.44 | |
| | | | | |
| C-Class: | |
| Net assets | | $ | 2,397,251 | |
| Capital shares outstanding | | | 96,464 | |
| Net asset value per share | | $ | 24.85 | |
| | | | | |
| Institutional Class: | |
| Net assets | | $ | 102,615,006 | |
| Capital shares outstanding | | | 4,127,589 | |
| Net asset value per share | | $ | 24.86 | |
STATEMENT OF OPERATIONS (Unaudited)
Period Ended March 31, 2015
| Investment Income: | |
| Interest | | $ | 2,507,624 | |
| Dividends from securities of unaffiliated issuers | | | 25,246 | |
| Dividends from securities of affiliated issuers | | | 1,217 | |
| Total investment income | | | 2,534,087 | |
| | | | | |
| Expenses: | |
| Management fees | | | 257,941 | |
| Transfer agent/maintenance fees: | |
| A-Class | | | 4,200 | |
| C-Class | | | 873 | |
| Institutional Class | | | 857 | |
| Distribution and service fees: | |
| A-Class | | | 41,624 | |
| C-Class | | | 8,178 | |
| Fund accounting/administration fees | | | 54,453 | |
| Registration fees | | | 49,692 | |
| Interest expense | | | 25,248 | |
| Trustees’ fees* | | | 4,603 | |
| Line of credit fees | | | 4,274 | |
| Custodian fees | | | 1,757 | |
| Tax expense | | | 2 | |
| Miscellaneous | | | 51,421 | |
| Total expenses | | | 505,123 | |
| Less: | |
| Expenses waived by Adviser | | | (110,543 | ) |
| Net expenses | | | 394,580 | |
| Net investment income | | | 2,139,507 | |
| | | | | |
| Net Realized and Unrealized Gain (Loss): | |
| Net realized gain (loss) on: | |
| Investments in unaffiliated issuers | | | (63,740 | ) |
| Net realized loss | | | (63,740 | ) |
| Net change in unrealized appreciation (depreciation) on: | |
| Investments in unaffiliated issuers | | | (122,031 | ) |
| Investments in affiliated issuers | | | 2,412 | |
| Net change in unrealized appreciation (depreciation) | | | (119,619 | ) |
| Net realized and unrealized loss | | | (183,359 | ) |
| Net increase in net assets resulting from operations | | $ | 1,956,148 | |
| * | Relates to Trustees not deemed “interested persons” within the meaning of Section 2(a)(19) of the 1940 Act. |
| 42 | THE GUGGENHEIM FUNDS SEMI-ANNUAL REPORT | SEE NOTES TO FINANCIAL STATEMENTS. |
STATEMENTS OF CHANGES IN NET ASSETS
| | | Period Ended March 31, 2015 (Unaudited) | | | Period Ended September 30, 2014a | |
| Increase (Decrease) in Net Assets from Operations: | | | | | | |
| Net investment income | | $ | 2,139,507 | | | $ | 1,097,055 | |
| Net realized gain (loss) on investments | | | (63,740 | ) | | | 112,474 | |
| Net change in unrealized appreciation (depreciation) on investments | | | (119,619 | ) | | | (260,661 | ) |
| Net increase in net assets resulting from operations | | | 1,956,148 | | | | 948,868 | |
| | | | | | | | | |
| Distributions to shareholders from: | | | | | | | | |
| Net investment income | | | | | | | | |
| A-Class | | | (624,827 | ) | | | (89,880 | ) |
| C-Class | | | (24,949 | ) | | | (5,453 | ) |
| Institutional Class | | | (1,579,606 | ) | | | (993,125 | ) |
| Net realized gains | | | | | | | | |
| A-Class | | | (10,524 | ) | | | — | |
| C-Class | | | (358 | ) | | | — | |
| Institutional Class | | | (24,979 | ) | | | — | |
| Total distributions to shareholders | | | (2,265,243 | ) | | | (1,088,458 | ) |
| | | | | | | | | |
| Capital share transactions: | | | | | | | | |
| Proceeds from sale of shares | | | | | | | | |
| A-Class | | | 40,118,541 | | | | 25,872,935 | |
| C-Class | | | 2,451,481 | | | | 1,176,069 | |
| Institutional Class | | | 47,017,597 | | | | 85,617,617 | |
| Distributions reinvested | | | | | | | | |
| A-Class | | | 585,806 | | | | 71,252 | |
| C-Class | | | 22,169 | | | | 4,971 | |
| Institutional Class | | | 1,602,040 | | | | 802,150 | |
| Cost of shares redeemed | | | | | | | | |
| A-Class | | | (8,292,966 | ) | | | (8,887,662 | ) |
| C-Class | | | (718,566 | ) | | | (537,027 | ) |
| Institutional Class | | | (14,919,573 | ) | | | (17,152,503 | ) |
| Net increase from capital share transactions | | | 67,866,529 | | | | 86,967,802 | |
| Net increase in net assets | | | 67,557,434 | | | | 86,828,212 | |
| | | | | | | | | |
| Net assets: | | | | | | | | |
| Beginning of period | | | 86,828,212 | | | | — | |
| End of period | | $ | 154,385,646 | | | $ | 86,828,212 | |
| Undistributed net investment income at end of period | | $ | 31,196 | | | $ | 121,071 | |
| | | | | | | | | |
| Capital share activity: | | | | | | | | |
| Shares sold | | | | | | | | |
| A-Class | | | 1,613,277 | | | | 1,034,665 | |
| C-Class | | | 98,750 | | | | 47,044 | |
| Institutional Class | | | 1,893,199 | | | | 3,423,937 | |
| Shares issued from reinvestment of distributions | | | | | | | | |
| A-Class | | | 23,595 | | | | 2,851 | |
| C-Class | | | 894 | | | | 200 | |
| Institutional Class | | | 64,514 | | | | 32,093 | |
| Shares redeemed | | | | | | | | |
| A-Class | | | (333,506 | ) | | | (355,338 | ) |
| C-Class | | | (28,959 | ) | | | (21,465 | ) |
| Institutional Class | | | (600,008 | ) | | | (686,146 | ) |
| Net increase in shares | | | 2,731,756 | | | | 3,477,841 | |
a | Since commencement of operations: December 16, 2013. |
| SEE NOTES TO FINANCIAL STATEMENTS. | THE GUGGENHEIM FUNDS SEMI-ANNUAL REPORT | 43 |
This table is presented to show selected data for a share outstanding throughout each period and to assist shareholders in evaluating a Fund’s performance for the periods presented.
| A-Class | | Period Ended March 31, 2015a | | | Period Ended September 30, 2014b | |
| Per Share Data | | | | | | |
| Net asset value, beginning of period | | $ | 24.97 | | | $ | 25.00 | |
| Income (loss) from investment operations: | |
Net investment income (loss)c | | | .44 | | | | .52 | |
| Net gain (loss) on investments (realized and unrealized) | | | (.07 | ) | | | (.08 | ) |
| Total from investment operations | | | .37 | | | | .44 | |
| Less distributions from: | |
| Net investment income | | | (.46 | ) | | | (.47 | ) |
| Net realized gains | | | (.01 | ) | | | — | |
| Total distributions | | | (.47 | ) | | | (.47 | ) |
| Net asset value, end of period | | $ | 24.87 | | | $ | 24.97 | |
| | |
Total Returnd | | | 1.51 | % | | | 1.75 | % |
| Ratios/Supplemental Data | |
| Net assets, end of period (in thousands) | | $ | 49,373 | | | $ | 17,035 | |
| Ratios to average net assets: | |
| Net investment income (loss) | | | 3.58 | % | | | 2.67 | % |
Total expensese | | | 1.05 | % | | | 1.14 | % |
Net expensesf,g | | | 0.85 | % | | | 0.83 | % |
| Portfolio turnover rate | | | 11 | % | | | 40 | % |
| C-Class | | Period Ended March 31, 2015a | | | Period Ended September 30, 2014b | |
| Per Share Data | | | | | | |
| Net asset value, beginning of period | | $ | 24.96 | | | $ | 25.00 | |
| Income (loss) from investment operations: | |
Net investment income (loss)c | | | .36 | | | | .38 | |
| Net gain (loss) on investments (realized and unrealized) | | | (.09 | ) | | | (.09 | ) |
| Total from investment operations | | | .27 | | | | .29 | |
| Less distributions from: | |
| Net investment income | | | (.37 | ) | | | (.33 | ) |
| Net realized gains | | | (.01 | ) | | | — | |
| Total distributions | | | (.38 | ) | | | (.33 | ) |
| Net asset value, end of period | | $ | 24.85 | | | $ | 24.96 | |
| | |
Total Returnd | | | 1.12 | % | | | 1.13 | % |
| Ratios/Supplemental Data | |
| Net assets, end of period (in thousands) | | $ | 2,397 | | | $ | 643 | |
| Ratios to average net assets: | |
| Net investment income (loss) | | | 2.94 | % | | | 1.93 | % |
Total expensese | | | 1.88 | % | | | 2.14 | % |
Net expensesf,g | | | 1.60 | % | | | 1.56 | % |
| Portfolio turnover rate | | | 11 | % | | | 40 | % |
| 44 | THE GUGGENHEIM FUNDS SEMI-ANNUAL REPORT | SEE NOTES TO FINANCIAL STATEMENTS. |
FINANCIAL HIGHLIGHTS (concluded)
This table is presented to show selected data for a share outstanding throughout each period and to assist shareholders in evaluating a Fund’s performance for the periods presented.
| Institutional Class | | Period Ended March 31, 2015a | | | Period Ended September 30, 2014b | |
| Per Share Data | | | | | | |
| Net asset value, beginning of period | | $ | 24.96 | | | $ | 25.00 | |
| Income (loss) from investment operations: | |
Net investment income (loss)c | | | .47 | | | | .57 | |
| Net gain (loss) on investments (realized and unrealized) | | | (.07 | ) | | | (.08 | ) |
| Total from investment operations | | | .40 | | | | .49 | |
| Less distributions from: | |
| Net investment income | | | (.49 | ) | | | (.53 | ) |
| Net realized gains | | | (.01 | ) | | | — | |
| Total distributions | | | (.50 | ) | | | (.53 | ) |
| Net asset value, end of period | | $ | 24.86 | | | $ | 24.96 | |
| | |
Total Returnd | | | 1.63 | % | | | 1.98 | % |
| Ratios/Supplemental Data | |
| Net assets, end of period (in thousands) | | $ | 102,615 | | | $ | 69,150 | |
| Ratios to average net assets: | |
| Net investment income (loss) | | | 3.81 | % | | | 2.90 | % |
Total expensese | | | 0.79 | % | | | 0.96 | % |
Net expensesf,g | | | 0.60 | % | | | 0.57 | % |
| Portfolio turnover rate | | | 11 | % | | | 40 | % |
a | Unaudited figures for the period ended March 31, 2015. Percentage amounts for the period, except total return and portfolio turnover rate, have been annualized. |
b | Since commencement of operations: December 16, 2013. Percentage amounts for the period, except total return and portfolio turnover rate, have been annualized. |
c | Net investment income (loss) per share was computed using average shares outstanding throughout the period. |
d | Total return does not reflect the impact of any applicable sales charges and has not been annualized. |
e | Does not include expenses of the underlying funds in which the Fund invests. |
f | Net expense information reflects the expense ratios after expense waivers. |
g | Net expenses may include expenses that are excluded from the expense limitation agreement. Excluding these expenses, the operating expense ratio for the periods would be: |
| | 03/31/15 | 09/30/14 |
| A-Class | 0.80% | 0.79% |
| C-Class | 1.55% | 1.52% |
| Institutional Class | 0.55% | 0.54% |
| SEE NOTES TO FINANCIAL STATEMENTS. | THE GUGGENHEIM FUNDS SEMI-ANNUAL REPORT | 45 |
FUND PROFILE (Unaudited) | March 31, 2015 |
MUNICIPAL INCOME FUND
OBJECTIVE: Seeks to provide current income with an emphasis on income exempt from federal income tax, while also considering capital appreciation.
Holdings Diversification (Market Exposure as % of Net Assets)
“Holdings Diversification (Market Exposure as % of Net Assets)” excludes any temporary cash investments.
| Portfolio Composition by Quality Rating* |
| Rating | % of Total Investments |
| Fixed Income Instruments | |
| AAA | 4.1% |
| AA | 64.2% |
| A | 15.6% |
| BBB | 6.4% |
| BB | 1.7% |
| B | 3.6% |
| Other Instruments | |
| Short Term Investments | 4.4% |
| Total Investments | 100.0% |
| | |
| The chart above reflects percentages of the value of total investments. |
| Inception Dates: |
| A-Class | April 28, 2004 |
| C-Class | January 13, 2012 |
| Institutional Class | January 13, 2012 |
| Ten Largest Holdings (% of Total Net Assets) |
| North Texas Tollway Authority Revenue Bonds | 4.5% |
| Triborough Bridge & Tunnel Authority Revenue Bonds | 4.0% |
| City of Detroit Michigan Water Supply System Revenue Revenue Bonds | 3.9% |
| Puerto Rico Highways & Transportation Authority Revenue Bonds | 3.5% |
| Metropolitan Transportation Authority Revenue Bonds | 3.5% |
| Michigan Finance Authority Revenue Bonds | 3.2% |
| Tustin Unified School District General Obligation Unlimited | 3.2% |
| County of Wayne Michigan General Obligation Limited | 3.0% |
| Arizona Health Facilities Authority Revenue Bonds | 2.9% |
| Hudson County Improvement Authority Revenue Bonds | 2.8% |
| Top Ten Total | 34.5% |
| | |
| “Ten Largest Holdings” exclude any temporary cash or derivative investments. |
| * | Source: BlackRock Solutions. Credit quality ratings are measured on a scale that generally ranges from AAA (highest) to D (lowest). All securities have been rated by Moody’s, Standard & Poor’s (“S&P”), or Fitch, which are all a Nationally Recognized Statistical Rating Organization (“NRSRO”). For purposes of this presentation, when ratings are available from more than one agency, the highest rating is used. Guggenheim Investments has converted Moody’s and Fitch ratings to the equivalent S&P rating. Security ratings are determined at the time of purchase and may change thereafter. |
| 46 | THE GUGGENHEIM FUNDS SEMI-ANNUAL REPORT | |
SCHEDULE OF INVESTMENTS (Unaudited) | March 31, 2015 |
| MUNICIPAL INCOME FUND | |
| | |
Shares | | | Value | |
| | | | | | | | |
SHORT TERM INVESTMENTS† - 4.4% | |
| Fidelity Institutional Tax-Exempt Portfolio 0.00% | | | 2,743,185 | | | $ | 2,743,185 | |
| Total Short Term Investments | | | | | | | | |
| (Cost $2,743,185) | | | | | | | 2,743,185 | |
| | | | | | | | |
| | | Face
Amount | | | | |
| | | | | | | | |
MUNICIPAL BONDS†† - 95.2% | |
| MICHIGAN - 23.8% | |
| Michigan Finance Authority Revenue Bonds | | | | | | | | |
| 5.00% due 07/01/31 | | $ | 1,800,000 | | | | 2,023,794 | |
| 5.00% due 07/01/32 | | | 1,200,000 | | | | 1,343,136 | |
| 5.00% due 07/01/44 | | | 1,200,000 | | | | 1,288,546 | |
| 5.00% due 10/01/39 | | | 1,000,000 | | | | 1,128,970 | |
| 5.00% due 07/01/33 | | | 400,000 | | | | 446,040 | |
| 5.00% due 07/01/34 | | | 300,000 | | | | 327,105 | |
| City of Detroit Michigan Water Supply System Revenue Revenue Bonds | | | | | | | | |
| 5.00% due 07/01/33 | | | 2,530,000 | | | | 2,597,060 | |
| 4.75% due 07/01/29 | | | 230,000 | | | | 246,197 | |
| 5.00% due 07/01/41 | | | 200,000 | | | | 211,746 | |
| 5.00% due 07/01/34 | | | 155,000 | | | | 156,761 | |
| 4.25% due 07/01/16 | | | 125,000 | | | | 130,193 | |
| County of Wayne Michigan General Obligation Ltd. | | | | | | | | |
| 5.00% due 12/01/30 | | | 1,845,000 | | | | 1,850,018 | |
| Detroit City School District General Obligation Unlimited | | | | | | | | |
| 5.00% due 05/01/32 | | | 1,000,000 | | | | 1,110,570 | |
| 5.00% due 05/01/30 | | | 300,000 | | | | 334,779 | |
| Detroit Wayne County Stadium Authority Revenue Bonds | | | | | | | | |
| 5.00% due 10/01/26 | | | 1,100,000 | | | | 1,200,441 | |
| City of Detroit Michigan Sewage Disposal System Revenue Revenue Bonds | | | | | | | | |
| 5.00% due 07/01/15 | | | 500,000 | | | | 505,610 | |
| Total Michigan | | | | | | | 14,900,966 | |
| | | | | | | | |
| CALIFORNIA - 17.0% | |
| Tustin Unified School District General Obligation Unlimited | | | | | | | | |
| 6.00% due 08/01/36 | | | 1,600,000 | | | | 1,980,944 | |
| Oakland Unified School District/Alameda County General Obligation Unlimited | | | | | | | | |
5.50% due 08/01/321 | | | 1,200,000 | | | | 1,377,384 | |
5.00% due 08/01/221 | | | 300,000 | | | | 348,126 | |
| Regents of the University of California Medical Center Pooled Revenue Revenue Bonds | | | | | | | | |
0.91% due 05/15/432 | | | 2,000,000 | | | | 1,695,420 | |
| Stockton Public Financing Authority Revenue Bonds | | | | | | | | |
| 6.25% due 10/01/38 | | | 1,000,000 | | | | 1,187,740 | |
| 6.25% due 10/01/40 | | | 250,000 | | | | 296,533 | |
| San Diego Unified School District General Obligation Unlimited | | | | | | | | |
6.63% due 07/01/413 | | | 1,500,000 | | | | 1,012,320 | |
| Metropolitan Water District of Southern California Revenue Bonds | | | | | | | | |
0.01% due 07/01/352 | | | 1,000,000 | | | | 1,000,000 | |
| State of California General Obligation Unlimited | | | | | | | | |
0.01% due 05/01/332 | | | 1,000,000 | | | | 1,000,000 | |
| College of the Sequoias Tulare Area Improvement District No. 3 General Obligation Unlimited | | | | | | | | |
6.85% due 08/01/423 | | | 1,000,000 | | | | 552,290 | |
| Culver Redevelopment Agency Tax Allocation | | | | | | | | |
0.00% due 11/01/234 | | | 195,000 | | | | 141,040 | |
| Total California | | | | | | | 10,591,797 | |
| | | | | | | | |
| NEW YORK - 10.3% | |
| Triborough Bridge & Tunnel Authority Revenue Bonds | | | | | | | | |
0.62% due 11/15/272 | | | 2,500,000 | | | | 2,501,949 | |
| Metropolitan Transportation Authority Revenue Bonds | | | | | | | | |
0.42% due 11/01/322 | | | 2,200,000 | | | | 2,167,198 | |
| New York City Water & Sewer System Revenue Bonds | | | | | | | | |
0.01% due 06/15/452 | | | 1,000,000 | | | | 1,000,000 | |
| Long Island Power Authority Revenue Bonds | | | | | | | | |
1.52% due 09/01/152 | | | 775,000 | | | | 778,604 | |
| Total New York | | | | | | | 6,447,751 | |
| | | | | | | | |
| TEXAS - 7.5% | |
| North Texas Tollway Authority Revenue Bonds | | | | | | | | |
| 5.75% due 01/01/40 | | | 2,500,000 | | | | 2,799,524 | |
| Texas Water Development Board Revenue Bonds | | | | | | | | |
0.02% due 07/15/192 | | | 1,000,000 | | | | 1,000,000 | |
| Harris County-Houston Sports Authority Revenue Bonds | | | | | | | | |
0.00% due 11/15/534 | | | 4,000,000 | | | | 633,920 | |
| New Hope Cultural Education Facilities Corp. Revenue Bonds | | | | | | | | |
| 5.00% due 04/01/46 | | | 250,000 | | | | 275,075 | |
| Total Texas | | | | | | | 4,708,519 | |
| | | | | | | | |
| PUERTO RICO - 7.5% | |
| Puerto Rico Electric Power Authority Revenue Bonds | | | | | | | | |
0.70% due 07/01/292 | | | 1,470,000 | | | | 1,092,048 | |
| 5.00% due 07/01/24 | | | 760,000 | | | | 759,932 | |
| 5.00% due 07/01/22 | | | 620,000 | | | | 618,388 | |
| Puerto Rico Highways & Transportation Authority Revenue Bonds | | | | | | | | |
1.03% due 07/01/272 | | | 2,800,000 | | | | 2,211,916 | |
| Total Puerto Rico | | | | | | | 4,682,284 | |
| SEE NOTES TO FINANCIAL STATEMENTS. | THE GUGGENHEIM FUNDS SEMI-ANNUAL REPORT | 47 |
SCHEDULE OF INVESTMENTS (Unaudited)(concluded) | March 31, 2015 |
| MUNICIPAL INCOME FUND | |
| | | Face
Amount | | | Value | |
| | | | | | | | | |
| ILLINOIS - 6.9% | |
| Metropolitan Water Reclamation District of Greater Chicago General Obligation Unlimited | | | | | | | | |
| 5.00% due 12/01/44 | | $ | 1,250,000 | | | $ | 1,434,638 | |
| Will County Township High School District No. 204 Joliet General Obligation Limited | | | | | | | | |
| 6.25% due 01/01/31 | | | 1,000,000 | | | | 1,190,190 | |
| Southern Illinois University Revenue Bonds | | | | | | | | |
| 5.00% due 04/01/32 | | | 1,000,000 | | | | 1,104,440 | |
| University of Illinois Revenue Bonds | | | | | | | | |
| 6.00% due 10/01/29 | | | 200,000 | | | | 237,782 | |
| City of Chicago Illinois General Obligation Unlimited | | | | | | | | |
| 5.00% due 01/01/24 | | | 100,000 | | | | 100,395 | |
| 5.00% due 01/01/23 | | | 70,000 | | | | 75,123 | |
| 5.00% due 01/01/22 | | | 55,000 | | | | 56,630 | |
| Metropolitan Pier & Exposition Authority Revenue Bonds | | | | | | | | |
0.00% due 06/15/454 | | | 500,000 | | | | 125,465 | |
| Total Illinois | | | | | | | 4,324,663 | |
| | | | | | | | |
| NEW JERSEY - 6.0% | |
| Hudson County Improvement Authority Revenue Bonds | | | | | | | | |
| 6.00% due 01/01/40 | | | 1,500,000 | | | | 1,724,985 | |
| New Jersey State Turnpike Authority Revenue Bonds | | | | | | | | |
0.69% due 01/01/242 | | | 1,000,000 | | | | 1,002,120 | |
| New Jersey Transportation Trust Fund Authority Revenue Bonds | | | | | | | | |
1.22% due 06/15/342 | | | 1,000,000 | | | | 1,000,430 | |
| Total New Jersey | | | | | | | 3,727,535 | |
| | | | | | | | |
| ARIZONA - 2.9% | |
| Arizona Health Facilities Authority Revenue Bonds | | | | | | | | |
0.99% due 01/01/372 | | | 2,000,000 | | | | 1,812,040 | |
| | | | | | | | |
| OREGON - 2.4% | |
| State of Oregon General Obligation Unlimited | | | | | | | | |
0.01% due 06/01/412 | | | 1,500,000 | | | | 1,500,000 | |
| | | | | | | | |
| MASSACHUSETTS - 1.9% | |
| Massachusetts Development Finance Agency Revenue Bonds | | | | | | | | |
| 6.88% due 01/01/41 | | | 1,000,000 | | | | 1,189,820 | |
| | | | | | | | |
| LOUISIANA - 1.8% | |
| New Orleans Aviation Board Revenue Bonds | | | | | | | | |
| 5.00% due 01/01/45 | | | 1,000,000 | | | | 1,109,000 | |
| | | | | | | | |
| WASHINGTON - 1.7% | |
| Greater Wenatchee Regional Events Center Public Facilities Dist Revenue Bonds | | | | | | | | |
5.00% due 09/01/271 | | | 500,000 | | | | 537,445 | |
5.25% due 09/01/321 | | | 500,000 | | | | 528,895 | |
| Total Washington | | | | | | | 1,066,340 | |
| | | | | | | | |
| PENNSYLVANIA - 1.6% | |
| Pennsylvania Turnpike Commission Revenue Bonds | | | | | | | | |
1.29% due 12/01/202 | | | 500,000 | | | | 511,130 | |
1.00% due 12/01/212 | | | 500,000 | | | | 504,910 | |
| Total Pennsylvania | | | | | | | 1,016,040 | |
| | | | | | | | |
| MISSISSIPPI - 1.4% | |
| Mississippi Development Bank Revenue Bonds | | | | | | | | |
| 6.50% due 10/01/31 | | | 500,000 | | | | 576,485 | |
| 6.25% due 10/01/26 | | | 230,000 | | | | 266,453 | |
| Total Mississippi | | | | | | | 842,938 | |
| | | | | | | | |
| WEST VIRGINIA - 0.9% | |
| West Virginia Higher Education Policy Commission Revenue Bonds | | | | | | | | |
| 5.00% due 04/01/29 | | | 500,000 | | | | 576,695 | |
| | | | | | | | |
| INDIANA - 0.8% | |
| County of Knox Indiana Revenue Bonds | | | | | | | | |
| 5.00% due 04/01/27 | | | 470,000 | | | | 519,580 | |
| | | | | | | | |
| FLORIDA - 0.8% | |
| County of Miami-Dade Florida Revenue Bonds | | | | | | | | |
0.00% due 10/01/454 | | | 2,000,000 | | | | 491,800 | |
| Total Municipal Bonds | | | | | | | | |
| (Cost $56,725,451) | | | | | | | 59,507,768 | |
| | | | | | | | |
| Total Investments - 99.6% | | | | | | | | |
| (Cost $59,468,636) | | | | | | $ | 62,250,953 | |
| Other Assets & Liabilities, net - 0.4% | | | | | | | 249,178 | |
| Total Net Assets - 100.0% | | | | | | $ | 62,500,131 | |
| † | Value determined based on Level 1 inputs — See Note 4. |
| †† | Value determined based on Level 2 inputs — See Note 4. |
| 1 | Illiquid security. |
| 2 | Variable rate security. Rate indicated is rate effective at March 31, 2015. |
| 3 | Security is a step up/step down bond. The coupon increases or decreases at regular intervals until the bond reaches full maturity. |
| 4 | Zero coupon rate security. |
| |
| See Sector Classification in Other Information section. |
| 48 | THE GUGGENHEIM FUNDS SEMI-ANNUAL REPORT | SEE NOTES TO FINANCIAL STATEMENTS. |
STATEMENT OF ASSETS AND LIABILITIES (Unaudited)
March 31, 2015
| Assets: | |
| Investments, at value (cost $59,468,636) | | $ | 62,250,953 | |
| Prepaid expenses | | | 24,595 | |
| Receivables: | |
| Interest | | | 518,853 | |
| Fund shares sold | | | 70,354 | |
| Total assets | | | 62,864,755 | |
| | | | | |
| Liabilities: | |
| Payable for: | |
| Fund shares redeemed | | | 224,282 | |
| Distributions to shareholders | | | 41,542 | |
| Management fees | | | 7,634 | |
| Distribution and service fees | | | 12,716 | |
| Trustees’ fees* | | | 5,293 | |
| Fund accounting/administration fees | | | 5,058 | |
| Transfer agent/maintenance fees | | | 2,796 | |
| Miscellaneous | | | 65,303 | |
| Total liabilities | | | 364,624 | |
| Net assets | | $ | 62,500,131 | |
| | | | | |
| Net assets consist of: | |
| Paid in capital | | $ | 87,713,622 | |
| Undistributed net investment income | | | — | |
| Accumulated net realized loss on investments | | | (27,995,808 | ) |
| Net unrealized appreciation on investments | | | 2,782,317 | |
| Net assets | | $ | 62,500,131 | |
| | | | | |
| A-Class: | |
| Net assets | | $ | 52,047,209 | |
| Capital shares outstanding | | | 4,087,090 | |
| Net asset value per share | | $ | 12.73 | |
| Maximum offering price per share (Net asset value divided by 95.25%) | | $ | 13.36 | |
| | | | | |
| C-Class: | |
| Net assets | | $ | 1,983,121 | |
| Capital shares outstanding | | | 155,803 | |
| Net asset value per share | | $ | 12.73 | |
| | | | | |
| Institutional Class: | |
| Net assets | | $ | 8,469,801 | |
| Capital shares outstanding | | | 664,815 | |
| Net asset value per share | | $ | 12.74 | |
STATEMENT OF OPERATIONS (Unaudited)
Period Ended March 31, 2015
| Investment Income: | |
| Interest | | $ | 851,569 | |
| Total investment income | | | 851,569 | |
| | | | | |
| Expenses: | |
| Management fees | | | 142,908 | |
| Transfer agent/maintenance fees: | |
| A-Class | | | 29,876 | |
| Institutional Class | | | 2,683 | |
| C-Class | | | 417 | |
| Distribution and service fees: | |
| A-Class | | | 60,098 | |
| C-Class | | | 7,978 | |
| Fund accounting/administration fees | | | 27,152 | |
| Registration fees | | | 34,590 | |
| Trustees’ fees* | | | 3,841 | |
| Line of credit fees | | | 3,556 | |
| Custodian fees | | | 739 | |
| Tax expense | | | 1 | |
| Miscellaneous | | | 34,737 | |
| Total expenses | | | 348,576 | |
| Less: | |
| Expenses waived by Adviser | | | (119,693 | ) |
| Net expenses | | | 228,883 | |
| Net investment income | | | 622,686 | |
| | | | | |
| Net Realized and Unrealized Gain (Loss): | |
| Net realized gain (loss) on: | |
| Investments | | | 413,218 | |
| Net realized gain | | | 413,218 | |
| Net change in unrealized appreciation (depreciation) on: | |
| Investments | | | 565,165 | |
| Net change in unrealized appreciation (depreciation) | | | 565,165 | |
| Net realized and unrealized gain | | | 978,383 | |
| Net increase in net assets resulting from operations | | $ | 1,601,069 | |
| * | Relates to Trustees not deemed “interested persons” within the meaning of Section 2(a)(19) of the 1940 Act. |
| SEE NOTES TO FINANCIAL STATEMENTS. | THE GUGGENHEIM FUNDS SEMI-ANNUAL REPORT | 49 |
STATEMENTS OF CHANGES IN NET ASSETS
| | | Period Ended March 31, 2015 (Unaudited) | | | Year Ended September 30, 2014 | |
| Increase (Decrease) in Net Assets from Operations: | | | | | | |
| Net investment income | | $ | 622,686 | | | $ | 1,630,155 | |
| Net realized gain on investments | | | 413,218 | | | | 597,388 | |
| Net change in unrealized appreciation (depreciation) on investments | | | 565,165 | | | | 3,446,106 | |
| Net increase in net assets resulting from operations | | | 1,601,069 | | | | 5,673,649 | |
| | | | | | | | | |
| Distributions to shareholders from: | | | | | | | | |
| Net investment income | | | | | | | | |
| A-Class | | | (521,319 | ) | | | (1,390,241 | ) |
| C-Class | | | (11,049 | ) | | | (20,717 | ) |
| Institutional Class | | | (90,318 | ) | | | (219,197 | ) |
| Total distributions to shareholders | | | (622,686 | ) | | | (1,630,155 | ) |
| | | | | | | | | |
| Capital share transactions: | | | | | | | | |
| Proceeds from sale of shares | | | | | | | | |
| A-Class | | | 12,400,798 | | | | 7,402,924 | |
| C-Class | | | 1,131,358 | | | | 333,716 | |
| Institutional Class | | | 3,093,514 | | | | 5,038,833 | |
| Distributions reinvested | | | | | | | | |
| A-Class | | | 301,379 | | | | 803,386 | |
| C-Class | | | 7,856 | | | | 13,179 | |
| Institutional Class | | | 46,917 | | | | 101,486 | |
| Cost of shares redeemed | | | | | | | | |
| A-Class | | | (5,579,894 | ) | | | (18,029,547 | ) |
| C-Class | | | (258,915 | ) | | | (826,566 | ) |
| Institutional Class | | | (1,243,629 | ) | | | (5,559,429 | ) |
| Net increase (decrease) from capital share transactions | | | 9,899,384 | | | | (10,722,018 | ) |
| Net increase (decrease) in net assets | | | 10,877,767 | | | | (6,678,524 | ) |
| | | | | | | | | |
| Net assets: | | | | | | | | |
| Beginning of period | | | 51,622,364 | | | | 58,300,888 | |
| End of period | | $ | 62,500,131 | | | $ | 51,622,364 | |
| Undistributed net investment income at end of period | | $ | — | | | $ | — | |
| | | | | | | | | |
| Capital share activity: | | | | | | | | |
| Shares sold | | | | | | | | |
| A-Class | | | 978,401 | | | | 621,507 | |
| C-Class | | | 89,108 | | | | 27,623 | |
| Institutional Class | | | 243,870 | | | | 423,863 | |
| Shares issued from reinvestment of distributions | | | | | | | | |
| A-Class | | | 23,762 | | | | 67,225 | |
| C-Class | | | 619 | | | | 1,099 | |
| Institutional Class | | | 3,693 | | | | 8,465 | |
| Shares redeemed | | | | | | | | |
| A-Class | | | (440,527 | ) | | | (1,515,958 | ) |
| C-Class | | | (20,447 | ) | | | (71,141 | ) |
| Institutional Class | | | (98,317 | ) | | | (463,637 | ) |
| Net increase (decrease) in shares | | | 780,162 | | | | (900,954 | ) |
| 50 | THE GUGGENHEIM FUNDS SEMI-ANNUAL REPORT | SEE NOTES TO FINANCIAL STATEMENTS. |
This table is presented to show selected data for a share outstanding throughout each period and to assist shareholders in evaluating a Fund’s performance for the periods presented.
A-Class† | | Period Ended March 31, 2015a | | | Year Ended September 30, 2014 | | | Year Ended September 30, 2013 | | | Period Ended September 30, 2012* | | | Year Ended December 31, 2011 | | | Year Ended December 31, 2010 | | | Year Ended December 31, 2009 | |
| Per Share Data | | | | | | | | | | | | | | | | | | | | | |
| Net asset value, beginning of period | | $ | 12.51 | | | $ | 11.59 | | | $ | 12.59 | | | $ | 11.82 | | | $ | 11.54 | | | $ | 11.01 | | | $ | 8.47 | |
| Income (loss) from investment operations: | |
Net investment income (loss)c | | | .14 | | | | .36 | | | | .38 | | | | .26 | | | | .64 | | | | .71 | | | | .75 | |
| Distributions to preferred shareholders from: | | | | | | | | | | | | | | | | | | | | | | | | | | | | |
| Net investment income | | | — | | | | — | | | | — | | | | (.01 | ) | | | (.10 | ) | | | (.10 | ) | | | (.11 | ) |
| Net gain (loss) on investments (realized and unrealized) | | | .22 | | | | .92 | | | | (1.00 | ) | | | .78 | | | | .54 | | | | .68 | | | | 2.69 | |
| Total from investment operations | | | .36 | | | | 1.28 | | | | (.62 | ) | | | 1.03 | | | | 1.08 | | | | 1.29 | | | | 3.33 | |
| Less distributions from: | |
| Net investment income | | | (.14 | ) | | | (.36 | ) | | | (.38 | ) | | | (.26 | ) | | | (.80 | ) | | | (.76 | ) | | | (.79 | ) |
| Total distributions | | | (.14 | ) | | | (.36 | ) | | | (.38 | ) | | | (.26 | ) | | | (.80 | ) | | | (.76 | ) | | | (.79 | ) |
| Net asset value, end of period | | $ | 12.73 | | | $ | 12.51 | | | $ | 11.59 | | | $ | 12.59 | | | $ | 11.82 | | | $ | 11.54 | | | $ | 11.01 | |
| | |
Total Returne | | | 2.87 | % | | | 11.20 | % | | | (5.09 | %) | | | 8.91 | % | | | 9.64 | % | | | 12.03 | % | | | 41.34 | % |
| Ratios/Supplemental Data | |
| Net assets, end of period (in thousands) | | $ | 52,047 | | | $ | 44,090 | | | $ | 50,463 | | | $ | 77,609 | | | $ | 182,150 | | | $ | 177,868 | | | $ | 169,674 | |
| Ratios to average net assets: | |
| Net investment income (loss) | | | 2.17 | % | | | 3.00 | % | | | 3.04 | % | | | 2.78 | % | | | 4.60 | % | | | 5.37 | % | | | 6.73 | % |
| Total expenses | | | 1.24 | % | | | 1.29 | % | | | 1.14 | % | | | 1.15 | % | | | 2.09 | % | | | 1.80 | % | | | 1.94 | % |
Net expensesd,f | | | 0.81 | % | | | 0.83 | % | | | 0.82 | % | | | 0.87 | % | | | 2.09 | % | | | 1.80 | % | | | 1.94 | % |
| Portfolio turnover rate | | | 50 | % | | | 173 | % | | | 91 | % | | | 121 | % | | | 104 | % | | | 156 | % | | | 151 | % |
| C-Class | | Period Ended March 31, 2015a | | | Year Ended September 30, 2014 | | | Year Ended September 30, 2013 | | | Period Ended September 30, 2012b | |
| Per Share Data | | | | | | | | | | | | |
| Net asset value, beginning of period | | $ | 12.50 | | | $ | 11.59 | | | $ | 12.58 | | | $ | 11.98 | |
| Income (loss) from investment operations: | |
Net investment income (loss)c | | | .09 | | | | .27 | | | | .28 | | | | .20 | |
| Net gain (loss) on investments (realized and unrealized) | | | .23 | | | | .91 | | | | (.98 | ) | | | .62 | |
| Total from investment operations | | | .32 | | | | 1.18 | | | | (.70 | ) | | | .82 | |
| Less distributions from: | |
| Net investment income | | | (.09 | ) | | | (.27 | ) | | | (.29 | ) | | | (.22 | ) |
| Total distributions | | | (.09 | ) | | | (.27 | ) | | | (.29 | ) | | | (.22 | ) |
| Net asset value, end of period | | $ | 12.73 | | | $ | 12.50 | | | $ | 11.59 | | | $ | 12.58 | |
| | |
Total Returne | | | 2.57 | % | | | 10.28 | % | | | (5.70 | %) | | | 7.04 | % |
| Ratios/Supplemental Data | |
| Net assets, end of period (in thousands) | | $ | 1,983 | | | $ | 1,082 | | | $ | 1,495 | | | $ | 1,176 | |
| Ratios to average net assets: | |
| Net investment income (loss) | | | 1.38 | % | | | 2.24 | % | | | 2.30 | % | | | 2.36 | % |
| Total expenses | | | 1.91 | % | | | 2.08 | % | | | 1.93 | % | | | 1.94 | % |
Net expensesd,f | | | 1.56 | % | | | 1.58 | % | | | 1.57 | % | | | 1.55 | % |
| Portfolio turnover rate | | | 50 | % | | | 173 | % | | | 91 | % | | | 121 | % |
| SEE NOTES TO FINANCIAL STATEMENTS. | THE GUGGENHEIM FUNDS SEMI-ANNUAL REPORT | 51 |
FINANCIAL HIGHLIGHTS (concluded)
This table is presented to show selected data for a share outstanding throughout each period and to assist shareholders in evaluating a Fund’s performance for the periods presented.
| Institutional Class | | Period Ended March 31, 2015a | | | Year Ended September 30, 2014 | | | Year Ended September 30, 2013 | | | Period Ended September 30, 2012b | |
| Per Share Data | | | | | | | | | | | | |
| Net asset value, beginning of period | | $ | 12.51 | | | $ | 11.60 | | | $ | 12.59 | | | $ | 11.98 | |
| Income (loss) from investment operations: | |
Net investment income (loss)c | | | .15 | | | | .39 | | | | .40 | | | | .29 | |
| Net gain (loss) on investments (realized and unrealized) | | | .23 | | | | .91 | | | | (.98 | ) | | | .62 | |
| Total from investment operations | | | .38 | | | | 1.30 | | | | (.58 | ) | | | .91 | |
| Less distributions from: | |
| Net investment income | | | (.15 | ) | | | (.39 | ) | | | (.41 | ) | | | (.30 | ) |
| Total distributions | | | (.15 | ) | | | (.39 | ) | | | (.41 | ) | | | (.30 | ) |
| Net asset value, end of period | | $ | 12.74 | | | $ | 12.51 | | | $ | 11.60 | | | $ | 12.59 | |
| | |
Total Returne | | | 3.08 | % | | | 11.38 | % | | | (4.76 | %) | | | 7.76 | % |
| Ratios/Supplemental Data | |
| Net assets, end of period (in thousands) | | $ | 8,470 | | | $ | 6,451 | | | $ | 6,343 | | | $ | 1,051 | |
| Ratios to average net assets: | |
| Net investment income (loss) | | | 2.41 | % | | | 3.23 | % | | | 3.35 | % | | | 3.37 | % |
| Total expenses | | | 0.94 | % | | | 0.97 | % | | | 0.93 | % | | | 0.86 | % |
Net expensesd,f | | | 0.56 | % | | | 0.58 | % | | | 0.57 | % | | | 0.55 | % |
| Portfolio turnover rate | | | 50 | % | | | 173 | % | | | 91 | % | | | 121 | % |
† | Effective January 13, 2012, the Fund acquired all of the assets and liabilities of the TS&W/Claymore Tax-Advantage Balanced Fund (“TYW”), a registered closed-end management investment company. The A-Class financial highlights for the periods prior to that date reflect performance of TYW. |
| * | Prior to January 13, 2012, the Fund’s fiscal year end was December 31. Percentage amounts for the period, except total return and portfolio turnover rate, have been annualized. |
a | Unaudited figures for the period ended March 31, 2015. Percentage amounts for the period, except total return and portfolio turnover rate, have been annualized. |
b | Since commencement of operations: January 13, 2012. Percentage amounts for the period, except total return and portfolio turnover rate, have been annualized. |
c | Net investment income (loss) per share was computed using average shares outstanding throughout the period. |
d | Net expense information reflects the expense ratios after expense waivers. |
e | Total return does not reflect the impact of any applicable sales charges and has not been annualized. |
f | Net expenses may include expenses that are excluded from the expense limitation agreement. Excluding these expenses, the operating expense ratio for the periods would be: |
| | 03/31/15 | 09/30/14 |
| A-Class | 0.80% | 0.80% |
| C-Class | 1.55% | 1.54% |
| Institutional Class | 0.55% | 0.55% |
| 52 | THE GUGGENHEIM FUNDS SEMI-ANNUAL REPORT | SEE NOTES TO FINANCIAL STATEMENTS. |
NOTES TO FINANCIAL STATEMENTS (Unaudited)
1. Organization and Significant Accounting Policies
Organization
Guggenheim Funds Trust (the "Trust"), a Delaware statutory trust, is registered with the SEC under the Investment Company Act of 1940 ("1940 Act”), as a non-diversified, open-ended investment company of the series type. Each series, in effect, is representing a separate Fund. The Trust is authorized to issue an unlimited number of shares. The Trust accounts for the assets of each Fund separately.
The Trust offers a combination of four separate classes of shares, A-Class shares, B-Class shares, C-Class shares and Institutional Class shares. Sales of shares of each Class are made without a front-end sales charge at the net asset value per share (“NAV”), with the exception of A-Class shares. A-Class shares are sold at the NAV, plus the applicable front-end sales charge. The sales charge varies depending on the amount purchased, but will not exceed 4.75%, except for Limited Duration Fund which will not exceed 2.25%. A-Class share purchases of $1 million or more are exempt from the front-end sales charge but have a 1% contingent deferred sales charge (“CDSC”), if shares are redeemed within 12 months of purchase. B-Class shares were offered without a front-end sales charge, but were subject to a CDSC of up to 5% for five years and convert to A-Class shares after eight years. Effective January 4, 2010, subscriptions for B-Class shares are no longer accepted. C-Class shares have a 1% CDSC if shares are redeemed within 12 months of purchase. Institutional Class shares are offered primarily for direct investment by institutions such as pension and profit sharing plans, endowments, foundations and corporations. Institutional Class shares have a minimum initial investment of $2 million and a minimum account balance of $1 million. Institutional Class shares are offered without a front-end sales charge or a CDSC. At March 31, 2015, the Trust consisted of eighteen funds.
As of January 1, 2012, A-Class, C-Class and Institutional Class shares of High Yield Fund are subject to a 2% redemption fee when shares are redeemed or exchanged within 90 days of purchase.
This report covers High Yield Fund, Investment Grade Bond Fund, Limited Duration Fund and the Municipal Income Fund (the “Funds”), while the other funds are in separate reports.
The Funds were previously series (the “Predecessor Funds”) of Security Income Fund, a different registered open-end investment company, which was organized as a Kansas corporation. In January 2014, at a special meeting of shareholders, the shareholders of the Predecessor Funds approved the reorganization of the Predecessor Funds with and into the Funds, corresponding “shell” series of the Trust. The Funds succeeded to the accounting and performance history of the Predecessor Funds. Any such historical information provided for the Funds that relate to periods prior to January 28, 2014, therefore, is that of the Predecessor Funds.
Guggenheim Investments (“GI”) provides advisory services, and Rydex Fund Services, LLC (“RFS”) provides transfer agent, administrative and accounting services to the Trust. Guggenheim Funds Distributors, LLC (“GFD”) acts as principal underwriter for the Trust. GI, RFS and GFD are affiliated entities.
Guggenheim Partners Investment Management (“GPIM”), an affiliate of GI, serves as investment sub-advisor (the “Sub-Advisor”) to the Municipal Income Fund and is responsible for the day-to-day management of the Fund’s portfolio.
Significant Accounting Policies
The Funds operate as investment companies and accordingly follow the investment company accounting and reporting guidance of the Financial Accounting Standards Board (“FASB”) Accounting Standards Codification Topic 946 Financial Services – Investment Companies.
The following significant accounting policies are in conformity with U.S. generally accepted accounting principles ("U.S. GAAP") and are consistently followed by the Trust. This requires management to make estimates and assumptions that affect the reported amount of assets and liabilities and disclosure of contingent assets and liabilities at the date of the financial statements and the reported amounts of revenues and expenses during the reporting period. Actual results could differ from these estimates. All time references are based on Eastern Time.
The NAV of each Class of the Funds is calculated by dividing the market value of the Fund’s securities and other assets, less all liabilities, attributable to the Class by the number of outstanding shares of the Class.
A. The Board of Trustees of the Funds (the “Board”) has adopted policies and procedures for the valuation of the Funds’ investments (the “Valuation Procedures”). Pursuant to the Valuation Procedures, the Board has delegated to a valuation committee, consisting
| | THE GUGGENHEIM FUNDS SEMI-ANNUAL REPORT | 53 |
NOTES TO FINANCIAL STATEMENTS (Unaudited)(continued)
of representatives from Guggenheim’s investment management, fund administration, legal and compliance departments (the “Valuation Committee”), the day-to-day responsibility for implementing the Valuation Procedures, including, under most circumstances, the responsibility for determining the fair value of the Funds' securities or other assets.
Valuations of the Funds’ securities are supplied primarily by pricing services appointed pursuant to the processes set forth in the Valuation Procedures. The Valuation Committee convenes monthly, or more frequently as needed and will review the valuation of all assets which have been fair valued for reasonableness. The Funds’ officers, through the Valuation Committee and consistent with the monitoring and review responsibilities set forth in the Valuation Procedures, regularly review procedures used by, and valuations provided by, the pricing services.
If the pricing service cannot or does not provide a valuation for a particular investment or such valuation is deemed unreliable, such investment is fair valued by the Valuation Committee.
Equity securities listed on an exchange (New York Stock Exchange (“NYSE”) or American Stock Exchange) are valued at the last quoted sales price as of the close of business on the NYSE, usually 4:00 p.m. on the valuation date. Equity securities listed on the NASDAQ market system are valued at the NASDAQ Official Closing Price on the valuation date, which may not necessarily represent the last sale price. If there has been no sale on such exchange or NASDAQ on a given day, the security is valued at the closing bid price on that day.
Generally, trading in foreign securities markets is substantially completed each day at various times prior to the close of the NYSE. The values of foreign securities are determined as of the close of such foreign markets or the close of the NYSE, if earlier. All investments quoted in foreign currency are valued in U.S. dollars on the basis of the foreign currency exchange rates prevailing at the close of business. Investments in foreign securities may involve risks not present in domestic investments. The Valuation Committee will determine the current value of such foreign securities by taking into consideration certain factors which may include those discussed above, as well as the following factors, among others: the value of the securities traded on other foreign markets, ADR trading, closed-end fund trading, foreign currency exchange activity, and the trading prices of financial products that are tied to foreign securities such as World Equity Benchmark Securities. In addition, the Board of Trustees has authorized the Valuation Committee and GI to use prices and other information supplied by a third party pricing vendor in valuing foreign securities.
Open-end investment companies ("Mutual Funds") are valued at their NAV as of the close of business, on the valuation date.
Debt securities with a maturity of greater than 60 days at acquisition are valued at prices that reflect broker/dealer supplied valuations or are obtained from independent pricing services, which may consider the trade activity, treasury spreads, yields or price of bonds of comparable quality, coupon, maturity, and type, as well as prices quoted by dealers who make markets in such securities. Short-term debt securities with a maturity of 60 days or less at acquisition are valued at amortized cost, provided such amount approximates market value.
Repurchase agreements are valued at amortized cost, which approximates market value.
Typically loans are valued using information provided by an independent third party pricing service which uses broker quotes in a non-active market.
Listed options are valued at the Official Settlement Price listed by the exchange, usually as of 4:00 p.m. Long options are valued using the bid price and short options are valued using the ask price. In the event that a settlement price is not available, fair valuation is enacted. Over-the-counter options are valued using the average bid price (for long options), or average ask price (for short options) obtained from one or more security dealers.
The value of interest rate swap agreements entered into by a Fund are accounted for using the unrealized gain or loss on the agreements that is determined using the spread priced off the previous day’s Chicago Mercantile Exchange (“CME“) price.
Forward foreign currency exchange contracts are valued daily based on the applicable exchange rate of the underlying currency. The change in value of the contract is recorded as unrealized appreciation or depreciation until the forward foreign currency contract is closed. When the forward foreign currency contract is closed, the Fund records a realized gain or loss equal to the difference between the value at the time the contract was opened and the value at the time it was closed.
| 54 | THE GUGGENHEIM FUNDS SEMI-ANNUAL REPORT | |
NOTES TO FINANCIAL STATEMENTS (Unaudited)(continued)
Investments for which market quotations are not readily available are fair valued as determined in good faith by GI under the direction of the Board of Trustees using methods established or ratified by the Board of Trustees. Valuations in accordance with these methods are intended to reflect each security’s (or asset’s) “fair value.” Each such determination is based on a consideration of all relevant factors, which are likely to vary from one pricing context to another. Examples of such factors may include, but are not limited to: (i) the type of security, (ii) the initial cost of the security, (iii) the existence of any contractual restrictions on the security’s disposition, (iv) the price and extent of public trading in similar securities of the issuer or of comparable companies, (v) quotations or evaluated prices from broker-dealers and/or pricing services, (vi) information obtained from the issuer, analysts, and/or the appropriate stock exchange (for exchange-traded securities), (vii) an analysis of the company’s financial statements, and (viii) an evaluation of the forces that influence the issuer and the market(s) in which the security is purchased and sold (e.g. the existence of pending merger activity, public offerings or tender offers that might affect the value of the security). In connection with derivative investments such factors may include, obtaining information as to how (a) these contracts and other derivative investments trade in the futures or other derivative markets, respectively, and (b) the securities underlying these contracts and other derivative investments trade in the cash market.
B. Certain U.S. Government and Agency Obligations are traded on a discount basis; the interest rates shown on the Schedules of Investments reflect the effective rates paid at the time of purchase by the Funds. Other securities bear interest at the rates shown, payable at fixed dates through maturity.
C. Senior loans in which the Funds invest generally pay interest rates which are periodically adjusted by reference to a base short-term, floating rate plus a premium. These base lending rates are generally (i) the lending rate offered by one or more major European banks, such as the one-month or three-month London Inter-Bank Offered Rate (LIBOR), (ii) the prime rate offered by one or more major United States banks, or (iii) the bank’s certificate of deposit rate. Senior floating rate interests often require prepayments from excess cash flows or permit the borrower to repay at its election. The rate at which the borrower repays cannot be predicted with accuracy. As a result, the actual remaining maturity may be substantially less than the stated maturities shown. The interest rate indicated is the rate in effect at March 31, 2015.
D. The Funds may purchase and sell interests in securities on a when-issued and delayed delivery basis, with payment and delivery scheduled for a future date. No income accrues to the Fund on such interests or securities in connection with such transactions prior to the date the Funds actually take delivery of such interests or securities. These transactions are subject to market fluctuations and are subject to the risk that the value at delivery may be more or less than the trade date purchase price. Although the Funds will generally purchase these securities with the intention of acquiring such securities, they may sell such securities before the settlement date.
E. Upon the purchase of an option, the premium paid is recorded as an investment, the value of which is marked-to-market daily. If a purchased option expires, the Fund realizes a loss in the amount of the cost of the option. When the Fund enters into a closing sale transaction, it realizes a gain or loss depending on whether the proceeds from the closing sale transaction are greater or less than the cost of the option. If the Fund exercises a put option, it realizes a gain or loss from the sale of the underlying security and the proceeds from such sale will be decreased by the premium originally paid. When the Fund exercises a call option, the cost of the security purchased by the Fund upon exercise increases by the premium originally paid.
When the Fund writes (sells) an option, an amount equal to the premium received is entered in that Fund’s accounting records as an asset and equivalent liability. The amount of the liability is subsequently marked-to-market to reflect the current value of the option written. When a written option expires, or if the Fund enters into a closing purchase transaction, it realizes a gain (or loss if the cost of a closing purchase transaction exceeds the premium received when the option was sold).
F. Swap agreements are marked-to-market daily and the change, if any, is recorded as unrealized gain or loss. Payments received or made as a result of an agreement or termination of the agreement are recognized as realized gains or losses.
G. Forward foreign currency exchange contracts are valued daily based on the applicable exchange rate of the underlying currency. The change in value of the contract is recorded as unrealized appreciation or depreciation until the forward foreign currency contract is closed. When the forward foreign currency contract is closed, the Fund records a realized gain or loss equal to the difference between the value at the time the contract was opened and the value at the time it was closed.
| | THE GUGGENHEIM FUNDS SEMI-ANNUAL REPORT | 55 |
NOTES TO FINANCIAL STATEMENTS (Unaudited)(continued)
Security transactions are recorded on the trade date for financial reporting purposes. Realized gains and losses from securities transactions are recorded using the identified cost basis. Proceeds from lawsuits related to investment holdings are recorded as realized gains in the respective Fund. Dividend income is recorded on the ex-dividend date, net of applicable taxes withheld by foreign countries. Taxable non-cash dividends are recorded as dividend income. Interest income, including amortization of premiums and accretion of discounts, is accrued on a daily basis. Interest income also includes paydown gains and losses on mortgage-backed and asset-backed securities and senior and subordinated loans. Amendment fees are earned as compensation for evaluating and accepting changes to the original loan agreement and are recognized when received. Dividend income from REITs is recorded based on the income included in the distributions received from the REIT investments using published REIT classifications, including some management estimates when actual amounts are not available. Distributions received in excess of this estimated amount are recorded as a reduction of the cost of investments or reclassified to capital gains. The actual amounts of income, return of capital, and capital gains are only determined by each REIT after its fiscal year-end, and may differ from the estimated amounts.
I. The Funds declare dividends from investment income daily. Each Fund pays its shareholders from its net investment income monthly and distributes any net capital gains that it has realized, at least annually. Distributions to shareholders are recorded on the ex-dividend date. Dividends are reinvested in additional shares unless shareholders request payment in cash. The character of distributions made during the year from net investment income or net realized gains may differ from their ultimate characterization for federal income tax purposes.
J. Interest and dividend income, most expenses, all realized gains and losses, and all unrealized gains and losses are allocated to the classes based upon the value of the outstanding shares in each class. Certain costs, such as distribution and service fees are charged directly to specific classes. In addition, certain expenses have been allocated to the individual Funds in the Trust on a pro rata basis upon the respective aggregate net assets of each Fund included in the Trust.
K. Under the fee arrangement with the custodian, the Funds may earn credits based on overnight custody cash balances. These credits are utilized to reduce related custodial expenses. The custodian fees disclosed in the Statements of Operations are before the reduction in expense from the related earnings credits, if any. For the period ended March 31, 2015, there were no earnings credits received.
L. The Funds may leave cash overnight in their cash account with the custodian. Periodically, a Fund may have cash due to the custodian bank as an overdraft balance. A fee is incurred on this overdraft, calculated by multiplying the overdraft by a rate based on the federal funds rate.
M. Under the Funds’ organizational documents, their Trustees and Officers are indemnified against certain liabilities arising out of the performance of their duties to the Trust. In addition, throughout the normal course of business, the Funds enter into contracts that contain a variety of representations and warranties which provide general indemnifications. The Funds’ maximum exposure under these arrangements is unknown, as this would involve future claims that may be made against the Funds and/or their affiliates that have not yet occurred. However, based on experience, the Funds expect the risk of loss to be remote.
N. The accounting records of the Fund are maintained in U.S. dollars. All assets and liabilities initially expressed in foreign currencies are converted into U.S. dollars at prevailing exchange rates. Purchases and sales of investment securities, dividend and interest income, and certain expenses are translated at the rates of exchange prevailing on the respective dates of such transactions. Changes in the relationship of these foreign currencies to the U.S. dollar can significantly affect the value of the investments and earnings of the Funds. Foreign investments may also subject the Funds to foreign government exchange restrictions, expropriation, taxation or other political, social or economic developments, all of which could affect the market and/or credit risk of the investments.
The Funds do not isolate that portion of the results of operations resulting from changes in the foreign exchange rates on investments from the fluctuations arising from changes in the market prices of securities held. Such fluctuations are included with the net realized and unrealized gain or loss on investments.
Reported net realized foreign exchange gains and losses arise from sales of foreign currencies and currency gains or losses realized between the trade and settlement dates on investment transactions. Net unrealized exchange gains and losses arise from changes in the fair
| 56 | THE GUGGENHEIM FUNDS SEMI-ANNUAL REPORT | |
NOTES TO FINANCIAL STATEMENTS (Unaudited)(continued)
values of assets and liabilities other than investments in securities at the fiscal period end, resulting from changes in exchange rates.
2. Financial Instruments
As part of their investment strategy, the Funds utilize a variety of derivative instruments. These investments involve, to varying degrees, elements of market risk and risks in excess of the amounts recognized in the Statements of Assets and Liabilities.
An option on a security gives the purchaser of the option the right to sell, and the writer of the option the obligation to buy, the underlying security (put option) or the purchaser of the option the right to buy, and the writer of the option the obligation to sell, the underlying security (call option) at any time during the option period. The risk associated with purchasing options is limited to the premium originally paid. The risk in writing a call option is that a Fund may incur a loss if the market price of the underlying security increases and the option is exercised. The risk in writing a put option is that a Fund may incur a loss if the market price of the underlying security decreases and the option is exercised. In addition, there may be an imperfect correlation between the movement in prices of options and the underlying securities and a Fund may not be able to enter into a closing transaction because of an illiquid secondary market or, for over-the-counter options, because of the counterparty’s inability to perform.
A swap is an agreement that obligates two parties to exchange a series of cash flows at specified intervals based upon or calculated by reference to changes in specified prices or rates for a specified amount of an underlying asset. A Fund utilizing OTC swaps bears the risk of loss of the amount expected to be received under a swap agreement in the event of the default or bankruptcy of a swap agreement counterparty. For Funds utilizing interest rate swaps, the exchange bears the risk of loss. Additionally, there is no guarantee that a Fund or an underlying fund could eliminate its exposure under an outstanding swap agreement by entering into an offsetting swap agreement with the same or another party.
A forward foreign currency exchange contract is an agreement between two parties to exchange two designated currencies at a specific time in the future. The contracts can be used to hedge or manage exposure to foreign currency risks with portfolio investments or to gain exposure to foreign currencies.
In conjunction with the use of derivative instruments, the Funds are required to maintain collateral in various forms. The Funds use, where appropriate, depending on the financial instrument utilized and the broker involved, margin deposits at the broker, cash and/or securities segregated at the custodian bank, discount notes or the repurchase agreements allocated to each Fund.
The Trust has established counterparty credit guidelines and enters into transactions only with financial institutions of investment grade or better. The Trust monitors the counterparty credit risk.
3. Fees and Other Transactions with Affiliates
Under the terms of an investment advisory contract, the Funds pay GI investment advisory fees calculated at the annualized rates below, based on the average daily net assets of the Funds:
| Fund | Management Fees (as a % of Net Assets) |
| High Yield Fund | 0.60% |
| Investment Grade Bond Fund | 0.50% |
| Limited Duration Fund | 0.45% |
| Municipal Income Fund | 0.50% |
RFS provides transfer agent services to the Funds for fees calculated at the rates below which are assessed to the applicable class of the Fund. For these services, RFS receives the following:
| Annual charge per account | $5.00 – $8.00 |
| Transaction fee | $0.60 – $1.10 |
Minimum annual charge per Fund† | $25,000 |
| Certain out-of-pocket charges | Varies |
† | Not subject to Funds during first twelve months of operations. |
RFS also acts as the administrative agent for the Funds, and as such performs administrative functions and the bookkeeping, accounting and pricing functions for each Fund. For these services, RFS receives the following:
| Fund | Fund Accounting/ Administrative Fees (as a % of Net Assets) |
| High Yield Fund | 0.095% |
| Investment Grade Bond Fund | 0.095% |
| Limited Duration Fund | 0.095% |
| Municipal Income Fund | 0.095% |
| | |
| Minimum annual charge per Fund | $25,000 |
| Certain out-of-pocket charges | Varies |
| | THE GUGGENHEIM FUNDS SEMI-ANNUAL REPORT | 57 |
NOTES TO FINANCIAL STATEMENTS (Unaudited)(continued)
RFS engages external service providers to perform other necessary services for the Trust, such as audit and accounting related services, legal services, custody, printing and mailing, etc., on a pass-through basis. Such expenses are allocated to various Funds within the complex based on relative net assets.
The Funds have adopted Distribution Plans related to the offering of A-Class, B-Class and C-Class shares pursuant to Rule 12b-1 under the 1940 Act. The plans provide for payments at an annual rate of 0.25% of the average daily net assets of each Fund’s A-Class shares and 1.00% of the average daily net assets of each Fund’s B-Class and C-Class shares.
Effective December 1, 2006, B-Class shares of the High Yield Fund ceased charging 12b-1 fees in accordance with the FINRA sales cap regulations. These fees may be reinstated at any time.
The investment advisory contracts for the following Funds provide that the total expenses be limited to a percentage of average net assets for each class of shares, exclusive of brokerage costs, dividends on securities sold short, expenses of other investment companies in which a Fund invests, interest, taxes, litigation, indemnification and extraordinary expenses. The limits are listed below:
| | Limit | Effective Date | Contract End Date |
| High Yield Fund - A-Class | 1.16% | 11/30/12 | 02/01/16 |
| High Yield Fund - B-Class | 1.91% | 11/30/12 | 02/01/16 |
| High Yield Fund - C-Class | 1.91% | 11/30/12 | 02/01/16 |
| High Yield Fund - Institutional Class | 0.91% | 11/30/12 | 02/01/16 |
| Investment Grade Bond Fund - A-Class | 1.00% | 11/30/12 | 02/01/16 |
| Investment Grade Bond Fund - B-Class | 1.75% | 11/30/12 | 02/01/16 |
| Investment Grade Bond Fund - C-Class | 1.75% | 11/30/12 | 02/01/16 |
| Investment Grade Bond Fund - Institutional Class | 0.75% | 11/30/12 | 02/01/16 |
| Limited Duration Fund - A-Class* | 0.80% | 12/01/13 | 02/01/16 |
| Limited Duration Fund - C-Class* | 1.55% | 12/01/13 | 02/01/16 |
| Limited Duration Fund - Institutional Class* | 0.55% | 12/01/13 | 02/01/16 |
| Municipal Income Fund - A-Class | 0.80% | 11/30/12 | 02/01/16 |
| Municipal Income Fund - C-Class | 1.55% | 11/30/12 | 02/01/16 |
| Municipal Income Fund - Institutional Class | 0.55% | 11/30/12 | 02/01/16 |
GI is entitled to reimbursement by the Funds for fees waived or expenses reimbursed during any of the previous 36 months, beginning on the date of the expense limitation agreement, if on any day the estimated operating expenses are less than the indicated percentages. At March 31, 2015, the amount of fees waived or expenses reimbursed that are subject to recoupment are presented in the following table:
| Fund | | Expires 2015 | | | Expires 2016 | | | Expires 2017 | | | Expires 2018 | | | Fund Total | |
| High Yield Fund | | $ | 205,368 | | | $ | 207,619 | | | $ | 81,112 | | | $ | 60,245 | | | $ | 554,344 | |
| Investment Grade Bond Fund | | | 165,867 | | | | 234,110 | | | | 184,543 | | | | 68,099 | | | | 652,619 | |
| Limited Duration Fund* | | | — | | | | — | | | | 147,314 | | | | 110,543 | | | | 257,857 | |
| Municipal Income Fund | | | 192,257 | | | | 236,488 | | | | 242,273 | | | | 119,693 | | | | 790,711 | |
| * | Since the commencement of operations: December 16, 2013 |
For the period ended March 31, 2015, no amounts were recouped by GI.
For the period ended March 31, 2015, GFD retained sales charges of $14,877 relating to sales of A-Class shares of the Trust.
Certain trustees and officers of the Trust are also officers of GI, RFS and GFD.
| 58 | THE GUGGENHEIM FUNDS SEMI-ANNUAL REPORT | |
NOTES TO FINANCIAL STATEMENTS (Unaudited)(continued)
In accordance with U.S. GAAP, fair value is defined as the price that the Funds would receive to sell an investment or pay to transfer a liability in an orderly transaction with an independent buyer in the principal market, or in the absence of a principal market, the most advantageous market for the investment or liability. U.S. GAAP establishes a three-tier fair value hierarchy based on the types of inputs used to value assets and liabilities and requires corresponding disclosure. The hierarchy and the corresponding inputs are summarized below:
| Level 1 — | quoted prices in active markets for identical assets or liabilities. |
| Level 2 — | significant other observable inputs (for example quoted prices for securities that are similar based on characteristics such as interest rates, prepayment speeds, credit risk, etc.). |
| Level 3 — | significant unobservable inputs based on the best information available under the circumstances, to the extent observable inputs are not available, which may include assumptions. |
The types of inputs available depend on a variety of factors, such as the type of security and the characteristics of the markets in which it trades, if any. Fair valuation determinations that rely on fewer or no observable inputs require greater judgment. Accordingly, fair value determinations for Level 3 securities require the greatest amount of judgment.
The following table summarizes the inputs used to value the Funds’ investments at March 31, 2015:
| | | Level 1 Investments In Securities | | | Level 2 Investments In Securities | | | Level 2 Other Financial Instruments* | | | Level 3 Investments In Securities | | | Total | |
| Assets | | | | | | | | | | | | | | | |
| High Yield Fund | | $ | 8,631,814 | | | $ | 147,966,186 | | | $ | 205,802 | | | $ | 6,352,671 | | | $ | 163,156,473 | |
| Investment Grade Bond Fund | | | 5,733,984 | | | | 143,808,004 | | | | 133,786 | | | | 6,481,470 | | | | 156,157,244 | |
| Limited Duration Fund | | | 12,598,449 | | | | 155,228,944 | | | | — | | | | 2,229,711 | | | | 170,057,104 | |
| Municipal Income Fund | | | 2,743,185 | | | | 59,507,768 | | | | — | | | | — | | | | 62,250,953 | |
| | |
| Liabilities | | | | | | | | | | | | | | | | | | | | |
| Investment Grade Bond Fund | | $ | — | | | $ | 173,635 | | | $ | — | | | $ | — | | | $ | 173,635 | |
| * | Other financial instruments may include forward foreign currency exchange contracts and/or swaps, which are reported as unrealized gain/loss at period end. |
Independent pricing services are used to value a majority of the Funds’ investments. When values are not available from a pricing service, they may be computed by the Funds’ investment adviser or an affiliate. In any event, values may be determined using a variety of sources and techniques, including: market prices; broker quotes; and models which derive prices based on inputs such as prices of securities with comparable maturities and characteristics or based on inputs such as anticipated cash flows or collateral, spread over Treasuries, and other information and analysis. A significant portion of the Funds’ assets and liabilities are categorized as Level 2 or Level 3, as indicated in this report.
Indicative quotes from broker-dealers, adjusted for fluctuations in criteria such as credit spreads and interest rates, may be also used to value the Funds’ assets and liabilities, i.e. prices provided by a broker-dealer or other market participant who has not committed to trade at that price. Although indicative quotes are typically received from established market participants, the Funds may not have the transparency to view the underlying inputs which support the market quotations. Significant changes in an indicative quote would generally result in significant changes in the fair value of the security.
Certain fixed income securities are valued by obtaining a monthly indicative quote from a broker-dealer, adjusted for fluctuations in criteria such as credit spreads and interest rates. The Funds’ fair valuation guidelines were recently revised to transition such monthly indicative quoted securities from Level 2 to Level 3.
| | THE GUGGENHEIM FUNDS SEMI-ANNUAL REPORT | 59 |
NOTES TO FINANCIAL STATEMENTS (Unaudited)(continued)
The inputs or methodologies used for valuing securities are not necessarily an indication of the risk associated with investing in those securities. The suitability of the techniques and sources employed to determine fair valuation are regularly monitored and subject to change.
The following is a summary of significant unobservable inputs used in the fair valuation of assets and liabilities categorized within level 3 of the fair value hierarchy:
| Fund | Category and Subcategory | Ending Balance at 03/31/15 | Valuation Technique | Unobservable Inputs |
| | Investments, at value | | | |
| High Yield Fund | Senior Floating Rate Interests | $4,605,401 | Model Priced | Purchase Price |
| | Corporate Bonds | 1,181,066 | Model Priced | Purchase Price |
| | | 549,720 | Option Adjusted Spread off the month end broker mark over the 3 month LIBOR | Indicative Quote |
| | Total Corporate Bonds | 1,730,786 | | |
| | Preferred Stocks | 16,484 | Option Adjusted Spread off the month end broker mark over the 3 month LIBOR | Indicative Quote |
| | | | | |
| Investment Grade Bond Fund | Asset-Backed Securities | 1,961,473 | Option Adjusted Spread off the month end broker mark over the 3 month LIBOR | Indicative Quote |
| | Corporate Bonds | 1,829,805 | Option Adjusted Spread off the month end broker mark over the 3 month LIBOR | Indicative Quote |
| | Preferred Stocks | 1,806,520 | Option Adjusted Spread off the month end broker mark over the 3 month LIBOR | Indicative Quote |
| | Mortgage-Backed Securities | 883,672 | Option Adjusted Spread off the month end broker mark over the 3 month LIBOR | Indicative Quote |
| | | | | |
| Limited Duration Fund | Asset-Backed Securities | 2,229,711 | Option Adjusted Spread off the month end broker mark over the 3 month LIBOR | Indicative Quote |
Any remaining Level 3 securities held by the Funds and excluded from the tables above, were not considered material to the Funds.
Transfers between investment levels may occur as the markets fluctuate and/or the availability of data used in an investment’s valuation changes. The Fund recognized transfers between the levels as of the beginning of the period. As of March 31, 2015, the Fund had transfers in/out of Level 3 due to changes in securities valuation method. The High Yield Fund also had transfers between Level 1 and Level 2 due to utilizing international fair value pricing during the period. See the table below for changes to and from Level 2 and Level 3. There were no other securities that transferred between levels.
Summary of Fair Value Level 3 Activity
Following is a reconciliation of Level 3 assets and liabilities for which significant unobservable inputs were used to determine fair value for the period ended March 31, 2015:
LEVEL 3 – Fair value measurement using significant unobservable inputs
| | | Senior Floating Rate Interests | | | Corporate Bonds | | | Preferred Stocks | | | Total | |
| High Yield Fund | | | | | | | | | | | | |
| Assets: | | | | | | | | | | | | |
| Beginning Balance | | $ | 1,762,119 | | | $ | 1,787,125 | | | $ | — | | | $ | 3,549,244 | |
| Purchases | | | 792,161 | | | | 10,973 | | | | — | | | | 803,134 | |
| Sales | | | (27,826 | ) | | | (6,250 | ) | | | — | | | | (34,076 | ) |
| Total realized gains or losses included in earnings | | | — | | | | — | | | | — | | | | — | |
| Total change in unrealized gains or losses included in earnings | | | (442,963 | ) | | | (61,062 | ) | | | (883 | ) | | | (504,908 | ) |
| Transfers in Level 3 | | | 2,805,893 | | | | — | | | | 17,367 | | | | 2,823,260 | |
| Transfers out of Level 3 | | | (283,983 | ) | | | — | | | | — | | | | (283,983 | ) |
| Ending Balance | | $ | 4,605,401 | | | $ | 1,730,786 | | | $ | 16,484 | | | $ | 6,352,671 | |
| 60 | THE GUGGENHEIM FUNDS SEMI-ANNUAL REPORT | |
NOTES TO FINANCIAL STATEMENTS (Unaudited)(continued)
| | | Asset-Backed Securities | | | Mortgage- Backed Securities | | | Corporate Bonds | | | Preferred Stocks | | | Total | |
| Investment Grade Bond Fund | | | | | | | | | | | | | | | |
| Assets: | | | | | | | | | | | | | | | |
| Beginning Balance | | $ | — | | | $ | 473,556 | | | $ | 2,255,460 | | | $ | 2,142,060 | | | $ | 4,871,076 | |
| Purchases | | | 1,974,283 | | | | — | | | | 1,209,700 | | | | — | | | | 3,183,983 | |
| Sales | | | (16,713 | ) | | | (4,461 | ) | | | (319,600 | ) | | | — | | | | (340,774 | ) |
| Total realized gains or losses included in earnings | | | — | | | | — | | | | 7,500 | | | | — | | | | 7,500 | |
| Total change in unrealized gains or losses included in earnings | | | 3,903 | | | | 69,466 | | | | (84,805 | ) | | | (335,540 | ) | | | (346,976 | ) |
| Transfers in Level 3 | | | — | | | | 345,111 | | | | — | | | | — | | | | 345,111 | |
| Transfers out of Level 3 | | | — | | | | — | | | | (1,238,450 | ) | | | — | | | | (1,238,450 | ) |
| Ending Balance | | $ | 1,961,473 | | | $ | 883,672 | | | $ | 1,829,805 | | | $ | 1,806,520 | | | $ | 6,481,470 | |
| | | Asset-Backed Securities | | | Total | |
| Limited Duration Fund | | | | | | |
| Assets: | | | | | | |
| Beginning Balance | | $ | 888,202 | | | $ | 888,202 | |
| Purchases | | | 1,461,425 | | | | 1,461,425 | |
| Sales | | | (122,986 | ) | | | (122,986 | ) |
| Total realized gains or losses included in earnings | | | — | | | | — | |
| Total change in unrealized gains or losses included in earnings | | | 3,070 | | | | 3,070 | |
| Transfers in Level 3 | | | — | | | | — | |
| Transfers out of Level 3 | | | — | | | | — | |
| Ending Balance | | $ | 2,229,711 | | | $ | 2,229,711 | |
5. Derivative Investment Holdings Categorized by Risk Exposure
U.S. GAAP requires disclosures to enable investors to better understand how and why the Funds use derivative instruments, how these derivative instruments are accounted for and their effects on the Funds’ financial position and results of operations.
The following Funds utilized derivatives for the following purposes:
| Fund | Hedge | Duration |
| High Yield Fund | x | — |
| Investment Grade Bond Fund | x | x |
The following table represents the notional amount of derivative instruments outstanding as an approximate percentage of the Funds’ net assets on a quarterly basis.
| | Approximate percentage of Fund’s Net Assets on a quarterly basis |
| Fund | Long |
| High Yield Fund | 10% |
| Investment Grade Bond Fund | —* |
| | THE GUGGENHEIM FUNDS SEMI-ANNUAL REPORT | 61 |
NOTES TO FINANCIAL STATEMENTS (Unaudited)(continued)
The following is a summary of the location of derivative investments on the Funds’ Statements of Assets and Liabilities as of March 31, 2015:
| Derivative Investment Type | Asset Derivatives | Liability Derivatives |
| Equity/Currency/Interest Rate contracts | Unrealized appreciation on forward foreign currency exchange contracts | Options written, at value |
| | Unrealized appreciation on swap agreements | |
| | Investments in unaffiliated issuers, at value | |
The following table sets forth the fair value of the Funds’ derivative investments categorized by primary risk exposure at March 31, 2015:
| Asset Derivative Investments Value | |
| Fund | | Forward Foreign Currency Exchange Contracts | | | Swaps Interest Rate Contracts | | | Options Written Equity Contracts | | | Options Purchased Equity Contracts | | | Total | |
| High Yield Fund | | $ | 205,802 | | | $ | — | | | $ | — | | | $ | — | | | $ | 205,802 | |
| Investment Grade Bond Fund | | | 11,026 | | | | 122,760 | | | | — | | | | 283,035 | | | | 416,821 | |
| Liability Derivative Investments Value | |
| Fund | | Forward Foreign Currency Exchange Contracts | | | Swaps Interest Rate Contracts | | | Options Written Equity Contracts | | | Options Purchased Equity Contracts | | | Total | |
| Investment Grade Bond Fund | | $ | — | | | $ | — | | | $ | 173,635 | | | $ | — | | | $ | 173,635 | |
The following is a summary of the location of derivative investments on the Funds' Statements of Operations for the period ended March 31, 2015:
| Derivative Investment Type | Location of Gain (Loss) on Derivatives |
| Equity/Currency/Interest Rate contracts | Net realized gain (loss) on forward foreign currency exchange contracts |
| | Net change in unrealized appreciation (depreciation) on forward foreign currency exchange contracts |
| | Net change in unrealized appreciation (depreciation) on options purchased |
| | Net change in unrealized appreciation (deprecation) on options written |
| | Net realized gain (loss) on swap agreements |
| | Net change in unrealized appreciation (depreciation) on swap agreements |
The following is a summary of the Funds’ realized gain (loss) and change in unrealized appreciation (depreciation) on derivative investments recognized on the Statements of Operations categorized by primary risk exposure for the period ended March 31, 2015:
| Realized Gain (Loss) on Derivative Investments Recognized on the Statements of Operations | |
| Fund | Forward Foreign Currency Exchange Contracts | | Swaps Interest Rate Contracts | | Options Written Equity Contracts | | Options Purchased Equity Contracts | | Total | |
| High Yield Fund | | $ | 1,625,653 | | | $ | — | | | $ | — | | | $ | — | | | $ | 1,625,653 | |
| Investment Grade Bond Fund | | | 73,194 | | | | 892,432 | | | | — | | | | — | | | | 965,626 | |
| 62 | THE GUGGENHEIM FUNDS SEMI-ANNUAL REPORT | |
NOTES TO FINANCIAL STATEMENTS (Unaudited)(continued)
| Change in Unrealized Appreciation (Depreciation) on Derivative Investments Recognized on the Statements of Operations | |
| Fund | | Forward Foreign Currency Exchange Contracts | | | Swaps Interest Rate Contracts | | | Options Written Equity Contracts | | | Options Purchased Equity Contracts | | | Total | |
| High Yield Fund | | $ | (266,505 | ) | | $ | — | | | $ | — | | | $ | — | | | $ | (266,505 | ) |
| Investment Grade Bond Fund | | | 11,026 | | | | (432,905 | ) | | | (23,030 | ) | | | (38,640 | ) | | | (483,549 | ) |
6. Federal Income Tax Information
The Funds intend to comply with the provisions of Subchapter M of the Internal Revenue Code applicable to regulated investment companies and will distribute substantially all taxable net investment income and capital gains sufficient to relieve the Funds from all, or substantially all, federal income, excise and state income taxes. Therefore, no provision for federal or state income tax is required.
Tax positions taken or expected to be taken in the course of preparing the Funds' tax returns are evaluated to determine whether the tax positions are “more-likely-than-not” of being sustained by the applicable tax authority. Tax positions not deemed to meet the more-likely-than-not threshold would be recorded as a tax benefit or expense in the current year. Management has analyzed the Funds' tax positions taken, or to be taken, on Federal income tax returns for all open tax years, and has concluded that no provision for income tax is required in the Funds' financial statements. The Funds' federal tax returns are subject to examination by the Internal Revenue Service for a period of three years after they are filed.
At March 31, 2015, the cost of securities for Federal income tax purposes, the aggregate gross unrealized gain for all securities for which there was an excess of value over tax cost and the aggregate gross unrealized loss for all securities for which there was an excess of tax cost over value, were as follows:
| Fund Name | | Tax Cost | | | Tax Unrealized Gain | | | Tax Unrealized Loss | | | Net Unrealized Gain (Loss) | |
| High Yield Fund | | $ | 167,714,264 | | | $ | 2,414,630 | | | $ | (7,178,223 | ) | | $ | (4,763,593 | ) |
| Investment Grade Bond Fund | | | 156,087,842 | | | | 4,155,860 | | | | (4,220,244 | ) | | | (64,384 | ) |
| Limited Duration Fund | | | 170,437,384 | | | | 898,150 | | | | (1,278,430 | ) | | | (380,280 | ) |
| Municipal Income Fund | | | 59,468,636 | | | | 2,854,475 | | | | (72,158 | ) | | | 2,782,317 | |
7. Securities Transactions
For the period ended March 31, 2015, the cost of purchases and proceeds from sales of investment securities, excluding government securities, short-term investments and derivatives, were as follows:
| Fund | | Purchases | | | Sales | |
| High Yield Fund | | $ | 72,081,176 | | | $ | 47,830,799 | |
| Investment Grade Bond Fund | | | 51,053,834 | | | | 26,428,264 | |
| Limited Duration Fund | | | 69,507,153 | | | | 12,448,036 | |
| Municipal Income Fund | | | 36,400,694 | | | | 26,899,318 | |
| | THE GUGGENHEIM FUNDS SEMI-ANNUAL REPORT | 63 |
NOTES TO FINANCIAL STATEMENTS (Unaudited)(continued)
Information as to options written by the Funds during the period ended March 31, 2015, and options outstanding at period end is provided below:
Written Call Options
| | | Investment Grade Bond Fund | |
| | | Number of Contracts | | | Premium Amount | |
| Balance at September 30, 2014 | | | — | | | $ | — | |
| Options Written | | | 1,984 | | | | 150,605 | |
| Options terminated in closing purchase transactions | | | — | | | | — | |
| Options expired | | | — | | | | — | |
| Options exercised | | | — | | | | — | |
| Balance at March 31, 2015 | | | 1,984 | | | $ | 150,605 | |
9. Line of Credit
The Trust, with the exception of Alpha Opportunity Fund and Capital Stewardship Fund, secured a committed, $625,000,000 line of credit from Citibank, N.A., good through October 9, 2015, at which time the line of credit may be renewed. This line of credit is reserved for emergency or temporary purposes. Fees related to borrowings, if any, vary under this arrangement between the greater of Citibank’s “base rate”, LIBOR plus 1.0%, and the Fed Funds rate, plus 0.50%. The Trust did not have any borrowings under this agreement as of and for the period-ended March 31, 2015. The Trust also pays a commitment fee at an annualized rate of 0.07% of the average daily amount of their unused commitment amount.
10. Loan Commitments
Pursuant to the terms of certain loan agreements, certain Funds held unfunded loan commitments as of March 31, 2015. The Funds are obligated to fund these loan commitments at the borrower’s discretion.
The unfunded loan commitments as of March 31, 2015 were as follows:
| Borrower | Maturity Date | | Face Amount | | | Value | |
| High Yield Fund | | | | | | | |
| Signode Industrial Group US, Inc. | 05/01/19 | | $ | 1,800,000 | | | $ | 183,317 | |
| Phillips-Medsize Corp. | 06/16/19 | | | 1,100,000 | | | | 110,294 | |
| Advantage Sales & Marketing, Inc. | 07/21/19 | | | 1,100,000 | | | | 122,516 | |
| McGraw-Hill Global Education Holdings LLC | 03/22/18 | | | 1,000,000 | | | | 80,796 | |
| Acosta, Inc. | 09/26/19 | | | 1,000,000 | | | | — | |
| Wencor Group | 06/19/19 | | | 950,000 | | | | 93,895 | |
| Pro Mach Group, Inc. | 10/22/19 | | | 900,000 | | | | 98,916 | |
| BBB Industries, LLC | 10/17/19 | | | 878,571 | | | | 112,564 | |
| SS&C Technologies, Inc. | 02/27/16 | | | 700,000 | | | | — | |
| Eyemart Express | 12/18/19 | | | 600,000 | | | | 68,708 | |
| Hillman Group, Inc. | 06/13/19 | | | 585,714 | | | | 54,670 | |
| Learning Care Group (US), Inc. | 05/05/21 | | | 500,000 | | | | — | |
| Rite Aid Corp. | 08/10/15 | | | 300,000 | | | | — | |
| Valeant Pharmaceuticals International, Inc. | 03/11/22 | | | 151,807 | | | | — | |
| | | | $ | 11,566,092 | | | $ | 925,676 | |
| 64 | THE GUGGENHEIM FUNDS SEMI-ANNUAL REPORT | |
NOTES TO FINANCIAL STATEMENTS (Unaudited)(continued)
In connection with transactions in repurchase agreements, it is the Funds’ policy that their custodian takes possession of the underlying collateral. The collateral is in the possession of the Funds’ custodian and is evaluated to ensure that its market value exceeds, at a minimum, 102% of the original face amount of the repurchase agreements.
| Fund | Counterparty and Terms of Agreement | Face Value | Repurchase Price | | Collateral | Par Value | Fair Value |
| Limited Duration Fund | Jefferies & Company, Inc. | | | | | | |
| | 2.43% - 3.18% | | | | Nomad CLO Ltd. | | |
| | Due 04/05/15 | | | | 0.00% | | |
| | -05/07/15 | $7,339,000 | $7,358,061 | | 01/15/25 | $4,467,500 | $3,797,375 |
| | | | | | Mc Funding 2006-1 | | |
| | | | | | 0.00% | | |
| | | | | | 12/20/20 | 3,673,009 | 1,259,658 |
| | | | | | Puerto Rico Commonwealth Aqueduct & Sewer Authority | | |
| | | | | | 6.00% | | |
| | | | | | 07/01/38 | 1,533,000 | 1,065,496 |
| | | | | | Atlas Senior Loan Fund Ltd. | | |
| | | | | | 0.00% | | |
| | | | | | 01/30/24 | 1,265,823 | 1,008,217 |
| | | | | | Government Development Bank for Puerto Rico | | |
| | | | | | 5.00% | | |
| | | | | | 08/01/23 | 1,017,250 | 532,001 |
| | | | | | ARES CLO Ltd. | | |
| | | | | | 0.00% | | |
| | | | | | 11/25/20 | 625,000 | 250,000 |
| | | | | | Commonwealth of Puerto Rico | | |
| | | | | | 5.50% | | |
| | | | | | 07/01/18 | 315,000 | 300,831 |
| | | | | | Structured Asset Investment Loan Trust | | |
| | | | | | 0.94% | | |
| | | | | | 08/25/35 | 280,000 | 193,042 |
In the event of counterparty default, the Funds have the right to collect the collateral to offset losses incurred. There is potential loss to the Funds in the event the Funds are delayed or prevented from exercising their rights to dispose of the collateral securities, including the risk of a possible decline in the value of the underlying securities during the period while the Funds seek to assert their rights. The Funds’ investment adviser, acting under the supervision of the Board of Trustees, reviews the value of the collateral and the creditworthiness of those banks and dealers with which the Funds enter into repurchase agreements to evaluate potential risks.
| | THE GUGGENHEIM FUNDS SEMI-ANNUAL REPORT | 65 |
NOTES TO FINANCIAL STATEMENTS (Unaudited)(continued)
Each of the Funds may enter into reverse repurchase agreements. Under a reverse repurchase agreement, a Fund sells securities and agrees to repurchase them at a particular price at a future date. In the event the buyer of securities under a reverse repurchase agreement files for bankruptcy or becomes insolvent, such buyer or its trustee or receiver may receive an extension of time to determine whether to enforce the Fund’s obligation to repurchase the securities, and the Fund’s use of the proceeds of the reverse repurchase agreement may effectively be restricted pending such decision.
For the period ended March 31, 2015, the following Funds entered into reverse repurchase agreements as follows:
| Fund | | Number of Days outstanding | | | Balance at March 31, 2015 | | | Average balance outstanding | | | Average interest rate | |
| High Yield Fund | | | 182 | | | $ | 20,355,264 | | | $ | 8,945,461 | | | | 0.50 | % |
| Investment Grade Bond Fund | | | 182 | | | | 14,195,563 | | | | 7,380,241 | | | | 0.27 | % |
| Limited Duration Fund | | | 182 | | | | 14,438,576 | | | | 7,593,889 | | | | 0.67 | % |
13. Affiliated Transactions
Investments representing 5% or more of the outstanding voting shares of a portfolio company of a fund, or control of or by, or common control under GI, result in that portfolio company being considered an affiliated company of such fund, as defined in the 1940 Act.
The Funds may invest in the Guggenheim Strategy Funds Trust consisting of Guggenheim Strategy Fund I, Guggenheim Strategy Fund II, and Guggenheim Strategy Fund III (collectively, the “Cash Management Funds”), open-end management investment companies managed by GI. The Cash Management Funds, which launched on March 11, 2014, are offered as cash management options only to mutual funds, trusts, and other accounts managed by GI and/or its affiliates, and are not available to the public. The Cash Management Funds pay no investment management fees. The Cash Management Funds’ annual report on Form N-CSR dated September 30, 2014 is available publicly or upon request. This information is available from the EDGAR database on the SEC’s website at http://www.sec.gov.
Transactions during the period ended March 31, 2015 in which the portfolio company is an “affiliated person” are as follows:
| Affiliated issuers by Fund | | Value 09/30/14 | | | Additions | | | Reductions | | | Value 03/31/15 | | | Shares 03/31/15 | | | Investment Income | | | Realized Gain (Loss) | | | Capital Gain Distributions | |
| Investment Grade Bond Fund | | | | | | | | | | | | | | | | | | | | | | | | |
| Guggenheim Strategy Fund I | | $ | — | | | $ | 2,000,676 | | | $ | — | | | $ | 2,002,284 | | | | 80,413 | | | $ | 811 | | | $ | — | | | $ | — | |
| | | | | | | | | | | | | | | | | | | | | | | | | | | | | | | | | |
| Limited Duration Fund | | | | | | | | | | | | | | | | | | | | | | | | | | | | | | | | |
| Guggenheim Strategy Fund I | | | — | | | | 3,001,014 | | | | — | | | | 3,003,426 | | | | 120,620 | | | | 1,217 | | | | — | | | | — | |
| 66 | THE GUGGENHEIM FUNDS SEMI-ANNUAL REPORT | |
NOTES TO FINANCIAL STATEMENTS (Unaudited)(continued)
The securities below are considered illiquid and restricted under guidelines established by the Board of Trustees:
| Fund | Restricted Securities | Acquisition Date | Cost | Value |
| High Yield Fund | Pacific Premier Bancorp, Inc. | | | |
| | 5.75% due 09/03/24 | 08/25/14 | $1,250,000 | $1,287,500 |
| | Odebrecht Offshore Drilling Finance Ltd. | | | |
| | 6.62% due 10/01/22 | 02/21/14 | 669,225 | 508,190 |
| | American Seafoods Group LLC / American Seafoods Finance, Inc. | | | |
| | 10.75% due 05/15/16 | 07/31/14 | 497,746 | 468,750 |
| | Nathan's Famous, Inc. | | | |
| | 10.00% due 03/15/20 | 02/27/15 | 252,624 | 262,500 |
| | R&R Ice Cream plc | | | |
| | 8.25% due 05/15/20 | 06/19/14 | 187,926 | 149,690 |
| | IronGate Energy Services LLC | | | |
| | 11.00% due 07/01/18 | 07/10/13 | 113,454 | 79,200 |
| | | | 2,970,975 | 2,755,830 |
| | | | | |
| Investment Grade Bond Fund | Cadence Bank North America | | | |
| | 6.25% due 06/28/29 | 06/06/14 | 200,000 | 205,000 |
| | Cadence Financial Corp. | | | |
| | 4.88% due 06/28/19 | 06/06/14 | 150,000 | 151,434 |
| | | | 350,000 | 356,434 |
| | | | | |
| Limited Duration Fund | Cadence Financial Corp. | | | |
| | 4.88% due 06/28/19 | 06/06/14 | 500,000 | 504,780 |
15. Offsetting
In the normal course of business, the Fund enters into transactions subject to enforceable master netting arrangements or other similar arrangements. Generally, the right to offset in those agreements allows the Fund to counteract the exposure to a specific counterparty with collateral received or delivered to that counterparty based on the terms of the arrangements. These arrangements provide for the right to liquidate upon the occurrence of an event of default, credit event upon merger or additional termination event.
In order to better define their contractual rights and to secure rights that will help the Fund mitigate its counterparty risk, the Fund may enter into an International Swaps and Derivatives Association, Inc. Master Agreement (“ISDA Master Agreement”) or similar agreement with its derivative contract counterparties. An ISDA Master Agreement is a bilateral agreement between a Fund and a counterparty that governs OTC derivatives, including foreign exchange contracts, and typically contains, among other things, collateral posting terms and netting provisions in the event of a default and/or termination event. The provisions of the ISDA Master Agreement typically permit a single net payment in the event of a default (close-out netting) or similar event, including the bankruptcy or insolvency of the counterparty.
For derivatives traded under an ISDA Master Agreement, the collateral requirements are typically calculated by netting the mark to market amount for each transaction under such agreement and comparing that amount to the value of any collateral currently pledged by the Fund and the counterparty. For financial reporting purposes, cash collateral that has been pledged to cover obligations of the Fund and cash collateral received from the counterparty, if any, is reported separately on the Statement of Assets and Liabilities as segregated cash with broker/receivable for variation margin, or payable for swap settlement/variation margin. Generally, the amount of collateral due from or to a counterparty must exceed a minimum transfer amount threshold (e.g., $300,000) before a transfer is required to be made. To the extent amounts due to the Fund from its counterparties are not fully collateralized, contractually or otherwise, the Fund bears the risk of loss from counterparty nonperformance. The Fund attempts to mitigate counterparty risk by only entering into agreements with counterparties that they believe to be of good standing and by monitoring the financial stability of those counterparties.
| | THE GUGGENHEIM FUNDS SEMI-ANNUAL REPORT | 67 |
NOTES TO FINANCIAL STATEMENTS (Unaudited)(concluded)
For financial reporting purposes, the Fund does not offset derivative assets and derivative liabilities that are subject to netting arrangements in the Statements of Assets and Liabilities.
The following tables present derivative financial instruments and secured financing transactions that are subject to enforceable netting arrangements and offset in the Statements of Assets and Liabilities in conformity with U.S. GAAP.
| | | | | | | | | | | | | Gross Amounts Not Offset in the Statements of Assets and Liabilities | | | | |
| Fund | Instrument | | Gross Amounts of Recognized Assets1 | | | Gross Amounts Offset in the Statements of Assets and Liabilities | | | Net Amount of Assets Presented on the Statements of Assets and Liabilities | | | Financial Instruments | | | Cash Collateral Received | | | Net Amount | |
| High Yield Fund | Forward foreign currency exchange contracts | | $ | 205,802 | | | $ | — | | | $ | 205,802 | | | $ | — | | | $ | — | | | $ | 205,802 | |
| Investment Grade Bond Fund | Forward foreign currency exchange contracts | | | 11,026 | | | | — | | | | 11,026 | | | | — | | | | — | | | | 11,026 | |
1 | Centrally cleared swaps are excluded from these reported amounts. |
16. Subsequent Event
P-Class Shares to be Offered
Effective following the close of business on April 30, 2015, or such later date as may be determined appropriate by management, High Yield Fund, Investment Grade Bond Fund, Limited Duration Fund and Municipal Income Fund (collectively, the “Funds”), each of which is a separate series of Guggenheim Funds Trust, will offer P-Class shares.
P-Class shares of the Funds are offered primarily through broker/dealers and other financial intermediaries with which Guggenheim Funds Distributors, LLC has an agreement for the use of P-Class shares of the Funds in investment products, programs or accounts. P-Class shares do not have a minimum initial investment amount, subsequent investment amount or a minimum account balance. The Funds reserves the right to modify their minimum investment amount and account balance requirements at any time, with or without prior notice to you.
Shareholders who currently have accounts held directly at Guggenheim Investments will not be permitted to purchase P-Class shares.
For more information, or to request copies of the Fund’s prospectuses, call Client Services at 800.820.0888 or visiting guggenheiminvestments.com.
| 68 | THE GUGGENHEIM FUNDS SEMI-ANNUAL REPORT | |
OTHER INFORMATION (Unaudited)
Proxy Voting Information
A description of the policies and procedures that the Trust uses to determine how to vote proxies relating to securities held in the Funds’ portfolios is available, without charge and upon request, by calling 800.820.0888. This information is also available from the EDGAR database on the SEC’s website at http://www.sec.gov.
Information regarding how the Funds voted proxies relating to portfolio securities during the most recent 12-month period ended June 30 is available without charge, upon request, by calling 800.820.0888. This information is also available from the EDGAR database on the SEC’s website at http://www.sec.gov.
Sector Classification
Information in the “Schedule of Investments” is categorized by sectors using sector-level classifications used by Bloomberg Industry Classification System, a widely recognized industry classification system provider. In each Fund’s registration statement, the Funds have investment policies relating to concentration in specific industries. For purposes of these investment policies, the Funds usually classify industries based on industry-level classifications used by widely recognized industry classification system providers such as Bloomberg Industry Classification System, Global Industry Classification Standards and Barclays Global Classification Scheme.
Quarterly Portfolio Schedules Information
The Trust files its complete schedule of portfolio holdings with the SEC for the first and third quarters of each fiscal year on Form N-Q; which are available on the SEC’s website at http://www.sec.gov. The Funds’ Forms N-Q may be reviewed and copied at the SEC’s Public Reference Room in Washington, DC, and that information on the operation of the Public Reference Room may be obtained by calling 800-SEC-0330. Copies of the portfolio holdings are also available to shareholders, without charge and upon request, by calling 800.820.0888.
| | THE GUGGENHEIM FUNDS SEMI-ANNUAL REPORT | 69 |
INFORMATION ON BOARD OF TRUSTEES AND OFFICERS (Unaudited)
Name, Address* and Year of Birth | Position(s) Held with the Trust | Term of Office and Length of Time Served** | Principal Occupation(s) During Past Five Years | Number of Portfolios in Fund Complex Overseen | Other Directorships Held by Trustees |
| INDEPENDENT TRUSTEES | | | | |
Randall C. Barnes (1951) | Trustee | Since 2014 | Current: Private Investor (2001-present). Former: Senior Vice President and Treasurer, PepsiCo, Inc. (1993-1997); President, Pizza Hut International (1991-1993); Senior Vice President, Strategic Planning and New Business Development, PepsiCo, Inc. (1987-1990). | 91 | Current: Trustee, Purpose Investments Inc. (2014-Present). |
Donald A. Chubb, Jr. (1946) | Trustee and Vice Chairman of the Board | Since 1994 | Current: Business broker and manager of commercial real estate, Griffith & Blair, Inc. (1997-present). | 87 | None. |
Jerry B. Farley (1946) | Trustee and Vice Chairman of the Audit Committee | Since 2005 | Current: President, Washburn University (1997-present). | 87 | Current: Westar Energy, Inc. (2004-present); CoreFirst Bank & Trust (2000-present). |
Roman Friedrich III (1946) | Trustee and Chairman of the Contracts Review Committee | Since 2014 | Current: Founder and President, Roman Friedrich & Company (1998-present). Former: Senior Managing Director, MLV & Co. LLC (2010-2011). | 87 | Current: Zincore Metals, Inc. (2009-present). Former: Mercator Minerals Ltd. (2013-2014); First Americas Gold Corp. (2012-2014); Blue Sky Uranium Corp. (2011-2012); Axiom Gold and Silver Corp. (2011-2012); Stratagold Corp. (2003-2009); GFM Resources Ltd. (2005-2010). |
Robert B. Karn III (1942) | Trustee and Chairman of the Audit Committee | Since 2014 | Current: Consultant (1998-present). Former: Arthur Andersen (1965-1997) and Managing Partner, Financial and Economic Consulting, St. Louis office (1987-1997). | 87 | Current: Peabody Energy Company (2003-present); GP Natural Resource Partners, LLC (2002- present). |
Ronald A. Nyberg (1953) | Trustee and Chairman of the Nominating and Governance Committee | Since 2014 | Current: Partner, Nyberg & Cassioppi, LLC (2000-present). Former: Executive Vice President, General Counsel, and Corporate Secretary, Van Kampen Investments (1982-1999). | 93 | Current: Edward-Elmhurst Healthcare System (2012-present). |
| 70 | THE GUGGENHEIM FUNDS SEMI-ANNUAL REPORT | |
INFORMATION ON BOARD OF TRUSTEES AND OFFICERS (Unaudited)(continued)
Name, Address* and Year of Birth | Position(s) Held with the Trust | Term of Office and Length of Time Served** | Principal Occupation(s) During Past Five Years | Number of Portfolios in Fund Complex Overseen | Other Directorships Held by Trustees |
| INDEPENDENT TRUSTEES - concluded | | |
Maynard F. Oliverius (1943) | Trustee and Vice Chairman of the Contracts Review Committee | Since 1998 | Current: Retired. Former: President and CEO, Stormont-Vail HealthCare (1996-2012). | 87 | Current: Fort Hays State University Foundation (1999-present); Stormont-Vail Foundation (2013-present); University of Minnesota HealthCare Alumni Association Foundation (2009-present). |
Ronald E. Toupin, Jr. (1958) | Trustee and Chairman of the Board | Since 2014 | Current: Portfolio Consultant (2010-present). Former: Vice President, Manager and Portfolio Manager, Nuveen Asset Management (1998-1999); Vice President, Nuveen Investment Advisory Corp. (1992-1999); Vice President and Manager, Nuveen Unit Investment Trusts (1991-1999); and Assistant Vice President and Portfolio Manager, Nuveen Unit Investment Trusts (1988-1999), each of John Nuveen & Co., Inc. (1982-1999). | 90 | Former: Bennett Group of Funds (2011-2013). |
| INTERESTED TRUSTEES | | | | |
Donald C. Cacciapaglia*** (1951) | President, Chief Executive Officer and Trustee | Since 2012 | Current: President and CEO, certain other funds in the Fund Complex (2012-present); Vice Chairman, Guggenheim Investments (2010-present). Former: Chairman and CEO, Channel Capital Group, Inc. (2002-2010). | 221 | Current: Clear Spring Life Insurance Company (2015-present); Guggenheim Partners Japan, Ltd. (2014-present); Delaware Life (2013-present); Guggenheim Life and Annuity Company (2011-present); Paragon Life Insurance Company of Indiana (2011-present). |
| * | The business address of each Trustee is c/o Guggenheim Investments, 805 King Farm Boulevard, Suite 600, Rockville, Maryland 20850 |
| ** | Each Trustee serves an indefinite term, until his successor is elected and qualified. Time served includes time served in the respective position for the Predecessor Corporation. |
| *** | This Trustee is deemed to be an "interested person" of the Funds under the 1940 Act by reason of his position with the Funds' Investment Manager and/or the parent of the Investment Manager. |
| | THE GUGGENHEIM FUNDS SEMI-ANNUAL REPORT | 71 |
INFORMATION ON BOARD OF TRUSTEES AND OFFICERS (Unaudited)(continued)
Name, Address* and Year of Birth | Position(s) held with the Trust | Term of Office and Length of Time Served** | Principal Occupations During Past Five Years |
| OFFICERS | | | |
Joseph M. Arruda (1966) | Assistant Treasurer | Since 2010 | Current: Assistant Treasurer, certain other funds in the Fund Complex (2006-present); Vice President, Security Investors, LLC (2010-present); CFO and Manager, Guggenheim Specialized Products, LLC (2009-present). Former: Vice President, Security Global Investors, LLC (2010-2011); Vice President, Rydex Advisors, LLC (2010); Vice President, Rydex Advisors II, LLC (2010). |
William H. Belden, III (1965) | Vice President | Since 2014 | Current: Vice President, certain other funds in the Fund Complex (2006-present); Managing Director, Guggenheim Funds Investment Advisors, LLC (2005-present). Former: Vice President of Management, Northern Trust Global Investments (1999-2005). |
Mark J. Furjanic (1959) | Assistant Treasurer | Since 2014 | Current: Vice President, Guggenheim Investments (2005-present); Assistant Treasurer, certain other funds in the Fund Complex (2008-present). Former: Senior Manager, Ernst & Young LLP (1999-2005). |
James M. Howley (1972) | Assistant Treasurer | Since 2014 | Current: Director, Guggenheim Investments (2004-present) ; Assistant Treasurer, certain other funds in the Fund Complex (2006-present). Former: Manager, Mutual Fund Administration of Van Kampen Investments, Inc. (1996-2004). |
Amy J. Lee (1961) | Vice President and Chief Legal Officer | Since 2007 (Vice President) Since 2014 (Chief Legal Officer) | Current: Chief Legal Officer, certain other funds in the Fund Complex (2013-present); Senior Managing Director, Guggenheim Investments (2012-present). Former: Vice President, Associate General Counsel and Assistant Secretary, Security Benefit Life Insurance Company and Security Benefit Corporation (2004-2012). |
Mark E. Mathiasen (1978) | Secretary | Since 2014 | Current: Secretary, certain other funds in the Fund Complex (2007-present); Managing Director, Guggenheim Investments (2007-present). |
Michael P. Megaris (1984) | Assistant Secretary | Since 2014 | Current: Assistant Secretary, certain other funds in the Fund Complex (2014-present); Associate, Guggenheim Investments (2012-present). Former: J.D., University of Kansas School of Law (2009-2012). |
| 72 | THE GUGGENHEIM FUNDS SEMI-ANNUAL REPORT | |
INFORMATION ON BOARD OF TRUSTEES AND OFFICERS (Unaudited)(concluded)
Name, Address* and Year of Birth | Position(s) held with the Trust | Term of Office and Length of Time Served** | Principal Occupations During Past Five Years |
| OFFICERS - concluded | |
Elisabeth Miller (1968) | Chief Compliance Officer | Since 2012 | Current: CCO, certain other funds in the Fund Complex (2012-present); CCO, Security Investors, LLC (2012-present); CCO, Guggenheim Funds Investment Advisors, LLC (2012-present); Managing Director, Guggenheim Investments (2012-present); Vice President, Guggenheim Funds Distributors, LLC (March 2014-present). Former: CCO, Guggenheim Distributors, LLC (2009-March 2014); Senior Manager, Security Investors, LLC (2004-2009); Senior Manager, Guggenheim Distributors, LLC (2004-2009). |
Alison Santay (1974) | AML Officer | Since 2013 | Current: AML Officer, certain other funds in the Fund Complex (2010-present); Director and AML Officer, Rydex Fund Services, LLC (2010-present); AML Officer, Security Investors, LLC (2010-present); Director, Shareholder Risk and Compliance, Rydex Fund Services, LLC (2004-present). Former: AML Officer, Guggenheim Distributors, LLC (2013-2014). |
Kimberly Scott (1974) | Assistant Treasurer | Since 2014 | Current: Vice President, Guggenheim Investments (2012-present) ; Assistant Treasurer, certain other funds in the Fund Complex (2012-present). Former: Financial Reporting Manager, Invesco, Ltd. (2010-2011); Vice President/Assistant Treasurer, Mutual Fund Administration for Van Kampen Investments, Inc./Morgan Stanley Investment Management (2009-2010); Manager of Mutual Fund Administration, Van Kampen Investments, Inc./Morgan Stanley Investment Management (2005-2009). |
Bryan Stone (1979) | Vice President | Since 2014 | Current: Vice President, certain other funds in the Fund Complex (2014-present); Director, Guggenheim Investments (2013-present). Former: Senior Vice President, Neuberger Berman Group LLC (2009-2013); Vice President, Morgan Stanley (2002-2009). |
John L. Sullivan (1955) | Chief Financial Officer and Treasurer | Since 2014 | Current: CFO, Chief Accounting Officer and Treasurer, certain other funds in the Fund Complex (2010-present); Senior Managing Director, Guggenheim Investments (2010-present). Former: Managing Director and CCO, each of the funds in the Van Kampen Investments fund complex (2004-2010); Managing Director and Head of Fund Accounting and Administration, Morgan Stanley Investment Management (2002-2004); CFO and Treasurer, Van Kampen Funds (1996-2004). |
| * | The business address of each officer is c/o Guggenheim Investments, 805 King Farm Boulevard, Suite 600, Rockville, Maryland 20850. |
| ** | Each officer serves an indefinite term, until his or her successor is duly elected and qualified. Time served includes time served in the respective position for the Predecessor Corporation. |
| | THE GUGGENHEIM FUNDS SEMI-ANNUAL REPORT | 73 |
GUGGENHEIM INVESTMENTS PRIVACY POLICIES (Unaudited)
Rydex Funds, Guggenheim Funds, Rydex Investments, Guggenheim Funds Distributors, LLC, Security Investors, LLC, Security Distributors, Inc., Guggenheim Partners Investment Managers, LLC, and Rydex Advisory Services (Collectively “Guggenheim Investments”).
Our Commitment to You
When you become a Guggenheim Investments investor, you entrust us with not only your hard-earned money but also with personal and financial information about you. We recognize that your relationship with us is based on trust and that you expect us to act responsibly and in your best interests. Because we have access to this private information about you, we hold ourselves to the highest standards in its safekeeping and use. This means, most importantly, that we do not sell client information to anyone—whether it is your personal information or if you are a current or former Guggenheim Investments client.
The Information We Collect About You
In the course of doing business with shareholders and investors, we collect nonpublic personal information about you. You typically provide personal information when you complete a Guggenheim Investments account application or when you request a transaction that involves Rydex and Guggenheim Investments funds or one of the Guggenheim Investments affiliated companies. “Nonpublic personal information” is personally identifiable private information about you. For example, it includes information regarding your name and address, Social Security or taxpayer identification number, assets, income, account balance, bank account information and investment activity (e.g., purchase and redemption history).
How We Handle Your Personal Information
As emphasized above, we do not sell information about current or former clients or their accounts to third parties. Nor do we share such information, except when necessary to complete transactions at your request or to make you aware of related investment products and services that we offer. Additional details about how we handle your personal information are provided below. To complete certain transactions or account changes that you direct, it may be necessary to provide identifying information to companies, individuals or groups that are not affiliated with Guggenheim Investments. For example, if you ask to transfer assets from another financial institution to Guggenheim Investments, we will need to provide certain information about you to that company to complete the transaction. To alert you to other Guggenheim Investments investment products and services, we may share your information within the Guggenheim Investments family of affiliated companies. This would include, for example, sharing your information within Guggenheim Investments so we can make you aware of new Rydex and Guggenheim Investments funds or the services offered through another Guggenheim Investments affiliated company. In certain instances, we may contract with nonaffiliated companies to perform services for us. Where necessary, we will disclose information we have about you to these third parties. In all such cases, we provide the third party with only the information necessary to carry out its assigned responsibilities and only for that purpose. And we require these third parties to treat your private information with the same high degree of confidentiality that we do. In certain instances, we may share information with other financial institutions regarding individuals and entities in response to the U.S.A. Patriot Act. Finally, we will release information about you if you direct us to do so, if we are compelled by law to do so or in other circumstances permitted by law.
Opt Out Provisions
We do not sell your personal information to anyone. The law allows you to “opt out” of only certain kinds of information sharing with third parties. The firm does not share personal information about you with any third parties that triggers this opt-out right. This means YOU ARE ALREADY OPTED OUT.
| 74 | THE GUGGENHEIM FUNDS SEMI-ANNUAL REPORT | |
GUGGENHEIM INVESTMENTS PRIVACY POLICIES (Unaudited)(concluded)
How We Protect Privacy Online
Our concern for the privacy of our shareholders also extends to those who use our web site, guggenheiminvestments.com. Our web site uses some of the most secure forms of online communication available, including encryption technology, Secure Socket Layer (SSL) protocol, firewalls and user names and passwords. These technologies provide a high level of security and privacy when you access your account information or initiate online transactions. The Guggenheim Investments web site offers customized features that require our use of “http cookies”—tiny pieces of information that we ask your browser to store. However, we make very limited use of these cookies. We only use cookies for session management and security features on the Guggenheim Investments web site. We do not use them to pull data from your hard drive, to learn your email address, or to view data in cookies created by other web sites. We will not share the information in our cookies or give others access to it. See the legal information area on our web site for more details about web site security and privacy features.
How We Safeguard Your Personal Information
We restrict access to nonpublic personal information about shareholders to our employees and in some cases to third parties (for example, the service providers described above) as permitted by law. We maintain strict physical, electronic and procedural safeguards that comply with federal standards to guard your nonpublic personal information.
We’ll Keep You Informed
As required by federal law, we will notify shareholders of our privacy policy annually. We reserve the right to modify this policy at any time, but rest assured that if we do change it, we will tell you promptly. You will also be able to access our privacy policy from our web site at guggenheiminvestments.com. Should you have any questions regarding our privacy policy, contact us at 800.820.0888 or 301.296.5100.
| | THE GUGGENHEIM FUNDS SEMI-ANNUAL REPORT | 75 |
This page intentionally left blank.
This page intentionally left blank.
3.31.2015
Guggenheim Funds Semi-Annual Report
| Fundamental Alpha |
| Guggenheim Mid Cap Value Fund | | |
| MCV-SEMI-0315x0915 | guggenheiminvestments.com |
| DEAR SHAREHOLDER | 2 |
| ECONOMIC AND MARKET OVERVIEW | 3 |
| ABOUT SHAREHOLDERS’ FUND EXPENSES | 5 |
| MID CAP VALUE FUND | 8 |
| NOTES TO FINANCIAL STATEMENTS | 19 |
| OTHER INFORMATION | 26 |
| INFORMATION ON BOARD OF TRUSTEES AND OFFICERS | 27 |
| GUGGENHEIM INVESTMENTS PRIVACY POLICIES | 35 |
| | THE GUGGENHEIM FUNDS SEMI-ANNUAL REPORT | 1 |
March 31, 2015
Dear Shareholder:
Security Investors, LLC (the “Investment Adviser”) is pleased to present the semiannual shareholder report for one of our Funds for the six-month period ended March 31, 2015.
The Investment Adviser is part of Guggenheim Investments, which represents the investment management businesses of Guggenheim Partners, LLC (“Guggenheim”), a global, diversified financial services firm.
Guggenheim Funds Distributors, LLC is the distributor of the Funds. Guggenheim Funds Distributors, LLC is affiliated with Guggenheim and the Investment Adviser.
We encourage you to read the Economic and Market Overview section of the report, which follows this letter.
We are committed to providing innovative investment solutions and appreciate the trust you place in us.
Sincerely,
Donald C. Cacciapaglia
President
April 30, 2015
Read a prospectus and summary prospectus (if available) carefully before investing. It contains the investment objectives, risks, charges, expenses and other information, which should be considered carefully before investing. Obtain a prospectus and summary prospectus (if available) at guggenheiminvestments.com or call 800.820.0888.
There can be no assurance that any investment product will achieve its investment objective(s). There are risks associated with investing, including the entire loss of principal invested. Investing involves market risks. The investment return and principal value of any investment product will fluctuate with changes in market conditions.
| 2 | THE GUGGENHEIM FUNDS SEMI-ANNUAL REPORT | |
ECONOMIC AND MARKET OVERVIEW (Unaudited) | March 31, 2015 |
The U.S. continued to enjoy a self-sustaining economic expansion for the six-month period ended March 31, 2015, although winter weather was likely to distort first-quarter economic data. In addition, U.S. companies scaled back hiring in the last month of the period, adding to evidence that the domestic economy has lost some momentum since the turn of the year. The March increase in payrolls was the smallest since December 2013 and broke a 12-month run of gains above 200,000.
Despite this short-term dislocation, the economy remains on track. Indeed, many other labor market indicators, such as initial jobless claims and the job openings rate, suggest that the U.S. labor market remains quite strong, supporting the conclusion that March’s payroll report was just a temporary blip, similar to the one witnessed last winter. As soon as temporary seasonal factors have dissipated, economic data is likely to bounce back. The labor market has improved over the past year, as subdued mortgage rates and tight housing inventory continue to point to fairly stable appreciation in the housing market, which is key to the ongoing recovery. Consumers are also being helped by lower fuel prices, which are acting as a tax cut for U.S. consumers, freeing up discretionary spending in other areas and acting as a support for consumption.
In Europe, economic data has been surprisingly good and should continue along that path on the back of the European Central Bank’s program of quantitative easing and depreciation of the euro. Japan’s economy remains weak and, without more structural reform, continued monetary accommodation could lead to stagflation. China’s policymakers appear likely to continue the supply of credit and do whatever else is necessary to maintain growth there at an acceptable pace for the near term.
Given weakness overseas and the effect of a stronger U.S. dollar on international earnings, some stocks could face a more challenging environment in the near term, but our research shows that equity markets tend to perform quite well in the periods leading up to a U.S. Federal Reserve (the “Fed”) rate increase. The yield on the 10-year Treasury note declined in January by more than 50 basis points before rebounding in February, echoing the pattern since 2009—Treasury yields decline and a sell-off ensues, driving rates higher. Then conditions stabilize, and rates test their previous lows. Liquidity from foreign central banks and comparatively attractive U.S. yields continue to push global investors to U.S. Treasuries, which should hold down U.S. interest rates in the near term.
Against this backdrop, the U.S. central bank feels pressure to raise its key rate above zero, but insists the decision will be data-dependent and not occur prematurely. With a secular inflation increase unlikely in the near term, slack in the economy, and disinflation being imported from abroad, the Fed may not hike until later in the year. The Fed for now appears to be focused on wage growth, which is
| | THE GUGGENHEIM FUNDS SEMI-ANNUAL REPORT | 3 |
ECONOMIC AND MARKET OVERVIEW (Unaudited)(concluded) | March 31, 2015 |
key for sustaining the expansion but also an indicator of inflationary pressure. The lack of sustained wage growth has been a topic that has confounded the Fed lately. Given the strengthening employment numbers and the apparent reduction in labor market slack, wages should start to increase more steadily across the board. This is one of the most important data points at the moment for the Fed.
The underlying U.S. economy remains strong and investors should avoid being panicked by seasonal setbacks. Indeed, considering the strength of the economy and the wave of liquidity emanating from various central banks around the world, the general investment environment should remain attractive.
For the six months ended March 31, 2015, the Standard & Poor’s 500® (“S&P 500”) Index* returned 5.93%. The Morgan Stanley Capital International (“MSCI”) Europe-Australasia-Far East (“EAFE”) Index* returned 1.13%. The return of the MSCI Emerging Markets Index* was -2.37%.
In the bond market, the Barclays U.S. Aggregate Bond Index* posted a 3.43% return for the period, while the Barclays U.S. Corporate High Yield Index* returned 1.49%. The return of the Bank of America Merrill Lynch 3-Month U.S. Treasury Bill Index* was 0.01% for the six-month period.
The opinions and forecasts expressed may not actually come to pass. This information is subject to change at any time, based on market and other conditions, and should not be construed as a recommendation of any specific security or strategy.
*Index Definitions:
The following indices are referenced throughout this report. Indices are unmanaged and not available for direct investment. Index performance does not reflect transaction costs, fees, or expenses.
Barclays U.S. Aggregate Bond Index is a broad-based benchmark that measures the investment grade, U.S. dollar-denominated, fixed-rate taxable bond market, including U.S. Treasuries, government-related and corporate securities, MBS (agency fixed-rate and hybrid ARM pass-throughs), ABS, and CMBS.
Barclays U.S. Corporate High Yield Index measures the market of U.S. dollar-denominated, non-investment grade, fixed-rate, taxable corporate bonds. Securities are classified as high yield if the middle rating of Moody’s, Fitch, and S&P is Ba1/BB+/BB+ or below.
Bank of America (“BofA”) Merrill Lynch 3-Month U.S. Treasury Bill Index is an unmanaged market index of U.S. Treasury securities maturing in 90 days that assumes reinvestment of all income.
MSCI EAFE Index is a free float-adjusted market capitalization index that is designed to measure the equity market performance of developed markets, excluding the U.S. & Canada.
MSCI Emerging Markets Index is a free float-adjusted market capitalization weighted index that is designed to measure equity market performance in the global emerging markets.
S&P 500® Index is a capitalization-weighted index of 500 stocks designed to measure the performance of the broad economy, representing all major industries and is considered a representation of the U.S. stock market.
| 4 | THE GUGGENHEIM FUNDS SEMI-ANNUAL REPORT | |
ABOUT SHAREHOLDERS’ FUND EXPENSES (Unaudited)
All mutual funds have operating expenses and it is important for our shareholders to understand the impact of costs on their investments. Shareholders of a Fund incur two types of costs: (i) transaction costs, including sales charges (loads) on purchase payments, reinvested dividends, or other distributions; and exchange fees; and (ii) ongoing costs, including management fees, administrative services, and shareholder reports, among others. These ongoing costs, or operating expenses, are deducted from a fund’s gross income and reduce the investment return of the fund.
A fund’s expenses are expressed as a percentage of its average net assets, which is known as the expense ratio. The following examples are intended to help investors understand the ongoing costs (in dollars) of investing in a Fund and to compare these costs with the ongoing costs of investing in other mutual funds.
The examples are based on an investment of $1,000 made at the beginning of the period and held for the entire six-month period beginning September 30, 2014 and ending March 31, 2015.
The following tables illustrate a Fund’s costs in two ways:
Table 1. Based on actual Fund return. This section helps investors estimate the actual expenses paid over the period. The “Ending Account Value” shown is derived from the Fund’s actual return, and the fourth column shows the dollar amount that would have been paid by an investor who started with $1,000 in the Fund. Investors may use the information here, together with the amount invested, to estimate the expenses paid over the period. Simply divide the Fund’s account value by $1,000 (for example, an $8,600 account value divided by $1,000 = 8.6), then multiply the result by the number provided under the heading “Expenses Paid During Period.”
Table 2. Based on hypothetical 5% return. This section is intended to help investors compare a Fund’s cost with those of other mutual funds. The table provides information about hypothetical account values and hypothetical expenses based on the Fund’s actual expense ratio and an assumed rate of return of 5% per year before expenses, which is not the Fund’s actual return. The hypothetical account values and expenses may not be used to estimate the actual ending account balance or expenses paid during the period. The example is useful in making comparisons because the U.S. Securities and Exchange Commission (the “SEC”) requires all mutual funds to calculate expenses based on the 5% return. Investors can assess a Fund’s costs by comparing this hypothetical example with the hypothetical examples that appear in shareholder reports of other funds.
| | THE GUGGENHEIM FUNDS SEMI-ANNUAL REPORT | 5 |
ABOUT SHAREHOLDERS’ FUND EXPENSES (Unaudited)(continued)
The calculations illustrated above assume no shares were bought or sold during the period. Actual costs may have been higher or lower, depending on the amount of investment and the timing of any purchases or redemptions.
Please note that the expenses shown in the table are meant to highlight your ongoing costs only and do not reflect any transactional costs, such as sales charges (loads) on purchase payments, and contingent deferred sales charges (“CDSC”) on redemptions, if any. Therefore, the second table is useful in comparing ongoing costs only, and will not help you determine the relative total costs of owning different funds. In addition, if these transactional costs were included, your costs would have been higher.
More information about a Fund’s expenses, including annual expense ratios for the past five years, can be found in the Financial Highlights section of this report. For additional information on operating expenses and other shareholder costs, please refer to the appropriate Fund prospectus.
| 6 | THE GUGGENHEIM FUNDS SEMI-ANNUAL REPORT | |
ABOUT SHAREHOLDERS’ FUND EXPENSES (Unaudited)(concluded)
| | Expense Ratio1 | Fund Return | Beginning Account Value September 30, 2014 | Ending Account Value March 31, 2015 | Expenses Paid During Period2 |
Table 1. Based on actual Fund return3 |
| Mid Cap Value Fund |
| A-Class | 1.40% | 3.82% | $1,000.00 | $1,038.20 | $7.11 |
| B-Class | 2.35% | 3.34% | 1,000.00 | 1,033.40 | 11.91 |
| C-Class | 2.08% | 3.48% | 1,000.00 | 1,034.80 | 10.55 |
| |
| Table 2. Based on hypothetical 5% return (before expenses) |
| Mid Cap Value Fund |
| A-Class | 1.40% | 5.00% | $1,000.00 | $1,017.95 | $7.04 |
| B-Class | 2.35% | 5.00% | 1,000.00 | 1,013.21 | 11.80 |
| C-Class | 2.08% | 5.00% | 1,000.00 | 1,014.56 | 10.45 |
1 | Annualized and excludes expenses of the underlying funds in which the Fund invests. |
2 | Expenses are equal to the Fund's annualized expense ratio, net of any applicable fee waivers, multiplied by the average account value over the period, multiplied by 182/365 (to reflect the one-half year period). |
3 | Actual cumulative return at net asset value for the period September 30, 2014 to March 31, 2015. |
| | THE GUGGENHEIM FUNDS SEMI-ANNUAL REPORT | 7 |
FUND PROFILE (Unaudited) | March 31, 2015 |
MID CAP VALUE FUND
OBJECTIVE: Seeks long-term growth of capital.
Holdings Diversification (Market Exposure as % of Net Assets)
"Holdings Diversification (Market Exposure as % of Net Assets)" excludes any temporary cash investments.
| Inception Dates: |
| A-Class | May 1, 1997 |
| B-Class | May 1, 1997 |
| C-Class | January 29, 1999 |
| Ten Largest Holdings (% of Total Net Assets) |
| Hanover Insurance Group, Inc. | 3.0% |
| Zions Bancorporation | 2.8% |
| Computer Sciences Corp. | 2.3% |
| Covanta Holding Corp. | 2.2% |
| Orbital ATK, Inc. | 2.2% |
| Alleghany Corp. | 2.1% |
| Reinsurance Group of America, Inc. — Class A | 2.0% |
| IXYS Corp. | 2.0% |
| DigitalGlobe, Inc. | 1.9% |
| Sonoco Products Co. | 1.9% |
| Top Ten Total | 22.4% |
| 8 | THE GUGGENHEIM FUNDS SEMI-ANNUAL REPORT | |
SCHEDULE OF INVESTMENTS (Unaudited) | March 31, 2015 |
| MID CAP VALUE FUND | |
| | |
Shares | | | Value | |
| | | | | | | | |
COMMON STOCKS† - 97.0% | |
| | | | | | | | |
| FINANCIAL - 30.2% | |
| Hanover Insurance Group, Inc. | | | 371,360 | | | $ | 26,953,308 | |
| Zions Bancorporation | | | 942,540 | | | | 25,448,580 | |
| Alleghany Corp.* | | | 39,260 | | | | 19,119,620 | |
| Reinsurance Group of America, Inc. — Class A | | | 194,404 | | | | 18,116,508 | |
| FirstMerit Corp. | | | 824,220 | | | | 15,709,633 | |
| American Financial Group, Inc. | | | 222,810 | | | | 14,293,262 | |
| Popular, Inc.* | | | 406,960 | | | | 13,995,355 | |
| Endurance Specialty Holdings Ltd. | | | 176,890 | | | | 10,815,055 | |
| Assured Guaranty Ltd. | | | 406,190 | | | | 10,719,354 | |
| Kilroy Realty Corp. | | | 129,250 | | | | 9,844,973 | |
| Sun Communities, Inc. | | | 145,670 | | | | 9,719,102 | |
| Wintrust Financial Corp. | | | 201,310 | | | | 9,598,461 | |
| Camden Property Trust | | | 117,210 | | | | 9,157,617 | |
| CubeSmart | | | 377,880 | | | | 9,125,802 | |
| Apartment Investment & Management Co. — Class A | | | 230,980 | | | | 9,091,373 | |
| NorthStar Realty Finance Corp. | | | 472,160 | | | | 8,555,539 | |
| Jones Lang LaSalle, Inc. | | | 45,910 | | | | 7,823,064 | |
| Symetra Financial Corp. | | | 300,050 | | | | 7,039,173 | |
| Trustmark Corp. | | | 262,400 | | | | 6,371,072 | |
| Alexandria Real Estate Equities, Inc. | | | 50,890 | | | | 4,989,256 | |
| Ocwen Financial Corp.* | | | 598,340 | | | | 4,936,305 | |
| Home Loan Servicing Solutions Ltd. | | | 275,091 | | | | 4,550,005 | |
| BioMed Realty Trust, Inc. | | | 200,740 | | | | 4,548,768 | |
| OFG Bancorp | | | 223,120 | | | | 3,641,318 | |
| Fulton Financial Corp. | | | 284,752 | | | | 3,513,840 | |
| UDR, Inc. | | | 72,900 | | | | 2,480,787 | |
| Chatham Lodging Trust | | | 68,020 | | | | 2,000,468 | |
| Total Financial | | | | | | | 272,157,598 | |
| | | | | | | | |
| CONSUMER, NON-CYCLICAL - 16.8% | |
| MEDNAX, Inc.* | | | 232,492 | | | | 16,857,995 | |
| Hormel Foods Corp. | | | 256,730 | | | | 14,595,100 | |
| Bunge Ltd. | | | 172,180 | | | | 14,180,745 | |
| HealthSouth Corp. | | | 305,020 | | | | 13,530,687 | |
| Kindred Healthcare, Inc. | | | 552,866 | | | | 13,152,682 | |
| Navigant Consulting, Inc.* | | | 857,822 | | | | 11,117,373 | |
| Hologic, Inc.* | | | 268,441 | | | | 8,865,264 | |
| ICF International, Inc.* | | | 214,910 | | | | 8,779,074 | |
| Quanta Services, Inc.* | | | 302,590 | | | | 8,632,893 | |
| Darling Ingredients, Inc.* | | | 456,071 | | | | 6,389,555 | |
| DeVry Education Group, Inc. | | | 188,220 | | | | 6,279,019 | |
| Apollo Education Group, Inc. — Class A* | | | 312,880 | | | | 5,919,690 | |
| Globus Medical, Inc. — Class A* | | | 229,530 | | | | 5,793,337 | |
| Emergent Biosolutions, Inc.* | | | 193,565 | | | | 5,566,929 | |
| Ingredion, Inc. | | | 69,950 | | | | 5,443,509 | |
| IPC Healthcare, Inc.* | | | 48,450 | | | | 2,259,708 | |
| Grand Canyon Education, Inc.* | | | 47,820 | | | | 2,070,606 | |
| Aegerion Pharmaceuticals, Inc.* | | | 78,265 | | | | 2,048,195 | |
| Total Consumer, Non-cyclical | | | | | | | 151,482,361 | |
| | | | | | | | |
| INDUSTRIAL - 14.3% | |
| Covanta Holding Corp. | | | 884,100 | | | | 19,830,363 | |
| Orbital ATK, Inc. | | | 256,412 | | | | 19,648,852 | |
| Sonoco Products Co. | | | 376,550 | | | | 17,117,963 | |
| FLIR Systems, Inc. | | | 464,090 | | | | 14,516,735 | |
| Owens-Illinois, Inc.* | | | 616,450 | | | | 14,375,614 | |
| Rock-Tenn Co. — Class A | | | 175,790 | | | | 11,338,455 | |
| Gentex Corp. | | | 539,660 | | | | 9,875,778 | |
| Oshkosh Corp. | | | 187,855 | | | | 9,165,445 | |
| Aegion Corp. — Class A* | | | 241,951 | | | | 4,367,216 | |
| Huntington Ingalls Industries, Inc. | | | 28,276 | | | | 3,962,881 | |
| UTI Worldwide, Inc.* | | | 220,850 | | | | 2,716,455 | |
| SEE NOTES TO FINANCIAL STATEMENTS. | THE GUGGENHEIM FUNDS SEMI-ANNUAL REPORT | 9 |
SCHEDULE OF INVESTMENTS (Unaudited)(continued) | March 31, 2015 |
| MID CAP VALUE FUND | |
| | |
Shares | | | Value | |
| | | | | | | | | |
| Kirby Corp.* | | | 33,450 | | | $ | 2,510,423 | |
| Total Industrial | | | | | | | 129,426,180 | |
| | | | | | | | |
| TECHNOLOGY - 9.4% | |
| Computer Sciences Corp. | | | 314,350 | | | | 20,520,767 | |
| IXYS Corp. | | | 1,446,569 | | | | 17,821,730 | |
| Diebold, Inc. | | | 392,940 | | | | 13,933,653 | |
| Maxwell Technologies, Inc.* | | | 1,330,391 | | | | 10,722,951 | |
| Cree, Inc.* | | | 134,490 | | | | 4,773,050 | |
| KEYW Holding Corp.* | | | 454,620 | | | | 3,741,523 | |
| IPG Photonics Corp.* | | | 36,180 | | | | 3,353,886 | |
| IGATE Corp.* | | | 67,020 | | | | 2,859,073 | |
| ManTech International Corp. — Class A | | | 81,750 | | | | 2,774,595 | |
| Stratasys Ltd.* | | | 42,150 | | | | 2,224,677 | |
| Teradyne, Inc. | | | 113,890 | | | | 2,146,827 | |
| Total Technology | | | | | | | 84,872,732 | |
| | | | | | | | |
| CONSUMER, CYCLICAL - 8.3% | |
| Visteon Corp.* | | | 109,960 | | | | 10,600,144 | |
| Chico’s FAS, Inc. | | | 533,190 | | | | 9,432,131 | |
| Ryland Group, Inc. | | | 168,410 | | | | 8,208,303 | |
| Brown Shoe Company, Inc. | | | 235,925 | | | | 7,738,340 | |
| WESCO International, Inc.* | | | 90,997 | | | | 6,359,780 | |
| DR Horton, Inc. | | | 198,120 | | | | 5,642,458 | |
| Dolby Laboratories, Inc. — Class A | | | 145,418 | | | | 5,549,151 | |
| Iconix Brand Group, Inc.* | | | 142,937 | | | | 4,812,689 | |
| United Stationers, Inc. | | | 104,032 | | | | 4,264,272 | |
| Wendy’s Co. | | | 385,480 | | | | 4,201,732 | |
| Steven Madden Ltd.* | | | 96,780 | | | | 3,677,640 | |
| Ascena Retail Group, Inc.* | | | 193,420 | | | | 2,806,524 | |
| Abercrombie & Fitch Co. — Class A | | | 65,950 | | | | 1,453,538 | |
| Total Consumer, Cyclical | | | | | | | 74,746,702 | |
| | | | | | | | |
| UTILITIES - 7.8% | |
| Pinnacle West Capital Corp. | | | 238,000 | | | | 15,172,500 | |
| AGL Resources, Inc. | | | 228,540 | | | | 11,347,011 | |
| Ameren Corp. | | | 258,641 | | | | 10,914,650 | |
| Westar Energy, Inc. | | | 236,910 | | | | 9,182,632 | |
| Great Plains Energy, Inc. | | | 305,307 | | | | 8,145,591 | |
| Black Hills Corp. | | | 132,143 | | | | 6,665,293 | |
| Avista Corp. | | | 152,550 | | | | 5,214,159 | |
| Portland General Electric Co. | | | 61,548 | | | | 2,282,815 | |
| EnerNOC, Inc.* | | | 146,740 | | | | 1,672,836 | |
| Total Utilities | | | | | | | 70,597,487 | |
| | | | | | | | |
| COMMUNICATIONS - 4.8% | |
| DigitalGlobe, Inc.* | | | 512,877 | | | | 17,473,720 | |
| Scholastic Corp. | | | 257,480 | | | | 10,541,231 | |
| Finisar Corp.* | | | 470,560 | | | | 10,041,750 | |
| Liquidity Services, Inc.* | | | 301,910 | | | | 2,982,871 | |
| NETGEAR, Inc.* | | | 60,260 | | | | 1,981,349 | |
| Total Communications | | | | | | | 43,020,921 | |
| | | | | | | | |
| ENERGY - 3.1% | |
| Sanchez Energy Corp.* | | | 546,800 | | | | 7,113,868 | |
| Whiting Petroleum Corp.* | | | 192,072 | | | | 5,935,025 | |
| Superior Energy Services, Inc. | | | 240,366 | | | | 5,369,776 | |
| Patterson-UTI Energy, Inc. | | | 282,920 | | | | 5,311,823 | |
| Oasis Petroleum, Inc.* | | | 241,830 | | | | 3,438,823 | |
| Resolute Energy Corp.* | | | 1,136,190 | | | | 640,129 | |
| Total Energy | | | | | | | 27,809,444 | |
| | | | | | | | |
| BASIC MATERIALS - 2.3% | |
| Landec Corp.* | | | 588,073 | | | | 8,203,619 | |
| Olin Corp. | | | 255,920 | | | | 8,199,677 | |
| Intrepid Potash, Inc.* | | | 398,619 | | | | 4,604,049 | |
| Total Basic Materials | | | | | | | 21,007,345 | |
| | | | | | | | |
| Total Common Stocks | | | | | | | | |
| (Cost $747,693,598) | | | | | | | 875,120,770 | |
| | | | | | | | |
CONVERTIBLE PREFERRED STOCKS††† - 0.0% | |
Thermoenergy Corp.*,1,2 | | | 858,334 | | | | 2,506 | |
| Total Convertible Preferred Stocks | | | | | | | | |
| (Cost $819,654) | | | | | | | 2,506 | |
| 10 | THE GUGGENHEIM FUNDS SEMI-ANNUAL REPORT | SEE NOTES TO FINANCIAL STATEMENTS. |
SCHEDULE OF INVESTMENTS (Unaudited)(concluded) | March 31, 2015 |
| MID CAP VALUE FUND | |
| | |
Shares | | | Value | |
| | | | | | | | | |
SHORT TERM INVESTMENTS† - 3.1% | |
| Dreyfus Treasury Prime Cash Management Fund 0.00% | | | 28,120,012 | | | $ | 28,120,012 | |
| Total Short Term Investments | | | | | | | | |
| (Cost $28,120,012) | | | | | | | 28,120,012 | |
| | | | | | | | |
| Total Investments - 100.1% | | | | | | | | |
| (Cost $776,633,264) | | | | | | $ | 903,243,288 | |
| Other Assets & Liabilities, net - (0.1)% | | | | | | | (932,061 | ) |
| Total Net Assets - 100.0% | | | | | | $ | 902,311,227 | |
| * | Non-income producing security. |
| † | Value determined based on Level 1 inputs — See Note 4. |
| ††† | Value determined based on Level 3 inputs — See Note 4. |
| 1 | PIPE (Private Investment in Public Equity) - Stock issued by a company in the secondary market as a means of raising capital more quickly and less expensively than through registration of a secondary public offering. |
| 2 | Illiquid security. |
| | |
| See Sector Classification in Other Information section. |
| SEE NOTES TO FINANCIAL STATEMENTS. | THE GUGGENHEIM FUNDS SEMI-ANNUAL REPORT | 11 |
STATEMENT OF ASSETS AND LIABILITIES (Unaudited) |
| MID CAP VALUE FUND |
March 31, 2015
| Assets: | |
| Investments, at value (cost $776,633,264) | | $ | 903,243,288 | |
| Prepaid expenses | | | 106,923 | |
| Receivables: | |
| Securities sold | | | 5,082,359 | |
| Dividends | | | 1,126,303 | |
| Fund shares sold | | | 442,264 | |
| Foreign taxes reclaim | | | 13,049 | |
| Cash | | | 9,998 | |
| Total assets | | | 910,024,184 | |
| | | | | |
| Liabilities: | |
| Payable for: | |
| Securities purchased | | | 4,080,673 | |
| Fund shares redeemed | | | 1,903,745 | |
| Management fees | | | 707,101 | |
| Distribution and service fees | | | 338,065 | |
| Fund accounting/administration fees | | | 84,186 | |
| Transfer agent/maintenance fees | | | 64,460 | |
| Trustees’ fees* | | | 4,945 | |
| Miscellaneous | | | 529,782 | |
| Total liabilities | | | 7,712,957 | |
| Net assets | | $ | 902,311,227 | |
| | | | | |
| Net assets consist of: | |
| Paid in capital | | $ | 684,822,567 | |
| Undistributed net investment income | | | 995,573 | |
| Accumulated net realized gain on investments | | | 89,883,063 | |
| Net unrealized appreciation on investments | | | 126,610,024 | |
| Net assets | | $ | 902,311,227 | |
| | | | | |
| A-Class: | |
| Net assets | | $ | 721,064,091 | |
| Capital shares outstanding | | | 20,966,958 | |
| Net asset value per share | | $ | 34.39 | |
| Maximum offering price per share (Net asset value divided by 95.25%) | | $ | 36.10 | |
| | | | | |
| B-Class: | |
| Net assets | | $ | 9,644,327 | |
| Capital shares outstanding | | | 369,544 | |
| Net asset value per share | | $ | 26.10 | |
| | | | | |
| C-Class: | |
| Net assets | | $ | 171,602,809 | |
| Capital shares outstanding | | | 6,251,316 | |
| Net asset value per share | | $ | 27.45 | |
| * | Relates to Trustees not deemed “interested persons” within the meaning of Section 2(a)(19) of the 1940 Act. |
| 12 | THE GUGGENHEIM FUNDS SEMI-ANNUAL REPORT | SEE NOTES TO FINANCIAL STATEMENTS. |
STATEMENT OF OPERATIONS (Unaudited) |
| MID CAP VALUE FUND |
Period Ended March 31, 2015
| Investment Income: | |
| Dividends (net of foreign withholding tax of $8,203) | | $ | 10,703,436 | |
| Interest | | | 10,319 | |
| Total investment income | | | 10,713,755 | |
| | | | | |
| Expenses: | |
| Management fees | | | 4,592,058 | |
| Transfer agent/maintenance fees: | | | | |
| A-Class | | | 914,500 | |
| B-Class | | | 21,791 | |
| C-Class | | | 109,811 | |
| Distribution and service fees: | | | | |
| A-Class | | | 1,206,368 | |
| B-Class | | | 55,762 | |
| C-Class | | | 909,112 | |
| Fund accounting/administration fees | | | 550,075 | |
| Trustees’ fees* | | | 57,437 | |
| Line of credit fees | | | 42,973 | |
| Custodian fees | | | 20,685 | |
| Tax expense | | | 52 | |
| Miscellaneous | | | 310,691 | |
| Total expenses | | | 8,791,315 | |
| Net investment income | | | 1,922,440 | |
| | | | | |
| Net Realized and Unrealized Gain (Loss): | |
| Net realized gain (loss) on: | |
| Investments in unaffiliated issuers | | $ | 102,487,933 | |
| Net realized gain | | | 102,487,933 | |
| Net change in unrealized appreciation (depreciation) on: | |
| Investments in unaffiliated issuers | | | (62,971,955 | ) |
| Investments in affiliated issuers | | | 589,738 | |
| Net change in unrealized appreciation (depreciation) | | | (62,382,217 | ) |
| Net realized and unrealized gain | | | 40,105,716 | |
| Net increase in net assets resulting from operations | | $ | 42,028,156 | |
| * | Relates to Trustees not deemed “interested persons” within the meaning of Section 2(a)(19) of the 1940 Act. |
| SEE NOTES TO FINANCIAL STATEMENTS. | THE GUGGENHEIM FUNDS SEMI-ANNUAL REPORT | 13 |
STATEMENTS OF CHANGES IN NET ASSETS |
| MID CAP VALUE FUND | |
| | | Period Ended March 31, 2015 (Unaudited) | | | Year Ended September 30, 2014 | |
| Increase (Decrease) in Net Assets from Operations: | | | | | | |
| Net investment income (loss) | | $ | 1,922,440 | | | $ | (674,993 | ) |
| Net realized gain on investments | | | 102,487,933 | | | | 183,049,385 | |
| Net change in unrealized appreciation (depreciation) on investments | | | (62,382,217 | ) | | | (112,657,063 | ) |
| Net increase in net assets resulting from operations | | | 42,028,156 | | | | 69,717,329 | |
| | | | | | | | | |
| Distributions to shareholders from: | | | | | | | | |
| Net realized gains | | | | | | | | |
| A-Class | | | (123,882,978 | ) | | | (66,154,623 | ) |
| B-Class | | | (1,863,094 | ) | | | (1,531,403 | ) |
| C-Class | | | (28,169,528 | ) | | | (16,551,729 | ) |
| Total distributions to shareholders | | | (153,915,600 | ) | | | (84,237,755 | ) |
| | | | | | | | | |
| Capital share transactions: | | | | | | | | |
| Proceeds from sale of shares | | | | | | | | |
| A-Class | | | 71,630,329 | | | | 212,574,766 | |
| B-Class | | | 59,102 | | | | 89,153 | |
| C-Class | | | 7,683,602 | | | | 26,075,051 | |
| Distributions reinvested | | | | | | | | |
| A-Class | | | 114,025,165 | | | | 60,093,834 | |
| B-Class | | | 1,753,261 | | | | 1,462,878 | |
| C-Class | | | 24,118,770 | | | | 12,947,243 | |
| Cost of shares redeemed | | | | | | | | |
| A-Class | | | (393,548,200 | ) | | | (285,246,325 | ) |
| B-Class | | | (3,471,935 | ) | | | (8,904,634 | ) |
| C-Class | | | (31,056,153 | ) | | | (60,608,402 | ) |
| Net decrease from capital share transactions | | | (208,806,059 | ) | | | (41,516,436 | ) |
| Net decrease in net assets | | | (320,693,503 | ) | | | (56,036,862 | ) |
| | | | | | | | | |
| Net assets: | | | | | | | | |
| Beginning of period | | | 1,223,004,730 | | | | 1,279,041,592 | |
| End of period | | $ | 902,311,227 | | | $ | 1,223,004,730 | |
| Undistributed net investment income/(Accumulated net investment loss) at end of period | | $ | 995,573 | | | $ | (926,867 | ) |
| 14 | THE GUGGENHEIM FUNDS SEMI-ANNUAL REPORT | SEE NOTES TO FINANCIAL STATEMENTS. |
STATEMENTS OF CHANGES IN NET ASSETS (concluded) |
| MID CAP VALUE FUND | |
| | | Period Ended March 31, 2015 (Unaudited) | | | Year Ended September 30, 2014 | |
| Capital share activity: | | | | | | |
| Shares sold | | | | | | |
| A-Class | | | 2,046,809 | | | | 5,437,655 | |
| B-Class | | | 2,300 | | | | 2,867 | |
| C-Class | | | 277,696 | | | | 808,772 | |
| Shares issued from reinvestment of distributions | | | | | | | | |
| A-Class | | | 3,380,581 | | | | 1,617,164 | |
| B-Class | | | 68,273 | | | | 49,371 | |
| C-Class | | | 893,950 | | | | 419,548 | |
| Shares redeemed | | | | | | | | |
| A-Class | | | (11,420,532 | ) | | | (7,320,216 | ) |
| B-Class | | | (131,402 | ) | | | (286,983 | ) |
| C-Class | | | (1,116,402 | ) | | | (1,870,843 | ) |
| Net decrease in shares | | | (5,998,727 | ) | | | (1,142,665 | ) |
| SEE NOTES TO FINANCIAL STATEMENTS. | THE GUGGENHEIM FUNDS SEMI-ANNUAL REPORT | 15 |
| FINANCIAL HIGHLIGHTS |
| MID CAP VALUE FUND | |
This table is presented to show selected data for a share outstanding throughout each period and to assist shareholders in evaluating a Fund’s performance for the periods presented.
| A-Class | | Period Ended March 31, 2015a | | | Year Ended Sept. 30, 2014 | | | Year Ended Sept. 30, 2013 | | | Year Ended Sept. 30, 2012 | | | Year Ended Sept. 30, 2011 | | | Year Ended Sept. 30, 2010 | |
| Per Share Data | | | | | | | | | | | | | | | | | | |
| Net asset value, beginning of period | | $ | 37.73 | | | $ | 38.15 | | | $ | 33.05 | | | $ | 27.13 | | | $ | 29.55 | | | $ | 26.58 | |
| Income (loss) from investment operations: | |
Net investment income (loss)b | | | .08 | | | | .03 | | | | .04 | | | | (.07 | ) | | | (.03 | ) | | | .11 | |
| Net gain (loss) on investments (realized and unrealized) | | | 1.27 | | | | 2.04 | | | | 8.59 | | | | 6.54 | | | | (2.31 | ) | | | 2.90 | |
| Total from investment operations | | | 1.35 | | | | 2.07 | | | | 8.63 | | | | 6.47 | | | | (2.34 | ) | | | 3.01 | |
| Less distributions from: | |
| Net investment income | | | — | | | | — | | | | — | | | | — | | | | (.08 | ) | | | (.04 | ) |
| Net realized gains | | | (4.69 | ) | | | (2.49 | ) | | | (3.53 | ) | | | (.55 | ) | | | — | | | | — | |
| Total distributions | | | (4.69 | ) | | | (2.49 | ) | | | (3.53 | ) | | | (.55 | ) | | | (.08 | ) | | | (.04 | ) |
| Net asset value, end of period | | $ | 34.39 | | | $ | 37.73 | | | $ | 38.15 | | | $ | 33.05 | | | $ | 27.13 | | | $ | 29.55 | |
| | |
Total Returnc | | | 3.82 | % | | | 5.52 | % | | | 28.93 | % | | | 24.13 | % | | | (7.98 | %) | | | 11.32 | % |
| Ratios/Supplemental Data | |
| Net assets, end of period (in thousands) | | $ | 721,064 | | | $ | 1,017,208 | | | $ | 1,038,762 | | | $ | 903,221 | | | $ | 973,467 | | | $ | 1,056,655 | |
| Ratios to average net assets: | |
| Net investment income (loss) | | | 0.45 | % | | | 0.08 | % | | | 0.11 | % | | | (0.22 | %) | | | (0.10 | %) | | | 0.38 | % |
Total expensesd | | | 1.40 | % | | | 1.39 | % | | | 1.39 | % | | | 1.46 | % | | | 1.32 | % | | | 1.37 | % |
| Portfolio turnover rate | | | 49 | % | | | 35 | % | | | 23 | % | | | 19 | % | | | 28 | % | | | 23 | % |
| 16 | THE GUGGENHEIM FUNDS SEMI-ANNUAL REPORT | SEE NOTES TO FINANCIAL STATEMENTS. |
FINANCIAL HIGHLIGHTS (continued) |
| MID CAP VALUE FUND | |
This table is presented to show selected data for a share outstanding throughout each period and to assist shareholders in evaluating a Fund’s performance for the periods presented.
| B-Class | | Period Ended March 31, 2015a | | | Year Ended Sept. 30, 2014 | | | Year Ended Sept. 30, 2013 | | | Year Ended Sept. 30, 2012 | | | Year Ended Sept. 30, 2011 | | | Year Ended Sept. 30, 2010 | |
| Per Share Data | | | | | | | | | | | | | | | | | | |
| Net asset value, beginning of period | | $ | 29.87 | | | $ | 30.95 | | | $ | 27.66 | | | $ | 22.99 | | | $ | 25.17 | | | $ | 22.78 | |
| Income (loss) from investment operations: | |
Net investment income (loss)b | | | (.07 | ) | | | (.25 | ) | | | (.19 | ) | | | (.29 | ) | | | (.24 | ) | | | (.09 | ) |
| Net gain (loss) on investments (realized and unrealized) | | | .99 | | | | 1.66 | | | | 7.01 | | | | 5.51 | | | | (1.94 | ) | | | 2.48 | |
| Total from investment operations | | | .92 | | | | 1.41 | | | | 6.82 | | | | 5.22 | | | | (2.18 | ) | | | 2.39 | |
| Less distributions from: | |
| Net realized gains | | | (4.69 | ) | | | (2.49 | ) | | | (3.53 | ) | | | (.55 | ) | | | — | | | | — | |
| Total distributions | | | (4.69 | ) | | | (2.49 | ) | | | (3.53 | ) | | | (.55 | ) | | | — | | | | — | |
| Net asset value, end of period | | $ | 26.10 | | | $ | 29.87 | | | $ | 30.95 | | | $ | 27.66 | | | $ | 22.99 | | | $ | 25.17 | |
| | |
Total Returnc | | | 3.34 | % | | | 4.62 | % | | | 27.93 | % | | | 23.02 | % | | | (8.66 | %) | | | 10.49 | % |
| Ratios/Supplemental Data | |
| Net assets, end of period (in thousands) | | $ | 9,644 | | | $ | 12,854 | | | $ | 20,584 | | | $ | 23,747 | | | $ | 27,960 | | | $ | 42,321 | |
| Ratios to average net assets: | |
| Net investment income (loss) | | | (0.51 | %) | | | (0.80 | %) | | | (0.67 | %) | | | (1.09 | %) | | | (0.86 | %) | | | (0.40 | %) |
Total expensesd | | | 2.35 | % | | | 2.23 | % | | | 2.16 | % | | | 2.33 | % | | | 2.07 | % | | | 2.12 | % |
| Portfolio turnover rate | | | 49 | % | | | 35 | % | | | 23 | % | | | 19 | % | | | 28 | % | | | 23 | % |
| SEE NOTES TO FINANCIAL STATEMENTS. | THE GUGGENHEIM FUNDS SEMI-ANNUAL REPORT | 17 |
FINANCIAL HIGHLIGHTS (concluded) |
| MID CAP VALUE FUND |
This table is presented to show selected data for a share outstanding throughout each period and to assist shareholders in evaluating a Fund’s performance for the periods presented.
| C-Class | | Period Ended March 31, 2015a | | | Year Ended Sept. 30, 2014 | | | Year Ended Sept. 30, 2013 | | | Year Ended Sept. 30, 2012 | | | Year Ended Sept. 30, 2011 | | | Year Ended Sept. 30, 2010 | |
| Per Share Data | | | | | | | | | | | | | | | | | | |
| Net asset value, beginning of period | | $ | 31.14 | | | $ | 32.13 | | | $ | 28.57 | | | $ | 23.68 | | | $ | 25.93 | | | $ | 23.47 | |
| Income (loss) from investment operations: | |
Net investment income (loss)b | | | (.03 | ) | | | (.21 | ) | | | (.18 | ) | | | (.25 | ) | | | (.24 | ) | | | (.09 | ) |
| Net gain (loss) on investments (realized and unrealized) | | | 1.03 | | | | 1.71 | | | | 7.27 | | | | 5.69 | | | | (2.01 | ) | | | 2.55 | |
| Total from investment operations | | | 1.00 | | | | 1.50 | | | | 7.09 | | | | 5.44 | | | | (2.25 | ) | | | 2.46 | |
| Less distributions from: | |
| Net realized gains | | | (4.69 | ) | | | (2.49 | ) | | | (3.53 | ) | | | (.55 | ) | | | — | | | | — | |
| Total distributions | | | (4.69 | ) | | | (2.49 | ) | | | (3.53 | ) | | | (.55 | ) | | | — | | | | — | |
| Net asset value, end of period | | $ | 27.45 | | | $ | 31.14 | | | $ | 32.13 | | | $ | 28.57 | | | $ | 23.68 | | | $ | 25.93 | |
| | |
Total Returnc | | | 3.48 | % | | | 4.74 | % | | | 27.98 | % | | | 23.28 | % | | | (8.68 | %) | | | 10.48 | % |
| Ratios/Supplemental Data | |
| Net assets, end of period (in thousands) | | $ | 171,603 | | | $ | 192,942 | | | $ | 219,695 | | | $ | 191,249 | | | $ | 188,745 | | | $ | 193,986 | |
| Ratios to average net assets: | |
| Net investment income (loss) | | | (0.22 | %) | | | (0.65 | %) | | | (0.62 | %) | | | (0.92 | %) | | | (0.85 | %) | | | (0.37 | %) |
Total expensesd | | | 2.08 | % | | | 2.12 | % | | | 2.12 | % | | | 2.17 | % | | | 2.07 | % | | | 2.12 | % |
| Portfolio turnover rate | | | 49 | % | | | 35 | % | | | 23 | % | | | 19 | % | | | 28 | % | | | 23 | % |
a | Unaudited figures for the period ended March 31, 2015. Percentage amounts for the period, except total return and portfolio turnover rate, have been annualized. |
b | Net investment income (loss) per share was computed using average shares outstanding throughout the period. |
c | Total return does not reflect the impact of any applicable sales charges and has not been annualized. |
d | Does not include expenses of the underlying funds in which the Fund invests. |
| 18 | THE GUGGENHEIM FUNDS SEMI-ANNUAL REPORT | SEE NOTES TO FINANCIAL STATEMENTS. |
NOTES TO FINANCIAL STATEMENTS (Unaudited)
1. Organization and Significant Accounting Policies
Organization
Guggenheim Funds Trust (the "Trust"), a Delaware statutory trust, is registered with the SEC under the Investment Company Act of 1940 ("1940 Act”), as a non-diversified, open-ended investment company of the series type. Each series, in effect, is representing a separate Fund. The Trust is authorized to issue an unlimited number of shares. The Trust accounts for the assets of each Fund separately.
The Trust offers a combination of four separate classes of shares, A-Class shares, B-Class shares, C-Class shares and Institutional Class shares. Sales of shares of each Class are made without a front-end sales charge at the net asset value per share (“NAV”), with the exception of A-Class shares. A-Class shares are sold at the NAV, plus the applicable front-end sales charge. The sales charge varies depending on the amount purchased, but will not exceed 4.75%. Prior to February 22, 2011, the maximum sales charge was 5.75%. A-Class share purchases of $1 million or more are exempt from the front-end sales charge but have a 1% contingent deferred sales charge (“CDSC”), if shares are redeemed within 12 months of purchase. B-Class shares were offered without a front-end sales charge, but were subject to a CDSC of up to 5% for five years and convert to A-Class shares after eight years. Effective January 4, 2010, subscriptions for B-Class shares are no longer accepted. C-Class shares have a 1% CDSC if shares are redeemed within 12 months of purchase. Institutional Class shares are offered primarily for direct investment by institutions such as pension and profit sharing plans, endowments, foundations and corporations. Institutional Class shares have a minimum initial investment of $2 million and a minimum account balance of $1 million. Institutional Class shares are offered without a front-end sales charge or a CDSC. At March 31, 2015, the Trust consisted of eighteen funds (the “Funds”).
This report covers the Mid Cap Value Fund (the “Fund”) while the other funds are in separate reports. Only A-Class, B-Class and C-Class shares had been issued by the Fund.
The Fund was previously a series (the “Predecessor Fund”) of Security Equity Fund, a different registered open-end investment company, which was organized as a Kansas corporation. In January 2014, at a special meeting of shareholders, the shareholders of the Predecessor Fund approved the reorganization of the Predecessor Fund with and into the Fund, a corresponding “shell” series of the Trust. The Fund succeeded to the accounting and performance history of the Predecessor Fund. Any such historical information provided for the Fund that relates to periods prior to January 28, 2014, therefore, is that of the Predecessor Fund.
| | THE GUGGENHEIM FUNDS SEMI-ANNUAL REPORT | 19 |
NOTES TO FINANCIAL STATEMENTS (Unaudited)(continued)
Guggenheim Investments (“GI”) provides advisory services, and Rydex Fund Services, LLC (“RFS”) provides transfer agent, administrative and accounting services to the Trust. Guggenheim Funds Distributors, LLC (“GFD”) acts as principal underwriter for the Trust. GI, RFS and GFD are affiliated entities.
Significant Accounting Policies
The Fund operates as an investment company and accordingly follows the investment company accounting and reporting guidance of the Financial Accounting Standards Board (“FASB”) Accounting Standards Codification Topic 946 Financial Services – Investment Companies.
The following significant accounting policies are in conformity with U.S. generally accepted accounting principles ("U.S. GAAP") and are consistently followed by the Trust. This requires management to make estimates and assumptions that affect the reported amount of assets and liabilities and disclosure of contingent assets and liabilities at the date of the financial statements and the reported amounts of revenues and expenses during the reporting period. Actual results could differ from these estimates. All time references are based on Eastern Time.
The NAV of each Class of the Fund is calculated by dividing the market value of the Fund’s securities and other assets, less all liabilities, attributable to the Class by the number of outstanding shares of the Class.
A. The Board of Trustees of the Fund (the “Board”) has adopted policies and procedures for the valuation of the Fund's investments (the “Valuation Procedures”). Pursuant to the Valuation Procedures, the Board has delegated to a valuation committee, consisting of representatives from Guggenheim’s investment management, fund administration, legal and compliance departments (the “Valuation Committee”), the day-to-day responsibility for implementing the Valuation Procedures, including, under most circumstances, the responsibility for determining the fair value of the Fund’s securities or other assets.
Valuations of the Fund's securities are supplied primarily by pricing services appointed pursuant to the processes set forth in the Valuation Procedures. The Valuation Committee convenes monthly, or more frequently as needed and will review the valuation of all assets which have been fair valued for reasonableness. The Fund's officers, through the Valuation Committee and consistent with the monitoring and review responsibilities set forth in the Valuation Procedures, regularly review procedures used by, and valuations provided by, the pricing services.
| 20 | THE GUGGENHEIM FUNDS SEMI-ANNUAL REPORT | |
NOTES TO FINANCIAL STATEMENTS (Unaudited)(continued)
If the pricing service cannot or does not provide a valuation for a particular investment or such valuation is deemed unreliable, such investment is fair valued by the Valuation Committee.
Equity securities listed on an exchange (New York Stock Exchange (“NYSE”) or American Stock Exchange) are valued at the last quoted sales price as of the close of business on the NYSE, usually 4:00 p.m. on the valuation date. Equity securities listed on the NASDAQ market system are valued at the NASDAQ Official Closing Price on the valuation date, which may not necessarily represent the last sale price. If there has been no sale on such exchange or NASDAQ on a given day, the security is valued at the closing bid price on that day.
Open-end investment companies (“Mutual Funds”) are valued at their NAV as of the close of business, on the valuation date.
Investments for which market quotations are not readily available are fair valued as determined in good faith by GI under the direction of the Board of Trustees using methods established or ratified by the Board of Trustees. These methods include, but are not limited to: (i) obtaining general information as to how these securities and assets trade; and (ii) obtaining other information and considerations, including current values in related markets.
B. Security transactions are recorded on the trade date for financial reporting purposes. Realized gains and losses from securities transactions are recorded using the identified cost basis. Proceeds from lawsuits related to investment holdings are recorded as realized gains in the Fund. Dividend income is recorded on the ex-dividend date, net of applicable taxes withheld by foreign countries. Taxable non-cash dividends are recorded as dividend income. Interest income, including amortization of premiums and accretion of discounts, is accrued on a daily basis. Interest income also includes paydown gains and losses on mortgage-backed and asset-backed securities and senior and subordinated loans. Amendment fees are earned as compensation for evaluating and accepting changes to the original loan agreement and are recognized when received. Dividend income from REITs is recorded based on the income included in the distributions received from the REIT investments using published REIT classifications, including some management estimates when actual amounts are not available. Distributions received in excess of this estimated amount are recorded as a reduction of the cost of investments or reclassified to capital gains. The actual amounts of income, return of capital, and capital gains are only determined by each REIT after its fiscal year-end, and may differ from the estimated amounts.
| | THE GUGGENHEIM FUNDS SEMI-ANNUAL REPORT | 21 |
NOTES TO FINANCIAL STATEMENTS (Unaudited)(continued)
Distributions of net investment income and net realized gains, if any, are declared and paid at least annually. Dividends are reinvested in additional shares unless shareholders request payment in cash. Distributions are recorded on the ex-dividend date and are determined in accordance with income tax regulations which may differ from U.S. GAAP.
D. Interest and dividend income, most expenses, all realized gains and losses, and all unrealized gains and losses are allocated to the classes based upon the value of the outstanding shares in each Class. Certain costs, such as distribution and service fees are charged directly to specific classes. In addition, certain expenses have been allocated to the individual Funds in the Trust on a pro rata basis upon the respective aggregate net assets of each Fund included in the Trust.
E. Under the fee arrangement with the custodian, the Fund may earn credits based on overnight custody cash balances. These credits are utilized to reduce related custodial expenses. The custodian fees disclosed in the Statement of Operations are before the reduction in expense from the related earnings credits, if any. For the period ended March 31, 2015, there were no earnings credits received.
F. The Fund may leave cash overnight in its cash account with the custodian. Periodically, the Fund may have cash due to the custodian bank as an overdraft balance. A fee is incurred on this overdraft, calculated by multiplying the overdraft by a rate based on the federal funds rate.
G. Under the Fund's organizational documents, its Trustees and Officers are indemnified against certain liabilities arising out of the performance of their duties to the Trust. In addition, throughout the normal course of business, the Fund enters into contracts that contain a variety of representations and warranties which provide general indemnifications. The Fund's maximum exposure under these arrangements is unknown, as this would involve future claims that may be made against the Fund and/or its affiliates that have not yet occurred. However, based on experience, the Fund expects the risk of loss to be remote.
2. Federal Income Tax Information
The Fund intends to comply with the provisions of Subchapter M of the Internal Revenue Code applicable to regulated investment companies and will distribute substantially all taxable net investment income and capital gains sufficient to relieve the Fund from all, or substantially all, federal income, excise and state income taxes. Therefore, no provision for federal or state income tax is required.
Tax positions taken or expected to be taken in the course of preparing the Fund’s tax returns are evaluated to determine whether the tax positions are “more-likely-than-not” of being sustained by the applicable tax authority. Tax positions
| 22 | THE GUGGENHEIM FUNDS SEMI-ANNUAL REPORT | |
NOTES TO FINANCIAL STATEMENTS (Unaudited)(continued)
not deemed to meet the more-likely-than-not threshold would be recorded as a tax benefit or expense in the current year. Management has analyzed the Fund’s tax positions taken, or to be taken, on Federal income tax returns for all open tax years, and has concluded that no provision for income tax is required in the Fund’s financial statements. The Fund’s federal tax returns are subject to examination by the Internal Revenue Service for a period of three years after they are filed.
At March 31, 2015, the cost of securities for Federal income tax purposes, the aggregate gross unrealized gain for all securities for which there was an excess of value over tax cost and the aggregate gross unrealized loss for all securities for which there was an excess of tax cost over value, were as follows:
| Fund | | Tax Cost | | | Tax Unrealized Gain | | | Tax Unrealized Loss | | | Net Unrealized Gain | |
| Mid Cap Value Fund | | $ | 778,137,233 | | | $ | 173,060,235 | | | $ | (47,954,180 | ) | | $ | 125,106,055 | |
3. Fees and Other Transactions with Affiliates
Under the terms of an investment advisory contract, the Fund pays GI investment advisory fees calculated at 1.00% of the average daily net assets of $200 million or less and 0.75% of the average daily net assets of the Fund in excess of $200 million.
RFS is paid the following for providing transfer agent services to the Fund. Transfer agent fees are assessed to the applicable class of the Fund.
| Annual charge per account | $5.00 – $8.00 |
| Transaction fee | $0.60 – $1.10 |
Minimum annual charge per Fund† | $25,000 |
| Certain out-of-pocket charges | Varies |
† | Not subject to Fund during first twelve months of operations. |
RFS also acts as the administrative agent for the Fund, and as such performs administrative functions and the bookkeeping, accounting and pricing functions for the Fund. For these services, RFS receives 0.095% of the average daily net assets of the Fund. The minimum annual charge for accounting/administrative fees is $25,000.
RFS engages external service providers to perform other necessary services for the Trust, such as audit and accounting related services, legal services, custody, printing and mailing, etc., on a pass-through basis. Such expenses are allocated to various Funds within the complex based on relative net assets.
| | THE GUGGENHEIM FUNDS SEMI-ANNUAL REPORT | 23 |
NOTES TO FINANCIAL STATEMENTS (Unaudited)(continued)
The Fund has adopted Distribution Plans related to the offering of A-Class, B-Class and C-Class shares pursuant to Rule 12b-1 under the 1940 Act. The plans provide for payments at an annual rate of 0.25% of the average daily net assets of the Fund’s A-Class shares and 1.00% of the average daily net assets of the Fund’s B-Class and C-Class shares.
For the period ended March 31, 2015, GFD retained sales charges of $ relating to sales of A-Class shares of the Trust.
Certain trustees and officers of the Trust are also officers of GI, RFS and GFD.
4. Fair Value Measurement
In accordance with U.S. GAAP, fair value is defined as the price that the Fund would receive to sell an investment or pay to transfer a liability in an orderly transaction with an independent buyer in the principal market, or in the absence of a principal market, the most advantageous market for the investment or liability. U.S. GAAP establishes a three-tier fair value hierarchy based on the types of inputs used to value assets and liabilities and requires corresponding disclosure. The hierarchy and the corresponding inputs are summarized below:
| Level 1 — | quoted prices in active markets for identical assets or liabilities. |
| Level 2 — | significant other observable inputs (for example quoted prices for securities that are similar based on characteristics such as interest rates, prepayment speeds, credit risk, etc.). |
| Level 3 — | significant unobservable inputs based on the best information available under the circumstances, to the extent observable inputs are not available, which may include assumptions. |
The types of inputs available depend on a variety of factors, such as the type of security and the characteristics of the markets in which it trades, if any. Fair valuation determinations that rely on fewer or no observable inputs require greater judgment. Accordingly, fair value determinations for Level 3 securities require the greatest amount of judgment.
The following table summarizes the inputs used to value the Fund's investments at March 31, 2015:
| | | Level 1 Investments In Securities | | | Level 2 Investments In Securities | | | Level 3 Investments In Securities | | | Total | |
| Assets | | | | | | | | | | | | |
| Mid Cap Value Fund | | $ | 903,240,782 | | | $ | — | | | $ | 2,506 | | | $ | 903,243,288 | |
| 24 | THE GUGGENHEIM FUNDS SEMI-ANNUAL REPORT | |
NOTES TO FINANCIAL STATEMENTS (Unaudited)(concluded)
For the period ended March 31, 2015, there were no transfers between levels.
The inputs or methodologies used for valuing securities are not necessarily an indication of the risk associated with investing in those securities. The suitability of the techniques and sources employed to determine fair valuation are regularly monitored and subject to change.
5. Securities Transactions
For the period ended March 31, 2015, the cost of purchases and proceeds from sales of investment securities, excluding government securities, short-term investments and derivatives, were as follows:
| Fund | | Purchases | | | Sales | |
| Mid Cap Value Fund | | $ | 553,455,434 | | | $ | 913,349,567 | |
6. Line of Credit
The Trust, with the exception of Alpha Opportunity Fund and Capital Stewardship Fund, secured a committed, $625,000,000 line of credit from Citibank, N.A., good through October 9, 2015, at which time the line of credit may be renewed. This line of credit is reserved for emergency or temporary purposes. Fees related to borrowings, if any, vary under this arrangement between the greater of Citibank’s “base rate”, LIBOR plus 1.0%, and the Fed Funds rate, plus 0.50%. The Trust did not have any borrowings under this agreement as of and for the period-ended March 31, 2015. The Trust also pays a commitment fee at an annualized rate of 0.07% of the average daily amount of their unused commitment amount.
7. Other Liabilities
The Fund wrote put option contracts through Lehman Brothers Inc., (“LBI”) that were exercised prior to the option contracts’ expiration and prior to the bankruptcy filing by LBI, during September, 2008. However, these transactions have not settled and the securities have not been delivered to the Fund as of March 31, 2015.
Although the ultimate resolution of these transactions is uncertain, the Fund has recorded a liability on its books equal to the difference between the strike price on the put options and the market price of the underlying security on the exercise date. The amount of the liability recorded by the Fund as of March 31, 2015, was $473,594.
| | THE GUGGENHEIM FUNDS SEMI-ANNUAL REPORT | 25 |
OTHER INFORMATION (Unaudited)
Proxy Voting Information
A description of the policies and procedures that the Trust uses to determine how to vote proxies relating to securities held in the Funds’ portfolios is available, without charge and upon request, by calling 800.820.0888. This information is also available from the EDGAR database on the SEC’s website at http://www.sec.gov.
Information regarding how the Funds voted proxies relating to portfolio securities during the most recent 12-month period ended June 30 is available without charge, upon request, by calling 800.820.0888. This information is also available from the EDGAR database on the SEC’s website at http://www.sec.gov.
Sector Classification
Information in the “Schedule of Investments” is categorized by sectors using sector-level classifications used by Bloomberg Industry Classification System, a widely recognized industry classification system provider. In each Fund’s registration statement, the Funds have investment policies relating to concentration in specific industries. For purposes of these investment policies, the Funds usually classify industries based on industry-level classifications used by widely recognized industry classification system providers such as Bloomberg Industry Classification System, Global Industry Classification Standards and Barclays Global Classification Scheme.
Quarterly Portfolio Schedules Information
The Trust files its complete schedule of portfolio holdings with the SEC for the first and third quarters of each fiscal year on Form N-Q; which are available on the SEC’s website at http://www.sec.gov. The Funds’ Forms N-Q may be reviewed and copied at the SEC’s Public Reference Room in Washington, DC, and that information on the operation of the Public Reference Room may be obtained by calling 800-SEC-0330. Copies of the portfolio holdings are also available to shareholders, without charge and upon request, by calling 800.820.0888.
| 26 | THE GUGGENHEIM FUNDS SEMI-ANNUAL REPORT | |
INFORMATION ON BOARD OF TRUSTEES AND OFFICERS (Unaudited)
Name, Address* and Year of Birth | Position(s) Held with the Trust | Term of Office and Length of Time Served** | Principal Occupation(s) During Past Five Years | Number of Portfolios in Fund Complex Overseen | Other Directorships Held by Trustees |
| INDEPENDENT TRUSTEES | | | |
Randall C. Barnes (1951) | Trustee | Since 2014 | Current: Private Investor (2001-present). Former: Senior Vice President and Treasurer, PepsiCo, Inc. (1993-1997); President, Pizza Hut International (1991-1993); Senior Vice President, Strategic Planning and New Business Development, PepsiCo, Inc. (1987-1990). | 91 | Current: Trustee, Purpose Investments Inc. (2014-Present). |
Donald A. Chubb, Jr. (1946) | Trustee and Vice Chairman of the Board | Since 1994 | Current: Business broker and manager of commercial real estate, Griffith & Blair, Inc. (1997-present). | 87 | None. |
Jerry B. Farley (1946) | Trustee and Vice Chairman of the Audit Committee | Since 2005 | Current: President, Washburn University (1997-present). | 87 | Current: Westar Energy, Inc. (2004-present); CoreFirst Bank & Trust (2000-present). |
| | THE GUGGENHEIM FUNDS SEMI-ANNUAL REPORT | 27 |
INFORMATION ON BOARD OF TRUSTEES AND OFFICERS (Unaudited)(continued)
Name, Address* and Year of Birth | Position(s) Held with the Trust | Term of Office and Length of Time Served** | Principal Occupation(s) During Past Five Years | Number of Portfolios in Fund Complex Overseen | Other Directorships Held by Trustees |
| INDEPENDENT TRUSTEES - continued | | |
Roman Friedrich III (1946) | Trustee and Chairman of the Contracts Review Committee | Since 2014 | Current: Founder and President, Roman Friedrich & Company (1998-present). Former: Senior Managing Director, MLV & Co. LLC (2010-2011). | 87 | Current: Zincore Metals, Inc. (2009-present). Former: Mercator Minerals Ltd. (2013-2014); First Americas Gold Corp. (2012-2014); Blue Sky Uranium Corp. (2011-2012); Axiom Gold and Silver Corp. (2011-2012); Stratagold Corp. (2003-2009); GFM Resources Ltd. (2005-2010). |
Robert B. Karn III (1942) | Trustee and Chairman of the Audit Committee | Since 2014 | Current: Consultant (1998-present). Former: Arthur Andersen (1965-1997) and Managing Partner, Financial and Economic Consulting, St. Louis office (1987-1997). | 87 | Current: Peabody Energy Company (2003-present); GP Natural Resource Partners, LLC (2002- present). |
Ronald A. Nyberg (1953) | Trustee and Chairman of the Nominating and Governance Committee | Since 2014 | Current: Partner, Nyberg & Cassioppi, LLC (2000-present). Former: Executive Vice President, General Counsel, and Corporate Secretary, Van Kampen Investments (1982-1999). | 93 | Current: Edward-Elmhurst Healthcare System (2012-present). |
| 28 | THE GUGGENHEIM FUNDS SEMI-ANNUAL REPORT | |
INFORMATION ON BOARD OF TRUSTEES AND OFFICERS (Unaudited)(continued)
Name, Address* and Year of Birth | Position(s) Held with the Trust | Term of Office and Length of Time Served** | Principal Occupation(s) During Past Five Years | Number of Portfolios in Fund Complex Overseen | Other Directorships Held by Trustees |
| INDEPENDENT TRUSTEES - concluded | | |
Maynard F. Oliverius (1943) | Trustee and Vice Chairman of the Contracts Review Committee | Since 1998 | Retired. Former: President and CEO, Stormont-Vail HealthCare (1996-2012). | 87 | Current: Fort Hays State University Foundation (1999-present); Stormont-Vail Foundation (2013-present); University of Minnesota HealthCare Alumni Association Foundation (2009-present). |
Ronald E. Toupin, Jr. (1958) | Trustee and Chairman of the Board | Since 2014 | Current: Portfolio Consultant (2010-present). Former: Vice President, Manager and Portfolio Manager, Nuveen Asset Management (1998-1999); Vice President, Nuveen Investment Advisory Corp. (1992-1999); Vice President and Manager, Nuveen Unit Investment Trusts (1991-1999); and Assistant Vice President and Portfolio Manager, Nuveen Unit Investment Trusts (1988-1999), each of John Nuveen & Co., Inc. (1982-1999). | 90 | Former: Bennett Group of Funds (2011-2013). |
| | THE GUGGENHEIM FUNDS SEMI-ANNUAL REPORT | 29 |
INFORMATION ON BOARD OF TRUSTEES AND OFFICERS (Unaudited)(continued)
Name, Address* and Year of Birth | Position(s) Held with the Trust | Term of Office and Length of Time Served** | Principal Occupation(s) During Past Five Years | Number of Portfolios in Fund Complex Overseen | Other Directorships Held by Trustees |
| INTERESTED TRUSTEE | |
Donald C. Cacciapaglia*** (1951) | President, Chief Executive Officer and Trustee | Since 2012 | Current: President and CEO, certain other funds in the Fund Complex (2012-present); Vice Chairman, Guggenheim Investments (2010-present). Former: Chairman and CEO, Channel Capital Group, Inc. (2002-2010). | 221 | Current: Clear Spring Life Insurance Company (2015-present); Guggenheim Partners Japan, Ltd. (2014-present); Delaware Life (2013-present); Guggenheim Life and Annuity Company (2011-present); Paragon Life Insurance Company of Indiana (2011-present). |
| * | The business address of each Trustee is c/o Guggenheim Investments, 805 King Farm Boulevard, Suite 600, Rockville, Maryland 20850. |
| ** | Each Trustee serves an indefinite term, until his successor is elected and qualified. Time served includes time served in the respective position for the Predecessor Corporation. |
| *** | This Trustee is deemed to be an "interested person" of the Funds under the 1940 Act by reason of his position with the Funds' Investment Manager and/or the parent of the Investment Manager. |
| 30 | THE GUGGENHEIM FUNDS SEMI-ANNUAL REPORT | |
INFORMATION ON BOARD OF TRUSTEES AND OFFICERS (Unaudited)(continued)
Name, Address* and Year of Birth | Position(s) held with the Trust | Term of Office and Length of Time Served** | Principal Occupations During Past Five Years |
| OFFICERS | | | |
Joseph M. Arruda (1966) | Assistant Treasurer | Since 2010 | Current: Assistant Treasurer, certain other funds in the Fund Complex (2006-present); Vice President, Security Investors, LLC (2010-present); CFO and Manager, Guggenheim Specialized Products, LLC (2009-present). Former: Vice President, Security Global Investors, LLC (2010-2011); Vice President, Rydex Advisors, LLC (2010); Vice President, Rydex Advisors II, LLC (2010). |
William H. Belden, III (1965) | Vice President | Since 2014 | Current: Vice President, certain other funds in the Fund Complex (2006-present); Managing Director, Guggenheim Funds Investment Advisors, LLC (2005-present). Former: Vice President of Management, Northern Trust Global Investments (1999-2005). |
Mark J. Furjanic (1959) | Assistant Treasurer | Since 2014 | Current: Vice President, Guggenheim Investments (2005-present); Assistant Treasurer, certain other funds in the Fund Complex (2008-present). Former: Senior Manager, Ernst & Young LLP (1999-2005). |
James Howley (1972) | Assistant Treasurer | Since 2014 | Current: Director, Guggenheim Investments (2004-present) ; Assistant Treasurer, certain other funds in the Fund Complex (2006-present). Former: Manager, Mutual Fund Administration of Van Kampen Investments, Inc. (1996-2004). |
| | THE GUGGENHEIM FUNDS SEMI-ANNUAL REPORT | 31 |
INFORMATION ON BOARD OF TRUSTEES AND OFFICERS (Unaudited)(continued)
Name, Address* and Year of Birth | Position(s) held with the Trust | Term of Office and Length of Time Served** | Principal Occupations During Past Five Years |
| OFFICERS - continued | |
Amy J. Lee (1961) | Vice President and Chief Legal Officer | Since 2007 (Vice President) Since 2014 (Chief Legal Officer) | Current: Chief Legal Officer, certain other funds in the Fund Complex (2013-present); Senior Managing Director, Guggenheim Investments (2012-present). Former: Vice President, Associate General Counsel and Assistant Secretary, Security Benefit Life Insurance Company and Security Benefit Corporation (2004-2012). |
Mark E. Mathiasen (1978) | Secretary | Since 2014 | Current: Secretary, certain other funds in the Fund Complex (2007-present); Managing Director, Guggenheim Investments (2007-present). |
Michael P. Megaris (1984) | Assistant Secretary | Since 2014 | Current: Assistant Secretary, certain other funds in the Fund Complex (2014-present); Associate, Guggenheim Investments (2012-present). Former: J.D., University of Kansas School of Law (2009-2012). |
Elisabeth Miller (1968) | Chief Compliance Officer | Since 2012 | Current: CCO, certain other funds in the Fund Complex (2012-present); CCO, Security Investors, LLC (2012-present); CCO, Guggenheim Funds Investment Advisors, LLC (2012-present); Managing Director, Guggenheim Investments (2012-present); Vice President, Guggenheim Funds Distributors, LLC (March 2014-present). Former: CCO, Guggenheim Distributors, LLC (2009-March 2014); Senior Manager, Security Investors, LLC (2004-2009); Senior Manager, Guggenheim Distributors, LLC (2004-2009). |
| 32 | THE GUGGENHEIM FUNDS SEMI-ANNUAL REPORT | |
INFORMATION ON BOARD OF TRUSTEES AND OFFICERS (Unaudited)(continued)
Name, Address* and Year of Birth | Position(s) held with the Trust | Term of Office and Length of Time Served** | Principal Occupations During Past Five Years |
| OFFICERS - continued | |
Alison Santay (1974) | AML Officer | Since 2013 | Current: AML Officer, certain other funds in the Fund Complex (2010-present); Director and AML Officer, Rydex Fund Services, LLC (2010-present); AML Officer, Security Investors, LLC (2010-present); Director, Shareholder Risk and Compliance, Rydex Fund Services, LLC (2004-present). Former: AML Officer, Guggenheim Distributors, LLC (2013-2014). |
Kimberly Scott (1974) | Assistant Treasurer | Since 2014 | Current: Vice President, Guggenheim Investments (2012-present) ; Assistant Treasurer, certain other funds in the Fund Complex (2012-present). Former: Financial Reporting Manager, Invesco, Ltd. (2010-2011); Vice President/Assistant Treasurer, Mutual Fund Administration for Van Kampen Investments, Inc./Morgan Stanley Investment Management (2009-2010); Manager of Mutual Fund Administration, Van Kampen Investments, Inc./Morgan Stanley Investment Management (2005-2009). |
Bryan Stone (1979) | Vice President | Since 2014 | Current: Vice President, certain other funds in the Fund Complex (2014-present); Director, Guggenheim Investments (2013-present). Former: Senior Vice President, Neuberger Berman Group LLC (2009-2013); Vice President, Morgan Stanley (2002-2009). |
| | THE GUGGENHEIM FUNDS SEMI-ANNUAL REPORT | 33 |
INFORMATION ON BOARD OF TRUSTEES AND OFFICERS (Unaudited)(concluded)
Name, Address* and Year of Birth | Position(s) held with the Trust | Term of Office and Length of Time Served** | Principal Occupations During Past Five Years |
| OFFICERS - concluded | |
John L. Sullivan (1955) | Chief Financial Officer and Treasurer | Since 2014 | Current: CFO, Chief Accounting Officer and Treasurer, certain other funds in the Fund Complex (2010-present); Senior Managing Director, Guggenheim Investments (2010-present). Former: Managing Director and CCO, each of the funds in the Van Kampen Investments fund complex (2004-2010); Managing Director and Head of Fund Accounting and Administration, Morgan Stanley Investment Management (2002-2004); CFO and Treasurer, Van Kampen Funds (1996-2004). |
| * | The business address of each officer is c/o Guggenheim Investments, 805 King Farm Boulevard, Suite 600, Rockville, Maryland 20850. |
| ** | Each officer serves an indefinite term, until his or her successor is duly elected and qualified. Time served includes time served in the respective position for the Predecessor Corporation. |
| 34 | THE GUGGENHEIM FUNDS SEMI-ANNUAL REPORT | |
GUGGENHEIM INVESTMENTS PRIVACY POLICIES (Unaudited)
Rydex Funds, Guggenheim Funds, Rydex Investments, Guggenheim Funds Distributors, LLC, Security Investors, LLC, Security Distributors, Inc., Guggenheim Partners Investment Managers, LLC, and Rydex Advisory Services (Collectively “Guggenheim Investments”).
Our Commitment to You
When you become a Guggenheim Investments investor, you entrust us with not only your hard-earned money but also with personal and financial information about you. We recognize that your relationship with us is based on trust and that you expect us to act responsibly and in your best interests. Because we have access to this private information about you, we hold ourselves to the highest standards in its safekeeping and use. This means, most importantly, that we do not sell client information to anyone—whether it is your personal information or if you are a current or former Guggenheim Investments client.
The Information We Collect About You
In the course of doing business with shareholders and investors, we collect nonpublic personal information about you. You typically provide personal information when you complete a Guggenheim Investments account application or when you request a transaction that involves Rydex and Guggenheim Investments funds or one of the Guggenheim Investments affiliated companies. “Nonpublic personal information” is personally identifiable private information about you. For example, it includes information regarding your name and address, Social Security or taxpayer identification number, assets, income, account balance, bank account information and investment activity (e.g., purchase and redemption history).
How We Handle Your Personal Information
As emphasized above, we do not sell information about current or former clients or their accounts to third parties. Nor do we share such information, except when necessary to complete transactions at your request or to make you aware of related investment products and services that we offer. Additional details about how we handle your personal information are provided below. To complete certain transactions or account changes that you direct, it may be necessary to provide identifying information to companies, individuals or groups that are not affiliated with Guggenheim Investments. For example, if you ask to transfer assets from another financial institution to Guggenheim Investments, we will need to provide certain information about you to that company to complete the transaction. To alert you to other Guggenheim Investments investment products and services, we may share your information within the Guggenheim Investments family of affiliated companies. This would include, for example, sharing your information within Guggenheim Investments so we can make you aware of
| | THE GUGGENHEIM FUNDS SEMI-ANNUAL REPORT | 35 |
GUGGENHEIM INVESTMENTS PRIVACY POLICIES (Unaudited)(continued)
new Rydex and Guggenheim Investments funds or the services offered through another Guggenheim Investments affiliated company. In certain instances, we may contract with nonaffiliated companies to perform services for us. Where necessary, we will disclose information we have about you to these third parties. In all such cases, we provide the third party with only the information necessary to carry out its assigned responsibilities and only for that purpose. And we require these third parties to treat your private information with the same high degree of confidentiality that we do. In certain instances, we may share information with other financial institutions regarding individuals and entities in response to the U.S.A. Patriot Act. Finally, we will release information about you if you direct us to do so, if we are compelled by law to do so or in other circumstances permitted by law.
Opt Out Provisions
We do not sell your personal information to anyone. The law allows you to “opt out” of only certain kinds of information sharing with third parties. The firm does not share personal information about you with any third parties that triggers this opt-out right. This means YOU ARE ALREADY OPTED OUT.
How We Protect Privacy Online
Our concern for the privacy of our shareholders also extends to those who use our web site, guggenheiminvestments.com. Our web site uses some of the most secure forms of online communication available, including encryption technology, Secure Socket Layer (SSL) protocol, firewalls and user names and passwords. These technologies provide a high level of security and privacy when you access your account information or initiate online transactions. The Guggenheim Investments web site offers customized features that require our use of “http cookies”—tiny pieces of information that we ask your browser to store. However, we make very limited use of these cookies. We only use cookies for session management and security features on the Guggenheim Investments web site. We do not use them to pull data from your hard drive, to learn your email address, or to view data in cookies created by other web sites. We will not share the information in our cookies or give others access to it. See the legal information area on our web site for more details about web site security and privacy features.
How We Safeguard Your Personal Information
We restrict access to nonpublic personal information about shareholders to our employees and in some cases to third parties (for example, the service providers described above) as permitted by law. We maintain strict physical, electronic and procedural safeguards that comply with federal standards to guard your nonpublic personal information.
| 36 | THE GUGGENHEIM FUNDS SEMI-ANNUAL REPORT | |
GUGGENHEIM INVESTMENTS PRIVACY POLICIES (Unaudited)(concluded)
We’ll Keep You Informed
As required by federal law, we will notify shareholders of our privacy policy annually. We reserve the right to modify this policy at any time, but rest assured that if we do change it, we will tell you promptly. You will also be able to access our privacy policy from our web site at guggenheiminvestments.com. Should you have any questions regarding our privacy policy, contact us at 800.820.0888 or 301.296.5100.
| | THE GUGGENHEIM FUNDS SEMI-ANNUAL REPORT | 37 |
3.31.2015
Guggenheim Funds Semi-Annual Report
| Fundamental Alpha |
| Guggenheim Mid Cap Value Institutional Fund | | |
| MCVI-SEMI-0315x0915 | guggenheiminvestments.com |
| DEAR SHAREHOLDER | 2 |
| ECONOMIC AND MARKET OVERVIEW | 3 |
| ABOUT SHAREHOLDERS’ FUND EXPENSES | 5 |
| MID CAP VALUE INSTITUTIONAL FUND | 8 |
| NOTES TO FINANCIAL STATEMENTS | 16 |
| OTHER INFORMATION | 24 |
| INFORMATION ON BOARD OF TRUSTEES AND OFFICERS | 25 |
| GUGGENHEIM INVESTMENTS PRIVACY POLICIES | 33 |
| | THE GUGGENHEIM FUNDS SEMI-ANNUAL REPORT | 1 |
March 31, 2015
Dear Shareholder:
Security Investors, LLC (the “Investment Adviser”) is pleased to present the semi-annual shareholder report for one of our Funds (the “Fund”) for the six-month period ended March 31, 2015.
The Investment Adviser is part of Guggenheim Investments, which represents the investment management businesses of Guggenheim Partners, LLC (“Guggenheim”), a global, diversified financial services firm.
Guggenheim Funds Distributors, LLC is the distributor of the Funds. Guggenheim Funds Distributors, LLC is affiliated with Guggenheim and the Investment Adviser.
We encourage you to read the Economic and Market Overview section of the report, which follows this letter.
We are committed to providing innovative investment solutions and appreciate the trust you place in us.
Sincerely,
Donald C. Cacciapaglia
President
April 30, 2015
Read a prospectus and summary prospectus (if available) carefully before investing. It contains the investment objectives, risks, charges, expenses and other information, which should be considered carefully before investing. Obtain a prospectus and summary prospectus (if available) at guggenheiminvestments.com or call 800.820.0888.
There can be no assurance that any investment product will achieve its investment objective(s). There are risks associated with investing, including the entire loss of principal invested. Investing involves market risks. The investment return and principal value of any investment product will fluctuate with changes in market conditions.
| 2 | THE GUGGENHEIM FUNDS SEMI-ANNUAL REPORT | |
ECONOMIC AND MARKET OVERVIEW (Unaudited) | March 31, 2015 |
The U.S. continued to enjoy a self-sustaining economic expansion for the six-month period ended March 31, 2015, although winter weather was likely to distort first-quarter economic data. In addition, U.S. companies scaled back hiring in the last month of the period, adding to evidence that the domestic economy has lost some momentum since the turn of the year. The March increase in payrolls was the smallest since December 2013 and broke a 12-month run of gains above 200,000.
Despite this short-term dislocation, the economy remains on track. Indeed, many other labor market indicators, such as initial jobless claims and the job openings rate, suggest that the U.S. labor market remains quite strong, supporting the conclusion that March’s payroll report was just a temporary blip, similar to the one witnessed last winter. As soon as temporary seasonal factors have dissipated, economic data is likely to bounce back. The labor market has improved over the past year, as subdued mortgage rates and tight housing inventory continue to point to fairly stable appreciation in the housing market, which is key to the ongoing recovery. Consumers are also being helped by lower fuel prices, which are acting as a tax cut for U.S. consumers, freeing up discretionary spending in other areas and acting as a support for consumption.
In Europe, economic data has been surprisingly good and should continue along that path on the back of the European Central Bank’s program of quantitative easing and depreciation of the euro. Japan’s economy remains weak and, without more structural reform, continued monetary accommodation could lead to stagflation. China’s policymakers appear likely to continue the supply of credit and do whatever else is necessary to maintain growth there at an acceptable pace for the near term.
Given weakness overseas and the effect of a stronger U.S. dollar on international earnings, some stocks could face a more challenging environment in the near term, but our research shows that equity markets tend to perform quite well in the periods leading up to a U.S. Federal Reserve (the “Fed”) rate increase. The yield on the 10-year Treasury note declined in January by more than 50 basis points before rebounding in February, echoing the pattern since 2009—Treasury yields decline and a sell-off ensues, driving rates higher. Then conditions stabilize, and rates test their previous lows. Liquidity from foreign central banks and comparatively attractive U.S. yields continue to push global investors to U.S. Treasuries, which should hold down U.S. interest rates in the near term.
Against this backdrop, the U.S. central bank feels pressure to raise its key rate above zero, but insists the decision will be data-dependent and not occur prematurely. With a secular inflation increase unlikely in the near term, slack in the economy, and disinflation being imported from abroad, the Fed may not hike rates until later
| | THE GUGGENHEIM FUNDS SEMI-ANNUAL REPORT | 3 |
ECONOMIC AND MARKET OVERVIEW (Unaudited)(concluded) | March 31, 2015 |
in the year. The Fed for now appears to be focused on wage growth, which is key for sustaining the expansion but also an indicator of inflationary pressure. The lack of sustained wage growth has been a topic that has confounded the Fed lately. Given the strengthening employment numbers and the apparent reduction in labor market slack, wages should start to increase more steadily across the board. This is one of the most important data points at the moment for the Fed.
The underlying U.S. economy remains strong and investors should avoid being panicked by seasonal setbacks. Indeed, considering the strength of the economy and the wave of liquidity emanating from various central banks around the world, the general investment environment should remain attractive.
For the six months ended March 31, 2015, the Standard & Poor’s 500® (“S&P 500”) Index* returned 5.93%. The Morgan Stanley Capital International (“MSCI”) Europe-Australasia-Far East (“EAFE”) Index* returned 1.13%. The return of the MSCI Emerging Markets Index* was -2.37%.
In the bond market, the Barclays U.S. Aggregate Bond Index* posted a 3.43% return for the period, while the Barclays U.S. Corporate High Yield Index* returned 1.49%. The return of the Bank of America Merrill Lynch 3-Month U.S. Treasury Bill Index* was 0.01% for the six-month period.
The opinions and forecasts expressed may not actually come to pass. This information is subject to change at any time, based on market and other conditions, and should not be construed as a recommendation of any specific security or strategy.
*Index Definitions:
The following indices are referenced throughout this report. Indices are unmanaged and not available for direct investment. Index performance does not reflect transaction costs, fees, or expenses.
Barclays U.S. Aggregate Bond Index is a broad-based benchmark that measures the investment grade, U.S. dollar-denominated, fixed-rate taxable bond market, including U.S. Treasuries, government-related and corporate securities, MBS (agency fixed-rate and hybrid ARM pass-throughs), ABS, and CMBS.
Barclays U.S. Corporate High Yield Index measures the market of U.S. dollar-denominated, non-investment grade, fixed-rate, taxable corporate bonds. Securities are classified as high yield if the middle rating of Moody’s, Fitch, and S&P is Ba1/BB+/BB+ or below.
Bank of America (“BofA”) Merrill Lynch 3-Month U.S. Treasury Bill Index is an unmanaged market index of U.S. Treasury securities maturing in 90 days that assumes reinvestment of all income.
MSCI EAFE Index is a free float-adjusted market capitalization index that is designed to measure the equity market performance of developed markets, excluding the U.S. & Canada.
MSCI Emerging Markets Index is a free float-adjusted market capitalization weighted index that is designed to measure equity market performance in the global emerging markets.
S&P 500® Index is a capitalization-weighted index of 500 stocks designed to measure the performance of the broad economy, representing all major industries and is considered a representation of the U.S. stock market.
| 4 | THE GUGGENHEIM FUNDS SEMI-ANNUAL REPORT | |
ABOUT SHAREHOLDERS’ FUND EXPENSES (Unaudited)
All mutual funds have operating expenses and it is important for our shareholders to understand the impact of costs on their investments. Shareholders of a Fund incur two types of costs: (i) transaction costs, including sales charges (loads) on purchase payments, reinvested dividends, or other distributions; and exchange fees; and (ii) ongoing costs, including management fees, administrative services, and shareholder reports, among others. These ongoing costs, or operating expenses, are deducted from a fund’s gross income and reduce the investment return of the fund.
A fund’s expenses are expressed as a percentage of its average net assets, which is known as the expense ratio. The following examples are intended to help investors understand the ongoing costs (in dollars) of investing in a Fund and to compare these costs with the ongoing costs of investing in other mutual funds.
The examples are based on an investment of $1,000 made at the beginning of the period and held for the entire six-month period beginning September 30, 2014 and ending March 31, 2015.
The following tables illustrate a Fund’s costs in two ways:
Table 1. Based on actual Fund return. This section helps investors estimate the actual expenses paid over the period. The “Ending Account Value” shown is derived from the Fund’s actual return, and the fourth column shows the dollar amount that would have been paid by an investor who started with $1,000 in the Fund. Investors may use the information here, together with the amount invested, to estimate the expenses paid over the period. Simply divide the Fund’s account value by $1,000 (for example, an $8,600 account value divided by $1,000 = 8.6), then multiply the result by the number provided under the heading “Expenses Paid During Period.”
Table 2. Based on hypothetical 5% return. This section is intended to help investors compare a Fund’s cost with those of other mutual funds. The table provides information about hypothetical account values and hypothetical expenses based on the Fund’s actual expense ratio and an assumed rate of return of 5% per year before expenses, which is not the Fund’s actual return. The hypothetical account values and expenses may not be used to estimate the actual ending account balance or expenses paid during the period. The example is useful in making comparisons because the U.S. Securities and Exchange Commission (the “SEC”) requires all mutual funds to calculate expenses based on the 5% return. Investors can assess a Fund’s costs by comparing this hypothetical example with the hypothetical examples that appear in shareholder reports of other funds.
| | THE GUGGENHEIM FUNDS SEMI-ANNUAL REPORT | 5 |
ABOUT SHAREHOLDERS’ FUND EXPENSES (Unaudited)(continued)
The calculations illustrated above assume no shares were bought or sold during the period. Actual costs may have been higher or lower, depending on the amount of investment and the timing of any purchases or redemptions.
Please note that the expenses shown in the table are meant to highlight your ongoing costs only and do not reflect any transactional costs, such as sales charges (loads) on purchase payments, and contingent deferred sales charges (“CDSC”) on redemptions, if any. Therefore, the second table is useful in comparing ongoing costs only, and will not help you determine the relative total costs of owning different funds. In addition, if these transactional costs were included, your costs would have been higher.
More information about a Fund’s expenses, including annual expense ratios for the past five years, can be found in the Financial Highlights section of this report. For additional information on operating expenses and other shareholder costs, please refer to the appropriate Fund prospectus.
| 6 | THE GUGGENHEIM FUNDS SEMI-ANNUAL REPORT | |
ABOUT SHAREHOLDERS’ FUND EXPENSES (Unaudited)(concluded)
| | Expense Ratio1 | Fund Return | Beginning Account Value September 30, 2014 | Ending Account Value March 31, 2015 | Expenses Paid During Period2 |
Table 1. Based on actual Fund return3 |
| Mid Cap Value Institutional Fund | 1.07% | 4.28% | $1,000.00 | $1,042.80 | $5.45 |
| |
| Table 2. Based on hypothetical 5% return (before expenses) |
| Mid Cap Value Institutional Fund | 1.07% | 5.00% | $1,000.00 | $1,019.60 | $5.39 |
1 | Annualized and excludes expenses of the underlying funds in which the Fund invests. |
2 | Expenses are equal to the Fund’s annualized expense ratio, net of any applicable fee waivers, multiplied by the average account value over the period, multiplied by 182/365 (to reflect the one-half year period). |
3 | Actual cumulative return at net asset value for the period September 30, 2014 to March 31, 2015. |
| | THE GUGGENHEIM FUNDS SEMI-ANNUAL REPORT | 7 |
FUND PROFILE (Unaudited) | March 31, 2015 |
MID CAP VALUE INSTITUTIONAL FUND
OBJECTIVE: Seeks long-term growth of capital.
Holdings Diversification (Market Exposure as % of Net Assets)
“Holdings Diversification (Market Exposure as % of Net Assets)” excludes any temporary cash investments.
Inception Date: July 11, 2008 |
| Ten Largest Holdings (% of Total Net Assets) |
| Hanover Insurance Group, Inc. | 3.0% |
| Zions Bancorporation | 2.9% |
| Computer Sciences Corp. | 2.3% |
| Orbital ATK, Inc. | 2.2% |
| Covanta Holding Corp. | 2.2% |
| Alleghany Corp. | 2.1% |
| DigitalGlobe, Inc. | 2.0% |
| Reinsurance Group of America, Inc. — Class A | 2.0% |
| IXYS Corp. | 2.0% |
| Sonoco Products Co. | 1.9% |
| Top Ten Total | 22.6% |
| | |
| “Ten Largest Holdings” exclude any temporary cash or derivative investments. |
| 8 | THE GUGGENHEIM FUNDS SEMI-ANNUAL REPORT | |
SCHEDULE OF INVESTMENTS (Unaudited) | March 31, 2015 |
| MID CAP VALUE INSTITUTIONAL FUND | |
| | |
Shares | | | Value | |
| | | | | | | | |
COMMON STOCKS† - 98.0% | |
| | | | | | | | |
| FINANCIAL - 30.6% | |
| Hanover Insurance Group, Inc. | | | 227,457 | | | $ | 16,508,828 | |
| Zions Bancorporation | | | 583,640 | | | | 15,758,280 | |
| Alleghany Corp.* | | | 24,050 | | | | 11,712,350 | |
| Reinsurance Group of America, Inc. — Class A | | | 117,963 | | | | 10,992,971 | |
| FirstMerit Corp. | | | 515,150 | | | | 9,818,759 | |
| American Financial Group, Inc. | | | 136,020 | | | | 8,725,683 | |
| Popular, Inc.* | | | 250,250 | | | | 8,606,098 | |
| Assured Guaranty Ltd. | | | 252,270 | | | | 6,657,405 | |
| Endurance Specialty Holdings Ltd. | | | 106,200 | | | | 6,493,068 | |
| Sun Communities, Inc. | | | 90,800 | | | | 6,058,176 | |
| Kilroy Realty Corp. | | | 78,470 | | | | 5,977,061 | |
| CubeSmart | | | 245,340 | | | | 5,924,961 | |
| Wintrust Financial Corp. | | | 124,110 | | | | 5,917,565 | |
| Apartment Investment & Management Co. — Class A | | | 148,490 | | | | 5,844,567 | |
| Camden Property Trust | | | 71,800 | | | | 5,609,734 | |
| NorthStar Realty Finance Corp. | | | 298,130 | | | | 5,402,116 | |
| Jones Lang LaSalle, Inc. | | | 27,790 | | | | 4,735,416 | |
| Symetra Financial Corp. | | | 192,094 | | | | 4,506,525 | |
| Trustmark Corp. | | | 164,300 | | | | 3,989,204 | |
| Ocwen Financial Corp.* | | | 394,880 | | | | 3,257,760 | |
| Alexandria Real Estate Equities, Inc. | | | 31,710 | | | | 3,108,848 | |
| BioMed Realty Trust, Inc. | | | 120,820 | | | | 2,737,781 | |
| Home Loan Servicing Solutions Ltd. | | | 146,547 | | | | 2,423,887 | |
| OFG Bancorp | | | 138,639 | | | | 2,262,588 | |
| Fulton Financial Corp. | | | 151,625 | | | | 1,871,053 | |
| Chatham Lodging Trust | | | 47,550 | | | | 1,398,446 | |
| UDR, Inc. | | | 40,880 | | | | 1,391,146 | |
| Total Financial | | | | | | | 167,690,276 | |
| | | | | | | | |
| CONSUMER, NON-CYCLICAL - 16.8% | |
| MEDNAX, Inc.* | | | 135,236 | | | | 9,805,962 | |
| Hormel Foods Corp. | | | 157,360 | | | | 8,945,915 | |
| Bunge Ltd. | | | 104,210 | | | | 8,582,736 | |
| HealthSouth Corp. | | | 191,360 | | | | 8,488,730 | |
| Kindred Healthcare, Inc. | | | 303,672 | | | | 7,224,357 | |
| Navigant Consulting, Inc.* | | | 518,780 | | | | 6,723,388 | |
| Hologic, Inc.* | | | 166,232 | | | | 5,489,812 | |
| Quanta Services, Inc.* | | | 192,350 | | | | 5,487,746 | |
| ICF International, Inc.* | | | 131,445 | | | | 5,369,528 | |
| Apollo Education Group, Inc. — Class A* | | | 207,390 | | | | 3,923,819 | |
| Darling Ingredients, Inc.* | | | 277,582 | | | | 3,888,924 | |
| DeVry Education Group, Inc. | | | 113,883 | | | | 3,799,137 | |
| Globus Medical, Inc. — Class A* | | | 146,910 | | | | 3,708,008 | |
| Ingredion, Inc. | | | 43,910 | | | | 3,417,076 | |
| Emergent Biosolutions, Inc.* | | | 112,957 | | | | 3,248,643 | |
| IPC Healthcare, Inc.* | | | 29,840 | | | | 1,391,738 | |
| Aegerion Pharmaceuticals, Inc.* | | | 50,748 | | | | 1,328,075 | |
| Grand Canyon Education, Inc.* | | | 30,000 | | | | 1,299,000 | |
| Total Consumer, Non-cyclical | | | | | | | 92,122,594 | |
| | | | | | | | |
| INDUSTRIAL - 14.6% | |
| Orbital ATK, Inc. | | | 160,208 | | | | 12,276,739 | |
| Covanta Holding Corp. | | | 536,470 | | | | 12,033,022 | |
| Sonoco Products Co. | | | 232,086 | | | | 10,550,630 | |
| FLIR Systems, Inc. | | | 293,620 | | | | 9,184,434 | |
| Owens-Illinois, Inc.* | | | 391,690 | | | | 9,134,211 | |
| Rock-Tenn Co. — Class A | | | 109,120 | | | | 7,038,240 | |
| Gentex Corp. | | | 322,680 | | | | 5,905,044 | |
| Oshkosh Corp. | | | 106,237 | | | | 5,183,303 | |
| Aegion Corp. — Class A* | | | 157,545 | | | | 2,843,687 | |
| Huntington Ingalls Industries, Inc. | | | 17,654 | | | | 2,474,208 | |
| UTI Worldwide, Inc.* | | | 141,060 | | | | 1,735,038 | |
| Kirby Corp.* | | | 18,020 | | | | 1,352,401 | |
| Total Industrial | | | | | | | 79,710,957 | |
| SEE NOTES TO FINANCIAL STATEMENTS. | THE GUGGENHEIM FUNDS SEMI-ANNUAL REPORT | 9 |
SCHEDULE OF INVESTMENTS (Unaudited)(continued) | March 31, 2015 |
| MID CAP VALUE INSTITUTIONAL FUND | |
| | |
Shares | | | Value | |
| | | | | | | | | |
| TECHNOLOGY - 9.4% | |
| Computer Sciences Corp. | | | 194,150 | | | $ | 12,674,111 | |
| IXYS Corp. | | | 867,679 | | | | 10,689,805 | |
| Diebold, Inc. | | | 246,000 | | | | 8,723,160 | |
| Maxwell Technologies, Inc.* | | | 785,431 | | | | 6,330,574 | |
| Cree, Inc.* | | | 84,440 | | | | 2,996,776 | |
| KEYW Holding Corp.* | | | 275,670 | | | | 2,268,764 | |
| IPG Photonics Corp.* | | | 20,730 | | | | 1,921,671 | |
| IGATE Corp.* | | | 42,870 | | | | 1,828,834 | |
| ManTech International Corp. — Class A | | | 48,420 | | | | 1,643,375 | |
| Teradyne, Inc. | | | 71,000 | | | | 1,338,350 | |
| Stratasys Ltd.* | | | 23,670 | | | | 1,249,303 | |
| Total Technology | | | | | | | 51,664,723 | |
| | | | | | | | |
| CONSUMER, CYCLICAL - 8.5% | |
| Visteon Corp.* | | | 68,350 | | | | 6,588,940 | |
| Chico’s FAS, Inc. | | | 353,200 | | | | 6,248,108 | |
| Ryland Group, Inc. | | | 105,480 | | | | 5,141,095 | |
| Brown Shoe Company, Inc. | | | 152,378 | | | | 4,997,998 | |
| WESCO International, Inc.* | | | 56,764 | | | | 3,967,236 | |
| Dolby Laboratories, Inc. — Class A | | | 90,292 | | | | 3,445,543 | |
| DR Horton, Inc. | | | 115,300 | | | | 3,283,744 | |
| Wendy’s Co. | | | 249,750 | | | | 2,722,275 | |
| Iconix Brand Group, Inc.* | | | 80,180 | | | | 2,699,661 | |
| United Stationers, Inc. | | | 65,696 | | | | 2,692,879 | |
| Steven Madden Ltd.* | | | 64,643 | | | | 2,456,434 | |
| Ascena Retail Group, Inc.* | | | 119,900 | | | | 1,739,749 | |
| Abercrombie & Fitch Co. — Class A | | | 37,690 | | | | 830,688 | |
| Total Consumer, Cyclical | | | | | | | 46,814,350 | |
| | | | | | | | |
| UTILITIES - 7.8% | |
| Pinnacle West Capital Corp. | | | 146,480 | | | | 9,338,101 | |
| AGL Resources, Inc. | | | 138,680 | | | | 6,885,462 | |
| Ameren Corp. | | | 157,244 | | | | 6,635,697 | |
| Westar Energy, Inc. | | | 154,790 | | | | 5,999,660 | |
| Great Plains Energy, Inc. | | | 176,915 | | | | 4,720,092 | |
| Black Hills Corp. | | | 75,099 | | | | 3,787,994 | |
| Avista Corp. | | | 88,290 | | | | 3,017,752 | |
| Portland General Electric Co. | | | 37,360 | | | | 1,385,682 | |
| EnerNOC, Inc.* | | | 93,180 | | | | 1,062,252 | |
| Total Utilities | | | | | | | 42,832,692 | |
| | | | | | | | |
| COMMUNICATIONS - 4.8% | |
| DigitalGlobe, Inc.* | | | 324,651 | | | | 11,060,860 | |
| Scholastic Corp. | | | 150,480 | | | | 6,160,651 | |
| Finisar Corp.* | | | 277,550 | | | | 5,922,917 | |
| Liquidity Services, Inc.* | | | 167,210 | | | | 1,652,035 | |
| NETGEAR, Inc.* | | | 38,000 | | | | 1,249,440 | |
| Total Communications | | | | | | | 26,045,903 | |
| | | | | | | | |
| ENERGY - 3.1% | |
| Sanchez Energy Corp.* | | | 336,997 | | | | 4,384,332 | |
| Patterson-UTI Energy, Inc. | | | 178,310 | | | | 3,347,770 | |
| Whiting Petroleum Corp.* | | | 108,241 | | | | 3,344,647 | |
| Superior Energy Services, Inc. | | | 149,684 | | | | 3,343,941 | |
| Oasis Petroleum, Inc.* | | | 149,670 | | | | 2,128,307 | |
| Resolute Energy Corp.* | | | 544,250 | | | | 306,630 | |
HydroGen Corp.*,†††,1 | | | 1,265,700 | | | | 1 | |
| Total Energy | | | | | | | 16,855,628 | |
| | | | | | | | |
| BASIC MATERIALS - 2.4% | |
| Landec Corp.* | | | 367,820 | | | | 5,131,089 | |
| Olin Corp. | | | 155,074 | | | | 4,968,571 | |
| Intrepid Potash, Inc.* | | | 241,200 | | | | 2,785,860 | |
| Total Basic Materials | | | | | | | 12,885,520 | |
| | | | | | | | |
| Total Common Stocks | | | | | | | | |
| (Cost $462,266,790) | | | | | | | 536,622,643 | |
| | | | | | | | |
CONVERTIBLE PREFERRED STOCKS††† - 0.0% | |
Thermoenergy Corp.*,2,3 | | | 793,750 | | | | 2,318 | |
| Total Convertible Preferred Stocks | | | | | | | | |
| (Cost $757,980) | | | | | | | 2,318 | |
| 10 | THE GUGGENHEIM FUNDS SEMI-ANNUAL REPORT | SEE NOTES TO FINANCIAL STATEMENTS. |
SCHEDULE OF INVESTMENTS (Unaudited)(concluded) | March 31, 2015 |
| MID CAP VALUE INSTITUTIONAL FUND | |
| | |
Shares | | | Value | |
| | | | | | | | | |
SHORT TERM INVESTMENTS† - 1.8% | |
Dreyfus Treasury Prime
Cash Management Fund 0.00% | | | 10,015,832 | | | $ | 10,015,832 | |
| Total Short Term Investments | | | | | | | | |
| (Cost $10,015,832) | | | | | | | 10,015,832 | |
| | | | | | | | |
| Total Investments - 99.8% | | | | | | | | |
| (Cost $473,040,602) | | | | | | $ | 546,640,793 | |
| Other Assets & Liabilities, net - 0.2% | | | | | | | 979,912 | |
| Total Net Assets - 100.0% | | | | | | $ | 547,620,705 | |
| * | Non-income producing security. |
| † | Value determined based on Level 1 inputs, unless otherwise noted — See Note 4. |
| ††† | Value determined based on Level 3 inputs — See Note 4. |
| 1 | Affiliated issuer — See Note 6. |
| 2 | PIPE (Private Investment in Public Equity) — Stock issued by a company in the secondary market as a means of raising capital more quickly and less expensively than through registration of a secondary public offering. |
| 3 | Illiquid security. |
| | |
| See Sector Classification in Other Information section. |
| SEE NOTES TO FINANCIAL STATEMENTS. | THE GUGGENHEIM FUNDS SEMI-ANNUAL REPORT | 11 |
STATEMENT OF ASSETS AND LIABILITIES (Unaudited) |
| MID CAP VALUE INSTITUTIONAL FUND |
March 31, 2015
| Assets: | |
| Investments in unaffiliated issuers, at value (cost $473,038,071) | | $ | 546,640,792 | |
| Investments in affiliated issuers, at value (cost $2,531) | | | 1 | |
| Total investments (cost $473,040,602) | | | 546,640,793 | |
| Prepaid expenses | | | 36,506 | |
| Cash | | | 4,415 | |
| Receivables: | |
| Securities sold | | | 3,592,545 | |
| Fund shares sold | | | 893,965 | |
| Dividends | | | 649,667 | |
| Foreign taxes reclaim | | | 10,107 | |
| Total assets | | | 551,827,998 | |
| | | | | |
| Liabilities: | |
| Payable for: | |
| Securities purchased | | | 2,665,846 | |
| Fund shares redeemed | | | 1,025,837 | |
| Management fees | | | 350,750 | |
| Fund accounting/administration fees | | | 44,428 | |
| Transfer agent/maintenance fees | | | 35,698 | |
| Trustees’ fees* | | | 2,668 | |
| Miscellaneous | | | 82,066 | |
| Total liabilities | | | 4,207,293 | |
| Net assets | | $ | 547,620,705 | |
| | | | | |
| Net assets consist of: | |
| Paid in capital | | $ | 460,091,903 | |
| Undistributed net investment income | | | 1,851,665 | |
| Accumulated net realized gain on investments | | | 12,076,946 | |
| Net unrealized appreciation on investments | | | 73,600,191 | |
| Net assets | | $ | 547,620,705 | |
| Capital shares outstanding | | | 47,480,126 | |
| Net asset value per share | | $ | 11.53 | |
| * | Relates to Trustees not deemed “interested persons” within the meaning of Section 2(a)(19) of the 1940 Act. |
| 12 | THE GUGGENHEIM FUNDS SEMI-ANNUAL REPORT | SEE NOTES TO FINANCIAL STATEMENTS. |
STATEMENT OF OPERATIONS (Unaudited) |
| MID CAP VALUE INSTITUTIONAL FUND |
Period Ended March 31, 2015
| Investment Income: | |
| Dividends (net of foreign withholding tax of $17) from unaffiliated issuers | | $ | 5,142,532 | |
| Interest | | | 23,994 | |
| Total investment income | | | 5,166,526 | |
| | | | | |
| Expenses: | |
| Management fees | | | 2,052,498 | |
| Transfer agent/maintenance fees | | | 377,680 | |
| Fund accounting/administration fees | | | 259,986 | |
| Trustees’ fees* | | | 28,763 | |
| Line of credit fees | | | 20,928 | |
| Custodian fees | | | 10,086 | |
| Tax expense | | | 24 | |
| Miscellaneous | | | 165,787 | |
| Total expenses | | | 2,915,752 | |
| Net investment income | | | 2,250,774 | |
| | | | | |
| Net Realized and Unrealized Gain (Loss): | |
| Net realized gain (loss) on: | |
| Investments in unaffiliated issuers | | $ | 26,276,272 | |
| Net realized gain | | | 26,276,272 | |
| Net change in unrealized appreciation (depreciation) on: | |
| Investments in unaffiliated issuers | | | (7,073,377 | ) |
| Net change in unrealized appreciation (depreciation) | | | (7,073,377 | ) |
| Net realized and unrealized gain | | | 19,202,895 | |
| Net increase in net assets resulting from operations | | $ | 21,453,669 | |
| * | Relates to Trustees not deemed “interested persons” within the meaning of Section 2(a)(19) of the 1940 Act. |
| SEE NOTES TO FINANCIAL STATEMENTS. | THE GUGGENHEIM FUNDS SEMI-ANNUAL REPORT | 13 |
STATEMENTS OF CHANGES IN NET ASSETS |
| MID CAP VALUE INSTITUTIONAL FUND | |
| | | Period Ended March 31, 2015 (Unaudited) | | | Year Ended September 30, 2014 | |
| Increase (Decrease) in Net Assets from Operations: | | | | | | |
| Net investment income | | $ | 2,250,774 | | | $ | 2,551,218 | |
| Net realized gain on investments | | | 26,276,272 | | | | 73,635,732 | |
| Net change in unrealized appreciation (depreciation) on investments | | | (7,073,377 | ) | | | (43,832,495 | ) |
| Net increase in net assets resulting from operations | | | 21,453,669 | | | | 32,354,455 | |
| | | | | | | | | |
| Distributions to shareholders from: | | | | | | | | |
| Net investment income | | | (2,549,762 | ) | | | (3,106,999 | ) |
| Net realized gains | | | (71,890,688 | ) | | | (35,348,105 | ) |
| Total distributions to shareholders | | | (74,440,450 | ) | | | (38,455,104 | ) |
| | | | | | | | | |
| Capital share transactions: | | | | | | | | |
| Proceeds from sale of shares | | | 147,904,945 | | | | 164,229,754 | |
| Distributions reinvested | | | 40,920,074 | | | | 23,335,832 | |
| Cost of shares redeemed | | | (186,318,170 | ) | | | (154,829,343 | ) |
| Net increase from capital share transactions | | | 2,506,849 | | | | 32,736,243 | |
| Net increase (decrease) in net assets | | | (50,479,932 | ) | | | 26,635,594 | |
| | | | | | | | | |
| Net assets: | | | | | | | | |
| Beginning of period | | | 598,100,637 | | | | 571,465,043 | |
| End of period | | $ | 547,620,705 | | | $ | 598,100,637 | |
| Undistributed net investment income at end of period | | $ | 1,851,665 | | | $ | 2,150,653 | |
| | | | | | | | | |
| Capital share activity: | | | | | | | | |
| Shares sold | | | 12,919,356 | | | | 12,370,911 | |
| Shares issued from reinvestment of distributions | | | 3,627,666 | | | | 1,834,578 | |
| Shares redeemed | | | (15,351,226 | ) | | | (11,576,179 | ) |
| Net increase in shares | | | 1,195,796 | | | | 2,629,310 | |
| 14 | THE GUGGENHEIM FUNDS SEMI-ANNUAL REPORT | SEE NOTES TO FINANCIAL STATEMENTS. |
| FINANCIAL HIGHLIGHTS |
| MID CAP VALUE INSTITUTIONAL FUND | |
This table is presented to show selected data for a share outstanding throughout each period and to assist shareholders in evaluating a Fund’s performance for the periods presented.
| Institutional Class | | Period Ended March 31, 2015a | | | Year Ended Sept. 30, 2014 | | | Year Ended Sept. 30, 2013 | | | Year Ended Sept. 30, 2012 | | | Year Ended Sept. 30, 2011 | | | Year Ended Sept. 30, 2010 | |
| Per Share Data | | | | | | | | | | | | | | | | | | |
| Net asset value, beginning of period | | $ | 12.92 | | | $ | 13.09 | | | $ | 11.29 | | | $ | 9.97 | | | $ | 11.34 | | | $ | 10.49 | |
| Income (loss) from investment operations: | |
Net investment income (loss)b | | | .05 | | | | .06 | | | | .06 | | | | .03 | | | | .04 | | | | .08 | |
| Net gain (loss) on investments (realized and unrealized) | | | .47 | | | | .65 | | | | 2.90 | | | | 2.30 | | | | (.87 | ) | | | 1.13 | |
| Total from investment operations | | | .52 | | | | .71 | | | | 2.96 | | | | 2.33 | | | | (.83 | ) | | | 1.21 | |
| Less distributions from: | |
| Net investment income | | | (.07 | ) | | | (.07 | ) | | | (.04 | ) | | | (.04 | ) | | | (.06 | ) | | | (.01 | ) |
| Net realized gains | | | (1.84 | ) | | | (.81 | ) | | | (1.12 | ) | | | (.97 | ) | | | (.48 | ) | | | (.35 | ) |
| Total distributions | | | (1.91 | ) | | | (.88 | ) | | | (1.16 | ) | | | (1.01 | ) | | | (.54 | ) | | | (.36 | ) |
| Net asset value, end of period | | $ | 11.53 | | | $ | 12.92 | | | $ | 13.09 | | | $ | 11.29 | | | $ | 9.97 | | | $ | 11.34 | |
| | |
Total Returnc | | | 4.28 | % | | | 5.53 | % | | | 28.89 | % | | | 24.96 | % | | | (8.05 | %) | | | 11.76 | % |
| Ratios/Supplemental Data | |
| Net assets, end of period (in thousands) | | $ | 547,621 | | | $ | 598,101 | | | $ | 571,465 | | | $ | 490,741 | | | $ | 472,266 | | | $ | 514,447 | |
| Ratios to average net assets: | |
| Net investment income (loss) | | | 0.82 | % | | | 0.42 | % | | | 0.51 | % | | | 0.30 | % | | | 0.34 | % | | | 0.78 | % |
Total expensese | | | 1.07 | % | | | 1.05 | % | | | 1.01 | % | | | 1.01 | % | | | 0.98 | % | | | 0.95 | % |
| Net expenses | | | 1.07 | % | | | 1.05 | % | | | 1.01 | % | | | 0.98 | %d | | | 0.90 | %d | | | 0.90 | %d |
| Portfolio turnover rate | | | 42 | % | | | 41 | % | | | 24 | % | | | 33 | % | | | 38 | % | | | 20 | % |
a | Unaudited figures for the period ended March 31, 2015. Percentage amounts for the period, except total return and portfolio turnover rate, have been annualized. |
b | Net investment income (loss) per share was computed using average shares outstanding throughout the period. |
c | Total return does not reflect the impact of any applicable sales charges. |
d | Net expense information reflects the expense ratios after expense waivers abs reimbursements, as applicable. |
e | Does not include expenses of the underlying funds in which the Fund invests. |
| SEE NOTES TO FINANCIAL STATEMENTS. | THE GUGGENHEIM FUNDS SEMI-ANNUAL REPORT | 15 |
NOTES TO FINANCIAL STATEMENTS (Unaudited)
1. Organization and Significant Accounting Policies
Organization
Guggenheim Funds Trust (the “Trust”), a Delaware statutory trust, is registered with the SEC under the Investment Company Act of 1940 (“1940 Act”), as a non-diversified, open-ended investment company of the series type. Each series, in effect, is representing a separate Fund. The Trust is authorized to issue an unlimited number of shares. The Trust accounts for the assets of each Fund separately.
The Trust offers a combination of four separate classes of shares, A-Class shares, B-Class shares, C-Class shares and Institutional Class shares. Sales of shares of each Class are made without a front-end sales charge at the net asset value per share (“NAV”), with the exception of A-Class shares. A-Class shares are sold at the NAV, plus the applicable front-end sales charge. The sales charge varies depending on the amount purchased, but will not exceed 4.75%. Prior to February 22, 2011, the maximum sales charge was 5.75%. A-Class share purchases of $1 million or more are exempt from the front-end sales charge but have a 1% contingent deferred sales charge (“CDSC”), if shares are redeemed within 12 months of purchase. B-Class shares were offered without a front-end sales charge, but were subject to a CDSC of up to 5% for five years and convert to A-Class shares after eight years. Effective January 4, 2010, subscriptions for B-Class shares are no longer accepted. C-Class shares have a 1% CDSC if shares are redeemed within 12 months of purchase. Institutional Class shares are offered primarily for direct investment by institutions such as pension and profit sharing plans, endowments, foundations and corporations. Institutional Class shares have a minimum initial investment of $2 million and a minimum account balance of $1 million. Institutional Class shares are offered without a front-end sales charge or a CDSC. At March 31, 2015, the Trust consisted of eighteen funds.
This report covers the Mid Cap Value Institutional Fund (the “Fund”) while the other funds are contained in separate reports.
The Fund was previously a series (“Predecessor Fund”) of Security Equity Fund, a different registered open-end investment company, which was organized as a Kansas corporation. In January 2014, at a special meeting of shareholders, the shareholders of the Predecessor Fund approved the reorganization of the Predecessor Fund with and into the Fund, a corresponding “shell” series of the Trust. The Fund succeeded to the accounting and performance history of the Predecessor Fund. Any such historical information provided for the Fund that relates to periods prior to January 28, 2014, therefore, is that of the Predecessor Fund.
| 16 | THE GUGGENHEIM FUNDS SEMI-ANNUAL REPORT | |
NOTES TO FINANCIAL STATEMENTS (Unaudited)(continued)
Guggenheim Investments (“GI”) provides advisory services, and Rydex Fund Services, LLC (“RFS”) provides transfer agent, administrative and accounting services to the Trust. Guggenheim Funds Distributors, LLC (“GFD”) acts as principal underwriter for the Trust. GI, RFS and GFD are affiliated entities.
Significant Accounting Policies
The Fund operates as an investment company and accordingly follows the investment company accounting and reporting guidance of the Financial Accounting Standards Board (“FASB”) Accounting Standards Codification Topic 946 Financial Services – Investment Companies.
The following significant accounting policies are in conformity with U.S. generally accepted accounting principles (“U.S. GAAP”) and are consistently followed by the Trust. This requires management to make estimates and assumptions that affect the reported amount of assets and liabilities and disclosure of contingent assets and liabilities at the date of the financial statements and the reported amounts of revenues and expenses during the reporting period. Actual results could differ from these estimates. All time references are based on Eastern Time.
The NAV of each Class of the Fund is calculated by dividing the market value of the Fund’s securities and other assets, less all liabilities, attributable to the Class by the number of outstanding shares of the Class.
A. The Board of Trustees of the Fund (the “Board”) has adopted policies and procedures for the valuation of the Fund’s investments (the “Valuation Procedures”). Pursuant to the Valuation Procedures, the Board has delegated to a valuation committee, consisting of representatives from Guggenheim’s investment management, fund administration, legal and compliance departments (the “Valuation Committee”), the day-to-day responsibility for implementing the Valuation Procedures, including, under most circumstances, the responsibility for determining the fair value of the Fund’s securities or other assets.
Valuations of the Fund’s securities are supplied primarily by pricing services appointed pursuant to the processes set forth in the Valuation Procedures. The Valuation Committee convenes monthly, or more frequently as needed and will review the valuation of all assets which have been fair valued for reasonableness. The Fund’s officers, through the Valuation Committee and consistent with the monitoring and review responsibilities set forth in the Valuation Procedures, regularly review procedures used by, and valuations provided by, the pricing services.
| | THE GUGGENHEIM FUNDS SEMI-ANNUAL REPORT | 17 |
NOTES TO FINANCIAL STATEMENTS (Unaudited)(continued)
If the pricing service cannot or does not provide a valuation for a particular investment or such valuation is deemed unreliable, such investment is fair valued by the Valuation Committee.
Equity securities listed on an exchange (New York Stock Exchange (“NYSE”) or American Stock Exchange) are valued at the last quoted sales price as of the close of business on the NYSE, usually 4:00 p.m. on the valuation date. Equity securities listed on the NASDAQ market system are valued at the NASDAQ Official Closing Price on the valuation date, which may not necessarily represent the last sale price. If there has been no sale on such exchange or NASDAQ on a given day, the security is valued at the closing bid price on that day.
Open-end investment companies (“Mutual Funds”) are valued at their NAV as of the close of business, on the valuation date.
Investments for which market quotations are not readily available are fair valued as determined in good faith by GI under the direction of the Board of Trustees using methods established or ratified by the Board of Trustees. These methods include, but are not limited to: (i) obtaining general information as to how these securities and assets trade; and (ii) obtaining other information and considerations, including current values in related markets.
B. Security transactions are recorded on the trade date for financial reporting purposes. Realized gains and losses from securities transactions are recorded using the identified cost basis. Proceeds from lawsuits related to investment holdings are recorded as realized gains in the Fund. Dividend income is recorded on the ex-dividend date, net of applicable taxes withheld by foreign countries. Taxable non-cash dividends are recorded as dividend income. Interest income, including amortization of premiums and accretion of discounts, is accrued on a daily basis. Dividend income from REITs is recorded based on the income included in distributions received from the REIT investments using published REIT reclassifications, including some management estimates when actual amounts are not available. Distributions received in excess of this estimated amount are recorded as a reduction of the cost of investments or reclassified to capital gains. The actual amounts of income, return of capital, and capital gains are only determined by each REIT after its fiscal year-end, and may differ from the estimated amounts.
C. Distributions of net investment income and net realized gains, if any, are declared and paid at least annually. Dividends are reinvested in additional shares unless shareholders request payment in cash. Distributions are recorded on the ex-dividend date and are determined in accordance with income tax regulations which may differ from U.S. GAAP.
| 18 | THE GUGGENHEIM FUNDS SEMI-ANNUAL REPORT | |
NOTES TO FINANCIAL STATEMENTS (Unaudited)(continued)
Certain expenses have been allocated to the individual Funds in the Trust on a pro rata basis upon the respective aggregate net assets of each Fund included in the Trust.
E. Under the fee arrangement with the custodian, the Fund may earn credits based on overnight custody cash balances. These credits are utilized to reduce related custodial expenses. The custodian fees disclosed in the Statement of Operations are before the reduction in expense from the related earnings credits, if any. For the period ended March 31, 2015, there were no earnings credits received.
The Fund may leave cash overnight in its cash account with the custodian. Periodically, the Fund may have cash due to the custodian bank as an overdraft balance. A fee is incurred on this overdraft, calculated by multiplying the overdraft by a rate based on the federal funds rate.
F. Under the Fund’s organizational documents, its Trustees and Officers are indemnified against certain liabilities arising out of the performance of their duties to the Trust. In addition, throughout the normal course of business, the Fund enters into contracts that contain a variety of representations and warranties which provide general indemnifications. The Fund’s maximum exposure under these arrangements is unknown, as this would involve future claims that may be made against the Fund and/or its affiliates that have not yet occurred. However, based on experience, the Fund expects the risk of loss to be remote.
2. Federal Income Tax Information
The Fund intends to comply with the provisions of Subchapter M of the Internal Revenue Code applicable to regulated investment companies and will distribute substantially all taxable net investment income and capital gains sufficient to relieve the Fund from all, or substantially all, federal income, excise and state income taxes. Therefore, no provision for federal or state income tax is required.
Tax positions taken or expected to be taken in the course of preparing the Fund’s tax returns are evaluated to determine whether the tax positions are “more-likely-than-not” of being sustained by the applicable tax authority. Tax positions not deemed to meet the more-likely-than-not threshold would be recorded as a tax benefit or expense in the current year. Management has analyzed the Fund’s tax positions taken, or to be taken, on Federal income tax returns for all open tax years, and has concluded that no provision for income tax is required in the Fund’s financial statements. The Fund’s federal tax returns are subject to examination by the Internal Revenue Service for a period of three years after they are filed.
| | THE GUGGENHEIM FUNDS SEMI-ANNUAL REPORT | 19 |
NOTES TO FINANCIAL STATEMENTS (Unaudited)(continued)
At March 31, 2015, the cost of securities for Federal income tax purposes, the aggregate gross unrealized gain for all securities for which there was an excess of value over tax cost and the aggregate gross unrealized loss for all securities for which there was an excess of tax cost over value, were as follows:
| Fund Name | | Tax Cost | | | Tax Unrealized Gain | | | Tax Unrealized Loss | | | Net Unrealized Gain | |
| Mid Cap Value Institutional Fund | | $ | 473,212,866 | | | $ | 102,009,040 | | | $ | (28,581,113 | ) | | $ | 73,427,927 | |
3. Fees and Other Transactions with Affiliates
Under the terms of an investment advisory contract, the Fund pays GI investment advisory fees calculated at an annualized rate of 0.75% of the average daily net assets of the Fund.
RFS provides transfer agent services to the Fund for fees calculated at the rates below, which are assessed to the applicable class of the Fund. For these services, RFS receives the following:
| Annual charge per account | $5.00 – $8.00 |
| Transaction fee | $0.60 – $1.10 |
Minimum annual charge per Fund† | $25,000 |
| Certain out-of-pocket charges | Varies |
† | Not subject to Fund during first twelve months of operations. |
RFS also acts as the administrative agent for the Fund, and as such performs administrative functions and the bookkeeping, accounting and pricing functions for the Fund. For these services, RFS receives 0.095% of the average daily net assets of the Fund. The minimum annual charge for fund accounting/administrative fees is $25,000.
RFS engages external service providers to perform other necessary services for the Trust, such as audit and accounting related services, legal services, custody, printing and mailing, etc., on a pass-through basis. Such expenses are allocated to various Funds within the complex based on relative net assets.
Certain trustees and officers of the Trust are also officers of GI, RFS and GFD.
4. Fair Value Measurement
In accordance with U.S. GAAP, fair value is defined as the price that the Fund would receive to sell an investment or pay to transfer a liability in an orderly transaction with an independent buyer in the principal market, or in the absence of
| 20 | THE GUGGENHEIM FUNDS SEMI-ANNUAL REPORT | |
NOTES TO FINANCIAL STATEMENTS (Unaudited)(continued)
a principal market, the most advantageous market for the investment or liability. U.S. GAAP establishes a three-tier fair value hierarchy based on the types of inputs used to value assets and liabilities and requires corresponding disclosure. The hierarchy and the corresponding inputs are summarized below:
| Level 1 — | quoted prices in active markets for identical assets or liabilities. |
| Level 2 — | significant other observable inputs (for example quoted prices for securities that are similar based on characteristics such as interest rates, prepayment speeds, credit risk, etc.). |
| Level 3 — | significant unobservable inputs based on the best information available under the circumstances, to the extent observable inputs are not available, which may include assumptions. |
The types of inputs available depend on a variety of factors, such as the type of security and the characteristics of the markets in which it trades, if any. Fair valuation determinations that rely on fewer or no observable inputs require greater judgment. Accordingly, fair value determinations for Level 3 securities require the greatest amount of judgment.
The following table summarizes the inputs used to value the Fund’s investments at March 31, 2015:
| | | Level 1 Investments In Securities | | | Level 2 Investments In Securities | | | Level 3 Investments In Securities | | | Total | |
| Assets | | | | | | | | | | | | |
| Mid Cap Value Institutional Fund | | $ | 546,638,475 | | | $ | — | | | $ | 2,318 | | | $ | 546,640,793 | |
Transfers between investment levels may occur as the markets fluctuate and/or the availability of data used in the investment’s valuation changes. The Fund recognizes transfers between the levels as of the beginning of the period.
For the period ended March 31, 2015, there were no transfers between levels.
The inputs or methodologies used for valuing securities are not necessarily an indication of the risk associated with investing in those securities. The suitability of the techniques and sources employed to determine fair valuation are regularly monitored and subject to change.
| | THE GUGGENHEIM FUNDS SEMI-ANNUAL REPORT | 21 |
NOTES TO FINANCIAL STATEMENTS (Unaudited)(continued)
5. Securities Transactions
For the period ended March 31, 2015, the cost of purchases and proceeds from sales of investment securities, excluding government securities, short-term investments and derivatives, were as follows:
| Fund | | Purchases | | | Sales | |
| Mid Cap Value Institutional Fund | | $ | 226,919,642 | | | $ | 285,554,756 | |
6. Affiliated Transactions
Investments representing 5% or more of the outstanding voting shares of a portfolio company of a fund, or control of or by, or common control under GI, result in that portfolio company being considered an affiliated company of such fund, as defined in the 1940 Act.
Transactions during the period ended March 31, 2015 in which the portfolio company is an “affiliated person” are as follows:
| Affiliated issuers by Fund | | Value 09/30/14 | | | Additions | | | Reductions | | | Value 03/31/15 | | | Shares 03/31/15 | | | Investment Income | |
| Mid Cap Value Institutional Fund | | | | | | | |
| Common Stock: | | | | | | | | | | | | | | | | | | |
| HydroGen Corp. | | $ | 1 | | | $ | — | | | $ | — | | | $ | 1 | | | | 1,265,700 | | | $ | — | |
7. Line of Credit
The Trust, with the exception of Alpha Opportunity Fund and Capital Stewardship Fund, secured a committed, $625,000,000 line of credit from Citibank, N.A., good through October 9, 2015, at which time the line of credit may be renewed. This line of credit is reserved for emergency or temporary purposes. Fees related to borrowings, if any, vary under this arrangement between the greater of Citibank’s “base rate”, LIBOR plus 1.0%, and the Fed Funds rate, plus 0.50%. The Trust did not have any borrowings under this agreement as of and for the period-ended March 31, 2015. The Trust also pays a commitment fee at an annualized rate of 0.07% of the average daily amount of their unused commitment amount.
8. Other Liabilities
The Fund wrote put option contracts through Lehman Brothers Inc., (“LBI”) that were exercised prior to the option contracts’ expiration and prior to the bankruptcy filing by LBI, during September 2008. However, these transactions have not settled and the securities have not been delivered to the Fund as of March 31, 2015.
| 22 | THE GUGGENHEIM FUNDS SEMI-ANNUAL REPORT | |
NOTES TO FINANCIAL STATEMENTS (Unaudited)(concluded)
Although the ultimate resolution of these transactions is uncertain, the Fund has recorded a liability on its books equal to the difference between the strike price on the put options and the market price of the underlying security on the exercise date. The amount of the liability recorded by the Fund as of March 31, 2015, was $15,940.
| | THE GUGGENHEIM FUNDS SEMI-ANNUAL REPORT | 23 |
OTHER INFORMATION (Unaudited)
Proxy Voting Information
A description of the policies and procedures that the Trust uses to determine how to vote proxies relating to securities held in the Funds’ portfolios is available, without charge and upon request, by calling 800.820.0888. This information is also available from the EDGAR database on the SEC’s website at http://www.sec.gov.
Information regarding how the Funds voted proxies relating to portfolio securities during the most recent 12-month period ended June 30 is available without charge, upon request, by calling 800.820.0888. This information is also available from the EDGAR database on the SEC’s website at http://www.sec.gov.
Sector Classification
Information in the “Schedule of Investments” is categorized by sectors using sector-level classifications used by Bloomberg Industry Classification System, a widely recognized industry classification system provider. In each Fund’s registration statement, the Funds have investment policies relating to concentration in specific industries. For purposes of these investment policies, the Funds usually classify industries based on industry-level classifications used by widely recognized industry classification system providers such as Bloomberg Industry Classification System, Global Industry Classification Standards and Barclays Global Classification Scheme.
Quarterly Portfolio Schedules Information
The Trust files its complete schedule of portfolio holdings with the SEC for the first and third quarters of each fiscal year on Form N-Q; which are available on the SEC’s website at http://www.sec.gov. The Funds’ Forms N-Q may be reviewed and copied at the SEC’s Public Reference Room in Washington, DC, and that information on the operation of the Public Reference Room may be obtained by calling 800-SEC-0330. Copies of the portfolio holdings are also available to shareholders, without charge and upon request, by calling 800.820.0888.
| 24 | THE GUGGENHEIM FUNDS SEMI-ANNUAL REPORT | |
INFORMATION ON BOARD OF TRUSTEES AND OFFICERS (Unaudited)
A Board of Trustees oversees the Trust, as well as other trusts of GI, in which its members have no stated term of service, and continue to serve after election until resignation. The Statement of Additional Information includes further information about Fund Trustees and Officers, and can be obtained without charge by calling 800.820.0888.
Name, Address* and Year of Birth | Position(s) Held with the Trust | Term of Office and Length of Time Served** | Principal Occupation(s) During Past Five Years | Number of Portfolios in Fund Complex Overseen | Other Directorships Held by Trustees |
| INDEPENDENT TRUSTEES | | | |
Randall C. Barnes (1951) | Trustee | Since 2014 | Current: Private Investor (2001-present). Former: Senior Vice President and Treasurer, PepsiCo, Inc. (1993-1997); President, Pizza Hut International (1991-1993); Senior Vice President, Strategic Planning and New Business Development, PepsiCo, Inc. (1987-1990). | 91 | Current: Trustee, Purpose Investments Inc. (2014-Present). |
Donald A. Chubb, Jr. (1946) | Trustee and Vice Chairman of the Board | Since 1994 | Current: Business broker and manager of commercial real estate, Griffith & Blair, Inc. (1997-present). | 87 | None. |
Jerry B. Farley (1946) | Trustee and Vice Chairman of the Audit Committee | Since 2005 | Current: President, Washburn University (1997-present). | 87 | Current: Westar Energy, Inc. (2004-present); CoreFirst Bank & Trust (2000-present). |
| | THE GUGGENHEIM FUNDS SEMI-ANNUAL REPORT | 25 |
INFORMATION ON BOARD OF TRUSTEES AND OFFICERS (Unaudited)(continued)
Name, Address* and Year of Birth | Position(s) Held with the Trust | Term of Office and Length of Time Served** | Principal Occupation(s) During Past Five Years | Number of Portfolios in Fund Complex Overseen | Other Directorships Held by Trustees |
| INDEPENDENT TRUSTEES - continued | | |
Roman Friedrich III (1946) | Trustee and Chairman of the Contracts Review Committee | Since 2014 | Current: Founder and President, Roman Friedrich & Company (1998-present). Former: Senior Managing Director, MLV & Co. LLC (2010-2011). | 87 | Current: Zincore Metals, Inc. (2009-present). Former: Mercator Minerals Ltd. (2013-2014); First Americas Gold Corp. (2012-2014); Blue Sky Uranium Corp. (2011-2012); Axiom Gold and Silver Corp. (2011-2012); Stratagold Corp. (2003-2009); GFM Resources Ltd. (2005-2010). |
Robert B. Karn III (1942) | Trustee and Chairman of the Audit Committee | Since 2014 | Current: Consultant (1998-present). Former: Arthur Andersen (1965-1997) and Managing Partner, Financial and Economic Consulting, St. Louis office (1987-1997). | 87 | Current: Peabody Energy Company (2003-present); GP Natural Resource Partners, LLC (2002- present). |
Ronald A. Nyberg (1953) | Trustee and Chairman of the Nominating and Governance Committee | Since 2014 | Current: Partner, Nyberg & Cassioppi, LLC (2000-present). Former: Executive Vice President, General Counsel, and Corporate Secretary, Van Kampen Investments (1982-1999). | 93 | Current: Edward-Elmhurst Healthcare System (2012-present). |
| 26 | THE GUGGENHEIM FUNDS SEMI-ANNUAL REPORT | |
INFORMATION ON BOARD OF TRUSTEES AND OFFICERS (Unaudited)(continued)
Name, Address* and Year of Birth | Position(s) Held with the Trust | Term of Office and Length of Time Served** | Principal Occupation(s) During Past Five Years | Number of Portfolios in Fund Complex Overseen | Other Directorships Held by Trustees |
| INDEPENDENT TRUSTEES - concluded | | |
Maynard F. Oliverius (1943) | Trustee and Vice Chairman of the Contracts Review Committee | Since 1998 | Retired. Former: President and CEO, Stormont-Vail HealthCare (1996-2012). | 87 | Current: Fort Hays State University Foundation (1999-present); Stormont-Vail Foundation (2013-present); University of Minnesota HealthCare Alumni Association Foundation (2009-present). |
Ronald E. Toupin, Jr. (1958) | Trustee and Chairman of the Board | Since 2014 | Current: Portfolio Consultant (2010-present). Former: Vice President, Manager and Portfolio Manager, Nuveen Asset Management (1998-1999); Vice President, Nuveen Investment Advisory Corp. (1992-1999); Vice President and Manager, Nuveen Unit Investment Trusts (1991-1999); and Assistant Vice President and Portfolio Manager, Nuveen Unit Investment Trusts (1988-1999), each of John Nuveen & Co., Inc. (1982-1999). | 90 | Former: Bennett Group of Funds (2011-2013). |
| | THE GUGGENHEIM FUNDS SEMI-ANNUAL REPORT | 27 |
INFORMATION ON BOARD OF TRUSTEES AND OFFICERS (Unaudited)(continued)
Name, Address* and Year of Birth | Position(s) Held with the Trust | Term of Office and Length of Time Served** | Principal Occupation(s) During Past Five Years | Number of Portfolios in Fund Complex Overseen | Other Directorships Held by Trustees |
| INTERESTED TRUSTEE | |
Donald C. Cacciapaglia*** (1951) | President, Chief Executive Officer and Trustee | Since 2012 | Current: President and CEO, certain other funds in the Fund Complex (2012-present); Vice Chairman, Guggenheim Investments (2010-present). Former: Chairman and CEO, Channel Capital Group, Inc. (2002-2010). | 221 | Current: Clear Spring Life Insurance Company (2015-present); Guggenheim Partners Japan, Ltd. (2014-present); Delaware Life (2013-present); Guggenheim Life and Annuity Company (2011-present); Paragon Life Insurance Company of Indiana (2011-present). |
| * | The business address of each Trustee is c/o Guggenheim Investments, 805 King Farm Boulevard, Suite 600, Rockville, Maryland 20850. |
| ** | Each Trustee serves an indefinite term, until his successor is elected and qualified. Time served includes time served in the respective position for the Predecessor Corporation. |
| *** | This Trustee is deemed to be an "interested person" of the Funds under the 1940 Act by reason of his position with the Funds' Investment Manager and/or the parent of the Investment Manager. |
| 28 | THE GUGGENHEIM FUNDS SEMI-ANNUAL REPORT | |
INFORMATION ON BOARD OF TRUSTEES AND OFFICERS (Unaudited)(continued)
Name, Address* and Year of Birth | Position(s) held with the Trust | Term of Office and Length of Time Served** | Principal Occupations During Past Five Years |
| OFFICERS | | | |
Joseph M. Arruda (1966) | Assistant Treasurer | Since 2010 | Current: Assistant Treasurer, certain other funds in the Fund Complex (2006-present); Vice President, Security Investors, LLC (2010-present); CFO and Manager, Guggenheim Specialized Products, LLC (2009-present). Former: Vice President, Security Global Investors, LLC (2010-2011); Vice President, Rydex Advisors, LLC (2010); Vice President, Rydex Advisors II, LLC (2010). |
William H. Belden, III (1965) | Vice President | Since 2014 | Current: Vice President, certain other funds in the Fund Complex (2006-present); Managing Director, Guggenheim Funds Investment Advisors, LLC (2005-present). Former: Vice President of Management, Northern Trust Global Investments (1999-2005). |
Mark J. Furjanic (1959) | Assistant Treasurer | Since 2014 | Current: Vice President, Guggenheim Investments (2005-present); Assistant Treasurer, certain other funds in the Fund Complex (2008-present). Former: Senior Manager, Ernst & Young LLP (1999-2005). |
James Howley (1972) | Assistant Treasurer | Since 2014 | Current: Director, Guggenheim Investments (2004-present) ; Assistant Treasurer, certain other funds in the Fund Complex (2006-present). Former: Manager, Mutual Fund Administration of Van Kampen Investments, Inc. (1996-2004). |
| | THE GUGGENHEIM FUNDS SEMI-ANNUAL REPORT | 29 |
INFORMATION ON BOARD OF TRUSTEES AND OFFICERS (Unaudited)(continued)
Name, Address* and Year of Birth | Position(s) held with the Trust | Term of Office and Length of Time Served** | Principal Occupations During Past Five Years |
| OFFICERS - continued | |
Amy J. Lee (1961) | Vice President and Chief Legal Officer | Since 2007 (Vice President) Since 2014 (Chief Legal Officer) | Current: Chief Legal Officer, certain other funds in the Fund Complex (2013-present); Senior Managing Director, Guggenheim Investments (2012-present). Former: Vice President, Associate General Counsel and Assistant Secretary, Security Benefit Life Insurance Company and Security Benefit Corporation (2004-2012). |
Mark E. Mathiasen (1978) | Secretary | Since 2014 | Current: Secretary, certain other funds in the Fund Complex (2007-present); Managing Director, Guggenheim Investments (2007-present). |
Michael P. Megaris (1984) | Assistant Secretary | Since 2014 | Current: Assistant Secretary, certain other funds in the Fund Complex (2014-present); Associate, Guggenheim Investments (2012-present). Former: J.D., University of Kansas School of Law (2009-2012). |
Elisabeth Miller (1968) | Chief Compliance Officer | Since 2012 | Current: CCO, certain other funds in the Fund Complex (2012-present); CCO, Security Investors, LLC (2012-present); CCO, Guggenheim Funds Investment Advisors, LLC (2012-present); Managing Director, Guggenheim Investments (2012-present); Vice President, Guggenheim Funds Distributors, LLC (March 2014-present). Former: CCO, Guggenheim Distributors, LLC (2009-March 2014); Senior Manager, Security Investors, LLC (2004-2009); Senior Manager, Guggenheim Distributors, LLC (2004-2009). |
| 30 | THE GUGGENHEIM FUNDS SEMI-ANNUAL REPORT | |
INFORMATION ON BOARD OF TRUSTEES AND OFFICERS (Unaudited)(continued)
Name, Address* and Year of Birth | Position(s) held with the Trust | Term of Office and Length of Time Served** | Principal Occupations During Past Five Years |
| OFFICERS - continued | |
Alison Santay (1974) | AML Officer | Since 2013 | Current: AML Officer, certain other funds in the Fund Complex (2010-present); Director and AML Officer, Rydex Fund Services, LLC (2010-present); AML Officer, Security Investors, LLC (2010-present); Director, Shareholder Risk and Compliance, Rydex Fund Services, LLC (2004-present). Former: AML Officer, Guggenheim Distributors, LLC (2013-2014). |
Kimberly Scott (1974) | Assistant Treasurer | Since 2014 | Current: Vice President, Guggenheim Investments (2012-present) ; Assistant Treasurer, certain other funds in the Fund Complex (2012-present). Former: Financial Reporting Manager, Invesco, Ltd. (2010-2011); Vice President/Assistant Treasurer, Mutual Fund Administration for Van Kampen Investments, Inc./Morgan Stanley Investment Management (2009-2010); Manager of Mutual Fund Administration, Van Kampen Investments, Inc./Morgan Stanley Investment Management (2005-2009). |
Bryan Stone (1979) | Vice President | Since 2014 | Current: Vice President, certain other funds in the Fund Complex (2014-present); Director, Guggenheim Investments (2013-present). Former: Senior Vice President, Neuberger Berman Group LLC (2009-2013); Vice President, Morgan Stanley (2002-2009). |
| | THE GUGGENHEIM FUNDS SEMI-ANNUAL REPORT | 31 |
INFORMATION ON BOARD OF TRUSTEES AND OFFICERS (Unaudited)(concluded)
Name, Address* and Year of Birth | Position(s) held with the Trust | Term of Office and Length of Time Served** | Principal Occupations During Past Five Years |
| OFFICERS - concluded | |
John L. Sullivan (1955) | Chief Financial Officer and Treasurer | Since 2014 | Current: CFO, Chief Accounting Officer and Treasurer, certain other funds in the Fund Complex (2010-present); Senior Managing Director, Guggenheim Investments (2010-present). Former: Managing Director and CCO, each of the funds in the Van Kampen Investments fund complex (2004-2010); Managing Director and Head of Fund Accounting and Administration, Morgan Stanley Investment Management (2002-2004); CFO and Treasurer, Van Kampen Funds (1996-2004). |
| * | The business address of each officer is c/o Guggenheim Investments, 805 King Farm Boulevard, Suite 600, Rockville, Maryland 20850. |
| ** | Each officer serves an indefinite term, until his or her successor is duly elected and qualified. Time served includes time served in the respective position for the Predecessor Corporation. |
| 32 | THE GUGGENHEIM FUNDS SEMI-ANNUAL REPORT | |
GUGGENHEIM INVESTMENTS PRIVACY POLICIES (Unaudited)
Rydex Funds, Guggenheim Funds, Rydex Investments, Guggenheim Funds Distributors, LLC, Security Investors, LLC, Security Distributors, Inc., Guggenheim Partners Investment Managers, LLC, and Rydex Advisory Services (Collectively “Guggenheim Investments”).
Our Commitment to You
When you become a Guggenheim Investments investor, you entrust us with not only your hard-earned money but also with personal and financial information about you. We recognize that your relationship with us is based on trust and that you expect us to act responsibly and in your best interests. Because we have access to this private information about you, we hold ourselves to the highest standards in its safekeeping and use. This means, most importantly, that we do not sell client information to anyone—whether it is your personal information or if you are a current or former Guggenheim Investments client.
The Information We Collect About You
In the course of doing business with shareholders and investors, we collect nonpublic personal information about you. You typically provide personal information when you complete a Guggenheim Investments account application or when you request a transaction that involves Rydex and Guggenheim Investments funds or one of the Guggenheim Investments affiliated companies. “Nonpublic personal information” is personally identifiable private information about you. For example, it includes information regarding your name and address, Social Security or taxpayer identification number, assets, income, account balance, bank account information and investment activity (e.g., purchase and redemption history).
How We Handle Your Personal Information
As emphasized above, we do not sell information about current or former clients or their accounts to third parties. Nor do we share such information, except when necessary to complete transactions at your request or to make you aware of related investment products and services that we offer. Additional details about how we handle your personal information are provided below. To complete certain transactions or account changes that you direct, it may be necessary to provide identifying information to companies, individuals or groups that are not affiliated with Guggenheim Investments. For example, if you ask to transfer assets from another financial institution to Guggenheim Investments, we will need to provide certain information about you to that company to complete the transaction. To alert you to other Guggenheim Investments investment products and services, we may share your information within the Guggenheim Investments family of affiliated companies. This would include, for example, sharing your information within Guggenheim Investments so we can make you aware of
| | THE GUGGENHEIM FUNDS SEMI-ANNUAL REPORT | 33 |
GUGGENHEIM INVESTMENTS PRIVACY POLICIES (Unaudited)(continued)
new Rydex and Guggenheim Investments funds or the services offered through another Guggenheim Investments affiliated company. In certain instances, we may contract with nonaffiliated companies to perform services for us. Where necessary, we will disclose information we have about you to these third parties. In all such cases, we provide the third party with only the information necessary to carry out its assigned responsibilities and only for that purpose. And we require these third parties to treat your private information with the same high degree of confidentiality that we do. In certain instances, we may share information with other financial institutions regarding individuals and entities in response to the U.S.A. Patriot Act. Finally, we will release information about you if you direct us to do so, if we are compelled by law to do so or in other circumstances permitted by law.
Opt Out Provisions
We do not sell your personal information to anyone. The law allows you to “opt out” of only certain kinds of information sharing with third parties. The firm does not share personal information about you with any third parties that triggers this opt-out right. This means YOU ARE ALREADY OPTED OUT.
How We Protect Privacy Online
Our concern for the privacy of our shareholders also extends to those who use our web site, guggenheiminvestments.com. Our web site uses some of the most secure forms of online communication available, including encryption technology, Secure Socket Layer (SSL) protocol, firewalls and user names and passwords. These technologies provide a high level of security and privacy when you access your account information or initiate online transactions. The Guggenheim Investments web site offers customized features that require our use of “http cookies”—tiny pieces of information that we ask your browser to store. However, we make very limited use of these cookies. We only use cookies for session management and security features on the Guggenheim Investments web site. We do not use them to pull data from your hard drive, to learn your email address, or to view data in cookies created by other web sites. We will not share the information in our cookies or give others access to it. See the legal information area on our web site for more details about web site security and privacy features.
How We Safeguard Your Personal Information
We restrict access to nonpublic personal information about shareholders to our employees and in some cases to third parties (for example, the service providers described above) as permitted by law. We maintain strict physical, electronic and procedural safeguards that comply with federal standards to guard your nonpublic personal information.
| 34 | THE GUGGENHEIM FUNDS SEMI-ANNUAL REPORT | |
GUGGENHEIM INVESTMENTS PRIVACY POLICIES (Unaudited)(concluded)
We’ll Keep You Informed
As required by federal law, we will notify shareholders of our privacy policy annually. We reserve the right to modify this policy at any time, but rest assured that if we do change it, we will tell you promptly. You will also be able to access our privacy policy from our web site at guggenheiminvestments.com. Should you have any questions regarding our privacy policy, contact us at 800.820.0888 or 301.296.5100.
| | THE GUGGENHEIM FUNDS SEMI-ANNUAL REPORT | 35 |
This page intentionally left blank.
This page intentionally left blank.
3.31.2015
Guggenheim Funds Semi-Annual Report
| | |
| Guggenheim Capital Stewardship Fund | | |
| CSF-SEMI-0315x0915 | guggenheiminvestments.com |
| DEAR SHAREHOLDER | 2 |
| ECONOMIC AND MARKET OVERVIEW | 3 |
| ABOUT SHAREHOLDERS’ FUND EXPENSES | 5 |
| CAPITAL STEWARDSHIP FUND | 7 |
| NOTES TO FINANCIAL STATEMENTS | 13 |
| OTHER INFORMATION | 17 |
| INFORMATION ON BOARD OF TRUSTEES AND OFFICERS | 18 |
| GUGGENHEIM INVESTMENTS PRIVACY POLICIES | 22 |
| | THE GUGGENHEIM FUNDS SEMI-ANNUAL REPORT | 1 |
March 31, 2015
Dear Shareholder:
Guggenheim Partners Investment Management (the “Investment Adviser”) and Concinnity Advisors, LP, the Fund’s subadviser (the “Sub-Adviser”), are pleased to present the semi-annual shareholder report for one of our Funds (the “Fund”) for the six-month period ended March 31, 2015.
The Investment Adviser is part of Guggenheim Investments, which represents the investment management businesses of Guggenheim Partners, LLC (“Guggenheim”), a global, diversified financial services firm. The Sub-Adviser is unaffiliated with Guggenheim.
Guggenheim Funds Distributors, LLC is the distributor of the Funds. Guggenheim Funds Distributors, LLC is affiliated with Guggenheim and the Investment Adviser.
We encourage you to read the Economic and Market Overview section of the report, which follows this letter.
We are committed to providing innovative investment solutions and appreciate the trust you place in us.
Sincerely,
Donald C. Cacciapaglia
President
April 30, 2015
Read a prospectus and summary prospectus (if available) carefully before investing. It contains the investment objectives, risks, charges, expenses and other information, which should be considered carefully before investing. Obtain a prospectus and summary prospectus (if available) at guggenheiminvestments.com or call 800.820.0888.
There can be no assurance that any investment product will achieve its investment objective(s). There are risks associated with investing, including the entire loss of principal invested. Investing involves market risks. The investment return and principal value of any investment product will fluctuate with changes in market conditions.
| 2 | THE GUGGENHEIM FUNDS SEMI-ANNUAL REPORT | |
ECONOMIC AND MARKET OVERVIEW (Unaudited) | March 31, 2015 |
The U.S. continued to enjoy a self-sustaining economic expansion for the six-month period ended March 31, 2015, although winter weather was likely to distort first-quarter economic data. In addition, U.S. companies scaled back hiring in the last month of the period, adding to evidence that the domestic economy has lost some momentum since the turn of the year. The March increase in payrolls was the smallest since December 2013 and broke a 12-month run of gains above 200,000.
Despite this short-term dislocation, the economy remains on track. Indeed, many other labor market indicators, such as initial jobless claims and the job openings rate, suggest that the U.S. labor market remains quite strong, supporting the conclusion that March’s payroll report was just a temporary blip, similar to the one witnessed last winter. As soon as temporary seasonal factors have dissipated, economic data is likely to bounce back. The labor market has improved over the past year, as subdued mortgage rates and tight housing inventory continue to point to fairly stable appreciation in the housing market, which is key to the ongoing recovery. Consumers are also being helped by lower fuel prices, which are acting as a tax cut for U.S. consumers, freeing up discretionary spending in other areas and acting as a support for consumption.
In Europe, economic data has been surprisingly good and should continue along that path on the back of the European Central Bank’s program of quantitative easing and depreciation of the euro. Japan’s economy remains weak and, without more structural reform, continued monetary accommodation could lead to stagflation. China’s policymakers appear likely to continue the supply of credit and do whatever else is necessary to maintain growth there at an acceptable pace for the near term.
Given weakness overseas and the effect of a stronger U.S. dollar on international earnings, some stocks could face a more challenging environment in the near term, but our research shows that equity markets tend to perform quite well in the periods leading up to a U.S. Federal Reserve (the “Fed”) rate increase. The yield on the 10-year Treasury note declined in January by more than 50 basis points before rebounding in February, echoing the pattern since 2009—Treasury yields decline and a sell-off ensues, driving rates higher. Then conditions stabilize, and rates test their previous lows. Liquidity from foreign central banks and comparatively attractive U.S. yields continue to push global investors to U.S. Treasuries, which should hold down U.S. interest rates in the near term.
Against this backdrop, the U.S. central bank feels pressure to raise its key rate above zero, but insists the decision will be data-dependent and not occur prematurely. With a secular inflation increase unlikely in the near term, slack in the economy, and disinflation being imported from abroad, the Fed may not hike rates until later in the year. The Fed for now appears to be focused on wage growth, which is key for sustaining the expansion but also an indicator of inflationary pressure. The lack of sustained wage growth has been a topic that has confounded the Fed lately. Given the strengthening employment numbers and the apparent reduction in labor market slack, wages should start to increase more steadily across the board. This is one of the most important data points at the moment for the Fed.
The underlying U.S. economy remains strong and investors should avoid being panicked by seasonal setbacks. Indeed, considering the strength of the economy and the wave of liquidity emanating from various central banks around the world, the general investment environment should remain attractive.
For the six months ended March 31, 2015, the Standard & Poor’s 500® (“S&P 500”) Index* returned 5.93%. The Morgan Stanley Capital International (“MSCI”) Europe-Australasia-Far East (“EAFE”) Index* returned 1.13%. The return of the MSCI Emerging Markets Index* was -2.37%.
In the bond market, the Barclays U.S. Aggregate Bond Index* posted a 3.43% return for the period, while the Barclays U.S. Corporate High Yield Index* returned 1.49%. The return of the Bank of America Merrill Lynch 3-Month U.S. Treasury Bill Index* was 0.01% for the six-month period.
The opinions and forecasts expressed may not actually come to pass. This information is subject to change at any time, based on market and other conditions, and should not be construed as a recommendation of any specific security or strategy.
| | THE GUGGENHEIM FUNDS SEMI-ANNUAL REPORT | 3 |
ECONOMIC AND MARKET OVERVIEW (Unaudited)(concluded) | March 31, 2015 |
*Index Definitions:
The following indices are referenced throughout this report. Indices are unmanaged and not available for direct investment. Index performance does not reflect transaction costs, fees, or expenses.
Barclays U.S. Aggregate Bond Index is a broad-based benchmark that measures the investment grade, U.S. dollar-denominated, fixed-rate taxable bond market, including U.S. Treasuries, government-related and corporate securities, MBS (agency fixed-rate and hybrid ARM pass-throughs), ABS, and CMBS.
Barclays U.S. Corporate High Yield Index measures the market of U.S. dollar-denominated, non-investment grade, fixed-rate, taxable corporate bonds. Securities are classified as high yield if the middle rating of Moody’s, Fitch, and S&P is Ba1/BB+/BB+ or below.
Bank of America (“BofA”) Merrill Lynch 3-Month U.S. Treasury Bill Index is an unmanaged market index of U.S. Treasury securities maturing in 90 days that assumes reinvestment of all income.
MSCI EAFE Index is a free float-adjusted market capitalization index that is designed to measure the equity market performance of developed markets, excluding the U.S. & Canada.
MSCI Emerging Markets Index is a free float-adjusted market capitalization weighted index that is designed to measure equity market performance in the global emerging markets.
S&P 500® Index is a capitalization-weighted index of 500 stocks designed to measure the performance of the broad economy, representing all major industries and is considered a representation of the U.S. stock market.
| 4 | THE GUGGENHEIM FUNDS SEMI-ANNUAL REPORT | |
ABOUT SHAREHOLDERS’ FUND EXPENSES (Unaudited)
All mutual funds have operating expenses and it is important for our shareholders to understand the impact of costs on their investments. Shareholders of a Fund incur two types of costs: (i) transaction costs, including sales charges (loads) on purchase payments, reinvested dividends, or other distributions; and exchange fees; and (ii) ongoing costs, including management fees, administrative services, and shareholder reports, among others. These ongoing costs, or operating expenses, are deducted from a fund’s gross income and reduce the investment return of the fund.
A fund’s expenses are expressed as a percentage of its average net assets, which is known as the expense ratio. The following examples are intended to help investors understand the ongoing costs (in dollars) of investing in a Fund and to compare these costs with the ongoing costs of investing in other mutual funds.
The examples are based on an investment of $1,000 made at the beginning of the period and held for the entire six-month period beginning September 30, 2014 and ending March 31, 2015.
The following tables illustrate a Fund’s costs in two ways:
Table 1. Based on actual Fund return. This section helps investors estimate the actual expenses paid over the period. The “Ending Account Value” shown is derived from the Fund’s actual return, and the fourth column shows the dollar amount that would have been paid by an investor who started with $1,000 in the Fund. Investors may use the information here, together with the amount invested, to estimate the expenses paid over the period. Simply divide the Fund’s account value by $1,000 (for example, an $8,600 account value divided by $1,000 = 8.6), then multiply the result by the number provided under the heading “Expenses Paid During Period.”
Table 2. Based on hypothetical 5% return. This section is intended to help investors compare a Fund’s cost with those of other mutual funds. The table provides information about hypothetical account values and hypothetical expenses based on the Fund’s actual expense ratio and an assumed rate of return of 5% per year before expenses, which is not the Fund’s actual return. The hypothetical account values and expenses may not be used to estimate the actual ending account balance or expenses paid during the period. The example is useful in making comparisons because the U.S. Securities and Exchange Commission (the “SEC”) requires all mutual funds to calculate expenses based on the 5% return. Investors can assess a Fund’s costs by comparing this hypothetical example with the hypothetical examples that appear in shareholder reports of other funds.
The calculations illustrated above assume no shares were bought or sold during the period. Actual costs may have been higher or lower, depending on the amount of investment and the timing of any purchases or redemptions.
Please note that the expenses shown in the table are meant to highlight your ongoing costs only and do not reflect any transactional costs, such as sales charges (loads) on purchase payments, and contingent deferred sales charges (“CDSC”) on redemptions, if any. Therefore, the second table is useful in comparing ongoing costs only, and will not help you determine the relative total costs of owning different funds. In addition, if these transactional costs were included, your costs would have been higher.
More information about a Fund’s expenses, including annual expense ratios for the past five years, can be found in the Financial Highlights section of this report. For additional information on operating expenses and other shareholder costs, please refer to the appropriate Fund prospectus.
| | THE GUGGENHEIM FUNDS SEMI-ANNUAL REPORT | 5 |
ABOUT SHAREHOLDERS’ FUND EXPENSES (Unaudited)(concluded)
| | Expense Ratio1 | Fund Return | Beginning Account Value September 30, 2014 | Ending Account Value March 31, 2015 | Expenses Paid During Period2 |
Table 1. Based on actual Fund return3 | | | | | |
| Capital Stewardship Fund | 1.13% | 3.70% | $1,000.00 | $1,037.00 | $5.74 |
| |
| Table 2. Based on hypothetical 5% return (before expenses) | | | | |
| Capital Stewardship Fund | 1.13% | 5.00% | $1,000.00 | $1,019.30 | $5.69 |
1 | Annualized and excludes expenses of the underlying funds in which the Fund invests. |
2 | Expenses are equal to the Fund's annualized expense ratio, net of any applicable fee waivers, multiplied by the average account value over the period, multiplied by 182/365 (to reflect the one-half year period). |
3 | Actual cumulative return at net asset value for the period September 30, 2014 to March 31, 2015. |
| 6 | THE GUGGENHEIM FUNDS SEMI-ANNUAL REPORT | |
FUND PROFILE (Unaudited) | March 31, 2015 |
CAPITAL STEWARDSHIP FUND
OBJECTIVE: Seeks long-term capital appreciation.
Holdings Diversification (Market Exposure as % of Net Assets)
“Holdings Diversification (Market Exposure as % of Net Assets)” excludes any temporary cash investments.
| Inception Date: |
| Institutional Class | September 26, 2014 |
| Ten Largest Holdings (% of Total Net Assets) |
| Apple, Inc. | 3.9% |
| Pfizer, Inc. | 2.3% |
| Microsoft Corp. | 2.2% |
| JPMorgan Chase & Co. | 2.0% |
| Johnson & Johnson | 1.9% |
| Procter & Gamble Co. | 1.9% |
| General Electric Co. | 1.8% |
| Merck & Company, Inc. | 1.6% |
| CVS Health Corp. | 1.6% |
| Entergy Corp. | 1.5% |
| Top Ten Total | 20.7% |
“Ten Largest Holdings” exclude any temporary cash or derivative investments.
| | THE GUGGENHEIM FUNDS SEMI-ANNUAL REPORT | 7 |
SCHEDULE OF INVESTMENTS (Unaudited) | March 31, 2015 |
| CAPITAL STEWARDSHIP FUND | |
| | |
Shares | | | Value | |
| | | | | | | | |
COMMON STOCKS† - 99.1% | |
| | | | | | | | |
| CONSUMER, NON-CYCLICAL - 28.5% | |
| Pfizer, Inc. | | | 136,450 | | | $ | 4,747,095 | |
| Johnson & Johnson | | | 40,667 | | | | 4,091,100 | |
| Procter & Gamble Co. | | | 49,132 | | | | 4,025,875 | |
| Merck & Company, Inc. | | | 59,357 | | | | 3,411,840 | |
| PepsiCo, Inc. | | | 32,531 | | | | 3,110,614 | |
| Aetna, Inc. | | | 28,793 | | | | 3,067,318 | |
| Coca-Cola Co. | | | 68,294 | | | | 2,769,322 | |
| Mondelez International, Inc. — Class A | | | 73,706 | | | | 2,660,049 | |
| Medtronic plc | | | 31,323 | | | | 2,442,881 | |
| Gilead Sciences, Inc.* | | | 24,740 | | | | 2,427,736 | |
| Amgen, Inc. | | | 14,956 | | | | 2,390,717 | |
| ConAgra Foods, Inc. | | | 64,431 | | | | 2,353,664 | |
| Kimberly-Clark Corp. | | | 21,562 | | | | 2,309,506 | |
| Kroger Co. | | | 28,882 | | | | 2,214,094 | |
| Eli Lilly & Co. | | | 28,512 | | | | 2,071,397 | |
| Kellogg Co. | | | 29,785 | | | | 1,964,321 | |
| AbbVie, Inc. | | | 31,259 | | | | 1,829,902 | |
| Baxter International, Inc. | | | 26,241 | | | | 1,797,509 | |
| Molson Coors Brewing Co. — Class B | | | 22,521 | | | | 1,676,688 | |
| DaVita HealthCare Partners, Inc.* | | | 20,063 | | | | 1,630,721 | |
| ADT Corp. | | | 35,598 | | | | 1,478,029 | |
| HCA Holdings, Inc.* | | | 17,569 | | | | 1,321,716 | |
| Bristol-Myers Squibb Co. | | | 20,490 | | | | 1,321,605 | |
| Colgate-Palmolive Co. | | | 11,681 | | | | 809,961 | |
| Avon Products, Inc. | | | 96,842 | | | | 773,768 | |
| ManpowerGroup, Inc. | | | 7,893 | | | | 679,982 | |
| RR Donnelley & Sons Co. | | | 31,781 | | | | 609,877 | |
| Total Consumer, Non-cyclical | | | | | | | 59,987,287 | |
| | | | | | | | |
| TECHNOLOGY - 17.1% | |
| Apple, Inc. | | | 65,791 | | | | 8,186,373 | |
| Microsoft Corp. | | | 115,444 | | | | 4,693,376 | |
| Intel Corp. | | | 87,271 | | | | 2,728,964 | |
| International Business Machines Corp. | | | 16,875 | | | | 2,708,438 | |
| EMC Corp. | | | 87,783 | | | | 2,243,734 | |
| Hewlett-Packard Co. | | | 70,985 | | | | 2,211,893 | |
| Western Digital Corp. | | | 19,100 | | | | 1,738,291 | |
| Xerox Corp. | | | 131,801 | | | | 1,693,643 | |
| CA, Inc. | | | 37,099 | | | | 1,209,798 | |
| Micron Technology, Inc.* | | | 44,135 | | | | 1,197,383 | |
| NetApp, Inc. | | | 32,070 | | | | 1,137,202 | |
| Computer Sciences Corp. | | | 14,986 | | | | 978,286 | |
| Pitney Bowes, Inc. | | | 40,219 | | | | 937,907 | |
| Teradyne, Inc. | | | 46,847 | | | | 883,066 | |
| SanDisk Corp. | | | 13,161 | | | | 837,303 | |
| QUALCOMM, Inc. | | | 12,002 | | | | 832,219 | |
| Lexmark International, Inc. — Class A | | | 15,842 | | | | 670,750 | |
| NCR Corp.* | | | 21,491 | | | | 634,199 | |
| Applied Materials, Inc. | | | 25,613 | | | | 577,829 | |
| Total Technology | | | | | | | 36,100,654 | |
| | | | | | | | |
| INDUSTRIAL - 15.8% | |
| General Electric Co. | | | 153,750 | | | | 3,814,537 | |
| Corning, Inc. | | | 99,567 | | | | 2,258,180 | |
| FedEx Corp. | | | 9,895 | | | | 1,637,128 | |
| Parker-Hannifin Corp. | | | 13,703 | | | | 1,627,642 | |
| Boeing Co. | | | 10,830 | | | | 1,625,366 | |
| CSX Corp. | | | 48,821 | | | | 1,616,951 | |
| Eaton Corporation plc | | | 22,219 | | | | 1,509,559 | |
| United Technologies Corp. | | | 12,876 | | | | 1,509,067 | |
| Thermo Fisher Scientific, Inc. | | | 9,867 | | | | 1,325,533 | |
| Agilent Technologies, Inc. | | | 31,665 | | | | 1,315,681 | |
| Deere & Co. | | | 14,931 | | | | 1,309,300 | |
| Emerson Electric Co. | | | 22,424 | | | | 1,269,647 | |
| Norfolk Southern Corp. | | | 12,230 | | | | 1,258,711 | |
| Stanley Black & Decker, Inc. | | | 13,197 | | | | 1,258,466 | |
| Raytheon Co. | | | 10,884 | | | | 1,189,077 | |
| Union Pacific Corp. | | | 10,264 | | | | 1,111,694 | |
| 3M Co. | | | 6,380 | | | | 1,052,381 | |
| Dover Corp. | | | 14,799 | | | | 1,022,907 | |
| Honeywell International, Inc. | | | 9,735 | | | | 1,015,458 | |
| Ryder System, Inc. | | | 10,118 | | | | 960,097 | |
| United Parcel Service, Inc. — Class B | | | 9,800 | | | | 950,012 | |
| Avnet, Inc. | | | 20,429 | | | | 909,091 | |
| AGCO Corp. | | | 13,008 | | | | 619,701 | |
| Timken Co. | | | 14,703 | | | | 619,584 | |
| Fluor Corp. | | | 10,783 | | | | 616,356 | |
| Total Industrial | | | | | | | 33,402,126 | |
| | | | | | | | |
| FINANCIAL - 11.6% | |
| JPMorgan Chase & Co. | | | 68,768 | | | | 4,165,965 | |
| Wells Fargo & Co. | | | 55,175 | | | | 3,001,521 | |
| Principal Financial Group, Inc. | | | 44,970 | | | | 2,310,109 | |
| Allstate Corp. | | | 29,932 | | | | 2,130,260 | |
| State Street Corp. | | | 28,558 | | | | 2,099,870 | |
| Travelers Companies, Inc. | | | 16,248 | | | | 1,756,896 | |
| Capital One Financial Corp. | | | 20,321 | | | | 1,601,701 | |
| Ameriprise Financial, Inc. | | | 11,862 | | | | 1,552,024 | |
| Visa, Inc. — Class A | | | 18,960 | | | | 1,240,174 | |
| Morgan Stanley | | | 28,459 | | | | 1,015,702 | |
| PNC Financial Services Group, Inc. | | | 10,742 | | | | 1,001,584 | |
| Simon Property Group, Inc. | | | 3,434 | | | | 671,828 | |
| Ventas, Inc. | | | 8,911 | | | | 650,681 | |
| Iron Mountain, Inc. | | | 17,123 | | | | 624,647 | |
| T. Rowe Price Group, Inc. | | | 7,541 | | | | 610,670 | |
| Total Financial | | | | | | | 24,433,632 | |
| | | | | | | | |
| ENERGY - 8.3% | |
| Chevron Corp. | | | 30,693 | | | | 3,222,152 | |
| ConocoPhillips | | | 42,169 | | | | 2,625,442 | |
| Hess Corp. | | | 35,205 | | | | 2,389,363 | |
| Occidental Petroleum Corp. | | | 29,445 | | | | 2,149,485 | |
| Marathon Oil Corp. | | | 75,204 | | | | 1,963,576 | |
| Valero Energy Corp. | | | 24,306 | | | | 1,546,348 | |
| Schlumberger Ltd. | | | 12,762 | | | | 1,064,861 | |
| 8 | THE GUGGENHEIM FUNDS SEMI-ANNUAL REPORT | SEE NOTES TO FINANCIAL STATEMENTS. |
SCHEDULE OF INVESTMENTS (Unaudited)(concluded) | March 31, 2015 |
| CAPITAL STEWARDSHIP FUND | |
| | |
Shares | | | Value | |
| | | | | | | | | |
| Spectra Energy Corp. | | | 28,431 | | | $ | 1,028,349 | |
| EOG Resources, Inc. | | | 8,423 | | | | 772,305 | |
| First Solar, Inc.* | | | 11,696 | | | | 699,304 | |
| Total Energy | | | | | | | 17,461,185 | |
| | | | | | | | |
| CONSUMER, CYCLICAL - 8.3% | |
| CVS Health Corp. | | | 32,473 | | | | 3,351,538 | |
| Wal-Mart Stores, Inc. | | | 38,767 | | | | 3,188,586 | |
| Ford Motor Co. | | | 118,701 | | | | 1,915,834 | |
| Delta Air Lines, Inc. | | | 41,970 | | | | 1,886,971 | |
| Target Corp. | | | 14,046 | | | | 1,152,755 | |
| Costco Wholesale Corp. | | | 7,307 | | | | 1,106,974 | |
| Macy’s, Inc. | | | 16,696 | | | | 1,083,737 | |
| PVH Corp. | | | 9,332 | | | | 994,418 | |
| Home Depot, Inc. | | | 6,537 | | | | 742,669 | |
| Ingram Micro, Inc. — Class A* | | | 29,559 | | | | 742,522 | |
| The Gap, Inc. | | | 15,078 | | | | 653,330 | |
| Whirlpool Corp. | | | 3,132 | | | | 632,852 | |
| Total Consumer, Cyclical | | | | | | | 17,452,186 | |
| | | | | | | | |
| COMMUNICATIONS - 6.6% | |
| Cisco Systems, Inc. | | | 102,590 | | | | 2,823,790 | |
| Google, Inc. — Class A* | | | 4,595 | | | | 2,548,847 | |
| AT&T, Inc. | | | 67,347 | | | | 2,198,879 | |
| Verizon Communications, Inc. | | | 36,166 | | | | 1,758,752 | |
| CenturyLink, Inc. | | | 42,223 | | | | 1,458,805 | |
| Walt Disney Co. | | | 10,576 | | | | 1,109,317 | |
| Motorola Solutions, Inc. | | | 10,967 | | | | 731,170 | |
| Facebook, Inc. — Class A* | | | 7,940 | | | | 652,787 | |
| Viacom, Inc. — Class B | | | 8,911 | | | | 608,621 | |
| Total Communications | | | | | | | 13,890,968 | |
| | | | | | | | |
| UTILITIES - 2.9% | |
| Entergy Corp. | | | 42,076 | | | | 3,260,470 | |
| Consolidated Edison, Inc. | | | 26,373 | | | | 1,608,753 | |
| CenterPoint Energy, Inc. | | | 63,762 | | | | 1,301,382 | |
| Total Utilities | | | | | | | 6,170,605 | |
| | | | | | | | |
| Total Common Stocks | | | | | | | | |
| (Cost $208,262,942) | | | | | | | 208,898,643 | |
| | | | | | | | |
EXCHANGE-TRADED FUNDS† - 0.6% | |
| SPDR S&P 500 ETF Trust | | | 5,811 | | | | 1,199,565 | |
| Total Exchange-Traded Funds | | | | | | | | |
| (Cost $1,205,056) | | | | | | | 1,199,565 | |
| | | | | | | | |
SHORT TERM INVESTMENTS† - 0.3% | |
| Dreyfus Treasury Prime Cash Management Fund 0.00% | | | 648,241 | | | | 648,241 | |
| Total Short Term Investments | | | | | | | | |
| (Cost $648,241) | | | | | | | 648,241 | |
| | | | | | | | |
| Total Investments - 100.0% | | | | | | | | |
| (Cost $210,116,239) | | | | | | $ | 210,746,449 | |
| Other Assets & Liabilities, net - 0.0% | | | | | | | (1,943 | ) |
| Total Net Assets - 100.0% | | | | | | $ | 210,744,506 | |
| * | Non-income producing security. |
| † | Value determined based on Level 1 inputs — See Note 4. |
| plc — Public Limited Company |
| | |
| See Sector Classification in Other Information section. |
| SEE NOTES TO FINANCIAL STATEMENTS. | THE GUGGENHEIM FUNDS SEMI-ANNUAL REPORT | 9 |
STATEMENT OF ASSETS AND LIABILITIES (Unaudited)
March 31, 2015
| Assets: | |
| Investments, at value (cost $210,116,239) | | $ | 210,746,449 | |
| Prepaid expenses | | | 102,285 | |
| Cash | | | 4,115 | |
| Receivables: | |
| Securities sold | | | 1,034,618 | |
| Dividends | | | 307,872 | |
| Total assets | | | 212,195,339 | |
| | | | | |
| Liabilities: | |
| Payable for: | |
| Fund shares redeemed | | | 1,241,403 | |
| Management fees | | | 162,851 | |
| Fund accounting/administration fees | | | 17,190 | |
| Trustees’ fees* | | | 572 | |
| Transfer agent/maintenance fees | | | 89 | |
| Miscellaneous | | | 28,728 | |
| Total liabilities | | | 1,450,833 | |
| Net assets | | $ | 210,744,506 | |
| | | | | |
| Net assets consist of: | |
| Paid in capital | | $ | 205,442,916 | |
| Undistributed net investment income | | | 698,840 | |
| Accumulated net realized gain on investments | | | 3,972,540 | |
| Net unrealized appreciation on investments | | | 630,210 | |
| Net assets | | $ | 210,744,506 | |
| Capital shares outstanding | | | 8,221,162 | |
| Net asset value per share | | $ | 25.63 | |
STATEMENT OF OPERATIONS (Unaudited)
Period Ended March 31, 2015
| Investment Income: | |
| Dividends | | $ | 2,521,184 | |
| Interest | | | 37 | |
| Total investment income | | | 2,521,221 | |
| | | | | |
| Expenses: | |
| Management fees | | | 948,669 | |
| Transfer agent/maintenance fees | | | 772 | |
| Fund accounting/administration fees | | | 100,136 | |
| Legal fees | | | 85,613 | |
| Trustees’ fees* | | | 5,481 | |
| Custodian fees | | | 2,992 | |
| Miscellaneous | | | 43,049 | |
| Total expenses | | | 1,186,712 | |
| Net investment income | | | 1,334,509 | |
| | | | | |
| Net Realized and Unrealized Gain (Loss): | |
| Net realized gain (loss) on: | |
| Investments | | | 3,972,540 | |
| Net realized gain | | | 3,972,540 | |
| Net change in unrealized appreciation (depreciation) on: | |
| Investments | | | 2,413,627 | |
| Net change in unrealized appreciation (depreciation) | | | 2,413,627 | |
| Net realized and unrealized gain | | | 6,386,167 | |
| Net increase in net assets resulting from operations | | $ | 7,720,676 | |
| * | Relates to Trustees not deemed “interested persons” within the meaning of Section 2(a)(19) of the 1940 Act. |
| 10 | THE GUGGENHEIM FUNDS SEMI-ANNUAL REPORT | SEE NOTES TO FINANCIAL STATEMENTS. |
STATEMENTS OF CHANGES IN NET ASSETS
| | | Period Ended March 31, 2015 (Unaudited) | | | Period Ended September 30, 2014a | |
| Increase (Decrease) in Net Assets from Operations: | | | | | | |
| Net investment income | | $ | 1,334,509 | | | $ | 1,464 | |
| Net realized gain on investments | | | 3,972,540 | | | | — | |
| Net change in unrealized appreciation (depreciation) on investments | | | 2,413,627 | | | | (1,783,417 | ) |
| Net increase (decrease) in net assets resulting from operations | | | 7,720,676 | | | | (1,781,953 | ) |
| | | | | | | | | |
| Distributions to shareholders from: | | | | | | | | |
| Net investment income | | | (637,133 | ) | | | — | |
| Total distributions to shareholders | | | (637,133 | ) | | | — | |
| | | | | | | | | |
| Capital share transactions: | | | | | | | | |
| Proceeds from sale of shares | | | 38,908,527 | | | | 297,903,896 | |
| Distributions reinvested | | | 476,495 | | | | — | |
| Cost of shares redeemed | | | (44,738,563 | ) | | | (87,107,439 | ) |
| Net increase (decrease) from capital share transactions | | | (5,353,541 | ) | | | 210,796,457 | |
| Net increase in net assets | | | 1,730,002 | | | | 209,014,504 | |
| | | | | | | | | |
| Net assets: | | | | | | | | |
| Beginning of period | | | 209,014,504 | | | | — | |
| End of period | | $ | 210,744,506 | | | $ | 209,014,504 | |
| Undistributed net investment income at end of period | | $ | 698,840 | | | $ | 1,464 | |
| | | | | | | | | |
| Capital share activity: | | | | | | | | |
| Shares sold | | | 1,485,730 | | | | 11,928,585 | |
| Shares issued from reinvestment of distributions | | | 18,671 | | | | — | |
| Shares redeemed | | | (1,714,722 | ) | | | (3,497,102 | ) |
| Net increase (decrease) in shares | | | (210,321 | ) | | | 8,431,483 | |
a | Since commencement of operations: September 26, 2014. |
| SEE NOTES TO FINANCIAL STATEMENTS. | THE GUGGENHEIM FUNDS SEMI-ANNUAL REPORT | 11 |
This table is presented to show selected data for a share outstanding throughout each period and to assist shareholders in evaluating a Fund’s performance for the periods presented.
| Institutional Class | | Period Ended March 31, 2015a | | | Period Ended September 30, 2014b | |
| Per Share Data | | | | | | |
| Net asset value, beginning of period | | $ | 24.79 | | | $ | 25.00 | |
| Income (loss) from investment operations: | |
Net investment income (loss)c | | | .16 | | | | — | d |
| Net gain (loss) on investments (realized and unrealized) | | | .76 | | | | (.21 | ) |
| Total from investment operations | | | .92 | | | | (.21 | ) |
| Less distributions from: | |
| Net investment income | | | (.08 | ) | | | — | |
| Total distributions | | | (.08 | ) | | | — | |
| Net asset value, end of period | | $ | 25.63 | | | $ | 24.79 | |
| | |
Total Returnf | | | 3.70 | % | | | (0.84 | %) |
| Ratios/Supplemental Data | |
| Net assets, end of period (in thousands) | | $ | 210,745 | | | $ | 209,015 | |
| Ratios to average net assets: | |
| Net investment income (loss) | | | 1.27 | % | | | 0.13 | % |
Total expensese | | | 1.13 | % | | | 1.24 | % |
| Portfolio turnover rate | | | 150 | % | | | — | |
a | Unaudited figures for the period ended March 31, 2015. Percentage amounts for the period, except total return and portfolio turnover rate, have been annualized. |
b | Since commencement of operations: September 26, 2014. Percentage amounts for the period, except total return and portfolio turnover rate, have been annualized. |
c | Net investment income (loss) per share was computed using average shares outstanding throughout the period. |
d | Net investment income is less than $0.01 per share. |
e | Does not include expenses of the underlying funds in which the Fund invests. |
f | Total return does not reflect the impact of any applicable sales charge and has not been annualized. |
| 12 | THE GUGGENHEIM FUNDS SEMI-ANNUAL REPORT | SEE NOTES TO FINANCIAL STATEMENTS. |
NOTES TO FINANCIAL STATEMENTS (Unaudited)
1. Organization and Significant Accounting Policies
Organization
Guggenheim Funds Trust (the “Trust”), a Delaware statutory trust, is registered with the SEC under the Investment Company Act of 1940 (“1940 Act”), as a non-diversified, open-ended investment company of the series type. Each series, in effect, is representing a separate Fund. The Trust is authorized to issue an unlimited number of shares. The Trust accounts for the assets of each Fund separately.
The Trust offers a combination of four separate classes of shares, A-Class shares, B-Class shares, C-Class shares and Institutional Class shares. Sales of shares of each Class are made without a front-end sales charge at the net asset value per share (“NAV”), with the exception of A-Class shares. A-Class shares are sold at the NAV, plus the applicable front-end sales charge. The sales charge varies depending on the amount purchased, but will not exceed 4.75%. Prior to February 22, 2011, the maximum sales charge was 5.75%. A-Class share purchases of $1 million or more are exempt from the front-end sales charge but have a 1% contingent deferred sales charge (“CDSC”), if shares are redeemed within 12 months of purchase. B-Class shares were offered without a front-end sales charge, but were subject to a CDSC of up to 5% for five years and convert to A-Class shares after eight years. Effective January 4, 2010, subscriptions for B-Class shares are no longer accepted. C-Class shares have a 1% CDSC if shares are redeemed within 12 months of purchase. Institutional Class shares are offered primarily for direct investment by institutions such as pension and profit sharing plans, endowments, foundations and corporations. Institutional Class shares have a minimum initial investment of $2 million and a minimum account balance of $1 million. Institutional Class shares are offered without a front-end sales charge or a CDSC. At March 31, 2015, the Trust consisted of eighteen funds.
This report covers the Capital Stewardship Fund (the “Fund”). As of March 31, 2015, only Institutional Class shares of the Fund were offered for subscription.
Guggenheim Investments (“GI”) provides advisory services, and Rydex Fund Services, LLC (“RFS”) provides transfer agent, administrative and accounting services to the Trust. Guggenheim Funds Distributors, LLC (“GFD”) acts as principal underwriter for the Trust. GI, RFS and GFD are affiliated entities.
Concinnity Advisors, LP (the “Sub-Adviser”) serves as the sub-adviser to the Fund and is responsible for the day-to-day management of the Fund’s portfolio.
Significant Accounting Policies
The Fund operates as an investment company and accordingly follows the investment company accounting and reporting guidance of the Financial Accounting Standards Board (“FASB”) Accounting Standards Codification Topic 946 Financial Services – Investment Companies.
The following significant accounting policies are in conformity with U.S. generally accepted accounting principles (“U.S. GAAP”) and are consistently followed by the Trust. This requires management to make estimates and assumptions that affect the reported amount of assets and liabilities and disclosure of contingent assets and liabilities at the date of the financial statements and the reported amounts of revenues and expenses during the reporting period. Actual results could differ from these estimates. All time references are based on Eastern Time.
The NAV of a fund is calculated by dividing the market value of the fund’s securities and other assets, less all liabilities, by the number of outstanding shares of the fund.
A. The Board of Trustees of the Fund (the “Board”) has adopted policies and procedures for the valuation of the Fund's investments (the “Valuation Procedures”). Pursuant to the Valuation Procedures, the Board has delegated to a valuation committee, consisting of representatives from Guggenheim’s investment management, fund administration, legal and compliance departments (the “Valuation Committee”), the day-to-day responsibility for implementing the Valuation Procedures, including, under most circumstances, the responsibility for determining the fair value of the Fund’s securities or other assets.
Valuations of the Fund's securities are supplied primarily by pricing services appointed pursuant to the processes set forth in the Valuation Procedures. The Valuation Committee convenes monthly, or more frequently as needed and will review the valuation of all assets which have been fair valued for reasonableness. The Fund's officers, through the Valuation Committee and consistent with the monitoring and review responsibilities set forth in the Valuation Procedures, regularly review procedures used by, and valuations provided by, the pricing services.
| | THE GUGGENHEIM FUNDS SEMI-ANNUAL REPORT | 13 |
NOTES TO FINANCIAL STATEMENTS (Unaudited)(continued)
If the pricing service cannot or does not provide a valuation for a particular investment or such valuation is deemed unreliable, such investment is fair valued by the Valuation Committee.
Equity securities listed on an exchange (New York Stock Exchange (“NYSE”) or American Stock Exchange) are valued at the last quoted sales price as of the close of business on the NYSE, usually 4:00 p.m. on the valuation date. Equity securities listed on the NASDAQ market system are valued at the NASDAQ Official Closing Price on the valuation date, which may not necessarily represent the last sale price. If there has been no sale on such exchange or NASDAQ on a given day, the security is valued at the closing bid price on that day.
Open-end investment companies (“Mutual Funds”) are valued at their NAV as of the close of business, on the valuation date. Exchange-traded funds (“ETFs”) and closed-end investment companies (“CEFs”) are valued at the last quoted sales price.
Investments for which market quotations are not readily available are fair valued as determined in good faith by GI under the direction of the Board of Trustees using methods established or ratified by the Board of Trustees. These methods include, but are not limited to: (i) obtaining general information as to how these securities and assets trade; and (ii) obtaining other information and considerations, including current values in related markets.
B. Security transactions are recorded on the trade date for financial reporting purposes. Realized gains and losses from securities transactions are recorded using the identified cost basis. Proceeds from lawsuits related to investment holdings are recorded as realized gains in the Fund. Dividend income is recorded on the ex-dividend date, net of applicable taxes withheld by foreign countries. Taxable non-cash dividends are recorded as dividend income. Interest income, including amortization of premiums and accretion of discounts, is accrued on a daily basis. Interest income also includes paydown gains and losses on mortgage-backed and asset-backed securities and senior and subordinated loans. Amendment fees are earned as compensation for evaluating and accepting changes to the original loan agreement and are recognized when received. Dividend income from REITs is recorded based on the income included in the distributions received from the REIT investments using published REIT classifications, including some management estimates when actual amounts are not available. Distributions received in excess of this estimated amount are recorded as a reduction of the cost of investments or reclassified to capital gains. The actual amounts of income, return of capital, and capital gains are only determined by each REIT after its fiscal year-end, and may differ from the estimated amounts.
C. Distributions of net investment income and net realized gains, if any, are declared and paid at least annually. Dividends are reinvested in additional shares unless shareholders request payment in cash. Distributions are recorded on the ex-dividend date and are determined in accordance with income tax regulations which may differ from U.S. GAAP.
D. Certain expenses have been allocated to the individual Funds in the Trust on a pro rata basis upon the respective aggregate net assets of each Fund included in the Trust.
E. Under the fee arrangement with the custodian, the Fund may earn credits based on overnight custody cash balances. These credits are utilized to reduce related custodial expenses. The custodian fees disclosed in the Statement of Operations are before the reduction in expense from the related earnings credits, if any. For the period ended March 31, 2015, there were no earnings credits received.
The Fund may leave cash overnight in its cash account with the custodian. Periodically, the Fund may have cash due to the custodian bank as an overdraft balance. A fee is incurred on this overdraft, calculated by multiplying the overdraft by a rate based on the federal funds rate.
F. Under the Fund's organizational documents, its Trustees and Officers are indemnified against certain liabilities arising out of the performance of their duties to the Trust. In addition, throughout the normal course of business, the Fund enters into contracts that contain a variety of representations and warranties which provide general indemnifications. The Fund's maximum exposure under these arrangements is unknown, as this would involve future claims that may be made against the Fund and/or its affiliates that have not yet occurred. However, based on experience, the Fund expects the risk of loss to be remote.
| 14 | THE GUGGENHEIM FUNDS SEMI-ANNUAL REPORT | |
NOTES TO FINANCIAL STATEMENTS (Unaudited)(continued)
The Fund intends to comply with the provisions of Subchapter M of the Internal Revenue Code applicable to regulated investment companies and will distribute substantially all taxable net investment income and capital gains sufficient to relieve the Fund from all, or substantially all, federal income, excise and state income taxes. Therefore, no provision for federal or state income tax is required.
Tax positions taken or expected to be taken in the course of preparing the Fund’s tax returns are evaluated to determine whether the tax positions are “more-likely-than-not” of being sustained by the applicable tax authority. Tax positions not deemed to meet the more-likely-than-not threshold would be recorded as a tax benefit or expense in the current year. Management has analyzed the Fund’s tax positions taken, or to be taken, on Federal income tax returns for all open tax years, and has concluded that no provision for income tax is required in the Fund’s financial statements. The Fund’s federal tax returns are subject to examination by the Internal Revenue Service for a period of three years after they are filed.
At March 31, 2015, the cost of securities for Federal income tax purposes, the aggregate gross unrealized gain for all securities for which there was an excess of value over tax cost and the aggregate gross unrealized loss for all securities for which there was an excess of tax cost over value, were as follows:
| Fund | | Tax Cost | | | Tax Unrealized Gain | | | Tax Unrealized Loss | | | Net Unrealized Gain | |
| Capital Stewardship Fund | | $ | 210,342,535 | | | $ | 8,152,040 | | | $ | (7,748,126 | ) | | $ | 403,914 | |
3. Fees and Other Transactions with Affiliates
Under the terms of an investment advisory contract, the Fund pays GI investment advisory fees calculated at an annualized rate of 0.90% of the average daily net assets of the Fund.
RFS is paid the following for providing transfer agent services to the Fund. For these services, RFS receives the following:
| Annual charge per account | $5.00 – $8.00 |
| Transaction fee | $0.60 – $1.10 |
Minimum annual charge per Fund† | $25,000 |
| Certain out-of-pocket charges | Varies |
† | Not subject to Fund during first twelve months of operations. |
RFS also acts as the administrative agent for the Fund, and as such performs administrative functions and the bookkeeping, accounting and pricing functions for the Fund. For these services, RFS receives 0.095% of the average daily net assets of the Fund. The minimum annual charge for administrative fees is $25,000.
RFS engages external service providers to perform other necessary services for the Trust, such as audit and accounting related services, legal services, custody, printing and mailing, etc., on a pass-through basis. Such expenses are allocated to various Funds within the complex based on relative net assets.
Certain trustees and officers of the Trust are also officers of GI, RFS and GFD.
4. Fair Value Measurement
In accordance with U.S. GAAP, fair value is defined as the price that the Fund would receive to sell an investment or pay to transfer a liability in an orderly transaction with an independent buyer in the principal market, or in the absence of a principal market, the most advantageous market for the investment or liability. U.S. GAAP establishes a three-tier fair value hierarchy based on the types of inputs used to value assets and liabilities and requires corresponding disclosure. The hierarchy and the corresponding inputs are summarized below:
| Level 1 — | quoted prices in active markets for identical assets or liabilities. |
| | THE GUGGENHEIM FUNDS SEMI-ANNUAL REPORT | 15 |
NOTES TO FINANCIAL STATEMENTS (Unaudited)(concluded)
| Level 2 — | significant other observable inputs (for example quoted prices for securities that are similar based on characteristics such as interest rates, prepayment speeds, credit risk, etc.). |
| Level 3 — | significant unobservable inputs based on the best information available under the circumstances, to the extent observable inputs are not available, which may include assumptions. |
The types of inputs available depend on a variety of factors, such as the type of security and the characteristics of the markets in which it trades, if any. Fair valuation determinations that rely on fewer or no observable inputs require greater judgment. Accordingly, fair value determinations for Level 3 securities require the greatest amount of judgment.
The following table summarizes the inputs used to value the Fund's investments at March 31, 2015:
| | | Level 1 Investments In Securities | | | Level 2 Investments In Securities | | | Level 3 Investments In Securities | | | Total | |
| Assets | | | | | | | | | | | | |
| Capital Stewardship Fund | | $ | 210,746,449 | | | $ | — | | | $ | — | | | $ | 210,746,449 | |
For the period ended March 31, 2015, there were no transfers between levels.
The inputs or methodologies used for valuing securities are not necessarily an indication of the risk associated with investing in those securities. The suitability of the techniques and sources employed to determine fair valuation are regularly monitored and subject to change.
5. Securities Transactions
For the period ended March 31, 2015, the cost of purchases and proceeds from sales of investment securities, excluding government securities, short-term investments and derivatives, were as follows:
| Fund | | Purchases | | | Sales | |
| Capital Stewardship Fund | | $ | 317,371,728 | | | $ | 321,903,083 | |
| 16 | THE GUGGENHEIM FUNDS SEMI-ANNUAL REPORT | |
OTHER INFORMATION (Unaudited)
Proxy Voting Information
A description of the policies and procedures that the Trust uses to determine how to vote proxies relating to securities held in the Funds’ portfolios is available, without charge and upon request, by calling 800.820.0888. This information is also available from the EDGAR database on the SEC’s website at http://www.sec.gov.
Information regarding how the Funds voted proxies relating to portfolio securities during the most recent 12-month period ended June 30 is available without charge, upon request, by calling 800.820.0888. This information is also available from the EDGAR database on the SEC’s website at http://www.sec.gov.
Sector Classification
Information in the “Schedule of Investments” is categorized by sectors using sector-level classifications used by Bloomberg Industry Classification System, a widely recognized industry classification system provider. In each Fund’s registration statement, the Funds have investment policies relating to concentration in specific industries. For purposes of these investment policies, the Funds usually classify industries based on industry-level classifications used by widely recognized industry classification system providers such as Bloomberg Industry Classification System, Global Industry Classification Standards and Barclays Global Classification Scheme.
Quarterly Portfolio Schedules Information
The Trust files its complete schedule of portfolio holdings with the SEC for the first and third quarters of each fiscal year on Form N-Q; which are available on the SEC’s website at http://www.sec.gov. The Funds’ Forms N-Q may be reviewed and copied at the SEC’s Public Reference Room in Washington, DC, and that information on the operation of the Public Reference Room may be obtained by calling 800-SEC-0330. Copies of the portfolio holdings are also available to shareholders, without charge and upon request, by calling 800.820.0888.
| | THE GUGGENHEIM FUNDS SEMI-ANNUAL REPORT | 17 |
INFORMATION ON BOARD OF TRUSTEES AND OFFICERS (Unaudited)
Name, Address* and Year of Birth | Position(s) Held with the Trust | Term of Office and Length of Time Served** | Principal Occupation(s) During Past Five Years | Number of Portfolios in Fund Complex Overseen | Other Directorships Held by Trustees |
| INDEPENDENT TRUSTEES | | | |
Randall C. Barnes (1951) | Trustee | Since 2014 | Current: Private Investor (2001-present). Former: Senior Vice President and Treasurer, PepsiCo, Inc. (1993-1997); President, Pizza Hut International (1991-1993); Senior Vice President, Strategic Planning and New Business Development, PepsiCo, Inc. (1987-1990). | 91 | Current: Trustee, Purpose Investments Inc. (2014-Present). |
Donald A. Chubb, Jr. (1946) | Trustee and Vice Chairman of the Board | Since 1994 | Current: Business broker and manager of commercial real estate, Griffith & Blair, Inc. (1997-present). | 87 | None. |
Jerry B. Farley (1946) | Trustee and Vice Chairman of the Audit Committee | Since 2005 | Current: President, Washburn University (1997-present). | 87 | Current: Westar Energy, Inc. (2004-present); CoreFirst Bank & Trust (2000-present). |
Roman Friedrich III (1946) | Trustee and Chairman of the Contracts Review Committee | Since 2014 | Current: Founder and President, Roman Friedrich & Company (1998-present). Former: Senior Managing Director, MLV & Co. LLC (2010-2011). | 87 | Current: Zincore Metals, Inc. (2009-present). Former: Mercator Minerals Ltd. (2013-2014); First Americas Gold Corp. (2012-2014); Blue Sky Uranium Corp. (2011-2012); Axiom Gold and Silver Corp. (2011-2012); Stratagold Corp. (2003-2009); GFM Resources Ltd. (2005-2010). |
Robert B. Karn III (1942) | Trustee and Chairman of the Audit Committee | Since 2014 | Current: Consultant (1998-present). Former: Arthur Andersen (1965-1997) and Managing Partner, Financial and Economic Consulting, St. Louis office (1987-1997). | 87 | Current: Peabody Energy Company (2003-present); GP Natural Resource Partners, LLC (2002- present). |
Ronald A. Nyberg (1953) | Trustee and Chairman of the Nominating and Governance Committee | Since 2014 | Current: Partner, Nyberg & Cassioppi, LLC (2000-present). Former: Executive Vice President, General Counsel, and Corporate Secretary, Van Kampen Investments (1982-1999). | 93 | Current: Edward-Elmhurst Healthcare System (2012-present). |
| 18 | THE GUGGENHEIM FUNDS SEMI-ANNUAL REPORT | |
INFORMATION ON BOARD OF TRUSTEES AND OFFICERS (Unaudited)(concluded)
Name, Address* and Year of Birth | Position(s) Held with the Trust | Term of Office and Length of Time Served** | Principal Occupation(s) During Past Five Years | Number of Portfolios in Fund Complex Overseen | Other Directorships Held by Trustees |
| INDEPENDENT TRUSTEES - concluded | | |
Maynard F. Oliverius (1943) | Trustee and Vice Chairman of the Contracts Review Committee | Since 1998 | Current: Retired. Former: President and CEO, Stormont-Vail HealthCare (1996-2012). | 87 | Current: Fort Hays State University Foundation (1999-present); Stormont-Vail Foundation (2013-present); University of Minnesota HealthCare Alumni Association Foundation (2009-present). |
Ronald E. Toupin, Jr. (1958) | Trustee and Chairman of the Board | Since 2014 | Current: Portfolio Consultant (2010-present). Former: Vice President, Manager and Portfolio Manager, Nuveen Asset Management (1998-1999); Vice President, Nuveen Investment Advisory Corp. (1992-1999); Vice President and Manager, Nuveen Unit Investment Trusts (1991-1999); and Assistant Vice President and Portfolio Manager, Nuveen Unit Investment Trusts (1988-1999), each of John Nuveen & Co., Inc. (1982-1999). | 90 | Former: Bennett Group of Funds (2011-2013). |
| INTERESTED TRUSTEE | |
Donald C. Cacciapaglia*** (1951) | President, Chief Executive Officer and Trustee | Since 2012 | Current: President and CEO, certain other funds in the Fund Complex (2012-present); Vice Chairman, Guggenheim Investments (2010-present). Former: Chairman and CEO, Channel Capital Group, Inc. (2002-2010). | 221 | Current: Clear Spring Life Insurance Company (2015-present); Guggenheim Partners Japan, Ltd. (2014-present); Delaware Life (2013-present); Guggenheim Life and Annuity Company (2011-present); Paragon Life Insurance Company of Indiana (2011-present). |
| * | The business address of each Trustee is c/o Guggenheim Investments, 805 King Farm Boulevard, Suite 600, Rockville, Maryland 20850. |
| ** | Each Trustee serves an indefinite term, until his successor is elected and qualified. Time served includes time served in the respective position for the Predecessor Corporation. |
| *** | This Trustee is deemed to be an “interested person” of the Funds under the 1940 Act by reason of his position with the Funds' Investment Manager and/or the parent of the Investment Manager. |
| | THE GUGGENHEIM FUNDS SEMI-ANNUAL REPORT | 19 |
INFORMATION ON BOARD OF TRUSTEES AND OFFICERS (Unaudited)(continued)
Name, Address* and Year of Birth | Position(s) held with the Trust | Term of Office and Length of Time Served** | Principal Occupations During Past Five Years |
| OFFICERS | | | |
Joseph M. Arruda (1966) | Assistant Treasurer | Since 2010 | Current: Assistant Treasurer, certain other funds in the Fund Complex (2006-present); Vice President, Security Investors, LLC (2010-present); CFO and Manager, Guggenheim Specialized Products, LLC (2009-present). Former: Vice President, Security Global Investors, LLC (2010-2011); Vice President, Rydex Advisors, LLC (2010); Vice President, Rydex Advisors II, LLC (2010). |
William H. Belden, III (1965) | Vice President | Since 2014 | Current: Vice President, certain other funds in the Fund Complex (2006-present); Managing Director, Guggenheim Funds Investment Advisors, LLC (2005-present). Former: Vice President of Management, Northern Trust Global Investments (1999-2005). |
Mark J. Furjanic (1959) | Assistant Treasurer | Since 2014 | Current: Vice President, Guggenheim Investments (2005-present); Assistant Treasurer, certain other funds in the Fund Complex (2008-present). Former: Senior Manager, Ernst & Young LLP (1999-2005). |
James M. Howley (1972) | Assistant Treasurer | Since 2014 | Current: Director, Guggenheim Investments (2004-present) ; Assistant Treasurer, certain other funds in the Fund Complex (2006-present). Former: Manager, Mutual Fund Administration of Van Kampen Investments, Inc. (1996-2004). |
Amy J. Lee (1961) | Vice President and Chief Legal Officer | Since 2007 (Vice President) Since 2014 (Chief Legal Officer) | Current: Chief Legal Officer, certain other funds in the Fund Complex (2013-present); Senior Managing Director, Guggenheim Investments (2012-present). Former: Vice President, Associate General Counsel and Assistant Secretary, Security Benefit Life Insurance Company and Security Benefit Corporation (2004-2012). |
Mark E. Mathiasen (1978) | Secretary | Since 2014 | Current: Secretary, certain other funds in the Fund Complex (2007-present); Managing Director, Guggenheim Investments (2007-present). |
Michael P. Megaris (1984) | Assistant Secretary | Since 2014 | Current: Assistant Secretary, certain other funds in the Fund Complex (2014-present); Associate, Guggenheim Investments (2012-present). Former: J.D., University of Kansas School of Law (2009-2012). |
Elisabeth Miller (1968) | Chief Compliance Officer | Since 2012 | Current: CCO, certain other funds in the Fund Complex (2012-present); CCO, Security Investors, LLC (2012-present); CCO, Guggenheim Funds Investment Advisors, LLC (2012-present); Managing Director, Guggenheim Investments (2012-present); Vice President, Guggenheim Funds Distributors, LLC (March 2014-present). Former: CCO, Guggenheim Distributors, LLC (2009-March 2014); Senior Manager, Security Investors, LLC (2004-2009); Senior Manager, Guggenheim Distributors, LLC (2004-2009). |
| 20 | THE GUGGENHEIM FUNDS SEMI-ANNUAL REPORT | |
INFORMATION ON BOARD OF TRUSTEES AND OFFICERS (Unaudited)(concluded)
Name, Address* and Year of Birth | Position(s) held with the Trust | Term of Office and Length of Time Served** | Principal Occupations During Past Five Years |
| OFFICERS - concluded | |
Alison Santay (1974) | AML Officer | Since 2013 | Current: AML Officer, certain other funds in the Fund Complex (2010-present); Director and AML Officer, Rydex Fund Services, LLC (2010-present); AML Officer, Security Investors, LLC (2010-present); Director, Shareholder Risk and Compliance, Rydex Fund Services, LLC (2004-present). Former: AML Officer, Guggenheim Distributors, LLC (2013-2014). |
Kimberly Scott (1974) | Assistant Treasurer | Since 2014 | Current: Vice President, Guggenheim Investments (2012-present) ; Assistant Treasurer, certain other funds in the Fund Complex (2012-present). Former: Financial Reporting Manager, Invesco, Ltd. (2010-2011); Vice President/Assistant Treasurer, Mutual Fund Administration for Van Kampen Investments, Inc./Morgan Stanley Investment Management (2009-2010); Manager of Mutual Fund Administration, Van Kampen Investments, Inc./Morgan Stanley Investment Management (2005-2009). |
Bryan Stone (1979) | Vice President | Since 2014 | Current: Vice President, certain other funds in the Fund Complex (2014-present); Director, Guggenheim Investments (2013-present). Former: Senior Vice President, Neuberger Berman Group LLC (2009-2013); Vice President, Morgan Stanley (2002-2009). |
John L. Sullivan (1955) | Chief Financial Officer and Treasurer | Since 2014 | Current: CFO, Chief Accounting Officer and Treasurer, certain other funds in the Fund Complex (2010-present); Senior Managing Director, Guggenheim Investments (2010-present). Former: Managing Director and CCO, each of the funds in the Van Kampen Investments fund complex (2004-2010); Managing Director and Head of Fund Accounting and Administration, Morgan Stanley Investment Management (2002-2004); CFO and Treasurer, Van Kampen Funds (1996-2004). |
| * | The business address of each officer is c/o Guggenheim Investments, 805 King Farm Boulevard, Suite 600, Rockville, Maryland 20850. |
| ** | Each officer serves an indefinite term, until his or her successor is duly elected and qualified. Time served includes time served in the respective position for the Predecessor Corporation. |
| | THE GUGGENHEIM FUNDS SEMI-ANNUAL REPORT | 21 |
GUGGENHEIM INVESTMENTS PRIVACY POLICIES (Unaudited)
Rydex Funds, Guggenheim Funds, Rydex Investments, Guggenheim Funds Distributors, LLC, Security Investors, LLC, Security Distributors, Inc., Guggenheim Partners Investment Managers, LLC, and Rydex Advisory Services (Collectively “Guggenheim Investments”).
Our Commitment to You
When you become a Guggenheim Investments investor, you entrust us with not only your hard-earned money but also with personal and financial information about you. We recognize that your relationship with us is based on trust and that you expect us to act responsibly and in your best interests. Because we have access to this private information about you, we hold ourselves to the highest standards in its safekeeping and use. This means, most importantly, that we do not sell client information to anyone—whether it is your personal information or if you are a current or former Guggenheim Investments client.
The Information We Collect About You
In the course of doing business with shareholders and investors, we collect nonpublic personal information about you. You typically provide personal information when you complete a Guggenheim Investments account application or when you request a transaction that involves Rydex and Guggenheim Investments funds or one of the Guggenheim Investments affiliated companies. “Nonpublic personal information” is personally identifiable private information about you. For example, it includes information regarding your name and address, Social Security or taxpayer identification number, assets, income, account balance, bank account information and investment activity (e.g., purchase and redemption history).
How We Handle Your Personal Information
As emphasized above, we do not sell information about current or former clients or their accounts to third parties. Nor do we share such information, except when necessary to complete transactions at your request or to make you aware of related investment products and services that we offer. Additional details about how we handle your personal information are provided below. To complete certain transactions or account changes that you direct, it may be necessary to provide identifying information to companies, individuals or groups that are not affiliated with Guggenheim Investments. For example, if you ask to transfer assets from another financial institution to Guggenheim Investments, we will need to provide certain information about you to that company to complete the transaction. To alert you to other Guggenheim Investments investment products and services, we may share your information within the Guggenheim Investments family of affiliated companies. This would include, for example, sharing your information within Guggenheim Investments so we can make you aware of new Rydex and Guggenheim Investments funds or the services offered through another Guggenheim Investments affiliated company. In certain instances, we may contract with nonaffiliated companies to perform services for us. Where necessary, we will disclose information we have about you to these third parties. In all such cases, we provide the third party with only the information necessary to carry out its assigned responsibilities and only for that purpose. And we require these third parties to treat your private information with the same high degree of confidentiality that we do. In certain instances, we may share information with other financial institutions regarding individuals and entities in response to the U.S.A. Patriot Act. Finally, we will release information about you if you direct us to do so, if we are compelled by law to do so or in other circumstances permitted by law.
Opt Out Provisions
We do not sell your personal information to anyone. The law allows you to “opt out” of only certain kinds of information sharing with third parties. The firm does not share personal information about you with any third parties that triggers this opt-out right. This means YOU ARE ALREADY OPTED OUT.
| 22 | THE GUGGENHEIM FUNDS SEMI-ANNUAL REPORT | |
GUGGENHEIM INVESTMENTS PRIVACY POLICIES (Unaudited)(concluded)
How We Protect Privacy Online
Our concern for the privacy of our shareholders also extends to those who use our web site, guggenheiminvestments.com. Our web site uses some of the most secure forms of online communication available, including encryption technology, Secure Socket Layer (SSL) protocol, firewalls and user names and passwords. These technologies provide a high level of security and privacy when you access your account information or initiate online transactions. The Guggenheim Investments web site offers customized features that require our use of “http cookies”—tiny pieces of information that we ask your browser to store. However, we make very limited use of these cookies. We only use cookies for session management and security features on the Guggenheim Investments web site. We do not use them to pull data from your hard drive, to learn your email address, or to view data in cookies created by other web sites. We will not share the information in our cookies or give others access to it. See the legal information area on our web site for more details about web site security and privacy features.
How We Safeguard Your Personal Information
We restrict access to nonpublic personal information about shareholders to our employees and in some cases to third parties (for example, the service providers described above) as permitted by law. We maintain strict physical, electronic and procedural safeguards that comply with federal standards to guard your nonpublic personal information.
We’ll Keep You Informed
As required by federal law, we will notify shareholders of our privacy policy annually. We reserve the right to modify this policy at any time, but rest assured that if we do change it, we will tell you promptly. You will also be able to access our privacy policy from our web site at guggenheiminvestments.com. Should you have any questions regarding our privacy policy, contact us at 800.820.0888 or 301.296.5100.
| | THE GUGGENHEIM FUNDS SEMI-ANNUAL REPORT | 23 |
This page intentionally left blank.
This page intentionally left blank.
This page intentionally left blank.
This page intentionally left blank.
This page intentionally left blank.
This page intentionally left blank.
3.31.2015
Guggenheim Funds Semi-Annual Report
| | | |
| Guggenheim Macro Opportunities Fund | | |
| MO-SEMI-0315x0915 | guggenheiminvestments.com |
| DEAR SHAREHOLDER | 2 |
| ECONOMIC AND MARKET OVERVIEW | 3 |
| ABOUT SHAREHOLDERS’ FUND EXPENSES | 5 |
| MACRO OPPORTUNITIES FUND | 8 |
| NOTES TO CONSOLIDATED FINANCIAL STATEMENTS | 55 |
| OTHER INFORMATION | 80 |
| INFORMATION ON BOARD OF TRUSTEES AND OFFICERS | 81 |
| GUGGENHEIM INVESTMENTS PRIVACY POLICIES | 89 |
| | THE GUGGENHEIM FUNDS SEMI-ANNUAL REPORT | 1 |
March 31, 2015
Dear Shareholder:
Guggenheim Partners Investment Management (the “Investment Adviser”) is pleased to present the semi-annual shareholder report for one of our Funds (the “Fund”) for the six-month period ended March 31, 2015.
The Investment Adviser is part of Guggenheim Investments, which represents the investment management businesses of Guggenheim Partners, LLC (“Guggenheim”), a global, diversified financial services firm.
Guggenheim Funds Distributors, LLC is the distributor of the Funds. Guggenheim Funds Distributors, LLC is affiliated with Guggenheim and the Investment Adviser.
We encourage you to read the Economic and Market Overview section of the report, which follows this letter.
We are committed to providing innovative investment solutions and appreciate the trust you place in us.
Sincerely,
Donald C. Cacciapaglia
President
April 30, 2015
Read a prospectus and summary prospectus (if available) carefully before investing. It contains the investment objectives, risks, charges, expenses and other information, which should be considered carefully before investing. Obtain a prospectus and summary prospectus (if available) at guggenheiminvestments.com or call 800.820.0888.
There can be no assurance that any investment product will achieve its investment objective(s). There are risks associated with investing, including the entire loss of principal invested. Investing involves market risks. The investment return and principal value of any investment product will fluctuate with changes in market conditions.
| 2 | THE GUGGENHEIM FUNDS SEMI-ANNUAL REPORT | |
ECONOMIC AND MARKET OVERVIEW (Unaudited) | March 31, 2015 |
The U.S. continued to enjoy a self-sustaining economic expansion for the six-month period ended March 31, 2015, although winter weather was likely to distort first-quarter economic data. In addition, U.S. companies scaled back hiring in the last month of the period, adding to evidence that the domestic economy has lost some momentum since the turn of the year. The March increase in payrolls was the smallest since December 2013 and broke a 12-month run of gains above 200,000.
Despite this short-term dislocation, the economy remains on track. Indeed, many other labor market indicators, such as initial jobless claims and the job openings rate, suggest that the U.S. labor market remains quite strong, supporting the conclusion that March’s payroll report was just a temporary blip, similar to the one witnessed last winter. As soon as temporary seasonal factors have dissipated, economic data is likely to bounce back. The labor market has improved over the past year, as subdued mortgage rates and tight housing inventory continue to point to fairly stable appreciation in the housing market, which is key to the ongoing recovery. Consumers are also being helped by lower fuel prices, which are acting as a tax cut for U.S. consumers, freeing up discretionary spending in other areas and acting as a support for consumption.
In Europe, economic data has been surprisingly good and should continue along that path on the back of the European Central Bank’s program of quantitative easing and depreciation of the euro. Japan’s economy remains weak and, without more structural reform, continued monetary accommodation could lead to stagflation. China’s policymakers appear likely to continue the supply of credit and do whatever else is necessary to maintain growth there at an acceptable pace for the near term.
Given weakness overseas and the effect of a stronger U.S. dollar on international earnings, some stocks could face a more challenging environment in the near term, but our research shows that equity markets tend to perform quite well in the periods leading up to a U.S. Federal Reserve (the “Fed”) rate increase. The yield on the 10-year Treasury note declined in January by more than 50 basis points before rebounding in February, echoing the pattern since 2009—Treasury yields decline and a sell-off ensues, driving rates higher. Then conditions stabilize, and rates test their previous lows. Liquidity from foreign central banks and comparatively attractive U.S. yields continue to push global investors to U.S. Treasuries, which should hold down U.S. interest rates in the near term.
Against this backdrop, the U.S. central bank feels pressure to raise its key rate above zero, but insists the decision will be data-dependent and not occur prematurely. With a secular inflation increase unlikely in the near term, slack in the economy, and disinflation being imported from abroad, the Fed may not hike rates until later in the year. The Fed for now appears to be focused on wage growth, which is key for sustaining the expansion but also an indicator of inflationary
| | THE GUGGENHEIM FUNDS SEMI-ANNUAL REPORT | 3 |
ECONOMIC AND MARKET OVERVIEW (Unaudited)(concluded) | March 31, 2015 |
pressure. The lack of sustained wage growth has been a topic that has confounded the Fed lately. Given the strengthening employment numbers and the apparent reduction in labor market slack, wages should start to increase more steadily across the board. This is one of the most important data points at the moment for the Fed.
The underlying U.S. economy remains strong and investors should avoid being panicked by seasonal setbacks. Indeed, considering the strength of the economy and the wave of liquidity emanating from various central banks around the world, the general investment environment should remain attractive.
For the six months ended March 31, 2015, the Standard & Poor’s 500® (“S&P 500”) Index* returned 5.93%. The Morgan Stanley Capital International (“MSCI”) Europe-Australasia-Far East (“EAFE”) Index* returned 1.13%. The return of the MSCI Emerging Markets Index* was -2.37%.
In the bond market, the Barclays U.S. Aggregate Bond Index* posted a 3.43% return for the period, while the Barclays U.S. Corporate High Yield Index* returned 1.49%. The return of the Bank of America Merrill Lynch 3-Month U.S. Treasury Bill Index* was 0.01% for the six-month period.
The opinions and forecasts expressed may not actually come to pass. This information is subject to change at any time, based on market and other conditions, and should not be construed as a recommendation of any specific security or strategy.
*Index Definitions:
The following indices are referenced throughout this report. Indices are unmanaged and not available for direct investment. Index performance does not reflect transaction costs, fees, or expenses.
Barclays U.S. Aggregate Bond Index is a broad-based benchmark that measures the investment grade, U.S. dollar-denominated, fixed-rate taxable bond market, including U.S. Treasuries, government-related and corporate securities, MBS (agency fixed-rate and hybrid ARM pass-throughs), ABS, and CMBS.
Barclays U.S. Corporate High Yield Index measures the market of U.S. dollar-denominated, non-investment grade, fixed-rate, taxable corporate bonds. Securities are classified as high yield if the middle rating of Moody’s, Fitch, and S&P is Ba1/BB+/BB+ or below.
Bank of America (“BofA”) Merrill Lynch 3-Month U.S. Treasury Bill Index is an unmanaged market index of U.S. Treasury securities maturing in 90 days that assumes reinvestment of all income.
MSCI EAFE Index is a free float-adjusted market capitalization index that is designed to measure the equity market performance of developed markets, excluding the U.S. & Canada.
MSCI Emerging Markets Index is a free float-adjusted market capitalization weighted index that is designed to measure equity market performance in the global emerging markets.
S&P 500® Index is a capitalization-weighted index of 500 stocks designed to measure the performance of the broad economy, representing all major industries and is considered a representation of the U.S. stock market.
| 4 | THE GUGGENHEIM FUNDS SEMI-ANNUAL REPORT | |
ABOUT SHAREHOLDERS’ FUND EXPENSES (Unaudited)
All mutual funds have operating expenses and it is important for our shareholders to understand the impact of costs on their investments. Shareholders of a Fund incur two types of costs: (i) transaction costs, including sales charges (loads) on purchase payments, reinvested dividends, or other distributions; and exchange fees; and (ii) ongoing costs, including management fees, administrative services, and shareholder reports, among others. These ongoing costs, or operating expenses, are deducted from a fund’s gross income and reduce the investment return of the fund.
A fund’s expenses are expressed as a percentage of its average net assets, which is known as the expense ratio. The following examples are intended to help investors understand the ongoing costs (in dollars) of investing in a Fund and to compare these costs with the ongoing costs of investing in other mutual funds.
The examples are based on an investment of $1,000 made at the beginning of the period and held for the entire six-month period beginning September 30, 2014 and ending March 31, 2015.
The following tables illustrate a Fund’s costs in two ways:
Table 1. Based on actual Fund return. This section helps investors estimate the actual expenses paid over the period. The “Ending Account Value” shown is derived from the Fund’s actual return, and the fourth column shows the dollar amount that would have been paid by an investor who started with $1,000 in the Fund. Investors may use the information here, together with the amount invested, to estimate the expenses paid over the period. Simply divide the Fund’s account value by $1,000 (for example, an $8,600 account value divided by $1,000 = 8.6), then multiply the result by the number provided under the heading “Expenses Paid During Period.”
Table 2. Based on hypothetical 5% return. This section is intended to help investors compare a Fund’s cost with those of other mutual funds. The table provides information about hypothetical account values and hypothetical expenses based on the Fund’s actual expense ratio and an assumed rate of return of 5% per year before expenses, which is not the Fund’s actual return. The hypothetical account values and expenses may not be used to estimate the actual ending account balance or expenses paid during the period. The example is useful in making comparisons because the U.S. Securities and Exchange Commission (the “SEC”) requires all mutual funds to calculate expenses based on the 5% return. Investors can assess a Fund’s costs by comparing this hypothetical example with the hypothetical examples that appear in shareholder reports of other funds.
| | THE GUGGENHEIM FUNDS SEMI-ANNUAL REPORT | 5 |
ABOUT SHAREHOLDERS’ FUND EXPENSES (Unaudited)(continued)
The calculations illustrated above assume no shares were bought or sold during the period. Actual costs may have been higher or lower, depending on the amount of investment and the timing of any purchases or redemptions.
Please note that the expenses shown in the table are meant to highlight your ongoing costs only and do not reflect any transactional costs, such as sales charges (loads) on purchase payments, and contingent deferred sales charges (“CDSC”) on redemptions, if any. Therefore, the second table is useful in comparing ongoing costs only, and will not help you determine the relative total costs of owning different funds. In addition, if these transactional costs were included, your costs would have been higher.
More information about a Fund’s expenses, including annual expense ratios for the past five years, can be found in the Financial Highlights section of this report. For additional information on operating expenses and other shareholder costs, please refer to the appropriate Fund prospectus.
| 6 | THE GUGGENHEIM FUNDS SEMI-ANNUAL REPORT | |
ABOUT SHAREHOLDERS’ FUND EXPENSES (Unaudited)(concluded)
| | Expense Ratio1 | Fund Return | Beginning Account Value September 30, 2014 | Ending Account Value March 31, 2015 | Expenses Paid During Period2 |
Table 1. Based on actual Fund return3 |
| Macro Opportunities Fund |
| A-Class | 1.32% | 2.97% | $1,000.00 | $1,029.70 | $6.68 |
| C-Class | 2.03% | 2.60% | 1,000.00 | 1,026.00 | 10.25 |
| Institutional Class | 0.98% | 3.14% | 1,000.00 | 1,031.40 | 4.96 |
| |
| Table 2. Based on hypothetical 5% return (before expenses) |
| Macro Opportunities Fund |
| A-Class | 1.32% | 5.00% | $1,000.00 | $1,018.35 | $6.64 |
| C-Class | 2.03% | 5.00% | 1,000.00 | 1,014.81 | 10.20 |
| Institutional Class | 0.98% | 5.00% | 1,000.00 | 1,020.04 | 4.94 |
1 | Annualized and excludes expenses of the underlying funds in which the Fund invests. |
2 | Expenses are equal to the Fund's annualized expense ratio, net of any applicable fee waivers, multiplied by the average account value over the period, multiplied by 182/365 (to reflect the one-half year period). |
3 | Actual cumulative return at net asset value for the period September 30, 2014 to March 31, 2015. |
| | THE GUGGENHEIM FUNDS SEMI-ANNUAL REPORT | 7 |
FUND PROFILE (Unaudited) | March 31, 2015 |
MACRO OPPORTUNITIES FUND
OBJECTIVE: Seeks to provide total return, comprised of current income and capital appreciation.
Consolidated Holdings Diversification (Market Exposure as % of Net Assets)
“Consolidated Holdings Diversification (Market Exposure as % of Net Assets)” excludes any temporary cash investments or investments in Guggenheim Strategy Funds Trust mutual funds. Investments in those Funds do not provide “market exposure” to meet the fund’s investment objective, but will significantly increase the portfolio’s exposure to certain other asset categories (and their associated risks), which may cause the Fund to deviate from its principal investment strategy, including: (i) high yield, high risk debt securities rated below the top four long-term rating categories by a nationally recognized statistical rating organization (also known as “junk bonds”); (ii) securities issued by the U.S. government or its agencies and instrumentalities; (iii) CLOs and similar investments; and (iv) other short-term fixed income securities.
| 8 | THE GUGGENHEIM FUNDS SEMI-ANNUAL REPORT | |
FUND PROFILE (Unaudited)(concluded) | March 31, 2015 |
| Inception Dates: |
| A-Class | November 30, 2011 |
| C-Class | November 30, 2011 |
| Institutional Class | November 30, 2011 |
| Ten Largest Holdings (% of Total Net Assets) |
| Guggenheim Strategy Fund I | 2.2% |
| Motel 6 Trust 2015-MTL6 — Class E | 1.9% |
| Nationstar HECM Loan Trust 2014-1A — Class A | 1.7% |
| LSTAR Securities Investment Trust 2015-1 | 1.7% |
| Guggenheim Limited Duration Fund - Institutional Class | 1.5% |
| LSTAR Securities Investment Trust 2015-2 | 1.5% |
| Vericrest Opportunity Loan Trust 2015-NPL3 | 1.3% |
| LSTAR Securities Investment Trust 2015-3 | 1.1% |
| iShares MSCI Spain Capped ETF | 1.1% |
| Volt XXXIII LLC 2015-NPL5 | 1.1% |
| Top Ten Total | 15.1% |
| |
| “Ten Largest Holdings” exclude any temporary cash or derivative investments. |
| Portfolio Composition by Quality Rating* |
| Rating | % of Total Investments |
| Fixed Income Instruments | |
| AAA | 0.2% |
| AA | 1.7% |
| A | 11.6% |
| BBB | 20.1% |
| BB | 14.1% |
| B | 20.5% |
| CCC | 9.1% |
| CC | 0.2% |
| D | 0.3% |
| NR** | 5.9% |
| Other Instruments | |
| Common Stocks | 5.2% |
| Short Term Investments | 4.1% |
| Mutual Funds | 3.8% |
| Exchange-Traded Funds | 3.6% |
| Repurchase Agreements | 1.6% |
| Preferred Stocks | 1.5% |
| Options Purchased | 0.4% |
| Exchange-Traded Funds Sold Short | -0.1% |
| Options Written | -0.1% |
| Common Stocks Sold Short | -3.7% |
| Total Investments | 100.0% |
| * | Source: BlackRock Solutions. Credit quality ratings are measured on a scale that generally ranges from AAA (highest) to D (lowest). All securities except for those labeled “NR” have been rated by Moody’s, Standard & Poor’s (“S&P”), or Fitch, which are all a Nationally Recognized Statistical Rating Organization (“NRSRO”). For purposes of this presentation, when ratings are available from more than one agency, the highest rating is used. Guggenheim Investments has converted Moody’s and Fitch ratings to the equivalent S&P rating. Security ratings are determined at the time of purchase and may change thereafter. |
| ** | NR securities do not necessarily indicate low credit quality. |
| | THE GUGGENHEIM FUNDS SEMI-ANNUAL REPORT | 9 |
CONSOLIDATED SCHEDULE OF INVESTMENTS (Unaudited) | March 31, 2015 |
| MACRO OPPORTUNITIES FUND | |
| | |
Shares | | | Value | |
| | | | | | | | |
COMMON STOCKS† - 5.6% | |
| | | | | | | | |
| CONSUMER, NON-CYCLICAL - 1.7% | |
| Archer-Daniels-Midland Co. | | | 39,186 | | | $ | 1,857,416 | |
| ConAgra Foods, Inc. | | | 47,486 | | | | 1,734,663 | |
| Merck & Company, Inc. | | | 26,141 | | | | 1,502,585 | |
| Express Scripts Holding Co.* | | | 16,138 | | | | 1,400,294 | |
| Kimberly-Clark Corp. | | | 12,883 | | | | 1,379,898 | |
| Kroger Co. | | | 17,281 | | | | 1,324,762 | |
| DaVita HealthCare Partners, Inc.* | | | 16,108 | | | | 1,309,258 | |
| Quest Diagnostics, Inc. | | | 16,118 | | | | 1,238,668 | |
| Ingredion, Inc. | | | 15,879 | | | | 1,235,703 | |
| Anthem, Inc. | | | 7,791 | | | | 1,203,008 | |
| Philip Morris International, Inc. | | | 15,370 | | | | 1,157,822 | |
| Molson Coors Brewing Co. — Class B | | | 15,290 | | | | 1,138,341 | |
| Coca-Cola Enterprises, Inc. | | | 25,302 | | | | 1,118,347 | |
| Baxter International, Inc. | | | 16,242 | | | | 1,112,576 | |
| UnitedHealth Group, Inc. | | | 8,678 | | | | 1,026,521 | |
| HCA Holdings, Inc.* | | | 13,161 | | | | 990,102 | |
| Johnson & Johnson | | | 9,621 | | | | 967,873 | |
| St. Jude Medical, Inc. | | | 14,635 | | | | 957,130 | |
| Aetna, Inc. | | | 8,982 | | | | 956,852 | |
| Gilead Sciences, Inc.* | | | 9,621 | | | | 944,108 | |
| Pfizer, Inc. | | | 26,950 | | | | 937,591 | |
| PepsiCo, Inc. | | | 9,627 | | | | 920,534 | |
| Cigna Corp. | | | 7,062 | | | | 914,105 | |
| Procter & Gamble Co. | | | 11,051 | | | | 905,519 | |
| Medtronic plc | | | 11,266 | | | | 878,635 | |
| Avon Products, Inc. | | | 109,393 | | | | 874,050 | |
| Campbell Soup Co. | | | 18,743 | | | | 872,487 | |
| Humana, Inc. | | | 4,698 | | | | 836,338 | |
| General Mills, Inc. | | | 14,509 | | | | 821,209 | |
| Omnicare, Inc. | | | 10,444 | | | | 804,815 | |
| Epizyme, Inc.* | | | 40,190 | | | | 754,769 | |
| Universal Health Services, Inc. — Class B | | | 6,229 | | | | 733,216 | |
| ManpowerGroup, Inc. | | | 8,129 | | | | 700,314 | |
| CR Bard, Inc. | | | 3,899 | | | | 652,498 | |
| United Rentals, Inc.* | | | 6,883 | | | | 627,454 | |
| PAREXEL International Corp.* | | | 8,940 | | | | 616,771 | |
| Dr Pepper Snapple Group, Inc. | | | 7,687 | | | | 603,276 | |
| SUPERVALU, Inc.* | | | 50,499 | | | | 587,303 | |
| Western Union Co. | | | 28,157 | | | | 585,947 | |
| AbbVie, Inc. | | | 9,873 | | | | 577,965 | |
| Quanta Services, Inc.* | | | 19,421 | | | | 554,081 | |
| Magellan Health, Inc.* | | | 7,715 | | | | 546,376 | |
| Eli Lilly & Co. | | | 7,430 | | | | 539,790 | |
| JM Smucker Co. | | | 4,526 | | | | 523,794 | |
| Tekmira Pharmaceuticals Corp.* | | | 28,927 | | | | 505,065 | |
| Molina Healthcare, Inc.* | | | 7,369 | | | | 495,860 | |
| Amgen, Inc. | | | 3,044 | | | | 486,583 | |
| MEDNAX, Inc.* | | | 6,517 | | | | 472,548 | |
| Cardinal Health, Inc. | | | 5,186 | | | | 468,140 | |
| Coca-Cola Co. | | | 11,531 | | | | 467,582 | |
| Varian Medical Systems, Inc.* | | | 4,873 | | | | 458,501 | |
| H&R Block, Inc. | | | 14,194 | | | | 455,202 | |
| Darling Ingredients, Inc.* | | | 30,928 | | | | 433,301 | |
| Hershey Co. | | | 4,190 | | | | 422,813 | |
| Centene Corp.* | | | 5,955 | | | | 420,959 | |
| Select Medical Holdings Corp. | | | 27,657 | | | | 410,153 | |
| United Therapeutics Corp.* | | | 2,353 | | | | 405,740 | |
| Halyard Health, Inc.* | | | 8,228 | | | | 404,818 | |
| Health Net, Inc.* | | | 6,563 | | | | 396,996 | |
| Andersons, Inc. | | | 9,361 | | | | 387,265 | |
| Cal-Maine Foods, Inc. | | | 9,896 | | | | 386,538 | |
| LifePoint Hospitals, Inc.* | | | 5,166 | | | | 379,443 | |
| Sanderson Farms, Inc. | | | 4,736 | | | | 377,222 | |
| Hill-Rom Holdings, Inc. | | | 7,688 | | | | 376,712 | |
| DENTSPLY International, Inc. | | | 7,373 | | | | 375,212 | |
| Chemed Corp. | | | 3,107 | | | | 370,976 | |
| Stryker Corp. | | | 4,004 | | | | 369,369 | |
| 10 | THE GUGGENHEIM FUNDS SEMI-ANNUAL REPORT | SEE NOTES TO FINANCIAL STATEMENTS. |
CONSOLIDATED SCHEDULE OF INVESTMENTS (Unaudited)(continued) | March 31, 2015 |
| MACRO OPPORTUNITIES FUND | |
| | |
Shares | | | Value | |
| | | | | | | | | |
| Total System Services, Inc. | | | 9,662 | | | $ | 368,605 | |
| Patterson Companies, Inc. | | | 7,351 | | | | 358,655 | |
| Medifast, Inc.* | | | 11,583 | | | | 347,143 | |
| Total Consumer, Non-cyclical | | | | | | | 52,726,165 | |
| | | | | | | | |
| INDUSTRIAL - 0.9% | |
| Corning, Inc. | | | 56,023 | | | | 1,270,602 | |
| Caterpillar, Inc. | | | 15,536 | | | | 1,243,346 | |
| Emerson Electric Co. | | | 20,704 | | | | 1,172,261 | |
| Fluor Corp. | | | 20,365 | | | | 1,164,064 | |
| Dover Corp. | | | 16,461 | | | | 1,137,785 | |
| Agilent Technologies, Inc. | | | 26,991 | | | | 1,121,476 | |
| FedEx Corp. | | | 6,262 | | | | 1,036,049 | |
| Joy Global, Inc. | | | 21,944 | | | | 859,766 | |
| Energizer Holdings, Inc. | | | 5,369 | | | | 741,190 | |
| Clean Harbors, Inc.* | | | 12,982 | | | | 737,117 | |
| AGCO Corp. | | | 15,097 | | | | 719,221 | |
| Parker-Hannifin Corp. | | | 5,978 | | | | 710,067 | |
| CSX Corp. | | | 20,010 | | | | 662,731 | |
| Oshkosh Corp. | | | 13,409 | | | | 654,225 | |
| Cummins, Inc. | | | 4,709 | | | | 652,856 | |
| Norfolk Southern Corp. | | | 6,237 | | | | 641,912 | |
| Terex Corp. | | | 23,925 | | | | 636,166 | |
| Jacobs Engineering Group, Inc.* | | | 13,332 | | | | 602,073 | |
| ITT Corp. | | | 14,829 | | | | 591,826 | |
| Kirby Corp.* | | | 7,628 | | | | 572,481 | |
| Timken Co. | | | 13,550 | | | | 570,997 | |
| Kennametal, Inc. | | | 16,605 | | | | 559,422 | |
| General Dynamics Corp. | | | 4,098 | | | | 556,222 | |
| Northrop Grumman Corp. | | | 3,379 | | | | 543,884 | |
| Jabil Circuit, Inc. | | | 22,785 | | | | 532,714 | |
| Con-way, Inc. | | | 11,541 | | | | 509,304 | |
| Avnet, Inc. | | | 11,282 | | | | 502,049 | |
| Triumph Group, Inc. | | | 8,109 | | | | 484,269 | |
| Stanley Black & Decker, Inc. | | | 4,911 | | | | 468,313 | |
| Deere & Co. | | | 5,116 | | | | 448,622 | |
| Arrow Electronics, Inc.* | | | 6,753 | | | | 412,946 | |
| Trinity Industries, Inc. | | | 11,479 | | | | 407,619 | |
| Sanmina Corp.* | | | 16,238 | | | | 392,797 | |
| Tech Data Corp.* | | | 6,686 | | | | 386,250 | |
| Waters Corp.* | | | 3,087 | | | | 383,776 | |
| Raytheon Co. | | | 3,425 | | | | 374,181 | |
| TE Connectivity Ltd. | | | 5,081 | | | | 363,901 | |
| Actuant Corp. — Class A | | | 15,088 | | | | 358,189 | |
| Valmont Industries, Inc. | | | 2,873 | | | | 353,034 | |
| Lincoln Electric Holdings, Inc. | | | 5,322 | | | | 348,006 | |
| Union Pacific Corp. | | | 3,147 | | | | 340,852 | |
| Total Industrial | | | | | | | 26,224,561 | |
| | | | | | | | |
| FINANCIAL - 0.7% | |
California Republic Bancorp*,†† | | | 166,500 | | | | 4,495,500 | |
| Allstate Corp. | | | 19,194 | | | | 1,366,036 | |
| Brixmor Property Group, Inc. | | | 45,860 | | | | 1,217,582 | |
| Travelers Companies, Inc. | | | 10,066 | | | | 1,088,436 | |
| Hartford Financial Services Group, Inc. | | | 25,763 | | | | 1,077,409 | |
| Aflac, Inc. | | | 15,213 | | | | 973,784 | |
| Prudential Financial, Inc. | | | 10,481 | | | | 841,729 | |
| American International Group, Inc. | | | 14,203 | | | | 778,182 | |
| MetLife, Inc. | | | 13,354 | | | | 675,045 | |
| State Street Corp. | | | 9,152 | | | | 672,947 | |
| Comerica, Inc. | | | 14,516 | | | | 655,107 | |
| Progressive Corp. | | | 23,754 | | | | 646,109 | |
| JPMorgan Chase & Co. | | | 10,319 | | | | 625,125 | |
| Bank of New York Mellon Corp. | | | 15,263 | | | | 614,183 | |
| Everest Re Group Ltd. | | | 3,470 | | | | 603,781 | |
| WR Berkley Corp. | | | 10,953 | | | | 553,236 | |
| Chubb Corp. | | | 5,459 | | | | 551,905 | |
| Nationstar Mortgage Holdings, Inc.* | | | 22,063 | | | | 546,500 | |
| Franklin Resources, Inc. | | | 10,506 | | | | 539,168 | |
| Principal Financial Group, Inc. | | | 9,707 | | | | 498,649 | |
| Assurant, Inc. | | | 7,334 | | | | 450,381 | |
| SEE NOTES TO FINANCIAL STATEMENTS. | THE GUGGENHEIM FUNDS SEMI-ANNUAL REPORT | 11 |
CONSOLIDATED SCHEDULE OF INVESTMENTS (Unaudited)(continued) | March 31, 2015 |
| MACRO OPPORTUNITIES FUND | |
| | |
Shares | | | Value | |
| | | | | | | | | |
| Berkshire Hathaway, Inc. — Class B* | | | 3,013 | | | $ | 434,836 | |
| Regions Financial Corp. | | | 45,272 | | | | 427,820 | |
| Loews Corp. | | | 10,475 | | | | 427,694 | |
| TCF Financial Corp. | | | 25,389 | | | | 399,115 | |
| ProAssurance Corp. | | | 8,625 | | | | 395,974 | |
| Charles Schwab Corp. | | | 12,382 | | | | 376,908 | |
| Northern Trust Corp. | | | 5,326 | | | | 370,956 | |
| Total Financial | | | | | | | 22,304,097 | |
| | | | | | | | |
| TECHNOLOGY - 0.7% | |
| Xerox Corp. | | | 115,646 | | | | 1,486,051 | |
| Intel Corp. | | | 42,808 | | | | 1,338,605 | |
| International Business Machines Corp. | | | 8,126 | | | | 1,304,224 | |
| CA, Inc. | | | 36,646 | | | | 1,195,026 | |
| Micron Technology, Inc.* | | | 43,775 | | | | 1,187,616 | |
| NetApp, Inc. | | | 32,713 | | | | 1,160,004 | |
| SanDisk Corp. | | | 17,020 | | | | 1,082,812 | |
| Western Digital Corp. | | | 10,011 | | | | 911,101 | |
| EMC Corp. | | | 34,423 | | | | 879,852 | |
| Seagate Technology plc | | | 16,296 | | | | 847,881 | |
| Hewlett-Packard Co. | | | 26,314 | | | | 819,944 | |
| Teradata Corp.* | | | 18,316 | | | | 808,469 | |
| Microsoft Corp. | | | 19,739 | | | | 802,489 | |
| Pitney Bowes, Inc. | | | 31,817 | | | | 741,972 | |
| Oracle Corp. | | | 16,972 | | | | 732,342 | |
| DST Systems, Inc. | | | 5,772 | | | | 639,018 | |
| Xilinx, Inc. | | | 14,450 | | | | 611,235 | |
| Accenture plc — Class A | | | 6,402 | | | | 599,803 | |
| QUALCOMM, Inc. | | | 7,589 | | | | 526,221 | |
| Computer Sciences Corp. | | | 7,783 | | | | 508,074 | |
| Apple, Inc. | | | 3,537 | | | | 440,109 | |
| KLA-Tencor Corp. | | | 7,507 | | | | 437,583 | |
| Lexmark International, Inc. — Class A | | | 9,691 | | | | 410,317 | |
| CACI International, Inc. — Class A* | | | 4,157 | | | | 373,797 | |
| Texas Instruments, Inc. | | | 6,351 | | | | 363,182 | |
| MKS Instruments, Inc. | | | 10,353 | | | | 350,035 | |
| Total Technology | | | | | | | 20,557,762 | |
| | | | | | | | |
| UTILITIES - 0.7% | |
| Public Service Enterprise Group, Inc. | | | 30,535 | | | | 1,280,027 | |
| AES Corp. | | | 95,493 | | | | 1,227,085 | |
| Entergy Corp. | | | 15,804 | | | | 1,224,652 | |
| Edison International | | | 18,492 | | | | 1,155,195 | |
| CenterPoint Energy, Inc. | | | 56,272 | | | | 1,148,511 | |
| DTE Energy Co. | | | 13,032 | | | | 1,051,552 | |
| Ameren Corp. | | | 22,708 | | | | 958,278 | |
| Pinnacle West Capital Corp. | | | 14,634 | | | | 932,918 | |
| NRG Energy, Inc. | | | 36,703 | | | | 924,549 | |
| PPL Corp. | | | 27,338 | | | | 920,197 | |
| American Electric Power Company, Inc. | | | 16,264 | | | | 914,850 | |
| PG&E Corp. | | | 16,657 | | | | 883,987 | |
| AGL Resources, Inc. | | | 16,643 | | | | 826,325 | |
| National Fuel Gas Co. | | | 11,720 | | | | 707,068 | |
| OGE Energy Corp. | | | 20,669 | | | | 653,347 | |
| Southwest Gas Corp. | | | 10,250 | | | | 596,243 | |
| Global Partners, LP | | | 16,102 | | | | 560,350 | |
| Questar Corp. | | | 23,004 | | | | 548,875 | |
| Vectren Corp. | | | 12,380 | | | | 546,453 | |
| Consolidated Edison, Inc. | | | 8,481 | | | | 517,341 | |
| MDU Resources Group, Inc. | | | 23,838 | | | | 508,703 | |
| UGI Corp. | | | 15,328 | | | | 499,540 | |
| Great Plains Energy, Inc. | | | 16,039 | | | | 427,921 | |
| PNM Resources, Inc. | | | 13,227 | | | | 386,228 | |
| NextEra Energy, Inc. | | | 3,629 | | | | 377,597 | |
| Westar Energy, Inc. | | | 9,649 | | | | 373,995 | |
| Total Utilities | | | | | | | 20,151,787 | |
| | | | | | | | |
| COMMUNICATIONS - 0.3% | |
| CenturyLink, Inc. | | | 41,248 | | | | 1,425,118 | |
| Telephone & Data Systems, Inc. | | | 45,093 | | | | 1,122,816 | |
| Juniper Networks, Inc. | | | 41,150 | | | | 929,167 | |
| Atlantic Tele-Network, Inc. | | | 12,627 | | | | 874,041 | |
| Time Warner, Inc. | | | 10,215 | | | | 862,555 | |
| Cisco Systems, Inc. | | | 30,972 | | | | 852,504 | |
| 12 | THE GUGGENHEIM FUNDS SEMI-ANNUAL REPORT | SEE NOTES TO FINANCIAL STATEMENTS. |
CONSOLIDATED SCHEDULE OF INVESTMENTS (Unaudited)(continued) | March 31, 2015 |
| MACRO OPPORTUNITIES FUND | |
| | |
Shares | | | Value | |
| | | | | | | | | |
| Windstream Holdings, Inc. | | | 97,201 | | | $ | 719,287 | |
| Symantec Corp. | | | 26,564 | | | | 620,668 | |
| Scripps Networks Interactive, Inc. — Class A | | | 8,658 | | | | 593,592 | |
| General Communication, Inc. — Class A* | | | 35,000 | | | | 551,600 | |
| VeriSign, Inc.* | | | 7,967 | | | | 533,550 | |
| Viacom, Inc. — Class B | | | 7,387 | | | | 504,532 | |
Cengage Learning Acquisitions, Inc.*,†† | | | 21,660 | | | | 485,314 | |
| NETGEAR, Inc.* | | | 11,468 | | | | 377,068 | |
| AT&T, Inc. | | | 11,118 | | | | 363,003 | |
| Cablevision Systems Corp. — Class A | | | 18,858 | | | | 345,101 | |
| Total Communications | | | | | | | 11,159,916 | |
| | | | | | | | |
| CONSUMER, CYCLICAL - 0.3% | |
| Wal-Mart Stores, Inc. | | | 22,326 | | | | 1,836,314 | |
| The Gap, Inc. | | | 22,085 | | | | 956,943 | |
| CVS Health Corp. | | | 7,957 | | | | 821,242 | |
| Macy’s, Inc. | | | 12,513 | | | | 812,219 | |
| PACCAR, Inc. | | | 11,546 | | | | 729,014 | |
| Alaska Air Group, Inc. | | | 10,832 | | | | 716,861 | |
| Delta Air Lines, Inc. | | | 12,633 | | | | 567,980 | |
| Ingram Micro, Inc. — Class A* | | | 20,965 | | | | 526,641 | |
| Fossil Group, Inc.* | | | 6,263 | | | | 516,384 | |
| Dana Holding Corp. | | | 22,311 | | | | 472,101 | |
| Costco Wholesale Corp. | | | 2,794 | | | | 423,277 | |
| WW Grainger, Inc. | | | 1,573 | | | | 370,929 | |
| Total Consumer, Cyclical | | | | | | | 8,749,905 | |
| | | | | | | | |
| ENERGY - 0.2% | |
| Valero Energy Corp. | | | 14,092 | | | | 896,533 | |
| Murphy Oil Corp. | | | 13,494 | | | | 628,820 | |
| Hess Corp. | | | 8,933 | | | | 606,282 | |
| First Solar, Inc.* | | | 9,380 | | | | 560,830 | |
| Chesapeake Energy Corp. | | | 39,348 | | | | 557,168 | |
| Apache Corp. | | | 8,911 | | | | 537,601 | |
| ConocoPhillips | | | 8,488 | | | | 528,463 | |
| Chevron Corp. | | | 4,957 | | | | 520,386 | |
| Marathon Oil Corp. | | | 16,642 | | | | 434,523 | |
| Anadarko Petroleum Corp. | | | 5,246 | | | | 434,421 | |
| Total Energy | | | | | | | 5,705,027 | |
| | | | | | | | |
| CONSUMER DISCRETIONARY - 0.1% | |
| Travelport, LLC* | | | 204,224 | | | | 3,410,541 | |
| | | | | | | | |
| BASIC MATERIALS - 0.0% | |
Mirabela Nickel Ltd.*,†† | | | 7,057,522 | | | | 752,544 | |
| United States Steel Corp. | | | 16,441 | | | | 401,160 | |
| Nucor Corp. | | | 7,856 | | | | 373,396 | |
| Total Basic Materials | | | | | | | 1,527,100 | |
| | | | | | | | |
| Total Common Stocks | | | | | | | | |
| (Cost $175,292,878) | | | | | | | 172,516,861 | |
| | | | | | | | |
PREFERRED STOCKS† - 1.6% | |
| FINANCIAL - 1.2% | |
Aspen Insurance Holdings Ltd. 5.95%1,2 | | | 571,100 | | | | 14,665,849 | |
Goldman Sachs Group, Inc. 5.50%1,2 | | | 260,000 | | | | 6,546,800 | |
Morgan Stanley 6.38%1,2 | | | 200,000 | | | | 5,208,000 | |
Cent CLO 16, LP due 08/01/24*,†††,3 | | | 7,000 | | | | 4,962,370 | |
CoBank ACB 6.20%1,2 | | | 38,000 | | | | 3,881,939 | |
ALM Loan Funding Ltd. due 06/20/23*,††,1,8 | | | 1,373 | | | | 1,084,505 | |
WhiteHorse II Ltd. due 06/15/17*,††,1,4,8 | | | 2,100,000 | | | | 2 | |
GSC Partners CDO Fund V Ltd. due 11/20/16*,††,1,4,8 | | | 5,200 | | | | — | |
| Total Financial | | | | | | | 36,349,465 | |
| | | | | | | | |
| INDUSTRIAL - 0.4% | |
| Seaspan Corp. 6.38% due 04/30/19 | | | 520,000 | | | | 13,093,600 | |
| Total Preferred Stocks | | | | | | | | |
| (Cost $51,600,964) | | | | | | | 49,443,065 | |
| SEE NOTES TO FINANCIAL STATEMENTS. | THE GUGGENHEIM FUNDS SEMI-ANNUAL REPORT | 13 |
CONSOLIDATED SCHEDULE OF INVESTMENTS (Unaudited)(continued) | March 31, 2015 |
| MACRO OPPORTUNITIES FUND | |
| | |
Shares | | | Value | |
| | | | | | | | | |
EXCHANGE-TRADED FUNDS† - 4.0% | |
| iShares MSCI Spain Capped ETF | | | 989,142 | | | $ | 34,402,359 | |
| iShares MSCI Italy Capped ETF | | | 2,258,875 | | | | 33,431,350 | |
| SPDR EURO STOXX 50 ETF | | | 848,582 | | | | 32,941,953 | |
| iShares iBoxx $ High Yield Corporate Bond ETF | | | 231,507 | | | | 20,976,849 | |
| Total Exchange-Traded Funds | | | | | | | | |
| (Cost $121,230,124) | | | | | | | 121,752,511 | |
| | | | | | | | |
MUTUAL FUNDS† - 4.2% | |
Guggenheim Strategy Fund I5 | | | 2,731,466 | | | | 68,013,502 | |
Guggenheim Limited Duration Fund - Institutional Class5 | | | 1,860,023 | | | | 46,240,184 | |
Guggenheim Risk Managed Real Estate Fund - Institutional Class5 | | | 403,870 | | | | 12,964,222 | |
| Total Mutual Funds | | | | | | | | |
| (Cost $124,638,247) | | | | | | | 127,217,908 | |
| | | | | | | | |
CLOSED-END FUNDS† - 0.1% | |
Guggenheim Strategic Opportunities Fund5 | | | 156,950 | | | | 3,350,883 | |
| Total Closed-End Funds | | | | | | | | |
| (Cost $3,108,835) | | | | | | | 3,350,883 | |
| | | | | | | | |
SHORT TERM INVESTMENTS† - 4.5% | |
| Federated U.S. Treasury Cash Reserve Fund 0.00% | | | 138,782,438 | | | | 138,782,438 | |
| Total Short Term Investments | | | | | | | | |
| (Cost $138,782,438) | | | | | | | 138,782,438 | |
| | | Face
Amount | | | | |
| | | | | | | | |
ASSET-BACKED SECURITIES†† - 35.7% | |
| Nationstar HECM Loan Trust | | | | | | | | |
2014-1A, 4.50%
due 11/25/174 | | $ | 53,129,822 | | | | 53,411,409 | |
| Vericrest Opportunity Loan Trust | | | | | | | | |
2015-NPL3, 3.38%
due 10/25/584 | | | 39,616,604 | | | | 39,541,333 | |
| AASET | | | | | | | | |
2014-1, 7.37%
due 12/15/291 | | | 19,370,192 | | | | 19,418,618 | |
2014-1, 5.13%
due 12/15/291 | | | 18,389,423 | | | | 18,435,397 | |
| VOLT XXXIII LLC | | | | | | | | |
2015-NPL5, 3.50%
due 03/25/554 | | | 33,500,000 | | | | 33,462,949 | |
| AIM Aviation Finance Ltd. | | | | | | | | |
2015-1A, 4.21%
due 02/15/404 | | | 19,880,952 | | | | 19,932,643 | |
2015-1A, 5.07%
due 02/15/404 | | | 9,194,940 | | | | 9,280,453 | |
| Treman Park CLO LLC | | | | | | | | |
2015-1A, 0.00%
due 04/20/273,4 | | | 28,400,000 | | | | 26,289,920 | |
| NRPL Trust | | | | | | | | |
2015-1A, 3.88%
due 11/01/544 | | | 25,002,351 | | | | 24,787,331 | |
| Castlelake Aircraft Securitization Trust | | | | | | | | |
2014-1, 7.50%
due 02/15/29 | | | 15,837,961 | | | | 15,798,366 | |
2014-1, 5.25%
due 02/15/29 | | | 8,625,705 | | | | 8,561,013 | |
| KVK CLO Ltd. | | | | | | | | |
2013-1A, due 04/14/254,8 | | | 11,900,000 | | | | 8,794,100 | |
2014-2A, 3.25%
due 07/15/261,4 | | | 8,250,000 | | | | 8,004,975 | |
2014-1A, 3.16%
due 05/15/261,4 | | | 5,000,000 | | | | 4,836,000 | |
| Avery 2013-3X | | | | | | | | |
due 01/18/258 | | | 19,800,000 | | | | 18,463,500 | |
| 14 | THE GUGGENHEIM FUNDS SEMI-ANNUAL REPORT | SEE NOTES TO FINANCIAL STATEMENTS. |
CONSOLIDATED SCHEDULE OF INVESTMENTS (Unaudited)(continued) | March 31, 2015 |
| MACRO OPPORTUNITIES FUND | |
| | | Face
Amount | | | Value | |
| | | | | | | | | |
| ING IM CLO Ltd. | | | | | | | | |
2013-1X, due 04/15/248 | | $ | 20,000,000 | | | $ | 16,764,000 | |
| GCAT LLC | | | | | | | | |
2014-2, 3.72%
due 10/25/194 | | | 16,756,563 | | | | 16,717,604 | |
| KKR Financial CLO Ltd. | | | | | | | | |
2007-1A, 2.51%
due 05/15/211,4 | | | 10,850,000 | | | | 10,807,685 | |
2007-1A, 5.25%
due 05/15/211,4 | | | 5,000,000 | | | | 4,994,500 | |
| Dryden 37 Senior Loan Fund | | | | | | | | |
2015-37A, due 04/15/27†††,4,8 | | | 9,500,000 | | | | 9,229,250 | |
2015-37A, due 04/15/274,8 | | | 6,500,000 | | | | 5,952,050 | |
| Gramercy Real Estate CDO Ltd. | | | | | | | | |
2007-1A, 0.54%
due 08/15/561,4 | | | 15,205,884 | | | | 13,700,501 | |
| Babson CLO Limited | | | | | | | | |
2012-2A, due 05/15/234,8 | | | 11,850,000 | | | | 8,465,640 | |
2014-IA, due 07/20/254,8 | | | 6,400,000 | | | | 5,071,360 | |
| OHA Credit Partners IX Ltd. | | | | | | | | |
2013-9A, 0.00%
due 10/20/253,4 | | | 14,000,000 | | | | 13,255,200 | |
| Cedar Woods CRE CDO Ltd. | | | | | | | | |
2006-1A, 0.44%
due 07/25/51 | | | 14,223,386 | | | | 12,862,208 | |
| Gramercy Park CLO Ltd. | | | | | | | | |
2014-1AR, 3.21%
due 07/17/231,4 | | | 7,500,000 | | | | 7,500,000 | |
2012-1A, due 07/17/234,8 | | | 2,650,000 | | | | 2,235,540 | |
2014-1AR, 4.30%
due 07/17/231,4 | | | 1,750,000 | | | | 1,745,275 | |
due 07/17/238 | | | 1,250,000 | | | | 1,054,500 | |
| Fortress Credit Opportunities VI CLO Ltd. | | | | | | | | |
2015-6A, 5.52%
due 10/10/261,4 | | | 5,400,000 | | | | 5,182,920 | |
2015-6A, 2.97%
due 10/10/261,4 | | | 4,000,000 | | | | 3,948,000 | |
2015-6A, 3.92%
due 10/10/261,4 | | | 3,000,000 | | | | 2,946,600 | |
| Northwoods Capital XIV Ltd. | | | | | | | | |
2014-14A, 3.61%
due 11/12/251,4 | | | 6,000,000 | | | | 5,852,400 | |
2014-14A, 2.72%
due 11/12/251,4 | | | 5,750,000 | | | | 5,750,000 | |
| RAIT CRE CDO I Ltd. | | | | | | | | |
2006-1X, 0.49%
due 11/20/46 | | | 12,381,505 | | | | 11,395,937 | |
| NewStar Clarendon Fund CLO LLC | | | | | | | | |
2015-1A, 2.96%
due 01/25/271,4 | | | 7,000,000 | | | | 6,990,900 | |
2015-1A, 3.61%
due 01/25/271,4 | | | 4,000,000 | | | | 3,896,800 | |
| N-Star Real Estate CDO IX Ltd. | | | | | | | | |
0.49% due 02/01/416 | | | 10,660,291 | | | | 10,186,974 | |
| Telos CLO Ltd. | | | | | | | | |
2014-6A, 3.23%
due 01/17/271,4 | | | 5,000,000 | | | | 4,871,500 | |
2013-3A, 3.26%
due 01/17/241,4 | | | 2,750,000 | | | | 2,691,975 | |
2013-3A, 4.51%
due 01/17/241,4 | | | 2,550,000 | | | | 2,508,945 | |
| Highbridge Loan Management 2012-1 Ltd. | | | | | | | | |
2014-1AR, 3.50%
due 09/20/221,4 | | | 6,500,000 | | | | 6,485,700 | |
2014-1AR, 4.50%
due 09/20/221,4 | | | 3,500,000 | | | | 3,491,600 | |
| Newstar Commercial Loan Funding LLC | | | | | | | | |
2015-1A, 4.12%
due 01/20/271,4 | | | 5,000,000 | | | | 4,976,000 | |
2013-1A, 4.80%
due 09/20/231,4 | | | 3,250,000 | | | | 3,159,650 | |
2013-1A, 5.55%
due 09/20/231,4 | | | 750,000 | | | | 741,075 | |
| SEE NOTES TO FINANCIAL STATEMENTS. | THE GUGGENHEIM FUNDS SEMI-ANNUAL REPORT | 15 |
CONSOLIDATED SCHEDULE OF INVESTMENTS (Unaudited)(continued) | March 31, 2015 |
| MACRO OPPORTUNITIES FUND | |
| | | Face
Amount | | | Value | |
| | | | | | | | | |
| ARES XXVI CLO Ltd. | | | | | | | | |
2013-1A, due 04/15/254,8 | | $ | 7,750,000 | | | $ | 5,266,900 | |
2013-1A, 3.00%
due 04/15/251,4 | | | 2,000,000 | | | | 1,951,600 | |
2013-1A, 4.00%
due 04/15/251,4 | | | 1,500,000 | | | | 1,461,300 | |
| Galaxy XIX CLO Ltd. | | | | | | | | |
2015-19A, due 01/24/274,8 | | | 5,500,000 | | | | 5,280,550 | |
2015-19A, 3.66%
due 01/24/271,4 | | | 3,000,000 | | | | 3,019,200 | |
| Neuberger Berman CLO Ltd. | | | | | | | | |
2012-12X,
due 07/25/238 | | | 7,000,000 | | | | 4,496,100 | |
2012-12A, due 07/25/234,8 | | | 5,900,000 | | | | 3,789,570 | |
| Atlas Senior Loan Fund V Ltd. | | | | | | | | |
2014-1A, 3.25%
due 07/16/261,4 | | | 8,000,000 | | | | 7,855,200 | |
| Stripes | | | | | | | | |
2013-1 A1, 3.84%
due 03/20/23 | | | 7,898,208 | | | | 7,838,971 | |
| MWAM CBO Ltd. | | | | | | | | |
2001-1A, 5.10%
due 01/30/311,4 | | | 4,445,663 | | | | 4,153,138 | |
2001-1A, 14.09%
due 01/30/314 | | | 3,261,457 | | | | 3,576,187 | |
| Atlas Senior Loan Fund II Ltd. | | | | | | | | |
2012-2A, due 01/30/244,8 | | | 9,600,000 | | | | 7,646,400 | |
| Irwin Home Equity Loan Trust | | | | | | | | |
2007-1, 5.85%
due 08/25/374 | | | 7,403,065 | | | | 7,574,357 | |
| GreenPoint Mortgage Funding Trust | | | | | | | | |
2005-HE4, 0.88%
due 07/25/301 | | | 7,627,337 | | | | 7,290,079 | |
| Cent CLO 16, LP | | | | | | | | |
2014-16AR, 3.50%
due 08/01/241,4 | | | 7,250,000 | | | | 7,250,725 | |
| CCR Incorporated MT100 Payment Rights Master Trust | | | | | | | | |
2010-CX, 0.62%
due 07/10/17†††,1 | | | 7,183,502 | | | | 7,026,902 | |
| Jasper CLO Ltd. | | | | | | | | |
2005-1A, 1.15%
due 08/01/171,4 | | | 7,000,000 | | | | 6,888,000 | |
| N-Star REL CDO VIII Ltd. | | | | | | | | |
2006-8A, 0.54%
due 02/01/411,4 | | | 5,350,000 | | | | 4,825,700 | |
2006-8A, 0.47%
due 02/01/411,4 | | | 2,032,118 | | | | 1,994,117 | |
| Turbine Engines Securitization Ltd. | | | | | | | | |
2013-1A, 5.13%
due 12/13/484 | | | 3,976,311 | | | | 4,027,208 | |
2013-1A, 6.37%
due 12/13/484 | | | 2,566,214 | | | | 2,639,351 | |
| Emerald Aviation Finance Ltd. | | | | | | | | |
2013-1, 6.35%
due 10/15/384,7 | | | 6,380,208 | | | | 6,475,911 | |
| Fortress Credit Opportunities V CLO Ltd. | | | | | | | | |
2014-5A, 4.73%
due 10/15/261,4 | | | 3,500,000 | | | | 3,306,800 | |
2014-5A, 3.78%
due 10/15/261,4 | | | 3,000,000 | | | | 2,913,300 | |
| SHACKLETON CLO Ltd. | | | | | | | | |
2013-4A, 3.25%
due 01/13/251,4 | | | 6,250,000 | | | | 6,104,375 | |
| HSI Asset Securitization Corporation Trust | | | | | | | | |
2005-OPT1, 0.59%
due 11/25/351 | | | 7,320,000 | | | | 6,031,892 | |
| CIT Mortgage Loan Trust | | | | | | | | |
2007-1, 1.62%
due 10/25/371,4 | | | 6,330,000 | | | | 6,014,285 | |
| 16 | THE GUGGENHEIM FUNDS SEMI-ANNUAL REPORT | SEE NOTES TO FINANCIAL STATEMENTS. |
CONSOLIDATED SCHEDULE OF INVESTMENTS (Unaudited)(continued) | March 31, 2015 |
| MACRO OPPORTUNITIES FUND | |
| | | Face
Amount | | | Value | |
| | | | | | | | | |
| Structured Asset Securities Corporation Mortgage Loan Trust | | | | | | | | |
2006-OPT1, 0.43%
due 04/25/361 | | $ | 6,613,922 | | | $ | 6,001,949 | |
| Dryden XXIII Senior Loan Fund | | | | | | | | |
2014-23RA, 3.20%
due 07/17/231,4 | | | 6,000,000 | | | | 6,000,000 | |
| ALM VII R-2 Ltd. | | | | | | | | |
2013-7R2A, 2.86%
due 04/24/241,4 | | | 3,250,000 | | | | 3,207,100 | |
2013-7R2A, 3.71%
due 04/24/241,4 | | | 2,500,000 | | | | 2,453,750 | |
| ALM XIV Ltd. | | | | | | | | |
2014-14A, 3.21%
due 07/28/261,4 | | | 3,100,000 | | | | 3,069,310 | |
2014-14A, 3.71%
due 07/28/261,4 | | | 2,500,000 | | | | 2,374,000 | |
| Willis Engine Securitization Trust II | | | | | | | | |
2012-A, 5.50%
due 09/15/374 | | | 5,336,747 | | | | 5,350,089 | |
| Fortress Credit Opportunities III CLO, LP | | | | | | | | |
2014-3A, 3.50%
due 04/28/261,4 | | | 5,500,000 | | | | 5,311,900 | |
| Neuberger Berman CLO XII Ltd. | | | | | | | | |
2014-12AR, 3.36%
due 07/25/231,4 | | | 5,300,000 | | | | 5,273,500 | |
| Eagle I Ltd. | | | | | | | | |
2014-1A, 5.29%
due 12/15/394 | | | 5,167,969 | | | | 5,211,380 | |
| Oak Hill Advisors Residential Loan Trust | | | | | | | | |
2015-NPL1, 3.47%
due 01/25/554 | | | 5,000,000 | | | | 4,999,650 | |
| Atlas Senior Loan Fund IV Ltd. | | | | | | | | |
2014-2A, 2.96%
due 02/17/261,4 | | | 3,900,000 | | | | 3,765,060 | |
2014-2A, 3.71%
due 02/17/261,4 | | | 1,210,000 | | | | 1,141,998 | |
| OCP CLO Ltd. | | | | | | | | |
2014-7A, 3.20%
due 10/20/261,4 | | | 5,000,000 | | | | 4,903,500 | |
| Mountain Hawk II CLO Ltd. | | | | | | | | |
2013-2A, 3.41%
due 07/22/241,4 | | | 2,750,000 | | | | 2,511,300 | |
2013-2A, 2.86%
due 07/22/241,4 | | | 2,500,000 | | | | 2,386,000 | |
| Golub Capital Partners CLO 24M Ltd. | | | | | | | | |
2015-24A, 4.52%
due 02/05/271,4 | | | 5,000,000 | | | | 4,848,038 | |
| Cerberus Onshore II CLO-2 LLC | | | | | | | | |
2014-1A, 3.63%
due 10/15/231,4 | | | 2,500,000 | | | | 2,440,750 | |
2014-1A, 4.43%
due 10/15/231,4 | | | 2,500,000 | | | | 2,390,750 | |
| GSAA Home Equity Trust | | | | | | | | |
2006-3, 0.47%
due 03/25/361 | | | 6,690,102 | | | | 4,790,595 | |
| Wrightwood Capital Real Estate CDO Ltd. | | | | | | | | |
2005-1A, 0.69%
due 11/21/401,4 | | | 5,000,000 | | | | 4,743,000 | |
| Highland Park CDO I Ltd. | | | | | | | | |
2006-1A, 0.59%
due 11/25/511,4 | | | 4,875,394 | | | | 4,656,002 | |
| NewStar Commercial Loan Trust | | | | | | | | |
2007-1A, 2.56%
due 09/30/221,4 | | | 4,000,000 | | | | 3,693,200 | |
2007-1A, 1.56%
due 09/30/221,4 | | | 1,000,000 | | | | 951,300 | |
| Soundview Home Loan Trust 2007-1 | | | | | | | | |
2007-1, 0.34%
due 03/25/371 | | | 5,007,954 | | | | 4,618,511 | |
| West CLO Ltd. | | | | | | | | |
2013-1A, due 11/07/254,8 | | | 5,300,000 | | | | 3,643,220 | |
| SEE NOTES TO FINANCIAL STATEMENTS. | THE GUGGENHEIM FUNDS SEMI-ANNUAL REPORT | 17 |
CONSOLIDATED SCHEDULE OF INVESTMENTS (Unaudited)(continued) | March 31, 2015 |
| MACRO OPPORTUNITIES FUND | |
| | | Face
Amount | | | Value | |
| | | | | | | | | |
2013-1A, 3.16%
due 11/07/251,4 | | $ | 1,000,000 | | | $ | 968,200 | |
| Battalion CLO Ltd. | | | | | | | | |
2007-1A, 2.40%
due 07/14/221,4 | | | 4,600,000 | | | | 4,490,060 | |
| NewStar Arlington Senior Loan Program LLC | | | | | | | | |
2014-1A, 4.51%
due 07/25/251,4 | | | 2,750,000 | | | | 2,560,250 | |
2014-1A, 3.56%
due 07/25/251,4 | | | 2,000,000 | | | | 1,916,400 | |
| Great Lakes CLO Ltd. | | | | | | | | |
2014-1A, 3.95%
due 04/15/251,4 | | | 3,000,000 | | | | 2,938,200 | |
2014-1A, 4.45%
due 04/15/251,4 | | | 1,500,000 | | | | 1,394,400 | |
| Copper River CLO Ltd. | | | | | | | | |
2007-1A, due 01/20/211,4,8 | | | 8,150,000 | | | | 4,186,655 | |
| Golub Capital Partners CLO 21M Ltd. | | | | | | | | |
2014-21A, 3.53%
due 10/25/261,4 | | | 4,300,000 | | | | 4,142,190 | |
| Flagship CLO VI | | | | | | | | |
2007-1A, 2.66%
due 06/10/211,4 | | | 4,200,000 | | | | 4,119,360 | |
| GSAA Home Equity Trust | | | | | | | | |
2007-7, 0.44%
due 07/25/371 | | | 4,855,654 | | | | 4,100,003 | |
| BlueMountain CLO Ltd. | | | | | | | | |
2012-2A, 4.36%
due 11/20/241,4 | | | 4,100,000 | | | | 4,077,860 | |
| Voya CLO Ltd. | | | | | | | | |
2015-3AR, 4.21%
due 10/15/221,4 | | | 4,000,000 | | | | 4,002,800 | |
| Golub Capital Partners CLO 10 Ltd. | | | | | | | | |
2014-10AR, 3.21%
due 10/20/211,4 | | | 4,000,000 | | | | 3,984,800 | |
| Oaktree EIF II Series A2 Ltd. | | | | | | | | |
2014-A2, 3.50%
due 11/15/251,4 | | | 4,000,000 | | | | 3,975,600 | |
| Marathon CLO V Ltd. | | | | | | | | |
2013-5A, due 02/21/254,8 | | | 4,000,000 | | | | 3,970,400 | |
| Catamaran CLO Ltd. | | | | | | | | |
2015-1A, 3.38%
due 04/22/271,4 | | | 4,000,000 | | | | 3,961,600 | |
| Saxon Asset Securities Trust | | | | | | | | |
2005-4, 0.61%
due 11/25/371 | | | 4,550,000 | | | | 3,921,545 | |
| Rockwall CDO II Ltd. | | | | | | | | |
2007-1A, 0.50%
due 08/01/241,4 | | | 2,459,794 | | | | 2,370,257 | |
2007-1A, 0.80%
due 08/01/241,4 | | | 1,500,000 | | | | 1,398,750 | |
| Putnam Structured Product CDO Ltd. | | | | | | | | |
2002-1A, 0.86%
due 01/10/381,4 | | | 3,989,801 | | | | 3,714,904 | |
| Grayson CLO Ltd. | | | | | | | | |
2006-1A, 0.66%
due 11/01/211,4 | | | 3,700,000 | | | | 3,502,050 | |
| LCM XII, LP | | | | | | | | |
2012-12A, 4.76%
due 10/19/221,4 | | | 3,500,000 | | | | 3,500,350 | |
| Banco Bradesco SA | | | | | | | | |
2014-1B, 5.43%
due 03/12/26†††,6 | | | 3,441,503 | | | | 3,464,905 | |
| AMMC CLO XI Ltd. | | | | | | | | |
2012-11A, due 10/30/234,8 | | | 5,650,000 | | | | 3,436,895 | |
| Fifth Street Senior Loan Fund I LLC | | | | | | | | |
2015-1A, 4.01%
due 01/20/271,4 | | | 3,500,000 | | | | 3,387,650 | |
| ACA CLO Ltd. | | | | | | | | |
2007-1A, 1.20%
due 06/15/221,4 | | | 3,550,000 | | | | 3,383,150 | |
| First Franklin Mortgage Loan Trust | | | | | | | | |
2006-FF1, 0.51%
due 01/25/361 | | | 2,750,000 | | | | 2,424,356 | |
| 18 | THE GUGGENHEIM FUNDS SEMI-ANNUAL REPORT | SEE NOTES TO FINANCIAL STATEMENTS. |
CONSOLIDATED SCHEDULE OF INVESTMENTS (Unaudited)(continued) | March 31, 2015 |
| MACRO OPPORTUNITIES FUND | |
| | | Face
Amount | | | Value | |
| | | | | | | | | |
2006-FF1, 0.61%
due 01/25/361 | | $ | 1,225,000 | | | $ | 931,375 | |
| Ivy Hill Middle Market Credit Fund IX Ltd. | | | | | | | | |
2014-9A, 3.54%
due 10/18/251,4 | | | 3,500,000 | | | | 3,342,150 | |
| Primus CLO II Ltd. | | | | | | | | |
2007-2A, 1.20%
due 07/15/211,4 | | | 3,500,000 | | | | 3,267,250 | |
| DIVCORE CLO Ltd. | | | | | | | | |
2013-1A B, 4.07%
due 11/15/32 | | | 3,250,000 | | | | 3,266,250 | |
| CIFC Funding 2012-I Ltd. | | | | | | | | |
2014-1AR, 3.33%
due 08/14/241,4 | | | 3,250,000 | | | | 3,261,375 | |
| GSAA Home Equity Trust | | | | | | | | |
2006-14, 0.42%
due 09/25/361 | | | 5,288,848 | | | | 3,251,758 | |
| Golub Capital Partners CLO 18 Ltd. | | | | | | | | |
2014-18A, 3.76%
due 04/25/261,4 | | | 2,200,000 | | | | 2,136,200 | |
2014-18A, 4.26%
due 04/25/261,4 | | | 1,200,000 | | | | 1,109,280 | |
| Duane Street CLO II Ltd. | | | | | | | | |
2006-2A, 4.01%
due 08/20/181,4 | | | 3,250,000 | | | | 3,201,900 | |
| ALM VII R Ltd. | | | | | | | | |
2013-7RA, 3.71%
due 04/24/241,4 | | | 3,250,000 | | | | 3,189,875 | |
| Oaktree EIF II Series A1 Ltd. | | | | | | | | |
2015-B1A, 3.46%
due 02/15/261,4 | | | 3,250,000 | | | | 3,189,225 | |
| Drug Royalty II Limited Partnership 2 | | | | | | | | |
2014-1, 3.48%
due 07/15/234 | | | 3,042,754 | | | | 3,091,760 | |
| GSAA Home Equity Trust | | | | | | | | |
2006-18, 6.00%
due 11/25/367 | | | 4,578,062 | | | | 3,062,998 | |
| Marathon CLO VII Ltd. | | | | | | | | |
2014-7A, 3.73%
due 10/28/251,4 | | | 3,000,000 | | | | 3,009,000 | |
| Shackleton I CLO Ltd. | | | | | | | | |
2012-1A, 5.01%
due 08/14/231,4 | | | 3,000,000 | | | | 2,999,700 | |
| CIFC Funding 2012-II Ltd. | | | | | | | | |
2012-2A, 4.52%
due 12/05/241,4 | | | 2,000,000 | | | | 2,000,000 | |
2012-2A, 3.27%
due 12/05/241,4 | | | 1,000,000 | | | | 986,900 | |
| ACIS CLO Ltd. | | | | | | | | |
2015-6A, 3.63%
due 05/01/271,4 | | | 3,000,000 | | | | 2,977,800 | |
| Carlyle Global Market Strategies CLO 2012-2 Ltd. | | | | | | | | |
2014-2AR, 4.16%
due 07/20/231,4 | | | 3,000,000 | | | | 2,977,500 | |
| Home Equity Asset Trust | | | | | | | | |
2005-7, 0.62%
due 01/25/361 | | | 3,250,000 | | | | 2,939,430 | |
| Race Point V CLO Ltd. | | | | | | | | |
2014-5AR, 3.99%
due 12/15/221,4 | | | 2,900,000 | | | | 2,893,910 | |
| Vibrant CLO II Ltd. | | | | | | | | |
2013-2A, 3.01%
due 07/24/241,4 | | | 3,000,000 | | | | 2,891,100 | |
| Franklin CLO Ltd. | | | | | | | | |
2007-6A, 2.51%
due 08/09/191,4 | | | 3,000,000 | | | | 2,889,000 | |
| Helios Series I Multi Asset CBO Ltd. | | | | | | | | |
2001-1A, 1.19%
due 12/13/361,4 | | | 3,075,483 | | | | 2,885,418 | |
| Mountain Hawk III CLO Ltd. | | | | | | | | |
2014-3A, 2.80%
due 04/18/251,4 | | | 3,000,000 | | | | 2,883,000 | |
| Sound Point CLO I Ltd. | | | | | | | | |
2012-1A, 4.81%
due 10/20/231,4 | | | 2,750,000 | | | | 2,759,900 | |
| Wachovia Asset Securitization Issuance II LLC Trust | | | | | | | | |
2007-HE1, 0.31%
due 07/25/371,4 | | | 3,054,152 | | | | 2,687,012 | |
| SEE NOTES TO FINANCIAL STATEMENTS. | THE GUGGENHEIM FUNDS SEMI-ANNUAL REPORT | 19 |
CONSOLIDATED SCHEDULE OF INVESTMENTS (Unaudited)(continued) | March 31, 2015 |
| MACRO OPPORTUNITIES FUND | |
| | | Face
Amount | | | Value | |
| | | | | | | | | |
| Marathon CLO VI Ltd. | | | | | | | | |
2014-6A, 3.11%
due 05/13/251,4 | | $ | 2,750,000 | | | $ | 2,664,200 | |
| ShackletonCLO Ltd. | | | | | | | | |
2014-5A, 2.96%
due 05/07/261,4 | | | 2,750,000 | | | | 2,633,675 | |
| Fortress Credit BSL Ltd. | | | | | | | | |
2013-1A, 3.15%
due 01/19/251,4 | | | 2,750,000 | | | | 2,633,400 | |
| Callidus Debt Partners CLO Fund VI Ltd. | | | | | | | | |
2007-6A, 3.26%
due 10/23/211,4 | | | 2,100,000 | | | | 2,044,350 | |
2007-6A, 1.51%
due 10/23/211,4 | | | 500,000 | | | | 480,250 | |
| Apidos CLO XX | | | | | | | | |
2015-20A, 3.42%
due 01/16/271,4 | | | 2,500,000 | | | | 2,504,000 | |
| LCM X, LP | | | | | | | | |
2014-10AR, 4.00%
due 04/15/221,4 | | | 2,500,000 | | | | 2,494,250 | |
| Gallatin CLO VII Ltd. | | | | | | | | |
2014-1A, 4.01%
due 07/15/231,4 | | | 2,500,000 | | | | 2,465,750 | |
| Great Lakes CLO Ltd. | | | | | | | | |
2012-1A, due 01/15/234,8 | | | 3,250,000 | | | | 2,436,525 | |
| Westwood CDO II Ltd. | | | | | | | | |
2007-2X, 2.05%
due 04/25/22 | | | 1,550,000 | | | | 1,476,065 | |
2007-2A, 2.06%
due 04/25/221,4 | | | 1,000,000 | | | | 952,300 | |
| San Gabriel CLO Ltd. | | | | | | | | |
2007-1A, 2.51%
due 09/10/211,4 | | | 2,450,000 | | | | 2,396,100 | |
| Finn Square CLO Ltd. | | | | | | | | |
2012-1A, due 12/24/234,8 | | | 3,250,000 | | | | 2,388,425 | |
| Keuka Park CLO Limited | | | | | | | | |
2013-1A, due 10/21/244,8 | | | 3,000,000 | | | | 2,372,100 | |
| Global Leveraged Capital Credit Opportunity Fund | | | | | | | | |
2006-1A, 1.26%
due 12/20/181,4 | | | 2,376,000 | | | | 2,330,143 | |
| Mountain Hawk I CLO Ltd. | | | | | | | | |
2013-1A, 2.98%
due 01/20/241,4 | | | 2,400,000 | | | | 2,327,520 | |
| Octagon Loan Funding Ltd. | | | | | | | | |
2014-1A, due 11/18/264,8 | | | 3,000,000 | | | | 2,267,400 | |
| GSAA Trust | | | | | | | | |
2005-10, 0.82%
due 06/25/351 | | | 2,462,000 | | | | 2,231,788 | |
| CIFC Funding Ltd. | | | | | | | | |
2013-2A, 3.86%
due 04/21/251,4 | | | 2,250,000 | | | | 2,171,700 | |
| Venture XII CLO Ltd. | | | | | | | | |
2013-12A, 3.91%
due 02/28/241,4 | | | 2,250,000 | | | | 2,163,600 | |
| Acis CLO Ltd. | | | | | | | | |
2013-1A, 4.76%
due 04/18/241,4 | | | 2,100,000 | | | | 2,105,880 | |
| Gale Force 4 CLO Ltd. | | | | | | | | |
2007-4A, 3.76%
due 08/20/211,4 | | | 2,000,000 | | | | 2,000,600 | |
| Ableco Capital LLC | | | | | | | | |
2013-1, 4.92%
due 05/31/191,6 | | | 2,000,000 | | | | 2,000,000 | |
| Northwoods Capital VII Ltd. | | | | | | | | |
2006-7A, 3.76%
due 10/22/211,4 | | | 2,000,000 | | | | 1,995,000 | |
| Neuberger Berman CLO XVIII Ltd. | | | | | | | | |
2014-18A, 3.38%
due 11/14/251,4 | | | 2,000,000 | | | | 1,989,600 | |
| OHA Credit Partners VII Ltd. | | | | | | | | |
2012-7A, 4.26%
due 11/20/231,4 | | | 2,000,000 | | | | 1,989,000 | |
| CIFC Funding Ltd. | | | | | | | | |
2006-1BA, 4.26%
due 12/22/201,4 | | | 2,000,000 | | | | 1,984,000 | |
| OCP CLO Ltd. | | | | | | | | |
2014-6A, 3.36%
due 07/17/261,4 | | | 2,000,000 | | | | 1,975,200 | |
| 20 | THE GUGGENHEIM FUNDS SEMI-ANNUAL REPORT | SEE NOTES TO FINANCIAL STATEMENTS. |
CONSOLIDATED SCHEDULE OF INVESTMENTS (Unaudited)(continued) | March 31, 2015 |
| MACRO OPPORTUNITIES FUND | |
| | | Face
Amount | | | Value | |
| | | | | | | | | |
| Adirondack Park CLO Ltd. | | | | | | | | |
2013-1A, 3.90%
due 04/15/241,4 | | $ | 2,000,000 | | | $ | 1,949,200 | |
| Salus CLO Ltd. | | | | | | | | |
2013-1AN, 6.98%
due 03/05/211,4 | | | 1,200,000 | | | | 1,187,280 | |
2013-1AN, 4.98%
due 03/05/211,4 | | | 750,000 | | | | 754,350 | |
| Lime Street CLO Corp. | | | | | | | | |
2007-1A, 2.77%
due 06/20/211,4 | | | 2,000,000 | | | | 1,939,000 | |
| AMMC CLO XIV Ltd. | | | | | | | | |
2014-14A, 3.06%
due 07/27/261,4 | | | 2,000,000 | | | | 1,937,600 | |
| Cerberus Onshore II CLO LLC | | | | | | | | |
2014-1A, 3.75%
due 10/15/231,4 | | | 1,000,000 | | | | 975,900 | |
2014-1A, 4.25%
due 10/15/231,4 | | | 1,000,000 | | | | 947,600 | |
| Churchill Financial Cayman Ltd. | | | | | | | | |
2007-1A, 1.50%
due 07/10/191,4 | | | 1,000,000 | | | | 960,900 | |
2007-1A, 2.85%
due 07/10/191,4 | | | 1,000,000 | | | | 942,600 | |
| Kingsland III Ltd. | | | | | | | | |
2006-3A, 1.86%
due 08/24/211,4 | | | 1,890,000 | | | | 1,824,984 | |
| Regatta Funding Ltd. | | | | | | | | |
2007-1X, 3.57%
due 06/15/201 | | | 1,800,000 | | | | 1,781,820 | |
| New Century Home Equity Loan Trust | | | | | | | | |
2004-4, 0.97%
due 02/25/351 | | | 1,974,581 | | | | 1,770,214 | |
| Symphony CLO XV Ltd. | | | | | | | | |
2014-15A, 3.40%
due 10/17/261,4 | | | 1,750,000 | | | | 1,749,825 | |
| Shackleton II CLO Ltd. | | | | | | | | |
2012-2A, 4.31%
due 10/20/231,4 | | | 1,750,000 | | | | 1,717,800 | |
| CIFC Funding Ltd. | | | | | | | | |
2014-1A, 3.05%
due 04/18/251,4 | | | 1,750,000 | | | | 1,708,000 | |
| Canyon Capital CLO Ltd. | | | | | | | | |
2013-1A, 3.05%
due 01/15/241,4 | | | 1,750,000 | | | | 1,706,775 | |
| Madison Park Funding XI Ltd. | | | | | | | | |
2013-11A, 3.76%
due 10/23/251,4 | | | 1,750,000 | | | | 1,683,500 | |
| West Coast Funding Ltd. | | | | | | | | |
2006-1A, 0.40%
due 11/02/411,4 | | | 1,692,385 | | | | 1,682,061 | |
| Airplanes Pass Through Trust | | | | | | | | |
2001-1A, 0.72%
due 03/15/191 | | | 3,903,457 | | | | 1,600,417 | |
| Telos CLO Ltd. | | | | | | | | |
2007-2A, 2.45%
due 04/15/221,4 | | | 1,650,000 | | | | 1,592,085 | |
| MCF CLO IV LLC | | | | | | | | |
2014-1A, 6.20%
due 10/15/251,4 | | | 1,750,000 | | | | 1,573,075 | |
| Landmark VIII CLO Ltd. | | | | | | | | |
2006-8A, 1.71%
due 10/19/201,4 | | | 1,650,000 | | | | 1,569,810 | |
| OHA Park Avenue CLO I Ltd. | | | | | | | | |
2007-1A, 3.52%
due 03/14/221,4 | | | 1,575,695 | | | | 1,525,745 | |
| Avalon IV Capital Ltd. | | | | | | | | |
2014-1AR, 4.11%
due 04/17/231,4 | | | 1,500,000 | | | | 1,496,700 | |
| Carlyle Global Market Strategies CLO Ltd. | | | | | | | | |
2012-3A, due 10/04/244,8 | | | 1,800,000 | | | | 1,494,000 | |
| OZLM Funding V Ltd. | | | | | | | | |
2013-5A, 3.23%
due 01/17/261,4 | | | 1,500,000 | | | | 1,482,600 | |
| SEE NOTES TO FINANCIAL STATEMENTS. | THE GUGGENHEIM FUNDS SEMI-ANNUAL REPORT | 21 |
CONSOLIDATED SCHEDULE OF INVESTMENTS (Unaudited)(continued) | March 31, 2015 |
| MACRO OPPORTUNITIES FUND | |
| | | Face
Amount | | | Value | |
| | | | | | | | | |
| New Century Home Equity Loan Trust | | | | | | | | |
2005-1, 0.89%
due 03/25/351 | | $ | 1,705,915 | | | $ | 1,482,493 | |
| MCF CLO I LLC | | | | | | | | |
2013-1A, 3.81%
due 04/20/231,4 | | | 1,500,000 | | | | 1,469,550 | |
| Black Diamond CLO Delaware Corp. | | | | | | | | |
2005-1A, 2.17%
due 06/20/171,4 | | | 1,500,000 | | | | 1,468,350 | |
| Bacchus Ltd. | | | | | | | | |
2006-1A, 1.81%
due 01/20/191,4 | | | 1,500,000 | | | | 1,468,050 | |
| Sands Point Funding Ltd. | | | | | | | | |
2006-1A, 2.01%
due 07/18/201,4 | | | 1,500,000 | | | | 1,464,900 | |
| Steele Creek CLO Ltd. | | | | | | | | |
2014-1A, 3.46%
due 08/21/261,4 | | | 1,500,000 | | | | 1,463,250 | |
| Greywolf CLO III Ltd. | | | | | | | | |
2014-1A, 3.11%
due 04/22/261,4 | | | 1,500,000 | | | | 1,460,250 | |
| Black Diamond CLO Delaware Corp. | | | | | | | | |
2005-2A, 2.07%
due 01/07/181,4 | | | 1,500,000 | | | | 1,458,150 | |
| Covenant Credit Partners CLO I Ltd. | | | | | | | | |
2014-1A, 3.18%
due 07/20/261,4 | | | 1,500,000 | | | | 1,437,750 | |
| Figueroa CLO Ltd. | | | | | | | | |
2013-2A, 4.00%
due 12/18/251,4 | | | 1,500,000 | | | | 1,423,950 | |
| Connecticut Valley Structured Credit CDO III Ltd. | | | | | | | | |
2006-3A, 0.91%
due 03/23/231,4 | | | 1,000,000 | | | | 968,000 | |
2006-3A, 6.68%
due 03/23/234 | | | 441,767 | | | | 439,116 | |
| TCW Global Project Fund III Ltd. | | | | | | | | |
2005-1A, 0.91%
due 09/01/171,4 | | | 860,193 | | | | 834,387 | |
2005-1A, 1.11%
due 09/01/17†††,1,4 | | | 600,000 | | | | 569,640 | |
| Kingsland IV Ltd. | | | | | | | | |
2007-4A, 1.70%
due 04/16/211,4 | | | 1,500,000 | | | | 1,400,250 | |
| Structured Asset Investment Loan Trust | | | | | | | | |
2005-2, 0.91%
due 03/25/351 | | | 1,500,000 | | | | 1,393,917 | |
| Duane Street CLO IV Ltd. | | | | | | | | |
2007-4A, 2.51%
due 11/14/211,4 | | | 1,400,000 | | | | 1,363,460 | |
| Cerberus Offshore Levered I, LP | | | | | | | | |
2012-1A, 6.27%
due 11/30/181,4 | | | 1,350,000 | | | | 1,350,540 | |
| Ares XXV CLO Ltd. | | | | | | | | |
2013-3A, due 01/17/244,8 | | | 2,000,000 | | | | 1,343,800 | |
| Asset Backed Securities Corporation Home Equity Loan Trust Series OOMC | | | | | | | | |
2006-HE5, 0.31%
due 07/25/361 | | | 1,471,403 | | | | 1,317,923 | |
| TICP CLO II Ltd. | | | | | | | | |
2014-2A, 3.26%
due 07/20/261,4 | | | 1,300,000 | | | | 1,276,080 | |
| ALM VI Ltd. | | | | | | | | |
2012-6A, due 06/14/234,8 | | | 1,600,000 | | | | 1,263,840 | |
| NewStar Commercial Loan Funding LLC | | | | | | | | |
2014-1A, 5.01%
due 04/20/251,4 | | | 1,250,000 | | | | 1,250,000 | |
| Galaxy XII CLO Ltd. | | | | | | | | |
2012-12A, 4.26%
due 05/19/231,4 | | | 1,250,000 | | | | 1,243,375 | |
| COA Summit CLO Ltd. | | | | | | | | |
2014-1A, 4.10%
due 04/20/231,4 | | | 1,250,000 | | | | 1,240,875 | |
| 22 | THE GUGGENHEIM FUNDS SEMI-ANNUAL REPORT | SEE NOTES TO FINANCIAL STATEMENTS. |
CONSOLIDATED SCHEDULE OF INVESTMENTS (Unaudited)(continued) | March 31, 2015 |
| MACRO OPPORTUNITIES FUND | |
| | | Face
Amount | | | Value | |
| | | | | | | | | |
| GoldenTree Loan Opportunities III Ltd. | | | | | | | | |
2007-3A, 3.45%
due 05/01/221,4 | | $ | 1,250,000 | | | $ | 1,214,500 | |
| Halcyon Loan Advisors Funding Ltd. | | | | | | | | |
2012-2A, 3.12%
due 12/20/241,4 | | | 1,250,000 | | | | 1,212,500 | |
| ColumbusNova CLO Ltd. | | | | | | | | |
2007-1A, 1.61%
due 05/16/191,4 | | | 1,250,000 | | | | 1,212,500 | |
| ICE EM CLO | | | | | | | | |
2007-1A, 1.23%
due 08/15/221,4 | | | 1,250,000 | | | | 1,193,500 | |
| ARES CLO Ltd. | | | | | | | | |
2013-1X, due 04/15/258 | | | 1,660,000 | | | | 1,128,136 | |
| Tricadia Ltd. | | | | | | | | |
2006-6A, 1.01%
due 11/05/411,4 | | | 1,150,000 | | | | 1,119,985 | |
| Black Diamond CLO 2006-1 Luxembourg S.A. | | | | | | | | |
2007-1A, 0.94%
due 04/29/191,4 | | | 1,100,000 | | | | 1,041,150 | |
| Blade Engine Securitization Ltd. | | | | | | | | |
2006-1A, 1.17%
due 09/15/411 | | | 794,764 | | | | 604,021 | |
2006-1A, 3.17%
due 09/15/411,4 | | | 1,029,910 | | | | 415,981 | |
| Marathon CLO Ltd. | | | | | | | | |
due 02/21/258 | | | 1,000,000 | | | | 992,600 | |
| Katonah Ltd. | | | | | | | | |
2007-10A, 2.26%
due 04/17/201,4 | | | 1,000,000 | | | | 987,600 | |
| Halcyon Loan Advisors Funding Ltd. | | | | | | | | |
2012-1A, 3.26%
due 08/15/231,4 | | | 1,000,000 | | | | 976,500 | |
| Palmer Square CLO Ltd. | | | | | | | | |
2014-1A, 2.81%
due 10/17/221,4 | | | 1,000,000 | | | | 975,600 | |
| OHA Loan Funding Ltd. | | | | | | | | |
2013-1A, 3.86%
due 07/23/251,4 | | | 1,000,000 | | | | 974,400 | |
| Gleneagles CLO Ltd. | | | | | | | | |
2005-1A, 1.15%
due 11/01/171,4 | | | 1,000,000 | | | | 974,400 | |
| Halcyon Loan Investors CLO I, Inc. | | | | | | | | |
2006-1A, 3.76%
due 11/20/201,4 | | | 1,000,000 | | | | 970,200 | |
| ACAS CLO Ltd. | | | | | | | | |
2013-1A, 3.01%
due 04/20/251,4 | | | 1,000,000 | | | | 970,200 | |
| Cavalry CLO II | | | | | | | | |
2013-2A, 4.25%
due 01/17/241,4 | | | 1,000,000 | | | | 967,800 | |
| Pangaea CLO Ltd. | | | | | | | | |
2007-1A, 0.76%
due 10/21/211,4 | | | 1,000,000 | | | | 964,400 | |
| Halcyon Loan Investors CLO II, Inc. | | | | | | | | |
2007-2A, 1.66%
due 04/24/211,4 | | | 1,000,000 | | | | 963,600 | |
| CIFC Funding Ltd. | | | | | | | | |
2013-4A, 3.76%
due 11/27/241,4 | | | 1,000,000 | | | | 959,000 | |
| WhiteHorse VIII Ltd. | | | | | | | | |
2014-1A, 3.01%
due 05/01/261,4 | | | 1,000,000 | | | | 943,800 | |
| Eastland CLO Ltd. | | | | | | | | |
2007-1A, 0.65%
due 05/01/221,4 | | | 1,000,000 | | | | 940,200 | |
| MCF CLO III LLC | | | | | | | | |
2014-3A, 3.46%
due 01/20/241,4 | | | 1,000,000 | | | | 916,400 | |
| Aames Mortgage Investment Trust | | | | | | | | |
2006-1, 0.49%
due 04/25/361 | | | 919,397 | | | | 901,379 | |
| Fortress Credit Opportunities | | | | | | | | |
2005-1A, 0.59%
due 07/15/191,4 | | | 940,428 | | | | 854,379 | |
| SEE NOTES TO FINANCIAL STATEMENTS. | THE GUGGENHEIM FUNDS SEMI-ANNUAL REPORT | 23 |
CONSOLIDATED SCHEDULE OF INVESTMENTS (Unaudited)(continued) | March 31, 2015 |
| MACRO OPPORTUNITIES FUND | |
| | | Face
Amount | | | Value | |
| | | | | | | | | |
| Babcock & Brown Air Funding I Ltd. | | | | | | | | |
2007-1A, 0.47%
due 11/14/331,4 | | $ | 945,789 | | | $ | 803,921 | |
| KKR Financial CLO Ltd. | | | | | | | | |
2007-1X, 5.25%
due 05/15/21 | | | 800,000 | | | | 799,120 | |
| Central Park CLO Ltd. | | | | | | | | |
2011-1A, 3.46%
due 07/23/221,4 | | | 750,000 | | | | 749,175 | |
| Garrison Funding Ltd. | | | | | | | | |
2013-2A, 4.88%
due 09/25/231,4 | | | 750,000 | | | | 743,100 | |
| Venture XV CLO Ltd. | | | | | | | | |
2013-15A, 3.35%
due 07/15/251,4 | | | 750,000 | | | | 741,600 | |
| Octagon Investment Partners XV Ltd. | | | | | | | | |
2013-1A, 3.11%
due 01/19/251,4 | | | 750,000 | | | | 739,650 | |
| Venture XIV CLO Ltd. | | | | | | | | |
2013-14A, 3.01%
due 08/28/251,4 | | | 750,000 | | | | 727,050 | |
| Westwood CDO I Ltd. | | | | | | | | |
2007-1A, 0.94%
due 03/25/211,4 | | | 700,000 | | | | 660,100 | |
| Asset Backed Securities Corporation Home Equity Loan Trust Series | | | | | | | | |
2004-HE8, 1.22%
due 12/25/341 | | | 680,993 | | | | 653,827 | |
| Northwind Holdings LLC | | | | | | | | |
2007-1A, 1.01%
due 12/01/371,4 | | | 613,950 | | | | 558,695 | |
| Aerco Ltd. | | | | | | | | |
2000-2A, 0.63%
due 07/15/251 | | | 1,143,801 | | | | 465,413 | |
| Credit Card Pass-Through Trust | | | | | | | | |
2012-BIZ, 0.00%
due 12/15/49†††,3,4 | | | 509,332 | | | | 450,097 | |
| TCW Global Project Fund II Ltd. | | | | | | | | |
2004-1A, 1.60%
due 06/24/161,4 | | | 308,984 | | | | 297,397 | |
| Marathon CLO II Ltd. | | | | | | | | |
2005-2A, due 12/20/194,8 | | | 2,250,000 | | | | 264,150 | |
| Garanti Diversified Payment Rights Finance Co. | | | | | | | | |
2007-A, 0.44%
due 07/09/171 | | | 260,000 | | | | 252,486 | |
| Diversified Asset Securitization Holdings II, LP | | | | | | | | |
2000-1A, 0.76%
due 09/15/351,4 | | | 230,254 | | | | 226,316 | |
| Drug Royalty Limited Partnership 1 | | | | | | | | |
2012-1, 5.50%
due 07/15/241,4 | | | 188,308 | | | | 193,759 | |
| Vega Containervessel plc | | | | | | | | |
2006-1A, 5.56%
due 02/10/214 | | | 123,365 | | | | 122,094 | |
| BlackRock Senior Income Series Corp. | | | | | | | | |
2004-1X,
due 09/15/16†††,8 | | | 2,400,000 | | | | 240 | |
| Total Asset-Backed Securities | | | | | | | | |
| (Cost $1,083,048,268) | | | | | | | 1,090,960,401 | |
| | | | | | | | |
SENIOR FLOATING RATE INTERESTS††,1,11 - 20.0% | |
| INDUSTRIAL - 4.4% | |
| Travelport Holdings LLC | | | | | | | | |
| 5.75% due 09/02/21 | | | 28,827,750 | | | | 29,064,425 | |
| CareCore National LLC | | | | | | | | |
| 5.50% due 03/05/21 | | | 8,004,325 | | | | 8,044,347 | |
| Rise Ltd. | | | | | | | | |
| 4.74% due 02/12/39 | | | 6,526,042 | | | | 6,574,987 | |
| Gates Global, Inc. | | | | | | | | |
| 4.25% due 07/05/21 | | | 6,481,864 | | | | 6,453,538 | |
| Nord Anglia Education Finance LLC | | | | | | | | |
| 4.50% due 03/31/21 | | | 4,122,237 | | | | 4,122,237 | |
| 24 | THE GUGGENHEIM FUNDS SEMI-ANNUAL REPORT | SEE NOTES TO FINANCIAL STATEMENTS. |
CONSOLIDATED SCHEDULE OF INVESTMENTS (Unaudited)(continued) | March 31, 2015 |
| MACRO OPPORTUNITIES FUND | |
| | | Face
Amount | | | Value | |
| | | | | | | | | |
| Connolly Corp. | | | | | | | | |
| 5.00% due 05/14/21 | | $ | 3,991,645 | | | $ | 4,009,128 | |
| SIRVA Worldwide, Inc. | | | | | | | | |
| 7.50% due 03/27/19 | | | 3,822,000 | | | | 3,802,890 | |
| AABS Ltd. | | | | | | | | |
| 4.87% due 01/15/38 | | | 3,428,507 | | | | 3,488,506 | |
| Hardware Holdings LLC | | | | | | | | |
6.75% due 03/30/206 | | | 3,482,500 | | | | 3,378,025 | |
| Brickman Group Holdings, Inc. | | | | | | | | |
| 4.00% due 12/18/20 | | | 3,327,067 | | | | 3,309,500 | |
| GYP Holdings III Corp. | | | | | | | | |
| 4.75% due 04/01/21 | | | 3,279,240 | | | | 3,191,127 | |
| NVA Holdings, Inc. | | | | | | | | |
| 4.99% due 08/14/21 | | | 2,347,125 | | | | 2,347,125 | |
| 8.00% due 08/14/22 | | | 750,000 | | | | 750,000 | |
| Berlin Packaging LLC | | | | | | | | |
| 4.50% due 10/01/21 | | | 2,936,497 | | | | 2,939,551 | |
| Mast Global | | | | | | | | |
8.75% due 09/12/19†††,6 | | | 2,915,195 | | | | 2,893,146 | |
| Flakt Woods | | | | | | | | |
2.63% due 03/20/17†††,6 | | EUR | 2,664,741 | | | | 2,806,965 | |
| AlliedBarton Security Services LLC | | | | | | | | |
| 4.25% due 02/12/21 | | | 2,712,378 | | | | 2,710,127 | |
| syncreon | | | | | | | | |
| 5.25% due 10/28/20 | | | 2,814,375 | | | | 2,694,764 | |
| Goodpack Ltd. | | | | | | | | |
| 4.75% due 09/09/21 | | | 2,550,000 | | | | 2,543,625 | |
| Pro Mach Group, Inc. | | | | | | | | |
| 5.50% due 10/22/21 | | | 2,500,000 | | | | 2,513,750 | |
| Knowledge Learning Corp. | | | | | | | | |
| 5.25% due 03/18/21 | | | 2,376,000 | | | | 2,395,792 | |
| Thermasys Corp. | | | | | | | | |
| 5.25% due 05/03/19 | | | 2,319,625 | | | | 2,313,826 | |
| MRC Global, Inc. | | | | | | | | |
| 5.00% due 11/08/19 | | | 2,216,250 | | | | 2,125,384 | |
| SIG Onex Wizard Acquisition | | | | | | | | |
| 5.25% due 03/11/22 | | | 2,000,000 | | | | 2,016,240 | |
| Ceva Logistics US Holdings | | | | | | | | |
| 6.50% due 03/19/21 | | | 1,989,754 | | | | 1,859,584 | |
| Power Borrower, LLC | | | | | | | | |
| 4.25% due 05/06/20 | | | 1,479,176 | | | | 1,464,385 | |
| 8.25% due 11/06/20 | | | 275,000 | | | | 267,438 | |
| Survitec | | | | | | | | |
| 8.00% due 02/24/22 | | GBP | 1,125,000 | | | | 1,671,201 | |
| Ceva Group plc (United Kingdom) | | | | | | | | |
| 6.50% due 03/19/21 | | | 1,381,773 | | | | 1,291,378 | |
due 03/19/198 | | | 200,000 | | | | 167,638 | |
| Dematic S.A. | | | | | | | | |
| 4.25% due 12/28/19 | | | 1,418,046 | | | | 1,413,324 | |
| Ceva Logistics Holdings BV (Dutch) | | | | | | | | |
| 6.50% due 03/19/21 | | | 1,442,571 | | | | 1,348,198 | |
| CPM Acquisition Corp. | | | | | | | | |
| 6.25% due 08/29/17 | | | 766,545 | | | | 766,545 | |
| 10.25% due 03/01/18 | | | 450,000 | | | | 450,000 | |
| API Technologies Corp. | | | | | | | | |
9.00% due 02/06/18†††,6 | | | 1,199,502 | | | | 1,190,386 | |
| Hillman Group, Inc. | | | | | | | | |
| 4.50% due 06/30/21 | | | 794,000 | | | | 799,622 | |
3.48% due 06/13/196 | | | 414,286 | | | | 375,617 | |
| SI Organization | | | | | | | | |
| 5.75% due 11/23/19 | | | 1,121,958 | | | | 1,125,885 | |
| Constantinople Acquisition GmbH | | | | | | | | |
| 4.75% due 02/25/22 | | | 1,000,000 | | | | 998,440 | |
| Element Materials Technology | | | | | | | | |
| 5.25% due 08/06/21 | | | 995,000 | | | | 995,000 | |
| US Infrastructure Corp. | | | | | | | | |
| 4.00% due 07/10/20 | | | 1,000,000 | | | | 992,500 | |
| Exopack Holdings SA | | | | | | | | |
| 5.25% due 05/08/19 | | | 987,500 | | | | 991,618 | |
| Mitchell International, Inc. | | | | | | | | |
| 8.50% due 10/11/21 | | | 900,000 | | | | 890,811 | |
| V.Group Ltd. | | | | | | | | |
| 5.00% due 06/25/21 | | | 794,000 | | | | 797,311 | |
| Capstone Logistics | | | | | | | | |
| 5.50% due 10/07/21 | | | 798,000 | | | | 794,010 | |
| SEE NOTES TO FINANCIAL STATEMENTS. | THE GUGGENHEIM FUNDS SEMI-ANNUAL REPORT | 25 |
CONSOLIDATED SCHEDULE OF INVESTMENTS (Unaudited)(continued) | March 31, 2015 |
| MACRO OPPORTUNITIES FUND | |
| | | Face
Amount | | | Value | |
| | | | | | | | | |
| Hunter Defense Technologies | | | | | | | | |
| 6.50% due 08/05/19 | | $ | 780,000 | | | $ | 780,000 | |
| NANA Development Corp. | | | | | | | | |
8.00% due 03/15/186 | | | 780,000 | | | | 746,850 | |
| Doncasters Group Ltd. | | | | | | | | |
| 9.50% due 10/09/20 | | | 744,828 | | | | 741,103 | |
| Hunter Fan Co. | | | | | | | | |
6.50% due 12/20/176 | | | 573,821 | | | | 568,082 | |
| Headwaters, Inc. | | | | | | | | |
| 4.50% due 03/11/22 | | | 500,000 | | | | 501,875 | |
| Tank Holdings Corp. | | | | | | | | |
| 5.25% due 03/11/22 | | | 500,000 | | | | 501,250 | |
| Douglas Dynamics, LLC | | | | | | | | |
| 5.25% due 12/31/21 | | | 498,750 | | | | 499,997 | |
| VAT Holding AG | | | | | | | | |
| 4.75% due 02/11/21 | | | 495,000 | | | | 492,936 | |
| Multiplan, Inc. | | | | | | | | |
| 3.75% due 03/31/21 | | | 483,750 | | | | 481,936 | |
| Waste Industries USA, Inc. | | | | | | | | |
| 4.25% due 02/27/20 | | | 300,000 | | | | 300,843 | |
| Landmark Aviation (US) | | | | | | | | |
| 4.75% due 10/25/19 | | | 288,548 | | | | 288,692 | |
| Ceva Logistics Canada, ULC | | | | | | | | |
| 6.50% due 03/19/21 | | | 248,719 | | | | 232,448 | |
| Camp Systems International | | | | | | | | |
| 8.25% due 11/29/19 | | | 120,000 | | | | 119,700 | |
| Landmark Aviation (CAD) | | | | | | | | |
| 4.75% due 10/25/19 | | | 11,452 | | | | 11,458 | |
| Total Industrial | | | | | | | 133,407,066 | |
| | | | | | | | |
| CONSUMER, CYCLICAL - 3.5% | |
| Sears Holdings Corp. | | | | | | | | |
| 5.50% due 06/30/18 | | | 6,568,335 | | | | 6,463,635 | |
| Sky Bet | | | | | | | | |
| 6.50% due 02/25/22 | | GBP | 3,700,000 | | | | 5,468,947 | |
| American Tire Distributors, Inc. | | | | | | | | |
| 5.25% due 09/24/21 | | | 2,763,181 | | | | 2,773,543 | |
| 7.00% due 06/01/18 | | | 2,456,976 | | | | 2,456,976 | |
| Burger King Corp. | | | | | | | | |
| 4.50% due 10/27/21 | | | 4,955,852 | | | | 5,002,635 | |
| Eyemart Express | | | | | | | | |
| 5.00% due 12/18/21 | | | 4,750,000 | | | | 4,773,750 | |
| Neiman Marcus Group, Inc. | | | | | | | | |
| 4.25% due 10/25/20 | | | 4,744,331 | | | | 4,725,638 | |
| National Vision, Inc. | | | | | | | | |
| 4.00% due 03/12/21 | | | 4,076,375 | | | | 4,027,132 | |
| 6.75% due 03/11/22 | | | 650,000 | | | | 632,125 | |
| Landry’s, Inc. | | | | | | | | |
| 4.00% due 04/24/18 | | | 4,528,384 | | | | 4,534,045 | |
| Advantage Sales & Marketing, Inc. | | | | | | | | |
4.25% due 07/23/216 | | | 4,389,000 | | | | 4,382,899 | |
| PetSmart, Inc. | | | | | | | | |
| 5.00% due 03/11/22 | | | 4,000,000 | | | | 4,028,920 | |
| ServiceMaster Co. | | | | | | | | |
| 4.25% due 07/01/21 | | | 3,734,750 | | | | 3,716,076 | |
| Mattress Firm | | | | | | | | |
| 5.25% due 10/20/21 | | | 3,341,625 | | | | 3,362,510 | |
| Hilton Worldwide Holdings, Inc. | | | | | | | | |
| 3.50% due 10/26/20 | | | 3,328,431 | | | | 3,331,460 | |
| Ipreo Holdings | | | | | | | | |
| 4.25% due 08/06/21 | | | 3,096,875 | | | | 3,069,777 | |
| Party City Holdings, Inc. | | | | | | | | |
| 4.00% due 07/27/19 | | | 2,650,000 | | | | 2,645,575 | |
| J. Crew Group, Inc. | | | | | | | | |
| 4.00% due 03/05/21 | | | 2,508,180 | | | | 2,322,023 | |
| CHG Healthcare Services, Inc. | | | | | | | | |
| 4.25% due 11/19/19 | | | 2,288,342 | | | | 2,292,347 | |
| Fitness International LLC | | | | | | | | |
| 5.50% due 07/01/20 | | | 2,382,746 | | | | 2,215,954 | |
| Men’s Wearhouse | | | | | | | | |
| 4.50% due 06/18/21 | | | 2,189,748 | | | | 2,197,960 | |
| Ceridian Corp. | | | | | | | | |
| 4.50% due 09/15/20 | | | 2,213,095 | | | | 2,178,527 | |
| Dealer Tire LLC | | | | | | | | |
| 5.50% due 12/22/21 | | | 1,995,000 | | | | 2,021,194 | |
| IntraWest Holdings S.à r.l. | | | | | | | | |
| 5.50% due 12/09/20 | | | 1,912,497 | | | | 1,923,858 | |
| 26 | THE GUGGENHEIM FUNDS SEMI-ANNUAL REPORT | SEE NOTES TO FINANCIAL STATEMENTS. |
CONSOLIDATED SCHEDULE OF INVESTMENTS (Unaudited)(continued) | March 31, 2015 |
| MACRO OPPORTUNITIES FUND | |
| | | Face
Amount | | | Value | |
| | | | | | | | | |
| 1-800 Contacts, Inc. | | | | | | | | |
| 4.25% due 01/29/21 | | $ | 1,863,496 | | | $ | 1,856,508 | |
| Burlington Coat Factory Warehouse Corp. | | | | | | | | |
| 4.25% due 08/13/21 | | | 1,799,125 | | | | 1,808,876 | |
| Capital Automotive LP | | | | | | | | |
| 6.00% due 04/30/20 | | | 1,770,000 | | | | 1,796,550 | |
| Compucom Systems, Inc. | | | | | | | | |
| 4.25% due 05/07/20 | | | 1,930,000 | | | | 1,794,900 | |
| Stuart Weitzman Acquisition Co. | | | | | | | | |
4.50% due 04/08/206 | | | 1,786,500 | | | | 1,784,267 | |
| Nassa Midco AS | | | | | | | | |
| 4.25% due 05/14/21 | | EUR | 1,650,000 | | | | 1,779,996 | |
| Kate Spade & Co. | | | | | | | | |
| 4.00% due 04/09/21 | | | 1,645,865 | | | | 1,643,116 | |
| Ollies Bargain Outlet | | | | | | | | |
| 4.75% due 09/28/19 | | | 1,502,706 | | | | 1,487,679 | |
| Southern Graphics, Inc. | | | | | | | | |
| 4.25% due 10/17/19 | | | 1,475,063 | | | | 1,472,304 | |
| TI Automotive Ltd. | | | | | | | | |
| 4.25% due 07/02/21 | | | 1,280,325 | | | | 1,278,725 | |
| Alexander Mann Solutions Ltd. | | | | | | | | |
| 5.75% due 12/20/19 | | | 1,283,750 | | | | 1,270,913 | |
| BBB Industries, LLC | | | | | | | | |
| 6.00% due 11/03/21 | | | 1,000,000 | | | | 998,750 | |
4.18% due 10/17/196 | | | 212,500 | | | | 185,274 | |
| Jacobs Entertainment, Inc. | | | | | | | | |
| 5.25% due 10/29/18 | | | 1,204,799 | | | | 1,168,655 | |
| BJ’s Wholesale Club, Inc. | | | | | | | | |
| 4.50% due 09/26/19 | | | 1,147,096 | | | | 1,146,580 | |
| California Pizza Kitchen, Inc. | | | | | | | | |
| 5.25% due 03/29/18 | | | 939,045 | | | | 913,456 | |
| Warner Music Group | | | | | | | | |
| 3.75% due 07/01/20 | | | 848,861 | | | | 827,639 | |
| GCA Services Group, Inc. | | | | | | | | |
| 9.25% due 11/01/20 | | | 440,000 | | | | 435,600 | |
| 4.30% due 11/01/19 | | | 305,960 | | | | 305,960 | |
| Armored AutoGroup, Inc. | | | | | | | | |
| 6.00% due 11/05/16 | | | 614,197 | | | | 614,965 | |
| Fleetpride Corp. | | | | | | | | |
| 5.25% due 11/19/19 | | | 607,741 | | | | 602,423 | |
| Dave & Busters, Inc. | | | | | | | | |
| 4.25% due 07/27/20 | | | 588,208 | | | | 589,860 | |
| Equinox Fitness | | | | | | | | |
| 5.00% due 01/31/20 | | | 548,618 | | | | 549,990 | |
| Packers Holdings | | | | | | | | |
| 5.00% due 12/02/21 | | | 500,000 | | | | 503,125 | |
| Container Store, Inc. | | | | | | | | |
| 4.25% due 04/06/19 | | | 329,196 | | | | 327,550 | |
| Navistar, Inc. | | | | | | | | |
| 5.75% due 08/17/17 | | | 298,611 | | | | 299,731 | |
| Arby’s | | | | | | | | |
| 4.75% due 11/15/20 | | | 197,500 | | | | 197,994 | |
| CKX Entertainment, Inc. | | | | | | | | |
9.00% due 06/21/176 | | | 43,475 | | | | 30,433 | |
| Total Consumer, Cyclical | | | | | | | 108,219,325 | |
| | | | | | | | |
| CONSUMER, NON-CYCLICAL - 3.1% | |
| Albertson’s (Safeway) Holdings LLC | | | | | | | | |
| 5.50% due 08/25/21 | | | 28,500,000 | | | | 28,725,719 | |
| 5.00% due 08/26/19 | | | 9,000,000 | | | | 9,052,919 | |
| One Call Medical, Inc. | | | | | | | | |
| 5.00% due 11/27/20 | | | 6,174,312 | | | | 6,171,719 | |
| Dollar Tree, Inc. | | | | | | | | |
| 4.25% due 03/09/22 | | | 4,750,000 | | | | 4,798,165 | |
| Performance Food Group | | | | | | | | |
| 6.25% due 11/14/19 | | | 4,052,917 | | | | 4,056,281 | |
| Harvard Drug | | | | | | | | |
| 5.00% due 08/16/20 | | | 3,998,876 | | | | 3,968,884 | |
| Valeant Pharmaceuticals International, Inc. | | | | | | | | |
| 4.00% due 03/11/22 | | | 3,397,590 | | | | 3,411,860 | |
| Grocery Outlet, Inc. | | | | | | | | |
| 5.75% due 10/21/21 | | | 3,042,375 | | | | 3,051,898 | |
| Heinz (H.J.) Co. | | | | | | | | |
| 3.25% due 06/05/20 | | | 2,985,384 | | | | 2,989,086 | |
| Continental Foods | | | | | | | | |
| 4.27% due 08/20/21 | | EUR | 2,000,000 | | | | 2,157,700 | |
| Dole Food Company, Inc. | | | | | | | | |
| 4.50% due 11/01/18 | | | 1,946,154 | | | | 1,950,417 | |
| SEE NOTES TO FINANCIAL STATEMENTS. | THE GUGGENHEIM FUNDS SEMI-ANNUAL REPORT | 27 |
CONSOLIDATED SCHEDULE OF INVESTMENTS (Unaudited)(continued) | March 31, 2015 |
| MACRO OPPORTUNITIES FUND | |
| | | Face
Amount | | | Value | |
| | | | | | | | | |
| Reddy Ice Holdings, Inc. | | | | | | | | |
6.75% due 04/01/196 | | $ | 1,078,491 | | | $ | 943,680 | |
10.75% due 10/01/196 | | | 1,125,000 | | | | 855,000 | |
| AdvancePierre Foods, Inc. | | | | | | | | |
| 9.50% due 10/10/17 | | | 1,006,000 | | | | 1,007,258 | |
| 5.75% due 07/10/17 | | | 730,680 | | | | 731,286 | |
| Diamond Foods, Inc. | | | | | | | | |
| 4.25% due 08/20/18 | | | 1,731,759 | | | | 1,729,058 | |
| Arctic Glacier Holdings, Inc. | | | | | | | | |
| 6.00% due 05/10/19 | | | 1,538,046 | | | | 1,526,511 | |
| Phillips-Medsize Corp. | | | | | | | | |
| 4.75% due 06/16/21 | | | 1,489,247 | | | | 1,486,760 | |
| Hearthside Foods | | | | | | | | |
| 4.50% due 06/02/21 | | | 1,389,500 | | | | 1,397,031 | |
| Authentic Brands | | | | | | | | |
| 5.50% due 05/27/21 | | | 1,389,500 | | | | 1,390,653 | |
| DJO Finance LLC | | | | | | | | |
| 4.25% due 09/15/17 | | | 1,222,031 | | | | 1,224,170 | |
| CTI Foods Holding Co. LLC | | | | | | | | |
| 8.25% due 06/28/21 | | | 1,205,000 | | | | 1,183,913 | |
| NES Global Talent | | | | | | | | |
| 6.50% due 10/03/19 | | | 1,129,792 | | | | 1,073,302 | |
| Nellson Nutraceutical (US) | | | | | | | | |
| 6.00% due 12/23/21 | | | 1,041,667 | | | | 1,036,896 | |
| INC Research | | | | | | | | |
| 4.50% due 11/15/21 | | | 997,500 | | | | 1,003,734 | |
| Winebow, Inc. | | | | | | | | |
| 4.75% due 07/01/21 | | | 992,500 | | | | 979,677 | |
| Nellson Nutraceutical (CAD) | | | | | | | | |
| 6.00% due 12/23/21 | | | 958,333 | | | | 953,944 | |
| Akorn, Inc. | | | | | | | | |
| 4.50% due 04/16/21 | | | 845,750 | | | | 848,397 | |
| Par Pharmaceuticals | | | | | | | | |
| 4.25% due 09/30/19 | | | 798,250 | | | | 797,252 | |
| Fender Musical Instruments Corp. | | | | | | | | |
| 5.75% due 04/03/19 | | | 614,250 | | | | 612,205 | |
| Mitel Networks Corp. | | | | | | | | |
| 5.25% due 01/31/20 | | | 575,391 | | | | 575,270 | |
| Hostess Brands | | | | | | | | |
| 6.75% due 04/09/20 | | | 559,350 | | | | 568,439 | |
| Catalent Pharma Solutions, Inc. | | | | | | | | |
| 4.25% due 05/20/21 | | | 354,224 | | | | 355,598 | |
| PPDI | | | | | | | | |
| 4.00% due 12/05/18 | | | 349,107 | | | | 348,961 | |
| Targus Group International, Inc. | | | | | | | | |
14.75% due 05/24/166 | | | 223,630 | | | | 177,226 | |
| Rite Aid Corp. | | | | | | | | |
| 5.75% due 08/21/20 | | | 100,000 | | | | 101,000 | |
| VWR Funding, Inc. | | | | | | | | |
| 3.43% due 04/03/17 | | | 50,539 | | | | 50,445 | |
| Total Consumer, Non-cyclical | | | | | | | 93,292,314 | |
| | | | | | | | |
| COMMUNICATIONS - 2.8% | |
| Univision Communications, Inc. | | | | | | | | |
| 4.00% due 03/01/20 | | | 22,626,562 | | | | 22,572,739 | |
| Avaya, Inc. | | | | | | | | |
| 4.68% due 10/26/17 | | | 13,877,677 | | | | 13,647,446 | |
| 6.50% due 03/31/18 | | | 8,757,187 | | | | 8,729,251 | |
| Charter Communications Operating LLC | | | | | | | | |
| 4.25% due 09/10/21 | | | 8,000,000 | | | | 8,062,240 | |
| Ziggo BV | | | | | | | | |
| 3.50% due 01/15/22 | | | 6,450,000 | | | | 6,406,978 | |
| Cengage Learning Acquisitions, Inc. | | | | | | | | |
| 7.00% due 03/31/20 | | | 6,381,476 | | | | 6,399,727 | |
| Anaren, Inc. | | | | | | | | |
| 5.50% due 02/18/21 | | | 1,975,000 | | | | 1,970,063 | |
| 9.25% due 08/18/21 | | | 1,500,000 | | | | 1,485,000 | |
| Interactive Data Corp. | | | | | | | | |
| 4.75% due 05/02/21 | | | 2,282,750 | | | | 2,291,790 | |
| Proquest LLC | | | | | | | | |
| 5.25% due 10/24/21 | | | 2,000,000 | | | | 2,001,880 | |
| Cumulus Media, Inc. | | | | | | | | |
| 4.25% due 12/23/20 | | | 1,739,922 | | | | 1,706,429 | |
| Lions Gate Entertainment Corp. | | | | | | | | |
| 5.00% due 03/11/22 | | | 1,700,000 | | | | 1,701,411 | |
| 28 | THE GUGGENHEIM FUNDS SEMI-ANNUAL REPORT | SEE NOTES TO FINANCIAL STATEMENTS. |
CONSOLIDATED SCHEDULE OF INVESTMENTS (Unaudited)(continued) | March 31, 2015 |
| MACRO OPPORTUNITIES FUND | |
| | | Face
Amount | | | Value | |
| | | | | | | | | |
| Springer Science + Business Media SA | | | | | | | | |
| 4.75% due 08/14/20 | | $ | 1,500,000 | | | $ | 1,501,875 | |
| Gogo LLC | | | | | | | | |
11.25% due 03/21/186 | | | 1,018,237 | | | | 1,038,602 | |
| 7.50% due 03/21/18 | | | 475,783 | | | | 456,752 | |
| Bureau van Dijk Electronic Publishing BV | | | | | | | | |
| 5.06% due 09/20/21 | | GBP | 1,000,000 | | | | 1,488,479 | |
| MergerMarket Ltd. | | | | | | | | |
| 4.50% due 02/04/21 | | | 1,188,995 | | | | 1,153,325 | |
| GCI Holdings | | | | | | | | |
| 4.75% due 02/02/22 | | | 900,000 | | | | 900,000 | |
| Liberty Cablevision of Puerto Rico LLC | | | | | | | | |
| 4.50% due 01/07/22 | | | 600,000 | | | | 596,628 | |
| Asurion Corp. | | | | | | | | |
| 4.25% due 07/08/20 | | | 498,731 | | | | 497,050 | |
| Internet Brands | | | | | | | | |
| 5.00% due 07/08/21 | | | 198,739 | | | | 198,429 | |
| Total Communications | | | | | | | 84,806,094 | |
| | | | | | | | |
| TECHNOLOGY - 2.6% | |
| TIBCO Software, Inc. | | | | | | | | |
| 6.50% due 12/04/20 | | | 8,800,000 | | | | 8,791,727 | |
| Advanced Computer Software | | | | | | | | |
| 10.50% due 01/31/23 | | | 4,750,000 | | | | 4,560,000 | |
| 6.50% due 01/31/22 | | | 3,500,000 | | | | 3,451,875 | |
| Telx Group | | | | | | | | |
| 4.50% due 04/09/20 | | | 4,848,789 | | | | 4,816,447 | |
| 7.50% due 04/09/21 | | | 875,000 | | | | 862,969 | |
| Micro Focus International plc | | | | | | | | |
| 5.25% due 11/19/21 | | | 4,692,647 | | | | 4,699,686 | |
| Greenway Medical Technologies | | | | | | | | |
6.00% due 11/04/206 | | | 3,604,375 | | | | 3,604,375 | |
9.25% due 11/04/216 | | | 550,000 | | | | 536,250 | |
| Sabre, Inc. | | | | | | | | |
| 4.00% due 02/19/19 | | | 3,305,924 | | | | 3,305,924 | |
| 4.50% due 02/19/19 | | | 248,737 | | | | 248,675 | |
| Avago Technologies Ltd. | | | | | | | | |
| 3.75% due 05/06/21 | | | 3,462,724 | | | | 3,467,710 | |
| Blue Coat Systems, Inc. | | | | | | | | |
| 4.00% due 05/31/19 | | | 3,215,197 | | | | 3,212,529 | |
| P2 Energy Solutions | | | | | | | | |
| 5.00% due 10/30/20 | | | 2,494,868 | | | | 2,416,903 | |
| 9.00% due 04/30/21 | | | 600,000 | | | | 552,000 | |
| Deltek, Inc. | | | | | | | | |
| 4.50% due 10/10/18 | | | 2,768,967 | | | | 2,773,286 | |
| Renaissance Learning Corp. | | | | | | | | |
| 4.50% due 04/09/21 | | | 2,831,611 | | | | 2,770,250 | |
| EIG Investors Corp. | | | | | | | | |
| 5.00% due 11/09/19 | | | 2,727,890 | | | | 2,736,428 | |
| Wall Street Systems | | | | | | | | |
| 4.50% due 04/30/21 | | | 2,576,087 | | | | 2,561,609 | |
| LANDesk Group, Inc. | | | | | | | | |
| 5.00% due 02/25/20 | | | 2,415,357 | | | | 2,409,319 | |
| Mirion Technologies | | | | | | | | |
| 5.75% due 01/26/22 | | | 2,250,000 | | | | 2,257,313 | |
| Active Network, Inc., The | | | | | | | | |
| 5.50% due 11/13/20 | | | 2,062,373 | | | | 2,052,928 | |
| Sparta Holding Corp. | | | | | | | | |
7.50% due 07/28/20††† | | | 1,895,250 | | | | 1,878,193 | |
| Sophos | | | | | | | | |
| 5.00% due 01/29/21 | | | 1,576,040 | | | | 1,579,318 | |
| Evergreen Skill | | | | | | | | |
| 5.75% due 04/28/21 | | | 1,551,050 | | | | 1,531,662 | |
| Sophia, LP | | | | | | | | |
| 4.00% due 07/19/18 | | | 1,438,639 | | | | 1,436,481 | |
| Data Device Corp. | | | | | | | | |
| 5.75% due 07/15/20 | | | 1,275,625 | | | | 1,266,058 | |
| GlobalLogic Holdings, Inc. | | | | | | | | |
| 6.25% due 05/31/19 | | | 1,185,000 | | | | 1,176,113 | |
| Flexera Software LLC | | | | | | | | |
| 4.50% due 04/02/20 | | | 828,033 | | | | 825,963 | |
| 8.00% due 04/02/21 | | | 350,000 | | | | 341,250 | |
| Go Daddy Operating Company, LLC | | | | | | | | |
| 4.75% due 05/13/21 | | | 1,129,894 | | | | 1,133,770 | |
| Aspect Software, Inc. | | | | | | | | |
| 7.25% due 05/07/16 | | | 1,135,931 | | | | 1,130,251 | |
| SEE NOTES TO FINANCIAL STATEMENTS. | THE GUGGENHEIM FUNDS SEMI-ANNUAL REPORT | 29 |
CONSOLIDATED SCHEDULE OF INVESTMENTS (Unaudited)(continued) | March 31, 2015 |
| MACRO OPPORTUNITIES FUND | |
| | | Face
Amount | | | Value | |
| | | | | | | | | |
| Eze Castle Software, Inc. | | | | | | | | |
| 4.00% due 04/06/20 | | $ | 700,000 | | | $ | 695,919 | |
| 7.25% due 04/05/21 | | | 400,000 | | | | 376,000 | |
| ION Trading Technologies Ltd. | | | | | | | | |
| 4.50% due 06/10/21 | | EUR | 900,000 | | | | 972,164 | |
| Infor, Inc. | | | | | | | | |
| 3.75% due 06/03/20 | | | 800,000 | | | | 792,128 | |
| Quorum Business Solutions | | | | | | | | |
| 5.75% due 08/07/21 | | | 668,325 | | | | 653,288 | |
| Paradigm Ltd | | | | | | | | |
4.75% due 07/30/196 | | | 729,674 | | | | 653,058 | |
| Hyland Software, Inc. | | | | | | | | |
| 4.75% due 02/19/21 | | | 633,600 | | | | 636,768 | |
| CCC Information Services, Inc. | | | | | | | | |
| 4.00% due 12/20/19 | | | 299,235 | | | | 297,739 | |
| Total Technology | | | | | | | 79,464,326 | |
| | | | | | | | |
| FINANCIAL - 1.8% | |
| Intertrust Group | | | | | | | | |
| 4.53% due 04/16/21 | | | 4,760,000 | | | | 4,752,051 | |
| 7.28% due 04/11/22 | | | 1,900,000 | | | | 1,891,298 | |
| Corporate Capital Trust | | | | | | | | |
| 4.00% due 05/20/19 | | | 4,993,883 | | | | 4,993,882 | |
| National Financial Partners Corp. | | | | | | | | |
| 4.50% due 07/01/20 | | | 3,939,977 | | | | 3,926,029 | |
4.42% due 07/01/186 | | | 703,704 | | | | 639,323 | |
| Magic Newco, LLC | | | | | | | | |
| 5.00% due 12/12/18 | | | 3,389,231 | | | | 3,391,636 | |
| 12.00% due 06/12/19 | | | 1,075,000 | | | | 1,169,063 | |
| Lineage Logistics LLC | | | | | | | | |
| 4.50% due 04/07/21 | | | 4,399,580 | | | | 4,358,356 | |
| STG-Fairway Acquisitions, Inc. | | | | | | | | |
| 6.25% due 02/28/19 | | | 2,793,029 | | | | 2,775,573 | |
10.50% due 08/28/19†††,6 | | | 1,400,000 | | | | 1,390,340 | |
| AssuredPartners | | | | | | | | |
| 5.00% due 04/02/21 | | | 3,986,241 | | | | 3,973,804 | |
| 7.75% due 04/02/22 | | | 199,500 | | | | 191,520 | |
| Hyperion Insurance | | | | | | | | |
| 5.50% due 03/26/22 | | | 3,300,000 | | | | 3,316,500 | |
| First Data Corp. | | | | | | | | |
| 3.67% due 03/23/18 | | | 3,110,000 | | | | 3,106,890 | |
| 4.17% due 03/24/21 | | | 178,213 | | | | 178,658 | |
| York Risk Services | | | | | | | | |
| 4.75% due 10/01/21 | | | 2,987,743 | | | | 2,975,284 | |
| Transunion Holding Co. | | | | | | | | |
| 4.00% due 04/09/21 | | | 2,772,544 | | | | 2,770,825 | |
| USI Holdings Corp. | | | | | | | | |
| 4.25% due 12/27/19 | | | 2,282,525 | | | | 2,283,484 | |
| Expert Global Solutions | | | | | | | | |
| 8.50% due 04/03/18 | | | 2,152,660 | | | | 2,146,375 | |
| American Stock Transfer & Trust | | | | | | | | |
| 5.75% due 06/26/20 | | | 1,586,512 | | | | 1,578,579 | |
| DTZ US Borrower, LLC | | | | | | | | |
| 5.50% due 11/04/21 | | | 1,000,000 | | | | 1,005,000 | |
| HUB International Ltd. | | | | | | | | |
| 4.00% due 10/02/20 | | | 800,000 | | | | 792,856 | |
| Cunningham Lindsey U.S., Inc. | | | | | | | | |
| 5.00% due 12/10/19 | | | 684,250 | | | | 672,276 | |
| 9.25% due 06/10/20 | | | 116,932 | | | | 113,132 | |
| HDV Holdings | | | | | | | | |
5.75% due 09/17/206 | | | 790,000 | | | | 782,179 | |
| Genex Services, Inc. | | | | | | | | |
| 5.25% due 05/28/21 | | | 694,750 | | | | 695,618 | |
| Total Financial | | | | | | | 55,870,531 | |
| | | | | | | | |
| BASIC MATERIALS - 1.4% | |
| Fortescue Metals Group Ltd. | | | | | | | | |
| 3.75% due 06/30/19 | | | 34,332,192 | | | | 30,949,785 | |
| Atkore International, Inc. | | | | | | | | |
| 4.50% due 04/09/21 | | | 1,985,000 | | | | 1,965,150 | |
| 7.75% due 10/09/21 | | | 850,000 | | | | 820,250 | |
| Ennis-Flint | | | | | | | | |
| 4.25% due 03/31/21 | | | 1,980,000 | | | | 1,942,875 | |
| 7.75% due 09/30/21 | | | 550,000 | | | | 495,000 | |
| 30 | THE GUGGENHEIM FUNDS SEMI-ANNUAL REPORT | SEE NOTES TO FINANCIAL STATEMENTS. |
CONSOLIDATED SCHEDULE OF INVESTMENTS (Unaudited)(continued) | March 31, 2015 |
| MACRO OPPORTUNITIES FUND | |
| | | Face
Amount | | | Value | |
| | | | | | | | | |
| Noranda Aluminum Acquisition Corp. | | | | | | | | |
| 5.75% due 02/28/19 | | $ | 2,382,362 | | | $ | 2,215,597 | |
| Orica Chemicals | | | | | | | | |
| 7.25% due 02/28/22 | | | 1,000,000 | | | | 980,000 | |
| Royal Adhesives and Sealants | | | | | | | | |
| 5.50% due 07/31/18 | | | 900,394 | | | | 902,645 | |
| Hoffmaster Group, Inc. | | | | | | | | |
| 5.25% due 05/09/20 | | | 498,744 | | | | 500,823 | |
6.37% due 05/09/196 | | | 142,857 | | | | 129,183 | |
| INEOS US Finance LLC | | | | | | | | |
| 4.25% due 03/11/22 | | | 600,000 | | | | 600,150 | |
| Chromaflo Technologies | | | | | | | | |
| 4.50% due 12/02/19 | | | 398,990 | | | | 395,000 | |
| Total Basic Materials | | | | | | | 41,896,458 | |
| | | | | | | | |
| UTILITIES - 0.2% | |
| Veresen Midstream LP | | | | | | | | |
| 6.00% due 04/01/22 | | | 2,700,000 | | | | 2,695,275 | |
| Expro Holdings UK 3 Ltd. | | | | | | | | |
| 5.75% due 09/02/21 | | | 1,795,500 | | | | 1,524,900 | |
| Southeast PowerGen LLC | | | | | | | | |
| 4.50% due 12/02/21 | | | 997,500 | | | | 1,002,488 | |
| Panda Temple II Power | | | | | | | | |
| 7.25% due 04/03/19 | | | 1,000,000 | | | | 975,000 | |
| Texas Competitive Electric Holdings Company LLC | | | | | | | | |
| 3.75% due 05/05/16 | | | 733,663 | | | | 737,104 | |
| Total Utilities | | | | | | | 6,934,767 | |
| | | | | | | | |
| ENERGY - 0.2% | |
| Dynegy, Inc. | | | | | | | | |
| 4.00% due 04/23/20 | | | 1,994,924 | | | | 1,997,736 | |
| FTS International | | | | | | | | |
| 5.75% due 04/16/21 | | | 2,572,727 | | | | 1,985,837 | |
| Cactus Wellhead | | | | | | | | |
| 7.00% due 07/31/20 | | | 1,492,500 | | | | 910,425 | |
| PSS Companies | | | | | | | | |
| 5.50% due 01/28/20 | | | 868,253 | | | | 681,578 | |
| Magnum Hunter Resources | | | | | | | | |
| 8.50% due 10/22/19 | | | 456,453 | | | | 449,415 | |
| Total Energy | | | | | | | 6,024,991 | |
| Total Senior Floating Rate Interests | | | | | | | | |
| (Cost $612,341,133) | | | | | | | 609,915,872 | |
| | | | | | | | |
CORPORATE BONDS††,11 - 19.2% | |
| FINANCIAL - 9.5% | |
| Bank of America Corp. | | | | | | | | |
6.25%1,2,9 | | | 19,150,000 | | | | 19,509,062 | |
5.13%1,2,9 | | | 16,450,000 | | | | 16,160,480 | |
6.10%1,2 | | | 15,000,000 | | | | 15,215,625 | |
6.50%1,2 | | | 1,900,000 | | | | 2,009,250 | |
| Citigroup, Inc. | | | | | | | | |
5.88%1,2,9 | | | 16,580,000 | | | | 16,745,799 | |
5.80%1,2,9 | | | 14,850,000 | | | | 14,887,125 | |
6.30%1,2,9 | | | 8,000,000 | | | | 8,170,000 | |
5.35%1,2,9 | | | 6,895,000 | | | | 6,670,913 | |
5.95%1,2 | | | 6,300,000 | | | | 6,378,750 | |
| JPMorgan Chase & Co. | | | | | | | | |
5.00%1,2,9 | | | 20,490,000 | | | | 20,130,400 | |
5.15%1,2,9 | | | 8,875,000 | | | | 8,664,219 | |
6.10%1,2 | | | 2,000,000 | | | | 2,060,000 | |
| SunTrust Banks, Inc. | | | | | | | | |
5.63%1,2,9 | | | 29,000,000 | | | | 29,561,875 | |
| HRG Group, Inc. | | | | | | | | |
7.88% due 07/15/199 | | | 15,971,000 | | | | 16,809,478 | |
| Fifth Third Bancorp | | | | | | | | |
5.10%1,2,9 | | | 11,720,000 | | | | 11,134,000 | |
4.90%1,2 | | | 3,000,000 | | | | 2,898,750 | |
| HSBC Holdings plc | | | | | | | | |
5.63%1,2,9 | | | 8,850,000 | | | | 8,932,969 | |
6.37%1,2 | | | 2,850,000 | | | | 2,910,563 | |
6.38%1,2 | | | 1,500,000 | | | | 1,533,750 | |
| Nordea Bank AB | | | | | | | | |
5.50%1,2,4,9 | | | 6,400,000 | | | | 6,504,000 | |
6.13%1,2,4 | | | 5,050,000 | | | | 5,210,994 | |
| Morgan Stanley | | | | | | | | |
5.55%1,2,9 | | | 11,000,000 | | | | 11,110,000 | |
| Jefferies Finance LLC / JFIN Company-Issuer Corp. | | | | | | | | |
7.37% due 04/01/204 | | | 5,575,000 | | | | 5,407,750 | |
| SEE NOTES TO FINANCIAL STATEMENTS. | THE GUGGENHEIM FUNDS SEMI-ANNUAL REPORT | 31 |
CONSOLIDATED SCHEDULE OF INVESTMENTS (Unaudited)(continued) | March 31, 2015 |
| MACRO OPPORTUNITIES FUND | |
| | | Face
Amount | | | Value | |
| | | | | | | | | |
7.50% due 04/15/214 | | $ | 2,550,000 | | | $ | 2,460,750 | |
6.87% due 04/15/224 | | | 1,100,000 | | | | 1,023,000 | |
| Oxford Finance LLC / Oxford Finance Company-Issuer, Inc. | | | | | | | | |
7.25% due 01/15/184,9 | | | 6,926,000 | | | | 7,133,780 | |
| CIC Receivables Master Trust | | | | | | | | |
4.89% due 10/07/21††† | | | 6,500,000 | | | | 6,651,450 | |
| Wilton Re Finance LLC | | | | | | | | |
5.88% due 03/30/331,4 | | | 5,750,000 | | | | 6,211,731 | |
| Customers Bank | | | | | | | | |
6.13% due 06/26/291,4 | | | 6,000,000 | | | | 6,165,000 | |
| Citizens Financial Group, Inc. | | | | | | | | |
5.50%1,2,4 | | | 5,000,000 | | | | 5,000,000 | |
| Cadence Financial Corp. | | | | | | | | |
4.88% due 06/28/1912 | | | 4,000,000 | | | | 4,038,240 | |
| Barclays plc | | | | | | | | |
8.25%1,2 | | | 3,150,000 | | | | 3,374,960 | |
| Univest Corporation of Pennsylvania | | | | | | | | |
5.10% due 03/30/251,6 | | | 2,500,000 | | | | 2,500,683 | |
| QBE Capital Funding III Ltd. | | | | | | | | |
7.25% due 05/24/411,4 | | | 1,650,000 | | | | 1,835,625 | |
| Credit Suisse Group AG | | | | | | | | |
6.25%1,2,4 | | | 1,845,000 | | | | 1,812,713 | |
| Jefferies LoanCore LLC / JLC Finance Corp. | | | | | | | | |
6.87% due 06/01/204 | | | 1,700,000 | | | | 1,576,750 | |
| Prosight Global Inc. | | | | | | | | |
7.50% due 11/26/20†††,6 | | | 850,000 | | | | 890,885 | |
| LCP Dakota Fund | | | | | | | | |
10.00% due 08/17/156 | | | 69,000 | | | | 68,979 | |
| Total Financial | | | | | | | 289,360,298 | |
| | | | | | | | |
| ENERGY - 2.0% | |
| ContourGlobal Power Holdings S.A. | | | | | | | | |
7.12% due 06/01/194,9 | | | 10,150,000 | | | | 10,353,000 | |
| Crestwood Midstream Partners Limited Partnership / Crestwood Midstream Finance Corp. | | | | | | | | |
| 7.75% due 04/01/19 | | | 7,200,000 | | | | 7,481,519 | |
| 6.25% due 04/01/23 | | | 1,500,000 | | | | 1,515,000 | |
| Exterran Holdings, Inc. | | | | | | | | |
7.25% due 12/01/189 | | | 6,432,000 | | | | 6,496,320 | |
| CONSOL Energy, Inc. | | | | | | | | |
| 8.00% due 04/01/23 | | | 5,950,000 | | | | 5,868,188 | |
| Penn Virginia Resource Partners Limited Partnership / Penn Virginia Resource Finance Corp. | | | | | | | | |
| 8.37% due 06/01/20 | | | 3,999,000 | | | | 4,358,910 | |
| Sabine Pass Liquefaction LLC | | | | | | | | |
5.62% due 03/01/254 | | | 3,800,000 | | | | 3,757,250 | |
| Atlas Energy Holdings Operating Company LLC / Atlas Resource Finance Corp. | | | | | | | | |
| 9.25% due 08/15/21 | | | 3,860,000 | | | | 2,663,400 | |
| 7.75% due 01/15/21 | | | 1,350,000 | | | | 918,000 | |
| Comstock Resources, Inc. | | | | | | | | |
10.00% due 03/15/204 | | | 2,800,000 | | | | 2,709,000 | |
| Gibson Energy, Inc. | | | | | | | | |
6.75% due 07/15/214 | | | 2,340,000 | | | | 2,386,800 | |
| Schahin II Finance Company SPV Ltd. | | | | | | | | |
5.87% due 09/25/224,9 | | | 3,344,367 | | | | 2,021,670 | |
| Unit Corp. | | | | | | | | |
| 6.62% due 05/15/21 | | | 2,100,000 | | | | 1,974,000 | |
| Antero Resources Corp. | | | | | | | | |
| 5.63% due 06/01/23 | | | 1,800,000 | | | | 1,782,000 | |
| TerraForm Power Operating LLC | | | | | | | | |
5.87% due 02/01/234 | | | 1,600,000 | | | | 1,660,000 | |
| Carrizo Oil & Gas, Inc. | | | | | | | | |
| 7.50% due 09/15/20 | | | 1,500,000 | | | | 1,541,250 | |
| 32 | THE GUGGENHEIM FUNDS SEMI-ANNUAL REPORT | SEE NOTES TO FINANCIAL STATEMENTS. |
CONSOLIDATED SCHEDULE OF INVESTMENTS (Unaudited)(continued) | March 31, 2015 |
| MACRO OPPORTUNITIES FUND | |
| | | Face
Amount | | | Value | |
| | | | | | | | | |
| Odebrecht Offshore Drilling Finance Ltd. | | | | | | | | |
6.62% due 10/01/2212 | | $ | 1,186,250 | | | $ | 907,481 | |
| Sunoco Limited Partnership / Sunoco Finance Corp. | | | | | | | | |
| 6.38% due 04/01/23 | | | 800,000 | | | | 824,000 | |
| Northern Oil and Gas, Inc. | | | | | | | | |
| 8.00% due 06/01/20 | | | 800,000 | | | | 710,000 | |
| IronGate Energy Services LLC | | | | | | | | |
11.00% due 07/01/1812 | | | 600,000 | | | | 396,000 | |
| Total Energy | | | | | | | 60,323,788 | |
| | | | | | | | |
| CONSUMER, NON-CYCLICAL - 1.8% | |
| Vector Group Ltd. | | | | | | | | |
7.75% due 02/15/219 | | | 17,210,000 | | | | 18,307,138 | |
| FTI Consulting, Inc. | | | | | | | | |
6.75% due 10/01/209 | | | 10,634,000 | | | | 11,218,870 | |
| Opal Acquisition, Inc. | | | | | | | | |
8.87% due 12/15/214,9 | | | 7,675,000 | | | | 7,809,313 | |
| Central Garden & Pet Co. | | | | | | | | |
8.25% due 03/01/189 | | | 7,325,000 | | | | 7,494,427 | |
| VRX Escrow Corp. | | | | | | | | |
5.88% due 05/15/234 | | | 3,050,000 | | | | 3,126,250 | |
5.38% due 03/15/204 | | | 2,700,000 | | | | 2,723,625 | |
| Physio-Control International, Inc. | | | | | | | | |
9.87% due 01/15/194 | | | 2,358,000 | | | | 2,505,375 | |
| Midas Intermediate Holdco II LLC / Midas Intermediate Holdco II Finance, Inc. | | | | | | | | |
7.87% due 10/01/224 | | | 2,000,000 | | | | 1,965,000 | |
| KeHE Distributors LLC / KeHE Finance Corp. | | | | | | | | |
7.62% due 08/15/214 | | | 625,000 | | | | 663,281 | |
| Premier Foods Finance plc | | | | | | | | |
5.56% due 03/16/201,12 | | | GBP 150,000 | | | | 198,068 | |
| Total Consumer, Non-cyclical | | | | | | | 56,011,347 | |
| | | | | | | | |
| COMMUNICATIONS - 1.5% | |
| MDC Partners, Inc. | | | | | | | | |
6.75% due 04/01/204,9 | | | 9,000,000 | | | | 9,483,749 | |
| Avaya, Inc. | | | | | | | | |
7.00% due 04/01/194,9 | | | 8,605,000 | | | | 8,540,462 | |
| Zayo Group LLC / Zayo Capital, Inc. | | | | | | | | |
6.00% due 04/01/239 | | | 7,500,000 | | | | 7,537,500 | |
| McGraw-Hill Global Education Holdings LLC / McGraw-Hill Global Education Finance | | | | | | | | |
| 9.75% due 04/01/21 | | | 4,775,000 | | | | 5,276,375 | |
| WMG Acquisition Corp. | | | | | | | | |
6.75% due 04/15/224 | | | 3,925,000 | | | | 3,718,938 | |
| Sprint Corp. | | | | | | | | |
| 7.62% due 02/15/25 | | | 2,600,000 | | | | 2,587,000 | |
| SITEL LLC / Sitel Finance Corp. | | | | | | | | |
11.00% due 08/01/174 | | | 2,495,000 | | | | 2,582,325 | |
| Sprint Communications, Inc. | | | | | | | | |
7.00% due 03/01/204 | | | 1,900,000 | | | | 2,094,750 | |
| CenturyLink, Inc. | | | | | | | | |
| 5.63% due 04/01/25 | | | 1,150,000 | | | | 1,154,313 | |
| GCI, Inc. | | | | | | | | |
| 6.88% due 04/15/25 | | | 765,000 | | | | 770,738 | |
| Level 3 Financing, Inc. | | | | | | | | |
| 9.38% due 04/01/19 | | | 500,000 | | | | 523,440 | |
| Expo Event Transco, Inc. | | | | | | | | |
9.00% due 06/15/214 | | | 400,000 | | | | 409,000 | |
| Altice Financing S.A. | | | | | | | | |
6.63% due 02/15/234 | | | 350,000 | | | | 360,500 | |
| Total Communications | | | | | | | 45,039,090 | |
| | | | | | | | |
| INDUSTRIAL - 1.5% | |
| Quality Distribution LLC / QD Capital Corp. | | | | | | | | |
9.88% due 11/01/189 | | | 9,551,000 | | | | 10,004,672 | |
| Xefin Lux SCA | | | | | | | | |
| 3.79% due 06/01/19 | | | EUR 5,000,000 | | | | 5,381,618 | |
| SEE NOTES TO FINANCIAL STATEMENTS. | THE GUGGENHEIM FUNDS SEMI-ANNUAL REPORT | 33 |
CONSOLIDATED SCHEDULE OF INVESTMENTS (Unaudited)(continued) | March 31, 2015 |
| MACRO OPPORTUNITIES FUND | |
| | | Face
Amount | | | Value | |
| | | | | | | | | |
| Reynolds Group Issuer Incorporated / Reynolds Group Issuer LLC / Reynolds Group Issuer Lu | | | | | | | | |
| 7.12% due 04/15/19 | | $ | 4,950,000 | | | $ | 5,129,438 | |
| Dynagas LNG Partners Limited Partnership / Dynagas Finance, Inc. | | | | | | | | |
| 6.25% due 10/30/19 | | | 5,950,000 | | | | 5,117,000 | |
| Reynolds Group Issuer Incorporated / Reynolds Group Issuer LLC / Reynolds Group Issuer | | | | | | | | |
| 7.87% due 08/15/19 | | | 3,500,000 | | | | 3,696,875 | |
| CEVA Group plc | | | | | | | | |
7.00% due 03/01/214 | | | 2,625,000 | | | | 2,546,250 | |
| Reliance Intermediate Holdings, LP | | | | | | | | |
6.50% due 04/01/234 | | | 2,250,000 | | | | 2,300,625 | |
| Skyway Concession Company LLC | | | | | | | | |
0.65% due 06/30/261,4 | | | 2,500,000 | | | | 2,075,000 | |
| Princess Juliana International Airport Operating Company N.V. | | | | | | | | |
5.50% due 12/20/274 | | | 1,928,444 | | | | 1,957,370 | |
| Chicago Bridge & Iron Co. | | | | | | | | |
5.15% due 12/27/22†††,6 | | | 1,650,000 | | | | 1,689,435 | |
| Marquette Transportation Company LLC / Marquette Transportation Finance Corp. | | | | | | | | |
| 10.87% due 01/15/17 | | | 1,340,000 | | | | 1,381,875 | |
| Ultra Resources, Inc. | | | | | | | | |
4.51% due 10/12/20†††,6 | | | 1,500,000 | | | | 1,374,300 | |
| SBM Baleia Azul | | | | | | | | |
5.50% due 09/15/27†††,6 | | | 984,720 | | | | 740,805 | |
| LMI Aerospace, Inc. | | | | | | | | |
7.37% due 07/15/194 | | | 600,000 | | | | 604,500 | |
| Unifrax I LLC / Unifrax Holding Co. | | | | | | | | |
7.50% due 02/15/194 | | | 500,000 | | | | 502,500 | |
| Novelis, Inc. | | | | | | | | |
| 8.38% due 12/15/17 | | | 450,000 | | | | 470,250 | |
| Total Industrial | | | | | | | 44,972,513 | |
| | | | | | | | |
| CONSUMER, CYCLICAL - 1.4% | |
| GRD Holdings III Corp. | | | | | | | | |
10.75% due 06/01/194,9 | | | 11,205,000 | | | | 12,185,437 | |
| Bumble Bee Holdings, Inc. | | | | | | | | |
9.00% due 12/15/174,9 | | | 6,287,000 | | | | 6,601,350 | |
| Wynn Las Vegas LLC / Wynn Las Vegas Capital Corp. | | | | | | | | |
5.50% due 03/01/254,9 | | | 6,250,000 | | | | 6,328,124 | |
| Men’s Wearhouse, Inc. | | | | | | | | |
7.00% due 07/01/224,9 | | | 3,150,000 | | | | 3,315,375 | |
| Sabre GLBL, Inc. | | | | | | | | |
8.50% due 05/15/194 | | | 2,990,000 | | | | 3,194,666 | |
| Rite Aid Corp. | | | | | | | | |
| 6.13% due 04/01/23 | | | 2,500,000 | | | | 2,562,500 | |
| Atlas Air 1999-1 Class A-1 Pass Through Trust | | | | | | | | |
7.20% due 01/02/196 | | | 2,132,423 | | | | 2,169,740 | |
| Checkers Drive-In Restaurants, Inc. | | | | | | | | |
11.00% due 12/01/174 | | | 1,800,000 | | | | 1,958,616 | |
| WMG Acquisition Corp. | | | | | | | | |
6.00% due 01/15/214 | | | 1,450,000 | | | | 1,479,000 | |
| Seminole Hard Rock Entertainment Incorporated / Seminole Hard Rock International LLC | | | | | | | | |
5.88% due 05/15/214 | | | 900,000 | | | | 903,375 | |
| Argos Merger Sub, Inc. | | | | | | | | |
7.12% due 03/15/234 | | | 500,000 | | | | 518,125 | |
| PF Chang’s China Bistro, Inc. | | | | | | | | |
10.25% due 06/30/204 | | | 465,000 | | | | 481,275 | |
| 34 | THE GUGGENHEIM FUNDS SEMI-ANNUAL REPORT | SEE NOTES TO FINANCIAL STATEMENTS. |
CONSOLIDATED SCHEDULE OF INVESTMENTS (Unaudited)(continued) | March 31, 2015 |
| MACRO OPPORTUNITIES FUND | |
| | | Face
Amount | | | Value | |
| | | | | | | | | |
| Guitar Center, Inc. | | | | | | | | |
6.50% due 04/15/194 | | $ | 285,000 | | | $ | 248,663 | |
| Total Consumer, Cyclical | | | | | | | 41,946,246 | |
| | | | | | | | |
| TECHNOLOGY - 0.6% | |
| Infor US, Inc. | | | | | | | | |
9.37% due 04/01/199 | | | 8,180,000 | | | | 8,771,413 | |
| 6.50% due 05/15/22 | | | 2,750,000 | | | | 2,818,750 | |
| First Data Corp. | | | | | | | | |
7.37% due 06/15/194 | | | 1,779,000 | | | | 1,859,055 | |
8.75% due 01/15/224 | | | 1,250,000 | | | | 1,345,313 | |
| Eagle Midco, Inc. | | | | | | | | |
9.00% due 06/15/184 | | | 3,050,000 | | | | 3,107,188 | |
| Epicor Software Corp. | | | | | | | | |
| 8.62% due 05/01/19 | | | 1,596,000 | | | | 1,667,820 | |
| Open Text Corp. | | | | | | | | |
5.63% due 01/15/234 | | | 1,000,000 | | | | 1,037,500 | |
| Total Technology | | | | | | | 20,607,039 | |
| | | | | | | | |
| BASIC MATERIALS - 0.4% | |
| TPC Group, Inc. | | | | | | | | |
8.75% due 12/15/204 | | | 5,550,000 | | | | 5,078,250 | |
| Eldorado Gold Corp. | | | | | | | | |
6.12% due 12/15/204,9 | | | 2,995,000 | | | | 2,912,638 | |
| KGHM International Ltd. | | | | | | | | |
7.75% due 06/15/194 | | | 2,285,000 | | | | 2,353,550 | |
| Mirabela Nickel Ltd. | | | | | | | | |
9.50% due 06/24/19†††,6 | | | 1,640,385 | | | | 1,640,385 | |
1.00% due 07/31/44†††,6 | | | 37,316 | | | | — | |
| Ineos Finance plc | | | | | | | | |
8.38% due 02/15/194 | | | 750,000 | | | | 797,400 | |
| Kaiser Aluminum Corp. | | | | | | | | |
| 8.25% due 06/01/20 | | | 250,000 | | | | 272,500 | |
| Total Basic Materials | | | | | | | 13,054,723 | |
| | | | | | | | |
| GOVERNMENT - 0.4% | |
| Dominican Republic International Bond | | | | | | | | |
6.85% due 01/27/454,9 | | | 11,600,000 | | | | 12,180,000 | |
| | | | | | | | |
| UTILITIES - 0.1% | |
| AES Corp. | | | | | | | | |
3.26% due 06/01/191 | | | 3,900,000 | | | | 3,880,500 | |
| FPL Energy National Wind LLC | | | | | | | | |
5.61% due 03/10/244 | | | 48,414 | | | | 48,414 | |
| Total Utilities | | | | | | | 3,928,914 | |
| Total Corporate Bonds | | | | | | | | |
| (Cost $589,367,763) | | | | | | | 587,423,958 | |
| | | | | | | | |
COLLATERALIZED MORTGAGE OBLIGATIONS†† - 10.8% | |
| LSTAR Securities Investment Trust | | | | | | | | |
2015-1, 2.18%
due 01/01/201,4 | | | 52,373,410 | | | | 51,655,893 | |
2015-2, 2.17%
due 01/01/201,4 | | | 45,917,782 | | | | 45,688,193 | |
2015-3, 2.18%
due 03/01/201,4 | | | 35,000,000 | | | | 34,825,000 | |
2014-1, 3.28%
due 09/01/211,4 | | | 26,192,459 | | | | 26,436,049 | |
| Motel 6 Trust | | | | | | | | |
2015-MTL6, 5.28%
due 02/05/304 | | | 58,000,000 | | | | 58,088,856 | |
| HarborView Mortgage Loan Trust | | | | | | | | |
2006-14, 0.33%
due 01/25/471 | | | 37,412,685 | | | | 28,683,969 | |
2006-12, 0.37%
due 01/19/381 | | | 12,722,857 | | | | 10,747,087 | |
| Nomura Resecuritization Trust | | | | | | | | |
2012-1R, 0.62%
due 08/27/471,4 | | | 12,646,809 | | | | 11,698,299 | |
2015-4R, 0.61%
due 03/26/361,4 | | | 8,496,000 | | | | 7,683,570 | |
| SRERS-2011 Funding Ltd. | | | | | | | | |
2011-RS, 0.43%
due 05/09/461,4 | | | 19,493,553 | | | | 18,534,470 | |
| CDGJ Commercial Mortgage Trust | | | | | | | | |
2014-BXCH, 4.42%
due 12/15/271,4 | | | 12,500,000 | | | | 12,516,763 | |
| SEE NOTES TO FINANCIAL STATEMENTS. | THE GUGGENHEIM FUNDS SEMI-ANNUAL REPORT | 35 |
CONSOLIDATED SCHEDULE OF INVESTMENTS (Unaudited)(continued) | March 31, 2015 |
| MACRO OPPORTUNITIES FUND | |
| | | Face
Amount | | | Value | |
| | | | | | | | | |
| CSMC Trust | | | | | | | | |
2014-SURF, 3.28%
due 02/15/291,4 | | $ | 9,300,000 | | | $ | 9,289,138 | |
| LSTAR Commercial Mortgage Trust | | | | | | | | |
2011-1, 5.42%
due 06/25/431,4 | | | 5,139,000 | | | | 5,215,052 | |
| Hilton USA Trust | | | | | | | | |
2013-HLT, 5.22%
due 11/05/181,4 | | | 4,300,000 | | | | 4,416,775 | |
| Morgan Stanley Capital I Trust | | | | | | | | |
2015-XLF1, 3.15%
due 08/13/161,4 | | | 3,300,000 | | | | 3,304,386 | |
| Morgan Stanley Re-REMIC Trust | | | | | | | | |
2010-R5, 0.48%
due 06/26/361,4 | | | 2,739,612 | | | | 1,968,767 | |
| Resource Capital Corporation CRE Notes 2013 Ltd. | | | | | | | | |
2013-CRE1, 3.67%
due 12/15/281,4 | | | 1,000,000 | | | | 999,998 | |
| Total Collateralized Mortgage Obligations | | | | | | | | |
| (Cost $330,525,140) | | | | | | | 331,752,265 | |
| | | | | | | | |
MORTGAGE-BACKED SECURITIES†† - 5.6% | |
| American Home Mortgage Assets Trust | | | | | | | | |
2007-1, 0.83%
due 02/25/471 | | | 34,425,425 | | | | 21,893,573 | |
2006-4, 0.36%
due 10/25/461 | | | 11,875,163 | | | | 8,249,225 | |
2006-6, 0.36%
due 12/25/461 | | | 6,973,634 | | | | 4,890,191 | |
| American Home Mortgage Investment Trust | | | | | | | | |
2006-1, 0.45%
due 03/25/461 | | | 11,135,804 | | | | 9,223,051 | |
2006-1,0.57%
due 03/25/461 | | | 6,758,041 | | | | 5,616,033 | |
| Washington Mutual Mortgage Pass-Through Certificates WMALT Series Trust | | | | | | | | |
2006-AR9, 0.97%
due 11/25/461 | | | 11,314,564 | | | | 7,886,568 | |
2006-8, 4.82%
due 10/25/367 | | | 4,151,829 | | | | 2,989,595 | |
2007-OA4, 0.89%
due 04/25/471 | | | 2,945,139 | | | | 2,162,836 | |
| Lehman XS Trust Series | | | | | | | | |
2006-16N, 0.36%
due 11/25/461 | | | 14,161,367 | | | | 11,822,236 | |
| IndyMac INDX Mortgage Loan Trust | | | | | | | | |
2006-AR4, 0.38%
due 05/25/461 | | | 12,341,735 | | | | 10,454,955 | |
| Luminent Mortgage Trust | | | | | | | | |
2006-2, 0.37%
due 02/25/461 | | | 13,712,635 | | | | 10,257,489 | |
| WaMu Mortgage Pass-Through Certificates Series Trust | | | | | | | | |
2007-OA3, 0.90%
due 04/25/471 | | | 12,540,284 | | | | 9,921,961 | |
| GreenPoint Mortgage Funding Trust | | | | | | | | |
2006-AR1, 0.46%
due 02/25/361 | | | 9,562,337 | | | | 8,230,170 | |
| Resource Capital Corporation | | | | | | | | |
2015-CRE3, 4.17%
due 03/15/321,4 | | | 7,000,000 | | | | 6,999,979 | |
| RALI Series Trust | | | | | | | | |
2007-QO3, 0.33%
due 03/25/471 | | | 7,665,977 | | | | 6,348,226 | |
| HarborView Mortgage Loan Trust | | | | | | | | |
2005-13, 0.46%
due 02/19/361 | | | 7,938,483 | | | | 5,939,596 | |
| Wells Fargo Alternative Loan Trust | | | | | | | | |
2007-PA3, 6.25%
due 07/25/37 | | | 6,142,073 | | | | 5,566,063 | |
| 36 | THE GUGGENHEIM FUNDS SEMI-ANNUAL REPORT | SEE NOTES TO FINANCIAL STATEMENTS. |
CONSOLIDATED SCHEDULE OF INVESTMENTS (Unaudited)(continued) | March 31, 2015 |
| MACRO OPPORTUNITIES FUND | |
| | | Face
Amount | | | Value | |
| | | | | | | | | |
| GreenPoint Mortgage Funding Trust Series | | | | | | | | |
2007-AR1, 0.25%
due 02/25/471 | | $ | 5,642,266 | | | $ | 5,269,966 | |
| GE Business Loan Trust | | | | | | | | |
2007-1A, 0.62%
due 04/16/351,4 | | | 5,512,209 | | | | 5,073,129 | |
| Structured Asset Mortgage Investments II Trust | | | | | | | | |
2006-AR1, 0.40%
due 02/25/361 | | | 5,249,569 | | | | 4,373,621 | |
| Alliance Bancorp Trust | | | | | | | | |
2007-OA1, 0.41%
due 07/25/371 | | | 5,014,245 | | | | 3,348,533 | |
| Carlyle Global Market Strategies | | | | | | | | |
2013-3X SUB,
due 07/15/258 | | | 4,000,000 | | | | 3,116,800 | |
| Chase Mortgage Finance Trust Series | | | | | | | | |
2006-S3, 6.00%
due 11/25/36 | | | 3,203,211 | | | | 2,797,018 | |
| Residential Asset Securitization Trust | | | | | | | | |
2006-A12, 6.25%
due 11/25/36 | | | 3,865,260 | | | | 2,751,910 | |
| First Horizon Alternative Mortgage Securities Trust | | | | | | | | |
2006-FA1, 5.75%
due 04/25/36 | | | 2,617,876 | | | | 2,137,245 | |
| Acis CLO Ltd. | | | | | | | | |
2013-2A, 4.10%
due 10/14/221,4 | | | 1,800,000 | | | | 1,783,620 | |
| Bear Stearns Mortgage Funding Trust | | | | | | | | |
2007-AR5, 0.34%
due 06/25/471 | | | 1,762,177 | | | | 1,408,015 | |
| Wachovia Bank Commercial Mortgage Trust Series | | | | | | | | |
2007-WHL8, 0.87%
due 06/15/201,4 | | | 1,256,378 | | | | 1,222,214 | |
| BAMLL-DB Trust | | | | | | | | |
2012-OSI, 6.79%
due 04/13/294 | | | 550,000 | | | | 580,300 | |
| Total Mortgage-Backed Securities | | | | | | | | |
| (Cost $172,163,703) | | | | | | | 172,314,118 | |
| | | | | | | | |
FOREIGN GOVERNMENT BONDS†† - 0.8% | |
| Kenya Government International Bond | | | | | | | | |
6.88% due 06/24/244,9 | | | 23,710,000 | | | | 24,759,168 | |
| Total Foreign Government Bonds | | | | | | | | |
| (Cost $24,350,841) | | | | | | | 24,759,168 | |
| | | | | | | | |
MUNICIPAL BONDS†† - 0.1% | |
| CALIFORNIA - 0.1% | |
| Stockton Public Financing Authority Revenue Bonds | | | | | | | | |
| 7.94% due 10/01/38 | | | 2,000,000 | | | | 2,288,160 | |
| | | | | | | | |
| PUERTO RICO - 0.0% | |
| Puerto Rico Highways & Transportation Authority Revenue Bonds | | | | | | | | |
1.03% due 07/01/271 | | | 200,000 | | | | 157,994 | |
| Total Municipal Bonds | | | | | | | | |
| (Cost $2,432,650) | | | | | | | 2,446,154 | |
| | | | | | | | |
REPURCHASE AGREEMENTS††,6,10 - 1.8% | |
Jefferies & Company, Inc.
issued 03/06/15 at 3.18% | | | | | | | | |
| due 04/06/15 | | | 19,793,000 | | | | 19,793,000 | |
issued 03/19/15 at 3.18%
due 04/17/15 | | | 11,344,000 | | | | 11,344,000 | |
issued 03/27/15 at 3.18%
due 05/01/15 | | | 10,675,000 | | | | 10,675,000 | |
issued 03/30/15 at 3.18%
due 04/24/15 | | | 5,600,000 | | | | 5,600,000 | |
issued 03/11/15 at 3.18%
due 04/10/15 | | | 2,376,000 | | | | 2,376,000 | |
issued 03/30/15 at 2.68%
due 04/24/15 | | | 1,235,000 | | | | 1,235,000 | |
| SEE NOTES TO FINANCIAL STATEMENTS. | THE GUGGENHEIM FUNDS SEMI-ANNUAL REPORT | 37 |
CONSOLIDATED SCHEDULE OF INVESTMENTS (Unaudited)(continued) | March 31, 2015 |
| MACRO OPPORTUNITIES FUND | |
| | | Face
Amount | | | Value | |
| | | | | | | | | |
issued 03/30/15 at 2.68%
due 05/07/15 | | $ | 1,072,000 | | | $ | 1,072,000 | |
issued 03/19/15 at 2.68%
due 04/17/15 | | | 865,000 | | | | 865,000 | |
Barclays
issued 10/27/14 at (0.10)% | | | | | | | | |
| due 10/30/15 | | | 368,375 | | | | 368,375 | |
issued 10/27/14 at (0.10)%
due 10/29/15 | | | 263,125 | | | | 263,125 | |
issued 11/12/14 at (0.10)%
due 11/13/15 | | | 211,000 | | | | 211,000 | |
issued 10/31/14 at (0.10)%
due 11/04/15 | | | 209,750 | | | | 209,750 | |
| | | | | | | | |
| Total Repurchase Agreements | | | | | | | | |
| (Cost $54,012,250) | | | | | | | 54,012,250 | |
| | | | | | | | |
| | | Contracts | | | | |
| | | | | | | | |
OPTIONS PURCHASED† - 0.4% | |
| Call options on: | | | | | | | | |
| iShares 7-10 Year Treasury Bond ETF Expiring September 2015 with strike price of $109.00 | | | 33,860 | | | | 4,063,199 | |
| iShares 20+ Year Treasury Bond ETF Expiring June 2015 with strike price of $134.00 | | | 12,891 | | | | 2,591,091 | |
U.S. Dollar/U.A.E. Dirham Expiring February 2016 with strike price of $3.67††† | | | 223,500,000 | | | | 752,301 | |
U.S. Dollar/U.A.E. Dirham Expiring February 2016 with strike price of $3.67††† | | | 74,500,000 | | | | 249,054 | |
| Total Call options | | | | | | | 7,655,645 | |
| Put options on: | | | | | | | | |
| Crude Oil Expiring June 2015 with strike price of $45.00 | | | 1,282 | | | | 2,922,960 | |
Euro/Danish Krone Expiring July 2015 with strike price of $7.41††† | | | 260,750,000 | | | | 2,063,706 | |
| Total Put options | | | | | | | 4,986,666 | |
| Total Options Purchased | | | | | | | | |
| (Cost $15,729,683) | | | | | | | 12,642,311 | |
| Total Investments – 114.4% | | | | | | | | |
| (Cost $3,498,624,917) | | | | | | $ | 3,499,290,163 | |
| | | | | | | | |
| | | Shares | | | | |
| | | | | | | | |
COMMON STOCKS SOLD SHORT† - (4.1)% | |
| MIDSTREAM NATURAL GAS - 0.0% | |
| Crestwood Equity Partners, LP | | | 2,252 | | | | (13,512 | ) |
| | | | | | | | |
| MIDSTREAM OIL - 0.0% | |
| Magellan Midstream Partners, LP | | | 370 | | | | (28,383 | ) |
| | | | | | | | |
| UTILITIES - 0.0% | |
| NiSource, Inc. | | | 10,204 | | | | (450,609 | ) |
| Dominion Resources, Inc. | | | 6,423 | | | | (455,198 | ) |
| Total Utilities | | | | | | | (905,807 | ) |
| | | | | | | | |
| ENERGY - (0.2)% | |
| Rose Rock Midstream, LP | | | 497 | | | | (23,608 | ) |
| Holly Energy Partners, LP | | | 773 | | | | (24,303 | ) |
| NuStar GP Holdings LLC | | | 1,031 | | | | (36,497 | ) |
| Tesoro Logistics, LP | | | 1,001 | | | | (53,854 | ) |
| Genesis Energy, LP | | | 1,549 | | | | (72,803 | ) |
| ONEOK, Inc. | | | 2,603 | | | | (125,569 | ) |
| SemGroup Corp. — Class A | | | 1,548 | | | | (125,914 | ) |
| Gulfport Energy Corp.* | | | 8,996 | | | | (413,006 | ) |
| Exterran Holdings, Inc. | | | 12,634 | | | | (424,123 | ) |
| Marathon Petroleum Corp. | | | 4,349 | | | | (445,294 | ) |
| Spectra Energy Corp. | | | 13,698 | | | | (495,457 | ) |
| 38 | THE GUGGENHEIM FUNDS SEMI-ANNUAL REPORT | SEE NOTES TO FINANCIAL STATEMENTS. |
CONSOLIDATED SCHEDULE OF INVESTMENTS (Unaudited)(continued) | March 31, 2015 |
| MACRO OPPORTUNITIES FUND | |
| | |
Shares | | | Value | |
| | | | | | | | | |
| SunCoke Energy, Inc. | | | 36,190 | | | $ | (540,679 | ) |
| HollyFrontier Corp. | | | 19,549 | | | | (787,238 | ) |
| Tesoro Corp. | | | 11,680 | | | | (1,066,268 | ) |
| Williams Companies, Inc. | | | 21,540 | | | | (1,089,708 | ) |
| Total Energy | | | | | | | (5,724,321 | ) |
| | | | | | | | |
| COMMUNICATIONS - (0.2)% | |
| Walt Disney Co. | | | 3,494 | | | | (366,486 | ) |
| ViaSat, Inc.* | | | 7,232 | | | | (431,100 | ) |
| Nielsen N.V. | | | 11,897 | | | | (530,249 | ) |
| Fortinet, Inc.* | | | 16,232 | | | | (567,308 | ) |
| Discovery Communications, Inc. — Class C* | | | 20,370 | | | | (600,405 | ) |
| Priceline Group, Inc.* | | | 518 | | | | (603,030 | ) |
| Facebook, Inc. — Class A* | | | 9,883 | | | | (812,531 | ) |
| TripAdvisor, Inc.* | | | 11,847 | | | | (985,315 | ) |
| Amazon.com, Inc.* | | | 3,332 | | | | (1,239,837 | ) |
| Total Communications | | | | | | | (6,136,261 | ) |
| | | | | | | | |
| TECHNOLOGY – (0.3)% | |
| CommVault Systems, Inc.* | | | 7,672 | | | | (335,266 | ) |
| Intuit, Inc. | | | 3,778 | | | | (366,315 | ) |
| Allscripts Healthcare Solutions, Inc.* | | | 31,070 | | | | (371,597 | ) |
| Akamai Technologies, Inc.* | | | 5,285 | | | | (375,473 | ) |
| Ultimate Software Group, Inc.* | | | 2,246 | | | | (381,719 | ) |
| Cognizant Technology Solutions Corp. — Class A* | | | 6,843 | | | | (426,935 | ) |
| Bottomline Technologies de, Inc.* | | | 16,006 | | | | (438,084 | ) |
| Cerner Corp.* | | | 6,502 | | | | (476,337 | ) |
| Solera Holdings, Inc. | | | 9,327 | | | | (481,833 | ) |
| Avago Technologies Ltd. | | | 4,292 | | | | (544,998 | ) |
| Skyworks Solutions, Inc. | | | 5,705 | | | | (560,744 | ) |
| Adobe Systems, Inc.* | | | 7,967 | | | | (589,080 | ) |
| Red Hat, Inc.* | | | 10,988 | | | | (832,341 | ) |
| Autodesk, Inc.* | | | 15,246 | | | | (894,025 | ) |
| salesforce.com, Inc.* | | | 13,463 | | | | (899,463 | ) |
| Total Technology | | | | | | | (7,974,210 | ) |
| | | | | | | | |
| CONSUMER, NON-CYCLICAL - (0.4)% | |
| Exelixis, Inc.* | | | 50,000 | | | | (128,500 | ) |
| Alkermes plc* | | | 3,444 | | | | (209,981 | ) |
| ACADIA Pharmaceuticals, Inc.* | | | 6,491 | | | | (211,542 | ) |
| Repligen Corp.* | | | 7,497 | | | | (227,609 | ) |
| Halozyme Therapeutics, Inc.* | | | 16,223 | | | | (231,664 | ) |
| Ultragenyx Pharmaceutical, Inc.* | | | 3,813 | | | | (236,749 | ) |
| Neurocrine Biosciences, Inc.* | | | 6,058 | | | | (240,563 | ) |
| Alnylam Pharmaceuticals, Inc.* | | | 2,323 | | | | (242,568 | ) |
| Biogen, Inc.* | | | 600 | | | | (253,344 | ) |
| Incyte Corp.* | | | 2,802 | | | | (256,831 | ) |
| Medivation, Inc.* | | | 2,034 | | | | (262,528 | ) |
| NewLink Genetics Corp.* | | | 4,815 | | | | (263,429 | ) |
| Anacor Pharmaceuticals, Inc.* | | | 4,767 | | | | (275,771 | ) |
| Insmed, Inc.* | | | 14,159 | | | | (294,507 | ) |
| Bluebird Bio, Inc.* | | | 2,526 | | | | (305,065 | ) |
| Receptos, Inc.* | | | 1,973 | | | | (325,328 | ) |
| Brown-Forman Corp. — Class B | | | 4,057 | | | | (366,550 | ) |
| Avery Dennison Corp. | | | 6,961 | | | | (368,307 | ) |
| Church & Dwight Company, Inc. | | | 4,332 | | | | (370,039 | ) |
| Monro Muffler Brake, Inc. | | | 5,876 | | | | (382,234 | ) |
| WhiteWave Foods Co. — Class A* | | | 8,828 | | | | (391,434 | ) |
| Perrigo Company plc | | | 2,689 | | | | (445,164 | ) |
| Robert Half International, Inc. | | | 7,911 | | | | (478,774 | ) |
| Cooper Companies, Inc. | | | 2,632 | | | | (493,289 | ) |
| Akorn, Inc.* | | | 10,756 | | | | (511,018 | ) |
| Equifax, Inc. | | | 5,638 | | | | (524,334 | ) |
| Endo International plc* | | | 6,087 | | | | (546,004 | ) |
| SEE NOTES TO FINANCIAL STATEMENTS. | THE GUGGENHEIM FUNDS SEMI-ANNUAL REPORT | 39 |
CONSOLIDATED SCHEDULE OF INVESTMENTS (Unaudited)(continued) | March 31, 2015 |
| MACRO OPPORTUNITIES FUND | |
| | |
Shares | | | Value | |
| | | | | | | | | |
| Edwards Lifesciences Corp.* | | | 3,975 | | | $ | (566,279 | ) |
| Danaher Corp. | | | 7,615 | | | | (646,514 | ) |
| McGraw Hill Financial, Inc. | | | 6,638 | | | | (686,369 | ) |
| AmerisourceBergen Corp. — Class A | | | 6,790 | | | | (771,819 | ) |
| Vertex Pharmaceuticals, Inc.* | | | 7,555 | | | | (891,263 | ) |
| Total Consumer, Non-cyclical | | | | | | | (12,405,370 | ) |
| | | | | | | | |
| INDUSTRIAL - (0.4)% | |
| Martin Midstream Partners, LP | | | 201 | | | | (7,123 | ) |
| Greif, Inc. — Class A | | | 8,907 | | | | (349,778 | ) |
| Graco, Inc. | | | 4,849 | | | | (349,904 | ) |
| CH Robinson Worldwide, Inc. | | | 4,985 | | | | (365,002 | ) |
| Allegion plc | | | 6,303 | | | | (385,555 | ) |
| Kansas City Southern | | | 3,898 | | | | (397,908 | ) |
| Knight Transportation, Inc. | | | 12,616 | | | | (406,866 | ) |
| B/E Aerospace, Inc. | | | 6,555 | | | | (417,029 | ) |
| UTI Worldwide, Inc.* | | | 37,165 | | | | (457,130 | ) |
| TimkenSteel Corp. | | | 17,888 | | | | (473,495 | ) |
| Lennox International, Inc. | | | 4,248 | | | | (474,459 | ) |
| Pall Corp. | | | 4,732 | | | | (475,045 | ) |
| Packaging Corporation of America | | | 6,969 | | | | (544,906 | ) |
| AMETEK, Inc. | | | 10,646 | | | | (559,341 | ) |
| Roper Industries, Inc. | | | 3,265 | | | | (561,580 | ) |
| Louisiana-Pacific Corp.* | | | 35,865 | | | | (592,131 | ) |
| Bemis Company, Inc. | | | 13,236 | | | | (612,959 | ) |
| General Electric Co. | | | 26,097 | | | | (647,467 | ) |
| Stericycle, Inc.* | | | 4,629 | | | | (650,050 | ) |
| Wabtec Corp. | | | 6,848 | | | | (650,628 | ) |
| Eagle Materials, Inc. | | | 7,926 | | | | (662,297 | ) |
| Sealed Air Corp. | | | 17,783 | | | | (810,194 | ) |
| Ball Corp. | | | 12,703 | | | | (897,340 | ) |
| Vulcan Materials Co. | | | 10,853 | | | | (914,908 | ) |
| Martin Marietta Materials, Inc. | | | 6,973 | | | | (974,826 | ) |
| Total Industrial | | | | | | | (13,637,921 | ) |
| | | | | | | | |
| BASIC MATERIALS - (0.5)% | |
| Monsanto Co. | | | 3,079 | | | | (346,511 | ) |
| HB Fuller Co. | | | 8,357 | | | | (358,265 | ) |
| Dow Chemical Co. | | | 7,667 | | | | (367,863 | ) |
| RPM International, Inc. | | | 9,575 | | | | (459,504 | ) |
| Mosaic Co. | | | 10,081 | | | | (464,331 | ) |
| CF Industries Holdings, Inc. | | | 1,749 | | | | (496,156 | ) |
| Allegheny Technologies, Inc. | | | 16,849 | | | | (505,638 | ) |
| Eastman Chemical Co. | | | 7,400 | | | | (512,524 | ) |
| Minerals Technologies, Inc. | | | 7,225 | | | | (528,148 | ) |
| Cytec Industries, Inc. | | | 10,375 | | | | (560,665 | ) |
| Valspar Corp. | | | 6,697 | | | | (562,749 | ) |
| Airgas, Inc. | | | 5,545 | | | | (588,380 | ) |
| EI du Pont de Nemours & Co. | | | 8,292 | | | | (592,629 | ) |
| Praxair, Inc. | | | 4,941 | | | | (596,576 | ) |
| International Flavors & Fragrances, Inc. | | | 5,226 | | | | (613,532 | ) |
| Sherwin-Williams Co. | | | 2,305 | | | | (655,773 | ) |
| Ashland, Inc. | | | 5,300 | | | | (674,743 | ) |
| Air Products & Chemicals, Inc. | | | 4,547 | | | | (687,870 | ) |
| Ecolab, Inc. | | | 6,242 | | | | (713,959 | ) |
| Freeport-McMoRan, Inc. | | | 40,479 | | | | (767,077 | ) |
| PPG Industries, Inc. | | | 3,811 | | | | (859,533 | ) |
| FMC Corp. | | | 15,473 | | | | (885,829 | ) |
| Compass Minerals International, Inc. | | | 10,203 | | | | (951,022 | ) |
| Total Basic Materials | | | | | | | (13,749,277 | ) |
| | | | | | | | |
| CONSUMER, CYCLICAL - (0.8)% | |
| Polaris Industries, Inc. | | | 2,395 | | | | (337,935 | ) |
| Home Depot, Inc. | | | 3,200 | | | | (363,552 | ) |
| Johnson Controls, Inc. | | | 7,284 | | | | (367,405 | ) |
| Ross Stores, Inc. | | | 3,508 | | | | (369,603 | ) |
| Domino’s Pizza, Inc. | | | 3,732 | | | | (375,253 | ) |
| 40 | THE GUGGENHEIM FUNDS SEMI-ANNUAL REPORT | SEE NOTES TO FINANCIAL STATEMENTS. |
CONSOLIDATED SCHEDULE OF INVESTMENTS (Unaudited)(continued) | March 31, 2015 |
| MACRO OPPORTUNITIES FUND | |
| | |
Shares | | | Value | |
| | | | | | | | | |
| Texas Roadhouse, Inc. — Class A | | | 10,335 | | | $ | (376,504 | ) |
| Leggett & Platt, Inc. | | | 8,199 | | | | (377,892 | ) |
| Fastenal Co. | | | 9,225 | | | | (382,238 | ) |
| Toll Brothers, Inc.* | | | 9,933 | | | | (390,764 | ) |
| L Brands, Inc. | | | 4,176 | | | | (393,755 | ) |
| Men’s Wearhouse, Inc. | | | 7,598 | | | | (396,616 | ) |
| Cinemark Holdings, Inc. | | | 8,800 | | | | (396,616 | ) |
| G-III Apparel Group Ltd.* | | | 3,543 | | | | (399,119 | ) |
| World Fuel Services Corp. | | | 7,038 | | | | (404,544 | ) |
| Carter’s, Inc. | | | 4,545 | | | | (420,276 | ) |
| Meritage Homes Corp.* | | | 8,647 | | | | (420,590 | ) |
| Marriott International, Inc. — Class A | | | 5,306 | | | | (426,178 | ) |
| Standard Pacific Corp.* | | | 48,178 | | | | (433,602 | ) |
| Whirlpool Corp. | | | 2,146 | | | | (433,621 | ) |
| American Eagle Outfitters, Inc. | | | 25,403 | | | | (433,883 | ) |
| Mohawk Industries, Inc.* | | | 2,375 | | | | (441,156 | ) |
| VF Corp. | | | 5,908 | | | | (444,931 | ) |
| Tractor Supply Co. | | | 5,254 | | | | (446,905 | ) |
| Signet Jewelers Ltd. | | | 3,235 | | | | (448,986 | ) |
| Buffalo Wild Wings, Inc.* | | | 2,543 | | | | (460,893 | ) |
| Lithia Motors, Inc. — Class A | | | 4,685 | | | | (465,736 | ) |
| Carnival Corp. | | | 9,994 | | | | (478,113 | ) |
| Thor Industries, Inc. | | | 7,648 | | | | (483,430 | ) |
| Kate Spade & Co.* | | | 15,882 | | | | (530,300 | ) |
| O’Reilly Automotive, Inc.* | | | 2,624 | | | | (567,414 | ) |
| Harman International Industries, Inc. | | | 4,311 | | | | (576,079 | ) |
| Pinnacle Entertainment, Inc.* | | | 16,520 | | | | (596,207 | ) |
| NIKE, Inc. — Class B | | | 6,250 | | | | (627,063 | ) |
| Skechers U.S.A., Inc. — Class A* | | | 8,873 | | | | (638,057 | ) |
| DR Horton, Inc. | | | 23,123 | | | | (658,543 | ) |
| Yum! Brands, Inc. | | | 8,546 | | | | (672,741 | ) |
| Jarden Corp.* | | | 13,492 | | | | (713,727 | ) |
| Mobile Mini, Inc. | | | 16,890 | | | | (720,190 | ) |
| Starbucks Corp. | | | 7,789 | | | | (737,618 | ) |
| Hanesbrands, Inc. | | | 22,108 | | | | (740,839 | ) |
| Lennar Corp. — Class A | | | 14,494 | | | | (750,934 | ) |
| Newell Rubbermaid, Inc. | | | 20,299 | | | | (793,082 | ) |
| Royal Caribbean Cruises Ltd. | | | 9,786 | | | | (800,984 | ) |
| Cabela’s, Inc.* | | | 14,597 | | | | (817,140 | ) |
| Starwood Hotels & Resorts Worldwide, Inc. | | | 10,150 | | | | (847,525 | ) |
| Under Armour, Inc. — Class A* | | | 14,505 | | | | (1,171,278 | ) |
| CarMax, Inc.* | | | 18,622 | | | | (1,285,104 | ) |
| Total Consumer, Cyclical | | | | | | | (25,814,921 | ) |
| | | | | | | | |
| FINANCIAL - (1.3)% | |
| PennyMac Financial Services, Inc. — Class A* | | | 2,086 | | | | (35,399 | ) |
| Dime Community Bancshares, Inc. | | | 3,728 | | | | (60,021 | ) |
| Essent Group Ltd.* | | | 4,550 | | | | (108,791 | ) |
| Capitol Federal Financial, Inc. | | | 8,734 | | | | (109,175 | ) |
| MGIC Investment Corp.* | | | 13,187 | | | | (126,991 | ) |
| Equity One, Inc. | | | 8,912 | | | | (237,861 | ) |
| Boston Private Financial Holdings, Inc. | | | 29,544 | | | | (358,960 | ) |
| Iron Mountain, Inc. | | | 9,979 | | | | (364,034 | ) |
| Education Realty Trust, Inc. | | | 10,425 | | | | (368,837 | ) |
| First Niagara Financial Group, Inc. | | | 41,885 | | | | (370,263 | ) |
| United Bankshares, Inc. | | | 9,933 | | | | (373,282 | ) |
| PNC Financial Services Group, Inc. | | | 4,010 | | | | (373,892 | ) |
| Boston Properties, Inc. | | | 2,680 | | | | (376,486 | ) |
| First Horizon National Corp. | | | 26,479 | | | | (378,385 | ) |
| Parkway Properties, Inc. | | | 22,274 | | | | (386,454 | ) |
| Navient Corp. | | | 19,023 | | | | (386,738 | ) |
| American Campus Communities, Inc. | | | 9,493 | | | | (406,965 | ) |
| Financial Engines, Inc. | | | 10,105 | | | | (422,692 | ) |
| SEE NOTES TO FINANCIAL STATEMENTS. | THE GUGGENHEIM FUNDS SEMI-ANNUAL REPORT | 41 |
CONSOLIDATED SCHEDULE OF INVESTMENTS (Unaudited)(continued) | March 31, 2015 |
| MACRO OPPORTUNITIES FUND | |
| | |
Shares | | | Value | |
| | | | | | | | | |
| National Retail Properties, Inc. | | | 10,451 | | | $ | (428,177 | ) |
| Public Storage | | | 2,202 | | | | (434,102 | ) |
| E*TRADE Financial Corp.* | | | 15,389 | | | | (439,433 | ) |
| Medical Properties Trust, Inc. | | | 30,206 | | | | (445,236 | ) |
| PrivateBancorp, Inc. — Class A | | | 12,684 | | | | (446,096 | ) |
| Simon Property Group, Inc. | | | 2,300 | | | | (449,972 | ) |
| SVB Financial Group* | | | 3,580 | | | | (454,803 | ) |
| Alexandria Real Estate Equities, Inc. | | | 4,647 | | | | (455,592 | ) |
| HCP, Inc. | | | 11,080 | | | | (478,767 | ) |
| Kilroy Realty Corp. | | | 6,319 | | | | (481,318 | ) |
| Cousins Properties, Inc. | | | 46,018 | | | | (487,791 | ) |
| Invesco Ltd. | | | 12,467 | | | | (494,815 | ) |
| American Tower Corp. — Class A | | | 5,269 | | | | (496,076 | ) |
| Citigroup, Inc. | | | 9,826 | | | | (506,236 | ) |
| Equity Residential | | | 6,625 | | | | (515,823 | ) |
| Sovran Self Storage, Inc. | | | 5,520 | | | | (518,549 | ) |
| Valley National Bancorp | | | 55,416 | | | | (523,127 | ) |
| Vornado Realty Trust | | | 4,677 | | | | (523,824 | ) |
| Sabra Health Care REIT, Inc. | | | 16,235 | | | | (538,190 | ) |
| Senior Housing Properties Trust | | | 24,313 | | | | (539,505 | ) |
| Plum Creek Timber Company, Inc. | | | 12,475 | | | | (542,039 | ) |
| FNB Corp. | | | 42,176 | | | | (554,193 | ) |
| UDR, Inc. | | | 16,349 | | | | (556,356 | ) |
| Goldman Sachs Group, Inc. | | | 3,009 | | | | (565,602 | ) |
| AvalonBay Communities, Inc. | | | 3,271 | | | | (569,972 | ) |
| EPR Properties | | | 9,601 | | | | (576,348 | ) |
| BB&T Corp. | | | 14,930 | | | | (582,121 | ) |
| U.S. Bancorp | | | 13,924 | | | | (608,061 | ) |
| Crown Castle International Corp. | | | 7,451 | | | | (615,006 | ) |
| Ventas, Inc. | | | 8,441 | | | | (616,362 | ) |
| Taubman Centers, Inc. | | | 8,068 | | | | (622,285 | ) |
| BlackRock, Inc. — Class A | | | 1,729 | | | | (632,538 | ) |
| Rayonier, Inc. | | | 24,183 | | | | (651,973 | ) |
| Federal Realty Investment Trust | | | 4,611 | | | | (678,785 | ) |
| Signature Bank* | | | 5,330 | | | | (690,661 | ) |
| General Growth Properties, Inc. | | | 24,272 | | | | (717,237 | ) |
| Extra Space Storage, Inc. | | | 10,815 | | | | (730,770 | ) |
| Webster Financial Corp. | | | 20,069 | | | | (743,557 | ) |
| Regency Centers Corp. | | | 10,958 | | | | (745,582 | ) |
| Bank of the Ozarks, Inc. | | | 20,350 | | | | (751,525 | ) |
| Health Care REIT, Inc. | | | 10,138 | | | | (784,276 | ) |
| Associated Banc-Corp. | | | 42,210 | | | | (785,106 | ) |
| Essex Property Trust, Inc. | | | 3,551 | | | | (816,374 | ) |
| Kite Realty Group Trust | | | 29,164 | | | | (821,550 | ) |
| People’s United Financial, Inc. | | | 54,710 | | | | (831,592 | ) |
| Morgan Stanley | | | 23,726 | | | | (846,780 | ) |
| Kimco Realty Corp. | | | 31,711 | | | | (851,440 | ) |
| SunTrust Banks, Inc. | | | 22,545 | | | | (926,374 | ) |
| Realty Income Corp. | | | 18,066 | | | | (932,206 | ) |
| Intercontinental Exchange, Inc. | | | 4,182 | | | | (975,535 | ) |
| CME Group, Inc. — Class A | | | 11,023 | | | | (1,043,988 | ) |
| New York Community Bancorp, Inc. | | | 66,573 | | | | (1,113,767 | ) |
| SL Green Realty Corp. | | | 9,063 | | | | (1,163,508 | ) |
| Total Financial | | | | | | | (39,546,127 | ) |
| Total Common Stocks Sold Short | | | | | | | | |
| (Proceeds $123,438,259) | | | | | | | (125,936,110 | ) |
| 42 | THE GUGGENHEIM FUNDS SEMI-ANNUAL REPORT | SEE NOTES TO FINANCIAL STATEMENTS. |
CONSOLIDATED SCHEDULE OF INVESTMENTS (Unaudited)(continued) | March 31, 2015 |
| MACRO OPPORTUNITIES FUND | |
| | |
Shares | | | Value | |
| | | | | | | | | |
EXCHANGE-TRADED FUNDS SOLD SHORT† - (0.1)% | |
| SPDR S&P Biotech ETF | | | 8,774 | | | $ | (1,978,537 | ) |
| Total Exchange-Traded Funds Sold Short | | | | | | | | |
| (Proceeds $2,001,877) | | | | | | | (1,978,537 | ) |
| | | | | | | | |
CLOSED-END FUNDS SOLD SHORT† - 0.0% | |
| Herzfeld Caribbean Basin Fund, Inc. | | | (34,488 | ) | | | (319,014 | ) |
| Total Closed-End Funds Sold Short | | | | | | | | |
| (Proceeds $373,071) | | | | | | | (319,014 | ) |
| | | | | | | | |
| | | Face
Amount | | | | |
| | | | | | | | |
CORPORATE BONDS SOLD SHORT†† - 0.0% | |
| Blackboard, Inc. | | | | | | | | |
7.75% due 11/15/194 | | $ | (1,000,000 | ) | | | (960,000 | ) |
| Total Corporate Bonds Sold Short | | | | | | | | |
| (Proceeds $1,016,500) | | | | | | | (960,000 | ) |
| | | | | | | | |
| | |
Contracts | | | | |
| | | | | | | | |
OPTIONS WRITTEN† - (0.2)% | |
| Call options on: | | | | | | | | |
| iShares 20+ Year Treasury Bond ETF Expiring June 2015 with strike price of $139.00 | | | 12,891 | | | | (1,211,754 | ) |
| iShares 7-10 Year Treasury Bond ETF Expiring September 2015 with strike price of $111.00 | | | 33,860 | | | | (2,878,100 | ) |
| Total Call options | | | | | | | (4,089,854 | ) |
| Put options on: | | | | | | | | |
| Crude Oil Expiring June 2015 with strike price of $35.00 | | | 1,282 | | | | (666,640 | ) |
| Total Options Written | | | | | | | | |
| (Premiums received $4,475,373) | | | | | | | (4,756,494 | ) |
| Total Securities Sold Short- (4.4)% | | | | | | | | |
| (Proceeds $131,305,080) | | | | | | $ | (133,950,155 | ) |
| Other Assets & Liabilities, net - (10.0)% | | | | | | | (307,470,369 | ) |
| Total Net Assets - 100.0% | | | | | | $ | 3,057,869,639 | |
| | | | | | | | | |
| SEE NOTES TO FINANCIAL STATEMENTS. | THE GUGGENHEIM FUNDS SEMI-ANNUAL REPORT | 43 |
CONSOLIDATED SCHEDULE OF INVESTMENTS (Unaudited)(continued) | March 31, 2015 |
| MACRO OPPORTUNITIES FUND | |
| | | | | | | | | |
| | | Units | | | Unrealized
Gain (Loss) | |
| | | | | | | | |
OTC EQUITY INDEX SWAP AGREEMENTS†† | |
Bank of America
April 2015 S&P 500 Homebuilding
Index Swap,
Terminating 04/13/1515
(Notional Value $53,608,722) | | | 74,496 | | | $ | 3,858,005 | |
Bank of America
July 2015 S&P 500 HomeBuilding
Index Swap,
Terminating 07/13/1515
(Notional Value $31,910,796) | | | 44,344 | | | | 1,433,318 | |
Bank of America
April 2015 S&P 1500 Education Services
Sub-Industry
Index Swap,
Terminating 04/13/1516
(Notional Value $79,530,410) | | | 1,495,776 | | | | (8,188,898 | ) |
| (Total Notional Value $165,049,928) | | | | | | $ | (2,897,575 | ) |
| |
OTC CURRENCY SWAP AGREEMENTS†† | |
Bank of America
June 2015 U.S. Dollar
Index Future Swap,
Terminating 06/12/1513
(Notional Value $63,820,080) | | | 647 | | | $ | (757,637 | ) |
OTC INTEREST RATE SWAP AGREEMENTS SOLD SHORT†† | |
Bank of America
June 2015 Japan Government
Bond 10 Year
Future Index Swap, Terminating 06/09/1514
(Notional Value $306,778,389) | | | 250 | | | $ | 402,855 | |
| | | | | | | | |
OTC EQUITY SWAP AGREEMENTS SOLD SHORT†† | |
Bank of America
Tesla Motors, Inc.
September 2015 Swap,
Terminating 09/15/15
(Notional Value $33,131,400) | | | 175,512 | | | $ | 249,810 | |
| 44 | THE GUGGENHEIM FUNDS SEMI-ANNUAL REPORT | SEE NOTES TO FINANCIAL STATEMENTS. |
CONSOLIDATED SCHEDULE OF INVESTMENTS (Unaudited)(continued) | March 31, 2015 |
| MACRO OPPORTUNITIES FUND | |
CENTRALLY CLEARED INTEREST RATE SWAP AGREEMENTS†† | |
| Counterparty | Floating
Rate | Floating
Rate Index | | Fixed
Rate | | Maturity Date | | Notional Amount | | | Market Value | | | Unrealized
Appreciation/
(Depreciation) | |
| Merrill Lynch | Pay | 3-Month USD-LIBOR | | | 3.13 | % | 06/08/25 | | $ | 45,300,000 | | | $ | 4,394,100 | | | $ | 4,394,100 | |
| Merrill Lynch | Pay | 3-Month USD-LIBOR | | | 2.93 | % | 08/24/25 | | | 52,200,000 | | | | 3,821,039 | | | | 3,821,039 | |
| Merrill Lynch | Pay | 3-Month USD-LIBOR | | | 2.61 | % | 12/29/25 | | | 30,000,000 | | | | 1,080,000 | | | | 1,080,000 | |
| Merrill Lynch | Pay | 3-Month USD-LIBOR | | | 2.59 | % | 12/29/25 | | | 15,000,000 | | | | 513,000 | | | | 513,000 | |
| Merrill Lynch | Pay | 3-Month USD-LIBOR | | | 2.54 | % | 12/29/25 | | | 15,000,000 | | | | 450,000 | | | | 450,000 | |
| Merrill Lynch | Receive | 6-Month EUR-EURIBOR | | | 0.97 | % | 12/29/25 | | | (11,350,000 | ) | | | (414,835 | ) | | | (414,835 | ) |
| Merrill Lynch | Receive | 3-Month USD-LIBOR | | | 1.59 | % | 07/02/18 | | | (34,550,000 | ) | | | (456,060 | ) | | | (456,060 | ) |
| Merrill Lynch | Pay | 6-Month EUR-EURIBOR | | | 2.16 | % | 12/29/25 | | | 100,000,000 | | | | (460,000 | ) | | | (460,000 | ) |
| Merrill Lynch | Receive | 6-Month EUR-EURIBOR | | | 1.05 | % | 12/29/25 | | | (11,350,000 | ) | | | (512,443 | ) | | | (512,443 | ) |
| Merrill Lynch | Receive | 6-Month EUR-EURIBOR | | | 0.99 | % | 12/29/25 | | | (22,700,000 | ) | | | (885,794 | ) | | | (885,794 | ) |
| Merrill Lynch | Receive | 3-Month USD-LIBOR | | | 2.73 | % | 07/02/23 | | | (23,800,000 | ) | | | (1,525,580 | ) | | | (1,525,580 | ) |
| Merrill Lynch | Receive | 6-Month EUR-EURIBOR | | | 0.83 | % | 12/29/25 | | | (81,750,000 | ) | | | (1,775,168 | ) | | | (1,775,168 | ) |
| Merrill Lynch | Receive | 6-Month EUR-EURIBOR | | | 1.42 | % | 08/24/25 | | | (36,653,000 | ) | | | (3,219,081 | ) | | | (3,219,081 | ) |
| Merrill Lynch | Receive | 6-Month EUR-EURIBOR | | | 1.89 | % | 06/08/25 | | | (31,500,000 | ) | | | (4,408,814 | ) | | | (4,408,814 | ) |
| | | | | | | | | | | | | | | | | | $ | (3,399,636 | ) |
FORWARD FOREIGN CURRENCY EXCHANGE CONTRACTS†† | |
| Counterparty | | Contracts
to Sell | | Currency | Settlement Date | | Settlement Value | | | Value at March 31, 2015 | | | Net Unrealized Appreciation | |
| Bank of America | | | 1,410,039,200 | | SUR | 05/18/15 | | $ | 28,169,797 | | | $ | 23,743,994 | | | $ | 4,425,803 | |
| BNY Mellon | | | 62,485,973 | | EUR | 06/02/15 | | | 69,927,988 | | | | 67,249,961 | | | | 2,678,027 | |
| Bank of America | | | 322,500,000,000 | | IDR | 07/02/15 | | | 25,000,000 | | | | 23,970,135 | | | | 1,029,865 | |
| BNY Mellon | | | 8,479,319 | | EUR | 04/13/15 | | | 10,000,000 | | | | 9,117,859 | | | | 882,141 | |
| Bank of America | | | 12,200,000 | | EUR | 04/07/15 | | | 13,482,098 | | | | 13,116,894 | | | | 365,204 | |
| BNY Mellon | | | 5,750,000 | | GBP | 04/07/15 | | | 8,629,743 | | | | 8,531,356 | | | | 98,387 | |
| BNY Mellon | | | 600,000 | | AUD | 04/07/15 | | | 465,816 | | | | 456,812 | | | | 9,004 | |
| | | | | | | | | | | | | | | | | $ | 9,488,431 | |
| SEE NOTES TO FINANCIAL STATEMENTS. | THE GUGGENHEIM FUNDS SEMI-ANNUAL REPORT | 45 |
CONSOLIDATED SCHEDULE OF INVESTMENTS (Unaudited)(concluded) | March 31, 2015 |
| MACRO OPPORTUNITIES FUND | |
| * | Non-income producing security. |
| † | Value determined based on Level 1 inputs, unless otherwise noted — See Note 4. |
| †† | Value determined based on Level 2 inputs, unless otherwise noted — See Note 4. |
| ††† | Value determined based on Level 3 inputs — See Note 4. |
| 1 | Variable rate security. Rate indicated is rate effective at March 31, 2015. |
| 2 | Perpetual maturity. |
| 3 | Zero coupon rate security. |
| 4 | Security is a 144A or Section 4(a)(2) security. The total market value of 144A or Section 4(a)(2) securities is $1,417,179,960 (cost $1,415,599,820), or 46.3% of total net assets. These securities have been determined to be liquid under guidelines established by the Board of Trustees. |
| 5 | Affiliated issuer — See Note 10. |
| 6 | Illiquid security. |
| 7 | Security is a step up/step down bond. The coupon increases or decreases at regular intervals until the bond reaches full maturity. |
| 8 | Residual interest. |
| 9 | Security or a portion thereof is held as collateral for reverse repurchase agreements — See Note 14. |
| 10 | Repurchase Agreements — See Note 13. |
| 11 | The face amount is denominated in U.S. Dollars unless otherwise indicated. |
| 12 | Security is a 144A or Section 4(a)(2) security. These securities are considered illiquid and restricted under guidelines established by the Board of Trustees. The total market value of 144A or Section 4(a)(2) securities is $5,539,789 (cost $6,028,311), or 0.2% of total net assets — See Note 15. |
| 13 | Total return based on U.S. Dollar Index +/- financing at a variable rate. |
| 14 | Total return based on Japan Government Bond 10 Year Future Index +/- financing at a variable rate. |
| 15 | Total return based on S&P 500 Home Building Index +/- financing at a variable rate. |
| 16 | Total return based on S&P 1500 Education Services Sub-Industry Index +/- financing at a variable rate. |
| plc — Public Limited Company |
| REIT — Real Estate Investment Trust |
| |
| See Sector Classification in Other Information section. |
| 46 | THE GUGGENHEIM FUNDS SEMI-ANNUAL REPORT | SEE NOTES TO FINANCIAL STATEMENTS. |
CONSOLIDATED STATEMENT OF ASSETS AND LIABILITIES (Unaudited) |
| MACRO OPPORTUNITIES FUND |
March 31, 2015
| Assets: | |
| Investments in unaffiliated issuers, at value (cost $3,316,865,585) | | $ | 3,314,709,122 | |
| Investments in affiliated issuers, at value (cost $127,747,082) | | | 130,568,791 | |
| Repurchase agreements, at value (cost $54,012,250) | | | 54,012,250 | |
| Total investments (cost $3,498,624,917) | | | 3,499,290,163 | |
| Foreign currency, at value (cost $1,556,083) | | | 1,553,061 | |
| Segregated cash with broker | | | 93,504,366 | |
| Cash | | | 16,474,582 | |
| Unrealized appreciation on swap agreements | | | 16,202,127 | |
| Unrealized appreciation on forward foreign currency exchange contracts | | | 9,488,431 | |
| Prepaid expenses | | | 213,837 | |
| Receivables: | |
| Fund shares sold | | | 17,099,039 | |
| Interest | | | 16,211,090 | |
| Securities sold | | | 7,243,503 | |
| Dividends | | | 536,061 | |
| Swap settlement | | | 390,292 | |
| Foreign taxes reclaim | | | 1,697 | |
| Total assets | | | 3,678,208,249 | |
| | | | | |
| Liabilities: | |
| Reverse Repurchase Agreements | | | 294,191,544 | |
| Securities sold short, at value (proceeds $126,829,707) | | | 129,193,661 | |
| Unrealized depreciation on swap agreements | | | 22,604,310 | |
| Options written, at value (premiums received $4,475,373) | | | 4,756,494 | |
| Unfunded loan commitments (Note 11) (cost $1,767,101) | | | 1,490,038 | |
| Segregated cash from broker | | | 80,000 | |
| Payable for: | |
| Securities purchased | | $ | 158,608,609 | |
| Fund shares redeemed | | | 5,257,616 | |
| Management fees | | | 1,728,635 | |
| Distribution and service fees | | | 451,742 | |
| Fund accounting/administration fees | | | 238,684 | |
| Transfer agent/maintenance fees | | | 84,424 | |
| Trustees’ fees* | | | 7,588 | |
| Miscellaneous | | | 1,645,265 | |
| Total liabilities | | | 620,338,610 | |
| Net assets | | $ | 3,057,869,639 | |
| | | | | |
| Net assets consist of: | |
| Paid in capital | | $ | 3,065,412,498 | |
| Distributions in excess of net investment income | | | (22,371,698 | ) |
| Accumulated net realized gain on investments | | | 13,375,585 | |
| Net unrealized appreciation on investments | | | 1,453,254 | |
| Net assets | | $ | 3,057,869,639 | |
| | | | | |
| A-Class: | |
| Net assets | | $ | 845,405,630 | |
| Capital shares outstanding | | | 31,284,239 | |
| Net asset value per share | | $ | 27.02 | |
| Maximum offering price per share (Net asset value divided by 95.25%) | | $ | 28.37 | |
| | | | | |
| C-Class: | |
| Net assets | | $ | 336,373,233 | |
| Capital shares outstanding | | | 12,457,612 | |
| Net asset value per share | | $ | 27.00 | |
| | | | | |
| Institutional Class: | |
| Net assets | | $ | 1,876,090,776 | |
| Capital shares outstanding | | | 69,346,854 | |
| Net asset value per share | | $ | 27.05 | |
| * | Relates to Trustees not deemed “interested persons” within the meaning of Section 2(a)(19) of the 1940 Act. |
| SEE NOTES TO FINANCIAL STATEMENTS. | THE GUGGENHEIM FUNDS SEMI-ANNUAL REPORT | 47 |
CONSOLIDATED STATEMENT OF OPERATIONS (Unaudited) |
| MACRO OPPORTUNITIES FUND |
Period Ended March 31, 2015
| Investment Income: | |
| Interest (net of foreign withholding tax of $6,290) | | $ | 50,407,114 | |
| Dividends from securities of unaffiliated issuers (net of foreign withholding tax $85) | | | 2,482,169 | |
| Dividends from securities of affiliated issuers | | | 1,093,383 | |
| Total investment income | | | 53,982,666 | |
| | | | | |
| Expenses: | |
| Management fees | | | 9,781,237 | |
| Transfer agent/maintenance fees: | |
| A-Class | | | 370,081 | |
| C-Class | | | 86,467 | |
| Institutional Class | | | 251,475 | |
| Distribution and service fees: | |
| A-Class | | | 724,377 | |
| C-Class | | | 1,411,899 | |
| Fund accounting/administration fees | | | 1,043,707 | |
| Prime broker interest expense | | | 190,020 | |
| Short interest expense | | | 184,803 | |
| Line of credit fees | | | 92,026 | |
| Trustees’ fees* | | | 90,882 | |
| Custodian fees | | | 44,568 | |
| Tax expense | | | 45 | |
| Miscellaneous | | | 456,230 | |
| Total expenses | | | 14,727,817 | |
| Less: | |
| Expenses waived by Adviser | | | (1,141,178 | ) |
| Expenses waived by Transfer Agent | |
| A-Class | | | (116,174 | ) |
| C-Class | | | (4,462 | ) |
| Institutional Class | | | (251,475 | ) |
| Total waived expenses | | | (1,513,289 | ) |
| Net expenses | | | 13,214,528 | |
| Net investment income | | | 40,768,138 | |
| | | | | |
| Net Realized and Unrealized Gain (Loss): | |
| Net realized gain (loss) on: | |
| Investments in unaffiliated issuers | | $ | 7,314,438 | |
| Swap agreements | | | 18,386,638 | |
| Foreign currency | | | (1,149,451 | ) |
| Forward foreign currency exchange contracts | | | 13,489,769 | |
| Securities sold short | | | (3,611,981 | ) |
| Options purchased | | | (8,895,011 | ) |
| Options written | | | 987,331 | |
| Realized gain distributions received from investment company shares | | | 72,555 | |
| Net realized gain | | | 26,594,288 | |
| Net change in unrealized appreciation (depreciation) on: | |
| Investments in unaffiliated issuers | | | (11,004,465 | ) |
| Investments in affiliated issuers | | | 2,112,584 | |
| Securities sold short | | | (2,363,954 | ) |
| Swap agreements | | | 1,575,999 | |
| Options purchased | | | 3,210,122 | |
| Options written | | | (505,539 | ) |
| Foreign currency | | | 657,725 | |
| Forward foreign currency exchange contracts | | | 7,346,416 | |
| Net change in unrealized appreciation (depreciation) | | | 1,028,888 | |
| Net realized and unrealized gain | | | 27,623,176 | |
| Net increase in net assets resulting from operations | | $ | 68,391,314 | |
| * | Relates to Trustees not deemed “interested persons” within the meaning of Section 2(a)(19) of the 1940 Act. |
| 48 | THE GUGGENHEIM FUNDS SEMI-ANNUAL REPORT | SEE NOTES TO FINANCIAL STATEMENTS. |
STATEMENTS OF CHANGES IN NET ASSETS |
| MACRO OPPORTUNITIES FUND | |
| | | Period Ended March 31, 2015 (Unaudited)* | | | Year Ended September 30, 2014 | |
| Increase (Decrease) in Net Assets from Operations: | | | | | | |
| Net investment income | | $ | 40,768,138 | | | $ | 46,716,434 | |
| Net realized gain on investments | | | 26,594,288 | | | | 4,333,637 | |
| Net change in unrealized appreciation (depreciation) on investments | | | 1,028,888 | | | | 14,470,302 | |
| Net increase in net assets resulting from operations | | | 68,391,314 | | | | 65,520,373 | |
| | | | | | | | | |
| Distributions to shareholders from: | | | | | | | | |
| Net investment income | | | | | | | | |
| A-Class | | | (12,505,047 | ) | | | (17,086,055 | ) |
| C-Class | | | (5,037,298 | ) | | | (7,695,611 | ) |
| Institutional Class | | | (30,938,170 | ) | | | (28,337,889 | ) |
| Return of capital | | | | | | | | |
| A-Class | | | — | | | | (289,690 | ) |
| C-Class | | | — | | | | (132,073 | ) |
| Institutional Class | | | — | | | | (511,136 | ) |
| Total distributions to shareholders | | | (48,480,515 | ) | | | (54,052,454 | ) |
| | | | | | | | | |
| Capital share transactions: | | | | | | | | |
| Proceeds from sale of shares | | | | | | | | |
| A-Class | | | 587,343,122 | | | | 293,031,487 | |
| C-Class | | | 104,313,981 | | | | 122,101,340 | |
| Institutional Class | | | 1,110,708,802 | | | | 693,090,752 | |
| Distributions reinvested | | | | | | | | |
| A-Class | | | 9,097,357 | | | | 13,577,467 | |
| C-Class | | | 4,050,967 | | | | 6,480,901 | |
| Institutional Class | | | 26,176,521 | | | | 23,567,363 | |
| Cost of shares redeemed | | | | | | | | |
| A-Class | | | (114,381,161 | ) | | | (289,559,280 | ) |
| C-Class | | | (22,618,594 | ) | | | (45,738,386 | ) |
| Institutional Class | | | (187,221,191 | ) | | | (222,136,368 | ) |
| Net increase from capital share transactions | | | 1,517,469,804 | | | | 594,415,276 | |
| Net increase in net assets | | | 1,537,380,603 | | | | 605,883,195 | |
| | | | | | | | | |
| Net assets: | | | | | | | | |
| Beginning of period | | | 1,520,489,036 | | | | 914,605,841 | |
| End of period | | $ | 3,057,869,639 | | | $ | 1,520,489,036 | |
| Distributions in excess of net investment income at end of period | | $ | (22,371,698 | ) | | $ | (7,364,111 | ) |
| SEE NOTES TO FINANCIAL STATEMENTS. | THE GUGGENHEIM FUNDS SEMI-ANNUAL REPORT | 49 |
STATEMENTS OF CHANGES IN NET ASSETS (concluded) |
| MACRO OPPORTUNITIES FUND | |
| | | Period Ended March 31, 2015 (Unaudited)* | | | Year Ended September 30, 2014 | |
| Capital share activity: | | | | | | | | |
| Shares sold | | | | | | | | |
| A-Class | | | 21,854,444 | | | | 10,851,399 | |
| C-Class | | | 3,877,988 | | | | 4,522,005 | |
| Institutional Class | | | 41,262,389 | | | | 25,608,053 | |
| Shares issued from reinvestment of distributions | | | | | | | | |
| A-Class | | | 337,768 | | | | 503,489 | |
| C-Class | | | 150,585 | | | | 240,545 | |
| Institutional Class | | | 970,879 | | | | 872,812 | |
| Shares redeemed | | | | | | | | |
| A-Class | | | (4,251,799 | ) | | | (10,733,837 | ) |
| C-Class | | | (841,353 | ) | | | (1,696,813 | ) |
| Institutional Class | | | (6,950,891 | ) | | | (8,236,308 | ) |
| Net increase in shares | | | 56,410,010 | | | | 21,931,345 | |
| 50 | THE GUGGENHEIM FUNDS SEMI-ANNUAL REPORT | SEE NOTES TO FINANCIAL STATEMENTS. |
| FINANCIAL HIGHLIGHTS |
| MACRO OPPORTUNITIES FUND | |
This table is presented to show selected data for a share outstanding throughout each period and to assist shareholders in evaluating a Fund’s performance for the periods presented.
| A-Class | | Period Ended March 31, 2015a,h | | | Year Ended Sept. 30, 2014 | | | Year Ended Sept. 30, 2013 | | | Period Ended Sept. 30, 2012b | |
| Per Share Data | | | | | | | | | | | | |
| Net asset value, beginning of period | | $ | 26.81 | | | $ | 26.31 | | | $ | 26.53 | | | $ | 25.00 | |
| Income (loss) from investment operations: | |
Net investment income (loss)c | | | .48 | | | | 1.10 | | | | 1.37 | | | | .99 | |
| Net gain (loss) on investments (realized and unrealized) | | | .31 | | | | .69 | | | | (.04 | ) | | | 1.52 | |
| Total from investment operations | | | .79 | | | | 1.79 | | | | 1.33 | | | | 2.51 | |
| Less distributions from: | |
| Net investment income | | | (.58 | ) | | | (1.27 | ) | | | (1.43 | ) | | | (.98 | ) |
| Net realized gains | | | — | | | | — | | | | (.12 | ) | | | — | |
| Return of capital | | | — | | | | (.02 | ) | | | — | | | | — | |
| Total distributions | | | (.58 | ) | | | (1.29 | ) | | | (1.55 | ) | | | (.98 | ) |
| Net asset value, end of period | | $ | 27.02 | | | $ | 26.81 | | | $ | 26.31 | | | $ | 26.53 | |
| | |
Total Returnf | | | 2.97 | % | | | 6.88 | % | | | 5.01 | % | | | 10.19 | % |
| Ratios/Supplemental Data | |
| Net assets, end of period (in thousands) | | $ | 845,406 | | | $ | 357,765 | | | $ | 334,751 | | | $ | 83,081 | |
| Ratios to average net assets: | |
| Net investment income (loss) | | | 3.61 | % | | | 4.08 | % | | | 5.11 | % | | | 4.61 | % |
Total expensesd | | | 1.46 | % | | | 1.51 | % | | | 1.56 | % | | | 1.61 | % |
Net expensese,g | | | 1.32 | % | | | 1.36 | % | | | 1.41 | % | | | 1.37 | % |
| Portfolio turnover rate | | | 14 | % | | | 54 | % | | | 84 | % | | | 46 | % |
| SEE NOTES TO FINANCIAL STATEMENTS. | THE GUGGENHEIM FUNDS SEMI-ANNUAL REPORT | 51 |
FINANCIAL HIGHLIGHTS (continued) |
| MACRO OPPORTUNITIES FUND |
This table is presented to show selected data for a share outstanding throughout each period and to assist shareholders in evaluating a Fund’s performance for the periods presented.
| C-Class | | Period Ended March 31, 2015a,h | | | Year Ended Sept. 30, 2014 | | | Year Ended Sept. 30, 2013 | | | Period Ended Sept. 30, 2012b | |
| Per Share Data | | | | | | | | | | | | |
| Net asset value, beginning of period | | $ | 26.79 | | | $ | 26.29 | | | $ | 26.51 | | | $ | 25.00 | |
| Income (loss) from investment operations: | |
Net investment income (loss)c | | | .38 | | | | .90 | | | | 1.17 | | | | .82 | |
| Net gain (loss) on investments (realized and unrealized) | | | .31 | | | | .69 | | | | (.03 | ) | | | 1.53 | |
| Total from investment operations | | | .69 | | | | 1.59 | | | | 1.14 | | | | 2.35 | |
| Less distributions from: | |
| Net investment income | | | (.48 | ) | | | (1.07 | ) | | | (1.24 | ) | | | (.84 | ) |
| Net realized gains | | | — | | | | — | | | | (.12 | ) | | | — | |
| Return of capital | | | — | | | | (.02 | ) | | | — | | | | — | |
| Total distributions | | | (.48 | ) | | | (1.09 | ) | | | (1.36 | ) | | | (.84 | ) |
| Net asset value, end of period | | $ | 27.00 | | | $ | 26.79 | | | $ | 26.29 | | | $ | 26.51 | |
| | |
Total Returnf | | | 2.60 | % | | | 6.10 | % | | | 4.26 | % | | | 9.54 | % |
| Ratios/Supplemental Data | |
| Net assets, end of period (in thousands) | | $ | 336,373 | | | $ | 248,359 | | | $ | 163,129 | | | $ | 32,711 | |
| Ratios to average net assets: | |
| Net investment income (loss) | | | 2.87 | % | | | 3.34 | % | | | 4.36 | % | | | 3.83 | % |
Total expensesd | | | 2.14 | % | | | 2.22 | % | | | 2.29 | % | | | 2.31 | % |
Net expensese,g | | | 2.03 | % | | | 2.10 | % | | | 2.15 | % | | | 2.11 | % |
| Portfolio turnover rate | | | 14 | % | | | 54 | % | | | 84 | % | | | 46 | % |
| 52 | THE GUGGENHEIM FUNDS SEMI-ANNUAL REPORT | SEE NOTES TO FINANCIAL STATEMENTS. |
FINANCIAL HIGHLIGHTS (continued) |
| MACRO OPPORTUNITIES FUND |
This table is presented to show selected data for a share outstanding throughout each period and to assist shareholders in evaluating a Fund’s performance for the periods presented.
| Institutional Class | | Period Ended March 31, 2015a,h | | | Year Ended Sept. 30, 2014 | | | Year Ended Sept. 30, 2013 | | | Period Ended Sept. 30, 2012b | |
| Per Share Data | | | | | | | | | | | | |
| Net asset value, beginning of period | | $ | 26.84 | | | $ | 26.34 | | | $ | 26.56 | | | $ | 25.00 | |
| Income (loss) from investment operations: | |
Net investment income (loss)c | | | .53 | | | | 1.18 | | | | 1.46 | | | | 1.12 | |
| Net gain (loss) on investments (realized and unrealized) | | | .30 | | | | .70 | | | | (.04 | ) | | | 1.47 | |
| Total from investment operations | | | .83 | | | | 1.88 | | | | 1.42 | | | | 2.59 | |
| Less distributions from: | |
| Net investment income | | | (.62 | ) | | | (1.36 | ) | | | (1.52 | ) | | | (1.03 | ) |
| Net realized gains | | | — | | | | — | | | | (.12 | ) | | | — | |
| Return of capital | | | — | | | | (.02 | ) | | | — | | | | — | |
| Total distributions | | | (.62 | ) | | | (1.38 | ) | | | (1.64 | ) | | | (1.03 | ) |
| Net asset value, end of period | | $ | 27.05 | | | $ | 26.84 | | | $ | 26.34 | | | $ | 26.56 | |
| | |
Total Returnf | | | 3.14 | % | | | 7.23 | % | | | 5.35 | % | | | 10.55 | % |
| Ratios/Supplemental Data | |
| Net assets, end of period (in thousands) | | $ | 1,876,091 | | | $ | 914,366 | | | $ | 416,727 | | | $ | 106,716 | |
| Ratios to average net assets: | |
| Net investment income (loss) | | | 3.93 | % | | | 4.37 | % | | | 5.43 | % | | | 5.22 | % |
Total expensesd | | | 1.12 | % | | | 1.18 | % | | | 1.23 | % | | | 1.31 | % |
Net expensese,g | | | 0.98 | % | | | 1.02 | % | | | 1.09 | % | | | 1.06 | % |
| Portfolio turnover rate | | | 14 | % | | | 54 | % | | | 84 | % | | | 46 | % |
| SEE NOTES TO FINANCIAL STATEMENTS. | THE GUGGENHEIM FUNDS SEMI-ANNUAL REPORT | 53 |
FINANCIAL HIGHLIGHTS (concluded) |
| MACRO OPPORTUNITIES FUND |
a | Unaudited figures for the period ended March 31, 2015. Percentage amounts for the period, except total return and portfolio turnover rate, have been annualized. |
b | Since commencement of operations: November 30, 2011. Percentage amounts for the period, except total return and portfolio turnover rate, have been annualized. |
c | Net investment income (loss) per share was computed using average shares outstanding throughout the period. |
d | Does not include expenses of the underlying funds in which the Fund invests. |
e | Net expense information reflects the expense ratios after expense waivers. |
f | Total return does not reflect the impact of any applicable sales charges and has not been annualized. |
g | Net expenses may include expenses that are excluded from the expense limitation agreement. Excluding these expenses, the operating expense ratios for the periods would be: |
| | 03/31/15 | 09/30/14 | 09/30/13 | 09/30/12 |
| A-Class | 1.27% | 1.27% | 1.29% | 1.27% |
| C-Class | 1.99% | 2.01% | 2.02% | 2.01% |
| Institutional Class | 0.94% | 0.94% | 0.96% | 0.95% |
| 54 | THE GUGGENHEIM FUNDS SEMI-ANNUAL REPORT | SEE NOTES TO FINANCIAL STATEMENTS. |
NOTES TO CONSOLIDATED FINANCIAL STATEMENTS (Unaudited)
1. Organization, Consolidation of Subsidiary and Significant Accounting Policies
Organization
Guggenheim Funds Trust (the “Trust”), a Delaware statutory trust, is registered with the SEC under the Investment Company Act of 1940 (“1940 Act”), as a non-diversified, open-ended investment company of the series type. Each series, in effect, is representing a separate Fund. The Trust is authorized to issue an unlimited number of shares. The Trust accounts for the assets of each Fund separately.
The Trust offers a combination of four separate classes of shares, A-Class shares, B-Class shares, C-Class shares and Institutional Class shares. Sales of shares of each Class are made without a front-end sales charge at the net asset value per share (“NAV”), with the exception of A-Class shares. A-Class shares are sold at the NAV, plus the applicable front-end sales charge. The sales charge varies depending on the amount purchased, but will not exceed 4.75%. A-Class share purchases of $1 million or more are exempt from the front-end sales charge but have a 1% contingent deferred sales charge (“CDSC”), if shares are redeemed within 12 months of purchase. B-Class shares were offered without a front-end sales charge, but were subject to a CDSC of up to 5% for five years and convert to A-Class shares after eight years. Effective January 4, 2010, subscriptions for B-Class shares are no longer accepted. C-Class shares have a 1% CDSC if shares are redeemed within 12 months of purchase. Institutional Class shares are offered primarily for direct investment by institutions such as pension and profit sharing plans, endowments, foundations and corporations. Institutional Class shares have a minimum initial investment of $2 million and a minimum account balance of $1 million. Institutional Class shares are offered without a front-end sales charge or a CDSC. At March 31, 2015, the Trust consisted of eighteen funds.
This report covers the Macro Opportunities Fund (the “Fund”) while the other funds are in separate reports. Only A-Class, C-Class and Institutional Class shares had been issued by the Fund.
The Fund was previously a series (the “Predecessor Fund”) of Security Income Fund, a different registered open-end investment company, which was organized as a Kansas corporation. In January 2014, at a special meeting of shareholders, the shareholders of the Predecessor Fund approved the reorganization of the Predecessor Fund with and into the Fund, corresponding “shell” series of the Trust. The Fund succeeded to the accounting and performance history of the Predecessor Fund. Any such historical information provided for the Fund that relates to periods prior to January 28, 2014, therefore, is that of the Predecessor Fund.
| | THE GUGGENHEIM FUNDS SEMI-ANNUAL REPORT | 55 |
NOTES TO CONSOLIDATED FINANCIAL STATEMENTS (Unaudited)(continued)
Guggenheim Investments (“GI”) provides advisory services, and Rydex Fund Services, LLC (“RFS”) provides transfer agent, administrative and accounting services to the Trust. Guggenheim Funds Distributors, LLC (“GFD”) acts as principal underwriter for the Trust. GI, RFS and GFD are affiliated entities.
Consolidation of Subsidiary
Each of the consolidated financial statements of the Fund includes the accounts of a wholly-owned and controlled Cayman Islands subsidiary (the “Subsidiary”). Significant inter-company accounts and transactions have been eliminated in consolidation for the Fund.
The Fund may invest up to 25% of its total assets in its Subsidiary which acts as an investment vehicle in order to effect certain investments consistent with the Fund’s investment objective and policies.
A summary of the Fund’s investment in its respective Subsidiary is as follows:
| Fund | Inception Date of Subsidiary | | Subsidiary Net Assets at March 31, 2015 | | | % of Net Assets of the Fund at March 31, 2015 | |
| Macro Opportunities Fund | 1/8/2015 | | $ | 2,315,863 | | | | 0.08 | % |
Significant Accounting Policies
The Fund operates as an investment company and accordingly follows the investment company accounting and reporting guidance of the Financial Accounting Standards Board (“FASB”) Accounting Standards Codification Topic 946 Financial Services – Investment Companies.
The following significant accounting policies are in conformity with U.S. generally accepted accounting principles (“U.S. GAAP”) and are consistently followed by the Trust. This requires management to make estimates and assumptions that affect the reported amount of assets and liabilities and disclosure of contingent assets and liabilities at the date of the financial statements and the reported amounts of revenues and expenses during the reporting period. Actual results could differ from these estimates. All time references are based on Eastern Time.
The NAV of each Class of the Fund is calculated by dividing the market value of the Fund’s securities and other assets, less all liabilities, attributable to the Class by the number of outstanding shares of the Class.
A. The Board of Trustees of the Fund (the “Board”) has adopted policies and procedures for the valuation of the Fund's investments (the “Valuation Procedures”). Pursuant to the Valuation Procedures, the Board has delegated
| 56 | THE GUGGENHEIM FUNDS SEMI-ANNUAL REPORT | |
NOTES TO CONSOLIDATED FINANCIAL STATEMENTS (Unaudited)(continued)
to a valuation committee, consisting of representatives from Guggenheim’s investment management, fund administration, legal and compliance departments (the “Valuation Committee”), the day-to-day responsibility for implementing the Valuation Procedures, including, under most circumstances, the responsibility for determining the fair value of the Fund’s securities or other assets.
Valuations of the Fund's securities are supplied primarily by pricing services appointed pursuant to the processes set forth in the Valuation Procedures. The Valuation Committee convenes monthly, or more frequently as needed and will review the valuation of all assets which have been fair valued for reasonableness. The Fund's officers, through the Valuation Committee and consistent with the monitoring and review responsibilities set forth in the Valuation Procedures, regularly review procedures used by, and valuations provided by, the pricing services.
If the pricing service cannot or does not provide a valuation for a particular investment or such valuation is deemed unreliable, such investment is fair valued by the Valuation Committee.
Equity securities listed on an exchange (New York Stock Exchange (“NYSE”) or American Stock Exchange) are valued at the last quoted sales price as of the close of business on the NYSE, usually 4:00 p.m. on the valuation date. Equity securities listed on the NASDAQ market system are valued at the NASDAQ Official Closing Price on the valuation date, which may not necessarily represent the last sale price. If there has been no sale on such exchange or NASDAQ on a given day, the security is valued at the closing bid price on that day.
Generally, trading in foreign securities markets is substantially completed each day at various times prior to the close of the NYSE. The values of foreign securities are determined as of the close of such foreign markets or the close of the NYSE, if earlier. All investments quoted in foreign currency are valued in U.S. dollars on the basis of the foreign currency exchange rates prevailing at the close of business. Investments in foreign securities may involve risks not present in domestic investments. The Valuation Committee will determine the current value of such foreign securities by taking into consideration certain factors which may include those discussed above, as well as the following factors, among others: the value of the securities traded on other foreign markets, ADR trading, closed-end fund trading, foreign currency exchange activity, and the trading prices of financial products that are tied to foreign securities such as World Equity Benchmark Securities. In addition, the Board of Trustees has authorized the Valuation Committee and GI to use prices and other information supplied by a third party pricing vendor in valuing foreign securities.
| | THE GUGGENHEIM FUNDS SEMI-ANNUAL REPORT | 57 |
NOTES TO CONSOLIDATED FINANCIAL STATEMENTS (Unaudited)(continued)
Open-end investment companies (“Mutual Funds”) are valued at their NAV as of the close of business, on the valuation date. Exchange-traded funds (“ETFs”) and closed-end investment companies (“CEFs”) are valued at the last quoted sales price.
Debt securities with a maturity of greater than 60 days at acquisition are valued at prices that reflect broker/dealer supplied valuations or are obtained from independent pricing services, which may consider the trade activity, treasury spreads, yields or price of bonds of comparable quality, coupon, maturity, and type, as well as prices quoted by dealers who make markets in such securities. Short-term debt securities with a maturity of 60 days or less at acquisition are valued at amortized cost, provided such amount approximates market value.
Repurchase agreements are valued at amortized cost, which approximates market value.
Typically loans are valued using information provided by an independent third party pricing service which uses broker quotes in a non-active market.
Listed options are valued at the Official Settlement Price listed by the exchange, usually as of 4:00 p.m. Long options are valued using the bid price and short options are valued using the ask price. In the event that a settlement price is not available, fair valuation is enacted. Over-the-counter options are valued using the average bid price (for long options), or average ask price (for short options) obtained from one or more security dealers.
The value of OTC swap agreements entered into by a Fund is accounted for using the unrealized gain or loss on the agreements that is determined by marking the agreements to the last quoted value of the index that the swap pertains to at the close of the NYSE. The swap's value is then adjusted to include dividends accrued, and financing charges and/or interest associated with the swap agreements.
The value of interest rate swap agreements entered into by a Fund are accounted for using the unrealized gain or loss on the agreements that is determined using the spread priced off the previous day’s Chicago Mercantile Exchange ( “CME”) price.
Forward foreign currency exchange contracts are valued daily based on the applicable exchange rate of the underlying currency. The change in value of the contract is recorded as unrealized appreciation or depreciation until the forward foreign currency contract is closed. When the forward foreign currency contract is closed, the Fund records a realized gain or loss equal to the difference between the value at the time the contract was opened and the value at the time it was closed.
| 58 | THE GUGGENHEIM FUNDS SEMI-ANNUAL REPORT | |
NOTES TO CONSOLIDATED FINANCIAL STATEMENTS (Unaudited)(continued)
Investments for which market quotations are not readily available are fair valued as determined in good faith by GI under the direction of the Board of Trustees using methods established or ratified by the Board of Trustees. Valuations in accordance with these methods are intended to reflect each security’s (or asset’s) “fair value.” Each such determination is based on a consideration of all relevant factors, which are likely to vary from one pricing context to another. Examples of such factors may include, but are not limited to: (i) the type of security, (ii) the initial cost of the security, (iii) the existence of any contractual restrictions on the security’s disposition, (iv) the price and extent of public trading in similar securities of the issuer or of comparable companies, (v) quotations or evaluated prices from broker-dealers and/or pricing services, (vi) information obtained from the issuer, analysts, and/or the appropriate stock exchange (for exchange-traded securities), (vii) an analysis of the company’s financial statements, and (viii) an evaluation of the forces that influence the issuer and the market(s) in which the security is purchased and sold (e.g. the existence of pending merger activity, public offerings or tender offers that might affect the value of the security). In connection with derivative investments such factors may include, obtaining information as to how (a) these contracts and other derivative investments trade in the futures or other derivative markets, respectively, and (b) the securities underlying these contracts and other derivative investments trade in the cash market.
B. Senior loans in which the Fund invests generally pay interest rates which are periodically adjusted by reference to a base short-term, floating rate plus a premium. These base lending rates are generally (i) the lending rate offered by one or more major European banks, such as the one-month or three-month London Inter-Bank Offered Rate (LIBOR), (ii) the prime rate offered by one or more major United States banks, or (iii) the bank’s certificate of deposit rate. Senior floating rate interests often require prepayments from excess cash flows or permit the borrower to repay at its election. The rate at which the borrower repays cannot be predicted with accuracy. As a result, the actual remaining maturity may be substantially less than the stated maturities shown. The interest rate indicated is the rate in effect at March 31, 2015.
C. The Fund may purchase and sell interests in securities on a when-issued and delayed delivery basis, with payment and delivery scheduled for a future date. No income accrues to the Fund on such interests or securities in connection with such transactions prior to the date the Fund actually take delivery of such interests or securities. These transactions are subject to market fluctuations and are subject to the risk that the value at delivery may be more or less than the trade date purchase price. Although the Fund will generally purchase these securities with the intention of acquiring such securities, they may sell such securities before the settlement date.
| | THE GUGGENHEIM FUNDS SEMI-ANNUAL REPORT | 59 |
NOTES TO CONSOLIDATED FINANCIAL STATEMENTS (Unaudited)(continued)
When the Fund engages in a short sale of a security, an amount equal to the proceeds is reflected as an asset and an equivalent liability. The amount of the liability is subsequently marked-to-market to reflect the market value of the short sale. The Fund maintains a segregated account of cash and/or securities as collateral for short sales.
Fees, if any, paid to brokers to borrow securities in connection with short sales are recorded as interest expense. In addition, the Fund must pay out the dividend rate of the equity or coupon rate of the obligation to the lender and record this as an expense. Short dividend or interest expense is a cost associated with the investment objective of short sales transactions, rather than an operational cost associated with the day-to-day management of any mutual fund. The Fund may also receive rebate income from the broker resulting from the investment of the proceeds from securities sold short.
E. Upon the purchase of an option, the premium paid is recorded as an investment, the value of which is marked-to-market daily. If a purchased option expires, the Fund realizes a loss in the amount of the cost of the option. When the Fund enters into a closing sale transaction, it realizes a gain or loss depending on whether the proceeds from the closing sale transaction are greater or less than the cost of the option. If the Fund exercises a put option, it realizes a gain or loss from the sale of the underlying security and the proceeds from such sale will be decreased by the premium originally paid. When the Fund exercises a call option, the cost of the security purchased by the Fund upon exercise increases by the premium originally paid.
When the Fund writes (sells) an option, an amount equal to the premium received is entered in that Fund’s accounting records as an asset and equivalent liability. The amount of the liability is subsequently marked-to-market to reflect the current value of the option written. When a written option expires, or if the Fund enters into a closing purchase transaction, it realizes a gain (or loss if the cost of a closing purchase transaction exceeds the premium received when the option was sold).
F. Swap agreements are marked-to-market daily and the change, if any, is recorded as unrealized gain or loss. Payments received or made as a result of an agreement or termination of the agreement are recognized as realized gains or losses.
G. Forward foreign currency exchange contracts are valued daily based on the applicable exchange rate of the underlying currency. The change in value of the contract is recorded as unrealized appreciation or depreciation until the forward foreign currency contract is closed. When the forward foreign currency contract is closed, the Fund records a realized gain or loss equal to the difference between the value at the time the contract was opened and the value at the time it was closed.
| 60 | THE GUGGENHEIM FUNDS SEMI-ANNUAL REPORT | |
NOTES TO CONSOLIDATED FINANCIAL STATEMENTS (Unaudited)(continued)
Security transactions are recorded on the trade date for financial reporting purposes. Realized gains and losses from securities transactions are recorded using the identified cost basis. Proceeds from lawsuits related to investment holdings are recorded as realized gains in the Fund. Dividend income is recorded on the ex-dividend date, net of applicable taxes withheld by foreign countries. Taxable non-cash dividends are recorded as dividend income. Interest income, including amortization of premiums and accretion of discounts, is accrued on a daily basis. Interest income also includes paydown gains and losses on mortgage-backed and asset-backed securities and senior and subordinated loans. Amendment fees are earned as compensation for evaluating and accepting changes to the original loan agreement and are recognized when received. Dividend income from REITs is recorded based on the income included in the distributions received from the REIT investments using published REIT classifications, including some management estimates when actual amounts are not available. Distributions received in excess of this estimated amount are recorded as a reduction of the cost of investments or reclassified to capital gains. The actual amounts of income, return of capital, and capital gains are only determined by each REIT after its fiscal year-end, and may differ from the estimated amounts.
I. The Fund declares dividends from investment income daily. The Fund pays its shareholders from its net investment income monthly and distributes any net capital gains that it has realized, at least annually. Distributions to shareholders are recorded on the ex-dividend date. Dividends are reinvested in additional shares unless shareholders request payment in cash. The character of distributions made during the year from net investment income or net realized gains may differ from their ultimate characterization for federal income tax purposes.
J. Interest and dividend income, most expenses, all realized gains and losses, and all unrealized gains and losses are allocated to the classes based upon the value of the outstanding shares in each Class. Certain costs, such as distribution and service fees are charged directly to specific classes. In addition, certain expenses have been allocated to the individual Funds in the Trust on a pro rata basis upon the respective aggregate net assets of each Fund included in the Trust.
K. Under the fee arrangement with the custodian, the Fund may earn credits based on overnight custody cash balances. These credits are utilized to reduce related custodial expenses. The custodian fees disclosed in the Statement of Operations are before the reduction in expense from the related earnings credits, if any. For the period ended March 31, 2015, there were no earnings credits received.
L. The Fund may leave cash overnight in its cash account with the custodian. Periodically, the Fund may have cash due to the custodian bank as an overdraft balance. A fee is incurred on this overdraft, calculated by multiplying the overdraft by a rate based on the federal funds rate.
| | THE GUGGENHEIM FUNDS SEMI-ANNUAL REPORT | 61 |
NOTES TO CONSOLIDATED FINANCIAL STATEMENTS (Unaudited)(continued)
M. Under the Fund's organizational documents, its Trustees and Officers are indemnified against certain liabilities arising out of the performance of their duties to the Trust. In addition, throughout the normal course of business, the Fund enters into contracts that contain a variety of representations and warranties which provide general indemnifications. The Fund's maximum exposure under these arrangements is unknown, as this would involve future claims that may be made against the Fund and/or its affiliates that have not yet occurred. However, based on experience, the Fund expects the risk of loss to be remote.
N. The accounting records of the Fund are maintained in U.S. dollars. All assets and liabilities initially expressed in foreign currencies are converted into U.S. dollars at prevailing exchange rates. Purchases and sales of investment securities, dividend and interest income, and certain expenses are translated at the rates of exchange prevailing on the respective dates of such transactions. Changes in the relationship of these foreign currencies to the U.S. dollar can significantly affect the value of the investments and earnings of the Funds. Foreign investments may also subject the Funds to foreign government exchange restrictions, expropriation, taxation or other political, social or economic developments, all of which could affect the market and/or credit risk of the investments.
The Funds do not isolate that portion of the results of operations resulting from changes in the foreign exchange rates on investments from the fluctuations arising from changes in the market prices of securities held. Such fluctuations are included with the net realized and unrealized gain or loss on investments.
Reported net realized foreign exchange gains and losses arise from sales of foreign currencies and currency gains or losses realized between the trade and settlement dates on investment transactions. Net unrealized exchange gains and losses arise from changes in the fair values of assets and liabilities other than investments in securities at the fiscal period end, resulting from changes in exchange rates.
2. Financial Instruments
As part of its investment strategy, the Fund utilizes short sales and a variety of derivative instruments. These investments involve, to varying degrees, elements of market risk and risks in excess of the amounts recognized in the Statement of Assets and Liabilities.
A short sale is a transaction in which a Fund sells a security it does not own. If the security sold short decreases in price between the time the Fund sells the security and closes its short position, that Fund will realize a gain on the transaction. Conversely, if the security increases in price during the period, that Fund will realize a loss on the transaction. The risk of such price increases is the principal risk of engaging in short sales.
| 62 | THE GUGGENHEIM FUNDS SEMI-ANNUAL REPORT | |
NOTES TO CONSOLIDATED FINANCIAL STATEMENTS (Unaudited)(continued)
An option on a security gives the purchaser of the option the right to sell, and the writer of the option the obligation to buy, the underlying security (put option) or the purchaser of the option the right to buy, and the writer of the option the obligation to sell, the underlying security (call option) at any time during the option period. The risk associated with purchasing options is limited to the premium originally paid. The risk in writing a call option is that a Fund may incur a loss if the market price of the underlying security increases and the option is exercised. The risk in writing a put option is that a Fund may incur a loss if the market price of the underlying security decreases and the option is exercised. In addition, there may be an imperfect correlation between the movement in prices of options and the underlying securities and a Fund may not be able to enter into a closing transaction because of an illiquid secondary market or, for over-the-counter options, because of the counterparty’s inability to perform.
A swap is an agreement that obligates two parties to exchange a series of cash flows at specified intervals based upon or calculated by reference to changes in specified prices or rates for a specified amount of an underlying asset. A Fund utilizing OTC swaps bears the risk of loss of the amount expected to be received under a swap agreement in the event of the default or bankruptcy of a swap agreement counterparty. For Funds utilizing interest rate swaps, the exchange bears the risk of loss. Additionally, there is no guarantee that a Fund or an underlying fund could eliminate its exposure under an outstanding swap agreement by entering into an offsetting swap agreement with the same or another party.
A forward foreign currency exchange contract is an agreement between two parties to exchange two designated currencies at a specific time in the future. The contracts can be used to hedge or manage exposure to foreign currency risks with portfolio investments or to gain exposure to foreign currencies.
In conjunction with the use short sales and of derivative instruments, the Fund is required to maintain collateral in various forms. The Fund uses, where appropriate, depending on the financial instrument utilized and the broker involved, margin deposits at the broker, cash and/or securities segregated at the custodian bank, discount notes or the repurchase agreements allocated to the Fund.
The Trust has established counterparty credit guidelines and enters into transactions only with financial institutions of investment grade or better. The Trust monitors the counterparty credit risk.
3. Fees and Other Transactions with Affiliates
Under the terms of an investment advisory contract, the Fund pays GI investment advisory fees calculated at an annualized rate of 0.89% of the average daily net assets of the Fund.
| | THE GUGGENHEIM FUNDS SEMI-ANNUAL REPORT | 63 |
NOTES TO CONSOLIDATED FINANCIAL STATEMENTS (Unaudited)(continued)
GI has contractually agreed to waive the management fee it receives from the Subsidiary in an amount equal to the management fee paid to GI by the Subsidiary. This undertaking will continue in effect for so long as the Fund invests in the Subsidiary, and may not be terminated by GI unless GI obtains the prior approval of the Fund’s Board of Trustees for such termination.
RFS provides transfer agent services to the Fund for fees calculated at the rates below which are assessed to the applicable class of the Fund. For these services, RFS receives the following:
| Annual charge per account | $5.00 – $8.00 |
| Transaction fee | $0.60 – $1.10 |
Minimum annual charge per Fund† | $25,000 |
| Certain out-of-pocket charges | Varies |
† | Not subject to Fund during first twelve months of operations. |
RFS also acts as the administrative agent for the Fund, and as such performs administrative functions and the bookkeeping, accounting and pricing functions for the Fund. For these services, RFS receives 0.095% of the average daily net assets of the Fund. The minimum annual charge for administrative fees is $25,000.
RFS engages external service providers to perform other necessary services for the Trust, such as audit and accounting related services, legal services, custody, printing and mailing, etc., on a pass-through basis. Such expenses are allocated to various Funds within the complex based on relative net assets.
The Fund has adopted Distribution Plans related to the offering of A-Class and C-Class shares pursuant to Rule 12b-1 under the 1940 Act. The plans provide for payments at an annual rate of 0.25% of the average daily net assets of the Fund’s A-Class shares and 1.00% of the average daily net assets of the Fund’s C-Class shares.
The investment advisory contract for the following Fund provides that the total expenses be limited to a percentage of average net assets for each class of shares, exclusive of brokerage costs, dividends on securities sold short, expenses of other investment companies in which a Fund invests, interest, taxes, litigation, indemnification and extraordinary expenses. The limits are listed below:
| | Limit | Effective Date | Contract End Date |
| Macro Opportunities Fund - A-Class | 1.36% | 11/30/12 | 02/01/16 |
| Macro Opportunities Fund - C-Class | 2.11% | 11/30/12 | 02/01/16 |
| Macro Opportunities Fund - Institutional Class | 0.95% | 11/30/12 | 02/01/16 |
| 64 | THE GUGGENHEIM FUNDS SEMI-ANNUAL REPORT | |
NOTES TO CONSOLIDATED FINANCIAL STATEMENTS (Unaudited)(continued)
GI is entitled to reimbursement by the Fund for fees waived or expenses reimbursed during any of the previous 36 months, beginning on the date of the expense limitation agreement, if on any day the estimated operating expenses are less than the indicated percentages. At March 31, 2015, the amount of fees waived or expenses reimbursed that are subject to recoupment are presented in the following table:
| Fund | | Expires 2015 | | | Expires 2016 | | | Expires 2017 | | | Expires 2018 | | | Fund Total | |
| Macro Opportunities Fund | | $ | 161,466 | | | $ | 961,870 | | | $ | 1,692,031 | | | $ | 1,346,426 | | | $ | 4,161,793 | |
For the period ended March 31, 2015, no amounts were recouped by GI.
If a Fund invests in an affiliated fund, the investing Fund’s Adviser has agreed to waive fees at the investing fund level through February 1, 2016. Fee waivers will be calculated at the investing Fund level without regard to any expense cap, if any, in effect for the investing Fund. Fees waived under this arrangement are not subject to reimbursement to GI.
During the period ended March 31, 2015, the following fund waived advisory fees related to investments in the affiliated funds.
| Fund | | Amount | |
| Macro Opportunities Fund | | $ | 163,681 | |
For the period ended March 31, 2015, GFD retained sales charges of $73,546 relating to sales of A-Class shares of the Trust.
Certain trustees and officers of the Trust are also officers of GI, RFS and GFD.
4. Fair Value Measurement
In accordance with U.S. GAAP, fair value is defined as the price that the Fund would receive to sell an investment or pay to transfer a liability in an orderly transaction with an independent buyer in the principal market, or in the absence of a principal market, the most advantageous market for the investment or liability. U.S. GAAP establishes a three-tier fair value hierarchy based on the types of inputs used to value assets and liabilities and requires corresponding disclosure. The hierarchy and the corresponding inputs are summarized below:
| Level 1 — | quoted prices in active markets for identical assets or liabilities. |
| Level 2 — | significant other observable inputs (for example quoted prices for securities that are similar based on characteristics such as interest rates, prepayment speeds, credit risk, etc.). |
| | THE GUGGENHEIM FUNDS SEMI-ANNUAL REPORT | 65 |
NOTES TO FINANCIAL STATEMENTS (Unaudited)(concluded)
| Level 3 — | significant unobservable inputs based on the best information available under the circumstances, to the extent observable inputs are not available, which may include assumptions. |
The types of inputs available depend on a variety of factors, such as the type of security and the characteristics of the markets in which it trades, if any. Fair valuation determinations that rely on fewer or no observable inputs require greater judgment. Accordingly, fair value determinations for Level 3 securities require the greatest amount of judgment.
The following table summarizes the inputs used to value the Fund's investments at March 31, 2015:
| | | Level 1 Investments In Securities | | | Level 2 Investments In Securities | | | Level 2 Other Financial Instruments* | | | Level 3 Investments In Securities | | | Total | |
| Assets | | | | | | | | | | | | | | | |
| Macro Opportunities Fund | | $ | 610,860,681 | | | $ | 2,836,514,727 | | | $ | 25,690,558 | | | $ | 51,914,755 | | | $ | 3,524,980,721 | |
| | |
| Liabilities | | | | | | | | | | | | | | | | | | | | |
| Macro Opportunities Fund | | $ | 132,990,155 | | | $ | 960,000 | | | $ | 22,604,310 | | | $ | — | | | $ | 156,554,465 | |
| * | Other financial instruments may include forward foreign currency exchange contracts and/or swaps, which are reported as unrealized gain/loss at period end. |
Independent pricing services are used to value a majority of the Fund's investments. When values are not available from a pricing service, they may be computed by the Fund's investment adviser or an affiliate. In any event, values may be determined using a variety of sources and techniques, including: market prices; broker quotes; and models which derive prices based on inputs such as prices of securities with comparable maturities and characteristics or based on inputs such as anticipated cash flows or collateral, spread over Treasuries, and other information and analysis. A significant portion of the Fund's assets and liabilities are categorized as Level 2 or Level 3, as indicated in this report.
Indicative quotes from broker-dealers, adjusted for fluctuations in criteria such as credit spreads and interest rates, may be also used to value the Fund’s assets and liabilities, i.e. prices provided by a broker-dealer or other market participant who has not committed to trade at that price. Although indicative quotes are typically received from established market participants, the Fund may not have the transparency to view the underlying inputs which support the market quotations. Significant changes in an indicative quote would generally result in significant changes in the fair value of the security.
| 66 | THE GUGGENHEIM FUNDS SEMI-ANNUAL REPORT | |
NOTES TO CONSOLIDATED FINANCIAL STATEMENTS (Unaudited)(continued)
Certain fixed income securities are valued by obtaining a monthly indicative quote from a broker-dealer, adjusted for fluctuations in criteria such as credit spreads and interest rates. The Fund's fair valuation guidelines were recently revised to transition such monthly indicative quoted securities from Level 2 to Level 3.
The inputs or methodologies used for valuing securities are not necessarily an indication of the risk associated with investing in those securities. The suitability of the techniques and sources employed to determine fair valuation are regularly monitored and subject to change.
The following is a summary of significant unobservable inputs used in the fair value valuation of assets and liabilities categorized within level 3 of the fair value hierarchy.
| Fund | Category and Subcategory | Ending Balance at 03/31/15 | Valuation Technique | Unobservable Inputs |
| | Investments, at value | | | |
| Macro Opportunities Fund | Asset-Backed Securities | $20,740,794 | Option Adjusted Spread off the month end broker mark over the 3 month LIBOR | Indicative Quote |
| | | 240 | Option Adjusted Spread off 60 day or greater broker mark over the 3 month LIBOR | Indicative Quote |
| | Total Asset-Backed Securities | 20,741,034 | | |
| | Corporate Bonds | 11,346,875 | Option Adjusted Spread off the month end broker mark over the 3 month LIBOR | Indicative Quote |
| | | 1,640,385 | Model Priced | Purchase Price |
| | Total Corporate Bonds | 12,987,260 | | |
| | Senior Floating Rate Interests | 10,159,030 | Model Priced | Purchase Price |
| | Preferred Stocks | 4,962,370 | Option Adjusted Spread off the month end broker mark over the 3 month LIBOR | Indicative Quote |
| | Options Purchased | 3,065,061 | Model Priced | Purchase Price |
Any remaining Level 3 securities held by the Fund and excluded from the table above, were not considered material to the Fund.
Transfers between investment levels may occur as the markets fluctuate and/or the availability of data used in an investment’s valuation changes. The Fund recognized transfers between the levels as of the beginning of the period. As
| | THE GUGGENHEIM FUNDS SEMI-ANNUAL REPORT | 67 |
NOTES TO CONSOLIDATED FINANCIAL STATEMENTS (Unaudited)(continued)
of March 31, 2015, the Fund had transfers in/out of Level 3 due to changes in securities valuation method and transfers between Level 1 and Level 2 due to utilizing international fair value pricing during the period. See the table below for changes to and from Level 2 and Level 3. There were no other securities that transferred between levels.
Summary of Fair Value Level 3 Activity
Following is a reconciliation of Level 3 assets and liabilities for which significant unobservable inputs were used to determine fair value for the period ended March 31, 2015:
LEVEL 3 – Fair value measurement using significant unobservable inputs
| | | Senior Floating Rate Interests | | | Asset-Backed Securities | | | Corporate Bonds | | | Preferred Stocks | | | Options Purchased | | | Total | |
| Macro Opportunities Fund | | | | | | | | | | | | | | | | | | |
| Assets: | | | | | | | | | | | | | | | | | | |
| Beginning Balance | | $ | 8,552,307 | | | $ | 12,653,156 | | | $ | 13,095,759 | | | $ | — | | | $ | — | | | $ | 34,301,222 | |
| Purchases | | | 2,517,293 | | | | 12,755,689 | | | | 2,735,725 | | | | 4,910,500 | | | | 4,596,569 | | | | 27,515,776 | |
| Sales | | | (215,862 | ) | | | (1,298,401 | ) | | | (26,620 | ) | | | — | | | | — | | | | (1,540,883 | ) |
| Total change in unrealized gains or losses included in earnings | | | (373,799 | ) | | | 155,107 | | | | (93,015 | ) | | | 51,870 | | | | (1,531,508 | ) | | | (1,791,345 | ) |
| Transfers in Level 3 | | | 3,213,135 | | | | 534,183 | | | | — | | | | — | | | | — | | | | 3,747,318 | |
| Transfers out of Level 3 | | | (3,534,044 | ) | | | (4,058,700 | ) | | | (2,724,589 | ) | | | — | | | | — | | | | (10,317,333 | ) |
| Ending Balance | | $ | 10,159,030 | | | $ | 20,741,034 | | | $ | 12,987,260 | | | $ | 4,962,370 | | | $ | 3,065,061 | | | $ | 51,914,755 | |
5. Derivative Investment Holdings Categorized by Risk Exposure
U.S. GAAP requires disclosures to enable investors to better understand how and why the Fund uses derivative instruments, how these derivative instruments are accounted for and their effects on the Fund's financial position and results of operations.
The Fund utilized derivatives for the following purposes:
| Fund | Index | Hedge | Duration |
| Macro Opportunities Fund | x | x | x |
| 68 | THE GUGGENHEIM FUNDS SEMI-ANNUAL REPORT | |
NOTES TO CONSOLIDATED FINANCIAL STATEMENTS (Unaudited)(continued)
The following table represents the notional amount of derivative instruments outstanding as an approximate percentage of the Fund’s net assets on a quarterly basis.
| | Approximate percentage of Fund's Net Assets on a quarterly basis |
| Fund | Long | Short |
| Macro Opportunities Fund | 20% | 15% |
The following is a summary of the location of derivative investments on the Fund's Statement of Assets and Liabilities as of March 31, 2015:
| Derivative Investment Type | Asset Derivatives | Liability Derivatives |
| Equity/Interest Rate/Currency contracts | Unrealized appreciation on forward foreign currency exchange contracts | Options written, at value |
| | Unrealized appreciation on swap agreements | Unrealized depreciation on swap agreements |
| | Investments in unaffiliated issuers, at value | |
The following table sets forth the fair value of the Fund's derivative investments categorized by primary risk exposure at March 31, 2015:
| Asset Derivative Investments Value | |
| Fund | | Forward Foreign Currency Exchange Contracts | | | Swaps Equity Contracts | | | Swaps Currency Contracts | | | Swaps Interest Rate Contracts | | | Options Written Equity Contracts | | | Options Purchased Equity Contracts | | | Total | |
| Macro Opportunities Fund | | $ | 9,488,431 | | | $ | 5,541,133 | | | $ | — | | | $ | 10,660,994 | | | $ | — | | | $ | 12,642,311 | | | $ | 38,332,869 | |
| Liability Derivative Investments Value | |
| Fund | | Forward Foreign Currency Exchange Contracts | | | Swaps Equity Contracts | | | Swaps Currency Contracts | | | Swaps Interest Rate Contracts | | | Options Written Equity Contracts | | | Options Purchased Equity Contracts | | | Total | |
| Macro Opportunities Fund | | $ | — | | | $ | 8,188,898 | | | $ | 757,637 | | | $ | 13,657,775 | | | $ | 4,756,494 | | | $ | — | | | $ | 27,360,804 | |
| | THE GUGGENHEIM FUNDS SEMI-ANNUAL REPORT | 69 |
NOTES TO CONSOLIDATED FINANCIAL STATEMENTS (Unaudited)(continued)
The following is a summary of the location of derivative investments on the Fund's Statement of Operations for the period ended March 31, 2015:
| Derivative Investment Type | Location of Gain (Loss) on Derivatives |
| Equity/Interest Rate/Currency contracts | Net realized gain (loss) on forward foreign currency exchange contracts |
| | Net change in unrealzed appreciation (depreciation) on forward foreign currency exchange contracts |
| | Net realized gain (loss) on options purchased |
| | Net change in unrealized appreciation (deprecitation) on options purchased |
| | Net realized gain (loss) on options written |
| | Net change in unrealized appreciation (depreciation) on options written |
| | Net realized gain (loss) on swap agreements |
| | Net change in unrealized appreciation (depreciation) on swap agreements |
The following is a summary of the Fund's realized gain (loss) and change in unrealized appreciation (depreciation) on derivative investments recognized on the Statement of Operations categorized by primary risk exposure for the period ended March 31, 2015:
| Realized Gain (Loss) on Derivative Investments Recognized on the Statement of Operations | |
| Fund | | Forward Foreign Currency Exchange Contracts | | | Swaps Equity Contracts | | | Swaps Currency Contracts | | | Swaps Interest Rate Contracts | | | Options Written Equity Contracts | | | Options Purchased Equity Contracts | | | Total | |
| Macro Opportunities Fund | | $ | 13,489,769 | | | $ | 14,093,064 | | | $ | 7,508,393 | | | $ | (3,214,819 | ) | | $ | 987,331 | | | $ | (8,895,011 | ) | | $ | 23,968,727 | |
Change in Unrealized Appreciation (Depreciation) on Derivative Investments Recognized on the Statement of Operations | |
| Fund | | Forward Foreign Currency Exchange Contracts | | | Swaps Equity Contracts | | | Swaps Currency Contracts | | | Swaps Interest Rate Contracts | | | Options Written Equity Contracts | | | Options Purchased Equity Contracts | | | Total | |
| Macro Opportunities Fund | | $ | 7,346,416 | | | $ | 3,361,973 | | | $ | (1,362,223 | ) | | $ | (423,751 | ) | | $ | (505,539 | ) | | $ | 3,210,122 | | | $ | 11,626,998 | |
| 70 | THE GUGGENHEIM FUNDS SEMI-ANNUAL REPORT | |
NOTES TO CONSOLIDATED FINANCIAL STATEMENTS (Unaudited)(continued)
In the normal course of business, the Fund enters into transactions subject to enforceable master netting arrangements or other similar arrangements. Generally, the right to offset in those agreements allows the Fund to counteract the exposure to a specific counterparty with collateral received or delivered to that counterparty based on the terms of the arrangements. These arrangements provide for the right to liquidate upon the occurrence of an event of default, credit event upon merger or additional termination event.
In order to better define their contractual rights and to secure rights that will help the Fund mitigate its counterparty risk, the Fund may enter into an International Swaps and Derivatives Association, Inc. Master Agreement (“ISDA Master Agreement”) or similar agreement with its derivative contract counterparties. An ISDA Master Agreement is a bilateral agreement between a Fund and a counterparty that governs OTC derivatives, including foreign exchange contracts, and typically contains, among other things, collateral posting terms and netting provisions in the event of a default and/or termination event. The provisions of the ISDA Master Agreement typically permit a single net payment in the event of a default (close-out netting) or similar event, including the bankruptcy or insolvency of the counterparty.
For derivatives traded under an ISDA Master Agreement, the collateral requirements are typically calculated by netting the mark to market amount for each transaction under such agreement and comparing that amount to the value of any collateral currently pledged by the Fund and the counterparty. For financial reporting purposes, cash collateral that has been pledged to cover obligations of the Fund and cash collateral received from the counterparty, if any, is reported separately on the Statement of Assets and Liabilities as segregated cash with broker/receivable for variation margin, or payable for swap settlement/variation margin. Generally, the amount of collateral due from or to a counterparty must exceed a minimum transfer amount threshold (e.g., $300,000) before a transfer is required to be made. To the extent amounts due to the Fund from its counterparties are not fully collateralized, contractually or otherwise, the Fund bears the risk of loss from counterparty nonperformance. The Fund attempts to mitigate counterparty risk by only entering into agreements with counterparties that they believe to be of good standing and by monitoring the financial stability of those counterparties.
For financial reporting purposes, the Fund does not offset derivative assets and derivative liabilities that are subject to netting arrangements in the Statement of Assets and Liabilities.
| | THE GUGGENHEIM FUNDS SEMI-ANNUAL REPORT | 71 |
NOTES TO CONSOLIDATED FINANCIAL STATEMENTS (Unaudited)(continued)
The following tables present derivative financial instruments and secured financing transactions that are subject to enforceable netting arrangements and offset in the Statement of Assets and Liabilities in conformity with U.S. GAAP.
| | | | | | | | | | | | | Gross Amounts Not Offset in the Statement of Assets and Liabilities | | | | |
| Fund | Instrument | | Gross Amounts of Recognized Assets1 | | | Gross Amounts Offset In the Statement of Assets and Liabilities | | | Net Amount of Assets Presented on the Statement of Assets and Liabilities | | | Financial Instruments | | | Cash Collateral Received | | | Net Amount | |
| Macro Opportunities Fund | Swap agreements | | $ | 5,943,988 | | | $ | — | | | $ | 5,943,988 | | | $ | 5,943,988 | | | $ | — | | | $ | — | |
| Forward foreign currency exchange contracts | | | 9,488,431 | | | | — | | | | 9,488,431 | | | | — | | | | — | | | | 9,488,431 | |
| | | | | | | | | | | | | Gross Amounts Not Offset in the Statement of Assets and Liabilities | | | | |
| Fund | Instrument | | Gross Amounts of Recognized Liabilities1 | | | Gross Amounts Offset In the Statement of Assets and Liabilities | | | Net Amount of Liabilities Presented on the Statement of Assets and Liabilities | | | Financial Instruments | | | Cash Collateral Pledged | | | Net Amount | |
| Macro Opportunities Fund | Swap agreements | | $ | 8,946,535 | | | $ | — | | | $ | 8,946,535 | | | $ | 5,943,988 | | | $ | — | | | $ | 3,002,547 | |
1 | Centrally cleared swaps are excluded from these reported amounts. |
| 72 | THE GUGGENHEIM FUNDS SEMI-ANNUAL REPORT | |
NOTES TO CONSOLIDATED FINANCIAL STATEMENTS (Unaudited)(continued)
The Fund intends to comply with the provisions of Subchapter M of the Internal Revenue Code applicable to regulated investment companies and will distribute substantially all taxable net investment income and capital gains sufficient to relieve the Fund from all, or substantially all, federal income, excise and state income taxes. Therefore, no provision for federal or state income tax is required.
Tax positions taken or expected to be taken in the course of preparing the Fund’s tax returns are evaluated to determine whether the tax positions are “more-likely-than-not” of being sustained by the applicable tax authority. Tax positions not deemed to meet the more-likely-than-not threshold would be recorded as a tax benefit or expense in the current year. Management has analyzed the Fund’s tax positions taken, or to be taken, on Federal income tax returns for all open tax years, and has concluded that no provision for income tax is required in the Fund’s financial statements. The Fund’s federal tax returns are subject to examination by the Internal Revenue Service for a period of three years after they are filed.
At March 31, 2015, the cost of securities for Federal income tax purposes, the aggregate gross unrealized gain for all securities for which there was an excess of value over tax cost and the aggregate gross unrealized loss for all securities for which there was an excess of tax cost over value, were as follows:
| Fund Name | | Tax Cost | | | Tax Unrealized Gain | | | Tax Unrealized Loss | | | Net Unrealized Loss | |
| Macro Opportunities Fund | | $ | 3,506,530,745 | | | $ | 52,820,980 | | | $ | (60,061,562 | ) | | $ | (7,240,582 | ) |
8. Securities Transactions
For the period ended March 31, 2015, the cost of purchases and proceeds from sales of investment securities, excluding government securities, short-term investments and derivatives, were as follows:
| Fund | | Purchases | | | Sales | |
| Macro Opportunities Fund | | $ | 1,933,910,314 | | | $ | 305,390,663 | |
| | THE GUGGENHEIM FUNDS SEMI-ANNUAL REPORT | 73 |
NOTES TO CONSOLIDATED FINANCIAL STATEMENTS (Unaudited)(continued)
Information as to options written by the Fund during the period ended March 31, 2015, and options outstanding at period end is provided below:
| Written Call Options | | | |
| | | Macro Opportunities Fund | |
| | | Number of Contracts | | | Premium Amount | |
| Balance at September 30, 2014 | | | 354 | | | $ | 225,834 | |
| Options Written | | | 46,751 | | | | 3,533,817 | |
| Options terminated in closing purchase transactions | | | — | | | | — | |
| Options expired | | | (354 | ) | | | (225,834 | ) |
| Options exercised | | | — | | | | — | |
| Balance at March 31, 2015 | | | 46,751 | | | $ | 3,533,817 | |
| Written Put Options | | | |
| | | Macro Opportunities Fund | |
| | | Number of Contracts | | | Premium Amount | |
| Balance at September 30, 2014 | | | — | | | $ | — | |
| Options Written | | | 2,949 | | | | 1,735,782 | |
| Options terminated in closing purchase transactions | | | (1,667 | ) | | | (794,226 | ) |
| Options expired | | | — | | | | — | |
| Options exercised | | | — | | | | — | |
| Balance at March 31, 2015 | | | 1,282 | | | $ | 941,556 | |
| 74 | THE GUGGENHEIM FUNDS SEMI-ANNUAL REPORT | |
NOTES TO CONSOLIDATED FINANCIAL STATEMENTS (Unaudited)(continued)
Investments representing 5% or more of the outstanding voting shares of a portfolio company of a fund, or control of or by, or common control under GI, result in that portfolio company being considered an affiliated company of such fund, as defined in the 1940 Act.
The Fund may invest in the Guggenheim Strategy Funds Trust consisting of Guggenheim Strategy Fund I, Guggenheim Strategy Fund II, and Guggenheim Strategy Fund III (collectively, the “Cash Management Funds”), open-end management investment companies managed by GI. The Cash Management Funds, which launched on March 11, 2014, are offered as cash management options only to mutual funds, trusts, and other accounts managed by GI and/or its affiliates, and are not available to the public. The Cash Management Funds pay no investment management fees. The Cash Management Funds’ annual report on Form N-CSR dated September 30, 2014 is available publicly or upon request. This information is available from the EDGAR database on the SEC's website at http://www.sec.gov.
Transactions during the period ended March 31, 2015 in which the portfolio company is an “affiliated person” are as follows:
| Affiliated issuers | | Value 09/30/14 | | | Additions | | | Reductions | | | Value 03/31/15 | | | Shares 03/31/15 | | | Investment Income | | | Realized Gain (Loss) | | | Capital Gain Distributions | |
| Macro Opportunities Fund | | | | | | | | | | | | | |
| Limited Duration Fund - Institutional Class | | $ | 45,498,128 | | | $ | 807,643 | | | $ | — | | | $ | 46,240,184 | | | | 1,860,023 | | | $ | 907,938 | | | $ | — | | | $ | 15,550 | |
| Guggenheim Strategy Fund I | | | — | | | | 68,000,542 | | | | — | | | | 68,013,502 | | | | 2,731,466 | | | | 13,502 | | | | — | | | | — | |
| Risk Managed Real Estate Fund - Institutional Class | | | 10,843,512 | | | | 68,832 | | | | — | | | | 12,964,222 | | | | 403,870 | | | | 29,040 | | | | — | | | | 57,005 | |
| Guggenheim Strategic Opportunities Fund | | | — | | | | 3,108,834 | | | | — | | | | 3,350,883 | | | | 156,950 | | | | 142,903 | | | | — | | | | — | |
| | | $ | 56,341,640 | | | $ | 71,985,851 | | | $ | — | | | $ | 130,568,791 | | | | | | | $ | 1,093,383 | | | $ | — | | | $ | 72,555 | |
| | THE GUGGENHEIM FUNDS SEMI-ANNUAL REPORT | 75 |
NOTES TO CONSOLIDATED FINANCIAL STATEMENTS (Unaudited)(continued)
Pursuant to the terms of certain loan agreements, the Fund held unfunded loan commitments as of March 31, 2015. The Fund is obligated to fund these loan commitments at the borrower’s discretion.
The unfunded loan commitments as of March 31, 2015 were as follows:
| Borrower | Maturity Date | | Face Amount | | | Value | |
| Cartrawler | 06/30/15 | | $ | 15,000,000 | | | $ | — | |
| Rite Aid Corp. | 08/10/15 | | | 7,750,000 | | | | — | |
| Acosta, Inc. | 09/26/19 | | | 6,000,000 | | | | — | |
| SS&C Technologies, Inc. | 02/27/16 | | | 4,500,000 | | | | — | |
| Signode Industrial Group US, Inc. | 05/01/19 | | | 3,400,000 | | | | 346,266 | |
| Valeant Pharmaceuticals International, Inc. | 03/11/22 | | | 2,602,410 | | | | — | |
| McGraw-Hill Global Education Holdings LLC | 03/22/18 | | | 2,000,000 | | | | 161,592 | |
| BBB Industries, LLC | 10/17/19 | | | 1,537,500 | | | | 196,986 | |
| Advantage Sales & Marketing, Inc. | 07/21/19 | | | 1,500,000 | | | | 167,067 | |
| Phillips-Medsize Corp. | 06/06/19 | | | 1,100,000 | | | | 110,294 | |
| Jacobs Douwe Eg | 07/23/21 | | | 1,000,000 | | | | — | |
| Pro Mach Group, Inc. | 10/22/19 | | | 900,000 | | | | 98,916 | |
| Ceva Group plc (United Kingdom) | 03/19/19 | | | 800,000 | | | | 129,447 | |
| IntraWest Holdings S.à r.l. | 12/10/18 | | | 750,000 | | | | 22,119 | |
| Hillman Group, Inc. | 06/13/19 | | | 585,714 | | | | 54,670 | |
| Learning Care Group (US), Inc. | 05/05/21 | | | 500,000 | | | | — | |
| Wencor Group | 06/19/19 | | | 500,000 | | | | 49,419 | |
| Eyemart Express | 12/18/19 | | | 500,000 | | | | 57,257 | |
| American Stock Transfer & Trust | 06/11/18 | | | 400,000 | | | | 34,706 | |
| Hoffmaster Group, Inc. | 05/09/19 | | | 357,143 | | | | 34,185 | |
| National Financial Partners Corp. | 07/01/18 | | | 296,296 | | | | 27,108 | |
| Internet Brands | 07/08/21 | | | 1,261 | | | | 6 | |
| | | | $ | 51,980,324 | | | $ | 1,490,038 | |
12. Line of Credit
The Trust, with the exception of Alpha Opportunity Fund and Capital Stewardship Fund, secured a committed, $625,000,000 line of credit from Citibank, N.A., good through October 9, 2015, at which time the line of credit may be renewed. This line of credit is reserved for emergency or temporary purposes. Fees related to borrowings, if any, vary under this arrangement between the greater of Citibank’s “base rate”, LIBOR plus 1.0%, and the Fed Funds rate, plus 0.50%. The Trust did not have any borrowings under this agreement as of and for the period-ended March 31, 2015. The Trust also pays a commitment fee at an annualized rate of 0.07% of the average daily amount of their unused commitment amount.
| 76 | THE GUGGENHEIM FUNDS SEMI-ANNUAL REPORT | |
NOTES TO CONSOLIDATED FINANCIAL STATEMENTS (Unaudited)(continued)
In connection with transactions in repurchase agreements, it is the Fund’s policy that its custodian takes possession of the underlying collateral. The collateral is in the possession of the Fund’s custodian and is evaluated to ensure that its market value exceeds, at a minimum, 102% of the original face amount of the repurchase agreements.
| Fund | Counterparty and Terms of Agreement | Face Value | Repurchase Price | | Collateral | Par Value | Fair Value |
Macro Opportunities Fund | Jefferies & Company, Inc. | | | | | | |
| | 2.68% - 3.18% | | | | ACIS CLO 2014-4 Ltd. | | |
| | Due 04/06/15 | | | | 0.00% | | |
| | -05/07/15 | $52,960,000 | $53,102,006 | | 05/01/26 | $25,375,000 | $20,727,792 |
| | | | | | CIFC Funding Ltd. | | |
| | | | | | 0.00% | | |
| | | | | | 01/19/23 | 12,500,000 | 9,125,000 |
| | | | | | Neuberger Berman CLO Ltd | | |
| | | | | | 0.00% | | |
| | | | | | 01/23/24 | 11,368,500 | 7,048,470 |
| | | | | | Whitehorse Ltd | | |
| | | | | | 0.00% | | |
| | | | | | 02/03/25 | 9,025,000 | 5,987,177 |
| | | | | | Ares CLO Ltd | | |
| | | | | | 0.00% | | |
| | | | | | 11/25/20 | 4,000,000 | 1,600,000 |
| | | | | | Puerto Rico Commonwealth Aqueduct & Sewer Authority | | |
| | | | | | 0.00% | | |
| | | | | | 11/25/20 | 3,087,000 | 2,145,588 |
| | | | | | Atlas Senior Loan Fund Ltd. | | |
| | | | | | 0.00% | | |
| | | | | | 01/30/24 | 2,025,765 | 1,613,504 |
| | | | | | Cent CDO x Ltd. | | |
| | | | | | 0.00% | | |
| | | | | | 12/15/17 | 2,000,000 | 1,241,831 |
| | | | | | Government Development Bank for Puerto Rico | | |
| | | | | | 5.00% | | |
| | | | | | 08/01/23 | 1,631,500 | 853,242 |
| | THE GUGGENHEIM FUNDS SEMI-ANNUAL REPORT | 77 |
NOTES TO CONSOLIDATED FINANCIAL STATEMENTS (Unaudited)(continued)
| Fund | Counterparty and Terms of Agreement | Face Value | Repurchase Price | | Collateral | Par Value | Fair Value |
| | | | | | Cedar Funding Ltd. | | |
| | | | | | 0.00% | | |
| | | | | | 10/23/26 | $1,294,000 | $1,103,116 |
| | | | | | Commonwealth of Puerto Rico | | |
| | | | | | 5.50% | | |
| | | | | | 07/01/18 | 332,500 | 317,544 |
| | | | | | Aberdeen Loan Funding Ltd. | | |
| | | | | | 0.00% | | |
| | | | | | 11/01/18 | 10,250 | 4,817,500 |
| | | | | | Red River CLO Ltd. | | |
| | | | | | 0.00% | | |
| | | | | | 07/27/18 | 9,000 | 3,150,000 |
| | | | | | Liberty Clo Ltd. | | |
| | | | | | 0.00% | | |
| | | | | | 11/01/17 | 5,000 | 1,355,778 |
| | Barclays | | | | Blackboard, Inc. | | |
| | (0.10)% | | | | 7.75% | | |
| | Due 10/29/15 - 11/13/15 | $1,052,250 | $1,051,175 | | 11/15/19 | 1,000,000 | 1,006,250 |
In the event of counterparty default, the Fund has the right to collect the collateral to offset losses incurred. There is potential loss to the Fund in the event the Fund is delayed or prevented from exercising its rights to dispose of the collateral securities, including the risk of a possible decline in the value of the underlying securities during the period while the Fund seeks to assert its rights. The Fund’s investment adviser, acting under the supervision of the Board of Trustees, reviews the value of the collateral and the creditworthiness of those banks and dealers with which the Fund enters into repurchase agreements to evaluate potential risks.
14. Reverse Repurchase Agreements
The Fund may enter into reverse repurchase agreements. Under a reverse repurchase agreement, a Fund sells securities and agrees to repurchase them at a particular price at a future date. In the event the buyer of securities under a reverse repurchase agreement files for bankruptcy or becomes insolvent, such buyer or its trustee or receiver may receive an extension of time to determine whether to enforce the Fund’s obligation to repurchase the securities, and the Fund’s use of the proceeds of the reverse repurchase agreement may effectively be restricted pending such decision.
| 78 | THE GUGGENHEIM FUNDS SEMI-ANNUAL REPORT | |
NOTES TO CONSOLIDATED FINANCIAL STATEMENTS (Unaudited)(concluded)
For the period ended March 31, 2015, the Fund entered into reverse repurchase agreements as follows:
| Fund | Number of Days outstanding | | Balance at March 31, 2015 | | Average balance outstanding | | Average interest rate | |
| Macro Opportunities Fund | | | 182 | | | $ | 294,191,544 | | | $ | 62,493,903 | | | | 0.59 | % |
15. Restricted Securities
The securities below are considered illiquid and restricted under guidelines established by the Board of Trustees:
| Fund | Restricted Securities | Acquisition Date | Cost | Value |
| Macro Opportunities Fund | Cadence Financial Corp. | | | |
| | 4.88% due 06/28/19 | 06/06/14 | $ 4,000,000 | $ 4,038,240 |
| | Odebrecht Offshore Drilling Finance Ltd. | | | |
| | 6.62% due 10/01/22 | 02/21/14 | 1,209,975 | 907,481 |
| | IronGate Energy Services LLC | | | |
| | 11.00% due 07/01/18 | 07/10/13 | 567,269 | 396,000 |
| | Premier Foods Finance plc | | | |
| | 5.56% due 03/16/20 | 03/06/14 | 251,067 | 198,068 |
| | | | 6,028,311 | 5,539,789 |
16. Subsequent Events
P-Class Shares to be Offered
Effective following the close of business on April 30, 2015, or such later date as may be determined appropriate by management, Macro Opportunities Fund (the “Fund”), a separate series of Guggenheim Funds Trust, will offer P-Class shares.
P-Class shares of the Fund are offered primarily through broker/dealers and other financial intermediaries with which Guggenheim Funds Distributors, LLC has an agreement for the use of P-Class shares of the Fund in investment products, programs or accounts. P-Class shares do not have a minimum initial investment amount, subsequent investment amount or a minimum account balance. The Fund reserves the right to modify its minimum investment amount and account balance requirements at any time, with or without prior notice to you.
Shareholders who currently have accounts held directly at Guggenheim Investments will not be permitted to purchase P-Class shares.
For more information, or to request copies of the Fund’s prospectuses, call Client Services at 800.820.0888 or visiting guggenheiminvestments.com.
| | THE GUGGENHEIM FUNDS SEMI-ANNUAL REPORT | 79 |
OTHER INFORMATION (Unaudited)
Proxy Voting Information
A description of the policies and procedures that the Trust uses to determine how to vote proxies relating to securities held in the Funds’ portfolios is available, without charge and upon request, by calling 800.820.0888. This information is also available from the EDGAR database on the SEC’s website at http://www.sec.gov.
Information regarding how the Funds voted proxies relating to portfolio securities during the most recent 12-month period ended June 30 is available without charge, upon request, by calling 800.820.0888. This information is also available from the EDGAR database on the SEC’s website at http://www.sec.gov.
Sector Classification
Information in the “Schedule of Investments” is categorized by sectors using sector-level classifications used by Bloomberg Industry Classification System, a widely recognized industry classification system provider. In each Fund’s registration statement, the Funds have investment policies relating to concentration in specific industries. For purposes of these investment policies, the Funds usually classify industries based on industry-level classifications used by widely recognized industry classification system providers such as Bloomberg Industry Classification System, Global Industry Classification Standards and Barclays Global Classification Scheme.
Quarterly Portfolio Schedules Information
The Trust files its complete schedule of portfolio holdings with the SEC for the first and third quarters of each fiscal year on Form N-Q; which are available on the SEC’s website at http://www.sec.gov. The Funds’ Forms N-Q may be reviewed and copied at the SEC’s Public Reference Room in Washington, DC, and that information on the operation of the Public Reference Room may be obtained by calling 800-SEC-0330. Copies of the portfolio holdings are also available to shareholders, without charge and upon request, by calling 800.820.0888.
| 80 | THE GUGGENHEIM FUNDS SEMI-ANNUAL REPORT | |
INFORMATION ON BOARD OF TRUSTEES AND OFFICERS (Unaudited)
Name, Address* and Year of Birth | Position(s) Held with the Trust | Term of Office and Length of Time Served** | Principal Occupation(s) During Past Five Years | Number of Portfolios in Fund Complex Overseen | Other Directorships Held by Trustees |
| INDEPENDENT TRUSTEES | | | |
Randall C. Barnes (1951) | Trustee | Since 2014 | Current: Private Investor (2001-present). Former: Senior Vice President and Treasurer, PepsiCo, Inc. (1993-1997); President, Pizza Hut International (1991-1993); Senior Vice President, Strategic Planning and New Business Development, PepsiCo, Inc. (1987-1990). | 91 | Current: Trustee, Purpose Investments Inc. (2014-Present). |
Donald A. Chubb, Jr. (1946 ) | Trustee and Vice Chairman of the Board | Since 1994 | Current: Business broker and manager of commercial real estate, Griffith & Blair, Inc. (1997-present). | 87 | None. |
Jerry B. Farley (1946) | Trustee and Vice Chairman of the Audit Committee | Since 2005 | Current: President, Washburn University (1997-present). | 87 | Current: Westar Energy, Inc. (2004-present); CoreFirst Bank & Trust (2000-present). |
| | THE GUGGENHEIM FUNDS SEMI-ANNUAL REPORT | 81 |
INFORMATION ON BOARD OF TRUSTEES AND OFFICERS (Unaudited)(continued)
Name, Address* and Year of Birth | Position(s) Held with the Trust | Term of Office and Length of Time Served** | Principal Occupation(s) During Past Five Years | Number of Portfolios in Fund Complex Overseen | Other Directorships Held by Trustees |
| INDEPENDENT TRUSTEES - continued | | |
Roman Friedrich III (1946) | Trustee and Chairman of the Contracts Review Committee | Since 2014 | Current: Founder and President, Roman Friedrich & Company (1998-present). Former: Senior Managing Director, MLV & Co. LLC (2010-2011). | 87 | Current: Zincore Metals, Inc. (2009-present). Former: Mercator Minerals Ltd. (2013-2014); First Americas Gold Corp. (2012-2014); Blue Sky Uranium Corp. (2011-2012); Axiom Gold and Silver Corp. (2011-2012); Stratagold Corp. (2003-2009); GFM Resources Ltd. (2005-2010). |
Robert B. Karn III (1942) | Trustee and Chairman of the Audit Committee | Since 2014 | Current: Consultant (1998-present). Former: Arthur Andersen (1965-1997) and Managing Partner, Financial and Economic Consulting, St. Louis office (1987-1997). | 87 | Current: Peabody Energy Company (2003-present); GP Natural Resource Partners, LLC (2002- present). |
Ronald A. Nyberg (1953) | Trustee and Chairman of the Nominating and Governance Committee | Since 2014 | Current: Partner, Nyberg & Cassioppi, LLC (2000-present). Former: Executive Vice President, General Counsel, and Corporate Secretary, Van Kampen Investments (1982-1999). | 93 | Current: Edward-Elmhurst Healthcare System (2012-present). |
| 82 | THE GUGGENHEIM FUNDS SEMI-ANNUAL REPORT | |
INFORMATION ON BOARD OF TRUSTEES AND OFFICERS (Unaudited)(continued)
Name, Address* and Year of Birth | Position(s) Held with the Trust | Term of Office and Length of Time Served** | Principal Occupation(s) During Past Five Years | Number of Portfolios in Fund Complex Overseen | Other Directorships Held by Trustees |
| INDEPENDENT TRUSTEES - concluded | | |
Maynard F. Oliverius (1943) | Trustee and Vice Chairman of the Contracts Review Committee | Since 1998 | Current: Retired. Former: President and CEO, Stormont-Vail HealthCare (1996-2012). | 87 | Current: Fort Hays State University Foundation (1999-present); Stormont-Vail Foundation (2013-present); University of Minnesota HealthCare Alumni Association Foundation (2009-present). |
Ronald E. Toupin, Jr. (1958) | Trustee and Chairman of the Board | Since 2014 | Current: Portfolio Consultant (2010-present). Former: Vice President, Manager and Portfolio Manager, Nuveen Asset Management (1998-1999); Vice President, Nuveen Investment Advisory Corp. (1992-1999); Vice President and Manager, Nuveen Unit Investment Trusts (1991-1999); and Assistant Vice President and Portfolio Manager, Nuveen Unit Investment Trusts (1988-1999), each of John Nuveen & Co., Inc. (1982-1999). | 90 | Former: Bennett Group of Funds (2011-2013). |
| | THE GUGGENHEIM FUNDS SEMI-ANNUAL REPORT | 83 |
INFORMATION ON BOARD OF TRUSTEES AND OFFICERS (Unaudited)(continued)
Name, Address* and Year of Birth | Position(s) Held with the Trust | Term of Office and Length of Time Served** | Principal Occupation(s) During Past Five Years | Number of Portfolios in Fund Complex Overseen | Other Directorships Held by Trustees |
| INTERESTED TRUSTEE | |
Donald C. Cacciapaglia*** (1951) | President, Chief Executive Officer and Trustee | Since 2012 | Current: President and CEO, certain other funds in the Fund Complex (2012-present); Vice Chairman, Guggenheim Investments (2010-present). Former: Chairman and CEO, Channel Capital Group, Inc. (2002-2010). | 221 | Current: Clear Spring Life Insurance Company (2015-present); Guggenheim Partners Japan, Ltd. (2014-present); Delaware Life (2013-present); Guggenheim Life and Annuity Company (2011-present); Paragon Life Insurance Company of Indiana (2011-present). |
| * | The business address of each Trustee is c/o Guggenheim Investments, 805 King Farm Boulevard, Suite 600, Rockville, Maryland 20850 |
| ** | Each Trustee serves an indefinite term, until his successor is elected and qualified. Time served includes time served in the respective position for the Predecessor Corporation. |
| *** | This Trustee is deemed to be an “interested person” of the Funds under the 1940 Act by reason of his position with the Funds' Investment Manager and/or the parent of the Investment Manager. |
| 84 | THE GUGGENHEIM FUNDS SEMI-ANNUAL REPORT | |
INFORMATION ON BOARD OF TRUSTEES AND OFFICERS (Unaudited)(continued)
Name, Address* and Year of Birth | Position(s) Held with the Trust | Term of Office and Length of Time Served** | Principal Occupations During Past Five Years |
| OFFICERS | | | |
Joseph M. Arruda (1966) | Assistant Treasurer | Since 2010 | Current: Assistant Treasurer, certain other funds in the Fund Complex (2006-present); Vice President, Security Investors, LLC (2010-present); CFO and Manager, Guggenheim Specialized Products, LLC (2009-present). Former: Vice President, Security Global Investors, LLC (2010-2011); Vice President, Rydex Advisors, LLC (2010); Vice President, Rydex Advisors II, LLC (2010). |
William H. Belden, III (1965) | Vice President | Since 2014 | Current: Vice President, certain other funds in the Fund Complex (2006-present); Managing Director, Guggenheim Funds Investment Advisors, LLC (2005-present). Former: Vice President of Management, Northern Trust Global Investments (1999-2005). |
Mark J. Furjanic (1959) | Assistant Treasurer | Since 2014 | Current: Vice President, Guggenheim Investments (2005-present); Assistant Treasurer, certain other funds in the Fund Complex (2008-present). Former: Senior Manager, Ernst & Young LLP (1999-2005). |
James M. Howley (1972) | Assistant Treasurer | Since 2014 | Current: Director, Guggenheim Investments (2004-present) ; Assistant Treasurer, certain other funds in the Fund Complex (2006-present). Former: Manager, Mutual Fund Administration of Van Kampen Investments, Inc. (1996-2004). |
| | THE GUGGENHEIM FUNDS SEMI-ANNUAL REPORT | 85 |
INFORMATION ON BOARD OF TRUSTEES AND OFFICERS (Unaudited)(continued)
Name, Address* and Year of Birth | Position(s) Held with the Trust | Term of Office and Length of Time Served** | Principal Occupations During Past Five Years |
| OFFICERS - continued | |
Amy J. Lee (1961) | Vice President and Chief Legal Officer | Since 2007 (Vice President) Since 2014 (Chief Legal Officer) | Current: Chief Legal Officer, certain other funds in the Fund Complex (2013-present); Senior Managing Director, Guggenheim Investments (2012-present). Former: Vice President, Associate General Counsel and Assistant Secretary, Security Benefit Life Insurance Company and Security Benefit Corporation (2004-2012). |
Mark E. Mathiasen (1978) | Secretary | Since 2014 | Current: Secretary, certain other funds in the Fund Complex (2007-present); Managing Director, Guggenheim Investments (2007-present). |
Michael P. Megaris (1984) | Assistant Secretary | Since 2014 | Current: Assistant Secretary, certain other funds in the Fund Complex (2014-present); Associate, Guggenheim Investments (2012-present). Former: J.D., University of Kansas School of Law (2009-2012). |
Elisabeth Miller (1968) | Chief Compliance Officer | Since 2012 | Current: CCO, certain other funds in the Fund Complex (2012-present); CCO, Security Investors, LLC (2012-present); CCO, Guggenheim Funds Investment Advisors, LLC (2012-present); Managing Director, Guggenheim Investments (2012-present); Vice President, Guggenheim Funds Distributors, LLC (March 2014-present). Former: CCO, Guggenheim Distributors, LLC (2009-March 2014); Senior Manager, Security Investors, LLC (2004-2009); Senior Manager, Guggenheim Distributors, LLC (2004-2009). |
| 86 | THE GUGGENHEIM FUNDS SEMI-ANNUAL REPORT | |
INFORMATION ON BOARD OF TRUSTEES AND OFFICERS (Unaudited)(continued)
Name, Address* and Year of Birth | Position(s) Held with the Trust | Term of Office and Length of Time Served** | Principal Occupations During Past Five Years |
| OFFICERS - continued | |
Alison Santay (1974) | AML Officer | Since 2013 | Current: AML Officer, certain other funds in the Fund Complex (2010-present); Director and AML Officer, Rydex Fund Services, LLC (2010-present); AML Officer, Security Investors, LLC (2010-present); Director, Shareholder Risk and Compliance, Rydex Fund Services, LLC (2004-present). Former: AML Officer, Guggenheim Distributors, LLC (2013-2014). |
Kimberly Scott (1974) | Assistant Treasurer | Since 2014 | Current: Vice President, Guggenheim Investments (2012-present) ; Assistant Treasurer, certain other funds in the Fund Complex (2012-present). Former: Financial Reporting Manager, Invesco, Ltd. (2010-2011); Vice President/Assistant Treasurer, Mutual Fund Administration for Van Kampen Investments, Inc./Morgan Stanley Investment Management (2009-2010); Manager of Mutual Fund Administration, Van Kampen Investments, Inc./Morgan Stanley Investment Management (2005-2009). |
Bryan Stone (1979) | Vice President | Since 2014 | Current: Vice President, certain other funds in the Fund Complex (2014-present); Director, Guggenheim Investments (2013-present). Former: Senior Vice President, Neuberger Berman Group LLC (2009-2013); Vice President, Morgan Stanley (2002-2009). |
| | THE GUGGENHEIM FUNDS SEMI-ANNUAL REPORT | 87 |
INFORMATION ON BOARD OF TRUSTEES AND OFFICERS (Unaudited)(concluded)
Name, Address* and Year of Birth | Position(s) Held with the Trust | Term of Office and Length of Time Served** | Principal Occupations During Past Five Years |
| OFFICERS - concluded | |
John L. Sullivan (1955) | Chief Financial Officer and Treasurer | Since 2014 | Current: CFO, Chief Accounting Officer and Treasurer, certain other funds in the Fund Complex (2010-present); Senior Managing Director, Guggenheim Investments (2010-present). Former: Managing Director and CCO, each of the funds in the Van Kampen Investments fund complex (2004-2010); Managing Director and Head of Fund Accounting and Administration, Morgan Stanley Investment Management (2002-2004); CFO and Treasurer, Van Kampen Funds (1996-2004). |
| * | The business address of each officer is c/o Guggenheim Investments, 805 King Farm Boulevard, Suite 600, Rockville, Maryland 20850. |
| ** | Each officer serves an indefinite term, until his or her successor is duly elected and qualified. Time served includes time served in the respective position for the Predecessor Corporation. |
| 88 | THE GUGGENHEIM FUNDS SEMI-ANNUAL REPORT | |
GUGGENHEIM INVESTMENTS PRIVACY POLICIES (Unaudited)
Rydex Funds, Guggenheim Funds, Rydex Investments, Guggenheim Funds Distributors, LLC, Security Investors, LLC, Security Distributors, Inc., Guggenheim Partners Investment Managers, LLC, and Rydex Advisory Services (Collectively “Guggenheim Investments”).
Our Commitment to You
When you become a Guggenheim Investments investor, you entrust us with not only your hard-earned money but also with personal and financial information about you. We recognize that your relationship with us is based on trust and that you expect us to act responsibly and in your best interests. Because we have access to this private information about you, we hold ourselves to the highest standards in its safekeeping and use. This means, most importantly, that we do not sell client information to anyone—whether it is your personal information or if you are a current or former Guggenheim Investments client.
The Information We Collect About You
In the course of doing business with shareholders and investors, we collect nonpublic personal information about you. You typically provide personal information when you complete a Guggenheim Investments account application or when you request a transaction that involves Rydex and Guggenheim Investments funds or one of the Guggenheim Investments affiliated companies. “Nonpublic personal information” is personally identifiable private information about you. For example, it includes information regarding your name and address, Social Security or taxpayer identification number, assets, income, account balance, bank account information and investment activity (e.g., purchase and redemption history).
How We Handle Your Personal Information
As emphasized above, we do not sell information about current or former clients or their accounts to third parties. Nor do we share such information, except when necessary to complete transactions at your request or to make you aware of related investment products and services that we offer. Additional details about how we handle your personal information are provided below. To complete certain transactions or account changes that you direct, it may be necessary to provide identifying information to companies, individuals or groups that are not affiliated with Guggenheim Investments. For example, if you ask to transfer assets from another financial institution to Guggenheim Investments, we will need to provide certain information about you to that company to complete the transaction. To alert you to other Guggenheim Investments investment products and services, we may share your information within the Guggenheim Investments family of affiliated companies. This would include, for example, sharing your information within Guggenheim Investments so we can make you aware of
| | THE GUGGENHEIM FUNDS SEMI-ANNUAL REPORT | 89 |
GUGGENHEIM INVESTMENTS PRIVACY POLICIES (Unaudited)(continued)
new Rydex and Guggenheim Investments funds or the services offered through another Guggenheim Investments affiliated company. In certain instances, we may contract with nonaffiliated companies to perform services for us. Where necessary, we will disclose information we have about you to these third parties. In all such cases, we provide the third party with only the information necessary to carry out its assigned responsibilities and only for that purpose. And we require these third parties to treat your private information with the same high degree of confidentiality that we do. In certain instances, we may share information with other financial institutions regarding individuals and entities in response to the U.S.A. Patriot Act. Finally, we will release information about you if you direct us to do so, if we are compelled by law to do so or in other circumstances permitted by law.
Opt Out Provisions
We do not sell your personal information to anyone. The law allows you to “opt out” of only certain kinds of information sharing with third parties. The firm does not share personal information about you with any third parties that triggers this opt-out right. This means YOU ARE ALREADY OPTED OUT.
How We Protect Privacy Online
Our concern for the privacy of our shareholders also extends to those who use our web site, guggenheiminvestments.com. Our web site uses some of the most secure forms of online communication available, including encryption technology, Secure Socket Layer (SSL) protocol, firewalls and user names and passwords. These technologies provide a high level of security and privacy when you access your account information or initiate online transactions. The Guggenheim Investments web site offers customized features that require our use of “http cookies”—tiny pieces of information that we ask your browser to store. However, we make very limited use of these cookies. We only use cookies for session management and security features on the Guggenheim Investments web site. We do not use them to pull data from your hard drive, to learn your email address, or to view data in cookies created by other web sites. We will not share the information in our cookies or give others access to it. See the legal information area on our web site for more details about web site security and privacy features.
How We Safeguard Your Personal Information
We restrict access to nonpublic personal information about shareholders to our employees and in some cases to third parties (for example, the service providers described above) as permitted by law. We maintain strict physical, electronic and procedural safeguards that comply with federal standards to guard your nonpublic personal information.
| 90 | THE GUGGENHEIM FUNDS SEMI-ANNUAL REPORT | |
GUGGENHEIM INVESTMENTS PRIVACY POLICIES (Unaudited)(concluded)
We’ll Keep You Informed
As required by federal law, we will notify shareholders of our privacy policy annually. We reserve the right to modify this policy at any time, but rest assured that if we do change it, we will tell you promptly. You will also be able to access our privacy policy from our web site at guggenheiminvestments.com. Should you have any questions regarding our privacy policy, contact us at 800.820.0888 or 301.296.5100.
| | THE GUGGENHEIM FUNDS SEMI-ANNUAL REPORT | 91 |
This page intentionally left blank.
This page intentionally left blank.
3.31.2015
Guggenheim Funds Semi-Annual Report
| | | |
| Guggenheim Floating Rate Strategies Fund | | |
| FR-SEMI-0315x0915 | guggenheiminvestments.com |
| DEAR SHAREHOLDER | 2 |
| ECONOMIC AND MARKET OVERVIEW | 3 |
| ABOUT SHAREHOLDERS’ FUND EXPENSES | 5 |
| FLOATING RATE STRATEGIES FUND | 8 |
| NOTES TO FINANCIAL STATEMENTS | 31 |
| OTHER INFORMATION | 49 |
| INFORMATION ON BOARD OF TRUSTEES AND OFFICERS | 50 |
| GUGGENHEIM INVESTMENTS PRIVACY POLICIES | 58 |
| | THE GUGGENHEIM FUNDS SEMI-ANNUAL REPORT | 1 |
March 31, 2015
Dear Shareholder:
Guggenheim Partners Investment Management (the “Investment Adviser”) is pleased to present the semi-annual shareholder report for one of our Funds (the “Fund”) for the six-month period ended March 31, 2015.
The Investment Adviser is part of Guggenheim Investments, which represents the investment management businesses of Guggenheim Partners, LLC (“Guggenheim”), a global, diversified financial services firm.
Guggenheim Funds Distributors, LLC is the distributor of the Funds. Guggenheim Funds Distributors, LLC is affiliated with Guggenheim and the Investment Adviser.
We encourage you to read the Economic and Market Overview section of the report, which follows this letter.
We are committed to providing innovative investment solutions and appreciate the trust you place in us.
Sincerely,
Donald C. Cacciapaglia
President
April 30, 2015
Read a prospectus and summary prospectus (if available) carefully before investing. It contains the investment objectives, risks, charges, expenses and other information, which should be considered carefully before investing. Obtain a prospectus and summary prospectus (if available) at guggenheiminvestments.com or call 800.820.0888.
There can be no assurance that any investment product will achieve its investment objective(s). There are risks associated with investing, including the entire loss of principal invested. Investing involves market risks. The investment return and principal value of any investment product will fluctuate with changes in market conditions.
| 2 | THE GUGGENHEIM FUNDS SEMI-ANNUAL REPORT | |
ECONOMIC AND MARKET OVERVIEW (Unaudited) | March 31, 2015 |
The U.S. continued to enjoy a self-sustaining economic expansion for the six-month period ended March 31, 2015, although winter weather was likely to distort first-quarter economic data. In addition, U.S. companies scaled back hiring in the last month of the period, adding to evidence that the domestic economy has lost some momentum since the turn of the year. The March increase in payrolls was the smallest since December 2013 and broke a 12-month run of gains above 200,000.
Despite this short-term dislocation, the economy remains on track. Indeed, many other labor market indicators, such as initial jobless claims and the job openings rate, suggest that the U.S. labor market remains quite strong, supporting the conclusion that March’s payroll report was just a temporary blip, similar to the one witnessed last winter. As soon as temporary seasonal factors have dissipated, economic data is likely to bounce back. The labor market has improved over the past year, as subdued mortgage rates and tight housing inventory continue to point to fairly stable appreciation in the housing market, which is key to the ongoing recovery. Consumers are also being helped by lower fuel prices, which are acting as a tax cut for U.S. consumers, freeing up discretionary spending in other areas and acting as a support for consumption.
In Europe, economic data has been surprisingly good and should continue along that path on the back of the European Central Bank’s program of quantitative easing and depreciation of the euro. Japan’s economy remains weak and, without more structural reform, continued monetary accommodation could lead to stagflation. China’s policymakers appear likely to continue the supply of credit and do whatever else is necessary to maintain growth there at an acceptable pace for the near term.
Given weakness overseas and the effect of a stronger U.S. dollar on international earnings, some stocks could face a more challenging environment in the near term, but our research shows that equity markets tend to perform quite well in the periods leading up to a U.S. Federal Reserve (the “Fed”) rate increase. The yield on the 10-year Treasury note declined in January by more than 50 basis points before rebounding in February, echoing the pattern since 2009—Treasury yields decline and a sell-off ensues, driving rates higher. Then conditions stabilize, and rates test their previous lows. Liquidity from foreign central banks and comparatively attractive U.S. yields continue to push global investors to U.S. Treasuries, which should hold down U.S. interest rates in the near term.
Against this backdrop, the U.S. central bank feels pressure to raise its key rate above zero, but insists the decision will be data-dependent and not occur prematurely. With a secular inflation increase unlikely in the near term, slack in the economy, and disinflation being imported from abroad, the Fed may not hike rates until later in the year. The Fed for now appears to be focused on wage growth,
| | THE GUGGENHEIM FUNDS SEMI-ANNUAL REPORT | 3 |
ECONOMIC AND MARKET OVERVIEW (Unaudited)(concluded) | March 31, 2015 |
which is key for sustaining the expansion but also an indicator of inflationary pressure. The lack of sustained wage growth has been a topic that has confounded the Fed lately. Given the strengthening employment numbers and the apparent reduction in labor market slack, wages should start to increase more steadily across the board. This is one of the most important data points at the moment for the Fed.
The underlying U.S. economy remains strong and investors should avoid being panicked by seasonal setbacks. Indeed, considering the strength of the economy and the wave of liquidity emanating from various central banks around the world, the general investment environment should remain attractive.
For the six months ended March 31, 2015, the Standard & Poor’s 500® (“S&P 500”) Index* returned 5.93%. The Morgan Stanley Capital International (“MSCI”) Europe-Australasia-Far East (“EAFE”) Index* returned 1.13%. The return of the MSCI Emerging Markets Index* was -2.37%.
In the bond market, the Barclays U.S. Aggregate Bond Index* posted a 3.43% return for the period, while the Barclays U.S. Corporate High Yield Index* returned 1.49%. The return of the Bank of America Merrill Lynch 3-Month U.S. Treasury Bill Index* was 0.01% for the six-month period.
The opinions and forecasts expressed may not actually come to pass. This information is subject to change at any time, based on market and other conditions, and should not be construed as a recommendation of any specific security or strategy.
*Index Definitions:
The following indices are referenced throughout this report. Indices are unmanaged and not available for direct investment. Index performance does not reflect transaction costs, fees, or expenses.
Barclays U.S. Aggregate Bond Index is a broad-based benchmark that measures the investment grade, U.S. dollar-denominated, fixed-rate taxable bond market, including U.S. Treasuries, government-related and corporate securities, MBS (agency fixed-rate and hybrid ARM pass-throughs), ABS, and CMBS.
Barclays U.S. Corporate High Yield Index measures the market of U.S. dollar-denominated, non-investment grade, fixed-rate, taxable corporate bonds. Securities are classified as high yield if the middle rating of Moody’s, Fitch, and S&P is Ba1/BB+/BB+ or below.
Bank of America (“BofA”) Merrill Lynch 3-Month U.S. Treasury Bill Index is an unmanaged market index of U.S. Treasury securities maturing in 90 days that assumes reinvestment of all income.
MSCI EAFE Index is a free float-adjusted market capitalization index that is designed to measure the equity market performance of developed markets, excluding the U.S. & Canada.
MSCI Emerging Markets Index is a free float-adjusted market capitalization weighted index that is designed to measure equity market performance in the global emerging markets.
S&P 500® Index is a capitalization-weighted index of 500 stocks designed to measure the performance of the broad economy, representing all major industries and is considered a representation of the U.S. stock market.
| 4 | THE GUGGENHEIM FUNDS SEMI-ANNUAL REPORT | |
ABOUT SHAREHOLDERS’ FUND EXPENSES (Unaudited)
All mutual funds have operating expenses and it is important for our shareholders to understand the impact of costs on their investments. Shareholders of a Fund incur two types of costs: (i) transaction costs, including sales charges (loads) on purchase payments, reinvested dividends, or other distributions; and exchange fees; and (ii) ongoing costs, including management fees, administrative services, and shareholder reports, among others. These ongoing costs, or operating expenses, are deducted from a fund’s gross income and reduce the investment return of the fund.
A fund’s expenses are expressed as a percentage of its average net assets, which is known as the expense ratio. The following examples are intended to help investors understand the ongoing costs (in dollars) of investing in a Fund and to compare these costs with the ongoing costs of investing in other mutual funds.
The examples are based on an investment of $1,000 made at the beginning of the period and held for the entire six-month period beginning September 30, 2014 and ending March 31, 2015.
The following tables illustrate a Fund’s costs in two ways:
Table 1. Based on actual Fund return. This section helps investors estimate the actual expenses paid over the period. The “Ending Account Value” shown is derived from the Fund’s actual return, and the fourth column shows the dollar amount that would have been paid by an investor who started with $1,000 in the Fund. Investors may use the information here, together with the amount invested, to estimate the expenses paid over the period. Simply divide the Fund’s account value by $1,000 (for example, an $8,600 account value divided by $1,000 = 8.6), then multiply the result by the number provided under the heading “Expenses Paid During Period.”
Table 2. Based on hypothetical 5% return. This section is intended to help investors compare a Fund’s cost with those of other mutual funds. The table provides information about hypothetical account values and hypothetical expenses based on the Fund’s actual expense ratio and an assumed rate of return of 5% per year before expenses, which is not the Fund’s actual return. The hypothetical account values and expenses may not be used to estimate the actual ending account balance or expenses paid during the period. The example is useful in making comparisons because the U.S. Securities and Exchange Commission (the “SEC”) requires all mutual funds to calculate expenses based on the 5% return. Investors can assess a Fund’s costs by comparing this hypothetical example with the hypothetical examples that appear in shareholder reports of other funds.
| | THE GUGGENHEIM FUNDS SEMI-ANNUAL REPORT | 5 |
ABOUT SHAREHOLDERS’ FUND EXPENSES (Unaudited)(continued)
The calculations illustrated above assume no shares were bought or sold during the period. Actual costs may have been higher or lower, depending on the amount of investment and the timing of any purchases or redemptions.
Please note that the expenses shown in the table are meant to highlight your ongoing costs only and do not reflect any transactional costs, such as sales charges (loads) on purchase payments, and contingent deferred sales charges ("CDSC") on redemptions, if any. Therefore, the second table is useful in comparing ongoing costs only, and will not help you determine the relative total costs of owning different funds. In addition, if these transactional costs were included, your costs would have been higher.
More information about a Fund’s expenses, including annual expense ratios for the past five years, can be found in the Financial Highlights section of this report. For additional information on operating expenses and other shareholder costs, please refer to the appropriate Fund prospectus.
| 6 | THE GUGGENHEIM FUNDS SEMI-ANNUAL REPORT | |
ABOUT SHAREHOLDERS’ FUND EXPENSES (Unaudited)(concluded)
| | Expense Ratio1 | Fund Return | Beginning Account Value September 30, 2014 | Ending Account Value March 31, 2015 | Expenses Paid During Period2 |
Table 1. Based on actual Fund return3 |
| Floating Rate Strategies Fund |
| A-Class | 1.03% | 1.86% | $1,000.00 | $1,018.60 | $5.18 |
| C-Class | 1.78% | 1.53% | 1,000.00 | 1,015.30 | 8.94 |
| Institutional Class | 0.79% | 1.98% | 1,000.00 | 1,019.80 | 3.98 |
| |
| Table 2. Based on hypothetical 5% return (before expenses) |
| Floating Rate Strategies Fund |
| A-Class | 1.03% | 5.00% | $1,000.00 | $1,019.80 | $5.19 |
| C-Class | 1.78% | 5.00% | 1,000.00 | 1,016.06 | 8.95 |
| Institutional Class | 0.79% | 5.00% | 1,000.00 | 1,020.99 | 3.98 |
1 | Annualized. |
2 | Expenses are equal to the Fund's annualized expense ratio, net of any applicable fee waivers, multiplied by the average account value over the period, multiplied by 182/365 (to reflect the one-half year period). |
3 | Actual cumulative return at net asset value for the period September 30, 2014 to March 31, 2015. |
| | THE GUGGENHEIM FUNDS SEMI-ANNUAL REPORT | 7 |
FUND PROFILE (Unaudited) | March 31, 2015 |
FLOATING RATE STRATEGIES FUND
OBJECTIVE: Seeks to provide a high level of current income while maximizing total return.
Holdings Diversification (Market Exposure as % of Net Assets)
“Holdings Diversification (Market Exposure as % of Net Assets)” excludes any temporary cash investments.
| Inception Dates: |
| A-Class | November 30, 2011 |
| C-Class | November 30, 2011 |
| Institutional Class | November 30, 2011 |
| Ten Largest Holdings (% of Total Net Assets) |
| Cartrawler | 1.4% |
| Albertson’s (Safeway) Holdings LLC | 1.1% |
| National Financial Partners Corp. | 1.0% |
| Multiplan, Inc. | 1.0% |
| Gates Global, Inc. | 1.0% |
| Party City Holdings, Inc. | 1.0% |
| Ziggo BV | 0.9% |
| Scout 24 AG | 0.9% |
| Flakt Woods | 0.9% |
| Sears Holding Corp. | 0.9% |
| Top Ten Total | 10.1% |
“Ten Largest Holdings” exclude any temporary cash or derivative instruments.
| 8 | THE GUGGENHEIM FUNDS SEMI-ANNUAL REPORT | |
FUND PROFILE (Unaudited)(concluded) | March 31, 2015 |
| Portfolio Composition by Quality Rating* |
| Rating | % of Total Investments |
| Fixed Income Instruments | |
| AAA | 0.2% |
| AA | 2.2% |
| A | 4.2% |
| BBB | 9.9% |
| BB | 24.5% |
| B | 49.1% |
| CCC | 4.4% |
| CC | 0.2% |
| D | 0.1% |
| NR** | 1.0% |
| Other Instruments | |
| Short Term Investments | 4.0% |
| Common Stocks | 0.2% |
| Total Investments | 100.0% |
The chart above reflects percentages of the value of total investments.
| * | Source: BlackRock Solutions. Credit quality ratings are measured on a scale that generally ranges from AAA (highest) to D (lowest). All securities except for those labeled “NR” have been rated by Moody’s, Standard & Poor’s (“S&P”), or Fitch, which are all a Nationally Recognized Statistical Rating Organization (“NRSRO”). For purposes of this presentation, when ratings are available from more than one agency, the highest rating is used. Guggenheim Investments has converted Moody’s and Fitch ratings to the equivalent S&P rating. Security ratings are determined at the time of purchase and may change thereafter. |
| ** | NR securities do not necessarily indicate low credit quality. |
| | THE GUGGENHEIM FUNDS SEMI-ANNUAL REPORT | 9 |
SCHEDULE OF INVESTMENTS (Unaudited) | March 31, 2015 |
| FLOATING RATE STRATEGIES FUND | |
| | |
Shares | | | Value | |
| | | | | | | | |
COMMON STOCKS† - 0.3% | |
| | | | | | | | |
| CONSUMER DISCRETIONARY - 0.3% | |
| Travelport, LLC* | | | 189,931 | | | $ | 3,171,847 | |
| | | | | | | | |
| BASIC MATERIALS - 0.0% | |
Mirabela Nickel Ltd.*,†† | | | 4,755,634 | | | | 507,094 | |
| | | | | | | | |
| Total Common Stocks | | | | | | | | |
| (Cost $5,290,286) | | | | | | | 3,678,941 | |
| | | | | | | | |
SHORT TERM INVESTMENTS† - 4.4% | |
| Federated U.S. Treasury Cash Reserve Fund 0.00% | | | 62,035,445 | | | | 62,035,445 | |
| Total Short Term Investments | | | | | | | | |
| (Cost $62,035,445) | | | | | | | 62,035,445 | |
| | | | | | | | |
| | | Face
Amount | | | | |
| | | | | | | | |
SENIOR FLOATING RATE INTERESTS††,3,8 - 74.6% | |
| | | | | | | | |
| INDUSTRIAL - 15.3% | |
| Amber Bidco Foster + Partners | | | | | | | | |
4.75% due 06/30/21†††,1 | | $ | 10,480,000 | | | | 10,289,264 | |
5.06% due 06/30/21†††,1 | | | GBP 3,500,000 | | | | 5,098,292 | |
| Multiplan, Inc. | | | | | | | | |
| 3.75% due 03/31/21 | | | 14,000,000 | | | | 13,947,499 | |
| Gates Global, Inc. | | | | | | | | |
| 4.25% due 07/05/21 | | | 13,722,682 | | | | 13,662,713 | |
| Flakt Woods | | | | | | | | |
2.63% due 03/20/17†††,1 | | | EUR 12,183,214 | | | | 12,833,465 | |
| Brickman Group Holdings, Inc. | | | | | | | | |
| 4.00% due 12/18/20 | | | 12,463,027 | | | | 12,397,222 | |
| US Infrastructure Corp. | | | | | | | | |
| 4.00% due 07/10/20 | | | 11,209,364 | | | | 11,125,294 | |
| Crosby Worldwide | | | | | | | | |
| 3.75% due 11/23/20 | | | 10,894,454 | | | | 10,036,516 | |
| Transdigm, Inc. | | | | | | | | |
| 3.75% due 02/28/20 | | | 4,500,000 | | | | 4,489,335 | |
| 3.75% due 06/04/21 | | | 4,037,150 | | | | 4,025,240 | |
| Rexnord LLC/ RBS Global, Inc. | | | | | | | | |
| 4.00% due 08/21/20 | | | 8,274,000 | | | | 8,268,208 | |
| Thermasys Corp. | | | | | | | | |
| 5.25% due 05/03/19 | | | 6,569,063 | | | | 6,552,640 | |
| CareCore National LLC | | | | | | | | |
| 5.50% due 03/05/21 | | | 6,460,621 | | | | 6,492,924 | |
| Hardware Holdings LLC | | | | | | | | |
6.75% due 03/30/201 | | | 6,218,750 | | | | 6,032,188 | |
| SIRVA Worldwide, Inc. | | | | | | | | |
| 7.50% due 03/27/19 | | | 5,880,000 | | | | 5,850,600 | |
| Mitchell International, Inc. | | | | | | | | |
| 8.50% due 10/11/21 | | | 3,050,000 | | | | 3,018,860 | |
| 4.50% due 10/13/20 | | | 2,802,685 | | | | 2,802,096 | |
| Doncasters Group Ltd. | | | | | | | | |
| 9.50% due 10/09/20 | | | 3,834,483 | | | | 3,815,310 | |
| 4.50% due 04/09/20 | | | 1,424,971 | | | | 1,426,153 | |
| Connolly Corp. | | | | | | | | |
| 5.00% due 05/14/21 | | | 4,962,500 | | | | 4,984,236 | |
| Berlin Packaging LLC | | | | | | | | |
| 4.50% due 10/01/21 | | | 4,933,230 | | | | 4,938,361 | |
| Mast Global | | | | | | | | |
8.75% due 09/12/19†††,1 | | | 4,715,756 | | | | 4,680,088 | |
| Power Borrower, LLC | | | | | | | | |
| 4.25% due 05/06/20 | | | 2,925,868 | | | | 2,896,610 | |
| 8.25% due 11/06/20 | | | 1,670,000 | | | | 1,624,075 | |
| syncreon | | | | | | | | |
| 5.25% due 10/28/20 | | | 3,752,500 | | | | 3,593,019 | |
| Knowledge Learning Corp. | | | | | | | | |
| 5.25% due 03/18/21 | | | 3,514,500 | | | | 3,543,776 | |
| Ceva Logistics US Holdings | | | | | | | | |
| 6.50% due 03/19/21 | | | 3,745,419 | | | | 3,500,393 | |
| Goodpack Ltd. | | | | | | | | |
| 4.75% due 09/09/21 | | | 3,471,436 | | | | 3,462,758 | |
| NVA Holdings, Inc. | | | | | | | | |
| 4.99% due 08/14/21 | | | 3,300,000 | | | | 3,300,000 | |
| Ceva Group plc (United Kingdom) | | | | | | | | |
| 6.50% due 03/19/21 | | | 2,600,985 | | | | 2,430,829 | |
| 10 | THE GUGGENHEIM FUNDS SEMI-ANNUAL REPORT | SEE NOTES TO FINANCIAL STATEMENTS. |
SCHEDULE OF INVESTMENTS (Unaudited)(continued) | March 31, 2015 |
| FLOATING RATE STRATEGIES FUND | |
| | | Face
Amount | | | Value | |
| | | | | | | | | |
due 03/19/192 | | $ | 600,000 | | | $ | 502,915 | |
| NANA Development Corp. | | | | | | | | |
8.00% due 03/15/181 | | | 3,060,000 | | | | 2,929,950 | |
| GYP Holdings III Corp. | | | | | | | | |
| 4.75% due 04/01/21 | | | 2,779,000 | | | | 2,704,328 | |
| Learning Care Group (US), Inc. | | | | | | | | |
| 5.50% due 05/05/21 | | | 2,530,875 | | | | 2,540,366 | |
| Ceva Logistics Holdings BV (Dutch) | | | | | | | | |
| 6.50% due 03/19/21 | | | 2,715,429 | | | | 2,537,785 | |
| SI Organization | | | | | | | | |
| 5.75% due 11/23/19 | | | 2,430,909 | | | | 2,439,417 | |
| Headwaters, Inc. | | | | | | | | |
| 4.50% due 03/11/22 | | | 2,000,000 | | | | 2,007,500 | |
| Tank Holdings Corp. | | | | | | | | |
| 5.25% due 03/11/22 | | | 2,000,000 | | | | 2,005,000 | |
| Berry Plastics Corp. | | | | | | | | |
| 3.50% due 02/08/20 | | | 1,083,417 | | | | 1,080,167 | |
| 3.75% due 01/06/21 | | | 815,500 | | | | 815,223 | |
| Constantinople Acquisition GmbH | | | | | | | | |
| 4.75% due 02/25/22 | | | 1,850,000 | | | | 1,847,114 | |
| Quikrete Holdings, Inc. | | | | | | | | |
| 4.00% due 09/28/20 | | | 1,750,000 | | | | 1,756,563 | |
| Nord Anglia Education Finance LLC | | | | | | | | |
| 4.50% due 03/31/21 | | | 1,637,625 | | | | 1,637,625 | |
| Dematic S.A. | | | | | | | | |
| 4.25% due 12/28/19 | | | 1,348,030 | | | | 1,343,541 | |
| Braas Monier Buildings Group | | | | | | | | |
| 4.57% due 10/15/20 | | | EUR 1,216,837 | | | | 1,317,651 | |
| Camp Systems International | | | | | | | | |
| 8.25% due 11/29/19 | | | 1,150,000 | | | | 1,147,125 | |
| Waste Industries USA, Inc. | | | | | | | | |
| 4.25% due 02/27/20 | | | 900,000 | | | | 902,529 | |
| AlliedBarton Security Services LLC | | | | | | | | |
| 4.25% due 02/12/21 | | | 700,000 | | | | 699,419 | |
| CPM Acquisition Corp. | | | | | | | | |
| 6.25% due 08/29/17 | | | 356,533 | | | | 356,533 | |
| 10.25% due 03/01/18 | | | 325,000 | | | | 325,000 | |
| Wireco Worldgroup, Inc. | | | | | | | | |
| 6.00% due 02/15/17 | | | 482,885 | | | | 480,470 | |
| Ceva Logistics Canada, ULC | | | | | | | | |
| 6.50% due 03/19/21 | | | 468,177 | | | | 437,549 | |
| Omnitracs, Inc. | | | | | | | | |
| 8.75% due 05/25/21 | | | 350,000 | | | | 341,908 | |
| Advanced Disposal Services, Inc. | | | | | | | | |
| 3.75% due 10/09/19 | | | 344,846 | | | | 340,722 | |
| Hunter Fan Co. | | | | | | | | |
6.50% due 12/20/171 | | | 220,700 | | | | 218,493 | |
| Total Safety U.S., Inc. | | | | | | | | |
| 9.25% due 09/13/20 | | | 99,750 | | | | 90,773 | |
| Total Industrial | | | | | | | 213,923,630 | |
| | | | | | | | |
| CONSUMER, CYCLICAL - 13.6% | |
| Party City Holdings, Inc. | | | | | | | | |
| 4.00% due 07/27/19 | | | 13,426,618 | | | | 13,404,195 | |
| Sears Holdings Corp. | | | | | | | | |
| 5.50% due 06/30/18 | | | 13,008,740 | | | | 12,801,381 | |
| BJ’s Wholesale Club, Inc. | | | | | | | | |
| 4.50% due 09/26/19 | | | 12,421,889 | | | | 12,416,299 | |
| PetSmart, Inc. | | | | | | | | |
| 5.00% due 03/11/22 | | | 12,000,000 | | | | 12,086,760 | |
| Eyemart Express | | | | | | | | |
| 5.00% due 12/18/21 | | | 12,000,000 | | | | 12,060,000 | |
| Warner Music Group | | | | | | | | |
| 3.75% due 07/01/20 | | | 12,176,221 | | | | 11,871,815 | |
| Ipreo Holdings | | | | | | | | |
| 4.25% due 08/06/21 | | | 8,979,328 | | | | 8,900,759 | |
| Neiman Marcus Group, Inc. | | | | | | | | |
| 4.25% due 10/25/20 | | | 7,927,116 | | | | 7,895,883 | |
| National Vision, Inc. | | | | | | | | |
| 4.00% due 03/12/21 | | | 7,400,000 | | | | 7,310,608 | |
| American Tire Distributors, Inc. | | | | | | | | |
| 5.25% due 09/24/21 | | | 5,050,047 | | | | 5,068,984 | |
| 7.00% due 06/01/18 | | | 2,188,945 | | | | 2,188,945 | |
| SEE NOTES TO FINANCIAL STATEMENTS. | THE GUGGENHEIM FUNDS SEMI-ANNUAL REPORT | 11 |
SCHEDULE OF INVESTMENTS (Unaudited)(continued) | March 31, 2015 |
| FLOATING RATE STRATEGIES FUND | |
| | | Face
Amount | | | Value | |
| | | | | | | | | |
| ServiceMaster Co. | | | | | | | | |
| 4.25% due 07/01/21 | | $ | 6,234,750 | | | $ | 6,203,576 | |
| Sky Bet | | | | | | | | |
| 6.50% due 02/25/22 | | | GBP 3,700,000 | | | | 5,468,947 | |
| Smart & Final Stores LLC | | | | | | | | |
| 4.75% due 11/15/19 | | | 5,410,926 | | | | 5,427,862 | |
| Pinnacle Foods Corp. | | | | | | | | |
| 3.00% due 04/29/20 | | | 5,000,000 | | | | 4,976,550 | |
| 1-800 Contacts, Inc. | | | | | | | | |
| 4.25% due 01/29/21 | | | 4,696,954 | | | | 4,679,341 | |
| Ceridian Corp. | | | | | | | | |
| 4.50% due 09/15/20 | | | 4,475,325 | | | | 4,405,421 | |
| Ollies Bargain Outlet | | | | | | | | |
| 4.75% due 09/28/19 | | | 4,118,706 | | | | 4,077,519 | |
| Compucom Systems, Inc. | | | | | | | | |
| 4.25% due 05/07/20 | | | 4,340,806 | | | | 4,036,949 | |
| TI Automotive Ltd. | | | | | | | | |
| 4.25% due 07/02/21 | | | 3,900,525 | | | | 3,895,649 | |
| Acosta, Inc. | | | | | | | | |
| 5.00% due 09/26/21 | | | 3,690,750 | | | | 3,724,779 | |
| Nassa Midco AS | | | | | | | | |
| 4.25% due 05/14/21 | | | EUR 3,300,000 | | | | 3,559,991 | |
| Digital Cinema | | | | | | | | |
| 3.25% due 05/17/21 | | | 3,414,706 | | | | 3,401,901 | |
| Fitness International LLC | | | | | | | | |
| 5.50% due 07/01/20 | | | 3,473,750 | | | | 3,230,588 | |
| Equinox Fitness | | | | | | | | |
| 5.00% due 01/31/20 | | | 3,172,816 | | | | 3,180,748 | |
| Capital Automotive LP | | | | | | | | |
| 6.00% due 04/30/20 | | | 2,830,000 | | | | 2,872,450 | |
| California Pizza Kitchen, Inc. | | | | | | | | |
| 5.25% due 03/29/18 | | | 2,934,517 | | | | 2,854,551 | |
| Pinnacle Entertainment, Inc. | | | | | | | | |
| 3.75% due 08/13/20 | | | 2,830,484 | | | | 2,828,955 | |
| Interline Brands, Inc. | | | | | | | | |
| 4.00% due 03/17/21 | | | 2,660,000 | | | | 2,645,051 | |
| TANK & RAST | | | | | | | | |
| 3.58% due 12/10/19 | | | EUR 2,340,000 | | | | 2,520,031 | |
| Mattress Firm | | | | | | | | |
| 5.25% due 10/20/21 | | | 2,443,875 | | | | 2,459,149 | |
| SNL Financial | | | | | | | | |
| 4.50% due 10/23/18 | | | 2,029,659 | | | | 2,029,659 | |
| GCA Services Group, Inc. | | | | | | | | |
| 4.30% due 11/01/19 | | | 1,670,981 | | | | 1,670,981 | |
| 9.25% due 11/01/20 | | | 200,000 | | | | 198,000 | |
| IntraWest Holdings S.à r.l. | | | | | | | | |
| 5.50% due 12/09/20 | | | 1,175,770 | | | | 1,182,754 | |
| Container Store, Inc. | | | | | | | | |
| 4.25% due 04/06/19 | | | 885,480 | | | | 881,051 | |
| Kate Spade & Co. | | | | | | | | |
| 4.00% due 04/09/21 | | | 587,120 | | | | 586,139 | |
| Fleetpride Corp. | | | | | | | | |
| 5.25% due 11/19/19 | | | 572,766 | | | | 567,754 | |
| Advantage Sales & Marketing, Inc. | | | | | | | | |
4.25% due 07/23/211 | | | 498,750 | | | | 498,057 | |
| Jacobs Entertainment, Inc. | | | | | | | | |
| 5.25% due 10/29/18 | | | 481,919 | | | | 467,462 | |
| Navistar, Inc. | | | | | | | | |
| 5.75% due 08/17/17 | | | 312,500 | | | | 313,672 | |
| CKX Entertainment, Inc. | | | | | | | | |
9.00% due 06/21/171 | | | 145,875 | | | | 102,113 | |
| Total Consumer, Cyclical | | | | | | | 190,953,279 | |
| | | | | | | | |
| TECHNOLOGY - 12.7% | |
| Infor, Inc. | | | | | | | | |
| 3.75% due 06/03/20 | | | 12,238,031 | | | | 12,113,077 | |
| Active Network, Inc., The | | | | | | | | |
| 5.50% due 11/13/20 | | | 12,140,605 | | | | 12,085,001 | |
| Go Daddy Operating Company, LLC | | | | | | | | |
| 4.75% due 05/13/21 | | | 12,010,174 | | | | 12,051,369 | |
| TIBCO Software, Inc. | | | | | | | | |
| 6.50% due 12/04/20 | | | 12,000,000 | | | | 11,988,720 | |
| Sabre, Inc. | | | | | | | | |
| 4.50% due 02/19/19 | | | 8,277,456 | | | | 8,275,387 | |
| 4.00% due 02/19/19 | | | 2,922,141 | | | | 2,922,141 | |
| Greenway Medical Technologies | | | | | | | | |
6.00% due 11/04/201 | | | 9,875,000 | | | | 9,875,000 | |
| Telx Group | | | | | | | | |
| 4.50% due 04/09/20 | | | 9,055,109 | | | | 8,994,711 | |
| 12 | THE GUGGENHEIM FUNDS SEMI-ANNUAL REPORT | SEE NOTES TO FINANCIAL STATEMENTS. |
SCHEDULE OF INVESTMENTS (Unaudited)(continued) | March 31, 2015 |
| FLOATING RATE STRATEGIES FUND | |
| | | Face
Amount | | | Value | |
| | | | | | | | | |
| 7.50% due 04/09/21 | | $ | 600,000 | | | $ | 591,750 | |
| Micro Focus International plc | | | | | | | | |
| 5.25% due 11/19/21 | | | 9,558,824 | | | | 9,573,162 | |
| GlobalLogic Holdings, Inc. | | | | | | | | |
| 6.25% due 05/31/19 | | | 9,628,125 | | | | 9,555,914 | |
| Advanced Computer Software | | | | | | | | |
| 6.50% due 01/31/22 | | | 6,500,000 | | | | 6,410,625 | |
| 10.50% due 01/31/23 | | | 2,200,000 | | | | 2,112,000 | |
| LANDesk Group, Inc. | | | | | | | | |
| 5.00% due 02/25/20 | | | 8,372,925 | | | | 8,351,993 | |
| Aspect Software, Inc. | | | | | | | | |
| 7.25% due 05/07/16 | | | 7,785,705 | | | | 7,746,776 | |
| Deltek, Inc. | | | | | | | | |
| 4.50% due 10/10/18 | | | 5,908,820 | | | | 5,918,038 | |
| Banca Civica (UK) - Chambertin | | | | | | | | |
5.07% due 08/12/20†††,1 | | | GBP 3,800,000 | | | | 5,509,918 | |
| EIG Investors Corp. | | | | | | | | |
| 5.00% due 11/09/19 | | | 5,354,955 | | | | 5,371,716 | |
| CDW LLC | | | | | | | | |
| 3.25% due 04/29/20 | | | 4,900,027 | | | | 4,851,664 | |
| Renaissance Learning Corp. | | | | | | | | |
| 4.50% due 04/09/21 | | | 4,656,213 | | | | 4,555,313 | |
| Sophos | | | | | | | | |
| 5.00% due 01/29/21 | | | 4,425,300 | | | | 4,434,505 | |
| Wall Street Systems | | | | | | | | |
| 4.50% due 04/30/21 | | | 4,300,091 | | | | 4,275,925 | |
| American Builders & Contractors Supply Co., Inc. | | | | | | | | |
| 3.50% due 04/16/20 | | | 4,258,226 | | | | 4,246,515 | |
| Blue Coat Systems, Inc. | | | | | | | | |
| 4.00% due 05/31/19 | | | 2,921,728 | | | | 2,919,303 | |
| Evergreen Skill | | | | | | | | |
| 5.75% due 04/28/21 | | | 2,747,250 | | | | 2,712,909 | |
| Eze Castle Software, Inc. | | | | | | | | |
| 7.25% due 04/05/21 | | | 1,441,176 | | | | 1,354,706 | |
| 4.00% due 04/06/20 | | | 1,000,000 | | | | 994,170 | |
| CCC Information Services, Inc. | | | | | | | | |
| 4.00% due 12/20/19 | | | 1,804,686 | | | | 1,795,662 | |
| Sparta Holding Corp. | | | | | | | | |
7.50% due 07/28/20††† | | | 1,446,375 | | | | 1,433,358 | |
| Applied Systems, Inc. | | | | | | | | |
| 4.29% due 01/25/21 | | | 1,313,977 | | | | 1,313,162 | |
| Paradigm Ltd | | | | | | | | |
4.75% due 07/30/191 | | | 1,402,666 | | | | 1,255,386 | |
| Lantiq Deutschland GmbH | | | | | | | | |
11.00% due 11/16/151 | | | 1,206,462 | | | | 1,194,397 | |
| Sophia, LP | | | | | | | | |
| 4.00% due 07/19/18 | | | 364,703 | | | | 364,156 | |
| P2 Energy Solutions | | | | | | | | |
| 9.00% due 04/30/21 | | | 390,000 | | | | 358,800 | |
| Total Technology | | | | | | | 177,507,229 | |
| | | | | | | | |
| COMMUNICATIONS - 10.6% | |
| Cartrawler | | | | | | | | |
| 4.25% due 04/29/21 | | | EUR 17,700,000 | | | | 18,955,792 | |
| Ziggo BV | | | | | | | | |
| 3.75% due 01/15/22 | | | EUR 12,300,000 | | | | 13,209,426 | |
| Scout24 AG | | | | | | | | |
| 4.00% due 02/12/21 | | | EUR 12,000,000 | | | | 12,907,886 | |
| Univision Communications, Inc. | | | | | | | | |
| 4.00% due 03/01/20 | | | 12,354,348 | | | | 12,325,453 | |
| Avaya, Inc. | | | | | | | | |
| 4.68% due 10/26/17 | | | 7,396,349 | | | | 7,273,644 | |
| 6.50% due 03/31/18 | | | 4,875,839 | | | | 4,860,285 | |
| Asurion Corp. | | | | | | | | |
| 4.25% due 07/08/20 | | | 6,580,855 | | | | 6,558,677 | |
| 5.00% due 05/24/19 | | | 3,822,692 | | | | 3,831,178 | |
| Light Tower Fiber LLC | | | | | | | | |
| 4.00% due 04/13/20 | | | 10,188,199 | | | | 10,143,677 | |
| Zayo Group LLC | | | | | | | | |
| 4.00% due 07/02/19 | | | 8,727,917 | | | | 8,734,900 | |
| Virgin Media Investment Holdings Ltd. | | | | | | | | |
| 3.50% due 06/07/20 | | | 7,552,995 | | | | 7,538,870 | |
| SEE NOTES TO FINANCIAL STATEMENTS. | THE GUGGENHEIM FUNDS SEMI-ANNUAL REPORT | 13 |
SCHEDULE OF INVESTMENTS (Unaudited)(continued) | March 31, 2015 |
| FLOATING RATE STRATEGIES FUND | |
| | | Face
Amount | | | Value | |
| | | | | | | | | |
| Lions Gate Entertainment Corp. | | | | | | | | |
| 5.00% due 03/11/22 | | $ | 7,000,000 | | | $ | 7,005,810 | |
| Cengage Learning Acquisitions, Inc. | | | | | | | | |
| 7.00% due 03/31/20 | | | 6,241,115 | | | | 6,258,964 | |
| Gogo LLC | | | | | | | | |
11.25% due 03/21/181 | | | 4,246,177 | | | | 4,331,101 | |
| 7.50% due 03/21/18 | | | 1,365,007 | | | | 1,310,406 | |
| CBS Outdoor Americas Capital LLC | | | | | | | | |
| 3.00% due 01/31/21 | | | 4,600,000 | | | | 4,588,500 | |
| Springer Science + Business Media SA | | | | | | | | |
| 4.75% due 08/14/20 | | | 4,100,000 | | | | 4,105,125 | |
| Live Nation Worldwide, Inc. | | | | | | | | |
| 3.50% due 08/14/20 | | | 2,955,000 | | | | 2,947,613 | |
| EMI Music Publishing | | | | | | | | |
| 3.75% due 06/29/18 | | | 2,577,845 | | | | 2,573,179 | |
| Interactive Data Corp. | | | | | | | | |
| 4.75% due 05/02/21 | | | 2,260,363 | | | | 2,269,314 | |
| Anaren, Inc. | | | | | | | | |
| 5.50% due 02/18/21 | | | 1,580,000 | | | | 1,576,050 | |
| 9.25% due 08/18/21 | | | 275,000 | | | | 272,250 | |
| Cumulus Media, Inc. | | | | | | | | |
| 4.25% due 12/23/20 | | | 1,759,229 | | | | 1,725,364 | |
| Internet Brands | | | | | | | | |
| 5.00% due 07/08/21 | | | 1,580,788 | | | | 1,578,322 | |
| Level 3 Communications, Inc. | | | | | | | | |
| 4.00% due 08/01/19 | | | 750,000 | | | | 751,095 | |
| Townsquare Media | | | | | | | | |
| 4.25% due 03/25/22 | | | 700,000 | | | | 700,441 | |
| Clientlogic Corp. | | | | | | | | |
| 7.50% due 01/30/17 | | | 250,000 | | | | 247,500 | |
| Total Communications | | | | | | | 148,580,822 | |
| | | | | | | | |
| FINANCIAL - 9.2% | |
| National Financial Partners Corp. | | | | | | | | |
| 4.50% due 07/01/20 | | | 14,331,896 | | | | 14,281,160 | |
4.42% due 07/01/181 | | | 2,111,111 | | | | 1,917,968 | |
| HUB International Ltd. | | | | | | | | |
| 4.00% due 10/02/20 | | | 12,603,690 | | | | 12,491,139 | |
| Transunion Holding Co. | | | | | | | | |
| 4.00% due 04/09/21 | | | 11,895,252 | | | | 11,887,877 | |
| Hyperion Insurance | | | | | | | | |
| 5.50% due 03/26/22 | | | 11,800,000 | | | | 11,859,000 | |
| York Risk Services | | | | | | | | |
| 4.75% due 10/01/21 | | | 11,610,453 | | | | 11,562,037 | |
| First Data Corp. | | | | | | | | |
| 3.67% due 03/23/18 | | | 8,200,000 | | | | 8,191,800 | |
| 4.17% due 03/24/21 | | | 1,199,869 | | | | 1,202,869 | |
| 3.67% due 09/24/18 | | | 400,000 | | | | 399,416 | |
| AssuredPartners | | | | | | | | |
| 5.00% due 04/02/21 | | | 8,281,466 | | | | 8,255,628 | |
| Magic Newco, LLC | | | | | | | | |
| 5.00% due 12/12/18 | | | 7,482,074 | | | | 7,487,386 | |
| 12.00% due 06/12/19 | | | 500,000 | | | | 543,750 | |
| Intertrust Group | | | | | | | | |
| 7.28% due 04/11/22 | | | 3,300,000 | | | | 3,284,886 | |
| 4.53% due 04/16/21 | | | 2,616,000 | | | | 2,611,631 | |
| American Stock Transfer & Trust | | | | | | | | |
| 5.75% due 06/26/20 | | | 5,769,134 | | | | 5,740,288 | |
| Expert Global Solutions | | | | | | | | |
| 8.50% due 04/03/18 | | | 4,174,422 | | | | 4,162,233 | |
8.32% due 04/02/17†††,1 | | | 304,167 | | | | 284,233 | |
| STG-Fairway Acquisitions, Inc. | | | | | | | | |
| 6.25% due 02/28/19 | | | 2,940,031 | | | | 2,921,656 | |
10.50% due 08/28/19†††,1 | | | 1,300,000 | | | | 1,291,030 | |
| WTG Holdings | | | | | | | | |
| 4.75% due 01/15/21 | | | 4,178,219 | | | | 4,178,219 | |
| Lineage Logistics LLC | | | | | | | | |
| 4.50% due 04/07/21 | | | 4,049,100 | | | | 4,011,160 | |
| Genex Services, Inc. | | | | | | | | |
| 5.25% due 05/28/21 | | | 2,779,000 | | | | 2,782,474 | |
| Fly Leasing Ltd. | | | | | | | | |
| 4.50% due 08/09/19 | | | 2,525,391 | | | | 2,531,704 | |
| Cunningham Lindsey U.S., Inc. | | | | | | | | |
| 5.00% due 12/10/19 | | | 1,615,080 | | | | 1,586,816 | |
| 14 | THE GUGGENHEIM FUNDS SEMI-ANNUAL REPORT | SEE NOTES TO FINANCIAL STATEMENTS. |
SCHEDULE OF INVESTMENTS (Unaudited)(continued) | March 31, 2015 |
| FLOATING RATE STRATEGIES FUND | |
| | | Face
Amount | | | Value | |
| | | | | | | | | |
| 9.25% due 06/10/20 | | $ | 194,886 | | | $ | 188,553 | |
| USI Holdings Corp. | | | | | | | | |
| 4.25% due 12/27/19 | | | 1,390,762 | | | | 1,391,346 | |
| AmWINS Group, LLC | | | | | | | | |
| 5.25% due 09/06/19 | | | 1,097,436 | | | | 1,105,667 | |
| Alliant Holdings I, LLC | | | | | | | | |
| 5.00% due 12/20/19 | | | 863,987 | | | | 866,147 | |
| Hamilton Lane Advisors LLC | | | | | | | | |
| 4.00% due 02/28/18 | | | 172,469 | | | | 171,607 | |
| Total Financial | | | | | | | 129,189,680 | |
| | | | | | | | |
| CONSUMER, NON-CYCLICAL - 9.2% | |
| Albertson’s (Safeway) Holdings LLC | | | | | | | | |
| 5.50% due 08/25/21 | | | 15,350,000 | | | | 15,471,571 | |
| Performance Food Group | | | | | | | | |
| 6.25% due 11/14/19 | | | 11,811,362 | | | | 11,821,164 | |
| Dollar Tree, Inc. | | | | | | | | |
| 4.25% due 03/09/22 | | | 11,000,000 | | | | 11,111,540 | |
| CTI Foods Holding Co. LLC | | | | | | | | |
| 8.25% due 06/28/21 | | | 8,650,000 | | | | 8,498,625 | |
| 4.50% due 06/28/20 | | | 1,329,750 | | | | 1,325,601 | |
| Par Pharmaceuticals | | | | | | | | |
| 4.25% due 09/30/19 | | | 9,541,000 | | | | 9,529,074 | |
| Valeant Pharmaceuticals International, Inc. | | | | | | | | |
| 4.00% due 03/11/22 | | | 5,379,518 | | | | 5,402,112 | |
| 3.50% due 08/05/20 | | | 4,000,000 | | | | 4,000,000 | |
| Authentic Brands | | | | | | | | |
| 5.50% due 05/27/21 | | | 8,436,250 | | | | 8,443,252 | |
| Dole Food Company, Inc. | | | | | | | | |
| 4.50% due 11/01/18 | | | 7,760,000 | | | | 7,776,994 | |
| Reddy Ice Holdings, Inc. | | | | | | | | |
6.75% due 04/01/191 | | | 4,804,456 | | | | 4,203,899 | |
10.75% due 10/01/191 | | | 2,000,000 | | | | 1,520,000 | |
| Arctic Glacier Holdings, Inc. | | | | | | | | |
| 6.00% due 05/10/19 | | | 5,420,421 | | | | 5,379,768 | |
| Pinnacle Foods Corp. | | | | | | | | |
| 3.00% due 04/29/20 | | | 4,700,000 | | | | 4,677,816 | |
| Hostess Brands | | | | | | | | |
| 6.75% due 04/09/20 | | | 2,772,000 | | | | 2,817,045 | |
| Serta Simmons Holdings LLC | | | | | | | | |
| 4.25% due 10/01/19 | | | 2,692,094 | | | | 2,696,025 | |
| Nellson Nutraceutical (US) | | | | | | | | |
| 6.00% due 12/23/21 | | | 2,187,500 | | | | 2,177,481 | |
| Continental Foods | | | | | | | | |
| 4.27% due 08/20/21 | | | EUR 2,000,000 | | | | 2,157,700 | |
| Post Holdings | | | | | | | | |
| 3.75% due 06/02/21 | | | 2,050,000 | | | | 2,053,137 | |
| Nellson Nutraceutical (CAD) | | | | | | | | |
| 6.00% due 12/23/21 | | | 2,012,500 | | | | 2,003,283 | |
| Akorn, Inc. | | | | | | | | |
| 4.50% due 04/16/21 | | | 1,990,000 | | | | 1,996,229 | |
| AdvancePierre Foods, Inc. | | | | | | | | |
| 5.75% due 07/10/17 | | | 1,451,511 | | | | 1,452,716 | |
| 9.50% due 10/10/17 | | | 461,000 | | | | 461,576 | |
| DJO Finance LLC | | | | | | | | |
| 4.25% due 09/15/17 | | | 1,895,844 | | | | 1,899,162 | |
| Mitel Networks Corp. | | | | | | | | |
| 5.25% due 01/31/20 | | | 1,879,095 | | | | 1,878,701 | |
| NES Global Talent | | | | | | | | |
| 6.50% due 10/03/19 | | | 1,738,141 | | | | 1,651,234 | |
| Catalent Pharma Solutions, Inc. | | | | | | | | |
| 4.25% due 05/20/21 | | | 1,209,424 | | | | 1,214,117 | |
| Aramark Corp. | | | | | | | | |
| 3.25% due 02/24/21 | | | 1,207,800 | | | | 1,204,781 | |
| Harvard Drug | | | | | | | | |
| 5.00% due 08/16/20 | | | 1,150,000 | | | | 1,141,375 | |
| Fender Musical Instruments Corp. | | | | | | | | |
| 5.75% due 04/03/19 | | | 1,025,667 | | | | 1,022,252 | |
| PPDI | | | | | | | | |
| 4.00% due 12/05/18 | | | 997,449 | | | | 997,030 | |
| Rite Aid Corp. | | | | | | | | |
| 5.75% due 08/21/20 | | | 500,000 | | | | 505,000 | |
| Targus Group International, Inc. | | | | | | | | |
14.75% due 05/24/161 | | | 223,630 | | | | 177,226 | |
| Total Consumer, Non-cyclical | | | | | | | 128,667,486 | |
| SEE NOTES TO FINANCIAL STATEMENTS. | THE GUGGENHEIM FUNDS SEMI-ANNUAL REPORT | 15 |
SCHEDULE OF INVESTMENTS (Unaudited)(continued) | March 31, 2015 |
| FLOATING RATE STRATEGIES FUND | |
| | | Face
Amount | | | Value | |
| | | | | | | | | |
| BASIC MATERIALS - 2.1% | |
| Chromaflo Technologies | | | | | | | | |
| 4.50% due 12/02/19 | | $ | 8,024,779 | | | $ | 7,944,530 | |
| Royal Adhesives and Sealants | | | | | | | | |
| 5.50% due 07/31/18 | | | 5,402,367 | | | | 5,415,873 | |
| INEOS US Finance LLC | | | | | | | | |
| 4.25% due 03/11/22 | | | 4,500,000 | | | | 4,501,125 | |
| Reynolds Group Holdings | | | | | | | | |
| 4.50% due 12/01/18 | | | 3,109,251 | | | | 3,120,910 | |
| Minerals Technologies, Inc. | | | | | | | | |
| 4.00% due 05/07/21 | | | 2,660,089 | | | | 2,670,065 | |
| Ennis-Flint | | | | | | | | |
| 4.25% due 03/31/21 | | | 2,079,000 | | | | 2,040,019 | |
| 7.75% due 09/30/21 | | | 270,000 | | | | 243,000 | |
| Fortescue Metals Group Ltd. | | | | | | | | |
| 3.75% due 06/30/19 | | | 1,945,000 | | | | 1,753,379 | |
| Hoffmaster Group, Inc. | | | | | | | | |
| 5.25% due 05/09/20 | | | 947,613 | | | | 951,565 | |
6.37% due 05/09/191 | | | 500,000 | | | | 452,141 | |
| Atkore International, Inc. | | | | | | | | |
| 7.75% due 10/09/21 | | | 400,000 | | | | 386,000 | |
| Total Basic Materials | | | | | | | 29,478,607 | |
| | | | | | | | |
| UTILITIES - 1.4% | |
| Veresen Midstream LP | | | | | | | | |
| 6.00% due 04/01/22 | | | 9,900,000 | | | | 9,882,675 | |
| Expro Holdings UK 3 Ltd. | | | | | | | | |
| 5.75% due 09/02/21 | | | 5,935,125 | | | | 5,040,642 | |
| Panda Temple II Power | | | | | | | | |
| 7.25% due 04/03/19 | | | 4,500,000 | | | | 4,387,500 | |
| Total Utilities | | | | | | | 19,310,817 | |
| | | | | | | | |
| ENERGY - 0.5% | |
| PSS Companies | | | | | | | | |
| 5.50% due 01/28/20 | | | 5,697,597 | | | | 4,472,613 | |
| Floatel International Ltd. | | | | | | | | |
| 6.00% due 06/27/20 | | | 3,329,435 | | | | 2,426,326 | |
| Total Energy | | | | | | | 6,898,939 | |
| Total Senior Floating Rate Interests | | | | | | | | |
| (Cost $1,067,785,990) | | | | | | | 1,044,510,489 | |
| | | | | | | | | |
ASSET-BACKED SECURITIES†† - 9.2% | |
| Gramercy Real Estate CDO Ltd. | | | | | | | | |
2007-1A, 0.54% due 08/15/563,4 | | | 11,055,298 | | | | 9,960,823 | |
| Cedar Woods CRE CDO Ltd. | | | | | | | | |
| 2006-1A, 0.44% due 07/25/51 | | | 7,578,033 | | | | 6,852,816 | |
| GreenPoint Mortgage Funding Trust | | | | | | | | |
2005-HE4, 0.88% due 07/25/303 | | | 6,436,943 | | | | 6,152,320 | |
| RAIT CRE CDO I Ltd. | | | | | | | | |
| 2006-1X, 0.49% due 11/20/46 | | | 6,190,752 | | | | 5,697,968 | |
| OHA Credit Partners IX Ltd. | | | | | | | | |
2013-9A, 0.00% due 10/20/254,7 | | | 6,000,000 | | | | 5,680,799 | |
| Structured Asset Securities Corporation Mortgage Loan Trust | | | | | | | | |
2006-OPT1, 0.43% due 04/25/363 | | | 4,300,000 | | | | 3,902,130 | |
2007-BC1, 0.30% due 02/25/373 | | | 900,000 | | | | 782,982 | |
| N-Star REL CDO VIII Ltd. | | | | | | | | |
2006-8A, 0.54% due 02/01/413,4 | | | 3,250,000 | | | | 2,931,500 | |
2006-8A, 0.47% due 02/01/413,4 | | | 1,332,536 | | | | 1,307,618 | |
| KKR Financial CLO Ltd. | | | | | | | | |
2007-1A, 2.51% due 05/15/213,4 | | | 4,100,000 | | | | 4,084,010 | |
| Avery 2013-3X | | | | | | | | |
due 01/18/252 | | | 4,300,020 | | | | 4,009,769 | |
| Castlelake Aircraft Securitization Trust | | | | | | | | |
| 2014-1, 5.25% due 02/15/29 | | | 3,985,244 | | | | 3,955,355 | |
| Golub Capital Partners CLO 24M Ltd. | | | | | | | | |
2015-24A, 4.02% due 02/05/273,4 | | | 3,750,000 | | | | 3,750,000 | |
| 16 | THE GUGGENHEIM FUNDS SEMI-ANNUAL REPORT | SEE NOTES TO FINANCIAL STATEMENTS. |
SCHEDULE OF INVESTMENTS (Unaudited)(continued) | March 31, 2015 |
| FLOATING RATE STRATEGIES FUND | |
| | | Face
Amount | | | Value | |
| | | | | | | | | |
| N-Star Real Estate CDO IX Ltd. | | | | | | | | |
0.49% due 02/01/411 | | $ | 3,597,848 | | | $ | 3,438,104 | |
| Fortress Credit Opportunities VI CLO Ltd. | | | | | | | | |
2015-6A, 3.92% due 10/10/263,4 | | | 3,500,000 | | | | 3,437,700 | |
| CIT Mortgage Loan Trust | | | | | | | | |
2007-1, 1.62% due 10/25/373,4 | | | 3,400,000 | | | | 3,230,422 | |
| Jasper CLO Ltd. | | | | | | | | |
2005-1A, 1.15% due 08/01/173,4 | | | 3,000,000 | | | | 2,952,000 | |
| Castlelake Aircraft Securitization Trust | | | | | | | | |
| 2014-1, 7.50% due 02/15/29 | | | 2,936,496 | | | | 2,929,155 | |
| NewStar Commercial Loan Funding LLC | | | | | | | | |
2013-1A, 4.80% due 09/20/233,4 | | | 2,750,000 | | | | 2,673,550 | |
2013-1A, 5.55% due 09/20/233,4 | | | 250,000 | | | | 247,025 | |
| Treman Park CLO LLC | | | | | | | | |
2015-1A, 0.00% due 04/20/274,7 | | | 3,000,000 | | | | 2,880,300 | |
| Halcyon Loan Advisors Funding Ltd. | | | | | | | | |
2012-1A, 3.26% due 08/15/233,4 | | | 2,600,000 | | | | 2,538,900 | |
| ALM XIV Ltd. | | | | | | | | |
2014-14A, 3.71% due 07/28/263,4 | | | 2,650,000 | | | | 2,516,440 | |
| Fortress Credit Opportunities V CLO Ltd. | | | | | | | | |
2014-5A, 4.73% due 10/15/263,4 | | | 2,500,000 | | | | 2,362,000 | |
| Wachovia Asset Securitization Issuance II LLC Trust | | | | | | | | |
2007-HE1, 0.31% due 07/25/373,4 | | | 2,570,900 | | | | 2,261,852 | |
| GSAMP Trust | | | | | | | | |
2005-HE6, 0.61% due 11/25/353 | | | 2,250,000 | | | | 2,086,826 | |
| Duane Street CLO IV Ltd. | | | | | | | | |
2007-4A, 2.51% due 11/14/213,4 | | | 2,000,000 | | | | 1,947,800 | |
| Highland Park CDO I Ltd. | | | | | | | | |
2006-1A, 0.59% due 11/25/513,4 | | | 1,713,528 | | | | 1,636,419 | |
| DIVCORE CLO Ltd. | | | | | | | | |
| 2013-1A B, 4.07% due 11/15/32 | | | 1,600,000 | | | | 1,608,000 | |
| MCF CLO I LLC | | | | | | | | |
2013-1A, 3.81% due 04/20/233,4 | | | 1,500,000 | | | | 1,469,550 | |
| TCW Global Project Fund III Ltd. | | | | | | | | |
2005-1A, 0.91% due 09/01/173,4 | | | 1,003,559 | | | | 973,452 | |
2005-1A, 1.11% due 09/01/17†††,3,4 | | | 500,000 | | | | 474,700 | |
| Global Leveraged Capital Credit Opportunity Fund | | | | | | | | |
2006-1A, 1.26% due 12/20/183,4 | | | 1,288,000 | | | | 1,263,142 | |
| Grayson CLO Ltd. | | | | | | | | |
2006-1A, 0.66% due 11/01/213,4 | | | 1,200,000 | | | | 1,135,800 | |
| GSAA Home Equity Trust | | | | | | | | |
2007-7, 0.44% due 07/25/373 | | | 1,286,266 | | | | 1,086,094 | |
| Telos CLO 2007-2 Ltd. | | | | | | | | |
2007-2A, 2.45% due 04/15/223,4 | | | 1,100,000 | | | | 1,061,390 | |
| Cerberus Onshore II CLO LLC | | | | | | | | |
2014-1A, 4.25% due 10/15/233,4 | | | 600,000 | | | | 568,560 | |
2014-1A, 3.75% due 10/15/233,4 | | | 500,000 | | | | 487,950 | |
| Telos CLO Ltd. | | | | | | | | |
2013-3A, 4.51% due 01/17/243,4 | | | 1,050,000 | | | | 1,033,095 | |
| SEE NOTES TO FINANCIAL STATEMENTS. | THE GUGGENHEIM FUNDS SEMI-ANNUAL REPORT | 17 |
SCHEDULE OF INVESTMENTS (Unaudited)(continued) | March 31, 2015 |
| FLOATING RATE STRATEGIES FUND | |
| | | Face
Amount | | | Value | |
| | | | | | | | | |
| Acis CLO Ltd. | | | | | | | | |
2013-1A, 4.76% due 04/18/243,4 | | $ | 1,000,000 | | | $ | 1,002,800 | |
| Gramercy Park CLO Ltd. | | | | | | | | |
2014-1AR, 4.30% due 07/17/233,4 | | | 1,000,000 | | | | 997,300 | |
| COA Summit CLO Limited | | | | | | | | |
2014-1A, 4.10% due 04/20/233,4 | | | 1,000,000 | | | | 992,700 | |
| ACIS CLO Ltd. | | | | | | | | |
2015-6A, 3.63% due 05/01/273,4 | | | 1,000,000 | | | | 992,600 | |
| Salus CLO Ltd. | | | | | | | | |
2013-1AN, 6.98% due 03/05/213,4 | | | 1,000,000 | | | | 989,400 | |
| Churchill Financial Cayman Ltd. | | | | | | | | |
2007-1A, 2.85% due 07/10/193,4 | | | 1,000,000 | | | | 942,600 | |
| NewStar Commercial Loan Trust | | | | | | | | |
2007-1A, 1.56% due 09/30/223,4 | | | 500,000 | | | | 475,650 | |
2007-1A, 2.56% due 09/30/223,4 | | | 500,000 | | | | 461,650 | |
| Putnam Structured Product CDO Ltd. | | | | | | | | |
2002-1A, 0.86% due 01/10/383,4 | | | 997,450 | | | | 928,726 | |
| ARES XXVI CLO Ltd. | | | | | | | | |
2013-1A, due 04/15/252,4 | | | 1,250,000 | | | | 849,500 | |
| Garrison Funding Ltd. | | | | | | | | |
2013-2A, 4.88% due 09/25/233,4 | | | 750,000 | | | | 743,100 | |
| Shackleton II CLO Ltd. | | | | | | | | |
2012-2A, 4.31% due 10/20/233,4 | | | 750,000 | | | | 736,200 | |
| Westchester CLO Ltd. | | | | | | | | |
2007-1A, 0.59% due 08/01/223,4 | | | 750,000 | | | | 714,300 | |
| New Century Home Equity Loan Trust | | | | | | | | |
2004-4, 0.97% due 02/25/353 | | | 783,564 | | | | 702,466 | |
| Airplanes Pass Through Trust | | | | | | | | |
2001-1A, 0.72% due 03/15/193 | | | 1,668,390 | | | | 684,040 | |
| KKR Financial CLO Ltd. | | | | | | | | |
| 2007-1X, 5.25% due 05/15/21 | | | 650,000 | | | | 649,285 | |
| NewStar Arlington Senior Loan Program LLC | | | | | | | | |
2014-1A, 3.56% due 07/25/253,4 | | | 600,000 | | | | 574,920 | |
| ACA CLO Ltd. | | | | | | | | |
2007-1A, 1.20% due 06/15/223,4 | | | 575,000 | | | | 547,975 | |
| Tricadia CDO Ltd. | | | | | | | | |
2006-6A, 1.01% due 11/05/413,4 | | | 550,000 | | | | 535,645 | |
| CIFC Funding Ltd. | | | | | | | | |
2012-2A, 4.52% due 12/05/243,4 | | | 500,000 | | | | 500,000 | |
| Aerco Ltd. | | | | | | | | |
2000-2A, 0.63% due 07/15/253 | | | 1,201,286 | | | | 488,803 | |
| Kingsland III Ltd. | | | | | | | | |
2006-3A, 1.86% due 08/24/213,4 | | | 500,000 | | | | 482,800 | |
| Pangaea CLO Ltd. | | | | | | | | |
2007-1A, 0.76% due 10/21/213,4 | | | 500,000 | | | | 482,200 | |
| Westwood CDO I Ltd. | | | | | | | | |
2007-1A, 0.94% due 03/25/213,4 | | | 500,000 | | | | 471,500 | |
| Kingsland IV Ltd. | | | | | | | | |
2007-4A, 1.70% due 04/16/213,4 | | | 500,000 | | | | 466,750 | |
| MCF CLO III LLC | | | | | | | | |
2014-3A, 3.46% due 01/20/243,4 | | | 500,000 | | | | 458,200 | |
| 18 | THE GUGGENHEIM FUNDS SEMI-ANNUAL REPORT | SEE NOTES TO FINANCIAL STATEMENTS. |
SCHEDULE OF INVESTMENTS (Unaudited)(continued) | March 31, 2015 |
| FLOATING RATE STRATEGIES FUND | |
| | | Face
Amount | | | Value | |
| | | | | | | | | |
| Babcock & Brown Air Funding I Ltd. | | | | | | | | |
2007-1A, 0.47% due 11/14/333,4 | | $ | 449,328 | | | $ | 381,929 | |
| Drug Royalty Limited Partnership 1 | | | | | | | | |
2012-1, 5.50% due 07/15/243,4 | | | 353,077 | | | | 363,298 | |
| Northwind Holdings LLC | | | | | | | | |
2007-1A, 1.01% due 12/01/373,4 | | | 396,990 | | | | 361,261 | |
| Eastland CLO Ltd. | | | | | | | | |
2007-1A, 0.65% due 05/01/223,4 | | | 350,000 | | | | 329,070 | |
| Cerberus Offshore Levered I, LP | | | | | | | | |
2012-1A, 6.27% due 11/30/183,4 | | | 250,000 | | | | 250,100 | |
2012-1A, 5.02% due 11/30/183,4 | | | 69,574 | | | | 69,567 | |
| Asset Backed Securities Corporation Home Equity Loan Trust Series | | | | | | | | |
2004-HE8, 1.22% due 12/25/343 | | | 317,797 | | | | 305,119 | |
| NewStar Commercial Loan Funding LLC | | | | | | | | |
2014-1A, 5.01% due 04/20/253,4 | | | 250,000 | | | | 250,000 | |
| Black Diamond CLO Delaware Corp. | | | | | | | | |
2005-2A, 2.07% due 01/07/183,4 | | | 250,000 | | | | 243,025 | |
| Great Lakes CLO Ltd. | | | | | | | | |
2014-1A, 4.45% due 04/15/253,4 | | | 250,000 | | | | 232,400 | |
| West Coast Funding Ltd. | | | | | | | | |
2006-1A, 0.40% due 11/02/413,4 | | | 202,346 | | | | 201,112 | |
| Credit Card Pass-Through Trust | | | | | | | | |
2012-BIZ, 0.00% due 12/15/49†††,4,7 | | | 219,344 | | | | 193,834 | |
| Diversified Asset Securitization Holdings II, LP | | | | | | | | |
2000-1A, 0.76% due 09/15/353,4 | | | 152,543 | | | | 149,935 | |
| Vega Containervessel plc | | | | | | | | |
2006-1A, 5.56% due 02/10/214 | | | 33,098 | | | | 32,757 | |
| Total Asset-Backed Securities | | | | | | | | |
| (Cost $123,997,699) | | | | | | | 128,602,833 | |
| | | | | | | | |
CORPORATE BONDS††,8 - 8.7% | |
| ENERGY - 3.2% | |
| Regency Energy Partners Limited Partnership / Regency Energy Finance Corp. | | | | | | | | |
| 8.37% due 06/01/19 | | | 6,540,000 | | | | 6,850,650 | |
| Crestwood Midstream Partners Limited Partnership / Crestwood Midstream Finance Corp. | | | | | | | | |
| 6.00% due 12/15/20 | | | 6,300,000 | | | | 6,331,500 | |
| CONSOL Energy, Inc. | | | | | | | | |
| 5.87% due 04/15/22 | | | 6,750,000 | | | | 6,108,750 | |
| Ultra Petroleum Corp. | | | | | | | | |
| 5.75% due 12/15/18 | | | 4,680,000 | | | | 4,223,700 | |
| Unit Corp. | | | | | | | | |
| 6.62% due 05/15/21 | | | 4,000,000 | | | | 3,760,000 | |
| ContourGlobal Power Holdings S.A. | | | | | | | | |
7.12% due 06/01/194 | | | 3,500,000 | | | | 3,570,000 | |
| Legacy Reserves Limited Partnership / Legacy Reserves Finance Corp. | | | | | | | | |
| 8.00% due 12/01/20 | | | 2,750,000 | | | | 2,255,000 | |
| Gibson Energy, Inc. | | | | | | | | |
6.75% due 07/15/214 | | | 1,780,000 | | | | 1,815,600 | |
| Ultra Resources, Inc. | | | | | | | | |
4.66% due 10/12/22†††,1 | | | 1,800,000 | | | | 1,573,740 | |
| SEE NOTES TO FINANCIAL STATEMENTS. | THE GUGGENHEIM FUNDS SEMI-ANNUAL REPORT | 19 |
SCHEDULE OF INVESTMENTS (Unaudited)(continued) | March 31, 2015 |
| FLOATING RATE STRATEGIES FUND | |
| | | Face
Amount | | | Value | |
| | | | | | | | | |
| Penn Virginia Resource Partners Limited Partnership / Penn Virginia Resource Finance Corp. | | | | | | | | |
| 8.37% due 06/01/20 | | $ | 1,340,000 | | | $ | 1,460,600 | |
| FTS International, Inc. | | | | | | | | |
6.25% due 05/01/224 | | | 1,950,000 | | | | 1,433,250 | |
| BreitBurn Energy Partners Limited Partnership / BreitBurn Finance Corp. | | | | | | | | |
| 7.87% due 04/15/22 | | | 1,670,000 | | | | 1,202,400 | |
| Atlas Energy Holdings Operating Company LLC / Atlas Resource Finance Corp. | | | | | | | | |
| 9.25% due 08/15/21 | | | 1,375,000 | | | | 948,750 | |
| 7.75% due 01/15/21 | | | 125,000 | | | | 85,000 | |
| Precision Drilling Corp. | | | | | | | | |
| 6.62% due 11/15/20 | | | 1,000,000 | | | | 942,500 | |
| Exterran Holdings, Inc. | | | | | | | | |
| 7.25% due 12/01/18 | | | 700,000 | | | | 707,000 | |
| Total Energy | | | | | | | 43,268,440 | |
| | | | | | | | |
| FINANCIAL - 1.9% | |
| Icahn Enterprises Limited Partnership / Icahn Enterprises Finance Corp. | | | | | | | | |
| 5.88% due 02/01/22 | | | 5,000,000 | | | | 5,150,000 | |
| 4.87% due 03/15/19 | | | 1,750,000 | | | | 1,782,813 | |
| 6.00% due 08/01/20 | | | 1,700,000 | | | | 1,765,960 | |
| 3.50% due 03/15/17 | | | 1,000,000 | | | | 1,007,500 | |
| Kennedy-Wilson, Inc. | | | | | | | | |
| 5.88% due 04/01/24 | | | 6,000,000 | | | | 6,015,000 | |
| Citigroup, Inc. | | | | | | | | |
5.35%3,5 | | | 4,000,000 | | | | 3,870,000 | |
| Credit Acceptance Corp. | | | | | | | | |
| 6.12% due 02/15/21 | | | 3,100,000 | | | | 2,968,250 | |
| Cabot Financial Luxembourg S.A. | | | | | | | | |
6.50% due 04/01/214 | | | GBP 1,300,000 | | | | 1,816,887 | |
| Oxford Finance LLC / Oxford Finance Company-Issuer, Inc. | | | | | | | | |
7.25% due 01/15/184 | | | 650,000 | | | | 669,500 | |
| HRG Group, Inc. | | | | | | | | |
| 7.88% due 07/15/19 | | | 490,000 | | | | 515,725 | |
| Fidelity & Guaranty Life Holdings, Inc. | | | | | | | | |
6.37% due 04/01/214 | | | 450,000 | | | | 472,500 | |
| LCP Dakota Fund | | | | | | | | |
10.00% due 08/17/151 | | | 28,800 | | | | 28,791 | |
| Total Financial | | | | | | | 26,062,926 | |
| | | | | | | | |
| CONSUMER, NON-CYCLICAL - 1.0% | |
| Central Garden & Pet Co. | | | | | | | | |
| 8.25% due 03/01/18 | | | 5,206,000 | | | | 5,326,415 | |
| Vector Group Ltd. | | | | | | | | |
| 7.75% due 02/15/21 | | | 4,440,000 | | | | 4,723,050 | |
| Opal Acquisition, Inc. | | | | | | | | |
8.87% due 12/15/214 | | | 3,770,000 | | | | 3,835,975 | |
| Premier Foods Finance plc | | | | | | | | |
5.56% due 03/16/203,9 | | | GBP 350,000 | | | | 462,159 | |
| Total Consumer, Non-cyclical | | | | | | | 14,347,599 | |
| | | | | | | | |
| COMMUNICATIONS - 0.9% | |
| Level 3 Financing, Inc. | | | | | | | | |
3.83% due 01/15/183 | | | 4,210,000 | | | | 4,241,575 | |
| Alcatel-Lucent USA, Inc. | | | | | | | | |
6.75% due 11/15/204 | | | 3,000,000 | | | | 3,195,000 | |
| Virgin Media Secured Finance plc | | | | | | | | |
5.38% due 04/15/214 | | | 1,800,000 | | | | 1,887,750 | |
| MDC Partners, Inc. | | | | | | | | |
6.75% due 04/01/204 | | | 1,000,000 | | | | 1,053,750 | |
| SITEL LLC / Sitel Finance Corp. | | | | | | | | |
11.00% due 08/01/174 | | | 670,000 | | | | 693,450 | |
| CyrusOne Limited Partnership / CyrusOne Finance Corp. | | | | | | | | |
| 6.37% due 11/15/22 | | | 600,000 | | | | 637,500 | |
| Avaya, Inc. | | | | | | | | |
7.00% due 04/01/194 | | | 610,000 | | | | 605,425 | |
| 20 | THE GUGGENHEIM FUNDS SEMI-ANNUAL REPORT | SEE NOTES TO FINANCIAL STATEMENTS. |
SCHEDULE OF INVESTMENTS (Unaudited)(continued) | March 31, 2015 |
| FLOATING RATE STRATEGIES FUND | |
| | | Face
Amount | | | Value | |
| | | | | | | | | |
| UPCB Finance VI Ltd. | | | | | | | | |
6.88% due 01/15/224 | | $ | 530,000 | | | $ | 565,775 | |
| Total Communications | | | | | | | 12,880,225 | |
| | | | | | | | |
| INDUSTRIAL - 0.8% | |
| CEVA Group plc | | | | | | | | |
7.00% due 03/01/214 | | | 5,800,000 | | | | 5,626,000 | |
| BMBG Bond Finance SCA | | | | | | | | |
5.07% due 10/15/203,4 | | | EUR 4,000,000 | | | | 4,339,952 | |
| Unifrax I LLC / Unifrax Holding Co. | | | | | | | | |
7.50% due 02/15/194 | | | 1,525,000 | | | | 1,532,625 | |
| Total Industrial | | | | | | | 11,498,577 | |
| | | | | | | | |
| CONSUMER, CYCLICAL - 0.4% | |
| GRD Holdings III Corp. | | | | | | | | |
10.75% due 06/01/194 | | | 3,680,000 | | | | 4,001,999 | |
| Checkers Drive-In Restaurants, Inc. | | | | | | | | |
11.00% due 12/01/174 | | | 1,000,000 | | | | 1,088,120 | |
| Men’s Wearhouse, Inc. | | | | | | | | |
7.00% due 07/01/224,6 | | | 525,000 | | | | 552,563 | |
| Atlas Air 1999-1 Class A-1 Pass Through Trust | | | | | | | | |
7.20% due 01/02/191 | | | 58,109 | | | | 59,126 | |
| Total Consumer, Cyclical | | | | | | | 5,701,808 | |
| | | | | | | | |
| TECHNOLOGY - 0.2% | |
| NCR Corp. | | | | | | | | |
| 6.38% due 12/15/23 | | | 1,800,000 | | | | 1,917,000 | |
| Eagle Midco, Inc. | | | | | | | | |
9.00% due 06/15/184 | | | 1,400,000 | | | | 1,426,250 | |
| Total Technology | | | | | | | 3,343,250 | |
| | | | | | | | |
| BASIC MATERIALS - 0.2% | |
| TPC Group, Inc. | | | | | | | | |
8.75% due 12/15/204 | | | 1,555,000 | | | | 1,422,825 | |
| Mirabela Nickel Ltd. | | | | | | | | |
9.50% due 06/24/19†††,1 | | | 1,113,492 | | | | 1,113,492 | |
1.00% due 07/31/44†††,1 | | | 25,316 | | | | — | |
| Total Basic Materials | | | | | | | 2,536,317 | |
| | | | | | | | |
| DIVERSIFIED - 0.1% | |
| HRG Group, Inc. | | | | | | | | |
| 7.75% due 01/15/22 | | | 1,975,000 | | | | 1,965,125 | |
| | | | | | | | |
| UTILITIES - 0.0% | |
| LBC Tank Terminals Holding Netherlands BV | | | | | | | | |
6.88% due 05/15/234 | | | 630,000 | | | | 644,175 | |
| Total Corporate Bonds | | | | | | | | |
| (Cost $127,127,929) | | | | | | | 122,248,442 | |
| | | | | | | | |
MORTGAGE-BACKED SECURITIES†† - 1.7% | |
| Washington Mutual Mortgage Pass-Through Certificates WMALT Series Trust | | | | | | | | |
2006-AR9, 0.97% due 11/25/463 | | | 4,648,340 | | | | 3,240,024 | |
2007-OA4, 0.89% due 04/25/473 | | | 3,786,607 | | | | 2,780,789 | |
| IndyMac INDX Mortgage Loan Trust | | | | | | | | |
2006-AR4, 0.38% due 05/25/463 | | | 3,630,766 | | | | 3,075,703 | |
| HarborView Mortgage Loan Trust | | | | | | | | |
2005-13, 0.46% due 02/19/363 | | | 4,089,521 | | | | 3,059,792 | |
| Structured Asset Mortgage Investments II Trust | | | | | | | | |
2006-AR1, 0.40% due 02/25/363 | | | 3,567,015 | | | | 2,971,819 | |
| Lehman XS Trust Series | | | | | | | | |
2006-16N, 0.36% due 11/25/463 | | | 3,236,884 | | | | 2,702,225 | |
| GreenPoint Mortgage Funding Trust | | | | | | | | |
2006-AR1, 0.46% due 02/25/363 | | | 3,029,651 | | | | 2,607,578 | |
| Acis CLO Ltd. | | | | | | | | |
2013-2A, 4.10% due 10/14/223,4 | | | 1,800,000 | | | | 1,783,620 | |
| SEE NOTES TO FINANCIAL STATEMENTS. | THE GUGGENHEIM FUNDS SEMI-ANNUAL REPORT | 21 |
SCHEDULE OF INVESTMENTS (Unaudited)(continued) | March 31, 2015 |
| FLOATING RATE STRATEGIES FUND | |
| | | Face
Amount | | | Value | |
| | | | | | | | | |
| Bear Stearns Mortgage Funding Trust | | | | | | | | |
2007-AR5, 0.34% due 06/25/473 | | $ | 927,462 | | | $ | 741,060 | |
| Alliance Bancorp Trust | | | | | | | | |
2007-OA1, 0.41% due 07/25/373 | | | 911,681 | | | | 608,824 | |
| Total Mortgage-Backed Securities | | | | | | | | |
| (Cost $23,391,077) | | | | | | | 23,571,434 | |
| | | | | | | | |
COLLATERALIZED MORTGAGE OBLIGATIONS†† - 1.3% | |
| LSTAR Securities Investment Trust | | | | | | | | |
2014-1, 3.28% due 09/01/213,4 | | | 6,213,540 | | | | 6,271,326 | |
| HarborView Mortgage Loan Trust | | | | | | | | |
2006-12, 0.37% due 01/19/383 | | | 4,274,175 | | | | 3,610,425 | |
| Nomura Resecuritization Trust | | | | | | | | |
2015-4R, 0.61% due 03/26/363,4 | | | 3,300,000 | | | | 2,984,438 | |
2012-1R, 0.62% due 08/27/473,4 | | | 3,133,473 | | | | 2,898,462 | |
| SRERS-2011 Funding Ltd. | | | | | | | | |
2011-RS, 0.43% due 05/09/463,4 | | | 1,486,796 | | | | 1,413,646 | |
| Morgan Stanley Re-REMIC Trust | | | | | | | | |
2010-R5, 0.48% due 06/26/363,4 | | | 1,417,041 | | | | 1,018,328 | |
| Total Collateralized Mortgage Obligations | | | | | | | | |
| (Cost $18,028,352) | | | | | | | 18,196,625 | |
| | | | | | | | |
COMMERCIAL PAPER†† - 9.9% | |
| VF Corp. | | | | | | | | |
| 0.40% due 04/13/15 | | | 15,750,000 | | | | 15,747,900 | |
| Snap-on, Inc. | | | | | | | | |
| 0.45% due 04/01/15 | | | 15,000,000 | | | | 15,000,000 | |
| General Mills, Inc. | | | | | | | | |
| 0.45% due 04/22/15 | | | 10,000,000 | | | | 9,997,375 | |
| 0.48% due 04/22/15 | | | 5,000,000 | | | | 4,998,600 | |
| Total General Mills, Inc. | | | | | | | 14,995,975 | |
| Bacardi Martini BV | | | | | | | | |
| 0.49% due 04/15/15 | | | 13,000,000 | | | | 12,997,523 | |
| Kellog Co. | | | | | | | | |
| 0.42% due 04/01/15 | | | 10,000,000 | | | | 10,000,000 | |
| Philip Morris International, Inc. | | | | | | | | |
| 0.07% due 04/23/15 | | | 10,000,000 | | | | 9,999,572 | |
| American Water Capital Corp. | | | | | | | | |
| 0.47% due 04/06/15 | | | 10,000,000 | | | | 9,999,347 | |
| Aetna, Inc. | | | | | | | | |
| 0.40% due 04/07/15 | | | 10,000,000 | | | | 9,999,333 | |
| MetLife Short Term Funding, LLC | | | | | | | | |
| 0.12% due 05/06/15 | | | 10,000,000 | | | | 9,998,833 | |
| Diageo Capital plc | | | | | | | | |
| 0.55% due 04/10/15 | | | 10,000,000 | | | | 9,998,625 | |
| Reed Elsevier, Inc. | | | | | | | | |
| 0.52% due 04/20/15 | | | 10,000,000 | | | | 9,997,256 | |
| Ryder Sys, Inc. | | | | | | | | |
| 0.50% due 04/24/15 | | | 10,000,000 | | | | 9,996,806 | |
| Total Commercial Paper | | | | | | | | |
| (Cost $138,731,170) | | | | | | | 138,731,170 | |
| | | | | | | | |
| Total Investments - 110.1% | | | | | | | | |
| (Cost $1,566,387,948) | | | | | | $ | 1,541,575,379 | |
| Other Assets & Liabilities, net - (10.1)% | | | | | | | (141,753,294 | ) |
| Total Net Assets - 100.0% | | | | | | $ | 1,399,822,085 | |
| | | | | | | | | |
| 22 | THE GUGGENHEIM FUNDS SEMI-ANNUAL REPORT | SEE NOTES TO FINANCIAL STATEMENTS. |
SCHEDULE OF INVESTMENTS (Unaudited)(concluded) | March 31, 2015 |
| FLOATING RATE STRATEGIES FUND | |
FORWARD FOREIGN CURRENCY EXCHANGE CONTRACTS†† | |
| Counterparty | | Contracts to Sell | | Currency | Settlement
Date | | Settlement
Value | | | Value at March 31, 2015 | | | Net Unrealized
Appreciation/
(Depreciation) | |
| BNY Mellon | | | 68,000,000 | | EUR | 04/07/15 | | $ | 74,984,960 | | | $ | 73,110,556 | | | $ | 1,874,404 | |
| BNY Mellon | | | 15,800,000 | | GBP | 04/07/15 | | | 23,945,712 | | | | 23,442,681 | | | | 503,031 | |
| BNY Mellon | | | 400,000 | | AUD | 04/07/15 | | | 310,828 | | | | 304,541 | | | | 6,287 | |
| BNY Mellon | | | (539,800 | ) | USD | 04/07/15 | | | (539,800 | ) | | | (537,578 | ) | | | (2,222 | ) |
| | | | | | | | | | | | | | | | | $ | 2,381,500 | |
| * | Non-income producing security. |
| † | Value determined based on Level 1 inputs, unless otherwise noted — See Note 4. |
| †† | Value determined based on Level 2 inputs, unless otherwise noted — See Note 4. |
| ††† | Value determined based on Level 3 inputs — See Note 4. |
| 1 | Illiquid security. |
| 2 | Residual interest. |
| 3 | Variable rate security. Rate indicated is rate effective at March 31, 2015. |
| 4 | Security is a 144A or Section 4(a)(2) security. The total market value of 144A or Section 4(a)(2) securities is $152,965,142 (cost $152,624,534), or 10.9% of total net assets. These securities have been determined to be liquid under guidelines established by the Board of Trustees. |
| 5 | Perpetual maturity. |
| 6 | Security or a portion thereof is held as collateral for reverse repurchase agreements — See Note 10. |
| 7 | Zero coupon rate security. |
| 8 | The face amount is denominated in U.S. Dollars unless otherwise indicated. |
| 9 | Security is a 144A or Section 4(a)(2) security. These securities are considered illiquid and restricted under guidelines established by the Board of Trustees. The total market value of 144A or Section 4(a)(2) securities is $462,159 (cost $585,823), or 0.03% of total net assets — See Note 11. |
| plc — Public Limited Company |
| REIT — Real Estate Investment Trust |
| |
| See Sector Classification in Other Information section. |
| SEE NOTES TO FINANCIAL STATEMENTS. | THE GUGGENHEIM FUNDS SEMI-ANNUAL REPORT | 23 |
STATEMENT OF ASSETS AND LIABILITIES (Unaudited) |
| FLOATING RATE STRATEGIES FUND |
March 31, 2015
| Assets: | |
| Investments, at value (cost $1,566,387,948) | | $ | 1,541,575,379 | |
| Foreign currency, at value (cost $5,782,903) | | | 5,778,408 | |
| Unrealized appreciation on forward foreign currency exchange contracts | | | 2,383,722 | |
| Cash | | | 2,346,217 | |
| Prepaid expenses | | | 83,192 | |
| Receivables: | |
| Fund shares sold | | | 6,510,482 | |
| Interest | | | 5,864,941 | |
| Securities sold | | | 5,803,081 | |
| Foreign taxes reclaim | | | 30,563 | |
| Total assets | | | 1,570,375,985 | |
| | | | | |
| Liabilities: | |
| Unfunded loan commitments, at value (Note 8) (proceeds $4,773,294) | | | 3,846,020 | |
| Reverse Repurchase Agreements | | | 404,250 | |
| Unrealized depreciation on forward foreign currency exchange contracts | | | 2,222 | |
| Payable for: | |
| Securities purchased | | | 161,100,915 | |
| Fund shares redeemed | | | 3,467,732 | |
| Management fees | | | 512,684 | |
| Distribution and service fees | | | 164,586 | |
| Fund accounting/administration fees | | | 106,838 | |
| Transfer agent/maintenance fees | | | 70,201 | |
| Trustees’ fees* | | | 3,333 | |
| Miscellaneous | | | 875,119 | |
| Total liabilities | | | 170,553,900 | |
| Net assets | | $ | 1,399,822,085 | |
| | | | | |
| Net assets consist of: | |
| Paid in capital | | $ | 1,414,401,299 | |
| Distributions in excess of net investment income | | | (6,539,416 | ) |
| Accumulated net realized gain on investments | | | 13,471,630 | |
| Net unrealized depreciation on investments | | | (21,511,428 | ) |
| Net assets | | $ | 1,399,822,085 | |
| | | | | |
| A-Class: | |
| Net assets | | $ | 305,986,539 | |
| Capital shares outstanding | | | 11,646,925 | |
| Net asset value per share | | $ | 26.27 | |
| Maximum offering price per share (Net asset value divided by 95.25%) | | $ | 27.58 | |
| | | | | |
| C-Class: | |
| Net assets | | $ | 121,333,158 | |
| Capital shares outstanding | | | 4,620,511 | |
| Net asset value per share | | $ | 26.26 | |
| | | | | |
| Institutional Class: | |
| Net assets | | $ | 972,502,388 | |
| Capital shares outstanding | | | 36,989,279 | |
| Net asset value per share | | $ | 26.29 | |
| * | Relates to Trustees not deemed “interested persons” within the meaning of Section 2(a)(19) of the 1940 Act. |
| 24 | THE GUGGENHEIM FUNDS SEMI-ANNUAL REPORT | SEE NOTES TO FINANCIAL STATEMENTS. |
STATEMENT OF OPERATIONS (Unaudited) |
| FLOATING RATE STRATEGIES FUND |
Period Ended March 31, 2015
| Investment Income: | |
| Interest (net of foreign withholding tax of $26,093) | | $ | 30,427,182 | |
| Dividends (net of foreign withholding tax of $2,139) | | | 26,351 | |
| Total investment income | | | 30,453,533 | |
| | | | | |
| Expenses: | |
| Management fees | | | 3,852,828 | |
| Transfer agent/maintenance fees: | |
| A-Class | | | 247,651 | |
| C-Class | | | 37,516 | |
| Institutional Class | | | 177,299 | |
| Distribution and service fees: | |
| A-Class | | | 378,159 | |
| C-Class | | | 609,048 | |
| Fund accounting/administration fees | | | 563,098 | |
| Line of credit fees | | | 83,784 | |
| Trustees’ fees* | | | 53,208 | |
| Custodian fees | | | 44,607 | |
| Tax expense | | | 22 | |
| Miscellaneous | | | 341,741 | |
| Total expenses | | | 6,388,961 | |
| Less: | |
| Expenses waived by Adviser | | | (225,764 | ) |
| Expenses waived by Transfer Agent | |
| A-Class | | | (247,473 | ) |
| C-Class | | | (37,503 | ) |
| Institutional Class | | | (177,161 | ) |
| Expenses waived by Distributor | |
| A-Class | | | (21,678 | ) |
| C-Class | | | (8,888 | ) |
| Total waived expenses | | | (718,467 | ) |
| Net expenses | | | 5,670,494 | |
| Net investment income | | | 24,783,039 | |
| | | | | |
| Net Realized and Unrealized Gain (Loss): | |
| Net realized gain (loss) on: | |
| Investments | | | (638,618 | ) |
| Foreign currency | | | (5,217,434 | ) |
| Forward foreign currency exchange contracts | | | 19,767,603 | |
| Net realized gain | | | 13,911,551 | |
| Net change in unrealized appreciation (depreciation) on: | |
| Investments | | | (14,214,768 | ) |
| Foreign currency | | | 31,603 | |
| Forward foreign currency exchange contracts | | | (1,716,214 | ) |
| Net change in unrealized appreciation (depreciation) | | | (15,899,379 | ) |
| Net realized and unrealized loss | | | (1,987,828 | ) |
| Net increase in net assets resulting from operations | | $ | 22,795,211 | |
| * | Relates to Trustees not deemed “interested persons” within the meaning of Section 2(a)(19) of the 1940 Act. |
| SEE NOTES TO FINANCIAL STATEMENTS. | THE GUGGENHEIM FUNDS SEMI-ANNUAL REPORT | 25 |
STATEMENTS OF CHANGES IN NET ASSETS |
| FLOATING RATE STRATEGIES FUND | |
| | | Period Ended March 31, 2015 (Unaudited) | | | Year Ended September 30, 2014 | |
| Increase (Decrease) in Net Assets from Operations: | | | | | | |
| Net investment income | | $ | 24,783,039 | | | $ | 51,193,821 | |
| Net realized gain on investments | | | 13,911,551 | | | | 8,475,388 | |
| Net change in unrealized appreciation (depreciation) on investments | | | (15,899,379 | ) | | | (8,424,760 | ) |
| Net increase in net assets resulting from operations | | | 22,795,211 | | | | 51,244,449 | |
| | | | | | | | | |
| Distributions to shareholders from: | | | | | | | | |
| Net investment income | | | | | | | | |
| A-Class | | | (7,654,230 | ) | | | (19,618,301 | ) |
| C-Class | | | (2,640,737 | ) | | | (5,268,652 | ) |
| Institutional Class | | | (19,878,223 | ) | | | (31,207,426 | ) |
| Net realized gains | | | | | | | | |
| A-Class | | | (968,588 | ) | | | (760,820 | ) |
| C-Class | | | (397,766 | ) | | | (250,718 | ) |
| Institutional Class | | | (2,326,329 | ) | | | (1,010,452 | ) |
| Total distributions to shareholders | | | (33,865,873 | ) | | | (58,116,369 | ) |
| | | | | | | | | |
| Capital share transactions: | | | | | | | | |
| Proceeds from sale of shares | | | | | | | | |
| A-Class | | | 91,029,462 | | | | 346,835,950 | |
| C-Class | | | 19,493,889 | | | | 58,742,934 | |
| Institutional Class | | | 459,848,578 | | | | 664,581,990 | |
| Distributions reinvested | | | | | | | | |
| A-Class | | | 6,838,268 | | | | 15,511,424 | |
| C-Class | | | 2,482,437 | | | | 4,571,714 | |
| Institutional Class | | | 18,206,437 | | | | 25,876,740 | |
| Cost of shares redeemed | | | | | | | | |
| A-Class | | | (153,814,215 | ) | | | (374,228,993 | ) |
| C-Class | | | (31,699,403 | ) | | | (51,062,726 | ) |
| Institutional Class | | | (252,545,466 | ) | | | (389,646,851 | ) |
| Net increase from capital share transactions | | | 159,839,987 | | | | 301,182,182 | |
| Net increase in net assets | | | 148,769,325 | | | | 294,310,262 | |
| | | | | | | | | |
| Net assets: | | | | | | | | |
| Beginning of period | | | 1,251,052,760 | | | | 956,742,498 | |
| End of period | | $ | 1,399,822,085 | | | $ | 1,251,052,760 | |
| Distributions in excess of net investment income at end of period | | $ | (6,539,416 | ) | | $ | (510,475 | ) |
| 26 | THE GUGGENHEIM FUNDS SEMI-ANNUAL REPORT | SEE NOTES TO FINANCIAL STATEMENTS. |
STATEMENTS OF CHANGES IN NET ASSETS (concluded) |
| FLOATING RATE STRATEGIES FUND | |
| | | Period Ended March 31, 2015 (Unaudited) | | | Year Ended September 30, 2014 | |
| Capital share activity: | | | | | | |
| Shares sold | | | | | | |
| A-Class | | | 3,475,569 | | | | 12,939,395 | |
| C-Class | | | 743,073 | | | | 2,194,462 | |
| Institutional Class | | | 17,516,387 | | | | 24,773,852 | |
| Shares issued from reinvestment of distributions | | | | | | | | |
| A-Class | | | 260,476 | | | | 579,106 | |
| C-Class | | | 94,631 | | | | 170,795 | |
| Institutional Class | | | 693,147 | | | | 965,789 | |
| Shares redeemed | | | | | | | | |
| A-Class | | | (5,857,702 | ) | | | (13,963,500 | ) |
| C-Class | | | (1,209,871 | ) | | | (1,905,834 | ) |
| Institutional Class | | | (9,606,704 | ) | | | (14,540,760 | ) |
| Net increase in shares | | | 6,109,006 | | | | 11,213,305 | |
| SEE NOTES TO FINANCIAL STATEMENTS. | THE GUGGENHEIM FUNDS SEMI-ANNUAL REPORT | 27 |
| FINANCIAL HIGHLIGHTS |
| FLOATING RATE STRATEGIES FUND | |
This table is presented to show selected data for a share outstanding throughout each period and to assist shareholders in evaluating a Fund’s performance for the periods presented.
| A-Class | | Period Ended March 31, 2015a | | | Year Ended Sept. 30, 2014 | | | Year Ended Sept. 30, 2013 | | | Period Ended Sept. 30, 2012b | |
| Per Share Data | | | | | | | | | | | | |
| Net asset value, beginning of period | | $ | 26.52 | | | $ | 26.62 | | | $ | 26.10 | | | $ | 25.00 | |
| Income (loss) from investment operations: | |
Net investment income (loss)c | | | .54 | | | | 1.10 | | | | 1.30 | | | | 1.09 | |
| Net gain (loss) on investments (realized and unrealized) | | | (.05 | ) | | | .05 | | | | .65 | | | | .97 | |
| Total from investment operations | | | .49 | | | | 1.15 | | | | 1.95 | | | | 2.06 | |
| Less distributions from: | |
| Net investment income | | | (.66 | ) | | | (1.20 | ) | | | (1.37 | ) | | | (.96 | ) |
| Net realized gains | | | (.08 | ) | | | (.05 | ) | | | (.06 | ) | | | — | |
| Total distributions | | | (.74 | ) | | | (1.25 | ) | | | (1.43 | ) | | | (.96 | ) |
| Net asset value, end of period | | $ | 26.27 | | | $ | 26.52 | | | $ | 26.62 | | | $ | 26.10 | |
| | |
Total Returne | | | 1.86 | % | | | 4.42 | % | | | 7.61 | % | | | 8.37 | % |
| Ratios/Supplemental Data | |
| Net assets, end of period (in thousands) | | $ | 305,987 | | | $ | 365,207 | | | $ | 378,324 | | | $ | 44,175 | |
| Ratios to average net assets: | |
| Net investment income (loss) | | | 4.13 | % | | | 4.10 | % | | | 4.90 | % | | | 5.13 | % |
| Total expenses | | | 1.25 | % | | | 1.18 | % | | | 1.19 | % | | | 1.39 | % |
Net expensesd,f | | | 1.03 | % | | | 1.04 | % | | | 1.05 | % | | | 1.06 | % |
| Portfolio turnover rate | | | 30 | % | | | 58 | % | | | 50 | % | | | 61 | % |
| 28 | THE GUGGENHEIM FUNDS SEMI-ANNUAL REPORT | SEE NOTES TO FINANCIAL STATEMENTS. |
FINANCIAL HIGHLIGHTS (continued) |
| FLOATING RATE STRATEGIES FUND |
This table is presented to show selected data for a share outstanding throughout each period and to assist shareholders in evaluating a Fund’s performance for the periods presented.
| C-Class | | Period Ended March 31, 2015a | | | Year Ended Sept. 30, 2014 | | | Year Ended Sept. 30, 2013 | | | Period Ended Sept. 30, 2012b | |
| Per Share Data | | | | | | | | | | | | |
| Net asset value, beginning of period | | $ | 26.51 | | | $ | 26.60 | | | $ | 26.09 | | | $ | 25.00 | |
| Income (loss) from investment operations: | |
Net investment income (loss)c | | | .44 | | | | .90 | | | | 1.11 | | | | .93 | |
| Net gain (loss) on investments (realized and unrealized) | | | (.05 | ) | | | .06 | | | | .63 | | | | .98 | |
| Total from investment operations | | | .39 | | | | .96 | | | | 1.74 | | | | 1.91 | |
| Less distributions from: | |
| Net investment income | | | (.56 | ) | | | (1.00 | ) | | | (1.17 | ) | | | (.82 | ) |
| Net realized gains | | | (.08 | ) | | | (.05 | ) | | | (.06 | ) | | | — | |
| Total distributions | | | (.64 | ) | | | (1.05 | ) | | | (1.23 | ) | | | (.82 | ) |
| Net asset value, end of period | | $ | 26.26 | | | $ | 26.51 | | | $ | 26.60 | | | $ | 26.09 | |
| | |
Total Returne | | | 1.53 | % | | | 3.64 | % | | | 6.77 | % | | | 7.72 | % |
| Ratios/Supplemental Data | |
| Net assets, end of period (in thousands) | | $ | 121,333 | | | $ | 132,370 | | | $ | 120,606 | | | $ | 24,358 | |
| Ratios to average net assets: | |
| Net investment income (loss) | | | 3.38 | % | | | 3.35 | % | | | 4.19 | % | | | 4.36 | % |
| Total expenses | | | 1.90 | % | | | 1.89 | % | | | 1.93 | % | | | 2.06 | % |
Net expensesd,f | | | 1.78 | % | | | 1.79 | % | | | 1.81 | % | | | 1.80 | % |
| Portfolio turnover rate | | | 30 | % | | | 58 | % | | | 50 | % | | | 61 | % |
| SEE NOTES TO FINANCIAL STATEMENTS. | THE GUGGENHEIM FUNDS SEMI-ANNUAL REPORT | 29 |
FINANCIAL HIGHLIGHTS (concluded) |
| FLOATING RATE STRATEGIES FUND |
This table is presented to show selected data for a share outstanding throughout each period and to assist shareholders in evaluating a Fund’s performance for the periods presented.
| Institutional Class | | Period Ended March 31, 2015a | | | Year Ended Sept. 30, 2014 | | | Year Ended Sept. 30, 2013 | | | Period Ended Sept. 30, 2012b | |
| Per Share Data | | | | | | | | | | | | |
| Net asset value, beginning of period | | $ | 26.54 | | | $ | 26.64 | | | $ | 26.12 | | | $ | 25.00 | |
| Income (loss) from investment operations: | |
Net investment income (loss)c | | | .57 | | | | 1.16 | | | | 1.36 | | | | 1.10 | |
| Net gain (loss) on investments (realized and unrealized) | | | (.05 | ) | | | .06 | | | | .65 | | | | 1.02 | |
| Total from investment operations | | | .52 | | | | 1.22 | | | | 2.01 | | | | 2.12 | |
| Less distributions from: | |
| Net investment income | | | (.69 | ) | | | (1.27 | ) | | | (1.43 | ) | | | (1.00 | ) |
| Net realized gains | | | (.08 | ) | | | (.05 | ) | | | (.06 | ) | | | — | |
| Total distributions | | | (.77 | ) | | | (1.32 | ) | | | (1.49 | ) | | | (1.00 | ) |
| Net asset value, end of period | | $ | 26.29 | | | $ | 26.54 | | | $ | 26.64 | | | $ | 26.12 | |
| | |
Total Returne | | | 1.98 | % | | | 4.67 | % | | | 7.86 | % | | | 8.59 | % |
| Ratios/Supplemental Data | |
| Net assets, end of period (in thousands) | | $ | 972,502 | | | $ | 753,476 | | | $ | 457,813 | | | $ | 72,197 | |
| Ratios to average net assets: | |
| Net investment income (loss) | | | 4.33 | % | | | 4.32 | % | | | 5.12 | % | | | 5.16 | % |
| Total expenses | | | 0.88 | % | | | 0.87 | % | | | 0.86 | % | | | 0.99 | % |
Net expensesd,f | | | 0.79 | % | | | 0.80 | % | | | 0.81 | % | | | 0.80 | % |
| Portfolio turnover rate | | | 30 | % | | | 58 | % | | | 50 | % | | | 61 | % |
a | Unaudited figures for the period ended March 31, 2015. Percentage amounts for the period, except total return and portfolio turnover rate, have been annualized. |
b | Since commencement of operations: November 30, 2011. Percentage amounts for the period, except total return and portfolio turnover rate, have been annualized. |
c | Net investment income (loss) per share was computed using average shares outstanding throughout the period. |
d | Net expense information reflects the expense ratios after expense waivers. |
e | Total return does not reflect the impact of any applicable sales charges and has not been annualized. |
f | Net expenses may include expenses that are excluded from the expense limitation agreement. Excluding these expenses, the expense ratios for the periods would be: |
| | 03/31/15 | 09/30/14 | 09/30/13 | 09/30/12 |
| A-Class | 1.02% | 1.02% | 1.03% | 1.01% |
| C-Class | 1.77% | 1.77% | 1.78% | 1.76% |
| Institutional Class | 0.78% | 0.78% | 0.79% | 0.77% |
| 30 | THE GUGGENHEIM FUNDS SEMI-ANNUAL REPORT | SEE NOTES TO FINANCIAL STATEMENTS. |
NOTES TO FINANCIAL STATEMENTS (Unaudited)
1. Organization and Significant Accounting Policies
Organization
Guggenheim Funds Trust (the ”Trust”), a Delaware statutory trust, is registered with the SEC under the Investment Company Act of 1940 (”1940 Act”), as a non-diversified, open-ended investment company of the series type. Each series, in effect, is representing a separate Fund. The Trust is authorized to issue an unlimited number of shares. The Trust accounts for the assets of each Fund separately.
The Trust offers a combination of four separate classes of shares, A-Class shares, B-Class shares, C-Class shares and Institutional Class shares. Sales of shares of each Class are made without a front-end sales charge at the net asset value per share (“NAV”), with the exception of A-Class shares. A-Class shares are sold at the NAV, plus the applicable front-end sales charge. The sales charge varies depending on the amount purchased, but will not exceed 4.75%. Class share purchases of $1 million or more are exempt from the front-end sales charge but have a 1% contingent deferred sales charge (“CDSC”), if shares are redeemed within 12 months of purchase. B-Class shares were offered without a front-end sales charge, but were subject to a CDSC of up to 5% for five years and convert to A-Class shares after eight years. Effective January 4, 2010, subscriptions for B-Class shares are no longer accepted. C-Class shares have a 1% CDSC if shares are redeemed within 12 months of purchase. Institutional Class shares are offered primarily for direct investment by institutions such as pension and profit sharing plans, endowments, foundations and corporations. Institutional Class shares have a minimum initial investment of $2 million and a minimum account balance of $1 million. Institutional Class shares are offered without a front-end sales charge or a CDSC. At March 31, 2015, the Trust consisted of eighteen funds.
This report covers the Floating Rate Strategies Fund (the “Fund”), while the other funds are in separate reports. Only A-Class, C-Class and Institutional Class shares had been issued by the Fund.
The Fund was previously a series (the “Predecessor Fund”) of Security Income Fund, a different registered open-end investment company, which was organized as a Kansas corporation. In January 2014, at a special meeting of shareholders, the shareholders of the Predecessor Fund approved the reorganization of the Predecessor Fund with and into the Fund, corresponding “shell” series of the Trust. The Fund succeeded to the accounting and performance history of the Predecessor Fund. Any such historical information provided for the Fund that relates to periods prior to January 28, 2014, therefore, is that of the Predecessor Fund.
| | THE GUGGENHEIM FUNDS SEMI-ANNUAL REPORT | 31 |
NOTES TO FINANCIAL STATEMENTS (Unaudited)(continued)
Guggenheim Investments (“GI”) provides advisory services, and Rydex Fund Services, LLC (“RFS”) provides transfer agent, administrative and accounting services to the Trust. Guggenheim Funds Distributors, LLC (“GFD”) acts as principal underwriter for the Trust. GI, RFS and GFD are affiliated entities.
Significant Accounting Policies
The Fund operates as an investment company and accordingly follows the investment company accounting and reporting guidance of the Financial Accounting Standards Board (“FASB”) Accounting Standards Codification Topic 946 Financial Services – Investment Companies.
The following significant accounting policies are in conformity with U.S. generally accepted accounting principles (”U.S. GAAP”) and are consistently followed by the Trust. This requires management to make estimates and assumptions that affect the reported amount of assets and liabilities and disclosure of contingent assets and liabilities at the date of the financial statements and the reported amounts of revenues and expenses during the reporting period. Actual results could differ from these estimates. All time references are based on Eastern Time.
The NAV of each Class of the Fund is calculated by dividing the market value of the Fund’s securities and other assets, less all liabilities, attributable to the Class by the number of outstanding shares of the Class.
A. The Board of Trustees of the Fund (the “Board”) has adopted policies and procedures for the valuation of the Fund's investments (the “Valuation Procedures”). Pursuant to the Valuation Procedures, the Board has delegated to a valuation committee, consisting of representatives from Guggenheim’s investment management, fund administration, legal and compliance departments (the “Valuation Committee”), the day-to-day responsibility for implementing the Valuation Procedures, including, under most circumstances, the responsibility for determining the fair value of the Fund’s securities or other assets.
Valuations of the Fund's securities are supplied primarily by pricing services appointed pursuant to the processes set forth in the Valuation Procedures. The Valuation Committee convenes monthly, or more frequently as needed and will review the valuation of all assets which have been fair valued for reasonableness. The Fund's officers, through the Valuation Committee and consistent with the monitoring and review responsibilities set forth in the Valuation Procedures, regularly review procedures used by, and valuations provided by, the pricing services.
If the pricing service cannot or does not provide a valuation for a particular investment or such valuation is deemed unreliable, such investment is fair valued by the Valuation Committee.
| 32 | THE GUGGENHEIM FUNDS SEMI-ANNUAL REPORT | |
NOTES TO FINANCIAL STATEMENTS (Unaudited)(continued)
Equity securities listed on an exchange (New York Stock Exchange (“NYSE”) or American Stock Exchange) are valued at the last quoted sales price as of the close of business on the NYSE, usually 4:00 p.m. on the valuation date. Equity securities listed on the NASDAQ market system are valued at the NASDAQ Official Closing Price on the valuation date, which may not necessarily represent the last sale price. If there has been no sale on such exchange or NASDAQ on a given day, the security is valued at the closing bid price on that day.
Generally, trading in foreign securities markets is substantially completed each day at various times prior to the close of the NYSE. The values of foreign securities are determined as of the close of such foreign markets or the close of the NYSE, if earlier. All investments quoted in foreign currency are valued in U.S. dollars on the basis of the foreign currency exchange rates prevailing at the close of business. Investments in foreign securities may involve risks not present in domestic investments. The Valuation Committee will determine the current value of such foreign securities by taking into consideration certain factors which may include those discussed above, as well as the following factors, among others: the value of the securities traded on other foreign markets, ADR trading, closed-end fund trading, foreign currency exchange activity, and the trading prices of financial products that are tied to foreign securities such as World Equity Benchmark Securities. In addition, the Board of Trustees has authorized the Valuation Committee and GI to use prices and other information supplied by a third party pricing vendor in valuing foreign securities.
Debt securities with a maturity of greater than 60 days at acquisition are valued at prices that reflect broker/dealer supplied valuations or are obtained from independent pricing services, which may consider the trade activity, treasury spreads, yields or price of bonds of comparable quality, coupon, maturity, and type, as well as prices quoted by dealers who make markets in such securities. Short-term debt securities with a maturity of 60 days or less at acquisition are valued at amortized cost, provided such amount approximates market value.
Typically loans are valued using information provided by an independent third party pricing service which uses broker quotes in a non-active market.
Forward foreign currency exchange contracts are valued daily based on the applicable exchange rate of the underlying currency. The change in value of the contract is recorded as unrealized appreciation or depreciation until the forward foreign currency contract is closed. When the forward foreign currency contract is closed, the Fund records a realized gain or loss equal to the difference between the value at the time the contract was opened and the value at the time it was closed.
| | THE GUGGENHEIM FUNDS SEMI-ANNUAL REPORT | 33 |
NOTES TO FINANCIAL STATEMENTS (Unaudited)(continued)
Investments for which market quotations are not readily available are fair valued as determined in good faith by GI under the direction of the Board of Trustees using methods established or ratified by the Board of Trustees. Valuations in accordance with these methods are intended to reflect each security’s (or asset’s) “fair value.” Each such determination is based on a consideration of all relevant factors, which are likely to vary from one pricing context to another. Examples of such factors may include, but are not limited to: (i) the type of security, (ii) the initial cost of the security, (iii) the existence of any contractual restrictions on the security’s disposition, (iv) the price and extent of public trading in similar securities of the issuer or of comparable companies, (v) quotations or evaluated prices from broker-dealers and/or pricing services, (vi) information obtained from the issuer, analysts, and/or the appropriate stock exchange (for exchange-traded securities), (vii) an analysis of the company’s financial statements, and (viii) an evaluation of the forces that influence the issuer and the market(s) in which the security is purchased and sold (e.g. the existence of pending merger activity, public offerings or tender offers that might affect the value of the security). In connection with derivative investments such factors may include, obtaining information as to how (a) these contracts and other derivative investments trade in the futures or other derivative markets, respectively, and (b) the securities underlying these contracts and other derivative investments trade in the cash market.
B. Senior loans in which the Fund invests generally pay interest rates which are periodically adjusted by reference to a base short-term, floating rate plus a premium. These base lending rates are generally (I) the lending rate offered by one or more major European banks, such as the one-month or three-month London Inter-Bank Offered Rate (LIBOR), (ii) the prime rate offered by one or more major United States banks, or (iii) the bank’s certificate of deposit rate. Senior floating rate interests often require prepayments from excess cash flows or permit the borrower to repay at its election. The rate at which the borrower repays cannot be predicted with accuracy. As a result, the actual remaining maturity may be substantially less than the stated maturities shown. The interest rate indicated is the rate in effect at March 31, 2015.
C. The Fund may purchase and sell interests in securities on a when-issued and delayed delivery basis, with payment and delivery scheduled for a future date. No income accrues to the Fund on such interests or securities in connection with such transactions prior to the date the Fund actually take delivery of such interests or securities. These transactions are subject to market fluctuations and are subject to the risk that the value at delivery may be more or less than the trade date purchase price. Although the Fund will generally purchase these securities with the intention of acquiring such securities, they may sell such securities before the settlement date.
| 34 | THE GUGGENHEIM FUNDS SEMI-ANNUAL REPORT | |
NOTES TO FINANCIAL STATEMENTS (Unaudited)(continued)
Forward foreign currency exchange contracts are valued daily based on the applicable exchange rate of the underlying currency. The change in value of the contract is recorded as unrealized appreciation or depreciation until the forward foreign currency contract is closed. When the forward foreign currency contract is closed, the Fund records a realized gain or loss equal to the difference between the value at the time the contract was opened and the value at the time it was closed.
E. Security transactions are recorded on the trade date for financial reporting purposes. Realized gains and losses from securities transactions are recorded using the identified cost basis. Proceeds from lawsuits related to investment holdings are recorded as realized gains in the Fund. Dividend income is recorded on the ex-dividend date, net of applicable taxes withheld by foreign countries. Taxable non-cash dividends are recorded as dividend income. Interest income, including amortization of premiums and accretion of discounts, is accrued on a daily basis. Interest income also includes paydown gains and losses on mortgage-backed and asset-backed securities and senior and subordinated loans. Amendment fees are earned as compensation for evaluating and accepting changes to the original loan agreement and are recognized when received. Dividend income from REITs is recorded based on the income included in the distributions received from the REIT investments using published REIT classifications, including some management estimates when actual amounts are not available. Distributions received in excess of this estimated amount are recorded as a reduction of the cost of investments or reclassified to capital gains. The actual amounts of income, return of capital, and capital gains are only determined by each REIT after its fiscal year-end, and may differ from the estimated amounts.
F. The Fund declares dividends from investment income daily. The Fund pays its shareholders from its net investment income monthly and distributes any net capital gains that it has realized, at least annually. Distributions to shareholders are recorded on the ex-dividend date. Dividends are reinvested in additional shares unless shareholders request payment in cash. The character of distributions made during the year from net investment income or net realized gains may differ from their ultimate characterization for federal income tax purposes.
G. Interest and dividend income, most expenses, all realized gains and losses, and all unrealized gains and losses are allocated to the classes based upon the value of the outstanding shares in each Class. Certain costs, such as distribution and service fees are charged directly to specific classes. In addition, certain expenses have been allocated to the individual Funds in the Trust on a pro rata basis upon the respective aggregate net assets of each Fund included in the Trust.
| | THE GUGGENHEIM FUNDS SEMI-ANNUAL REPORT | 35 |
NOTES TO FINANCIAL STATEMENTS (Unaudited)(continued)
Under the fee arrangement with the custodian, the Fund may earn credits based on overnight custody cash balances. These credits are utilized to reduce related custodial expenses. The custodian fees disclosed in the Statement of Operations are before the reduction in expense from the related earnings credits, if any. For the period ended March 31, 2015, there were no earnings credits received.
I. The Fund may leave cash overnight in its cash account with the custodian. Periodically, the Fund may have cash due to the custodian bank as an overdraft balance. A fee is incurred on this overdraft, calculated by multiplying the overdraft by a rate based on the federal funds rate.
J. Under the Fund's organizational documents, its Trustees and Officers are indemnified against certain liabilities arising out of the performance of their duties to the Trust. In addition, throughout the normal course of business, the Fund enters into contracts that contain a variety of representations and warranties which provide general indemnifications. The Fund's maximum exposure under these arrangements is unknown, as this would involve future claims that may be made against the Fund and/or its affiliates that have not yet occurred. However, based on experience, the Fund expects the risk of loss to be remote.
K. The accounting records of the Fund are maintained in U.S. dollars. All assets and liabilities initially expressed in foreign currencies are converted into U.S. dollars at prevailing exchange rates. Purchases and sales of investment securities, dividend and interest income, and certain expenses are translated at the rates of exchange prevailing on the respective dates of such transactions. Changes in the relationship of these foreign currencies to the U.S. dollar can significantly affect the value of the investments and earnings of the Fund. Foreign investments may also subject the Fund to foreign government exchange restrictions, expropriation, taxation or other political, social or economic developments, all of which could affect the market and/or credit risk of the investments.
The Fund does not isolate that portion of the results of operations resulting from changes in the foreign exchange rates on investments from the fluctuations arising from changes in the market prices of securities held. Such fluctuations are included with the net realized and unrealized gain or loss on investments.
Reported net realized foreign exchange gains and losses arise from sales of foreign currencies and currency gains or losses realized between the trade and settlement dates on investment transactions. Net unrealized exchange gains and losses arise from changes in the fair values of assets and liabilities other than investments in securities at the fiscal period end, resulting from changes in exchange rates.
| 36 | THE GUGGENHEIM FUNDS SEMI-ANNUAL REPORT | |
NOTES TO FINANCIAL STATEMENTS (Unaudited)(continued)
As part of its investment strategy, the Fund utilizes derivative instruments. These investments involve, to varying degrees, elements of market risk and risks in excess of the amounts recognized in the Statement of Assets and Liabilities.
A forward foreign currency exchange contract is an agreement between two parties to exchange two designated currencies at a specific time in the future. The contracts can be used to hedge or manage exposure to foreign currency risks with portfolio investments or to gain exposure to foreign currencies.
The Trust has established counterparty credit guidelines and enters into transactions only with financial institutions of investment grade or better. The Trust monitors the counterparty credit risk.
3. Fees and Other Transactions with Affiliates
Under the terms of an investment advisory contract, the Fund pays GI investment advisory fees calculated at an annualized rate of 0.65% of the average daily net assets of the Fund.
RFS provides transfer agent services to the Fund for fees calculated at the rates below which are assessed to the applicable class of the Fund. For these services, RFS receives the following:
| Annual charge per account | $5.00 – $8.00 |
| Transaction fee | $0.60 – $1.10 |
Minimum annual charge per Fund† | $25,000 |
| Certain out-of-pocket charges | Varies |
† | Not subject to Fund during first twelve months of operations. |
RFS also acts as the administrative agent for the Fund, and as such performs administrative functions and the bookkeeping, accounting and pricing functions for the Fund. For these services, RFS receives 0.095% of the average daily net assets of the Fund. The minimum annual charge for administrative fees is $25,000.
RFS engages external service providers to perform other necessary services for the Trust, such as audit and accounting related services, legal services, custody, printing and mailing, etc., on a pass-through basis. Such expenses are allocated to various Funds within the complex based on relative net assets.
| | THE GUGGENHEIM FUNDS SEMI-ANNUAL REPORT | 37 |
NOTES TO FINANCIAL STATEMENTS (Unaudited)(continued)
The Fund has adopted Distribution Plans related to the offering of A-Class and C-Class shares pursuant to Rule 12b-1 under the 1940 Act. The plans provide for payments at an annual rate of 0.25% of the average daily net assets of the Fund’s A-Class shares and 1.00% of the average daily net assets of the Fund’s C-Class shares.
The investment advisory contract for the following Fund provides that the total expenses be limited to a percentage of average net assets for each class of shares, exclusive of brokerage costs, dividends on securities sold short, expenses of other investment companies in which the Fund invests, interest, taxes, litigation, indemnification and extraordinary expenses. The limits are listed below:
| | Limit | Effective Date | Contract End Date |
| Floating Rate Strategies Fund - A-Class | 1.02% | 11/30/12 | 02/01/16 |
| Floating Rate Strategies Fund - C-Class | 1.77% | 11/30/12 | 02/01/16 |
| Floating Rate Strategies Fund - Institutional Class | 0.78% | 11/30/12 | 02/01/16 |
GI is entitled to reimbursement by the Fund for fees waived or expenses reimbursed during any of the previous 36 months, beginning on the date of the expense limitation agreement, if on any day the estimated operating expenses are less than the indicated percentages. At March 31, 2015, the amount of fees waived or expenses reimbursed that are subject to recoupment are presented in the following table:
| Fund | | Expires 2015 | | | Expires 2016 | | | Expires 2017 | | | Expires 2018 | | | Fund Total | |
| Floating Rate Strategies Fund | | $ | 127,768 | | | $ | 430,026 | | | $ | 1,206,044 | | | $ | 718,467 | | | $ | 2,482,305 | |
For the period ended March 31, 2015, no amounts were recouped by GI.
For the period ended March 31, 2015, GFD retained sales charges of $46,666 relating to sales of A-Class shares of the Trust.
Certain trustees and officers of the Trust are also officers of GI, RFS and GFD.
| 38 | THE GUGGENHEIM FUNDS SEMI-ANNUAL REPORT | |
NOTES TO FINANCIAL STATEMENTS (Unaudited)(continued)
In accordance with U.S. GAAP, fair value is defined as the price that the Fund would receive to sell an investment or pay to transfer a liability in an orderly transaction with an independent buyer in the principal market, or in the absence of a principal market, the most advantageous market for the investment or liability. U.S. GAAP establishes a three-tier fair value hierarchy based on the types of inputs used to value assets and liabilities and requires corresponding disclosure. The hierarchy and the corresponding inputs are summarized below:
| Level 1 — | quoted prices in active markets for identical assets or liabilities. |
| Level 2 — | significant other observable inputs (for example quoted prices for securities that are similar based on characteristics such as interest rates, prepayment speeds, credit risk, etc.). |
| Level 3 — | significant unobservable inputs based on the best information available under the circumstances, to the extent observable inputs are not available, which may include assumptions. |
The types of inputs available depend on a variety of factors, such as the type of security and the characteristics of the markets in which it trades, if any. Fair valuation determinations that rely on fewer or no observable inputs require greater judgment. Accordingly, fair value determinations for Level 3 securities require the greatest amount of judgment.
The following table summarizes the inputs used to value the Fund's investments at March 31, 2015:
| | | Level 1 Investments In Securities | | | Level 2 Investments In Securities | | | Level 2 Other Financial Instruments* | | | Level 3 Investments In Securities | | | Total | |
| Assets | | | | | | | | | | | | | | | |
| Floating Rate Strategies Fund | | $ | 65,207,292 | | | $ | 1,431,592,673 | | | $ | 2,383,722 | | | $ | 44,775,414 | | | $ | 1,543,959,101 | |
| | |
| Liabilities | | | | | | | | | | | | | | | | | | | | |
| Floating Rate Strategies Fund | | $ | — | | | $ | — | | | $ | 2,222 | | | $ | — | | | $ | 2,222 | |
| * | Other financial instruments may include forward foreign currency exchange contracts, which are reported as unrealized gain/loss at period end. |
Independent pricing services are used to value a majority of the Fund's investments. When values are not available from a pricing service, they may be computed by the Fund's investment adviser or an affiliate. In any event, values may be determined using a variety of sources and techniques, including: market prices;
| | THE GUGGENHEIM FUNDS SEMI-ANNUAL REPORT | 39 |
NOTES TO FINANCIAL STATEMENTS (Unaudited)(continued)
broker quotes; and models which derive prices based on inputs such as prices of securities with comparable maturities and characteristics or based on inputs such as anticipated cash flows or collateral, spread over Treasuries, and other information and analysis. A significant portion of the Fund's assets and liabilities are categorized as Level 2 or Level 3, as indicated in this report.
Indicative quotes from broker-dealers, adjusted for fluctuations in criteria such as credit spreads and interest rates, may be also used to value the Fund’s assets and liabilities, i.e. prices provided by a broker-dealer or other market participant who has not committed to trade at that price. Although indicative quotes are typically received from established market participants, the Fund may not have the transparency to view the underlying inputs which support the market quotations. Significant changes in an indicative quote would generally result in significant changes in the fair value of the security.
Certain fixed income securities are valued by obtaining a monthly indicative quote from a broker-dealer, adjusted for fluctuations in criteria such as credit spreads and interest rates. The Fund's fair valuation guidelines were recently revised to transition such monthly indicative quoted securities from Level 2 to Level 3.
The inputs or methodologies used for valuing securities are not necessarily an indication of the risk associated with investing in those securities. The suitability of the techniques and sources employed to determine fair valuation are regularly monitored and subject to change.
The following is a summary of significant unobservable inputs used in the fair value valuation of assets and liabilities categorized within level 3 of the fair value hierarchy.
| Fund | Category and Subcategory | Ending Balance at 03/31/15 | Valuation Technique | Unobservable Inputs |
| | Investments, at value | | | |
| Floating Rate Strategies Fund | Senior Floating Rate Interests | $41,419,648 | Model Priced | Purchase Price |
| | Corporate Bonds | 1,573,740 | Option Adjusted Spread off the month end broker mark over the 3 month LIBOR | Indicative Quote |
| | | 1,113,492 | Model Priced | Purchase Price |
| | Total Corporate Bonds | 2,687,232 | | |
| | Asset-Backed Securities | 668,534 | Option Adjusted Spread off the month end broker mark over the 3 month LIBOR | Indicative Quote |
| 40 | THE GUGGENHEIM FUNDS SEMI-ANNUAL REPORT | |
NOTES TO FINANCIAL STATEMENTS (Unaudited)(continued)
Any remaining Level 3 securities held by the Fund and excluded from the table above, were not considered material to the Fund.
Transfers between investment levels may occur as the markets fluctuate and/or the availability of data used in an investment’s valuation changes. The Fund recognized transfers between the levels as of the beginning of the period. As of March 31, 2015, the Fund had transfers in/out of Level 3 due to changes in securities valuation method and transfers between Level 1 and Level 2 due to utilizing international fair value pricing during the period. See the table below for changes to and from Level 2 and Level 3. There were no other securities that transferred between levels.
Summary of Fair Value Level 3 Activity
Following is a reconciliation of Level 3 assets and liabilities for which significant unobservable inputs were used to determine fair value for the period ended March 31, 2015:
LEVEL 3 – Fair value measurement using significant unobservable inputs
| | | Senior Floating Rate Interests | | | Asset-Backed Securities | | | Corporate Bonds | | | Total | |
| Floating Rate Strategies Fund | | | | | | | | | | | | |
| Assets: | | | | | | | | | | | | |
| Beginning Balance | | $ | 27,188,014 | | | $ | 2,113,450 | | | $ | 2,729,079 | | | $ | 32,030,543 | |
| Purchases | | | 2,387,260 | | | | — | | | | 50,494 | | | | 2,437,754 | |
| Sales | | | (527,856 | ) | | | (64,390 | ) | | | — | | | | (592,246 | ) |
| Total realized gains or losses included in earnings | | | (11,318 | ) | | | — | | | | — | | | | (11,318 | ) |
| Total change in unrealized gains or losses included in earnings | | | (2,861,098 | ) | | | 63,750 | | | | (92,341 | ) | | | (2,889,689 | ) |
| Transfers in Level 3 | | | 15,244,646 | | | | 240,274 | | | | — | | | | 15,484,920 | |
| Transfers out of Level 3 | | | — | | | | (1,684,550 | ) | | | — | | | | (1,684,550 | ) |
| Ending Balance | | $ | 41,419,648 | | | $ | 668,534 | | | $ | 2,687,232 | | | $ | 44,775,414 | |
5. Derivative Investment Holdings Categorized by Risk Exposure
U.S. GAAP requires disclosures to enable investors to better understand how and why the Fund uses derivative instruments, how these derivative instruments are accounted for and their effects on the Fund's financial position and results of operations.
The Fund utilized derivatives for hedging purposes.
| | THE GUGGENHEIM FUNDS SEMI-ANNUAL REPORT | 41 |
NOTES TO FINANCIAL STATEMENTS (Unaudited)(continued)
The following table represents the notional amount of derivative instruments outstanding as an approximate percentage of the Fund’s net assets on a quarterly basis.
| | Approximate percentage of Fund's Net Assets on a quarterly basis |
| Fund | Long |
| Floating Rate Strategies Fund | 5% |
The following is a summary of the location of derivative investments on the Fund's Statement of Assets and Liabilities as of March 31, 2015:
| Derivative Investment Type | Asset Derivatives | Liability Derivatives |
| Currency contracts | Unrealized appreciation on forward foreign currency exchange contracts | Unrealized depreciation on forward foreign currency exchange contracts |
The following table sets forth the fair value of the Fund's derivative investments categorized by primary risk exposure at March 31, 2015:
| Asset Derivative Investments Value | |
| Fund | | Forward Foreign Currency Exchange Contracts | | | Total | |
| Floating Rate Strategies Fund | | $ | 2,383,722 | | | $ | 2,383,722 | |
| Liability Derivative Investments Value | |
| Fund | | Forward Foreign Currency Exchange Contracts | | | Total | |
| Floating Rate Strategies Fund | | $ | 2,222 | | | $ | 2,222 | |
| 42 | THE GUGGENHEIM FUNDS SEMI-ANNUAL REPORT | |
NOTES TO FINANCIAL STATEMENTS (Unaudited)(continued)
The following is a summary of the location of derivative investments on the Fund's Statement of Operations for the period ended March 31, 2015:
| Derivative Investment Type | Location of Gain (Loss) on Derivatives |
| Currency contracts | Net realized gain (loss) on forward foreign currency exchange contracts |
| | Net change in unrealized appreciation (depreciation) on forward foreign currency exchange contracts |
The following is a summary of the Fund's realized gain (loss) and change in unrealized appreciation (depreciation) on derivative investments recognized on the Statement of Operations categorized by primary risk exposure for the period ended March 31, 2015:
Realized Gain (Loss) on Derivative Investments Recognized on the Statement of Operations | |
| Fund | | Forward Foreign Currency Exchange Contracts | | | Total | |
| Floating Rate Strategies Fund | | $ | 19,767,603 | | | $ | 19,767,603 | |
Change in Unrealized Appreciation (Depreciation) on Derivative Investments Recognized on the Statement of Operations | |
| Fund | | Forward Foreign Currency Exchange Contracts | | | Total | |
| Floating Rate Strategies Fund | | $ | (1,716,214 | ) | | $ | (1,716,214 | ) |
6. Federal Income Tax Information
The Fund intends to comply with the provisions of Subchapter M of the Internal Revenue Code applicable to regulated investment companies and will distribute substantially all taxable net investment income and capital gains sufficient to relieve the Fund from all, or substantially all, federal income, excise and state income taxes. Therefore, no provision for federal or state income tax is required.
| | THE GUGGENHEIM FUNDS SEMI-ANNUAL REPORT | 43 |
NOTES TO FINANCIAL STATEMENTS (Unaudited)(continued)
Tax positions taken or expected to be taken in the course of preparing the Fund’s tax returns are evaluated to determine whether the tax positions are “more-likely-than-not” of being sustained by the applicable tax authority. Tax positions not deemed to meet the more-likely-than-not threshold would be recorded as a tax benefit or expense in the current year. Management has analyzed the Fund’s tax positions taken, or to be taken, on Federal income tax returns for all open tax years, and has concluded that no provision for income tax is required in the Fund’s financial statements. The Fund’s federal tax returns are subject to examination by the Internal Revenue Service for a period of three years after they are filed.
At March 31, 2015, the cost of securities for Federal income tax purposes, the aggregate gross unrealized gain for all securities for which there was an excess of value over tax cost and the aggregate gross unrealized loss for all securities for which there was an excess of tax cost over value, were as follows:
| Fund | Tax Cost | | Tax Unrealized Gain | | Tax Unrealized Loss | | Net Unrealized Loss | |
| Floating Rate Strategies Fund | | $ | 1,567,070,555 | | | $ | 12,583,919 | | | $ | (38,079,095 | ) | | $ | (25,495,176 | ) |
7. Securities Transactions
For the period ended March 31, 2015, the cost of purchases and proceeds from sales of investment securities, excluding government securities, short-term investments and derivatives, were as follows:
| Fund | Purchases | | Sales | |
| Floating Rate Strategies Fund | | $ | 470,995,961 | | | $ | 337,644,286 | |
| 44 | THE GUGGENHEIM FUNDS SEMI-ANNUAL REPORT | |
NOTES TO FINANCIAL STATEMENTS (Unaudited)(continued)
Pursuant to the terms of certain loan agreements, the Fund held unfunded loan commitments as of March 31, 2015. The Fund is obligated to fund these loan commitments at the borrower’s discretion. The unfunded loan commitments as of March 31, 2015 were as follows:
| Borrower | Maturity Date | | Face Amount | | | Value | |
| Floating Rate Strategies Fund | | | | | | | |
| Signode Industrial Group US, Inc. | 05/01/19 | | $ | 11,400,000 | | | $ | 1,161,010 | |
| Advantage Sales & Marketing, Inc. | 07/21/19 | | | 8,000,000 | | | | 891,024 | |
| IntraWest Holdings S.à r.l. | 12/10/18 | | | 6,900,000 | | | | 203,495 | |
| SS&C Technologies, Inc. | 02/27/16 | | | 5,400,000 | | | | — | |
| Valeant Pharmaceuticals International, Inc. | 03/11/22 | | | 4,120,482 | | | | — | |
| Banca Civica (UK) - Chambertin | 08/12/20 | | | 3,800,000 | | | | 151,244 | |
| McGraw-Hill Global Education Holdings LLC | 03/22/18 | | | 3,500,000 | | | | 282,786 | |
| Wencor Group | 06/19/19 | | | 2,850,000 | | | | 281,686 | |
| Rite Aid Corp. | 08/10/15 | | | 2,600,000 | | | | — | |
| Ceva Group plc (United Kingdom) | 03/19/19 | | | 2,400,000 | | | | 388,342 | |
| Blue Coat Systems, Inc. | 02/15/17 | | | 1,500,000 | | | | 66,240 | |
| Intertrust Group | 02/15/19 | | | 1,475,000 | | | | 77,565 | |
| Hoffmaster Group, Inc. | 05/09/19 | | | 1,250,000 | | | | 119,647 | |
| National Financial Partners Corp. | 07/01/18 | | | 888,889 | | | | 81,323 | |
| American Stock Transfer & Trust | 06/11/18 | | | 800,000 | | | | 69,413 | |
| Expert Global Solutions | 04/02/17 | | | 552,155 | | | | 33,587 | |
| Kronos, Inc. | 10/26/17 | | | 500,000 | | | | 38,609 | |
| Internet Brands | 07/08/21 | | | 10,028 | | | | 49 | |
| | | | $ | 57,946,554 | | | $ | 3,846,020 | |
9. Line of Credit
The Trust, with the exception of Alpha Opportunity Fund and Capital Stewardship Fund, secured a committed, $625,000,000 line of credit from Citibank, N.A., good through October 9, 2015, at which time the line of credit may be renewed. This line of credit is reserved for emergency or temporary purposes. Fees related to borrowings, if any, vary under this arrangement between the greater of Citibank’s “base rate”, LIBOR plus 1.0%, and the Fed Funds rate, plus 0.50%. The Trust did not have any borrowings under this agreement as of and for the period-ended March 31, 2015. The Trust also pays a commitment fee at an annualized rate of 0.07% of the average daily amount of their unused commitment amount.
| | THE GUGGENHEIM FUNDS SEMI-ANNUAL REPORT | 45 |
NOTES TO FINANCIAL STATEMENTS (Unaudited)(continued)
The Fund may enter into reverse repurchase agreements. Under a reverse repurchase agreement, a Fund sells securities and agrees to repurchase them at a particular price at a future date. In the event the buyer of securities under a reverse repurchase agreement files for bankruptcy or becomes insolvent, such buyer or its trustee or receiver may receive an extension of time to determine whether to enforce the Fund’s obligation to repurchase the securities, and the Fund’s use of the proceeds of the reverse repurchase agreement may effectively be restricted pending such decision.
For the period ended March 31, 2015, the Fund entered into reverse repurchase agreements as follows:
| Fund | Number of Days outstanding | | Balance at March 31, 2015 | | Average balance outstanding | | Average interest rate | |
| Floating Rate Strategies Fund | | | 181 | | | $ | 404,250 | | | $ | 406,262 | | | | (0.80 | %) |
11. Restricted Securities
The securities below are considered illiquid and restricted under guidelines established by the Board of Trustees:
| Fund | Restricted Securities | Acquisition Date | Cost | | Value | |
| Floating Rate Strategies Fund | Premier Foods Finance plc | | | | | |
| 5.56% due 03/16/20 | 03/06/14 | | $ | 585,823 | | | $ | 462,159 | |
12. Offsetting
In the normal course of business, the Fund enters into transactions subject to enforceable master netting arrangements or other similar arrangements. Generally, the right to offset in those agreements allows the Fund to counteract the exposure to a specific counterparty with collateral received or delivered to that counterparty based on the terms of the arrangements. These arrangements provide for the right to liquidate upon the occurrence of an event of default, credit event upon merger or additional termination event.
In order to better define their contractual rights and to secure rights that will help the Fund mitigate its counterparty risk, the Fund may enter into an International Swaps and Derivatives Association, Inc. Master Agreement (“ISDA Master Agreement”) or similar agreement with its derivative contract counterparties. An ISDA Master Agreement is a bilateral agreement between a Fund and a counterparty that governs OTC derivatives, including foreign exchange contracts, and typically contains, among other things, collateral posting terms and netting
| 46 | THE GUGGENHEIM FUNDS SEMI-ANNUAL REPORT | |
NOTES TO FINANCIAL STATEMENTS (Unaudited)(continued)
provisions in the event of a default and/or termination event. The provisions of the ISDA Master Agreement typically permit a single net payment in the event of a default (close-out netting) or similar event, including the bankruptcy or insolvency of the counterparty.
For derivatives traded under an ISDA Master Agreement, the collateral requirements are typically calculated by netting the mark to market amount for each transaction under such agreement and comparing that amount to the value of any collateral currently pledged by the Fund and the counterparty. For financial reporting purposes, cash collateral that has been pledged to cover obligations of the Fund and cash collateral received from the counterparty, if any, is reported separately on the Statement of Assets and Liabilities as segregated cash with broker/receivable for variation margin, or payable for swap settlement/variation margin. Generally, the amount of collateral due from or to a counterparty must exceed a minimum transfer amount threshold (e.g., $300,000) before a transfer is required to be made. To the extent amounts due to the Fund from its counterparties are not fully collateralized, contractually or otherwise, the Fund bears the risk of loss from counterparty nonperformance. The Fund attempts to mitigate counterparty risk by only entering into agreements with counterparties that they believe to be of good standing and by monitoring the financial stability of those counterparties.
For financial reporting purposes, the Fund does not offset derivative assets and derivative liabilities that are subject to netting arrangements in the Statement of Assets and Liabilities.
The following tables present derivative financial instruments and secured financing transactions that are subject to enforceable netting arrangements and offset in the Statement of Assets and Liabilities in conformity with U.S. GAAP.
| | | | | | | | | | | | | Gross Amounts Not Offset in the Statement of Assets and Liabilities | | | | |
| Fund | Instrument | | Gross Amounts of Recognized Assets | | | Gross Amounts Offset in the Statement of Assets and Liabilities | | | Net Amount of Assets Presented on the Statement of Assets and Liabilities | | | Financial Instruments | | | Cash Collateral Received | | | Net Amount | |
| Floating Rate Strategies Fund | Forward foreign currency exchange contracts | | $ | 2,383,722 | | | $ | — | | | $ | 2,383,722 | | | $ | — | | | $ | — | | | $ | 2,383,722 | |
| | THE GUGGENHEIM FUNDS SEMI-ANNUAL REPORT | 47 |
NOTES TO FINANCIAL STATEMENTS (Unaudited)(concluded)
| | | | | | | | | | | | | Gross Amounts Not Offset in the Statement of Assets and Liabilities | | | | |
| Fund | Instrument | | Gross Amounts of Recognized Liabilities | | | Gross Amounts Offset in the Statement of Assets and Liabilities | | | Net Amount of Liabilities Presented on the Statement of Assets and Liabilities | | | Financial Instruments | | | Cash Collateral Received | | | Net Amount | |
| Floating Rate Strategies Fund | Forward foreign currency exchange contracts | | $ | 2,222 | | | $ | — | | | $ | 2,222 | | | $ | — | | | $ | — | | | $ | 2,222 | |
13. Subsequent Event
P-Class Shares to be Offered
Effective following the close of business on April 30, 2015, or such later date as may be determined appropriate by management, Floating Rate Strategies Fund (the “Fund”), a separate series of Guggenheim Funds Trust, will offer P-Class shares.
P-Class shares of the Fund are offered primarily through broker/dealers and other financial intermediaries with which Guggenheim Funds Distributors, LLC has an agreement for the use of P-Class shares of the Fund in investment products, programs or accounts. P-Class shares do not have a minimum initial investment amount, subsequent investment amount or a minimum account balance. The Fund reserves the right to modify its minimum investment amount and account balance requirements at any time, with or without prior notice to you.
Shareholders who currently have accounts held directly at Guggenheim Investments will not be permitted to purchase P-Class shares.
For more information, or to request copies of the Fund’s prospectuses, call Client Services at 800.820.0888 or visiting guggenheiminvestments.com.
| 48 | THE GUGGENHEIM FUNDS SEMI-ANNUAL REPORT | |
OTHER INFORMATION (Unaudited)
Proxy Voting Information
A description of the policies and procedures that the Trust uses to determine how to vote proxies relating to securities held in the Funds’ portfolios is available, without charge and upon request, by calling 800.820.0888. This information is also available from the EDGAR database on the SEC’s website at http://www.sec.gov.
Information regarding how the Funds voted proxies relating to portfolio securities during the most recent 12-month period ended June 30 is available without charge, upon request, by calling 800.820.0888. This information is also available from the EDGAR database on the SEC’s website at http://www.sec.gov.
Sector Classification
Information in the “Schedule of Investments” is categorized by sectors using sector-level classifications used by Bloomberg Industry Classification System, a widely recognized industry classification system provider. In each Fund’s registration statement, the Funds have investment policies relating to concentration in specific industries. For purposes of these investment policies, the Funds usually classify industries based on industry-level classifications used by widely recognized industry classification system providers such as Bloomberg Industry Classification System, Global Industry Classification Standards and Barclays Global Classification Scheme.
Quarterly Portfolio Schedules Information
The Trust files its complete schedule of portfolio holdings with the SEC for the first and third quarters of each fiscal year on Form N-Q; which are available on the SEC’s website at http://www.sec.gov. The Funds’ Forms N-Q may be reviewed and copied at the SEC’s Public Reference Room in Washington, DC, and that information on the operation of the Public Reference Room may be obtained by calling 800-SEC-0330. Copies of the portfolio holdings are also available to shareholders, without charge and upon request, by calling 800.820.0888.
| | THE GUGGENHEIM FUNDS SEMI-ANNUAL REPORT | 49 |
INFORMATION ON BOARD OF TRUSTEES AND OFFICERS (Unaudited)
Name, Address* and Year of Birth | Position(s) Held with the Trust | Term of Office and Length of Time Served** | Principal Occupation(s) During Past Five Years | Number of Portfolios in Fund Complex Overseen | Other Directorships Held by Trustees |
| INDEPENDENT TRUSTEES | | | |
Randall C. Barnes (1951) | Trustee | Since 2014 | Current: Private Investor (2001-present). Former: Senior Vice President and Treasurer, PepsiCo, Inc. (1993-1997); President, Pizza Hut International (1991-1993); Senior Vice President, Strategic Planning and New Business Development, PepsiCo, Inc. (1987-1990). | 91 | Current: Trustee, Purpose Investments Inc. (2014-Present). |
Donald A. Chubb, Jr. (1946) | Trustee and Vice Chairman of the Board | Since 1994 | Current: Business broker and manager of commercial real estate, Griffith & Blair, Inc. (1997-present). | 87 | None. |
Jerry B. Farley (1946) | Trustee and Vice Chairman of the Audit Committee | Since 2005 | Current: President, Washburn University (1997-present). | 87 | Current: Westar Energy, Inc. (2004-present); CoreFirst Bank & Trust (2000-present). |
| 50 | THE GUGGENHEIM FUNDS SEMI-ANNUAL REPORT | |
INFORMATION ON BOARD OF TRUSTEES AND OFFICERS (Unaudited)(continued)
Name, Address* and Year of Birth | Position(s) Held with the Trust | Term of Office and Length of Time Served** | Principal Occupation(s) During Past Five Years | Number of Portfolios in Fund Complex Overseen | Other Directorships Held by Trustees |
| INDEPENDENT TRUSTEES - continued | | |
Roman Friedrich III (1946) | Trustee and Chairman of the Contracts Review Committee | Since 2014 | Current: Founder and President, Roman Friedrich & Company (1998-present). Former: Senior Managing Director, MLV & Co. LLC (2010-2011). | 87 | Current: Zincore Metals, Inc. (2009-present). Former: Mercator Minerals Ltd. (2013-2014); First Americas Gold Corp. (2012-2014); Blue Sky Uranium Corp. (2011-2012); Axiom Gold and Silver Corp. (2011-2012); Stratagold Corp. (2003-2009); GFM Resources Ltd. (2005-2010). |
Robert B. Karn III (1942) | Trustee and Chairman of the Audit Committee | Since 2014 | Current: Consultant (1998-present). Former: Arthur Andersen (1965-1997) and Managing Partner, Financial and Economic Consulting, St. Louis office (1987-1997). | 87 | Current: Peabody Energy Company (2003-present); GP Natural Resource Partners, LLC (2002- present). |
Ronald A. Nyberg (1953) | Trustee and Chairman of the Nominating and Governance Committee | Since 2014 | Current: Partner, Nyberg & Cassioppi, LLC (2000-present). Former: Executive Vice President, General Counsel, and Corporate Secretary, Van Kampen Investments (1982-1999). | 93 | Current: Edward-Elmhurst Healthcare System (2012-present). |
| | THE GUGGENHEIM FUNDS SEMI-ANNUAL REPORT | 51 |
INFORMATION ON BOARD OF TRUSTEES AND OFFICERS (Unaudited)(continued)
Name, Address* and Year of Birth | Position(s) Held with the Trust | Term of Office and Length of Time Served** | Principal Occupation(s) During Past Five Years | Number of Portfolios in Fund Complex Overseen | Other Directorships Held by Trustees |
| INDEPENDENT TRUSTEES - concluded | | |
Maynard F. Oliverius (1943) | Trustee and Vice Chairman of the Contracts Review Committee | Since 1998 | Current: Retired. Former: President and CEO, Stormont-Vail HealthCare (1996-2012). | 87 | Current: Fort Hays State University Foundation (1999-present); Stormont-Vail Foundation (2013-present); University of Minnesota HealthCare Alumni Association Foundation (2009-present). |
Ronald E. Toupin, Jr. (1958) | Trustee and Chairman of the Board | Since 2014 | Current: Portfolio Consultant (2010-present). Former: Vice President, Manager and Portfolio Manager, Nuveen Asset Management (1998-1999); Vice President, Nuveen Investment Advisory Corp. (1992-1999); Vice President and Manager, Nuveen Unit Investment Trusts (1991-1999); and Assistant Vice President and Portfolio Manager, Nuveen Unit Investment Trusts (1988-1999), each of John Nuveen & Co., Inc. (1982-1999). | 90 | Former: Bennett Group of Funds (2011-2013). |
| 52 | THE GUGGENHEIM FUNDS SEMI-ANNUAL REPORT | |
INFORMATION ON BOARD OF TRUSTEES AND OFFICERS (Unaudited)(continued)
Name, Address* and Year of Birth | Position(s) Held with the Trust | Term of Office and Length of Time Served** | Principal Occupation(s) During Past Five Years | Number of Portfolios in Fund Complex Overseen | Other Directorships Held by Trustees |
| INTERESTED TRUSTEE | |
Donald C. Cacciapaglia*** (1951) | President, Chief Executive Officer and Trustee | Since 2012 | Current: President and CEO, certain other funds in the Fund Complex (2012-present); Vice Chairman, Guggenheim Investments (2010-present). Former: Chairman and CEO, Channel Capital Group, Inc. (2002-2010). | 221 | Current: Clear Spring Life Insurance Company (2015-present); Guggenheim Partners Japan, Ltd. (2014-present); Delaware Life (2013-present); Guggenheim Life and Annuity Company (2011-present); Paragon Life Insurance Company of Indiana (2011-present). |
| * | The business address of each Trustee is c/o Guggenheim Investments, 805 King Farm Boulevard, Suite 600, Rockville, Maryland 20850. |
| ** | Each Trustee serves an indefinite term, until his successor is elected and qualified. Time served includes time served in the respective position for the Predecessor Corporation. |
| *** | This Trustee is deemed to be an "interested person" of the Funds under the 1940 Act by reason of his position with the Funds' Investment Manager and/or the parent of the Investment Manager. |
| | THE GUGGENHEIM FUNDS SEMI-ANNUAL REPORT | 53 |
INFORMATION ON BOARD OF TRUSTEES AND OFFICERS (Unaudited)(continued)
Name, Address* and Year of Birth | Position(s) held with the Trust | Term of Office and Length of Time Served** | Principal Occupations During Past Five Years |
| OFFICERS | | | |
Joseph M. Arruda (1966) | Assistant Treasurer | Since 2010 | Current: Assistant Treasurer, certain other funds in the Fund Complex (2006-present); Vice President, Security Investors, LLC (2010-present); CFO and Manager, Guggenheim Specialized Products, LLC (2009-present). Former: Vice President, Security Global Investors, LLC (2010-2011); Vice President, Rydex Advisors, LLC (2010); Vice President, Rydex Advisors II, LLC (2010). |
William H. Belden, III (1965) | Vice President | Since 2014 | Current: Vice President, certain other funds in the Fund Complex (2006-present); Managing Director, Guggenheim Funds Investment Advisors, LLC (2005-present). Former: Vice President of Management, Northern Trust Global Investments (1999-2005). |
Mark J. Furjanic (1959) | Assistant Treasurer | Since 2014 | Current: Vice President, Guggenheim Investments (2005-present); Assistant Treasurer, certain other funds in the Fund Complex (2008-present). Former: Senior Manager, Ernst & Young LLP (1999-2005). |
James M. Howley (1972) | Assistant Treasurer | Since 2014 | Current: Director, Guggenheim Investments (2004-present) ; Assistant Treasurer, certain other funds in the Fund Complex (2006-present). Former: Manager, Mutual Fund Administration of Van Kampen Investments, Inc. (1996-2004). |
| 54 | THE GUGGENHEIM FUNDS SEMI-ANNUAL REPORT | |
INFORMATION ON BOARD OF TRUSTEES AND OFFICERS (Unaudited)(continued)
Name, Address* and Year of Birth | Position(s) held with the Trust | Term of Office and Length of Time Served** | Principal Occupations During Past Five Years |
| OFFICERS - continued | |
Amy J. Lee (1961) | Vice President and Chief Legal Officer | Since 2007 (Vice President) Since 2014 (Chief Legal Officer) | Current: Chief Legal Officer, certain other funds in the Fund Complex (2013-present); Senior Managing Director, Guggenheim Investments (2012-present). Former: Vice President, Associate General Counsel and Assistant Secretary, Security Benefit Life Insurance Company and Security Benefit Corporation (2004-2012). |
Mark E. Mathiasen (1978) | Secretary | Since 2014 | Current: Secretary, certain other funds in the Fund Complex (2007-present); Managing Director, Guggenheim Investments (2007-present). |
Michael P. Megaris (1984) | Assistant Secretary | Since 2014 | Current: Assistant Secretary, certain other funds in the Fund Complex (2014-present); Associate, Guggenheim Investments (2012-present). Former: J.D., University of Kansas School of Law (2009-2012). |
Elisabeth Miller (1968) | Chief Compliance Officer | Since 2012 | Current: CCO, certain other funds in the Fund Complex (2012-present); CCO, Security Investors, LLC (2012-present); CCO, Guggenheim Funds Investment Advisors, LLC (2012-present); Managing Director, Guggenheim Investments (2012-present); Vice President, Guggenheim Funds Distributors, LLC (March 2014-present). Former: CCO, Guggenheim Distributors, LLC (2009-March 2014); Senior Manager, Security Investors, LLC (2004-2009); Senior Manager, Guggenheim Distributors, LLC (2004-2009). |
| | THE GUGGENHEIM FUNDS SEMI-ANNUAL REPORT | 55 |
INFORMATION ON BOARD OF TRUSTEES AND OFFICERS (Unaudited)(continued)
Name, Address* and Year of Birth | Position(s) held with the Trust | Term of Office and Length of Time Served** | Principal Occupations During Past Five Years |
| OFFICERS - continued | |
Alison Santay (1974) | AML Officer | Since 2013 | Current: AML Officer, certain other funds in the Fund Complex (2010-present); Director and AML Officer, Rydex Fund Services, LLC (2010-present); AML Officer, Security Investors, LLC (2010-present); Director, Shareholder Risk and Compliance, Rydex Fund Services, LLC (2004-present). Former: AML Officer, Guggenheim Distributors, LLC (2013-2014). |
Kimberly Scott (1974) | Assistant Treasurer | Since 2014 | Current: Vice President, Guggenheim Investments (2012-present) ; Assistant Treasurer, certain other funds in the Fund Complex (2012-present). Former: Financial Reporting Manager, Invesco, Ltd. (2010-2011); Vice President/Assistant Treasurer, Mutual Fund Administration for Van Kampen Investments, Inc./Morgan Stanley Investment Management (2009-2010); Manager of Mutual Fund Administration, Van Kampen Investments, Inc./Morgan Stanley Investment Management (2005-2009). |
Bryan Stone (1979) | Vice President | Since 2014 | Current: Vice President, certain other funds in the Fund Complex (2014-present); Director, Guggenheim Investments (2013-present). Former: Senior Vice President, Neuberger Berman Group LLC (2009-2013); Vice President, Morgan Stanley (2002-2009). |
| 56 | THE GUGGENHEIM FUNDS SEMI-ANNUAL REPORT | |
INFORMATION ON BOARD OF TRUSTEES AND OFFICERS (Unaudited)(concluded)
Name, Address* and Year of Birth | Position(s) held with the Trust | Term of Office and Length of Time Served** | Principal Occupations During Past Five Years |
| OFFICERS - concluded | |
John L. Sullivan (1955) | Chief Financial Officer and Treasurer | Since 2014 | Current: CFO, Chief Accounting Officer and Treasurer, certain other funds in the Fund Complex (2010-present); Senior Managing Director, Guggenheim Investments (2010-present). Former: Managing Director and CCO, each of the funds in the Van Kampen Investments fund complex (2004-2010); Managing Director and Head of Fund Accounting and Administration, Morgan Stanley Investment Management (2002-2004); CFO and Treasurer, Van Kampen Funds (1996-2004). |
| * | The business address of each officer is c/o Guggenheim Investments, 805 King Farm Boulevard, Suite 600, Rockville, Maryland 20850. |
| ** | Each officer serves an indefinite term, until his or her successor is duly elected and qualified. Time served includes time served in the respective position for the Predecessor Corporation. |
| | THE GUGGENHEIM FUNDS SEMI-ANNUAL REPORT | 57 |
GUGGENHEIM INVESTMENTS PRIVACY POLICIES (Unaudited)
Rydex Funds, Guggenheim Funds, Rydex Investments, Guggenheim Funds Distributors, LLC, Security Investors, LLC, Security Distributors, Inc., Guggenheim Partners Investment Managers, LLC, and Rydex Advisory Services (Collectively “Guggenheim Investments”).
Our Commitment to You
When you become a Guggenheim Investments investor, you entrust us with not only your hard-earned money but also with personal and financial information about you. We recognize that your relationship with us is based on trust and that you expect us to act responsibly and in your best interests. Because we have access to this private information about you, we hold ourselves to the highest standards in its safekeeping and use. This means, most importantly, that we do not sell client information to anyone—whether it is your personal information or if you are a current or former Guggenheim Investments client.
The Information We Collect About You
In the course of doing business with shareholders and investors, we collect nonpublic personal information about you. You typically provide personal information when you complete a Guggenheim Investments account application or when you request a transaction that involves Rydex and Guggenheim Investments funds or one of the Guggenheim Investments affiliated companies. “Nonpublic personal information” is personally identifiable private information about you. For example, it includes information regarding your name and address, Social Security or taxpayer identification number, assets, income, account balance, bank account information and investment activity (e.g., purchase and redemption history).
How We Handle Your Personal Information
As emphasized above, we do not sell information about current or former clients or their accounts to third parties. Nor do we share such information, except when necessary to complete transactions at your request or to make you aware of related investment products and services that we offer. Additional details about how we handle your personal information are provided below. To complete certain transactions or account changes that you direct, it may be necessary to provide identifying information to companies, individuals or groups that are not affiliated with Guggenheim Investments. For example, if you ask to transfer assets from another financial institution to Guggenheim Investments, we will need to provide certain information about you to that company to complete the transaction. To alert you to other Guggenheim Investments investment products and services, we may share your information within the Guggenheim Investments family of affiliated companies. This would include, for example, sharing your information within Guggenheim Investments so we can make you aware of
| 58 | THE GUGGENHEIM FUNDS SEMI-ANNUAL REPORT | |
GUGGENHEIM INVESTMENTS PRIVACY POLICIES (Unaudited)(continued)
new Rydex and Guggenheim Investments funds or the services offered through another Guggenheim Investments affiliated company. In certain instances, we may contract with nonaffiliated companies to perform services for us. Where necessary, we will disclose information we have about you to these third parties. In all such cases, we provide the third party with only the information necessary to carry out its assigned responsibilities and only for that purpose. And we require these third parties to treat your private information with the same high degree of confidentiality that we do. In certain instances, we may share information with other financial institutions regarding individuals and entities in response to the U.S.A. Patriot Act. Finally, we will release information about you if you direct us to do so, if we are compelled by law to do so or in other circumstances permitted by law.
Opt Out Provisions
We do not sell your personal information to anyone. The law allows you to “opt out” of only certain kinds of information sharing with third parties. The firm does not share personal information about you with any third parties that triggers this opt-out right. This means YOU ARE ALREADY OPTED OUT.
How We Protect Privacy Online
Our concern for the privacy of our shareholders also extends to those who use our web site, guggenheiminvestments.com. Our web site uses some of the most secure forms of online communication available, including encryption technology, Secure Socket Layer (SSL) protocol, firewalls and user names and passwords. These technologies provide a high level of security and privacy when you access your account information or initiate online transactions. The Guggenheim Investments web site offers customized features that require our use of “http cookies”—tiny pieces of information that we ask your browser to store. However, we make very limited use of these cookies. We only use cookies for session management and security features on the Guggenheim Investments web site. We do not use them to pull data from your hard drive, to learn your email address, or to view data in cookies created by other web sites. We will not share the information in our cookies or give others access to it. See the legal information area on our web site for more details about web site security and privacy features.
How We Safeguard Your Personal Information
We restrict access to nonpublic personal information about shareholders to our employees and in some cases to third parties (for example, the service providers described above) as permitted by law. We maintain strict physical, electronic and procedural safeguards that comply with federal standards to guard your nonpublic personal information.
| | THE GUGGENHEIM FUNDS SEMI-ANNUAL REPORT | 59 |
GUGGENHEIM INVESTMENTS PRIVACY POLICIES (Unaudited)(concluded)
We’ll Keep You Informed
As required by federal law, we will notify shareholders of our privacy policy annually. We reserve the right to modify this policy at any time, but rest assured that if we do change it, we will tell you promptly. You will also be able to access our privacy policy from our web site at guggenheiminvestments.com. Should you have any questions regarding our privacy policy, contact us at 800.820.0888 or 301.296.5100.
| 60 | THE GUGGENHEIM FUNDS SEMI-ANNUAL REPORT | |
This page intentionally left blank.
3.31.2015
Guggenheim Funds Semi-Annual Report
| | |
| Guggenheim Total Return Bond Fund | | |
| TRB-SEMI-0315x0915 | guggenheiminvestments.com |
| DEAR SHAREHOLDER | 2 |
| ECONOMIC AND MARKET OVERVIEW | 3 |
| ABOUT SHAREHOLDERS’ FUND EXPENSES | 5 |
| TOTAL RETURN BOND FUND | 8 |
| NOTES TO FINANCIAL STATEMENTS | 40 |
| OTHER INFORMATION | 63 |
| INFORMATION ON BOARD OF TRUSTEES AND OFFICERS | 64 |
| GUGGENHEIM INVESTMENTS PRIVACY POLICIES | 72 |
| | THE GUGGENHEIM FUNDS SEMI-ANNUAL REPORT | 1 |
March 31, 2015
Dear Shareholder:
Guggenheim Partners Investment Management (the “Investment Adviser”) is pleased to present the semi-annual shareholder report for one of our Funds (the “Fund”) for the six-month period ended March 31, 2015.
The Investment Adviser is part of Guggenheim Investments, which represents the investment management businesses of Guggenheim Partners, LLC (“Guggenheim”), a global, diversified financial services firm.
Guggenheim Funds Distributors, LLC is the distributor of the Funds. Guggenheim Funds Distributors, LLC is affiliated with Guggenheim and the Investment Adviser.
We encourage you to read the Economic and Market Overview section of the report, which follows this letter.
We are committed to providing innovative investment solutions and appreciate the trust you place in us.
Sincerely,
Donald C. Cacciapaglia
President
April 30, 2015
| 2 | THE GUGGENHEIM FUNDS SEMI-ANNUAL REPORT | |
ECONOMIC AND MARKET OVERVIEW (Unaudited) | March 31, 2015 |
The U.S. continued to enjoy a self-sustaining economic expansion for the six-month period ended March 31, 2015, although winter weather was likely to distort first-quarter economic data. In addition, U.S. companies scaled back hiring in the last month of the period, adding to evidence that the domestic economy has lost some momentum since the turn of the year. The March increase in payrolls was the smallest since December 2013 and broke a 12-month run of gains above 200,000.
Despite this short-term dislocation, the economy remains on track. Indeed, many other labor market indicators, such as initial jobless claims and the job openings rate, suggest that the U.S. labor market remains quite strong, supporting the conclusion that March’s payroll report was just a temporary blip, similar to the one witnessed last winter. As soon as temporary seasonal factors have dissipated, economic data is likely to bounce back. The labor market has improved over the past year, as subdued mortgage rates and tight housing inventory continue to point to fairly stable appreciation in the housing market, which is key to the ongoing recovery. Consumers are also being helped by lower fuel prices, which are acting as a tax cut for U.S. consumers, freeing up discretionary spending in other areas and acting as a support for consumption.
In Europe, economic data has been surprisingly good and should continue along that path on the back of the European Central Bank’s program of quantitative easing and depreciation of the euro. Japan’s economy remains weak and, without more structural reform, continued monetary accommodation could lead to stagflation. China’s policymakers appear likely to continue the supply of credit and do whatever else is necessary to maintain growth there at an acceptable pace for the near term.
Given weakness overseas and the effect of a stronger U.S. dollar on international earnings, some stocks could face a more challenging environment in the near term, but our research shows that equity markets tend to perform quite well in the periods leading up to a U.S. Federal Reserve (the “Fed”) rate increase. The yield on the 10-year Treasury note declined in January by more than 50 basis points before rebounding in February, echoing the pattern since 2009—Treasury yields decline and a sell-off ensues, driving rates higher. Then conditions stabilize, and rates test their previous lows. Liquidity from foreign central banks and comparatively attractive U.S. yields continue to push global investors to U.S. Treasuries, which should hold down U.S. interest rates in the near term.
Against this backdrop, the U.S. central bank feels pressure to raise its key rate above zero, but insists the decision will be data-dependent and not occur prematurely. With a secular inflation increase unlikely in the near term, slack in the economy, and disinflation being imported from abroad, the Fed may not hike rates until later in the year. The Fed for now appears to be focused on wage growth,
| | THE GUGGENHEIM FUNDS SEMI-ANNUAL REPORT | 3 |
ECONOMIC AND MARKET OVERVIEW (Unaudited)(concluded) | March 31, 2015 |
which is key for sustaining the expansion but also an indicator of inflationary pressure. The lack of sustained wage growth has been a topic that has confounded the Fed lately. Given the strengthening employment numbers and the apparent reduction in labor market slack, wages should start to increase more steadily across the board. This is one of the most important data points at the moment for the Fed.
The underlying U.S. economy remains strong and investors should avoid being panicked by seasonal setbacks. Indeed, considering the strength of the economy and the wave of liquidity emanating from various central banks around the world, the general investment environment should remain attractive.
For the six months ended March 31, 2015, the Standard & Poor’s 500® (“S&P 500”) Index* returned 5.93%. The Morgan Stanley Capital International (“MSCI”) Europe-Australasia-Far East (“EAFE”) Index* returned 1.13%. The return of the MSCI Emerging Markets Index* was -2.37%.
In the bond market, the Barclays U.S. Aggregate Bond Index* posted a 3.43% return for the period, while the Barclays U.S. Corporate High Yield Index* returned 1.49%. The return of the Bank of America Merrill Lynch 3-Month U.S. Treasury Bill Index* was 0.01% for the six-month period.
The opinions and forecasts expressed may not actually come to pass. This information is subject to change at any time, based on market and other conditions, and should not be construed as a recommendation of any specific security or strategy.
*Index Definitions:
The following indices are referenced throughout this report. Indices are unmanaged and not available for direct investment. Index performance does not reflect transaction costs, fees, or expenses.
Barclays U.S. Aggregate Bond Index is a broad-based benchmark that measures the investment grade, U.S. dollar-denominated, fixed-rate taxable bond market, including U.S. Treasuries, government-related and corporate securities, MBS (agency fixed-rate and hybrid ARM pass-throughs), ABS, and CMBS.
Barclays U.S. Corporate High Yield Index measures the market of U.S. dollar-denominated, non-investment grade, fixed-rate, taxable corporate bonds. Securities are classified as high yield if the middle rating of Moody’s, Fitch, and S&P is Ba1/BB+/BB+ or below.
Bank of America (“BofA”) Merrill Lynch 3-Month U.S. Treasury Bill Index is an unmanaged market index of U.S. Treasury securities maturing in 90 days that assumes reinvestment of all income.
MSCI EAFE Index is a free float-adjusted market capitalization index that is designed to measure the equity market performance of developed markets, excluding the U.S. & Canada.
MSCI Emerging Markets Index is a free float-adjusted market capitalization weighted index that is designed to measure equity market performance in the global emerging markets.
S&P 500® Index is a capitalization-weighted index of 500 stocks designed to measure the performance of the broad economy, representing all major industries and is considered a representation of the U.S. stock market.
| 4 | THE GUGGENHEIM FUNDS SEMI-ANNUAL REPORT | |
ABOUT SHAREHOLDERS’ FUND EXPENSES (Unaudited)
All mutual funds have operating expenses and it is important for our shareholders to understand the impact of costs on their investments. Shareholders of a Fund incur two types of costs: (i) transaction costs, including sales charges (loads) on purchase payments, reinvested dividends, or other distributions; and exchange fees; and (ii) ongoing costs, including management fees, administrative services, and shareholder reports, among others. These ongoing costs, or operating expenses, are deducted from a fund’s gross income and reduce the investment return of the fund.
A fund’s expenses are expressed as a percentage of its average net assets, which is known as the expense ratio. The following examples are intended to help investors understand the ongoing costs (in dollars) of investing in a Fund and to compare these costs with the ongoing costs of investing in other mutual funds.
The examples are based on an investment of $1,000 made at the beginning of the period and held for the entire six-month period beginning September 30, 2014 and ending March 31, 2015.
The following tables illustrate a Fund’s costs in two ways:
Table 1. Based on actual Fund return. This section helps investors estimate the actual expenses paid over the period. The “Ending Account Value” shown is derived from the Fund’s actual return, and the fourth column shows the dollar amount that would have been paid by an investor who started with $1,000 in the Fund. Investors may use the information here, together with the amount invested, to estimate the expenses paid over the period. Simply divide the Fund’s account value by $1,000 (for example, an $8,600 account value divided by $1,000 = 8.6), then multiply the result by the number provided under the heading “Expenses Paid During Period.”
Table 2. Based on hypothetical 5% return. This section is intended to help investors compare a Fund’s cost with those of other mutual funds. The table provides information about hypothetical account values and hypothetical expenses based on the Fund’s actual expense ratio and an assumed rate of return of 5% per year before expenses, which is not the Fund’s actual return. The hypothetical account values and expenses may not be used to estimate the actual ending account balance or expenses paid during the period. The example is useful in making comparisons because the U.S. Securities and Exchange Commission (the “SEC”) requires all mutual funds to calculate expenses based on the 5% return. Investors can assess a Fund’s costs by comparing this hypothetical example with the hypothetical examples that appear in shareholder reports of other funds.
| | THE GUGGENHEIM FUNDS SEMI-ANNUAL REPORT | 5 |
ABOUT SHAREHOLDERS’ FUND EXPENSES (Unaudited)(continued)
The calculations illustrated above assume no shares were bought or sold during the period. Actual costs may have been higher or lower, depending on the amount of investment and the timing of any purchases or redemptions.
Please note that the expenses shown in the table are meant to highlight your ongoing costs only and do not reflect any transactional costs, such as sales charges (loads) on purchase payments, and contingent deferred sales charges (“CDSC”) on redemptions, if any. Therefore, the second table is useful in comparing ongoing costs only, and will not help you determine the relative total costs of owning different funds. In addition, if these transactional costs were included, your costs would have been higher.
More information about a Fund’s expenses, including annual expense ratios for the past five years, can be found in the Financial Highlights section of this report. For additional information on operating expenses and other shareholder costs, please refer to the appropriate Fund prospectus.
| 6 | THE GUGGENHEIM FUNDS SEMI-ANNUAL REPORT | |
ABOUT SHAREHODLERS’ FUND EXPENSES (Unaudited)(concluded)
| | Expense Ratio1 | Fund Return | Beginning Account Value September 30, 2014 | Ending Account Value March 31, 2015 | Expenses Paid During Period2 |
Table 1. Based on actual Fund return3 |
| Total Return Bond Fund |
| A-Class | 0.87% | 2.95% | $1,000.00 | $1,029.50 | $4.40 |
| C-Class | 1.58% | 2.59% | 1,000.00 | 1,025.90 | 7.98 |
| Institutional Class | 0.52% | 3.14% | 1,000.00 | 1,031.40 | 2.63 |
| |
| Table 2. Based on hypothetical 5% return (before expenses) |
| Total Return Bond Fund |
| A-Class | 0.87% | 5.00% | $1,000.00 | $1,020.59 | $4.38 |
| C-Class | 1.58% | 5.00% | 1,000.00 | 1,017.05 | 7.95 |
| Institutional Class | 0.52% | 5.00% | 1,000.00 | 1,022.34 | 2.62 |
1 | Annualized and excludes expenses of the underlying funds in which the Fund invests. |
2 | Expenses are equal to the Fund's annualized expense ratio, net of any applicable fee waivers, multiplied by the average account value over the period, multiplied by 182/365 (to reflect the one-half year period). |
3 | Actual cumulative return at net asset value for the period September 30, 2014 to March 31, 2015. |
| | THE GUGGENHEIM FUNDS SEMI-ANNUAL REPORT | 7 |
FUND PROFILE (Unaudited) | March 31, 2015 |
TOTAL RETURN BOND FUND
OBJECTIVE: Seeks to provide total return, comprised of current income and capital appreciation.
Holdings Diversification
(Market Exposure as % of Net Assets)
“Holdings Diversification (Market Exposure as % of Net Assets)” excludes any temporary cash investments or investments in Guggenheim Strategy Funds Trust mutual funds. Investments in those Funds do not provide “market exposure” to meet the fund’s investment objective, but will significantly increase the portfolio’s exposure to certain other asset categories (and their associated risks), which may cause the Fund to deviate from its principal investment strategy, including: (i) high yield, high risk debt securities rated below the top four long-term rating categories by a nationally recognized statistical rating organization (also known as “junk bonds”); (ii) securities issued by the U.S. government or its agencies and instrumentalities; (iii) CLOs and similar investments; and (iv) other short-term fixed income securities.
| 8 | THE GUGGENHEIM FUNDS SEMI-ANNUAL REPORT | |
FUND PROFILE (Unaudited)(concluded) | March 31, 2015 |
| Inception Dates: |
| A-Class | November 30, 2011 |
| C-Class | November 30, 2011 |
| Institutional Class | November 30, 2011 |
| Portfolio Composition by Quality Rating* |
| Rating | % of Total Investments |
| Fixed Income Instruments | |
| AAA | 6.7% |
| AA | 13.0% |
| A | 16.4% |
| BBB | 25.8% |
| BB | 7.3% |
| B | 7.6% |
| CCC | 5.3% |
| CC | 0.1% |
| D | 0.3% |
| NR** | 5.1% |
| Other Instruments | |
| Short Term Investments | 7.6% |
| Mutual Funds | 2.0% |
| Repurchase Agreements | 1.5% |
| Preferred Stocks | 0.7% |
| Exchange-Traded Funds | 0.4% |
| Options Purchased | 0.2% |
| Common Stocks | 0.1% |
| Options Written | -0.1% |
| Total Investments | 100.0% |
| |
| The chart above reflects percentages of the value of total investments. |
| Ten Largest Holdings (% of Total Net Assets) |
| Guggenheim Strategy Fund I | 2.3% |
| AIM Aviation Finance Ltd. — Class A1 | 2.3% |
| Nationstar HECM Loan Trust 2014-1A — Class A | 1.5% |
| LMREC 2015-CRE1, Inc. — Class A | 1.4% |
| Vericrest Opportunity Loan Trust 2015-NPL3 — Class A1 | 1.1% |
| LSTAR Securities Investment Trust — 2015-2 | 1.1% |
| Motel 6 Trust 2015-MTL6 — Class E | 1.1% |
| VOLT XXXIII LLC — Class A1 | 1.1% |
| Deutsche Bank AG | 1.0% |
| LSTAR Securities Investment Trust 2015-3 | 1.0% |
| Top Ten Total | 13.9% |
“Ten Largest Holdings” exclude any temporary cash or derivative instruments.
| * | Source: BlackRock Solutions. Credit quality ratings are measured on a scale that generally ranges from AAA (highest) to D (lowest). All securities except for those labeled “NR” have been rated by Moody’s, Standard & Poor’s (“S&P”), or Fitch, which are all a Nationally Recognized Statistical Rating Organization (“NRSRO”). For purposes of this presentation, when ratings are available from more than one agency, the highest rating is used. Guggenheim Investments has converted Moody’s and Fitch ratings to the equivalent S&P rating. Security ratings are determined at the time of purchase and may change thereafter. |
| ** | NR securities do not necessarily indicate low credit quality. |
| | THE GUGGENHEIM FUNDS SEMI-ANNUAL REPORT | 9 |
SCHEDULE OF INVESTMENTS (Unaudited) | March 31, 2015 |
| TOTAL RETURN BOND FUND | |
| | |
Shares | | | Value | |
| | | | | | | | |
PREFERRED STOCKS† - 0.8% | |
| | | | | | | | |
| FINANCIAL - 0.7% | |
Aspen Insurance Holdings Ltd. 5.95%1,2 | | | 193,400 | | | $ | 4,966,512 | |
CoBank ACB 6.20%1,2 | | | 13,000 | | | | 1,328,032 | |
Goldman Sachs Group, Inc. 5.50%1,2 | | | 52,100 | | | | 1,311,878 | |
Morgan Stanley 6.38%1,2 | | | 48,000 | | | | 1,249,920 | |
Wells Fargo & Co. 5.85%1,2 | | | 30,000 | | | | 795,600 | |
AgriBank FCB 6.88%1,2 | | | 2,500 | | | | 260,000 | |
City National Corp. 6.75%1,2 | | | 8,000 | | | | 233,040 | |
WhiteHorse II Ltd.
due 06/15/17*,††,1,3,13 | | | 450,000 | | | | — | |
GSC Partners CDO Fund V Ltd. due 11/20/16*,††,1,3,13 | | | 1,325 | | | | — | |
| Total Financial | | | | | | | 10,144,982 | |
| | | | | | | | |
| INDUSTRIAL - 0.1% | |
Seaspan Corp.
6.38% due 04/30/19 | | | 44,000 | | | | 1,107,920 | |
| Total Preferred Stocks | | | | | | | | |
| (Cost $11,616,172) | | | | | | | 11,252,902 | |
| | | | | | | | |
EXCHANGE-TRADED FUNDS† - 0.5% | |
| iShares iBoxx $ High Yield Corporate Bond ETF | | | 77,193 | | | | 6,994,458 | |
| Total Exchange-Traded Funds | | | | | | | | |
| (Cost $6,996,264) | | | | | | | 6,994,458 | |
| | | | | | | | |
MUTUAL FUNDS† - 2.3% | |
Guggenheim Strategy Fund I4 | | | 1,326,815 | | | | 33,037,683 | |
| Total Mutual Funds | | | | | | | | |
| (Cost $33,011,155) | | | | | | | 33,037,683 | |
| | | | | | | | |
CLOSED-END FUNDS† - 0.1% | |
Guggenheim Strategic Opportunities Fund4 | | | 50,000 | | | | 1,067,500 | |
| Total Closed-End Funds | | | | | | | | |
| (Cost $990,390) | | | | | | | 1,067,500 | |
| | | | | | | | |
SHORT TERM INVESTMENTS† - 8.8% | |
| Federated U.S. Treasury Cash Reserve Fund 0.00% | | | 123,619,761 | | | | 123,619,761 | |
| Total Short Term Investments | | | | | | | | |
| (Cost $123,619,761) | | | | | | | 123,619,761 | |
| | | | | | | | |
| | | Face
Amount | | | | |
| | | | | | | | |
ASSET-BACKED SECURITIES†† - 38.3% | |
| AIM Aviation Finance Ltd. | | | | | | | | |
2015-1A, 4.21% due 02/15/403 | | $ | 32,803,571 | | | | 32,888,862 | |
2015-1A, 5.07% due 02/15/403 | | | 2,733,631 | | | | 2,759,054 | |
| Nationstar HECM Loan Trust | | | | | | | | |
2014-1A, 4.50% due 11/25/173 | | | 21,364,699 | | | | 21,477,932 | |
| Vericrest Opportunity Loan Trust | | | | | | | | |
2015-NPL3, 3.38% due 10/25/583 | | | 15,846,642 | | | | 15,816,533 | |
| VOLT XXXIII LLC | | | | | | | | |
2015-NPL5, 3.50% due 03/25/553 | | | 15,000,000 | | | | 14,983,410 | |
| Treman Park CLO LLC | | | | | | | | |
2015-1A, 0.00% due 04/20/273,5 | | | 13,600,000 | | | | 12,638,680 | |
| AASET | | | | | | | | |
2014-1, 5.13% due 12/15/291 | | | 9,562,500 | | | | 9,586,406 | |
2014-1, 7.37% due 12/15/291 | | | 2,942,308 | | | | 2,949,663 | |
| NRPL Trust | | | | | | | | |
2015-1A, 3.88% due 11/01/543 | | | 10,920,723 | | | | 10,826,805 | |
| CIT Mortgage Loan Trust | | | | | | | | |
2007-1, 1.62% due 10/25/371,3 | | | 10,880,000 | | | | 10,337,349 | |
| Oaktree EIF II Series A2 Ltd. | | | | | | | | |
2014-A2, 2.60% due 11/15/251,3 | | | 8,000,000 | | | | 7,999,200 | |
| 10 | THE GUGGENHEIM FUNDS SEMI-ANNUAL REPORT | SEE NOTES TO FINANCIAL STATEMENTS. |
SCHEDULE OF INVESTMENTS (Unaudited)(continued) | March 31, 2015 |
| TOTAL RETURN BOND FUND | |
| | | Face
Amount | | | Value | |
| | | | | | | | | |
2014-A2, 3.50% due 11/15/251,3 | | $ | 2,000,000 | | | $ | 1,987,800 | |
| Fortress Credit BSL II Ltd. | | | | | | | | |
2013-2A, 1.76% due 10/19/251,3 | | | 10,000,000 | | | | 9,913,000 | |
| Dryden 37 Senior Loan Fund | | | | | | | | |
2015-37A, due 04/15/27†††,3,13 | | | 10,000,000 | | | | 9,715,000 | |
| New Century Home Equity Loan Trust | | | | | | | | |
2005-3, 0.68% due 07/25/351 | | | 10,870,000 | | | | 9,615,666 | |
| GCAT LLC | | | | | | | | |
2014-2, 3.72% due 10/25/193 | | | 8,605,368 | | | | 8,585,360 | |
| Oak Hill Advisors Residential Loan Trust | | | | | | | | |
2015-NPL1, 3.47% due 01/25/553 | | | 8,500,000 | | | | 8,499,405 | |
| ING IM CLO Ltd. | | | | | | | | |
2013-1X, due 04/15/2413 | | | 9,500,000 | | | | 7,962,900 | |
| ACIS CLO Ltd. | | | | | | | | |
2015-6A, 2.74% due 05/01/271,3 | | | 7,500,000 | | | | 7,477,500 | |
2013-2A, 3.46% due 10/14/221,3 | | | 375,000 | | | | 375,150 | |
| CKE Restaurant Holdings, Inc. | | | | | | | | |
2013-1A, 4.47% due 03/20/433 | | | 7,464,150 | | | | 7,706,205 | |
| Spirit Master Funding LLC | | | | | | | | |
2014-2A, 5.76% due 03/20/423 | | | 5,084,429 | | | | 5,608,735 | |
2014-4A, 4.63% due 01/20/453 | | | 2,000,000 | | | | 2,077,500 | |
| Avery 2013-3X | | | | | | | | |
due 01/18/2513 | | | 7,500,060 | | | | 6,993,806 | |
| Cerberus Onshore II CLO LLC | | | | | | | | |
2014-1A, 2.25% due 10/15/231,3 | | | 7,000,000 | | | | 6,987,400 | |
| TICC CLO LLC | | | | | | | | |
2012-1A, 3.76% due 08/25/231,3 | | | 6,250,000 | | | | 6,265,625 | |
2012-1A, 5.01% due 08/25/231,3 | | | 350,000 | | | | 350,035 | |
| Marathon CLO VII Ltd. | | | | | | | | |
2014-7A, 3.73% due 10/28/251,3 | | | 4,000,000 | | | | 4,012,000 | |
2014-7A, 2.88% due 10/28/251,3 | | | 2,500,000 | | | | 2,522,000 | |
| GreenPoint Mortgage Funding Trust | | | | | | | | |
2005-HE4, 0.88% due 07/25/301 | | | 6,570,973 | | | | 6,280,424 | |
| Fifth Street Senior Loan Fund I LLC | | | | | | | | |
2015-1A, 2.26% due 01/20/271,3 | | | 5,000,000 | | | | 4,979,500 | |
2015-1A, 3.26% due 01/20/271,3 | | | 1,250,000 | | | | 1,243,000 | |
| Chesterfield Financial Holdings LLC | | | | | | | | |
2014-1A, 4.50% due 12/15/343 | | | 6,100,000 | | | | 6,116,470 | |
| Oxford Finance Funding Trust | | | | | | | | |
2014-1A, 3.48% due 12/15/223 | | | 6,000,000 | | | | 6,002,400 | |
| Northwoods Capital XIV Ltd. | | | | | | | | |
2014-14A, 2.72% due 11/12/251,3 | | | 6,000,000 | | | | 6,000,000 | |
| OHA Credit Partners IX Ltd. | | | | | | | | |
2013-9A, 0.00% due 10/20/253,5 | | | 6,000,000 | | | | 5,680,800 | |
| Muir Woods CLO Ltd. | | | | | | | | |
2012-1A, 2.84% due 09/14/231,3 | | | 5,500,000 | | | | 5,501,650 | |
| KKR Financial CLO Ltd. | | | | | | | | |
2007-1A, 2.51% due 05/15/211,3 | | | 2,900,000 | | | | 2,888,690 | |
2007-1A, 5.25% due 05/15/211,3 | | | 2,500,000 | | | | 2,497,250 | |
| Golub Capital Partners Clo 24M Ltd. | | | | | | | | |
2015-24A, 2.97% due 02/05/271,3 | | | 5,000,000 | | | | 5,000,000 | |
| SEE NOTES TO FINANCIAL STATEMENTS. | THE GUGGENHEIM FUNDS SEMI-ANNUAL REPORT | 11 |
SCHEDULE OF INVESTMENTS (Unaudited)(continued) | March 31, 2015 |
| TOTAL RETURN BOND FUND | |
| | | Face
Amount | | | Value | |
| | | | | | | | | |
| SHACKLETON CLO Ltd. | | | | | | | | |
2013-4A, 2.25% due 01/13/251,3 | | $ | 5,000,000 | | | $ | 4,935,500 | |
| Fortress Credit Opportunities VI CLO Ltd. | | | | | | | | |
2015-6A, 2.97% due 10/10/261,3 | | | 5,000,000 | | | | 4,935,000 | |
| Popular ABS Mortgage Pass-Through Trust | | | | | | | | |
2005-5, 0.61% due 11/25/351 | | | 5,082,149 | | | | 4,764,495 | |
| Castlelake Aircraft Securitization Trust | | | | | | | | |
| 2014-1, 5.25% due 02/15/29 | | | 3,037,708 | | | | 3,014,925 | |
| 2014-1, 7.50% due 02/15/29 | | | 1,510,336 | | | | 1,506,560 | |
| Babson CLO Limited | | | | | | | | |
2012-2A, due 05/15/233,13 | | | 4,750,000 | | | | 3,393,400 | |
2014-IA, due 07/20/253,13 | | | 1,300,000 | | | | 1,030,120 | |
| Soundview Home Loan Trust | | | | | | | | |
2007-1, 0.34% due 03/25/371 | | | 4,757,557 | | | | 4,387,585 | |
| Park Place Securities Incorporated Asset-Backed Pass-Through Certificates Series | | | | | | | | |
2005-WCW2, 0.70% due 07/25/351 | | | 5,000,000 | | | | 4,368,710 | |
| ACAS CLO Ltd. | | | | | | | | |
2014-1AR, 2.57% due 09/20/231,3 | | | 4,000,000 | | | | 4,016,400 | |
| Canyon Capital CLO Ltd. | | | | | | | | |
2013-1A, 2.20% due 01/15/241,3 | | | 4,000,000 | | | | 3,949,600 | |
| MWAM CBO Ltd. | | | | | | | | |
2001-1A, 5.10% due 01/30/311,3 | | | 2,116,982 | | | | 1,977,685 | |
2001-1A, 14.09% due 01/30/313 | | | 1,630,728 | | | | 1,788,094 | |
| Rockwall CDO II Ltd. | | | | | | | | |
2007-1A, 0.80% due 08/01/241,3 | | | 2,100,000 | | | | 1,958,250 | |
2007-1A, 0.50% due 08/01/241,3 | | | 1,651,211 | | | | 1,591,107 | |
| Steele Creek CLO Ltd. | | | | | | | | |
2014-1A, 2.48% due 08/21/261,3 | | | 3,300,000 | | | | 3,270,300 | |
2014-1A, 3.46% due 08/21/261,3 | | | 250,000 | | | | 243,875 | |
| Cent CLO 16, LP | | | | | | | | |
2014-16AR, 2.50% due 08/01/241,3 | | | 1,750,000 | | | | 1,758,050 | |
2014-16AR, 3.50% due 08/01/241,3 | | | 1,750,000 | | | | 1,750,175 | |
| Halcyon Loan Advisors Funding Ltd. | | | | | | | | |
2012-2A, 3.12% due 12/20/241,3 | | | 3,000,000 | | | | 2,910,000 | |
2012-2A, 4.77% due 12/20/241,3 | | | 600,000 | | | | 595,140 | |
| Madison Park Funding VIII Ltd. | | | | | | | | |
2014-8AR, 3.06% due 04/22/221,3 | | | 2,000,000 | | | | 2,000,000 | |
2014-8AR, 2.46% due 04/22/221,3 | | | 1,500,000 | | | | 1,501,500 | |
| First NLC Trust | | | | | | | | |
2005-1, 0.63% due 05/25/351 | | | 4,146,584 | | | | 3,485,909 | |
| OCP CLO Ltd. | | | | | | | | |
2014-7A, 2.30% due 10/20/261,3 | | | 3,500,000 | | | | 3,478,650 | |
| Greywolf CLO III Ltd. | | | | | | | | |
2014-1A, 3.11% due 04/22/261,3 | | | 2,000,000 | | | | 1,947,000 | |
2014-1A, 2.31% due 04/22/261,3 | | | 1,500,000 | | | | 1,487,100 | |
| Banco Bradesco SA | | | | | | | | |
4.21% due 03/12/26†††,6 | | | 3,343,174 | | | | 3,365,908 | |
| Fortress Credit Opportunities V CLO Ltd. | | | | | | | | |
2014-5A, 3.78% due 10/15/261,3 | | | 1,750,000 | | | | 1,699,425 | |
2014-5A, 2.88% due 10/15/261,3 | | | 1,500,000 | | | | 1,473,450 | |
| 12 | THE GUGGENHEIM FUNDS SEMI-ANNUAL REPORT | SEE NOTES TO FINANCIAL STATEMENTS. |
SCHEDULE OF INVESTMENTS (Unaudited)(continued) | March 31, 2015 |
| TOTAL RETURN BOND FUND | |
| | | Face
Amount | | | Value | |
| | | | | | | | | |
| CIFC Funding Ltd. | | | | | | | | |
2007-1A, 1.76% due 05/10/211,3 | | $ | 3,250,000 | | | $ | 3,131,700 | |
| Rockwall CDO Ltd. | | | | | | | | |
2006-1A, 0.75% due 08/01/211,3 | | | 2,900,000 | | | | 2,828,950 | |
2006-1A, 0.90% due 08/01/211,3 | | | 200,000 | | | | 189,540 | |
| GSAA Trust | | | | | | | | |
2005-10, 0.82% due 06/25/351 | | | 3,312,000 | | | | 3,002,308 | |
| CIFC Funding Ltd. | | | | | | | | |
2015-1A, 2.47% due 01/22/271,3 | | | 3,000,000 | | | | 2,997,900 | |
| Octagon Investment Partners XIX Ltd. | | | | | | | | |
2014-1A, 3.10% due 04/15/261,3 | | | 3,000,000 | | | | 2,936,700 | |
| Neuberger Berman CLO Ltd. | | | | | | | | |
2012-12X, due 07/25/2313 | | | 3,000,000 | | | | 1,926,900 | |
2012-12A, due 07/25/233,13 | | | 1,500,000 | | | | 963,450 | |
| RAIT CRE CDO I Ltd. | | | | | | | | |
| 2006-1X, 0.49% due 11/20/46 | | | 3,095,376 | | | | 2,848,984 | |
| Irwin Home Equity Loan Trust | | | | | | | | |
2007-1, 5.85% due 08/25/373 | | | 2,776,149 | | | | 2,840,384 | |
| KVK CLO Ltd. | | | | | | | | |
2013-1A, due 04/14/253,13 | | | 3,800,000 | | | | 2,808,200 | |
| Golub Capital Partners CLO 21M Ltd. | | | | | | | | |
2014-21A, 2.68% due 10/25/261,3 | | | 2,700,000 | | | | 2,631,420 | |
| Hana Small Business Lending Loan Trust | | | | | | | | |
2014-2014, 3.07% due 01/25/401,3 | | | 2,520,146 | | | | 2,492,676 | |
| Emerald Aviation Finance Ltd. | | | | | | | | |
2013-1, 4.65% due 10/15/383 | | | 1,914,062 | | | | 1,966,699 | |
2013-1, 6.35% due 10/15/383,7 | | | 410,156 | | | | 416,309 | |
| Structured Asset Securities Corporation Mortgage Loan Trust | | | | | | | | |
2006-OPT1, 0.43% due 04/25/361 | | | 1,400,000 | | | | 1,270,461 | |
2006-BC6, 0.34% due 01/25/371 | | | 1,250,000 | | | | 1,041,820 | |
| Voya CLO Ltd. | | | | | | | | |
2015-3AR, 3.21% due 10/15/221,3 | | | 2,250,000 | | | | 2,251,125 | |
| Cerberus Onshore II CLO-2 LLC | | | | | | | | |
2014-1A, 2.98% due 10/15/231,3 | | | 2,250,000 | | | | 2,244,150 | |
| St. James River CLO Ltd. | | | | | | | | |
2007-1A, 2.57% due 06/11/211,3 | | | 2,250,000 | | | | 2,204,775 | |
| CCR Incorporated MT100 Payment Rights Master Trust | | | | | | | | |
2010-CX, 0.62% due 07/10/17†††,1 | | | 1,197,250 | | | | 1,171,150 | |
2012-CA, 4.75% due 07/10/223 | | | 950,000 | | | | 950,656 | |
| Stripes 2013-1 A1 | | | | | | | | |
| 3.84% due 03/20/23 | | | 2,088,032 | | | | 2,072,372 | |
| N-Star Real Estate CDO IX Ltd. | | | | | | | | |
0.49% due 02/01/416 | | | 2,132,058 | | | | 2,037,395 | |
| Great Lakes CLO Ltd. | | | | | | | | |
2012-1A, 4.35% due 01/15/231,3 | | | 1,250,000 | | | | 1,250,000 | |
2012-1A, due 01/15/233,13 | | | 1,000,000 | | | | 749,700 | |
| Avis Budget Rental Car Funding AESOP LLC | | | | | | | | |
2015-1A, 3.96% due 07/20/213 | | | 2,000,000 | | | | 1,994,980 | |
| STORE Master Funding LLC | | | | | | | | |
2012-1A, 5.77% due 08/20/423 | | | 1,830,891 | | | | 1,983,826 | |
| ALM VII R Ltd. | | | | | | | | |
2013-7RA, 2.86% due 04/24/241,3 | | | 2,000,000 | | | | 1,973,600 | |
| SEE NOTES TO FINANCIAL STATEMENTS. | THE GUGGENHEIM FUNDS SEMI-ANNUAL REPORT | 13 |
SCHEDULE OF INVESTMENTS (Unaudited)(continued) | March 31, 2015 |
| TOTAL RETURN BOND FUND | |
| | | Face
Amount | | | Value | |
| | | | | | | | | |
| TICP CLO I Ltd. | | | | | | | | |
2014-1A, 3.26% due 04/26/261,3 | | $ | 2,000,000 | | | $ | 1,964,200 | |
| Telos CLO Ltd. | | | | | | | | |
2013-3A, 3.26% due 01/17/241,3 | | | 2,000,000 | | | | 1,957,800 | |
| NewStar Clarendon Fund CLO LLC | | | | | | | | |
2015-1A, 3.61% due 01/25/271,3 | | | 2,000,000 | | | | 1,948,400 | |
| Duane Street CLO IV Ltd. | | | | | | | | |
2007-4A, 2.51% due 11/14/211,3 | | | 2,000,000 | | | | 1,947,800 | |
| Ivy Hill Middle Market Credit Fund IX Ltd. | | | | | | | | |
2014-9A, 2.69% due 10/18/251,3 | | | 1,000,000 | | | | 970,000 | |
2014-9A, 3.54% due 10/18/251,3 | | | 1,000,000 | | | | 954,900 | |
| Galaxy XIX CLO Ltd. | | | | | | | | |
2015-19A, due 01/24/273,13 | | | 2,000,000 | | | | 1,920,200 | |
| Sound Point CLO IV Ltd. | | | | | | | | |
2013-3A, 2.61% due 01/21/261,3 | | | 2,000,000 | | | | 1,877,000 | |
| Newstar Trust | | | | | | | | |
2012-2A, 4.51% due 01/20/231,3 | | | 1,000,000 | | | | 995,900 | |
2012-2A, 3.51% due 01/20/231,3 | | | 750,000 | | | | 748,725 | |
| ARES XXVI CLO Ltd. | | | | | | | | |
2013-1A, due 04/15/253,13 | | | 2,550,000 | | | | 1,732,980 | |
| Westchester CLO Ltd. | | | | | | | | |
2007-1A, 0.69% due 08/01/221,3 | | | 1,850,000 | | | | 1,709,585 | |
| Gramercy Park CLO Ltd. | | | | | | | | |
2014-1AR, 3.21% due 07/17/231,3 | | | 1,600,000 | | | | 1,600,000 | |
| Race Point V CLO Ltd. | | | | | | | | |
2014-5AR, 3.09% due 12/15/221,3 | | | 1,100,000 | | | | 1,100,440 | |
2014-5AR, 3.99% due 12/15/221,3 | | | 500,000 | | | | 498,950 | |
| NewStar Arlington Senior Loan Program LLC | | | | | | | | |
2014-1A, 4.76% due 07/25/253 | | | 700,000 | | | | 704,760 | |
2014-1A, 2.86% due 07/25/251,3 | | | 500,000 | | | | 489,850 | |
2014-1A, 3.56% due 07/25/251,3 | | | 400,000 | | | | 383,280 | |
| Gramercy Real Estate CDO Ltd. | | | | | | | | |
2007-1A, 0.54% due 08/15/561,3 | | | 1,706,783 | | | | 1,537,811 | |
| ACA CLO Ltd. | | | | | | | | |
2007-1A, 1.20% due 06/15/221,3 | | | 1,575,000 | | | | 1,500,975 | |
| Oaktree EIF II Series A1 Ltd. | | | | | | | | |
2015-B1A, 2.66% due 02/15/261,3 | | | 1,500,000 | | | | 1,500,300 | |
| Adirondack Park CLO Limited | | | | | | | | |
2013-1A, 3.25% due 04/15/241,3 | | | 1,500,000 | | | | 1,500,000 | |
| Northwoods Capital Ltd. | | | | | | | | |
| 2006-7X, 1.80% due 10/22/21 | | | 1,500,000 | | | | 1,492,500 | |
| OCP CLO Ltd. | | | | | | | | |
2014-6A, 2.31% due 07/17/261,3 | | | 1,500,000 | | | | 1,484,100 | |
| Telos CLO Ltd. | | | | | | | | |
2014-6A, 2.33% due 01/17/271,3 | | | 1,500,000 | | | | 1,477,050 | |
| MCF CLO I LLC | | | | | | | | |
2013-1A, 3.81% due 04/20/231,3 | | | 1,500,000 | | | | 1,469,550 | |
| ING Investment Management CLO IV Ltd. | | | | | | | | |
2007-4A, 2.46% due 06/14/221,3 | | | 1,500,000 | | | | 1,447,350 | |
| NYLIM Flatiron CLO Ltd. | | | | | | | | |
2006-1A, 1.73% due 08/08/201,3 | | | 1,500,000 | | | | 1,445,250 | |
| Turbine Engines Securitization Ltd. | | | | | | | | |
2013-1A, 5.13% due 12/13/483 | | | 1,420,111 | | | | 1,438,289 | |
| 14 | THE GUGGENHEIM FUNDS SEMI-ANNUAL REPORT | SEE NOTES TO FINANCIAL STATEMENTS. |
SCHEDULE OF INVESTMENTS (Unaudited)(continued) | March 31, 2015 |
| TOTAL RETURN BOND FUND | |
| | | Face
Amount | | | Value | |
| | | | | | | | | |
| UCFC Manufactured Housing Contract | | | | | | | | |
| 1997-2, 7.38% due 10/15/28 | | $ | 1,326,706 | | | $ | 1,435,157 | |
| Miramax LLC | | | | | | | | |
2014-1A, 3.34% due 07/20/263 | | | 1,359,000 | | | | 1,374,654 | |
| Willis Engine Securitization Trust II | | | | | | | | |
2012-A, 5.50% due 09/15/373 | | | 1,334,187 | | | | 1,337,522 | |
| Structured Asset Investment Loan Trust | | | | | | | | |
2005-2, 0.91% due 03/25/351 | | | 1,373,500 | | | | 1,276,363 | |
| N-Star REL CDO VIII Ltd. | | | | | | | | |
2006-8A, 0.54% due 02/01/411,3 | | | 1,400,000 | | | | 1,262,800 | |
| Dryden XXIII Senior Loan Fund | | | | | | | | |
2014-23RA, 3.20% due 07/17/231,3 | | | 1,250,000 | | | | 1,250,000 | |
| COA Summit CLO Limited | | | | | | | | |
2014-1A, 3.06% due 04/20/231,3 | | | 1,250,000 | | | | 1,238,625 | |
| Venture XIV CLO Ltd. | | | | | | | | |
2013-14A, 3.01% due 08/28/251,3 | | | 1,250,000 | | | | 1,211,750 | |
| Wrightwood Capital Real Estate CDO Ltd. | | | | | | | | |
2005-1A, 0.69% due 11/21/401,3 | | | 1,250,000 | | | | 1,185,750 | |
| GSAA Home Equity Trust | | | | | | | | |
2006-18, 6.00% due 11/25/367 | | | 1,664,621 | | | | 1,113,731 | |
| Apidos CDO III Ltd. | | | | | | | | |
2006-3A, 2.02% due 06/12/201,3 | | | 1,100,000 | | | | 1,084,160 | |
| Telos CLO 2007-2 Ltd. | | | | | | | | |
2007-2A, 2.45% due 04/15/221,3 | | | 1,100,000 | | | | 1,061,390 | |
| Drug Royalty II Limited Partnership 2 | | | | | | | | |
2014-1, 3.08% due 07/15/231,3 | | | 1,029,855 | | | | 1,045,810 | |
| ALM XIV Ltd. | | | | | | | | |
2014-14A, 3.21% due 07/28/261,3 | | | 750,000 | | | | 742,575 | |
2014-14A, 3.71% due 07/28/261,3 | | | 300,000 | | | | 284,880 | |
| Fortress Credit Opportunities III CLO, LP | | | | | | | | |
2014-3A, 2.75% due 04/28/261,3 | | | 650,000 | | | | 639,145 | |
2014-3A, 3.50% due 04/28/261,3 | | | 400,000 | | | | 386,320 | |
| Global Leveraged Capital Credit Opportunity Fund | | | | | | | | |
2006-1A, 1.26% due 12/20/181,3 | | | 1,036,000 | | | | 1,016,005 | |
| Garanti Diversified Payment Rights Finance Co. | | | | | | | | |
2007-A, 0.44% due 07/09/171 | | | 1,040,000 | | | | 1,009,944 | |
| Ares XXIII CLO Ltd. | | | | | | | | |
2014-1AR, 3.46% due 04/19/231,3 | | | 1,000,000 | | | | 1,000,100 | |
| Symphony CLO XV Ltd. | | | | | | | | |
2014-15A, 3.40% due 10/17/261,3 | | | 1,000,000 | | | | 999,900 | |
| Newstar Commercial Loan Funding LLC | | | | | | | | |
2015-1A, 3.07% due 01/20/271,3 | | | 1,000,000 | | | | 996,500 | |
| Neuberger Berman CLO XVIII Ltd. | | | | | | | | |
2014-18A, 3.38% due 11/14/251,3 | | | 1,000,000 | | | | 994,800 | |
| Catamaran CLO Ltd. | | | | | | | | |
2015-1A, 3.38% due 04/22/271,3 | | | 1,000,000 | | | | 990,400 | |
| Gallatin CLO VII Ltd. | | | | | | | | |
2014-1A, 3.15% due 07/15/231,3 | | | 1,000,000 | | | | 990,400 | |
| SEE NOTES TO FINANCIAL STATEMENTS. | THE GUGGENHEIM FUNDS SEMI-ANNUAL REPORT | 15 |
SCHEDULE OF INVESTMENTS (Unaudited)(continued) | March 31, 2015 |
| TOTAL RETURN BOND FUND | |
| | | Face
Amount | | | Value | |
| | | | | | | | | |
| Flagship CLO VI | | | | | | | | |
2007-1A, 2.66% due 06/10/211,3 | | $ | 1,000,000 | | | $ | 980,800 | |
| San Gabriel CLO Ltd. | | | | | | | | |
2007-1A, 2.51% due 09/10/211,3 | | | 1,000,000 | | | | 978,000 | |
| Lime Street CLO Corp. | | | | | | | | |
2007-1A, 2.77% due 06/20/211,3 | | | 1,000,000 | | | | 969,500 | |
| Ivy Hill Middle Market Credit Fund VII Ltd. | | | | | | | | |
2013-7A, 3.71% due 10/20/251,3 | | | 1,000,000 | | | | 967,000 | |
| WhiteHorse IV Ltd. | | | | | | | | |
2007-4A, 1.71% due 01/17/201,3 | | | 1,000,000 | | | | 962,300 | |
| Highbridge Loan Management Ltd. | | | | | | | | |
2013-2A, 3.96% due 10/20/241,3 | | | 1,000,000 | | | | 955,900 | |
| Atlas Senior Loan Fund II Ltd. | | | | | | | | |
2012-2A, due 01/30/243,13 | | | 1,200,000 | | | | 955,800 | |
| Churchill Financial Cayman Ltd. | | | | | | | | |
2007-1A, 2.85% due 07/10/191,3 | | | 1,000,000 | | | | 942,600 | |
| Highland Park CDO I Ltd. | | | | | | | | |
2006-1A, 0.59% due 11/25/511,3 | | | 938,360 | | | | 896,134 | |
| Icon Brand Holdings LLC | | | | | | | | |
2013-1A, 4.35% due 01/25/433 | | | 886,614 | | | | 895,214 | |
| Keuka Park CLO Limited | | | | | | | | |
2013-1A, due 10/21/243,13 | | | 1,000,000 | | | | 790,700 | |
| Acis CLO Ltd. | | | | | | | | |
2013-1A, 3.21% due 04/18/241,3 | | | 800,000 | | | | 784,400 | |
| Salus CLO 2012-1 Ltd. | | | | | | | | |
2013-1A, 5.77% due 03/05/211,3 | | | 750,000 | | | | 777,000 | |
| Copper River CLO Ltd. | | | | | | | | |
2007-1A, due 01/20/211,3,13 | | | 1,500,000 | | | | 770,550 | |
| CIFC Funding 2012-I Ltd. | | | | | | | | |
2014-1AR, 3.33% due 08/14/241,3 | | | 750,000 | | | | 752,625 | |
| ARES XII CLO Ltd. | | | | | | | | |
2007-12A, 3.51% due 11/25/201,3 | | | 750,000 | | | | 750,000 | |
| Central Park CLO Ltd. | | | | | | | | |
2011-1A, 3.46% due 07/23/221,3 | | | 750,000 | | | | 749,175 | |
| Golub Capital Partners CLO 10 Ltd. | | | | | | | | |
2014-10AR, 3.21% due 10/20/211,3 | | | 750,000 | | | | 747,150 | |
| Carlyle Global Market Strategies CLO 2012-2 Ltd. | | | | | | | | |
2014-2AR, 4.16% due 07/20/231,3 | | | 750,000 | | | | 744,375 | |
| GSAMP Trust | | | | | | | | |
2005-HE6, 0.61% due 11/25/351 | | | 800,000 | | | | 741,982 | |
| Finn Square CLO Ltd. | | | | | | | | |
2012-1A, due 12/24/233,13 | | | 1,000,000 | | | | 734,900 | |
| Venture XII CLO Ltd. | | | | | | | | |
2013-12A, 3.11% due 02/28/241,3 | | | 750,000 | | | | 731,700 | |
| Grayson CLO Ltd. | | | | | | | | |
2006-1A, 0.66% due 11/01/211,3 | | | 750,000 | | | | 709,875 | |
| NewStar Commercial Loan Funding LLC | | | | | | | | |
2013-1A, 4.80% due 09/20/231,3 | | | 700,000 | | | | 680,540 | |
| Saxon Asset Securities Trust | | | | | | | | |
2005-4, 0.61% due 11/25/371 | | | 750,000 | | | | 646,409 | |
| Black Diamond CLO 2012-1 Ltd. | | | | | | | | |
2013-1A, 3.50% due 02/01/231,3 | | | 650,000 | | | | 645,320 | |
| Blade Engine Securitization Ltd. | | | | | | | | |
2006-1A, 1.17% due 09/15/411 | | | 794,764 | | | | 604,021 | |
| 16 | THE GUGGENHEIM FUNDS SEMI-ANNUAL REPORT | SEE NOTES TO FINANCIAL STATEMENTS. |
SCHEDULE OF INVESTMENTS (Unaudited)(continued) | March 31, 2015 |
| TOTAL RETURN BOND FUND | |
| | | Face
Amount | | | Value | |
| | | | | | | | | |
| Anchorage Capital CLO 4 Ltd. | | | | | | | | |
2014-4A, 2.42% due 07/28/261,3 | | $ | 600,000 | | | $ | 595,020 | |
| Babcock & Brown Air Funding I Ltd. | | | | | | | | |
2007-1A, 0.47% due 11/14/331,3 | | | 662,995 | | | | 563,546 | |
| GSAA Home Equity Trust | | | | | | | | |
2007-7, 0.44% due 07/25/371 | | | 643,133 | | | | 543,047 | |
| Ares XXV CLO Ltd. | | | | | | | | |
2013-3A, due 1/17/243,13 | | | 750,000 | | | | 503,925 | |
| DIVCORE CLO Ltd. | | | | | | | | |
| 2013-1A B, 4.07% due 11/15/32 | | | 500,000 | | | | 502,500 | |
| GoldenTree Credit Opportunities Financing Ltd. | | | | | | | | |
2012-1A, 4.27% due 09/15/241,3 | | | 500,000 | | | | 502,100 | |
| Apidos CLO IX | | | | | | | | |
2012-9A, 4.00% due 07/15/231,3 | | | 500,000 | | | | 500,050 | |
| KKR CLO Trust | | | | | | | | |
2012-1A, 3.57% due 12/15/241,3 | | | 500,000 | | | | 498,700 | |
| NewStar Commercial Loan Funding LLC | | | | | | | | |
2014-1A, 3.86% due 04/20/251,3 | | | 500,000 | | | | 498,650 | |
| Garrison Funding Ltd. | | | | | | | | |
2013-2A, 3.63% due 09/25/231,3 | | | 500,000 | | | | 495,600 | |
| OZLM Funding V Ltd. | | | | | | | | |
2013-5A, 3.23% due 01/17/261,3 | | | 500,000 | | | | 494,200 | |
| CIFC Funding Ltd. | | | | | | | | |
2014-1A, 3.05% due 04/18/251,3 | | | 500,000 | | | | 488,000 | |
| Golub Capital Partners CLO 18 Ltd. | | | | | | | | |
2014-18A, 3.76% due 04/25/261,3 | | | 500,000 | | | | 485,500 | |
| Golub Capital Partners Fundings Ltd. | | | | | | | | |
2007-1A, 1.02% due 03/15/221,3 | | | 500,000 | | | | 485,300 | |
| ColumbusNova CLO Limited | | | | | | | | |
2007-1A, 1.61% due 05/16/191,3 | | | 500,000 | | | | 485,000 | |
| AMMC CLO XIV Ltd. | | | | | | | | |
2014-14A, 3.06% due 07/27/261,3 | | | 500,000 | | | | 484,400 | |
| NewStar Commercial Loan Trust | | | | | | | | |
2007-1A, 1.56% due 09/30/221,3 | | | 500,000 | | | | 475,650 | |
| Westwood CDO I Ltd. | | | | | | | | |
2007-1A, 0.94% due 03/25/211,3 | | | 500,000 | | | | 471,500 | |
| ICE EM CLO | | | | | | | | |
2007-1A, 0.98% due 08/15/221,3 | | | 465,358 | | | | 452,467 | |
| MCF CLO IV LLC | | | | | | | | |
2014-1A, 6.20% due 10/15/251,3 | | | 500,000 | | | | 449,450 | |
| New Century Home Equity Loan Trust | | | | | | | | |
2005-1, 0.89% due 03/25/351 | | | 496,266 | | | | 431,271 | |
| Golub Capital Partners CLO 17 Ltd. | | | | | | | | |
2013-17A, 4.09% due 10/25/251,3 | | | 400,000 | | | | 394,840 | |
| ALM VII R-2 Ltd. | | | | | | | | |
2013-7R2A, 2.86% due 04/24/241,3 | | | 400,000 | | | | 394,720 | |
| Northwind Holdings LLC | | | | | | | | |
2007-1A, 1.01% due 12/01/371,3 | | | 396,990 | | | | 361,261 | |
| Covenant Credit Partners CLO I Ltd. | | | | | | | | |
2014-1A, 3.18% due 07/20/261,3 | | | 350,000 | | | | 335,475 | |
| SEE NOTES TO FINANCIAL STATEMENTS. | THE GUGGENHEIM FUNDS SEMI-ANNUAL REPORT | 17 |
SCHEDULE OF INVESTMENTS (Unaudited)(continued) | March 31, 2015 |
| TOTAL RETURN BOND FUND | |
| | | Face
Amount | | | Value | |
| | | | | | | | | |
| Cerberus Offshore Levered I, LP | | | | | | | | |
2012-1A, 6.27% due 11/30/181,3 | | $ | 250,000 | | | $ | 250,100 | |
2012-1A, 5.02% due 11/30/181,3 | | | 69,574 | | | | 69,567 | |
| Airplanes Pass Through Trust | | | | | | | | |
2001-1A, 0.72% due 03/15/191 | | | 762,282 | | | | 312,535 | |
| Salus CLO Ltd. | | | | | | | | |
2013-1AN, 3.98% due 03/05/211,3 | | | 300,000 | | | | 300,990 | |
| TCW Global Project Fund III Ltd. | | | | | | | | |
2005-1A, 0.91% due 09/01/171,3 | | | 286,731 | | | | 278,129 | |
| TICP CLO II Ltd. | | | | | | | | |
2014-2A, 3.26% due 07/20/261,3 | | | 250,000 | | | | 245,400 | |
| Great Lakes CLO Ltd. | | | | | | | | |
2014-1A, 3.95% due 04/15/251,3 | | | 250,000 | | | | 244,850 | |
| Eastland CLO Ltd. | | | | | | | | |
2007-1A, 0.65% due 05/01/221,3 | | | 250,000 | | | | 235,050 | |
| Carlyle Global Market Strategies CLO Ltd. | | | | | | | | |
2012-3A, due 10/04/243,13 | | | 250,000 | | | | 207,500 | |
| Aerco Ltd. | | | | | | | | |
2000-2A, 0.63% due 07/15/251 | | | 481,251 | | | | 195,821 | |
| West Coast Funding Ltd. | | | | | | | | |
2006-1A, 0.40% due 11/02/411,3 | | | 151,579 | | | | 150,654 | |
| First Franklin Mortgage Loan Trust | | | | | | | | |
2006-FF1, 0.51% due 01/25/361 | | | 150,000 | | | | 132,238 | |
| Drug Royalty Limited Partnership 1 | | | | | | | | |
2012-1, 5.50% due 07/15/241,3 | | | 117,692 | | | | 121,099 | |
| Vega Containervessel plc | | | | | | | | |
2006-1A, 5.56% due 02/10/213 | | | 70,709 | | | | 69,981 | |
| Marathon CLO II Ltd. | | | | | | | | |
2005-2A, due 12/20/193,13 | | | 250,000 | | | | 29,350 | |
| BlackRock Senior Income Series Corp. | | | | | | | | |
2004-1X, due 09/15/16†††,13 | | | 500,000 | | | | 50 | |
| Total Asset-Backed Securities | | | | | | | | |
| (Cost $534,934,264) | | | | | | | 539,197,290 | |
| | | | | | | | |
CORPORATE BONDS††,11 - 24.6% | |
| | | | | | | | |
| FINANCIAL - 16.8% | |
| Citigroup, Inc. | | | | | | | | |
5.80%1,2,8 | | | 8,500,000 | | | | 8,521,250 | |
5.88%1,2 | | | 5,685,000 | | | | 5,741,850 | |
5.35%1,2,8 | | | 4,365,000 | | | | 4,223,138 | |
6.30%1,2 | | | 2,375,000 | | | | 2,425,469 | |
5.95%1,2 | | | 2,000,000 | | | | 2,025,000 | |
| 5.37% due 08/09/20 | | | 500,000 | | | | 572,071 | |
| Bank of America Corp. | | | | | | | | |
6.25%1,2,8 | | | 8,550,000 | | | | 8,710,312 | |
6.10%1,2 | | | 6,800,000 | | | | 6,897,750 | |
5.13%1,2,8 | | | 5,050,000 | | | | 4,961,120 | |
6.50%1,2 | | | 2,000,000 | | | | 2,115,000 | |
| EPR Properties | | | | | | | | |
5.75% due 08/15/228 | | | 9,115,000 | | | | 10,034,712 | |
5.25% due 07/15/238 | | | 4,400,000 | | | | 4,749,474 | |
| 4.50% due 04/01/25 | | | 2,250,000 | | | | 2,287,413 | |
| Deutsche Bank AG | | | | | | | | |
| 4.50% due 04/01/25 | | | 13,750,000 | | | | 13,738,862 | |
| JPMorgan Chase & Co. | | | | | | | | |
5.00%1,2,8 | | | 9,750,000 | | | | 9,578,887 | |
5.15%1,2 | | | 2,125,000 | | | | 2,074,531 | |
6.10%1,2 | | | 2,000,000 | | | | 2,060,000 | |
| Teachers Insurance & Annuity Association of America | | | | | | | | |
4.90% due 09/15/443,8 | | | 8,900,000 | | | | 10,047,388 | |
4.38% due 09/15/541,3 | | | 1,300,000 | | | | 1,353,255 | |
| 18 | THE GUGGENHEIM FUNDS SEMI-ANNUAL REPORT | SEE NOTES TO FINANCIAL STATEMENTS. |
SCHEDULE OF INVESTMENTS (Unaudited)(continued) | March 31, 2015 |
| TOTAL RETURN BOND FUND | |
| | | Face
Amount | | | Value | |
| | | | | | | | | |
| SunTrust Banks, Inc. | | | | | | | | |
5.63%1,2,8 | | $ | 9,900,000 | | | $ | 10,091,813 | |
| Icahn Enterprises Limited Partnership / Icahn Enterprises Finance Corp. | | | | | | | | |
5.88% due 02/01/228 | | | 6,100,000 | | | | 6,283,000 | |
| 6.00% due 08/01/20 | | | 3,100,000 | | | | 3,220,280 | |
| 3.50% due 03/15/17 | | | 200,000 | | | | 201,500 | |
| Odyssey Re Holdings Corp. | | | | | | | | |
6.88% due 05/01/158 | | | 7,775,000 | | | | 7,804,786 | |
| Kemper Corp. | | | | | | | | |
4.35% due 02/15/258 | | | 7,500,000 | | | | 7,675,154 | |
| HSBC Holdings plc | | | | | | | | |
6.38%1,2 | | | 4,000,000 | | | | 4,090,000 | |
5.63%1,2 | | | 2,200,000 | | | | 2,220,625 | |
6.37% 1,2 | | | 800,000 | | | | 817,000 | |
| Assured Guaranty US Holdings, Inc. | | | | | | | | |
5.00% due 07/01/248 | | | 6,100,000 | | | | 6,528,275 | |
| WP Carey, Inc. | | | | | | | | |
4.00% due 02/01/258 | | | 6,250,000 | | | | 6,267,550 | |
| HRG Group, Inc. | | | | | | | | |
7.88% due 07/15/198 | | | 5,050,000 | | | | 5,315,125 | |
| Morgan Stanley | | | | | | | | |
5.55%1,2 | | | 5,250,000 | | | | 5,302,500 | |
| Nippon Life Insurance Co. | | | | | | | | |
5.10% due 10/16/441,3,8 | | | 4,750,000 | | | | 5,147,813 | |
| Citizens Financial Group, Inc. | | | | | | | | |
5.50%1,2,3 | | | 5,000,000 | | | | 5,000,000 | |
| First American Financial Corp. | | | | | | | | |
4.60% due 11/15/248 | | | 4,000,000 | | | | 4,180,244 | |
| 4.30% due 02/01/23 | | | 500,000 | | | | 500,658 | |
| Fort Benning Family Communities LLC | | | | | | | | |
0.52% due 01/15/361,3 | | | 6,000,000 | | | | 4,657,500 | |
| Ironshore Holdings US, Inc. | | | | | | | | |
8.50% due 05/15/203 | | | 3,835,000 | | | | 4,657,067 | |
| Fifth Third Bancorp | | | | | | | | |
4.90%1,2 | | | 2,000,000 | | | | 1,932,500 | |
5.10%1,2 | | | 1,840,000 | | | | 1,748,000 | |
| Nordea Bank AB | | | | | | | | |
5.50%1,2,3,8 | | | 2,000,000 | | | | 2,032,500 | |
6.13%1,2,3 | | | 1,300,000 | | | | 1,341,444 | |
| Corporation Financiera de Desarrollo S.A. | | | | | | | | |
5.25% due 07/15/291,3 | | | 3,150,000 | | | | 3,275,528 | |
| Wintrust Financial Corp. | | | | | | | | |
| 5.00% due 06/13/24 | | | 2,700,000 | | | | 2,888,087 | |
| Itau Unibanco Holding S.A./Cayman Island | | | | | | | | |
5.13% due 05/13/233 | | | 2,650,000 | | | | 2,582,955 | |
| Susquehanna Bancshares, Inc. | | | | | | | | |
| 5.38% due 08/15/22 | | | 2,300,000 | | | | 2,562,800 | |
| AmTrust Financial Services, Inc. | | | | | | | | |
| 6.13% due 08/15/23 | | | 2,000,000 | | | | 2,133,240 | |
| Montpelier Re Holdings Ltd. | | | | | | | | |
| 4.70% due 10/15/22 | | | 2,000,000 | | | | 2,108,896 | |
| Customers Bank | | | | | | | | |
6.13% due 06/26/291,3 | | | 2,000,000 | | | | 2,055,000 | |
| Farmers Exchange Capital III | | | | | | | | |
5.45% due 10/15/541,3 | | | 2,000,000 | | | | 1,977,854 | |
| Banco Inbursa S.A. Institucion de Banca Multiple | | | | | | | | |
4.13% due 06/06/243 | | | 2,000,000 | | | | 1,970,000 | |
| Ares Finance Company LLC | | | | | | | | |
4.00% due 10/08/243 | | | 1,800,000 | | | | 1,770,521 | |
| Cadence Bank North America | | | | | | | | |
6.25% due 06/28/291,12 | | | 1,200,000 | | | | 1,230,000 | |
| BBVA Bancomer S.A. | | | | | | | | |
4.38% due 04/10/243 | | | 1,150,000 | | | | 1,191,688 | |
| Pacific Northwest Communities LLC | | | | | | | | |
5.91% due 06/15/503 | | | 1,000,000 | | | | 1,121,180 | |
| Atlantic Marine Corporations Communities LLC | | | | | | | | |
5.43% due 12/01/503 | | | 1,066,327 | | | | 1,108,894 | |
| Univest Corporation of Pennsylvania | | | | | | | | |
5.10% due 03/30/251,6 | | | 1,000,000 | | | | 1,000,273 | |
| Wilton Re Finance LLC | | | | | | | | |
5.88% due 03/30/331,3 | | | 925,000 | | | | 999,278 | |
| SEE NOTES TO FINANCIAL STATEMENTS. | THE GUGGENHEIM FUNDS SEMI-ANNUAL REPORT | 19 |
SCHEDULE OF INVESTMENTS (Unaudited)(continued) | March 31, 2015 |
| TOTAL RETURN BOND FUND | |
| | | Face
Amount | | | Value | |
| | | | | | | | | |
| Dai-ichi Life Insurance Company Ltd. | | | | | | | | |
5.10%1,2,3 | | $ | 800,000 | | | $ | 871,000 | |
| Royal Bank of Scotland Group plc | | | | | | | | |
| 5.12% due 05/28/24 | | | 700,000 | | | | 734,378 | |
| ACC Group Housing LLC | | | | | | | | |
6.35% due 07/15/54†††,3 | | | 625,000 | | | | 652,813 | |
| Realty Income Corp. | | | | | | | | |
| 6.75% due 08/15/19 | | | 500,000 | | | | 588,529 | |
| Hartford Financial Services Group, Inc. | | | | | | | | |
| 5.12% due 04/15/22 | | | 500,000 | | | | 569,760 | |
| Tri-Command Military Housing LLC | | | | | | | | |
5.38% due 02/15/483 | | | 562,305 | | | | 538,834 | |
| CIC Receivables Master Trust | | | | | | | | |
4.89% due 10/07/21††† | | | 500,000 | | | | 511,650 | |
| QBE Capital Funding III Ltd. | | | | | | | | |
7.25% due 05/24/411,3 | | | 368,000 | | | | 409,400 | |
| Credit Suisse Group AG | | | | | | | | |
6.25%1,2,3 | | | 300,000 | | | | 294,750 | |
| Allstate Corp. | | | | | | | | |
5.75% due 08/15/531 | | | 250,000 | | | | 272,188 | |
| Cadence Financial Corp. | | | | | | | | |
4.88% due 06/28/1912 | | | 250,000 | | | | 252,390 | |
| Jackson National Life Insurance Co. | | | | | | | | |
8.15% due 03/15/273 | | | 125,000 | | | | 167,699 | |
| National Life Insurance Co. | | | | | | | | |
10.50% due 09/15/393 | | | 100,000 | | | | 162,155 | |
| MetLife Capital Trust IV | | | | | | | | |
7.88% due 12/15/373 | | | 115,000 | | | | 152,375 | |
| Scottrade Financial Services, Inc. | | | | | | | | |
6.13% due 07/11/213 | | | 125,000 | | | | 136,788 | |
| Prosight Global Inc. | | | | | | | | |
7.50% due 11/26/20†††,6 | | | 100,000 | | | | 104,810 | |
| LCP Dakota Fund | | | | | | | | |
10.00% due 08/17/156 | | | 28,800 | | | | 28,791 | |
| Total Financial | | | | | | | 235,557,320 | |
| | | | | | | | |
| CONSUMER, NON-CYCLICAL - 2.0% | |
| Actavis Funding SCS | | | | | | | | |
| 4.75% due 03/15/45 | | | 11,000,000 | | | | 11,691,415 | |
| Vector Group Ltd. | | | | | | | | |
7.75% due 02/15/218 | | | 3,850,000 | | | | 4,095,437 | |
| CDK Global, Inc. | | | | | | | | |
4.50% due 10/15/248 | | | 3,750,000 | | | | 3,865,099 | |
| Opal Acquisition, Inc. | | | | | | | | |
8.87% due 12/15/213 | | | 2,000,000 | | | | 2,035,000 | |
| Central Garden & Pet Co. | | | | | | | | |
| 8.25% due 03/01/18 | | | 1,728,000 | | | | 1,767,969 | |
| FTI Consulting, Inc. | | | | | | | | |
| 6.75% due 10/01/20 | | | 1,000,000 | | | | 1,055,000 | |
| Valeant Pharmaceuticals International, Inc. | | | | | | | | |
5.50% due 03/01/233 | | | 1,000,000 | | | | 1,007,500 | |
| Pfizer, Inc. | | | | | | | | |
| 7.20% due 03/15/39 | | | 500,000 | | | | 735,125 | |
| Kraft Foods Group, Inc. | | | | | | | | |
| 6.88% due 01/26/39 | | | 500,000 | | | | 665,392 | |
| Express Scripts Holding Co. | | | | | | | | |
| 7.25% due 06/15/19 | | | 500,000 | | | | 598,963 | |
| Anthem, Inc. | | | | | | | | |
| 6.38% due 06/15/37 | | | 400,000 | | | | 520,060 | |
| Reynolds American, Inc. | | | | | | | | |
| 6.15% due 09/15/43 | | | 400,000 | | | | 494,234 | |
| Total Consumer, Non-cyclical | | | | | | | 28,531,194 | |
| | | | | | | | |
| CONSUMER, CYCLICAL - 1.8% | |
| Wynn Las Vegas LLC / Wynn Las Vegas Capital Corp. | | | | | | | | |
5.50% due 03/01/253,8 | | | 6,500,000 | | | | 6,581,249 | |
| QVC, Inc. | | | | | | | | |
| 4.85% due 04/01/24 | | | 2,500,000 | | | | 2,598,890 | |
| 4.37% due 03/15/23 | | | 1,000,000 | | | | 1,018,851 | |
7.38% due 10/15/203 | | | 650,000 | | | | 674,375 | |
| United Airlines 2014-2 Class B Pass Through Trust | | | | | | | | |
| 4.63% due 09/03/22 | | | 2,875,000 | | | | 2,892,968 | |
| GRD Holdings III Corp. | | | | | | | | |
10.75% due 06/01/193 | | | 2,175,000 | | | | 2,365,313 | |
| Bumble Bee Holdings, Inc. | | | | | | | | |
9.00% due 12/15/173 | | | 1,791,000 | | | | 1,880,550 | |
| 20 | THE GUGGENHEIM FUNDS SEMI-ANNUAL REPORT | SEE NOTES TO FINANCIAL STATEMENTS. |
SCHEDULE OF INVESTMENTS (Unaudited)(continued) | March 31, 2015 |
| TOTAL RETURN BOND FUND | |
| | | Face
Amount | | | Value | |
| | | | | | | | | |
| Suburban Propane Partners Limited Partnership/Suburban Energy Finance Corp. | | | | | | | | |
| 7.37% due 08/01/21 | | $ | 1,618,000 | | | $ | 1,739,350 | |
| Northern Group Housing LLC | | | | | | | | |
6.80% due 08/15/533 | | | 1,200,000 | | | | 1,463,868 | |
| HP Communities LLC | | | | | | | | |
5.62% due 09/15/323 | | | 1,000,000 | | | | 1,049,230 | |
| Rite Aid Corp. | | | | | | | | |
| 6.13% due 04/01/23 | | | 1,000,000 | | | | 1,025,000 | |
| Petco Animal Supplies, Inc. | | | | | | | | |
9.25% due 12/01/183 | | | 600,000 | | | | 630,000 | |
| Hasbro, Inc. | | | | | | | | |
| 6.35% due 03/15/40 | | | 400,000 | | | | 474,016 | |
| Continental Airlines 2012-2 Class B Pass Through Trust | | | | | | | | |
| 5.50% due 10/29/20 | | | 271,794 | | | | 288,782 | |
| Continental Airlines 2012-1 Class B Pass Through Trust | | | | | | | | |
| 6.25% due 04/11/20 | | | 254,391 | | | | 271,563 | |
| Atlas Air 1999-1 Class A-1 Pass Through Trust | | | | | | | | |
7.20% due 01/02/196 | | | 58,109 | | | | 59,126 | |
| Total Consumer, Cyclical | | | | | | | 25,013,131 | |
| | | | | | | | |
| COMMUNICATIONS - 1.1% | |
| CBS Corp. | | | | | | | | |
4.60% due 01/15/458 | | | 4,000,000 | | | | 4,072,107 | |
| Juniper Networks, Inc. | | | | | | | | |
4.35% due 06/15/258 | | | 3,750,000 | | | | 3,801,888 | |
| Avaya, Inc. | | | | | | | | |
7.00% due 04/01/193 | | | 1,700,000 | | | | 1,687,250 | |
| McGraw-Hill Global Education Holdings LLC / McGraw-Hill Global Education Finance | | | | | | | | |
| 9.75% due 04/01/21 | | | 1,500,000 | | | | 1,657,500 | |
| Tencent Holdings Ltd. | | | | | | | | |
3.80% due 02/11/253 | | | 1,500,000 | | | | 1,532,861 | |
| DISH DBS Corp. | | | | | | | | |
| 5.88% due 11/15/24 | | | 800,000 | | | | 801,000 | |
| Vodafone Group plc | | | | | | | | |
| 7.88% due 02/15/30 | | | 500,000 | | | | 684,732 | |
| Time Warner, Inc. | | | | | | | | |
| 6.50% due 11/15/36 | | | 500,000 | | | | 648,887 | |
| Symantec Corp. | | | | | | | | |
| 4.20% due 09/15/20 | | | 500,000 | | | | 527,199 | |
| Baidu, Inc. | | | | | | | | |
| 3.25% due 08/06/18 | | | 500,000 | | | | 517,945 | |
| Total Communications | | | | | | | 15,931,369 | |
| | | | | | | | |
| INDUSTRIAL - 0.9% | |
| Princess Juliana International Airport Operating Company N.V. | | | | | | | | |
5.50% due 12/20/273 | | | 2,915,089 | | | | 2,958,815 | |
| Quality Distribution LLC / QD Capital Corp. | | | | | | | | |
| 9.88% due 11/01/18 | | | 2,360,000 | | | | 2,472,100 | |
| Trimble Navigation Ltd. | | | | | | | | |
| 4.75% due 12/01/24 | | | 1,700,000 | | | | 1,792,368 | |
| Dynagas LNG Partners Limited Partnership / Dynagas Finance, Inc. | | | | | | | | |
| 6.25% due 10/30/19 | | | 1,700,000 | | | | 1,462,000 | |
| Reynolds Group Issuer Incorporated / Reynolds Group Issuer LLC / Reynolds Group Issuer Lu | | | | | | | | |
| 7.12% due 04/15/19 | | | 800,000 | | | | 829,000 | |
| Chicago Bridge & Iron Co. | | | | | | | | |
5.15% due 12/27/22†††,6 | | | 750,000 | | | | 767,925 | |
| Skyway Concession Company LLC | | | | | | | | |
0.65% due 06/30/261,3 | | | 750,000 | | | | 622,500 | |
| L-3 Communications Corp. | | | | | | | | |
| 4.75% due 07/15/20 | | | 450,000 | | | | 490,543 | |
| CEVA Group plc | | | | | | | | |
7.00% due 03/01/213 | | | 500,000 | | | | 485,000 | |
| Xefin Lux SCA | | | | | | | | |
| 3.79% due 06/01/19 | | | EUR 450,000 | | | | 484,346 | |
| SEE NOTES TO FINANCIAL STATEMENTS. | THE GUGGENHEIM FUNDS SEMI-ANNUAL REPORT | 21 |
SCHEDULE OF INVESTMENTS (Unaudited)(continued) | March 31, 2015 |
| TOTAL RETURN BOND FUND | |
| | | Face
Amount | | | Value | |
| | | | | | | | | |
| SBM Baleia Azul | | | | | | | | |
5.50% due 09/15/27†††,6 | | $ | 447,600 | | | $ | 336,729 | |
| Marquette Transportation Company LLC / Marquette Transportation Finance Corp. | | | | | | | | |
| 10.87% due 01/15/17 | | | 120,000 | | | | 123,750 | |
| Total Industrial | | | | | | | 12,825,076 | |
| | | | | | | | |
| ENERGY - 0.8% | |
| ContourGlobal Power Holdings S.A. | | | | | | | | |
7.12% due 06/01/193 | | | 2,650,000 | | | | 2,703,000 | |
| Sabine Pass Liquefaction LLC | | | | | | | | |
5.62% due 03/01/253 | | | 1,500,000 | | | | 1,483,125 | |
| Exterran Holdings, Inc. | | | | | | | | |
| 7.25% due 12/01/18 | | | 1,400,000 | | | | 1,414,000 | |
| Crestwood Midstream Partners Limited Partnership / Crestwood Midstream Finance Corp. | | | | | | | | |
| 7.75% due 04/01/19 | | | 925,000 | | | | 961,168 | |
| Antero Resources Corp. | | | | | | | | |
| 5.63% due 06/01/23 | | | 750,000 | | | | 742,499 | |
| BreitBurn Energy Partners Limited Partnership / BreitBurn Finance Corp. | | | | | | | | |
| 7.87% due 04/15/22 | | | 1,000,000 | | | | 720,000 | |
| Atlas Energy Holdings Operating Company LLC / Atlas Resource Finance Corp. | | | | | | | | |
| 9.25% due 08/15/21 | | | 1,000,000 | | | | 690,000 | |
| Unit Corp. | | | | | | | | |
| 6.62% due 05/15/21 | | | 700,000 | | | | 658,000 | |
| Baker Hughes, Inc. | | | | | | | | |
| 5.13% due 09/15/40 | | | 450,000 | | | | 512,504 | |
| Marathon Petroleum Corp. | | | | | | | | |
| 5.13% due 03/01/21 | | | 450,000 | | | | 506,156 | |
| Schahin II Finance Company SPV Ltd. | | | | | | | | |
5.87% due 09/25/223,8 | | | 781,800 | | | | 472,598 | |
| Odebrecht Drilling Norbe VIII/IX Ltd. | | | | | | | | |
6.35% due 06/30/2112 | | | 187,000 | | | | 161,288 | |
| Total Energy | | | | | | | 11,024,338 | |
| | | | | | | | |
| BASIC MATERIALS - 0.6% | |
| Yamana Gold, Inc. | | | | | | | | |
| 4.95% due 07/15/24 | | | 3,750,000 | | | | 3,687,044 | |
| Newcrest Finance Pty Ltd. | | | | | | | | |
4.20% due 10/01/223 | | | 850,000 | | | | 799,890 | |
4.45% due 11/15/213 | | | 625,000 | | | | 614,383 | |
| TPC Group, Inc. | | | | | | | | |
8.75% due 12/15/203 | | | 745,000 | | | | 681,675 | |
| International Paper Co. | | | | | | | | |
| 7.30% due 11/15/39 | | | 500,000 | | | | 667,092 | |
| Eldorado Gold Corp. | | | | | | | | |
6.12% due 12/15/203 | | | 550,000 | | | | 534,875 | |
| LYB International Finance BV | | | | | | | | |
| 4.00% due 07/15/23 | | | 450,000 | | | | 476,672 | |
| AngloGold Ashanti Holdings plc | | | | | | | | |
| 5.13% due 08/01/22 | | | 445,000 | | | | 419,420 | |
| Total Basic Materials | | | | | | | 7,881,051 | |
| | | | | | | | |
| UTILITIES - 0.4% | |
| AES Corp. | | | | | | | | |
3.26% due 06/01/191,8 | | | 5,000,000 | | | | 4,975,000 | |
| | | | | | | | |
| TECHNOLOGY - 0.1% | |
| NCR Corp. | | | | | | | | |
| 6.38% due 12/15/23 | | | 1,000,000 | | | | 1,065,000 | |
| Open Text Corp. | | | | | | | | |
5.63% due 01/15/233 | | | 1,000,000 | | | | 1,037,500 | |
| Total Technology | | | | | | | 2,102,500 | |
| | | | | | | | |
| DIVERSIFIED - 0.1% | |
| Leucadia National Corp. | | | | | | | | |
| 5.50% due 10/18/23 | | | 1,500,000 | | | | 1,547,429 | |
| | | | | | | | |
| 22 | THE GUGGENHEIM FUNDS SEMI-ANNUAL REPORT | SEE NOTES TO FINANCIAL STATEMENTS. |
SCHEDULE OF INVESTMENTS (Unaudited)(continued) | March 31, 2015 |
| TOTAL RETURN BOND FUND | |
| | | Face
Amount | | | Value | |
| | | | | | | | | |
| GOVERNMENT - 0.0% | |
| Commonwealth of the Bahamas | | | | | | | | |
6.95% due 11/20/293 | | $ | 110,000 | | | $ | 129,663 | |
| Total Corporate Bonds | | | | | | | | |
| (Cost $341,619,888) | | | | | | | 345,518,071 | |
| | | | | | | | |
MORTGAGE-BACKED SECURITIES†† - 12.3% | |
| LMREC, Inc. | | | | | | | | |
2015-CRE1, 1.92% due 02/22/321,3 | | | 20,000,000 | | | | 20,192,000 | |
2015-CRE1, 3.67% due 02/22/321,3 | | | 2,000,000 | | | | 1,995,000 | |
Fannie Mae9 | | | | | | | | |
| 5.00% due 04/14/16 | | | 8,500,000 | | | | 9,449,450 | |
| 3.00% due 04/14/16 | | | 8,500,000 | | | | 8,656,400 | |
| American Home Mortgage Investment Trust | | | | | | | | |
2006-1, 0.45% due 03/25/461 | | | 10,022,224 | | | | 8,300,746 | |
2006-1, 0.57% due 03/25/461 | | | 4,496,081 | | | | 3,736,311 | |
| WaMu Mortgage Pass-Through Certificates Series Trust | | | | | | | | |
2007-OA3, 0.90% due 04/25/471 | | | 9,151,683 | | | | 7,240,875 | |
2006-AR11, 1.05% due 09/25/461 | | | 2,591,563 | | | | 1,964,146 | |
| American Home Mortgage Assets Trust | | | | | | | | |
2007-1, 0.83% due 02/25/471 | | | 14,462,134 | | | | 9,197,499 | |
| Morgan Stanley Resecuritization Trust | | | | | | | | |
2014-R9, 0.31% due 11/26/461,3 | | | 9,408,251 | | | | 8,531,402 | |
| Capmark Military Housing Trust | | | | | | | | |
2007-AETC, 5.75% due 02/10/52†††,3 | | | 8,419,256 | | | | 8,423,466 | |
| Banc of America Funding Trust | | | | | | | | |
2014-R7, 0.31% due 09/26/361 | | | 8,961,209 | | | | 8,264,924 | |
| Lehman XS Trust Series | | | | | | | | |
2005-7N, 0.44% due 12/25/351 | | | 4,023,832 | | | | 3,514,982 | |
2007-15N, 0.42% due 08/25/371 | | | 2,807,164 | | | | 2,275,504 | |
| Washington Mutual Mortgage Pass-Through Certificates WMALT Series Trust | | | | | | | | |
2006-AR1, 0.42% due 02/25/361 | | | 4,066,356 | | | | 3,095,648 | |
2006-8, 4.82% due 10/25/367 | | | 1,467,565 | | | | 1,119,924 | |
2006-AR9, 0.97% due 11/25/461 | | | 1,405,312 | | | | 979,542 | |
| Resource Capital Corporation | | | | | | | | |
2015-CRE3, 2.57% due 03/15/321,3 | | | 4,500,000 | | | | 4,499,995 | |
2015-CRE3, 4.17% due 03/15/321,3 | | | 2,000,000 | | | | 1,999,994 | |
| BCAP LLC | | | | | | | | |
2014-RR2, 0.43% due 03/26/361,3 | | | 6,394,676 | | | | 5,984,777 | |
| Motel 6 Trust | | | | | | | | |
2015-MTL6, 3.64% due 02/05/303 | | | 5,000,000 | | | | 5,045,759 | |
| Luminent Mortgage Trust | | | | | | | | |
2006-2, 0.37% due 02/25/461 | | | 6,423,056 | | | | 4,804,652 | |
| Comm Mortgage Trust | | | | | | | | |
2013-CR13, 1.01% due 12/10/231 | | | 53,198,308 | | | | 2,998,363 | |
| 2013-CR13, 3.04% due 12/10/18 | | | 450,000 | | | | 470,145 | |
| RALI Series Trust | | | | | | | | |
2005-QO1, 1.63% due 08/25/351 | | | 4,030,006 | | | | 3,425,182 | |
| SEE NOTES TO FINANCIAL STATEMENTS. | THE GUGGENHEIM FUNDS SEMI-ANNUAL REPORT | 23 |
SCHEDULE OF INVESTMENTS (Unaudited)(continued) | March 31, 2015 |
| TOTAL RETURN BOND FUND | |
| | | Face
Amount | | | Value | |
| | | | | | | | | |
| RFMSI Series Trust | | | | | | | | |
| 2006-S11, 6.00% due 11/25/36 | | $ | 3,527,036 | | | $ | 3,296,015 | |
| RALI Series Trust | | | | | | | | |
2007-QO3, 0.33% due 03/25/471 | | | 3,629,614 | | | | 3,005,698 | |
| CDGJ Commercial Mortgage Trust | | | | | | | | |
2014-BXCH, 2.67% due 12/15/271,3 | | | 3,000,000 | | | | 3,004,197 | |
| Freddie Mac Multifamily Structured Pass Through Certificates | | | | | | | | |
2015-K043, 0.68% due 12/25/241 | | | 45,000,000 | | | | 2,039,580 | |
| 2014-K715, 2.86% due 01/25/21 | | | 450,000 | | | | 474,180 | |
| JPMBB Commercial Mortgage Securities Trust | | | | | | | | |
2013-C12, 0.89% due 07/15/451 | | | 55,563,813 | | | | 2,167,211 | |
| Hyatt Hotel Portfolio Trust | | | | | | | | |
2015-HYT, 3.22% due 11/15/291,3 | | | 2,000,000 | | | | 2,006,172 | |
| Alternative Loan Trust | | | | | | | | |
| 2003-18CB, 5.25% due 09/25/33 | | | 1,845,857 | | | | 1,917,516 | |
| Hilton USA Trust | | | | | | | | |
2013-HLT, 4.41% due 11/05/303 | | | 1,750,000 | | | | 1,801,149 | |
| GS Mortgage Securities Trust | | | | | | | | |
2015-GC28, 1.18% due 02/10/481 | | | 21,983,011 | | | | 1,718,104 | |
| Boca Hotel Portfolio Trust | | | | | | | | |
2013-BOCA, 3.22% due 08/15/261,3 | | | 1,700,000 | | | | 1,697,991 | |
| BLCP Hotel Trust | | | | | | | | |
2014-CLRN, 2.68% due 08/15/291,3 | | | 1,500,000 | | | | 1,502,887 | |
| BBCMS Trust | | | | | | | | |
2013-TYSN, 3.71% due 09/05/323 | | | 1,500,000 | | | | 1,495,007 | |
| BAMLL Commercial Mortgage Securities Trust | | | | | | | | |
2014-ICTS, 3.12% due 06/15/281,3 | | | 1,500,000 | | | | 1,494,338 | |
| BB-UBS Trust | | | | | | | | |
2012-SHOW, 4.03% due 11/05/361,3 | | | 1,500,000 | | | | 1,472,267 | |
| WFRBS Commercial Mortgage Trust | | | | | | | | |
2013-C12, 1.49% due 03/15/481,3 | | | 14,682,350 | | | | 1,157,468 | |
| GMAC Commercial Mortgage Asset Corp. | | | | | | | | |
2003-PRES, 6.24% due 10/10/41†††,3 | | | 960,351 | | | | 1,085,677 | |
| Alliance Bancorp Trust | | | | | | | | |
2007-OA1, 0.41% due 07/25/371 | | | 1,367,521 | | | | 913,236 | |
| Chase Mortgage Finance Trust Series | | | | | | | | |
| 2006-S3, 6.00% due 11/25/36 | | | 995,956 | | | | 869,661 | |
| Wells Fargo Alternative Loan Trust | | | | | | | | |
| 2007-PA3, 6.25% due 07/25/37 | | | 935,594 | | | | 847,853 | |
| LSTAR Commercial Mortgage Trust | | | | | | | | |
2014-2, 5.14% due 01/20/411,3 | | | 500,000 | | | | 515,488 | |
| Residential Asset Securitization Trust | | | | | | | | |
| 2006-A12, 6.25% due 11/25/36 | | | 721,516 | | | | 513,690 | |
| GreenPoint Mortgage Funding Trust Series | | | | | | | | |
2007-AR1, 0.25% due 02/25/471 | | | 504,274 | | | | 471,000 | |
| Structured Asset Mortgage Investments II Trust | | | | | | | | |
2006-AR1, 0.40% due 02/25/361 | | | 538,417 | | | | 448,576 | |
| 24 | THE GUGGENHEIM FUNDS SEMI-ANNUAL REPORT | SEE NOTES TO FINANCIAL STATEMENTS. |
SCHEDULE OF INVESTMENTS (Unaudited)(continued) | March 31, 2015 |
| TOTAL RETURN BOND FUND | |
| | | Face
Amount | | | Value | |
| | | | | | | | | |
| Citigroup Commercial Mortgage Trust | | | | | | | | |
2013-GC15, 4.37% due 09/10/461 | | $ | 380,000 | | | $ | 429,500 | |
| BAMLL-DB Trust | | | | | | | | |
2012-OSI, 5.81% due 04/13/293 | | | 200,000 | | | | 211,361 | |
| Total Mortgage-Backed Securities | | | | | | | | |
| (Cost $172,166,502) | | | | | | | 172,722,508 | |
| | | | | | | | |
COLLATERALIZED MORTGAGE OBLIGATIONS†† - 10.0% | |
| LSTAR Securities Investment Trust | | | | | | | | |
2015-2, 2.17% due 01/01/201,3 | | | 15,552,797 | | | | 15,475,033 | |
2015-3, 2.18% due 03/01/201,3 | | | 13,750,000 | | | | 13,681,250 | |
2015-1, 2.18% due 01/01/201,3 | | | 11,858,131 | | | | 11,695,674 | |
2014-1, 3.28% due 09/01/211,3 | | | 8,220,991 | | | | 8,297,446 | |
| Motel 6 Trust | | | | | | | | |
2015-MTL6, 5.28% due 02/05/303 | | | 15,000,000 | | | | 15,022,980 | |
2015-MTL6, 4.53% due 02/05/303 | | | 10,000,000 | | | | 10,105,840 | |
| CSMC Series | | | | | | | | |
2014-ICE, 2.32% due 04/15/271,3 | | | 12,350,000 | | | | 12,313,160 | |
2014-6R, 0.35% due 09/27/361,3 | | | 1,383,003 | | | | 1,313,474 | |
| HarborView Mortgage Loan Trust | | | | | | | | |
2006-14, 0.33% due 01/25/471 | | | 12,224,145 | | | | 9,372,142 | |
2006-12, 0.37% due 01/19/381 | | | 3,948,341 | | | | 3,335,191 | |
| Morgan Stanley Capital I Trust | | | | | | | | |
2015-XLF1, 2.35% due 08/13/161,3 | | | 7,600,000 | | | | 7,600,935 | |
| COMM Mortgage Trust | | | | | | | | |
2014-KYO, 2.53% due 06/11/271,3 | | | 6,000,000 | | | | 5,994,090 | |
| SRERS-2011 Funding Ltd. | | | | | | | | |
2011-RS, 0.43% due 05/09/461,3 | | | 5,947,186 | | | | 5,654,584 | |
| Resource Capital Corporation Ltd. | | | | | | | | |
2015-CRE3, 3.32% due 03/15/321,3 | | | 3,000,000 | | | | 2,999,994 | |
2014-CRE2, 2.68% due 04/15/321,3 | | | 1,000,000 | | | | 987,095 | |
| Nomura Resecuritization Trust | | | | | | | | |
2015-4R, 0.61% due 03/26/361,3 | | | 3,300,000 | | | | 2,984,438 | |
2012-1R, 0.62% due 08/27/471,3 | | | 451,672 | | | | 417,796 | |
| Hilton USA Trust | | | | | | | | |
2013-HLT, 5.22% due 11/05/181,3 | | | 3,000,000 | | | | 3,081,471 | |
| CSAIL 2015-C1 Commercial Mortgage Trust | | | | | | | | |
2015-C1, 1.12% due 04/15/501 | | | 35,000,000 | | | | 2,456,230 | |
| GAHR Commericial Mortgage Trust | | | | | | | | |
2015-NRF, 3.38% due 12/15/193 | | | 2,250,000 | | | | 2,225,716 | |
| CDGJ Commercial Mortgage Trust | | | | | | | | |
2014-BXCH, 4.42% due 12/15/271,3 | | | 2,000,000 | | | | 2,002,682 | |
| CSMC Trust | | | | | | | | |
2014-SURF, 3.28% due 02/15/291,3 | | | 2,000,000 | | | | 1,997,664 | |
| LSTAR Commercial Mortgage Trust | | | | | | | | |
2011-1, 5.42% due 06/25/431,3 | | | 1,000,000 | | | | 1,014,799 | |
| SEE NOTES TO FINANCIAL STATEMENTS. | THE GUGGENHEIM FUNDS SEMI-ANNUAL REPORT | 25 |
SCHEDULE OF INVESTMENTS (Unaudited)(continued) | March 31, 2015 |
| TOTAL RETURN BOND FUND | |
| | | Face
Amount | | | Value | |
| | | | | | | | | |
| Morgan Stanley Re-REMIC Trust | | | | | | | | |
2010-R5, 0.48% due 06/26/361,3 | | $ | 629,796 | | | $ | 452,590 | |
| Total Collateralized Mortgage Obligations | | | | | | | | |
| (Cost $140,082,743) | | | | | | | 140,482,274 | |
| | | | | | | | |
SENIOR FLOATING RATE INTERESTS††,1,11 - 6.6% | |
| | | | | | | | |
| COMMUNICATIONS - 1.4% | |
| Avaya, Inc. | | | | | | | | |
| 4.68% due 10/26/17 | | | 4,811,236 | | | | 4,731,418 | |
| 6.50% due 03/31/18 | | | 1,397,494 | | | | 1,393,036 | |
| Univision Communications, Inc. | | | | | | | | |
| 4.00% due 03/01/20 | | | 3,291,344 | | | | 3,283,618 | |
| Charter Communications Operating LLC | | | | | | | | |
| 4.25% due 09/10/21 | | | 3,000,000 | | | | 3,023,340 | |
| Internet Brands | | | | | | | | |
| 5.00% due 07/08/21 | | | 1,885,230 | | | | 1,882,289 | |
| Light Tower Fiber LLC | | | | | | | | |
| 4.00% due 04/13/20 | | | 1,591,223 | | | | 1,584,270 | |
| EMI Music Publishing | | | | | | | | |
| 3.75% due 06/29/18 | | | 1,250,000 | | | | 1,247,738 | |
| Proquest LLC | | | | | | | | |
| 5.25% due 10/24/21 | | | 1,000,000 | | | | 1,000,940 | |
| Ziggo BV | | | | | | | | |
| 3.50% due 01/15/22 | | | 1,000,000 | | | | 993,330 | |
| Interactive Data Corp. | | | | | | | | |
| 4.75% due 05/02/21 | | | 397,000 | | | | 398,572 | |
| Total Communications | | | | | | | 19,538,551 | |
| | | | | | | | |
| CONSUMER, CYCLICAL - 1.2% | |
| Party City Holdings, Inc. | | | | | | | | |
| 4.00% due 07/27/19 | | | 2,300,000 | | | | 2,296,158 | |
| Warner Music Group | | | | | | | | |
| 3.75% due 07/01/20 | | | 2,094,180 | | | | 2,041,825 | |
| Equinox Fitness | | | | | | | | |
| 5.00% due 01/31/20 | | | 1,695,729 | | | | 1,699,968 | |
| Eyemart Express | | | | | | | | |
| 5.00% due 12/18/21 | | | 1,500,000 | | | | 1,507,500 | |
| Burger King Corp. | | | | | | | | |
| 4.50% due 10/27/21 | | | 1,486,756 | | | | 1,500,791 | |
| Mattress Firm | | | | | | | | |
| 5.25% due 10/20/21 | | | 1,246,875 | | | | 1,254,668 | |
| BBB Industries, LLC | | | | | | | | |
| 6.00% due 11/03/21 | | | 1,000,000 | | | | 998,750 | |
| Hilton Worldwide Holdings, Inc. | | | | | | | | |
| 3.50% due 10/26/20 | | | 950,980 | | | | 951,846 | |
| 1-800 Contacts, Inc. | | | | | | | | |
| 4.25% due 01/29/21 | | | 746,622 | | | | 743,822 | |
| ServiceMaster Co. | | | | | | | | |
| 4.25% due 07/01/21 | | | 696,500 | | | | 693,018 | |
| Neiman Marcus Group, Inc. | | | | | | | | |
| 4.25% due 10/25/20 | | | 594,000 | | | | 591,660 | |
| Michaels Stores, Inc. | | | | | | | | |
| 4.00% due 01/28/20 | | | 547,250 | | | | 548,717 | |
| Sears Holdings Corp. | | | | | | | | |
| 5.50% due 06/30/18 | | | 497,984 | | | | 490,046 | |
| Compucom Systems, Inc. | | | | | | | | |
| 4.25% due 05/07/20 | | | 300,000 | | | | 279,000 | |
| Container Store, Inc. | | | | | | | | |
| 4.25% due 04/06/19 | | | 259,881 | | | | 258,581 | |
| Fleetpride Corp. | | | | | | | | |
| 5.25% due 11/19/19 | | | 159,075 | | | | 157,683 | |
| Capital Automotive LP | | | | | | | | |
| 6.00% due 04/30/20 | | | 140,000 | | | | 142,100 | |
| Navistar, Inc. | | | | | | | | |
| 5.75% due 08/17/17 | | | 62,500 | | | | 62,734 | |
| Total Consumer, Cyclical | | | | | | | 16,218,867 | |
| | | | | | | | |
| INDUSTRIAL - 1.1% | |
| Travelport Holdings LLC | | | | | | | | |
| 5.75% due 09/02/21 | | | 7,231,875 | | | | 7,291,249 | |
| Rise Ltd. | | | | | | | | |
| 4.74% due 02/12/39 | | | 5,174,219 | | | | 5,213,025 | |
| Brickman Group Holdings, Inc. | | | | | | | | |
| 4.00% due 12/18/20 | | | 895,233 | | | | 890,506 | |
| Hardware Holdings LLC | | | | | | | | |
6.75% due 03/30/206 | | | 845,750 | | | | 820,378 | |
| 26 | THE GUGGENHEIM FUNDS SEMI-ANNUAL REPORT | SEE NOTES TO FINANCIAL STATEMENTS. |
SCHEDULE OF INVESTMENTS (Unaudited)(continued) | March 31, 2015 |
| TOTAL RETURN BOND FUND | |
| | | Face
Amount | | | Value | |
| | | | | | | | | |
| CareCore National LLC | | | | | | | | |
| 5.50% due 03/05/21 | | $ | 596,985 | | | $ | 599,970 | |
| AABS Ltd. | | | | | | | | |
| 4.87% due 01/15/38 | | | 433,988 | | | | 441,583 | |
| Wencor Group | | | | | | | | |
| 4.50% due 06/19/21 | | | 298,542 | | | | 297,049 | |
| CPM Acquisition Corp. | | | | | | | | |
| 6.25% due 08/29/17 | | | 160,440 | | | | 160,440 | |
| 10.25% due 03/01/18 | | | 70,000 | | | | 70,000 | |
| Thermasys Corp. | | | | | | | | |
| 5.25% due 05/03/19 | | | 96,250 | | | | 96,009 | |
| Total Industrial | | | | | | | 15,880,209 | |
| | | | | | | | |
| CONSUMER, NON-CYCLICAL - 0.9% | |
| Albertson’s (Safeway) Holdings LLC | | | | | | | | |
| 5.50% due 08/25/21 | | | 6,850,000 | | | | 6,904,252 | |
| One Call Medical, Inc. | | | | | | | | |
| 5.00% due 11/27/20 | | | 1,695,707 | | | | 1,694,995 | |
| Hanesbrands, Inc. | | | | | | | | |
| 3.50% due 07/30/21 | | | EUR 1,290,250 | | | | 1,392,541 | |
| Grocery Outlet, Inc. | | | | | | | | |
| 5.75% due 10/21/21 | | | 997,500 | | | | 1,000,622 | |
| Mallinckrodt International Finance | | | | | | | | |
| 3.25% due 03/19/21 | | | 498,741 | | | | 497,184 | |
| Siemens Audiology Solutions | | | | | | | | |
| 5.50% due 01/17/22 | | | 400,000 | | | | 404,752 | |
| Performance Food Group | | | | | | | | |
| 6.25% due 11/14/19 | | | 347,478 | | | | 347,766 | |
| Sage Products, Inc. | | | | | | | | |
| 5.00% due 12/13/19 | | | 187,122 | | | | 188,759 | |
| Arctic Glacier Holdings, Inc. | | | | | | | | |
| 6.00% due 05/10/19 | | | 120,859 | | | | 119,953 | |
| Total Consumer, Non-cyclical | | | | | | | 12,550,824 | |
| | | | | | | | |
| BASIC MATERIALS - 0.9% | |
| Fortescue Metals Group Ltd. | | | | | | | | |
| 3.75% due 06/30/19 | | | 13,017,828 | | | | 11,735,312 | |
| Platform Specialty Products | | | | | | | | |
| 4.75% due 06/07/20 | | | 498,750 | | | | 501,348 | |
| Total Basic Materials | | | | | | | 12,236,660 | |
| | | | | | | | |
| TECHNOLOGY - 0.6% | |
| Avago Technologies Ltd. | | | | | | | | |
| 3.75% due 05/06/21 | | | 2,462,973 | | | | 2,466,520 | |
| TIBCO Software, Inc. | | | | | | | | |
| 6.50% due 12/04/20 | | | 2,000,000 | | | | 1,998,120 | |
| Advanced Computer Software | | | | | | | | |
| 10.50% due 01/31/23 | | | 2,000,000 | | | | 1,920,000 | |
| Micro Focus International plc | | | | | | | | |
| 5.25% due 11/19/21 | | | 661,765 | | | | 662,757 | |
| EIG Investors Corp. | | | | | | | | |
| 5.00% due 11/09/19 | | | 635,448 | | | | 637,437 | |
| Deltek, Inc. | | | | | | | | |
| 4.50% due 10/10/18 | | | 614,767 | | | | 615,726 | |
| Sabre, Inc. | | | | | | | | |
| 4.00% due 02/19/19 | | | 369,816 | | | | 369,816 | |
| Evergreen Skill | | | | | | | | |
| 5.75% due 04/28/21 | | | 171,250 | | | | 169,109 | |
| Aspect Software, Inc. | | | | | | | | |
| 7.25% due 05/07/16 | | | 16,103 | | | | 16,022 | |
| Total Technology | | | | | | | 8,855,507 | |
| | | | | | | | |
| FINANCIAL - 0.5% | |
| Corporate Capital Trust | | | | | | | | |
| 4.00% due 05/20/19 | | | 4,592,500 | | | | 4,592,499 | |
| National Financial Partners Corp. | | | | | | | | |
| 4.50% due 07/01/20 | | | 1,217,518 | | | | 1,213,208 | |
| Hyperion Insurance | | | | | | | | |
| 5.50% due 03/26/22 | | | 1,000,000 | | | | 1,005,000 | |
| First Data Corp. | | | | | | | | |
| 3.67% due 03/23/18 | | | 320,000 | | | | 319,680 | |
| 3.67% due 09/24/18 | | | 200,000 | | | | 199,708 | |
| American Stock Transfer & Trust | | | | | | | | |
| 5.75% due 06/26/20 | | | 240,381 | | | | 239,179 | |
| Total Financial | | | | | | | 7,569,274 | |
| Total Senior Floating Rate Interests | | | | | | | | |
| (Cost $92,877,544) | | | | | | | 92,849,892 | |
| | | | | | | | |
| SEE NOTES TO FINANCIAL STATEMENTS. | THE GUGGENHEIM FUNDS SEMI-ANNUAL REPORT | 27 |
SCHEDULE OF INVESTMENTS (Unaudited)(continued) | March 31, 2015 |
| TOTAL RETURN BOND FUND | |
| | | Face
Amount | | | Value | |
| | | | | | | | | |
MUNICIPAL BONDS†† - 6.5% | |
| | | | | | | | |
| NEW JERSEY - 1.5% | |
| New Jersey Transportation Trust Fund Authority Revenue Bonds | | | | | | | | |
0.00% due 12/15/305,8 | | $ | 14,335,000 | | | $ | 7,337,369 | |
0.00% due 12/15/325,8 | | | 11,750,000 | | | | 5,288,558 | |
| New Jersey Economic Development Authority Revenue Bonds | | | | | | | | |
| 7.43% due 02/15/29 | | | 6,475,000 | | | | 8,143,736 | |
| Total New Jersey | | | | | | | 20,769,663 | |
| | | | | | | | |
| CALIFORNIA - 1.3% | |
| Alhambra Unified School District General Obligation Unlimited | | | | | | | | |
0.00% due 08/01/405 | | | 5,850,000 | | | | 2,063,471 | |
0.00% due 08/01/425 | | | 5,760,000 | | | | 1,844,410 | |
| Long Beach Unified School District General Obligation Unlimited | | | | | | | | |
0.00% due 08/01/375 | | | 4,700,000 | | | | 1,879,295 | |
0.00% due 08/01/385 | | | 3,000,000 | | | | 1,144,620 | |
0.00% due 08/01/335 | | | 1,300,000 | | | | 626,288 | |
| San Marcos Unified School District General Obligation Unlimited | | | | | | | | |
0.00% due 08/01/475,8 | | | 13,100,000 | | | | 3,289,279 | |
| Antelope Valley Community College District General Obligation Unlimited | | | | | | | | |
0.00% due 08/01/345 | | | 5,600,000 | | | | 2,478,896 | |
| San Diego Unified School District General Obligation Unlimited | | | | | | | | |
0.00% due 07/01/445 | | | 8,000,000 | | | | 2,351,520 | |
| Stockton Unified School District General Obligation Unlimited | | | | | | | | |
0.00% due 08/01/365 | | | 1,950,000 | | | | 836,745 | |
0.00% due 08/01/355 | | | 1,265,000 | | | | 565,847 | |
| San Francisco City & County Redevelopment Agency Tax Allocation | | | | | | | | |
| 4.87% due 08/01/35 | | | 500,000 | | | | 513,780 | |
| Inland Valley Development Agency Tax Allocation | | | | | | | | |
| 5.50% due 03/01/33 | | | 400,000 | | | | 438,876 | |
| Total California | | | | | | | 18,033,027 | |
| | | | | | | | |
| ILLINOIS - 1.0% | |
| State of Illinois General Obligation Unlimited | | | | | | | | |
5.65% due 12/01/388 | | | 5,350,000 | | | | 5,689,564 | |
| 6.90% due 03/01/35 | | | 1,600,000 | | | | 1,891,552 | |
| 6.63% due 02/01/35 | | | 500,000 | | | | 570,965 | |
| County of Cook Illinois General Obligation Unlimited | | | | | | | | |
6.23% due 11/15/348 | | | 2,300,000 | | | | 2,623,725 | |
| City of Chicago Illinois General Obligation Unlimited | | | | | | | | |
| 5.43% due 01/01/42 | | | 1,000,000 | | | | 921,470 | |
| 6.05% due 01/01/29 | | | 500,000 | | | | 507,915 | |
| 6.31% due 01/01/44 | | | 300,000 | | | | 307,896 | |
| 5.00% due 01/01/27 | | | 200,000 | | | | 214,642 | |
0.00% due 01/01/305 | | | 310,000 | | | | 162,905 | |
| Chicago Transit Authority Revenue Bonds | | | | | | | | |
| 6.20% due 12/01/40 | | | 1,000,000 | | | | 1,192,000 | |
| Chicago, Illinois, Second Lien Wastewater Transmission Revenue Project Bonds, Taxable Build America Bonds | | | | | | | | |
| 6.90% due 01/01/40 | | | 260,000 | | | | 341,253 | |
| Metropolitan Water Reclamation District of Greater Chicago General Obligation Unlimited | | | | | | | | |
| 5.00% due 12/01/44 | | | 250,000 | | | | 286,928 | |
| Total Illinois | | | | | | | 14,710,815 | |
| | | | | | | | |
| 28 | THE GUGGENHEIM FUNDS SEMI-ANNUAL REPORT | SEE NOTES TO FINANCIAL STATEMENTS. |
SCHEDULE OF INVESTMENTS (Unaudited)(continued) | March 31, 2015 |
| TOTAL RETURN BOND FUND | |
| | | Face
Amount | | | Value | |
| | | | | | | | | |
| TEXAS - 0.8% | |
| Harris County-Houston Sports Authority Revenue Bonds | | | | | | | | |
0.00% due 11/15/465,8 | | $ | 15,315,000 | | | $ | 3,576,359 | |
0.00% due 11/15/425 | | | 6,315,000 | | | | 1,819,604 | |
0.00% due 11/15/485 | | | 7,965,000 | | | | 1,672,252 | |
0.00% due 11/15/445 | | | 4,250,000 | | | | 1,102,875 | |
| Dallas, Texas, Convention Center Hotel Development Corporation, Hotel Revenue Bonds, Taxable Build America Bonds | | | | | | | | |
7.09% due 01/01/428 | | | 2,000,000 | | | | 2,644,420 | |
| Total Texas | | | | | | | 10,815,510 | |
| | | | | | | | |
| PUERTO RICO - 0.7% | |
| Puerto Rico Highways & Transportation Authority Revenue Bonds | | | | | | | | |
| 5.25% due 07/01/35 | | | 1,250,000 | | | | 1,283,450 | |
| 4.95% due 07/01/26 | | | 850,000 | | | | 875,543 | |
| 5.50% due 07/01/28 | | | 800,000 | | | | 846,312 | |
| 5.00% due 07/01/29 | | | 765,000 | | | | 764,633 | |
| Commonwealth of Puerto Rico General Obligation Unlimited | | | | | | | | |
| 5.00% due 07/01/31 | | | 1,500,000 | | | | 1,512,555 | |
| 5.13% due 07/01/30 | | | 1,035,000 | | | | 1,035,145 | |
| Puerto Rico Commonwealth Aqueduct & Sewer Authority Revenue Bonds | | | | | | | | |
| 5.13% due 07/01/47 | | | 2,000,000 | | | | 1,992,020 | |
| Puerto Rico Electric Power Authority Revenue Bonds | | | | | | | | |
0.70% due 07/01/291 | | | 1,000,000 | | | | 742,890 | |
| 5.00% due 07/01/24 | | | 400,000 | | | | 399,964 | |
| Puerto Rico Municipal Finance Agency General Obligation Unlimited | | | | | | | | |
| 5.00% due 08/01/27 | | | 550,000 | | | | 542,003 | |
| Total Puerto Rico | | | | | | | 9,994,515 | |
| | | | | | | | |
| FLORIDA - 0.4% | |
| County of Miami-Dade Florida Revenue Bonds | | | | | | | | |
0.00% due 10/01/455,8 | | | 13,000,000 | | | | 3,196,700 | |
0.00% due 10/01/425,8 | | | 10,000,000 | | | | 2,827,600 | |
| Total Florida | | | | | | | 6,024,300 | |
| | | | | | | | |
| MICHIGAN - 0.4% | |
| Detroit City School District General Obligation Unlimited | | | | | | | | |
| 7.75% due 05/01/39 | | | 4,900,000 | | | | 6,000,931 | |
| | | | | | | | |
| ALABAMA - 0.2% | |
| County of Jefferson Alabama Sewer Revenue Revenue Bonds | | | | | | | | |
0.00% due 10/01/365 | | | 2,350,000 | | | | 705,447 | |
0.00% due 10/01/345 | | | 1,800,000 | | | | 615,564 | |
0.00% due 10/01/355 | | | 1,375,000 | | | | 440,550 | |
0.00% due 10/01/315 | | | 725,000 | | | | 307,371 | |
0.00% due 10/01/325 | | | 720,000 | | | | 283,579 | |
| Total Alabama | | | | | | | 2,352,511 | |
| | | | | | | | |
| NEW YORK - 0.1% | |
| Port Auth NY & NJ-182 | | | | | | | | |
| 5.31% due 08/01/46 | | | 1,500,000 | | | | 1,660,890 | |
| | | | | | | | |
| CONNECTICUT - 0.1% | |
| Town of Hamden Connecticut General Obligation Unlimited | | | | | | | | |
| 5.20% due 08/15/44 | | | 750,000 | | | | 754,395 | |
| | | | | | | | |
| MASSACHUSETTS - 0.0% | |
| Massachusetts Housing Finance Agency Revenue Bonds | | | | | | | | |
| 4.51% due 12/01/40 | | | 400,000 | | | | 401,756 | |
| Total Municipal Bonds | | | | | | | | |
| (Cost $89,237,800) | | | | | | | 91,518,313 | |
| | | | | | | | |
| SEE NOTES TO FINANCIAL STATEMENTS. | THE GUGGENHEIM FUNDS SEMI-ANNUAL REPORT | 29 |
SCHEDULE OF INVESTMENTS (Unaudited)(continued) | March 31, 2015 |
| TOTAL RETURN BOND FUND | |
| | | Face
Amount | | | Value | |
| | | | | | | | | |
U.S. GOVERNMENT SECURITIES†† - 1.6% | |
| U.S. Treasury Bonds | | | | | | | | |
0.00% due 11/15/445 | | $ | 21,525,000 | | | $ | 9,938,500 | |
| 8.13% due 05/15/21 | | | 1,000,000 | | | | 1,383,125 | |
| 4.38% due 05/15/40 | | | 1,000,000 | | | | 1,351,172 | |
| 8.75% due 08/15/20 | | | 500,000 | | | | 689,805 | |
| 3.88% due 08/15/40 | | | 500,000 | | | | 629,414 | |
| 6.13% due 11/15/27 | | | 400,000 | | | | 579,188 | |
| Total U.S. Treasury Bonds | | | | | | | 14,571,204 | |
| U.S. Treasury Notes | | | | | | | | |
| 1.38% due 12/31/18 | | | 1,800,000 | | | | 1,815,609 | |
| 2.25% due 11/15/24 | | | 1,186,000 | | | | 1,219,264 | |
| 3.13% due 05/15/19 | | | 1,000,000 | | | | 1,075,781 | |
| 2.88% due 03/31/18 | | | 1,000,000 | | | | 1,058,359 | |
| 2.38% due 06/30/18 | | | 800,000 | | | | 835,250 | |
| 2.75% due 02/28/18 | | | 500,000 | | | | 527,031 | |
| 2.38% due 05/31/18 | | | 500,000 | | | | 522,110 | |
| 1.38% due 09/30/18 | | | 500,000 | | | | 505,313 | |
| 1.25% due 10/31/18 | | | 400,000 | | | | 402,156 | |
| Total U.S. Treasury Notes | | | | | | | 7,960,873 | |
| Total U.S. Government Securities | | | | | | | | |
| (Cost $22,182,212) | | | | | | | 22,532,077 | |
| | | | | | | | |
FOREIGN GOVERNMENT BONDS†† - 1.2% | |
| Kenya Government International Bond | | | | | | | | |
6.88% due 06/24/243,8 | | | 8,950,000 | | | | 9,346,038 | |
| Mexico Government International Bond | | | | | | | | |
4.60% due 01/23/468 | | | 7,100,000 | | | | 7,259,750 | |
| Total Foreign Government Bonds | | | | | | | | |
| (Cost $16,255,149) | | | | | | | 16,605,788 | |
| | | | | | | | |
FEDERAL AGENCY NOTES†† - 0.4% | |
Freddie Mac9 | | | | | | | | |
| 2.38% due 01/13/22 | | | 5,000,000 | | | | 5,170,485 | |
| Total Federal Agency Notes | | | | | | | | |
| (Cost $5,125,650) | | | | | | | 5,170,485 | |
| | | | | | | | |
REPURCHASE AGREEMENTS††,6,10 - 1.7% | |
| Jefferies & Company, Inc. | | | | | | | | |
issued 03/06/15 at 3.18%
due 04/06/15 | | | 14,509,000 | | | | 14,509,000 | |
issued 03/30/15 at 3.18%
due 05/07/15 | | | 3,700,000 | | | | 3,700,000 | |
issued 03/30/15 at 2.68%
due 04/24/15 | | | 3,692,000 | | | | 3,692,000 | |
issued 03/30/15 at 3.18%
due 04/24/15 | | | 1,000,000 | | | | 1,000,000 | |
issued 03/10/15 at 2.68%
due 04/08/15 | | | 917,000 | | | | 917,000 | |
issued 03/30/15 at 2.68%
due 05/07/15 | | | 395,000 | | | | 395,000 | |
issued 03/09/15 at 2.43%
due 04/05/15 | | | 332,290 | | | | 332,290 | |
| Total Repurchase Agreements | | | | | | | | |
| (Cost $24,545,290) | | | | | | | 24,545,290 | |
| | | | | | | | |
| 30 | THE GUGGENHEIM FUNDS SEMI-ANNUAL REPORT | SEE NOTES TO FINANCIAL STATEMENTS. |
SCHEDULE OF INVESTMENTS (Unaudited)(continued) | March 31, 2015 |
| TOTAL RETURN BOND FUND | |
| | |
Contracts | | | Value | |
| | | | | | | | |
OPTIONS PURCHASED† - 0.2% | |
| Call options on: | | | | | | | | |
| iShares 7-10 Year Treasury Bond ETF Expiring September 2015 with strike price of $109 | | | 15,000 | | | $ | 1,800,000 | |
| iShares 20+ Year Treasury Bond ETF Expiring September 2015 with strike price of $134 | | | 5,859 | | | | 1,177,659 | |
| Total Options Purchased | | | | | | | | |
| (Cost $3,384,288) | | | | | | | 2,977,659 | |
| | | | | | | | |
| Total Investments - 115.9% | | | | | | | | |
| (Cost $1,618,645,072) | | | | | | $ | 1,630,091,951 | |
| | | | | | | | |
OPTIONS WRITTEN† - (0.1)% | |
| Call options on: | | | | | | | | |
| iShares 20+ Year Treasury Bond ETF Expiring September 2015 with strike price of $139 | | | 5,859 | | | | (550,746 | ) |
| iShares 7-10 Year Treasury Bond ETF Expiring September 2015 with strike price of $111 | | | 15,000 | | | | (1,275,000 | ) |
| Total Options Written | | | | | | | | |
| (Premiums received $1,584,336) | | | | | | $ | (1,825,746 | ) |
| Other Assets & Liabilities, net - (15.8)% | | | | | | | (221,953,150 | ) |
| Total Net Assets - 100.0% | | | | | | $ | 1,406,313,055 | |
| | | | | | | | | |
| SEE NOTES TO FINANCIAL STATEMENTS. | THE GUGGENHEIM FUNDS SEMI-ANNUAL REPORT | 31 |
SCHEDULE OF INVESTMENTS (Unaudited)(concluded) | March 31, 2015 |
| TOTAL RETURN BOND FUND | |
CENTRALLY CLEARED INTEREST RATE SWAP AGREEMENTS†† | |
| Counterparty | Floating
Rate | Floating
Rate Index | | Fixed
Rate | | Maturity Date | | Notional Amount | | | Market Value | | | Unrealized Appreciation | |
| Merrill Lynch | Pay | 3-Month USD-LIBOR | | 2.06 | % | 12/24/21 | | $ | 23,000,000 | | | $ | 427,800 | | | $ | 427,800 | |
| Merrill Lynch | Pay | 3-Month USD-LIBOR | | 2.23 | % | 03/13/25 | | | 6,000,000 | | | | 109,800 | | | | 109,800 | |
| Merrill Lynch | Pay | 3-Month USD-LIBOR | | 2.29 | % | 12/24/24 | | | 3,000,000 | | | | 74,100 | | | | 74,100 | |
| | | | | | | | | | | | | | | | | $ | 611,700 | |
FORWARD FOREIGN CURRENCY EXCHANGE CONTRACTS†† | |
| Counterparty | Contracts to Sell | Currency | Settlement Date | | Settlement Value | | | Value at
March 31,
2015 | | | Net
Unrealized
Appreciation | |
| BNY Mellon | 1,800,000 | EUR | 04/07/15 | | $ | 1,984,896 | | | $ | 1,935,279 | | | $ | 49,617 | |
| * | Non-income producing security. |
| † | Value determined based on Level 1 inputs, unless otherwise noted — See Note 4. |
| †† | Value determined based on Level 2 inputs, unless otherwise noted — See Note 4. |
| ††† | Value determined based on Level 3 inputs — See Note 4. |
| 1 | Variable rate security. Rate indicated is rate effective at March 31, 2015. |
| 2 | Perpetual maturity. |
| 3 | Security is a 144A or Section 4(a)(2) security. The total market value of 144A or Section 4(a)(2) securities is $749,315,015 (cost $745,199,143), or 53.3% of total net assets. These securities have been determined to be liquid under guidelines established by the Board of Trustees. |
| 4 | Affiliated issuer — See Note 9. |
| 5 | Zero coupon rate security. |
| 6 | Illiquid security. |
| 7 | Security is a step up/step down bond. The coupon increases or decreases at regular intervals until the bond reaches full maturity. |
| 8 | Security or a portion thereof is held as collateral for reverse repurchase agreements — See Note 13. |
| 9 | On September 7, 2008, the issuer was placed in conservatorship by the Federal Housing Finance Agency (FHFA). As conservator, the FHFA has full powers to control the assets and operations of the firm. |
| 10 | Repurchase Agreements — See Note 12. |
| 11 | The face amount is denominated in U.S. Dollars unless otherwise noted. |
| 12 | Security is a 144A or Section 4(a)(2) security. These securities are considered illiquid and restricted under guidelines established by the Board of Trustees. The total market value of 144A or Section 4(a)(2) securities is $1,643,678 (cost $1,645,579), or 0.1% of total net assets — See Note 14. |
| 13 | Residual interest. |
| plc — Public Limited Company |
| REIT — Real Estate Investment Trust |
| |
| See Sector Classification in Other Information section. |
| 32 | THE GUGGENHEIM FUNDS SEMI-ANNUAL REPORT | SEE NOTES TO FINANCIAL STATEMENTS. |
STATEMENT OF ASSETS AND LIABILITIES (Unaudited) |
| TOTAL RETURN BOND FUND |
March 31, 2015
| Assets: | |
| Investments in unaffiliated issuers, at value (cost $1,560,098,237) | | $ | 1,571,441,478 | |
| Investments in affiliated issuers, at value (cost $34,001,545) | | | 34,105,183 | |
| Repurchase agreements, at value (cost $24,545,290) | | | 24,545,290 | |
| Total investments (cost $1,618,645,072) | | | 1,630,091,951 | |
| Foreign currency, at value (cost $7,820) | | | 7,820 | |
| Cash | | | 22,535,281 | |
| Segregated cash with broker | | | 1,094,886 | |
| Unrealized appreciation on swap agreements | | | 611,700 | |
| Prepaid expenses | | | 95,172 | |
| Unrealized appreciation on forward foreign currency exchange contracts | | | 49,617 | |
| Receivables: | |
| Fund shares sold | | | 12,292,428 | |
| Interest | | | 7,407,437 | |
| Securities sold | | | 2,396,643 | |
| Swap settlement | | | 150,243 | |
| Dividends | | | 89,606 | |
| Total assets | | | 1,676,822,784 | |
| | | | | |
| Liabilities: | |
| Reverse Repurchase Agreements | | | 160,566,149 | |
| Options written, at value (premiums received $1,584,336) | | | 1,825,746 | |
| Segregated cash from broker | | | 697,802 | |
| Unfunded loan commitments, at value (Note 10) (proceeds $62) | | | 59 | |
| Payable for: | |
| Securities purchased | | | 103,408,229 | |
| Fund shares redeemed | | | 2,547,914 | |
| Management fees | | | 336,326 | |
| Distribution and service fees | | | 120,148 | |
| Fund accounting/administration fees | | | 104,887 | |
| Transfer agent/maintenance fees | | | 29,634 | |
| Trustees’ fees* | | | 2,364 | |
| Miscellaneous | | | 870,471 | |
| Total liabilities | | | 270,509,729 | |
| Net assets | | $ | 1,406,313,055 | |
| | | | | |
| Net assets consist of: | |
| Paid in capital | | $ | 1,396,537,448 | |
| Distributions in excess of net investment income | | | (6,382,571 | ) |
| Accumulated net realized gain on investments | | | 4,291,402 | |
| Net unrealized appreciation on investments | | | 11,866,776 | |
| Net assets | | $ | 1,406,313,055 | |
| | | | | |
| A-Class: | |
| Net assets | | $ | 352,955,248 | |
| Capital shares outstanding | | | 12,995,526 | |
| Net asset value per share | | $ | 27.16 | |
| Maximum offering price per share (Net asset value divided by 95.25%) | | $ | 28.51 | |
| | | | | |
| C-Class: | |
| Net assets | | $ | 62,042,740 | |
| Capital shares outstanding | | | 2,284,522 | |
| Net asset value per share | | $ | 27.16 | |
| | | | | |
| Institutional Class: | |
| Net assets | | $ | 991,315,067 | |
| Capital shares outstanding | | | 36,458,860 | |
| Net asset value per share | | $ | 27.19 | |
| * | Relates to Trustees not deemed ”interested persons” within the meaning of Section 2(a)(19) of the 1940 Act. |
| SEE NOTES TO FINANCIAL STATEMENTS. | THE GUGGENHEIM FUNDS SEMI-ANNUAL REPORT | 33 |
STATEMENT OF OPERATIONS (Unaudited) |
| TOTAL RETURN BOND FUND |
Period Ended March 31, 2015
| Investment Income: | |
| Interest | | $ | 15,680,918 | |
| Dividends from securities of unaffiliated issuers | | | 312,808 | |
| Dividends from securities of affiliated issuers | | | 78,883 | |
| Total investment income | | | 16,072,609 | |
| | | | | |
| Expenses: | |
| Management fees | | | 1,967,081 | |
| Transfer agent/maintenance fees: | |
| A-Class | | | 160,803 | |
| C-Class | | | 17,166 | |
| Institutional Class | | | 109,674 | |
| Distribution and service fees: | |
| A-Class | | | 251,810 | |
| C-Class | | | 202,388 | |
| Fund accounting/administration fees | | | 373,740 | |
| Short interest expense | | | 52,558 | |
| Trustees’ fees* | | | 25,928 | |
| Line of credit fees | | | 21,221 | |
| Custodian fees | | | 12,043 | |
| Tax expense | | | 14 | |
| Miscellaneous | | | 170,680 | |
| Total expenses | | | 3,365,106 | |
| Less: | |
| Expenses waived by Adviser | | | (590,995 | ) |
| Expenses waived by Transfer Agent | |
| A-Class | | | (57,158 | ) |
| C-Class | | | (2,525 | ) |
| Institutional Class | | | (109,674 | ) |
| Total waived expenses | | | (760,352 | ) |
| Net expenses | | | 2,604,754 | |
| Net investment income | | | 13,467,855 | |
| | | | | |
| Net Realized and Unrealized Gain (Loss): | |
| Net realized gain (loss) on: | |
| Investments in unaffiliated issuers | | $ | 2,051,653 | |
| Investments in affiliated issuers | | | (22,805 | ) |
| Swap agreements | | | 2,333,156 | |
| Foreign currency | | | 59,054 | |
| Forward foreign currency exchange contracts | | | 353,744 | |
| Realized gain distributions received from investment company shares | | | 875 | |
| Net realized gain | | | 4,775,677 | |
| Net change in unrealized appreciation (depreciation) on: | |
| Investments in unaffiliated issuers | | | 7,036,550 | |
| Investments in affiliated issuers | | | 109,328 | |
| Swap agreements | | | (74,350 | ) |
| Options purchased | | | (406,629 | ) |
| Options written | | | (241,410 | ) |
| Foreign currency | | | (101,252 | ) |
| Forward foreign currency exchange contracts | | | 25,808 | |
| Net change in unrealized appreciation (depreciation) | | | 6,348,045 | |
| Net realized and unrealized gain | | | 11,123,722 | |
| Net increase in net assets resulting from operations | | $ | 24,591,577 | |
| * | Relates to Trustees not deemed ”interested persons” within the meaning of Section 2(a)(19) of the 1940 Act. |
| 34 | THE GUGGENHEIM FUNDS SEMI-ANNUAL REPORT | SEE NOTES TO FINANCIAL STATEMENTS. |
STATEMENTS OF CHANGES IN NET ASSETS |
| TOTAL RETURN BOND FUND | |
| | | Period Ended March 31, 2015 (Unaudited) | | | Year Ended September 30, 2014 | |
| Increase (Decrease) in Net Assets from Operations: | | | | | | |
| Net investment income | | $ | 13,467,855 | | | $ | 8,940,719 | |
| Net realized gain on investments | | | 4,775,677 | | | | 1,657,336 | |
| Net change in unrealized appreciation (depreciation) on investments | | | 6,348,045 | | | | 6,412,075 | |
| Net increase in net assets resulting from operations | | | 24,591,577 | | | | 17,010,130 | |
| | | | | | | | | |
| Distributions to shareholders from: | | | | | | | | |
| Net investment income | | | | | | | | |
| A-Class | | | (3,962,406 | ) | | | (4,018,032 | ) |
| C-Class | | | (648,130 | ) | | | (745,825 | ) |
| Institutional Class | | | (11,681,408 | ) | | | (6,681,315 | ) |
| Net realized gains | | | | | | | | |
| A-Class | | | (151,030 | ) | | | — | |
| C-Class | | | (42,876 | ) | | | — | |
| Institutional Class | | | (494,795 | ) | | | — | |
| Total distributions to shareholders | | | (16,980,645 | ) | | | (11,445,172 | ) |
| | | | | | | | | |
| Capital share transactions: | | | | | | | | |
| Proceeds from sale of shares | | | | | | | | |
| A-Class | | | 290,389,691 | | | | 73,424,986 | |
| C-Class | | | 38,468,353 | | | | 12,451,028 | |
| Institutional Class | | | 821,706,177 | | | | 248,033,503 | |
| Distributions reinvested | | | | | | | | |
| A-Class | | | 3,760,175 | | | | 3,570,349 | |
| C-Class | | | 530,485 | | | | 648,333 | |
| Institutional Class | | | 9,658,492 | | | | 5,534,525 | |
| Cost of shares redeemed | | | | | | | | |
| A-Class | | | (34,012,918 | ) | | | (62,746,577 | ) |
| C-Class | | | (2,437,176 | ) | | | (4,094,381 | ) |
| Institutional Class | | | (115,941,832 | ) | | | (64,105,887 | ) |
| Net increase from capital share transactions | | | 1,012,121,447 | | | | 212,715,879 | |
| Net increase in net assets | | | 1,019,732,379 | | | | 218,280,837 | |
| | | | | | | | | |
| Net assets: | | | | | | | | |
| Beginning of period | | | 386,580,676 | | | | 168,299,839 | |
| End of period | | $ | 1,406,313,055 | | | $ | 386,580,676 | |
| Distributions in excess of net investment income at end of period | | $ | (6,382,571 | ) | | $ | (2,009,658 | ) |
| SEE NOTES TO FINANCIAL STATEMENTS. | THE GUGGENHEIM FUNDS SEMI-ANNUAL REPORT | 35 |
STATEMENTS OF CHANGES IN NET ASSETS(concluded) |
| TOTAL RETURN BOND FUND | |
| | | Period Ended March 31, 2015 (Unaudited) | | | Year Ended September 30, 2014 | |
| Capital share activity: | | | | | | | | |
| Shares sold | | | | | | | | |
| A-Class | | | 10,744,286 | | | | 2,741,493 | |
| C-Class | | | 1,422,968 | | | | 463,711 | |
| Institutional Class | | | 30,350,476 | | | | 9,217,148 | |
| Shares issued from reinvestment of distributions | | | | | | | | |
| A-Class | | | 138,754 | | | | 133,810 | |
| C-Class | | | 19,590 | | | | 24,313 | |
| Institutional Class | | | 356,090 | | | | 206,692 | |
| Shares redeemed | | | | | | | | |
| A-Class | | | (1,258,262 | ) | | | (2,345,333 | ) |
| C-Class | | | (90,137 | ) | | | (154,292 | ) |
| Institutional Class | | | (4,284,893 | ) | | | (2,377,106 | ) |
| Net increase in shares | | | 37,398,872 | | | | 7,910,436 | |
| 36 | THE GUGGENHEIM FUNDS SEMI-ANNUAL REPORT | SEE NOTES TO FINANCIAL STATEMENTS. |
| FINANCIAL HIGHLIGHTS |
| TOTAL RETURN BOND FUND | |
This table is presented to show selected data for a share outstanding throughout each period and to assist shareholders in evaluating a Fund’s performance for the periods presented.
| A-Class | | Period Ended March 31, 2015a | | | Year Ended Sept. 30, 2014 | | | Year Ended Sept. 30, 2013 | | | Period Ended Sept. 30, 2012b | |
| Per Share Data | | | | | | | | | | | | |
| Net asset value, beginning of period | | $ | 26.94 | | | $ | 26.16 | | | $ | 26.51 | | | $ | 25.00 | |
| Income (loss) from investment operations: | |
Net investment income (loss)c | | | .43 | | | | 1.01 | | | | 1.20 | | | | 1.08 | |
| Net gain (loss) on investments (realized and unrealized) | | | .36 | | | | 1.13 | | | | (.28 | ) | | | 1.35 | |
| Total from investment operations | | | .79 | | | | 2.14 | | | | .92 | | | | 2.43 | |
| Less distributions from: | |
| Net investment income | | | (.53 | ) | | | (1.36 | ) | | | (1.23 | ) | | | (.92 | ) |
| Net realized gains | | | (.04 | ) | | | — | | | | (.04 | ) | | | — | |
| Total distributions | | | (.57 | ) | | | (1.36 | ) | | | (1.27 | ) | | | (.92 | ) |
| Net asset value, end of period | | $ | 27.16 | | | $ | 26.94 | | | $ | 26.16 | | | $ | 26.51 | |
| | |
Total Returnf | | | 2.95 | % | | | 8.34 | % | | | 3.53 | % | | | 9.78 | % |
| Ratios/Supplemental Data | |
| Net assets, end of period (in thousands) | | $ | 352,955 | | | $ | 90,805 | | | $ | 74,328 | | | $ | 30,689 | |
| Ratios to average net assets: | |
| Net investment income (loss) | | | 3.22 | % | | | 3.80 | % | | | 4.47 | % | | | 5.10 | % |
Total expensesd | | | 1.07 | % | | | 1.19 | % | | | 1.27 | % | | | 1.51 | % |
Net expensese,g | | | 0.87 | % | | | 0.94 | % | | | 0.98 | % | | | 0.85 | % |
| Portfolio turnover rate | | | 22 | % | | | 52 | % | | | 94 | % | | | 69 | % |
| SEE NOTES TO FINANCIAL STATEMENTS. | THE GUGGENHEIM FUNDS SEMI-ANNUAL REPORT | 37 |
FINANCIAL HIGHLIGHTS (continued) |
| TOTAL RETURN BOND FUND |
This table is presented to show selected data for a share outstanding throughout each period and to assist shareholders in evaluating a Fund’s performance for the periods presented.
| C-Class | | Period Ended March 31, 2015a | | | Year Ended Sept. 30, 2014 | | | Year Ended Sept. 30, 2013 | | | Period Ended Sept. 30, 2012b | |
| Per Share Data | | | | | | | | | | | | |
| Net asset value, beginning of period | | $ | 26.94 | | | $ | 26.16 | | | $ | 26.50 | | | $ | 25.00 | |
| Income (loss) from investment operations: | |
Net investment income (loss)c | | | .34 | | | | .82 | | | | .99 | | | | .94 | |
| Net gain (loss) on investments (realized and unrealized) | | | .36 | | | | 1.12 | | | | (.27 | ) | | | 1.32 | |
| Total from investment operations | | | .70 | | | | 1.94 | | | | .72 | | | | 2.26 | |
| Less distributions from: | |
| Net investment income | | | (.44 | ) | | | (1.16 | ) | | | (1.02 | ) | | | (.76 | ) |
| Net realized gains | | | (.04 | ) | | | — | | | | (.04 | ) | | | — | |
| Total distributions | | | (.48 | ) | | | (1.16 | ) | | | (1.06 | ) | | | (.76 | ) |
| Net asset value, end of period | | $ | 27.16 | | | $ | 26.94 | | | $ | 26.16 | | | $ | 26.50 | |
| | |
Total Returnf | | | 2.59 | % | | | 7.58 | % | | | 2.77 | % | | | 9.09 | % |
| Ratios/Supplemental Data | |
| Net assets, end of period (in thousands) | | $ | 62,043 | | | $ | 25,107 | | | $ | 15,654 | | | $ | 6,607 | |
| Ratios to average net assets: | |
| Net investment income (loss) | | | 2.49 | % | | | 3.10 | % | | | 3.70 | % | | | 4.38 | % |
Total expensesd | | | 1.75 | % | | | 1.90 | % | | | 2.07 | % | | | 2.26 | % |
Net expensese,g | | | 1.58 | % | | | 1.66 | % | | | 1.77 | % | | | 1.63 | % |
| Portfolio turnover rate | | | 22 | % | | | 52 | % | | | 94 | % | | | 69 | % |
| 38 | THE GUGGENHEIM FUNDS SEMI-ANNUAL REPORT | SEE NOTES TO FINANCIAL STATEMENTS. |
FINANCIAL HIGHLIGHTS (concluded) |
| TOTAL RETURN BOND FUND |
This table is presented to show selected data for a share outstanding throughout each period and to assist shareholders in evaluating a Fund’s performance for the periods presented.
| Institutional Class | | Period Ended March 31, 2015a | | | Year Ended Sept. 30, 2014 | | | Year Ended Sept. 30, 2013 | | | Period Ended Sept. 30, 2012b | |
| Per Share Data | | | | | | | | | | | | |
| Net asset value, beginning of period | | $ | 26.97 | | | $ | 26.19 | | | $ | 26.54 | | | $ | 25.00 | |
| Income (loss) from investment operations: | |
Net investment income (loss)c | | | .48 | | | | 1.09 | | | | 1.28 | | | | 1.06 | |
| Net gain (loss) on investments (realized and unrealized) | | | .36 | | | | 1.14 | | | | (.27 | ) | | | 1.44 | |
| Total from investment operations | | | .84 | | | | 2.23 | | | | 1.01 | | | | 2.50 | |
| Less distributions from: | |
| Net investment income | | | (.58 | ) | | | (1.45 | ) | | | (1.32 | ) | | | (.96 | ) |
| Net realized gains | | | (.04 | ) | | | — | | | | (.04 | ) | | | — | |
| Total distributions | | | (.62 | ) | | | (1.45 | ) | | | (1.36 | ) | | | (.96 | ) |
| Net asset value, end of period | | $ | 27.19 | | | $ | 26.97 | | | $ | 26.19 | | | $ | 26.54 | |
| | |
Total Returnf | | | 3.14 | % | | | 8.74 | % | | | 3.88 | % | | | 10.09 | % |
| Ratios/Supplemental Data | |
| Net assets, end of period (in thousands) | | $ | 991,315 | | | $ | 270,668 | | | $ | 78,318 | | | $ | 44,566 | |
| Ratios to average net assets: | |
| Net investment income (loss) | | | 3.57 | % | | | 4.09 | % | | | 4.78 | % | | | 4.91 | % |
Total expensesd | | | 0.71 | % | | | 0.81 | % | | | 0.89 | % | | | 0.99 | % |
Net expensese,g | | | 0.52 | % | | | 0.57 | % | | | 0.64 | % | | | 0.52 | % |
| Portfolio turnover rate | | | 22 | % | | | 52 | % | | | 94 | % | | | 69 | % |
a | Unaudited figures for the period ended March 31, 2015. Percentage amounts for the period, except total return and portfolio turnover rate, have been annualized. |
b | Since commencement of operations: November 30, 2011. Percentage amounts for the period, except total return and portfolio turnover rate, have been annualized. |
c | Net investment income (loss) per share was computed using average shares outstanding throughout the period. |
d | Does not include expenses of the underlying funds in which the Fund invests. |
e | Net expense information reflects the expense ratios after expense waivers. |
f | Total return does not reflect the impact of any applicable sales charges and has not been annualized. |
g | Net expenses may include expenses that are excluded from the expense limitation agreement. Excluding these expenses, the operating expense ratios for the periods would be: |
| | 03/31/15 | 09/30/14 | 09/30/13 | 09/30/12 |
| A-Class | 0.85% | 0.86% | 0.86% | 0.82% |
| C-Class | 1.57% | 1.58% | 1.64% | 1.59% |
| Institutional Class | 0.50% | 0.50% | 0.52% | 0.50% |
| SEE NOTES TO FINANCIAL STATEMENTS. | THE GUGGENHEIM FUNDS SEMI-ANNUAL REPORT | 39 |
NOTES TO FINANCIAL STATEMENTS (Unaudited)
1. Organization and Significant Accounting Policies
Organization
Guggenheim Funds Trust (the “Trust”), a Delaware statutory trust, is registered with the SEC under the Investment Company Act of 1940 (“1940 Act”), as a non-diversified, open-ended investment company of the series type. Each series, in effect, is representing a separate Fund. The Trust is authorized to issue an unlimited number of shares. The Trust accounts for the assets of each Fund separately.
The Trust offers a combination of four separate classes of shares, A-Class shares, B-Class shares, C-Class shares and Institutional Class shares. Sales of shares of each Class are made without a front-end sales charge at the net asset value per share (“NAV”), with the exception of A-Class shares. A-Class shares are sold at the NAV, plus the applicable front-end sales charge. The sales charge varies depending on the amount purchased, but will not exceed 4.75%. A-Class share purchases of $1 million or more are exempt from the front-end sales charge but have a 1% contingent deferred sales charge (“CDSC”), if shares are redeemed within 12 months of purchase. B-Class shares were offered without a front-end sales charge, but were subject to a CDSC of up to 5% for five years and convert to A-Class shares after eight years. Effective January 4, 2010, subscriptions for B-Class shares are no longer accepted. C-Class shares have a 1% CDSC if shares are redeemed within 12 months of purchase. Institutional Class shares are offered primarily for direct investment by institutions such as pension and profit sharing plans, endowments, foundations and corporations. Institutional Class shares have a minimum initial investment of $2 million and a minimum account balance of $1 million. Institutional Class shares are offered without a front-end sales charge or a CDSC. At March 31, 2015, the Trust consisted of eighteen funds.
This report covers the Total Return Bond Fund (the “Fund”), while the other funds are in separate reports. Only A-Class, C-Class and Institutional shares had been issued by the Fund.
The Fund was previously a series (the “Predecessor Fund”) of Security Income Fund, a different registered open-end investment company, which was organized as a Kansas corporation. In January 2014, at a special meeting of shareholders, the shareholders of the Predecessor Fund approved the reorganization of the Predecessor Fund with and into the Fund, corresponding “shell” series of the Trust. The Fund succeeded to the accounting and performance history of the Predecessor Fund. Any such historical information provided for the Fund that relates to periods prior to January 28, 2014, therefore, is that of the Predecessor Fund.
| 40 | THE GUGGENHEIM FUNDS SEMI-ANNUAL REPORT | |
NOTES TO FINANCIAL STATEMENTS (Unaudited)(continued)
Guggenheim Investments (“GI”) provides advisory services, and Rydex Fund Services, LLC (“RFS”) provides transfer agent, administrative and accounting services to the Trust. Guggenheim Funds Distributors, LLC (“GFD”) acts as principal underwriter for the Trust. GI, RFS and GFD are affiliated entities.
Significant Accounting Policies
The Fund operates as an investment company and accordingly follows the investment company accounting and reporting guidance of the Financial Accounting Standards Board (“FASB”) Accounting Standards Codification Topic 946 Financial Services – Investment Companies.
The following significant accounting policies are in conformity with U.S. generally accepted accounting principles (“U.S. GAAP”) and are consistently followed by the Trust. This requires management to make estimates and assumptions that affect the reported amount of assets and liabilities and disclosure of contingent assets and liabilities at the date of the financial statements and the reported amounts of revenues and expenses during the reporting period. Actual results could differ from these estimates. All time references are based on Eastern Time.
The NAV of each Class of the Fund is calculated by dividing the market value of the Fund’s securities and other assets, less all liabilities, attributable to the Class by the number of outstanding shares of the Class.
A. The Board of Trustees of the Fund (the “Board”) has adopted policies and procedures for the valuation of the Fund's investments (the “Valuation Procedures”). Pursuant to the Valuation Procedures, the Board has delegated to a valuation committee, consisting of representatives from Guggenheim’s investment management, fund administration, legal and compliance departments (the “Valuation Committee”), the day-to-day responsibility for implementing the Valuation Procedures, including, under most circumstances, the responsibility for determining the fair value of the Fund’s securities or other assets.
Valuations of the Fund's securities are supplied primarily by pricing services appointed pursuant to the processes set forth in the Valuation Procedures. The Valuation Committee convenes monthly, or more frequently as needed and will review the valuation of all assets which have been fair valued for reasonableness. The Fund's officers, through the Valuation Committee and consistent with the monitoring and review responsibilities set forth in the Valuation Procedures, regularly review procedures used by, and valuations provided by, the pricing services.
| | THE GUGGENHEIM FUNDS SEMI-ANNUAL REPORT | 41 |
NOTES TO FINANCIAL STATEMENTS (Unaudited)(continued)
If the pricing service cannot or does not provide a valuation for a particular investment or such valuation is deemed unreliable, such investment is fair valued by the Valuation Committee.
Equity securities listed on an exchange (New York Stock Exchange (“NYSE”) or American Stock Exchange) are valued at the last quoted sales price as of the close of business on the NYSE, usually 4:00 p.m. on the valuation date. Equity securities listed on the NASDAQ market system are valued at the NASDAQ Official Closing Price on the valuation date, which may not necessarily represent the last sale price. If there has been no sale on such exchange or NASDAQ on a given day, the security is valued at the closing bid price on that day.
Generally, trading in foreign securities markets is substantially completed each day at various times prior to the close of the NYSE. The values of foreign securities are determined as of the close of such foreign markets or the close of the NYSE, if earlier. All investments quoted in foreign currency are valued in U.S. dollars on the basis of the foreign currency exchange rates prevailing at the close of business. Investments in foreign securities may involve risks not present in domestic investments. The Valuation Committee will determine the current value of such foreign securities by taking into consideration certain factors which may include those discussed above, as well as the following factors, among others: the value of the securities traded on other foreign markets, ADR trading, closed-end fund trading, foreign currency exchange activity, and the trading prices of financial products that are tied to foreign securities such as World Equity Benchmark Securities. In addition, the Board of Trustees has authorized the Valuation Committee and GI to use prices and other information supplied by a third party pricing vendor in valuing foreign securities.
Open-end investment companies (“Mutual Funds”) are valued at their NAV as of the close of business, on the valuation date. Exchange-traded funds (“ETFs”) and closed-end investment companies (“CEFs”) are valued at the last quoted sales price.
Debt securities with a maturity of greater than 60 days at acquisition are valued at prices that reflect broker/dealer supplied valuations or are obtained from independent pricing services, which may consider the trade activity, treasury spreads, yields or price of bonds of comparable quality, coupon, maturity, and type, as well as prices quoted by dealers who make markets in such securities. Short-term debt securities with a maturity of 60 days or less at acquisition are valued at amortized cost, provided such amount approximates market value.
Repurchase agreements are valued at amortized cost, which approximates market value.
| 42 | THE GUGGENHEIM FUNDS SEMI-ANNUAL REPORT | |
NOTES TO FINANCIAL STATEMENTS (Unaudited)(continued)
Typically loans are valued using information provided by an independent third party pricing service which uses broker quotes in a non-active market.
Listed options are valued at the Official Settlement Price listed by the exchange, usually as of 4:00 p.m. Long options are valued using the bid price and short options are valued using the ask price. In the event that a settlement price is not available, fair valuation is enacted. Over-the-counter options are valued using the average bid price (for long options), or average ask price (for short options) obtained from one or more security dealers.
The value of interest rate swap agreements entered into by a Fund are accounted for using the unrealized gain or loss on the agreements that is determined using the spread priced off the previous day’s Chicago Mercantile Exchange (“CME”) price.
Forward foreign currency exchange contracts are valued daily based on the applicable exchange rate of the underlying currency. The change in value of the contract is recorded as unrealized appreciation or depreciation until the forward foreign currency contract is closed. When the forward foreign currency contract is closed, the Fund records a realized gain or loss equal to the difference between the value at the time the contract was opened and the value at the time it was closed.
Investments for which market quotations are not readily available are fair valued as determined in good faith by GI under the direction of the Board of Trustees using methods established or ratified by the Board of Trustees. Valuations in accordance with these methods are intended to reflect each security’s (or asset’s) “fair value.” Each such determination is based on a consideration of all relevant factors, which are likely to vary from one pricing context to another. Examples of such factors may include, but are not limited to: (i) the type of security, (ii) the initial cost of the security, (iii) the existence of any contractual restrictions on the security’s disposition, (iv) the price and extent of public trading in similar securities of the issuer or of comparable companies, (v) quotations or evaluated prices from broker-dealers and/or pricing services, (vi) information obtained from the issuer, analysts, and/or the appropriate stock exchange (for exchange-traded securities), (vii) an analysis of the company’s financial statements, and (viii) an evaluation of the forces that influence the issuer and the market(s) in which the security is purchased and sold (e.g. the existence of pending merger activity, public offerings or tender offers that might affect the value of the security). In connection with derivative investments such factors may include, obtaining information as to how (a) these contracts and other derivative investments trade in the futures or other derivative markets, respectively, and (b) the securities underlying these contracts and other derivative investments trade in the cash market.
| | THE GUGGENHEIM FUNDS SEMI-ANNUAL REPORT | 43 |
NOTES TO FINANCIAL STATEMENTS (Unaudited)(continued)
Certain U.S. Government and Agency Obligations are traded on a discount basis; the interest rates shown on the Schedule of Investments reflect the effective rates paid at the time of purchase by the Fund. Other securities bear interest at the rates shown, payable at fixed dates through maturity.
C. Senior loans in which the Fund invests generally pay interest rates which are periodically adjusted by reference to a base short-term, floating rate plus a premium. These base lending rates are generally (i) the lending rate offered by one or more major European banks, such as the one-month or three-month London Inter-Bank Offered Rate (LIBOR), (ii) the prime rate offered by one or more major United States banks, or (iii) the bank’s certificate of deposit rate. Senior floating rate interests often require prepayments from excess cash flows or permit the borrower to repay at its election. The rate at which the borrower repays cannot be predicted with accuracy. As a result, the actual remaining maturity may be substantially less than the stated maturities shown. The interest rate indicated is the rate in effect at March 31, 2015.
D. The Fund may purchase and sell interests in securities on a when-issued and delayed delivery basis, with payment and delivery scheduled for a future date. No income accrues to the Fund on such interests or securities in connection with such transactions prior to the date the Fund actually take delivery of such interests or securities. These transactions are subject to market fluctuations and are subject to the risk that the value at delivery may be more or less than the trade date purchase price. Although the Fund will generally purchase these securities with the intention of acquiring such securities, they may sell such securities before the settlement date.
E. Upon the purchase of an option, the premium paid is recorded as an investment, the value of which is marked-to-market daily. If a purchased option expires, the Fund realizes a loss in the amount of the cost of the option. When the Fund enters into a closing sale transaction, it realizes a gain or loss depending on whether the proceeds from the closing sale transaction are greater or less than the cost of the option. If the Fund exercises a put option, it realizes a gain or loss from the sale of the underlying security and the proceeds from such sale will be decreased by the premium originally paid. When the Fund exercises a call option, the cost of the security purchased by the Fund upon exercise increases by the premium originally paid.
When the Fund writes (sells) an option, an amount equal to the premium received is entered in that Fund’s accounting records as an asset and equivalent liability. The amount of the liability is subsequently marked-to-market to reflect the current
| 44 | THE GUGGENHEIM FUNDS SEMI-ANNUAL REPORT | |
NOTES TO FINANCIAL STATEMENTS (Unaudited)(continued)
value of the option written. When a written option expires, or if the Fund enters into a closing purchase transaction, it realizes a gain (or loss if the cost of a closing purchase transaction exceeds the premium received when the option was sold).
F. Swap agreements are marked-to-market daily and the change, if any, is recorded as unrealized gain or loss. Payments received or made as a result of an agreement or termination of the agreement are recognized as realized gains or losses.
G. Forward foreign currency exchange contracts are valued daily based on the applicable exchange rate of the underlying currency. The change in value of the contract is recorded as unrealized appreciation or depreciation until the forward foreign currency contract is closed. When the forward foreign currency contract is closed, the Fund records a realized gain or loss equal to the difference between the value at the time the contract was opened and the value at the time it was closed.
H. Security transactions are recorded on the trade date for financial reporting purposes. Realized gains and losses from securities transactions are recorded using the identified cost basis. Proceeds from lawsuits related to investment holdings are recorded as realized gains in the Fund. Dividend income is recorded on the ex-dividend date, net of applicable taxes withheld by foreign countries. Taxable non-cash dividends are recorded as dividend income. Interest income, including amortization of premiums and accretion of discounts, is accrued on a daily basis. Interest income also includes paydown gains and losses on mortgage-backed and asset-backed securities and senior and subordinated loans. Amendment fees are earned as compensation for evaluating and accepting changes to the original loan agreement and are recognized when received. Dividend income from REITs is recorded based on the income included in the distributions received from the REIT investments using published REIT classifications, including some management estimates when actual amounts are not available. Distributions received in excess of this estimated amount are recorded as a reduction of the cost of investments or reclassified to capital gains. The actual amounts of income, return of capital, and capital gains are only determined by each REIT after its fiscal year-end, and may differ from the estimated amounts.
I. The Fund declares dividends from investment income daily. The Fund pays its shareholders from its net investment income monthly and distributes any net capital gains that it has realized, at least annually. Distributions to shareholders are recorded on the ex-dividend date. Dividends are reinvested in additional shares unless shareholders request payment in cash. The character of distributions made during the year from net investment income or net realized gains may differ from their ultimate characterization for federal income tax purposes.
| | THE GUGGENHEIM FUNDS SEMI-ANNUAL REPORT | 45 |
NOTES TO FINANCIAL STATEMENTS (Unaudited)(continued)
Interest and dividend income, most expenses, all realized gains and losses, and all unrealized gains and losses are allocated to the classes based upon the value of the outstanding shares in each Class. Certain costs, such as distribution and service fees are charged directly to specific classes. In addition, certain expenses have been allocated to the individual Funds in the Trust on a pro rata basis upon the respective aggregate net assets of each Fund included in the Trust.
K. Under the fee arrangement with the custodian, the Fund may earn credits based on overnight custody cash balances. These credits are utilized to reduce related custodial expenses. The custodian fees disclosed in the Statement of Operations are before the reduction in expense from the related earnings credits, if any. For the period ended March 31, 2015, there were no earnings credits received.
L. The Fund may leave cash overnight in its cash account with the custodian. Periodically, the Fund may have cash due to the custodian bank as an overdraft balance. A fee is incurred on this overdraft, calculated by multiplying the overdraft by a rate based on the federal funds rate.
M. Under the Fund's organizational documents, its Trustees and Officers are indemnified against certain liabilities arising out of the performance of their duties to the Trust. In addition, throughout the normal course of business, the Fund enters into contracts that contain a variety of representations and warranties which provide general indemnifications. The Fund's maximum exposure under these arrangements is unknown, as this would involve future claims that may be made against the Fund and/or its affiliates that have not yet occurred. However, based on experience, the Fund expects the risk of loss to be remote.
N. The accounting records of the Fund are maintained in U.S. dollars. All assets and liabilities initially expressed in foreign currencies are converted into U.S. dollars at prevailing exchange rates. Purchases and sales of investment securities, dividend and interest income, and certain expenses are translated at the rates of exchange prevailing on the respective dates of such transactions. Changes in the relationship of these foreign currencies to the U.S. dollar can significantly affect the value of the investments and earnings of the Funds. Foreign investments may also subject the Funds to foreign government exchange restrictions, expropriation, taxation or other political, social or economic developments, all of which could affect the market and/or credit risk of the investments.
The Funds do not isolate that portion of the results of operations resulting from changes in the foreign exchange rates on investments from the fluctuations arising from changes in the market prices of securities held. Such fluctuations are included with the net realized and unrealized gain or loss on investments.
| 46 | THE GUGGENHEIM FUNDS SEMI-ANNUAL REPORT | |
NOTES TO FINANCIAL STATEMENTS (Unaudited)(continued)
Reported net realized foreign exchange gains and losses arise from sales of foreign currencies and currency gains or losses realized between the trade and settlement dates on investment transactions. Net unrealized exchange gains and losses arise from changes in the fair values of assets and liabilities other than investments in securities at the fiscal period end, resulting from changes in exchange rates.
2. Financial Instruments
As part of its investment strategy, the Fund utilizes a variety of derivative instruments. These investments involve, to varying degrees, elements of market risk and risks in excess of the amounts recognized in the Statement of Assets and Liabilities.
An option on a security gives the purchaser of the option the right to sell, and the writer of the option the obligation to buy, the underlying security (put option) or the purchaser of the option the right to buy, and the writer of the option the obligation to sell, the underlying security (call option) at any time during the option period. The risk associated with purchasing options is limited to the premium originally paid. The risk in writing a call option is that a Fund may incur a loss if the market price of the underlying security increases and the option is exercised. The risk in writing a put option is that a Fund may incur a loss if the market price of the underlying security decreases and the option is exercised. In addition, there may be an imperfect correlation between the movement in prices of options and the underlying securities and a Fund may not be able to enter into a closing transaction because of an illiquid secondary market or, for over-the-counter options, because of the counterparty’s inability to perform.
A swap is an agreement that obligates two parties to exchange a series of cash flows at specified intervals based upon or calculated by reference to changes in specified prices or rates for a specified amount of an underlying asset. A Fund utilizing OTC swaps bears the risk of loss of the amount expected to be received under a swap agreement in the event of the default or bankruptcy of a swap agreement counterparty. For Funds utilizing interest rate swaps, the exchange bears the risk of loss. Additionally, there is no guarantee that a Fund or an underlying fund could eliminate its exposure under an outstanding swap agreement by entering into an offsetting swap agreement with the same or another party.
A forward foreign currency exchange contract is an agreement between two parties to exchange two designated currencies at a specific time in the future. The contracts can be used to hedge or manage exposure to foreign currency risks with portfolio investments or to gain exposure to foreign currencies.
| | THE GUGGENHEIM FUNDS SEMI-ANNUAL REPORT | 47 |
NOTES TO FINANCIAL STATEMENTS (Unaudited)(continued)
In conjunction with the use of derivative instruments, the Fund is required to maintain collateral in various forms. The Fund uses, where appropriate, depending on the financial instrument utilized and the broker involved, margin deposits at the broker, cash and/or securities segregated at the custodian bank, discount notes or the repurchase agreements allocated to the Fund.
The Trust has established counterparty credit guidelines and enters into transactions only with financial institutions of investment grade or better. The Trust monitors the counterparty credit risk.
3. Fees and Other Transactions with Affiliates
Under the terms of an investment advisory contract, the Fund pays GI investment advisory fees calculated at an annualized rate of 0.50% of the average daily net assets of the Fund.
RFS provides transfer agent services to the Fund for fees calculated at the rates below which are assessed to the applicable class of the Fund. For these services, RFS receives the following:
| Annual charge per account | $5.00 – $8.00 |
| Transaction fee | $0.60 – $1.10 |
Minimum annual charge per Fund† | $25,000 |
| Certain out-of-pocket charges | Varies |
† | Not subject to Fund during first twelve months of operations. |
RFS also acts as the administrative agent for the Fund, and as such performs administrative functions and the bookkeeping, accounting and pricing functions for the Fund. For these services, RFS receives 0.095% of the average daily net assets of the Fund. The minimum annual charge for administrative fees is $25,000.
RFS engages external service providers to perform other necessary services for the Trust, such as audit and accounting related services, legal services, custody, printing and mailing, etc., on a pass-through basis. Such expenses are allocated to various Funds within the complex based on relative net assets.
The Fund has adopted Distribution Plans related to the offering of A-Class and C-Class shares pursuant to Rule 12b-1 under the 1940 Act. The plans provide for payments at an annual rate of 0.25% of the average daily net assets of the Fund’s A-Class shares and 1.00% of the average daily net assets of the Fund’s C-Class shares.
| 48 | THE GUGGENHEIM FUNDS SEMI-ANNUAL REPORT | |
NOTES TO FINANCIAL STATEMENTS (Unaudited)(continued)
The investment advisory contract for the following Fund provides that the total expenses be limited to a percentage of average net assets for each class of shares, exclusive of brokerage costs, dividends on securities sold short, expenses of other investment companies in which a Fund invests, interest, taxes, litigation, indemnification and extraordinary expenses. The limits are listed below:
| | Limit | Effective Date | Contract End Date |
| Total Return Bond Fund - A-Class | 0.90% | 11/30/12 | 02/01/16 |
| Total Return Bond Fund - C-Class | 1.65% | 11/30/12 | 02/01/16 |
| Total Return Bond Fund - Institutional Class | 0.50% | 11/30/12 | 02/01/16 |
GI is entitled to reimbursement by the Funds for fees waived or expenses reimbursed during any of the previous 36 months, beginning on the date of the expense limitation agreement, if on any day the estimated operating expenses are less than the indicated percentages. At March 31, 2015, the amount of fees waived or expenses reimbursed that are subject to recoupment are presented in the following table:
| Fund | | Expires 2015 | | | Expires 2016 | | | Expires 2017 | | | Expires 2018 | | | Fund Total | |
| Total Return Bond Fund | | $ | 154,714 | | | $ | 462,339 | | | $ | 561,202 | | | $ | 753,086 | | | $ | 1,931,341 | |
For the period ended March 31, 2015, no amounts were recouped by GI.
If a Fund invests in an affiliated fund, the investing Fund’s Adviser has agreed to waive fees at the investing fund level through February 1, 2016. Fee waivers will be calculated at the investing Fund level without regard to any expense cap, if any, in effect for the investing Fund. Fees waived under this arrangement are not subject to reimbursement to GI.
During the period ended March 31, 2015, the following fund waived advisory fees related to investments in the affiliated funds.
| Fund | | Amount | |
| Total Return Bond Fund | | $ | 7,266 | |
For the period ended March 31, 2015, GFD retained sales charges of $3,966 relating to sales of A-Class shares of the Trust.
Certain trustees and officers of the Trust are also officers of GI, RFS and GFD.
| | THE GUGGENHEIM FUNDS SEMI-ANNUAL REPORT | 49 |
NOTES TO FINANCIAL STATEMENTS (Unaudited)(continued)
In accordance with U.S. GAAP, fair value is defined as the price that the Fund would receive to sell an investment or pay to transfer a liability in an orderly transaction with an independent buyer in the principal market, or in the absence of a principal market, the most advantageous market for the investment or liability. U.S. GAAP establishes a three-tier fair value hierarchy based on the types of inputs used to value assets and liabilities and requires corresponding disclosure. The hierarchy and the corresponding inputs are summarized below:
| Level 1 — | quoted prices in active markets for identical assets or liabilities. |
| Level 2 — | significant other observable inputs (for example quoted prices for securities that are similar based on characteristics such as interest rates, prepayment speeds, credit risk, etc.). |
| Level 3 — | significant unobservable inputs based on the best information available under the circumstances, to the extent observable inputs are not available, which may include assumptions. |
The types of inputs available depend on a variety of factors, such as the type of security and the characteristics of the markets in which it trades, if any. Fair valuation determinations that rely on fewer or no observable inputs require greater judgment. Accordingly, fair value determinations for Level 3 securities require the greatest amount of judgment.
The following table summarizes the inputs used to value the Fund's investments at March 31, 2015:
| | | Level 1 Investments In Securities | | | Level 2 Investments In Securities | | | Level 2 Other Financial Instruments* | | | Level 3 Investments In Securities | | | Total | |
| Assets | | | | | | | | | | | | | | | |
| Total Return Bond Fund | | $ | 178,949,963 | | | $ | 1,425,006,810 | | | $ | 661,317 | | | $ | 26,135,178 | | | $ | 1,630,753,268 | |
| | |
| Liabilities | | | | | | | | | | | | | | | | | | | | |
| Total Return Bond Fund | | $ | 1,825,746 | | | $ | — | | | $ | — | | | $ | — | | | $ | 1,825,746 | |
| * | Other financial instruments may include forward foreign currency exchange contracts and/or swaps, which are reported as unrealized gain/loss at period end. |
| 50 | THE GUGGENHEIM FUNDS SEMI-ANNUAL REPORT | |
NOTES TO FINANCIAL STATEMENTS (Unaudited)(continued)
Independent pricing services are used to value a majority of the Fund's investments. When values are not available from a pricing service, they may be computed by the Fund's investment adviser or an affiliate. In any event, values may be determined using a variety of sources and techniques, including: market prices; broker quotes; and models which derive prices based on inputs such as prices of securities with comparable maturities and characteristics or based on inputs such as anticipated cash flows or collateral, spread over Treasuries, and other information and analysis. A significant portion of the Fund's assets and liabilities are categorized as Level 2 or Level 3, as indicated in this report.
Indicative quotes from broker-dealers, adjusted for fluctuations in criteria such as credit spreads and interest rates, may be also used to value the Fund’s assets and liabilities, i.e. prices provided by a broker-dealer or other market participant who has not committed to trade at that price. Although indicative quotes are typically received from established market participants, the Fund may not have the transparency to view the underlying inputs which support the market quotations. Significant changes in an indicative quote would generally result in significant changes in the fair value of the security.
Certain fixed income securities are valued by obtaining a monthly indicative quote from a broker-dealer, adjusted for fluctuations in criteria such as credit spreads and interest rates. The Fund's fair valuation guidelines were recently revised to transition such monthly indicative quoted securities from Level 2 to Level 3.
The inputs or methodologies used for valuing securities are not necessarily an indication of the risk associated with investing in those securities. The suitability of the techniques and sources employed to determine fair valuation are regularly monitored and subject to change.
| | THE GUGGENHEIM FUNDS SEMI-ANNUAL REPORT | 51 |
NOTES TO FINANCIAL STATEMENTS (Unaudited)(continued)
The following is a summary of significant unobservable inputs used in the fair value valuation of assets and liabilities categorized within level 3 of the fair value hierarchy.
| Fund | Category and Subcategory | Ending Balance at 03/31/15 | | Valuation Technique | Unobservable Inputs |
| | Investments, at value | | | | |
| Total Return Bond Fund | Asset-Backed Securities | $14,252,108 | | Option Adjusted Spread off the month end broker mark over the 3 month LIBOR | Indicative Quote |
| | | 50 | | Option Adjusted Spread off 60 day or greater broker mark over the 3 month LIBOR | Indicative Quote |
| | Total Asset-Backed Securities | 14,252,108 | | | |
| | Mortgage-Backed Securities | 9,509,143 | | Option Adjusted Spread off the month end broker mark over the 3 month LIBOR | Indicative Quote |
| | Corporate Bonds | 2,373,927 | | Option Adjusted Spread off the month end broker mark over the 3 month LIBOR | Indicative Quote |
Transfers between investment levels may occur as the markets fluctuate and/or the availability of data used in an investment’s valuation changes. The Fund recognized transfers between the levels as of the beginning of the period. As of March 31, 2015, the Fund had transfers in/out of Level 3 due to changes in securities valuation method. See the table below for changes to and from Level 2 and Level 3. There were no other securities that transferred between levels.
| 52 | THE GUGGENHEIM FUNDS SEMI-ANNUAL REPORT | |
NOTES TO FINANCIAL STATEMENTS (Unaudited)(continued)
Summary of Fair Value Level 3 Activity
Following is a reconciliation of Level 3 assets and liabilities for which significant unobservable inputs were used to determine fair value for the period ended March 31, 2015:
LEVEL 3 – Fair value measurement using significant unobservable inputs
| | | Mortgage- Backed Securities | | | Asset- Backed Securities | | | Corporate Bonds | | | Total | |
| Total Return Bond Fund | | | | | | | | | | | | |
| Assets: | | | | | | | | | | | | |
| Beginning Balance | | $ | 947,112 | | | $ | 1,827,929 | | | $ | 3,121,033 | | | $ | 5,896,074 | |
| Purchases | | | 7,331,908 | | | | 13,142,830 | | | | 1,209,700 | | | | 21,684,438 | |
| Sales | | | (6,386 | ) | | | (243,288 | ) | | | (652,725 | ) | | | (902,399 | ) |
| Total realized gains or losses included in earnings | | | — | | | | — | | | | 15,625 | | | | 15,625 | |
| Total change in unrealized gains or losses included in earnings | | | 102,573 | | | | 5,887 | | | | (81,256 | ) | | | 27,204 | |
| Transfers in Level 3 | | | 1,133,936 | | | | 50 | | | | — | | | | 1,133,986 | |
| Transfers out of Level 3 | | | — | | | | (481,300 | ) | | | (1,238,450 | ) | | | (1,719,750 | ) |
| Ending Balance | | $ | 9,509,143 | | | $ | 14,252,108 | | | $ | 2,373,927 | | | $ | 26,135,178 | |
5. Derivative Investment Holdings Categorized by Risk Exposure
U.S. GAAP requires disclosures to enable investors to better understand how and why the Fund uses derivative instruments, how these derivative instruments are accounted for and their effects on the Fund's financial position and results of operations.
The Fund utilized derivatives for hedging and duration purposes.
The following table represents the notional amount of derivative instruments outstanding as an approximate percentage of the Fund’s net assets on a quarterly basis.
| | Approximate percentage of Fund's Net Assets on a quarterly basis |
| Fund | Long |
| Total Return Bond Fund | 5% |
| | THE GUGGENHEIM FUNDS SEMI-ANNUAL REPORT | 53 |
NOTES TO FINANCIAL STATEMENTS (Unaudited)(continued)
The following is a summary of the location of derivative investments on the Fund's Statement of Assets and Liabilities as of March 31, 2015:
| Derivative Investment Type | Asset Derivatives | Liability Derivatives |
| Equity/Currency/Interest Rate contracts | Unrealized appreciation on forward foreign
currency exchange contracts | Options, written at value |
| | Unrealized appreciation on swap agreements | |
| | Investments in unaffiliated issuers, at value | |
The following table sets forth the fair value of the Fund's derivative investments categorized by primary risk exposure at March 31, 2015:
| Asset Derivative Investments Value | |
| Fund | | Forward Foreign Currency Exchange Contracts | | | Swaps Interest Rate Contracts | | | Options Written Equity Contracts | | | Options Purchased Equity Contracts | | | Total | |
| Total Return Bond Fund | | $ | 49,617 | | | $ | 611,700 | | | $ | — | | | $ | 2,977,659 | | | $ | 3,638,976 | |
| Liability Derivative Investments Value | |
| Fund | | Forward Foreign Currency Exchange Contracts | | | Swaps Interest Rate Contracts | | | Options Written Equity Contracts | | | Options Purchased Equity Contracts | | | Total | |
| Total Return Bond Fund | | $ | — | | | $ | — | | | $ | 1,825,746 | | | $ | — | | | $ | 1,825,746 | |
The following is a summary of the location of derivative investments on the Fund's Statement of Operations for the period ended March 31, 2015:
| Derivative Investment Type | Location of Gain (Loss) on Derivatives |
| Equity/Currency/Interest Rate contracts | Net realized gain (loss) on forward foreign currency exchange contracts |
| | Net change in unrealized appreciation (depreciation) on forward foreign currency exchange contracts |
| | Net change in unrealized appreciation (depreciation) on options purchased |
| | Net change in unrealized appreciation (depreciation) on options written |
| | Net realized gain (loss) on swap agreements |
| | Net change in unrealized appreciation (depreciation) on swap agreements |
| 54 | THE GUGGENHEIM FUNDS SEMI-ANNUAL REPORT | |
NOTES TO FINANCIAL STATEMENTS (Unaudited)(continued)
The following is a summary of the Fund's realized gain (loss) and change in unrealized appreciation (depreciation) on derivative investments recognized on the Statement of Operations categorized by primary risk exposure for the period ended March 31, 2015:
Realized Gain (Loss) on Derivative Investments Recognized on the Statement of Operations | |
| Fund | | Forward Foreign Currency Exchange Contracts | | | Swaps Interest Rate Contracts | | | Options Written Equity Contracts | | | Options Purchased Equity Contracts | | | Total | |
| Total Return Bond Fund | | $ | 353,744 | | | $ | 2,333,156 | | | $ | — | | | $ | — | | | $ | 2,686,900 | |
Change in Unrealized Appreciation (Depreciation) on Derivative Investments Recognized on the Statement of Operations | |
| Fund | | Forward Foreign Currency Exchange Contracts | | | Swaps Interest Rate Contracts | | | Options Written Equity Contracts | | | Options Purchased Equity Contracts | | | Total | |
| Total Return Bond Fund | | $ | 25,808 | | | $ | (74,350 | ) | | $ | (241,410 | ) | | $ | (406,629 | ) | | $ | (696,581 | ) |
6. Federal Income Tax Information
The Fund intends to comply with the provisions of Subchapter M of the Internal Revenue Code applicable to regulated investment companies and will distribute substantially all taxable net investment income and capital gains sufficient to relieve the Fund from all, or substantially all, federal income, excise and state income taxes. Therefore, no provision for federal or state income tax is required.
Tax positions taken or expected to be taken in the course of preparing the Fund’s tax returns are evaluated to determine whether the tax positions are “more-likely-than-not” of being sustained by the applicable tax authority. Tax positions not deemed to meet the more-likely-than-not threshold would be recorded as a tax benefit or expense in the current year. Management has analyzed the Fund’s tax positions taken, or to be taken, on Federal income tax returns for all open tax years, and has concluded that no provision for income tax is required in the Fund’s financial statements. The Fund’s federal tax returns are subject to examination by the Internal Revenue Service for a period of three years after they are filed.
| | THE GUGGENHEIM FUNDS SEMI-ANNUAL REPORT | 55 |
NOTES TO FINANCIAL STATEMENTS (Unaudited)(continued)
At March 31, 2015, the cost of securities for Federal income tax purposes, the aggregate gross unrealized gain for all securities for which there was an excess of value over tax cost and the aggregate gross unrealized loss for all securities for which there was an excess of tax cost over value, were as follows:
| Fund | | Tax Cost | | | Tax Unrealized Gain | | | Tax Unrealized Loss | | | Net Unrealized Gain | |
| Total Return Bond Fund | | $ | 1,621,733,046 | | | $ | 19,866,629 | | | $ | (11,507,723 | ) | | $ | 8,358,906 | |
7. Securities Transactions
For the period ended March 31, 2015, the cost of purchases and proceeds from sales of investment securities, excluding government securities, short-term investments and derivatives, were as follows:
| Fund | | Purchases | | | Sales | |
| Total Return Bond Fund | | $ | 1,233,084,057 | | | $ | 179,415,496 | |
For the period ended March 31, 2015, the cost of purchases and sales of government securities were:
| Fund | | Purchases | | | Sales | |
| Total Return Bond Fund | | $ | 5,010,547 | | | $ | 2,098,313 | |
8. Options Written
Information as to options written by the Fund during the period ended March 31, 2015, and options outstanding at period end is provided below:
| Written Call Options | | | |
| | | Total Return Bond Fund | |
| | | Number of Contracts | | | Premium Amount | |
| Balance at September 30, 2014 | | | — | | | $ | — | |
| Options Written | | | 20,859 | | | | 1,584,336 | |
| Options terminated in closing purchase transactions | | | — | | | | — | |
| Options expired | | | — | | | | — | |
| Options exercised | | | — | | | | — | |
| Balance at March 31, 2015 | | | 20,859 | | | $ | 1,584,336 | |
| 56 | THE GUGGENHEIM FUNDS SEMI-ANNUAL REPORT | |
NOTES TO FINANCIAL STATEMENTS (Unaudited)(continued)
Investments representing 5% or more of the outstanding voting shares of a portfolio company of a fund, or control of or by, or common control under GI, result in that portfolio company being considered an affiliated company of such fund, as defined in the 1940 Act.
The Fund may invest in the Guggenheim Strategy Funds Trust consisting of Guggenheim Strategy Fund I, Guggenheim Strategy Fund II, and Guggenheim Strategy Fund III (collectively, the “Cash Management Funds”), open-end management investment companies managed by GI. The Cash Management Funds, which launched on March 11, 2014, are offered as cash management options only to mutual funds, trusts, and other accounts managed by GI and/or its affiliates, and are not available to the public. The Cash Management Funds pay no investment management fees. The Cash Management Funds’ annual report on Form N-CSR dated September 30, 2014 is available publicly or upon request. This information is available from the EDGAR database on the SEC's website at http://www.sec.gov.
Transactions during the period ended March 31, 2015 in which the portfolio company is an “affiliated person” are as follows:
| Affiliated issuers by Fund | | Value 09/30/14 | | | Additions | | | Reductions | | | Value 03/31/15 | | | Shares 03/31/15 | | | Investment Income | | | Realized Gain (Loss) | | | Capital Gain Distributions | |
| Total Return Bond Fund | | | | | | | | | | | | | |
| Limited Duration Fund - Institutional Class | | $ | 2,059,674 | | | $ | 520,841 | | | $ | (2,563,399 | ) | | $ | — | | | | — | | | $ | 19,975 | | | $ | (22,805 | ) | | $ | 875 | |
| Guggenheim Strategy Fund I | | | — | | | | 33,000,448 | | | | — | | | | 33,037,683 | | | | 1,326,815 | | | | 13,383 | | | | — | | | | — | |
| Guggenheim Strategic Opportunities Fund | | | — | | | | 990,390 | | | | — | | | | 1,067,500 | | | | 50,000 | | | | 45,525 | | | | — | | | | — | |
| | | $ | 2,059,674 | | | $ | 34,511,679 | | | $ | (2,563,399 | ) | | $ | 34,105,183 | | | | | | | $ | 78,883 | | | $ | (22,805 | ) | | $ | 875 | |
10. Loan Commitments
Pursuant to the terms of certain loan agreements, the Fund held unfunded loan commitments as of March 31, 2015. The Fund is obligated to fund these loan commitments at the borrower’s discretion.
| | THE GUGGENHEIM FUNDS SEMI-ANNUAL REPORT | 57 |
NOTES TO FINANCIAL STATEMENTS (Unaudited)(continued)
The unfunded loan commitments as of March 31, 2015 were as follows:
| Borrower | Maturity Date | | Face Amount | | | Value | |
| Total Return Bond Fund | | | | | | | |
| Cartrawler | 06/30/15 | | $ | 6,500,000 | | | $ | — | |
| Acosta, Inc. | 09/26/19 | | | 2,200,000 | | | | — | |
| SS&C Technologies, Inc. | 02/27/16 | | | 2,000,000 | | | | — | |
| Rite Aid Corp. | 08/10/15 | | | 1,650,000 | | | | — | |
| Internet Brands | 07/08/21 | | | 11,959 | | | | 59 | |
| | | | $ | 12,361,959 | | | $ | 59 | |
11. Line of Credit
The Trust, with the exception of Alpha Opportunity Fund and Capital Stewardship Fund, secured a committed, $625,000,000 line of credit from Citibank, N.A., good through October 9, 2015, at which time the line of credit may be renewed. This line of credit is reserved for emergency or temporary purposes. Fees related to borrowings, if any, vary under this arrangement between the greater of Citibank’s “base rate”, LIBOR plus 1.0%, and the Fed Funds rate, plus 0.50%. The Trust did not have any borrowings under this agreement as of and for the period-ended March 31, 2015. The Trust also pays a commitment fee at an annualized rate of 0.07% of the average daily amount of their unused commitment amount.
12. Repurchase Agreements
In connection with transactions in repurchase agreements, it is the Fund’s policy that its custodian takes possession of the underlying collateral. The collateral is in the possession of the Fund’s custodian and is evaluated to ensure that its market value exceeds, at a minimum, 102% of the original face amount of the repurchase agreements.
| Fund | Counterparty and Terms of Agreement | Face Value | Repurchase Price | | Collateral | Par Value | Fair Value |
| Total Return Bond Fund | Jefferies & Company, Inc. | | | | | | |
| | 2.43% - 3.18% | | | | Acis CLO Ltd. | | |
| | Due 04/05/15 - | | | | 0.00% | | |
| | 05/07/15 | $24,545,290 | $24,610,154 | | 02/02/26 | $19,875,000 | $14,935,653 |
| | | | | | Puerto Rico Sales Tax Financing Corp. | | |
| | | | | | 0.00% | | |
| | | | | | 08/01/39 | 12,317,500 | 1,243,000 |
| 58 | THE GUGGENHEIM FUNDS SEMI-ANNUAL REPORT | |
NOTES TO FINANCIAL STATEMENTS (Unaudited)(continued)
| Fund | Counterparty and Terms of Agreement | Face Value | Repurchase Price | | Collateral | Par Value | Fair Value |
| | | | | | Venture CDO Ltd. | | |
| | | | | | 0.00% | | |
| | | | | | 02/28/24 | $ 5,000,000 | $ 4,050,000 |
| | | | | | Government Development Bank for Puerto Rico | | |
| | | | | | 5.00% | | |
| | | | | | 08/01/23 | 3,802,500 | 1,988,631 |
| | | | | | Countrywide Alternative Loan Trust | | |
| | | | | | 1.51% | | |
| | | | | | 11/25/47 | 1,922,400 | 1,458,039 |
| | | | | | Aegis Asset Backed Securities Trust | | |
| | | | | | 0.64% | | |
| | | | | | 10/25/35 | 1,256,250 | 813,249 |
| | | | | | Puerto Rico Public Finance Corp. | | |
| | | | | | 6.00% | | |
| | | | | | 08/01/26 | 707,000 | 372,313 |
| | | | | | Jasper CLO Ltd. | | |
| | | | | | 6.00% | | |
| | | | | | 08/01/17 | 2,500 | 1,200,000 |
In the event of counterparty default, the Fund has the right to collect the collateral to offset losses incurred. There is potential loss to the Fund in the event the Fund is delayed or prevented from exercising its rights to dispose of the collateral securities, including the risk of a possible decline in the value of the underlying securities during the period while the Fund seeks to assert its rights. The Fund’s investment adviser, acting under the supervision of the Board of Trustees, reviews the value of the collateral and the creditworthiness of those banks and dealers with which the Fund enters into repurchase agreements to evaluate potential risks.
13. Reverse Repurchase Agreements
The Fund may enter into reverse repurchase agreements. Under a reverse repurchase agreement, a Fund sells securities and agrees to repurchase them at a particular price at a future date. In the event the buyer of securities under a reverse repurchase agreement files for bankruptcy or becomes insolvent, such buyer or its trustee or receiver may receive an extension of time to determine whether to
| | THE GUGGENHEIM FUNDS SEMI-ANNUAL REPORT | 59 |
NOTES TO FINANCIAL STATEMENTS (Unaudited)(continued)
enforce the Fund’s obligation to repurchase the securities, and the Fund’s use of the proceeds of the reverse repurchase agreement may effectively be restricted pending such decision.
For the period ended March 31, 2015, the Fund entered into reverse repurchase agreements as follows:
| Fund | | Number of Days outstanding | | | Balance at March 31, 2015 | | | Average balance outstanding | | | Average interest rate | |
| Total Return Bond Fund | | | 182 | | | $ | 160,566,149 | | | $ | 27,394,183 | | | | 0.38 | % |
14. Restricted Securities
The securities below are considered illiquid and restricted under guidelines established by the Board of Trustees:
| Fund | Restricted Securities | Acquisition Date | Cost | Value |
| Total Return Bond Fund | Cadence Bank North America | | | |
| | 6.25% due 06/28/29 | 06/06/14 | $1,200,000 | $1,230,000 |
| | Cadence Financial Corp. | | | |
| | 4.88% due 06/28/19 | 06/06/14 | 250,000 | 252,390 |
| | Odebrecht Drilling Norbe VIII/IX Ltd. | | | |
| | 6.35% due 06/30/21 | 12/01/11 | 195,579 | 161,288 |
| | | | 1,645,579 | 1,643,678 |
15. Offsetting
In the normal course of business, the Fund enters into transactions subject to enforceable master netting arrangements or other similar arrangements. Generally, the right to offset in those agreements allows the Fund to counteract the exposure to a specific counterparty with collateral received or delivered to that counterparty based on the terms of the arrangements. These arrangements provide for the right to liquidate upon the occurrence of an event of default, credit event upon merger or additional termination event.
In order to better define their contractual rights and to secure rights that will help the Fund mitigate its counterparty risk, the Fund may enter into an International Swaps and Derivatives Association, Inc. Master Agreement (“ISDA Master Agreement”) or similar agreement with its derivative contract counterparties. An ISDA Master Agreement is a bilateral agreement between a Fund and a counterparty that governs OTC derivatives, including foreign exchange contracts, and typically contains, among other things, collateral posting terms and netting provisions in the event of a default and/or termination event. The provisions of the
| 60 | THE GUGGENHEIM FUNDS SEMI-ANNUAL REPORT | |
NOTES TO FINANCIAL STATEMENTS (Unaudited)(continued)
ISDA Master Agreement typically permit a single net payment in the event of a default (close-out netting) or similar event, including the bankruptcy or insolvency of the counterparty.
For derivatives traded under an ISDA Master Agreement, the collateral requirements are typically calculated by netting the mark to market amount for each transaction under such agreement and comparing that amount to the value of any collateral currently pledged by the Fund and the counterparty. For financial reporting purposes, cash collateral that has been pledged to cover obligations of the Fund and cash collateral received from the counterparty, if any, is reported separately on the Statement of Assets and Liabilities as segregated cash with broker/receivable for variation margin, or payable for swap settlement/variation margin. Generally, the amount of collateral due from or to a counterparty must exceed a minimum transfer amount threshold (e.g., $300,000) before a transfer is required to be made. To the extent amounts due to the Fund from its counterparties are not fully collateralized, contractually or otherwise, the Fund bears the risk of loss from counterparty nonperformance. The Fund attempts to mitigate counterparty risk by only entering into agreements with counterparties that they believe to be of good standing and by monitoring the financial stability of those counterparties.
For financial reporting purposes, the Fund does not offset derivative assets and derivative liabilities that are subject to netting arrangements in the Statement of Assets and Liabilities.
The following tables present derivative financial instruments and secured financing transactions that are subject to enforceable netting arrangements and offset in the Statement of Assets and Liabilities in conformity with U.S. GAAP.
| | | | | | | | | | | | | Gross Amounts Not Offset in the Statement of Assets and Liabilities | | | | |
| Fund | Instrument | | Gross Amounts of Recognized Assets1 | | | Gross Amounts Offset in the Statement of Assets and Liabilities | | | Net Amount of Assets Presented on the Statement of Assets and Liabilities | | | Financial Instruments | | | Cash Collateral Received | | | Net Amount | |
| Total Return Bond Fund | Forward foreign currency exchange contracts | | $ | 49,617 | | | $ | — | | | $ | 49,617 | | | $ | — | | | $ | — | | | $ | 49,617 | |
1 | Centrally cleared swaps are excluded from these reported amounts. |
| | THE GUGGENHEIM FUNDS SEMI-ANNUAL REPORT | 61 |
NOTES TO FINANCIAL STATEMENTS (Unaudited)(concluded)
P-Class Shares to be Offered
Effective following the close of business on April 30, 2015, or such later date as may be determined appropriate by management, Total Return Bond Fund (the “Fund”), a separate series of Guggenheim Funds Trust, will offer P-Class shares.
P-Class shares of the Fund are offered primarily through broker/dealers and other financial intermediaries with which Guggenheim Funds Distributors, LLC has an agreement for the use of P-Class shares of the Fund in investment products, programs or accounts. P-Class shares do not have a minimum initial investment amount, subsequent investment amount or a minimum account balance. The Fund reserves the right to modify its minimum investment amount and account balance requirements at any time, with or without prior notice to you.
Shareholders who currently have accounts held directly at Guggenheim Investments will not be permitted to purchase P-Class shares.
For more information, or to request copies of the Fund’s prospectuses, call Client Services at 800.820.0888 or visiting guggenheiminvestments.com.
| 62 | THE GUGGENHEIM FUNDS SEMI-ANNUAL REPORT | |
OTHER INFORMATION (Unaudited)
Proxy Voting Information
A description of the policies and procedures that the Trust uses to determine how to vote proxies relating to securities held in the Funds’ portfolios is available, without charge and upon request, by calling 800.820.0888. This information is also available from the EDGAR database on the SEC’s website at http://www.sec.gov.
Information regarding how the Funds voted proxies relating to portfolio securities during the most recent 12-month period ended June 30 is available without charge, upon request, by calling 800.820.0888. This information is also available from the EDGAR database on the SEC’s website at http://www.sec.gov.
Sector Classification
Information in the “Schedule of Investments” is categorized by sectors using sector-level classifications used by Bloomberg Industry Classification System, a widely recognized industry classification system provider. In each Fund’s registration statement, the Funds have investment policies relating to concentration in specific industries. For purposes of these investment policies, the Funds usually classify industries based on industry-level classifications used by widely recognized industry classification system providers such as Bloomberg Industry Classification System, Global Industry Classification Standards and Barclays Global Classification Scheme.
Quarterly Portfolio Schedules Information
The Trust files its complete schedule of portfolio holdings with the SEC for the first and third quarters of each fiscal year on Form N-Q; which are available on the SEC’s website at http://www.sec.gov. The Funds’ Forms N-Q may be reviewed and copied at the SEC’s Public Reference Room in Washington, DC, and that information on the operation of the Public Reference Room may be obtained by calling 800-SEC-0330. Copies of the portfolio holdings are also available to shareholders, without charge and upon request, by calling 800.820.0888.
| | THE GUGGENHEIM FUNDS SEMI-ANNUAL REPORT | 63 |
INFORMATION ON BOARD OF TRUSTEES AND OFFICERS (Unaudited)
Name, Address* and Year of Birth | Position(s) Held with the Trust | Term of Office and Length of Time Served** | Principal Occupation(s) During Past Five Years | Number of Portfolios in Fund Complex Overseen | Other Directorships Held by Trustees |
| INDEPENDENT TRUSTEES | | | |
Randall C. Barnes (1951) | Trustee | Since 2014 | Current: Private Investor (2001-present). Former: Senior Vice President and Treasurer, PepsiCo, Inc. (1993-1997); President, Pizza Hut International (1991-1993); Senior Vice President, Strategic Planning and New Business Development, PepsiCo, Inc. (1987-1990). | 91 | Current: Trustee, Purpose Investments Inc. (2014-Present). |
Donald A. Chubb, Jr. (1946) | Trustee and Vice Chairman of the Board | Since 1994 | Current: Business broker and manager of commercial real estate, Griffith & Blair, Inc. (1997-present). | 87 | None. |
Jerry B. Farley (1946) | Trustee and Vice Chairman of the Audit Committee | Since 2005 | Current: President, Washburn University (1997-present). | 87 | Current: Westar Energy, Inc. (2004-present); CoreFirst Bank & Trust (2000-present). |
| 64 | THE GUGGENHEIM FUNDS SEMI-ANNUAL REPORT | |
INFORMATION ON BOARD OF TRUSTEES AND OFFICERS (Unaudited)(continued)
Name, Address* and Year of Birth | Position(s) Held with the Trust | Term of Office and Length of Time Served** | Principal Occupation(s) During Past Five Years | Number of Portfolios in Fund Complex Overseen | Other Directorships Held by Trustees |
| INDEPENDENT TRUSTEES - continued | | |
Roman Friedrich III (1946) | Trustee and Chairman of the Contracts Review Committee | Since 2014 | Current: Founder and President, Roman Friedrich & Company (1998-present). Former: Senior Managing Director, MLV & Co. LLC (2010-2011). | 87 | Current: Zincore Metals, Inc. (2009-present). Former: Mercator Minerals Ltd. (2013-2014); First Americas Gold Corp. (2012-2014); Blue Sky Uranium Corp. (2011-2012); Axiom Gold and Silver Corp. (2011-2012); Stratagold Corp. (2003-2009); GFM Resources Ltd. (2005-2010). |
Robert B. Karn III (1942) | Trustee and Chairman of the Audit Committee | Since 2014 | Current: Consultant (1998-present). Former: Arthur Andersen (1965-1997) and Managing Partner, Financial and Economic Consulting, St. Louis office (1987-1997). | 87 | Current: Peabody Energy Company (2003-present); GP Natural Resource Partners, LLC (2002- present). |
Ronald A. Nyberg (1953) | Trustee and Chairman of the Nominating and Governance Committee | Since 2014 | Current: Partner, Nyberg & Cassioppi, LLC (2000-present). Former: Executive Vice President, General Counsel, and Corporate Secretary, Van Kampen Investments (1982-1999). | 93 | Current: Edward-Elmhurst Healthcare System (2012-present). |
| | THE GUGGENHEIM FUNDS SEMI-ANNUAL REPORT | 65 |
INFORMATION ON BOARD OF TRUSTEES AND OFFICERS (Unaudited)(continued)
Name, Address* and Year of Birth | Position(s) Held with the Trust | Term of Office and Length of Time Served** | Principal Occupation(s) During Past Five Years | Number of Portfolios in Fund Complex Overseen | Other Directorships Held by Trustees |
| INDEPENDENT TRUSTEES - concluded | | |
Maynard F. Oliverius (1943) | Trustee and Vice Chairman of the Contracts Review Committee | Since 1998 | Current: Retired. Former: President and CEO, Stormont-Vail HealthCare (1996-2012). | 87 | Current: Fort Hays State University Foundation (1999-present); Stormont-Vail Foundation (2013-present); University of Minnesota HealthCare Alumni Association Foundation (2009-present). |
Ronald E. Toupin, Jr. (1958) | Trustee and Chairman of the Board | Since 2014 | Current: Portfolio Consultant (2010-present). Former: Vice President, Manager and Portfolio Manager, Nuveen Asset Management (1998-1999); Vice President, Nuveen Investment Advisory Corp. (1992-1999); Vice President and Manager, Nuveen Unit Investment Trusts (1991-1999); and Assistant Vice President and Portfolio Manager, Nuveen Unit Investment Trusts (1988-1999), each of John Nuveen & Co., Inc. (1982-1999). | 90 | Former: Bennett Group of Funds (2011-2013). |
| 66 | THE GUGGENHEIM FUNDS SEMI-ANNUAL REPORT | |
INFORMATION ON BOARD OF TRUSTEES AND OFFICERS (Unaudited)(continued)
Name, Address* and Year of Birth | Position(s) Held with the Trust | Term of Office and Length of Time Served** | Principal Occupation(s) During Past Five Years | Number of Portfolios in Fund Complex Overseen | Other Directorships Held by Trustees |
| INTERESTED TRUSTEE | |
Donald C. Cacciapaglia*** (1951) | President, Chief Executive Officer and Trustee | Since 2012 | Current: President and CEO, certain other funds in the Fund Complex (2012-present); Vice Chairman, Guggenheim Investments (2010-present). Former: Chairman and CEO, Channel Capital Group, Inc. (2002-2010). | 221 | Current: Clear Spring Life Insurance Company (2015-present); Guggenheim Partners Japan, Ltd. (2014-present); Delaware Life (2013-present); Guggenheim Life and Annuity Company (2011-present); Paragon Life Insurance Company of Indiana (2011-present). |
| * | The business address of each Trustee is c/o Guggenheim Investments, 805 King Farm Boulevard, Suite 600, Rockville, Maryland 20850. |
| ** | Each Trustee serves an indefinite term, until his successor is elected and qualified. Time served includes time served in the respective position for the Predecessor Corporation. |
| *** | This Trustee is deemed to be an "interested person" of the Funds under the 1940 Act by reason of his position with the Funds' Investment Manager and/or the parent of the Investment Manager. |
| | THE GUGGENHEIM FUNDS SEMI-ANNUAL REPORT | 67 |
INFORMATION ON BOARD OF TRUSTEES AND OFFICERS (Unaudited)(continued)
Name, Address* and Year of Birth | Position(s) held with the Trust | Term of Office and Length of Time Served** | Principal Occupations During Past Five Years |
| OFFICERS | | | |
Joseph M. Arruda (1966) | Assistant Treasurer | Since 2010 | Current: Assistant Treasurer, certain other funds in the Fund Complex (2006-present); Vice President, Security Investors, LLC (2010-present); CFO and Manager, Guggenheim Specialized Products, LLC (2009-present). Former: Vice President, Security Global Investors, LLC (2010-2011); Vice President, Rydex Advisors, LLC (2010); Vice President, Rydex Advisors II, LLC (2010). |
William H. Belden, III (1965) | Vice President | Since 2014 | Current: Vice President, certain other funds in the Fund Complex (2006-present); Managing Director, Guggenheim Funds Investment Advisors, LLC (2005-present). Former: Vice President of Management, Northern Trust Global Investments (1999-2005). |
Mark J. Furjanic (1959) | Assistant Treasurer | Since 2014 | Current: Vice President, Guggenheim Investments (2005-present); Assistant Treasurer, certain other funds in the Fund Complex (2008-present). Former: Senior Manager, Ernst & Young LLP (1999-2005). |
James M. Howley (1972) | Assistant Treasurer | Since 2014 | Current: Director, Guggenheim Investments (2004-present) ; Assistant Treasurer, certain other funds in the Fund Complex (2006-present). Former: Manager, Mutual Fund Administration of Van Kampen Investments, Inc. (1996-2004). |
| 68 | THE GUGGENHEIM FUNDS SEMI-ANNUAL REPORT | |
INFORMATION ON BOARD OF TRUSTEES AND OFFICERS (Unaudited)(continued)
Name, Address* and Year of Birth | Position(s) held with the Trust | Term of Office and Length of Time Served** | Principal Occupations During Past Five Years |
| OFFICERS - continued | |
Amy J. Lee (1961) | Vice President and Chief Legal Officer | Since 2007 (Vice President) Since 2014 (Chief Legal Officer) | Current: Chief Legal Officer, certain other funds in the Fund Complex (2013-present); Senior Managing Director, Guggenheim Investments (2012-present). Former: Vice President, Associate General Counsel and Assistant Secretary, Security Benefit Life Insurance Company and Security Benefit Corporation (2004-2012). |
Mark E. Mathiasen (1978) | Secretary | Since 2014 | Current: Secretary, certain other funds in the Fund Complex (2007-present); Managing Director, Guggenheim Investments (2007-present). |
Michael P. Megaris (1984) | Assistant Secretary | Since 2014 | Current: Assistant Secretary, certain other funds in the Fund Complex (2014-present); Associate, Guggenheim Investments (2012-present). Former: J.D., University of Kansas School of Law (2009-2012). |
Elisabeth Miller (1968) | Chief Compliance Officer | Since 2012 | Current: CCO, certain other funds in the Fund Complex (2012-present); CCO, Security Investors, LLC (2012-present); CCO, Guggenheim Funds Investment Advisors, LLC (2012-present); Managing Director, Guggenheim Investments (2012-present); Vice President, Guggenheim Funds Distributors, LLC (March 2014-present). Former: CCO, Guggenheim Distributors, LLC (2009-March 2014); Senior Manager, Security Investors, LLC (2004-2009); Senior Manager, Guggenheim Distributors, LLC (2004-2009). |
| | THE GUGGENHEIM FUNDS SEMI-ANNUAL REPORT | 69 |
INFORMATION ON BOARD OF TRUSTEES AND OFFICERS (Unaudited)(continued)
Name, Address* and Year of Birth | Position(s) held with the Trust | Term of Office and Length of Time Served** | Principal Occupations During Past Five Years |
| OFFICERS - continued | |
Alison Santay (1974) | AML Officer | Since 2013 | Current: AML Officer, certain other funds in the Fund Complex (2010-present); Director and AML Officer, Rydex Fund Services, LLC (2010-present); AML Officer, Security Investors, LLC (2010-present); Director, Shareholder Risk and Compliance, Rydex Fund Services, LLC (2004-present). Former: AML Officer, Guggenheim Distributors, LLC (2013-2014). |
Kimberly Scott (1974) | Assistant Treasurer | Since 2014 | Current: Vice President, Guggenheim Investments (2012-present) ; Assistant Treasurer, certain other funds in the Fund Complex (2012-present). Former: Financial Reporting Manager, Invesco, Ltd. (2010-2011); Vice President/Assistant Treasurer, Mutual Fund Administration for Van Kampen Investments, Inc./Morgan Stanley Investment Management (2009-2010); Manager of Mutual Fund Administration, Van Kampen Investments, Inc./Morgan Stanley Investment Management (2005-2009). |
Bryan Stone (1979) | Vice President | Since 2014 | Current: Vice President, certain other funds in the Fund Complex (2014-present); Director, Guggenheim Investments (2013-present). Former: Senior Vice President, Neuberger Berman Group LLC (2009-2013); Vice President, Morgan Stanley (2002-2009). |
| 70 | THE GUGGENHEIM FUNDS SEMI-ANNUAL REPORT | |
INFORMATION ON BOARD OF TRUSTEES AND OFFICERS (Unaudited)(concluded)
Name, Address* and Year of Birth | Position(s) held with the Trust | Term of Office and Length of Time Served** | Principal Occupations During Past Five Years |
| OFFICERS - concluded | |
John L. Sullivan (1955) | Chief Financial Officer and Treasurer | Since 2014 | Current: CFO, Chief Accounting Officer and Treasurer, certain other funds in the Fund Complex (2010-present); Senior Managing Director, Guggenheim Investments (2010-present). Former: Managing Director and CCO, each of the funds in the Van Kampen Investments fund complex (2004-2010); Managing Director and Head of Fund Accounting and Administration, Morgan Stanley Investment Management (2002-2004); CFO and Treasurer, Van Kampen Funds (1996-2004). |
| * | The business address of each officer is c/o Guggenheim Investments, 805 King Farm Boulevard, Suite 600, Rockville, Maryland 20850. |
| ** | Each officer serves an indefinite term, until his or her successor is duly elected and qualified. Time served includes time served in the respective position for the Predecessor Corporation. |
| | THE GUGGENHEIM FUNDS SEMI-ANNUAL REPORT | 71 |
GUGGENHEIM INVESTMENTS PRIVACY POLICIES (Unaudited)
Rydex Funds, Guggenheim Funds, Rydex Investments, Guggenheim Funds Distributors, LLC, Security Investors, LLC, Security Distributors, Inc., Guggenheim Partners Investment Managers, LLC, and Rydex Advisory Services (Collectively “Guggenheim Investments”).
Our Commitment to You
When you become a Guggenheim Investments investor, you entrust us with not only your hard-earned money but also with personal and financial information about you. We recognize that your relationship with us is based on trust and that you expect us to act responsibly and in your best interests. Because we have access to this private information about you, we hold ourselves to the highest standards in its safekeeping and use. This means, most importantly, that we do not sell client information to anyone—whether it is your personal information or if you are a current or former Guggenheim Investments client.
The Information We Collect About You
In the course of doing business with shareholders and investors, we collect nonpublic personal information about you. You typically provide personal information when you complete a Guggenheim Investments account application or when you request a transaction that involves Rydex and Guggenheim Investments funds or one of the Guggenheim Investments affiliated companies. “Nonpublic personal information” is personally identifiable private information about you. For example, it includes information regarding your name and address, Social Security or taxpayer identification number, assets, income, account balance, bank account information and investment activity (e.g., purchase and redemption history).
How We Handle Your Personal Information
As emphasized above, we do not sell information about current or former clients or their accounts to third parties. Nor do we share such information, except when necessary to complete transactions at your request or to make you aware of related investment products and services that we offer. Additional details about how we handle your personal information are provided below. To complete certain transactions or account changes that you direct, it may be necessary to provide identifying information to companies, individuals or groups that are not affiliated with Guggenheim Investments. For example, if you ask to transfer assets from another financial institution to Guggenheim Investments, we will need to provide certain information about you to that company to complete the transaction. To alert you to other Guggenheim Investments investment products and services, we may share your information within the Guggenheim Investments family of affiliated companies. This would include, for example, sharing your information within Guggenheim Investments so we can make you aware of
| 72 | THE GUGGENHEIM FUNDS SEMI-ANNUAL REPORT | |
GUGGENHEIM INVESTMENTS PRIVACY POLICIES (Unaudited)(continued)
new Rydex and Guggenheim Investments funds or the services offered through another Guggenheim Investments affiliated company. In certain instances, we may contract with nonaffiliated companies to perform services for us. Where necessary, we will disclose information we have about you to these third parties. In all such cases, we provide the third party with only the information necessary to carry out its assigned responsibilities and only for that purpose. And we require these third parties to treat your private information with the same high degree of confidentiality that we do. In certain instances, we may share information with other financial institutions regarding individuals and entities in response to the U.S.A. Patriot Act. Finally, we will release information about you if you direct us to do so, if we are compelled by law to do so or in other circumstances permitted by law.
Opt Out Provisions
We do not sell your personal information to anyone. The law allows you to “opt out” of only certain kinds of information sharing with third parties. The firm does not share personal information about you with any third parties that triggers this opt-out right. This means YOU ARE ALREADY OPTED OUT.
How We Protect Privacy Online
Our concern for the privacy of our shareholders also extends to those who use our web site, guggenheiminvestments.com. Our web site uses some of the most secure forms of online communication available, including encryption technology, Secure Socket Layer (SSL) protocol, firewalls and user names and passwords. These technologies provide a high level of security and privacy when you access your account information or initiate online transactions. The Guggenheim Investments web site offers customized features that require our use of “http cookies”—tiny pieces of information that we ask your browser to store. However, we make very limited use of these cookies. We only use cookies for session management and security features on the Guggenheim Investments web site. We do not use them to pull data from your hard drive, to learn your email address, or to view data in cookies created by other web sites. We will not share the information in our cookies or give others access to it. See the legal information area on our web site for more details about web site security and privacy features.
| | THE GUGGENHEIM FUNDS SEMI-ANNUAL REPORT | 73 |
GUGGENHEIM INVESTMENTS PRIVACY POLICIES (Unaudited)(concluded)
How We Safeguard Your Personal Information
We restrict access to nonpublic personal information about shareholders to our employees and in some cases to third parties (for example, the service providers described above) as permitted by law. We maintain strict physical, electronic and procedural safeguards that comply with federal standards to guard your nonpublic personal information.
We’ll Keep You Informed
As required by federal law, we will notify shareholders of our privacy policy annually. We reserve the right to modify this policy at any time, but rest assured that if we do change it, we will tell you promptly. You will also be able to access our privacy policy from our web site at guggenheiminvestments.com. Should you have any questions regarding our privacy policy, contact us at 800.820.0888 or 301.296.5100.
| 74 | THE GUGGENHEIM FUNDS SEMI-ANNUAL REPORT | |
This page intentionally left blank.
This page intentionally left blank.
This page intentionally left blank.
Not required at this time.
Not required at this time.
Not required at this time.
Not applicable.
The Schedule of Investments is included under Item 1 of this form.
Not applicable.
Not applicable.
The registrant does not currently have in place procedures by which shareholders may recommend nominees to the registrant’s board.
There have been no changes to the procedures by which shareholders may recommend nominees to the registrant’s board.
Pursuant to the requirements of the Securities Exchange Act of 1934 and the Investment Company Act of 1940, the registrant has duly caused this report to be signed on its behalf by the undersigned, thereunto duly authorized.