UNITED STATES
SECURITIES AND EXCHANGE COMMISSION
Washington, D.C. 20549
FORM N-CSR
CERTIFIED SHAREHOLDER REPORT OF REGISTERED MANAGEMENT
INVESTMENT COMPANIES
Investment Company Act file number 811- 01136
Guggenheim Funds Trust
(Exact name of registrant as specified in charter)
805 King Farm Boulevard, Suite 600
Rockville, Maryland 20850
(Address of principal executive offices) (Zip code)
Donald C. Cacciapaglia, President
Guggenheim Funds Trust
805 King Farm Boulevard, Suite 600
Rockville, Maryland 20850
(Name and address of agent for service)
Registrant's telephone number, including area code: 1-301-296-5100
Date of fiscal year end: September 30
Date of reporting period: March 31, 2014
Form N-CSR is to be used by management investment companies to file reports with the Commission not later than 10 days after the transmission to stockholders of any report that is required to be transmitted to stockholders under Rule 30e-1 under the Investment Company Act of 1940 (17 CFR 270.30e-1). The Commission may use the information provided on Form N-CSR in its regulatory, disclosure review, inspection, and policymaking roles.
A registrant is required to disclose the information specified by Form N-CSR, and the Commission will make this information public. A registrant is not required to respond to the collection of information contained in Form N-CSR unless the Form displays a currently valid Office of Management and Budget (“OMB”) control number. Please direct comments concerning the accuracy of the information collection burden estimate and any suggestions for reducing the burden to Secretary, Securities and Exchange Commission, 450 Fifth Street, NW, Washington, DC 20549-0609. The OMB has reviewed this collection of information under the clearance requirements of 44 U.S.C. §3507.
Item 1. Reports to Stockholders.

3.31.2014
Guggenheim Funds Semi-Annual Report
Fundamental Alpha
StylePlus—Large Core Fund
Small Cap Value Fund
Enhanced World Equity Fund
World Equity Income Fund
Risk Managed Real Estate Fund
| SBE-SEMI-0314x0914 | guggenheiminvestments.com |

Go Green! Eliminate Mailbox Clutter
Go paperless with Guggenheim Investments eDelivery—a service giving you full online access to account information and documents. Save time, cut down on mailbox clutter and be a friend to the environment with eDelivery.
With Guggenheim Investments eDelivery you can:
| • | View online confirmations and statements at your convenience. |
| • | Receive email notifications when your most recent confirmations, statements and other account documents are available for review. |
| • | Access prospectuses, annual reports and semiannual reports online. |

If you have questions about the Guggenheim Investments eDelivery service, contact one of our Shareholder Service Representatives at 800.820.0888.
This report and the financial statements contained herein are submitted for the general information of our shareholders. The report is not authorized for distribution to prospective investors unless preceded or accompanied by an effective prospectus.
Distributed by Guggenheim Funds Distributors, LLC. GI-GOGREEN-0414 x0415 #12604
TABLE OF CONTENTS
| THE GUGGENHEIM FUNDS SEMI-ANNUAL REPORT | 1 |
March 31, 2014
Dear Shareholder:
Security Investors, LLC and Guggenheim Partners Investment Management (the “Investment Advisers”) are pleased to present the semi-annual shareholder report for one or more of our Funds (the “Funds”) for the six-month period ended March 31, 2014.
The Investment Advisers are part of Guggenheim Investments, which represents the investment management businesses of Guggenheim Partners, LLC, ("Guggenheim") a global, diversified financial services firm.
Guggenheim Funds Distributors, LLC is the distributor of the Funds. Guggenheim Funds Distributors, LLC is affiliated with Guggenheim and the Investment Advisers.
We encourage you to read the Economic and Market Overview section of the report, which follows this letter, and then the Fund Profile for each Fund.
We are committed to providing innovative investment solutions and appreciate the trust you place in us.
Sincerely,

Donald C. Cacciapaglia
President
April 30, 2014
Read a prospectus and summary prospectus (if available) carefully before investing. It contains the investment objectives, risks, charges, expenses and other information, which should be considered carefully before investing. Obtain a prospectus and summary prospectus (if available) at guggenheiminvestments.com or call 800.820.0888.
There can be no assurance that any investment product will achieve its investment objective(s). There are risks associated with investing, including the entire loss of principal invested. Investing involves market risks. The investment return and principal value of any investment product will fluctuate with changes in market conditions.
| 2 | THE GUGGENHEIM FUNDS SEMI-ANNUAL REPORT |
| ECONOMIC AND MARKET OVERVIEW (Unaudited) | March 31, 2014 |
Investment markets continued to rally through the six months ended March 31, 2014, thanks to a steadily improving U.S. economy and ongoing U.S. central bank easing. Contributing to performance of equities were growing confidence in the sustainability of the U.S. economic recovery, favorable corporate profit growth, supportive valuations, interest rates below their long-run level, and positive inflows, as investors concerned about the end of quantitative easing and its impact on interest rates rotated out of fixed-income investments into equities.
In January 2014, based on positive economic data and a better jobs picture, the U.S. Federal Reserve (the “Fed”) began its long-expected tapering program, reducing monthly purchases by $10 billion. The Fed continued to taper even after acknowledging in March that the economy had slowed during the winter months, which were unusually harsh for much of the U.S. By April, it was buying only $55 billion a month, down from $85 billion in December 2013.
In March 2014, while noting that the U.S. economy has not yet reached full employment, the Fed also unlinked attainment of a 6.5% unemployment level with a potential rate hike, since the unemployment rate in February was approaching that level. Revised guidance from new Fed Chair Janet Yellen seemed to indicate that a rise might not be considered until mid-2015, at the earliest, although she stressed that it would depend on labor market conditions and the inflation rate. Still, the date was earlier than many market participants had expected, which knocked the market off record highs reached earlier in the six-month period.
Even though upcoming economic reports may reflect the impacts from the severe winter weather, and international tensions remain high, the arrival of spring was expected to return the U.S. economy to its improving trend. Pent-up demand resulting from the huge gap in household formation over the prior several years continues to buoy the housing market, while a pickup in global demand bodes well for the U.S. manufacturing sector. Consumption is rising due to an increase in net worth, resulting from the rebound in housing and asset prices, which has boosted retail sales, and consumer sentiment measures. The consensus expectation for 2014 growth stands at 3.0%, compared with 1.9% for 2013.
Momentum driven by the favorable macro environment is supporting equities and moving spreads tighter, helping perpetuate the risk-on mode that has prevailed in the U.S. since 2008. Investors who want income will have to keep investing, but buying cheap securities may be a thing of the past. Recent volatility indicates that investors must guard against becoming complacent about the quality of investments they make and their inherent risks. The Fed continues pumping enormous amounts of liquidity into the system, but with little expectation that it will raise interest rates before 2015, the expansion is likely to continue. Even when the Fed does hike, it typically takes another two years before a recession threatens growth. While the economy may be entering a new era where interest rates head higher over the long term, there is likely a ceiling on how high rates can rise in advance of eventual monetary tightening.
For the six months ended March 31, 2014, the Standard & Poor’s 500® (“S&P 500”) Index* returned 12.51%. The Morgan Stanley Capital International (“MSCI”) Europe-Australasia-Far East (“EAFE”) Index* returned 6.41%. The return of the MSCI Emerging Markets Index* was 1.39%.
In the bond market, the Barclays U.S. Aggregate Bond Index* posted a 1.70% return for the period, while the Barclays U.S. Corporate High Yield Index* returned 6.67%. The return of the BofA Merrill Lynch 3-Month U.S. Treasury Bill Index* was 0.03% for the six-month period.
The opinions and forecasts expressed may not actually come to pass. This information is subject to change at any time, based on market and other conditions, and should not be construed as a recommendation of any specific security or strategy.
| THE GUGGENHEIM FUNDS SEMI-ANNUAL REPORT | 3 |
| ECONOMIC AND MARKET OVERVIEW (Unaudited)(concluded) | March 31, 2014 |
*Index Definitions:
The following indices are referenced throughout this report. Indices are unmanaged and not available for direct investment. Index performance does not reflect transaction costs, fees, or expenses.
Barclays U.S. Aggregate Bond Index is a broad-based benchmark that measures the investment grade, U.S. dollar denominated, fixed-rate taxable bond market, including U.S. Treasuries, government-related and corporate securities, MBS (agency fixed-rate and hybrid ARM pass-throughs), ABS, and CMBS.
Barclays U.S. Corporate High Yield Index measures the market of USD-denominated, non-investment grade, fixed-rate, taxable corporate bonds. Securities are classified as high yield if the middle rating of Moody’s, Fitch, and S&P is Ba1/BB+/BB+ or below.
BofA Merrill Lynch 3-Month U.S. Treasury Bill Index is an unmanaged market index of U.S. Treasury securities maturing in 90 days that assumes reinvestment of all income.
MSCI EAFE Index is a free float-adjusted market capitalization index that is designed to measure the equity market performance of developed markets, excluding the U.S. & Canada.
MSCI Emerging Markets Index is a free float-adjusted market capitalization weighted index that is designed to measure equity market performance in the global emerging markets.
S&P 500® Index is a capitalization-weighted index of 500 stocks designed to measure the performance of the broad economy, representing all major industries and is considered a representation of the U.S. stock market.
| 4 | THE GUGGENHEIM FUNDS SEMI-ANNUAL REPORT |
| ABOUT SHAREHOLDERS’ FUND EXPENSES (Unaudited) |
All mutual funds have operating expenses and it is important for our shareholders to understand the impact of costs on their investments. Shareholders of a Fund incur two types of costs: (i) transaction costs, including sales charges (loads) on purchase payments, reinvested dividends, or other distributions; and exchange fees; and (ii) ongoing costs, including management fees, administrative services, and shareholder reports, among others. These ongoing costs, or operating expenses, are deducted from a fund’s gross income and reduce the investment return of the fund.
A fund’s expenses are expressed as a percentage of its average net assets, which is known as the expense ratio. The following examples are intended to help investors understand the ongoing costs (in dollars) of investing in a Fund and to compare these costs with the ongoing costs of investing in other mutual funds.
The examples are based on an investment of $1,000 made at the beginning of the period and held for the entire six-month period beginning September 30, 2013 and ending March 31, 2014.
The following tables illustrate a Fund’s costs in two ways:
Table 1. Based on actual Fund return. This section helps investors estimate the actual expenses paid over the period. The “Ending Account Value” shown is derived from the Fund’s actual return, and the fourth column shows the dollar amount that would have been paid by an investor who started with $1,000 in the Fund. Investors may use the information here, together with the amount invested, to estimate the expenses paid over the period. Simply divide the Fund’s account value by $1,000 (for example, an $8,600 account value divided by $1,000 = 8.6), then multiply the result by the number provided under the heading “Expenses Paid During Period.”
Table 2. Based on hypothetical 5% return. This section is intended to help investors compare a Fund’s cost with those of other mutual funds. The table provides information about hypothetical account values and hypothetical expenses based on the Fund’s actual expense ratio and an assumed rate of return of 5% per year before expenses, which is not the Fund’s actual return. The hypothetical account values and expenses may not be used to estimate the actual ending account balance or expenses paid during the period. The example is useful in making comparisons because the U.S. Securities and Exchange Commission (the “SEC”) requires all mutual funds to calculate expenses based on the 5% return. Investors can assess a Fund’s costs by comparing this hypothetical example with the hypothetical examples that appear in shareholder reports of other funds.
The calculations illustrated above assume no shares were bought or sold during the period. Actual costs may have been higher or lower, depending on the amount of investment and the timing of any purchases or redemptions.
Please note that the expenses shown in the table are meant to highlight your ongoing costs only and do not reflect any transactional costs, such as sales charges (loads) on purchase payments, and contingent deferred sales charges (“CDSC”) on redemptions, if any. Therefore, the second table is useful in comparing ongoing costs only, and will not help you determine the relative total costs of owning different funds. In addition, if these transactional costs were included, your costs would have been higher.
More information about a Fund’s expenses, including annual expense ratios for the past five years, can be found in the Financial Highlights section of this report. For additional information on operating expenses and other shareholder costs, please refer to the appropriate Fund prospectus.
| THE GUGGENHEIM FUNDS SEMI-ANNUAL REPORT | 5 |
| ABOUT SHAREHOLDERS’ FUND EXPENSES (Unaudited)(continued) |
| | | | | | | | Beginning | | | Ending | | | Expenses |
| | Expense | | | Fund | | | Account Value | | | Account Value | | | Paid During |
| | Ratio1 | | | Return | | | September 30, 2013 | | | March 31, 2014 | | | Period2 |
| Table 1. Based on actual Fund return3 |
| | | | | | | | | | | | | | |
| StylePlus—Large Core Fund | | | | | | | | | | | | | |
| A-Class | 1.44% | | | 13.91% | | | $1,000.00 | | | $1,139.10 | | | $ 7.68 |
| B-Class | 3.00% | | | 13.02% | | | 1,000.00 | | | 1,130.20 | | | 15.93 |
| C-Class | 2.42% | | | 13.31% | | | 1,000.00 | | | 1,133.10 | | | 12.87 |
| Institutional Class | 1.62% | | | 13.78% | | | 1,000.00 | | | 1,137.80 | | | 8.63 |
| | | | | | | | | | | | | | |
| Small Cap Value Fund | | | | | | | | | | | | | |
| A-Class | 1.32% | | | 10.56% | | | 1,000.00 | | | 1,105.60 | | | 6.93 |
| C-Class | 2.07% | | | 10.16% | | | 1,000.00 | | | 1,101.60 | | | 10.85 |
| Institutional Class | 1.07% | | | 10.66% | | | 1,000.00 | | | 1,106.60 | | | 5.62 |
| | | | | | | | | | | | | | |
| Enhanced World Equity Fund | | | | | | | | | | | | | |
| A-Class | 1.25% | | | 6.95% | | | 1,000.00 | | | 1,069.50 | | | 6.45 |
| C-Class | 2.00% | | | 7.14% | | | 1,000.00 | | | 1,071.40 | | | 10.33 |
| Institutional Class | 1.00% | | | 7.12% | | | 1,000.00 | | | 1,071.20 | | | 5.16 |
| | | | | | | | | | | | | | |
| World Equity Income Fund | | | | | | | | | | | | | |
| A-Class | 1.49% | | | 7.64% | | | 1,000.00 | | | 1,076.40 | | | 7.71 |
| B-Class4 | 1.24% | | | 7.75% | | | 1,000.00 | | | 1,077.50 | | | 6.42 |
| C-Class | 2.24% | | | 7.26% | | | 1,000.00 | | | 1,072.60 | | | 11.57 |
| Institutional Class | 1.24% | | | 7.72% | | | 1,000.00 | | | 1,077.20 | | | 6.42 |
| | | | | | | | | | | | | | |
| Risk Managed Real Estate Fund5 | | | | | | | | | | | | | |
| A-Class | 1.27% | | | 0.80% | | | 1,000.00 | | | 1,008.00 | | | 0.03 |
| C-Class | 2.04% | | | 0.80% | | | 1,000.00 | | | 1,008.00 | | | 0.06 |
| Institutional Class | 1.10% | | | 0.80% | | | 1,000.00 | | | 1,008.00 | | | 0.03 |
| 6 | THE GUGGENHEIM FUNDS SEMI-ANNUAL REPORT |
| ABOUT SHAREHOLDERS’ FUND EXPENSES (Unaudited)(concluded) |
| | | | | | | | Beginning | | | Ending | | | Expenses |
| | Expense | | | Fund | | | Account Value | | | Account Value | | | Paid During |
| | Ratio1 | | | Return | | | September 30, 2013 | | | March 31, 2014 | | | Period2 |
| Table 2. Based on hypothetical 5% return (before expenses) |
| | | | | | | | | | | | | | |
| StylePlus—Large Core Fund | | | | | | | | | | | | | |
| A-Class | 1.44% | | | 5.00% | | | $1,000.00 | | | $1,017.75 | | | $ 7.24 |
| B-Class | 3.00% | | | 5.00% | | | 1,000.00 | | | 1,009.97 | | | 15.03 |
| C-Class | 2.42% | | | 5.00% | | | 1,000.00 | | | 1,012.86 | | | 12.14 |
| Institutional Class | 1.62% | | | 5.00% | | | 1,000.00 | | | 1,016.85 | | | 8.15 |
| | | | | | | | | | | | | | |
| Small Cap Value Fund | | | | | | | | | | | | | |
| A-Class | 1.32% | | | 5.00% | | | 1,000.00 | | | 1,018.35 | | | 6.64 |
| C-Class | 2.07% | | | 5.00% | | | 1,000.00 | | | 1,014.61 | | | 10.40 |
| Institutional Class | 1.07% | | | 5.00% | | | 1,000.00 | | | 1,019.60 | | | 5.39 |
| | | | | | | | | | | | | | |
| Enhanced World Equity Fund | | | | | | | | | | | | | |
| A-Class | 1.25% | | | 5.00% | | | 1,000.00 | | | 1,018.70 | | | 6.29 |
| C-Class | 2.00% | | | 5.00% | | | 1,000.00 | | | 1,014.96 | | | 10.05 |
| Institutional Class | 1.00% | | | 5.00% | | | 1,000.00 | | | 1,019.95 | | | 5.04 |
| | | | | | | | | | | | | | |
| World Equity Income Fund | | | | | | | | | | | | | |
| A-Class | 1.49% | | | 5.00% | | | 1,000.00 | | | 1,017.50 | | | 7.49 |
| B-Class4 | 1.24% | | | 5.00% | | | 1,000.00 | | | 1,018.75 | | | 6.24 |
| C-Class | 2.24% | | | 5.00% | | | 1,000.00 | | | 1,013.76 | | | 11.25 |
| Institutional Class | 1.24% | | | 5.00% | | | 1,000.00 | | | 1,018.75 | | | 6.24 |
| | | | | | | | | | | | | | |
| Risk Managed Real Estate Fund5 | | | | | | | | | | | | | |
| A-Class | 1.27% | | | 5.00% | | | 1,000.00 | | | 1,018.60 | | | 6.39 |
| C-Class | 2.04% | | | 5.00% | | | 1,000.00 | | | 1,014.76 | | | 10.25 |
| Institutional Class | 1.10% | | | 5.00% | | | 1,000.00 | | | 1,019.45 | | | 5.54 |
| 1 | Annualized and excludes expenses of the underlying funds in which the funds invest. This ratio represents net expenses, which includes extraordinary expenses. Excluding extraordinary expenses, the operating expense ratios would be: |
| | | Small Cap Value Fund | | | World Equity Income Fund | |
| A-Class | | | 1.30 | % | | | 1.46 | % |
| B-Class | | | — | | | | 1.21 | % |
| C-Class | | | 2.05 | % | | | 2.21 | % |
| Institutional Class | | | 1.05 | % | | | 1.21 | % |
| 2 | Expenses are equal to the Fund’s annualized expense ratio, net of any applicable fee waivers, multiplied by the average account value over the period, multiplied by 182/365 (to reflect the one-half year period). |
| 3 | Actual cumulative return at net asset value for the period September 30, 2013 to March 31, 2014. |
| 4 | B-Class shares did not charge 12b-1 fees during the period. |
| 5 | Since the commencement of operations: March 31, 2014. Due to the limited length of Class operations, current expense ratios may not be indicative of future expense ratios. Expenses paid based on actual fund return are calculated using 1 day from the commencement of operations. Expenses paid based on the hypothetical 5% return are calculated using 182 days. |
| THE GUGGENHEIM FUNDS SEMI-ANNUAL REPORT | 7 |
| FUND PROFILE (Unaudited) | March 31, 2014 |
STYLEPLUS—LARGE CORE FUND
OBJECTIVE: Seeks long-term growth of capital.
Holdings Diversification
(Market Exposure as % of Net Assets)
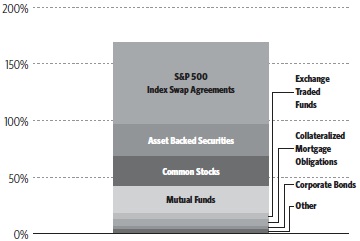
“Holdings Diversification (Market Exposure as % of Net Assets)” excludes any temporary cash investments.
| Ten Largest Holdings (% of Total Net Assets) | |
| Guggenheim Strategy Fund III | 11.1% |
| Guggenheim Strategy Fund I | 8.7% |
| Guggenheim BulletShares 2016 High Yield Corporate Bond ETF | 2.0% |
| Guggenheim BulletShares 2015 High Yield Corporate Bond ETF | 2.0% |
| Floating Rate Strategies Fund Institutional Class | 1.8% |
| Macro Opportunities Fund Institutional Class | 1.7% |
| Guggenheim BulletShares 2017 High Yield Corporate Bond ETF | 1.7% |
| Duane Street CLO IV Ltd. 2007-4A | 1.2% |
| HSI Asset Securitization Corporation Trust 2007-WF1 | 1.2% |
| Garrison Funding Ltd. 2013-2A | 1.0% |
| Top Ten Total | 32.4% |
| Inception Dates: | |
| A-Class | September 10, 1962 |
| B-Class | October 19, 1993 |
| C-Class | January 29, 1999 |
| Institutional Class | March 1, 2012 |
| Portfolio Composition by Quality Rating* | |
| Fixed Income Instruments | |
| AAA | 9.5% |
| AA | 4.2% |
| A | 6.7% |
| BBB | 9.4% |
| BB | 1.7% |
| B | 6.0% |
| CCC | 3.6% |
| Other Instruments | |
| Common Stocks | 26.8% |
| Mutual Funds | 23.5% |
| Exchange Traded Funds | 5.8% |
| Short Term Investments | 2.8% |
| Total Investments | 100.0% |
The table above reflects percentages of the value of total investments.
| * | Source: Factset. Credit quality ratings are measured on a scale that generally ranges from AAA (highest) to D (lowest). All rated securities have been rated by Moody’s, Standard & Poor’s (“S&P”), or Fitch, which are all a Nationally Recognized Statistical Rating Organization (“NRSRO”). For purposes of this presentation, when ratings are available from more than one agency, the highest rating is used. Guggenheim Investments has converted Moody’s and Fitch ratings to the equivalent S&P rating. Unrated securities do not necessarily indicate low credit quality. Security ratings are determined at the time of purchase and may change thereafter. |
| 8 | THE GUGGENHEIM FUNDS SEMI-ANNUAL REPORT |
| SCHEDULE OF INVESTMENTS (Unaudited) | March 31, 2014 |
| STYLEPLUS—LARGE CORE FUND | |
| | | Shares | | | Value | |
| | | | | | | |
| COMMON STOCKS† - 26.5% | | | | | | | | |
| | | | | | | | | |
| INFORMATION TECHNOLOGY - 5.1% | | | | | | | | |
| Apple, Inc. | | | 3,597 | | | $ | 1,930,654 | |
| Cisco Systems, Inc. | | | 38,534 | | | | 863,547 | |
| Intel Corp. | | | 32,358 | | | | 835,159 | |
| Hewlett-Packard Co. | | | 21,514 | | | | 696,193 | |
| Microsoft Corp. | | | 15,546 | | | | 637,231 | |
| International Business Machines Corp. | | | 3,273 | | | | 630,020 | |
| Corning, Inc. | | | 29,197 | | | | 607,882 | |
| TE Connectivity Ltd. | | | 9,876 | | | | 594,634 | |
| Western Digital Corp. | | | 6,365 | | | | 584,434 | |
| Oracle Corp. | | | 13,631 | | | | 557,644 | |
| Google, Inc. — Class C* | | | 419 | | | | 466,980 | |
| EMC Corp. | | | 16,314 | | | | 447,167 | |
| Texas Instruments, Inc. | | | 7,710 | | | | 363,527 | |
| QUALCOMM, Inc. | | | 2,892 | | | | 228,063 | |
| Accenture plc — Class A | | | 2,620 | | | | 208,866 | |
| Adobe Systems, Inc.* | | | 2,383 | | | | 156,658 | |
| Visa, Inc. — Class A | | | 706 | | | | 152,397 | |
| Intuit, Inc. | | | 1,959 | | | | 152,273 | |
| Total Information Technology | | | | | | | 10,113,329 | |
| | | | | | | | | |
| HEALTH CARE - 4.8% | | | | | | | | |
| Pfizer, Inc. | | | 36,349 | | | | 1,167,531 | |
| Merck & Company, Inc. | | | 17,319 | | | | 983,200 | |
| Express Scripts Holding Co.* | | | 9,674 | | | | 726,421 | |
| Johnson & Johnson | | | 7,191 | | | | 706,372 | |
| UnitedHealth Group, Inc. | | | 8,537 | | | | 699,948 | |
| Eli Lilly & Co. | | | 11,804 | | | | 694,783 | |
| Abbott Laboratories | | | 16,087 | | | | 619,510 | |
| Medtronic, Inc. | | | 9,512 | | | | 585,368 | |
| Cardinal Health, Inc. | | | 8,357 | | | | 584,823 | |
| WellPoint, Inc. | | | 5,485 | | | | 546,032 | |
| Aetna, Inc. | | | 6,806 | | | | 510,246 | |
| Covidien plc | | | 5,038 | | | | 371,099 | |
| McKesson Corp. | | | 1,874 | | | | 330,892 | |
| Becton Dickinson and Co. | | | 2,707 | | | | 316,936 | |
| Cigna Corp. | | | 3,240 | | | | 271,285 | |
| AbbVie, Inc. | | | 2,956 | | | | 151,938 | |
| Total Health Care | | | | | | | 9,266,384 | |
| | | | | | | | | |
| CONSUMER STAPLES - 4.2% | | | | | | | | |
| Wal-Mart Stores, Inc. | | | 12,100 | | | | 924,803 | |
| CVS Caremark Corp. | | | 10,336 | | | | 773,753 | |
| Mondelez International, Inc. — Class A | | | 20,099 | | | | 694,420 | |
| Procter & Gamble Co. | | | 8,594 | | | | 692,676 | |
| Kimberly-Clark Corp. | | | 5,763 | | | | 635,371 | |
| Archer-Daniels-Midland Co. | | | 14,345 | | | | 622,430 | |
| Kraft Foods Group, Inc. | | | 10,940 | | | | 613,734 | |
| Philip Morris International, Inc. | | | 7,190 | | | | 588,645 | |
| PepsiCo, Inc. | | | 5,705 | | | | 476,368 | |
| Kellogg Co. | | | 6,885 | | | | 431,758 | |
| Kroger Co. | | | 9,481 | | | | 413,846 | |
| General Mills, Inc. | | | 7,440 | | | | 385,541 | |
| Costco Wholesale Corp. | | | 2,881 | | | | 321,750 | |
| Altria Group, Inc. | | | 6,397 | | | | 239,440 | |
| Reynolds American, Inc. | | | 4,005 | | | | 213,947 | |
| Coca-Cola Co. | | | 3,943 | | | | 152,436 | |
| Total Consumer Staples | | | | | | | 8,180,918 | |
| | | | | | | | | |
| INDUSTRIALS - 3.9% | | | | | | | | |
| General Electric Co. | | | 48,872 | | | | 1,265,296 | |
| Boeing Co. | | | 6,222 | | | | 780,798 | |
| Caterpillar, Inc. | | | 7,488 | | | | 744,083 | |
| FedEx Corp. | | | 4,755 | | | | 630,323 | |
| Lockheed Martin Corp. | | | 3,775 | | | | 616,231 | |
| Raytheon Co. | | | 6,210 | | | | 613,486 | |
| General Dynamics Corp. | | | 5,352 | | | | 582,940 | |
| Northrop Grumman Corp. | | | 4,570 | | | | 563,847 | |
| Emerson Electric Co. | | | 6,901 | | | | 460,987 | |
| Deere & Co. | | | 4,813 | | | | 437,020 | |
| United Technologies Corp. | | | 2,562 | | | | 299,344 | |
| CSX Corp. | | | 6,566 | | | | 190,217 | |
| Eaton Corporation plc | | | 2,451 | | | | 184,119 | |
| United Parcel Service, Inc. — Class B | | | 1,727 | | | | 168,175 | |
| Total Industrials | | | | | | | 7,536,866 | |
| | | | | | | | | |
| ENERGY - 3.8% | | | | | | | | |
| Exxon Mobil Corp. | | | 16,040 | | | | 1,566,787 | |
| ConocoPhillips | | | 11,060 | | | | 778,072 | |
| Anadarko Petroleum Corp. | | | 7,687 | | | | 651,550 | |
| Apache Corp. | | | 7,462 | | | | 618,973 | |
| Devon Energy Corp. | | | 9,130 | | | | 611,071 | |
| Marathon Oil Corp. | | | 16,299 | | | | 578,940 | |
| Baker Hughes, Inc. | | | 8,871 | | | | 576,792 | |
| Valero Energy Corp. | | | 10,727 | | | | 569,604 | |
| Pioneer Natural Resources Co. | | | 2,649 | | | | 495,734 | |
| Marathon Petroleum Corp. | | | 2,658 | | | | 231,352 | |
| Chevron Corp. | | | 1,555 | | | | 184,905 | |
| Occidental Petroleum Corp. | | | 1,750 | | | | 166,758 | |
| Hess Corp. | | | 1,871 | | | | 155,068 | |
| Phillips 66 | | | 1,972 | | | | 151,962 | |
| Total Energy | | | | | | | 7,337,568 | |
| | | | | | | | | |
| CONSUMER DISCRETIONARY - 1.8% | | | | | | | | |
| Time Warner, Inc. | | | 10,006 | | | | 653,692 | |
| Target Corp. | | | 10,543 | | | | 637,957 | |
| Comcast Corp. — Class A | | | 12,404 | | | | 620,448 | |
| General Motors Co. | | | 16,683 | | | | 574,228 | |
| Johnson Controls, Inc. | | | 5,734 | | | | 271,333 | |
| Ford Motor Co. | | | 17,365 | | | | 270,894 | |
| Home Depot, Inc. | | | 2,574 | | | | 203,681 | |
| Macy’s, Inc. | | | 2,857 | | | | 169,392 | |
| Viacom, Inc. — Class B | | | 1,798 | | | | 152,812 | |
| Total Consumer Discretionary | | | | | | | 3,554,437 | |
| | | | | | | | | |
| FINANCIALS - 1.8% | | | | | | | | |
| JPMorgan Chase & Co. | | | 18,396 | | | | 1,116,821 | |
| Citigroup, Inc. | | | 11,789 | | | | 561,156 | |
| Aflac, Inc. | | | 7,552 | | | | 476,078 | |
| Wells Fargo & Co. | | | 6,390 | | | | 317,839 | |
| Capital One Financial Corp. | | | 3,736 | | | | 288,270 | |
| MetLife, Inc. | | | 4,640 | | | | 244,992 | |
| Bank of America Corp. | | | 11,817 | | | | 203,252 | |
| SEE NOTES TO FINANCIAL STATEMENTS. | THE GUGGENHEIM FUNDS SEMI-ANNUAL REPORT | 9 |
| SCHEDULE OF INVESTMENTS (Unaudited)(continued) | March 31, 2014 |
| STYLEPLUS—LARGE CORE FUND | |
| | | Shares | | | Value | |
| | | | | | | |
| Allstate Corp. | | | 2,875 | | | $ | 162,668 | |
| Berkshire Hathaway, Inc. — Class B* | | | 1,296 | | | | 161,961 | |
| Total Financials | | | | | | | 3,533,037 | |
| | | | | | | | | |
| TELECOMMUNICATION SERVICES - 0.7% | | | | | | | | |
| Verizon Communications, Inc. | | | 18,012 | | | | 856,831 | |
| AT&T, Inc. | | | 12,041 | | | | 422,278 | |
| Total Telecommunication Services | | | | | | | 1,279,109 | |
| | | | | | | | | |
| UTILITIES - 0.3% | | | | | | | | |
| Exelon Corp. | | | 18,826 | | | | 631,801 | |
| | | | | | | | | |
| MATERIALS - 0.1% | | | | | | | | |
| Freeport-McMoRan Copper & Gold, Inc. | | | 4,462 | | | | 147,558 | |
| | | | | | | | | |
| Total Common Stocks | | | | | | | | |
| (Cost $47,298,788) | | | | | | | 51,581,007 | |
| | | | | | | | | |
| EXCHANGE TRADED FUNDS†,4 - 5.7% | | | | | | | | |
| Guggenheim BulletShares 2016 | | | | | | | | |
| High Yield Corporate Bond ETF | | | 143,700 | | | | 3,923,010 | |
| Guggenheim BulletShares 2015 | | | | | | | | |
| High Yield Corporate Bond ETF | | | 143,700 | | | | 3,884,211 | |
| Guggenheim BulletShares 2017 | | | | | | | | |
| High Yield Corporate Bond ETF | | | 118,900 | | | | 3,272,128 | |
| Total Exchange Traded Funds | | | | | | | | |
| (Cost $10,939,310) | | | | | | | 11,079,349 | |
| | | | | | | | | |
| MUTUAL FUNDS†,4 - 23.3% | | | | | | | | |
| Guggenheim Strategy Fund III | | | 860,200 | | | | 21,487,797 | |
| Guggenheim Strategy Fund I | | | 680,000 | | | | 16,993,200 | |
| Floating Rate Strategies Fund | | | | | | | | |
| Institutional Class | | | 128,211 | | | | 3,447,601 | |
| Macro Opportunities Fund | | | | | | | | |
| Institutional Class | | | 124,939 | | | | 3,390,839 | |
| Total Mutual Funds | | | | | | | | |
| (Cost $45,436,366) | | | | | | | 45,319,437 | |
| | | | | | | | | |
| SHORT TERM INVESTMENTS† - 2.8% | | | | | | | | |
| Dreyfus Treasury Prime Cash | | | | | | | | |
| Management Fund | | | 5,360,818 | | | | 5,360,818 | |
| Total Short Term Investments | | | | | | | | |
| (Cost $5,360,818) | | | | | | | 5,360,818 | |
| | | Face | | | | |
| | | Amount | | | | |
| | | | | | | |
| ASSET BACKED SECURITIES†† - 28.4% | | | | | | | | |
| Duane Street CLO IV Ltd. | | | | | | | | |
| 2007-4A, 0.47% due 11/14/211,2 | | $ | 2,451,236 | | | | 2,408,585 | |
| HSI Asset Securitization Corporation Trust | | | | | | | | |
| 2007-WF1, 0.32% due 05/25/371 | | | 2,513,461 | | | | 2,323,250 | |
| Garrison Funding Ltd. | | | | | | | | |
| 2013-2A, 2.13% due 09/25/231,2 | | | 1,980,000 | | | | 1,970,298 | |
| JP Morgan Mortgage Acquisition Trust | | | | | | | | |
| 2007-CH3, 0.30% due 03/25/371 | | | 1,802,923 | | | | 1,719,907 | |
| Brentwood CLO Corp. | | | | | | | | |
| 2006-1A, 0.51% due 02/01/221,2 | | | 1,263,398 | | | | 1,238,635 | |
| 2006-1A, 1.06% due 02/01/221,2 | | | 500,000 | | | | 455,300 | |
| Argent Securities Incorporated Asset-Backed | | | | | | | | |
| Pass-Through Certificates Series | | | | | | | | |
| 2005-W3, 0.49% due 11/25/351 | | | 1,785,649 | | | | 1,683,146 | |
| JP Morgan Mortgage Acquisition Trust | | | | | | | | |
| 2006-CH2, 0.25% due 10/25/361 | | | 1,607,505 | | | | 1,585,177 | |
| Cornerstone CLO Ltd. | | | | | | | | |
| 2007-1A, 0.46% due 07/15/211,2 | | | 1,600,000 | | | | 1,565,120 | |
| Foothill CLO Ltd. | | | | | | | | |
| 2007-1A, 0.48% due 02/22/211,2 | | | 1,561,927 | | | | 1,539,436 | |
| NewStar Commercial Loan Trust | | | | | | | | |
| 2006-1A, 0.61% due 03/30/221,2 | | | 900,000 | | | | 877,590 | |
| 2006-1A, 0.50% due 03/30/221,2 | | | 625,676 | | | | 622,548 | |
| Goldman Sachs Asset Management CLO plc | | | | | | | | |
| 2007-1A, 2.99% due 08/01/221,2 | | | 1,500,000 | | | | 1,468,350 | |
| ALM VII R-2 Ltd. | | | | | | | | |
| 2013-7R2A, 2.84% due 04/24/241,2 | | | 1,450,000 | | | | 1,422,885 | |
| Salus CLO 2012-1 Ltd. | | | | | | | | |
| 2013-1AN, 2.49% due 03/05/21†††,1,2 | | | 1,400,000 | | | | 1,400,000 | |
| Halcyon Structured Asset Management | | | | | | | | |
| Long Secured/Short Unsecured Ltd. | | | | | | | | |
| 2007-2A, 3.99% due 10/29/211,2 | | | 1,400,000 | | | | 1,380,680 | |
| Aegis Asset Backed Securities Trust | | | | | | | | |
| 2005-3, 0.62% due 08/25/351 | | | 1,347,942 | | | | 1,328,526 | |
| Central Park CLO Ltd. | | | | | | | | |
| 2011-1A, 3.44% due 07/23/221,2 | | | 1,320,000 | | | | 1,300,200 | |
| Lehman XS Trust | | | | | | | | |
| 2007-9, 0.27% due 06/25/371 | | | 1,444,095 | | | | 1,262,301 | |
| Cerberus Onshore II CLO LLC | | | | | | | | |
| 2014-1A, 2.95% due 10/15/23†††,1,2 | | | 1,000,000 | | | | 990,200 | |
| 2014-1A, 2.25% due 10/15/23†††,1,2 | | | 250,000 | | | | 250,000 | |
| Black Diamond CLO Delaware Corp. | | | | | | | | |
| 2005-1A, 2.13% due 06/20/171,2 | | | 1,250,000 | | | | 1,221,750 | |
| N-Star REL CDO VIII Ltd. | | | | | | | | |
| 2006-8A, 0.44% due 02/01/41†††,1,2 | | | 1,290,223 | | | | 1,215,906 | |
| Symphony CLO IX, LP | | | | | | | | |
| 2012-9A, 2.74% due 04/16/221,2 | | | 700,000 | | | | 699,300 | |
| 2012-9A, 3.49% due 04/16/221,2 | | | 500,000 | | | | 502,650 | |
| KKR Financial CLO Ltd. | | | | | | | | |
| 2007-1A, 2.49% due 05/15/211,2 | | | 1,150,000 | | | | 1,105,840 | |
| Wells Fargo Home Equity | | | | | | | | |
| Asset-Backed Securities Trust | | | | | | | | |
| 2006-3, 0.30% due 01/25/371 | | | 1,182,813 | | | | 1,075,007 | |
| GreenPoint Mortgage Funding Trust | | | | | | | | |
| 2005-HE4, 0.86% due 07/25/301 | | | 1,100,000 | | | | 995,426 | |
| Symphony CLO VII Ltd. | | | | | | | | |
| 2011-7A, 3.44% due 07/28/211,2 | | | 1,000,000 | | | | 988,000 | |
| Popular ABS Mortgage Pass-Through Trust | | | | | | | | |
| 2005-A, 0.58% due 06/25/351 | | | 1,008,320 | | | | 965,899 | |
| GSC Group CDO Fund VIII Ltd. | | | | | | | | |
| 2007-8A, 0.62% due 04/17/211,2 | | | 1,000,000 | | | | 928,800 | |
| FM Leveraged Capital Fund II | | | | | | | | |
| 2006-2A, 1.84% due 11/15/201,2 | | | 881,875 | | | | 880,111 | |
| Hewett’s Island CDO Ltd. | | | | | | | | |
| 2007-6A, 2.49% due 06/09/191,2 | | | 900,000 | | | | 877,860 | |
| Race Point CLO Ltd. | | | | | | | | |
| 2014-5AR, 3.08% due 12/15/221,2 | | | 850,000 | | | | 852,805 | |
| 10 | THE GUGGENHEIM FUNDS SEMI-ANNUAL REPORT | SEE NOTES TO FINANCIAL STATEMENTS. |
| SCHEDULE OF INVESTMENTS (Unaudited)(continued) | March 31, 2014 |
| STYLEPLUS—LARGE CORE FUND | |
| | | Face | | | | |
| | | Amount | | | Value | |
| | | | | | | |
| California Republic Auto Receivables Trust | | | | | | | | |
| 2013-2, 1.23% due 03/15/19 | | $ | 850,000 | | | $ | 851,737 | |
| TICC CLO LLC | | | | | | | | |
| 2011-1A, 2.49% due 07/25/211,2 | | | 850,000 | | | | 847,195 | |
| Black Diamond CLO 2006-1 Luxembourg S.A. | | | | | | | | |
| 2007-1A, 0.63% due 04/29/191,2 | | | 900,000 | | | | 834,120 | |
| West Coast Funding Ltd. | | | | | | | | |
| 2006-1A, 0.37% due 11/02/411,2 | | | 863,843 | | | | 832,053 | |
| Global Leveraged Capital Credit | | | | | | | | |
| Opportunity Fund | | | | | | | | |
| 2006-1A, 0.54% due 12/20/181,2 | | | 791,615 | | | | 786,944 | |
| Northwoods Capital VII Ltd. | | | | | | | | |
| 2006-7A, 1.79% due 10/22/211,2 | | | 810,000 | | | | 774,765 | |
| H2 Asset Funding Ltd. | | | | | | | | |
| 2014-1, 2.15% due 03/19/37 | | | 750,000 | | | | 750,750 | |
| OFSI Fund V Ltd. | | | | | | | | |
| 2013-5A, 3.44% due 04/17/251,2 | | | 750,000 | | | | 750,000 | |
| Golub Capital Partners CLO Ltd. | | | | | | | | |
| 2014-18A, 2.73% due 04/25/26†††,1,2 | | | 720,000 | | | | 720,360 | |
| Triton Container Finance LLC | | | | | | | | |
| 2012-1A, 4.21% due 05/14/272 | | | 653,333 | | | | 655,311 | |
| Accredited Mortgage Loan Trust | | | | | | | | |
| 2007-1, 0.28% due 02/25/371 | | | 670,662 | | | | 624,216 | |
| Soundview Home Loan Trust | | | | | | | | |
| 2003-1, 2.40% due 08/25/311 | | | 553,701 | | | | 565,232 | |
| Tricadia CDO | | | | | | | | |
| 2006-6A, 0.79% due 11/05/41†††,1,2 | | | 600,000 | | | | 558,060 | |
| Riverside Park CLO Ltd. | | | | | | | | |
| 2011-1A, 2.99% due 09/27/211,2 | | | 550,000 | | | | 539,660 | |
| Newcastle CDO IX 1 Ltd. | | | | | | | | |
| 2007-9A, 0.41% due 05/25/521,2 | | | 523,768 | | | | 522,196 | |
| Halcyon Loan Advisors Funding Ltd. | | | | | | | | |
| 2012-1A, 3.24% due 08/15/231,2 | | | 500,000 | | | | 498,900 | |
| Ares XVI CLO Ltd. | | | | | | | | |
| 2011-16A, 3.54% due 05/17/211,2 | | | 500,000 | | | | 498,700 | |
| ACS 2007-1 Pass Through Trust | | | | | | | | |
| 2007-1A, 0.46% due 06/14/371,2 | | | 502,988 | | | | 478,492 | |
| NewStar Commercial Loan Trust | | | | | | | | |
| 2007-1A, 1.53% due 09/30/221,2 | | | 500,000 | | | | 468,350 | |
| Golub Capital Partners Fundings Ltd. | | | | | | | | |
| 2007-1A, 0.48% due 03/15/221,2 | | | 452,566 | | | | 445,280 | |
| Race Point IV CLO Ltd. | | | | | | | | |
| 2007-4A, 0.99% due 08/01/211,2 | | | 450,000 | | | | 429,660 | |
| DIVCORE CLO Ltd. | | | | | | | | |
| 2013-1A B, 4.05% due 11/15/32††† | | | 400,000 | | | | 398,200 | |
| Textainer Marine Containers Ltd. | | | | | | | | |
| 2012-1A, 4.21% due 04/15/272 | | | 323,333 | | | | 323,631 | |
| Legg Mason Real Estate CDO I Ltd. | | | | | | | | |
| 2006-1A, 0.43% due 03/25/381,2 | | | 83,229 | | | | 81,814 | |
| Total Asset Backed Securities | | | | | | | | |
| (Cost $55,114,864) | | | | | | | 55,337,114 | |
| | | | | | | | | |
| COLLATERALIZED MORTGAGE OBLIGATIONS†† - 5.5% | | | | | | | | |
| Boca Hotel Portfolio Trust | | | | | | | | |
| 2013-BOCA, 3.21% due 08/15/261,2 | | | 1,550,000 | | | | 1,552,087 | |
| Resource Capital Corporation Ltd. | | | | | | | | |
| 2013-CRE1, 3.01% due 12/15/28†††,1,2 | | | 1,500,000 | | | | 1,504,500 | |
| Hilton USA Trust | | | | | | | | |
| 2013-HLF, 2.91% due 11/05/301,2 | | | 1,350,000 | | | | 1,352,543 | |
| SRERS-2011 Funding Ltd. | | | | | | | | |
| 2011-RS, 0.40% due 05/09/461,2 | | | 1,234,113 | | | | 1,141,431 | |
| COMM 2007-FL14 Mortgage Trust | | | | | | | | |
| 2007-FL14, 0.91% due 06/15/221,2 | | | 1,096,136 | | | | 1,081,851 | |
| Wachovia Bank Commercial Mortgage Trust | | | | | | | | |
| 2007-WHL8, 0.24% due 06/15/201,2 | | | 1,035,942 | | | | 1,026,573 | |
| HarborView Mortgage Loan Trust | | | | | | | | |
| 2006-12, 0.35% due 01/19/381 | | | 1,094,383 | | | | 919,489 | |
| Banc of America Merrill Lynch | | | | | | | | |
| Commercial Mortgage, Inc. | | | | | | | | |
| 2005-6, 5.72% due 09/10/471,2 | | | 891,500 | | | | 916,241 | |
| Banc of America Large Loan Trust | | | | | | | | |
| 2007-BMB1, 1.26% due 08/15/291,2 | | | 800,000 | | | | 795,266 | |
| GCCFC Commercial Mortgage Trust | | | | | | | | |
| 2006-FL4A, 0.38% due 11/05/211,2 | | | 447,090 | | | | 445,469 | |
| Total Collateralized Mortgage Obligations | | | | | | | | |
| (Cost $10,630,082) | | | | | | | 10,735,450 | |
| | | | | | | | | |
| CORPORATE BONDS†† - 3.4% | | | | | | | | |
| FINANCIALS - 1.5% | | | | | | | | |
| Emigrant Bancorp, Inc. | | | | | | | | |
| 6.25% due 06/15/142 | | | 1,350,000 | | | | 1,358,655 | |
| Icahn Enterprises Limited Partnership / | | | | | | | | |
| Icahn Enterprises Finance Corp. | | | | | | | | |
| 3.50% due 03/15/172 | | | 1,170,000 | | | | 1,181,700 | |
| Nationstar Mortgage LLC / | | | | | | | | |
| Nationstar Capital Corp. | | | | | | | | |
| 6.50% due 08/01/18 | | | 355,000 | | | | 356,775 | |
| Total Financials | | | | | | | 2,897,130 | |
| | | | | | | | | |
| TELECOMMUNICATION SERVICES - 0.6% | | | | | | | | |
| Level 3 Financing, Inc. | | | | | | | | |
| 3.85% due 01/15/181,2 | | | 1,120,000 | | | | 1,139,600 | |
| | | | | | | | | |
| INDUSTRIALS - 0.4% | | | | | | | | |
| International Lease Finance Corp. | | | | | | | | |
| 2.18% due 06/15/161 | | | 640,000 | | | | 644,800 | |
| Victor Technologies Group, Inc. | | | | | | | | |
| 9.00% due 12/15/17 | | | 150,000 | | | | 160,875 | |
| Total Industrials | | | | | | | 805,675 | |
| | | | | | | | | |
| MATERIALS - 0.3% | | | | | | | | |
| Anglo American Capital plc | | | | | | | | |
| 9.38% due 04/08/142 | | | 590,000 | | | | 590,736 | |
| | | | | | | | | |
| CONSUMER STAPLES - 0.3% | | | | | | | | |
| Harbinger Group, Inc. | | | | | | | | |
| 7.88% due 07/15/19 | | | 500,000 | | | | 548,750 | |
| | | | | | | | | |
| INFORMATION TECHNOLOGY - 0.2% | | | | | | | | |
| iGATE Corp. | | | | | | | | |
| 9.00% due 05/01/16 | | | 290,000 | | | | 304,500 | |
| SEE NOTES TO FINANCIAL STATEMENTS. | THE GUGGENHEIM FUNDS SEMI-ANNUAL REPORT | 11 |
| SCHEDULE OF INVESTMENTS (Unaudited)(concluded) | March 31, 2014 |
| STYLEPLUS—LARGE CORE FUND | |
| | | Face | | | | |
| | | Amount | | | Value | |
| | | | | | | |
| CONSUMER DISCRETIONARY - 0.1% | | | | | | | | |
| Vail Resorts, Inc. | | | | | | | | |
| 6.50% due 05/01/19 | | $ | 250,000 | | | $ | 262,813 | |
| Total Corporate Bonds | | | | | | | | |
| (Cost $6,512,638) | | | | | | | 6,549,204 | |
| | | | | | | | | |
| SENIOR FLOATING RATE INTERESTS†† - 3.3% | | | | | | | | |
| INDUSTRIALS - 1.2% | | | | | | | | |
| Travelport Holdings Ltd. | | | | | | | | |
| 6.25% due 06/26/19 | | | 1,558,225 | | | | 1,592,802 | |
| Thermasys Corp. | | | | | | | | |
| 5.25% due 05/03/19 | | | 641,875 | | | | 638,666 | |
| Total Industrials | | | | | | | 2,231,468 | |
| | | | | | | | | |
| FINANCIALS - 0.9% | | | | | | | | |
| National Financial Partners | | | | | | | | |
| 5.25% due 07/01/20 | | | 1,270,416 | | | | 1,276,374 | |
| First Data Corp. | | | | | | | | |
| 4.15% due 03/23/18 | | | 150,000 | | | | 150,251 | |
| Knight/Getco | | | | | | | | |
| 5.75% due 12/05/17 | | | 109,346 | | | | 109,482 | |
| Cunningham Lindsey U.S., Inc. | | | | | | | | |
| 5.00% due 12/10/19 | | | 108,897 | | | | 108,852 | |
| Total Financials | | | | | | | 1,644,959 | |
| | | | | | | | | |
| INFORMATION TECHNOLOGY - 0.5% | | | | | | | | |
| Blue Coat Systems, Inc. | | | | | | | | |
| 4.00% due 05/31/19 | | | 1,042,519 | | | | 1,044,260 | |
| | | | | | | | | |
| CONSUMER DISCRETIONARY - 0.4% | | | | | | | | |
| Pinnacle Entertainment, Inc. | | | | | | | | |
| 3.75% due 08/15/16 | | | 347,846 | | | | 349,723 | |
| Sears Holdings Corp. | | | | | | | | |
| 5.50% due 06/30/18 | | | 199,500 | | | | 200,348 | |
| Go Daddy Operating Company LLC | | | | | | | | |
| 4.00% due 12/17/18 | | | 175,908 | | | | 176,260 | |
| Laureate Education, Inc. | | | | | | | | |
| 5.00% due 06/15/18 | | | 96,772 | | | | 95,805 | |
| Total Consumer Discretionary | | | | | | | 822,136 | |
| | | | | | | | | |
| ENERGY - 0.3% | | | | | | | | |
| Pacific Drilling | | | | | | | | |
| 4.50% due 05/18/18 | | | 664,975 | | | | 667,136 | |
| Total Senior Floating Rate Interests | | | | | | | | |
| (Cost $6,326,462) | | | | | | | 6,409,959 | |
| | | | | | | | | |
| MUNICIPAL BONDS†† - 0.2% | | | | | | | | |
| MICHIGAN - 0.2% | | | | | | | | |
| Michigan Finance Authority Revenue Notes | | | | | | | | |
| 4.38% due 08/20/14 | | | 300,000 | | | | 303,267 | |
| Total Municipal Bonds | | | | | | | | |
| (Cost $300,000) | | | | | | | 303,267 | |
| Total Investments - 99.1% | | | | | | | | |
| (Cost $187,919,328) | | | | | | $ | 192,675,605 | |
| Other Assets & Liabilities, net - 0.9% | | | | | | | 1,738,706 | |
| Total Net Assets - 100.0% | | | | | | $ | 194,414,311 | |
| | | | | | Unrealized | |
| | | Units | | | Gain | |
| | | | | | | |
| OTC EQUITY INDEX SWAP AGREEMENTS†† | | | | | | | | |
| Morgan Stanley Capital Services, Inc. | | | | | | | | |
| May 2014 S&P 500 Index Swap, | | | | | | | | |
| Terminating 05/05/143 | | | | | | | | |
| (Notional Value $141,998,266) | | | 75,840 | | | $ | — | |
| * | | Non-income producing security. |
| † | | Value determined based on Level 1 inputs — See Note 4. |
| †† | | Value determined based on Level 2 inputs, unless otherwise noted — See Note 4. |
| ††† | | Value determined based on Level 3 inputs — See Note 4. |
| 1 | | Variable rate security. Rate indicated is rate effective at March 31, 2014. |
| 2 | | Security is a 144A or Section 4(a)(2) security. The total market value of 144A or Section 4(a)(2) securities is $53,294,994 (cost $53,049,491), or 27.4% of total net assets. |
| 3 | | Total Return based on S&P 500 Index +/- financing at a variable rate. |
| 4 | | Affiliated funds — See Note 9. |
| | | plc — Public Limited Company |
| 12 | THE GUGGENHEIM FUNDS SEMI-ANNUAL REPORT | SEE NOTES TO FINANCIAL STATEMENTS. |
| STYLEPLUS—LARGE CORE FUND |
| STATEMENT OF ASSETS |
| AND LIABILITIES (Unaudited) |
| March 31, 2014 |
| Assets: | | | | |
| Investments in unaffiliated issuers, at value | | | | |
| (cost $131,543,652) | | $ | 136,276,819 | |
| Investments in affiliated issuers, at value | | | | |
| (cost $56,375,676) | | | 56,398,786 | |
| Total investments | | | | |
| (cost $187,919,328) | | | 192,675,605 | |
| Cash | | | 699,924 | |
| Prepaid expenses | | | 48,054 | |
| Receivables: | | | | |
| Securities sold | | | 11,699,173 | |
| Swap settlement | | | 1,141,849 | |
| Interest | | | 272,475 | |
| Dividends | | | 110,395 | |
| Fund shares sold | | | 21,592 | |
| Total assets | | | 206,669,067 | |
| Liabilities: | | | | |
| Segregated cash from broker | | | 11,000 | |
| Payable for: | | | | |
| Securities purchased | | | 11,861,893 | |
| Fund shares redeemed | | | 140,228 | |
| Management fees | | | 121,087 | |
| Distribution and service fees | | | 44,851 | |
| Fund accounting/administration fees | | | 15,612 | |
| Transfer agent/maintenance fees | | | 15,229 | |
| Trustees’ fees* | | | 884 | |
| Miscellaneous | | | 43,972 | |
| Total liabilities | | | 12,254,756 | |
| Net assets | | $ | 194,414,311 | |
| Net assets consist of: | | | | |
| Paid in capital | | $ | 168,825,297 | |
| Undistributed net investment income | | | 285,705 | |
| Accumulated net realized gain on investments | | | 20,547,032 | |
| Net unrealized appreciation on investments | | | 4,756,277 | |
| Net assets | | $ | 194,414,311 | |
| A-Class: | | | | |
| Net assets | | $ | 188,459,181 | |
| Capital shares outstanding | | | 8,202,403 | |
| Net asset value per share | | $ | 22.98 | |
| Maximum offering price per share | | | | |
| (Net asset value divided by 95.25%) | | $ | 24.13 | |
| B-Class: | | | | |
| Net assets | | $ | 3,320,746 | |
| Capital shares outstanding | | | 191,584 | |
| Net asset value per share | | $ | 17.33 | |
| C-Class: | | | | |
| Net assets | | $ | 2,603,444 | |
| Capital shares outstanding | | | 134,620 | |
| Net asset value per share | | $ | 19.34 | |
| Institutional Class: | | | | |
| Net assets | | $ | 30,940 | |
| Capital shares outstanding | | | 1,353 | |
| Net asset value per share | | $ | 22.87 | |
| STATEMENT OF |
| OPERATIONS (Unaudited) |
| Period Ended March 31, 2014 |
| Investment Income: | | | | |
| Interest | | $ | 1,048,600 | |
| Dividends from securities of unaffiliated issuers | | | 525,168 | |
| Dividends from securities of affiliated issuers | | | 412,107 | |
| Total investment income | | | 1,985,875 | |
| | | | | |
| Expenses: | | | | |
| Management fees | | | 710,425 | |
| Transfer agent/maintenance fees: | | | | |
| A-Class | | | 127,924 | |
| B-Class | | | 16,582 | |
| C-Class | | | 4,494 | |
| Institutional Class | | | 82 | |
| Distribution and service fees: | | | | |
| A-Class | | | 229,299 | |
| B-Class | | | 17,576 | |
| C-Class | | | 12,316 | |
| Fund accounting/administration fees | | | 89,986 | |
| Legal fees | | | 95,380 | |
| Trustees’ fees* | | | 7,924 | |
| Line of credit interest expense | | | 5,501 | |
| Custodian fees | | | 3,272 | |
| Tax expense | | | 5 | |
| Miscellaneous | | | 82,122 | |
| Total expenses | | | 1,402,888 | |
| Less: | | | | |
| Expenses waived by Advisor | | | (2,171 | ) |
| Net expenses | | | 1,400,717 | |
| Net investment income | | | 585,158 | |
| | | | | |
| Net Realized and Unrealized Gain (Loss): | | | | |
| Net realized gain (loss) on: | | | | |
| Investments in unaffiliated issuers | | | 3,775,475 | |
| Investments in affiliated issuers | | | (21,401 | ) |
| Swap agreements | | | 21,120,495 | |
| Futures contracts | | | 74,299 | |
| Net realized gain | | | 24,948,868 | |
| Net change in unrealized appreciation (depreciation) on: | | | | |
| Investments in unaffiliated issuers | | | 3,093,211 | |
| Investments in affiliated issuers | | | 251,013 | |
| Swap agreements | | | (4,297,408 | ) |
| Futures contracts | | | 11,851 | |
| Net change in unrealized appreciation (depreciation) | | | (941,333 | ) |
| Net realized and unrealized gain | | | 24,007,535 | |
| Net increase in net assets resulting from operations | | $ | 24,592,693 | |
* Relates to Trustees not deemed “interested persons” within the meaning of Section 2(a)(19) of the 1940 Act.
| SEE NOTES TO FINANCIAL STATEMENTS. | THE GUGGENHEIM FUNDS SEMI-ANNUAL REPORT | 13 |
| STYLEPLUS—LARGE CORE FUND |
| STATEMENTS | OF CHANGES IN NET ASSETS |
| | | Period Ended | | | | |
| | | March 31, | | | Year Ended | |
| | | 2014 | | | September 30, | |
| | | (Unaudited) | | | 2013 | |
| | | | | | | | | |
| Increase (Decrease) In Net Assets From Operations: | | | | | | | | |
| Net investment income | | $ | 585,158 | | | $ | 387,876 | |
| Net realized gain on investments | | | 24,948,868 | | | | 41,977,296 | |
| Net change in unrealized appreciation (depreciation) on investments | | | (941,333 | ) | | | (18,317,757 | ) |
| Net increase in net assets resulting from operations | | | 24,592,693 | | | | 24,047,415 | |
| | | | | | | | | |
| Distributions to shareholders from: | | | | | | | | |
| Net investment income | | | | | | | | |
| A-Class | | | (394,204 | ) | | | (616,535 | ) |
| Institutional Class | | | (125 | ) | | | (73 | ) |
| Net realized gains | | | | | | | | |
| A-Class | | | (30,898,467 | ) | | | — | |
| B-Class | | | (755,687 | ) | | | — | |
| C-Class | | | (490,315 | ) | | | — | |
| Institutional Class | | | (4,758 | ) | | | — | |
| Total distributions to shareholders | | | (32,543,556 | ) | | | (616,608 | ) |
| | | | | | | | | |
| Capital share transactions: | | | | | | | | |
| Proceeds from sale of shares | | | | | | | | |
| A-Class | | | 2,002,482 | | | | 3,891,702 | |
| B-Class | | | 6,754 | | | | 216,333 | |
| C-Class | | | 341,213 | | | | 827,015 | |
| Institutional Class | | | 1,184 | | | | 12,929 | |
| Distributions reinvested | | | | | | | | |
| A-Class | | | 29,159,069 | | | | 571,200 | |
| B-Class | | | 750,686 | | | | — | |
| C-Class | | | 483,096 | | | | — | |
| Institutional Class | | | 4,883 | | | | 73 | |
| Cost of shares redeemed | | | | | | | | |
| A-Class | | | (10,859,809 | ) | | | (23,445,161 | ) |
| B-Class | | | (731,819 | ) | | | (1,828,228 | ) |
| C-Class | | | (310,928 | ) | | | (459,100 | ) |
| Institutional Class | | | — | | | | — | |
| Net increase (decrease) from capital share transactions | | | 20,846,811 | | | | (20,213,237 | ) |
| Net increase in net assets | | | 12,895,948 | | | | 3,217,570 | |
| | | | | | | | | |
| Net assets: | | | | | | | | |
| Beginning of period | | | 181,518,363 | | | | 178,300,793 | |
| End of period | | $ | 194,414,311 | | | $ | 181,518,363 | |
| Undistributed net investment income at end of period | | $ | 285,705 | | | $ | 94,876 | |
| | | | | | | | | |
| Capital share activity: | | | | | | | | |
| Shares sold | | | | | | | | |
| A-Class | | | 86,078 | | | | 171,925 | |
| B-Class | | | 401 | | | | 12,018 | |
| C-Class | | | 16,628 | | | | 41,241 | |
| Institutional Class | | | 50 | | | | 592 | |
| Shares issued from reinvestment of distributions | | | | | | | | |
| A-Class | | | 1,349,957 | | | | 27,448 | |
| B-Class | | | 45,857 | | | | — | |
| C-Class | | | 26,486 | | | | — | |
| Institutional Class | | | 227 | | | | 4 | |
| Shares redeemed | | | | | | | | |
| A-Class | | | (469,645 | ) | | | (1,051,893 | ) |
| B-Class | | | (41,189 | ) | | | (100,705 | ) |
| C-Class | | | (16,214 | ) | | | (23,259 | ) |
| Net increase (decrease) in shares | | | 998,636 | | | | (922,629 | ) |
| 14 | THE GUGGENHEIM FUNDS SEMI-ANNUAL REPORT | SEE NOTES TO FINANCIAL STATEMENTS. |
| STYLEPLUS—LARGE CORE FUND |
| |
| FINANCIAL HIGHLIGHTS |
This table is presented to show selected data for a share outstanding throughout each period and to assist shareholders in evaluating a Fund’s performance for the periods presented.
| | | Period Ended | | | Year Ended | | | Year Ended | | | Year Ended | | | Year Ended | | | Year Ended | |
| | | March 31, | | | September 30, | | | September 30, | | | September 30, | | | September 30, | | | September 30, | |
| A-Class | | 2014a | | | 2013 | | | 2012 | | | 2011g | | | 2010g | | | 2009g | |
| Per Share Data | | | | | | | | | | | | | | | | | | | | | | | | |
| Net asset value, beginning of period | | $ | 24.27 | | | $ | 21.25 | | | $ | 16.79 | | | $ | 17.56 | | | $ | 16.20 | | | $ | 17.04 | |
| Income (loss) from investment operations: | | | | | | | | | | | | | | | | | | | | | | | | |
| Net investment income (loss)b | | | .08 | | | | .06 | | | | .06 | | | | .01 | | | | .04 | | | | .04 | |
| Net gain (loss) on investments (realized and unrealized) | | | 3.02 | | | | 3.04 | | | | 4.42 | | | | (.74 | ) | | | 1.32 | | | | (.80 | ) |
| Total from investment operations | | | 3.10 | | | | 3.10 | | | | 4.48 | | | | (.73 | ) | | | 1.36 | | | | (.76 | ) |
| Less distributions from: | | | | | | | | | | | | | | | | | | | | | | | | |
| Net investment income | | | (.06 | ) | | | (.08 | ) | | | (.02 | ) | | | (.04 | ) | | | — | | | | (.04 | ) |
| Net realized gains | | | (4.33 | ) | | | — | | | | — | | | | — | | | | — | | | | — | |
| Return of capital | | | — | | | | — | | | | — | | | | — | | | | — | | | | (.04 | ) |
| Total distributions | | | (4.39 | ) | | | (.08 | ) | | | (.02 | ) | | | (.04 | ) | | | — | | | | (.08 | ) |
| Net asset value, end of period | | $ | 22.98 | | | $ | 24.27 | | | $ | 21.25 | | | $ | 16.79 | | | $ | 17.56 | | | $ | 16.20 | |
| | | | | | | | | | | | | | | | | | | | | | | | | |
| Total Returnc | | | 13.91 | % | | | 14.64 | % | | | 26.71 | % | | | (4.11 | %) | | | 8.40 | % | | | (4.32 | %) |
| Ratios/Supplemental Data | | | | | | | | | | | | | | | | | | | | | | | | |
| Net assets, end of period (in thousands) | | $ | 188,459 | | | $ | 175,601 | | | $ | 171,907 | | | $ | 156,232 | | | $ | 174,371 | | | $ | 175,404 | |
| Ratios to average net assets: | | | | | | | | | | | | | | | | | | | | | | | | |
| Net investment income (loss) | | | 0.66 | % | | | 0.26 | % | | | 0.32 | % | | | 0.06 | % | | | 0.31 | % | | | 0.28 | % |
| Total expensesd | | | 1.44 | % | | | 1.37 | % | | | 1.36 | % | | | 1.35 | % | | | 1.43 | % | | | 1.49 | % |
| Net expensese | | | 1.44 | % | | | 1.37 | % | | | 1.36 | % | | | 1.35 | % | | | 1.43 | % | | | 1.49 | % |
| Portfolio turnover rate | | | 58 | % | | | 217 | % | | | 101 | % | | | 92 | % | | | 100 | % | | | 69 | % |
| | | Period Ended | | | Year Ended | | | Year Ended | | | Year Ended | | | Year Ended | | | Year Ended | |
| | | March 31, | | | September 30, | | | September 30, | | | September 30, | | | September 30, | | | September 30, | |
| B-Class | | 2014a | | | 2013 | | | 2012 | | | 2011g | | | 2010g | | | 2009g | |
| Per Share Data | | | | | | | | | | | | | | | | | | | | | | | | |
| Net asset value, beginning of period | | $ | 19.39 | | | $ | 17.13 | | | $ | 13.69 | | | $ | 14.40 | | | $ | 13.36 | | | $ | 14.12 | |
| Income (loss) from investment operations: | | | | | | | | | | | | | | | | | | | | | | | | |
| Net investment income (loss)b | | | (.08 | ) | | | (.17 | ) | | | (.15 | ) | | | (.11 | ) | | | (.08 | ) | | | (.04 | ) |
| Net gain (loss) on investments (realized and unrealized) | | | 2.35 | | | | 2.43 | | | | 3.59 | | | | (.60 | ) | | | 1.12 | | | | (.68 | ) |
| Total from investment operations | | | 2.27 | | | | 2.26 | | | | 3.44 | | | | (.71 | ) | | | 1.04 | | | | (.72 | ) |
| Less distributions from: | | | | | | | | | | | | | | | | | | | | | | | | |
| Net realized gains | | | (4.33 | ) | | | — | | | | — | | | | — | | | | — | | | | — | |
| Return of capital | | | — | | | | — | | | | — | | | | — | | | | — | | | | (.04 | ) |
| Total distributions | | | (4.33 | ) | | | — | | | | — | | | | — | | | | — | | | | (.04 | ) |
| Net asset value, end of period | | $ | 17.33 | | | $ | 19.39 | | | $ | 17.13 | | | $ | 13.69 | | | $ | 14.40 | | | $ | 13.36 | |
| | | | | | | | | | | | | | | | | | | | | | | | | |
| Total Returnc | | | 13.02 | % | | | 13.19 | % | | | 25.13 | % | | | (4.93 | %) | | | 7.78 | % | | | (4.96 | %) |
| Ratios/Supplemental Data | | | | | | | | | | | | | | | | | | | | | | | | |
| Net assets, end of period (in thousands) | | $ | 3,321 | | | $ | 3,617 | | | $ | 4,714 | | | $ | 5,121 | | | $ | 6,817 | | | $ | 7,784 | |
| Ratios to average net assets: | | | | | | | | | | | | | | | | | | | | | | | | |
| Net investment income (loss) | | | (0.91 | %) | | | (0.94 | %) | | | (0.92 | %) | | | (0.70 | %) | | | (0.48 | %) | | | (0.46 | %) |
| Total expensesd | | | 3.00 | % | | | 2.59 | % | | | 2.59 | % | | | 2.10 | % | | | 2.17 | % | | | 2.24 | % |
| Net expensese | | | 3.00 | % | | | 2.59 | % | | | 2.59 | % | | | 2.10 | % | | | 2.17 | % | | | 2.24 | % |
| Portfolio turnover rate | | | 58 | % | | | 217 | % | | | 101 | % | | | 92 | % | | | 100 | % | | | 69 | % |
| SEE NOTES TO FINANCIAL STATEMENTS. | THE GUGGENHEIM FUNDS SEMI-ANNUAL REPORT | 15 |
| STYLEPLUS—LARGE CORE FUND |
| |
| FINANCIAL HIGHLIGHTS (concluded) |
This table is presented to show selected data for a share outstanding throughout each period and to assist shareholders in evaluating a Fund’s performance for the periods presented.
| | | Period Ended | | | Year Ended | | | Year Ended | | | Year Ended | | | Year Ended | | | Year Ended | |
| | | March 31, | | | September 30, | | | September 30, | | | September 30, | | | September 30, | | | September 30, | |
| C-Class | | 2014a | | | 2013 | | | 2012 | | | 2011g | | | 2010g | | | 2009g | |
| Per Share Data | | | | | | | | | | | | | | | | | | | | | | | | |
| Net asset value, beginning of period | | $ | 21.12 | | | $ | 18.60 | | | $ | 14.81 | | | $ | 15.56 | | | $ | 14.48 | | | $ | 15.24 | |
| Income (loss) from investment operations: | | | | | | | | | | | | | | | | | | | | | | | | |
| Net investment income (loss)b | | | (.03 | ) | | | (.15 | ) | | | (.10 | ) | | | (.12 | ) | | | (.08 | ) | | | (.04 | ) |
| Net gain (loss) on investments (realized and unrealized) | | | 2.58 | | | | 2.67 | | | | 3.89 | | | | (.63 | ) | | | 1.16 | | | | (.68 | ) |
| Total from investment operations | | | 2.55 | | | | 2.52 | | | | 3.79 | | | | (.75 | ) | | | 1.08 | | | | (.72 | ) |
| Less distributions from: | | | | | | | | | | | | | | | | | | | | | | | | |
| Net realized gains | | | (4.33 | ) | | | — | | | | — | | | | — | | | | — | | | | — | |
| Return of capital | | | — | | | | — | | | | — | | | | — | | | | — | | | | (.04 | ) |
| Total distributions | | | (4.33 | ) | | | — | | | | — | | | | — | | | | — | | | | (.04 | ) |
| Net asset value, end of period | | $ | 19.34 | | | $ | 21.12 | | | $ | 18.60 | | | $ | 14.81 | | | $ | 15.56 | | | $ | 14.48 | |
| | | | | | | | | | | | | | | | | | | | | | | | | |
| Total Returnc | | | 13.31 | % | | | 13.55 | % | | | 25.59 | % | | | (4.82 | %) | | | 7.46 | % | | | (4.60 | %) |
| Ratios/Supplemental Data | | | | | | | | | | | | | | | | | | | | | | | | |
| Net assets, end of period (in thousands) | | $ | 2,603 | | | $ | 2,275 | | | $ | 1,669 | | | $ | 1,600 | | | $ | 2,158 | | | $ | 2,244 | |
| Ratios to average net assets: | | | | | | | | | | | | | | | | | | | | | | | | |
| Net investment income (loss) | | | (0.31 | %) | | | (0.77 | %) | | | (0.55 | %) | | | (0.70 | %) | | | (0.44 | %) | | | (0.47 | %) |
| Total expensesd | | | 2.42 | % | | | 2.34 | % | | | 2.22 | % | | | 2.10 | % | | | 2.18 | % | | | 2.24 | % |
| Net expensese | | | 2.42 | % | | | 2.34 | % | | | 2.22 | % | | | 2.10 | % | | | 2.18 | % | | | 2.24 | % |
| Portfolio turnover rate | | | 58 | % | | | 217 | % | | | 101 | % | | | 92 | % | | | 100 | % | | | 69 | % |
| | | Period Ended | | | Year Ended | | | Period Ended | |
| | | March 31, | | | September 30, | | | September 30, | |
| Institutional Class | | 2014a | | | 2013 | | | 2012f | |
| Per Share Data | | | | | | | | | | | | |
| Net asset value, beginning of period | | $ | 24.25 | | | $ | 21.28 | | | $ | 20.84 | |
| Income (loss) from investment operations: | | | | | | | | | | | | |
| Net investment income (loss)b | | | .06 | | | | .06 | | | | .07 | |
| Net gain (loss) on investments (realized and unrealized) | | | 3.00 | | | | 3.06 | | | | .37 | |
| Total from investment operations | | | 3.06 | | | | 3.12 | | | | .44 | |
| Less distributions from: | | | | | | | | | | | | |
| Net investment income | | | (.11 | ) | | | (.15 | ) | | | — | |
| Net realized gains | | | (4.33 | ) | | | — | | | | — | |
| Total distributions | | | (4.44 | ) | | | (.15 | ) | | | — | |
| Net asset value, end of period | | $ | 22.87 | | | $ | 24.25 | | | $ | 21.28 | |
| | | | | | | | | | | | | |
| Total Returnc | | | 13.78 | % | | | 14.79 | % | | | 2.11 | % |
| Ratios/Supplemental Data | | | | | | | | | | | | |
| Net assets, end of period (in thousands) | | $ | 31 | | | $ | 26 | | | $ | 10 | |
| Ratios to average net assets: | | | | | | | | | | | | |
| Net investment income (loss) | | | 0.48 | % | | | 0.26 | % | | | 0.59 | % |
| Total expensesd | | | 1.63 | % | | | 1.25 | % | | | 1.12 | % |
| Net expensese | | | 1.62 | % | | | 1.25 | % | | | 1.12 | % |
| Portfolio turnover rate | | | 58 | % | | | 217 | % | | | 101 | % |
| a | Unaudited figures for the period ended March 31, 2014. Percentage amounts for the period, except total return and portfolio turnover rate, have been annualized. |
| b | Net investment income (loss) per share was computed using average shares outstanding throughout the period. |
| c | Total return does not reflect the impact of any applicable sales charges and has not been annualized. |
| d | Does not include expenses of the underlying funds in which the Fund invests. |
| e | Net expense information reflects the expense ratios after expense waivers. |
| f | Since commencement of operations: March 1, 2012. Percentage amounts for the period, except total return and portfolio turnover rate, have been annualized. The portfolio turnover rate stated is for the entire fiscal year of the Fund, not since commencement of operations of the Class. |
| g | Reverse share split — Per share amounts for period September 30, 2009 through April 8, 2011 have been restated to reflect a 1:4 reverse share split effective April 8, 2011. |
| 16 | THE GUGGENHEIM FUNDS SEMI-ANNUAL REPORT | SEE NOTES TO FINANCIAL STATEMENTS. |
| FUND PROFILE (Unaudited) | March 31, 2014 |
SMALL CAP VALUE FUND
OBJECTIVE: Seeks long-term capital appreciation.
Holdings Diversification
(Market Exposure as % of Net Assets)
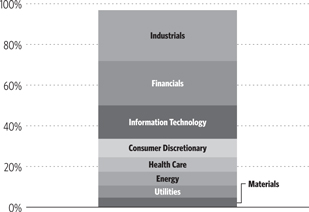
“Holdings Diversification (Market Exposure as % of Net Assets)” excludes any temporary cash investments.
| Inception Dates: | |
| A-Class | July 11, 2008 |
| C-Class | July 11, 2008 |
| Institutional Class | July 11, 2008 |
| Ten Largest Holdings (% of Total Net Assets) | |
| Hanover Insurance Group, Inc. | 4.1% |
| Covanta Holding Corp. | 2.6% |
| Maxwell Technologies, Inc. | 2.2% |
| Reinsurance Group of America, Inc. — Class A | 2.2% |
| PMFG, Inc. | 1.8% |
| UGI Corp. | 1.8% |
| Laclede Group, Inc. | 1.7% |
| KEYW Holding Corp. | 1.6% |
| Celadon Group, Inc. | 1.6% |
| Patterson-UTI Energy, Inc. | 1.6% |
| Top Ten Total | 21.2% |
| THE GUGGENHEIM FUNDS SEMI-ANNUAL REPORT | 17 |
| SCHEDULE OF INVESTMENTS (Unaudited) | March 31, 2014 |
| SMALL CAP VALUE FUND | |
| | | Shares | | | Value | |
| | | | | | | |
| COMMON STOCKS† - 96.4% | | | | | | | | |
| | | | | | | | | |
| INDUSTRIALS - 24.6% | | | | | | | | |
| Covanta Holding Corp. | | | 81,150 | | | $ | 1,464,757 | |
| PMFG, Inc.* | | | 168,660 | | | | 1,006,900 | |
| KEYW Holding Corp.* | | | 47,238 | | | | 883,822 | |
| Celadon Group, Inc. | | | 36,612 | | | | 880,153 | |
| Curtiss-Wright Corp. | | | 13,540 | | | | 860,331 | |
| ABM Industries, Inc. | | | 28,610 | | | | 822,251 | |
| Orbital Sciences Corp.* | | | 25,014 | | | | 697,891 | |
| Aegion Corp. — Class A* | | | 26,413 | | | | 668,514 | |
| Great Lakes Dredge & Dock Corp.* | | | 71,355 | | | | 651,471 | |
| Navigant Consulting, Inc.* | | | 34,610 | | | | 645,823 | |
| Powell Industries, Inc. | | | 9,197 | | | | 595,966 | |
| ICF International, Inc.* | | | 14,490 | | | | 576,847 | |
| Energy Recovery, Inc.* | | | 103,040 | | | | 548,173 | |
| General Cable Corp. | | | 21,272 | | | | 544,776 | |
| DigitalGlobe, Inc.* | | | 18,415 | | | | 534,219 | |
| Dynamic Materials Corp. | | | 24,772 | | | | 471,659 | |
| Sterling Construction Company, Inc.* | | | 47,638 | | | | 413,021 | |
| Rand Logistics, Inc.* | | | 46,390 | | | | 320,091 | |
| Marten Transport Ltd. | | | 12,960 | | | | 278,899 | |
| Global Power Equipment Group, Inc. | | | 13,030 | | | | 259,167 | |
| LMI Aerospace, Inc.* | | | 18,000 | | | | 253,800 | |
| AZZ, Inc. | | | 2,960 | | | | 132,253 | |
| Luxfer Holdings plc ADR | | | 3,617 | | | | 70,821 | |
| Saia, Inc.* | | | 1,290 | | | | 49,291 | |
| Total Industrials | | | | | | | 13,630,896 | |
| | | | | | | | | |
| FINANCIALS - 21.8% | | | | | | | | |
| Hanover Insurance Group, Inc. | | | 37,290 | | | | 2,291,098 | |
| Reinsurance Group of America, Inc. — Class A | | | 14,950 | | | | 1,190,468 | |
| Home Loan Servicing Solutions Ltd. | | | 40,490 | | | | 874,584 | |
| Endurance Specialty Holdings Ltd. | | | 14,384 | | | | 774,291 | |
| Horace Mann Educators Corp. | | | 26,140 | | | | 758,060 | |
| Safeguard Scientifics, Inc.* | | | 29,960 | | | | 664,513 | |
| 1st Source Corp. | | | 19,910 | | | | 638,912 | |
| PICO Holdings, Inc.* | | | 21,672 | | | | 563,255 | |
| Campus Crest Communities, Inc. | | | 53,580 | | | | 465,074 | |
| Berkshire Hills Bancorp, Inc. | | | 17,030 | | | | 440,736 | |
| OFG Bancorp | | | 24,800 | | | | 426,312 | |
| BancFirst Corp. | | | 7,325 | | | | 414,815 | |
| Simmons First National Corp. — Class A | | | 10,520 | | | | 392,080 | |
| AMERISAFE, Inc. | | | 8,905 | | | | 391,019 | |
| Lexington Realty Trust | | | 29,747 | | | | 324,540 | |
| PrivateBancorp, Inc. — Class A | | | 10,626 | | | | 324,199 | |
| Navigators Group, Inc.* | | | 5,220 | | | | 320,456 | |
| Ocwen Financial Corp.* | | | 8,081 | | | | 316,614 | |
| Redwood Trust, Inc. | | | 13,066 | | | | 264,978 | |
| Employers Holdings, Inc. | | | 10,696 | | | | 216,380 | |
| Hancock Holding Co. | | | 140 | | | | 5,131 | |
| Total Financials | | | | | | | 12,057,515 | |
| | | | | | | | | |
| INFORMATION TECHNOLOGY - 16.4% | | | | | | | | |
| Maxwell Technologies, Inc.* | | | 92,518 | | | | 1,195,332 | |
| Insight Enterprises, Inc.* | | | 33,084 | | | | 830,739 | |
| Global Cash Access Holdings, Inc.* | | | 99,760 | | | | 684,354 | |
| Digi International, Inc.* | | | 66,091 | | | | 670,824 | |
| IXYS Corp. | | | 45,470 | | | | 516,084 | |
| Spansion, Inc. — Class A* | | | 28,730 | | | | 500,477 | |
| Newport Corp.* | | | 23,580 | | | | 487,634 | |
| FLIR Systems, Inc. | | | 13,477 | | | | 485,172 | |
| RF Micro Devices, Inc.* | | | 55,270 | | | | 435,528 | |
| Integrated Device Technology, Inc.* | | | 35,330 | | | | 432,086 | |
| Semtech Corp.* | | | 15,980 | | | | 404,933 | |
| Carbonite, Inc.* | | | 30,820 | | | | 314,056 | |
| Silicon Graphics International Corp.* | | | 24,740 | | | | 303,807 | |
| Diodes, Inc.* | | | 11,320 | | | | 295,678 | |
| Liquidity Services, Inc.* | | | 11,300 | | | | 294,365 | |
| Mercury Systems, Inc.* | | | 20,980 | | | | 277,146 | |
| Brooks Automation, Inc. | | | 25,240 | | | | 275,873 | |
| Rubicon Technology, Inc.* | | | 22,950 | | | | 259,106 | |
| Entropic Communications, Inc.* | | | 60,550 | | | | 247,650 | |
| Multi-Fineline Electronix, Inc.* | | | 13,300 | | | | 170,240 | |
| Total Information Technology | | | | | | | 9,081,084 | |
| | | | | | | | | |
| CONSUMER DISCRETIONARY - 9.1% | | | | | | | | |
| Brown Shoe Company, Inc. | | | 30,734 | | | | 815,679 | |
| DeVry Education Group, Inc. | | | 18,880 | | | | 800,323 | |
| International Speedway Corp. — Class A | | | 23,021 | | | | 782,484 | |
| Cabela’s, Inc.* | | | 7,610 | | | | 498,531 | |
| Scholastic Corp. | | | 14,372 | | | | 495,547 | |
| Chico’s FAS, Inc. | | | 23,950 | | | | 383,919 | |
| Gentex Corp. | | | 11,650 | | | | 367,325 | |
| Jones Group, Inc. | | | 23,942 | | | | 358,412 | |
| Guess?, Inc. | | | 12,289 | | | | 339,176 | |
| Stage Stores, Inc.1 | | | 8,018 | | | | 196,040 | |
| Total Consumer Discretionary | | | | | | | 5,037,436 | |
| | | | | | | | | |
| HEALTH CARE - 7.1% | | | | | | | | |
| Emergent Biosolutions, Inc.* | | | 33,230 | | | | 839,722 | |
| Invacare Corp. | | | 36,750 | | | | 700,823 | |
| Greatbatch, Inc.* | | | 14,368 | | | | 659,779 | |
| Kindred Healthcare, Inc. | | | 27,244 | | | | 638,054 | |
| Tornier N.V.* | | | 22,960 | | | | 487,211 | |
| Alere, Inc.* | | | 10,784 | | | | 370,430 | |
| Discovery Laboratories, Inc.* | | | 108,640 | | | | 233,576 | |
| Total Health Care | | | | | | | 3,929,595 | |
| | | | | | | | | |
| ENERGY - 6.8% | | | | | | | | |
| Patterson-UTI Energy, Inc. | | | 27,680 | | | | 876,902 | |
| Resolute Energy Corp.* | | | 95,340 | | | | 686,448 | |
| Oasis Petroleum, Inc.* | | | 15,880 | | | | 662,672 | |
| Clayton Williams Energy, Inc.* | | | 4,381 | | | | 495,097 | |
| Sanchez Energy Corp.* | | | 13,158 | | | | 389,872 | |
| C&J Energy Services, Inc.* | | | 12,850 | | | | 374,706 | |
| Energy XXI Bermuda Ltd. | | | 11,450 | | | | 269,877 | |
| Total Energy | | | | | | | 3,755,574 | |
| | | | | | | | | |
| UTILITIES - 5.9% | | | | | | | | |
| UGI Corp. | | | 21,683 | | | | 988,961 | |
| Laclede Group, Inc. | | | 20,256 | | | | 955,070 | |
| Black Hills Corp. | | | 10,551 | | | | 608,266 | |
| South Jersey Industries, Inc. | | | 7,330 | | | | 411,140 | |
| MDU Resources Group, Inc. | | | 8,053 | | | | 276,298 | |
| Total Utilities | | | | | | | 3,239,735 | |
| 18 | THE GUGGENHEIM FUNDS SEMI-ANNUAL REPORT | SEE NOTES TO FINANCIAL STATEMENTS. |
| SCHEDULE OF INVESTMENTS (Unaudited)(concluded) | March 31, 2014 |
| SMALL CAP VALUE FUND | |
| | | Shares | | | Value | |
| | | | | | | |
| MATERIALS - 4.7% | | | | | | | | |
| Royal Gold, Inc. | | | 9,572 | | | $ | 599,398 | |
| Allied Nevada Gold Corp.* | | | 128,910 | | | | 555,602 | |
| Landec Corp.* | | | 37,416 | | | | 417,563 | |
| Coeur Mining, Inc.* | | | 42,806 | | | | 397,668 | |
| Olin Corp. | | | 12,622 | | | | 348,493 | |
| Berry Plastics Group, Inc.* | | | 11,140 | | | | 257,891 | |
| Total Materials | | | | | | | 2,576,615 | |
| Total Common Stocks | | | | | | | | |
| (Cost $42,345,025) | | | | | | | 53,308,450 | |
| | | | | | | | | |
| CONVERTIBLE PREFERRED STOCKS††† - 0.0% | | | | | | | | |
| Thermoenergy Corp.*,2,3 | | | 6,250 | | | | 438 | |
| Total Convertible Preferred Stocks | | | | | | | | |
| (Cost $5,968) | | | | | | | 438 | |
| | | | | | | | | |
| SHORT TERM INVESTMENTS† - 5.7% | | | | | | | | |
| Dreyfus Treasury Prime Cash | | | | | | | | |
| Management Fund | | | 3,137,623 | | | | 3,137,623 | |
| Total Short Term Investments | | | | | | | | |
| (Cost $3,137,623) | | | | | | | 3,137,623 | |
| | | Face | | | | |
| | | Amount | | | | |
| | | | | | | |
| CONVERTIBLE BONDS†† - 0.4% | | | | | | | | |
| INDUSTRIALS - 0.4% | | | | | | | | |
| DryShips, Inc. | | | | | | | | |
| 5.00% due 12/01/14 | | $ | 200,000 | | | | 197,750 | |
| Total Convertible Bonds | | | | | | | | |
| (Cost $185,605) | | | | | | | 197,750 | |
| Total Investments - 102.5% | | | | | | | | |
| (Cost $45,674,221) | | | | | | $ | 56,644,261 | |
| | | Contracts | | | | |
| | | | | | | |
| OPTIONS WRITTEN† - 0.0% | | | | | | | | |
| Call options on: | | | | | | | | |
| Stage Stores, Inc. | | | | | | | | |
| Expiring April 2014 | | | | | | | | |
| with strike price of $25.00 | | | 80 | | | | (4,800 | ) |
| Total Options Written | | | | | | | | |
| (Premiums received $7,440) | | | | | | | (4,800 | ) |
| Other Assets & Liabilities, net - (2.5)% | | | | | | | (1,362,987 | ) |
| Total Net Assets - 100.0% | | | | | | $ | 55,276,474 | |
| * | | Non-income producing security. |
| † | | Value determined based on Level 1 inputs — See Note 4. |
| †† | | Value determined based on Level 2 inputs — See Note 4. |
| ††† | | Value determined based on Level 3 inputs — See Note 4. |
| 1 | | All or a portion of this security is pledged as collateral for open options written contracts at March 31, 2014. |
| 2 | | PIPE (Private Investment in Public Equity) — Stock issued by a company in the secondary market as a means of raising capital more quickly and less expensively than through registration of a secondary public offering. |
ADR — American Depositary Receipt
plc — Public Limited Company
| SEE NOTES TO FINANCIAL STATEMENTS. | THE GUGGENHEIM FUNDS SEMI-ANNUAL REPORT | 19 |
| SMALL CAP VALUE FUND |
| |
| STATEMENT OF ASSETS |
| AND LIABILITIES (Unaudited) |
| March 31, 2014 |
| Assets: | | | | |
| Investments, at value | | | | |
| (cost $45,674,221) | | $ | 56,644,261 | |
| Prepaid expenses | | | 25,266 | |
| Receivables: | | | | |
| Dividends | | | 67,257 | |
| Securities sold | | | 60,618 | |
| Fund shares sold | | | 34,744 | |
| Investment advisor | | | 15,076 | |
| Interest | | | 3,324 | |
| Total assets | | | 56,850,546 | |
| Liabilities: | | | | |
| Options written, at value | | | | |
| (premiums received $7,440) | | | 4,800 | |
| Payable for: | | | | |
| Securities purchased | | | 1,461,122 | |
| Management fees | | | 46,548 | |
| Fund shares redeemed | | | 24,489 | |
| Distribution and service fees | | | 12,662 | |
| Fund accounting/administration fees | | | 4,422 | |
| Transfer agent/maintenance fees | | | 4,098 | |
| Trustees’ fees* | | | 174 | |
| Miscellaneous | | | 15,757 | |
| Total liabilities | | | 1,574,072 | |
| Net assets | | $ | 55,276,474 | |
| Net assets consist of: | | | | |
| Paid in capital | | $ | 42,114,372 | |
| Accumulated net investment loss | | | (221,195 | ) |
| Accumulated net realized gain on investments | | | 2,410,617 | |
| Net unrealized appreciation on investments | | | 10,972,680 | |
| Net assets | | $ | 55,276,474 | |
| A-Class: | | | | |
| Net assets | | $ | 22,286,153 | |
| Capital shares outstanding | | | 1,211,431 | |
| Net asset value per share | | $ | 18.40 | |
| Maximum offering price per share | | | | |
| (Net asset value divided by 95.25%) | | $ | 19.32 | |
| C-Class: | | | | |
| Net assets | | $ | 9,552,094 | |
| Capital shares outstanding | | | 545,052 | |
| Net asset value per share | | $ | 17.53 | |
| Institutional Class: | | | | |
| Net assets | | $ | 23,438,227 | |
| Capital shares outstanding | | | 1,257,919 | |
| Net asset value per share | | $ | 18.63 | |
| STATEMENT OF |
| OPERATIONS (Unaudited) |
| Period Ended March 31, 2014 |
| Investment Income: | | | | |
| Dividends | | $ | 308,305 | |
| Interest | | | 14,782 | |
| Total investment income | | | 323,087 | |
| | | | | |
| Expenses: | | | | |
| Management fees | | | 252,129 | |
| Transfer agent/maintenance fees: | | | | |
| A-Class | | | 27,744 | |
| C-Class | | | 6,181 | |
| Institutional Class | | | 247 | |
| Distribution and service fees: | | | | |
| A-Class | | | 24,551 | |
| C-Class | | | 39,998 | |
| Fund accounting/administration fees | | | 23,952 | |
| Proxy expense | | | 4,974 | |
| Custodian fees | | | 2,711 | |
| Trustees’ fees* | | | 2,184 | |
| Tax expense | | | 1 | |
| Miscellaneous | | | 45,082 | |
| Total expenses | | | 429,754 | |
| Less: | | | | |
| Expenses waived | | | (95,495 | ) |
| Net expenses | | | 334,259 | |
| Net investment loss | | | (11,172 | ) |
| | | | | |
| Net Realized and Unrealized Gain (Loss): | | | | |
| Net realized gain (loss) on: | | | | |
| Investments | | | 3,393,941 | |
| Options written | | | 80,049 | |
| Net realized gain | | | 3,473,990 | |
| Net change in unrealized appreciation (depreciation) on: | | | | |
| Investments | | | 1,506,307 | |
| Options written | | | (2,933 | ) |
| Net change in unrealized appreciation (depreciation) | | | 1,503,374 | |
| Net realized and unrealized gain | | | 4,977,364 | |
| Net increase in net assets resulting from operations | | $ | 4,966,192 | |
* Relates to Trustees not deemed “interested persons” within the meaning of Section 2(a)(19) of the 1940 Act.
| 20 | THE GUGGENHEIM FUNDS SEMI-ANNUAL REPORT | SEE NOTES TO FINANCIAL STATEMENTS. |
| SMALL CAP VALUE FUND |
| |
| STATEMENTS OF CHANGES IN NET ASSETS |
| | | Period Ended | | | | |
| | | March 31, | | | Year Ended | |
| | | 2014 | | | September 30, | |
| | | (Unaudited) | | | 2013 | |
| | | | | | | | | |
| Increase (Decrease) In Net Assets From Operations: | | | | | | | | |
| Net investment income (loss) | | $ | (11,172 | ) | | $ | 11,190 | |
| Net realized gain on investments | | | 3,473,990 | | | | 3,160,916 | |
| Net change in unrealized appreciation (depreciation) on investments | | | 1,503,374 | | | | 7,028,196 | |
| Net increase in net assets resulting from operations | | | 4,966,192 | | | | 10,200,302 | |
| | | | | | | | | |
| Distributions to shareholders from: | | | | | | | | |
| Net investment income | | | | | | | | |
| A-Class | | | (33,808 | ) | | | (11,056 | ) |
| Institutional Class | | | (89,016 | ) | | | (53,908 | ) |
| Net realized gains | | | | | | | | |
| A-Class | | | (1,236,307 | ) | | | (1,047,645 | ) |
| C-Class | | | (508,183 | ) | | | (266,068 | ) |
| Institutional Class | | | (1,474,064 | ) | | | (1,552,279 | ) |
| Total distributions to shareholders | | | (3,341,378 | ) | | | (2,930,956 | ) |
| | | | | | | | | |
| Capital share transactions: | | | | | | | | |
| Proceeds from sale of shares | | | | | | | | |
| A-Class | | | 6,027,820 | | | | 10,521,756 | |
| C-Class | | | 3,447,789 | | | | 2,264,197 | |
| Institutional Class | | | 454,789 | | | | 331,808 | |
| Distributions reinvested | | | | | | | | |
| A-Class | | | 1,239,655 | | | | 1,042,444 | |
| C-Class | | | 485,717 | | | | 248,604 | |
| Institutional Class | | | 25,070 | | | | 4,422 | |
| Cost of shares redeemed | | | | | | | | |
| A-Class | | | (2,108,525 | ) | | | (10,445,396 | ) |
| C-Class | | | (511,393 | ) | | | (372,708 | ) |
| Institutional Class | | | (96,209 | ) | | | (88,984 | ) |
| Net increase from capital share transactions | | | 8,964,713 | | | | 3,506,143 | |
| Net increase in net assets | | | 10,589,527 | | | | 10,775,489 | |
| | | | | | | | | |
| Net assets: | | | | | | | | |
| Beginning of period | | | 44,686,947 | | | | 33,911,458 | |
| End of period | | $ | 55,276,474 | | | $ | 44,686,947 | |
| Accumulated net investment loss at end of period | | $ | (221,195 | ) | | $ | (87,199 | ) |
| | | | | | | | | |
| Capital share activity: | | | | | | | | |
| Shares sold | | | | | | | | |
| A-Class | | | 332,004 | | | | 653,325 | |
| C-Class | | | 199,873 | | | | 142,887 | |
| Institutional Class | | | 24,924 | | | | 20,199 | |
| Shares issued from reinvestment of distributions | | | | | | | | |
| A-Class | | | 71,163 | | | | 75,267 | |
| C-Class | | | 29,190 | | | | 18,636 | |
| Institutional Class | | | 1,422 | | | | 316 | |
| Shares redeemed | | | | | | | | |
| A-Class | | | (117,453 | ) | | | (620,391 | ) |
| C-Class | | | (29,153 | ) | | | (24,580 | ) |
| Institutional Class | | | (5,316 | ) | | | (5,715 | ) |
| Net increase in shares | | | 506,654 | | | | 259,944 | |
| SEE NOTES TO FINANCIAL STATEMENTS. | THE GUGGENHEIM FUNDS SEMI-ANNUAL REPORT | 21 |
| SMALL CAP VALUE FUND |
| |
| FINANCIAL HIGHLIGHTS |
This table is presented to show selected data for a share outstanding throughout each period and to assist shareholders in evaluating a Fund’s performance for the periods presented.
| | | Period Ended | | | Year Ended | | | Year Ended | | | Year Ended | | | Year Ended | | | Year Ended | |
| | | March 31, | | | September 30, | | | September 30, | | | September 30, | | | September 30, | | | September 30, | |
| A-Class | | 2014a | | | 2013 | | | 2012 | | | 2011 | | | 2010 | | | 2009 | |
| Per Share Data | | | | | | | | | | | | | | | | | | | | | | | | |
| Net asset value, beginning of period | | $ | 17.81 | | | $ | 15.04 | | | $ | 11.66 | | | $ | 14.35 | | | $ | 13.24 | | | $ | 11.48 | |
| Income (loss) from investment operations: | | | | | | | | | | | | | | | | | | | | | | | | |
| Net investment income (loss)b | | | (— | )d | | | (— | )d | | | (.03 | ) | | | (.07 | ) | | | (.05 | ) | | | (.05 | ) |
| Net gain (loss) on investments (realized and unrealized) | | | 1.81 | | | | 4.05 | | | | 3.73 | | | | (.63 | ) | | | 1.54 | | | | 2.44 | |
| Total from investment operations | | | 1.81 | | | | 4.05 | | | | 3.70 | | | | (.70 | ) | | | 1.49 | | | | 2.39 | |
| Less distributions from: | | | | | | | | | | | | | | | | | | | | | | | | |
| Net investment income | | | (.03 | ) | | | (.01 | ) | | | — | | | | — | | | | — | | | | — | |
| Net realized gains | | | (1.19 | ) | | | (1.27 | ) | | | (.32 | ) | | | (1.99 | ) | | | (.38 | ) | | | (.63 | ) |
| Total distributions | | | (1.22 | ) | | | (1.28 | ) | | | (.32 | ) | | | (1.99 | ) | | | (.38 | ) | | | (.63 | ) |
| Net asset value, end of period | | $ | 18.40 | | | $ | 17.81 | | | $ | 15.04 | | | $ | 11.66 | | | $ | 14.35 | | | $ | 13.24 | |
| | | | | | | | | | | | | | | | | | | | | | | | | |
| Total Returnc | | | 10.56 | % | | | 29.39 | % | | | 32.19 | % | | | (7.31 | %) | | | 11.53 | % | | | 24.15 | % |
| Ratios/Supplemental Data | | | | | | | | | | | | | | | | | | | | | | | | |
| Net assets, end of period (in thousands) | | $ | 22,286 | | | $ | 16,487 | | | $ | 12,294 | | | $ | 7,592 | | | $ | 6,209 | | | $ | 3,245 | |
| Ratios to average net assets: | | | | | | | | | | | | | | | | | | | | | | | | |
| Net investment income (loss) | | | (0.02 | %) | | | (0.02 | %) | | | (0.24 | %) | | | (0.52 | %) | | | (0.34 | %) | | | (0.46 | %) |
| Total expenses | | | 1.84 | % | | | 1.91 | % | | | 2.14 | % | | | 2.33 | % | | | 2.45 | % | | | 4.92 | % |
| Net expensese | | | 1.32 | %f | | | 1.30 | % | | | 1.30 | % | | | 1.30 | % | | | 1.30 | % | | | 1.55 | % |
| Portfolio turnover rate | | | 24 | % | | | 34 | % | | | 62 | % | | | 70 | % | | | 140 | % | | | 58 | % |
| | | Period Ended | | | Year Ended | | | Year Ended | | | Year Ended | | | Year Ended | | | Year Ended | |
| | | March 31, | | | September 30, | | | September 30, | | | September 30, | | | September 30, | | | September 30, | |
| C-Class | | 2014a | | | 2013 | | | 2012 | | | 2011 | | | 2010 | | | 2009 | |
| Per Share Data | | | | | | | | | | | | | | | | | | | | | | | | |
| Net asset value, beginning of period | | $ | 17.05 | | | $ | 14.54 | | | $ | 11.36 | | | $ | 14.13 | | | $ | 13.11 | | | $ | 11.46 | |
| Income (loss) from investment operations: | | | | | | | | | | | | | | | | | | | | | | | | |
| Net investment income (loss)b | | | (.07 | ) | | | (.12 | ) | | | (.14 | ) | | | (.18 | ) | | | (.15 | ) | | | (.11 | ) |
| Net gain (loss) on investments (realized and unrealized) | | | 1.74 | | | | 3.90 | | | | 3.64 | | | | (.60 | ) | | | 1.55 | | | | 2.39 | |
| Total from investment operations | | | 1.67 | | | | 3.78 | | | | 3.50 | | | | (.78 | ) | | | 1.40 | | | | 2.28 | |
| Less distributions from: | | | | | | | | | | | | | | | | | | | | | | | | |
| Net realized gains | | | (1.19 | ) | | | (1.27 | ) | | | (.32 | ) | | | (1.99 | ) | | | (.38 | ) | | | (.63 | ) |
| Total distributions | | | (1.19 | ) | | | (1.27 | ) | | | (.32 | ) | | | (1.99 | ) | | | (.38 | ) | | | (.63 | ) |
| Net asset value, end of period | | $ | 17.53 | | | $ | 17.05 | | | $ | 14.54 | | | $ | 11.36 | | | $ | 14.13 | | | $ | 13.11 | |
| | | | | | | | | | | | | | | | | | | | | | | | | |
| Total Returnc | | | 10.16 | % | | | 28.34 | % | | | 31.35 | % | | | (8.07 | %) | | | 10.94 | % | | | 23.16 | % |
| Ratios/Supplemental Data | | | | | | | | | | | | | | | | | | | | | | | | |
| Net assets, end of period (in thousands) | | $ | 9,552 | | | $ | 5,885 | | | $ | 3,026 | | | $ | 2,305 | | | $ | 1,353 | | | $ | 709 | |
| Ratios to average net assets: | | | | | | | | | | | | | | | | | | | | | | | | |
| Net investment income (loss) | | | (0.76 | %) | | | (0.75 | %) | | | (1.00 | %) | | | (1.26 | %) | | | (1.09 | %) | | | (1.15 | %) |
| Total expenses | | | 2.47 | % | | | 2.58 | % | | | 2.70 | % | | | 3.07 | % | | | 3.22 | % | | | 6.40 | % |
| Net expensese | | | 2.07 | %f | | | 2.05 | % | | | 2.05 | % | | | 2.05 | % | | | 2.05 | % | | | 2.30 | % |
| Portfolio turnover rate | | | 24 | % | | | 34 | % | | | 62 | % | | | 70 | % | | | 140 | % | | | 58 | % |
| 22 | THE GUGGENHEIM FUNDS SEMI-ANNUAL REPORT | SEE NOTES TO FINANCIAL STATEMENTS. |
| SMALL CAP VALUE FUND |
| |
| FINANCIAL HIGHLIGHTS (concluded) |
This table is presented to show selected data for a share outstanding throughout each period and to assist shareholders in evaluating a Fund’s performance for the periods presented.
| | | Period Ended | | | Year Ended | | | Year Ended | | | Year Ended | | | Year Ended | | | Year Ended | |
| | | March 31, | | | September 30, | | | September 30, | | | September 30, | | | September 30, | | | September 30, | |
| Institutional Class | | 2014a | | | 2013 | | | 2012 | | | 2011 | | | 2010 | | | 2009 | |
| Per Share Data | | | | | | | | | | | | | | | | | | | | | | | | |
| Net asset value, beginning of period | | $ | 18.04 | | | $ | 15.21 | | | $ | 11.76 | | | $ | 14.43 | | | $ | 13.28 | | | $ | 11.49 | |
| Income (loss) from investment operations: | | | | | | | | | | | | | | | | | | | | | | | | |
| Net investment income (loss)b | | | .02 | | | | .04 | | | | — | d | | | (.04 | ) | | | (.01 | ) | | | (.01 | ) |
| Net gain (loss) on investments (realized and unrealized) | | | 1.83 | | | | 4.10 | | | | 3.77 | | | | (.64 | ) | | | 1.54 | | | | 2.43 | |
| Total from investment operations | | | 1.85 | | | | 4.14 | | | | 3.77 | | | | (.68 | ) | | | 1.53 | | | | 2.42 | |
| Less distributions from: | | | | | | | | | | | | | | | | | | | | | | | | |
| Net investment income | | | (.07 | ) | | | (.04 | ) | | | — | | | | — | | | | — | | | | — | |
| Net realized gains | | | (1.19 | ) | | | (1.27 | ) | | | (.32 | ) | | | (1.99 | ) | | | (.38 | ) | | | (.63 | ) |
| Total distributions | | | (1.26 | ) | | | (1.31 | ) | | | (.32 | ) | | | (1.99 | ) | | | (.38 | ) | | | (.63 | ) |
| Net asset value, end of period | | $ | 18.63 | | | $ | 18.04 | | | $ | 15.21 | | | $ | 11.76 | | | $ | 14.43 | | | $ | 13.28 | |
| | | | | | | | | | | | | | | | | | | | | | | | | |
| Total Returnc | | | 10.66 | % | | | 29.74 | % | | | 32.51 | % | | | (7.11 | %) | | | 11.80 | % | | | 24.40 | % |
| Ratios/Supplemental Data | | | | | | | | | | | | | | | | | | | | | | | | |
| Net assets, end of period (in thousands) | | $ | 23,438 | | | $ | 22,315 | | | $ | 18,591 | | | $ | 638 | | | $ | 734 | | | $ | 630 | |
| Ratios to average net assets: | | | | | | | | | | | | | | | | | | | | | | | | |
| Net investment income (loss) | | | 0.19 | % | | | 0.23 | % | | | 0.02 | % | | | (0.30 | %) | | | (0.08 | %) | | | (0.14 | %) |
| Total expenses | | | 1.31 | % | | | 1.34 | % | | | 1.44 | % | | | 2.09 | % | | | 2.21 | % | | | 5.44 | % |
| Net expensese | | | 1.07 | %f | | | 1.05 | % | | | 1.05 | % | | | 1.05 | % | | | 1.05 | % | | | 1.30 | % |
| Portfolio turnover rate | | | 24 | % | | | 34 | % | | | 62 | % | | | 70 | % | | | 140 | % | | | 58 | % |
| a | Unaudited figures for the period ended March 31, 2014. Percentage amounts for the period, except total return and portfolio turnover rate, have been annualized. |
| b | Net investment income (loss) per share was computed using average shares outstanding throughout the period. |
| c | Total return does not reflect the impact of any applicable sales charges and has not been annualized. |
| d | Net investment income (loss) is less than $0.01 per share. |
| e | Net expense information reflects the expense ratios after expense waivers and reimbursements, as applicable. |
| f | Net expenses include extraordinary expenses. Excluding extraordinary expenses, the operating expense ratio would be 1.30%, 2.05% and 1.05% for the A-Class, C-Class, and Institutional Class, respectively. |
| SEE NOTES TO FINANCIAL STATEMENTS. | THE GUGGENHEIM FUNDS SEMI-ANNUAL REPORT | 23 |
| FUND PROFILE (Unaudited) | March 31, 2014 |
ENHANCED WORLD EQUITY FUND
OBJECTIVE: Seeks to achieve total return, comprised of capital appreciation and current income.
Holdings Diversification
(Market Exposure as % of Net Assets)
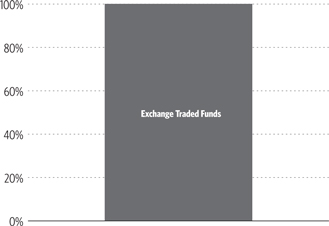
“Holdings Diversification (Market Exposure as % of Net Assets)” excludes any temporary cash investments.
| Inception Dates: | |
| A-Class | June 18, 2013 |
| C-Class | June 18, 2013 |
| Institutional Class | June 18, 2013 |
| Ten Largest Holdings (% of Total Net Assets) |
| SPDR S&P 500 ETF Trust | 49.3% |
| iShares MSCI EAFE ETF | 12.7% |
| iShares MSCI South Korea Capped ETF | 5.2% |
| Vanguard FTSE Emerging Markets ETF | 5.2% |
| iShares MSCI Taiwan ETF | 5.1% |
| iShares MSCI United Kingdom ETF | 5.0% |
| iShares MSCI Japan ETF | 4.1% |
| iShares Russell 2000 ETF | 3.4% |
| iShares MSCI Mexico Capped ETF | 2.6% |
| iShares MSCI Italy Capped ETF | 2.6% |
| Top Ten Total | 95.2% |
| 24 | THE GUGGENHEIM FUNDS SEMI-ANNUAL REPORT |
| SCHEDULE OF INVESTMENTS (Unaudited) | March 31, 2014 |
| ENHANCED WORLD EQUITY FUND | |
| | | Shares | | | Value | |
| | | | | | | |
| EXCHANGE TRADED FUNDS† - 100.1% | | | | | | | | |
| SPDR S&P 500 ETF Trust1 | | | 15,200 | | | $ | 2,843,008 | |
| iShares MSCI EAFE ETF1 | | | 10,900 | | | | 732,153 | |
| iShares MSCI South Korea Capped ETF1 | | | 4,900 | | | | 301,350 | |
| Vanguard FTSE Emerging Markets ETF1 | | | 7,400 | | | | 300,292 | |
| iShares MSCI Taiwan ETF1 | | | 20,500 | | | | 294,790 | |
| iShares MSCI United Kingdom ETF1 | | | 14,100 | | | | 290,319 | |
| iShares MSCI Japan ETF1 | | | 20,800 | | | | 235,664 | |
| iShares Russell 2000 ETF1 | | | 1,700 | | | | 197,778 | |
| iShares MSCI Mexico Capped ETF1 | | | 2,300 | | | | 147,085 | |
| iShares MSCI Italy Capped ETF1 | | | 8,300 | | | | 146,993 | |
| Materials Select Sector SPDR Fund1 | | | 3,000 | | | | 141,840 | |
| SPDR S&P Homebuilders ETF1 | | | 4,300 | | | | 139,965 | |
| Total Exchange Traded Funds | | | | | | | | |
| (Cost $5,717,407) | | | | | | | 5,771,237 | |
| | | | | | | | | |
| SHORT TERM INVESTMENTS† - 0.7% | | | | | | | | |
| Dreyfus Treasury Prime Cash | | | | | | | | |
| Management Fund | | | 40,701 | | | | 40,701 | |
| Total Short Term Investments | | | | | | | | |
| (Cost $40,701) | | | | | | | 40,701 | |
| Total Long Investments - 100.8% | | | | | | | | |
| (Cost $5,758,108) | | | | | | $ | 5,811,938 | |
| | | Contracts | | | | |
| | | | | | | |
| OPTIONS WRITTEN† - (1.4)% | | | | | | | | |
| Call options on: | | | | | | | | |
| Vanguard FTSE Emerging Markets ETF | | | | | | | | |
| Expiring April 2014 | | | | | | | | |
| with strike price of $40.00 | | | 11 | | | | (1,243 | ) |
| iShares MSCI South Korea Capped ETF | | | | | | | | |
| Expiring April 2014 | | | | | | | | |
| with strike price of $60.00 | | | 7 | | | | (1,372 | ) |
| iShares MSCI Mexico Capped ETF | | | | | | | | |
| Expiring April 2014 | | | | | | | | |
| with strike price of $62.00 | | | 20 | | | | (4,600 | ) |
| iShares MSCI Italy Capped ETF | | | | | | | | |
| Expiring April 2014 | | | | | | | | |
| with strike price of $17.00 | | | 71 | | | | (5,680 | ) |
| iShares MSCI Taiwan ETF | | | | | | | | |
| Expiring April 2014 | | | | | | | | |
| with strike price of $14.00 | | | 174 | | | | (8,874 | ) |
| iShares MSCI South Korea Capped ETF | | | | | | | | |
| Expiring April 2014 | | | | | | | | |
| with strike price of $59.00 | | | 42 | | | | (12,054 | ) |
| Vanguard FTSE Emerging Markets ETF | | | | | | | | |
| Expiring April 2014 | | | | | | | | |
| with strike price of $39.00 | | | 63 | | | | (12,222 | ) |
| iShares MSCI EAFE ETF | | | | | | | | |
| Expiring April 2014 | | | | | | | | |
| with strike price of $66.00 | | | 93 | | | | (15,810 | ) |
| SPDR S&P 500 ETF Trust | | | | | | | | |
| Expiring April 2014 | | | | | | | | |
| with strike price of $188.00 | | | 152 | | | | (19,000 | ) |
| Total Options Written | | | | | | | | |
| (Premiums received $47,049) | | | | | | | (80,855 | ) |
| Other Assets & Liabilities, net - 0.6% | | | | | | | 35,505 | |
| Total Net Assets - 100.0% | | | | | | $ | 5,766,588 | |
| † | Value determined based on Level 1 inputs — See Note 4. |
| 1 | All or a portion of this security is pledged as collateral for open options written contracts at March 31, 2014. |
| SEE NOTES TO FINANCIAL STATEMENTS. | THE GUGGENHEIM FUNDS SEMI-ANNUAL REPORT | 25 |
| ENHANCED WORLD EQUITY FUND |
| STATEMENT OF ASSETS |
| AND LIABILITIES (Unaudited) |
| March 31, 2014 |
| Assets: | | | | |
| Investments, at value | | | | |
| (cost $5,758,108) | | $ | 5,811,938 | |
| Prepaid expenses | | | 41,768 | |
| Cash | | | 1,291 | |
| Receivables: | | | | |
| Securities sold | | | 21,041 | |
| Investment advisor | | | 12,343 | |
| Dividends | | | 1,567 | |
| Total assets | | | 5,889,948 | |
| Liabilities: | | | | |
| Options written, at value | | | | |
| (premiums received $47,049) | | | 80,855 | |
| Payable for: | | | | |
| Professional fees | | | 18,609 | |
| Management fees | | | 3,419 | |
| Fund accounting/administration fees | | | 2,123 | |
| Trustees’ fees* | | | 368 | |
| Transfer agent/maintenance fees | | | 120 | |
| Distribution and service fees | | | 112 | |
| Miscellaneous | | | 17,754 | |
| Total liabilities | | | 123,360 | |
| Net assets | | $ | 5,766,588 | |
| Net assets consist of: | | | | |
| Paid in capital | | $ | 5,463,711 | |
| Undistributed net investment income | | | 3,189 | |
| Accumulated net realized gain on investments | | | 279,664 | |
| Net unrealized appreciation on investments | | | 20,024 | |
| Net assets | | $ | 5,766,588 | |
| A-Class: | | | | |
| Net assets | | $ | 82,133 | |
| Capital shares outstanding | | | 3,083 | |
| Net asset value per share | | $ | 26.64 | |
| Maximum offering price per share | | | | |
| (Net asset value divided by 95.25%) | | $ | 27.96 | |
| C-Class: | | | | |
| Net assets | | $ | 78,912 | |
| Capital shares outstanding | | | 2,967 | |
| Net asset value per share | | $ | 26.59 | |
| Institutional Class: | | | | |
| Net assets | | $ | 5,605,543 | |
| Capital shares outstanding | | | 211,068 | |
| Net asset value per share | | $ | 26.56 | |
| STATEMENT OF |
| OPERATIONS (Unaudited) |
| Period Ended March 31, 2014 |
| Investment Income: | | | | |
| Dividends | | $ | 35,059 | |
| Total investment income | | | 35,059 | |
| | | | | |
| Expenses: | | | | |
| Management fees | | | 20,879 | |
| Transfer agent/maintenance fees: | | | | |
| A-Class | | | 175 | |
| C-Class | | | 366 | |
| Institutional Class | | | 82 | |
| Distribution and service fees: | | | | |
| A-Class | | | 196 | |
| C-Class | | | 1,844 | |
| Fund accounting/administration fees | | | 12,465 | |
| Legal fees | | | 21,589 | |
| Registration fees | | | 18,481 | |
| Professional fees | | | 17,752 | |
| Printing expenses | | | 6,396 | |
| Custodian fees | | | 4,095 | |
| Trustees’ fees* | | | 124 | |
| Miscellaneous | | | 296 | |
| Total expenses | | | 104,740 | |
| Less: | | | | |
| Expenses waived by Advisor | | | (72,870 | ) |
| Net expenses | | | 31,870 | |
| Net investment income | | | 3,189 | |
| | | | | |
| Net Realized and Unrealized Gain (Loss): | | | | |
| Net realized gain (loss) on: | | | | |
| Investments | | | 135,349 | |
| Options written | | | 176,408 | |
| Net realized gain | | | 311,757 | |
| Net change in unrealized appreciation (depreciation) on: | | | | |
| Investments | | | 133,701 | |
| Options written | | | (51,407 | ) |
| Net change in unrealized appreciation (depreciation) | | | 82,294 | |
| Net realized and unrealized gain | | | 394,051 | |
| Net increase in net assets resulting from operations | | $ | 397,240 | |
* Relates to Trustees not deemed “interested persons” within the meaning of Section 2(a)(19) of the 1940 Act.
| 26 | THE GUGGENHEIM FUNDS SEMI-ANNUAL REPORT | SEE NOTES TO FINANCIAL STATEMENTS. |
| ENHANCED WORLD EQUITY FUND |
| |
| STATEMENTS OF CHANGES IN NET ASSETS |
| | | Period Ended | | | | |
| | | March 31, | | | Period Ended | |
| | | 2014 | | | September 30, | |
| | | (Unaudited) | | | 2013a | |
| | | | | | | | | |
| Increase (Decrease) in net assets from operations: | | | | | | | | |
| Net investment income | | $ | 3,189 | | | $ | 28,029 | |
| Net realized gain on investments | | | 311,757 | | | | 241,426 | |
| Net change in unrealized appreciation (depreciation) on investments | | | 82,294 | | | | (62,270 | ) |
| Net increase in net assets resulting from operations | | | 397,240 | | | | 207,185 | |
| | | | | | | | | |
| Distributions to shareholders from: | | | | | | | | |
| Net investment income | | | | | | | | |
| Institutional Class | | | (28,029 | ) | | | — | |
| Net realized gains | | | | | | | | |
| A-Class | | | (7,329 | ) | | | — | |
| C-Class | | | (19,881 | ) | | | — | |
| Institutional Class | | | (245,722 | ) | | | — | |
| Total distributions to shareholders | | | (300,961 | ) | | | — | |
| | | | | | | | | |
| Capital share transactions: | | | | | | | | |
| Proceeds from sale of shares | | | | | | | | |
| A-Class | | | 154,907 | | | | 102,365 | |
| C-Class | | | 601,849 | | | | 410,855 | |
| Institutional Class | | | 5,680 | | | | 5,006,074 | |
| Distributions reinvested | | | | | | | | |
| A-Class | | | 7,324 | | | | — | |
| C-Class | | | 19,881 | | | | — | |
| Institutional Class | | | 273,751 | | | | — | |
| Cost of shares redeemed | | | | | | | | |
| A-Class | | | (180,660 | ) | | | — | |
| C-Class | | | (910,958 | ) | | | (27,311 | ) |
| Institutional Class | | | (633 | ) | | | — | |
| Net increase (decrease) from capital share transactions | | | (28,859 | ) | | | 5,491,983 | |
| Net increase in net assets | | | 67,420 | | | | 5,699,168 | |
| | | | | | | | | |
| Net assets: | | | | | | | | |
| Beginning of period | | | 5,699,168 | | | | — | |
| End of period | | $ | 5,766,588 | | | $ | 5,699,168 | |
| Undistributed net investment income at end of period | | $ | 3,189 | | | $ | 28,029 | |
| | | | | | | | | |
| Capital share activity: | | | | | | | | |
| Shares sold | | | | | | | | |
| A-Class | | | 5,854 | | | | 4,016 | |
| C-Class | | | 23,743 | | | | 15,611 | |
| Institutional Class | | | 216 | | | | 200,246 | |
| Shares issued from reinvestment of distributions | | | | | | | | |
| A-Class | | | 283 | | | | — | |
| C-Class | | | 773 | | | | — | |
| Institutional Class | | | 10,631 | | | | — | |
| Shares redeemed | | | | | | | | |
| A-Class | | | (7,070 | ) | | | — | |
| C-Class | | | (36,081 | ) | | | (1,079 | ) |
| Institutional Class | | | (25 | ) | | | — | |
| Net increase (decrease) in shares | | | (1,676 | ) | | | 218,794 | |
a Since commencement of operations: June 18, 2013.
| SEE NOTES TO FINANCIAL STATEMENTS. | THE GUGGENHEIM FUNDS SEMI-ANNUAL REPORT | 27 |
| ENHANCED WORLD EQUITY FUND |
| |
| FINANCIAL HIGHLIGHTS |
This table is presented to show selected data for a share outstanding throughout each period and to assist shareholders in evaluating a Fund’s performance for the periods presented.
| | | Period Ended | | | Period Ended | |
| | | March 31, | | | September 30, | |
| A-Class | | 2014a | | | 2013b | |
| Per Share Data | | | | | | | | |
| Net asset value, beginning of period | | $ | 26.03 | | | $ | 25.00 | |
| Income (loss) from investment operations: | | | | | | | | |
| Net investment income (loss)c | | | (.01 | ) | | | (.03 | ) |
| Net gain (loss) on investments (realized and unrealized) | | | 1.85 | | | | 1.06 | |
| Total from investment operations | | | 1.84 | | | | 1.03 | |
| Less distributions from: | | | | | | | | |
| Net realized gains | | | (1.23 | ) | | | — | |
| Total distributions | | | (1.23 | ) | | | — | |
| Net asset value, end of period | | $ | 26.64 | | | $ | 26.03 | |
| | | | | | | | | |
| Total Return | | | 6.95 | % | | | 4.32 | % |
| Ratios/Supplemental Data | | | | | | | | |
| Net assets, end of period (in thousands) | | $ | 82 | | | $ | 105 | |
| Ratios to average net assets: | | | | | | | | |
| Net investment income (loss) | | | (0.11 | %) | | | (0.36 | %) |
| Total expensesd | | | 3.89 | % | | | 7.21 | %f |
| Net expensese | | | 1.25 | % | | | 1.25 | % |
| Portfolio turnover rate | | | 300 | % | | | 174 | % |
| | | Period Ended | | | Period Ended | |
| | | March 31, | | | September 30, | |
| C-Class | | 2014a | | | 2013b | |
| Per Share Data | | | | | | | | |
| Net asset value, beginning of period | | $ | 25.96 | | | $ | 25.00 | |
| Income (loss) from investment operations: | | | | | | | | |
| Net investment income (loss)c | | | (.09 | ) | | | (.03 | ) |
| Net gain (loss) on investments (realized and unrealized) | | | 1.95 | | | | .99 | |
| Total from investment operations | | | 1.86 | | | | .96 | |
| Less distributions from: | | | | | | | | |
| Net realized gains | | | (1.23 | ) | | | — | |
| Total distributions | | | (1.23 | ) | | | — | |
| Net asset value, end of period | | $ | 26.59 | | | $ | 25.96 | |
| | | | | | | | | |
| Total Return | | | 7.14 | % | | | 4.00 | % |
| Ratios/Supplemental Data | | | | | | | | |
| Net assets, end of period (in thousands) | | $ | 79 | | | $ | 377 | |
| Ratios to average net assets: | | | | | | | | |
| Net investment income (loss) | | | (0.70 | %) | | | (0.43 | %) |
| Total expensesd | | | 4.53 | % | | | 9.26 | %f |
| Net expensese | | | 2.00 | % | | | 2.00 | % |
| Portfolio turnover rate | | | 300 | % | | | 174 | % |
| 28 | THE GUGGENHEIM FUNDS SEMI-ANNUAL REPORT | SEE NOTES TO FINANCIAL STATEMENTS. |
| ENHANCED WORLD EQUITY FUND |
| |
| FINANCIAL HIGHLIGHTS (concluded) |
This table is presented to show selected data for a share outstanding throughout each period and to assist shareholders in evaluating a Fund’s performance for the periods presented.
| | | Period Ended | | | Period Ended | |
| | | March 31, | | | September 30, | |
| Institutional Class | | 2014a | | | 2013b | |
| Per Share Data | | | | | | | | |
| Net asset value, beginning of period | | $ | 26.05 | | | $ | 25.00 | |
| Income (loss) from investment operations: | | | | | | | | |
| Net investment income (loss)c | | | .02 | | | | .14 | |
| Net gain (loss) on investments (realized and unrealized) | | | 1.86 | | | | .91 | |
| Total from investment operations | | | 1.88 | | | | 1.05 | |
| Less distributions from: | | | | | | | | |
| Net investment income | | | (.14 | ) | | | — | |
| Net realized gains | | | (1.23 | ) | | | — | |
| Total distributions | | | (1.37 | ) | | | — | |
| Net asset value, end of period | | $ | 26.56 | | | $ | 26.05 | |
| | | | | | | | | |
| Total Return | | | 7.12 | % | | | 4.40 | % |
| Ratios/Supplemental Data | | | | | | | | |
| Net assets, end of period (in thousands) | | $ | 5,606 | | | $ | 5,217 | |
| Ratios to average net assets: | | | | | | | | |
| Net investment income (loss) | | | 0.17 | % | | | 1.96 | % |
| Total expensesd | | | 3.43 | % | | | 5.11 | %f |
| Net expensese | | | 1.00 | % | | | 1.00 | % |
| Portfolio turnover rate | | | 300 | % | | | 174 | % |
| a | Unaudited figures for the period ended March 31, 2014. Percentage amounts for the period, except total return and portfolio turnover rate, have been annualized. |
| b | Since commencement of operations: June 18, 2013. Percentage amounts for the period, except total return and portfolio turnover rate, have been annualized. |
| c | Net investment income (loss) per share was computed using average shares outstanding throughout the period. |
| d | Does not include expenses of the underlying funds in which the Fund invests. |
| e | Net expense information reflects the expense ratios after expense waivers and reimbursements, as applicable. |
| f | Due to limited length of Fund operations, ratios for this period are not indicative of future performance. |
| SEE NOTES TO FINANCIAL STATEMENTS. | THE GUGGENHEIM FUNDS SEMI-ANNUAL REPORT | 29 |
| FUND PROFILE (Unaudited) | March 31, 2014 |
WORLD EQUITY INCOME FUND
OBJECTIVE: Seeks to provide total return, comprised of capital appreciation and income.
Holdings Diversification
(Market Exposure as % of Net Assets)
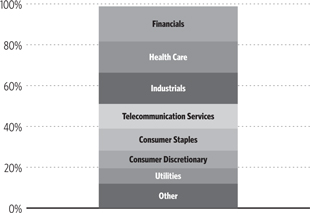
“Holdings Diversification (Market Exposure as % of Net Assets)” excludes any temporary cash investments.
INVESTMENT CONCENTRATION
At March 31, 2014, the investment diversification of the Fund by country was as follows:
| Country | | % of Net Assets | | | Value | |
| United States | | | 48.0 | % | | | $37,483,818 | |
| Japan | | | 12.0 | % | | | 9,326,545 | |
| Australia | | | 10.5 | % | | | 8,199,570 | |
| Britain | | | 4.8 | % | | | 3,720,588 | |
| Germany | | | 4.7 | % | | | 3,635,057 | |
| France | | | 4.5 | % | | | 3,518,726 | |
| Canada | | | 4.1 | % | | | 3,208,492 | |
| New Zealand | | | 2.0 | % | | | 1,538,568 | |
| Spain | | | 1.6 | % | | | 1,225,251 | |
| Singapore | | | 1.5 | % | | | 1,160,371 | |
| Denmark | | | 1.2 | % | | | 939,666 | |
| Finland | | | 1.1 | % | | | 851,890 | |
| Bermuda | | | 1.0 | % | | | 826,103 | |
| Belgium | | | 1.0 | % | | | 820,829 | |
| Other | | | 1.4 | % | | | 1,115,976 | |
| Total Investments | | | 99.4 | % | | | $77,571,448 | |
| Inception Dates: | |
| A-Class | October 1, 1993 |
| B-Class | October 19, 1993 |
| C-Class | January 29, 1999 |
| Institutional Class | May 2, 2011 |
| Ten Largest Holdings (% of Total Net Assets) | |
| Raytheon Co. | 2.2% |
| Lockheed Martin Corp. | 2.2% |
| Canon, Inc. | 2.2% |
| WellPoint, Inc. | 2.1% |
| Eli Lilly & Co. | 2.1% |
| Altria Group, Inc. | 2.1% |
| General Mills, Inc. | 2.0% |
| Deutsche Telekom AG | 2.0% |
| AstraZeneca plc | 2.0% |
| GDF Suez | 2.0% |
| Top Ten Total | 20.9% |
| 30 | THE GUGGENHEIM FUNDS SEMI-ANNUAL REPORT |
| SCHEDULE OF INVESTMENTS (Unaudited) | March 31, 2014 |
| WORLD EQUITY INCOME FUND | |
| | | Shares | | | Value | |
| | | | | | | |
| COMMON STOCKS† - 98.1% | | | | | | | | |
| | | | | | | | | |
| FINANCIALS - 17.2% | | | | | | | | |
| Banco Santander S.A. | | | 128,500 | | | $ | 1,225,251 | |
| Admiral Group plc | | | 40,100 | | | | 953,950 | |
| National Australia Bank Ltd. | | | 27,000 | | | | 887,774 | |
| Insurance Australia Group Ltd. | | | 170,700 | | | | 881,635 | |
| Aozora Bank Ltd. | | | 293,400 | | | | 835,727 | |
| Annaly Capital Management, Inc. | | | 75,300 | | | | 826,041 | |
| Bank of Queensland Ltd.1 | | | 67,000 | | | | 798,322 | |
| American Capital Agency Corp. | | | 36,100 | | | | 775,789 | |
| Bendigo and Adelaide Bank Ltd. | | | 72,000 | | | | 759,757 | |
| Hannover Rueck SE | | | 7,600 | | | | 679,848 | |
| Stockland | | | 194,900 | | | | 677,709 | |
| CFS Retail Property Trust Group | | | 354,700 | | | | 621,617 | |
| CNP Assurances | | | 29,200 | | | | 618,315 | |
| Health Care REIT, Inc. | | | 9,000 | | | | 536,400 | |
| People’s United Financial, Inc. | | | 30,000 | | | | 446,100 | |
| Swedbank AB — Class A | | | 15,100 | | | | 405,230 | |
| HCP, Inc. | | | 10,100 | | | | 391,779 | |
| ASX Ltd. | | | 10,000 | | | | 334,462 | |
| ICAP plc | | | 52,500 | | | | 330,395 | |
| New York Community Bancorp, Inc. | | | 20,000 | | | | 321,400 | |
| Natixis | | | 28,600 | | | | 210,052 | |
| Total Financials | | | | | | | 13,517,553 | |
| | | | | | | | | |
| HEALTH CARE - 15.3% | | | | | | | | |
| WellPoint, Inc. | | | 16,700 | | | | 1,662,485 | |
| Eli Lilly & Co. | | | 27,800 | | | | 1,636,308 | |
| AstraZeneca plc | | | 24,100 | | | | 1,557,450 | |
| Cardinal Health, Inc. | | | 20,500 | | | | 1,434,590 | |
| Bristol-Myers Squibb Co. | | | 20,100 | | | | 1,044,195 | |
| Coloplast A/S — Class B | | | 10,000 | | | | 809,118 | |
| UnitedHealth Group, Inc. | | | 8,700 | | | | 713,313 | |
| Humana, Inc. | | | 6,000 | | | | 676,320 | |
| AmerisourceBergen Corp. — Class A | | | 9,900 | | | | 649,341 | |
| Pfizer, Inc. | | | 20,100 | | | | 645,612 | |
| Vertex Pharmaceuticals, Inc.* | | | 6,900 | | | | 487,968 | |
| Amgen, Inc. | | | 2,900 | | | | 357,686 | |
| McKesson Corp. | | | 1,500 | | | | 264,855 | |
| Total Health Care | | | | | | | 11,939,241 | |
| | | | | | | | | |
| INDUSTRIALS - 15.3% | | | | | | | | |
| Raytheon Co. | | | 17,600 | | | | 1,738,703 | |
| Lockheed Martin Corp. | | | 10,400 | | | | 1,697,696 | |
| Northrop Grumman Corp. | | | 9,000 | | | | 1,110,420 | |
| ITOCHU Corp. | | | 94,900 | | | | 1,108,846 | |
| Sumitomo Corp. | | | 79,900 | | | | 1,016,409 | |
| Delta Air Lines, Inc. | | | 26,100 | | | | 904,365 | |
| Mitsui & Company Ltd. | | | 59,200 | | | | 836,824 | |
| Auckland International Airport Ltd.* | | | 250,637 | | | | 828,750 | |
| Bouygues S.A. | | | 19,800 | | | | 825,852 | |
| L-3 Communications Holdings, Inc. | | | 6,000 | | | | 708,900 | |
| Dai Nippon Printing Company Ltd. | | | 35,600 | | | | 341,117 | |
| FedEx Corp. | | | 1,700 | | | | 225,352 | |
| ANA Holdings, Inc. | | | 98,100 | | | | 211,949 | |
| Sojitz Corp. | | | 100,500 | | | | 171,370 | |
| AP Moeller - Maersk A/S — Class B | | | 8 | | | | 95,951 | |
| Singapore Technologies Engineering Ltd. | | | 25,200 | | | | 76,530 | |
| AP Moeller - Maersk A/S — Class A | | | 3 | | | | 34,597 | |
| TNT Express N.V. | | | 35 | | | | 344 | |
| Total Industrials | | | | | | | 11,933,975 | |
| | | | | | | | | |
| TELECOMMUNICATION SERVICES - 12.1% | | | | | | | | |
| Deutsche Telekom AG | | | 98,100 | | | | 1,585,331 | |
| NTT DOCOMO, Inc. | | | 94,100 | | | | 1,484,230 | |
| Telstra Corporation Ltd. | | | 244,700 | | | | 1,152,651 | |
| Frontier Communications Corp. | | | 166,700 | | | | 950,190 | |
| Elisa Oyj | | | 29,600 | | | | 851,890 | |
| Belgacom S.A. | | | 26,212 | | | | 820,829 | |
| Windstream Holdings, Inc. | | | 92,600 | | | | 763,024 | |
| Telecom Corporation of New Zealand Ltd. | | | 335,200 | | | | 709,818 | |
| BT Group plc | | | 61,100 | | | | 386,554 | |
| StarHub Ltd. | | | 80,600 | | | | 269,124 | |
| BCE, Inc. | | | 5,700 | | | | 245,526 | |
| Bezeq The Israeli Telecommunication Corporation Ltd. | | | 111,900 | | | | 199,315 | |
| Total Telecommunication Services | | | | | | | 9,418,482 | |
| | | | | | | | | |
| CONSUMER STAPLES - 10.8% | | | | | | | | |
| Altria Group, Inc. | | | 43,000 | | | | 1,609,490 | |
| General Mills, Inc. | | | 30,800 | | | | 1,596,056 | |
| Kimberly-Clark Corp. | | | 10,500 | | | | 1,157,625 | |
| Dr Pepper Snapple Group, Inc. | | | 16,700 | | | | 909,482 | |
| Woolworths Ltd. | | | 23,400 | | | | 775,046 | |
| Metcash Ltd. | | | 245,100 | | | | 595,449 | |
| Wesfarmers Ltd. | | | 14,100 | | | | 538,531 | |
| Safeway, Inc. | | | 13,800 | | | | 509,772 | |
| Tyson Foods, Inc. — Class A | | | 11,200 | | | | 492,912 | |
| Wal-Mart Stores, Inc. | | | 2,700 | | | | 206,361 | |
| Total Consumer Staples | | | | | | | 8,390,724 | |
| | | | | | | | | |
| CONSUMER DISCRETIONARY - 7.9% | | | | | | | | |
| Singapore Press Holdings Ltd. | | | 244,000 | | | | 814,717 | |
| Darden Restaurants, Inc. | | | 15,900 | | | | 807,084 | |
| Shaw Communications, Inc. — Class B | | | 32,500 | | | | 776,105 | |
| McDonald’s Corp. | | | 7,300 | | | | 715,619 | |
| Target Corp. | | | 11,300 | | | | 683,763 | |
| Ford Motor Co. | | | 33,700 | | | | 525,720 | |
| Kohl’s Corp. | | | 8,700 | | | | 494,160 | |
| Sankyo Company Ltd. | | | 11,500 | | | | 484,111 | |
| Daimler AG — Class D | | | 5,000 | | | | 472,481 | |
| Lagardere SCA | | | 8,300 | | | | 329,553 | |
| ProSiebenSat.1 Media AG | | | 1,983 | | | | 90,756 | |
| Total Consumer Discretionary | | | | | | | 6,194,069 | |
| | | | | | | | | |
| UTILITIES - 7.6% | | | | | | | | |
| GDF Suez | | | 56,100 | | | | 1,534,954 | |
| Entergy Corp. | | | 12,800 | | | | 855,679 | |
| TransAlta Corp. | | | 52,100 | | | | 605,113 | |
| SSE plc | | | 20,100 | | | | 492,238 | |
| Consolidated Edison, Inc. | | | 7,900 | | | | 423,835 | |
| Southern Co. | | | 8,800 | | | | 386,672 | |
| Duke Energy Corp. | | | 4,900 | | | | 348,978 | |
| Cheung Kong Infrastructure Holdings Ltd. | | | 50,500 | | | | 322,283 | |
| Pepco Holdings, Inc. | | | 15,400 | | | | 315,392 | |
| SEE NOTES TO FINANCIAL STATEMENTS. | THE GUGGENHEIM FUNDS SEMI-ANNUAL REPORT | 31 |
| SCHEDULE OF INVESTMENTS (Unaudited)(concluded) | March 31, 2014 |
| WORLD EQUITY INCOME FUND | |
| | | Shares | | | Value | |
| | | | | | | |
| E.ON SE | | | 15,000 | | | $ | 293,242 | |
| SP AusNet | | | 145,400 | | | | 176,618 | |
| Power Assets Holdings Ltd. | | | 20,300 | | | | 176,006 | |
| HK Electric Investments and | | | | | | | | |
| HK Electric Investments Ltd.*,1 | | | 19,775 | | | | 12,799 | |
| Total Utilities | | | | | | | 5,943,809 | |
| | | | | | | | | |
| INFORMATION TECHNOLOGY - 7.0% | | | | | | | | |
| Canon, Inc. | | | 54,500 | | | | 1,684,925 | |
| Intel Corp. | | | 32,700 | | | | 843,987 | |
| Apple, Inc. | | | 1,500 | | | | 805,110 | |
| Avnet, Inc. | | | 9,000 | | | | 418,770 | |
| Ricoh Company Ltd. | | | 35,300 | | | | 406,985 | |
| Adobe Systems, Inc.* | | | 4,900 | | | | 322,126 | |
| Leidos Holdings, Inc. | | | 7,900 | | | | 279,423 | |
| Alliance Data Systems Corp.* | | | 900 | | | | 245,205 | |
| Western Union Co. | | | 14,900 | | | | 243,764 | |
| Western Digital Corp. | | | 2,400 | | | | 220,368 | |
| Total Information Technology | | | | | | | 5,470,663 | |
| | | | | | | | | |
| ENERGY - 4.3% | | | | | | | | |
| Seadrill Ltd. | | | 23,400 | | | | 826,103 | |
| Canadian Oil Sands Ltd.1 | | | 38,500 | | | | 807,597 | |
| TonenGeneral Sekiyu K.K. | | | 84,300 | | | | 744,052 | |
| ConocoPhillips | | | 9,200 | | | | 647,220 | |
| Penn West Petroleum Ltd. | | | 40,100 | | | | 335,158 | |
| Total Energy | | | | | | | 3,360,130 | |
| | | | | | | | | |
| MATERIALS - 0.6% | | | | | | | | |
| Agnico Eagle Mines Ltd. | | | 14,500 | | | | 438,993 | |
| Total Common Stocks | | | | | | | | |
| (Cost $72,076,382) | | | | | | | 76,607,639 | |
| | | | | | | | | |
| PREFERRED STOCKS† - 0.7% | | | | | | | | |
| Porsche Automobil Holding SE | | | 5,000 | | | | 513,398 | |
| Total Preferred Stocks | | | | | | | | |
| (Cost $505,904) | | | | | | | 513,398 | |
| | | | | | | | | |
| SHORT TERM INVESTMENTS† - 0.6% | | | | | | | | |
| Goldman Sachs Financial Square Funds - | | | | | | | | |
| Treasury Instruments Fund | | | 450,411 | | | | 450,411 | |
| Total Short Term Investments | | | | | | | | |
| (Cost $450,411) | | | | | | | 450,411 | |
| Total Investments - 99.4% | | | | | | | | |
| (Cost $73,032,697) | | | | | | $ | 77,571,448 | |
| Other Assets & Liabilities, net - 0.6% | | | | | | | 470,092 | |
| Total Net Assets - 100.0% | | | | | | $ | 78,041,540 | |
| * | Non-income producing security. |
| † | Value determined based on Level 1 inputs — See Note 4. |
plc — Public Limited Company
REIT — Real Estate Investment Trust
| 32 | THE GUGGENHEIM FUNDS SEMI-ANNUAL REPORT | SEE NOTES TO FINANCIAL STATEMENTS. |
| WORLD EQUITY INCOME FUND |
| |
| STATEMENT OF ASSETS |
| AND LIABILITIES (Unaudited) |
| March 31, 2014 |
| Assets: | | | | |
| Investments, at value | | | | |
| (cost $73,032,697) | | $ | 77,571,448 | |
| Foreign currency, at value | | | | |
| (cost $185,611) | | | 185,269 | |
| Cash | | | 32,645 | |
| Prepaid expenses | | | 29,491 | |
| Receivables: | | | | |
| Dividends | | | 221,648 | |
| Fund shares sold | | | 99,477 | |
| Foreign taxes reclaim | | | 86,198 | |
| Investment advisor | | | 23,815 | |
| Total assets | | | 78,249,991 | |
| Liabilities: | | | | |
| Payable for: | | | | |
| Fund shares redeemed | | | 80,096 | |
| Management fees | | | 45,944 | |
| Custodian fees | | | 21,421 | |
| Distribution and service fees | | | 18,279 | |
| Fund accounting/administration fees | | | 9,845 | |
| Transfer agent/maintenance fees | | | 9,454 | |
| Trustees’ fees* | | | 393 | |
| Miscellaneous | | | 23,019 | |
| Total liabilities | | | 208,451 | |
| Net assets | | $ | 78,041,540 | |
| Net assets consist of: | | | | |
| Paid in capital | | $ | 95,877,415 | |
| Undistributed net investment income | | | 122,448 | |
| Accumulated net realized loss on investments | | | (22,500,242 | ) |
| Net unrealized appreciation on investments and | | | | |
| foreign currency | | | 4,541,919 | |
| Net assets | | $ | 78,041,540 | |
| A-Class: | | | | |
| Net assets | | $ | 71,865,067 | |
| Capital shares outstanding | | | 5,375,236 | |
| Net asset value per share | | $ | 13.37 | |
| Maximum offering price per share | | | | |
| (Net asset value divided by 95.25%) | | $ | 14.04 | |
| B-Class: | | | | |
| Net assets | | $ | 2,063,404 | |
| Capital shares outstanding | | | 177,389 | |
| Net asset value per share | | $ | 11.63 | |
| C-Class: | | | | |
| Net assets | | $ | 3,776,215 | |
| Capital shares outstanding | | | 328,716 | |
| Net asset value per share | | $ | 11.49 | |
| Institutional Class: | | | | |
| Net assets | | $ | 336,854 | |
| Capital shares outstanding | | | 25,404 | |
| Net asset value per share | | $ | 13.26 | |
| STATEMENT OF |
| OPERATIONS (Unaudited) |
| Period Ended March 31, 2014 |
| Investment Income: | | | | |
| Dividends (net of foreign withholding tax of $165,578) | | $ | 1,358,964 | |
| Total investment income | | | 1,358,964 | |
| | | | | |
| Expenses: | | | | |
| Management fees | | | 261,492 | |
| Transfer agent/maintenance fees: | | | | |
| A-Class | | | 52,491 | |
| B-Class | | | 10,576 | |
| C-Class | | | 5,645 | |
| Institutional Class | | | 208 | |
| Distribution and service fees: | | | | |
| A-Class | | | 85,704 | |
| C-Class | | | 18,239 | |
| Fund accounting/administration fees | | | 56,034 | |
| Legal fees | | | 88,413 | |
| Custodian fees | | | 22,270 | |
| Proxy expense | | | 8,081 | |
| Tax expense | | | 4,206 | |
| Trustees’ fees* | | | 3,085 | |
| Miscellaneous | | | 97,143 | |
| Total expenses | | | 713,587 | |
| Less: | | | | |
| Expenses waived by Advisor | | | (145,493 | ) |
| Net expenses | | | 568,094 | |
| Net investment income | | | 790,870 | |
| | | | | |
| Net Realized and Unrealized Gain (Loss): | | | | |
| Net realized gain (loss) on: | | | | |
| Investments | | | 1,306,020 | |
| Foreign currency | | | (13,519 | ) |
| Net realized gain | | | 1,292,501 | |
| Net change in unrealized appreciation (depreciation) on: | | | | |
| Investments | | | 3,383,860 | |
| Foreign currency | | | (1,158 | ) |
| Net change in unrealized appreciation (depreciation) | | | 3,382,702 | |
| Net realized and unrealized gain | | | 4,675,203 | |
| Net increase in net assets resulting from operations | | $ | 5,466,073 | |
* Relates to Trustees not deemed “interested persons” within the meaning of Section 2(a)(19) of the 1940 Act.
| SEE NOTES TO FINANCIAL STATEMENTS. | THE GUGGENHEIM FUNDS SEMI-ANNUAL REPORT | 33 |
| WORLD EQUITY INCOME FUND |
| |
| STATEMENTS OF CHANGES IN NET ASSETS |
| | | Period Ended | | | | |
| | | March 31, | | | Year Ended | |
| | | 2014 | | | September 30, | |
| | | (Unaudited) | | | 2013 | |
| | | | | | | | | |
| Increase (Decrease) In Net Assets From Operations: | | | | | | | | |
| Net investment income | | $ | 790,870 | | | $ | 1,126,395 | |
| Net realized gain on investments and foreign currency | | | 1,292,501 | | | | 6,107,494 | |
| Net change in unrealized appreciation (depreciation) on investments and foreign currency | | | 3,382,702 | | | | 7,243,481 | |
| Net increase in net assets resulting from operations | | | 5,466,073 | | | | 14,477,370 | |
| | | | | | | | | |
| Distributions to shareholders from: | | | | | | | | |
| Net investment income | | | | | | | | |
| A-Class | | | (984,130 | ) | | | (1,672,199 | ) |
| B-Class | | | (43,635 | ) | | | (73,946 | ) |
| C-Class | | | (27,121 | ) | | | (47,041 | ) |
| Institutional Class | | | (5,408 | ) | | | (4,606 | ) |
| Total distributions to shareholders | | | (1,060,294 | ) | | | (1,797,792 | ) |
| | | | | | | | | |
| Capital share transactions: | | | | | | | | |
| Proceeds from sale of shares | | | | | | | | |
| A-Class | | | 5,192,740 | | | | 15,420,639 | |
| B-Class | | | 10,197 | | | | 425,854 | |
| C-Class | | | 681,960 | | | | 688,147 | |
| Institutional Class | | | 97,959 | | | | 378,957 | |
| Distributions reinvested | | | | | | | | |
| A-Class | | | 977,713 | | | | 1,659,730 | |
| B-Class | | | 43,427 | | | | 73,635 | |
| C-Class | | | 26,522 | | | | 46,791 | |
| Institutional Class | | | 5,408 | | | | 4,606 | |
| Cost of shares redeemed | | | | | | | | |
| A-Class | | | (4,323,012 | ) | | | (24,573,617 | ) |
| B-Class | | | (487,843 | ) | | | (1,387,459 | ) |
| C-Class | | | (527,395 | ) | | | (952,484 | ) |
| Institutional Class | | | (35,018 | ) | | | (254,172 | ) |
| Net increase (decrease) from capital share transactions | | | 1,662,658 | | | | (8,469,373 | ) |
| Net increase (decrease) in net assets | | | 6,068,437 | | | | (4,210,205 | ) |
| | | | | | | | | |
| Net assets: | | | | | | | | |
| Beginning of period | | | 71,973,103 | | | | 67,762,898 | |
| End of period | | $ | 78,041,540 | | | $ | 71,973,103 | |
| Undistributed net investment income at end of period | | $ | 122,448 | | | $ | 391,872 | |
| | | | | | | | | |
| Capital share activity: | | | | | | | | |
| Shares sold | | | | | | | | |
| A-Class | | | 399,488 | | | | 1,314,259 | |
| B-Class | | | 893 | | | | 41,564 | |
| C-Class | | | 60,911 | | | | 68,601 | |
| Institutional Class | | | 7,571 | | | | 33,315 | |
| Shares issued from reinvestment of distributions | | | | | | | | |
| A-Class | | | 75,685 | | | | 148,443 | |
| B-Class | | | 3,882 | | | | 7,438 | |
| C-Class | | | 2,380 | | | | 5,072 | |
| Institutional Class | | | 422 | | | | 398 | |
| Shares redeemed | | | | | | | | |
| A-Class | | | (333,914 | ) | | | (2,089,282 | ) |
| B-Class | | | (43,273 | ) | | | (138,796 | ) |
| C-Class | | | (47,496 | ) | | | (95,590 | ) |
| Institutional Class | | | (2,709 | ) | | | (22,190 | ) |
| Net increase (decrease) in shares | | | 123,840 | | | | (726,768 | ) |
| 34 | THE GUGGENHEIM FUNDS SEMI-ANNUAL REPORT | SEE NOTES TO FINANCIAL STATEMENTS. |
| WORLD EQUITY INCOME FUND |
| |
| FINANCIAL HIGHLIGHTS |
This table is presented to show selected data for a share outstanding throughout each period and to assist shareholders in evaluating a Fund’s performance for the periods presented.
| | | Period Ended | | | Year Ended | | | Year Ended | | | Year Ended | | | Year Ended | | | Year Ended | |
| | | March 31, | | | September 30, | | | September 30, | | | September 30, | | | September 30, | | | September 30, | |
| A-Class | | 2014a | | | 2013 | | | 2012 | | | 2011 | | | 2010 | | | 2009 | |
| Per Share Data | | | | | | | | | | | | | | | | | | | | | | | | |
| Net asset value, beginning of period | | $ | 12.60 | | | $ | 10.55 | | | $ | 9.70 | | | $ | 10.52 | | | $ | 9.97 | | | $ | 10.35 | |
| Income (loss) from investment operations: | | | | | | | | | | | | | | | | | | | | | | | | |
| Net investment income (loss)b | | | .14 | | | | .18 | | | | .15 | | | | .05 | | | | .02 | | | | .05 | |
| Net gain (loss) on investments | | | | | | | | | | | | | | | | | | | | | | | | |
| (realized and unrealized) | | | .82 | | | | 2.16 | | | | .70 | | | | (.81 | ) | | | .53 | | | | (.35 | ) |
| Total from investment operations | | | .96 | | | | 2.34 | | | | .85 | | | | (.76 | ) | | | .55 | | | | (.30 | ) |
| Less distributions from: | | | | | | | | | | | | | | | | | | | | | | | | |
| Net investment income | | | (.19 | ) | | | (.29 | ) | | | (—) | c | | | (.06 | ) | | | — | | | | (.02 | ) |
| Return of capital | | | — | | | | — | | | | — | | | | — | | | | — | | | | (.06 | ) |
| Total distributions | | | (.19 | ) | | | (.29 | ) | | | (—) | c | | | (.06 | ) | | | — | | | | (.08 | ) |
| Net asset value, end of period | | $ | 13.37 | | | $ | 12.60 | | | $ | 10.55 | | | $ | 9.70 | | | $ | 10.52 | | | $ | 9.97 | |
| | | | | | | | | | | | | | | | | | | | | | | | | |
| Total Returnd | | | 7.64 | % | | | 22.58 | % | | | 8.82 | % | | | (7.32 | %) | | | 5.52 | % | | | (2.71 | %) |
| Ratios/Supplemental Data | | | | | | | | | | | | | | | | | | | | | | | | |
| Net assets, end of period (in thousands) | | $ | 71,865 | | | $ | 65,966 | | | $ | 61,838 | | | $ | 65,573 | | | $ | 78,201 | | | $ | 97,205 | |
| Ratios to average net assets: | | | | | | | | | | | | | | | | | | | | | | | | |
| Net investment income (loss) | | | 2.15 | % | | | 1.59 | % | | | 1.45 | % | | | 0.40 | % | | | 0.24 | % | | | 0.63 | % |
| Total expenses | | | 1.85 | % | | | 1.93 | % | | | 2.05 | % | | | 1.85 | % | | | 1.86 | % | | | 1.89 | % |
| Net expensese | | | 1.49 | %h | | | 1.59 | % | | | 1.63 | % | | | 1.82 | % | | | 1.86 | % | | | 1.89 | % |
| Portfolio turnover rate | | | 60 | % | | | 154 | % | | | 41 | % | | | 206 | % | | | 288 | % | | | 368 | % |
| | | Period Ended | | | Year Ended | | | Year Ended | | | Year Ended | | | Year Ended | | | Year Ended | |
| | | March 31, | | | September 30, | | | September 30, | | | September 30, | | | September 30, | | | September 30, | |
| B-Class | | 2014a,g | | | 2013g | | | 2012g | | | 2011g | | | 2010g | | | 2009g | |
| Per Share Data | | | | | | | | | | | | | | | | | | | | | | | | |
| Net asset value, beginning of period | | $ | 11.01 | | | $ | 9.22 | | | $ | 8.46 | | | $ | 9.19 | | | $ | 8.69 | | | $ | 9.05 | |
| Income (loss) from investment operations: | | | | | | | | | | | | | | | | | | | | | | | | |
| Net investment income (loss)b | | | .13 | | | | .18 | | | | .14 | | | | .05 | | | | .04 | | | | .07 | |
| Net gain (loss) on investments | | | | | | | | | | | | | | | | | | | | | | | | |
| (realized and unrealized) | | | .71 | | | | 1.90 | | | | .63 | | | | (.69 | ) | | | .46 | | | | (.32 | ) |
| Total from investment operations | | | .84 | | | | 2.08 | | | | .77 | | | | (.64 | ) | | | .50 | | | | (.25 | ) |
| Less distributions from: | | | | | | | | | | | | | | | | | | | | | | | | |
| Net investment income | | | (.22 | ) | | | (.29 | ) | | | (.01 | ) | | | (.09 | ) | | | — | | | | (.04 | ) |
| Return of capital | | | — | | | | — | | | | — | | | | — | | | | — | | | | (.07 | ) |
| Total distributions | | | (.22 | ) | | | (.29 | ) | | | (.01 | ) | | | (.09 | ) | | | — | | | | (.11 | ) |
| Net asset value, end of period | | $ | 11.63 | | | $ | 11.01 | | | $ | 9.22 | | | $ | 8.46 | | | $ | 9.19 | | | $ | 8.69 | |
| | | | | | | | | | | | | | | | | | | | | | | | | |
| Total Returnd | | | 7.75 | % | | | 22.95 | % | | | 9.07 | % | | | (7.13 | %) | | | 5.75 | % | | | (2.45 | %) |
| Ratios/Supplemental Data | | | | | | | | | | | | | | | | | | | | | | | | |
| Net assets, end of period (in thousands) | | $ | 2,063 | | | $ | 2,378 | | | $ | 2,820 | | | $ | 4,148 | | | $ | 6,769 | | | $ | 11,155 | |
| Ratios to average net assets: | | | | | | | | | | | | | | | | | | | | | | | | |
| Net investment income (loss) | | | 2.33 | % | | | 1.77 | % | | | 1.60 | % | | | 0.53 | % | | | 0.45 | % | | | 0.90 | % |
| Total expenses | | | 2.40 | % | | | 2.43 | % | | | 2.34 | % | | | 1.61 | % | | | 1.61 | % | | | 1.65 | % |
| Net expensese | | | 1.24 | %h | | | 1.31 | % | | | 1.38 | % | | | 1.59 | % | | | 1.61 | % | | | 1.65 | % |
| Portfolio turnover rate | | | 60 | % | | | 154 | % | | | 41 | % | | | 206 | % | | | 288 | % | | | 368 | % |
| SEE NOTES TO FINANCIAL STATEMENTS. | THE GUGGENHEIM FUNDS SEMI-ANNUAL REPORT | 35 |
| WORLD EQUITY INCOME FUND |
| |
| FINANCIAL HIGHLIGHTS (concluded) |
This table is presented to show selected data for a share outstanding throughout each period and to assist shareholders in evaluating a Fund’s performance for the periods presented.
| | | Period Ended | | | Year Ended | | | Year Ended | | | Year Ended | | | Year Ended | | | Year Ended | |
| | | March 31, | | | September 30, | | | September 30, | | | September 30, | | | September 30, | | | September 30, | |
| C-Class | | 2014a | | | 2013 | | | 2012 | | | 2011 | | | 2010 | | | 2009 | |
| Per Share Data | | | | | | | | | | | | | | | | | | | | | | | | |
| Net asset value, beginning of period | | $ | 10.79 | | | $ | 9.01 | | | $ | 8.33 | | | $ | 9.06 | | | $ | 8.66 | | | $ | 9.04 | |
| Income (loss) from investment operations: | | | | | | | | | | | | | | | | | | | | | | | | |
| Net investment income (loss)b | | | .08 | | | | .08 | | | | .06 | | | | (.04 | ) | | | (.04 | ) | | | (.01 | ) |
| Net gain (loss) on investments (realized and unrealized) | | | .70 | | | | 1.84 | | | | .62 | | | | (.69 | ) | | | .44 | | | | (.31 | ) |
| Total from investment operations | | | .78 | | | | 1.92 | | | | .68 | | | | (.73 | ) | | | .40 | | | | (.32 | ) |
| Less distributions from: | | | | | | | | | | | | | | | | | | | | | | | | |
| Net investment income | | | (.08 | ) | | | (.14 | ) | | | — | | | | — | | | | — | | | | — | |
| Return of capital | | | — | | | | — | | | | — | | | | — | | | | — | | | | (.06 | ) |
| Total distributions | | | (.08 | ) | | | (.14 | ) | | | — | | | | — | | | | — | | | | (.06 | ) |
| Net asset value, end of period | | $ | 11.49 | | | $ | 10.79 | | | $ | 9.01 | | | $ | 8.33 | | | $ | 9.06 | | | $ | 8.66 | |
| | | | | | | | | | | | | | | | | | | | | | | | | |
| Total Returnd | | | 7.26 | % | | | 21.57 | % | | | 8.16 | % | | | (8.06 | %) | | | 4.62 | % | | | (3.39 | %) |
| Ratios/Supplemental Data | | | | | | | | | | | | | | | | | | | | | | | | |
| Net assets, end of period (in thousands) | | $ | 3,776 | | | $ | 3,377 | | | $ | 3,015 | | | $ | 3,426 | | | $ | 4,295 | | | $ | 4,838 | |
| Ratios to average net assets: | | | | | | | | | | | | | | | | | | | | | | | | |
| Net investment income (loss) | | | 1.42 | % | | | 0.80 | % | | | 0.68 | % | | | (0.37 | %) | | | (0.50 | %) | | | (0.11 | %) |
| Total expenses | | | 2.75 | % | | | 2.89 | % | | | 2.88 | % | | | 2.60 | % | | | 2.62 | % | | | 2.65 | % |
| Net expensese | | | 2.24 | %h | | | 2.35 | % | | | 2.38 | % | | | 2.58 | % | | | 2.62 | % | | | 2.65 | % |
| Portfolio turnover rate | | | 60 | % | | | 154 | % | | | 41 | % | | | 206 | % | | | 288 | % | | | 368 | % |
| | | Period Ended | | | Year Ended | | | Year Ended | | | Period Ended | |
| | | March 31, | | | September 30, | | | September 30, | | | September 30, | |
| Institutional Class | | 2014a | | | 2013 | | | 2012 | | | 2011f | |
| Per Share Data | | | | | | | | | | | | | | | | |
| Net asset value, beginning of period | | $ | 12.53 | | | $ | 10.50 | | | $ | 9.70 | | | $ | 12.37 | |
| Income (loss) from investment operations: | | | | | | | | | | | | | | | | |
| Net investment income (loss)b | | | .16 | | | | .28 | | | | .28 | | | | .13 | |
| Net gain (loss) on investments (realized and unrealized) | | | .80 | | | | 2.10 | | | | .52 | | | | (2.80 | ) |
| Total from investment operations | | | .96 | | | | 2.38 | | | | .80 | | | | (2.67 | ) |
| Less distributions from: | | | | | | | | | | | | | | | | |
| Net investment income | | | (.23 | ) | | | (.35 | ) | | | (—) | c | | | — | |
| Total distributions | | | (.23 | ) | | | (.35 | ) | | | (—) | c | | | — | |
| Net asset value, end of period | | $ | 13.26 | | | $ | 12.53 | | | $ | 10.50 | | | $ | 9.70 | |
| | | | | | | | | | | | | | | | | |
| Total Returnd | | | 7.72 | % | | | 23.17 | % | | | 8.17 | % | | | (21.58 | %) |
| Ratios/Supplemental Data | | | | | | | | | | | | | | | | |
| Net assets, end of period (in thousands) | | $ | 337 | | | $ | 252 | | | $ | 90 | | | $ | 285 | |
| Ratios to average net assets: | | | | | | | | | | | | | | | | |
| Net investment income (loss) | | | 2.45 | % | | | 2.42 | % | | | 2.70 | % | | | 2.99 | % |
| Total expenses | | | 1.60 | % | | | 1.73 | % | | | 1.90 | % | | | 2.27 | % |
| Net expensese | | | 1.24 | %h | | | 1.26 | % | | | 1.32 | % | | | 1.36 | % |
| Portfolio turnover rate | | | 60 | % | | | 154 | % | | | 41 | % | | | 206 | % |
| a | Unaudited figures for the period ended March 31, 2014. Percentage amounts for the period, except total return and portfolio turnover rate, have been annualized. |
| b | Net investment income (loss) per share was computed using average shares outstanding throughout the period. |
| c | Distributions from net investment income are less than $0.01 per share. |
| d | Total return does not reflect the impact of any applicable sales charges and has not been annualized. |
| e | Net expense information reflects the expense ratios after expense waivers and reimbursements, as applicable. |
| f | Since commencement of operations: May 2, 2011. Percentage amounts for the period, except total return and portfolio turnover rate, have been annualized. The portfolio turnover rate stated is for the entire fiscal year of the Fund, not since commencement of operations of the Class. |
| g | Effective August 25, 2005, B-Class shares ceased charging 12b-1 fees in accordance with FINRA sales cap regulations. Per share informations reflects this change. This fee will be reinstated when sales exceed the sales cap limit. |
| h | Net expenses include extraordinary expenses. Excluding extraordinary expenses, the operating expense ratio would be 1.46%, 1.21%, 2.21% and 1.21% for the A-Class, B-Class, C-Class and Institutional Class, respectively. |
| 36 | THE GUGGENHEIM FUNDS SEMI-ANNUAL REPORT | SEE NOTES TO FINANCIAL STATEMENTS. |
| FUND PROFILE (Unaudited) | March 31, 2014 |
RISK MANAGED REAL ESTATE FUND
OBJECTIVE: Seeks to provide total return, comprised of capital appreciation and current income.
Holdings Diversification
(Market Exposure as % of Net Assets)
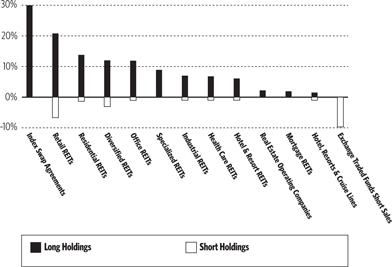
“Holdings Diversification (Market Exposure as % of Net Assets)” excludes any temporary cash investments.
| Inception Dates: |
| A-Class | March 28, 2014 |
| C-Class | March 28, 2014 |
| Institutional Class | March 28, 2014 |
| Ten Largest Holdings (% of Total Net Assets) |
| Simon Property Group, Inc. | | | 6.6 | % |
| Boston Properties, Inc. | | | 3.1 | % |
| Vornado Realty Trust | | | 3.0 | % |
| WP Carey, Inc. | | | 2.8 | % |
| Camden Property Trust | | | 2.5 | % |
| Spirit Realty Capital, Inc. | | | 2.5 | % |
| Prologis, Inc. | | | 2.5 | % |
| Sun Communities, Inc. | | | 2.5 | % |
| Forest City Enterprises, Inc. — Class A | | | 2.2 | % |
| Ventas, Inc. | | | 2.2 | % |
| Top Ten Total | | | 29.9 | % |
| | THE GUGGENHEIM FUNDS SEMI-ANNUAL REPORT | 37 |
| SCHEDULE OF INVESTMENTS (Unaudited) | March 31, 2014 |
| RISK MANAGED REAL ESTATE FUND | |
| | | Shares | | | Value | |
| | | | | | | |
| COMMON STOCKS† - 92.6% | | | | | | | | |
| | | | | | | | | |
| REAL ESTATE INVESTMENT TRUSTS (REITs) - 88.9% | | | | | | | | |
| RETAIL REITs - 20.8% | | | | | | | | |
| Simon Property Group, Inc. | | | 4,083 | | | $ | 669,613 | |
| Glimcher Realty Trust | | | 19,770 | | | | 198,293 | |
| General Growth Properties, Inc.1 | | | 8,955 | | | | 197,010 | |
| Retail Properties of America, Inc. — Class A | | | 13,497 | | | | 182,749 | |
| Taubman Centers, Inc. | | | 2,549 | | | | 180,444 | |
| Ramco-Gershenson Properties Trust | | | 10,569 | | | | 172,275 | |
| Retail Opportunity Investments Corp. | | | 10,068 | | | | 150,416 | |
| Regency Centers Corp. | | | 2,102 | | | | 107,328 | |
| Kimco Realty Corp. | | | 4,900 | | | | 107,212 | |
| Pennsylvania Real Estate Investment Trust | | | 4,425 | | | | 79,871 | |
| DDR Corp. | | | 3,647 | | | | 60,103 | |
| Total Retail REITs | | | | | | | 2,105,314 | |
| | | | | | | | | |
| RESIDENTIAL REITs - 13.8% | | | | | | | | |
| Camden Property Trust | | | 3,754 | | | | 252,795 | |
| Sun Communities, Inc. | | | 5,485 | | | | 247,319 | |
| Equity Residential | | | 3,717 | | | | 215,549 | |
| American Campus Communities, Inc. | | | 4,984 | | | | 186,152 | |
| Equity Lifestyle Properties, Inc. | | | 4,480 | | | | 182,112 | |
| Essex Property Trust, Inc.1 | | | 1,052 | | | | 178,893 | |
| UDR, Inc. | | | 3,004 | | | | 77,593 | |
| AvalonBay Communities, Inc. | | | 387 | | | | 50,821 | |
| Total Residential REITs | | | | | | | 1,391,234 | |
| | | | | | | | | |
| DIVERSIFIED REITs - 11.9% | | | | | | | | |
| Vornado Realty Trust1 | | | 3,074 | | | | 302,973 | |
| WP Carey, Inc.1 | | | 4,748 | | | | 285,212 | |
| Spirit Realty Capital, Inc. | | | 22,805 | | | | 250,399 | |
| Duke Realty Corp. | | | 10,929 | | | | 184,482 | |
| Empire State Realty Trust, Inc. — Class A | | | 12,169 | | | | 183,874 | |
| Total Diversified REITs | | | | | | | 1,206,940 | |
| | | | | | | | | |
| OFFICE REITs - 11.8% | | | | | | | | |
| Boston Properties, Inc. | | | 2,722 | | | | 311,750 | |
| Hudson Pacific Properties, Inc. | | | 9,040 | | | | 208,553 | |
| SL Green Realty Corp. | | | 1,487 | | | | 149,622 | |
| Douglas Emmett, Inc. | | | 5,292 | | | | 143,625 | |
| Highwoods Properties, Inc. | | | 2,668 | | | | 102,478 | |
| Brandywine Realty Trust | | | 6,517 | | | | 94,236 | |
| BioMed Realty Trust, Inc. | | | 3,911 | | | | 80,136 | |
| Kilroy Realty Corp. | | | 993 | | | | 58,170 | |
| Digital Realty Trust, Inc. | | | 965 | | | | 51,222 | |
| Total Office REITs | | | | | | | 1,199,792 | |
| | | | | | | | | |
| SPECIALIZED REITs - 8.9% | | | | | | | | |
| Extra Space Storage, Inc. | | | 3,354 | | | | 162,702 | |
| Crown Castle International Corp. | | | 2,157 | | | | 159,143 | |
| Plum Creek Timber Company, Inc. | | | 3,701 | | | | 155,590 | |
| Public Storage | | | 847 | | | | 142,711 | |
| American Tower Corp. — Class A | | | 1,434 | | | | 117,402 | |
| Rayonier, Inc. | | | 2,272 | | | | 104,308 | |
| Sovran Self Storage, Inc. | | | 734 | | | | 53,912 | |
| Total Specialized REITs | | | | | | | 895,768 | |
| | | | | | | | | |
| INDUSTRIAL REITs - 7.0% | | | | | | | | |
| Prologis, Inc.1 | | | 6,070 | | | | 247,837 | |
| DCT Industrial Trust, Inc. | | | 25,545 | | | | 201,295 | |
| EastGroup Properties, Inc. | | | 3,115 | | | | 195,965 | |
| STAG Industrial, Inc. | | | 2,662 | | | | 64,154 | |
| Total Industrial REITs | | | | | | | 709,251 | |
| | | | | | | | | |
| HEALTH CARE REITs - 6.8% | | | | | | | | |
| Ventas, Inc.1 | | | 3,602 | | | | 218,173 | |
| Sabra Health Care REIT, Inc. | | | 5,946 | | | | 165,834 | |
| Healthcare Trust of America, Inc. — Class A | | | 12,552 | | | | 142,967 | |
| HCP, Inc. | | | 2,166 | | | | 84,019 | |
| Health Care REIT, Inc. | | | 1,234 | | | | 73,546 | |
| Total Health Care REITs | | | | | | | 684,539 | |
| | | | | | | | | |
| HOTEL & RESORT REITs - 6.0% | | | | | | | | |
| Sunstone Hotel Investors, Inc. | | | 15,737 | | | | 216,069 | |
| RLJ Lodging Trust | | | 7,608 | | | | 203,438 | |
| Chesapeake Lodging Trust | | | 7,186 | | | | 184,896 | |
| Host Hotels & Resorts, Inc. | | | 447 | | | | 9,047 | |
| Total Hotel & Resort REITs | | | | | | | 613,450 | |
| MORTGAGE REITs - 1.9% | | | | | | | | |
| Blackstone Mortgage Trust, Inc. — Class A | | | 6,604 | | | | 189,865 | |
| Total Real Estate Investment Trusts (REITs) | | | | | | | 8,996,153 | |
| REAL ESTATE MANAGEMENT & DEVELOPMENT - 2.2% | | | | | | | | |
| REAL ESTATE OPERATING COMPANIES - 2.2% | | | | | | | | |
| Forest City Enterprises, Inc. — Class A* | | | 11,499 | | | | 219,631 | |
| HOTELS, RESTAURANTS & LEISURE - 1.5% | | | | | | | | |
| HOTELS, RESORTS & CRUISE LINES - 1.5% | | | | | | | | |
| Starwood Hotels & Resorts Worldwide, Inc. | | | 1,947 | | | | 154,981 | |
| Total Common Stocks | | | | | | | | |
| (Cost $9,299,459) | | | | | | | 9,370,765 | |
| Total Investments - 92.6% | | | | | | | | |
| (Cost $9,299,459) | | | | | | $ | 9,370,765 | |
| COMMON STOCKS SOLD SHORT† - 16.1% | | | | | | | | |
| HOTELS, RESTAURANTS & LEISURE - 1.0% | | | | | | | | |
| HOTELS, RESORTS & CRUISE LINES - 1.0% | | | | | | | | |
| Hilton Worldwide Holdings, Inc.* | | | (4,532 | ) | | | (100,792 | ) |
| REAL ESTATE INVESTMENT TRUSTS (REITs) - 15.1% | | | | | | | | |
| HEALTH CARE REITs - 1.0% | | | | | | | | |
| Omega Healthcare Investors, Inc. | | | (3,024 | ) | | | (101,364 | ) |
| INDUSTRIAL REITs - 1.0% | | | | | | | | |
| First Industrial Realty Trust, Inc. | | | (5,442 | ) | | | (105,139 | ) |
| HOTEL & RESORT REITs - 1.0% | | | | | | | | |
| Hospitality Properties Trust | | | (3,664 | ) | | | (105,230 | ) |
| OFFICE REITs - 1.0% | | | | | | | | |
| Government Properties Income Trust | | | (4,206 | ) | | | (105,991 | ) |
| 38 | THE GUGGENHEIM FUNDS SEMI-ANNUAL REPORT | SEE NOTES TO FINANCIAL STATEMENTS. |
| SCHEDULE OF INVESTMENTS (Unaudited)(concluded) | March 31, 2014 |
| RISK MANAGED REAL ESTATE FUND |
| | | Shares | | | Value | |
| | | | | | | |
| RESIDENTIAL REITs - 1.4% | | | | | | | | |
| Apartment Investment & | | | | | | | | |
| Management Co. — Class A | | | (2,262 | ) | | $ | (68,358 | ) |
| Home Properties, Inc. | | | (1,196 | ) | | | (71,904 | ) |
| Total Residential REITs | | | | | | | (140,262 | ) |
| | | | | | | | | |
| DIVERSIFIED REITs - 3.1% | | | | | | | | |
| Washington Real Estate Investment Trust | | | (4,227 | ) | | | (100,941 | ) |
| Liberty Property Trust | | | (2,768 | ) | | | (102,305 | ) |
| Cousins Properties, Inc. | | | (9,846 | ) | | | (112,934 | ) |
| Total Diversified REITs | | | | | | | (316,180 | ) |
| | | | | | | | | |
| RETAIL REITs - 6.6% | | | | | | | | |
| Rouse Properties, Inc. | | | (3,990 | ) | | | (68,788 | ) |
| Weingarten Realty Investors | | | (3,091 | ) | | | (92,730 | ) |
| National Retail Properties, Inc. | | | (2,766 | ) | | | (94,929 | ) |
| Realty Income Corp. | | | (2,503 | ) | | | (102,273 | ) |
| Brixmor Property Group, Inc. | | | (4,820 | ) | | | (102,811 | ) |
| Federal Realty Investment Trust | | | (917 | ) | | | (105,198 | ) |
| Tanger Factory Outlet Centers, Inc. | | | (3,127 | ) | | | (109,445 | ) |
| Total Retail REITs | | | | | | | (676,174 | ) |
| Total Real Estate Investment Trusts (REITs) | | | | | | | (1,550,340 | ) |
| Total Common Stocks Sold Short | | | | | | | | |
| (Cost $1,641,779) | | | | | | | (1,651,132 | ) |
| | | | | | | | | |
| EXCHANGE TRADED FUNDS SOLD SHORT† - (9.7)% | | | | | | | | |
| iShares US Real Estate ETF | | | 14,423 | | | | (976,004 | ) |
| Total Exchange Traded Funds Sold Short | | | | | | | | |
| (Proceeds $970,491) | | | | | | | (976,004 | ) |
| Total Securities Sold Short - (25.8)% | | | | | | | | |
| (Proceeds $2,612,270) | | | | | | $ | (2,627,136 | ) |
| Other Assets & Liabilities, net - 33.2% | | | | | | | 3,355,939 | |
| Total Net Assets - 100.0% | | | | | | $ | 10,099,568 | |
| | | | | | Unrealized | |
| | | Units | | | Gain | |
| | | | | | | |
| OTC EQUITY INDEX SWAP AGREEMENTS†† | | | | | | | | |
| Bank of America Corp. | | | | | | | | |
| May 2014 Merrill Lynch | | | | | | | | |
| Guggenheim Real Estate | | | | | | | | |
| Investment Trust Basket Index Swap, | | | | | | | | |
| Terminating 05/05/142 | | | | | | | | |
| (Notional Value $3,024,944) | | | 29,776 | | | $ | 23,175 | |
| * | Non-income producing security. |
| † | Value determined based on Level 1 inputs — See Note 4. |
| †† | Value determined based on Level 2 inputs — See Note 4. |
| 1 | All or a portion of this security is pledged as short security collateral at March 31, 2014. |
| 2 | Total Return based on Merrill Lynch Guggenheim Real Estate Investment Trust Basket Index +/- financing at a variable rate. REIT — Real Estate Investment Trust |
| SEE NOTES TO FINANCIAL STATEMENTS. | THE GUGGENHEIM FUNDS SEMI-ANNUAL REPORT | 39 |
| RISK MANAGED REAL ESTATE FUND |
| |
| STATEMENT OF ASSETS |
| AND LIABILITIES (Unaudited) |
March 31, 2014
| Assets: | | | | |
| Investments, at value | | | | |
| (cost $9,299,459) | | $ | 9,370,765 | |
| Cash | | | 10,010,050 | |
| Unrealized appreciation on swap agreements | | | 23,175 | |
| Receivables: | | | | |
| Securities sold | | | 2,636,884 | |
| Fund shares sold | | | 10,025 | |
| Investment advisor | | | 302 | |
| Total assets | | | 22,051,201 | |
| Liabilities: | | | | |
| Securities sold short, at value | | | | |
| (proceeds $2,612,270) | | | 2,627,136 | |
| Payable for: | | | | |
| Securities purchased | | | 9,323,893 | |
| Management fees | | | 206 | |
| Fund accounting/administration fees | | | 26 | |
| Trustees’ fees* | | | 19 | |
| Transfer agent/maintenance fees | | | 17 | |
| Miscellaneous | | | 336 | |
| Total liabilities | | | 11,951,633 | |
| Net assets | | $ | 10,099,568 | |
| Net assets consist of: | | | | |
| Paid in capital | | $ | 10,020,074 | |
| Accumulated net investment loss | | | (302 | ) |
| Accumulated net realized gain on investments | | | 181 | |
| Net unrealized appreciation on investments | | | 79,615 | |
| Net assets | | $ | 10,099,568 | |
| A-class: | | | | |
| Net assets | | $ | 10,104 | |
| Capital shares outstanding | | | 401 | |
| Net asset value per share | | $ | 25.20 | |
| Maximum offering price per share | | | | |
| (Net asset value divided by 95.25%) | | $ | 26.46 | |
| C-class: | | | | |
| Net assets | | $ | 10,104 | |
| Capital shares outstanding | | | 401 | |
| Net asset value per share | | $ | 25.20 | |
| Institutional Class: | | | | |
| Net assets | | $ | 10,079,360 | |
| Capital shares outstanding | | | 400,001 | |
| Net asset value per share | | $ | 25.20 | |
| STATEMENT OF |
| OPERATIONS (Unaudited) |
Period Ended March 31, 2014**
| Investment Income: | | $ | — | |
| | | | | |
| Expenses: | | | | |
| Management fees | | | 206 | |
| Transfer agent/maintenance fees: | | | | |
| A-Class | | | 7 | |
| C-Class | | | 1 | |
| Institutional Class | | | 11 | |
| Fund accounting/administration fees | | | 26 | |
| Professional fees | | | 133 | |
| Printing expenses | | | 109 | |
| Legal fees | | | 55 | |
| Trustees’ fees* | | | 19 | |
| Custodian fees | | | 16 | |
| Miscellaneous | | | 21 | |
| Total expenses | | | 604 | |
| Less: | | | | |
| Expenses waived by Advisor | | | (302 | ) |
| Net expenses | | | 302 | |
| Net investment loss | | | (302 | ) |
| | | | | |
| Net Realized And Unrealized Gain (loss): | | | | |
| Net realized gain (loss) on: | | | | |
| Investments | | | 181 | |
| Net realized gain | | | 181 | |
| Net change in unrealized appreciation (depreciation) on: | | | | |
| Investments | | | 71,306 | |
| Securities sold short | | | (14,866 | ) |
| Swap agreements | | | 23,175 | |
| Net change in unrealized appreciation (depreciation) | | | 79,615 | |
| Net realized and unrealized gain | | | 79,796 | |
| Net increase in net assets resulting from operations | | $ | 79,494 | |
| * | Relates to Trustees not deemed “interested persons” within the meaning of Section 2(a)(19) of the 1940 Act. |
| ** | Since commencement of operations: March 31, 2014. |
| 40 | THE GUGGENHEIM FUNDS SEMI-ANNUAL REPORT | SEE NOTES TO FINANCIAL STATEMENTS. |
| RISK MANAGED REAL ESTATE FUND |
| |
| STATEMENT OF CHANGES IN NET ASSETS |
| | | Period Ended | |
| | | March 31, | |
| | | 2014a | |
| | | | |
| Increase (Decrease) In Net Assets From Operations: | | | | |
| Net investment loss | | $ | (302 | ) |
| Net realized gain on investments | | | 181 | |
| Net change in unrealized appreciation (depreciation) on investments | | | 79,615 | |
| Net increase in net assets resulting from operations | | | 79,494 | |
| | | | | |
| Capital share transactions: | | | | |
| Proceeds from sale of shares | | | | |
| A-Class | | | 10,025 | |
| C-Class | | | 10,025 | |
| Institutional Class | | | 10,000,024 | |
| Net increase from capital share transactions | | | 10,020,074 | |
| Net increase in net assets | | | 10,099,568 | |
| | | | | |
| Net assets: | | | | |
| Beginning of period | | | — | |
| End of period | | $ | 10,099,568 | |
| Accumulated net investment loss at end of period | | $ | (302 | ) |
| | | | | |
| Capital share activity: | | | | |
| Shares sold | | | | |
| A-Class | | | 401 | |
| C-Class | | | 401 | |
| Institutional Class | | | 400,001 | |
| Net increase from capital share transactions | | | 400,803 | |
| a | Since commencement of operations: March 31, 2014. |
| SEE NOTES TO FINANCIAL STATEMENTS. | THE GUGGENHEIM FUNDS SEMI-ANNUAL REPORT | 41 |
| RISK MANAGED REAL ESTATE FUND |
| |
| FINANCIAL HIGHLIGHTS |
This table is presented to show selected data for a share outstanding throughout each period and to assist shareholders in evaluating a Fund’s performance for the periods presented.
| | | Period Ended | |
| | | March 31, | |
| A-Class | | 2014a | |
| Per Share Data | | | | |
| Net asset value, beginning of period | | $ | 25.00 | |
| Income (loss) from investment operations: | | | | |
| Net investment income (loss)b | | | (—) | f |
| Net gain (loss) on investments | | | | |
| (realized and unrealized) | | | 0.20 | |
| Total from investment operations | | | 0.20 | |
| Net asset value, end of period | | $ | 25.20 | |
| | | | | |
| Total Return | | | 0.80 | % |
| Ratios/Supplemental Data | | | | |
| Net assets, end of period (in thousands) | | $ | 10 | |
| Ratios to average net assets: | | | | |
| Net investment income (loss) | | | (1.27 | %) |
| Total expensesc,e | | | 26.18 | % |
| Net expensesd | | | 1.27 | % |
| Portfolio turnover rate | | | — | |
| | | Period Ended | |
| | | March 31, | |
| C-Class | | 2014a | |
| Per Share Data | | | | |
| Net asset value, beginning of period | | $ | 25.00 | |
| Income (loss) from investment operations: | | | | |
| Net investment income (loss)b | | | (—) | f |
| Net gain (loss) on investments | | | | |
| (realized and unrealized) | | | 0.20 | |
| Total from investment operations | | | 0.20 | |
| Net asset value, end of period | | $ | 25.20 | |
| | | | | |
| Total Return | | | 0.80 | % |
| Ratios/Supplemental Data | | | | |
| Net assets, end of period (in thousands) | | $ | 10 | |
| Ratios to average net assets: | | | | |
| Net investment income (loss) | | | (2.04 | %) |
| Total expensesc,e | | | 3.17 | % |
| Net expensesd | | | 2.04 | % |
| Portfolio turnover rate | | | — | |
| 42 | THE GUGGENHEIM FUNDS SEMI-ANNUAL REPORT | SEE NOTES TO FINANCIAL STATEMENTS. |
| RISK MANAGED REAL ESTATE FUND |
| |
| FINANCIAL HIGHLIGHTS (concluded) |
This table is presented to show selected data for a share outstanding throughout each period and to assist shareholders in evaluating a Fund’s performance for the periods presented.
| | | Period Ended | |
| | | March 31, | |
| Institutional Class | | 2014a | |
| Per Share Data | | | | |
| Net asset value, beginning of period | | $ | 25.00 | |
| Income (loss) from investment operations: | | | | |
| Net investment income (loss)b | | | (—) | f |
| Net gain (loss) on investments | | | | |
| (realized and unrealized) | | | 0.20 | |
| Total from investment operations | | | 0.20 | |
| Net asset value, end of period | | $ | 25.20 | |
| | | | | |
| Total Return | | | 0.80 | % |
| Ratios/Supplemental Data | | | | |
| Net assets, end of period (in thousands) | | $ | 10,079 | |
| Ratios to average net assets: | | | | |
| Net investment income (loss) | | | (1.10 | %) |
| Total expensesc,e | | | 2.18 | % |
| Net expensesd | | | 1.10 | % |
| Portfolio turnover rate | | | — | |
| a | Since commencement of operations: March 31, 2014. Percentage amounts for the period, except total return and portfolio turnover rate, have been annualized. |
| b | Net investment income (loss) per share was computed using average shares outstanding throughout the period. |
| c | Does not include expenses of the underlying funds in which the Fund invests. |
| d | Net expense information reflects the expense ratios after expense waivers. |
| e | Due to limited length of Fund operations, ratios for this period are not indicative of future performance. |
| f | Net investment income (loss) is less than $0.01 per share. |
| SEE NOTES TO FINANCIAL STATEMENTS. | THE GUGGENHEIM FUNDS SEMI-ANNUAL REPORT | 43 |
| NOTES TO FINANCIAL STATEMENTS (Unaudited) |
1. Organization and Significant Accounting Policies
Organization
Guggenheim Funds Trust (the “Trust”), a Delaware statutory trust, is registered with the SEC under the Investment Company Act of 1940 (“1940 Act”), as a non-diversified, open-ended investment company of the series type. Each series, in effect, is representing a separate Fund. The Trust is authorized to issue an unlimited number of shares. The Trust accounts for the assets of each Fund separately.
The Trust offers a combination of four separate classes of shares, A-Class shares, B-Class shares, C-Class shares and Institutional Class shares. Sales of shares of each Class are made without a front-end sales charge at the net asset value (“NAV”), with the exception of A-Class shares. A-Class shares are sold at the NAV, plus the applicable front-end sales charge. The sales charge varies depending on the amount purchased, but will not exceed 4.75%. Prior to February 22, 2011, the maximum sales charge was 5.75%. A-Class share purchases of $1 million or more are exempt from the front-end sales charge but have a 1% contingent deferred sales charge (“CDSC”), if shares are redeemed within 12 months of purchase. B-Class shares were offered without a front-end sales charge, but were subject to a CDSC of up to 5% for five years and convert to A-Class shares after eight years. Effective January 4, 2010, subscriptions for B-Class shares are no longer accepted. C-Class shares have a 1% CDSC if shares are redeemed within 12 months of purchase. Institutional Class shares are offered primarily for direct investment by institutions such as pension and profit sharing plans, endowments, foundations and corporations. Institutional Class shares have a minimum initial investment of $2 million and a minimum account balance of $1 million. Institutional Class shares are offered without a front-end sales charge or a CDSC.
At March 31, 2014, the Trust consisted of sixteen separate funds. This report covers certain Equity Funds (the “Funds”), while the other funds are contained in separate reports. Only A-Class, B-Class, C-Class and Institutional Class shares had been issued by the Funds.
Guggenheim Investments (“GI”) provides advisory services and Rydex Fund Services, LLC (“RFS”) provides transfer agent, administrative and accounting services to the Trust. Guggenheim Funds Distributors, LLC (“GFD”) acts as principal underwriter for the Trust. GI, RFS and GFD are affiliated entities.
Significant Accounting Policies
The following significant accounting policies are in conformity with U.S. generally accepted accounting principles (“U.S. GAAP”) and are consistently followed by the Trust. This requires management to make estimates and assumptions that affect the reported amount of assets and liabilities and disclosure of contingent assets and liabilities at the date of the financial statements and the reported amounts of revenues and expenses during the reporting period. Actual results could differ from these estimates. All time references are based on Eastern Time.
A. Valuations of the Funds’ securities are supplied primarily by pricing services approved by the Board of Trustees. A Valuation Committee (“Valuation Committee”) is responsible for the oversight of the valuation process of the Funds and convenes monthly, or more frequently as needed. The Valuation Committee will review the valuation of all assets which have been fair valued for reasonableness. The Trust’s officers, through the Valuation Committee under the general supervision of the Board of Trustees, regularly review procedures used by, and valuations provided by, the pricing services.
Equity securities listed on an exchange (New York Stock Exchange (“NYSE”) or American Stock Exchange) are valued at the last quoted sales price as of the close of business on the NYSE, usually 4:00 p.m. on the valuation date. Equity securities listed on the NASDAQ market system are valued at the NASDAQ Official Closing Price on the valuation date, which may not necessarily represent the last sale price. If there has been no sale on such exchange or NASDAQ on such day, the security is valued at the closing bid price on such day.
Open-end investment companies (“Mutual Funds”) are valued at their NAV as of the close of business on the valuation date. Exchange Traded Funds (“ETFs”) and closed-end investment companies are valued at the last quoted sales price.
Debt securities with a maturity of greater than 60 days at acquisition are valued at prices that reflect broker/dealer supplied valuations or are obtained from independent pricing services, which may consider the trade activity, treasury spreads, yields or price of bonds of comparable quality, coupon, maturity, and type, as well as prices quoted by dealers who make markets in such securities. Short-term debt securities with a maturity of 60 days or
| 44 | THE GUGGENHEIM FUNDS SEMI-ANNUAL REPORT | |
| NOTES TO FINANCIAL STATEMENTS (Unaudited)(continued) |
less at acquisition and repurchase agreements are valued at amortized cost, which approximates market value.
Listed options are valued at the Official Settlement Price listed by the exchange, usually as of 4:00 p.m. Long options are valued using the bid price and short options are valued using the ask price. In the event that a settlement price is not available, fair valuation is enacted. Over-the-counter options are valued using the average bid price (for long options), or average ask price (for short options) obtained from one or more security dealers.
Premiums received from options written are entered in a Fund’s accounting records as an asset and equivalent liability. The amount of the liability is subsequently marked-to-market to reflect the current value of the option written. When an option written expires, or if a Fund enters into a closing purchase transaction, it realizes a gain (or loss if the cost of a closing purchase transaction exceeds the premium received when the option was sold).
Typically loans are valued using information provided by an independent third party pricing service which uses broker quotes in a non-active market, or price derived from significant observable inputs and is also compared to broker quote (matrixed). If the pricing service cannot or does not provide a valuation for a particular loan or such valuation is deemed unreliable, such loan is fair valued by the Valuation Committee.
The value of futures contracts is accounted for using the unrealized gain or loss on the contracts that is determined by marking the contracts to their current realized settlement prices. Financial futures contracts are valued at the 4:00 p.m. price on the valuation date. In the event that the exchange for a specific futures contract closes earlier than 4:00 p.m., the futures contract is valued at the Official Settlement Price of the exchange. However, the underlying securities from which the futures contract value is derived are monitored until 4:00 p.m. to determine if fair valuation would provide a more accurate valuation.
The value of index swap agreements entered into by a Fund is accounted for using the unrealized gain or loss on the agreements that is determined by marking the agreements to the last quoted value of the index that the swap pertains to at the close of the NYSE. The swap’s market value is then adjusted to include dividends accrued, and financing charges and/or interest associated with the swap agreements.
Generally, trading in foreign securities markets is substantially completed each day at various times prior to the close of the NYSE. The values of foreign securities are determined as of the close of such foreign markets or the close of the NYSE, if earlier. All investments quoted in foreign currency are valued in U.S. dollars on the basis of the foreign currency exchange rates prevailing at the close of business. Investments in foreign securities may involve risks not present in domestic investments. The Valuation Committee will determine the current value of such foreign securities by taking into consideration certain factors which may include those discussed above, as well as the following factors, among others: the value of the securities traded on other foreign markets, ADR trading, closed-end fund trading, foreign currency exchange activity, and the trading prices of financial products that are tied to foreign securities such as World Equity Benchmark Securities. In addition, the Board of Trustees has authorized the Valuation Committee and GI to use prices and other information supplied by a third party pricing vendor in valuing foreign securities.
Investments for which market quotations are not readily available are fair valued as determined in good faith by GI under the direction of the Board of Trustees using methods established or ratified by the Board of Trustees. Valuations in accordance with these methods are intended to reflect each security’s (or asset’s) “fair value.” Each such determination is based on a consideration of all relevant factors, which are likely to vary from one pricing context to another. Examples of such factors may include, but are not limited to: (i) the type of security, (ii) the initial cost of the security, (iii) the existence of any contractual restrictions on the security’s disposition, (iv) the price and extent of public trading in similar securities of the issuer or of comparable companies, (v) quotations or evaluated prices from broker-dealers and/or pricing services, (vi) information obtained from the issuer, analysts, and/or the appropriate stock exchange (for exchange traded securities), (vii) an analysis of the company’s financial statements, and (viii) an evaluation of the forces that influence the issuer and the market(s) in which the security is purchased and sold (e.g. the existence of pending merger activity, public offerings or tender offers that might affect the value of the security).
B. Senior loans in which the Funds invest generally pay interest rates which are periodically adjusted by reference to a base short-term, floating rate plus a premium. These
| | THE GUGGENHEIM FUNDS SEMI-ANNUAL REPORT | 45 |
| NOTES TO FINANCIAL STATEMENTS (Unaudited)(continued) |
base lending rates are generally (i) the lending rate offered by one or more major European banks, such as the London Inter-Bank Offered Rate (LIBOR), (ii) the prime rate offered by one or more major United States banks, or (iii) the bank’s certificate of deposit rate. Senior floating rate interests often require prepayments from excess cash flows or permit the borrower to repay at its election. The rate at which the borrower repays cannot be predicted with accuracy. As a result, the actual remaining maturity may be substantially less than the stated maturities shown. The interest rate indicated is the rate in effect at March 31, 2014.
C. Security transactions are recorded on the trade date for financial reporting purposes. Realized gains and losses from securities transactions are recorded using the identified cost basis. Proceeds from lawsuits related to investment holdings are recorded as realized gains in the respective Fund. Dividend income is recorded on the ex-dividend date, net of applicable taxes withheld by foreign countries. Taxable non-cash dividends are recorded as dividend income. Interest income, including amortization of premiums and accretion of discounts, is accrued on a daily basis. Distributions received from investments in REITs are recorded as dividend income on the ex-dividend date, subject to reclassification upon notice of the character of such distribution by the issuer. Interest income also includes paydown gains and losses on mortgage-backed and asset-backed securities and senior and subordinated loans. Amendment fees are earned as compensation for evaluating and accepting changes to the original loan agreement and are recognized when received.
D. The Funds may purchase and sell interests in securities on a when-issued and delayed delivery basis, with payment and delivery scheduled for a future date. No income accrues to the Fund on such interests or securities in connection with such transactions prior to the date the Funds actually take delivery of such interests or securities. These transactions are subject to market fluctuations and are subject to the risk that the value at delivery may be more or less than the trade date purchase price. Although the Funds will generally purchase these securities with the intention of acquiring such securities, they may sell such securities before the settlement date.
E. The accounting records of the Funds are maintained in U.S. dollars. All assets and liabilities initially expressed in foreign currencies are converted into U.S. dollars at prevailing exchange rates. Purchases and sales of investment securities, dividend and interest income, and certain expenses are translated at the rates of exchange prevailing on the respective dates of such transactions. Changes in the relationship of these foreign currencies to the U.S. dollar can significantly affect the value of the investments and earnings of the Funds. Foreign investments may also subject the Funds to foreign government exchange restrictions, expropriation, taxation or other political, social or economic developments, all of which could affect the market and/or credit risk of the investments.
The Funds do not isolate that portion of the results of operations resulting from changes in the foreign exchange rates on investments from the fluctuations arising from changes in the market prices of securities held. Such fluctuations are included with the net realized and unrealized gain or loss on investments.
Reported net realized foreign exchange gains and losses arise from sales of foreign currencies and currency gains or losses realized between the trade and settlement dates on investment transactions. Net unrealized exchange gains and losses arise from changes in the fair values of assets and liabilities other than investments in securities at the fiscal period end, resulting from changes in exchange rates.
F. Dividends from net investment income are declared quarterly in the World Equity Income Fund and Risk Managed Real Estate Fund. Distributions of net investment income in the remaining Funds and distributions of net realized gains, if any, are declared at least annually and recorded on the ex-dividend date and are determined in accordance with income tax regulations which may differ from U.S. GAAP. Dividends are reinvested in additional shares unless shareholders request payment in cash.
G. When a Fund engages in a short sale of a security, an amount equal to the proceeds is reflected as an asset and an equivalent liability. The amount of the liability is subsequently marked-to-market to reflect the market value of the short sale. The Fund maintains a segregated account of cash and/or securities as collateral for short sales. The Fund is exposed to market risk based on the amount, if any, that the market value of the security exceeds the market value of the securities in the segregated account.
Fees, if any, paid to brokers to borrow securities in connection with short sales are recorded as interest expense. In addition, the Fund must pay out the
| 46 | THE GUGGENHEIM FUNDS SEMI-ANNUAL REPORT | |
| NOTES TO FINANCIAL STATEMENTS (Unaudited)(continued) |
dividend rate of the equity or coupon rate of the treasury obligation to the lender and record this as an expense. Short dividend or interest expense is a cost associated with the investment objective of short sales transactions, rather than an operational cost associated with the day-to-day management of any mutual fund. The Funds may also receive rebate income from the broker resulting from the investment of the proceeds from securities sold short.
H. Upon entering into a futures contract, a Fund deposits and maintains as collateral such initial margin as required by the exchange on which the transaction is affected. Pursuant to the contract, the Fund agrees to receive from or pay to the broker an amount of cash equal to the daily fluctuation in value of the contract. Such receipts or payments are known as variation margin and are recorded by the Fund as unrealized gains or losses. When the contract is closed, the Fund records a realized gain or loss equal to the difference between the value of the contract at the time it was opened and the value at the time it was closed.
I. Swap agreements are marked-to-market daily and the change, if any, is recorded as unrealized gain or loss. Payments received or made as a result of an agreement or termination of the agreement are recognized as realized gains or losses.
J. Interest and dividend income, most expenses, all realized gains and losses, and all unrealized gains and losses are allocated to the classes based upon the value of the outstanding shares in each class. Certain costs, such as distribution and service fees relating to A-Class shares, B-Class shares and C-Class shares and transfer agent fees related to each class, are charged directly to specific classes. In addition, other expenses common to various funds within the fund complex are generally allocated amongst such funds on the basis of average net assets.
K. Under the fee arrangement with the custodian, the Funds may earn credits based on overnight custody cash balances. These credits are utilized to reduce related custodial expenses. The custodian fees disclosed in the Statement of Operations are before the reduction in expense from the related earnings credits, if any. For the period ended March 31, 2014, there were no earnings credits received.
L. The Funds may leave cash overnight in their cash account with the custodian, Bank of New York Mellon. Periodically, a Fund may have cash due to the custodian bank as an overdraft balance. A fee is incurred on this overdraft, calculated by multiplying the overdraft by a rate based on the federal funds rate. Segregated cash with the broker is held as collateral for investments in derivative instruments such as futures contracts or swap agreements.
M. Under the Funds’ organizational documents, its Officers and Trustees are indemnified against certain liabilities arising out of the performance of their duties to the Trust. In addition, throughout the normal course of business, the Funds enter into contracts that contain a variety of representations and warranties which provide general indemnifications. The Funds’ maximum exposure under these arrangements is unknown, as this would involve future claims that may be made against the Funds and/or their affiliates that have not yet occurred. However, based on experience, the Funds expect the risk of loss to be remote.
2. Financial Instruments
As part of their investment strategy, the Funds utilize short sales and a variety of derivative instruments including futures, options and swap agreements. These investments involve, to varying degrees, elements of market risk and risks in excess of the amounts recognized in the Statements of Assets and Liabilities.
A short sale is a transaction in which a Fund sells a security it does not own. If the security sold short decreases in price between the time the Fund sells the security and closes its short position, that Fund will realize a gain on the transaction. Conversely, if the security increases in price during the period, that Fund will realize a loss on the transaction. The risk of such price increases is the principal risk of engaging in short sales.
A futures contract is an agreement to purchase (long) or sell (short) an agreed amount of securities or other instruments at a set price for delivery at a future date. There are significant risks associated with a Fund’s use of futures contracts and related options, including (i) there may be an imperfect or no correlation between the changes in market value of the underlying asset and the prices of futures contracts; (ii) there may not be a liquid secondary market for a futures contract; (iii) trading
| | THE GUGGENHEIM FUNDS SEMI-ANNUAL REPORT | 47 |
| NOTES TO FINANCIAL STATEMENTS (Unaudited)(continued) |
restrictions or limitations may be imposed by an exchange; and (iv) government regulations may restrict trading in futures contracts. When investing in futures, there is minimal counterparty credit risk to the Fund because futures are exchange-traded and the exchange’s clearinghouse, as counterparty to all exchange-traded futures, guarantees against default. Cash deposits are shown as restricted cash on the Statement of Assets and Liabilities; securities held as collateral are noted on the Schedule of Investments.
A swap is an agreement that obligates two parties to exchange a series of cash flows at specified intervals based upon or calculated by reference to changes in specified prices or rates for a specified amount of an underlying asset. A Fund bears the risk of loss of the amount expected to be received under a swap agreement in the event of the default or bankruptcy of a swap agreement counterparty. Additionally, there is no guarantee that a Fund or an underlying fund could eliminate its exposure under an outstanding swap agreement by entering into an offsetting swap agreement with the same or another party.
An option on a security gives the purchaser of the option the right to sell, and the writer of the option the obligation to buy, the underlying security (put option) or the purchaser of the option the right to buy, and the writer of the option the obligation to sell, the underlying security (call option) at any time during the option period. The risk associated with purchasing options is limited to the premium originally paid. The risk in writing a call option is that a Fund may incur a loss if the market price of the underlying security increases and the option is exercised. The risk in writing a put option is that a Fund may incur a loss if the market price of the underlying security decreases and the option is exercised. In addition, there may be an imperfect correlation between the movement in prices of options and the underlying securities and a Fund may not be able to enter into a closing transaction because of an illiquid secondary market or, for over-the-counter options, because of the counterparty’s inability to perform.
In conjunction with the use of short sales, futures, options and swap agreements, the Funds are required to maintain collateral in various forms. The Funds use, where appropriate, depending on the financial instrument utilized and the broker involved, margin deposits at the broker, cash and/or securities segregated at the custodian bank, discount notes, or the repurchase agreements allocated to each Fund.
The Trust has established counterparty credit guidelines and enters into transactions only with financial institutions of investment grade or better. The Trust monitors the counterparty credit risk.
Small Cap Value Fund and Enhanced World Equity Fund utilized options to minimally hedge the Fund’s portfolio to increase returns, to maintain exposure to the equity markets, and create liquidity. StylePlus—Large Core Fund utilized swap agreements and futures contracts to obtain index exposure and create liquidity for purposes of creating leverage. Risk Managed Real Estate Fund utilized swap agreements to obtain leverage for the Fund. The use of derivative instruments by a Fund to achieve leveraged exposure to the underlying index creates leveraging risk. The more a Fund invests in leveraged instruments, the more this leverage will magnify any losses on those investments. A Fund’s investment in these instruments generally requires a small investment relative to the amount of investment exposure assumed. As a result, such investments may give rise to losses that exceed the amount invested in those instruments. Since a Fund’s investment strategy involves consistently applied leverage, the value of the Fund’s shares will tend to increase or decrease more than the value of any increase or decrease in the underlying index.
3. Fees and Other Transactions with Affiliates
Management fees are paid monthly to GI, based on the following annual rates.
| | | Management Fees | |
| Fund | | (as a % of net assets) | |
| StylePlus—Large Core Fund | | | 0.75 | % |
| Small Cap Value Fund | | | 1.00 | % |
| Enhanced World Equity Fund | | | 0.70 | % |
| World Equity Income Fund | | | 0.70 | % |
| Risk Managed Real Estate Fund | | | 0.75 | % |
| 48 | THE GUGGENHEIM FUNDS SEMI-ANNUAL REPORT | |
| NOTES TO FINANCIAL STATEMENTS (Unaudited)(continued) |
RFS also acts as the administrative agent for the Funds, and as such performs administrative functions and the bookkeeping, accounting and pricing functions for each Fund. For these services, RFS receives the following:
| | | Fund Accounting/ | |
| | | Administrative Fees | |
| Fund | | (as a % of net assets) | |
| StylePlus—Large Core Fund | | | 0.095 | % |
| Small Cap Value Fund | | | 0.095 | % |
| Enhanced World Equity Fund | | | 0.095 | % |
| World Equity Income Fund | | | greater of 0.15% or $60,000 | |
| Risk Managed Real Estate Fund | | | 0.095 | % |
| Minimum charge per Fund1 | | $ | 25,000 | |
| Certain out-of-pocket charges | | | Varies | |
RFS is paid the following for providing transfer agent services to the Funds. The transfer agent fees are assessed to the applicable Class of the Funds in which they were incurred.
| Annual charge per account | $5.00 – $8.00 |
| Transaction fee | $0.60 – $1.10 |
| Minimum annual charge per Fund1 | $25,000 |
| Certain out-of-pocket charges | Varies |
1Not subject to Funds during first twelve months of operations.
The investment advisory contracts for the following Funds provide that the total expenses be limited to a percentage of average net assets for each class of shares, exclusive of brokerage costs, dividends on securities sold short, expenses of other investment companies in which a Fund invests, interest, taxes, litigation, indemnification and extraordinary expenses (as determined under U.S. GAAP). The limits are listed below:
| | | | | | Effective | | Contract |
| Fund | | Limit | | | Date | | End Date |
| Small Cap Value Fund – A-Class | | | 1.30 | % | | 11/30/12 | | 02/01/15 |
| Small Cap Value Fund – C-Class | | | 2.05 | % | | 11/30/12 | | 02/01/15 |
| Small Cap Value Fund – Institutional Class | | | 1.05 | % | | 11/30/12 | | 02/01/15 |
| Enhanced World Equity Fund – A-Class | | | 1.25 | % | | 06/05/13 | | 02/01/15 |
| Enhanced World Equity Fund – C-Class | | | 2.00 | % | | 06/05/13 | | 02/01/15 |
| Enhanced World Equity Fund – Institutional Class | | | 1.00 | % | | 06/05/13 | | 02/01/15 |
| World Equity Income Fund – A-Class | | | 1.46 | %* | | 08/15/13 | | 02/01/15 |
| World Equity Income Fund – B-Class | | | 2.21 | %* | | 08/15/13 | | 02/01/15 |
| World Equity Income Fund – C-Class | | | 2.21 | %* | | 08/15/13 | | 02/01/15 |
| World Equity Income Fund – Institutional Class | | | 1.21 | %* | | 08/15/13 | | 02/01/15 |
| Risk Managed Real Estate Fund – A-Class** | | | 1.30 | % | | 03/26/14 | | 04/01/15 |
| Risk Managed Real Estate Fund – C-Class** | | | 2.05 | % | | 03/26/14 | | 04/01/15 |
| Risk Managed Real Estate Fund – Institutional Class** | | | 1.10 | % | | 03/26/14 | | 04/01/15 |
| * | Expense Limitation Agreement prior to 08/15/13 for A-Class, B-Class, C-Class and Institutional Class was 1.61%, 2.36%, 2.36% and 1.36%, respectively. |
| ** | Since commencement of operations: March 31, 2014. |
GI is entitled to reimbursement by the Funds for fees waived or expenses reimbursed during any of the previous 36 months, beginning on the date of the expense limitation agreement, if on any day the estimated operating expenses are less than the indicated percentages. At March 31, 2014, the amount of fees waived or expenses reimbursed that are subject to recoupment are presented in the following table:
| Fund | | Expires 2014 | | | Expires 2015 | | | Expires 2016 | | | Expires 2017 | | | Fund Total | |
| Small Cap Value Fund | | | $61,360 | | | | $175,113 | | | | $175,376 | | | | $ 95,495 | | | | $507, 344 | |
| Enhanced World Equity Fund | | | — | | | | — | | | | 61,313 | | | | 72,870 | | | | 134,183 | |
| World Equity Income Fund | | | 26,732 | | | | 314,425 | | | | 269,453 | | | | 145,493 | | | | 756,103 | |
| Risk Managed Real Estate Fund | | | — | | | | — | | | | — | | | | 302 | | | | 302 | |
For the period ended March 31, 2014, no amounts were recouped by GI.
| | THE GUGGENHEIM FUNDS SEMI-ANNUAL REPORT | 49 |
| NOTES TO FINANCIAL STATEMENTS (Unaudited)(continued) |
If a Fund invests in an affiliated fund, the investing Fund’s Adviser will determine whether to waive fees at the investing Fund level. Fee waivers will be calculated at the investing Fund level without regard to any expense cap in effect for the investing Fund.
The Funds have adopted Distribution Plans related to the offering of A-Class, B-Class and C-Class shares pursuant to Rule 12b-1 under the 1940 Act. The plans provide for payments at an annual rate of 0.25% of the average daily net assets of each Fund’s A-Class shares and 1.00% of the average daily net assets of each Fund’s B-Class and C-Class shares. Effective August 25, 2005, the World Equity Income Fund ceased charging 12b-1 fees on B-Class shares in accordance with the FINRA sales cap regulations. These fees may be reinstated at any time.
During the period ended March 31, 2014, GFD retained sales charges of $28,373 relating to sales of A-Class shares of the Funds.
Certain officers and trustees of the Funds are also officers and/or trustees of GI, RFS and GFD.
At March 31, 2014, GI and its subsidiaries owned over twenty percent of the outstanding shares of the Funds, as follows:
| | | Percent of outstanding
shares owned | |
| Risk Managed Real Estate Fund | | | 100 | % |
4. Fair Value Measurement
In accordance with U.S. GAAP, fair value is defined as the price that the Funds would receive to sell an investment or pay to transfer a liability in an orderly transaction with an independent buyer in the principal market, or in the absence of a principal market, the most advantageous market for the investment or liability. U.S. GAAP establishes a three-tier fair value hierarchy based on the types of inputs used to value assets and liabilities and requires corresponding disclosure. The hierarchy and the corresponding inputs are summarized below:
Level 1 — quoted prices in active markets for identical assets or liabilities.
Level 2 — significant other observable inputs (for example quoted prices for securities that are similar based on characteristics such as interest rates, prepayment speeds, credit risk, etc.).
Level 3 — significant unobservable inputs based on the best information available under the circumstances, to the extent observable inputs are not available, which may include assumptions.
The types of inputs available depend on a variety of factors, such as the type of security and the characteristics of the markets in which it trades, if any. Fair valuation determinations that rely on fewer or no observable inputs require greater judgment. Accordingly, fair value determinations for Level 3 securities require the greatest amount of judgment.
The following table summarizes the inputs used to value the Funds’ net assets at March 31, 2014:
| | | Level 1 | | | Level 1 | | | Level 2 | | | Level 2 | | | Level 3 | | | | |
| | | Investments | | | Other Financial | | | Investments | | | Other Financial | | | Investments | | | | |
| | | In Securities | | | Instruments | | | In Securities | | | Instruments* | | | In Securities | | | Total | |
| Assets | | | | | | | | | | | | | | | | | | | | | | | | |
| StylePlus—Large Core Fund | | $ | 113,340,611 | | | $ | — | | | $ | 72,297,768 | | | $ | — | | | $ | 7,037,226 | | | $ | 192,675,605 | |
| Small Cap Value Fund | | | 56,446,073 | | | | — | | | | 197,750 | | | | — | | | | 438 | | | | 56,644,261 | |
| Enhanced World Equity Fund | | | 5,811,938 | | | | — | | | | — | | | | — | | | | — | | | | 5,811,938 | |
| World Equity Income Fund | | | 77,571,448 | | | | — | | | | — | | | | — | | | | — | | | | 77,571,448 | |
| Risk Managed Real Estate Fund | | | 9,370,765 | | | | — | | | | — | | | | 23,175 | | | | — | | | | 9,393,940 | |
| | | | | | | | | | | | | | | | | | | | | | | | | |
| Liabilities | | | | | | | | | | | | | | | | | | | | | | | | |
| Small Cap Value Fund | | $ | — | | | $ | 4,800 | | | $ | — | | | $ | — | | | $ | — | | | $ | 4,800 | |
| Enhanced World Equity Fund | | | — | | | | 80,855 | | | | — | | | | — | | | | — | | | | 80,855 | |
| Risk Managed Real Estate Fund | | | 2,627,136 | | | | — | | | | — | | | | — | | | | — | | | | 2,627,136 | |
| * | Other financial instruments may include swaps, which are reported as unrealized gain/loss at period end. |
Independent pricing services are used to value a majority of the Funds’ investments. When values are not available from a pricing service, they may be computed by the Funds’ investment adviser or an affiliate. In any event, values may be
| 50 | THE GUGGENHEIM FUNDS SEMI-ANNUAL REPORT | |
| NOTES TO FINANCIAL STATEMENTS (Unaudited)(continued) |
determined using a variety of sources and techniques, including: market prices; broker quotes; and models which derive prices based on inputs such as prices of securities with comparable maturities and characteristics or based on inputs such as anticipated cash flows or collateral, spread over Treasuries, and other information and analysis. A significant portion of the Funds’ assets and liabilities are categorized as Level 2 or Level 3, as indicated in this report.
Indicative quotes from broker-dealers, adjusted for fluctuations in criteria such as credit spreads and interest rates, may be also used to value the Funds’ assets and liabilities, i.e. prices provided by a broker-dealer or other market participant who has not committed to trade at that price. Although Indicative quotes are typically received from established market participants, the Funds may not have the transparency to view the underlying inputs which support the market quotations. Significant changes in an indicative quote would generally result in significant changes in the fair value of the security.
Certain fixed income securities are valued by obtaining a monthly indicative quote from a broker-dealer, adjusted for fluctuations in criteria such as credit spreads and interest rates. The Funds’ fair valuation guidelines were recently revised to transition such monthly indicative quoted securities from Level 2 to Level 3.
The inputs or methodologies used for valuing securities are not necessarily an indication of the risk associated with investing in those securities. The suitability of the techniques and sources employed to determine fair valuation are regularly monitored and subject to change.
The following is a summary of significant unobservable inputs used in the fair valuation of assets and liabilities categorized within Level 3 of the fair value hierarchy:
| | | Category | | Ending Balance | | | Valuation | | Unobservable |
| Fund | | and Subcategory | | at 03/31/14 | | | Technique | | Inputs |
| | | | | | | | | | |
| StylePlus—Large Core Fund | | Investments, at value Asset-Backed Securities | | $ | 5,532,726 | | | Option Adjusted Spread off the month end broker mark over the 3 month LIBOR | | Indicative Quote |
| | | Collateralized Mortgage Obligations | | | 1,504,500 | | | Option Adjusted Spread off the trade price over the 3 month LIBOR | | Indicative Quote |
Any remaining Level 3 securities held by the Funds and excluded from the tables above, were not considered material to the Funds.
Transfers between investment levels may occur as the markets fluctuate and/or the availability of data used in the investment’s valuation changes. The Funds recognize transfers between the levels as of the beginning of the period. As of March 31, 2014, StylePlus—Large Core Fund had securities with a total value of $7,037,226 transfer from Level 2 to Level 3 and a security with a total value of $847,195 transfer from Level 3 to Level 2 due to changes in the securities valuation method. There were no other securities that transferred between levels.
Summary of Fair Value Level 3 Activity
Following is a reconciliation of Level 3 assets for which significant unobservable inputs were used to determine fair value for the period ended March 31, 2014:
LEVEL 3 - Fair value measurement using significant unobservable inputs
| | | Total | |
| StylePlus—Large Core Fund | | | | |
| Assets: | | | | |
| Beginning Balance | | $ | 847,036 | |
| Purchases | | | 4,413,707 | |
| Sales | | | (25,269 | ) |
| Total change in unrealized gains or losses included in earnings | | | 55,097 | |
| Transfers out of Level 3 | | | (847,036 | ) |
| Transfers into Level 3 | | | 2,593,691 | |
| Ending Balance | | $ | 7,037,226 | |
| | THE GUGGENHEIM FUNDS SEMI-ANNUAL REPORT | 51 |
| NOTES TO FINANCIAL STATEMENTS (Unaudited)(continued) |
5. Derivative Investment Holdings Categorized by Risk Exposure
U.S. GAAP requires disclosures to enable investors to better understand how and why the Funds use derivative instruments, how these derivative instruments are accounted for and their effects on the Funds’ financial position and results of operations.
The following table represents the notional amount of derivative instruments outstanding, as an approximate percentage of the Funds’ net assets on a daily basis.
| | | Approximate percentage | |
| | | of Fund’s net assets | |
| | | on a daily basis | |
| Fund | | Long | |
| StylePlus—Large Core Fund | | | 75 | % |
| Risk Managed Real Estate Fund | | | 30 | % |
The following is a summary of the location of derivative investments on the Funds’ Statements of Assets and Liabilities as of March 31, 2014:
| Derivative Investment Type | Asset Derivatives | Liability Derivatives |
| Equity contracts | Investments | Options written, at value |
| | Unrealized appreciation on swap agreements | Unrealized depreciation on swap agreements |
The following table sets forth the fair value of the Funds’ derivative investments categorized by primary risk exposure at March 31, 2014:
| Asset Derivative Investments Value |
| | | Swaps | | | Options | | | Total Value at | |
| | | Equity | | | Written Equity | | | March 31, | |
| Fund | | Contracts | | | Contracts | | | 2014 | |
| StylePlus—Large Core Fund | | $ | — | | | $ | — | | | $ | — | |
| Risk Managed Real Estate Fund | | | 23,175 | | | | — | | | | 23,175 | |
| Liability Derivative Investments Value |
| | | Swaps | | | Options | | | Total Value at | |
| | | Equity | | | Written Equity | | | March 31, | |
| Fund | | Contracts | | | Contracts | | | 2014 | |
| Small Cap Value Fund | | $ | — | | | $ | 4,800 | | | $ | 4,800 | |
| Enhanced World Equity Fund | | | — | | | | 80,855 | | | | 80,855 | |
The following is a summary of the location of derivative investments on the Funds’ Statements of Operations for the period ended March 31, 2014:
| Derivative Investment Type | Location of Gain (Loss) on Derivatives |
| Equity contracts | Net realized gain (loss) on futures contracts |
| | Net realized gain (loss) on swap agreements |
| | Net realized gain (loss) on options written |
| | Net change in unrealized appreciation (depreciation) on futures contracts |
| | Net change in unrealized appreciation (depreciation) on swap agreements |
| | Net change in unrealized appreciation (depreciation) on options written |
| 52 | THE GUGGENHEIM FUNDS SEMI-ANNUAL REPORT | |
| NOTES TO FINANCIAL STATEMENTS (Unaudited)(continued) |
The following is a summary of the Funds’ realized gain (loss) and change in unrealized appreciation (depreciation) on derivative investments recognized on the Statements of Operations categorized by primary risk exposure for the period ended March 31, 2014:
| Realized Gain (Loss) on Derivative Investments Recognized on the Statements of Operations |
| | | Futures | | | Swaps | | | Options | | | | |
| | | Equity | | | Equity | | | Written Equity | | | | |
| Fund | | Contracts | | | Contracts | | | Contracts | | | Total | |
| StylePlus—Large Core Fund | | $ | 74,299 | | �� | $ | 21,120,495 | | | $ | — | | | $ | 21,194,794 | |
| Small Cap Value Fund | | | — | | | | — | | | | 80,049 | | | | 80,049 | |
| Enhanced World Equity Fund | | | — | | | | — | | | | 176,408 | | | | 176,408 | |
| Change in Unrealized Appreciation (Depreciation) on Derivative Investments Recognized on the Statements of Operations |
| | | Futures | | | Swaps | | | Options | | | | |
| | | Equity | | | Equity | | | Written Equity | | | | |
| Fund | | Contracts | | | Contracts | | | Contracts | | | Total | |
| StylePlus—Large Core Fund | | $ | 11,851 | | | $ | (4,297,408 | ) | | $ | — | | | $ | (4,285,557 | ) |
| Small Cap Value Fund | | | — | | | | — | | | | (2,933 | ) | | | (2,933 | ) |
| Enhanced World Equity Fund | | | — | | | | — | | | | (51,407 | ) | | | (51,407 | ) |
| Risk Managed Real Estate Fund | | | — | | | | 23,175 | | | | — | | | | 23,175 | |
6. Federal Income Tax Information
The Funds intend to comply with the provisions of Subchapter M of the Internal Revenue Code applicable to regulated investment companies and will distribute substantially all taxable net investment income and capital gains sufficient to relieve it from all, or substantially all, federal income, excise and state income taxes. Therefore, no provision for federal or state income tax is required.
Tax positions taken or expected to be taken in the course of preparing the Funds’ tax returns are evaluated to determine whether the tax positions are “more-likely-than-not” of being sustained by the applicable tax authority. Tax positions not deemed to meet the more-likely-than-not threshold would be recorded as a tax benefit or expense in the current year. Management has analyzed the Funds’ tax positions taken, or to be taken, on Federal income tax returns for all open tax years, and has concluded that no provision for income tax is required in the Funds’ financial statements. The Funds’ federal tax returns are subject to examination by the Internal Revenue Service for a period of three fiscal years after they are filed.
The RIC Modernization Act of 2010 was signed into law on December 22, 2010 and simplified some of the tax provisions applicable to regulated investment companies, the tax reporting to their shareholders and improved the tax efficiency of certain fund structures. The greatest impact to the disclosure in the financial reports for the Funds was on the treatment of net capital losses, effective for tax years beginning after December 22, 2010.
One of the more prominent changes addresses capital loss carryforwards. The Funds are permitted to carry forward capital losses incurred in taxable years beginning after December 22, 2010 for an unlimited period. However, any losses incurred during those future taxable years will be required to be utilized prior to the losses incurred in pre-enactment taxable years. Under pre-enactment law, capital losses could be carried forward for eight years, and carried forward as short-term capital, irrespective of the character of the original loss. As a result of this ordering rule, pre-enactment capital carryforwards may potentially expire unused. Additionally, post-enactment capital losses that are carried forward will retain their character as either short-term or long-term capital losses rather than being considered all short-term as under previous law.
| | THE GUGGENHEIM FUNDS SEMI-ANNUAL REPORT | 53 |
| NOTES TO FINANCIAL STATEMENTS (Unaudited)(continued) |
At March 31, 2014, the cost of securities for Federal income tax purposes, the aggregate gross unrealized gain for all securities for which there was an excess of value over tax cost and the aggregate gross unrealized loss for all securities for which there was an excess of tax cost over value, were as follows:
| | | | | | Tax | | | Tax | | | Net | |
| | | Tax | | | Unrealized | | | Unrealized | | | Unrealized | |
| Fund | | Cost | | | Gain | | | Loss | | | Gain | |
| StylePlus—Large Core Fund | | $ | 187,959,372 | | | $ | 5,314,628 | | | $ | (598,395 | ) | | $ | 4,716,233 | |
| Small Cap Value Fund | | | 45,876,708 | | | | 12,950,337 | | | | (2,182,784 | ) | | | 10,767,553 | |
| Enhanced World Equity Fund | | | 5,775,961 | | | | 58,265 | | | | (22,288 | ) | | | 35,977 | |
| World Equity Income Fund | | | 73,256,874 | | | | 5,927,928 | | | | (1,613,354 | ) | | | 4,314,574 | |
| Risk Managed Real Estate Fund | | | 9,299,459 | | | | 75,712 | | | | (4,406 | ) | | | 71,306 | |
7. Options Written
Transactions in options written during the period ended March 31, 2014 were as follows:
Call Options Written
| | | | | | Enhanced World | |
| | | Small Cap Value Fund | | | Equity Fund | |
| | | Number of | | | Premium | | | Number of | | | Premium | |
| | | Contracts | | | Amount | | | Contracts | | | Amount | |
| Balance at September 30, 2013 | | | 107 | | | $ | 31,283 | | | | 370 | | | $ | 34,151 | |
| Options Written | | | 210 | | | | 35,346 | | | | 5,294 | | | | 391,430 | |
| Options terminated in closing purchase transactions | | | — | | | | — | | | | (4,761 | ) | | | (363,095 | ) |
| Options expired | | | (237 | ) | | | (59,189 | ) | | | (164 | ) | | | (9,665 | ) |
| Options exercised | | | — | | | | — | | | | (106 | ) | | | (5,772 | ) |
| Balance at March 31, 2014 | | | 80 | | | $ | 7,440 | | | | 633 | | | $ | 47,049 | |
Put Options Written
| | | | | | | | | Enhanced World | |
| | | Small Cap Value Fund | | | Equity Fund | |
| | | Number of | | | Premium | | | Number of | | | Premium | |
| | | Contracts | | | Amount | | | Contracts | | | Amount | |
| Balance at September 30, 2013 | | | 200 | | | $ | 12,810 | | | | — | | | $ | — | |
| Options Written | | | 60 | | | | 8,050 | | | | — | | | | — | |
| Options terminated in closing purchase transactions | | | — | | | | — | | | | — | | | | — | |
| Options expired | | | (260 | ) | | | (20,860 | ) | | | — | | | | — | |
| Options exercised | | | — | | | | — | | | | — | | | | — | |
| Balance at March 31, 2014 | | | — | | | $ | — | | | | — | | | $ | — | |
8. Securities Transactions
For the period ended March 31, 2014, the cost of purchases and proceeds from sales of investment securities, excluding government securities, short-term investments and derivatives were as follows:
| Fund | | Purchases | | | Sales | |
| StylePlus—Large Core Fund | | $ | 150,827,470 | | | $ | 82,664,581 | |
| Small Cap Value Fund | | | 13,062,532 | | | | 11,649,158 | |
| Enhanced World Equity Fund | | | 17,783,873 | | | | 17,837,275 | |
| World Equity Income Fund | | | 44,942,185 | | | | 49,541,570 | |
| Risk Managed Real Estate Fund | | | 6,711,623 | | | | 24,615 | |
9. Affiliated Transactions
Investments representing 5% or more of the outstanding voting shares of a portfolio company of a fund, or control of or by, or common control under GI, result in that portfolio company being considered an affiliated company of such fund,
| 54 | THE GUGGENHEIM FUNDS SEMI-ANNUAL REPORT | |
| NOTES TO FINANCIAL STATEMENTS (Unaudited)(continued) |
as defined in the 1940 Act. Transactions during the period ended March 31, 2014 in which the portfolio company is an “affiliated person” are as follows:
| | | | | Value | | | | | | | | | Value | | | Shares | | | Investment | | | Realized | |
| Fund | | Security | | 09/30/13 | | | Additions | | | Reductions | | | 03/31/14 | | | 03/31/14 | | | Income | | | Gain (Loss) | |
| StylePlus—Large Core Fund | | Exchange Traded Funds: | | | | | | | | | | | | | | | | | | | | | | | | | | | | |
| | | Guggenheim BulletShares 2016 High Yield Corporate Bond ETF | | $ | 2,242,106 | | | $ | 1,602,803 | | | $ | — | | | $ | 3,923,010 | | | | 143,700 | | | $ | 65,545 | | | $ | — | |
| | | Guggenheim BulletShares 2015 High Yield Corporate Bond ETF | | | 2,243,640 | | | | 1,603,391 | | | | — | | | | 3,884,211 | | | | 143,700 | | | | 85,628 | | | | — | |
| | | Guggenheim BulletShares 2017 High Yield Corporate Bond ETF | | | — | | | | 3,238,907 | | | | — | | | | 3,272,128 | | | | 118,900 | | | | 19,725 | | | | — | |
| | | Guggenheim BulletShares 2014 High Yield Corporate Bond ETF | | | 2,244,797 | | | | 1,596,131 | | | | 3,816,831 | | | | — | | | | — | | | | 46,672 | | | | (27,442 | ) |
| | | Mutual Funds: | | | | | | | | | | | | | | | | | | | | | | | | | | | | |
| | | Floating Rate Strategies Fund Institutional Class | | | 3,332,741 | | | | 83,274 | | | | — | | | | 3,447,601 | | | | 128,211 | | | | 79,544 | | | | 3,152 | |
| | | Macro Opportunities Fund Institutional Class | | | 3,199,526 | | | | 92,923 | | | | — | | | | 3,390,839 | | | | 124,939 | | | | 90,949 | | | | — | |
| | | Guggenheim Enhanced World Equity Fund Institutional Class | | | — | | | | — | | | | 3,962,356 | | | | — | | | | — | | | | 6,840 | | | | 2,889 | |
| | | Guggenheim Strategy Fund III | | | — | | | | 21,500,000 | | | | — | | | | 21,487,797 | | | | 860,200 | | | | 7,326 | | | | — | |
| | | Guggenheim Strategy Fund I | | | — | | | | 17,000,000 | | | | — | | | | 16,993,200 | | | | 680,000 | | | | 9,878 | | | | — | |
10. Other Liabilities
StylePlus—Large Core Fund wrote put option contracts through LBI that were exercised prior to the option contracts’ expiration and prior to the bankruptcy filing by LBI, during September, 2008. However, these transactions have not settled and the securities have not been delivered to the Fund as of March 31, 2014.
Although the ultimate resolution of these transactions is uncertain, the Fund has recorded a liability on its’ book equaI to the difference between the strike price on the put options and the market price of the underlying security on the exercise date. The amount of the liability recorded by the Fund as of March 31, 2014 was $18,615.
11. Line of Credit
The Trust secured a committed, $275,000,000 line of credit from Citibank, N.A., with no set termination date. This line of credit is reserved for emergency or temporary purposes. Fees related to borrowings, if any, vary under this arrangement between the greater of LIBOR and the Fed Funds rate, plus 1.25%. The Funds did not have any borrowings under this agreement at March 31, 2014.
12. Offsetting
In the normal course of business, the Funds enter into transactions subject to enforceable master netting arrangements or other similar arrangements. Generally, the right to offset in those agreements allows the Funds to counteract the exposure to a specific counterparty with collateral received or delivered to that counterparty based on the terms of the arrangements. These arrangements provide for the right to liquidate upon the occurrence of an event of default, credit event upon merger or additional termination event.
In order to better define their contractual rights and to secure rights that will help the Funds mitigate their counterparty risk, the Funds may enter into an International Swaps and Derivatives Association, Inc. Master Agreement (“ISDA Master Agreement”) or similar agreement with their derivative contract counterparties. An ISDA Master Agreement is a bilateral agreement between a Fund and a counterparty that governs OTC derivatives, including foreign exchange contracts, and typically contains, among other things, collateral posting terms and netting provisions in the event of a default and/or termination event. The provisions of the ISDA Master Agreement typically permit a single net payment in the event of a default (close-out netting) or similar event, including the bankruptcy or insolvency of the counterparty.
| | THE GUGGENHEIM FUNDS SEMI-ANNUAL REPORT | 55 |
| NOTES TO FINANCIAL STATEMENTS (Unaudited)(concluded) |
For derivatives traded under an ISDA Master Agreement, the collateral requirements are typically calculated by netting the mark to market amount for each transaction under such agreement and comparing that amount to the value of any collateral currently pledged by the Funds and the counterparty. For financial reporting purposes, cash collateral that has been pledged to cover obligations of the Funds and cash collateral received from the counterparty, if any, is reported separately on the Statement of Assets and Liabilities as segregated cash with broker/receivable for variation margin, or payable for swap settlement/variation margin. Generally, the amount of collateral due from or to a counterparty must exceed a minimum transfer amount threshold (e.g., $300,000) before a transfer is required to be made. To the extent amounts due to the Funds from their counterparties are not fully collateralized, contractually or otherwise, the Funds bear the risk of loss from counterparty nonperformance. The Funds attempt to mitigate counterparty risk by only entering into agreements with counterparties that they believe to be of good standing and by monitoring the financial stability of those counterparties.
For financial reporting purposes, the Funds do not offset derivative assets and derivative liabilities that are subject to netting arrangements in the Statement of Assets and Liabilities.
The following tables present derivative financial instruments and secured financing transactions that are subject to enforceable netting arrangements and offset in the Statements of Assets and Liabilities in conformity with U.S. GAAP.
| | | | | | | | | | | | | | Gross Amounts Not Offset | |
| | | | | | | | | | | | | | in the Statements of Assets | |
| | | | | | | | | | | Net Amount of Assets | | | and Liabilities | |
| | | | | | | | Gross Amounts Offset | | | Presented on the | | | | | | Cash | | | | |
| | | | | Gross Amounts of | | | in the Statements of | | | Statements of Assets | | | Financial | | | Collateral | | | Net | |
| Fund | | Instrument | | Recognized Assets | | | Assets and Liabilities | | | and Liabilities | | | Instruments | | | Received | | | Amount | |
| StylePlus—Large | | | | | | | | | | | | | | | | | | | | | | | | | | |
| Core Fund | | Swap equity contracts | | $ | — | | | $ | — | | | $ | — | | | $ | — | | | $ | — | | | $ | — | |
| Risk Managed Real | | | | | | | | | | | | | | | | | | | | | | | | | | |
| Estate Fund | | Swap equity contracts | | | 23,175 | | | | — | | | | 23,175 | | | | — | | | | — | | | | 23,175 | |
| 56 | THE GUGGENHEIM FUNDS SEMI-ANNUAL REPORT | |
| OTHER INFORMATION (Unaudited) |
Proxy Voting Information
A description of the policies and procedures that the Trust uses to determine how to vote proxies relating to securities held in the Funds’ portfolios is available, without charge and upon request, by calling 800.820.0888. This information is also available from the EDGAR database on the SEC’s website at http://www.sec.gov.
Information regarding how the Funds voted proxies relating to portfolio securities during the most recent 12-month period ended June 30 is available without charge, upon request, by calling 800.820.0888. This information is also available from the EDGAR database on the SEC’s website at http://www.sec.gov.
At a special meeting of shareholders held on January 8, 2014, the shareholders of the Funds voted on whether to approve the election of nominees to the Board of Directors of each corporation. A description of the number of shares voted is as follows:
| | | For | | | Withhold | | | Total | |
| Randall C. Barnes | | | 11,339,287 | | | | 181,086 | | | | 11,520,373 | |
| Roman Friedrich III | | | 11,327,799 | | | | 192,574 | | | | 11,520,373 | |
| Robert B. Karn III | | | 11,324,738 | | | | 195,635 | | | | 11,520,373 | |
| Ronald A. Nyberg | | | 11,341,191 | | | | 179,182 | | | | 11,520,373 | |
| Ronald E. Toupin, Jr. | | | 11,339,092 | | | | 181,281 | | | | 11,520,373 | |
At a special meeting of shareholders held on January 8, 2014, the shareholders of the Funds also voted on whether to approve the Funds from Kansas Corporations into Delaware Statutory Trusts. A description of the number of shares voted is as follows:
| Fund | | Shares For | | | Shares
Against | | | Shares Abstained | |
| StylePlus—Large Core Fund | | | 3,831,943 | | | | 107,321 | | | | 106,477 | |
| Small Cap Value Fund | | | 1,763,325 | | | | 6,691 | | | | 2,515 | |
| Enhanced World Equity Fund | | | 207,224 | | | | 211 | | | | 189 | |
| World Equity Income Fund | | | 3,652,153 | | | | 11,002 | | | | 17,129 | |
| Risk Managed Real Estate Fund | | | - | | | | - | | | | - | |
At a special meeting of shareholders held on January 8, 2014, the shareholders of the Funds also voted on whether to approve changes to the fundamental investment policies. A description of the number of shares voted is as follows:
Diversification
| Fund | | Shares For | | | Shares
Against | | | Shares
Abstained | |
| StylePlus—Large Core Fund | | | 3,836,467 | | | | 109,996 | | | | 99,278 | |
| Small Cap Value Fund | | | 1,757,863 | | | | 12,153 | | | | 2,515 | |
| Enhanced World Equity Fund | | | 207,224 | | | | 211 | | | | 189 | |
| World Equity Income Fund | | | 3,655,992 | | | | 10,200 | | | | 14,092 | |
| Risk Managed Real Estate Fund | | | - | | | | - | | | | - | |
Underwriting
| Fund | | Shares For | | | Shares
Against | | | Shares Abstained | |
| StylePlus—Large Core Fund | | | 3,825,576 | | | | 113,306 | | | | 106,859 | |
| Small Cap Value Fund | | | 1,757,368 | | | | 12,648 | | | | 2,515 | |
| Enhanced World Equity Fund | | | 207,224 | | | | 211 | | | | 189 | |
| World Equity Income Fund | | | 3,652,925 | | | | 12,554 | | | | 14,805 | |
| Risk Managed Real Estate Fund | | | - | | | | - | | | | - | |
Industry Concentration
| Fund | | Shares For | | | Shares
Against | | | Shares Abstained | |
| StylePlus—Large Core Fund | | | 3,804,563 | | | | 133,084 | | | | 108,094 | |
| Small Cap Value Fund | | | 1,757,691 | | | | 12,325 | | | | 2,515 | |
| Enhanced World Equity Fund | | | 207,224 | | | | 211 | | | | 189 | |
| World Equity Income Fund | | | 3,653,292 | | | | 12,554 | | | | 14,438 | |
| Risk Managed Real Estate Fund | | | - | | | | - | | | | - | |
| | THE GUGGENHEIM FUNDS SEMI-ANNUAL REPORT | 57 |
| OTHER INFORMATION (Unaudited)(continued) |
Real Estate
| Fund | | Shares For | | | Shares
Against | | | Shares Abstained | |
| StylePlus—Large Core Fund | | | 3,806,359 | | | | 137,330 | | | | 102,052 | |
| Small Cap Value Fund | | | 1,756,625 | | | | 13,391 | | | | 2,515 | |
| Enhanced World Equity Fund | | | 207,224 | | | | 211 | | | | 189 | |
| World Equity Income Fund | | | 3,654,925 | | | | 11,261 | | | | 14,098 | |
| Risk Managed Real Estate Fund | | | - | | | | - | | | | - | |
Commodities
| Fund | | Shares For | | | Shares
Against | | | Shares Abstained | |
| StylePlus—Large Core Fund | | | 3,793,987 | | | | 138,661 | | | | 113,093 | |
| Small Cap Value Fund | | | 1,754,064 | | | | 12,856 | | | | 2,611 | |
| Enhanced World Equity Fund | | | 207,224 | | | | 211 | | | | 189 | |
| World Equity Income Fund | | | 3,652,773 | | | | 13,413 | | | | 140,098 | |
| Risk Managed Real Estate Fund | | | - | | | | - | | | | - | |
Loans
| Fund | | Shares For | | | Shares
Against | | | Shares Abstained | |
| StylePlus—Large Core Fund | | | 3,774,250 | | | | 160,822 | | | | 110,669 | |
| Small Cap Value Fund | | | 1,758,055 | | | | 11,693 | | | | 2,783 | |
| Enhanced World Equity Fund | | | 207,224 | | | | 211 | | | | 189 | |
| World Equity Income Fund | | | 3,652,093 | | | | 13,117 | | | | 15,074 | |
| Risk Managed Real Estate Fund | | | - | | | | - | | | | - | |
Borrowing
| Fund | | Shares For | | | Shares
Against | | | Shares Abstained | |
| StylePlus—Large Core Fund | | | 3,770,304 | | | | 163,988 | | | | 111,449 | |
| Small Cap Value Fund | | | 1,758,057 | | | | 11,691 | | | | 2,783 | |
| Enhanced World Equity Fund | | | 207,224 | | | | 211 | | | | 189 | |
| World Equity Income Fund | | | 3,651,728 | | | | 13,109 | | | | 15,447 | |
| Risk Managed Real Estate Fund | | | - | | | | - | | | | - | |
Senior Securities
| Fund | | Shares For | | | Shares
Against | | | Shares Abstained | |
| StylePlus—Large Core Fund | | | 3,807,600 | | | | 132,759 | | | | 105,382 | |
| Small Cap Value Fund | | | 1,757,955 | | | | 11,631 | | | | 2,945 | |
| Enhanced World Equity Fund | | | 207,224 | | | | 211 | | | | 189 | |
| World Equity Income Fund | | | 3,656,013 | | | | 9,839 | | | | 14,432 | |
| Risk Managed Real Estate Fund | | | - | | | | - | | | | - | |
Quarterly Portfolio Schedules Information
The Trust files its complete schedule of portfolio holdings with the SEC for the first and third quarters of each fiscal year on Form N-Q; which are available on the SEC’s website at http://www.sec.gov. The Funds’ Forms N-Q may be reviewed and copied at the SEC’s Public Reference Room in Washington, DC, and that information on the operation of the Public Reference Room may be obtained by calling 1-800-SEC-0330. Copies of the portfolio holdings are also available to shareholders, without charge and upon request, by calling 800.820.0888.
| 58 | THE GUGGENHEIM FUNDS SEMI-ANNUAL REPORT | |
| OTHER INFORMATION (Unaudited)(continued) |
Office Locations
The offices of Guggenheim Investments can be found in the following locations:
330 Madison Avenue
10th Floor
New York, NY 10017
(Headquarters)
Four Irvington Centre
805 King Farm Boulevard
Suite 600
Rockville, MD 20850
9401 Indian Creek Parkway
40 Corporate Woods
Suite 850
Overland Park, KS 66210
Distributor change
Effective March 3, 2014, Guggenheim Distributors, LLC (“GD”), the distributor for shares of the Funds was consolidated into and with Guggenheim Funds Distributors, LLC (“GFD”). Following the consolidation, GFD serves as the Funds’ distributor.
GD and GFD are both indirect, wholly-owned subsidiaries of Guggenheim Capital, LLC and, therefore, the consolidation will not result in a change of actual control of the Funds’ distributor. The primary goal of the consolidation is to achieve greater operational efficiencies and allow all of the Guggenheim funds, including funds that are not series of the Trusts, to be distributed by a single distributor.
The consolidation is not expected to affect the day-to-day management of the Funds or result in any material changes to the distribution of the Funds, including any changes to the distribution fees paid by the Funds.
Guggenheim Funds Trust
Guggenheim Funds Trust (the “Trust”), which was organized as a Delaware statutory trust on November 8, 2013, is registered with the Securities and Exchange Commission (“SEC”) as an investment company. The Trust is an open-end management investment company that, upon the demand of the investor, must redeem its shares and pay the investor the next calculated NAV. The Guggenheim Enhanced World Equity Fund (“Enhanced World Equity Fund”), Guggenheim Large Cap Value Fund (“Large Cap Value Fund”), Guggenheim Mid Cap Value Fund (“Mid Cap Value Fund”), Guggenheim Mid Cap Value Institutional Fund (“Mid Cap Value Institutional Fund”), Guggenheim Small Cap Value Fund (“Small Cap Value Fund”), Guggenheim StylePlus—Large Core Fund (“StylePlus—Large Core Fund”), Guggenheim StylePlus—Mid Growth Fund (“StylePlus—Mid Growth Fund”) and Guggenheim World Equity Income Fund (“World Equity Income Fund”) (collectively, the “Funds”) were previously series (the “Predecessor Funds”) of Security Equity Fund, Security Large Cap Value Fund and Security Mid Cap Growth Fund (the “Predecessor Corporations”), different registered open-end investment companies, which were organized as Kansas corporations. In January 2014, at special meetings of shareholders, the shareholders of each Predecessor Fund approved the reorganization of each Predecessor Fund with and into a corresponding “shell” series of the Trust. The shell series of the Trust succeeded to the accounting and performance histories of the Predecessor Funds. Any such historical information provided for a series of the Trust that relates to periods prior to January 28, 2014, therefore, is that of the corresponding Predecessor Fund.
Board Considerations in Approving the Investment Advisory Agreements
At a meeting held on November 11, 2013, in connection with other actions taken to consider whether to approve the reorganization of the funds from series of Kansas corporations (the “Predecessor Funds”) into series of a Delaware statutory trust, Guggenheim Funds Trust (the “Trust” and its series, the “New Series”), the members of the Boards of Directors of the Kansas
| | THE GUGGENHEIM FUNDS SEMI-ANNUAL REPORT | 59 |
| OTHER INFORMATION (Unaudited)(continued) |
corporations (collectively, the “Predecessor Board” and the members individually, “Directors”), including the Directors who are not “interested persons,” as defined by the Investment Company Act of 1940, as amended (the “1940 Act”), of the corporations (the “Independent Directors”) appointed the then-investment advisers and sub-advisers of the Predecessor Funds, to serve in the same capacity to the corresponding New Series. The Predecessor Board also approved corresponding advisory and sub-advisory agreements, subject, for each Predecessor Fund, to approval of the reorganization of that fund by its shareholders and approval of the new agreements by the initial sole shareholder of the corresponding New Series. The Directors based their approval on a variety of factors, including: the findings they had made during their May, June and August 2013 meetings at which the advisory and sub-advisory agreements of the Predecessor Funds had the most recently been approved, which are discussed in the Annual Report of the Predecessor Funds for the fiscal year ended September 30, 2013; the fact that new agreements are the same as the agreements then in place for the Predecessor Funds except for the name of the signatory, the applicable state law and the term of the agreements; and the intention that the new agreements would be subject to re-consideration after the reorganizations at meetings scheduled to be held for these purposes in April and May 2014.
Guggenheim Risk Managed Real Estate Fund
At the meeting held on February 12, 2014 (the “February Meeting”), each member of the Board of Trustees of the Guggenheim Funds Trust (the “Board” and the members individually, “Trustees”) who is not an “interested person,” as defined by the 1940 Act, of the Trust (collectively, the “Independent Trustees”), met independently of Fund management to consider the approval of the Advisory Agreement between Guggenheim Partners Investment Management, LLC (“GPIM”) and the Trust, on behalf of its new series, Guggenheim Risk Managed Real Estate Fund (the “Risk Managed Real Estate Fund” or the “New Fund”). As part of its review process, the Independent Trustees were represented by independent legal counsel (“Independent Legal Counsel”). Independent Legal Counsel reviewed with the Independent Trustees various factors relevant to the consideration of the Advisory Agreement and the legal responsibilities of the Trustees related to such consideration and assisted the Independent Trustees in their deliberations.
The Trustees, including the Independent Trustees, discussed the Advisory Agreement in light of the regulatory requirements and criteria and assessed information concerning the Risk Managed Real Estate Fund’s proposed fees and expenses, investment objective and policies, investment strategies and models, portfolio construction process, strategy performance and portfolio management team, among other things. For this purpose, management updated and supplemented materials previously provided to the Board in connection with the consideration of the Advisory Agreement between GPIM and Security Income Fund with respect to GPIM’s management of Guggenheim Total Return Bond Fund, Guggenheim Macro Opportunities Fund and Guggenheim Floating Rate Strategies Fund. Among other things, GPIM provided additional key personnel biographies, information on significant personnel changes and peer group comparisons of the proposed contractual advisory fee and total net expense ratio, as set forth in a report prepared by an independent, third party research provider, FUSE Research Networks LLC (“FUSE”). The Board also considered the variety of written materials, reports and oral presentations it received throughout the year, including information regarding performance and operating results of other registered investment companies for which GPIM serves as investment adviser or sub-adviser.
Following an analysis and discussion of the factors identified below, the Directors concluded that it was in the best interests of the Risk Managed Real Estate Fund to approve the Advisory Agreement.
Nature, Extent and Quality of Services to be Provided by GPIM: With respect to the nature, extent and quality of services to be provided by GPIM, the Independent Trustees considered the functions to be performed by GPIM for the Risk Managed Real Estate Fund and reviewed information describing the background and experience of the persons to be responsible for the day-to-day management of the Risk Managed Real Estate Fund. In this regard, the Trustees took into account the nature and quality of services provided by GPIM in the past, the firm’s management capabilities demonstrated with respect to the other mutual funds managed by GPIM, the professional qualifications and experience of its portfolio managers and its investment and management oversight processes.
The Board also considered the acceptability of the terms of the Advisory Agreement, noting that the terms were consistent with the terms of the investment advisory/management agreements of other registered investment companies for which
| 60 | THE GUGGENHEIM FUNDS SEMI-ANNUAL REPORT | |
| OTHER INFORMATION (Unaudited)(concluded) |
GPIM serves as investment adviser. Based on the foregoing, and based on other information received (both oral and written) at the February Meeting, as well as other considerations, the Board concluded that the Adviser and its personnel were qualified to serve the Risk Managed Real Estate Fund in such capacity.
Investment Performance: With respect to performance, the Board noted that the Risk Managed Real Estate Fund had no performance history and, instead, considered that, according to data previously presented by GPIM, the proposed strategies’ back-tested performance generated positive excess returns, net of fees, relative to the FTSE NAREIT Equity REITS Index, with respect to the long-only strategy, and 1-Month LIBOR + 200bps benchmark, with respect to the long/short strategy. The Board also considered management’s explanation that, based on a dynamic exposure model, the Adviser will manage and modulate exposure to the real estate markets by actively allocating between two real estate strategies: a traditional long-only strategy and a long/short market neutral strategy to seek to provide a differentiated strategy within the real estate mutual fund category. The Board noted that the New Fund’s investment objective is to seek to provide total return, comprised of capital appreciation and current income. In this connection, the Board noted that the New Fund will pursue its investment objective by investing, under normal circumstances, at least 80% of its net assets (plus the amount of borrowings for investment purposes) in: (i) long and short equity securities of issuers primarily engaged in the real estate industry, such as real estate investment trusts (“REITs”); and (ii) equity-like securities, including individual securities, exchange-traded funds (“ETFs”) and derivatives, giving exposure to issuers primarily engaged in the real estate industry. The Board also noted that GPIM may dynamically adjust the New Fund’s level of long and short exposure to the real estate markets over time based on macroeconomic, industry-specific and other factors, but that GPIM expects the Fund’s net exposure over time will be long biased.
Comparative Fees, Costs of Services to be Provided and the Profits to be Realized by GPIM from its Relationship with the Risk Managed Real Estate Fund: The Board compared the Risk Managed Real Estate Fund’s proposed contractual advisory fee and total net expense ratio to its peer group, as set forth in the FUSE report. The Board also reviewed the median advisory fees and expense ratios, including certain expense ratio components (e.g., distribution fees and fee waivers/reimbursements) of the peer group of funds. The Board considered that the Risk Managed Real Estate Fund’s proposed contractual advisory fee and total net expense ratio was equal to or below both the average and median fees of its peer group for each of Class A, Class C and Institutional Class shares. The Board also took into account that GPIM proposed a fee waiver/expense limitation agreement with respect to the Risk Managed Real Estate Fund limiting ordinary operating expenses to 1.30% for Class A shares, 2.05% for Class C shares and 1.10% for Institutional shares. With respect to the costs of advisory services to be provided and estimated level of profitability, on the basis of the Trustees’ review of the fees to be charged by GPIM for investment advisory and related services, the Board concluded that it was too early to predict profitability from the Risk Managed Real Estate Fund, but the Trustees also noted that they would have the opportunity in the future to periodically re-examine this matter.
The Board considered other benefits to be available to GPIM because of its relationship with the Risk Managed Real Estate Fund and noted that GPIM may be deemed to benefit from proposed arrangements whereby an affiliate, Rydex Fund Services, LLC, will provide accounting and administration services and transfer agency services to the New Fund. In this regard, the Trustees considered its prior review of the compensation arrangements for the provision of the foregoing services.
Economies of Scale to be Realized: With respect to economies of scale, the Board considered that the New Fund was in its start-up phase and concluded that the advisory fee schedule reflected an appropriate level of sharing of any economies of scale. The Trustees considered management’s view that the Risk Managed Real Estate Fund’s proposed advisory fee appropriately reflected the current economic environment and the competitive nature of the mutual fund market. The Trustees also noted that they would have the opportunity in the future to periodically re-examine whether the New Fund had achieved economies of scale and the appropriateness of the advisory fees payable by the Risk Managed Real Estate Fund to GPIM.
Overall Conclusions: Based on the foregoing, the Trustees determined that the proposed investment advisory fee for the Risk Managed Real Estate Fund is fair and reasonable in light of the extent and quality of the services to be provided and other benefits to be received and that the approval of the Advisory Agreement is in the best interests of the Risk Managed Real Estate Fund and its shareholders. In reaching this conclusion, no single factor was determinative. The Board, including all of the Independent Trustees, approved the Advisory Agreement for an initial term of two years with respect to the Risk Managed Real Estate Fund.
| | THE GUGGENHEIM FUNDS SEMI-ANNUAL REPORT | 61 |
| INFORMATION ON BOARD OF TRUSTEES AND OFFICERS (Unaudited) |
INDEPENDENT TRUSTEES
| | | | | | | | | Number of | | Other |
| | | Position(s) | | Term of Office | | | | Portfolios in | | Directorships |
| Name, Address* | | Held with | | and Length of | | Principal Occupation(s) | | Fund Complex | | Held by |
| and Year of Birth | | the Trust | | Time Served** | | During Past Five Years | | Overseen | | Trustees |
| | | | | | | | | | | |
| Randall C. Barnes | | Trustee | | Since 2014 | | Current: Private Investor | | 86 | | None. |
| (1951) | | | | | | (2001–present). | | | | |
| | | | | | | | | | | |
| | | | | | | Former: Senior Vice President and Treasurer, PepsiCo, Inc. (1993–1997); President, Pizza Hut International (1991–1993); Senior Vice President, Strategic Planning and New Business Development, PepsiCo, Inc. (1987–1990). | | | | |
| | | | | | | | | | | |
Donald A. Chubb, Jr.
(1946) | | Trustee and Vice Chairman of the Board | | Since 1994 | | Current: Business broker and manager of commercial real estate, Griffith & Blair, Inc. (1997–present). | | 82 | | None. |
| | | | | | | | | | | |
Jerry B. Farley
(1946) | | Trustee and Vice Chairman of the Audit Committee | | Since 2005 | | Current: President, Washburn University (1997–present). | | 82 | | Current: Westar Energy, Inc. (2004–present); CoreFirst Bank & Trust (2000–present). |
| | | | | | | | | | | |
Roman Friedrich III
(1946) | | Trustee and Chairman of the Contracts Review Committee | | Since 2014 | | Current: Founder and President, Roman Friedrich & Company (1998–present). Former: Senior Managing Director, MLV & Co. LLC (2010–2011). | | 82 | | Current: Mercator Minerals Ltd. (2013–present); First Americas Gold Corp. (2012–present); Zincore Metals, Inc. (2009–present). Former: Blue Sky Uranium Corp. (2011–2012); Axiom Gold and Silver Corp. (2011–2012); Stratagold Corp. (2003–2009); GFM Resources Ltd. (2005–2010). |
| | | | | | | | | | | |
Robert B. Karn III
(1942) | | Trustee and Chairman of the Audit Committee | | Since 2014 | | Current: Consultant (1998-present). Former: Arthur Andersen (1965–1997) and Managing Partner, Financial and Economic Consulting, St. Louis office (1987–1997). | | 82 | | Current: Peabody Energy Company (2003–present); GP Natural Resource Partners, LLC (2002–present). |
| | | | | | | | | | | |
Ronald A. Nyberg
(1953) | | Trustee and Chairman of the Nominating and Governance Committee | | Since 2014 | | Current: Partner, Nyberg & Cassioppi, LLC (2000–present). Former: Executive Vice President, General Counsel, and Corporate Secretary, Van Kampen Investments (1982–1999). | | 88 | | None. |
| 62 | THE GUGGENHEIM FUNDS SEMI-ANNUAL REPORT | |
| INFORMATION ON BOARD OF TRUSTEES AND OFFICERS (Unaudited)(continued) |
INDEPENDENT TRUSTEES - concluded
| | | | | | | | | Number of | | Other |
| | | Position(s) | | Term of Office | | | | Portfolios in | | Directorships |
| Name, Address* | | Held with | | and Length of | | Principal Occupation(s) | | Fund Complex | | Held by |
| and Year of Birth | | the Trust | | Time Served** | | During Past Five Years | | Overseen | | Trustees |
| | | | | | | | | | | |
Maynard F. Oliverius
(1943) | | Trustee and Vice Chairman of the Contracts Review Committee | | Since 1998 | | Retired. Former: President and CEO, Stormont–Vail HealthCare (1996–2012). | | 82 | | None. |
| | | | | | | | | | | |
Ronald E. Toupin, Jr.
(1958) | | Trustee and Chairman of the Board | | Since 2014 | | Current: Portfolio Consultant (2010–present). Former: Vice President, Manager and Portfolio Manager, Nuveen Asset Management (1998–1999); Vice President, Nuveen Investment Advisory Corp. (1992–1999); Vice President and Manager, Nuveen Unit Investment Trusts (1991–1999); and Assistant Vice President and Portfolio Manager, Nuveen Unit Investment Trusts (1988–1999), each of John Nuveen & Co., Inc. (1982–1999). | | 85 | | Former: Bennett Group of Funds (2011–2013). |
| INTERESTED TRUSTEE | | | | | | | | | | |
| | | | | | | | | | | |
Donald C. Cacciapaglia***
(1951) | | President, Chief Executive Officer and Trustee | | Since 2012 | | Current: President and CEO, certain other funds in the Fund Complex (2012–present); Vice Chairman, Guggenheim Investments (2010–present). Former: Chairman and CEO, Channel Capital Group, Inc. (2002–2010). | | 214 | | Current: Delaware Life (2013–present); Guggenheim Life and Annuity Company (2011–present); Paragon Life Insurance Company of Indiana (2011–present). |
| * | | The business address of each Trustee is c/o Guggenheim Investments, 805 King Farm Boulevard, Suite 600, Rockville, Maryland 20850. |
| ** | | Each Trustee serves an indefinite term, until his successor is elected and qualified. Time served includes time served in the respective position for the Predecessor Corporation. |
| *** | | This Trustee is deemed to be an “interested person” of the Funds under the 1940 Act by reason of his position with the Funds’ Investment Manager and/or the parent of the Investment Manager. |
| | THE GUGGENHEIM FUNDS SEMI-ANNUAL REPORT | 63 |
| INFORMATION ON BOARD OF TRUSTEES AND OFFICERS (Unaudited)(continued) |
OFFICERS
| | | Position(s) | | Term of Office | | |
| Name, Address* | | Held with | | and Length of | | Principal Occupation(s) |
| and Year of Birth | | the Trust | | Time Served** | | During Past Five Years |
| | | | | | | |
Joseph M. Arruda
(1966) | | Assistant Treasurer | | Since 2010 | | Current: Assistant Treasurer, certain other funds in the Fund Complex (2006–present); Vice President, Security Investors, LLC (2010–present); CFO and Manager, Guggenheim Specialized Products, LLC (2009–present). |
| | | | | | | |
| | | | | | | Former: Vice President, Security Global Investors, LLC (2010–2011); Vice President, Rydex Advisors, LLC (2010); Vice President, Rydex Advisors II, LLC (2010). |
| | | | | | | |
William H. Belden, III
(1965) | | Vice President | | Since 2014 | | Current: Vice President, certain other funds in the Fund Complex (2006– present); Managing Director, Guggenheim Funds Investment Advisors, LLC (2005–present). |
| | | | | | | |
| | | | | | | Former: Vice President of Management, Northern Trust Global Investments (1999–2005). |
| | | | | | | |
Mark J. Furjanic
(1959) | | Assistant Treasurer | | Since 2014 | | Current: Vice President, Guggenheim Investments (2005–present); Assistant Treasurer, certain other funds in the Fund Complex (2008–present). |
| | | | | | | |
| | | | | | | Former: Senior Manager, Ernst & Young LLP (1999–2005). |
| | | | | | | |
James Howley
(1972) | | Assistant Treasurer | | Since 2014 | | Current: Director, Guggenheim Investments (2004–present) ; Assistant Treasurer, certain other funds in the Fund Complex (2006–present). |
| | | | | | | |
| | | | | | | Former: Manager, Mutual Fund Administration of Van Kampen Investments, Inc. (1996–2004). |
| | | | | | | |
Amy J. Lee
(1961) | | Vice President and Chief Legal Officer | | Since 1987 (Secretary) Since 2007 (Vice President) | | Current: Chief Legal Officer, certain other funds in the Fund Complex (2013–present); Senior Managing Director, Guggenheim Investments (2012–present). Former: Vice President, Associate General Counsel and Assistant Secretary, Security Benefit Life Insurance Company and Security Benefit Corporation (2004–2012). |
| | | | | | | |
Derek Maltbie
(1972) | | Assistant Treasurer | | Since 2014 | | Current: Vice President, Guggenheim Investments (2012–present); Assistant Treasurer, certain other funds in the Fund Complex (2011–present). |
| | | | | | | |
| | | | | | | Former: Assistant Vice President, Guggenheim Funds Investment Advisors, LLC (2005–2011); Supervisor, Mutual Fund Administration, Van Kampen Investments, Inc. (1995–2005). |
| | | | | | | |
Mark E. Mathiasen
(1978) | | Secretary | | Since 2013 | | Current: Secretary, certain other funds in the Fund Complex (2007–present); Managing Director and Associate General Counsel, Guggenheim Funds Services, LLC, and affiliates (2007–present). |
| | | | | | | |
Michael P. Megaris
(1984) | | Assistant Secretary | | Since 2014 | | Current: Assistant Secretary, certain other funds in the Fund Complex (April 2014–present); Associate, Guggenheim Investments (2012–present). |
| | | | | | | |
| | | | | | | Former: J.D., University of Kansas School of Law (2009–2012). |
| | | | | | | |
Elisabeth Miller
(1968) | | Chief Compliance Officer | | Since 2012 | | Current: CCO, certain other funds in the Fund Complex (2012–present); CCO, Security Investors, LLC (2012–present); CCO, Guggenheim Funds Investment Advisors, LLC (2012–present); Vice President, Guggenheim Funds Distributors, LLC (March 2014–present). |
| | | | | | | |
| | | | | | | Former: CCO, Guggenheim Distributors, LLC (2009–March 2014); Senior Manager, Security Investors, LLC (2004–2009); Senior Manager, Guggenheim Distributors, LLC (2004–2009). |
| | | | | | | |
Alison Santay
(1974) | | AML Officer | | Since 2013 | | Current: AML Officer, certain other funds in the Fund Complex (2010–present); Director and AML Officer, Rydex Fund Services, LLC (2010–present); AML Officer, Security Investors, LLC (2010–present); Director, Shareholder Risk and Compliance, Rydex Fund Services, LLC (2004–present). |
| | | | | | | |
| | | | | | | Former: AML Officer, Guggenheim Distributors, LLC (2013–March 2014). |
| 64 | THE GUGGENHEIM FUNDS SEMI-ANNUAL REPORT | |
| INFORMATION ON BOARD OF TRUSTEES AND OFFICERS (Unaudited)(concluded) |
OFFICERS- concluded
| | | Position(s) | | Term of Office | | |
| Name, Address* | | Held with | | and Length of | | Principal Occupation(s) |
| and Year of Birth | | the Trust | | Time Served** | | During Past Five Years |
| | | | | | | |
Kimberly Scott
(1974) | | Assistant Treasurer | | Since 2014 | | Current: Vice President, Guggenheim Investments (2012–present) ; Assistant Treasurer, certain other funds in the Fund Complex (2012–present). |
| | | | | | | |
| | | | | | | Former: Financial Reporting Manager, Invesco, Ltd. (2010–2011); Vice President/Assistant Treasurer, Mutual Fund Administration for Van Kampen Investments, Inc./Morgan Stanley Investment Management (2009–2010); Manager of Mutual Fund Administration, Van Kampen Investments, Inc./Morgan Stanley Investment Management (2005–2009). |
| | | | | | | |
Bryan Stone
(1979) | | Vice President | | Since 2014 | | Current: Vice President, certain other funds in the Fund Complex (April 2014–present); Director, Guggenheim Investments (2013–present). |
| | | | | | | |
| | | | | | | Former: Senior Vice President, Neuberger Berman Group LLC (2009–2013); Vice President, Morgan Stanley (2002–2009). |
| | | | | | | |
John L. Sullivan
(1955) | | Chief Financial Officer and Treasurer | | Since 2014 | | Current: CFO, Chief Accounting Officer and Treasurer, certain other funds in the Fund Complex (2010–present); Senior Managing Director, Guggenheim Investments (2010–present). Former: Managing Director and CCO, each of the funds in the Van Kampen Investments fund complex (2004–2010); Managing Director and Head of Fund Accounting and Administration, Morgan Stanley Investment Management (2002–2004); CFO and Treasurer, Van Kampen Funds (1996–2004). |
| * | | The business address of each officer is c/o Guggenheim Investments, 805 King Farm Boulevard, Suite 600, Rockville, Maryland 20850. |
| ** | | Each officer serves an indefinite term, until his or her successor is duly elected and qualified. Time served includes time served in the respective position for the Predecessor Corporation. |
| | THE GUGGENHEIM FUNDS SEMI-ANNUAL REPORT | 65 |
| GUGGENHEIM INVESTMENTS PRIVACY POLICIES (Unaudited) |
Rydex Funds, Guggenheim Funds, Rydex Investments, Guggenheim Funds Distributors, LLC, Security Investors, LLC, Security Distributors, Inc., Guggenheim Partners Investment Managers, LLC, and Rydex Advisory Services (Collectively “Guggenheim Investments”).
Our Commitment to You
When you become a Guggenheim Investments investor, you entrust us with not only your hard-earned money but also with personal and financial information about you. We recognize that your relationship with us is based on trust and that you expect us to act responsibly and in your best interests. Because we have access to this private information about you, we hold ourselves to the highest standards in its safekeeping and use. This means, most importantly, that we do not sell client information to anyone—whether it is your personal information or if you are a current or former Guggenheim Investments client.
The Information We Collect About You
In the course of doing business with shareholders and investors, we collect nonpublic personal information about you. You typically provide personal information when you complete a Guggenheim Investments account application or when you request a transaction that involves Rydex and Guggenheim Investments funds or one of the Guggenheim Investments affiliated companies. “Nonpublic personal information” is personally identifiable private information about you. For example, it includes information regarding your name and address, Social Security or taxpayer identification number, assets, income, account balance, bank account information and investment activity (e.g., purchase and redemption history).
How We Handle Your Personal Information
As emphasized above, we do not sell information about current or former clients or their accounts to third parties. Nor do we share such information, except when necessary to complete transactions at your request or to make you aware of related investment products and services that we offer. Additional details about how we handle your personal information are provided below. To complete certain transactions or account changes that you direct, it may be necessary to provide identifying information to companies, individuals or groups that are not affiliated with Guggenheim Investments. For example, if you ask to transfer assets from another financial institution to Guggenheim Investments, we will need to provide certain information about you to that company to complete the transaction. To alert you to other Guggenheim Investments investment products and services, we may share your information within the Guggenheim Investments family of affiliated companies. This would include, for example, sharing your information within Guggenheim Investments so we can make you aware of new Rydex and Guggenheim Investments funds or the services offered through another Guggenheim Investments affiliated company. In certain instances, we may contract with nonaffiliated companies to perform services for us. Where necessary, we will disclose information we have about you to these third parties. In all such cases, we provide the third party with only the information necessary to carry out its assigned responsibilities and only for that purpose. And we require these third parties to treat your private information with the same high degree of confidentiality that we do. In certain instances, we may share information with other financial institutions regarding individuals and entities in response to the U.S.A. Patriot Act. Finally, we will release information about you if you direct us to do so, if we are compelled by law to do so or in other circumstances permitted by law.
Opt Out Provisions
We do not sell your personal information to anyone. The law allows you to “opt out” of only certain kinds of information sharing with third parties. The firm does not share personal information about you with any third parties that triggers this opt-out right. This means YOU ARE ALREADY OPTED OUT.
How We Protect Privacy Online
Our concern for the privacy of our shareholders also extends to those who use our web site, guggenheiminvestments.com. Our web site uses some of the most secure forms of online communication available, including encryption technology, Secure Socket Layer (SSL) protocol, firewalls and user names and passwords. These technologies provide a high level of security and privacy when you access your account information or initiate online transactions. The Guggenheim Investments web site offers customized features that require our use of “http cookies”—tiny pieces of information that we
| 66 | THE GUGGENHEIM FUNDS SEMI-ANNUAL REPORT | |
| GUGGENHEIM INVESTMENTS PRIVACY POLICIES (Unaudited)(concluded) |
ask your browser to store. However, we make very limited use of these cookies. We only use cookies for session management and security features on the Guggenheim Investments web site. We do not use them to pull data from your hard drive, to learn your email address, or to view data in cookies created by other web sites. We will not share the information in our cookies or give others access to it. See the legal information area on our web site for more details about web site security and privacy features.
How We Safeguard Your Personal Information
We restrict access to nonpublic personal information about shareholders to our employees and in some cases to third parties (for example, the service providers described above) as permitted by law. We maintain strict physical, electronic and procedural safeguards that comply with federal standards to guard your nonpublic personal information.
We’ll Keep You Informed
As required by federal law, we will notify shareholders of our privacy policy annually. We reserve the right to modify this policy at any time, but rest assured that if we do change it, we will tell you promptly. You will also be able to access our privacy policy from our web site at guggenheiminvestments.com. Should you have any questions regarding our privacy policy, contact us at 800.820.0888 or 301.296.5100.
| | THE GUGGENHEIM FUNDS SEMI-ANNUAL REPORT | 67 |
This page intentionally left blank.
This page intentionally left blank.
This page intentionally left blank.
This page intentionally left blank.
This page intentionally left blank.

3.31.2014
Guggenheim Funds Semi-Annual Report
Fundamental Alpha
Large Cap Value Fund
| SBLCV-SEMI-0314x0914 | guggenheiminvestments.com |

Go Green! Eliminate Mailbox Clutter
Go paperless with Guggenheim Investments eDelivery—a service giving you full online access to account information and documents. Save time, cut down on mailbox clutter and be a friend to the environment with eDelivery.
With Guggenheim Investments eDelivery you can:
| • | View online confirmations and statements at your convenience. |
| • | Receive email notifications when your most recent confirmations, statements and other account documents are available for review. |
| • | Access prospectuses, annual reports and semiannual reports online. |

If you have questions about the Guggenheim Investments eDelivery service, contact one of our Shareholder Service Representatives at 800.820.0888.
This report and the financial statements contained herein are submitted for the general information of our shareholders. The report is not authorized for distribution to prospective investors unless preceded or accompanied by an effective prospectus.
Distributed by Guggenheim Funds Distributors, LLC. GI-GOGREEN-0414 x0415 #12604
| THE GUGGENHEIM FUNDS SEMI-ANNUAL REPORT | 1 |
Dear Shareholder:
Security Investors, LLC (the “Investment Adviser”) is pleased to present the semi-annual shareholder report for one Fund in our Guggenheim Funds Trust (the “Fund”) for the six-month period ended March 31, 2014.
The Investment Adviser is part of Guggenheim Investments, which represents the investment management businesses of Guggenheim Partners, LLC, (“Guggenheim“) a global, diversified financial services firm.
Guggenheim Funds Distributors, LLC is the distributor of the Funds. Guggenheim Funds Distributors, LLC is affiliated with Guggenheim and the Investment Adviser.
We encourage you to read the Economic and Market Overview section of the report, which follows this letter, and then the Fund Profile for the Fund.
We are committed to providing innovative investment solutions and appreciate the trust you place in us.
Sincerely,

Donald C. Cacciapaglia
President
April 30, 2014
Read a prospectus and summary prospectus (if available) carefully before investing. It contains the investment objectives, risks, charges, expenses and other information, which should be considered carefully before investing. Obtain a prospectus and summary prospectus (if available) at guggenheiminvestments.com or call 800.820.0888.
There can be no assurance that any investment product will achieve its investment objective(s). There are risks associated with investing, including the entire loss of principal invested. Investing involves market risks. The investment return and principal value of any investment product will fluctuate with changes in market conditions.
| 2 | THE GUGGENHEIM FUNDS SEMI-ANNUAL REPORT |
| ECONOMIC AND MARKET OVERVIEW (Unaudited) | March 31, 2014 |
Investment markets continued to rally through the six months ended March 31, 2014, thanks to a steadily improving U.S. economy and ongoing U.S. central bank easing. Contributing to performance of equities were growing confidence in the sustainability of the U.S. economic recovery, favorable corporate profit growth, supportive valuations, interest rates below their long-run level, and positive inflows, as investors concerned about the end of quantitative easing and its impact on interest rates rotated out of fixed-income investments into equities.
In January 2014, based on positive economic data and a better jobs picture, the U.S. Federal Reserve (the “Fed”) began its long-expected tapering program, reducing monthly purchases by $10 billion. The Fed continued to taper even after acknowledging in March that the economy had slowed during the winter months, which were unusually harsh for much of the U.S. By April, it was buying only $55 billion a month, down from $85 billion in December 2013.
In March 2014, while noting that the U.S. economy has not yet reached full employment, the Fed also unlinked attainment of a 6.5% unemployment level with a potential rate hike, since the unemployment rate in February was approaching that level. Revised guidance from new Fed Chair Janet Yellen seemed to indicate that a rise might not be considered until mid-2015, at the earliest, although she stressed that it would depend on labor market conditions and the inflation rate. Still, the date was earlier than many market participants had expected, which knocked the market off record highs reached earlier in the six-month period.
Even though upcoming economic reports may reflect the impacts from the severe winter weather, and international tensions remain high, the arrival of spring was expected to return the U.S. economy to its improving trend. Pent-up demand resulting from the huge gap in household formation over the prior several years continues to buoy the housing market, while a pickup in global demand bodes well for the U.S. manufacturing sector. Consumption is rising due to an increase in net worth, resulting from the rebound in housing and asset prices, which has boosted retail sales, and consumer sentiment measures. The consensus expectation for 2014 growth stands at 3.0%, compared with 1.9% for 2013.
Momentum driven by the favorable macro environment is supporting equities and moving spreads tighter, helping perpetuate the risk-on mode that has prevailed in the U.S. since 2008. Investors who want income will have to keep investing, but buying cheap securities may be a thing of the past. Recent volatility indicates that investors must guard against becoming complacent about the quality of investments they make and their inherent risks. The Fed continues pumping enormous amounts of liquidity into the system, but with little expectation that it will raise interest rates before 2015, the expansion is likely to continue. Even when the Fed does hike, it typically takes another two years before a recession threatens growth. While the economy may be entering a new era where interest rates head higher over the long term, there is likely a ceiling on how high rates can rise in advance of eventual monetary tightening.
For the six months ended March 31, 2014, the Standard & Poor’s 500® (“S&P 500”) Index* returned 12.51%. The Morgan Stanley Capital International (“MSCI”) Europe-Australasia-Far East (“EAFE”) Index* returned 6.41%. The return of the MSCI Emerging Markets Index* was 1.39%.
In the bond market, the Barclays U.S. Aggregate Bond Index* posted a 1.70% return for the period, while the Barclays U.S. Corporate High Yield Index* returned 6.67%. The return of the BofA Merrill Lynch 3-Month U.S. Treasury Bill Index* was 0.03% for the six-month period.
The opinions and forecasts expressed may not actually come to pass. This information is subject to change at any time, based on market and other conditions, and should not be construed as a recommendation of any specific security or strategy.
| THE GUGGENHEIM FUNDS SEMI-ANNUAL REPORT | 3 |
| ECONOMIC AND MARKET OVERVIEW (Unaudited)(concluded) | March 31, 2014 |
*Index Definitions:
The following indices are referenced throughout this report. Indices are unmanaged and not available for direct investment. Index performance does not reflect transaction costs, fees, or expenses.
Barclays U.S. Aggregate Bond Index is a broad-based benchmark that measures the investment grade, U.S. dollar denominated, fixed-rate taxable bond market, including U.S. Treasuries, government-related and corporate securities, MBS (agency fixed-rate and hybrid ARM pass-throughs), ABS, and CMBS.
Barclays U.S. Corporate High Yield Index measures the market of USD-denominated, non-investment grade, fixed-rate, taxable corporate bonds. Securities are classified as high yield if the middle rating of Moody’s, Fitch, and S&P is Ba1/BB+/BB+ or below.
BofA Merrill Lynch 3-Month U.S. Treasury Bill Index is an unmanaged market index of U.S. Treasury securities maturing in 90 days that assumes reinvestment of all income.
MSCI EAFE Index is a free float-adjusted market capitalization index that is designed to measure the equity market performance of developed markets, excluding the U.S. & Canada.
MSCI Emerging Markets Index is a free float-adjusted market capitalization weighted index that is designed to measure equity market performance in the global emerging markets.
S&P 500® Index is a capitalization-weighted index of 500 stocks designed to measure the performance of the broad economy, representing all major industries and is considered a representation of the U.S. stock market.
| 4 | THE GUGGENHEIM FUNDS SEMI-ANNUAL REPORT |
| ABOUT SHAREHOLDERS’ FUND EXPENSES (Unaudited) |
All mutual funds have operating expenses and it is important for our shareholders to understand the impact of costs on their investments. Shareholders of a Fund incur two types of costs: (i) transaction costs, including sales charges (loads) on purchase payments, reinvested dividends, or other distributions; and exchange fees; and (ii) ongoing costs, including management fees, administrative services, and shareholder reports, among others. These ongoing costs, or operating expenses, are deducted from a fund’s gross income and reduce the investment return of the fund.
A fund’s expenses are expressed as a percentage of its average net assets, which is known as the expense ratio. The following examples are intended to help investors understand the ongoing costs (in dollars) of investing in a Fund and to compare these costs with the ongoing costs of investing in other mutual funds.
The examples are based on an investment of $1,000 made at the beginning of the period and held for the entire six-month period beginning September 30, 2013 and ending March 31, 2014.
The following tables illustrate a Fund’s costs in two ways:
Table 1. Based on actual Fund return. This section helps investors estimate the actual expenses paid over the period. The “Ending Account Value” shown is derived from the Fund’s actual return, and the fourth column shows the dollar amount that would have been paid by an investor who started with $1,000 in the Fund. Investors may use the information here, together with the amount invested, to estimate the expenses paid over the period. Simply divide the Fund’s account value by $1,000 (for example, an $8,600 account value divided by $1,000 = 8.6), then multiply the result by the number provided under the heading “Expenses Paid During Period.”
Table 2. Based on hypothetical 5% return. This section is intended to help investors compare a Fund’s cost with those of other mutual funds. The table provides information about hypothetical account values and hypothetical expenses based on the Fund’s actual expense ratio and an assumed rate of return of 5% per year before expenses, which is not the Fund’s actual return. The hypothetical account values and expenses may not be used to estimate the actual ending account balance or expenses paid during the period. The example is useful in making comparisons because the U.S. Securities and Exchange Commission (the “SEC”) requires all mutual funds to calculate expenses based on the 5% return. Investors can assess a Fund’s costs by comparing this hypothetical example with the hypothetical examples that appear in shareholder reports of other funds.
The calculations illustrated above assume no shares were bought or sold during the period. Actual costs may have been higher or lower, depending on the amount of investment and the timing of any purchases or redemptions.
Please note that the expenses shown in the table are meant to highlight your ongoing costs only and do not reflect any transactional costs, such as sales charges (loads) on purchase payments, and contingent deferred sales charges (“CDSC”) on redemptions, if any. Therefore, the second table is useful in comparing ongoing costs only, and will not help you determine the relative total costs of owning different funds. In addition, if these transactional costs were included, your costs would have been higher.
More information about a Fund’s expenses, including annual expense ratios for the past five years, can be found in the Financial Highlights section of this report. For additional information on operating expenses and other shareholder costs, please refer to the appropriate Fund prospectus.
| THE GUGGENHEIM FUNDS SEMI-ANNUAL REPORT | 5 |
| ABOUT SHAREHOLDERS’ FUND EXPENSES (Unaudited)(concluded) |
| | | | | | | | | Beginning | | | Ending | | | Expenses | |
| | | Expense | | | Fund | | | Account Value | | | Account Value | | | Paid During | |
| | | Ratio1 | | | Return | | | September 30, 2013 | | | March 31, 2014 | | | Period2 | |
| | | | | | | | | | | | | | | | |
| Table 1. Based on actual Fund return3 | | | | | | | | | |
| | | | | | | | | | | | | | | | | | | | | |
| Large Cap Value Fund | | | | | | �� | | | | | | | | | | | | | | |
| A-Class | | | 1.17 | % | | | 11.38 | % | | | $1,000.00 | | | | $1,113.80 | | | | $6.17 | |
| B-Class4 | | | 0.92 | % | | | 11.49 | % | | | 1,000.00 | | | | 1,114.90 | | | | 4.85 | |
| C-Class | | | 1.92 | % | | | 10.91 | % | | | 1,000.00 | | | | 1,109.10 | | | | 10.10 | |
| Institutional Class | | | 0.92 | % | | | 11.49 | % | | | 1,000.00 | | | | 1,114.90 | | | | 4.85 | |
| | | | | | | | | | | | | | | | | | | | | |
| Table 2. Based on hypothetical 5% return (before expenses) | | | | | | | | | |
| | | | | | | | | | | | | | | | | | | | | |
| Large Cap Value Fund | | | | | | | | | | | | | | | | | | | | |
| A-Class | | | 1.17 | % | | | 5.00 | % | | | $1,000.00 | | | | $1,019.10 | | | | $5.89 | |
| B-Class4 | | | 0.92 | % | | | 5.00 | % | | | 1,000.00 | | | | 1,020.34 | | | | 4.63 | |
| C-Class | | | 1.92 | % | | | 5.00 | % | | | 1,000.00 | | | | 1,015.36 | | | | 9.65 | |
| Institutional Class | | | 0.92 | % | | | 5.00 | % | | | 1,000.00 | | | | 1,020.34 | | | | 4.63 | |
| 1 | This ratio represents annualized net expenses, which include extraordinary expenses. Excluding extraordinary expenses, the operating expense ratio would be 1.15%, 0.90%, 1.90% and 0.90% for the A-Class, B-Class, C-Class and Institutional Class, respectively. This ratio excludes expenses of the underlying fund in which the Fund invests. |
| 2 | Expenses are equal to the Fund’s annualized expense ratio, net of any applicable fee waivers, multiplied by the average account value over the period, multiplied by 182/365 (to reflect the one-half year period). |
| 3 | Actual cumulative return at net asset value for the period September 30, 2013 to March 31, 2014. |
| 4 | B-Class shares did not charge 12b-1 fees during the period. |
| 6 | THE GUGGENHEIM FUNDS SEMI-ANNUAL REPORT |
| FUND PROFILE (Unaudited) | March 31, 2014 |
LARGE CAP VALUE FUND
OBJECTIVE: Seeks long-term growth of capital.
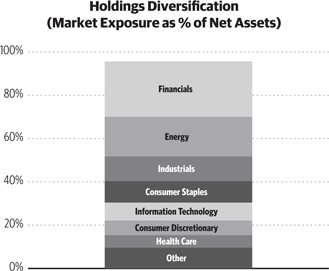
“Holdings Diversification (Market Exposure as % of Net Assets)” excludes any temporary cash investments.
| Inception Dates: | |
| A-Class | | August 7, 1944 | |
| B-Class | | October 19, 1993 | |
| C-Class | | January 29, 1999 | |
| Institutional Class | | June 7, 2013 | |
| Ten Largest Holdings (% of Total Net Assets) |
| Wells Fargo & Co. | | | 4.6 | % |
| CVS Caremark Corp. | | | 3.5 | % |
| American International Group, Inc. | | | 3.2 | % |
| JPMorgan Chase & Co. | | | 3.0 | % |
| Edison International | | | 2.8 | % |
| Time Warner, Inc. | | | 2.7 | % |
| Parker Hannifin Corp. | | | 2.6 | % |
| iShares Russell 1000 Value ETF | | | 2.5 | % |
| TE Connectivity Ltd. | | | 2.5 | % |
| Citigroup, Inc. | | | 2.4 | % |
| Top Ten Total | | | 29.8 | % |
| THE GUGGENHEIM FUNDS SEMI-ANNUAL REPORT | 7 |
| SCHEDULE OF INVESTMENTS (Unaudited) | March 31, 2014 |
| LARGE CAP VALUE FUND | |
| | | Shares | | | Value | |
| | | | | | | |
| COMMON STOCKS† - 92.8% | | | | | | | | |
| | | | | | | | | |
| FINANCIALS - 25.3% | | | | | | | | |
| Wells Fargo & Co. | | | 66,170 | | | $ | 3,291,295 | |
| American International Group, Inc. | | | 45,032 | | | | 2,252,050 | |
| JPMorgan Chase & Co. | | | 34,660 | | | | 2,104,208 | |
| Citigroup, Inc. | | | 36,070 | | | | 1,716,932 | |
| Allstate Corp. | | | 24,955 | | | | 1,411,954 | |
| Bank of New York Mellon Corp. | | | 36,650 | | | | 1,293,379 | |
| Reinsurance Group of America, Inc. — Class A | | | 13,265 | | | | 1,056,292 | |
| Bank of America Corp. | | | 57,600 | | | | 990,720 | |
| Aon plc | | | 9,875 | | | | 832,265 | |
| Franklin Resources, Inc. | | | 12,480 | | | | 676,166 | |
| U.S. Bancorp | | | 14,253 | | | | 610,884 | |
| CME Group, Inc. — Class A | | | 7,710 | | | | 570,617 | |
| SLM Corp. | | | 21,360 | | | | 522,893 | |
| Home Loan Servicing Solutions Ltd. | | | 17,800 | | | | 384,480 | |
| Ocwen Financial Corp.* | | | 7,570 | | | | 296,593 | |
| Total Financials | | | | | | | 18,010,728 | |
| | | | | | | | | |
| ENERGY - 18.3% | | | | | | | | |
| Apache Corp. | | | 18,987 | | | | 1,574,972 | |
| Chevron Corp. | | | 12,955 | | | | 1,540,478 | |
| Cameco Corp. | | | 65,590 | | | | 1,502,011 | |
| Halliburton Co. | | | 24,705 | | | | 1,454,878 | |
| Whiting Petroleum Corp.* | | | 20,895 | | | | 1,449,904 | |
| Phillips 66 | | | 14,735 | | | | 1,135,479 | |
| Exxon Mobil Corp. | | | 8,910 | | | | 870,329 | |
| Marathon Oil Corp. | | | 23,080 | | | | 819,802 | |
| Patterson-UTI Energy, Inc. | | | 25,430 | | | | 805,622 | |
| Superior Energy Services, Inc. | | | 19,070 | | | | 586,593 | |
| Suncor Energy, Inc. | | | 15,960 | | | | 557,962 | |
| ConocoPhillips | | | 5,255 | | | | 369,689 | |
| Oasis Petroleum, Inc.* | | | 8,100 | | | | 338,013 | |
| Total Energy | | | | | | | 13,005,732 | |
| | | | | | | | | |
| INDUSTRIALS - 11.4% | | | | | | | | |
| Parker Hannifin Corp. | | | 15,525 | | | | 1,858,498 | |
| Republic Services, Inc. — Class A | | | 46,060 | | | | 1,573,409 | |
| United Technologies Corp. | | | 13,190 | | | | 1,541,120 | |
| Quanta Services, Inc.* | | | 29,600 | | | | 1,092,240 | |
| URS Corp. | | | 18,660 | | | | 878,140 | |
| Covanta Holding Corp. | | | 39,160 | | | | 706,838 | |
| General Cable Corp. | | | 18,220 | | | | 466,614 | |
| Total Industrials | | | | | | | 8,116,859 | |
| | | | | | | | | |
| CONSUMER STAPLES - 9.9% | | | | | | | | |
| CVS Caremark Corp. | | | 33,400 | | | | 2,500,324 | |
| Wal-Mart Stores, Inc. | | | 19,335 | | | | 1,477,774 | |
| Bunge Ltd. | | | 17,770 | | | | 1,412,893 | |
| Mondelez International, Inc. — Class A | | | 32,980 | | | | 1,139,459 | |
| Kraft Foods Group, Inc. | | | 8,671 | | | | 486,443 | |
| Total Consumer Staples | | | | | | | 7,016,893 | |
| | | | | | | | | |
| INFORMATION TECHNOLOGY - 8.3% | | | | | | | | |
| TE Connectivity Ltd. | | | 29,010 | | | | 1,746,692 | |
| Computer Sciences Corp. | | | 27,635 | | | | 1,680,761 | |
| Cisco Systems, Inc. | | | 68,520 | | | | 1,535,533 | |
| QUALCOMM, Inc. | | | 4,570 | | | | 360,390 | |
| NetApp, Inc. | | | 8,885 | | | | 327,857 | |
| FLIR Systems, Inc. | | | 7,060 | | | | 254,160 | |
| Total Information Technology | | | | | | | 5,905,393 | |
| | | | | | | | | |
| CONSUMER DISCRETIONARY - 6.7% | | | | | | | | |
| Time Warner, Inc. | | | 29,295 | | | | 1,913,842 | |
| Lowe’s Companies, Inc. | | | 24,180 | | | | 1,182,402 | |
| DeVry Education Group, Inc. | | | 17,840 | | | | 756,238 | |
| PulteGroup, Inc. | | | 29,890 | | | | 573,589 | |
| Kohl’s Corp. | | | 6,320 | | | | 358,976 | |
| Total Consumer Discretionary | | | | | | | 4,785,047 | |
| | | | | | | | | |
| HEALTH CARE - 5.8% | | | | | | | | |
| Aetna, Inc. | | | 16,870 | | | | 1,264,744 | |
| Teva Pharmaceutical Industries Ltd. ADR | | | 23,845 | | | | 1,259,970 | |
| Pfizer, Inc. | | | 27,150 | | | | 872,058 | |
| UnitedHealth Group, Inc. | | | 9,185 | | | | 753,078 | |
| Total Health Care | | | | | | | 4,149,850 | |
| | | | | | | | | |
| MATERIALS - 3.7% | | | | | | | | |
| Dow Chemical Co. | | | 34,770 | | | | 1,689,474 | |
| Coeur Mining, Inc.* | | | 66,630 | | | | 618,993 | |
| Potash Corporation of Saskatchewan, Inc. | | | 8,930 | | | | 323,445 | |
| Total Materials | | | | | | | 2,631,912 | |
| | | | | | | | | |
| UTILITIES - 2.8% | | | | | | | | |
| Edison International | | | 35,245 | | | | 1,995,219 | |
| | | | | | | | | |
| TELECOMMUNICATION SERVICES - 0.6% | | | | | | | | |
| Windstream Holdings, Inc. | | | 53,271 | | | | 438,953 | |
| | | | | | | | | |
| Total Common Stocks | | | | | | | | |
| (Cost $50,739,270) | | | | | | | 66,056,586 | |
| | | | | | | | | |
| WARRANTS† - 0.3% | | | | | | | | |
| American International Group, Inc. | | | | | | | | |
| $45.00, 01/19/21* | | | 8,920 | | | | 182,325 | |
| | | | | | | | | |
| Total Warrants | | | | | | | | |
| (Cost $167,892) | | | | | | | 182,325 | |
| | | | | | | | | |
| EXCHANGE TRADED FUNDS† - 2.5% | | | | | | | | |
| iShares Russell 1000 Value ETF | | | 18,340 | | | | 1,769,810 | |
| | | | | | | | | |
| Total Exchange Traded Funds | | | | | | | | |
| (Cost $1,571,783) | | | | | | | 1,769,810 | |
| | | | | | | | | |
| SHORT TERM INVESTMENTS† - 5.2% | | | | | | | | |
| Dreyfus Treasury Prime Cash | | | | | | | | |
| Management Fund | | | 3,664,812 | | | | 3,664,812 | |
| | | | | | | | | |
| Total Short Term Investments | | | | | | | | |
| (Cost $3,664,812) | | | | | | | 3,664,812 | |
| | | | | | | | | |
| Total Investments - 100.8% | | | | | | | | |
| (Cost $56,143,757) | | | | | | $ | 71,673,533 | |
| | | | | | | | | |
| Other Assets & Liabilities, net - (0.8)% | | | | | | | (578,320 | ) |
| | | | | | | | | |
| Total Net Assets - 100.0% | | | | | | $ | 71,095,213 | |
| * | Non-income producing security. |
| † | Value determined based on Level 1 inputs — See Note 3. |
| | ADR — American Depositary Receipt |
plc — Public Limited Company
| 8 | THE GUGGENHEIM FUNDS SEMI-ANNUAL REPORT | SEE NOTES TO FINANCIAL STATEMENTS. |
| STATEMENT OF ASSETS | | | |
| AND LIABILITIES (Unaudited) | | | |
| March 31, 2014 | | | | |
| | | | | |
| Assets: | | | | |
| Investments, at value | | | | |
| (cost $56,143,757) | | $ | 71,673,533 | |
| Prepaid expenses | | | 43,050 | |
| Receivables: | | | | |
| Fund shares sold | | | 340,631 | |
| Dividends | | | 101,463 | |
| Investment advisor | | | 23,596 | |
| Foreign taxes reclaim | | | 1,397 | |
| Total assets | | | 72,183,670 | |
| Liabilities: | | | | |
| Overdraft due to custodian bank | | | 13,870 | |
| Payable for: | | | | |
| Securities purchased | | | 934,821 | |
| Management fees | | | 38,334 | |
| Fund shares redeemed | | | 31,490 | |
| Distribution and service fees | | | 15,951 | |
| Transfer agent/maintenance fees | | | 8,647 | |
| Fund accounting/administration fees | | | 5,603 | |
| Trustees’ fees* | | | 1,071 | |
| Miscellaneous | | | 38,670 | |
| Total liabilities | | | 1,088,457 | |
| Net assets | | $ | 71,095,213 | |
| Net assets consist of: | | | | |
| Paid in capital | | $ | 60,878,015 | |
| Undistributed net investment income | | | 241,785 | |
| Accumulated net realized loss on investments | | | (5,554,363 | ) |
| Net unrealized appreciation on investments | | | 15,529,776 | |
| Net assets | | $ | 71,095,213 | |
| A-Class: | | | | |
| Net assets | | $ | 62,513,914 | |
| Capital shares outstanding | | | 1,476,996 | |
| Net asset value per share | | $ | 42.33 | |
| Maximum offering price per share | | | | |
| (Net asset value divided by 95.25)% | | $ | 44.44 | |
| B-Class: | | | | |
| Net assets | | $ | 1,771,877 | |
| Capital shares outstanding | | | 45,445 | |
| Net asset value per share | | $ | 38.99 | |
| C-Class: | | | | |
| Net assets | | $ | 3,616,477 | |
| Capital shares outstanding | | | 91,138 | |
| Net asset value per share | | $ | 39.68 | |
| Institutional Class: | | | | |
| Net assets | | $ | 3,192,945 | |
| Capital shares outstanding | | | 75,412 | |
| Net asset value per share | | $ | 42.34 | |
| STATEMENT OF | | | |
| OPERATIONS (Unaudited) | | | |
| Period Ended March 31, 2014 | | | | |
| | | | | |
| Investment Income: | | | | |
| Dividends (net of foreign withholding tax of $3,365) | | $ | 618,747 | |
| Total investment income | | | 618,747 | |
| Expenses: | | | | |
| Management fees | | | 204,829 | |
| Transfer agent/maintenance fees: | | | | |
| A-Class | | | 42,720 | |
| B-Class | | | 5,477 | |
| C-Class | | | 4,490 | |
| Institutional Class | | | 54 | |
| Distribution and service fees: | | | | |
| A-Class | | | 68,366 | |
| C-Class | | | 17,511 | |
| Fund accounting/administration fees | | | 29,936 | |
| Legal fees | | | 42,508 | |
| Registration fees | | | 31,835 | |
| Printing expenses | | | 26,369 | |
| Trustees’ fees* | | | 2,749 | |
| Custodian fees | | | 164 | |
| Tax expense | | | 134 | |
| Miscellaneous | | | 19,381 | |
| Total expenses | | | 496,523 | |
| Less: | | | | |
| Expenses waived/reimbursed by Advisor | | | (119,561 | ) |
| Net expenses | | | 376,962 | |
| Net investment income | | | 241,785 | |
| Net Realized and Unrealized Gain (Loss): | | | | |
| Net realized gain (loss) on: | | | | |
| Investments | | | 2,905,686 | |
| Net realized gain | | | 2,905,686 | |
| Net change in unrealized appreciation | | | | |
| (depreciation) on: | | | | |
| Investments | | | 3,541,227 | |
| Net change in unrealized appreciation | | | | |
| (depreciation) | | | 3,541,227 | |
| Net realized and unrealized gain | | | 6,446,913 | |
| Net increase in net assets resulting from operations | | $ | 6,688,698 | |
* Relates to Trustees not deemed “interested persons” within the meaning of Section 2(a)(19) of the 1940 Act.
| SEE NOTES TO FINANCIAL STATEMENTS. | THE GUGGENHEIM FUNDS SEMI-ANNUAL REPORT | 9 |
| STATEMENTS OF CHANGES IN NET ASSETS |
| | | Period Ended | | | | |
| | | March 31, | | | Year Ended | |
| | | 2014 | | | September 30, | |
| | | (Unaudited) | | | 2013 | |
| | | | | | | |
| Increase (Decrease) In Net Assets From Operations: | | | | | | | | |
| Net investment income | | $ | 241,785 | | | $ | 414,311 | |
| Net realized gain on investments | | | 2,905,686 | | | | 5,855,722 | |
| Net change in unrealized appreciation (depreciation) on investments | | | 3,541,227 | | | | 4,740,834 | |
| Net increase in net assets resulting from operations | | | 6,688,698 | | | | 11,010,867 | |
| | | | | | | | | |
| Distributions to shareholders from: | | | | | | | | |
| Net investment income | | | | | | | | |
| A-Class | | | (360,085 | ) | | | (378,277 | ) |
| B-Class | | | (19,432 | ) | | | (26,337 | ) |
| C-Class | | | (8,265 | ) | | | (6,353 | ) |
| Institutional Class | | | (26,519 | ) | | | — | |
| Total distributions to shareholders | | | (414,301 | ) | | | (410,967 | ) |
| | | | | | | | | |
| Capital share transactions: | | | | | | | | |
| Proceeds from sale of shares | | | | | | | | |
| A-Class | | | 15,148,921 | | | | 13,972,222 | |
| B-Class | | | 46,444 | | | | 382,680 | |
| C-Class | | | 467,066 | | | | 2,021,529 | |
| Institutional Class | | | 247,360 | | | | 2,198,427 | * |
| Distributions reinvested | | | | | | | | |
| A-Class | | | 345,368 | | | | 364,307 | |
| B-Class | | | 19,404 | | | | 26,251 | |
| C-Class | | | 8,202 | | | | 6,329 | |
| Institutional Class | | | 26,519 | | | | — | * |
| Cost of shares redeemed | | | | | | | | |
| A-Class | | | (5,725,996 | ) | | | (17,227,823 | ) |
| B-Class | | | (421,782 | ) | | | (1,086,876 | ) |
| C-Class | | | (709,846 | ) | | | (1,278,271 | ) |
| Institutional Class | | | (208,020 | ) | | | (56,720 | )* |
| Net increase (decrease) from capital share transactions | | | 9,243,640 | | | | (677,945 | ) |
| Net increase in net assets | | | 15,518,037 | | | | 9,921,955 | |
| | | | | | | | | |
| Net assets: | | | | | | | | |
| Beginning of period | | | 55,577,176 | | | | 45,655,221 | |
| End of period | | $ | 71,095,213 | | | $ | 55,577,176 | |
| Undistributed net investment income at end of period | | $ | 241,785 | | | $ | 414,301 | |
| | | | | | | | | |
| Capital share activity: | | | | | | | | |
| Shares sold | | | | | | | | |
| A-Class | | | 375,045 | | | | 395,711 | |
| B-Class | | | 1,234 | | | | 11,387 | |
| C-Class | | | 12,097 | | | | 59,294 | |
| Institutional Class | | | 6,070 | | | | 75,389 | * |
| Shares issued from reinvestment of distributions | | | | | | | | |
| A-Class | | | 8,728 | | | | 11,707 | |
| B-Class | | | 533 | | | | 916 | |
| C-Class | | | 220 | | | | 216 | |
| Institutional Class | | | 670 | | | | — | * |
| Shares redeemed | | | | | | | | |
| A-Class | | | (142,506 | ) | | | (489,224 | ) |
| B-Class | | | (11,383 | ) | | | (34,294 | ) |
| C-Class | | | (18,614 | ) | | | (39,102 | ) |
| Institutional Class | | | (5,217 | ) | | | (1,500 | )* |
| Net increase (decrease) in shares | | | 226,877 | | | | (9,500 | ) |
* Since commencement of operations: June 7, 2013.
| 10 | THE GUGGENHEIM FUNDS SEMI-ANNUAL REPORT | SEE NOTES TO FINANCIAL STATEMENTS. |
This table is presented to show selected data for a share outstanding throughout each period and to assist shareholders in evaluating a Fund’s performance for the periods presented.
| | | Period Ended | | | Year Ended | | | Year Ended | | | Year Ended | | | Year Ended | | | Year Ended | |
| | | March 31, | | | September 30, | | | September 30, | | | September 30, | | | September 30, | | | September 30, | |
| A-Class | | 2014a | | | 2013 | | | 2012 | | | 2011i | | | 2010i | | | 2009i | |
| Per Share Data | | | | | | | | | | | | | | | | | | | | | | | | |
| Net asset value, beginning of period | | $ | 38.28 | | | $ | 31.25 | | | $ | 24.58 | | | $ | 26.08 | | | $ | 24.92 | | | $ | 26.88 | |
| Income (loss) from investment operations: | | | | | | | | | | | | | | | | | | | | | | | | |
| Net investment income (loss)b | | | .16 | | | | .29 | | | | .25 | | | | .16 | | | | .12 | | | | .20 | |
| Net gain (loss) on investments (realized and unrealized) | | | 4.18 | | | | 7.03 | | | | 6.58 | | | | (1.54 | ) | | | 1.24 | | | | (1.80 | ) |
| Total from investment operations | | | 4.34 | | | | 7.32 | | | | 6.83 | | | | (1.38 | ) | | | 1.36 | | | | (1.60 | ) |
| Less distributions from: | | | | | | | | | | | | | | | | | | | | | | | | |
| Net investment income | | | (.29 | ) | | | (.29 | ) | | | (.16 | ) | | | (.12 | ) | | | (.20 | ) | | | (.20 | ) |
| Net realized gains | | | — | | | | — | | | | — | | | | — | | | | — | | | | (.16 | ) |
| Total distributions | | | (.29 | ) | | | (.29 | ) | | | (.16 | ) | | | (.12 | ) | | | (.20 | ) | | | (.36 | ) |
| Net asset value, end of period | | $ | 42.33 | | | $ | 38.28 | | | $ | 31.25 | | | $ | 24.58 | | | $ | 26.08 | | | $ | 24.92 | |
| | | | | | | | | | | | | | | | | | | | | | | | | |
| Total Returnc | | | 11.38 | % | | | 23.62 | % | | | 27.90 | % | | | (5.38 | )% | | | 5.46 | % | | | (5.59 | )% |
| Ratios/Supplemental Data | | | | | | | | | | | | | | | | | | | | | | | | |
| Net assets, end of period (in thousands) | | $ | 62,514 | | | $ | 47,307 | | | $ | 41,173 | | | $ | 41,036 | | | $ | 47,718 | | | $ | 38,008 | |
| Ratios to average net assets: | | | | | | | | | | | | | | | | | | | | | | | | |
| Net investment income (loss) | | | 0.80 | % | | | 0.82 | % | | | 0.86 | % | | | 0.56 | % | | | 0.46 | % | | | 0.88 | % |
| Total expensesd | | | 1.54 | % | | | 1.48 | % | | | 1.65 | % | | | 1.52 | % | | | 1.59 | % | | | 1.70 | % |
| Net expensese,j | | | 1.17 | % | | | 1.15 | % | | | 1.18 | % | | | 1.15 | % | | | 1.18 | % | | | 1.25 | % |
| Portfolio turnover rate | | | 16 | % | | | 43 | % | | | 16 | % | | | 26 | % | | | 29 | % | | | 25 | % |
| | | Period Ended | | | Year Ended | | | Year Ended | | | Year Ended | | | Year Ended | | | Year Ended | |
| | | March 31, | | | September 30, | | | September 30, | | | September 30, | | | September 30, | | | September 30, | |
| B-Class | | 2014a,h | | | 2013h | | | 2012h | | | 2011h,i | | | 2010h,i | | | 2009h,i | |
| Per Share Data | | | | | | | | | | | | | | | | | | | | | | | | |
| Net asset value, beginning of period | | $ | 35.34 | | | $ | 28.89 | | | $ | 22.75 | | | $ | 24.16 | | | $ | 23.12 | | | $ | 25.16 | |
| Income (loss) from investment operations: | | | | | | | | | | | | | | | | | | | | | | | | |
| Net investment income (loss)b | | | .18 | | | | .34 | | | | .29 | | | | .21 | | | | .16 | | | | .24 | |
| Net gain (loss) on investments (realized and unrealized) | | | 3.85 | | | | 6.49 | | | | 6.09 | | | | (1.46 | ) | | | 1.16 | | | | (1.84 | ) |
| Total from investment operations | | | 4.03 | | | | 6.83 | | | | 6.38 | | | | (1.25 | ) | | | 1.32 | | | | (1.60 | ) |
| Less distributions from: | | | | | | | | | | | | | | | | | | | | | | | | |
| Net investment income | | | (.38 | ) | | | (.38 | ) | | | (.24 | ) | | | (.16 | ) | | | (.28 | ) | | | (.28 | ) |
| Net realized gains | | | — | | | | — | | | | — | | | | — | | | | — | | | | (.16 | ) |
| Total distributions | | | (.38 | ) | | | (.38 | ) | | | (.24 | ) | | | (.16 | ) | | | (.28 | ) | | | (.44 | ) |
| Net asset value, end of period | | $ | 38.99 | | | $ | 35.34 | | | $ | 28.89 | | | $ | 22.75 | | | $ | 24.16 | | | $ | 23.12 | |
| | | | | | | | | | | | | | | | | | | | | | | | | |
| Total Returnc | | | 11.49 | % | | | 23.94 | % | | | 28.23 | % | | | (5.22 | )% | | | 5.78 | % | | | (5.91 | )% |
| Ratios/Supplemental Data | | | | | | | | | | | | | | | | | | | | | | | | |
| Net assets, end of period (in thousands) | | $ | 1,772 | | | $ | 1,946 | | | $ | 2,226 | | | $ | 2,682 | | | $ | 4,132 | | | $ | 4,802 | |
| Ratios to average net assets: | | | | | | | | | | | | | | | | | | | | | | | | |
| Net investment income (loss) | | | 1.00 | % | | | 1.07 | % | | | 1.10 | % | | | 0.78 | % | | | 0.68 | % | | | 1.16 | % |
| Total expensesd | | | 1.73 | % | | | 1.74 | % | | | 1.93 | % | | | 1.29 | % | | | 1.33 | % | | | 1.47 | % |
| Net expensese,j | | | 0.92 | % | | | 0.90 | % | | | 0.93 | % | | | 0.90 | % | | | 0.94 | % | | | 1.00 | % |
| Portfolio turnover rate | | | 16 | % | | | 43 | % | | | 16 | % | | | 26 | % | | | 29 | % | | | 25 | % |
| SEE NOTES TO FINANCIAL STATEMENTS. | THE GUGGENHEIM FUNDS SEMI-ANNUAL REPORT | 11 |
| FINANCIAL HIGHLIGHTS (concluded) |
This table is presented to show selected data for a share outstanding throughout each period and to assist shareholders in evaluating a Fund’s performance for the periods presented.
| | | Period Ended | | | Year Ended | | | Year Ended | | | Year Ended | | | Year Ended | | | Year Ended | |
| | | March 31, | | | September 30, | | | September 30, | | | September 30, | | | September 30, | | | September 30, | |
| C-Class | | 2014a | | | 2013 | | | 2012 | | | 2011i | | | 2010i | | | 2009i | |
| Per Share Data | | | | | | | | | | | | | | | | | | | | | | | | |
| Net asset value, beginning of period | | $ | 35.86 | | | $ | 29.30 | | | $ | 23.08 | | | $ | 24.60 | | | $ | 23.48 | | | $ | 25.40 | |
| Income (loss) from investment operations: | | | | | | | | | | | | | | | | | | | | | | | | |
| Net investment income (loss)b | | | (— | )g | | | .02 | | | | .03 | | | | (.05 | ) | | | (.08 | ) | | | .04 | |
| Net gain (loss) on investments (realized and unrealized) | | | 3.91 | | | | 6.62 | | | | 6.19 | | | | (1.47 | ) | | | 1.20 | | | | (1.80 | ) |
| Total from investment operations | | | 3.91 | | | | 6.64 | | | | 6.22 | | | | (1.52 | ) | | | 1.12 | | | | (1.76 | ) |
| Less distributions from: | | | | | | | | | | | | | | | | | | | | | | | | |
| Net investment income (loss) | | | (.09 | ) | | | (.08 | ) | | | — | | | | — | | | | — | | | | — | |
| Net realized gains | | | — | | | | — | | | | — | | | | — | | | | — | | | | (.16 | ) |
| Total distributions | | | (.09 | ) | | | (.08 | ) | | | — | | | | — | | | | — | | | | (.16 | ) |
| Net asset value, end of period | | $ | 39.68 | | | $ | 35.86 | | | $ | 29.30 | | | $ | 23.08 | | | $ | 24.60 | | | $ | 23.48 | |
| | | | | | | | | | | | | | | | | | | | | | | | | |
| Total Returnc | | | 10.91 | % | | | 22.73 | % | | | 26.95 | % | | | (6.18 | )% | | | 4.77 | % | | | (6.80 | )% |
| Ratios/Supplemental Data | | | | | | | | | | | | | | | | | | | | | | | | |
| Net assets, end of period (in thousands) | | $ | 3,616 | | | $ | 3,494 | | | $ | 2,257 | | | $ | 2,013 | | | $ | 2,493 | | | $ | 3,128 | |
| Ratios to average net assets: | | | | | | | | | | | | | | | | | | | | | | | | |
| Net investment income (loss) | | | (0.01 | )% | | | 0.08 | % | | | 0.12 | % | | | (0.20 | )% | | | (0.31 | )% | | | 0.14 | % |
| Total expensesd | | | 2.39 | % | | | 2.47 | % | | | 2.45 | % | | | 2.27 | % | | | 2.33 | % | | | 2.46 | % |
| Net expensese,j | | | 1.92 | % | | | 1.90 | % | | | 1.93 | % | | | 1.90 | % | | | 1.94 | % | | | 2.00 | % |
| Portfolio turnover rate | | | 16 | % | | | 43 | % | | | 16 | % | | | 26 | % | | | 29 | % | | | 25 | % |
| | | Period Ended | | | Period Ended | |
| | | March 31, | | | September 30, | |
| Institutional Class | | 2014a | | | 2013f | |
| Per Share Data | | | | | | | | |
| Net asset value, beginning of period | | $ | 38.32 | | | $ | 36.84 | |
| Income (loss) from investment operations: | | | | | | | | |
| Net investment income (loss)b | | | .20 | | | | .13 | |
| Net gain (loss) on investments (realized and unrealized) | | | 4.18 | | | | 1.35 | |
| Total from investment operations | | | 4.38 | | | | 1.48 | |
| Less distributions from: | | | | | | | | |
| Net investment income | | | (.36 | ) | | | — | |
| Total distributions | | | (.36 | ) | | | — | |
| Net asset value, end of period | | $ | 42.34 | | | $ | 38.32 | |
| | | | | | | | | |
| Total Returnc | | | 11.49 | % | | | 4.02 | % |
| Ratios/Supplemental Data | | | | | | | | |
| Net assets, end of period (in thousands) | | $ | 3,193 | | | $ | 2,831 | |
| Ratios to average net assets: | | | | | | | | |
| Net investment income (loss) | | | 1.01 | % | | | 1.12 | % |
| Total expensesd | | | 1.14 | % | | | 1.12 | % |
| Net expensese,j | | | 0.92 | % | | | 0.89 | % |
| Portfolio turnover rate | | | 16 | % | | | 43 | % |
| a | Unaudited figures for the period ended March 31, 2014. Percentage amounts for the period, except total return and portfolio turnover rate, have been annualized. |
| b | Net investment income (loss) per share was computed using average shares outstanding throughout the period. |
| c | Total return does not reflect the impact of any applicable sales charges and has not been annualized. |
| d | Does not include expenses of the underlying funds in which the Fund invests. |
| e | Net expense information reflects the expense ratios after expense waivers, and reimbursements, as applicable. |
| f | Since commencement of operations: June 7, 2013. Percentage amounts for the period, except total return and portfolio turnover rate, have been annualized. The portfolio turnover rate stated is for the entire fiscal year of the Fund, not since commencement of operations for the class. |
| g | Net investment income is less than $0.01 per share. |
| h | Effective August 1, 2007 — B-Class shares ceased charging 12b-1 fees in accordance with FINRA sales cap regulations. Per share information reflects this change. This fee will be reinstated when sales exceed the sales cap limits. |
| i | Reverse share split — Per share amounts for the years ended September 30, 2009 and September 30, 2010 and the period October 1, 2010 through April 8, 2011 have been restated to reflect a 1:4 reverse share split effective April 8, 2011. |
| j | Net expenses may include extraordinary expenses. Excluding extraordinary expenses, the operating expense ratio for the period ended March 31, 2014 would be 1.15%, 0.90%, 1.90% and 0.90% for the A-Class shares, B-Class shares, C-Class shares and Institutional Class shares, respectively. |
| 12 | THE GUGGENHEIM FUNDS SEMI-ANNUAL REPORT | SEE NOTES TO FINANCIAL STATEMENTS. |
| NOTES TO FINANCIAL STATEMENTS (Unaudited) |
1. Organization and Significant Accounting Policies
Organization
Guggenheim Funds Trust (the “Trust”), a Delaware statutory trust is registered with the SEC under the Investment Company Act of 1940 (“1940 Act”), as a non-diversified, open-ended investment company of the series type. Each series, in effect, is representing a separate Fund (collectively the “Funds”). The Trust is authorized to issue an unlimited number of no par value shares. The Trust accounts for the assets of each Fund separately.
The Trust offers four separate classes of shares, A-Class shares, B-Class shares, C-Class shares and Institutional shares. Sales of shares of each Class are made without a front-end sales charge at the net asset value (“NAV”), with the exception of A-Class shares. A-Class shares are sold at the NAV, plus the applicable front-end sales charge. The sales charge varies depending on the amount purchased, but will not exceed 4.75%. Prior to February 22, 2011, the maximum sales charge was 5.75%. A-Class share purchases of $1 million or more are exempt from the front-end sales charge but have a 1% contingent deferred sales charge (“CDSC”) if shares are redeemed within 12 months of purchase. B-Class shares were offered without a front-end sales charge, but were subject to a CDSC for five years and convert to A-Class shares after eight years. Effective January 4, 2010, subscriptions for B-Class shares are no longer accepted, except for transfers of B-Class shares between affiliated Guggenheim funds. C-Class shares have a 1% CDSC if shares are redeemed within 12 months of purchase. Institutional Class shares are offered primarily for direct investment by institutions such as pension and profit sharing plans, endowments, foundations and corporations. Institutional Class shares have a minimum initial investment of $2 million and a minimum account balance of $1 million. Institutional Class shares are offered without a front-end sales charge or a CDSC.
At March 31, 2014, the Trust consisted of sixteen separate funds. This report covers the Large Cap Value Fund (the “Fund”), while the other funds are contained in separate reports.
Guggenheim Investments (“GI”) provides advisory services and Rydex Fund Services, LLC (“RFS”) provides transfer agent, administrative and accounting services to the Trust. Guggenheim Funds Distributors, LLC (“GFD”) acts as principal underwriter to the Funds. GI, RFS and GFD are affiliated entities.
Significant Accounting Policies
The following significant accounting policies are in conformity with U.S. generally accepted accounting principles (“U.S. GAAP”) and are consistently followed by the Trust. This requires management to make estimates and assumptions that affect the reported amount of assets and liabilities and disclosure of contingent assets and liabilities at the date of the financial statements and the reported amounts of revenues and expenses during the reporting period. Actual results could differ from these estimates. The information contained in these notes may not apply to every Fund in the Trust. All time references are based on Eastern Time.
A. Valuations of the Fund’s securities are supplied primarily by pricing services approved by the Board of Trustees. A Valuation Committee (“Valuation Committee”) is responsible for the oversight of the valuation process of the Fund and convenes monthly, or more frequently as needed. The Valuation Committee will review the valuation of all assets which have been fair valued for reasonableness. The Trust’s officers, through the Valuation Committee under the general supervision of the Board of Trustees, regularly review procedures used by, and valuations provided by, the pricing services.
Equity securities listed on an exchange (New York Stock Exchange (“NYSE”) or American Stock Exchange) are valued at the last quoted sales price as of the close of business on the NYSE, usually 4:00 p.m. on the valuation date. Equity securities listed on the NASDAQ market system are valued at the NASDAQ Official Closing Price on the valuation date, which may not necessarily represent the last sale price. If there has been no sale on such exchange or NASDAQ on such day, the security is valued at the closing bid price on such day.
Open-end investment companies are valued at their NAV as of the close of business, on the valuation date. ETFs are valued at the last quoted sales price.
Investments for which market quotations are not readily available are fair valued as determined in good faith by GI under the direction of the Board of Trustees using methods established or ratified by the Board of Trustees. These methods include, but are not limited to: (i) obtaining general information as to how these securities and assets trade;
| THE GUGGENHEIM FUNDS SEMI-ANNUAL REPORT | 13 |
| NOTES TO FINANCIAL STATEMENTS (Unaudited)(continued) |
and (ii) obtaining other information and considerations, including current values in related markets.
B. Securities transactions are recorded on the trade date for financial reporting purposes. Realized gains and losses from securities transactions are recorded using the identified cost basis. Dividend income is recorded on the ex-dividend date, net of applicable taxes withheld by foreign countries. Taxable non-cash dividends are recorded as dividend income. Interest income, including amortization of premiums and accretion of discount, is accrued on a daily basis.
C. Interest and dividend income, most expenses, all realized gains and losses, and all unrealized gains and losses are allocated to the classes based upon the value of the outstanding shares in each class. Certain costs, such as distribution and service fees relating to A-Class shares, B-Class shares and C-Class shares and transfer agent fees related to each class, are charged directly to specific classes. In addition, other expenses common to various funds within the fund complex are generally allocated amongst such funds on the basis of average net assets.
D. Distributions of net investment income and net realized gains, if any, are declared and paid at least annually. Distributions are recorded on the ex-dividend date and are determined in accordance with income tax regulations which may differ from U.S. GAAP.
E. Under the fee arrangement with the custodian, the Fund may earn credits based on overnight custody cash balances. These credits are utilized to reduce related custodial expenses. The custodian fees disclosed in the Statement of Operations are before the reduction in expense from the related earnings credits, if any. For the period ended March 31, 2014, there were no earnings credits received.
F. Under the Fund’s organizational documents, its Officers and Trustees are indemnified against certain liabilities arising out of the performance of their duties to the Trust. In addition, throughout the normal course of business, the Fund enters into contracts that contain a variety of representations and warranties which provide general indemnifications. The Fund’s maximum exposure under these arrangements is unknown, as this would involve future claims that may be made against the Fund and/or its affiliates that have not yet occurred. However, based on experience, the Fund expects the risk of loss to be remote.
2. Fees and other transactions with affiliates
Management fees are paid monthly to GI, based on the following rate:
| | | Management Fees (as a % of net assets) | |
| Large Cap Value Fund | | | 0.65% | |
RFS also acts as the administrative agent for the Fund, and as such performs administrative functions and the bookkeeping, accounting and pricing functions for the Fund. For these services, RFS receives the following:
| | | Administrative Fees | |
| | | (as a % of net assets) | |
| Large Cap Value Fund | | | 0.095% | |
| Minimum annual charge per Fund | | | $25,000 | |
| Certain out-of-pocket charges | | | Varies | |
RFS is paid the following for providing transfer agent services to the Fund. The transfer agent fees are assessed to the applicable Class of the Fund in which they were incurred.
| Annual charge per account | | $5.00 – $8.00 |
| Transaction fee | | $0.60 – $1.10 |
| Minimum annual charge per Fund | | $25,000 |
| Certain out-of-pocket charges | | Varies |
The investment advisory contracts for the Fund provides that the total expenses be limited to a percentage of average net assets for each class of shares, exclusive of brokerage costs, dividends on securities sold short, expenses of other investment companies in which a Fund invests, interest, taxes, litigation, indemnification and extraordinary expenses. The limits are listed below:
| | | | | | Effective | | Contract |
| | | Limit | | | Date | | End Date |
| Large Cap Value Fund – A-Class | | | 1.15 | % | | 11/30/12 | | 02/01/15 |
| Large Cap Value Fund – B-Class | | | 1.90 | % | | 11/30/12 | | 02/01/15 |
| Large Cap Value Fund – C-Class | | | 1.90 | % | | 11/30/12 | | 02/01/15 |
| Large Cap Value Fund - Institutional Class | | | 0.90 | % | | 06/05/13 | | 02/01/15 |
GI is entitled to reimbursement by the Fund for fees waived or expenses reimbursed during any of the previous 36 months, beginning on the date of the expense limitation agreement, if on any day the estimated operating expenses are less than the indicated percentages. At March 31, 2014, the amount of fees waived or expenses reimbursed that are subject to recoupment are presented in the following table:
| 14 | THE GUGGENHEIM FUNDS SEMI-ANNUAL REPORT |
| NOTES TO FINANCIAL STATEMENTS (Unaudited)(continued) |
| | | Expires in | | | Expires in | | | Expires in | | | Expires in | | | Fund | |
| Fund | | 2014 | | | 2015 | | | 2016 | | | 2017 | | | Total | |
| Large Cap Value Fund | | $ | 50,582 | | | $ | 243,289 | | | $ | 189,178 | | | $ | 119,561 | | | $ | 602,610 | |
For the period ended March 31, 2014, no amounts were recouped by GI.
The Fund has adopted Distribution Plans related to the offering of A-Class, B-Class and C-Class shares pursuant to Rule 12b-1 under the 1940 Act. The plans provide for payments at an annual rate of 0.25% of the average daily net assets of A-Class shares and 1.00% of the average daily net assets of B-Class and C-Class shares. Effective August 1, 2007, the Fund ceased charging 12b-1 fees on B-Class shares in accordance with the FINRA sales cap regulations. These fees may be reinstated at any time.
During the period ended March 31, 2014, GFD retained sales charges of $245,369 relating to sales of A-Class shares of the Fund.
Certain officers and trustees of the Trust are also officers of GI, RFS and GDF.
In accordance with U.S. GAAP, fair value is defined as the price that the Funds would receive to sell an investment or pay to transfer a liability in an orderly transaction with an independent buyer in the principal market, or in the absence of a principal market, the most advantageous market for the investment or liability. U.S. GAAP establishes a three-tier fair value hierarchy based on the types of inputs used to value assets and liabilities and requires corresponding disclosure. The hierarchy and the corresponding inputs are summarized below:
Level 1 — quoted prices in active markets for identical assets or liabilities.
Level 2 — significant other observable inputs (for example quoted prices for securities that are similar based on characteristics such as interest rates, prepayment speeds, credit risk, etc.).
Level 3 — significant unobservable inputs based on the best information available under the circumstances, to the extent observable inputs are not available, which may include assumptions.
The types of inputs available depend on a variety of factors, such as the type of security and the characteristics of the markets in which it trades, if any. Fair valuation determinations that rely on fewer or no observable inputs require greater judgment. Accordingly, fair value determinations for Level 3 securities require the greatest amount of judgment.
The following table summarizes the inputs used to value the Funds’ net assets at March 31, 2014:
| | | Level 1 | | | Level 2 | | | Level 3 | | | | |
| | | Investments | | | Investments | | | Investments | | | | |
| | | In Securities | | | In Securities | | | In Securities | | | Total | |
| Assets | | | | | | | | | | | | | | | | |
| Large Cap Value Fund | | $ | 71,673,533 | | | $ | — | | | $ | — | | | $ | 71,673,533 | |
The inputs or methodologies used for valuing securities are not necessarily an indication of the risk associated with investing in those securities. The suitability of the techniques and sources employed to determine fair valuation are regularly monitored and subject to change.
For the period ended March 31, 2014, there were no transfers between levels.
| THE GUGGENHEIM FUNDS SEMI-ANNUAL REPORT | 15 |
| NOTES TO FINANCIAL STATEMENTS (Unaudited)(concluded) |
| 4. | Federal Income Tax Information |
The Fund intends to comply with the provisions of Subchapter M of the Internal Revenue Code applicable to regulated investment companies and will distribute substantially all taxable net investment income and capital gains sufficient to relieve the Fund from all, or substantially all, federal income, excise and state income taxes. Therefore, no provision for federal or state income tax is required.
Tax positions taken or expected to be taken in the course of preparing the Fund’s tax returns are evaluated to determine whether the tax positions are “more-likely-than-not” of being sustained by the applicable tax authority. Tax positions not deemed to meet the more-likely-than-not threshold would be recorded as a tax benefit or expense in the current year. Management has analyzed the Fund’s tax positions taken, or to be taken, on Federal income tax returns for all open tax years, and has concluded that no provision for income tax is required in the Fund’s financial statements. The Fund’s federal tax returns are subject to examination by the Internal Revenue Service for a period of three fiscal years after they are filed.
The RIC Modernization Act of 2010 was signed into law on December 22, 2010 and simplified some of the tax provisions applicable to regulated investment companies, the tax reporting to their shareholders and improved the tax efficiency of certain fund structures. The greatest impact to the disclosure in the financial reports for the Fund was on the treatment of net capital losses, effective for tax years beginning after December 22, 2010.
One of the more prominent changes addresses capital loss carryforwards. The Fund is permitted to carry forward capital losses incurred in taxable years beginning after December 22, 2010 for an unlimited period. However, any losses incurred during those future taxable years will be required to be utilized prior to the losses incurred in pre-enactment taxable years. Under pre-enactment law, capital losses could be carried forward for eight years, and carried forward as short-term capital, irrespective of the character of the original loss. As a result of this ordering rule, pre-enactment capital carryforwards may potentially expire unused. Additionally, post-enactment capital losses that are carried forward will retain their character as either short-term or long-term capital losses rather than being considered all short-term as under previous law.
At March 31, 2014, the cost of securities for Federal income tax purposes, the aggregate gross unrealized gain for all securities for which there was an excess of value over tax cost and the aggregate gross unrealized loss for all securities for which there was an excess of tax cost over value, were as follows:
| | | | | | Tax | | | Tax | | | Net | |
| | | Tax | | | Unrealized | | | Unrealized | | | Unrealized | |
| Fund | | Cost | | | Gain | | | Loss | | | Gain | |
| Large Cap Value Fund | | $ | 56,254,206 | | | $ | 16,706,929 | | | $ | (1,287,602 | ) | | $ | 15,419,327 | |
| 5. | Securities Transactions |
For the period ended March 31, 2014, the cost of purchases and proceeds from sales of investment securities, excluding government securities and short-term investments, were as follows:
| Fund | | Purchases | | | Sales | |
| Large Cap Value Fund | | $ | 18,050,179 | | | $ | 9,978,978 | |
| 16 | THE GUGGENHEIM FUNDS SEMI-ANNUAL REPORT |
| OTHER INFORMATION (Unaudited) |
Proxy Voting Information
A description of the policies and procedures that the Trust uses to determine how to vote proxies relating to securities held in the Funds’ portfolios is available, without charge and upon request, by calling 1.800.820.0888. This information is also available from the EDGAR database on the SEC’s website at http://www.sec.gov.
Information regarding how the Funds voted proxies relating to portfolio securities during the most recent 12-month period ended June 30 is available without charge, upon request, by calling 1.800.820.0888. This information is also available from the EDGAR database on the SEC’s website at http://www.sec.gov.
At a special meeting of shareholders held on January 8, 2014, the shareholders of the Funds voted on whether to approve the election of nominees to the Board of Directors of each corporation. A description of the number of shares voted is as follows:
| | For | Withhold | Total |
| Randall C. Barnes | 1,034,635 | 27,710 | 1,062,345 |
| Roman Friedrich III | 1,024,509 | 37,836 | 1,062,345 |
| Robert B. Karn III | 1,025,736 | 26,609 | 1,052,345 |
| Ronald A. Nyberg | 1,034,088 | 28,257 | 1,062,345 |
| Ronald E. Toupin, Jr. | 1,034,635 | 27,710 | 1,062,345 |
At a special meeting of shareholders held on January 8, 2014, the shareholders of the Funds also voted on whether to approve the Funds from Kansas Corporations into Delaware Statutory Trusts. A description of the number of shares voted is as follows:
| Fund | Shares For | Shares Against | Shares Abstained | |
| Large Cap Value Fund | 777,725 | 20,808 | 23,603 | |
At a special meeting of shareholders held on January 8, 2014, the shareholders of the Funds also voted on whether to approve changes to the fundamental investment policies. A description of the number of shares voted is as follows:
| Diversification | | | |
| Fund | Shares For | Shares Against | Shares Abstained |
| Large Cap Value Fund | 787,563 | 9,461 | 25,112 |
| | | | |
| Underwriting | | | |
| Fund | Shares For | Shares Against | Shares Abstained |
| Large Cap Value Fund | 784,990 | 11,521 | 25,625 |
| | | | |
| Industry Concentration | | | |
| Fund | Shares For | Shares Against | Shares Abstained |
| Large Cap Value Fund | 785,363 | 11,742 | 25,031 |
| | | | |
| Real Estate | | | |
| Fund | Shares For | Shares Against | Shares Abstained |
| Large Cap Value Fund | 784,127 | 13,129 | 24,880 |
| | | | |
| Commodities | | | |
| Fund | Shares For | Shares Against | Shares Abstained |
| Large Cap Value Fund | 789,673 | 6,837 | 25,626 |
| | | | |
| Loans | | | |
| Fund | Shares For | Shares Against | Shares Abstained |
| Large Cap Value Fund | 784,460 | 12,876 | 24,800 |
| | | | |
| THE GUGGENHEIM FUNDS SEMI-ANNUAL REPORT | 17 |
| OTHER INFORMATION (Unaudited)(continued) |
| Borrowing | | | |
| Fund | Shares For | Shares Against | Shares Abstained |
| Large Cap Value Fund | 785,388 | 11,948 | 24,800 |
| | | | |
| Senior Securities | | | |
| Fund | Shares For | Shares Against | Shares Abstained |
| Large Cap Value Fund | 790,815 | 6,441 | 24,880 |
Quarterly Portfolio Schedules Information
The Trust files its complete schedule of portfolio holdings with the SEC for the first and third quarters of each fiscal year on Form N-Q; which are available on the SEC’s website at http://www.sec.gov. The Funds’ Forms N-Q may be reviewed and copied at the SEC’s Public Reference Room in Washington, DC, and that information on the operation of the Public Reference Room may be obtained by calling 1-800-SEC-0330. Copies of the portfolio holdings are also available to shareholders, without charge and upon request, by calling 1.800.820.0888.
Office Locations
The offices of Guggenheim Investments can be found in the following locations:
330 Madison Avenue
10th Floor
New York, NY 10017
(Headquarters)
Four Irvington Centre
805 King Farm Boulevard
Suite 600
Rockville, MD 20850
9401 Indian Creek Parkway
40 Corporate Woods
Suite 850
Overland Park, KS 66210
Board Considerations in Approving the Investment Advisory Agreements
At a meeting held on November 11, 2013, in connection with other actions taken to consider whether to approve the reorganization of the funds from series of Kansas corporations (the “Predecessor Funds”) into series of a Delaware statutory trust, Guggenheim Funds Trust (the “Trust” and its series, the “New Series”), the members of the Boards of Directors of the Kansas corporations (collectively, the “Predecessor Board” and the members individually, “Directors”), including the Directors who are not “interested persons,” as defined by the Investment Company Act of 1940, as amended (the “1940 Act”), of the corporations (the “Independent Directors”) appointed the then-investment advisers and sub-advisers of the Predecessor Funds, to serve in the same capacity to the corresponding New Series. The Predecessor Board also approved corresponding advisory and sub-advisory agreements, subject, for each Predecessor Fund, to approval of the reorganization of that fund by its shareholders and approval of the new agreements by the initial sole shareholder of the corresponding New Series. The Directors based their approval on a variety of factors, including: the findings they had made during their May, June and August 2013 meetings at which the advisory and sub-advisory agreements of the Predecessor Funds had the most recently been approved, which are discussed in the Annual Report of the Predecessor Funds for the fiscal year ended September 30, 2013; the fact that new agreements are the same as the agreements then in place for the Predecessor Funds except for the name of the signatory, the applicable state law and the term of the agreements; and the intention that the new agreements would be subject to re-consideration after the reorganizations at meetings scheduled to be held for these purposes in April and May 2014.
| 18 | THE GUGGENHEIM FUNDS SEMI-ANNUAL REPORT |
| OTHER INFORMATION (Unaudited)(concluded) |
Distributor change
Effective March 3, 2014, Guggenheim Distributors, LLC (“GD”), the distributor for shares of the Fund was consolidated into and with Guggenheim Funds Distributors, LLC (“GFD”). Following the consolidation, GFD serves as the Fund’s distributor.
GD and GFD are both indirect, wholly-owned subsidiaries of Guggenheim Capital, LLC and, therefore, the consolidation will not result in a change of actual control of the Fund’s distributor. The primary goal of the consolidation is to achieve greater operational efficiencies and allow all of the Guggenheim funds, including funds that are not series of the Trusts, to be distributed by a single distributor.
The consolidation is not expected to affect the day-to-day management of the Fund or result in any material changes to the distribution of the Fund, including any changes to the distribution fees paid by the Fund.
Guggenheim Funds Trust
Guggenheim Funds Trust (the “Trust”), which was organized as a Delaware statutory trust on November 8, 2013, is registered with the Securities and Exchange Commission (“SEC”) as an investment company. The Trust is an open-end management investment company that, upon the demand of the investor, must redeem its shares and pay the investor the next calculated NAV. The Guggenheim Enhanced World Equity Fund (“Enhanced World Equity Fund”), Guggenheim Large Cap Value Fund (“Large Cap Value Fund”), Guggenheim Mid Cap Value Fund (“Mid Cap Value Fund”), Guggenheim Mid Cap Value Institutional Fund (“Mid Cap Value Institutional Fund”), Guggenheim Small Cap Value Fund (“Small Cap Value Fund”), Guggenheim StylePlus—Large Core Fund (“StylePlus—Large Core Fund”), Guggenheim StylePlus—Mid Growth Fund (“StylePlus—Mid Growth Fund”) and Guggenheim World Equity Income Fund (“World Equity Income Fund”) (collectively, the “Funds”) were previously series (the “Predecessor Funds”) of Security Equity Fund, Security Large Cap Value Fund and Security Mid Cap Growth Fund (the “Predecessor Corporations”), different registered open-end investment companies, which were organized as Kansas corporations. In January 2014, at special meetings of shareholders, the shareholders of each Predecessor Fund approved the reorganization of each Predecessor Fund with and into a corresponding “shell” series of the Trust. The shell series of the Trust succeeded to the accounting and performance histories of the Predecessor Funds. Any such historical information provided for a series of the Trust that relates to periods prior to January 28, 2014, therefore, is that of the corresponding Predecessor Fund.
| THE GUGGENHEIM FUNDS SEMI-ANNUAL REPORT | 19 |
| INFORMATION ON BOARD OF TRUSTEES AND OFFICERS (Unaudited) |
INDEPENDENT TRUSTEES
All Directors and Officers may be reached c/o Guggenheim Investments, 805 King Farm Boulevard, Suite 600, Rockville, MD 20850.
| | | | | | | | | Number of | | Other | |
| | | Position(s) | | Term of Office | | | | Portfolios in | | Directorships | |
| Name, Address* | | Held with | | and Length of | | Principal Occupation(s) | | Fund Complex | | Held by | |
| and Year of Birth | | the Trust | | Time Served** | | During Past Five Years | | Overseen | | Trustees | |
| | | | | | | | | | | | |
Randall C. Barnes
(1951) | | Trustee | | Since 2014 | | Current: Private Investor (2001–present).
Former: Senior Vice President and Treasurer, PepsiCo, Inc. (1993–1997); President, Pizza Hut International (1991–1993); Senior Vice President, Strategic Planning and New Business Development, PepsiCo, Inc. (1987–1990). | | 86 | | None. | |
| | | | | | | | | | | | |
Donald A. Chubb, Jr.
(1946) | | Trustee and Vice Chairman of the Board | | Since 1994 | | Current: Business broker and manager of commercial real estate, Griffith & Blair, Inc. (1997–present). | | 82 | | None. | |
| | | | | | | | | | | | |
Jerry B. Farley
(1946) | | Trustee and Vice Chairman of the Audit Committee | | Since 2005 | | Current: President, Washburn University (1997–present). | | 82 | | Current: Westar Energy, Inc. (2004–present); CoreFirst Bank & Trust (2000–present). | |
| | | | | | | | | | | | |
Roman Friedrich III
(1946) | | Trustee and Chairman of the Contracts Review Committee | | Since 2014 | | Current: Founder and President, Roman Friedrich & Company (1998–present).
Former: Senior Managing Director, MLV & Co. LLC (2010–2011). | | 82 | | Current: Mercator Minerals Ltd. (2013–present); First Americas Gold Corp. (2012–present); Zincore Metals, Inc. (2009–present). | |
| | | | | | | | | | | | |
| | | | | | | | | | | Former: Blue Sky Uranium Corp. (2011–2012); Axiom Gold and Silver Corp. (2011–2012); Stratagold Corp. (2003–2009); GFM Resources Ltd. (2005–2010). | |
| | | | | | | | | | | | |
Robert B. Karn III
(1942) | | Trustee and Chairman of the Audit Committee | | Since 2014 | | Current: Consultant (1998–present).
Former: Arthur Andersen (1965–1997) and Managing Partner, Financial and Economic Consulting, St. Louis office (1987–1997). | | 82 | | Current: Peabody Energy Company (2003–present); GP Natural Resource Partners, LLC (2002–present). | |
| | | | | | | | | | | | |
Ronald A. Nyberg
(1953) | | Trustee and Chairman of the Nominating and Governance Committee | | Since 2014 | | Current: Partner, Nyberg & Cassioppi, LLC (2000–present).
Former: Executive Vice President, General Counsel, and Corporate Secretary, Van Kampen Investments (1982–1999). | | 88 | | None. | |
| 20 | THE GUGGENHEIM FUNDS SEMI-ANNUAL REPORT |
| INFORMATION ON BOARD OF TRUSTEES AND OFFICERS (Unaudited)(continued) |
INDEPENDENT TRUSTEES – concluded
| | | | | | | | | Number of | | Other | |
| | | Position(s) | | Term of Office | | | | Portfolios in | | Directorships | |
| Name, Address* | | Held with | | and Length of | | Principal Occupation(s) | | Fund Complex | | Held by | |
| and Year of Birth | | the Trust | | Time Served** | | During Past Five Years | | Overseen | | Trustees | |
| | | | | | | | | | | | |
Maynard F. Oliverius
(1943) | | Trustee and Vice Chairman of the Contracts Review Committee | | Since 1998 | | Retired.
Former: President and CEO, Stormont-Vail HealthCare (1996–2012). | | 82 | | None. | |
| | | | | | | | | | | | |
Ronald E. Toupin, Jr.
(1958) | | Trustee and Chairman of the Board | | Since 2014 | | Current: Portfolio Consultant (2010–present).
Former: Vice President, Manager and Portfolio Manager, Nuveen Asset Management (1998–1999); Vice President, Nuveen Investment Advisory Corp. (1992–1999); Vice President and Manager, Nuveen Unit Investment Trusts (1991–1999); and Assistant Vice President and Portfolio Manager, Nuveen Unit Investment Trusts (1988–1999), each of John Nuveen & Co., Inc. (1982–1999). | | 85 | | Former: Bennett Group of Funds (2011–2013). | |
INTERESTED TRUSTEE
Donald C. Cacciapaglia***
(1951) | | President Chief Executive Officer and Trustee | | Since 2012 | | Current: President and CEO, certain other funds in the Fund Complex (2012–present); Vice Chairman, Guggenheim Investments (2010–present). Former: Chairman and CEO, Channel Capital Group, Inc. (2002–2010). | | 214 | | Current: Delaware Life (2013–present); Guggenheim Life and Annuity Company (2011–present); Paragon Life Insurance Company of Indiana (2011–present). | |
| * | The business address of each Trustee is c/o Guggenheim Investments, 805 King Farm Boulevard, Suite 600, Rockville, Maryland 20850. |
| ** | Each Trustee serves an indefinite term, until his successor is elected and qualified. Time served includes time served in the respective position for the Predecessor Corporation. |
| *** | This Trustee is deemed to be an “interested person” of the Funds under the 1940 Act by reason of his position with the Funds’ Investment Manager and/or the parent of the Investment Manager. |
| THE GUGGENHEIM FUNDS SEMI-ANNUAL REPORT | 21 |
| INFORMATION ON BOARD OF TRUSTEES AND OFFICERS (Unaudited)(continued) |
OFFICERS
| | | Position(s) | | Term of Office | | |
| Name, Address* | | Held with | | and Length of | | Principal Occupation(s) |
| and Year of Birth | | the Trust | | Time Served** | | During Past Five Years |
| | | | | | | |
Joseph M. Arruda (1966) | | Assistant Treasurer | | Since 2010 | | Current: Assistant Treasurer, certain other funds in the Fund Complex (2006–present); Vice President, Security Investors, LLC (2010–present); CFO and Manager, Guggenheim Specialized Products, LLC (2009–present). |
| | | | | | | |
| | | | | | | Former: Vice President, Security Global Investors, LLC (2010–2011); Vice President, Rydex Advisors, LLC (2010); Vice President, Rydex Advisors II, LLC (2010). |
| | | | | | | |
William H. Belden, III (1965) | | Vice President | | Since 2014 | | Current: Vice President, certain other funds in the Fund Complex (2006–present); Managing Director, Guggenheim Funds Investment Advisors, LLC (2005–present). |
| | | | | | | |
| | | | | | | Former: Vice President of Management, Northern Trust Global Investments (1999–2005). |
| | | | | | | |
Mark J. Furjanic (1959) | | Assistant Treasurer | | Since 2014 | | Current: Vice President, Guggenheim Investments (2005–present); Assistant Treasurer, certain other funds in the Fund Complex (2008–present). |
| | | | | | | |
| | | | | | | Former: Senior Manager, Ernst & Young LLP (1999–2005). |
| | | | | | | |
James Howley (1972) | | Assistant
Treasurer | | Since 2014 | | Current: Director, Guggenheim Investments (2004–present); Assistant Treasurer, certain other funds in the Fund Complex (2006–present). |
| | | | | | | |
| | | | | | | Former: Manager, Mutual Fund Administration of Van Kampen Investments, Inc. (1996–2004). |
| | | | | | | |
Amy J. Lee
(1961) | | Vice President and Chief Legal Officer | | Since 1987 (Secretary)
Since 2007 (Vice President) | | Current: Chief Legal Officer, certain other funds in the Fund Complex (2013–present); Senior Managing Director, Guggenheim Investments (2012–present). |
| | | | | | |
| | | | | | | Former: Vice President, Associate General Counsel and Assistant Secretary, Security Benefit Life Insurance Company and Security Benefit Corporation (2004–2012). |
| | | | | | | |
Derek Maltbie (1972) | | Assistant Treasurer | | Since 2014 | | Current: Vice President, Guggenheim Investments (2012–present); Assistant Treasurer, certain other funds in the Fund Complex (2011–present). |
| | | | | | | |
| | | | | | | Former: Assistant Vice President, Guggenheim Funds Investment Advisors, LLC (2005–2011); Supervisor, Mutual Fund Administration, Van Kampen Investments, Inc. (1995–2005). |
| | | | | | | |
Mark E. Mathiasen (1978) | | Secretary | | Since 2013 | | Current: Secretary, certain other funds in the Fund Complex (2007–present); Managing Director and Associate General Counsel, Guggenheim Funds Services, LLC, and affiliates (2007–present). |
| | | | | | | |
Michael P. Megaris (1984) | | Assistant Secretary | | Since 2014 | | Current: Assistant Secretary, certain other funds in the Fund Complex (April 2014–present); Associate, Guggenheim Investments (2012–present). |
| | | | | | | |
| | | | | | | Former: J.D., University of Kansas School of Law (2009–2012). |
| | | | | | | |
Elisabeth Miller
(1968) | | Chief Compliance Officer | | Since 2012 | | Current: CCO, certain other funds in the Fund Complex (2012–present); CCO, Security Investors, LLC (2012–present); CCO, Guggenheim Funds Investment Advisors, LLC (2012–present); Vice President, Guggenheim Funds Distributors, LLC (March 2014–present). |
| | | | | | | |
| | | | | | | Former: CCO, Guggenheim Distributors, LLC (2009–March 2014); Senior Manager, Security Investors, LLC (2004–2009); Senior Manager, Guggenheim Distributors, LLC (2004–2009). |
| | | | | | | |
Alison Santay
(1974) | | AML Officer | | Since 2013 | | Current: AML Officer, certain other funds in the Fund Complex (2010–present); Director and AML Officer, Rydex Fund Services, LLC (2010–present); AML Officer, Security Investors, LLC (2010–present); Director, Shareholder Risk and Compliance, Rydex Fund Services, LLC (2004–present). |
| | | | | | | |
| | | | | | | Former: AML Officer, Guggenheim Distributors, LLC (2013–March 2014). |
| 22 | THE GUGGENHEIM FUNDS SEMI-ANNUAL REPORT |
| INFORMATION ON BOARD OF TRUSTEES AND OFFICERS (Unaudited)(concluded) |
OFFICERS – concluded
| | | Position(s) | | Term of Office | | |
| Name, Address* | | Held with | | and Length of | | Principal Occupation(s) |
| and Year of Birth | | the Trust | | Time Served** | | During Past Five Years |
| | | | | | | |
Kimberly Scott
(1974) | | Assistant Treasurer | | Since 2014 | | Current: Vice President, Guggenheim Investments (2012–present); Assistant Treasurer, certain other funds in the Fund Complex (2012–present). |
| | | | | | | |
| | | | | | | Former: Financial Reporting Manager, Invesco, Ltd. (2010–2011); Vice President/Assistant Treasurer, Mutual Fund Administration for Van Kampen Investments, Inc./Morgan Stanley Investment Management (2009–2010); Manager of Mutual Fund Administration, Van Kampen Investments, Inc./Morgan Stanley Investment Management (2005–2009). |
| | | | | | | |
Bryan Stone
(1979) | | Vice President | | Since 2014 | | Current: Vice President, certain other funds in the Fund Complex (April 2014– present); Director, Guggenheim Investments (2013–present). |
| | | | | | | |
| | | | | | | Former: Senior Vice President, Neuberger Berman Group LLC (2009–2013); Vice President, Morgan Stanley (2002–2009). |
| | | | | | | |
John L. Sullivan
(1955) | | Chief Financial Officer and Treasurer | | Since 2014 | | Current: CFO, Chief Accounting Officer and Treasurer, certain other funds in the Fund Complex (2010–present); Senior Managing Director, Guggenheim Investments (2010–present). |
| | | | | | | |
| | | | | | | Former: Managing Director and CCO, each of the funds in the Van Kampen Investments fund complex (2004–2010); Managing Director and Head of Fund Accounting and Administration, Morgan Stanley Investment Management (2002–2004); CFO and Treasurer, Van Kampen Funds (1996–2004). |
| * | The business address of each officer is c/o Guggenheim Investments, 805 King Farm Boulevard, Suite 600, Rockville, Maryland 20850. |
| ** | Each officer serves an indefinite term, until his or her successor is duly elected and qualified. Time served includes time served in the respective position for the Predecessor Corporation. |
| THE GUGGENHEIM FUNDS SEMI-ANNUAL REPORT | 23 |
| GUGGENHEIM INVESTMENTS PRIVACY POLICIES (Unaudited) |
Rydex Funds, Guggenheim Funds, Rydex Investments, Guggenheim Funds Distributors, LLC, Security Investors, LLC, Security Distributors, Inc., Guggenheim Partners Investment Managers, LLC, and Rydex Advisory Services (Collectively “Guggenheim Investments”).
Our Commitment to You
When you become a Guggenheim Investments investor, you entrust us with not only your hard-earned money but also with personal and financial information about you. We recognize that your relationship with us is based on trust and that you expect us to act responsibly and in your best interests. Because we have access to this private information about you, we hold ourselves to the highest standards in its safekeeping and use. This means, most importantly, that we do not sell client information to anyone—whether it is your personal information or if you are a current or former Guggenheim Investments client.
The Information We Collect About You
In the course of doing business with shareholders and investors, we collect nonpublic personal information about you. You typically provide personal information when you complete a Guggenheim Investments account application or when you request a transaction that involves Rydex and Guggenheim Investments funds or one of the Guggenheim Investments affiliated companies. “Nonpublic personal information” is personally identifiable private information about you. For example, it includes information regarding your name and address, Social Security or taxpayer identification number, assets, income, account balance, bank account information and investment activity (e.g., purchase and redemption history).
How We Handle Your Personal Information
As emphasized above, we do not sell information about current or former clients or their accounts to third parties. Nor do we share such information, except when necessary to complete transactions at your request or to make you aware of related investment products and services that we offer. Additional details about how we handle your personal information are provided below. To complete certain transactions or account changes that you direct, it may be necessary to provide identifying information to companies, individuals or groups that are not affiliated with Guggenheim Investments. For example, if you ask to transfer assets from another financial institution to Guggenheim Investments, we will need to provide certain information about you to that company to complete the transaction. To alert you to other Guggenheim Investments investment products and services, we may share your information within the Guggenheim Investments family of affiliated companies. This would include, for example, sharing your information within Guggenheim Investments so we can make you aware of new Rydex and Guggenheim Investments funds or the services offered through another Guggenheim Investments affiliated company. In certain instances, we may contract with nonaffiliated companies to perform services for us. Where necessary, we will disclose information we have about you to these third parties. In all such cases, we provide the third party with only the information necessary to carry out its assigned responsibilities and only for that purpose. And we require these third parties to treat your private information with the same high degree of confidentiality that we do. In certain instances, we may share information with other financial institutions regarding individuals and entities in response to the U.S.A. Patriot Act. Finally, we will release information about you if you direct us to do so, if we are compelled by law to do so or in other circumstances permitted by law.
Opt Out Provisions
We do not sell your personal information to anyone. The law allows you to “opt out” of only certain kinds of information sharing with third parties. The firm does not share personal information about you with any third parties that triggers this opt-out right. This means YOU ARE ALREADY OPTED OUT.
How We Protect Privacy Online
Our concern for the privacy of our shareholders also extends to those who use our web site, guggenheiminvestments. com. Our web site uses some of the most secure forms of online communication available, including encryption technology, Secure Socket Layer (SSL) protocol, firewalls and user names and passwords. These technologies provide a high level of security and privacy when you access your account information or initiate online transactions. The Guggenheim
| 24 | THE GUGGENHEIM FUNDS SEMI-ANNUAL REPORT |
| GUGGENHEIM INVESTMENTS PRIVACY POLICIES (Unaudited)(concluded) |
Investments web site offers customized features that require our use of “http cookies”—tiny pieces of information that we ask your browser to store. However, we make very limited use of these cookies. We only use cookies for session management and security features on the Guggenheim Investments web site. We do not use them to pull data from your hard drive, to learn your email address, or to view data in cookies created by other web sites. We will not share the information in our cookies or give others access to it. See the legal information area on our web site for more details about web site security and privacy features.
How We Safeguard Your Personal Information
We restrict access to nonpublic personal information about shareholders to our employees and in some cases to third parties (for example, the service providers described above) as permitted by law. We maintain strict physical, electronic and procedural safeguards that comply with federal standards to guard your nonpublic personal information.
We’ll Keep You Informed
As required by federal law, we will notify shareholders of our privacy policy annually. We reserve the right to modify this policy at any time, but rest assured that if we do change it, we will tell you promptly. You will also be able to access our privacy policy from our web site at guggenheiminvestments.com. Should you have any questions regarding our privacy policy, contact us at 800.820.0888 or 301.296.5100.
| THE GUGGENHEIM FUNDS SEMI-ANNUAL REPORT | 25 |
This page intentionally left blank.
This page intentionally left blank.
This page intentionally left blank.
This page intentionally left blank.
3.31.2014
Guggenheim Funds Semi-Annual Report
Fundamental Alpha
StylePlus—Mid Growth Fund
SBMCG-SEMI-0314x0914 | guggenheiminvestments.com |
Go Green! Eliminate Mailbox Clutter
Go paperless with Guggenheim Investments eDelivery—a service giving you full online access to account information and documents. Save time, cut down on mailbox clutter and be a friend to the environment with eDelivery.
With Guggenheim Investments eDelivery you can:
| • | View online confirmations and statements at your convenience. |
| • | Receive email notifications when your most recent confirmations, statements and other account documents are available for review. |
| • | Access prospectuses, annual reports and semiannual reports online. |
If you have questions about the Guggenheim Investments eDelivery service, contact one of our Shareholder Service Representatives at 800.820.0888.
This report and the financial statements contained herein are submitted for the general information of our shareholders. The report is not authorized for distribution to prospective investors unless preceded or accompanied by an effective prospectus.
Distributed by Guggenheim Funds Distributors, LLC. GI-GOGREEN-0414 x0415 #12604
| THE GUGGENHEIM FUNDS SEMI-ANNUAL REPORT | 1 |
Dear Shareholder:
Security Investors, LLC (the “Investment Adviser”) is pleased to present the semi-annual shareholder report for one of our Funds (the “Fund”) for the six-month period ended March 31, 2014.
The Investment Adviser is part of Guggenheim Investments, which represents the investment management businesses of Guggenheim Partners, LLC, (“Guggenheim”) a global, diversified financial services firm.
Guggenheim Funds Distributors, LLC is the distributor of the Fund. Guggenheim Funds Distributors, LLC is affiliated with Guggenheim and the Investment Adviser.
We encourage you to read the Economic and Market Overview section of the report, which follows this letter, and then the Fund Profile for the Fund.
We are committed to providing innovative investment solutions and appreciate the trust you place in us.
Sincerely,

Donald C. Cacciapaglia
President
April 30, 2014
Read a prospectus and summary prospectus (if available) carefully before investing. It contains the investment objectives, risks, charges, expenses and other information, which should be considered carefully before investing. Obtain a prospectus and summary prospectus (if available) at guggenheiminvestments.com or call 800.820.0888.
There can be no assurance that any investment product will achieve its investment objective(s). There are risks associated with investing, including the entire loss of principal invested. Investing involves market risks. The investment return and principal value of any investment product will fluctuate with changes in market conditions.
| 2 | THE GUGGENHEIM FUNDS SEMI-ANNUAL REPORT |
| ECONOMIC AND MARKET OVERVIEW (Unaudited) | March 31, 2014 |
Investment markets continued to rally through the six months ended March 31, 2014, thanks to a steadily improving U.S. economy and ongoing U.S. central bank easing. Contributing to performance of equities were growing confidence in the sustainability of the U.S. economic recovery, favorable corporate profit growth, supportive valuations, interest rates below their long-run level, and positive inflows, as investors concerned about the end of quantitative easing and its impact on interest rates rotated out of fixed-income investments into equities.
In January 2014, based on positive economic data and a better jobs picture, the U.S. Federal Reserve (the “Fed”) began its long-expected tapering program, reducing monthly purchases by $10 billion. The Fed continued to taper even after acknowledging in March that the economy had slowed during the winter months, which were unusually harsh for much of the U.S. By April, it was buying only $55 billion a month, down from $85 billion in December 2013.
In March 2014, while noting that the U.S. economy has not yet reached full employment, the Fed also unlinked attainment of a 6.5% unemployment level with a potential rate hike, since the unemployment rate in February was approaching that level. Revised guidance from new Fed Chair Janet Yellen seemed to indicate that a rise might not be considered until mid-2015, at the earliest, although she stressed that it would depend on labor market conditions and the inflation rate. Still, the date was earlier than many market participants had expected, which knocked the market off record highs reached earlier in the six-month period.
Even though upcoming economic reports may reflect the impacts from the severe winter weather, and international tensions remain high, the arrival of spring was expected to return the U.S. economy to its improving trend. Pent-up demand resulting from the huge gap in household formation over the prior several years continues to buoy the housing market, while a pickup in global demand bodes well for the U.S. manufacturing sector. Consumption is rising due to an increase in net worth, resulting from the rebound in housing and asset prices, which has boosted retail sales, and consumer sentiment measures. The consensus expectation for 2014 growth stands at 3.0%, compared with 1.9% for 2013.
Momentum driven by the favorable macro environment is supporting equities and moving spreads tighter, helping perpetuate the risk-on mode that has prevailed in the U.S. since 2008. Investors who want income will have to keep investing, but buying cheap securities may be a thing of the past. Recent volatility indicates that investors must guard against becoming complacent about the quality of investments they make and their inherent risks. The Fed continues pumping enormous amounts of liquidity into the system, but with little expectation that it will raise interest rates before 2015, the expansion is likely to continue. Even when the Fed does hike, it typically takes another two years before a recession threatens growth. While the economy may be entering a new era where interest rates head higher over the long term, there is likely a ceiling on how high rates can rise in advance of eventual monetary tightening.
For the six months ended March 31, 2014, the Standard & Poor’s 500® (“S&P 500”) Index* returned 12.51%. The Morgan Stanley Capital International (“MSCI”) Europe-Australasia-Far East (“EAFE”) Index* returned 6.41%. The return of the MSCI Emerging Markets Index* was 1.39%.
In the bond market, the Barclays U.S. Aggregate Bond Index* posted a 1.70% return for the period, while the Barclays U.S. Corporate High Yield Index* returned 6.67%. The return of the BofA Merrill Lynch 3-Month U.S. Treasury Bill Index* was 0.03% for the six-month period.
The opinions and forecasts expressed may not actually come to pass. This information is subject to change at any time, based on market and other conditions, and should not be construed as a recommendation of any specific security or strategy.
| THE GUGGENHEIM FUNDS SEMI-ANNUAL REPORT | 3 |
| ECONOMIC AND MARKET OVERVIEW (Unaudited)(concluded) | March 31, 2014 |
*Index Definitions:
The following indices are referenced throughout this report. Indices are unmanaged and not available for direct investment. Index performance does not reflect transaction costs, fees, or expenses.
Barclays U.S. Aggregate Bond Index is a broad-based benchmark that measures the investment grade, U.S. dollar denominated, fixed-rate taxable bond market, including U.S. Treasuries, government-related and corporate securities, MBS (agency fixed-rate and hybrid ARM pass-throughs), ABS, and CMBS.
Barclays U.S. Corporate High Yield Index measures the market of USD-denominated, non-investment grade, fixed-rate, taxable corporate bonds. Securities are classified as high yield if the middle rating of Moody’s, Fitch, and S&P is Ba1/BB+/BB+ or below.
BofA Merrill Lynch 3-Month U.S. Treasury Bill Index is an unmanaged market index of U.S. Treasury securities maturing in 90 days that assumes reinvestment of all income.
MSCI EAFE Index is a free float-adjusted market capitalization index that is designed to measure the equity market performance of developed markets, excluding the U.S. & Canada.
MSCI Emerging Markets Index is a free float-adjusted market capitalization weighted index that is designed to measure equity market performance in the global emerging markets.
S&P 500® Index is a capitalization-weighted index of 500 stocks designed to measure the performance of the broad economy, representing all major industries and is considered a representation of the U.S. stock market.
| 4 | THE GUGGENHEIM FUNDS SEMI-ANNUAL REPORT |
| ABOUT SHAREHOLDERS’ FUND EXPENSES (Unaudited) |
All mutual funds have operating expenses and it is important for our shareholders to understand the impact of costs on their investments. Shareholders of a Fund incur two types of costs: (i) transaction costs, including sales charges (loads) on purchase payments, reinvested dividends, or other distributions; and exchange fees; and (ii) ongoing costs, including management fees, administrative services, and shareholder reports, among others. These ongoing costs, or operating expenses, are deducted from a fund’s gross income and reduce the investment return of the fund.
A fund’s expenses are expressed as a percentage of its average net assets, which is known as the expense ratio. The following examples are intended to help investors understand the ongoing costs (in dollars) of investing in a Fund and to compare these costs with the ongoing costs of investing in other mutual funds.
The examples are based on an investment of $1,000 made at the beginning of the period and held for the entire six-month period beginning September 30, 2013 and ending March 31, 2014.
The following tables illustrate a Fund’s costs in two ways:
Table 1. Based on actual Fund return. This section helps investors estimate the actual expenses paid over the period. The “Ending Account Value” shown is derived from the Fund’s actual return, and the fourth column shows the dollar amount that would have been paid by an investor who started with $1,000 in the Fund. Investors may use the information here, together with the amount invested, to estimate the expenses paid over the period. Simply divide the Fund’s account value by $1,000 (for example, an $8,600 account value divided by $1,000 = 8.6), then multiply the result by the number provided under the heading “Expenses Paid During Period.”
Table 2. Based on hypothetical 5% return. This section is intended to help investors compare a Fund’s cost with those of other mutual funds. The table provides information about hypothetical account values and hypothetical expenses based on the Fund’s actual expense ratio and an assumed rate of return of 5% per year before expenses, which is not the Fund’s actual return. The hypothetical account values and expenses may not be used to estimate the actual ending account balance or expenses paid during the period. The example is useful in making comparisons because the U.S. Securities and Exchange Commission (the “SEC”) requires all mutual funds to calculate expenses based on the 5% return. Investors can assess a Fund’s costs by comparing this hypothetical example with the hypothetical examples that appear in shareholder reports of other funds.
The calculations illustrated above assume no shares were bought or sold during the period. Actual costs may have been higher or lower, depending on the amount of investment and the timing of any purchases or redemptions.
Please note that the expenses shown in the table are meant to highlight your ongoing costs only and do not reflect any transactional costs, such as sales charges (loads) on purchase payments, and contingent deferred sales charges (“CDSC”) on redemptions, if any. Therefore, the second table is useful in comparing ongoing costs only, and will not help you determine the relative total costs of owning different funds. In addition, if these transactional costs were included, your costs would have been higher.
More information about a Fund’s expenses, including annual expense ratios for the past five years, can be found in the Financial Highlights section of this report. For additional information on operating expenses and other shareholder costs, please refer to the appropriate Fund prospectus.
| THE GUGGENHEIM FUNDS SEMI-ANNUAL REPORT | 5 |
| ABOUT SHAREHOLDERS’ FUND EXPENSES (Unaudited)(concluded) |
| | | | | | | | | Beginning | | | Ending | | | Expenses | |
| | | Expense | | | Fund | | | Account Value | | | Account Value | | | Paid During | |
| | | Ratio1 | | | Return | | | September 30, 2013 | | | March 31, 2014 | | | Period2 | |
| Table 1. Based on actual Fund return3 | | | | | | | | | | | | | | |
| | | | | | | | | | | | | | | | | | | | | |
| StylePlus—Mid Growth Fund | | | | | | | | | | | | | | | | | | | | |
| A-Class | | | 1.76 | % | | | 11.52 | % | | | $1,000.00 | | | | $1,115.20 | | | | $ 9.28 | |
| B-Class | | | 3.30 | % | | | 10.68 | % | | | 1,000.00 | | | | 1,106.80 | | | | 17.33 | |
| C-Class | | | 2.70 | % | | | 10.99 | % | | | 1,000.00 | | | | 1,109.90 | | | | 14.20 | |
| Institutional Class | | | 2.02 | % | | | 11.37 | % | | | 1,000.00 | | | | 1,113.70 | | | | 10.64 | |
| | | | | | | | | | | | | | | | | | | | | |
| Table 2. Based on hypothetical 5% return (before expenses) | | | | | | | | | | | | |
| | | | | | | | | | | | | | | | | | | | | |
| StylePlus—Mid Growth Fund | | | | | | | | | | | | | | | | | | | | |
| A-Class | | | 1.76 | % | | | 5.00 | % | | | $1,000.00 | | | | $1,016.16 | | | | $ 8.85 | |
| B-Class | | | 3.30 | % | | | 5.00 | % | | | 1,000.00 | | | | 1,008.48 | | | | 16.52 | |
| C-Class | | | 2.70 | % | | | 5.00 | % | | | 1,000.00 | | | | 1,011.47 | | | | 13.54 | |
| Institutional Class | | | 2.02 | % | | | 5.00 | % | | | 1,000.00 | | | | 1,014.86 | | | | 10.15 | |
| 1 | Annualized and excludes expenses of the underlying funds in which the Fund invests. |
| 2 | Expenses are equal to the Fund’s annualized expense ratio, net of any applicable fee waivers, multiplied by the average account value over the period, multiplied by 182/365 (to reflect the one-half year period). |
| 3 | Actual cumulative return at net asset value for the period September 30, 2013 to March 31, 2014. |
| 6 | THE GUGGENHEIM FUNDS SEMI-ANNUAL REPORT |
| FUND PROFILE (Unaudited) | March 31, 2014 |
STYLEPLUS—MID GROWTH FUND
OBJECTIVE: Seeks long-term growth of capital.
Holdings Diversification (Market Exposure as % of Net Assets)
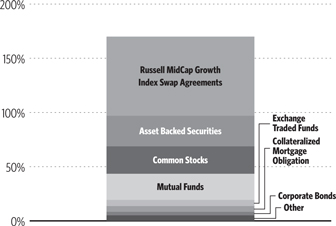
“Holdings Diversification (Market Exposure as % of Net Assets)” excludes any temporary cash investments.
| Portfolio Composition by Quality Rating* | | | |
| Rating | | | |
| Fixed Income Instruments | | | | |
| AAA | | | 9.4 | % |
| AA | | | 3.6 | % |
| A | | | 7.3 | % |
| BBB | | | 9.3 | % |
| BB | | | 1.7 | % |
| B | | | 5.8 | % |
| CCC | | | 3.5 | % |
| Other Instruments | | | | |
| Common Stock | | | 25.6 | % |
| Mutual Funds | | | 24.4 | % |
| Exchanged Traded Funds | | | 5.8 | % |
| Short Term Investments | | | 3.8 | % |
| Total Investments | | | 100.0 | % |
The chart above reflects percentages of the value of total investments.
| Inception Dates: | |
| A-Class | September 17, 1969 |
| B-Class | October 19, 1993 |
| C-Class | January 29, 1999 |
| Institutional Class | March 1, 2012 |
| Ten Largest Holdings (% of Total Net Assets) | | | |
| Guggenheim Strategy Fund III | | | 11.3 | % |
| Guggenheim Strategy Fund I | | | 9.5 | % |
| Guggenheim BulletShares 2016 High Yield Corporate Bond ETF | | | 2.0 | % |
| Guggenheim BulletShares 2015 High Yield Corporate Bond ETF | | | 1.9 | % |
| Guggenheim BulletShares 2017 High Yield Corporate Bond ETF | | | 1.8 | % |
| Floating Rate Strategies Fund Institutional Class | | | 1.7 | % |
| Macro Opportunities Fund Institutional Class | | | 1.7 | % |
| Duane Street CLO IV Ltd. — Class A1T | | | 1.2 | % |
| HSI Asset Securitization Corporation Trust 2007-WF1 — Class 2A3 | | | 1.2 | % |
| N-Star REL CDO VIII Ltd. — Class A1 | | | 1.0 | % |
| Top Ten Total | | | 33.3 | % |
| * | Source: Factset. Credit quality ratings are measured on a scale that generally ranges from AAA (highest) to D (lowest). All rated securities have been rated by Moody’s, Standard & Poor’s (“S&P”), or Fitch, which are all a Nationally Recognized Statistical Rating Organization (“NRSRO”). For purposes of this presentation, when ratings are available from more than one agency, the highest rating is used. Guggenheim Investments has converted Moody’s and Fitch ratings to the equivalent S&P rating. Unrated securities do not necessarily indicate low credit quality. Security ratings are determined at the time of purchase and may change thereafter. |
| THE GUGGENHEIM FUNDS SEMI-ANNUAL REPORT | 7 |
| SCHEDULE OF INVESTMENTS (Unaudited) | March 31, 2014 |
| STYLEPLUS—MID GROWTH FUND |
| | | Shares | | | Value | |
| | | | | | | |
| COMMON STOCKS† - 25.3% | | | | | | | | |
| INDUSTRIALS - 5. 6% | | | | | | | | |
| Ingersoll-Rand plc | | | 4,951 | | | $ | 283,394 | |
| Avis Budget Group, Inc.* | | | 5,260 | | | | 256,162 | |
| Fluor Corp. | | | 2,841 | | | | 220,831 | |
| Masco Corp. | | | 9,532 | | | | 211,706 | |
| Waste Management, Inc. | | | 4,992 | | | | 210,014 | |
| Southwest Airlines Co. | | | 8,840 | | | | 208,711 | |
| Delta Air Lines, Inc. | | | 5,760 | | | | 199,584 | |
| United Continental Holdings, Inc.* | | | 4,466 | | | | 199,318 | |
| Hertz Global Holdings, Inc.* | | | 7,297 | | | | 194,392 | |
| Dover Corp. | | | 2,324 | | | | 189,987 | |
| Stanley Black & Decker, Inc. | | | 2,203 | | | | 178,972 | |
| Waste Connections, Inc. | | | 3,927 | | | | 172,238 | |
| AECOM Technology Corp.* | | | 5,304 | | | | 170,630 | |
| RR Donnelley & Sons Co. | | | 7,955 | | | | 142,395 | |
| Nielsen Holdings N.V. | | | 3,160 | | | | 141,031 | |
| WW Grainger, Inc. | | | 519 | | | | 131,130 | |
| Carlisle Companies, Inc. | | | 1,519 | | | | 120,517 | |
| MRC Global, Inc.* | | | 4,301 | | | | 115,955 | |
| Iron Mountain, Inc. | | | 4,033 | | | | 111,189 | |
| Dun & Bradstreet Corp. | | | 1,028 | | | | 102,132 | |
| Rockwell Automation, Inc. | | | 790 | | | | 98,395 | |
| IHS, Inc. — Class A* | | | 791 | | | | 96,107 | |
| Roper Industries, Inc. | | | 710 | | | | 94,792 | |
| United Rentals, Inc.* | | | 952 | | | | 90,383 | |
| Equifax, Inc. | | | 1,280 | | | | 87,078 | |
| Kirby Corp.* | | | 795 | | | | 80,494 | |
| Pitney Bowes, Inc. | | | 3,078 | | | | 79,997 | |
| Alaska Air Group, Inc. | | | 806 | | | | 75,208 | |
| IDEX Corp. | | | 1,003 | | | | 73,109 | |
| CH Robinson Worldwide, Inc. | | | 1,336 | | | | 69,993 | |
| Cintas Corp. | | | 1,165 | | | | 69,446 | |
| Colfax Corp.* | | | 931 | | | | 66,408 | |
| Expeditors International of Washington, Inc. | | | 1,664 | | | | 65,944 | |
| Manitowoc Company, Inc. | | | 2,095 | | | | 65,888 | |
| KAR Auction Services, Inc. | | | 2,146 | | | | 65,131 | |
| Total Industrials | | | | | | | 4,738,661 | |
| INFORMATION TECHNOLOGY - 5.4% | | | | | | | | |
| NetApp, Inc. | | | 8,298 | | | | 306,196 | |
| Symantec Corp. | | | 15,101 | | | | 301,566 | |
| SanDisk Corp. | | | 3,372 | | | | 273,773 | |
| Western Union Co. | | | 14,497 | | | | 237,170 | |
| Intuit, Inc. | | | 2,819 | | | | 219,121 | |
| Motorola Solutions, Inc. | | | 3,036 | | | | 195,184 | |
| Vantiv, Inc. — Class A* | | | 5,899 | | | | 178,267 | |
| Broadcom Corp. — Class A | | | 4,900 | | | | 154,252 | |
| Alliance Data Systems Corp.* | | | 565 | | | | 153,934 | |
| Harris Corp. | | | 2,016 | | | | 147,491 | |
| DST Systems, Inc. | | | 1,482 | | | | 140,479 | |
| Fiserv, Inc.* | | | 2,443 | | | | 138,494 | |
| Fidelity National Information Services, Inc. | | | 2,563 | | | | 136,992 | |
| Total System Services, Inc. | | | 4,244 | | | | 129,060 | |
| ON Semiconductor Corp.* | | | 13,344 | | | | 125,434 | |
| Citrix Systems, Inc.* | | | 2,058 | | | | 118,191 | |
| Anixter International, Inc. | | | 1,125 | | | | 114,210 | |
| Teradata Corp.* | | | 2,252 | | | | 110,776 | |
| Paychex, Inc. | | | 2,499 | | | | 106,457 | |
| FireEye, Inc.* | | | 1,700 | | | | 104,669 | |
| Cadence Design Systems, Inc.* | | | 6,280 | | | | 97,591 | |
| VeriSign, Inc.* | | | 1,803 | | | | 97,200 | |
| Applied Materials, Inc. | | | 4,354 | | | | 88,909 | |
| Booz Allen Hamilton Holding Corp. | | | 3,790 | | | | 83,380 | |
| LinkedIn Corp. — Class A* | | | 435 | | | | 80,449 | |
| ARRIS Group, Inc.* | | | 2,590 | | | | 72,986 | |
| Genpact Ltd.* | | | 3,825 | | | | 66,632 | |
| Global Payments, Inc. | | | 926 | | | | 65,848 | |
| Rovi Corp.* | | | 2,884 | | | | 65,698 | |
| Jack Henry & Associates, Inc. | | | 1,175 | | | | 65,518 | |
| Broadridge Financial Solutions, Inc. | | | 1,761 | | | | 65,404 | |
| TIBCO Software, Inc.* | | | 3,190 | | | | 64,821 | |
| FactSet Research Systems, Inc. | | | 597 | | | | 64,363 | |
| SS&C Technologies Holdings, Inc.* | | | 1,608 | | | | 64,352 | |
| IAC/InterActiveCorp | | | 888 | | | | 63,394 | |
| NeuStar, Inc. — Class A* | | | 1,823 | | | | 59,266 | |
| Total Information Technology | | | | | | | 4,557,527 | |
| HEALTH CARE - 4.2% | | | | | | | | |
| Endo International plc* | | | 3,975 | | | | 272,885 | |
| DaVita HealthCare Partners, Inc.* | | | 3,485 | | | | 239,942 | |
| HCA Holdings, Inc.* | | | 4,385 | | | | 230,213 | |
| Hologic, Inc.* | | | 10,454 | | | | 224,761 | |
| Universal Health Services, Inc. — Class B | | | 2,487 | | | | 204,108 | |
| Aetna, Inc. | | | 2,515 | | | | 188,549 | |
| Actavis plc* | | | 896 | | | | 184,442 | |
| Laboratory Corporation of America Holdings* | | | 1,769 | | | | 173,733 | |
| St. Jude Medical, Inc. | | | 2,434 | | | | 159,159 | |
| Agilent Technologies, Inc. | | | 2,770 | | | | 154,898 | |
| Henry Schein, Inc.* | | | 1,209 | | | | 144,318 | |
| Perrigo Company plc | | | 879 | | | | 135,946 | |
| Becton Dickinson and Co. | | | 1,160 | | | | 135,813 | |
| Zoetis, Inc. | | | 4,053 | | | | 117,294 | |
| CR Bard, Inc. | | | 775 | | | | 114,685 | |
| Quest Diagnostics, Inc. | | | 1,878 | | | | 108,774 | |
| Mylan, Inc.* | | | 2,152 | | | | 105,082 | |
| Vertex Pharmaceuticals, Inc.* | | | 1,442 | | | | 101,978 | |
| Cigna Corp. | | | 1,072 | | | | 89,759 | |
| Alexion Pharmaceuticals, Inc.* | | | 494 | | | | 75,152 | |
| Catamaran Corp.* | | | 1,588 | | | | 71,079 | |
| Cerner Corp.* | | | 1,249 | | | | 70,256 | |
| Tenet Healthcare Corp.* | | | 1,572 | | | | 67,297 | |
| ResMed, Inc. | | | 1,464 | | | | 65,426 | |
| Salix Pharmaceuticals Ltd.* | | | 630 | | | | 65,274 | |
| Zimmer Holdings, Inc. | | | 663 | | | | 62,707 | |
| Total Health Care | | | | | | | 3,563,530 | |
| CONSUMER DISCRETIONARY - 3.9% | | | | | | | | |
| Macy’s, Inc. | | | 4,036 | | | | 239,295 | |
| Bed Bath & Beyond, Inc.* | | | 2,339 | | | | 160,923 | |
| Scripps Networks Interactive, Inc. — Class A | | | 2,066 | | | | 156,830 | |
| 8 | THE GUGGENHEIM FUNDS SEMI-ANNUAL REPORT | SEE NOTES TO FINANCIAL STATEMENTS. |
| SCHEDULE OF INVESTMENTS (Unaudited)(continued) | March 31, 2014 |
| STYLEPLUS—MID GROWTH FUND |
| | | Shares | | | Value | |
| | | | | | | |
| Liberty Interactive Corp. — Class A* | | | 5,352 | | | $ | 154,512 | |
| Delphi Automotive plc | | | 2,267 | | | | 153,838 | |
| Best Buy Company, Inc. | | | 5,762 | | | | 152,174 | |
| Harley-Davidson, Inc. | | | 2,237 | | | | 149,007 | |
| Omnicom Group, Inc. | | | 1,781 | | | | 129,300 | |
| Whirlpool Corp. | | | 829 | | | | 123,902 | |
| VF Corp. | | | 1,940 | | | | 120,047 | |
| Dollar General Corp.* | | | 2,078 | | | | 115,287 | |
| Coach, Inc. | | | 2,017 | | | | 100,164 | |
| Discovery Communications, Inc. — Class A* | | | 1,202 | | | | 99,405 | |
| The Gap, Inc. | | | 2,430 | | | | 97,346 | |
| Nordstrom, Inc. | | | 1,498 | | | | 93,550 | |
| Wynn Resorts Ltd. | | | 372 | | | | 82,640 | |
| International Game Technology | | | 5,604 | | | | 78,792 | |
| Interpublic Group of Companies, Inc. | | | 4,463 | | | | 76,496 | |
| Charter Communications, Inc. — Class A* | | | 614 | | | | 75,645 | |
| Ross Stores, Inc. | | | 1,018 | | | | 72,838 | |
| Wyndham Worldwide Corp. | | | 963 | | | | 70,521 | |
| Starwood Hotels & Resorts Worldwide, Inc. | | | 837 | | | | 66,625 | |
| Dillard’s, Inc. — Class A | | | 719 | | | | 66,436 | |
| Lear Corp. | | | 790 | | | | 66,139 | |
| Genuine Parts Co. | | | 760 | | | | 66,006 | |
| Expedia, Inc. | | | 904 | | | | 65,540 | |
| L Brands, Inc. | | | 1,146 | | | | 65,058 | |
| Newell Rubbermaid, Inc. | | | 2,174 | | | | 65,003 | |
| Dollar Tree, Inc.* | | | 1,237 | | | | 64,547 | |
| Cablevision Systems Corp. — Class A | | | 3,802 | | | | 64,140 | |
| Darden Restaurants, Inc. | | | 1,235 | | | | 62,689 | |
| Jarden Corp.* | | | 1,035 | | | | 61,924 | |
| Netflix, Inc.* | | | 155 | | | | 54,565 | |
| Total Consumer Discretionary | | | | | | | 3,271,184 | |
| CONSUMER STAPLES - 3.0% | | | | | | | | |
| Kroger Co. | | | 7,657 | | | | 334,229 | |
| ConAgra Foods, Inc. | | | 9,326 | | | | 289,387 | |
| Lorillard, Inc. | | | 4,252 | | | | 229,948 | |
| Coca-Cola Enterprises, Inc. | | | 4,488 | | | | 214,346 | |
| JM Smucker Co. | | | 2,073 | | | | 201,580 | |
| Whole Foods Market, Inc. | | | 3,819 | | | | 193,661 | |
| Kellogg Co. | | | 3,040 | | | | 190,638 | |
| Dr Pepper Snapple Group, Inc. | | | 3,073 | | | | 167,356 | |
| Campbell Soup Co. | | | 3,271 | | | | 146,802 | |
| Clorox Co. | | | 1,649 | | | | 145,128 | |
| Hershey Co. | | | 1,153 | | | | 120,373 | |
| Constellation Brands, Inc. — Class A* | | | 1,284 | | | | 109,101 | |
| Mead Johnson Nutrition Co. — Class A | | | 795 | | | | 66,096 | |
| Brown-Forman Corp. — Class B | | | 724 | | | | 64,936 | |
| Ingredion, Inc. | | | 952 | | | | 64,812 | |
| Total Consumer Staples | | | | | | | 2,538,393 | |
| ENERGY - 2.3% | | | | | | | | |
| Pioneer Natural Resources Co. | | | 1,718 | | | | 321,506 | |
| Cabot Oil & Gas Corp. | | | 5,238 | | | | 177,462 | |
| Equities Corp. | | | 1,581 | | | | 153,310 | |
| Concho Resources, Inc.* | | | 1,120 | | | | 137,200 | |
| Noble Energy, Inc. | | | 1,923 | | | | 136,610 | |
| Southwestern Energy Co.* | | | 2,962 | | | | 136,282 | |
| FMC Technologies, Inc.* | | | 2,500 | | | | 130,725 | |
| Cameron International Corp.* | | | 1,994 | | | | 123,169 | |
| CVR Energy, Inc. | | | 2,566 | | | | 108,414 | |
| SM Energy Co. | | | 1,479 | | | | 105,438 | |
| Range Resources Corp. | | | 1,229 | | | | 101,970 | |
| Oceaneering International, Inc. | | | 1,081 | | | | 77,681 | |
| Kosmos Energy Ltd.* | | | 6,707 | | | | 73,777 | |
| ONEOK, Inc. | | | 1,114 | | | | 66,005 | |
| QEP Resources, Inc. | | | 1,996 | | | | 58,762 | |
| Total Energy | | | | | | | 1,908,311 | |
| FINANCIALS - 0.5% | | | | | | | | |
| Crown Castle International Corp. | | | 3,717 | | | | 274,240 | |
| IntercontinentalExchange Group, Inc. | | | 501 | | | | 99,113 | |
| Total Financials | | | | | | | 373,353 | |
| TELECOMMUNICATION SERVICES - 0.3% | | | | | | | | |
| SBA Communications Corp. — Class A* | | | 2,327 | | | | 211,664 | |
| Intelsat S.A.* | | | 3,472 | | | | 64,996 | |
| Total Telecommunication Services | | | | | | | 276,660 | |
| MATERIALS - 0.1% | | | | | | | | |
| Packaging Corporation of America | | | 937 | | | | 65,937 | |
| Total Common Stocks | | | | | | | | |
| (Cost $19,990,694) | | | | | | | 21,293,556 | |
| | | | | | | | | |
| EXCHANGE TRADED FUNDS†,4 - 5.7% | | | | | | | | |
| Guggenheim BulletShares 2016 High Yield | | | | | | | | |
| Corporate Bond ETF | | | 60,500 | | | | 1,651,650 | |
| Guggenheim BulletShares 2015 High Yield | | | | | | | | |
| Corporate Bond ETF | | | 60,400 | | | | 1,632,612 | |
| Guggenheim BulletShares 2017 High Yield | | | | | | | | |
| Corporate Bond ETF | | | 56,400 | | | | 1,552,128 | |
| Total Exchange Traded Funds | | | | | | | | |
| (Cost $4,775,403) | | | | | | | 4,836,390 | |
| | | | | | | | | |
| MUTUAL FUNDS†,4 - 24.1% | | | | | | | | |
| Guggenheim Strategy Fund III | | | 380,088 | | | | 9,494,599 | |
| Guggenheim Strategy Fund I | | | 320,000 | | | | 7,996,800 | |
| Floating Rate Strategies Fund | | | | | | | | |
| Institutional Class | | | 53,020 | | | | 1,425,699 | |
| Macro Opportunities Fund | | | | | | | | |
| Institutional Class | | | 51,666 | | | | 1,402,227 | |
| Total Mutual Funds | | | | | | | | |
| (Cost $20,368,422) | | | | | | | 20,319,325 | |
| | | | | | | | | |
| SHORT TERM INVESTMENTS† - 3.8% | | | | | | | | |
| Dreyfus Treasury Prime Cash | | | | | | | | |
| Management Fund | | | 3,167,553 | | | | 3,167,553 | |
| Total Short Term Investments | | | | | | | | |
| (Cost $3,167,553) | | | | | | | 3,167,553 | |
| SEE NOTES TO FINANCIAL STATEMENTS. | THE GUGGENHEIM FUNDS SEMI-ANNUAL REPORT | 9 |
| SCHEDULE OF INVESTMENTS (Unaudited)(continued) | March 31, 2014 |
| STYLEPLUS—MID GROWTH FUND |
| | | Face | | | | |
| | | Amount | | | Value | |
| | | | | | | |
| ASSET BACKED SECURITIES†† - 28.2% | | | | | | | | |
| Duane Street CLO IV Ltd. | | | | | | | | |
| 2007-4A, 0.47% due 11/14/211,2 | | $ | 1,017,494 | | | $ | 999,791 | |
| HSI Asset Securitization | | | | | | | | |
| Corporation Trust | | | | | | | | |
| 2007-WF1, 0.32% due 05/25/371 | | | 1,060,366 | | | | 980,121 | |
| N-Star REL CDO VIII Ltd. | | | | | | | | |
| 2006-8A, 0.44% due 02/01/41†††,1,2 | | | 889,809 | | | | 838,556 | |
| Garrison Funding 2013-2 Ltd. | | | | | | | | |
| 2013-2A, 2.13% due 09/25/231,2 | | | 830,000 | | | | 825,933 | |
| JP Morgan Mortgage | | | | | | | | |
| Acquisition Trust | | | | | | | | |
| 2007-CH3, 0.30% due 03/25/371 | | | 806,677 | | | | 769,533 | |
| Brentwood CLO Corp. | | | | | | | | |
| 2006-1A, 0.51% due 02/01/221,2 | | | 518,895 | | | | 508,725 | |
| 2006-1A, 1.06% due 02/01/221,2 | | | 250,000 | | | | 227,650 | |
| Argent Securities Incorporated | | | | | | | | |
| Asset-Backed Pass-Through | | | | | | | | |
| Certificates Series | | | | | | | | |
| 2005-W3, 0.49% due 11/25/351 | | | 776,369 | | | | 731,802 | |
| NewStar Commercial Loan Trust | | | | | | | | |
| 2006-1A, 0.61% due 03/30/221,2 | | | 400,000 | | | | 390,040 | |
| 2006-1A, 0.50% due 03/30/221,2 | | | 284,398 | | | | 282,976 | |
| Foothill CLO Ltd. | | | | | | | | |
| 2007-1A, 0.48% due 02/22/211,2 | | | 656,606 | | | | 647,151 | |
| JP Morgan Mortgage | | | | | | | | |
| Acquisition Trust | | | | | | | | |
| 2006-CH2, 0.25% due 10/25/361 | | | 652,846 | | | | 643,778 | |
| Salus CLO 2012-1 Ltd. | | | | | | | | |
| 2013-1AN, 2.49% due 03/05/21†††,1,2 | | | 600,000 | | | | 600,000 | |
| Cerberus Onshore II CLO LLC | | | | | | | | |
| 2014-1A, 2.95% due 10/15/23†††,1,2 | | | 350,000 | | | | 346,570 | |
| 2014-1A, 2.25% due 10/15/23†††,1,2 | | | 250,000 | | | | 250,000 | |
| Halcyon Structured Asset Management | | | | | | | | |
| Long Secured/Short | | | | | | | | |
| Unsecured 2007-2 Ltd. | | | | | | | | |
| 2007-2A, 3.99% due 10/29/211,2 | | | 600,000 | | | | 591,720 | |
| ALM VII R-2 Ltd. | | | | | | | | |
| 2013-7R2A, 2.84% due 04/24/241,2 | | | 600,000 | | | | 588,780 | |
| Cornerstone CLO Ltd. | | | | | | | | |
| 2007-1A, 0.46% due 07/15/211,2 | | | 600,000 | | | | 586,920 | |
| Aegis Asset Backed Securities Trust | | | | | | | | |
| 2005-3, 0.62% due 08/25/351 | | | 577,689 | | | | 569,368 | |
| Central Park CLO Ltd. | | | | | | | | |
| 2011-1A, 3.44% due 07/23/221,2 | | | 550,000 | | | | 541,750 | |
| Lehman XS Trust | | | | | | | | |
| 2007-9, 0.27% due 06/25/371 | | | 605,246 | | | | 529,053 | |
| Symphony CLO IX, LP | | | | | | | | |
| 2012-9A, 3.49% due 04/16/221,2 | | | 500,000 | | | | 502,650 | |
| TICC CLO LLC | | | | | | | | |
| 2011-1A, 2.49% due 07/25/211,2 | | | 500,000 | | | | 498,350 | |
| Symphony CLO VII Ltd. | | | | | | | | |
| 2011-7A, 3.44% due 07/28/211,2 | | | 500,000 | | | | 494,000 | |
| Goldman Sachs Asset Management CLO plc | | | | | | | | |
| 2007-1A, 2.99% due 08/01/221,2 | | | 500,000 | | | | 489,450 | |
| Black Diamond CLO 2005-1 Delaware Corp. | | | | | | | | |
| 2005-1A, 2.13% due 06/20/171,2 | | | 500,000 | | | | 488,700 | |
| KKR Financial CLO 2007-1 Ltd. | | | | | | | | |
| 2007-1A, 2.49% due 05/15/211,2 | | | 500,000 | | | | 480,800 | |
| NewStar Commercial Loan Trust | | | | | | | | |
| 2007-1A, 1.53% due 09/30/221,2 | | | 500,000 | | | | 468,350 | |
| Wells Fargo Home Equity Asset-Backed | | | | | | | | |
| Securities 2006-2 Trust | | | | | | | | |
| 2006-3, 0.30% due 01/25/371 | | | 490,979 | | | | 446,229 | |
| Race Point CLO Ltd. | | | | | | | | |
| 2014-5AR, 3.08% due 12/15/221,2 | | | 400,000 | | | | 401,320 | |
| Popular ABS Mortgage | | | | | | | | |
| Pass-Through Trust | | | | | | | | |
| 2005-A, 0.58% due 06/25/351 | | | 412,096 | | | | 394,759 | |
| Hewett’s Island CDO Ltd. | | | | | | | | |
| 2007-6A, 2.49% due 06/09/191,2 | | | 400,000 | | | | 390,160 | |
| GSC Group CDO Fund VIII Ltd. | | | | | | | | |
| 2007-8A, 0.62% due 04/17/211,2 | | | 400,000 | | | | 371,520 | |
| Black Diamond CLO 2006-1 Luxembourg S.A. | | | | | | | | |
| 2007-1A, 0.63% due 04/29/191,2 | | | 400,000 | | | | 370,720 | |
| GreenPoint Mortgage Funding Trust | | | | | | | | |
| 2005-HE4, 0.86% due 07/25/301 | | | 400,000 | | | | 361,973 | |
| FM Leveraged Capital Fund II | | | | | | | | |
| 2006-2A, 1.84% due 11/15/201,2 | | | 352,750 | | | | 352,044 | |
| West Coast Funding Ltd. | | | | | | | | |
| 2006-1A, 0.37% due 11/02/411,2 | | | 365,472 | | | | 352,023 | |
| Northwoods Capital VII Ltd. | | | | | | | | |
| 2006-7A, 1.79% due 10/22/211,2 | | | 340,000 | | | | 325,210 | |
| Global Leveraged Capital Credit Opportunity Fund | | | | | | | | |
| 2006-1A, 0.54% due 12/20/181,2 | | | 316,646 | | | | 314,778 | |
| Golub Capital Partners CLO Ltd. | | | | | | | | |
| 2014-18A, 2.73% due 04/25/26†††,1,2 | | | 310,000 | | | | 310,155 | |
| California Republic Auto Receivables Trust | | | | | | | | |
| 2013-2, 1.23% due 03/15/19 | | | 300,000 | | | | 300,613 | |
| H2 Asset Funding Ltd. | | | | | | | | |
| 2014-1, 2.15% due 03/19/37 | | | 300,000 | | | | 300,300 | |
| OFSI Fund V Ltd. | | | | | | | | |
| 2013-5A, 3.44% due 04/17/251,2 | | | 300,000 | | | | 300,000 | |
| Triton Container Finance LLC | | | | | | | | |
| 2012-1A, 4.21% due 05/14/272 | | | 285,833 | | | | 286,699 | |
| Accredited Mortgage Loan Trust | | | | | | | | |
| 2007-1, 0.28% due 02/25/371 | | | 281,245 | | | | 261,768 | |
| DIVCORE CLO Ltd. | | | | | | | | |
| 2013-1A B, 4.05% due 11/15/32††† | | | 250,000 | | | | 248,875 | |
| Riverside Park CLO Ltd. | | | | | | | | |
| 2011-1A, 2.99% due 09/27/211,2 | | | 250,000 | | | | 245,300 | |
| Race Point IV CLO Ltd. | | | | | | | | |
| 2007-4A, 0.99% due 08/01/211,2 | | | 250,000 | | | | 238,700 | |
| Soundview Home Loan Trust | | | | | | | | |
| 2003-1, 2.40% due 08/25/311 | | | 230,340 | | | | 235,137 | |
| Tricadia CDO 2006-6 Ltd. | | | | | | | | |
| 2006-6A, 0.79% due 11/05/41†††,1,2 | | | 250,000 | | | | 232,525 | |
| Newcastle CDO IX 1 Ltd. | | | | | | | | |
| 2007-9A, 0.41% due 05/25/521,2 | | | 216,054 | | | | 215,406 | |
| Textainer Marine Containers Ltd. | | | | | | | | |
| 2012-1A, 4.21% due 04/15/272 | | | 202,083 | | | | 202,269 | |
| Golub Capital Partners Fundings Ltd. | | | | | | | | |
| 2007-1A, 0.48% due 03/15/221,2 | | | 197,998 | | | | 194,810 | |
| 10 | THE GUGGENHEIM FUNDS SEMI-ANNUAL REPORT | SEE NOTES TO FINANCIAL STATEMENTS. |
| SCHEDULE OF INVESTMENTS (Unaudited)(continued) | March 31, 2014 |
| STYLEPLUS—MID GROWTH FUND |
| | | Face | | | | |
| | | Amount | | | Value | |
| | | | | | | |
| ACS 2007-1 Pass Through Trust | | | | | | | | |
| 2007-1A, 0.46% due 06/14/371,2 | | $ | 191,614 | | | $ | 182,283 | |
| Legg Mason Real Estate CDO I Ltd. | | | | | | | | |
| 2006-1A, 0.43% due 03/25/381,2 | | | 33,292 | | | | 32,726 | |
| Total Asset Backed Securities | | | | | | | | |
| (Cost $23,640,207) | | | | | | | 23,740,819 | |
| | | | | | | | | |
| COLLATERALIZED MORTGAGE OBLIGATIONS†† - 5.3% | | | | | | | | |
| Boca Hotel Portfolio Trust | | | | | | | | |
| 2013-BOCA, 3.21% due 08/15/261,2 | | | 650,000 | | | | 650,876 | |
| Resource Capital Corporation CRE Notes 2013 Ltd. | | | | | | | | |
| 2013-CRE1, 3.01% due 12/15/28†††,1,2 | | | 600,000 | | | | 601,800 | |
| Hilton USA Trust | | | | | | | | |
| 2013-HLF, 2.91% due 11/05/301,2 | | | 600,000 | | | | 601,130 | |
| SRERS-2011 Funding Ltd. | | | | | | | | |
| 2011-RS, 0.40% due 05/09/461,2 | | | 544,462 | | | | 503,573 | |
| COMM 2007-FL14 Mortgage Trust | | | | | | | | |
| 2007-FL14, 0.91% due 06/15/221,2 | | | 449,942 | | | | 444,078 | |
| Wachovia Bank Commercial Mortgage | | | | | | | | |
| Trust Series 2007-WHALE 8 | | | | | | | | |
| 2007-WHL8, 0.24% due 06/15/201,2 | | | 437,023 | | | | 433,070 | |
| Banc of America Merrill Lynch | | | | | | | | |
| Commercial Mortgage, Inc. | | | | | | | | |
| 2005-6, 5.72% due 09/10/471,2 | | | 356,600 | | | | 366,496 | |
| HarborView Mortgage Loan Trust | | | | | | | | |
| 2006-12, 0.35% due 01/19/381 | | | 420,917 | | | | 353,650 | |
| Banc of America Large Loan Trust | | | | | | | | |
| 2007-BMB1, 1.26% due 08/15/291,2 | | | 330,000 | | | | 328,047 | |
| GCCFC Commercial Mortgage Trust | | | | | | | | |
| 2006-FL4A, 0.38% due 11/05/211,2 | | | 195,602 | | | | 194,893 | |
| Total Collateralized Mortgage Obligations | | | | | | | | |
| (Cost $4,428,377) | | | | | | | 4,477,613 | |
| | | | | | | | | |
| CORPORATE BONDS†† - 3.2% | | | | | | | | |
| FINANCIALS - 0.8% | | | | | | | | |
| Emigrant Bancorp, Inc. | | | | | | | | |
| 6.25% due 06/15/142 | | | 583,000 | | | | 586,737 | |
| Nationstar Mortgage LLC / | | | | | | | | |
| Nationstar Capital Corp. | | | | | | | | |
| 6.50% due 08/01/18 | | | 140,000 | | | | 140,700 | |
| Total Financials | | | | | | | 727,437 | |
| TELECOMMUNICATION SERVICES - 0.6% | | | | | | | | |
| Level 3 Financing, Inc. | | | | | | | | |
| 3.85% due 01/15/181,2 | | | 480,000 | | | | 488,400 | |
| FINANCIAL INSTITUTIONS - 0.6% | | | | | | | | |
| Icahn Enterprises Limited Partnership / | | | | | | | | |
| Icahn Enterprises Finance Corp. | | | | | | | | |
| 3.50% due 03/15/172 | | | 480,000 | | | | 484,800 | |
| INDUSTRIALS - 0.4% | | | | | | | | |
| International Lease Finance Corp. | | | | | | | | |
| 2.18% due 06/15/161 | | | 270,000 | | | | 272,025 | |
| Victor Technologies Group, Inc. | | | | | | | | |
| 9.00% due 12/15/17 | | | 50,000 | | | | 53,625 | |
| Total Industrials | | | | | | | 325,650 | |
| MATERIALS - 0.3% | | | | | | | | |
| Anglo American Capital plc | | | | | | | | |
| 9.38% due 04/08/142 | | | 240,000 | | | | 240,300 | |
| CONSUMER STAPLES - 0.3% | | | | | | | | |
| Harbinger Group, Inc. | | | | | | | | |
| 7.88% due 07/15/19 | | | 200,000 | | | | 219,500 | |
| INFORMATION TECHNOLOGY - 0.1% | | | | | | | | |
| iGATE Corp. | | | | | | | | |
| 9.00% due 05/01/16 | | | 120,000 | | | | 126,000 | |
| CONSUMER DISCRETIONARY - 0.1% | | | | | | | | |
| Vail Resorts, Inc. | | | | | | | | |
| 6.50% due 05/01/19 | | | 100,000 | | | | 105,125 | |
| Total Corporate Bonds | | | | | | | | |
| (Cost $2,702,226) | | | | | | | 2,717,212 | |
| | | | | | | | | |
| SENIOR FLOATING RATE INTERESTS†† - 3.2% | | | | | | | | |
| INDUSTRIALS - 1.1% | | | | | | | | |
| Travelport Holdings Ltd. | | | | | | | | |
| 6.25% due 06/26/19 | | | 645,125 | | | | 659,439 | |
| Thermasys Corp. | | | | | | | | |
| 5.25% due 05/03/19 | | | 266,625 | | | | 265,292 | |
| Total Industrials | | | | | | | 924,731 | |
| FINANCIALS - 0.9% | | | | | | | | |
| National Financial Partners | | | | | | | | |
| 5.25% due 07/01/20 | | | 526,032 | | | | 528,499 | |
| First Data Corp. | | | | | | | | |
| 4.15% due 03/23/18 | | | 100,000 | | | | 100,167 | |
| Cunningham Lindsey U.S., Inc. | | | | | | | | |
| 5.00% due 12/10/19 | | | 98,997 | | | | 98,956 | |
| Knight/Getco | | | | | | | | |
| 5.75% due 12/05/17 | | | 46,729 | | | | 46,787 | |
| Total Financials | | | | | | | 774,409 | |
| INFORMATION TECHNOLOGY - 0.5% | | | | | | | | |
| Blue Coat Systems, Inc. | | | | | | | | |
| 4.00% due 05/31/19 | | | 458,450 | | | | 459,216 | |
| CONSUMER DISCRETIONARY - 0.4% | | | | | | | | |
| Pinnacle Entertainment, Inc. | | | | | | | | |
| 3.75% due 08/15/16 | | | 147,166 | | | | 147,961 | |
| Sears Holdings Corp. | | | | | | | | |
| 5.50% due 06/30/18 | | | 99,750 | | | | 100,174 | |
| Go Daddy Operating Company LLC | | | | | | | | |
| 4.00% due 12/17/18 | | | 48,486 | | | | 48,582 | |
| Total Consumer Discretionary | | | | | | | 296,717 | |
| ENERGY - 0.3% | | | | | | | | |
| Pacific Drilling | | | | | | | | |
| 4.50% due 05/18/18 | | | 218,350 | | | | 219,060 | |
| Total Senior Floating Rate Interests | | | | | | | | |
| (Cost $2,638,471) | | | | | | | 2,674,133 | |
| SEE NOTES TO FINANCIAL STATEMENTS. | THE GUGGENHEIM FUNDS SEMI-ANNUAL REPORT | 11 |
| SCHEDULE OF INVESTMENTS (Unaudited)(concluded) | March 31, 2014 |
| STYLEPLUS—MID GROWTH FUND |
| | | Face | | | | |
| | | Amount | | | Value | |
| | | | | | | |
| MUNICIPAL BONDS†† - 0.1% | | | | | | | | |
| MICHIGAN - 0.1% | | | | | | | | |
| Michigan Finance Authority Revenue Notes | | | | | | | | |
| 4.38% due 08/20/14 | | $ | 120,000 | | | $ | 121,307 | |
| Total Municipal Bonds | | | | | | | | |
| (Cost $120,000) | | | | | | | 121,307 | |
| Total Investments - 98.9% | | | | | | | | |
| (Cost $81,831,353) | | | | | | $ | 83,347,908 | |
| Other Assets & Liabilities, net - 1.1% | | | | | | | 914,116 | |
| Total Net Assets - 100.0% | | | | | | $ | 84,262,024 | |
| | | | | | Unrealized | |
| | | Contracts | | | Gain | |
| | | | | | | |
| EQUITY FUTURES CONTRACTS PURCHASED† | | | | | | | | |
| June 2014 S&P MidCap 400 Index | | | | | | | | |
| Mini Futures Contracts | | | | | | | | |
| (Aggregate Value of | | | | | | | | |
| Contracts $1,510,960) | | | 11 | | | $ | 4,804 | |
| | | | | | | | | |
| | | | Units | | | | | |
| OTC EQUITY INDEX SWAP AGREEMENTS†† | | | | | | | | |
| Morgan Stanley Capital Services, Inc. | | | | | | | | |
| May 2014 Russell MidCap Growth | | | | | | | | |
| Index Swap, Terminating 05/05/143 | | | | | | | | |
| (Notional Value $61,599,769) | | | 89,610 | | | $ | — | |
| * | Non-income producing security. |
| † | Value determined based on Level 1 inputs — See Note 4. |
| †† | Value determined based on Level 2 inputs — See Note 4. |
| ††† | Value determined based on Level 3 inputs — See Note 4. |
| 1 | Variable rate security. Rate indicated is rate effective at March 31, 2014. |
| 2 | Security is a 144A or Section 4(a)(2) security. The total market value of 144A or Section 4(a)(2) securities is $22,891,709 (cost $22,773,394), or 27.2% of total net assets. |
| 3 | Total Return based on Russell MidCap Growth Index +/- financing at a variable rate. |
| 4 | Affiliated funds — See Note 8. |
| | plc — Public Limited Company |
| 12 | THE GUGGENHEIM FUNDS SEMI-ANNUAL REPORT | SEE NOTES TO FINANCIAL STATEMENTS. |
| STYLEPLUS—MID GROWTH FUND |
| STATEMENT OF ASSETS | | | |
| AND LIABILITIES (Unaudited) | | | |
| March 31, 2014 | | | |
| | | | |
| Assets: | | | | |
| Investments in unaffiliated issuers, at value | | | | |
| (cost $56,687,529) | | $ | 58,192,193 | |
| Investments in affiliated issuers, at value | | | | |
| (cost $25,143,824) | | | 25,155,715 | |
| Total investments | | | | |
| (cost $81,831,353) | | | 83,347,908 | |
| Segregated cash with broker | | | 1,913,017 | |
| Cash | | | 252,185 | |
| Prepaid expenses | | | 49,878 | |
| Receivables: | | | | |
| Securities sold | | | 4,108,910 | |
| Interest | | | 112,891 | |
| Dividends | | | 27,998 | |
| Fund shares sold | | | 22,185 | |
| Variation margin | | | 14,996 | |
| Total assets | | | 89,849,968 | |
| Liabilities: | | | | |
| Payable for: | | | | |
| Securities purchased | | | 4,187,758 | |
| Swap settlement | | | 1,204,244 | |
| Fund shares redeemed | | | 60,047 | |
| Management fees | | | 53,387 | |
| Distribution and service fees | | | 22,250 | |
| Transfer agent/maintenance fees | | | 18,309 | |
| Fund accounting/administration fees | | | 6,879 | |
| Trustees’ fees* | | | 4,398 | |
| Miscellaneous | | | 30,672 | |
| Total liabilities | | | 5,587,944 | |
| Net assets | | $ | 84,262,024 | |
| Net assets consist of: | | | | |
| Paid in capital | | $ | 74,682,005 | |
| Accumulated net investment loss | | | (439,743 | ) |
| Accumulated net realized gain on investments | | | 8,498,403 | |
| Net unrealized appreciation on investments | | | 1,521,359 | |
| Net assets | | $ | 84,262,024 | |
| A-Class: | | | | |
| Net assets | | $ | 77,820,924 | |
| Capital shares outstanding | | | 1,760,610 | |
| Net asset value per share | | $ | 44.20 | |
| Maximum offering price per share | | | | |
| (Net asset value divided by 95.25%) | | $ | 46.40 | |
| B-Class: | | | | |
| Net assets | | $ | 2,017,954 | |
| Capital shares outstanding | | | 66,273 | |
| Net asset value per share | | $ | 30.45 | |
| C-Class: | | | | |
| Net assets | | $ | 4,399,309 | |
| Capital shares outstanding | | | 121,151 | |
| Net asset value per share | | $ | 36.31 | |
| Institutional Class: | | | | |
| Net assets | | $ | 23,837 | |
| Capital shares outstanding | | | 538 | |
| Net asset value per share | | $ | 44.34 | |
| STATEMENT OF | | | |
| OPERATIONS (Unaudited) | | | |
| Period Ended March 31, 2014 | | | |
| | | | |
| Investment Income: | | | | |
| Interest | | $ | 421,617 | |
| Dividends from securities of unaffiliated issuers | | | 135,890 | |
| Dividends from securities of affiliated issuers | | | 174,231 | |
| Total investment income | | | 731,738 | |
| | | | | |
| Expenses: | | | | |
| Management fees | | | 303,675 | |
| Transfer agent/maintenance fees: | | | | |
| A-Class | | | 70,044 | |
| B-Class | | | 10,406 | |
| C-Class | | | 7,976 | |
| Institutional Class | | | 80 | |
| Distribution and service fees: | | | | |
| A-Class | | | 93,167 | |
| B-Class | | | 10,604 | |
| C-Class | | | 21,513 | |
| Fund accounting/administration fees | | | 38,465 | |
| Legal fees | | | 91,255 | |
| Printing expenses | | | 37,613 | |
| Custodian fees | | | 2,424 | |
| Line of credit interest expense | | | 2,348 | |
| Trustees’ fees* | | | 1,021 | |
| Tax expense | | | 55 | |
| Miscellaneous | | | 60,334 | |
| Total expenses | | | 750,980 | |
| Less: | | | | |
| Expenses waived by Advisor | | | (921 | ) |
| Net expenses | | | 750,059 | |
| Net investment loss | | | (18,321 | ) |
| | | | | |
| Net Realized and Unrealized Gain (Loss): | | | | |
| Net realized gain (loss) on: | | | | |
| Investments in unaffiliated issuers | | | 2,008,754 | |
| Investments in affiliated issuers | | | (8,991 | ) |
| Swap agreements | | | 8,846,746 | |
| Futures contracts | | | 120,300 | |
| Net realized gain | | | 10,966,809 | |
| Net change in unrealized appreciation (depreciation) on: | | | | |
| Investments in unaffiliated issuers | | | 538,019 | |
| Investments in affiliated issuers | | | 106,137 | |
| Swap agreements | | | (2,867,157 | ) |
| Futures contracts | | | (1,267 | ) |
| Net change in unrealized appreciation (depreciation) | | | (2,224,268 | ) |
| Net realized and unrealized gain | | | 8,742,541 | |
| Net increase in net assets resulting from operations | | $ | 8,724,220 | |
* Relates to Trustees not deemed “interested persons” within the meaning of Section 2(a)(19) of the 1940 Act.
| SEE NOTES TO FINANCIAL STATEMENTS. | THE GUGGENHEIM FUNDS SEMI-ANNUAL REPORT | 13 |
| STYLEPLUS—MID GROWTH FUND |
| |
| STATEMENTS OF CHANGES IN NET ASSETS |
| | | Period Ended | | | | |
| | | March 31, | | | Year Ended | |
| | | 2014 | | | September 30, | |
| | | (Unaudited) | | | 2013 | |
| Increase (Decrease) In Net Assets From Operations: | | | | | | | | |
| Net investment loss | | $ | (18,321 | ) | | $ | (373,253 | ) |
| Net realized gain on investments | | | 10,966,809 | | | | 14,868,014 | |
| Net change in unrealized appreciation (depreciation) on investments | | | (2,224,268 | ) | | | (1,298,013 | ) |
| Net increase in net assets resulting from operations | | | 8,724,220 | | | | 13,196,748 | |
| | | | | | | | | |
| Distributions to shareholders from: | | | | | | | | |
| Net realized gains | | | | | | | | |
| A-Class | | | (6,590,240 | ) | | | — | |
| B-Class | | | (268,820 | ) | | | — | |
| C-Class | | | (456,906 | ) | | | — | |
| Institutional Class | | | (2,003 | ) | | | — | |
| Total distributions to shareholders | | | (7,317,969 | ) | | | — | |
| | | | | | | | | |
| Capital share transactions: | | | | | | | | |
| Proceeds from sale of shares | | | | | | | | |
| A-Class | | | 3,357,939 | | | | 4,893,749 | |
| B-Class | | | 8,239 | | | | 101,193 | |
| C-Class | | | 182,380 | | | | 502,866 | |
| Institutional Class | | | 7 | | | | 8,544 | |
| Distributions reinvested | | | | | | | | |
| A-Class | | | 6,337,566 | | | | — | |
| B-Class | | | 267,782 | | | | — | |
| C-Class | | | 436,749 | | | | — | |
| Institutional Class | | | 2,003 | | | | — | |
| Cost of shares redeemed | | | | | | | | |
| A-Class | | | (4,105,676 | ) | | | (11,996,493 | ) |
| B-Class | | | (388,154 | ) | | | (1,015,996 | ) |
| C-Class | | | (314,633 | ) | | | (1,451,309 | ) |
| Institutional Class | | | — | | | | — | |
| Net increase (decrease) from capital share transactions | | | 5,784,202 | | | | (8,957,446 | ) |
| Net increase in net assets | | | 7,190,453 | | | | 4,239,302 | |
| | | | | | | | | |
| Net assets: | | | | | | | | |
| Beginning of period | | | 77,071,571 | | | | 72,832,269 | |
| End of period | | $ | 84,262,024 | | | $ | 77,071,571 | |
| Accumulated net investment loss at end of period | | $ | (439,743 | ) | | $ | (421,422 | ) |
| | | | | | | | | |
| Capital share activity: | | | | | | | | |
| Shares sold | | | | | | | | |
| A-Class | | | 76,735 | | | | 124,546 | |
| B-Class | | | 255 | | | | 3,484 | |
| C-Class | | | 5,008 | | | | 15,252 | |
| Institutional Class | | | — | | | | 213 | |
| Shares issued from reinvestment of distributions | | | | | | | | |
| A-Class | | | 152,676 | | | | — | |
| B-Class | | | 9,321 | | | | — | |
| C-Class | | | 12,770 | | | | — | |
| Institutional Class | | | 48 | | | | — | |
| Shares redeemed | | | | | | | | |
| A-Class | | | (94,031 | ) | | | (305,981 | ) |
| B-Class | | | (12,681 | ) | | | (35,652 | ) |
| C-Class | | | (8,641 | ) | | | (43,786 | ) |
| Institutional Class | | | — | | | | — | |
| Net increase (decrease) in shares | | | 141,460 | | | | (241,924 | ) |
| 14 | THE GUGGENHEIM FUNDS SEMI-ANNUAL REPORT | SEE NOTES TO FINANCIAL STATEMENTS. |
| STYLEPLUS—MID GROWTH FUND |
| |
| FINANCIAL HIGHLIGHTS |
This table is presented to show selected data for a share outstanding throughout each period and to assist shareholders in evaluating a Fund’s performance for the periods presented.
| | | Period Ended | | | Year Ended | | | Year Ended | | | Year Ended | | | Year Ended | | | Year Ended | |
| | | March 31, | | | September 30, | | | September 30, | | | September 30, | | | September 30, | | | September 30, | |
| A-Class | | 2014a | | | 2013 | | | 2012 | | | 2011g | | | 2010g | | | 2009g | |
| Per Share Data | | | | | | | | | | | | | | | | | | | | | | | | |
| Net asset value, beginning of period | | $ | 43.54 | | | $ | 36.40 | | | $ | 28.67 | | | $ | 29.44 | | | $ | 26.16 | | | $ | 25.84 | |
| Income (loss) from investment operations: | | | | | | | | | | | | | | | | | | | | | | | | |
| Net investment income (loss)b | | | .01 | | | | (.16 | ) | | | (.25 | ) | | | (.24 | ) | | | (.24 | ) | | | (.20 | ) |
| Net gain (loss) on investments (realized and unrealized) | | | 4.74 | | | | 7.30 | | | | 7.98 | | | | (.53 | ) | | | 3.52 | | | | .72 | |
| Total from investment operations | | | 4.75 | | | | 7.14 | | | | 7.73 | | | | (.77 | ) | | | 3.28 | | | | .52 | |
| Less distributions from: | | | | | | | | | | | | | | | | | | | | | | | | |
| Net realized gains | | | (4.09 | ) | | | — | | | | — | | | | — | | | | — | | | | (.20 | ) |
| Total distributions | | | (4.09 | ) | | | — | | | | — | | | | — | | | | — | | | | (.20 | ) |
| Net asset value, end of period | | $ | 44.20 | | | $ | 43.54 | | | $ | 36.40 | | | $ | 28.67 | | | $ | 29.44 | | | $ | 26.16 | |
| | | | | | | | | | | | | | | | | | | | | | | | | |
| Total Returnc | | | 11.52 | % | | | 19.62 | % | | | 26.96 | % | | | (2.62 | %) | | | 12.54 | % | | | 2.32 | % |
| Ratios/Supplemental Data | | | | | | | | | | | | | | | | | | | | | | | | |
| Net assets, end of period (in thousands) | | $ | 77,821 | | | $ | 70,767 | | | $ | 65,767 | | | $ | 62,575 | | | $ | 71,858 | | | $ | 71,985 | |
| Ratios to average net assets: | | | | | | | | | | | | | | | | | | | | | | | | |
| Net investment income (loss) | | | 0.05 | % | | | (0.40 | %) | | | (0.74 | %) | | | (0.72 | %) | | | (0.85 | %) | | | (0.99 | %) |
| Total expensesd | | | 1.76 | % | | | 1.57 | % | | | 1.62 | % | | | 1.49 | % | | | 1.67 | % | | | 1.78 | % |
| Net expenses | | | 1.76 | %e | | | 1.57 | % | | | 1.62 | % | | | 1.49 | % | | | 1.67 | % | | | 1.78 | % |
| Portfolio turnover rate | | | 61 | % | | | 214 | % | | | 149 | % | | | 157 | % | | | 133 | % | | | 138 | % |
| | | Period Ended | | | Year Ended | | | Year Ended | | | Year Ended | | | Year Ended | | | Year Ended | |
| | | March 31, | | | September 30, | | | September 30, | | | September 30, | | | September 30, | | | September 30, | |
| B-Class | | 2014a | | | 2013 | | | 2012 | | | 2011g | | | 2010g | | | 2009g | |
| Per Share Data | | | | | | | | | | | | | | | | | | | | | | | | |
| Net asset value, beginning of period | | $ | 31.43 | | | $ | 26.68 | | | $ | 21.30 | | | $ | 22.04 | | | $ | 19.72 | | | $ | 19.68 | |
| Income (loss) from investment operations: | | | | | | | | | | | | | | | | | | | | | | | | |
| Net investment income (loss)b | | | (.23 | ) | | | (.54 | ) | | | (.52 | ) | | | (.37 | ) | | | (.32 | ) | | | (.28 | ) |
| Net gain (loss) on investments (realized and unrealized) | | | 3.34 | | | | 5.29 | | | | 5.90 | | | | (.37 | ) | | | 2.64 | | | | .52 | |
| Total from investment operations | | | 3.11 | | | | 4.75 | | | | 5.38 | | | | (.74 | ) | | | 2.32 | | | | .24 | |
| Less distributions from: | | | | | | | | | | | | | | | | | | | | | | | | |
| Net realized gains | | | (4.09 | ) | | | — | | | | — | | | | — | | | | — | | | | (.20 | ) |
| Total distributions | | | (4.09 | ) | | | — | | | | — | | | | — | | | | — | | | | (.20 | ) |
| Net asset value, end of period | | $ | 30.45 | | | $ | 31.43 | | | $ | 26.68 | | | $ | 21.30 | | | $ | 22.04 | | | $ | 19.72 | |
| | | | | | | | | | | | | | | | | | | | | | | | | |
| Total Returnc | | | 10.68 | % | | | 17.80 | % | | | 25.26 | % | | | (3.36 | %) | | | 11.76 | % | | | 1.61 | % |
| Ratios/Supplemental Data | | | | | | | | | | | | | | | | | | | | | | | | |
| Net assets, end of period (in thousands) | | $ | 2,018 | | | $ | 2,181 | | | $ | 2,710 | | | $ | 3,197 | | | $ | 4,537 | | | $ | 7,454 | |
| Ratios to average net assets: | | | | | | | | | | | | | | | | | | | | | | | | |
| Net investment income (loss) | | | (1.50 | %) | | | (1.90 | %) | | | (2.08 | %) | | | (1.50 | %) | | | (1.60 | %) | | | (1.73 | %) |
| Total expensesd | | | 3.31 | % | | | 3.07 | % | | | 2.95 | % | | | 2.26 | % | | | 2.42 | % | | | 2.53 | % |
| Net expenses | | | 3.30 | %e | | | 3.07 | % | | | 2.95 | % | | | 2.26 | % | | | 2.42 | % | | | 2.53 | % |
| Portfolio turnover rate | | | 61 | % | | | 214 | % | | | 149 | % | | | 157 | % | | | 133 | % | | | 138 | % |
| SEE NOTES TO FINANCIAL STATEMENTS. | THE GUGGENHEIM FUNDS SEMI-ANNUAL REPORT | 15 |
| STYLEPLUS—MID GROWTH FUND |
| |
| FINANCIAL HIGHLIGHTS (concluded) |
This table is presented to show selected data for a share outstanding throughout each period and to assist shareholders in evaluating a Fund’s performance for the periods presented.
| | | Period Ended | | | Year Ended | | | Year Ended | | | Year Ended | | | Year Ended | | | Year Ended | |
| | | March 31, | | | September 30, | | | September 30, | | | September 30, | | | September 30, | | | September 30, | |
| C-Class | | 2014a | | | 2013 | | | 2012 | | | 2011g | | | 2010g | | | 2009g | |
| Per Share Data | | | | | | | | | | | | | | | | | | | | | | | | |
| Net asset value, beginning of period | | $ | 36.63 | | | $ | 30.92 | | | $ | 24.55 | | | $ | 25.40 | | | $ | 22.76 | | | $ | 22.68 | |
| Income (loss) from investment operations: | | | | | | | | | | | | | | | | | | | | | | | | |
| Net investment income (loss)b | | | (.16 | ) | | | (.45 | ) | | | (.46 | ) | | | (.42 | ) | | | (.40 | ) | | | (.32 | ) |
| Net gain (loss) on investments (realized and unrealized) | | | 3.93 | | | | 6.16 | | | | 6.83 | | | | (.43 | ) | | | 3.04 | | | | .60 | |
| Total from investment operations | | | 3.77 | | | | 5.71 | | | | 6.37 | | | | (.85 | ) | | | 2.64 | | | | .28 | |
| Less distributions from: | | | | | | | | | | | | | | | | | | | | | | | | |
| Net realized gains | | | (4.09 | ) | | | — | | | | — | | | | — | | | | — | | | | (.20 | ) |
| Total distributions | | | (4.09 | ) | | | — | | | | — | | | | — | | | | — | | | | (.20 | ) |
| Net asset value, end of period | | $ | 36.31 | | | $ | 36.63 | | | $ | 30.92 | | | $ | 24.55 | | | $ | 25.40 | | | $ | 22.76 | |
| | | | | | | | | | | | | | | | | | | | | | | | | |
| Total Returnc | | | 10.99 | % | | | 18.47 | % | | | 25.95 | % | | | (3.35 | %) | | | 11.60 | % | | | 1.58 | % |
| Ratios/Supplemental Data | | | | | | | | | | | | | | | | | | | | | | | | |
| Net assets, end of period (in thousands) | | $ | 4,399 | | | $ | 4,103 | | | $ | 4,346 | | | $ | 4,162 | | | $ | 5,339 | | | $ | 5,622 | |
| Ratios to average net assets: | | | | | | | | | | | | | | | | | | | | | | | | |
| Net investment income (loss) | | | (0.89 | %) | | | (1.36 | %) | | | (1.57 | %) | | | (1.48 | %) | | | (1.60 | %) | | | (1.74 | %) |
| Total expensesd | | | 2.70 | % | | | 2.53 | % | | | 2.45 | % | | | 2.25 | % | | | 2.43 | % | | | 2.54 | % |
| Net expenses | | | 2.70 | %e | | | 2.53 | % | | | 2.45 | % | | | 2.25 | % | | | 2.43 | % | | | 2.54 | % |
| Portfolio turnover rate | | | 61 | % | | | 214 | % | | | 149 | % | | | 157 | % | | | 133 | % | | | 138 | % |
| | | Period Ended | | | Year Ended | | | Period Ended | |
| | | March 31, | | | September 30, | | | September 30, | |
| Institutional Class | | 2014a | | | 2013 | | | 2012f | |
| Per Share Data | | | | | | | | | | | | |
| Net asset value, beginning of period | | $ | 43.72 | | | $ | 36.46 | | | $ | 36.16 | |
| Income (loss) from investment operations: | | | | | | | | | | | | |
| Net investment income (loss)b | | | (.05 | ) | | | (.07 | ) | | | (.08 | ) |
| Net gain (loss) on investments (realized and unrealized) | | | 4.76 | | | | 7.33 | | | | .38 | |
| Total from investment operations | | | 4.71 | | | | 7.26 | | | | .30 | |
| Less distributions from: | | | | | | | | | | | | |
| Net realized gains | | | (4.09 | ) | | | — | | | | — | |
| Total distributions | | | (4.09 | ) | | | — | | | | — | |
| Net asset value, end of period | | $ | 44.34 | | | $ | 43.72 | | | $ | 36.46 | |
| | | | | | | | | | | | | |
| Total Returnc | | | 11.37 | % | | | 19.91 | % | | | 0.83 | % |
| Ratios/Supplemental Data | | | | | | | | | | | | |
| Net assets, end of period (in thousands) | | $ | 24 | | | $ | 21 | | | $ | 10 | |
| Ratios to average net assets: | | | | | | | | | | | | |
| Net investment income (loss) | | | (0.22 | %) | | | (0.17 | %) | | | (0.41 | %) |
| Total expensesd | | | 2.03 | % | | | 1.33 | % | | | 1.37 | % |
| Net expenses | | | 2.02 | %e | | | 1.33 | % | | | 1.37 | % |
| Portfolio turnover rate | | | 61 | % | | | 214 | % | | | 149 | % |
| a | Unaudited figures for the period ended March 31, 2014. Percentage amounts for the period, except total return and portfolio turnover rate, have been annualized. |
| b | Net investment income (loss) per share was computed using average shares outstanding throughout the period. |
| c | Total return does not reflect the impact of any applicable sales charges and has not been annualized. |
| d | Does not include expenses of the underlying funds in which the Fund invests. |
| e | Net expense information reflects the expense ratios after expense waivers. |
| f | Since commencement of operations: March 1, 2012. Percentage amounts for the period, except total return and portfolio turnover rate, have been annualized. The portfolio turnover rate stated is for the entire fiscal year of the Fund, not since commencement of operations of the Class. |
| g | Reverse share split — Per share amounts for the period October 1, 2008 through April 8, 2011 have been restated to reflect a 1:4 reverse share split effective April 8, 2011. |
| 16 | THE GUGGENHEIM FUNDS SEMI-ANNUAL REPORT | SEE NOTES TO FINANCIAL STATEMENTS. |
| NOTES TO FINANCIAL STATEMENTS (Unaudited) |
1. Organization and Significant Accounting Policies
Organization
Guggenheim Funds Trust (the “Trust”), a Delaware statutory trust, is registered with the SEC under the Investment Company Act of 1940 (“1940 Act”), as a non-diversified, open-ended investment company of the series type. Each series, in effect, is representing a separate Fund (collectively the “Funds”). The Trust is authorized to issue an unlimited number of shares. The Trust accounts for the assets of each Fund separately.
The Trust offers a combination of four separate classes of shares, A-Class shares, B-Class shares, C-Class shares and Institutional Class shares. Sales of shares of each Class are made without a front-end sales charge at the net asset value (“NAV”), with the exception of A-Class shares. A-Class shares are sold at the NAV, plus the applicable front-end sales charge. The sales charge varies depending on the amount purchased, but will not exceed 4.75%. Prior to February 22, 2011, the maximum sales charge was 5.75%. A-Class share purchases of $1 million or more are exempt from the front-end sales charge but have a 1% contingent deferred sales charge (“CDSC”), if shares are redeemed within 12 months of purchase. B-Class shares were offered without a front-end sales charge, but were subject to a CDSC of up to 5% for five years and convert to A-Class shares after eight years. Effective January 4, 2010, subscriptions for B-Class shares are no longer accepted. C-Class shares have a 1% CDSC if shares are redeemed within 12 months of purchase. Institutional Class shares are offered primarily for direct investment by institutions such as pension and profit sharing plans, endowments, foundations and corporations. Institutional Class shares have a minimum initial investment of $2 million and a minimum account balance of $1 million. Institutional Class shares are offered without a front-end sales charge or a CDSC.
At March 31, 2014, the Trust consisted of sixteen separate funds. This report covers the StylePlus—Mid Growth Fund (the “Fund”).
Guggenheim Investments (“GI”) provides advisory and Rydex Fund Services, LLC (“RFS”) provides the transfer agent, administrative and accounting services to the Trust. Guggenheim Funds Distributors, LLC (“GFD”) acts as principal underwriter to the Funds. GI, RFS and GFD are affiliated entities.
Significant Accounting Policies
The following significant accounting policies are in conformity with U.S. generally accepted accounting principles (“U.S. GAAP”) and are consistently followed by the Trust. This requires management to make estimates and assumptions that affect the reported amount of assets and liabilities and disclosure of contingent assets and liabilities at the date of the financial statements and the reported amounts of revenues and expenses during the reporting period. Actual results could differ from these estimates. All time references are based on Eastern Time.
A. Valuations of the Fund’s securities are supplied primarily by pricing services approved by the Board of Trustees. A Valuation Committee (“Valuation Committee”) is responsible for the oversight of the valuation process of the Funds and convenes monthly, or more frequently as needed. The Valuation Committee will review the valuation of all assets which have been fair valued for reasonableness. The Trust’s officers, through the Valuation Committee under the general supervision of the Board of Trustees, regularly review procedures used by, and valuations provided by, the pricing services.
Equity securities listed on an exchange (New York Stock Exchange (“NYSE”) or American Stock Exchange) are valued at the last quoted sales price as of the close of business on the NYSE, usually 4:00 p.m. on the valuation date. Equity securities listed on the NASDAQ market system are valued at the NASDAQ Official Closing Price on the valuation date, which may not necessarily represent the last sale price. If there has been no sale on such exchange or NASDAQ on such day, the security is valued at the closing bid price on such day.
Open-end investment companies (“Mutual Funds”) are valued at their NAV as of the close of business on the valuation date. Exchange Traded Funds (“ETFs”) and closed-end investment companies are valued at the last quoted sales price.
Debt securities with a maturity of greater than 60 days at acquisition are valued at prices that reflect broker/dealer supplied valuations or are obtained from independent pricing services, which may consider the trade activity, treasury spreads, yields or price of bonds of comparable quality, coupon, maturity, and type, as well as prices quoted by dealers who make markets in such securities. Short-term debt securities with a maturity
| THE GUGGENHEIM FUNDS SEMI-ANNUAL REPORT | 17 |
| NOTES TO FINANCIAL STATEMENTS (Unaudited)(continued) |
of 60 days or less at acquisition and repurchase agreements are valued at amortized cost, which approximates market value.
Typically loans are valued using information provided by an independent third party pricing service which uses broker quotes in a non-active market, or price derived from significant observable inputs and is also compared to broker quote (matrixed). If the pricing service cannot or does not provide a valuation for a particular loan or such valuation is deemed unreliable, such loan is fair valued by the Valuation Committee.
The value of futures contracts is accounted for using the unrealized gain or loss on the contracts that is determined by marking the contracts to their current realized settlement prices. Financial futures contracts are valued at the 4:00 p.m. price on the valuation date. In the event that the exchange for a specific futures contract closes earlier than 4:00 p.m., the futures contract is valued at the Official Settlement Price of the exchange. However, the underlying securities from which the futures contract value is derived are monitored until 4:00 p.m. to determine if fair valuation would provide a more accurate valuation.
The value of index swap agreements entered into by the Fund is accounted for using the unrealized gain or loss on the agreements that is determined using the last quoted value of the index that the swap pertains to at the close of the NYSE, adjusted to include dividends accrued, and financing charges and/or interest associated with the swap agreements.
Investments for which market quotations are not readily available are fair valued as determined in good faith by GI under the direction of the Board of Trustees using methods established or ratified by the Board of Trustees. Valuations in accordance with these methods are intended to reflect each security’s (or asset’s) “fair value.” Each such determination is based on a consideration of all relevant factors, which are likely to vary from one pricing context to another. Examples of such factors may include, but are not limited to: (i) the type of security, (ii) the initial cost of the security, (iii) the existence of any contractual restrictions on the security’s disposition, (iv) the price and extent of public trading in similar securities of the issuer or of comparable companies, (v) quotations or evaluated prices from broker-dealers and/or pricing services, (vi) information obtained from the issuer, analysts, and/or the appropriate stock exchange (for exchange traded securities), (vii) an analysis of the company’s financial statements, and (viii) an evaluation of the forces that influence the issuer and the market(s) in which the security is purchased and sold (e.g. the existence of pending merger activity, public offerings or tender offers that might affect the value of the security).
B. Senior loans in which the Fund invests generally pay interest rates which are periodically adjusted by reference to a base short-term, floating rate plus a premium. These base lending rates are generally (I) the lending rate offered by one or more major European banks, such as the London Inter-Bank Offered Rate (LIBOR), (ii) the prime rate offered by one or more major United States banks, or (iii) the bank’s certificate of deposit rate. Senior floating rate interests often require prepayments from excess cash flows or permit the borrower to repay at its election. The rate at which the borrower repays cannot be predicted with accuracy. As a result, the actual remaining maturity may be substantially less than the stated maturities shown. The interest rate indicated is the rate in effect at March 31, 2014.
C. Securities transactions are recorded on the trade date for financial reporting purposes. Realized gains and losses from securities transactions are recorded using the identified cost basis. Dividend income is recorded on the ex-dividend date, net of applicable taxes withheld by foreign countries. Taxable non-cash dividends are recorded as dividend income. Interest income, including amortization of premiums and accretion of discount, is accrued on a daily basis.
D. The Fund may purchase and sell interests in securities on a when-issued and delayed delivery basis, with payment and delivery scheduled for a future date. No income accrues to the Fund on such interests or securities in connection with such transactions prior to the date the Fund actually take delivery of such interests or securities. These transactions are subject to market fluctuations and are subject to the risk that the value at delivery may be more or less than the trade date purchase price. Although the Fund will generally purchase these securities with the intention of acquiring such securities, they may sell such securities before the settlement date.
E. Distributions of net investment income and net realized gains, if any, are declared and paid at least annually. Distributions are recorded on the ex-dividend date
| 18 | THE GUGGENHEIM FUNDS SEMI-ANNUAL REPORT |
| NOTES TO FINANCIAL STATEMENTS (Unaudited)(continued) |
and are determined in accordance with income tax regulations which may differ from U.S. GAAP.
F. Upon entering into a futures contract, the Fund deposits and maintains as collateral such initial margin as required by the exchange on which the transaction is affected. Pursuant to the contract, the Fund agrees to receive from or pay to the broker an amount of cash equal to the daily fluctuation in value of the contract. Such receipts or payments are known as variation margin and are recorded by the Fund as unrealized gains or losses. When the contract is closed, the Fund records a realized gain or loss equal to the difference between the value of the contract at the time it was opened and the value at the time it was closed.
G. Interest and dividend income, most expenses, all realized gains and losses, and all unrealized gains and losses are allocated to the classes bases upon the value of the outstanding shares in each class. Certain costs, such as distribution and service fees relating to the A-Class shares, B-Class shares and C-Class shares and transfer agent fees related to each class, are charged directly to specific classes. In addition, other expenses common to various within the fund complex are generally allocated amongst such funds on the basis of average net assets.
H. Swap agreements are marked-to-market daily and the change, if any, is recorded as unrealized gain or loss. Payments received or made as a result of an agreement or termination of the agreement are recognized as realized gains or losses.
I. Under the fee arrangement with the custodian, the Fund may earn credits based on overnight custody cash balances. These credits are utilized to reduce related custodial expenses. The custodian fees disclosed in the Statement of Operations are before the reduction in expense from the related earnings credits, if any. For the period ended March 31, 2014, there were no earnings credits received.
J. The Fund may leave cash overnight in its cash account with the custodian, U.S. Bank. Periodically, a Fund may have cash due to the custodian bank as an overdraft balance. A fee is incurred on this overdraft, calculated by multiplying the overdraft by a rate based on the federal funds rate.
Segregated cash with the broker is held as collateral for investments in derivative instruments such as futures contracts or swap agreements.
K. Under the Fund’s organizational documents, its Officers and Trustees are indemnified against certain liabilities arising out of the performance of their duties to the Trust. In addition, throughout the normal course of business, the Fund enters into contracts that contain a variety of representations and warranties which provide general indemnifications. The Fund’s maximum exposure under these arrangements is unknown, as this would involve future claims that may be made against the Fund and/or its affiliates that have not yet occurred. However, based on experience, the Fund expects the risk of loss to be remote.
2. Financial Instruments
As part of its investment strategy, the Fund utilizes a variety of derivative instruments including futures and swaps. These investments involve, to varying degrees, elements of market risk and risks in excess of the amounts recognized in the Statement of Assets and Liabilities.
A futures contract is an agreement to purchase (long) or sell (short) an agreed amount of securities or other instruments at a set price for delivery at a future date. There are significant risks associated with a Fund’s or an underlying fund’s use of futures contracts, including (i) there may be an imperfect or no correlation between the changes in market value of the underlying asset and the prices of futures contracts; (ii) there may not be a liquid secondary market for a futures contract; (iii) trading restrictions or limitations may be imposed by an exchange; and (iv) government regulations may restrict trading in futures contracts. When investing in futures, there is minimal counterparty credit risk to the Fund because futures are exchange-traded and the exchange’s clearinghouse, as counterparty to all exchange-traded futures, guarantees against default. Cash deposits are shown as restricted cash on the Statement of Assets and Liabilities; securities held as collateral are noted on the Schedule of Investments.
A swap is an agreement that obligates two parties to exchange a series of cash flows at specified intervals based upon or calculated by reference to changes in specified prices or rates for a specified amount of an underlying asset. A Fund utilizing OTC swaps bears the risk of loss of the amount expected to be received under a swap agreement in the event of the default or bankruptcy of a swap agreement counterparty. Additionally,
| THE GUGGENHEIM FUNDS SEMI-ANNUAL REPORT | 19 |
| NOTES TO FINANCIAL STATEMENTS (Unaudited)(continued) |
there is no guarantee that a Fund or an underlying fund could eliminate its exposure under an outstanding swap agreement by entering into an offsetting swap agreement with the same or another party.
An investment in derivative instruments generally requires a small investment relative to the amount of investment exposure assumed, this creates an opportunity for increased net income but, at the same time, leverage risk. The Fund’s use of leverage, through borrowings or instruments such as derivatives, may cause the Fund to be more volatile and riskier than if it had not been leveraged.
In conjunction with the use of futures and swap agreements, the Fund is required to maintain collateral in various forms. The Fund uses, where appropriate, depending on the financial instrument utilized and the broker involved, margin deposits at the broker, cash and/or securities segregated at the custodian bank, discount notes, or the repurchase agreements allocated to the Fund.
The Trust has established counterparty credit guidelines and enters into transactions only with financial institutions of investment grade or better. The Trust monitors the counterparty credit risk.
The Fund utilized derivatives to achieve leveraged exposure. The use of derivative instruments by the Fund to achieve leveraged exposure to the underlying index creates leveraging risk. The more a Fund invests in leveraged instruments, the more this leverage will magnify any losses on those investments. A Fund’s investment in these instruments generally requires a small investment relative to the amount of investment exposure assumed. As a result, such investments may give rise to losses that exceed the amount invested in those instruments. Since a Fund’s investment strategy involves consistently applied leverage, the value of the Fund’s shares will tend to increase or decrease more than the value of any increase or decrease in the underlying index.
3. Fees and other transactions with affiliates
Management fees are paid monthly to GI, based on the following rate:
| | | Management Fees | |
| Fund | | (as a % of net assets) | |
| StylePlus—Mid Growth Fund | | | 0.75% | |
RFS also acts as the administrative agent for the Fund, and as such performs administrative functions and the bookkeeping, accounting and pricing functions. For these services, RFS receives the following:
| | | Fund Accounting/ | |
| | | Administrative Fees | |
| | | (as a % of net assets) | |
| StylePlus—Mid Growth Fund | | | 0.095% | |
| Minimum annual charge per Fund | | | $25,000 | |
| Certain out-of-pocket charges | | | Varies | |
RFS is paid the following for providing transfer agent services to the Fund. The transfer agent fees are assessed to the applicable Class of the Fund in which they were incurred.
| Annual charge per account | | | $5.00 – $8.00 | |
| Transaction fee | | | $0.60 – $1.10 | |
| Minimum annual charge per Fund† | | | $25,000 | |
| Certain out-of-pocket charges | | | Varies | |
† Not subject to the Fund during first twelve months of operations.
If a Fund invests in an affiliated fund, the investing Fund’s Adviser will determine whether to waive fees at the investing Fund level.
The Fund has adopted Distribution Plans related to the offering of A-Class, B-Class and C-Class shares pursuant to Rule 12b-1 under the 1940 Act. The plans provide for payments at an annual rate of 0.25% of the average daily net assets of the Fund’s A-Class shares and 1.00% of the average daily net assets of the Fund’s B-Class and C-Class shares.
During the year ended March 31, 2014, GFD retained sales charges of $5,998 relating to sales of A-Class shares of the Fund.
Certain officers and trustees of the Fund are also officers and/or trustees of GI and its affiliates, which include GI and GFD.
4. Fair Value Measurement
In accordance with U.S. GAAP, fair value is defined as the price that the Fund would receive to sell an investment or pay to transfer a liability in an orderly transaction with an independent buyer in the principal market, or in the absence of a principal market, the most advantageous market for the investment or liability. U.S. GAAP establishes a three-tier fair value hierarchy based on the types of inputs used to value assets and liabilities and requires corresponding disclosure. The hierarchy and the corresponding inputs are summarized below:
Level 1 — quoted prices in active markets for identical assets or liabilities.
| 20 | THE GUGGENHEIM FUNDS SEMI-ANNUAL REPORT |
| NOTES TO FINANCIAL STATEMENTS (Unaudited)(continued) |
Level 2 — significant other observable inputs (for example quoted prices for securities that are similar based on characteristics such as interest rates, prepayment speeds, credit risk, etc.).
Level 3 — significant unobservable inputs based on the best information available under the circumstances, to the extent observable inputs are not available, which may include assumptions.
The types of inputs available depend on a variety of factors, such as the type of security and the characteristics of the markets in which it trades, if any. Fair valuation determinations that rely on fewer or no observable inputs require greater judgment. Accordingly, fair value determinations for Level 3 securities require the greatest amount of judgment.
The following table summarizes the inputs used to value the Fund’s net assets at March 31, 2014:
| | | Level 1 | | | Level 1 | | | Level 2 | | | Level 2 | | | Level 3 | | | | |
| | | Investments | | | Other Financial | | | Investments | | | Other Financial | | | Investments | | | | |
| | | In Securities | | | Instruments* | | | In Securities | | | Instruments* | | | In Securities | | | Total | |
| Assets | | | | | | | | | | | | | | | | | | | | | | | | |
| StylePlus—Mid Growth Fund | | $ | 49,616,824 | | | $ | 4,804 | | | $ | 30,302,603 | | | $ | — | | | $ | 3,428,481 | | | $ | 83,352,712 | |
* Other financial instruments may include futures contracts and/or swaps, which are reported as unrealized gain/loss at period end.
Independent pricing services are used to value a majority of the Fund’s investments. When values are not available from a pricing service, they may be computed by the Fund’s investment adviser or an affiliate. In any event, values may be determined using a variety of sources and techniques, including: market prices; broker quotes; and models which derive prices based on inputs such as prices of securities with comparable maturities and characteristics or based on inputs such as anticipated cash flows or collateral, spread over Treasuries, and other information and analysis. A significant portion of the Fund’s assets and liabilities are categorized as Level 2 or Level 3, as indicated in this report.
Indicative quotes from broker-dealers, adjusted for fluctuations in criteria such as credit spreads and interest rates, may be also used to value the Fund’s assets and liabilities, i.e. prices provided by a broker-dealer or other market participant who has not committed to trade at that price. Although Indicative quotes are typically received from established market participants, the Fund may not have the transparency to view the underlying inputs which support the market quotations. Significant changes in an indicative quote would generally result in significant changes in the fair value of the security.
Certain fixed income securities are valued by obtaining a monthly indicative quote from a broker-dealer, adjusted for fluctuations in criteria such as credit spreads and interest rates. The Fund’s fair valuation guidelines were recently revised to transition such monthly indicative quoted securities from Level 2 to Level 3.
The inputs or methodologies used for valuing securities are not necessarily an indication of the risk associated with investing in those securities. The suitability of the techniques and sources employed to determine fair valuation are regularly monitored and subject to change.
The following is a summary of significant unobservable inputs used in the fair valuation of assets and liabilities categorized within Level 3 of the fair value hierarchy:
| | | Category | | Ending Balance | | | Valuation | | Unobservable |
| Fund | | and Subcategory | | at 03/31/14 | | | Technique | | Inputs |
| | | | | | | | | | | |
| StylePlus—Mid Growth Fund | | Investments, at value Asset-Backed Securities | | $ | 2,826,681 | | | Option Adjusted Spread off the month end broker mark over the 3 month LIBOR | | Indicative Quote |
| | | Collateralized Mortgage Obligations | | | 601,800 | | | Option Adjusted Spread off the trade price over the 3 month LIBOR | | Indicative Quote |
Any remaining Level 3 securities held by the Fund and excluded from the tables above, were not considered material to the Fund.
| THE GUGGENHEIM FUNDS SEMI-ANNUAL REPORT | 21 |
| NOTES TO FINANCIAL STATEMENTS (Unaudited)(continued) |
Financial assets and liabilities categorized as Level 2 for the Fund consists primarily of fixed income investments. Fixed income investments generally have bid and ask prices that can be observed in the marketplace. Bid prices reflect the highest price that market participants are willing to pay for an asset. Ask prices represent the lowest price that market participants are willing to accept for an asset. For financial assets and liabilities whose inputs are based on bid-ask prices obtained from third party pricing services, fair value may not always be a predetermined point in the bid-ask range. The Fund’s policy is to allow for mid-market pricing and adjusting to the point within the bid-ask range that meets the Fund’s best estimate of fair value.
Transfers between investment levels may occur as the markets fluctuate and/or the availability of data used in the investment’s valuation changes. The Fund recognizes transfers between the levels as of the beginning of the period. As of March 31, 2014, StylePlus—Mid Growth Fund had securities with a total value of $3,428,481 transfer from Level 2 to Level 3 and a total value of $498,350 transfer from Level 3 to Level 2 due to changes in the securities valuation method. There were no other securities that transferred between levels.
Summary of Fair Value Level 3 Activity
Following is a reconciliation of Level 3 assets for which significant unobservable inputs were used to determine fair value for the year ended March 31, 2014:
LEVEL 3 – Fair value measurement using significant unobservable inputs
| | | Total | |
| StylePlus—Mid Growth Fund | | | | |
| Assets: | | | | |
| Beginning Balance | | $ | 498,251 | |
| Total change in unrealized gains or losses included in earnings | | | 13 | |
| Transfers into Level 3 | | | 3,428,481 | |
| Transfers out of Level 3 | | | (498,350 | ) |
| Ending Balance | | $ | 3,428,481 | |
5. Derivative Investment Holdings Categorized by Risk Exposure
U.S. GAAP requires disclosures to enable investors to better understand how and why the Fund uses derivative instruments, how these derivative instruments are accounted for and its effects on the Fund’s financial position and results of operations.
The Fund utilized futures and swap agreements for the following purposes:
| | | Index | | | |
| Fund | | Exposure | | Leverage | |
| StylePlus—Mid Growth Fund | | x | | x | |
The following table represents the notional amount of derivative instruments outstanding, as an approximate percentage of the Fund’s net assets on a daily basis.
| | | Approximate percentage of Fund’s | |
| | | net assets on a daily basis | |
| Fund | | Long | |
| StylePlus—Mid Growth Fund | | | 75 | % |
The following is a summary of the location of derivative investments on the Fund’s Statement of Assets and Liabilities as of March 31, 2014:
| Derivative Investment Type | Asset Derivatives | Liability Derivatives |
| Equity contracts | Variation margin | Variation margin |
| | Unrealized appreciation on swap agreements | Unrealized depreciation on swap agreements |
| 22 | THE GUGGENHEIM FUNDS SEMI-ANNUAL REPORT |
| NOTES TO FINANCIAL STATEMENTS (Unaudited)(continued) |
The following table sets forth the fair value of the Fund’s derivative investments categorized by primary risk exposure at March 31, 2014:
| Asset Derivative Investments Value | |
| | | Futures | | | Swaps | | | Total Value at | |
| | | Equity | | | Equity | | | March 31, | |
| Fund | | Contracts* | | | Contracts | | | 2014 | |
| StylePlus—Mid Growth Fund | | $ | 4,804 | | | $ | — | | | $ | 4,804 | |
* Includes cumulative appreciation (depreciation) of futures contracts as reported on the Schedule of Investments. Only current day’s variation margin is reported within the Statement of Assets and Liabilities.
The following is a summary of the location of derivative investments on the Fund’s Statement of Operations for the year ended March 31, 2014:
| Derivative Investment Type | Location of Gain (Loss) on Derivatives |
| Equity contracts | Net realized gain (loss) on swap agreements |
| | Net realized gain (loss) on futures contracts |
| | Net change in unrealized appreciation (depreciation) on swap agreements |
| | Net change in unrealized appreciation (depreciation) on futures contracts |
The following is a summary of the Fund’s realized gain (loss) and change in unrealized appreciation (depreciation) on derivative investments recognized on the Statement of Operations categorized by primary risk exposure for the year ended March 31, 2014:
| Realized Gain (Loss) on Derivative Investments Recognized on the Statement of Operations | |
| | | Futures | | | Swaps | | | | |
| | | Equity | | | Equity | | | | |
| Fund | | Contracts | | | Contracts | | | Total | |
| StylePlus—Mid Growth Fund | | $ | 120,300 | | | $ | 8,846,746 | | | $ | 8,967,046 | |
| | | | | | | | | | | | | |
| Change in Unrealized Appreciation (Depreciation) on Derivative Investments Recognized on the Statement of Operations | |
| | | | Futures | | | | Swaps | | | | | |
| | | | Equity | | | | Equity | | | | | |
| Fund | | | Contracts | | | | Contracts | | | | Total | |
| StylePlus—Mid Growth Fund | | $ | (1,267 | ) | | $ | (2,867,157 | ) | | $ | (2,868,424 | ) |
6. Federal Income Tax Information
The Fund intends to comply with the provisions of Subchapter M of the Internal Revenue Code applicable to regulated investment companies and distribute substantially all taxable net investment income and capital gains sufficient to relieve the Fund from all, or substantially all, federal income, excise and state income taxes. Therefore, no provision for federal or state income tax is required.
Tax positions taken or expected to be taken in the course of preparing the Fund’s tax returns are evaluated to determine whether the tax positions are “more-likely-than-not” of being sustained by the applicable tax authority. Tax positions not deemed to meet the more-likely-than-not threshold would be recorded as a tax benefit or expense in the current year.
Management has analyzed the Fund’s tax positions taken, or to be taken, on Federal income tax returns for all open tax years, and has concluded that no provision for income tax is required in the Fund’s financial statements. The Fund’s federal tax returns are subject to examination by the Internal Revenue Service for a period of three fiscal years after they are filed.
The RIC Modernization Act of 2010 was signed into law on December 22, 2010 and simplified some of the tax provisions applicable to regulated investment companies, the tax reporting to their shareholders and improved the tax efficiency of certain fund structures. The greatest impact to the disclosure in the financial reports for the Fund was on the treatment of net capital losses, effective for tax years beginning after December 22, 2010.
| THE GUGGENHEIM FUNDS SEMI-ANNUAL REPORT | 23 |
| NOTES TO FINANCIAL STATEMENTS (Unaudited)(continued) |
One of the more prominent changes addresses capital loss carryforwards. The Fund is permitted to carry forward capital losses incurred in taxable years beginning after December 22, 2010 for an unlimited period. However, any losses incurred during those future taxable years will be required to be utilized prior to the losses incurred in pre-enactment taxable years. Under pre-enactment law, capital losses could be carried forward for eight years, and carried forward as short-term capital, irrespective of the character of the original loss. As a result of this ordering rule, pre-enactment capital carryforwards may potentially expire unused. Additionally, post-enactment capital losses that are carried forward will retain their character as either short-term or long-term capital losses rather than being considered all short-term as under previous law.
At March 31, 2014, the cost of securities for Federal income tax purposes, the aggregate gross unrealized gain for all securities for which there was an excess of value over tax cost and the aggregate gross unrealized loss for all securities for which there was an excess of tax cost over value, were as follows:
| | | | | | Tax | | | Tax | | | Net | |
| | | Tax | | | Unrealized | | | Unrealized | | | Unrealized | |
| Fund | | Cost | | | Gain | | | Loss | | | Gain | |
| StylePlus—Mid Growth Fund | | $ | 78,687,826 | | | $ | 2,011,482 | | | $ | (518,953 | ) | | $ | 1,492,529 | |
7. Securities Transactions
For the year ended March 31, 2014, the cost of purchases and proceeds from sales of investment securities, excluding government securities, short-term investments and derivatives, were as follows:
| Fund | | Purchases | | | Sales | |
| StylePlus—Mid Growth Fund | | $ | 66,797,304 | | | $ | 37,291,883 | |
8. Affiliated Transactions
Investments representing 5% or more of the outstanding voting shares of a portfolio company of a fund, or control of or by, or common control under GI, result in that portfolio company being considered an affiliated company of such fund, as defined in the 1940 Act. Transactions during the year ended March 31, 2014 in which the portfolio company is an “affiliated person” are as follows:
| | | | | Value | | | | | | | | | Value | | | Shares | | | Investment | | | Realized | |
| Fund | | Security | | 09/30/13 | | | Additions | | | Reductions | | | 03/31/14 | | | 03/31/14 | | | Income | | | Gain (Loss) | |
| StylePlus—Mid | | Exchange Traded Funds: | | | | | | | | | | | | | | | | | | | | | | | | | |
| Growth Fund | | Guggenheim BulletShares 2016 | | | | | | | | | | | | | | | | | | | | | | | | | | | | |
| | | High Yield Corporate Bond ETF | | $ | 965,092 | | | $ | 653,469 | | | $ | — | | | $ | 1,651,650 | | | | 60,500 | | | $ | 27,726 | | | $ | — | |
| | | Guggenheim BulletShares 2015 | | | | | | | | | | | | | | | | | | | | | | | | | | | | |
| | | High Yield Corporate Bond ETF | | | 964,231 | | | | 652,605 | | | | — | | | | 1,632,612 | | | | 60,400 | | | | 36,131 | | | | — | |
| | | Guggenheim BulletShares 2017 | | | | | | | | | | | | | | | | | | | | | | | | | | | | |
| | | High Yield Corporate Bond ETF | | | — | | | | 1,536,370 | | | | — | | | | 1,552,128 | | | | 56,400 | | | | 9,357 | | | | — | |
| | | Guggenheim Enhanced Short | | | | | | | | | | | | | | | | | | | | | | | | | | | | |
| | | Duration ETF | | | 1,669,991 | | | | — | | | | (1,670,440 | ) | | | — | | | | — | | | | 2,887 | | | | 1,226 | |
| | | Guggenheim BulletShares 2014 | | | | | | | | | | | | | | | | | | | | | | | | | | | | |
| | | High Yield Corporate Bond ETF | | | 963,581 | | | | 652,332 | | | | (1,605,830 | ) | | | — | | | | — | | | | 19,739 | | | | (11,520 | ) |
| | | Total | | | 4,562,895 | | | | 3,494,776 | | | | (3,276,270 | ) | | | 4,836,390 | | | | 177,300 | | | | 95,839 | | | | (10,294 | ) |
| | | Mutual Funds: | | | | | | | | | | | | | | | | | | | | | | | | | | | | |
| | | Floating Rate Strategies Fund | | | | | | | | | | | | | | | | | | | | | | | | | | | | |
| | | Institutional Class | | | 1,378,201 | | | | 34,436 | | | | — | | | | 1,425,699 | | | | 53,020 | | | | 32,894 | | | | 1,303 | |
| | | Macro Opportunities Fund | | | | | | | | | | | | | | | | | | | | | | | | | | | | |
| | | Institutional Class | | | 1,323,112 | | | | 38,427 | | | | — | | | | 1,402,227 | | | | 51,666 | | | | 37,611 | | | | — | |
| | | Guggenheim Strategy Fund III | | | — | | | | 9,500,000 | | | | — | | | | 9,494,599 | | | | 380,088 | | | | 3,238 | | | | — | |
| | | Guggenheim Strategy Fund I | | | — | | | | 8,000,000 | | | | — | | | | 7,996,800 | | | | 320,000 | | | | 4,649 | | | | — | |
| | | Total | | | 2,701,313 | | | | 17,572,863 | | | | — | | | | 20,319,325 | | | | 804,774 | | | | 78,392 | | | | 1,303 | |
9. Offsetting
In the normal course of business, the Fund enters into transactions subject to enforceable master netting arrangements or other similar arrangements. Generally, the right to offset in those agreements allows the Fund to counteract the exposure to a specific counterparty with collateral received or delivered to that counterparty based on the terms of the
| 24 | THE GUGGENHEIM FUNDS SEMI-ANNUAL REPORT |
| NOTES TO FINANCIAL STATEMENTS (Unaudited)(concluded) |
arrangements. These arrangements provide for the right to liquidate upon the occurrence of an event of default, credit event upon merger or additional termination event.
In order to better define their contractual rights and to secure rights that will help the Fund mitigate its counterparty risk, the Fund may enter into an International Swaps and Derivatives Association, Inc. Master Agreement (“ISDA Master Agreement”) or similar agreement with their derivative contract counterparties. An ISDA Master Agreement is a bilateral agreement between a Fund and a counterparty that governs OTC derivatives, including foreign exchange contracts, and typically contains, among other things, collateral posting terms and netting provisions in the event of a default and/or termination event. The provisions of the ISDA Master Agreement typically permit a single net payment in the event of a default (close-out netting) or similar event, including the bankruptcy or insolvency of the counterparty.
For derivatives traded under an ISDA Master Agreement, the collateral requirements are typically calculated by netting the mark to market amount for each transaction under such agreement and comparing that amount to the value of any collateral currently pledged by the Fund and the counterparty. For financial reporting purposes, cash collateral that has been pledged to cover obligations of the Fund and cash collateral received from the counterparty, if any, is reported separately on the Statement of Assets and Liabilities as segregated cash with broker/receivable for variation margin, or payable for swap settlement/variation margin. Generally, the amount of collateral due from or to a counterparty must exceed a minimum transfer amount threshold (e.g., $300,000) before a transfer is required to be made. To the extent amounts due to the Fund from its counterparties are not fully collateralized, contractually or otherwise, the Fund bears the risk of loss from counterparty nonperformance. The Fund attempts to mitigate counterparty risk by only entering into agreements with counterparties that they believe to be of good standing and by monitoring the financial stability of those counterparties.
For financial reporting purposes, the Fund does not offset derivative assets and derivative liabilities that are subject to netting arrangements in the Statement of Assets and Liabilities.
The following tables present derivative financial instruments and secured financing transactions that are subject to enforceable netting arrangements and offset in the Statement of Assets and Liabilities in conformity with U.S. GAAP.
| | | | | | | | | | | | | | | Gross Amounts Not Offset | | | | |
| | | | | | | | | | | | | | | in the Statement of Assets | | | | |
| | | | | | | | | | | | | | | and Liabilities | | | | |
| | | | | | | | | | | Net Amount of Assets | | | | | | | |
| | | | | | | | Gross Amounts Offset | | Presented on the | | | | | Cash | | | | |
| | | | | Gross Amounts of | | in the Statement of | | Statement of Assets | | Financial | | Collateral | | Net | |
| Fund | | Instrument | | Recognized Liabilities1 | | Assets and Liabilities | | and Liabilities | | Instruments | | Received2 | | Amount | |
| StylePlus—Mid Growth Fund | | Swap equity contracts | | $ | — | | $ | — | | $ | — | | $ | — | | $ | — | | $ | — | |
1 Exchange traded futures are excluded from these reported amounts.
2 Excludes maintenance margin deposits held at the broker related to derivatives. These amounts are reflected as Segregated cash with broker on the Statement of Assets and Liabilities.
10. Line of Credit
The Trust secured a committed, $275,000,000 line of credit from Citibank, N.A., with no set termination date. This line of credit is reserved for emergency or temporary purposes. Fees related to borrowings, if any, vary under this arrangement between the greater of LIBOR and the Fed Funds rate, plus 1.25%. The Fund did not have any borrowings under this agreement at March 31, 2014.
| THE GUGGENHEIM FUNDS SEMI-ANNUAL REPORT | 25 |
| OTHER INFORMATION (Unaudited) |
Proxy Voting Information
A description of the policies and procedures that the Trust uses to determine how to vote proxies relating to securities held in the Funds’ portfolios is available, without charge and upon request, by calling 1.800.820.0888. This information is also available from the EDGAR database on the SEC’s website at http://www.sec.gov.
Information regarding how the Funds voted proxies relating to portfolio securities during the most recent 12-month period ended June 30 is available without charge, upon request, by calling 1.800.820.0888. This information is also available from the EDGAR database on the SEC’s website at http://www.sec.gov.
At a special meeting of shareholders held on January 8, 2014, the shareholders of the Fund voted on whether to approve the election of nominees to the Board of Directors of each corporation. A description of the number of shares voted is as follows:
| | | For | | | Withhold | | | Total | |
| Randall C. Barnes | | | 1,089,568 | | | | 22,657 | | | | 1,112,225 | |
| Roman Friedrich III | | | 1,089,542 | | | | 22,683 | | | | 1,112,225 | |
| Robert B. Karn III | | | 1,088,352 | | | | 23,873 | | | | 1,112,225 | |
| Ronald A. Nyberg | | | 1,089,625 | | | | 22,600 | | | | 1,112,225 | |
| Ronald E. Toupin, Jr. | | | 1,089,566 | | | | 22,659 | | | | 1,112,225 | |
At a special meeting of shareholders held on January 8, 2014, the shareholders of the Fund also voted on whether to approve the Fund from Kansas Corporations into Delaware Statutory Trusts. A description of the number of shares voted is as follows:
| Fund | | Shares For | | | Shares
Against | | | Shares
Abstained | |
| StylePlus - Mid Growth Fund | | | 949,309 | | | | 17,554 | | | | 22,284 | |
At a special meeting of shareholders held on January 8, 2014, the shareholders of the Fund also voted on whether to approve changes to the fundamental investment policies. A description of the number of shares voted is as follows:
| Diversification | | | | | | | | | |
| Fund | | Shares For | | | Shares
Against | | | Shares
Abstained | |
| StylePlus - Mid Growth Fund | | | 947,574 | | | | 18,364 | | | | 23,209 | |
| Underwriting | | | | | | | | | |
| Fund | | Shares For | | | Shares
Against | | | Shares
Abstained | |
| StylePlus - Mid Growth Fund | | | 943,588 | | | | 23,208 | | | | 22,351 | |
| Industry Concentration | | | | | | | | | |
| Fund | | Shares For | | | Shares
Against | | | Shares
Abstained | |
| StylePlus - Mid Growth Fund | | | 945,935 | | | | 20,591 | | | | 22,621 | |
| Real Estate | | | | | | | | | |
| Fund | | Shares For | | | Shares
Against | | | Shares
Abstained | |
| StylePlus - Mid Growth Fund | | | 947,249 | | | | 20,020 | | | | 21,878 | |
| Commodities | | | | | | | | | |
| Fund | | Shares For | | | Shares
Against | | | Shares
Abstained | |
| StylePlus - Mid Growth Fund | | | 943,903 | | | | 23,221 | | | | 22,023 | |
| 26 | THE GUGGENHEIM FUNDS SEMI-ANNUAL REPORT |
| OTHER INFORMATION (Unaudited) |
| Loans | | | | | | | | | |
| Fund | | Shares For | | | Shares
Against | | | Shares
Abstained | |
| StylePlus - Mid Growth Fund | | | 939,453 | | | | 27,513 | | | | 22,181 | |
| Borrowing | | | | | | | | | |
| Fund | | Shares For | | | Shares
Against | | | Shares
Abstained | |
| StylePlus - Mid Growth Fund | | | 939,772 | | | | 26,645 | | | | 22,730 | |
| Senior Securities | | | | | | | | | |
| Fund | | Shares For | | | Shares
Against | | | Shares
Abstained | |
| StylePlus - Mid Growth Fund | | | 943,937 | | | | 23,030 | | | | 22,180 | |
Quarterly Portfolio Schedules Information
The Trust files its complete schedule of portfolio holdings with the SEC for the first and third quarters of each fiscal year on Form N-Q; which are available on the SEC’s website at http://www.sec.gov. The Funds’ Forms N-Q may be reviewed and copied at the SEC’s Public Reference Room in Washington, DC, and that information on the operation of the Public Reference Room may be obtained by calling 1-800-SEC-0330. Copies of the portfolio holdings are also available to shareholders, without charge and upon request, by calling 1.800.820.0888.
Office Locations
The offices of Guggenheim Investments can be found in the following locations:
330 Madison Avenue
10th Floor
New York, NY 10017
(Headquarters)
Four Irvington Centre
805 King Farm Boulevard
Suite 600
Rockville, MD 20850
9401 Indian Creek Parkway
40 Corporate Woods
Suite 850
Overland Park, KS 66210
Distributor change
Effective March 3, 2014, Guggenheim Distributors, LLC (“GD”), the distributor for shares of the Fund will be consolidated into and with Guggenheim Funds Distributors, LLC (“GFD”). Following the consolidation, GFD will serve as the Fund’s distributor.
GD and GFD are both indirect, wholly-owned subsidiaries of Guggenheim Capital, LLC and, therefore, the consolidation will not result in a change of actual control of the Fund’s distributor. The primary goal of the consolidation is to achieve greater operational efficiencies and allow all of the Guggenheim funds, including funds that are not series of the Trusts, to be distributed by a single distributor.
The consolidation is not expected to affect the day-to-day management of the Fund or result in any material changes to the distribution of the Fund, including any changes to the distribution fees paid by the Fund.
| THE GUGGENHEIM FUNDS SEMI-ANNUAL REPORT | 27 |
| OTHER INFORMATION (Unaudited)(concluded) |
Guggenheim Funds Trust
Guggenheim Funds Trust (the “Trust”), which was organized as a Delaware statutory trust on November 8, 2013, is registered with the Securities and Exchange Commission (“SEC”) as an investment company. The Trust is an open-end management investment company that, upon the demand of the investor, must redeem its shares and pay the investor the next calculated NAV. The Guggenheim Enhanced World Equity Fund (“Enhanced World Equity Fund”), Guggenheim Large Cap Value Fund (“Large Cap Value Fund”), Guggenheim Mid Cap Value Fund (“Mid Cap Value Fund”), Guggenheim Mid Cap Value Institutional Fund (“Mid Cap Value Institutional Fund”), Guggenheim Small Cap Value Fund (“Small Cap Value Fund”), Guggenheim StylePlus—Large Core Fund (“StylePlus—Large Core Fund”), Guggenheim StylePlus—Mid Growth Fund (“StylePlus—Mid Growth Fund”) and Guggenheim World Equity Income Fund (“World Equity Income Fund”) (collectively, the “Funds”) were previously series (the “Predecessor Funds”) of Security Equity Fund, Security Large Cap Value Fund and Security Mid Cap Growth Fund (the “Predecessor Corporations”), different registered open-end investment companies, which were organized as Kansas corporations. In January 2014, at special meetings of shareholders, the shareholders of each Predecessor Fund approved the reorganization of each Predecessor Fund with and into a corresponding “shell” series of the Trust. The shell series of the Trust succeeded to the accounting and performance histories of the Predecessor Funds. Any such historical information provided for a series of the Trust that relates to periods prior to January 28, 2014, therefore, is that of the corresponding Predecessor Fund.
Board Considerations in Approving the Investment Advisory Agreements
At a meeting held on November 11, 2013, in connection with other actions taken to consider whether to approve the reorganization of the funds from series of Kansas corporations (the “Predecessor Funds”) into series of a Delaware statutory trust, Guggenheim Funds Trust (the “Trust” and its series, the “New Series”), the members of the Boards of Directors of the Kansas corporations (collectively, the “Predecessor Board” and the members individually, “Directors”), including the Directors who are not “interested persons,” as defined by the Investment Company Act of 1940, as amended (the “1940 Act”), of the corporations (the “Independent Directors”) appointed the then-investment advisers and sub-advisers of the Predecessor Funds, to serve in the same capacity to the corresponding New Series. The Predecessor Board also approved corresponding advisory and sub-advisory agreements, subject, for each Predecessor Fund, to approval of the reorganization of that fund by its shareholders and approval of the new agreements by the initial sole shareholder of the corresponding New Series. The Directors based their approval on a variety of factors, including: the findings they had made during their May, June and August 2013 meetings at which the advisory and sub-advisory agreements of the Predecessor Funds had the most recently been approved, which are discussed in the Annual Report of the Predecessor Funds for the fiscal year ended September 30, 2013; the fact that new agreements are the same as the agreements then in place for the Predecessor Funds except for the name of the signatory, the applicable state law and the term of the agreements; and the intention that the new agreements would be subject to re-consideration after the reorganizations at meetings scheduled to be held for these purposes in April and May 2014.
| 28 | THE GUGGENHEIM FUNDS SEMI-ANNUAL REPORT |
| INFORMATION ON BOARD OF TRUSTEES AND OFFICERS (Unaudited) |
INDEPENDENT TRUSTEES
| | | | | | | | | Number of | | Other |
| | | Position(s) | | Term of Office | | | | Portfolios in | | Directorships |
| Name, Address* | | Held with | | and Length of | | Principal Occupation(s) | | Fund Complex | | Held by |
| and Year of Birth | | the Trust | | Time Served** | | During Past Five Years | | Overseen | | Trustees |
| | | | | | | | | | | |
Randall C. Barnes
(1951) | | Trustee | | Since 2014 | | Current: Private Investor (2001–present). | | 86 | | None |
| | | | | | | | | | | |
| | | | | | | Former: Senior Vice President and Treasurer, PepsiCo, Inc. (1993–1997); President, Pizza Hut International (1991–1993); Senior Vice President, Strategic Planning and New Business Development, PepsiCo, Inc. (1987–1990). | | | | |
| | | | | | | | | | | |
Donald A. Chubb, Jr.
(1946 ) | | Trustee and Vice Chairman of the Board | | Since 1994 | | Current: Business broker and manager of commercial real estate, Griffith & Blair, Inc. (1997–present). | | 82 | | None |
| | | | | | | | | | | |
Jerry B. Farley
(1946) | | Trustee and Vice Chairman of the Audit Committee | | Since 2005 | | Current: President, Washburn University (1997–present). | | 82 | | Current: Westar Energy, Inc. (2004–present); CoreFirst Bank & Trust (2000–present). |
| | | | | | | | | | | |
Roman Friedrich III
(1946) | | Trustee and Chairman of the Contracts Review Committee | | Since 2014 | | Current: Founder and President, Roman Friedrich & Company (1998–present).
Former: Senior Managing Director, MLV & Co. LLC (2010–2011). | | 82 | | Current: Mercator Minerals Ltd. (2013–present); First Americas Gold Corp. (2012–present); Zincore Metals, Inc. (2009–present). |
| | | | | | | | | | | Former: Blue Sky Uranium Corp. (2011–2012); Axiom Gold and Silver Corp. (2011–2012); Stratagold Corp. (2003–2009); GFM Resources Ltd. (2005–2010). |
| | | | | | | | | | | |
Robert B. Karn III
(1942) | | Trustee and Chairman of the Audit Committee | | Since 2014 | | Current: Consultant (1998–present).
Former: Arthur Andersen (1965–1997) and Managing Partner, Financial and Economic Consulting, St. Louis office (1987–1997). | | 82 | | Current: Peabody Energy Company (2003–present); GP Natural Resource Partners, LLC (2002–present). |
| THE GUGGENHEIM FUNDS SEMI-ANNUAL REPORT | 29 |
| INFORMATION ON BOARD OF TRUSTEES AND OFFICERS (Unaudited)(continued) |
INDEPENDENT TRUSTEES - concluded
| | | | | | | | | Number of | | Other |
| | | Position(s) | | Term of Office | | | | Portfolios in | | Directorships |
| Name, Address* | | Held with | | and Length of | | Principal Occupation(s) | | Fund Complex | | Held by |
| and Year of Birth | | the Trust | | Time Served** | | During Past Five Years | | Overseen | | Trustees |
| | | | | | | | | | | |
Ronald A. Nyberg
(1953) | | Trustee and Chairman of the Nominating and Governance Committee | | Since 2014 | | Current: Partner, Nyberg & Cassioppi, LLC (2000–present). Former: Executive Vice President, General Counsel, and Corporate Secretary, Van Kampen Investments (1982-1999). | | 88 | | None |
| | | | | | | | | | | |
Maynard F. Oliverius
(1943) | | Trustee and Vice Chairman of the Contracts Review Committee | | Since 1998 | | Retired. Former: President and CEO, Stormont-Vail HealthCare (1996-2012). | | 82 | | None |
Ronald E. Toupin, Jr.
(1958) | | Trustee and Chairman of the Board | | Since 2014 | | Current: Portfolio Consultant (2010–present). Former: Vice President, Manager and Portfolio Manager, Nuveen Asset Management (1998-1999); Vice President, Nuveen Investment Advisory Corp. (1992-1999); Vice President and Manager, Nuveen Unit Investment Trusts (1991-1999); and Assistant Vice President and Portfolio Manager, Nuveen Unit Investment Trusts (1988-1999), each of John Nuveen & Co., Inc. (1982-1999). | | 85 | | Former: Bennett Group of Funds (2011-2013). |
| | | | | | | | | | | |
| INTERESTED TRUSTEE | | | | | | |
| | | | | | | | | | | |
Donald C. Cacciapaglia***
(1951) | | President, Chief Executive Officer and Trustee | | Since 2012 | | Current: President and CEO, certain other funds in the Fund Complex (2012–present); Vice Chairman, Guggenheim Investments (2010–present). Former: Chairman and CEO, Channel Capital Group, Inc. (2002-2010). | | 214 | | Current: Delaware Life (2013–present); Guggenheim Life and Annuity Company (2011–present); Paragon Life Insurance Company of Indiana (2011–present). |
President and Portfolio Manager, Nuveen Unit Investment Trusts (1988–1999), each of John Nuveen & Co., Inc. (1982–1999).
| * | The business address of each Trustee is c/o Guggenheim Investments, 805 King Farm Boulevard, Suite 600, Rockville, Maryland 20850. |
| ** | Each Trustee serves an indefinite term, until his successor is elected and qualified. Time served includes time served in the respective position for the Predecessor Corporation. |
| *** | This Trustee is deemed to be an “interested person” of the Funds under the 1940 Act by reason of his position with the Funds’ Investment Manager and/or the parent of the Investment Manager. |
| 30 | THE GUGGENHEIM FUNDS SEMI-ANNUAL REPORT |
| INFORMATION ON BOARD OF TRUSTEES AND OFFICERS (Unaudited)(continued) |
OFFICERS
| | | Position(s) | | Term of Office | | |
| Name, Address* | | held with | | and Length of | | Principal Occupations |
| and Year of Birth | | the Trust | | Time Served** | | During Past Five Years |
| | | | | | | |
Joseph M. Arruda
(1966) | | Assistant Treasurer | | Since 2010 | | Current: Assistant Treasurer, certain other funds in the Fund Complex (2006–present); Vice President, Security Investors, LLC (2010–present); CFO and Manager, Guggenheim Specialized Products, LLC (2009–present). |
| | | | | | | |
| | | | | | | Former: Vice President, Security Global Investors, LLC (2010-2011); Vice President, Rydex Advisors, LLC (2010); Vice President, Rydex Advisors II, LLC (2010). |
| | | | | | | |
William H. Belden, III
(1965) | | Vice President | | Since 2014 | | Current: Vice President, certain other funds in the Fund Complex (2006–present); Managing Director, Guggenheim Funds Investment Advisors, LLC (2005–present). |
| | | | | | | |
| | | | | | | Former: Vice President of Management, Northern Trust Global Investments (1999-2005). |
| | | | | | | |
Mark J. Furjanic
(1959) | | Assistant Treasurer | | Since 2014 | | Current: Vice President, Guggenheim Investments (2005–present); Assistant Treasurer, certain other funds in the Fund Complex (2008–present). |
| | | | | | | |
| | | | | | | Former: Senior Manager, Ernst & Young LLP (1999-2005). |
| | | | | | | |
James Howley
(1972) | | Assistant Treasurer | | Since 2014 | | Current: Director, Guggenheim Investments (2004–present); Assistant Treasurer, certain other funds in the Fund Complex (2006–present). |
| | | | | | | |
| | | | | | | Former: Manager, Mutual Fund Administration of Van Kampen Investments, Inc. (1996-2004). |
| | | | | | | |
Amy J. Lee
(1961) | | Vice President and Chief Legal Officer | | Since 1987 (Secretary) Since 2007 (Vice President) | | Current: Chief Legal Officer, certain other funds in the Fund Complex (2013–present); Senior Managing Director, Guggenheim Investments (2012–present). Former: Vice President, Associate General Counsel and Assistant Secretary, Security Benefit Life Insurance Company and Security Benefit Corporation (2004-2012). |
| | | | | | | |
Derek Maltbie
(1972) | | Assistant Treasurer | | Since 2014 | | Current: Vice President, Guggenheim Investments (2012–present); Assistant Treasurer, certain other funds in the Fund Complex (2011–present). |
| | | | | | | |
| | | | | | | Former: Assistant Vice President, Guggenheim Funds Investment Advisors, LLC (2005-2011); Supervisor, Mutual Fund Administration, Van Kampen Investments, Inc. (1995-2005). |
| | | | | | | |
Mark E. Mathiasen
(1978) | | Secretary | | Since 2013 | | Current: Secretary, certain other funds in the Fund Complex (2007–present); Managing Director and Associate General Counsel, Guggenheim Funds Services, LLC, and affiliates (2007–present). |
| | | | | | | |
Michael P. Megaris
(1984) | | Assistant Secretary | | Since 2014 | | Current: Assistant Secretary, certain other funds in the Fund Complex (April 2014–present); Associate, Guggenheim Investments (2012–present). |
| | | | | | | |
| | | | | | | Former: J.D., University of Kansas School of Law (2009-2012). |
| | | | | | | |
Elisabeth Miller
(1968) | | Chief Compliance Officer | | Since 2012 | | Current: CCO, certain other funds in the Fund Complex (2012–present); CCO, Security Investors, LLC (2012–present); CCO, Guggenheim Funds Investment Advisors, LLC (2012–present); Vice President, Guggenheim Funds Distributors, LLC (March 2014–present). Former: CCO, Guggenheim Distributors, LLC (2009-March 2014); Senior Manager, Security Investors, LLC (2004-2009); Senior Manager, Guggenheim Distributors, LLC (2004-2009). |
| THE GUGGENHEIM FUNDS SEMI-ANNUAL REPORT | 31 |
| INFORMATION ON BOARD OF TRUSTEES AND OFFICERS (Unaudited)(concluded) |
OFFICERS - concluded
| | | Position(s) | | Term of Office | | |
| Name, Address* | | held with | | and Length of | | Principal Occupations |
| and Year of Birth | | the Trust | | Time Served** | | During Past Five Years |
| | | | | | | |
Alison Santay
(1974) | | AML Officer | | Since 2013 | | Current: AML Officer, certain other funds in the Fund Complex (2010–present); Director and AML Officer, Rydex Fund Services, LLC (2010–present); AML Officer, Security Investors, LLC (2010–present); Director, Shareholder Risk and Compliance, Rydex Fund Services, LLC (2004–present). |
| | | | | | | |
| | | | | | | Former: AML Officer, Guggenheim Distributors, LLC (2013-March 2014). |
| | | | | | | |
Kimberly Scott
(1974) | | Assistant Treasurer | | Since 2014 | | Current: Vice President, Guggenheim Investments (2012–present); Assistant Treasurer, certain other funds in the Fund Complex (2012–present). |
| | | | | | | |
| | | | | | | Former: Financial Reporting Manager, Invesco, Ltd. (2010-2011); Vice President/Assistant Treasurer, Mutual Fund Administration for Van Kampen Investments, Inc./Morgan Stanley Investment Management (2009-2010); Manager of Mutual Fund Administration, Van Kampen Investments, Inc./Morgan Stanley Investment Management (2005-2009). |
| | | | | | | |
Bryan Stone
(1979) | | Vice President | | Since 2014 | | Current: Vice President, certain other funds in the Fund Complex (April 2014–present); Director, Guggenheim Investments (2013–present). |
| | | | | | | |
| | | | | | | Former: Senior Vice President, Neuberger Berman Group LLC (2009-2013); Vice President, Morgan Stanley (2002-2009). |
| | | | | | | |
John L. Sullivan
(1955) | | Chief Financial Officer and Treasurer | | Since 2014 | | Current: CFO, Chief Accounting Officer and Treasurer, certain other funds in the Fund Complex (2010–present); Senior Managing Director, Guggenheim Investments (2010–present). Former: Managing Director and CCO, each of the funds in the Van Kampen Investments fund complex (2004-2010); Managing Director and Head of Fund Accounting and Administration, Morgan Stanley Investment Management (2002-2004); CFO and Treasurer, Van Kampen Funds (1996-2004). |
| * | The business address of each officer is c/o Guggenheim Investments, 805 King Farm Boulevard, Suite 600, Rockville, Maryland 20850. |
| ** | Each officer serves an indefinite term, until his or her successor is duly elected and qualified. Time served includes time served in the respective position for the Predecessor Corporation. |
| 32 | THE GUGGENHEIM FUNDS SEMI-ANNUAL REPORT |
| GUGGENHEIM INVESTMENTS PRIVACY POLICIES (Unaudited) |
Rydex Funds, Guggenheim Funds, Rydex Investments, Guggenheim Funds Distributors, LLC, Security Investors, LLC, Security Distributors, Inc., Guggenheim Partners Investment Managers, LLC, and Rydex Advisory Services (Collectively “Guggenheim Investments”).
Our Commitment to You
When you become a Guggenheim Investments investor, you entrust us with not only your hard-earned money but also with personal and financial information about you. We recognize that your relationship with us is based on trust and that you expect us to act responsibly and in your best interests. Because we have access to this private information about you, we hold ourselves to the highest standards in its safekeeping and use. This means, most importantly, that we do not sell client information to anyone—whether it is your personal information or if you are a current or former Guggenheim Investments client.
The Information We Collect About You
In the course of doing business with shareholders and investors, we collect nonpublic personal information about you. You typically provide personal information when you complete a Guggenheim Investments account application or when you request a transaction that involves Rydex and Guggenheim Investments funds or one of the Guggenheim Investments affiliated companies. “Nonpublic personal information” is personally identifiable private information about you. For example, it includes information regarding your name and address, Social Security or taxpayer identification number, assets, income, account balance, bank account information and investment activity (e.g., purchase and redemption history).
How We Handle Your Personal Information
As emphasized above, we do not sell information about current or former clients or their accounts to third parties. Nor do we share such information, except when necessary to complete transactions at your request or to make you aware of related investment products and services that we offer. Additional details about how we handle your personal information are provided below. To complete certain transactions or account changes that you direct, it may be necessary to provide identifying information to companies, individuals or groups that are not affiliated with Guggenheim Investments. For example, if you ask to transfer assets from another financial institution to Guggenheim Investments, we will need to provide certain information about you to that company to complete the transaction. To alert you to other Guggenheim Investments investment products and services, we may share your information within the Guggenheim Investments family of affiliated companies. This would include, for example, sharing your information within Guggenheim Investments so we can make you aware of new Rydex and Guggenheim Investments funds or the services offered through another Guggenheim Investments affiliated company. In certain instances, we may contract with nonaffiliated companies to perform services for us. Where necessary, we will disclose information we have about you to these third parties. In all such cases, we provide the third party with only the information necessary to carry out its assigned responsibilities and only for that purpose. And we require these third parties to treat your private information with the same high degree of confidentiality that we do. In certain instances, we may share information with other financial institutions regarding individuals and entities in response to the U.S.A. Patriot Act. Finally, we will release information about you if you direct us to do so, if we are compelled by law to do so or in other circumstances permitted by law.
Opt Out Provisions
We do not sell your personal information to anyone. The law allows you to “opt out” of only certain kinds of information sharing with third parties. The firm does not share personal information about you with any third parties that triggers this opt-out right. This means YOU ARE ALREADY OPTED OUT.
How We Protect Privacy Online
Our concern for the privacy of our shareholders also extends to those who use our web site, guggenheiminvestments.com. Our web site uses some of the most secure forms of online communication available, including encryption technology, Secure Socket Layer (SSL) protocol, firewalls and user names and passwords. These technologies provide a high level
| THE GUGGENHEIM FUNDS SEMI-ANNUAL REPORT | 33 |
| GUGGENHEIM INVESTMENTS PRIVACY POLICIES (Unaudited)(concluded) |
of security and privacy when you access your account information or initiate online transactions. The Guggenheim Investments web site offers customized features that require our use of “http cookies”—tiny pieces of information that we ask your browser to store. However, we make very limited use of these cookies. We only use cookies for session management and security features on the Guggenheim Investments web site. We do not use them to pull data from your hard drive, to learn your email address, or to view data in cookies created by other web sites. We will not share the information in our cookies or give others access to it. See the legal information area on our web site for more details about web site security and privacy features.
How We Safeguard Your Personal Information
We restrict access to nonpublic personal information about shareholders to our employees and in some cases to third parties (for example, the service providers described above) as permitted by law. We maintain strict physical, electronic and procedural safeguards that comply with federal standards to guard your nonpublic personal information.
We’ll Keep You Informed
As required by federal law, we will notify shareholders of our privacy policy annually. We reserve the right to modify this policy at any time, but rest assured that if we do change it, we will tell you promptly. You will also be able to access our privacy policy from our web site at guggenheiminvestments.com. Should you have any questions regarding our privacy policy, contact us at 800.820.0888 or 301.296.5100.
| 34 | THE GUGGENHEIM FUNDS SEMI-ANNUAL REPORT |
This page intentionally left blank.
This page intentionally left blank.
This page intentionally left blank.
This page intentionally left blank.
| Item 2. | Code of Ethics. |
| | |
| | Not required at this time. |
| | |
| Item 3. | Audit Committee Financial Expert. |
| | |
| | Not required at this time. |
| | |
| Item 4. | Principal Accountant Fees and Services. |
| | |
| | Not required at this time. |
| | |
| Item 5. | Audit Committee of Listed Registrants. |
| | |
| | Not applicable. |
| | |
| Item 6. | Investments. |
| | |
| | The Schedule of Investments is included under Item 1 of this form. |
| | |
| Item 7. | Disclosure of Proxy Voting Policies and Procedures for Closed-End Management Investment Companies. |
| | |
| | Not applicable. |
| | |
| Item 8. | Portfolio Managers of Closed-end Management Investment Companies |
| | |
| | Not applicable |
| | |
| Item 9. | Purchases of Equity Securities by Closed-End Management Investment Company and Affiliated Purchasers. |
| | |
| | Not applicable. |
| | |
| Item 10. | Submission of Matters to a Vote of Security Holders. |
The registrant does not currently have in place procedures by which shareholders may recommend nominees to the registrant’s board.
There have been no changes to the procedures by which shareholders may recommend nominees to the registrant’s board.
| Item 11. | Controls and Procedures. |
| | | |
| | (a) | The registrant’s President (principal executive officer) and Treasurer (principal financial officer) have evaluated the registrant’s disclosure controls and procedures within 90 days of this filing and have concluded that the registrant’s disclosure controls and procedures were effective as of that date in ensuring that information required to be disclosed by the registrant in this Form N-CSR was recorded, processed, summarized, and reported timely. |
| | | |
| | (b) | The registrant’s principal executive officer and principal financial officer are aware of no change in the registrant’s internal control over financial reporting that occurred during the registrant’s second fiscal quarter covered by this report that has materially affected, or is reasonably likely to materially affect, the registrant’s internal control over financial reporting. |
| | | |
| Item 12. | Exhibits. |
| | | |
| | (a)(2) | Separate certifications by the President (principal executive officer) and Treasurer (principal financial officer) of the registrant as required by Rule 30a-2(a) under the Act (17 CFR 270.30a-2(a)) are attached. |
| | | |
| | (b) | A certification by the registrant’s President (principal executive officer) and Treasurer (principal financial officer) as required by Rule 30a-2(b) under the Act (17 CFR 270.30a-2(b)) is attached. |
SIGNATURES
Pursuant to the requirements of the Securities Exchange Act of 1934 and the Investment Company Act of 1940, the registrant has duly caused this report to be signed on its behalf by the undersigned, thereunto duly authorized.
(Registrant) Guggenheim Funds Trust
By (Signature and Title) */s/ Donald C. Cacciapaglia
Donald C. Cacciapaglia, President
Date June 6, 2014
Pursuant to the requirements of the Securities Exchange Act of 1934 and the Investment Company Act of 1940, this report has been signed below by the following persons on behalf of the registrant and in the capacities and on the dates indicated.
By (Signature and Title) */s/ Donald C. Cacciapaglia
Donald C. Cacciapaglia, President
Date June 6, 2014
By (Signature and Title) * /s/ John L. Sullivan
John L. Sullivan, Chief Financial Officer, Chief Accounting Officer and Treasurer
Date June 6, 2014
* Print the name and title of each signing officer under his or her signature.