UNITED STATES
SECURITIES AND EXCHANGE COMMISSION
Washington, D.C. 20549
FORM N-CSR
CERTIFIED SHAREHOLDER REPORT OF REGISTERED MANAGEMENT
INVESTMENT COMPANIES
| Investment Company Act file number | 811- 01136 |
| | |
| Guggenheim Funds Trust |
| |
| (Exact name of registrant as specified in charter) |
| | 805 King Farm Boulevard, Suite 600 |
| Rockville, Maryland 20850 |
| |
| (Address of principal executive offices) (Zip code) |
| | Donald C. Cacciapaglia, President |
| Guggenheim Funds Trust |
| 805 King Farm Boulevard, Suite 600 |
| Rockville, Maryland 20850 |
| |
| (Name and address of agent for service) |
| Registrant’s telephone number, including area code: | 1-301-296-5100 |
| | |
| | |
| Date of fiscal year end: | September 30 |
| | |
| Date of reporting period: | March 31, 2014 |
Form N-CSR is to be used by management investment companies to file reports with the Commission not later than 10 days after the transmission to stockholders of any report that is required to be transmitted to stockholders under Rule 30e-1 under the Investment Company Act of 1940 (17 CFR 270.30e-1). The Commission may use the information provided on Form N-CSR in its regulatory, disclosure review, inspection, and policymaking roles.
A registrant is required to disclose the information specified by Form N-CSR, and the Commission will make this information public. A registrant is not required to respond to the collection of information contained in Form N-CSR unless the Form displays a currently valid Office of Management and Budget (“OMB”) control number. Please direct comments concerning the accuracy of the information collection burden estimate and any suggestions for reducing the burden to Secretary, Securities and Exchange Commission, 450 Fifth Street, NW, Washington, DC 20549-0609. The OMB has reviewed this collection of information under the clearance requirements of 44 U.S.C. §3507.
| Item 1. | | Reports to Stockholders. |
3.31.2014
Guggenheim Funds Semi-Annual Report
Floating Rate Strategies Fund
High Yield Fund
Investment Grade Bond Fund
Limited Duration Fund
Macro Opportunities Fund
Municipal Income Fund
Total Return Bond Fund
| SBINC-SEMI-0314x0914 | guggenheiminvestments.com |
Go Green! Eliminate Mailbox Clutter
Go paperless with Guggenheim Investments eDelivery—a service giving you full online access to account information and documents. Save time, cut down on mailbox clutter and be a friend to the environment with eDelivery.
With Guggenheim Investments eDelivery you can:
| • | View online confirmations and statements at your convenience. |
| | |
| • | Receive email notifications when your most recent confirmations, statements and other account documents are available for review. |
| | |
| • | Access prospectuses, annual reports and semiannual reports online. |
| | |
| | It’s easy to enroll: |
| | |
| | 1. Visit guggenheiminvestments.com/edelivery |
| | |
| | 2. Follow the simple enrollment instructions |
| | |
If you have questions about the Guggenheim Investments eDelivery service, contact one of our Shareholder Service Representatives at 800.820.0888.
This report and the financial statements contained herein are submitted for the general information of our shareholders. The report is not authorized for distribution to prospective investors unless preceded or accompanied by an effective prospectus.
Distributed by Guggenheim Funds Distributors, LLC. GI-GOGREEN-0414 x0415 #12604
| TABLE OF CONTENTS | | |
| |
| | | |
| DEAR SHAREHOLDER | | 2 |
| | | |
| ECONOMIC AND MARKET OVERVIEW | | 3 |
| | | |
| ABOUT SHAREHOLDERS’ FUND EXPENSES | | 4 |
| | | |
| FLOATING RATE STRATEGIES FUND | | 8 |
| | | |
| HIGH YIELD FUND | | 22 |
| | | |
| INVESTMENT GRADE BOND FUND | | 34 |
| | | |
| LIMITED DURATION FUND | | 46 |
| | | |
| MACRO OPPORTUNITIES FUND | | 54 |
| | | |
| MUNICIPAL INCOME FUND | | 70 |
| | | |
| TOTAL RETURN BOND FUND | | 78 |
| | | |
| NOTES TO FINANCIAL STATEMENTS | | 90 |
| | | |
| OTHER INFORMATION | | 105 |
| | | |
| INFORMATION ON BOARD OF TRUSTEES AND OFFICERS | | 110 |
| | | |
| GUGGENHEIM INVESTMENTS PRIVACY POLICIES | | 112 |
| |
| THE GUGGENHEIM FUNDS SEMI-ANNUAL REPORT | 1 |
Dear Shareholder:
Security Investors, LLC and Guggenheim Partners Investment Management (the “Investment Advisers”) are pleased to present the semi-annual shareholder report for seven Funds in our Guggenheim Funds Trust (the “Funds”) for the six-month period ended March 31, 2014.
The Investment Advisers are part of Guggenheim Investments, which represents the investment management businesses of Guggenheim Partners, LLC, (“Guggenheim”) a global, diversified financial services firm.
Guggenheim Funds Distributors, LLC is the distributor of the Funds. Guggenheim Funds Distributors, LLC is affiliated with Guggenheim and the Investment Advisers.
We encourage you to read the Economic and Market Overview section of the report, which follows this letter.
We are committed to providing innovative investment solutions and appreciate the trust you place in us.
Sincerely,

Donald C. Cacciapaglia
President
April 30, 2014
Read a prospectus and summary prospectus (if available) carefully before investing. It contains the investment objectives, risks, charges, expenses and other information, which should be considered carefully before investing. Obtain a prospectus and summary prospectus (if available) at guggenheiminvestments.com or call 800.820.0888.
There can be no assurance that any investment product will achieve its investment objective(s). There are risks associated with investing, including the entire loss of principal invested. Investing involves market risks. The investment return and principal value of any investment product will fluctuate with changes in market conditions.
| |
| 2 | THE GUGGENHEIM FUNDS SEMI-ANNUAL REPORT |
| ECONOMIC AND MARKET OVERVIEW | March 31, 2014 |
| |
Investment markets continued to rally through the six months ended March 31, 2014, thanks to a steadily improving U.S. economy and ongoing U.S. central bank easing. Contributing to performance of equities were growing confidence in the sustainability of the U.S. economic recovery, favorable corporate profit growth, supportive valuations, interest rates below their long-run level, and positive inflows, as investors concerned about the end of quantitative easing and its impact on interest rates rotated out of fixed-income investments into equities.
In January 2014, based on positive economic data and a better jobs picture, the U.S. Federal Reserve (the “Fed”) began its long-expected tapering program, reducing monthly purchases by $10 billion. The Fed continued to taper even after acknowledging in March that the economy had slowed during the winter months, which were unusually harsh for much of the U.S. By April, it was buying only $55 billion a month, down from $85 billion in December 2013.
In March 2014, while noting that the U.S. economy has not yet reached full employment, the Fed also unlinked attainment of a 6.5% unemployment level with a potential rate hike, since the unemployment rate in February was approaching that level. Revised guidance from new Fed Chair Janet Yellen seemed to indicate that a rise might not be considered until mid-2015, at the earliest, although she stressed that it would depend on labor market conditions and the inflation rate. Still, the date was earlier than many market participants had expected, which knocked the market off record highs reached earlier in the six-month period.
Even though upcoming economic reports may reflect the impacts from the severe winter weather, and international tensions remain high, the arrival of spring was expected to return the U.S. economy to its improving trend. Pent-up demand resulting from the huge gap in household formation over the prior several years continues to buoy the housing market, while a pickup in global demand bodes well for the U.S. manufacturing sector. Consumption is rising due to an increase in net worth, resulting from the rebound in housing and asset prices, which has boosted retail sales, and consumer sentiment measures. The consensus expectation for 2014 growth stands at 3.0%, compared with 1.9% for 2013.
Momentum driven by the favorable macro environment is supporting equities and moving spreads tighter, helping perpetuate the risk-on mode that has prevailed in the U.S. since 2008. Investors who want income will have to keep investing, but buying cheap securities may be a thing of the past. Recent volatility indicates that investors must guard against becoming complacent about the quality of investments they make and their inherent risks. The Fed continues pumping enormous amounts of liquidity into the system, but with little expectation that it will raise interest rates before 2015, the expansion is likely to continue. Even when the Fed does hike, it typically takes another two years before a recession threatens growth. While the economy may be entering a new era where interest rates head higher over the long term, there is likely a ceiling on how high rates can rise in advance of eventual monetary tightening.
For the six months ended March 31, 2014, the Standard & Poor’s 500® (“S&P 500”) Index* returned 12.51%. The Morgan Stanley Capital International (“MSCI”) Europe-Australasia-Far East (“EAFE”) Index* returned 6.41%. The return of the MSCI Emerging Markets Index* was 1.39%.
In the bond market, the Barclays U.S. Aggregate Bond Index* posted a 1.70% return for the period, while the Barclays U.S. Corporate High Yield Index* returned 6.67%. The return of the BofA Merrill Lynch 3-Month U.S. Treasury Bill Index* was 0.03% for the six-month period.
The opinions and forecasts expressed may not actually come to pass. This information is subject to change at any time, based on market and other conditions, and should not be construed as a recommendation of any specific security or strategy.
*Index Definitions:
The following indices are referenced throughout this report. Indices are unmanaged and not available for direct investment. Index performance does not reflect transaction costs, fees, or expenses.
Barclays U.S. Aggregate Bond Index is a broad-based benchmark that measures the investment grade, U.S. dollar denominated, fixed-rate taxable bond market, including U.S. Treasuries, government-related and corporate securities, MBS (agency fixed-rate and hybrid ARM pass-throughs), ABS, and CMBS.
Barclays U.S. Corporate High Yield Index measures the market of USD-denominated, non-investment grade, fixed-rate, taxable corporate bonds. Securities are classified as high yield if the middle rating of Moody’s, Fitch, and S&P is Ba1/BB+/BB+ or below.
BofA Merrill Lynch 3-Month U.S. Treasury Bill Index is an unmanaged market index of U.S. Treasury securities maturing in 90 days that assumes reinvestment of all income.
MSCI EAFE Index is a free float-adjusted market capitalization index that is designed to measure the equity market performance of developed markets, excluding the U.S. & Canada.
MSCI Emerging Markets Index is a free float-adjusted market capitalization weighted index that is designed to measure equity market performance in the global emerging markets.
S&P 500® Index is a capitalization-weighted index of 500 stocks designed to measure the performance of the broad economy, representing all major industries and is considered a representation of the U.S. stock market.
| |
| THE GUGGENHEIM FUNDS SEMI-ANNUAL REPORT | 3 |
| ABOUT SHAREHOLDERS’ FUND EXPENSES (Unaudited) |
| |
All mutual funds have operating expenses and it is important for our shareholders to understand the impact of costs on their investments. Shareholders of a Fund incur two types of costs: (i) transaction costs, including sales charges (loads) on purchase payments, reinvested dividends, or other distributions; and exchange fees; and (ii) ongoing costs, including management fees, administrative services, and shareholder reports, among others. These ongoing costs, or operating expenses, are deducted from a fund’s gross income and reduce the investment return of the fund.
A fund’s expenses are expressed as a percentage of its average net assets, which is known as the expense ratio. The following examples are intended to help investors understand the ongoing costs (in dollars) of investing in a Fund and to compare these costs with the ongoing costs of investing in other mutual funds.
The examples are based on an investment of $1,000 made at the beginning of the period and held for the entire six-month period beginning September 30, 2013 and ending March 31, 2014.
The following tables illustrate a Fund’s costs in two ways:
Table 1. Based on actual Fund return. This section helps investors estimate the actual expenses paid over the period. The “Ending Account Value” shown is derived from the Fund’s actual return, and the fourth column shows the dollar amount that would have been paid by an investor who started with $1,000 in the Fund. Investors may use the information here, together with the amount invested, to estimate the expenses paid over the period. Simply divide the Fund’s account value by $1,000 (for example, an $8,600 account value divided by $1,000 = 8.6), then multiply the result by the number provided under the heading “Expenses Paid During Period.”
Table 2. Based on hypothetical 5% return. This section is intended to help investors compare a Fund’s cost with those of other mutual funds. The table provides information about hypothetical account values and hypothetical expenses based on the Fund’s actual expense ratio and an assumed rate of return of 5% per year before expenses, which is not the Fund’s actual return. The hypothetical account values and expenses may not be used to estimate the actual ending account balance or expenses paid during the period. The example is useful in making comparisons because the U.S. Securities and Exchange Commission (the “SEC”) requires all mutual funds to calculate expenses based on the 5% return. Investors can assess a Fund’s costs by comparing this hypothetical example with the hypothetical examples that appear in shareholder reports of other funds.
The calculations illustrated above assume no shares were bought or sold during the period. Actual costs may have been higher or lower, depending on the amount of investment and the timing of any purchases or redemptions.
Please note that the expenses shown in the table are meant to highlight your ongoing costs only and do not reflect any transactional costs, such as sales charges (loads) on purchase payments, and contingent deferred sales charges (“CDSC”) on redemptions, if any. Therefore, the second table is useful in comparing ongoing costs only, and will not help you determine the relative total costs of owning different funds. In addition, if these transactional costs were included, your costs would have been higher.
More information about a Fund’s expenses, including annual expense ratios for the past five years, can be found in the Financial Highlights section of this report. For additional information on operating expenses and other shareholder costs, please refer to the appropriate Fund prospectus.
| |
| 4 | THE GUGGENHEIM FUNDS SEMI-ANNUAL REPORT |
| ABOUT SHAREHOLDERS’ FUND EXPENSES (Unaudited) (continued) |
| |
| | | | | | | | | | | Beginning | | | Ending | | | Expenses | |
| | | Expense | | | Fund | | | Account Value | | | Account Value | | | Paid During | |
| | | Ratio1 | | | Return | | | September 30, 2013 | | | March 31, 2014 | | | Period2 | |
| |
| Table 1. Based on actual Fund return3 |
| Floating Rate Strategies Fund | | | | | | | | | | | | | | | | | | | | |
A-Class | | | 1.05 | % | | | 3.30 | % | | | $1,000.00 | | | | $1,033.00 | | | | $5.32 | |
C-Class | | | 1.80 | % | | | 2.91 | % | | | 1,000.00 | | | | 1,029.10 | | | | 9.11 | |
Institutional Class | | | 0.80 | % | | | 3.38 | % | | | 1,000.00 | | | | 1,033.80 | | | | 4.06 | |
| High Yield Fund | | | | | | | | | | | | | | | | | | | | |
A-Class | | | 1.24 | % | | | 8.11 | % | | | 1,000.00 | | | | 1,081.10 | | | | 6.43 | |
B-Class | | | 0.96 | % | | | 8.26 | % | | | 1,000.00 | | | | 1,082.60 | | | | 4.98 | |
C-Class | | | 1.97 | % | | | 7.76 | % | | | 1,000.00 | | | | 1,077.60 | | | | 10.20 | |
Institutional Class | | | 0.97 | % | | | 8.28 | % | | | 1,000.00 | | | | 1,082.80 | | | | 5.04 | |
| Investment Grade Bond Fund | | | | | | | | | | | | | | | | | | | | |
A-Class | | | 1.07 | % | | | 4.75 | % | | | 1,000.00 | | | | 1,047.50 | | | | 5.46 | |
B-Class | | | 1.82 | % | | | 4.43 | % | | | 1,000.00 | | | | 1,044.30 | | | | 9.28 | |
C-Class | | | 1.82 | % | | | 4.37 | % | | | 1,000.00 | | | | 1,043.70 | | | | 9.27 | |
Institutional Class | | | 0.82 | % | | | 4.82 | % | | | 1,000.00 | | | | 1,048.20 | | | | 4.19 | |
| Limited Duration Fund4 | | | | | | | | | | | | | | | | | | | | |
A-Class | | | 1.30 | % | | | 0.52 | % | | | 1,000.00 | | | | 1,005.20 | | | | 3.79 | 5 |
C-Class | | | 1.53 | % | | | 0.33 | % | | | 1,000.00 | | | | 1,003.30 | | | | 4.45 | 5 |
Institutional Class | | | 0.54 | % | | | 0.62 | % | | | 1,000.00 | | | | 1,006.20 | | | | 1.57 | 5 |
| Macro Opportunities Fund | | | | | | | | | | | | | | | | | | | | |
A-Class | | | 1.40 | % | | | 5.72 | % | | | 1,000.00 | | | | 1,057.20 | | | | 7.18 | |
C-Class | | | 2.14 | % | | | 5.34 | % | | | 1,000.00 | | | | 1,053.40 | | | | 10.96 | |
Institutional Class | | | 1.08 | % | | | 5.93 | % | | | 1,000.00 | | | | 1,059.30 | | | | 5.54 | |
| Municipal Income Fund | | | | | | | | | | | | | | | | | | | | |
A-Class | | | 0.83 | % | | | 4.63 | % | | | 1,000.00 | | | | 1,046.30 | | | | 4.23 | |
C-Class | | | 1.58 | % | | | 4.15 | % | | | 1,000.00 | | | | 1,041.50 | | | | 8.04 | |
Institutional Class | | | 0.58 | % | | | 4.67 | % | | | 1,000.00 | | | | 1,046.70 | | | | 2.96 | |
| Total Return Bond Fund | | | | | | | | | | | | | | | | | | | | |
A-Class | | | 1.10 | % | | | 4.97 | % | | | 1,000.00 | | | | 1,049.70 | | | | 5.62 | |
C-Class | | | 1.66 | % | | | 4.60 | % | | | 1,000.00 | | | | 1,046.00 | | | | 8.47 | |
Institutional Class | | | 0.56 | % | | | 5.13 | % | | | 1,000.00 | | | | 1,051.30 | | | | 2.86 | |
| | | | | | | | | | | | | | | | | | | | | |
| |
| |
| THE GUGGENHEIM FUNDS SEMI-ANNUAL REPORT | 5 |
| ABOUT SHAREHOLDERS’ FUND EXPENSES (Unaudited) (concluded) |
| |
| | | | | | | | | | | Beginning | | | Ending | | | Expenses | |
| | | Expense | | | Fund | | | Account Value | | | Account Value | | | Paid During | |
| | | Ratio1 | | | Return | | | September 30, 2013 | | | March 31, 2014 | | | Period2 | |
| |
| Table 2. Based on hypothetical 5% return (before expenses) |
| Floating Rate Strategies Fund | | | | | | | | | | | | | | | | | | | | |
A-Class | | | 1.05 | % | | | 5.00 | % | | | $1,000.00 | | | | $1,019.70 | | | | $5.29 | |
C-Class | | | 1.80 | % | | | 5.00 | % | | | 1,000.00 | | | | 1,015.96 | | | | 9.05 | |
Institutional Class | | | 0.80 | % | | | 5.00 | % | | | 1,000.00 | | | | 1,020.94 | | | | 4.03 | |
| High Yield Fund | | | | | | | | | | | | | | | | | | | | |
A-Class | | | 1.24 | % | | | 5.00 | % | | | 1,000.00 | | | | 1,018.75 | | | | 6.24 | |
B-Class | | | 0.96 | % | | | 5.00 | % | | | 1,000.00 | | | | 1,020.14 | | | | 4.84 | |
C-Class | | | 1.97 | % | | | 5.00 | % | | | 1,000.00 | | | | 1,015.11 | | | | 9.90 | |
Institutional Class | | | 0.97 | % | | | 5.00 | % | | | 1,000.00 | | | | 1,020.09 | | | | 4.89 | |
| Investment Grade Bond Fund | | | | | | | | | | | | | | | | | | | | |
A-Class | | | 1.07 | % | | | 5.00 | % | | | 1,000.00 | | | | 1,019.60 | | | | 5.39 | |
B-Class | | | 1.82 | % | | | 5.00 | % | | | 1,000.00 | | | | 1,015.86 | | | | 9.15 | |
C-Class | | | 1.82 | % | | | 5.00 | % | | | 1,000.00 | | | | 1,015.86 | | | | 9.15 | |
Institutional Class | | | 0.82 | % | | | 5.00 | % | | | 1,000.00 | | | | 1,020.84 | | | | 4.13 | |
| Limited Duration Fund4 | | | | | | | | | | | | | | | | | | | | |
A-Class | | | 1.30 | % | | | 5.00 | % | | | 1,000.00 | | | | 1,018.45 | | | | 6.54 | 5 |
C-Class | | | 1.53 | % | | | 5.00 | % | | | 1,000.00 | | | | 1,017.30 | | | | 7.70 | 5 |
Institutional Class | | | 0.54 | % | | | 5.00 | % | | | 1,000.00 | | | | 1,022.24 | | | | 2.72 | 5 |
| Macro Opportunities Fund | | | | | | | | | | | | | | | | | | | | |
A-Class | | | 1.40 | % | | | 5.00 | % | | | 1,000.00 | | | | 1,017.95 | | | | 7.04 | |
C-Class | | | 2.14 | % | | | 5.00 | % | | | 1,000.00 | | | | 1,014.26 | | | | 10.75 | |
Institutional Class | | | 1.08 | % | | | 5.00 | % | | | 1,000.00 | | | | 1,019.55 | | | | 5.44 | |
| Municipal Income Fund | | | | | | | | | | | | | | | | | | | | |
A-Class | | | 0.83 | % | | | 5.00 | % | | | 1,000.00 | | | | 1,020.79 | | | | 4.18 | |
C-Class | | | 1.58 | % | | | 5.00 | % | | | 1,000.00 | | | | 1,017.05 | | | | 7.95 | |
Institutional Class | | | 0.58 | % | | | 5.00 | % | | | 1,000.00 | | | | 1,022.04 | | | | 2.92 | |
| Total Return Bond Fund | | | | | | | | | | | | | | | | | | | | |
A-Class | | | 1.10 | % | | | 5.00 | % | | | 1,000.00 | | | | 1,019.45 | | | | 5.54 | |
C-Class | | | 1.66 | % | | | 5.00 | % | | | 1,000.00 | | | | 1,016.65 | | | | 8.35 | |
Institutional Class | | | 0.56 | % | | | 5.00 | % | | | 1,000.00 | | | | 1,022.14 | | | | 2.82 | |
| | | | | | | | | | | | | | | | | | | | | |
| |
| 1 | This ratio represents annualized net expenses, which includes interest expense related to reverse repurchase agreements.Excluding interest expense, the operating expense ratios would be: |
| | | Floating Rate | | High Yield | | Investment Grade | | Macro Opportunities | | Total Return |
| | | Strategies Fund | | Fund | | Bond Fund | | Fund | | Bond Fund |
| |
| A-Class | | 1.04 | % | | 1.18 | % | | 1.03 | % | | 1.31 | % | | 0.93 | % |
| B-Class | | — | | | 0.91 | % | | 1.78 | % | | — | | | — | |
| C-Class | | 1.79 | % | | 1.91 | % | | 1.78 | % | | 2.04 | % | | 1.49 | % |
| Institutional Class | | 0.80 | % | | 0.91 | % | | 0.78 | % | | 0.98 | % | | 0.40 | % |
| 2 | Expenses are equal to the Fund’s annualized expense ratio, net of any applicable fee waivers, multiplied by the average account value over the period, multiplied by 182/365 (to reflect the one-half year period). |
| 3 | Actual cumulative return at net asset value for the period September 30, 2013 to March 31, 2014. |
| 4 | Since commencement of operations: December 16, 2013. |
| 5 | Expenses are equal to the Fund’s annualized expense ratio, net of any applicable fee waivers, multiplied by the average account value over the period, multiplied by 106/365 (to reflect the since inception period). |
| |
| 6 | THE GUGGENHEIM FUNDS SEMI-ANNUAL REPORT |
This page intentionally left blank.
| |
| THE GUGGENHEIM FUNDS SEMI-ANNUAL REPORT | 7 |
| FUND PROFILE (Unaudited) | March 31, 2014 |
| |
| FLOATING RATE STRATEGIES FUND |
| OBJECTIVE: Seeks to provide a high level of current income while maximizing total return. |
Holdings Diversification
(Market Exposure as % of Net Assets)
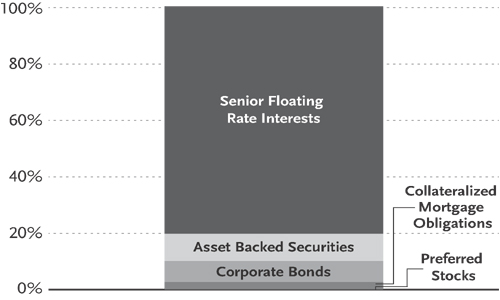
“Holdings Diversification (Market Exposure as % of Net Assets)” excludes any temporary cash investments.
| Ten Largest Holdings (% of Total Net Assets) | | | |
| |
| Alliance Boots Ltd. | | 1.3 | % |
| Scout24 AG | | 1.2 | % |
| Flakt Woods | | 1.2 | % |
| Infor (US), Inc. | | 1.1 | % |
| HUB International Ltd. | | 1.0 | % |
| Crosby Worldwide | | 1.0 | % |
| National Financial Partners | | 0.9 | % |
| Smart & Final Stores LLC | | 0.9 | % |
| Sears Holdings Corp. | | 0.9 | % |
| Chromaflo Technologies | | 0.9 | % |
| |
| Top Ten Total | | 10.4 | % |
| |
| Inception Dates: | | |
| |
| A-Class | | November 30, 2011 |
| C-Class | | November 30, 2011 |
| Institutional Class | | November 30, 2011 |
| Portfolio Composition by Quality Rating* |
| |
| Rating | | | |
| |
| Fixed Income Instruments | | | |
AAA | | 0.3 | % |
AA | | 1.2 | % |
A | | 1.8 | % |
BBB | | 8.0 | % |
BB | | 21.4 | % |
B | | 54.4 | % |
CCC | | 6.7 | % |
CC | | 0.2 | % |
NR | | 1.6 | % |
| Other Instruments | | | |
Short Term Investments | | 4.2 | % |
Preferred Stocks | | 0.2 | % |
| |
| Total Investments | | 100.0 | % |
| |
The chart above reflects percentages of the value of total investments.
| * | Source: Factset. Credit quality ratings are measured on a scale that generally ranges from AAA (highest) to D (lowest). All securities have been rated by Moody’s, Standard & Poor’s (“S&P”), or Fitch, which are all a Nationally Recognized Statistical Rating Organization (“NRSRO”). For purposes of this presentation, when ratings are available from more than one agency, the highest rating is used. Guggenheim Investments has converted Moody’s and Fitch ratings to the equivalent S&P rating. Unrated securities do not necessarily indicate low credit quality. Security ratings are determined at the time of purchase and may change thereafter. |
| |
| 8 | THE GUGGENHEIM FUNDS SEMI-ANNUAL REPORT |
| SCHEDULE OF INVESTMENTS (Unaudited) | | March 31, 2014 |
| |
| FLOATING RATE STRATEGIES FUND | | |
| | | | SHARES | | | VALUE | |
| |
| | | | | | | | |
| PREFERRED STOCKS† - 0.2% | | | | | | | |
| Aspen Insurance Holdings Ltd. 5.95%1,2 | | | 96,000 | | $ | 2,381,760 | |
| | | | | | | |
| Total Preferred Stocks | | | | | | | |
(Cost $2,400,000) | | | | | | 2,381,760 | |
| | | | | | | |
| | | | | | | | |
| SHORT TERM INVESTMENTS† - 4.5% | | | | | | | |
| Federated U.S. Treasury Cash Reserve Fund | | | 59,798,206 | | | 59,798,206 | |
| | | | | | | |
| Total Short Term Investments | | | | | | | |
(Cost $59,798,206) | | | | | | 59,798,206 | |
| | | | | | | |
| | | | | | | | |
| | | | FACE | | | | |
| | | | AMOUNT | | | | |
| | | | | | | |
| SENIOR FLOATING RATE INTERESTS†† - 80.6% | | | | | | | |
| | | | | | | | |
| CONSUMER DISCRETIONARY - 18.5% | | | | | | | |
Alliance Boots Ltd. | | | | | | | |
3.96% due 07/09/17 | | $ | 10,521,726 | | | 17,594,093 | |
3.46% due 07/09/15 | | | 2,986,900 | | | 4,974,731 | |
Smart & Final Stores LLC | | | | | | | |
4.75% due 11/15/19 | | | 12,463,336 | | | 12,463,336 | |
Sears Holdings Corp. | | | | | | | |
5.50% due 06/30/18 | | | 11,870,250 | | | 11,920,699 | |
BJ’s Wholesale Club, Inc. | | | | | | | |
4.50% due 09/26/19 | | | 11,540,105 | | | 11,568,955 | |
Neiman Marcus Group, Inc. | | | | | | | |
4.25% due 10/25/20 | | | 10,224,375 | | | 10,250,958 | |
Laureate Education, Inc. | | | | | | | |
5.00% due 06/15/18 | | | 9,727,484 | | | 9,630,209 | |
Guitar Center, Inc. | | | | | | | |
8.25% due 04/09/17 | | | 9,492,851 | | | 9,449,374 | |
Go Daddy Operating Company LLC | | | | | | | |
4.00% due 12/17/18 | | | 8,182,388 | | | 8,198,753 | |
Alexander Mann Solutions Ltd. | | | | | | | |
5.75% due 12/20/19 | | | 7,980,000 | | | 7,999,950 | |
Steinway Musical Instruments, Inc. | | | | | | | |
4.75% due 09/19/19 | | | 4,389,000 | | | 4,424,683 | |
9.25% due 09/18/20 | | | 3,300,000 | | | 3,399,000 | |
Hilton Worldwide Holdings, Inc. | | | | | | | |
3.50% due 10/26/20 | | | 7,631,579 | | | 7,640,432 | |
Lions Gate Entertainment Corp. | | | | | | | |
5.00% due 07/19/20 | | | 7,400,000 | | | 7,529,500 | |
Hudson’s Bay Co. | | | | | | | |
4.75% due 11/04/20 | | | 6,250,000 | | | 6,328,125 | |
IntraWest Holdings S.à.r.l. | | | | | | | |
7.75% due 12/10/186 | | | 5,300,000 | | | 5,096,737 | |
5.50% due 12/09/20 | | | 1,057,350 | | | 1,070,567 | |
CHG Healthcare Services, Inc. | | | | | | | |
4.25% due 11/19/19 | | | 5,131,410 | | | 5,137,825 | |
Connolly Holdings, Inc. | | | | | | | |
5.00% due 01/29/21 | | | 4,937,625 | | | 4,982,903 | |
TI Automotive Ltd. | | | | | | | |
5.50% due 03/28/19 | | | 4,950,000 | | | 4,962,375 | |
PSAV-Audio Visual Services Corp. | | | | | | | |
4.50% due 01/25/21 | | | 4,350,000 | | | 4,371,750 | |
William Morris Endeavor | | | | | | | |
5.25% due 03/19/21 | | | 3,400,000 | | | 3,376,642 | |
8.25% due 03/21/22 | | | 930,000 | | | 937,561 | |
Pinnacle Entertainment, Inc. | | | | | | | |
3.75% due 08/13/20 | | | 4,265,263 | | | 4,271,916 | |
Playa Resorts Holdings | | | | | | | |
4.00% due 08/09/19 | | | 4,179,000 | | | 4,192,080 | |
Landry’s, Inc. | | | | | | | |
4.00% due 04/24/18 | | | 4,053,655 | | | 4,073,924 | |
Party City Holdings, Inc. | | | | | | | |
4.00% due 07/27/19 | | | 4,008,881 | | | 4,008,120 | |
CPA Global | | | | | | | |
4.50% due 12/03/20 | | | 3,950,000 | | | 3,987,051 | |
Digital Cinema | | | | | | | |
3.25% due 05/17/21 | | | 3,870,000 | | | 3,840,975 | |
Warner Music Group | | | | | | | |
3.75% due 07/01/20 | | | 3,731,250 | | | 3,709,795 | |
ValleyCrest Companies LLC | | | | | | | |
5.50% due 06/13/19 | | | 3,573,000 | | | 3,599,798 | |
Ollies Bargain Outlet | | | | | | | |
5.25% due 09/28/19 | | | 3,365,444 | | | 3,352,824 | |
Capital Automotive LP | | | | | | | |
6.00% due 04/30/20 | | | 2,000,000 | | | 2,042,500 | |
4.00% due 04/10/19 | | | 1,141,519 | | | 1,144,019 | |
Armored AutoGroup, Inc. | | | | | | | |
6.00% due 11/05/16 | | | 3,144,148 | | | 3,161,850 | |
Fender Musical Instruments Corp. | | | | | | | |
5.75% due 04/03/19 | | | 2,856,000 | | | 2,866,710 | |
Serta Simmons Holdings LLC | | | | | | | |
4.25% due 10/01/19 | | | 2,849,110 | | | 2,857,828 | |
Arby’s | | | | | | | |
5.00% due 11/15/20 | | | 2,836,463 | | | 2,851,524 | |
California Pizza Kitchen, Inc. | | | | | | | |
5.25% due 03/29/18 | | | 2,964,384 | | | 2,808,754 | |
Centaur LLC | | | | | | | |
5.25% due 02/20/19 | | | 2,631,848 | | | 2,636,796 | |
Boyd Gaming Corp. | | | | | | | |
4.00% due 08/14/20 | | | 2,447,700 | | | 2,448,924 | |
Mitel Networks Corp. | | | | | | | |
5.25% due 01/31/20 | | | 2,384,025 | | | 2,406,387 | |
Fleetpride Corp. | | | | | | | |
5.25% due 11/19/19 | | | 1,977,475 | | | 1,949,790 | |
9.25% due 05/15/20 | | | 380,000 | | | 373,350 | |
Compucom Systems, Inc. | | | | | | | |
4.25% due 05/07/20 | | | 2,277,700 | | | 2,272,712 | |
SNL Financial | | | | | | | |
4.50% due 10/23/18 | | | 2,094,750 | | | 2,104,344 | |
Hoyts Group Holdings LLC | | | | | | | |
4.00% due 05/29/20 | | | 2,081,763 | | | 2,080,472 | |
NES Global Talent | | | | | | | |
6.50% due 10/03/19 | | | 1,987,500 | | | 1,987,500 | |
Southern Graphics, Inc. | | | | | | | |
4.25% due 10/17/19 | | | 1,860,439 | | | 1,858,114 | |
Totes Isotoner Corp. | | | | | | | |
7.25% due 07/07/17 | | | 1,599,776 | | | 1,603,775 | |
La Quinta Intermediate Holdings | | | | | | | |
4.00% due 02/19/21 | | | 1,500,000 | | | 1,499,070 | |
AlixPartners, LLP | | | | | | | |
4.00% due 07/10/20 | | | 1,422,755 | | | 1,424,533 | |
1-800 Contacts, Inc. | | | | | | | |
4.25% due 01/31/21 | | | 1,300,000 | | | 1,302,275 | |
Men’s Wearhouse | | | | | | | |
7.75% due 03/11/15†††,6 | | | 1,100,000 | | | 1,100,000 | |
Cooper Standard Automotive, Inc. | | | | | | | |
4.00% due 03/26/21 | | | 940,000 | | | 940,592 | |
| |
| SEE NOTES TO FINANCIAL STATEMENTS. | | THE GUGGENHEIM FUNDS SEMI-ANNUAL REPORT | 9 |
| SCHEDULE OF INVESTMENTS (Unaudited) (continued) | | March 31, 2014 |
| |
| FLOATING RATE STRATEGIES FUND | | |
| | | | FACE | | | | |
| | | | AMOUNT | | | VALUE | |
| |
| | | | | | | | |
NAB Holdings LLC | | | | | | | |
7.00% due 04/24/18 | | $ | 912,500 | | $ | 915,922 | |
Container Store, Inc. | | | | | | | |
4.25% due 04/06/19 | | | 895,380 | | | 896,499 | |
Rite Aid Corp. | | | | | | | |
5.75% due 08/21/20 | | | 500,000 | | | 510,315 | |
Equinox Fitness | | | | | | | |
4.25% due 01/31/20 | | | 495,000 | | | 496,648 | |
Jacobs Entertainment, Inc. | | | | | | | |
5.25% due 10/29/18 | | | 492,500 | | | 494,963 | |
Reynolds Group Holdings | | | | | | | |
4.00% due 12/01/18 | | | 493,762 | | | 494,903 | |
Sleepy’s LLC | | | | | | | |
5.00% due 03/30/19 | | | 490,000 | | | 492,450 | |
Navistar, Inc. | | | | | | | |
5.75% due 08/17/17 | | | 312,500 | | | 317,447 | |
David’s Bridal, Inc. | | | | | | | |
5.03% due 10/11/19 | | | 246,875 | | | 246,566 | |
Targus Group International, Inc. | | | | | | | |
12.00% due 05/24/166 | | | 231,236 | | | 191,348 | |
CKX Entertainment, Inc. | | | | | | | |
9.00% due 06/21/176 | | | 145,875 | | | 126,911 | |
| | | | | | | |
| Total Consumer Discretionary | | | | | | 249,251,432 | |
| | | | | | | |
| | | | | | | | |
| INDUSTRIALS - 16.5% | | | | | | | |
Flakt Woods | | | | | | | |
8.00% due 04/01/17 | | | 12,115,820 | | | 16,191,148 | |
Crosby Worldwide | | | | | | | |
4.00% due 11/23/20 | | | 12,967,500 | | | 12,891,898 | |
Brickman Group Holdings, Inc. | | | | | | | |
4.00% due 12/18/20 | | | 10,077,000 | | | 10,087,984 | |
7.50% due 12/17/21 | | | 1,400,000 | | | 1,424,500 | |
Travelport Holdings Ltd. | | | | | | | |
6.25% due 06/26/19 | | | 5,093,883 | | | 5,206,917 | |
9.50% due 01/31/16 | | | 4,935,000 | | | 5,095,388 | |
US Shipping Corp. | | | | | | | |
9.00% due 04/30/18 | | | 9,707,806 | | | 9,901,963 | |
Minimax Viking | | | | | | | |
4.50% due 08/14/20 | | | 9,452,500 | | | 9,519,424 | |
Mitchell International, Inc. | | | | | | | |
4.50% due 10/12/20 | | | 6,384,000 | | | 6,393,576 | |
8.50% due 10/11/21 | | | 3,050,000 | | | 3,114,813 | |
Rexnord LLC/ RBS Global, Inc. | | | | | | | |
4.00% due 08/21/20 | | | 8,358,000 | | | 8,357,916 | |
Doncasters Group Ltd. | | | | | | | |
9.50% due 10/09/20 | | | 6,950,000 | | | 7,054,250 | |
5.50% due 04/09/20 | | | 1,257,300 | | | 1,262,543 | |
US Infrastructure Corp. | | | | | | | |
4.00% due 07/10/20 | | | 6,848,250 | | | 6,835,444 | |
Thermasys Corp. | | | | | | | |
5.25% due 05/03/19 | | | 6,739,688 | | | 6,705,989 | |
SIRVA Worldwide, Inc. | | | | | | | |
7.50% due 03/27/19 | | | 5,940,000 | | | 6,058,800 | |
Tank & Rast | | | | | | | |
4.06% due 12/10/19 | | | 2,340,000 | | | 3,252,015 | |
3.81% due 12/10/18 | | | 1,750,000 | | | 2,412,847 | |
Berlin Packaging LLC | | | | | | | |
4.75% due 04/02/19 | | | 3,582,000 | | | 3,599,910 | |
8.75% due 04/10/20 | | | 1,900,000 | | | 1,942,750 | |
SRA International, Inc. | | | | | | | |
6.50% due 07/20/18 | | | 5,055,529 | | | 5,065,033 | |
Power Borrower, LLC | | | | | | | |
4.25% due 05/06/20 | | | 2,955,637 | | | 2,938,406 | |
8.25% due 11/06/20 | | | 1,670,000 | | | 1,653,300 | |
Quikrete | | | | | | | |
4.00% due 09/28/20 | | | 4,577,000 | | | 4,581,760 | |
HD Supply, Inc. | | | | | | | |
4.00% due 06/28/18 | | | 4,431,106 | | | 4,432,036 | |
IPC Systems, Inc. | | | | | | | |
7.75% due 07/31/17 | | | 4,121,091 | | | 4,120,433 | |
NaNa Development Corp. | | | | | | | |
8.00% due 03/15/18 | | | 4,080,000 | | | 4,039,200 | |
Filtration Group Corp. | | | | | | | |
4.50% due 11/20/20 | | | 3,840,375 | | | 3,862,764 | |
Sutherland Global Services, Inc. | | | | | | | |
7.25% due 03/06/19 | | | 3,800,000 | | | 3,819,000 | |
syncreon | | | | | | | |
5.25% due 10/28/20 | | | 3,790,500 | | | 3,795,238 | |
Ceva Logistics US Holdings | | | | | | | |
6.50% due 03/19/21 | | | 3,783,251 | | | 3,767,475 | |
Knowledge Learning Corp. | | | | | | | |
5.25% due 03/12/21 | | | 3,550,000 | | | 3,569,987 | |
Multiplan, Inc. | | | | | | | |
4.00% due 03/31/21 | | | 3,400,000 | | | 3,391,500 | |
Emerald Expositions | | | | | | | |
5.50% due 06/17/20 | | | 3,132,123 | | | 3,153,014 | |
Camp Systems International | | | | | | | |
4.75% due 05/31/19 | | | 1,895,213 | | | 1,914,165 | |
8.25% due 11/29/19 | | | 1,150,000 | | | 1,171,563 | |
GYP Holdings III Corp. | | | | | | | |
4.75% due 03/26/21 | | | 2,800,000 | | | 2,786,000 | |
Ceva Logistics Holdings BV (Dutch) | | | | | | | |
6.50% due 03/19/21 | | | 2,742,857 | | | 2,731,419 | |
Mast Global | | | | | | | |
8.75% due 09/12/19†††,6 | | | 2,715,625 | | | 2,688,469 | |
Osmose Holdings, Inc. | | | | | | | |
4.75% due 11/26/18 | | | 2,619,792 | | | 2,632,891 | |
Ceva Group Plc (United Kingdom) | | | | | | | |
6.50% due 03/19/21 | | | 2,600,985 | | | 2,590,139 | |
Ranpak | | | | | | | |
4.50% due 04/25/19 | | | 2,005,124 | | | 2,015,149 | |
8.50% due 04/23/20 | | | 500,000 | | | 510,000 | |
Univision Communications, Inc. | | | | | | | |
4.00% due 03/01/20 | | | 2,504,700 | | | 2,499,791 | |
Nord Anglia Education Finance LLC | | | | | | | |
4.50% due 03/19/21 | | | 2,500,000 | | | 2,496,875 | |
Realogy Corp. | | | | | | | |
3.75% due 03/05/20 | | | 2,475,047 | | | 2,482,472 | |
MRC Global, Inc. | | | | | | | |
4.75% due 11/08/19 | | | 2,417,850 | | | 2,445,559 | |
GCA Services Group, Inc. | | | | | | | |
4.27% due 11/01/19 | | | 1,796,465 | | | 1,798,711 | |
9.25% due 11/01/20 | | | 200,000 | | | 202,250 | |
Berry Plastics Corp. | | | | | | | |
3.50% due 02/08/20 | | | 1,094,472 | | | 1,089,000 | |
3.75% due 01/06/21 | | | 900,000 | | | 897,624 | |
ServiceMaster Co. | | | | | | | |
4.25% due 01/31/17 | | | 1,757,934 | | | 1,758,303 | |
Dematic S.A. | | | | | | | |
4.25% due 12/28/19 | | | 1,361,681 | | | 1,363,955 | |
CareCore National LLC | | | | | | | |
5.50% due 03/05/21 | | | 1,350,000 | | | 1,357,317 | |
| |
| 10 | THE GUGGENHEIM FUNDS SEMI-ANNUAL REPORT | | SEE NOTES TO FINANCIAL STATEMENTS. |
| SCHEDULE OF INVESTMENTS (Unaudited) (continued) | | March 31, 2014 |
| |
| FLOATING RATE STRATEGIES FUND | | |
| | | | FACE | | | | |
| | | | AMOUNT | | | VALUE | |
| |
| | | | | | | | |
Helm Financial Corp. | | | | | | | |
6.25% due 06/01/17 | | $ | 1,150,133 | | $ | 1,147,258 | |
Travelport LLC | | | | | | | |
5.50% due 06/21/18†††,6 | | | 833,333 | | | 752,859 | |
CPM Acquisition Corp. | | | | | | | |
6.25% due 08/29/17 | | | 379,192 | | | 381,561 | |
10.25% due 03/01/18 | | | 325,000 | | | 329,063 | |
Panolam Industries International, Inc. | | | | | | | |
7.25% due 08/23/17 | | | 572,763 | | | 557,012 | |
Wireco Worldgroup, Inc. | | | | | | | |
6.00% due 02/15/17 | | | 492,500 | | | 494,963 | |
Ceva Logistics Canada, ULC | | | | | | | |
6.50% due 03/19/21 | | | 472,906 | | | 470,934 | |
Omnitracs, Inc. | | | | | | | |
8.75% due 05/25/21 | | | 350,000 | | | 354,375 | |
Advanced Disposal Services, Inc. | | | | | | | |
3.75% due 10/09/19 | | | 351,369 | | | 350,442 | |
Total Safety U.S., Inc. | | | | | | | |
5.75% due 03/13/20 | | | 198,000 | | | 198,248 | |
9.25% due 09/13/20 | | | 99,750 | | | 99,750 | |
Hamilton Sundstrand | | | | | | | |
4.00% due 12/13/19 | | | 257,117 | | | 256,394 | |
SI Organization | | | | | | | |
5.50% due 11/22/16 | | | 243,759 | | | 238,124 | |
Hunter Fan Co. | | | | | | | |
6.50% due 12/20/17 | | | 223,010 | | | 222,731 | |
Wyle Services Corp. | | | | | | | |
5.00% due 03/26/17 | | | 190,786 | | | 190,786 | |
Awas Aviation Holdings LLC | | | | | | | |
3.50% due 06/10/16 | | | 189,229 | | | 189,229 | |
DynCorp International, Inc. | | | | | | | |
6.25% due 07/07/16 | | | 84,224 | | | 84,698 | |
| | | | | | | |
| Total Industrials | | | | | | 223,249,300 | |
| | | | | | | |
| | | | | | | | |
| INFORMATION TECHNOLOGY - 11.5% | | | | | | | |
Infor (US), Inc. | | | | | | | |
3.75% due 06/03/20 | | | 18,521,036 | | | 18,450,198 | |
Sabre, Inc. | | | | | | | |
4.50% due 02/19/19 | | | 8,361,491 | | | 8,357,310 | |
4.25% due 02/19/19 | | | 2,952,035 | | | 2,950,795 | |
Active Network, Inc., The | | | | | | | |
5.50% due 11/13/20 | | | 9,875,250 | | | 9,955,536 | |
Greenway Medical Technologies | | | | | | | |
6.00% due 11/04/20 | | | 9,975,000 | | | 9,912,656 | |
GlobalLogic Holdings, Inc. | | | | | | | |
6.25% due 05/31/19 | | | 9,725,625 | | | 9,628,369 | |
CallCredit Info Group Ltd. | | | | | | | |
7.75% due 03/26/21 | | | 5,300,000 | | | 8,901,809 | |
LANDesk Group, Inc. | | | | | | | |
5.00% due 02/25/20 | | | 8,457,500 | | | 8,460,122 | |
Aspect Software, Inc. | | | | | | | |
7.25% due 05/07/16 | | | 8,101,342 | | | 8,202,608 | |
Applied Systems, Inc. | | | | | | | |
4.25% due 01/25/21 | | | 7,331,625 | | | 7,349,954 | |
Activision Blizzard | | | | | | | |
3.25% due 10/12/20 | | | 6,356,250 | | | 6,349,894 | |
ION Trading Technologies Ltd. | | | | | | | |
4.50% due 05/22/20 | | | 3,937,500 | | | 3,941,201 | |
8.25% due 05/22/21 | | | 1,800,000 | | | 1,818,000 | |
EIG Investors Corp. | | | | | | | |
5.00% due 11/09/19 | | | 5,409,320 | | | 5,436,366 | |
Deltek, Inc. | | | | | | | |
4.50% due 10/10/18 | | | 5,117,024 | | | 5,142,609 | |
P2 Energy Solutions | | | | | | | |
5.00% due 10/30/20 | | | 4,568,550 | | | 4,602,814 | |
9.00% due 04/30/21 | | | 390,000 | | | 396,338 | |
CDW LLC | | | | | | | |
3.25% due 04/29/20 | | | 4,950,012 | | | 4,900,511 | |
Sophos | | | | | | | |
5.00% due 01/29/21 | | | 4,800,000 | | | 4,812,000 | |
Paradigm Ltd | | | | | | | |
4.75% due 07/30/196 | | | 4,129,316 | | | 4,133,198 | |
Verint Systems, Inc. | | | | | | | |
3.50% due 09/06/19 | | | 3,467,000 | | | 3,455,732 | |
Blue Coat Systems, Inc. | | | | | | | |
4.00% due 05/31/19 | | | 3,286,000 | | | 3,291,488 | |
Kronos, Inc. | | | | | | | |
4.50% due 10/30/19 | | | 2,424,996 | | | 2,441,365 | |
SRS Distribution, Inc. | | | | | | | |
4.75% due 08/28/19 | | | 2,279,019 | | | 2,279,019 | |
Eze Castle Software, Inc. | | | | | | | |
7.25% due 04/04/21 | | | 1,441,176 | | | 1,448,382 | |
8.50% due 03/14/21 | | | 800,000 | | | 810,000 | |
Lantiq Deutschland GmbH | | | | | | | |
11.00% due 11/16/156 | | | 1,881,406 | | | 1,862,592 | |
Attachmate Group, Inc., The | | | | | | | |
7.25% due 11/22/17 | | | 1,119,620 | | | 1,125,923 | |
Hyland Software, Inc. | | | | | | | |
4.75% due 02/19/21 | | | 1,089,000 | | | 1,098,529 | |
Wall Street Systems | | | | | | | |
5.75% due 10/25/19 | | | 641,875 | | | 641,875 | |
9.25% due 10/25/20 | | | 150,000 | | | 151,125 | |
American Builders & Contractors | | | | | | | |
Supply Co., Inc. | | | | | | | |
3.50% due 04/16/20 | | | 696,500 | | | 694,139 | |
Sophia, LP | | | | | | | |
4.00% due 07/19/18 | | | 382,139 | | | 382,139 | |
Epicor Software | | | | | | | |
4.00% due 05/16/18 | | | 374,063 | | | 374,717 | |
SumTotal Systems | | | | | | | |
6.25% due 11/16/18 | | | 331,073 | | | 329,004 | |
| | | | | | | |
| Total Information Technology | | | | | | 154,088,317 | |
| | | | | | | |
| | | | | | | | |
| TELECOMMUNICATION SERVICES - 10.3% | | | | | | | |
Ziggo BV | | | | | | | |
3.75% due 01/15/22 | | | 6,445,200 | | | 8,830,328 | |
3.50% due 01/15/22 | | | 5,854,800 | | | 8,021,443 | |
Scout24 AG | | | | | | | |
4.48% due 02/05/21 | | | 12,000,000 | | | 16,689,398 | |
Alcatel-Lucent, Inc. | | | | | | | |
4.50% due 01/30/19 | | | 11,444,482 | | | 11,492,778 | |
Cumulus Media, Inc. | | | | | | | |
4.25% due 12/23/20 | | | 10,967,750 | | | 11,008,879 | |
Zayo Group LLC | | | | | | | |
4.00% due 07/02/19 | | | 9,875,481 | | | 9,877,950 | |
Expert Global Solutions | | | | | | | |
8.50% due 04/03/18 | | | 8,973,458 | | | 8,737,905 | |
7.80% due 04/02/176 | | | 937,500 | | | 883,575 | |
Asurion Corp. | | | | | | | |
4.25% due 07/08/20 | | | 4,128,800 | | | 4,111,831 | |
6.00% due 05/24/19 | | | 3,891,170 | | | 3,897,512 | |
| |
| SEE NOTES TO FINANCIAL STATEMENTS. | | THE GUGGENHEIM FUNDS SEMI-ANNUAL REPORT | 11 |
| SCHEDULE OF INVESTMENTS (Unaudited) (continued) | | March 31, 2014 |
| |
| FLOATING RATE STRATEGIES FUND | | |
| | | | FACE | | | | |
| | | | AMOUNT | | | VALUE | |
| |
| | | | | | | | |
Avaya, Inc. | | | | | | | |
6.50% due 03/31/18 | | $ | 4,933,593 | | $ | 4,938,724 | |
4.73% due 10/26/17 | | | 2,338,791 | | | 2,281,538 | |
Light Tower Fiber LLC | | | | | | | |
4.00% due 04/13/20 | | | 6,458,731 | | | 6,414,360 | |
Cengage Learning Acquisitions, Inc. | | | | | | | |
7.00% due 03/06/20 | | | 5,650,000 | | | 5,708,873 | |
Trader Media Corporation Ltd. | | | | | | | |
5.00% due 12/08/17 | | | 3,376,319 | | | 5,645,041 | |
Gogo LLC | | | | | | | |
11.25% due 06/21/176 | | | 4,342,631 | | | 4,690,042 | |
CBS Outdoor Americas Capital LLC | | | | | | | |
3.00% due 01/31/21 | | | 4,600,000 | | | 4,579,898 | |
Associated Partners, Inc. | | | | | | | |
6.66% due 12/21/15†††,6 | | | 3,250,000 | | | 3,258,125 | |
Univision Communications, Inc. | | | | | | | |
4.00% due 03/01/20 | | | 3,006,951 | | | 3,010,289 | |
Live Nation Worldwide, Inc. | | | | | | | |
3.50% due 08/14/20 | | | 2,985,000 | | | 2,978,463 | |
Hemisphere Media Group, Inc. | | | | | | | |
6.25% due 07/30/20 | | | 2,580,500 | | | 2,586,951 | |
EMI Music Publishing | | | | | | | |
3.75% due 06/29/18 | | | 2,367,010 | | | 2,365,329 | |
Virgin Media Investment Holdings Ltd. | | | | | | | |
3.50% due 06/08/20 | | | 2,000,000 | | | 1,994,660 | |
Anaren, Inc. | | | | | | | |
5.50% due 02/18/21 | | | 1,596,000 | | | 1,603,980 | |
9.25% due 08/18/21 | | | 275,000 | | | 277,750 | |
Syniverse Technologies, Inc. | | | | | | | |
4.00% due 04/23/19 | | | 1,163,426 | | | 1,163,914 | |
Level 3 Communications, Inc. | | | | | | | |
4.00% due 08/01/19 | | | 750,000 | | | 751,688 | |
Clientlogic Corp. | | | | | | | |
6.99% due 01/30/17 | | | 250,000 | | | 252,500 | |
Telx Group | | | | | | | |
5.25% due 09/25/17 | | | 243,789 | | | 245,312 | |
| | | | | | | |
| Total Telecommunication Services | | | | | | 138,299,036 | |
| | | | | | | |
| | | | | | | | |
| FINANCIALS - 9.2% | | | | | | | |
HUB International Ltd. | | | | | | | |
4.75% due 10/02/20 | | | 13,731,000 | | | 13,736,766 | |
National Financial Partners | | | | | | | |
5.25% due 07/01/20 | | | 12,530,831 | | | 12,589,601 | |
First Data Corp. | | | | | | | |
4.15% due 03/23/18 | | | 9,300,000 | | | 9,315,531 | |
4.15% due 03/24/21 | | | 1,374,285 | | | 1,376,291 | |
4.15% due 09/24/18 | | | 400,000 | | | 400,388 | |
Magic Newco, LLC | | | | | | | |
5.00% due 12/12/18 | | | 9,903,160 | | | 9,989,813 | |
12.00% due 06/12/19 | | | 500,000 | | | 572,500 | |
Ceridian Corp. | | | | | | | |
4.40% due 05/09/17 | | | 5,848,903 | | | 5,869,374 | |
American Stock Transfer & Trust | | | | | | | |
5.75% due 06/26/20 | | | 5,828,800 | | | 5,848,210 | |
WTG Holdings | | | | | | | |
4.75% due 01/15/21 | | | 5,735,625 | | | 5,749,964 | |
AmWINS Group, LLC | | | | | | | |
5.00% due 09/06/19 | | | 4,755,955 | | | 4,784,206 | |
International Lease Finance | | | | | | | |
3.50% due 03/06/21 | | | 4,700,000 | | | 4,700,987 | |
Wastequip, Inc. | | | | | | | |
5.50% due 08/09/19 | | | 4,429,031 | | | 4,462,249 | |
Nuveen Investments, Inc. | | | | | | | |
4.15% due 05/13/17 | | | 4,000,000 | | | 4,009,280 | |
6.50% due 02/28/19 | | | 400,000 | | | 400,500 | |
RCS Capital | | | | | | | |
6.50% due 03/29/19 | | | 4,350,000 | | | 4,371,750 | |
STG-Fairway Acquisitions, Inc. | | | | | | | |
6.25% due 02/28/19 | | | 2,977,505 | | | 2,984,949 | |
10.50% due 08/28/19††† | | | 1,300,000 | | | 1,287,000 | |
Topaz Power Holdings LLC | | | | | | | |
5.25% due 02/26/20 | | | 3,950,000 | | | 3,864,404 | |
Cetera Financial Group, Inc. | | | | | | | |
6.50% due 08/07/19 | | | 3,555,000 | | | 3,555,000 | |
Lineage Logistics LLC | | | | | | | |
4.50% due 03/31/21 | | | 3,250,000 | | | 3,241,875 | |
Fly Leasing Ltd. | | | | | | | |
4.50% due 08/09/19 | | | 2,660,078 | | | 2,685,562 | |
Intertrust Group | | | | | | | |
4.65% due 02/04/20 | | | 2,616,000 | | | 2,605,379 | |
Transunion Holding Co. | | | | | | | |
4.00% due 03/19/21 | | | 2,500,000 | | | 2,504,175 | |
Grosvenor Capital Management | | | | | | | |
Holdings, LLLP | | | | | | | |
3.75% due 01/04/21 | | | 2,169,563 | | | 2,157,370 | |
USI Holdings Corp. | | | | | | | |
4.25% due 12/27/19 | | | 1,970,125 | | | 1,976,291 | |
iStar Financial, Inc. | | | | | | | |
4.50% due 10/15/17 | | | 1,952,824 | | | 1,957,100 | |
Cunningham Lindsey U.S., Inc. | | | | | | | |
5.00% due 12/10/19 | | | 1,631,602 | | | 1,630,917 | |
9.25% due 06/10/20 | | | 194,886 | | | 194,399 | |
AssuredPartners | | | | | | | |
0.00% due 01/31/193 | | | 1,600,000 | | | 1,584,000 | |
Alliant Holdings I, LLC | | | | | | | |
4.25% due 12/20/19 | | | 1,425,543 | | | 1,430,290 | |
CNO Financial Group, Inc. | | | | | | | |
3.75% due 09/28/18 | | | 727,926 | | | 727,475 | |
Knight/Getco | | | | | | | |
5.75% due 12/05/17 | | | 607,477 | | | 608,236 | |
Hamilton Lane Advisors LLC | | | | | | | |
5.25% due 02/28/18 | | | 196,875 | | | 196,875 | |
| | | | | | | |
| Total Financials | | | | | | 123,368,707 | |
| | | | | | | |
| | | | | | | | |
| CONSUMER STAPLES - 4.6% | | | | | | | |
Performance Food Group | | | | | | | |
6.25% due 11/14/19 | | | 9,921,453 | | | 10,053,705 | |
CTI Foods Holding Co. LLC | | | | | | | |
8.25% due 06/28/21 | | | 8,650,000 | | | 8,693,250 | |
4.50% due 06/28/20 | | | 1,343,250 | | | 1,343,250 | |
Dole Food Company, Inc. | | | | | | | |
4.50% due 11/01/18 | | | 7,980,000 | | | 8,009,925 | |
Reddy Ice Holdings, Inc. | | | | | | | |
6.75% due 04/01/19 | | | 4,853,481 | | | 4,804,946 | |
10.75% due 10/01/19 | | | 2,000,000 | | | 1,920,000 | |
Arctic Glacier Holdings, Inc. | | | | | | | |
5.00% due 05/10/19 | | | 6,433,607 | | | 6,441,649 | |
Grocery Outlet, Inc. | | | | | | | |
5.50% due 12/17/18 | | | 6,048,438 | | | 6,059,809 | |
| |
| 12 | THE GUGGENHEIM FUNDS SEMI-ANNUAL REPORT | | SEE NOTES TO FINANCIAL STATEMENTS. |
| SCHEDULE OF INVESTMENTS (Unaudited) (continued) | | March 31, 2014 |
| |
| FLOATING RATE STRATEGIES FUND | | |
| | | | FACE | | | | |
| | | | AMOUNT | | | VALUE | |
| |
| | | | | | | | |
Darling International, Inc. | | | | | | | |
3.25% due 01/08/21 | | $ | 6,000,000 | | $ | 5,987,520 | |
Hostess Brands | | | | | | | |
6.75% due 04/09/20 | | | 2,800,000 | | | 2,908,500 | |
DS Waters of America, Inc. | | | | | | | |
5.25% due 08/30/20 | | | 2,487,500 | | | 2,524,813 | |
AdvancePierre Foods, Inc. | | | | | | | |
5.75% due 07/10/17 | | | 1,706,360 | | | 1,711,036 | |
9.50% due 10/10/17 | | | 751,000 | | | 728,470 | |
Aramark Corp. | | | | | | | |
3.25% due 02/24/21 | | | 1,220,000 | | | 1,207,544 | |
| | | | | | | |
| Total Consumer Staples | | | | | | 62,394,417 | |
| | | | | | | |
| | | | | | | | |
| MATERIALS - 3.5% | | | | | | | |
Chromaflo Technologies | | | | | | | |
4.50% due 12/02/19 | | | 11,720,625 | | | 11,749,926 | |
Oxbow Carbon | | | | | | | |
8.00% due 01/19/20 | | | 4,900,000 | | | 4,998,000 | |
4.25% due 07/19/19 | | | 3,940,158 | | | 3,958,204 | |
WR Grace & Co. | | | | | | | |
3.00% due 02/03/21 | | | 8,842,105 | | | 8,816,286 | |
Royal Adhesives and Sealants | | | | | | | |
5.50% due 07/31/18 | | | 5,045,605 | | | 5,105,547 | |
CPG International, Inc. | | | | | | | |
4.75% due 09/30/20 | | | 3,710,345 | | | 3,716,541 | |
Atkore International, Inc. | | | | | | | |
4.50% due 03/26/21 | | | 2,300,000 | | | 2,295,699 | |
7.75% due 09/27/21 | | | 400,000 | | | 402,000 | |
Ennis-Flint | | | | | | | |
4.25% due 03/31/21 | | | 2,100,000 | | | 2,096,073 | |
7.75% due 09/30/21 | | | 550,000 | | | 550,000 | |
United Central Industrial Supply | | | | | | | |
9.50% due 10/09/17†††,6 | | | 1,700,000 | | | 1,700,000 | |
Fortescue Metals Group Ltd. | | | | | | | |
4.25% due 06/30/19 | | | 995,000 | | | 1,002,174 | |
Kloeckner Pentaplast S.A. | | | | | | | |
4.75% due 12/21/16 | | | 285,529 | | | 288,028 | |
| | | | | | | |
| Total Materials | | | | | | 46,678,478 | |
| | | | | | | |
| | | | | | | | |
| HEALTH CARE - 3.1% | | | | | | | |
Community Health Systems, Inc. | | | | | | | |
4.25% due 01/27/21 | | | 10,623,375 | | | 10,705,069 | |
Akorn, Inc. | | | | | | | |
4.50% due 11/13/20 | | | 6,300,000 | | | 6,355,125 | |
Valeant Pharmaceuticals International, Inc. | | | | | | | |
3.75% due 08/05/20 | | | 5,602,430 | | | 5,615,652 | |
Merge Healthcare, Inc. | | | | | | | |
6.00% due 04/23/196 | | | 4,512,406 | | | 4,241,662 | |
Learning Care Group (US), Inc. | | | | | | | |
5.75% due 05/08/19 | | | 4,227,174 | | | 4,240,405 | |
Harvard Drug | | | | | | | |
5.00% due 08/16/20 | | | 3,320,163 | | | 3,337,794 | |
DJO Finance LLC | | | | | | | |
4.75% due 09/15/17 | | | 2,567,500 | | | 2,574,715 | |
Ceramtec GMBH | | | | | | | |
4.25% due 08/30/20 | | | 2,284,515 | | | 2,286,410 | |
Catalent Pharma Solutions, Inc. | | | | | | | |
4.25% due 09/15/17 | | | 1,178,462 | | | 1,181,149 | |
Healthport, Inc. | | | | | | | |
5.25% due 10/04/19 | | | 748,125 | | | 755,606 | |
| | | | | | | |
Total Health Care | | | | | | 41,293,587 | |
| | | | | | | |
| | | | | | | | |
| ENERGY - 2.5% | | | | | | | |
Ocean Rig ASA | | | | | | | |
6.00% due 03/31/21 | | | 7,788,691 | | | 7,926,628 | |
Rice Energy | | | | | | | |
8.50% due 10/25/18 | | | 6,538,714 | | | 6,653,142 | |
Pacific Drilling | | | | | | | |
4.50% due 05/18/18 | | | 5,705,631 | | | 5,724,175 | |
PSS Companies | | | | | | | |
5.50% due 01/28/20 | | | 5,250,000 | | | 5,276,250 | |
Panda Temple II Power | | | | | | | |
7.25% due 04/03/19 | | | 4,500,000 | | | 4,606,875 | |
Varel International Energy Funding Corp. | | | | | | | |
9.25% due 07/17/17 | | | 956,250 | | | 963,422 | |
Crestwood | | | | | | | |
7.00% due 06/19/19 | | | 731,855 | | | 744,209 | |
Panda Sherman | | | | | | | |
9.00% due 09/14/18 | | | 600,000 | | | 613,500 | |
EP Energy LLC | | | | | | | |
4.50% due 04/30/19 | | | 281,250 | | | 281,835 | |
Sheridan Production Partners | | | | | | | |
4.25% due 10/01/19 | | | 244,375 | | | 245,494 | |
| | | | | | | |
Total Energy | | | | | | 33,035,530 | |
| | | | | | | |
| | | | | | | | |
| UTILITIES - 0.9% | | | | | | | |
Astoria Generating Company | | | | | | | |
Acquisitions LLC | | | | | | | |
8.50% due 10/26/17 | | | 6,825,000 | | | 7,029,750 | |
Linden Cogeneration Power | | | | | | | |
3.75% due 12/17/20 | | | 4,800,507 | | | 4,820,525 | |
| | | | | | | |
| Total Utilities | | | | | | 11,850,275 | |
| | | | | | | |
| | | | | | | | |
| Total Senior Floating Rate Interests | | | | | | | |
(Cost $1,075,198,469) | | | | | | 1,083,509,079 | |
| | | | | | | |
| | | | | | | | |
| ASSET BACKED SECURITIES†† - 9.6% | | | | | | | |
Gramercy Real Estate CDO 2007-1 Ltd. | | | | | | | |
2007-1A, 0.52% due 08/15/561,4 | | | 11,647,489 | | | 9,969,087 | |
Castlelake Aircraft Securitization Trust | | | | | | | |
2014-1, 5.25% due 02/15/29††† | | | 4,705,825 | | | 4,752,883 | |
2014-1, 7.50% due 02/15/29††† | | | 3,500,000 | | | 3,535,000 | |
Cedar Woods CRE CDO Ltd. | | | | | | | |
0.42% due 07/25/51††† | | | 8,849,225 | | | 7,224,507 | |
GreenPoint Mortgage Funding Trust | | | | | | | |
2005-HE4, 0.86% due 07/25/301 | | | 6,800,000 | | | 6,153,544 | |
RAIT CRE CDO I Ltd. | | | | | | | |
2006-1X, 0.49% due 11/20/46†††,1 | | | 6,498,237 | | | 5,498,808 | |
N-Star REL CDO VIII Ltd. | | | | | | | |
2006-8A, 0.51% due 02/01/411,4 | | | 3,250,000 | | | 2,811,900 | |
2006-8A, 0.44% due 02/01/41†††,1,4 | | | 1,779,618 | | | 1,677,112 | |
Structured Asset Securities Corporation | | | | | | | |
Mortgage Loan Trust | | | | | | | |
2006-OPT1, 0.41% due 04/25/361 | | | 4,300,000 | | | 3,697,200 | |
2007-BC1, 0.28% due 02/25/371 | | | 900,000 | | | 732,559 | |
N-Star Real Estate CDO IX Ltd. | | | | | | | |
0.51% due 02/01/41†††,6 | | | 4,804,968 | | | 4,366,275 | |
KKR Financial CLO 2007-1 Ltd. | | | | | | | |
2007-1A, 2.49% due 05/15/211,4 | | | 4,100,000 | | | 3,942,560 | |
Newstar Commercial Loan | | | | | | | |
Funding 2013-1 LLC | | | | | | | |
2013-1A, 4.78% due 09/20/231,4 | | | 2,750,000 | | | 2,750,000 | |
2013-1A, 5.53% due 09/20/231,4 | | | 250,000 | | | 249,350 | |
| |
| SEE NOTES TO FINANCIAL STATEMENTS. | | THE GUGGENHEIM FUNDS SEMI-ANNUAL REPORT | 13 |
| SCHEDULE OF INVESTMENTS (Unaudited) (continued) | | March 31, 2014 |
| |
| FLOATING RATE STRATEGIES FUND | | |
| | | | FACE | | | | |
| | | | AMOUNT | | | VALUE | |
| |
| | | | | | | | |
Lehman XS Trust | | | | | | | |
2007-9, 0.27% due 06/25/371 | | $ | 3,226,703 | | $ | 2,820,500 | |
Jasper CLO Ltd. | | | | | | | |
2005-1A, 1.14% due 08/01/171,4 | | | 3,000,000 | | | 2,813,322 | |
Halcyon Loan Advisors Funding 2012-1 Ltd. | | | | | | | |
2012-1A, 3.24% due 08/15/231,4 | | | 2,600,000 | | | 2,594,280 | |
Wachovia Asset Securitization | | | | | | | |
Issuance II LLC 2007-HE1 Trust | | | | | | | |
2007-HE1, 0.29% due 07/25/371,4 | | | 2,914,538 | | | 2,438,099 | |
Highland Park CDO I Ltd. | | | | | | | |
2006-1A, 0.56% due 11/25/511,4,7 | | | 2,616,693 | | | 2,402,909 | |
Tricadia CDO 2006-6 Ltd. | | | | | | | |
2006-6A, 0.79% due 11/05/41†††,1,4 | | | 1,750,000 | | | 1,627,675 | |
2006-6A, 0.99% due 11/05/41†††,1,4 | | | 550,000 | | | 499,675 | |
TCW Global Project Fund III Ltd. | | | | | | | |
2005-1A, 0.89% due 09/01/17†††,1,4 | | | 1,750,000 | | | 1,625,400 | |
2005-1A, 1.09% due 09/01/17†††,1,4 | | | 500,000 | | | 427,250 | |
GSAMP Trust | | | | | | | |
2005-HE6, 0.59% due 11/25/351 | | | 2,250,000 | | | 2,001,276 | |
Duane Street CLO IV Ltd. | | | | | | | |
2007-4A, 2.49% due 11/14/211,4 | | | 2,000,000 | | | 1,907,000 | |
West Coast Funding Ltd. | | | | | | | |
2006-1A, 0.37% due 11/02/411,4 | | | 1,853,939 | | | 1,785,714 | |
Acis CLO 2013-2 Ltd. | | | | | | | |
4.09% due 10/14/221,4 | | | 1,800,000 | | | 1,758,780 | |
Northwoods Capital VII Ltd. | | | | | | | |
2006-7A, 3.74% due 10/22/211,4 | | | 1,000,000 | | | 969,100 | |
2006-7A, 1.79% due 10/22/211,4 | | | 700,000 | | | 669,550 | |
Rockwall CDO II Ltd. | | | | | | | |
2007-1A, 0.49% due 08/01/241,4 | | | 1,740,241 | | | 1,614,073 | |
HSI Asset Securitization Corporation Trust | | | | | | | |
2007-WF1, 0.32% due 05/25/371 | | | 1,728,004 | | | 1,597,234 | |
DIVCORE CLO Ltd. | | | | | | | |
2013-1A B, 4.05% due 11/15/32††† | | | 1,600,000 | | | 1,592,800 | |
Home Equity Asset Trust | | | | | | | |
2006-3, 0.46% due 07/25/361 | | | 1,717,393 | | | 1,562,293 | |
MCF CLO I LLC | | | | | | | |
2013-1A, 3.79% due 04/20/231,4 | | | 1,500,000 | | | 1,482,900 | |
Copper River CLO Ltd. | | | | | | | |
2007-1A, 1.74% due 01/20/21†††,1,4 | | | 1,000,000 | | | 914,000 | |
2007-1A, 1.04% due 01/20/211,4 | | | 500,000 | | | 452,650 | |
New Century Home Equity Loan Trust | | | | | | | |
2004-4, 0.95% due 02/25/351 | | | 1,441,499 | | | 1,308,169 | |
GSAA Home Equity Trust | | | | | | | |
2007-7, 0.42% due 07/25/371 | | | 1,464,803 | | | 1,269,005 | |
Global Leveraged Capital Credit | | | | | | | |
Opportunity Fund | | | | | | | |
2006-1A, 1.24% due 12/20/181,4 | | | 1,288,000 | | | 1,238,154 | |
Newcastle Cdo Viii 1 Ltd. | | | | | | | |
2006-8A, 0.43% due 11/25/52†††,1,4 | | | 1,201,297 | | | 1,150,242 | |
Putnam Structured Product CDO 2002-1 Ltd. | | | | | | | |
2002-1A, 0.83% due 01/10/381,4 | | | 1,270,409 | | | 1,129,902 | |
Grayson CLO Ltd. | | | | | | | |
2006-1A, 0.65% due 11/01/211,4 | | | 1,200,000 | | | 1,104,600 | |
Halcyon Structured Asset Management | | | | | | | |
Long Secured/Short Unsecured 2007-1 Ltd. | | | | | | | |
2007-1A, 2.54% due 08/07/211,4 | | | 1,100,000 | | | 1,083,830 | |
Cerberus Onshore II CLO LLC | | | | | | | |
2014-1A, 4.25% due 10/15/23†††,1,4 | | | 600,000 | | | 573,060 | |
2014-1A, 3.75% due 10/15/23†††,1,4 | | | 500,000 | | | 486,900 | |
Telos CLO 2007-2 Ltd. | | | | | | | |
2007-2A, 2.44% due 04/15/221,4 | | | 1,100,000 | | | 1,043,350 | |
Genesis Funding Ltd. | | | | | | | |
2006-1A, 0.40% due 12/19/321,4 | | | 1,108,835 | | | 1,033,323 | |
Telos CLO Ltd. | | | | | | | |
2013-3A, 4.49% due 01/17/241,4 | | | 1,050,000 | | | 1,032,675 | |
ARES XXVI CLO Ltd. | | | | | | | |
2013-1A, 0.00% due 04/15/253,4 | | | 1,250,000 | | | 1,028,875 | |
Salus CLO 2012-1 Ltd. | | | | | | | |
2013-1AN, 6.99% due 03/05/21†††,1,4 | | | 1,000,000 | | | 1,001,900 | |
Aerco Ltd. | | | | | | | |
2000-2A, 1.12% due 07/15/251 | | | 1,657,879 | | | 1,001,028 | |
Acis CLO 2013-1 Ltd. | | | | | | | |
2013-1A, 4.74% due 04/18/241,4 | | | 1,000,000 | | | 1,000,000 | |
COA Summit CLO Ltd. | | | | | | | |
2014-1A, 4.09% due 04/20/23†††,1,4 | | | 1,000,000 | | | 996,200 | |
Halcyon Structured Asset Management | | | | | | | |
Long Secured/Short Unsecured 2007-2 Ltd. | | | | | | | |
2007-2A, 3.99% due 10/29/211,4 | | | 1,000,000 | | | 986,200 | |
Hewett’s Island CDO Ltd. | | | | | | | |
2007-6A, 2.49% due 06/09/191,4 | | | 1,000,000 | | | 975,400 | |
Liberty CLO Ltd. | | | | | | | |
2005-1A, 0.74% due 11/01/171,4 | | | 1,000,000 | | | 965,600 | |
NewStar Commercial Loan Trust | | | | | | | |
2007-1A, 2.53% due 09/30/22†††,1,4 | | | 500,000 | | | 481,750 | |
2007-1A, 1.53% due 09/30/221,4 | | | 500,000 | | | 468,350 | |
Churchill Financial Cayman Ltd. | | | | | | | |
2007-1A, 2.84% due 07/10/191,4 | | | 1,000,000 | | | 930,700 | |
Airplanes Pass Through Trust | | | | | | | |
2001-1A, 0.71% due 03/15/191 | | | 1,705,538 | | | 801,603 | |
Shackleton II CLO Ltd. | | | | | | | |
2012-2A, 4.29% due 10/20/231,4 | | | 750,000 | | | 750,375 | |
Garrison Funding 2013-2 Ltd. | | | | | | | |
2013-2A, 4.98% due 09/25/231,4 | | | 750,000 | | | 745,125 | |
Westchester CLO Ltd. | | | | | | | |
2007-1A, 0.58% due 08/01/221,4 | | | 750,000 | | | 705,750 | |
KKR Financial CLO Ltd. | | | | | | | |
5.24% due 05/15/21 | | | 650,000 | | | 648,245 | |
Drug Royalty Limited Partnership | | | | | | | |
2012-1, 5.49% due 07/15/241,4 | | | 508,462 | | | 528,274 | |
ACA CLO 2007-1 Ltd. | | | | | | | |
2007-1A, 1.19% due 06/15/221,4 | | | 575,000 | | | 526,413 | |
Cent CLO | | | | | | | |
2012-16A, 3.74% due 08/01/241,4 | | | 500,000 | | | 502,700 | |
CIFC Funding 2012-II Ltd. | | | | | | | |
2012-2A, 4.49% due 12/05/241,4 | | | 500,000 | | | 501,400 | |
Cerberus Offshore Levered I, LP | | | | | | | |
2012-1A, 6.23% due 11/30/181,4 | | | 250,000 | | | 250,575 | |
2012-1A, 4.98% due 11/30/181,4 | | | 250,000 | | | 249,825 | |
Fraser Sullivan CLO VI Ltd. | | | | | | | |
2011-6A, 4.74% due 11/22/221,4 | | | 500,000 | | | 500,363 | |
Gleneagles CLO Ltd. | | | | | | | |
2005-1A, 1.14% due 11/01/171,4 | | | 500,000 | | | 475,200 | |
Pangaea CLO Ltd. | | | | | | | |
2007-1A, 0.74% due 10/21/211,4 | | | 500,000 | | | 469,800 | |
Kingsland III Ltd. | | | | | | | |
2006-3A, 1.84% due 08/24/211,4 | | | 500,000 | | | 464,850 | |
Westwood CDO I Ltd. | | | | | | | |
2007-1A, 0.90% due 03/25/211,4 | | | 500,000 | | | 463,050 | |
Kingsland IV Ltd. | | | | | | | |
2007-4A, 1.69% due 04/16/21†††,1,4 | | | 500,000 | | | 461,600 | |
| |
| 14 | THE GUGGENHEIM FUNDS SEMI-ANNUAL REPORT | | SEE NOTES TO FINANCIAL STATEMENTS. |
| SCHEDULE OF INVESTMENTS (Unaudited) (continued) | | March 31, 2014 |
| |
| FLOATING RATE STRATEGIES FUND | | |
| | | | FACE | | | | |
| | | | AMOUNT | | | VALUE | |
| |
| | | | | | | | |
MCF CLO III LLC | | | | | | | |
2014-3A, 3.46% due 01/20/24†††,1,4 | | $ | 500,000 | | $ | 459,300 | |
ACS 2007-1 Pass Through Trust | | | | | | | |
2007-1A, 0.46% due 06/14/371,4 | | | 479,036 | | | 455,707 | |
Northwind Holdings LLC | | | | | | | |
2007-1A, 1.02% due 12/01/371,4 | | | 456,875 | | | 419,320 | |
Babcock & Brown Air Funding I Ltd. | | | | | | | |
2007-1A, 0.62% due 11/14/331,4 | | | 484,789 | | | 402,375 | |
Newcastle CDO IX 1 Ltd. | | | | | | | |
2007-9A, 0.41% due 05/25/521,4,7 | | | 379,732 | | | 378,592 | |
Aircraft Lease Securitisation Ltd. | | | | | | | |
2007-1A, 0.42% due 05/10/321,4 | | | 389,463 | | | 376,806 | |
OFSI Fund Ltd. | | | | | | | |
2006-1A, 1.08% due 09/20/191,4 | | | 370,000 | | | 356,199 | |
Raspro Trust | | | | | | | |
2005-1A, 0.63% due 03/23/241,4 | | | 370,274 | | | 336,949 | |
Credit Card Pass-Through Trust | | | | | | | |
2012-BIZ, 0.00% due 12/15/49†††,3,4 | | | 369,709 | | | 317,543 | |
Eastland CLO Ltd. | | | | | | | |
2007-1A, 0.64% due 05/01/221,4 | | | 350,000 | | | 311,675 | |
Asset Backed Securities Corporation | | | | | | | |
Home Equity Loan Trust Series | | | | | | | |
2004-HE8, 1.20% due 12/25/341 | | | 347,746 | | | 307,280 | |
Accredited Mortgage Loan Trust | | | | | | | |
2007-1, 0.28% due 02/25/371 | | | 324,514 | | | 302,040 | |
Diversified Asset Securitization | | | | | | | |
Holdings II, LP | | | | | | | |
2000-1A, 0.72% due 09/15/351,4 | | | 281,963 | | | 281,737 | |
Ivy Hill Middle Market Credit Fund Ltd. | | | | | | | |
2011-3A, 6.74% due 01/15/221,4 | | | 250,000 | | | 250,000 | |
Black Diamond CLO 2005-2 Delaware Corp. | | | | | | | |
2005-2A, 2.03% due 01/07/181,4 | | | 250,000 | | | 238,125 | |
Structured Asset Receivables Trust Series | | | | | | | |
2005-1A, 0.74% due 01/21/151,4 | | | 217,655 | | | 206,229 | |
Castle Trust | | | | | | | |
2003-1AW, 0.91% due 05/15/271,4 | | | 58,623 | | | 55,692 | |
Vega Containervessel plc | | | | | | | |
2006-1A, 5.56% due 02/10/21†††,4 | | | 44,130 | | | 43,261 | |
Legg Mason Real Estate CDO I Ltd. | | | | | | | |
2006-1A, 0.43% due 03/25/381,4 | | | 24,969 | | | 24,544 | |
| | | | | | | |
| Total Asset Backed Securities | | | | | | | |
(Cost $126,781,313) | | | | | | 129,775,000 | |
| | | | | | | |
| | | | | | | | |
| CORPORATE BONDS†† - 7.4% | | | | | | | |
| FINANCIALS - 2.0% | | | | | | | |
Icahn Enterprises Limited | | | | | | | |
Partnership / Icahn | | | | | | | |
Enterprises Finance Corp. | | | | | | | |
5.88% due 02/01/224 | | | 5,000,000 | | | 5,074,999 | |
6.00% due 08/01/204 | | | 1,700,000 | | | 1,802,000 | |
4.88% due 03/15/194 | | | 1,750,000 | | | 1,780,625 | |
3.50% due 03/15/174 | | | 1,000,000 | | | 1,010,000 | |
Citigroup, Inc. | | | | | | | |
5.35% due 05/29/491,2 | | | 4,000,000 | | | 3,710,000 | |
Credit Acceptance Corp. | | | | | | | |
6.13% due 02/15/214 | | | 3,100,000 | | | 3,224,000 | |
Wilton Re Finance LLC | | | | | | | |
5.88% due 03/30/331,4 | | | 2,750,000 | | | 2,736,250 | |
Cabot Financial Luxembourg S.A. | | | | | | | |
6.50% due 04/01/214 | | | 1,300,000 | | | 2,171,283 | |
Nationstar Mortgage LLC/Nationstar | | | | | | | |
Capital Corp. | | | | | | | |
6.50% due 07/01/21 | | | 2,000,000 | | | 1,885,000 | |
Opal Acquisition, Inc. | | | | | | | |
8.88% due 12/15/214 | | | 1,775,000 | | | 1,783,875 | |
Ally Financial, Inc. | | | | | | | |
3.50% due 01/27/19 | | | 1,750,000 | | | 1,750,000 | |
Oxford Finance LLC / Oxford Finance | | | | | | | |
Company-Issuer, Inc. | | | | | | | |
7.25% due 01/15/184 | | | 650,000 | | | 689,000 | |
Fidelity & Guaranty Life Holdings, Inc. | | | | | | | |
6.38% due 04/01/214 | | | 450,000 | | | 479,250 | |
LCP Dakota Fund | | | | | | | |
10.00% due 08/17/156 | | | 30,933 | | | 30,933 | |
| | | | | | | |
| Total Financials | | | | | | 28,127,215 | |
| | | | | | | |
| | | | | | | | |
| ENERGY - 1.6% | | | | | | | |
Unit Corp. | | | | | | | |
6.63% due 05/15/21 | | | 4,000,000 | | | 4,240,000 | |
Eagle Rock Energy Partners | | | | | | | |
Limited Partnership / Eagle | | | | | | | |
Rock Energy Finance Corp. | | | | | | | |
8.38% due 06/01/19 | | | 2,600,000 | | | 2,821,000 | |
Rosetta Resources, Inc. | | | | | | | |
5.88% due 06/01/22 | | | 2,700,000 | | | 2,760,750 | |
Midstates Petroleum Company | | | | | | | |
Incorporated / Midstates | | | | | | | |
Petroleum Co LLC | | | | | | | |
10.75% due 10/01/20 | | | 2,000,000 | | | 2,210,000 | |
BreitBurn Energy Partners Limited | | | | | | | |
Partnership / BreitBurn Finance Corp. | | | | | | | |
7.88% due 04/15/22 | | | 2,000,000 | | | 2,165,000 | |
Ultra Petroleum Corp. | | | | | | | |
5.75% due 12/15/184 | | | 1,750,000 | | | 1,837,500 | |
Penn Virginia Resource Partners Limited | | | | | | | |
Partnership / Penn Virginia | | | | | | | |
Resource Finance Corp. | | | | | | | |
8.38% due 06/01/20 | | | 1,612,000 | | | 1,809,470 | |
Atlas Energy Holdings Operating | | | | | | | |
Company LLC / Atlas Resource | | | | | | | |
Finance Corp. | | | | | | | |
9.25% due 08/15/214 | | | 1,500,000 | | | 1,650,000 | |
Gibson Energy, Inc. | | | | | | | |
6.75% due 07/15/214 | | | 1,055,000 | | | 1,131,488 | |
Bill Barrett Corp. | | | | | | | |
7.63% due 10/01/19 | | | 800,000 | | | 867,000 | |
| | | | | | | |
| Total Energy | | | | | | 21,492,208 | |
| | | | | | | |
| | | | | | | | |
| UTILITIES - 0.8% | | | | | | | |
Crestwood Midstream Partners Limited | | | | | | | |
Partnership / Crestwood Midstream | | | | | | | |
Finance Corp. | | | | | | | |
6.00% due 12/15/20 | | | 6,300,000 | | | 6,599,250 | |
Legacy Reserves Limited Partnership / Legacy | | | | | | | |
Reserves Finance Corp. | | | | | | | |
8.00% due 12/01/20 | | | 2,750,000 | | | 2,942,500 | |
LBC Tank Terminals Holding Netherlands BV | | | | | | | |
6.88% due 05/15/234 | | | 630,000 | | | 672,525 | |
| | | | | | | |
| Total Utilities | | | | | | 10,214,275 | |
| | | | | | | |
| |
| SEE NOTES TO FINANCIAL STATEMENTS. | | THE GUGGENHEIM FUNDS SEMI-ANNUAL REPORT | 15 |
| SCHEDULE OF INVESTMENTS (Unaudited) (continued) | | March 31, 2014 |
| |
| FLOATING RATE STRATEGIES FUND | | |
| | | | FACE | | | | |
| | | | AMOUNT | | | VALUE | |
| |
| | | | | | | | |
| INDUSTRIALS - 0.6% | | | | | | | |
Premier Foods Finance plc | | | | | | | |
5.52% due 03/15/201,4 | | $ | 2,750,000 | | $ | 4,660,123 | |
Ultra Resources, Inc. | | | | | | | |
4.66% due 10/12/22†††,6 | | | 1,800,000 | | | 1,618,200 | |
Travelport LLC | | | | | | | |
11.88% due 09/01/16 | | | 1,300,000 | | | 1,326,000 | |
Travelport LLC / Travelport Holdings, Inc. | | | | | | | |
6.36% due 03/01/161,4 | | | 1,012,539 | | | 1,020,133 | |
| | | | | | | |
| Total Industrials | | | | | | 8,624,456 | |
| | | | | | | |
| | | | | | | | |
| CONSUMER DISCRETIONARY - 0.6% | | | | | | | |
GRD Holdings III Corp. | | | | | | | |
10.75% due 06/01/194 | | | 3,680,000 | | | 4,048,000 | |
Checkers Drive-In Restaurants, Inc. | | | | | | | |
11.00% due 12/01/174 | | | 1,000,000 | | | 1,115,000 | |
MDC Partners, Inc. | | | | | | | |
6.75% due 04/01/204 | | | 1,000,000 | | | 1,052,500 | |
Laureate Education, Inc. | | | | | | | |
9.25% due 09/01/194 | | | 970,000 | | | 1,033,050 | |
Continental Airlines 2012-2 | | | | | | | |
Class B Pass Through Trust | | | | | | | |
5.50% due 10/29/20 | | | 400,000 | | | 421,000 | |
Atlas Air 1999-1 Class A-1 Pass Through Trust | | | | | | | |
7.20% due 01/02/196 | | | 91,923 | | | 99,621 | |
WMG Acquisition Corp. | | | | | | | |
11.50% due 10/01/18 | | | 50,000 | | | 56,825 | |
| | | | | | | |
| Total Consumer Discretionary | | | | | | 7,825,996 | |
| | | | | | | |
| | | | | | | | |
| TELECOMMUNICATION SERVICES - 0.6% | | | | | | | |
Alcatel-Lucent USA, Inc. | | | | | | | |
6.75% due 11/15/204 | | | 3,000,000 | | | 3,172,500 | |
Virgin Media Secured Finance plc | | | | | | | |
5.38% due 04/15/214 | | | 1,800,000 | | | 1,858,500 | |
SITEL LLC / Sitel Finance Corp. | | | | | | | |
11.00% due 08/01/174 | | | 670,000 | | | 719,413 | |
CyrusOne Limited Partnership / CyrusOne | | | | | | | |
Finance Corp. | | | | | | | |
6.38% due 11/15/22 | | | 600,000 | | | 633,000 | |
Avaya, Inc. | | | | | | | |
7.00% due 04/01/194 | | | 610,000 | | | 605,425 | |
UPCB Finance VI Ltd. | | | | | | | |
6.88% due 01/15/224 | | | 530,000 | | | 577,700 | |
| | | | | | | |
| Total Telecommunication Services | | | | | | 7,566,538 | |
| | | | | | | |
| | | | | | | | |
| CONSUMER STAPLES - 0.4% | | | | | | | |
Harbinger Group, Inc. | | | | | | | |
7.88% due 07/15/19 | | | 2,300,000 | | | 2,524,250 | |
Central Garden and Pet Co. | | | | | | | |
8.25% due 03/01/18 | | | 2,000,000 | | | 2,062,500 | |
Vector Group Ltd. | | | | | | | |
7.75% due 02/15/21 | | | 1,000,000 | | | 1,075,000 | |
| | | | | | | |
| Total Consumer Staples | | | | | | 5,661,750 | |
| | | | | | | |
| | | | | | | | |
| MATERIALS - 0.3% | | | | | | | |
TPC Group, Inc. | | | | | | | |
8.75% due 12/15/204 | | | 2,000,000 | | | 2,192,500 | |
Unifrax I LLC / Unifrax Holding Co. | | | | | | | |
7.50% due 02/15/194 | | | 1,525,000 | | | 1,616,500 | |
Mirabela Nickel Ltd. | | | | | | | |
8.75% due 04/15/184,5,6 | | | 2,000,000 | | | 480,000 | |
| | | | | | | |
| Total Materials | | | | | | 4,289,000 | |
| | | | | | | |
| | | | | | | | |
| INFORMATION TECHNOLOGY - 0.3% | | | | | | | |
NCR Corp. | | | | | | | |
6.38% due 12/15/234 | | | 1,800,000 | | | 1,912,500 | |
Eagle Midco, Inc. | | | | | | | |
9.00% due 06/15/184 | | | 1,400,000 | | | 1,470,000 | |
| | | | | | | |
| Total Information Technology | | | | | | 3,382,500 | |
| | | | | | | |
| | | | | | | | |
| HEALTH CARE - 0.2% | | | | | | | |
Valeant Pharmaceuticals International, Inc. | | | | | | | |
5.63% due 12/01/214 | | | 2,000,000 | | | 2,100,000 | |
| | | | | | | |
| Total Corporate Bonds | | | | | | | |
(Cost $98,441,862) | | | | | | 99,283,938 | |
| | | | | | | |
| | | | | | | | |
| COLLATERALIZED MORTGAGE OBLIGATION†† - 2.5% | | | | | | | |
Lehman XS Trust Series | | | | | | | |
2005-7N,0.42% due 12/25/351 | | | 3,147,702 | | | 2,967,112 | |
2006-16N,0.34% due 11/25/461 | | | 3,499,141 | | | 2,851,030 | |
HarborView Mortgage Loan Trust | | | | | | | |
2006-12,0.35% due 01/19/381 | | | 4,693,221 | | | 3,943,193 | |
Nomura Resecuritization Trust | | | | | | | |
2012-1R,0.60% due 08/27/471,4 | | | 4,064,336 | | | 3,744,473 | |
COMM 2006-FL12 Mortgage Trust | | | | | | | |
2006-FL12,0.45% due 12/15/201,4 | | | 2,273,925 | | | 2,255,597 | |
2006-FL12,0.50% due 12/15/201,4 | | | 1,299,536 | | | 1,283,350 | |
Washington Mutual Mortgage | | | | | | | |
Pass-Through Certificates WMALT | | | | | | | |
Series 2006-AR9 Trust | | | | | | | |
2006-AR9,0.97% due 11/25/461 | | | 5,219,219 | | | 3,475,013 | |
IndyMac INDX Mortgage Loan Trust | | | | | | | |
2006-AR4,0.36% due 05/25/461 | | | 3,870,694 | | | 3,294,618 | |
Washington Mutual Mortgage | | | | | | | |
Pass-Through Certificates WMALT | | | | | | | |
Series 2007-OA4 Trust | | | | | | | |
2007-OA4,0.89% due 04/25/471 | | | 4,062,407 | | | 3,034,041 | |
GreenPoint Mortgage Funding Trust | | | | | | | |
2006-AR1,0.44% due 02/25/361 | | | 3,295,517 | | | 2,626,913 | |
Structured Asset Mortgage | | | | | | | |
Investments II Trust | | | | | | | |
2006-AR1,0.38% due 02/25/361 | | | 1,842,085 | | | 1,566,881 | |
SRERS-2011 Funding Ltd. | | | | | | | |
2011-RS,0.40% due 05/09/461,4 | | | 1,633,385 | | | 1,510,718 | |
Bear Stearns Mortgage Funding Trust | | | | | | | |
2007-AR5,0.32% due 06/25/471 | | | 1,013,355 | | | 815,415 | |
| | | | | | | |
| Total Collateralized Mortgage Obligations | | | | | | | |
(Cost $32,854,689) | | | | | | 33,368,354 | |
| | | | | | | |
| | | | | | | | |
| COMMERCIAL PAPER†† - 2.2% | | | | | | | |
Pacific Gas & Electric Co. | | | | | | | |
0.19% due 04/02/144 | | | 10,000,000 | | | 9,999,948 | |
Northeast Utilities | | | | | | | |
0.18% due 04/09/144 | | | 10,000,000 | | | 9,999,600 | |
| |
| 16 | THE GUGGENHEIM FUNDS SEMI-ANNUAL REPORT | | SEE NOTES TO FINANCIAL STATEMENTS. |
| SCHEDULE OF INVESTMENTS (Unaudited) (concluded) | | March 31, 2014 |
| |
| FLOATING RATE STRATEGIES FUND | | |
| | | | FACE | | | | |
| | | | AMOUNT | | | VALUE | |
| |
| | | | | | | | |
Duke Energy Corp. | | | | | | | |
0.17% due 04/03/144 | | $ | 8,700,000 | | $ | 8,699,908 | |
0.19% due 04/03/144 | | | 1,000,000 | | | 999,989 | |
| | | | | | | |
| Total Duke Energy Corp. | | | | | | 9,699,897 | |
| | | | | | | |
| Total Commercial Paper | | | | | | | |
(Cost $29,699,445) | | | | | | 29,699,445 | |
| | | | | | | |
| Total Investments - 107.0% | | | | | | | |
(Cost $1,425,173,984) | | | | | $ | 1,437,815,782 | |
| | | | | | | |
| Other Assets & Liabilities, net - (7.0)% | | | | | | (94,508,087 | ) |
| | | | | | | |
| Total Net Assets - 100.0% | | | | | $ | 1,343,307,695 | |
| |
FORWARD FOREIGN CURRENCY EXCHANGE CONTRACTS††
| Contracts to Sell | | Currency | | Counterparty | | Settlement
Date | | Settlement
Value | | Value at
03/31/14 | | Net Unrealized
Appreciation/
(Depreciation) |
| |
| 22,700,000 | | Euro | | BNY Mellon | | 04/30/14 | | $ | 31,314,196 | | $ | 31,280,143 | | $ | 34,053 | |
| 21,000,000 | | GBP | | BNY Mellon | | 04/30/14 | | | 34,956,810 | | | 35,021,820 | | | (65,010 | ) |
| | | | | | | | | | | | | | | $ | (30,957 | ) |
| † | | Value determined based on Level 1 inputs — See Note 4. |
| †† | | Value determined based on Level 2 inputs, unless otherwise noted — See Note 4. |
| ††† | | Value determined based on Level 3 inputs — See Note 4. |
| 1 | | Variable rate security. Rate indicated is rate effective at March 31, 2014. |
| 2 | | Perpetual maturity. |
| 3 | | Security with no rate was unsettled at March 31, 2014. |
| 4 | | Security is a 144A or Section 4(a)(2) security. The total market value of 144A or Section 4(a)(2) securities is $172,772,973 (Cost $169,660,792), or 12.9% of total net assets. |
| 5 | | Security is in default of interest and/or principal obligations. |
| 6 | | Illiquid security. |
| 7 | | Security or a portion thereof is held as collateral for reverse repurchase agreements — See Note 11. |
| | | plc — Public Limited Company |
| | | REIT — Real Estate Investment Trust |
| |
| SEE NOTES TO FINANCIAL STATEMENTS. | | THE GUGGENHEIM FUNDS SEMI-ANNUAL REPORT | 17 |
| FLOATING RATE STRATEGIES FUND |
| STATEMENT OF ASSETS AND LIABILITIES (Unaudited) |
| |
| March 31, 2014 |
| ASSETS: | | | | |
| Investments, at value (cost $1,425,173,984) | | $ | 1,437,815,782 | |
| Foreign currency, at value (cost $69,993) | | | 69,910 | |
| Segregated cash with broker | | | 372,000 | |
| Prepaid expenses | | | 194,816 | |
| Receivables: | | | | |
Securities sold | | | 10,833,614 | |
Interest | | | 5,107,646 | |
Fund shares sold | | | 5,027,244 | |
Investment advisor | | | 194,633 | |
Dividends | | | 35,702 | |
Foreign taxes reclaim | | | 7,273 | |
| | | | |
| Total assets | | | 1,459,658,620 | |
| | | | |
| LIABILITIES: | | | | |
| Due to custodian bank | | | 5,002,262 | |
| Reverse Repurchase Agreements | | | 1,940,631 | |
Unfunded loan commitments, at value (commitment fees received $429,351) | | | 366,750 | |
Unrealized depreciation on forward foreign currency exchange contracts | | | 30,957 | |
| Payable for: | | | | |
Securities purchased | | | 104,075,599 | |
Fund shares redeemed | | | 2,989,331 | |
Management fees | | | 720,932 | |
Distribution and service fees | | | 232,082 | |
Fund accounting/administration fees | | | 105,366 | |
Transfer agent/maintenance fees | | | 18,232 | |
Trustees’ fees* | | | 1,137 | |
Miscellaneous | | | 867,646 | |
| | | | |
| Total liabilities | | | 116,350,925 | |
| | | | |
| NET ASSETS | | $ | 1,343,307,695 | |
| | | | |
| NET ASSETS CONSIST OF: | | | | |
| Paid in capital | | $ | 1,330,052,941 | |
| Undistributed net investment income | | | 621,650 | |
| Accumulated net realized gain on investments | | | 84,735 | |
| Net unrealized appreciation on investments | | | 12,548,369 | |
| | | | |
| Net assets | | $ | 1,343,307,695 | |
| | | | |
| A-CLASS: | | | | |
| Net assets | | $ | 492,313,753 | |
| Capital shares outstanding | | | 18,325,154 | |
| Net asset value per share | | | $26.87 | |
| | | | |
Maximum offering price per share (Net asset value divided by 95.25%) | | | $28.21 | |
| | | | |
| C-CLASS: | | | | |
| Net assets | | $ | 154,861,844 | |
| Capital shares outstanding | | | 5,767,018 | |
| Net asset value per share | | | $26.85 | |
| | | | |
| INSTITUTIONAL CLASS: | | | | |
| Net assets | | $ | 696,132,098 | |
| Capital shares outstanding | | | 25,892,766 | |
| Net asset value per share | | | $26.89 | |
| | | | |
| STATEMENT OF OPERATIONS ( Unaudited) |
| |
| Period Ended March 31, 2014 |
| INVESTMENT INCOME: | | | | |
| Interest (net of foreign withholding tax of $15,606) | | $ | 30,674,412 | |
| Dividends | | | 71,405 | |
| | | | |
Total investment income | | | 30,745,817 | |
| | | | |
| EXPENSES: | | | | |
| Management fees | | | 3,699,037 | |
| Transfer agent/maintenance fees | | | | |
A-Class | | | 188,725 | |
C-Class | | | 39,892 | |
Institutional Class | | | 84,241 | |
| Distribution and service fees: | | | | |
A-Class | | | 538,756 | |
C-Class | | | 694,973 | |
| Fund accounting/administration fees | | | 540,621 | |
| Line of credit interest expense | | | 54,278 | |
| Trustees’ fees* | | | 43,800 | |
| Short interest expense | | | 31,528 | |
| Custodian fees | | | 1,888 | |
| Tax expense | | | 26 | |
| Miscellaneous | | | 357,174 | |
| | | | |
Total expenses | | | 6,274,939 | |
| | | | |
| Less: | | | | |
| Expenses waived by Advisor | | | (146,918) | |
| Expenses waived by Transfer Agent | | | | |
A-Class | | | (185,125) | |
C-Class | | | (36,399) | |
Institutional Class | | | (82,951) | |
| Expenses waived by Distributor | | | | |
A-Class | | | (17,769) | |
C-Class | | | (5,283) | |
| | | | |
| Total expenses waived | | | (474,445) | |
| | | | |
| Net expenses | | | 5,800,494 | |
| | | | |
| Net investment income | | | 24,945,323 | |
| | | | |
| NET REALIZED AND UNREALIZED GAIN (LOSS): | | | | |
| Net realized gain (loss) on: | | | | |
Investments | | | 1,436,343 | |
Unfunded loan commitments | | | 215,018 | |
Foreign currency | | | (735,538) | |
| | | | |
Net realized gain | | | 915,823 | |
| | | | |
Net change in unrealized appreciation (depreciation) on: | | | | |
Investments | | | 10,639,140 | |
Unfunded loan commitments | | | (108,662) | |
Foreign currency | | | (156,030) | |
| | | | |
Net change in unrealized appreciation (depreciation) | | | 10,374,448 | |
| | | | |
| Net realized and unrealized gain | | | 11,290,271 | |
| | | | |
| Net increase in net assets resulting | | | | |
from operations | | $ | 36,235,594 | |
| | | | |
* Relates to Trustees not deemed “interested persons” within the meaning of Section 2(a)(19) of the 1940 Act.
| |
| 18 | THE GUGGENHEIM FUNDS SEMI-ANNUAL REPORT | SEE NOTES TO FINANCIAL STATEMENTS. |
| FLOATING RATE STRATEGIES FUND |
| STATEMENTS OF CHANGES IN NET ASSETS |
| |
| | | Period Ended | | | | | |
| | | March 31, | | | Year Ended | |
| | | 2014 | | September 30, | |
| | | (Unaudited) | | | 2013 | |
| |
| | | | | | | | | |
| INCREASE (DECREASE) IN NET ASSETS FROM OPERATIONS: | | | | | | | | |
| Net investment income | | $ | 24,945,323 | | | $ | 22,811,058 | |
| Net realized gain on investments | | | 915,823 | | | | 1,357,739 | |
| Net change in unrealized appreciation (depreciation) on investments | | | 10,374,448 | | | | 47,569 | |
| |
| Net increase in net assets resulting from operations | | | 36,235,594 | | | | 24,216,366 | |
| |
| | | | | | | | | |
| DISTRIBUTIONS TO SHAREHOLDERS FROM: | | | | | | | | |
| Net investment income | | | | | | | | |
A-Class | | | (9,156,928 | ) | | | (8,633,219 | ) |
C-Class | | | (2,432,740 | ) | | | (2,743,608 | ) |
Institutional Class | | | (12,732,550 | ) | | | (11,457,765 | ) |
| Net realized gains | | | | | | | | |
A-Class | | | (760,820 | ) | | | (132,969 | ) |
C-Class | | | (250,718 | ) | | | (75,574 | ) |
Institutional Class | | | (1,010,452 | ) | | | (201,041 | ) |
| |
| Total distributions to shareholders | | | (26,344,208 | ) | | | (23,244,176 | ) |
| |
| | | | | | | | | |
| CAPITAL SHARE TRANSACTIONS: | | | | | | | | |
| Proceeds from sale of shares | | | | | | | | |
A-Class | | | 224,533,132 | | | | 402,666,976 | |
C-Class | | | 42,611,471 | | | | 104,350,559 | |
Institutional Class | | | 355,308,749 | | | | 475,637,894 | |
| Distributions reinvested | | | | | | | | |
A-Class | | | 7,610,691 | | | | 6,868,671 | |
C-Class | | | 2,269,095 | | | | 2,445,945 | |
Institutional Class | | | 11,339,496 | | | | 10,574,134 | |
| Cost of shares redeemed | | | | | | | | |
A-Class | | | (121,993,705 | ) | | | (75,616,322 | ) |
C-Class | | | (11,854,982 | ) | | | (10,919,310 | ) |
Institutional Class | | | (133,150,136 | ) | | | (100,967,437 | ) |
| |
| Net increase from capital share transactions | | | 376,673,811 | | | | 815,041,110 | |
| |
| Net increase in net assets | | | 386,565,197 | | | | 816,013,300 | |
| | | | | | | | | |
| NET ASSETS: | | | | | | | | |
Beginning of period | | | 956,742,498 | | | | 140,729,198 | |
| |
End of period | | $ | 1,343,307,695 | | | $ | 956,742,498 | |
| |
| Undistributed/(Distributions in excess of) net investment income at end of period | | $ | 621,650 | | | $ | (1,455 | ) |
| |
| | | | | | | | | |
| CAPITAL SHARE ACTIVITY: | | | | | | | | |
| Shares sold | | | | | | | | |
A-Class | | | 8,379,532 | | | | 15,101,427 | |
C-Class | | | 1,592,786 | | | | 3,917,569 | |
Institutional Class | | | 13,249,945 | | | | 17,831,851 | |
| Shares issued from reinvestment of distributions | | | | | | | | |
A-Class | | | 283,932 | | | | 257,605 | |
C-Class | | | 84,691 | | | | 91,877 | |
Institutional Class | | | 422,693 | | | | 396,547 | |
| Shares redeemed | | | | | | | | |
A-Class | | | (4,551,891 | ) | | | (2,837,771 | ) |
C-Class | | | (443,714 | ) | | | (409,799 | ) |
Institutional Class | | | (4,967,440 | ) | | | (3,804,751 | ) |
| |
| Net increase in shares | | | 14,050,534 | | | | 30,544,555 | |
| |
| |
| SEE NOTES TO FINANCIAL STATEMENTS. | | THE GUGGENHEIM FUNDS SEMI-ANNUAL REPORT | 19 |
| FLOATING RATE STRATEGIES FUND |
| FINANCIAL HIGHLIGHTS |
| |
| This table is presented to show selected data for a share outstanding throughout each period and to assist shareholders in evaluating a Fund’s performance for the periods presented. |
| | | Period Ended | | | Year Ended | | | Period Ended | |
| | | | March 31, | | | September 30, | | | September 30, | |
| A-Class | | | 2014a | | | | 2013 | | | | 2012b | |
| |
| Per Share Data | | | | | | | | | | | | |
| Net asset value, beginning of period | | $ | 26.62 | | | $ | 26.10 | | | $ | 25.00 | |
| |
| Income (loss) from investment operations: | | | | | | | | | | | | |
| Net investment income (loss)c | | | .58 | | | | 1.30 | | | | 1.09 | |
| Net gain (loss) on investments (realized and unrealized) | | | .29 | | | | .65 | | | | .97 | |
| | | |
| Total from investment operations | | | .87 | | | | 1.95 | | | | 2.06 | |
| |
| Less distributions from: | | | | | | | | | | | | |
| Net investment income | | | (.57 | ) | | | (1.37 | ) | | | (.96 | ) |
| Net realized gains | | | (.05 | ) | | | (.06 | ) | | | — | |
| | | |
| Total distributions | | | (.62 | ) | | | (1.43 | ) | | | (.96 | ) |
| |
| Net asset value, end of period | | $ | 26.87 | | | $ | 26.62 | | | $ | 26.10 | |
| | | |
| | | | | | | | | | | | | |
| |
| Total Returne | | | 3.30% | | | | 7.61% | | | | 8.37% | |
| |
| Ratios/Supplemental Data | | | | | | | | | | | | |
| Net assets, end of period (in thousands) | | $ | 492,314 | | | $ | 378,324 | | | $ | 44,175 | |
| |
| Ratios to average net assets: | | | | | | | | | | | | |
| Net investment income (loss) | | | 4.35% | | | | 4.90% | | | | 5.13% | |
| Total expenses | | | 1.17% | | | | 1.19% | | | | 1.39% | |
| Net expensesd,f | | | 1.05% | | | | 1.05% | | | | 1.06% | |
| |
| Portfolio turnover rate | | | 26% | | | | 50% | | | | 61% | |
| | | | | | | | | | | | | |
| | | Period Ended | | | Year Ended | | | Period Ended | |
| | | | March 31, | | | September 30, | | | September 30, | |
| C-Class | | | 2014a | | | | 2013 | | | | 2012b | |
| |
| Per Share Data | | | | | | | | | | | | |
| Net asset value, beginning of period | | $ | 26.60 | | | $ | 26.09 | | | $ | 25.00 | |
| |
| Income (loss) from investment operations: | | | | | | | | | | | | |
| Net investment income (loss)c | | | .48 | | | | 1.11 | | | | .93 | |
| Net gain (loss) on investments (realized and unrealized) | | | .29 | | | | .63 | | | | .98 | |
| | | |
| Total from investment operations | | | .77 | | | | 1.74 | | | | 1.91 | |
| |
| Less distributions from: | | | | | | | | | | | | |
| Net investment income | | | (.47 | ) | | | (1.17 | ) | | | (.82 | ) |
| Net realized gains | | | (.05 | ) | | | (.06 | ) | | | — | |
| | | |
| Total distributions | | | (.52 | ) | | | (1.23 | ) | | | (.82 | ) |
| |
| Net asset value, end of period | | $ | 26.85 | | | $ | 26.60 | | | $ | 26.09 | |
| | | |
| | | | | | | | | | | | | |
| |
| Total Returne | | | 2.91% | | | | 6.77% | | | | 7.72% | |
| |
| Ratios/Supplemental Data | | | | | | | | | | | | |
| Net assets, end of period (in thousands) | | $ | 154,862 | | | $ | 120,606 | | | $ | 24,358 | |
| |
| Ratios to average net assets: | | | | | | | | | | | | |
| Net investment income (loss) | | | 3.61% | | | | 4.19% | | | | 4.36% | |
| Total expenses | | | 1.88% | | | | 1.93% | | | | 2.06% | |
| Net expensesd,f | | | 1.80% | | | | 1.81% | | | | 1.80% | |
| |
| Portfolio turnover rate | | | 26% | | | | 50% | | | | 61% | |
| |
| 20 | THE GUGGENHEIM FUNDS SEMI-ANNUAL REPORT | | SEE NOTES TO FINANCIAL STATEMENTS. |
| FLOATING RATE STRATEGIES FUND |
| FINANCIAL HIGHLIGHTS (concluded) |
| |
| This table is presented to show selected data for a share outstanding throughout each period and to assist shareholders in evaluating a Fund’s performance for the periods presented. |
| | | Period Ended | | | Year Ended | | | Period Ended | |
| | | | March 31, | | | September 30, | | | September 30, | |
| Institutional Class | | | 2014a | | | | 2013 | | | | 2012b | |
| |
| Per Share Data | | | | | | | | | | | | |
| Net asset value, beginning of period | | $ | 26.64 | | | $ | 26.12 | | | $ | 25.00 | |
| |
| Income (loss) from investment operations: | | | | | | | | | | | | |
| Net investment income (loss)c | | | .61 | | | | 1.36 | | | | 1.10 | |
| Net gain (loss) on investments (realized and unrealized) | | | .29 | | | | .65 | | | | 1.02 | |
| | | |
| Total from investment operations | | | .90 | | | | 2.01 | | | | 2.12 | |
| |
| Less distributions from: | | | | | | | | | | | | |
| Net investment income | | | (.60 | ) | | | (1.43 | ) | | | (1.00 | ) |
| Net realized gains | | | (.05 | ) | | | (.06 | ) | | | — | |
| | | |
| Total distributions | | | (.65 | ) | | | (1.49 | ) | | | (1.00 | ) |
| |
| Net asset value, end of period | | $ | 26.89 | | | $ | 26.64 | | | $ | 26.12 | |
| | | |
| | | | | | | | | | | | | |
| |
| Total Returne | | | 3.38% | | | | 7.86% | | | | 8.59% | |
| |
| Ratios/Supplemental Data | | | | | | | | | | | | |
| Net assets, end of period (in thousands) | | $ | 696,132 | | | $ | 457,813 | | | $ | 72,197 | |
| |
| Ratios to average net assets: | | | | | | | | | | | | |
| Net investment income (loss) | | | 4.60% | | | | 5.12% | | | | 5.16% | |
| Total expenses | | | 0.86% | | | | 0.86% | | | | 0.99% | |
| Net expensesd,f | | | 0.80% | | | | 0.81% | | | | 0.80% | |
| |
| Portfolio turnover rate | | | 26% | | | | 50% | | | | 61% | |
| a | Unaudited figures for the period ended March 31, 2014. Percentage amounts for the period, except total return and portfolio turnover rate, have been annualized. |
| b | Since commencement of operations: November 30, 2011. Percentage amounts for the period, except total return and portfolio turnover rate, have been annualized. |
| c | Net investment income (loss) per share was computed using average shares outstanding throughout the period. |
| d | Net expense information reflects the expense ratios after expense waivers. |
| e | Total return does not reflect the impact of any applicable sales charges and has been annualized. |
| f | Excluding Interest expense, the operating expense ratios for the periods presented would be: |
| | | 03/31/14 | | 09/30/13 | | 09/30/12 |
| |
| A-Class | | 1.04 | % | | 1.03 | % | | 1.01 | % |
| C-Class | | 1.79 | % | | 1.78 | % | | 1.76 | % |
| Institutional Class | | 0.80 | % | | 0.79 | % | | 0.77 | % |
| |
| SEE NOTES TO FINANCIAL STATEMENTS. | | THE GUGGENHEIM FUNDS SEMI-ANNUAL REPORT | 21 |
| FUND PROFILE (Unaudited) | March 31, 2014 |
| |
| HIGH YIELD FUND |
| | |
| OBJECTIVE: | Seeks high current income. Capital appreciation is a secondary objective. |
| | |
| Holdings Diversification |
| (Market Exposure as % of Net Assets) |

| “Holdings Diversification (Market Exposure as % of Net Assets)” excludes any temporary cash investments. |
| Ten Largest Holdings (% of Total Net Assets) | | | |
| |
| Media General, Inc. — Class A | | 2.4 | % |
| Flakt Woods | | 1.6 | % |
| MDC Partners, Inc. | | 1.6 | % |
| GRD Holdings III Corp. | | 1.6 | % |
| BreitBurn Energy Partners Limited | | | |
Partnership / BreitBurn | | | |
Finance Corp. | | 1.5 | % |
| Central Garden and Pet Co. | | 1.4 | % |
| Credit Acceptance Corp. | | 1.3 | % |
| TPC Group, Inc. | | 1.3 | % |
| Gibson Energy, Inc. | | 1.2 | % |
| Seaspan Corp. | | 1.2 | % |
| |
| Top Ten Total | | 15.1 | % |
| |
| Inception Dates: | | | |
| |
| A-Class | | August 5, 1996 |
| B-Class | | August 5, 1996 |
| C-Class | | May 1, 2000 |
| Institutional Class | | July 11, 2008 |
| | | | |
| Portfolio Composition by Quality Rating* |
| |
| Rating | | | |
| |
| Fixed Income Instruments | | | |
AAA | | 0.1 | % |
A | | 0.6 | % |
BBB | | 6.0 | % |
BB | | 27.9 | % |
B | | 46.5 | % |
CCC | | 11.7 | % |
CC | | 0.1 | % |
D | | 0.1 | % |
NR | | 0.1 | % |
| Other Instruments | | | |
Common Stocks | | 2.8 | % |
Preferred Stocks | | 2.1 | % |
Short Term Investments | | 2.0 | % |
| |
| Total Investments | | 100.0 | % |
| |
| The chart above reflects percentages of the value of total investments. |
| * | Source: Factset. Credit quality ratings are measured on a scale that generally ranges from AAA (highest) to D (lowest). All securities have been rated by Moody’s, Standard & Poor’s (“S&P”), or Fitch, which are all a Nationally Recognized Statistical Rating Organization (“NRSRO”). For purposes of this presentation, when ratings are available from more than one agency, the highest rating is used. Guggenheim Investments has converted Moody’s and Fitch ratings to the equivalent S&P rating. Unrated securities do not necessarily indicate low credit quality. Security ratings are determined at the time of purchase and may change thereafter. |
| |
| 22 | THE GUGGENHEIM FUNDS SEMI-ANNUAL REPORT |
| SCHEDULE OF INVESTMENTS (Unaudited) | | March 31, 2014 |
| |
| HIGH YIELD FUND | | |
| | | | SHARES | | | VALUE | |
| |
| | | | | | | | |
| COMMON STOCKS† - 3.3% | | | | | | | |
| | | | | | | | |
| CONSUMER DISCRETIONARY - 2.9% | | | | | | | |
Media General, Inc. — Class A* | | | 170,963 | | $ | 3,140,591 | |
Metro-Goldwyn-Mayer, Inc.*,††† | | | 7,040 | | | 528,000 | |
Sonic Automotive, Inc. — Class A | | | 15,103 | | | 339,515 | |
| | | | | | | |
| Total Consumer Discretionary | | | | | | 4,008,106 | |
| | | | | | | |
| | | | | | | | |
| FINANCIALS - 0.2% | | | | | | | |
CIT Group, Inc.7 | | | 4,569 | | | 223,972 | |
Leucadia National Corp. | | | 81 | | | 2,268 | |
| | | | | | | |
| Total Financials | | | | | | 226,240 | |
| | | | | | | |
| | | | | | | | |
| ENERGY - 0.2% | | | | | | | |
Stallion Oilfield Holdings Ltd.* | | | 8,257 | | | 222,939 | |
| | | | | | | |
| | | | | | | | |
| CONSUMER STAPLES - 0.0% | | | | | | | |
Crimson Wine Group Ltd.* | | | 8 | | | 71 | |
| | | | | | | |
| Total Common Stocks | | | | | | | |
(Cost $1,130,781) | | | | | | 4,457,356 | |
| | | | | | | |
| | | | | | | | |
| PREFERRED STOCKS† - 2.6% | | | | | | | |
Seaspan Corp. | | | | | | | |
6.38% due 04/30/19* | | | 64,000 | | | 1,600,000 | |
Kemper Corp. | | | | | | | |
7.38% due 02/27/54 | | | 39,000 | | | 1,003,860 | |
Aspen Insurance Holdings Ltd. | | | | | | | |
5.95%1,2 | | | 22,000 | | | 545,820 | |
Medianews Group, Inc.* | | | 11,074 | | | 276,850 | |
U.S. Shipping Corp.*,†††,7 | | | 14,718 | | | 11,774 | |
| | | | | | | |
| Total Preferred Stocks | | | | | | | |
(Cost $3,665,629) | | | | | | 3,438,304 | |
| | | | | | | |
| | | | | | | | |
| SHORT TERM INVESTMENTS† - 2.4% | | | | | | | |
Dreyfus Treasury Prime Cash | | | | | | | |
Management Fund | | | 3,268,415 | | | 3,268,415 | |
| | | | | | | |
| Total Short Term Investments | | | | | | | |
(Cost $3,268,415) | | | | | | 3,268,415 | |
| | | | | | | |
| | | | | | | | |
| | | | FACE | | | | |
| | | | AMOUNT | | | | |
| | | | | | | |
| CORPORATE BONDS†† - 85.7% | | | | | | | |
| | | | | | | | |
| ENERGY - 15.1% | | | | | | | |
BreitBurn Energy Partners Limited | | | | | | | |
Partnership / BreitBurn Finance Corp. | | | | | | | |
7.88% due 04/15/228 | | $ | 1,900,000 | | | 2,056,749 | |
Gibson Energy, Inc. | | | | | | | |
6.75% due 07/15/213 | | | 1,500,000 | | | 1,608,750 | |
Crestwood Midstream Partners Limited | | | | | | | |
Partnership / Crestwood Midstream | | | | | | | |
Finance Corp. | | | | | | | |
7.75% due 04/01/198 | | | 1,000,000 | | | 1,085,000 | |
6.13% due 03/01/223 | | | 400,000 | | | 418,000 | |
SandRidge Energy, Inc. | | | | | | | |
7.50% due 03/15/218 | | | 1,000,000 | | | 1,067,500 | |
8.75% due 01/15/20 | | | 295,000 | | | 317,863 | |
Bill Barrett Corp. | | | | | | | |
7.00% due 10/15/228 | | | 800,000 | | | 842,000 | |
7.63% due 10/01/19 | | | 500,000 | | | 541,875 | |
Endeavor Energy Resources Limited | | | | | | | |
Partnership / EER Finance, Inc. | | | | | | | |
7.00% due 08/15/213 | | | 1,250,000 | | | 1,312,500 | |
Eagle Rock Energy Partners Limited | | | | | | | |
Partnership / Eagle Rock Energy | | | | | | | |
Finance Corp. | | | | | | | |
8.38% due 06/01/198 | | | 1,165,000 | | | 1,264,025 | |
Exterran Holdings, Inc. | | | | | | | |
7.25% due 12/01/188 | | | 1,065,000 | | | 1,124,906 | |
Midstates Petroleum Company | | | | | | | |
Incorporated / Midstates | | | | | | | |
Petroleum Co LLC | | | | | | | |
10.75% due 10/01/208 | | | 1,000,000 | | | 1,105,000 | |
Hiland Partners Limited Partnership / | | | | | | | |
Hiland Partners Finance Corp. | | | | | | | |
7.25% due 10/01/203 | | | 1,000,000 | | | 1,087,500 | |
Penn Virginia Resource Partners Limited | | | | | | | |
Partnership / Penn Virginia Resource | | | | | | | |
Finance Corp. | | | | | | | |
8.25% due 04/15/188 | | | 1,000,000 | | | 1,045,000 | |
Atlas Energy Holdings Operating Company | | | | | | | |
LLC / Atlas Resource Finance Corp. | | | | | | | |
9.25% due 08/15/213 | | | 700,000 | | | 770,000 | |
Precision Drilling Corp. | | | | | | | |
6.63% due 11/15/208 | | | 700,000 | | | 749,000 | |
Unit Corp. | | | | | | | |
6.63% due 05/15/21 | | | 700,000 | | | 742,000 | |
Memorial Production Partners Limited | | | | | | | |
Partnership / Memorial Production | | | | | | | |
Finance Corp. | | | | | | | |
7.63% due 05/01/213 | | | 600,000 | | | 633,000 | |
Ultra Petroleum Corp. | | | | | | | |
5.75% due 12/15/183 | | | 600,000 | | | 630,000 | |
SESI LLC | | | | | | | |
7.13% due 12/15/21 | | | 400,000 | | | 446,000 | |
SM Energy Co. | | | | | | | |
6.50% due 11/15/21 | | | 350,000 | | | 378,000 | |
Pacific Drilling S.A. | | | | | | | |
5.38% due 06/01/203 | | | 350,000 | | | 347,375 | |
Rosetta Resources, Inc. | | | | | | | |
5.88% due 06/01/22 | | | 300,000 | | | 306,750 | |
Carrizo Oil & Gas, Inc. | | | | | | | |
7.50% due 09/15/20 | | | 225,000 | | | 247,500 | |
IronGate Energy Services LLC | | | | | | | |
11.00% due 07/01/183 | | | 100,000 | | | 99,500 | |
SemGroup, LP | | | | | | | |
8.75% due 11/15/15†††,7 | | | 1,300,000 | | | – | |
| | | | | | | |
| Total Energy | | | | | | 20,225,793 | |
| | | | | | | |
| | | | | | | | |
| CONSUMER DISCRETIONARY - 14.0% | | | | | | | |
MDC Partners, Inc. | | | | | | | |
6.75% due 04/01/203 | | | 2,000,000 | | | 2,105,000 | |
GRD Holdings III Corp. | | | | | | | |
10.75% due 06/01/193 | | | 1,900,000 | | | 2,090,000 | |
Checkers Drive-In Restaurants, Inc. | | | | | | | |
11.00% due 12/01/173 | | | 1,400,000 | | | 1,561,000 | |
Continental Airlines 2012-2 Class B | | | | | | | |
Pass Through Trust | | | | | | | |
5.50% due 10/29/20 | | | 1,450,000 | | | 1,526,125 | |
Laureate Education, Inc. | | | | | | | |
9.25% due 09/01/193 | | | 1,290,000 | | | 1,373,850 | |
| |
| SEE NOTES TO FINANCIAL STATEMENTS. | | THE GUGGENHEIM FUNDS SEMI-ANNUAL REPORT | 23 |
| SCHEDULE OF INVESTMENTS (Unaudited) (continued) | | March 31, 2014 |
| |
| HIGH YIELD FUND | | |
| | | | FACE | | | | |
| | | | AMOUNT | | | VALUE | |
| |
| | | | | | | | |
Sabre GLBL, Inc. | | | | | | | |
8.50% due 05/15/193 | | $ | 1,150,000 | | $ | 1,270,750 | |
AmeriGas Finance LLC / AmeriGas | | | | | | | |
Finance Corp. | | | | | | | |
7.00% due 05/20/228 | | | 1,150,000 | | | 1,256,375 | |
Travelport LLC / Travelport | | | | | | | |
Holdings, Inc. | | | | | | | |
13.88% due 03/01/163 | | | 1,163,256 | | | 1,227,235 | |
WMG Acquisition Corp. | | | | | | | |
11.50% due 10/01/188 | | | 655,000 | | | 744,408 | |
6.00% due 01/15/213 | | | 200,000 | | | 208,500 | |
Dufry Finance SCA | | | | | | | |
5.50% due 10/15/203 | | | 650,000 | | | 677,144 | |
DreamWorks Animation SKG, Inc. | | | | | | | |
6.88% due 08/15/203 | | | 600,000 | | | 649,500 | |
CPG Merger Sub LLC | | | | | | | |
8.00% due 10/01/213 | | | 600,000 | | | 645,000 | |
Sirius XM Holdings, Inc. | | | | | | | |
5.88% due 10/01/203 | | | 550,000 | | | 578,875 | |
Stanadyne Corp. | | | | | | | |
10.00% due 08/15/14 | | | 525,000 | | | 523,031 | |
Vail Resorts, Inc. | | | | | | | |
6.50% due 05/01/19 | | | 365,000 | | | 383,706 | |
Whirlpool Corp. | | | | | | | |
2.40% due 03/01/198 | | | 350,000 | | | 347,082 | |
Suburban Propane Partners Limited | | | | | | | |
Partnership/Suburban Energy | | | | | | | |
Finance Corp. | | | | | | | |
7.50% due 10/01/18 | | | 168,000 | | | 178,500 | |
7.38% due 08/01/21 | | | 149,000 | | | 164,273 | |
Live Nation Entertainment, Inc. | | | | | | | |
7.00% due 09/01/203 | | | 300,000 | | | 328,125 | |
GLP Capital Limited Partnership / GLP | | | | | | | |
Financing II, Inc. | | | | | | | |
4.88% due 11/01/203 | | | 300,000 | | | 307,875 | |
Seminole Hard Rock Entertainment | | | | | | | |
Incorporated / Seminole Hard Rock | | | | | | | |
International LLC | | | | | | | |
5.88% due 05/15/213 | | | 250,000 | | | 251,875 | |
Gibson Brands, Inc. | | | | | | | |
8.88% due 08/01/183 | | | 125,000 | | | 133,125 | |
Stanadyne Holdings, Inc. | | | | | | | |
11.99% due 02/15/154 | | | 170,000 | | | 128,350 | |
| | | | | | | |
| Total Consumer Discretionary | | | | | | 18,659,704 | |
| | | | | | | |
| | | | | | | | |
| INDUSTRIALS - 12.5% | | | | | | | |
Guitar Center, Inc. | | | | | | | |
6.50% due 04/15/193 | | | 1,550,000 | | | 1,540,312 | |
Deutsche Raststatten | | | | | | | |
6.75% due 12/30/20 | | | 800,000 | | | 1,201,604 | |
Virgin Media Finance plc | | | | | | | |
6.38% due 04/15/233 | | | 950,000 | | | 1,007,000 | |
CEVA Group plc | | | | | | | |
9.00% due 09/01/213 | | | 400,000 | | | 409,000 | |
7.00% due 03/01/213 | | | 400,000 | | | 407,000 | |
FTI Consulting, Inc. | | | | | | | |
6.00% due 11/15/228 | | | 800,000 | | | 815,999 | |
Marquette Transportation Company | | | | | | | |
LLC / Marquette Transportation | | | | | | | |
Finance Corp. | | | | | | | |
10.88% due 01/15/178 | | | 755,000 | | | 794,637 | |
ADT Corp. | | | | | | | |
6.25% due 10/15/213 | | | 750,000 | | | 770,625 | |
Odebrecht Offshore Drilling | | | | | | | |
Finance Ltd. | | | | | | | |
6.63% due 10/01/223 | | | 700,000 | | | 724,500 | |
AmeriGas Finance LLC / AmeriGas | | | | | | | |
Finance Corp. | | | | | | | |
6.75% due 05/20/208 | | | 650,000 | | | 703,625 | |
WMG Acquisition Corp. | | | | | | | |
6.75% due 04/15/223 | | | 550,000 | | | 550,000 | |
5.63% due 04/15/223 | | | 150,000 | | | 152,250 | |
Briggs & Stratton Corp. | | | | | | | |
6.88% due 12/15/208 | | | 600,000 | | | 666,000 | |
Amsted Industries, Inc. | | | | | | | |
5.00% due 03/15/223 | | | 650,000 | | | 653,250 | |
CSC Holdings LLC | | | | | | | |
7.63% due 07/15/18 | | | 500,000 | | | 581,250 | |
Ultra Resources, Inc. | | | | | | | |
4.51% due 10/12/20†††,7 | | | 600,000 | | | 558,660 | |
HCA, Inc. | | | | | | | |
5.00% due 03/15/24 | | | 350,000 | | | 350,656 | |
3.75% due 03/15/19 | | | 200,000 | | | 200,750 | |
Greektown Holdings LLC/Greektown | | | | | | | |
Mothership Corp. | | | | | | | |
8.88% due 03/15/193 | | | 500,000 | | | 516,250 | |
Building Materials Corporation of America | | | | | | | |
6.75% due 05/01/213 | | | 400,000 | | | 434,000 | |
Travelport LLC / Travelport Holdings, Inc. | | | | | | | |
6.36% due 03/01/161,3 | | | 405,015 | | | 408,053 | |
Nielsen Finance LLC / Nielsen | | | | | | | |
Finance Co. | | | | | | | |
5.00% due 04/15/223 | | | 400,000 | | | 401,000 | |
Nissan Motor Acceptance Corp. | | | | | | | |
2.35% due 03/04/193 | | | 400,000 | | | 397,574 | |
Audatex North America, Inc. | | | | | | | |
6.13% due 11/01/233 | | | 350,000 | | | 372,313 | |
Level 3 Financing, Inc. | | | | | | | |
6.13% due 01/15/213 | | | 350,000 | | | 369,250 | |
Knowledge Universe Education LLC | | | | | | | |
7.75% due 02/01/153 | | | 350,000 | | | 350,438 | |
USG Corp. | | | | | | | |
5.88% due 11/01/213 | | | 300,000 | | | 319,500 | |
ARAMARK Corp. | | | | | | | |
5.75% due 03/15/20 | | | 300,000 | | | 316,875 | |
Grifols Worldwide Operations Ltd. | | | | | | | |
5.25% due 04/01/223 | | | 300,000 | | | 306,750 | |
Spectrum Brands, Inc. | | | | | | | |
6.63% due 11/15/22 | | | 225,000 | | | 244,969 | |
Travelport LLC | | | | | | | |
11.88% due 09/01/16 | | | 200,000 | | | 204,000 | |
| | | | | | | |
| Total Industrials | | | | | | 16,728,090 | |
| | | | | | | |
| | | | | | | | |
| FINANCIALS - 11.3% | | | | | | | |
Icahn Enterprises Limited | | | | | | | |
Partnership / Icahn Enterprises | | | | | | | |
Finance Corp. | | | | | | | |
6.00% due 08/01/203 | | | 1,400,000 | | | 1,484,000 | |
5.88% due 02/01/223 | | | 300,000 | | | 304,500 | |
4.88% due 03/15/193 | | | 200,000 | | | 203,500 | |
3.50% due 03/15/173 | | | 150,000 | | | 151,500 | |
| |
| 24 | THE GUGGENHEIM FUNDS SEMI-ANNUAL REPORT | | SEE NOTES TO FINANCIAL STATEMENTS. |
| SCHEDULE OF INVESTMENTS (Unaudited) (continued) | | March 31, 2014 |
| |
| HIGH YIELD FUND | | |
| | | | FACE | | | | |
| | | | AMOUNT | | | VALUE | |
| |
| | | | | | | | |
Credit Acceptance Corp. | | | | | | | |
6.13% due 02/15/213 | | $ | 1,700,000 | | $ | 1,768,000 | |
Opal Acquisition, Inc. | | | | | | | |
8.88% due 12/15/213 | | | 1,550,000 | | | 1,557,750 | |
Kennedy-Wilson, Inc. | | | | | | | |
8.75% due 04/01/198 | | | 1,200,000 | | | 1,311,000 | |
5.88% due 04/01/24 | | | 200,000 | | | 200,000 | |
Lancashire Holdings Ltd. | | | | | | | |
5.70% due 10/01/223 | | | 1,000,000 | | | 1,028,836 | |
Nationstar Mortgage LLC / | | | | | | | |
Nationstar Capital Corp. | | | | | | | |
6.50% due 08/01/188 | | | 700,000 | | | 703,500 | |
6.50% due 06/01/22 | | | 350,000 | | | 324,625 | |
American Equity Investment | | | | | | | |
Life Holding Co. | | | | | | | |
6.63% due 07/15/21 | | | 800,000 | | | 853,000 | |
ARC Properties Operating Partnership | | | | | | | |
Limited Partnership/Clark | | | | | | | |
Acquisition LLC | | | | | | | |
3.00% due 02/06/193 | | | 700,000 | | | 696,811 | |
Wilton Re Finance LLC | | | | | | | |
5.88% due 03/30/331,3 | | | 650,000 | | | 646,750 | |
AIA Group Ltd. | | | | | | | |
2.25% due 03/11/193,8 | | | 650,000 | | | 642,444 | |
Oxford Finance LLC / Oxford | | | | | | | |
Finance Company-Issuer, Inc. | | | | | | | |
7.25% due 01/15/183 | | | 600,000 | | | 636,000 | |
Nielsen Company Luxembourg SARL | | | | | | | |
5.50% due 10/01/213 | | | 500,000 | | | 521,875 | |
ING US, Inc. | | | | | | | |
5.65% due 05/15/531 | | | 475,000 | | | 472,150 | |
Cabot Financial Luxembourg S.A. | | | | | | | |
6.50% due 04/01/213 | | | 200,000 | | | 334,044 | |
Majid AL Futtaim Holding | | | | | | | |
7.12% due 12/31/49 | | | 300,000 | | | 321,648 | |
DuPont Fabros Technology, LP | | | | | | | |
5.88% due 09/15/21 | | | 300,000 | | | 317,250 | |
Jefferies Finance LLC / JFIN | | | | | | | |
Company-Issuer Corp. | | | | | | | |
7.38% due 04/01/203 | | | 300,000 | | | 315,000 | |
Fidelity & Guaranty Life Holdings, Inc. | | | | | | | |
6.38% due 04/01/213 | | | 250,000 | | | 266,250 | |
| | | | | | | |
| Total Financials | | | | | | 15,060,433 | |
| | | | | | | |
| | | | | | | | |
| INFORMATION TECHNOLOGY - 8.1% | | | | | | | |
First Data Corp. | | | | | | | |
8.75% due 01/15/223 | | | 1,050,000 | | | 1,147,125 | |
6.75% due 11/01/203 | | | 850,000 | | | 913,750 | |
Eagle Midco, Inc. | | | | | | | |
9.00% due 06/15/183 | | | 1,300,000 | | | 1,364,999 | |
Aspect Software, Inc. | | | | | | | |
10.63% due 05/15/178 | | | 1,235,000 | | | 1,306,013 | |
IAC | | | | | | | |
4.75% due 12/15/22 | | | 495,000 | | | 484,481 | |
4.88% due 11/30/18 | | | 400,000 | | | 417,500 | |
Activision Blizzard, Inc. | | | | | | | |
5.63% due 09/15/213 | | | 700,000 | | | 749,000 | |
Audatex North America, Inc. | | | | | | | |
6.00% due 06/15/213 | | | 700,000 | | | 747,250 | |
iGATE Corp. | | | | | | | |
9.00% due 05/01/16 | | | 350,000 | | | 367,500 | |
4.75% due 04/15/193 | | | 350,000 | | | 351,313 | |
CyrusOne Limited Partnership / | | | | | | | |
CyrusOne Finance Corp. | | | | | | | |
6.38% due 11/15/228 | | | 650,000 | | | 685,750 | |
NCR Corp. | | | | | | | |
5.88% due 12/15/213 | | | 400,000 | | | 421,000 | |
6.38% due 12/15/233 | | | 200,000 | | | 212,500 | |
ViaSat, Inc. | | | | | | | |
6.88% due 06/15/20 | | | 500,000 | | | 536,250 | |
Alcatel-Lucent USA, Inc. | | | | | | | |
8.88% due 01/01/203 | | | 400,000 | | | 454,000 | |
Stratus Technologies Bermuda | | | | | | | |
Limited / Stratus Technologies, Inc. | | | | | | | |
12.00% due 03/29/15 | | | 366 | | | 406,260 | |
Brocade Communications Systems, Inc. | | | | | | | |
4.63% due 01/15/233 | | | 275,000 | | | 262,625 | |
| | | | | | | |
| Total Information Technology | | | | | | 10,827,316 | |
| | | | | | | |
| | | | | | | | |
| UTILITIES - 6.6% | | | | | | | |
Legacy Reserves Limited Partnership / | | | | | | | |
Legacy Reserves Finance Corp. | | | | | | | |
6.63% due 12/01/21 | | | 940,000 | | | 937,650 | |
8.00% due 12/01/20 | | | 465,000 | | | 497,550 | |
LBC Tank Terminals Holding | | | | | | | |
Netherlands BV | | | | | | | |
6.88% due 05/15/233 | | | 1,150,000 | | | 1,227,625 | |
Atlas Pipeline Partners Limited | | | | | | | |
Partnership / Atlas Pipeline | | | | | | | |
Finance Corp. | | | | | | | |
6.63% due 10/01/208 | | | 1,000,000 | | | 1,065,000 | |
Sabine Pass Liquefaction LLC | | | | | | | |
6.25% due 03/15/223 | | | 700,000 | | | 729,750 | |
5.63% due 04/15/23 | | | 200,000 | | | 199,000 | |
Atlas Energy Holdings Operating | | | | | | | |
Company LLC / Atlas Resource | | | | | | | |
Finance Corp. | | | | | | | |
7.75% due 01/15/218 | | | 850,000 | | | 892,500 | |
NGL Energy Partners Limited | | | | | | | |
Partnership / NGL Energy | | | | | | | |
Finance Corp. | | | | | | | |
6.88% due 10/15/213 | | | 750,000 | | | 780,000 | |
AES Corp. | | | | | | | |
5.50% due 03/15/24 | | | 650,000 | | | 645,125 | |
Crestwood Midstream Partners | | | | | | | |
Limited Partnership / Crestwood | | | | | | | |
Midstream Finance Corp. | | | | | | | |
6.00% due 12/15/20 | | | 400,000 | | | 419,000 | |
Access Midstream Partners | | | | | | | |
Limited Partnership / ACMP | | | | | | | |
Finance Corp. | | | | | | | |
4.88% due 03/15/24 | | | 400,000 | | | 399,000 | |
Summit Midstream Holdings | | | | | | | |
LLC / Summit Midstream | | | | | | | |
Finance Corp. | | | | | | | |
7.50% due 07/01/213 | | | 350,000 | | | 374,500 | |
Jones Energy Holdings LLC / | | | | | | | |
Jones Energy Finance Corp. | | | | | | | |
6.75% due 04/01/223 | | | 300,000 | | | 305,625 | |
| |
| SEE NOTES TO FINANCIAL STATEMENTS. | | THE GUGGENHEIM FUNDS SEMI-ANNUAL REPORT | 25 |
| SCHEDULE OF INVESTMENTS (Unaudited) (continued) | | March 31, 2014 |
| |
| HIGH YIELD FUND | | |
| | | | FACE | | | | |
| | | | AMOUNT | | | VALUE | |
| |
| | | | | | | | |
Midstates Petroleum Company | | | | | | | |
Incorporated / Midstates | | | | | | | |
Petroleum Co LLC | | | | | | | |
9.25% due 06/01/21 | | $ | 200,000 | | $ | 209,000 | |
Exterran Partners Limited | | | | | | | |
Partnership / EXLP Finance Corp. | | | | | | | |
6.00% due 04/01/21 | | | 125,000 | | | 124,375 | |
| | | | | | | |
| Total Utilities | | | | | | 8,805,700 | |
| | | | | | | |
| | | | | | | | |
| CONSUMER STAPLES - 6.1% | | | | | | | |
Central Garden and Pet Co. | | | | | | | |
8.25% due 03/01/188 | | | 1,750,000 | | | 1,804,688 | |
Vector Group Ltd. | | | | | | | |
7.75% due 02/15/21 | | | 1,440,000 | | | 1,548,000 | |
Harbinger Group, Inc. | | | | | | | |
7.88% due 07/15/198 | | | 1,340,000 | | | 1,470,650 | |
Premier Foods plc | | | | | | | |
6.50% due 03/15/213 | | | 500,000 | | | 856,255 | |
Bumble Bee Holdco SCA | | | | | | | |
9.63% due 03/15/183 | | | 700,000 | | | 735,000 | |
KeHE Distributors LLC / KeHE | | | | | | | |
Finance Corp. | | | | | | | |
7.63% due 08/15/213 | | | 650,000 | | | 698,750 | |
US Foods, Inc. | | | | | | | |
8.50% due 06/30/198 | | | 395,000 | | | 427,390 | |
Diamond Foods, Inc. | | | | | | | |
7.00% due 03/15/193 | | | 300,000 | | | 310,500 | |
Darling International, Inc. | | | | | | | |
5.38% due 01/15/223 | | | 300,000 | | | 308,250 | |
| | | | | | | |
| Total Consumer Staples | | | | | | 8,159,483 | |
| | | | | | | |
| | | | | | | | |
| TELECOMMUNICATION SERVICES - 5.1% | | | | | | | |
UPCB Finance VI Ltd. | | | | | | | |
6.88% due 01/15/223 | | | 1,200,000 | | | 1,307,999 | |
SITEL LLC / Sitel Finance Corp. | | | | | | | |
11.00% due 08/01/173 | | | 1,150,000 | | | 1,234,813 | |
Univision Communications, Inc. | | | | | | | |
5.13% due 05/15/233 | | | 450,000 | | | 460,125 | |
6.75% due 09/15/223 | | | 295,000 | | | 326,344 | |
Zayo Group LLC / Zayo Capital, Inc. | | | | | | | |
8.13% due 01/01/20 | | | 550,000 | | | 603,625 | |
Avaya, Inc. | | | | | | | |
7.00% due 04/01/193 | | | 600,000 | | | 595,500 | |
Unitymedia Hessen GmbH & | | | | | | | |
Company KG / Unitymedia | | | | | | | |
NRW GmbH | | | | | | | |
5.50% due 01/15/233 | | | 550,000 | | | 561,000 | |
DISH DBS Corp. | | | | | | | |
6.75% due 06/01/21 | | | 300,000 | | | 336,000 | |
5.88% due 07/15/22 | | | 150,000 | | | 160,125 | |
Expo Event Transco, Inc. | | | | | | | |
9.00% due 06/15/213 | | | 400,000 | | | 407,000 | |
Alcatel-Lucent USA, Inc. | | | | | | | |
6.75% due 11/15/203 | | | 350,000 | | | 370,125 | |
Baker & Taylor Acquisitions Corp. | | | | | | | |
15.00% due 04/01/173,7 | | | 268,000 | | | 214,400 | |
Virgin Media Secured Finance plc | | | | | | | |
5.38% due 04/15/213 | | | 200,000 | | | 206,500 | |
| | | | | | | |
| Total Telecommunication Services | | | | | | 6,783,556 | |
| | | | | | | |
| | | | | | | | |
| MATERIALS - 4.7% | | | | | | | |
TPC Group, Inc. | | | | | | | |
8.75% due 12/15/203 | | | 1,595,000 | | | 1,748,519 | |
KGHM International Ltd. | | | | | | | |
7.75% due 06/15/193 | | | 1,150,000 | | | 1,213,249 | |
Clearwater Paper Corp. | | | | | | | |
4.50% due 02/01/23 | | | 675,000 | | | 649,688 | |
Kaiser Aluminum Corp. | | | | | | | |
8.25% due 06/01/20 | | | 575,000 | | | 648,313 | |
Pretium Packaging LLC / Pretium | | | | | | | |
Finance, Inc. | | | | | | | |
11.50% due 04/01/16 | | | 550,000 | | | 588,500 | |
Eldorado Gold Corp. | | | | | | | |
6.13% due 12/15/203 | | | 425,000 | | | 425,000 | |
Unifrax I LLC / Unifrax Holding Co. | | | | | | | |
7.50% due 02/15/193 | | | 350,000 | | | 371,000 | |
Reynolds Group Issuer Incorporated / | | | | | | | |
Reynolds Group Issuer LLC / | | | | | | | |
Reynolds Group Issuer Lu | | | | | | | |
6.88% due 02/15/21 | | | 300,000 | | | 324,000 | |
Steel Dynamics, Inc. | | | | | | | |
7.63% due 03/15/20 | | | 250,000 | | | 270,625 | |
Mirabela Nickel Ltd. | | | | | | | |
8.75% due 04/15/183,5,7 | | | 435,000 | | | 104,400 | |
| | | | | | | |
| Total Materials | | | | | | 6,343,294 | |
| | | | | | | |
| | | | | | | | |
| HEALTH CARE - 2.2% | | | | | | | |
Valeant Pharmaceuticals | | | | | | | |
International, Inc. | | | | | | | |
5.63% due 12/01/213 | | | 600,000 | | | 629,999 | |
6.75% due 08/15/183 | | | 400,000 | | | 440,000 | |
Catalent Pharma Solutions, Inc. | | | | | | | |
7.88% due 10/15/188 | | | 750,000 | | | 762,188 | |
Symbion, Inc. | | | | | | | |
8.00% due 06/15/16 | | | 475,000 | | | 498,750 | |
Physio-Control International, Inc. | | | | | | | |
9.88% due 01/15/193 | | | 309,000 | | | 346,853 | |
Catamaran Corp. | | | | | | | |
4.75% due 03/15/21 | | | 200,000 | | | 202,750 | |
| | | | | | | |
| Total Health Care | | | | | | 2,880,540 | |
| | | | | | | |
| Total Corporate Bonds | | | | | | | |
(Cost $111,353,798) | | | | | | 114,473,909 | |
| | | | | | | |
| | | | | | | | |
| SENIOR FLOATING RATE INTERESTS†† - 25.9% | | | | | | | |
| | | | | | | | |
| INDUSTRIALS - 6.5% | | | | | | | |
Flakt Woods | | | | | | | |
8.00% due 04/01/17 | | | 1,600,000 | | | 2,138,182 | |
Mitchell International, Inc. | | | | | | | |
8.50% due 10/11/21 | | | 1,250,000 | | | 1,276,562 | |
Travelport Holdings Ltd. | | | | | | | |
9.50% due 01/31/16 | | | 988,752 | | | 1,020,886 | |
GCA Services Group, Inc. | | | | | | | |
9.25% due 11/01/20 | | | 800,000 | | | 809,000 | |
syncreon | | | | | | | |
5.25% due 10/28/20 | | | 608,475 | | | 609,236 | |
US Shipping Corp. | | | | | | | |
9.00% due 04/30/18 | | | 547,122 | | | 558,064 | |
CareCore National LLC | | | | | | | |
5.50% due 03/05/21 | | | 500,000 | | | 502,710 | |
| |
| 26 | THE GUGGENHEIM FUNDS SEMI-ANNUAL REPORT | | SEE NOTES TO FINANCIAL STATEMENTS. |
| SCHEDULE OF INVESTMENTS (Unaudited) (continued) | | March 31, 2014 |
| |
| HIGH YIELD FUND | | |
| | | | FACE | | | | |
| | | | AMOUNT | | | VALUE | |
| |
| | | | | | | | |
SIRVA Worldwide, Inc. | | | | | | | |
7.50% due 03/27/19 | | $ | 396,000 | | $ | 403,920 | |
Knowledge Learning Corp. | | | | | | | |
5.25% due 03/12/21 | | | 300,000 | | | 301,689 | |
GYP Holdings III Corp. | | | | | | | |
7.75% due 03/25/22 | | | 250,000 | | | 250,938 | |
Mast Global | | | | | | | |
8.75% due 09/12/19†††,7 | | | 246,875 | | | 244,406 | |
Panolam Industries International, Inc. | | | | | | | |
7.25% due 08/23/17 | | | 204,558 | | | 198,933 | |
Ceva Logistics US Holdings | | | | | | | |
6.50% due 03/19/21 | | | 98,522 | | | 98,111 | |
NaNa Development Corp. | | | | | | | |
8.00% due 03/15/18 | | | 88,889 | | | 88,000 | |
Ceva Logistics Holdings BV (Dutch) | | | | | | | |
6.50% due 03/19/21 | | | 71,429 | | | 71,131 | |
Ceva Group Plc (United Kingdom) | | | | | | | |
6.50% due 03/19/21 | | | 67,734 | | | 67,452 | |
Ceva Logistics Canada, ULC | | | | | | | |
6.50% due 03/19/21 | | | 12,315 | | | 12,264 | |
| | | | | | | |
| Total Industrials | | | | | | 8,651,484 | |
| | | | | | | |
| | | | | | | | |
| CONSUMER DISCRETIONARY - 4.7% | | | | | | | |
Steinway Musical Instruments, Inc. | | | | | | | |
9.25% due 09/18/20 | | | 1,050,000 | | | 1,081,500 | |
Lions Gate Entertainment Corp. | | | | | | | |
5.00% due 07/19/20 | | | 600,000 | | | 610,500 | |
IntraWest Holdings S.à r.l. | | | | | | | |
5.50% due 12/09/20 | | | 598,500 | | | 605,981 | |
NES Global Talent | | | | | | | |
6.50% due 10/03/19 | | | 596,250 | | | 596,250 | |
Alexander Mann Solutions Ltd. | | | | | | | |
5.75% due 12/20/19 | | | 498,750 | | | 499,997 | |
National Vision, Inc. | | | | | | | |
6.75% due 03/11/22 | | | 450,000 | | | 451,125 | |
PSAV-Audio Visual Services Corp. | | | | | | | |
4.50% due 01/25/21 | | | 400,000 | | | 402,000 | |
Tectum Holdings, Inc. | | | | | | | |
10.25% due 03/12/19 | | | 375,000 | | | 374,063 | |
Neiman Marcus Group, Inc. | | | | | | | |
4.25% due 10/25/20 | | | 339,525 | | | 340,408 | |
Hilton Worldwide Holdings, Inc. | | | | | | | |
3.50% due 10/26/20 | | | 328,158 | | | 328,539 | |
Men’s Wearhouse | | | | | | | |
7.75% due 03/11/15†††,7 | | | 250,000 | | | 250,000 | |
Fleetpride Corp. | | | | | | | |
9.25% due 05/15/20 | | | 240,000 | | | 235,800 | |
Connolly Holdings, Inc. | | | | | | | |
5.00% due 01/29/21 | | | 199,500 | | | 201,329 | |
Targus Group International, Inc. | | | | | | | |
12.00% due 05/24/16,7 | | | 231,861 | | | 191,865 | |
Cooper Standard Automotive, Inc. | | | | | | | |
4.00% due 03/26/21 | | | 80,000 | | | 80,050 | |
| | | | | | | |
| Total Consumer Discretionary | | | | | | 6,249,407 | |
| | | | | | | |
| | | | | | | | |
| TELECOMMUNICATION SERVICES - 4.3% | | | | | | | |
Scout24 AG | | | | | | | |
4.48% due 02/05/21 | | | 1,000,000 | | | 1,390,783 | |
Expert Global Solutions | | | | | | | |
8.50% due 04/03/18 | | | 1,395,064 | | | 1,358,444 | |
Associated Partners, Inc. | | | | | | | |
6.66% due 12/21/15†††,7 | | | 1,000,000 | | | 1,002,500 | |
Anaren, Inc. | | | | | | | |
9.25% due 08/18/21 | | | 500,000 | | | 505,000 | |
Cengage Learning Acquisitions, Inc. | | | | | | | |
7.00% due 03/06/20 | | | 300,000 | | | 303,126 | |
0.00% due 07/31/176 | | | 139,630 | | | 131,496 | |
MergerMarket Ltd. | | | | | | | |
4.50% due 02/04/21 | | | 300,000 | | | 298,500 | |
Avaya, Inc. | | | | | | | |
6.50% due 03/31/18 | | | 295,673 | | | 295,981 | |
Cumulus Media, Inc. | | | | | | | |
4.25% due 12/23/20 | | | 249,267 | | | 250,202 | |
Hemisphere Media Group, Inc. | | | | | | | |
6.25% due 07/30/20 | | | 223,313 | | | 223,871 | |
| | | | | | | |
| Total Telecommunication Services | | | | | | 5,759,903 | |
| | | | | | | |
| | | | | | | | |
| INFORMATION TECHNOLOGY - 3.4% | | | | | | | |
Greenway Medical Technologies | | | | | | | |
9.25% due 11/04/21 | | | 550,000 | | | 555,500 | |
6.00% due 11/04/20 | | | 349,125 | | | 346,943 | |
Applied Systems, Inc. | | | | | | | |
4.25% due 01/25/21 | | | 598,500 | | | 599,996 | |
Wall Street Systems | | | | | | | |
9.25% due 10/25/20 | | | 500,000 | | | 503,750 | |
SumTotal Systems | | | | | | | |
6.25% due 11/16/18 | | | 444,755 | | | 441,975 | |
EIG Investors Corp. | | | | | | | |
5.00% due 11/09/19 | | | 398,000 | | | 399,990 | |
Infor (US), Inc. | | | | | | | |
3.75% due 06/03/20 | | | 399,000 | | | 397,504 | |
Sophos | | | | | | | |
5.00% due 01/29/21 | | | 300,000 | | | 300,750 | |
Flexera Software LLC | | | | | | | |
8.00% due 04/02/21 | | | 250,000 | | | 250,000 | |
P2 Energy Solutions | | | | | | | |
5.00% due 10/30/20 | | | 199,500 | | | 200,996 | |
GlobalLogic Holdings, Inc. | | | | | | | |
6.25% due 05/31/19 | | | 199,500 | | | 197,505 | |
LANDesk Group, Inc. | | | | | | | |
5.00% due 02/25/20 | | | 179,100 | | | 179,156 | |
Sabre, Inc. | | | | | | | |
4.25% due 02/19/19 | | | 110,305 | | | 110,258 | |
Active Network, Inc., The | | | | | | | |
5.50% due 11/13/20 | | | 99,750 | | | 100,561 | |
| | | | | | | |
| Total Information Technology | | | | | | 4,584,884 | |
| | | | | | | |
| | | | | | | | |
| FINANCIALS - 1.8% | | | | | | | |
Magic Newco, LLC | | | | | | | |
12.00% due 06/12/19 | | | 500,000 | | | 572,500 | |
5.00% due 12/12/18 | | | 198,991 | | | 200,732 | |
Cunningham Lindsey U.S., Inc. | | | | | | | |
9.25% due 06/10/20 | | | 623,636 | | | 622,077 | |
Cetera Financial Group, Inc. | | | | | | | |
6.50% due 08/07/19 | | | 493,750 | | | 493,750 | |
National Financial Partners | | | | | | | |
5.25% due 07/01/20 | | | 248,128 | | | 249,292 | |
STG-Fairway Acquisitions, Inc. | | | | | | | |
6.25% due 02/28/19 | | | 248,125 | | | 248,746 | |
| |
| SEE NOTES TO FINANCIAL STATEMENTS. | | THE GUGGENHEIM FUNDS SEMI-ANNUAL REPORT | 27 |
| SCHEDULE OF INVESTMENTS (Unaudited) (concluded) | | March 31, 2014 |
| |
| HIGH YIELD FUND | | |
| | | | FACE | | | | |
| | | | AMOUNT | | | VALUE | |
| |
| | | | | | | | |
Knight/Getco | | | | | | | |
5.75% due 12/05/17 | | $ | 18,692 | | $ | 18,715 | |
| | | | | | | |
| Total Financials | | | | | | 2,405,812 | |
| | | | | | | |
| | | | | | | | |
| CONSUMER STAPLES - 1.6% | | | | | | | |
AdvancePierre Foods, Inc. | | | | | | | |
9.50% due 10/10/17 | | | 751,000 | | | 728,470 | |
Reddy Ice Holdings, Inc. | | | | | | | |
6.75% due 04/01/19 | | | 594,000 | | | 588,060 | |
CTI Foods Holding Co. LLC | | | | | | | |
8.25% due 06/28/21 | | | 340,000 | | | 341,700 | |
Performance Food Group | | | | | | | |
6.25% due 11/14/19 | | | 248,125 | | | 251,433 | |
Arctic Glacier Holdings, Inc. | | | | | | | |
5.00% due 05/10/19 | | | 213,315 | | | 213,581 | |
| | | | | | | |
| Total Consumer Staples | | | | | | 2,123,244 | |
| | | | | | | |
| | | | | | | | |
| ENERGY - 1.4% | | | | | | | |
Varel International Energy Funding Corp. | | | | | | | |
9.25% due 07/17/17 | | | 717,188 | | | 722,566 | |
PSS Companies | | | | | | | |
5.50% due 01/28/20 | | | 500,000 | | | 502,500 | |
Panda Sherman | | | | | | | |
9.00% due 09/14/18 | | | 425,000 | | | 434,563 | |
Rice Energy | | | | | | | |
8.50% due 10/25/18 | | | 247,500 | | | 251,831 | |
| | | | | | | |
| Total Energy | | | | | | 1,911,460 | |
| | | | | | | |
| | | | | | | | |
| UTILITIES - 1.0% | | | | | | | |
Astoria Generating Company | | | | | | | |
Acquisitions LLC | | | | | | | |
8.50% due 10/26/17 | | | 1,267,500 | | | 1,305,525 | |
| | | | | | | |
| | | | | | | | |
| HEALTH CARE - 0.9% | | | | | | | |
Nextech Systems LLC | | | | | | | |
6.00% due 10/28/18†††,7 | | | 296,250 | | | 290,324 | |
Catalent Pharma Solutions, Inc. | | | | | | | |
6.50% due 12/31/17 | | | 250,000 | | | 252,500 | |
Learning Care Group (US), Inc. | | | | | | | |
5.75% due 05/08/19 | | | 248,125 | | | 248,902 | |
Merge Healthcare, Inc. | | | | | | | |
6.00% due 04/23/19,7 | | | 225,620 | | | 212,083 | |
Community Health Systems, Inc. | | | | | | | |
4.25% due 01/27/21 | | | 149,625 | | | 150,776 | |
| | | | | | | |
| Total Health Care | | | | | | 1,154,585 | |
| | | | | | | |
| | | | | | | | |
| MATERIALS - 0.3% | | | | | | | |
Atkore International, Inc. | | | | | | | |
7.75% due 09/27/21 | | | 450,000 | | | 452,250 | |
| | | | | | | |
| Total Senior Floating Rate Interests | | | | | | | |
(Cost $34,158,108) | | | | | | 34,598,554 | |
| | | | | | | |
| | | | | | | | |
| COLLATERALIZED MORTGAGE OBLIGATIONS†† - 0.4% | | | | | | | |
SRERS-2011 Funding Ltd. | | | | | | | |
2011-RS,0.40% due 05/09/461,3 | | | 544,462 | | | 503,573 | |
| | | | | | | |
| Total Collateralized Mortgage Obligations | | | | | | | |
(Cost $503,355) | | | | | | 503,573 | |
| | | | | | | |
| | | | | | | | |
| ASSET BACKED SECURITIES†† - 0.1% | | | | | | | |
Bristol Bay Funding Ltd. | | | | | | | |
2004-1A, 1.24% due 02/01/161,3 | | | 130,269 | | | 129,461 | |
| | | | | | | |
| Total Asset Backed Securities | | | | | | | |
(Cost $129,166) | | | | | | 129,461 | |
| | | | | | | |
| Total Investments - 120.4% | | | | | | | |
(Cost $154,209,252) | | | | | $ | 160,869,572 | |
| | | | | | | |
| Other Assets & Liabilities, net - (20.4)% | | | | | | (27,260,960 | ) |
| | | | | | | |
| Total Net Assets - 100.0% | | | | | $ | 133,608,612 | |
| |
FORWARD FOREIGN CURRENCY EXCHANGE CONTRACTS††
| Contracts to Sell | | Currency | | Counterparty | | Settlement
Date | | Settlement
Value | | Value at
03/31/14 | | Net Unrealized
Appreciation/
(Depreciation) |
| |
| 1,800,000 | | Euro | | BNY Mellon | | 04/30/14 | | $ | 2,483,064 | | $ | 2,480,364 | | $ | 2,700 | |
| 700,000 | | GBP | | BNY Mellon | | 04/30/14 | | | 1,165,227 | | | 1,167,592 | | | (2,365 | ) |
| | | | | | | | | | | | | | | $ | 335 | |
| * | | Non-income producing security. |
| † | | Value determined based on Level 1 inputs, unless otherwise noted — See Note 4. |
| †† | | Value determined based on Level 2 inputs, unless otherwise noted — See Note 4. |
| ††† | | Value determined based on Level 3 inputs — See Note 4. |
| 1 | | Variable rate security. Rate indicated is rate effective at March 31, 2014. |
| 2 | | Perpetual maturity. |
| 3 | | Security is a 144A or Section 4(a)(2) security. The total market value of 144A or Section 4(a)(2) securities is $65,400,981 (cost $63,721,151), or 48.9% of total net assets. |
| 4 | | Security is a step up/step down bond. The coupon increases or decreases at regular intervals until the bond reaches full maturity. |
| 5 | | Security is in default of interest and/or principal obligations. |
| 6 | | Security with no rate was unsettled at March 31, 2014. |
| 7 | | Illiquid security. |
| 8 | | Security or a portion thereof is held as collateral for reverse repurchase agreements — See Note 11. |
| | | plc — Public Limited Company |
| | | REIT — Real Estate Investment Trust |
| |
| 28 | THE GUGGENHEIM FUNDS SEMI-ANNUAL REPORT | | SEE NOTES TO FINANCIAL STATEMENTS. |
| STATEMENT OF ASSETS AND LIABILITIES (Unaudited) | | | | |
| |
| March 31, 2014 | | | | |
| | | | | |
| ASSETS: | | | | |
| Investments, at value (cost $154,209,252) | | $ | 160,869,572 | |
| Unrealized appreciation on forward foreign | | | | |
currency exchange contracts | | | 335 | |
| Prepaid expenses | | | 54,170 | |
| Receivables: | | | | |
Interest | | | 2,481,659 | |
Securities sold | | | 746,325 | |
Fund shares sold | | | 371,111 | |
Dividends | | | 8,559 | |
Investment advisor | | | 3,317 | |
Foreign taxes reclaim | | | 442 | |
| | | | |
| Total assets | | | 164,535,490 | |
| | | | |
| LIABILITIES: | | | | |
| Reverse Repurchase Agreements | | | 19,413,394 | |
| Overdraft due to custodian bank | | | 46,394 | |
| Payable for: | | | | |
Securities purchased | | | 10,913,175 | |
Fund shares redeemed | | | 210,422 | |
Management fees | | | 68,257 | |
Distribution and service fees | | | 29,630 | |
Transfer agent/maintenance fees | | | 11,507 | |
Fund accounting/administration fees | | | 10,807 | |
Security Investors | | | 1,077 | |
Trustees’ fees* | | | 624 | |
Miscellaneous | | | 221,591 | |
| | | | |
| Total liabilities | | | 30,926,878 | |
| | | | |
| NET ASSETS | | $ | 133,608,612 | |
| | | | |
| NET ASSETS CONSIST OF: | | | | |
| Paid in capital | | $ | 127,393,380 | |
| Accumulated net investment loss | | | (246,320 | ) |
| Accumulated net realized loss on investments | | | (193,345 | ) |
| Net unrealized appreciation on investments | | | 6,654,897 | |
| | | | |
| Net assets | | $ | 133,608,612 | |
| | | | |
| A-CLASS: | | | | |
| Net assets | | $ | 93,569,148 | |
| Capital shares outstanding | | | 7,604,644 | |
| Net asset value per share | | | $12.30 | |
| | | | |
| Maximum offering price per share | | | | |
(Net asset value divided by 95.25%) | | | $12.91 | |
| | | | |
| B-CLASS: | | | | |
| Net assets | | $ | 1,394,940 | |
| Capital shares outstanding | | | 114,149 | |
| Net asset value per share | | | $12.22 | |
| | | | |
| C-CLASS: | | | | |
| Net assets | | $ | 12,703,182 | |
| Capital shares outstanding | | | 1,024,234 | |
| Net asset value per share | | | $12.40 | |
| | | | |
| INSTITUTIONAL CLASS: | | | | |
| Net assets | | $ | 25,941,342 | |
| Capital shares outstanding | | | 2,569,215 | |
| Net asset value per share | | | $10.10 | |
| | | | |
| STATEMENT OF OPERATIONS (Unaudited) | | | | |
| |
| Period Ended March 31, 2014 | | | | |
| | | | | |
| INVESTMENT INCOME: | | | | |
| Interest | | $ | 4,158,443 | |
| Dividends | | | 18,043 | |
| | | | |
Total investment income | | | 4,176,486 | |
| | | | |
| | | | | |
| EXPENSES: | | | | |
| Management fees | | | 346,055 | |
| Transfer agent/maintenance fees | | | | |
A-Class | | | 50,630 | |
B-Class | | | 8,141 | |
C-Class | | | 9,018 | |
Institutional Class | | | 4,446 | |
| Distribution and service fees: | | | | |
A-Class | | | 100,445 | |
C-Class | | | 52,560 | |
| Fund accounting/administration fees | | | 54,563 | |
| Short interest expense | | | 28,816 | |
| Line of credit interest expense | | | 5,422 | |
| Trustees’ fees* | | | 5,316 | |
| Custodian fees | | | 910 | |
| Tax expense | | | 2 | |
| Miscellaneous | | | 96,514 | |
| | | | |
Total expenses | | | 762,838 | |
| | | | |
| Less: | | | | |
| Expenses waived by Advisor | | | (44,637 | ) |
| | | | |
| Net expenses | | | 718,201 | |
| | | | |
| Net investment income | | | 3,458,285 | |
| | | | |
| | | | | |
| NET REALIZED AND UNREALIZED GAIN (LOSS): | | | | |
| Net realized gain (loss) on: | | | | |
Investments | | | 661,603 | |
Foreign currency | | | (45,480 | ) |
| | | | |
| Net realized gain | | | 616,123 | |
| | | | |
| Net change in unrealized appreciation | | | | |
(depreciation) on: | | | | |
Investments | | | 4,095,861 | |
Foreign currency | | | (5,423 | ) |
| | | | |
| Net change in unrealized appreciation | | | | |
(depreciation) | | | 4,090,438 | |
| | | | |
| Net realized and unrealized gain | | | 4,706,561 | |
| | | | |
| Net increase in net assets resulting | | | | |
from operations | | $ | 8,164,846 | |
| | | | |
| * Relates to Trustees not deemed “interested persons” within the meaning of Section 2(a)(19) of the 1940 Act. | |
| |
| SEE NOTES TO FINANCIAL STATEMENTS. | | THE GUGGENHEIM FUNDS SEMI-ANNUAL REPORT | 29 |
| STATEMENTS OF CHANGES IN NET ASSETS | | | | | | | | |
| |
| | | Period Ended | | | | | |
| | | March 31, | | | Year Ended | |
| | | 2014 | | | September 30, | |
| | | (Unaudited) | | | 2013 | |
| |
| INCREASE (DECREASE) IN NET ASSETS FROM OPERATIONS: | | | | | | | | |
| Net investment income | | $ | 3,458,285 | | | $ | 6,288,703 | |
| Net realized gain (loss) on investments | | | 616,123 | | | | (84,912 | ) |
| Net change in unrealized appreciation (depreciation) on investments | | | 4,090,438 | | | | 2,346,050 | |
| |
| Net increase in net assets resulting from operations | | | 8,164,846 | | | | 8,549,841 | |
| |
| | | | | | | | | |
| DISTRIBUTIONS TO SHAREHOLDERS FROM: | | | | | | | | |
| Net investment income | | | | | | | | |
A-Class | | | (2,787,985 | ) | | | (4,965,936 | ) |
B-Class | | | (55,183 | ) | | | (159,633 | ) |
C-Class | | | (325,536 | ) | | | (643,147 | ) |
Institutional Class | | | (819,876 | ) | | | (1,199,068 | ) |
| Net realized gains | | | | | | | | |
A-Class | | | – | | | | (1,585,188 | ) |
B-Class | | | – | | | | (52,625 | ) |
C-Class | | | – | | | | (230,586 | ) |
Institutional Class | | | – | | | | (428,291 | ) |
| |
| Total distributions to shareholders | | | (3,988,580 | ) | | | (9,264,474 | ) |
| |
| | | | | | | | | |
| CAPITAL SHARE TRANSACTIONS: | | | | | | | | |
| Proceeds from sale of shares | | | | | | | | |
A-Class | | | 30,087,146 | | | | 38,631,261 | |
B-Class | | | 28,300 | | | | 372,026 | |
C-Class | | | 3,848,171 | | | | 3,038,894 | |
Institutional Class | | | 11,005,678 | | | | 12,079,625 | |
| Redemption fees collected | | | | | | | | |
A-Class | | | 19,955 | | | | 39,291 | |
B-Class | | | 337 | | | | 1,267 | |
C-Class | | | 2,576 | | | | 5,860 | |
Institutional Class | | | 5,973 | | | | 9,020 | |
| Distributions reinvested | | | | | | | | |
A-Class | | | 2,431,195 | | | | 5,926,872 | |
B-Class | | | 51,984 | | | | 202,480 | |
C-Class | | | 243,656 | | | | 709,020 | |
Institutional Class | | | 516,165 | | | | 934,337 | |
| Cost of shares redeemed | | | | | | | | |
A-Class | | | (12,359,486 | ) | | | (37,955,365 | ) |
B-Class | | | (436,804 | ) | | | (1,020,724 | ) |
C-Class | | | (1,240,857 | ) | | | (3,278,088 | ) |
Institutional Class | | | (5,133,642 | ) | | | (3,983,265 | ) |
| |
| Net increase from capital share transactions | | | 29,070,347 | | | | 15,712,511 | |
| |
| Net increase in net assets | | | 33,246,613 | | | | 14,997,878 | |
| NET ASSETS: | | | | | | | | |
| Beginning of period | | | 100,361,999 | | | | 85,364,121 | |
| |
| End of period | | $ | 133,608,612 | | | $ | 100,361,999 | |
| |
| (Distributions in excess of)/Undistributed net investment income at end of period | | $ | (246,320 | ) | | $ | 283,975 | |
| |
| | | | | | | | | |
| CAPITAL SHARE ACTIVITY: | | | | | | | | |
| Shares sold | | | | | | | | |
A-Class | | | 2,480,103 | | | | 3,257,493 | |
B-Class | | | 2,362 | | | | 31,410 | |
C-Class | | | 314,027 | | | | 252,867 | |
Institutional Class | | | 1,103,217 | | | | 1,230,655 | |
| Shares issued from reinvestment of distributions | | | | | | | | |
A-Class | | | 200,056 | | | | 500,071 | |
B-Class | | | 4,309 | | | | 17,194 | |
C-Class | | | 19,917 | | | | 59,371 | |
Institutional Class | | | 51,770 | | | | 95,923 | |
| Shares redeemed | | | | | | | | |
A-Class | | | (1,019,902 | ) | | | (3,182,863 | ) |
B-Class | | | (36,390 | ) | | | (86,562 | ) |
C-Class | | | (101,796 | ) | | | (272,695 | ) |
Institutional Class | | | (512,021 | ) | | | (407,628 | ) |
| |
| Net increase in shares | | | 2,505,652 | | | | 1,495,236 | |
| |
| |
| 30 | THE GUGGENHEIM FUNDS SEMI-ANNUAL REPORT | | SEE NOTES TO FINANCIAL STATEMENTS. |
| FINANCIAL HIGHLIGHTS |
| |
| This table is presented to show selected data for a share outstanding throughout each period and to assist shareholders in evaluating a Fund’s performance for the periods presented. |
| | | Period Ended | | | Year Ended | | | Period Ended | | | Year Ended | | | Year Ended | | | Year Ended | |
| | | March 31, | | | September 30, | | | September 30, | | | December 31, | | | December 31, | | | December 31, | |
| A-Class | | 2014a | | | 2013 | | | 2012b | | | 2011 | | | 2010 | | | 2009 | |
| |
| Per Share Data | | | | | | | | | | | | | | | | | | | | | | | | |
| Net asset value, beginning of period | | $ | 11.85 | | | $ | 11.95 | | | $ | 11.12 | | | $ | 12.89 | | | $ | 12.07 | | | $ | 7.70 | |
| Income (loss) from investment operations: | | | | | | | | | | | | | | | | | | | | | | | | |
| Net investment income (loss)c | | | .36 | | | | .81 | | | | .58 | | | | .87 | | | | .96 | | | | .90 | |
| Net gain (loss) on investments (realized and unrealized) | | | .45 | | | | .27 | | | | .84 | | | | (1.30 | ) | | | .78 | | | | 4.30 | |
| | | |
| Total from investment operations | | | .81 | | | | 1.08 | | | | 1.42 | | | | (.43 | ) | | | 1.74 | | | | 5.20 | |
| |
| Less distributions from: | | | | | | | | | | | | | | | | | | | | | | | | |
| Net investment income | | | (.36 | ) | | | (.90 | ) | | | (.59 | ) | | | (1.07 | ) | | | (.92 | ) | | | (.83 | ) |
| Net realized gains | | | — | | | | (.29 | ) | | | — | | | | (.27 | ) | | | — | | | | — | |
| Return of capital | | | — | | | | — | | | | — | | | | — | | | | — | | | | (— | )d |
| | | |
| Total distributions | | | (.36 | ) | | | (1.19 | ) | | | (.59 | ) | | | (1.34 | ) | | | (.92 | ) | | | (.83 | ) |
| Redemption fees collected | | | — | e | | | .01 | | | | — | e | | | — | | | | — | | | | — | |
| Net asset value, end of period | | $ | 12.30 | | | $ | 11.85 | | | $ | 11.95 | | | $ | 11.12 | | | $ | 12.89 | | | $ | 12.07 | |
| | | |
| | | | | | | | | | | | | | | | | | | | | | | | | |
| |
| Total Returng | | | 8.11% | | | | 9.54% | | | | 12.93% | | | | (3.50% | ) | | | 14.92% | | | | 70.53% | |
| |
| Ratios/Supplemental Data | | | | | | | | | | | | | | | | | | | | | | | | |
| Net assets, end of period (in thousands) | | $ | 93,569 | | | $ | 70,451 | | | $ | 64,174 | | | $ | 86,041 | | | $ | 172,443 | | | $ | 155,899 | |
| |
| Ratios to average net assets: | | | | | | | | | | | | | | | | | | | | | | | | |
| Net investment income (loss) | | | 6.03% | | | | 6.84% | | | | 7.19% | | | | 6.92% | | | | 7.69% | | | | 8.49% | |
| Total expenses | | | 1.32% | | | | 1.41% | | | | 1.44% | | | | 1.34% | | | | 1.28% | | | | 1.41% | |
| Net expensesf,i | | | 1.24% | | | | 1.18% | | | | 1.17% | | | | 1.18% | | | | 1.14% | | | | 1.10% | |
| |
| Portfolio turnover rate | | | 25% | | | | 101% | | | | 55% | | | | 102% | | | | 77% | | | | 53% | |
| | | | | | | | | | | | | | | | | | | | | | | | | |
| | | Period Ended | | | Year Ended | | | Period Ended | | | Year Ended | | | Year Ended | | | Year Ended | |
| | | March 31, | | | September 30, | | | September 30, | | | December 31, | | | December 31, | | | December 31, | |
| B-Class | | 2014a,h | | | 2013h | | | 2012h,b | | | 2011h | | | 2010h | | | 2009h | |
| |
| Per Share Data | | | | | | | | | | | | | | | | | | | | | | | | |
| Net asset value, beginning of period | | $ | 11.77 | | | $ | 11.89 | | | $ | 11.07 | | | $ | 12.84 | | | $ | 12.05 | | | $ | 7.67 | |
| |
| Income (loss) from investment operations: | | | | | | | | | | | | | | | | | | | | | | | | |
| Net investment income (loss)c | | | .38 | | | | .84 | | | | .62 | | | | .92 | | | | 1.00 | | | | .92 | |
| Net gain (loss) on investments (realized and unrealized) | | | .45 | | | | .26 | | | | .81 | | | | (1.32 | ) | | | .78 | | | | 4.30 | |
| | | |
| Total from investment operations | | | .83 | | | | 1.10 | | | | 1.43 | | | | (.40 | ) | | | 1.78 | | | | 5.22 | |
| |
| Less distributions from: | | | | | | | | | | | | | | | | | | | | | | | | |
| Net investment income | | | (.38 | ) | | | (.94 | ) | | | (.61 | ) | | | (1.10 | ) | | | (.99 | ) | | | (.84 | ) |
| Net realized gains | | | — | | | | (.29 | ) | | | — | | | | (.27 | ) | | | — | | | | — | |
| Return of capital | | | — | | | | — | | | | — | | | | — | | | | — | | | | (— | )d |
| | | |
| Total distributions | | | (.38 | ) | | | (1.23 | ) | | | (.61 | ) | | | (1.37 | ) | | | (.99 | ) | | | (.84 | ) |
| |
| Redemption fees collected | | | — | e | | | .01 | | | | — | e | | | — | | | | — | | | | — | |
| |
| Net asset value, end of period | | $ | 12.22 | | | $ | 11.77 | | | $ | 11.89 | | | $ | 11.07 | | | $ | 12.84 | | | $ | 12.05 | |
| | | |
| | | | | | | | | | | | | | | | | | | | | | | | | |
| |
| Total Returng | | | 8.26% | | | | 9.79% | | | | 13.20% | | | | (3.32% | ) | | | 15.28% | | | | 71.07% | |
| |
| Ratios/Supplemental Data | | | | | | | | | | | | | | | | | | | | | | | | |
| Net assets, end of period (in thousands) | | $ | 1,395 | | | $ | 1,693 | | | $ | 2,162 | | | $ | 2,777 | | | $ | 4,872 | | | $ | 6,996 | |
| |
| Ratios to average net assets: | | | | | | | | | | | | | | | | | | | | | | | | |
| Net investment income (loss) | | | 6.29% | | | | 7.10% | | | | 7.43% | | | | 7.38% | | | | 8.01% | | | | 9.08% | |
| Total expenses | | | 1.99% | | | | 1.89% | | | | 1.62% | | | | 1.10% | | | | 1.04% | | | | 1.19% | |
| Net expensesf,i | | | 0.96% | | | | 0.93% | | | | 0.92% | | | | 0.94% | | | | 0.89% | | | | 0.85% | |
| |
| Portfolio turnover rate | | | 25% | | | | 101% | | | | 55% | | | | 102% | | | | 77% | | | | 53% | |
| |
| SEE NOTES TO FINANCIAL STATEMENTS. | | THE GUGGENHEIM FUNDS SEMI-ANNUAL REPORT | 31 |
| FINANCIAL HIGHLIGHTS (continued) |
| |
| This table is presented to show selected data for a share outstanding throughout each period and to assist shareholders in evaluating a Fund’s performance for the periods presented. |
| | Period Ended | | Year Ended | | Period Ended | | Year Ended | | Year Ended | | Year Ended | |
| | | March 31, | | September 30, | | September 30, | | December 31, | | December 31, | | December 31, | |
| C-Class | | 2014a | | | 2013 | | | 2012b | | | 2011 | | | 2010 | | | 2009 | |
| |
| Per Share Data | | | | | | | | | | | | | | | | | | |
| Net asset value, beginning of period | $ | 11.95 | | $ | 12.03 | | $ | 11.20 | | $ | 12.97 | | $ | 12.14 | | $ | 7.73 | |
| |
| Income (loss) from investment operations: | | | | | | | | | | | | | | | | | | |
| Net investment income (loss)c | | .32 | | | .73 | | | .56 | | | .79 | | | .87 | | | .83 | |
| Net gain (loss) on investments (realized and unrealized) | | .45 | | | .27 | | | .80 | | | (1.32 | ) | | .79 | | | 4.33 | |
| | |
| Total from investment operations | | .77 | | | 1.00 | | | 1.36 | | | .53 | | | 1.66 | | | 5.16 | |
| |
| Less distributions from: | | | | | | | | | | | | | | | | | | |
| Net investment income | | (.32 | ) | | (.80 | ) | | (.53 | ) | | (.97 | ) | | (.83 | ) | | (.75 | ) |
| Net realized gains | | — | | | (.29 | ) | | — | | | (.27 | ) | | — | | | — | |
| Return of capital | | — | | | — | | | — | | | — | | | — | | | (— | )d |
| | |
| Total distributions | | (.32 | ) | | (1.09 | ) | | (.53 | ) | | (1.24 | ) | | (.83 | ) | | (.75 | ) |
| |
| Redemption fees collected | | — | e | | .01 | | | — | e | | — | | | — | | | — | |
| |
| Net asset value, end of period | $ | 12.40 | | $ | 11.95 | | $ | 12.03 | | $ | 11.20 | | $ | 12.97 | | $ | 12.14 | |
| | |
| | | | | | | | | | | | | | | | | | | |
| |
| Total Returng | | 7.76% | | | 8.69% | | | 12.33% | | | (4.30% | ) | | 14.07% | | | 69.42% | |
| |
| Ratios/Supplemental Data | | | | | | | | | | | | | | | | | | |
| Net assets, end of period (in thousands) | $ | 12,703 | | $ | 9,463 | | $ | 9,054 | | $ | 7,991 | | $ | 10,264 | | $ | 8,048 | |
| |
| Ratios to average net assets: | | | | | | | | | | | | | | | | | | |
| Net investment income (loss) | | 5.30% | | | 6.10% | | | 6.37% | | | 6.32% | | | 6.92% | | | 8.11% | |
| Total expenses | | 2.09% | | | 2.17% | | | 2.19% | | | 2.08% | | | 2.04% | | | 2.19% | |
| Net expensesf,i | | 1.97% | | | 1.93% | | | 1.92% | | | 1.94% | | | 1.89% | | | 1.85% | |
| |
| Portfolio turnover rate | | 25% | | | 101% | | | 55% | | | 102% | | | 77% | | | 53% | |
| | Period Ended | | Year Ended | | Period Ended | | Year Ended | | Year Ended | | Year Ended | |
| | | March 31, | | September 30, | | September 30, | | December 31, | | December 31, | | December 31, | |
| Institutional Class | | 2014a | | | 2013 | | | 2012b | | | 2011 | | | 2010 | | | 2009 | |
| |
| Per Share Data | | | | | | | | | | | | | | | | | | |
| Net asset value, beginning of period | $ | 9.74 | | $ | 9.90 | | $ | 9.26 | | $ | 10.96 | | $ | 10.47 | | $ | 6.74 | |
| |
| Income (loss) from investment operations: | | | | | | | | | | | | | | | | | | |
| Net investment income (loss)c | | .31 | | | .70 | | | .55 | | | .79 | | | .86 | | | .81 | |
| Net gain (loss) on investments (realized and unrealized) | | .36 | | | .22 | | | .64 | | | (1.12 | ) | | .68 | | | 3.76 | |
| | |
| Total from investment operations | | .67 | | | .92 | | | 1.19 | | | (.33 | ) | | 1.54 | | | 4.57 | |
| |
| Less distributions from: | | | | | | | | | | | | | | | | | | |
| Net investment income | | (.31 | ) | | (.80 | ) | | (.55 | ) | | (1.10 | ) | | (1.05 | ) | | (.84 | ) |
| Net realized gains | | — | | | (.29 | ) | | — | | | (.27 | ) | | — | | | — | |
| Return of capital | | — | | | — | | | — | | | — | | | — | | | (— | )d |
| | |
| Total distributions | | (.31 | ) | | (1.09 | ) | | (.55 | ) | | (1.37 | ) | | (1.05 | ) | | (.84 | ) |
| |
| Redemption fees collected | | — | e | | .01 | | | — | e | | — | | | — | | | — | |
| |
| Net asset value, end of period | $ | 10.10 | | $ | 9.74 | | $ | 9.90 | | $ | 9.26 | | $ | 10.96 | | $ | 10.47 | |
| | |
| | | | | | | | | | | | | | | | | | | |
| |
| Total Returng | | 8.28% | | | 9.97% | | | 13.17% | | | (3.30% | ) | | 15.33% | | | 71.18% | |
| |
| Ratios/Supplemental Data | | | | | | | | | | | | | | | | | | |
| Net assets, end of period (in thousands) | $ | 25,941 | | $ | 18,755 | | $ | 9,974 | | $ | 7,900 | | $ | 2,785 | | $ | 2,649 | |
| |
| Ratios to average net assets: | | | | | | | | | | | | | | | | | | |
| Net investment income (loss) | | 6.29% | | | 7.12% | | | 7.42% | | | 7.61% | | | 7.99% | | | 8.79% | |
| Total expenses | | 0.97% | | | 1.01% | | | 1.11% | | | 1.08% | | | 1.02% | | | 1.16% | |
| Net expensesf,i | | 0.97% | | | 0.93% | | | 0.92% | | | 0.95% | | | 0.89% | | | 0.85% | |
| |
| Portfolio turnover rate | | 25% | | | 101% | | | 55% | | | 102% | | | 77% | | | 53% | |
| |
| 32 | THE GUGGENHEIM FUNDS SEMI-ANNUAL REPORT | | SEE NOTES TO FINANCIAL STATEMENTS. |
| FINANCIAL HIGHLIGHTS (concluded) |
| |
| a | Unaudited figures for the period ended March 31, 2014. Percentage amounts for the period, except total return and portfolio turnover rate, have been annualized. |
| b | The Fund changed its fiscal year end from December 31 to September 30. |
| c | Net investment income (loss) per share was computed using average shares outstanding throughout the period. |
| d | Distributions from return of capital are less than $0.01 per share. |
| e | Redemption fees collected are less than $0.01 per share. |
| f | Net expense information reflects the expense ratios after expense waivers. |
| g | Total return does not reflect the impact of any applicable sales charges and has not been annualized. |
| h | Effective December 31, 2006, B-Class shares ceased charging 12b-1 fees in accordance with FINRA (formerly NASD). Sales cap regulations, per share information reflects this change. This fee will be reinstated when sales reach above the sales cap limit. |
| i | Excluding interest expense, the operating expense ratios for the period presented would be: |
| | | | 03/31/14 |
| | |
| | A-Class | | 1.18 | % |
| | B-Class | | 0.91 | % |
| | C-Class | | 1.91 | % |
| | Institutional Class | | 0.91 | % |
| |
| SEE NOTES TO FINANCIAL STATEMENTS. | | THE GUGGENHEIM FUNDS SEMI-ANNUAL REPORT | 33 |
| FUND PROFILE (Unaudited) | March 31, 2014 |
| |
| INVESTMENT GRADE BOND FUND |
| | |
| OBJECTIVE: | Seeks to provide current income. |
| | |
| Holdings Diversification |
| (Market Exposure as % of Net Assets) |
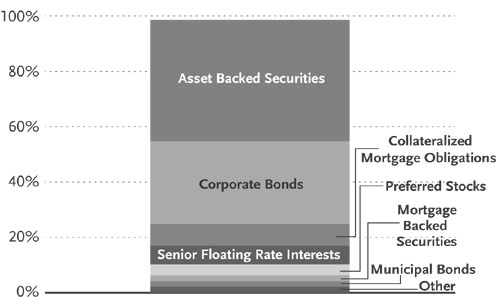
| “Holdings Diversi.cation (Market Exposure as % of Net Assets)” excludes any temporary cash investments. |
| Ten Largest Holdings (% of Total Net Assets) | | |
| |
| Willis Engine Securitization Trust II — Class A | 2.3 | % |
| Guggenheim Limited Duration Fund — Institutional Class | 1.8 | % |
| Northwoods Capital VIII Ltd. — Class D | 1.7 | % |
| Prudential Financial, Inc. | 1.6 | % |
Argent Securities Incorporated Asset-Backed Pass-Through Certificates Series 2005-W3 — Class A2D | 1.5 | % |
| T2 Income Fund CLO Ltd. — Class C | 1.4 | % |
| Northeast Utilities | 1.4 | % |
| CBS Corp. | 1.3 | % |
| JPMorgan Chase & Co. | 1.3 | % |
| Garanti Diversified Payment Rights Finance Co. | 1.2 | % |
| |
| Top Ten Total | 15.5 | % |
| |
| Inception Dates: | |
| |
| A-Class | August 15, 1985 |
| B-Class | October 19, 1993 |
| C-Class | May 1, 2000 |
| Institutional Class | January 29, 2013 |
| | |
| Portfolio Composition by Quality Rating* |
| |
| Rating | |
| |
| Fixed Income Instruments | |
AAA | 2.1% |
AA | 11.1% |
A | 25.2% |
BBB | 35.2% |
BB | 2.6% |
B | 11.5% |
CCC | 2.3% |
CC | 0.5% |
D | 1.4% |
NR | 0.9% |
| Other Instruments | |
Preferred Stocks | 3.8% |
Mutual Funds | 1.7% |
Short Term Investments | 1.6% |
Common Stocks | 0.1% |
| |
| Total Investments | 100.0% |
| |
The chart above reflects percentages of the value of total investments. |
| * | Source: Factset. Credit quality ratings are measured on a scale that generally ranges from AAA (highest) to D (lowest). All securities have been rated by Moody’s, Standard & Poor’s (“S&P”), or Fitch, which are all a Nationally Recognized Statistical Rating Organization (“NRSRO”). For purposes of this presentation, when ratings are available from more than one agency, the highest rating is used. Guggenheim Investments has converted Moody’s and Fitch ratings to the equivalent S&P rating. Unrated securities do not necessarily indicate low credit quality. Security ratings are determined at the time of purchase and may change thereafter. |
| |
| 34 | THE GUGGENHEIM FUNDS SEMI-ANNUAL REPORT |
| SCHEDULE OF INVESTMENTS (Unaudited) | | March 31, 2014 |
| |
| INVESTMENT GRADE BOND FUND | | |
| | | | SHARES | | | VALUE | |
| |
| | | | | | | | |
| COMMON STOCKS† - 0.1% | | | | | | | |
| | | | | | | | |
| FINANCIALS - 0.1% | | | | | | | |
Rescap Liquidating Trust*,†† | | | 5,199 | | $ | 76,685 | |
| | | | | | | |
| | | | | | | | |
| CONSUMER DISCRETIONARY - 0.0% | | | | | | | |
Harry & David Holdings, Inc.* | | | 7 | | | 882 | |
| | | | | | | |
| MATERIALS - 0.0% | | | | | | | |
Constar International Holdings LLC*,†††,7 | | | 68 | | | – | |
| | | | | | | |
| Total Common Stocks | | | | | | | |
(Cost $263,058) | | | | | | 77,567 | |
| | | | | | | |
| | | | | | | | |
| PREFERRED STOCKS† - 4.0% | | | | | | | |
Aspen Insurance Holdings Ltd. | | | | | | | |
5.95%1,2 | | | 40,000 | | | 992,400 | |
Seaspan Corp. | | | | | | | |
6.38% due 04/30/19* | | | 22,000 | | | 550,000 | |
Woodbourne Capital Trust III | | | | | | | |
0.01%*,†††,1,2,3 | | | 950,000 | | | 504,545 | |
Woodbourne Capital Trust I | | | | | | | |
0.01%*,†††,1,2,3 | | | 950,000 | | | 504,545 | |
Woodbourne Capital Trust II | | | | | | | |
0.01%*,†††,1,2,3 | | | 950,000 | | | 504,545 | |
Woodbourne Capital Trust IV | | | | | | | |
0.01%*,†††,1,2,3 | | | 950,000 | | | 504,545 | |
Wells Fargo & Co. | | | | | | | |
5.85%1,2 | | | 15,000 | | | 373,500 | |
Morgan Stanley | | | | | | | |
7.13%1,2 | | | 10,000 | | | 265,300 | |
AgriBank FCB | | | | | | | |
6.88%1,2 | | | 1,500 | | | 154,641 | |
City National Corp. | | | 4,000 | | | 110,840 | |
Constar International | | | | | | | |
Holdings LLC*,†††,7 | | | 7 | | | – | |
| | | | | | | |
| Total Preferred Stocks | | | | | | | |
(Cost $6,243,354) | | | | | | 4,464,861 | |
| | | | | | | |
| | | | | | | | |
| MUTUAL FUNDS† - 1.8% | | | | | | | |
Guggenheim Limited Duration | | | | | | | |
Fund - Institutional Class6 | | | 80,032 | | | 2,000,800 | |
| | | | | | | |
| Total Mutual Funds | | | | | | | |
(Cost $2,000,000) | | | | | | 2,000,800 | |
| | | | | | | |
| | | | | | | | |
| SHORT TERM INVESTMENTS† - 1.7% | | | | | | | |
Dreyfus Treasury Prime Cash | | | | | | | |
Management Fund | | | 1,920,631 | | | 1,920,631 | |
| | | | | | | |
| Total Short Term Investments | | | | | | | |
(Cost $1,920,631) | | | | | | 1,920,631 | |
| | | | | | | |
| | | | | | | | |
| | | | FACE | | | | |
| | | | AMOUNT | | | | |
| | | | | | | |
| ASSET BACKED SECURITIES†† - 43.8% | | | | | | | |
Willis Engine Securitization Trust II | | | | | | | |
2012-A, 5.50% due 09/15/37†††,3 | | $ | 2,581,418 | | | 2,595,616 | |
Northwoods Capital VIII Ltd. | | | | | | | |
2007-8A, 2.24% due 07/28/221,3 | | | 1,950,000 | | | 1,886,820 | |
T2 Income Fund CLO Ltd. | | | | | | | |
2007-1A, 1.74% due 07/15/191,3 | | | 1,600,000 | | | 1,548,800 | |
2007-1X, 1.74% due 07/15/191 | | | 250,000 | | | 242,000 | |
Castlelake Aircraft Securitization Trust | | | | | | | |
2014-1, 5.25% due 02/15/29††† | | | 1,238,375 | | | 1,250,759 | |
2014-1, 7.50% due 02/15/29††† | | | 500,000 | | | 505,000 | |
Argent Securities Incorporated | | | | | | | |
Asset-Backed Pass-Through | | | | | | | |
Certificates Series | | | | | | | |
2005-W3, 0.49% due 11/25/351 | | | 1,746,830 | | | 1,646,555 | |
Emerald Aviation Finance Ltd. | | | | | | | |
2013-1, 4.65% due 10/15/383 | | | 1,217,448 | | | 1,229,622 | |
2013-1, 6.35% due 10/15/383 | | | 243,490 | | | 247,434 | |
Garanti Diversified Payment Rights | | | | | | | |
Finance Co. | | | | | | | |
2007-A, 0.43% due 07/09/17††† | | | 1,456,000 | | | 1,379,560 | |
Grayson CLO Ltd. | | | | | | | |
2006-1A, 0.65% due 11/01/211,3 | | | 1,400,000 | | | 1,288,700 | |
Telos CLO Ltd. | | | | | | | |
2013-3A, 3.24% due 01/17/241,3 | | | 1,250,000 | | | 1,232,750 | |
Gramercy Real Estate CDO 2007-1 Ltd. | | | | | | | |
2007-1A, 0.52% due 08/15/561,3 | | | 1,430,393 | | | 1,224,274 | |
CKE Restaurant Holdings, Inc. | | | | | | | |
2013-1A, 4.47% due 03/20/433 | | | 1,132,750 | | | 1,144,189 | |
Telos CLO 2007-2 Ltd. | | | | | | | |
2007-2A, 2.44% due 04/15/221,3 | | | 1,100,000 | | | 1,043,350 | |
Great Lakes CLO 2012-1 Ltd. | | | | | | | |
2012-1A, 4.34% due 01/15/231,3 | | | 1,000,000 | | | 1,008,800 | |
Fraser Sullivan CLO VI Ltd. | | | | | | | |
2011-6A, 4.74% due 11/22/223 | | | 1,000,000 | | | 1,000,726 | |
Figueroa CLO 2013-1 Ltd. | | | | | | | |
2013-1A, 2.98% due 03/21/241,3 | | | 1,000,000 | | | 991,500 | |
Venture XIV CLO Ltd. | | | | | | | |
2013-14A, 2.98% due 08/28/251,3 | | | 1,000,000 | | | 982,700 | |
ALM VII R Ltd. | | | | | | | |
2013-7RA, 2.84% due 04/24/241,3 | | | 1,000,000 | | | 978,700 | |
KKR Financial CLO 2007-1 Ltd. | | | | | | | |
2007-1A, 2.49% due 05/15/211,3 | | | 1,000,000 | | | 961,600 | |
Rockwall CDO II Ltd. | | | | | | | |
2007-1A, 0.79% due 08/01/241,3 | | | 1,100,000 | | | 936,760 | |
West Coast Funding Ltd. | | | | | | | |
2006-1A, 0.37% due 11/02/411,3 | | | 930,292 | | | 896,057 | |
RAIT CRE CDO I Ltd. | | | | | | | |
2006-1X, 0.49% due 11/20/46†††,1 | | | 1,055,963 | | | 893,556 | |
MCF CLO I LLC | | | | | | | |
2013-1A, 3.79% due 04/20/231,3 | | | 900,000 | | | 889,740 | |
N-Star Real Estate CDO IX Ltd. | | | | | | | |
0.51% due 02/01/41†††,7 | | | 978,790 | | | 889,426 | |
Turbine Engines Securitization Ltd. | | | | | | | |
2013-1A, 5.13% due 12/13/48†††,3 | | | 890,137 | | | 880,523 | |
ICE EM CLO | | | | | | | |
2007-1A, 0.93% due 08/15/221,3 | | | 850,000 | | | 801,125 | |
COA Summit CLO Limited | | | | | | | |
2014-1A, 3.04% due 04/20/23†††,1,3 | | | 800,000 | | | 796,720 | |
Drug Royalty II Limited Partnership | | | | | | | |
2012-1, 4.24% due 01/15/251,3 | | | 751,858 | | | 768,774 | |
Newstar Trust | | | | | | | |
2012-2A, 3.49% due 01/20/231,3 | | | 750,000 | | | 751,725 | |
OZLM Funding Ltd. | | | | | | | |
2012-2A, 3.49% due 10/30/231,3 | | | 750,000 | | | 750,000 | |
| |
| SEE NOTES TO FINANCIAL STATEMENTS. | | THE GUGGENHEIM FUNDS SEMI-ANNUAL REPORT | 35 |
| SCHEDULE OF INVESTMENTS (Unaudited) (continued) | | March 31, 2014 |
| |
| INVESTMENT GRADE BOND FUND | | |
| | | | FACE | | | | |
| | | | AMOUNT | | | VALUE | |
| |
| | | | | | | | |
ARES XII CLO Ltd. | | | | | | | |
2007-12A, 3.48% due 11/25/201,3 | | $ | 750,000 | | $ | 742,875 | |
Tricadia CDO 2006-6 Ltd. | | | | | | | |
2006-6A, 0.79% due 11/05/41†††,1,3 | | | 750,000 | | | 697,575 | |
Icon Brands Holdings LLC | | | | | | | |
2013-1A, 4.35% due 01/25/43†††,3 | | | 670,918 | | | 667,899 | |
Ivy Hill Middle Market Credit Fund VII Ltd. | | | | | | | |
2013-7A, 3.69% due 10/20/251,3 | | | 600,000 | | | 598,500 | |
Black Diamond CLO 2012-1 Ltd. | | | | | | | |
2013-1A, 3.49% due 02/01/231,3 | | | 550,000 | | | 550,000 | |
Halcyon Structured Asset Management Long | | | | | | | |
Secured/Short Unsecured 2007-2 Ltd. | | | | | | | |
2007-2A, 3.99% due 10/29/211,3 | | | 550,000 | | | 542,410 | |
Structured Asset Securities Corporation | | | | | | | |
Mortgage Loan Trust | | | | | | | |
2006-OPT1, 0.41% due 04/25/361 | | | 600,000 | | | 515,888 | |
Newcastle Cdo Viii 1 Ltd. | | | | | | | |
2006-8A, 0.43% due 11/25/52†††,1,3 | | | 528,571 | | | 506,107 | |
Cent CLO | | | | | | | |
2012-16A, 3.74% due 08/01/241,3 | | | 500,000 | | | 502,700 | |
Apidos CDO IX | | | | | | | |
2012-9A, 3.99% due 07/15/231,3 | | | 500,000 | | | 501,900 | |
Triton Container Finance LLC | | | | | | | |
2012-1A, 4.21% due 05/14/273 | | | 490,000 | | | 491,483 | |
Acis CLO 2013-1 Ltd. | | | | | | | |
2013-1A, 3.19% due 04/18/241,3 | | | 500,000 | | | 487,000 | |
Textainer Marine Containers Ltd. | | | | | | | |
2012-1A, 4.21% due 04/15/273 | | | 485,000 | | | 485,447 | |
MCF CLO III LLC | | | | | | | |
2014-3A, 3.21% due 01/20/24†††,1,3 | | | 500,000 | | | 478,250 | |
Golub Capital Partners Fundings Ltd. | | | | | | | |
2007-1A, 0.98% due 03/15/221,3 | | | 500,000 | | | 463,850 | |
Cerberus Offshore Levered I, LP | | | | | | | |
2012-1A, 4.98% due 11/30/181,3 | | | 450,000 | | | 449,685 | |
N-Star REL CDO VIII Ltd. | | | | | | | |
2006-8A, 0.51% due 02/01/411,3 | | | 500,000 | | | 432,600 | |
Lehman XS Trust | | | | | | | |
2007-9, 0.27% due 06/25/371 | | | 488,444 | | | 426,955 | |
Eastland CLO Ltd. | | | | | | | |
2007-1A, 0.64% due 05/01/221,3 | | | 450,000 | | | 400,725 | |
Westwood CDO I Ltd. | | | | | | | |
2007-1A, 0.90% due 03/25/211,3 | | | 400,000 | | | 370,440 | |
Halcyon Loan Advisors Funding 2012-2 Ltd. | | | | | | | |
2012-2A, 4.73% due 12/20/241,3 | | | 350,000 | | | 351,365 | |
Newstar Commercial Loan Funding 2013-1 LLC | | | | | | | |
2013-1A, 4.78% due 09/20/231,3 | | | 350,000 | | | 350,000 | |
Northwoods Capital VII Ltd. | | | | | | | |
2006-7A, 1.79% due 10/22/211,3 | | | 350,000 | | | 334,775 | |
CIFC Funding 2012-II Ltd. | | | | | | | |
2012-2A, 4.49% due 12/05/241,3 | | | 300,000 | | | 300,840 | |
Salus CLO 2012-1 Ltd. | | | | | | | |
2013-1AN, 3.99% due 03/05/21†††,1,3 | | | 300,000 | | | 300,570 | |
DIVCORE CLO Ltd. | | | | | | | |
2013-1A B, 4.05% due 11/15/32††† | | | 300,000 | | | 298,650 | |
GreenPoint Mortgage Funding Trust | | | | | | | |
2005-HE4, 0.86% due 07/25/301 | | | 300,000 | | | 271,480 | |
TICC CLO 2012-1 LLC | | | | | | | |
2012-1A, 4.98% due 08/25/231,3 | | | 250,000 | | | 251,150 | |
Ivy Hill Middle Market Credit Fund Ltd. | | | | | | | |
2011-3A, 6.24% due 01/15/221,3 | | | 250,000 | | | 251,075 | |
Garrison Funding 2013-2 Ltd. | | | | | | | |
2013-2A, 3.73% due 09/25/23†††,1,3 | | | 250,000 | | | 249,350 | |
Golub Capital Partners CLO 17 Ltd. | | | | | | | |
2013-17A, 3.99% due 10/25/251,3 | | | 250,000 | | | 248,875 | |
Acis CLO 2013-2 Ltd. | | | | | | | |
3.45% due 10/14/221,3 | | | 250,000 | | | 247,600 | |
Cerberus Onshore II CLO LLC | | | | | | | |
2014-1A, 2.95% due 10/15/23†††,1,3 | | | 250,000 | | | 247,550 | |
Race Point IV CLO Ltd. | | | | | | | |
2007-4A, 2.24% due 08/01/211,3 | | | 250,000 | | | 237,625 | |
Carlyle Global Market Strategies | | | | | | | |
CLO 2012-3 Ltd. | | | | | | | |
2012-3A, 0.00% due 10/04/243,9 | | | 250,000 | | | 234,600 | |
STORE Master Funding LLC | | | | | | | |
2013-2A, 4.37% due 07/20/43†††,3 | | | 99,025 | | | 100,639 | |
2013-1A, 4.16% due 03/20/433 | | | 98,457 | | | 99,094 | |
GSAA Home Equity Trust | | | | | | | |
2007-7, 0.42% due 07/25/371 | | | 219,721 | | | 190,351 | |
New Century Home Equity Loan Trust | | | | | | | |
2005-1, 0.87% due 03/25/351 | | | 171,479 | | | 149,390 | |
Credit-Based Asset Servicing and | | | | | | | |
Securitization LLC | | | | | | | |
2005-CB5, 0.41% due 08/25/351 | | | 143,100 | | | 142,136 | |
Avis Budget Rental Car Funding AESOP LLC | | | | | | | |
2013-2A, 4.00% due 05/21/183 | | | 100,000 | | | 103,900 | |
Newcastle CDO IX 1 Ltd. | | | | | | | |
2007-9A, 0.41% due 05/25/521,3 | | | 78,565 | | | 78,329 | |
First Franklin Mortgage Loan Trust | | | | | | | |
2006-FF1, 0.49% due 01/25/361 | | | 50,000 | | | 43,289 | |
Legg Mason Real Estate CDO I Ltd. | | | | | | | |
2006-1A, 0.43% due 03/25/381,3 | | | 16,646 | | | 16,363 | |
| | | | | | | |
| Total Asset Backed Securities | | | | | | | |
(Cost $48,030,495) | | | | | | 49,055,146 | |
| | | | | | | |
| | | | | | | | |
| CORPORATE BONDS†† - 29.9% | | | | | | | |
| FINANCIALS - 16.9% | | | | | | | |
Prudential Financial, Inc. | | | | | | | |
5.63% due 06/15/431,8 | | | 1,750,000 | | | 1,785,000 | |
JPMorgan Chase & Co. | | | | | | | |
5.15% due 12/31/491,2 | | | 1,500,000 | | | 1,406,251 | |
Icahn Enterprises Limited Partnership / | | | | | | | |
Icahn Enterprises Finance Corp. | | | | | | | |
6.00% due 08/01/203 | | | 800,000 | | | 848,000 | |
4.88% due 03/15/193 | | | 450,000 | | | 457,875 | |
Kaupthing Bank HF | | | | | | | |
3.49% due 01/15/103,4 | | | 5,000,000 | | | 1,187,500 | |
Susquehanna Bancshares, Inc. | | | | | | | |
5.38% due 08/15/22 | | | 1,200,000 | | | 1,175,462 | |
EPR Properties | | | | | | | |
5.25% due 07/15/23 | | | 1,000,000 | | | 1,016,193 | |
5.75% due 08/15/22 | | | 100,000 | | | 105,949 | |
PNC Financial Services Group, Inc. | | | | | | | |
4.85% due 05/29/491,2 | | | 1,100,000 | | | 1,031,250 | |
General Electric Capital Corp. | | | | | | | |
5.25% due 06/29/491,2 | | | 750,000 | | | 729,525 | |
7.13% due 12/15/491,2 | | | 250,000 | | | 285,000 | |
AmTrust Financial Services, Inc. | | | | | | | |
6.13% due 08/15/233 | | | 1,000,000 | | | 992,930 | |
Lancashire Holdings Ltd. | | | | | | | |
5.70% due 10/01/223 | | | 900,000 | | | 925,952 | |
| |
| 36 | THE GUGGENHEIM FUNDS SEMI-ANNUAL REPORT | | SEE NOTES TO FINANCIAL STATEMENTS. |
| SCHEDULE OF INVESTMENTS (Unaudited) (continued) | | March 31, 2014 |
| |
| INVESTMENT GRADE BOND FUND | | |
| | | | FACE | | | | |
| | | | AMOUNT | | | VALUE | |
| |
| | | | | | | | |
Macquarie Group Ltd. | | | | | | | |
6.25% due 01/14/213,8 | | $ | 800,000 | | $ | 894,480 | |
Hospitality Properties Trust | | | | | | | |
4.50% due 06/15/23 | | | 900,000 | | | 891,633 | |
Fifth Third Bancorp | | | | | | | |
5.10% due 12/31/491,2 | | | 920,000 | | | 846,400 | |
Leucadia National Corp. | | | | | | | |
5.50% due 10/18/238 | | | 800,000 | | | 833,468 | |
Nuveen Investments, Inc. | | | | | | | |
9.13% due 10/15/173 | | | 760,000 | | | 803,700 | |
StanCorp Financial Group, Inc. | | | | | | | |
5.00% due 08/15/228 | | | 600,000 | | | 611,286 | |
Credit Suisse AG | | | | | | | |
6.50% due 08/08/233,8 | | | 500,000 | | | 548,750 | |
National Rural Utilities Cooperative | | | | | | | |
Finance Corp. | | | | | | | |
4.75% due 04/30/431 | | | 500,000 | | | 472,500 | |
Bank of New York Mellon Corp. | | | | | | | |
4.50% due 12/31/491,2 | | | 440,000 | | | 400,400 | |
CICRMT 2014-A A | | | | | | | |
4.89% due 10/08/21 | | | 300,000 | | | 300,000 | |
Emigrant Bancorp, Inc. | | | | | | | |
6.25% due 06/15/143 | | | 100,000 | | | 100,641 | |
Prosight Global Inc. | | | | | | | |
7.50% due 11/20/20†††,7 | | | 100,000 | | | 98,910 | |
TIG Holdings, Inc. | | | | | | | |
8.60% due 01/15/273 | | | 34,000 | | | 30,303 | |
| | | | | | | |
| Total Financials | | | | | | 18,779,358 | |
| | | | | | | |
| | | | | | | | |
| CONSUMER DISCRETIONARY - 4.6% | | | | | | | |
Sabre GLBL, Inc. | | | | | | | |
8.50% due 05/15/193 | | | 1,150,000 | | | 1,270,750 | |
Hawaiian Airlines 2013-1 Class A | | | | | | | |
Pass Through Certificates | | | | �� | | | |
3.90% due 01/15/26 | | | 800,000 | | | 773,000 | |
Northern Group Housing LLC | | | | | | | |
6.80% due 08/15/533 | | | 600,000 | | | 630,690 | |
GLP Capital Limited Partnership / GLP | | | | | | | |
Financing II, Inc. | | | | | | | |
4.88% due 11/01/203 | | | 350,000 | | | 359,187 | |
4.38% due 11/01/183 | | | 150,000 | | | 153,938 | |
QVC, Inc. | | | | | | | |
4.38% due 03/15/23 | | | 500,000 | | | 492,734 | |
Continental Airlines 2012-2 Class B | | | | | | | |
Pass Through Trust | | | | | | | |
5.50% due 10/29/20 | | | 400,000 | | | 421,000 | |
AmeriGas Finance LLC / AmeriGas | | | | | | | |
Finance Corp. | | | | | | | |
7.00% due 05/20/22 | | | 350,000 | | | 382,375 | |
GRD Holdings III Corp. | | | | | | | |
10.75% due 06/01/193 | | | 250,000 | | | 275,000 | |
Stanadyne Corp. | | | | | | | |
10.00% due 08/15/14 | | | 240,000 | | | 239,100 | |
Continental Airlines 2012-1 Class B | | | | | | | |
Pass Through Trust | | | | | | | |
6.25% due 04/11/20 | | | 118,665 | | | 126,675 | |
| | | | | | | |
| Total Consumer Discretionary | | | | | | 5,124,449 | |
| | | | | | | |
| | | | | | | | |
| MATERIALS - 2.9% | | | | | | | |
Newcrest Finance Pty Ltd. | | | | | | | |
4.20% due 10/01/223,11 | | | 1,200,000 | | | 1,035,143 | |
4.45% due 11/15/213 | | | 500,000 | | | 447,641 | |
AngloGold Ashanti Holdings plc | | | | | | | |
5.13% due 08/01/228 | | | 1,250,000 | | | 1,165,474 | |
Barrick Gold Corp. | | | | | | | |
4.10% due 05/01/238 | | | 625,000 | | | 592,897 | |
Mosaic Global Holdings, Inc. | | | | | | | |
7.38% due 08/01/18 | | | 18,000 | | | 20,551 | |
Constar International, Inc | | | | | | | |
11.00% due 12/31/17†††,7 | | | 5,747 | | | — | |
| | | | | | | |
| Total Materials | | | | | | 3,261,706 | |
| | | | | | | |
| | | | | | | | |
| ENERGY - 2.4% | | | | | | | |
Midstates Petroleum Company | | | | | | | |
Incorporated / Midstates | | | | | | | |
Petroleum Co LLC | | | | | | | |
10.75% due 10/01/20 | | | 600,000 | | | 663,000 | |
BreitBurn Energy Partners Limited | | | | | | | |
Partnership / BreitBurn Finance Corp. | | | | | | | |
7.88% due 04/15/22 | | | 600,000 | | | 649,500 | |
Eagle Rock Energy Partners Limited | | | | | | | |
Partnership / Eagle Rock Energy | | | | | | | |
Finance Corp. | | | | | | | |
8.38% due 06/01/19 | | | 455,000 | | | 493,675 | |
SESI LLC | | | | | | | |
7.13% due 12/15/21 | | | 250,000 | | | 278,750 | |
Hiland Partners Limited Partnership / | | | | | | | |
Hiland Partners Finance Corp. | | | | | | | |
7.25% due 10/01/203 | | | 250,000 | | | 271,875 | |
Crestwood Midstream Partners Limited | | | | | | | |
Partnership / Crestwood Midstream | | | | | | | |
Finance Corp. | | | | | | | |
7.75% due 04/01/19 | | | 150,000 | | | 162,750 | |
Penn Virginia Resource Partners Limited | | | | | | | |
Partnership / Penn Virginia Resource | | | | | | | |
Finance Corp. | | | | | | | |
8.38% due 06/01/20 | | | 114,000 | | | 127,965 | |
Williams Companies, Inc. | | | | | | | |
8.75% due 03/15/32 | | | 12,000 | | | 14,466 | |
| | | | | | | |
| Total Energy | | | | | | 2,661,981 | |
| | | | | | | |
| | | | | | | | |
| INDUSTRIALS - 1.2% | | | | | | | |
Chicago Bridge & Iron Co. | | | | | | | |
5.15% due 12/27/22†††,7 | | | 750,000 | | | 721,575 | |
SBM Baleia Azul Sarl | | | | | | | |
5.50% due 09/15/27†††,7 | | | 471,900 | | | 457,696 | |
ADT Corp. | | | | | | | |
6.25% due 10/15/213 | | | 150,000 | | | 154,125 | |
| | | | | | | |
| Total Industrials | | | | | | 1,333,396 | |
| | | | | | | |
| | | | | | | | |
| UTILITIES - 1.1% | | | | | | | |
Legacy Reserves Limited Partnership / | | | | | | | |
Legacy Reserves Finance Corp. | | | | | | | |
8.00% due 12/01/20 | | | 1,200,000 | | | 1,284,000 | |
| | | | | | | |
| | | | | | | | |
| TELECOMMUNICATION SERVICES - 0.6% | | | | | | | |
Avaya, Inc. | | | | | | | |
7.00% due 04/01/193 | | | 650,000 | | | 645,125 | |
Nortel Networks Ltd. | | | | | | | |
6.88% due 09/01/234 | | | 31,000 | | | 15,190 | |
| | | | | | | |
| Total Telecommunication Services | | | | | | 660,315 | |
| | | | | | | |
| |
| SEE NOTES TO FINANCIAL STATEMENTS. | | THE GUGGENHEIM FUNDS SEMI-ANNUAL REPORT | 37 |
| SCHEDULE OF INVESTMENTS (Unaudited) (continued) | | March 31, 2014 |
| |
| INVESTMENT GRADE BOND FUND | | |
| | | | FACE | | | | |
| | | | AMOUNT | | | VALUE | |
| |
| | | | | | | | |
| INFORMATION TECHNOLOGY - 0.2% | | | | | | | |
First Data Corp. | | | | | | | |
8.75% due 01/15/223 | | $ | 250,000 | | $ | 273,125 | |
| | | | | | | |
| Total Corporate Bonds | | | | | | | |
(Cost $37,261,065) | | | | | | 33,378,330 | |
| | | | | | | |
| | | | | | | | |
| COLLATERALIZED MORTGAGE OBLIGATIONS†† - 7.8% | | | | | | | |
Alternative Loan Trust | | | | | | | |
2003-18CB,5.25% due 09/25/33 | | | 1,123,390 | | | 1,166,837 | |
Hilton USA Trust | | | | | | | |
2013-HLT,4.41% due 11/05/303 | | | 1,100,000 | | | 1,118,992 | |
Boca Hotel Portfolio Trust | | | | | | | |
2013-BOCA,3.21% due 08/15/261,3 | | | 1,000,000 | | | 1,001,347 | |
MASTR Adjustable Rate | | | | | | | |
Mortgages Trust 2003-5 | | | | | | | |
2003-5,2.09% due 11/25/331 | | | 986,245 | | | 945,672 | |
Madison Avenue Trust | | | | | | | |
4.03% due 10/12/321,3 | | | 875,000 | | | 861,169 | |
BBCMS Trust | | | | | | | |
2013-TYSN,3.71% due 09/05/323 | | | 900,000 | | | 822,261 | |
Washington Mutual Mortgage Pass-Through | | | | | | | |
Certificates WMALT Series 2006-AR9 Trust | | | | | | | |
2006-AR9,0.97% due 11/25/461 | | | 809,181 | | | 538,762 | |
Motel 6 Trust | | | | | | | |
2012-MTL6,3.78% due 10/05/253 | | | 500,000 | | | 503,531 | |
Spirit Master Funding LLC | | | | | | | |
2007-1A,5.74% due 03/20/253 | | | 358,558 | | | 367,899 | |
2006-1A,5.76% due 03/20/243 | | | 123,413 | | | 128,658 | |
Residential Asset Securitization Trust | | | | | | | |
2006-A12,6.25% due 11/25/36 | | | 512,941 | | | 394,396 | |
Nomura Resecuritization Trust | | | | | | | |
2012-1R,0.60% due 08/27/471,3 | | | 366,156 | | | 337,340 | |
SRERS-2011 Funding Ltd. | | | | | | | |
2011-RS,0.40% due 05/09/461,3 | | | 362,975 | | | 335,715 | |
Credit Suisse Mortgage Capital Certificates | | | | | | | |
2006-TF2A,0.56% due 10/15/211,3 | | | 200,000 | | | 193,662 | |
JP Morgan Mortgage Trust 2006-A3 | | | | | | | |
2006-A3,2.86% due 04/25/361 | | | 37,269 | | | 33,176 | |
| Total Collateralized Mortgage Obligations | | | | | | | |
| | | | | | | |
(Cost $8,719,407) | | | | | | 8,749,417 | |
| | | | | | | |
| | | | | | | | |
| SENIOR FLOATING RATE INTERESTS†† - 6.7% | | | | | | | |
| | | | | | | | |
| CONSUMER DISCRETIONARY - 2.8% | | | | | | | |
Landry’s, Inc. | | | | | | | |
4.00% due 04/24/18 | | | 754,168 | | | 757,940 | |
Compucom Systems, Inc. | | | | | | | |
4.25% due 05/07/20 | | | 756,190 | | | 754,534 | |
Neiman Marcus Group, Inc. | | | | | | | |
4.25% due 10/25/20 | | | 448,875 | | | 450,042 | |
Ollies Bargain Outlet | | | | | | | |
5.25% due 09/28/19 | | | 395,002 | | | 393,521 | |
Arby’s | | | | | | | |
5.00% due 11/15/20 | | | 349,125 | | | 350,979 | |
1-800 Contacts, Inc. | | | | | | | |
4.25% due 01/31/21 | | | 200,000 | | | 200,350 | |
NES Global Talent | | | | | | | |
6.50% due 10/03/19 | | | 149,063 | | | 149,063 | |
| | | | | | | |
| Total Consumer Discretionary | | | | | | 3,056,429 | |
| | | | | | | |
| | | | | | | | |
| INDUSTRIALS - 1.9% | | | | | | | |
Rise Ltd. | | | | | | | |
4.74% due 02/12/39 | | | 746,094 | | | 751,690 | |
Travelport Holdings Ltd. | | | | | | | |
6.25% due 06/26/19 | | | 496,250 | | | 507,262 | |
AABS Ltd. | | | | | | | |
4.87% due 01/15/38††† | | | 466,146 | | | 469,642 | |
VAT Holding AG | | | | | | | |
4.75% due 02/11/21 | | | 250,000 | | | 251,145 | |
Emerald Expositions | | | | | | | |
5.50% due 06/17/20 | | | 99,250 | | | 99,912 | |
| | | | | | | |
| Total Industrials | | | | | | 2,079,651 | |
| | | | | | | |
| | | | | | | | |
| TELECOMMUNICATION SERVICES - 0.9% | | | | | | | |
MergerMarket Ltd. | | | | | | | |
4.50% due 02/04/21 | | | 600,000 | | | 597,000 | |
Asurion Corp. | | | | | | | |
6.00% due 05/24/19 | | | 461,196 | | | 461,948 | |
| | | | | | | |
| Total Telecommunication Services | | | | | | 1,058,948 | |
| | | | | | | |
| | | | | | | | |
| INFORMATION TECHNOLOGY - 0.6% | | | | | | | |
P2 Energy Solutions | | | | | | | |
5.00% due 10/30/20 | | | 349,125 | | | 351,743 | |
Greenway Medical Technologies | | | | | | | |
6.00% due 11/04/20 | | | 349,125 | | | 346,943 | |
| | | | | | | |
| Total Information Technology | | | | | | 698,686 | |
| | | | | | | |
| | | | | | | | |
| FINANCIALS - 0.3% | | | | | | | |
Magic Newco, LLC | | | | | | | |
5.00% due 12/12/18 | | | 248,112 | | | 250,283 | |
American Stock Transfer & Trust | | | | | | | |
5.75% due 06/26/20 | | | 97,147 | | | 97,470 | |
| | | | | | | |
| Total Financials | | | | | | 347,753 | |
| | | | | | | |
| | | | | | | | |
| CONSUMER STAPLES - 0.1% | | | | | | | |
Performance Food Group | | | | | | | |
6.25% due 11/14/19 | | | 99,749 | | | 101,078 | |
| | | | | | | |
| | | | | | | | |
| HEALTH CARE - 0.1% | | | | | | | |
Akorn, Inc. | | | | | | | |
4.50% due 11/13/20 | | | 100,000 | | | 100,875 | |
| | | | | | | |
| Total Senior Floating Rate Interests | | | | | | | |
(Cost $7,396,926) | | | | | | 7,443,420 | |
| | | | | | | |
| | | | | | | | |
| MORTGAGE BACKED SECURITIES†† - 2.2% | | | | | | | |
Fannie Mae5 | | | | | | | |
2013-28,3.00% due 04/25/43 | | | 915,373 | | | 741,938 | |
2013-34,3.00% due 04/25/43 | | | 441,256 | | | 393,407 | |
2013-17,2.50% due 03/25/43 | | | 327,689 | | | 273,164 | |
2013-54,3.00% due 06/25/33 | | | 146,195 | | | 121,682 | |
1990-108,7.00% due 09/25/20 | | | 8,798 | | | 9,751 | |
Freddie Mac5 | | | | | | | |
2013-4184,3.00% due 03/15/43 | | | 515,637 | | | 419,776 | |
2013-4180,3.00% due 03/15/43 | | | 425,996 | | | 364,668 | |
2013-4224,3.00% due 07/15/43 | | | 101,262 | | | 92,090 | |
Ginnie Mae | | | | | | | |
#518436, 7.25% due 09/15/29 | | | 9,623 | | | 11,172 | |
#1849, 8.50% due 08/20/24 | | | 1,154 | | | 1,322 | |
| | | | | | | |
| Total Mortgage Backed Securities | | | | | | | |
(Cost $2,817,177) | | | | | | 2,428,970 | |
| | | | | | | |
| |
| 38 | THE GUGGENHEIM FUNDS SEMI-ANNUAL REPORT | | SEE NOTES TO FINANCIAL STATEMENTS. |
| SCHEDULE OF INVESTMENTS (Unaudited) (concluded) | | March 31, 2014 |
| |
| INVESTMENT GRADE BOND FUND | | |
| | | | FACE | | | | |
| | | | AMOUNT | | | VALUE | |
| |
| | | | | | | | |
| MUNICIPAL BONDS†† - 2.0% | | | | | | | |
| NEW YORK - 0.9% | | | | | | | |
New York City Water & Sewer | | | | | | | |
System Revenue Bonds | | | | | | | |
0.30% due 06/15/331 | | $ | 1,000,000 | | $ | 1,000,000 | |
| | | | | | | |
| | | | | | | | |
| MICHIGAN - 0.8% | | | | | | | |
City of Detroit Michigan Water | | | | | | | |
Supply System Revenue | | | | | | | |
Revenue Bonds | | | | | | | |
5.00% due 07/01/33 | | | 300,000 | | | 299,609 | |
5.00% due 07/01/23 | | | 250,000 | | | 251,403 | |
5.00% due 07/01/30 | | | 50,000 | | | 49,016 | |
Detroit City School District | | | | | | | |
General Obligation Unlimited | | | | | | | |
7.75% due 05/01/39 | | | 100,000 | | | 110,742 | |
City of Detroit Michigan Sewage | | | | | | | |
Disposal System Revenue | | | | | | | |
Revenue Bonds | | | | | | | |
5.50% due 07/01/22 | | | 100,000 | | | 100,649 | |
| | | | | | | |
| Total Michigan | | | | | | 811,419 | |
| | | | | | | |
| | | | | | | | |
| ILLINOIS - 0.1% | | | | | | | |
City of Chicago Illinois General | | | | | | | |
Obligation Unlimited | | | | | | | |
5.00% due 01/01/27 | | | 150,000 | | | 155,517 | |
| | | | | | | |
| | | | | | | | |
| CALIFORNIA - 0.1% | | | | | | | |
County of Sacramento California | | | | | | | |
Revenue Bonds | | | | | | | |
7.25% due 08/01/25 | | | 100,000 | | | 109,475 | |
| | | | | | | |
| | | | | | | | |
| ALABAMA - 0.1% | | | | | | | |
County of Jefferson Alabama | | | | | | | |
Sewer Revenue Revenue Bonds | | | | | | | |
0.00% due 10/01/34 | | | 350,000 | | | 99,943 | |
| | | | | | | |
| | | | | | | | |
| OTHER TERRITORIES - 0.0% | | | | | | | |
Commonwealth of Puerto Rico | | | | | | | |
General Obligation Unlimited | | | | | | | |
8.00% due 07/01/35 | | | 30,000 | | | 27,994 | |
| | | | | | | |
| Total Municipal Bonds | | | | | | | |
(Cost $2,179,535) | | | | | | 2,204,348 | |
| | | | | | | |
| | | | | | | | |
| COMMERCIAL PAPER†† - 4.5% | | | | | | | |
Northeast Utilities | | | | | | | |
0.18% due 04/01/143 | | | 1,500,000 | | | 1,500,000 | |
CBS Corp. | | | | | | | |
0.21% due 04/02/143 | | | 1,500,000 | | | 1,499,991 | |
Duke Energy Corp. | | | | | | | |
0.19% due 04/03/143 | | | 1,000,000 | | | 999,989 | |
American Water Capital Corp. | | | | | | | |
0.23% due 04/10/143 | | | 1,000,000 | | | 999,943 | |
| | | | | | | |
| Total Commercial Paper | | | | | | | |
(Cost $4,999,923) | | | | | | 4,999,923 | |
| | | | | | | |
| Total Investments - 104.5% | | | | | | | |
(Cost $121,831,571) | | | | | $ | 116,723,413 | |
| | | | | | | |
| Other Assets & Liabilities, net - (4.5)% | | | | | | (5,049,346 | ) |
| | | | | | | |
| Total Net Assets - 100.0% | | | | | $ | 111,674,067 | |
| | |
| | |
CENTRALLY CLEARED INTEREST RATE SWAP AGREEMENTS††
| | | Pay | | | | | | | | | | | | | | | | Unrealized | |
| | | Floating | | Floating | | Fixed | | | Maturity | | Notional | | Market | | | Appreciation/ | |
| Counterparty | | Rate | | Rate Index | | Rate | | | Date | | Amount | | Value | | | (Depreciation | ) |
| |
| Merrill Lynch | | Pay | | 3-Month USD-LIBOR | | 3.89% | | | 09/09/2043 | | $ | 1,850,000 | | $ | 127,280 | | | $ | 127,280 | |
| Merrill Lynch | | Pay | | 3-Month USD-LIBOR | | 1.97% | | | 09/09/2018 | | | 5,850,000 | | | 97,110 | | | | 97,110 | |
| Merrill Lynch | | Pay | | 3-Month USD-LIBOR | | 3.68% | | | 08/29/2043 | | | 1,450,000 | | | 44,950 | | | | 44,950 | |
| Merrill Lynch | | Pay | | 3-Month USD-LIBOR | | 1.70% | | | 08/29/2018 | | | 5,950,000 | | | 35,105 | | | | 35,105 | |
| Merrill Lynch | | Pay | | 3-Month USD-LIBOR | | 3.65% | | | 09/26/2018 | | | 450,000 | | | 10,035 | | | | 10,035 | |
| Merrill Lynch | | Pay | | 3-Month USD-LIBOR | | 1.59% | | | 09/26/2018 | | | 9,300,000 | | | (12,090 | ) | | | (12,090 | ) |
| | | | | | | | | | | | | | | | | | | |
| | | | | | | | | | | | | | | | | | | $ | 302,390 | |
| | | | | | | | | | | | | | | | | | | |
| * | | Non-income producing security. |
| † | | Value determined based on Level 1 inputs, unless otherwise noted — See Note 4. |
| †† | | Value determined based on Level 2 inputs, unless otherwise noted — See Note 4. |
| ††† | | Value determined based on Level 3 inputs — See Note 4. |
| 1 | | Variable rate security. Rate indicated is rate effective at March 31, 2014. |
| 2 | | Perpetual maturity. |
| 3 | | Security is a 144A or Section 4(a)(2) security. The total market value of 144A or Section 4(a)(2) securities is $65,205,558 (cost $69,672,016), or 58.4% of total net assets. |
| 4 | | Security is in default of interest and/or principal obligations. |
| 5 | | On September 7, 2008, the issuer was placed in conservatorship by the Federal Housing Finance Agency (FHFA). As conservator, the FHFA has full powers to control the assets and operations of the firm. |
| 6 | | Affiliated funds. |
| 7 | | Illiquid security. |
| 8 | | Security or a portion thereof is held as collateral for reverse repurchase agreements — See Note 11. |
| 9 | | Security with no rate was unsettled at March 31, 2014. |
| | | plc — Public Limited Company |
| | | REIT — Real Estate Investment Trust |
| |
| SEE NOTES TO FINANCIAL STATEMENTS. | | THE GUGGENHEIM FUNDS SEMI-ANNUAL REPORT | 39 |
| INVESTMENT GRADE BOND FUND | |
| STATEMENT OF ASSETS AND LIABILITIES (Unaudited) |
| |
| March 31, 2014 |
| ASSETS: | | | | |
| Investments in unaffiliated issuers, at value (cost $119,831,571) | | $ | 114,722,613 | |
| Investments in affiliated issuers, at value (cost $2,000,000) | | | 2,000,800 | |
| | | | |
| Total Investments (cost $121,831,571) | | | 116,723,413 | |
| Segregated cash with broker | | | 603,244 | |
| Unrealized appreciation on swap agreements | | | 314,480 | |
| Prepaid expenses | | | 47,781 | |
| Receivables: | | | | |
Securities sold | | | 2,184,180 | |
Interest | | | 841,317 | |
Fund shares sold | | | 636,254 | |
Dividends | | | 22,595 | |
Investment advisor | | | 22,465 | |
| | | | |
| Total assets | | | 121,395,729 | |
| | | | |
| LIABILITIES: | | | | |
| Reverse Repurchase Agreements | | | 6,200,680 | |
| Due to broker | | | 539,079 | |
| Due to custodian bank | | | 310,403 | |
| Unrealized depreciation on swap agreements | | | 12,090 | |
| Payable for: | | | | |
Securities purchased | | | 2,340,776 | |
Fund shares redeemed | | | 100,274 | |
Management fees | | | 46,735 | |
Distribution and service fees | | | 36,580 | |
Transfer agent/maintenance fees | | | 12,592 | |
Fund accounting/administration fees | | | 8,903 | |
Trustees’ fees* | | | 3,097 | |
Miscellaneous | | | 110,453 | |
| | | | |
| Total liabilities | | | 9,721,662 | |
| | | | |
| NET ASSETS | | $ | 111,674,067 | |
| | | | |
| NET ASSETS CONSIST OF: | | | | |
| Paid in capital | | $ | 144,880,128 | |
| Accumulated net investment loss | | | (1,194,429 | ) |
| Accumulated net realized loss on investments | | | (27,188,350 | ) |
| Net unrealized depreciation on investments | | | (4,823,282 | ) |
| | | | |
| Net assets | | $ | 111,674,067 | |
| | | | |
| A-CLASS: | | | | |
| Net assets | | $ | 90,104,760 | |
| Capital shares outstanding | | | 4,956,132 | |
| Net asset value per share | | | $18.18 | |
| | | | |
| Maximum offering price per share | | | | |
(Net asset value divided by 95.25%) | | | $19.09 | |
| | | | |
| B-CLASS: | | | | |
| Net assets | | $ | 2,437,525 | |
| Capital shares outstanding | | | 134,640 | |
| Net asset value per share | | | $18.10 | |
| | | | |
| C-CLASS: | | | | |
| Net assets | | $ | 18,915,975 | |
| Capital shares outstanding | | | 1,044,994 | |
| Net asset value per share | | | $18.10 | |
| | | | |
| INSTITUTIONAL CLASS: | | | | |
| Net assets | | $ | 215,807 | |
| Capital shares outstanding | | | 11,887 | |
| Net asset value per share | | | $18.15 | |
| | | | |
| STATEMENT OF OPERATIONS (Unaudited) |
| |
| Period Ended March 31, 2014 |
| INVESTMENT INCOME: | | | | |
| Interest | | $ | 2,454,168 | |
| Dividends | | | 110,156 | |
| | | | |
Total investment income | | | 2,564,324 | |
| | | | |
| EXPENSES: | | | | |
| Management fees | | | 267,153 | |
| Transfer agent/maintenance fees | | | | |
A-Class | | | 50,949 | |
B-Class | | | 9,447 | |
C-Class | | | 16,643 | |
Institutional Class | | | 181 | |
| Distribution and service fees: | | | | |
A-Class | | | 107,308 | |
B-Class | | | 13,373 | |
C-Class | | | 90,781 | |
| Fund accounting/administration fees | | | 50,759 | |
| Registration fees | | | 39,979 | |
| Short interest expense | | | 23,076 | |
| Trustees’ fees* | | | 5,939 | |
| Line of credit interest expense | | | 5,616 | |
| Custodian fees | | | 413 | |
| Tax expense | | | 2 | |
| Miscellaneous | | | 62,833 | |
| | | | |
Total expenses | | | 744,452 | |
| | | | |
| Less: | | | | |
| Expenses waived by Advisor | | | (94,650 | ) |
| | | | |
| Net expenses | | | 649,802 | |
| | | | |
| Net investment income | | | 1,914,522 | |
| | | | |
| NET REALIZED AND UNREALIZED GAIN (LOSS): | | | | |
| Net realized gain (loss) on: | | | | |
Investments in unaffiliated issuers | | | 265,522 | |
Swap agreements | | | 221,971 | |
| | | | |
| Net realized gain | | | 487,493 | |
| | | | |
| Net change in unrealized appreciation | | | | |
(depreciation) on: | | | | |
Investments in unaffiliated issuers | | | 2,513,627 | |
Investments in affiliated issuers | | | 800 | |
Swap agreements | | | (7,880 | ) |
| | | | |
| Net change in unrealized appreciation | | | | |
(depreciation) | | | 2,506,547 | |
| | | | |
| Net realized and unrealized gain | | | 2,994,040 | |
| | | | |
| Net increase in net assets resulting | | | | |
from operations | | $ | 4,908,562 | |
| | | | |
* Relates to Trustees not deemed “interested persons” within the meaning of Section 2(a)(19) of the 1940 Act.
| |
| 40 | THE GUGGENHEIM FUNDS SEMI-ANNUAL REPORT | | SEE NOTES TO FINANCIAL STATEMENTS. |
| INVESTMENT GRADE BOND FUND |
| | STATEMENTS OF CHANGES IN NET ASSETS |
| |
| | | Period Ended | | | | | |
| | | March 31, | | | Year Ended | |
| | | 2014 | | | September 30, | |
| | | (Unaudited) | | | 2013 | |
| |
| | | | | | | | | |
| INCREASE (DECREASE) IN NET ASSETS FROM OPERATIONS: | | | | | | | | |
| Net investment income | | $ | 1,914,522 | | | $ | 3,757,320 | |
| Net realized gain on investments | | | 487,493 | | | | 4,952,858 | |
| Net change in unrealized appreciation (depreciation) on investments | | | 2,506,547 | | | | (4,987,231 | ) |
| |
| Net increase in net assets resulting from operations | | | 4,908,562 | | | | 3,722,947 | |
| |
| | | | | | | | | |
| DISTRIBUTIONS TO SHAREHOLDERS FROM: | | | | | | | | |
| Net investment income | | | | | | | | |
A-Class | | | (2,231,477 | ) | | | (3,408,190 | ) |
B-Class | | | (59,403 | ) | | | (119,783 | ) |
C-Class | | | (404,651 | ) | | | (654,081 | ) |
Institutional Class | | | (5,015 | ) | | | (2,951 | ) |
| |
| Total distributions to shareholders | | | (2,700,546 | ) | | | (4,185,005 | ) |
| |
| | | | | | | | | |
| CAPITAL SHARE TRANSACTIONS: | | | | | | | | |
| Proceeds from sale of shares | | | | | | | | |
A-Class | | | 13,590,161 | | | | 22,376,229 | |
B-Class | | | 5,863 | | | | 432,699 | |
C-Class | | | 2,611,906 | | | | 10,703,187 | |
Institutional Class | | | 91,037 | | | | 174,306 | |
| Distributions reinvested | | | | | | | | |
A-Class | | | 2,131,144 | | | | 3,261,071 | |
B-Class | | | 59,233 | | | | 119,401 | |
C-Class | | | 366,766 | | | | 609,091 | |
Institutional Class | | | 5,015 | | | | 2,451 | |
| Cost of shares redeemed | | | | | | | | |
A-Class | | | (11,035,677 | ) | | | (39,676,207 | ) |
B-Class | | | (736,916 | ) | | | (2,665,979 | ) |
C-Class | | | (2,310,211 | ) | | | (14,287,993 | ) |
Institutional Class | | | (58,074 | ) | | | – | |
| |
| Net increase (decrease) from capital share transactions | | | 4,720,247 | | | | (18,951,744 | ) |
| |
| Net increase (decrease) in net assets | | | 6,928,263 | | | | (19,413,802 | ) |
| | | | | | | | | |
| NET ASSETS: | | | | | | | | |
Beginning of period | | | 104,745,804 | | | | 124,159,606 | |
| |
End of period | | $ | 111,674,067 | | | $ | 104,745,804 | |
| |
| Distributions in excess of net investment income at end of period | | $ | (1,194,429 | ) | | $ | (425,919 | ) |
| |
| | | | | | | | | |
| CAPITAL SHARE ACTIVITY: | | | | | | | | |
| Shares sold | | | | | | | | |
A-Class | | | 754,462 | | | | 1,246,284 | |
B-Class | | | 325 | | | | 24,231 | |
C-Class | | | 145,180 | | | | 595,542 | |
Institutional Class | | | 5,035 | | | | 9,638 | |
| Shares issued from reinvestment of distributions | | | | | | | | |
A-Class | | | 118,223 | | | | 181,120 | |
B-Class | | | 3,301 | | | | 6,659 | |
C-Class | | | 20,443 | | | | 33,953 | |
Institutional Class | | | 290 | | | | 137 | |
| Shares redeemed | | | | | | | | |
A-Class | | | (613,618 | ) | | | (2,203,124 | ) |
B-Class | | | (41,195 | ) | | | (148,667 | ) |
C-Class | | | (128,852 | ) | | | (795,823 | ) |
Institutional Class | | | (3,213 | ) | | | – | |
| |
| Net increase (decrease) in shares | | | 260,381 | | | | (1,050,050 | ) |
| |
| |
| SEE NOTES TO FINANCIAL STATEMENTS. | | THE GUGGENHEIM FUNDS SEMI-ANNUAL REPORT | 41 |
| INVESTMENT GRADE BOND FUND |
| FINANCIAL HIGHLIGHTS |
| |
| This table is presented to show selected data for a share outstanding throughout each period and to assist shareholders in evaluating a Fund’s performance for the periods presented. |
| | | Period Ended | | | Year Ended | | | Period Ended | | | Year Ended | | | Year Ended | | | Year Ended | |
| | | March 31, | | | September 30, | | | September 30, | | | December 31, | | | December 31, | | | December 31, | |
| A-Class | | 2014a | | | 2013 | | | 2012b | | | 2011e | | | 2010e | | | 2009e | |
| |
| Per Share Data | | | | | | | | | | | | | | | | | | | | | | | | |
| Net asset value, beginning of period | | $ | 17.81 | | | $ | 17.92 | | | $ | 17.41 | | | $ | 16.71 | | | $ | 16.20 | | | $ | 15.12 | |
| |
| Income (loss) from investment operations: | | | | | | | | | | | | | | | | | | | | | | | | |
| Net investment income (loss)c | | | .34 | | | | .61 | | | | .27 | | | | .42 | | | | .40 | | | | .48 | |
| Net gain (loss) on investments (realized and unrealized) | | | .41 | | | | (.04 | ) | | | .51 | | | | .74 | | | | .59 | | | | 1.12 | |
| | | |
| Total from investment operations | | | .75 | | | | .57 | | | | .78 | | | | 1.16 | | | | .99 | | | | 1.60 | |
| |
| Less distributions from: | | | | | | | | | | | | | | | | | | | | | | | | |
| Net investment income | | | (.38 | ) | | | (.68 | ) | | | (.27 | ) | | | (.46 | ) | | | (.48 | ) | | | (.52 | ) |
| | | |
| Total distributions | | | (.38 | ) | | | (.68 | ) | | | (.27 | ) | | | (.46 | ) | | | (.48 | ) | | | (.52 | ) |
| |
| Net asset value, end of period | | $ | 18.18 | | | $ | 17.81 | | | $ | 17.92 | | | $ | 17.41 | | | $ | 16.71 | | | $ | 16.20 | |
| | | |
| | | | | | | | | | | | | | | | | | | | | | | | | |
| |
| Total Returng | | | 4.75% | | | | 3.21% | | | | 4.51% | | | | 6.94% | | | | 6.11% | | | | 10.63% | |
| |
| Ratios/Supplemental Data | | | | | | | | | | | | | | | | | | | | | | | | |
| Net assets, end of period (in thousands) | | $ | 90,105 | | | $ | 83,642 | | | $ | 98,063 | | | $ | 108,999 | | | $ | 101,971 | | | $ | 104,972 | |
| |
| Ratios to average net assets: | | | | | | | | | | | | | | | | | | | | | | | | |
| Net investment income (loss) | | | 3.73% | | | | 3.40% | | | | 2.04% | | | | 2.43% | | | | 2.51% | | | | 3.04% | |
| Total expenses | | | 1.22% | | | | 1.21% | | | | 1.15% | | | | 1.15% | | | | 1.21% | | | | 1.31% | |
| Net expensesd,h | | | 1.07% | | | | 1.04% | | | | 1.00% | | | | 1.00% | | | | 0.98% | | | | 0.95% | |
| |
| Portfolio turnover rate | | | 26% | | | | 119% | | | | 52% | | | | 43% | | | | 39% | | | | 89% | |
| | | | | | | | | | | | | | | | | | | | | | | | | |
| | | Period Ended | | | Year Ended | | | Period Ended | | | Year Ended | | | Year Ended | | | Year Ended | |
| | | March 31, | | | September 30, | | | September 30, | | | December 31, | | | December 31, | | | December 31, | |
| B-Class | | 2014a | | | 2013 | | | 2012b | | | 2011e | | | 2010e | | | 2009e | |
| |
| Per Share Data | | | | | | | | | | | | | | | | | | | | | | | | |
| Net asset value, beginning of period | | $ | 17.73 | | | $ | 17.82 | | | $ | 17.32 | | | $ | 16.62 | | | $ | 16.12 | | | $ | 15.04 | |
| |
| Income (loss) from investment operations: | | | | | | | | | | | | | | | | | | | | | | | | |
| Net investment income (loss)c | | | .26 | | | | .47 | | | | .16 | | | | .29 | | | | .28 | | | | .36 | |
| Net gain (loss) on investments (realized and unrealized) | | | .42 | | | | (.04 | ) | | | .51 | | | | .74 | | | | .54 | | | | 1.12 | |
| | | |
| Total from investment operations | | | .68 | | | | .43 | | | | .67 | | | | 1.03 | | | | .82 | | | | 1.48 | |
| |
| Less distributions from: | | | | | | | | | | | | | | | | | | | | | | | | |
| Net investment income | | | (.31 | ) | | | (.52 | ) | | | (.17 | ) | | | (.33 | ) | | | (.32 | ) | | | (.40 | ) |
| | | |
| Total distributions | | | (.31 | ) | | | (.52 | ) | | | (.17 | ) | | | (.33 | ) | | | (.32 | ) | | | (.40 | ) |
| |
| Net asset value, end of period | | $ | 18.10 | | | $ | 17.73 | | | $ | 17.82 | | | $ | 17.32 | | | $ | 16.62 | | | $ | 16.12 | |
| | | |
| | | | | | | | | | | | | | | | | | | | | | | | | |
| |
| Total Returng | | | 4.43% | | | | 2.42% | | | | 3.91% | | | | 6.35% | | | | 5.08% | | | | 9.87% | |
| |
| Ratios/Supplemental Data | | | | | | | | | | | | | | | | | | | | | | | | |
| Net assets, end of period (in thousands) | | $ | 2,438 | | | $ | 3,054 | | | $ | 5,168 | | | $ | 6,993 | | | $ | 11,619 | | | $ | 16,249 | |
| |
| Ratios to average net assets: | | | | | | | | | | | | | | | | | | | | | | | | |
| Net investment income (loss) | | | 2.94% | | | | 2.64% | | | | 1.29% | | | | 1.72% | | | | 1.76% | | | | 2.31% | |
| Total expenses | | | 2.56% | | | | 2.67% | | | | 2.12% | | | | 1.92% | | | | 1.95% | | | | 2.06% | |
| Net expensesd,h | | | 1.82% | | | | 1.79% | | | | 1.75% | | | | 1.75% | | | | 1.73% | | | | 1.70% | |
| |
| Portfolio turnover rate | | | 26% | | | | 119% | | | | 52% | | | | 43% | | | | 39% | | | | 89% | |
| |
| 42 | THE GUGGENHEIM FUNDS SEMI-ANNUAL REPORT | | SEE NOTES TO FINANCIAL STATEMENTS. |
| INVESTMENT GRADE BOND FUND |
| FINANCIAL HIGHLIGHTS (continued) |
| |
| This table is presented to show selected data for a share outstanding throughout each period and to assist shareholders in evaluating a Fund’s performance for the periods presented. |
| | | Period Ended | | | Year Ended | | | Period Ended | | | Year Ended | | | Year Ended | | | Year Ended | |
| | | March 31, | | | September 30, | | | September 30, | | | December 31, | | | December 31, | | | December 31, | |
| C-Class | | 2014a | | | 2013 | | | 2012b | | | 2011e | | | 2010e | | | 2009e | |
| |
| Per Share Data | | | | | | | | | | | | | | | | | | | | | | | | |
| Net asset value, beginning of period | | $ | 17.73 | | | $ | 17.82 | | | $ | 17.31 | | | $ | 16.62 | | | $ | 16.12 | | | $ | 15.04 | |
| |
| Income (loss) from investment operations: | | | | | | | | | | | | | | | | | | | | | | | | |
| Net investment income (loss)c | | | .27 | | | | .48 | | | | .17 | | | | .29 | | | | .28 | | | | .36 | |
| Net gain (loss) on investments (realized | | | | | | | | | | | | | | | | | | | | | | | | |
| and unrealized) | | | .41 | | | | (.05 | ) | | | .51 | | | | .73 | | | | .54 | | | | 1.12 | |
| | | |
| Total from investment operations | | | .68 | | | | .43 | | | | .68 | | | | 1.02 | | | | .82 | | | | 1.48 | |
| |
| Less distributions from: | | | | | | | | | | | | | | | | | | | | | | | | |
| Net investment income | | | (.31 | ) | | | (.52 | ) | | | (.17 | ) | | | (.33 | ) | | | (.32 | ) | | | (.40 | ) |
| | | |
| Total distributions | | | (.31 | ) | | | (.52 | ) | | | (.17 | ) | | | (.33 | ) | | | (.32 | ) | | | (.40 | ) |
| |
| Net asset value, end of period | | $ | 18.10 | | | $ | 17.73 | | | $ | 17.82 | | | $ | 17.31 | | | $ | 16.62 | | | $ | 16.12 | |
| | | |
| | | | | | | | | | | | | | | | | | | | | | | | | |
| |
| Total Returng | | | 4.37% | | | | 2.42% | | | | 3.95% | | | | 6.32% | | | | 5.05% | | | | 9.85% | |
| |
| Ratios/Supplemental Data | | | | | | | | | | | | | | | | | | | | | | | | |
| Net assets, end of period (in thousands) | | $ | 18,916 | | | $ | 17,876 | | | $ | 20,929 | | | $ | 22,035 | | | $ | 19,284 | | | $ | 20,843 | |
| |
| Ratios to average net assets: | | | | | | | | | | | | | | | | | | | | | | | | |
| Net investment income (loss) | | | 2.97% | | | | 2.65% | | | | 1.29% | | | | 1.68% | | | | 1.76% | | | | 2.28% | |
| Total expenses | | | 2.04% | | | | 2.03% | | | | 1.92% | | | | 1.90% | | | | 1.96% | | | | 2.05% | |
| Net expensesd,h | | | 1.82% | | | | 1.79% | | | | 1.75% | | | | 1.75% | | | | 1.73% | | | | 1.70% | |
| |
| Portfolio turnover rate | | | 26% | | | | 119% | | | | 52% | | | | 43% | | | | 39% | | | | 89% | |
| | | Period Ended | | | Period Ended | |
| | | March 31, | | | September 30, | |
| Institutional Class | | 2014a | | | 2013f | |
| |
| Per Share Data | | | | | | | | |
| Net asset value, beginning of period | | $ | 17.80 | | | $ | 18.00 | |
| |
| Income (loss) from investment operations: | | | | | | | | |
| Net investment income (loss)c | | | .36 | | | | .46 | |
| Net gain (loss) on investments (realized and unrealized) | | | .39 | | | | (.21 | ) |
| | | |
| Total from investment operations | | | .75 | | | | .25 | |
| |
| Less distributions from: | | | | | | | | |
| Net investment income | | | (.40 | ) | | | (.45 | ) |
| | | |
| Total distributions | | | (.40 | ) | | | (.45 | ) |
| |
| Net asset value, end of period | | $ | 18.15 | | | $ | 17.80 | |
| | | |
| | | | | | | | | |
| |
| Total Returng | | | 4.82% | | | | 1.35% | |
| |
| Ratios/Supplemental Data | | | | | | | | |
| Net assets, end of period (in thousands) | | $ | 216 | | | $ | 174 | |
| |
| Ratios to average net assets: | | | | | | | | |
| Net investment income (loss) | | | 4.00% | | | | 3.85% | |
| Total expenses | | | 1.06% | | | | 1.17% | |
| Net expensesd,h | | | 0.82% | | | | 0.82% | |
| |
| Portfolio turnover rate | | | 26% | | | | 119% | |
| |
| SEE NOTES TO FINANCIAL STATEMENTS. | | THE GUGGENHEIM FUNDS SEMI-ANNUAL REPORT | 43 |
| INVESTMENT GRADE BOND FUND |
| | FINANCIAL HIGHLIGHTS (concluded) |
| |
| a | | Unaudited figures for the period ended March 31, 2014. Percentage amounts for the period, except total return and portfolio turnover rate, have been annualized. |
| b | | The Fund changed its fiscal year end from December 31 to September 30 in 2012. |
| c | | Net investment income (loss) per share was computed using average shares outstanding throughout the period. |
| d | | Net expense information reflects the expense ratios after expense waivers, and includes interest expense, if any. |
| e | | Per share amounts for the years ended December 31, 2009 - December 31, 2010 and the period January 1, 2011 through April 8, 2011 have been restated to reflect 1:4 reverse share split effective April 8, 2011. |
| f | | Since commencement of operations: January 29, 2013. Percentage amounts for the period, except total return and portfolio turnover rate, have been annualized. |
| g | | Total return does not reflect the impact of any applicable sales charges and has not been annualized. |
| h | | Excluding interest expense, the operating expense ratios for the periods presented would be: |
| | | |
| | | 03/31/14 | | 09/30/13 |
| |
| A-Class | | 1.03% | | 1.02% |
| B-Class | | 1.78% | | 1.77% |
| C-Class | | 1.78% | | 1.77% |
| Institutional Class | | 0.78% | | 0.77% |
| |
| 44 | THE GUGGENHEIM FUNDS SEMI-ANNUAL REPORT | | SEE NOTES TO FINANCIAL STATEMENTS. |
| This page intentionally left blank. |
| |
| THE GUGGENHEIM FUNDS SEMI-ANNUAL REPORT | 45 |
| FUND PROFILE (Unaudited) | March 31, 2014 |
| |
Holdings Diversification
(Market Exposure as % of Net Assets)

“Holdings Diversification (Market Exposure as % of Net Assets)” excludes any temporary cash investments.
| Ten Largest Holdings (% of Total Net Assets) | | | |
| |
| State Street | | 4.2 | % |
| West Coast Funding Ltd. — Class A1A | | 4.2 | % |
| SRERS-2011 Funding Ltd. — Class A1B1 | | 4.1 | % |
| Guggenheim BulletShares 2017 | | | |
High Yield Corporate Bond ETF | | 3.0 | % |
| Guggenheim BulletShares 2016 | | | |
High Yield Corporate Bond ETF | | 2.6 | % |
| Guggenheim BulletShares 2015 | | | |
High Yield Corporate Bond ETF | | 2.6 | % |
| H2 Asset Funding Ltd. | | 2.1 | % |
| CSMC Trust 2014-SURF | | 2.1 | % |
| CCR Incorporated MT100 Payment | | | |
Rights Master Trust — Class C | | 2.1 | % |
| Halcyon Structured Asset | | | |
Management Long | | | |
Secured/Short Unsecured | | | |
2007-2 Ltd. — Class C | | 2.1 | % |
| |
| Top Ten Total | | 29.1 | % |
| |
| Inception Dates: | | |
| |
| A-Class | | December 16, 2013 |
| C-Class | | December 16, 2013 |
| Institutional Class | | December 16, 2013 |
| Portfolio Composition by Quality Rating* |
| |
| Rating | | | |
| |
| Fixed Income Instruments | | | |
AAA | | 2.2 | % |
AA | | 2.2 | % |
A | | 23.7 | % |
BBB | | 35.9 | % |
BB | | 5.2 | % |
B | | 7.2 | % |
CCC | | 8.8 | % |
D | | 1.1 | % |
| Other Instruments | | | |
Exchanged Traded Funds | | 8.7 | % |
Repurchase Agreement | | 4.5 | % |
Preferred Stocks | | 0.5 | % |
| |
| Total Investments | | 100.0 | % |
| |
The chart above reflects percentages of the value of total investments.
| * | Source: Factset. Credit quality ratings are measured on a scale that generally ranges from AAA (highest) to D (lowest). All securities have been rated by Moody’s, Standard & Poor’s (“S&P”), or Fitch, which are all a Nationally Recognized Statistical Rating Organization (“NRSRO”). For purposes of this presentation, when ratings are available from more than one agency, the highest rating is used. Guggenheim Investments has converted Moody’s and Fitch ratings to the equivalent S&P rating. Unrated securities do not necessarily indicate low credit quality. Security ratings are determined at the time of purchase and may change thereafter. |
| |
| 46 | THE GUGGENHEIM FUNDS SEMI-ANNUAL REPORT |
| SCHEDULE OF INVESTMENTS (Unaudited) | | March 31, 2014 |
| |
| LIMITED DURATION FUND | | |
| | | | SHARES | | | VALUE | |
| |
| | | | | | | | |
| PREFERRED STOCKS† - 0.5% | | | | | | | |
PNC Financial Services Group, Inc. | | | | | | | |
6.13%1,2 | | | 8,000 | | $ | 213,680 | |
| | | | | | | |
| Total Preferred Stocks | | | | | | | |
(Cost $202,400) | | | | | | 213,680 | |
| | | | | | | |
| | | | | | | | |
| EXCHANGE TRADED FUNDS†,5 - 8.2% | | | | | | | |
Guggenheim BulletShares 2017 | | | | | | | |
High Yield Corporate Bond ETF6 | | | 52,178 | | | 1,435,939 | |
Guggenheim BulletShares 2016 | | | | | | | |
High Yield Corporate Bond ETF6 | | | 44,894 | | | 1,225,606 | |
Guggenheim BulletShares 2015 | | | | | | | |
High Yield Corporate Bond ETF6 | | | 45,200 | | | 1,221,756 | |
| | | | | | | |
| Total Exchange Traded Funds | | | | | | | |
(Cost $3,865,007) | | | | | | 3,883,301 | |
| | | | | | | |
| | | | | | | | |
| | | | FACE | | | | |
| | | | AMOUNT | | | | |
| | | | | | | |
| ASSET BACKED SECURITIES†† - 56.5% | | | | | | | |
West Coast Funding Ltd. | | | | | | | |
2006-1A, 0.37% due 11/02/411,3 | | $ | 2,059,933 | | | 1,984,128 | |
Castlelake Aircraft Securitization Trust | | | | | | | |
2014-1, 7.50% due 02/15/29††† | | | 500,000 | | | 505,000 | |
2014-1, 5.25% due 02/15/29††† | | | 500,000 | | | 505,000 | |
H2 Asset Funding Ltd. | | | | | | | |
2014-1, 2.15% due 03/19/37 | | | 1,000,000 | | | 1,001,000 | |
CCR Incorporated MT100 Payment | | | | | | | |
Rights Master Trust | | | | | | | |
2010-CA, 0.60% due 07/10/171,3 | | | 1,022,946 | | | 990,212 | |
Halcyon Structured Asset Management Long | | | | | | | |
Secured/Short Unsecured 2007-2 Ltd. | | | | | | | |
2007-2A, 3.99% due 10/29/211,3 | | | 1,000,000 | | | 986,200 | |
Flagship CLO VI | | | | | | | |
2007-1A, 2.64% due 06/10/211,3 | | | 1,000,000 | | | 955,100 | |
Duane Street CLO IV Ltd. | | | | | | | |
2007-4A, 2.49% due 11/14/211,3 | | | 1,000,000 | | | 953,500 | |
San Gabriel CLO Ltd. | | | | | | | |
2007-1A, 2.49% due 09/10/211,3 | | | 1,000,000 | | | 953,400 | |
Westbrook CLO Ltd. | | | | | | | |
2006-1A, 1.93% due 12/20/201,3 | | | 1,000,000 | | | 953,400 | |
Black Diamond CLO 2005-2 Delaware Corp. | | | | | | | |
2005-2A, 2.03% due 01/07/181,3 | | | 1,000,000 | | | 952,500 | |
FM Leveraged Capital Fund II | | | | | | | |
2006-2X, 3.99% due 11/15/201 | | | 750,000 | | | 748,350 | |
Accredited Mortgage Loan Trust | | | | | | | |
2007-1, 0.28% due 02/25/371 | | | 540,856 | | | 503,400 | |
Cent CLO | | | | | | | |
2012-16A, 3.74% due 08/01/241,3 | | | 500,000 | | | 502,700 | |
Symphony CLO IX, LP | | | | | | | |
2012-9A, 3.49% due 04/16/221,3 | | | 500,000 | | | 502,650 | |
Shackleton II CLO Ltd. | | | | | | | |
2012-2A, 4.29% due 10/20/231,3 | | | 500,000 | | | 500,250 | |
OZLM Funding Ltd. | | | | | | | |
2012-2A, 3.49% due 10/30/231,3 | | | 500,000 | | | 500,000 | |
Halcyon Loan Advisors Funding 2012-1 Ltd. | | | | | | | |
2012-1A, 3.24% due 08/15/231,3 | | | 500,000 | | | 498,900 | |
COA Summit CLO Ltd. | | | | | | | |
2014-1A, 4.09% due 04/20/23†††,1,3 | | | 500,000 | | | 498,100 | |
Figueroa CLO 2013-1 Ltd. | | | | | | | |
2013-1A, 2.98% due 03/21/241,3 | | | 500,000 | | | 495,750 | |
BlueMountain CLO 2012-2 Ltd. | | | | | | | |
2012-2A, 2.98% due 11/20/241,3 | | | 500,000 | | | 494,500 | |
Golub Capital Partners CLO Ltd. | | | | | | | |
2014-18A, 3.73% due 04/25/26†††,1,3 | | | 250,000 | | | 250,150 | |
2014-18A, 4.23% due 04/25/26†††,1,3 | | | 250,000 | | | 242,750 | |
Triton Container Finance LLC | | | | | | | |
2012-1A, 4.21% due 05/14/273 | | | 490,000 | | | 491,483 | |
GSAA Home Equity Trust | | | | | | | |
2006-18, 6.00% due 11/25/36 | | | 694,301 | | | 491,299 | |
ALM VII R-2 Ltd. | | | | | | | |
2013-7R2A, 2.84% due 04/24/241,3 | | | 500,000 | | | 490,650 | |
Telos CLO 2013-4 Ltd. | | | | | | | |
2013-4A, 2.99% due 07/17/24†††,1,3 | | | 500,000 | | | 490,100 | |
Structured Asset Securities Corporation | | | | | | | |
Mortgage Loan Trust | | | | | | | |
2007-BC1, 0.28% due 02/25/371 | | | 600,000 | | | 488,372 | |
NewStar Commercial Loan Trust | | | | | | | |
2006-1A, 0.91% due 03/30/221,3 | | | 500,000 | | | 482,600 | |
Icon Brands Holdings LLC | | | | | | | |
2013-1A, 4.35% due 01/25/43†††,3 | | | 479,227 | | | 477,071 | |
Race Point IV CLO Ltd. | | | | | | | |
2007-4A, 2.24% due 08/01/211,3 | | | 500,000 | | | 475,250 | |
Genesis Funding Ltd. | | | | | | | |
2006-1A, 0.40% due 12/19/321,3 | | | 506,896 | | | 472,376 | |
Tricadia CDO 2006-6 Ltd. | | | | | | | |
2006-6A, 0.79% due 11/05/41†††,1,3 | | | 500,000 | | | 465,050 | |
Katonah IX CLO Ltd. | | | | | | | |
2006-9A, 1.64% due 01/25/19†††,1,3 | | | 500,000 | | | 464,250 | |
Copper River CLO Ltd. | | | | | | | |
2007-1A, 1.74% due 01/20/21†††,1,3 | | | 500,000 | | | 457,000 | |
Connecticut Valley Structured | | | | | | | |
Credit CDO III Ltd. | | | | | | | |
2006-3A, 6.68% due 03/23/23†††,3 | | | 441,767 | | | 433,417 | |
Gramercy Real Estate CDO 2007-1 Ltd. | | | | | | | |
2007-1A, 0.52% due 08/15/561,3 | | | 490,421 | | | 419,751 | |
CIFC Funding 2012-III Ltd. | | | | | | | |
2013-3A, 4.49% due 01/29/251,3 | | | 400,000 | | | 401,120 | |
GSAMP Trust | | | | | | | |
2005-HE6, 0.59% due 11/25/351 | | | 450,000 | | | 400,255 | |
Soundview Home Loan Trust | | | | | | | |
2003-1, 2.40% due 08/25/311 | | | 354,369 | | | 361,749 | |
Cronos Containers Program Ltd. | | | | | | | |
2012-1A, 4.21% due 05/18/273 | | | 265,417 | | | 266,157 | |
Race Point CLO Ltd. | | | | | | | |
2014-5AR, 3.98% due 12/15/221,3 | | | 250,000 | | | 250,450 | |
CKE Restaurant Holdings, Inc. | | | | | | | |
2013-1A, 4.47% due 03/20/433 | | | 246,250 | | | 248,737 | |
ALM IV Ltd. | | | | | | | |
2011-4A, 2.99% due 07/18/221,3 | | | 250,000 | | | 248,150 | |
Cerberus Onshore II CLO LLC | | | | | | | |
2014-1A, 2.95% due 10/15/23†††,1,3 | | | 250,000 | | | 247,550 | |
Hewett’s Island CDO Ltd. | | | | | | | |
2007-6A, 2.49% due 06/09/191,3 | | | 250,000 | | | 243,850 | |
T2 Income Fund CLO Ltd. | | | | | | | |
2007-1A, 1.74% due 07/15/191,3 | | | 250,000 | | | 242,000 | |
Kingsland IV Ltd. | | | | | | | |
2007-4A, 1.69% due 04/16/21†††,1,3 | | | 250,000 | | | 230,800 | |
| |
| SEE NOTES TO FINANCIAL STATEMENTS. | | THE GUGGENHEIM FUNDS SEMI-ANNUAL REPORT | 47 |
| SCHEDULE OF INVESTMENTS (Unaudited) (continued) | | March 31, 2014 |
| |
| LIMITED DURATION FUND | | |
| | | | FACE | | | | |
| | | | AMOUNT | | | VALUE | |
| |
| | | | | | | | |
Textainer Marine Containers Ltd. | | | | | | | |
2012-1A, 4.21% due 04/15/273 | | $ | 202,083 | | $ | 202,269 | |
OFSI Fund V Ltd. | | | | | | | |
2013-5A, 3.44% due 04/17/251,3 | | | 200,000 | | | 200,000 | |
| | | | | | | |
| Total Asset Backed Securities | | | | | | | |
(Cost $26,645,021) | | | | | | 26,618,696 | |
| | | | | | | |
| | | | | | | | |
| COLLATERALIZED MORTGAGE OBLIGATIONS†† - 10.8% | | | | | | | |
SRERS-2011 Funding Ltd. | | | | | | | |
2011-RS,0.40% due 05/09/461,3 | | | 2,068,955 | | | 1,913,576 | |
CSMC Trust 2014-SURF | | | | | | | |
2.40% due 02/15/291,3 | | | 1,000,000 | | | 997,183 | |
First Horizon Alternative Mortgage | | | | | | | |
Securities Trust | | | | | | | |
2006-FA1,5.75% due 04/25/36 | | | 559,235 | | | 495,330 | |
HarborView Mortgage Loan Trust | | | | | | | |
2006-12,0.35% due 01/19/381 | | | 589,283 | | | 495,109 | |
Residential Asset Securitization Trust | | | | | | | |
2006-A12,6.25% due 11/25/36 | | | 637,710 | | | 490,330 | |
Hilton USA Trust | | | | | | | |
2013-HLT,4.41% due 11/05/303 | | | 450,000 | | | 457,770 | |
Motel 6 Trust | | | | | | | |
2012-MTL6,3.78% due 10/05/253 | | | 250,000 | | | 251,765 | |
| | | | | | | |
| Total Collateralized Mortgage Obligations | | | | | | | |
(Cost $5,104,445) | | | | | | 5,101,063 | |
| | | | | | | |
| | | | | | | | |
| SENIOR FLOATING RATE INTERESTS†† - 8.2% | | | | | | | |
| | | | | | | | |
| INDUSTRIALS - 3.5% | | | | | | | |
Rise Ltd. | | | | | | | |
4.74% due 02/12/39 | | | 497,396 | | | 501,126 | |
AABS Ltd. | | | | | | | |
4.87% due 01/15/38 | | | 463,542 | | | 467,018 | |
HD Supply, Inc. | | | | | | | |
4.00% due 06/28/18 | | | 400,000 | | | 400,084 | |
Dematic S.A. | | | | | | | |
4.25% due 12/28/19 | | | 250,000 | | | 250,418 | |
| | | | | | | |
| Total Industrials | | | | | | 1,618,646 | |
| | | | | | | |
| | | | | | | | |
| CONSUMER DISCRETIONARY - 1.6% | | | | | | | |
Smart & Final Stores LLC | | | | | | | |
4.75% due 11/15/19 | | | 324,496 | | | 324,496 | |
Acosta, Inc. | | | | | | | |
4.25% due 03/03/18 | | | 250,000 | | | 250,875 | |
Arby’s | | | | | | | |
5.00% due 11/15/20 | | | 199,500 | | | 200,559 | |
| | | | | | | |
| Total Consumer Discretionary | | | | | | 775,930 | |
| | | | | | | |
| | | | | | | | |
| MATERIALS - 1.1% | | | | | | | |
Fortescue Metals Group Ltd. | | | | | | | |
4.25% due 06/30/19 | | | 498,747 | | | 502,343 | |
| | | | | | | |
| | | | | | | | |
| INFORMATION TECHNOLOGY - 1.1% | | | | | | | |
Blue Coat Systems, Inc. | | | | | | | |
4.00% due 05/31/19 | | | 200,000 | | | 200,334 | |
Sabre, Inc. | | | | | | | |
4.25% due 02/19/19 | | | 199,495 | | | 199,411 | |
Epicor Software | | | | | | | |
4.00% due 05/16/18 | | | 99,750 | | | 99,925 | |
| | | | | | | |
| Total Information Technology | | | | | | 499,670 | |
| | | | | | | |
| | | | | | | | |
| CONSUMER STAPLES - 0.5% | | | | | | | |
Diamond Foods, Inc. | | | | | | | |
4.25% due 08/20/18 | | | 250,000 | | | 250,470 | |
| | | | | | | |
| | | | | | | | |
| TELECOMMUNICATION SERVICES - 0.4% | | | | | | | |
Asurion Corp. | | | | | | | |
6.00% due 05/24/19 | | | 200,000 | | | 200,326 | |
| | | | | | | |
| Total Senior Floating Rate Interests | | | | | | | |
(Cost $3,854,242) | | | | | | 3,847,385 | |
| | | | | | | |
| | | | | | | | |
| CORPORATE BONDS†† - 6.8% | | | | | | | |
| | | | | | | | |
| FINANCIALS - 4.4% | | | | | | | |
Macquarie Bank Ltd. | | | | | | | |
1.02% due 03/24/171,3 | | | 500,000 | | | 500,729 | |
Schahin II Finance Company SPV Ltd. | | | | | | | |
5.88% due 09/25/223 | | | 417,900 | | | 402,751 | |
Icahn Enterprises Limited Partnership / | | | | | | | |
Icahn Enterprises Finance Corp. | | | | | | | |
3.50% due 03/15/173 | | | 350,000 | | | 353,500 | |
Citigroup, Inc. | | | | | | | |
5.35% due 05/29/491,2 | | | 300,000 | | | 278,249 | |
Emigrant Bancorp, Inc. | | | | | | | |
6.25% due 06/15/143 | | | 250,000 | | | 251,603 | |
Ally Financial, Inc. | | | | | | | |
3.50% due 01/27/19 | | | 250,000 | | | 250,000 | |
| | | | | | | |
| Total Financials | | | | | | 2,036,832 | |
| | | | | | | |
| | | | | | | | |
| INDUSTRIALS - 1.1% | | | | | | | |
AmeriGas Finance LLC / AmeriGas | | | | | | | |
Finance Corp. | | | | | | | |
6.75% due 05/20/20 | | | 250,000 | | | 270,625 | |
ADT Corp. | | | | | | | |
4.13% due 04/15/19 | | | 250,000 | | | 248,048 | |
| | | | | | | |
| Total Industrials | | | | | | 518,673 | |
| | | | | | | |
| | | | | | | | |
| INFORMATION TECHNOLOGY - 0.5% | | | | | | | |
Jabil Circuit, Inc. | | | | | | | |
4.70% due 09/15/22 | | | 250,000 | | | 247,188 | |
| | | | | | | |
| | | | | | | | |
| MATERIALS - 0.4% | | | | | | | |
KGHM International Ltd. | | | | | | | |
7.75% due 06/15/193 | | | 200,000 | | | 211,000 | |
| | | | | | | |
| |
| 48 | THE GUGGENHEIM FUNDS SEMI-ANNUAL REPORT | | SEE NOTES TO FINANCIAL STATEMENTS. |
| SCHEDULE OF INVESTMENTS (Unaudited) (concluded) | | March 31, 2014 |
| |
| LIMITED DURATION FUND | | |
| | | | FACE | | | | |
| | | | AMOUNT | | | VALUE | |
| |
| | | | | | | | |
| ENERGY - 0.4% | | | | | | | |
Precision Drilling Corp. | | | | | | | |
6.63% due 11/15/20 | | $ | 190,000 | | $ | 203,300 | |
| | | | | | | |
| Total Corporate Bonds | | | | | | | |
(Cost $3,209,642) | | | | | | 3,216,993 | |
| | | | | | | |
| | | | | | | | |
| REPURCHASE AGREEMENT††,4 - 4.2% | | | | | | | |
Jefferies & Company, Inc. issued 03/20/14 | | | | | | | |
at 2.66% due 04/10/14 | | | 838,000 | | | 838,000 | |
Jefferies & Company, Inc. issued 03/27/14 | | | | | | | |
at 2.66% due 04/10/14 | | | 500,000 | | | 500,000 | |
Jefferies & Company, Inc. issued 03/10/14 | | | | | | | |
at 2.66% due 04/10/14 | | | 250,000 | | | 250,000 | |
Jefferies & Company, Inc. issued 03/25/14 | | | | | | | |
at 2.66% due 04/10/14 | | | 249,000 | | | 249,000 | |
Jefferies & Company, Inc. issued 03/14/14 | | | | | | | |
at 2.66% due 04/10/14 | | | 161,000 | | | 161,000 | |
| | | | | | | |
| Total Repurchase Agreement | | | | | | | |
(Cost $1,998,000) | | | | | | 1,998,000 | |
| | | | | | | |
| Total Investments - 95.2% | | | | | | | |
(Cost $44,878,757) | | | | | $ | 44,879,118 | |
| | | | | | | |
| Other Assets & Liabilities, net - 4.8% | | | | | | 2,284,703 | |
| | | | | | | |
| Total Net Assets - 100.0% | | | | | $ | 47,163,821 | |
| † | | Value determined based on Level 1 inputs — See Note 4. |
| †† | | Value determined based on Level 2 inputs, unless otherwise noted — See Note 4. |
| ††† | | Value determined based on Level 3 inputs — See Note 4. |
| 1 | | Variable rate security. Rate indicated is rate effective at March 31, 2014. |
| 2 | | Perpetual maturity. |
| 3 | | Security is a 144A or Section 4(a)(2) security. The total market value of 144A or Section 4(a)(2) securities is $26,954,148 (cost $26,979,696), or 57.2% of total net assets. |
| 4 | | Repurchase Agreement — See Note 9. |
| 5 | | Investment in a product that pays a management fee to a party related to the advisor. |
| 6 | | Affiliated funds. |
| |
| SEE NOTES TO FINANCIAL STATEMENTS. | | THE GUGGENHEIM FUNDS SEMI-ANNUAL REPORT | 49 |
| STATEMENT OF ASSETS AND LIABILITIES (Unaudited) |
| |
| March 31, 2014 |
| ASSETS: | | | | |
| Investments, in unaffiliated issuers, at value (cost $39,015,750) | | $ | 38,997,817 | |
| Investments, in affiliated issuers, at value (cost $3,865,007) | | | 3,883,301 | |
| Repurchase agreements, at value (cost $1,998,000) | | | 1,998,000 | |
| | | | |
| Total investments (cost $44,878,757) | | | 44,879,118 | |
| Cash | | | 1,543,282 | |
| Prepaid expenses | | | 50,435 | |
| Receivables: | | | | |
Fund shares sold | | | 3,299,674 | |
Interest | | | 127,500 | |
Investment advisor | | | 43,446 | |
| | | | |
| Total assets | | | 49,943,455 | |
| | | | |
| LIABILITIES: | | | | |
| Payable for: | | | | |
Securities purchased | | | 2,733,625 | |
Management fees | | | 13,606 | |
Fund accounting/administration fees | | | 2,948 | |
Transfer agent/maintenance fees | | | 146 | |
Distribution and service fees | | | 99 | |
Trustees’ fees* | | | 7 | |
Miscellaneous | | | 29,203 | |
| | | | |
| Total liabilities | | | 2,779,634 | |
| | | | |
| NET ASSETS | | $ | 47,163,821 | |
| | | | |
| NET ASSETS CONSIST OF: | | | | |
| Paid in capital | | $ | 47,166,010 | |
| Undistributed net investment income | | | 348 | |
| Accumulated net realized loss on investments | | | (2,898 | ) |
| Net unrealized appreciation on investments | | | 361 | |
| | | | |
| Net assets | | $ | 47,163,821 | |
| | | | |
| A-CLASS: | | | | |
| Net assets | | $ | 3,809,980 | |
| Capital shares outstanding | | | 152,337 | |
| Net asset value per share | | | $25.01 | |
| | | | |
| Maximum offering price per share | | | | |
(Net asset value divided by 95.25%) | | | $25.59 | |
| | | | |
| C-CLASS: | | | | |
| Net assets | | $ | 280,799 | |
| Capital shares outstanding | | | 11,233 | |
| Net asset value per share | | | $25.00 | |
| | | | |
| INSTITUTIONAL CLASS: | | | | |
| Net assets | | $ | 43,073,042 | |
| Capital shares outstanding | | | 1,722,669 | |
| Net asset value per share | | | $25.00 | |
| | | | |
| STATEMENT OF OPERATIONS (Unaudited) |
| |
| Period Ended March 31, 2014 |
| INVESTMENT INCOME: | | | | |
| Interest | | $ | 153,515 | |
| Dividends from affiliated issuers | | | 17,464 | |
| | | | |
Total investment income | | | 170,979 | |
| | | | |
| EXPENSES: | | | | |
| Management fees | | | 26,552 | |
| Transfer agent/maintenance fees | | | | |
A-Class | | | 155 | |
C-Class | | | 130 | |
Institutional Class | | | 33 | |
| Distribution and service fees: | | | | |
A-Class | | | 35 | |
C-Class | | | 196 | |
| Fund accounting/administration fees | | | 5,605 | |
| Legal fees | | | 27,578 | |
| Printing expenses | | | 11,137 | |
| Registration fees | | | 9,965 | |
| Professional fees | | | 5,250 | |
| Custodian fees | | | 1,260 | |
| Trustees’ fees* | | | 308 | |
| Miscellaneous | | | 33 | |
| | | | |
Total expenses | | | 88,237 | |
| | | | |
| Less: | | | | |
| Expenses waived by Advisor | | | (55,867 | ) |
| | | | |
| Net expenses | | | 32,370 | |
| | | | |
| Net investment income | | | 138,609 | |
| | | | |
| | | | | |
| NET REALIZED AND UNREALIZED GAIN (LOSS): | | | | |
| Net realized gain (loss) on: | | | | |
Investments | | | (2,898 | ) |
| | | | |
| Net realized loss | | | (2,898 | ) |
| | | | |
| Net change in unrealized appreciation (depreciation) on: | | | | |
Investments, in unaffiliated issuers | | | (17,933 | ) |
Investments, in affiliated issuers | | | 18,294 | |
| | | | |
| Net change in unrealized appreciation (depreciation) | | | 361 | |
| | | | |
| Net realized and unrealized loss | | | (2,537 | ) |
| | | | |
| Net increase in net assets resulting from operations | | $ | 136,072 | |
| | | | |
* Relates to Trustees not deemed “interested persons” within the meaning of Section 2(a)(19) of the 1940 Act.
| |
| 50 | THE GUGGENHEIM FUNDS SEMI-ANNUAL REPORT | SEE NOTES TO FINANCIAL STATEMENTS. |
| STATEMENT OF CHANGES IN NET ASSETS |
| |
| | | Period Ended | |
| | | March 31, | |
| | | 20141 | |
| |
| INCREASE (DECREASE) IN NET ASSETS FROM OPERATIONS: | | | | |
| Net investment income | | $ | 138,609 | |
| Net realized loss on investments | | | (2,898 | ) |
| Net change in unrealized appreciation (depreciation) on investments | | | 361 | |
| |
| Net increase in net assets resulting from operations | | | 136,072 | |
| |
| | | | | |
| DISTRIBUTIONS TO SHAREHOLDERS FROM: | | | | |
| Net investment income | | | | |
A-Class | | | (265 | ) |
C-Class | | | (285 | ) |
Institutional Class | | | (137,711 | ) |
| |
| Total distributions to shareholders | | | (138,261 | ) |
| |
| | | | | |
| CAPITAL SHARE TRANSACTIONS: | | | | |
| Proceeds from sale of shares | | | | |
A-Class | | | 4,109,614 | |
C-Class | | | 281,279 | |
Institutional Class | | | 43,000,095 | |
| Distributions reinvested | | | | |
A-Class | | | 265 | |
C-Class | | | 283 | |
Institutional Class | | | 75,458 | |
| Cost of shares redeemed | | | | |
A-Class | | | (300,150 | ) |
C-Class | | | (834 | ) |
Institutional Class | | | – | |
| |
| Net increase from capital share transactions | | | 47,166,010 | |
| |
| Net increase in net assets | | | 47,163,821 | |
| | | | | |
| NET ASSETS: | | | | |
Beginning of year | | | – | |
| |
End of year | | $ | 47,163,821 | |
| |
| Undistributed net investment income at end of year | | $ | 348 | |
| |
| | | | | |
| CAPITAL SHARE ACTIVITY: | | | | |
| Shares sold | | | | |
A-Class | | | 164,327 | |
C-Class | | | 11,255 | |
Institutional Class | | | 1,719,652 | |
| Shares issued from reinvestment of distributions | | | | |
A-Class | | | 11 | |
C-Class | | | 11 | |
Institutional Class | | | 3,017 | |
| Shares redeemed | | | | |
A-Class | | | (12,001 | ) |
C-Class | | | (33 | ) |
Institutional Class | | | – | |
| |
| Net increase in shares | | | 1,886,239 | |
| |
1 Since commencement of operations: December 16, 2013.
| |
| SEE NOTES TO FINANCIAL STATEMENTS. | THE GUGGENHEIM FUNDS SEMI-ANNUAL REPORT | 51 |
| FINANCIAL HIGHLIGHTS |
| |
| This table is presented to show selected data for a share outstanding throughout each period and to assist shareholders in evaluating a Fund’s performance for the periods presented. |
| | | Period Ended | | | Period Ended | | | Period Ended | |
| | | March 31, | | | March 31, | | | March 31, | |
| | | 2014 | | | 2014 | | | 2014 | |
| | | A-Classa | | | C-Classa | | | Institutional Classa | |
| |
| Per Share Data | | | | | | | | | | | | |
| Net asset value, beginning of period | | $ | 25.00 | | | $ | 25.00 | | | $ | 25.00 | |
| Income (loss) from investment operations: | | | | | | | | | | | | |
| Net investment income (loss)b | | | .14 | | | | .10 | | | | .17 | |
| Net gain on investments (realized and unrealized) | | | (.01 | ) | | | (.02 | ) | | | (.01 | ) |
| | | |
| Total from investment operations | | | 25.13 | | | | 25.08 | | | | 25.16 | |
| |
| Less distributions from: | | | | | | | | | | | | |
| Net investment income | | | (.12 | ) | | | (.08 | ) | | | (.16 | ) |
| | | |
| Total distributions | | | (.12 | ) | | | (.08 | ) | | | (.16 | ) |
| |
| Net asset value, end of period | | $ | 25.01 | | | $ | 25.00 | | | $ | 25.00 | |
| | | |
| | | | | | | | | | | | | |
| |
| Total Returne | | | 0.52% | | | | 0.33% | | | | 0.62% | |
| |
| Ratios/Supplemental Data | | | | | | | | | | | | |
| Net assets, end of period (in thousands) | | $ | 3,810 | | | $ | 281 | | | $ | 43,073 | |
| |
| Ratios to average net assets: | | | | | | | | | | | | |
| Net investment income (loss) | | | 2.07% | | | | 1.37% | | | | 2.32% | |
| Total expensesc | | | 4.59% | | | | 3.23% | | | | 1.46% | |
| Net expensesd | | | 1.30% | | | | 1.53% | | | | 0.54% | |
| |
| Portfolio turnover rate | | | 4% | | | | 4% | | | | 4% | |
| a | Since commencement of operations: December 16, 2013. Percentage amounts for the period, except total return and portfolio turnover rate, have been annualized. |
| b | Net investment income (loss) per share was computed using average shares outstanding throughout the period. |
| c | Does not include expenses of the underlying funds in which the Fund invests. |
| d | Net expense information reflects the expense ratios after expense waivers. |
| e | Total return does not reflect the impact of any applicable sales charges and has not been annualized. |
| |
| 52 | THE GUGGENHEIM FUNDS SEMI-ANNUAL REPORT | SEE NOTES TO FINANCIAL STATEMENTS. |
This page intentionally left blank.
| |
| THE GUGGENHEIM FUNDS SEMI-ANNUAL REPORT | 53 |
| FUND PROFILE (Unaudited) | March 31, 2014 |
| |
| OBJECTIVE: Seeks to provide total return, comprised of current income and capital appreciation. |
Holdings Diversification
(Market Exposure as % of Net Assets)
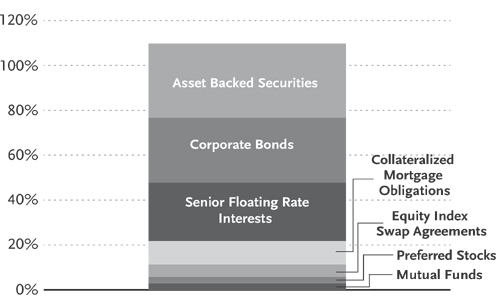
“Holdings Diversification (Market Exposure as % of Net Assets)” excludes any temporary cash investments.
| Ten Largest Holdings (% of Total Net Assets) | | | |
| |
| Guggenheim Limited Duration Fund - Institutional Class | | 1.7 | % |
| West Coast Funding Ltd. — Class A1A | | 1.3 | % |
| Gramercy Real Estate CDO 2007-1 Ltd. — Class A1 | | 1.2 | % |
| Cedar Woods CRE CDO Ltd. | | 1.2 | % |
| Nomura Resecuritization Trust — Class A | | 1.2 | % |
| N-Star Real Estate CDO IX Ltd. | | 1.1 | % |
| Seaspan Corp. | | 1.1 | % |
| iShares MSCI Spain Capped ETF | | 1.0 | % |
| Bank of America Corp. | | 1.0 | % |
| Emigrant Bancorp, Inc. | | 1.0 | % |
| |
| Top Ten Total | | 11.8 | % |
| |
| Inception Dates: | | |
| |
| A-Class | | November 30, 2011 |
| C-Class | | November 30, 2011 |
| Institutional Class | | November 30, 2011 |
| Portfolio Composition by Quality Rating* |
| |
| Rating | | | |
| |
| Fixed Income Instruments | | | |
AAA | | 1.9 | % |
AA | | 4.1 | % |
A | | 7.5 | % |
BBB | | 15.7 | % |
BB | | 11.1 | % |
B | | 32.1 | % |
CCC | | 13.6 | % |
CC | | 0.7 | % |
D | | 0.8 | % |
NR | | 0.2 | % |
| Other Instruments | | | |
Short Term Investments | | 4.1 | % |
Preferred Stocks | | 2.6 | % |
Mutual Funds | | 2.3 | % |
Exchanged Traded Funds | | 1.7 | % |
Common Stocks | | 0.8 | % |
Other | | 0.9 | % |
| |
| Total Investments | | 100.0 | % |
| |
The chart above reflects percentages of the value of total investments.
| * | Source: Factset. Credit quality ratings are measured on a scale that generally ranges from AAA (highest) to D (lowest). All securities have been rated by Moody’s, Standard & Poor’s (“S&P”), or Fitch, which are all a Nationally Recognized Statistical Rating Organization (“NRSRO”). For purposes of this presentation, when ratings are available from more than one agency, the highest rating is used. Guggenheim Investments has converted Moody’s and Fitch ratings to the equivalent S&P rating. Unrated securities do not necessarily indicate low credit quality. Security ratings are determined at the time of purchase and may change thereafter. |
| |
| 54 | THE GUGGENHEIM FUNDS SEMI-ANNUAL REPORT |
| SCHEDULE OF INVESTMENTS (Unaudited) | | March 31, 2014 |
| |
| MACRO OPPORTUNITIES FUND | | |
| | | | | SHARES | | | VALUE | |
| |
| | | | | | | | | |
| COMMON STOCKS† - 0.9% | | | | | | | |
| | | | | | | | | |
| MATERIALS - 0.9% | | | | | | | |
| Newmont Mining Corp. | | | 443,746 | | $ | 10,401,406 | |
| | | | | | | | |
| Total Common Stocks | | | | | | | |
| | (Cost $10,979,297) | | | | | | 10,401,406 | |
| | | | | | | | |
| | | | | | | | | |
| PREFERRED STOCKS† - 3.0% | | | | | | | |
| | Seaspan Corp. | | | | | | | |
| | 6.38% due 04/30/19* | | | 490,000 | | | 12,250,000 | |
| | Aspen Insurance Holdings Ltd. | | | | | | | |
| | 5.95%1,2 | | | 320,000 | | | 7,939,200 | |
| | Goldman Sachs Group, Inc. | | | | | | | |
| | 5.50%1 | | | 260,000 | | | 6,198,400 | |
| | Morgan Stanley | | | | | | | |
| | 7.13%1,2 | | | 105,000 | | | 2,785,650 | |
| | GSC Partners CDO Fund Limited / | | | | | | | |
| | GSC Partners CDO Fund Corp. | | | | | | | |
| | due 11/20/16*,1,3 | | | 5,200 | | | 2,332,096 | |
| | Alm Loan Funding | | | | | | | |
| | due 06/20/23*,1 | | | 1,373 | | | 1,262,199 | |
| | City National Corp. | | | 24,000 | | | 665,040 | |
| | WhiteHorse II Ltd. | | | | | | | |
| | due 06/15/17*,1,3 | | | 2,100,000 | | | 105,000 | |
| | | | | | | | |
| Total Preferred Stocks | | | | | | | |
| | (Cost $33,169,418) | | | | | | 33,537,585 | |
| | | | | | | | |
| | | | | | | | | |
| EXCHANGE TRADED FUNDS† - 2.0% | | | | | | | |
| | iShares MSCI Spain Capped ETF | | | 286,530 | | | 11,690,424 | |
| | SPDR EURO STOXX 50 ETF | | | 253,600 | | | 10,818,576 | |
| | | | | | | | |
| Total Exchange Traded Funds | | | | | | | |
| | (Cost $18,779,085) | | | | | | 22,509,000 | |
| | | | | | | | |
| | | | | | | | | |
| MUTUAL FUNDS† - 2.6% | | | | | | | |
| | Guggenheim Limited Duration Fund - | | | | | | | |
| | Institutional Class4 | | | 800,261 | | | 20,006,521 | |
| | Guggenheim Risk Managed Real Estate | | | | | | | |
| | Fund - Institutional Class*,4 | | | 400,000 | | | 10,080,000 | |
| | | | | | | | |
| Total Mutual Funds | | | | | | | |
| | (Cost $30,012,532) | | | | | | 30,086,521 | |
| | | | | | | | |
| | | | | | | | | |
| SHORT TERM INVESTMENTS† - 4.7% | | | | | | | |
| Federated U.S. Treasury Cash Reserve Fund | | | 53,523,572 | | | 53,523,572 | |
| | | | | | | | |
| Total Short Term Investments | | | | | | | |
| | (Cost $53,523,572) | | | | | | 53,523,572 | |
| | | | | | | | |
| | | | | | | | | |
| | | | | FACE | | | | |
| | | | | AMOUNT | | | | |
| | | | | | | | |
| ASSET BACKED SECURITIES†† - 33.2% | | | | | | | |
| | Castlelake Aircraft Securitization Trust | | | | | | | |
| | 2014-1, 5.25% due 02/15/29††† | | $ | 8,520,020 | | | 8,605,220 | |
| | 2014-1, 7.50% due 02/15/29††† | | | 6,400,000 | | | 6,464,000 | |
| | West Coast Funding Ltd. | | | | | | | |
| | 2006-1A, 0.37% due 11/02/411,3 | | | 15,505,977 | | | 14,935,357 | |
| | Gramercy Real Estate CDO 2007-1 Ltd. | | | | | | | |
| | 2007-1A, 0.52% due 08/15/561,3 | | | 16,020,407 | | | 13,711,866 | |
| | Cedar Woods CRE CDO Ltd. | | | | | | | |
| | 0.42% due 07/25/51††† | | | 16,609,314 | | | 13,559,844 | |
| | N-Star Real Estate CDO IX Ltd. | | | | | | | |
| | 0.51% due 02/01/41†††,9 | | | 14,236,943 | | | 12,937,110 | |
| | GSAA Home Equity Trust | | | | | | | |
| | 2007-7, 0.42% due 07/25/371 | | | 5,529,633 | | | 4,790,493 | |
| | 2006-18, 6.00% due 11/25/36 | | | 4,985,850 | | | 3,528,072 | |
| | 2006-14, 0.40% due 09/25/361 | | | 5,579,509 | | | 3,318,536 | |
| | RAIT CRE CDO I Ltd. | | | | | | | |
| | 2006-1X, 0.49% due 11/20/46†††,1 | | | 12,996,474 | | | 10,997,616 | |
| | KKR Financial CLO 2007-1 Ltd. | | | | | | | |
| | 2007-1A, 2.49% due 05/15/211,3 | | | 10,850,000 | | | 10,433,360 | |
| | CCR Incorporated MT100 | | | | | | | |
| | Payment Rights Master Trust | | | | | | | |
| | 2010-CA, 0.60% due 07/10/171,3 | | | 9,305,513 | | | 9,007,736 | |
| | GreenPoint Mortgage Funding Trust | | | | | | | |
| | 2005-HE4, 0.86% due 07/25/301 | | | 8,000,000 | | | 7,239,464 | |
| | N-Star REL CDO VIII Ltd. | | | | | | | |
| | 2006-8A, 0.51% due 02/01/411,3 | | | 5,350,000 | | | 4,628,820 | |
| | 2006-8A, 0.44% due 02/01/41†††,1,3 | | | 2,713,917 | | | 2,557,596 | |
| | Emerald Aviation Finance Ltd. | | | | | | | |
| | 2013-1, 6.35% due 10/15/383 | | | 6,817,708 | | | 6,928,155 | |
| | Turbine Engines Securitization Ltd. | | | | | | | |
| | 2013-1A, 5.13% due 12/13/48†††,3 | | | 4,153,971 | | | 4,109,108 | |
| | 2013-1A, 6.38% due 12/13/48†††,3 | | | 2,810,286 | | | 2,766,445 | |
| | Highland Park CDO I Ltd. | | | | | | | |
| | 2006-1A, 0.56% due 11/25/511,3,11 | | | 7,445,115 | | | 6,836,849 | |
| | Jasper CLO Ltd. | | | | | | | |
| | 2005-1A, 1.14% due 08/01/171,3 | | | 7,000,000 | | | 6,564,418 | |
| | Structured Asset Securities | | | | | | | |
| | Corporation Mortgage Loan Trust | | | | | | | |
| | 2006-OPT1, 0.41% due 04/25/361 | | | 6,613,922 | | | 5,686,743 | |
| | Willis Engine Securitization Trust II | | | | | | | |
| | 2012-A, 5.50% due 09/15/37†††,3,11 | | | 5,632,184 | | | 5,663,161 | |
| | Lehman XS Trust | | | | | | | |
| | 2007-9, 0.27% due 06/25/371 | | | 6,317,916 | | | 5,522,567 | |
| | Home Equity Asset Trust | | | | | | | |
| | 2006-3, 0.46% due 07/25/361 | | | 3,042,239 | | | 2,767,491 | |
| | 2005-7, 0.60% due 01/25/361 | | | 3,250,000 | | | 2,739,461 | |
| | New Century Home Equity Loan Trust | | | | | | | |
| | 2004-4, 0.95% due 02/25/351 | | | 3,632,577 | | | 3,296,585 | |
| | 2005-1, 0.87% due 03/25/351 | | | 2,357,840 | | | 2,054,108 | |
| | ARES XXVI CLO Ltd. | | | | | | | |
| | 2013-1A, 0.00% due 04/15/253,7 | | | 6,450,000 | | | 5,308,995 | |
| | Accredited Mortgage Loan Trust | | | | | | | |
| | 2007-1, 0.28% due 02/25/371 | | | 5,588,848 | | | 5,201,802 | |
| | NewStar Commercial Loan Trust | | | | | | | |
| | 2006-1A, 0.91% due 03/30/221,3 | | | 3,200,000 | | | 3,088,640 | |
| | 2007-1A, 2.53% due 09/30/22†††,1,3 | | | 1,000,000 | | | 963,500 | |
| | 2007-1A, 1.53% due 09/30/221,3 | | | 1,000,000 | | | 936,700 | |
| | Genesis Funding Ltd. | | | | | | | |
| | 2006-1A, 0.40% due 12/19/321,3 | | | 5,316,072 | | | 4,954,048 | |
| | AMMC CDO | | | | | | | |
| | 2012-11A, 0.00% due 10/30/233,7 | | | 5,650,000 | | | 4,705,320 | |
| | Putnam Structured Product | | | | | | | |
| | CDO 2002-1 Ltd. | | | | | | | |
| | 2002-1A, 0.83% due 01/10/381,3 | | | 5,081,636 | | | 4,519,607 | |
| | Telos CLO Ltd. | | | | | | | |
| | 2013-3A, 4.49% due 01/17/241,3 | | | 2,550,000 | | | 2,507,925 | |
| | 2013-3A, 3.24% due 01/17/241,3 | | | 1,750,000 | | | 1,725,850 | |
| | Newstar Commercial Loan Funding | | | | | | | |
| | 2013-1 LLC | | | | | | | |
| | 2013-1A, 4.78% due 09/20/231,3 | | | 3,250,000 | | | 3,250,000 | |
| | 2013-1A, 5.53% due 09/20/231,3 | | | 750,000 | | | 748,050 | |
| |
| SEE NOTES TO FINANCIAL STATEMENTS. | | THE GUGGENHEIM FUNDS SEMI-ANNUAL REPORT | 55 |
| SCHEDULE OF INVESTMENTS (Unaudited) (continued) | | March 31, 2014 |
| |
| MACRO OPPORTUNITIES FUND | | |
| | | | | FACE | | | | |
| | | | | AMOUNT | | | VALUE | |
| |
| | | | | | | | | |
| | Northwoods Capital VII Ltd. | | | | | | | |
| | 2006-7A, 3.74% due 10/22/211,3 | | $ | 2,000,000 | | $ | 1,938,200 | |
| | 2006-7A, 1.79% due 10/22/211,3 | | | 1,600,000 | | | 1,530,400 | |
| | Grayson CLO Ltd. | | | | | | | |
| | 2006-1A, 0.65% due 11/01/211,3,11 | | | 3,700,000 | | | 3,405,850 | |
| | CIT Mortgage Loan Trust | | | | | | | |
| | 2007-1, 1.60% due 10/25/371,3 | | | 3,750,000 | | | 3,397,046 | |
| | Golub Capital Partners CLO Ltd. | | | | | | | |
| | 2014-18A, 3.73% due 04/25/26†††,1,3 | | | 2,200,000 | | | 2,201,320 | |
| | 2014-18A, 4.23% due 04/25/26†††,1,3 | | | 1,200,000 | | | 1,165,200 | |
| | First Franklin Mortgage Loan Trust | | | | | | | |
| | 2006-FF1, 0.49% due 01/25/361 | | | 2,750,000 | | | 2,380,903 | |
| | 2006-FF1, 0.59% due 01/25/361 | | | 1,225,000 | | | 937,523 | |
| | Rockwall CDO II Ltd. | | | | | | | |
| | 2007-1A, 0.49% due 08/01/241,3 | | | 2,592,421 | | | 2,404,470 | |
| | 2007-1A, 0.79% due 08/01/241,3 | | | 1,050,000 | | | 894,180 | |
| | DIVCORE CLO Ltd. | | | | | | | |
| | 2013-1A B, 4.05% due 11/15/32††† | | | 3,250,000 | | | 3,235,375 | |
| | Marathon CLO II Ltd. | | | | | | | |
| | 2005-2A, 2.03% due 12/20/191,3 | | | 2,050,000 | | | 2,004,695 | |
| | 2005-2A, 0.00% due 12/20/193,7 | | | 2,250,000 | | | 1,122,750 | |
| | Great Lakes CLO 2012-1 Ltd. | | | | | | | |
| | 2012-1A, % due 01/15/23†††,3 | | | 3,250,000 | | | 2,941,900 | |
| | Battalion Clo 2007-I Ltd. | | | | | | | |
| | 2007-1A, 2.39% due 07/14/22†††,1,3 | | | 3,100,000 | | | 2,941,125 | |
| | KVK CLO Ltd. | | | | | | | |
| | 2014-1A, 3.13% due 05/15/261,3 | | | 3,000,000 | | | 2,938,500 | |
| | Wachovia Asset Securitization | | | | | | | |
| | Issuance II LLC 2007-HE1 Trust | | | | | | | |
| | 2007-HE1, 0.29% due 07/25/371,3 | | | 3,462,384 | | | 2,896,388 | |
| | Newcastle Cdo Viii 1 Ltd. | | | | | | | |
| | 2006-8A, 0.43% due 11/25/52†††,1,3 | | | 3,003,243 | | | 2,875,605 | |
| | Finn Square CLO Ltd. | | | | | | | |
| | 2012-1A, 0.00% due 12/24/233,7 | | | 3,250,000 | | | 2,735,200 | |
| | Atlas Senior Loan Fund II Ltd. | | | | | | | |
| | 2012-2A, 0.00% due 01/30/243,7 | | | 2,850,000 | | | 2,703,795 | |
| | Icon Brands Holdings LLC | | | | | | | |
| | 2013-1A, 4.35% due 01/25/43†††,3 | | | 2,683,673 | | | 2,671,596 | |
| | Citigroup Mortgage Loan Trust 2007-WFHE2 | | | | | | | |
| | 2007-WFH2, 0.50% due 03/25/371 | | | 3,200,000 | | | 2,666,605 | |
| | Sands Point Funding Ltd. | | | | | | | |
| | 2006-1A, 0.50% due 07/18/201,3 | | | 2,592,342 | | | 2,570,567 | |
| | Halcyon Structured Asset Management Long | | | | | | | |
| | Secured/Short Unsecured 2007-2 Ltd. | | | | | | | |
| | 2007-2A, 3.99% due 10/29/211,3 | | | 2,600,000 | | | 2,564,120 | |
| | ACA CLO 2007-1 Ltd. | | | | | | | |
| | 2007-1A, 1.19% due 06/15/221,3 | | | 2,800,000 | | | 2,563,400 | |
| | Flagship CLO VI | | | | | | | |
| | 2007-1A, 2.64% due 06/10/211,3 | | | 2,670,000 | | | 2,550,117 | |
| | Park Place Securities Incorporated Series | | | | | | | |
| | 2005-WHQ2, 0.61% due 05/25/351 | | | 3,000,000 | | | 2,533,281 | |
| | Callidus Debt Partners Clo Fund VI Ltd. | | | | | | | |
| | 2007-6A, 3.24% due 10/23/211,3 | | | 2,100,000 | | | 2,022,090 | |
| | 2007-6A, 1.49% due 10/23/211,3 | | | 500,000 | | | 470,950 | |
| | Wells Fargo Home Equity Asset-Backed | | | | | | | |
| | Securities 2005-4 Trust | | | | | | | |
| | 2006-1, 0.41% due 05/25/361 | | | 2,800,000 | | | 2,429,823 | |
| | HSI Asset Securitization Corporation Trust | | | | | | | |
| | 2007-WF1, 0.32% due 05/25/371 | | | 2,592,006 | | | 2,395,851 | |
| | San Gabriel CLO Ltd. | | | | | | | |
| | 2007-1A, 2.49% due 09/10/211,3 | | | 2,450,000 | | | 2,335,830 | |
| | Global Leveraged Capital Credit | | | | | | | |
| | Opportunity Fund | | | | | | | |
| | 2006-1A, 1.24% due 12/20/181,3 | | | 2,376,000 | | | 2,284,049 | |
| | Bear Stearns Asset Backed Securities Trust | | | | | | | |
| | 2005-3, 0.90% due 09/25/351 | | | 2,250,000 | | | 2,121,957 | |
| | Acis CLO 2013-1 Ltd. | | | | | | | |
| | 2013-1A, 4.74% due 04/18/241,3 | | | 2,100,000 | | | 2,100,000 | |
| | Halcyon Structured Asset Management | | | | | | | |
| | Long Secured/Short | | | | | | | |
| | Unsecured 2007-1 Ltd. | | | | | | | |
| | 2007-1A, 2.54% due 08/07/211,3 | | | 2,100,000 | | | 2,069,130 | |
| | Ableco Capital LLC | | | | | | | |
| | 2013-1, 4.92% due 05/31/191,9 | | | 2,000,000 | | | 2,000,000 | |
| | Salus CLO 2012-1 Ltd. | | | | | | | |
| | 2013-1AN, 6.99% due 03/05/21†††,1,3 | | | 1,200,000 | | | 1,202,280 | |
| | 2013-1AN, 4.99% due 03/05/21†††,1,3 | | | 750,000 | | | 751,425 | |
| | Cerberus Onshore II CLO LLC | | | | | | | |
| | 2014-1A, 3.75% due 10/15/23†††,1,3 | | | 1,000,000 | | | 973,800 | |
| | 2014-1A, 4.25% due 10/15/23†††,1,3 | | | 1,000,000 | | | 955,100 | |
| | TCW Global Project Fund III Ltd. | | | | | | | |
| | 2005-1A, 0.89% due 09/01/17†††,1,3 | | | 1,500,000 | | | 1,393,200 | |
| | 2005-1A, 1.09% due 09/01/17†††,1,3 | | | 600,000 | | | 512,700 | |
| | Airplanes Pass Through Trust | | | | | | | |
| | 2001-1A, 0.71% due 03/15/191 | | | 3,990,370 | | | 1,875,474 | |
| | Churchill Financial Cayman Ltd. | | | | | | | |
| | 2007-1A, 1.49% due 07/10/191,3 | | | 1,000,000 | | | 942,600 | |
| | 2007-1A, 2.84% due 07/10/191,3 | | | 1,000,000 | | | 930,700 | |
| | TCW Global Project Fund II Ltd. | | | | | | | |
| | 2004-1A, 1.59% due 06/15/16†††,1,3 | | | 2,000,000 | | | 1,860,600 | |
| | Acis CLO 2013-2 Ltd. | | | | | | | |
| | 4.09% due 10/14/221,3 | | | 1,800,000 | | | 1,758,780 | |
| | Kingsland III Ltd. | | | | | | | |
| | 2006-3A, 1.84% due 08/24/211,3 | | | 1,890,000 | | | 1,757,133 | |
| | Shackleton II CLO Ltd. | | | | | | | |
| | 2012-2A, 4.29% due 10/20/231,3 | | | 1,750,000 | | | 1,750,875 | |
| | Liberty CLO Ltd. | | | | | | | |
| | 2005-1A, 0.74% due 11/01/171,3 | | | 1,750,000 | | | 1,689,800 | |
| | Carlyle Global Market Strategies | | | | | | | |
| | CLO 2012-3 Ltd. | | | | | | | |
| | 2012-3A, 0.00% due 10/04/243,7 | | | 1,800,000 | | | 1,689,120 | |
| | Landmark VIII CDO Ltd. | | | | | | | |
| | 2006-8A, 1.69% due 10/19/201,3 | | | 1,650,000 | | | 1,577,235 | |
| | Ares XXV CLO Ltd. | | | | | | | |
| | 2013-3A, 0.00% due 01/17/243,7 | | | 2,000,000 | | | 1,572,800 | |
| | Asset Backed Securities Corporation | | | | | | | |
| | Home Equity Loan Trust Series OOMC | | | | | | | |
| | 2006-HE5, 0.29% due 07/25/361 | | | 1,695,446 | | | 1,567,743 | |
| | Telos CLO 2007-2 Ltd. | | | | | | | |
| | 2007-2A, 2.44% due 04/15/221,3 | | | 1,650,000 | | | 1,565,025 | |
| | MCF CLO I LLC | | | | | | | |
| | 2013-1A, 3.79% due 04/20/231,3 | | | 1,500,000 | | | 1,482,900 | |
| | ALM VI Ltd. | | | | | | | |
| | 2012-6A, 0.00% due 06/14/233,7 | | | 1,600,000 | | | 1,470,880 | |
| | Westwood CDO II Ltd. | | | | | | | |
| | 2007-2X, 2.04% due 04/25/221 | | | 1,550,000 | | | 1,429,410 | |
| | Black Diamond CLO 2005-2 Delaware Corp. | | | | | | | |
| | 2005-2A, 2.03% due 01/07/181,3 | | | 1,500,000 | | | 1,428,750 | |
| | Bacchus 2006-1 Ltd. | | | | | | | |
| | 2006-1A, 1.79% due 01/20/191,3 | | | 1,500,000 | | | 1,417,200 | |
| | Race Point CLO Ltd. | | | | | | | |
| | 2014-5AR, 3.98% due 12/15/221,3 | | | 1,400,000 | | | 1,402,520 | |
| |
| 56 | THE GUGGENHEIM FUNDS SEMI-ANNUAL REPORT | | SEE NOTES TO FINANCIAL STATEMENTS. |
| SCHEDULE OF INVESTMENTS (Unaudited) (continued) | | March 31, 2014 |
| |
| MACRO OPPORTUNITIES FUND | | |
| | | | | FACE | | | | |
| | | | | AMOUNT | | | VALUE | |
| |
| | | | | | | | | |
| | Kingsland IV Ltd. | | | | | | | |
| | 2007-4A, 1.69% due 04/16/21†††,1,3 | | $ | 1,500,000 | | $ | 1,384,800 | |
| | Copper River CLO Ltd. | | | | | | | |
| | 2007-1A, 1.74% due 01/20/21†††,1,3 | | | 1,000,000 | | | 914,000 | |
| | 2007-1A, 1.04% due 01/20/211,3 | | | 500,000 | | | 452,650 | |
| | Cerberus Offshore Levered I, LP | | | | | | | |
| | 2012-1A, 6.23% due 11/30/181,3 | | | 1,350,000 | | | 1,353,105 | |
| | Duane Street CLO IV Ltd. | | | | | | | |
| | 2007-4A, 2.49% due 11/14/211,3 | | | 1,400,000 | | | 1,334,900 | |
| | Structured Asset Investment Loan Trust | | | | | | | |
| | 2005-2, 0.89% due 03/25/351 | | | 1,500,000 | | | 1,293,671 | |
| | Ivy Hill Middle Market Credit Fund Ltd. | | | | | | | |
| | 2011-3A, 6.74% due 01/15/221,3 | | | 1,250,000 | | | 1,250,000 | |
| | COA Summit CLO Ltd. | | | | | | | |
| | 2014-1A, 4.09% due 04/20/23†††,1,3 | | | 1,250,000 | | | 1,245,250 | |
| | KKR Financial CLO 2007-A Corp. | | | | | | | |
| | 2007-AA, 4.74% due 10/15/171,3 | | | 1,212,324 | | | 1,217,537 | |
| | Blade Engine Securitization Ltd. | | | | | | | |
| | 2006-1A, 3.16% due 09/15/411,3 | | | 1,076,986 | | | 613,882 | |
| | 2006-1A, 1.16% due 09/15/411 | | | 840,292 | | | 588,205 | |
| | Fannie Mae5 | | | | | | | |
| | 2013-52, 3.00% due 06/25/4311 | | | 1,482,590 | | | 1,197,048 | |
| | ICE EM CLO | | | | | | | |
| | 2007-1A, 1.18% due 08/15/221,3 | | | 1,250,000 | | | 1,146,875 | |
| | Newcastle CDO IX 1 Ltd. | | | | | | | |
| | 2007-9A, 0.41% due 05/25/521,3,11 | | | 1,113,006 | | | 1,109,667 | |
| | Aames Mortgage Investment Trust | | | | | | | |
| | 2006-1, 0.47% due 04/25/361 | | | 1,183,602 | | | 1,103,813 | |
| | T2 Income Fund CLO Ltd. | | | | | | | |
| | 2007-1A, 2.99% due 07/15/191,3 | | | 700,000 | | | 675,430 | |
| | 2007-1A, 1.74% due 07/15/191,3 | | | 400,000 | | | 387,200 | |
| | Tricadia CDO 2006-6 Ltd. | | | | | | | |
| | 2006-6A, 0.99% due 11/05/41†††,1,3 | | | 1,150,000 | | | 1,044,775 | |
| | Black Diamond CLO 2006-1 Luxembourg S.A. | | | | | | | |
| | 2007-1A, 0.93% due 04/29/191,3 | | | 1,100,000 | | | 1,002,650 | |
| | Fortress Credit Opportunities | | | | | | | |
| | 0.57% due 07/15/1911 | | | 1,100,000 | | | 969,430 | |
| | Pacifica CDO V Corp. | | | | | | | |
| | 2006-5A, 5.81% due 01/26/203 | | | 950,000 | | | 968,620 | |
| | Aerco Ltd. | | | | | | | |
| | 2000-2A, 1.12% due 07/15/251,11 | | | 1,578,545 | | | 953,126 | |
| | Gleneagles CLO Ltd. | | | | | | | |
| | 2005-1A, 1.14% due 11/01/171,3 | | | 1,000,000 | | | 950,400 | |
| | Pangaea CLO Ltd. | | | | | | | |
| | 2007-1A, 0.74% due 10/21/211,3 | | | 1,000,000 | | | 939,600 | |
| | MCF CLO III LLC | | | | | | | |
| | 2014-3A, 3.46% due 01/20/24†††,1,3 | | | 1,000,000 | | | 918,600 | |
| | Eastland CLO Ltd. | | | | | | | |
| | 2007-1A, 0.64% due 05/01/221,3 | | | 1,000,000 | | | 890,500 | |
| | Babcock & Brown Air Funding I Ltd. | | | | | | | |
| | 2007-1A, 0.62% due 11/14/331,3 | | | 1,020,430 | | | 846,957 | |
| | KKR Financial CLO Ltd. | | | | | | | |
| | 5.24% due 05/15/21 | | | 800,000 | | | 797,840 | |
| | Garrison Funding 2013-2 Ltd. | | | | | | | |
| | 2013-2A, 4.98% due 09/25/231,3 | | | 750,000 | | | 745,125 | |
| | Central Park CLO Ltd. | | | | | | | |
| | 2011-1A, 3.44% due 07/23/221,3 | | | 750,000 | | | 738,750 | |
| | ACS 2007-1 Pass Through Trust | | | | | | | |
| | 2007-1A, 0.46% due 06/14/371,3 | | | 766,458 | | | 729,131 | |
| | Credit Card Pass-Through Trust | | | | | | | |
| | 2012-BIZ, 0.00% due 12/15/49†††,3,7 | | | 821,576 | | | 705,652 | |
| | Asset Backed Securities Corporation | | | | | | | |
| | Home Equity Loan Trust Series | | | | | | | |
| | 2004-HE8, 1.20% due 12/25/341 | | | 745,171 | | | 658,458 | |
| | Northwind Holdings LLC | | | | | | | |
| | 2007-1A, 1.02% due 12/01/371,3 | | | 706,563 | | | 648,483 | |
| | Westwood CDO I Ltd. | | | | | | | |
| | 2007-1A, 0.90% due 03/25/211,3 | | | 700,000 | | | 648,270 | |
| | Fraser Sullivan CLO VI Ltd. | | | | | | | |
| | 2011-6A, 4.74% due 11/22/221,3 | | | 600,000 | | | 600,436 | |
| | Structured Asset Receivables Trust Series | | | | | | | |
| | 2005-1A, 0.74% due 01/21/151,3 | | | 574,066 | | | 543,928 | |
| | Summit Lake CLO Ltd. | | | | | | | |
| | 2005-1A, 0.00% due 02/24/183,7 | | | 1,550,000 | | | 538,160 | |
| | MC Funding Limited/MC | | | | | | | |
| | Funding 2006-1 LLC | | | | | | | |
| | 2006-1A, 1.18% due 12/20/201,3 | | | 500,000 | | | 476,800 | |
| | Connecticut Valley Structured | | | | | | | |
| | Credit CDO III Ltd. | | | | | | | |
| | 2006-3A, 6.68% due 03/23/23†††,3 | | | 441,767 | | | 433,417 | |
| | Diversified Asset Securitization Holdings II, LP | | | | | | | |
| | 2000-1A, 0.72% due 09/15/351,3 | | | 425,604 | | | 425,263 | |
| | OFSI Fund Ltd. | | | | | | | |
| | 2006-1A, 1.08% due 09/20/191,3 | | | 370,000 | | | 356,199 | |
| | Garanti Diversified Payment Rights Finance Co. | | | | | | | |
| | 2007-A, 0.43% due 07/09/17††† | | | 364,000 | | | 344,890 | |
| | Raspro Trust | | | | | | | |
| | 2005-1A, 0.63% due 03/23/241,3 | | | 345,589 | | | 314,486 | |
| | Drug Royalty Limited Partnership | | | | | | | |
| | 2012-1, 5.49% due 07/15/241,3 | | | 271,179 | | | 281,746 | |
| | Tricadia CDO 2005-4 Ltd. | | | | | | | |
| | 2005-4A, 0.79% due 12/11/401,3 | | | 268,873 | | | 262,957 | |
| | Aircraft Lease Securitisation Ltd. | | | | | | | |
| | 2007-1A, 0.42% due 05/10/321,3 | | | 256,692 | | | 248,349 | |
| | Vega Containervessel plc | | | | | | | |
| | 2006-1A, 5.56% due 02/10/21†††,3 | | | 164,486 | | | 161,246 | |
| | SBI Home Equity Loan Trust 2006-1 | | | | | | | |
| | 2006-1A, 0.30% due 04/25/351,3 | | | 72,195 | | | 70,163 | |
| | Castle Trust | | | | | | | |
| | 2003-1AW, 0.91% due 05/15/271,3 | | | 69,896 | | | 66,401 | |
| | Legg Mason Real Estate CDO I Ltd. | | | | | | | |
| | 2006-1A, 0.43% due 03/25/381,3 | | | 48,273 | | | 47,452 | |
| | BlackRock Senior Income Series | | | | | | | |
| | 2004-1X, 0.00% due 09/15/167 | | | 2,400,000 | | | 240 | |
| | | | | | | | |
| Total Asset Backed Securities | | | | | | | |
| | (Cost $372,854,256) | | | | | | 377,114,992 | |
| | | | | | | | |
| | | | | | | | | |
| CORPORATE BONDS†† - 29.0% | | | | | | | |
| FINANCIALS - 13.3% | | | | | | | |
| | Bank of America Corp. | | | | | | | |
| | 5.20% due 12/29/491,2 | | | 12,200,000 | | | 11,467,999 | |
| | Emigrant Bancorp, Inc. | | | | | | | |
| | 6.25% due 06/15/143 | | | 11,150,000 | | | 11,221,482 | |
| | Fifth Third Bancorp | | | | | | | |
| | 5.10% due 12/31/491,2 | | | 11,720,000 | | | 10,782,399 | |
| | Icahn Enterprises Limited Partnership/ | | | | | | | |
| | Icahn Enterprises Finance Corp. | | | | | | | |
| | 4.88% due 03/15/193,11 | | | 6,500,000 | | | 6,613,749 | |
| | 6.00% due 08/01/203 | | | 3,450,000 | | | 3,657,000 | |
| | 5.88% due 02/01/223 | | | 300,000 | | | 304,500 | |
| |
| SEE NOTES TO FINANCIAL STATEMENTS. | | THE GUGGENHEIM FUNDS SEMI-ANNUAL REPORT | 57 |
| SCHEDULE OF INVESTMENTS (Unaudited) (continued) | | March 31, 2014 |
| |
| MACRO OPPORTUNITIES FUND | | |
| | | | | FACE | | | | |
| | | | | AMOUNT | | | VALUE | |
| |
| | | | | | | | | |
| | Citigroup, Inc. | | | | | | | |
| | 5.35% due 05/29/491,2 | | $ | 6,725,000 | | $ | 6,237,438 | |
| | 5.95% due 12/29/491,2 | | | 3,800,000 | | | 3,714,500 | |
| | Nationstar Mortgage LLC/ | | | | | | | |
| | Nationstar Capital Corp. | | | | | | | |
| | 6.50% due 06/01/22 | | | 5,635,000 | | | 5,226,463 | |
| | 6.50% due 07/01/21 | | | 3,050,000 | | | 2,874,625 | |
| | 7.88% due 10/01/20 | | | 815,000 | | | 823,150 | |
| | 6.50% due 08/01/18 | | | 340,000 | | | 341,700 | |
| | JPMorgan Chase & Co. | | | | | | | |
| | 5.15% due 12/31/491,2,11 | | | 8,875,000 | | | 8,320,313 | |
| | ING US, Inc. | | | | | | | |
| | 5.65% due 05/15/531 | | | 7,500,000 | | | 7,455,000 | |
| | EPR Properties | | | | | | | |
| | 5.75% due 08/15/2211 | | | 4,350,000 | | | 4,608,764 | |
| | 5.25% due 07/15/23 | | | 2,000,000 | | | 2,032,388 | |
| | CICRMT 2014-A A | | | | | | | |
| | 4.89% due 10/08/21 | | | 6,500,000 | | | 6,500,000 | |
| | General Electric Capital Corp. | | | | | | | |
| | 5.25% due 06/29/491,2 | | | 6,500,000 | | | 6,322,549 | |
| | PNC Financial Services Group, Inc. | | | | | | | |
| | 4.85% due 05/29/491,2,11 | | | 6,150,000 | | | 5,765,625 | |
| | Wilton Re Finance LLC | | | | | | | |
| | 5.88% due 03/30/331,3 | | | 5,750,000 | | | 5,721,250 | |
| | Oxford Finance LLC/Oxford Finance | | | | | | | |
| | Company-Issuer, Inc. | | | | | | | |
| | 7.25% due 01/15/183 | | | 3,801,000 | | | 4,029,060 | |
| | Prudential Financial, Inc. | | | | | | | |
| | 5.63% due 06/15/431,11 | | | 3,800,000 | | | 3,876,000 | |
| | Opal Acquisition, Inc. | | | | | | | |
| | 8.88% due 12/15/213 | | | 3,650,000 | | | 3,668,250 | |
| | Barclays plc | | | | | | | |
| | 8.25% due 12/15/181,2 | | | 3,150,000 | | | 3,307,500 | |
| | Kennedy-Wilson, Inc. | | | | | | | |
| | 8.75% due 04/01/1911 | | | 2,925,000 | | | 3,195,563 | |
| | Fidelity & Guaranty Life Holdings, Inc. | | | | | | | |
| | 6.38% due 04/01/213 | | | 2,900,000 | | | 3,088,500 | |
| | Nuveen Investments, Inc. | | | | | | | |
| | 9.13% due 10/15/173 | | | 2,490,000 | | | 2,633,175 | |
| | Schahin II Finance Company SPV Ltd. | | | | | | | |
| | 5.88% due 09/25/223,11 | | | 2,490,800 | | | 2,400,509 | |
| | Nationwide Mutual Insurance Co. | | | | | | | |
| | 9.38% due 08/15/393,11 | | | 1,400,000 | | | 2,058,893 | |
| | Bank of New York Mellon Corp. | | | | | | | |
| | 4.50% due 12/31/491,2 | | | 2,200,000 | | | 2,002,000 | |
| | Credit Acceptance Corp. | | | | | | | |
| | 6.13% due 02/15/213 | | | 1,900,000 | | | 1,976,000 | |
| | QBE Capital Funding III Ltd. | | | | | | | |
| | 7.25% due 05/24/411,3,11 | | | 1,650,000 | | | 1,765,500 | |
| | Jefferies LoanCore LLC / JLC Finance Corp. | | | | | | | |
| | 6.88% due 06/01/203 | | | 1,700,000 | | | 1,725,500 | |
| | Itau Unibanco Holding S.A./Cayman Island | | | | | | | |
| | 5.13% due 05/13/233 | | | 1,450,000 | | | 1,392,000 | |
| | Susquehanna Bancshares, Inc. | | | | | | | |
| | 5.38% due 08/15/2211 | | | 1,400,000 | | | 1,371,373 | |
| | Jefferies Finance LLC / JFIN | | | | | | | |
| | Company-Issuer Corp. | | | | | | | |
| | 7.38% due 04/01/203 | | | 1,075,000 | | | 1,128,750 | |
| | Prosight Global Inc. | | | | | | | |
| | 7.50% due 11/20/20†††,9 | | | 850,000 | | | 840,735 | |
| | American Equity Investment | | | | | | | |
| | Life Holding Co. | | | | | | | |
| | 6.63% due 07/15/21 | | | 500,000 | | | 533,125 | |
| | Ironshore Holdings US, Inc. | | | | | | | |
| | 8.50% due 05/15/203 | | | 315,000 | | | 367,237 | |
| | Scottrade Financial Services, Inc. | | | | | | | |
| | 6.13% due 07/11/213 | | | 125,000 | | | 126,819 | |
| | LCP Dakota Fund | | | | | | | |
| | 10.00% due 08/17/159 | | | 74,110 | | | 74,110 | |
| | | | | | | | |
| Total Financials | | | | | | 151,551,493 | |
| | | | | | | | |
| | | | | | | | | |
| ENERGY - 3.1% | | | | | | | |
| | Penn Virginia Resource Partners Limited | | | | | | | |
| | Partnership / Penn Virginia | | | | | | | |
| | Resource Finance Corp. | | | | | | | |
| | 8.38% due 06/01/20 | | | 4,846,000 | | | 5,439,635 | |
| | Crestwood Midstream Partners Limited | | | | | | | |
| | Partnership / Crestwood Midstream | | | | | | | |
| | Finance Corp. | | | | | | | |
| | 7.75% due 04/01/19 | | | 2,745,000 | | | 2,978,325 | |
| | 6.13% due 03/01/223 | | | 2,300,000 | | | 2,403,500 | |
| | Eagle Rock Energy Partners Limited | | | | | | | |
| | Partnership/Eagle Rock Energy | | | | | | | |
| | Finance Corp. | | | | | | | |
| | 8.38% due 06/01/1911 | | | 4,650,000 | | | 5,045,250 | |
| | BreitBurn Energy Partners Limited | | | | | | | |
| | Partnership / BreitBurn Finance Corp. | | | | | | | |
| | 7.88% due 04/15/22 | | | 4,075,000 | | | 4,411,187 | |
| | Memorial Production Partners Limited | | | | | | | |
| | Partnership / Memorial Production | | | | | | | |
| | Finance Corp. | | | | | | | |
| | 7.63% due 05/01/213 | | | 2,290,000 | | | 2,415,949 | |
| | Gibson Energy, Inc. | | | | | | | |
| | 6.75% due 07/15/213 | | | 1,800,000 | | | 1,930,500 | |
| | SandRidge Energy, Inc. | | | | | | | |
| | 7.50% due 03/15/21 | | | 1,525,000 | | | 1,627,938 | |
| | 7.50% due 02/15/23 | | | 250,000 | | | 265,000 | |
| | Midstates Petroleum Company Incorporated / | | | | | | | |
| | Midstates Petroleum Co LLC | | | | | | | |
| | 10.75% due 10/01/20 | | | 1,450,000 | | | 1,602,250 | |
| | Pacific Drilling S.A. | | | | | | | |
| | 5.38% due 06/01/203 | | | 1,400,000 | | | 1,389,500 | |
| | Unit Corp. | | | | | | | |
| | 6.63% due 05/15/21 | | | 1,150,000 | | | 1,219,000 | |
| | Atlas Energy Holdings Operating Company | | | | | | | |
| | LLC / Atlas Resource Finance Corp. | | | | | | | |
| | 9.25% due 08/15/213 | | | 1,060,000 | | | 1,166,000 | |
| | Endeavor Energy Resources Limited | | | | | | | |
| | Partnership / EER Finance, Inc. | | | | | | | |
| | 7.00% due 08/15/213 | | | 850,000 | | | 892,500 | |
| | Precision Drilling Corp. | | | | | | | |
| | 6.63% due 11/15/20 | | | 800,000 | | | 856,000 | |
| | IronGate Energy Services LLC | | | | | | | |
| | 11.00% due 07/01/183 | | | 500,000 | | | 497,500 | |
| | Bill Barrett Corp. | | | | | | | |
| | 7.00% due 10/15/22 | | | 300,000 | | | 315,750 | |
| | 7.63% due 10/01/19 | | | 77,000 | | | 83,449 | |
| | Ultra Petroleum Corp. | | | | | | | |
| | 5.75% due 12/15/183 | | | 200,000 | | | 210,000 | |
| | | | | | | | |
| Total Energy | | | | | | 34,749,233 | |
| | | | | | | | |
| |
| 58 | THE GUGGENHEIM FUNDS SEMI-ANNUAL REPORT | | SEE NOTES TO FINANCIAL STATEMENTS. |
| SCHEDULE OF INVESTMENTS (Unaudited) (continued) | | March 31, 2014 |
| |
| MACRO OPPORTUNITIES FUND | | |
| | | | | FACE | | | | |
| | | | | AMOUNT | | | VALUE | |
| |
| | | | | | | | | |
| INDUSTRIALS - 2.8% | | | | | | | |
| | Infor US, Inc. | | | | | | | |
| | 9.38% due 04/01/19 | | $ | 7,250,000 | | $ | 8,165,313 | |
| | Guitar Center, Inc. | | | | | | | |
| | 6.50% due 04/15/193 | | | 4,500,000 | | | 4,471,875 | |
| | CEVA Group plc | | | | | | | |
| | 9.00% due 09/01/213 | | | 2,000,000 | | | 2,045,000 | |
| | 7.00% due 03/01/213 | | | 200,000 | | | 203,500 | |
| | Premier Foods Finance plc | | | | | | | |
| | 5.52% due 03/15/201,3 | | | 1,250,000 | | | 2,118,238 | |
| | ADT Corp. | | | | | | | |
| | 6.25% due 10/15/213 | | | 2,000,000 | | | 2,055,000 | |
| | Princess Juliana International | | | | | | | |
| | Airport Operating Company N.V. | | | | | | | |
| | 5.50% due 12/20/273 | | | 2,030,282 | | | 1,999,827 | |
| | Chicago Bridge & Iron Co. | | | | | | | |
| | 5.15% due 12/27/22†††,9 | | | 1,650,000 | | | 1,587,465 | |
| | Marquette Transportation Company LLC / | | | | | | | |
| | Marquette Transportation Finance Corp. | | | | | | | |
| | 10.88% due 01/15/17 | | | 1,340,000 | | | 1,410,350 | |
| | Ultra Resources, Inc. | | | | | | | |
| | 4.51% due 10/12/20†††,9 | | | 1,500,000 | | | 1,396,650 | |
| | Odebrecht Offshore Drilling Finance Ltd. | | | | | | | |
| | 6.63% due 10/01/223 | | | 1,250,000 | | | 1,293,750 | |
| | WMG Acquisition Corp. | | | | | | | |
| | 6.75% due 04/15/223 | | | 1,250,000 | | | 1,250,000 | |
| | Greektown Holdings LLC/Greektown | | | | | | | |
| | Mothership Corp. | | | | | | | |
| | 8.88% due 03/15/193 | | | 1,100,000 | | | 1,135,750 | |
| | SBM Baleia Azul Sarl | | | | | | | |
| | 5.50% due 09/15/27†††,9 | | | 1,038,180 | | | 1,006,931 | |
| | Level 3 Financing, Inc. | | | | | | | |
| | 6.13% due 01/15/213 | | | 500,000 | | | 527,500 | |
| | Travelport LLC | | | | | | | |
| | 11.88% due 09/01/16 | | | 250,000 | | | 255,000 | |
| | Quality Distribution LLC / QD Capital Corp. | | | | | | | |
| | 9.88% due 11/01/18 | | | 200,000 | | | 218,500 | |
| | Virgin Media Finance plc | | | | | | | |
| | 6.38% due 04/15/233 | | | 200,000 | | | 212,000 | |
| | Victor Technologies Group, Inc. | | | | | | | |
| | 9.00% due 12/15/17 | | | 96,000 | | | 102,960 | |
| | | | | | | | |
| Total Industrials | | | | | | 31,455,609 | |
| | | | | | | | |
| | | | | | | | | |
| CONSUMER DISCRETIONARY - 2.3% | | | | | | | |
| | MDC Partners, Inc. | | | | | | | |
| | 6.75% due 04/01/203 | | | 8,500,000 | | | 8,946,249 | |
| | GRD Holdings III Corp. | | | | | | | |
| | 10.75% due 06/01/193 | | | 3,605,000 | | | 3,965,500 | |
| | Laureate Education, Inc. | | | | | | | |
| | 9.25% due 09/01/193 | | | 2,931,000 | | | 3,121,515 | |
| | Sabre GLBL, Inc. | | | | | | | |
| | 8.50% due 05/15/193 | | | 2,000,000 | | | 2,210,000 | |
| | WMG Acquisition Corp. | | | | | | | |
| | 11.50% due 10/01/18 | | | 1,440,000 | | | 1,636,560 | |
| | CPG Merger Sub LLC | | | | | | | |
| | 8.00% due 10/01/213 | | | 1,050,000 | | | 1,128,750 | |
| | Stanadyne Corp. | | | | | | | |
| | 10.00% due 08/15/14 | | | 1,100,000 | | | 1,095,875 | |
| | AmeriGas Finance LLC / AmeriGas | | | | | | | |
| | Finance Corp. | | | | | | | |
| | 7.00% due 05/20/22 | | | 600,000 | | | 655,500 | |
| | Continental Airlines 2012-2 Class B | | | | | | | |
| | Pass Through Trust | | | | | | | |
| | 5.50% due 10/29/20 | | | 500,000 | | | 526,249 | |
| | Checkers Drive-In Restaurants, Inc. | | | | | | | |
| | 11.00% due 12/01/173 | | | 450,000 | | | 501,750 | |
| | PF Chang’s China Bistro, Inc. | | | | | | | |
| | 10.25% due 06/30/203 | | | 465,000 | | | 489,413 | |
| | Gibson Brands, Inc. | | | | | | | |
| | 8.88% due 08/01/183 | | | 450,000 | | | 479,250 | |
| | DreamWorks Animation SKG, Inc. | | | | | | | |
| | 6.88% due 08/15/203 | | | 400,000 | | | 433,000 | |
| | Seminole Hard Rock Entertainment | | | | | | | |
| | Incorporated / Seminole Hard Rock | | | | | | | |
| | International LLC | | | | | | | |
| | 5.88% due 05/15/213 | | | 400,000 | | | 403,000 | |
| | Continental Airlines 2009-2 Class B | | | | | | | |
| | Pass Through Trust | | | | | | | |
| | 9.25% due 05/10/17 | | | 243,849 | | | 273,111 | |
| | Live Nation Entertainment, Inc. | | | | | | | |
| | 7.00% due 09/01/203 | | | 190,000 | | | 207,813 | |
| | Continental Airlines 2012-1 Class B | | | | | | | |
| | Pass Through Trust | | | | | | | |
| | 6.25% due 04/11/20 | | | 189,865 | | | 202,681 | |
| | Empire Today LLC / Empire Today | | | | | | | |
| | Finance Corp. | | | | | | | |
| | 11.38% due 02/01/173 | | | 110,000 | | | 111,788 | |
| | Atlas Air 1999-1 Class A-1 Pass Through Trust | | | | | | | |
| | 7.20% due 01/02/199 | | | 91,923 | | | 99,621 | |
| | | | | | | | |
| Total Consumer Discretionary | | | | | | 26,487,625 | |
| | | | | | | | |
| | | | | | | | | |
| UTILITIES - 2.0% | | | | | | | |
| | Legacy Reserves Limited Partnership/Legacy | | | | | | | |
| | Reserves Finance Corp. | | | | | | | |
| | 8.00% due 12/01/20 | | | 5,000,000 | | | 5,350,000 | |
| | 6.63% due 12/01/21 | | | 2,500,000 | | | 2,493,750 | |
| | Atlas Pipeline Partners Limited | | | | | | | |
| | Partnership/Atlas Pipeline Finance Corp. | | | | | | | |
| | 5.88% due 08/01/2311 | | | 4,750,000 | | | 4,690,625 | |
| | 4.75% due 11/15/21 | | | 1,750,000 | | | 1,662,500 | |
| | LBC Tank Terminals Holding | | | | | | | |
| | Netherlands BV | | | | | | | |
| | 6.88% due 05/15/233 | | | 3,150,000 | | | 3,362,625 | |
| | NGL Energy Partners Limited | | | | | | | |
| | Partnership/NGL Energy Finance Corp. | | | | | | | |
| | 6.88% due 10/15/213 | | | 2,800,000 | | | 2,912,000 | |
| | Atlas Energy Holdings Operating | | | | | | | |
| | Company LLC/Atlas Resource | | | | | | | |
| | Finance Corp. | | | | | | | |
| | 7.75% due 01/15/21 | | | 1,100,000 | | | 1,155,000 | |
| | Exterran Partners Limited | | | | | | | |
| | Partnership/EXLP Finance Corp. | | | | | | | |
| | 6.00% due 04/01/21 | | | 900,000 | | | 895,500 | |
| | Midstates Petroleum Company | | | | | | | |
| | Incorporated/Midstates | | | | | | | |
| | Petroleum Co LLC | | | | | | | |
| | 9.25% due 06/01/21 | | | 450,000 | | | 470,250 | |
| | FPL Energy National Wind LLC | | | | | | | |
| | 5.61% due 03/10/243 | | | 53,687 | | | 52,192 | |
| | | | | | | | |
| Total Utilities | | | | | | 23,044,442 | |
| | | | | | | | |
| |
| SEE NOTES TO FINANCIAL STATEMENTS. | | THE GUGGENHEIM FUNDS SEMI-ANNUAL REPORT | 59 |
| SCHEDULE OF INVESTMENTS (Unaudited) (continued) | | March 31, 2014 |
| |
| MACRO OPPORTUNITIES FUND | | |
| | | | | FACE | | | | |
| | | | | AMOUNT | | | VALUE | |
| |
| | | | | | | | | |
| MATERIALS - 1.8% | | | | | | | |
| | TPC Group, Inc. | | | | | | | |
| | 8.75% due 12/15/203,11 | | $ | 7,300,000 | | $ | 8,002,625 | |
| | Clearwater Paper Corp. | | | | | | | |
| | 4.50% due 02/01/23 | | | 2,750,000 | | | 2,646,875 | |
| | Barrick Gold Corp. | | | | | | | |
| | 4.10% due 05/01/23 | | | 2,500,000 | | | 2,371,588 | |
| | Eldorado Gold Corp. | | | | | | | |
| | 6.13% due 12/15/203 | | | 2,250,000 | | | 2,250,000 | |
| | KGHM International Ltd. | | | | | | | |
| | 7.75% due 06/15/193 | | | 1,435,000 | | | 1,513,925 | |
| | AngloGold Ashanti Holdings plc | | | | | | | |
| | 5.13% due 08/01/22 | | | 1,450,000 | | | 1,351,951 | |
| | Mirabela Nickel Ltd. | | | | | | | |
| | 8.75% due 04/15/183,6,9 | | | 2,948,000 | | | 707,520 | |
| | Unifrax I LLC / Unifrax Holding Co. | | | | | | | |
| | 7.50% due 02/15/193 | | | 500,000 | | | 530,000 | |
| | Pretium Packaging LLC / Pretium | | | | | | | |
| | Finance, Inc. | | | | | | | |
| | 11.50% due 04/01/16 | | | 342,000 | | | 365,940 | |
| | Kaiser Aluminum Corp. | | | | | | | |
| | 8.25% due 06/01/20 | | | 250,000 | | | 281,875 | |
| | Alcoa, Inc. | | | | | | | |
| | 5.87% due 02/23/22 | | | 250,000 | | | 263,614 | |
| | | | | | | | |
| Total Materials | | | | | | 20,285,913 | |
| | | | | | | | |
| | | | | | | | | |
| TELECOMMUNICATION SERVICES - 1.4% | | | | | | | |
| | Avaya, Inc. | | | | | | | |
| | 7.00% due 04/01/193,11 | | | 5,705,000 | | | 5,662,212 | |
| | Alcatel-Lucent USA, Inc. | | | | | | | |
| | 8.88% due 01/01/203 | | | 2,200,000 | | | 2,497,000 | |
| | 6.75% due 11/15/203 | | | 1,000,000 | | | 1,057,500 | |
| | SITEL LLC / Sitel Finance Corp. | | | | | | | |
| | 11.00% due 08/01/173 | | | 2,020,000 | | | 2,168,975 | |
| | Expo Event Transco, Inc. | | | | | | | |
| | 9.00% due 06/15/213 | | | 1,975,000 | | | 2,009,563 | |
| | Unitymedia Hessen GmbH & Company | | | | | | | |
| | KG/Unitymedia NRW GmbH | | | | | | | |
| | 5.50% due 01/15/233 | | | 1,200,000 | | | 1,224,000 | |
| | CyrusOne Limited Partnership/CyrusOne | | | | | | | |
| | Finance Corp. | | | | | | | |
| | 6.38% due 11/15/22 | | | 675,000 | | | 712,125 | |
| | UPCB Finance VI Ltd. | | | | | | | |
| | 6.88% due 01/15/223 | | | 400,000 | | | 436,000 | |
| | | | | | | | |
| Total Telecommunication Services | | | | | | 15,767,375 | |
| | | | | | | | |
| | | | | | | | | |
| INFORMATION TECHNOLOGY - 1.2% | | | | | | | |
| | Stream Global Services, Inc. | | | | | | | |
| | 11.25% due 10/01/14 | | | 3,880,000 | | | 3,880,000 | |
| | Aspect Software, Inc. | | | | | | | |
| | 10.63% due 05/15/17 | | | 3,514,000 | | | 3,716,055 | |
| | Eagle Midco, Inc. | | | | | | | |
| | 9.00% due 06/15/183 | | | 3,050,000 | | | 3,202,500 | |
| | IAC | | | | | | | |
| | 4.88% due 11/30/18 | | | 1,000,000 | | | 1,043,750 | |
| | ViaSat, Inc. | | | | | | | |
| | 6.88% due 06/15/20 | | | 750,000 | | | 804,375 | |
| | First Data Corp. | | | | | | | |
| | 8.75% due 01/15/223 | | | 300,000 | | | 327,750 | |
| | 6.75% due 11/01/203 | | | 300,000 | | | 322,500 | |
| | Stratus Technologies Bermuda | | | | | | | |
| | Limited/Stratus Technologies, Inc. | | | | | | | |
| | 19.99% due 03/29/15 | | | 321 | | | 356,310 | |
| | Audatex North America, Inc. | | | | | | | |
| | 6.00% due 06/15/213 | | | 300,000 | | | 320,250 | |
| | | | | | | | |
| Total Information Technology | | | | | | 13,973,490 | |
| | | | | | | | |
| | | | | | | | | |
| CONSUMER STAPLES - 1.0% | | | | | | | |
| | Vector Group Ltd. | | | | | | | |
| | 7.75% due 02/15/2111 | | | 4,475,000 | | | 4,810,626 | |
| | Harbinger Group, Inc. | | | | | | | |
| | 7.88% due 07/15/19 | | | 2,400,000 | | | 2,634,000 | |
| | Premier Foods plc | | | | | | | |
| | 6.50% due 03/15/213 | | | 1,000,000 | | | 1,712,511 | |
| | Bumble Bee Holdings, Inc. | | | | | | | |
| | 9.00% due 12/15/173 | | | 826,000 | | | 900,340 | |
| | Central Garden and Pet Co. | | | | | | | |
| | 8.25% due 03/01/18 | | | 525,000 | | | 541,406 | |
| | KeHE Distributors LLC / KeHE Finance Corp. | | | | | | | |
| | 7.63% due 08/15/213 | | | 500,000 | | | 537,500 | |
| | Diamond Foods, Inc. | | | | | | | |
| | 7.00% due 03/15/193 | | | 200,000 | | | 207,000 | |
| | | | | | | | |
| Total Consumer Staples | | | | | | 11,343,383 | |
| | | | | | | | |
| | | | | | | | | |
| HEALTH CARE - 0.1% | | | | | | | |
| | Symbion, Inc. | | | | | | | |
| | 8.00% due 06/15/16 | | | 600,000 | | | 630,000 | |
| | Physio-Control International, Inc. | | | | | �� | | |
| | 9.88% due 01/15/193 | | | 303,000 | | | 340,118 | |
| | | | | | | | |
| Total Health Care | | | | | | 970,118 | |
| | | | | | | | |
| Total Corporate Bonds | | | | | | | |
| | (Cost $329,031,261) | | | | | | 329,628,681 | |
| | | | | | | | |
| | | | | | | | | |
| SENIOR FLOATING RATE INTERESTS†† - 25.9% | | | | | | | |
| INDUSTRIALS - 7.3% | | | | | | | |
| | Travelport Holdings Ltd. | | | | | | | |
| | 6.25% due 06/26/19 | | | 10,217,787 | | | 10,444,520 | |
| | 9.50% due 01/31/16 | | | 3,222,799 | | | 3,327,540 | |
| | 4.19% due 12/01/16 | | | 653,144 | | | 667,840 | |
| | Rise Ltd. | | | | | | | |
| | 4.74% due 02/12/39 | | | 6,963,542 | | | 7,015,768 | |
| | SIRVA Worldwide, Inc. | | | | | | | |
| | 7.50% due 03/27/19 | | | 3,861,000 | | | 3,938,220 | |
| | AABS Ltd. | | | | | | | |
| | 4.87% due 01/15/38††† | | | 3,661,979 | | | 3,689,444 | |
| | Flakt Woods | | | | | | | |
| | 8.00% due 04/01/17 | | | 2,650,000 | | | 3,541,365 | |
| | Multiplan, Inc. | | | | | | | |
| | 4.00% due 03/31/21 | | | 3,000,000 | | | 2,992,500 | |
| | syncreon | | | | | | | |
| | 5.25% due 10/28/20 | | | 2,842,875 | | | 2,846,429 | |
| | Berlin Packaging LLC | | | | | | | |
| | 4.75% due 04/02/19 | | | 1,990,000 | | | 1,999,950 | |
| | 8.75% due 04/10/20 | | | 600,000 | | | 613,500 | |
| | Nord Anglia Education Finance LLC | | | | | | | |
| | 4.50% due 03/19/21 | | | 2,600,000 | | | 2,596,750 | |
| | ServiceMaster Co. | | | | | | | |
| | 4.25% due 01/31/17 | | | 2,468,750 | | | 2,469,268 | |
| | Knowledge Learning Corp. | | | | | | | |
| | 5.25% due 03/12/21 | | | 2,400,000 | | | 2,413,512 | |
| |
| 60 | THE GUGGENHEIM FUNDS SEMI-ANNUAL REPORT | | SEE NOTES TO FINANCIAL STATEMENTS. |
| SCHEDULE OF INVESTMENTS (Unaudited) (continued) | | March 31, 2014 |
| |
| MACRO OPPORTUNITIES FUND | | |
| | | | | FACE | | | | |
| | | | | AMOUNT | | | VALUE | |
| |
| | | | | | | | | |
| | Thermasys Corp. | | | | | | | |
| | 5.25% due 05/03/19 | | $ | 2,379,875 | | $ | 2,367,976 | |
| | MRC Global, Inc. | | | | | | | |
| | 4.75% due 11/08/19 | | | 2,238,750 | | | 2,264,406 | |
| | GYP Holdings III Corp. | | | | | | | |
| | 4.75% due 03/26/21 | | | 2,000,000 | | | 1,990,000 | |
| | 7.75% due 03/25/22 | | | 200,000 | | | 200,750 | |
| | Ceva Logistics US Holdings | | | | | | | |
| | 6.50% due 03/19/21 | | | 2,009,852 | | | 2,001,471 | |
| | IPC Systems, Inc. | | | | | | | |
| | 7.75% due 07/31/17 | | | 1,685,497 | | | 1,683,768 | |
| | Mast Global | | | | | | | |
| | 8.75% due 09/12/19†††,9 | | | 1,678,750 | | | 1,661,963 | |
| | Emerald Expositions | | | | | | | |
| | 5.50% due 06/17/20 | | | 1,488,756 | | | 1,498,686 | |
| | AlliedBarton Security Services LLC | | | | | | | |
| | 4.25% due 02/12/21 | | | 1,476,190 | | | 1,470,197 | |
| | Ceva Logistics Holdings BV (Dutch) | | | | | | | |
| | 6.50% due 03/19/21 | | | 1,457,143 | | | 1,451,067 | |
| | Dematic S.A. | | | | | | | |
| | 4.25% due 12/28/19 | | | 1,432,406 | | | 1,434,798 | |
| | Sutherland Global Services, Inc. | | �� | | | | | |
| | 7.25% due 03/06/19 | | | 1,425,000 | | | 1,432,125 | |
| | Ceva Group Plc (United Kingdom) | | | | | | | |
| | 6.50% due 03/19/21 | | | 1,381,773 | | | 1,376,011 | |
| | Doncasters Group Ltd. | | | | | | | |
| | 9.50% due 10/09/20 | | | 1,350,000 | | | 1,370,250 | |
| | Power Borrower, LLC | | | | | | | |
| | 4.25% due 05/06/20 | | | 1,092,098 | | | 1,085,732 | |
| | 8.25% due 11/06/20 | | | 275,000 | | | 272,250 | |
| | CPM Acquisition Corp. | | | | | | | |
| | 6.25% due 08/29/17 | | | 815,262 | | | 820,357 | |
| | 10.25% due 03/01/18 | | | 450,000 | | | 455,625 | |
| | US Shipping Corp. | | | | | | | |
| | 9.00% due 04/30/18 | | | 1,250,550 | | | 1,275,561 | |
| | CareCore National LLC | | | | | | | |
| | 5.50% due 03/05/21 | | | 1,050,000 | | | 1,055,691 | |
| | NaNa Development Corp. | | | | | | | |
| | 8.00% due 03/15/18 | | | 1,040,000 | | | 1,029,600 | |
| | Exopack Holdings SA | | | | | | | |
| | 5.25% due 05/08/19 | | | 997,500 | | | 1,007,784 | |
| | Mitchell International, Inc. | | | | | | | |
| | 8.50% due 10/11/21 | | | 900,000 | | | 919,125 | |
| | GCA Services Group, Inc. | | | | | | | |
| | 9.25% due 11/01/20 | | | 440,000 | | | 444,950 | |
| | 4.27% due 11/01/19 | | | 328,937 | | | 329,348 | |
| | Ranpak | | | | | | | |
| | 8.50% due 04/23/20 | | | 650,000 | | | 663,000 | |
| | SRA International, Inc. | | | | | | | |
| | 6.50% due 07/20/18 | | | 660,000 | | | 661,241 | |
| | Hunter Fan Co. | | | | | | | |
| | 6.50% due 12/20/17 | | | 579,826 | | | 579,101 | |
| | VAT Holding AG | | | | | | | |
| | 4.75% due 02/11/21 | | | 500,000 | | | 502,290 | |
| | Panolam Industries International, Inc. | | | | | | | |
| | 7.25% due 08/23/17 | | | 433,663 | | | 421,738 | |
| | Travelport LLC | | | | | | | |
| | 5.50% due 06/21/18†††,9 | | | 416,667 | | | 376,430 | |
| | Ceva Logistics Canada, ULC | | | | | | | |
| | 6.50% due 03/19/21 | | | 251,232 | | | 250,184 | |
| | Helm Financial Corp. | | | | | | | |
| | 6.25% due 06/01/17 | | | 137,524 | | | 137,181 | |
| | Camp Systems International | | | | | | | |
| | 8.25% due 11/29/19 | | | 120,000 | | | 122,250 | |
| | | | | | | | |
| Total Industrials | | | | | | 83,169,512 | |
| | | | | | | | |
| | | | | | | | | |
| CONSUMER DISCRETIONARY - 5.4% | | | | | | | |
| | Lions Gate Entertainment Corp. | | | | | | | |
| | 5.00% due 07/19/20 | | | 7,650,000 | | | 7,783,876 | |
| | Landry’s, Inc. | | | | | | | |
| | 4.00% due 04/24/18 | | | 4,430,740 | | | 4,452,894 | |
| | Neiman Marcus Group, Inc. | | | | | | | |
| | 4.25% due 10/25/20 | | | 4,240,875 | | | 4,251,901 | |
| | David’S Bridal, Inc. | | | | | | | |
| | 5.03% due 10/11/19 | | | 2,913,125 | | | 2,909,484 | |
| | William Morris Endeavor | | | | | | | |
| | 5.25% due 03/19/21 | | | 2,500,000 | | | 2,482,825 | |
| | 8.25% due 03/21/22 | | | 210,000 | | | 211,707 | |
| | National Vision, Inc. | | | | | | | |
| | 4.00% due 03/12/21 | | | 2,700,000 | | | 2,679,750 | |
| | La Quinta Intermediate Holdings | | | | | | | |
| | 4.00% due 02/19/21 | | | 2,500,000 | | | 2,498,450 | |
| | CHG Healthcare Services, Inc. | | | | | | | |
| | 4.25% due 11/19/19 | | | 2,318,031 | | | 2,320,929 | |
| | Fleetpride Corp. | | | | | | | |
| | 5.25% due 11/19/19 | | | 2,123,496 | | | 2,093,767 | |
| | 9.25% due 05/15/20 | | | 150,000 | | | 147,375 | |
| | Sears Holdings Corp. | | | | | | | |
| | 5.50% due 06/30/18 | | | 2,194,500 | | | 2,203,827 | |
| | J. Crew Group, Inc. | | | | | | | |
| | 4.00% due 03/05/21 | | | 1,900,000 | | | 1,894,775 | |
| | IntraWest Holdings S.à r.l. | | | | | | | |
| | 5.50% due 12/09/20 | | | 1,097,250 | | | 1,110,966 | |
| | 7.75% due 12/10/189 | | | 750,000 | | | 721,236 | |
| | Stuart Weitzman Acquisition Co. | | | | | | | |
| | 4.50% due 03/04/20 | | | 1,800,000 | | | 1,796,256 | |
| | TI Automotive Ltd. | | | | | | | |
| | 5.50% due 03/28/19 | | | 1,633,500 | | | 1,637,584 | |
| | Southern Graphics, Inc. | | | | | | | |
| | 4.25% due 10/17/19 | | | 1,534,863 | | | 1,532,944 | |
| | Guitar Center, Inc. | | | | | | | |
| | 8.25% due 04/09/17 | | | 1,481,877 | | | 1,475,091 | |
| | Alexander Mann Solutions Ltd. | | | | | | | |
| | 5.75% due 12/20/19 | | | 1,296,750 | | | 1,299,992 | |
| | NES Global Talent | | | | | | | |
| | 6.50% due 10/03/19 | | | 1,291,875 | | | 1,291,875 | |
| | Capital Automotive LP | | | | | | | |
| | 6.00% due 04/30/20 | | | 1,250,000 | | | 1,276,563 | |
| | Jacobs Entertainment, Inc. | | | | | | | |
| | 5.25% due 10/29/18 | | | 1,231,250 | | | 1,237,406 | |
| | Men’s Wearhouse | | | | | | | |
| | 7.75% due 03/11/15†††,9 | | | 1,100,000 | | | 1,100,000 | |
| | Laureate Education, Inc. | | | | | | | |
| | 5.00% due 06/15/18 | | | 1,035,476 | | | 1,025,121 | |
| | 1-800 Contacts, Inc. | | | | | | | |
| | 4.25% due 01/31/21 | | | 1,000,000 | | | 1,001,750 | |
| | Ollies Bargain Outlet | | | | | | | |
| | 5.25% due 09/28/19 | | | 988,001 | | | 984,296 | |
| | ValleyCrest Companies LLC | | | | | | | |
| | 5.50% due 06/13/19 | | | 893,250 | | | 899,949 | |
| |
| SEE NOTES TO FINANCIAL STATEMENTS. | | THE GUGGENHEIM FUNDS SEMI-ANNUAL REPORT | 61 |
| SCHEDULE OF INVESTMENTS (Unaudited) (continued) | | March 31, 2014 |
| |
| MACRO OPPORTUNITIES FUND | | |
| | | | | FACE | | | | |
| | | | | AMOUNT | | | VALUE | |
| |
| | | | | | | | | |
| | California Pizza Kitchen, Inc. | | | | | | | |
| | 5.25% due 03/29/18 | | $ | 948,603 | | $ | 898,801 | |
| | Fender Musical Instruments Corp. | | | | | | | |
| | 5.75% due 04/03/19 | | | 803,250 | | | 806,262 | |
| | PSAV-Audio Visual Services Corp. | | | | | | | |
| | 4.50% due 01/25/21 | | | 650,000 | | | 653,250 | |
| | Steinway Musical Instruments, Inc. | | | | | | | |
| | 9.25% due 09/18/20 | | | 625,000 | | | 643,750 | |
| | Armored AutoGroup, Inc. | | | | | | | |
| | 6.00% due 11/05/16 | | | 620,801 | | | 624,296 | |
| | Acosta, Inc. | | | | | | | |
| | 4.25% due 03/03/18 | | | 600,000 | | | 602,100 | |
| | Horseshoe Baltimore | | | | | | | |
| | 8.25% due 07/02/20 | | | 550,000 | | | 572,000 | |
| | Mitel Networks Corp. | | | | | | | |
| | 5.25% due 01/31/20 | | | 438,900 | | | 443,017 | |
| | Go Daddy Operating Company LLC | | | | | | | |
| | 4.00% due 12/17/18 | | | 336,428 | | | 337,100 | |
| | Navistar, Inc. | | | | | | | |
| | 5.75% due 08/17/17 | | | 298,611 | | | 303,338 | |
| | Cooper Standard Automotive, Inc. | | | | | | | |
| | 4.00% due 03/26/21 | | | 240,000 | | | 240,151 | |
| | Arby’s | | | | | | | |
| | 5.00% due 11/15/20 | | | 199,500 | | | 200,559 | |
| | Targus Group International, Inc. | | | | | | | |
| | 12.00% due 05/24/169 | | | 231,236 | | | 191,348 | |
| | NAB Holdings LLC | | | | | | | |
| | 7.00% due 04/24/18 | | | 159,688 | | | 160,286 | |
| | Rite Aid Corp. | | | | | | | |
| | 5.75% due 08/21/20 | | | 100,000 | | | 102,063 | |
| | Container Store, Inc. | | | | | | | |
| | 4.25% due 04/06/19 | | | 80,786 | | | 80,887 | |
| | Totes Isotoner Corp. | | | | | | | |
| | 7.25% due 07/07/17 | | | 74,209 | | | 74,394 | |
| | CKX Entertainment, Inc. | | | | | | | |
| | 9.00% due 06/21/179 | | | 43,475 | | | 37,823 | |
| | | | | | | | |
| Total Consumer Discretionary | | | | | | 61,294,014 | |
| | | | | | | | |
| | | | | | | | | |
| FINANCIALS - 3.5% | | | | | | | |
| | Magic Newco, LLC | | | | | | | |
| | 5.00% due 12/12/18 | | | 3,423,949 | | | 3,453,909 | |
| | 12.00% due 06/12/19 | | | 1,075,000 | | | 1,230,875 | |
| | Intertrust Group | | | | | | | |
| | 4.65% due 02/04/20 | | | 4,360,000 | | | 4,342,299 | |
| | STG-Fairway Acquisitions, Inc. | | | | | | | |
| | 6.25% due 02/28/19 | | | 2,828,630 | | | 2,835,701 | |
| | 10.50% due 08/28/19††† | | | 1,400,000 | | | 1,386,000 | |
| | First Data Corp. | | | | | | | |
| | 4.15% due 03/23/18 | | | 3,110,000 | | | 3,115,194 | |
| | 4.15% due 03/24/21 | | | 178,213 | | | 178,473 | |
| | iStar Financial, Inc. | | | | | | | |
| | 4.50% due 10/15/17 | | | 2,733,953 | | | 2,739,940 | |
| | Transunion Holding Co. | | | | | | | |
| | 4.00% due 03/19/21 | | | 2,600,000 | | | 2,604,342 | |
| | Lineage Logistics LLC | | | | | | | |
| | 4.50% due 03/31/21 | | | 2,500,000 | | | 2,493,750 | |
| | RCS Capital | | | | | | | |
| | 6.50% due 03/29/19 | | | 2,000,000 | | | 2,010,000 | |
| | National Financial Partners | | | | | | | |
| | 5.25% due 07/01/20 | | | 1,935,399 | | | 1,944,476 | |
| | USI Holdings Corp. | | | | | | | |
| | 4.25% due 12/27/19 | | | 1,920,872 | | | 1,926,884 | |
| | Topaz Power Holdings LLC | | | | | | | |
| | 5.25% due 02/26/20 | | | 1,826,875 | | | 1,787,287 | |
| | Ceridian Corp. | | | | | | | |
| | 4.40% due 05/09/17 | | | 1,603,465 | | | 1,609,077 | |
| | American Stock Transfer & Trust | | | | | | | |
| | 5.75% due 06/26/20 | | | 1,602,920 | | | 1,608,258 | |
| | AssuredPartners | | | | | | | |
| | 0.00% due 01/31/197 | | | 1,300,000 | | | 1,287,000 | |
| | 7.75% due 03/31/22 | | | 200,000 | | | 199,500 | |
| | Cunningham Lindsey U.S., Inc. | | | | | | | |
| | 5.00% due 12/10/19 | | | 691,250 | | | 690,960 | |
| | 9.25% due 06/10/20 | | | 116,932 | | | 116,639 | |
| | Nuveen Investments, Inc. | | | | | | | |
| | 4.15% due 05/13/17 | | | 800,000 | | | 801,856 | |
| | HDV Holdings | | | | | | | |
| | 5.75% due 12/18/18 | | | 662,344 | | | 657,376 | |
| | Cetera Financial Group, Inc. | | | | | | | |
| | 6.50% due 08/07/19 | | | 493,750 | | | 493,750 | |
| | Knight/Getco | | | | | | | |
| | 5.75% due 12/05/17 | | | 42,056 | �� | | 42,109 | |
| | | | | | | | |
| Total Financials | | | | | | 39,555,655 | |
| | | | | | | | |
| | | | | | | | | |
| INFORMATION TECHNOLOGY - 3.1% | | | | | | | |
| | Greenway Medical Technologies | | | | | | | |
| | 6.00% due 11/04/20 | | | 3,640,875 | | | 3,618,119 | |
| | 9.25% due 11/04/21 | | | 550,000 | | | 555,500 | |
| | P2 Energy Solutions | | | | | | | |
| | 5.00% due 10/30/20 | | | 2,992,500 | | | 3,014,944 | |
| | 9.00% due 04/30/21 | | | 600,000 | | | 609,750 | |
| | EIG Investors Corp. | | | | | | | |
| | 5.00% due 11/09/19 | | | 2,755,584 | | | 2,769,362 | |
| | Blue Coat Systems, Inc. | | | | | | | |
| | 4.00% due 05/31/19 | | | 2,668,844 | | | 2,673,301 | |
| | LANDesk Group, Inc. | | | | | | | |
| | 5.00% due 02/25/20 | | | 2,238,750 | | | 2,239,444 | |
| | Sabre, Inc. | | | | | | | |
| | 4.25% due 02/19/19 | | | 2,210,550 | | | 2,209,621 | |
| | Deltek, Inc. | | | | | | | |
| | 4.50% due 10/10/18 | | | 2,174,232 | | | 2,185,104 | |
| | Paradigm Ltd | | | | | | | |
| | 4.75% due 07/30/199 | | | 2,148,343 | | | 2,150,362 | |
| | Wall Street Systems | | | | | | | |
| | 5.75% due 10/25/19 | | | 1,431,875 | | | 1,431,875 | |
| | 9.25% due 10/25/20 | | | 600,000 | | | 604,500 | |
| | Active Network, Inc., The | | | | | | | |
| | 5.50% due 11/13/20 | | | 1,496,250 | | | 1,508,415 | |
| | Flexera Software LLC | | | | | | | |
| | 4.50% due 04/02/20 | | | 900,000 | | | 900,000 | |
| | 8.00% due 04/02/21 | | | 350,000 | | | 350,000 | |
| | SumTotal Systems | | | | | | | |
| | 6.25% due 11/16/18 | | | 1,252,997 | | | 1,245,165 | |
| | Sophos | | | | | | | |
| | 5.00% due 01/29/21 | | | 1,200,000 | | | 1,203,000 | |
| | Applied Systems, Inc. | | | | | | | |
| | 4.25% due 01/25/21 | | | 1,197,000 | | | 1,199,993 | |
| | GlobalLogic Holdings, Inc. | | | | | | | |
| | 6.25% due 05/31/19 | | | 1,197,000 | | | 1,185,030 | |
| |
| 62 | THE GUGGENHEIM FUNDS SEMI-ANNUAL REPORT | | SEE NOTES TO FINANCIAL STATEMENTS. |
| SCHEDULE OF INVESTMENTS (Unaudited) (continued) | | March 31, 2014 |
| |
| MACRO OPPORTUNITIES FUND | | |
| | | | | FACE | | | | |
| | | | | AMOUNT | | | VALUE | |
| |
| | | | | | | | | |
| | Aspect Software, Inc. | | | | | | | |
| | 7.25% due 05/07/16 | | $ | 776,719 | | $ | 786,428 | |
| | Hyland Software, Inc. | | | | | | | |
| | 4.75% due 02/19/21 | | | 640,000 | | | 645,600 | |
| | Attachmate Group, Inc., The | | | | | | | |
| | 7.25% due 11/22/17 | | | 610,702 | | | 614,140 | |
| | Eze Castle Software, Inc. | | | | | | | |
| | 7.25% due 04/04/21 | | | 400,000 | | | 402,000 | |
| | 8.50% due 03/14/21 | | | 150,000 | | | 151,875 | |
| | ION Trading Technologies Ltd. | | | | | | | |
| | 8.25% due 05/22/21 | | | 425,000 | | | 429,250 | |
| | | | | | | | |
| Total Information Technology | | | | | | 34,682,778 | |
| | | | | | | | |
| | | | | | | | | |
| TELECOMMUNICATION SERVICES - 2.8% | | | | | | | |
| | Associated Partners, Inc. | | | | | | | |
| | 6.66% due 12/21/15†††,9 | | | 4,250,000 | | | 4,260,624 | |
| | Cengage Learning Acquisitions, Inc. | | | | | | | |
| | 7.00% due 03/06/20 | | | 2,750,000 | | | 2,778,655 | |
| | 9.50% due 07/03/14 | | | 726,178 | | | 691,234 | |
| | 0.00% due 07/31/177 | | | 707,069 | | | 665,883 | |
| | Avaya, Inc. | | | | | | | |
| | 6.50% due 03/31/18 | | | 2,910,734 | | | 2,913,762 | |
| | 4.73% due 10/26/17 | | | 1,049,782 | | | 1,024,084 | |
| | Anaren, Inc. | | | | | | | |
| | 5.50% due 02/18/21 | | | 1,995,000 | | | 2,004,975 | |
| | 9.25% due 08/18/21 | | | 1,500,000 | | | 1,515,000 | |
| | Scout24 AG | | | | | | | |
| | 4.48% due 02/05/21 | | | 2,500,000 | | | 3,476,957 | |
| | Cumulus Media, Inc. | | | | | | | |
| | 4.25% due 12/23/20 | | | 3,140,765 | | | 3,152,543 | |
| | Alcatel-Lucent, Inc. | | | | | | | |
| | 4.50% due 01/30/19 | | | 2,589,480 | | | 2,600,408 | |
| | Trader Media Corporation Ltd. | | | | | | | |
| | 5.00% due 12/08/17 | | | 1,000,000 | | | 1,671,951 | |
| | Expert Global Solutions | | | | | | | |
| | 8.50% due 04/03/18 | | | 1,596,203 | | | 1,554,303 | |
| | Gogo LLC | | | | | | | |
| | 11.25% due 06/21/179 | | | 1,041,367 | | | 1,124,676 | |
| | MergerMarket Ltd. | | | | | | | |
| | 4.50% due 02/04/21 | | | 1,000,000 | | | 995,000 | |
| | Hemisphere Media Group, Inc. | | | | | | | |
| | 6.25% due 07/30/20 | | | 545,875 | | | 547,240 | |
| | Max Broadcast Group LLC | | | | | | | |
| | 6.25% due 03/31/15†††,9 | | | 426,982 | | | 375,744 | |
| | | | | | | | |
| Total Telecommunication Services | | | | | | 31,353,039 | |
| | | | | | | | |
| | | | | | | | | |
| CONSUMER STAPLES - 1.3% | | | | | | | |
| | Grocery Outlet, Inc. | | | | | | | |
| | 5.50% due 12/17/18 | | | 2,524,181 | | | 2,528,927 | |
| | AdvancePierre Foods, Inc. | | | | | | | |
| | 9.50% due 10/10/17 | | | 1,696,000 | | | 1,645,120 | |
| | 5.75% due 07/10/17 | | | 858,155 | | | 860,506 | |
| | Performance Food Group | | | | | | | |
| | 6.25% due 11/14/19 | | | 2,357,436 | | | 2,388,861 | |
| | Reddy Ice Holdings, Inc. | | | | | | | |
| | 10.75% due 10/01/19 | | | 1,125,000 | | | 1,080,000 | |
| | 6.75% due 04/01/19 | | | 1,089,496 | | | 1,078,601 | |
| | Diamond Foods, Inc. | | | | | | | |
| | 4.25% due 08/20/18 | | | 1,850,000 | | | 1,853,478 | |
| | Arctic Glacier Holdings, Inc. | | | | | | | |
| | 5.00% due 05/10/19 | | | 1,823,423 | | | 1,825,703 | |
| | CTI Foods Holding Co. LLC | | | | | | | |
| | 8.25% due 06/28/21 | | | 1,205,000 | | | 1,211,025 | |
| | Hostess Brands | | | | | | | |
| | 6.75% due 04/09/20 | | | 565,000 | | | 586,894 | |
| | DS Waters of America, Inc. | | | | | | | |
| | 5.25% due 08/30/20 | | | 199,000 | | | 201,985 | |
| | | | | | | | |
| Total Consumer Staples | | | | | | 15,261,100 | |
| | | | | | | | |
| | | | | | | | | |
| HEALTH CARE - 1.2% | | | | | | | |
| | Nextech Systems LLC | | | | | | | |
| | 6.00% due 10/28/18†††,9 | | | 3,653,750 | | | 3,580,675 | |
| | Learning Care Group (US), Inc. | | | | | | | |
| | 5.75% due 05/08/19 | | | 2,506,063 | | | 2,513,906 | |
| | Community Health Systems, Inc. | | | | | | | |
| | 4.25% due 01/27/21 | | | 1,995,000 | | | 2,010,342 | |
| | Merge Healthcare, Inc. | | | | | | | |
| | 6.00% due 04/23/199 | | | 2,030,583 | | | 1,908,748 | |
| | Harvard Drug | | | | | | | |
| | 5.00% due 08/16/20 | | | 1,742,656 | | | 1,751,909 | |
| | DJO Finance LLC | | | | | | | |
| | 4.75% due 09/15/17 | | | 1,234,375 | | | 1,237,844 | |
| | Catalent Pharma Solutions, Inc. | | | | | | | |
| | 6.50% due 12/31/17 | | | 300,000 | | | 303,000 | |
| | 4.25% due 09/15/17 | | | 246,875 | | | 247,438 | |
| | VWR Funding, Inc. | | | | | | | |
| | 3.40% due 04/03/17 | | | 197,493 | | | 197,781 | |
| | | | | | | | |
| Total Health Care | | | | | | 13,751,643 | |
| | | | | | | | |
| | | | | | | | | |
| MATERIALS - 0.6% | | | | | | | |
| | Ennis-Flint | | | | | | | |
| | 4.25% due 03/31/21 | | | 2,000,000 | | | 1,996,260 | |
| | 7.75% due 09/30/21 | | | 1,150,000 | | | 1,150,000 | |
| | Atkore International, Inc. | | | | | | | |
| | 4.50% due 03/26/21 | | | 1,400,000 | | | 1,397,382 | |
| | 7.75% due 09/27/21 | | | 850,000 | | | 854,250 | |
| | Royal Adhesives and Sealants | | | | | | | |
| | 5.50% due 07/31/18 | | | 840,934 | | | 850,924 | |
| | United Central Industrial Supply | | | | | | | |
| | 9.50% due 10/09/17†††,9 | | | 500,000 | | | 500,000 | |
| | Oxbow Carbon | | | | | | | |
| | 8.00% due 01/19/20 | | | 450,000 | | | 459,000 | |
| | | | | | | | |
| Total Materials | | | | | | 7,207,816 | |
| | | | | | | | |
| | | | | | | | | |
| ENERGY - 0.6% | | | | | | | |
| | Ocean Rig ASA | | | | | | | |
| | 6.00% due 03/31/21 | | | 2,095,667 | | | 2,132,781 | |
| | Panda Temple II Power | | | | | | | |
| | 7.25% due 04/03/19 | | | 1,000,000 | | | 1,023,750 | |
| | Varel International Energy Funding Corp. | | | | | | | |
| | 9.25% due 07/17/17 | | | 956,250 | | | 963,422 | |
| | Rice Energy | | | | | | | |
| | 8.50% due 10/25/18 | | | 891,744 | | | 907,350 | |
| | PSS Companies | | | | | | | |
| | 5.50% due 01/28/20 | | | 800,000 | | | 804,000 | |
| | Atlas Energy LP | | | | | | | |
| | 6.50% due 07/31/19 | | | 447,750 | | | 459,503 | |
| | | | | | | | |
| Total Energy | | | | | | 6,290,806 | |
| | | | | | | | |
| |
| SEE NOTES TO FINANCIAL STATEMENTS. | | THE GUGGENHEIM FUNDS SEMI-ANNUAL REPORT | 63 |
| SCHEDULE OF INVESTMENTS (Unaudited) (continued) | | March 31, 2014 |
| |
| MACRO OPPORTUNITIES FUND | | |
| | | | | FACE | | | | |
| | | | | AMOUNT | | | VALUE | |
| |
| | | | | | | | | |
| UTILITIES - 0.1% | | | | | | | |
| | Astoria Generating Company | | | | | | | |
| | Acquisitions LLC | | | | | | | |
| | 8.50% due 10/26/17 | | $ | 1,462,500 | | $ | 1,506,375 | |
| | | | | | | | |
| Total Senior Floating Rate Interests | | | | | | | |
| | (Cost $290,937,917) | | | | | | 294,072,738 | |
| | | | | | | | |
| | | | | | | | | |
| COLLATERALIZED MORTGAGE | | | | | | | |
| OBLIGATIONS†† - 10.5% | | | | | | | |
| | Lehman XS Trust Series | | | | | | | |
| | 2005-7N, 0.42% due 12/25/351 | | | 8,385,674 | | | 7,904,571 | |
| | 2006-16N, 0.34% due 11/25/461 | | | 9,331,041 | | | 7,602,746 | |
| | Nomura Resecuritization Trust | | | | | | | |
| | 2012-1R, 0.60% due 08/27/471,3 | | | 14,536,410 | | | 13,392,394 | |
| | IndyMac INDX Mortgage Loan Trust | | | | | | | |
| | 2006-AR4, 0.36% due 05/25/461 | | | 13,157,299 | | | 11,199,098 | |
| | Washington Mutual Mortgage | | | | | | | |
| | Pass-Through Certificates | | | | | | | |
| | WMALT Series 2006-AR9 Trust | | | | | | | |
| | 2006-AR9, 0.97% due 11/25/461 | | | 12,704,145 | | | 8,458,560 | |
| | HarborView Mortgage Loan Trust | | | | | | | |
| | 2006-12, 0.35% due 01/19/381 | | | 9,868,392 | | | 8,291,314 | |
| | CSMC Trust 2014-SURF | | | | | | | |
| | 3.26% due 02/15/291,3 | | | 7,300,000 | | | 7,314,593 | |
| | GreenPoint Mortgage Funding Trust | | | | | | | |
| | 2006-AR1, 0.44% due 02/25/361 | | | 8,779,463 | | | 6,998,259 | |
| | SRERS-2011 Funding Ltd. | | | | | | | |
| | 2011-RS, 0.40% due 05/09/461,3 | | | 6,896,515 | | | 6,378,588 | |
| | Wells Fargo Alternative | | | | | | | |
| | Loan 2007-PA3 Trust | | | | | | | |
| | 2007-PA3, 6.25% due 07/25/37 | | | 6,953,939 | | | 6,324,816 | |
| | COMM 2006-FL12 Mortgage Trust | | | | | | | |
| | 2006-FL12, 0.45% due 12/15/201,3 | | | 3,248,464 | | | 3,222,282 | |
| | 2006-FL12, 0.50% due 12/15/201,3 | | | 2,599,072 | | | 2,566,700 | |
| | Structured Asset Mortgage | | | | | | | |
| | Investments II Trust | | | | | | | |
| | 2006-AR1, 0.38% due 02/25/361 | | | 5,157,838 | | | 4,387,267 | |
| | Chase Mortgage Finance Trust Series | | | | | | | |
| | 2006-S3, 6.00% due 11/25/36 | | | 4,003,325 | | | 3,459,189 | |
| | Residential Asset Securitization Trust | | | | | | | |
| | 2006-A12, 6.25% due 11/25/36 | | | 4,158,977 | | | 3,197,804 | |
| | Washington Mutual Mortgage | | | | | | | |
| | Pass-Through Certificates | | | | | | | |
| | WMALT Series 2006-8 Trust | | | | | | | |
| | 2006-8, 5.77% due 10/25/36 | | | 4,483,836 | | | 3,131,735 | |
| | First Horizon Alternative Mortgage | | | | | | | |
| | Securities Trust | | | | | | | |
| | 2006-FA1, 5.75% due 04/25/36 | | | 3,040,840 | | | 2,693,354 | |
| | Alliance Bancorp Trust | | | | | | | |
| | 2007-OA1, 0.39% due 07/25/371 | | | 3,936,208 | | | 2,594,536 | |
| | Washington Mutual Mortgage | | | | | | | |
| | Pass-Through Certificates | | | | | | | |
| | WMALT Series 2007-OA4 Trust | | | | | | | |
| | 2007-OA4, 0.89% due 04/25/471 | | | 3,159,650 | | | 2,359,810 | |
| | Wachovia Bank Commercial | | | | | | | |
| | Mortgage Trust Series | | | | | | | |
| | 2007-WHL8, 0.86% due 06/15/201,3 | | | 2,190,914 | | | 2,142,589 | |
| | American Home Mortgage Assets Trust | | | | | | | |
| | 2006-4, 0.34% due 10/25/461 | | | 2,632,991 | | | 1,754,667 | |
| | Bear Stearns Mortgage Funding Trust | | | | | | | |
| | 2007-AR5, 0.32% due 06/25/471 | | | 1,925,375 | | | 1,549,289 | |
| | Resource Capital Corporation | | | | | | | |
| | CRE Notes 2013 Ltd., | | | | | | | |
| | 3.66% due 12/15/28†††,1,3 | | | 1,000,000 | | | 1,000,500 | |
| | Credit Suisse Mortgage Capital Certificates | | | | | | | |
| | 2006-TF2A, | | | | | | | |
| | 0.56% due 10/15/211,3 | | | 1,000,000 | | | 968,310 | |
| | BAMLL-DB Trust | | | | | | | |
| | 2012-OSI, 6.79% due 04/13/293 | | | 550,000 | | | 574,606 | |
| | | | | | | | |
| Total Collateralized Mortgage Obligations | | | | | | | |
| | (Cost $118,139,334) | | | | | | 119,467,577 | |
| | | | | | | | |
| | | | | | | | | |
| MORTGAGE BACKED SECURITIES†† - 1.3% | | | | | | | |
| | Fannie Mae5,11 | | | | | | | |
| | 2013-28, 3.00% due 04/25/43 | | | 3,203,805 | | | 2,596,781 | |
| | 2013-34, 3.00% due 04/25/43 | | | 2,206,282 | | | 1,967,035 | |
| | 2013-54, 3.00% due 06/25/33 | | | 1,799,670 | | | 1,480,894 | |
| | 2013-17, 2.50% due 03/25/43 | | | 1,529,214 | | | 1,274,765 | |
| | 2013-2, 3.00% due 02/25/43 | | | 937,036 | | | 799,258 | |
| | Freddie Mac5,11 | | | | | | | |
| | 2013-4184, 3.00% due 03/15/43 | | | 3,179,763 | | | 2,588,621 | |
| | 2013-4204, 3.00% due 05/15/43 | | | 2,910,420 | | | 2,206,579 | |
| | 2013-4180, 3.00% due 03/15/43 | | | 2,129,979 | | | 1,823,340 | |
| | | | | | | | |
| Total Mortgage Backed Securities | | | | | | | |
| | (Cost $17,443,861) | | | | | | 14,737,273 | |
| | | | | | | | |
| | | | | | | | | |
| MUNICIPAL BONDS†† - 0.0% | | | | | | | |
| OTHER TERRITORIES - 0.0% | | | | | | | |
| | Commonwealth of Puerto Rico General | | | | | | | |
| | Obligation Unlimited | | | | | | | |
| | 8.00% due 07/01/35 | | | 220,000 | | | 205,291 | |
| | | | | | | | |
| Total Municipal Bonds | | | | | | | |
| | (Cost $204,611) | | | | | | 205,291 | |
| | | | | | | | |
| | | | | | | | | |
| REPURCHASE AGREEMENTS††,8 - 0.8% | | | | | | | |
| | Jefferies & Company, Inc. issued 03/14/14 at | | | | | | | |
| | 2.16% due 04/15/14 | | | 4,648,000 | | | 4,648,000 | |
| | Jefferies & Company, Inc. issued 03/31/14 at | | | | | | | |
| | 2.16% due 04/15/14 | | | 4,272,000 | | | 4,272,000 | |
| | | | | | | | |
| Total Repurchase Agreements | | | | | | | |
| | (Cost $8,920,000) | | | | | | 8,920,000 | |
| | | | | | | | |
| | | | CONTRACTS | | | | |
| | | | | | | | |
| OPTIONS PURCHASED† - 0.2% | | | | | | | |
| | Call options on: | | | | | | | |
| | June 2014 U.S. Dollar/Turkish Lira | | | | | | | |
| | Expiring with strike price of $2.28 | | | 120,000,000 | | | 1,277,160 | |
| | January 2015 SPDR Gold Shares Expiring | | | | | | | |
| | with strike price of $140.00 | | | 4,355 | | | 1,088,750 | |
| | | | | | | | |
| Total Call options | | | | | | 2,365,910 | |
| | | | | | | | |
| Total Options Purchased | | | | | | | |
| | (Cost $8,107,174) | | | | | | 2,365,910 | |
| | | | | | | | |
| Total Investments - 114.1% | | | | | | | |
| | (Cost $1,292,102,318) | | | | | $ | 1,296,570,546 | |
| | | | | | | | |
| |
| 64 | THE GUGGENHEIM FUNDS SEMI-ANNUAL REPORT | | SEE NOTES TO FINANCIAL STATEMENTS. |
| SCHEDULE OF INVESTMENTS (Unaudited) (concluded) | | March 31, 2014 |
| |
| MACRO OPPORTUNITIES FUND | | |
| | | | CONTRACTS | | VALUE | |
| |
| | | | | | | | | |
| OPTIONS WRITTEN† - 0.0% | | | | | | | |
| | Call options on: | | | | | | | |
| | SPDR Gold Trust Expiring January 2015 | | | | | | | |
| | with strike price of $155.00 | | | 354 | | $ | (38,940 | ) |
| | | | | | | | |
| Total Options Written | | | | | | | |
| | (Premiums received $225,834) | | | | | | (38,940 | ) |
| | | | | | | | |
| Other Assets & Liabilities, net - (14.1)% | | | | | | (160,339,784 | ) |
| | | | | | | | |
| Total Net Assets - 100.0% | | | | | $ | 1,136,191,822 | |
| | | | | | | | |
| | | | | | | | | |
| |
| | | | | | | | | |
| | | | | | | UNREALIZED | |
| | | | | | | GAIN (LOSS) | |
| | | | | | | | |
| CURRENCY FUTURES CONTRACTS PURCHASED† | | | | | | | |
| | June 2014 U.S. Dollar Index Futures Contracts | | | | | | | |
| | (Aggregate Value of Contracts $18,538,905) | | | 231 | | $ | 120,351 | |
| | | | | | | | |
| | | | | | | | | |
| | | | UNITS | | | | |
| | | | | | | | |
| OTC EQUITY INDEX SWAP AGREEMENTS†† | | | | | | | |
| | Bank of America May 2014 S&P 1500 | | | | | | | |
| | Education Services Sub-Industry Index | | | | | | | |
| | May 2014 Swap, Terminating 05/05/14 | | | | | | | |
| | (Notional Value $34,718,789) | | | 590,757 | | | 2,960,441 | |
| | Bank of America April 2014 S&P 500 | | | | | | | |
| | Homebuilding Index April 2014 Swap, | | | | | | | |
| | Terminating 04/11/14 (Notional Value | | | | | | | |
| | $27,150,699) | | | 47,642 | | | (29,902 | ) |
| | | | | | | | |
| (Total Notional Value $61,869,488) | | | | | $ | 2,930,539 | |
| | | | | | | | |
| | | | | | | | | |
| OTC TOTAL RETURN SWAPS AGREEMENTS SOLD SHORT†† | | | | | | | |
| | Bank of America June 2014 Japan | | | | | | | |
| | Government Bond 10 Year Future | | | | | | | |
| | June 2014 Swap, Terminating 06/12/1410 | | | | | | | |
| | (Notional Value $77,090,055) | | | 55,000,000 | | $ | 43,269 | |
| | | | | | | | |
CENTRALLY CLEARED INTEREST RATE SWAPS AGREEMENTS††
| | | Receive | | | | | | | | | | | | | | | |
| | | Floating | | Floating | | Fixed | | Maturity | | Notional | | | Market | | | Unrealized | |
| Counterparty | | Rate | | Rate Index | | Rate | | Date | | Amount | | | Value | | | (Depreciation | ) |
| |
| Merrill Lynch | | Receive | | 3-Month USD-LIBOR | | 2.73% | | 07/02/2023 | | $(23,800,000 | ) | | $(119,000 | ) | | $ | (119,000 | ) |
| Merrill Lynch | | Receive | | 3-Month USD-LIBOR | | 1.59% | | 07/02/2018 | | (34,550,000 | ) | | (190,025 | ) | | | (190,025 | ) |
| | | | | | | | | | | | | | | | | |
| | | | | | | | | | | | | | | | | $ | (309,025 | ) |
| | | | | | | | | | | | | | | | | |
FORWARD FOREIGN CURRENCY EXCHANGE CONTRACTS††
| Contracts to Sell | | Currency | | Counterparty | | Settlement
Date | | Settlement
Value | | Value at
03/31/14 | | Net Unrealized
Appreciation |
| |
| 15,700,000 | | Euro | | Bank of America | | 06/18/14 | | $ | 30,710,379 | | $ | 30,499,085 | | $ | 211,294 |
| * | | Non-income producing security. |
| † | | Value determined based on Level 1 inputs — See Note 4. |
| †† | | Value determined based on Level 2 inputs, unless otherwise noted — See Note 4. |
| ††† | | Value determined based on Level 3 inputs — See Note 4. |
| 1 | | Variable rate security. Rate indicated is rate effective at March 31, 2014. |
| 2 | | Perpetual maturity. |
| 3 | | Security is a 144A or Section 4(a)(2) security. The total market value of 144A or Section 4(a)(2) securities is $430,598,369 (cost $423,659,414), or 37.9% of total net assets. |
| 4 | | Affiliated funds. |
| 5 | | On September 7, 2008, the issuer was placed in conservatorship by the Federal Housing Finance Agency (FHFA). As conservator, the FHFA has full powers to control the assets and operations of the firm. |
| 6 | | Security is in default of interest and/or principal obligations. |
| 7 | | Security with no rate was unsettled at March 31, 2014. |
| 8 | | Repurchase Agreements — See Note 9. |
| 9 | | Illiquid security. |
| 10 | | Total return based on Japan Government Bond 10 year Future Index +/- financing at a variable rate. |
| 11 | | Security or a portion thereof is held as collateral for reverse repurchase agreements — See Note 11. |
| | | plc — Public Limited Company |
| | | REIT — Real Estate Investment Trust |
| |
| SEE NOTES TO FINANCIAL STATEMENTS. | | THE GUGGENHEIM FUNDS SEMI-ANNUAL REPORT | 65 |
| STATEMENT OF ASSETS AND LIABILITIES (Unaudited) |
| |
| March 31, 2014 |
| ASSETS: | | | | |
| Investments in unaffiliated issuers, at value | | | | |
(cost $1,255,889,835) | | $ | 1,257,564,025 | |
| Investments in affiliated issuers, at value (cost $30,012,532) | | | 30,086,521 | |
| Repurchase agreements, at value (cost $8,920,000) | | | 8,920,000 | |
| | | | |
| Total investments (cost $1,294,822,367) | | | 1,296,570,546 | |
| Cash | | | 3,412,317 | |
| Unrealized appreciation on swap agreements | | | 3,003,710 | |
Unrealized appreciation on forward foreign currency exchange contracts | | | 211,294 | |
| Segregated cash with broker | | | 2,136,650 | |
| Prepaid expenses | | | 179,261 | |
| Receivables: | | | | |
Fund shares sold | | | 8,765,153 | |
Securities sold | | | 8,658,536 | |
Interest | | | 8,398,614 | |
Dividends | | | 224,185 | |
Investment advisor | | | 209,982 | |
Variation margin | | | 120,351 | |
Foreign taxes reclaim | | | 2,526 | |
| | | | |
| Total assets | | | 1,331,893,125 | |
| | | | |
| LIABILITIES: | | | | |
| Reverse Repurchase Agreements | | | 90,066,961 | |
| Due to Broker | | | 1,114,000 | |
| Unfunded loan commitment, at value | | | | |
(commitment fees received $119,155) | | | 104,778 | |
| Unrealized depreciation on swap agreements | | | 338,927 | |
| Options written, at value (premiums received $225,834) | | | 38,940 | |
| Payable for: | | | | |
Securities purchased | | | 98,992,574 | |
Fund shares redeemed | | | 2,914,828 | |
Management fees | | | 822,034 | |
Distribution and service fees | | | 240,786 | |
Fund accounting/administration fees | | | 87,954 | |
Transfer agent/maintenance fees | | | 26,416 | |
Trustees’ fees* | | | 849 | |
Miscellaneous | | | 952,256 | |
| | | | |
| Total liabilities | | | 195,701,303 | |
| | | | |
| NET ASSETS | | $ | 1,136,191,822 | |
| | | | |
| NET ASSETS CONSIST OF: | | | | |
| Paid in capital | | $ | 1,148,137,574 | |
| Accumulated net investment loss | | | (2,059,138 | ) |
| Accumulated net realized loss on investments | | | (17,542,857 | ) |
| Net unrealized appreciation on investments | | | 7,656,243 | |
| | | | |
| Net assets | | $ | 1,136,191,822 | |
| | | | |
| A-CLASS: | | | | |
| Net assets | | $ | 389,647,123 | |
| Capital shares outstanding | | | 14,371,483 | |
| Net asset value per share | | | $27.11 | |
| | | | |
| Maximum offering price per share | | | | |
(Net asset value divided by 95.25%) | | | $28.46 | |
| | | | |
| C-CLASS: | | | | |
| Net assets | | $ | 195,798,829 | |
| Capital shares outstanding | | | 7,227,098 | |
| Net asset value per share | | | $27.09 | |
| | | | |
| INSTITUTIONAL CLASS: | | | | |
| Net assets | | $ | 550,745,870 | |
| Capital shares outstanding | | | 20,289,389 | |
| Net asset value per share | | | $27.14 | |
| | | | |
| STATEMENT OF OPERATIONS (Unaudited) |
| |
| Period Ended March 31, 2014 |
| INVESTMENT INCOME: | | | | |
| Interest | | $ | 27,529,556 | |
| Dividends from securities of unaffiliated issuers | | | 2,195,080 | |
| Dividends from securities of affiliated issuers | | | 12,532 | |
| | | | |
Total investment income | | | 29,737,168 | |
| | | | |
| | | | | |
| EXPENSES: | | | | |
| Management fees | | | 4,267,908 | |
| Transfer agent/maintenance fees | | | | |
A-Class | | | 173,671 | |
C-Class | | | 59,905 | |
Institutional Class | | | 66,113 | |
| Distribution and service fees: | | | | |
A-Class | | | 423,498 | |
C-Class | | | 867,518 | |
| Fund accounting/administration fees | | | 455,556 | |
| Short interest expense | | | 449,551 | |
| Line of credit interest expense | | | 56,627 | |
| Trustees’ fees* | | | 32,981 | |
| Custodian fees | | | 2,275 | |
| Tax expense | | | 20 | |
| Miscellaneous | | | 433,762 | |
| | | | |
Total expenses | | | 7,289,385 | |
| | | | |
| Less: | | | | |
| Expenses waived by Advisor | | | (544,340 | ) |
| Expenses waived by Transfer Agent | | | | |
A-Class | | | (41,822 | ) |
C-Class | | | (4,431 | ) |
Institutional Class | | | (66,113 | ) |
| | | | |
| Total expenses waived | | | (656,706 | ) |
| | | | |
| Net expenses | | | 6,632,679 | |
| | | | |
| Net investment income | | | 23,104,489 | |
| | | | |
| | | | | |
| NET REALIZED AND UNREALIZED GAIN (LOSS): | | | | |
| Net realized gain (loss) on: | | | | |
Investments in unaffiliated issuers | | | 778,073 | |
Swap agreements | | | 1,734,141 | |
Futures contracts | | | (197,112 | ) |
Foreign currency | | | (36,609 | ) |
Securities sold short | | | 118,617 | |
Options purchased | | | (2,359,857 | ) |
Options written | | | 516,281 | |
| | | | |
| Net realized gain | | | 553,534 | |
| | | | |
| Net change in unrealized appreciation (depreciation) on: | | | | |
Investments in unaffiliated issuers | | | 26,289,007 | |
Investments in affiliated issuers | | | 73,989 | |
Unfunded loan commitments | | | 5,023 | |
Swap agreements | | | 4,143,547 | |
Futures contracts | | | 120,351 | |
Options purchased | | | (1,774,801 | ) |
Options written | | | (61,336 | ) |
Foreign currency | | | 201,610 | |
| | | | |
| Net change in unrealized appreciation (depreciation) | | | 28,997,390 | |
| | | | |
| Net realized and unrealized gain | | | 29,550,924 | |
| | | | |
| Net increase in net assets resulting from operations | | $ | 52,655,413 | |
| | | | |
* Relates to Trustees not deemed “interested persons” within the meaning of Section 2(a)(19) of the 1940 Act.
| |
| 66 | THE GUGGENHEIM FUNDS SEMI-ANNUAL REPORT | SEE NOTES TO FINANCIAL STATEMENTS. |
| STATEMENTS OF CHANGES IN NET ASSETS |
| |
| | | Period Ended | | | | | |
| | | March 31, | | | Year Ended | |
| | | 2014 | | | September 30, | |
| | | (Unaudited) | | | 2013 | |
| |
| | | | | | | | | |
| INCREASE (DECREASE) IN NET ASSETS FROM OPERATIONS: | | | | | | | | |
| Net investment income | | $ | 23,104,489 | | | $ | 34,053,445 | |
| Net realized gain (loss) on investments | | | 553,534 | | | | (4,447,248 | ) |
| Net change in unrealized appreciation (depreciation) on investments | | | 28,997,390 | | | | (26,368,248 | ) |
| |
| Net increase in net assets resulting from operations | | | 52,655,413 | | | | 3,237,949 | |
| |
| | | | | | | | | |
| DISTRIBUTIONS TO SHAREHOLDERS FROM: | | | | | | | | |
| Net investment income | | | | | | | | |
A-Class | | | (8,706,171 | ) | | | (12,522,539 | ) |
C-Class | | | (3,833,605 | ) | | | (4,768,075 | ) |
Institutional Class | | | (12,206,914 | ) | | | (17,291,805 | ) |
| Net realized gains | | | | | | | | |
A-Class | | | – | | | | (501,652 | ) |
C-Class | | | – | | | | (204,259 | ) |
Institutional Class | | | – | | | | (603,940 | ) |
| |
| Total distributions to shareholders | | | (24,746,690 | ) | | | (35,892,270 | ) |
| |
| | | | | | | | | |
| CAPITAL SHARE TRANSACTIONS: | | | | | | | | |
| Proceeds from sale of shares | | | | | | | | |
A-Class | | | 139,917,746 | | | | 444,592,091 | |
C-Class | | | 44,911,797 | | | | 180,978,622 | |
Institutional Class | | | 206,386,518 | | | | 608,202,900 | |
| Value of proceeds of merger | | | | | | | | |
A-Class | | | – | | | | 12,881,126 | |
C-Class | | | – | | | | 6,546,846 | |
Institutional Class | | | – | | | | 2,252,116 | |
| Distributions reinvested | | | | | | | | |
A-Class | | | 6,880,773 | | | | 10,739,892 | |
C-Class | | | 3,206,940 | | | | 4,399,264 | |
Institutional Class | | | 10,044,864 | | | | 14,904,818 | |
| Cost of shares redeemed | | | | | | | | |
A-Class | | | (101,843,184 | ) | | | (204,778,201 | ) |
C-Class | | | (20,529,055 | ) | | | (56,074,395 | ) |
Institutional Class | | | (95,299,141 | ) | | | (299,893,193 | ) |
| |
| Net increase from capital share transactions | | | 193,677,258 | | | | 724,751,886 | |
| |
| Net increase in net assets | | | 221,585,981 | | | | 692,097,565 | |
| | | | | | | | | |
| NET ASSETS: | | | | | | | | |
Beginning of period | | | 914,605,841 | | | | 222,508,276 | |
| |
End of period | | $ | 1,136,191,822 | | | $ | 914,605,841 | |
| |
| Distributions in excess of net investment loss at end of period | | $ | (2,059,138 | ) | | $ | (416,937 | ) |
| |
| | | | | | | | | |
| CAPITAL SHARE ACTIVITY: | | | | | | | | |
| Shares sold | | | | | | | | |
A-Class | | | 5,198,628 | | | | 13,508,658 | † |
C-Class | | | 1,668,580 | | | | 5,550,606 | † |
Institutional Class | | | 7,653,881 | | | | 18,519,609 | † |
| Shares issued from reinvestment of distributions | | | | | | | | |
A-Class | | | 256,050 | | | | 391,935 | |
C-Class | | | 119,433 | | | | 160,703 | |
Institutional Class | | | 373,238 | | | | 544,723 | |
| Shares redeemed | | | | | | | | |
A-Class | | | (3,805,970 | ) | | | (4,309,477 | ) |
C-Class | | | (765,570 | ) | | | (740,595 | ) |
Institutional Class | | | (3,557,650 | ) | | | (7,262,144 | ) |
| |
| Net increase in shares | | | 7,140,620 | | | | 26,364,018 | |
| |
† Includes 470,457 A-Class, 239,285 C-Class and 82,164 Institutional Class shares issued in connection with Fund merger.
| |
| SEE NOTES TO FINANCIAL STATEMENTS. | THE GUGGENHEIM FUNDS SEMI-ANNUAL REPORT | 67 |
| FINANCIAL HIGHLIGHTS |
| |
| This table is presented to show selected data for a share outstanding throughout each period and to assist shareholders in evaluating a Fund’s performance for the periods presented. |
| | | Period Ended | | | Year Ended | | | Period Ended | |
| | | March 31, | | | September 30, | | | September 30, | |
| A-Class | | 2014a | | | 2013 | | | 2012b | |
| |
| Per Share Data | | | | | | | | | | | | |
| Net asset value, beginning of period | | $ | 26.31 | | | $ | 26.53 | | | $ | 25.00 | |
| |
| Income (loss) from investment operations: | | | | | | | | | | | | |
| Net investment income (loss)c | | | .64 | | | | 1.37 | | | | .99 | |
| Net gain (loss) on investments (realized and unrealized) | | | .85 | | | | (.04 | ) | | | 1.52 | |
| | | |
| Total from investment operations | | | 1.49 | | | | 1.33 | | | | 2.51 | |
| |
| Less distributions from: | | | | | | | | | | | | |
| Net investment income | | | (.69 | ) | | | (1.43 | ) | | | (.98 | ) |
| Net realized gains | | | — | | | | (.12 | ) | | | — | |
| | | |
| Total distributions | | | (.69 | ) | | | (1.55 | ) | | | (.98 | ) |
| |
| Net asset value, end of period | | $ | 27.11 | | | $ | 26.31 | | | $ | 26.53 | |
| | | |
| |
| |
| Total Returnf | | | 5.72% | | | | 5.01% | | | | 10.19% | |
| |
| Ratios/Supplemental Data | | | | | | | | | | | | |
| Net assets, end of period (in thousands) | | $ | 389,647 | | | $ | 334,751 | | | $ | 83,081 | |
| |
| Ratios to average net assets: | | | | | | | | | | | | |
| Net investment income (loss) | | | 4.79% | | | | 5.11% | | | | 4.61% | |
| Total expensesd | | | 1.54% | | | | 1.56% | | | | 1.61% | |
| Net expensese,g | | | 1.40% | | | | 1.41% | | | | 1.37% | |
| |
| Portfolio turnover rate | | | 20% | | | | 84% | | | | 46% | |
| | | | | | | | | | | | | |
| | | | Period Ended | | | | Year Ended | | | | Period Ended | |
| | | | March 31, | | | | September 30, | | | | September 30, | |
| C-Class | | | 2014a | | | | 2013 | | | | 2012b | |
| |
| Per Share Data | | | | | | | | | | | | |
| Net asset value, beginning of period | | $ | 26.29 | | | $ | 26.51 | | | $ | 25.00 | |
| |
| Income (loss) from investment operations: | | | | | | | | | | | | |
| Net investment income (loss)c | | | .54 | | | | 1.17 | | | | .82 | |
| Net gain (loss) on investments (realized and unrealized) | | | .85 | | | | (.03 | ) | | | 1.53 | |
| | | |
| Total from investment operations | | | 1.39 | | | | 1.14 | | | | 2.35 | |
| |
| Less distributions from: | | | | | | | | | | | | |
| Net investment income | | | (.59 | ) | | | (1.24 | ) | | | (.84 | ) |
| Net realized gains | | | — | | | | (.12 | ) | | | — | |
| | | |
| Total distributions | | | (.59 | ) | | | (1.36 | ) | | | (.84 | ) |
| |
| Net asset value, end of period | | $ | 27.09 | | | $ | 26.29 | | | $ | 26.51 | |
| | | |
| |
| |
| Total Returnf | | | 5.34% | | | | 4.26% | | | | 9.54% | |
| |
| Ratios/Supplemental Data | | | | | | | | | | | | |
| Net assets, end of period (in thousands) | | $ | 195,799 | | | $ | 163,129 | | | $ | 32,711 | |
| |
| Ratios to average net assets: | | | | | | | | | | | | |
| Net investment income (loss) | | | 4.07% | | | | 4.36% | | | | 3.83% | |
| Total expensesd | | | 2.26% | | | | 2.29% | | | | 2.31% | |
| Net expensese,g | | | 2.14% | | | | 2.15% | | | | 2.11% | |
| |
| Portfolio turnover rate | | | 20% | | | | 84% | | | | 46% | |
| |
| 68 | THE GUGGENHEIM FUNDS SEMI-ANNUAL REPORT | SEE NOTES TO FINANCIAL STATEMENTS. |
| FINANCIAL HIGHLIGHTS (concluded) |
| |
| This table is presented to show selected data for a share outstanding throughout each period and to assist shareholders in evaluating a Fund’s performance for the periods presented. |
| | | Period Ended | | | Year Ended | | | Period Ended | |
| | | March 31, | | | September 30, | | | September 30, | |
| Institutional Class | | 2014a | | | 2013 | | | 2012b | |
| |
| Per Share Data | | | | | | | | | | | | |
| Net asset value, beginning of period | | $ | 26.34 | | | $ | 26.56 | | | $ | 25.00 | |
| |
| Income (loss) from investment operations: | | | | | | | | | | | | |
| Net investment income (loss)c | | | .68 | | | | 1.46 | | | | 1.12 | |
| Net gain (loss) on investments (realized and unrealized) | | | .86 | | | | (.04 | ) | | | 1.47 | |
| | | |
| Total from investment operations | | | 1.54 | | | | 1.42 | | | | 2.59 | |
| |
| Less distributions from: | | | | | | | | | | | | |
| Net investment income | | | (.74 | ) | | | (1.52 | ) | | | (1.03 | ) |
| Net realized gains | | | — | | | | (.12 | ) | | | — | |
| | | |
| Total distributions | | | (.74 | ) | | | (1.64 | ) | | | (1.03 | ) |
| |
| Net asset value, end of period | | $ | 27.14 | | | $ | 26.34 | | | $ | 26.56 | |
| | | |
| | | | | | | | | | | | | |
| |
| Total Returnf | | | 5.93% | | | | 5.35% | | | | 10.55% | |
| |
| Ratios/Supplemental Data | | | | | | | | | | | | |
| Net assets, end of period (in thousands) | | $ | 550,746 | | | $ | 416,727 | | | $ | 106,716 | |
| |
| Ratios to average net assets: | | | | | | | | | | | | |
| Net investment income (loss) | | | 5.13% | | | | 5.43% | | | | 5.22% | |
| Total expensesd | | | 1.22% | | | | 1.23% | | | | 1.31% | |
| Net expensese,g | | | 1.08% | | | | 1.09% | | | | 1.06% | |
| |
| Portfolio turnover rate | | | 20% | | | | 84% | | | | 46% | |
| a | Unaudited figures for the period ended March 31, 2014. Percentage amounts for the period, except total return and portfolio turnover rate, have been annualized. |
| b | Since commencement of operations: November 30, 2011. Percentage amounts for the period, except total return and portfolio turnover rate, have been annualized. |
| c | Net investment income(loss) per share was computed using average shares outstanding throughout the period. |
| d | Does not include expenses of the underlying funds in which the Fund invests. |
| e | Net expense information reflects the expense ratios after expense waivers, and includes interest expense, if any. |
| f | Total return does not reflect the impact of any applicable sales charge and has not been annualized. |
| g | Excluding interest expense, the operating expense ratios for the periods presented would be: |
| | | 03/31/14 | | 09/30/13 | | 09/30/12 |
| |
| A-Class | | | 1.31 | % | | | 1.29 | % | | | 1.27 | % |
C-Class | | | 2.04 | % | | | 2.02 | % | | | 2.01 | % | | Institutional Class | | | 0.98 | % | | | 0.96 | % | | | 0.95 | % |
| |
| SEE NOTES TO FINANCIAL STATEMENTS. | THE GUGGENHEIM FUNDS SEMI-ANNUAL REPORT | 69 |
| FUND PROFILE (Unaudited) | March 31, 2014 |
| |
Holdings Diversification
(Market Exposure as % of Net Assets)
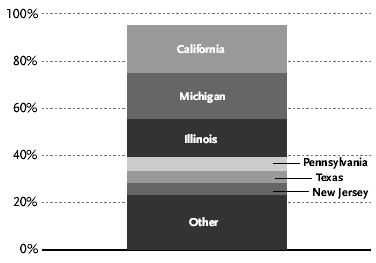
“Holdings Diversification (Market Exposure as % of Net Assets)” excludes any temporary cash investments.
| Ten Largest Holdings (% of Total Net Assets) | | | |
| |
| State of Illinois General | | | |
Obligation Unlimited | | 6.2 | % |
| Michigan Finance Authority | | | |
Revenue Notes | | 5.6 | % |
| North Texas Tollway Authority | | | |
Revenue Bonds | | 5.2 | % |
| State of California General | | | |
Obligation Unlimited | | 3.7 | % |
| Tustin Unified School District General | | | |
Obligation Unlimited | | 3.5 | % |
| Hudson County Improvement Authority | | | |
Revenue Bonds | | 3.1 | % |
| Detroit City School District General | | | |
Obligation Unlimited | | 2.8 | % |
| Northern Illinois University | | | |
Revenue Bonds | | 2.5 | % |
| Apple Valley Unified School District | | | |
General Obligation Unlimited | | 2.4 | % |
| Oakland Unified School | | | |
District/Alameda County | | | |
General Obligation Unlimited | | 2.4 | % |
| |
| Top Ten Total | | 37.4 | % |
| |
| Inception Dates: | | |
| |
| A-Class | | April 28, 2004 |
| C-Class | | January 13, 2012 |
| Institutional Class | | January 13, 2012 |
| Portfolio Composition by Quality Rating* |
| |
| Rating | | | |
| |
| Fixed Income Instruments | | | |
AA | | 51.8 | % |
A | | 33.0 | % |
BBB | | 4.6 | % |
BB | | 5.9 | % |
| Other Instruments | | | |
Short Term Investments | | 4.7 | % |
| |
| Total Investments | | 100.0 | % |
| |
The chart above reflects percentages of the value of total investments.
| * | Source: Factset. Credit quality ratings are measured on a scale that generally ranges from AAA (highest) to D (lowest). All securities have been rated by Moody’s, Standard & Poor’s (“S&P”), or Fitch, which are all a Nationally Recognized Statistical Rating Organization (“NRSRO”). For purposes of this presentation, when ratings are available from more than one agency, the highest rating is used. Guggenheim Investments has converted Moody’s and Fitch ratings to the equivalent S&P rating. Unrated securities do not necessarily indicate low credit quality. Security ratings are determined at the time of purchase and may change thereafter. |
| |
| 70 | THE GUGGENHEIM FUNDS SEMI-ANNUAL REPORT |
| SCHEDULE OF INVESTMENTS (Unaudited) | | March 31, 2014 |
| |
| MUNICIPAL INCOME FUND | | |
| | | | SHARES | | | VALUE | |
| |
| | | | | | | | |
| SHORT TERM INVESTMENTS† - 4.7% | | | | | | | |
Fidelity Institutional Tax-Exempt Portfolio | | | 2,528,738 | | $ | 2,528,738 | |
| | | | | | | |
| Total Short Term Investments | | | | | | | |
(Cost $2,528,738) | | | | | | 2,528,738 | |
| | | | | | | |
| | | | | | | | |
| | | | FACE | | | | |
| | | | AMOUNT | | | | |
| | | | | | | | |
| MUNICIPAL BONDS†† - 95.1% | | | | | | | |
| | | | | | | | |
| CALIFORNIA - 20.5% | | | | | | | |
State of California General | | | | | | | |
Obligation Unlimited | | | | | | | |
0.02% due 05/01/341 | | $ | 2,000,000 | | | 2,000,000 | |
5.00% due 02/01/27 | | | 750,000 | | | 851,685 | |
Tustin Unified School District | | | | | | | |
General Obligation Unlimited | | | | | | | |
6.00% due 08/01/36 | | | 1,600,000 | | | 1,866,783 | |
Oakland Unified School | | | | | | | |
District/Alameda County General | | | | | | | |
Obligation Unlimited | | | | | | | |
5.50% due 08/01/322 | | | 1,200,000 | | | 1,270,572 | |
5.00% due 08/01/222 | | | 300,000 | | | 327,642 | |
Stockton Public Financing | | | | | | | |
Authority Revenue Bonds | | | | | | | |
6.25% due 10/01/38 | | | 1,000,000 | | | 1,100,770 | |
6.25% due 10/01/40 | | | 250,000 | | | 276,593 | |
Apple Valley Unified School District | | | | | | | |
General Obligation Unlimited | | | | | | | |
5.00% due 08/01/28 | | | 1,180,000 | | | 1,290,329 | |
Stockton Unified School District | | | | | | | |
General Obligation Unlimited | | | | | | | |
5.00% due 07/01/282 | | | 500,000 | | | 539,185 | |
5.00% due 01/01/292 | | | 200,000 | | | 214,214 | |
San Bernardino City Unified School | | | | | | | |
District General Obligation Unlimited | | | | | | | |
5.00% due 08/01/25 | | | 250,000 | | | 280,210 | |
5.00% due 08/01/26 | | | 250,000 | | | 277,893 | |
5.00% due 08/01/32 | | | 150,000 | | | 159,656 | |
East Side Union High School District | | | | | | | |
General Obligation Unlimited | | | | | | | |
5.00% due 08/01/26 | | | 300,000 | | | 341,121 | |
Los Rios Community College District | | | | | | | |
General Obligation Unlimited | | | | | | | |
5.00% due 08/01/25 | | | 200,000 | | | 230,120 | |
| | | | | | | |
| Total California | | | | | | 11,026,773 | |
| | | | | | | |
| | | | | | | | |
| MICHIGAN - 19.4% | | | | | | | |
Michigan Finance Authority Revenue Notes | | | | | | | |
4.38% due 08/20/14 | | | 3,000,000 | | | 3,034,259 | |
City of Detroit Michigan Water Supply | | | | | | | |
System Revenue Revenue Bonds | | | | | | | |
5.00% due 07/01/18 | | | 1,165,000 | | | 1,170,497 | |
5.00% due 07/01/30 | | | 300,000 | | | 289,998 | |
5.00% due 07/01/33 | | | 280,000 | | | 276,937 | |
4.75% due 07/01/29 | | | 230,000 | | | 228,678 | |
5.00% due 07/01/16 | | | 200,000 | | | 200,562 | |
4.25% due 07/01/16 | | | 125,000 | | | 124,210 | |
5.25% due 07/01/22 | | | 95,000 | | | 94,303 | |
Detroit City School District General | | | | | | | |
Obligation Unlimited | | | | | | | |
5.00% due 05/01/32 | | | 1,500,000 | | | 1,538,024 | |
5.00% due 05/01/18 | | | 500,000 | | | 514,770 | |
5.00% due 05/01/30 | | | 300,000 | | | 311,088 | |
City of Detroit Michigan Sewage Disposal | | | | | | | |
System Revenue Revenue Bonds | | | | | | | |
5.00% due 07/01/21 | | | 540,000 | | | 532,062 | |
5.00% due 07/01/15 | | | 500,000 | | | 501,495 | |
5.50% due 07/01/22 | | | 200,000 | | | 201,166 | |
5.00% due 07/01/24 | | | 155,000 | | | 154,988 | |
5.25% due 07/01/19 | | | 100,000 | | | 100,406 | |
Oakland University Revenue Bonds | | | | | | | |
5.00% due 03/01/32 | | | 600,000 | | | 632,436 | |
Michigan Finance Authority | | | | | | | |
Revenue Bonds | | | | | | | |
5.00% due 11/01/27 | | | 500,000 | | | 531,215 | |
| | | | | | | |
| Total Michigan | | | | | | 10,437,094 | |
| | | | | | | |
| | | | | | | | |
| ILLINOIS - 15.9% | | | | | | | |
State of Illinois General Obligation Unlimited | | | | | | | |
5.00% due 02/01/22 | | | 3,000,000 | | | 3,364,560 | |
Northern Illinois University Revenue Bonds | | | | | | | |
5.50% due 04/01/21 | | | 1,160,000 | | | 1,317,853 | |
Will County Township High School | | | | | | | |
District No. 204 Joliet General | | | | | | | |
Obligation Limited | | | | | | | |
6.25% due 01/01/31 | | | 1,000,000 | | | 1,143,310 | |
Southern Illinois University Revenue Bonds | | | | | | | |
5.00% due 04/01/32 | | | 1,000,000 | | | 1,057,430 | |
Chicago Park District General | | | | | | | |
Obligation Limited | | | | | | | |
5.00% due 01/01/36 | | | 1,000,000 | | | 1,032,340 | |
City of Chicago Illinois General | | | | | | | |
Obligation Unlimited | | | | | | | |
5.00% due 01/01/24 | | | 260,000 | | | 261,926 | |
5.00% due 01/01/26 | | | 100,000 | | | 103,588 | |
5.00% due 01/01/23 | | | 70,000 | | | 75,521 | |
5.00% due 01/01/22 | | | 55,000 | | | 57,715 | |
University of Illinois Revenue Bonds | | | | | | | |
6.00% due 10/01/29 | | | 200,000 | | | 223,804 | |
| | | | | | | |
| Total Illinois | | | | | | 8,638,047 | |
| | | | | | | |
| | | | | | | | |
| PENNSYLVANIA - 6.1% | | | | | | | |
State Public School Building Authority | | | | | | | |
Revenue Bonds | | | | | | | |
5.00% due 04/01/28 | | | 1,000,000 | | | 1,064,370 | |
5.00% due 04/01/31 | | | 1,000,000 | | | 1,042,840 | |
Pennsylvania Turnpike Commission | | | | | | | |
Revenue Bonds | | | | | | | |
1.33% due 12/01/201 | | | 500,000 | | | 506,950 | |
5.00% due 12/01/28 | | | 200,000 | | | 220,522 | |
Monroeville Finance Authority | | | | | | | |
Revenue Bonds | | | | | | | |
5.00% due 02/15/29 | | | 450,000 | | | 488,061 | |
| | | | | | | |
| Total Pennsylvania | | | | | | 3,322,743 | |
| | | | | | | |
| |
| SEE NOTES TO FINANCIAL STATEMENTS. | | THE GUGGENHEIM FUNDS SEMI-ANNUAL REPORT | 71 |
| SCHEDULE OF INVESTMENTS (Unaudited) (concluded) | | March 31, 2014 |
| |
| MUNICIPAL INCOME FUND | | |
| | | | FACE | | | | |
| | | | AMOUNT | | | VALUE | |
| |
| | | | | | | | |
| TEXAS - 5.2% | | | | | | | |
North Texas Tollway Authority | | | | | | | |
Revenue Bonds | | | | | | | |
5.75% due 01/01/40 | | $ | 2,500,000 | | $ | 2,793,775 | |
| | | | | | | | |
| NEW JERSEY - 5.1% | | | | | | | |
Hudson County Improvement | | | | | | | |
Authority Revenue Bonds | | | | | | | |
6.00% due 01/01/40 | | | 1,500,000 | | | 1,662,375 | |
New Jersey State Turnpike | | | | | | | |
Authority Revenue Bonds | | | | | | | |
5.00% due 01/01/28 | | | 1,000,000 | | | 1,111,170 | |
| | | | | | | |
| Total New Jersey | | | | | | 2,773,545 | |
| | | | | | | |
| | | | | | | | |
| WASHINGTON - 3.6% | | | | | | | |
Greater Wenatchee Regional Events | | | | | | | |
Center Public Facilities Dist Revenue Bonds | | | | | | | |
5.25% due 09/01/322 | | | 1,000,000 | | | 983,730 | |
5.00% due 09/01/272 | | | 1,000,000 | | | 981,760 | |
| | | | | | | |
| Total Washington | | | | | | 1,965,490 | |
| | | | | | | |
| | | | | | | | |
| FLORIDA - 2.6% | | | | | | | |
City of Jacksonville Florida Revenue Bonds | | | | | | | |
5.00% due 10/01/30 | | | 600,000 | | | 658,278 | |
County of Miami-Dade Florida Transit | | | | | | | |
System Sales Surtax Revenue Revenue Bonds | | | | | | | |
5.00% due 07/01/31 | | | 500,000 | | | 545,080 | |
Miami-Dade County Health Facilities | | | | | | | |
Authority Revenue Bonds | | | | | | | |
5.00% due 08/01/24 | | | 200,000 | | | 216,818 | |
| | | | | | | |
| Total Florida | | | | | | 1,420,176 | |
| | | | | | | |
| | | | | | | | |
| OTHER TERRITORIES - 2.2% | | | | | | | |
Commonwealth of Puerto Rico General | | | | | | | |
Obligation Unlimited | | | | | | | |
8.00% due 07/01/35 | | | 1,300,000 | | | 1,214,148 | |
| | | | | | | |
| | | | | | | | |
| MASSACHUSETTS - 2.1% | | | | | | | |
Massachusetts Development Finance | | | | | | | |
Agency Revenue Bonds | | | | | | | |
6.88% due 01/01/41 | | | 1,000,000 | | | 1,148,760 | |
| | | | | | | |
| | | | | | | | |
| TENNESSEE - 2.0% | | | | | | | |
Memphis Center City Revenue Finance Corp. | | | | | | | |
Revenue Bonds | | | | | | | |
5.25% due 11/01/30 | | | 1,000,000 | | | 1,105,130 | |
| | | | | | | |
| | | | | | | | |
| WEST VIRGINIA - 2.0% | | | | | | | |
West Virginia Higher Education Policy | | | | | | | |
Commission Revenue Bonds | | | | | | | |
5.00% due 04/01/29 | | | 1,000,000 | | | 1,092,210 | |
| | | | | | | | |
| LOUISIANA - 2.0% | | | | | | | |
Louisiana Stadium & Exposition District | | | | | | | |
Revenue Bonds | | | | | | | |
5.00% due 07/01/28 | | | 1,000,000 | | | 1,090,350 | |
| | | | | | | |
| | | | | | | | |
| COLORADO - 2.0% | | | | | | | |
University of Colorado Hospital Authority | | | | | | | |
Revenue Bonds | | | | | | | |
5.00% due 11/15/27 | | | 1,000,000 | | | 1,088,350 | |
| | | | | | | |
| | | | | | | | |
| MISSISSIPPI - 1.5% | | | | | | | |
Mississippi Development Bank Revenue Bonds | | | | | | | |
6.50% due 10/01/31 | | | 500,000 | | | 556,000 | |
6.25% due 10/01/26 | | | 230,000 | | | 259,240 | |
| | | | | | | |
| Total Mississippi | | | | | | 815,240 | |
| | | | | | | |
| | | | | | | | |
| WYOMING - 1.0% | | | | | | | |
County of Sweetwater Wyoming | | | | | | | |
Revenue Bonds | | | | | | | |
5.00% due 09/01/242 | | | 500,000 | | | 537,670 | |
| | | | | | | |
| | | | | | | | |
| INDIANA - 0.9% | | | | | | | |
County of Knox Indiana Revenue Bonds | | | | | | | |
5.00% due 04/01/27 | | | 470,000 | | | 497,537 | |
| | | | | | | |
| | | | | | | | |
| OHIO - 0.6% | | | | | | | |
University of Toledo Revenue Bonds | | | | | | | |
5.00% due 06/01/30 | | | 300,000 | | | 323,166 | |
| | | | | | | |
| | | | | | | | |
| KENTUCKY - 0.4% | | | | | | | |
City of Owensboro Kentucky Electric Light & | | | | | | | |
Power System Revenue Revenue Bonds | | | | | | | |
5.00% due 01/01/26 | | | 200,000 | | | 214,522 | |
| | | | | | | |
| Total Municipal Bonds | | | | | | | |
(Cost $50,978,279) | | | | | | 51,504,726 | |
| | | | | | | |
| Total Investments - 99.8% | | | | | | | |
(Cost $53,507,017) | | | | | $ | 54,033,464 | |
| | | | | | | |
| Other Assets & Liabilities, net - 0.2% | | | | | | 130,077 | |
| | | | | | | |
| Total Net Assets - 100.0% | | | | | $ | 54,163,541 | |
| † | | Value determined based on Level 1 inputs — See Note 4. |
| †† | | Value determined based on Level 2 inputs — See Note 4. |
| 1 | | Variable rate security. Rate indicated is rate effective at March 31, 2014. |
| 2 | | Illiquid security. |
| |
| 72 | THE GUGGENHEIM FUNDS SEMI-ANNUAL REPORT | | SEE NOTES TO FINANCIAL STATEMENTS. |
| STATEMENT OF ASSETS AND LIABILITIES (Unaudited) |
| |
| March 31, 2014 |
| ASSETS: | | | | |
| Investments, at value (cost $53,507,017) | | $ | 54,033,464 | |
| Prepaid expenses | | | 41,179 | |
| Receivables: | | | | |
Securities sold | | | 3,782,985 | |
Interest | | | 697,609 | |
Investment advisor | | | 21,530 | |
Fund shares sold | | | 16,216 | |
| | | | |
| Total assets | | | 58,592,983 | |
| | | | |
| LIABILITIES: | | | | |
| Payable for: | | | | |
Securities purchased | | | 3,840,752 | |
Fund shares redeemed | | | 441,375 | |
Management fees | | | 23,338 | |
Distribution and service fees | | | 10,604 | |
Transfer agent/maintenance fees | | | 4,652 | |
Fund accounting/administration fees | | | 4,484 | |
Trustees’ fees* | | | 2,820 | |
Miscellaneous | | | 101,417 | |
| | | | |
| Total liabilities | | | 4,429,442 | |
| | | | |
| NET ASSETS | | $ | 54,163,541 | |
| | | | |
| NET ASSETS CONSIST OF: | | | | |
| Paid in capital | | $ | 82,785,554 | |
| Undistributed net investment income | | | 159 | |
| Accumulated net realized loss on investments | | | (29,148,619 | ) |
| Net unrealized appreciation on investments | | | 526,447 | |
| | | | |
| Net assets | | $ | 54,163,541 | |
| | | | |
| A-CLASS: | | | | |
| Net assets | | $ | 45,723,720 | |
| Capital shares outstanding | | | 3,831,036 | |
| Net asset value per share | | | $11.94 | |
| | | | |
| Maximum offering price per share | | | | |
(Net asset value divided by 95.25%) | | | $12.54 | |
| | | | |
| C-CLASS: | | | | |
| Net assets | | $ | 884,093 | |
| Capital shares outstanding | | | 74,108 | |
| Net asset value per share | | | $11.93 | |
| | | | |
| INSTITUTIONAL CLASS: | | | | |
| Net assets | | $ | 7,555,728 | |
| Capital shares outstanding | | | 632,768 | |
| Net asset value per share | | | $11.94 | |
| | | | |
| STATEMENT OF OPERATIONS (Unaudited) |
| |
| Period Ended March 31, 2014 |
| INVESTMENT INCOME: | | | | |
| Interest | | $ | 1,098,771 | |
| | | | |
Total investment income | | | 1,098,771 | |
| | | | |
| | | | | |
| EXPENSES: | | | | |
| Management fees | | | 138,669 | |
| Transfer agent/maintenance fees | | | | |
A-Class | | | 31,315 | |
Institutional Class | | | 2,607 | |
C-Class | | | 1,327 | |
| Distribution and service fees: | | | | |
A-Class | | | 60,032 | |
C-Class | | | 4,424 | |
| Fund accounting/administration fees | | | 26,347 | |
| Registration fees | | | 26,242 | |
| Trustees’ fees* | | | 4,204 | |
| Line of credit interest expense | | | 3,273 | |
| Custodian fees | | | 2,450 | |
| Tax expense | | | 1 | |
| Miscellaneous | | | 44,354 | |
| | | | |
Total expenses | | | 345,245 | |
| | | | |
| Less: | | | | |
| Expenses waived by Advisor | | | (119,813 | ) |
| | | | |
| Net expenses | | | 225,432 | |
| | | | |
| Net investment income | | | 873,339 | |
| | | | |
| | | | | |
| NET REALIZED AND UNREALIZED GAIN (LOSS): | | | | |
| Net realized gain (loss) on: | | | | |
Investments | | | (142,205 | ) |
| | | | |
Net realized loss | | | (142,205 | ) |
| | | | |
| Net change in unrealized appreciation | | | | |
(depreciation) on: | | | | |
Investments | | | 1,755,401 | |
| | | | |
| Net change in unrealized appreciation | | | | |
(depreciation) | | | 1,755,401 | |
| | | | |
| Net realized and unrealized gain | | | 1,613,196 | |
| | | | |
Net increase in net assets resulting from operations | | $ | 2,486,535 | |
| | | | |
* Relates to Trustees not deemed “interested persons” within the meaning of Section 2(a)(19) of the 1940 Act.
| |
| SEE NOTES TO FINANCIAL STATEMENTS. | THE GUGGENHEIM FUNDS SEMI-ANNUAL REPORT | 73 |
| STATEMENTS OF CHANGES IN NET ASSETS |
| |
| | | Period Ended | | | | | |
| | | March 31, | | | Year Ended | |
| | | 2014 | | | September 30, | |
| | | (Unaudited) | | | 2013 | |
| |
| | | | | | | | | |
| INCREASE (DECREASE) IN NET ASSETS FROM OPERATIONS: | | | | | | | | |
| Net investment income | | $ | 873,339 | | | $ | 2,227,579 | |
| Net realized gain (loss) on investments | | | (142,205 | ) | | | 745,503 | |
| Net change in unrealized appreciation (depreciation) on investments | | | 1,755,401 | | | | (6,505,597 | ) |
| |
| Net increase (decrease) in net assets resulting from operations | | | 2,486,535 | | | | (3,532,515 | ) |
| |
| | | | | | | | | |
| DISTRIBUTIONS TO SHAREHOLDERS FROM: | | | | | | | | |
| Net investment income | | | | | | | | |
A-Class | | | (752,518 | ) | | | (2,041,962 | ) |
C-Class | | | (10,561 | ) | | | (48,584 | ) |
Institutional Class | | | (110,101 | ) | | | (137,034 | ) |
| |
| Total distributions to shareholders | | | (873,180 | ) | | | (2,227,580 | ) |
| |
| | | | | | | | | |
| CAPITAL SHARE TRANSACTIONS: | | | | | | | | |
| Proceeds from sale of shares | | | | | | | | |
A-Class | | | 3,883,029 | | | | 4,925,340 | |
C-Class | | | 133,685 | | | | 1,778,562 | |
Institutional Class | | | 3,075,906 | | | | 7,258,077 | |
| Distributions reinvested | | | | | | | | |
A-Class | | | 440,177 | | | | 1,250,808 | |
C-Class | | | 6,529 | | | | 38,482 | |
Institutional Class | | | 51,837 | | | | 50,050 | |
| Cost of shares redeemed | | | | | | | | |
A-Class | | | (10,440,770 | ) | | | (28,310,051 | ) |
C-Class | | | (772,120 | ) | | | (1,263,296 | ) |
Institutional Class | | | (2,128,975 | ) | | | (1,502,777 | ) |
| |
| Net decrease from capital share transactions | | | (5,750,702 | ) | | | (15,774,805 | ) |
| |
| Net decrease in net assets | | | (4,137,347 | ) | | | (21,534,900 | ) |
| | | | | | | | | |
| NET ASSETS: | | | | | | | | |
Beginning of period | | | 58,300,888 | | | | 79,835,788 | |
| |
End of period | | $ | 54,163,541 | | | $ | 58,300,888 | |
| |
| Undistributed net investment income at end of period | | $ | 159 | | | $ | – | |
| |
| | | | | | | | | |
| CAPITAL SHARE ACTIVITY: | | | | | | | | |
| Shares sold | | | | | | | | |
A-Class | | | 332,549 | | | | 388,242 | |
C-Class | | | 11,312 | | | | 139,985 | |
Institutional Class | | | 263,579 | | | | 582,166 | |
| Shares issued from reinvestment of distributions | | | | | | | | |
A-Class | | | 37,557 | | | | 101,493 | |
C-Class | | | 558 | | | | 3,135 | |
Institutional Class | | | 4,403 | | | | 4,176 | |
| Shares redeemed | | | | | | | | |
A-Class | | | (891,750 | ) | | | (2,302,372 | ) |
C-Class | | | (66,704 | ) | | | (107,647 | ) |
Institutional Class | | | (182,092 | ) | | | (122,904 | ) |
| |
| Net decrease in shares | | | (490,588 | ) | | | (1,313,726 | ) |
| |
| |
| 74 | THE GUGGENHEIM FUNDS SEMI-ANNUAL REPORT | SEE NOTES TO FINANCIAL STATEMENTS. |
| FINANCIAL HIGHLIGHTS |
| |
| This table is presented to show selected data for a share outstanding throughout each period and to assist shareholders in evaluating a Fund’s performance for the periods presented. |
| | | Period Ended | �� | | Year Ended | | | Period Ended | | | Year Ended | | | Year Ended | | | Year Ended | |
| | | March 31, | | | September 30, | | | September 30, | | | December 31, | | | December 31, | | | December 31, | |
| A-Class† | | 2014a | | | 2013 | | | 2012* | | | 2011 | | | 2010 | | | 2009 | |
| |
| Per Share Data | | | | | | | | | | | | | | | | | | | | | | | | |
| Net asset value, beginning of period | | $ | 11.59 | | | $ | 12.59 | | | $ | 11.82 | | | $ | 11.54 | | | $ | 11.01 | | | $ | 8.47 | |
| |
| Income (loss) from investment operations: | | | | | | | | | | | | | | | | | | | | | | | | |
| Net investment income (loss)b | | | .18 | | | | .38 | | | | .26 | | | | .64 | | | | .71 | | | | .75 | |
| Net gain (loss) on investments (realized and unrealized) | | | .35 | | | | (1.00 | ) | | | .78 | | | | .54 | | | | .68 | | | | 2.69 | |
| | | |
| Total from investment operations | | | .53 | | | | (.62 | ) | | | 1.03 | | | | 1.08 | | | | 1.29 | | | | 3.33 | |
| |
| Less distributions from: | | | | | | | | | | | | | | | | | | | | | | | | |
| Net investment income | | | (.18 | ) | | | (.38 | ) | | | (.26 | ) | | | (.80 | ) | | | (.76 | ) | | | (.79 | ) |
| | | |
| Total distributions | | | (.18 | ) | | | (.38 | ) | | | (.26 | ) | | | (.80 | ) | | | (.76 | ) | | | (.79 | ) |
| |
| Net asset value, end of period | | $ | 11.94 | | | $ | 11.59 | | | $ | 12.59 | | | $ | 11.82 | | | $ | 11.54 | | | $ | 11.01 | |
| | | |
| | | | | | | | | | | | | | | | | | | | | | | | | |
| |
| Total Returne | | | 4.63% | | | | (5.09% | ) | | | 8.91% | | | | 9.64% | | | | 12.03% | | | | 41.34% | |
| |
| Ratios/Supplemental Data | | | | | | | | | | | | | | | | | | | | | | | | |
| Net assets, end of period (in thousands) | | $ | 45,724 | | | $ | 50,463 | | | $ | 77,609 | | | $ | 182,150 | | | $ | 177,868 | | | $ | 169,674 | |
| |
| Ratios to average net assets: | | | | | | | | | | | | | | | | | | | | | | | | |
| Net investment income (loss) | | | 3.13% | | | | 3.04% | | | | 2.78% | | | | 4.60% | | | | 5.37% | | | | 6.73% | |
| Total expenses | | | 1.27% | | | | 1.14% | | | | 1.15% | | | | 2.09% | | | | 1.80% | | | | 1.94% | |
| Net expensesc | | | 0.83% | | | | 0.82% | | | | 0.87% | | | | 2.09% | | | | 1.80% | | | | 1.94% | |
| |
| Portfolio turnover rate | | | 71% | | | | 91% | | | | 121% | | | | 104% | | | | 156% | | | | 151% | |
| | | Period Ended | | | Year Ended | | | Period Ended | |
| | | March 31, | | | September 30, | | | September 30, | |
| C-Class | | 2014a | | | 2013 | | | 2012d | |
| |
| Per Share Data | | | | | | | | | | | | |
| Net asset value, beginning of period | | $ | 11.59 | | | $ | 12.58 | | | $ | 11.98 | |
| |
| Income (loss) from investment operations: | | | | | | | | | | | | |
| Net investment income (loss)b | | | .14 | | | | .28 | | | | .20 | |
| Net gain (loss) on investments (realized and unrealized) | | | .34 | | | | (.98 | ) | | | .62 | |
| | | |
| Total from investment operations | | | .48 | | | | (.70 | ) | | | .82 | |
| |
| Less distributions from: | | | | | | | | | | | | |
| Net investment income | | | (.14 | ) | | | (.29 | ) | | | (.22 | ) |
| | | |
| Total distributions | | | (.14 | ) | | | (.29 | ) | | | (.22 | ) |
| |
| Net asset value, end of period | | $ | 11.93 | | | $ | 11.59 | | | $ | 12.58 | |
| | | |
| | | | | | | | | | | | | |
| |
| Total Returne | | | 4.15% | | | | (5.70% | ) | | | 7.04% | |
| |
| Ratios/Supplemental Data | | | | | | | | | | | | |
| Net assets, end of period (in thousands) | | $ | 884 | | | $ | 1,495 | | | $ | 1,176 | |
| |
| Ratios to average net assets: | | | | | | | | | | | | |
| Net investment income (loss) | | | 2.39% | | | | 2.30% | | | | 2.36% | |
| Total expenses | | | 2.19% | | | | 1.93% | | | | 1.94% | |
| Net expensesc | | | 1.58% | | | | 1.57% | | | | 1.55% | |
| |
| Portfolio turnover rate | | | 71% | | | | 91% | | | | 121% | |
| |
| SEE NOTES TO FINANCIAL STATEMENTS. | | THE GUGGENHEIM FUNDS SEMI-ANNUAL REPORT | 75 |
| FINANCIAL HIGHLIGHTS (concluded) |
| |
| This table is presented to show selected data for a share outstanding throughout each period and to assist shareholders in evaluating a Fund’s performance for the periods presented. |
| | | Period Ended | | | Year Ended | | | Period Ended | |
| | | March 31, | | | September 30, | | | September 30, | |
| Institutional Class | | 2014a | | | 2013 | | | 2012d | |
| |
| Per Share Data | | | | | | | | | | | | |
| Net asset value, beginning of period | | $ | 11.60 | | | $ | 12.59 | | | $ | 11.98 | |
| |
| Income (loss) from investment operations: | | | | | | | | | | | | |
| Net investment income (loss)b | | | .20 | | | | .40 | | | | .29 | |
| Net gain (loss) on investments (realized and unrealized) | | | .34 | | | | (.98 | ) | | | .62 | |
| | | |
| Total from investment operations | | | .54 | | | | (.58 | ) | | | .91 | |
| |
| Less distributions from: | | | | | | | | | | | | |
| Net investment income | | | (.20 | ) | | | (.41 | ) | | | (.30 | ) |
| | | |
| Total distributions | | | (.20 | ) | | | (.41 | ) | | | (.30 | ) |
| |
| Net asset value, end of period | | $ | 11.94 | | | $ | 11.60 | | | $ | 12.59 | |
| | | |
| | | | | | | | | | | | | |
| |
| Total Returne | | | 4.67% | | | | (4.76% | ) | | | 7.76% | |
| |
| Ratios/Supplemental Data | | | | | | | | | | | | |
| Net assets, end of period (in thousands) | | $ | 7,556 | | | $ | 6,343 | | | $ | 1,051 | |
| |
| Ratios to average net assets: | | | | | | | | | | | | |
| Net investment income (loss) | | | 3.36% | | | | 3.35% | | | | 3.37% | |
| Total expenses | | | 0.97% | | | | 0.93% | | | | 0.86% | |
| Net expensesc | | | 0.58% | | | | 0.57% | | | | 0.55% | |
| |
| Portfolio turnover rate | | | 71% | | | | 91% | | | | 121% | |
| † | Effective January 13, 2012, the Fund acquired all of the assets and liabilities of the TS&W/Claymore Tax-Advantage Balance Fund(“TYW”), a registered closed-end management investment company. The A-Class financial highlights for the periods prior to that date reflect performance of TYW. |
| * | Prior to January 13, 2012, the Fund’s fiscal year end was December 31. Percentage amounts for the period, except total return and portfolio turnover rate, have been annualized. |
| a | Unaudited figures for the period ended March 31, 2014. Percentage amounts for the period, except total return and portfolio turnover rate, have been annualized. |
| b | Net investment income (loss) per share was computed using average shares outstanding throughout the period. |
| c | Net expense information reflects the expense ratios after expense waivers. |
| d | Since commencement of operations: January 13, 2012. Percentage amounts for the period, except total return and portfolio turnover rate, have been annualized. |
| e | Total return does not reflect the impact of any applicable sales charges and has not been annualized. |
| |
| 76 | THE GUGGENHEIM FUNDS SEMI-ANNUAL REPORT | | SEE NOTES TO FINANCIAL STATEMENTS. |
| |
| | | This page intentionally left blank. |
| |
| THE GUGGENHEIM FUNDS SEMI-ANNUAL REPORT | 77 |
| FUND PROFILE (Unaudited) | | March 31, 2014 |
| |
| TOTAL RETURN BOND FUND |
| |
| OBJECTIVE: | Seeks to provide total return, comprised of current income and capital appreciation. |
| Holdings Diversification |
| (Market Exposure as% of Net Assets) |
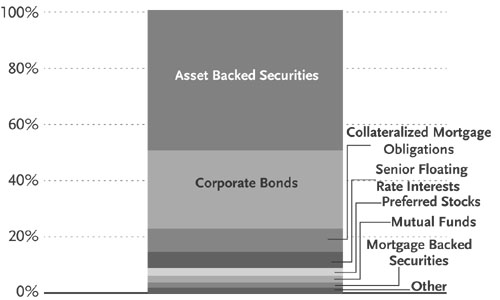
“Holdings Diversification (Market Exposure as % of Net Assets)” excludes any temporary cash investments.
| Ten Largest Holdings (% of Total Net Assets) | | | |
| |
| Guggenheim Limited Duration | | | |
Fund — Institutional Class | | 2.4 | % |
| Princess Juliana International | | | |
Airport Operating Company N.V. | | 1.4 | % |
| PNC Financial Services Group, Inc. | | 1.4 | % |
| KKR Financial CLO 2007-1 Ltd. — Class D | | 1.3 | % |
| RAIT CRE CDO I Ltd. — Class A1B | | 1.3 | % |
| Rockwall CDO Ltd. — Class A1LB | | 1.3 | % |
| N-Star Real Estate CDO IX Ltd. | | 1.2 | % |
| Itau Unibanco Holding S.A./Cayman | | | |
Island | | 1.2 | % |
| Castlelake Aircraft Securitization | | | |
Trust 2014-1 — Class A1 | | 1.2 | % |
| JPMorgan Chase & Co. | | 1.2 | % |
| |
| Top Ten Total | | 13.9 | % |
| |
| Inception Dates: | | |
| |
| A-Class | | November 30, 2011 |
| C-Class | | November 30, 2011 |
| Institutional Class | | November 30, 2011 |
| Portfolio Composition by Quality Rating* |
| |
| Rating | | | |
| |
| Fixed Income Instruments | | | |
AAA | | 3.9 | % |
AA | | 12.2 | % |
A | | 22.1 | % |
BBB | | 32.9 | % |
BB | | 5.4 | % |
B | | 7.3 | % |
CCC | | 5.1 | % |
CC | | 0.5 | % |
D | | 0.7 | % |
NR | | 0.9 | % |
| Other Instruments | | | |
Short Term Investments | | 4.0 | % |
Preferred Stocks | | 2.7 | % |
Mutual Funds | | 2.3 | % |
| |
| Total Investments | | 100.0 | % |
| |
The chart above reflects percentages of the value of total investments.
| * | Source: Factset. Credit quality ratings are measured on a scale that generally ranges from AAA (highest) to D (lowest). All securities have been rated by Moody’s, Standard & Poor’s (“S&P”), or Fitch, which are all a Nationally Recognized Statistical Rating Organization (“NRSRO”). For purposes of this presentation, when ratings are available from more than one agency, the highest rating is used. Guggenheim Investments has converted Moody’s and Fitch ratings to the equivalent S&P rating. Unrated securities do not necessarily indicate low credit quality. Security ratings are determined at the time of purchase and may change thereafter. |
| |
| 78 | THE GUGGENHEIM FUNDS SEMI-ANNUAL REPORT |
| SCHEDULE OF INVESTMENTS (Unaudited) | | March 31, 2014 |
| |
| TOTAL RETURN BOND FUND | | |
| | | | SHARES | | | VALUE | |
| |
| | | | | | | | |
| PREFERRED STOCKS† - 2.8% | | | | | | | |
Aspen Insurance Holdings Ltd. | | | | | | | |
5.95%1,2 | | | 80,000 | | $ | 1,984,800 | |
Seaspan Corp. | | | | | | | |
6.38% due 04/30/19* | | | 44,000 | | | 1,100,000 | |
Wells Fargo & Co. | | | | | | | |
5.85%1,2 | | | 30,000 | | | 747,000 | |
GSC Partners CDO Fund Limited/GSC | | | | | | | |
Partners CDO Fund Corp. | | | | | | | |
due 11/20/16*,1,3 | | | 1,325 | | | 594,236 | |
Reinsurance Group of America, Inc. | | | | | | | |
6.20% due 09/15/421 | | | 20,000 | | | 529,800 | |
Morgan Stanley | | | | | | | |
7.13%1,2 | | | 16,000 | | | 424,480 | |
AgriBank FCB | | | | | | | |
6.88%1,2 | | | 2,500 | | | 257,735 | |
City National Corp. | | | 8,000 | | | 221,680 | |
WhiteHorse II Ltd. | | | | | | | |
due 06/15/17*,1,3 | | | 450,000 | | | 22,500 | |
| | | | | | | |
| Total Preferred Stocks | | | | | | | |
(Cost $5,911,625) | | | | | | 5,882,231 | |
| | | | | | | |
| | | | | | | | |
| MUTUAL FUNDS† - 2.4% | | | | | | | |
Guggenheim Limited Duration | | | | | | | |
Fund - Institutional Class6 | | | 199,760 | | | 4,994,007 | |
| | | | | | | |
| Total Mutual Funds | | | | | | | |
(Cost $5,000,000) | | | | | | 4,994,007 | |
| | | | | | | |
| | | | | | | | |
| SHORT TERM INVESTMENTS† - 4.2% | | | | | | | |
Federated U.S. Treasury Cash Reserve Fund | | | 8,720,276 | | | 8,720,276 | |
| | | | | | | |
| Total Short Term Investments | | | | | | | |
(Cost $8,720,276) | | | | | | 8,720,276 | |
| | | | | | | |
| | | | | | | | |
| | | | FACE | | | | |
| | | | AMOUNT | | | | |
| | | | | | | |
| ASSET BACKED SECURITIES†† - 50.0% | | | | | | | |
Rockwall CDO II Ltd. | | | | | | | |
2007-1A, 0.79% due 08/01/241,3 | | $ | 1,900,000 | | | 1,618,040 | |
2007-1A, 0.49% due 08/01/241,3 | | | 1,740,241 | | | 1,614,073 | |
Castlelake Aircraft Securitization Trust | | | | | | | |
2014-1, 5.25% due 02/15/29††† | | | 2,476,750 | | | 2,501,518 | |
2014-1, 7.50% due 02/15/29††† | | | 500,000 | | | 505,000 | |
Rockwall CDO Ltd. | | | | | | | |
2006-1A, 0.74% due 08/01/211,3 | | | 2,900,000 | | | 2,728,609 | |
2006-1A, 0.89% due 08/01/211,3 | | | 200,000 | | | 182,840 | |
KKR Financial CLO 2007-1 Ltd. | | | | | | | |
2007-1A, 2.49% due 05/15/211,3 | | | 2,900,000 | | | 2,788,639 | |
RAIT CRE CDO I Ltd. | | | | | | | |
2006-1X, 0.49% due 11/20/46†††,1 | | | 3,249,118 | | | 2,749,403 | |
N-Star Real Estate CDO IX Ltd. | | | | | | | |
0.51% due 02/01/41†††,5 | | | 2,847,389 | | | 2,587,422 | |
Emerald Aviation Finance Ltd. | | | | | | | |
2013-1, 4.65% due 10/15/383 | | | 2,045,312 | | | 2,065,766 | |
2013-1, 6.35% due 10/15/383 | | | 438,281 | | | 445,381 | |
CKE Restaurant Holdings, Inc. | | | | | | | |
2013-1A, 4.47% due 03/20/433 | | | 2,314,750 | | | 2,338,124 | |
Drug Royalty II Limited Partnership | | | | | | | |
2012-1, 4.24% due 01/15/251,3 | | | 2,255,573 | | | 2,306,323 | |
Great Lakes CLO 2012-1 Ltd. | | | | | | | |
2012-1A, 4.34% due 01/15/231,3 | | | 1,250,000 | | | 1,261,000 | |
2012-1A, 0.00% due 01/15/23†††,3,8 | | | 1,000,000 | | | 905,200 | |
T2 Income Fund CLO Ltd. | | | | | | | |
2007-1A, 1.74% due 07/15/191,3 | | | 1,250,000 | | | 1,210,000 | |
2007-1X, 1.74% due 07/15/191 | | | 925,000 | | | 895,400 | |
Telos CLO Ltd. | | | | | | | |
2013-3A, 3.24% due 01/17/241,3 | | | 2,000,000 | | | 1,972,400 | |
TICP CLO I Ltd. | | | | | | | |
2014-1A, 3.23% due 04/26/261,3 | | | 2,000,000 | | | 1,968,400 | |
ALM VII R Ltd. | | | | | | | |
2013-7RA, 2.84% due 04/24/241,3 | | | 2,000,000 | | | 1,957,400 | |
GSAA Home Equity Trust | | | | | | | |
2006-18, 6.00% due 11/25/36 | | | 1,812,896 | | | 1,282,836 | |
2007-7, 0.42% due 07/25/371 | | | 732,402 | | | 634,502 | |
Duane Street CLO IV Ltd. | | | | | | | |
2007-4A, 2.49% due 11/14/211,3 | | | 2,000,000 | | | 1,907,000 | |
Argent Securities Incorporated | | | | | | | |
Asset-Backed Pass-Through | | | | | | | |
Certificates Series | | | | | | | |
2005-W3, 0.49% due 11/25/351 | | | 2,018,559 | | | 1,902,686 | |
Newstar Trust | | | | | | | |
2012-2A, 4.49% due 01/20/231,3 | | | 1,000,000 | | | 1,002,300 | |
2012-2A, 3.49% due 01/20/231,3 | | | 750,000 | | | 751,725 | |
Westchester CLO Ltd. | | | | | | | |
2007-1A, 0.68% due 08/01/221,3 | | | 1,850,000 | | | 1,676,840 | |
Gramercy Real Estate CDO 2007-1 Ltd. | | | | | | | |
2007-1A, 0.52% due 08/15/561,3 | | | 1,798,209 | | | 1,539,087 | |
ARES XXVI CLO Ltd. | | | | | | | |
2013-1A, 0.00% due 04/15/253,8 | | | 1,850,000 | | | 1,522,735 | |
CCR Incorporated MT100 Payment | | | | | | | |
Rights Master Trust | | | | | | | |
2010-CA, 0.60% due 07/10/171,3 | | | 1,550,919 | | | 1,501,289 | |
MCF CLO I LLC | | | | | | | |
2013-1A, 3.79% due 04/20/231,3 | | | 1,500,000 | | | 1,482,900 | |
Octagon Investment Partners XIX Ltd. | | | | | | | |
2014-1A, 3.08% due 04/15/261,3 | | | 1,500,000 | | | 1,479,900 | |
Greywolf CLO Ltd. | | | | | | | |
2014-1A, 3.08% due 04/22/261,3 | | | 1,500,000 | | | 1,474,800 | |
Turbine Engines Securitization Ltd. | | | | | | | |
2013-1A, 5.13% due 12/13/48†††,3 | | | 1,483,561 | | | 1,467,539 | |
Northwoods Capital Ltd. | | | | | | | |
2006-7X, 1.78% due 10/22/21 | | | 1,500,000 | | | 1,434,750 | |
Willis Engine Securitization Trust II | | | | | | | |
2012-A, 5.50% due 09/15/37†††,3,7 | | | 1,408,046 | | | 1,415,790 | |
Garanti Diversified Payment | | | | | | | |
Rights Finance Co. | | | | | | | |
2007-A, 0.43% due 07/09/17††† | | | 1,456,000 | | | 1,379,560 | |
West Coast Funding Ltd. | | | | | | | |
2006-1A, 0.37% due 11/02/411,3 | | | 1,388,793 | | | 1,337,686 | |
Highland Park CDO I Ltd. | | | | | | | |
2006-1A, 0.56% due 11/25/511,3,7 | | | 1,432,951 | | | 1,315,879 | |
Fraser Sullivan CLO VI Ltd. | | | | | | | |
2011-6A, 4.74% due 11/22/221,3 | | | 1,250,000 | | | 1,250,908 | |
COA Summit CLO Limited 2014-1 | | | | | | | |
2014-1A, 3.04% due 04/20/23†††,1,3 | | | 1,250,000 | | | 1,244,875 | |
Venture XIV CLO Ltd. | | | | | | | |
2013-14A, 2.98% due 08/28/251,3 | | | 1,250,000 | | | 1,228,375 | |
N-Star REL CDO VIII Ltd. | | | | | | | |
2006-8A, 0.51% due 02/01/411,3 | | | 1,400,000 | | | 1,211,280 | |
Structured Asset Securities Corporation | | | | | | | |
Mortgage Loan Trust | | | | | | | |
2006-OPT1, 0.41% due 04/25/361 | | | 1,400,000 | | | 1,203,740 | |
| |
| SEE NOTES TO FINANCIAL STATEMENTS. | | THE GUGGENHEIM FUNDS SEMI-ANNUAL REPORT | 79 |
| SCHEDULE OF INVESTMENTS (Unaudited) (continued) | | March 31, 2014 |
| |
| TOTAL RETURN BOND FUND | | |
| | | | FACE | | | | |
| | | | AMOUNT | | | VALUE | |
| |
| | | | | | | | |
Race Point CLO Ltd. | | | | | | | |
2014-5AR, 3.08% due 12/15/221,3 | | $ | 1,100,000 | | $ | 1,103,630 | |
Marathon CLO II Ltd. | | | | | | | |
2005-2A, 2.03% due 12/20/191,3 | | | 1,000,000 | | | 977,900 | |
2005-2A, 0.00% due 12/20/193,8 | | | 250,000 | | | 124,750 | |
Salus CLO 2012-1 Ltd. | | | | | | | |
2013-1A, 5.74% due 03/05/21†††,1,3 | | | 750,000 | | | 773,100 | |
2013-1AN, 3.99% due 03/05/21†††,1,3 | | | 300,000 | | | 300,570 | |
Telos CLO 2007-2 Ltd. | | | | | | | |
2007-2A, 2.44% due 04/15/221,3 | | | 1,100,000 | | | 1,043,350 | |
Ivy Hill Middle Market Credit Fund VII Ltd. | | | | | | | |
2013-7A, 3.69% due 10/20/251,3 | | | 1,000,000 | | | 997,500 | |
Global Leveraged Capital Credit | | | | | | | |
Opportunity Fund | | | | | | | |
2006-1A, 1.24% due 12/20/181,3 | | | 1,036,000 | | | 995,907 | |
Halcyon Structured Asset Management | | | | | | | |
Long Secured/Short Unsecured 2007-2 Ltd. | | | | | | | |
2007-2A, 3.99% due 10/29/211,3 | | | 1,000,000 | | | 986,200 | |
ACA CLO 2007-1 Ltd. | | | | | | | |
2007-1A, 1.19% due 06/15/221,3 | | | 1,075,000 | | | 984,163 | |
Icon Brands Holdings LLC | | | | | | | |
2013-1A, 4.35% due 01/25/43†††,3 | | | 958,455 | | | 954,141 | |
San Gabriel CLO Ltd. | | | | | | | |
2007-1A, 2.49% due 09/10/211,3 | | | 1,000,000 | | | 953,400 | |
CCR, Inc. | | | | | | | |
2012-CA, 4.75% due 07/10/223 | | | 950,000 | | | 933,288 | |
Churchill Financial Cayman Ltd. | | | | | | | |
2007-1A, 2.84% due 07/10/191,3 | | | 1,000,000 | | | 930,700 | |
Genesis Funding Ltd. | | | | | | | |
2006-1A, 0.40% due 12/19/321,3 | | | 912,413 | | | 850,278 | |
Finn Square CLO Ltd. | | | | | | | |
2012-1A, 0.00% due 12/24/233,8 | | | 1,000,000 | | | 841,600 | |
Textainer Marine Containers Ltd. | | | | | | | |
2012-1A, 4.21% due 04/15/273 | | | 808,333 | | | 809,078 | |
Acis CLO 2013-1 Ltd. | | | | | | | |
2013-1A, 3.19% due 04/18/241,3 | | | 800,000 | | | 779,200 | |
ARES XII CLO Ltd. | | | | | | | |
2007-12A, 3.48% due 11/25/201,3 | | | 750,000 | | | 742,875 | |
Central Park CLO Ltd. | | | | | | | |
2011-1A, 3.44% due 07/23/221,3 | | | 750,000 | | | 738,750 | |
Triton Container Finance LLC | | | | | | | |
2012-1A, 4.21% due 05/14/273 | | | 726,833 | | | 729,033 | |
Lehman XS Trust | | | | | | | |
2007-9, 0.27% due 06/25/371 | | | 828,231 | | | 723,967 | |
GSAMP Trust | | | | | | | |
2005-HE6, 0.59% due 11/25/351 | | | 800,000 | | | 711,565 | |
Newstar Commercial Loan Funding 2013-1 LLC | | | | | | | |
2013-1A, 4.78% due 09/20/231,3 | | | 700,000 | | | 700,000 | |
Grayson CLO Ltd. | | | | | | | |
2006-1A, 0.65% due 11/01/211,3 | | | 750,000 | | | 690,375 | |
Black Diamond CLO 2012-1 Ltd. | | | | | | | |
2013-1A, 3.49% due 02/01/231,3 | | | 650,000 | | | 650,000 | |
Halcyon Loan Advisors Funding 2012-2 Ltd. | | | | | | | |
2012-2A, 4.73% due 12/20/241,3 | | | 600,000 | | | 602,340 | |
New Century Home Equity Loan Trust | | | | | | | |
2005-1, 0.87% due 03/25/351 | | | 685,917 | | | 597,559 | |
Babcock & Brown Air Funding I Ltd. | | | | | | | |
2007-1A, 0.62% due 11/14/331,3 | | | 715,318 | | | 593,714 | |
Ares XXV CLO Ltd. | | | | | | | |
2013-3A, 0.00% due 01/17/243,8 | | | 750,000 | | | 589,800 | |
Blade Engine Securitization Ltd. | | | | | | | |
2006-1A, 1.16% due 09/15/411 | | | 840,292 | | | 588,205 | |
Newcastle Cdo Viii 1 Ltd. | | | | | | | |
2006-8A, 0.43% due 11/25/52†††,1,3 | | | 600,649 | | | 575,121 | |
GreenPoint Mortgage Funding Trust | | | | | | | |
2005-HE4, 0.86% due 07/25/301 | | | 600,000 | | | 542,960 | |
Pacifica CDO V Corp. | | | | | | | |
2006-5A, 5.81% due 01/26/203 | | | 500,000 | | | 509,800 | |
Apidos CDO IX | | | | | | | |
2012-9A, 3.99% due 07/15/231,3 | | | 500,000 | | | 501,900 | |
GoldenTree Credit Opportunities | | | | | | | |
2012-1 Financing Ltd. | | | | | | | |
2012-1A, 4.23% due 09/15/241,3 | | | 500,000 | | | 501,200 | |
Ivy Hill Middle Market Credit Fund Ltd. | | | | | | | |
2011-3A, 6.24% due 01/15/221,3 | | | 250,000 | | | 251,075 | |
2011-3A, 6.74% due 01/15/221,3 | | | 250,000 | | | 250,000 | |
Cerberus Offshore Levered I, LP | | | | | | | |
2012-1A, 6.23% due 11/30/181,3 | | | 250,000 | | | 250,575 | |
2012-1A, 4.98% due 11/30/181,3 | | | 250,000 | | | 249,825 | |
Golub Capital Partners CLO Ltd. | | | | | | | |
2014-18A, 3.73% due 04/25/26†††,1,3 | | | 500,000 | | | 500,300 | |
Garrison Funding 2013-2 Ltd. | | | | | | | |
2013-2A, 3.73% due 09/25/23†††,1,3 | | | 500,000 | | | 498,700 | |
DIVCORE CLO Ltd. | | | | | | | |
2013-1A B, 4.05% due 11/15/32††† | | | 500,000 | | | 497,750 | |
Flagship CLO VI | | | | | | | |
2007-1A, 2.64% due 06/10/211,3 | | | 500,000 | | | 477,550 | |
MC Funding Limited/MC | | | | | | | |
Funding 2006-1 LLC | | | | | | | |
2006-1A, 1.18% due 12/20/201,3 | | | 500,000 | | | 476,800 | |
Gleneagles CLO Ltd. | | | | | | | |
2005-1A, 1.14% due 11/01/171,3 | | | 500,000 | | | 475,200 | |
ICE EM CLO | | | | | | | |
2007-1A, 0.93% due 08/15/221,3 | | | 500,000 | | | 471,250 | |
NewStar Commercial Loan Trust | | | | | | | |
2007-1A, 1.53% due 09/30/221,3 | | | 500,000 | | | 468,350 | |
TCW Global Project Fund III Ltd. | | | | | | | |
2005-1A, 0.89% due 09/01/17†††,1,3 | | | 500,000 | | | 464,400 | |
Golub Capital Partners Fundings Ltd. | | | | | | | |
2007-1A, 0.98% due 03/15/221,3 | | | 500,000 | | | 463,850 | |
Westwood CDO I Ltd. | | | | | | | |
2007-1A, 0.90% due 03/25/211,3 | | | 500,000 | | | 463,050 | |
Copper River CLO Ltd. | | | | | | | |
2007-1A, 1.04% due 01/20/211,3 | | | 500,000 | | | 452,650 | |
Northwind Holdings LLC | | | | | | | |
2007-1A, 1.02% due 12/01/371,3 | | | 456,875 | | | 419,320 | |
Aerco Ltd. | | | | | | | |
2000-2A, 1.12% due 07/15/251 | | | 664,169 | | | 401,025 | |
Golub Capital Partners CLO 17 Ltd. | | | | | | | |
2013-17A, 3.99% due 10/25/251,3 | | | 400,000 | | | 398,200 | |
Acis CLO 2013-2 Ltd., | | | | | | | |
3.45% due 10/14/221,3 | | | 375,000 | | | 371,400 | |
Airplanes Pass Through Trust | | | | | | | |
2001-1A, 0.71% due 03/15/191 | | | 779,254 | | | 366,250 | |
OFSI Fund Ltd. | | | | | | | |
2006-1A, 1.08% due 09/20/191,3 | | | 370,000 | | | 356,199 | |
TICC CLO 2012-1 LLC | | | | | | | |
2012-1A, 4.98% due 08/25/231,3 | | | 350,000 | | | 351,610 | |
Carlyle Global Market Strategies | | | | | | | |
CLO 2012-3 Ltd. | | | | | | | |
2012-3A, 0.00% due 10/04/243,8 | | | 250,000 | | | 234,600 | |
| |
| 80 | THE GUGGENHEIM FUNDS SEMI-ANNUAL REPORT | | SEE NOTES TO FINANCIAL STATEMENTS. |
| SCHEDULE OF INVESTMENTS (Unaudited) (continued) | | March 31, 2014 |
| |
| TOTAL RETURN BOND FUND | | |
| | | | FACE | | | | |
| | | | AMOUNT | | | VALUE | |
| |
| | | | | | | | |
Eastland CLO Ltd. | | | | | | | |
2007-1A, 0.64% due 05/01/221,3 | | $ | 250,000 | | $ | 222,625 | |
Newcastle CDO IX 1 Ltd. | | | | | | | |
2007-9A, 0.41% due 05/25/521,3,7 | | | 222,601 | | | 221,933 | |
Avis Budget Rental Car Funding AESOP LLC | | | | | | | |
2013-2A, 4.00% due 05/21/183 | | | 200,000 | | | 207,800 | |
Drug Royalty Limited Partnership | | | | | | | |
2012-1, 5.49% due 07/15/241,3 | | | 169,487 | | | 176,091 | |
First Franklin Mortgage Loan Trust | | | | | | | |
2006-FF1, 0.49% due 01/25/361 | | | 150,000 | | | 129,867 | |
Structured Asset Receivables Trust Series | | | | | | | |
2005-1A, 0.74% due 01/21/151,3 | | | 126,966 | | | 120,300 | |
Vega Containervessel plc | | | | | | | |
2006-1A, 5.56% due 02/10/21†††,3 | | | 94,279 | | | 92,421 | |
Raspro Trust | | | | | | | |
2005-1A, 0.63% due 03/23/241,3 | | | 98,740 | | | 89,853 | |
Castle Trust | | | | | | | |
2003-1AW, 0.91% due 05/15/271,3 | | | 58,623 | | | 55,692 | |
Legg Mason Real Estate CDO I Ltd. | | | | | | | |
2006-1A, 0.43% due 03/25/381,3 | | | 16,646 | | | 16,363 | |
BlackRock Senior Income Series | | | | | | | |
2004-1X, 0.00% due 09/15/168 | | | 500,000 | | | 50 | |
| | | | | | | |
| Total Asset Backed Securities | | | | | | | |
(Cost $103,410,017) | | | | | | 104,820,763 | |
| | | | | | | |
| | | | | | | | |
| CORPORATE BONDS†† - 27.8% | | | | | | | |
| | | | | | | | |
| FINANCIALS - 15.7% | | | | | | | |
General Electric Capital Corp. | | | | | | | |
7.13% due 12/15/491,2,7 | | | 1,920,000 | | | 2,188,799 | |
5.25% due 06/29/491,2 | | | 1,000,000 | | | 972,700 | |
EPR Properties | | | | | | | |
5.25% due 07/15/237 | | | 2,250,000 | | | 2,286,437 | |
5.75% due 08/15/22 | | | 680,000 | | | 720,450 | |
PNC Financial Services Group, Inc. | | | | | | | |
4.85% due 05/29/491,2 | | | 3,050,000 | | | 2,859,375 | |
Itau Unibanco Holding S.A./Cayman Island | | | | | | | |
5.13% due 05/13/233,7 | | | 2,650,000 | | | 2,544,000 | |
JPMorgan Chase & Co. | | | | | | | |
5.15% due 12/31/491,2,7 | | | 2,625,000 | | | 2,460,937 | |
AmTrust Financial Services, Inc. | | | | | | | |
6.13% due 08/15/233 | | | 2,000,000 | | | 1,985,860 | |
Icahn Enterprises Limited Partnership/Icahn | | | | | | | |
Enterprises Finance Corp. | | | | | | | |
6.00% due 08/01/203 | | | 1,550,000 | | | 1,643,000 | |
3.50% due 03/15/173 | | | 200,000 | | | 202,000 | |
Bank of America Corp. | | | | | | | |
5.20% due 12/29/491,2 | | | 1,950,000 | | | 1,833,000 | |
Fifth Third Bancorp | | | | | | | |
5.10% due 12/31/491,2 | | | 1,840,000 | | | 1,692,800 | |
Prudential Financial, Inc. | | | | | | | |
5.63% due 06/15/431,7 | | | 1,200,000 | | | 1,224,000 | |
5.88% due 09/15/421 | | | 300,000 | | | 313,125 | |
Bank of New York Mellon Corp. | | | | | | | |
4.50% due 12/31/491,2 | | | 1,280,000 | | | 1,164,800 | |
Credit Suisse AG | | | | | | | |
6.50% due 08/08/233 | | | 1,000,000 | | | 1,097,500 | |
National Rural Utilities Cooperative | | | | | | | |
Finance Corp. | | | | | | | |
4.75% due 04/30/431 | | | 1,000,000 | | | 945,000 | |
Credit Acceptance Corp. | | | | | | | |
6.13% due 02/15/213 | | | 860,000 | | | 894,400 | |
Ironshore Holdings US, Inc. | | | | | | | |
8.50% due 05/15/203 | | | 720,000 | | | 839,398 | |
Schahin II Finance Company SPV Ltd. | | | | | | | |
5.88% due 09/25/223,7 | | | 835,800 | | | 805,502 | |
StanCorp Financial Group, Inc. | | | | | | | |
5.00% due 08/15/22 | | | 650,000 | | | 662,227 | |
Jefferies Group LLC | | | | | | | |
6.88% due 04/15/21 | | | 550,000 | | | 640,443 | |
Kennedy-Wilson, Inc. | | | | | | | |
8.75% due 04/01/19 | | | 500,000 | | | 546,250 | |
CICRMT 2014-A A | | | | | | | |
4.89% due 10/08/21 | | | 500,000 | | | 500,000 | |
QBE Capital Funding III Ltd. | | | | | | | |
7.25% due 05/24/411,3 | | | 368,000 | | | 393,760 | |
Susquehanna Bancshares, Inc. | | | | | | | |
5.38% due 08/15/22 | | | 400,000 | | | 391,821 | |
Nationwide Mutual Insurance Co. | | | | | | | |
9.38% due 08/15/393 | | | 210,000 | | | 308,834 | |
Allstate Corp. | | | | | | | |
5.75% due 08/15/531 | | | 250,000 | | | 262,500 | |
Jackson National Life Insurance Co. | | | | | | | |
8.15% due 03/15/273 | | | 125,000 | | | 159,782 | |
National Life Insurance Co. | | | | | | | |
10.50% due 09/15/393 | | | 100,000 | | | 138,914 | |
MetLife Capital Trust IV | | | | | | | |
7.88% due 12/15/373 | | | 115,000 | | | 135,700 | |
Scottrade Financial Services, Inc. | | | | | | | |
6.13% due 07/11/213 | | | 125,000 | | | 126,819 | |
Prosight Global Inc. | | | | | | | |
7.50% due 11/20/20†††,5 | | | 100,000 | | | 98,910 | |
LCP Dakota Fund | | | | | | | |
10.00% due 08/17/155 | | | 30,933 | | | 30,933 | |
| | | | | | | |
| Total Financials | | | | | | 33,069,976 | |
| | | | | | | |
| | | | | | | | |
| CONSUMER DISCRETIONARY - 3.3% | | | | | | | |
GLP Capital Limited Partnership/GLP | | | | | | | |
Financing II, Inc. | | | | | | | |
4.88% due 11/01/203 | | | 2,000,000 | | | 2,052,500 | |
4.38% due 11/01/183 | | | 150,000 | | | 153,938 | |
Hawaiian Airlines 2013-1 Class A | | | | | | | |
Pass Through Certificates | | | | | | | |
3.90% due 01/15/26 | | | 1,570,000 | | | 1,517,012 | |
Northern Group Housing LLC | | | | | | | |
6.80% due 08/15/533 | | | 1,200,000 | | | 1,261,380 | |
Continental Airlines 2012-2 Class B | | | | | | | |
Pass Through Trust | | | | | | | |
5.50% due 10/29/20 | | | 300,000 | | | 315,750 | |
WMG Acquisition Corp. | | | | | | | |
6.00% due 01/15/213 | | | 300,000 | | | 312,750 | |
Dufry Finance SCA | | | | | | | |
5.50% due 10/15/203 | | | 300,000 | | | 312,528 | |
Continental Airlines 2012-1 Class B | | | | | | | |
Pass Through Trust | | | | | | | |
6.25% due 04/11/20 | | | 284,797 | | | 304,021 | |
Laureate Education, Inc. | | | | | | | |
9.25% due 09/01/193 | | | 220,000 | | | 234,300 | |
GRD Holdings III Corp. | | | | | | | |
10.75% due 06/01/193 | | | 125,000 | | | 137,500 | |
| |
| SEE NOTES TO FINANCIAL STATEMENTS. | | THE GUGGENHEIM FUNDS SEMI-ANNUAL REPORT | 81 |
| SCHEDULE OF INVESTMENTS (Unaudited) (continued) | | March 31, 2014 |
| |
| TOTAL RETURN BOND FUND | | |
| | | | FACE | | | | |
| | | | AMOUNT | | | VALUE | |
| |
| | | | | | | | |
Delta Air Lines 2011-1 Class B | | | | | | | |
Pass Through Trust | | | | | | | |
7.13% due 10/15/14 | | $ | 130,000 | | $ | 133,575 | |
Atlas Air 1999-1 Class A-1 Pass | | | | | | | |
Through Trust | | | | | | | |
7.20% due 01/02/195 | | | 91,923 | | | 99,621 | |
Stanadyne Corp. | | | | | | | |
10.00% due 08/15/14 | | | 60,000 | | | 59,775 | |
| | | | | | | |
Total Consumer Discretionary | | | | | | 6,894,650 | |
| | | | | | | |
| | | | | | | | |
| MATERIALS - 2.9% | | | | | | | |
Barrick Gold Corp. | | | | | | | |
4.10% due 05/01/237 | | | 2,300,000 | | | 2,181,860 | |
Newcrest Finance Pty Ltd. | | | | | | | |
4.20% due 10/01/223 | | | 850,000 | | | 733,226 | |
4.45% due 11/15/213,7 | | | 625,000 | | | 559,551 | |
TPC Group, Inc. | | | | | | | |
8.75% due 12/15/203 | | | 1,000,000 | | | 1,096,250 | |
AngloGold Ashanti Holdings plc | | | | | | | |
5.13% due 08/01/22 | | | 875,000 | | | 815,833 | |
Alcoa, Inc. | | | | | | | |
5.40% due 04/15/21 | | | 530,000 | | | 556,054 | |
5.87% due 02/23/22 | | | 100,000 | | | 105,446 | |
Xstrata Finance Canada Ltd. | | | | | | | |
4.95% due 11/15/213 | | | 125,000 | | | 129,203 | |
| | | | | | | |
| Total Materials | | | | | | 6,177,423 | |
| | | | | | | |
| | | | | | | | |
| INDUSTRIALS - 2.5% | | | | | | | |
Princess Juliana International Airport | | | | | | | |
Operating Company N.V. | | | | | | | |
5.50% due 12/20/273 | | | 3,069,030 | | | 3,022,995 | |
Chicago Bridge & Iron Co. | | | | | | | |
5.15% due 12/27/22†††,5 | | | 750,000 | | | 721,575 | |
ADT Corp. | | | | | | | |
4.13% due 04/15/19 | | | 650,000 | | | 644,924 | |
SBM Baleia Azul Sarl | | | | | | | |
5.50% due 09/15/27†††,5 | | | 471,900 | | | 457,696 | |
Embraer S.A. | | | | | | | |
5.15% due 06/15/22 | | | 200,000 | | | 207,500 | |
Marquette Transportation Company | | | | | | | |
LLC/Marquette Transportation | | | | | | | |
Finance Corp. | | | | | | | |
10.88% due 01/15/17 | | | 120,000 | | | 126,300 | |
| | | | | | | |
| Total Industrials | | | | | | 5,180,990 | |
| | | | | | | |
| | | | | | | | |
| ENERGY - 1.0% | | | | | | | |
Reliance Holding USA, Inc. | | | | | | | |
5.40% due 02/14/223 | | | 550,000 | | | 575,977 | |
Crestwood Midstream Partners Limited | | | | | | | |
Partnership/Crestwood Midstream | | | | | | | |
Finance Corp. | | | | | | | |
7.75% due 04/01/19 | | | 425,000 | | | 461,125 | |
SESI LLC | | | | | | | |
7.13% due 12/15/21 | | | 400,000 | | | 446,000 | |
Midstates Petroleum Company | | | | | | | |
Incorporated/Midstates | | | | | | | |
Petroleum Co LLC | | | | | | | |
10.75% due 10/01/20 | | | 200,000 | | | 221,000 | |
Odebrecht Drilling Norbe VIII/IX Ltd. | | | | | | | |
6.35% due 06/30/213 | | | 202,500 | | | 210,094 | |
Bill Barrett Corp. | | | | | | | |
7.63% due 10/01/19 | | | 125,000 | | | 135,469 | |
Eagle Rock Energy Partners Limited | | | | | | | |
Partnership/Eagle Rock Energy | | | | | | | |
Finance Corp. | | | | | | | |
8.38% due 06/01/19 | | | 110,000 | | | 119,350 | |
| | | | | | | |
| Total Energy | | | | | | 2,169,015 | |
| | | | | | | |
| | | | | | | | |
| UTILITIES - 0.9% | | | | | | | |
Sabine Pass Liquefaction LLC | | | | | | | |
6.25% due 03/15/223 | | | 920,000 | | | 959,100 | |
5.63% due 04/15/23 | | | 582,000 | | | 579,090 | |
Legacy Reserves Limited Partnership/Legacy | | | | | | | |
Reserves Finance Corp. | | | | | | | |
6.63% due 12/01/21 | | | 350,000 | | | 349,125 | |
| | | | | | | |
| Total Utilities | | | | | | 1,887,315 | |
| | | | | | | |
| | | | | | | | |
| INDUSTRIAL - 0.5% | | | | | | | |
QVC, Inc. | | | | | | | |
4.85% due 04/01/243 | | | 1,000,000 | | | 1,013,055 | |
| | | | | | | |
| | | | | | | | |
| TELECOMMUNICATION SERVICES - 0.4% | | | | | | | |
DISH DBS Corp. | | | | | | | |
5.88% due 07/15/22 | | | 500,000 | | | 533,750 | |
Avaya, Inc. | | | | | | | |
7.00% due 04/01/193 | | | 250,000 | | | 248,125 | |
| | | | | | | |
| Total Telecommunication Services | | | | | | 781,875 | |
| | | | | | | |
| | | | | | | | |
| FINANCIAL INSTITUTIONS - 0.2% | | | | | | | |
Tri-Command Military Housing LLC | | | | | | | |
5.38% due 02/15/483 | | | 568,190 | | | 484,218 | |
| | | | | | | |
| | | | | | | | |
| CONSUMER STAPLES - 0.2% | | | | | | | |
Bumble Bee Holdings, Inc. | | | | | | | |
9.00% due 12/15/173 | | | 224,000 | | | 244,160 | |
Harbinger Group, Inc. | | | | | | | |
7.88% due 07/15/19 | | | 200,000 | | | 219,500 | |
| | | | | | | |
| Total Consumer Staples | | | | | | 463,660 | |
| | | | | | | |
| | | | | | | | |
| CAYMAN ISLANDS - 0.1% | | | | | | | |
Government of the Cayman Islands | | | | | | | |
5.95% due 11/24/193 | | | 125,000 | | | 141,250 | |
| | | | | | | |
| | | | | | | | |
| BAHAMAS - 0.1% | | | | | | | |
Commonwealth of the Bahamas | | | | | | | |
6.95% due 11/20/293 | | | 110,000 | | | 118,360 | |
| | | | | | | |
| Total Corporate Bonds | | | | | | | |
(Cost $58,600,841) | | | | | | 58,381,787 | |
| | | | | | | |
| | | | | | | | |
| COLLATERALIZED MORTGAGE OBLIGATIONS†† - 8.3% | | | | | | | |
Alternative Loan Trust | | | | | | | |
2003-18CB, 5.25% due 09/25/33 | | | 2,246,780 | | | 2,333,675 | |
Hilton USA Trust 2013-HLT, | | | | | | | |
4.41% due 11/05/303 | | | 1,750,000 | | | 1,780,215 | |
Boca Hotel Portfolio Trust | | | | | | | |
2013-BOCA, 3.21% due 08/15/261,3 | | | 1,700,000 | | | 1,702,289 | |
HarborView Mortgage Loan Trust | | | | | | | |
2006-12, 0.35% due 01/19/381 | | | 1,641,575 | | | 1,379,233 | |
BBCMS Trust | | | | | | | |
2013-TYSN, 3.71% due 09/05/323 | | | 1,500,000 | | | 1,370,435 | |
BB-UBS Trust | | | | | | | |
2012-SHOW, 4.03% due 11/05/361,3 | | | 1,500,000 | | | 1,340,591 | |
| |
| 82 | THE GUGGENHEIM FUNDS SEMI-ANNUAL REPORT | | SEE NOTES TO FINANCIAL STATEMENTS. |
| SCHEDULE OF INVESTMENTS (Unaudited) (continued) | | March 31, 2014 |
| |
| TOTAL RETURN BOND FUND | | |
| | | | FACE | | | | |
| | | | AMOUNT | | | VALUE | |
| |
| | | | | | | | |
Washington Mutual Mortgage | | | | | | | |
Pass-Through Certificates WMALT | | | | | | | |
Series 2006-AR9 Trust | | | | | | | |
2006-AR9, 0.97% due 11/25/461 | | $ | 1,577,903 | | $ | 1,050,585 | |
Wells Fargo Alternative Loan 2007-PA3 Trust | | | | | | | |
2007-PA3, 6.25% due 07/25/37 | | | 1,059,262 | | | 963,431 | |
Spirit Master Funding LLC | | | | | | | |
2007-1A, 5.74% due 03/20/253 | | | 537,837 | | | 551,848 | |
2006-1A, 5.76% due 03/20/243 | | | 205,689 | | | 214,431 | |
Motel 6 Trust | | | | | | | |
2012-MTL6, 3.78% due 10/05/253 | | | 750,000 | | | 755,296 | |
Madison Avenue Trust, | | | | | | | |
4.03% due 10/12/321,3 | | | 750,000 | | | 738,145 | |
SRERS-2011 Funding Ltd. 2011-RS, | | | | | | | |
0.40% due 05/09/461,3 | | | 725,949 | | | 671,430 | |
Residential Asset Securitization Trust | | | | | | | |
2006-A12, 6.25% due 11/25/36 | | | 776,342 | | | 596,923 | |
Nomura Resecuritization Trust | | | | | | | |
2012-1R, 0.60% due 08/27/471,3 | | | 585,850 | | | 539,744 | |
Chase Mortgage Finance Trust Series | | | | | | | |
2006-S3, 6.00% due 11/25/36 | | | 571,904 | | | 494,170 | |
Washington Mutual Mortgage Pass-Through | | | | | | | |
Certificates WMALT Series 2006-8 Trust | | | | | | | |
2006-8, 5.77% due 10/25/36 | | | 672,575 | | | 469,760 | |
Credit Suisse Mortgage Capital Certificates | | | | | | | |
2006-TF2A, 0.56% due 10/15/211,3 | | | 250,000 | | | 242,078 | |
BAMLL-DB Trust | | | | | | | |
2012-OSI, 5.81% due 04/13/293 | | | 200,000 | | | 210,573 | |
| | | | | | | |
| Total Collateralized Mortgage Obligations | | | | | | | |
(Cost $17,320,842) | | | | | | 17,404,852 | |
| | | | | | | |
| | | | | | | | |
| SENIOR FLOATING RATE INTERESTS†† - 5.7% | | | | | | | |
| | | | | | | | |
| INDUSTRIALS - 1.6% | | | | | | | |
Rise Ltd. | | | | | | | |
4.74% due 02/12/39 | | | 1,200,000 | | | 1,209,000 | |
Travelport Holdings Ltd. | | | | | | | |
6.25% due 06/26/19 | | | 1,012,350 | | | 1,034,814 | |
AABS Ltd. | | | | | | | |
4.87% due 01/15/38††† | | | 463,542 | | | 467,018 | |
Emerald Expositions | | | | | | | |
5.50% due 06/17/20 | | | 272,939 | | | 274,759 | |
CPM Acquisition Corp. | | | | | | | |
6.25% due 08/29/17 | | | 170,636 | | | 171,703 | |
10.25% due 03/01/18 | | | 70,000 | | | 70,875 | |
Thermasys Corp. | | | | | | | |
5.25% due 05/03/19 | | | 98,750 | | | 98,256 | |
IPC Systems, Inc. | | | | | | | |
7.75% due 07/31/17 | | | 60,000 | | | 60,000 | |
| | | | | | | |
| Total Industrials | | | | | | 3,386,425 | |
| | | | | | | |
| | | | | | | | |
| CONSUMER DISCRETIONARY - 1.3% | | | | | | | |
Centaur LLC | | | | | | | |
5.25% due 02/20/19 | | | 921,147 | | | 922,879 | |
Neiman Marcus Group, Inc. | | | | | | | |
4.25% due 10/25/20 | | | 600,000 | | | 601,560 | |
Fleetpride Corp. | | | | | | | |
5.25% due 11/19/19 | | | 543,125 | | | 535,521 | |
9.25% due 05/15/20 | | | 60,000 | | | 58,950 | |
1-800 Contacts, Inc. | | | | | | | |
4.25% due 01/31/21 | | | 300,000 | | | 300,525 | |
Laureate Education, Inc. | | | | | | | |
5.00% due 06/15/18 | | | 172,183 | | | 170,462 | |
Capital Automotive LP | | | | | | | |
6.00% due 04/30/20 | | | 100,000 | | | 102,125 | |
Navistar, Inc. | | | | | | | |
5.75% due 08/17/17 | | | 62,500 | | | 63,489 | |
Container Store, Inc. | | | | | | | |
4.25% due 04/06/19 | | | 35,905 | | | 35,950 | |
| | | | | | | |
| Total Consumer Discretionary | | | | | | 2,791,461 | |
| | | | | | | |
| | | | | | | | |
| TELECOMMUNICATION SERVICES - 1.1% | | | | | | | |
Associated Partners, Inc. | | | | | | | |
6.66% due 12/21/15†††,5 | | | 1,000,000 | | | 1,002,500 | |
Avaya, Inc. | | | | | | | |
4.73% due 10/26/17 | | | 83982,179 | | | 958,135 | |
Light Tower Fiber LLC | | | | | | | |
4.00% due 04/13/20 | | | 397,000 | | | 394,273 | |
| | | | | | | |
| Total Telecommunication Services | | | | | | 2,354,908 | |
| | | | | | | |
| | | | | | | | |
| INFORMATION TECHNOLOGY - 0.7% | | | | | | | |
EIG Investors Corp. | | | | | | | |
5.00% due 11/09/19 | | | 641,899 | | | 645,109 | |
Sabre, Inc. | | | | | | | |
4.25% due 02/19/19 | | | 373,599 | | | 373,442 | |
SumTotal Systems | | | | | | | |
6.25% due 11/16/18 | | | 309,334 | | | 307,400 | |
Deltek, Inc. | | | | | | | |
4.50% due 10/10/18 | | | 197,995 | | | 198,985 | |
Aspect Software, Inc. | | | | | | | |
7.25% due 05/07/16 | | | 16,755 | | | 16,965 | |
| | | | | | | |
| Total Information Technology | | | | | | 1,541,901 | |
| | | | | | | |
| | | | | | | | |
| FINANCIALS - 0.7% | | | | | | | |
Nuveen Investments, Inc. | | | | | | | |
4.15% due 05/13/17 | | | 750,000 | | | 751,741 | |
National Financial Partners | | | | | | | |
5.25% due 07/01/20 | | | 397,005 | | | 398,867 | |
American Stock Transfer & Trust | | | | | | | |
5.75% due 06/26/20 | | | 242,867 | | | 243,675 | |
First Data Corp. | | | | | | | |
4.15% due 03/23/18 | | | 20,000 | | | 20,033 | |
| | | | | | | |
| Total Financials | | | | | | 1,414,316 | |
| | | | | | | |
| | | | | | | | |
| CONSUMER STAPLES - 0.3% | | | | | | | |
Grocery Outlet, Inc. | | | | | | | |
5.50% due 12/17/18 | | | 296,478 | | | 297,035 | |
Arctic Glacier Holdings, Inc. | | | | | | | |
5.00% due 05/10/19 | | | 143,067 | | | 143,246 | |
Performance Food Group | | | | | | | |
6.25% due 11/14/19 | | | 99,749 | | | 101,078 | |
| | | | | | | |
| Total Consumer Staples | | | | | | 541,359 | |
| | | | | | | |
| Total Senior Floating Rate Interests | | | | | | | |
(Cost $11,913,741) | | | | | | 12,030,370 | |
| | | | | | | |
| MORTGAGE BACKED SECURITIES†† - 1.8% | | | | | | | |
Fannie Mae4 | | | | | | | |
2013-28, 3.00% due 04/25/43 | | | 1,373,059 | | | 1,112,905 | |
2013-34, 3.00% due 04/25/43 | | | 706,010 | | | 629,451 | |
2013-17, 2.50% due 03/25/43 | | | 436,918 | | | 364,219 | |
2013-54, 3.00% due 06/25/43 | | | 178,885 | | | 143,655 | |
| |
| SEE NOTES TO FINANCIAL STATEMENTS. | | THE GUGGENHEIM FUNDS SEMI-ANNUAL REPORT | 83 |
| SCHEDULE OF INVESTMENTS (Unaudited) (continued) | | March 31, 2014 |
| |
| TOTAL RETURN BOND FUND | | |
| | | | FACE | | | | |
| | | | AMOUNT | | | VALUE | |
| |
| | | | | | | | |
Freddie Mac4 | | | | | | | |
2013-4184, 3.00% due 03/15/43 | | $ | 816,426 | | $ | 664,646 | |
2013-4180, 3.00% due 03/15/43 | | | 681,593 | | | 583,469 | |
2013-4224, 3.00% due 07/15/43 | | | 303,787 | | | 276,271 | |
| | | | | | | |
| Total Mortgage Backed Securities | | | | | | | |
(Cost $4,365,723) | | | | | | 3,774,616 | |
| | | | | | | |
| | | | | | | | |
| MUNICIPAL BONDS†† - 1.8% | | | | | | | |
| | | | | | | | |
| ILLINOIS - 1.2% | | | | | | | |
County of Cook Illinois General | | | | | | | |
Obligation Unlimited | | | | | | | |
6.23% due 11/15/34 | | | 1,900,000 | | | 2,058,422 | |
City of Chicago Illinois General | | | | | | | |
Obligation Unlimited | | | | | | | |
6.31% due 01/01/44 | | | 300,000 | | | 305,880 | |
5.00% due 01/01/27 | | | 200,000 | | | 207,356 | |
| | | | | | | |
| Total Illinois | | | | | | 2,571,658 | |
| | | | | | | |
| | | | | | | | |
| MICHIGAN - 0.4% | | | | | | | |
City of Detroit Michigan Water Supply | | | | | | | |
System Revenue Revenue Bonds | | | | | | | |
5.00% due 07/01/33 | | | 600,000 | | | 599,220 | |
5.00% due 07/01/30 | | | 50,000 | | | 49,016 | |
City of Detroit Michigan Sewage | | | | | | | |
Disposal System Revenue Revenue Bonds | | | | | | | |
5.50% due 07/01/22 | | | 170,000 | | | 171,103 | |
| | | | | | | |
| Total Michigan | | | | | | 819,339 | |
| | | | | | | |
| | | | | | | | |
| CALIFORNIA - 0.1% | | | | | | | |
County of Sacramento California | | | | | | | |
Revenue Bonds | | | | | | | |
7.25% due 08/01/25 | | | 180,000 | | | 197,055 | |
| | | | | | | |
| | | | | | | | |
| ALABAMA - 0.1% | | | | | | | |
County of Jefferson Alabama Sewer | | | | | | | |
Revenue Revenue Bonds | | | | | | | |
0.00% due 10/01/34 | | | 550,000 | | | 157,053 | |
| | | | | | | |
| | | | | | | | |
| OTHER TERRITORIES - 0.0% | | | | | | | |
Commonwealth of Puerto Rico General | | | | | | | |
Obligation Unlimited | | | | | | | |
8.00% due 07/01/35 | | | 30,000 | | | 27,994 | |
| | | | | | | |
| Total Municipal Bonds | | | | | | | |
(Cost $3,725,927) | | | | | | 3,773,099 | |
| | | | | | | |
| Total Investments - 104.8% | | | | | | | |
(Cost $218,968,992) | | | | | $ | 219,782,001 | |
| | | | | | | |
| Other Assets & Liabilities, net - (4.8)% | | | | | | (10,060,919 | ) |
| | | | | | | |
| Total Net Assets - 100.0% | | | | | $ | 209,721,082 | |
| |
| 84 | THE GUGGENHEIM FUNDS SEMI-ANNUAL REPORT | | SEE NOTES TO FINANCIAL STATEMENTS. |
| SCHEDULE OF INVESTMENTS (Unaudited) (concluded) | | March 31, 2014 |
| |
| TOTAL RETURN BOND FUND | | |
CENTRALLY CLEARED INTEREST RATE SWAP AGREEMENTS††
| | | Receive | | | | | | | | | | | | | Unrealized | |
| | | Floating | | Floating | | Fixed | | Maturity | | Notional | | Market | | | Appreciation/ | |
| Counterparty | | Rate | | Rate Index | | Rate | | Date | | Amount | | Value | | | (Depreciation) | |
| |
| Merrill Lynch | | Receive | | 3-Month USD-LIBOR | | 3.89% | | 09/09/2043 | | $2,750,000 | | $189,200 | | | $ | 189,200 | |
| Merrill Lynch | | Receive | | 3-Month USD-LIBOR | | 3.68% | | 08/29/2043 | | 2,000,000 | | 62,000 | | | | 62,000 | |
| Merrill Lynch | | Receive | | 3-Month USD-LIBOR | | 1.70% | | 08/29/2018 | | 8,200,000 | | 48,380 | | | | 48,380 | |
| Merrill Lynch | | Receive | | 3-Month USD-LIBOR | | 3.65% | | 09/26/2018 | | 900,000 | | 20,070 | | | | 20,070 | |
| Merrill Lynch | | Receive | | 3-Month USD-LIBOR | | 1.59% | | 09/26/2018 | | 18,000,000 | | (23,400 | ) | | | (23,400 | ) |
| | | | | | | | | | | | | | | | | |
| | | | | | | | | | | | | | | | $ | 296,250 | |
| | | | | | | | | | | | | | | | | |
| * | | Non-income producing security. |
| † | | Value determined based on Level 1 inputs — See Note 4. |
| †† | | Value determined based on Level 2 inputs, unless otherwise noted — See Note 4. |
| ††† | | Value determined based on Level 3 inputs — See Note 4. |
| 1 | | Variable rate security. Rate indicated is rate effective at March 31, 2014. |
| 2 | | Perpetual maturity. |
| 3 | | Security is a 144A or Section 4(a)(2) security. The total market value of 144A or Section 4(a)(2) securities is $119,194,488 (cost $117,334,571), or 56.8% of total net assets. |
| 4 | | On September 7, 2008, the issuer was placed in conservatorship by the Federal Housing Finance Agency (FHFA). As conservator, the FHFA has full powers to control the assets and operations of the firm. |
| 5 | | Illiquid security. |
| 6 | | Affiliated funds. |
| 7 | | Security or a portion thereof is held as collateral for reverse repurchase agreements — See Note 11. |
| 8 | | Security with no rate was unsettled at March 31, 2014. |
| | | plc — Public Limited Company |
| |
| SEE NOTES TO FINANCIAL STATEMENTS. | | THE GUGGENHEIM FUNDS SEMI-ANNUAL REPORT | 85 |
| STATEMENT OF ASSETS AND LIABILITIES (Unaudited) |
| |
| March 31, 2014 |
| ASSETS: | | | | |
| Investments in unaffiliated issuers, at value | | | | |
(cost $213,968,992) | | | $214,787,994 | |
| Investments in affiliated issuers, at value | | | | |
(cost $5,000,000) | | | 4,994,007 | |
| | | |
| Total Investments (cost $218,968,992) | | | 219,782,001 | |
| Cash | | | 4,367,262 | |
| Segregated cash with broker | | | 971,854 | |
| Unrealized appreciation on swap agreements | | | 319,650 | |
| Prepaid expenses | | | 60,674 | |
| Receivables: | | | | |
Securities sold | | | 3,821,470 | |
Fund shares sold | | | 1,406,215 | |
Interest | | | 1,304,619 | |
Investment advisor | | | 55,488 | |
Dividends | | | 46,827 | |
| | | |
| Total assets | | | 232,136,060 | |
| | | |
| LIABILITIES: | | | | |
| Reverse Repurchase Agreements | | | 13,164,670 | |
| Due to broker | | | 310,079 | |
| Unrealized depreciation on swap agreements | | | 23,400 | |
| Payable for: | | | | |
Securities purchased | | | 8,073,609 | |
Fund shares redeemed | | | 496,204 | |
Management fees | | | 83,956 | |
Distribution and service fees | | | 28,974 | |
Fund accounting/administration fees | | | 16,045 | |
Transfer agent/maintenance fees | | | 10,420 | |
Trustees’ fees* | | | 119 | |
Miscellaneous | | | 207,502 | |
| | | |
| Total liabilities | | | 22,414,978 | |
| | | |
| NET ASSETS | | | $209,721,082 | |
| | | |
| NET ASSETS CONSIST OF: | | | | |
| Paid in capital | | | $210,049,924 | |
| Accumulated net investment loss | | | (1,093,662 | ) |
| Accumulated net realized loss on investments | | | (344,439 | ) |
| Net unrealized appreciation on investments | | | 1,109,259 | |
| | | |
| Net assets | | | $209,721,082 | |
| | | |
| A-CLASS: | | | | |
| Net assets | | | $74,911,014 | |
| Capital shares outstanding | | | 2,812,279 | |
| Net asset value per share | | | $26.64 | |
| | | |
| Maximum offering price per share | | | | |
(Net asset value divided by 95.25%) | | | $27.97 | |
| | | |
| C-CLASS: | | | | |
| Net assets | | | $16,148,513 | |
| Capital shares outstanding | | | 606,306 | |
| Net asset value per share | | | $26.63 | |
| | | |
| INSTITUTIONAL CLASS: | | | | |
| Net assets | | | $118,661,555 | |
| Capital shares outstanding | | | 4,450,515 | |
| Net asset value per share | | | $26.66 | |
| | | |
| STATEMENT OF OPERATIONS (Unaudited) |
| |
| Period Ended March 31, 2014 |
| INVESTMENT INCOME: | | | | |
| Interest | | | $4,834,783 | |
| Dividends | | | 442,052 | |
| Other income | | | 2,089 | |
| | | | |
Total investment income | | | 5,278,924 | |
| | | | |
| | | | | |
| EXPENSES: | | | | |
| Management fees | | | 438,055 | |
| Transfer agent/maintenance fees | | | | |
A-Class | | | 60,555 | |
C-Class | | | 9,317 | |
Institutional Class | | | 12,405 | |
| Distribution and service fees: | | | | |
A-Class | | | 89,299 | |
C-Class | | | 76,586 | |
| Fund accounting/administration fees | | | 83,229 | |
| Short interest expense | | | 88,349 | |
| Line of credit interest expense | | | 12,247 | |
| Trustees’ fees* | | | 6,868 | |
| Custodian fees | | | 1,872 | |
| Tax expense | | | 4 | |
| Miscellaneous | | | 118,462 | |
| | | | |
Total expenses | | | 997,248 | |
| | | | |
| Less: | | | | |
| Expenses waived by Advisor | | | (198,924 | ) |
| Expenses waived by Transfer Agent | | | | |
A-Class | | | (14,159 | ) |
C-Class | | | (2,086 | ) |
Institutional class | | | (12,405 | ) |
| | | | |
| Total expenses waived | | | (227,574 | ) |
| | | | |
| Net investment income | | | 4,509,250 | |
| | | | |
| | | | | |
| NET REALIZED AND UNREALIZED GAIN (LOSS): | | | | |
| Net realized gain (loss) on: | | | | |
Investments | | | 203,708 | |
Swap agreements | | | 279,466 | |
| | | | |
| Net realized gain | | | 483,174 | |
| | | | |
| Net change in unrealized appreciation (depreciation) on: | | | | |
Investments in unaffiliated issuers | | | 3,517,795 | |
Investments in affiliated issuers | | | 5,993 | |
Swap agreements | | | 27,639 | |
| | | | |
| Net change in unrealized appreciation (depreciation) | | | 3,551,427 | |
| | | | |
| Net realized and unrealized gain | | | 4,034,601 | |
| | | | |
| Net increase in net assets resulting from operations | | | $8,543,851 | |
| | | | |
| * | Relates to Trustees not deemed “interested persons” within the meaning of Section 2(a)(19) of the 1940 Act. |
| |
| 86 | THE GUGGENHEIM FUNDS SEMI-ANNUAL REPORT | SEE NOTES TO FINANCIAL STATEMENTS. |
STATEMENTS OF CHANGES IN NET ASSETS
| |
| | Period Ended | | | | | |
| | | | March 31, | | | | Year Ended | |
| | | | 2014 | | September 30, | |
| | | | (Unaudited) | | 2013 | |
| |
| INCREASE (DECREASE) IN NET ASSETS FROM OPERATIONS: | | | | | | | | |
| Net investment income | | $ | 4,509,250 | | | $ | 7,630,397 | |
| Net realized gain (loss) on investments | | | 483,174 | | | | (827,535 | ) |
| Net change in unrealized appreciation (depreciation) on investments | | | 3,551,427 | | | | (4,499,916 | ) |
| |
| Net increase in net assets resulting from operations | | | 8,543,851 | | | | 2,302,946 | |
| |
| DISTRIBUTIONS TO SHAREHOLDERS FROM: | | | | | | | | |
| Net investment income | | | | | | | | |
A-Class | | | (2,180,880 | ) | | | (4,198,859 | ) |
C-Class | | | (413,340 | ) | | | (480,541 | ) |
Institutional Class | | | (2,878,190 | ) | | | (3,074,263 | ) |
| Net realized gains | | | | | | | | |
A-Class | | | – | | | | (123,764 | ) |
C-Class | | | – | | | | (14,771 | ) |
Institutional Class | | | – | | | | (95,407 | ) |
| |
| Total distributions to shareholders | | | (5,472,410 | ) | | | (7,987,605 | ) |
| |
| CAPITAL SHARE TRANSACTIONS: | | | | | | | | |
| Proceeds from sale of shares | | | | | | | | |
A-Class | | | 19,201,524 | | | | 137,427,154 | |
C-Class | | | 2,439,611 | | | | 16,018,870 | |
Institutional Class | | | 45,648,771 | | | | 85,915,365 | |
| Distributions reinvested | | | | | | | | |
A-Class | | | 1,931,121 | | | | 3,973,854 | |
C-Class | | | 367,348 | | | | 466,640 | |
Institutional Class | | | 2,368,614 | | | | 2,862,381 | |
| Cost of shares redeemed | | | | | | | | |
A-Class | | | (21,802,572 | ) | | | (93,839,214 | ) |
C-Class | | | (2,580,743 | ) | | | (6,970,535 | ) |
Institutional Class | | | (9,223,872 | ) | | | (53,732,302 | ) |
| |
| Net increase from capital share transactions | | | 38,349,802 | | | | 92,122,213 | |
| |
| Net increase in net assets | | | 41,421,243 | | | | 86,437,554 | |
| | | | | | | | | |
| NET ASSETS: | | | | | | | | |
Beginning of period | | | 168,299,839 | | | | 81,862,285 | |
| |
End of period | | $ | 209,721,082 | | | $ | 168,299,839 | |
| |
| Distributions in excess of net investment income at end of period | | $ | (1,093,662 | ) | | $ | (130,502 | ) |
| |
| CAPITAL SHARE ACTIVITY: | | | | | | | | |
| Shares sold | | | | | | | | |
A-Class | | | 724,659 | | | | 5,090,896 | |
C-Class | | | 91,972 | | | | 592,730 | |
Institutional Class | | | 1,719,492 | | | | 3,206,663 | |
| Shares issued from reinvestment of distributions | | | | | | | | |
A-Class | | | 73,012 | | | | 148,154 | |
C-Class | | | 13,895 | | | | 17,425 | |
Institutional Class | | | 89,447 | | | | 106,608 | |
| Shares redeemed | | | | | | | | |
A-Class | | | (826,170 | ) | | | (3,555,975 | ) |
C-Class | | | (97,930 | ) | | | (261,112 | ) |
Institutional Class | | | (348,877 | ) | | | (2,002,250 | ) |
| |
| Net increase in shares | | | 1,439,500 | | | | 3,343,139 | |
| |
| |
| SEE NOTES TO FINANCIAL STATEMENTS. | THE GUGGENHEIM FUNDS SEMI-ANNUAL REPORT | 87 |
This table is presented to show selected data for a share outstanding throughout each period and to assist shareholders in evaluating a Fund’s performance for the periods presented.
| | | | Period Ended | | | | Year Ended | | | | Period Ended | |
| | | | March 31, | | | | September 30, | | | | September 30, | |
| A-Class | | | 2014 | a | | | 2013 | | | | 2012 | b |
| |
| Per Share Data | | | | | | | | | | | | | | | |
| Net asset value, beginning of period | | | $ | 26.16 | | | | $ | 26.51 | | | | $ | 25.00 | |
| |
| Income (loss) from investment operations: | | | | | | | | | | | | | | | |
| Net investment income (loss)c | | | | .65 | | | | | 1.20 | | | | | 1.08 | |
| Net gain (loss) on investments (realized and unrealized) | | | | .53 | | | | | (.28 | ) | | | | 1.35 | |
| | | | |
| Total from investment operations | | | | 1.18 | | | | | .92 | | | | | 2.43 | |
| |
| Less distributions from: | | | | | | | | | | | | | | | |
| Net investment income | | | | (.70 | ) | | | | (1.23 | ) | | | | (.92 | ) |
| Net realized gains | | | | — | | | | | (.04 | ) | | | | — | |
| | | | |
| Total distributions | | | | (.70 | ) | | | | (1.27 | ) | | | | (.92 | ) |
| |
| Net asset value, end of period | | | $ | 26.64 | | | | $ | 26.16 | | | | $ | 26.51 | |
| | | | |
| | | | | | | | | | | | | | | | |
| |
| Total Returnd | | | | 4.97% | | | | | 3.53% | | | | | 9.78% | |
| |
| Ratios/Supplemental Data | | | | | | | | | | | | | | | |
| Net assets, end of period (in thousands) | | | $ | 74,911 | | | | $ | 74,328 | | | | $ | 30,689 | |
| |
| Ratios to average net assets: | | | | | | | | | | | | | | | |
| Net investment income (loss) | | | | 4.92% | | | | | 4.47% | | | | | 5.10% | |
| Total expenses | | | | 1.37% | | | | | 1.27% | | | | | 1.51% | |
| Net expensese,f | | | | 1.10% | | | | | 0.98% | | | | | 0.85% | |
| |
| Portfolio turnover rate | | | | 20% | | | | | 94% | | | | | 69% | |
| | | | | | | | | | | | | | | | |
| | | | Period Ended | | | | Year Ended | | | | Period Ended | |
| | | | March 31, | | | | September 30, | | | | September 30, | |
| C-Class | | | 2014 | a | | | | 2013 | | | | | 2012 | b |
| |
| Per Share Data | | | | | | | | | | | | | | | |
| Net asset value, beginning of period | | | $ | 26.16 | | | | $ | 26.50 | | | | $ | 25.00 | |
| |
| Income (loss) from investment operations: | | | | | | | | | | | | | | | |
| Net investment income (loss)c | | | | .58 | | | | | .99 | | | | | .94 | |
| Net gain (loss) on investments (realized and unrealized) | | | | .50 | | | | | (.27 | ) | | | | 1.32 | |
| | | | |
Total from investment operations | | | | 1.08 | | | | | .72 | | | | | 2.26 | |
| |
| Less distributions from: | | | | | | | | | | | | | | | |
| Net investment income | | | | (.61 | ) | | | | (1.02 | ) | | | | (.76 | ) |
| Net realized gains | | | | — | | | | | (.04 | ) | | | | — | |
| | | | |
| Total distributions | | | | (.61 | ) | | | | (1.06 | ) | | | | (.76 | ) |
| |
| Net asset value, end of period | | | $ | 26.63 | | | | $ | 26.16 | | | | $ | 26.50 | |
| | | | |
| | | | | | | | | | | | | | | | |
| |
| Total Returnd | | | | 4.60% | | | | | 2.77% | | | | | 9.09% | |
| |
| Ratios/Supplemental Data | | | | | | | | | | | | | | | |
| Net assets, end of period (in thousands) | | | $ | 16,149 | | | | $ | 15,654 | | | | $ | 6,607 | |
| |
| Ratios to average net assets: | | | | | | | | | | | | | | | |
| Net investment income (loss) | | | | 4.37% | | | | | 3.70% | | | | | 4.38% | |
| Total expenses | | | | 1.91% | | | | | 2.07% | | | | | 2.26% | |
| Net expensese,f | | | | 1.66% | | | | | 1.77% | | | | | 1.63% | |
| |
| Portfolio turnover rate | | | | 20% | | | | | 94% | | | | | 69% | |
| |
| 88 | THE GUGGENHEIM FUNDS SEMI-ANNUAL REPORT | SEE NOTES TO FINANCIAL STATEMENTS. |
| FINANCIAL HIGHLIGHTS (concluded) |
| This table is presented to show selected data for a share outstanding throughout each period and to assist shareholders in evaluating a Fund’s performance for the periods presented. |
| | | | Period Ended | | | | Year Ended | | | | Period Ended | |
| | | | March 31, | | | | September 30, | | | | September 30, | |
| Institutional Class | | | 2014 | a | | | 2013 | | | | 2012 | b |
| |
| Per Share Data | | | | | | | | | | | | | | | |
| Net asset value, beginning of period | | | $ | 26.19 | | | | $ | 26.54 | | | | $ | 25.00 | |
| |
| Income (loss) from investment operations: | | | | | | | | | | | | | | | |
| Net investment income (loss)c | | | | .72 | | | | | 1.28 | | | | | 1.06 | |
| Net gain (loss) on investments (realized and unrealized) | | | | .50 | | | | | (.27 | ) | | | | 1.44 | |
| | | | |
| Total from investment operations | | | | 1.22 | | | | | 1.01 | | | | | 2.50 | |
| |
| Less distributions from: | | | | | | | | | | | | | | | |
| Net investment income | | | | (.75 | ) | | | | (1.32 | ) | | | | (.96 | ) |
| Net realized gains | | | | — | | | | | (.04 | ) | | | | — | |
| | | | |
| Total distributions | | | | (.75 | ) | | | | (1.36 | ) | | | | (.96 | ) |
| |
| Net asset value, end of period | | | $ | 26.66 | | | | $ | 26.19 | | | | $ | 26.54 | |
| | | | |
| | | |
| |
| Total Returnd | | | | 5.13% | | | | | 3.88% | | | | | 10.09% | |
| |
| Ratios/Supplemental Data | | | | | | | | | | | | | | | |
| Net assets, end of period (in thousands) | | | $ | 118,662 | | | | $ | 78,318 | | | | $ | 44,566 | |
| |
| Ratios to average net assets: | | | | | | | | | | | | | | | |
| Net investment income (loss) | | | | 5.46% | | | | | 4.78% | | | | | 4.91% | |
| Total expenses | | | | 0.82% | | | | | 0.89% | | | | | 0.99% | |
| Net expensese,f | | | | 0.56% | | | | | 0.64% | | | | | 0.52% | |
| |
| Portfolio turnover rate | | | | 20% | | | | | 94% | | | | | 69% | |
| a | Unaudited figures for the period ended March 31, 2014. Percentage amounts for the period, except total return and portfolio turnover rate, have been annualized. |
| b | Since commencement of operations: November 30, 2011. Percentage amounts for the period, except total return and portfolio turnover rate, have been annualized. |
| c | Net investment income (loss) per share was computed using average shares outstanding throughout the period. |
| d | Total return does not reflect the impact of any applicable sales charges and has not been annualized. |
| e | Net expense information reflects the expense ratios after expense waivers, and includes interest expense if any. |
| f | Excluding interest expense, the operating expense ratios for the periods presented would be: |
| | | 03/31/14 | | 09/30/13 | | 09/30/12 |
| |
| A-Class | | 0.93 | % | | 0.86 | % | | 0.82 | % |
| C-Class | | 1.49 | % | | 1.64 | % | | 1.59 | % |
| Institutional Class | | 0.40 | % | | 0.52 | % | | 0.50 | % |
| |
| SEE NOTES TO FINANCIAL STATEMENTS. | THE GUGGENHEIM FUNDS SEMI-ANNUAL REPORT | 89 |
NOTES TO FINANCIAL STATEMENTS (Unaudited)
1. Organization, and Significant Accounting Policies Organization
Guggenheim Funds Trust (the “Trust”), a Delaware statutory trust, is registered with the SEC under the Investment Company Act of 1940 (“1940 Act”), as a non-diversified, open-ended investment company of the series type. Each series, in effect, is representing a separate Fund. The Trust is authorized to issue an unlimited number of shares. The Trust accounts for the assets of each Fund separately.
Effective January 13, 2012, the TS&W/Claymore Tax-Advantage Balance Fund (“TYW”) was reorganized with and into the Municipal Income Fund. For Financial reporting purposes, TYW’s financial and performance history prior to the reorganization has been carried forward and is reflected in the Municipal Income Fund’s financial statements and financial highlights.
The Trust offers a combination of four separate classes of shares, A-Class shares, B-Class shares, C-Class shares and Institutional Class shares. Sales of shares of each Class are made without a front-end sales charge at the net asset value per share (“NAV”), with the exception of A-Class shares. A-Class shares are sold at the NAV, plus the applicable front-end sales charge. The sales charge varies depending on the amount purchased, but will not exceed 4.75%. A-Class share purchases of $1 million or more are exempt from the front-end sales charge but have a 1% contingent deferred sales charge (“CDSC”) if shares are redeemed within 12 months of purchase. B-Class shares were offered without a front-end sales charge, but were subject to a CDSC of up to 5% for five years and convert to A-Class shares after eight years. Effective January 4, 2010, subscriptions for B-Class shares are no longer accepted. C-Class shares have a 1% CDSC if shares are redeemed within 12 months of purchase. Institutional Class shares are offered primarily for direct investment by institutions such as pension and profit sharing plans, endowments, foundations and corporations. Institutional Class shares have a minimum initial investment of $2 million and a minimum account balance of $1 million. Institutional Class shares are offered without a front-end sales charge or a CDSC.
As of January 1, 2012, A-Class, C-Class and Institutional Class shares of High Yield Fund are subject to a 2% redemption fee when shares are redeemed or exchanged within 90 days of purchase.
At March 31, 2014, the Trust consisted of sixteen separate funds. This report covers certain Income Funds (the “Funds”) , while the other funds are contained in separate reports. Only A-Class, B-Class, C-Class and Institutional Class shares had been issued by the Funds.
Guggenheim Investments (“GI”) provides advisory services to the Funds. Rydex Fund Services, LLC (“RFS”) acts as the transfer agent and provides administrative and accounting services to the Funds. Guggenheim Funds Distributors, LLC (“GFD”) acts as principal underwriter to the Funds. GI, RFS and GFD are affiliated entities.
Guggenheim Partners Investment Management (“GPIM”), an affiliate of GI serves as investment sub-advisor (the “Sub-Advisor”) to the Municipal Income Fund and is responsible for the day-to-day management of the Fund’s portfolio.
Significant Accounting Policies
The following significant accounting policies are in conformity with U.S. generally accepted accounting principles (“U.S. GAAP”) and are consistently followed by the Trust. This requires management to make estimates and assumptions that affect the reported amount of assets and liabilities and disclosure of contingent assets and liabilities at the date of the financial statements and the reported amounts of revenues and expenses during the reporting period. Actual results could differ from these estimates. All time references are based on Eastern Time.
A. Valuations of the Funds’ securities are supplied primarily by pricing services approved by the Board of Trustees. A Valuation Committee (“Valuation Committee”) is responsible for the oversight of the valuation process of the Funds and convenes monthly, or more frequently as needed. The Valuation Committee will review the valuation of all assets which have been fair valued for reasonableness. The Trust’s officers, through the Valuation Committee under the general supervision of the Board of Trustees, regularly review procedures used by, and valuations provided by, the pricing services.
Equity securities listed on an exchange (New York Stock Exchange (“NYSE”) or American Stock Exchange) are valued at the last quoted sales price as of the close of business on the NYSE, usually 4:00 p.m. on the valuation date. Equity securities listed on the NASDAQ market system are valued at the NASDAQ Official Closing Price on the valuation date, which may not necessarily represent the last sale price. If there has been no sale on such exchange or NASDAQ on such day, the security is valued at the closing bid price on such day.
Open-end investment companies (“Mutual Funds”) are valued at their NAV as of the close of business on the valuation date. Exchange Traded Funds (“ETFs”) and closed-end investment companies are valued at the last quoted sales price.
U.S. government securities are valued by either independent pricing services, the last traded fill price, or at the reported bid price at the close of business. Debt securities with a maturity of greater than 60 days at acquisition are valued at prices that reflect broker/dealer supplied valuations or are obtained from independent pricing services, which may consider the trade activity, treasury spreads, yields or price of bonds of comparable quality, coupon, maturity, and type, as well as prices quoted by dealers who make markets in such securities. Short-term debt securities with a maturity of 60 days or less at acquisition and repurchase agreements are valued at amortized cost, which approximates market value.
| |
| 90 | THE GUGGENHEIM FUNDS SEMI-ANNUAL REPORT |
NOTES TO FINANCIAL STATEMENTS (Unaudited) (continued)
Listed options are valued at the Official Settlement Price listed by the exchange, usually as of 4:00 p.m. Long options are valued using the bid price and short options are valued using the ask price. In the event that a settlement price is not available, fair valuation is enacted. Over-the-counter options are valued using the average bid price (for long options), or average ask price (for short options) obtained from one or more security dealers.
Premiums received from options written are entered in a Fund’s accounting records as an asset and equivalent liability. The amount of the liability is subsequently marked-to-market to reflect the current value of the option written. When an option written expires, or if a Fund enters into a closing purchase transaction, it realizes a gain (or loss if the cost of a closing purchase transaction exceeds the premium received when the option was sold).
Typically loans are valued using information provided by an independent third party pricing service which uses broker quotes in a non-active market, or price derived from significant observable inputs and is also compared to broker quote (matrixed). If the pricing service cannot or does not provide a valuation for a particular loan or such valuation is deemed unreliable, such loan is fair valued by the Valuation Committee.
The value of futures contracts is accounted for using the unrealized gain or loss on the contracts that is determined by marking the contracts to their current realized settlement prices. Financial futures contracts are valued at the 4:00 p.m. price on the valuation date. In the event that the exchange for a specific futures contract closes earlier than 4:00 p.m., the futures contract is valued at the Official Settlement Price of the exchange. However, the underlying securities from which the futures contract value is derived are monitored until 4:00 p.m. to determine if fair valuation would provide a more accurate valuation.
The value of index swap agreements entered into by a Fund is accounted for using the unrealized gain or loss on the agreements that is determined using the last quoted value of the index that the swap pertains to at the close of the NYSE, adjusted to include dividends accrued, and financing charges and/or interest associated with the swap agreements.
Interest rate swap agreements entered into by a Fund are accounted for using the unrealized gain or loss on the agreements that is determined using the spread priced off the previous day’s CME price
Generally, trading in foreign securities markets is substantially completed each day at various times prior to the close of the NYSE. The values of foreign securities are determined as of the close of such foreign markets or the close of the NYSE, if earlier. All investments quoted in foreign currency are valued in U.S. dollars on the basis of the foreign currency exchange rates prevailing at the close of business. Investments in foreign securities may involve risks not present in domestic investments. The Valuation Committee will determine the current value of such foreign securities by taking into consideration certain factors which may include those discussed above, as well as the following factors, among others: the value of the securities traded on other foreign markets, ADR trading, closed-end fund trading, foreign currency exchange activity, and the trading prices of financial products that are tied to foreign securities such as World Equity Benchmark Securities. In addition, the Board of Trustees has authorized the Valuation Committee and GI to use prices and other information supplied by a third party pricing vendor in valuing foreign securities.
Investments for which market quotations are not readily available are fair valued as determined in good faith by GI under the direction of the Board of Trustees using methods established or ratified by the Board of Trustees. Valuations in accordance with these methods are intended to reflect each security’s (or asset’s) “fair value.” Each such determination is based on a consideration of all relevant factors, which are likely to vary from one pricing context to another. Examples of such factors may include, but are not limited to: (i) the type of security, (ii) the initial cost of the security, (iii) the existence of any contractual restrictions on the security’s disposition, (iv) the price and extent of public trading in similar securities of the issuer or of comparable companies, (v) quotations or evaluated prices from broker-dealers and/or pricing services, (vi) information obtained from the issuer, analysts, and/or the appropriate stock exchange (for exchange traded securities), (vii) an analysis of the company’s financial statements, and (viii) an evaluation of the forces that influence the issuer and the market(s) in which the security is purchased and sold (e.g. the existence of pending merger activity, public offerings or tender offers that might affect the value of the security).
B. Senior loans in which the Funds invests generally pay interest based on rates which are periodically adjusted by reference to a base short-term, floating rate plus a premium. These base lending rates are generally (i) the lending rate offered by one or more major European banks, such as the London Inter-Bank Offered Rate (LIBOR), (ii) the prime rate offered by one or more major United States banks, or (iii) the bank’s certificate of deposit rate. Senior floating rate interests often require prepayments from excess cash flows or permit the borrower to repay at its election. The rate at which the borrower repays cannot be predicted with accuracy. As a result, the actual remaining maturity may be substantially less than the stated maturities shown. The interest rate indicated is the rate in effect at March 31, 2014.
C. Securities transactions are recorded on the trade date for financial reporting purposes. Realized gains and losses from securities transactions are recorded using the identified cost basis. Dividend income is recorded on the ex-dividend date, net of applicable taxes withheld by foreign countries. Taxable non-cash dividends are recorded as dividend income. Interest income, including amortization of premiums and accretion of
| |
| THE GUGGENHEIM FUNDS SEMI-ANNUAL REPORT | 91 |
NOTES TO FINANCIAL STATEMENTS (Unaudited) (continued)
discount, is accrued on a daily basis. Distributions received from investments in REITs are recorded as dividend income on the ex-dividend date, subject to reclassification upon notice of the character of such distribution by the issuer.
D. The Funds may purchase and sell interests in securities on a when-issued and delayed delivery basis, with payment and delivery scheduled for a future date. No income accrues to the Fund on such interests or securities in connection with such transactions prior to the date the Funds actually take delivery of such interests or securities. These transactions are subject to market fluctuations and are subject to the risk that the value at delivery may be more or less than the trade date purchase price. Although the Funds will generally purchase these securities with the intention of acquiring such securities, they may sell such securities before the settlement date.
E. The accounting records of the Fund are maintained in U.S. dollars. All assets and liabilities initially expressed in foreign currencies are converted into U.S. dollars at prevailing exchange rates. Purchases and sales of investment securities, dividend and interest income, and certain expenses are translated at the rates of exchange prevailing on the respective dates of such transactions. Changes in the relationship of these foreign currencies to the U.S. dollar can significantly affect the value of the investments and earnings of the Funds. Foreign investments may also subject the Funds to foreign government exchange restrictions, expropriation, taxation or other political, social or economic developments, all of which could affect the market and/or credit risk of the investments.
The Funds do not isolate that portion of the results of operations resulting from changes in the foreign exchange rates on investments from the fluctuations arising from changes in the market prices of securities held. Such fluctuations are included with the net realized and unrealized gain or loss on investments.
Reported net realized foreign exchange gains and losses arise from sales of foreign currencies and currency gains or losses realized between the trade and settlement dates on investment transactions. Net unrealized exchange gains and losses arise from changes in the fair values of assets and liabilities other than investments in securities at the fiscal period end, resulting from changes in exchange rates.
F. Upon entering into a futures contract, a Fund deposits and maintains as collateral such initial margin as required by the exchange on which the transaction is affected. Pursuant to the contract, the Fund agrees to receive from or pay to the broker an amount of cash equal to the daily fluctuation in value of the contract. Such receipts or payments are known as variation margin and are recorded by the Fund as unrealized gains or losses. When the contract is closed, the Fund records a realized gain or loss equal to the difference between the value of the contract at the time it was opened and the value at the time it was closed.
G. Swap agreements are marked-to-market daily and the change, if any, is recorded as unrealized gain/loss. Payments received or made as a result of an agreement or termination of the agreement are recognized as realized gains or losses.
H. Forward foreign currency exchange contracts are valued daily based on the applicable exchange rate of the underlying currency. The change in value of the contract is recorded as unrealized appreciation or depreciation until the forward foreign currency contract is closed. When the forward foreign currency contract is closed, the Fund records a realized gain or loss equal to the difference between the value at the time the contract was opened and the value at the time it was closed.
I. Expenses that are directly related to one of the Funds are charged directly to that Fund. Other operating expenses are allocated to the funds on the basis of relative net assets. Class specific expenses, such as 12b-1 fees, and transfer agent fees are borne by that class. Income, other expenses, and realized and unrealized gains and losses of a Fund are allocated to each respective class in proportion to the relative net assets of each class.
J. The Funds declare dividends from investment income daily. Each Fund pays its shareholders from its net investment income monthly and distributes any net capital gains that it has realized, at least annually. Distributions to shareholders are recorded on the ex-dividend date. The character of distributions made during the year from net investment income or net realized gains may differ from their ultimate characterization for federal income tax purposes.
K. Under the fee arrangement with the custodian, the Funds may earn credits based on overnight custody cash balances. These credits are utilized to reduce related custodial expenses. The custodian fees disclosed in the Statement of Operations are before the reduction in expense from the related earnings credits, if any. For the period ended March 31, 2014, there were no earnings credits received.
L. Under the Funds’ organizational documents, its officers and trustees are indemnified against certain liabilities arising out of the performance of their duties to the Trust. In addition, throughout the normal course of business, the Funds enter into contracts that contain a variety of representations and warranties which provide general indemnifications. The Funds’ maximum exposure under these arrangements is unknown, as this would involve future claims that may be made against the Funds and/or their affiliates that have not yet occurred. However, based on experience, the Funds expect the risk of loss to be remote.
2. Financial Instruments
As part of their investment strategy, the Funds utilize a variety of derivative instruments including futures, options and swap agreements.
| |
| 92 | THE GUGGENHEIM FUNDS SEMI-ANNUAL REPORT |
NOTES TO FINANCIAL STATEMENTS (Unaudited) (continued)
These investments involve, to varying degrees, elements of market risk and risks in excess of the amounts recognized in the Statements of Assets and Liabilities.
A futures contract is an agreement to purchase (long) or sell (short) an agreed amount of securities or other instruments at a set price for delivery at a future date. There are significant risks associated with a Fund’s use of futures contracts and related options, including (i) there may be an imperfect or no correlation between the changes in market value of the underlying asset and the prices of futures contracts; (ii) there may not be a liquid secondary market for a futures contract; (iii) trading restrictions or limitations may be imposed by an exchange; and (iv) government regulations may restrict trading in futures contracts. When investing in futures, there is minimal counterparty credit risk to the fund because futures are exchange-traded and the exchange’s clearinghouse, as counterparty to all exchange-traded futures, guarantees against default. Cash deposits are shown as restricted cash on the Statement of Assets and Liabilities; securities held as collateral are noted on the Schedule of Investments.
A swap is an agreement that obligates two parties to exchange a series of cash flows at specified intervals based upon or calculated by reference to changes in specified prices or rates for a specified amount of an underlying asset. A Fund bears the risk of loss of the amount expected to be received under a swap agreement in the event of the default or bankruptcy of a swap agreement counterparty. Additionally, there is no guarantee that a Fund or an underlying fund could eliminate its exposure under an outstanding swap agreement by entering into an offsetting swap agreement with the same or another party.
An option on a security gives the purchaser of the option the right to sell, and the writer of the option the obligation to buy, the underlying security (put option) or the purchaser of the option the right to buy, and the writer of the option the obligation to sell, the underlying security (call option) at any time during the option period. The risk associated with purchasing options is limited to the premium originally paid. The risk in writing a call option is that a Fund may incur a loss if the market price of the underlying security increases and the option is exercised. The risk in writing a put option is that a Fund may incur a loss if the market price of the underlying security decreases and the option is exercised. In addition, there may be an imperfect correlation between the movement in prices of options and the underlying securities and a Fund may not be able to enter into a closing transaction because of an illiquid secondary market or, for over-the-counter options, because of the counterparty’s inability to perform.
In conjunction with the use of futures, options and swap agreements, the Funds are required to maintain collateral in various forms. The Funds use, where appropriate, depending on the financial instrument utilized and the broker involved, margin deposits at the broker, cash and/or securities segregated at the custodian bank, discount notes, or the repurchase agreements allocated to each Fund.
A forward foreign currency exchange contract is an agreement between two parties to exchange two designated currencies at a specific time in the future. The contracts can be used to hedge or manage exposure to foreign currency risks with portfolio investments or to gain exposure to foreign currencies.
The Trust has established counterparty credit guidelines and enters into transactions only with financial institutions of investment grade or better. The Trust monitors the counterparty credit risk.
Floating Rates Strategies Fund, High Yield Fund, Investment Grade Bond Fund, Macro Opportunities Fund and Total Return Bond Fund utilized derivatives to achieve leveraged exposure. The use of derivative instruments by a Fund to achieve leveraged exposure to the underlying index creates leveraging risk. The more a Fund invests in leveraged instruments, the more this leverage will magnify any losses on those investments. A Fund’s investment in these instruments generally requires a small investment relative to the amount of investment exposure assumed. As a result, such investments may give rise to losses that exceed the amount invested in those instruments. Since a Fund’s investment strategy involves consistently applied leverage, the value of the Fund’s shares will tend to increase or decrease more than the value of any increase or decrease in the underlying index.
3. Fees and Other Transactions with Affiliates
Management fees are paid monthly to GI based on the following annual rates:
| | | Management Fees |
| Fund | | (as a% of net assets) |
| |
| Floating Rate Strategies Fund | | 0.65 | % |
| High Yield Fund | | 0.60 | % |
| Investment Grade Bond Fund | | 0.50 | % |
| Limited Duration Fund | | 0.45 | % |
| Macro Opportunities Fund | | 0.89 | % |
| Municipal Income Fund | | 0.50 | % |
| Total Return Bond Fund | | 0.50 | % |
| |
| THE GUGGENHEIM FUNDS SEMI-ANNUAL REPORT | 93 |
NOTES TO FINANCIAL STATEMENTS (Unaudited) (continued)
RFS also acts as the administrative agent for the Funds, and as such performs administrative functions and the bookkeeping, accounting and pricing functions for each Fund. For these services, RFS receives the following:
| | | Fund Accounting/ |
| | | Administrative Fees |
| Fund | | (as a% of net assets) |
| |
| Floating Rate Strategies Fund | | 0.095 | % |
| High Yield Fund | | 0.095 | % |
| Investment Grade Bond Fund | | 0.095 | % |
| Limited Duration Fund | | 0.095 | % |
| Macro Opportunities Fund | | 0.095 | % |
| Municipal Income Fund | | 0.095 | % |
| Total Return Bond Fund | | 0.095 | % |
| | | | |
| Minimum annual charge per Fund | | $25,000 | |
| Certain out-of-pocket charges | | Varies | |
RFS is paid the following for providing transfer agent services to the Funds. The transfer agent fees are assessed to the applicable class of the Funds in which they were incurred. Prior to May 1, 2012, transfer agent fees were aggregated by the High Yield Fund and Investment Grade Bond Fund, and allocated based on the daily net assets of each Class of the Fund.
| Annual charge per account | | $5.00 – $8.00 |
| Transaction fee | | $0.60 – $1.10 |
| Minimum annual charge per Fund1 | | $25,000 |
| Certain out-of-pocket charges | | Varies |
| 1 | | Not subject to Funds during first twelve months of operations. |
The investment advisory contracts for the following Funds provide that the total expenses be limited to a percentage of average net assets for each class of shares, exclusive of brokerage costs, dividends on securities sold short, expenses of other investment companies in which a Fund invests, interest, taxes, litigation, indemnification and extraordinary expenses (as determined under U.S. GAAP). The limits are listed below:
| | | | | Effective | | | Contract | |
| | | Limit | | Date | | | End Date | |
| |
| | | | | | | | | | | | | |
| Floating Rate Strategies Fund - A-Class | | | 1.02 | % | | | 11/30/12 | | | | 02/01/15 | |
| Floating Rate Strategies Fund - C-Class | | | 1.77 | % | | | 11/30/12 | | | | 02/01/15 | |
| Floating Rate Strategies Fund - Institutional Class | | | 0.78 | % | | | 11/30/12 | | | | 02/01/15 | |
| High Yield Fund A-Class | | | 1.16 | % | | | 11/30/12 | | | | 02/01/15 | |
| High Yield Fund B-Class | | | 1.91 | % | | | 11/30/12 | | | | 02/01/15 | |
| High Yield Fund C-Class | | | 1.91 | % | | | 11/30/12 | | | | 02/01/15 | |
| High Yield Fund - Institutional Class | | | 0.91 | % | | | 11/30/12 | | | | 02/01/15 | |
| Investment Grade Bond Fund - A-Class | | | 1.00 | % | | | 11/30/12 | | | | 02/01/15 | |
| Investment Grade Bond Fund - B-Class | | | 1.75 | % | | | 11/30/12 | | | | 02/01/15 | |
| Investment Grade Bond Fund - C-Class | | | 1.75 | % | | | 11/30/12 | | | | 02/01/15 | |
| Investment Grade Bond Fund - Institutional Class* | | | 0.75 | % | | | 11/30/12 | | | | 02/01/15 | |
| Limited Duration Fund - A-Class** | | | 0.80 | % | | | 12/01/13 | | | | 02/01/15 | |
| Limited Duration Fund - C-Class** | | | 1.55 | % | | | 12/01/13 | | | | 02/01/15 | |
| Limited Duration Fund - Institutional Class** | | | 0.55 | % | | | 12/01/13 | | | | 02/01/15 | |
| Macro Opportunities Fund - A-Class | | | 1.36 | % | | | 11/30/12 | | | | 02/01/15 | |
| Macro Opportunities Fund - C-Class | | | 2.11 | % | | | 11/30/12 | | | | 02/01/15 | |
| Macro Opportunities Fund - Institutional Class | | | 0.95 | % | | | 11/30/12 | | | | 02/01/15 | |
| Municipal Income Fund - A-Class | | | 0.80 | % | | | 11/30/12 | | | | 02/01/15 | |
| Municipal Income Fund - C-Class | | | 1.55 | % | | | 11/30/12 | | | | 02/01/15 | |
| Municipal Income Fund - Institutional Class | | | 0.55 | % | | | 11/30/12 | | | | 02/01/15 | |
| Total Return Bond Fund - A-Class | | | 0.90 | % | | | 11/30/12 | | | | 02/01/15 | |
| Total Return Bond Fund - C-Class | | | 1.65 | % | | | 11/30/12 | | | | 02/01/15 | |
| Total Return Bond Fund - Institutional Class | | | 0.50 | % | | | 11/30/12 | | | | 02/01/15 | |
| * | | Since the commencement of operations: January 29, 2013 |
| ** | | Since the commencement of operations: December 16, 2013 |
| |
| 94 | THE GUGGENHEIM FUNDS SEMI-ANNUAL REPORT |
NOTES TO FINANCIAL STATEMENTS (Unaudited) (continued)
GI is entitled to reimbursement by the Funds for fees waived or expenses reimbursed during any of the previous 36 months, beginning on the date of the expense limitation agreement, if on any day the estimated operating expenses are less than the indicated percentages. At March 31, 2014, the amount of fees waived or expenses reimbursed that are subject to recoupment are presented in the following table:
| | | Expires | | | Expires | | | Expires | | | Expires | | | Fund | |
| Fund | | 2014 | | | 2015 | | | 2016 | | | 2017 | | | Total | |
| |
| Floating Rate Strategies Fund | | | $ | — | | | | $ | 127,768 | | | | $ | 430,026 | | | | $ | 474,445 | | | | $ | 1,032,239 | |
| High Yield Fund | | | | 26,017 | | | | | 205,368 | | | | | 207,619 | | | | | 43,198 | | | | | 482,202 | |
| Investment Grade Bond Fund | | | | 5,458 | | | | | 165,867 | | | | | 234,110 | | | | | 94,527 | | | | | 499,962 | |
| Limited Duration Fund | | | | — | | | | | — | | | | | — | | | | | 55,510 | | | | | 55,510 | |
| Macro Opportunities Fund | | | | — | | | | | 161,466 | | | | | 961,870 | | | | | 654,733 | | | | | 1,778,069 | |
| Municipal Income Fund | | | | — | | | | | 192,257 | | | | | 236,488 | | | | | 119,813 | | | | | 548,558 | |
| Total Return Bond Fund | | | | — | | | | | 154,714 | | | | | 462,339 | | | | | 227,082 | | | | | 844,135 | |
For the period ended March 31, 2014, no amounts were recouped by GI.
If a Fund invests in an affiliated fund, the investing Fund’s Adviser will determine whether to waive fees at the investing Fund level. Fee waivers will be calculated at the investing Fund level without regard to any expense cap in effect for the investing Fund.
The Funds have adopted distribution plans related to the offering of Class A, Class B and Class C shares. Each such distribution plan has been adopted pursuant to Rule 12b-1 of the Investment Company Act of 1940. The plans provide for payments at an annual rate of 0.25% of the average daily net assets of A-Class Shares of each Fund and 1.00% of the average daily assets of B-Class and C-Class shares. Effective October 16, 2009, GFD became the sole distributor of the Funds. The distribution fees were paid to GFD effective October 16, 2009. Effective December 1, 2006, Class B shares of the High Yield Fund ceased charging 12b-1 fees in accordance with the FINRA sales cap regulations. These fees may be reinstated at any time.
During the period ended March 31, 2014, GFD retained sales charges of $139,056 relating to sales of A-Class shares of the Funds.
Certain officers and trustees of the Trust are also officers of GI, RFS and GFD.
At March 31, 2014, GI and its subsidiaries owned over twenty percent of the outstanding shares of the following Fund.
| | | Percent of |
| | | outstanding |
| Fund | | shares owned |
| |
| Limited Duration Fund | | 60 | % |
4. Fair Value Measurement
In accordance with U.S. GAAP, fair value is defined as the price that the Funds would receive to sell an investment or pay to transfer a liability in an orderly transaction with an independent buyer in the principal market, or in the absence of a principal market, the most advantageous market for the investment or liability. U.S. GAAP establishes a three-tier fair value hierarchy based on the types of inputs used to value assets and liabilities and requires corresponding disclosure. The hierarchy and the corresponding inputs are summarized below:
Level 1 — quoted prices in active markets for identical assets or liabilities.
Level 2 — significant other observable inputs (for example quoted prices for securities that are similar based on characteristics such as interest rates, prepayment speeds, credit risk, etc.).
Level 3 — significant unobservable inputs based on the best information available under the circumstances, to the extent observable inputs are not available, which may include assumptions.
The types of inputs available depend on a variety of factors, such as the type of security and the characteristics of the markets in which it trades, if any. Fair valuation determinations that rely on fewer or no observable inputs require greater judgment. Accordingly, fair value determinations for Level 3 securities require the greatest amount of judgment.
| |
| THE GUGGENHEIM FUNDS SEMI-ANNUAL REPORT | 95 |
NOTES TO FINANCIAL STATEMENTS (Unaudited) (continued)
The following table summarizes the inputs used to value the Funds’ net assets at March 31, 2014:
| | | Level 1 | | | Level 1 | | | Level 2 | | | Level 2 | | | Level 3 | | |
| | | Investments | | | Other Financial | | | Investments | | | Other Financial | | | Investments | | |
| | | In Securities | | | Instruments* | | | In Securities | | | Instruments* | | | In Securities | | Total |
| |
| Assets | | | | | | | | | | | | | | | | | | | | | | | | | | | |
| Floating Rate Strategies Fund | | | $ | 62,179,966 | | | | $ | — | | | | $ | 1,323,518,022 | | | | $ | — | | | | $ | 52,117,794 | | $ | 1,437,815,782 |
| High Yield Fund | | | | 10,624,301 | | | | | — | | | | | 147,359,607 | | | | | 335 | | | | | 2,885,664 | | | 160,869,907 |
| Investment Grade Bond Fund | | | | 6,368,994 | | | | | — | | | | | 93,850,666 | | | | | 314,480 | | | | | 16,503,753 | | | 117,037,893 |
| Limited Duration Fund | | | | 4,096,981 | | | | | — | | | | | 35,515,899 | | | | | — | | | | | 5,266,238 | | | 44,879,118 |
| Macro Opportunities Fund | | | | 150,058,084 | | | | | 2,486,261 | | | | | 1,019,925,935 | | | | | 3,215,004 | | | | | 124,220,617 | | | 1,299,905,901 |
| Municipal Income Fund | | | | 2,528,738 | | | | | — | | | | | 51,504,726 | | | | | — | | | | | — | | | 54,033,464 |
| Total Return Bond Fund | | | | 19,596,514 | | | | | — | | | | | 178,024,978 | | | | | 319,650 | | | | | 22,160,509 | | | 220,101,651 |
| |
| Liabilities | | | | | | | | | | | | | | | | | | | | | | | | | | | |
| Floating Rate Strategies Fund | | | $ | — | | | | $ | — | | | | $ | — | | | | $ | 30,957 | | | | $ | — | | $ | 30,957 |
| Investment Grade Bond Fund | | | | — | | | | | — | | | | | — | | | | | 12,090 | | | | | — | | | 12,090 |
| Macro Opportunities Fund | | | | — | | | | | 38,940 | | | | | — | | | | | 338,927 | | | | | — | | | 377,867 |
| Total Return Bond Fund | | | | — | | | | | — | | | | | — | | | | | 23,400 | | | | | — | | | 23,400 |
| * | | Other financial instruments may include options, forward foreign currency contracts, futures contracts and/or swaps, which are reported as unrealized gain/loss at period end. |
Independent pricing services are used to value a majority of the Funds’ investments. When values are not available from a pricing service, they may be computed by the Funds’ investment adviser or an affiliate. In any event, values may be determined using a variety of sources and techniques, including: market prices; broker quotes; and models which derive prices based on inputs such as prices of securities with comparable maturities and characteristics or based on inputs such as anticipated cash flows or collateral, spread over Treasuries, and other information and analysis. A significant portion of the Funds’ assets and liabilities are categorized as Level 2 or Level 3, as indicated in this report.
Indicative quotes from broker-dealers, adjusted for fluctuations in criteria such as credit spreads and interest rates, may be also used to value the Funds’ assets and liabilities, i.e. prices provided by a broker-dealer or other market participant who has not committed to trade at that price. Although Indicative quotes are typically received from established market participants, the Funds may not have the transparency to view the underlying inputs which support the market quotations. Significant changes in an indicative quote would generally result in significant changes in the fair value of the security.
Certain fixed income securities are valued by obtaining a monthly indicative quote from a broker-dealer, adjusted for fluctuations in criteria such as credit spreads and interest rates. The Funds’ fair valuation guidelines were recently revised to transition such monthly indicative quoted securities from Level 2 to Level 3.
The inputs or methodologies used for valuing securities are not necessarily an indication of the risk associated with investing in those securities. The suitability of the techniques and sources employed to determine fair valuation are regularly monitored and subject to change.
| |
| 96 | THE GUGGENHEIM FUNDS SEMI-ANNUAL REPORT |
NOTES TO FINANCIAL STATEMENTS (Unaudited) (continued)
The following is a summary of significant unobservable inputs used in the fair valuation of assets and liabilities categorized within Level 3 of the fair value hierarchy:
| | | | | | | Ending Balance | | | | | | |
| Fund | | | Category and Subcategory | | | at 03/31/14 | | | Valuation Technique | | | Unobservable Inputs |
| |
| | | | Investments, at value | | | | | | | | | |
| Floating Rate Strategies Fund | | | Asset-Backed Securities | | | $39,713,142 | | | Option Adjusted Spread off the | | | Indicative Quote |
| | | | | | | | | | month end broker mark over the | | | |
| | | | | | | | | | 3 month LIBOR | | | |
| | | | Senior Floating Rate Interests | | | 10,786,453 | | | Monthly Model Priced | | | Trade Price |
| | | | Corporate Bonds | | | 1,618,200 | | | Option Adjusted Spread off the | | | Trade Price |
| | | | | | | | | | trade price over the 3 month LIBOR | | | |
| High Yield Fund | | | Senior Floating Rate Interests | | | 1,787,231 | | | Monthly Model Priced | | | Trade Price |
| | | | Corporate Bonds | | | 558,660 | | | Option Adjusted Spread off the | | | Trade Price |
| | | | | | | | | | trade price over the 3 month LIBOR | | | |
| Investment Grade Bond Fund | | | Asset-Backed Securities | | | 12,737,749 | | | Option Adjusted Spread off the | | | Indicative Quote |
| | | | | | | | | | month end broker mark over the | | | |
| | | | | | | | | | 3 month LIBOR | | | |
| | | | Preferred Stock | | | 2,018,180 | | | Option Adjusted Spread off the | | | Indicative Quote |
| | | | | | | | | | month end broker mark over the | | | |
| | | | | | | | | | 3 month LIBOR | | | |
| | | | Corporate Bonds | | | 1,278,181 | | | Option Adjusted Spread off the | | | Indicative Quote |
| | | | | | | | | | month end broker mark over the | | | |
| | | | | | | | | | 3 month LIBOR | | | |
| | | | Senior Floating Rate Interests | | | 469,642 | | | Option Adjusted Spread off the | | | Indicative Quote |
| | | | | | | | | | month end broker mark over the | | | |
| | | | | | | | | | 3 month LIBOR | | | |
| Limited Duration Fund | | | Asset-Backed Securities | | | 5,266,238 | | | Option Adjusted Spread off the | | | Indicative Quote |
| | | | | | | | | | month end broker mark over the | | | |
| | | | | | | | | | 3 month LIBOR | | | |
| Macro Opportunities Fund | | | Asset-Backed Securities | | | $101,457,458 | | | Option Adjusted Spread off the | | | Indicative Quote |
| | | | | | | | | | month end broker mark over the | | | |
| | | | | | | | | | 3 month LIBOR | | | |
| | | | Senior Floating Rate Interests | | | 13,241,436 | | | Monthly Model Priced | | | Trade Price |
| | | | | | | 3,689,444 | | | Option Adjusted Spread off the | | | Indicative Quote |
| | | | | | | | | | month end broker mark over the | | | |
| | | | | | | | | | 3 month LIBOR | | | |
| | | | Total Senior Floating Rate Interests | | | 16,930,880 | | | | | | |
| | | | Corporate Bonds | | | 3,435,131 | | | Option Adjusted Spread off the | | | Indicative Quote |
| | | | | | | | | | month end broker mark over the | | | |
| | | | | | | | | | 3 month LIBOR | | | |
| | | | | | | 1,396,650 | | | Option Adjusted Spread off the | | | Trade Price |
| | | | | | | | | | trade price over the 3 month LIBOR | | | |
| | | | Total Corporate Bonds | | | 4,831,781 | | | | | | |
| | | | Collateralized Mortgage Obligation | | | 1,000,500 | | | Option Adjusted Spread off the | | | Indicative Quote |
| | | | | | | | | | month end broker mark over the | | | |
| | | | | | | | | | 3 month LIBOR | | | |
| Total Return Bond Fund | | | Asset-Backed Securities | | | 19,412,812 | | | Option Adjusted Spread off the | | | Indicative Quote |
| | | | | | | | | | month end broker mark over the | | | |
| | | | | | | | | | 3 month LIBOR | | | |
| | | | Senior Floating Rate Interests | | | 1,002,500 | | | Monthly Model Priced | | | Trade Price |
| | | | | | | 467,018 | | | Option Adjusted Spread off the | | | Indicative Quote |
| | | | | | | | | | month end broker mark over the | | | |
| | | | | | | | | | 3 month LIBOR | | | |
| | | | Total Senior Floating Rate Interests | | | 1,469,518 | | | | | | |
| | | | Corporate Bonds | | | 1,278,181 | | | Option Adjusted Spread off the | | | Indicative Quote |
| | | | | | | | | | month end broker mark over the | | | |
| | | | | | | | | | 3 month LIBOR | | | |
Any remaining Level 3 securities held by the Funds and excluded from the tables above, were not considered material to the Funds.
Transfers between investment levels may occur as the markets fluctuate and/or the availability of data used in an investment’s valuation changes. The Funds recognized transfers between the levels as of the beginning of the period. As of March 31, 2014, High Yield Fund had securities with a total value of $276,850 transfer from Level 2 to Level 1 and the Funds had transfers in/out of Level 3 due to changes in securities valuation method. See the tables below for changes to and from Level 2 and Level 3.
| |
| THE GUGGENHEIM FUNDS SEMI-ANNUAL REPORT | 97 |
NOTES TO FINANCIAL STATEMENTS (Unaudited) (continued)
Summary of Fair Value Level 3 Activity
Following is a reconciliation of Level 3 assets for which significant unobservable inputs were used to determine fair value for the period ended March 31, 2014:
LEVEL 3 – Fair value measurement using significant unobservable inputs
| | | Total | |
| |
| Floating Rate Strategies Fund | | | | | |
| Assets: | | | | | |
| Beginning Balance | | | $ | 10,532,530 | |
| Purchases | | | | 30,280,835 | |
| Sales | | | | (3,293,787 | ) |
| Total change in unrealized gains or losses included in earnings | | | | 408,687 | |
| Transfers into Level 3 | | | | 17,129,399 | |
| Transfers out of Level 3 | | | | (2,939,870 | ) |
| |
| Ending Balance | | | $ | 52,117,794 | |
| |
| | | | | | |
| High Yield Fund | | | | | |
| Assets: | | | | | |
| Beginning Balance | | | $ | 3 | |
| Purchases | | | | 1,354,852 | |
| Sales | | | | (6,875 | ) |
| Total change in unrealized gains or losses included in earnings | | | | 139,608 | |
| Transfers into Level 3 | | | | 1,398,079 | |
| Transfers out of Level 3 | | | | (3 | ) |
| |
| Ending Balance | | | $ | 2,885,664 | |
| |
| | | | | | |
| Investment Grade Bond Fund | | | | | |
| Assets: | | | | | |
| Beginning Balance | | | $ | 382,749 | |
| Purchases | | | | 6,847,075 | |
| Sales | | | | (1,119,641 | ) |
| Total change in unrealized gains or losses included in earnings | | | | 233,976 | |
| Transfers into Level 3 | | | | 10,542,343 | |
| Transfers out of Level 3 | | | | (382,749 | ) |
| |
| Ending Balance | | | $ | 16,503,753 | |
| |
| | | | | | |
| Limited Duration Fund | | | | | |
| Assets: | | | | | |
| Beginning Balance | | | $ | — | |
| Purchases | | | | 5,256,995 | |
| Total change in unrealized gains or losses included in earnings | | | | 9,243 | |
| |
| Ending Balance | | | $ | 5,266,238 | |
| |
| | | | | | |
| Macro Opportunities Fund | | | | | |
| Assets: | | | | | |
| Beginning Balance | | | $ | 24,277,702 | |
| Purchases | | | | 67,765,240 | |
| Sales | | | | (8,539,815 | ) |
| Total realized gains or losses included in earnings | | | | (19,244 | ) |
| Total change in unrealized gains or losses included in earnings | | | | 1,372,050 | |
| Transfers into Level 3 | | | | 49,391,547 | |
| Transfers out of Level 3 | | | | (10,026,863 | ) |
| |
| Ending Balance | | | $ | 124,220,617 | |
| |
| | | | | | |
| Total Return Bond Fund | | | | | |
| Assets: | | | | | |
| Beginning Balance | | | $ | 2,590,364 | |
| Purchases | | | | 10,612,527 | |
| Sales | | | | (1,442,248 | ) |
| Total realized gains or losses included in earnings | | | | (296 | ) |
| Total change in unrealized gains or losses included in earnings | | | | 338,107 | |
| Transfers into Level 3 | | | | 12,652,418 | |
| Transfers out of Level 3 | | | | (2,590,363 | ) |
| |
| Ending Balance | | | $ | 22,160,509 | |
| |
| |
| 98 | THE GUGGENHEIM FUNDS SEMI-ANNUAL REPORT |
NOTES TO FINANCIAL STATEMENTS (Unaudited) (continued)
5. Securities Transactions
For the period ended March 31, 2014, the cost of purchases and proceeds from sales of investment securities, excluding government securities and short-term investments, were as follows:
| Fund | | Purchases | | Sales | |
| |
| Floating Rate Strategies Fund | | | $ | 656,630,353 | | | $ | 283,514,305 | |
| High Yield Fund | | | | 88,190,676 | | | | 29,118,261 | |
| Investment Grade Bond Fund | | | | 32,238,271 | | | | 26,465,517 | |
| Limited Duration Fund | | | | 41,403,596 | | | | 786,117 | |
| Macro Opportunities Fund | | | | 452,524,229 | | | | 193,859,866 | |
| Municipal Income Fund | | | | 35,826,731 | | | | 42,405,160 | |
| Total Return Bond Fund | | | | 70,105,650 | | | | 35,088,994 | |
6. Derivative Investment Holdings Categorized by Risk Exposure
U.S. GAAP requires disclosures to enable investors to better understand how and why the Funds use derivative instruments, how these derivatives instruments are accounted for and their effects on the Funds’ financial position and results of operations.
The Funds may engage in derivatives transactions for speculative purposes to enhance total return, seek to hedge against fluctuations in securities prices, interest rates or currency rates, change the effective duration of its portfolio, manage certain investment risks and/or as a substitute for the purchase or sale of securities or currencies.
The Funds utilized derivatives for the following purposes:
| Fund | | Index Exposure | | Hedge | | Duration | | Leverage |
| |
| Floating Rate Strategies Fund | | | | x | | | | x |
| High Yield Fund | | | | x | | | | x |
| Investment Grade Bond Fund | | | | | | x | | x |
| Macro Opportunities Fund | | x | | x | | | | x |
| Total Return Bond Fund | | | | | | x | | x |
The following is a summary of the location of derivative investments on the Funds’ Statements of Assets and Liabilities as of March 31, 2014:
| Derivative Investment Type | | Asset Derivatives | | Liability Derivatives |
| |
| Currency contracts | | Variation margin | | |
| Equity/Commodities contracts | | Investments, at value | | Options written, at value |
| Interest Rate contracts | | Unrealized appreciation on | | Unrealized depreciation |
| | | swap agreements | | on swap agreements |
| | | Unrealized appreciation on | | |
| | | forward foreign currency | | |
| | | exchange contracts | | |
The following table sets forth the fair values of the Funds’ derivative investments categorized by primary risk exposure at March 31, 2014:
| Asset Derivative Investments Value |
| |
| | | | | | | | | | | | | | | Forward | | | | | | | | | | | | | | | | | | | | | |
| | | | | | | | | | | | | | | Foreign | | Purchased | | Purchased | | Options | | Options | | | | | |
| | | Future | | Swaps | | Swaps | | Currency | | Options | | Options | | Written | | Written | | | | | |
| | | Currency | | Equity | | Interest Rate | | Exchange | | Currency | | Commodity | | Commodity | | Currency | | | | | |
| Fund | | Contracts | | Contracts | | Contracts | | Contracts | | Contracts | | Contracts* | | Contracts | | Contracts | | Total | |
| |
| High Yield Fund | | | $ | — | | | $ | — | | | $ | — | | | $ | 335 | | | $ | — | | | $ | — | | | $ | — | | | $ | — | | | $ | 335 | |
| Investment Grade Bond Fund | | | | — | | | | — | | | | 314,480 | | | | — | | | | — | | | | — | | | | — | | | | — | | | | 314,480 | |
| Macro Opportunities Fund | | | | 120,351 | | | | 2,960,441 | | | | 43,269 | | | | 211,294 | | | | 1,277,160 | | | | 1,088,750 | | | | — | | | | — | | | | 5,701,265 | |
| Total Return Bond Fund | | | | — | | | | — | | | | 319,650 | | | | — | | | | — | | | | — | | | | — | | | | — | | | | 319,650 | |
| Liability Derivative Investments Value |
| |
| | | | | | | | | | | | | | | Forward | | | | | | | | | | | | | | | | | | | | | |
| | | | | | | | | | | | | | | Foreign | | Purchased | | Purchased | | Options | | Options | | | | | |
| | | Future | | Swaps | | Swaps | | Currency | | Options | | Options | | Written | | Written | | | | | |
| | | Currency | | Equity | | Interest Rate | | Exchange | | Currency | | Commodity | | Commodity | | Currency | | | | | |
| Fund | | Contracts | | Contracts | | Contracts | | Contracts | | Contracts | | Contracts* | | Contracts | | Contracts | | Total | |
| |
| Floating Rate Strategies Fund | | | $ | — | | | $ | — | | | $ | — | | | $ | 30,957 | | | $ | — | | | $ | — | | | $ | — | | | $ | — | | | $ | 30,957 | |
| Investment Grade Bond Fund | | | | — | | | | — | | | | 12,090 | | | | — | | | | — | | | | — | | | | — | | | | — | | | | 12,090 | |
| Macro Opportunities Fund | | | | — | | | | 29,902 | | | | 309,025 | | | | — | | | | — | | | | — | | | | 38,940 | | | | — | | | | 377,867 | |
| Total Return Bond Fund | | | | — | | | | — | | | | 23,400 | | | | — | | | | — | | | | — | | | | — | | | | — | | | | 23,400 | |
| |
| THE GUGGENHEIM FUNDS SEMI-ANNUAL REPORT | 99 |
NOTES TO FINANCIAL STATEMENTS (Unaudited) (continued)
The following is a summary of the location of derivative instruments on the Funds’ Statements of Operations for the period ended March 31, 2014:
| Derivative Investment Type | | Location of Gain (Loss) on Derivatives |
| |
| Commodity/Equity/Interest Rate/Currency contracts | | Net realized gain (loss) on futures contracts |
| | | Net change in unrealized appreciation (depreciation) on futures contracts |
| | | Net realized gain (loss) on options purchased |
| | | Net change in unrealized appreciation (depreciation) on options purchased |
| | | Net realized gain (loss) on options written |
| | | Net change in unrealized appreciation (depreciation) on options written |
| | | Net realized gain (loss) on swap agreements |
| | | Net change in unrealized appreciation (depreciation) on swap agreements |
| | | Net realized gain (loss) on forward foreign currency exchange contracts |
| | | Net change in unrealized appreciation (depreciation) on forward foreign currency |
| | | exchange contracts |
The following is a summary of the Funds’ realized gain (loss) and change in unrealized appreciation (depreciation) on derivative investments recognized on the Statements of Operations categorized by primary risk exposure for the period ended March 31, 2014:
| Realized Gain (Loss) on Derivative Investments Recognized on the Statements of Operations |
| |
| | | | | | | | | | | | | | | | Forward | | | | | | | | | | | | | | | | | | | | | |
| | | | | | | | | | | | | | | | Foreign | | | Purchased | | | Purchased | | | Options | | | Options | | | | | |
| | | | Future | | | Swaps | | | Swaps | | | Currency | | | Options | | | Options | | | Written | | | Written | | | | | |
| | | | Currency | | | Equity | | | Interest Rate | | | Exchange | | | Currency | | | Commodity | | | Commodity | | | Currency | | | | | |
| Fund | | | Contracts | | | Contracts | | | Contracts | | | Contracts | | | Contracts | | | Contracts* | | | Contracts | | | Contracts | | | Total | |
| |
| Floating Rate Strategies Fund | | | $ | — | | | $ | — | | | $ | — | | | $ | (735,538 | ) | | $ | — | | | $ | — | | | $ | — | | | $ | — | | | $ | (735,538 | ) |
| High Yield Fund | | | | — | | | | — | | | | — | | | | (45,480 | ) | | | — | | | | — | | | | — | | | | — | | | | (45,480 | ) |
| Investment Grade Bond Fund | | | | — | | | | — | | | | 221,971 | | | | — | | | | — | | | | — | | | | — | | | | — | | | | 221,971 | |
| Macro Opportunities Fund | | | | (197,112 | ) | | | 4,053,143 | | | | (1,803,523 | ) | | | (36,609 | ) | | | (1,202,738 | ) | | | (1,157,119 | ) | | | 284,377 | | | | 231,904 | | | | 208,932 | |
| Total Return Bond Fund | | | | — | | | | — | | | | 279,466 | | | | — | | | | — | | | | — | | | | — | | | | — | | | | 279,466 | |
| Change in Unrealized Appreciation (Depreciation) on Derivative Investments Recognized on the Statements of Operations |
| |
| | | | | | | | | | | | | | | | Forward | | | | | | | | | | | | | | | | | | | | | | | | | |
| | | | | | | | | | | | | | | | Foreign | | | Purchased | | | Purchased | | | Options | | | Options | | | Options | | | | | |
| | | | Future | | | Swaps | | | Swaps | | | Currency | | | Options | | | Options | | | Written | | | Written | | | Written | | | | | |
| | | | Currency | | | Equity | | | Interest Rate | | | Exchange | | | Currency | | | Commodity | | | Commodity | | | Currency | | | Commodity | | | | | |
| Fund | | | Contracts | | | Contracts | | | Contracts | | | Contracts | | | Contracts | | | Contracts* | | | Contracts | | | Contracts | | | Contracts | | | Total | |
| |
| Floating Rate Strategies Fund | | | $ | — | | | $ | — | | | $ | — | | | $ | (156,030 | ) | | $ | — | | | $ | — | | | $ | — | | | $ | — | | | $ | — | | | $ | (156,030 | ) |
| High Yield Fund | | | | — | | | | — | | | | — | | | | (5,423 | ) | | | — | | | | — | | | | — | | | | — | | | | — | | | | (5,423 | ) |
| Investment Grade Bond Fund | | | | — | | | | — | | | | (7,880 | ) | | | — | | | | — | | | | — | | | | — | | | | — | | | | — | | | | (7,880 | ) |
| Macro Opportunities Fund | | | | 120,351 | | | | 2,930,539 | | | | 1,213,008 | | | | 201,610 | | | | (462,840 | ) | | | (1,959,750 | ) | | | 647,789 | | | | 88,501 | | | | (149,837 | ) | | | 2,427,761 | |
| Total Return Bond Fund | | | | — | | | | — | | | | 27,639 | | | | — | | | | — | | | | — | | | | — | | | | — | | | | — | | | | 27,639 | |
7. Options Written
Transactions in options written during the period ended March 31, 2014 were as follows:
Written Call Options
| | | | Macro Opportunities Fund | |
| | | | |
| | | | Number of | | | Premium | |
| | | | contracts | | | amount | |
| |
| Balance at September 30, 2013 | | | 354 | | | $ | 225,834 | |
| Options Written | | | 13,662 | | | | 231,904 | |
| Options terminated in closing purchase transactions | | | — | | | | — | |
| Options expired | | | (13,662 | ) | | | (231,904 | ) |
| Options exercised | | | — | | | | — | |
| Balance at March 31, 2014 | | | 354 | | | $ | 225,834 | |
Written Put Options
| | | | Macro Opportunities Fund | |
| | | | |
| | | | Number of | | | Premium | |
| | | | contracts | | | amount | |
| |
| Balance at September 30, 2013 | | | 1,922 | | | $ | 284,377 | |
| Options Written | | | — | | | | — | |
| Options terminated in closing purchase transactions | | | — | | | | — | |
| Options expired | | | (1,922 | ) | | | (284,377 | ) |
| Options exercised | | | — | | | | — | |
| Balance at March 31, 2014 | | | — | | | $ | — | |
| |
| 100 | THE GUGGENHEIM FUNDS SEMI-ANNUAL REPORT |
NOTES TO FINANCIAL STATEMENTS (Unaudited) (continued)
8. Federal Income Tax Information
The Funds intend to comply with the provisions of Subchapter M of the Internal Revenue Code applicable to regulated investment companies and distribute substantially all taxable net investment income and capital gains sufficient to relieve the Funds from all, or substantially all, federal income, excise and state income taxes. Therefore, no provision for federal or state income tax is required.
Tax positions taken or expected to be taken in the course of preparing the Funds’ tax returns are evaluated to determine whether the tax positions are “more-likely-than-not” of being sustained by the applicable tax authority. Tax positions not deemed to meet the more-likely-than-not threshold would be recorded as a tax benefit or expense in the current year. Management has analyzed the Funds’ tax positions taken, or to be taken, on Federal income tax returns for all open tax years, and has concluded that no provision for income tax is required in the Funds’ financial statements. The Fund’s federal tax returns are subject to examination by the Internal Revenue Service for a period of three fiscal years after they are filed
The RIC Modernization Act of 2010 was signed into law on December 22, 2010 and simplified some of the tax provisions applicable to regulated investment companies, the tax reporting to their shareholders and improved the tax efficiency of certain fund structures. The greatest impact to the disclosure in the financial reports for the Funds was on the treatment of net capital losses, effective for tax years beginning after December 22, 2010.
One of the more prominent changes addresses capital loss carryforwards. The Fund is permitted to carry forward capital losses incurred in taxable years beginning after December 22, 2010 for an unlimited period. However, any losses incurred during those future taxable years will be required to be utilized prior to the losses incurred in pre-enactment taxable years. Under pre-enactment law, capital losses could be carried forward for eight years, and carried forward as short-term capital, irrespective of the character of the original loss. As a result of this ordering rule, pre-enactment capital carryforwards may potentially expire unused. Additionally, post-enactment capital losses that are carried forward will retain their character as either short-term or long-term capital losses rather than being considered all short-term as under previous law.
At March 31, 2014, the cost of securities for Federal income tax purposes, the aggregate gross unrealized gain for all securities for which there was an excess of value over tax cost and the aggregate gross unrealized loss for all securities for which there was an excess of tax cost over value, were as follows:
| | | Tax | | Tax | | Tax | | | Net Unrealized |
| Fund | | Cost | | Unrealized Gain | | Unrealized Loss | | | Gain/(Loss) |
| |
| Floating Rate Strategies Fund | | $ | 1,425,212,778 | | $ | 17,183,773 | | $ | (4,580,769 | ) | | $ | 12,603,004 | |
| High Yield Fund | | | 154,209,252 | | | 7,624,666 | | | (964,346 | ) | | | 6,660,320 | |
| Investment Grade Bond Fund | | | 121,854,946 | | | 2,049,682 | | | (7,181,215 | ) | | | (5,131,533 | ) |
| Limited Duration Fund | | | 44,878,757 | | | 108,307 | | | (107,947 | ) | | | 360 | |
| Macro Opportunities Fund | | | 1,292,137,507 | | | 29,988,277 | | | (25,555,238 | ) | | | 4,433,039 | |
| Municipal Income Fund | | | 53,507,017 | | | 1,132,360 | | | (605,913 | ) | | | 526,447 | |
| Total Return Bond Fund | | | 219,027,730 | | | 4,245,228 | | | (3,490,958 | ) | | | 754,270 | |
9. Loan Commitments
Pursuant to the terms of certain loan agreements, certain Funds held unfunded loan commitments as of March 31, 2014. The funds are obliged to fund these loan commitments at the borrower’s discretion.
At March 31, 2014, the Funds had the following unfunded loan commitments:
| Floating Rate Strategies Fund | | | | | | |
| |
| Borrower | | Maturity Date | | Amount | |
| |
| WR Grace & Co. | | 02/03/21 | | $ | 3,157,895 | |
| National Financial Partners Corp. | | 07/01/18 | | | 3,000,000 | |
| Blue Coat Systems, Inc. | | 05/31/18 | | | 1,500,000 | |
| Travelport LLC | | 06/21/18 | | | 1,166,667 | |
| American Stock Transfer & Trust | | 06/11/18 | | | 800,000 | |
| Kronos, Inc. | | 10/26/17 | | | 500,000 | |
| Power Buyer LLC | | 05/06/20 | | | 199,630 | |
| Expert Global Solutions | | 04/02/17 | | | 62,500 | |
| |
| | | | | $ | 10,386,692 | |
| |
| THE GUGGENHEIM FUNDS SEMI-ANNUAL REPORT | 101 |
NOTES TO FINANCIAL STATEMENTS (Unaudited) (continued)
| Macro Opportunities Fund | | | | | | |
| |
| Borrower | | Maturity Date | | Amount | |
| |
| National Financial Partners Corp. | | 07/01/18 | | $ | 1,000,000 | |
| Travelport LLC | | 06/21/18 | | | 583,333 | |
| AlliedBarton Security Services LLC | | 02/12/21 | | | 523,810 | |
| American Stock Transfer & Trust | | 06/11/18 | | | 400,000 | |
| Power Buyer LLC | | 05/06/20 | | | 73,763 | |
| |
| | | | | $ | 2,580,906 | |
10. Repurchase Agreements
In connection with transactions in repurchase agreements, it is the Funds’ policy that their custodian takes possession of the underlying collateral. The collateral is in the possession of the Funds’ custodian and is evaluated to ensure that its market value exceeds, at a minimum, 102% of the original face amount of the repurchase agreements.
At March 31, 2014, the collateral for the repurchase agreements was as follows:
| | | Counterparty and | | | Face | | | | | | | | | | | |
| Fund | | Terms of Agreement | | | Value | | Repurchase Price | | Collateral | | Par Value | | Fair Value | |
| |
| Limited Duration Bond Fund | | Jefferies & Company, Inc. | | | | | | | PPSI 2005-WHQ4 M2 | | | | | | | |
| | | 2.66% | | | | | | | 4.16% | | | | | | | |
| | | Due 04/10/14 | | | $1,998,000 | | $2,001,000 | | 09/25/35 | | $ | 1,448,000 | | $ | 1,047,498 | |
| | | | | | | | | | Harborview Mortgage | | | | | | | |
| | | | | | | | | | Loan Trust | | | | | | | |
| | | | | | | | | | 5.53% | | | | | | | |
| | | | | | | | | | 07/19/47 | | | 1,601,100 | | | 624,999 | |
| | | | | | | | | | GSAMP 2005-WMC2 A2C | | | | | | | |
| | | | | | | | | | 4.52% | | | | | | | |
| | | | | | | | | | 11/25/35 | | | 515,500 | | | 311,251 | |
| | | | | | | | | | WAMU 2004-AR13 | | | | | | | |
| | | | | | | | | | 2.51% | | | | | | | |
| | | | | | | | | | 11/25/34 | | | 3,005,332 | | | 276,220 | |
| | | | | | | | | | Puerto Rico | | | | | | | |
| | | | | | | | | | Electric Power Authority | | | | | | | |
| | | | | | | | | | 5.40% | | | | | | | |
| | | | | | | | | | 07/01/28 | | | 350,000 | | | 214,666 | |
| | | | | | | | | | | | | | | | | |
| Macro Opportunities Fund | | Jefferies & Company, Inc. | | | | | | | Puerto Rico Commonwealth | | | | | | | |
| | | 2.16% | | | | | | | Aqueduct & Sewer | | | | | | | |
| | | Due 04/15/14 | | | $8,920,000 | | $8,933,022 | | Authority | | | | | | | |
| | | | | | | | | | 5.35% - 6.00% | | | | | | | |
| | | | | | | | | | 07/01/27 - 07/01/44 | | $ | 12,290,000 | | $ | 8,748,031 | |
| | | | | | | | | | Puerto Rico Electric | | | | | | | |
| | | | | | | | | | Power Authority | | | | | | | |
| | | | | | | | | | 5.25% - 6.75% | | | | | | | |
| | | | | | | | | | 07/01/28 - 07/01/36 | | | 4,300,000 | | | 3,145,341 | |
In the event of counterparty default, the Funds have the right to collect the collateral to offset losses incurred. There is potential loss to the Funds in the event the Funds are delayed or prevented from exercising their rights to dispose of the collateral securities, including the risk of a possible decline in the value of the underlying securities during the period while the Funds seek to assert their rights. The Funds’ investment advisor, acting under the supervision of the Board of Trustees, reviews the value of the collateral and the creditworthiness of those banks and dealers with which the Funds enter into repurchase agreements to evaluate potential risks.
11. Reverse Repurchase Agreements
Each of the Funds may enter into reverse repurchase agreements. Under a reverse repurchase agreement, a Fund sells securities and agrees to repurchase them at a particular price at a future date. In the event the buyer of securities under a reverse repurchase agreement files for bankruptcy or becomes insolvent, such buyer or its trustee or receiver may receive an extension of time to determine whether to enforce the Fund’s obligation to repurchase the securities, and the Fund’s use of the proceeds of the reverse repurchase agreement may effectively be restricted pending such decision.
| |
| 102 | THE GUGGENHEIM FUNDS SEMI-ANNUAL REPORT |
NOTES TO FINANCIAL STATEMENTS (Unaudited) (continued)
For the period ended March 31, 2014, the following Funds entered into reverse repurchase agreements:
| | | Number of Days | | | | | | | | | |
| Fund | | outstanding | | Balance at March 31, 2014 | | Average balance outstanding | | Average interest rate |
| |
| Floating Rate Strategies Fund | | 182 | | $ | 1,940,631 | | $ | 3,020,927 | | 1.04 | % |
| High Yield Fund | | 182 | | | 19,413,394 | | | 8,530,408 | | 0.35 | % |
| Investment Grade Bond Fund | | 182 | | | 6,200,680 | | | 6,719,645 | | 0.34 | % |
| Macro Opportunities Fund | | 182 | | | 90,066,961 | | | 88,083,153 | | 0.51 | % |
| Total Return Bond Fund | | 182 | | | 13,164,670 | | | 14,616,605 | | 0.60 | % |
12. Line of Credit
The Trust secured a committed, $275,000,000 line of credit from Citibank, N.A., with no set termination date. This line of credit is reserved for emergency or temporary purposes. Fees related to borrowings, if any, vary under this arrangement between the greater of LIBOR and the Fed Funds rate, plus 1.25%. The Funds did not have any borrowings under this agreement at March 31, 2014.
In addition, on November 30, 2011, the Macro Opportunities Fund and Total Return Bond Fund (the “Funds”) entered into an unlimited credit facility agreement with an approved counterparty whereby the counterparty has agreed to provide secured financing to the Fund and the Fund will provide pledged collateral to the counterparty. The Funds did not have borrowings under this agreement as of and for the period ended March 31, 2014.
13. Fund Merger
On January 18, 2013, the Macro Opportunities Fund acquired all of the net assets of Flexible Strategies Fund, a separate series of the Rydex Series Funds, in exchange for shares of the Macro Opportunities Fund, pursuant to an agreement and plan of reorganization approved by the Board of Trustees and approved by the shareholders of the Flexible Strategies Fund. The primary reason for the transaction was to combine a smaller fund into a larger fund with a similar investment objective. The acquisition was accomplished through a combination of a tax-free exchange of the outstanding shares of the Flexible Strategies Fund (360,213 A-Class, 185,597 H-Class, 282,801 C-Class and 94,826 Institutional Class) valued at $21,680,088 ($8,501,033 A-Class, $4,380,093 H-Class, $6,546,846 C-Class, and $2,252,116 Institutional Class) for respective shares of the Macro Opportunities Fund (470,457 A-Class*, 239,285 C-Class, and 82,164 Institutional Class). For financial reporting purposes, the net assets received and shares issued by Macro Opportunities Fund were recorded at fair value; however, the Flexible Strategies Fund’s cost of the investments were carried forward to align ongoing reporting of Macro Opportunities Fund realized and unrealized gains and losses with amounts distributable to shareholders for tax purposes.
Flexible Strategies Fund’s net assets on January 18, 2013 were $21,680,088 including $414,395 of unrealized appreciation. Flexible Strategies Fund’s net assets were primarily comprised of investments with a fair value of $21,674,911. The aggregate net assets of Macro Opportunities Fund immediately before and after the acquisition were $407,464,601 and $429,144,689, respectively.
The financial statements reflect the operations of the Macro Opportunities Fund for the period prior to the acquisition and the combined fund for the period subsequent to the fund merger. Because the combined investment portfolios have been managed as a single integrated portfolio since the acquisition was completed, it is not practicable to separate the amounts of revenue and earnings of the Flexible Strategies Fund that have been included in the combined fund’s Statement of Operations since the acquisition was completed. Assuming the acquisition had been completed on October 1, 2012, Macro Opportunities Fund pro-forma net investment income, net realized and unrealized loss on investments and net increase in net assets from operations for the period October 1, 2012 to September 30, 2013 would have been $34,155,336, $(30,390,985) and $3,764,351, respectively. Guggenheim Investments and its affiliates bore all of the expenses related to the reorganization.
*Includes 159,974 A-Class shares received in exchange for H-Class shares of Flexible Strategies Fund.
14. Offsetting
In the normal course of business, the Funds enter into transactions subject to enforceable master netting arrangements or other similar arrangements. Generally, the right to offset in those agreements allows the Funds to counteract the exposure to a specific counterparty with collateral received or delivered to that counterparty based on the terms of the arrangements. These arrangements provide for the right to liquidate upon the occurrence of an event of default, credit event upon merger or additional termination event.
In order to better define their contractual rights and to secure rights that will help the Funds mitigate their counterparty risk, the Funds may enter into an International Swaps and Derivatives Association, Inc. Master Agreement (“ISDA Master Agreement”) or similar agreement with their derivative contract counterparties. An ISDA Master Agreement is a bilateral agreement between a Fund and a counterparty that governs OTC derivatives, including foreign
| |
| THE GUGGENHEIM FUNDS SEMI-ANNUAL REPORT | 103 |
NOTES TO FINANCIAL STATEMENTS (Unaudited) (concluded)
exchange contracts, and typically contains, among other things, collateral posting terms and netting provisions in the event of a default and/or termination event. The provisions of the ISDA Master Agreement typically permit a single net payment in the event of a default (close-out netting) or similar event, including the bankruptcy or insolvency of the counterparty.
For derivatives traded under an ISDA Master Agreement, the collateral requirements are typically calculated by netting the mark to market amount for each transaction under such agreement and comparing that amount to the value of any collateral currently pledged by the Funds and the counterparty. For financial reporting purposes, cash collateral that has been pledged to cover obligations of the Funds and cash collateral received from the counterparty, if any, is reported separately on the Statement of Assets and Liabilities as segregated cash with broker/ receivable for variation margin, or payable for swap settlement/variation margin. Generally, the amount of collateral due from or to a counterparty must exceed a minimum transfer amount threshold (e.g., $300,000) before a transfer is required to be made. To the extent amounts due to the Funds from their counterparties are not fully collateralized, contractually or otherwise, the Funds bear the risk of loss from counterparty nonperformance. The Funds attempt to mitigate counterparty risk by only entering into agreements with counterparties that they believe to be of good standing and by monitoring the financial stability of those counterparties.
For financial reporting purposes, the Funds do not offset derivative assets and derivative liabilities that are subject to netting arrangements in the Statement of Assets and Liabilities.
The following tables present derivative financial instruments and secured financing transactions that are subject to enforceable netting arrangements and offset in the Statements of Assets and Liabilities in conformity with U.S. GAAP.
| | | | | | | | | | | | Net Amount | | | | | | | | | |
| | | | | | | | | Gross Amounts | | | of Liabilities | | | | | | | | | |
| | | | | | Gross | | | Offset in | | | Presented on | | | | | | | | | |
| | | | | | Amounts of | | | the Statements | | | the Statements | | | | | | Cash | | | |
| | | | | | Recognized | | | of Assets | | | of Assets | | | Financial | | | Collateral | | | Net |
| Fund | | Instrument | | | Liabilities1 | | | and Liabilities | | | and Liabilities | | | Instruments | | | Pledged2 | | | Amount |
| |
| Macro Opportunities Fund | | Swap equity contracts | | | $ 29,902 | | | $ — | | | $ 29,902 | | | $ — | | | $ — | | | $ 29,902 |
| 1 | | Exchange traded futures are excluded from these reported amounts. |
| 2 | | Excludes maintenance margin deposits held at the broker related to derivatives. These amounts are reflected as Segregated cash with broker on the Statements of Assets and Liabilities. |
| |
| 104 | THE GUGGENHEIM FUNDS SEMI-ANNUAL REPORT |
OTHER INFORMATION (Unaudited)
Proxy Voting Information
A description of the policies and procedures that the Trust uses to determine how to vote proxies relating to securities held in the Funds’ portfolios is available, without charge and upon request, by calling 800.820.0888. This information is also available from the EDGAR database on the SEC’s website at http://www.sec.gov.
Information regarding how the Funds voted proxies relating to portfolio securities during the most recent 12-month period ended June 30 is available without charge, upon request, by calling 800.820.0888. This information is also available from the EDGAR database on the SEC’s website at http://www.sec.gov.
At a special meeting of shareholders held on January 24, 2014, the shareholders of the Funds voted on whether to approve the election of nominees to the Board of Directors of each corporation. A description of the number of shares voted is as follows:
| | | For | | Withhold | | Total |
| |
| Randall C. Barnes | | 66,355,900 | | 1,147,113 | | 67,503,013 |
| Roman Friedrich III | | 66,305,115 | | 1,197,898 | | 67,503,013 |
| Robert B. Karn III | | 66,296,743 | | 1,206,270 | | 67,503,013 |
| Ronald A. Nyberg | | 66,343,771 | | 1,159,242 | | 67,503,013 |
| Ronald E. Toupin, Jr. | | 66,344,399 | | 1,158,614 | | 67,503,013 |
At a special meeting of shareholders held on January 24, 2014, the shareholders of the Funds also voted on whether to approve the Funds from Kansas Corporations into Delaware Statutory Trusts. A description of the number of shares voted is as follows:
| Fund | | Shares For | | Shares Against | | Shares Abstained |
| |
| Floating Rate Strategies Fund | | 19,424,859 | | 202,292 | | 239,247 |
| High Yield Fund | | 5,194,349 | | 24,599 | | 55,235 |
| Investment Grade Bond Fund | | 3,370,662 | | 22,580 | | 28,584 |
| Limited Duration Fund | | — | | — | | — |
| Macro Opportunities Fund | | 17,755,274 | | 166,264 | | 240,186 |
| Municipal Income Fund | | 2,397,778 | | 158,583 | | 46,564 |
| Total Return Bond Fund | | 3,812,530 | | 3,405 | | 13,412 |
At a special meeting of shareholders held on January 8, 2014, the shareholders of the Funds also voted on whether to approve changes to the fundamental investment policies. A description of the number of shares voted is as follows:
| Diversification | | | | | | |
| | | | | | | |
| Fund | | Shares For | | Shares Against | | Shares Abstained |
| |
| Floating Rate Strategies Fund | | 19,043,248 | | 248,689 | | 574,461 |
| High Yield Fund | | 5,181,959 | | 52,052 | | 40,172 |
| Investment Grade Bond Fund | | 3,364,708 | | 17,042 | | 40,076 |
| Limited Duration Fund | | — | | — | | — |
| Macro Opportunities Fund | | 17,484,154 | | 163,214 | | 514,356 |
| Municipal Income Fund | | 2,224,215 | | 324,317 | | 54,393 |
| Total Return Bond Fund | | 3,812,291 | | 3,405 | | 13,651 |
| | | | | | | |
| Underwriting | | | | | | |
| | | | | | | |
| Fund | | Shares For | | Shares Against | | Shares Abstained |
| |
| Floating Rate Strategies Fund | | 18,982,211 | | 298,353 | | 585,834 |
| High Yield Fund | | 5,153,169 | | 76,454 | | 44,560 |
| Investment Grade Bond Fund | | 3,300,563 | | 82,306 | | 38,957 |
| Limited Duration Fund | | — | | — | | — |
| Macro Opportunities Fund | | 17,447,610 | | 185,719 | | 528,395 |
| Municipal Income Fund | | 2,221,466 | | 321,638 | | 59,821 |
| Total Return Bond Fund | | 3,810,559 | | 3,405 | | 15,383 |
| |
| THE GUGGENHEIM FUNDS SEMI-ANNUAL REPORT | 105 |
OTHER INFORMATION (Unaudited) (continued)
| Industry Concentration | | | | | | |
| | | | | | | |
| Fund | | Shares For | | Shares Against | | Shares Abstained |
| |
| Floating Rate Strategies Fund | | 18,999,080 | | 283,893 | | 583,425 |
| High Yield Fund | | 5,187,644 | | 54,202 | | 32,337 |
| Investment Grade Bond Fund | | 3,362,605 | | 20,041 | | 39,180 |
| Limited Duration Fund | | — | | — | | — |
| Macro Opportunities Fund | | 17,479,149 | | 170,784 | | 511,791 |
| Municipal Income Fund | | 2,224,599 | | 322,286 | | 56,040 |
| Total Return Bond Fund | | 3,812,291 | | 3,405 | | 13,651 |
| | | | | | | |
| Real Estate | | | | | | |
| | | | | | | |
| Fund | | Shares For | | Shares Against | | Shares Abstained |
| |
| Floating Rate Strategies Fund | | 19,031,621 | | 249,074 | | 585,703 |
| High Yield Fund | | 5,187,334 | | 55,326 | | 31,523 |
| Investment Grade Bond Fund | | 3,360,191 | | 20,257 | | 41,378 |
| Limited Duration Fund | | — | | — | | — |
| Macro Opportunities Fund | | 17,468,625 | | 175,702 | | 517,397 |
| Municipal Income Fund | | 2,220,106 | | 324,313 | | 58,506 |
| Total Return Bond Fund | | 3,811,136 | | 3,406 | | 14,805 |
| | | | | | | |
| Commodities | | | | | | |
| | | | | | | |
| Fund | | Shares For | | Shares Against | | Shares Abstained |
| |
| Floating Rate Strategies Fund | | 19,019,533 | | 25,723 | | 588,142 |
| High Yield Fund | | 5,162,082 | | 69,526 | | 42,575 |
| Investment Grade Bond Fund | | 3,365,320 | | 17,310 | | 39,196 |
| Limited Duration Fund | | — | | — | | — |
| Macro Opportunities Fund | | 17,480,224 | | 164,804 | | 516,696 |
| Municipal Income Fund | | 2,214,287 | | 332,088 | | 56,550 |
| Total Return Bond Fund | | 3,809,404 | | 3,406 | | 16,537 |
| | | | | | | |
| Loans | | | | | | |
| | | | | | | |
| Fund | | Shares For | | Shares Against | | Shares Abstained |
| |
| Floating Rate Strategies Fund | | 18,951,425 | | 319,169 | | 595,804 |
| High Yield Fund | | 5,161,966 | | 69,584 | | 42,633 |
| Investment Grade Bond Fund | | 3,296,742 | | 84,534 | | 40,550 |
| Limited Duration Fund | | — | | — | | — |
| Macro Opportunities Fund | | 17,430,634 | | 201,144 | | 529,946 |
| Municipal Income Fund | | 2,210,239 | | 333,029 | | 59,657 |
| Total Return Bond Fund | | 3,809,199 | | 3,611 | | 16,537 |
| | | | | | | |
| Borrowing | | | | | | |
| | | | | | | |
| Fund | | Shares For | | Shares Against | | Shares Abstained |
| |
| Floating Rate Strategies Fund | | 18,951,276 | | 316,849 | | 598,273 |
| High Yield Fund | | 5,164,423 | | 67,126 | | 42,634 |
| Investment Grade Bond Fund | | 3,298,577 | | 83,174 | | 40,075 |
| Limited Duration Fund | | — | | — | | — |
| Macro Opportunities Fund | | 17,421,477 | | 219,758 | | 520,489 |
| Municipal Income Fund | | 2,200,237 | | 341,883 | | 60,805 |
| Total Return Bond Fund | | 3,808,865 | | 5,677 | | 14,805 |
| | | | | | | |
| Senior Securities | | | | | | |
| | | | | | | |
| Fund | | Shares For | | Shares Against | | Shares Abstained |
| |
| Floating Rate Strategies Fund | | 19,023,526 | | 249,154 | | 593,718 |
| High Yield Fund | | 5,186,498 | | 56,161 | | 31,524 |
| Investment Grade Bond Fund | | 3,301,604 | | 79,922 | | 40,300 |
| Limited Duration Fund | | — | | — | | — |
| Macro Opportunities Fund | | 17,460,752 | | 179,089 | | 521,883 |
| Municipal Income Fund | | 2,212,873 | | 333,439 | | 56,613 |
| Total Return Bond Fund | | 3,808,249 | | 4,561 | | 16,537 |
| |
| 106 | THE GUGGENHEIM FUNDS SEMI-ANNUAL REPORT |
OTHER INFORMATION (Unaudited) (continued)
Quarterly Portfolio Schedules Information
The Trust files its complete schedule of portfolio holdings with the SEC for the first and third quarters of each fiscal year on Form N-Q; which are available on the SEC’s website at http://www.sec.gov. The Funds’ Forms N-Q may be reviewed and copied at the SEC’s Public Reference Room in Washington, DC, and that information on the operation of the Public Reference Room may be obtained by calling 1-800-SEC-0330. Copies of the portfolio holdings are also available to shareholders, without charge and upon request, by calling 800.820.0888.
| Office Locations |
| |
| The offices of Guggenheim Investments can be found in the following locations: |
| | 330 Madison Avenue |
| 10th Floor |
| New York, NY 10017 |
| (Headquarters) |
| | Four Irvington Centre |
| 805 King Farm Boulevard |
| Suite 600 |
| Rockville, MD 20850 |
| | 9401 Indian Creek Parkway |
| 40 Corporate Woods |
| Suite 850 |
| Overland Park, KS 66210 |
Board Considerations in Approving the Investment Advisory Agreements
At a meeting held on November 11, 2013 (the “November Meeting”), in connection with other actions taken to consider whether to approve the reorganization of the funds from series of Kansas corporations (the “Predecessor Funds”) into series of a Delaware statutory trust, Guggenheim Funds Trust (the “Trust” and its series, the “New Series”), the members of the Boards of Directors of the Kansas corporations (collectively, the “Predecessor Board” and the members individually, “Directors”), including the Directors who are not “interested persons,” as defined by the Investment Company Act of 1940, as amended (the “1940 Act”), of the corporations (the “Independent Directors”) appointed the then-investment advisers and sub-advisers of the Predecessor Funds, including, as discussed below, with respect to the Guggenheim Limited Duration Fund, a newly organized series of one of the Kansas corporations, Security Income Fund (“Limited Duration Fund” or the “New Fund”), to serve in the same capacity to the corresponding New Series. The Predecessor Board also approved corresponding advisory and sub-advisory agreements, subject, for each Predecessor Fund, to approval of the reorganization of that fund by its shareholders (or, in the case of Limited Duration Fund, its sole initial shareholder) and approval of the new agreements by the initial sole shareholder of the corresponding New Series. The Directors based their approval on a variety of factors, including: the findings they had made during their May, June and August 2013 meetings at which the advisory and sub-advisory agreements of the Predecessor Funds had the most recently been approved, which are discussed in the Annual Report of the Predecessor Funds for the fiscal year ended September 30, 2013; the fact that new agreements are the same as the agreements then in place for the Predecessor Funds except for the name of the signatory, the applicable state law and the term of the agreements; and the intention that the new agreements would be subject to re-consideration after the reorganizations at meetings scheduled to be held for these purposes in April and May 2014.
Guggenheim Limited Duration Fund
At the November Meeting, each of the Independent Directors of Security Income Fund met independently of Fund management to consider the approval of the Advisory Agreement between Guggenheim Partners Investment Management, LLC (“GPIM” or the “Adviser”) and Security Income Fund, with respect to Limited Duration Fund. As part of its review process, the Independent Directors were represented by independent legal counsel (“Independent Legal Counsel”). Independent Legal Counsel reviewed with the Independent Directors various factors relevant to the consideration of the Advisory Agreement and the legal responsibilities of the Directors related to such consideration and assisted the Independent Directors in their deliberations.
The Directors, including the Independent Directors, discussed the Advisory Agreement in light of the regulatory requirements and criteria and assessed information concerning the Limited Duration Fund’s proposed fees and expenses, investment objective and policies, investment strategies, portfolio construction process and portfolio management team, among other things. For this purpose, management updated and supplemented materials previously
| |
| THE GUGGENHEIM FUNDS SEMI-ANNUAL REPORT | 107 |
OTHER INFORMATION (Unaudited) (continued)
provided to the Board in connection with the consideration of the Advisory Agreement between GPIM and Security Income Fund with respect to GPIM’s management of Guggenheim Total Return Bond Fund, Guggenheim Macro Opportunities Fund and Guggenheim Floating Rate Strategies Fund, other series of Security Income Fund. Among other things, GPIM provided updated organizational charts, information on significant personnel changes, schedules showing the proposed advisory fee for Limited Duration Fund compared to advisory fees charged by GPIM to other funds and to other non-fund clients with similar investment objectives to the New Fund and peer group comparisons of the proposed contractual advisory fee and total net expense ratio, as set forth in a report prepared by an independent, third party research provider, FUSE Research Networks LLC (“FUSE”). The Board also considered the variety of written materials, reports and oral presentations it received throughout the year, including information regarding performance and operating results of other registered investment companies for which GPIM serves as investment adviser or sub-adviser.
Following an analysis and discussion of the factors identified below, the Directors concluded that it was in the best interests of the Limited Duration Fund to approve the Advisory Agreement.
Nature, Extent and Quality of Services to be Provided by GPIM: With respect to the nature, extent and quality of services to be provided by GPIM, the Independent Directors considered the functions to be performed by GPIM for the Limited Duration Fund and reviewed information describing the background and experience of the persons to be responsible for the day-to-day management of the Limited Duration Fund. In this regard, the Independent Directors took into account the nature and quality of services provided by GPIM in the past, the firm’s management capabilities demonstrated with respect to the other mutual funds managed by GPIM, the professional qualifications and experience of its portfolio managers, and its investment and management oversight processes.
The Board also considered the acceptability of the terms of the Advisory Agreement, noting that the terms were consistent with the terms of the investment advisory/management agreements of other registered investment companies for which GPIM serves as investment adviser. Based on the foregoing, and based on other information received (both oral and written) at the November Meeting, as well as other considerations, the Board concluded that the Adviser and its personnel were qualified to serve the Limited Duration Fund in such capacity.
Investment Performance: With respect to performance, the Board noted that the Limited Duration Fund had no performance history and, instead, considered GPIM’s fixed-income expertise and the performance of other fixed income funds managed by GPIM.
Comparative Fees, Costs of Services to be Provided and the Profits to be Realized by GPIM from its Relationship with the Limited Duration Fund: The Board compared the Limited Duration Fund’s proposed contractual advisory fee and total net expense ratio to its peer group, as set forth in the FUSE report. The Board also reviewed the median advisory fees and expense ratios, including expense ratio components (e.g., transfer agency fees, other operating expenses, distribution fees and fee waivers/reimbursements) of the peer group of funds. In addition, the Board considered the New Fund’s proposed advisory fee as compared to the advisory fee charged by GPIM to other funds and clients with a similar investment objective and strategies, noting that although the Adviser not charge a lower advisory fee to any such registered investment companies, it does charge a lower advisory fee to certain separate account clients. In this regard, the Directors considered the Adviser’s explanation that lower fees are imposed in certain instances due to numerous factors, including the scope of contract, types of investors, applicable regulation and legal structure, tax status, redemptions, product lifecycle and economies of scale.
In considering the comparative fee and expense data, the Board noted that although the proposed contractual advisory fee for the New Fund’s Class A shares was above the peer group median, the total expense ratio was equal to the peer group median. The Board also took into account that the Adviser proposed a fee waiver/expense limitation agreement with respect to the Limited Duration Fund limiting ordinary operating expenses to 0.80% for Class A shares, 1.55% for Class C shares and 0.55% for Institutional shares. With respect to the costs of advisory services to be provided and estimated level of Profitability, on the basis of the Directors’ review of the fees to be charged by GPIM for investment advisory and related services, the Board concluded that it was too early to predict Profitability from the Limited Duration Fund, but the Directors also noted that they would have the opportunity in the future to periodically re-examine this matter.
The Board considered other benefits to be available to GPIM because of its relationship with the Limited Duration Fund and noted that GPIM may be deemed to benefit from proposed arrangements whereby an affiliate, Rydex Fund Services, LLC, will provide accounting and administration services and transfer agency services to the New Fund. In this regard, the Directors considered its prior review of the compensation arrangements for the provision of the foregoing services.
Economies of Scale to be Realized: With respect to economies of scale, the Board considered that the New Fund was in its start-up phase and concluded that the advisory fee schedule reflected an appropriate level of sharing of any economies of scale. The Directors considered management’s view that the Limited Duration Fund’s proposed advisory fee appropriately reflected the current economic environment and the competitive nature of the mutual fund market. The
| |
| 108 | THE GUGGENHEIM FUNDS SEMI-ANNUAL REPORT |
OTHER INFORMATION (Unaudited) (concluded)
Directors also noted that they would have the opportunity in the future to periodically re-examine whether the Limited Duration Fund had achieved economies of scale and the appropriateness of the advisory fees payable by the Limited Duration Fund to GPIM.
Overall Conclusions: Based on the foregoing, the Directors determined that the proposed investment advisory fee for the Limited Duration Fund is fair and reasonable in light of the extent and quality of the services to be provided and other benefits to be received and that the approval of the Advisory Agreement is in the best interests of the Limited Duration Fund and its shareholders. In reaching this conclusion, no single factor was determinative. The Board, including all of the Independent Directors, approved the Advisory Agreement with respect to the Limited Duration Fund for an initial term of two years.
Distributor Change
Effective March 3, 2014, Guggenheim Distributors, LLC (“GD”), the distributor for shares of the Funds will be consolidated into and with Guggenheim Funds Distributors, LLC (“GFD”). Following the consolidation, GFD will serve as the Funds’ distributor.
GD and GFD are both indirect, wholly-owned subsidiaries of Guggenheim Capital, LLC and, therefore, the consolidation will not result in a change of actual control of the Funds’ distributor. The primary goal of the consolidation is to achieve greater operational efficiencies and allow all of the Guggenheim funds, including funds that are not series of the Trusts, to be distributed by a single distributor.
The consolidation is not expected to affect the day-to-day management of the Funds or result in any material changes to the distribution of the Funds, including any changes to the distribution fees paid by the Funds.
Guggenheim Funds Trust
Guggenheim Funds Trust (the “Trust”), which was organized as a Delaware statutory trust on November 8, 2013, is registered with the Securities and Exchange Commission (“SEC”) as an investment company. The Trust is an open-end management investment company that, upon the demand of the investor, must redeem its shares and pay the investor the next calculated NAV. The Guggenheim Enhanced World Equity Fund (“Enhanced World Equity Fund”), Guggenheim Large Cap Value Fund (“Large Cap Value Fund”), Guggenheim Mid Cap Value Fund (“Mid Cap Value Fund”), Guggenheim Mid Cap Value Institutional Fund (“Mid Cap Value Institutional Fund”), Guggenheim Small Cap Value Fund (“Small Cap Value Fund”), Guggenheim StylePlus—Large Core Fund (“StylePlus— Large Core Fund”), Guggenheim StylePlus—Mid Growth Fund (“StylePlus—Mid Growth Fund”) and Guggenheim World Equity Income Fund (“World Equity Income Fund”) (collectively, the “Funds”) were previously series (the “Predecessor Funds”) of Security Equity Fund, Security Large Cap Value Fund and Security Mid Cap Growth Fund (the “Predecessor Corporations”), different registered open-end investment companies, which were organized as Kansas corporations. In January 2014, at special meetings of shareholders, the shareholders of each Predecessor Fund approved the reorganization of each Predecessor Fund with and into a corresponding “shell” series of the Trust. The shell series of the Trust succeeded to the accounting and performance histories of the Predecessor Funds. Any such historical information provided for a series of the Trust that relates to periods prior to January 28, 2014, therefore, is that of the corresponding Predecessor Fund.
| |
| THE GUGGENHEIM FUNDS SEMI-ANNUAL REPORT | 109 |
INFORMATION ON BOARD OF TRUSTEES AND OFFICERS (Unaudited)
| Name, Address* | | Position(s) Held | | Term of Office | | Principal Occupation(s) | | Number of | | Other Directorships |
| and Year of Birth | | with the Trust | | and Length of | | During Past Five Years | | Portfolios in | | Held by Trustees |
| | | | | Time Served** | | | | Fund Complex | | |
| | | | | | | | | Overseen | | |
| Independent Trustees | | | | | | | | | | |
| | | | | | | | | | | |
| Randall C. Barnes | | Trustee | | Since 2014 | | Current: Private Investor (2001-present). | | 86 | | None. |
| (1951) | | | | | | | | | | |
| | | | | | | Former: Senior Vice President and Treasurer, | | | | |
| | | | | | | PepsiCo, Inc. (1993-1997); President, Pizza Hut | | | | |
| | | | | | | International (1991-1993); Senior Vice | | | | |
| | | | | | | President, Strategic Planning and New Business | | | | |
| | | | | | | Development, PepsiCo, Inc. (1987-1990). | | | | |
| Donald A. Chubb, Jr. | | Trustee and | | Since 1994 | | Current: Business broker and manager of | | 82 | | None. |
| (1946) | | Vice Chairman | | | | commercial real estate, Griffith & Blair, Inc. | | | | |
| | | of the Board | | | | (1997-present). | | | | |
| Jerry B. Farley | | Trustee and | | Since 2005 | | Current: President, Washburn University | | 82 | | Current: Westar Energy, |
| (1946) | | Vice Chairman | | | | (1997-present). | | | | Inc. (2004-present); |
| | | of the Audit | | | | | | | | CoreFirst Bank & Trust |
| | | Committee | | | | | | | | (2000-present). |
| Roman Friedrich III | | Trustee and | | Since 2014 | | Current: Founder and President, Roman | | 82 | | Current: Mercator Minerals |
| (1946) | | Chairman of the | | | | Friedrich & Company (1998-present). | | | | Ltd. (2013-present); First |
| | | Contracts Review | | | | | | | | Americas Gold Corp. |
| | | Committee | | | | Former: Senior Managing Director, MLV & Co. | | | | (2012-present); Zincore |
| | | | | | | LLC (2010-2011). | | | | Metals, Inc. (2009-present). |
| | | | | | | | | | | |
| | | | | | | | | | | Former: Blue Sky Uranium |
| | | | | | | | | | | Corp. (2011-2012); Axiom |
| | | | | | | | | | | Gold and Silver Corp. |
| | | | | | | | | | | (2011-2012); Stratagold |
| | | | | | | | | | | Corp. (2003-2009); GFM |
| | | | | | | | | | | Resources Ltd. (2005-2010). |
| Robert B. Karn III | | Trustee and | | Since 2014 | | Current: Consultant (1998-present). | | 82 | | Current: Peabody Energy |
| (1942) | | Chairman of the | | | | | | | | Company (2003-present); |
| | | Audit Committee | | | | Former: Arthur Andersen (1965-1997) and | | | | GP Natural Resource |
| | | | | | | Managing Partner, Financial and Economic | | | | Partners, LLC (2002- present). |
| | | | | | | Consulting, St. Louis office (1987-1997). | | | | |
| Ronald A. Nyberg | | Trustee and | | Since 2014 | | Current: Partner, Nyberg & Cassioppi, LLC | | 88 | | None. |
| (1953) | | Chairman of the | | | | (2000-present). | | | | |
| | | Nominating and | | | | | | | | |
| | | Governance | | | | Former: Executive Vice President, | | | | |
| | | Committee | | | | General Counsel, and Corporate Secretary, | | | | |
| | | | | | | Van Kampen Investments (1982-1999). | | | | |
| Maynard F. Oliverius | | Trustee and Vice | | Since 1998 | | Retired. | | 82 | | None. |
| (1943) | | Chairman of the | | | | | | | | |
| | | Contracts Review | | | | Former: President and CEO, Stormont-Vail | | | | |
| | | Committee | | | | HealthCare (1996-2012). | | | | |
| Ronald E. Toupin, Jr. | | Trustee and | | Since 2014 | | Current: Portfolio Consultant (2010-present). | | 85 | | Former: Bennett Group of |
| (1958) | | Chairman of the | | | | | | | | Funds (2011-2013). |
| | | Board | | | | Former: Vice President, Manager and Portfolio | | | | |
| | | | | | | Manager, Nuveen Asset Management | | | | |
| | | | | | | (1998-1999); Vice President, Nuveen | | | | |
| | | | | | | Investment Advisory Corp. (1992-1999); | | | | |
| | | | | | | Vice President and Manager, Nuveen Unit | | | | |
| | | | | | | Investment Trusts (1991-1999); and Assistant | | | | |
| | | | | | | Vice President and Portfolio Manager, Nuveen | | | | |
| | | | | | | Unit Investment Trusts (1988-1999), each of | | | | |
| | | | | | | John Nuveen & Co., Inc. (1982-1999). | | | | |
| | | | | | | | | | | |
| Interested Trustee | | | | | | | | | | |
| | | | | | | | | | | |
| Donald C. Cacciapaglia*** | | President, Chief | | Since 2012 | | Current: President and CEO, certain other funds | | 214 | | Current: Delaware Life |
| (1951) | | Executive Officer | | | | in the Fund Complex (2012-present); Vice | | | | (2013-present); Guggenheim |
| | | and Trustee | | | | Chairman, Guggenheim Investments | | | | Life and Annuity Company |
| | | | | | | (2010-present). | | | | (2011-present); Paragon Life |
| | | | | | | | | | | Insurance Company of |
| | | | | | | Former: Chairman and CEO, Channel Capital | | | | Indiana (2011-present). |
| | | | | | | Group, Inc. (2002-2010). | | | | |
| * | The business address of each Trustee is c/o Guggenheim Investments, 805 King Farm Boulevard, Suite 600, Rockville, Maryland 20850 |
| ** | Each Trustee serves an indefinite term, until his successor is elected and qualified. Time served includes time served in the respective position for the Predecessor Corporation. |
| *** | This Trustee is deemed to be an “interested person” of the Funds under the 1940 Act by reason of his position with the Funds’ Investment Manager and/or the parent of the Investment Manager. |
| |
| 110 | THE GUGGENHEIM FUNDS SEMI-ANNUAL REPORT |
INFORMATION ON BOARD OF TRUSTEES AND OFFICERS (Unaudited) (concluded)
| OFFICERS | | | | | | |
| | | | | | | |
| Name, Address* | | Position(s) Held | | Term of Office | | Principal Occupation(s) |
| and Year of Birth | | with the Trust | | and Length of | | During Past Five Years |
| | | | | Time Served** | | |
Joseph M. Arruda
(1966) | | Assistant Treasurer | | Since 2010 | | Current: Assistant Treasurer, certain other funds in the Fund Complex (2006-present); Vice President, Security Investors, LLC (2010-present); CFO and Manager, Guggenheim Specialized Products, LLC (2009-present). |
| | | | | | | |
| | | | | | | Former: Vice President, Security Global Investors, LLC (2010-2011); Vice President, Rydex Advisors, LLC (2010); Vice President, Rydex Advisors II, LLC (2010). |
| | | | | | | |
William H. Belden, III
(1965) | | Vice President | | Since 2014 | | Current: Vice President, certain other funds in the Fund Complex (2006-present); Managing Director, Guggenheim Funds Investment Advisors, LLC (2005-present). |
| | | | | | | |
| | | | | | | Former: Vice President of Management, Northern Trust Global Investments (1999-2005). |
| | | | | | | |
Mark J. Furjanic
(1959) | | Assistant Treasurer | | Since 2014 | | Current: Vice President, Guggenheim Investments (2005-present); Assistant Treasurer, certain other funds in the Fund Complex (2008-present). |
| | | | | | | |
| | | | | | | Former: Senior Manager, Ernst & Young LLP (1999-2005). |
| | | | | | | |
James Howley
(1972) | | Assistant Treasurer | | Since 2014 | | Current: Director, Guggenheim Investments (2004-present); Assistant Treasurer, certain other funds in the Fund Complex (2006-present). |
| | | | | | | |
| | | | | | | Former: Manager, Mutual Fund Administration of Van Kampen Investments, Inc. (1996-2004). |
| | | | | | | |
| Amy J. Lee | | Vice President and | | Since 1987 | | Current: Chief Legal Officer, certain other funds in the Fund Complex (2013-present); Senior Managing |
| (1961) | | Chief Legal Officer | | (Secretary) | | Director, Guggenheim Investments (2012-present). |
| | | | | Since 2007 | | |
| | | | | (Vice President) | | Former: Vice President, Associate General Counsel and Assistant Secretary, Security Benefit Life Insurance Company and Security Benefit Corporation (2004-2012). |
| | | | | | | |
Derek Maltbie
(1972) | | Assistant Treasurer | | Since 2014 | | Current: Vice President, Guggenheim Investments (2012-present); Assistant Treasurer, certain other funds in the Fund Complex (2011-present). |
| | | | | | | |
| | | | | | | Former: Assistant Vice President, Guggenheim Funds Investment Advisors, LLC (2005-2011); Supervisor, Mutual Fund Administration, Van Kampen Investments, Inc. (1995-2005). |
| | | | | | | |
Mark E. Mathiasen
(1978) | | Secretary | | Since 2013 | | Current: Secretary, certain other funds in the Fund Complex (2007-present); Managing Director and Associate General Counsel, Guggenheim Funds Services, LLC, and affiliates (2007-present). |
| | | | | | | |
Michael P. Megaris
(1984) | | Assistant Secretary | | Since 2014 | | Current: Assistant Secretary, certain other funds in the Fund Complex (April 2014-present); Associate, Guggenheim Investments (2012-present). |
| | | | | | | |
| | | | | | | Former: J.D., University of Kansas School of Law (2009-2012). |
| | | | | | | |
Elisabeth Miller
(1968) | | Chief Compliance Officer | | Since 2012 | | Current: CCO, certain other funds in the Fund Complex (2012-present); CCO, Security Investors, LLC (2012-present); CCO, Guggenheim Funds Investment Advisors, LLC (2012-present); Vice President, Guggenheim Funds Distributors, LLC (March 2014-present). |
| | | | | | | |
| | | | | | | Former: CCO, Guggenheim Distributors, LLC (2009-March 2014); Senior Manager, Security Investors, LLC (2004-2009); Senior Manager, Guggenheim Distributors, LLC (2004-2009). |
| | | | | | | |
Alison Santay
(1974) | | AML Officer | | Since 2013 | | Current: AML Officer, certain other funds in the Fund Complex (2010-present); Director and AML Officer, Rydex Fund Services, LLC (2010-present); AML Officer, Security Investors, LLC (2010-present); Director, Shareholder Risk and Compliance, Rydex Fund Services, LLC (2004-present). |
| | | | | | | |
| | | | | | | Former: AML Officer, Guggenheim Distributors, LLC (2013-March 2014). |
| | | | | | | |
Kimberly Scott
(1974) | | Assistant Treasurer | | Since 2014 | | Current: Vice President, Guggenheim Investments (2012-present) ; Assistant Treasurer, certain other funds in the Fund Complex (2012-present). |
| | | | | | | |
| | | | | | | Former: Financial Reporting Manager, Invesco, Ltd. (2010-2011); Vice President/Assistant Treasurer, Mutual Fund Administration for Van Kampen Investments, Inc./Morgan Stanley Investment Management (2009-2010); Manager of Mutual Fund Administration, Van Kampen Investments, Inc./Morgan Stanley Investment Management (2005-2009). |
| | | | | | | |
Bryan Stone
(1979) | | Vice President | | Since 2014 | | Current: Vice President, certain other funds in the Fund Complex (April 2014-present); Director, Guggenheim Investments (2013-present). |
| | | | | | | |
| | | | | | | Former: Senior Vice President, Neuberger Berman Group LLC (2009-2013); Vice President, Morgan Stanley (2002-2009). |
| | | | | | | |
John L. Sullivan
(1955) | | Chief Financial
Officer and
Treasurer | | Since 2014 | | Current: CFO, Chief Accounting Officer and Treasurer, certain other funds in the Fund Complex (2010-present); Senior Managing Director, Guggenheim Investments (2010-present). |
| | | | | | | |
| | | | | | | Former: Managing Director and CCO, each of the funds in the Van Kampen Investments fund complex (2004-2010); Managing Director and Head of Fund Accounting and Administration, Morgan Stanley Investment Management (2002-2004); CFO and Treasurer, Van Kampen Funds (1996-2004). |
| * | The business address of each officer is c/o Guggenheim Investments, 805 King Farm Boulevard, Suite 600, Rockville, Maryland 20850. |
| ** | Each officer serves an indefinite term, until his or her successor is duly elected and qualified. Time served includes time served in the respective position for the Predecessor Corporation. |
| |
| THE GUGGENHEIM FUNDS SEMI-ANNUAL REPORT | 111 |
GUGGENHEIM INVESTMENTS PRIVACY POLICIES (Unaudited)
Rydex Funds, Guggenheim Funds, Rydex Investments, Guggenheim Funds Distributors, LLC, Security Investors, LLC, Security Distributors, Inc., Guggenheim Partners Investment Managers, LLC, and Rydex Advisory Services (Collectively “Guggenheim Investments”).
Our Commitment to You
When you become a Guggenheim Investments investor, you entrust us with not only your hard-earned money but also with personal and financial information about you. We recognize that your relationship with us is based on trust and that you expect us to act responsibly and in your best interests. Because we have access to this private information about you, we hold ourselves to the highest standards in its safekeeping and use. This means, most importantly, that we do not sell client information to anyone—whether it is your personal information or if you are a current or former Guggenheim Investments client.
The Information We Collect About You
In the course of doing business with shareholders and investors, we collect nonpublic personal information about you. You typically provide personal information when you complete a Guggenheim Investments account application or when you request a transaction that involves Rydex and Guggenheim Investments funds or one of the Guggenheim Investments affiliated companies. “Nonpublic personal information” is personally identifiable private information about you. For example, it includes information regarding your name and address, Social Security or taxpayer identification number, assets, income, account balance, bank account information and investment activity (e.g., purchase and redemption history).
How We Handle Your Personal Information
As emphasized above, we do not sell information about current or former clients or their accounts to third parties. Nor do we share such information, except when necessary to complete transactions at your request or to make you aware of related investment products and services that we offer. Additional details about how we handle your personal information are provided below. To complete certain transactions or account changes that you direct, it may be necessary to provide identifying information to companies, individuals or groups that are not affiliated with Guggenheim Investments. For example, if you ask to transfer assets from another financial institution to Guggenheim Investments, we will need to provide certain information about you to that company to complete the transaction. To alert you to other Guggenheim Investments investment products and services, we may share your information within the Guggenheim Investments family of affiliated companies. This would include, for example, sharing your information within Guggenheim Investments so we can make you aware of new Rydex and Guggenheim Investments funds or the services offered through another Guggenheim Investments affiliated company. In certain instances, we may contract with nonaffiliated companies to perform services for us. Where necessary, we will disclose information we have about you to these third parties. In all such cases, we provide the third party with only the information necessary to carry out its assigned responsibilities and only for that purpose. And we require these third parties to treat your private information with the same high degree of confidentiality that we do. In certain instances, we may share information with other financial institutions regarding individuals and entities in response to the U.S.A. Patriot Act. Finally, we will release information about you if you direct us to do so, if we are compelled by law to do so or in other circumstances permitted by law.
Opt Out Provisions
We do not sell your personal information to anyone. The law allows you to “opt out” of only certain kinds of information sharing with third parties. The firm does not share personal information about you with any third parties that triggers this opt-out right. This means YOU ARE ALREADY OPTED OUT.
How We Protect Privacy Online
Our concern for the privacy of our shareholders also extends to those who use our web site, guggenheiminvestments.com. Our web site uses some of the most secure forms of online communication available, including encryption technology, Secure Socket Layer (SSL) protocol, firewalls and user names and passwords. These technologies provide a high level of security and privacy when you access your account information or initiate online transactions. The Guggenheim Investments web site offers customized features that require our use of “http cookies”—tiny pieces of information that we ask your browser to store. However, we make very limited use of these cookies. We only use cookies for session management and security features on the Guggenheim Investments web site. We do not use them to pull data from your hard drive, to learn your email address, or to view data in cookies created by other web sites. We will not share the information in our cookies or give others access to it. See the legal information area on our web site for more details about web site security and privacy features.
How We Safeguard Your Personal Information
We restrict access to nonpublic personal information about shareholders to our employees and in some cases to third parties (for example, the service providers described above) as permitted by law. We maintain strict physical, electronic and procedural safeguards that comply with federal standards to guard your nonpublic personal information.
| |
| 112 | THE GUGGENHEIM FUNDS SEMI-ANNUAL REPORT |
GUGGENHEIM INVESTMENTS PRIVACY POLICIES (Unaudited) (concluded)
We’ll Keep You Informed
As required by federal law, we will notify shareholders of our privacy policy annually. We reserve the right to modify this policy at any time, but rest assured that if we do change it, we will tell you promptly. You will also be able to access our privacy policy from our web site at guggenheiminvestments.com. Should you have any questions regarding our privacy policy, contact us at 800.820.0888 or 301.296.5100.
| |
| THE GUGGENHEIM FUNDS SEMI-ANNUAL REPORT | 113 |
This page intentionally left blank.
This page intentionally left blank.
This page intentionally left blank.
This page intentionally left blank.
| Item 2. | | Code of Ethics. |
| | | |
| | | Not required at this time. |
| | | |
| Item 3. | | Audit Committee Financial Expert. |
| | | |
| | | Not required at this time. |
| | | |
| Item 4. | | Principal Accountant Fees and Services. |
| | | |
| | | Not required at this time. |
| | | |
| Item 5. | | Audit Committee of Listed Registrants. |
| | | |
| | | Not applicable. |
| | | |
| Item 6. | | Investments. |
| | | |
| | | The Schedule of Investments is included under Item 1 of this form. |
| | | |
| Item 7. | | Disclosure of Proxy Voting Policies and Procedures for Closed-End Management Investment Companies. |
| | | |
| | | Not applicable. |
| | | |
| Item 8. | | Portfolio Mangers of Closed-end Management Investment Companies |
| | | |
| | | Not applicable |
| | | |
| Item 9. | | Purchases of Equity Securities by Closed-End Management Investment Company and Affiliated Purchasers. |
| | | |
| | | Not applicable. |
| | | |
| Item 10. | | Submission of Matters to a Vote of Security Holders. |
The registrant does not currently have in place procedures by which shareholders may recommend nominees to the registrant’s board.
There have been no changes to the procedures by which shareholders may recommend nominees to the registrant’s board.
| Item 11. | | Controls and Procedures. |
| | (a) | | The registrant’s President (principal executive officer) and Treasurer (principal financial officer) have evaluated the registrant’s disclosure controls and |
| | | | procedures within 90 days of this filing and have concluded that the registrant’s disclosure controls and procedures were effective as of that date in ensuring that information required to be disclosed by the registrant in this Form N-CSR was recorded, processed, summarized, and reported timely. |
| | | | |
| | (b) | | The registrant’s principal executive officer and principal financial officer are aware of no change in the registrant’s internal control over financial reporting that occurred during the registrant’s second fiscal quarter covered by this report that has materially affected, or is reasonably likely to materially affect, the registrant’s internal control over financial reporting. |
| | (a)(2) | | Separate certifications by the President (principal executive officer) and Treasurer (principal financial officer) of the registrant as required by Rule 30a-2(a) under the Act (17 CFR 270.30a-2(a)) are attached. |
| | | | |
| | (b) | | A certification by the registrant’s President (principal executive officer) and Treasurer (principal financial officer) as required by Rule 30a-2(b) under the Act (17 CFR 270.30a-2(b)) is attached. |
SIGNATURES
Pursuant to the requirements of the Securities Exchange Act of 1934 and the Investment Company Act of 1940, the registrant has duly caused this report to be signed on its behalf by the undersigned, thereunto duly authorized.
| (Registrant) | | Guggenheim Funds Trust | |
| | | | |
| By (Signature and Title)* | | /s/ Donald C. Cacciapaglia | |
| | | | |
| | | Donald C. Cacciapaglia, President | |
Pursuant to the requirements of the Securities Exchange Act of 1934 and the Investment Company Act of 1940, this report has been signed below by the following persons on behalf of the registrant and in the capacities and on the dates indicated.
| By (Signature and Title)* | | /s/ Donald C. Cacciapaglia | |
| | | | |
| | | Donald C. Cacciapaglia, President | |
| By (Signature and Title)* | | /s/ John L. Sullivan | |
| | | | |
| | | John L. Sullivan, Chief Financial Officer,
Chief Accounting Officer and Treasurer | |
* Print the name and title of each signing officer under his or her signature.