As filed with the Securities and Exchange Commission on [date]
UNITED STATES
SECURITIES AND EXCHANGE COMMISSION
Washington, D.C. 20549
FORM N-CSR
CERTIFIED SHAREHOLDER REPORT OF REGISTERED MANAGEMENT INVESTMENT COMPANIES
Investment Company Act file number 811-06628
The Yacktman Funds, Inc.
(Exact name of registrant as specified in charter)
6300 Bridgeport Parkway
Building One, Suite 320
Austin, TX 78730
(Address of principal executive offices) (Zip code)
Donald A. Yacktman
c/o Yacktman Asset Management Co.
6300 Bridgeport Parkway
Building One, Suite 320
Austin, TX 78730
(Name and address of agent for service)
512-767-6700
Registrant's telephone number, including area code
Date of fiscal year end: December 31
Date of reporting period: December 31, 2006
Item 1. Report to Stockholders.
This report is submitted for the general information of shareholders of The Yacktman Funds. It is not authorized for distribution to prospective investors unless accompanied or preceded by an effective Prospectus for the Funds, which contains more information concerning the Funds’ investment policies, as well as fees and expenses and other pertinent information. Read the Prospectus carefully.
The Yacktman Funds, Inc.
MESSAGE TO SHAREHOLDERS |
Dear Fellow Shareholder:
Since the stock market peak of March 31, 2000, $10,000 invested in
The Yacktman Fund and The Yacktman Focused Fund would equal
$27,694 and $26,471, respectively, while the same amount invested in
the S&P 500® Index would equal $10,572. We achieved these results
through our characteristic risk-averse methods. Patient, long-term investing
yields handsome rewards.

Average Annual Returns | The Yacktman Fund | S&P 500® |
| One Year (01/01/06 - 12/31/06) | 15.95% | 15.80% |
| Five Years (01/01/01 - 12/31/06) | 13.27% | 6.19% |
| Ten Years (01/01/97 - 12/31/06) | 9.60% | 8.42% |
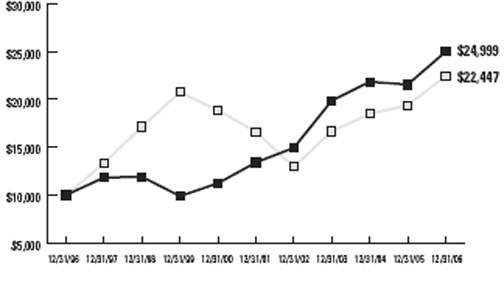
The chart assumes an initial gross investment of $10,000 made on 12/31/96.
2
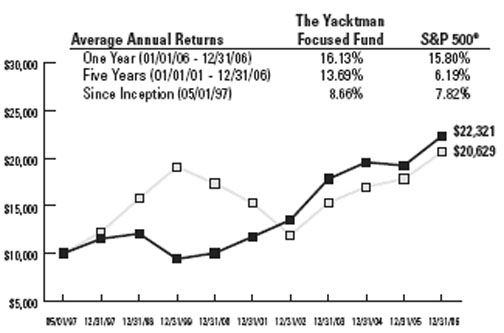
The chart assumes an initial gross investment of $10,000 made on 5/1/97 (inception).
* The S&P 500® is an unmanaged but commonly used measure of common stock total return performance.
Returns shown include the reinvestment of all dividends, but do not reflect the deduction of taxes that a shareholder would pay on Fund distributions or the redemption of Fund shares. The above past performance is not predictive of future results. The investment return and principal value of the Funds will fluctuate so that your shares, when redeemed, may be worth more or less than their original cost.
Rolling Ten Year Returns | |||
| The Yacktman Fund | S&P 500® Index | ||
| Ten Year | Ten Year | ||
| Time Period | Annualized Returns | Annualized Returns | |
| 1992-2002 | 9.57% | 9.34% | |
| 1993-2003 | 13.52% | 11.07% | |
| 1994-2004 | 13.63% | 12.07% | |
| 1995-2005 | 10.51% | 9.07% | |
| 1996-2006 | 9.60% | 8.42% | |
In the year ended December 31, 2006, stocks rallied sharply, and The Yacktman Fund and Focused Fund increased 15.95% and 16.13%, respectively. Many of our core holdings performed exceptionally well.
3
The Yacktman Funds, Inc.
In 2006, we were able to find a number of new securities to add to the portfolio, and many of our core positions performed exceptionally well. Henkel, Liberty Media, Kraft, Unilever, Coca-Cola, and Lancaster Colony were all up more than 20% each last year. While some of these businesses executed well, a good deal of the strong returns were from the stocks performing well in a market that was rising.
Coca-Cola shares rallied strongly in 2006, though they remain far below their all-time high reached in 1998. We are encouraged by many of the steps the new management team has taken and believe the business will continue to benefit from a continued increase in the standard of living around the globe.
Towards the end of the year, Liberty Capital entered into a favorable transaction with News Corporation to swap its 18% ownership stake in NWS stock for 39% ownership of Direct TV, three regional sports television networks, and cash. This transaction was highly favorable to Liberty as they received a small premium to the value of the News Corporation shares, and at the same time significantly reduced a potential tax liability.
Microsoft was a big purchase in 2006 when the shares declined on fears of product delays and cost increases. By year end, the stock had rallied well above its lows.
AmeriCredit was a disappointing performer last year as the stock declined a bit less than 2%. We believe the stock is inexpensive at less than ten times this years earnings. In 2006, AmeriCredit acquired two auto finance companies which focus on better credit quality customers. We like these deals as they give the company the ability to write auto loans across the entire credit spectrum and not just focus on sub prime.
We believe the quality of the businesses we own is the highest since the firm’s beginning in 1992. Some of the greatest franchises in the world, such as Coca-Cola, Pepsi, Wrigley, Microsoft and Wal-Mart are now significant positions.
4
We are optimistic about 2007 because we were able to make several substantial additions to the portfolio in 2006. Most major professional sports have a “Hall of Fame” to celebrate the greatest participants in their field. If there were a similar kind of recognition for all-time best businesses, many of our largest purchases last year would be first-ballot inductees. Among these would be Microsoft, AIG, Wrigley, Home Depot, eBay and Pepsi. Below is a table showing the broad number of categories which these new purchases would represent in our “Business Hall of Fame.”
Business Category | Company |
| Software | Microsoft |
| Insurance | AIG |
| Chewing Gum | Wrigley |
| Home Improvement Retailing | Home Depot |
| Internet Auction/Commerce | eBay |
| Snack Chips/Beverages | Pepsi |
For a good investor, identifying a great business is not particularly difficult. What is more challenging is being patient enough to wait for a price that will deliver a strong risk adjusted return. As attractive as the businesses listed in the chart above are, had we owned a portfolio of them for the better part of this decade, the results would not have been acceptable. By acquiring these positions recently at far better prices, we feel good about their potential going forward.
We would be more than happy to own less than “Hall of Fame” caliber companies if we expected to provide a good return at an acceptable level of risk. Back in 2002, our portfolio looked more like a “Hall of Shame” with large positions in Tyco, Qwest Debt, EDS, and other companies which seemed to be on the front page of the newspaper with some new scandal. However, the fears in the marketplace seemed overblown, and the valuations on these securities got so out of line that the returns for the “uncertainty” were generous.
We generally invest with a minimum 3-5 year time horizon, which allows us to focus on what is really important. Does the business have a competitive advantage, and is it strengthening or weakening? Do the normalized operating results provide a sufficient risk adjusted return at the current price level? What is the quality of the balance sheet? Will management reinvest intelligently or squander or take your money, or make prudent capital allocation decisions?These are some of the many questions we ask ourselves as we analyze a business and its financials.
5
The Yacktman Funds, Inc.
All-Time Dow Jones High
Recently, there has been a lot of press as the Dow Jones Industrial Average reached a new all-time high and the S&P 500 reached levels not seen in many years. Unfortunately since the beginning of 2000, investors in an S&P 500 index fund would have been better served keeping their money in a savings account.
We are pleased that your investment in the Yacktman Funds did far better than either the S&P 500 index fund or a savings account. It seems ironic that the same people who were throwing “all time high” parties years ago brought out the hats, balloons, and noisemakers again, perhaps to feel better about the years of poor returns or because they already had the supplies in the attic from 2000.
Looking Forward
We are pleased to have delivered strong results in 2006 and are optimistic about the portfolio going forward. In addition, 2006 was satisfying in terms of the number and quality of the new positions we were able to purchase, as well as the results delivered by many of our long standing holdings. There is plenty of value in our portfolios even though the market has reached new highs; we are still finding attractive new opportunities to analyze. As always, our team will continue to diligently seek new portfolio additions, work hard to manage the current holdings, and do our best to deliver strong results.
Sincerely,
The Yacktman Team
6
EXPENSE EXAMPLE
For the Six Months Ended December 31, 2006 (Unaudited)
As a shareholder of the Yacktman Funds (the “Funds”), you incur ongoing costs, including management fees and other Fund expenses. If you invest through a financial intermediary, you may also incur additional costs such as a transaction fee charged on the purchase or sale of the Fund or an asset-based management fee. This Example is intended to help you understand your ongoing costs (in dollars) of investing in the Fund and to compare these costs with the ongoing costs of investing in other mutual funds.
The Example is based on an investment of $1,000 invested at the beginning of the period and held for the entire period from July 1, 2006 to December 31, 2006.
Actual Expenses
The first line of the table on the next page provides information about actual account values and actual expenses. You may use the information in this line, together with the amount you invested, to estimate the expenses you paid over the period. Simply divide your account value by $1,000 (for example, an $8,600 account value divided by $1,000 = 8.6), then multiply the result by the number in the first line under the heading entitled “Expenses Paid During Period” to estimate the expenses you paid on your account during the period.
Hypothetical Example for Comparison Purposes
The second line of the table on the next page provides information about hypothetical account values and hypothetical expenses based on the Funds’ actual expense ratios and an assumed rate of return of 5% per year before expenses, which is not the Funds’ actual return. The hypothetical account values and expenses may not be used to estimate the actual ending account balance or expenses you paid for the period. You may use this information to compare the ongoing costs of investing in the Fund and other funds. To do so, compare this 5% hypothetical example with the 5% hypothetical examples that appear in the shareholder reports of the other funds.
7
The Yacktman Funds, Inc.
EXPENSE EXAMPLE (Cont'd.)
For the Six Months Ended December 31, 2006 (Unaudited)
Please note that the expenses shown in the table are meant to highlight your ongoing costs only and do not reflect any costs that may be associated with investing in the Fund through a financial intermediary. Therefore, the second line of the table is useful in comparing the ongoing costs only, and will not help you determine the relative total costs of owning different funds. In addition, if any costs associated with investing through a financial intermediary were included, your costs would have been higher.
THE YACKTMAN FUND | ||||
| Expenses | ||||
| Beginning | Ending | paid during | ||
| account | account | period | ||
| value | value | 7/1/06- | ||
| 7/1/06 | 12/31/06 | 12/31/061 | ||
| Actual | $1,000.00 | $1,116.90 | $5.12 | |
| Hypothetical | ||||
| (5% return | ||||
| before expenses) | 1,000.00 | 1,020.37 | 4.89 | |
THE YACKTMAN FOCUSED FUND | ||||
| Expenses | ||||
| Beginning | Ending | paid during | ||
| account | account | period | ||
| value | value | 7/1/06- | ||
| 7/1/06 | 12/31/06 | 12/31/061 | ||
| Actual | $1,000.00 | $1,115.80 | $6.67 | |
| Hypothetical | ||||
| (5% return | ||||
| before expenses) | 1,000.00 | 1,018.90 | 6.36 | |
1 Expenses are equal to the Funds’ annualized expense ratios (0.96% for The Yacktman Fund and 1.25% for The Yacktman Focused Fund), multiplied by the average account value over the period, multiplied by 184/365 (to reflect the one-half year period).
8
The Yacktman Fund
TOP TEN EQUITY HOLDINGS (Unaudited) | ||
| December 31, 2006 | ||
Percentage of | ||
Net Assets | ||
| Coca-Cola Co. | 9.2% | |
| Microsoft Corp. | 5.7 | |
| Lancaster Colony Corp. | 4.5 | |
| AmeriCredit Corp. | 3.5 | |
| Liberty Media Holding Corp., Interactive Series A | 3.3 | |
| Kraft Foods, Inc. | 3.1 | |
| PepsiCo, Inc. | 3.1 | |
| Liberty Media Holding Corp., Capital Series A | 3.0 | |
| Pfizer, Inc. | 2.8 | |
| Henkel KGaA | 2.6 | |
Total | 40.8% | |
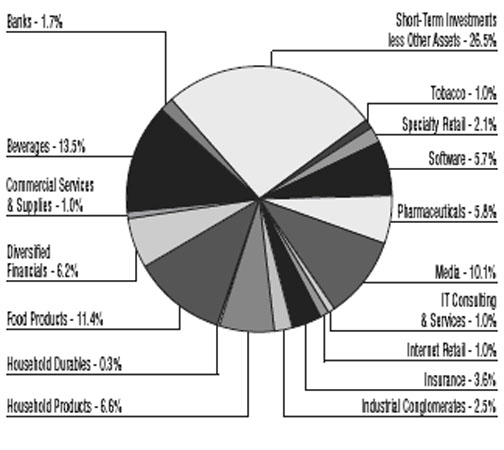
FUND DIVERSIFICATION (Unaudited)
December 31, 2006
9
The Yacktman Fund
EQUITY PURCHASES & SALES (Unaudited)
For the Six Months Ended December 31, 2006
Net Shares | Current | ||||
NEW PURCHASES | Purchased | Shares Held | |||
American International Group, Inc. | |||||
A provider of a variety of insurance | |||||
and insurance-related services in the | |||||
United States and overseas. The | |||||
company writes property & casualty | |||||
and life insurance, as well as provides | |||||
financial services. | 90,000 | 90,000 | |||
eBay, Inc. | |||||
A person-to-person trading community | |||||
on the Internet. It is a fully automated, | |||||
topically arranged 24-hour service on | |||||
which sellers can list items for sale and | |||||
buyers can bid on the items. | 149,000 | 149,000 | |||
Furniture Brands International, Inc. | |||||
A manufacturer and distributor of | |||||
residential furniture. It markets its | |||||
products under the Broyhill, Lane and | |||||
Thomasville brand names. | 71,100 | 71,100 | |||
Home Depot, Inc. | |||||
A retail store that sells building materials | |||||
and home improvement products. It | |||||
operates in North and South America. | 50,000 | 50,000 | |||
Quanta Capital Holdings Limited | |||||
A Bermuda holding company formed to | |||||
provide specialty insurance, reinsurance, | |||||
risk assessment and risk consulting | |||||
products and services on a global basis. | 900,000 | 900,000 | |||
10
| Net Shares | Current | ||||
PURCHASES | Purchased | Shares Held | |||
| AmeriCredit Corp. | 70,000 | 600,000 | |||
| PepsiCo, Inc. | 119,500 | 209,500 | |||
| Viacom, Inc., Class B | 70,000 | 160,000 | |||
| Wm. Wrigley Jr. Co. | 19,000 | 159,000 | |||
Net Shares | Current | ||||
| SALES | Sold | Shares Held | |||
| Bristol Myers Squibb Co. | 80,000 | 150,000 | |||
| CBS Corp., Class B | 90,000 | — | |||
| Electronic Data Systems Corp. | 150,000 | — | |||
| Federal National Mortgage Association | 30,000 | 70,000 | |||
| Henkel KGaA | 20,000 | 85,879 | |||
| Kraft Foods, Inc. | 285,000 | 375,000 | |||
| Lancaster Colony Corp. | 47,942 | 442,058 | |||
| Pfizer, Inc. | 80,000 | 470,000 | |||
| Trizec Properties, Inc. | 60,000 | — | |||
| Unilever N.V. | 190,000 | 200,000 | |||
11
The Yacktman Fund
PORTFOLIO OF INVESTMENTS
December 31, 2006
Number | |||||||
of Shares | Value | ||||||
COMMON STOCKS - 73.51% | |||||||
Banks - 1.69% | |||||||
| U.S. Bancorp | 150,000 | $ | 5,428,500 | ||||
| Washington Mutual, Inc. (a) | 40,000 | 1,819,600 | |||||
| 7,248,100 | |||||||
Beverages - 13.54% | |||||||
| Anheuser-Busch Cos., Inc. | 110,000 | 5,412,000 | |||||
| Coca-Cola Co. (a) | 820,000 | 39,565,000 | |||||
| PepsiCo, Inc. | 209,500 | 13,104,225 | |||||
| 58,081,225 | |||||||
Commercial Services & Supplies - 0.97% | |||||||
| H&R Block, Inc. (a) | 180,000 | 4,147,200 | |||||
Diversified Financials - 6.23% | |||||||
| AmeriCredit Corp. (a)(b) | 600,000 | 15,102,000 | |||||
| Federal Home Loan Mortgage Corp. | 110,000 | 7,469,000 | |||||
| Federal National Mortgage Association | 70,000 | 4,157,300 | |||||
| 26,728,300 | |||||||
Food Products - 11.40% | |||||||
| Cadbury Schweppes plc - ADR | 180,000 | 7,727,400 | |||||
| Kraft Foods, Inc. (a) | 375,000 | 13,387,500 | |||||
| Lancaster Colony Corp. | 442,058 | 19,587,590 | |||||
| Wm. Wrigley Jr. Co. | 159,000 | 8,223,480 | |||||
| 48,925,970 | |||||||
Household Durables - 0.27% | |||||||
| Furniture Brands International, Inc. (a) | 71,100 | 1,153,953 | |||||
Household Products - 6.65% | |||||||
| Clorox Co. (a) | 110,000 | 7,056,500 | |||||
| Colgate-Palmolive Co. | 75,000 | 4,893,000 | |||||
| Henkel KGaA - ADR | 85,879 | 11,120,618 | |||||
| Unilever NV - ADR | 200,000 | 5,450,000 | |||||
| 28,520,118 | |||||||
Industrial Conglomerates - 2.48% | |||||||
| Tyco International Ltd. | 350,000 | 10,640,000 | |||||
12
| Number | |||||||
of Shares | Value | ||||||
Insurance - 3.64% | |||||||
| American International Group, Inc. (a) | 90,000 | $ | 6,449,400 | ||||
| Marsh & McLennan Cos., Inc. (a) | 80,000 | 2,452,800 | |||||
| MBIA, Inc. | 40,000 | 2,922,400 | |||||
| MGIC Investment Corp. (a) | 30,000 | 1,876,200 | |||||
| Quanta Capital Holdings Limited (b) | 900,000 | 1,935,000 | |||||
| 15,635,800 | |||||||
Internet Retail - 1.05% | |||||||
| eBay, Inc. (a)(b) | 149,000 | 4,480,430 | |||||
IT Services - 0.95% | |||||||
| First Data Corp. | 160,000 | 4,083,200 | |||||
Media - 10.11% | |||||||
| Discovery Holding Co., Class A (a)(b) | 260,000 | 4,183,400 | |||||
| Interpublic Group of Cos., Inc. (a)(b) | 481,155 | 5,889,337 | |||||
| Liberty Media Holding Corp., | |||||||
| Capital Series A (a)(b) | 130,000 | 12,737,400 | |||||
| Liberty Media Holding Corp., | |||||||
| Interactive Series A (b) | 650,000 | 14,020,500 | |||||
| Viacom, Inc., Class B (a)(b) | 160,000 | 6,564,800 | |||||
| 43,395,437 | |||||||
Pharmaceuticals - 5.76% | |||||||
| Bristol-Myers Squibb Co. | 150,000 | 3,948,000 | |||||
| Johnson & Johnson | 130,000 | 8,582,600 | |||||
| Pfizer, Inc. | 470,000 | 12,173,000 | |||||
| 24,703,600 | |||||||
Software - 5.69% | |||||||
| Microsoft Corp. | 818,000 | 24,425,480 | |||||
Specialty Retail - 2.08% | |||||||
| Home Depot, Inc. (a) | 50,000 | 2,008,000 | |||||
| Wal-Mart Stores, Inc. | 150,000 | 6,927,000 | |||||
| 8,935,000 | |||||||
Tobacco - 1.00% | |||||||
| Altria Group, Inc. | 50,000 | 4,291,000 | |||||
| Total Common Stocks | |||||||
| (Cost $221,269,914) | 315,394,813 | ||||||
13
The Yacktman Fund
PORTFOLIO OF INVESTMENTS (Cont'd.) | |||||||
| December 31, 2006 | |||||||
Principal | |||||||
Amount | Value | ||||||
SHORT TERM INVESTMENTS - 43.34% | |||||||
Commercial Paper - 26.38% | |||||||
| Abbey National plc, | |||||||
| 5.17%, 01/03/2007 | $ | 19,538,000 | $ | 19,532,388 | |||
| American General Finance Corp., | |||||||
| 5.15%, 01/03/2007 | 19,538,000 | 19,532,410 | |||||
| Chesham Finance, Ltd., | |||||||
| 5.15%, 01/02/2007 | 17,532,000 | 17,529,492 | |||||
| General Electric Capital Corp., | |||||||
| 5.10%, 01/03/2007 | 19,538,000 | 19,532,464 | |||||
| Rabobank Financial Corp., | |||||||
| 5.15%, 01/02/2007 | 17,532,000 | 17,529,492 | |||||
| Toyota Motor Credit Corp., | |||||||
| 5.15%, 01/03/2007 | 19,538,000 | 19,532,410 | |||||
| Total Commercial Paper | 113,188,656 | ||||||
Demand Note - 0.26% | |||||||
| U.S. Bancorp, 5.07% | 1,112,445 | 1,112,445 | |||||
Other Short-Term Investment - 16.70% | |||||||
| Securities Lending Investment Account | 71,655,321 | ||||||
| Total Short-Term Investments | |||||||
| (cost $185,956,422) | 185,956,422 | ||||||
Total Investments - 116.85% | |||||||
| (cost $407,226,336) | 501,351,235 | ||||||
| Liabilities in Excess of Other Assets - (0.15)% | (624,198 | ) | |||||
| Less Liabilities for Collateral | |||||||
| on Securities Loaned - (16.70)% | (71,655,321 | ) | |||||
| Total Net Assets - 100.00% | $ | 429,071,716 | |||||
Percentages are stated as a percent of net assets.
ADR American Depository Receipt
(a) All or a portion of the security has been committed for securities lending (See Note 5)
(b) Non-income producing
See notes to financial statements
14
The Yacktman Focused Fund
TOP TEN EQUITY HOLDINGS (Unaudited) | |
| December 31, 2006 | |
Percentage of | |
Net Assets | |
| Coca-Cola Co. | 12.0% |
| Microsoft Corp. | 6.3 |
| Lancaster Colony Corp. | 4.9 |
| AmeriCredit Corp. | 4.9 |
| PepsiCo, Inc. | 4.2 |
| Liberty Media Holding Corp., Interactive Series A | 3.6 |
| Henkel KGaA | 3.6 |
| Liberty Media Holding Corp., Capital Series A | 3.6 |
| Kraft Foods, Inc. | 3.6 |
| Tyco International | 3.0 |
Total | 49.7% |
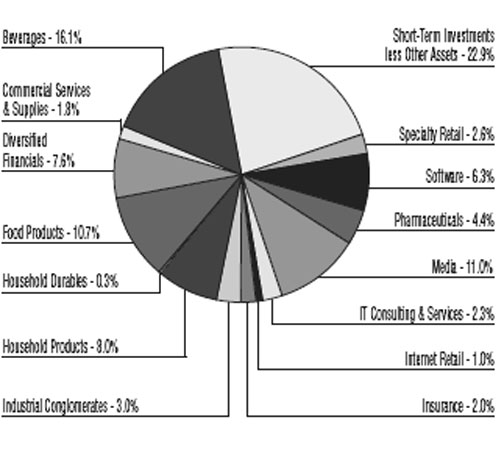
FUND DIVERSIFICATION (Unaudited)
December 31, 2006
15
The Yacktman Focused Fund
EQUITY PURCHASES & SALES (Unaudited) | ||
| For the Six Months Ended December 31, 2006 | ||
Net Shares | Current | |
PURCHASES | Purchased | Shares Held |
| American International Group, Inc. | 18,000 | 18,000 |
| Coca-Cola Co. | 40,000 | 225,000 |
| eBay, Inc. | 30,000 | 30,000 |
| First Data Corp. | 80,000 | 80,000 |
| Furniture Brands International, Inc. | 15,000 | 15,000 |
| Home Depot, Inc. | 19,000 | 19,000 |
| PepsiCo, Inc. | 60,000 | 60,000 |
| Quanta Capital Holdings Limited | 227,500 | 227,500 |
| Wm. Wrigley Jr. Co. | 15,000 | 40,000 |
Net Shares | Current | |
SALES | Sold | Shares Held |
| AmeriCredit Corp. | 5,000 | 175,000 |
| Bristol Myers Squibb Co. | 55,000 | — |
| Kraft Foods, Inc. | 55,000 | 90,000 |
| Liberty Media Holding Corp., | ||
| Interactive Series A | 17,500 | 150,000 |
| Pfizer, Inc. | 10,000 | 90,000 |
| Unilever N.V. | 45,000 | 30,000 |
16
The Yacktman Focused Fund
PORTFOLIO OF INVESTMENTS | |||||||
| December 31, 2006 | |||||||
Number of | |||||||
Shares | Value | ||||||
COMMON STOCKS - 77.13% | |||||||
Beverages - 16.14% | |||||||
| Coca-Cola Co. | 225,000 | $ | 10,856,250 | ||||
| PepsiCo, Inc. | 60,000 | 3,753,000 | |||||
| 14,609,250 | |||||||
Commercial Services & Supplies - 1.78% | |||||||
| H&R Block, Inc. (a) | 70,000 | 1,612,800 | |||||
Diversified Financials - 7.64% | |||||||
| AmeriCredit Corp. (a)(b) | 175,000 | 4,404,750 | |||||
| Federal Home Loan Mortgage Corp. | 37,000 | 2,512,300 | |||||
| 6,917,050 | |||||||
Food Products - 10.73% | |||||||
| Kraft Foods, Inc. | 90,000 | 3,213,000 | |||||
| Lancaster Colony Corp. | 100,000 | 4,431,000 | |||||
| Wm. Wrigley Jr. Co. | 40,000 | 2,068,800 | |||||
| 9,712,800 | |||||||
Household Durables - 0.27% | |||||||
| Furniture Brands International, Inc. (a) | 15,000 | 243,450 | |||||
Household Products - 8.05% | |||||||
| Clorox Co. (a) | 30,000 | 1,924,500 | |||||
| Colgate-Palmolive Co. | 20,000 | 1,304,800 | |||||
| Henkel KGaA - ADR | 25,000 | 3,237,293 | |||||
| Unilever NV - ADR | 30,000 | 817,500 | |||||
| 7,284,093 | |||||||
Industrial Conglomerates - 3.02% | |||||||
| Tyco International Ltd. | 90,000 | 2,736,000 | |||||
Insurance - 1.96% | |||||||
| American International Group, Inc. (a) | 18,000 | 1,289,880 | |||||
| Quanta Capital Holdings Limited (b) | 227,500 | 489,125 | |||||
| 1,779,005 | |||||||
Internet Retail - 1.00% | |||||||
| eBay, Inc. (b) | 30,000 | 902,100 | |||||
IT Services - 2.25% | |||||||
| First Data Corp. | 80,000 | 2,041,600 | |||||
Media - 11.00% | |||||||
| Discovery Holding Co., Class A (a)(b) | 67,000 | 1,078,030 | |||||
| Interpublic Group of Cos, Inc. (a)(b) | 193,100 | 2,363,544 | |||||
17
The Yacktman Focused Fund
PORTFOLIO OF INVESTMENTS (Cont'd.) | |||||||
| December 31, 2006 | |||||||
Number of | |||||||
Shares | Value | ||||||
Media - 11.00% (cont.) | |||||||
| Liberty Media Holding Corp., | |||||||
| Capital Series A (a)(b) | 33,500 | $ | 3,282,330 | ||||
| Liberty Media Holding Corp., | |||||||
| Interactive Series A (b) | 150,000 | 3,235,500 | |||||
| 9,959,404 | |||||||
Pharmaceuticals - 4.40% | |||||||
| Johnson & Johnson | 25,000 | 1,650,500 | |||||
| Pfizer, Inc. | 90,000 | 2,331,000 | |||||
| 3,981,500 | |||||||
Software - 6.26% | |||||||
| Microsoft Corp. | 190,000 | 5,673,400 | |||||
Specialty Retail - 2.63% | |||||||
| Home Depot, Inc. (a) | 19,000 | 763,040 | |||||
| Wal-Mart Stores, Inc. | 35,000 | 1,616,300 | |||||
| 2,379,340 | |||||||
| Total Common Stocks | |||||||
| (Cost $51,537,145) | 69,831,792 | ||||||
Principal | |||||||
Amount | Value | ||||||
SHORT TERM INVESTMENTS - 41.04% | |||||||
Commercial Paper - 21.60% | |||||||
| Abbey National plc | |||||||
| 5.17%, 01/03/2007 | $ | 3,372,000 | 3,371,031 | ||||
| American General Finance Corp. | |||||||
| 5.15%, 01/03/2007 | 3,372,000 | 3,371,035 | |||||
| Chesham Finance, Ltd. | |||||||
| 5.15%, 01/02/2007 | 3,037,000 | 3,036,565 | |||||
| General Electric Capital Corp. | |||||||
| 5.10%, 01/03/2007 | 3,372,000 | 3,371,045 | |||||
| Rabobank Financial Corp. | |||||||
| 5.15%, 01/02/2007 | 3,037,000 | 3,036,566 | |||||
| Toyota Motor Credit Corp. | |||||||
| 5.15%, 01/03/2007 | 3,372,000 | 3,371,035 | |||||
| Total Commercial Paper | 19,557,277 | ||||||
Demand Note - 1.03% | |||||||
| U.S. Bancorp, 5.07% | 930,378 | 930,378 | |||||
18
Value | ||
Other Short-Term Investment - 18.41% | ||
| Securities Lending Investment Account | 16,668,059 | |
| Total Short-Term Investments | ||
| (cost $37,155,714) | 37,155,714 | |
| Total Investments - 118.17% | ||
| (Cost $88,692,859) | 106,987,506 | |
| Other Assets in Excess of Liabilities - 0.24% | 214,770 | |
| Less Liabilities for Collateral | ||
| on Securities Loaned - (18.41)% | (16,668,059) | |
| Total Net Assets - 100.00% | $ 90,534,217 |
SCHEDULE OF OPTIONS WRITTEN
December 31, 2006
Contracts | Value | ||||||
CALL OPTIONS | |||||||
| ebay, Inc. | |||||||
| Expiration: April 2007, | |||||||
| Exercise, Price: $32.50 | 300 | $ | 52,500 | ||||
| Total Options Written | |||||||
| (premiums received $107,997) | $ | 52,500 | |||||
Percentages are stated as a percent of net assets.
ADR American Depository Receipt
(a) All or a portion of the security has been committed for securities lending
(See Note 5)
(b) Non-income producing
See notes to financial statements.
19
The Yacktman Focused Fund
STATEMENTS OF ASSETS & LIABILITIES
December 31, 2006
The Yacktman | The Yacktman | ||||||
Fund | Focused Fund | ||||||
ASSETS | |||||||
| Investments, at market value | |||||||
| (cost $407,226,336 and | |||||||
| $88,692,859 respectively) | $ | 501,351,235 | $ | 106,987,506 | |||
| Receivable for fund shares sold | 2,194,388 | 597,291 | |||||
| Dividends and interest receivable | 389,328 | 75,683 | |||||
| Prepaid expenses | 28,840 | 11,528 | |||||
| Total Assets | 503,963,791 | 107,672,008 | |||||
LIABILITIES: | |||||||
| Options written at value | |||||||
| (premiums received | |||||||
| $0, $107,997 respectively) | — | 52,500 | |||||
| Collateral for securities loaned | 71,655,321 | 16,668,059 | |||||
| Payable for fund shares redeemed | 2,847,421 | 302,715 | |||||
| Accrued investment advisory fees | 236,967 | 64,104 | |||||
| Other accrued expenses | 152,366 | 50,413 | |||||
| Total Liabilities | 74,892,075 | 17,137,791 | |||||
NET ASSETS | $ | 429,071,716 | $ | 90,534,217 | |||
NET ASSETS CONSIST OF: | |||||||
| Capital stock | $ | 334,955,572 | $ | 72,444,031 | |||
| Undistributed net | |||||||
| investment income | — | 411 | |||||
| Undistributed accumulated | |||||||
| net realized loss | (8,755 | ) | (260,369 | ) | |||
| Net unrealized appreciation | |||||||
| on investments | 94,124,899 | 18,294,647 | |||||
| Written Options | — | 55,497 | |||||
| Total Net Assets | $ | 429,071,716 | $ | 90,534,217 | |||
CAPITAL STOCK, $0.0001 par value | |||||||
| Authorized | 500,000,000 | 500,000,000 | |||||
| Issued and Outstanding | 27,180,984 | 5,659,573 | |||||
NET ASSET VALUE, | |||||||
REDEMPTION PRICE, AND | |||||||
OFFERING PRICE PER SHARE | $ | 15.79 | $ | 16.00 | |||
See notes to financial statements
20
STATEMENTS OF OPERATIONS
For the Year Ended December 31, 2006
The Yacktman | The Yacktman | ||||||
Fund | Focused Fund | ||||||
INVESTMENT INCOME: | |||||||
| Dividend income | $ | 6,024,195(1 | ) | $ | 1,111,013(2 | ) | |
| Interest income | 5,176,529 | 980,942 | |||||
| Securities lending income, net | |||||||
| (See Note 5) | 66,784 | 15,022 | |||||
| Total investment income | 11,267,508 | 2,106,977 | |||||
EXPENSES: | |||||||
| Investment advisory fees | 2,564,940 | 796,658 | |||||
| Shareholder servicing fees | 644,808 | 119,513 | |||||
| Administration and accounting fees | 213,382 | 50,000 | |||||
| Custody fees | 78,928 | 25,629 | |||||
| Federal and state registration fees | 60,511 | 25,172 | |||||
| Professional fees | 61,815 | 35,203 | |||||
| Reports to shareholders | 86,374 | 9,643 | |||||
| Directors fees and expenses | 26,565 | 3,044 | |||||
| Miscellaneous costs | 68,194 | 15,083 | |||||
| Total expenses before | |||||||
| reimbursements | 3,805,517 | 1,079,945 | |||||
| Expense reimbursements | |||||||
| (See Note 4) | — | (84,113 | ) | ||||
| Net Expenses | 3,805,517 | 995,832 | |||||
NET INVESTMENT INCOME | 7,461,991 | 1,111,145 | |||||
REALIZED AND | |||||||
UNREALIZED GAIN: | |||||||
| Net realized gain on investments | 23,665,748 | 6,099,164 | |||||
| Change in unrealized | |||||||
| appreciation on investments | 27,783,515 | 4,979,772 | |||||
| Net realized and unrealized | |||||||
| gain on investments | 51,449,263 | 11,078,936 | |||||
NET INCREASE IN NET ASSETS | |||||||
RESULTING FROM OPERATIONS | $ | 58,911,254 | $ | 12,190,081 | |||
(1) Net of $118,718 in foreign withholding taxes
(2) Net of $25,036 in foreign withholding taxes
See notes to financial statements
21
The Yacktman Funds, Inc.
STATEMENTS OF CHANGES IN NET ASSETS
The Yacktman Fund | The Yacktman Focused Fund | ||||||||||||
Year Ended December 31, | Year Ended December 31, | ||||||||||||
2006 | 2005 | 2006 | 2005 | ||||||||||
OPERATIONS: | |||||||||||||
| Net investment income | $ | 7,461,991 | $ | 8,337,183 | $ | 1,111,145 | $ | 1,240,195 | |||||
| Net realized gain on investments | 23,665,748 | 5,536,066 | 6,099,164 | 1,994,356 | |||||||||
Change in unrealized appreciation (depreciation) on investments | 27,783,515 | (19,038,159 | ) | 4,979,772 | (5,284,051 | ) | |||||||
| Net increase (decrease) in net assets resulting from operations | 58,911,254 | (5,164,910 | ) | 12,190,081 | (2,049,500 | ) | |||||||
CAPITAL SHARE TRANSACTIONS: | |||||||||||||
| Proceeds from shares sold | 107,956,324 | 267,195,629 | 35,431,193 | 49,628,717 | |||||||||
| Proceeds from reinvestment of distributions | 28,350,940 | 12,283,531 | 6,747,920 | 2,870,353 | |||||||||
| Redemption fees | 8,603 | 68 | 2,745 | 89 | |||||||||
| 136,315,867 | 279,479,228 | 42,181,858 | 52,499,159 | ||||||||||
| Payments for shares redeemed | (173,857,373 | ) | (186,939,415 | ) | (41,227,292 | ) | (59,901,687 | ) | |||||
| Net increase (decrease) | (37,541,506 | ) | 92,539,813 | 954,566 | (7,402,528 | ) | |||||||
| DISTRIBUTIONS PAID FROM: | |||||||||||||
| Net investment income | (7,580,239 | ) | (8,211,462 | ) | (1,121,617 | ) | (1,216,086 | ) | |||||
| Net realized gains | (23,629,873 | ) | (5,559,012 | ) | (6,096,510 | ) | (1,987,207 | ) | |||||
| Total distributions | (31,210,112 | ) | (13,770,474 | ) | (7,218,127 | ) | (3,203,293 | ) | |||||
TOTAL INCREASE (DECREASE) IN NET ASSETS | (9,840,364 | ) | 73,604,429 | 5,926,520 | (12,655,321 | ) | |||||||
NET ASSETS: | |||||||||||||
| Beginning of period | 438,912,080 | 365,307,651 | 84,607,697 | 97,263,018 | |||||||||
End of period (including undistributed net investment income of $0, $82,256, $411 and $10,896, respectively) | $ | 429,071,716 | $ | 438,912,080 | $ | 90,534,217 | $ | 84,607,697 | |||||
TRANSACTIONS IN SHARES: | |||||||||||||
| Shares sold | 6,784,464 | 17,654,730 | 2,199,336 | 3,182,602 | |||||||||
| Issued in reinvestment of distributions | 1,789,832 | 835,614 | 420,431 | 191,496 | |||||||||
| Shares redeemed | (11,309,919 | ) | (12,380,546 | ) | (2,617,408 | ) | (3,860,169 | ) | |||||
| Net increase (decrease) | (2,735,623 | ) | 6,109,798 | 2,359 | (486,071 | ) | |||||||
See notes to financial statements
22 & 23
The Yacktman Funds, Inc.
FINANCIAL HIGHLIGHTS
The Yacktman Fund | ||||||||||||||||
Year Ended December 31, | ||||||||||||||||
For a Fund share outstanding throughout each period | 2006 | 2005 | 2004 | 2003 | 2002 | |||||||||||
Net asset value, beginning of period | $ | 14.67 | $ | 15.34 | $ | 15.24 | $ | 12.33 | $ | 11.16 | ||||||
Income from investment operations: | ||||||||||||||||
| Net investment income | 0.30 | 0.28 | 0.12 | 0.23 | 0.13 | |||||||||||
Net realized and unrealized gain (loss) on investments | 2.05 | (0.48 | ) | 1.40 | 3.84 | 1.14 | ||||||||||
Total from investment operations | 2.35 | (0.20 | ) | 1.52 | 4.07 | 1.27 | ||||||||||
| Less distributions: | ||||||||||||||||
| From net investment income | (0.30 | ) | (0.28 | ) | (0.12 | ) | (0.17 | ) | (0.10 | ) | ||||||
| From net realized gains | (0.93 | ) | (0.19 | ) | (1.30 | ) | (0.99 | ) | — | |||||||
| Total distributions | (1.23 | ) | (0.47 | ) | (1.42 | ) | (1.16 | ) | (0.10 | ) | ||||||
Net asset value, end of period | $ | 15.79 | $ | 14.67 | $ | 15.34 | $ | 15.24 | $ | 12.33 | ||||||
| Total Return | 15.95 | % | (1.30 | )% | 9.93 | % | 33.03 | % | 11.41 | % | ||||||
| Supplemental data and ratios: | ||||||||||||||||
| Net assets, end of period (000s) | $ | 429,072 | $ | 438,912 | $ | 365,308 | $ | 325,428 | $ | 421,292 | ||||||
Ratio of net expenses to average net assets | 0.96 | % | 0.92 | % | 0.95 | % | 0.94 | % | 0.99 | % | ||||||
Ratio of net investment income to average net assets | 1.90 | % | 1.86 | % | 0.73 | % | 1.25 | % | 2.01 | % | ||||||
| Portfolio turnover rate | 17.93 | % | 8.64 | % | 23.82 | % | 40.01 | % | 39.19 | % | ||||||
See notes to financial statements
24 & 25
The Yacktman Funds, Inc.
FINANCIAL HIGHLIGHTS (cont'd.)
| The Yacktman Focused Fund | ||||||||||||||||
Year Ended December 31 | ||||||||||||||||
For a Fund share outstanding throughout each period | 2006 | 2005 | 2004 | 2003 | 2002 | |||||||||||
Net asset value, beginning of period | $ | 14.96 | $ | 15.83 | $ | 16.28 | $ | 12.48 | $ | 10.92 | ||||||
Income from investment operations | ||||||||||||||||
| Net investment income | 0.21 | 0.22 | 0.03 | 0.07 | 0.08 | |||||||||||
Net realized and unrealized gain (loss) on investments | 2.20 | (0.51 | ) | 1.59 | 3.90 | 1.56 | ||||||||||
Total from investment operations | 2.41 | (0.29 | ) | 1.62 | 3.97 | 1.64 | ||||||||||
| Less distributions: | ||||||||||||||||
| From net investment income | (0.21 | ) | (0.22 | ) | (0.03 | ) | (0.07 | ) | (0.08 | ) | ||||||
| From net realized gains | (1.16 | ) | (0.36 | ) | (2.04 | ) | (0.10 | ) | — | |||||||
| Total distributions | (1.37 | ) | (0.58 | ) | (2.07 | ) | (0.17 | ) | (0.08 | ) | ||||||
Net asset value, end of period | $ | 16.00 | $ | 14.96 | $ | 15.83 | $ | 16.28 | $ | 12.48 | ||||||
| Total Return | 16.13 | % | (1.83 | )% | 9.96 | % | 31.79 | % | 14.99 | % | ||||||
| Supplemental data and ratios: | ||||||||||||||||
| Net assets, end of period (000s) | $ | 90,534 | $ | 84,608 | $ | 97,263 | $ | 127,355 | $ | 115,250 | ||||||
Ratio of expenses before expense reimbursements to average net assets (See Note 4) | 1.36 | % | 1.32 | % | 1.33 | % | 1.36%(1 | ) | 1.45 | % | ||||||
Ratio of net expenses to average net assets | 1.25 | % | 1.25 | % | 1.25 | % | 1.26%(2 | ) | 1.25 | % | ||||||
Ratio of net investment income to average net assets | 1.40 | % | 1.30 | % | 0.16 | % | 0.51 | % | 1.68 | % | ||||||
| Portfolio turnover rate | 30.61 | % | 5.62 | % | 19.26 | % | 71.38 | % | 49.95 | % | ||||||
(1) The ratio of expenses before expense reimbursements to average net assets,
excluding interest expense, was 1.35%
(2) The ratio of expenses to average net assets, excluding interest expense, was 1.25%
See notes to financial statements
26 & 27
The Yacktman Funds, Inc.
NOTES TO THE FINANCIAL STATEMENTS
December 31, 2006
1. | ORGANIZATION |
The Yacktman Funds, Inc. (comprised of The Yacktman Fund and The Yacktman Focused Fund, hereafter referred to as the “Funds”) is registered as an open-end management investment company under the Investment Company Act of 1940 (the “1940 Act”). The Funds consist of two investment portfolios: The Yacktman Fund is a diversified fund that commenced operations July 6, 1992 and The Yacktman Focused Fund is a non-diversified fund that commenced operations May 1, 1997. The objective of each of the Funds is to produce long-term capital appreciation with current income as a secondary objective. Yacktman Asset Management Co. is the Funds’ investment adviser (the “Adviser”).
2. | SIGNIFICANT ACCOUNTING POLICIES |
The following is a summary of significant accounting policies consistently followed by the Funds in the preparation of their financial statements. The financial statements have been prepared in conformity with accounting principles generally accepted in the United States of America, which require management to make certain estimates and assumptions during the reporting period. Actual results could differ from those estimates.
a) Investment Valuation - Securities which are traded on a national stock exchange are valued at the last sale price on the securities exchange on which such securities are primarily traded. Securities that are traded on the Nasdaq National Market or the Nasdaq Smallcap Market are valued at the Nasdaq Official Closing Price. Exchange-traded securities for which there were no transactions are valued at the current bid prices. Securities traded on only over-the-counter markets are valued on the basis of closing over-the-counter bid prices. Short-term debt instruments maturing within 60 days are valued by the amortized cost method, which approximates fair value. Debt securities (other than short-term instruments) are valued at the mean price furnished by a national pricing service, subject to review by the Adviser and determination of the appropriate price whenever a furnished price is significantly different from the previous day's furnished price. Options written or purchased by The Yacktman Focused Fund are valued at the last sales price if such last sales price is between the current bid and asked prices. Otherwise, options are valued at the mean between the current bid and asked prices. Any securities for which there are no readily available market quotations and other assets will be valued at their fair value as determined in good faith by the Adviser pursuant to procedures established by and under the supervision of the Board of Directors. The fair value of a security is the amount which a Fund might reasonably expect to receive upon a current sale. Valuing securities at fair value involves greater reliance on judgment than valuing securities that have readily available market quotations. There can be no assurance that the Funds could obtain the fair value assigned to a security if they were to sell the security at approximately the time at which the Funds determine their net asset value per share.
28
b) Options - Premiums received by The Yacktman Focused Fund upon writing options are recorded as an asset with a corresponding liability which is subsequently adjusted to the current market value of the option. Changes between the initial premiums received and the current value of the options are recorded in unrealized gains and losses. When an option expires, is exercised, or is closed, the Fund realizes a gain or loss, and the liability is eliminated. The Fund continues to bear the risk of adverse movements in the price of the underlying security during the period of the option, although any potential loss would be reduced by the amount of option premium received.
c) Federal Income Taxes - It is each Fund’s policy to meet the requirements of the Internal Revenue Code applicable to regulated investment companies and to distribute substantially all investment company net taxable income and net capital gains to its shareholders in a manner which results in no tax cost to the Fund. Therefore, no federal income tax provision is required.
d) Distributions to Shareholders - Dividends from net investment income and distributions of net realized capital gains, if any, are declared and paid at least annually. Distributions to shareholders are recorded on the ex-dividend date. The character of distributions made during the year from net investment income or net realized gains may differ from the characterization for federal income tax purposes due to differences in the recognition of income, expense and gain items for financial statement and tax purposes. Additionally, the Funds may utilize earnings and profits distributed to shareholders on redemption of shares as part of the dividends paid deduction for income tax purposes. Where appropriate, reclassifications between capital accounts are made for such differences that are permanent in nature.
29
The Yacktman Funds, Inc.
NOTES TO THE FINANCIAL STATEMENTS (Cont'd.)
December 31, 2006
Accordingly, at December 31, 2006, reclassifications were recorded to increase (decrease) undistributed net investment income by $35,842 and $(13), and increase (decrease) undistributed net realized gains (losses) by $(1,712) and $13 for The Yacktman Fund and The Yacktman Focused Fund, respectively. Accumulated paid-in-capital was increased (decreased) by $(34,130) for The Yacktman Fund.
e) Guarantees and Indemnifications - In the normal course of business, the Funds enter into contracts with service providers that contain general indemnification clauses. The Funds’ maximum exposure under these arrangements is unknown as this would involve future claims against the Funds that have not yet occurred. Based on experience, the Funds expect the risk of loss to beremote.
f) Redemption Fee - Effective April 1, 2005, those who buy and sell the Funds within thirty calendar days will incur a 2% redemption fee, retained for the benefit of long-term shareholders, recorded as additional capital in the statement of changes in net assets.
g) Other - Investment transactions and shareholder transactions are accounted for on the trade date. Net realized gains and losses on securities are computed on the basis of specific security lot identification. Dividend income is recognized on the ex-dividend date and interest income is recognized on an accrual basis.
3. | INVESTMENT TRANSACTIONS |
For the year ended December 31, 2006, the aggregate purchases and sales of securities, excluding short-term securities, were $53,427,207 and $82,172,412 for The Yacktman Fund and $18,368,244 and $20,460,619 for The Yacktman Focused Fund, respectively. For the year ended December 31, 2006, there were no purchases or sales of U.S. Government securities for The Yacktman Fund and The Yacktman Focused Fund.
4. | OPTION CONTRACTS WRITTEN |
The premium amount and number of option contracts written during the year ended December 31, 2006 in The Yacktman Focused Fund, were as follows:
30
Amount of | Number of | ||
Premiums | Contracts | ||
| Outstanding at 12/31/05 | — | — | |
| Options written | $(107,997) | (300) | |
| Options expired | — | — | |
| Options closed | — | — | |
| Outstanding at 12/31/06 | $(107,997) | (300) |
5. | INVESTMENT ADVISORY AGREEMENT |
The Funds have agreements with the Adviser, with whom certain officers and directors of the Funds are affiliated, to furnish investment advisory services to the Funds. Under the terms of these agreements, The Yacktman Fund will pay the Adviser a monthly fee at the annual rate of 0.65% on the first $500,000,000 of average daily net assets, 0.60% on the next $500,000,000 of average daily net assets and 0.55% on average daily net assets in excess of $1,000,000,000, and The Yacktman Focused Fund will pay the Adviser a monthly fee at the annual rate of 1% of its average daily net assets. The Adviser has voluntarily agreed to reimburse The Yacktman Focused Fund for all expenses exceeding 1.25% of its average daily net assets (exclusive of interest, taxes, brokerage commissions and extraordinary expenses).
6. | SECURITIES LENDING |
The Funds have entered into a securities lending arrangement with the custodian. Under the terms of the agreement, the custodian is authorized to loan securities on behalf of the Funds to approved brokers against the receipt of cash collateral at least equal to the value of the securities loaned. The cash collateral is invested by the custodian in a money market pooled account approved by the Adviser. Each Fund has an individual interest of cash collateral contributed, although risk is mitigated by the collateral, the Funds could experience a delay in recovering their securities and possible loss of income or value if the borrower fails to return them. The agreement provides that after predetermined rebates to the brokers, the income generated from lending transactions is allocated 60% to the Funds and 40% to the custodian. As of December 31, 2006, The Yacktman Fund had on loan securities valued at $69,123,940 and collateral of $71,655,321 and The Yacktman Focused Fund had on loan securities valued at $16,081,219 and collateral of $16,668,059.
31
The Yacktman Funds, Inc.
NOTES TO THE FINANCIAL STATEMENTS(Cont'd.)
December 31, 2006
The cash collateral received by the Funds was pooled and at December 31, 2006, was invested in the following:
Security Type | Security Name | Value |
| Commercial Paper | Fenway Funding LLC | $1,998,802 |
| Commercial Paper | Fenway Funding LLC | 1,989,636 |
| Commercial Paper | Jupiter Securities LLC | 3,995,816 |
| Commercial Paper | Mortgage Interest Networking Trust II | 3,961,650 |
| Commercial Paper | Rams Funding LLC | 3,975,719 |
| Commercial Paper | Thornburg Mortgage Capital LLC | 3,981,607 |
| Corporate Bond | Bayerische Landesbank | 3,000,000 |
| Corporate Note | Metlife Global | 7,000,000 |
| Corporate Note | Premium Asset Trust | 6,000,000 |
| Corporate Paydown Security | Leafs LLC | 5,420,117 |
| Repurchase Agreement | Credit Suisse First Boston | 10,000,000 |
| Repurchase Agreement | Credit Suisse First Boston | 8,000,000 |
| Repurchase Agreement | Credit Suisse First Boston | 5,000,000 |
| Repurchase Agreement | Morgan Stanley | 24,000,000 |
| Money Market Mutual Fund | AIM Short Term Liquid Asset Fund | 20 |
| Cash | 13 |
Maturity | Maturity | ||
Security Type | Security Name | Rate | Date |
| Commercial Paper | Fenway Funding LLC | 5.39% | 01/02/07 |
| Commercial Paper | Fenway Funding LLC | 5.36% | 01/05/07 |
| Commercial Paper | Jupiter Securities LLC | 5.39% | 01/05/07 |
| Commercial Paper | Mortgage Interest Networking Trust II | 5.36% | 02/16/07 |
| Commercial Paper | Rams Funding LLC | 5.36% | 01/08/07 |
| Commercial Paper | Thornburg Mortgage Capital LLC | 5.36% | 01/18/07 |
| Corporate Bond | Bayerische Landesbank | 5.40% | 02/22/08 |
| Corporate Note | Metlife Global | 5.45% | 04/28/08 |
| Corporate Note | Premium Asset Trust | 5.50% | 06/01/07 |
| Corporate Paydown Security | Leafs LLC | 5.36% | 04/20/07 |
| Repurchase Agreement | Credit Suisse First Boston | 5.36% | 01/02/07 |
| Repurchase Agreement | Credit Suisse First Boston | 5.32% | 01/02/07 |
| Repurchase Agreement | Credit Suisse First Boston | 5.32% | 01/02/07 |
| Repurchase Agreement | Morgan Stanley | 5.36% | 01/02/07 |
| Money Market Mutual Fund | AIM Short Term Liquid Asset Fund |
32
7. | LINE OF CREDIT |
The Yacktman Fund and The Yacktman Focused Fund have established a line of credit (“LOC”) with U.S. Bank, N.A. to be used for temporary or emergency purposes, primarily for financing redemption payments. The LOC will mature, unless renewed, on March 31, 2007; borrowing under the LOC is limited to the lesser of $15,000,000, 10% of the pre-borrowing net assets of the Fund, 10% of the market value of the assets of the Fund, or 10% of the sum of the fair market value of certain assets of the Fund. For The Yacktman Focused Fund, borrowing under the LOC is limited to the lesser of $15,000,000, 331/3% of the pre-borrowing net assets of the Fund, or 331/3% of the sum of the fair market value of certain assets of the Fund. During the year ended December 31, 2006, The Yacktman Fund and The Yacktman Focused Fund had no outstanding borrowings under the LOC and incurred no interest expense.
8. | TAX INFORMATION |
The following information for the Funds is presented on an income tax basis as of December 31, 2006:
The Yacktman | The Yacktman | ||||||
Fund | Focused Fund | ||||||
| Tax cost of investments | $ | 407,235,091 | $ | 88,953,228 | |||
| Gross unrealized appreciation | 94,867,685 | 18,517,979 | |||||
| Gross unrealized depreciation | (751,541 | ) | (428,204 | ) | |||
| Net tax unrealized appreciation | $ | 94,116,144 | $ | 18,089,775 | |||
As of December 31, 2006, the components of accumulated earnings were as follows:
| The Yacktman | The Yacktman | ||||||
Fund | Focused Fund | ||||||
| Undistributed ordinary income | $ | — | $ | 411 | |||
Undistributed long-term capital gains | — | — | |||||
| Accumulated earnings | — | 411 | |||||
Net unrealized appreciation on investments | 94,116,144 | 18,089,775 | |||||
| Total accumulated earnings | $ | 94,116,144 | $ | 18,090,186 | |||
33
The Yacktman Funds, Inc.
NOTES TO THE FINANCIAL STATEMENTS (Cont'd.)
December 31, 2006
The tax character of distributions paid during the fiscal years ended December 31, 2006 and December 31, 2005 were as follows:
The Yacktman | The Yacktman | ||||||
Fund | Focused Fund | ||||||
| 2006 | |||||||
| Ordinary income | $ | 8,033,111 | $ | 1,121,630 | |||
| Long-term capital gains | $ | 23,177,001 | $ | 6,096,497 | |||
| 2005 | |||||||
| Ordinary income | $ | 9,235,326 | $ | 1,532,907 | |||
| Long-term capital gains | $ | 4,535,148 | $ | 1,670,386 | |||
9. | NEW ACCOUNTING PRONOUNCEMENTS |
In July 2006, the Financial Accounting Standards Board ("FASB") released FASB Interpretation No. 48 "Accounting for Uncertainty in Income Taxes" ("FIN 48"). FIN 48 provides guidance for how uncertain tax positions should be recognized, measured, presented and disclosed in the financial statements. FIN 48 requires the evaluation of tax positions taken or expected to be taken in the course of preparing the Fund's tax returns to determine whether the tax positions are "more likely than not" of being sustained by the applicable tax authority. Tax positions not deemed to meet the more likely than not threshold would be recorded as a tax benefit or expense in the current year. It is required as of the date of the last Net Asset Value ("NAV") calculation in the first required financial statement reporting period for fiscal years beginning after December 15, 2006 and is to be applied to all open tax years as of the effective date. At this time, management is evaluating the implications of FIN 48 and its impact on the financial statements has not yet been determined.
34
In September 2006, the Financial Accounting Standards Board ("FASB") issued Statement on Financial Accounting Standards No. 157, "Fair Value Measurements" (FAS 157). This standard clarifies the definition of fair value for financial reporting, establishes a framework for measuring fair value and requires additional disclosures about the use of fair value measurements. FAS 157 is effective for financial statements issued for fiscal years beginning after November 15, 2007 and interim periods within those fiscal years. As of December 31, 2006, the Funds do not believe the adoption of FAS 157 will impact the amounts reported in the financial statements, however, additional disclosures will be required about the inputs used to develop the measurements of fair value and the effect of certain measurements reported in the statement of operations for a fiscal period.
35
The Yacktman Funds, Inc.
REPORT OF INDEPENDENT REGISTERED
PUBLIC ACCOUNTING FIRM
TO THE BOARD OF DIRECTORS AND SHAREHOLDERS OF
THE YACKTMAN FUNDS, INC.
In our opinion, the accompanying statements of assets and liabilities, including the schedules of investments, and the related statements of operations and of changes in net assets and the financial highlights present fairly, in all material respects, the financial position of The Yacktman Fund and The Yacktman Focused Fund (constituting The Yacktman Funds, Inc., hereafter referred to as the “Funds”) at December 31, 2006, and the results of each of their operations for the year then ended, the changes in each of their net assets for each of the two years in the period then ended and the financial highlights for each of the five years in the period then ended in conformity with accounting principles generally accepted in the United States of America. These financial statements and financial highlights (hereafter referred to as “financial statements”) are the responsibility of the Funds’ management; our responsibility is to express an opinion on these financial statements based on our audits. We conducted our audits of these financial statements in accordance with the standards of the Public Company Accounting Oversight Board (United States). Those standards require that we plan and perform the audit to obtain reasonable assurance about whether the financial statements are free of material misstatement. An audit includes examining, on a test basis, evidence supporting the amounts and disclosures in the financial statements, assessing the accounting principles used and significant estimates made by management, and evaluating the overall financial statement presentation. We believe that our audits, which included confirmation of securities at December 31, 2006 by correspondence with the custodian, provide a reasonable basis for our opinion.

Milwaukee, Wisconsin
February 9, 2007
36
The Yacktman Funds, Inc.
ADDITIONAL INFORMATION (Unaudited)
For the year ended December 31, 2006, 76.30% and 99.66% of the dividends paid from net investment income, including short-term capital gains, for The Yacktman Fund and The Yacktman Focused Fund, respectively, qualify for the dividends received deduction available to corporate shareholders.
For the year ended December 31, 2006, 76.13% and 99.75% of the dividends paid from net investment income, including short-term capital gains, for The Yacktman Fund and The Yacktman Focused Fund, respectively, are designated as qualified dividend income.
The Funds hereby designate approximately, $23,177,001 and $6,096,497 as long-term capital gain distributions for The Yacktman Fund and The Yacktman Focused Fund, respectively, for the purposes of the dividends paid deduction.
37
The Yacktman Funds, Inc.
PROXY VOTING POLICIES AND PROCEDURES
For a description of the policies and procedures that the Funds use to determine how to vote proxies relating to portfolio securities, please call 1-800-525-8258 and request a Statement of Additional Information. One will be mailed to you free of charge. The Statement of Additional Information is also available on the Web site of the Securities and Exchange Commission at http://www.sec.gov. Information on how the Funds voted proxies relating to portfolio securities during the twelve month period ended June 30, 2005, is available without charge, upon request, by calling 1-800-525-8258 or by accessing the Web site of the Securities and Exchange Commission.
38
The Yacktman Funds, Inc.
DISCLOSURE OF PORTFOLIO HOLDINGS
The Funds will file complete schedules of portfolio holdings with the Securities and Exchange Commission for the first and third quarters of each fiscal year on Form N-Q. Each Fund’s Form N-Q will be available on the Web site of the Securities and Exchange Commission at http://www.sec.gov.
39
The Yacktman Funds, Inc.
DIRECTOR AND OFFICER INFORMATION (Unaudited)
Independent Directors | |||||||
| Name | Age | Address | Current position held with the Funds | Term of office and length of time served | Principal occupation during the past five years | Number of portfolios overseen within the Fund complex | Other directorships held outside the Fund complex |
| Bruce B. Bingham | 58 | c/o Yacktman Asset Management Co. 6300 Bridgepoint Parkway Building One, Suite 320 Austin, TX 78730 | Director | Indefinite, until successor elected 8 years | Mr. Bingham has been a partner in Hamilton Partners, a real estate development firm, for more than five years | 2 | None |
| Albert J. Malwitz | 70 | c/o Yacktman Asset Management Co. 6300 Bridgepoint Parkway Building One, Suite 320 Austin, TX 78730 | Director | Indefinite, until successor elected 8 years | Mr. Malwitz has been owner and chief executive officer of Arlington Fastener Co., a manufacturer and distributor of industrial fasteners, for more than five years | 2 | None |
| George J. Stevenson | 67 | c/o Yacktman Asset Management Co. 6300 Bridgepoint Parkway Building One, Suite 320 Austin, TX 78730 | Director | Indefinite, until successor elected 8 years | Mr. Stevenson has been President of Stevenson & Company, a registered business broker, and President of Healthmate Products Co., a fruit juice concentrate manufacturing company, for more than five years | 2 | None |
Interested Director* | |||||||
| Donald A. Yacktman | 65 | c/o Yacktman Asset Management Co. 6300 Bridgepoint Parkway Building One, Suite 320 Austin, TX 78730 | Director President Treasurer | Indefinite, until successor elected 14 years | Mr. Yacktman has been President of Yacktman Asset Management Co. since April, 1992 | 2 | None |
| Officer | |||||||
| Stephen Yacktman | 36 | c/o Yacktman Asset Management Co 6300 Bridgepoint Parkway Building One, Suite 320 Austin, TX 78730 | Vice President Secretary | Indefinite, until successor elected 4 years | Mr. Yacktman has been Vice President of Yacktman Asset Management Co. for more than five years | N/A | None |
Officer | |||||||
| Kent A. Arnett | 65 | c/o Yacktman Asset Management Co. 6300 Bridgepoint Parkway Building One, Suite 320 Austin, TX 78730 | Vice President Chief Compliance Officer | Indefinite, until successor elected 2 years | Mr. Arnett has been Vice President and Chief Compliance Officer of Yacktman Asset Management Co. for 2 years, and Vice President of JPMorgan Chase Bank for more than five years | N/A | None |
*The Interested Director serves as director and officer of The Yacktman Funds.
Additional information about the Funds’ directors is available in the Statement of Additional Information and is available, without charge, upon request, by calling 1-800-525-8258.
40 & 41
Item 2. Code of Ethics.
The registrant has adopted a code of ethics that applies to the registrant’s principal executive officer and principal financial officer. The registrant has not made any amendments to its code of ethics during the period covered by this report. The registrant has not granted any waivers from any provisions of the code of ethics during the period covered by this report.
A copy of the registrant’s Code of Ethics is filed herewith.
Item 3. Audit Committee Financial Expert.
The registrant’s board of directors has determined that it does not have an audit committee financial expert serving on its audit committee. At this time, the registrant believes that the experience provided by each member of the audit committee together offers the registrant adequate oversight for the registrant’s level of financial complexity.
Item 4. Principal Accountant Fees and Services.
The registrant has engaged its principal accountant to perform audit services, audit-related services, tax services and other services during the past two fiscal years. “Audit services” refer to performing an audit of the registrant's annual financial statements or services that are normally provided by the accountant in connection with statutory and regulatory filings or engagements for those fiscal years. “Audit-related services” refer to the assurance and related services by the principal accountant that are reasonably related to the performance of the audit. “Tax services” refer to professional services rendered by the principal accountant for tax compliance, tax advice, and tax planning. The following table details the aggregate fees billed or expected to be billed for each of the last two fiscal years for audit fees, audit-related fees, tax fees and other fees by the principal accountant.
| FYE 12/31/2006 | FYE 12/31/2005 | |
| Audit Fees | $43,000 | $40,700 |
| Audit-Related Fees | $0 | $0 |
| Tax Fees | $7,650 | $7,100 |
| All Other Fees | $0 | $0 |
The audit committee has adopted pre-approval policies and procedures that require the audit committee to pre-approve all audit and non-audit services of the registrant, including services provided to any entity affiliated with the registrant. All of the principal accountant’s hours spent on auditing the registrant’s financial statements were attributed to work performed by full-time permanent employees of the principal accountant. (If more than 50 percent of the accountant’s hours were spent to audit the registrant's financial statements for the most recent fiscal year, state how many hours were attributed to work performed by persons other than the principal accountant's full-time, permanent employees.)
The following table indicates the non-audit fees billed or expected to be billed by the registrant’s accountant for services to the registrant and to the registrant’s investment adviser (and any other controlling entity, etc.—not sub-adviser) for the last two years. The audit committee of the board of trustees/directors has considered whether the provision of non-audit services that were rendered to the registrant's investment adviser is compatible with maintaining the principal accountant's independence and has concluded that the provision of such non-audit services by the accountant has not compromised the accountant’s independence.
| Non-Audit Related Fees | FYE 12/31/2006 | FYE 12/31/2005 |
| Registrant | $0 | $0 |
| Registrant’s Investment Adviser | $0 | $0 |
Item 5. Audit Committee of Listed Registrants.
Not applicable to registrants who are not listed issuers (as defined in Rule 10A-3 under the Securities Exchange Act of 1934).
Item 6. Schedule of Investments.
Schedule of Investments is included as part of the report to shareholders filed under Item 1 of this Form.
Item 7. Disclosure of Proxy Voting Policies and Procedures for Closed-End Management Investment Companies.
Not applicable to open-end investment companies.
Item 8. Portfolio Managers of Closed-End Management Investment Companies.
Not applicable to open-end investment companies.
Item 9. Purchases of Equity Securities by Closed-End Management Investment Company and Affiliated Purchasers.
Not applicable to open-end investment companies.
Item 10. Submission of Matters to a Vote of Security Holders.
Not Applicable.
Item 11. Controls and Procedures.
| (a) | The Registrant’s President/Chief Executive Officer and Treasurer/Chief Financial Officer have reviewed the Registrant's disclosure controls and procedures (as defined in Rule 30a-3(c) under the Investment Company Act of 1940 (the “Act”)) as of a date within 90 days of the filing of this report, as required by Rule 30a-3(b) under the Act and Rules 13a-15(b) or 15d-15(b) under the Securities Exchange Act of 1934. Based on their review, such officers have concluded that the disclosure controls and procedures are effective in ensuring that information required to be disclosed in this report is appropriately recorded, processed, summarized and reported and made known to them by others within the Registrant and by the Registrant’s service provider. |
| (b) | There were no changes in the Registrant's internal control over financial reporting (as defined in Rule 30a-3(d) under the Act) that occurred during the second fiscal quarter of the period covered by this report that has materially affected, or is reasonably likely to materially affect, the Registrant's internal control over financial reporting. |
Item 12. Exhibits.
| (a) | (1) Any code of ethics or amendment thereto, that is subject of the disclosure required by Item 2, to the extent that the registrant intends to satisfy Item 2 requirements through filing an exhibit. Filed herewith |
(2) Certifications pursuant to Section 302 of the Sarbanes-Oxley Act of 2002. Filed herewith.
(3) Any written solicitation to purchase securities under Rule 23c-1 under the Act sent or given during the period covered by the report by or on behalf of the registrant to 10 or more persons. Not applicable to open-end investment companies.
| (b) | Certification pursuant to Section 906 of the Sarbanes-Oxley Act of 2002. Furnished herewith. |
SIGNATURES
Pursuant to the requirements of the Securities Exchange Act of 1934 and the Investment Company Act of 1940, the registrant has duly caused this report to be signed on its behalf by the undersigned, thereunto duly authorized.
(Registrant) The Yacktman Funds, Inc.
By (Signature and Title)* /s/ Donald A. Yacktman
Donald A. Yacktman, President, Treasurer
Date March 5, 2007
Pursuant to the requirements of the Securities Exchange Act of 1934 and the Investment Company Act of 1940, this report has been signed below by the following persons on behalf of the registrant and in the capacities and on the dates indicated.
By (Signature and Title)* _/s/ Donald A. Yacktman_________________
Doanld A. Yacktman, President
Date March 5, 2007
By (Signature and Title)* __/s/ Donald A. Yacktman_________________
Donald A. Yacktman, Treasurer
Date March 5, 2007
* Print the name and title of each signing officer under his or her signature.