As filed with the Securities and Exchange Commission on March 6, 2009
UNITED STATES
SECURITIES AND EXCHANGE COMMISSION
Washington, D.C. 20549
FORM N-CSR
CERTIFIED SHAREHOLDER REPORT OF REGISTERED MANAGEMENT INVESTMENT COMPANIES
Investment Company Act file number 811-06628
The Yacktman Funds, Inc.
(Exact name of registrant as specified in charter)
6300 Bridgepoint Parkway
Building One, Suite 320
Austin, TX 78730
(Address of principal executive offices) (Zip code)
Donald A. Yacktman
c/o Yacktman Asset Management Co.
6300 Bridgepoint Parway
Building One, Suite 320
Austin, TX 78730
(Name and address of agent for service)
512.767.6700
Registrant's telephone number, including area code
Date of fiscal year end: December 31
Date of reporting period: December 31, 2008
Item 1. Reports to Stockholders.

The Yacktman Funds, Inc.
MESSAGE TO SHAREHOLDERS |
The financial markets seemed to race from one panic to the next in the fourth quarter. The S&P 500 slid 21.9% compared to the Yacktman Fund and Focused Fund, which declined by 18.4% and 18.8% respectively. For the full year of 2008, the S&P 500 suffered one of its worst years in modern history falling 37.0% compared to the Yacktman Fund and Focused Fund declines of 26.1% and 23.5% respectively. Investors in the Yacktman Fund and Focused Fund throughout 2008 had 17% and 21% more money at year-end than if they had put their money into an S&P 500 index fund. While we never like to see the funds decline in value, we feel that last year will turn out to be very valuable for patient shareholders, as we were able to protect assets substantially better than the overall market and find many bargains amidst the chaos. In addition, we believe many of the declines in our holdings were driven by investors’ fears rather than fundamental long-term challenges in the businesses. |   |
| 10-Year Returns for a $10,000 Investment in The Yacktman Fund | |||
| 10-Year | The Yacktman | S&P 500 | Excess |
| Period Ending | Fund | Index | Return |
| 12/31/02 | $24,941 | $24,423 | $ 518 |
| 12/31/03 | 35,541 | 28,574 | 6,967 |
| 12/31/04 | 35,886 | 31,253 | 4,633 |
| 12/31/05 | 27,165 | 23,826 | 3,339 |
| 12/31/06 | 25,010 | 22,444 | 2,566 |
| 12/31/07 | 21,851 | 17,757 | 4,094 |
| 12/31/08 | 16,057 | 8,700 | 7,357 |
Average Excess Return of The Yacktman Fund vs. the S&P 500 = $4,211 | |||
2
The Yacktman Funds, Inc.
| Average Annual Returns | The Yacktman Fund | S&P 500® |
| One Year (01/01/08 – 12/31/08) | -26.05% | -37.00% |
| Three Years (01/01/06 – 12/31/08) | -3.94% | -8.36% |
| Five Years (01/01/04 – 12/31/08) | -0.77% | -2.19% |
| Ten Years (01/01/99 – 12/31/08) | 4.85% | -1.38% |
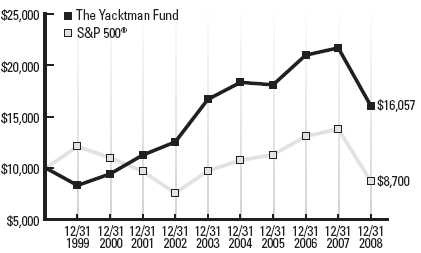
The chart assumes an initial gross investment of $10,000 made on 12/31/98.
| Average Annual Returns | The Yacktman Focused Fund | S&P 500® |
| One Year (01/01/08 – 12/31/08) | -23.48% | -37.00% |
| Three Years (01/01/06 – 12/31/08) | -2.76% | -8.36% |
| Five Years (01/01/04 – 12/31/08) | -0.15% | -2.19% |
| Ten Years (01/01/99 – 12/31/08) | 3.89% | -1.38% |
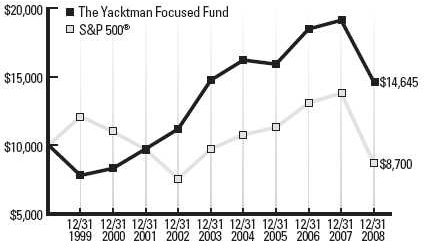
The chart assumes an initial gross investment of $10,000 made on 12/31/98.
* The S&P 500® is an unmanaged but commonly used measure of common stock total return performance.
Returns shown include the reinvestment of all dividends, but do not reflect the deduction of taxes that a shareholder would pay on Fund distributions or the redemption of Fund shares. The above past performance is not predictive of future results. The investment return and principal value of the Funds will fluctuate so that your shares, when redeemed, may be worth more or less than their original cost.
3
The Yacktman Funds, Inc.
Portfolio Update
One reason our funds managed the declines of 2008 better than many others is that we went into the year with a decent-sized cash position—a result of fewer bargains than we would have liked and the extremely risky climate. Holding cash was unpopular with some investors during the rising market, but was necessary to avoid severe pain in 2008. We would rather stick to our discipline and produce the strongest results we can rather than do what is popular and potentially more risky. The current climate is completely different than last year, and we are fully invested and believe our portfolio is full of great opportunities.
In addition, our overweight position in dominant, well-capitalized global franchises helped to cushion against the worst declines. As a nice surprise, we had Wrigley acquired at a substantial premium by Mars. For several years we have written about the extremely high level of corporate profit margins and our preference to own companies which have stable margins in both good times and bad. This strategy paid off well last year as the consumer sector proved to be the best performing group in the S&P 500.
During the most recent quarter, we trimmed or eliminated some of our long held consumer sector holdings. Securities that performed fairly well during the market decline such as Wal-Mart and Johnson & Johnson were eliminated from the funds as we were able to acquire new positions in quality companies at much more attractive valuations. In many cases the new stocks we purchased had declined by more than 50% from their 12 month highs and were selling at single digit multiples of earnings.
Selected New Purchases
Examples of new purchases made during the quarter include the following:
| Media: | Retail | Energy |
| Viacom | Abercrombie & Fitch | Conoco Philips |
| NewsCorp | Williams Sonoma | USG |
| Dish Networks | Limited Brands | |
| (Debt) | ||
| Healthcare | Technology | Financial |
| United Health | Dell | American Express |
| Wellpoint |
4
How good were the deals?
Viacom was our biggest purchase. It owns various cable networks, including Nickelodeon, MTV, and Comedy Central, as well as the movie studio, Paramount. In the last few quarters, the stock dropped from the low 40’s to a bit under $12, due in part to the market correction, what we believe were overblown concerns about its debt levels, and uncertainty caused by the personal financial troubles of the Chairman, Sumner Redstone. We expect the company to continue to generate significant free cash flow going forward, and believe that at its low point the stock was selling for only 5-6 times our estimate of 2009 earnings. It could be argued that the valuation was even lower than this as Paramount contributes little to Viacom’s earnings; yet it has substantial value in its film library and significant potential for profit expansion.
Abercrombie and Fitch was a smaller purchase. It is a successfully run retailer with a strong balance sheet. Excess cash is more than $6 per share. Pre-tax earnings for the year ended February 29, 2008 (which were likely at a level that will not be seen for some time) were more than $8 per share, valuing the stock at less than 1 times trailing pre-tax income. The solid balance sheet should enable the company to manage through the difficult consumer environment even if business is challenging for several years.
Other Top 10 Positions
Many of our largest holdings like Coca Cola, PepsiCo, Microsoft, and eBay, declined during the fourth quarter even though the business issues they face do not appear to be especially significant or long term. Some fund positions, such as Lancaster Colony could benefit from declines in commodity prices which could help them expand their margins which had been pressured in the last few years. AmeriCredit, an auto finance company, continued to carefully manage its business in a difficult consumer finance industry.
5
The Yacktman Funds, Inc.
Where is the Money Management Industry Now?
As we have said before, “Investing is a marathon not a sprint.” In 2008, trendy ways of investing fell significantly out of favor. International markets were hit harder than domestic markets. Commodity investments collapsed. Many hedge funds, with their high fee structures, investor lock-ups, and non-transparent nature became unpopular. Private equity and venture capital funds were exposed as investment vehicles which seem to perform well in strong markets. Given investor uncertainty, we thought it made sense to outline below our firm’s background, as well as the investment strategies and approach for the Yacktman Funds. These strategies have stood the test of time and have the ability to work well through most environments.
Experienced investment team with strong long-term track record:
Our firm was founded in 1992 by an already experienced and well-regarded investor who has expanded, built, and developed the investment group since then. Our core team has had no turnover since 2001, and our funds have outperformed the S&P 500 over each of the 1, 3, 5, and 10 year periods ending December 31, 2008.
Straightforward, disciplined investment approach:
Our favorite investments are well-capitalized companies with dominant franchises run by good management teams. We like businesses that are predictable and capitalized to weather difficult economic environments. The Yacktman Fund does not employ leverage. We work hard to achieve absolute returns. In an environment like last year’s, where that is not possible on a short term basis, we attempt to minimize losses and take advantage of the new bargains that a falling market creates. We are open about our approach to investing so that all Yacktman Fund investors can understand and have confidence in what we do. As investors, we look for value and do not participate in speculative activities or market fads.
High degree of liquidity, no loads:
Investors have daily liquidity with our funds. After an initial holding period of 30 days, there are no fees to redeem. Our funds are no load funds.
6
Investor Safeguards:
The mutual funds assets are held in custody by U.S. Bank, N.A., a large, well-capitalized financial institution. Further, our custodian keeps the mutual fund assets in a separate account, which is protected in the event of the custodian’s bankruptcy. We also have external auditors and attorneys employed on behalf of the fund shareholders. Mutual fund pricing is handled by an independent 3rd party, and is calculated each trading day. We publish our holdings list on a quarterly basis on our website, www.yacktman.com. What we do is visible to all our investors and the appropriate safeguards are in place to give our investors a high degree of confidence that we act responsibly with their money.
Conclusion
In our 2007 annual letter our conclusion was the following, “Periods of uncertainty can produce panic, regret, or opportunities. We expect to use the panic others feel to adjust our portfolio.” During the last year we saw far more panic than we imagined, but experienced none of it at our firm. We also had very little regret because we believe the bargains we purchased will prove valuable in the future.
We believe that market conditions in 2008 created some of the best investment opportunities we have ever seen. The securities we purchased offer exciting prospects and position us well for the future. There are many problems in the financial world, but these challenges have been coupled with declining prices which present opportunities for investors like us who are disciplined, rational, and patient to prosper over time.
Sincerely,
The Yacktman Team
7
The Yacktman Funds, Inc.
EXPENSE EXAMPLE
For the Six Months Ended December 31, 2008 (Unaudited)
As a shareholder of the Yacktman Funds (the “Funds”), you incur ongoing costs, including management fees and other Fund expenses. If you invest through a financial intermediary, you may also incur additional costs such as a transaction fee charged on the purchase or sale of the Fund or an asset-based management fee. This Example is intended to help you understand your ongoing costs (in dollars) of investing in the Fund and to compare these costs with the ongoing costs of investing in other mutual funds.
The Example is based on an investment of $1,000 invested at the beginning of the period and held for the entire period from July 1, 2008 to December 31, 2008.
Actual Expenses
The first line of the table on the next page provides information about actual account values and actual expenses. You may use the information in this line, together with the amount you invested, to estimate the expenses you paid over the period. Simply divide your account value by $1,000 (for example, an $8,600 account value divided by $1,000 = 8.6), then multiply the result by the number in the first line under the heading entitled “Expenses Paid During Period” to estimate the expenses you paid on your account during the period.
Hypothetical Example for Comparison Purposes
The second line of the table on the next page provides information about hypothetical account values and hypothetical expenses based on the Funds’ actual expense ratios and an assumed rate of return of 5% per year before expenses, which is not the Funds’ actual return. The hypothetical account values and expenses may not be used to estimate the actual ending account balance or expenses you paid for the period. You may use this information to compare the ongoing costs of investing in the Fund and other funds. To do so, compare this 5% hypothetical example with the 5% hypothetical examples that appear in the shareholder reports of the other funds.
8
Please note that the expenses shown in the table are meant to highlight your ongoing costs only and do not reflect any costs that may be associated with investing in the Fund through a financial intermediary. Therefore, the second line of the table is useful in comparing the ongoing costs only, and will not help you determine the relative total costs of owning different funds. In addition, if any costs associated with investing through a financial intermediary were included, your costs would have been higher.
| THE YACKTMAN FUND | |||
Beginning account value 07/01/08 | Ending account value 12/31/08 | Expenses paid during period 07/01/08- 12/31/081 | |
| Actual | $1,000.00 | $851.40 | $4.08 |
Hypothetical (5% return before expenses) | 1,000.00 | 1,020.73 | 4.45 |
| THE YACKTMAN FOCUSED FUND | |||
Beginning account value 07/01/08 | Ending account value 12/31/08 | Expenses paid during period 07/01/08 - 12/31/081 | |
| Actual | $1,000.00 | $862.60 | $5.85 |
Hypothetical (5% return before expenses) | 1,000.00 | 1,018.85 | 6.34 |
| 1 | Expenses are equal to the Funds’ annualized expense ratios (0.88% for The Yacktman Fund and 1.25% for The Yacktman Focused Fund), multiplied by the average account value over the period, multiplied by 184/366 (to reflect the one-half year period). |
9
The Yacktman Fund
TOP TEN EQUITY HOLDINGS (Unaudited)
December 31, 2008
Percentage of Net Assets | ||||
| Viacom, Inc. | 9.25 | % | ||
| Coca-Cola Co. | 8.70 | % | ||
| Microsoft Corp. | 7.47 | % | ||
| AmeriCredit Corp. | 7.10 | % | ||
| eBay, Inc. | 5.18 | % | ||
| Lancaster Colony Corp. | 4.45 | % | ||
| PepsiCo, Inc. | 4.43 | % | ||
| Liberty Media Corp. | 4.41 | % | ||
| Conoco Phillips | 3.84 | % | ||
| News Corp. | 3.74 | % | ||
| Total | 58.57 | % | ||
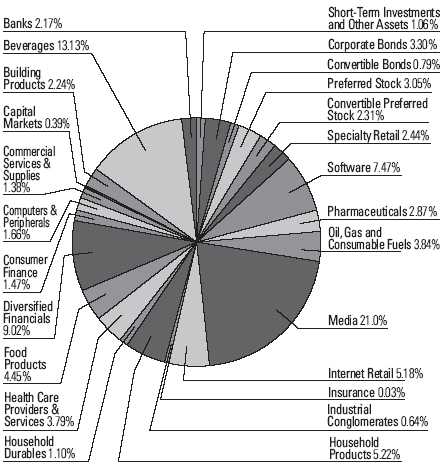
FUND DIVERSIFICATION (Unaudited)
December 31, 2008
10
The Yacktman Fund
For the Six Months Ended December 31, 2008
| NEW PURCHASES | Net Shares Purchased | Current Shares Held | ||
| Abercrombie & Fitch Co. | ||||
| A specialty retailer that operates stores selling casual apparel for men, women, and kids. | 145,000 | 145,000 | ||
| American Express Co. | ||||
| Through its subsidiaries provides travel-related, financial advisory, and international banking services around the world. | 235,000 | 235,000 | ||
| The Bancorp, Inc. | ||||
| A holding company for the Bancorp Bank. The Bank offers services including interest bearing checking accounts, a full line of loan products, and online bill payment. | 676,354 | 676,354 | ||
| Bank of America Corp. | ||||
| Accepts deposits and offers banking, investing, asset management, and other financial and risk-management products and services. | 100,000 | 100,000 | ||
| Citigroup, Inc. | ||||
| A diversified financial services holding company that provides a broad range of financial services to consumer and corporate customers around the world. | 200,000 | 200,000 | ||
| Comcast Corp. | ||||
| Develops, manages, and operates hybrid fiber-coaxial broadband cable communications networks and also provides programming content. | 100,000 | 100,000 |
11
The Yacktman Fund
EQUITY PURCHASES & SALES (Continued) (Unaudited)
For the Six Months Ended December 31, 2008
| NEW PURCHASES | Net Shares Purchased | Current Shares Held | ||
| ConocoPhillips | ||||
| An international, integrated energy company which operates in several business segments. The company explores for and produces petroleum, and refines, markets, supplies, and transports petroleum. | 220,000 | 220,000 | ||
| Dell, Inc. | ||||
| Provides products and services required for customers worldwide to build their information-technology and internet infrastructures. The company sells personal computers, servers, storage systems, and other technology products and services. | 480,000 | 480,000 | ||
| Dish Network Corp. | ||||
| Provides a direct broadcast satellite subscription television service in the U.S. | 420,000 | 420,000 | ||
| The Walt Disney Co. | ||||
| An entertainment company that conducts operations in media networks, studio entertainment, theme parks and resorts, consumer products, and internet and direct marketing. | 194,700 | 194,700 | ||
| Merrill Lynch & Co., Inc. | ||||
| Offers wealth management, investment banking, and securities brokerage services. | 100,000 | 100,000 | ||
| News Corp. | ||||
| An international media company with operations including the production and distribution of motion pictures and television programming. | 1,219,000 | 1,219,000 |
12
| NEW PURCHASES | Net Shares Purchased | Current Shares Held | ||
| USG Corp. | ||||
| Through its subsidiaries manufactures and distributes building materials. The company produces a wide range of products for use in new residential, new non-residential, and repair and remodel construction. | 825,950 | 825,950 | ||
| UnitedHealth Group, Inc. | ||||
| Owns and manages organized health systems in the U.S. and internationally. The company provides employers products and resources to plan and administer employee benefit programs. | 249,000 | 249,000 | ||
| WellPoint, Inc. | ||||
| A health benefits company that provides health benefits, dental and vision benefits, pharmacy benefits, life insurance, and life and disability insurance benefits. | 109,500 | 109,500 | ||
| Williams-Sonoma, Inc. | ||||
| Retails cooking and serving equipment, home furnishings, and home accessories through retail stores and mail order catalogs. | 350,000 | 350,000 |
13
The Yacktman Fund
EQUITY PURCHASES & SALES (Continued) (Unaudited)
For the Six Months Ended December 31, 2008
| Net Shares | Current | |||||||
| PURCHASES | Purchased | Shares Held | ||||||
| American International Group, Inc. | ||||||||
| Preferred | 169,000 | 169,000 | ||||||
| AmeriCredit Corp. | 1,296,000 | 2,756,000 | ||||||
| eBay, Inc. | 690,000 | 1,100,000 | ||||||
| Federal National Mortgage Association | ||||||||
| Preferred | 404,243 | 404,243 | ||||||
| Furniture Brands International, Inc. | 1,308,000 | 1,483,000 | ||||||
| Interpublic Group of Cos., Inc., Preferred | 18,500 | 18,500 | ||||||
| Liberty Media Holding Corp., | ||||||||
| Interactive Series A | 3,805,000 | 4,190,000 | ||||||
| Microsoft Corp. | 352,000 | 1,140,000 | ||||||
| Pfizer, Inc. | 30,000 | 480,000 | ||||||
| Resource America, Inc. | 332,551 | 579,551 | ||||||
| SLM Corp. | 230,000 | 230,000 | ||||||
| SLM Corp. Preferred | 324,200 | 324,200 | ||||||
| Viacom, Inc., Class B | 1,280,000 | 1,440,000 | ||||||
Net Shares | Current | |||||||
| SALES | Sold | Shares Held | ||||||
| American International Group, Inc. | 80,000 | - | ||||||
| Anheuser-Busch Cos., Inc. | 47,770 | - | ||||||
| Clorox Co. | 48,000 | 112,000 | ||||||
| Colgate Palmolive Co. | 50,000 | - | ||||||
| Federal Home Loan Mortgage Corp. | 90,000 | - | ||||||
| Federal National Mortgage Association | 50,000 | - | ||||||
| Interpublic Group of Cos., Inc. | 481,155 | - | ||||||
| Johnson & Johnson | 130,000 | - | ||||||
| Kraft Foods, Inc. | 100,000 | - | ||||||
| MBIA, Inc. | 360,000 | - | ||||||
| PepsiCo, Inc. | 120,000 | 240,000 | ||||||
| Proctor & Gamble Co. | 40,000 | 150,000 | ||||||
| Wal-Mart Stores, Inc. | 75,000 | - | ||||||
14
The Yacktman Fund
December 31, 2008
| Number | ||||||||
| of Shares | Value | |||||||
| COMMON STOCKS - 89.49% | ||||||||
| Banks - 2.17% | ||||||||
| Bank of America Corp. | 100,000 | $ | 1,408,000 | |||||
| The Bancorp, Inc. (a) | 676,354 | 2,536,328 | ||||||
| U.S. Bancorp | 100,000 | 2,501,000 | ||||||
| 6,445,328 | ||||||||
| Beverages - 13.13% | ||||||||
| Coca-Cola Co. | 570,000 | 25,803,900 | ||||||
| PepsiCo, Inc. | 240,000 | 13,144,800 | ||||||
| 38,948,700 | ||||||||
| Building Products - 2.24% | ||||||||
| USG Corp. (a) | 825,950 | 6,640,638 | ||||||
| Capital Markets - 0.39% | ||||||||
| Merrill Lynch & Co. Inc. | 100,000 | 1,164,000 | ||||||
| Commercial Services & Supplies - 1.38% | ||||||||
| H&R Block, Inc. | 180,000 | 4,089,600 | ||||||
| Computers & Peripherals - 1.66% | ||||||||
| Dell, Inc. (a) | 480,000 | 4,915,200 | ||||||
| Consumer Finance - 1.47% | ||||||||
| American Express Co. | 235,000 | 4,359,250 | ||||||
| Diversified Financials - 9.02% | ||||||||
| Citigroup, Inc. | 200,000 | 1,342,000 | ||||||
| AmeriCredit Corp. (a) | 2,756,000 | 21,055,840 | ||||||
| Resource America, Inc. | 579,551 | 2,318,204 | ||||||
| SLM Corp. (a) | 230,000 | 2,047,000 | ||||||
| 26,763,044 | ||||||||
| Food Products - 4.45% | ||||||||
| Lancaster Colony Corp. | 385,000 | 13,205,500 | ||||||
| Health Care Providers & Services - 3.79% | ||||||||
| UnitedHealth Group, Inc. | 249,000 | 6,623,400 | ||||||
| WellPoint, Inc. (a) | 109,500 | 4,613,235 | ||||||
| 11,236,635 | ||||||||
See notes to financial statements
15
The Yacktman Fund
PORTFOLIO OF INVESTMENTS (Cont'd.)
December 31, 2008
| Number | ||||||||
| of Shares | Value | |||||||
| Household Durables - 1.10% | ||||||||
| Furniture Brands International, Inc. | 1,483,000 | $ | 3,277,430 | |||||
| Household Products - 5.22% | ||||||||
| Clorox Co. | 112,000 | 6,222,720 | ||||||
| Procter & Gamble Co. | 150,000 | 9,273,000 | ||||||
| 15,495,720 | ||||||||
| Industrial Conglomerates - 0.64% | ||||||||
| Tyco International Ltd. | 87,500 | 1,890,000 | ||||||
| Insurance - 0.03% | ||||||||
| MGIC Investment Corp. | 30,000 | 104,400 | ||||||
| Internet Retail - 5.18% | ||||||||
| eBay, Inc. (a) | 1,100,000 | 15,356,000 | ||||||
| Media - 21.00% | ||||||||
| Comcast Corp. | 100,000 | 1,615,000 | ||||||
| Dish Network Corp. (a) | 420,000 | 4,657,800 | ||||||
| Liberty Media Holding Corp., | ||||||||
| Interactive-Series A (a) | 4,190,000 | 13,072,800 | ||||||
| News Corp. - Class A | 1,219,000 | 11,080,710 | ||||||
| Viacom, Inc. - Class B (a) | 1,440,000 | 27,446,400 | ||||||
| The Walt Disney Co. | 194,700 | 4,417,743 | ||||||
| 62,290,453 | ||||||||
| Oil, Gas & Consumable Fuels - 3.84% | ||||||||
| ConocoPhillips | 220,000 | 11,396,000 | ||||||
| Pharmaceuticals - 2.87% | ||||||||
| Pfizer, Inc. | 480,000 | 8,500,800 | ||||||
| Software - 7.47% | ||||||||
| Microsoft Corp. | 1,140,000 | 22,161,600 | ||||||
| Specialty Retail - 2.44% | ||||||||
| Abercrombie & Fitch Co. - Class A | 145,000 | 3,345,150 | ||||||
| Home Depot, Inc. | 50,000 | 1,151,000 | ||||||
| Williams-Sonoma, Inc. | 350,000 | 2,751,000 | ||||||
| 7,247,150 | ||||||||
| TOTAL COMMON STOCKS | ||||||||
| (Cost $297,109,078) | 265,487,448 | |||||||
See notes to financial statements
16
| Number | ||||||||
| of Shares | Value | |||||||
| CONVERTIBLE PREFERRED STOCKS - 2.31% | ||||||||
| Advertising - 2.31% | ||||||||
| Interpublic Group of Cos., Inc. (c) | 18,500 | $ | 6,841,929 | |||||
TOTAL CONVERTIBLE PREFERRED STOCKS (Cost $7,805,425) | 6,841,929 | |||||||
| PREFERRED STOCKS - 3.05% | ||||||||
| Diversified Financials - 2.60% | ||||||||
| Federal National Mortgage Association | 110,055 | 57,229 | ||||||
| Federal National Mortgage Association | 134,188 | 138,213 | ||||||
| Federal National Mortgage Association | 160,000 | 132,800 | ||||||
| SLM Corp. | 324,200 | 7,382,034 | ||||||
| 7,710,276 | ||||||||
| Insurance - 0.45% | ||||||||
| American International Group, Inc. | 169,000 | 1,341,860 | ||||||
| TOTAL PREFERRED STOCKS | ||||||||
| (Cost $10,479,607) | 9,052,136 | |||||||
| Principal | ||||||||
| Amount | Value | |||||||
| CONVERTIBLE BONDS - 0.79% | ||||||||
| Convertible Bonds - 0.79% | ||||||||
| Rait Financial Trust | ||||||||
| 6.875%, 04/15/2027 | ||||||||
| (acquired on 08/20/07) (b) | $ | 6,750,000 | 2,345,625 | |||||
| TOTAL CONVERTIBLE BONDS | ||||||||
| (Cost $4,519,747) | 2,345,625 | |||||||
See notes to financial statements
17
The Yacktman Fund
December 31, 2008
| Principal | |||||||||
| Amount | Value | ||||||||
| CORPORATE BONDS - 3.30% | |||||||||
| Diversified Telecommunication | |||||||||
| Services - 0.69% | |||||||||
| Embarq Corp. | |||||||||
| 7.995%, 06/01/2036 | $ | 3,000,000 | $ | 2,029,212 | |||||
| Advertising - 1.91% | |||||||||
| Interpublic Group of Cos., Inc. | |||||||||
| 6.250%, 11/15/2014 | 10,250,000 | 4,612,500 | |||||||
| Interpublic Group of Cos., Inc. | |||||||||
| 7.250%, 08/15/2011 | 2,000,000 | 1,050,000 | |||||||
| 5,662,500 | |||||||||
| Specialty Retail - 0.70% | |||||||||
| Limited Brands, Inc. | |||||||||
| 7.600%, 07/15/2037 | 4,000,000 | 2,078,972 | |||||||
| TOTAL CORPORATE BONDS | |||||||||
| (Cost $10,615,538) | 9,770,684 | ||||||||
| SHORT TERM INVESTMENTS - 0.69% | |||||||||
| Demand Notes - 0.69% | |||||||||
| U.S. Bancorp | |||||||||
0.00%(d) | 2,052,405 | 2,052,405 | |||||||
| TOTAL SHORT TERM INVESTMENTS | |||||||||
| (Cost $2,052,405) | 2,052,405 | ||||||||
| Total Investments | |||||||||
| (Cost $332,581,800) - 99.63% | 295,550,227 | ||||||||
| Other Assets in Excess of Liabilities - 0.37% | 1,108,719 | ||||||||
| TOTAL NET ASSETS - 100.00% | $ | 296,658,946 | |||||||
Percentages are stated as a percent of net assets.
| (a) | Non Income Producing |
| (b) | Restricted security as defined in Rule 144(a) under the Securities Act of 1933. |
| (c) | As of December 31, 2008, the Adviser has fair valued this security. |
| (d) | Variable rate security. Rate shown represents the rate as of December 31, 2008. |
See notes to financial statements
18
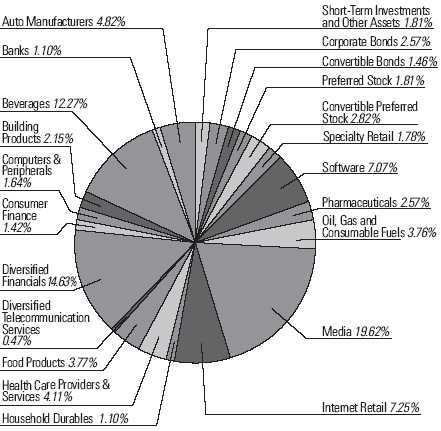
The Yacktman Focused Fund
December 31, 2008
| Percentage of | ||||
| Net Assets | ||||
| AmeriCredit Corp. | 11.88 | % | ||
| Viacom, Inc. | 10.68 | % | ||
| Coca-Cola Co. | 8.30 | % | ||
| eBay, Inc. | 7.25 | % | ||
| Microsoft Corp. | 7.07 | % | ||
| Toyota Industries Corp. | 4.82 | % | ||
| Liberty Media Corp. | 4.27 | % | ||
| PepsiCo, Inc. | 3.97 | % | ||
| Lancaster Colony Corp. | 3.77 | % | ||
| Conoco Phillips | 3.76 | % | ||
| Total | 65.77 | % | ||
FUND DIVERSIFICATION (Unaudited)
December 31, 2008
19
The Yacktman Focused Fund
EQUITY PURCHASES & SALES (Unaudited)
For the Six Months Ended December 31, 2008
| NEW PURCHASES | Net Shares Purchased | Current Shares Held | ||
| Toyota Industries Corp. | ||||
| A member of the Toyota Motor Group which assembles motor vehicles and manufactures automotive parts such as engines and air conditioner compressors. | 150,000 | 150,000 |
20
| Net Shares | Current | |||||||
| PURCHASES | Purchased | Shares Held | ||||||
| Abercrombie & Fitch Co. | 30,000 | 30,000 | ||||||
| American Express Co. | 50,000 | 50,000 | ||||||
| American International Group, Inc. | ||||||||
| Preferred | 67,000 | 67,000 | ||||||
| AmeriCredit Corp. | 413,000 | 1,018,000 | ||||||
| The Bancorp, Inc. | 191,326 | 191,326 | ||||||
| ConocoPhillips | 47,500 | 47,500 | ||||||
| Dell, Inc. | 105,000 | 105,000 | ||||||
| Dish Network Corp. | 87,000 | 87,000 | ||||||
| eBay, Inc. | 231,000 | 340,000 | ||||||
| Federal National Mortgage | ||||||||
| Association Preferred | 86,949 | 86,949 | ||||||
| Furniture Brands International, Inc. | 325,000 | 325,000 | ||||||
| Interpublic Group of Cos., Inc. | ||||||||
| Preferred | 5,000 | 5,000 | ||||||
| Liberty Media Holding Corp., | ||||||||
| Interactive Series A | 786,000 | 896,000 | ||||||
| Microsoft Corp. | 41,000 | 238,000 | ||||||
| News Corp. | 230,000 | 230,000 | ||||||
| Pfizer, Inc. | 5,000 | 95,000 | ||||||
| Resource America, Inc. | 70,000 | 143,700 | ||||||
| SLM Corp. | 98,000 | 138,000 | ||||||
| SLM Corp. Preferred | 25,000 | 25,000 | ||||||
| USG Corp | 175,000 | 175,000 | ||||||
| UnitedHealth Group, Inc. | 60,000 | 60,000 | ||||||
| Viacom Inc. | 327,000 | 367,000 | ||||||
| WellPoint, Inc. | 26,000 | 26,000 | ||||||
| Williams Sonoma, Inc. | 60,000 | 60,000 | ||||||
| Net Shares | Current | |||||||
| SALES | Sold | Shares Held | ||||||
| Clorox Co. | 28,000 | - | ||||||
| Coca-Cola Co. | 25,000 | 120,000 | ||||||
| Home Depot, Inc. | 19,000 | - | ||||||
| Johnson & Johnson | 25,000 | - | ||||||
| Lancaster Colony Corp. | 18,000 | 72,000 | ||||||
| MBIA Inc. | 107,000 | - | ||||||
| PepsiCo, Inc. | 39,000 | 47,500 | ||||||
| Procter & Gamble Co. | 45,000 | - | ||||||
| Pulte Homes, Inc. | 160,000 | - | ||||||
| Wal-Mart Stores, Inc. | 30,000 | - | ||||||
21
The Yacktman Focused Fund
PORTFOLIO OF INVESTMENTS
December 31, 2008
| Number of | ||||||||
| Shares | Value | |||||||
| COMMON STOCKS - 89.53% | ||||||||
| Auto Manufacturers - 4.82% | ||||||||
| Toyota Industries Corporation - | ||||||||
| ADR (c) | 150,000 | $ | 3,153,885 | |||||
| Banks - 1.10% | ||||||||
| The Bancorp, Inc. (a) | 191,326 | 717,472 | ||||||
| Beverages - 12.27% | ||||||||
| Coca-Cola Co. | 120,000 | 5,432,400 | ||||||
| PepsiCo, Inc. | 47,500 | 2,601,575 | ||||||
| 8,033,975 | ||||||||
| Building Products - 2.15% | ||||||||
| USG Corp. (a) | 175,000 | 1,407,000 | ||||||
| Computers & Peripherals - 1.64% | ||||||||
| Dell, Inc. (a) | 105,000 | 1,075,200 | ||||||
| Consumer Finance - 1.42% | ||||||||
| American Express Co. | 50,000 | 927,500 | ||||||
| Diversified Financials - 14.63% | ||||||||
| AmeriCredit Corp. (a) | 1,018,000 | 7,777,520 | ||||||
| Resource America, Inc. | 143,700 | 574,800 | ||||||
| SLM Corp. (a) | 138,000 | 1,228,200 | ||||||
| 9,580,520 | ||||||||
| Diversified Telecommunication | ||||||||
| Services - 0.47% | ||||||||
| Sprint Nextel Corp. (a) | 170,000 | 311,100 | ||||||
| Food Products - 3.77% | ||||||||
| Lancaster Colony Corp. | 72,000 | 2,469,600 | ||||||
| Health Care Providers & | ||||||||
| Services - 4.11% | ||||||||
| UnitedHealth Group, Inc. | 60,000 | 1,596,000 | ||||||
| WellPoint, Inc. (a) | 26,000 | 1,095,380 | ||||||
| 2,691,380 | ||||||||
| Household Durables - 1.10% | ||||||||
| Furniture Brands International, Inc.(e) | 325,000 | 718,250 | ||||||
| Internet Retail - 7.25% | ||||||||
| eBay, Inc. (a) | 340,000 | 4,746,400 | ||||||
See notes to financial statements
22
| Number of | ||||||||
| Shares | Value | |||||||
| Media - 19.62% | ||||||||
| Dish Network Corp. (a) | 87,000 | $ | 964,830 | |||||
| Liberty Media Holding Corp., | ||||||||
| Interactive-Series A (a) | 896,000 | 2,795,520 | ||||||
| News Corp.- Class A | 230,000 | 2,090,700 | ||||||
| Viacom, Inc. (a) | 367,000 | 6,995,020 | ||||||
| 12,846,070 | ||||||||
| Oil, Gas & Consumable Fuels - 3.76% | ||||||||
| ConocoPhillips | 47,500 | 2,460,500 | ||||||
| Pharmaceuticals - 2.57% | ||||||||
| Pfizer, Inc. | 95,000 | 1,682,450 | ||||||
| Software - 7.07% | ||||||||
| Microsoft Corp. | 238,000 | 4,626,720 | ||||||
| Specialty Retail - 1.78% | ||||||||
| Abercrombie & Fitch Co. - Class A | 30,000 | 692,100 | ||||||
| Williams-Sonoma, Inc. | 60,000 | 471,600 | ||||||
| 1,163,700 | ||||||||
| TOTAL COMMON STOCKS | ||||||||
| (Cost $69,483,487) | 58,611,722 | |||||||
| CONVERTIBLE PREFERRED STOCKS - 2.82% | ||||||||
| Advertising - 2.82% | ||||||||
| Interpublic Group of Cos., Inc. (c) | 5,000 | 1,849,170 | ||||||
| TOTAL CONVERTIBLE PREFERRED | ||||||||
| STOCKS (Cost $2,125,000) | 1,849,170 | |||||||
| PREFERRED STOCKS - 1.81% | ||||||||
| Diversified Financials - 1.00% | ||||||||
| Federal National Mortgage Association | 30,000 | 24,900 | ||||||
| Federal National Mortgage Association | 48,949 | 51,886 | ||||||
| Federal National Mortgage Association | 8,000 | 8,000 | ||||||
| SLM Corp. | 25,000 | 569,250 | ||||||
| 654,036 | ||||||||
| Insurance - 0.81% | ||||||||
| American International Group, Inc. | 67,000 | 531,980 | ||||||
| TOTAL PREFERRED STOCKS | ||||||||
| (Cost $1,173,244) | 1,186,016 | |||||||
See notes to financial statements
23
The Yacktman Focused Fund
PORTFOLIO OF INVESTMENTS (Cont'd.)
December 31, 2008
| Principal | ||||||||
| Amount | Value | |||||||
| CONVERTIBLE BONDS - 1.46% | ||||||||
| Consumer Finance - 0.69% | ||||||||
| AmeriCredit Corp. | ||||||||
| 0.750%, 09/15/2011 | $ | 1,000,000 | $ | 450,000 | ||||
| Convertible Bonds - 0.77% | ||||||||
| Rait Financial Trust | ||||||||
| 6.875%, 04/15/2027 | ||||||||
| (acquired on 08/20/07) (b) | 1,450,000 | 503,875 | ||||||
| TOTAL CONVERTIBLE BONDS | ||||||||
| (Cost $1,376,582) | 953,875 | |||||||
| CORPORATE BONDS - 2.57% | ||||||||
| Media - 1.38% | ||||||||
| Interpublic Group of Cos., Inc. | ||||||||
| 6.250%, 11/15/2014 | 2,000,000 | 900,000 | ||||||
| Specialty Retail - 1.19% | ||||||||
| Limited Brands, Inc. | ||||||||
| 7.600%, 07/15/2037 | 1,500,000 | 779,615 | ||||||
| TOTAL CORPORATE BONDS | ||||||||
| (Cost $1,842,193) | 1,679,615 | |||||||
| SHORT TERM INVESTMENTS - 1.37% | ||||||||
| Demand Notes - 1.37% | ||||||||
| U.S. Bancorp | ||||||||
0.00%(d) | 897,737 | 897,737 | ||||||
| TOTAL SHORT TERM INVESTMENTS | ||||||||
| (Cost $897,737) | 897,737 | |||||||
| Total Investments | ||||||||
| (Cost $76,898,243) - 99.56% | 65,178,135 | |||||||
| Other Assets in Excess of Liabilities - 0.44% | 288,606 | |||||||
| TOTAL NET ASSETS - 100.00% | $ | 65,466,741 | ||||||
Percentages are stated as a percent of net assets. ADR American Depository Receipt
| (a) | Non Income Producing |
| (b) | Restricted security as defined in Rule 144(a) under the Securities Act of 1933. |
| (c) | As of December 31, 2008, the Adviser has fair valued this security. |
| (d) | Variable rate security. Rate shown represents the rate as of December 31, 2008 |
| (e) | A portion of the security is pledged for all options written. |
See notes to financial statements
24
The Yacktman Focused Fund
SCHEDULE OF OPTIONS WRITTEN
December 31, 2008
| Contracts | Value | |||||||
| COVERED PUT OPTIONS | ||||||||
| Furniture Brands International, Inc. | ||||||||
| Expiration: January 2009, | ||||||||
| Exercise Price: $7.50 | 1,000 | $ | 5,000 | |||||
| Total Options Written | ||||||||
| (Premiums received $148,999) | $ | 5,000 | ||||||
See notes to financial statements
25
The Yacktman Funds, Inc.
STATEMENTS OF ASSETS & LIABILITIES
December 31, 2008
The Yacktman Fund | The Yacktman Focused Fund | |||||||
| ASSETS | ||||||||
| Investments, at market value | ||||||||
(Cost $332,581,800 and $ 76,898,243 respectively) | $ | 295,550,227 | $ | 65,178,135 | ||||
| Receivable for fund shares sold | 1,793,086 | 487,350 | ||||||
| Dividends and interest receivable | 929,267 | 178,900 | ||||||
| Prepaid expenses | 52,543 | 18,812 | ||||||
| Total Assets | 298,325,123 | 65,863,197 | ||||||
| LIABILITIES: | ||||||||
| Options written at value | ||||||||
| (premiums received $0, $148,999 respectively) | — | 5,000 | ||||||
| Payable for fund shares redeemed | 1,321,559 | 283,323 | ||||||
| Accrued investment advisory fees | 159,718 | 47,108 | ||||||
| Other accrued expenses | 184,900 | 61,025 | ||||||
| Total Liabilities | 1,666,177 | 396,456 | ||||||
| NET ASSETS | $ | 296,658,946 | $ | 65,466,741 | ||||
| NET ASSETS CONSIST OF: | ||||||||
| Capital stock | $ | 334,199,707 | $ | 78,253,222 | ||||
Undistributed accumulated net investment income | — | — | ||||||
Undistributed accumulated net realized loss | (509,188 | ) | (1,210,372 | ) | ||||
| Net unrealized appreciation | ||||||||
| (depreciation) | ||||||||
| Investments | (37,031,573 | ) | (11,720,108 | ) | ||||
| Written Options | — | 143,999 | ||||||
| Total Net Assets | $ | 296,658,946 | $ | 65,466,741 | ||||
| CAPITAL STOCK, $0.0001 par value | ||||||||
| Authorized | 500,000,000 | 500,000,000 | ||||||
| Issued and Outstanding | 30,638,656 | 6,568,555 | ||||||
NET ASSET VALUE AND OFFERING PRICE PER SHARE | $ | 9.68 | $ | 9.97 | ||||
See notes to financial statements
26
The Yacktman Funds, Inc.
STATEMENTS OF OPERATIONS
For the Year Ended December 31, 2008
The Yacktman Fund | The Yacktman Focused Fund | |||||||
| INVESTMENT INCOME: | ||||||||
Dividend income1 | $ | 5,761,060 | $ | 1,144,286 | ||||
| Interest income | 1,687,093 | 478,637 | ||||||
| Securities lending income | ||||||||
| (See Note 6) | 264,265 | 120,348 | ||||||
| Total investment income | 7,712,418 | 1,743,271 | ||||||
| EXPENSES: | ||||||||
| Investment advisory fees | 1,745,836 | 680,363 | ||||||
| Shareholder servicing fees | 417,648 | 103,374 | ||||||
| Administration and accounting fees | 122,312 | 30,019 | ||||||
| Reports to shareholders | 55,429 | 14,748 | ||||||
| Professional fees | 49,037 | 27,958 | ||||||
| Compliance expenses | 46,386 | 12,374 | ||||||
| Federal and state registration fees | 35,346 | 21,183 | ||||||
| Custody fees | 31,190 | 16,560 | ||||||
| Directors fees and expenses | 27,640 | 7,468 | ||||||
| Miscellaneous expenses | 17,168 | 7,007 | ||||||
| Total expenses | ||||||||
| before reimbursements | 2,547,992 | 921,054 | ||||||
| Expense reimbursements | ||||||||
| (See Note 5) | — | (70,600 | ) | |||||
| Net Expenses | 2,547,992 | 850,454 | ||||||
| NET INVESTMENT INCOME | 5,164,426 | 892,817 | ||||||
REALIZED AND UNREALIZED GAIN (LOSS): | ||||||||
| Net realized gain on: | ||||||||
| Investments | 782,343 | 602,515 | ||||||
| Written Options | — | 1,079,745 | ||||||
| Total | 782,343 | 1,682,260 | ||||||
| Change in unrealized | ||||||||
| depreciation on: | ||||||||
| Investments | (90,439,239 | ) | (21,345,210 | ) | ||||
| Written Options | — | (283,330 | ) | |||||
| Total | (90,439,239 | ) | (21,628,540 | ) | ||||
| Net realized and unrealized | ||||||||
| loss on investments | (89,656,896 | ) | (19,946,280 | ) | ||||
NET DECREASE IN NET ASSETS RESULTING FROM OPERATIONS | $ | (84,492,470 | ) | $ | (19,053,463 | ) | ||
1 Net of $0 and $4,549, respectively, in foreign witholding tax.
See notes to financial statements
27
The Yacktman Funds, Inc.
STATEMENTS OF CHANGES IN NET ASSETS
| The Yacktman | ||||||||||||||||
| The Yacktman Fund | Focused Fund | |||||||||||||||
| Year Ended | Year Ended | Year Ended | Year Ended | |||||||||||||
| Dec. 31, 2008 | Dec. 31, 2007 | Dec. 31, 2008 | Dec. 31, 2007 | |||||||||||||
| OPERATIONS: | ||||||||||||||||
| Net investment income | $ | 5,164,426 | $ | 6,272,556 | $ | 892,817 | $ | 944,478 | ||||||||
| Net realized gain on investments | 782,343 | 47,451,753 | 1,682,260 | 10,492,983 | ||||||||||||
| Net change in unrealized depreciation on investments | (90,439,239 | ) | (40,717,233 | ) | (21,628,540 | ) | (8,297,713 | ) | ||||||||
| Net increase (decrease) in net assets resulting from operations | (84,492,470 | ) | 13,007,076 | (19,053,463 | ) | 3,139,748 | ||||||||||
| CAPITAL SHARE TRANSACTIONS: | ||||||||||||||||
| Proceeds from shares sold | 261,825,791 | 42,667,635 | 65,280,545 | 17,465,433 | ||||||||||||
| Proceeds from reinvestment of distributions | 6,367,896 | 48,661,291 | 4,350,042 | 10,024,203 | ||||||||||||
| Redemption fees | 161,978 | 12,987 | 20,248 | 1,797 | ||||||||||||
| 268,355,665 | 91,341,913 | 69,650,835 | 27,491,433 | |||||||||||||
| Payments for shares redeemed | (172,240,981 | ) | (188,163,475 | ) | (47,722,837 | ) | (43,610,240 | ) | ||||||||
| Net increase (decrease) | 96,114,684 | (96,821,562 | ) | 21,927,998 | (16,118,807 | ) | ||||||||||
| DISTRIBUTIONS PAID FROM: | ||||||||||||||||
| Net investment income | (5,352,880 | ) | (6,230,830 | ) | (955,328 | ) | (943,854 | ) | ||||||||
| Net realized gains | (1,184,867 | ) | (47,451,921 | ) | (3,504,831 | ) | (9,558,939 | ) | ||||||||
| Total distributions | (6,537,747 | ) | (53,682,751 | ) | (4,460,159 | ) | (10,502,793 | ) | ||||||||
| TOTAL INCREASE (DECREASE) IN NET ASSETS | 5,084,467 | (137,497,237 | ) | (1,585,624 | ) | (23,481,852 | ) | |||||||||
| NET ASSETS: | ||||||||||||||||
| Beginning of period | 291,574,479 | 429,071,716 | 67,052,365 | 90,534,217 | ||||||||||||
| End of period (including accumulated undistributed net investment income (loss) of $0, $41,558, $0 and $1,035 respectively) | $ | 296,658,946 | $ | 291,574,479 | $ | 65,466,741 | $ | 67,052,365 | ||||||||
| TRANSACTIONS IN SHARES: | ||||||||||||||||
| Shares sold | 23,591,917 | 2,697,059 | 5,238,874 | 1,092,637 | ||||||||||||
| Issued in reinvestment of distributions | 672,428 | 3,604,540 | 447,075 | 709,929 | ||||||||||||
| Shares redeemed | (15,398,687 | ) | (11,709,585 | ) | (3,906,759 | ) | (2,672,774 | ) | ||||||||
| Net increase (decrease) | 8,865,658 | (5,407,986 | ) | 1,779,190 | (870,208 | ) | ||||||||||
See notes to financial statements
28-29
The Yacktman Funds, Inc.
FINANCIAL HIGHLIGHTS
| The Yacktman Fund | ||||||||||||||||||||
| Year Ended December 31, | ||||||||||||||||||||
| For a Fund share outstanding throughout each year | 2008 | 2007 | 2006 | 2005 | 2004 | |||||||||||||||
| NET ASSET VALUE: | ||||||||||||||||||||
| Beginning of period | $ | 13.39 | $ | 15.79 | $ | 14.67 | $ | 15.34 | $ | 15.24 | ||||||||||
| OPERATIONS: | ||||||||||||||||||||
| Net investment income | 0.17 | 0.35 | 0.30 | 0.28 | 0.12 | |||||||||||||||
| Net realized and unrealized gain (loss) on investments | (3.66 | ) | 0.21 | 2.05 | (0.48 | ) | 1.40 | |||||||||||||
| Total from operations | (3.49 | ) | 0.56 | 2.35 | (0.20 | ) | 1.52 | |||||||||||||
| LESS DISTRIBUTIONS: | ||||||||||||||||||||
| From net investment income | (0.18 | ) | (0.34 | ) | (0.30 | ) | (0.28 | ) | (0.12 | ) | ||||||||||
| From net realized gains | (0.04 | ) | (2.62 | ) | (0.93 | ) | (0.19 | ) | (1.30 | ) | ||||||||||
| Total distributions | (0.22 | ) | (2.96 | ) | (1.23 | ) | (0.47 | ) | (1.42 | ) | ||||||||||
| NET ASSET VALUE: | ||||||||||||||||||||
| End of period | $ | 9.68 | $ | 13.39 | $ | 15.79 | $ | 14.67 | $ | 15.34 | ||||||||||
| TOTAL RETURN | (26.05 | )% | 3.39 | % | 15.95 | % | (1.30 | )% | 9.93 | % | ||||||||||
| SUPPLEMENTAL DATA AND RATIOS | ||||||||||||||||||||
| Net assets; end of period (000's) | $ | 296,659 | $ | 291,574 | $ | 429,072 | $ | 438,912 | $ | 365,308 | ||||||||||
| Ratio of net expenses to average net assets | 0.95 | % | 0.95 | % | 0.96 | % | 0.92 | % | 0.95 | % | ||||||||||
| Ratio of net investment income to average net assets | 1.92 | % | 1.71 | % | 1.90 | % | 1.86 | % | 0.73 | % | ||||||||||
| Portfolio turnover rate | 32.77 | % | 23.82 | % | 17.93 | % | 8.64 | % | 23.82 | % | ||||||||||
See notes to financial statements
30-31
The Yacktman Funds, Inc.
| The Yacktman Focused Fund | ||||||||||||||||||||
| Year Ended December 31, | ||||||||||||||||||||
| For a Fund share outstanding throughout each year | 2008 | 2007 | 2006 | 2005 | 2004 | |||||||||||||||
| NET ASSET VALUE: | ||||||||||||||||||||
| Beginning of period | $ | 14.00 | $ | 16.00 | $ | 14.96 | $ | 15.83 | $ | 16.28 | ||||||||||
| OPERATIONS: | ||||||||||||||||||||
| Net investment income | 0.15 | 0.23 | 0.21 | 0.22 | 0.03 | |||||||||||||||
| Net realized and unrealized (loss) on investments | (3.45 | ) | 0.34 | 2.20 | (0.51 | ) | 1.59 | |||||||||||||
| Total from operations | (3.30 | ) | 0.57 | 2.41 | (0.29 | ) | 1.62 | |||||||||||||
| LESS DISTRIBUTIONS: | ||||||||||||||||||||
| From net investment income | (0.16 | ) | (0.23 | ) | (0.21 | ) | (0.22 | ) | (0.03 | ) | ||||||||||
| From net realized gains | (0.57 | ) | (2.34 | ) | (1.16 | ) | (0.36 | ) | (2.04 | ) | ||||||||||
| Total distributions | (0.73 | ) | (2.57 | ) | (1.37 | ) | (0.58 | ) | (2.07 | ) | ||||||||||
| NET ASSET VALUE: | ||||||||||||||||||||
| End of period | $ | 9.97 | $ | 14.00 | $ | 16.00 | $ | 14.96 | $ | 15.83 | ||||||||||
| TOTAL RETURN | (23.48 | )% | 3.46 | % | 16.13 | % | (1.83 | )% | 9.96 | % | ||||||||||
| SUPPLEMENTAL DATA AND RATIOS | ||||||||||||||||||||
| Net assets; end of period (000's) | $ | 65,467 | $ | 67,052 | $ | 90,534 | $ | 84,608 | $ | 97,263 | ||||||||||
| Ratio of expenses before expense reimbursements to average net assets (See Note 5) | 1.35 | % | 1.38 | % | 1.35 | % | 1.32 | % | 1.33 | % | ||||||||||
| Ratio of net expenses to average net assets | 1.25 | % | 1.25 | % | 1.25 | % | 1.25 | % | 1.25 | % | ||||||||||
| Ratio of net investment income to average net assets | 1.31 | % | 1.23 | % | 1.40 | % | 1.30 | % | 0.16 | % | ||||||||||
| Portfolio turnover rate | 67.11 | % | 30.49 | % | 30.61 | % | 5.62 | % | 19.26 | % | ||||||||||
See notes to financial statements
32-33
The Yacktman Funds, Inc.
December 31, 2008
| 1. | ORGANIZATION |
The Yacktman Funds, Inc. (comprised of The Yacktman Fund and The Yacktman Focused Fund, hereafter referred to as the “Funds”) is registered as an open-end management investment company under the Investment Company Act of 1940 (the “1940 Act”). The Funds consist of two investment portfolios: The Yacktman Fund is a diversified fund that commenced operations July 6, 1992 and The Yacktman Focused Fund is a non-diversified fund that commenced operations May 1, 1997. The objective of each of the Funds is to produce long-term capital appreciation with current income as a secondary objective. Yacktman Asset Management Co. is the Funds’ investment adviser (the “Adviser”).
| 2. | SIGNIFICANT ACCOUNTING POLICIES |
The following is a summary of significant accounting policies consistently followed by the Funds in the preparation of their financial statements. The financial statements have been prepared in conformity with accounting principles generally accepted in the United States of America, which require management to make certain estimates and assumptions that affect the reported amounts of assets and liabilities and disclosure of contingent assets and liabilities at the date of the financial statements and the reported amounts of increases and decreases in net assets from operations during the reporting period. Actual results could differ from those estimates.
a) Investment Valuation - Securities which are traded on a national stock exchange are valued at the last sale price on the securities exchange on which such securities are primarily traded. Securities that are traded on the Nasdaq National Market or the Nasdaq Smallcap Market are valued at the Nasdaq Official Closing Price. Exchange-traded securities for which there were no transactions are valued at the current bid prices. Securities traded on only over-the-counter markets are valued on the basis of closing over-the-counter bid prices. Short-term debt instruments maturing within 60 days are valued by the amortized cost method, which approximates fair value. Debt securities (other than short-term instruments) are valued at the mean price furnished by a national pricing service, subject to review by the Adviser and determination of the appropriate price whenever a furnished price is significantly different from the previous day's furnished price. Options written or purchased by The Yacktman Focused Fund are valued at the last sales price if such last sales price is between the current bid and asked prices. Otherwise, options are valued at the mean between the current bid and asked prices. Any securities for which there are no readily available market quotations and other assets will be valued at their fair value as determined in good faith by the Adviser pursuant to procedures established by and under the supervision of the Board of Directors. The fair value of a security is the amount which a Fund might reasonably expect to receive upon a current sale. Valuing securities at fair value involves greater reliance on judgment than valuing securities that have readily available market quotations. There can be no assurance that the Funds could obtain the fair value assigned to a security if they were to sell the security at approximately the time at which the Funds determine their net asset value per share.
34
FASB Interpretation 157
In September 2006, the Financial Accounting Standards Board issued Standard No. 157, “Fair Value Measurements” (“FAS 157”) effective for fiscal years beginning after November 15, 2007. FAS 157 clarifies the definition of fair value for financial reporting, establishes a framework for measuring fair value and requires additional disclosure about the use of fair value measurements in an effort to make the measurement of fair value more consistent and comparable. The Funds have adopted FAS 157 effective January 1, 2008. A summary of the fair value hierarchy under FAS 157 is described below:
Various inputs are used in determining the value of the Funds’ investments. These inputs are summarized in the three broad levels listed below:
| Level 1: | Quoted prices in active markets for identical securities. |
| Level 2: | Other significant observable inputs (including quoted prices for similar securities, interest rates, prepayment speeds, credit risk, etc.) |
| Level 3: | Significant unobservable inputs (including the Funds’ own assumptions in determining the fair value of investments) |
The inputs or methodology used for valuing securities are not an indication of the risk associated with investing in those securities.
35
The Yacktman Funds, Inc.
December 31, 2008
The following is a summary of the inputs used, as of December 31, 2008, in valuing the Funds’ investments carried at fair value:
| Description | Total | Level 1 Quoted prices in active markets for identical assets | Level 2 Significant other observable inputs | Level 3 Significant unobservable inputs | ||||||||||||
| The Yacktman Fund | ||||||||||||||||
| Assets: | ||||||||||||||||
Investment in Securities | $ | 295,550,227 | $ | 274,539,584 | $ | 21,010,643 | $ | — | ||||||||
Other Financial Instruments* | — | — | — | — | ||||||||||||
| The Yacktman Focused Fund | ||||||||||||||||
| Assets: | ||||||||||||||||
Investment in Securities | $ | 65,178,135 | $ | 56,643,853 | $ | 8,534,282 | $ | — | ||||||||
Other Financial Instruments* | 5,000 | 5,000 | — | — | ||||||||||||
| * | Other financial instruments are written options not reflected in the portfolio of investments. |
b) Option writing - When The Yacktman Focused Fund writes an option, an amount equal to the premium received by The Yacktman Focused Fund is recorded as a liability and is subsequently adjusted to the current fair value of the option written. Premiums received from writing options that expire unexercised are treated by The Yacktman Focused Fund on the expiration date as realized gains from investments. The difference between the premium and the amount paid on effecting a closing purchase transaction, including brokerage commissions, is also treated as a realized gain, or, if the premium is less than the amount paid for the closing purchase transaction, as a realized loss. If a call option is exercised, the premium is added to the proceeds from the sale of the underlying security or currency in determining whether The Yacktman Focused Fund has realized a gain or loss. If a put option is exercised, the premium reduces the cost basis of the securities purchased by The Yacktman Focused Fund. The Yacktman Focused Fund as a writer of an option bears the market risk of an unfavorable change in the price of the security underlying the written option.
36
c) Federal Income Taxes - It is each Fund’s policy to meet the requirements of the Internal Revenue Code applicable to regulated investment companies and to distribute substantially all investment company net taxable income and net capital gains to its shareholders in a manner which results in no tax cost to the Fund. Therefore, no federal income tax provision is required.
FASB Interpretation 48
Effective June 29, 2007, the Funds adopted Financial Accounting Standards Board (FASB) Interpretation No. 48 (FIN 48), “Accounting for Uncertainty in Income Taxes”. FIN 48 requires the evaluation of tax positions taken on previously filed tax returns or expected to be taken on future returns. These positions must meet a “more likely than not” standard that, based on the technical merits, have a more than fifty percent likelihood of being sustained upon examination. In evaluating whether a tax position has met the recognition threshold, the Funds must presume that the position will be examined by the appropriate taxing authority that has full knowledge of all relevant information. Tax positions not deemed to meet the “more-likely-than-not” threshold are recorded as a tax expense in the current year.
FIN 48 requires the Funds to analyze all open tax years, as defined by the Statute of Limitations. Open tax years are those that are open for exam by taxing authorities. As of December 31, 2008, open tax years include the tax years ended December 31, 2005 through 2008. The Funds have no examinations in progress.
The Funds have reviewed all open tax years and major jurisdictions and concluded that the adoption of FIN 48 resulted in no effect to the Funds' financial position or results of operations. As of December 31, 2008, there is no tax liability resulting from unrecognized tax benefits relating to uncertain income tax positions taken or expected to be taken on the Funds’ tax returns for all open tax years. The Funds are also not aware of any tax positions for which it is reasonably possible that the total amounts of unrecognized tax benefits will significantly change in the next twelve months. The Funds recognize interest and penalties, if any, related to unrecognized tax benefits as income tax expense in the statement of operations. During the period, the Funds did not incur any interest or penalties.
37
The Yacktman Funds, Inc.
December 31, 2008
d) Distributions to Shareholders - Dividends from net investment income and distributions of net realized capital gains, if any, are declared and paid at least annually. Distri bu tions to shareholders are recorded on the ex-dividend date. The character of distributions made during the year from net investment income or net realized gains may differ from the characterization for federal income tax purposes due to differences in the recognition of income, expense and gain items for financial statement and tax purposes. Additionally, the Funds may utilize earnings and profits distributed to shareholders on redemption of shares as part of the dividends paid deduction for income tax purposes. Where appropriate, reclassifications between capital accounts are made for such differences that are permanent in nature.
Accordingly, at December 31, 2008, reclassifications were recorded to increase undistributed net investment income by $146,896 and $61,476, and increase (decrease) undistributed net realized gains (losses) by $(97,909) and $(61,476) for The Yacktman Fund and The Yacktman Focused Fund, respectively. ccumulated paid-in-capital was decreased by $(48,987) for The Yacktman Fund.
e) Guarantees and Indemnifications - In the normal course of business, the Funds enter into contracts with service providers that contain general indemnification clauses. The Funds’ maximum exposure under these arrangements is unknown as this would involve future claims against the Funds that have not yet occurred. Based on experience, the Funds expect the risk of loss to be remote.
f) Redemption Fee - Effective April 1, 2005, those who buy and sell the Funds within thirty calendar days will incur a 2% redemption fee, retained for the benefit of long-term shareholders, recorded as additional capital in the statement of changes in net assets.
g) Other - Investment transactions and shareholder transactions are accounted for on the trade date. Net realized gains and losses on securities are computed on the basis of specific security lot identification. Dividend income is recognized on the ex-dividend date and interest income is recognized on an accrual basis. Withholding taxes on foreign dividends have been provided for in accordance with the Funds’ understanding of the applicable country’s tax rules and regulations. Expenses incurred by the Funds that do not relate to a specific fund are allocated to the individual Funds based on each Fund’s relative net assets or another appropriate basis (as determined by the Board of Directors.)
38
| 3. | INVESTMENT TRANSACTIONS |
For the year ended December 31, 2008, the aggregate purchases and sales of securities, excluding short-term securities, were $208,011,547 and $80,078,155 for The Yacktman Fund and $72,743,992 and $39,219,226 for The Yacktman Focused Fund, respectively. For the year ended December 31 2008, there were no purchases or sales of U.S. Government securities for The Yacktman Fund and The Yacktman Focused Fund.
| 4. | OPTION CONTRACTS WRITTEN |
The premium amount and number of option contracts written during the year ended December 31, 2008 in The Yacktman Focused Fund, were as follows:
Amount of Premiums | Number of Contracts | |||||||
| Outstanding at 12/31/2007 | $ | (586,889 | ) | (2,571 | ) | |||
| Options written | (2,059,144 | ) | (9,815 | ) | ||||
| Options expired | 679,093 | 3,331 | ||||||
| Options closed | 1,817,941 | 8,055 | ||||||
| Outstanding at 12/31/2008 | $ | (148,999 | ) | (1,000 | ) | |||
| 5. | INVESTMENT ADVISORY AGREEMENT |
The Funds have agreements with the Adviser, with whom certain officers and directors of the Funds are affiliated, to furnish investment advisory services to the Funds. Under the terms of these agreements, The Yacktman Fund will pay the Adviser a monthly fee at the annual rate of 0.65% on the first $500,000,000 of average daily net assets, 0.60% on the next $500,000,000 of average daily net assets and 0.55% on average daily net assets in excess of $1,000,000,000, and The Yacktman Focused Fund will pay the Adviser a monthly fee at the annual rate of 1% of its average daily net assets. The Adviser has contractually agreed to reimburse The Yacktman Fund for all expenses exceeding 2.00% of its average daily net assets (exclusive of interest, taxes, brokerage commissions and extraordinary expenses). The Adviser has voluntarily agreed to reimburse The Yacktman Focused Fund for all expenses exceeding 1.25% of its average daily net assets (exclusive of interest, taxes, brokerage commissions and extraordinary expenses). The Funds are not obligated to reimburse the Adviser for any fees or expenses waived in previous fiscal years. During the year ended December 31, 2008, the Adviser voluntarily waived $70,600 of Investment advisory fees for The Yacktman Focused Fund.
39
The Yacktman Funds, Inc.
NOTES TO THE FINANCIAL STATEMENTS (Cont’d.)
December 31, 2008
| 6. | SECURITIES LENDING |
The Funds entered into a securities lending arrangement with the custodian which was terminated in August 2008. Under the terms of the agreement, the custodian was authorized to loan securities on behalf of the Funds to approved brokers against the receipt of cash collateral at least equal to the value of the securities loaned. The cash collateral was invested by the custodian in a money market pooled account approved by the Adviser. Each Fund had an individual interest of cash collateral contributed. Although risk was mitigated by the collateral, the Funds could have experienced a delay in recovering their securities and possible loss of income or value if the borrower failed to return them. The agreement provided that after predetermined rebates to the brokers, the income generated from lending transactions would be allocated 60% to the Funds and 40% to the custodian. As of December 31, 2008, the Funds were no longer subject to the securities lending arrangement.
| 7. | LINE OF CREDIT |
The Yacktman Fund and The Yacktman Focused Fund have established a line of credit (“LOC”) with U.S. Bank, N.A. to be used for temporary or emergency purposes, primarily for financing redemption payments, using the securities in each Fund’s respective portfolio as collateral. The LOC will mature, unless renewed, on March 31, 2009 for each of the Funds. For The Yacktman Fund, borrowing under the LOC is limited to the lesser of $15,000,000, 10% of the pre-borrowing net assets of the Fund, 10% of the market value of the assets of the Fund, or 10% of the sum of the fair market value of certain assets of the Fund. For The Yacktman Focused Fund, borrowing under the LOC is limited to the lesser of $15,000,000, 33 1/3% of the pre-borrowing net assets of the Fund, or 33 1/3% of the sum of the fair market value of certain assets of the Fund. The interest rate paid by the Funds on outstanding borrowings is equal to the Prime Rate, less 0.50%, which was 2.75% as of December 31, 2008. During the year ended December 31, 2008, The Yacktman Focused Fund had average outstanding borrowings of $31,828 under the LOC and paid a weighted average interest rate of 3.68%. During the year ended December 31, 2008, there were no borrowings for The Yacktman Fund.
40
| 8. | TAX INFORMATION |
The following information for the Funds is presented on an income tax basis as of December 31, 2008:
The Yacktman Fund | The Yacktman Focused Fund | |||||||
| Tax cost of investments | $ | 333,090,988 | $ | 78,065,501 | ||||
| Gross unrealized appreciation | 31,022,982 | 5,128,885 | ||||||
| Gross unrealized depreciation | (68,563,743 | ) | (18,016,251 | ) | ||||
| Net tax unrealized depreciation | $ | (37,540,761 | ) | $ | (12,887,366 | ) | ||
As of December 31, 2008, the components of accumulated earnings were as follows:
The Yacktman Fund | The Yacktman Focused Fund | |||||||
| Undistributed ordinary income | $ | — | $ | — | ||||
Undistributed long-term capital gains | — | 34 | ||||||
| Accumulated earnings | — | 34 | ||||||
Net unrealized depreciation on investments | (37,540,761 | ) | (12,887,336 | ) | ||||
Other accumulated gains/(losses) | — | 100,851 | ||||||
| Total accumulated earnings | $ | (37,540,761 | ) | $ | (12,786,481 | ) | ||
The tax basis of investments for tax and financial reporting purposes differs, principally due to the deferral of losses on wash sales.
41
The Yacktman Funds, Inc.
NOTES TO THE FINANCIAL STATEMENTS (Cont’d.)
December 31, 2008
As of December 31, 2008, The Yacktman Focused Fund had $43,148 of post-October losses, which are deferred until January 1, 2009, for tax purposes. Net capital losses incurred after October 31 and within the taxable year are deferred to arise on the first day of The Yacktman Focused Fund’s next taxable year.
The tax character of distributions paid during the fiscal years ended December 31, 2008 and December 31, 2007 were as follows:
The Yacktman Fund | The Yacktman Focused Fund | |||||||
| 2008 | ||||||||
| Ordinary income | $ | 6,537,747 | $ | 2,097,803 | ||||
| Long-term capital gains | $ | — | $ | 2,362,356 | ||||
| 2007 | ||||||||
| Ordinary income | $ | 7,052,011 | $ | 2,038,950 | ||||
| Long-term capital gains | $ | 46,630,740 | $ | 8,463,843 | ||||
| 9. | NEW ACCOUNTING PRONOUNCEMENTS |
FASB Interpretation 161
In March 2008, Statement of Financial Accounting Standards No. 161, "Disclosures about Derivative Instruments and Hedging Activities" ("SFAS 161") was issued and is effective for fiscal years beginning after November 15, 2008. SFAS 161 is intended to improve financial reporting for derivative instruments by requiring enhanced disclosure that enables investors to understand how and why an entity uses derivatives, how derivatives are accounted for, and how derivative instruments affect an entity's results of operations and financial position. Management is currently evaluating the implications of SFAS 161 and the impact on the Funds’ financial statement disclosures, if any.
42
The Yacktman Funds, Inc.
REPORT OF INDEPENDENT REGISTERED PUBLIC ACCOUNTING FIRM
To The Shareholders and Board of Directors
The Yacktman Funds, Inc.
We have audited the accompanying statements of assets and liabilities, including the portfolios of investments and the schedule of options written, of The Yacktman Funds, Inc., comprising The Yacktman Fund and The Yacktman Focused Fund, (the “Funds”), as of December 31, 2008, and the related statements of operations and changes in net assets, and the financial highlights for the year then ended. These financial statements and financial highlights are the responsibility of the Funds’ management. Our responsibility is to express an opinion on these financial statements and financial highlights based on our audit. The statement of changes in net assets for the year ended December 31, 2007, and the financial highlights for the periods indicated prior to December 31, 2008, were audited by another independent registered public accounting firm, who expressed unqualified opinions on those statements and financial highlights.
We conducted our audit in accordance with the standards of the Public Company Accounting Oversight Board (United States). Those standards require that we plan and perform the audit to obtain reasonable assurance about whether the financial statements and financial highlights are free of material misstatement. An audit includes examining, on a test basis, evidence supporting the amounts and disclosures in the financial statements. Our procedures included confirmation of securities owned as of December 31, 2008 by correspondence with the Funds’ custodian. An audit also includes assessing the accounting principles used and significant estimates made by management, as well as evaluating the overall financial statement presentation. We believe that our audit provides a reasonable basis for our opinion.
In our opinion, the financial statements and financial highlights referred to above present fairly, in all material respects, the financial position of each of the funds constituting The Yacktman Funds, Inc., as of December 31, 2008, and the results of their operations, the changes in their net assets, and their financial highlights for the year then ended, in conformity with accounting principles generally accepted in the United States of America.
COHEN FUND AUDIT SERVICES, LTD.
Westlake, Ohio
February 25, 2009
43
The Yacktman Funds, Inc.
ADDITIONAL INFORMATION (Unaudited)
For the year ended December 31, 2008, 87.01% and 53.52% of the dividends paid from net investment income, including short-term capital gains, for The Yacktman Fund and The Yacktman Focused Fund, respectively, qualify for the dividends received deduction available to corporate shareholders.
For the year ended December 31, 2008, 89.22% and 55.27% of the dividends paid from net investment income, including short-term capital gains, for The Yacktman Fund and The Yacktman Focused Fund, respectively, are designated as qualified dividend income.
The Funds hereby designate approximately 19.62% and 57.40% as short-term capital gain distributions for The Yacktman Fund and The Yacktman Focused Fund, respectively, for the purposes of the dividends paid deduction.
CHANGE IN INDEPENDENT REGISTERED PUBLIC ACCOUNTING FIRM (Unaudited)
On September 15, 2008, PricewaterhouseCoopers LLP was replaced as the independent registered public accounting firm for the Yacktman Funds (the "Funds"). The decision to replace PricewaterhouseCoopers LLP was approved by the Funds' audit committee and was ratified by the Board of Directors. The reports of PricewaterhouseCoopers LLP on the Funds' financial statements for the year ended December 31, 2007 did not contain an adverse opinion or disclaimer of opinion, nor were they qualified or modified as to uncertainty, audit scope or accounting principles.
During the two most recent fiscal years and through September 15, 2008, there were no disagreements with PricewaterhouseCoopers LLP on any matter of accounting principles or practices, financial statement disclosure, or auditing scope or procedure, which disagreements, if not resolved to the satisfaction of PricewaterhouseCoopers LLP would have caused them to make reference to the subject matter of the disagreements in connection with their reports on the financial statements for such years. At no time preceding the replacement of PricewaterhouseCoopers LLP did any of the events enumerated in paragraphs (1)(v)(A) through (D) of item 304(a) of Regulation S-K occur.
44
CHANGE IN INDEPENDENT REGISTERED PUBLIC ACCOUNTING FIRM (Unaudited) (Continued)
On September 15, 2008, the Funds’ Board of Directors engaged the firm Cohen Fund Audit Services, Ltd. to serve as the new independent registered public accounting firm to the Funds. At no time preceding the engagement of Cohen Fund Audit Services, Ltd. did the Funds’ management consult Cohen Fund Audit Services, Ltd. regarding either (i) the application of accounting principles to a specified transaction, either completed or proposed, or the type of audit opinion that might be rendered on the Funds’ financial statements, or (ii) any matter that was either the subject of a disagreement or a reportable event, as such terms are defined in Item 304 of Regulation S-K.
PROXY VOTING POLICIES AND PROCEDURES
For a description of the policies and procedures that the Funds use to determine how to vote proxies relating to portfolio securities, please call 1-800-525-8258 and request a Statement of Additional Information. One will be mailed to you free of charge. The Statement of Additional Information is also available on the Web site of the Securities and Exchange Commission at http://www.sec.gov. Information on how the Funds voted proxies relating to portfolio securities during the twelve month period ended June 30, 2008, is available without charge, upon request, by calling 1-800-525-8258 or by accessing the Web site of the Securities and Exchange Commission.
DISCLOSURE OF PORTFOLIO HOLDINGS
The Funds will file complete schedules of portfolio holdings with the Securities and Exchange Commission for the first and third quarters of each fiscal year on Form N-Q. Each Fund’s Form N-Q will be available on the Web site of the Securities and Exchange Commission at http://www.sec.gov.
45
The Yacktman Funds, Inc.
DIRECTOR AND OFFICER INFORMATION (Unaudited)
| Independent Directors | |||
| Name | Age | Address | Current position held with the Funds |
| Bruce B. Bingham | 60 | c/o Yacktman Asset Management Co. 6300 Bridgepoint Parkway Building One, Suite 320 Austin, TX 78730 | Director |
| Albert J. Malwitz | 72 | c/o Yacktman Asset Management Co. 6300 Bridgepoint Parkway Building One, Suite 320 Austin, TX 78730 | Director |
| George J. Stevenson | 69 | c/o Yacktman Asset Management Co. 6300 Bridgepoint Parkway Building One, Suite 320 Austin, TX 78730 | Director |
| Interested Director* | |||
| Donald A. Yacktman | 67 | c/o Yacktman Asset Management Co. 6300 Bridgepoint Parkway Building One, Suite 320 Austin, TX 78730 | Director President Treasurer |
| Officer | |||
| Stephen Yacktman | 38 | c/o Yacktman Asset Management Co. 6300 Bridgepoint Parkway Building One, Suite 320 Austin, TX 78730 | Vice President Secretary |
| Officer | |||
| Kent A. Arnett | 67 | c/o Yacktman Asset Management Co. 6300 Bridgepoint Parkway Building One, Suite 320 Austin, TX 78730 | Vice President Chief Compliance Officer |
| Officer | |||
| Jason Subotky | 38 | c/o Yacktman Asset Management Co. 6300 Bridgepoint Parkway Building One, Suite 320 Austin, TX 78730 | Vice President |
*The Interested Director serves as director and officer of The Yacktman Funds.
Additional information about the Funds’ directors is available in the Statement of Additional Information and is available, without charge, upon request, by calling 1-800-525-8258.
46
Term of office and length of time served | Principal occupation during the past five years | Number of portfolios overseen within the Fund complex | Other directorships held outside the Fund complex | |||
Indefinite, until successor elected 9 years | Mr. Bingham has been a partner in Hamilton Partners, a real estate development firm, for more than five years | 2 | None | |||
Indefinite, until successor elected 9 years | Mr. Malwitz has been owner and chief executive officer of Arlington Fastener Co., a manufacturer and distributor of industrial fasteners, for more than five years | 2 | None | |||
Indefinite, until successor elected 9 years | Mr. Stevenson has been President of Stevenson & Company, a registered business broker, and President of Healthmate Products Co., a fruit juice concentrate manufacturing company, for more than five years | 2 | None | |||
Indefinite, until successor elected 15 years | Mr. Yacktman has been President of Yacktman Asset Management Co. since April, 1992 | 2 | None | |||
Indefinite, until successor elected 5 years | Mr. Yacktman has been Vice President of Yacktman Asset Management Co. for more than five years | N/A | None | |||
Indefinite, until successor elected 3 years | Mr. Arnett has been Vice President and Chief Compliance Officer of Yacktman Asset Management Co. for 3 years, and Vice President of JPMorgan Chase Bank for more than five years | N/A | None | |||
Indefinite, until successor elected 1 year | Mr. Subotky has been Vice President and Portfolio Manager for Yacktman Asset Management for more than five years. | N/A | None | |||
47
48
Item 2. Code of Ethics.
The registrant has adopted a code of ethics that applies to the registrant’s principal executive officer and principal financial officer. The registrant has not made any amendments to its code of ethics during the period covered by this report. The registrant has not granted any waivers from any provisions of the code of ethics during the period covered by this report.
A copy of the registrant’s Code of Ethics is filed herewith.
Item 3. Audit Committee Financial Expert.
The registrant’s board of directors has determined that it does not have an audit committee financial expert serving on its audit committee. At this time, the registrant believes that the experience provided by each member of the audit committee together offers the registrant adequate oversight for the registrant’s level of financial complexity.
Item 4. Principal Accountant Fees and Services.
The registrant has engaged its principal accountant to perform audit services, audit-related services, tax services and other services during the past two fiscal years. “Audit services” refer to performing an audit of the registrant's annual financial statements or services that are normally provided by the accountant in connection with statutory and regulatory filings or engagements for those fiscal years. “Audit-related services” refer to the assurance and related services by the principal accountant that are reasonably related to the performance of the audit. “Tax services” refer to professional services rendered by the principal accountant for tax compliance, tax advice, and tax planning. The following table details the aggregate fees billed or expected to be billed for each of the last two fiscal years for audit fees, audit-related fees, tax fees and other fees by the principal accountant. The fees for FYE 12/31/2007 were billed by PricewaterhouseCoopers LLC. The fees for FYE 12/31/2008 were billed by Cohen Fund Audit Services, Ltd.
| FYE 12/31/2008 | FYE 12/31/2007 | |||||||
| Audit Fees | $ | 31,000 | $ | 45,000 | ||||
| Audit-Related Fees | $ | 0 | $ | 0 | ||||
| Tax Fees | $ | 5,000 | $ | 8,100 | ||||
| All Other Fees | $ | 0 | $ | 0 | ||||
The audit committee has adopted pre-approval policies and procedures that require the audit committee to pre-approve all audit and non-audit services of the registrant, including services provided to any entity affiliated with the registrant.
There were no services that were approved applicable to non-audit services pursuant to waiver of pre-approval requirement.
None of the hours expended on the principal accountant’s engagement to audit the Funds’ financial statements for the fiscal year ended December 31, 2008 were attributable to work performed by persons other than the principal accountant’s full-time, permanent employees.
The following table indicates the non-audit fees billed or expected to be billed by the registrant’s accountant for services to the registrant and to the registrant’s investment adviser (and any other controlling entity, etc.—not sub-adviser) for the last two years. The audit committee of the board of directors has considered whether the provision of non-audit services that were rendered to the registrant's investment adviser is compatible with maintaining the principal accountant's independence and has concluded that the provision of such non-audit services by the accountant has not compromised the accountant’s independence.
| Non-Audit Related Fees | FYE 12/31/2008 | FYE 12/31/2007 | ||||||
| Registrant | $ | 5,000 | $ | 8,100 | ||||
| Registrant’s Investment Adviser | $ | 0 | $ | 0 | ||||
Item 5. Audit Committee of Listed Registrants.
Not applicable to registrants who are not listed issuers (as defined in Rule 10A-3 under the Securities Exchange Act of 1934).
Item 6. Investments.
Schedule of Investments is included as part of the report to shareholders filed under Item 1 of this Form.
Item 7. Disclosure of Proxy Voting Policies and Procedures for Closed-End Management Investment Companies.
Not applicable to open-end investment companies.
Item 8. Portfolio Managers of Closed-End Management Investment Companies.
Not applicable to open-end investment companies.
Item 9. Purchases of Equity Securities by Closed-End Management Investment Company and Affiliated Purchasers.
Not applicable to open-end investment companies.
Item 10. Submission of Matters to a Vote of Security Holders.
Not Applicable.
Item 11. Controls and Procedures.
| (a) | The Registrant’s [President/Chief Executive Officer] and [Treasurer/Chief Financial Officer] have reviewed the Registrant's disclosure controls and procedures (as defined in Rule 30a-3(c) under the Investment Company Act of 1940 (the “Act”)) as of a date within 90 days of the filing of this report, as required by Rule 30a-3(b) under the Act and Rules 13a-15(b) or 15d-15(b) under the Securities Exchange Act of 1934. Based on their review, such officers have concluded that the disclosure controls and procedures are effective in ensuring that information required to be disclosed in this report is appropriately recorded, processed, summarized and reported and made known to them by others within the Registrant and by the Registrant’s service provider. |
| (b) | There were no changes in the Registrant's internal control over financial reporting (as defined in Rule 30a-3(d) under the Act) that occurred during the second fiscal quarter of the period covered by this report that has materially affected, or is reasonably likely to materially affect, the Registrant's internal control over financial reporting. |
Item 12. Exhibits.
| (a) | (1) Any code of ethics or amendment thereto, that is the subject of the disclosure required by Item 2, to the extent that the registrant intends to satisfy Item 2 requirements through filing an exhibit. Filed herewith |
(2) A separate certification for each principal executive and principal financial officer pursuant to Section 302 of the Sarbanes-Oxley Act of 2002. Filed herewith.
(3) Any written solicitation to purchase securities under Rule 23c-1 under the Act sent or given during the period covered by the report by or on behalf of the registrant to 10 or more persons. Not applicable to open-end investment companies.
| (b) | Certifications pursuant to Section 906 of the Sarbanes-Oxley Act of 2002. Furnished herewith. |
SIGNATURES
Pursuant to the requirements of the Securities Exchange Act of 1934 and the Investment Company Act of 1940, the registrant has duly caused this report to be signed on its behalf by the undersigned, thereunto duly authorized.
(Registrant) The Yacktman Funds, Inc.
By (Signature and Title) /s/ Donald A. Yacktman
Donald A. Yacktman, President
Date 3/3/09 60;
Pursuant to the requirements of the Securities Exchange Act of 1934 and the Investment Company Act of 1940, this report has been signed below by the following persons on behalf of the registrant and in the capacities and on the dates indicated.
By (Signature and Title) /s/ Donald A. Yacktman
Donald A. Yacktman, President/Treasurer
Date 3/3/09 60;