UNITED STATES
SECURITIES AND EXCHANGE COMMISSION
Washington, D.C. 20549
FORM N-CSR
CERTIFIED SHAREHOLDER REPORT OF REGISTERED
MANAGEMENT INVESTMENT COMPANIES
Investment Company Act file number 811-06628
The Yacktman Funds, Inc.
(Exact name of registrant as specified in charter)
6300 Bridgepoint Parkway
Building One, Suite 320
Austin, TX 78730
(Address of principal executive offices) (Zip code)
Donald A. Yacktman
c/o Yacktman Asset Management Co.
6300 Bridgepoint Parkway
Building One, Suite 320
Austin, TX 78730
(Name and address of agent for service)
512.767.6700
Registrant's telephone number, including area code
Date of fiscal year end: 12.31.11
Date of reporting period: 12.31.11
Item 1. Reports to Stockholders.
| ANNUAL REPORT |
December 31, 2011
The Yacktman Funds, Inc.
| MESSAGE TO SHAREHOLDERS |
 |  |  |
| Donald A. Yacktman | Stephen Yacktman | Jason Subotky |
In 2011, The Yacktman Focused Fund and The Yacktman Fund appreciated 7.41% and 7.30%, compared to the S&P 500 which was up 2.11%. We are pleased to have delivered solid returns in a year where the S&P 500 was barely higher and, according to The Wall Street Journal, the average diversified U.S. stock fund declined 2.9%.
| The Yacktman | ||
| Average Annual Returns | Focused Fund | S&P 500® |
| One Year (01/01/11 - 12/31/11) | 7.41% | 2.11% |
| Three Years (01/01/09 - 12/31/11) | 25.04% | 14.11% |
| Five Years (01/01/07 - 12/31/11) | 9.13% | -0.25% |
| Ten Years (01/01/02 - 12/31/11) | 11.39% | 2.92% |
| Cumulative Returns | ||
| One Year (01/01/11 - 12/31/11) | 7.41% | 2.11% |
| Three Years (01/01/09 - 12/31/11) | 95.52% | 48.59% |
| Five Years (01/01/07 - 12/31/11) | 54.79% | -1.24% |
| Ten Years (01/01/02 - 12/31/11) | 194.07% | 33.35% |
n The Yacktman Focused Fund
o S&P 500®
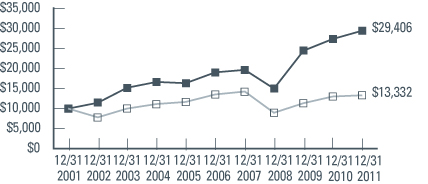
The chart assumes an initial gross investment of $10,000 made on 12/31/01.
2
The Yacktman Funds, Inc.
| Average Annual Returns | The Yacktman Fund | S&P 500® |
| One Year (01/01/11 - 12/31/11) | 7.30% | 2.11% |
| Three Years (01/01/09 - 12/31/11) | 24.41% | 14.11% |
| Five Years (01/01/07 - 12/31/11) | 8.04% | -0.25% |
| Ten Years (01/01/02 - 12/31/11) | 10.63% | 2.92% |
| Cumulative Returns | ||
| One Year (01/01/11 - 12/31/11) | 7.30% | 2.11% |
| Three Years (01/01/09 - 12/31/11) | 92.56% | 48.59% |
| Five Years (01/01/07 - 12/31/11) | 47.21% | -1.24% |
| Ten Years (01/01/02 - 12/31/11) | 174.52% | 33.35% |
n The Yacktman Fund
o S&P 500®
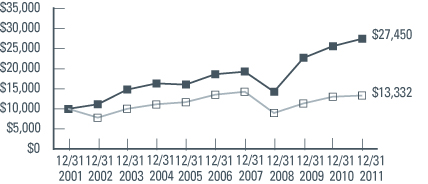
The chart assumes an initial gross investment of $10,000 made on 12/31/01.
Returns shown include the reinvestment of all dividends, but do not reflect the deduction of taxes that a shareholder would pay on Fund distributions or the redemption of Fund shares. The above past performance is not predictive of future results. The investment return and principal value of the Funds will fluctuate so that your shares, when redeemed, may be worth more or less than their original cost.
Even after a very successful year where our funds stood out for solid absolute and strong relative returns, we wanted to remind investors that we prefer to judge results over longer time periods. We are proud of the long-term performance as $10,000 invested in The Yacktman Focused Fund and The Yacktman Fund ten years ago would be $29,406 and $27,450 compared to $13,332 in the S&P 500 on December 31, 2011.
In 2011 there was a significant amount of market volatility as concerns about the financial health of many countries and financial institutions, especially those in Europe, increased greatly. In the steepest of the declines our funds performed much better than the overall market, something
3
The Yacktman Funds, Inc.
we were also able to accomplish in the down markets of 2008-2009 and 2000-2002. We believe protecting capital in challenging times is one of the keys to long-term investment success.
Our top positions continue to be in some of the greatest businesses in the world. Many of these companies offer products or services that are staples of today’s global society, giving their businesses a level of predictability and consistency which we think is especially valuable in an environment where there is a high degree of uncertainty.
Top 10 Positions
| The Yacktman | % of Net | % of Net | ||
| Focused Fund | Assets | The Yacktman Fund | Assets | |
| PepsiCo, Inc. | 10.8% | PepsiCo, Inc. | 10.5% | |
| News Corp., Class A | 10.4% | News Corp., Class A | 10.4% | |
| Procter & Gamble Co. | 8.6% | Procter & Gamble Co. | 4.9% | |
| Microsoft Corp. | 6.7% | Microsoft Corp. | 4.8% | |
| C.R. Bard, Inc. | 4.2% | Cisco Systems, Inc. | 4.5% | |
| Cisco Systems, Inc. | 4.1% | Johnson & Johnson | 3.7% | |
| Sysco Corp. | 3.3% | Coca-Cola Co. | 3.6% | |
| Coca-Cola Co. | 3.1% | C.R. Bard, Inc. | 3.5% | |
| Pfizer, Inc. | 2.7% | Sysco Corp. | 3.5% | |
| U.S. Bancorp | 2.4% | U.S. Bancorp | 2.8% |
Portfolio Holdings
Media
News Corp, Viacom, and Comcast had strong returns in 2011, yet all three companies still sell at low multiples of earnings and free cash flow. By far our largest media position is News Corp, which we think has an outstanding group of businesses and continues to be priced at a very compelling valuation.
Last year, News Corp was the top contributor to results in each fund, and interestingly was also the most controversial holding. In the middle of the year, a phone hacking scandal at one of News Corp’s newspapers in the United Kingdom became a significant short-term issue. Management
4
handled the situation effectively by closing the newspaper where the activities took place, cancelling a proposed transaction to take full control of the largest satellite operator in the United Kingdom, BSkyB, and announcing a return of capital to shareholders via stock repurchase.
We bought additional News Corp shares during the controversy, as we did not think that the company’s most valuable assets, cable and television content, would be materially impacted by the scandal. This proved to be the case, and News Corp’s cable and television content businesses posted another stellar year in 2011, achieving high rates of growth in revenues and earnings. From August through the end of the year, News Corp management repurchased $2.5 billion of stock, representing more than 5% of the company’s outstanding shares, at what we think were very attractive prices. At less than 12 times our estimate of calendar 2012 earnings per share, we think News Corp is still inexpensive.
“Old Tech”
Last year, the shares of many more established technology companies were out of favor, allowing us to increase our weighting to a group which we call “old tech”. At the end of 2011, Microsoft and Cisco were our largest “old tech” positions and in the top six holdings of each fund. We also owned smaller positions in HP, Corning, and Research in Motion, all of which underperformed in 2011.
Microsoft’s shares were modestly weaker last year even though the company delivered solid business results. At year end, the stock sold at slightly more than seven times our estimate of 2012 earnings after adjusting for the excess cash on the balance sheet. At this low multiple, Microsoft can be a good investment if the business just delivers stable results. If Microsoft achieves success from new products like Windows 8, we think the stock could perform exceptionally well.
5
The Yacktman Funds, Inc.
During 2011 we substantially increased our position in Cisco Systems as the shares collapsed in the middle of the year. We think management has taken a realistic and prudent approach to handling the company’s short-term challenges, as did other investors, and the stock rebounded solidly at the end of the year. We think the shares continue to be attractive at current prices.
Consumer Staples
Our largest positions in consumer staple companies produced solid results in 2011, with PepsiCo, Procter & Gamble, Coca-Cola, and Clorox appreciating in the mid-to-high single digits. These businesses tend to be fairly stable and predictable, with a strong ability to handle uncertain economic periods. We reduced our weightings in Coca-Cola and Clorox during the year due to their strong price performance.
Healthcare
In 2011 pharmaceutical shares were generally strong and medical device stocks weaker. Pfizer was a solid contributor to fund results with the stock appreciating more than 20% in 2011. Johnson & Johnson, which has a diverse set of businesses, including medical device, pharmaceutical, and consumer health also performed well. Medical device stocks like C.R. Bard, Stryker, and Becton Dickinson all declined in the mid-to-high single digit range.
C.R. Bard underperformed in 2011 due to slower customer demand as the weak economy caused a reduced number of patient procedures. Bard is more than 100 years old and sells a wide variety of modestly priced, often disposable medical devices and supplies. We are impressed by the company’s product portfolio as well as the CEO, Tim Ring, who is focused on delivering results over the long term while managing risk. We increased our position in C.R. Bard as the stock declined.
6
Special Situations
Apollo Group and H&R Block both increased more than 35% in 2011. Apollo’s shares rose sharply as the company demonstrated an ability to successfully handle changes in government student lending policies. H&R Block’s stock increased as concerns about potential legacy liabilities from the Option One mortgage business, a unit that was sold in 2008, decreased, and a new CEO, Bill Cobb took over.
Conclusion
We are happy with the results of 2011. We achieved solid returns in a turbulent market and effectively managed portfolio risk. Currently, the quality level of the companies in the funds is extremely high and valuations are attractive. We will work hard to objectively examine current positions and new opportunities and, as always, we will continue to be diligent, objective, and patient when managing The Yacktman Funds.
Sincerely,
The Yacktman Team
The S&P 500 is an unmanaged but commonly used measure of common stock total return performance.
The performance data quoted for The Yacktman Fund and The Yacktman Focused Fund represents past performance. Past performance does not guarantee future results. The investment return and principal value of an investment will fluctuate so that the investor’s shares, when redeemed, may be worth more or less than their original cost. The current performance may be higher or lower than the performance data quoted. The most recent month-end performance data may be obtained by calling this toll free number 1-800-525-8258.
An investor should consider the investment objectives, risks and charges and expenses of the Funds carefully before investing. The Funds’ prospectus contains this and other important information about the Funds. An investor may obtain a prospectus by clicking here or by calling this toll free number 1-800-525-8258. The prospectus should be read carefully before investing.
An investor should consider the investment objectives, risks and charges and expenses of the Funds carefully before investing. The Funds’
7
The Yacktman Funds, Inc.
prospectus contains this and other important information about the Funds. An investor may obtain a prospectus at www.yacktman.com or by calling this toll free number 1-800-525-8258. The prospectus should be read carefully before investing.
Please reference schedule of investments for security exposure to each Fund.
Distributed by Rafferty Capital Markets, LLC.
FINRA FX2012-0217-0318/H
8
The Yacktman Funds, Inc.
EXPENSE EXAMPLE
For the Six Months Ended December 31, 2011 (Unaudited)
As a shareholder of the Yacktman Funds (the “Funds”), you incur ongoing costs, including management fees and other Fund expenses. If you invest through a financial intermediary, you may also incur additional costs such as a transaction fee charged on the purchase or sale of the Fund or an asset-based management fee. This Example is intended to help you understand your ongoing costs (in dollars) of investing in the Fund and to compare these costs with the ongoing costs of investing in other mutual funds.
The Example is based on an investment of $1,000 invested at the beginning of the period and held for the entire period from July 1, 2011 to December 31, 2011.
Actual Expenses
The first line of the table on the next page provides information about actual account values and actual expenses. You may use the information in this line, together with the amount you invested, to estimate the expenses you paid over the period. Simply divide your account value by $1,000 (for example, an $8,600 account value divided by $1,000 = 8.6), then multiply the result by the number in the first line under the heading entitled “Expenses Paid During Period” to estimate the expenses you paid on your account during the period.
Hypothetical Example for Comparison Purposes
The second line of the table on the next page provides information about hypothetical account values and hypothetical expenses based on the Funds’ actual expense ratios and an assumed rate of return of 5% per year before expenses, which is not the Funds’ actual return. The hypothetical account values and expenses may not be used to estimate the actual ending account balance or expenses you paid for the period. You may use this information to compare the ongoing costs of investing in the Funds and other funds. To do so, compare this 5% hypothetical example with the 5% hypothetical examples that appear in the shareholder reports of the other funds.
9
The Yacktman Funds, Inc.
EXPENSE EXAMPLE (Cont’d.)
For the Six Months Ended December 31, 2011 (Unaudited)
Please note that the expenses shown in the table are meant to highlight your ongoing costs only and do not reflect any costs that may be associated with investing in the Funds through a financial intermediary. Therefore, the second line of the table is useful in comparing the ongoing costs only, and will not help you determine the relative total costs of owning different funds. In addition, if any costs associated with investing through a financial intermediary were included, your costs would have been higher.
THE YACKTMAN FOCUSED FUND
| Expenses | |||
| Beginning | Ending | paid during | |
| account | account | period | |
| value | value | 07/01/11- | |
| 07/01/11 | 12/31/11 | 12/31/111 | |
| Actual | $1,000.00 | $ 993.20 | $6.28 |
| Hypothetical | |||
| (5% return | |||
| before expenses) | 1,000.00 | 1,018.90 | 6.36 |
THE YACKTMAN FUND
| Expenses | |||
| Beginning | Ending | paid during | |
| account | account | period | |
| value | value | 07/01/11- | |
| 07/01/11 | 12/31/11 | 12/31/111 | |
| Actual | $1,000.00 | $ 988.70 | $4.06 |
| Hypothetical | |||
| (5% return | |||
| before expenses) | 1,000.00 | 1,021.12 | 4.13 |
| 1 | Expenses are equal to the Funds’ annualized expense ratios (1.25% for The Yacktman Focused Fund and 0.81% for The Yacktman Fund), multiplied by the average account value over the period, multiplied by 184/365 (to reflect the one-half year period). |
10
The Yacktman Funds, Inc.
EQUITY PURCHASES & SALES
For the Six Months Ended December 31, 2011 (Unaudited)
| Current | Current | |
| NEW PURCHASES | Shares Held | Shares Held |
| The Yacktman | The Yacktman | |
| Focused Fund | Fund | |
| Avon Products, Inc. | 5,300,000 | 7,400,000 |
| Avon Products, Inc. manufactures | ||
| and direct sells beauty and related | ||
| products. The Company markets its | ||
| products to consumers worldwide | ||
| through independent sales | ||
| representatives. Avon’s product line | ||
| includes beauty, fashion and home. | ||
| Bank of America Corp. | — | 5,000,000 |
| Bank of America Corporation accepts | ||
| deposits and offers banking, investing, | ||
| asset management, and other financial | ||
| and risk-management products and | ||
| services. The Company has a mortgage | ||
| lending subsidiary, and an investment | ||
| banking and securities brokerage subsidiary. | ||
| Goldman Sachs Group, Inc. | 250,000 | 350,000 |
| The Goldman Sachs Group, Inc., a | ||
| bank holding company, is a global | ||
| investment banking and securities | ||
| firm specializing in investment banking, | ||
| trading and principal investments, | ||
| asset management and securities | ||
| services. The Company provides | ||
| services to corporations, financial | ||
| institutions, governments, and | ||
| high-net worth individuals. |
11
The Yacktman Funds, Inc.
| Current | Current | |
| NEW PURCHASES | Shares Held | Shares Held |
| The Yacktman | The Yacktman | |
| Focused Fund | Fund | |
| Janus Capital Group, Inc. | — | 4,560,000 |
| Janus Capital Group, Inc. is a global | ||
| asset management firm offering | ||
| individual investors and institutional | ||
| clients asset management services. | ||
| The Company provides investment | ||
| management, administration, | ||
| distribution and related services to | ||
| individual and institutional investors | ||
| through mutual funds, separate | ||
| accounts and subadvised relationships. | ||
| Northern Trust Corp. | 550,000 | — |
| Northern Trust Corporation is a | ||
| financial holding company that | ||
| provides investment management, | ||
| asset and fund administration, fiduciary, | ||
| and banking solutions for corporations, | ||
| institutions, and affluent individuals. | ||
| Northern Trust’s banking operations | ||
| are its primary operations. | ||
| State Street Corp. | 550,000 | — |
| State Street Corporation services | ||
| institutional investors and manages | ||
| financial assets worldwide. The | ||
| Company’s products and services | ||
| include custody, accounting, | ||
| administration, daily pricing, | ||
| international exchange services, | ||
| cash management, financial asset | ||
| management, securities lending, and | ||
| investment advisory services. |
12
(This Page Intentionally Left Blank.)
13
The Yacktman Focused Fund
TOP TEN EQUITY HOLDINGS
December 31, 2011 (Unaudited)
| Percentage of | |
| Net Assets | |
| PepsiCo, Inc. | 10.75% |
| News Corp., Class A | 10.40% |
| Procter & Gamble Co. | 8.56% |
| Microsoft Corp. | 6.66% |
| C.R. Bard, Inc. | 4.23% |
| Cisco Systems, Inc. | 4.11% |
| Sysco Corp. | 3.30% |
| Coca-Cola Co. | 3.09% |
| Pfizer, Inc. | 2.73% |
| U.S. Bancorp | 2.44% |
| Total | 56.27% |
FUND DIVERSIFICATION*
December 31, 2011 (Unaudited)
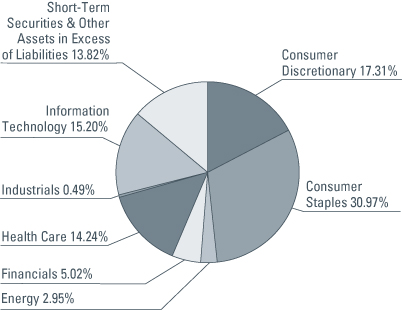
*Calculated as a percentage of net assets as of December 31, 2011.
14
The Yacktman Focused Fund
EQUITY PURCHASES & SALES
For the Six Months Ended December 31, 2011 (Unaudited)
| Net Shares | Current | ||||||||
| PURCHASES | Purchased | Shares Held | |||||||
| Avon Products, Inc. | 5,300,000 | 5,300,000 | |||||||
| The Bancorp, Inc. | 111,574 | 336,000 | |||||||
| Bank of New York Mellon Corp. | 2,250,000 | 2,250,000 | |||||||
| Becton, Dickinson & Co. | 420,000 | 770,000 | |||||||
| Cisco Systems, Inc. | 1,200,000 | 10,100,000 | |||||||
| Clorox Co. | 150,000 | 950,000 | |||||||
| ConocoPhilips | 100,000 | 1,160,000 | |||||||
| Corning, Inc. | 2,980,000 | 3,800,000 | |||||||
| Covidien Plc | 300,000 | 800,000 | |||||||
| C.R. Bard, Inc. | 1,415,000 | 2,000,000 | |||||||
| Goldman Sachs Group, Inc. | 250,000 | 250,000 | |||||||
| Hewlett-Packard Co. | 1,300,000 | 3,200,000 | |||||||
| Johnson & Johnson | 150,000 | 1,500,000 | |||||||
| Microsoft Corp. | 2,250,000 | 11,400,000 | |||||||
| News Corp., Class A | 5,300,000 | 25,900,000 | |||||||
| News Corp., Class B | 19,600 | 19,600 | |||||||
| Northern Trust Corp. | 550,000 | 550,000 | |||||||
| Patterson Companies., Inc. | 430,000 | 430,000 | |||||||
| PepsiCo, Inc. | 2,600,000 | 7,200,000 | |||||||
| Procter & Gamble Co. | 1,400,000 | 5,700,000 | |||||||
| Research In Motion Ltd. | 2,250,000 | 3,150,000 | |||||||
| State Street Corp. | 550,000 | 550,000 | |||||||
| Stryker Corp. | 1,300,000 | 1,850,000 | |||||||
| Sysco Corp. | 1,400,000 | 5,000,000 | |||||||
| U.S. Bancorp | 500,000 | 4,000,000 | |||||||
| Viacom, Inc., Class B | 400,000 | 2,300,000 | |||||||
| Wal-Mart Stores, Inc. | 100,000 | 1,000,000 | |||||||
| Net Shares | Current | ||||||||
| SALES | Sold | Shares Held | |||||||
| eBay, Inc. | 200,000 | — | |||||||
| Lancaster Colony Corp. | 216,500 | — | |||||||
15
The Yacktman Focused Fund
PORTFOLIO OF INVESTMENTS
December 31, 2011
| Number | ||||||||
| of Shares | Value | |||||||
| COMMON STOCKS - 86.01% | ||||||||
| Auto Manufacturers - 0.49% | ||||||||
| Toyota Industries | ||||||||
| Corporation - ADR (a) | 800,000 | $ | 21,783,200 | |||||
| Beverages - 13.84% | ||||||||
| Coca-Cola Co. | 1,960,000 | 137,141,200 | ||||||
| PepsiCo, Inc. | 7,200,000 | 477,720,000 | ||||||
| 614,861,200 | ||||||||
| Capital Markets - 2.51% | ||||||||
| Bank of New York Mellon Corp. | 2,250,000 | 44,797,500 | ||||||
| Goldman Sachs Group, Inc. | 250,000 | 22,607,500 | ||||||
| Northern Trust Corp. | 550,000 | 21,813,000 | ||||||
| State Street Corp. | 550,000 | 22,170,500 | ||||||
| 111,388,500 | ||||||||
| Commercial Banks - 2.49% | ||||||||
| The Bancorp, Inc. (a) | 336,000 | 2,429,280 | ||||||
| U.S. Bancorp | 4,000,000 | 108,200,000 | ||||||
| 110,629,280 | ||||||||
| Communications | ||||||||
| Equipment - 1.03% | ||||||||
| Cisco Systems, Inc. | 10,100,000 | 182,608,000 | ||||||
| Research In Motion Ltd. (a) | 3,150,000 | 45,675,000 | ||||||
| 228,283,000 | ||||||||
| Computers & Peripherals - 1.85% | ||||||||
| Hewlett-Packard Co. | 3,200,000 | 82,432,000 | ||||||
| Diversified Consumer | ||||||||
| Services - 5.14% | ||||||||
| Apollo Group, Inc., Class A (a) | 1,200,000 | 64,644,000 | ||||||
| H&R Block, Inc. | 3,800,000 | 62,054,000 | ||||||
| 126,698,000 | ||||||||
| Diversified Financial | ||||||||
| Services - 0.02% | ||||||||
| Resource America, Inc., Class A | 215,000 | 1,023,400 | ||||||
See notes to financial statements.
16
| Number | ||||||||
| of Shares | Value | |||||||
| Electronic Equipment, Instruments | ||||||||
| & Components - 1.11% | ||||||||
| Corning, Inc. | 3,800,000 | $ | 49,324,000 | |||||
| Food & Staples Retailing - 3.30% | ||||||||
| Sysco Corp. | 5,000,000 | 146,650,000 | ||||||
| Health Care Equipment | ||||||||
| & Supplies - 8.41% | ||||||||
| Becton, Dickinson & Co. | 770,000 | 57,534,400 | ||||||
| C.R. Bard, Inc. | 2,200,000 | 188,100,000 | ||||||
| Covidien Plc | 800,000 | 36,008,000 | ||||||
| Stryker Corp. | 1,850,000 | 91,963,500 | ||||||
| 373,605,900 | ||||||||
| Health Care Providers | ||||||||
| & Services - 0.89% | ||||||||
| Patterson Companies, Inc. | 430,000 | 12,693,600 | ||||||
| UnitedHealth Group, Inc. | 530,000 | 26,860,400 | ||||||
| 39,554,000 | ||||||||
| Household Products - 10.40% | ||||||||
| Clorox Co. | 950,000 | 63,232,000 | ||||||
| Colgate-Palmolive Co. | 200,000 | 18,478,000 | ||||||
| Procter & Gamble Co. | 5,700,000 | 380,247,000 | ||||||
| 461,957,000 | ||||||||
| IT Services - 2.27% | ||||||||
| Total System Services, Inc. | 1,000,000 | 19,560,000 | ||||||
| Media - 14.28% | ||||||||
| Comcast Corp. , Class A | 2,300,000 | 54,188,000 | ||||||
| Liberty Interactive | ||||||||
| Corp., Series A (a) | 840,000 | 13,620,600 | ||||||
| News Corp., Class A | 25,900,000 | 462,056,000 | ||||||
| News Corp., Class B | 19,600 | 356,328 | ||||||
| Viacom, Inc., Class B | 2,300,000 | 104,443,000 | ||||||
| 634,663,928 | ||||||||
| Oil, Gas & Consumable | ||||||||
| Fuels - 2.95% | ||||||||
| ConocoPhillips | 1,160,000 | 84,529,200 | ||||||
See notes to financial statements.
17
The Yacktman Focused Fund
PORTFOLIO OF INVESTMENTS (Cont’d.)
December 31, 2011
| Number | ||||||||
| of Shares | Value | |||||||
| Oil, Gas & Consumable | ||||||||
| Fuels - 2.95% (Continued) | ||||||||
| Exxon Mobil Corp. | 550,000 | $ | 46,618,000 | |||||
| 131,147,200 | ||||||||
| Personal Products - 2.08% | ||||||||
| Avon Products, Inc. | 5,300,000 | 92,591,000 | ||||||
| Pharmaceuticals - 4.94% | ||||||||
| Johnson & Johnson | 1,500,000 | 98,370,000 | ||||||
| Pfizer, Inc. | 5,600,000 | 121,184,000 | ||||||
| 219,554,000 | ||||||||
| Software - 6.66% | ||||||||
| Microsoft Corp. | 11,400,000 | 295,944,000 | ||||||
| Specialty Retail - 1.35% | ||||||||
| Wal-Mart Stores, Inc. | 1,000,000 | 59,760,000 | ||||||
| TOTAL COMMON STOCKS | ||||||||
| (Cost $3,453,306,079) | 3,821,409,608 | |||||||
| Principal | ||||||||
| Amount | Value | |||||||
| CORPORATE BONDS - 0.17% | ||||||||
| Media - 0.17% | ||||||||
| Liberty Interactive LLC | ||||||||
| 8.250%, 02/01/2030 | $ | 8,000,000 | 7,730,000 | |||||
| TOTAL CORPORATE BONDS | ||||||||
| (Cost $7,377,605) | 7,730,000 | |||||||
| SHORT-TERM INVESTMENTS - 13.34% | ||||||||
| Commercial Paper - 0.55% | ||||||||
| American Express Co. | ||||||||
| 0.003%, 01/03/2012 | 24,366,000 | 24,365,993 | ||||||
| Demand Note - 0.01% | ||||||||
| U.S. Bancorp | ||||||||
| 0.00% | 373,167 | 373,167 | ||||||
See notes to financial statements.
18
| Principal | ||||||||
| Amount | Value | |||||||
| U.S. Treasury Bills - 12.78% | ||||||||
| U.S. Treasury Bill | ||||||||
| 0.016%, 01/05/2012 | $ | 44,508,000 | $ | 44,507,901 | ||||
| 0.001%, 01/19/2012 | 22,941,000 | 22,940,989 | ||||||
| 0.008%, 02/02/2012 | 41,396,000 | 41,395,709 | ||||||
| 0.001%, 02/09/2012 | 21,832,000 | 21,831,976 | ||||||
| 0.004%, 02/16/2012 | 64,427,000 | 64,426,622 | ||||||
| 0.005%, 02/23/2012 | 78,130,000 | 78,129,425 | ||||||
| 0.017%, 03/15/2012 | 30,523,000 | 30,521,931 | ||||||
| 0.014%, 03/22/2012 | 50,736,000 | 50,734,326 | ||||||
| 0.017%, 04/19/2012 | 30,575,000 | 30,573,410 | ||||||
| 0.019%, 04/26/2012 | 24,366,000 | 24,364,465 | ||||||
| 0.022%, 05/03/2012 | 60,760,000 | 60,755,382 | ||||||
| 0.032%, 05/17/2012 | 33,877,000 | 33,872,867 | ||||||
| 0.037%, 05/31/2012 | 25,917,000 | 25,912,983 | ||||||
| 0.051%, 06/21/2012 | 38,069,000 | 38,059,673 | ||||||
| 568,027,659 | ||||||||
| TOTAL SHORT-TERM | ||||||||
| INVESTMENTS | ||||||||
| (Cost $592,781,779) | 592,766,819 | |||||||
| Total Investments | ||||||||
| (Cost $4,053,465,463) - 99.52% | 4,421,906,427 | |||||||
| Other Assets in Excess | ||||||||
| of Liabilities - 0.48% | 21,292,873 | |||||||
| TOTAL NET ASSETS - 100.00% | $ | 4,443,199,300 | ||||||
Percentages are stated as a percent of net assets.
ADR American Depository Receipt
PLC Public Limited Company
(a)Non-Income Producing
The Global Industry Classification Standard (GICS®) was developed by and/or is the exclusive property of MSCI, Inc. and Standard & Poor Financial Services LLC (“S&P”). GICS is a service mark of MSCI and S&P and has been licensed for use by U.S. Bancorp Fund Services, LLC.
See notes to financial statements.
19
The Yacktman Fund
TOP TEN EQUITY HOLDINGS
December 31, 2011 (Unaudited)
| Percentage of | |
| Net Assets | |
| PepsiCo, Inc. | 10.54% |
| News Corp., Class A | 10.43% |
| Procter & Gamble Co. | 4.93% |
| Microsoft Corp. | 4.83% |
| Cisco Systems, Inc. | 4.54% |
| Johnson & Johnson | 3.65% |
| Coca-Cola Co. | 3.61% |
| C.R. Bard, Inc. | 3.46% |
| Sysco Corp. | 3.45% |
| U.S. Bancorp | 2.79% |
| Total | 52.23% |
FUND DIVERSIFICATION*
December 31, 2011 (Unaudited)
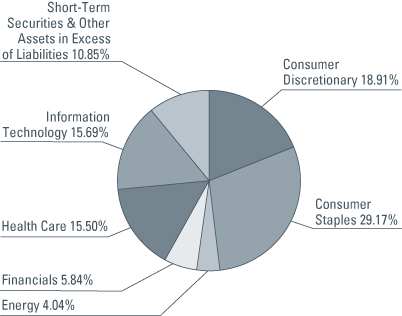
*Calculated as a percentage of net assets as of December 31, 2011.
20
The Yacktman Fund
EQUITY PURCHASES & SALES
For the Six Months Ended December 31, 2011 (Unaudited)
| Net Shares | Current | ||||||||
| PURCHASES | Purchased | Shares Held | |||||||
| Avon Products, Inc. | 7,400,000 | 7,400,000 | |||||||
| The Bancorp, Inc. | 50,546 | 760,000 | |||||||
| Bank of America Corp. | 5,000,000 | 5,000,000 | |||||||
| Bank of New York Mellon Corp. | 2,000,000 | 4,200,000 | |||||||
| Becton, Dickinson & Co. | 50,000 | 800,000 | |||||||
| C.R. Bard, Inc. | 1,195,000 | 2,550,000 | |||||||
| Cisco Systems, Inc. | 800,000 | 15,800,000 | |||||||
| Corning, Inc. | 3,970,000 | 5,500,000 | |||||||
| Exxon Mobil Corp. | 50,000 | 1,150,000 | |||||||
| Goldman Sachs Group, Inc. | 350,000 | 350,000 | |||||||
| Hewlett-Packard Co. | 1,750,000 | 5,150,000 | |||||||
| Janus Capital Group, Inc. | 4,560,000 | 4,560,000 | |||||||
| Johnson & Johnson | 200,000 | 3,500,000 | |||||||
| Microsoft Corp. | 1,100,000 | 11,700,000 | |||||||
| News Corp., Class A | 4,300,000 | 36,800,000 | |||||||
| Patterson Companies, Inc. | 1,550,000 | 2,050,000 | |||||||
| PepsiCo., Inc. | 2,500,000 | 10,000,000 | |||||||
| Procter & Gamble Co. | 400,000 | 4,650,000 | |||||||
| Research In Motion Ltd. | 3,000,000 | 4,500,000 | |||||||
| Stryker Corp. | 1,578,617 | 2,498,617 | |||||||
| Sysco Corp. | 1,200,000 | 7,400,000 | |||||||
| U.S. Bancorp | 700,000 | 6,500,000 | |||||||
| Wal-Mart Stores, Inc. | 200,000 | 1,700,000 | |||||||
21
The Yacktman Fund
PORTFOLIO OF INVESTMENTS
December 31, 2011
| Number | ||||||||
| of Shares | Value | |||||||
| COMMON STOCKS - 89.15% | ||||||||
| Beverages - 14.16% | ||||||||
| Coca-Cola Co. | 3,250,000 | $ | 227,402,500 | |||||
| PepsiCo, Inc. | 10,000,000 | 663,500,000 | ||||||
| 890,902,500 | ||||||||
| Capital Markets - 2.29% | ||||||||
| Bank of New York Mellon Corp. | 4,200,000 | 83,622,000 | ||||||
| Goldman Sachs Group, Inc. | 350,000 | 31,650,500 | ||||||
| Janus Capital Group, Inc. | 4,560,000 | 28,773,600 | ||||||
| 144,046,100 | ||||||||
| Commercial Banks - 2.88% | ||||||||
| The Bancorp, Inc. (a) | 760,000 | 5,494,800 | ||||||
| U.S. Bancorp | 6,500,000 | 175,825,000 | ||||||
| 181,319,800 | ||||||||
| Communications | ||||||||
| Equipment - 5.58% | ||||||||
| Cisco Systems, Inc. | 15,800,000 | 285,664,000 | ||||||
| Research In Motion Ltd. (a) | 4,500,000 | 65,250,000 | ||||||
| 350,914,000 | ||||||||
| Computers & Peripherals - 2.11% | ||||||||
| Hewlett-Packard Co. | 5,150,000 | 132,664,000 | ||||||
| Consumer Finance - 0.18% | ||||||||
| American Express Co. | 235,000 | 11,084,950 | ||||||
| Diversified Consumer | ||||||||
| Services - 3.45% | ||||||||
| Apollo Group, Inc., Class A (a) | 2,050,000 | 110,433,500 | ||||||
| H&R Block, Inc. | 6,500,000 | 106,145,000 | ||||||
| 216,578,500 | ||||||||
| Diversified Financial | ||||||||
| Services - 0.49% | ||||||||
| Bank of America Corp. | 5,000,000 | 27,800,000 | ||||||
| Resource America, Inc., Class A | 659,226 | 3,137,916 | ||||||
| 30,937,916 | ||||||||
See notes to financial statements.
22
| Number | ||||||||
| of Shares | Value | |||||||
| Electronic Equipment, Instruments | ||||||||
| & Components - 1.13% | ||||||||
| Corning, Inc. | 5,500,000 | $ | 71,390,000 | |||||
| Food & Staples Retailing - 3.45% | ||||||||
| Sysco Corp. | 7,400,000 | 217,042,000 | ||||||
| Food Products - 0.51% | ||||||||
| Lancaster Colony Corp. | 460,000 | 31,896,400 | ||||||
| Health Care Equipment | ||||||||
| & Supplies - 7.24% | ||||||||
| Becton, Dickinson & Co. | 800,000 | 59,776,000 | ||||||
| C.R. Bard, Inc. | 2,550,000 | 218,025,000 | ||||||
| Covidien Plc | 850,000 | 38,258,500 | ||||||
| Medtronic, Inc. | 400,000 | 15,300,000 | ||||||
| Stryker Corp. | 2,498,617 | 124,206,251 | ||||||
| 455,565,751 | ||||||||
| Health Care Providers | ||||||||
| & Services - 1.93% | ||||||||
| Patterson Companies, Inc. | 2,050,000 | 60,516,000 | ||||||
| UnitedHealth Group, Inc. | 1,200,000 | 60,816,000 | ||||||
| 121,332,000 | ||||||||
| Household Products - 7.39% | ||||||||
| Clorox Co. | 1,400,000 | 93,184,000 | ||||||
| Colgate-Palmolive Co. | 670,000 | 61,901,300 | ||||||
| Procter & Gamble Co. | 4,650,000 | 310,201,500 | ||||||
| 465,286,800 | ||||||||
| Internet Software | ||||||||
| & Services - 0.60% | ||||||||
| eBay, Inc. (a) | 1,250,000 | 37,912,500 | ||||||
| IT Services - 0.56% | ||||||||
| Total System Services, Inc. | 1,800,000 | 35,208,000 | ||||||
| Media - 15.46% | ||||||||
| Comcast Corp. | 4,700,000 | 110,732,000 | ||||||
| Liberty Interactive | ||||||||
| Corp., Series A (a) | 2,900,000 | 47,023,500 | ||||||
| News Corp., Class A | 36,800,000 | 656,512,000 | ||||||
See notes to financial statements.
23
The Yacktman Fund
PORTFOLIO OF INVESTMENTS (Cont’d.)
December 31, 2011
| Number | ||||||||
| of Shares | Value | |||||||
| Media - 15.46% (Continued) | ||||||||
| Viacom, Inc., Class B | 3,500,000 | $ | 158,935,000 | |||||
| 973,202,500 | ||||||||
| Oil, Gas & Consumable Fuels - 4.04% | ||||||||
| ConocoPhillips | 2,150,000 | 156,670,500 | ||||||
| Exxon Mobil Corp. | 1,150,000 | 97,474,000 | ||||||
| 254,144,500 | ||||||||
| Personal Products - 2.05% | ||||||||
| Avon Products, Inc. | 7,400,000 | 129,278,000 | ||||||
| Pharmaceuticals - 6.33% | ||||||||
| Johnson & Johnson | 3,500,000 | 229,530,000 | ||||||
| Pfizer, Inc. | 7,800,000 | 168,792,000 | ||||||
| 398,322,000 | ||||||||
| Semiconductor & Semiconductor | ||||||||
| Equipment - 0.88% | ||||||||
| Intel Corp. | 2,300,000 | 55,775,000 | ||||||
| Software - 4.83% | ||||||||
| Microsoft Corp. | 11,700,000 | 303,732,000 | ||||||
| Specialty Retail - 1.61% | ||||||||
| Wal-Mart Stores, Inc. | 1,700,000 | 101,592,000 | ||||||
| TOTAL COMMON STOCKS | ||||||||
| (Cost $4,967,664,331) | 5,610,127,217 | |||||||
| Principal | ||||||||
| Amount | Value | |||||||
| SHORT-TERM INVESTMENTS - 10.38% | ||||||||
| Commercial Paper - 0.65% | ||||||||
| American Express Co. | ||||||||
| 0.003%, 01/03/2012 | $ | 41,206,000 | 41,205,988 | |||||
| Demand Note - 0.01% | ||||||||
| U.S. Bancorp | ||||||||
| 0.00% | 380,960 | 380,960 | ||||||
See notes to financial statements.
24
| Principal | ||||||||
| Amount | Value | |||||||
| U.S. Treasury Bills - 9.72% | ||||||||
| U.S. Treasury Bill | ||||||||
| 0.007%, 02/02/2012 | $ | 82,183,000 | $ | 82,182,454 | ||||
| 0.020%, 02/09/2012 | 29,248,000 | 29,247,366 | ||||||
| 0.005%, 02/23/2012 | 33,442,000 | 33,441,754 | ||||||
| 0.017%, 03/29/2012 | 35,127,000 | 35,125,525 | ||||||
| 0.022%, 05/03/2012 | 83,972,000 | 83,965,618 | ||||||
| 0.032%, 05/17/2012 | 102,861,000 | 102,848,451 | ||||||
| 0.037%, 05/31/2012 | 41,965,000 | 41,958,495 | ||||||
| 0.051%, 06/21/2012 | 203,185,000 | 203,135,220 | ||||||
| 611,904,883 | ||||||||
| TOTAL SHORT-TERM | ||||||||
| INVESTMENTS | ||||||||
| (Cost $653,542,638) | 653,491,831 | |||||||
| Total Investments | ||||||||
| (Cost $5,621,206,969) - 99.53% | 6,263,619,048 | |||||||
| Other Assets in Excess | ||||||||
| of Liabilities - 0.47% | 29,463,562 | |||||||
| TOTAL NET ASSETS - 100.00% | $ | 6,293,082,610 | ||||||
Percentages are stated as a percent of net assets.
PLC Public Limited Company
(a)Non-Income Producing
See notes to financial statements.
25
The Yacktman Funds, Inc.
STATEMENTS OF ASSETS & LIABILITIES
December 31, 2011
| The Yacktman | The Yacktman | |||||||
| Focused Fund | Fund | |||||||
| ASSETS: | ||||||||
| Investments, at value | ||||||||
| (Cost $4,053,465,463 and | ||||||||
| $5,621,206,969 respectively) | $ | 4,421,906,428 | $ | 6,263,619,048 | ||||
| Receivable for | ||||||||
| fund shares sold | 54,992,544 | 42,036,311 | ||||||
| Dividends and | ||||||||
| interest receivable | 7,467,688 | 10,616,140 | ||||||
| Prepaid expenses | 199,919 | 186,620 | ||||||
| Total Assets | 4,484,566,579 | 6,316,458,119 | ||||||
| LIABILITIES: | ||||||||
| Payable for fund | ||||||||
| shares redeemed | 4,123,353 | 8,670,761 | ||||||
| Payable for | ||||||||
| investments purchased | 32,684,458 | 10,111,052 | ||||||
| Accrued investment | ||||||||
| advisory fees | 3,578,466 | 2,913,951 | ||||||
| Other accrued expenses | 981,002 | 1,679,745 | ||||||
| Total Liabilities | 41,367,279 | 23,375,509 | ||||||
| NET ASSETS | $ | 4,443,199,300 | $ | 6,293,082,610 | ||||
| NET ASSETS CONSIST OF: | ||||||||
| Capital stock | $ | 4,077,032,589 | $ | 5,654,464,126 | ||||
| Undistributed net | ||||||||
| investment income | 423 | 5,269 | ||||||
| Undistributed accumulated | ||||||||
| net realized loss | (2,274,677 | ) | (3,798,864 | ) | ||||
| Net unrealized appreciation | ||||||||
| Investments | 368,440,965 | 642,412,079 | ||||||
| Total Net Assets | $ | 4,443,199,300 | $ | 6,293,082,610 | ||||
| CAPITAL STOCK, $0.0001 par value | ||||||||
| Authorized | 500,000,000 | 500,000,000 | ||||||
| Issued and Outstanding | 236,653,112 | 359,303,658 | ||||||
| NET ASSET VALUE, REDEMPTION | ||||||||
| PRICE, AND OFFERING PRICE | ||||||||
| PER SHARE (Note 2) | $ | 18.78 | $ | 17.51 | ||||
See notes to financial statements.
26
The Yacktman Funds, Inc.
STATEMENTS OF OPERATIONS
For the Year Ended December 31, 2011
| The Yacktman | The Yacktman | |||||||
| Focused Fund | Fund | |||||||
| INVESTMENT INCOME: | ||||||||
Dividend income(1) | $ | 65,277,579 | $ | 104,958,682 | ||||
| Interest income | 932,117 | 751,126 | ||||||
| Total investment income | 66,209,696 | 105,709,808 | ||||||
| EXPENSES: | ||||||||
| Investment advisory fees | 30,961,107 | 28,633,960 | ||||||
| Shareholder servicing fees | 5,573,605 | 8,697,805 | ||||||
| Administration and accounting fees | 1,041,905 | 1,730,580 | ||||||
| Federal and state registration fees | 561,608 | 815,823 | ||||||
| Reports to shareholders | 202,580 | 361,420 | ||||||
| Custody fees | 172,280 | 279,065 | ||||||
| Directors fees and expenses | 42,850 | 67,640 | ||||||
| Professional fees | 32,779 | 42,450 | ||||||
| Compliance expenses | 33,585 | 55,320 | ||||||
| Miscellaneous expenses | 26,673 | 48,442 | ||||||
| Net Expenses | 38,648,972 | 40,732,505 | ||||||
| NET INVESTMENT INCOME | 27,560,724 | 64,977,303 | ||||||
| REALIZED AND UNREALIZED GAIN: | ||||||||
| Net realized gain (loss) on | ||||||||
| Investments | 20,804,139 | 18,993,470 | ||||||
| Written Options | 59,729 | — | ||||||
| Total | 20,863,868 | 18,993,470 | ||||||
| Change in unrealized | ||||||||
| appreciation (depreciation) on | ||||||||
| Investments | 156,568,966 | 226,166,229 | ||||||
| Written Options | (833,979 | ) | — | |||||
| Total | 155,734,987 | 226,166,229 | ||||||
| Net realized and unrealized | ||||||||
| gain on investments | 176,598,855 | 245,159,699 | ||||||
| NET INCREASE IN NET ASSETS | ||||||||
| RESULTING FROM OPERATIONS | $ | 204,159,579 | $ | 310,137,002 | ||||
(1)Net of $35,439 and $0, respectively in foreign withholding taxes.
See notes to financial statements.
27
The Yacktman Funds, Inc.
STATEMENTS OF CHANGES
IN NET ASSETS
OPERATIONS:
Net investment income
Net realized gain on investments
Net change in unrealized appreciation on investments
Net increase in net assets resulting from operations
CAPITAL SHARE TRANSACTIONS:
Proceeds from shares sold
Proceeds from reinvestment of distributions
Redemption fees
Payments for shares redeemed
Net increase
DISTRIBUTIONS PAID FROM:
Net investment income
Net realized gains
Total distributions
TOTAL INCREASE IN NET ASSETS
NET ASSETS:
Beginning of period
End of period (including undistributed net investment income
of $423, $1,267, $5,269, and $6,569, respectively)
TRANSACTIONS IN SHARES:
Shares sold
Issued in reinvestment of distributions
Shares redeemed
Net increase
See notes to financial statements.
28
| The Yacktman Focused Fund | The Yacktman Fund | |||||||||||||
| Year Ended | Year Ended | Year Ended | Year Ended | |||||||||||
| December 31, | December 31, | December 31, | December 31, | |||||||||||
| 2011 | 2010 | 2011 | 2010 | |||||||||||
| $ | 27,560,724 | $ | 11,317,997 | $ | 64,977,303 | $ | 30,258,360 | |||||||
| 20,863,868 | 28,703,833 | 18,993,470 | 89,401,060 | |||||||||||
| 155,734,987 | 117,427,840 | 226,166,229 | 184,285,383 | |||||||||||
| 204,159,579 | 157,449,670 | 310,137,002 | 303,944,803 | |||||||||||
| 3,148,739,337 | 1,659,807,320 | 3,853,558,468 | 2,628,081,237 | |||||||||||
| 43,205,204 | 35,211,871 | 74,256,597 | 107,073,601 | |||||||||||
| 363,938 | 153,817 | 446,315 | 331,217 | |||||||||||
| 3,192,308,479 | 1,695,173,008 | 3,928,261,380 | 2,735,486,055 | |||||||||||
| (903,851,317 | ) | (483,537,199 | ) | (1,277,454,765 | ) | (904,378,793 | ) | |||||||
| 2,288,457,162 | 1,211,635,809 | 2,650,806,615 | 1,831,107,262 | |||||||||||
| (27,560,769 | ) | (11,317,968 | ) | (64,978,603 | ) | (30,259,482 | ) | |||||||
| (21,449,602 | ) | (27,835,852 | ) | (19,374,588 | ) | (89,528,134 | ) | |||||||
| (49,010,371 | ) | (39,153,820 | ) | (84,353,191 | ) | (119,787,616 | ) | |||||||
| 2,443,606,370 | 1,329,931,659 | 2,876,590,426 | 2,015,264,449 | |||||||||||
| 1,999,592,930 | 669,661,271 | 3,416,492,184 | 1,401,227,735 | |||||||||||
| $ | 4,443,199,300 | $ | 1,999,592,930 | $ | 6,293,082,610 | $ | 3,416,492,184 | |||||||
| 170,577,353 | 98,654,763 | 222,940,629 | 164,842,717 | |||||||||||
| 2,294,475 | 1,992,751 | 4,226,328 | 6,477,518 | |||||||||||
| (49,315,952 | ) | (29,067,513 | ) | (74,434,686 | ) | (56,835,852 | ) | |||||||
| 123,555,876 | 71,580,001 | 152,732,271 | 114,484,383 | |||||||||||
See notes to financial statements.
29
The Yacktman Funds, Inc.
FINANCIAL HIGHLIGHTS
For a Fund share outstanding throughout each year
NET ASSET VALUE:
Beginning of year
OPERATIONS:
Net investment income
Net realized and unrealized gain (loss)
on investment securities
Total from operations
Redemption Fee Proceeds
LESS DISTRIBUTIONS:
From net investment income
From net realized gains
Total distributions
NET ASSET VALUE:
End of year
TOTAL RETURN
SUPPLEMENTAL DATA AND RATIOS
Net assets; end of year (000's)
Ratio of expenses before expense reimbursements
to average net assets (See Note 4)
Ratio of net expenses to average net assets
Ratio of net investment income to average net assets
Portfolio turnover rate
See notes to financial statements.
30
| The Yacktman Focused Fund | ||||||||||||||||||
| Year Ended December 31, | ||||||||||||||||||
| 2011 | 2010 | 2009 | 2008 | 2007 | ||||||||||||||
| $ | 17.68 | $ | 16.13 | $ | 9.97 | $ | 14.00 | $ | 16.00 | |||||||||
| 0.12 | 0.10 | 0.05 | 0.15 | 0.23 | ||||||||||||||
| 1.19 | 1.81 | 6.21 | (3.45 | ) | 0.34 | |||||||||||||
| 1.31 | 1.91 | 6.26 | (3.30 | ) | 0.57 | |||||||||||||
| — | * | — | * | — | * | — | * | — | * | |||||||||
| (0.12 | ) | (0.10 | ) | (0.05 | ) | (0.16 | ) | (0.23 | ) | |||||||||
| (0.09 | ) | (0.26 | ) | (0.05 | ) | (0.57 | ) | (2.34 | ) | |||||||||
| (0.21 | ) | (0.36 | ) | (0.10 | ) | (0.73 | ) | (2.57 | ) | |||||||||
| $ | 18.78 | $ | 17.68 | $ | 16.13 | $ | 9.97 | $ | 14.00 | |||||||||
| 7.41 | % | 11.84 | % | 62.76 | % | (23.48 | %) | 3.46 | % | |||||||||
| $ | 4,443,199 | $ | 1,999,593 | $ | 669,661 | $ | 65,467 | $ | 67,052 | |||||||||
| 1.25 | % | 1.27 | % | 1.28 | % | 1.35 | % | 1.38 | % | |||||||||
| 1.25 | % | 1.25 | % | 1.25 | % | 1.25 | % | 1.25 | % | |||||||||
| 0.89 | % | 0.93 | % | 0.79 | % | 1.31 | % | 1.23 | % | |||||||||
| 2.08 | % | 6.06 | % | 8.26 | % | 67.11 | % | 30.49 | % | |||||||||
*Amount represents less than $0.01 per share.
See notes to financial statements.
31
The Yacktman Funds, Inc.
FINANCIAL HIGHLIGHTS (Cont’d.)
For a Fund share outstanding throughout each year
NET ASSET VALUE:
Beginning of year
OPERATIONS:
Net investment income
Net realized and unrealized gain (loss)
on investment securities
Total from operations
Redemption Fee Proceeds
LESS DISTRIBUTIONS:
From net investment income
From net realized gains
Total distributions
NET ASSET VALUE:
End of year
TOTAL RETURN
SUPPLEMENTAL DATA AND RATIOS
Net assets; end of year (000's)
Ratio of net expenses to average net assets
Ratio of net investment income to average net assets
Portfolio turnover rate
See notes to financial statements.
32
| The Yacktman Fund | ||||||||||||||||||
| Year Ended December 31, | ||||||||||||||||||
| 2011 | 2010 | 2009 | 2008 | 2007 | ||||||||||||||
| $ | 16.54 | $ | 15.22 | $ | 9.68 | $ | 13.39 | $ | 15.79 | |||||||||
| 0.18 | 0.15 | 0.10 | 0.17 | 0.35 | ||||||||||||||
| 1.02 | 1.77 | 5.64 | (3.66 | ) | 0.21 | |||||||||||||
| 1.20 | 1.92 | 5.74 | (3.49 | ) | 0.56 | |||||||||||||
| — | * | — | * | — | * | — | * | — | * | |||||||||
| (0.18 | ) | (0.15 | ) | (0.10 | ) | (0.18 | ) | (0.34 | ) | |||||||||
| (0.05 | ) | (0.45 | ) | (0.10 | ) | (0.04 | ) | (2.62 | ) | |||||||||
| (0.23 | ) | (0.60 | ) | (0.20 | ) | (0.22 | ) | (2.96 | ) | |||||||||
| $ | 17.51 | $ | 16.54 | $ | 15.22 | $ | 9.68 | $ | 13.39 | |||||||||
| 7.30 | % | 12.64 | % | 59.31 | % | (26.05 | %) | 3.39 | % | |||||||||
| $ | 6,293,083 | $ | 3,416,492 | $ | 1,401,228 | $ | 296,659 | $ | 291,574 | |||||||||
| 0.80 | % | 0.85 | % | 0.93 | % | 0.95 | % | 0.95 | % | |||||||||
| 1.28 | % | 1.30 | % | 1.43 | % | 1.92 | % | 1.71 | % | |||||||||
| 2.76 | % | 9.73 | % | 14.29 | % | 32.77 | % | 23.82 | % | |||||||||
*Amount represents less than $0.01 per share.
See notes to financial statements.
33
The Yacktman Funds, Inc.
NOTES TO THE FINANCIAL STATEMENTS
December 31, 2011
1. ORGANIZATION
The Yacktman Funds, Inc. (comprised of The Yacktman Focused Fund and the Yacktman Fund, hereafter referred to as the “Funds”) is registered as an open-end management investment company under the Investment Company Act of 1940 (the “1940 Act”). The Funds consist of two investment portfolios: The Yacktman Focused Fund is a non-diversified fund that commenced operations May 1, 1997 and The Yacktman Fund is a diversified fund that commenced operations July 6, 1992. The objective of each of the Funds is to produce long-term capital appreciation with current income as a secondary objective. Yacktman Asset Management Co. is the Funds’ investment adviser (the “Adviser”).
2. SIGNIFICANT ACCOUNTING POLICIES
The following is a summary of significant accounting policies consistently followed by the Funds in the preparation of their financial statements. The financial statements have been prepared in conformity with accounting principles generally accepted in the United States of America (“GAAP”), which require management to make certain estimates and assumptions that affect the reported amounts of assets and liabilities and disclosure of contingent assets and liabilities at the date of the financial statements and the reported amounts of increases and decreases in net assets from operations during the reporting period. Actual results could differ from those estimates.
a) Investment Valuation – Securities which are traded on a national stock exchange are valued at the last sale price on the securities exchange on which such securities are primarily traded. Securities that are traded on the Nasdaq National Market or the Nasdaq Smallcap Market are valued at the Nasdaq Official Closing Price. Exchange-traded securities for which there were no transactions are valued at the current bid prices. Securities traded on only over-the-counter markets are valued on the basis of
34
closing over-the-counter bid prices. Short-term debt instruments maturing within 60 days are valued by the amortized cost method, which approximates fair value. Debt securities (other than short-term instruments) are valued at the mean price furnished by a national pricing service, subject to review by the Adviser and determination of the appropriate price whenever a furnished price is significantly different from the previous day’s furnished price. Options written or purchased by The Yacktman Focused Fund are valued at the last sales price if such last sales price is between the current bid and asked prices. Otherwise, options are valued at the mean between the current bid and asked prices. Any securities for which there are no readily available market quotations and other assets will be valued at their fair value as determined in good faith by the Adviser pursuant to procedures established by and under the supervision of the Board of Directors. The fair value of a security is the amount which a Fund might reasonably expect to receive upon a current sale. Valuing securities for which there are no readily available market quotations involves greater reliance on judgement and there can be no assurance that the Funds could obtain the fair value assigned to a security if they were to sell the security at approximately the time at which the Funds determine their net asset value per share.
Valuation Measurements
The Funds have adopted authoritative fair valuation accounting standards which establish an authoritative definition of fair value and set out a hierarchy for measuring fair value. These standards require additional disclosures about the various inputs and valuation techniques used to develop the measurements of fair value and a discussion in changes in valuation techniques and related inputs, if any, during the period. In addition, these standards require expanded disclosure for each major category of assets. These inputs are summarized in the three broad levels listed below:
35
The Yacktman Funds, Inc.
NOTES TO THE FINANCIAL STATEMENTS
December 31, 2011 (Cont’d.)
| Level 1 – | Quoted prices in active markets for identical securities. |
| Level 2 – | Other significant observable inputs (including quoted prices for similar securities, interest rates, prepayment speeds, credit risk, etc.). |
| Level 3 – | Significant unobservable inputs (including the Fund’s own assumptions in determining the fair value of investments). |
The inputs or methodology used for valuing securities are not necessarily an indication of the risk associated with investing in those securities. The following is a summary of the inputs used to value the Funds’ net assets as of December 31, 2011:
THE YACKTMAN FOCUSED FUND
| Level 1 | Level 2 | Level 3 | Total | |||||||||||||
Common Stock* | $ | 3,799,626,408 | $ | 21,783,200 | ** | $ | — | $ | 3,821,409,608 | |||||||
Corporate Bonds* | — | 7,730,000 | — | 7,730,000 | ||||||||||||
| Short-Term | ||||||||||||||||
| Investments | — | 592,766,820 | — | 592,766,820 | ||||||||||||
| Total Investments | ||||||||||||||||
| in Securities | $ | 3,799,626,408 | $ | 622,280,020 | $ | — | $ | 4,421,906,428 | ||||||||
| * | Please refer to the portfolio of investments to view securities by industry type. |
| ** | Amount represents a security in the Auto Manufacturers industry. |
THE YACKTMAN FUND
| Level 1 | Level 2 | Level 3 | Total | |||||||||||||
Common Stock* | $ | 5,610,127,217 | $ | — | $ | — | $ | 5,610,127,217 | ||||||||
| Short-Term | ||||||||||||||||
| Investments | — | 653,491,831 | — | 653,491,831 | ||||||||||||
| Total Investments | ||||||||||||||||
| in Securities | $ | 5,610,127,217 | $ | 653,491,831 | $ | — | $ | 6,263,619,048 | ||||||||
| * | Please refer to the portfolio of investments to view securities by industry type. |
The Funds did not invest in any Level 3 investments during the year. There were no significant transfers into or out of Level 1 or Level 2 during the year. It is the Funds’ policy to consider transfers into or out of Level 1 and Level 2 as of the end of the reporting period.
36
b) Option Writing – The Yacktman Focused Fund may use options to generate income and to hedge against losses caused by declines in the prices of stocks in its portfolio or for any other permissible purposes consistent with the Fund’s investment objective. When The Yacktman Focused Fund writes an option, an amount equal to the premium received by The Yacktman Focused Fund is recorded as a liability and is subsequently adjusted to the current fair value of the option written. Premiums received from writing options that expire unexercised are treated by The Yacktman Focused Fund on the expiration date as realized gains from written options. The difference between the premium and the amount paid on effecting a closing purchase transaction, including brokerage commissions, is also treated as a realized gain, or, if the premium is less than the amount paid for the closing purchase transaction, as a realized loss. If a call option is exercised, the premium is added to the proceeds from the sale of the underlying security or currency in determining whether The Yacktman Focused Fund has realized a gain or loss. If a put option is exercised, the premium reduces the cost basis of the securities purchased by The Yacktman Focused Fund. The Yacktman Focused Fund as a writer of an option bears the market risk of an unfavorable change in the price of the security underlying the written option.
37
The Yacktman Funds, Inc.
NOTES TO THE FINANCIAL STATEMENTS
December 31, 2011 (Cont’d.)
The Effect of Derivative Instruments on the Statement of Operations as of December 31, 2011
| Amount of Realized Gain on | |||||||||
| Derivatives Recognized in Income | |||||||||
| Derivatives not accounted | |||||||||
| for as hedging instruments | Written Options | Total | |||||||
| Equity Contracts | $ | 59,729 | $ | 59,729 | |||||
| Total | $ | 59,729 | $ | 59,729 | |||||
| Change in Unrealized Depreciation | |||||||||
| on Derivatives Recognized in Income | |||||||||
| Derivatives not accounted | |||||||||
| for as hedging instruments | Written Options | Total | |||||||
| Equity Contracts | $ | (833,979 | ) | $ | (833,979 | ) | |||
| Total | $ | (833,979 | ) | $ | (833,979 | ) | |||
See Note 4 for additional disclosure related to transactions in written options during the year.
c) Federal Income Taxes – It is each Fund’s policy to meet the requirements of the Internal Revenue Code applicable to regulated investment companies and to distribute substantially all investment company net taxable income and net capital gains to its shareholders in a manner which results in no tax cost to the Fund. Therefore, no federal income tax provision is required.
The Funds have adopted financial reporting rules regarding recognition and measurement of tax positions taken or expected to be taken on a tax return. The Funds have reviewed all open tax years and major jurisdictions and concluded that there is no impact on the Funds’ net assets and no tax liability resulting from unrecognized tax benefits relating to uncertain income tax positions taken or expected to be taken on a tax return. The Funds recognize interest and penalties, if any, related to unrecognized tax benefits as income tax expense in the Statement of Operations. During the year, the Funds did not incur any interest or penalties. The Funds are not subject to examination by U.S. federal tax authorities for any tax years before 2008.
38
d) Distributions to Shareholders – Dividends from net investment income and distributions of net realized capital gains, if any, are declared and paid at least annually. Distributions to shareholders are recorded on the ex-dividend date. The character of distributions made during the year from net investment income or net realized gains may differ from the characterization for federal income tax purposes due to differences in the recognition of income, expense and gain items for financial statement and tax purposes. Additionally, the Funds may utilize earnings and profits distributed to shareholders on redemption of shares as part of the dividends paid deduction for income tax purposes. Where appropriate, reclassifications between capital accounts are made for such differences that are permanent in nature. No such reclassifications were made for the year ended December 31, 2011.
e) Guarantees and Indemnifications – In the normal course of business, the Funds enter into contracts with service providers that contain general indemnification clauses. The Funds’ maximum exposure under these arrangements is unknown as this would involve future claims against the Funds that have not yet occurred. Based on experience, the Funds expect the risk of loss to be remote.
f) Redemption Fee – Effective April 1, 2005, those who buy and sell the Funds within thirty calendar days will incur a 2% redemption fee, retained for the benefit of long-term shareholders, recorded as additional capital in the statement of changes in net assets.
g) Other – Investment transactions and shareholder transactions are accounted for on the trade date. Net realized gains and losses on securities are computed on the basis of high original cost. Dividend income is recognized on the ex-dividend date and interest income is recognized on an accrual basis. Discounts and premiums on securities purchased are accreted and amortized over the lives of the respective securities. Withholding taxes
39
The Yacktman Funds, Inc.
NOTES TO THE FINANCIAL STATEMENTS
December 31, 2011 (Cont’d.)
on foreign dividends have been provided for in accordance with the Funds’ understanding of the applicable country’s tax rules and regulations. Expenses incurred by the Funds that do not relate to a specific Fund are allocated to the individual Funds based on each Fund’s relative net assets or another appropriate basis (as determined by the Board of Directors.)
3. INVESTMENT TRANSACTIONS
For the year ended December 31, 2011, the aggregate purchases and sales of securities, excluding short-term securities, were $1,996,033,953 and $57,039,848 for The Yacktman Focused Fund and $2,486,132,171 and $123,751,801 for The Yacktman Fund, respectively. For the year ended December 31, 2011, there were no long-term purchases or sales of U.S. Government securities for The Yacktman Focused Fund and The Yacktman Fund.
4. OPTION CONTRACTS WRITTEN
The premium amount and number of option contracts written during the year ended December 31, 2011 in The Yacktman Focused Fund were as follows:
| Amount of | Number of | ||||||||
| Premiums | Contracts | ||||||||
| Outstanding at 1/1/2011 | $ | 1,208,979 | 6,000 | ||||||
| Options written | — | — | |||||||
| Options exercised | (1,149,250 | ) | (5,638 | ) | |||||
| Options expired | (59,729 | ) | (362 | ) | |||||
| Options closed | — | — | |||||||
| Outstanding at 12/31/2011 | $ | — | — | ||||||
See Note 2 for additional disclosure related to transactions in written options during the year.
5. INVESTMENT ADVISORY AGREEMENT
The Funds have agreements with the Adviser, with whom certain officers and directors of the Funds are affiliated, to furnish investment advisory services to the Funds. Under the terms of these agreements, The Yacktman Focused Fund will pay the Adviser a monthly fee at the annual rate of 1% of its average daily net assets, and The Yacktman
40
Fund will pay the Adviser a monthly fee at the annual rate of 0.65% on the first $500,000,000 of average daily net assets, 0.60% on the next $500,000,000 of average daily net assets and 0.55% on average daily net assets in excess of $1,000,000,000. The Adviser has voluntarily agreed to reimburse The Yacktman Focused Fund for all expenses exceeding 1.25% of its average daily net assets (exclusive of interest, taxes, brokerage commissions and extraordinary expenses). The Adviser has contractually agreed to reimburse The Yacktman Fund for all expenses exceeding 2.00% of its average daily net assets (exclusive of interest, taxes, brokerage commissions and extraordinary expenses). The Funds are not obligated to reimburse the Adviser for any fees or expenses waived in previous fiscal years.
6. LINE OF CREDIT
The Yacktman Focused Fund and The Yacktman Fund have established a line of credit (“LOC”) with U.S. Bank, N.A. to be used for temporary or emergency purposes, primarily for financing redemption payments, using the securities in each Fund’s respective portfolio as collateral. The LOC will mature, unless renewed, on March 31, 2012 for each of the Funds. For The Yacktman Focused Fund, borrowing under the LOC is limited to the lesser of $15,000,000, 33 1/3% of the value of the assets of the Fund, or the sum of the value of certain assets of the Fund, as defined in the LOC. For The Yacktman Fund, borrowing under the LOC is limited to the lesser of $15,000,000, or 33 1/3% of the value of unencumbered assets of the Fund. The interest rate paid by the Funds on outstanding borrowings is equal to the Prime Rate, less 0.50%, which was 2.75% as of December 31, 2011. During the year ended December 31, 2011, there were no borrowings for The Yacktman Focused Fund or The Yacktman Fund.
41
The Yacktman Funds, Inc.
NOTES TO THE FINANCIAL STATEMENTS
December 31, 2011 (Cont’d.)
7. TAX INFORMATION
As of December 31, 2011, the components of distributable earnings on a tax basis were as follows:
| The Yacktman | The Yacktman | |||||||
| Focused Fund | Fund | |||||||
| Tax cost of investments | $ | 4,055,728,851 | $ | 5,625,011,922 | ||||
| Gross unrealized | ||||||||
| appreciation | 457,510,483 | 803,472,164 | ||||||
| Gross unrealized | ||||||||
| depreciation | (91,332,906 | ) | (164,865,038 | ) | ||||
| Net tax unrealized | ||||||||
| appreciation | 366,177,577 | 638,607,126 | ||||||
| Undistributed | ||||||||
| ordinary income | 423 | 8,731 | ||||||
| Undistributed long-term | ||||||||
| capital gains | 716 | 2,627 | ||||||
| Accumulated earnings | 1,139 | 11,358 | ||||||
| Other accumulated | ||||||||
| gains (losses) | (12,005 | ) | — | |||||
| Total accumulated | ||||||||
| earnings | $ | 366,166,711 | $ | 638,618,484 | ||||
The tax basis of investments for tax and financial reporting purposes differs, principally due to the deferral of losses on wash sales.
As of December 31, 2011, The Yacktman Focused Fund had $12,005 of post-October losses, which are deferred until January 1, 2012, for tax purposes. Net capital losses incurred after October 31 and within the taxable year are deferred to arise on the first day of The Yacktman Focused Fund’s next taxable year.
42
The tax character of distributions paid during the fiscal years ended December 31, 2011 and December 31, 2010 were as follows:
| The Yacktman | The Yacktman | ||||||||
| Focused Fund | Fund | ||||||||
| 2011 | |||||||||
| Ordinary income | $ | 36,428,123 | $ | 67,564,948 | |||||
| Long-term capital gains | $ | 12,582,248 | $ | 16,788,243 | |||||
| 2010 | |||||||||
| Ordinary income | $ | 13,809,855 | $ | 33,567,621 | |||||
| Long-term capital gains | $ | 25,343,965 | $ | 86,219,995 | |||||
43
The Yacktman Funds, Inc.
REPORT OF INDEPENDENT REGISTERED
PUBLIC ACCOUNTING FIRM
To the Shareholders and Board of Directors
The Yacktman Funds, Inc.
We have audited the accompanying statements of assets and liabilities, including the portfolios of investments, of The Yacktman Funds, Inc., comprising The Yacktman Focused Fund and The Yacktman Fund (the “Funds”) as of December 31, 2011, and the related statements of operations for the year then ended, the statements of changes in net assets for each of the two years in the period then ended, and the financial highlights for each of the four years in the period then ended. These financial statements and financial highlights are the responsibility of Fund management. Our responsibility is to express an opinion on these financial statements and financial highlights based on our audits. The financial highlights for the period indicated prior to December 31, 2008, was audited by another independent registered public accounting firm, who expressed an unqualified opinion on those financial highlights.
We conducted our audits in accordance with the standards of the Public Company Accounting Oversight Board (United States). Those standards require that we plan and perform the audit to obtain reasonable assurance about whether the financial statements and financial highlights are free of material misstatement. An audit includes examining, on a test basis, evidence supporting the amounts and disclosures in the financial statements. Our procedures included confirmation of securities owned as of December 31, 2011 by correspondence with the custodian and brokers. An audit also includes assessing the accounting principles used and significant estimates made by management, as well as evaluating the overall financial statement presentation. We believe that our audits provide a reasonable basis for our opinion.
In our opinion, the financial statements and financial highlights referred to above present fairly, in all material respects, the financial position of each of the funds constituting The Yacktman Funds, Inc., as of December 31, 2011, the results of their operations for the year then ended, the changes in their net assets for each of the two years in the period then ended, and the financial highlights for each of the four years in the period then ended, in conformity with accounting principles generally accepted in the United States of America.
COHEN FUND AUDIT SERVICES, LTD.
Westlake, Ohio
February 23, 2012
44
The Yacktman Funds, Inc.
ADDITIONAL INFORMATION
(Unaudited)
For the year ended December 31, 2011, 100% and 100% of the dividends paid from net investment income, including short-term capital gains, for The Yacktman Focused Fund and The Yacktman Fund, respectively, qualify for the dividends received deduction available to corporate shareholders.
For the year ended December 31, 2011, 100% and 100% of the dividends paid from net investment income, including short-term capital gains, for The Yacktman Focused Fund and The Yacktman Fund, respectively, are designated as qualified dividend income.
The Funds hereby designate approximately 24.34% and 3.83% as short-term capital gain distributions for The Yacktman Focused Fund and The Yacktman Fund, respectively, for the purposes of the dividends paid deduction.
PROXY VOTING POLICIES
AND PROCEDURES
For a description of the policies and procedures that the Funds use to determine how to vote proxies relating to portfolio securities, please call 1-800-525-8258 and request a Statement of Additional Information. One will be mailed to you free of charge. The Statement of Additional Information is also available on the Web site of the Securities and Exchange Commission at http://www.sec.gov. Information on how the Funds voted proxies relating to portfolio securities during the twelve month period ended June 30, 2011, is available without charge, upon request, by calling 1-800-525-8258 or by accessing the Web site of the Securities and Exchange Commission.
DISCLOSURE OF PORTFOLIO HOLDINGS
The Funds will file complete schedules of portfolio holdings with the Securities and Exchange Commission for the first and third quarters of each fiscal year on Form N-Q. Each Fund’s Form N-Q will be available on the Web site of the Securities and Exchange Commission at http://www.sec.gov.
45
The Yacktman Funds, Inc.
DIRECTOR AND OFFICER INFORMATION
(Unaudited)
| Current | |||
| position held | |||
| Name | Age | Address | with the Funds |
| Independent Directors | |||
| Bruce B. Bingham | 63 | c/o Yacktman Asset | Director |
| Management Co. | |||
| 6300 Bridgepoint Parkway | |||
| Building One, Suite 320 | |||
| Austin, TX 78730 | |||
| Albert J. Malwitz | 75 | c/o Yacktman Asset | Director |
| Management Co. | |||
| 6300 Bridgepoint Parkway | |||
| Building One, Suite 320 | |||
| Austin, TX 78730 | |||
| George J. Stevenson | 72 | c/o Yacktman Asset | Director |
| Management Co. | |||
| 6300 Bridgepoint Parkway | |||
| Building One, Suite 320 | |||
| Austin, TX 78730 | |||
| Interested Director* | |||
| Donald A. Yacktman | 70 | c/o Yacktman Asset | Director |
| Management Co. | |||
| 6300 Bridgepoint Parkway | President | ||
| Building One, Suite 320 | Treasurer | ||
| Austin, TX 78730 | |||
| Officers | |||
| Stephen Yacktman | 41 | c/o Yacktman Asset | Vice |
| Management Co. | President | ||
| 6300 Bridgepoint Parkway | Secretary | ||
| Building One, Suite 320 | |||
| Austin, TX 78730 |
* The Interested Director serves as director and officer of The Yacktman Funds.
Additional information about the Funds’ directors is available in the Statement of Additional Information and is available, without charge, upon request, by calling 1-800-525-8258.
46
| Principal | Number | Other | |
| occupation | of portfolios | directorships | |
| Term of office | during the | overseen | held outside |
| and length of | past five | within the | the Fund |
| time served | years | Fund complex | complex |
| Indefinite, | Mr. Bingham has been a | 2 | None |
| until | partner in Hamilton | ||
| successor | Partners, a real estate | ||
| elected | development firm, for | ||
| more than five years | |||
| 13 years | |||
| Indefinite, | Mr. Malwitz has been | 2 | None |
| until | owner and chief executive | ||
| successor | officer of Arlington Fastener | ||
| elected | Co., a manufacturer and | ||
| distributor of industrial | |||
| 13 years | fasteners, for more | ||
| than five years | |||
| Indefinite, | Mr. Stevenson has been | 2 | None |
| until | President of Stevenson & | ||
| successor | Company, a registered | ||
| elected | business broker, and | ||
| President of Healthmate | |||
| 13 years | Products Co., a fruit juice | ||
| concentrate manufacturing | |||
| company, for more | |||
| than five years | |||
| Indefinite, | Mr. Yacktman has been | 2 | None |
| until | President of Yacktman | ||
| successor | Asset Management Co. | ||
| elected | since April, 1992 | ||
| 20 years | |||
| Indefinite, | Mr. Yacktman has been | N/A | None |
| until | Vice President of Yacktman | ||
| successor | Asset Management Co. | ||
| elected | for more than five years | ||
| 9 years |
47
The Yacktman Funds, Inc.
DIRECTOR AND OFFICER INFORMATION
(Unaudited) (Cont’d.)
| Current | |||
| position held | |||
| Name | Age | Address | with the Funds |
| Kent A. Arnett | 70 | c/o Yacktman Asset | Vice |
| Management Co. | President | ||
| 6300 Bridgepoint Parkway | Chief | ||
| Building One, Suite 320 | Compliance | ||
| Austin, TX 78730 | Officer | ||
| Jason Subotky | 41 | c/o Yacktman Asset | Vice |
| Management Co. | President | ||
| 6300 Bridgepoint Parkway | |||
| Building One, Suite 320 | |||
| Austin, TX 78730 |
48
| Principal | Number | Other | |
| occupation | of portfolios | directorships | |
| Term of office | during the | overseen | held outside |
| and length of | past five | within the | the Fund |
| time served | years | Fund complex | complex |
| Indefinite, | Mr. Arnett has been | N/A | None |
| until | Vice President and | ||
| successor | Chief Compliance Officer | ||
| elected | of Yacktman Asset | ||
| Management Co. for | |||
| 7 years | five years | ||
| Indefinite, | Mr. Subotky has been | N/A | None |
| until | Vice President and | ||
| successor | Portfolio Manager for | ||
| elected | Yacktman Asset | ||
| Management for more | |||
| 4 years | than five years |
49
The Yacktman Funds, Inc.
PRIVACY POLICY
We collect the following nonpublic personal information about you:
•Information we receive from you on or in applications or other forms, correspondence or conversations.
•Information about your transactions with us, our affiliates or others.
We do not disclose any nonpublic personal information about our current or former shareholders to anyone, except as permitted by law. For example, we are permitted by law to disclose all of the information we collect, as described above, to our transfer agent to process your transactions. Furthermore, we restrict access to your nonpublic personal information to those persons who require such information to provide products or services to you. We maintain physical, electronic and procedural safeguards that comply with federal standards to guard your nonpublic personal information.
In the event that you hold shares of the Fund(s) through a financial intermediary, including, but not limited to, a broker-dealer, bank or trust company, the privacy policy of your financial intermediary may govern how your nonpublic personal information would be shared with nonaffiliated third parties.
50
(This Page Intentionally Left Blank.)
For Fund information and
shareholder services, call
1-800-525-8258
Web site: www.yacktman.com
The Yacktman Funds, Inc.
Shareholder Services Center
615 East Michigan Street, 3rd Floor
Milwaukee, Wisconsin 53202-5207
This report is submitted for the general information of shareholders of The Yacktman Funds. It is not authorized for distribution to prospective investors unless accompanied or preceded by an effective Prospectus for the Funds, which contains more information concerning the Funds’ investment policies, as well as fees and expenses and other pertinent information. Read the Prospectus carefully.
YA-410-0212
Item 2. Code of Ethics.
The registrant has adopted a code of ethics that applies to the registrant’s principal executive officer and principal financial officer. The registrant has not made any amendments to its code of ethics during the period covered by this report. The registrant has not granted any waivers from any provisions of the code of ethics during the period covered by this report.
A copy of the registrant’s Code of Ethics is filed herewith.
Item 3. Audit Committee Financial Expert.
The registrant’s board of directors has determined that it does not have an audit committee financial expert serving on its audit committee. At this time, the registrant believes that the experience provided by each member of the audit committee together offers the registrant adequate oversight for the registrant’s level of financial complexity.
Item 4. Principal Accountant Fees and Services.
The registrant has engaged its principal accountant to perform audit services, audit-related services, tax services and other services during the past two fiscal years. “Audit services” refer to performing an audit of the registrant's annual financial statements or services that are normally provided by the accountant in connection with statutory and regulatory filings or engagements for those fiscal years. “Audit-related services” refer to the assurance and related services by the principal accountant that are reasonably related to the performance of the audit. “Tax services” refer to professional services rendered by the principal accountant for tax compliance, tax advice, and tax planning. The following table details the aggregate fees billed or expected to be billed for each of the last two fiscal years for audit fees, audit-related fees, tax fees and other fees by the principal accountant.
| FYE 12/31/2011 | FYE 12/31/2010 | |
| Audit Fees | $34,000 | $32,000 |
| Audit-Related Fees | $0 | $0 |
| Tax Fees | $5,000 | $5,000 |
| All Other Fees | $0 | $0 |
The audit committee has adopted pre-approval policies and procedures that require the audit committee to pre-approve all audit and non-audit services of the registrant, including services provided to any entity affiliated with the registrant.
There were no services that were approved applicable to non-audit services pursuant to waiver of pre-approval requirement.
All of the principal accountant’s hours spent on auditing the registrant’s financial statements were attributed to work performed by full-time permanent employees of the principal accountant. The following table indicates the non-audit fees billed or expected to be billed by the registrant’s accountant for services to the registrant and to the registrant’s investment adviser (and any other controlling entity, etc.—not sub-adviser) for the last two years. The audit committee of the board of trustees/directors has considered whether the provision of non-audit services that were rendered to the registrant's investment adviser is compatible with maintaining the principal accountant's independence and has concluded that the provision of such non-audit services by the accountant has not compromised the accountant’s independence.
| Non-Audit Related Fees | FYE 12/31/2011 | FYE 12/31/2010 |
| Registrant | $5,000 | $5,000 |
| Registrant’s Investment Adviser | $5,000 | $5,000 |
Item 5. Audit Committee of Listed Registrants.
Not applicable to registrants who are not listed issuers (as defined in Rule 10A-3 under the Securities Exchange Act of 1934).
Item 6. Investments.
Schedule of Investments is included as part of the report to shareholders filed under Item 1 of this Form.
Item 7. Disclosure of Proxy Voting Policies and Procedures for Closed-End Management Investment Companies.
Not applicable to open-end investment companies.
Item 8. Portfolio Managers of Closed-End Management Investment Companies.
Not applicable to open-end investment companies.
Item 9. Purchases of Equity Securities by Closed-End Management Investment Company and Affiliated Purchasers.
Not applicable to open-end investment companies.
Item 10. Submission of Matters to a Vote of Security Holders.
Not Applicable.
Item 11. Controls and Procedures.
| (a) | The Registrant’s [President/Chief Executive Officer] and [Treasurer/Chief Financial Officer] have reviewed the Registrant's disclosure controls and procedures (as defined in Rule 30a-3(c) under the Investment Company Act of 1940 (the “Act”)) as of a date within 90 days of the filing of this report, as required by Rule 30a-3(b) under the Act and Rules 13a-15(b) or 15d-15(b) under the Securities Exchange Act of 1934. Based on their review, such officers have concluded that the disclosure controls and procedures are effective in ensuring that information required to be disclosed in this report is appropriately recorded, processed, summarized and reported and made known to them by others within the Registrant and by the Registrant’s service provider. |
| (b) | There were no changes in the Registrant's internal control over financial reporting (as defined in Rule 30a-3(d) under the Act) that occurred during the second fiscal quarter of the period covered by this report that has materially affected, or is reasonably likely to materially affect, the Registrant's internal control over financial reporting. |
Item 12. Exhibits.
| (a) | (1) Any code of ethics or amendment thereto, that is the subject of the disclosure required by Item 2, to the extent that the registrant intends to satisfy Item 2 requirements through filing an exhibit. Filed herewith. |
(2) A separate certification for each principal executive and principal financial officer pursuant to Section 302 of the Sarbanes-Oxley Act of 2002. Filed herewith.
(3) Any written solicitation to purchase securities under Rule 23c-1 under the Act sent or given during the period covered by the report by or on behalf of the registrant to 10 or more persons. Not applicable to open-end investment companies.
| (b) | Certifications pursuant to Section 906 of the Sarbanes-Oxley Act of 2002. Furnished herewith. |
SIGNATURES
Pursuant to the requirements of the Securities Exchange Act of 1934 and the Investment Company Act of 1940, the registrant has duly caused this report to be signed on its behalf by the undersigned, thereunto duly authorized.
(Registrant) The Yacktman Funds, Inc.
By (Signature and Title)* /s/ Donald A. Yacktman
Donald A. Yacktman, President
Date 2/26/12
Pursuant to the requirements of the Securities Exchange Act of 1934 and the Investment Company Act of 1940, this report has been signed below by the following persons on behalf of the registrant and in the capacities and on the dates indicated.
By (Signature and Title)* /s/ Donald A. Yacktman
Donald A. Yacktman, President/Treasurer
Date 2/26/12