UNITED STATES
SECURITIES AND EXCHANGE COMMISSION
Washington, D.C. 20549
FORM N-CSR
CERTIFIED SHAREHOLDER REPORT OF REGISTERED
MANAGEMENT INVESTMENT COMPANIES
Investment Company Act file number 811-06628
The Yacktman Funds, Inc.
(Exact name of registrant as specified in charter)
6300 Bridgepoint Parkway
Building One, Suite 320
Austin, TX 78730
(Address of principal executive offices) (Zip code)
Donald A. Yacktman
c/o Yacktman Asset Management Co.
6300 Bridgepoint Parkway
Building One, Suite 320
Austin, TX 78730
(Name and address of agent for service)
512.767.6700
Registrant's telephone number, including area code
Date of fiscal year end: December 31
Date of reporting period: December 31, 2009
Item 1. Reports to Stockholders.
ANNUAL REPORT
December 31, 2009
The Yacktman Funds, Inc.
| MESSAGE TO SHAREHOLDERS |
 |  |  |
| Donald A. Yacktman | Stephen Yacktman | Jason Subotky |
In 2009 The Yacktman Fund and The Yacktman Focused Fund appreciated 59.31% and 62.76% respectively, compared to the S&P 500 which appreciated 26.46%. For the decade, The Yacktman Fund increased 207.86% and The Yacktman Focused Fund rose 205.67% compared to the S&P 500 which declined 9.1%. The annualized return from 2000-2009 was 11.91% for The Yacktman Fund and 11.82% for The Yacktman Focused Fund compared to the S&P 500’s -.95% annual result.
TOTAL RETURNS – UNAUDITED
AS OF DECEMBER 31, 2009
| ANNUALIZED | SINCE INCEPTION | ||||||
| 1- | 3- | 5- | 10- | ||||
| YEAR | YEAR | YEAR | YEAR | 7/6/1992 | 5/1/1997 | ||
| The Yacktman | |||||||
| Fund (YACKX) | 59.31% | 6.79% | 6.87% | 11.90% | 10.03% | ||
| The Yacktman | |||||||
| Focused Fund | |||||||
| (YAFFX) | 62.76% | 8.82% | 8.00% | 11.82% | 8.70% | ||
S&P 500® Index | 26.46% | -5.63% | 0.42% | -0.95% | 7.94% | 4.47% | |
What a Year
Both funds had outstanding returns in 2009. We achieved strong results while steadfastly adhering to our high quality approach to investing. Some positions like AmeriCredit and Liberty Interactive more than doubled during the year. Many other securities, including Microsoft, eBay, and Viacom, were up more than 50%.
2
| Average Annual Returns | The Yacktman Fund | S&P 500® |
| One Year (01/01/09 - 12/31/09) | 59.31% | 26.46% |
| Three Years (01/01/07 - 12/31/09) | 6.79% | -5.63% |
| Five Years (01/01/05 - 12/31/09) | 6.87% | 0.42% |
| Ten Years (01/01/00 - 12/31/09) | 11.90% | -0.95% |
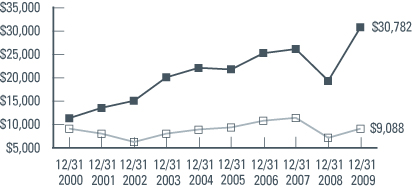
The chart assumes an initial gross investment of $10,000 made on 12/31/99.
| The Yacktman | ||
| Average Annual Returns | Focused Fund | S&P 500® |
| One Year (01/01/09 - 12/31/09) | 62.76% | 26.46% |
| Three Years (01/01/07 - 12/31/09) | 8.82% | -5.63% |
| Five Years (01/01/05 - 12/31/09) | 8.00% | 0.42% |
| Ten Years (01/01/00 - 12/31/09) | 11.82% | -0.95% |
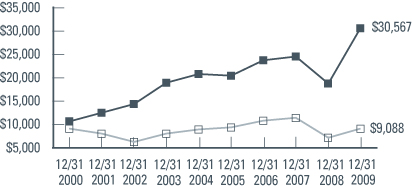
The chart assumes an initial gross investment of $10,000 made on 12/31/99.
| * | The S&P 500® is an unmanaged but commonly used measure of common stock total return performance. |
Returns shown include the reinvestment of all dividends, but do not reflect the deduction of taxes that a shareholder would pay on Fund distributions or the redemption of Fund shares. The above past performance is not predictive of future results. The investment return and principal value of the Funds will fluctuate so that your shares, when redeemed, may be worth more or less than their original cost.
3
What a Decade
During the last 10 years we witnessed the bursting of a bubble in technology stocks, panicking over corporate credibility in 2002 and a near imploding of the global financial system in 2008. Throughout this period we objectively and methodically stuck with our discipline of balancing risk/reward, and owning high quality companies at attractive valuations and from time to time, special situations. During the steepest market corrections, our funds provided solid protection and we were able to find many spectacular bargains.
Review of 2008-2009
Going into the recent downturn we held some cash and owned several defensive stocks like Coca-Cola and PepsiCo. In the financial services sector, AmeriCredit was our largest investment. We purchased AmeriCredit heavily in the last quarter of 2007, and due to the panic in financial stocks, as well as some business-specific issues, it slid throughout much of 2008 and into early 2009. We believed the shares were a bargain, and we added to our position as the price dropped. As fears of a financial meltdown subsided, AmeriCredit’s price increased in 2009.
As the market declines accelerated in 2008, we invested excess cash and decreased positions in some of our defensive stocks that had held up well, in order to purchase consumer-based cyclical stocks which were trading at extremely high cash yields and were significantly underpriced based on normal (non-severe economic environment) earnings. We also made significant purchases in media, starting with Viacom, and later adding News Corporation and Comcast, bought shares in retailers Williams-Sonoma and Abercrombie & Fitch, and a materials stock, USG. We also purchased small positions in Bank of America and Barclays when they were being priced for doomsday.
4
We outperformed when the market dropped in 2008 and again outperformed when it recovered in 2009. Looking forward, we will continue to objectively examine investment opportunities. If we believe we will get a similar return, we would rather own more Coca Cola, than a financial or a cyclical company with higher business risk.
In the last few months we have moved back towards consumer franchise companies, many of which did not participate materially in the rally. In our top 10 holdings, PepsiCo, Clorox, Comcast, Procter & Gamble, and Johnson & Johnson were all laggards as the market rose, allowing us to initiate a new position or increase our position in these securities at very attractive valuations.
Overall, the strong returns of 2009 more than offset the losses in 2008. Being prepared before the severe declines, opportunistic during the turmoil, and objective throughout allowed us to produce solid results in what was a difficult two-year period for the S&P 500.
| 2 Year | 2008-2009 | |
| Total Return | Annualized | |
| The Yacktman Fund | 17.81% | 8.54% |
| The Yacktman Focused Fund | 24.54% | 11.60% |
| S&P 500 | -20.32% | -10.74% |
At Yacktman Asset Management we enjoy market volatility. It creates opportunities. The very best bargains are often available during periods of pronounced market swings. We think that our ability to perform over long periods of time, and especially in difficult markets, is evident in our results.
Portfolio Review
The portfolio is very well positioned today. The severe market correction of 2008-09 created some spectacular bargains, which, despite significant recoveries from the bottom, continue to offer substantial upside. In 2009, we reduced the percentage weighting in some positions, like AmeriCredit and Liberty Interactive that performed exceptionally well, and increased or took new positions in stocks which lagged in the market rally.
5
The Yacktman Funds, Inc.
During the fourth quarter, we increased our position in Comcast, the largest provider of pay television, when the shares declined on fears that the company would overspend to purchase majority ownership of NBC/Universal, a leading provider of cable content and film and television programming. When the final terms of the transaction were announced, investors breathed a sigh of relief and the shares rallied a bit. At year end, Comcast’s stock, traded at less than half the level it was at in 1999, even though its sales per share have more than doubled since then, and its earnings per share have increased dramatically.
The terms of the NBC/Universal deal also highlighted the value in two of our other significant positions, News Corporation and Viacom. If Viacom were valued at the same multiple of pre-tax earnings as NBC/Universal, its shares would now be more than 60% above today’s level. News Corp’s stock would also see a significant rise using this valuation methodology.
Back to the Future
During the latter half of the year, we increased the consumer products company holdings in both The Yacktman Fund and The Yacktman Focused Fund. Our funds are now positioned more like they were a couple of years ago, with an emphasis on very high quality consumer franchise companies, though many of the securities we own are cheaper today than they were then. Cash levels are also lower than a few years back due to more attractive investment opportunities.
As mentioned earlier, we have increased our holdings in PepsiCo, Procter & Gamble, Clorox, and Johnson & Johnson. Their stock prices lagged during 2009 as securities which had greater potential to benefit from an economic recovery rallied significantly more than stable consumer franchises in general, and these securities
6
specifically. PepsiCo, Procter & Gamble, Clorox, and Johnson & Johnson are “old friends” which we have owned off and on since our firm was founded in 1992. They all produce significant amounts of free cash flow, have dominant market shares in many of their product categories, and have the ability to take pricing higher if inflation becomes an issue.
Conclusion
We are pleased with the results we delivered in 2009 and for the entire decade. Our strong team, disciplined investment approach, and objectivity should serve shareholders well in the new decade. We are optimistic about the current positions in The Yacktman Fund and The Yacktman Focused Fund, and as always will diligently look for new bargains to add to our holdings.
Both funds have seen strong growth in assets. We feel we currently have the ability to manage significantly more money without materially impacting our ability to produce results. The Yacktman team gets its greatest satisfaction by performing well. Should our growth reach a point where we feel it could impact our ability to generate the kind of longer term results investors have come to expect, we will take steps to limit inflows.
At year end, Jason Subotky, a Vice President of the Yacktman Funds, joined Donald and Stephen Yacktman as a co-manager of The Yacktman Fund and The Yacktman Focused Fund. Jason has been part of the investment team at Yacktman Asset Management since 2001 and has made a significant contribution to our results.
Our team will work hard to examine the opportunities ahead. We appreciate the confidence of our shareholders and, as always, we will continue to be diligent, objective, and patient when managing the funds.
Sincerely,
The Yacktman Team
7
EXPENSE EXAMPLE
For the Six Months Ended December 31, 2009 (Unaudited)
As a shareholder of the Yacktman Funds (the “Funds”), you incur ongoing costs, including management fees and other Fund expenses. If you invest through a financial intermediary, you may also incur additional costs such as a transaction fee charged on the purchase or sale of the Fund or an asset-based management fee. This Example is intended to help you understand your ongoing costs (in dollars) of investing in the Fund and to compare these costs with the ongoing costs of investing in other mutual funds.
The Example is based on an investment of $1,000 invested at the beginning of the period and held for the entire period from July 1, 2009 to December 31, 2009.
Actual Expenses
The first line of the table on the next page provides information about actual account values and actual expenses. You may use the information in this line, together with the amount you invested, to estimate the expenses you paid over the period. Simply divide your account value by $1,000 (for example, an $8,600 account value divided by $1,000 = 8.6), then multiply the result by the number in the first line under the heading entitled “Expenses Paid During Period” to estimate the expenses you paid on your account during the period.
Hypothetical Example for Comparison Purposes
The second line of the table on the next page provides information about hypothetical account values and hypothetical expenses based on the Funds’ actual expense ratios and an assumed rate of return of 5% per year before expenses, which is not the Funds’ actual return. The hypothetical account values and expenses may not be used to estimate the actual ending account balance or expenses you paid for the period. You may use this information to compare the ongoing costs of investing in the Fund and other funds. To do so, compare this 5% hypothetical example with the 5% hypothetical examples that appear in the shareholder reports of the other funds.
8
Please note that the expenses shown in the table are meant to highlight your ongoing costs only and do not reflect any costs that may be associated with investing in the Fund through a financial intermediary. Therefore, the second line of the table is useful in comparing the ongoing costs only, and will not help you determine the relative total costs of owning different funds. In addition, if any costs associated with investing through a financial intermediary were included, your costs would have been higher.
THE YACKTMAN FUND
| Expenses | |||
| Beginning | Ending | paid during | |
| account | account | period | |
| value | value | 07/01/09- | |
| 07/01/09 | 12/31/09 | 12/31/091 | |
| Actual | $1,000.00 | $1,280.90 | $5.29 |
| Hypothetical | |||
| (5% return | |||
| before expenses) | 1,000.00 | 1,020.57 | 4.69 |
THE YACKTMAN FOCUSED FUND
| Expenses | |||
| Beginning | Ending | paid during | |
| account | account | period | |
| value | value | 07/01/09- | |
| 07/01/09 | 12/31/09 | 12/31/091 | |
| Actual | $1,000.00 | $1,260.80 | $7.12 |
| Hypothetical | |||
| (5% return | |||
| before expenses) | 1,000.00 | 1,018.90 | 6.36 |
| 1 | Expenses are equal to the Funds’ annualized expense ratios (0.92% for The Yacktman Fund and 1.25% for The Yacktman Focused Fund), multiplied by the average account value over the period, multiplied by 184/365 (to reflect the one-half year period). |
9
TOP TEN EQUITY HOLDINGS
December 31, 2009 (Unaudited)
| Percentage of | |||||
| Net Assets | |||||
| PepsiCo, Inc. | 8.85 | % | |||
| News Corp., Class A | 8.50 | % | |||
| Coca-Cola Co. | 7.06 | % | |||
| ConocoPhillips | 4.99 | % | |||
| Comcast Corp., Class A | 4.56 | % | |||
| Pfizer, Inc. | 4.54 | % | |||
| Viacom, Inc., Class B | 4.29 | % | |||
| Microsoft Corp. | 4.26 | % | |||
| Procter & Gamble Co. | 4.24 | % | |||
| Clorox Co. | 3.70 | % | |||
| Total | 54.99 | % | |||
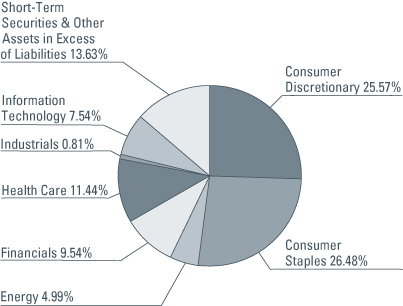
FUND DIVERSIFICATION
December 31, 2009 (Unaudited)
10
The Yacktman Fund
EQUITY PURCHASES & SALES
For the Six Months Ended December 31, 2009 (Unaudited)
| Net Shares | Current | |
| NEW PURCHASES | Purchased | Shares Held |
| Bank of New York Mellon Corp. | 300,000 | 300,000 |
| Bank of New York Mellon Corporation | ||
| is a global financial services company. | ||
| The company provides a complete | ||
| range of financial and securities | ||
| services to financial institutions, | ||
| corporations and individuals worldwide. | ||
| CareFusion Corp. | 55,000 | 55,000 |
| CareFusion Corporation provides | ||
| health care products and services. | ||
| The company offers products that | ||
| focus on breaking the cycle of harmful | ||
| medication errors and reducing | ||
| hospital acquired infections. | ||
| Clorox Co. | 850,000 | 850,000 |
| The Clorox Company produces | ||
| and markets non-durable consumer | ||
| products sold primarily through | ||
| grocery and other retail stores. | ||
| H&R Block, Inc. | 1,330,000 | 1,330,000 |
| H&R Block, Inc. provides a wide range | ||
| of financial products and services | ||
| through its subsidiaries. The company | ||
| provides tax services to the general | ||
| public, accounting and consulting | ||
| services, and consumer financial and | ||
| personal productivity software. | ||
| Stryker Corp. | 110,000 | 110,000 |
| Stryker Corporation develops, | ||
| manufacturers, and markets | ||
| specialty surgical and medical products. |
11
The Yacktman Fund
EQUITY PURCHASES & SALES (Cont’d.)
For the Six Months Ended December 31, 2009 (Unaudited)
| Net Shares | Current | |
| NEW PURCHASES | Purchased | Shares Held |
| Wal-Mart Stores, Inc. | 290,000 | 290,000 |
| Wal-Mart Stores, Inc. operates | ||
| discount stores, supercenters, and | ||
| neighborhood markets. The company's | ||
| discount stores and supercenters offer | ||
| merchandise such as apparel, | ||
| housewares, small appliances, | ||
| electronics, and hardware. |
12
| Net Shares | Current | |||||||
| PURCHASES | Purchased | Shares Held | ||||||
| Bank of New York Mellon Corp. | 300,000 | 300,000 | ||||||
| H&R Block, Inc. | 1,330,000 | 1,330,000 | ||||||
| CareFusion Corp. | 55,000 | 55,000 | ||||||
| Clorox Co. | 850,000 | 850,000 | ||||||
| Coca-Cola Co. | 1,035,000 | 1,735,000 | ||||||
| Comcast Corp., Class A | 3,470,000 | 3,990,000 | ||||||
| ConocoPhilips | 725,000 | 1,370,000 | ||||||
| Interpublic Group of Cos., Inc. | ||||||||
| Preferred | 2,500 | 21,000 | ||||||
| Johnson & Johnson | 420,000 | 620,000 | ||||||
| Loews Corp. | 10,000 | 270,000 | ||||||
| Microsoft Corp. | 780,000 | 1,960,000 | ||||||
| News Corp., Class A | 5,710,000 | 8,700,000 | ||||||
| PepsiCo, Inc. | 1,540,000 | 2,040,000 | ||||||
| Pfizer, Inc. | 1,630,000 | 3,500,000 | ||||||
| Procter & Gamble Co. | 540,000 | 980,000 | ||||||
| Stryker Corp. | 110,000 | 110,000 | ||||||
| The Bancorp, Inc. | 33,100 | 709,454 | ||||||
| UnitedHealth Group, Inc. | 690,000 | 1,150,000 | ||||||
| U.S. Bancorp | 770,000 | 1,410,000 | ||||||
| Viacom, Inc., Class B | 540,000 | 2,020,000 | ||||||
| Wal-Mart Stores, Inc. | 290,000 | 290,000 | ||||||
| Net Shares | Current | |||||||
| SALES | Sold | Shares Held | ||||||
| American International Group, Inc. | ||||||||
| Preferred | 225,000 | — | ||||||
| AmeriCredit Corp. | 242,400 | 2,350,000 | ||||||
| BAC Capital Trust I | 25,000 | — | ||||||
| BAC Capital Trust X | 16,300 | 48,700 | ||||||
| Furniture Brands International, Inc. | 446,800 | 818,200 | ||||||
| Liberty Media Holding Corp., | ||||||||
| Interactive - Series A | 192,000 | 2,900,000 | ||||||
| Williams Sonoma, Inc. | 350,000 | — | ||||||
13
The Yacktman Fund
PORTFOLIO OF INVESTMENTS
December 31, 2009
| Number | ||||||||
| of Shares | Value | |||||||
| COMMON STOCKS - 83.46% | ||||||||
| Banks - 2.99% | ||||||||
| The Bancorp, Inc. (a) | 709,454 | $ | 4,866,854 | |||||
| Bank Of America Corp. | 352,000 | 5,301,120 | ||||||
| U.S. Bancorp | 1,410,000 | 31,739,100 | ||||||
| 41,907,074 | ||||||||
| Beverages - 15.91% | ||||||||
| Coca-Cola Co. | 1,735,000 | 98,895,000 | ||||||
| PepsiCo, Inc. | 2,040,000 | 124,032,000 | ||||||
| 222,927,000 | ||||||||
| Building Products - 0.59% | ||||||||
| USG Corp. (a) | 585,950 | 8,232,598 | ||||||
| Capital Markets - 0.60% | ||||||||
| Bank Of New York Mellon Corp. | 300,000 | 8,391,000 | ||||||
| Commercial Services | ||||||||
| & Supplies - 2.15% | ||||||||
| H&R Block, Inc. | 1,330,000 | 30,084,600 | ||||||
| Computers & Peripherals - 1.41% | ||||||||
| Dell, Inc. (a) | 480,000 | 6,892,800 | ||||||
| Hewlett-Packard Co. | 250,000 | 12,877,500 | ||||||
| 19,770,300 | ||||||||
| Consumer Finance - 0.68% | ||||||||
| American Express Co. | 235,000 | 9,522,200 | ||||||
| Distributors - 0.25% | ||||||||
| Prestige Brands Holdings, Inc. (a) | 446,600 | 3,510,276 | ||||||
| Diversified Financial | ||||||||
| Services - 3.38% | ||||||||
| AmeriCredit Corp. (a) | 2,350,000 | 44,744,000 | ||||||
| Resource America, Inc., Class A | 659,226 | 2,663,273 | ||||||
| 47,407,273 | ||||||||
| Food Products - 0.86% | ||||||||
| Lancaster Colony Corp. | 242,500 | 12,052,250 | ||||||
See notes to financial statements.
14
| Number | ||||||||
| of Shares | Value | |||||||
| Health Care Equipment | ||||||||
| & Supplies - 0.84% | ||||||||
| CareFusion Corp. (a) | 55,000 | $ | 1,375,550 | |||||
| Covidien Plc | 100,000 | 4,789,000 | ||||||
| Stryker Corp. | 110,000 | 5,540,700 | ||||||
| 11,705,250 | ||||||||
| Health Care Providers | ||||||||
| & Services - 3.21% | ||||||||
| Cardinal Health, Inc. | 110,000 | 3,546,400 | ||||||
| UnitedHealth Group, Inc. | 1,150,000 | 35,052,000 | ||||||
| WellPoint, Inc. (a) | 109,500 | 6,382,755 | ||||||
| 44,981,155 | ||||||||
| Household Durables - 0.32% | ||||||||
| Furniture Brands | ||||||||
| International, Inc. (a) | 818,200 | 4,467,372 | ||||||
| Household Products - 8.35% | ||||||||
| Clorox Co. | 850,000 | 51,850,000 | ||||||
| Colgate-Palmolive Co. | 70,000 | 5,750,500 | ||||||
| Procter & Gamble Co. | 980,000 | 59,417,400 | ||||||
| 117,017,900 | ||||||||
| Industrial Conglomerates - 0.22% | ||||||||
| Tyco International Ltd. | 87,500 | 3,122,000 | ||||||
| Insurance - 0.71% | ||||||||
| Loews Corp. | 270,000 | 9,814,500 | ||||||
| MGIC Investment Corp. (a) | 30,000 | 173,400 | ||||||
| 9,987,900 | ||||||||
| Internet Retail - 1.87% | ||||||||
| eBay, Inc. (a) | 1,110,000 | 26,129,400 | ||||||
| Media - 20.90% | ||||||||
| Comcast Corp., Class A | 3,990,000 | 63,879,900 | ||||||
| Dish Network Corp., Class A (a) | 420,000 | 8,723,400 | ||||||
| Liberty Media Holding | ||||||||
| Corp., Interactive-Series A (a) | 2,900,000 | 31,436,000 | ||||||
| News Corp., Class A | 8,700,000 | 119,103,000 | ||||||
See notes to financial statements.
15
The Yacktman Fund
PORTFOLIO OF INVESTMENTS (Cont’d.)
December 31, 2009
| Number | ||||||||
| of Shares | Value | |||||||
| Media - 20.90% (Cont’d) | ||||||||
| Viacom, Inc., Class B (a) | 2,020,000 | $ | 60,054,600 | |||||
| The Walt Disney Co. | 300,000 | 9,675,000 | ||||||
| 292,871,900 | ||||||||
| Oil, Gas & Consumable | ||||||||
| Fuels - 4.99% | ||||||||
| ConocoPhilips | 1,370,000 | 69,965,900 | ||||||
| Pharmaceuticals - 7.39% | ||||||||
| Johnson & Johnson | 620,000 | 39,934,200 | ||||||
| Pfizer, Inc. | 3,500,000 | 63,665,000 | ||||||
| 103,599,200 | ||||||||
| Software - 4.27% | ||||||||
| Microsoft Corp. | 1,960,000 | 59,760,400 | ||||||
| Specialty Retail - 1.57% | ||||||||
| Abercrombie & Fitch Co. - Class A | 145,000 | 5,053,250 | ||||||
| Home Depot, Inc. | 50,000 | 1,446,500 | ||||||
| Wal-Mart Stores, Inc. | 290,000 | 15,500,500 | ||||||
| 22,000,250 | ||||||||
| TOTAL COMMON STOCKS | ||||||||
| (Cost $949,528,671) | 1,169,413,198 | |||||||
| CONVERTIBLE PREFERRED STOCKS - 1.12% | ||||||||
| Advertising - 1.12% | ||||||||
| Interpublic Group of | ||||||||
| Cos., Inc., Series B | 21,000 | 15,667,858 | ||||||
| TOTAL CONVERTIBLE PREFERRED | ||||||||
| STOCKS (Cost $9,117,925) | 15,667,858 | |||||||
See notes to financial statements.
16
| Number | ||||||||
| of Shares | Value | |||||||
| PREFERRED STOCKS - 0.97% | ||||||||
| Banks - 0.07% | ||||||||
| BAC Capital Trust X, Series B | 48,700 | $ | 944,293 | |||||
| Diversified Financial | ||||||||
| Services - 0.90% | ||||||||
| Federal National Mortgage | ||||||||
| Association, Series F (a) | 110,055 | 158,479 | ||||||
| Federal National Mortgage | ||||||||
| Association, Series M (a) | 134,188 | 194,573 | ||||||
| Federal National Mortgage | ||||||||
| Association, Series S (a) | 160,000 | 176,000 | ||||||
| SLM Corp., Series A | 324,200 | 12,183,436 | ||||||
| 12,712,488 | ||||||||
| TOTAL PREFERRED STOCKS | ||||||||
| (Cost $9,973,308) | 13,656,781 | |||||||
| Principal | ||||||||
| Amount | Value | |||||||
| CONVERTIBLE BONDS - 0.20% | ||||||||
| Mortgage REITs - 0.20% | ||||||||
| RAIT Financial Trust | ||||||||
| 6.875%, 04/15/2027 (c) | $ | 6,750,000 | 2,835,000 | |||||
| TOTAL CONVERTIBLE BONDS | ||||||||
| (Cost $5,046,791) | 2,835,000 | |||||||
| CORPORATE BONDS - 0.62% | ||||||||
| Advertising - 0.36% | ||||||||
| Interpublic Group of Cos., Inc. | ||||||||
| 6.250%, 11/15/2014 | 5,250,000 | 5,066,250 | ||||||
| Specialty Retail - 0.26% | ||||||||
| Limited Brands, Inc. | ||||||||
| 7.600%, 07/15/2037 | 4,000,000 | 3,580,000 | ||||||
| TOTAL CORPORATE BONDS | ||||||||
| (Cost $4,591,925) | 8,646,250 | |||||||
See notes to financial statements.
17
The Yacktman Fund
PORTFOLIO OF INVESTMENTS (Cont’d.)
December 31, 2009
| Principal | ||||||||
| Amount | Value | |||||||
| SHORT-TERM INVESTMENTS - 11.19% | ||||||||
| Commercial Paper - 6.24% | ||||||||
| General Electric Capital | ||||||||
| 0.025%, 01/06/2010 | $ | 43,695,000 | $ | 43,694,970 | ||||
| Intesa Funding | ||||||||
| 0.250%, 01/06/2010 | 43,695,000 | 43,694,696 | ||||||
| 87,389,666 | ||||||||
| Demand Notes - 4.95% | ||||||||
| U.S. Bancorp | ||||||||
| 0.000% (b) | 69,356,047 | 69,356,047 | ||||||
| TOTAL SHORT-TERM | ||||||||
| INVESTMENTS | ||||||||
| (Cost $156,745,713) | 156,745,713 | |||||||
| Total Investments | ||||||||
| (Cost $1,135,004,333) - 97.56% | 1,366,964,800 | |||||||
| Other Assets in Excess | ||||||||
| of Liabilities - 2.44% | 34,262,935 | |||||||
| TOTAL NET ASSETS - 100.00% | $ | 1,401,227,735 | ||||||
Percentages are stated as a percent of net assets.
| (a) | Non-Income Producing |
| (b) | Variable rate security. Rate shown represents the rate as of December 31, 2009. |
| (c) | Restricted security as defined in Rule 144(a) under the Securities Act of 1933. |
See notes to financial statements.
18
The Yacktman Focused Fund
TOP TEN EQUITY HOLDINGS
December 31, 2009 (Unaudited)
| Percentage of | |||||
| Net Assets | |||||
| PepsiCo, Inc. | 9.26 | % | |||
| News Corp., Class A | 8.99 | % | |||
| Coca-Cola Co. | 6.98 | % | |||
| Microsoft Corp. | 6.19 | % | |||
| Pfizer, Inc. | 5.57 | % | |||
| Viacom, Inc., Class B | 5.11 | % | |||
| ConocoPhillips | 5.03 | % | |||
| Comcast Corp., Class A | 4.33 | % | |||
| Clorox Co. | 4.28 | % | |||
| Procter & Gamble Co. | 3.89 | % | |||
| Total | 59.63 | % | |||
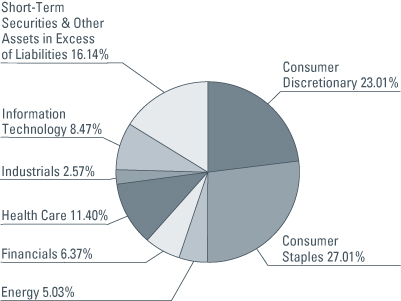
FUND DIVERSIFICATION
December 31, 2009 (Unaudited)
19
The Yacktman Focused Fund
EQUITY PURCHASES & SALES
For the Six Months Ended December 31, 2009 (Unaudited)
| Net Shares | Current | |||||||
| PURCHASES | Purchased | Shares Held | ||||||
| Clorox Co. | 470,000 | 470,000 | ||||||
| Coca-Cola Co. | 500,000 | 820,000 | ||||||
| Comcast Corp., Class A | 1,660,000 | 1,810,000 | ||||||
| ConocoPhilips | 431,000 | 660,000 | ||||||
| Hewlett-Packard Co. | 5,000 | 95,000 | ||||||
| H&R Block, Inc. | 580,000 | 580,000 | ||||||
| Johnson & Johnson | 240,000 | 310,000 | ||||||
| Lancaster Colony Corp. | 111,200 | 171,200 | ||||||
| Loews Corp. | 10,000 | 90,000 | ||||||
| Microsoft Corp. | 715,000 | 1,360,000 | ||||||
| News Corp., Class A | 2,580,000 | 4,400,000 | ||||||
| PepsiCo, Inc. | 735,000 | 1,020,000 | ||||||
| Pfizer, Inc. | 1,415,000 | 2,050,000 | ||||||
| Procter & Gamble Co. | 300,000 | 430,000 | ||||||
| The Bancorp, Inc. | 33,100 | 224,426 | ||||||
| Toyota Industries Corp. | 375,000 | 500,000 | ||||||
| U.S. Bancorp | 505,000 | 680,000 | ||||||
| UnitedHealth Group, Inc. | 370,000 | 530,000 | ||||||
| Viacom, Inc., Class B | 505,000 | 1,150,000 | ||||||
| Wal-Mart Stores, Inc. | 135,000 | 135,000 | ||||||
| Net Shares | Current | |||||||
| SALES | Sold | Shares Held | ||||||
| American International | ||||||||
| Group, Inc. Preferred | 67,000 | — | ||||||
| AmeriCredit Corp. | 95,000 | 880,000 | ||||||
| BAC Capital Trust XII | 23,000 | — | ||||||
| Dish Network Corp. | 87,000 | — | ||||||
| Williams Sonoma, Inc. | 60,000 | — | ||||||
20
The Yacktman Focused Fund
PORTFOLIO OF INVESTMENTS
December 31, 2009
| Number | ||||||||
| of Shares | Value | |||||||
| COMMON STOCKS - 82.60% | ||||||||
| Auto Manufacturers - 2.20% | ||||||||
| Toyota Industries | ||||||||
| Corporation - ADR | 500,000 | $ | 14,755,000 | |||||
| Banks - 2.67% | ||||||||
| The Bancorp, Inc. (a) | 224,426 | 1,539,562 | ||||||
| Bank Of America Corp. | 67,000 | 1,009,020 | ||||||
| U.S. Bancorp | 680,000 | 15,306,800 | ||||||
| 17,855,382 | ||||||||
| Beverages - 16.24% | ||||||||
| Coca-Cola Co. | 820,000 | 46,740,000 | ||||||
| PepsiCo, Inc. | 1,020,000 | 62,016,000 | ||||||
| 108,756,000 | ||||||||
| Building Products - 0.37% | ||||||||
| USG Corp. (a) | 175,000 | 2,458,750 | ||||||
| Commercial Services | ||||||||
| & Supplies - 1.96% | ||||||||
| H&R Block, Inc. | 580,000 | 13,119,600 | ||||||
| Computers & Peripherals - 0.96% | ||||||||
| Dell, Inc. (a) | 105,000 | 1,507,800 | ||||||
| Hewlett-Packard Co. | 95,000 | 4,893,450 | ||||||
| 6,401,250 | ||||||||
| Consumer Finance - 0.30% | ||||||||
| American Express Co. | 50,000 | 2,026,000 | ||||||
| Diversified Financial | ||||||||
| Services - 2.63% | ||||||||
| AmeriCredit Corp. (a) | 880,000 | 16,755,200 | ||||||
| Resource America, Inc. | 215,000 | 868,600 | ||||||
| 17,623,800 | ||||||||
| Food Products - 1.27% | ||||||||
| Lancaster Colony Corp. | 171,200 | 8,508,640 | ||||||
See notes to financial statements.
21
The Yacktman Focused Fund
PORTFOLIO OF INVESTMENTS (Cont’d.)
December 31, 2009
| Number | ||||||||
| of Shares | Value | |||||||
| Health Care Equipment | ||||||||
| & Supplies - 0.21% | ||||||||
| Covidien Plc | 30,000 | $ | 1,436,700 | |||||
| Health Care Providers | ||||||||
| & Services - 2.64% | ||||||||
| UnitedHealth Group, Inc. | 530,000 | 16,154,400 | ||||||
| WellPoint, Inc. (a) | 26,000 | 1,515,540 | ||||||
| 17,669,940 | ||||||||
| Household Durables - 0.13% | ||||||||
| Furniture Brands | ||||||||
| International, Inc. (a) | 160,000 | 873,600 | ||||||
| Household Products - 8.42% | ||||||||
| Clorox Co. | 470,000 | 28,670,000 | ||||||
| Colgate-Palmolive Co. | 20,000 | 1,643,000 | ||||||
| Procter & Gamble Co. | 430,000 | 26,070,900 | ||||||
| 56,383,900 | ||||||||
| Insurance - 0.49% | ||||||||
| Loews Corp. | 90,000 | 3,271,500 | ||||||
| Internet Retail - 1.32% | ||||||||
| eBay, Inc. (a) | 375,000 | 8,827,500 | ||||||
| Media - 19.79% | ||||||||
| Comcast Corp., Class A | 1,810,000 | 28,978,100 | ||||||
| Liberty Media Holding | ||||||||
| Corp., Interactive-Series A (a) | 840,000 | 9,105,600 | ||||||
| News Corp., Class A | 4,400,000 | 60,236,000 | ||||||
| Viacom, Inc., Class B (a) | 1,150,000 | 34,189,500 | ||||||
| 132,509,200 | ||||||||
| Oil, Gas & Consumable | ||||||||
| Fuels - 5.03% | ||||||||
| ConocoPhilips | 660,000 | 33,706,200 | ||||||
| Pharmaceuticals - 8.55% | ||||||||
| Johnson & Johnson | 310,000 | 19,967,100 | ||||||
| Pfizer, Inc. | 2,050,000 | 37,289,500 | ||||||
| 57,256,600 | ||||||||
See notes to financial statements.
22
| Number | ||||||||
| of Shares | Value | |||||||
| Software - 6.19% | ||||||||
| Microsoft Corp. | 1,360,000 | $ | 41,466,400 | |||||
| Specialty Retail - 1.23% | ||||||||
| Abercrombie & Fitch Co. - Class A | 30,000 | 1,045,500 | ||||||
| Wal-Mart Stores, Inc. | 135,000 | 7,215,750 | ||||||
| 8,261,250 | ||||||||
| TOTAL COMMON STOCKS | ||||||||
| (Cost $460,578,537) | 553,167,212 | |||||||
| CONVERTIBLE PREFERRED STOCKS - 0.56% | ||||||||
| Advertising - 0.56% | ||||||||
| Interpublic Group of | ||||||||
| Cos., Inc., Series B | 5,000 | 3,730,443 | ||||||
| TOTAL CONVERTIBLE PREFERRED | ||||||||
| STOCKS (Cost $2,125,000) | 3,730,443 | |||||||
| PREFERRED STOCKS - 0.20% | ||||||||
| Diversified Financial Services - 0.20% | ||||||||
| Federal National Mortgage | ||||||||
| Association, Series S (a) | 30,000 | 33,000 | ||||||
| Federal National Mortgage | ||||||||
| Association, Series N (a) | 48,949 | 73,423 | ||||||
| Federal National Mortgage | ||||||||
| Association, Series L (a) | 8,000 | 11,840 | ||||||
| SLM Corp., Series A | 31,903 | 1,198,915 | ||||||
| TOTAL PREFERRED STOCKS | ||||||||
| (Cost $1,001,598) | 1,317,178 | |||||||
See notes to financial statements.
23
The Yacktman Focused Fund
PORTFOLIO OF INVESTMENTS (Cont’d.)
December 31, 2009
| Principal | ||||||||
| Amount | Value | |||||||
| CONVERTIBLE BONDS - 0.09% | ||||||||
| Mortgage REITs - 0.09% | ||||||||
| RAIT Financial Trust | ||||||||
| 6.875%, 04/15/2027 | ||||||||
| (Acquired 08/15/2007) (c) | $ | 1,250,000 | $ | 609,000 | ||||
| TOTAL CONVERTIBLE BONDS | ||||||||
| (Cost $1,062,908) | 609,000 | |||||||
| CORPORATE BONDS - 0.41% | ||||||||
| Advertising - 0.21% | ||||||||
| Interpublic Group of Cos., Inc. | ||||||||
| 6.250%, 11/15/2014 | 1,500,000 | 1,447,500 | ||||||
| Specialty Retail - 0.20% | ||||||||
| Limited Brands, Inc. | ||||||||
| 7.600%, 07/15/2037 | 1,500,000 | 1,342,500 | ||||||
| TOTAL CORPORATE BONDS | ||||||||
| (Cost $1,567,652) | 2,790,000 | |||||||
See notes to financial statements.
24
| Principal | ||||||||
| Amount | Value | |||||||
| SHORT-TERM INVESTMENTS - 12.20% | ||||||||
| Commercial Paper - 7.32% | ||||||||
| General Electric Capital | ||||||||
| 0.025%, 01/06/2010 | 24,516,000 | $ | 24,515,983 | |||||
| Intesa Funding | ||||||||
| 0.250%, 01/06/2010 | 24,516,000 | 24,515,830 | ||||||
| 49,031,813 | ||||||||
| Demand Notes - 4.88% | ||||||||
| U.S. Bancorp | ||||||||
| 0.000% (b) | 32,646,884 | 32,646,884 | ||||||
| TOTAL SHORT-TERM | ||||||||
| INVESTMENTS (Cost $81,678,697) | 81,678,697 | |||||||
| Total Investments | ||||||||
| (Cost $548,014,392) - 96.06% | 643,292,530 | |||||||
| Other Assets in Excess | ||||||||
| of Liabilities - 3.94% | 26,368,741 | |||||||
| TOTAL NET ASSETS - 100.00% | $ | 669,661,271 | ||||||
Percentages are stated as a percent of net assets.
ADR American Depository Receipt
| (a) | Non-Income Producing |
| (b) | Variable rate security. Rate shown represents the rate as of December 31, 2009. |
| (c) | Restricted security as defined in Rule 144(A) under the Securities Act of 1933. |
See notes to financial statements.
25
The Yacktman Funds, Inc.
STATEMENTS OF ASSETS & LIABILITIES
December 31, 2009
| The Yacktman | The Yacktman | |||||||
| Fund | Focused Fund | |||||||
| ASSETS: | ||||||||
| Investments, at value | ||||||||
| (Cost $1,135,004,333 and | ||||||||
| $548,014,392 respectively) | $ | 1,366,964,800 | $ | 643,292,530 | ||||
| Cash | 16,300,795 | 15,925,042 | ||||||
| Receivable for fund shares sold | 25,296,853 | 19,672,960 | ||||||
| Dividends and interest | ||||||||
| receivable | 1,886,581 | 681,872 | ||||||
| Prepaid expenses | 86,104 | 48,146 | ||||||
| Total Assets | 1,410,535,133 | 679,620,550 | ||||||
| LIABILITIES: | ||||||||
| Payable for fund | ||||||||
| shares redeemed | 1,780,728 | 475,613 | ||||||
| Payable for investments | ||||||||
| purchased | 6,434,922 | 8,886,351 | ||||||
| Accrued investment | ||||||||
| advisory fees | 699,992 | 439,899 | ||||||
| Other accrued expenses | 391,756 | 157,416 | ||||||
| Total Liabilities | 9,307,398 | 9,959,279 | ||||||
| NET ASSETS | $ | 1,401,227,735 | $ | 669,661,271 | ||||
| NET ASSETS CONSIST OF: | ||||||||
| Capital stock | $ | 1,172,550,249 | $ | 576,939,618 | ||||
| Undistributed net | ||||||||
| investment income | 7,691 | 1,238 | ||||||
| Undistributed accumulated | ||||||||
| net realized loss | (3,290,672 | ) | (2,557,723 | ) | ||||
| Net unrealized appreciation | ||||||||
| investments | 231,960,467 | 95,278,138 | ||||||
| Total Net Assets | $ | 1,401,227,735 | $ | 669,661,271 | ||||
| CAPITAL STOCK, | ||||||||
| $0.0001 par value | ||||||||
| Authorized | 500,000,000 | 500,000,000 | ||||||
| Issued and Outstanding | 92,087,004 | 41,517,235 | ||||||
| NET ASSET VALUE, | ||||||||
| REDEMPTION PRICE, AND | ||||||||
| OFFERING PRICE PER SHARE | $ | 15.22 | $ | 16.13 | ||||
See notes to financial statements.
26
The Yacktman Funds, Inc.
STATEMENTS OF OPERATIONS
For the Year Ended December 31, 2009
| The Yacktman | The Yacktman | |||||||
| Fund | Focused Fund | |||||||
| INVESTMENT INCOME: | ||||||||
Dividend income(1) | $ | 13,195,200 | $ | 4,653,726 | ||||
| Interest income | 2,354,628 | 628,298 | ||||||
| Total investment income | 15,549,828 | 5,282,024 | ||||||
| EXPENSES: | ||||||||
| Investment advisory fees | 4,212,748 | 2,589,932 | ||||||
| Shareholder servicing fees | 1,235,568 | 463,089 | ||||||
| Administration and accounting fees | 248,380 | 73,120 | ||||||
| Reports to shareholders | 92,290 | 34,340 | ||||||
| Professional fees | 51,052 | 30,497 | ||||||
| Compliance expenses | 54,710 | 17,995 | ||||||
| Federal and state registration fees | 115,741 | 64,860 | ||||||
| Custody fees | 55,707 | 24,900 | ||||||
| Directors fees and expenses | 27,630 | 11,255 | ||||||
| Miscellaneous expenses | 24,352 | 5,305 | ||||||
| Total expenses before | ||||||||
| reimbursements | 6,118,178 | 3,315,293 | ||||||
| Expense reimbursements | ||||||||
| (See Note 5) | — | (77,878 | ) | |||||
| Net Expenses | 6,118,178 | 3,237,415 | ||||||
| NET INVESTMENT INCOME | 9,431,650 | 2,044,609 | ||||||
| REALIZED AND UNREALIZED GAIN: | ||||||||
| Net realized gain on: | ||||||||
| Investments | 6,086,225 | 395,568 | ||||||
| Written options | — | 148,999 | ||||||
| Total | 6,086,225 | 544,567 | ||||||
| Change in unrealized | ||||||||
| appreciation on: | ||||||||
| Investments | 268,992,040 | 106,998,246 | ||||||
| Written options | — | (143,999 | ) | |||||
| Total | 268,992,040 | 106,854,247 | ||||||
| Net realized and unrealized | ||||||||
| gain on investments | 275,078,265 | 107,398,814 | ||||||
| NET INCREASE IN NET ASSETS | ||||||||
| RESULTING FROM OPERATIONS | $ | 284,509,915 | $ | 109,443,423 | ||||
| (1) | Net of $0 and $9,594, respectively in foreign withholding taxes. |
See notes to financial statements.
27
STATEMENTS OF CHANGES
IN NET ASSETS
OPERATIONS:
Net investment income
Net realized gain on investments
Net change in unrealized appreciation (depreciation)
on investments
Net increase (decrease) in net assets resulting
from operations
CAPITAL SHARE TRANSACTIONS:
Proceeds from shares sold
Proceeds from reinvestment of distributions
Redemption fees
Payments for shares redeemed
Net increase
DISTRIBUTIONS PAID FROM:
Net investment income
Net realized gains
Total distributions
TOTAL INCREASE (DECREASE) IN NET ASSETS
NET ASSETS:
Beginning of period
End of period (including undistributed net investment
income of $7,691, $0, $1,238 and $0 respectively)
TRANSACTIONS IN SHARES:
Shares sold
Issued in reinvestment of distributions
Shares redeemed
Net increase
See notes to financial statements.
28
| The Yacktman Fund | The Yacktman Focused Fund | |||||||||||||
| Year Ended | Year Ended | Year Ended | Year Ended | |||||||||||
| December 31, | December 31, | December 31, | December 31, | |||||||||||
| 2009 | 2008 | 2009 | 2008 | |||||||||||
| $ | 9,431,650 | $ | 5,164,426 | $ | 2,044,609 | $ | 892,817 | |||||||
| 6,086,225 | 782,343 | 544,567 | 1,682,260 | |||||||||||
| 268,992,040 | (90,439,239 | ) | 106,854,247 | (21,628,540 | ) | |||||||||
| 284,509,915 | (84,492,470 | ) | 109,443,423 | (19,053,463 | ) | |||||||||
| 974,703,674 | 261,825,791 | 580,342,430 | 65,280,545 | |||||||||||
| 17,513,359 | 6,367,896 | 3,762,203 | 4,350,042 | |||||||||||
| 93,244 | 161,978 | 67,513 | 20,248 | |||||||||||
| 992,310,277 | 268,355,665 | 584,172,146 | 69,650,835 | |||||||||||
| (153,959,735 | ) | (172,240,981 | ) | (85,485,750 | ) | (47,722,837 | ) | |||||||
| 838,350,542 | 96,114,684 | 498,686,396 | 21,927,998 | |||||||||||
| (9,423,959 | ) | (5,352,880 | ) | (2,043,371 | ) | (955,328 | ) | |||||||
| (8,867,709 | ) | (1,184,867 | ) | (1,891,918 | ) | (3,504,831 | ) | |||||||
| (18,291,668 | ) | (6,537,747 | ) | (3,935,289 | ) | (4,460,159 | ) | |||||||
| 1,104,568,789 | 5,084,467 | 604,194,530 | (1,585,624 | ) | ||||||||||
| 296,658,946 | 291,574,479 | 65,466,741 | 67,052,365 | |||||||||||
| $ | 1,401,227,735 | $ | 296,658,946 | $ | 669,661,271 | $ | 65,466,741 | |||||||
| 73,413,825 | 23,591,917 | 40,860,941 | 5,238,874 | |||||||||||
| 1,140,936 | 672,428 | 231,236 | 447,075 | |||||||||||
| (13,106,413 | ) | (15,398,687 | ) | (6,143,497 | ) | (3,906,759 | ) | |||||||
| 61,448,348 | 8,865,658 | 34,948,680 | 1,779,190 | |||||||||||
See notes to financial statements.
29
The Yacktman Funds, Inc.
FINANCIAL HIGHLIGHTS
For a Fund share outstanding throughout each year
NET ASSET VALUE:
Beginning of period
OPERATIONS:
Net investment income
Net realized and unrealized gain (loss)
on investment securities
Total from operations
LESS DISTRIBUTIONS:
From net investment income
From net realized gains
Total distributions
NET ASSET VALUE:
End of period
TOTAL RETURN
SUPPLEMENTAL DATA AND RATIOS
Net assets; end of period (000's)
Ratio of net expenses to average net assets
Ratio of net investment income to average net assets
Portfolio turnover rate
See notes to financial statements.
30
| The Yacktman Fund | ||||||||||||||||||
| Year Ended December 31, | ||||||||||||||||||
| 2009 | 2008 | 2007 | 2006 | 2005 | ||||||||||||||
| $ | 9.68 | $ | 13.39 | $ | 15.79 | $ | 14.67 | $ | 15.34 | |||||||||
| 0.10 | 0.17 | 0.35 | 0.30 | 0.28 | ||||||||||||||
| 5.64 | (3.66 | ) | 0.21 | 2.05 | (0.48 | ) | ||||||||||||
| 5.74 | (3.49 | ) | 0.56 | 2.35 | (0.20 | ) | ||||||||||||
| (0.10 | ) | (0.18 | ) | (0.34 | ) | (0.30 | ) | (0.28 | ) | |||||||||
| (0.10 | ) | (0.04 | ) | (2.62 | ) | (0.93 | ) | (0.19 | ) | |||||||||
| (0.20 | ) | (0.22 | ) | (2.96 | ) | (1.23 | ) | (0.47 | ) | |||||||||
| $ | 15.22 | $ | 9.68 | $ | 13.39 | $ | 15.79 | $ | 14.67 | |||||||||
| 59.31 | % | (26.05 | )% | 3.39 | % | 15.95 | % | (1.30 | )% | |||||||||
| $ | 1,401,228 | $ | 296,659 | $ | 291,574 | $ | 429,072 | $ | 438,912 | |||||||||
| 0.93 | % | 0.95 | % | 0.95 | % | 0.96 | % | 0.92 | % | |||||||||
| 1.43 | % | 1.92 | % | 1.71 | % | 1.90 | % | 1.86 | % | |||||||||
| 14.29 | % | 32.77 | % | 23.82 | % | 17.93 | % | 8.64 | % | |||||||||
See notes to financial statements.
31
FINANCIAL HIGHLIGHTS (Cont’d.)
The Yacktman Focused Fund
For a Fund share outstanding throughout each year
NET ASSET VALUE:
Beginning of period
OPERATIONS:
Net investment income
Net realized and unrealized (loss) on investment securities
Total from operations
LESS DISTRIBUTIONS:
From net investment income
From net realized gains
Total distributions
NET ASSET VALUE:
End of period
TOTAL RETURN
SUPPLEMENTAL DATA AND RATIOS
Net assets; end of period (000's)
Ratio of expenses before expense reimbursements
to average net assets (See Note 5)
Ratio of net expenses to average net assets
Ratio of net investment income to average net assets
Portfolio turnover rate
See notes to financial statements.
32
| The Yacktman Focused Fund | ||||||||||||||||||
| Year Ended December 31, | ||||||||||||||||||
| 2009 | 2008 | 2007 | 2006 | 2005 | ||||||||||||||
| $ | 9.97 | $ | 14.00 | $ | 16.00 | $ | 14.96 | $ | 15.83 | |||||||||
| 0.05 | 0.15 | 0.23 | 0.21 | 0.22 | ||||||||||||||
| 6.21 | (3.45 | ) | 0.34 | 2.20 | (0.51 | ) | ||||||||||||
| 6.26 | (3.30 | ) | 0.57 | 2.41 | (0.29 | ) | ||||||||||||
| (0.05 | ) | (0.16 | ) | (0.23 | ) | (0.21 | ) | (0.22 | ) | |||||||||
| (0.05 | ) | (0.57 | ) | (2.34 | ) | (1.16 | ) | (0.36 | ) | |||||||||
| (0.10 | ) | (0.73 | ) | (2.57 | ) | (1.37 | ) | (0.58 | ) | |||||||||
| $ | 16.13 | $ | 9.97 | $ | 14.00 | $ | 16.00 | $ | 14.96 | |||||||||
| 62.76 | % | (23.48 | )% | 3.46 | % | 16.13 | % | (1.83 | )% | |||||||||
| $ | 669,661 | $ | 65,467 | $ | 67,052 | $ | 90,534 | $ | 84,608 | |||||||||
| 1.28 | % | 1.35 | % | 1.38 | % | 1.35 | % | 1.32 | % | |||||||||
| 1.25 | % | 1.25 | % | 1.25 | % | 1.25 | % | 1.25 | % | |||||||||
| 0.79 | % | 1.31 | % | 1.23 | % | 1.40 | % | 1.30 | % | |||||||||
| 8.26 | % | 67.11 | % | 30.49 | % | 30.61 | % | 5.62 | % | |||||||||
See notes to financial statements.
33
The Yacktman Funds, Inc.
NOTES TO THE FINANCIAL STATEMENTS
December 31, 2009
1. ORGANIZATION
The Yacktman Funds, Inc. (comprised of The Yacktman Fund and The Yacktman Focused Fund, hereafter referred to as the “Funds”) is registered as an open-end management investment company under the Investment Company Act of 1940 (the “1940 Act”). The Funds consist of two investment portfolios: The Yacktman Fund is a diversified fund that commenced operations July 6, 1992 and The Yacktman Focused Fund is a non-diversified fund that commenced operations May 1, 1997. The objective of each of the Funds is to produce long-term capital appreciation with current income as a secondary objective. Yacktman Asset Management Co. is the Funds’ investment adviser (the “Adviser”).
2. SIGNIFICANT ACCOUNTING POLICIES
The following is a summary of significant accounting policies consistently followed by the Funds in the preparation of their financial statements. The financial statements have been prepared in conformity with accounting principles generally accepted in the United States of America, which require management to make certain estimates and assumptions that affect the reported amounts of assets and liabilities and disclosure of contingent assets and liabilities at the date of the financial statements and the reported amounts of increases and decreases in net assets from operations during the reporting period. Actual results could differ from those estimates.
a) Subsequent Events Evaluation - In preparing these financial statements, the Funds have evaluated events and transactions for potential recognition or disclosure resulting from subsequent events through February 25, 2010, the date the financial statements were issued. This evaluation did not result in any subsequent events that necessitated disclosures and/or adjustments.
b) Investment Valuation - Securities which are traded on a national stock exchange are valued at the last sale price
34
on the securities exchange on which such securities are primarily traded. Securities that are traded on the Nasdaq National Market or the Nasdaq Smallcap Market are valued at the Nasdaq Official Closing Price. Exchangetraded securities for which there were no transactions are valued at the current bid prices. Securities traded on only over-the-counter markets are valued on the basis of closing over-the-counter bid prices. Short-term debt instruments maturing within 60 days are valued by the amortized cost method, which approximates fair value. Debt securities (other than short-term instruments) are valued at the mean price furnished by a national pricing service, subject to review by the Adviser and determination of the appropriate price whenever a furnished price is significantly different from the previous day’s furnished price. Options written or purchased by The Yacktman Focused Fund are valued at the last sales price if such last sales price is between the current bid and asked prices. Otherwise, options are valued at the mean between the current bid and asked prices. Any securities for which there are no readily available market quotations and other assets will be valued at their fair value as determined in good faith by the Adviser pursuant to procedures established by and under the supervision of the Board of Directors. The fair value of a security is the amount which a Fund might reasonably expect to receive upon a current sale. Valuing securities for which there are no readily available market quotations involves greater reliance on judgement and there can be no assurance that the Funds could obtain the fair value assigned to a security if they were to sell the security at approximately the time at which the Funds determine their net asset value per share.
Valuation Measurements
The Funds have adopted authoritative fair valuation accounting standards which establish an authoritative definition of fair value and set out a hierarchy for measuring fair value. These standards require additional disclosures about the various inputs and valuation
35
NOTES TO THE FINANCIAL STATEMENTS
December 31, 2009 (Cont’d.)
techniques used to develop the measurements of fair value and a discussion in changes in valuation techniques and related inputs, if any, during the period. In addition, these standards require expanded disclosure for each major category of assets. These inputs are summarized in the three broad levels listed below:
| Level 1 – | Quoted prices in active markets for identical securities. |
| Level 2 – | Other significant observable inputs (including quoted prices for similar securities, interest rates, prepayment speeds, credit risk, etc.). |
| Level 3 – | Significant unobservable inputs (including the Funds’ own assumptions in determining the fair value of investments). |
The inputs or methodology used for valuing securities are not necessarily an indication of the risk associated with investing in those securities. The following is a summary of the inputs used to value the Funds’ net assets as of December 31, 2009:
36
THE YACKTMAN FUND
| Level 1 | Level 2 | Level 3 | Total | |||||||||||||
| Common Stock | ||||||||||||||||
| Consumer | ||||||||||||||||
| Discretionary | $ | 333,923,622 | $ | — | — | $ | 333,923,622 | |||||||||
| Consumer Staples | 371,007,926 | — | — | 371,007,926 | ||||||||||||
| Energy | 69,965,900 | — | — | 69,965,900 | ||||||||||||
| Financials | 117,215,448 | — | — | 117,215,448 | ||||||||||||
| Health Care | 160,285,605 | — | — | 160,285,605 | ||||||||||||
| Industrials | 11,354,597 | — | — | 11,354,597 | ||||||||||||
| Information | ||||||||||||||||
| Technology | 105,660,100 | — | — | 105,660,100 | ||||||||||||
| Total | ||||||||||||||||
| Common Stock | 1,169,413,198 | — | — | 1,169,413,198 | ||||||||||||
| Convertible | ||||||||||||||||
| Preferred Stock* | — | 15,667,858 | — | 15,667,858 | ||||||||||||
| Preferred Stock* | 13,656,781 | — | — | 13,656,781 | ||||||||||||
| Convertible Bonds* | — | 2,835,000 | — | 2,835,000 | ||||||||||||
| Corporate Bonds* | — | 8,646,250 | — | 8,646,250 | ||||||||||||
| Short-Term | ||||||||||||||||
| Investments | — | 156,745,713 | — | 156,745,713 | ||||||||||||
| Total Investments | ||||||||||||||||
| in Securities | $ | 1,183,069,979 | $ | 183,894,821 | $ | — | $ | 1,366,964,800 | ||||||||
| * | Please refer to the portfolio of investments to view securities by industry type. |
37
The Yacktman Funds, Inc.
NOTES TO THE FINANCIAL STATEMENTS
December 31, 2009 (Cont’d.)
THE YACKTMAN FOCUSED FUND
| Level 1 | Level 2 | Level 3 | Total | |||||||||||||
| Common Stock | ||||||||||||||||
| Automobiles | $ | — | $ | 14,755,000 | — | $ | 14,755,000 | |||||||||
| Consumer | ||||||||||||||||
| Discretionary | 147,547,900 | — | — | 147,547,900 | ||||||||||||
| Consumer Staples | 180,864,290 | — | — | 180,864,290 | ||||||||||||
| Energy | 33,706,200 | — | — | 33,706,200 | ||||||||||||
| Financials | 40,776,682 | — | — | 40,776,682 | ||||||||||||
| Health Care | 76,363,240 | — | — | 76,363,240 | ||||||||||||
| Industrials | 2,458,750 | — | — | 2,458,750 | ||||||||||||
| Information | ||||||||||||||||
| Technology | 56,695,150 | — | — | 56,695,150 | ||||||||||||
| Total | ||||||||||||||||
| Common Stock | 538,412,212 | 14,755,000 | — | 553,167,212 | ||||||||||||
| Convertible | ||||||||||||||||
| Preferred Stock* | — | 3,730,443 | — | 3,730,443 | ||||||||||||
| Preferred Stock* | 1,317,178 | — | — | 1,317,178 | ||||||||||||
| Convertible Bonds* | — | 609,000 | — | 609,000 | ||||||||||||
| Corporate Bonds* | — | 2,790,000 | — | 2,790,000 | ||||||||||||
| Short-Term | ||||||||||||||||
| Investments | — | 81,678,697 | — | 81,678,697 | ||||||||||||
| Total Investments | ||||||||||||||||
| in Securities | $ | 539,729,390 | $ | 103,563,140 | $ | — | $ | 643,292,530 | ||||||||
| * | Please refer to the portfolio of investments to view securities by industry type. |
The Funds have adopted derivative instruments disclosure standards, in order to enable the investor to understand how and why an entity used derivatives, how derivatives are accounted for, and how derivative instruments affect a Fund’s results of operations and financial position.
The Yacktman Focused Fund
The Yacktman Focused Fund may use options to generate income and to hedge against losses caused by declines in the prices of stocks in its portfolio or for any other permissible purposes consistent with the Fund's investment objective.
The Yacktman Focused Fund did not hold any derivatives as of December 31, 2009.
38
The Effect of Derivative Instruments on the Statement of Operations for the Period Ended December 31, 2009
| Amount of Realized Gain or (Loss) on | ||||||||
Derivatives Recognized in Income | ||||||||
| Derivatives not accounted | ||||||||
| for as hedging instruments | Written Options | Total | ||||||
| Equity Contracts | $ | 148,999 | $ | 148,999 | ||||
| Total | $ | 148,999 | $ | 148,999 | ||||
Change in Unrealized Appreciation or (Depreciation) | ||||||||
on Derivatives Recognized in Income | ||||||||
| Derivatives not accounted | ||||||||
| for as hedging instruments | Written Options | Total | ||||||
| Equity Contracts | $ | (143,999 | ) | $ | (143,999 | ) | ||
| Total | $ | (143,999 | ) | $ | (143,999 | ) | ||
See Note 4 for additional disclosure related to transactions in written options during the period.
c) Option Writing - When The Yacktman Focused Fund writes an option, an amount equal to the premium received by The Yacktman Focused Fund is recorded as a liability and is subsequently adjusted to the current fair value of the option written. Premiums received from writing options that expire unexercised are treated by The Yacktman Focused Fund on the expiration date as realized gains from investments. The difference between the premium and the amount paid on effecting a closing purchase transaction, including brokerage commissions, is also treated as a realized gain, or, if the premium is less than the amount paid for the closing purchase transaction, as a realized loss. If a call option is exercised, the premium is added to the proceeds from the sale of the underlying security or currency in determining whether The Yacktman Focused Fund has realized a gain or loss. If a put option is exercised, the premium reduces the cost basis of the securities purchased by The Yacktman Focused Fund. The Yacktman Focused Fund as a writer of an option bears the market risk of an unfavorable change in the price of the security underlying the written option. A risk of using derivatives is that the counterparty to a
39
NOTES TO THE FINANCIAL STATEMENTS
December 31, 2009 (Cont’d.)
derivative may fail to comply with their obligation to the Fund.
d) Federal Income Taxes - It is each Fund’s policy to meet the requirements of the Internal Revenue Code applicable to regulated investment companies and to distribute substantially all investment company net taxable income and net capital gains to its shareholders in a manner which results in no tax cost to the Fund. Therefore, no federal income tax provision is required.
The Funds have adopted financial reporting rules regarding recognition and measurement of tax positions taken or expected to be taken on a tax return. The Funds have reviewed all open tax years and major jurisdictions and concluded that there is no impact on the Funds’ net assets and no tax liability resulting from unrecognized tax benefits relating to uncertain income tax positions taken or expected to be taken on a tax return. The Funds recognize interest and penalties, if any, related to unrecognized tax benefits as income tax expense in the Statement of Operations. During the period, the Funds did not incur any interest or penalties. The Funds are not subject to examination by U.S. federal tax authorities for any tax years before 2006.
e) Distributions to Shareholders - Dividends from net investment income and distributions of net realized capital gains, if any, are declared and paid at least annually. Distributions to shareholders are recorded on the exdividend date. The character of distributions made during the year from net investment income or net realized gains may differ from the characterization for federal income tax purposes due to differences in the recognition of income, expense and gain items for financial statement and tax purposes. Additionally, the Funds may utilize earnings and profits distributed to shareholders on redemption of shares as part of the dividends paid deduction for income tax purposes. Where appropriate, reclassifications between capital accounts are made for such differences
40
that are permanent in nature. No such reclassifications were made for the year ended December 31, 2009.
f) Guarantees and Indemnifications - In the normal course of business, the Funds enter into contracts with service providers that contain general indemnification clauses. The Funds’ maximum exposure under these arrangements is unknown as this would involve future claims against the Funds that have not yet occurred. Based on experience, the Funds expect the risk of loss to be remote.
g) Redemption Fee - Effective April 1, 2005, those who buy and sell the Funds within thirty calendar days will incur a 2% redemption fee, retained for the benefit of long-term shareholders, recorded as additional capital in the statement of changes in net assets.
h) Other - Investment transactions and shareholder transactions are accounted for on the trade date. Net realized gains and losses on securities are computed on the basis of specific security lot identification. Dividend income is recognized on the ex-dividend date and interest income is recognized on an accrual basis. Withholding taxes on foreign dividends have been provided for in accordance with the Funds’ understanding of the applicable country’s tax rules and regulations. Expenses incurred by the Funds that do not relate to a specific fund are allocated to the individual Funds based on each Fund’s relative net assets or another appropriate basis (as determined by the Board of Directors.)
3. INVESTMENT TRANSACTIONS
For the year ended December 31, 2009, the aggregate purchases and sales of securities, excluding short-term securities, were $725,845,709 and $84,365,537 for The Yacktman Fund and $408,811,792 and $19,032,441 for The Yacktman Focused Fund, respectively. For the year ended December 31, 2009, there were no purchases or sales of U.S. Government securities for The Yacktman Fund and The Yacktman Focused Fund.
41
The Yacktman Funds, Inc.
NOTES TO THE FINANCIAL STATEMENTS
December 31, 2009 (Cont’d.)
4. OPTION CONTRACTS WRITTEN
The premium amount and number of option contracts written during the year ended December 31, 2009 in The Yacktman Focused Fund, were as follows:
| Amount of | Number of | |||||||
| Premiums | Contracts | |||||||
| Outstanding at 12/31/2008 | $ | (148,999 | ) | (1,000 | ) | |||
| Options written | — | — | ||||||
| Options expired | 148,999 | 1,000 | ||||||
| Options closed | — | — | ||||||
| Outstanding at 12/31/2009 | $ | — | — | |||||
See Note 2 for additional disclosure about written options.
5. INVESTMENT ADVISORY AGREEMENT
The Funds have agreements with the Adviser, with whom certain officers and directors of the Funds are affiliated, to furnish investment advisory services to the Funds. Under the terms of these agreements, The Yacktman Fund will pay the Adviser a monthly fee at the annual rate of 0.65% on the first $500,000,000 of average daily net assets, 0.60% on the next $500,000,000 of average daily net assets and 0.55% on average daily net assets in excess of $1,000,000,000, and The Yacktman Focused Fund will pay the Adviser a monthly fee at the annual rate of 1% of its average daily net assets. The Adviser has contractually agreed to reimburse The Yacktman Fund for all expenses exceeding 2.00% of its average daily net assets (exclusive of interest, taxes, brokerage commissions and extraordinary expenses). The Adviser has voluntarily agreed to reimburse The Yacktman Focused Fund for all expenses exceeding 1.25% of its average daily net assets (exclusive of interest, taxes, brokerage commissions and extraordinary expenses). The Funds are not obligated to reimburse the Adviser for any fees or expenses waived in previous fiscal years. During the year ended December 31, 2009, the Adviser voluntarily waived $77,878 of investment advisory fees for The Yacktman Focused Fund.
42
6. LINE OF CREDIT
The Yacktman Fund and The Yacktman Focused Fund have established a line of credit (“LOC”) with U.S. Bank, N.A. to be used for temporary or emergency purposes, primarily for financing redemption payments, using the securities in each Fund’s respective portfolio as collateral. The LOC will mature, unless renewed, on March 31, 2010 for each of the Funds. For The Yacktman Fund, borrowing under the LOC is limited to the lesser of $15,000,000, 10% of the preborrowing net assets of the Fund, 10% of the market value of the assets of the Fund, or 33 1/3% of the sum of the market value of certain assets of the Fund. For The Yacktman Focused Fund, borrowing under the LOC is limited to the lesser of $15,000,000, 33 1/3% of the preborrowing net assets of the Fund, 33 1/3% of the market value of the assets of the Fund, or 33 1/3% of the sum of the market value of certain assets of the Fund. The interest rate paid by the Funds on outstanding borrowings is equal to the Prime Rate, less 0.50%, which was 2.75% as of December 31, 2009. During the year ended December 31, 2009, The Yacktman Fund had average outstanding borrowings of $45,315 under the LOC and paid a weighted average interest rate of 2.75%. During the year ended December 31, 2009, there were no borrowings for The Yacktman Focused Fund.
The Yacktman Fund and The Yacktman Focused Fund have established a line of credit (“LOC”) with U.S. Bank, N.A. to be used for temporary or emergency purposes, primarily for financing redemption payments, using the securities in each Fund’s respective portfolio as collateral. The LOC will mature, unless renewed, on March 31, 2010 for each of the Funds. For The Yacktman Fund, borrowing under the LOC is limited to the lesser of $15,000,000, 10% of the preborrowing net assets of the Fund, 10% of the market value of the assets of the Fund, or 33 1/3% of the sum of the market value of certain assets of the Fund. For The Yacktman Focused Fund, borrowing under the LOC is limited to the lesser of $15,000,000, 33 1/3% of the preborrowing net assets of the Fund, 33 1/3% of the market value of the assets of the Fund, or 33 1/3% of the sum of the market value of certain assets of the Fund. The interest rate paid by the Funds on outstanding borrowings is equal to the Prime Rate, less 0.50%, which was 2.75% as of December 31, 2009. During the year ended December 31, 2009, The Yacktman Fund had average outstanding borrowings of $45,315 under the LOC and paid a weighted average interest rate of 2.75%. During the year ended December 31, 2009, there were no borrowings for The Yacktman Focused Fund.
43
The Yacktman Funds, Inc.
NOTES TO THE FINANCIAL STATEMENTS
December 31, 2009 (Cont’d.)
7. TAX INFORMATION
As of December 31, 2009 the components of distributable earnings on a tax basis were as follows:
| The Yacktman | The Yacktman | |||||||
| Fund | Focused Fund | |||||||
| Tax cost of investments | $ | 1,138,295,825 | $ | 551,311,964 | ||||
| Gross unrealized appreciation | 247,163,331 | 98,684,730 | ||||||
| Gross unrealized depreciation | (18,494,356 | ) | (6,704,164 | ) | ||||
| Net tax unrealized | ||||||||
| appreciation | 228,668,975 | 91,980,566 | ||||||
| Undistributed ordinary income | 8,511 | 47,543 | ||||||
| Undistributed long-term | ||||||||
| capital gains | — | 693,544 | ||||||
| Accumulated earnings | 8,511 | 741,087 | ||||||
| Other accumulated | ||||||||
| gains/(losses) | — | — | ||||||
| Total accumulated earnings | $ | 228,677,486 | $ | 92,721,653 | ||||
The tax basis of investments for tax and financial reporting purposes differs, principally due to the deferral of losses on wash sales.
The tax character of distributions paid during the fiscal years ended December 31, 2009 and December 31, 2008 were as follows:
| The Yacktman | The Yacktman | |||||||
| Fund | Focused Fund | |||||||
| 2009 | ||||||||
| Ordinary income | $ | 18,291,668 | $ | 3,935,255 | ||||
| Long-term capital gains | $ | — | $ | 34 | ||||
| 2008 | ||||||||
| Ordinary income | $ | 6,537,747 | $ | 2,097,803 | ||||
| Long-term capital gains | $ | — | $ | 2,362,356 | ||||
44
The Yacktman Funds, Inc.
REPORT OF INDEPENDENT REGISTERED PUBLIC ACCOUNTING FRIM
To the Shareholders and Board of Directors
The Yacktman Funds, Inc.
We have audited the accompanying statements of assets and liabilities, including the portfolios of investments, of The Yacktman Funds, Inc., comprising The Yacktman Fund and The Yacktman Focused Fund (the “Funds”), as of December 31, 2009, and the related statements of operations for the year then ended, and the statements of changes in net assets and the financial highlights for each of the two years in the period then ended. These financial statements and financial highlights are the responsibility of the Funds’ management. Our responsibility is to express an opinion on these financial statements and financial highlights based on our audits. The financial highlights for the periods indicated prior to December 31, 2008, were audited by another independent registered public accounting firm, who expressed unqualified opinions on those financial highlights.
We conducted our audits in accordance with the standards of the Public Company Accounting Oversight Board (United States). Those standards require that we plan and perform the audit to obtain reasonable assurance about whether the financial statements and financial highlights are free of material misstatement. An audit includes examining, on a test basis, evidence supporting the amounts and disclosures in the financial statements. Our procedures included confirmation of securities owned as of December 31, 2009 by correspondence with the custodian and brokers. An audit also includes assessing the accounting principles used and significant estimates made by management, as well as evaluating the overall financial statement presentation. We believe that our audits provide a reasonable basis for our opinion.
In our opinion, the financial statements and financial highlights referred to above present fairly, in all material respects, the financial position of each of the funds constituting The Yacktman Funds, Inc., as of December 31, 2009, the results of their operations for the year then ended, and the changes in their net assets and financial highlights for each of the two years in the period then ended, in conformity with accounting principles generally accepted in the United States of America.
COHEN FUND AUDIT SERVICES, LTD.
Westlake, Ohio
February 25, 2010
45
The Yacktman Funds, Inc.
ADDITIONAL INFORMATION
(Unaudited)
For the year ended December 31, 2009, 71.64% and 100.00% of the dividends paid from net investment income, including short-term capital gains, for The Yacktman Fund and The Yacktman Focused Fund, respectively, qualify for the dividends received deduction available to corporate shareholders.
For the year ended December 31, 2009, 70.55% and 100.00% of the dividends paid from net investment income, including short-term capital gains, for The Yacktman Fund and The Yacktman Focused Fund, respectively, are designated as qualified dividend income.
The Funds hereby designate approximately 48.48% and 48.07% as short-term capital gain distributions for The Yacktman Fund and The Yacktman Focused Fund, respectively, for the purposes of the dividends paid deduction.
PROXY VOTING POLICIES
AND PROCEDURES
For a description of the policies and procedures that the Funds use to determine how to vote proxies relating to portfolio securities, please call 1-800-525-8258 and request a Statement of Additional Information. One will be mailed to you free of charge. The Statement of Additional Information is also available on the Web site of the Securities and Exchange Commission at http://www.sec.gov. Information on how the Funds voted proxies relating to portfolio securities during the twelve month period ended June 30, 2009, is available without charge, upon request, by calling 1-800-525-8258 or by accessing the Web site of the Securities and Exchange Commission.
DISCLOSURE OF PORTFOLIO HOLDINGS
The Funds will file complete schedules of portfolio holdings with the Securities and Exchange Commission for the first and third quarters of each fiscal year on Form N-Q. Each Fund’s Form N-Q will be available on the Web site of the Securities and Exchange Commission at http://www.sec.gov.
46
(This Page Intentionally Left Blank.)
47
The Yacktman Funds, Inc.
DIRECTOR AND OFFICER INFORMATION
(Unaudited)
| Current | |||
| position held | |||
| Name | Age | Address | with the Funds |
| Independent Directors | |||
| Bruce B. Bingham | 61 | c/o Yacktman Asset | Director |
| Management Co. | |||
| 6300 Bridgepoint Parkway | |||
| Building One, Suite 320 | |||
| Austin, TX 78730 | |||
| Albert J. Malwitz | 73 | c/o Yacktman Asset | Director |
| Management Co. | |||
| 6300 Bridgepoint Parkway | |||
| Building One, Suite 320 | |||
| Austin, TX 78730 | |||
| George J. Stevenson | 70 | c/o Yacktman Asset | Director |
| Management Co. | |||
| 6300 Bridgepoint Parkway | |||
| Building One, Suite 320 | |||
| Austin, TX 78730 | |||
| Interested Director* | |||
| Donald A. Yacktman | 68 | c/o Yacktman Asset | Director |
| Management Co. | |||
| 6300 Bridgepoint Parkway | President | ||
| Building One, Suite 320 | Treasurer | ||
| Austin, TX 78730 | |||
| Officers | |||
| Stephen Yacktman | 39 | c/o Yacktman Asset | Vice |
| Management Co. | President | ||
| 6300 Bridgepoint Parkway | Secretary | ||
| Building One, Suite 320 | Officer | ||
| Austin, TX 78730 |
| * | The Interested Director serves as director and officer of The Yacktman Funds. |
Additional information about the Funds’ directors is available in the Statement of Additional Information and is available, without charge, upon request, by calling 1-800-525-8258.
48
| Principal | Number | Other | |
| occupation | of portfolios | directorships | |
| Term of office | during the | overseen | held outside |
| and length of | past five | within the | the Fund |
| time served | years | Fund complex | complex |
| Indefinite, | Mr. Bingham has been a | 2 | None |
| until | partner in Hamilton | ||
| successor | Partners, a real estate | ||
| elected | development firm, for | ||
| more than five years | |||
| 11 years | |||
| Indefinite, | Mr. Malwitz has been | 2 | None |
| until | owner and chief executive | ||
| successor | officer of Arlington Fastener | ||
| elected | Co., a manufacturer and | ||
| distributor of industrial | |||
| 11 years | fasteners, for more | ||
| than five years | |||
| Indefinite, | Mr. Stevenson has been | 2 | None |
| until | President of Stevenson & | ||
| successor | Company, a registered | ||
| elected | business broker, and | ||
| President of Healthmate | |||
| 11 years | Products Co., a fruit juice | ||
| concentrate manufacturing | |||
| company, for more | |||
| than five years | |||
| Indefinite, | Mr. Yacktman has been | 2 | None |
| until | President of Yacktman | ||
| successor | Asset Management Co. | ||
| elected | since April, 1992 | ||
| 18 years | |||
| Indefinite, | Mr. Yacktman has been | N/A | None |
| until | Vice President of Yacktman | ||
| successor | Asset Management Co. | ||
| elected | for more than five years | ||
| 7 years |
49
The Yacktman Funds, Inc.
DIRECTOR AND OFFICER INFORMATION
(Unaudited) (Cont’d.)
| Current | |||
| position held | |||
| Name | Age | Address | with the Funds |
| Kent A. Arnett | 68 | c/o Yacktman Asset | Vice |
| Management Co. | President | ||
| 6300 Bridgepoint Parkway | Chief | ||
| Building One, Suite 320 | Compliance | ||
| Austin, TX 78730 | Officer | ||
| Jason Subotky | 39 | c/o Yacktman Asset | Vice |
| Management Co. | President | ||
| 6300 Bridgepoint Parkway | |||
| Building One, Suite 320 | |||
| Austin, TX 78730 |
50
| Principal | Number | Other | |
| occupation | of portfolios | directorships | |
| Term of office | during the | overseen | held outside |
| and length of | past five | within the | the Fund |
| time served | years | Fund complex | complex |
| Indefinite, | Mr. Arnett has been | N/A | None |
| until | Vice President and | ||
| successor | Chief Compliance Officer | ||
| elected | of Yacktman Asset | ||
| Management Co. for | |||
| 5 years | five years | ||
| Indefinite, | Mr. Subotky has been | N/A | None |
| until | Vice President and | ||
| successor | Portfolio Manager for | ||
| elected | Yacktman Asset | ||
| Management for more | |||
| 2 years | than five years |
51
For Fund information and
shareholder services, call
1-800-525-8258
Web site: www.yacktman.com
The Yacktman Funds, Inc.
Shareholder Services Center
615 East Michigan Street, 3rd Floor
Milwaukee, Wisconsin 53202-5207
This report is submitted for the general information of shareholders of The Yacktman Funds. It is not authorized for distribution to prospective investors unless accompanied or preceded by an effective Prospectus for the Funds, which contains more information concerning the Funds’ investment policies, as well as fees and expenses and other pertinent information. Read the Prospectus carefully.
YA-410-0210
Item 2. Code of Ethics.
The registrant has adopted a code of ethics that applies to the registrant’s principal executive officer and principal financial officer. The registrant has not made any amendments to its code of ethics during the period covered by this report. The registrant has not granted any waivers from any provisions of the code of ethics during the period covered by this report.
A copy of the registrant’s Code of Ethics is filed herewith.
Item 3. Audit Committee Financial Expert.
The registrant’s board of directors has determined that there is at least one audit committee financial expert serving on its audit committee. At this time, the registrant believes that the experience provided by each member of the audit committee together offers the registrant adequate oversight for the registrant’s level of financial complexity.
Item 4. Principal Accountant Fees and Services.
The registrant has engaged its principal accountant to perform audit services, audit-related services, tax services and other services during the past two fiscal years. “Audit services” refer to performing an audit of the registrant's annual financial statements or services that are normally provided by the accountant in connection with statutory and regulatory filings or engagements for those fiscal years. “Audit-related services” refer to the assurance and related services by the principal accountant that are reasonably related to the performance of the audit. “Tax services” refer to professional services rendered by the principal accountant for tax compliance, tax advice, and tax planning. The following table details the aggregate fees billed or expected to be billed for each of the last two fiscal years for audit fees, audit-related fees, tax fees and other fees by the principal accountant. The fees for FYE 12/31/2008 and 12/31/2009 were billed by Cohen Fund Audit Services, Ltd.
| FYE 12/31/2009 | FYE 12/31/2008 | |
| Audit Fees | $31,000 | $31,000 |
| Audit-Related Fees | $0 | $0 |
| Tax Fees | $5,000 | $5,000 |
| All Other Fees | $0 | $0 |
The audit committee has adopted pre-approval policies and procedures that require the audit committee to pre-approve all audit and non-audit services of the registrant, including services provided to any entity affiliated with the registrant.
There were no services that were approved applicable to non-audit services pursuant to waiver of pre-approval requirement.
None of the hours expended on the principal accountant’s engagement to audit the Funds’ financial statements for the fiscal year ended December 31, 2009 were attributable to work performed by persons other than the principal accountant’s full-time, permanent employees.
The following table indicates the non-audit fees billed or expected to be billed by the registrant’s accountant for services to the registrant and to the registrant’s investment adviser (and any other controlling entity, etc.—not sub-adviser) for the last two years. The audit committee of the board of trustees/directors has considered whether the provision of non-audit services that were rendered to the registrant's investment adviser is compatible with maintaining the principal accountant's independence and has concluded that the provision of such non-audit services by the accountant has not compromised the accountant’s independence.
| Non-Audit Related Fees | FYE 12/31/2009 | FYE 12/31/2008 |
| Registrant | $5,000 | $5,000 |
| Registrant’s Investment Adviser | $0 | $0 |
Item 5. Audit Committee of Listed Registrants.
Not applicable to registrants who are not listed issuers (as defined in Rule 10A-3 under the Securities Exchange Act of 1934).
Item 6. Investments.
Schedule of Investments is included as part of the report to shareholders filed under Item 1 of this Form.
Item 7. Disclosure of Proxy Voting Policies and Procedures for Closed-End Management Investment Companies.
Not applicable to open-end investment companies.
Item 8. Portfolio Managers of Closed-End Management Investment Companies.
Not applicable to open-end investment companies.
Item 9. Purchases of Equity Securities by Closed-End Management Investment Company and Affiliated Purchasers.
Not applicable to open-end investment companies.
Item 10. Submission of Matters to a Vote of Security Holders.
Not Applicable.
Item 11. Controls and Procedures.
| (a) | The Registrant’s [President/Chief Executive Officer] and [Treasurer/Chief Financial Officer] have reviewed the Registrant's disclosure controls and procedures (as defined in Rule 30a-3(c) under the Investment Company Act of 1940 (the “Act”)) as of a date within 90 days of the filing of this report, as required by Rule 30a-3(b) under the Act and Rules 13a-15(b) or 15d-15(b) under the Securities Exchange Act of 1934. Based on their review, such officers have concluded that the disclosure controls and procedures are effective in ensuring that information required to be disclosed in this report is appropriately recorded, processed, summarized and reported and made known to them by others within the Registrant and by the Registrant’s service provider. |
| (b) | There were no changes in the Registrant's internal control over financial reporting (as defined in Rule 30a-3(d) under the Act) that occurred during the second fiscal quarter of the period covered by this report that has materially affected, or is reasonably likely to materially affect, the Registrant's internal control over financial reporting. |
Item 12. Exhibits.
| (a) | (1) Any code of ethics or amendment thereto, that is the subject of the disclosure required by Item 2, to the extent that the registrant intends to satisfy Item 2 requirements through filing an exhibit. Filed herewith. |
(2) A separate certification for each principal executive and principal financial officer pursuant to Section 302 of the Sarbanes-Oxley Act of 2002. Filed herewith.
(3) Any written solicitation to purchase securities under Rule 23c-1 under the Act sent or given during the period covered by the report by or on behalf of the registrant to 10 or more persons. Not applicable to open-end investment companies.
| (b) | Certifications pursuant to Section 906 of the Sarbanes-Oxley Act of 2002. Furnished herewith. |
SIGNATURES
Pursuant to the requirements of the Securities Exchange Act of 1934 and the Investment Company Act of 1940, the registrant has duly caused this report to be signed on its behalf by the undersigned, thereunto duly authorized.
(Registrant) The Yacktman Funds, Inc
By (Signature and Title)* /s/ Donald A. Yacktman
Donald A. Yacktman, President
Date February, 26, 2010
Pursuant to the requirements of the Securities Exchange Act of 1934 and the Investment Company Act of 1940, this report has been signed below by the following persons on behalf of the registrant and in the capacities and on the dates indicated.
By (Signature and Title)* /s/ Donald A. Yacktman
Donald A. Yacktman, President/Treasurer
Date February, 26, 2010