As filed with the Securities and Exchange Commission on September 4, 2008
UNITED STATES
SECURITIES AND EXCHANGE COMMISSION
Washington, D.C. 20549
SECURITIES AND EXCHANGE COMMISSION
Washington, D.C. 20549
FORM N-CSR
CERTIFIED SHAREHOLDER REPORT OF REGISTERED MANAGEMENT INVESTMENT COMPANIES
Investment Company Act file number 811-06628
The Yacktman Funds, Inc.
(Exact name of registrant as specified in charter)
(Exact name of registrant as specified in charter)
6300 Bridgepoint Parkway
Building One, Suite 320
Austin TX 78730
(Address of principal executive offices) (Zip code)
(Address of principal executive offices) (Zip code)
Donald A. Yacktman
c/o Yacktman Asset Management Co.
6300 Bridgepoint Parkway
Building One, Suite 320
Austin TX 78730
(Name and address of agent for service)
(Name and address of agent for service)
512.767.6700
Registrant's telephone number, including area code
Date of fiscal year end: 12/31/08
Date of reporting period: 06/30/08
Item 1. Report to Stockholders.
This report is submitted for the general information of shareholders of The Yacktman Funds. It is not authorized for distribution to prospective investors unless accompanied or preceded by an effective Prospectus for the Funds, which contains more information concerning the Funds’ investment policies, as well as fees and expenses and other pertinent information. Read the Prospectus carefully.
The Yacktman Funds, Inc.
| MESSAGE TO SHAREHOLDERS |
“He had a good temperament for an investor. He wasn't disturbed horribly by the difficult periods."
| — | Charlie Munger - June 2008, commenting on the death of billionair e Otis Booth |
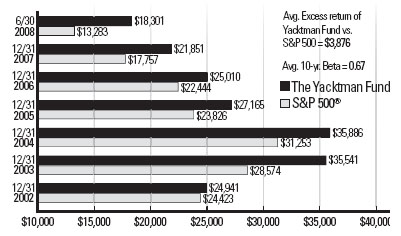
When Mr. Booth died, he was estimated by Forbes to be one of the wealthiest men in the world with a net worth of more than $2 billion. Much of his fortune came from choosing to invest with Charlie Munger (and later Warren Bufett) and patiently waiting. Some periods, like 1973-74, were far more difficult than we are seeing today. The first half of 2008 was one of immense vola tiltiy with The Yacktman Fund and Focused Fund declining by 13.14% and 11.29% respectively compared to the S&P 500 dropping 11.9 1%. From the amount of daily noise in the media, one might think the losses were far worse than this, though some of the collapses at the individual security level were stunning in their speed and size. We were able to use the panic to add to current holdings and make some new investments. At current prices, we believe our portfolio is full of bargains. |   |
10-Year Returns for a $10,000 investment in The Yacktman Fund
1
The Yacktman Funds, Inc.
| Average Annual Returns | The Yacktman Fund | S&P 500 ® |
| OneYear( 06/30/07 -0 6/30/08) | -13.17% | -13.12% |
| Five Years( 06/3 0/0 3- 06/30/08) | 5.84% | 7.58% |
| Ten Years (06/30/98 - 06/30/08) | 6.23% | 2.88% |
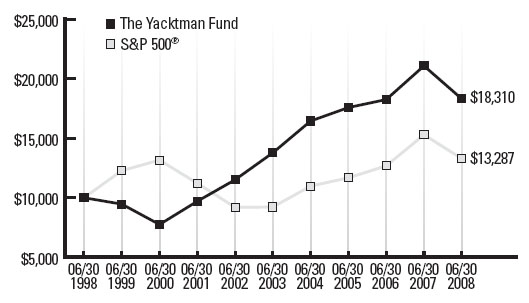
The chart assumes an initial gross investment of $10,000 made on 06/30/98.
| The Yacktman | ||
| Average Annual Returns | Focused Fund | S&P 500® |
| OneY ear( 06/30/07 -0 6/30/0 8) | -11.21% | -13.12% |
| Five Yea rs( 06/30/0 3- 06/30/08) | 5.97% | 7.58% |
| Ten Yea rs (06 3 / 0/9 8 - 06/3 0/08) | 5.08% | 2.88% |
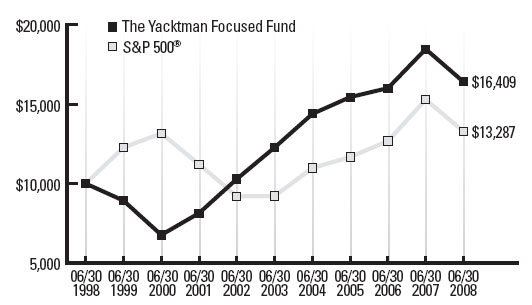
The chart assumes an initial gross investment of $10,000 made on 06/30/98
* The S&P 500® s i an unmanaged but commonly used measure of common stock total return performance.
Returns shown include the reinvestment of all dividends, but do not reflect the deduction of taxes that a shareholder would pay on Fund distributions or the redemption of Fund shares. The above past performance is not predictive of future results. The investment return and principal value of the Funds will fluctuate so that your shares,when redeemed, may be worth more or less than their original cost.
2
Market Update
We do not usually address the overall market as we are more concerned about the businesses we purchase and how they perform individually. However, the events of the first half of the year were some of the most dramatic we have seen, therefore, we will touch on the macro environment briefly.
At times, the financial system approached total chaos with Bear Stearns nearing insolvency only to be saved through major governmental intervention and a shotgun marriage with JP Morgan. Additional casualties included several large asset management funds which melted down. Peloton partners, a UK based firm, had a hedge fund that went from being up 87% and named Eurohedge’s Credit Hedge Fund of the Year in 2007 to liquidation; and Carlyle Capital, a publicaly traded fund, went bankrupt. Many international markets got hammered with former high-flying countries like China leading the way. Additionally, people began to question the solvency of large financial institutions like Fannie Mae and Freddie Mac.
After years of excess, many consumers are in financial trouble. Corporate profits, which had been running at unsustainably high levels, are now declining. Many companies and investors are facing liquidity issues. In addition, with the elimination of the up tick rule (requiring a stock to trade at a higher price than the previous trade before it can be shorted) and the increased assets managed by hedge funds, stocks that were already weak got hammered by aggressive shorting.
But there is good news, too. Despite all of the issues above, we feel confident for several reasons:
| 1) | We prepared for this environment |
| 2) | Our portfolio has a significant weighting in superior global franchises |
| 3) | We believe our portfolio is full of outstanding deals |
3
The Yacktman Funds, Inc.
| 1) | Preparation before the panic |
Between 2004 and 2007 we positioned our portfolio with lots of excess cash and a substantial weighting in attractively priced global consumer businesses. This stance helped limit our downside over the last 12 months with the consumer stocks holding up well and cash acting as protection from declines.
| 2) | DominantGlobal Franchises |
In the last few years we stocked the portfolio with companies like Coca Cola, PepsiCo, Wrigley, Procter & Gamble, Johnson & Johnson, and Anheuser Busch, all of which are great consumer businesses with significant global exposure that were selling at very attractive prices. All of these companies were founded in the 1800’s and have withstood far more turbulent environments than those of the last few months. These companies experienced the financial panic of 1907, major wars, the rise and fall (largely) of communism, the great depression, and so on. It is interesting to note, in the midst of the recent financial market panic, both Wrigley and Anheuser Busch agreed to be acquired for significant premiums above their prior stock prices.
Great consumer companies are like the 1927 Yankees
The NewYork Yankees are considered to be one of the best sports franchises in history and many believe their best club was the 1927 team. Their offensive line-up consisted of eight position players and was anchored by Babe Ruth and Lou Gehrig. It was nicknamed “Murderer’s Row” because it was difficult for a pitcher to face these hitters without getting killed. Looking at our portfolio, we feel like we have a“ Murderer’s Row” of businesses among our top holdings. Our “Murderer’s Row” is composed of companies that enjoy high profit margins, strong balance sheets, and leadership positions in their industries.
4
TheYacktman Starting Line-up
| Coca-Cola | #1 Global Beverage Company | |
| PepsiCo | #1 Global Snack Chip Company (Frito Lay) | |
| #2 Beverages | ||
| Microsoft | #1 Global Software Company | |
| eBay | #1 Online Auction Company/Leader Online Payments | |
| Wal-Mart | #1 World’s largest retailer | |
| Procter & Gamble | #1 Global Consumer Products Company; | |
| #1 in Razor Blades, Detergent, etc | ||
| Johnson & Johnson | #1 Global Medical Devices; | |
| significant in consumer brands and pharmaceutical | ||
The companies in the list above should provide relatively good stability during stressed financial markets if an investor does not pay too high a multiple of earnings. Each business is very well capitalized (one could actually argue that most companies mentioned above are underleveraged) and has a huge benefit from the size and dominance of its business. Further, these companies are trading at attractive valuation levels. A lousy business at a great price can still be a good investment. However, a great business can be a lousy investment if it is overpriced. The best scenario is acquiring shares of a great business at a good price, which we believe we did with each of these companies.
During the first half of the year, Coca Cola, Pepsi, and Procter & Gamble delivered solid business results; however, their stocks declined. Microsoft and eBay also executed well and saw their stock prices fall. In short periods of time when nearly every sector declines, it can be difficult to be the salmon swimming upstream and producing positive results.
5
The Yacktman Funds, Inc.
| 3) | We believe significant bargains are in the portfolio - Trash versus Treasure |
In 1995, an unknown author sent around copies of her book to literary agents. The man who would eventually represent the author initially threw the book away as he did not believe there was a profitable market for it. Due to the book’s unusual binding, his office assistant pulled it out of the trash and read the synopsis which led to the agent representing this author. This book was the first in the Harry Potter series.
We believe that one of our largest positions has been incorrectly thrown away by many others. We initially purchased AmeriCredit, a subprime auto finance company in 2003. AmeriCredit has a seasoned management team that has been through several significant down cycles. The company makes high interest rate loans on mostly used cars to subprime and near- prime customers. At the end of the quarter the stock sold for less than 60% of tangible book value and 2-3 times normal earnings.
Unlike most financial companies, AmeriCredit issues detailed data on its loan portfolio on a monthly basis. Over the last few quarters, AmeriCredit has taken positive steps to protect its franchise and navigate the difficult environment. Although the earnings have been impacted, we believe the value of the franchise is being significantly underappreciated.
6
Microsoft and eBay
Microsoft and eBay have never been this cheap before. We believe both companies still have solid growth prospects, even though the stocks are selling at low multiples. Each company also has a very strong balance sheet and generates significant free cash.
Over the next 12 months, Microsoft expects to earn about $2.15 per share, up from $1.87, a growth rate o f 15%. If it hits its estimated results, the earnings will have grown at approximately 50% over the 2-year period between fiscal 2007 and 2009. At just a bit north of $27 per share at the end of the quarter, the stock is just 13 ½ times next years’ earnings.
eBay closed the quarter just above $27per share with expected cash earnings of $1.70 in 2009. Between 2002 and 2008, it is expected that eBay will have grown both revenue and earnings about seven fold. Over the course of these years, the shares outstanding have only increased slightly as any acquisitions were largely offset by share repurchase. Despite the 7-fold increase in earnings, the shares trade at slightly more than double the low they hit in 2002 and just a bit less than 16 times estimated 2009 cash earnings. We believe eBay has reasonable growth ahead in its core auction business and has a substantially undervalued asset in PayPal, which is one of the leading online payment platforms.
Differences between the Funds
We are often asked why we have two mutual funds with a similar investment approach. The Yacktman Focused Fund was created after the Yacktman Fund and is designed to give us more flexibility in our investment approach. This Focused Fund is able to own more concentrated positions than the Yacktman Fund and can also use option strategies, which the Yacktman Fund cannot. In the last year or so, the top 10 positions in the Focused Fund have become significantly larger than the top 10 positions (of the same stocks) in the Yacktman Fund. As a result, the Yacktman Fund has several smaller holdings that are not in the Focused Fund.
7
The Yacktman Funds, Inc.
In the F ocused Fund, we have used option positions as a risk-reducing measure by selling call options (In selling a call option we are selling the right to another person to buy one of our holdings, at a specified price, if the price of the security exceeds a predetermined level during the term of the option. In return, we receive some cash from the buyer which we can use as a hedge against a decrease in the price of the security we hold. If the price of the security does not exceed the predetermined level, during the option period, we have some cash and are not required to sell the security. We have, therefore, reduced the impact of a potential price decrease in the security). When a stock is volatile, people are willing to pay a significant sum of money to purchase such call options. This strategy has worked well with positions like Sallie Mae, Bed Bath & B eyond, and others.
Conclusion
Many investors have difficulty dealingwith the strong downside volatility that occurred during the first half of the year. We believe that by taking our patient and practiced approach to investing we have been able to use the market declines to deploy cash in securities we believe will produce attractive returns over time. We are extremely happy with our portfolio and firmly believe now is a terrific time to invest capital in our approach.
Sincerely,
TheYacktman Team
8
The Yacktman Funds, Inc.
EXPENSE EXAMPLE
For the Six Months Ended June 30, 2008 (Unaudited)
As a shareholder of the Yacktman Funds (the “Funds”), you incur ongoing costs, including management fees and other Fund expenses. If you invest through a financial intermediary, you may also incur additional costs such as a transaction fee charged on the purchase or sale of the F und or an asset-based management fee. This Example is intended to help you understand your ongoing costs (in dollars) of investing in the Fund and to compare these costs with the ongoing costs of investing in other mutual funds.
The Example is based on an investment of $1,000 invested at the beginning of the period and held for the entire period from January 1, 2008 to June 30, 2008.
Actual Expenses
The first line of the table on the next page provides information about actual account values and actual expenses. You may use the information in this line, together with the amount you invested, to estimate the expenses you paid over the period. Simply divide your account value by $1,000 (for example, an $8,600 account value divided by $1,000 = 8.6), then multiply the result by the number in the first line under the heading entitled “Expenses Paid D uring Period” to estimate the expenses you paid on your account during the period.
Hypothetical Example for Comparison Purposes
The second line of the table on the next page provides information about hypothetical account values and hypothetical expenses based on the Funds’ actual expense ratios and an assumed rate of return of 5% per year before expenses, which is not the Funds’ actual return. The hypothetical account values and expenses may not be used to estimate the actual ending account balance or expenses you paid for the period. You may use this information to compare the ongoing costs of investing in the Fund and other funds. To do so, compare this 5% hypothetical example with the 5% hypothetical examples that appear in the shareholder reports of the other funds.
9
The Yacktman Funds, Inc.
EXPENSE EXAMPLE (Cont'd.)
For the Six Months Ended June 30, 2008 (Unaudited)
Please note that the expenses shown in the table are meant to highlight your ongoing costs only and do not reflect any costs that may be associa ted with investing in the Fund through a financial intermediary. Therefore, the second line of the table is useful in comparing the ongoing costs only, and will not help you determine the relative total costs of owning different funds. In addition, if any costs associated with investing through a financial intermediary were included, your costs would have been higher.
THE YACKTMAN FUND
| Expenses | |||
| Beginning | Ending | paid during | |
| account | account | period | |
| value | value | 01/01/08 - | |
| 01/01/08 | 06/30/08 | 06/30/081 | |
| Actual | $1,000.00 | $868.60 | $4.60 |
| Hypothetical | |||
| (5% return | |||
| before expenses) | 1,000.00 | 1,019.94 | 4.97 |
THE YACKTMAN FOCUSED FUND
| Expenses | |||
| Beginning | Ending | paid during | |
| account | account | period | |
| value | value | 01/01/08- | |
| 01/01/08 | 06/30/08 | 06/30/081 | |
| Actual | $1,000.00 | $887.10 | $5.86 |
| Hypothetical | |||
| (5% return | |||
| before expenses) | 1,000.00 | 1,018.65 | 6.27 |
| 1 | Expenses are equal to the F unds’ annualized expense ratios (0.99% forT he Yacktman Fund and 1.25% for TheYacktman Focused Fund), multiplied by the average account value over the period, multiplied by 182/366 (to reflect the one-half year period). |
See notes to financial statements
10
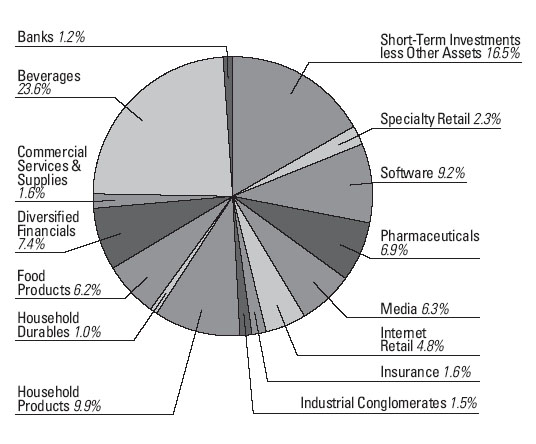
The Yacktman Fund
TOP TEN EQUITY HOLDINGS (Unaudited)
June 30, 2008
| Percentage of | ||
| Net Assets | ||
| Coca-Cola Co. | 12.60% | |
| PepsiCo, Inc. | 9.74% | |
| Microsoft Corp. | 9.22% | |
| AmeriCredit Corp. | 5.35% | |
| Lancaster Colony Corp. | 4.96% | |
| Procter & Gamble Co. | 4.91% | |
| eBay, Inc. | 4.77% | |
| Johnson& Johnson | 3.56% | |
| Clorox Co. | 3.55% | |
| Pfizer, Inc. | 3.34% | |
| Total | 62.00% | |
FUND DIVERSIFICATION (Unaudited)
June 30, 2008
See notes to financial statements
11
The Yacktman Fund
EQUITY PURCHASES & SALES (Unaudited)
For the Six Months Ended June 30, 2008
| Net Shares | Current | |
| NEW PURCHASES | Purchased | Shares Held |
| MBIA, Inc. | ||
| MBIA, Inc., through its subsidiaries, | ||
| is a financial guarantor and a provider | ||
| of specialized financial services. | ||
| The Company provides products and | ||
| services that meet the credit | ||
| enhancement, financial, and | ||
| investment needs of its public and | ||
| private clients worldwide. | 360,000 | 360,000 |
| Sprint Nextel Corp. | ||
| Sprint Nextel Corporation offers a | ||
| range of wireless and wireline | ||
| communications services to consumer, | ||
| business, and government customers. | ||
| The Company develops, engineers, | ||
| and deploys various technologies, | ||
| including two wireless networks | ||
| offering mobile data services, instant | ||
| national and international push-to-talk | ||
| capabilities, and a global Tier 1 | ||
| Internet backbone. | 170,000 | 170,000 |
See notes to financial statements
12
| Net Shares | Current | |
| PURCHASES | Purchased | Shares Held |
| eBay, Inc. | 210,000 | 410,000 |
| Procter & Gamble Co. | 10,000 | 190,000 |
| Resource America, Inc. | 127,000 | 247,000 |
| Viacom, Inc., Class B | 30,000 | 160,000 |
| Net Shares | Current | |
| SALES | Sold | Shares Held |
| AmeriCredit Corp. | 70,000 | 1,460,000 |
| Anheuser-Busch Cos., Inc. | 42,230 | 47,770 |
| Coca-Cola Co. | 40,000 | 570,000 |
| Covidien Ltd. | 175,000 | — |
| Furniture Brands International, Inc. | 186,500 | 175,000 |
| Pulte Homes, Inc. | 300,000 | — |
| U.S.Bancorp | 30,000 | 100,000 |
| Wal-Mart Stores, Inc. | 75,000 | 75,000 |
| Wm Wrigley Jr. Co. | 110,000 | — |
See notes to financial statements
13
The Yacktman Fund
PORTFOLIO OF INVESTMENTS
June 30, 2008 (Unaudited)
| Number | ||||||||
| of Shares | Value | |||||||
| COMMON STOCKS - 83.48% | ||||||||
| Banks - 1.19% | ||||||||
| U.S. Bancorp (b ) | 100,000 | $ | 2,789,000 | |||||
| Beverages - 23.60% | ||||||||
| Anheuser-Busch Cos., Inc. | 47,770 | 2,967,472 | ||||||
| Coca-Cola Co. | 570,000 | 29,628,600 | ||||||
| PepsiCo, Inc. | 360,000 | 22,892,400 | ||||||
| 55,488,472 | ||||||||
| Commercial Services & | ||||||||
Supplies - 16.4% | ||||||||
| H&R Block, Inc. | 180,000 | 3,852,000 | ||||||
| Diversified Financials - 7.37% | ||||||||
| AmeriCredit Corp. (a)(b) | 1,460,000 | 12,585,200 | ||||||
| Federal Home Loan | ||||||||
Mortgage Corp. (b) | 90,000 | 1,476,000 | ||||||
| Federal National | ||||||||
Mortgage Association | 50,000 | 975,500 | ||||||
| Resource America, Inc. | 247,000 | 2,302,040 | ||||||
| 17,338,740 | ||||||||
| Food Products - 6.17% | ||||||||
| Kraft Foods, Inc. | 100,000 | 2,845,000 | ||||||
| Lancaster Colony Corp. | 385,000 | 11,657,800 | ||||||
| 14,502,800 | ||||||||
| Household Durables - 0.99% | ||||||||
| Furniture Brands | ||||||||
International, Inc. | 175,000 | 2,338,000 | ||||||
| Household Products - 9.94% | ||||||||
| Clorox Co. | 160,000 | 8,352,000 | ||||||
| Colgate-Palmolive Co. (b) | 50,000 | 3,455,000 | ||||||
| Procter & Gamble Co. | 190,000 | 11,553,900 | ||||||
| 23,360,900 | ||||||||
| Industrial Conglomerates -1.49% | ||||||||
| Tyco International Ltd. | 87,500 | 3,503,500 | ||||||
See notes to financial statements
14
| Number | ||||||||
| of Shares | Value | |||||||
| Insurance - 1.65% | ||||||||
| American International | ||||||||
Group, Inc. (b) | 80,000 | 2,116,800 | ||||||
| MBIA, Inc. | 360,000 | 1,580,400 | ||||||
| MGIC Investment Corp. (b) | 30,000 | 183,300 | ||||||
| 3,880,500 | ||||||||
| Internet Retail - 4.77% | ||||||||
| eBay, Inc.(a) | 410,000 | $ | 11,205,300 | |||||
| Media - 6.26% | ||||||||
| Interpublic Group of Cos., Inc. (a) | 481,155 | 4,137,933 | ||||||
| Liberty Media Holding Corp., | ||||||||
| Interactive Series A (a) | 385,000 | 5,682,600 | ||||||
| Viacom, Inc., Class B (a) | 160,000 | 4,886,400 | ||||||
| 14,706,933 | ||||||||
| Pharmaceuticals - 6.90% | ||||||||
| Johnson & Johnson | 130,000 | 8,364,200 | ||||||
| Pfizer, Inc. | 450,000 | 7,861,500 | ||||||
| 16,225,700 | ||||||||
| Software - 9.22% | ||||||||
| Microsoft Corp. | 788,000 | 21,677,880 | ||||||
| Specialty Retail - 2.29% | ||||||||
| Home Depot, Inc. | 50,000 | 1,171,000 | ||||||
| Wal-Mart Stores, Inc. | 75,000 | 4,215,000 | ||||||
| 5,386,000 | ||||||||
| TOTAL COMMON STOCKS | ||||||||
(Cost $189,208,310) | $ | 196,255,725 | ||||||
See notes to financial statements
15
The Yacktman Fund
PORTFOLIO OF INVESTMENTS (Cont'd).
June 30, 2008 (Unaudited)
| Principal | ||||||||
| Amount | Value | |||||||
| CONVERTIBLE BONDS -1.40% | ||||||||
| Rait Financial Trust | ||||||||
| 6.875%, 04/15/2027 (c) | 6,750,000 | 3,299,063 | ||||||
| TOTAL CONVERTIBLE BONDS | ||||||||
(Cost $4,292,765) | 3,299,063 | |||||||
| SHORT TERM INVESTMENTS- 11.83% | ||||||||
| Commercial Paper - 11.5 9% | ||||||||
| American Express | ||||||||
| 1.950%, 07/02/2008 | 7,103,000 | 7,102,615 | ||||||
| Deutsche Bank | ||||||||
| 0.000%, 07/01/2008 | 6,526,000 | 6,526,000 | ||||||
| General Electric | ||||||||
| 1.800%, 07/02/2008 | 7,103,000 | 7,102,645 | ||||||
| Rabobank | ||||||||
| 0.000%, 07/01/2008 | 6,526,000 | 6,526,000 | ||||||
| 27,257,260 | ||||||||
| Demand Notes - 0.24% | ||||||||
| U.S. Bancorp | ||||||||
| 2.233% | 558,728 | 558,728 | ||||||
| Other Short-Term Investments - 3.14% | ||||||||
| Securities Lending Investment Account | 7,381,189 | |||||||
| TOTAL SHORT TERM INVESTMENTS | ||||||||
(Cost $35,197,177) | 35,197,177 | |||||||
| Total Investments - 99.85% | ||||||||
(Cost $228,698,252) | 234,751,965 | |||||||
| Other Assets in Excess of Liabilities - 3.29% | 7,739,770 | |||||||
| Less Liabilities for Collateral on | ||||||||
Securities Loaned - (3.14)% | (7,381,189 | ) | ||||||
| TOTAL NET ASSETS - 100.00% | 235,110,546 | |||||||
Percentages are stated as a percent of net assets.
| (a) | Non Income Producing |
| (b) | All or a portion of the security has been committed for securities lending (See Note 6) |
| (c) | Restricted security as defined in Rule 144(a) under the Securities Act of 1933. |
See notes to financial statements
16
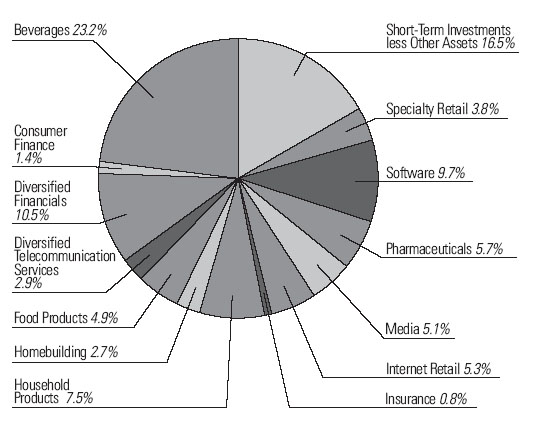
The Yacktman Focused Fund
TOP TEN EQUITY HOLDINGS (Unaudited)
June 30, 2008
| Percentage of | ||
| Net Assets | ||
| Coca-Cola Co. | 13.44% | |
| PepsiCo, Inc. | 9.81% | |
| Microsoft Corp. | 9.67% | |
| AmeriCredit Corp. | 9.30% | |
| eBay, Inc. | 5.31% | |
| Procter & Gamble Co. | 4.88% | |
| Lancaster Colony Corp. | 4.86% | |
| Wal-Mart Stores, Inc. | 3.01% | |
| Liberty Media Corp. | 2.90% | |
| Sprint Nextel Corp. | 2.88% | |
| Total | 66.06% | |
FUND DIVERSIFICATION (Unaudited)
June 30, 2008
See notes to financial statements
17
The Yacktman Focused Fund
EQUITY PURCHASES & SALES (Unaudited)
For the Six Months Ended June 30, 2008
| Net Shares | Current | |
| PURCHASES | Purchased | Shares Held |
| AmeriCredit Corp. | 15,000 | 605,000 |
| Lancaster Colony Corp. | 10,000 | 90,000 |
| MBIA, Inc. | 107,000 | 107,000 |
| Microsoft Corp. | 7,000 | 107,000 |
| Procter & Gamble Co. | 10,000 | 90,000 |
| Pulte Homes, Inc. | 20,000 | 45,000 |
| Resource America, Inc. | 53,700 | 160,000 |
| SLM Corp. | 40,000 | 40,000 |
| Sprint Nextel Corp. | 170,000 | 170,000 |
| Viacom, Inc., Class B | 40,000 | 40,000 |
| Net Shares | Current | |
| SALES | Sold | Shares Held |
| American International Group, Inc. | 15,000 | — |
| Coca-Cola Co. | 5,000 | 145,000 |
| Colgate Palmolive Co. | 20,000 | — |
| Covidien Ltd. | 35,000 | — |
| Federal Home Loan Mortgage Corp. | 37,000 | — |
| Furniture Brands International, Inc. | 74,500 | — |
| PepsiCo, Inc. | 3,500 | 86,500 |
| Tyco International Limited, Inc. | 17,500 | — |
| Wal-Mart Stores, Inc. | 5,000 | 30,000 |
| Wm Wrigley Jr. Co. | 35,000 | — |
See notes to financial statements
18
PORTFOLIO OF INVESTMENTS
June 30, 2008 (Unaudited)
| Number | ||||||||
| of Shares | Value | |||||||
| COMMON STOCKS – 83.51% | ||||||||
| Beverages – 23.26% | ||||||||
| Coca-Cola Co. | 145,000 | 7,537,100 | ||||||
| PepsiCo, Inc. | 86,500 | 5,500,535 | ||||||
| 13,037,635 | ||||||||
| Consumer Finance – 1.38% | ||||||||
| SLM Corp. (a) | 40,000 | 774,000 | ||||||
| Diversified Financials – 10.53% | ||||||||
| AmeriCredit Corp. (a) (b) | 605,000 | 5,215,100 | ||||||
| Resource America, Inc. | 73,700 | 686,884 | ||||||
| 5,901,984 | ||||||||
| Diversified Telecommunication | ||||||||
| Services – 2.88% | ||||||||
| Sprint Nextel Corp. | 170,000 | 1,615,000 | ||||||
| Food Products – 4.86% | ||||||||
| Lancaster Colony Corp. | 90,000 | 2,725,200 | ||||||
| Homebuilding – 2.75% | ||||||||
| Pulte Homes, Inc. | 160,000 | 1,540,800 | ||||||
| Household Products – 7.49% | ||||||||
| Clorox Co. | 28,000 | 1,461,600 | ||||||
| Procter & Gamble Co. | 45,000 | 2,736,450 | ||||||
| 4,198,050 | ||||||||
| Insurance – 0.84% | ||||||||
| MBIA, Inc. | 107,000 | 469,730 | ||||||
| Internet Retail – 5.31% | ||||||||
| eBay, Inc. (a) | 109,000 | 2,978,970 | ||||||
| Media – 5.07% | ||||||||
| Liberty Media Holding Corp., | ||||||||
Interactive Series A (a) | 110,000 | 1,623,600 | ||||||
| Viacom, Inc. (a) | 40,000 | 1,221,600 | ||||||
| 2,845,200 | ||||||||
| Pharmaceuticals – 5.67% | ||||||||
| Johnson & Johnson | 25,000 | 1,608,500 | ||||||
| Pfizer, Inc. | 90,000 | 1,572,300 | ||||||
| 3,180,800 | ||||||||
See notes to financial statements
19
The Yacktman Focused Fund
PORTFOLIO OF INVESTMENTS (Cont'd.)
June 30, 2008 (Unaudited)
| Number of | ||||||||
| Shares | Value | |||||||
| Software - 9.67% | ||||||||
| Microsoft Corp. | 197,000 | 5,419,470 | ||||||
| Specialty Retail - 3.80% | ||||||||
| Home Depot, Inc. | 19,000 | 444,980 | ||||||
| Wal-Mart Stores, Inc. | 30,000 | 1,686,000 | ||||||
| 2,130,980 | ||||||||
| TOTAL COMMON STOCKS | ||||||||
(Cost $46,170,361) | 46,817,819 | |||||||
| Principal | ||||||||
| Amount | Value | |||||||
| CONVERTIBLE BONDS -1.40% | ||||||||
| Rait Financial Trust | ||||||||
| 6.875%, 04/15/2027(c) | 1,450,000 | 708,688 | ||||||
| TOTAL CONVERTIBLE BONDS | ||||||||
(Cost $894,858) | 708,688 | |||||||
| SHORT TERM INVESTMENTS-21.23% | ||||||||
| Commercial Paper - 16.34% | ||||||||
| American Express | ||||||||
| 1.950%, 07/02/2008 | 2,584,860 | 2,584,860 | ||||||
| Deutsche Bank | ||||||||
| 0.000%, 07/01/2008 | 1,995,000 | 1,995,000 | ||||||
| General Electric | ||||||||
| 1.800%, 07/02/2008 | 2,584,870 | 2,584,870 | ||||||
| Rabobank | ||||||||
| 0.000%, 07/01/2008 | 1,995,000 | 1,995,000 | ||||||
| 9,159,730 | ||||||||
| Demand Notes - 0.05% | ||||||||
| US Bancorp | ||||||||
| 2.233% | 29,232 | 29,232 | ||||||
| Other Short-Term Investment - 4.84% | ||||||||
| Securities Lending Investment Account | 2,715,970 | |||||||
| TOTAL SHORT TERM INVESTMENTS | ||||||||
(Cost $11,904,932) | 11,904,932 | |||||||
See notes to financial statements
20
| Principal | ||||||||
| Amount | Value | |||||||
| Total Investments -1 06.00% | ||||||||
(Cost $58,970,151) | 59,431,459 | |||||||
| Liabilities in Excess of | ||||||||
Other Assets - (1.16)% | (651,543 | ) | ||||||
| Liabilities for Collateral on | ||||||||
Securities Lending - (4.84)% | (2,715,970 | ) | ||||||
| TOTAL NET ASSETS - 100.00% | 56,063,926 | |||||||
Percentages are stated as a percent of net assets.
| (a) | Non Income Producing |
| (b) | All or a portion of the security has been committed for securities lending ( c ) Restricted security as defined in Rule 144(a) under the Securities Act of 1933. |
SCHEDULE OF OPTIONS WRITTEN
| June 30, 2008 (Unaudited) | Contracts | Value | ||||||
| PUT OPTIONS | ||||||||
| eBay, Inc. | ||||||||
Expiration: July, 2008, | ||||||||
Exercise Price: $32.50 | 200 | $ | 1,600 | |||||
| Pulte Homes, Inc. | ||||||||
Expiration: July, 2008, | ||||||||
Exercise Price: $10.00 | 720 | 39,600 | ||||||
Expiration: January, 2009, | ||||||||
Exercise Price: $15.00 | 725 | 47,125 | ||||||
Expiration: January, 2010, | ||||||||
Exercise Price: $20.00 | 150 | 14,250 | ||||||
| SLM Corp. | ||||||||
Expiration: July, 2008, | ||||||||
Exercise Price: $17.50 | 400 | 102,000 | ||||||
| Sprin t Nextel Corp. | ||||||||
Expiration: January, 2009, | ||||||||
Exercise Price: $7.50 | 1,700 | 467,500 | ||||||
| 672,075 | ||||||||
| Total Options Written | ||||||||
(Premiums received $740,028) | $ | 672,075 | ||||||
See notes to financial statements
21
The Yacktman Funds, Inc.
STATEMENTS OF ASSETS & LIABILITIES
June 30, 2008 (Unaudited)
| The Yacktman | The Yacktman | |||||||
| Fund | Focused Fund | |||||||
| ASSETS | ||||||||
Investments, at market value | ||||||||
(Cost $228,698,252 and | ||||||||
$58,970,151 respectively) | $ | 234,751,965 | $ | 59,431,439 | ||||
Cash | 558 | — | ||||||
Receivable for fund shares sold | 2,303,333 | 128,148 | ||||||
Receivable for investments sold | 8,290,701 | — | ||||||
Dividends and interest receivable | 423,483 | 84,466 | ||||||
Prepaid expenses | 19,506 | 12,803 | ||||||
TotalAssets | 245,789,546 | 59,656,856 | ||||||
| LIABILITIES: | ||||||||
Options written at value | ||||||||
(premiums received $0, | ||||||||
$740,028 respectively) | — | 672,076 | ||||||
Collateral for securities loaned | 7,381,189 | 2,715,970 | ||||||
Payable for fund shares redeemed | 615,276 | 103,034 | ||||||
Payable for investments purchased | 2,270,612 | — | ||||||
Payable to Custodian | — | 2,690 | ||||||
Accrued investment advisory fees | 131,142 | 45,059 | ||||||
Other accrued expenses | 280,781 | 54,101 | ||||||
Total Liabilities | 10,679,000 | 3,592,930 | ||||||
| NET ASSETS | $ | 235,110,546 | $ | 56,063,926 | ||||
| NET ASSETS CONSIST OF: | ||||||||
Capital stock | $ | 217,660,400 | $ | 52,768,000 | ||||
Undistributed net | ||||||||
investment income | 2,142,422 | 433,698 | ||||||
Undistributed accumulated | ||||||||
net realized gain | 9,254,011 | 2,332,986 | ||||||
Net unrealized appreciation | ||||||||
Investments | 6,053,713 | 461,288 | ||||||
Written Options | — | 67,954 | ||||||
Total Net Assets | $ | 235,110,546 | $ | 56,063,926 | ||||
CAPITAL STOCK, $0.0001 par value | ||||||||
Authorized | 500,000,000 | 500,000,000 | ||||||
Issued and Outstanding | 20,215,174 | 4,514,310 | ||||||
| NET ASSET VALUE, | ||||||||
| REDEMPTION PRICE, AND | ||||||||
| OFFERING PRICE PER SHARE | $ | 11.63 | $ | 12.42 | ||||
See notes to financial statements
22
STATEMENTS OF OPERATIONS
For the Year Ended June 30, 2008 (Unaudited)
| The Yacktman | The Yacktman | |||||||
| Fund | Focused Fund | |||||||
| INVESTMENT INCOME: | ||||||||
Dividend income | $ | 2,480,760 | $ | 514,800 | ||||
Interest income | 752,465 | 279,127 | ||||||
Securities lending income | ||||||||
(See Note 6) | 201,679 | 100,599 | ||||||
Total investment income | 3,434,904 | 894,526 | ||||||
| EXPENSES: | ||||||||
Investment advisory fees | 851,152 | 368,662 | ||||||
Shareholder servicing fees | 244,741 | 52,828 | ||||||
Administration and accounting fees | 61,899 | 19,452 | ||||||
Reports to shareholders | 30,326 | 7,580 | ||||||
Professional fees | 26,565 | 16,465 | ||||||
Federal and state registration fees | 21,201 | 15,216 | ||||||
Custody fees | 14,226 | 6,366 | ||||||
Directors fees and expenses | 13,491 | 3,435 | ||||||
Miscellaneous costs | 28,881 | 6,817 | ||||||
Total expenses | ||||||||
before reimbursements | 1,292,482 | 496,821 | ||||||
Expense reimbursements | ||||||||
(See Note 5) | — | (35,993 | ) | |||||
Net Expenses | 1,292,482 | 460,828 | ||||||
| NET INVESTMENT INCOME | 2,142,422 | 433,698 | ||||||
| REALIZED AND UNREALIZED LOSS: | ||||||||
Net realized gain on investments | 9,255,338 | 1,658,276 | ||||||
Change in unrealized | ||||||||
depreciation on investments | (47,353,953 | ) | (9,523,189 | ) | ||||
Net realized and unrealized | ||||||||
loss on investments | (38,098,615 | ) | (7,864,913 | ) | ||||
| NET DECREASE IN NET ASSETS | ||||||||
| RESULTING FROM OPERATIONS | $ | (35,956,193 | ) | $ | (7,431,215 | ) | ||
See notes to financial statements
23
The Yacktman Funds, Inc.
STATEMENTS OF CHANGES IN NET ASSETS
| The Yacktman Fund | The Yacktman Focused Fund | |||||||||||||||
| Six Months Ended | Six Months Ended | |||||||||||||||
| June 30, 2008 | Year Ended | June 30, 2008 | Year Ended | |||||||||||||
| (Unaudited) | Dec. 31, 2007 | (Unaudited) | Dec. 31, 2007 | |||||||||||||
| OPERATIONS: | ||||||||||||||||
Net investment income | $ | 2,142,422 | $ | 6,272,556 | $ | 433,698 | $ | 944,478 | ||||||||
Net realized gain on investments | 9,255,338 | 47,451,753 | 1,658,276 | 10,492,983 | ||||||||||||
Net change in unrealized depreciation on investments | (47,353,953 | ) | (40,717,233 | ) | (9,523,189 | ) | (8,297,713 | ) | ||||||||
Net increase (decrease) in net assets | ||||||||||||||||
resulting from operations | (35,956,193 | ) | 13,007,076 | (7,431,215 | ) | 3,139,748 | ||||||||||
| CAPITAL SHARE TRANSACTIONS: | ||||||||||||||||
Proceeds from shares sold | 46,229,104 | 42,667,635 | 25,027,550 | 17,465,433 | ||||||||||||
Proceeds from reinvestment of distributions | — | 48,661,291 | — | 10,024,203 | ||||||||||||
Redemption fees | 2,183 | 12,987 | 5,247 | 1,797 | ||||||||||||
| 46,231,287 | 91,341,913 | 25,032,797 | 27,491,433 | |||||||||||||
Payments for shares redeemed | (66,739,027 | ) | (188,163,475 | ) | (28,590,021 | ) | (43,610,240 | ) | ||||||||
Net decrease | (20,507,740 | ) | (96,8 21,562 | ) | (3,557,224 | ) | (16,118,807 | ) | ||||||||
| DISTRIBUTIONS PAID FROM: | ||||||||||||||||
Net investment income | — | (6,230,830 | ) | — | (943,854 | ) | ||||||||||
Net realized gains | — | (47,451,921 | ) | — | (9,558,939 | ) | ||||||||||
Total distributions | — | (53,682,751 | ) | — | (10,502,793 | ) | ||||||||||
| TOTAL DECREASE IN NET ASSETS | (56,463,933 | ) | (137,497,237 | ) | (10,988,439 | ) | (23,481,852 | ) | ||||||||
| NET ASSETS: | ||||||||||||||||
Beginning of period | 291,574,479 | 429,071,716 | 67,052,365 | 90,534,217 | ||||||||||||
End of period (including undistributed net investment | ||||||||||||||||
Income of $2,142,422, $41,550, $433,698 and $1,035 respectively) | $ | 235,110,546 | $ | 291,574,479 | $ | 56,063,926 | $ | 67,052,365 | ||||||||
| TRANSACTIONS IN SHARES: | ||||||||||||||||
Shares sold | 3,682,548 | 2,697,059 | 1,853,880 | 1,092,637 | ||||||||||||
Issued in reinvestment of distributions | — | 3,604,540 | — | 709,929 | ||||||||||||
Shares redeemed | (5,240,372 | ) | (11,709,585 | ) | (2,128,935 | ) | (2,672,774 | ) | ||||||||
Net decrease | (1,557,824 | ) | (5,407,986 | ) | (275,055 | ) | (870,208 | ) | ||||||||
See notes to financial statements
24-25
The Yacktman Funds, Inc.
FINANCIAL HIGHLIGHTS
| The Yacktman Fund | ||||||||||||||||||||||||
| For a Fund share outstanding | Six Months Ended | Year Ended December 31, | ||||||||||||||||||||||
| throughout each period | June 30, 2008 | |||||||||||||||||||||||
| (Unaudited) | 2007 | 2006 | 2005 | 2004 | 2003 | |||||||||||||||||||
| NET ASSET VALUE: | ||||||||||||||||||||||||
Beginning of period | $ | 13.39 | $ | 15.79 | $ | 14.67 | $ | 15.34 | $ | 15.24 | $ | 12.33 | ||||||||||||
| OPERATIONS: | ||||||||||||||||||||||||
Net investment income | 0.10 | 0.35 | 0.30 | 0.28 | 0.12 | 0.23 | ||||||||||||||||||
Net realized and unrealized gain | ||||||||||||||||||||||||
(loss) on investment securities | (1.86 | ) | 0.21 | 2.05 | (0.48 | ) | 1.40 | 3.84 | ||||||||||||||||
Total from operations | (1.76 | ) | 0.56 | 2.35 | (0.20 | ) | 1.52 | 4.07 | ||||||||||||||||
| LESS DISTRIBUTIONS: | ||||||||||||||||||||||||
From net investment income | — | (0.34 | ) | (0.30 | ) | (0.28 | ) | (0.12 | ) | (0.17 | ) | |||||||||||||
From net realized gains | — | (2.62 | ) | (0.93 | ) | (0.19 | ) | (1.30 | ) | (0.99 | ) | |||||||||||||
Total distributions | — | (2.96 | ) | (1.23 | ) | (0.47 | ) | (1.42 | ) | (1.16 | ) | |||||||||||||
| NET ASSET VALUE: | ||||||||||||||||||||||||
End of period | $ | 11.63 | $ | 13.39 | $ | 15.79 | $ | 14.67 | $ | 15.34 | $ | 15.24 | ||||||||||||
| TOTAL RETURN | -13.14 | %(1) | 3.39 | % | 15.95 | % | -1.30 | % | 9.93 | % | 33.03 | % | ||||||||||||
| SUPPLEMENTAL DATA AND RATIOS | ||||||||||||||||||||||||
Net assets; end of period (000's) | $ | 235,111 | $ | 291,574 | $ | 429,072 | $ | 438,912 | $ | 365,308 | $ | 325,428 | ||||||||||||
Ratio of net expenses to average | ||||||||||||||||||||||||
net assets | 0.99 | %(2) | 0.95 | % | 0.96 | % | 0.92 | % | 0.95 | % | 0.94 | % | ||||||||||||
Ratio of net investment income | ||||||||||||||||||||||||
to average net assets | 1.64 | %(2) | 1.71 | % | 1.90 | % | 1.86 | % | 0.73 | % | 1.25 | % | ||||||||||||
Portfolio turnover rate | 5.28 | %(2) | 23.87 | % | 17.93 | % | 8.64 | % | 23.82 | % | 40.01 | |||||||||||||
| (1) | Not Annualized |
| (2) | Annualized |
See notes to financial statements
26-27
The Yacktman Funds, Inc.
FINANCIAL HIGHLIGHTS (Cont'd.)
| The Yacktman Focused Fund | ||||||||||||||||||||||||
| For a Fund share outstanding | Six Months Ended | Year Ended December 31, | ||||||||||||||||||||||
| throughout each period | June 30, 2008 | |||||||||||||||||||||||
| (Unaudited) | 2007 | 2006 | 2005 | 2004 | 2003 | |||||||||||||||||||
| NET ASSET VALUE: | ||||||||||||||||||||||||
Beginning of period | $ | 14.00 | $ | 16.00 | $ | 14.96 | $ | 15.83 | $ | 16.28 | $ | 12.48 | ||||||||||||
| OPERATIONS: | ||||||||||||||||||||||||
Net investment income | 0.10 | 0.23 | 0.21 | 0.22 | 0.03 | 0.07 | ||||||||||||||||||
Net realized and unrealized (loss) | ||||||||||||||||||||||||
on investment securities | (1.68 | ) | 0.34 | 2.20 | (0.51 | ) | 1.59 | 3.90 | ||||||||||||||||
Total from operations | (1.58 | ) | 0.57 | 2.41 | (0.29 | ) | 1.62 | 3.97 | ||||||||||||||||
| LESS DISTRIBUTIONS: | ||||||||||||||||||||||||
From net investment income | ─ | (0.23 | ) | (0.21 | ) | (0.22 | ) | (0.03 | ) | (0.07 | ) | |||||||||||||
From net realized gains | ─ | (2.34 | ) | (1.16 | ) | (0.36 | ) | (2.04 | ) | (0.10 | ) | |||||||||||||
Total distributions | ─ | (2.57 | ) | (1.37 | ) | (0.58 | ) | (2.07 | ) | (0.17 | ) | |||||||||||||
| NET ASSET VALUE: | ||||||||||||||||||||||||
End of period | $ | 12.42 | $ | 14.00 | $ | 16.00 | $ | 14.96 | $ | 15.83 | $ | 16.28 | ||||||||||||
| TOTAL RETURN | -11.29 | %(1) | 3.46 | % | 16.13 | % | -1.83 | % | 9.96 | % | 31.79 | % | ||||||||||||
| SUPPLEMENTAL DATA AND RATIOS | ||||||||||||||||||||||||
Net assets; end of period (000's) | $ | 56,064 | $ | 67,052 | $ | 90,534 | $ | 84,608 | $ | 97,263 | $ | 127,355 | ||||||||||||
Ratio of expenses before expense | ||||||||||||||||||||||||
reimbursements to average | ||||||||||||||||||||||||
net assets (See Note 4) | 1.35 | %(2) | 1.38 | % | 1.35 | % | 1.32 | % | 1.33 | % | 1.36 | %(3) | ||||||||||||
Ratio of net expenses to | ||||||||||||||||||||||||
average net assets | 1.25 | %(2) | 1.25 | % | 1.25 | % | 1.25 | % | 1.25 | % | 1.26 | %(4) | ||||||||||||
Ratio of net investment income to | ||||||||||||||||||||||||
average net assets | 1.18 | %(2) | 1.23 | % | 1.40 | % | 1.30 | % | 0.16 | % | 0.51 | % | ||||||||||||
Portfolio turnover rate | 28.73 | %(2) | 33.89 | % | 30.61 | % | 5.62 | % | 19.26 | % | 71.38 | % | ||||||||||||
| (1) | Not Annualized |
| (2) | Annualized |
| (3) | The ratio of expenses before expense reimbursements to average net assets, excluding interest expense, was 1.35% |
| (4) | The ratio of expenses to average net assets, excluding interest expense, was 1.25% |
See notes to financial statements
28-29
The Yacktman Funds, Inc.
NOTES TO THE FINANCIAL STATEMENTS
June 30, 2008 (Unaudited)
| 1. | ORGANIZATION |
The Yacktman Funds, Inc. (comprised of The Yacktman Fund and The Yacktman Focused Fund, hereafter referred to as the “Funds”) is registered as an open-end management investment company under the Investment Company Act of 1940 (the “1940 Act”). The Funds consist of two investment portfolios: The Yacktman Fund is a diversified fund that commenced operations July 6, 1992 and The Yacktman Focused Fund is a non-diversified fund that commenced operations May 1, 1997. The objective of each of the Funds is to produce long-term capital appreciation with current income as a secondary objective. Yacktman Asset Management Co. is the Funds’ investment adviser (the “Adviser”).
| 2. | SIGNIFICANT ACCOUNTING POLICIES |
The following is a summary of significant accounting policies consistently followed by the Funds in the preparation of their financial statements. The financial statements have been prepared in conformity with accounting principles generally accepted in the United States of America, which require management to make certain estimates and assumptions during the reporting period. Actual results could differ from those estimates.
a) Investment Valuation - Securities which are traded on a national stock exchange are valued at the last sale price on the securities exchange on which such securities are primarily traded. Securities that are traded on the Nasdaq National Market or the Nasdaq Smallcap Market are valued at the Nasdaq Official Closing Price. Exchange-traded securities for which there were no transactions are valued at the current bid prices. Securities traded on only over-the-counter markets are valued on the basis of closing over-the-counter bid prices. Short-term debt instruments maturing within 60 days are valued by the amortized cost method, which approximates fair value. Debt securities (other than short-term instruments) are valued at the mean price furnished by a national pricing service, subject to review by the Adviser and determination of the appropriate price whenever a furnished price is significantly different from the previous day's furnished price. Options written or purchased by The Yacktman Focused Fund are valued at the last sales price if such last sales price is between the current bid and asked prices. Otherwise, options are valued at the mean between the current bid and asked prices. Any securities for which there are no readily available market quotations and other assets will be valued at their fair value as determined in good faith by the Adviser pursuant to procedures established by and under the supervision of the Board of Directors. The fair value of a security is the amount which a Fund might reasonably expect to receive upon a current sale. Valuing securities at fair value involves greater reliance on judgment than valuing securities that have readily available market quotations. There can be no assurance that the Funds could obtain the fair value assigned to a security if they were to sell the security at approxim ately the time at which the Funds determine their net asset value per share.
30
b) Options - Premiums received by The Yacktman Focused Fund upon writing options are recorded as an asset with a corresponding liability which is subsequently adjusted to the current market value of the option. Changes between the initial premiums received and the current value of the options are recorded in unrealized gains and losses. When an option expires, or is closed, the Fund realizes a gain or loss, and the liability is eliminated. The Fund continues to bear the risk of adverse movements in the price of the underlying security during the period of the option, although any potential loss would be reduced by the amount of option premium received.
c) Federal IncomeTaxes – It is each Fund’s policy to meet the requirements of the Internal Revenue Code applicable to regulated investment companies and to distribute substantially all investment company net taxable income and net capital gains to its shareholders in a manner which results in no tax cost to the Fund. Therefore, no federal income tax provision is required.
d) Distributions to Shareholders - Dividends from net investment income and distributions of net realized capital gains, if any, are declared and paid at least annually. Distributions to shareholders are recorded on the ex-dividend date. The character of distributions made during the year from net investment income or net realized gains may differ from the characterization for federal income tax purposes due to differences in the recognition of income, expense and gain items for financial statement and tax purposes.
31
The Yacktman Funds, Inc.
NOTES TO THE FINANCIAL STATEMENTS (Cont'd.)
June 30, 2008 (Unaudited)
Additionally, the Funds may utilize earnings and profits distributed to shareholders on redemption of shares as part of the dividends paid deduction for income tax purposes. Where appropriate, reclassifications between capital accounts are made for such diffferences that are permanent in nature.
Accordingly, at December 31, 2007, reclassifications were recorded to increase (decrease) undistributed net investment income by $(168) and $(4,755), and increase (decrease) undistributed net realized gains (losses) by $34,298 and $4,755 for The Yacktman Fund and The Yacktm n Focused Fund, respectively. Accumulated paid -in -capital was increased by $34,130 for The Yacktman Fund.
e) Guarantees and Indemnifications - In the normal course of business, the Funds enter into contracts with service providers that contain general indemnification clauses. The Funds’ maximum exposure under these arrangements is unknown as this would involve future claims against the Funds that have not yet occurred. Based on experience, the Funds expect the risk of loss to be remote.
f) Redemption Fee - Effective April 1, 2005, those who buy and sell the Funds within thirty calendar days will incur a 2% redemption fee, retained for the benefit of long-term shareholders, recorded as additional capital in the statement of changes in net assets.
g) Other - Investment transactions and shareholder transactions are accounted for on the trade date. Net realized gains and losses on securities are computed on the basis of specific security lot identification. Dividend income is recognized on the ex-dividend date and interest income is recognized on an accrual basis.
| 3. | INVESTMENT TRANSACTIONS |
For the six months ended June 30, 2008, the aggregate purchases and sales of securities, excluding short-term securities, were $12,492,897 and $37,223,913 for The Yacktman Fund and $16,895,959 and $21,330,350 for The Yacktman Focused Fund, respectively. For the six months ended June 30 2008, there were no purchases or sales of U.S.Government securities for The Yacktman Fund and The Yacktman Focused Fund.
32
| 4. | OPTION CONTRACTS WRITTEN |
The premium amount and number of option contracts written during the six months ended June 30, 2008 in The Yacktman Focused Fund, were as follows:
| Amount of | Number of | |||||||
| Premiums | Contracts | |||||||
| Outstanding at 12/31/2007 | $ | (586,889 | ) | (2,571 | ) | |||
| Options written | (987,933 | ) | (5,115 | ) | ||||
| Options expired | 509,678 | 2,531 | ||||||
| Options closed | 325,116 | 1,260 | ||||||
| Outstanding at 06/30/2008 | $ | (740,028 | ) | (3,895 | ) | |||
| 5. | INVESTMENT ADVISORY AGREEMENT |
The Funds have agreements with the Adviser, with whom certain officers and directors of the Funds are affiliated, to furnish investment advisory services to the Funds. Under the terms of these agreements, The Yacktman Fund will pay the Adviser a monthly fee at the annual rate of 0.65% on the first $500,000,000 of average daily net assets, 0.60% on the next $500,000,000 of average daily net assets and 0.55% on average daily net assets in excess of $1,000,000,000, and The Yacktman Focused F und will pay the Advis r a monthly fee at the annual rate of 1% of its average daily net assets. The Adviser has voluntarily agreed to reimburse TheYacktman Focused Fund for all expenses exceeding 1.25% of its average daily net assets (exclusive of interest, taxes, brokerage commissions and extraordinary expenses). During the six months ended June 30, 2008, the Adviser voluntarily waived $35,993 of Investment Advisory Fees.
| 6. | SECURITIES LENDING |
The Funds have entered in to a securities lending arrangement with the custodian. Under the terms of the agreement, the custodian is authorized to loan securities on behalf of the Funds to approved brokers against the receipt of cash collateral at least equal to the value of the securities loaned. The cash collateral is invested by the custodian in a money market pooled account approved by the Adviser. Each Fund has an individual interest of cash collateral contributed, although risk is mitigated by the collateral, the Funds could experience a delay in recovering their securities and possible loss of income or value if the borrower fails to return them.
33
The Yacktman Funds, Inc.
NOTES TO THE FINANCIAL STATEMENTS (Cont'd.)
June 30, 2008 (Unaudited)
The agreement provides that after predetermined rebates to the brokers, the income generated from lending transactions is allocated 60% to the Funds and 40% to the custodian. As of June 30, 2008, The Yacktman Fund had on loan securities valued at $6,643,632 and collateral of $7,381,189 and TheYacktman Focused Fund had on loan securities valued at $2,341,166 and collateral of $2,715,970.
The cash collateral received by the Funds was pooled and at June 30 2008, was invested in the following:
| Security Type | Security Name | Value | |
| Corporate Bond | Bayerische Landesbank | 3,000,000 | |
| Repurchase Agreement | Morgan Stanley | 7,100,000 | |
| Maturity | Maturity | ||
| Security Type | Security Name | Rate | Date |
| Corporate Bond | Bayerische Landesbank | 2.75% | 08/23/08 |
| Repurchase Agreement | Morgan Stanley | 2.51% | 07/01/08 |
| 7. | LINE OF CREDIT |
TheYacktman Fund and The Yacktman Focused Fund have established a line of credit (“LOC”) with U.S. Bank, N.A. to be used for temporary or emergency purposes, primarily for financing redemption payments. The LOC will mature, unless renewed, on March 31, 2009; borrowing under the LOC is limited to the lesser of $ 15,000,000, 10% of the pre-borrowing net assets of the Fund, 10% of the market value of the assets of the F und, or 10% of the sum of the fair market value of certain assets of the Fund. For TheYacktman Focused Fund, borrowing under the LOC is limited to the lesser of $15,000,000, 331/3% of the pre-borrowing net assets of the F und, or 331/3% of the sum of the fair market value of certain assets of the Fund. During the six months ended June 30, 2008, The Yacktman Fund and TheYacktman Focused Fund had no outstanding borrowings under the LOC and incurred no interest expense.
34
| 8. | TAX INFORMATION |
The following information for the Funds is presented on an income tax basis as of December31, 2007:
| The Yacktman | The Yacktman | |||||||
| Fund | Focused Fund | |||||||
| Tax cost of investments | $ | 251,486,610 | $ | 59,117,586 | ||||
| Gross unrealized appreciation | 61,384,095 | 11,664,781 | ||||||
| Gross unrealized depreciation | (7,985,184 | ) | (2,042,345 | ) | ||||
| Net tax unrealized appreciation | $ | 53,398,911 | $ | 9,622,436 | ||||
As of December 31, 2007, the components of accumulated earnings were as follows:
| TheYacktman Fund | The Yacktman Focused Fund | |||||||
| Undistributed ordinary income | $ | 41,558 | $ | 15,547 | ||||
| Undistributed long-term | ||||||||
capital gains | — | 661,829 | ||||||
| Accumulated earnings | 41,558 | 677,376 | ||||||
| Net unrealized appreciation | ||||||||
on investments | 53,398,911 | 427,329 | ||||||
| Total accumulated earnings | $ | 53,440,469 | $ | 10,727,141 | ||||
The tax character of distributions paid during the fiscal years ended December 31, 2007 and December 31, 2006 were as follows:
| TheYacktman Fund | The Yacktman Focused Fund | |||||||
| 2007 | ||||||||
| Ordinary income | $ | 7,052,011 | $ | 2,038,950 | ||||
| Long-term capital gains | $ | 46,630,740 | $ | 8,463,843 | ||||
| 2006 | ||||||||
| Ordinary income | $ | 8,033,111 | $ | 1,121,630 | ||||
| Long-term capital gains | $ | 23,177,001 | $ | 6,096,497 | ||||
35
The Yacktman Funds, Inc.
NOTES TO THE FINANCIAL STATEMENTS (Cont'd.)
June 30, 2008 (Unaudited)
| 9. | NEW ACCOUNTING PRONOUNCEMENTS |
FASB Interpretation 48
Effective June 29, 2007, The Yacktman Funds, (the"Funds") adopted Financial Accounting Standards Board (FASB) Interpretation No. 48 (FIN48), “Accounting for Uncertainty in Income Taxes”. FIN 48 requires the evaluation of tax positions taken on previously filed tax returns or expected to be taken on future returns. These positions must meet a “more likely than not” standard that, based on the technical merits, have a more than fifty percent likelihood of being sustained upon examination. In evaluating whether a tax posi ion has met the recognition threshold, the Funds must presume that the position will be examined by the appropriate taxing authority that has full knowledge of all relevant information. Tax positions not deemed to meet the “more-likely-than-not” threshold are recorded as a tax expense in the current year.
FIN 48 requires the Funds to analyze all open tax years, as defined by the Statute of Limitations, for all major jurisdictions. Open tax years are those that are open for exam by taxing authorities. Major jurisdictions for the Funds include Federal and the state of NewYork. As of June 29, 2007, open Federal and New York tax years include the tax years ended December 31, 2003 through 2006. The Funds have no examination in progress.
The Funds have reviewed all open tax years and major jurisdictions and concluded that the adoption of FIN 48 resulted in no effect to the Funds' financial position or results of operations. There is no tax liability resulting from unrecognized tax benefits relating to uncertain income tax positions taken or expected to be taken on the tax return for the fiscal year-end December 31, 2006. The Funds are also not aware of any tax positions for which it is reasonably possible that the total amounts of unrecognized tax benefits will significantly change in the next twelve months.
36
FASB Interpretation 157
In September 2006, the Financial Accounting Standards Board issued Standard No. 157, “Fair Value Measurements” (“FAS 157”) effective for fiscal years beginning after November 15, 2007. FAS 157 clarifies the definition of fair value for financial reporting, establishes a framework for measuring fair value and requires additional disclosure about the use of fair value measurements in an effort to make the measurement of fair value more consistent and comparable. The Fund (Portfolio) has adopted FAS 157 effective January 1, 2008. A summary of the fair value hierarchy under FAS 157 is described below:
Various in puts are used in determining the value of the Fund's investments. These inputs are summarized in the three broad levels listed below:
| Level 1: | Quoted prices in active markets for identical securities. |
| Level 2: | Other significant observable inputs (including quoted prices for similar securities, interest rates, prepayment speeds, credit risk, etc.) |
| Level 3: | Significant unobservable inputs (including the Fund's own assumptions in determining the fair value of investments) |
The inputs or methodology used for valuing securities are not an indication of the risk associated with investing in those securities.
On the following page is a summary of the inputs used, as of June 30, 2008, in valuing the Fund’s investments carried at fair value:
37
The Yacktman Funds, Inc.
NOTES TO THE FINANCIAL STATEMENTS (Cont'd.)
June 30, 2008 (Unaudited)
| Level 1 | Level 2 | Level 3 | ||||||||||||||
| Quoted prices in | Significant other | Significant | ||||||||||||||
| active markets for | observable | unobservable | ||||||||||||||
| Description | Total | identical assets | inputs | inputs | ||||||||||||
| The Yacktman Fund | ||||||||||||||||
| Assets: | ||||||||||||||||
Investment | ||||||||||||||||
in Securities | $ | 234,751,965 | $ | 196,255,725 | $ | 38,496,240 | $ | — | ||||||||
| Other Financial | ||||||||||||||||
Instruments | $ | — | $ | — | $ | — | $ | — | ||||||||
| Total | $ | 234,751,965 | $ | 196,255,725 | $ | 38,496,240 | $ | — | ||||||||
| The Yacktman Focused Fund | ||||||||||||||||
| Assets: | ||||||||||||||||
Investment | ||||||||||||||||
in Securities | $ | 59,431,439 | $ | 46,817,819 | $ | 12,613,620 | $ | — | ||||||||
| Other Financial | ||||||||||||||||
Instruments | $ | 672,075 | $ | 672,075 | $ | — | $ | — | ||||||||
| Total | $ | 60,103,514 | $ | 47,489,894 | $ | — | $ | — | ||||||||
| * | Other financial instruments are derivative instruments not reflected in the Portfolio of Investments, such as futures, written options, forwards and swap contracts, which are valued at the unrealized appreciation (depreciation) on the instrument. |
FASB Interpretation 161
In March 2008, Statement of Financial Accounting Standards No. 161, "Disclosures about Derivative Instruments and Hedging Activities" "(SFAS 161") was issued and is effective for fiscal years beginning after November 15, 2008. SFAS 161 is intended to improve financial reporting for derivative instruments by requiring enhanced disclosure that enables investors to understand how and why an entity uses derivatives, how derivatives are accounted for, and how derivative instruments affect an entity's results of operations and financial position. Management is currently evaluating the implications of SFAS 161. The impact on the Fund's financial statement disclosures, if any, is currently being assessed.
38
The Yacktman Funds, Inc.
| 10. | INVESTMENT ADVISORY DISCLOSURE |
On March 7, 2008, the Board of Directors of The Yacktman Funds, Inc.approved the continuation of each Fund’s investment advisory agreement with Yacktman Asset Management Co. (the “Adviser”). Prior to approving the continuation of the agreements, the Board considered:
| • | The nature, extent and quality of the services provided by the Adviser |
| • | The investment performance of the Funds |
| • | The costs of the services to be provided and profits to be realized by the Adviser and its affiliates from the relaitonship with the Funds |
| • | The extent to which economies of scale would be realized as the mutual fund grows and whether fee levels reflect these economies of scale for the benefit of mutu l fund investors |
| • | The expense ratios of the Funds |
In considering the nature, extent and quality of the services provided by the Adviser, the Board considered an oral presentation by the Adviser describing the portfolio management, shareholder communication, and regulatory compliance services provided by the Adviser to the Funds. The Directors concluded that the Adviser was providing essential services to the Funds.
The Directors compared the performance of the Funds to benchmark indices over various periods of time and concluded that the performance of the Funds warranted the continuation of the advisory agreements. The Directors noted that in addition to the absolute performance of the Funds, they also noted that the Funds adhered to their investment style.
In concluding that the advisory fees payable by the Funds were reasonable, the Directors reviewed a report of the costs of services provided by, and the profits realized by the Adviser, from its relationship with the Funds and concluded that such profits were reasonable and not excessive. As part of its analysis, the Board considered the value of the research the Adviser received from broker-dealers executing securities transactions for the Funds.
39
The Yacktman Funds, Inc.
NOTES TO THE FINANCIAL STATEMENTS (Cont'd.)
June 30, 2008 (Unaudited)
The Directors also reviewed reports comparing the expense ratios and advisory fees paid by the Funds to those paid by other comparable mutual funds and concluded that the advisory fees paid by the Funds and the expense ratios of the Funds were in the range of comparable mutual funds.
The Directors also considered whether the investment advisory agreement fee schedules should be adjusted for an increase in assets under management. They concluded that “breakpoints” embodied in the investment advisory agreement for TheYacktman Fund were appropriate, and breakpoints for TheYacktman Focused Fund were not warranted at this time given the anticipated growth of that Fund in the next year and the other factors considered.
40
The Yacktman Funds, Inc.
ADDITIONAL INFORMATION (Unaudited)
For the year ended December 31, 2007, 74.60% and 52.30% of the dividends paid from net investment income, including short-term capital gain, for The Yacktman Fund and TheYacktman Focused Fund, respectively, qualify for the dividends received deduction available to corporate shareholders.
For the year ended December 31, 2007, 77.50% and 54.36% of the dividends paid from net investment income, including short-term capital gains, for The Yacktman Fund and TheYacktman Focused Fund, respectively, are designated as qualified dividend income. The Funds hereby designate approximately $46,630,740 and $8,463,843 as long-term capital gain distributions for The Yacktman Fund and The Yacktman Focused Fund, respectively, for the purposes of the dividends paid deduction.
PROXY VOTING POLICIES AND PROCEDURES
For a description of the policies and procedures that the Funds use to determine how to vote proxies relating to portfolio securities, please call 1-800-525-8258 and request a Statement of Additional information. One will be mailed to you free of charge. The Statement of Additional Information is also available on the Website of the Securities and Exchange Commission at http://www.sec.gov. Information on how the Funds voted proxies relating to portfolio securities during the twelve month period ended June 30, 2007, is available without charge, upon request, by calling 1-800-525-8258 or by accessing the Web site of the Securities and Exchange Commission.
DISCLOSURE OF PORTFOLIO HOLDINGS
The Funds will file complete schedules of portfolio holdings with the Securities and Exchange Commission for the first and third quarters of each fiscal year on Form N-Q. Each Fund’s Form N -Q will be available on the Web site of the Securities and Exchange Commission at http:/ www.sec.gov.
41

Item 2. Code of Ethics.
Not applicable for semi-annual reports.
Item 3. Audit Committee Financial Expert.
Not applicable for semi-annual reports.
Item 4. Principal Accountant Fees and Services.
Not applicable for semi-annual reports.
Item 5. Audit Committee of Listed Registrants.
Not applicable to registrants who are not listed issuers (as defined in Rule 10A-3 under the Securities Exchange Act of 1934).
Item 6. Schedule of Investments.
Schedule of Investments is included as part of the report to shareholders filed under Item 1 of this Form.
Item 7. Disclosure of Proxy Voting Policies and Procedures for Closed-End Management Investment Companies.
Not applicable to open-end investment companies.
Item 8. Portfolio Managers of Closed-End Management Investment Companies.
Not applicable to open-end investment companies.
Item 9. Purchases of Equity Securities by Closed‑End Management Investment Company and Affiliated Purchasers.
Not applicable to open-end investment companies.
Item 10. Submission of Matters to a Vote of Security Holders.
Not Applicable.
Item 11. Controls and Procedures.
(a) The Registrant’s President/Chief Executive Officer and Treasurer/Chief Financial Officer have reviewed the Registrant's disclosure controls and procedures (as defined in Rule 30a-3(c) under the Investment Company Act of 1940 (the “Act”)) as of a date within 90 days of the filing of this report, as required by Rule 30a-3(b) under the Act and Rules 13a-15(b) or 15d‑15(b) under the Securities Exchange Act of 1934. Based on their review, such officers have concluded that the disclosure controls and procedures are effective in ensuring that information required to be disclosed in this report is appropriately recorded, processed, summarized and reported and made known to them by others within the Registrant and by the Registrant’s service provider.
(b) There were no changes in the Registrant's internal control over financial reporting (as defined in Rule 30a-3(d) under the Act) that occurred during the second fiscal quarter of the period covered by this report that has materially affected, or is reasonably likely to materially affect, the Registrant's internal control over financial reporting.
Item 12. Exhibits.
(a) (1) Any code of ethics or amendment thereto, that is subject of the disclosure required by Item 2, to the extent that the registrant intends to satisfy Item 2 requirements through filing an exhibit. Not applicable to semi-annual reports.
(2) Certifications pursuant to Section 302 of the Sarbanes-Oxley Act of 2002. Filed herewith.
(3) Any written solicitation to purchase securities under Rule 23c‑1 under the Act sent or given during the period covered by the report by or on behalf of the registrant to 10 or more persons. Not applicable to open-end investment companies.
(b) Certification pursuant to Section 906 of the Sarbanes‑Oxley Act of 2002. Furnished herewith.
SIGNATURES
Pursuant to the requirements of the Securities Exchange Act of 1934 and the Investment Company Act of 1940, the registrant has duly caused this report to be signed on its behalf by the undersigned, thereunto duly authorized.
(Registrant) The Yacktman Funds, Inc.
By (Signature and Title) /s/ Donald A. Yacktman
Donald A. Yacktman, President & Treasurer
Date August 28, 2008
Pursuant to the requirements of the Securities Exchange Act of 1934 and the Investment Company Act of 1940, this report has been signed below by the following persons on behalf of the registrant and in the capacities and on the dates indicated.
By (Signature and Title) /s/ Donald A. Yacktman
Donald A. Yacktman, President & Treasurer
Date August 28, 2008