UNITED STATES
SECURITIES AND EXCHANGE COMMISSION
Washington, D.C. 20549
FORM N-CSR
CERTIFIED SHAREHOLDER REPORT OF REGISTERED
MANAGEMENT INVESTMENT COMPANIES
Investment Company Act file number 811-06628
The Yacktman Funds, Inc.
(Exact name of registrant as specified in charter)
6300 Bridgepoint Parkway
Building One, Suite 320
Austin, TX 78730
(Address of principal executive offices) (Zip code)
Donald A. Yacktman
c/o Yacktman Asset Management Co.
6300 Bridgepoint Parkway
Building One, Suite 320
Austin, TX 78730
(Name and address of agent for service)
512.767.6700
Registrant's telephone number, including area code
Date of fiscal year end: 12/31/10
Date of reporting period: 06/30/10
Item 1. Reports to Stockholders.
| SEMI-ANNUAL REPORT |
June 30, 2010
The Yacktman Funds, Inc.
| MESSAGE TO SHAREHOLDERS |
 |  |  |
| Donald A. Yacktman | Stephen Yacktman | Jason Subotky |
During the first six months of 2010, The Yacktman Funds outperformed again in a down market. The Yacktman Focused Fund and The Yacktman Fund declined by 4.77% and 4.34% respectively while the S&P 500 declined 6.65%. While we are generally not very concerned about how we perform compared to a benchmark over short periods of time, we feel it is critically important to provide better protection than the general market during sharp declines.
We took advantage of lower prices by making additional purchases in many of our favorite holdings and new positions to the funds. We maintain sufficient excess cash to bargain hunt should the opportunities get even better.
We are proud of the long term results for our funds. In the last 10 years, The Yacktman Focused Fund and The Yacktman Fund have appreciated 12.49% and 11.85% annually, compared to the S&P 500 which is down 1.59% per year. That translates into a total return of 224.41% for The Yacktman Focused Fund, and 206.84% for The Yacktman Fund compared to a decline of 14.8% for the S&P 500. A shareholder who invested $10,000 10 years ago would now have $32,438 in The Yacktman Focused Fund, and $30,654 in The Yacktman Fund compared to $8,521 in the S&P 500 index.
2
The Yacktman Funds, Inc.
| ANNUALIZED | |||||
| 1- | 3- | 5- | 10- | ||
| As of June 30, 2010 | YTD | YEAR | YEAR | YEAR | YEAR |
| The Yacktman | |||||
| Focused Fund | |||||
| (YAFFX) | -4.77% | 20.06% | 5.88% | 7.26% | 12.49% |
| The Yacktman | |||||
| Fund (YACKX) | -4.34% | 22.53% | 4.05% | 6.20% | 11.85% |
S&P 500® Index | -6.65% | 14.43% | -9.81% | -0.79% | -1.59% |
| CUMULATIVE RETURN | |||||
| 1- | 3- | 5- | 10- | ||
| As of June 30, 2010 | YEAR | YEAR | YEAR | YEAR | |
| The Yacktman | |||||
| Focused Fund | |||||
| (YAFFX) | 20.06% | 18.70% | 41.96% | 224.41% | |
| The Yacktman | |||||
| Fund (YACKX) | 22.53% | 12.66% | 35.11% | 206.84% | |
S&P 500® Index | 14.43% | -26.64% | -3.91% | -14.79% | |
There Are Good Bargains in The Funds
With the recent price declines, we think many of our top positions offer exceptional potential over time. To us, the risk/reward of our funds is especially compelling, given the quality of the major positions we hold.
Emphasis on High Quality Holdings
Both funds have significant positions in some of the most attractive businesses in the world. It surprises some that we have achieved such strong outperformance while having large weightings in well-known stocks like Coca-Cola, PepsiCo, Pfizer, and Microsoft, as these companies are not exactly undiscovered or underfollowed.
We strive to be as objective as possible in evaluating all opportunities, and if the best businesses in the world are available at compelling valuations we are willing to own big positions in them. We sleep well at night knowing that dominant, well capitalized companies purchased at attractive valuations should produce solid results over time, even in a world with an extreme amount of uncertainty.
We are also willing to own lower quality businesses, but we have to project a meaningfully higher expected rate of return on the investment. Currently, we think most of the best values are in the highest quality companies.
3
The Yacktman Funds, Inc.
| Average Annual Returns | The Yacktman Fund | S&P 500® |
| One Year (07/01/09 - 06/30/10) | 22.53% | 14.43% |
| Three Years (07/01/07 - 06/30/10) | 4.05% | -9.81% |
| Five Years (07/01/05 - 06/30/10) | 6.20% | -0.79% |
| Ten Years (07/01/00 - 06/30/10) | 11.85% | -1.59% |
n The Yacktman Fund
o S&P 500®
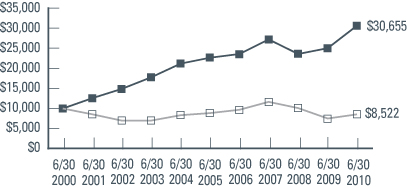
The chart assumes an initial gross investment of $10,000 made on 6/30/00.
| The Yacktman | ||
| Average Annual Returns | Focused Fund | S&P 500® |
| One Year (07/01/09 - 06/30/10) | 20.06% | 14.43% |
| Three Years (07/01/07 - 06/30/10) | 5.88% | -9.81% |
| Five Years (07/01/05 - 06/30/10) | 7.26% | -0.79% |
| Ten Years (07/01/00 - 06/30/10) | 12.49% | -1.59% |
n The Yacktman Focused Fund
o S&P 500®
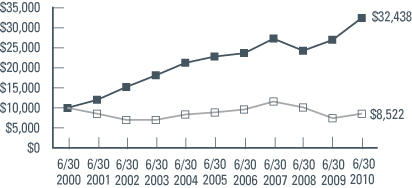
The chart assumes an initial gross investment of $10,000 made on 6/30/00.
Returns shown include the reinvestment of all dividends, but do not reflect the deduction of taxes that a shareholder would pay on Fund distributions or the redemption of Fund shares. The above past performance is not predictive of future results. The investment return and principal value of the Funds will fluctuate so that your shares, when redeemed, may be worth more or less than their original cost.
4
Long Product Cycle, Short Repurchase Cycle
We like businesses that sell products in well-established, slowly changing markets like beverage, household products, personal care, and food. These “consumer staple” products typically sell at low price points and are consumed and repurchased frequently.
Category leaders like Coca-Cola in soft drinks or Tide in laundry detergents may continue their dominance for generations, making it easier to predict the future prospects of these businesses. We are extremely confident that Clorox will be the leader in bleach sales in 10 years, while we are less certain about who will be the dominant seller of cell phones even a few years from now.
Value of Recurring Revenues
The media companies we own are largely subscription businesses, which we also like. Comcast gets paid predictable monthly fees from its customers for providing cable television, internet, and telephone services. News Corp and Viacom receive recurring monthly fees for the cable content they provide to pay television providers. Even in a challenged economy, pay television is one of the last items to be cut by households.
Positions greater than 6% of Assets
| The Yacktman Focused Fund | The Yacktman Fund |
| PepsiCo | PepsiCo |
| News Corporation | News Corporation |
| Coca-Cola | Coca-Cola |
| Clorox | |
| Pfizer |
Due to The Yacktman Focused Fund’s ability to concentrate more assets in our best ideas, we have five positions greater than 6% compared to three in The Yacktman Fund.
5
The Yacktman Funds, Inc.
What We Like About Our Top Positions
PepsiCo
Frito Lay, the most valuable division of PepsiCo, is the dominant snack chip company in the world. This business has significantly higher market share than any of its competitors, and its dominant market share produces substantially higher margins than most other packaged food companies. Strong distribution and innovation have allowed Frito Lay to grow faster than other large food companies. Outside of snack chips, PepsiCo has a collection of solid businesses including Pepsi, Tropicana, Quaker Oats, and Gatorade.
News Corporation
News Corporation is a global media conglomerate. In the last decade-plus, Rupert Murdoch has transformed the company from somewhat cyclical, advertising-based businesses like newspapers and network television, to more recurring revenue businesses like cable content. We expect the cable content business, which was in its infancy a little more than a decade ago, to produce approximately 50% of News Corporation’s pre-tax profits in the next 12 months.
News Corporation wants to increase its recurring revenue base even further by acquiring the 61% of BSkyB (the dominant pay television provider in the United Kingdom) it does not own. News Corporation has been the largest shareholder of BSkyB for more than 20 years and would be highly accretive to free cash flow per share at the proposed transaction price.
Coca-Cola
Coca-Cola products account for nearly 3% of beverage consumption around the world. Increased per capita consumption and global expansion have driven more than a century of growth. Today, Coca-Cola is primarily an international company; the stagnant North American
6
Clorox
Clorox is a leading household products company, owning a diverse group of well-known brands, including Glad, Clorox Bleach, Kingsford Charcoal, Brita, Armor All and Hidden Valley Ranch. These are products that consumers purchase and use in both good economies and bad. Clorox has extremely high market share in many of its brands, which translates into high margins and strong free cash generation.
Pfizer
Pfizer is the largest pharmaceutical company in the world. Pharmaceuticals are a cost effective way to treat an aging population. However, Pfizer is the least predictable business of the five in this list because it is fighting patent expirations, pricing controls, and greater competition than consumer or subscriber based businesses.
To compensate for the less predictable future, the stock trades at less than 7 times free cash flow. We believe the company should generate more than $10 per share in free cash flow over the next 5 years. Given the significant residual value of the business at that point, we see lots of safety in the June 30th, 2010 price of slightly more than $14 per share. There can be material upside if the company has even modest success with drugs in its pipeline, finds accretive acquisitions, successfully expands its generic business, or grows its biologic drug presence.
Price
“It’s almost all about the price”
Identifying great companies is not especially difficult. Appraising the future prospects of a business and paying an appropriate price are far more critical to managing risk and generating attractive returns than just picking
7
The Yacktman Funds, Inc.
leaders. Ten years ago, all five stocks described above sold at substantially higher multiples of earnings than today. Due to the low prices, the average dividend yield as of June 30th for these five companies is 3.3%.
Global Economic Issues
Economic issues may cause short term pressure on the earnings of some of the companies in our funds, though we think we are being sufficiently compensated for that possibility by current valuation levels. We are optimistic and patient, and believe that owning securities at attractive prices and adhering to high quality standards will allow us to the endure bumps in the road that may lie ahead.
Over the longer term, we like businesses that have international exposure. The United States represents less than 5% of the world’s population, and for most large companies, the only way to achieve sustained growth over long periods of time, is to expand around the globe.
Conclusion
We are highly confident about the long-term prospects for our funds. We currently own many top- quality companies at what we think are very attractive valuations. In a world where there are significant economic issues we are comfortable because we feel our funds own many businesses that can prosper in good times and bad.
Our team will work hard to objectively examine the opportunities ahead. We appreciate the confidence of our shareholders, and, as always, we will continue to be diligent, objective, and patient when managing The Yacktman Funds.
Sincerely,
The Yacktman Team
8
The performance data quoted for the Yacktman Funds represents past performance. Past performance does not guarantee future results. The investment return and principal value of an investment will fluctuate so that the investor’s shares, when redeemed, may be worth more or less than their original cost. The current performance may be higher or lower than the performance data quoted. The most recent month-end performance may be obtained by clicking on “Updated Performance” at www.yacktman.com. Cumulative returns assumes the reinvestment of dividends in the security or index.
An investor should consider the investment objectives, risks and charges and expenses of the Funds carefully before investing. The Funds’ prospectus contains this and other important information about the Funds. An investor may obtain a prospectus by also going to the Yacktman website at www.yacktman.com and clicking on “Prospectus” in the left hand column or by calling this toll free number 1-800-525-8258. The prospectus should be read carefully before investing.
9
The Yacktman Funds, Inc.
EXPENSE EXAMPLE
For the Six Months Ended June 30, 2010 (Unaudited)
As a shareholder of the Yacktman Funds (the “Funds”), you incur ongoing costs, including management fees and other Fund expenses. If you invest through a financial intermediary, you may also incur additional costs such as a transaction fee charged on the purchase or sale of the Fund or an asset-based management fee. This Example is intended to help you understand your ongoing costs (in dollars) of investing in the Fund and to compare these costs with the ongoing costs of investing in other mutual funds.
The Example is based on an investment of $1,000 invested at the beginning of the period and held for the entire period from January 1, 2010 to June 30, 2010.
Actual Expenses
The first line of the table on the next page provides information about actual account values and actual expenses. You may use the information in this line, together with the amount you invested, to estimate the expenses you paid over the period. Simply divide your account value by $1,000 (for example, an $8,600 account value divided by $1,000 = 8.6), then multiply the result by the number in the first line under the heading entitled “Expenses Paid During Period” to estimate the expenses you paid on your account during the period.
Hypothetical Example for Comparison Purposes
The second line of the table on the next page provides information about hypothetical account values and hypothetical expenses based on the Funds’ actual expense ratios and an assumed rate of return of 5% per year before expenses, which is not the Funds’ actual return. The hypothetical account values and expenses may not be used to estimate the actual ending account balance or expenses you paid for the period. You may use this information to compare the ongoing costs of investing in the Fund and other funds. To do so, compare this 5% hypothetical example with the 5% hypothetical examples that appear in the shareholder reports of the other funds.
10
Please note that the expenses shown in the table are meant to highlight your ongoing costs only and do not reflect any costs that may be associated with investing in the Fund through a financial intermediary. Therefore, the second line of the table is useful in comparing the ongoing costs only, and will not help you determine the relative total costs of owning different funds. In addition, if any costs associated with investing through a financial intermediary were included, your costs would have been higher.
THE YACKTMAN FUND
| Expenses | |||
| Beginning | Ending | paid during | |
| account | account | period | |
| value | value | 01/01/10- | |
| 01/01/10 | 06/30/10 | 06/30/101 | |
| Actual | $1,000.00 | $ 956.60 | $4.03 |
| Hypothetical | |||
| (5% return | |||
| before expenses) | 1,000.00 | 1,020.68 | 4.16 |
THE YACKTMAN FOCUSED FUND
| Expenses | |||
| Beginning | Ending | paid during | |
| account | account | period | |
| value | value | 01/01/10- | |
| 01/01/10 | 06/30/10 | 06/30/101 | |
| Actual | $1,000.00 | $ 952.30 | $6.00 |
| Hypothetical | |||
| (5% return | |||
| before expenses) | 1,000.00 | 1,018.65 | 6.21 |
| 1 | Expenses are equal to the Funds’ annualized expense ratios (0.83% for The Yacktman Fund and 1.24% for The Yacktman Focused Fund), multiplied by the average account value over the period, multiplied by 181/365 (to reflect the one-half year period). |
11
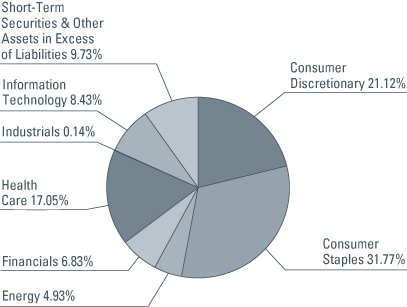
The Yacktman Fund
TOP TEN EQUITY HOLDINGS
June 30, 2010 (Unaudited)
| Percentage of | ||||||
| Net Assets | ||||||
| PepsiCo, Inc. | 8.82 | % | ||||
| News Corp., Class A | 8.21 | % | ||||
| Coca-Cola Co. | 7.91 | % | ||||
| Johnson & Johnson | 5.10 | % | ||||
| Procter & Gamble Co. | 5.07 | % | ||||
| Pfizer, Inc. | 5.03 | % | ||||
| Microsoft Corp. | 4.94 | % | ||||
| Clorox Co. | 4.94 | % | ||||
| ConocoPhillips | 4.93 | % | ||||
| Viacom, Inc., Class B | 4.70 | % | ||||
| Total | 59.65 | % | ||||
FUND DIVERSIFICATION
June 30, 2010 (Unaudited)
12
The Yacktman Fund
EQUITY PURCHASES & SALES
For the Six Months Ended June 30, 2010 (Unaudited)
| Net Shares | Current | |||||||
| NEW PURCHASES | Purchased | Shares Held | ||||||
| Becton, Dickinson & Co. | 500,000 | 500,000 | ||||||
| Becton, Dickinson and Company | ||||||||
| manufactures and sells a variety of | ||||||||
| medical supplies and devices and | ||||||||
| diagnostic systems. The Company’s | ||||||||
| products are used by health care | ||||||||
| professionals, medical research | ||||||||
| institutions, and the general public. | ||||||||
| Becton’s products are marketed | ||||||||
| worldwide. | ||||||||
| C.R. Bard, Inc. | 720,000 | 720,000 | ||||||
| C.R. Bard, Inc. designs, manufactures, | ||||||||
| packages, distributes, and sells medical, | ||||||||
| surgical, diagnostic, and patient care | ||||||||
| devices. The Company sells a broad | ||||||||
| range of products worldwide to hospitals, | ||||||||
| individual healthcare professionals, | ||||||||
| extended care facilities and alternate | ||||||||
| site facilities. Bard markets vascular, | ||||||||
| urological, oncological, and surgical | ||||||||
| specialties products. | ||||||||
| Sysco Corp. | 1,750,000 | 1,750,000 | ||||||
| Sysco Corporation distributes food | ||||||||
| and related products primarily to the | ||||||||
| food service industry. The Company | ||||||||
| also distributes personal care guest | ||||||||
| amenities, housekeeping supplies, | ||||||||
| room accessories, and textiles to the | ||||||||
| lodging industry. | ||||||||
13
The Yacktman Fund
EQUITY PURCHASES & SALES (Cont’d.)
For the Six Months Ended June 30, 2010 (Unaudited)
| Net Shares | Current | |||||||
| NEW PURCHASES | Purchased | Shares Held | ||||||
| Total System Services, Inc. | 1,200,000 | 1,200,000 | ||||||
| Total System Services, Inc. provides | ||||||||
| electronic payment processing and | ||||||||
| related services to financial and | ||||||||
| nonfinancial institutions. The Company’s | ||||||||
| services include processing consumer, | ||||||||
| retail, commercial, government services, | ||||||||
| stored value and debit cards. Total | ||||||||
| System serves institutions throughout | ||||||||
| the United States and internationally. | ||||||||
14
| Net Shares | Current | |||||||
| PURCHASES | Purchased | Shares Held | ||||||
| Bank of New York Mellon Corp. | 200,000 | 500,000 | ||||||
| Becton, Dickinson & Co. | 500,000 | 500,000 | ||||||
| C.R. Bard, Inc. | 720,000 | 720,000 | ||||||
| Clorox Co. | 850,000 | 1,700,000 | ||||||
| Coca-Cola Co. | 1,645,000 | 3,380,000 | ||||||
| Comcast Corp., Class A | 710,000 | 4,700,000 | ||||||
| ConocoPhillips | 680,000 | 2,050,000 | ||||||
| Covidien Plc | 150,000 | 250,000 | ||||||
| eBay, Inc. | 640,000 | 1,750,000 | ||||||
| H&R Block, Inc. | 970,000 | 2,300,000 | ||||||
| Johnson & Johnson | 1,230,000 | 1,850,000 | ||||||
| Microsoft Corp. | 2,570,000 | 4,530,000 | ||||||
| News Corp., Class A | 6,000,000 | 14,700,000 | ||||||
| PepsiCo, Inc. | 1,060,000 | 3,100,000 | ||||||
| Pfizer, Inc. | 4,050,000 | 7,550,000 | ||||||
| Procter & Gamble Co. | 830,000 | 1,810,000 | ||||||
| Sysco Corp. | 1,750,000 | 1,750,000 | ||||||
| Total System Services, Inc. | 1,200,000 | 1,200,000 | ||||||
| U.S. Bancorp | 1,040,000 | 2,450,000 | ||||||
| UnitedHealth Group, Inc. | 50,000 | 1,200,000 | ||||||
| Viacom, Inc., Class B | 1,190,000 | 3,210,000 | ||||||
| Wal-Mart Stores, Inc. | 410,000 | 700,000 | ||||||
| Net Shares | Current | |||||||
| SALES | Sold | Shares Held | ||||||
| AmeriCredit Corp. | 350,000 | 2,000,000 | ||||||
| BAC Capital Trust X | 48,700 | — | ||||||
| Cardinal Health, Inc. | 110,000 | — | ||||||
| CareFusion Corp. | 55,000 | — | ||||||
| Federal National Mortgage Association | 404,243 | — | ||||||
| Furniture Brands International, Inc. | 818,200 | — | ||||||
| Home Depot, Inc. | 50,000 | — | ||||||
| SLM Corp., Series A | 164,200 | 160,000 | ||||||
| USG Corp. | 585,950 | — | ||||||
| Walt Disney Co. | 300,000 | — | ||||||
15
The Yacktman Fund
PORTFOLIO OF INVESTMENTS
June 30, 2010 (Unaudited)
| Number | ||||||||
| of Shares | Value | |||||||
| COMMON STOCKS - 88.82% | ||||||||
| Banks - 3.05% | ||||||||
| The Bancorp, Inc. (a) | 709,454 | $ | 5,555,025 | |||||
| Bank of America Corp. | 352,000 | 5,058,240 | ||||||
| U.S. Bancorp | 2,450,000 | 54,757,500 | ||||||
| 65,370,765 | ||||||||
| Beverages - 16.74% | ||||||||
| Coca-Cola Co. | 3,380,000 | 169,405,600 | ||||||
| PepsiCo, Inc. | 3,100,000 | 188,945,000 | ||||||
| 358,350,600 | ||||||||
| Capital Markets - 0.58% | ||||||||
| Bank of New York Mellon Corp. | 500,000 | 12,345,000 | ||||||
| Commercial Services | ||||||||
| & Supplies - 1.69% | ||||||||
| H&R Block, Inc. | 2,300,000 | 36,087,000 | ||||||
| Computers & Peripherals - 0.78% | ||||||||
| Dell, Inc. (a) | 480,000 | 5,788,800 | ||||||
| Hewlett-Packard Co. | 250,000 | 10,820,000 | ||||||
| 16,608,800 | ||||||||
| Consumer Finance - 0.44% | ||||||||
| American Express Co. | 235,000 | 9,329,500 | ||||||
| Distributors - 0.15% | ||||||||
| Prestige Brands Holdings, Inc. (a) | 446,600 | 3,161,928 | ||||||
| Diversified Financial | ||||||||
| Services - 1.82% | ||||||||
| AmeriCredit Corp. (a) | 2,000,000 | 36,440,000 | ||||||
| Resource America, Inc., Class A | 659,226 | 2,538,020 | ||||||
| 38,978,020 | ||||||||
| Food & Staples Retailing - 2.33% | ||||||||
| Sysco Corp. | 1,750,000 | 49,997,500 | ||||||
| Food Products - 0.60% | ||||||||
| Lancaster Colony Corp. | 242,500 | 12,939,800 | ||||||
See notes to financial statements.
16
| Number | ||||||||
| of Shares | Value | |||||||
| Health Care Equipment | ||||||||
| & Supplies - 5.07% | ||||||||
| Becton Dickinson & Co. | 550,000 | $ | 37,191,000 | |||||
| C.R. Bard, Inc. | 720,000 | 55,821,600 | ||||||
| Covidien Plc | 250,000 | 10,045,000 | ||||||
| Stryker Corp. | 110,000 | 5,506,600 | ||||||
| 108,564,200 | ||||||||
| Health Care Providers | ||||||||
| & Services - 1.84% | ||||||||
| UnitedHealth Group, Inc. | 1,200,000 | 34,080,000 | ||||||
| WellPoint, Inc. (a) | 109,500 | 5,357,835 | ||||||
| 39,437,835 | ||||||||
| Household Products - 10.26% | ||||||||
| Clorox Co. | 1,700,000 | 105,672,000 | ||||||
| Colgate-Palmolive Co. | 70,000 | 5,513,200 | ||||||
| Procter & Gamble Co. | 1,810,000 | 108,563,800 | ||||||
| 219,749,000 | ||||||||
| Industrial Conglomerates - 0.14% | ||||||||
| Tyco International Ltd. | 87,500 | 3,082,625 | ||||||
| Insurance - 0.43% | ||||||||
| Loews Corp. | 270,000 | 8,993,700 | ||||||
| MGIC Investment Corp. (a) | 30,000 | 206,700 | ||||||
| 9,200,400 | ||||||||
| Internet Retail - 1.69% | ||||||||
| eBay, Inc. (a) | 1,850,000 | 36,278,500 | ||||||
| IT Services - 1.02% | ||||||||
| Total System Services, Inc. | 1,600,000 | 21,760,000 | ||||||
| Media - 18.30% | ||||||||
| Comcast Corp. | 4,700,000 | 77,221,000 | ||||||
| Dish Network Corp., Class A | 420,000 | 7,623,000 | ||||||
| Liberty Media Holding Corp., | ||||||||
| Interactive-Series A (a) | 2,900,000 | 30,450,000 | ||||||
| News Corp., Class A | 14,700,000 | 175,812,000 | ||||||
| Viacom, Inc., Class B (a) | 3,210,000 | 100,697,700 | ||||||
| 391,803,700 | ||||||||
See notes to financial statements.
17
The Yacktman Fund
PORTFOLIO OF INVESTMENTS (Cont’d.)
June 30, 2010 (Unaudited)
| Number | ||||||||
| of Shares | Value | |||||||
| Oil, Gas & | ||||||||
| Consumable Fuels - 4.93% | ||||||||
| ConocoPhillips | 2,150,000 | $ | 105,543,500 | |||||
| Pharmaceuticals - 10.13% | ||||||||
| Johnson & Johnson | 1,850,000 | 109,261,000 | ||||||
| Pfizer, Inc. | 7,550,000 | 107,663,000 | ||||||
| 216,924,000 | ||||||||
| Software - 4.94% | ||||||||
| Microsoft Corp. | 4,600,000 | 105,846,000 | ||||||
| Specialty Retail - 1.89% | ||||||||
| Abercrombie & Fitch Co. - Class A | 145,000 | 4,450,050 | ||||||
| Wal-Mart Stores, Inc. | 750,000 | 36,052,500 | ||||||
| 40,502,550 | ||||||||
| TOTAL COMMON STOCKS | ||||||||
| (Cost $1,841,225,201) | 1,901,861,223 | |||||||
| CONVERTIBLE PREFERRED STOCKS - 0.76% | ||||||||
| Advertising - 0.76% | ||||||||
| Interpublic Group of | ||||||||
| Cos., Inc., Series B | 21,000 | 16,275,000 | ||||||
| TOTAL CONVERTIBLE | ||||||||
| PREFERRED STOCKS | ||||||||
| (Cost $9,117,925) | 16,275,000 | |||||||
| PREFERRED STOCKS - 0.29% | ||||||||
| Diversified Financial Services - 0.29% | ||||||||
| SLM Corp. | 160,000 | 6,048,000 | ||||||
| TOTAL PREFERRED STOCKS | ||||||||
| (Cost $3,895,008) | 6,048,000 | |||||||
See notes to financial statements.
18
| Principal | ||||||||
| Amount | Value | |||||||
| CONVERTIBLE BONDS - 0.23% | ||||||||
| Mortgage REITs - 0.23% | ||||||||
| RAIT Financial Trust | ||||||||
| 6.875%, 04/15/2027 (c) | $ | 6,750,000 | $ | 4,969,687 | ||||
| TOTAL CONVERTIBLE BONDS | ||||||||
| (Cost $5,351,781) | 4,969,687 | |||||||
| CORPORATE BONDS - 0.17% | ||||||||
| Specialty Retail - 0.17% | ||||||||
| Limited Brands, Inc. | ||||||||
| 7.600%, 07/15/2037 | 4,000,000 | 3,680,000 | ||||||
| TOTAL CORPORATE BONDS | ||||||||
| (Cost $1,737,207) | 3,680,000 | |||||||
| SHORT-TERM INVESTMENTS - 11.49% | ||||||||
| Commercial Paper - 11.48% | ||||||||
| BNP Paribas, | ||||||||
| 0.043%, 7/07/2010 | 81,922,000 | 81,921,318 | ||||||
| Intesa Funding, | ||||||||
| 0.000%, 07/01/2010 | 81,922,000 | 81,922,000 | ||||||
| Natixis USA, | ||||||||
| 0.171%, 07/07/2010 | 81,922,000 | 81,919,269 | ||||||
| 245,762,587 | ||||||||
See notes to financial statements.
19
The Yacktman Fund
PORTFOLIO OF INVESTMENTS (Cont’d.)
June 30, 2010 (Unaudited)
| Principal | ||||||||
| Amount | Value | |||||||
| Demand Notes - 0.01% | ||||||||
| U.S. Bancorp | ||||||||
| 0.000% (b) | $ | 251,120 | $ | 251,120 | ||||
| TOTAL SHORT-TERM | ||||||||
| INVESTMENTS | ||||||||
| (Cost $246,013,707) | 246,013,707 | |||||||
| Total Investments | ||||||||
| (Cost $2,107,340,829) - 101.76% | 2,178,847,617 | |||||||
| Liabilities in Excess | ||||||||
| of Other Assets - (1.76)% | (37,632,587 | ) | ||||||
| TOTAL NET ASSETS - 100.00% | $ | 2,141,215,030 | ||||||
Percentages are stated as a percent of net assets.
| (a) | Non-Income Producing |
| (b) | Variable rate security. Rate shown represents the rate as of June 30, 2010. |
| (c) | Restricted security as defined in Rule 144(a) under the Securities Act of 1933. |
See notes to financial statements.
20
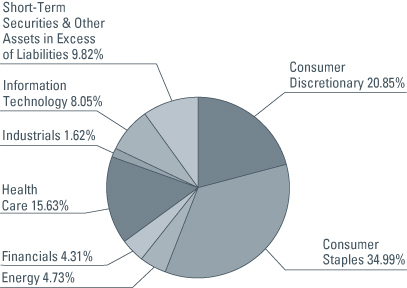
The Yacktman Focused Fund
TOP TEN EQUITY HOLDINGS
June 30, 2010 (Unaudited)
| Percentage of | ||||||
| Net Assets | ||||||
| PepsiCo, Inc. | 11.14 | % | ||||
| News Corp., Class A | 9.34 | % | ||||
| Coca-Cola Co. | 9.02 | % | ||||
| Clorox Co. | 7.19 | % | ||||
| Pfizer, Inc. | 6.88 | % | ||||
| Microsoft Corp. | 4.97 | % | ||||
| Viacom, Inc., Class B | 4.90 | % | ||||
| ConocoPhillips | 4.73 | % | ||||
| Comcast Corp., Class A | 3.47 | % | ||||
| Johnson & Johnson | 2.98 | % | ||||
| Total | 64.62 | % | ||||
FUND DIVERSIFICATION
June 30, 2010 (Unaudited)
21
The Yacktman Focused Fund
EQUITY PURCHASES & SALES
For the Six Months Ended June 30, 2010 (Unaudited)
| Net Shares | Current | |||||||
| PURCHASES | Purchased | Shares Held | ||||||
| Becton, Dickinson & Co. | 230,000 | 230,000 | ||||||
| C.R. Bard, Inc. | 380,000 | 380,000 | ||||||
| Clorox Co. | 790,000 | 1,260,000 | ||||||
| Coca-Cola Co. | 1,140,000 | 1,960,000 | ||||||
| Comcast Corp., Class A | 490,000 | 2,300,000 | ||||||
| ConocoPhillips | 390,000 | 1,050,000 | ||||||
| eBay, Inc. | 475,000 | 850,000 | ||||||
| H&R Block, Inc. | 570,000 | 1,150,000 | ||||||
| Johnson & Johnson | 240,000 | 550,000 | ||||||
| Lancaster Colony Corp. | 28,800 | 200,000 | ||||||
| Microsoft Corp. | 940,000 | 2,300,000 | ||||||
| News Corp., Class A | 4,100,000 | 8,500,000 | ||||||
| PepsiCo, Inc. | 970,000 | 1,990,000 | ||||||
| Pfizer, Inc. | 3,200,000 | 5,250,000 | ||||||
| Procter & Gamble Co. | 40,000 | 470,000 | ||||||
| Sysco Corp. | 910,000 | 910,000 | ||||||
| Total System Services, Inc. | 600,000 | 600,000 | ||||||
| Toyota Industries Corp. | 200,000 | 700,000 | ||||||
| U.S. Bancorp | 540,000 | 1,220,000 | ||||||
| Viacom, Inc., Class B | 550,000 | 1,700,000 | ||||||
| Wal-Mart Stores, Inc. | 225,000 | 360,000 | ||||||
| Net Shares | Current | |||||||
| SALES | Sold | Shares Held | ||||||
| Abercrombie & Fitch Co. | 30,000 | — | ||||||
| American Express Co. | 50,000 | — | ||||||
| Bank of America Corp. | 67,000 | — | ||||||
| Colgate-Palmolive Co. | 20,000 | — | ||||||
| Covidien Plc | 30,000 | — | ||||||
| Dell, Inc. | 105,000 | — | ||||||
| Federal National Mortgage Association | 86,949 | — | ||||||
| Furniture Brands International, Inc. | 160,000 | — | ||||||
| Interpublic Group of Cos., Inc., Series B | 5,000 | — | ||||||
| Loews Corp. | 90,000 | — | ||||||
| SLM Corp., Series A | 31,903 | — | ||||||
| USG Corp. | 175,000 | — | ||||||
| WellPoint, Inc. | 26,000 | — | ||||||
22
The Yacktman Focused Fund
PORTFOLIO OF INVESTMENTS
June 30, 2010 (Unaudited)
| Number | ||||||||
| of Shares | Value | |||||||
| COMMON STOCKS - 89.40% | ||||||||
| Auto Manufacturers - 1.62% | ||||||||
| Toyota Industries | ||||||||
| Corporation - ADR (a) | 700,000 | $ | 17,605,000 | |||||
| Banks - 2.66% | ||||||||
| The Bancorp, Inc. (a) | 224,426 | 1,757,256 | ||||||
| U.S. Bancorp | 1,220,000 | 27,267,000 | ||||||
| 29,024,256 | ||||||||
| Beverages - 20.16% | ||||||||
| Coca-Cola Co. | 1,960,000 | 98,235,200 | ||||||
| PepsiCo, Inc. | 1,990,000 | 121,290,500 | ||||||
| 219,525,700 | ||||||||
| Commercial Services | ||||||||
| & Supplies - 1.66% | ||||||||
| H&R Block, Inc. | 1,150,000 | 18,043,500 | ||||||
| Computers & Peripherals - 0.38% | ||||||||
| Hewlett-Packard Co. | 95,000 | 4,111,600 | ||||||
| Diversified Financial | ||||||||
| Services - 1.55% | ||||||||
| AmeriCredit Corp. (a) | 880,000 | 16,033,600 | ||||||
| Resource America, Inc., Class A | 215,000 | 827,750 | ||||||
| 16,861,350 | ||||||||
| Food & Staples Retailing - 2.39% | ||||||||
| Sysco Corp. | 910,000 | 25,998,700 | ||||||
| Food Products - 0.98% | ||||||||
| Lancaster Colony Corp. | 200,000 | 10,672,000 | ||||||
| Health Care Equipment | ||||||||
| & Supplies - 4.38% | ||||||||
| Becton Dickinson & Co. | 270,000 | 18,257,400 | ||||||
| C.R. Bard, Inc. | 380,000 | 29,461,400 | ||||||
| 47,718,800 | ||||||||
| Health Care Providers | ||||||||
| & Services - 1.38% | ||||||||
| UnitedHealth Group, Inc. | 530,000 | 15,052,000 | ||||||
See notes to financial statements.
23
The Yacktman Focused Fund
PORTFOLIO OF INVESTMENTS (Cont’d.)
June 30, 2010 (Unaudited)
| Number | ||||||||
| of Shares | Value | |||||||
| Household Products - 9.78% | ||||||||
| Clorox Co. | 1,260,000 | $ | 78,321,600 | |||||
| Procter & Gamble Co. | 470,000 | 28,190,600 | ||||||
| 106,512,200 | ||||||||
| Internet Retail - 1.71% | ||||||||
| eBay, Inc. (a) | 950,000 | 18,629,500 | ||||||
| IT Services - 1.00% | ||||||||
| Total System Services, Inc. | 800,000 | 10,880,000 | ||||||
| Media - 18.51% | ||||||||
| Comcast Corp. | 2,300,000 | 37,789,000 | ||||||
| Liberty Media Holding | ||||||||
| Corp., Interactive-Series A (a) | 840,000 | 8,820,000 | ||||||
| News Corp., Class A | 8,500,000 | 101,660,000 | ||||||
| Viacom, Inc., Class B (a) | 1,700,000 | 53,329,000 | ||||||
| 201,598,000 | ||||||||
| Oil, Gas & | ||||||||
| Consumable Fuels - 4.73% | ||||||||
| ConocoPhillips | 1,050,000 | 51,544,500 | ||||||
| Pharmaceuticals - 9.86% | ||||||||
| Johnson & Johnson | 550,000 | 32,483,000 | ||||||
| Pfizer, Inc. | 5,250,000 | 74,865,000 | ||||||
| 107,348,000 | ||||||||
| Software - 4.97% | ||||||||
| Microsoft Corp. | 2,350,000 | 54,073,500 | ||||||
| Specialty Retail - 1.68% | ||||||||
| Wal-Mart Stores, Inc. | 380,000 | 18,266,600 | ||||||
| TOTAL COMMON STOCKS | ||||||||
| (Cost $961,762,665) | 973,465,206 | |||||||
See notes to financial statements.
24
| Principal | ||||||||
| Amount | Value | |||||||
| CONVERTIBLE BONDS - 0.10% | ||||||||
| Mortgage REITs - 0.10% | ||||||||
| RAIT Financial Trust | ||||||||
| 6.875%, 04/15/2027 (c) | $ | 1,450,000 | $ | 1,067,562 | ||||
| TOTAL CONVERTIBLE BONDS | ||||||||
| (Cost $1,131,544) | 1,067,562 | |||||||
| CORPORATE BONDS - 0.68% | ||||||||
| Media - 0.68% | ||||||||
| Liberty Media Corp. | ||||||||
| 8.250%, 02/01/2030 | 8,000,000 | 7,400,000 | ||||||
| TOTAL CORPORATE BONDS | ||||||||
| (Cost $7,358,223) | 7,400,000 | |||||||
| SHORT-TERM INVESTMENTS - 11.97% | ||||||||
| Commercial Paper - 11.00% | ||||||||
| BNP Paribas, | ||||||||
| 0.043%, 07/07/2010 | 39,932,000 | 39,931,667 | ||||||
| Intesa Funding, | ||||||||
| 0.000%, 07/01/2010 | 39,932,000 | 39,932,000 | ||||||
| Natixis USA, | ||||||||
| 0.171%, 07/07/2010 | 39,932,000 | 39,930,669 | ||||||
| 119,794,336 | ||||||||
| Demand Notes - 0.00% | ||||||||
| U.S. Bancorp | ||||||||
| 0.000% (b) | 54,729 | 54,729 | ||||||
See notes to financial statements.
25
The Yacktman Focused Fund
PORTFOLIO OF INVESTMENTS (Cont’d.)
June 30, 2010 (Unaudited)
| Principal | ||||||||
| Amount | Value | |||||||
| US Treasury Bills - 0.97% | ||||||||
| U.S. Treasury Bill | ||||||||
| 0.199%, 02/10/2011 | $ | 10,525,000 | $ | 10,511,907 | ||||
| TOTAL SHORT-TERM | ||||||||
| INVESTMENTS | ||||||||
| (Cost $130,361,098) | 130,360,972 | |||||||
| Total Investments | ||||||||
| (Cost $1,100,613,530) - 102.15% | 1,112,293,740 | |||||||
| Liabilities in Excess | ||||||||
| of Other Assets - (2.15)% | (23,415,482 | ) | ||||||
| TOTAL NET ASSETS - 100.00% | $ | 1,088,878,258 | ||||||
Percentages are stated as a percent of net assets.
ADR American Depository Receipt
| (a) | Non-Income Producing |
| (b) | Variable Rate |
| (c) | Restricted security as defined in Rule 144(a) under the Securities Act of 1933. |
See notes to financial statements.
26
The Yacktman Focused Fund
SCHEDULE OF OPTIONS WRITTEN
June 30, 2010 (Unaudited)
| Contracts | Value | |||||||
| PUT OPTIONS | ||||||||
| BP plc | ||||||||
| Expiration: January, 2011 | ||||||||
| Exercise Price: $20.00 | 5,000 | $ | 1,325,000 | |||||
| Total Options Written | ||||||||
| (Premiums received $1,455,525) | $ | 1,325,000 | ||||||
See notes to financial statements.
27
The Yacktman Funds, Inc.
STATEMENTS OF ASSETS & LIABILITIES
June 30, 2010 (Unaudited)
| The Yacktman | The Yacktman | |||||||
| Fund | Focused Fund | |||||||
| ASSETS: | ||||||||
| Investments, at market value | ||||||||
| (Cost $2,107,340,829 and | ||||||||
| $1,100,613,530, respectively) | $ | 2,178,847,617 | $ | 1,112,293,740 | ||||
| Receivable for fund shares sold | 15,425,577 | 5,973,643 | ||||||
| Dividends and interest | ||||||||
| receivable | 3,526,699 | 2,043,802 | ||||||
| Prepaid expenses | 210,389 | 158,565 | ||||||
| Total Assets | 2,198,010,282 | 1,120,469,750 | ||||||
| LIABILITIES: | ||||||||
| Options written at value | ||||||||
| (premiums received | ||||||||
| $0 and $1,455,525, respectively) | — | 1,325,000 | ||||||
| Payable for fund | ||||||||
| shares redeemed | 11,010,654 | 3,660,856 | ||||||
| Payable for investments | ||||||||
| purchased | 44,347,155 | 25,501,599 | ||||||
| Accrued investment | ||||||||
| advisory fees | 1,057,182 | 899,384 | ||||||
| Other accrued expenses | 380,261 | 204,653 | ||||||
| Total Liabilities | 56,795,252 | 31,591,492 | ||||||
| NET ASSETS | $ | 2,141,215,030 | $ | 1,088,878,258 | ||||
| NET ASSETS CONSIST OF: | ||||||||
| Capital stock | $ | 2,038,392,260 | $ | 1,063,476,457 | ||||
| Undistributed net | ||||||||
| investment income | 12,662,674 | 4,731,966 | ||||||
| Undistributed accumulated | ||||||||
| net realized gain | 18,653,308 | 8,859,100 | ||||||
| Net unrealized appreciation | ||||||||
| Investments | 71,506,788 | 11,810,735 | ||||||
| Total Net Assets | $ | 2,141,215,030 | $ | 1,088,878,258 | ||||
| CAPITAL STOCK, $0.0001 par value | ||||||||
| Authorized | 500,000,000 | 500,000,000 | ||||||
| Issued and Outstanding | 147,107,327 | 70,897,854 | ||||||
| NET ASSET VALUE, | ||||||||
| REDEMPTION PRICE, AND | ||||||||
| OFFERING PRICE PER SHARE | $ | 14.56 | $ | 15.36 | ||||
See notes to financial statements.
28
The Yacktman Funds, Inc.
STATEMENTS OF OPERATIONS
For the Period Ended June 30, 2010 (Unaudited)
| The Yacktman | The Yacktman | |||||||
| Fund | Focused Fund | |||||||
| INVESTMENT INCOME: | ||||||||
Dividend income(1) | $ | 19,553,009 | $ | 9,988,998 | ||||
| Interest income | 966,736 | 560,362 | ||||||
| Total investment income | 20,519,745 | 10,549,360 | ||||||
| EXPENSES: | ||||||||
| Investment advisory fees | 5,584,912 | 4,706,132 | ||||||
| Shareholder servicing fees | 1,772,997 | 863,405 | ||||||
| Administration and accounting fees | 251,230 | 103,575 | ||||||
| Federal and state registration fees | 90,815 | 57,345 | ||||||
| Custody fees | 46,350 | 26,772 | ||||||
| Professional fees | 32,614 | 20,945 | ||||||
| Reports to shareholders | 31,950 | 16,435 | ||||||
| Compliance expenses | 23,885 | 10,990 | ||||||
| Directors fees and expenses | 21,250 | 9,665 | ||||||
| Miscellaneous expenses | 8,759 | 3,368 | ||||||
| Net Expenses | 7,864,762 | 5,818,632 | ||||||
| NET INVESTMENT INCOME | 12,654,983 | 4,730,728 | ||||||
| REALIZED AND UNREALIZED | ||||||||
| GAIN (LOSS): | ||||||||
| Net realized gain on: | ||||||||
| Investments | 21,943,980 | 11,416,823 | ||||||
| Written Options | — | — | ||||||
| Total | 21,943,980 | 11,416,823 | ||||||
| Change in unrealized | ||||||||
| appreciation (depreciation) on: | ||||||||
| Investments | (160,453,679 | ) | (83,597,928 | ) | ||||
| Written Options | — | 130,525 | ||||||
| Total | (160,453,679 | ) | (83,467,403 | ) | ||||
| Net realized and unrealized | ||||||||
| gain (loss) on investments | (138,509,699 | ) | (72,050,580 | ) | ||||
| NET DECREASE IN NET ASSETS | ||||||||
| RESULTING FROM OPERATIONS | $ | (125,854,716 | ) | $ | (67,319,852 | ) | ||
| (1) | Net of $0 and $27,408, respectively in foreign withholding taxes. |
See notes to financial statements.
29
The Yacktman Funds, Inc.
STATEMENTS OF CHANGES
IN NET ASSETS
| OPERATIONS: | |
| Net investment income | |
| Net realized gain on investments | |
| Net change in unrealized appreciation (depreciation) | |
| on investments | |
| Net increase (decrease) in net assets resulting | |
| from operations | |
| CAPITAL SHARE TRANSACTIONS: | |
| Proceeds from shares sold | |
| Proceeds from reinvestment of distributions | |
| Redemption fees | |
| Payments for shares redeemed | |
| Net increase | |
| DISTRIBUTIONS PAID FROM: | |
| Net investment income | |
| Net realized gains | |
| Total distributions | |
| TOTAL INCREASE IN NET ASSETS | |
| NET ASSETS: | |
| Beginning of period | |
| End of period (including undistributed net investment income | |
| of $12,662,674, $7,691, $4,731,966 and $1,238 respectively) | |
| TRANSACTIONS IN SHARES: | |
| Shares Sold | |
| Issued in reinvestment of distributions | |
| Shares Redeemed | |
| Net increase |
See notes to financial statements.
30
| The Yacktman Fund | The Yacktman Focused Fund | |||||||||||||
| Six Months Ended | Year Ended | Six Months Ended | Year Ended | |||||||||||
| June 30, | December 31, | June 30, | December 31, | |||||||||||
| 2010 | 2009 | 2010 | 2009 | |||||||||||
| (Unaudited) | (Unaudited) | |||||||||||||
| $ | 12,654,983 | $ | 9,431,650 | $ | 4,730,728 | $ | 2,044,609 | |||||||
| 21,943,980 | 6,086,225 | 11,416,823 | 544,567 | |||||||||||
| (160,453,679 | ) | 268,992,040 | (83,467,403 | ) | 106,854,247 | |||||||||
| (125,854,716 | ) | 284,509,915 | (67,319,852 | ) | 109,443,423 | |||||||||
| 1,185,701,598 | 974,703,674 | 762,711,818 | 580,342,430 | |||||||||||
| — | 17,513,359 | — | 3,762,203 | |||||||||||
| 168,055 | 93,244 | 100,714 | 67,513 | |||||||||||
| 1,185,869,653 | 992,310,277 | 762,812,532 | 584,172,146 | |||||||||||
| (320,027,642 | ) | (153,959,735 | ) | (276,275,693 | ) | (85,485,750 | ) | |||||||
| 865,842,011 | 838,350,542 | 486,536,839 | 498,686,396 | |||||||||||
| — | (9,423,959 | ) | — | (2,043,371 | ) | |||||||||
| — | (8,867,709 | ) | — | (1,891,918 | ) | |||||||||
| — | (18,291,668 | ) | — | (3,935,289 | ) | |||||||||
| 739,987,295 | 1,104,568,789 | 419,216,987 | 604,194,530 | |||||||||||
| 1,401,227,735 | 296,658,946 | 669,661,271 | 65,466,741 | |||||||||||
| $ | 2,141,215,030 | $ | 1,401,227,735 | $ | 1,088,878,258 | $ | 669,661,271 | |||||||
| 75,619,371 | 73,413,825 | 46,208,069 | 40,860,941 | |||||||||||
| — | 1,140,936 | — | 231,236 | |||||||||||
| (20,599,048 | ) | (13,106,413 | ) | (16,827,450 | ) | (6,143,497 | ) | |||||||
| 55,020,323 | 61,448,348 | 29,380,619 | 34,948,680 | |||||||||||
See notes to financial statements.
31
The Yacktman Funds, Inc.
FINANCIAL HIGHLIGHTS
| The Yacktman Fund | ||||
| For a Fund share outstanding | Six Months Ended | |||
| throughout each period | June 30, 2010 | |||
| (Unaudited) | ||||
| NET ASSET VALUE: | ||||
| Beginning of period | $ | 15.22 | ||
| OPERATIONS: | ||||
| Net investment income | 0.09 | |||
| Net realized and unrealized gain (loss) | ||||
| on investment securities | (0.75 | ) | ||
| Total from operations | (0.66 | ) | ||
| LESS DISTRIBUTIONS: | ||||
| From net investment income | — | |||
| From net realized gains | — | |||
| Total distributions | — | |||
| NET ASSET VALUE: | ||||
| End of period | $ | 14.56 | ||
| TOTAL RETURN | (4.34 | )% | ||
| SUPPLEMENTAL DATA AND RATIOS | ||||
| Net assets; end of period (000’s) | $ | 2,141,215 | ||
| Ratio of net expenses to | ||||
| average net assets | 0.83 | % | ||
| Ratio of net investment income to | ||||
| average net assets | 1.34 | % | ||
| Portfolio turnover rate | 4.60 | % | ||
See notes to financial statements.
32
| The Yacktman Fund | ||||||||||||||||||
| Year Ended December 31, | ||||||||||||||||||
| 2009 | 2008 | 2007 | 2006 | 2005 | ||||||||||||||
| $ | 9.68 | $ | 13.39 | $ | 15.79 | $ | 14.67 | $ | 15.34 | |||||||||
| 0.10 | 0.17 | 0.35 | 0.30 | 0.28 | ||||||||||||||
| 5.64 | (3.66 | ) | 0.21 | 2.05 | (0.48 | ) | ||||||||||||
| 5.74 | (3.49 | ) | 0.56 | 2.35 | (0.20 | ) | ||||||||||||
| (0.10 | ) | (0.18 | ) | (0.34 | ) | (0.30 | ) | (0.28 | ) | |||||||||
| (0.10 | ) | (0.04 | ) | (2.62 | ) | (0.93 | ) | (0.19 | ) | |||||||||
| (0.20 | ) | (0.22 | ) | (2.96 | ) | (1.23 | ) | (0.47 | ) | |||||||||
| $ | 15.22 | $ | 9.68 | $ | 13.39 | $ | 15.79 | $ | 14.67 | |||||||||
| 59.31 | % | (26.05 | )% | 3.39 | % | 15.95 | % | (1.30 | )% | |||||||||
| $ | 1,401,228 | $ | 296,659 | $ | 291,574 | $ | 429,072 | $ | 438,912 | |||||||||
| 0.93 | % | 0.95 | % | 0.95 | % | 0.96 | % | 0.92 | % | |||||||||
| 1.43 | % | 1.92 | % | 1.71 | % | 1.90 | % | 1.86 | % | |||||||||
| 14.29 | % | 32.77 | % | 23.82 | % | 17.93 | % | 8.64 | % | |||||||||
See notes to financial statements.
33
The Yacktman Funds, Inc.
FINANCIAL HIGHLIGHTS (Cont’d.)
| The Yacktman Focused Fund | ||||
| For a Fund share outstanding | Six Months Ended | |||
| throughout each period | June 30, 2010 | |||
| (Unaudited) | ||||
| NET ASSET VALUE: | ||||
| Beginning of period | $ | 16.13 | ||
| OPERATIONS: | ||||
| Net investment income | 0.07 | |||
| Net realized and unrealized (loss) | ||||
| on investment securities | (0.84 | ) | ||
| Total from operations | (0.77 | ) | ||
| LESS DISTRIBUTIONS: | ||||
| From net investment income | — | |||
| From net realized gains | — | |||
| Total distributions | — | |||
| NET ASSET VALUE: | ||||
| End of period | $ | 15.36 | ||
| TOTAL RETURN | (4.77 | )% | ||
| SUPPLEMENTAL DATA AND RATIOS | ||||
| Net assets; end of period (000’s) | $ | 1,088,878 | ||
| Ratio of expenses before | ||||
| expense reimbursements to | ||||
| average net assets (See Note 4) | 1.24 | % | ||
| Ratio of net expenses to | ||||
| average net assets | 1.24 | % | ||
| Ratio of net investment income to | ||||
| average net assets | 1.01 | % | ||
| Portfolio turnover rate | 4.06 | % | ||
See notes to financial statements.
34
| The Yacktman Focused Fund | ||||||||||||||||||
| Year Ended December 31, | ||||||||||||||||||
| 2009 | 2008 | 2007 | 2006 | 2005 | ||||||||||||||
| $ | 9.97 | $ | 14.00 | $ | 16.00 | $ | 14.96 | $ | 15.83 | |||||||||
| 0.05 | 0.15 | 0.23 | 0.21 | 0.22 | ||||||||||||||
| 6.21 | (3.45 | ) | 0.34 | 2.20 | (0.51 | ) | ||||||||||||
| 6.26 | (3.30 | ) | 0.57 | 2.41 | (0.29 | ) | ||||||||||||
| (0.05 | ) | (0.16 | ) | (0.23 | ) | (0.21 | ) | (0.22 | ) | |||||||||
| (0.05 | ) | (0.57 | ) | (2.34 | ) | (1.16 | ) | (0.36 | ) | |||||||||
| (0.10 | ) | (0.73 | ) | (2.57 | ) | (1.37 | ) | (0.58 | ) | |||||||||
| $ | 16.13 | $ | 9.97 | $ | 14.00 | $ | 16.00 | $ | 14.96 | |||||||||
| 62.76 | % | (23.48 | )% | 3.46 | % | 16.13 | % | (1.83 | )% | |||||||||
| $ | 669,661 | $ | 65,467 | $ | 67,052 | $ | 90,534 | $ | 84,608 | |||||||||
| 1.28 | % | 1.35 | % | 1.38 | % | 1.35 | % | 1.32 | % | |||||||||
| 1.25 | % | 1.25 | % | 1.25 | % | 1.25 | % | 1.25 | % | |||||||||
| 0.79 | % | 1.31 | % | 1.23 | % | 1.40 | % | 1.30 | % | |||||||||
| 8.26 | % | 67.11 | % | 30.49 | % | 30.61 | % | 5.62 | % | |||||||||
See notes to financial statements.
35
The Yacktman Funds, Inc.
NOTES TO THE FINANCIAL STATEMENTS
June 30, 2010 (Unaudited)
1. ORGANIZATION
The Yacktman Funds, Inc. (comprised of The Yacktman Fund and The Yacktman Focused Fund, hereafter referred to as the “Funds”) is registered as an open-end management investment company under the Investment Company Act of 1940 (the “1940 Act”). The Funds consist of two investment portfolios: The Yacktman Fund is a diversified fund that commenced operations July 6, 1992 and The Yacktman Focused Fund is a non-diversified fund that commenced operations May 1, 1997. The objective of each of the Funds is to produce long-term capital appreciation with current income as a secondary objective. Yacktman Asset Management Co. is the Funds’ investment adviser (the “Adviser”).
2. SIGNIFICANT ACCOUNTING POLICIES
The following is a summary of significant accounting policies consistently followed by the Funds in the preparation of their financial statements. The financial statements have been prepared in conformity with accounting principles generally accepted in the United States of America, which require management to make certain estimates and assumptions that affect the reported amounts of assets and liabilities and disclosure of contingent assets and liabilities at the date of the financial statements and the reported amounts of increases and decreases in net assets from operations during the reporting period. Actual results could differ from those estimates.
a) Subsequent Events Evaluation – In preparing these financial statements, the Funds have evaluated events and transactions for potential recognition or disclosure resulting from subsequent events. This evaluation did not result in any subsequent events that necessitated disclosures and/or adjustments.
b) Investment Valuation – Securities which are traded on a national stock exchange are valued at the last sale price on the securities exchange on which such securities are
36
primarily traded. Securities that are traded on the Nasdaq National Market or the Nasdaq Smallcap Market are valued at the Nasdaq Official Closing Price. Exchange-traded securities for which there were no transactions are valued at the current bid prices. Securities traded on only over-the-counter markets are valued on the basis of closing over-the-counter bid prices. Short-term debt instruments maturing within 60 days are valued by the amortized cost method, which approximates fair value. Debt securities (other than short-term instruments) are valued at the mean price furnished by a national pricing service, subject to review by the Adviser and determination of the appropriate price whenever a furnished price is significantly different from the previous day’s furnished price . Options written or purchased by The Yacktman Focused Fund are valued at the last sales price if such last sales price is between the current bid and asked prices. Otherwise, options are valued at the mean between the current bid and asked prices. Any securities for which there are no readily available market quotations and other assets will be valued at their fair value as determined in good faith by the Adviser pursuant to procedures established by and under the supervision of the Board of Directors. The fair value of a security is the amount which a Fund might reasonably expect to receive upon a current sale. Valuing securities for which there are no readily available market quotations involves greater reliance on judgement and there can be no assurance that the Funds could obtain the fair value assigned to a security if they were to sell the security at approximately the time at which the Funds determine their net asset value per share.
Valuation Measurements
The Trust has adopted authoritative fair valuation accounting standards which establish an authoritative definition of fair value and set out a hierarchy for measuring fair value. These standards require additional disclosures about the various inputs and valuation
37
The Yacktman Funds, Inc.
NOTES TO THE FINANCIAL STATEMENTS
June 30, 2010 (Unaudited) (Cont’d.)
techniques used to develop the measurements of fair value and a discussion in changes in valuation techniques and related inputs, if any, during the period. In addition, these standards require expanded disclosure for each major category of assets. These inputs are summarized in the three broad levels listed below:
| Level 1 – | Quoted prices in active markets for identical securities. |
| Level 2 – | Other significant observable inputs (including quoted prices for similar securities, interest rates, prepayment speeds, credit risk, etc.). |
| Level 3 – | Significant unobservable inputs (including the Fund’s own assumptions in determining the fair value of investments). |
The inputs or methodology used for valuing securities are not an indication of the risk associated with investing in those securities. For example, money market securities are valued using amortized cost, in accordance with the Investment Company Act of 1940. Generally, amortized cost reflects the current fair value of a security, but since the value is not obtained from a quoted price in an active market, such securities are reflected as Level 2.
The inputs or methodology used for valuing securities are not necessarily an indication of the risk associated with investing in those securities. The following is a summary of the inputs used to value the Fund’s net assets as of June 30, 2010:
38
THE YACKTMAN FUND
| Level 1 | Level 2 | Level 3 | Total | |||||||||||||
| Common Stock | ||||||||||||||||
| Consumer | ||||||||||||||||
| Discretionary | $ | 432,340,750 | — | — | $ | 432,340,750 | ||||||||||
| Consumer Staples | 680,251,328 | — | — | 680,251,328 | ||||||||||||
| Energy | 105,543,500 | — | — | 105,543,500 | ||||||||||||
| Financials | 135,223,685 | — | — | 135,223,685 | ||||||||||||
| Health Care | 364,926,035 | — | — | 364,926,035 | ||||||||||||
| Industrials | 3,082,625 | — | — | 3,082,625 | ||||||||||||
| Information | ||||||||||||||||
| Technology | 180,493,300 | — | — | 180,493,300 | ||||||||||||
| Total | ||||||||||||||||
| Common Stock | 1,901,861,223 | — | — | 1,901,861,223 | ||||||||||||
| Convertible | ||||||||||||||||
| Preferred Stock* | — | $ | 16,275,000 | — | 16,275,000 | |||||||||||
| Preferred Stock* | 6,048,000 | — | — | 6,048,000 | ||||||||||||
| Convertible Bonds* | — | 4,969,687 | — | 4,969,687 | ||||||||||||
| Corporate Bonds* | — | 3,680,000 | — | 3,680,000 | ||||||||||||
| Short-Term | ||||||||||||||||
| Investments | — | 246,013,707 | — | 246,013,707 | ||||||||||||
| Total Investments | ||||||||||||||||
| in Securities | $ | 1,907,909,223 | $ | 270,938,394 | — | $ | 2,178,847,617 | |||||||||
| * | Please refer to the portfolio of investments to view securities by industry type. |
39
The Yacktman Funds, Inc.
NOTES TO THE FINANCIAL STATEMENTS
June 30, 2010 (Unaudited) (Cont’d.)
THE YACKTMAN FOCUSED FUND
| Level 1 | Level 2 | Level 3 | Total | |||||||||||||
| Common Stock | ||||||||||||||||
| Automobiles | — | $ | 17,605,000 | — | $ | 17,605,000 | ||||||||||
| Consumer | ||||||||||||||||
| Discretionary | $ | 219,641,500 | — | — | 219,641,500 | |||||||||||
| Consumer Staples | 380,975,200 | — | — | 380,975,200 | ||||||||||||
| Energy | 51,544,500 | — | — | 51,544,500 | ||||||||||||
| Financials | 45,885,606 | — | — | 45,885,606 | ||||||||||||
| Health Care | 170,118,800 | — | — | 170,118,800 | ||||||||||||
| Industrials | — | — | — | — | ||||||||||||
| Information | ||||||||||||||||
| Technology | 87,694,600 | — | 87,694,600 | |||||||||||||
| Total | ||||||||||||||||
| Common Stock | 955,860,206 | 17,605,000 | — | 973,465,206 | ||||||||||||
| Convertible Bonds* | — | 1,067,562 | — | 1,067,562 | ||||||||||||
| Corporate Bonds* | — | 7,400,000 | — | 7,400,000 | ||||||||||||
| Short-Term | ||||||||||||||||
| Investments | — | 130,360,972 | — | 130,360,972 | ||||||||||||
| Total Investments | ||||||||||||||||
| in Securities | $ | 955,860,206 | $ | 156,433,534 | — | $ | 1,112,293,740 | |||||||||
| Other Financial | ||||||||||||||||
| Instruments^ | ||||||||||||||||
| Options Written | $ | (1,325,000 | ) | — | — | $ | (1,325,000 | ) | ||||||||
| * | Please refer to the portfolio of investments to view securities by industry type. |
| ^ | Other financial instruments are written options not reflected in the portfolio of investments. |
The Global Industry Classification Standard (GICS®) was developed by and/or is the exclusive property of MSCI, Inc. and Standard & Poor Financial Services LLC (“S&P”). GICS is a service mark of MSCI and S&P and has been licensed for use by U.S. Bancorp Fund Services, LLC.
The Company has adopted derivative instruments disclosure standards, in order to enable the investor to understand how and why an entity used derivatives, how derivatives are accounted for, and how derivative instruments affect an entity’s results of operations and financial position.
40
The Yacktman Focused Fund
The Fund may use options to generate income and to hedge against losses caused by declines in the prices of stocks in its portfolio or for any other permissible purposes consistent with the Fund’s investment objective.
The Effect of Derivative Instruments on the Statement of Operations for the Period Ended June 30, 2010
| Amount of Realized Gain or (Loss) on | ||||||||
| Derivatives Recognized in Income | ||||||||
| Derivatives not accounted | ||||||||
| for as hedging instruments | Written Options | Total | ||||||
| Equity Contracts | $ | 0 | $ | 0 | ||||
| Total | $ | 0 | $ | 0 | ||||
| Change in Unrealized Appreciation or (Depreciation) | ||||||||
| on Derivatives Recognized in Income | ||||||||
| Derivatives not accounted | ||||||||
| for as hedging instruments | Written Options | Total | ||||||
| Equity Contracts | $ | 130,525 | $ | 130,525 | ||||
| Total | $ | 130,525 | $ | 130,525 | ||||
The average monthly market value of written options during the six months ended June 30, 2010 in The Yacktman Focused Fund was $220,833.
See note 4 for additional disclosure related to transactions in written options during the period.
c) Option Writing – When the Yacktman Focused Fund writes an option, an amount equal to the premium received by The Yacktman Focused Fund is recorded as a liability and is subsequently adjusted to the current fair value of the option written. Premiums received from writing options that expire unexercised are treated by the Yacktman Focused Fund on the expiration date as realized gains from investments. The difference between the premium and the amount paid on effecting a closing purchase transaction, including brokerage commissions, is also treated as a realized gain, or, if the premium is less than the amount paid for the closing purchase transaction, as a realized loss. If a call option is exercised, the
41
The Yacktman Funds, Inc.
NOTES TO THE FINANCIAL STATEMENTS
June 30, 2010 (Unaudited) (Cont’d.)
premium is added to the proceeds from the sale of the underlying security or currency in determining whether The Yacktman Focused Fund has realized a gain or loss. If a put option is exercised, the premium reduces the cost basis of the securities purchased by The Yacktman Focused Fund. The Yacktman Focused Fund as a writer of an option bears the market risk of an unfavorable change in the price of the security underlying the written option. A risk of using derivatives is that the counterparty to a derivative may fail to comply with their obligation to the Fund.
d) Federal Income Taxes – It is each Fund’s policy to meet the requirements of the Internal Revenue Code applicable to regulated investment companies and to distribute substantially all investment company net taxable income and net capital gains to its shareholders in a manner which results in no tax cost to the Fund. Therefore, no federal income tax provision is required.
The Funds have adopted financial reporting rules regarding recognition and measurement of tax positions taken or expected to be taken on a tax return. The Funds have reviewed all open tax years and major jurisdictions and concluded that there is no impact on the Funds’ net assets and no tax liability resulting from unrecognized tax benefits relating to uncertain income tax positions taken or expected to be taken on a tax return. The Funds recognize interest and penalties, if any, related to unrecognized tax benefits as income tax expense in the Statement of Operations. During the period, the Funds did not incur any interest or penalties. The Funds are not subject to examination by U.S. federal tax authorities for any tax years before 2006.
e) Distributions to Shareholders – Dividends from net investment income and distributions of net realized capital gains, if any, are declared and paid at least annually. Distributions to shareholders are recorded on the ex-dividend date. The character of distributions made during
42
the year from net investment income or net realized gains may differ from the characterization for federal income tax purposes due to differences in the recognition of income, expense and gain items for financial statement and tax purposes. Additionally, the Funds may utilize earnings and profits distributed to shareholders on redemption of shares as part of the dividends paid deduction for income tax purposes. Where appropriate, reclassifications between capital accounts are made for such differences that are permanent in nature. No such reclassifications were made for the six months ended June 30, 2010.
f) Guarantees and Indemnifications – In the normal course of business, the Funds enter into contracts with service providers that contain general indemnification clauses. The Funds’ maximum exposure under these arrangements is unknown as this would involve future claims against the Funds that have not yet occurred. Based on experience, the Funds expect the risk of loss to be remote.
g) Redemption Fee – Effective April 1, 2005, those who buy and sell the Funds within thirty calendar days will incur a 2% redemption fee, retained for the benefit of long-term shareholders, recorded as additional capital in the statement of changes in net assets.
h) Other – Investment transactions and shareholder transactions are accounted for on the trade date. Net realized gains and losses on securities are computed on the basis of specific security lot identification. Dividend income is recognized on the ex-dividend date and interest income is recognized on an accrual basis. Withholding taxes on foreign dividends have been provided for in accordance with the Funds’ understanding of the applicable country’s tax rules and regulations. Expenses incurred by the Funds that do not relate to a specific fund are allocated to the individual Funds based on each Fund’s relative net assets or another appropriate basis (as determined by the Board of Directors.)
43
The Yacktman Funds, Inc.
NOTES TO THE FINANCIAL STATEMENTS
June 30, 2010 (Unaudited) (Cont’d.)
3. INVESTMENT TRANSACTIONS
For the six months ended June 30, 2010, the aggregate purchases and sales of securities, excluding short-term securities, were $937,454,035 and $75,438,883 for The Yacktman Fund and $531,236,164 and $33,019,999 for The Yacktman Focused Fund, respectively. For the six months ended June 30, 2010, there were no long-term purchases or sales of U.S. Government securities for The Yacktman Fund and The Yacktman Focused Fund.
4. OPTION CONTRACTS WRITTEN
The premium amount and number of option contracts written during the six months ended June 30, 2009 in The Yacktman Focused Fund, were as follows:
| Amount of | Number of | |||||||
| Premiums | Contracts | |||||||
| Outstanding at 12/31/2009 | $ | 0 | 0 | |||||
| Options written | 1,455,525 | 5,000 | ||||||
| Options expired | 0 | 0 | ||||||
| Options closed | 0 | 0 | ||||||
| Outstanding at 6/30/2010 | $ | 1,455,525 | 5,000 | |||||
See Note 2 for additional disclosure about written options.
5. INVESTMENT ADVISORY AGREEMENT
The Funds have agreements with the Adviser, with whom certain officers and directors of the Funds are affiliated, to furnish investment advisory services to the Funds. Under the terms of these agreements, The Yacktman Fund will pay the Adviser a monthly fee at the annual rate of 0.65% on the first $500,000,000 of average daily net assets, 0.60% on the next $500,000,000 of average daily net assets and 0.55% on average daily net assets in excess of $1,000,000,000, and The Yacktman Focused Fund will pay the Adviser a monthly fee at the annual rate of 1% of its average daily net assets. The Adviser has contractually agreed to reimburse The Yacktman Fund for all expenses exceeding 2.00% of its average daily net assets (exclusive of interest, taxes, brokerage commissions and extraordinary expenses). The Adviser has voluntarily
44
agreed to reimburse The Yacktman Focused Fund for all expenses exceeding 1.25% of its average daily net assets (exclusive of interest, taxes, brokerage commissions and extraordinary expenses). The Funds are not obligated to reimburse the Adviser for any fees or expenses waived in previous fiscal years.
6. LINE OF CREDIT
The Yacktman Fund and The Yacktman Focused Fund have established a line of credit (“LOC”) with U.S. Bank, N.A. to be used for temporary or emergency purposes, primarily for financing redemption payments, using the securities in each Fund’s respective portfolio as collateral. The LOC will mature, unless renewed, on March 31, 2011 for each of the Funds. For The Yacktman Fund, borrowing under the LOC is limited to the lesser of $15,000,000, 10% of the preborrowing net assets of the Fund, 10% of the market value of the assets of the Fund, or 33 1/3% of the sum of the market value of certain assets of the Fund. For The Yacktman Focused Fund, borrowing under the LOC is limited to the lesser of $15,000,000, 33 1/3% of the preborrowing net assets of the Fund, 33 1/3% of the market value of the as sets of the Fund, or 33 1/3% of the sum of the market value of certain assets of the Fund. The interest rate paid by the Funds on outstanding borrowings is equal to the Prime Rate, less 0.50%, which was 2.75% as of June 30, 2010. During the six months ended June 30, 2010, there were no borrowings for The Yacktman Fund. During the six months ended June 30, 2010, The Yacktman Focused Fund had average outstanding borrowings of $65,077 under the LOC and paid a weighted average interest rate of 2.75%.
45
The Yacktman Funds, Inc.
NOTES TO THE FINANCIAL STATEMENTS
June 30, 2010 (Unaudited) (Cont’d.)
7. TAX INFORMATION
As of December 31, 2009, the components of distributable earnings on a tax basis were as follows:
| The Yacktman | The Yacktman | |||||||
| Fund | Focused Fund | |||||||
| Tax cost of investments | $ | 1,138,295,825 | $ | 551,311,964 | ||||
| Gross unrealized appreciation | 247,163,331 | 98,684,730 | ||||||
| Gross unrealized depreciation | (18,494,356 | ) | (6,704,164 | ) | ||||
| Net tax unrealized | ||||||||
| appreciation | 228,668,975 | 91,980,566 | ||||||
| Undistributed ordinary income | 8,511 | 47,543 | ||||||
| Undistributed long-term | ||||||||
| capital gains | — | 693,544 | ||||||
| Accumulated earnings | 8,511 | 741,087 | ||||||
| Other accumulated | ||||||||
| gains/(losses) | — | — | ||||||
| Total accumulated earnings | $ | 228,677,486 | $ | 92,721,653 | ||||
The tax basis of investments for tax and financial reporting purposes differs, principally due to the deferral of losses on wash sales.
The tax character of distributions paid during the fiscal years ended December 31, 2009 and December 31, 2008 were as follows:
| The Yacktman | The Yacktman | |||||||
| Fund | Focused Fund | |||||||
| 2009 | ||||||||
| Ordinary income | $ | 18,291,668 | $ | 3,935,255 | ||||
| Long-term capital gains | $ | — | $ | 34 | ||||
| 2008 | ||||||||
| Ordinary income | $ | 6,537,747 | $ | 2,097,803 | ||||
| Long-term capital gains | $ | — | $ | 2,362,356 | ||||
46
The Yacktman Funds, Inc.
ADDITIONAL INFORMATION
(Unaudited)
For the year ended December 31, 2009, 71.64% and 100.00% of the dividends paid from net investment income, including short-term capital gains, for The Yacktman Fund and The Yacktman Focused Fund, respectively, qualify for the dividends received deduction available to corporate shareholders.
For the year ended December 31, 2009, 70.55% and 100.00% of the dividends paid from net investment income, including short-term capital gains, for The Yacktman Fund and The Yacktman Focused Fund, respectively, are designated as qualified dividend income.
The Funds hereby designate approximately 48.48% and 48.07% as short-term capital gain distributions for The Yacktman Fund and The Yacktman Focused Fund, respectively, for the purposes of the dividends paid deduction.
PROXY VOTING POLICIES
AND PROCEDURES
For a description of the policies and procedures that the Funds use to determine how to vote proxies relating to portfolio securities, please call 1-800-525-8258 and request a Statement of Additional Information. One will be mailed to you free of charge. The Statement of Additional Information is also available on the Web site of the Securities and Exchange Commission at http://www.sec.gov. Information on how the Funds voted proxies relating to portfolio securities during the twelve month period ended June 30, 2009, is available without charge, upon request, by calling 1-800-525-8258 or by accessing the Web site of the Securities and Exchange Commission.
DISCLOSURE OF PORTFOLIO HOLDINGS
The Funds will file complete schedules of portfolio holdings with the Securities and Exchange Commission for the first and third quarters of each fiscal year on Form N-Q. Each Fund’s Form N-Q will be available on the Web site of the Securities and Exchange Commission at http://www.sec.gov.
47
The Yacktman Funds, Inc.
INVESTMENT ADVISORY
DISCLOSURE
On February 26, 2010, the Board of Directors of The Yacktman Funds, Inc. approved the continuation of each Fund’s investment advisory agreement with Yacktman Asset Management Co. (the “Adviser”). Prior to approving the continuation of the agreements, the Board considered:
| • | The nature, extent and quality of the services provided by the Adviser |
| • | The investment performance of the Funds and Adviser |
| • | The costs of the services to be provided and profits to be realized by the Adviser and its affiliates from the relationship with the Funds |
| • | The extent to which economies of scale would be realized as the Funds grow and whether fee levels reflect these economies of scale for the benefit of mutual fund investors |
| • | The expense ratios of the Funds |
In considering the nature, extent and quality of the services provided by Yacktman Asset Management Co., the Board considered a written and an oral presentation by the Adviser describing the portfolio management, shareholder communication, and regulatory compliance services provided by the Adviser to the Funds. The Directors concluded that the Adviser was providing essential services to the Funds.
The Directors compared the performance of the Funds to benchmark indices over various periods of time and concluded that the performance of the Funds warranted the continuation of the advisory agreements. The Directors noted that in addition to the absolute performance of the Funds, they also noted that the Funds adhered to their investment style.
In concluding that the advisory fees payable by the Funds were reasonable, the Directors reviewed a report of the
48
costs of services provided by, and the profits realized by the Adviser, from its relationship with the Funds and concluded that such profits were reasonable and not excessive. As part of its analysis, the Board considered the value of the research the Adviser received from broker-dealers executing securities transactions for the Funds. The Directors also reviewed reports comparing the expense ratios and advisory fees paid by the Funds to those paid by other comparable mutual funds and concluded that the advisory fees paid by the Funds and the expense ratios of the Funds were in the range of comparable mutual funds.
The Directors also considered whether the investment advisory agreement fee schedules should be adjusted for an increase in assets under management. They concluded that “breakpoints” embodied in the investment advisory agreement for The Yacktman Fund were appropriate, and breakpoints for The Yacktman Focused Fund were not warranted at this time given the anticipated growth of that Fund in the next year and the other factors considered.
49
(This Page Intentionally Left Blank.)
For Fund information and
shareholder services, call
1-800-525-8258
Web site: www.yacktman.com
The Yacktman Funds, Inc.
Shareholder Services Center
615 East Michigan Street, 3rd Floor
Milwaukee, Wisconsin 53202-5207
This report is submitted for the general information of shareholders of The Yacktman Funds. It is not authorized for distribution to prospective investors unless accompanied or preceded by an effective Prospectus for the Funds, which contains more information concerning the Funds’ investment policies, as well as fees and expenses and other pertinent information. Read the Prospectus carefully.
YA-410-0810
Item 2. Code of Ethics.
Not applicable for semi-annual reports.
Item 3. Audit Committee Financial Expert.
Not applicable for semi-annual reports.
Item 4. Principal Accountant Fees and Services.
Not applicable for semi-annual reports.
Item 5. Audit Committee of Listed Registrants.
Not applicable to registrants who are not listed issuers (as defined in Rule 10A-3 under the Securities Exchange Act of 1934).
Item 6. Investments.
Schedule of Investments is included as part of the report to shareholders filed under Item 1 of this form.
Item 7. Disclosure of Proxy Voting Policies and Procedures for Closed-End Management Investment Companies.
Not applicable to open-end investment companies.
Item 8. Portfolio Managers of Closed-End Management Investment Companies.
Not applicable to open-end investment companies.
Item 9. Purchases of Equity Securities by Closed-End Management Investment Company and Affiliated Purchasers.
Not applicable to open-end investment companies.
Item 10. Submission of Matters to a Vote of Security Holders.
Not Applicable.
Item 11. Controls and Procedures.
| (a) | The Registrant’s [President/Chief Executive Officer] and [Treasurer/Chief Financial Officer] have reviewed the Registrant's disclosure controls and procedures (as defined in Rule 30a-3(c) under the Investment Company Act of 1940 (the “Act”)) as of a date within 90 days of the filing of this report, as required by Rule 30a-3(b) under the Act and Rules 13a-15(b) or 15d-15(b) under the Securities Exchange Act of 1934. Based on their review, such officers have concluded that the disclosure controls and procedures are effective in ensuring that information required to be disclosed in this report is appropriately recorded, processed, summarized and reported and made known to them by others within the Registrant and by the Registrant’s service provider. |
| (b) | There were no changes in the Registrant's internal control over financial reporting (as defined in Rule 30a-3(d) under the Act) that occurred during the second fiscal quarter of the period covered by this report that has materially affected, or is reasonably likely to materially affect, the Registrant's internal control over financial reporting. |
Item 12. Exhibits.
| (a) | (1) Any code of ethics or amendment thereto, that is the subject of the disclosure required by Item 2, to the extent that the registrant intends to satisfy Item 2 requirements through filing an exhibit. Not applicable to semi-annual reports. |
(2) Certifications pursuant to Section 302 of the Sarbanes-Oxley Act of 2002. Filed herewith.
(3) Any written solicitation to purchase securities under Rule 23c-1 under the Act sent or given during the period covered by the report by or on behalf of the registrant to 10 or more persons. Not applicable to open-end investment companies.
| (b) | Certifications pursuant to Section 906 of the Sarbanes-Oxley Act of 2002. Furnished herewith. |
SIGNATURES
Pursuant to the requirements of the Securities Exchange Act of 1934 and the Investment Company Act of 1940, the registrant has duly caused this report to be signed on its behalf by the undersigned, thereunto duly authorized.
(Registrant) The Yacktman Funds, Inc.
By (Signature and Title)* /s/ Donald A. Yacktman
Donald A. Yacktman, President & Treasurer
Date 8/27/10
Pursuant to the requirements of the Securities Exchange Act of 1934 and the Investment Company Act of 1940, this report has been signed below by the following persons on behalf of the registrant and in the capacities and on the dates indicated.
By (Signature and Title)* /s/ Donald A. Yacktman
Donald A. Yacktman, President & Treasurer
Date 8/27/10