UNITED STATES
SECURITIES AND EXCHANGE COMMISSION
Washington, D.C. 20549
FORM N-CSR
CERTIFIED SHAREHOLDER REPORT OF REGISTERED
MANAGEMENT INVESTMENT COMPANIES
Investment Company Act file number 811-06628
The Yacktman Funds, Inc.
(Exact name of registrant as specified in charter)
6300 Bridgepoint Parkway
Building One, Suite 320
Austin, TX 78730
(Address of principal executive offices) (Zip code)
Donald A. Yacktman
c/o Yacktman Asset Management Co.
6300 Bridgepoint Parkway
Building One, Suite 320
Austin, TX 78730
(Name and address of agent for service)
512.767.6700
Registrant's telephone number, including area code
Date of fiscal year end: 12/31/09
Date of reporting period: 06/30/09
Item 1. Reports to Stockholders.
| SEMI-ANNUAL REPORT |
June 30, 2009
The Yacktman Funds, Inc.
| MESSAGE TO SHAREHOLDERS |
 |  |
| Donald A. Yacktman | Stephen Yacktman |
For the first six months of 2009 The Yacktman Fund and The Yacktman Focused Fund appreciated 24.38% and 29.09% respectively, handily outperforming the S&P 500 which appreciated 3.16%. The funds performed exceptionally well in the second quarter, producing returns of 34.83% and 36.91% versus the 15.93% return of the S&P 500.
THE YACKTMAN FUNDS, INC.
TOTAL RETURNS – UNAUDITED
AS OF MONTH ENDING: JUNE 30, 2009
| CUMULATIVE | ||||||||||||||||||||
| YTD | 3 MOS. | 1-YEAR | ||||||||||||||||||
| The Yacktman Fund (YACKX) | 24.38% | 34.83% | 5.89% | |||||||||||||||||
| The Yacktman Focused Fund (YAFFX) | 29.09% | 36.91% | 11.35% | |||||||||||||||||
S&P 500® Index | 3.16% | 15.93% | -26.21% | |||||||||||||||||
| ANNUALIZED | ||||||||||||||||||||
| SINCE INCEPTION | ||||||||||||||||||||
| 3-YEAR | 5-YEAR | 10-YEAR | 7/6/1992 | 5/1/1997 | ||||||||||||||||
| The Yacktman | ||||||||||||||||||||
| Fund (YACKX) | 2.03% | 3.34% | 7.43% | 8.75% | ||||||||||||||||
| The Yacktman | ||||||||||||||||||||
| Focused Fund (YAFFX) | 4.47% | 4.89% | 7.43% | 7.01% | ||||||||||||||||
S&P 500® Index | -8.22% | -2.24% | -2.22% | 6.89% | 2.92% | |||||||||||||||
Over the last year ended June 30 2009, both funds are solidly positive, a result few diversified equity mutual fund managers can claim in a period when the S&P 500 declined more than 26%. An investor in The Yacktman Fund and The Yacktman Focused Fund has 44% and 51% more money than an investor in an S&P 500 index fund over the last 12 months. Our funds have largely erased the declines of the last 18 months with The Yacktman Fund down 8.03% and The Yacktman Focused Fund off only
2
The Yacktman Funds, Inc.
1.22%. This compares very favorably to the S&P 500 which is down 35%. Protecting capital during down markets is critical to achieving superior long-term investment performance.
Return from December 31, 2007 – June 30, 2009
| Yacktman Fund | Focused Fund | S&P 500 |
| -8.03% | -1.22% | -35% |
The recovery from the lows reached on March 9th has also been extraordinary. The Yacktman Fund has appreciated by nearly 67% and The Yacktman Focused Fund by more than 70% compared to the nearly 37% rally in the S&P 500.
Return from March 9th Low
| Yacktman Fund | Focused Fund | S&P 500 |
| 67% | 70.5% | 36.9% |
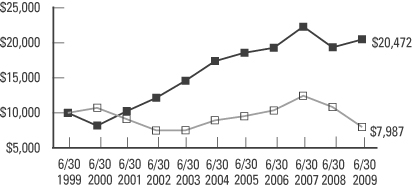
| Average Annual Returns | The Yacktman Fund | S&P 500® |
| One Year (07/01/08 – 06/30/09) | 5.89% | -26.21% |
| Three Years (07/01/06 – 06/30/09) | 2.03% | -8.22% |
| Five Years (07/01/04 – 06/30/09) | 3.34% | -2.24% |
| Ten Years (07/01/99 – 06/30/09) | 7.43% | -2.22% |

■ | The Yacktman Fund |
o | S&P 500® |
The chart assumes an initial gross investment of $10,000 made on 06/30/99.
3
The Yacktman Funds, Inc.
| The Yacktman | ||
| Average Annual Returns | Focused Fund | S&P 500® |
| One Year (07/01/08 – 06/30/09) | 11.35% | -26.21% |
| Three Years (07/01/06 – 06/30/09) | 4.47% | -8.22% |
| Five Years (07/01/04 – 06/30/09) | 4.89% | -2.24% |
| Ten Years (07/01/99 – 06/30/09) | 7.43% | -2.22% |
■ | The Yacktman Focused Fund |
o | S&P 500® |
The chart assumes an initial gross investment of $10,000 made on 06/30/99.
| * | The S&P 500® is an unmanaged but commonly used measure of common stock total return performance. |
Returns shown include the reinvestment of all dividends, but do not reflect the deduction of taxes that a shareholder would pay on Fund distributions or the redemption of Fund shares. The above past performance is not predictive of future results. The investment return and principal value of the Funds will fluctuate so that your shares, when redeemed, may be worth more or less than their original cost.
We are Excited about Current Holdings
Even after the strong results, we think the funds are well positioned for further appreciation. The fact that there is still significant upside opportunity is a function of how inexpensive some of the positions were. Several of our holdings sold at a fraction of liquidation value or low-to-mid single digit multiple of earnings at the height of market panic. Even now, most of the companies we hold are far cheaper than they were at times other than the panicked moments of the last 18 months.
How these strong results were produced
Frequently we are asked what differentiates us from other investors. In our opinion, our advantages come from doing our homework, having a long time horizon while remaining opportunistic, and staying objective.
4
Doing our Homework
Doing our homework is a combination of understanding businesses and reading the financial statements. The more confident we feel in our ability to accurately understand and forecast the prospects and earning power of a business, the more willing we are to own a meaningful position in the shares if they are attractively priced. Too often in the investment world, reading the financial statements has been replaced with standardized data feeds. In our opinion there is no substitute for getting information directly from the source.
A Longer Time Horizon
Our time horizon is “however long it takes”. We focus on forward rates of return by projecting free cash flow and expected growth rates and make every effort to buy the highest rates of return available with the least amount of risk and leverage. We do not try to forecast stock price movements in this calculation. This keeps us focused on the cash flow of the business and not the share price. In most cases, stock movement is eventually a result of cash flow.
Objectivity
Being objective means we constantly assess current positions, weigh them against other opportunities, and act based on fresh evaluations. We like to ask ourselves, “If we were investing new money, would the portfolio look like it does today?” In this process we must be willing to let go of historically great performing securities in order to purchase new investments that have better prospects. Sometimes, objectivity requires selling positions at a loss to improve the portfolio.
What We Look For in Attractive Investments
We prefer companies we believe have understandable, durable business fundamentals, coupled with strong or manageable balance sheets. However, if offered enough
5
The Yacktman Funds, Inc.
of a return premium, we may be flexible on these characteristics. Each security is examined on its own merits and then compared with other viable alternatives. We carefully look through the capital structure of each company, examining the risk/reward for the debt as well as the equity. Sometimes we find an opportunity in a bond which we feel has a similar or better return potential compared to the equity and provides more protection in the event of business deterioration or reorganization.
In the last 18 months many changes in the investment environment have occurred. At first, the best return prospects were stable businesses with great balance sheets. People had become overly complacent with the prevailing high margins that businesses were experiencing. Businesses with stable margins looked expensive compared to those with atypically high margins. So, while others were speculating on the hope that high margins would continue, we were busy investing in safer businesses we felt offered superior rates of return and stable margins, such as Coca Cola, PepsiCo, and Procter & Gamble. At the same time, we did not ignore opportunities in other sectors including media, retail, and finance.
Security Selection Matters
During the heaviest of the declines of the last 18 months, we reduced consumer staples positions that had held up well and increased positions in consumer-based cyclical stocks that were trading at extremely high cash yields. We purchased shares in retailers like Williams-Sonoma and Abercrombie & Fitch, as well as USG, a manufacturer of building materials. In media, we bought significant positions in Viacom and News Corp. Many of the stocks we purchased had suffered declines of 60% or more from their highs which left them at very attractive prices.
In recent months, we have had the opportunity to move back toward where we started and have again found higher returns in the safer businesses. While we have entered and exited the last 18 months with many of the
6
same stocks, we now hold most of these positions at much lower prices, which offers promising future prospects. The volatility of the last 18 months has been our friend.
Portfolio Review
Pfizer
This year we increased our weighting in Pfizer. We believe concerns about upcoming patent expiration on products such as Lipitor, unhappiness about the price the company offered to acquire Wyeth, and general investor discomfort about changes in the American healthcare system are overblown. The shares appear to be extremely cheap, as we expect the company to generate more than $2 per share in free cash flow for several years to come. At a $15 share price, the free cash yield should help protect our investment, even in the absence of solid innovation or if there are severe and unfavorable changes to the American healthcare system.
Coca Cola, PepsiCo, and Procter & Gamble
All three of these stocks sell at prices well below their highs even though their business results showed durability during a difficult economic period and, in our opinion, the securities were not overvalued at the higher levels. Each of these companies is a strong free cash generator in good times and bad and should continue to produce solid growth as international markets expand.
Microsoft
Microsoft shares rebounded with the market as investors turned their focus from the economy toward the business fundamentals and inexpensive valuation. Over the next year, Microsoft should experience one of its most significant product upgrade cycles ever with new product offerings available in several business lines. Coupled with the strong free cash flow and solid balance sheet, the stock is attractive in the mid 20’s.
7
The Yacktman Fund
NewsCorp and Viacom
NewsCorp and Viacom recovered nicely from the astonishing declines their shares experienced over the prior 12-18 months. Both companies have strong, diverse media franchises and offer considerable upside from current levels. In fact, at quarter end, Viacom and NewsCorp are still off 48% and 54% from their December 2007 closing prices even though, in our opinion, neither stock was irrationally priced at the higher level. Further, we believe there has been no material permanent damage to the earnings power of either business.
AmeriCredit and Toyota Industries
AmeriCredit reported an operating profit for the quarter, which highlighted the strength of its business model. Recently, the asset-backed market has shown significant signs of life. If the auto finance asset-backed offerings are robust, AmeriCredit could increase its lending activities at what could be extremely profitable rates. The shares are still priced as though there is a significant likelihood of liquidation. If the business model recovers, AmeriCredit could have substantial upside from current levels.
New legislation referred to as “cash for clunkers” provides for used cars to be surrendered to auto dealerships and destroyed in exchange for the owners receiving up to $4,500 towards the purchase of a new car. AmeriCredit’s earnings should benefit modestly from this legislation as the destruction of low end used cars would cause an increase in the value of those remaining (the kind AmeriCredit repossesses when a loan goes bad). Toyota Industries, owned in the Focused Fund, should see sales perk up a bit from this legislation.
We Prefer Classics not Clunkers
We like to own businesses that are high quality, understandable and well capitalized. Generally, the market does not fully appreciate these securities as
8
people fail to appropriately value their superior business models or simply think they are not exciting enough. Our willingness to hold these positions and watch grass grow while the world spins around us has resulted in superior returns over time.
Many of these companies have held dominant positions for decades and, in some cases, for more than a century. While occasionally we may buy a clunker that can be fixed-up, we prefer to drive around in classics (like Coca Cola, PepsiCo, and Procter and Gamble), that do not go out of style. We like to own these classics when we believe that they will provide similar or better return prospects than lower quality businesses.
Conclusion
Both the Yacktman Fund and Focused Funds have seen steady inflows during the last few months as our strong results have received notice. As of June 30, 2009, Yacktman Asset Management Co. manages approximately $1.2 billion, all in our value style, and could easily handle multiples of that amount in the current environment. We believe our moderate size is an advantage compared to fund complexes that manage $20 billion or more, and will strive to keep assets at a level that allows us to achieve the highest quality results for our investors.
Looking forward, we will continue to work hard and objectively examine investment opportunities. We appreciate the confidence of our shareholders and, as always, we will continue to be objective, diligent, and patient when managing the money that is invested in the funds.
Sincerely,
The Yacktman Team
9
The Yacktman Funds, Inc.
EXPENSE EXAMPLE
For the Six Months Ended June 30, 2009 (Unaudited)
As a shareholder of the Yacktman Funds (the “Funds”), you incur ongoing costs, including management fees and other Fund expenses. If you invest through a financial intermediary, you may also incur additional costs such as a transaction fee charged on the purchase or sale of the Fund or an asset-based management fee. This Example is intended to help you understand your ongoing costs (in dollars) of investing in the Fund and to compare these costs with the ongoing costs of investing in other mutual funds.
The Example is based on an investment of $1,000 invested at the beginning of the period and held for the entire period from January 1, 2009 to June 30, 2009.
Actual Expenses
The first line of the table on the next page provides information about actual account values and actual expenses. You may use the information in this line, together with the amount you invested, to estimate the expenses you paid over the period. Simply divide your account value by $1,000 (for example, an $8,600 account value divided by $1,000 = 8.6), then multiply the result by the number in the first line under the heading entitled “Expenses Paid During Period” to estimate the expenses you paid on your account during the period.
Hypothetical Example for Comparison Purposes
The second line of the table on the next page provides information about hypothetical account values and hypothetical expenses based on the Funds’ actual expense ratios and an assumed rate of return of 5% per year before expenses, which is not the Funds’ actual return. The hypothetical account values and expenses may not be used to estimate the actual ending account balance or expenses you paid for the period. You may use this information to compare the ongoing costs of investing in the Fund and other funds. To do so, compare this 5% hypothetical example with the 5% hypothetical examples that appear in the shareholder reports of the other funds.
10
Please note that the expenses shown in the table are meant to highlight your ongoing costs only and do not reflect any costs that may be associated with investing in the Fund through a financial intermediary. Therefore, the second line of the table is useful in comparing the ongoing costs only, and will not help you determine the relative total costs of owning different funds. In addition, if any costs associated with investing through a financial intermediary were included, your costs would have been higher.
| THE YACKTMAN FUND | |||
| Expenses | |||
| Beginning | Ending | paid during | |
| account | account | period | |
| value | value | 01/01/09- | |
| 01/01/09 | 06/30/09 | 06/30/091 | |
| Actual | $1,000.00 | $1,243.80 | $5.20 |
| Hypothetical | |||
| (5% return | |||
| before expenses) | 1,000.00 | 1,020.16 | 4.68 |
THE YACKTMAN FOCUSED FUND | |||
| Expenses | |||
| Beginning | Ending | paid during | |
| account | account | period | |
| value | value | 01/01/09- | |
| 01/01/09 | 06/30/09 | 06/30/091 | |
| Actual | $1,000.00 | $1,290.90 | $7.10 |
| Hypothetical | |||
| (5% return | |||
| before expenses) | 1,000.00 | 1,018.60 | 6.26 |
| 1 | Expenses are equal to the Funds’ annualized expense ratios, including interest expense (0.93% for The Yacktman Fund and 1.25% for The Yacktman Focused Fund), multiplied by the average account value over the period, multiplied by 181/365 (to reflect the one-half year period). |
11
The Yacktman Fund
TOP TEN EQUITY HOLDINGS
June 30, 2009 (Unaudited)
| Percentage of | |
| Net Assets | |
| AmeriCredit Corp. | 6.35% |
| Viacom, Inc. | 6.07% |
| Coca-Cola Co. | 6.07% |
| Pfizer, Inc. | 5.07% |
| Microsoft Corp. | 5.07% |
| PepsiCo, Inc. | 4.97% |
| News Corp. | 4.92% |
| ConocoPhillips | 4.90% |
| Procter & Gamble Co. | 4.06% |
| eBay, Inc. | 3.44% |
| Total | 50.92% |
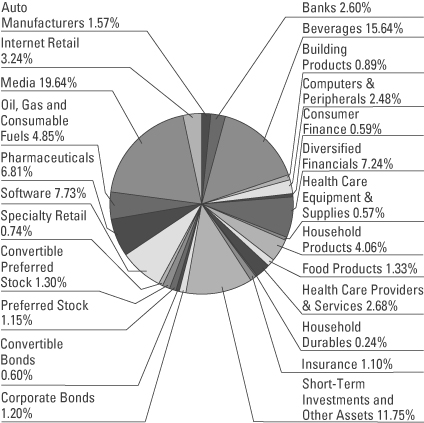
FUND DIVERSIFICATION
June 30, 2009 (Unaudited)

12
The Yacktman Fund
EQUITY PURCHASES & SALES
For the Six Months Ended June 30, 2009 (Unaudited)
| Net Shares | Current | |||||||
| NEW PURCHASES | Purchased | Shares Held | ||||||
| Cardinal Health, Inc. | ||||||||
| Provides complementary products | ||||||||
| and services to healthcare | ||||||||
| providers and manufacturers. | 110,000 | 110,000 | ||||||
Colgate-Palmolive Co. | ||||||||
| A consumer products company | ||||||||
| that markets its products | ||||||||
| throughout the world. | 70,000 | 70,000 | ||||||
Covidien Plc | ||||||||
| A global healthcare products | ||||||||
| company. Develops, manufactures | ||||||||
| and distributes a diverse range of | ||||||||
| medical devices and supplies, | ||||||||
| diagnostics imaging agents, | ||||||||
| pharmaceuticals and other | ||||||||
| healthcare products for use in | ||||||||
| clinical and home settings. | 100,000 | 100,000 | ||||||
Hewlett-Packard Co. | ||||||||
| Provides imaging and printing | ||||||||
| systems, computing systems, and | ||||||||
| information technology services | ||||||||
| for business and home. | 250,000 | 250,000 | ||||||
Johnson & Johnson | ||||||||
| Manufacturers health care | ||||||||
| products and provides related | ||||||||
| services for the consumer, | ||||||||
| pharmaceutical, and medical | ||||||||
| devices and diagnostics markets. | 200,000 | 200,000 | ||||||
13
The Yacktman Fund
EQUITY PURCHASES & SALES (Cont’d.)
For the Six Months Ended June 30, 2009 (Unaudited)
| Net Shares | Current | |||||||
| NEW PURCHASES | Purchased | Shares Held | ||||||
| Loews Corp. | ||||||||
| A diversified holding company. | ||||||||
| Through its subsidiaries, it is | ||||||||
| involved in a variety of business | ||||||||
| including commercial | ||||||||
| property-casualty insurance, | ||||||||
| offshore drilling, natural gas | ||||||||
| exploration and production, | ||||||||
| operation of natural gas pipeline | ||||||||
| systems, and the operation of | ||||||||
| hotels and resorts. | 260,000 | 260,000 | ||||||
Prestige Brands Holdings, Inc. | ||||||||
| Sells brand name over-the-counter | ||||||||
| drug, household cleaning and | ||||||||
| personal care products. | 446,600 | 446,600 | ||||||
14
| Net Shares | Current | |||||||
| PURCHASES | Purchased | Shares Held | ||||||
| American International | ||||||||
| Group, Inc. Preferred | 56,000 | 225,000 | ||||||
| BAC Capital Trust I | 25,000 | 25,000 | ||||||
| BAC Capital Trust X | 65,000 | 65,000 | ||||||
| Bank of America Corp. | 252,000 | 352,000 | ||||||
| Cardinal Health, Inc. | 110,000 | 110,000 | ||||||
| Coca Cola Co. | 130,000 | 700,000 | ||||||
| Colgate-Palmolive Co. | 70,000 | 70,000 | ||||||
| Comcast Corp. | 420,000 | 520,000 | ||||||
| ConocoPhillips | 425,000 | 645,000 | ||||||
| Covidien Plc | 100,000 | 100,000 | ||||||
| eBay, Inc. | 10,000 | 1,110,000 | ||||||
| Federal National Mortgage | ||||||||
| Association Preferred | 110,055 | 404,243 | ||||||
| Hewlett-Packard Co. | 250,000 | 250,000 | ||||||
| Johnson & Johnson | 200,000 | 200,000 | ||||||
| Loews Corp. | 260,000 | 260,000 | ||||||
| Microsoft Corp. | 40,000 | 1,180,000 | ||||||
| News Corp. | 1,771,000 | 2,990,000 | ||||||
| PepsiCo Inc. | 260,000 | 500,000 | ||||||
| Pfizer Inc. | 1,390,000 | 1,870,000 | ||||||
| Prestige Brands Holdings, Inc. | 446,600 | 446,600 | ||||||
| Procter & Gamble Co. | 290,000 | 440,000 | ||||||
| Resource America Inc. | 79,675 | 659,226 | ||||||
| UnitedHealth Group, Inc. | 211,000 | 460,000 | ||||||
| U.S. Bancorp | 540,000 | 640,000 | ||||||
| Viacom, Inc. | 40,000 | 1,480,000 | ||||||
| Walt Disney Co. | 105,300 | 300,000 | ||||||
| Net Shares | Current | |||||||
| SALES | Sold | Shares Held | ||||||
| AmeriCredit Corp. | 163,600 | 2,592,400 | ||||||
| Citigroup, Inc. | 200,000 | — | ||||||
| Clorox Co. | 112,000 | — | ||||||
| Furniture Brands International, Inc. | 218,000 | 1,265,000 | ||||||
| H&R Block, Inc. | 180,000 | — | ||||||
| Lancaster Colony Corp. | 142,500 | 242,500 | ||||||
| Liberty Media Corp. | 1,098,000 | 3,092,000 | ||||||
| Merrill Lynch & Co., Inc. | 100,000 | — | ||||||
| SLM Corp. | 230,000 | — | ||||||
| USG Corp. | 240,000 | 585,950 | ||||||
15
The Yacktman Fund
PORTFOLIO OF INVESTMENTS
June 30, 2009 (Unaudited)
| Number | ||||||||
| of Shares | Value | |||||||
| COMMON STOCKS - 80.62% | ||||||||
| Banks - 3.65% | ||||||||
| The Bancorp, Inc. (a) | 676,354 | $ | 4,058,124 | |||||
| Bank of America Corp. | 352,000 | 4,646,400 | ||||||
| U.S. Bancorp | 640,000 | 11,468,800 | ||||||
| 20,173,324 | ||||||||
| Beverages - 11.04% | ||||||||
| Coca-Cola Co. | 700,000 | 33,593,000 | ||||||
| PepsiCo, Inc. | 500,000 | 27,480,000 | ||||||
| 61,073,000 | ||||||||
| Building Products - 1.07% | ||||||||
| USG Corp. (a) | 585,950 | 5,900,516 | ||||||
Computers & Peripherals - 2.94% | ||||||||
| Dell, Inc. (a) | 480,000 | 6,590,400 | ||||||
| Hewlett-Packard Co. | 250,000 | 9,662,500 | ||||||
| 16,252,900 | ||||||||
| Consumer Finance - 0.99% | ||||||||
| American Express Co. | 235,000 | 5,461,400 | ||||||
Distributors - 0.49% | ||||||||
| Prestige Brands Holdings, Inc. (a) | 446,600 | 2,746,590 | ||||||
Diversified Financials - 6.99% | ||||||||
| AmeriCredit Corp. (a) | 2,592,400 | 35,127,020 | ||||||
| Resource America, Inc. | 659,226 | 3,546,636 | ||||||
| 38,673,656 | ||||||||
| Food Products - 1.93% | ||||||||
| Lancaster Colony Corp. | 242,500 | 10,686,975 | ||||||
Health Care Equipment & | ||||||||
| Supplies - 0.68% | ||||||||
| Covidien Plc | 100,000 | 3,744,000 | ||||||
Health Care Providers & | ||||||||
| Services - 3.69% | ||||||||
| Cardinal Health, Inc. | 110,000 | 3,360,500 | ||||||
| UnitedHealth Group, Inc. | 460,000 | 11,490,800 | ||||||
| WellPoint, Inc. (a) | 109,500 | 5,572,455 | ||||||
| 20,423,755 | ||||||||
See notes to financial statements.
16
| Number | ||||||||
| of Shares | Value | |||||||
| Household Durables - 0.69% | ||||||||
| Furniture Brands International, Inc. | 1,265,000 | $ | 3,832,950 | |||||
Household Products - 4.96% | ||||||||
| Colgate-Palmolive Co. | 70,000 | 4,951,800 | ||||||
| Procter & Gamble Co. | 440,000 | 22,484,000 | ||||||
| 27,435,800 | ||||||||
| Industrial Conglomerates - 0.41% | ||||||||
| Tyco International Ltd. | 87,500 | 2,273,250 | ||||||
Insurance - 1.31% | ||||||||
| Loews Corp. | 260,000 | 7,124,000 | ||||||
| MGIC Investment Corp. | 30,000 | 132,000 | ||||||
| 7,256,000 | ||||||||
| Internet Retail - 3.44% | ||||||||
| eBay, Inc. (a) | 1,110,000 | 19,014,300 | ||||||
Media - 17.62% | ||||||||
| Comcast Corp. | 520,000 | 7,332,000 | ||||||
| Dish Network Corp. (a) | 420,000 | 6,808,200 | ||||||
| Liberty Media Holding Corp., | ||||||||
| Interactive-Series A (a) | 3,092,000 | 15,490,920 | ||||||
| News Corp. - Class A | 2,990,000 | 27,238,900 | ||||||
| Viacom, Inc. - Class B (a) | 1,480,000 | 33,596,000 | ||||||
| The Walt Disney Co. | 300,000 | 6,999,000 | ||||||
| 97,465,020 | ||||||||
| Oil, Gas & Consumable Fuels - 4.90% | ||||||||
| ConocoPhillips | 645,000 | 27,128,700 | ||||||
Pharmaceuticals - 7.12% | ||||||||
| Johnson & Johnson | 200,000 | 11,360,000 | ||||||
| Pfizer, Inc. | 1,870,000 | 28,050,000 | ||||||
| 39,410,000 | ||||||||
| Software - 5.07% | ||||||||
| Microsoft Corp. | 1,180,000 | 28,048,600 | ||||||
See notes to financial statements.
17
The Yacktman Fund
PORTFOLIO OF INVESTMENTS (Cont’d.)
June 30, 2009 (Unaudited)
| Number | ||||||||
| of Shares | Value | |||||||
| Specialty Retail - 1.63% | ||||||||
| Abercrombie & Fitch Co. - Class A | 145,000 | $ | 3,681,550 | |||||
| Home Depot, Inc. | 50,000 | 1,181,500 | ||||||
| Williams-Sonoma, Inc. | 350,000 | 4,154,500 | ||||||
| 9,017,550 | ||||||||
| TOTAL COMMON STOCKS | ||||||||
| (Cost $417,588,463) | 446,018,286 | |||||||
| CONVERTIBLE PREFERRED STOCKS - 1.72% | ||||||||
Advertising - 1.72% | ||||||||
| Interpublic Group of Cos., Inc. (d) | 18,500 | 9,512,682 | ||||||
| TOTAL CONVERTIBLE | ||||||||
| PREFERRED STOCKS | ||||||||
| (Cost $7,805,425) | 9,512,682 | |||||||
| PREFERRED STOCKS - 2.83% | ||||||||
Banks - 0.29% | ||||||||
| Bac Capital Trust I | 25,000 | 473,000 | ||||||
| Bac Capital Trust X | 65,000 | 1,144,650 | ||||||
| 1,617,650 | ||||||||
| Diversified Financials - 2.17% | ||||||||
| Federal National | ||||||||
| Mortgage Association | 404,243 | 563,638 | ||||||
| SLM Corp. | 324,200 | 11,444,260 | ||||||
| 12,007,898 | ||||||||
| Insurance - 0.37% | ||||||||
| American International Group, Inc. | 225,000 | 2,031,750 | ||||||
| TOTAL PREFERRED STOCKS | ||||||||
| (Cost $11,315,164) | 15,657,298 | |||||||
See notes to financial statements.
18
| Principal | ||||||||
| Amount | Value | |||||||
| CONVERTIBLE BONDS - 0.35% | ||||||||
Mortgage REITs - 0.35% | ||||||||
| RAIT Financial Trust | ||||||||
| 6.875%, 04/15/2027 (b) | $ | 6,750,000 | $ | 1,932,188 | ||||
| TOTAL CONVERTIBLE BONDS | ||||||||
| (Cost $4,767,549) | 1,932,188 | |||||||
| CORPORATE BONDS - 1.83% | ||||||||
Advertising - 0.84% | ||||||||
| Interpublic Group of Cos., Inc. | ||||||||
| 6.250%, 11/15/2014 | 5,250,000 | 4,620,000 | ||||||
Diversified Telecommunication | ||||||||
| Services - 0.48% | ||||||||
| Embarq Corp. | ||||||||
| 7.995%, 06/01/2036 | 3,000,000 | 2,644,800 | ||||||
Specialty Retail - 0.51% | ||||||||
| Limited Brands, Inc. | ||||||||
| 7.600%, 07/15/2037 | 4,000,000 | 2,846,772 | ||||||
| TOTAL CORPORATE BONDS | ||||||||
| (Cost $6,258,482) | 10,111,572 | |||||||
| SHORT-TERM INVESTMENTS - 13.60% | ||||||||
Commercial Paper - 13.58% | ||||||||
| BNP Paribas | ||||||||
| 0.000%, 07/01/2009 | 19,266,000 | 19,266,000 | ||||||
| Citigroup Funding | ||||||||
| 0.000%, 07/01/2009 | 18,293,000 | 18,293,000 | ||||||
| HSBC Finance | ||||||||
| 0.000%, 07/01/2009 | 18,293,000 | 18,293,000 | ||||||
| Societe Generale | ||||||||
| 0.000%, 07/01/2009 | 19,266,000 | 19,266,000 | ||||||
| 75,118,000 | ||||||||
See notes to financial statements.
19
The Yacktman Fund
PORTFOLIO OF INVESTMENTS (Cont’d.)
June 30, 2009 (Unaudited)
| Principal | ||||||||
| Amount | Value | |||||||
| Demand Notes - 0.02% | ||||||||
U.S. Bancorp 0.000% (c) | $ | 94,593 | $ | 94,593 | ||||
| TOTAL SHORT-TERM | ||||||||
| INVESTMENTS | ||||||||
| (Cost $75,212,593) | 75,212,593 | |||||||
| Total Investments | ||||||||
| (Cost $522,947,676) - 100.95% | 558,444,619 | |||||||
| Liabilities in Excess | ||||||||
| of Other Assets - (0.95)% | (5,233,976 | ) | ||||||
| TOTAL NET ASSETS - 100.00% | $ | 553,210,643 | ||||||
Percentages are stated as a percent of net assets.
| (a) | Non-Income Producing |
| (b) | Restricted security as defined in Rule 144(a) under the Securities Act of 1933. |
| (c) | Variable rate security. Rate shown represents the rate as of June 30, 2009. |
| (d) | As of June 30, 2009, the Adviser has fair valued this security. |
See notes to financial statements.
20
The Yacktman Focused Fund
TOP TEN EQUITY HOLDINGS
June 30, 2009 (Unaudited)
| Percentage of | |
| Net Assets | |
| News Corp. | 8.36% |
| PepsiCo, Inc. | 7.90% |
| Coca-Cola Co. | 7.74% |
| Microsoft Corp. | 7.73% |
| Viacom, Inc. | 7.38% |
| AmeriCredit Corp. | 6.66% |
| ConocoPhillips | 4.85% |
| Pfizer, Inc. | 4.80% |
| Procter & Gamble Co. | 3.35% |
| eBay, Inc. | 3.24% |
| Total | 62.01% |
FUND DIVERSIFICATION
June 30, 2009 (Unaudited)
21
The Yacktman Focused Fund
EQUITY PURCHASES & SALES
For the Six Months Ended June 30, 2009 (Unaudited)
| Net Shares | Current | |||||||
| PURCHASES | Purchased | Shares Held | ||||||
| BAC Capital Trust XII | 23,000 | 23,000 | ||||||
| Bank of America Corp. | 67,000 | 67,000 | ||||||
| Coca Cola Co. | 200,000 | 320,000 | ||||||
| Colgate-Palmolive Co. | 20,000 | 20,000 | ||||||
| Comcast Corp. | 150,000 | 150,000 | ||||||
| ConocoPhillips | 181,500 | 229,000 | ||||||
| Covidien Plc | 30,000 | 30,000 | ||||||
| eBay, Inc. | 35,000 | 375,000 | ||||||
| Hewlett-Packard Co. | 90,000 | 90,000 | ||||||
| Johnson & Johnson | 70,000 | 70,000 | ||||||
| Loews Corp. | 80,000 | 80,000 | ||||||
| Microsoft Corp. | 407,000 | 645,000 | ||||||
| News Corp. | 1,590,000 | 1,820,000 | ||||||
| PepsiCo, Inc. | 237,500 | 285,000 | ||||||
| Pfizer, Inc. | 540,000 | 635,000 | ||||||
| Procter & Gamble Co. | 130,000 | 130,000 | ||||||
| Resource America, Inc. | 71,300 | 215,000 | ||||||
| SLM Corp. | 6,903 | 31,903 | ||||||
| UnitedHealth Group, Inc. | 100,000 | 160,000 | ||||||
| U.S. Bancorp | 175,000 | 175,000 | ||||||
| Viacom, Inc. | 278,000 | 645,000 | ||||||
| Net Shares | Current | |||||||
| SALES | Sold | Shares Held | ||||||
| AmeriCredit Corp. | 43,000 | 975,000 | ||||||
| Furniture Brands International, Inc. | 165,000 | 160,000 | ||||||
| Lancaster Colony Corp. | 12,000 | 60,000 | ||||||
| Liberty Media Corp. | 56,000 | 840,000 | ||||||
| SLM Corp. | 138,000 | — | ||||||
| Sprint Nextel Corp. | 170,000 | — | ||||||
| Toyota Industries Corp. | 25,000 | 125,000 | ||||||
22
The Yacktman Focused Fund
PORTFOLIO OF INVESTMENTS
June 30, 2009 (Unaudited)
| Number | ||||||||
| of Shares | Value | |||||||
| COMMON STOCKS - 84.00% | ||||||||
Auto Manufacturers - 1.57% | ||||||||
| Toyota Industries | ||||||||
| Corporation - ADR (d) | 125,000 | $ | 3,115,775 | |||||
Banks - 2.60% | ||||||||
| The Bancorp, Inc. (a) | 191,326 | 1,147,956 | ||||||
| Bank of America Corp. | 67,000 | 884,400 | ||||||
| US Bancorp | 175,000 | 3,136,000 | ||||||
| 5,168,356 | ||||||||
| Beverages - 15.64% | ||||||||
| Coca-Cola Co. | 320,000 | 15,356,800 | ||||||
| PepsiCo, Inc. | 285,000 | 15,663,600 | ||||||
| 31,020,400 | ||||||||
| Building Products - 0.89% | ||||||||
| USG Corp. (a) | 175,000 | 1,762,250 | ||||||
Computers & Peripherals - 2.48% | ||||||||
| Dell, Inc. (a) | 105,000 | 1,441,650 | ||||||
| Hewlett-Packard Co. | 90,000 | 3,478,500 | ||||||
| 4,920,150 | ||||||||
| Consumer Finance - 0.59% | ||||||||
| American Express Co. | 50,000 | 1,162,000 | ||||||
Diversified Financials - 7.24% | ||||||||
| AmeriCredit Corp. (a) | 975,000 | 13,211,250 | ||||||
| Resource America, Inc. | 215,000 | 1,156,700 | ||||||
| 14,367,950 | ||||||||
| Food Products - 1.33% | ||||||||
| Lancaster Colony Corp. | 60,000 | 2,644,200 | ||||||
Health Care Equipment & | ||||||||
| Supplies - 0.57% | ||||||||
| Covidien Plc | 30,000 | 1,123,200 | ||||||
See notes to financial statements.
23
The Yacktman Focused Fund
PORTFOLIO OF INVESTMENTS (Cont’d.)
June 30, 2009 (Unaudited)
| Number | ||||||||
| of Shares | Value | |||||||
| Health Care Providers & | ||||||||
| Services - 2.68% | ||||||||
| UnitedHealth Group, Inc. | 160,000 | $ | 3,996,800 | |||||
| WellPoint, Inc. (a) | 26,000 | 1,323,140 | ||||||
| 5,319,940 | ||||||||
| Household Durables - 0.24% | ||||||||
| Furniture Brands International, Inc. | 160,000 | 484,800 | ||||||
Household Products - 4.06% | ||||||||
| Colgate-Palmolive Co. | 20,000 | 1,414,800 | ||||||
| Procter & Gamble Co. | 130,000 | 6,643,000 | ||||||
| 8,057,800 | ||||||||
| Insurance - 1.10% | ||||||||
| Loews Corp. | 80,000 | 2,192,000 | ||||||
Internet Retail - 3.24% | ||||||||
| eBay, Inc. (a) | 375,000 | 6,423,750 | ||||||
Media - 19.64% | ||||||||
| Comcast Corp. | 150,000 | 2,115,000 | ||||||
| Dish Network Corp. (a) | 87,000 | 1,410,270 | ||||||
| Liberty Media Holding Corp., | ||||||||
| Interactive-Series A (a) | 840,000 | 4,208,400 | ||||||
| News Corp. - Class A | 1,820,000 | 16,580,200 | ||||||
| Viacom, Inc. (a) | 645,000 | 14,641,500 | ||||||
| 38,955,370 | ||||||||
| Oil, Gas & Consumable Fuels - 4.85% | ||||||||
| ConocoPhillips | 229,000 | 9,631,740 | ||||||
Pharmaceuticals - 6.81% | ||||||||
| Johnson & Johnson | 70,000 | 3,976,000 | ||||||
| Pfizer, Inc. | 635,000 | 9,525,000 | ||||||
| 13,501,000 | ||||||||
| Software - 7.73% | ||||||||
| Microsoft Corp. | 645,000 | 15,331,650 | ||||||
See notes to financial statements.
24
| Number | ||||||||
| of Shares | Value | |||||||
| Specialty Retail - 0.74% | ||||||||
| Abercrombie & Fitch Co. - Class A | 30,000 | $ | 761,700 | |||||
| Williams-Sonoma, Inc. | 60,000 | 712,200 | ||||||
| 1,473,900 | ||||||||
| TOTAL COMMON STOCKS | ||||||||
| (Cost $152,987,158) | 166,656,231 | |||||||
| CONVERTIBLE PREFERRED | ||||||||
| STOCKS - 1.30% | ||||||||
Advertising - 1.30% | ||||||||
| Interpublic Group of Cos., Inc. (d) | 5,000 | 2,570,995 | ||||||
| TOTAL CONVERTIBLE | ||||||||
| PREFERRED STOCKS | ||||||||
| (Cost $2,125,000) | 2,570,995 | |||||||
| PREFERRED STOCKS - 1.15% | ||||||||
Diversified Financials - 0.63% | ||||||||
| Federal National | ||||||||
| Mortgage Association | 86,949 | 125,873 | ||||||
| SLM Corp. | 31,903 | 1,126,176 | ||||||
| 1,252,049 | ||||||||
| Insurance - 0.31% | ||||||||
| American International Group, Inc. | 67,000 | 605,010 | ||||||
Regional Banks - 0.21% | ||||||||
| Bac Capital Trust XII | 23,000 | 420,670 | ||||||
| TOTAL PREFERRED STOCKS | ||||||||
| (Cost $1,434,908) | 2,277,729 | |||||||
See notes to financial statements.
25
The Yacktman Focused Fund
PORTFOLIO OF INVESTMENTS (Cont’d.)
June 30, 2009 (Unaudited)
| Principal | ||||||||
| Amount | Value | |||||||
| CONVERTIBLE BONDS - 0.60% | ||||||||
Consumer Finance - 0.39% | ||||||||
| Americredit Corp. | ||||||||
| 0.750%, 09/15/2011 | $ | 1,000,000 | $ | 766,250 | ||||
Mortgage REITs - 0.21% | ||||||||
| RAIT Financial Trust | ||||||||
| 6.875%, 04/15/2027 | ||||||||
| (acquired on 04/12/07) (b) | 1,450,000 | 415,062 | ||||||
| TOTAL CONVERTIBLE BONDS | ||||||||
| (Cost $1,504,156) | 1,181,312 | |||||||
| CORPORATE BONDS - 1.20% | ||||||||
Advertising - 0.66% | ||||||||
| Interpublic Group of Cos., Inc. | ||||||||
| 6.250%, 11/15/2014 | 1,500,000 | 1,320,000 | ||||||
Specialty Retail - 0.54% | ||||||||
| Limited Brands, Inc. | ||||||||
| 7.600%, 07/15/2037 | 1,500,000 | 1,067,540 | ||||||
| TOTAL CORPORATE BONDS | ||||||||
| (Cost $1,531,715) | 2,387,540 | |||||||
| SHORT-TERM INVESTMENTS - 11.30% | ||||||||
Commercial Paper - 11.25% | ||||||||
| BNP Paribas | ||||||||
| 0.000%, 07/01/2009 | 5,591,000 | 5,591,000 | ||||||
| Citigroup Funding | ||||||||
| 0.000%, 07/01/2009 | 5,570,000 | 5,570,000 | ||||||
| HSBC Finance | ||||||||
| 0.000%, 07/01/2009 | 5,570,000 | 5,570,000 | ||||||
| Societe Generale | ||||||||
| 0.000%, 07/01/2009 | 5,591,000 | 5,591,000 | ||||||
| 22,322,000 | ||||||||
See notes to financial statements.
26
| Principal | ||||||||
| Amount | Value | |||||||
| Demand Notes - 0.05% | ||||||||
US Bancorp 0.000% (c) | $ | 105,343 | $ | 105,343 | ||||
| TOTAL SHORT-TERM | ||||||||
| INVESTMENTS | ||||||||
| (Cost $22,427,343) | 22,427,343 | |||||||
| Total Investments | ||||||||
| (Cost $182,010,280) - 99.55% | 197,501,150 | |||||||
| Other Assets in Excess | ||||||||
| of Liabilities - 0.45% | 891,326 | |||||||
| TOTAL NET ASSETS - 100.00% | $ | 198,392,476 | ||||||
Percentages are stated as a percent of net assets.
ADR American Depository Receipt
| (a) | Non-Income Producing |
| (b) | Restricted security as defined in Rule 144(a) under the Securities Act of 1933. |
| (c) | Variable Rate security. Rate shown represents the rate as of June 30, 2009. |
| (d) | As of June 30, 2009, the Adviser has fair valued this security. |
See notes to financial statements.
27
The Yacktman Funds, Inc.
STATEMENTS OF ASSETS & LIABILITIES
June 30, 2009 (Unaudited)
| The Yacktman | The Yacktman | |||||||
| Fund | Focused Fund | |||||||
| ASSETS: | ||||||||
| Investments, at market value | ||||||||
| (Cost $522,947,676 and | ||||||||
| $182,010,280 respectively) | $ | 558,444,619 | $ | 197,501,150 | ||||
| Cash | 118 | — | ||||||
| Receivable for fund shares sold | 6,411,751 | 4,216,396 | ||||||
| Dividends and interest receivable | 927,954 | 305,642 | ||||||
| Prepaid expenses | 55,335 | 54,288 | ||||||
| Total Assets | 565,839,777 | 202,077,476 | ||||||
| LIABILITIES: | ||||||||
| Payable for fund shares redeemed | 220,807 | 186,520 | ||||||
| Payable for investments | ||||||||
| purchased | 12,022,413 | 3,305,219 | ||||||
| Accrued investment | ||||||||
| advisory fees | 280,343 | 165,823 | ||||||
| Payable to Custodian | 7,960 | 3,155 | ||||||
| Other accrued expenses | 97,611 | 24,283 | ||||||
| Total Liabilities | 12,629,134 | 3,685,000 | ||||||
| NET ASSETS | $ | 553,210,643 | $ | 198,392,476 | ||||
| NET ASSETS CONSIST OF: | ||||||||
| Capital stock | $ | 516,292,308 | $ | 185,473,315 | ||||
| Undistributed net | ||||||||
| investment income | 4,044,722 | 740,867 | ||||||
| Undistributed accumulated | ||||||||
| net realized loss | (2,623,330 | ) | (3,312,576 | ) | ||||
| Net unrealized appreciation | ||||||||
| Investments | 35,496,943 | 15,490,870 | ||||||
| Total Net Assets | $ | 553,210,643 | $ | 198,392,476 | ||||
| CAPITAL STOCK, $0.0001 par value | ||||||||
| Authorized | 500,000,000 | 500,000,000 | ||||||
| Issued and Outstanding | 45,936,322 | 15,418,258 | ||||||
| NET ASSET VALUE, REDEMPTION | ||||||||
| PRICE, AND OFFERING PRICE | ||||||||
| PER SHARE | $ | 12.04 | $ | 12.87 | ||||
See notes to financial statements.
28
The Yacktman Funds, Inc.
STATEMENTS OF OPERATIONS
For the Six Months Ended June 30, 2009 (Unaudited)
| The Yacktman | The Yacktman | |||||||
| Fund | Focused Fund | |||||||
| INVESTMENT INCOME: | ||||||||
| Dividend income | $ | 3,949,350 | $ | 1,004,371 | 1 | |||
| Interest income | 1,668,581 | 345,248 | ||||||
| Total investment income | 5,617,931 | 1,349,619 | ||||||
| EXPENSES: | ||||||||
| Investment advisory fees | 1,094,334 | 487,002 | ||||||
| Shareholder servicing fees | 251,771 | 57,813 | ||||||
| Administration and | ||||||||
| accounting fees | 70,285 | 17,005 | ||||||
| Federal and state registration fees | 33,757 | 13,600 | ||||||
| Professional fees | 29,079 | 14,684 | ||||||
| Compliance expenses | 28,575 | 6,635 | ||||||
| Reports to shareholders | 24,425 | 5,205 | ||||||
| Custody fees | 14,260 | 4,450 | ||||||
| Directors fees and expenses | 13,430 | 3,275 | ||||||
| Interest expense | 1,263 | — | ||||||
| Miscellaneous expenses | 12,030 | 3,095 | ||||||
| Total expenses | ||||||||
| before reimbursements | 1,573,209 | 612,764 | ||||||
| Expense reimbursements | ||||||||
| (See Note 5) | — | (4,012 | ) | |||||
| Net Expenses | 1,573,209 | 608,752 | ||||||
| NET INVESTMENT INCOME | 4,044,722 | 740,867 | ||||||
| REALIZED AND UNREALIZED LOSS: | ||||||||
| Net realized loss on investments | (2,114,142 | ) | (2,102,204 | ) | ||||
| Change in unrealized | ||||||||
| appreciation (depreciation) on: | ||||||||
| Investments | 72,528,516 | 27,210,978 | ||||||
| Written Options | — | (143,999 | ) | |||||
| Total | 72,528,516 | 27,066,979 | ||||||
| Net realized and unrealized | ||||||||
| gain on investments | 70,414,374 | 24,964,775 | ||||||
| NET INCREASE IN NET ASSETS | ||||||||
| RESULTING FROM OPERATIONS | $ | 74,459,096 | $ | 25,705,642 | ||||
| 1 | Net of $0 and $2,311, respectively, in foreign withholding taxes. |
See notes to financial statements.
29
The Yacktman Funds, Inc.
STATEMENTS OF CHANGES
IN NET ASSETS
OPERATIONS:
Net investment income
Net realized gain (loss) on investments
Net change in unrealized appreciation (depreciation)
on investments
Net increase (decrease) in net assets resulting
from operations
CAPITAL SHARE TRANSACTIONS:
Proceeds from shares sold
Proceeds from reinvestment of distributions
Redemption fees
Payments for shares redeemed
Net increase
DISTRIBUTIONS PAID FROM:
Net investment income
Net realized gains
Total distributions
TOTAL INCREASE (DECREASE) IN NET ASSETS
NET ASSETS:
Beginning of period
End of period (including undistributed net investment
income of $4,044,722, $0, $740,867 and $0 respectively)
TRANSACTIONS IN SHARES:
Shares Sold
Issued in reinvestment of distributions
Shares Redeemed
Net increase
See notes to financial statements.
30
| The Yacktman Fund | The Yacktman Focused Fund | |||||||||||||
| Six Months Ended | Year Ended | Six Months Ended | Year Ended | |||||||||||
| June 30, 2009 | December 31, | June 30, 2009 | December 31, | |||||||||||
| (Unaudited) | 2008 | (Unaudited) | 2008 | |||||||||||
| $ | 4,044,722 | $ | 5,164,426 | $ | 740,867 | $ | 892,817 | |||||||
| (2,114,142 | ) | 782,343 | (2,102,204 | ) | 1,682,260 | |||||||||
| 72,528,516 | (90,439,239 | ) | 27,066,979 | (21,628,540 | ) | |||||||||
| 74,459,096 | (84,492,470 | ) | 25,705,642 | (19,053,463 | ) | |||||||||
| 246,165,876 | 261,825,791 | 127,278,856 | 65,280,545 | |||||||||||
| — | 6,367,896 | — | 4,350,042 | |||||||||||
| 31,360 | 161,978 | 21,169 | 20,248 | |||||||||||
| 246,197,236 | 268,355,665 | 127,300,025 | 69,650,835 | |||||||||||
| (64,104,635 | ) | (172,240,981 | ) | (20,079,932 | ) | (47,722,837 | ) | |||||||
| 182,092,601 | 96,114,684 | 107,220,093 | 21,927,998 | |||||||||||
| — | (5,352,880 | ) | — | (955,328 | ) | |||||||||
| — | (1,184,867 | ) | — | (3,504,831 | ) | |||||||||
| — | (6,537,747 | ) | — | (4,460,159 | ) | |||||||||
| 256,551,697 | 5,084,467 | 132,925,735 | (1,585,624 | ) | ||||||||||
| 296,658,946 | 291,574,479 | 65,466,741 | 67,052,365 | |||||||||||
| $ | 553,210,643 | $ | 296,658,946 | $ | 198,392,476 | $ | 65,466,741 | |||||||
| 22,132,573 | 23,591,917 | 10,655,969 | 5,238,874 | |||||||||||
| — | 672,428 | — | 447,075 | |||||||||||
| (6,834,908 | ) | (15,398,687 | ) | (1,806,266 | ) | (3,906,759 | ) | |||||||
| 15,297,665 | 8,865,658 | 8,849,703 | 1,779,190 | |||||||||||
See notes to financial statements.
31
The Yacktman Funds, Inc.
FINANCIAL HIGHLIGHTS
| The Yacktman Fund | ||||
| Six Months Ended | ||||
| For a Fund share outstanding | June 30, 2009 | |||
| throughout each period | (Unaudited) | |||
| NET ASSET VALUE: | ||||
| Beginning of period | $ | 9.68 | ||
| OPERATIONS: | ||||
| Net investment income | 0.09 | |||
| Net realized and unrealized gain (loss) | ||||
| on investment securities | 2.27 | |||
| Total from operations | 2.36 | |||
| LESS DISTRIBUTIONS: | ||||
| From net investment income | — | |||
| From net realized gains | — | |||
| Total distributions | — | |||
| NET ASSET VALUE: | ||||
| End of period | $ | 12.04 | ||
| TOTAL RETURN | 24.38% | 1 | ||
| SUPPLEMENTAL DATA AND RATIOS | ||||
| Net assets; end of period (000’s) | $ | 553,211 | ||
| Ratio of net expenses to | ||||
| average net assets | 0.94% | 2 | ||
| Ratio of net investment income to | ||||
| average net assets | 2.41% | 2 | ||
| Portfolio turnover rate | 12.07% | 2 | ||
| 1 | Not Annualized. |
| 2 | Annualized. |
See notes to financial statements.
32
| The Yacktman Fund | ||||||||||||||||||
| Year Ended | ||||||||||||||||||
| 2008 | 2007 | 2006 | 2005 | 2004 | ||||||||||||||
| $ | 13.39 | $ | 15.79 | $ | 14.67 | $ | 15.34 | $ | 15.24 | |||||||||
| 0.17 | 0.35 | 0.30 | 0.28 | 0.12 | ||||||||||||||
| (3.66 | ) | 0.21 | 2.05 | (0.48 | ) | 1.40 | ||||||||||||
| (3.49 | ) | 0.56 | 2.35 | (0.20 | ) | 1.52 | ||||||||||||
| (0.18 | ) | (0.34 | ) | (0.30 | ) | (0.28 | ) | (0.12 | ) | |||||||||
| (0.04 | ) | (2.62 | ) | (0.93 | ) | (0.19 | ) | (1.30 | ) | |||||||||
| (0.22 | ) | (2.96 | ) | (1.23 | ) | (0.47 | ) | (1.42 | ) | |||||||||
| $ | 9.68 | $ | 13.39 | $ | 15.79 | $ | 14.67 | $ | 15.34 | |||||||||
| (26.05)% | 3.39% | 15.95% | (1.30)% | 9.93% | ||||||||||||||
| $ | 296,659 | $ | 291,574 | $ | 429,072 | $ | 438,912 | $ | 365,308 | |||||||||
| 0.95% | 0.95% | 0.96% | 0.92% | 0.95% | ||||||||||||||
| 1.92% | 1.71% | 1.90% | 1.86% | 0.73% | ||||||||||||||
| 32.77% | 23.82% | 17.93% | 8.64% | 23.82% | ||||||||||||||
See notes to financial statements.
33
The Yacktman Funds, Inc.
FINANCIAL HIGHLIGHTS (Cont’d.)
| The Yacktman Focused Fund | ||||
| Six Months Ended | ||||
| For a Fund share outstanding | June 30, 2009 | |||
| throughout each period | (Unaudited) | |||
| NET ASSET VALUE: | ||||
| Beginning of period | $ | 9.97 | ||
| OPERATIONS: | ||||
| Net investment income | 0.05 | |||
| Net realized and unrealized (loss) | ||||
| on investment securities | 2.85 | |||
| Total from operations | 2.90 | |||
| LESS DISTRIBUTIONS: | ||||
| From net investment income | — | |||
| From net realized gains | — | |||
| Total distributions | — | |||
| NET ASSET VALUE: | ||||
| End of period | $ | 12.87 | ||
| TOTAL RETURN | 29.09% | 1 | ||
| SUPPLEMENTAL DATA AND RATIOS | ||||
| Net assets; end of period (000’s) | $ | 198,392 | ||
| Ratio of expenses before | ||||
| expense reimbursements to | ||||
| average net assets (See Note 4) | 1.26% | 2 | ||
| Ratio of net expenses to | ||||
| average net assets | 1.25% | 2 | ||
| Ratio of net investment income to | ||||
| average net assets | 1.53% | 2 | ||
| Portfolio turnover rate | 9.28% | 2 | ||
| 1 | Not Annualized. |
| 2 | Annualized. |
See notes to financial statements.
34
The Yacktman Focused Fund
Year Ended
| 2008 | 2007 | 2006 | 2005 | 2004 | ||||||||||||||
| $ | 14.00 | $ | 16.00 | $ | 14.96 | $ | 15.83 | $ | 16.28 | |||||||||
| 0.15 | 0.23 | 0.21 | 0.22 | 0.03 | ||||||||||||||
| (3.45 | ) | 0.34 | 2.20 | (0.51 | ) | 1.59 | ||||||||||||
| (3.30 | ) | 0.57 | 2.41 | (0.29 | ) | 1.62 | ||||||||||||
| (0.16 | ) | (0.23 | ) | (0.21 | ) | (0.22 | ) | (0.03 | ) | |||||||||
| (0.57 | ) | (2.34 | ) | (1.16 | ) | (0.36 | ) | (2.04 | ) | |||||||||
| (0.73 | ) | (2.57 | ) | (1.37 | ) | (0.58 | ) | (2.07 | ) | |||||||||
| $ | 9.97 | $ | 14.00 | $ | 16.00 | $ | 14.96 | $ | 15.83 | |||||||||
| (23.48)% | 3.46% | 16.13% | (1.83)% | 9.96% | ||||||||||||||
| $ | 65,467 | $ | 67,052 | $ | 90,534 | $ | 84,608 | $ | 97,263 | |||||||||
| 1.35% | 1.38% | 1.35% | 1.32% | 1.33% | ||||||||||||||
| 1.25% | 1.25% | 1.25% | 1.25% | 1.25% | ||||||||||||||
| 1.31% | 1.23% | 1.40% | 1.30% | 0.16% | ||||||||||||||
| 67.11% | 30.49% | 30.61% | 5.62% | 19.26% | ||||||||||||||
See notes to financial statements.
35
The Yacktman Funds, Inc.
NOTES TO THE FINANCIAL STATEMENTS
June 30, 2009 (Unaudited)
1. ORGANIZATION
The Yacktman Funds, Inc. (comprised of The Yacktman Fund and The Yacktman Focused Fund, hereafter referred to as the “Funds”) is registered as an open-end management investment company under the Investment Company Act of 1940 (the “1940 Act”). The Funds consist of two investment portfolios: The Yacktman Fund is a diversified fund that commenced operations July 6, 1992 and The Yacktman Focused Fund is a non-diversified fund that commenced operations May 1, 1997. The objective of each of the Funds is to produce long-term capital appreciation with current income as a secondary objective. Yacktman Asset Management Co. is the Funds’ investment adviser (the “Adviser”).
2. SIGNIFICANT ACCOUNTING POLICIES
The following is a summary of significant accounting policies consistently followed by the Funds in the preparation of their financial statements. The financial statements have been prepared in conformity with accounting principles generally accepted in the United States of America, which require management to make certain estimates and assumptions that affect the reported amounts of assets and liabilities and disclosure of contingent assets and liabilities at the date of the financial statements and the reported amounts of increases and decreases in net assets from operations during the reporting period. Actual results could differ from those estimates.
a) Subsequent Events Evaluation - In preparing these financial statements, the Company has evaluated events and transactions for potential recognition or disclosure resulting from subsequent events through August 28, 2009, the date the financial statements were issued. This evaluation did not result in any subsequent events that necessitated disclosures and/or adjustments.
b) Investment Valuation - Securities which are traded on a national stock exchange are valued at the last sale price
36
on the securities exchange on which such securities are primarily traded. Securities that are traded on the Nasdaq National Market or the Nasdaq Smallcap Market are valued at the Nasdaq Official Closing Price. Exchangetraded securities for which there were no transactions are valued at the current bid prices. Securities traded on only overthecounter markets are valued on the basis of closing overthecounter bid prices. Short-term debt instruments maturing within 60 days are valued by the amortized cost method, which approximates fair value. Debt securities (other than short-term instruments) are valued at the mean price furnished by a national pricing service, subject to review by the Adviser and determination of the appropriate price whenever a furnished price is significantly different from the previous day’s furnished price. Options written or purchased by The Yacktman Focused Fund are valued at the last sales price if such last sales price is between the current bid and asked prices. Otherwise, options are valued at the mean between the current bid and asked prices. Any securities for which there are no readily available market quotations and other assets will be valued at their fair value as determined in good faith by the Adviser pursuant to procedures established by and under the supervision of the Board of Directors. The fair value of a security is the amount which a Fund might reasonably expect to receive upon a current sale. Valuing securities at fair value involves greater reliance on judgment than valuing securities that have readily available market quotations. There can be no assurance that the Funds could obtain the fair value assigned to a security if they were to sell the security at approximately the time at which the Funds determine their net asset value per share.
Valuation Measurements
Statement of Financial Accounting Standards No. 157 “Fair Value Measurements” (SFAS 157) establishes an authoritative definition of fair value and sets out a hierarchy for measuring fair value. SFAS 157 requires additional disclosures about the various inputs used to
37
The Yacktman Funds, Inc.
NOTES TO THE FINANCIAL STATEMENTS
June 30, 2009 (Unaudited) (Cont’d.)
develop the measurements of fair value. These inputs are summarized in the three broad levels listed below:
| Level 1 – | Quoted prices in active markets for identical securities. |
| Level 2 – | Other significant observable inputs (including quoted prices for similar securities, interest rates, prepayment speeds, credit risk, etc.). |
| Level 3 – | Significant unobservable inputs (including the Fund's own assumptions in determining the fair value of investments). |
The inputs or methodology used for valuing securities are not necessarily an indication of the risk associated with investing in those securities. The following is a summary of the inputs used to value the Fund's net assets as of June 30, 2009:
THE YACKTMAN FUND
| Level 1 | Level 2 | Level 3 | Total | |||||||||||||
| Equity | ||||||||||||||||
| Consumer | ||||||||||||||||
| Discretionary | $ | 34,611,389 | $ | — | — | $ | 34,611,389 | |||||||||
| Consumer Staples | 99,195,775 | — | — | 99,195,775 | ||||||||||||
| Energy | 30,675,336 | — | — | 30,675,336 | ||||||||||||
| Financials | 83,675,042 | — | — | 83,675,042 | ||||||||||||
| Health Care | 63,577,755 | — | — | 63,577,755 | ||||||||||||
| Industrials | 8,173,767 | — | — | 8,173,767 | ||||||||||||
| Information | ||||||||||||||||
| Technology | 44,301,500 | — | — | 44,301,500 | ||||||||||||
| Media | 97,465,020 | 9,512,682 | — | 106,977,702 | ||||||||||||
| Total Equity | 461,675,584 | 9,512,682 | — | 471,188,266 | ||||||||||||
| Fixed Income | ||||||||||||||||
| Corporate Bonds | — | 12,043,760 | — | 12,043,760 | ||||||||||||
| Total Fixed | ||||||||||||||||
| Income | — | 12,043,760 | — | 12,043,760 | ||||||||||||
| Short Term | ||||||||||||||||
| Investments | — | 75,212,593 | — | 75,212,593 | ||||||||||||
| Total Investments | ||||||||||||||||
| in Securities | $ | 461,675,584 | $ | 96,769,035 | — | $ | 558,444,619 | |||||||||
38
THE YACKTMAN FOCUSED FUND
| Level 1 | Level 2 | Level 3 | Total | |||||||||||||
| Equity | ||||||||||||||||
| Automobiles | — | $ | 3,115,775 | — | $ | 3,115,775 | ||||||||||
| Consumer | ||||||||||||||||
| Discretionary | $ | 8,382,450 | — | — | 8,382,450 | |||||||||||
| Consumer Staples | 41,722,400 | — | — | 41,722,400 | ||||||||||||
| Energy | 10,788,440 | — | — | 10,788,440 | ||||||||||||
| Financials | 24,011,335 | — | — | 24,011,335 | ||||||||||||
| Health Care | 19,944,140 | — | — | 19,944,140 | ||||||||||||
| Industrials | 1,762,250 | — | — | 1,762,250 | ||||||||||||
| Information | ||||||||||||||||
| Technology | 20,251,800 | — | — | 20,251,800 | ||||||||||||
| Media | 38,955,370 | 2,570,995 | — | 41,526,365 | ||||||||||||
| Total Equity | 165,818,185 | 5,686,770 | — | 171,504,955 | ||||||||||||
| Fixed Income | ||||||||||||||||
| Corporate Bonds | — | 3,568,852 | — | 3,568,852 | ||||||||||||
| Total Fixed | ||||||||||||||||
| Income | — | 3,568,852 | — | 3,568,852 | ||||||||||||
| Short Term | ||||||||||||||||
| Investments | — | 22,427,343 | — | 22,427,343 | ||||||||||||
| Total Investments | ||||||||||||||||
| in Securities | $ | 165,818,185 | $ | 31,682,965 | — | $ | 197,501,150 | |||||||||
c) Option writing - When The Yacktman Focused Fund writes an option, an amount equal to the premium received by The Yacktman Focused Fund is recorded as a liability and is subsequently adjusted to the current fair value of the option written. Premiums received from writing options that expire unexercised are treated by The Yacktman Focused Fund on the expiration date as realized gains from investments. The difference between the premium and the amount paid on effecting a closing purchase transaction, including brokerage commissions, is also treated as a realized gain, or, if the premium is less than the amount paid for the closing purchase transaction, as a realized loss. If a call option is exercised, the premium is added to the proceeds from the sale of the underlying security or currency in determining whether The Yacktman Focused Fund has realized a gain or loss. If a put option is exercised, the premium reduces the cost basis of the securities purchased by The Yacktman
39
The Yacktman Funds, Inc.
NOTES TO THE FINANCIAL STATEMENTS
June 30, 2009 (Unaudited) (Cont’d.)
Focused Fund. The Yacktman Focused Fund as a writer of an option bears the market risk of an unfavorable change in the price of the security underlying the written option.
d) Federal Income Taxes - It is each Fund’s policy to meet the requirements of the Internal Revenue Code applicable to regulated investment companies and to distribute substantially all investment company net taxable income and net capital gains to its shareholders in a manner which results in no tax cost to the Fund. Therefore, no federal income tax provision is required.
FASB Interpretation 48
Effective June 29, 2007, the Funds adopted Financial Accounting Standards Board (FASB) Interpretation No. 48 (FIN 48), “Accounting for Uncertainty in Income Taxes”. FIN 48 requires the evaluation of tax positions taken on previously filed tax returns or expected to be taken on future returns. These positions must meet a “more likely than not” standard that, based on the technical merits, have a more than fifty percent likelihood of being sustained upon examination. In evaluating whether a tax position has met the recognition threshold, the Funds must presume that the position will be examined by the appropriate taxing authority that has full knowledge of all relevant information. Tax positions not deemed to meet the “more-likely-than-not” threshold are recorded as a tax expense in the current year.
FIN 48 requires the Funds to analyze all open tax years, as defined by the Statute of Limitations. Open tax years are those that are open for exam by taxing authorities. As of June 30, 2009, open tax years include the tax years ended December 31, 2005 through 2008. The Funds have no examinations in progress.
The Funds have reviewed all open tax years and major jurisdictions and concluded that the adoption of FIN 48 resulted in no effect to the Funds‘ financial position or results of operations. As of June 30, 2009, there is no tax liability resulting from unrecognized tax benefits relating
40
to uncertain income tax positions taken or expected to be taken on the Funds’ tax returns for all open tax years. The Funds are also not aware of any tax positions for which it is reasonably possible that the total amounts of unrecognized tax benefits will significantly change in the next twelve months. The Funds recognize interest and penalties, if any, related to unrecognized tax benefits as income tax expense in the statement of operations. During the period, the Funds did not incur any interest or penalties.
e) Distributions to Shareholders - Dividends from net investment income and distributions of net realized capital gains, if any, are declared and paid at least annually. Distributions to shareholders are recorded on the exdividend date. The character of distributions made during the year from net investment income or net realized gains may differ from the characterization for federal income tax purposes due to differences in the recognition of income, expense and gain items for financial statement and tax purposes. Additionally, the Funds may utilize earnings and profits distributed to shareholders on redemption of shares as part of the dividends paid deduction for income tax purposes. Where appropriate, reclassifications between capital accounts are made for such differences that are permanent in nature.
Accordingly, at December 31, 2008, reclassifications were recorded to increase undistributed net investment income by $146,896 and $61,476, and increase (decrease) undistributed net realized gains (losses) by $(97,909) and $(61,476) for The Yacktman Fund and The Yacktman Focused Fund, respectively. Accumulated paid-in-capital was decreased by $(48,987) for The Yacktman Fund.
f) Guarantees and Indemnifications - In the normal course of business, the Funds enter into contracts with service providers that contain general indemnification clauses. The Funds’ maximum exposure under these arrangements is unknown as this would involve future
41
The Yacktman Funds, Inc.
NOTES TO THE FINANCIAL STATEMENTS
June 30, 2009 (Unaudited) (Cont’d.)
claims against the Funds that have not yet occurred. Based on experience, the Funds expect the risk of loss to be remote.
g) Redemption Fee - Effective April 1, 2005, those who buy and sell the Funds within thirty calendar days will incur a 2% redemption fee, retained for the benefit of long-term shareholders, recorded as additional capital in the statement of changes in net assets.
h) Other - Investment transactions and shareholder transactions are accounted for on the trade date. Net realized gains and losses on securities are computed on the basis of specific security lot identification. Dividend income is recognized on the exdividend date and interest income is recognized on an accrual basis. Withholding taxes on foreign dividends have been provided for in accordance with the Funds’ understanding of the applicable country’s tax rules and regulations. Expenses incurred by the Funds that do not relate to a specific fund are allocated to the individual Funds based on each Fund’s relative net assets or another appropriate basis (as determined by the Board of Directors.)
3. INVESTMENT TRANSACTIONS
For the six months ended June 30, 2009, the aggregate purchases and sales of securities, excluding short-term securities, were $157,677,501 and $38,968,211 for The Yacktman Fund and $94,263,883 and $8,604,268 for The Yacktman Focused Fund, respectively. For the six months ended June 30, 2009, there were no purchases or sales of U.S. Government securities for The Yacktman Fund and The Yacktman Focused Fund.
4. OPTION CONTRACTS WRITTEN
The premium amount and number of option contracts written during the year ended June 30, 2009 in The Yacktman Focused Fund, were as follows:
42
| Amount of | Number of | |||||||
| Premiums | Contracts | |||||||
| Outstanding at 12/31/2008 | $ | (148,999 | ) | (1,000 | ) | |||
| Options written | — | — | ||||||
| Options expired | 148,999 | 1,000 | ||||||
| Options closed | — | — | ||||||
| Outstanding at 12/31/2008 | $ | — | — | |||||
5. INVESTMENT ADVISORY AGREEMENT
The Funds have agreements with the Adviser, with whom certain officers and directors of the Funds are affiliated, to furnish investment advisory services to the Funds. Under the terms of these agreements, The Yacktman Fund will pay the Adviser a monthly fee at the annual rate of 0.65% on the first $500,000,000 of average daily net assets, 0.60% on the next $500,000,000 of average daily net assets and 0.55% on average daily net assets in excess of $1,000,000,000, and The Yacktman Focused Fund will pay the Adviser a monthly fee at the annual rate of 1% of its average daily net assets. The Adviser has contractually agreed to reimburse The Yacktman Fund for all expenses exceeding 2.00% of its average daily net assets (exclusive of interest, taxes, brokerage commissions and extraordinary expenses). The Adviser has voluntarily agreed to reimburse The Yacktman Focused Fund for all expenses exceeding 1.25% of its average daily net assets (exclusive of interest, taxes, brokerage commissions and extraordinary expenses). The Funds are not obligated to reimburse the Adviser for any fees or expenses waived in previous fiscal years. During the six months ended June 30, 2009, the Adviser voluntarily waived $4,012 of Investment advisory fees for The Yacktman Focused Fund.
6. LINE OF CREDIT
The Yacktman Fund and The Yacktman Focused Fund have established a line of credit (“LOC”) with U.S. Bank, N.A. to be used for temporary or emergency purposes, primarily for financing redemption payments, using the securities in each Fund’s respective portfolio as collateral. The LOC will mature, unless renewed, on March 31, 2010 for each of the
43
The Yacktman Funds, Inc.
NOTES TO THE FINANCIAL STATEMENTS
June 30, 2009 (Unaudited) (Cont’d.)
Funds. For The Yacktman Fund, borrowing under the LOC is limited to the lesser of $15,000,000, 10% of the preborrowing net assets of the Fund, 10% of the market value of the assets of the Fund, or 33.33% of the sum of the fair market value of certain assets of the Fund. For The Yacktman Focused Fund, borrowing under the LOC is limited to the lesser of $15,000,000, 33 1⁄3% of the preborrowing net assets of the Fund, or 33 1⁄3% of the sum of the fair market value of certain assets of the Fund. The interest rate paid by the Funds on outstanding borrowings is equal to the Prime Rate, less 0.50%, which was 2.75% as of December 31, 2008. During the six months ended June 30, 2009, The Yacktman Fund had average outstanding borrowings of $91,381 under the LOC and paid a weighted average interest rate of 2.75%. During the six months ended June 30, 2009, there were no borrowings for The Yacktman Focused Fund.
44
7. TAX INFORMATION
The following information for the Funds is presented on an income tax basis as of December 31, 2008:
| The Yacktman | The Yacktman | |||||||
| Fund | Focused Fund | |||||||
| Tax cost of investments | $ | 333,090,988 | $ | 78,065,501 | ||||
| Gross unrealized appreciation | 31,022,982 | 5,128,885 | ||||||
| Gross unrealized depreciation | (68,563,743 | ) | (18,016,251 | ) | ||||
| Net tax unrealized | ||||||||
| depreciation | $ | (37,540,761 | ) | $ | (12,887,366 | ) | ||
As of December 31, 2008, the components of accumulated earnings were as follows:
| The Yacktman | The Yacktman | |||||||
| Fund | Focused Fund | |||||||
| Undistributed ordinary income | $ | — | $ | — | ||||
| Undistributed long-term | ||||||||
| capital gains | — | 34 | ||||||
| Accumulated earnings | — | 34 | ||||||
| Net unrealized depreciation | ||||||||
| on investments | (37,540,761 | ) | (12,887,336 | ) | ||||
| Other accumulated | ||||||||
| gains/(losses) | — | 100,851 | ||||||
| Total accumulated earnings | $ | (37,540,761 | ) | $ | (12,786,481 | ) | ||
The tax basis of investments for tax and financial reporting purposes differs, principally due to the deferral of losses on wash sales.
As of December 31, 2008, The Yacktman Focused Fund had $43,148 of post-October losses, which are deferred until January 1, 2009, for tax purposes. Net capital losses incurred after October 31 and within the taxable year are deferred to arise on the first day of The Yacktman Focused Fund’s next taxable year.
The tax character of distributions paid during the fiscal years ended December 31, 2008 and December 31, 2007 were as follows:
45
The Yacktman Funds, Inc.
NOTES TO THE FINANCIAL STATEMENTS
June 30, 2009 (Unaudited) (Cont’d.)
| The Yacktman | The Yacktman | |||||||
| Fund | Focused Fund | |||||||
| 2008 | ||||||||
| Ordinary income | $ | 6,537,747 | $ | 2,097,803 | ||||
| Long-term capital gains | $ | — | $ | 2,362,356 | ||||
| 2007 | ||||||||
| Ordinary income | $ | 7,052,011 | $ | 2,038,950 | ||||
| Long-term capital gains | $ | 46,630,740 | $ | 8,463,843 | ||||
8. NEW ACCOUNTING PRONOUNCEMENTS
FASB Interpretation 161
In March 2008, Statement of Financial Accounting Standards No. 161, “Disclosures about Derivative Instruments and Hedging Activities“ (“SFAS 161”) was issued and is effective for fiscal years beginning after November 15, 2008. SFAS 161 is intended to improve financial reporting for derivative instruments by requiring enhanced disclosure that enables investors to understand how and why an entity uses derivatives, how derivatives are accounted for, and how derivative instruments affect an entity’s results of operations and financial position.
46
The Yacktman Funds, Inc.
ADDITIONAL INFORMATION
(Unaudited)
For the year ended December 31, 2008, 87.01% and 53.52% of the dividends paid from net investment income, including short-term capital gains, for The Yacktman Fund and The Yacktman Focused Fund, respectively, qualify for the dividends received deduction available to corporate shareholders.
For the year ended December 31, 2008, 89.22% and 55.27% of the dividends paid from net investment income, including short-term capital gains, for The Yacktman Fund and The Yacktman Focused Fund, respectively, are designated as qualified dividend income.
The Funds hereby designate approximately 19.62% and 57.40% as short-term capital gain distributions for The Yacktman Fund and The Yacktman Focused Fund, respectively, for the purposes of the dividends paid deduction.
PROXY VOTING POLICIES
AND PROCEDURES
For a description of the policies and procedures that the Funds use to determine how to vote proxies relating to portfolio securities, please call 1-800-525-8258 and request a Statement of Additional Information. One will be mailed to you free of charge. The Statement of Additional Information is also available on the Web site of the Securities and Exchange Commission at http://www.sec.gov. Information on how the Funds voted proxies relating to portfolio securities during the twelve month period ended June 30, 2008, is available without charge, upon request, by calling 1-800-525-8258 or by accessing the Web site of the Securities and Exchange Commission.
DISCLOSURE OF PORTFOLIO HOLDINGS
The Funds will file complete schedules of portfolio holdings with the Securities and Exchange Commission for the first and third quarters of each fiscal year on Form N-Q. Each Fund’s Form N-Q will be available on the Web site of the Securities and Exchange Commission at http://www.sec.gov.
47
The Yacktman Fund
INVESTMENT ADVISORY
DISCLOSURE
On March 2, 2009, the Board of Directors of The Yacktman Funds, Inc. approved the continuation of each Fund’s investment advisory agreement with Yacktman Asset Management Co. (the “Adviser”). Prior to approving the continuation of the agreements, the Board considered:
| • | The nature, extent and quality of the services provided by the Adviser |
| • | The investment performance of the Funds and Adviser |
| • | The costs of the services to be provided and profits to be realized by the Adviser and its affiliates from the relationship with the Funds |
| • | The extent to which economies of scale would be realized as the Funds grow and whether fee levels reflect these economies of scale for the benefit of mutual fund investors |
| • | The expense ratios of the Funds |
In considering the nature, extent and quality of the services provided by Yacktman Asset Management Co., the Board considered a written and an oral presentation by the Adviser describing the portfolio management, shareholder communication, and regulatory compliance services provided by the Adviser to the Funds. The Directors concluded that the Adviser was providing essential services to the Funds.
The Directors compared the performance of the Funds to benchmark indices over various periods of time and concluded that the performance of the Funds warranted the continuation of the advisory agreements. The Directors noted that in addition to the absolute performance of the Funds, they also noted that the Funds adhered to their investment style.
In concluding that the advisory fees payable by the Funds were reasonable, the Directors reviewed a report of the costs of services provided by, and the profits realized by the Adviser, from its relationship with the Funds and
48
concluded that such profits were reasonable and not excessive. As part of its analysis, the Board considered the value of the research the Adviser received from broker-dealers executing securities transactions for the Funds. The Directors also reviewed reports comparing the expense ratios and advisory fees paid by the Funds to those paid by other comparable mutual funds and concluded that the advisory fees paid by the Funds and the expense ratios of the Funds were in the range of comparable mutual funds.
The Directors also considered whether the investment advisory agreement fee schedules should be adjusted for an increase in assets under management. They concluded that “breakpoints” embodied in the investment advisory agreement for The Yacktman Fund were appropriate, and breakpoints for The Yacktman Focused Fund were not warranted at this time given the anticipated growth of that Fund in the next year and the other factors considered.
49
(This Page Intentionally Left Blank.)
For Fund information and
shareholder services, call
1-800-525-8258
Web site: www.yacktman.com
The Yacktman Funds, Inc.
Shareholder Services Center
615 East Michigan Street, 3rd Floor
Milwaukee, Wisconsin 53202-5207
This report is submitted for the general information of shareholders of The Yacktman Funds. It is not authorized for distribution to prospective investors unless accompanied or preceded by an effective Prospectus for the Funds, which contains more information concerning the Funds’ investment policies, as well as fees and expenses and other pertinent information. Read the Prospectus carefully.
YA-410-0809
Item 2. Code of Ethics.
Not applicable for semi-annual reports.
Item 3. Audit Committee Financial Expert.
Not applicable for semi-annual reports.
Item 4. Principal Accountant Fees and Services.
Not applicable for semi-annual reports.
Item 5. Audit Committee of Listed Registrants.
Not applicable to registrants who are not listed issuers (as defined in Rule 10A-3 under the Securities Exchange Act of 1934).
Item 6. Investments.
Schedule of Investments is included as part of the report to shareholders filed under Item 1 of this form.
Item 7. Disclosure of Proxy Voting Policies and Procedures for Closed-End Management Investment Companies.
Not applicable to open-end investment companies.
Item 8. Portfolio Managers of Closed-End Management Investment Companies.
Not applicable to open-end investment companies.
Item 9. Purchases of Equity Securities by Closed-End Management Investment Company and Affiliated Purchasers.
Not applicable to open-end investment companies.
Item 10. Submission of Matters to a Vote of Security Holders.
Not Applicable.
Item 11. Controls and Procedures.
| (a) | The Registrant’s [President/Chief Executive Officer] and [Treasurer/Chief Financial Officer] have reviewed the Registrant's disclosure controls and procedures (as defined in Rule 30a-3(c) under the Investment Company Act of 1940 (the “Act”)) as of a date within 90 days of the filing of this report, as required by Rule 30a-3(b) under the Act and Rules 13a-15(b) or 15d-15(b) under the Securities Exchange Act of 1934. Based on their review, such officers have concluded that the disclosure controls and procedures are effective in ensuring that information required to be disclosed in this report is appropriately recorded, processed, summarized and reported and made known to them by others within the Registrant and by the Registrant’s service provider. |
| (b) | There were no changes in the Registrant's internal control over financial reporting (as defined in Rule 30a-3(d) under the Act) that occurred during the second fiscal quarter of the period covered by this report that has materially affected, or is reasonably likely to materially affect, the Registrant's internal control over financial reporting. |
Item 12. Exhibits.
| (a) | (1) Any code of ethics or amendment thereto, that is the subject of the disclosure required by Item 2, to the extent that the registrant intends to satisfy Item 2 requirements through filing an exhibit. Not applicable to semi-annual reports. |
(2) Certifications pursuant to Section 302 of the Sarbanes-Oxley Act of 2002. Filed herewith.
(3) Any written solicitation to purchase securities under Rule 23c-1 under the Act sent or given during the period covered by the report by or on behalf of the registrant to 10 or more persons. Not applicable to open-end investment companies.
| (b) | Certifications pursuant to Section 906 of the Sarbanes-Oxley Act of 2002. Furnished herewith. |
SIGNATURES
Pursuant to the requirements of the Securities Exchange Act of 1934 and the Investment Company Act of 1940, the registrant has duly caused this report to be signed on its behalf by the undersigned, thereunto duly authorized.
(Registrant) The Yacktman Funds, Inc.
By (Signature and Title)* /s/ Donald A. Yacktman
Donald A. Yacktman, President & Treasurer
Date 08/28/09
Pursuant to the requirements of the Securities Exchange Act of 1934 and the Investment Company Act of 1940, this report has been signed below by the following persons on behalf of the registrant and in the capacities and on the dates indicated.
By (Signature and Title)* /s/ Donald A. Yacktman
Donald A. Yacktman, President & Treasurer
Date 08/28/09