UNITED STATES
SECURITIES AND EXCHANGE COMMISSION
Washington, D.C. 20549
FORM N-CSR
CERTIFIED SHAREHOLDER REPORT OF REGISTERED
MANAGEMENT INVESTMENT COMPANIES
Investment Company Act file number: 811-06637
The UBS Funds
(Exact name of registrant as specified in charter)
One North Wacker Drive, Chicago, IL 60606-2807
(Address of principal executive offices) (Zip code)
Keith A. Weller, Esq.
UBS Asset Management
One North Wacker Drive
Chicago, IL 60606
(Name and address of agent for service)
Copy to:
Jana L. Cresswell, Esq.
Stradley Ronon Stevens & Young, LLP
2005 Market Street, Suite 2600
Philadelphia, PA 19103-7098
Registrant’s telephone number, including area code: 888-793 8637
Date of fiscal year end: June 30
Date of reporting period: June 30, 2024
Item 1. Reports to Stockholders.
| | (a) | Copy of the report transmitted to shareholders: |
TABLE OF CONTENTS
0000886244ubs:UBSIndexFTSEWorldGovernmentBondIndexHedgedinUSD19579AdditionalIndexMember2024-02-290000886244ubs:UBSIndexMSCIACWIexMinusUSIndex19581AdditionalIndexMember2014-07-012024-06-300000886244ubs:UBSIndexRussell3000IndexTRUSD19558AdditionalIndexMember2019-09-30
Annual Shareholder Report
June 30, 2024
UBS Engage For Impact Fund
This annual shareholder report contains important information about UBS Engage For Impact Fund for the period of July 1, 2023 to June 30, 2024. You can find additional information about the Fund at http://www.ubs.com/port-info . You can also request this information by contacting us at 1-800-647-1568.
What were the Fund costs for the last year?
Annual Fund Operating Expenses
(based on a hypothetical $10,000 investment)
| Class Name | Cost of a $10,000 investment | Costs paid as a percentage of a $10,000 investment |
|---|
| Class P | $94 | 0.88% |
How did the Fund perform last year and what affected its performance?
Portfolio performance summary
What worked:
• Stock selection in Consumer Staples and Energy contributed positively to performance.
• The individual stock positions that contributed to performance the most were:
• Micron rose on continued positive sentiment regarding rising demand for High Bandwidth Memory, which is increasingly of interest in the artificial intelligence boom.
• Sprouts Farmers Market shares rallied on strong first quarter operating results with double-digit growth in gross profit dollars, and an upward revision in full year guidance reflecting a positive outlook.
• Galp Energia shares traded well following the completion of its first phase of Mopane exploration campaign in Namibia; as the discovery surprised investors to the upside, with maximum flows achieved during well tests.
What didn’t work:
• Stock selection in Consumer Discretionary and Information Technology contributed negatively to performance
• The individual stock positions that negatively impacted performance the most were:
• Not owning NVIDIA detracted from relative performance as shares rallied on strong revenue, bullish forward guidance and a liquidity-raising stock split. Data centre revenue was up 427% year on year, driven by strong demand for their graphics processing units.
• Spectris shares were weighed by a recent downgrade in guidance to the bottom end of the expected range, which management attributed to weakness in China and the healthcare sector. We believe the stock is more attractively valued than US peers, therefore giving us conviction in the potential upside in share price.
• JTOWER shares fell on news competitors KDDI and Softbank are in talks to broaden the scope of their 5G cellular network partnership, which investors interpretated as a sharp close to JTower’s tower co-sharing expansion potential. We believe the infrastructure growth potential to be significant still.
The Fund did not invest in derivatives during the reporting period.
UBS Engage For Impact Fund

| Class P | MSCI All Country World Index (net) |
|---|
| 10/31/2018 | $10,050 | $10,154 |
| 11/30/2018 | $10,170 | $10,302 |
| 12/31/2018 | $9,316 | $9,577 |
| 1/31/2019 | $10,167 | $10,333 |
| 2/28/2019 | $10,547 | $10,609 |
| 3/31/2019 | $10,657 | $10,743 |
| 4/30/2019 | $10,957 | $11,105 |
| 5/31/2019 | $10,067 | $10,447 |
| 6/30/2019 | $10,827 | $11,131 |
| 7/31/2019 | $10,587 | $11,163 |
| 8/31/2019 | $10,367 | $10,899 |
| 9/30/2019 | $10,527 | $11,128 |
| 10/31/2019 | $10,827 | $11,432 |
| 11/30/2019 | $11,177 | $11,712 |
| 12/31/2019 | $11,519 | $12,124 |
| 1/31/2020 | $11,108 | $11,990 |
| 2/29/2020 | $10,347 | $11,022 |
| 3/31/2020 | $8,580 | $9,534 |
| 4/30/2020 | $9,669 | $10,555 |
| 5/31/2020 | $10,224 | $11,014 |
| 6/30/2020 | $10,419 | $11,366 |
| 7/31/2020 | $10,841 | $11,967 |
| 8/31/2020 | $11,416 | $12,699 |
| 9/30/2020 | $11,180 | $12,290 |
| 10/31/2020 | $11,087 | $11,991 |
| 11/30/2020 | $12,752 | $13,469 |
| 12/31/2020 | $13,470 | $14,095 |
| 1/31/2021 | $13,574 | $14,031 |
| 2/28/2021 | $13,895 | $14,356 |
| 3/31/2021 | $14,237 | $14,739 |
| 4/30/2021 | $14,609 | $15,383 |
| 5/31/2021 | $14,827 | $15,623 |
| 6/30/2021 | $14,765 | $15,829 |
| 7/31/2021 | $14,796 | $15,938 |
| 8/31/2021 | $15,417 | $16,337 |
| 9/30/2021 | $14,816 | $15,662 |
| 10/31/2021 | $15,562 | $16,461 |
| 11/30/2021 | $15,096 | $16,065 |
| 12/31/2021 | $15,657 | $16,707 |
| 1/31/2022 | $14,223 | $15,887 |
| 2/28/2022 | $13,698 | $15,477 |
| 3/31/2022 | $13,896 | $15,812 |
| 4/30/2022 | $13,010 | $14,546 |
| 5/31/2022 | $13,104 | $14,563 |
| 6/30/2022 | $11,623 | $13,336 |
| 7/31/2022 | $12,369 | $14,267 |
| 8/31/2022 | $11,903 | $13,742 |
| 9/30/2022 | $10,912 | $12,426 |
| 10/31/2022 | $11,728 | $13,176 |
| 11/30/2022 | $12,731 | $14,198 |
| 12/31/2022 | $12,158 | $13,639 |
| 1/31/2023 | $12,982 | $14,617 |
| 2/28/2023 | $12,617 | $14,198 |
| 3/31/2023 | $12,617 | $14,636 |
| 4/30/2023 | $12,723 | $14,846 |
| 5/31/2023 | $12,381 | $14,687 |
| 6/30/2023 | $13,123 | $15,540 |
| 7/31/2023 | $13,841 | $16,109 |
| 8/31/2023 | $13,546 | $15,659 |
| 9/30/2023 | $12,993 | $15,011 |
| 10/31/2023 | $12,264 | $14,560 |
| 11/30/2023 | $13,240 | $15,904 |
| 12/31/2023 | $14,159 | $16,667 |
| 1/31/2024 | $13,874 | $16,765 |
| 2/29/2024 | $14,656 | $17,485 |
| 3/31/2024 | $15,107 | $18,034 |
| 4/30/2024 | $14,609 | $17,439 |
| 5/31/2024 | $15,035 | $18,147 |
| 6/30/2024 | $14,917 | $18,551 |
Average Annual Total Returns (%)
| 1 Year | 5 Years | Since Inception 10/24/18 |
|---|
| Class P | 13.67% | 6.62% | 7.29% |
| MSCI All Country World Index (net) | 19.38% | 10.76% | 11.49% |
Performance data represents past performance, which does not guarantee future results.
The graph and table do not reflect the deduction of taxes that a shareholder would pay on Fund distributions or a redemption of Fund shares.
| FUND STATISTICS | |
|---|
| Total Net Assets | $51,747,265 |
| # of Portfolio Holdings | 48 |
| Portfolio Turnover Rate | 28% |
| Total Advisory Fees Paid | $0 |
What is the Fund’s investment objective?
The Fund seeks to maximize total return, consisting of capital appreciation and current income.
Top 5 Holdings (% of Net Assets)
| Broadcom, Inc. | 4.5% |
| AstraZeneca PLC (United Kingdom) | 4.2 |
| Micron Technology, Inc. | 4.2 |
| Alcon, Inc. (Switzerland) | 4.0 |
| Danone SA (France) | 3.9 |
UBS Engage For Impact Fund
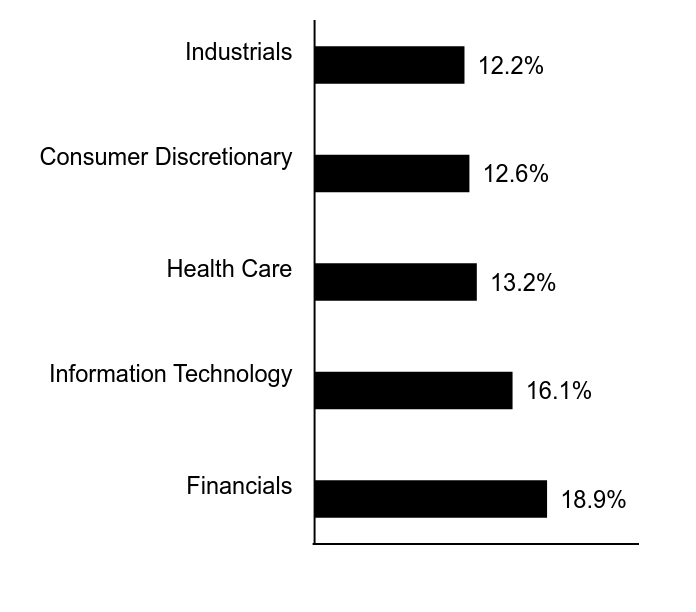
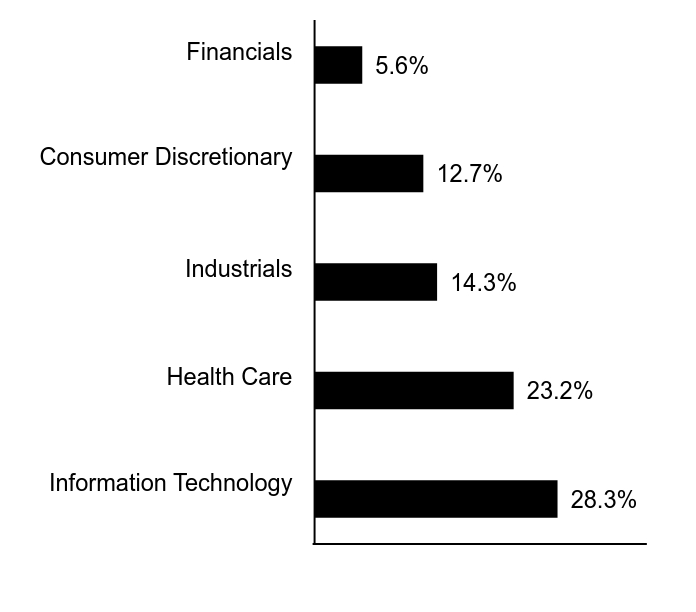
Top 5 Sectors (% of Net Assets)
| Value | Value |
|---|
| Information Technology | 27.4% |
| Health Care | 16.4% |
| Industrials | 13.3% |
| Consumer Staples | 9.8% |
| Financials | 9.4% |
If you wish to view additional information about the Fund, including but not limited to financial statements or holdings, please visit http://www.ubs.com/port-info .
UBS Engage For Impact Fund
Annual Shareholder Report
June 30, 2024
UBS Engage For Impact Fund
This annual shareholder report contains important information about UBS Engage For Impact Fund for the period of July 1, 2023 to June 30, 2024. You can find additional information about the Fund at http://www.ubs.com/port-info . You can also request this information by contacting us at 1-800-647-1568.
What were the Fund costs for the last year?
Annual Fund Operating Expenses
(based on a hypothetical $10,000 investment)
| Class Name | Cost of a $10,000 investment | Costs paid as a percentage of a $10,000 investment |
|---|
| Class P2 | $30 | 0.28% |
How did the Fund perform last year and what affected its performance?
Portfolio performance summary
What worked:
• Stock selection in Consumer Staples and Energy contributed positively to performance.
• The individual stock positions that contributed to performance the most were:
• Micron rose on continued positive sentiment regarding rising demand for High Bandwidth Memory, which is increasingly of interest in the artificial intelligence boom.
• Sprouts Farmers Market shares rallied on strong first quarter operating results with double-digit growth in gross profit dollars, and an upward revision in full year guidance reflecting a positive outlook.
• Galp Energia shares traded well following the completion of its first phase of Mopane exploration campaign in Namibia; as the discovery surprised investors to the upside, with maximum flows achieved during well tests.
What didn’t work:
• Stock selection in Consumer Discretionary and Information Technology contributed negatively to performance
• The individual stock positions that negatively impacted performance the most were:
• Not owning NVIDIA detracted from relative performance as shares rallied on strong revenue, bullish forward guidance and a liquidity-raising stock split. Data centre revenue was up 427% year on year, driven by strong demand for their graphics processing units.
• Spectris shares were weighed by a recent downgrade in guidance to the bottom end of the expected range, which management attributed to weakness in China and the healthcare sector. We believe the stock is more attractively valued than US peers, therefore giving us conviction in the potential upside in share price.
• JTOWER shares fell on news competitors KDDI and Softbank are in talks to broaden the scope of their 5G cellular network partnership, which investors interpretated as a sharp close to JTower’s tower co-sharing expansion potential. We believe the infrastructure growth potential to be significant still.
The Fund did not invest in derivatives during the reporting period.
UBS Engage For Impact Fund
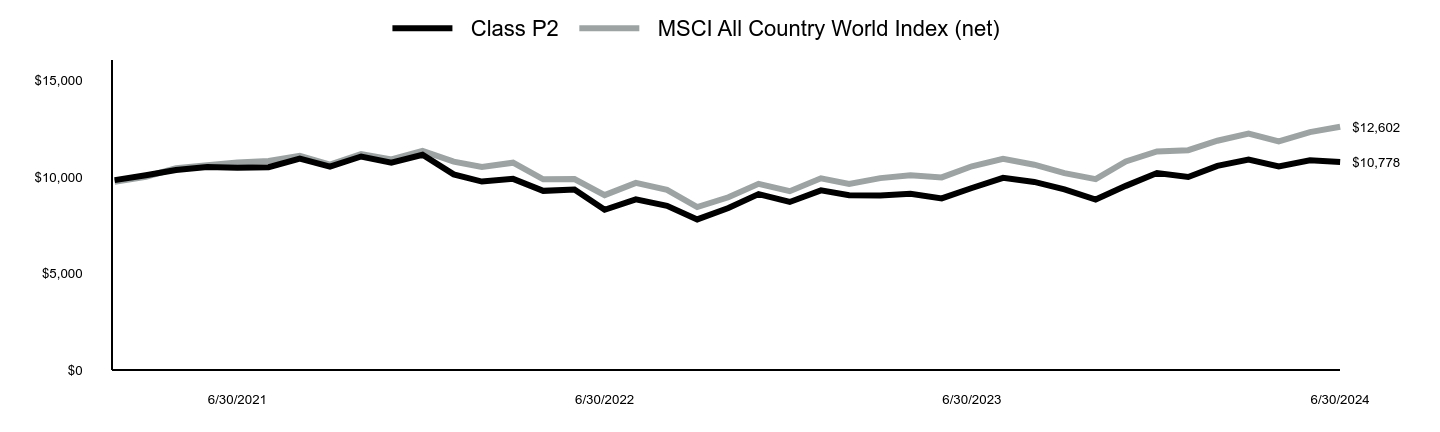
| Class P2 | MSCI All Country World Index (net) |
|---|
| 2/28/2021 | $9,839 | $9,752 |
| 3/31/2021 | $10,088 | $10,012 |
| 4/30/2021 | $10,359 | $10,450 |
| 5/31/2021 | $10,521 | $10,613 |
| 6/30/2021 | $10,477 | $10,753 |
| 7/31/2021 | $10,506 | $10,827 |
| 8/31/2021 | $10,953 | $11,098 |
| 9/30/2021 | $10,535 | $10,639 |
| 10/31/2021 | $11,063 | $11,182 |
| 11/30/2021 | $10,740 | $10,913 |
| 12/31/2021 | $11,150 | $11,350 |
| 1/31/2022 | $10,137 | $10,792 |
| 2/28/2022 | $9,763 | $10,514 |
| 3/31/2022 | $9,904 | $10,741 |
| 4/30/2022 | $9,281 | $9,881 |
| 5/31/2022 | $9,356 | $9,893 |
| 6/30/2022 | $8,301 | $9,059 |
| 7/31/2022 | $8,841 | $9,692 |
| 8/31/2022 | $8,508 | $9,335 |
| 9/30/2022 | $7,802 | $8,441 |
| 10/31/2022 | $8,392 | $8,951 |
| 11/30/2022 | $9,115 | $9,645 |
| 12/31/2022 | $8,706 | $9,265 |
| 1/31/2023 | $9,305 | $9,930 |
| 2/28/2023 | $9,052 | $9,645 |
| 3/31/2023 | $9,043 | $9,942 |
| 4/30/2023 | $9,128 | $10,085 |
| 5/31/2023 | $8,892 | $9,977 |
| 6/30/2023 | $9,431 | $10,556 |
| 7/31/2023 | $9,954 | $10,943 |
| 8/31/2023 | $9,743 | $10,637 |
| 9/30/2023 | $9,355 | $10,197 |
| 10/31/2023 | $8,833 | $9,891 |
| 11/30/2023 | $9,541 | $10,804 |
| 12/31/2023 | $10,205 | $11,323 |
| 1/31/2024 | $9,999 | $11,389 |
| 2/29/2024 | $10,573 | $11,878 |
| 3/31/2024 | $10,907 | $12,251 |
| 4/30/2024 | $10,547 | $11,846 |
| 5/31/2024 | $10,864 | $12,327 |
| 6/30/2024 | $10,778 | $12,602 |
Average Annual Total Returns (%)
| 1 Year | Since Inception 2/23/21 |
|---|
| Class P2 | 14.29% | 2.26% |
| MSCI All Country World Index (net) | 19.38% | 7.15% |
Performance data represents past performance, which does not guarantee future results.
The graph and table do not reflect the deduction of taxes that a shareholder would pay on Fund distributions or a redemption of Fund shares.
| FUND STATISTICS | |
|---|
| Total Net Assets | $51,747,265 |
| # of Portfolio Holdings | 48 |
| Portfolio Turnover Rate | 28% |
| Total Advisory Fees Paid | $0 |
What is the Fund’s investment objective?
The Fund seeks to maximize total return, consisting of capital appreciation and current income.
Top 5 Holdings (% of Net Assets)
| Broadcom, Inc. | 4.5% |
| AstraZeneca PLC (United Kingdom) | 4.2 |
| Micron Technology, Inc. | 4.2 |
| Alcon, Inc. (Switzerland) | 4.0 |
| Danone SA (France) | 3.9 |
UBS Engage For Impact Fund
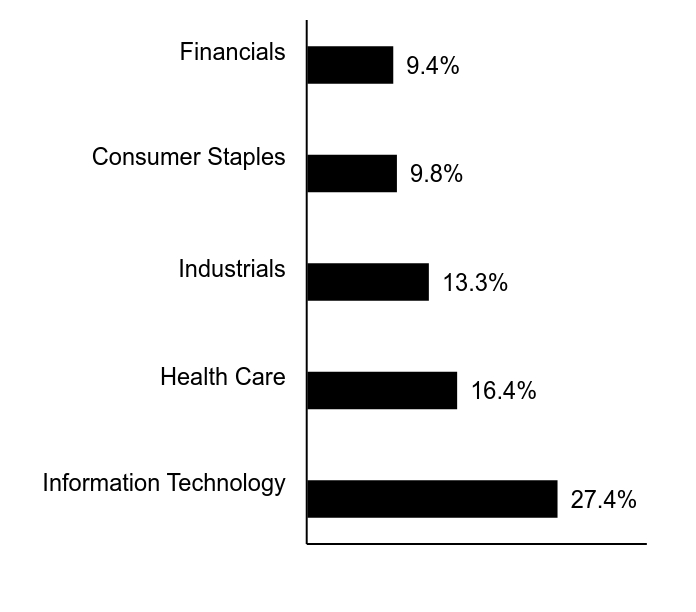
Top 5 Sectors (% of Net Assets)
| Value | Value |
|---|
| Information Technology | 27.4% |
| Health Care | 16.4% |
| Industrials | 13.3% |
| Consumer Staples | 9.8% |
| Financials | 9.4% |
If you wish to view additional information about the Fund, including but not limited to financial statements or holdings, please visit http://www.ubs.com/port-info .
UBS Engage For Impact Fund
Annual Shareholder Report
June 30, 2024
UBS Global Allocation Fund
This annual shareholder report contains important information about UBS Global Allocation Fund for the period of July 1, 2023 to June 30, 2024. You can find additional information about the Fund at http://www.ubs.com/port-info . You can also request this information by contacting us at 1-800-647-1568.
What were the Fund costs for the last year?
Annual Fund Operating Expenses
(based on a hypothetical $10,000 investment)
| Class Name | Cost of a $10,000 investment | Costs paid as a percentage of a $10,000 investment |
|---|
| Class A | $127 | 1.21% |
How did the Fund perform last year and what affected its performance?
Portfolio performance summary
Asset allocation:
• In October 2023, the yield on 10-year US Treasury bonds reached 5%, but by the end of the reporting period, yields had declined about 1%. As a result, the fund’s slight underweight duration relative to the Fund’s secondary benchmark index, a blend of 60% MSCI All Country World Index (net)/40% FTSE World Government Bond Index (Hedged in USD), hurt performance.
• From an asset class perspective, the largest detractor has been in foreign currency exposure. Our overweight positions in Japanese yen and Brazilian real were our largest detractors to performance. Additionally, within US equities our positioning has detracted from overall performance due to opportunistic positions in US small-cap and mid-cap stocks which underperformed large-cap equities.
• With respect to our tactical asset allocation decisions, an overweight in the EURO STOXX Banks sector was the largest contributor.
Bottom-up security selection:
Security selection in US large-cap value, emerging markets equity, international equity, China equity, and US securitized fixed income strategies detracted from performance. Meanwhile, security selection within US large-cap growth, intermediate investment grade fixed income, global government fixed income, and below-investment grade fixed income contributed to performance.
We use derivatives extensively for capital management, risk management, and expressing asset allocation views. We utilize various futures which include equity regional, equity style, fixed income regional in both government and corporate credit. Futures are sometimes used to manage overall regional exposure while increasing exposure to active managers. We also utilize futures to gain exposure to asset classes when limited by our max allocation to external ETFs by SEC rules.
UBS Global Allocation Fund
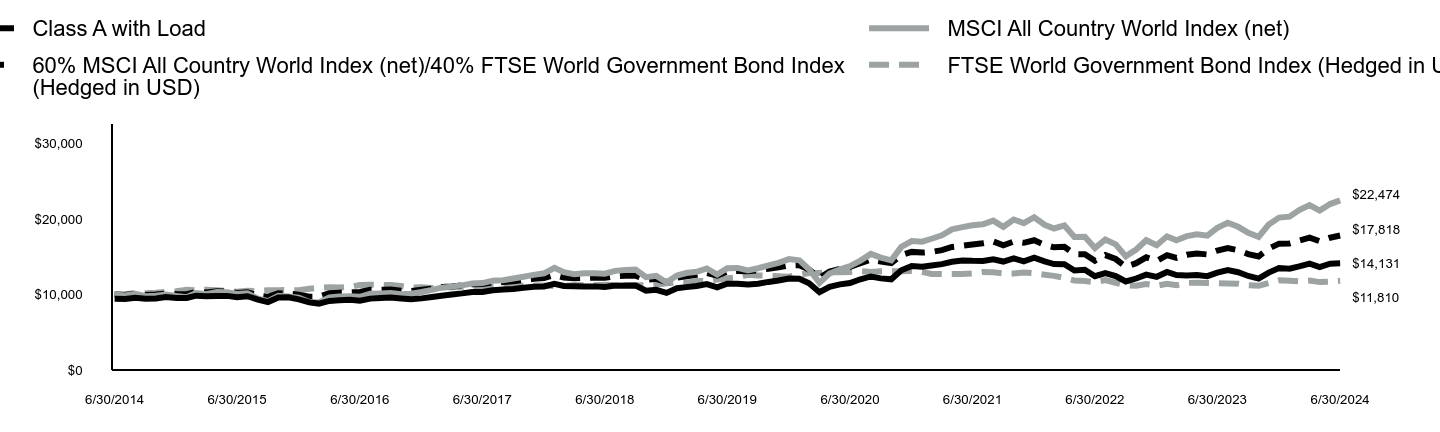
| Class A with Load | MSCI All Country World Index (net) | 60% MSCI All Country World Index (net)/40% FTSE World Government Bond Index (Hedged in USD) | FTSE World Government Bond Index (Hedged in USD) |
|---|
| 6/30/2014 | $9,452 | $10,000 | $10,000 | $10,000 |
| 7/31/2014 | $9,409 | $9,879 | $9,943 | $10,040 |
| 8/31/2014 | $9,572 | $10,097 | $10,128 | $10,173 |
| 9/30/2014 | $9,443 | $9,770 | $9,923 | $10,153 |
| 10/31/2014 | $9,486 | $9,838 | $9,991 | $10,221 |
| 11/30/2014 | $9,675 | $10,003 | $10,137 | $10,338 |
| 12/31/2014 | $9,546 | $9,810 | $10,054 | $10,426 |
| 1/31/2015 | $9,538 | $9,656 | $10,042 | $10,638 |
| 2/28/2015 | $9,846 | $10,194 | $10,347 | $10,558 |
| 3/31/2015 | $9,769 | $10,036 | $10,282 | $10,638 |
| 4/30/2015 | $9,795 | $10,327 | $10,430 | $10,556 |
| 5/31/2015 | $9,820 | $10,314 | $10,395 | $10,490 |
| 6/30/2015 | $9,649 | $10,071 | $10,195 | $10,354 |
| 7/31/2015 | $9,769 | $10,158 | $10,300 | $10,486 |
| 8/31/2015 | $9,315 | $9,462 | $9,869 | $10,468 |
| 9/30/2015 | $8,998 | $9,119 | $9,686 | $10,553 |
| 10/31/2015 | $9,606 | $9,835 | $10,153 | $10,581 |
| 11/30/2015 | $9,632 | $9,754 | $10,105 | $10,586 |
| 12/31/2015 | $9,360 | $9,578 | $9,986 | $10,561 |
| 1/31/2016 | $8,956 | $9,000 | $9,705 | $10,774 |
| 2/29/2016 | $8,798 | $8,938 | $9,713 | $10,907 |
| 3/31/2016 | $9,149 | $9,601 | $10,165 | $10,964 |
| 4/30/2016 | $9,228 | $9,742 | $10,248 | $10,945 |
| 5/31/2016 | $9,299 | $9,755 | $10,280 | $11,010 |
| 6/30/2016 | $9,185 | $9,696 | $10,340 | $11,270 |
| 7/31/2016 | $9,457 | $10,114 | $10,622 | $11,310 |
| 8/31/2016 | $9,527 | $10,148 | $10,629 | $11,273 |
| 9/30/2016 | $9,606 | $10,210 | $10,666 | $11,266 |
| 10/31/2016 | $9,483 | $10,036 | $10,502 | $11,120 |
| 11/30/2016 | $9,378 | $10,113 | $10,480 | $10,935 |
| 12/31/2016 | $9,490 | $10,331 | $10,624 | $10,957 |
| 1/31/2017 | $9,670 | $10,614 | $10,766 | $10,874 |
| 2/28/2017 | $9,849 | $10,911 | $10,985 | $10,970 |
| 3/31/2017 | $10,010 | $11,045 | $11,061 | $10,957 |
| 4/30/2017 | $10,154 | $11,217 | $11,194 | $11,029 |
| 5/31/2017 | $10,342 | $11,465 | $11,365 | $11,086 |
| 6/30/2017 | $10,333 | $11,517 | $11,379 | $11,045 |
| 7/31/2017 | $10,558 | $11,839 | $11,579 | $11,068 |
| 8/31/2017 | $10,674 | $11,884 | $11,653 | $11,180 |
| 9/30/2017 | $10,728 | $12,114 | $11,759 | $11,110 |
| 10/31/2017 | $10,890 | $12,365 | $11,926 | $11,160 |
| 11/30/2017 | $11,024 | $12,605 | $12,077 | $11,187 |
| 12/31/2017 | $11,070 | $12,808 | $12,195 | $11,192 |
| 1/31/2018 | $11,425 | $13,530 | $12,575 | $11,115 |
| 2/28/2018 | $11,134 | $12,962 | $12,260 | $11,121 |
| 3/31/2018 | $11,098 | $12,685 | $12,163 | $11,258 |
| 4/30/2018 | $11,070 | $12,806 | $12,214 | $11,213 |
| 5/31/2018 | $11,079 | $12,822 | $12,233 | $11,236 |
| 6/30/2018 | $10,988 | $12,752 | $12,212 | $11,279 |
| 7/31/2018 | $11,179 | $13,137 | $12,422 | $11,254 |
| 8/31/2018 | $11,152 | $13,240 | $12,486 | $11,267 |
| 9/30/2018 | $11,179 | $13,298 | $12,496 | $11,216 |
| 10/31/2018 | $10,497 | $12,301 | $11,934 | $11,216 |
| 11/30/2018 | $10,615 | $12,481 | $12,072 | $11,293 |
| 12/31/2018 | $10,215 | $11,602 | $11,643 | $11,483 |
| 1/31/2019 | $10,834 | $12,518 | $12,236 | $11,585 |
| 2/28/2019 | $10,979 | $12,853 | $12,428 | $11,576 |
| 3/31/2019 | $11,125 | $13,015 | $12,617 | $11,797 |
| 4/30/2019 | $11,389 | $13,454 | $12,864 | $11,777 |
| 5/31/2019 | $10,952 | $12,656 | $12,499 | $11,989 |
| 6/30/2019 | $11,425 | $13,485 | $13,062 | $12,161 |
| 7/31/2019 | $11,425 | $13,524 | $13,126 | $12,256 |
| 8/31/2019 | $11,325 | $13,203 | $13,090 | $12,610 |
| 9/30/2019 | $11,425 | $13,481 | $13,224 | $12,535 |
| 10/31/2019 | $11,671 | $13,850 | $13,419 | $12,481 |
| 11/30/2019 | $11,853 | $14,188 | $13,594 | $12,431 |
| 12/31/2019 | $12,129 | $14,688 | $13,848 | $12,355 |
| 1/31/2020 | $12,080 | $14,526 | $13,881 | $12,634 |
| 2/29/2020 | $11,496 | $13,352 | $13,297 | $12,836 |
| 3/31/2020 | $10,307 | $11,550 | $12,224 | $12,845 |
| 4/30/2020 | $11,028 | $12,787 | $13,054 | $12,961 |
| 5/31/2020 | $11,350 | $13,343 | $13,387 | $12,944 |
| 6/30/2020 | $11,515 | $13,769 | $13,660 | $12,982 |
| 7/31/2020 | $12,022 | $14,498 | $14,148 | $13,111 |
| 8/31/2020 | $12,392 | $15,385 | $14,610 | $12,977 |
| 9/30/2020 | $12,139 | $14,889 | $14,371 | $13,075 |
| 10/31/2020 | $12,012 | $14,527 | $14,158 | $13,067 |
| 11/30/2020 | $13,210 | $16,318 | $15,215 | $13,092 |
| 12/31/2020 | $13,778 | $17,075 | $15,648 | $13,109 |
| 1/31/2021 | $13,679 | $16,998 | $15,558 | $13,012 |
| 2/28/2021 | $13,847 | $17,391 | $15,640 | $12,730 |
| 3/31/2021 | $14,026 | $17,856 | $15,878 | $12,706 |
| 4/30/2021 | $14,342 | $18,637 | $16,296 | $12,707 |
| 5/31/2021 | $14,501 | $18,927 | $16,460 | $12,730 |
| 6/30/2021 | $14,461 | $19,176 | $16,626 | $12,800 |
| 7/31/2021 | $14,451 | $19,308 | $16,794 | $12,991 |
| 8/31/2021 | $14,679 | $19,791 | $17,026 | $12,952 |
| 9/30/2021 | $14,372 | $18,974 | $16,523 | $12,798 |
| 10/31/2021 | $14,778 | $19,942 | $17,017 | $12,774 |
| 11/30/2021 | $14,402 | $19,462 | $16,852 | $12,926 |
| 12/31/2021 | $14,872 | $20,241 | $17,195 | $12,809 |
| 1/31/2022 | $14,386 | $19,247 | $16,587 | $12,619 |
| 2/28/2022 | $14,042 | $18,749 | $16,253 | $12,473 |
| 3/31/2022 | $14,018 | $19,156 | $16,319 | $12,195 |
| 4/30/2022 | $13,188 | $17,622 | $15,359 | $11,865 |
| 5/31/2022 | $13,283 | $17,643 | $15,328 | $11,785 |
| 6/30/2022 | $12,429 | $16,156 | $14,480 | $11,646 |
| 7/31/2022 | $12,844 | $17,284 | $15,223 | $11,919 |
| 8/31/2022 | $12,453 | $16,648 | $14,704 | $11,561 |
| 9/30/2022 | $11,729 | $15,054 | $13,675 | $11,199 |
| 10/31/2022 | $12,121 | $15,962 | $14,151 | $11,159 |
| 11/30/2022 | $12,642 | $17,200 | $14,930 | $11,398 |
| 12/31/2022 | $12,345 | $16,524 | $14,454 | $11,161 |
| 1/31/2023 | $12,991 | $17,708 | $15,206 | $11,413 |
| 2/28/2023 | $12,581 | $17,200 | $14,848 | $11,232 |
| 3/31/2023 | $12,531 | $17,731 | $15,283 | $11,535 |
| 4/30/2023 | $12,581 | $17,986 | $15,436 | $11,575 |
| 5/31/2023 | $12,432 | $17,793 | $15,309 | $11,523 |
| 6/30/2023 | $12,904 | $18,826 | $15,826 | $11,493 |
| 7/31/2023 | $13,240 | $19,515 | $16,154 | $11,457 |
| 8/31/2023 | $12,954 | $18,970 | $15,873 | $11,439 |
| 9/30/2023 | $12,456 | $18,186 | $15,361 | $11,226 |
| 10/31/2023 | $12,108 | $17,639 | $15,047 | $11,159 |
| 11/30/2023 | $12,904 | $19,267 | $16,072 | $11,514 |
| 12/31/2023 | $13,508 | $20,192 | $16,738 | $11,878 |
| 1/31/2024 | $13,419 | $20,311 | $16,775 | $11,839 |
| 2/29/2024 | $13,724 | $21,182 | $17,158 | $11,752 |
| 3/31/2024 | $14,093 | $21,847 | $17,534 | $11,842 |
| 4/30/2024 | $13,635 | $21,126 | $17,071 | $11,647 |
| 5/31/2024 | $14,093 | $21,984 | $17,527 | $11,715 |
| 6/30/2024 | $14,131 | $22,474 | $17,818 | $11,810 |
Average Annual Total Returns (%)
| 1 Year | 5 Years | 10 Years |
|---|
| Class A | 9.51% | 4.34% | 4.10% |
| Class A with Load | 3.52% | 3.17% | 3.52% |
| MSCI All Country World Index (net) | 19.38% | 10.76% | 8.43% |
| 60% MSCI All Country World Index (net)/40% FTSE World Government Bond Index (Hedged in USD) | 12.58% | 6.41% | 5.95% |
| FTSE World Government Bond Index (Hedged in USD) | 2.75% | (0.58%) | 1.68% |
Performance data represents past performance, which does not guarantee future results.
The graph and table do not reflect the deduction of taxes that a shareholder would pay on Fund distributions or a redemption of Fund shares.
| FUND STATISTICS | |
|---|
| Total Net Assets | $153,472,343 |
| # of Portfolio Holdings | 330 |
| Portfolio Turnover Rate | 82% |
| Total Advisory Fees Paid | $758,956 |
What is the Fund’s investment objective?
The Fund seeks to maximize total return, consisting of capital appreciation and current income.
| PACE International Equity Investments, Class P2 | 9.4% |
| UBS Emerging Markets Equity Opportunity Fund, Class P2 | 6.4 |
| PACE International Emerging Markets Equity Investments, Class P2 | 6.4 |
| PACE High Yield Investments, Class P2 | 5.9 |
| SPDR Portfolio High Yield Bond ETF | 4.6 |
UBS Global Allocation Fund
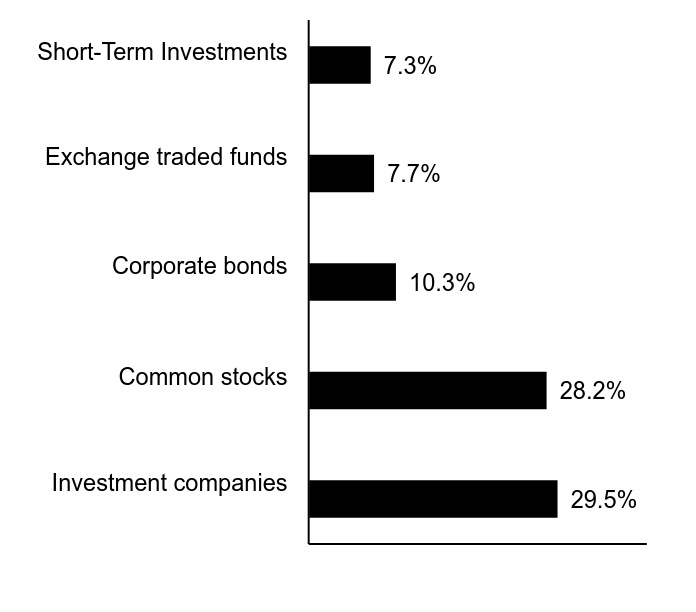
| Value | Value |
|---|
| Investment companies | 29.5% |
| Common stocks | 28.2% |
| Corporate bonds | 10.3% |
| Exchange traded funds | 7.7% |
| Short-Term Investments | 7.3% |
If you wish to view additional information about the Fund, including but not limited to financial statements or holdings, please visit http://www.ubs.com/port-info .
UBS Global Allocation Fund
Annual Shareholder Report
June 30, 2024
UBS Global Allocation Fund
This annual shareholder report contains important information about UBS Global Allocation Fund for the period of July 1, 2023 to June 30, 2024. You can find additional information about the Fund at http://www.ubs.com/port-info . You can also request this information by contacting us at 1-800-647-1568.
What were the Fund costs for the last year?
Annual Fund Operating Expenses
(based on a hypothetical $10,000 investment)
| Class Name | Cost of a $10,000 investment | Costs paid as a percentage of a $10,000 investment |
|---|
| Class P | $101 | 0.96% |
How did the Fund perform last year and what affected its performance?
Portfolio performance summary
Asset allocation:
• In October 2023, the yield on 10-year US Treasury bonds reached 5%, but by the end of the reporting period, yields had declined about 1%. As a result, the fund’s slight underweight duration relative to the Fund’s secondary benchmark index, a blend of 60% MSCI All Country World Index (net)/40% FTSE World Government Bond Index (Hedged in USD), hurt performance.
• From an asset class perspective, the largest detractor has been in foreign currency exposure. Our overweight positions in Japanese yen and Brazilian real were our largest detractors to performance. Additionally, within US equities our positioning has detracted from overall performance due to opportunistic positions in US small-cap and mid-cap stocks which underperformed large-cap equities.
• With respect to our tactical asset allocation decisions, an overweight in the EURO STOXX Banks sector was the largest contributor.
Bottom-up security selection:
Security selection in US large-cap value, emerging markets equity, international equity, China equity, and US securitized fixed income strategies detracted from performance. Meanwhile, security selection within US large-cap growth, intermediate investment grade fixed income, global government fixed income, and below-investment grade fixed income contributed to performance.
We use derivatives extensively for capital management, risk management, and expressing asset allocation views. We utilize various futures which include equity regional, equity style, fixed income regional in both government and corporate credit. Futures are sometimes used to manage overall regional exposure while increasing exposure to active managers. We also utilize futures to gain exposure to asset classes when limited by our max allocation to external ETFs by SEC rules.
UBS Global Allocation Fund
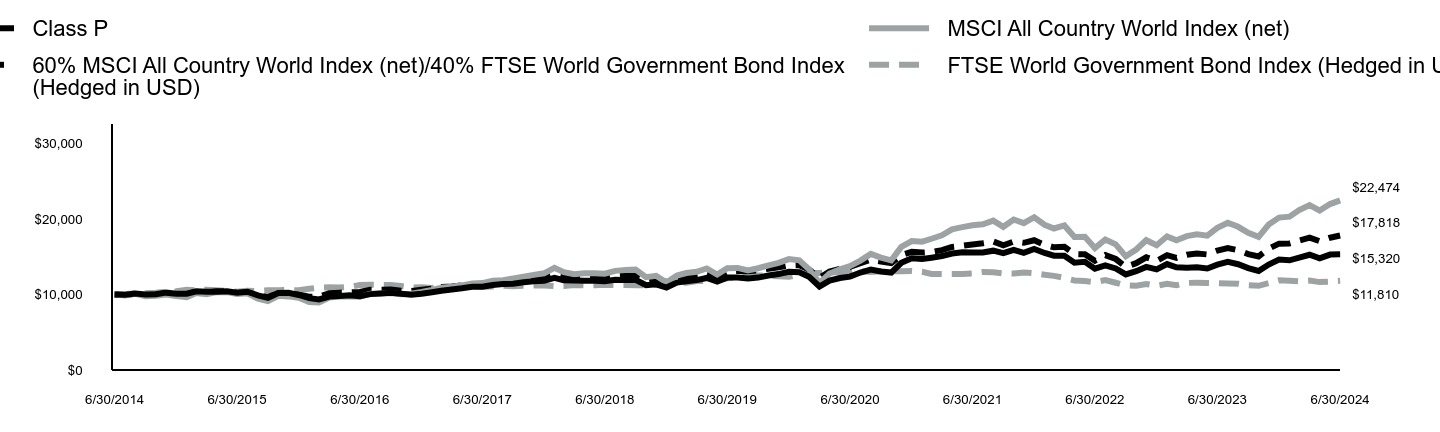
| Class P | MSCI All Country World Index (net) | 60% MSCI All Country World Index (net)/40% FTSE World Government Bond Index (Hedged in USD) | FTSE World Government Bond Index (Hedged in USD) |
|---|
| 6/30/2014 | $10,000 | $10,000 | $10,000 | $10,000 |
| 7/31/2014 | $9,956 | $9,879 | $9,943 | $10,040 |
| 8/31/2014 | $10,124 | $10,097 | $10,128 | $10,173 |
| 9/30/2014 | $10,000 | $9,770 | $9,923 | $10,153 |
| 10/31/2014 | $10,044 | $9,838 | $9,991 | $10,221 |
| 11/30/2014 | $10,249 | $10,003 | $10,137 | $10,338 |
| 12/31/2014 | $10,116 | $9,810 | $10,054 | $10,426 |
| 1/31/2015 | $10,107 | $9,656 | $10,042 | $10,638 |
| 2/28/2015 | $10,436 | $10,194 | $10,347 | $10,558 |
| 3/31/2015 | $10,356 | $10,036 | $10,282 | $10,638 |
| 4/30/2015 | $10,382 | $10,327 | $10,430 | $10,556 |
| 5/31/2015 | $10,418 | $10,314 | $10,395 | $10,490 |
| 6/30/2015 | $10,231 | $10,071 | $10,195 | $10,354 |
| 7/31/2015 | $10,364 | $10,158 | $10,300 | $10,486 |
| 8/31/2015 | $9,884 | $9,462 | $9,869 | $10,468 |
| 9/30/2015 | $9,556 | $9,119 | $9,686 | $10,553 |
| 10/31/2015 | $10,204 | $9,835 | $10,153 | $10,581 |
| 11/30/2015 | $10,231 | $9,754 | $10,105 | $10,586 |
| 12/31/2015 | $9,944 | $9,578 | $9,986 | $10,561 |
| 1/31/2016 | $9,524 | $9,000 | $9,705 | $10,774 |
| 2/29/2016 | $9,350 | $8,938 | $9,713 | $10,907 |
| 3/31/2016 | $9,725 | $9,601 | $10,165 | $10,964 |
| 4/30/2016 | $9,807 | $9,742 | $10,248 | $10,945 |
| 5/31/2016 | $9,889 | $9,755 | $10,280 | $11,010 |
| 6/30/2016 | $9,770 | $9,696 | $10,340 | $11,270 |
| 7/31/2016 | $10,054 | $10,114 | $10,622 | $11,310 |
| 8/31/2016 | $10,136 | $10,148 | $10,629 | $11,273 |
| 9/30/2016 | $10,227 | $10,210 | $10,666 | $11,266 |
| 10/31/2016 | $10,090 | $10,036 | $10,502 | $11,120 |
| 11/30/2016 | $9,981 | $10,113 | $10,480 | $10,935 |
| 12/31/2016 | $10,100 | $10,331 | $10,624 | $10,957 |
| 1/31/2017 | $10,296 | $10,614 | $10,766 | $10,874 |
| 2/28/2017 | $10,493 | $10,911 | $10,985 | $10,970 |
| 3/31/2017 | $10,661 | $11,045 | $11,061 | $10,957 |
| 4/30/2017 | $10,820 | $11,217 | $11,194 | $11,029 |
| 5/31/2017 | $11,026 | $11,465 | $11,365 | $11,086 |
| 6/30/2017 | $11,026 | $11,517 | $11,379 | $11,045 |
| 7/31/2017 | $11,260 | $11,839 | $11,579 | $11,068 |
| 8/31/2017 | $11,382 | $11,884 | $11,653 | $11,180 |
| 9/30/2017 | $11,438 | $12,114 | $11,759 | $11,110 |
| 10/31/2017 | $11,625 | $12,365 | $11,926 | $11,160 |
| 11/30/2017 | $11,766 | $12,605 | $12,077 | $11,187 |
| 12/31/2017 | $11,826 | $12,808 | $12,195 | $11,192 |
| 1/31/2018 | $12,206 | $13,530 | $12,575 | $11,115 |
| 2/28/2018 | $11,892 | $12,962 | $12,260 | $11,121 |
| 3/31/2018 | $11,854 | $12,685 | $12,163 | $11,258 |
| 4/30/2018 | $11,826 | $12,806 | $12,214 | $11,213 |
| 5/31/2018 | $11,835 | $12,822 | $12,233 | $11,236 |
| 6/30/2018 | $11,750 | $12,752 | $12,212 | $11,279 |
| 7/31/2018 | $11,959 | $13,137 | $12,422 | $11,254 |
| 8/31/2018 | $11,921 | $13,240 | $12,486 | $11,267 |
| 9/30/2018 | $11,959 | $13,298 | $12,496 | $11,216 |
| 10/31/2018 | $11,236 | $12,301 | $11,934 | $11,216 |
| 11/30/2018 | $11,359 | $12,481 | $12,072 | $11,293 |
| 12/31/2018 | $10,931 | $11,602 | $11,643 | $11,483 |
| 1/31/2019 | $11,588 | $12,518 | $12,236 | $11,585 |
| 2/28/2019 | $11,759 | $12,853 | $12,428 | $11,576 |
| 3/31/2019 | $11,911 | $13,015 | $12,617 | $11,797 |
| 4/30/2019 | $12,197 | $13,454 | $12,864 | $11,777 |
| 5/31/2019 | $11,731 | $12,656 | $12,499 | $11,989 |
| 6/30/2019 | $12,244 | $13,485 | $13,062 | $12,161 |
| 7/31/2019 | $12,244 | $13,524 | $13,126 | $12,256 |
| 8/31/2019 | $12,140 | $13,203 | $13,090 | $12,610 |
| 9/30/2019 | $12,244 | $13,481 | $13,224 | $12,535 |
| 10/31/2019 | $12,511 | $13,850 | $13,419 | $12,481 |
| 11/30/2019 | $12,710 | $14,188 | $13,594 | $12,431 |
| 12/31/2019 | $13,012 | $14,688 | $13,848 | $12,355 |
| 1/31/2020 | $12,961 | $14,526 | $13,881 | $12,634 |
| 2/29/2020 | $12,339 | $13,352 | $13,297 | $12,836 |
| 3/31/2020 | $11,064 | $11,550 | $12,224 | $12,845 |
| 4/30/2020 | $11,839 | $12,787 | $13,054 | $12,961 |
| 5/31/2020 | $12,186 | $13,343 | $13,387 | $12,944 |
| 6/30/2020 | $12,369 | $13,769 | $13,660 | $12,982 |
| 7/31/2020 | $12,910 | $14,498 | $14,148 | $13,111 |
| 8/31/2020 | $13,307 | $15,385 | $14,610 | $12,977 |
| 9/30/2020 | $13,042 | $14,889 | $14,371 | $13,075 |
| 10/31/2020 | $12,910 | $14,527 | $14,158 | $13,067 |
| 11/30/2020 | $14,195 | $16,318 | $15,215 | $13,092 |
| 12/31/2020 | $14,813 | $17,075 | $15,648 | $13,109 |
| 1/31/2021 | $14,709 | $16,998 | $15,558 | $13,012 |
| 2/28/2021 | $14,885 | $17,391 | $15,640 | $12,730 |
| 3/31/2021 | $15,093 | $17,856 | $15,878 | $12,706 |
| 4/30/2021 | $15,435 | $18,637 | $16,296 | $12,707 |
| 5/31/2021 | $15,601 | $18,927 | $16,460 | $12,730 |
| 6/30/2021 | $15,570 | $19,176 | $16,626 | $12,800 |
| 7/31/2021 | $15,560 | $19,308 | $16,794 | $12,991 |
| 8/31/2021 | $15,809 | $19,791 | $17,026 | $12,952 |
| 9/30/2021 | $15,477 | $18,974 | $16,523 | $12,798 |
| 10/31/2021 | $15,923 | $19,942 | $17,017 | $12,774 |
| 11/30/2021 | $15,518 | $19,462 | $16,852 | $12,926 |
| 12/31/2021 | $16,031 | $20,241 | $17,195 | $12,809 |
| 1/31/2022 | $15,510 | $19,247 | $16,587 | $12,619 |
| 2/28/2022 | $15,138 | $18,749 | $16,253 | $12,473 |
| 3/31/2022 | $15,125 | $19,156 | $16,319 | $12,195 |
| 4/30/2022 | $14,219 | $17,622 | $15,359 | $11,865 |
| 5/31/2022 | $14,331 | $17,643 | $15,328 | $11,785 |
| 6/30/2022 | $13,425 | $16,156 | $14,480 | $11,646 |
| 7/31/2022 | $13,872 | $17,284 | $15,223 | $11,919 |
| 8/31/2022 | $13,450 | $16,648 | $14,704 | $11,561 |
| 9/30/2022 | $12,668 | $15,054 | $13,675 | $11,199 |
| 10/31/2022 | $13,090 | $15,962 | $14,151 | $11,159 |
| 11/30/2022 | $13,661 | $17,200 | $14,930 | $11,398 |
| 12/31/2022 | $13,337 | $16,524 | $14,454 | $11,161 |
| 1/31/2023 | $14,038 | $17,708 | $15,206 | $11,413 |
| 2/28/2023 | $13,610 | $17,200 | $14,848 | $11,232 |
| 3/31/2023 | $13,545 | $17,731 | $15,283 | $11,535 |
| 4/30/2023 | $13,597 | $17,986 | $15,436 | $11,575 |
| 5/31/2023 | $13,441 | $17,793 | $15,309 | $11,523 |
| 6/30/2023 | $13,960 | $18,826 | $15,826 | $11,493 |
| 7/31/2023 | $14,324 | $19,515 | $16,154 | $11,457 |
| 8/31/2023 | $14,012 | $18,970 | $15,873 | $11,439 |
| 9/30/2023 | $13,493 | $18,186 | $15,361 | $11,226 |
| 10/31/2023 | $13,116 | $17,639 | $15,047 | $11,159 |
| 11/30/2023 | $13,973 | $19,267 | $16,072 | $11,514 |
| 12/31/2023 | $14,629 | $20,192 | $16,738 | $11,878 |
| 1/31/2024 | $14,536 | $20,311 | $16,775 | $11,839 |
| 2/29/2024 | $14,881 | $21,182 | $17,158 | $11,752 |
| 3/31/2024 | $15,267 | $21,847 | $17,534 | $11,842 |
| 4/30/2024 | $14,788 | $21,126 | $17,071 | $11,647 |
| 5/31/2024 | $15,294 | $21,984 | $17,527 | $11,715 |
| 6/30/2024 | $15,320 | $22,474 | $17,818 | $11,810 |
Average Annual Total Returns (%)
| 1 Year | 5 Years | 10 Years |
|---|
| Class P | 9.74% | 4.58% | 4.36% |
| MSCI All Country World Index (net) | 19.38% | 10.76% | 8.43% |
| 60% MSCI All Country World Index (net)/40% FTSE World Government Bond Index (Hedged in USD) | 12.58% | 6.41% | 5.95% |
| FTSE World Government Bond Index (Hedged in USD) | 2.75% | (0.58%) | 1.68% |
Performance data represents past performance, which does not guarantee future results.
The graph and table do not reflect the deduction of taxes that a shareholder would pay on Fund distributions or a redemption of Fund shares.
| FUND STATISTICS | |
|---|
| Total Net Assets | $153,472,343 |
| # of Portfolio Holdings | 330 |
| Portfolio Turnover Rate | 82% |
| Total Advisory Fees Paid | $758,956 |
What is the Fund’s investment objective?
The Fund seeks to maximize total return, consisting of capital appreciation and current income.
| PACE International Equity Investments, Class P2 | 9.4% |
| UBS Emerging Markets Equity Opportunity Fund, Class P2 | 6.4 |
| PACE International Emerging Markets Equity Investments, Class P2 | 6.4 |
| PACE High Yield Investments, Class P2 | 5.9 |
| SPDR Portfolio High Yield Bond ETF | 4.6 |
UBS Global Allocation Fund
| Value | Value |
|---|
| Investment companies | 29.5% |
| Common stocks | 28.2% |
| Corporate bonds | 10.3% |
| Exchange traded funds | 7.7% |
| Short-Term Investments | 7.3% |
If you wish to view additional information about the Fund, including but not limited to financial statements or holdings, please visit http://www.ubs.com/port-info .
UBS Global Allocation Fund
Annual Shareholder Report
June 30, 2024
UBS US Dividend Ruler Fund
This annual shareholder report contains important information about UBS US Dividend Ruler Fund for the period of July 1, 2023 to June 30, 2024. You can find additional information about the Fund at http://www.ubs.com/port-info . You can also request this information by contacting us at 1-800-647-1568.
What were the Fund costs for the last year?
Annual Fund Operating Expenses
(based on a hypothetical $10,000 investment)
| Class Name | Cost of a $10,000 investment | Costs paid as a percentage of a $10,000 investment |
|---|
| Class P | $55 | 0.51% |
How did the Fund perform last year and what affected its performance?
Portfolio performance summary
What worked:
• Stock selection within the financials, materials, and energy sectors were additive to performance
• Within sectors, the portfolio’s overweight to technology and underweight to consumer discretionary were positive performance contributors.
• Several holdings were beneficial for absolute performance, including:
• Broadcom’s shares rallied given its growing exposure to artificial intelligence infrastructure
• While artificial intelligence adoption remains in its early days, Microsoft appears to be a leader in monetizing its vast amount of data across its Office platform and leading Azure cloud offering.
• Shares of Taiwan Semiconductor ADR rallied amid robust artificial intelligence datacenter demand from key customers such as NVIDIA.
What didn't work:
• Stock selection within industrials and consumer discretionary were the largest relative detractors.
• Within sectors, the portfolio’s underweight to communication services was the largest detractor.
• Several holdings weighed on absolute performance, including:
• Shares of RTX slid amid issues with its geared turbofan engines. The associated cost of grounding the impacted planes, including actual repairs and remediation to customers, led management to cut its free cash flow guidance for 2024.
• Starbucks shares fell due to declining same stores sales. The company blamed softer “occasional visitor” traffic and social media disinformation tied to its stance on the Middle East conflict.
• Shares of UPS lagged due to weak parcel volumes and elevated labor costs. Looking forward, volumes appear to be near trough levels. Margins should also begin to rebound driven by greater mix of more profitable segments such as healthcare and small and medium-sized businesses, and lessening labor costs headwinds.
The Fund did not invest in derivatives during the reporting period.
UBS US Dividend Ruler Fund
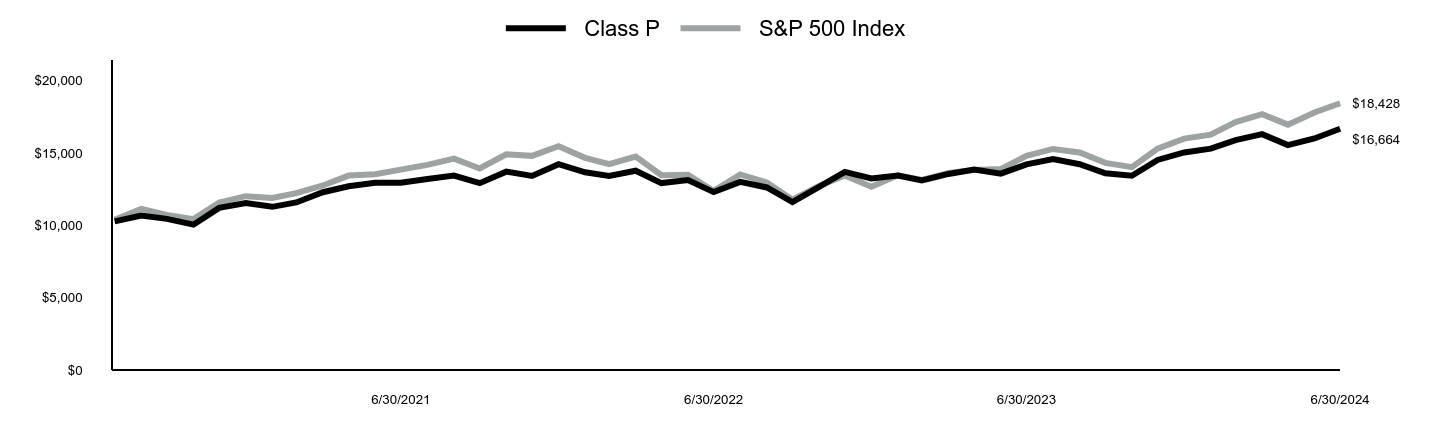
| Class P | S&P 500 Index |
|---|
| 7/31/2020 | $10,270 | $10,385 |
| 8/31/2020 | $10,670 | $11,131 |
| 9/30/2020 | $10,440 | $10,708 |
| 10/31/2020 | $10,040 | $10,423 |
| 11/30/2020 | $11,200 | $11,564 |
| 12/31/2020 | $11,534 | $12,009 |
| 1/31/2021 | $11,272 | $11,888 |
| 2/28/2021 | $11,574 | $12,215 |
| 3/31/2021 | $12,281 | $12,750 |
| 4/30/2021 | $12,694 | $13,431 |
| 5/31/2021 | $12,937 | $13,525 |
| 6/30/2021 | $12,937 | $13,840 |
| 7/31/2021 | $13,189 | $14,169 |
| 8/31/2021 | $13,431 | $14,600 |
| 9/30/2021 | $12,906 | $13,921 |
| 10/31/2021 | $13,703 | $14,896 |
| 11/30/2021 | $13,401 | $14,793 |
| 12/31/2021 | $14,221 | $15,456 |
| 1/31/2022 | $13,660 | $14,656 |
| 2/28/2022 | $13,400 | $14,218 |
| 3/31/2022 | $13,764 | $14,745 |
| 4/30/2022 | $12,912 | $13,460 |
| 5/31/2022 | $13,120 | $13,484 |
| 6/30/2022 | $12,289 | $12,371 |
| 7/31/2022 | $12,995 | $13,512 |
| 8/31/2022 | $12,611 | $12,961 |
| 9/30/2022 | $11,603 | $11,767 |
| 10/31/2022 | $12,652 | $12,720 |
| 11/30/2022 | $13,681 | $13,431 |
| 12/31/2022 | $13,236 | $12,657 |
| 1/31/2023 | $13,439 | $13,452 |
| 2/28/2023 | $13,098 | $13,124 |
| 3/31/2023 | $13,545 | $13,606 |
| 4/30/2023 | $13,843 | $13,818 |
| 5/31/2023 | $13,566 | $13,878 |
| 6/30/2023 | $14,205 | $14,795 |
| 7/31/2023 | $14,578 | $15,271 |
| 8/31/2023 | $14,216 | $15,027 |
| 9/30/2023 | $13,588 | $14,311 |
| 10/31/2023 | $13,417 | $14,010 |
| 11/30/2023 | $14,514 | $15,289 |
| 12/31/2023 | $15,031 | $15,984 |
| 1/31/2024 | $15,294 | $16,253 |
| 2/29/2024 | $15,886 | $17,121 |
| 3/31/2024 | $16,291 | $17,671 |
| 4/30/2024 | $15,535 | $16,950 |
| 5/31/2024 | $15,995 | $17,790 |
| 6/30/2024 | $16,664 | $18,428 |
Average Annual Total Returns (%)
| 1 Year | Since Inception 7/9/20 |
|---|
| Class P | 17.31% | 13.71% |
| S&P 500 Index | 24.56% | 16.62% |
Performance data represents past performance, which does not guarantee future results.
The graph and table do not reflect the deduction of taxes that a shareholder would pay on Fund distributions or a redemption of Fund shares.
| FUND STATISTICS | |
|---|
| Total Net Assets | $199,336,082 |
| # of Portfolio Holdings | 32 |
| Portfolio Turnover Rate | 26% |
| Total Advisory Fees Paid | $183,794 |
What is the Fund’s investment objective?
The Fund seeks to maximize total return, consisting of capital appreciation and current income.
Top 5 Holdings (% of Net Assets)
| Microsoft Corp. | 11.9% |
| Broadcom, Inc. | 5.7 |
| Oracle Corp. | 5.1 |
| Taiwan Semiconductor Manufacturing Co. Ltd. (Taiwan) | 4.5 |
| JPMorgan Chase & Co. | 4.4 |
UBS US Dividend Ruler Fund
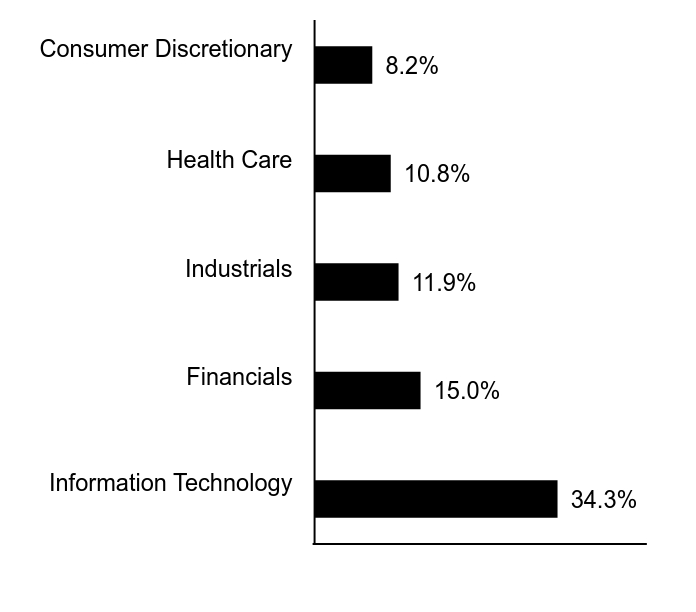
Top 5 Sectors (% of Net Assets)
| Value | Value |
|---|
| Information Technology | 34.3% |
| Financials | 15.0% |
| Industrials | 11.9% |
| Health Care | 10.8% |
| Consumer Discretionary | 8.2% |
If you wish to view additional information about the Fund, including but not limited to financial statements or holdings, please visit http://www.ubs.com/port-info .
UBS US Dividend Ruler Fund
Annual Shareholder Report
June 30, 2024
UBS US Dividend Ruler Fund
This annual shareholder report contains important information about UBS US Dividend Ruler Fund for the period of July 1, 2023 to June 30, 2024. You can find additional information about the Fund at http://www.ubs.com/port-info . You can also request this information by contacting us at 1-800-647-1568.
What were the Fund costs for the last year?
Annual Fund Operating Expenses
(based on a hypothetical $10,000 investment)
| Class Name | Cost of a $10,000 investment | Costs paid as a percentage of a $10,000 investment |
|---|
| Class P2 | $17 | 0.16% |
How did the Fund perform last year and what affected its performance?
Portfolio performance summary
What worked:
• Stock selection within the financials, materials, and energy sectors were additive to performance
• Within sectors, the portfolio’s overweight to technology and underweight to consumer discretionary were positive performance contributors.
• Several holdings were beneficial for absolute performance, including:
• Broadcom’s shares rallied given its growing exposure to artificial intelligence infrastructure
• While artificial intelligence adoption remains in its early days, Microsoft appears to be a leader in monetizing its vast amount of data across its Office platform and leading Azure cloud offering.
• Shares of Taiwan Semiconductor ADR rallied amid robust artificial intelligence datacenter demand from key customers such as NVIDIA.
What didn't work:
• Stock selection within industrials and consumer discretionary were the largest relative detractors.
• Within sectors, the portfolio’s underweight to communication services was the largest detractor.
• Several holdings weighed on absolute performance, including:
• Shares of RTX slid amid issues with its geared turbofan engines. The associated cost of grounding the impacted planes, including actual repairs and remediation to customers, led management to cut its free cash flow guidance for 2024.
• Starbucks shares fell due to declining same stores sales. The company blamed softer “occasional visitor” traffic and social media disinformation tied to its stance on the Middle East conflict.
• Shares of UPS lagged due to weak parcel volumes and elevated labor costs. Looking forward, volumes appear to be near trough levels. Margins should also begin to rebound driven by greater mix of more profitable segments such as healthcare and small and medium-sized businesses, and lessening labor costs headwinds.
The Fund did not invest in derivatives during the reporting period.
UBS US Dividend Ruler Fund
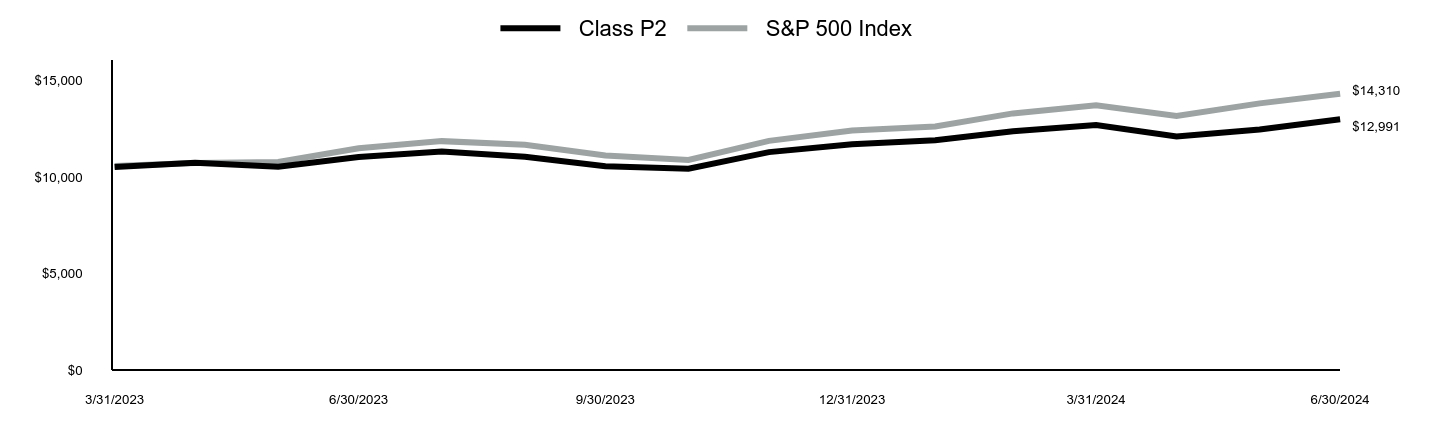
| Class P2 | S&P 500 Index |
|---|
| 3/31/2023 | $10,512 | $10,565 |
| 4/30/2023 | $10,744 | $10,730 |
| 5/31/2023 | $10,529 | $10,777 |
| 6/30/2023 | $11,033 | $11,489 |
| 7/31/2023 | $11,322 | $11,858 |
| 8/31/2023 | $11,050 | $11,669 |
| 9/30/2023 | $10,562 | $11,113 |
| 10/31/2023 | $10,430 | $10,879 |
| 11/30/2023 | $11,289 | $11,872 |
| 12/31/2023 | $11,691 | $12,412 |
| 1/31/2024 | $11,905 | $12,620 |
| 2/29/2024 | $12,366 | $13,294 |
| 3/31/2024 | $12,691 | $13,722 |
| 4/30/2024 | $12,101 | $13,162 |
| 5/31/2024 | $12,460 | $13,814 |
| 6/30/2024 | $12,991 | $14,310 |
Average Annual Total Returns (%)
| 1 Year | Since Inception 3/15/23 |
|---|
| Class P2 | 17.74% | 22.43% |
| S&P 500 Index | 24.56% | 31.93% |
Performance data represents past performance, which does not guarantee future results.
The graph and table do not reflect the deduction of taxes that a shareholder would pay on Fund distributions or a redemption of Fund shares.
| FUND STATISTICS | |
|---|
| Total Net Assets | $199,336,082 |
| # of Portfolio Holdings | 32 |
| Portfolio Turnover Rate | 26% |
| Total Advisory Fees Paid | $183,794 |
What is the Fund’s investment objective?
The Fund seeks to maximize total return, consisting of capital appreciation and current income.
Top 5 Holdings (% of Net Assets)
| Microsoft Corp. | 11.9% |
| Broadcom, Inc. | 5.7 |
| Oracle Corp. | 5.1 |
| Taiwan Semiconductor Manufacturing Co. Ltd. (Taiwan) | 4.5 |
| JPMorgan Chase & Co. | 4.4 |
UBS US Dividend Ruler Fund
Top 5 Sectors (% of Net Assets)
| Value | Value |
|---|
| Information Technology | 34.3% |
| Financials | 15.0% |
| Industrials | 11.9% |
| Health Care | 10.8% |
| Consumer Discretionary | 8.2% |
If you wish to view additional information about the Fund, including but not limited to financial statements or holdings, please visit http://www.ubs.com/port-info .
UBS US Dividend Ruler Fund
Annual Shareholder Report
June 30, 2024
UBS All China Equity Fund
This annual shareholder report contains important information about UBS All China Equity Fund for the period of July 1, 2023 to June 30, 2024. You can find additional information about the Fund at http://www.ubs.com/port-info . You can also request this information by contacting us at 1-800-647-1568.
What were the Fund costs for the last year?
Annual Fund Operating Expenses
(based on a hypothetical $10,000 investment)
| Class Name | Cost of a $10,000 investment | Costs paid as a percentage of a $10,000 investment |
|---|
| Class P | $161 | 1.70% |
How did the Fund perform last year and what affected its performance?
Portfolio performance summary
What worked:
• Security selection within the consumer staples sector was additive to performance.
• An overweight in the communication services sector and an underweight in the information technology sector was also positive for performance.
• With respect to specific securities, our positioning in China Merchants Bank, NetEase and TAL Education were the main contributors.
What didn’t work:
• Security selection within the financials sector detracted from performance.
• An overweight in the consumer staples and health care sectors also dragged on performance.
• With respect to specific securities, underweighting PDD and overweighting JOINN Laboratories and Yunnan Energy hindered performance.
The Fund did not invest in derivatives during the reporting period.
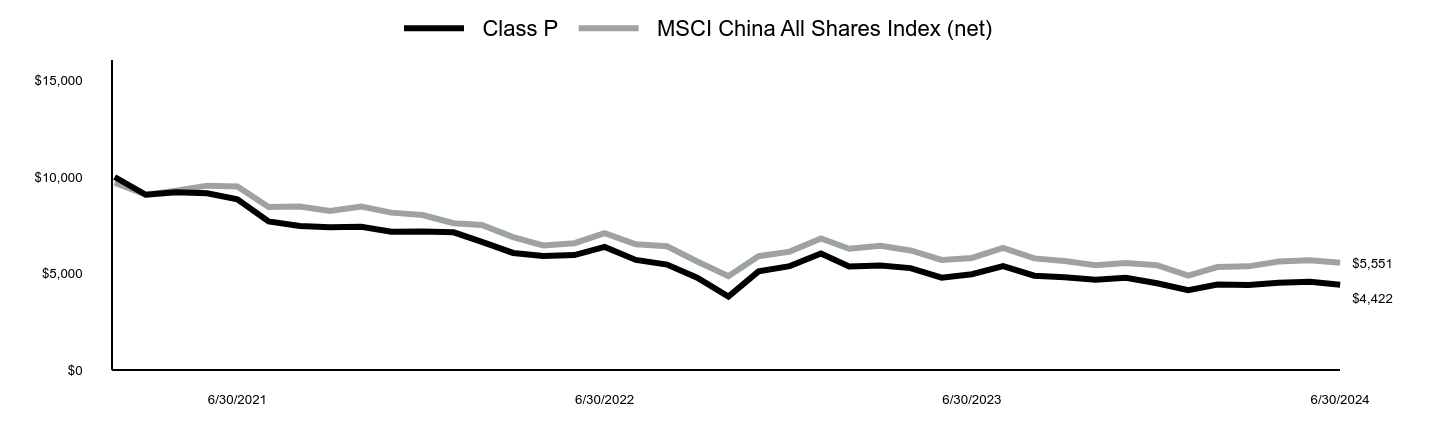
UBS All China Equity Fund
| Class P | MSCI China All Shares Index (net) |
|---|
| 2/28/2021 | $10,000 | $9,698 |
| 3/31/2021 | $9,080 | $9,082 |
| 4/30/2021 | $9,210 | $9,292 |
| 5/31/2021 | $9,160 | $9,552 |
| 6/30/2021 | $8,840 | $9,507 |
| 7/31/2021 | $7,700 | $8,449 |
| 8/31/2021 | $7,460 | $8,467 |
| 9/30/2021 | $7,390 | $8,238 |
| 10/31/2021 | $7,420 | $8,467 |
| 11/30/2021 | $7,160 | $8,154 |
| 12/31/2021 | $7,173 | $8,030 |
| 1/31/2022 | $7,133 | $7,602 |
| 2/28/2022 | $6,639 | $7,509 |
| 3/31/2022 | $6,065 | $6,885 |
| 4/30/2022 | $5,903 | $6,453 |
| 5/31/2022 | $5,954 | $6,570 |
| 6/30/2022 | $6,377 | $7,085 |
| 7/31/2022 | $5,702 | $6,513 |
| 8/31/2022 | $5,460 | $6,408 |
| 9/30/2022 | $4,785 | $5,622 |
| 10/31/2022 | $3,808 | $4,862 |
| 11/30/2022 | $5,108 | $5,897 |
| 12/31/2022 | $5,382 | $6,134 |
| 1/31/2023 | $6,033 | $6,812 |
| 2/28/2023 | $5,362 | $6,279 |
| 3/31/2023 | $5,413 | $6,441 |
| 4/30/2023 | $5,280 | $6,192 |
| 5/31/2023 | $4,782 | $5,700 |
| 6/30/2023 | $4,965 | $5,806 |
| 7/31/2023 | $5,382 | $6,328 |
| 8/31/2023 | $4,884 | $5,783 |
| 9/30/2023 | $4,802 | $5,642 |
| 10/31/2023 | $4,680 | $5,428 |
| 11/30/2023 | $4,782 | $5,537 |
| 12/31/2023 | $4,495 | $5,427 |
| 1/31/2024 | $4,131 | $4,887 |
| 2/29/2024 | $4,433 | $5,335 |
| 3/31/2024 | $4,402 | $5,370 |
| 4/30/2024 | $4,526 | $5,625 |
| 5/31/2024 | $4,568 | $5,691 |
| 6/30/2024 | $4,422 | $5,551 |
Average Annual Total Returns (%)
| 1 Year | Since Inception 2/24/21 |
|---|
| Class P | (10.93%) | (21.64%) |
| MSCI China All Shares Index (net) | (4.39%) | (16.14%) |
Performance data represents past performance, which does not guarantee future results.
The graph and table do not reflect the deduction of taxes that a shareholder would pay on Fund distributions or a redemption of Fund shares.
| FUND STATISTICS | |
|---|
| Total Net Assets | $2,765,410 |
| # of Portfolio Holdings | 39 |
| Portfolio Turnover Rate | 6% |
| Total Advisory Fees Paid | $0 |
What is the Fund’s investment objective?
The Fund seeks to maximize capital appreciation.
Top 5 Holdings (% of Net Assets)
| NetEase, Inc. (China) | 14.5% |
| Tencent Holdings Ltd. (China) | 11.7 |
| Kweichow Moutai Co. Ltd., Class A (China) | 9.5 |
| China Merchants Bank Co. Ltd., Class H (China) | 9.1 |
| Hong Kong Exchanges & Clearing Ltd. (Hong Kong) | 4.4 |
UBS All China Equity Fund
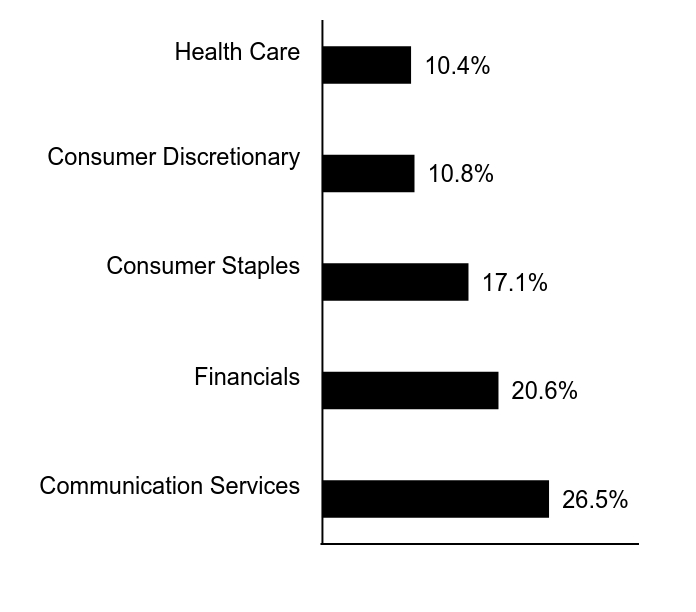
Top 5 Sectors (% of Net Assets)
| Value | Value |
|---|
| Communication Services | 26.5% |
| Financials | 20.6% |
| Consumer Staples | 17.1% |
| Consumer Discretionary | 10.8% |
| Health Care | 10.4% |
If you wish to view additional information about the Fund, including but not limited to financial statements or holdings, please visit http://www.ubs.com/port-info .
UBS All China Equity Fund
Annual Shareholder Report
June 30, 2024
UBS All China Equity Fund
This annual shareholder report contains important information about UBS All China Equity Fund for the period of July 1, 2023 to June 30, 2024. You can find additional information about the Fund at http://www.ubs.com/port-info . You can also request this information by contacting us at 1-800-647-1568.
What were the Fund costs for the last year?
Annual Fund Operating Expenses
(based on a hypothetical $10,000 investment)
| Class Name | Cost of a $10,000 investment | Costs paid as a percentage of a $10,000 investment |
|---|
| Class P2 | $86 | 0.91% |
How did the Fund perform last year and what affected its performance?
Portfolio performance summary
What worked:
• Security selection within the consumer staples sector was additive to performance.
• An overweight in the communication services sector and an underweight in the information technology sector was also positive for performance.
• With respect to specific securities, our positioning in China Merchants Bank, NetEase and TAL Education were the main contributors.
What didn’t work:
• Security selection within the financials sector detracted from performance.
• An overweight in the consumer staples and health care sectors also dragged on performance.
• With respect to specific securities, underweighting PDD and overweighting JOINN Laboratories and Yunnan Energy hindered performance.
The Fund did not invest in derivatives during the reporting period.
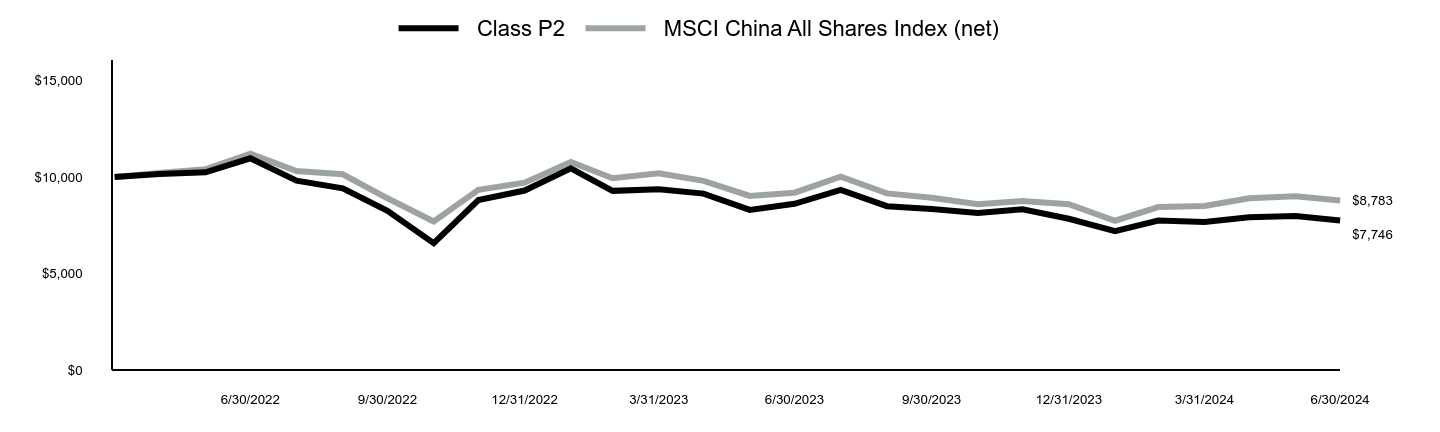
UBS All China Equity Fund
| Class P2 | MSCI China All Shares Index (net) |
|---|
| 3/31/2022 | $10,000 | $10,000 |
| 4/30/2022 | $10,156 | $10,211 |
| 5/31/2022 | $10,242 | $10,397 |
| 6/30/2022 | $10,969 | $11,210 |
| 7/31/2022 | $9,810 | $10,305 |
| 8/31/2022 | $9,412 | $10,139 |
| 9/30/2022 | $8,253 | $8,896 |
| 10/31/2022 | $6,574 | $7,693 |
| 11/30/2022 | $8,806 | $9,332 |
| 12/31/2022 | $9,299 | $9,707 |
| 1/31/2023 | $10,446 | $10,780 |
| 2/28/2023 | $9,281 | $9,936 |
| 3/31/2023 | $9,369 | $10,192 |
| 4/30/2023 | $9,140 | $9,798 |
| 5/31/2023 | $8,293 | $9,019 |
| 6/30/2023 | $8,611 | $9,186 |
| 7/31/2023 | $9,334 | $10,012 |
| 8/31/2023 | $8,487 | $9,150 |
| 9/30/2023 | $8,346 | $8,928 |
| 10/31/2023 | $8,134 | $8,588 |
| 11/30/2023 | $8,328 | $8,761 |
| 12/31/2023 | $7,837 | $8,587 |
| 1/31/2024 | $7,199 | $7,734 |
| 2/29/2024 | $7,746 | $8,442 |
| 3/31/2024 | $7,673 | $8,497 |
| 4/30/2024 | $7,910 | $8,901 |
| 5/31/2024 | $7,983 | $9,005 |
| 6/30/2024 | $7,746 | $8,783 |
Average Annual Total Returns (%)
| 1 Year | Since Inception 4/21/22 |
|---|
| Class P2 | (10.04%) | (11.54%) |
| MSCI China All Shares Index (net) | (4.39%) | (6.93%) |
Performance data represents past performance, which does not guarantee future results.
The graph and table do not reflect the deduction of taxes that a shareholder would pay on Fund distributions or a redemption of Fund shares.
| FUND STATISTICS | |
|---|
| Total Net Assets | $2,765,410 |
| # of Portfolio Holdings | 39 |
| Portfolio Turnover Rate | 6% |
| Total Advisory Fees Paid | $0 |
What is the Fund’s investment objective?
The Fund seeks to maximize capital appreciation.
Top 5 Holdings (% of Net Assets)
| NetEase, Inc. (China) | 14.5% |
| Tencent Holdings Ltd. (China) | 11.7 |
| Kweichow Moutai Co. Ltd., Class A (China) | 9.5 |
| China Merchants Bank Co. Ltd., Class H (China) | 9.1 |
| Hong Kong Exchanges & Clearing Ltd. (Hong Kong) | 4.4 |
UBS All China Equity Fund
Top 5 Sectors (% of Net Assets)
| Value | Value |
|---|
| Communication Services | 26.5% |
| Financials | 20.6% |
| Consumer Staples | 17.1% |
| Consumer Discretionary | 10.8% |
| Health Care | 10.4% |
If you wish to view additional information about the Fund, including but not limited to financial statements or holdings, please visit http://www.ubs.com/port-info .
UBS All China Equity Fund
Annual Shareholder Report
June 30, 2024
UBS Emerging Markets Equity Opportunity Fund
This annual shareholder report contains important information about UBS Emerging Markets Equity Opportunity Fund for the period of July 1, 2023 to June 30, 2024. You can find additional information about the Fund at http://www.ubs.com/port-info . You can also request this information by contacting us at 1-800-647-1568.
What were the Fund costs for the last year?
Annual Fund Operating Expenses
(based on a hypothetical $10,000 investment)
| Class Name | Cost of a $10,000 investment | Costs paid as a percentage of a $10,000 investment |
|---|
| Class P | $105 | 1.00% |
How did the Fund perform last year and what affected its performance?
Portfolio performance summary
What worked:
• On a sector level, stock selection within Consumer Discretionary and Information Technology added value
• On a stock level PDD, SK Hynix, and Mediatek were among the top contributors
• The Fund's holding in PDD (China, Consumer Discretionary) was the top contributor to results over the reporting period. PDD has been reporting better-than-expected results for the past few quarters. The company has been seeing strong revenue growth underpinned by higher market share gain, as well as improvement in profitability.
• The Fund’s position in SK Hynix (South Korea, Information Technology) was also additive for returns. SK Hynix outperformed with strong demand expectations for High Bandwidth Memory, spurred by Nvidia’s strong guidance that reflected robust demand for artificial intelligence.
What didn’t work:
• On a sector level, stock selection within Financials and Consumer Staples detracted
• On a stock level China Mengniu, Samsung SDI and Ping An Insurance were among the main detractors
• The Fund’s position in China Mengniu (China, Consumer Discretionary) was a headwind for returns. The stock underperformed amid concerns about weak consumption and dairy demand. In addition, weakening raw milk prices added to pricing pressure and raised risks of milk powder inventory write-down. The unexpected change in CEO also caused concerns on the company’s strategy.
• The Fund's position in Samsung SDI (Korea, Materials) also contributed negatively to performance. The stock underperformed on concerns about slowdown in electric vehicle demand and its effect on the supply chain.
The Fund did not invest in derivatives during the reporting period.
UBS Emerging Markets Equity Opportunity Fund
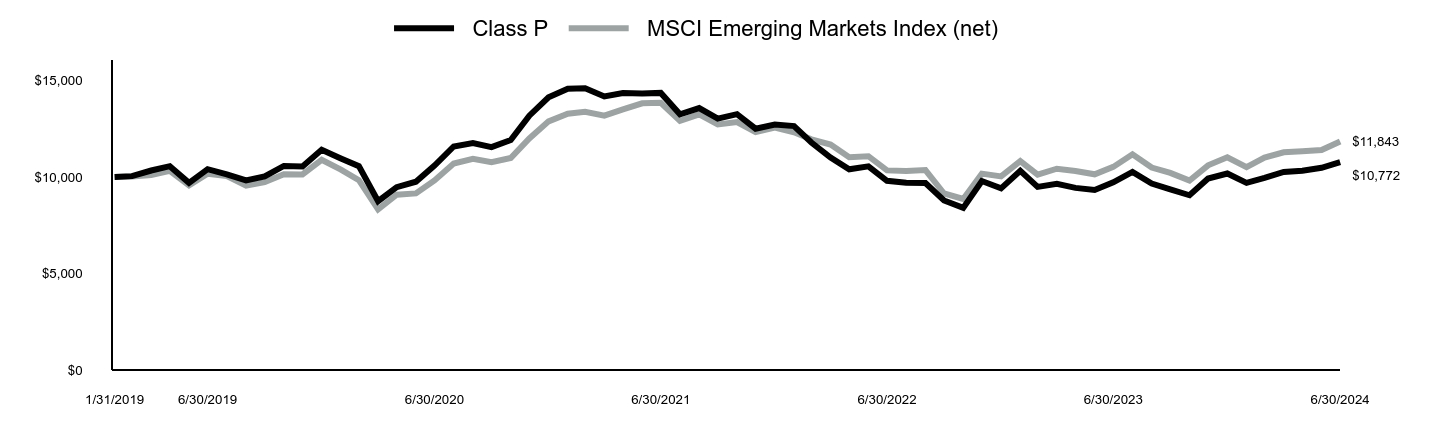
| Class P | MSCI Emerging Markets Index (net) |
|---|
| 1/31/2019 | $10,000 | $10,000 |
| 2/28/2019 | $10,045 | $10,022 |
| 3/31/2019 | $10,336 | $10,107 |
| 4/30/2019 | $10,561 | $10,319 |
| 5/31/2019 | $9,697 | $9,571 |
| 6/30/2019 | $10,404 | $10,168 |
| 7/31/2019 | $10,135 | $10,044 |
| 8/31/2019 | $9,821 | $9,554 |
| 9/30/2019 | $10,034 | $9,736 |
| 10/31/2019 | $10,572 | $10,147 |
| 11/30/2019 | $10,549 | $10,133 |
| 12/31/2019 | $11,410 | $10,889 |
| 1/31/2020 | $10,963 | $10,381 |
| 2/29/2020 | $10,561 | $9,834 |
| 3/31/2020 | $8,747 | $8,319 |
| 4/30/2020 | $9,470 | $9,081 |
| 5/31/2020 | $9,757 | $9,151 |
| 6/30/2020 | $10,595 | $9,823 |
| 7/31/2020 | $11,582 | $10,701 |
| 8/31/2020 | $11,755 | $10,938 |
| 9/30/2020 | $11,548 | $10,762 |
| 10/31/2020 | $11,915 | $10,984 |
| 11/30/2020 | $13,178 | $12,000 |
| 12/31/2020 | $14,125 | $12,882 |
| 1/31/2021 | $14,577 | $13,277 |
| 2/28/2021 | $14,601 | $13,379 |
| 3/31/2021 | $14,172 | $13,177 |
| 4/30/2021 | $14,346 | $13,505 |
| 5/31/2021 | $14,322 | $13,818 |
| 6/30/2021 | $14,357 | $13,842 |
| 7/31/2021 | $13,245 | $12,910 |
| 8/31/2021 | $13,569 | $13,248 |
| 9/30/2021 | $13,025 | $12,722 |
| 10/31/2021 | $13,256 | $12,847 |
| 11/30/2021 | $12,503 | $12,323 |
| 12/31/2021 | $12,716 | $12,555 |
| 1/31/2022 | $12,638 | $12,317 |
| 2/28/2022 | $11,788 | $11,949 |
| 3/31/2022 | $11,002 | $11,679 |
| 4/30/2022 | $10,397 | $11,029 |
| 5/31/2022 | $10,551 | $11,078 |
| 6/30/2022 | $9,804 | $10,342 |
| 7/31/2022 | $9,701 | $10,316 |
| 8/31/2022 | $9,688 | $10,359 |
| 9/30/2022 | $8,786 | $9,145 |
| 10/31/2022 | $8,400 | $8,861 |
| 11/30/2022 | $9,791 | $10,175 |
| 12/31/2022 | $9,409 | $10,032 |
| 1/31/2023 | $10,319 | $10,824 |
| 2/28/2023 | $9,489 | $10,123 |
| 3/31/2023 | $9,647 | $10,429 |
| 4/30/2023 | $9,436 | $10,311 |
| 5/31/2023 | $9,330 | $10,138 |
| 6/30/2023 | $9,726 | $10,523 |
| 7/31/2023 | $10,266 | $11,178 |
| 8/31/2023 | $9,660 | $10,489 |
| 9/30/2023 | $9,357 | $10,215 |
| 10/31/2023 | $9,054 | $9,818 |
| 11/30/2023 | $9,923 | $10,604 |
| 12/31/2023 | $10,179 | $11,018 |
| 1/31/2024 | $9,693 | $10,507 |
| 2/29/2024 | $9,950 | $11,006 |
| 3/31/2024 | $10,260 | $11,279 |
| 4/30/2024 | $10,327 | $11,330 |
| 5/31/2024 | $10,475 | $11,394 |
| 6/30/2024 | $10,772 | $11,843 |
Average Annual Total Returns (%)
| 1 Year | 5 Years | Since Inception 1/31/19 |
|---|
| Class P | 10.76% | 0.70% | 1.38% |
| MSCI Emerging Markets Index (net) | 12.55% | 3.10% | 3.18% |
Performance data represents past performance, which does not guarantee future results.
The graph and table do not reflect the deduction of taxes that a shareholder would pay on Fund distributions or a redemption of Fund shares.
| FUND STATISTICS | |
|---|
| Total Net Assets | $459,208,131 |
| # of Portfolio Holdings | 37 |
| Portfolio Turnover Rate | 42% |
| Total Advisory Fees Paid | $652,074 |
What is the Fund’s investment objective?
The Fund seeks to maximize capital appreciation.
Top 5 Holdings (% of Net Assets)
| Taiwan Semiconductor Manufacturing Co. Ltd. (Taiwan) | 10.1% |
| Samsung Electronics Co. Ltd. (South Korea) | 7.6 |
| Tencent Holdings Ltd. (China) | 6.9 |
| Reliance Industries Ltd. (India) | 4.8 |
| HDFC Bank Ltd. (India) | 4.4 |
UBS Emerging Markets Equity Opportunity Fund
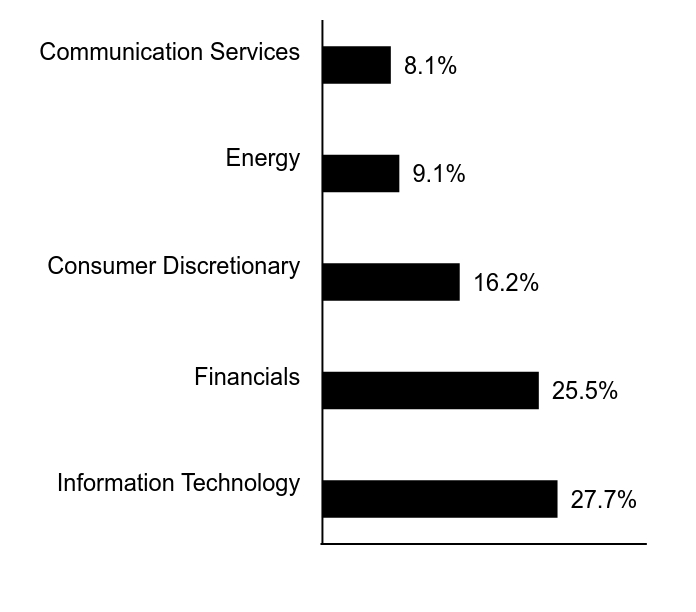
Top 5 Sectors (% of Net Assets)
| Value | Value |
|---|
| Information Technology | 27.7% |
| Financials | 25.5% |
| Consumer Discretionary | 16.2% |
| Energy | 9.1% |
| Communication Services | 8.1% |
If you wish to view additional information about the Fund, including but not limited to financial statements or holdings, please visit http://www.ubs.com/port-info .
UBS Emerging Markets Equity Opportunity Fund
Annual Shareholder Report
June 30, 2024
UBS Emerging Markets Equity Opportunity Fund
This annual shareholder report contains important information about UBS Emerging Markets Equity Opportunity Fund for the period of July 1, 2023 to June 30, 2024. You can find additional information about the Fund at http://www.ubs.com/port-info . You can also request this information by contacting us at 1-800-647-1568.
What were the Fund costs for the last year?
Annual Fund Operating Expenses
(based on a hypothetical $10,000 investment)
| Class Name | Cost of a $10,000 investment | Costs paid as a percentage of a $10,000 investment |
|---|
| Class P2 | $26 | 0.25% |
How did the Fund perform last year and what affected its performance?
Portfolio performance summary
What worked:
• On a sector level, stock selection within Consumer Discretionary and Information Technology added value
• On a stock level PDD, SK Hynix, and Mediatek were among the top contributors
• The Fund's holding in PDD (China, Consumer Discretionary) was the top contributor to results over the reporting period. PDD has been reporting better-than-expected results for the past few quarters. The company has been seeing strong revenue growth underpinned by higher market share gain, as well as improvement in profitability.
• The Fund’s position in SK Hynix (South Korea, Information Technology) was also additive for returns. SK Hynix outperformed with strong demand expectations for High Bandwidth Memory, spurred by Nvidia’s strong guidance that reflected robust demand for artificial intelligence.
What didn’t work:
• On a sector level, stock selection within Financials and Consumer Staples detracted
• On a stock level China Mengniu, Samsung SDI and Ping An Insurance were among the main detractors
• The Fund’s position in China Mengniu (China, Consumer Discretionary) was a headwind for returns. The stock underperformed amid concerns about weak consumption and dairy demand. In addition, weakening raw milk prices added to pricing pressure and raised risks of milk powder inventory write-down. The unexpected change in CEO also caused concerns on the company’s strategy.
• The Fund's position in Samsung SDI (Korea, Materials) also contributed negatively to performance. The stock underperformed on concerns about slowdown in electric vehicle demand and its effect on the supply chain.
The Fund did not invest in derivatives during the reporting period.
UBS Emerging Markets Equity Opportunity Fund
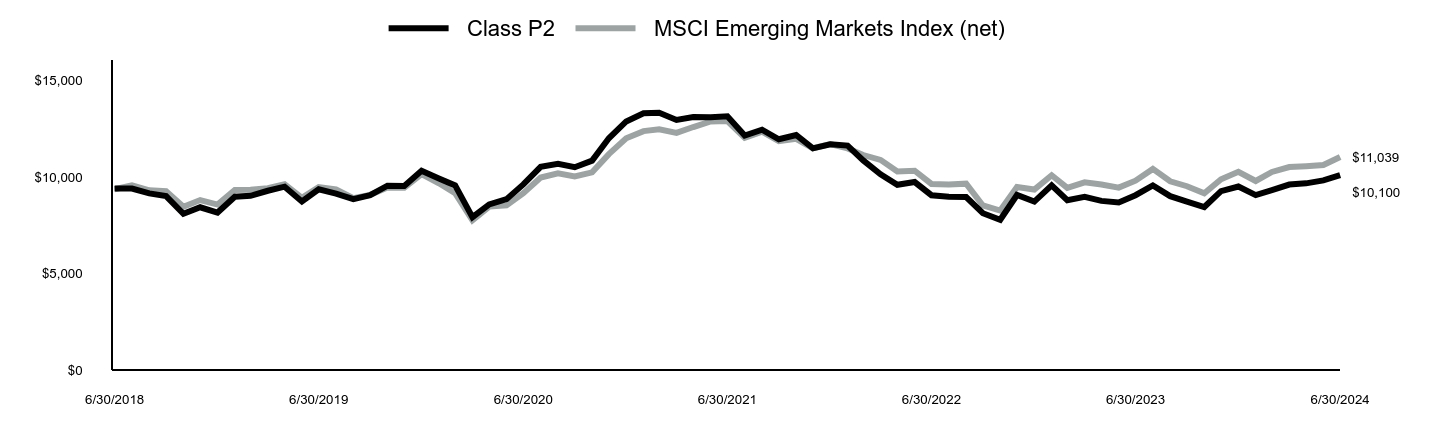
| Class P2 | MSCI Emerging Markets Index (net) |
|---|
| 6/30/2018 | $9,410 | $9,365 |
| 7/31/2018 | $9,400 | $9,570 |
| 8/31/2018 | $9,150 | $9,312 |
| 9/30/2018 | $9,010 | $9,262 |
| 10/31/2018 | $8,090 | $8,456 |
| 11/30/2018 | $8,430 | $8,804 |
| 12/31/2018 | $8,159 | $8,571 |
| 1/31/2019 | $8,974 | $9,321 |
| 2/28/2019 | $9,024 | $9,342 |
| 3/31/2019 | $9,286 | $9,421 |
| 4/30/2019 | $9,497 | $9,619 |
| 5/31/2019 | $8,733 | $8,921 |
| 6/30/2019 | $9,366 | $9,478 |
| 7/31/2019 | $9,135 | $9,362 |
| 8/31/2019 | $8,853 | $8,906 |
| 9/30/2019 | $9,055 | $9,076 |
| 10/31/2019 | $9,548 | $9,458 |
| 11/30/2019 | $9,538 | $9,445 |
| 12/31/2019 | $10,319 | $10,150 |
| 1/31/2020 | $9,926 | $9,677 |
| 2/29/2020 | $9,564 | $9,166 |
| 3/31/2020 | $7,920 | $7,755 |
| 4/30/2020 | $8,582 | $8,465 |
| 5/31/2020 | $8,851 | $8,530 |
| 6/30/2020 | $9,616 | $9,157 |
| 7/31/2020 | $10,526 | $9,975 |
| 8/31/2020 | $10,681 | $10,195 |
| 9/30/2020 | $10,505 | $10,032 |
| 10/31/2020 | $10,846 | $10,239 |
| 11/30/2020 | $12,005 | $11,186 |
| 12/31/2020 | $12,879 | $12,008 |
| 1/31/2021 | $13,299 | $12,376 |
| 2/28/2021 | $13,331 | $12,471 |
| 3/31/2021 | $12,953 | $12,282 |
| 4/30/2021 | $13,110 | $12,588 |
| 5/31/2021 | $13,100 | $12,880 |
| 6/30/2021 | $13,142 | $12,902 |
| 7/31/2021 | $12,144 | $12,034 |
| 8/31/2021 | $12,449 | $12,349 |
| 9/30/2021 | $11,956 | $11,858 |
| 10/31/2021 | $12,176 | $11,975 |
| 11/30/2021 | $11,483 | $11,487 |
| 12/31/2021 | $11,696 | $11,703 |
| 1/31/2022 | $11,625 | $11,481 |
| 2/28/2022 | $10,859 | $11,138 |
| 3/31/2022 | $10,140 | $10,886 |
| 4/30/2022 | $9,598 | $10,281 |
| 5/31/2022 | $9,739 | $10,326 |
| 6/30/2022 | $9,055 | $9,640 |
| 7/31/2022 | $8,973 | $9,616 |
| 8/31/2022 | $8,961 | $9,656 |
| 9/30/2022 | $8,124 | $8,524 |
| 10/31/2022 | $7,782 | $8,260 |
| 11/30/2022 | $9,067 | $9,485 |
| 12/31/2022 | $8,727 | $9,351 |
| 1/31/2023 | $9,571 | $10,090 |
| 2/28/2023 | $8,800 | $9,436 |
| 3/31/2023 | $8,971 | $9,721 |
| 4/30/2023 | $8,763 | $9,611 |
| 5/31/2023 | $8,678 | $9,450 |
| 6/30/2023 | $9,057 | $9,809 |
| 7/31/2023 | $9,559 | $10,419 |
| 8/31/2023 | $9,008 | $9,777 |
| 9/30/2023 | $8,727 | $9,522 |
| 10/31/2023 | $8,445 | $9,152 |
| 11/30/2023 | $9,265 | $9,884 |
| 12/31/2023 | $9,506 | $10,271 |
| 1/31/2024 | $9,063 | $9,794 |
| 2/29/2024 | $9,316 | $10,260 |
| 3/31/2024 | $9,607 | $10,514 |
| 4/30/2024 | $9,670 | $10,561 |
| 5/31/2024 | $9,822 | $10,620 |
| 6/30/2024 | $10,100 | $11,039 |
Average Annual Total Returns (%)
| 1 Year | 5 Years | Since Inception 6/4/18 |
|---|
| Class P2 | 11.51% | 1.52% | 0.16% |
| MSCI Emerging Markets Index (net) | 12.55% | 3.10% | 1.64% |
Performance data represents past performance, which does not guarantee future results.
The graph and table do not reflect the deduction of taxes that a shareholder would pay on Fund distributions or a redemption of Fund shares.
| FUND STATISTICS | |
|---|
| Total Net Assets | $459,208,131 |
| # of Portfolio Holdings | 37 |
| Portfolio Turnover Rate | 42% |
| Total Advisory Fees Paid | $652,074 |
What is the Fund’s investment objective?
The Fund seeks to maximize capital appreciation.
Top 5 Holdings (% of Net Assets)
| Taiwan Semiconductor Manufacturing Co. Ltd. (Taiwan) | 10.1% |
| Samsung Electronics Co. Ltd. (South Korea) | 7.6 |
| Tencent Holdings Ltd. (China) | 6.9 |
| Reliance Industries Ltd. (India) | 4.8 |
| HDFC Bank Ltd. (India) | 4.4 |
UBS Emerging Markets Equity Opportunity Fund
Top 5 Sectors (% of Net Assets)
| Value | Value |
|---|
| Information Technology | 27.7% |
| Financials | 25.5% |
| Consumer Discretionary | 16.2% |
| Energy | 9.1% |
| Communication Services | 8.1% |
If you wish to view additional information about the Fund, including but not limited to financial statements or holdings, please visit http://www.ubs.com/port-info .
UBS Emerging Markets Equity Opportunity Fund
Annual Shareholder Report
June 30, 2024
UBS International Sustainable Equity Fund
This annual shareholder report contains important information about UBS International Sustainable Equity Fund for the period of July 1, 2023 to June 30, 2024. You can find additional information about the Fund at http://www.ubs.com/port-info . You can also request this information by contacting us at 1-800-647-1568.
What were the Fund costs for the last year?
Annual Fund Operating Expenses
(based on a hypothetical $10,000 investment)
| Class Name | Cost of a $10,000 investment | Costs paid as a percentage of a $10,000 investment |
|---|
| Class A | $131 | 1.26% |
How did the Fund perform last year and what affected its performance?
Portfolio performance summary
What worked:
• Stock selection in Information Technology and Consumer Staples contributed positively to performance over the reporting period.
• Several individual stock positions were positive for performance during the 12-month period. The largest contributors were:
• Taiwan Semiconductor Manufacturing shares climbed after the company surprised to the upside on net profits due to strong growth in shipments for their high-performance computing chips used to power generative artificial intelligence.
• Banco Sabadell shares jumped after reporting strong net profit in the first quarter on the back of higher-than-expected interest rates. The company is now forecasting continued growth in lending income for the remainder of 2024.
• SK Hynix shares rallied after the company posted its fastest pace of revenue growth since 2010 and announced plans to expand the capacity of its highly differentiated chips.
What didn’t work:
• Stock selection in Materials and Energy contributed negatively to performance over the reporting period.
• The individual stock positions that negatively impacted performance the most were:
• Not owning Novo Nordisk contributed negatively to relative performance after the company reported a 37% year-over-year increase in sales, of which 55% were from diabetes and weight loss drugs. The company also bounced after an early-stage drug trial found that an oral version of amycretic can lead to significant weight loss.
• Spectris shares were weighed by a recent downgrade in guidance to the bottom end of the expected range, which management attributed to weakness in China and the healthcare sector. We believe the stock is more attractively valued than US peers, therefore giving us conviction in the potential upside in share price.
• Nippon Telegraph share price declined on the back of dissapointing quarterly results and a guide down in net profit and operating income for the fiscal year 2024.
The Fund did not invest in derivatives during the reporting period.
UBS International Sustainable Equity Fund
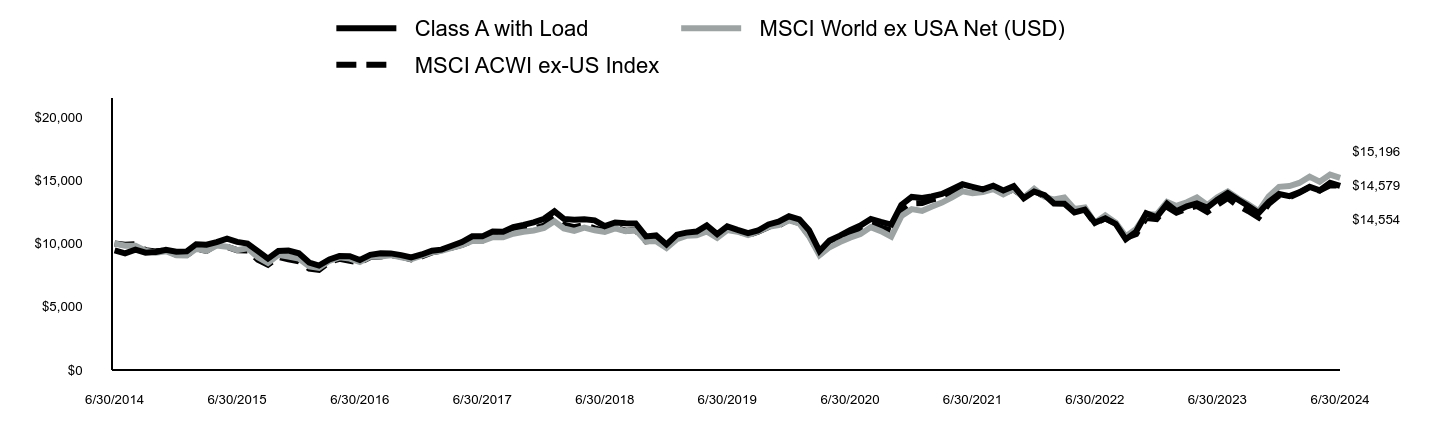
| Class A with Load | MSCI World ex USA Net (USD) | MSCI ACWI ex-US Index |
|---|
| 6/30/2014 | $9,451 | $10,000 | $10,000 |
| 7/31/2014 | $9,219 | $9,822 | $9,901 |
| 8/31/2014 | $9,514 | $9,829 | $9,956 |
| 9/30/2014 | $9,271 | $9,426 | $9,473 |
| 10/31/2014 | $9,335 | $9,276 | $9,380 |
| 11/30/2014 | $9,504 | $9,390 | $9,447 |
| 12/31/2014 | $9,356 | $9,078 | $9,107 |
| 1/31/2015 | $9,377 | $9,046 | $9,093 |
| 2/28/2015 | $9,944 | $9,586 | $9,580 |
| 3/31/2015 | $9,901 | $9,426 | $9,425 |
| 4/30/2015 | $10,115 | $9,834 | $9,901 |
| 5/31/2015 | $10,383 | $9,749 | $9,746 |
| 6/30/2015 | $10,126 | $9,472 | $9,474 |
| 7/31/2015 | $9,998 | $9,622 | $9,448 |
| 8/31/2015 | $9,399 | $8,921 | $8,726 |
| 9/30/2015 | $8,811 | $8,471 | $8,321 |
| 10/31/2015 | $9,410 | $9,108 | $8,941 |
| 11/30/2015 | $9,442 | $8,963 | $8,756 |
| 12/31/2015 | $9,231 | $8,802 | $8,591 |
| 1/31/2016 | $8,496 | $8,196 | $8,007 |
| 2/29/2016 | $8,258 | $8,082 | $7,915 |
| 3/31/2016 | $8,744 | $8,630 | $8,559 |
| 4/30/2016 | $9,004 | $8,908 | $8,784 |
| 5/31/2016 | $8,993 | $8,807 | $8,636 |
| 6/30/2016 | $8,701 | $8,540 | $8,504 |
| 7/31/2016 | $9,101 | $8,960 | $8,924 |
| 8/31/2016 | $9,231 | $8,968 | $8,981 |
| 9/30/2016 | $9,220 | $9,077 | $9,091 |
| 10/31/2016 | $9,079 | $8,901 | $8,961 |
| 11/30/2016 | $8,896 | $8,758 | $8,753 |
| 12/31/2016 | $9,131 | $9,044 | $8,977 |
| 1/31/2017 | $9,429 | $9,313 | $9,295 |
| 2/28/2017 | $9,517 | $9,421 | $9,444 |
| 3/31/2017 | $9,826 | $9,660 | $9,683 |
| 4/30/2017 | $10,113 | $9,865 | $9,890 |
| 5/31/2017 | $10,565 | $10,194 | $10,211 |
| 6/30/2017 | $10,565 | $10,204 | $10,243 |
| 7/31/2017 | $10,951 | $10,507 | $10,621 |
| 8/31/2017 | $10,940 | $10,505 | $10,676 |
| 9/30/2017 | $11,293 | $10,777 | $10,874 |
| 10/31/2017 | $11,469 | $10,925 | $11,079 |
| 11/30/2017 | $11,679 | $11,035 | $11,169 |
| 12/31/2017 | $11,955 | $11,233 | $11,419 |
| 1/31/2018 | $12,546 | $11,757 | $12,054 |
| 2/28/2018 | $11,944 | $11,198 | $11,486 |
| 3/31/2018 | $11,877 | $11,004 | $11,283 |
| 4/30/2018 | $11,922 | $11,257 | $11,464 |
| 5/31/2018 | $11,833 | $11,044 | $11,199 |
| 6/30/2018 | $11,375 | $10,922 | $10,988 |
| 7/31/2018 | $11,665 | $11,191 | $11,251 |
| 8/31/2018 | $11,610 | $10,979 | $11,016 |
| 9/30/2018 | $11,587 | $11,065 | $11,066 |
| 10/31/2018 | $10,561 | $10,186 | $10,166 |
| 11/30/2018 | $10,639 | $10,177 | $10,262 |
| 12/31/2018 | $9,930 | $9,651 | $9,798 |
| 1/31/2019 | $10,701 | $10,339 | $10,538 |
| 2/28/2019 | $10,860 | $10,605 | $10,744 |
| 3/31/2019 | $10,951 | $10,659 | $10,808 |
| 4/30/2019 | $11,428 | $10,961 | $11,093 |
| 5/31/2019 | $10,747 | $10,442 | $10,498 |
| 6/30/2019 | $11,360 | $11,063 | $11,130 |
| 7/31/2019 | $11,076 | $10,930 | $10,995 |
| 8/31/2019 | $10,826 | $10,661 | $10,656 |
| 9/30/2019 | $11,030 | $10,960 | $10,930 |
| 10/31/2019 | $11,507 | $11,314 | $11,311 |
| 11/30/2019 | $11,734 | $11,456 | $11,411 |
| 12/31/2019 | $12,152 | $11,821 | $11,905 |
| 1/31/2020 | $11,911 | $11,592 | $11,585 |
| 2/29/2020 | $11,049 | $10,563 | $10,670 |
| 3/31/2020 | $9,395 | $9,071 | $9,125 |
| 4/30/2020 | $10,234 | $9,704 | $9,816 |
| 5/31/2020 | $10,624 | $10,117 | $10,137 |
| 6/30/2020 | $11,049 | $10,463 | $10,596 |
| 7/31/2020 | $11,417 | $10,742 | $11,068 |
| 8/31/2020 | $11,945 | $11,296 | $11,542 |
| 9/30/2020 | $11,704 | $10,978 | $11,258 |
| 10/31/2020 | $11,497 | $10,546 | $11,016 |
| 11/30/2020 | $13,048 | $12,165 | $12,498 |
| 12/31/2020 | $13,684 | $12,718 | $13,173 |
| 1/31/2021 | $13,603 | $12,582 | $13,202 |
| 2/28/2021 | $13,719 | $12,903 | $13,463 |
| 3/31/2021 | $13,916 | $13,232 | $13,634 |
| 4/30/2021 | $14,288 | $13,648 | $14,035 |
| 5/31/2021 | $14,683 | $14,122 | $14,474 |
| 6/30/2021 | $14,485 | $13,979 | $14,380 |
| 7/31/2021 | $14,276 | $14,072 | $14,143 |
| 8/31/2021 | $14,566 | $14,298 | $14,412 |
| 9/30/2021 | $14,195 | $13,887 | $13,951 |
| 10/31/2021 | $14,532 | $14,300 | $14,283 |
| 11/30/2021 | $13,580 | $13,631 | $13,640 |
| 12/31/2021 | $14,109 | $14,323 | $14,204 |
| 1/31/2022 | $13,829 | $13,691 | $13,681 |
| 2/28/2022 | $13,165 | $13,478 | $13,410 |
| 3/31/2022 | $13,140 | $13,635 | $13,431 |
| 4/30/2022 | $12,451 | $12,739 | $12,588 |
| 5/31/2022 | $12,681 | $12,845 | $12,678 |
| 6/30/2022 | $11,635 | $11,636 | $11,587 |
| 7/31/2022 | $11,992 | $12,215 | $11,984 |
| 8/31/2022 | $11,545 | $11,644 | $11,599 |
| 9/30/2022 | $10,333 | $10,566 | $10,440 |
| 10/31/2022 | $10,946 | $11,149 | $10,752 |
| 11/30/2022 | $12,387 | $12,336 | $12,021 |
| 12/31/2022 | $12,081 | $12,276 | $11,931 |
| 1/31/2023 | $13,140 | $13,283 | $12,899 |
| 2/28/2023 | $12,559 | $12,973 | $12,446 |
| 3/31/2023 | $12,937 | $13,261 | $12,750 |
| 4/30/2023 | $13,169 | $13,637 | $12,972 |
| 5/31/2023 | $12,835 | $13,043 | $12,500 |
| 6/30/2023 | $13,459 | $13,663 | $13,061 |
| 7/31/2023 | $13,981 | $14,105 | $13,592 |
| 8/31/2023 | $13,459 | $13,559 | $12,978 |
| 9/30/2023 | $12,966 | $13,102 | $12,568 |
| 10/31/2023 | $12,414 | $12,549 | $12,050 |
| 11/30/2023 | $13,285 | $13,728 | $13,134 |
| 12/31/2023 | $13,912 | $14,479 | $13,794 |
| 1/31/2024 | $13,751 | $14,541 | $13,657 |
| 2/29/2024 | $14,043 | $14,789 | $14,003 |
| 3/31/2024 | $14,481 | $15,288 | $14,441 |
| 4/30/2024 | $14,204 | $14,883 | $14,181 |
| 5/31/2024 | $14,802 | $15,452 | $14,593 |
| 6/30/2024 | $14,554 | $15,196 | $14,579 |
Average Annual Total Returns (%)
| 1 Year | 5 Years | 10 Years |
|---|
| Class A | 8.14% | 5.08% | 4.41% |
| Class A with Load | 2.19% | 3.90% | 3.82% |
| MSCI World ex USA Net (USD) | 11.22% | 6.55% | 4.27% |
| MSCI ACWI ex-US Index | 11.62% | 5.55% | 3.84% |
Performance data represents past performance, which does not guarantee future results.
The graph and table do not reflect the deduction of taxes that a shareholder would pay on Fund distributions or a redemption of Fund shares.
| FUND STATISTICS | |
|---|
| Total Net Assets | $156,016,053 |
| # of Portfolio Holdings | 67 |
| Portfolio Turnover Rate | 47% |
| Total Advisory Fees Paid | $651,929 |
What is the Fund’s investment objective?
The Fund seeks to maximize total return, consisting of capital appreciation and current income by investing primarily in the equity securities of non-US issuers.
Top 5 Holdings (% of Net Assets)
| Taiwan Semiconductor Manufacturing Co. Ltd. (Taiwan) | 3.1% |
| Sony Group Corp. (Japan) | 3.0 |
| London Stock Exchange Group PLC (United Kingdom) | 2.7 |
| Unilever PLC (United Kingdom) | 2.6 |
| AIB Group PLC (Ireland) | 2.6 |
UBS International Sustainable Equity Fund
Top 5 Sectors (% of Net Assets)
| Value | Value |
|---|
| Financials | 18.9% |
| Information Technology | 16.1% |
| Health Care | 13.2% |
| Consumer Discretionary | 12.6% |
| Industrials | 12.2% |
If you wish to view additional information about the Fund, including but not limited to financial statements or holdings, please visit http://www.ubs.com/port-info .
UBS International Sustainable Equity Fund
Annual Shareholder Report
June 30, 2024
UBS International Sustainable Equity Fund
This annual shareholder report contains important information about UBS International Sustainable Equity Fund for the period of July 1, 2023 to June 30, 2024. You can find additional information about the Fund at http://www.ubs.com/port-info . You can also request this information by contacting us at 1-800-647-1568.
What were the Fund costs for the last year?
Annual Fund Operating Expenses
(based on a hypothetical $10,000 investment)
| Class Name | Cost of a $10,000 investment | Costs paid as a percentage of a $10,000 investment |
|---|
| Class P | $105 | 1.01% |
How did the Fund perform last year and what affected its performance?
Portfolio performance summary
What worked:
• Stock selection in Information Technology and Consumer Staples contributed positively to performance over the reporting period.
• Several individual stock positions were positive for performance during the 12-month period. The largest contributors were:
• Taiwan Semiconductor Manufacturing shares climbed after the company surprised to the upside on net profits due to strong growth in shipments for their high-performance computing chips used to power generative artificial intelligence.
• Banco Sabadell shares jumped after reporting strong net profit in the first quarter on the back of higher-than-expected interest rates. The company is now forecasting continued growth in lending income for the remainder of 2024.
• SK Hynix shares rallied after the company posted its fastest pace of revenue growth since 2010 and announced plans to expand the capacity of its highly differentiated chips.
What didn’t work:
• Stock selection in Materials and Energy contributed negatively to performance over the reporting period.
• The individual stock positions that negatively impacted performance the most were:
• Not owning Novo Nordisk contributed negatively to relative performance after the company reported a 37% year-over-year increase in sales, of which 55% were from diabetes and weight loss drugs. The company also bounced after an early-stage drug trial found that an oral version of amycretic can lead to significant weight loss.
• Spectris shares were weighed by a recent downgrade in guidance to the bottom end of the expected range, which management attributed to weakness in China and the healthcare sector. We believe the stock is more attractively valued than US peers, therefore giving us conviction in the potential upside in share price.
• Nippon Telegraph share price declined on the back of dissapointing quarterly results and a guide down in net profit and operating income for the fiscal year 2024.
The Fund did not invest in derivatives during the reporting period.
UBS International Sustainable Equity Fund

| Class P with Load | MSCI World ex USA Net (USD) | MSCI ACWI ex-US Index |
|---|
| 6/30/2014 | $10,000 | $10,000 | $10,000 |
| 7/31/2014 | $9,755 | $9,822 | $9,901 |
| 8/31/2014 | $10,067 | $9,829 | $9,956 |
| 9/30/2014 | $9,811 | $9,426 | $9,473 |
| 10/31/2014 | $9,878 | $9,276 | $9,380 |
| 11/30/2014 | $10,067 | $9,390 | $9,447 |
| 12/31/2014 | $9,907 | $9,078 | $9,107 |
| 1/31/2015 | $9,930 | $9,046 | $9,093 |
| 2/28/2015 | $10,528 | $9,586 | $9,580 |
| 3/31/2015 | $10,483 | $9,426 | $9,425 |
| 4/30/2015 | $10,720 | $9,834 | $9,901 |
| 5/31/2015 | $11,003 | $9,749 | $9,746 |
| 6/30/2015 | $10,732 | $9,472 | $9,474 |
| 7/31/2015 | $10,596 | $9,622 | $9,448 |
| 8/31/2015 | $9,975 | $8,921 | $8,726 |
| 9/30/2015 | $9,353 | $8,471 | $8,321 |
| 10/31/2015 | $9,986 | $9,108 | $8,941 |
| 11/30/2015 | $10,020 | $8,963 | $8,756 |
| 12/31/2015 | $9,796 | $8,802 | $8,591 |
| 1/31/2016 | $9,018 | $8,196 | $8,007 |
| 2/29/2016 | $8,766 | $8,082 | $7,915 |
| 3/31/2016 | $9,293 | $8,630 | $8,559 |
| 4/30/2016 | $9,568 | $8,908 | $8,784 |
| 5/31/2016 | $9,556 | $8,807 | $8,636 |
| 6/30/2016 | $9,247 | $8,540 | $8,504 |
| 7/31/2016 | $9,671 | $8,960 | $8,924 |
| 8/31/2016 | $9,819 | $8,968 | $8,981 |
| 9/30/2016 | $9,808 | $9,077 | $9,091 |
| 10/31/2016 | $9,648 | $8,901 | $8,961 |
| 11/30/2016 | $9,465 | $8,758 | $8,753 |
| 12/31/2016 | $9,718 | $9,044 | $8,977 |
| 1/31/2017 | $10,034 | $9,313 | $9,295 |
| 2/28/2017 | $10,128 | $9,421 | $9,444 |
| 3/31/2017 | $10,456 | $9,660 | $9,683 |
| 4/30/2017 | $10,772 | $9,865 | $9,890 |
| 5/31/2017 | $11,252 | $10,194 | $10,211 |
| 6/30/2017 | $11,252 | $10,204 | $10,243 |
| 7/31/2017 | $11,662 | $10,507 | $10,621 |
| 8/31/2017 | $11,662 | $10,505 | $10,676 |
| 9/30/2017 | $12,037 | $10,777 | $10,874 |
| 10/31/2017 | $12,236 | $10,925 | $11,079 |
| 11/30/2017 | $12,458 | $11,035 | $11,169 |
| 12/31/2017 | $12,751 | $11,233 | $11,419 |
| 1/31/2018 | $13,393 | $11,757 | $12,054 |
| 2/28/2018 | $12,740 | $11,198 | $11,486 |
| 3/31/2018 | $12,680 | $11,004 | $11,283 |
| 4/30/2018 | $12,728 | $11,257 | $11,464 |
| 5/31/2018 | $12,633 | $11,044 | $11,199 |
| 6/30/2018 | $12,146 | $10,922 | $10,988 |
| 7/31/2018 | $12,466 | $11,191 | $11,251 |
| 8/31/2018 | $12,407 | $10,979 | $11,016 |
| 9/30/2018 | $12,383 | $11,065 | $11,066 |
| 10/31/2018 | $11,279 | $10,186 | $10,166 |
| 11/30/2018 | $11,374 | $10,177 | $10,262 |
| 12/31/2018 | $10,620 | $9,651 | $9,798 |
| 1/31/2019 | $11,444 | $10,339 | $10,538 |
| 2/28/2019 | $11,613 | $10,605 | $10,744 |
| 3/31/2019 | $11,710 | $10,659 | $10,808 |
| 4/30/2019 | $12,231 | $10,961 | $11,093 |
| 5/31/2019 | $11,504 | $10,442 | $10,498 |
| 6/30/2019 | $12,158 | $11,063 | $11,130 |
| 7/31/2019 | $11,855 | $10,930 | $10,995 |
| 8/31/2019 | $11,601 | $10,661 | $10,656 |
| 9/30/2019 | $11,807 | $10,960 | $10,930 |
| 10/31/2019 | $12,328 | $11,314 | $11,311 |
| 11/30/2019 | $12,582 | $11,456 | $11,411 |
| 12/31/2019 | $13,021 | $11,821 | $11,905 |
| 1/31/2020 | $12,763 | $11,592 | $11,585 |
| 2/29/2020 | $11,854 | $10,563 | $10,670 |
| 3/31/2020 | $10,073 | $9,071 | $9,125 |
| 4/30/2020 | $10,982 | $9,704 | $9,816 |
| 5/31/2020 | $11,400 | $10,117 | $10,137 |
| 6/30/2020 | $11,866 | $10,463 | $10,596 |
| 7/31/2020 | $12,259 | $10,742 | $11,068 |
| 8/31/2020 | $12,824 | $11,296 | $11,542 |
| 9/30/2020 | $12,566 | $10,978 | $11,258 |
| 10/31/2020 | $12,345 | $10,546 | $11,016 |
| 11/30/2020 | $14,016 | $12,165 | $12,498 |
| 12/31/2020 | $14,709 | $12,718 | $13,173 |
| 1/31/2021 | $14,622 | $12,582 | $13,202 |
| 2/28/2021 | $14,746 | $12,903 | $13,463 |
| 3/31/2021 | $14,970 | $13,232 | $13,634 |
| 4/30/2021 | $15,368 | $13,648 | $14,035 |
| 5/31/2021 | $15,791 | $14,122 | $14,474 |
| 6/30/2021 | $15,592 | $13,979 | $14,380 |
| 7/31/2021 | $15,356 | $14,072 | $14,143 |
| 8/31/2021 | $15,679 | $14,298 | $14,412 |
| 9/30/2021 | $15,281 | $13,887 | $13,951 |
| 10/31/2021 | $15,654 | $14,300 | $14,283 |
| 11/30/2021 | $14,634 | $13,631 | $13,640 |
| 12/31/2021 | $15,199 | $14,323 | $14,204 |
| 1/31/2022 | $14,911 | $13,691 | $13,681 |
| 2/28/2022 | $14,198 | $13,478 | $13,410 |
| 3/31/2022 | $14,171 | $13,635 | $13,431 |
| 4/30/2022 | $13,430 | $12,739 | $12,588 |
| 5/31/2022 | $13,677 | $12,845 | $12,678 |
| 6/30/2022 | $12,552 | $11,636 | $11,587 |
| 7/31/2022 | $12,936 | $12,215 | $11,984 |
| 8/31/2022 | $12,456 | $11,644 | $11,599 |
| 9/30/2022 | $11,153 | $10,566 | $10,440 |
| 10/31/2022 | $11,811 | $11,149 | $10,752 |
| 11/30/2022 | $13,375 | $12,336 | $12,021 |
| 12/31/2022 | $13,056 | $12,276 | $11,931 |
| 1/31/2023 | $14,200 | $13,283 | $12,899 |
| 2/28/2023 | $13,573 | $12,973 | $12,446 |
| 3/31/2023 | $13,981 | $13,261 | $12,750 |
| 4/30/2023 | $14,232 | $13,637 | $12,972 |
| 5/31/2023 | $13,887 | $13,043 | $12,500 |
| 6/30/2023 | $14,561 | $13,663 | $13,061 |
| 7/31/2023 | $15,125 | $14,105 | $13,592 |
| 8/31/2023 | $14,561 | $13,559 | $12,978 |
| 9/30/2023 | $14,028 | $13,102 | $12,568 |
| 10/31/2023 | $13,432 | $12,549 | $12,050 |
| 11/30/2023 | $14,388 | $13,728 | $13,134 |
| 12/31/2023 | $15,066 | $14,479 | $13,794 |
| 1/31/2024 | $14,892 | $14,541 | $13,657 |
| 2/29/2024 | $15,208 | $14,789 | $14,003 |
| 3/31/2024 | $15,682 | $15,288 | $14,441 |
| 4/30/2024 | $15,398 | $14,883 | $14,181 |
| 5/31/2024 | $16,046 | $15,452 | $14,593 |
| 6/30/2024 | $15,777 | $15,196 | $14,579 |
Average Annual Total Returns (%)
| 1 Year | 5 Years | 10 Years |
|---|
| Class P | 8.36% | 5.35% | 4.67% |
| MSCI World ex USA Net (USD) | 11.22% | 6.55% | 4.27% |
| MSCI ACWI ex-US Index | 11.62% | 5.55% | 3.84% |
Performance data represents past performance, which does not guarantee future results.
The graph and table do not reflect the deduction of taxes that a shareholder would pay on Fund distributions or a redemption of Fund shares.
| FUND STATISTICS | |
|---|
| Total Net Assets | $156,016,053 |
| # of Portfolio Holdings | 67 |
| Portfolio Turnover Rate | 47% |
| Total Advisory Fees Paid | $651,929 |
What is the Fund’s investment objective?
The Fund seeks to maximize total return, consisting of capital appreciation and current income by investing primarily in the equity securities of non-US issuers.
Top 5 Holdings (% of Net Assets)
| Taiwan Semiconductor Manufacturing Co. Ltd. (Taiwan) | 3.1% |
| Sony Group Corp. (Japan) | 3.0 |
| London Stock Exchange Group PLC (United Kingdom) | 2.7 |
| Unilever PLC (United Kingdom) | 2.6 |
| AIB Group PLC (Ireland) | 2.6 |
UBS International Sustainable Equity Fund
Top 5 Sectors (% of Net Assets)
| Value | Value |
|---|
| Financials | 18.9% |
| Information Technology | 16.1% |
| Health Care | 13.2% |
| Consumer Discretionary | 12.6% |
| Industrials | 12.2% |
If you wish to view additional information about the Fund, including but not limited to financial statements or holdings, please visit http://www.ubs.com/port-info .
UBS International Sustainable Equity Fund
Annual Shareholder Report
June 30, 2024
UBS International Sustainable Equity Fund
This annual shareholder report contains important information about UBS International Sustainable Equity Fund for the period of July 1, 2023 to June 30, 2024. You can find additional information about the Fund at http://www.ubs.com/port-info . You can also request this information by contacting us at 1-800-647-1568.
What were the Fund costs for the last year?
Annual Fund Operating Expenses
(based on a hypothetical $10,000 investment)
| Class Name | Cost of a $10,000 investment | Costs paid as a percentage of a $10,000 investment |
|---|
| Class P2 | $27 | 0.26% |
How did the Fund perform last year and what affected its performance?
Portfolio performance summary
What worked:
• Stock selection in Information Technology and Consumer Staples contributed positively to performance over the reporting period.
• Several individual stock positions were positive for performance during the 12-month period. The largest contributors were:
• Taiwan Semiconductor Manufacturing shares climbed after the company surprised to the upside on net profits due to strong growth in shipments for their high-performance computing chips used to power generative artificial intelligence.
• Banco Sabadell shares jumped after reporting strong net profit in the first quarter on the back of higher-than-expected interest rates. The company is now forecasting continued growth in lending income for the remainder of 2024.
• SK Hynix shares rallied after the company posted its fastest pace of revenue growth since 2010 and announced plans to expand the capacity of its highly differentiated chips.
What didn’t work:
• Stock selection in Materials and Energy contributed negatively to performance over the reporting period.
• The individual stock positions that negatively impacted performance the most were:
• Not owning Novo Nordisk contributed negatively to relative performance after the company reported a 37% year-over-year increase in sales, of which 55% were from diabetes and weight loss drugs. The company also bounced after an early-stage drug trial found that an oral version of amycretic can lead to significant weight loss.
• Spectris shares were weighed by a recent downgrade in guidance to the bottom end of the expected range, which management attributed to weakness in China and the healthcare sector. We believe the stock is more attractively valued than US peers, therefore giving us conviction in the potential upside in share price.
• Nippon Telegraph share price declined on the back of dissapointing quarterly results and a guide down in net profit and operating income for the fiscal year 2024.
The Fund did not invest in derivatives during the reporting period.
UBS International Sustainable Equity Fund
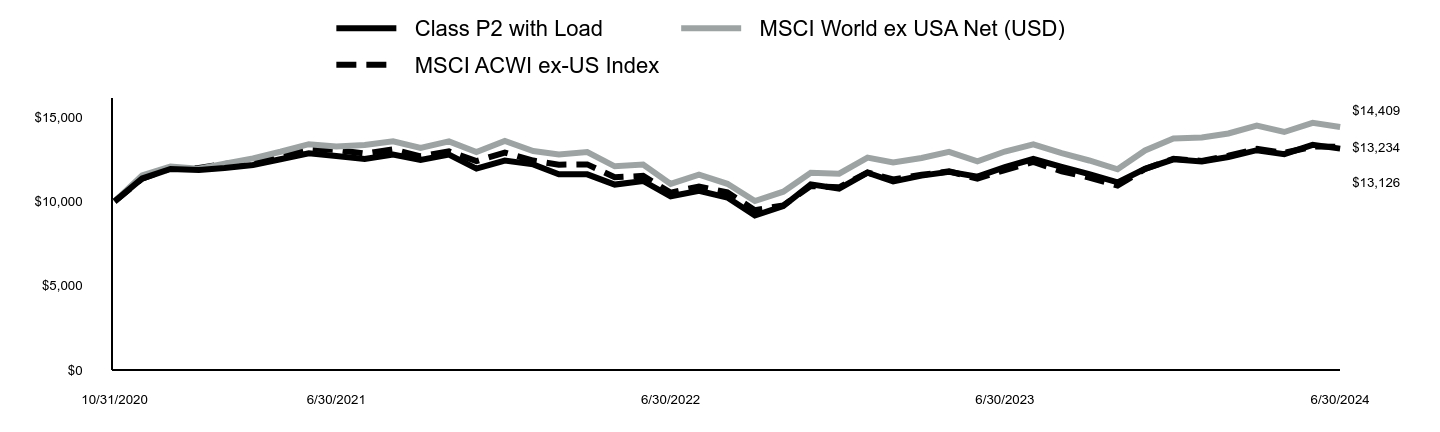
| Class P2 with Load | MSCI World ex USA Net (USD) | MSCI ACWI ex-US Index |
|---|
| 10/31/2020 | $10,000 | $10,000 | $10,000 |
| 11/30/2020 | $11,353 | $11,534 | $11,345 |
| 12/31/2020 | $11,924 | $12,059 | $11,958 |
| 1/31/2021 | $11,864 | $11,930 | $11,984 |
| 2/28/2021 | $11,975 | $12,234 | $12,222 |
| 3/31/2021 | $12,156 | $12,546 | $12,376 |
| 4/30/2021 | $12,499 | $12,941 | $12,740 |
| 5/31/2021 | $12,852 | $13,391 | $13,139 |
| 6/30/2021 | $12,691 | $13,255 | $13,054 |
| 7/31/2021 | $12,519 | $13,343 | $12,839 |
| 8/31/2021 | $12,781 | $13,557 | $13,083 |
| 9/30/2021 | $12,459 | $13,167 | $12,664 |
| 10/31/2021 | $12,771 | $13,559 | $12,966 |
| 11/30/2021 | $11,945 | $12,925 | $12,382 |
| 12/31/2021 | $12,418 | $13,581 | $12,894 |
| 1/31/2022 | $12,194 | $12,982 | $12,419 |
| 2/28/2022 | $11,611 | $12,780 | $12,173 |
| 3/31/2022 | $11,600 | $12,928 | $12,192 |
| 4/30/2022 | $10,995 | $12,079 | $11,427 |
| 5/31/2022 | $11,208 | $12,179 | $11,509 |
| 6/30/2022 | $10,300 | $11,033 | $10,519 |
| 7/31/2022 | $10,625 | $11,582 | $10,879 |
| 8/31/2022 | $10,222 | $11,041 | $10,529 |
| 9/30/2022 | $9,157 | $10,019 | $9,477 |
| 10/31/2022 | $9,717 | $10,571 | $9,760 |
| 11/30/2022 | $11,006 | $11,697 | $10,912 |
| 12/31/2022 | $10,751 | $11,640 | $10,831 |
| 1/31/2023 | $11,696 | $12,594 | $11,709 |
| 2/28/2023 | $11,178 | $12,300 | $11,298 |
| 3/31/2023 | $11,528 | $12,574 | $11,574 |
| 4/30/2023 | $11,748 | $12,931 | $11,775 |
| 5/31/2023 | $11,463 | $12,367 | $11,347 |
| 6/30/2023 | $12,033 | $12,955 | $11,856 |
| 7/31/2023 | $12,512 | $13,374 | $12,338 |
| 8/31/2023 | $12,046 | $12,857 | $11,781 |
| 9/30/2023 | $11,619 | $12,423 | $11,409 |
| 10/31/2023 | $11,126 | $11,899 | $10,938 |
| 11/30/2023 | $11,930 | $13,017 | $11,923 |
| 12/31/2023 | $12,494 | $13,729 | $12,522 |
| 1/31/2024 | $12,362 | $13,788 | $12,397 |
| 2/29/2024 | $12,626 | $14,023 | $12,711 |
| 3/31/2024 | $13,034 | $14,496 | $13,109 |
| 4/30/2024 | $12,797 | $14,112 | $12,873 |
| 5/31/2024 | $13,350 | $14,652 | $13,247 |
| 6/30/2024 | $13,126 | $14,409 | $13,234 |
Average Annual Total Returns (%)
| 1 Year | Since Inception 10/30/20 |
|---|
| Class P2 | 9.08% | 7.70% |
| MSCI World ex USA Net (USD) | 11.22% | 10.48% |
| MSCI ACWI ex-US Index | 11.62% | 7.94% |
Performance data represents past performance, which does not guarantee future results.
The graph and table do not reflect the deduction of taxes that a shareholder would pay on Fund distributions or a redemption of Fund shares.
| FUND STATISTICS | |
|---|
| Total Net Assets | $156,016,053 |
| # of Portfolio Holdings | 67 |
| Portfolio Turnover Rate | 47% |
| Total Advisory Fees Paid | $651,929 |
What is the Fund’s investment objective?
The Fund seeks to maximize total return, consisting of capital appreciation and current income by investing primarily in the equity securities of non-US issuers.
Top 5 Holdings (% of Net Assets)
| Taiwan Semiconductor Manufacturing Co. Ltd. (Taiwan) | 3.1% |
| Sony Group Corp. (Japan) | 3.0 |
| London Stock Exchange Group PLC (United Kingdom) | 2.7 |
| Unilever PLC (United Kingdom) | 2.6 |
| AIB Group PLC (Ireland) | 2.6 |
UBS International Sustainable Equity Fund
Top 5 Sectors (% of Net Assets)
| Value | Value |
|---|
| Financials | 18.9% |
| Information Technology | 16.1% |
| Health Care | 13.2% |
| Consumer Discretionary | 12.6% |
| Industrials | 12.2% |
If you wish to view additional information about the Fund, including but not limited to financial statements or holdings, please visit http://www.ubs.com/port-info .
UBS International Sustainable Equity Fund
Annual Shareholder Report
June 30, 2024
UBS Multi Income Bond Fund
This annual shareholder report contains important information about UBS Multi Income Bond Fund for the period of July 1, 2023 to June 30, 2024. You can find additional information about the Fund at http://www.ubs.com/port-info . You can also request this information by contacting us at 1-800-647-1568.
What were the Fund costs for the last year?
Annual Fund Operating Expenses
(based on a hypothetical $10,000 investment)
| Class Name | Cost of a $10,000 investment | Costs paid as a percentage of a $10,000 investment |
|---|
| Class A | $99 | 0.97% |
How did the Fund perform last year and what affected its performance?
Performance Summary:
What Worked:
• Active Duration and Yield Curve: Our bias to be underweight duration relative to the index contributed to performance.
• Overweight IG Corporate Bonds: An overweight position to investment grade corporate bonds was additive.
• Allocation to High Yield: The allocation to high yield corporate credit was also additive.
What Didn’t Work:
• Issue Selection: On balance the corporate allocations contributed overall, but issue selection within the financial sector in the corporate allocation detracted.
• Issue Selection Mortgage Backed Securities (“MBS”): Security selection within the MBS allocation detracted from performance.
• Active Foreign Currency: Active currency decisions detracted from performance during the period, particularly exposure to the Brazilian real.
During the reporting period, we used derivatives for risk management purposes and as a tool to help enhance returns across various strategies. A number of credit derivatives, including credit default swap index options and total return swaps, were used to manage the Fund’s credit exposure. For active currency management, we utilized foreign exchange forwards. For managing interest rate exposure, we utilized interest rate futures during the reporting period. Derivatives were just one tool, among others, that we used to implement our overall strategy.
UBS Multi Income Bond Fund
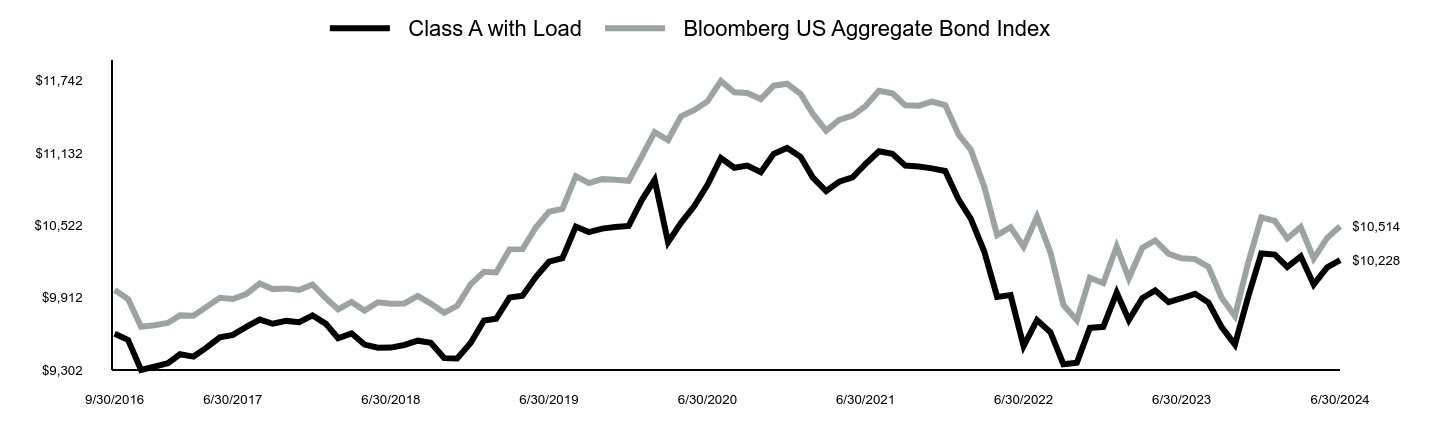
| Class A with Load | Bloomberg US Aggregate Bond Index |
|---|
| 9/30/2016 | $9,608 | $9,977 |
| 10/31/2016 | $9,556 | $9,900 |
| 11/30/2016 | $9,302 | $9,666 |
| 12/31/2016 | $9,331 | $9,680 |
| 1/31/2017 | $9,360 | $9,699 |
| 2/28/2017 | $9,435 | $9,764 |
| 3/31/2017 | $9,415 | $9,759 |
| 4/30/2017 | $9,490 | $9,834 |
| 5/31/2017 | $9,578 | $9,910 |
| 6/30/2017 | $9,598 | $9,900 |
| 7/31/2017 | $9,665 | $9,942 |
| 8/31/2017 | $9,727 | $10,032 |
| 9/30/2017 | $9,692 | $9,984 |
| 10/31/2017 | $9,716 | $9,990 |
| 11/30/2017 | $9,705 | $9,977 |
| 12/31/2017 | $9,762 | $10,023 |
| 1/31/2018 | $9,691 | $9,907 |
| 2/28/2018 | $9,570 | $9,813 |
| 3/31/2018 | $9,611 | $9,876 |
| 4/30/2018 | $9,516 | $9,803 |
| 5/31/2018 | $9,490 | $9,873 |
| 6/30/2018 | $9,491 | $9,860 |
| 7/31/2018 | $9,513 | $9,863 |
| 8/31/2018 | $9,549 | $9,926 |
| 9/30/2018 | $9,531 | $9,862 |
| 10/31/2018 | $9,403 | $9,784 |
| 11/30/2018 | $9,400 | $9,843 |
| 12/31/2018 | $9,530 | $10,024 |
| 1/31/2019 | $9,719 | $10,130 |
| 2/28/2019 | $9,734 | $10,124 |
| 3/31/2019 | $9,913 | $10,319 |
| 4/30/2019 | $9,928 | $10,321 |
| 5/31/2019 | $10,087 | $10,505 |
| 6/30/2019 | $10,215 | $10,636 |
| 7/31/2019 | $10,244 | $10,660 |
| 8/31/2019 | $10,511 | $10,936 |
| 9/30/2019 | $10,465 | $10,878 |
| 10/31/2019 | $10,494 | $10,911 |
| 11/30/2019 | $10,508 | $10,905 |
| 12/31/2019 | $10,517 | $10,897 |
| 1/31/2020 | $10,739 | $11,107 |
| 2/29/2020 | $10,905 | $11,307 |
| 3/31/2020 | $10,380 | $11,241 |
| 4/30/2020 | $10,543 | $11,440 |
| 5/31/2020 | $10,686 | $11,494 |
| 6/30/2020 | $10,863 | $11,566 |
| 7/31/2020 | $11,089 | $11,739 |
| 8/31/2020 | $11,007 | $11,644 |
| 9/30/2020 | $11,025 | $11,638 |
| 10/31/2020 | $10,970 | $11,586 |
| 11/30/2020 | $11,124 | $11,699 |
| 12/31/2020 | $11,174 | $11,715 |
| 1/31/2021 | $11,099 | $11,631 |
| 2/28/2021 | $10,926 | $11,463 |
| 3/31/2021 | $10,810 | $11,320 |
| 4/30/2021 | $10,889 | $11,410 |
| 5/31/2021 | $10,926 | $11,447 |
| 6/30/2021 | $11,039 | $11,527 |
| 7/31/2021 | $11,146 | $11,656 |
| 8/31/2021 | $11,125 | $11,634 |
| 9/30/2021 | $11,025 | $11,533 |
| 10/31/2021 | $11,017 | $11,530 |
| 11/30/2021 | $11,002 | $11,564 |
| 12/31/2021 | $10,980 | $11,535 |
| 1/31/2022 | $10,738 | $11,286 |
| 2/28/2022 | $10,579 | $11,160 |
| 3/31/2022 | $10,303 | $10,850 |
| 4/30/2022 | $9,918 | $10,439 |
| 5/31/2022 | $9,933 | $10,506 |
| 6/30/2022 | $9,504 | $10,341 |
| 7/31/2022 | $9,723 | $10,594 |
| 8/31/2022 | $9,621 | $10,294 |
| 9/30/2022 | $9,351 | $9,850 |
| 10/31/2022 | $9,363 | $9,722 |
| 11/30/2022 | $9,657 | $10,080 |
| 12/31/2022 | $9,666 | $10,034 |
| 1/31/2023 | $9,954 | $10,343 |
| 2/28/2023 | $9,723 | $10,075 |
| 3/31/2023 | $9,907 | $10,331 |
| 4/30/2023 | $9,972 | $10,394 |
| 5/31/2023 | $9,874 | $10,281 |
| 6/30/2023 | $9,907 | $10,244 |
| 7/31/2023 | $9,944 | $10,237 |
| 8/31/2023 | $9,871 | $10,172 |
| 9/30/2023 | $9,666 | $9,913 |
| 10/31/2023 | $9,517 | $9,757 |
| 11/30/2023 | $9,912 | $10,198 |
| 12/31/2023 | $10,285 | $10,589 |
| 1/31/2024 | $10,275 | $10,560 |
| 2/29/2024 | $10,171 | $10,411 |
| 3/31/2024 | $10,260 | $10,507 |
| 4/30/2024 | $10,023 | $10,241 |
| 5/31/2024 | $10,167 | $10,415 |
| 6/30/2024 | $10,228 | $10,514 |
Average Annual Total Returns (%)
| 1 Year | 5 Years | Since Inception 9/29/16 |
|---|
| Class A | 3.24% | 0.03% | 0.78% |
| Class A with Load | (0.63%) | (0.74%) | 0.29% |
| Bloomberg US Aggregate Bond Index | 2.63% | (0.23%) | 0.65% |
Performance data represents past performance, which does not guarantee future results.
The graph and table do not reflect the deduction of taxes that a shareholder would pay on Fund distributions or a redemption of Fund shares.
| FUND STATISTICS | |
|---|
| Total Net Assets | $20,319,550 |
| # of Portfolio Holdings | 160 |
| Portfolio Turnover Rate | 32% |
| Total Advisory Fees Paid | $0 |
What is the Fund’s investment objective?
The Fund seeks to maximize total return, consisting of capital appreciation and current income.
Top 5 Holdings (% of Net Assets)
| U.S. Treasury Notes , 4.375%, due 05/15/34 | 2.1% |
| Turkiye Government Bonds (Turkey), 12.600%, due 10/01/25 | 2.0 |
| BX Trust, Class D , 6.746%, due 10/15/36 (1 mo. USD Term SOFR + 1.416%) | 1.9 |
| EQT Corp. , 3.900%, due 10/01/27 | 1.7 |
| Masco Corp. , 1.500%, due 02/15/28 | 1.7 |
UBS Multi Income Bond Fund
| Value | Value |
|---|
| Corporate bonds | 74.0% |
| Non-U.S. government agency obligations | 7.9% |
| Asset-backed securities | 6.0% |
| Mortgage-backed securities | 5.7% |
| U.S. Treasury obligations | 2.1% |
If you wish to view additional information about the Fund, including but not limited to financial statements or holdings, please visit http://www.ubs.com/port-info .
UBS Multi Income Bond Fund
Annual Shareholder Report
June 30, 2024
UBS Multi Income Bond Fund
This annual shareholder report contains important information about UBS Multi Income Bond Fund for the period of July 1, 2023 to June 30, 2024. You can find additional information about the Fund at http://www.ubs.com/port-info . You can also request this information by contacting us at 1-800-647-1568.
What were the Fund costs for the last year?
Annual Fund Operating Expenses
(based on a hypothetical $10,000 investment)
| Class Name | Cost of a $10,000 investment | Costs paid as a percentage of a $10,000 investment |
|---|
| Class P | $74 | 0.73% |
How did the Fund perform last year and what affected its performance?
Performance Summary:
What Worked:
• Active Duration and Yield Curve: Our bias to be underweight duration relative to the index contributed to performance.
• Overweight IG Corporate Bonds: An overweight position to investment grade corporate bonds was additive.
• Allocation to High Yield: The allocation to high yield corporate credit was also additive.
What Didn’t Work:
• Issue Selection: On balance the corporate allocations contributed overall, but issue selection within the financial sector in the corporate allocation detracted.
• Issue Selection Mortgage Backed Securities (“MBS”): Security selection within the MBS allocation detracted from performance.
• Active Foreign Currency: Active currency decisions detracted from performance during the period, particularly exposure to the Brazilian real.
During the reporting period, we used derivatives for risk management purposes and as a tool to help enhance returns across various strategies. A number of credit derivatives, including credit default swap index options and total return swaps, were used to manage the Fund’s credit exposure. For active currency management, we utilized foreign exchange forwards. For managing interest rate exposure, we utilized interest rate futures during the reporting period. Derivatives were just one tool, among others, that we used to implement our overall strategy.
UBS Multi Income Bond Fund
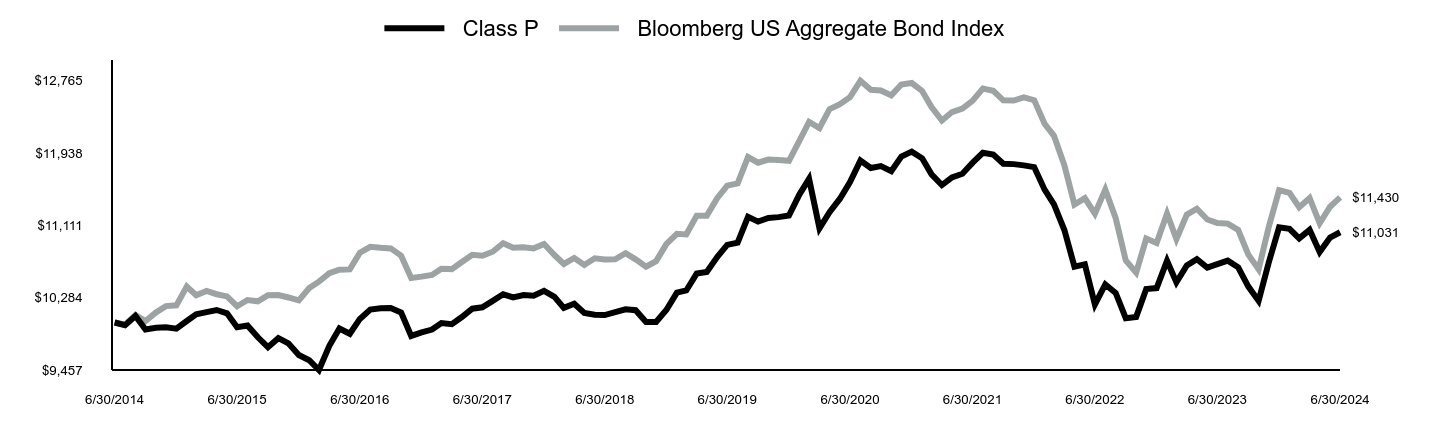
| Class P | Bloomberg US Aggregate Bond Index |
|---|
| 6/30/2014 | $10,000 | $10,000 |
| 7/31/2014 | $9,969 | $9,975 |
| 8/31/2014 | $10,074 | $10,085 |
| 9/30/2014 | $9,920 | $10,017 |
| 10/31/2014 | $9,939 | $10,115 |
| 11/30/2014 | $9,945 | $10,187 |
| 12/31/2014 | $9,929 | $10,196 |
| 1/31/2015 | $10,017 | $10,410 |
| 2/28/2015 | $10,093 | $10,312 |
| 3/31/2015 | $10,118 | $10,360 |
| 4/30/2015 | $10,143 | $10,323 |
| 5/31/2015 | $10,105 | $10,298 |
| 6/30/2015 | $9,946 | $10,186 |
| 7/31/2015 | $9,966 | $10,257 |
| 8/31/2015 | $9,831 | $10,242 |
| 9/30/2015 | $9,717 | $10,311 |
| 10/31/2015 | $9,821 | $10,313 |
| 11/30/2015 | $9,762 | $10,286 |
| 12/31/2015 | $9,628 | $10,252 |
| 1/31/2016 | $9,569 | $10,393 |
| 2/29/2016 | $9,457 | $10,467 |
| 3/31/2016 | $9,733 | $10,563 |
| 4/30/2016 | $9,931 | $10,604 |
| 5/31/2016 | $9,871 | $10,607 |
| 6/30/2016 | $10,041 | $10,797 |
| 7/31/2016 | $10,148 | $10,865 |
| 8/31/2016 | $10,163 | $10,853 |
| 9/30/2016 | $10,166 | $10,847 |
| 10/31/2016 | $10,114 | $10,764 |
| 11/30/2016 | $9,846 | $10,509 |
| 12/31/2016 | $9,886 | $10,524 |
| 1/31/2017 | $9,919 | $10,544 |
| 2/28/2017 | $9,993 | $10,615 |
| 3/31/2017 | $9,980 | $10,610 |
| 4/30/2017 | $10,062 | $10,692 |
| 5/31/2017 | $10,158 | $10,774 |
| 6/30/2017 | $10,174 | $10,763 |
| 7/31/2017 | $10,247 | $10,809 |
| 8/31/2017 | $10,322 | $10,906 |
| 9/30/2017 | $10,287 | $10,854 |
| 10/31/2017 | $10,314 | $10,861 |
| 11/30/2017 | $10,305 | $10,847 |
| 12/31/2017 | $10,361 | $10,897 |
| 1/31/2018 | $10,294 | $10,771 |
| 2/28/2018 | $10,167 | $10,669 |
| 3/31/2018 | $10,214 | $10,737 |
| 4/30/2018 | $10,108 | $10,658 |
| 5/31/2018 | $10,089 | $10,734 |
| 6/30/2018 | $10,085 | $10,720 |
| 7/31/2018 | $10,118 | $10,723 |
| 8/31/2018 | $10,151 | $10,792 |
| 9/30/2018 | $10,141 | $10,722 |
| 10/31/2018 | $10,006 | $10,638 |
| 11/30/2018 | $10,005 | $10,701 |
| 12/31/2018 | $10,145 | $10,898 |
| 1/31/2019 | $10,341 | $11,014 |
| 2/28/2019 | $10,366 | $11,007 |
| 3/31/2019 | $10,559 | $11,219 |
| 4/30/2019 | $10,577 | $11,221 |
| 5/31/2019 | $10,749 | $11,421 |
| 6/30/2019 | $10,887 | $11,564 |
| 7/31/2019 | $10,913 | $11,589 |
| 8/31/2019 | $11,207 | $11,890 |
| 9/30/2019 | $11,153 | $11,826 |
| 10/31/2019 | $11,194 | $11,862 |
| 11/30/2019 | $11,204 | $11,856 |
| 12/31/2019 | $11,223 | $11,848 |
| 1/31/2020 | $11,462 | $12,076 |
| 2/29/2020 | $11,642 | $12,293 |
| 3/31/2020 | $11,076 | $12,221 |
| 4/30/2020 | $11,260 | $12,438 |
| 5/31/2020 | $11,415 | $12,496 |
| 6/30/2020 | $11,606 | $12,575 |
| 7/31/2020 | $11,850 | $12,762 |
| 8/31/2020 | $11,765 | $12,659 |
| 9/30/2020 | $11,787 | $12,652 |
| 10/31/2020 | $11,730 | $12,596 |
| 11/30/2020 | $11,897 | $12,720 |
| 12/31/2020 | $11,953 | $12,737 |
| 1/31/2021 | $11,876 | $12,646 |
| 2/28/2021 | $11,693 | $12,463 |
| 3/31/2021 | $11,571 | $12,308 |
| 4/30/2021 | $11,658 | $12,405 |
| 5/31/2021 | $11,700 | $12,445 |
| 6/30/2021 | $11,824 | $12,533 |
| 7/31/2021 | $11,940 | $12,673 |
| 8/31/2021 | $11,920 | $12,649 |
| 9/30/2021 | $11,815 | $12,539 |
| 10/31/2021 | $11,810 | $12,536 |
| 11/30/2021 | $11,796 | $12,573 |
| 12/31/2021 | $11,776 | $12,541 |
| 1/31/2022 | $11,518 | $12,271 |
| 2/28/2022 | $11,350 | $12,134 |
| 3/31/2022 | $11,057 | $11,797 |
| 4/30/2022 | $10,638 | $11,349 |
| 5/31/2022 | $10,664 | $11,422 |
| 6/30/2022 | $10,206 | $11,243 |
| 7/31/2022 | $10,436 | $11,518 |
| 8/31/2022 | $10,337 | $11,192 |
| 9/30/2022 | $10,049 | $10,709 |
| 10/31/2022 | $10,064 | $10,570 |
| 11/30/2022 | $10,382 | $10,959 |
| 12/31/2022 | $10,393 | $10,909 |
| 1/31/2023 | $10,705 | $11,245 |
| 2/28/2023 | $10,459 | $10,954 |
| 3/31/2023 | $10,651 | $11,232 |
| 4/30/2023 | $10,723 | $11,300 |
| 5/31/2023 | $10,628 | $11,177 |
| 6/30/2023 | $10,666 | $11,137 |
| 7/31/2023 | $10,707 | $11,130 |
| 8/31/2023 | $10,631 | $11,059 |
| 9/30/2023 | $10,413 | $10,778 |
| 10/31/2023 | $10,247 | $10,607 |
| 11/30/2023 | $10,683 | $11,088 |
| 12/31/2023 | $11,087 | $11,512 |
| 1/31/2024 | $11,070 | $11,481 |
| 2/29/2024 | $10,961 | $11,318 |
| 3/31/2024 | $11,059 | $11,423 |
| 4/30/2024 | $10,806 | $11,134 |
| 5/31/2024 | $10,971 | $11,323 |
| 6/30/2024 | $11,031 | $11,430 |
Average Annual Total Returns (%)
| 1 Year | 5 Years | 10 Years |
|---|
| Class P | 3.42% | 0.26% | 0.99% |
| Bloomberg US Aggregate Bond Index | 2.63% | (0.23%) | 1.35% |
Performance data represents past performance, which does not guarantee future results.
The graph and table do not reflect the deduction of taxes that a shareholder would pay on Fund distributions or a redemption of Fund shares.
| FUND STATISTICS | |
|---|
| Total Net Assets | $20,319,550 |
| # of Portfolio Holdings | 160 |
| Portfolio Turnover Rate | 32% |
| Total Advisory Fees Paid | $0 |
What is the Fund’s investment objective?
The Fund seeks to maximize total return, consisting of capital appreciation and current income.
Top 5 Holdings (% of Net Assets)
| U.S. Treasury Notes , 4.375%, due 05/15/34 | 2.1% |
| Turkiye Government Bonds (Turkey), 12.600%, due 10/01/25 | 2.0 |
| BX Trust, Class D , 6.746%, due 10/15/36 (1 mo. USD Term SOFR + 1.416%) | 1.9 |
| EQT Corp. , 3.900%, due 10/01/27 | 1.7 |
| Masco Corp. , 1.500%, due 02/15/28 | 1.7 |
UBS Multi Income Bond Fund
| Value | Value |
|---|
| Corporate bonds | 74.0% |
| Non-U.S. government agency obligations | 7.9% |
| Asset-backed securities | 6.0% |
| Mortgage-backed securities | 5.7% |
| U.S. Treasury obligations | 2.1% |
If you wish to view additional information about the Fund, including but not limited to financial statements or holdings, please visit http://www.ubs.com/port-info .
UBS Multi Income Bond Fund
Annual Shareholder Report
June 30, 2024
UBS Multi Income Bond Fund
This annual shareholder report contains important information about UBS Multi Income Bond Fund for the period of October 11, 2023 to June 30, 2024. You can find additional information about the Fund at http://www.ubs.com/port-info . You can also request this information by contacting us at 1-800-647-1568.
What were the Fund costs for the last period?
Annual Fund Operating Expenses
(based on a hypothetical $10,000 investment)
| Class Name | Cost of a $10,000 investment | Costs paid as a percentage of a $10,000 investment |
|---|
| Class P2 | $19 | 0.26% |
How did the Fund perform last year and what affected its performance?
Performance Summary:
What Worked:
• Active Duration and Yield Curve: Our bias to be underweight duration relative to the index contributed to performance.
• Overweight IG Corporate Bonds: An overweight position to investment grade corporate bonds was additive.
• Allocation to High Yield: The allocation to high yield corporate credit was also additive.
What Didn’t Work:
• Issue Selection: On balance the corporate allocations contributed overall, but issue selection within the financial sector in the corporate allocation detracted.
• Issue Selection Mortgage Backed Securities (“MBS”): Security selection within the MBS allocation detracted from performance.
• Active Foreign Currency: Active currency decisions detracted from performance during the period, particularly exposure to the Brazilian real.
During the reporting period, we used derivatives for risk management purposes and as a tool to help enhance returns across various strategies. A number of credit derivatives, including credit default swap index options and total return swaps, were used to manage the Fund’s credit exposure. For active currency management, we utilized foreign exchange forwards. For managing interest rate exposure, we utilized interest rate futures during the reporting period. Derivatives were just one tool, among others, that we used to implement our overall strategy.
UBS Multi Income Bond Fund
| Class P2 | Bloomberg US Aggregate Bond Index |
|---|
| 10/31/2023 | $9,871 | $9,826 |
| 11/30/2023 | $10,289 | $10,271 |
| 12/31/2023 | $10,685 | $10,664 |
| 1/31/2024 | $10,676 | $10,635 |
| 2/29/2024 | $10,577 | $10,485 |
| 3/31/2024 | $10,671 | $10,582 |
| 4/30/2024 | $10,434 | $10,314 |
| 5/31/2024 | $10,600 | $10,489 |
| 6/30/2024 | $10,665 | $10,589 |
Average Annual Total Returns (%)
| Since Inception 10/11/23 |
|---|
| Class P2 | 6.65% |
| Bloomberg US Aggregate Bond Index | 5.89% |
Performance data represents past performance, which does not guarantee future results.
The graph and table do not reflect the deduction of taxes that a shareholder would pay on Fund distributions or a redemption of Fund shares.
The total return for the period of less than one year in the table has not been annualized.
| FUND STATISTICS | |
|---|
| Total Net Assets | $20,319,550 |
| # of Portfolio Holdings | 160 |
| Portfolio Turnover Rate | 32% |
| Total Advisory Fees Paid | $0 |
What is the Fund’s investment objective?
The Fund seeks to maximize total return, consisting of capital appreciation and current income.
Top 5 Holdings (% of Net Assets)
| U.S. Treasury Notes , 4.375%, due 05/15/34 | 2.1% |
| Turkiye Government Bonds (Turkey), 12.600%, due 10/01/25 | 2.0 |
| BX Trust, Class D , 6.746%, due 10/15/36 (1 mo. USD Term SOFR + 1.416%) | 1.9 |
| EQT Corp. , 3.900%, due 10/01/27 | 1.7 |
| Masco Corp. , 1.500%, due 02/15/28 | 1.7 |
UBS Multi Income Bond Fund
| Value | Value |
|---|
| Corporate bonds | 74.0% |
| Non-U.S. government agency obligations | 7.9% |
| Asset-backed securities | 6.0% |
| Mortgage-backed securities | 5.7% |
| U.S. Treasury obligations | 2.1% |
If you wish to view additional information about the Fund, including but not limited to financial statements or holdings, please visit http://www.ubs.com/port-info .
UBS Multi Income Bond Fund
Annual Shareholder Report
June 30, 2024
UBS Sustainable Development Bank Bond Fund
This annual shareholder report contains important information about UBS Sustainable Development Bank Bond Fund for the period of July 1, 2023 to June 30, 2024. You can find additional information about the Fund at http://www.ubs.com/port-info . You can also request this information by contacting us at 1-800-647-1568.
What were the Fund costs for the last year?
Annual Fund Operating Expenses
(based on a hypothetical $10,000 investment)
| Class Name | Cost of a $10,000 investment | Costs paid as a percentage of a $10,000 investment |
|---|
| Class P | $27 | 0.27% |
How did the Fund perform last year and what affected its performance?
Portfolio performance summary:
The Fund seeks to minimize tracking error relative to the Solactive Global Multilateral Development Bank Bond USD 40% 1-5 Year 60% 5-10 Year Total Return Index (before fees and expenses), which is designed to measure the performance of the US dollar-denominated multilateral development bank bond market.
• During the reporting period, yields on 10-year US Treasury bonds increased while yields on 2-year US Treasury bonds fell, resulting in the US Treasury bond yield curve to steepen. Moreover, the yield on the 10-year US Treasury bond was 0.35% below the yield on the 2-year US Treasury bond, which is defined as an inverted yield curve.
• Duration positioning was a detractor from returns. Active deviations were mainly caused by flows which led to a slight overweight of the portfolio duration compared to the benchmark duration.
• Sector positioning added to the relative performance due to the performance of out-of-benchmark holdings.
• Valuation discrepancies between the portfolio and its benchmark added to the relative performance.
The Fund did not invest in derivatives during the reporting period.
UBS Sustainable Development Bank Bond Fund
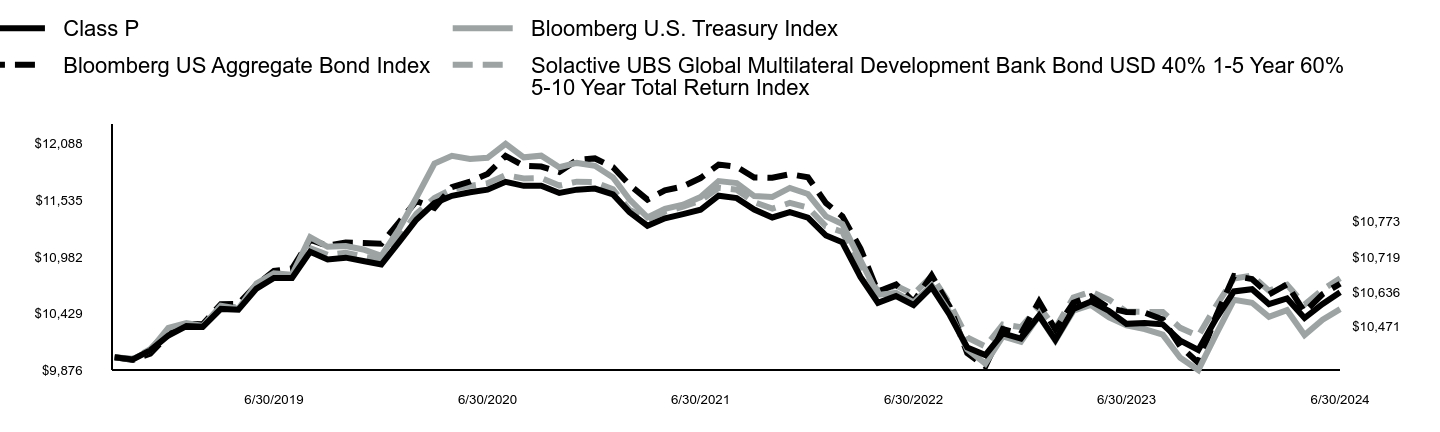
| Class P | Bloomberg U.S. Treasury Index | Bloomberg US Aggregate Bond Index | Solactive UBS Global Multilateral Development Bank Bond USD 40% 1-5 Year 60% 5-10 Year Total Return Index |
|---|
| 9/30/2018 | $10,000 | $10,000 | $10,000 | $10,000 |
| 10/31/2018 | $9,980 | $9,982 | $9,975 | $9,986 |
| 11/30/2018 | $10,068 | $10,070 | $10,035 | $10,080 |
| 12/31/2018 | $10,213 | $10,287 | $10,219 | $10,266 |
| 1/31/2019 | $10,306 | $10,335 | $10,328 | $10,327 |
| 2/28/2019 | $10,298 | $10,307 | $10,322 | $10,317 |
| 3/31/2019 | $10,473 | $10,504 | $10,520 | $10,489 |
| 4/30/2019 | $10,466 | $10,475 | $10,523 | $10,492 |
| 5/31/2019 | $10,671 | $10,721 | $10,709 | $10,696 |
| 6/30/2019 | $10,775 | $10,820 | $10,844 | $10,803 |
| 7/31/2019 | $10,775 | $10,807 | $10,868 | $10,805 |
| 8/31/2019 | $11,031 | $11,175 | $11,149 | $11,067 |
| 9/30/2019 | $10,956 | $11,080 | $11,090 | $11,001 |
| 10/31/2019 | $10,974 | $11,088 | $11,123 | $11,022 |
| 11/30/2019 | $10,942 | $11,054 | $11,118 | $10,984 |
| 12/31/2019 | $10,907 | $10,992 | $11,110 | $10,957 |
| 1/31/2020 | $11,130 | $11,261 | $11,324 | $11,175 |
| 2/29/2020 | $11,345 | $11,560 | $11,528 | $11,403 |
| 3/31/2020 | $11,507 | $11,894 | $11,460 | $11,557 |
| 4/30/2020 | $11,579 | $11,970 | $11,664 | $11,643 |
| 5/31/2020 | $11,614 | $11,939 | $11,718 | $11,676 |
| 6/30/2020 | $11,639 | $11,950 | $11,792 | $11,702 |
| 7/31/2020 | $11,715 | $12,087 | $11,968 | $11,781 |
| 8/31/2020 | $11,676 | $11,955 | $11,871 | $11,749 |
| 9/30/2020 | $11,678 | $11,971 | $11,865 | $11,752 |
| 10/31/2020 | $11,606 | $11,858 | $11,812 | $11,678 |
| 11/30/2020 | $11,639 | $11,900 | $11,928 | $11,717 |
| 12/31/2020 | $11,649 | $11,872 | $11,944 | $11,712 |
| 1/31/2021 | $11,592 | $11,758 | $11,858 | $11,642 |
| 2/28/2021 | $11,419 | $11,545 | $11,687 | $11,443 |
| 3/31/2021 | $11,286 | $11,367 | $11,541 | $11,349 |
| 4/30/2021 | $11,359 | $11,452 | $11,632 | $11,424 |
| 5/31/2021 | $11,400 | $11,492 | $11,670 | $11,473 |
| 6/30/2021 | $11,442 | $11,566 | $11,752 | $11,531 |
| 7/31/2021 | $11,580 | $11,723 | $11,884 | $11,657 |
| 8/31/2021 | $11,556 | $11,703 | $11,861 | $11,638 |
| 9/30/2021 | $11,445 | $11,576 | $11,758 | $11,517 |
| 10/31/2021 | $11,367 | $11,567 | $11,755 | $11,453 |
| 11/30/2021 | $11,419 | $11,656 | $11,790 | $11,509 |
| 12/31/2021 | $11,366 | $11,596 | $11,760 | $11,464 |
| 1/31/2022 | $11,190 | $11,377 | $11,507 | $11,280 |
| 2/28/2022 | $11,124 | $11,302 | $11,378 | $11,226 |
| 3/31/2022 | $10,785 | $10,950 | $11,062 | $10,885 |
| 4/30/2022 | $10,533 | $10,610 | $10,642 | $10,648 |
| 5/31/2022 | $10,599 | $10,630 | $10,711 | $10,701 |
| 6/30/2022 | $10,511 | $10,536 | $10,543 | $10,617 |
| 7/31/2022 | $10,687 | $10,704 | $10,800 | $10,794 |
| 8/31/2022 | $10,414 | $10,439 | $10,495 | $10,525 |
| 9/30/2022 | $10,097 | $10,078 | $10,042 | $10,193 |
| 10/31/2022 | $10,022 | $9,938 | $9,912 | $10,107 |
| 11/30/2022 | $10,233 | $10,204 | $10,276 | $10,320 |
| 12/31/2022 | $10,183 | $10,151 | $10,230 | $10,295 |
| 1/31/2023 | $10,408 | $10,405 | $10,545 | $10,494 |
| 2/28/2023 | $10,170 | $10,162 | $10,272 | $10,285 |
| 3/31/2023 | $10,473 | $10,456 | $10,533 | $10,585 |
| 4/30/2023 | $10,546 | $10,512 | $10,597 | $10,642 |
| 5/31/2023 | $10,453 | $10,390 | $10,481 | $10,565 |
| 6/30/2023 | $10,327 | $10,312 | $10,444 | $10,446 |
| 7/31/2023 | $10,335 | $10,276 | $10,437 | $10,444 |
| 8/31/2023 | $10,322 | $10,222 | $10,370 | $10,443 |
| 9/30/2023 | $10,163 | $9,996 | $10,107 | $10,288 |
| 10/31/2023 | $10,072 | $9,876 | $9,947 | $10,209 |
| 11/30/2023 | $10,374 | $10,219 | $10,397 | $10,499 |
| 12/31/2023 | $10,644 | $10,562 | $10,795 | $10,771 |
| 1/31/2024 | $10,666 | $10,533 | $10,766 | $10,798 |
| 2/29/2024 | $10,520 | $10,395 | $10,614 | $10,651 |
| 3/31/2024 | $10,576 | $10,461 | $10,712 | $10,710 |
| 4/30/2024 | $10,384 | $10,218 | $10,441 | $10,516 |
| 5/31/2024 | $10,522 | $10,367 | $10,618 | $10,663 |
| 6/30/2024 | $10,636 | $10,471 | $10,719 | $10,773 |
Average Annual Total Returns (%)
| 1 Year | 5 Years | Since Inception 10/24/18 |
|---|
| Class P | 2.99% | (0.26%) | 1.09% |
| Bloomberg U.S. Treasury Index | 1.55% | (0.65%) | 0.81% |
| Bloomberg US Aggregate Bond Index | 2.63% | (0.23%) | 1.23% |
| Solactive UBS Global Multilateral Development Bank Bond USD 40% 1-5 Year 60% 5-10 Year Total Return Index | 3.13% | (0.05%) | 1.32% |
Performance data represents past performance, which does not guarantee future results.
The graph and table do not reflect the deduction of taxes that a shareholder would pay on Fund distributions or a redemption of Fund shares.
| FUND STATISTICS | |
|---|
| Total Net Assets | $79,245,768 |
| # of Portfolio Holdings | 70 |
| Portfolio Turnover Rate | 28% |
| Total Advisory Fees Paid | $0 |
What is the Fund’s investment objective?
The Fund seeks current income.
Top 5 Holdings (% of Net Assets)
| Inter-American Development Bank (Supranationals), 1.125%, due 01/13/31 | 5.8% |
| Inter-American Development Bank (Supranationals), 2.250%, due 06/18/29 | 5.6 |
| International Bank for Reconstruction & Development (Supranationals), 1.250%, due 02/10/31 | 4.2 |
| International Bank for Reconstruction & Development (Supranationals), 1.625%, due 11/03/31 | 3.9 |
| International Bank for Reconstruction & Development (Supranationals), 1.750%, due 10/23/29 | 3.4 |
UBS Sustainable Development Bank Bond Fund
Asset Class Allocation (% of Net Assets)
| Value | Value |
|---|
| Non-U.S. government agency obligations | 99.0% |
| Short-Term Investments | 0.5% |
If you wish to view additional information about the Fund, including but not limited to financial statements or holdings, please visit http://www.ubs.com/port-info .
UBS Sustainable Development Bank Bond Fund
Annual Shareholder Report
June 30, 2024
UBS Sustainable Development Bank Bond Fund
This annual shareholder report contains important information about UBS Sustainable Development Bank Bond Fund for the period of July 1, 2023 to June 30, 2024. You can find additional information about the Fund at http://www.ubs.com/port-info . You can also request this information by contacting us at 1-800-647-1568.
What were the Fund costs for the last year?
Annual Fund Operating Expenses
(based on a hypothetical $10,000 investment)
| Class Name | Cost of a $10,000 investment | Costs paid as a percentage of a $10,000 investment |
|---|
| Class P2 | $17 | 0.17% |
How did the Fund perform last year and what affected its performance?
Portfolio performance summary:
The Fund seeks to minimize tracking error relative to the Solactive Global Multilateral Development Bank Bond USD 40% 1-5 Year 60% 5-10 Year Total Return Index (before fees and expenses), which is designed to measure the performance of the US dollar-denominated multilateral development bank bond market.
• During the reporting period, yields on 10-year US Treasury bonds increased while yields on 2-year US Treasury bonds fell, resulting in the US Treasury bond yield curve to steepen. Moreover, the yield on the 10-year US Treasury bond was 0.35% below the yield on the 2-year US Treasury bond, which is defined as an inverted yield curve.
• Duration positioning was a detractor from returns. Active deviations were mainly caused by flows which led to a slight overweight of the portfolio duration compared to the benchmark duration.
• Sector positioning added to the relative performance due to the performance of out-of-benchmark holdings.
• Valuation discrepancies between the portfolio and its benchmark added to the relative performance.
The Fund did not invest in derivatives during the reporting period.
UBS Sustainable Development Bank Bond Fund

| Class P2 | Bloomberg U.S. Treasury Index | Bloomberg US Aggregate Bond Index | Solactive UBS Global Multilateral Development Bank Bond USD 40% 1-5 Year 60% 5-10 Year Total Return Index |
|---|
| 9/30/2020 | $10,000 | $10,000 | $10,000 | $10,000 |
| 10/31/2020 | $10,000 | $10,000 | $10,000 | $10,000 |
| 11/30/2020 | $10,028 | $10,035 | $10,098 | $10,033 |
| 12/31/2020 | $10,037 | $10,012 | $10,112 | $10,029 |
| 1/31/2021 | $9,990 | $9,916 | $10,040 | $9,969 |
| 2/28/2021 | $9,841 | $9,736 | $9,895 | $9,798 |
| 3/31/2021 | $9,728 | $9,586 | $9,771 | $9,718 |
| 4/30/2021 | $9,792 | $9,658 | $9,848 | $9,782 |
| 5/31/2021 | $9,829 | $9,691 | $9,880 | $9,824 |
| 6/30/2021 | $9,866 | $9,753 | $9,950 | $9,874 |
| 7/31/2021 | $9,986 | $9,886 | $10,061 | $9,981 |
| 8/31/2021 | $9,967 | $9,869 | $10,042 | $9,965 |
| 9/30/2021 | $9,863 | $9,762 | $9,955 | $9,862 |
| 10/31/2021 | $9,797 | $9,755 | $9,952 | $9,807 |
| 11/30/2021 | $9,843 | $9,830 | $9,982 | $9,855 |
| 12/31/2021 | $9,799 | $9,779 | $9,956 | $9,816 |
| 1/31/2022 | $9,648 | $9,594 | $9,742 | $9,659 |
| 2/28/2022 | $9,601 | $9,531 | $9,633 | $9,612 |
| 3/31/2022 | $9,310 | $9,234 | $9,365 | $9,321 |
| 4/30/2022 | $9,095 | $8,948 | $9,010 | $9,118 |
| 5/31/2022 | $9,143 | $8,964 | $9,068 | $9,163 |
| 6/30/2022 | $9,069 | $8,885 | $8,926 | $9,091 |
| 7/31/2022 | $9,231 | $9,027 | $9,144 | $9,242 |
| 8/31/2022 | $8,987 | $8,803 | $8,885 | $9,012 |
| 9/30/2022 | $8,714 | $8,499 | $8,502 | $8,728 |
| 10/31/2022 | $8,650 | $8,380 | $8,391 | $8,654 |
| 11/30/2022 | $8,834 | $8,605 | $8,700 | $8,837 |
| 12/31/2022 | $8,792 | $8,560 | $8,661 | $8,815 |
| 1/31/2023 | $8,987 | $8,775 | $8,927 | $8,986 |
| 2/28/2023 | $8,782 | $8,570 | $8,696 | $8,807 |
| 3/31/2023 | $9,046 | $8,818 | $8,917 | $9,064 |
| 4/30/2023 | $9,110 | $8,865 | $8,971 | $9,113 |
| 5/31/2023 | $9,030 | $8,762 | $8,874 | $9,047 |
| 6/30/2023 | $8,922 | $8,696 | $8,842 | $8,945 |
| 7/31/2023 | $8,930 | $8,665 | $8,836 | $8,943 |
| 8/31/2023 | $8,920 | $8,620 | $8,779 | $8,942 |
| 9/30/2023 | $8,784 | $8,430 | $8,556 | $8,809 |
| 10/31/2023 | $8,707 | $8,328 | $8,421 | $8,742 |
| 11/30/2023 | $8,969 | $8,617 | $8,803 | $8,990 |
| 12/31/2023 | $9,203 | $8,907 | $9,140 | $9,223 |
| 1/31/2024 | $9,224 | $8,882 | $9,115 | $9,246 |
| 2/29/2024 | $9,098 | $8,766 | $8,986 | $9,120 |
| 3/31/2024 | $9,149 | $8,822 | $9,069 | $9,171 |
| 4/30/2024 | $8,983 | $8,617 | $8,840 | $9,005 |
| 5/31/2024 | $9,104 | $8,742 | $8,990 | $9,130 |
| 6/30/2024 | $9,194 | $8,830 | $9,075 | $9,225 |
Average Annual Total Returns (%)
| 1 Year | Since Inception 10/30/20 |
|---|
| Class P2 | 3.04% | (2.27%) |
| Bloomberg U.S. Treasury Index | 1.55% | (3.34%) |
| Bloomberg US Aggregate Bond Index | 2.63% | (2.61%) |
| Solactive UBS Global Multilateral Development Bank Bond USD 40% 1-5 Year 60% 5-10 Year Total Return Index | 3.13% | (2.18%) |
Performance data represents past performance, which does not guarantee future results.
The graph and table do not reflect the deduction of taxes that a shareholder would pay on Fund distributions or a redemption of Fund shares.
| FUND STATISTICS | |
|---|
| Total Net Assets | $79,245,768 |
| # of Portfolio Holdings | 70 |
| Portfolio Turnover Rate | 28% |
| Total Advisory Fees Paid | $0 |
What is the Fund’s investment objective?
The Fund seeks current income.
Top 5 Holdings (% of Net Assets)
| Inter-American Development Bank (Supranationals), 1.125%, due 01/13/31 | 5.8% |
| Inter-American Development Bank (Supranationals), 2.250%, due 06/18/29 | 5.6 |
| International Bank for Reconstruction & Development (Supranationals), 1.250%, due 02/10/31 | 4.2 |
| International Bank for Reconstruction & Development (Supranationals), 1.625%, due 11/03/31 | 3.9 |
| International Bank for Reconstruction & Development (Supranationals), 1.750%, due 10/23/29 | 3.4 |
UBS Sustainable Development Bank Bond Fund
Asset Class Allocation (% of Net Assets)
| Value | Value |
|---|
| Non-U.S. government agency obligations | 99.0% |
| Short-Term Investments | 0.5% |
If you wish to view additional information about the Fund, including but not limited to financial statements or holdings, please visit http://www.ubs.com/port-info .
UBS Sustainable Development Bank Bond Fund
Annual Shareholder Report
June 30, 2024
UBS U.S. Small Cap Growth Fund
This annual shareholder report contains important information about UBS U.S. Small Cap Growth Fund for the period of July 1, 2023 to June 30, 2024. You can find additional information about the Fund at http://www.ubs.com/port-info . You can also request this information by contacting us at 1-800-647-1568.
What were the Fund costs for the last year?
Annual Fund Operating Expenses
(based on a hypothetical $10,000 investment)
| Class Name | Cost of a $10,000 investment | Costs paid as a percentage of a $10,000 investment |
|---|
| Class A | $132 | 1.26% |
How did the Fund perform last year and what affected its performance?
Portfolio performance summary:
What worked:
Stock selection within the Information Technology and Health Care sectors was positive for performance, while overweighting Information Technology and underweighting Utilities also contributed to results.
• Medpace (MEDP), a full-service clinical research organization, outperformed on the back of strong demand for clinical services and an improved biotech funding outlook.
• Pure Storage (PSTG), an all-flash enterprise storage provider, outperformed after quarterly earnings reports suggested that the transition to storage-as-a-service is resonating with large enterprises.
• Viking Therapeutics (VKTX), a biopharmaceutical company focused on developing therapeutics for patients suffering from metabolic and endocrine disorders, advanced after the company reported strong efficacy data in its Phase 2 trial of the company’s GLP-1/GIP dual agonist weight loss drug.
What didn't work:
Stock selection within Industrials and Financials sectors was negative for performance while underweighting Financials and Consumer Staples also detracted from returns.
• MicroStrategy (MSTR), a provider of business intelligence software and services, has been acquiring bitcoin for many years and shares of the stock moved higher as the price of bitcoin surged during the period. The Fund does not own shares of MicroStrategy.
• Inspire Medical Systems (INSP), a developer of implantable neurostimulation systems to treat obstructive sleep apnea, declined after reporting a deceleration in US sales growth.
• Treace Medical Concepts (TMCI), an orthopedic medical device company, underperformed after the company revised down its full year guidance to reflect an increasingly competitive landscape for lapiplasty products.
The Fund did not invest in derivatives during the reporting period.
UBS U.S. Small Cap Growth Fund

| Class A with Load | Russell 2000 Growth Index | Russell 3000 Index TR (USD) |
|---|
| 6/30/2014 | $9,450 | $10,000 | $10,000 |
| 7/31/2014 | $8,977 | $9,394 | $9,803 |
| 8/31/2014 | $9,534 | $9,918 | $10,214 |
| 9/30/2014 | $8,981 | $9,387 | $10,001 |
| 10/31/2014 | $9,447 | $9,969 | $10,276 |
| 11/30/2014 | $9,481 | $10,034 | $10,525 |
| 12/31/2014 | $9,865 | $10,331 | $10,525 |
| 1/31/2015 | $9,495 | $10,095 | $10,232 |
| 2/28/2015 | $10,162 | $10,822 | $10,825 |
| 3/31/2015 | $10,374 | $11,016 | $10,715 |
| 4/30/2015 | $10,046 | $10,692 | $10,763 |
| 5/31/2015 | $10,532 | $11,085 | $10,912 |
| 6/30/2015 | $10,925 | $11,234 | $10,729 |
| 7/31/2015 | $10,763 | $11,280 | $10,909 |
| 8/31/2015 | $9,763 | $10,425 | $10,250 |
| 9/30/2015 | $9,231 | $9,767 | $9,952 |
| 10/31/2015 | $9,638 | $10,321 | $10,738 |
| 11/30/2015 | $10,027 | $10,699 | $10,797 |
| 12/31/2015 | $9,624 | $10,189 | $10,576 |
| 1/31/2016 | $8,275 | $9,085 | $9,979 |
| 2/29/2016 | $7,869 | $9,020 | $9,976 |
| 3/31/2016 | $8,508 | $9,711 | $10,678 |
| 4/30/2016 | $8,701 | $9,808 | $10,744 |
| 5/31/2016 | $8,919 | $10,073 | $10,936 |
| 6/30/2016 | $9,005 | $10,026 | $10,959 |
| 7/31/2016 | $9,684 | $10,682 | $11,394 |
| 8/31/2016 | $9,725 | $10,795 | $11,423 |
| 9/30/2016 | $9,918 | $10,951 | $11,441 |
| 10/31/2016 | $9,375 | $10,270 | $11,193 |
| 11/30/2016 | $10,298 | $11,189 | $11,694 |
| 12/31/2016 | $10,237 | $11,342 | $11,922 |
| 1/31/2017 | $10,556 | $11,526 | $12,147 |
| 2/28/2017 | $10,777 | $11,808 | $12,599 |
| 3/31/2017 | $10,887 | $11,948 | $12,607 |
| 4/30/2017 | $10,976 | $12,168 | $12,741 |
| 5/31/2017 | $10,976 | $12,058 | $12,871 |
| 6/30/2017 | $11,144 | $12,473 | $12,987 |
| 7/31/2017 | $11,065 | $12,579 | $13,232 |
| 8/31/2017 | $10,950 | $12,564 | $13,258 |
| 9/30/2017 | $11,489 | $13,248 | $13,581 |
| 10/31/2017 | $11,699 | $13,454 | $13,877 |
| 11/30/2017 | $12,134 | $13,840 | $14,299 |
| 12/31/2017 | $12,196 | $13,856 | $14,442 |
| 1/31/2018 | $12,819 | $14,396 | $15,203 |
| 2/28/2018 | $12,650 | $13,986 | $14,642 |
| 3/31/2018 | $12,738 | $14,174 | $14,349 |
| 4/30/2018 | $12,772 | $14,188 | $14,403 |
| 5/31/2018 | $13,979 | $15,082 | $14,810 |
| 6/30/2018 | $14,060 | $15,200 | $14,907 |
| 7/31/2018 | $14,080 | $15,461 | $15,401 |
| 8/31/2018 | $15,653 | $16,423 | $15,942 |
| 9/30/2018 | $15,355 | $16,039 | $15,968 |
| 10/31/2018 | $13,396 | $14,010 | $14,793 |
| 11/30/2018 | $13,382 | $14,229 | $15,089 |
| 12/31/2018 | $11,622 | $12,566 | $13,685 |
| 1/31/2019 | $13,122 | $14,017 | $14,859 |
| 2/28/2019 | $14,002 | $14,922 | $15,382 |
| 3/31/2019 | $13,979 | $14,721 | $15,606 |
| 4/30/2019 | $14,560 | $15,169 | $16,230 |
| 5/31/2019 | $13,550 | $14,043 | $15,179 |
| 6/30/2019 | $14,897 | $15,125 | $16,246 |
| 7/31/2019 | $15,279 | $15,273 | $16,487 |
| 8/31/2019 | $14,805 | $14,614 | $16,151 |
| 9/30/2019 | $13,826 | $14,494 | $16,434 |
| 10/31/2019 | $14,109 | $14,906 | $16,788 |
| 11/30/2019 | $15,012 | $15,784 | $17,426 |
| 12/31/2019 | $15,066 | $16,145 | $17,929 |
| 1/31/2020 | $14,967 | $15,968 | $17,910 |
| 2/29/2020 | $13,993 | $14,815 | $16,444 |
| 3/31/2020 | $11,543 | $11,986 | $14,182 |
| 4/30/2020 | $13,408 | $13,771 | $16,061 |
| 5/31/2020 | $15,330 | $15,072 | $16,919 |
| 6/30/2020 | $16,287 | $15,651 | $17,306 |
| 7/31/2020 | $17,450 | $16,189 | $18,289 |
| 8/31/2020 | $18,647 | $17,139 | $19,614 |
| 9/30/2020 | $18,779 | $16,771 | $18,900 |
| 10/31/2020 | $19,092 | $16,899 | $18,492 |
| 11/30/2020 | $21,749 | $19,879 | $20,741 |
| 12/31/2020 | $24,127 | $21,737 | $21,675 |
| 1/31/2021 | $24,165 | $22,785 | $21,578 |
| 2/28/2021 | $25,938 | $23,537 | $22,253 |
| 3/31/2021 | $25,390 | $22,797 | $23,050 |
| 4/30/2021 | $26,644 | $23,294 | $24,238 |
| 5/31/2021 | $25,372 | $22,628 | $24,349 |
| 6/30/2021 | $26,050 | $23,690 | $24,949 |
| 7/31/2021 | $25,725 | $22,827 | $25,371 |
| 8/31/2021 | $26,514 | $23,242 | $26,095 |
| 9/30/2021 | $25,650 | $22,351 | $24,924 |
| 10/31/2021 | $26,291 | $23,397 | $26,610 |
| 11/30/2021 | $24,694 | $22,254 | $26,205 |
| 12/31/2021 | $25,321 | $22,353 | $27,236 |
| 1/31/2022 | $21,863 | $19,357 | $25,634 |
| 2/28/2022 | $22,528 | $19,442 | $24,988 |
| 3/31/2022 | $22,778 | $19,530 | $25,799 |
| 4/30/2022 | $19,867 | $17,134 | $23,484 |
| 5/31/2022 | $18,964 | $16,811 | $23,452 |
| 6/30/2022 | $17,372 | $15,770 | $21,490 |
| 7/31/2022 | $19,249 | $17,536 | $23,506 |
| 8/31/2022 | $18,869 | $17,371 | $22,629 |
| 9/30/2022 | $17,134 | $15,808 | $20,531 |
| 10/31/2022 | $18,786 | $17,309 | $22,214 |
| 11/30/2022 | $19,225 | $17,590 | $23,374 |
| 12/31/2022 | $18,152 | $16,461 | $22,005 |
| 1/31/2023 | $20,020 | $18,099 | $23,521 |
| 2/28/2023 | $19,515 | $17,903 | $22,971 |
| 3/31/2023 | $18,758 | $17,461 | $23,585 |
| 4/30/2023 | $18,278 | $17,258 | $23,837 |
| 5/31/2023 | $18,291 | $17,261 | $23,929 |
| 6/30/2023 | $19,844 | $18,692 | $25,563 |
| 7/31/2023 | $20,652 | $19,566 | $26,480 |
| 8/31/2023 | $19,604 | $18,548 | $25,968 |
| 9/30/2023 | $18,278 | $17,324 | $24,731 |
| 10/31/2023 | $16,663 | $15,988 | $24,076 |
| 11/30/2023 | $18,493 | $17,444 | $26,321 |
| 12/31/2023 | $20,614 | $19,533 | $27,717 |
| 1/31/2024 | $20,500 | $18,906 | $28,024 |
| 2/29/2024 | $23,050 | $20,442 | $29,541 |
| 3/31/2024 | $23,201 | $21,014 | $30,494 |
| 4/30/2024 | $21,624 | $19,396 | $29,152 |
| 5/31/2024 | $21,952 | $20,434 | $30,530 |
| 6/30/2024 | $21,889 | $20,400 | $31,475 |
Average Annual Total Returns (%)
| 1 Year | 5 Years | 10 Years |
|---|
| Class A | 10.30% | 8.00% | 8.76% |
| Class A with Load | 4.27% | 6.79% | 8.15% |
| Russell 2000 Growth Index | 9.14% | 6.17% | 7.39% |
| Russell 3000 Index TR (USD) | 23.13% | 14.14% | 12.15% |
Performance data represents past performance, which does not guarantee future results.
The graph and table do not reflect the deduction of taxes that a shareholder would pay on Fund distributions or a redemption of Fund shares.
| FUND STATISTICS | |
|---|
| Total Net Assets | $133,314,788 |
| # of Portfolio Holdings | 86 |
| Portfolio Turnover Rate | 51% |
| Total Advisory Fees Paid | $713,521 |
What is the Fund’s investment objective?
The Fund seeks to provide long-term capital appreciation.
Top 5 Holdings (% of Net Assets)
| Medpace Holdings, Inc. | 3.1% |
| Pure Storage, Inc., Class A | 2.7 |
| Universal Display Corp. | 2.4 |
| Ryman Hospitality Properties, Inc. | 2.4 |
| RadNet, Inc. | 2.2 |
UBS U.S. Small Cap Growth Fund
Top 5 Sectors (% of Net Assets)
| Value | Value |
|---|
| Information Technology | 28.3% |
| Health Care | 23.2% |
| Industrials | 14.3% |
| Consumer Discretionary | 12.7% |
| Financials | 5.6% |
If you wish to view additional information about the Fund, including but not limited to financial statements or holdings, please visit http://www.ubs.com/port-info .
UBS U.S. Small Cap Growth Fund
Annual Shareholder Report
June 30, 2024
UBS U.S. Small Cap Growth Fund
This annual shareholder report contains important information about UBS U.S. Small Cap Growth Fund for the period of July 1, 2023 to June 30, 2024. You can find additional information about the Fund at http://www.ubs.com/port-info . You can also request this information by contacting us at 1-800-647-1568.
What were the Fund costs for the last year?
Annual Fund Operating Expenses
(based on a hypothetical $10,000 investment)
| Class Name | Cost of a $10,000 investment | Costs paid as a percentage of a $10,000 investment |
|---|
| Class P | $106 | 1.01% |
How did the Fund perform last year and what affected its performance?
Portfolio performance summary:
What worked:
Stock selection within the Information Technology and Health Care sectors was positive for performance, while overweighting Information Technology and underweighting Utilities also contributed to results.
• Medpace (MEDP), a full-service clinical research organization, outperformed on the back of strong demand for clinical services and an improved biotech funding outlook.
• Pure Storage (PSTG), an all-flash enterprise storage provider, outperformed after quarterly earnings reports suggested that the transition to storage-as-a-service is resonating with large enterprises.
• Viking Therapeutics (VKTX), a biopharmaceutical company focused on developing therapeutics for patients suffering from metabolic and endocrine disorders, advanced after the company reported strong efficacy data in its Phase 2 trial of the company’s GLP-1/GIP dual agonist weight loss drug.
What didn't work:
Stock selection within Industrials and Financials sectors was negative for performance while underweighting Financials and Consumer Staples also detracted from returns.
• MicroStrategy (MSTR), a provider of business intelligence software and services, has been acquiring bitcoin for many years and shares of the stock moved higher as the price of bitcoin surged during the period. The Fund does not own shares of MicroStrategy.
• Inspire Medical Systems (INSP), a developer of implantable neurostimulation systems to treat obstructive sleep apnea, declined after reporting a deceleration in US sales growth.
• Treace Medical Concepts (TMCI), an orthopedic medical device company, underperformed after the company revised down its full year guidance to reflect an increasingly competitive landscape for lapiplasty products.
The Fund did not invest in derivatives during the reporting period.
UBS U.S. Small Cap Growth Fund
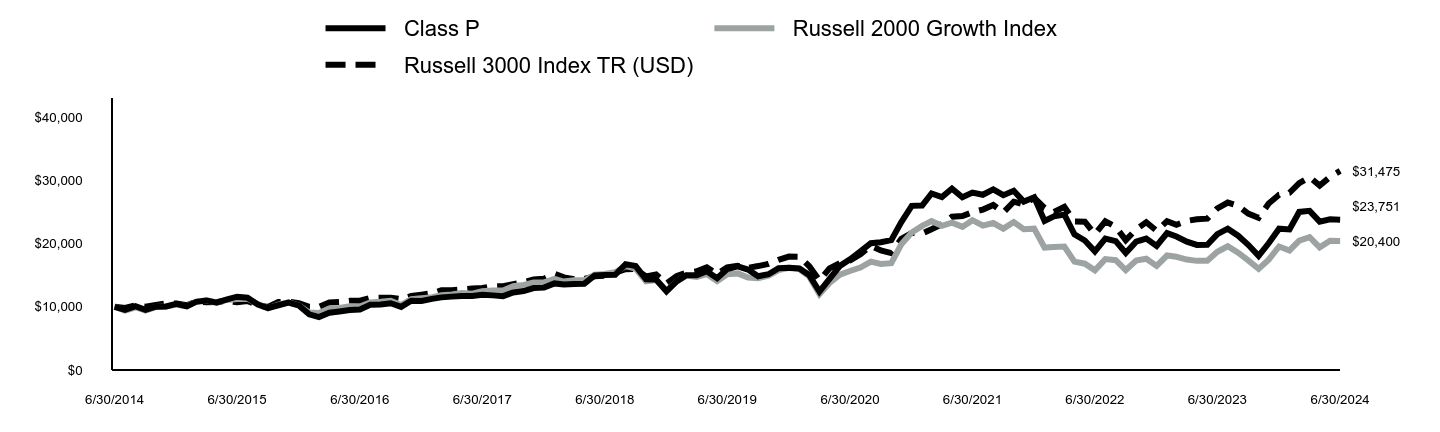
| Class P | Russell 2000 Growth Index | Russell 3000 Index TR (USD) |
|---|
| 6/30/2014 | $10,000 | $10,000 | $10,000 |
| 7/31/2014 | $9,500 | $9,394 | $9,803 |
| 8/31/2014 | $10,092 | $9,918 | $10,214 |
| 9/30/2014 | $9,508 | $9,387 | $10,001 |
| 10/31/2014 | $10,004 | $9,969 | $10,276 |
| 11/30/2014 | $10,046 | $10,034 | $10,525 |
| 12/31/2014 | $10,457 | $10,331 | $10,525 |
| 1/31/2015 | $10,064 | $10,095 | $10,232 |
| 2/28/2015 | $10,771 | $10,822 | $10,825 |
| 3/31/2015 | $11,002 | $11,016 | $10,715 |
| 4/30/2015 | $10,655 | $10,692 | $10,763 |
| 5/31/2015 | $11,177 | $11,085 | $10,912 |
| 6/30/2015 | $11,593 | $11,234 | $10,729 |
| 7/31/2015 | $11,422 | $11,280 | $10,909 |
| 8/31/2015 | $10,364 | $10,425 | $10,250 |
| 9/30/2015 | $9,801 | $9,767 | $9,952 |
| 10/31/2015 | $10,240 | $10,321 | $10,738 |
| 11/30/2015 | $10,651 | $10,699 | $10,797 |
| 12/31/2015 | $10,220 | $10,189 | $10,576 |
| 1/31/2016 | $8,798 | $9,085 | $9,979 |
| 2/29/2016 | $8,365 | $9,020 | $9,976 |
| 3/31/2016 | $9,049 | $9,711 | $10,678 |
| 4/30/2016 | $9,255 | $9,808 | $10,744 |
| 5/31/2016 | $9,486 | $10,073 | $10,936 |
| 6/30/2016 | $9,577 | $10,026 | $10,959 |
| 7/31/2016 | $10,301 | $10,682 | $11,394 |
| 8/31/2016 | $10,351 | $10,795 | $11,423 |
| 9/30/2016 | $10,557 | $10,951 | $11,441 |
| 10/31/2016 | $9,984 | $10,270 | $11,193 |
| 11/30/2016 | $10,964 | $11,189 | $11,694 |
| 12/31/2016 | $10,904 | $11,342 | $11,922 |
| 1/31/2017 | $11,246 | $11,526 | $12,147 |
| 2/28/2017 | $11,484 | $11,808 | $12,599 |
| 3/31/2017 | $11,603 | $11,948 | $12,607 |
| 4/30/2017 | $11,702 | $12,168 | $12,741 |
| 5/31/2017 | $11,702 | $12,058 | $12,871 |
| 6/30/2017 | $11,883 | $12,473 | $12,987 |
| 7/31/2017 | $11,800 | $12,579 | $13,232 |
| 8/31/2017 | $11,681 | $12,564 | $13,258 |
| 9/30/2017 | $12,257 | $13,248 | $13,581 |
| 10/31/2017 | $12,485 | $13,454 | $13,877 |
| 11/30/2017 | $12,952 | $13,840 | $14,299 |
| 12/31/2017 | $13,024 | $13,856 | $14,442 |
| 1/31/2018 | $13,693 | $14,396 | $15,203 |
| 2/28/2018 | $13,509 | $13,986 | $14,642 |
| 3/31/2018 | $13,608 | $14,174 | $14,349 |
| 4/30/2018 | $13,647 | $14,188 | $14,403 |
| 5/31/2018 | $14,940 | $15,082 | $14,810 |
| 6/30/2018 | $15,032 | $15,200 | $14,907 |
| 7/31/2018 | $15,052 | $15,461 | $15,401 |
| 8/31/2018 | $16,739 | $16,423 | $15,942 |
| 9/30/2018 | $16,431 | $16,039 | $15,968 |
| 10/31/2018 | $14,330 | $14,010 | $14,793 |
| 11/30/2018 | $14,323 | $14,229 | $15,089 |
| 12/31/2018 | $12,442 | $12,566 | $13,685 |
| 1/31/2019 | $14,053 | $14,017 | $14,859 |
| 2/28/2019 | $14,997 | $14,922 | $15,382 |
| 3/31/2019 | $14,975 | $14,721 | $15,606 |
| 4/30/2019 | $15,604 | $15,169 | $16,230 |
| 5/31/2019 | $14,521 | $14,043 | $15,179 |
| 6/30/2019 | $15,970 | $15,125 | $16,246 |
| 7/31/2019 | $16,380 | $15,273 | $16,487 |
| 8/31/2019 | $15,875 | $14,614 | $16,151 |
| 9/30/2019 | $14,828 | $14,494 | $16,434 |
| 10/31/2019 | $15,136 | $14,906 | $16,788 |
| 11/30/2019 | $16,102 | $15,784 | $17,426 |
| 12/31/2019 | $16,169 | $16,145 | $17,929 |
| 1/31/2020 | $16,059 | $15,968 | $17,910 |
| 2/29/2020 | $15,026 | $14,815 | $16,444 |
| 3/31/2020 | $12,389 | $11,986 | $14,182 |
| 4/30/2020 | $14,400 | $13,771 | $16,061 |
| 5/31/2020 | $16,466 | $15,072 | $16,919 |
| 6/30/2020 | $17,507 | $15,651 | $17,306 |
| 7/31/2020 | $18,751 | $16,189 | $18,289 |
| 8/31/2020 | $20,043 | $17,139 | $19,614 |
| 9/30/2020 | $20,191 | $16,771 | $18,900 |
| 10/31/2020 | $20,528 | $16,899 | $18,492 |
| 11/30/2020 | $23,392 | $19,879 | $20,741 |
| 12/31/2020 | $25,953 | $21,737 | $21,675 |
| 1/31/2021 | $25,996 | $22,785 | $21,578 |
| 2/28/2021 | $27,915 | $23,537 | $22,253 |
| 3/31/2021 | $27,333 | $22,797 | $23,050 |
| 4/30/2021 | $28,687 | $23,294 | $24,238 |
| 5/31/2021 | $27,324 | $22,628 | $24,349 |
| 6/30/2021 | $28,062 | $23,690 | $24,949 |
| 7/31/2021 | $27,715 | $22,827 | $25,371 |
| 8/31/2021 | $28,566 | $23,242 | $26,095 |
| 9/30/2021 | $27,646 | $22,351 | $24,924 |
| 10/31/2021 | $28,340 | $23,397 | $26,610 |
| 11/30/2021 | $26,630 | $22,254 | $26,205 |
| 12/31/2021 | $27,309 | $22,353 | $27,236 |
| 1/31/2022 | $23,584 | $19,357 | $25,634 |
| 2/28/2022 | $24,303 | $19,442 | $24,988 |
| 3/31/2022 | $24,582 | $19,530 | $25,799 |
| 4/30/2022 | $21,448 | $17,134 | $23,484 |
| 5/31/2022 | $20,471 | $16,811 | $23,452 |
| 6/30/2022 | $18,764 | $15,770 | $21,490 |
| 7/31/2022 | $20,793 | $17,536 | $23,506 |
| 8/31/2022 | $20,385 | $17,371 | $22,629 |
| 9/30/2022 | $18,506 | $15,808 | $20,531 |
| 10/31/2022 | $20,299 | $17,309 | $22,214 |
| 11/30/2022 | $20,782 | $17,590 | $23,374 |
| 12/31/2022 | $19,630 | $16,461 | $22,005 |
| 1/31/2023 | $21,651 | $18,099 | $23,521 |
| 2/28/2023 | $21,109 | $17,903 | $22,971 |
| 3/31/2023 | $20,296 | $17,461 | $23,585 |
| 4/30/2023 | $19,777 | $17,258 | $23,837 |
| 5/31/2023 | $19,800 | $17,261 | $23,929 |
| 6/30/2023 | $21,482 | $18,692 | $25,563 |
| 7/31/2023 | $22,351 | $19,566 | $26,480 |
| 8/31/2023 | $21,233 | $18,548 | $25,968 |
| 9/30/2023 | $19,800 | $17,324 | $24,731 |
| 10/31/2023 | $18,050 | $15,988 | $24,076 |
| 11/30/2023 | $20,037 | $17,444 | $26,321 |
| 12/31/2023 | $22,340 | $19,533 | $27,717 |
| 1/31/2024 | $22,227 | $18,906 | $28,024 |
| 2/29/2024 | $24,992 | $20,442 | $29,541 |
| 3/31/2024 | $25,162 | $21,014 | $30,494 |
| 4/30/2024 | $23,457 | $19,396 | $29,152 |
| 5/31/2024 | $23,818 | $20,434 | $30,530 |
| 6/30/2024 | $23,751 | $20,400 | $31,475 |
Average Annual Total Returns (%)
| 1 Year | 5 Years | 10 Years |
|---|
| Class P | 10.56% | 8.26% | 9.04% |
| Russell 2000 Growth Index | 9.14% | 6.17% | 7.39% |
| Russell 3000 Index TR (USD) | 23.13% | 14.14% | 12.15% |
Performance data represents past performance, which does not guarantee future results.
The graph and table do not reflect the deduction of taxes that a shareholder would pay on Fund distributions or a redemption of Fund shares.
| FUND STATISTICS | |
|---|
| Total Net Assets | $133,314,788 |
| # of Portfolio Holdings | 86 |
| Portfolio Turnover Rate | 51% |
| Total Advisory Fees Paid | $713,521 |
What is the Fund’s investment objective?
The Fund seeks to provide long-term capital appreciation.
Top 5 Holdings (% of Net Assets)
| Medpace Holdings, Inc. | 3.1% |
| Pure Storage, Inc., Class A | 2.7 |
| Universal Display Corp. | 2.4 |
| Ryman Hospitality Properties, Inc. | 2.4 |
| RadNet, Inc. | 2.2 |
UBS U.S. Small Cap Growth Fund
Top 5 Sectors (% of Net Assets)
| Value | Value |
|---|
| Information Technology | 28.3% |
| Health Care | 23.2% |
| Industrials | 14.3% |
| Consumer Discretionary | 12.7% |
| Financials | 5.6% |
If you wish to view additional information about the Fund, including but not limited to financial statements or holdings, please visit http://www.ubs.com/port-info .
UBS U.S. Small Cap Growth Fund
Annual Shareholder Report
June 30, 2024
UBS US Quality Growth At Reasonable Price Fund
This annual shareholder report contains important information about UBS US Quality Growth At Reasonable Price Fund for the period of July 1, 2023 to June 30, 2024. You can find additional information about the Fund at http://www.ubs.com/port-info . You can also request this information by contacting us at 1-800-647-1568.
What were the Fund costs for the last year?
Annual Fund Operating Expenses
(based on a hypothetical $10,000 investment)
| Class Name | Cost of a $10,000 investment | Costs paid as a percentage of a $10,000 investment |
|---|
| Class P | $59 | 0.51% |
How did the Fund perform last year and what affected its performance?
Portfolio performance summary
What worked:
• Stock selection within the consumer discretionary and health care sectors were meaningful contributors to performance relative to the Russell 1000 Growth Index.
• Within sectors, our industrials underweight was a modest contributor to performance.
• Several holdings were beneficial for absolute performance, including:
• While artificial intelligence adoption remains in its early days, Microsoft appears to be a leader in monetizing its vast amount of data across its Office platform and leading Azure cloud offering.
• Amazon.com stock rallied on significant operating margin improvement in its e-commerce segment. Its shares also benefitted from a stabilization in the company’s Amazon Web Services cloud segment growth.
• Shares of Alphabet benefited from strong digital advertising markets leading to better Search and YouTube revenues. Improved sentiment in the company’s AI offerings also supported shares.
What didn’t work:
• Stock selection within technology was a meaningful detractor from relative performance.
• Within sectors, our underweight to technology and overweight to financials detracted from performance.
• Several individual holdings weighed on absolute performance, including:
• A difficult consumer spending environment for apparel and greater competition pressured shares of NIKE. Given continued revenue growth headwinds, we removed the company from the portfolio in April 2024.
• Rockwell Automation shares fell amid uneven execution and struggling industrial automation trends. We removed the company in April 2024.
• Honeywell stock underperformed given continued weakness in its more economically sensitive “short-cycle” businesses, despite strength in its aerospace segment. We removed the company in February 2024.
The Fund did not invest in derivatives during the reporting period.
UBS US Quality Growth At Reasonable Price Fund
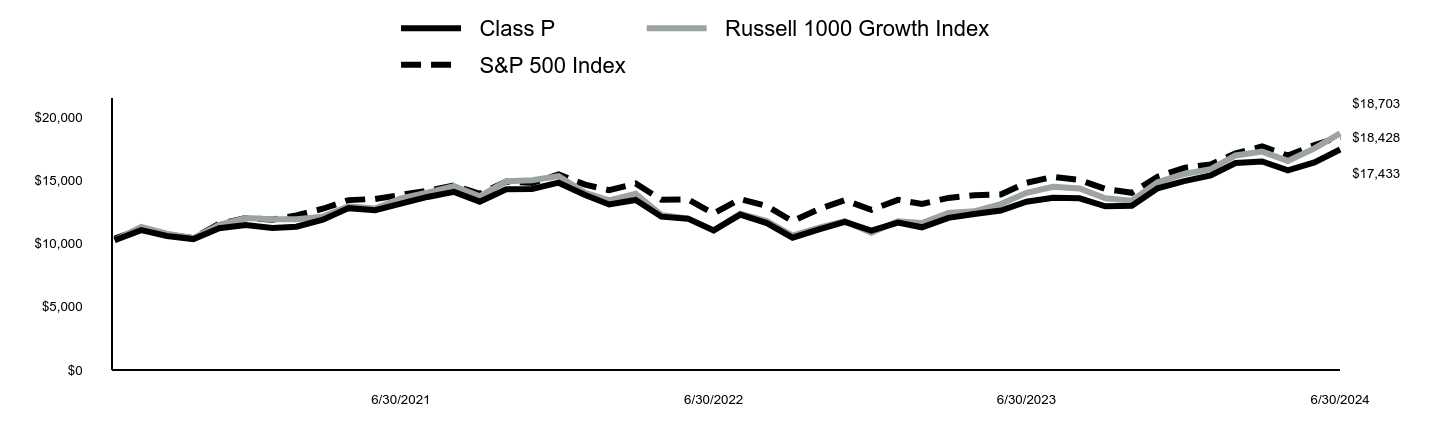
| Class P | Russell 1000 Growth Index | S&P 500 Index |
|---|
| 7/31/2020 | $10,260 | $10,257 | $10,385 |
| 8/31/2020 | $11,060 | $11,315 | $11,131 |
| 9/30/2020 | $10,600 | $10,783 | $10,708 |
| 10/31/2020 | $10,350 | $10,417 | $10,423 |
| 11/30/2020 | $11,210 | $11,483 | $11,564 |
| 12/31/2020 | $11,463 | $12,011 | $12,009 |
| 1/31/2021 | $11,222 | $11,923 | $11,888 |
| 2/28/2021 | $11,332 | $11,920 | $12,215 |
| 3/31/2021 | $11,884 | $12,125 | $12,750 |
| 4/30/2021 | $12,797 | $12,950 | $13,431 |
| 5/31/2021 | $12,637 | $12,770 | $13,525 |
| 6/30/2021 | $13,149 | $13,572 | $13,840 |
| 7/31/2021 | $13,681 | $14,019 | $14,169 |
| 8/31/2021 | $14,082 | $14,543 | $14,600 |
| 9/30/2021 | $13,309 | $13,729 | $13,921 |
| 10/31/2021 | $14,293 | $14,918 | $14,896 |
| 11/30/2021 | $14,313 | $15,009 | $14,793 |
| 12/31/2021 | $14,809 | $15,326 | $15,456 |
| 1/31/2022 | $13,837 | $14,011 | $14,656 |
| 2/28/2022 | $13,083 | $13,416 | $14,218 |
| 3/31/2022 | $13,445 | $13,940 | $14,745 |
| 4/30/2022 | $12,122 | $12,257 | $13,460 |
| 5/31/2022 | $11,967 | $11,972 | $13,484 |
| 6/30/2022 | $11,037 | $11,024 | $12,371 |
| 7/31/2022 | $12,287 | $12,347 | $13,512 |
| 8/31/2022 | $11,616 | $11,772 | $12,961 |
| 9/30/2022 | $10,458 | $10,627 | $11,767 |
| 10/31/2022 | $11,120 | $11,248 | $12,720 |
| 11/30/2022 | $11,709 | $11,761 | $13,431 |
| 12/31/2022 | $11,023 | $10,861 | $12,657 |
| 1/31/2023 | $11,660 | $11,766 | $13,452 |
| 2/28/2023 | $11,284 | $11,626 | $13,124 |
| 3/31/2023 | $12,025 | $12,421 | $13,606 |
| 4/30/2023 | $12,339 | $12,543 | $13,818 |
| 5/31/2023 | $12,610 | $13,115 | $13,878 |
| 6/30/2023 | $13,309 | $14,012 | $14,795 |
| 7/31/2023 | $13,612 | $14,484 | $15,271 |
| 8/31/2023 | $13,570 | $14,354 | $15,027 |
| 9/30/2023 | $12,944 | $13,573 | $14,311 |
| 10/31/2023 | $12,986 | $13,380 | $14,010 |
| 11/30/2023 | $14,364 | $14,839 | $15,289 |
| 12/31/2023 | $14,938 | $15,496 | $15,984 |
| 1/31/2024 | $15,389 | $15,882 | $16,253 |
| 2/29/2024 | $16,364 | $16,966 | $17,121 |
| 3/31/2024 | $16,489 | $17,264 | $17,671 |
| 4/30/2024 | $15,787 | $16,532 | $16,950 |
| 5/31/2024 | $16,416 | $17,522 | $17,790 |
| 6/30/2024 | $17,433 | $18,703 | $18,428 |
Average Annual Total Returns (%)
| 1 Year | Since Inception 7/9/20 |
|---|
| Class P | 30.98% | 15.00% |
| Russell 1000 Growth Index | 33.48% | 17.06% |
| S&P 500 Index | 24.56% | 16.62% |
Performance data represents past performance, which does not guarantee future results.
The graph and table do not reflect the deduction of taxes that a shareholder would pay on Fund distributions or a redemption of Fund shares.
| FUND STATISTICS | |
|---|
| Total Net Assets | $287,283,849 |
| # of Portfolio Holdings | 36 |
| Portfolio Turnover Rate | 27% |
| Total Advisory Fees Paid | $467,496 |
What is the Fund’s investment objective?
The Fund seeks to provide capital appreciation.
Top 5 Holdings (% of Net Assets)
| Microsoft Corp. | 13.4% |
| Apple, Inc. | 8.4 |
| Amazon.com, Inc. | 8.3 |
| Alphabet, Inc., Class A | 6.0 |
| Meta Platforms, Inc., Class A | 5.9 |
UBS US Quality Growth At Reasonable Price Fund
Top 5 Sectors (% of Net Assets)
| Value | Value |
|---|
| Information Technology | 43.0% |
| Consumer Discretionary | 14.3% |
| Health Care | 11.9% |
| Communication Services | 11.9% |
| Financials | 8.3% |
If you wish to view additional information about the Fund, including but not limited to financial statements or holdings, please visit http://www.ubs.com/port-info .
UBS US Quality Growth At Reasonable Price Fund
| | (b) | Copy of each notice transmitted to shareholders in reliance on Rule 30e-3 under the Investment Company Act of 1940, as amended (the “1940 Act”), that contains disclosures specified by paragraph (c)(3) of that rule: Not applicable to the registrant. |
Item 2. Code of Ethics.
The registrant has adopted a code of ethics that applies to its principal executive officer, principal financial officer, principal accounting officer or controller, or persons performing similar functions pursuant to Section 406 of the Sarbanes-Oxley Act of 2002. (The registrant has designated the code of ethics adopted pursuant to Sarbanes-Oxley as a “Code of Conduct” to lessen the risk of confusion with its separate code of ethics adopted pursuant to Rule 17j-1 under the 1940 Act.).
Item 3. Audit Committee Financial Expert.
The registrant’s Board has determined that the following person serving on the registrant’s Audit Committee is an “audit committee financial expert” as defined in item 3 of Form N-CSR: Muhammad Gigani. Mr. Gigani is independent as defined in item 3 of Form N-CSR.
Item 4. Principal Accountant Fees and Services.
For the fiscal years ended June 30, 2024 and June 30, 2023, the aggregate Ernst & Young LLP (E&Y) audit fees for professional services rendered to the registrant were approximately $628,193 and $643,193, respectively.
Fees included in the audit fees category are those associated with the annual audits of financial statements and services that are normally provided in connection with statutory and regulatory filings.
In each of the fiscal years ended June 30, 2024 and June 30, 2023, the aggregate audit-related fees billed by E&Y for services rendered to the registrant that are reasonably related to the performance of the audits of the financial statements, but not reported as audit fees, were approximately $29,491 and $30,992 respectively.
Fees included in the audit-related fees category are those associated with the reading and providing of comments on the 2023 and 2022 semiannual financial statements.
There were no audit-related fees required to be approved pursuant to paragraph (c)(7)(ii) of Rule 2-01 of Regulation S-X during the fiscal years indicated above.
In each of the fiscal years ended June 30, 2024 and June 30, 2023, the aggregate tax fees billed by E&Y for professional services rendered to the registrant were approximately $178,660 and $155,224, respectively.
Fees included in the tax fees category comprise all services performed by professional staff in the independent accountant’s tax division except those services related to the audits. This category comprises fees for review of tax compliance, tax return preparation and excise tax calculations.
There were no tax fees required to be approved pursuant to paragraph (c)(7)(ii) of Rule 2-01 of Regulation S-X during the fiscal years indicated above.
In each of the fiscal years ended June 30, 2024 and June 30, 2023, there were no fees billed by E&Y for products and services, other than the services reported in Item 4(a)-(c) above, rendered to the registrant.
Fees included in all other fees category would consist of services related to internal control reviews, strategy and other consulting, financial information systems design and implementation, consulting on other information systems, and other tax services unrelated to the registrant.
There were no “all other fees” required to be approved pursuant to paragraph (c)(7)(ii) of Rule 2-01 of Regulation S-X during the fiscal years indicated above.
| (e) | (1) Audit Committee Pre-Approval Policies and Procedures: |
The Audit Committee Charter contains the Audit Committee’s pre-approval policies and procedures. Reproduced below is an excerpt from the Audit Committee Charter regarding pre-approval policies and procedures:
To carry out its purposes, the Audit Committee shall have the following duties and powers:
(a) To pre-approve the engagement of, and to recommend to the Board the engagement, retention or termination of, the independent auditors to provide audit, review or attest services to The UBS Funds, and, in connection therewith, to review and evaluate the capabilities and independence of the auditors and receive the auditors’ specific representations as to their independence. In evaluating the auditor’s qualifications, performance and independence, the Committee must, among other things, obtain and review a report by the auditors, at least annually, describing the following items: (i) all relationships between the independent auditors and The UBS Funds, as well as with The UBS Funds' investment advisor or any control affiliate of the investment advisor that provides ongoing services to The UBS Funds; (ii) any material issues raised by the most recent internal quality control review, or peer review, of the audit firm, or by any inquiry or investigation by governmental or professional authorities, within the preceding five years, with respect to one or more independent audits carried out by the firm, and any steps taken to deal with any such issues; and (iii) the audit firm’s internal quality control procedures.
(b) To pre-approve all non-audit services to be provided to The UBS Funds by the independent auditors when, without such pre-approval, the auditors would not be independent of The UBS Funds under applicable federal securities laws, rules or auditing standards.
(c) To pre-approve all non-audit services to be provided by The UBS Funds’ independent auditors to The UBS Funds’ investment advisor or to any entity, that controls, is controlled by or is under common control with The UBS Funds investment advisor (“advisor affiliate”) and that provides ongoing services to The UBS Funds when, without such pre-approval by the Committee, the auditors would not be independent of The UBS Funds under applicable federal securities laws, rules or auditing standards.
(d) To establish, if deemed necessary or appropriate as an alternative to Committee pre-approval of services to be provided by the independent auditors as required by paragraphs (b) and (c) above, policies and procedures to permit such services to be pre-approved by other means, such as by action of a designated member or members of the Committee, subject to subsequent Committee review or oversight.
(e) To consider whether the non-audit services provided by The UBS Funds’ independent auditor to The UBS Funds investment advisor or any advisor affiliate that provides on-going services to The UBS Funds, which services were not pre-approved by the Committee, are compatible with maintaining the auditors’ independence.
Pursuant to Section (d), the Committee has delegated its responsibility to pre-approve the audit and permissible non-audit services required by paragraphs (a), (b) and (c) of Section 4, not exceeding $100,000 (excluding reasonable out-of-pocket expenses) on an annual basis to the Chairperson. All such pre-approvals will be subject to subsequent Committee review or oversight, including being reported to the full Committee on a quarterly basis at the Committee’s next regularly scheduled meeting after pre-approval. The Committee may not delegate to management its responsibility to pre-approve services to be performed by the independent auditor. Requests or applications to provide services that require specific pre-approval by the Committee, or the Chairperson will be submitted by both the Fund’s independent auditors and the Fund’s Treasurer or other designated Fund officer and must include a joint statement as to whether, in their view, the request or application is consistent with U.S. Securities and Exchange Commission rules on auditor independence.
(e) (2) Services approved pursuant to paragraph (c)(7)(i)(C) of Rule 2-01 of Regulation S-X:
Audit-Related Fees:
There were no amounts that were approved by the audit committee pursuant to the de minimis exception for the fiscal years ended June 30, 2024 and June 30, 2023 on behalf of the registrant.
There were no amounts that were required to be approved by the audit committee pursuant to the de minimis exception for the fiscal years ended June 30, 2024 and June 30, 2023 on behalf of the registrant’s service providers that relate directly to the operations and financial reporting of the registrant.
Tax Fees:
There were no amounts that were approved by the audit committee pursuant to the de minimis exception for the fiscal years ended June 30, 2024 and June 30, 2023 on behalf of the registrant.
There were no amounts that were required to be approved by the audit committee pursuant to the de minimis exception for the fiscal years ended June 30, 2024 and June 30, 2023 on behalf of the registrant’s service providers that relate directly to the operations and financial reporting of the registrant.
All Other Fees:
There were no amounts that were approved by the audit committee pursuant to the de minimis exception for the fiscal years ended June 30, 2024 and June 30, 2023 on behalf of the registrant.
There were no amounts that were required to be approved by the audit committee pursuant to the de minimis exception for the fiscal years ended June 30, 2024 and June 30, 2023 on behalf of the registrant’s service providers that relate directly to the operations and financial reporting of the registrant.
| (f) | For the fiscal year ended June 30, 2024, if greater than 50%, specify the percentage of hours spent on the audit of the registrant’s financial statements for the most recent fiscal year that were attributed to work performed by persons who are not full-time, permanent employees of E&Y. According to E&Y, such amount was below 50%, therefore disclosure item not applicable to this filing. |
| (g) | For the fiscal years ended June 30, 2024 and June 30, 2023, the aggregate fees billed by E&Y of $800,600 and $2,196,986, respectively, for non-audit services rendered on behalf of the registrant (“covered”), its investment adviser (not including any sub-adviser whose role is primarily portfolio management and is subcontracted with or overseen by another investment adviser) and any entity controlling, controlled by, or under common control with the adviser (“non-covered”) that provides ongoing services (or provided during the relevant fiscal period) to the registrant for each of the last two fiscal years of the registrant is shown in the table below: |
| | | 2024 | | | 2023 | |
| Covered Services | | $ | 208,151 | | | $ | 186,216 | |
| Non-Covered Services | | $ | 592,449 | | | | 2,010,770 | |
| (h) | The registrant’s audit committee was not required to consider whether the provision of non-audit services that were rendered to the registrant’s investment adviser (not including any sub-adviser whose role is primarily portfolio management and is subcontracted with or overseen by another investment adviser), and any entity controlling, controlled by, or under common control with the investment adviser that provides ongoing services to the registrant that were not pre-approved pursuant to paragraph (c)(7)(ii) of Rule 2-01 of Regulation S-X is compatible with maintaining the principal accountant’s independence. |
Item 5. Audit Committee of Listed Registrants.
Not applicable to the registrant.
Item 6. Investments.
| (a) | Included as part of the financial statements filed under Item 7(a) of this form. |
Item 7. Financial Statements and Financial Highlights for Open-End Management Investment Companies.
(a) Copy of the most recent financial statements:

The UBS Funds
Annual Financial Statements | June 30, 2024
UBS All China Equity Fund
Portfolio of investments
| | | Number of
shares | | Value | |
Common stocks: 93.7% | |
China: 84.1% | |
Alibaba Group Holding Ltd. | | | 5,400 | | | $ | 48,669 | | |
Anhui Conch Cement Co. Ltd., Class H | | | 6,500 | | | | 15,462 | | |
Anhui Gujing Distillery Co. Ltd., Class B | | | 5,200 | | | | 77,242 | | |
China Jinmao Holdings Group Ltd. | | | 82,000 | | | | 6,486 | | |
China Merchants Bank Co. Ltd., Class H | | | 55,500 | | | | 252,200 | | |
China Resources Land Ltd. | | | 22,000 | | | | 74,939 | | |
Chinasoft International Ltd.1 | | | 52,000 | | | | 27,276 | | |
Country Garden Services Holdings Co. Ltd.1 | | | 7,000 | | | | 4,311 | | |
CSPC Pharmaceutical Group Ltd. | | | 96,000 | | | | 76,453 | | |
Far East Horizon Ltd. | | | 56,000 | | | | 36,326 | | |
Fuyao Glass Industry Group Co. Ltd., Class H2 | | | 10,000 | | | | 57,928 | | |
Hainan Meilan International Airport Co. Ltd., Class H*,1 | | | 23,000 | | | | 22,665 | | |
Hangzhou Silan Microelectronics Co. Ltd., Class A* | | | 8,500 | | | | 20,419 | | |
Horizon Construction Development Ltd.*,1 | | | 12,444 | | | | 2,392 | | |
Inner Mongolia Yili Industrial Group Co. Ltd., Class A | | | 21,600 | | | | 76,713 | | |
Jiangsu Hengrui Pharmaceuticals Co. Ltd., Class A* | | | 7,500 | | | | 39,642 | | |
Joinn Laboratories China Co. Ltd., Class H2 | | | 20,272 | | | | 19,404 | | |
Kingsoft Corp. Ltd. | | | 3,000 | | | | 8,641 | | |
Kweichow Moutai Co. Ltd., Class A | | | 1,300 | | | | 261,927 | | |
Longfor Group Holdings Ltd.1,2 | | | 18,000 | | | | 24,591 | | |
Meituan, Class B*,2 | | | 5,590 | | | | 79,458 | | |
Midea Group Co. Ltd., Class A | | | 8,700 | | | | 77,132 | | |
NetEase, Inc. | | | 21,000 | | | | 401,014 | | |
Ping An Insurance Group Co. of China Ltd., Class H | | | 21,500 | | | | 97,407 | | |
Smoore International Holdings Ltd.2 | | | 11,000 | | | | 13,313 | | |
TAL Education Group, ADR* | | | 3,168 | | | | 33,803 | | |
Tencent Holdings Ltd. | | | 6,800 | | | | 322,594 | | |
Wanhua Chemical Group Co. Ltd., Class A | | | 1,400 | | | | 15,550 | | |
| | | Number of
shares | | Value | |
Common stocks—(concluded) | |
China—(concluded) | |
Wuliangye Yibin Co. Ltd., Class A* | | | 1,300 | | | $ | 22,853 | | |
WuXi AppTec Co. Ltd., Class H2 | | | 6,100 | | | | 22,812 | | |
Wuxi Biologics Cayman, Inc.*,2 | | | 5,500 | | | | 8,094 | | |
WuXi XDC Cayman, Inc.* | | | 11 | | | | 24 | | |
Yihai International Holding Ltd.1 | | | 12,000 | | | | 20,066 | | |
Yunnan Baiyao Group Co. Ltd., Class A | | | 6,020 | | | | 42,365 | | |
Yunnan Energy New Material Co. Ltd., Class A | | | 3,400 | | | | 14,799 | | |
| | | | | | 2,324,970 | | |
Hong Kong: 9.6% | |
AIA Group Ltd. | | | 9,400 | | | | 63,598 | | |
Hong Kong Exchanges & Clearing Ltd. | | | 3,800 | | | | 121,612 | | |
SSY Group Ltd. | | | 148,000 | | | | 79,845 | | |
| | | | | | 265,055 | | |
Total common stocks
(cost $3,909,536) | | | | | 2,590,025 | | |
Short-term investments: 8.6% | |
Investment companies: 8.6% | |
State Street Institutional U.S. Government
Money Market Fund, 5.254%3
(cost $238,425) | | | 238,425 | | | | 238,425 | | |
Total investments: 102.3%
(cost $4,147,961) | | | | | 2,828,450 | | |
Liabilities in excess of other assets: (2.3%) | | | | | (63,040 | ) | |
Net assets: 100.0% | | | | $ | 2,765,410 | | |
For a listing of defined portfolio acronyms that are used throughout the Portfolio of investments as well as the tables that follow, please refer to the Glossary of terms used in the Portfolio of investments.
1
UBS All China Equity Fund
Portfolio of investments
Fair valuation summary
The following is a summary of the fair valuations according to the inputs used as of June 30, 2024 in valuing the Fund's investments. In the event a fund holds investments for which fair value is measured using the NAV per share practical expedient (or its equivalent), a separate column will be added to the fair value hierarchy table; this is intended to permit reconciliation to the amounts presented in the Portfolio of investments:
Description | | Unadjusted
quoted prices in
active market for
identical investments
(Level 1) | | Other significant
observable inputs
(Level 2) | | Unobservable
inputs
(Level 3) | | Total | |
Assets | |
Common stocks | | $ | 33,803 | | | $ | 2,556,222 | | | $ | — | | | $ | 2,590,025 | | |
Short-term investments | | | — | | | | 238,425 | | | | — | | | | 238,425 | | |
Total | | $ | 33,803 | | | $ | 2,794,647 | | | $ | — | | | $ | 2,828,450 | | |
At June 30, 2024, there were no transfers in or out of Level 3.
Portfolio footnotes
* Non-income producing security.
1 Security, or portion thereof, was on loan at the period end.
2 Security exempt from registration pursuant to Rule 144A under the Securities Act of 1933. These securities are considered liquid, unless noted otherwise, and may be resold in transactions exempt from registrations, normally to qualified institutional buyers. Securities exempt from registration pursuant to Rule 144A, in the amount of $225,600, represented 8.2% of the Fund's net assets at period end.
3 Rate shown reflects yield at June 30, 2024.
See accompanying notes to financial statements.
2
UBS Global Allocation Fund
Portfolio of investments
| | | Number of
shares | | Value | |
Common stocks: 28.2% | |
Australia: 0.2% | |
Glencore PLC | | | 57,806 | | | $ | 328,932 | | |
Austria: 0.3% | |
BAWAG Group AG1 | | | 6,078 | | | | 384,221 | | |
Canada: 0.5% | |
Canadian Pacific Kansas City Ltd.2 | | | 5,699 | | | | 448,822 | | |
Shopify, Inc., Class A* | | | 3,650 | | | | 241,082 | | |
| | | | | | 689,904 | | |
Denmark: 0.1% | |
Genmab AS* | | | 826 | | | | 206,990 | | |
France: 0.4% | |
LVMH Moet Hennessy Louis Vuitton SE | | | 420 | | | | 322,472 | | |
Pernod Ricard SA2 | | | 2,319 | | | | 316,404 | | |
| | | | | | 638,876 | | |
Germany: 0.5% | |
Infineon Technologies AG | | | 9,826 | | | | 360,617 | | |
Knorr-Bremse AG | | | 5,416 | | | | 413,972 | | |
| | | | | | 774,589 | | |
Hong Kong: 0.2% | |
AIA Group Ltd. | | | 41,617 | | | | 281,570 | | |
India: 0.2% | |
HDFC Bank Ltd., ADR | | | 5,626 | | | | 361,920 | | |
Ireland: 0.3% | |
AIB Group PLC | | | 82,859 | | | | 437,586 | | |
Italy: 0.1% | |
Wizz Air Holdings PLC*,1,2 | | | 7,179 | | | | 202,471 | | |
Japan: 1.4% | |
ITOCHU Corp.2 | | | 8,600 | | | | 422,760 | | |
JTOWER, Inc.*,2 | | | 9,400 | | | | 98,830 | | |
Keyence Corp. | | | 700 | | | | 306,375 | | |
Nippon Telegraph & Telephone Corp. | | | 317,400 | | | | 300,134 | | |
Shin-Etsu Chemical Co. Ltd. | | | 8,600 | | | | 334,382 | | |
SoftBank Group Corp. | | | 4,700 | | | | 302,310 | | |
Sony Group Corp. | | | 4,500 | | | | 383,495 | | |
| | | | | | 2,148,286 | | |
Netherlands: 0.7% | |
Heineken Holding NV | | | 3,447 | | | | 271,692 | | |
Koninklijke Philips NV*,2 | | | 18,536 | | | | 466,153 | | |
Universal Music Group NV2 | | | 10,059 | | | | 299,238 | | |
| | | | | | 1,037,083 | | |
Portugal: 0.4% | |
Galp Energia SGPS SA | | | 30,999 | | | | 654,726 | | |
South Korea: 0.2% | |
Samsung Electronics Co. Ltd. | | | 5,880 | | | | 346,060 | | |
| | | Number of
shares | | Value | |
Common stocks—(continued) | |
Spain: 0.2% | |
Banco de Sabadell SA | | | 193,404 | | | $ | 373,395 | | |
Sweden: 0.2% | |
Hexpol AB | | | 21,572 | | | | 239,129 | | |
Switzerland: 0.8% | |
Alcon, Inc. | | | 4,458 | | | | 396,280 | | |
Novartis AG, Registered Shares | | | 4,998 | | | | 532,145 | | |
Sandoz Group AG | | | 7,760 | | | | 281,285 | | |
| | | | | | 1,209,710 | | |
United Kingdom: 1.0% | |
Ashtead Group PLC | | | 5,249 | | | | 349,970 | | |
British American Tobacco PLC | | | 9,864 | | | | 303,019 | | |
Legal & General Group PLC | | | 90,751 | | | | 259,871 | | |
London Stock Exchange Group PLC | | | 3,400 | | | | 403,166 | | |
Spectris PLC | | | 5,887 | | | | 206,547 | | |
| | | | | | 1,522,573 | | |
United States: 20.5% | |
Adobe, Inc.* | | | 414 | | | | 229,994 | | |
Advanced Micro Devices, Inc.* | | | 1,209 | | | | 196,112 | | |
Airbnb, Inc., Class A* | | | 120 | | | | 18,196 | | |
Allstate Corp. | | | 1,857 | | | | 296,489 | | |
Alphabet, Inc., Class A | | | 8,511 | | | | 1,550,279 | | |
Amazon.com, Inc.* | | | 6,835 | | | | 1,320,864 | | |
Ameriprise Financial, Inc. | | | 839 | | | | 358,412 | | |
APA Corp. | | | 8,547 | | | | 251,624 | | |
Apollo Global Management, Inc. | | | 2,602 | | | | 307,218 | | |
Apple, Inc. | | | 9,010 | | | | 1,897,686 | | |
Aptiv PLC* | | | 6,810 | | | | 479,560 | | |
Berkshire Hathaway, Inc., Class B* | | | 1,869 | | | | 760,309 | | |
Bio-Rad Laboratories, Inc., Class A* | | | 1,767 | | | | 482,585 | | |
BlackRock, Inc. | | | 493 | | | | 388,149 | | |
Bristol-Myers Squibb Co. | | | 11,878 | | | | 493,293 | | |
Broadcom, Inc. | | | 419 | | | | 672,717 | | |
Brunswick Corp. | | | 3,047 | | | | 221,730 | | |
Bunge Global SA | | | 3,085 | | | | 329,385 | | |
CF Industries Holdings, Inc. | | | 2,493 | | | | 184,781 | | |
Chipotle Mexican Grill, Inc.* | | | 3,191 | | | | 199,916 | | |
Constellation Brands, Inc., Class A | | | 853 | | | | 219,460 | | |
Cooper Cos., Inc. | | | 1,712 | | | | 149,458 | | |
Devon Energy Corp. | | | 7,793 | | | | 369,388 | | |
Dexcom, Inc.* | | | 1,665 | | | | 188,778 | | |
Dynatrace, Inc.* | | | 5,255 | | | | 235,109 | | |
Eli Lilly & Co. | | | 643 | | | | 582,159 | | |
Exxon Mobil Corp. | | | 1,116 | | | | 128,474 | | |
Fidelity National Information Services, Inc. | | | 7,682 | | | | 578,915 | | |
GE Vernova, Inc.* | | | 1,125 | | | | 192,949 | | |
General Electric Co. | | | 1,100 | | | | 174,867 | | |
Haleon PLC | | | 124,532 | | | | 506,685 | | |
Hayward Holdings, Inc.* | | | 16,552 | | | | 203,590 | | |
HubSpot, Inc.* | | | 383 | | | | 225,890 | | |
Hyatt Hotels Corp., Class A | | | 1,068 | | | | 162,251 | | |
IAC, Inc.* | | | 5,151 | | | | 241,324 | | |
3
UBS Global Allocation Fund
Portfolio of investments
| | | Number of
shares | | Value | |
Common stocks—(concluded) | |
United States—(concluded) | |
Ingersoll Rand, Inc. | | | 8,881 | | | $ | 806,750 | | |
Intel Corp. | | | 7,641 | | | | 236,642 | | |
IQVIA Holdings, Inc.* | | | 776 | | | | 164,077 | | |
Keysight Technologies, Inc.* | | | 2,639 | | | | 360,883 | | |
Las Vegas Sands Corp. | | | 4,830 | | | | 213,727 | | |
Live Nation Entertainment, Inc.* | | | 2,123 | | | | 199,010 | | |
Lyft, Inc., Class A* | | | 16,471 | | | | 232,241 | | |
Marsh & McLennan Cos., Inc. | | | 1,330 | | | | 280,258 | | |
Marvell Technology, Inc. | | | 3,091 | | | | 216,061 | | |
Mastercard, Inc., Class A | | | 1,249 | | | | 551,009 | | |
Meta Platforms, Inc., Class A | | | 1,552 | | | | 782,549 | | |
Micron Technology, Inc. | | | 2,943 | | | | 387,093 | | |
Microsoft Corp. | | | 4,783 | | | | 2,137,762 | | |
Mondelez International, Inc., Class A | | | 6,654 | | | | 435,438 | | |
NextEra Energy, Inc. | | | 8,684 | | | | 614,914 | | |
NIKE, Inc., Class B | | | 2,853 | | | | 215,031 | | |
Northrop Grumman Corp. | | | 732 | | | | 319,115 | | |
NVIDIA Corp. | | | 14,572 | | | | 1,800,225 | | |
Oracle Corp. | | | 2,279 | | | | 321,795 | | |
Palo Alto Networks, Inc.* | | | 737 | | | | 249,850 | | |
Prologis, Inc. | | | 2,955 | | | | 331,876 | | |
Regal Rexnord Corp. | | | 2,327 | | | | 314,657 | | |
S&P Global, Inc. | | | 429 | | | | 191,334 | | |
Schlumberger NV | | | 2,288 | | | | 107,948 | | |
Starbucks Corp. | | | 3,391 | | | | 263,989 | | |
Take-Two Interactive Software, Inc.* | | | 3,487 | | | | 542,194 | | |
Tesla, Inc.* | | | 797 | | | | 157,710 | | |
T-Mobile U.S., Inc. | | | 1,871 | | | | 329,633 | | |
TransDigm Group, Inc. | | | 193 | | | | 246,579 | | |
Uber Technologies, Inc.* | | | 2,163 | | | | 157,207 | | |
UnitedHealth Group, Inc. | | | 1,490 | | | | 758,797 | | |
Vulcan Materials Co. | | | 869 | | | | 216,103 | | |
Walmart, Inc. | | | 8,174 | | | | 553,462 | | |
Walt Disney Co. | | | 3,014 | | | | 299,260 | | |
Wells Fargo & Co. | | | 13,260 | | | | 787,511 | | |
Williams Cos., Inc. | | | 17,565 | | | | 746,512 | | |
Zoom Video Communications, Inc., Class A* | | | 3,054 | | | | 180,766 | | |
| | | | | | 31,508,564 | | |
Total common stocks
(cost $34,956,810) | | | | | 43,346,585 | | |
| | | Face
amount3 | | | |
Asset-backed securities: 2.0% | |
Cayman Islands: 0.2% | |
Dryden 60 CLO Ltd.,
Series 2018-60A, Class A,
3 mo. USD Term SOFR + 1.312%,
6.640%, due 07/15/311,4 | | | 236,852 | | | | 237,040 | | |
| | | Face
amount3 | | Value | |
Asset-backed securities—(continued) | |
United States: 1.8% | |
AmeriCredit Automobile Receivables Trust
Series 2020-2, Class C,
1.480%, due 02/18/26 | | | 110,659 | | | $ | 109,866 | | |
Series 2022-1, Class A3,
2.450%, due 11/18/26 | | | 64,612 | | | | 63,639 | | |
BMW Vehicle Lease Trust,
Series 2024-1, Class A3,
4.980%, due 03/25/27 | | | 100,000 | | | | 99,462 | | |
Dell Equipment Finance Trust,
Series 2023-3, Class D,
6.750%, due 10/22/291 | | | 175,000 | | | | 177,926 | | |
Drive Auto Receivables Trust
Series 2021-1, Class D,
1.450%, due 01/16/29 | | | 84,894 | | | | 82,844 | | |
Series 2024-1, Class A3,
5.350%, due 02/15/28 | | | 100,000 | | | | 99,737 | | |
DT Auto Owner Trust,
Series 2021-1A, Class D,
1.160%, due 11/16/261 | | | 100,000 | | | | 97,528 | | |
Exeter Automobile Receivables Trust
Series 2021-1A, Class D,
1.080%, due 11/16/26 | | | 79,149 | | | | 77,536 | | |
Series 2022-2A, Class B,
3.650%, due 10/15/26 | | | 14,995 | | | | 14,980 | | |
Series 2023-4A, Class A2,
6.070%, due 12/15/25 | | | 71,499 | | | | 71,532 | | |
Series 2024-3A, Class B,
5.570%, due 09/15/28 | | | 100,000 | | | | 100,093 | | |
GLS Auto Receivables Issuer Trust,
Series 2020-2A, Class C,
4.570%, due 04/15/261 | | | 20,646 | | | | 20,628 | | |
GM Financial Automobile Leasing Trust,
Series 2023-1, Class B,
5.510%, due 01/20/27 | | | 100,000 | | | | 99,867 | | |
HPEFS Equipment Trust
Series 2022-1A, Class B,
1.790%, due 05/21/291 | | | 200,000 | | | | 199,040 | | |
Series 2024-1A, Class D,
5.820%, due 11/20/311 | | | 100,000 | | | | 99,994 | | |
Series 2024-2A, Class D,
5.820%, due 04/20/321 | | | 100,000 | | | | 99,766 | | |
Hyundai Auto Lease Securitization Trust,
Series 2024-B, Class B,
5.560%, due 08/15/281 | | | 100,000 | | | | 100,233 | | |
Hyundai Auto Receivables Trust,
Series 2024-A, Class C,
5.270%, due 07/15/31 | | | 100,000 | | | | 99,767 | | |
OneMain Financial Issuance Trust,
Series 2020-2A, Class B,
2.210%, due 09/14/351 | | | 100,000 | | | | 90,353 | | |
Santander Drive Auto Receivables Trust
Series 2020-2, Class D,
2.220%, due 09/15/26 | | | 14,308 | | | | 14,285 | | |
4
UBS Global Allocation Fund
Portfolio of investments
| | | Face
amount3 | | Value | |
Asset-backed securities—(concluded) | |
United States—(concluded) | |
Series 2020-4, Class D,
1.480%, due 01/15/27 | | | 99,690 | | | $ | 98,460 | | |
Series 2022-5, Class C,
4.740%, due 10/16/28 | | | 100,000 | | | | 98,904 | | |
Series 2023-2, Class A3,
5.210%, due 07/15/27 | | | 100,000 | | | | 99,708 | | |
Series 2023-3, Class A3,
5.610%, due 10/15/27 | | | 125,000 | | | | 124,948 | | |
Series 2023-3, Class A2,
6.080%, due 08/17/26 | | | 87,864 | | | | 87,944 | | |
Series 2023-4, Class A2,
6.180%, due 02/16/27 | | | 138,223 | | | | 138,388 | | |
Series 2023-6, Class A2,
6.080%, due 05/17/27 | | | 59,098 | | | | 59,192 | | |
Series 2024-3, Class C,
5.640%, due 08/15/30 | | | 100,000 | | | | 100,165 | | |
SFS Auto Receivables Securitization Trust,
Series 2024-1A, Class A2,
5.350%, due 06/21/271 | | | 87,138 | | | | 86,968 | | |
Synchrony Card Funding LLC,
Series 2024-A1, Class A,
5.040%, due 03/15/30 | | | 100,000 | | | | 99,735 | | |
| | | | | | 2,813,488 | | |
Total asset-backed securities
(cost $3,052,504) | | | | | 3,050,528 | | |
Corporate bonds: 10.3% | |
Canada: 0.5% | |
Canadian Imperial Bank of Commerce
3.945%, due 08/04/25 | | | 810,000 | | | | 796,214 | | |
United States: 9.8% | |
Air Lease Corp.
5.300%, due 02/01/28 | | | 750,000 | | | | 748,377 | | |
American Express Co.
3.950%, due 08/01/25 | | | 810,000 | | | | 796,691 | | |
Bank of America Corp.
(fixed, converts to FRN on 07/21/31),
2.299%, due 07/21/324 | | | 1,000,000 | | | | 818,626 | | |
Broadcom, Inc.
4.300%, due 11/15/32 | | | 900,000 | | | | 841,203 | | |
Centene Corp.
2.450%, due 07/15/28 | | | 250,000 | | | | 221,957 | | |
Charter Communications Operating LLC/
Charter Communications Operating Capital
4.908%, due 07/23/25 | | | 187,000 | | | | 185,184 | | |
Cheniere Energy Partners LP
4.500%, due 10/01/29 | | | 810,000 | | | | 771,640 | | |
Citigroup, Inc.
(fixed, converts to FRN on 06/11/34),
5.449%, due 06/11/354 | | | 725,000 | | | | 719,320 | | |
Comcast Corp.
5.250%, due 11/07/25 | | | 540,000 | | | | 539,617 | | |
| | | Face
amount3 | | Value | |
Corporate bonds—(concluded) | |
United States—(concluded) | |
Consolidated Edison Co. of New York, Inc.
5.500%, due 03/15/34 | | | 375,000 | | | $ | 380,903 | | |
Discovery Communications LLC
3.625%, due 05/15/30 | | | 900,000 | | | | 791,951 | | |
General Motors Co.
5.400%, due 10/15/29 | | | 810,000 | | | | 805,854 | | |
Goldman Sachs Group, Inc.
(fixed, converts to FRN on 04/25/29),
5.727%, due 04/25/304 | | | 900,000 | | | | 915,980 | | |
John Deere Capital Corp.
4.800%, due 01/09/26 | | | 650,000 | | | | 645,945 | | |
JPMorgan Chase & Co.
3.625%, due 12/01/27 | | | 810,000 | | | | 774,860 | | |
Morgan Stanley
(fixed, converts to FRN on 07/20/32),
4.889%, due 07/20/334 | | | 900,000 | | | | 867,609 | | |
Oracle Corp.
6.250%, due 11/09/32 | | | 750,000 | | | | 793,808 | | |
Pacific Gas & Electric Co.
4.550%, due 07/01/30 | | | 750,000 | | | | 710,736 | | |
Southern California Edison Co.
5.850%, due 11/01/27 | | | 630,000 | | | | 642,263 | | |
Southwestern Energy Co.
5.375%, due 02/01/29 | | | 750,000 | | | | 729,006 | | |
T-Mobile USA, Inc.
3.500%, due 04/15/31 | | | 540,000 | | | | 485,145 | | |
Wells Fargo & Co.
(fixed, converts to FRN on 07/25/32),
4.897%, due 07/25/334 | | | 900,000 | | | | 865,678 | | |
| | | | | | 15,052,353 | | |
Total corporate bonds
(cost $15,832,140) | | | | | 15,848,567 | | |
Mortgage-backed securities: 0.7% | |
United States: 0.7% | |
Bank,
Series 2022-BNK39, Class A4,
2.928%, due 02/15/554 | | | 200,000 | | | | 169,993 | | |
BWAY Mortgage Trust,
Series 2013-1515, Class A2,
3.454%, due 03/10/331 | | | 100,000 | | | | 94,889 | | |
Citigroup Commercial Mortgage Trust,
Series 2018-C5, Class A4,
4.228%, due 06/10/514 | | | 100,000 | | | | 95,416 | | |
Extended Stay America Trust,
Series 2021-ESH, Class D,
1 mo. USD Term SOFR + 2.364%,
7.694%, due 07/15/381,4 | | | 136,169 | | | | 136,084 | | |
Flagstar Mortgage Trust,
Series 2018-5, Class A2,
4.000%, due 09/25/481,4 | | | 40,219 | | | | 36,999 | | |
5
UBS Global Allocation Fund
Portfolio of investments
| | | Face
amount3 | | Value | |
Mortgage-backed securities—(concluded) | |
United States—(concluded) | |
Hudson Yards Mortgage Trust,
Series 2016-10HY, Class A,
2.835%, due 08/10/381 | | | 100,000 | | | $ | 93,520 | | |
JP Morgan Chase Commercial
Mortgage Securities Trust,
Series 2021-2NU, Class D,
2.146%, due 01/05/401,4 | | | 125,000 | | | | 91,051 | | |
MFA Trust
Series 2020-NQM3, Class A1,
1.014%, due 01/26/651,4 | | | 18,517 | | | | 16,875 | | |
Series 2021-NQM1, Class A1,
1.153%, due 04/25/651,4 | | | 22,319 | | | | 20,487 | | |
New Residential Mortgage Loan Trust,
Series 2021-NQ2R, Class A1,
0.941%, due 10/25/581,4 | | | 42,881 | | | | 39,288 | | |
Residential Mortgage Loan Trust,
Series 2020-2, Class A1,
1.654%, due 05/25/601,4 | | | 9,242 | | | | 9,154 | | |
Verus Securitization Trust
Series 2019-4, Class A1,
3.642%, due 11/25/591,4 | | | 7,869 | | | | 7,639 | | |
Series 2020-5, Class A1,
1.218%, due 05/25/651,4 | | | 23,434 | | | | 22,044 | | |
Series 2021-R2, Class A1,
0.918%, due 02/25/641,4 | | | 34,569 | | | | 30,678 | | |
Series 2021-R3, Class A1,
1.020%, due 04/25/641,4 | | | 44,876 | | | | 40,204 | | |
Wells Fargo Commercial Mortgage Trust,
Series 2018-C45, Class AS,
4.405%, due 06/15/514 | | | 130,000 | | | | 122,398 | | |
Total mortgage-backed securities
(cost $1,097,036) | | | | | 1,026,719 | | |
Non-U.S. government agency obligations: 4.3% | |
Australia: 0.2% | |
Australia Government Bonds
Series 138, 3.250%, due 04/21/295 | | AUD | 455,000 | | | | 292,625 | | |
Austria: 0.0%† | |
Republic of Austria Government Bonds
3.150%, due 06/20/445 | | EUR | 45,000 | | | | 47,332 | | |
Belgium: 0.1% | |
Kingdom of Belgium Government Bonds
Series 71, 3.750%, due 06/22/455 | | EUR | 73,000 | | | | 81,092 | | |
Canada: 0.3% | |
Canada Government Bonds
1.000%, due 06/01/27 | | CAD | 320,000 | | | | 217,236 | | |
4.000%, due 03/01/29 | | CAD | 200,000 | | | | 149,207 | | |
Series WL43, 5.750%, due 06/01/29 | | CAD | 180,000 | | | | 145,216 | | |
| | | | | | 511,659 | | |
Finland: 0.0%† | |
Finland Government Bonds
Series 30Y, 1.375%, due 04/15/475 | | EUR | 20,000 | | | | 15,077 | | |
| | | Face
amount3 | | Value | |
Non-U.S. government agency obligations—(continued) | |
France: 0.4% | |
French Republic Government Bonds OAT
Series OAT, 0.000%, due 11/25/315,6 | | EUR | 485,000 | | | $ | 414,484 | | |
Series OAT, 0.000%, due 05/25/325,6 | | EUR | 75,000 | | | | 62,999 | | |
Series OAT, 0.500%, due 05/25/405 | | EUR | 85,000 | | | | 57,950 | | |
Series OAT, 3.250%, due 05/25/455 | | EUR | 95,000 | | | | 96,463 | | |
| | | | | | 631,896 | | |
Germany: 0.4% | |
Bundesrepublik Deutschland Bundesanleihe
0.000%, due 11/15/285,6 | | EUR | 300,000 | | | | 289,161 | | |
Series 10Y, 2.200%, due 02/15/345 | | EUR | 130,000 | | | | 135,919 | | |
2.500%, due 07/04/445 | | EUR | 146,000 | | | | 151,520 | | |
| | | | | | 576,600 | | |
Ireland: 0.1% | |
Ireland Government Bonds
1.500%, due 05/15/505 | | EUR | 261,000 | | | | 194,684 | | |
Italy: 0.4% | |
Italy Buoni Poliennali Del Tesoro
Series 10Y, 0.950%, due 12/01/315 | | EUR | 195,000 | | | | 171,335 | | |
Series 17Y, 1.650%, due 03/01/325 | | EUR | 30,000 | | | | 27,657 | | |
Series 10Y, 3.000%, due 08/01/295 | | EUR | 140,000 | | | | 146,264 | | |
Series 31Y, 3.250%, due 09/01/465 | | EUR | 85,000 | | | | 76,095 | | |
Series 31Y, 4.000%, due 02/01/375 | | EUR | 118,000 | | | | 124,793 | | |
| | | | | | 546,144 | | |
Japan: 0.6% | |
Japan Government CPI-Linked Bonds
Series 26, 0.005%, due 03/10/31 | | JPY | 54,088,000 | | | | 359,208 | | |
Japan Government Forty Year Bonds
Series 12, 0.500%, due 03/20/59 | | JPY | 18,000,000 | | | | 65,393 | | |
Japan Government Thirty Year Bonds
Series 51, 0.300%, due 06/20/46 | | JPY | 7,600,000 | | | | 33,449 | | |
Japan Government Twenty Year Bonds
Series 156, 0.400%, due 03/20/36 | | JPY | 77,500,000 | | | | 436,773 | | |
| | | | | | 894,823 | | |
New Zealand: 1.0% | |
New Zealand Government Bonds
Series 0429, 3.000%, due 04/20/29 | | NZD | 300,000 | | | | 170,750 | | |
New Zealand Government Bonds
Inflation-Linked
Series 0925, 2.000%, due 09/20/255,7 | | NZD | 2,269,500 | | | | 1,366,649 | | |
| | | | | | 1,537,399 | | |
Spain: 0.3% | |
Spain Government Bonds
1.450%, due 10/31/275 | | EUR | 155,000 | | | | 157,800 | | |
1.500%, due 04/30/275 | | EUR | 97,000 | | | | 99,564 | | |
2.350%, due 07/30/335 | | EUR | 57,000 | | | | 56,559 | | |
3.450%, due 07/30/665 | | EUR | 10,000 | | | | 9,493 | | |
4.200%, due 01/31/375 | | EUR | 44,000 | | | | 50,230 | | |
5.150%, due 10/31/445 | | EUR | 79,000 | | | | 100,043 | | |
| | | | | | 473,689 | | |
6
UBS Global Allocation Fund
Portfolio of investments
| | | Face
amount3 | | Value | |
Non-U.S. government agency obligations—(concluded) | | | |
United Kingdom: 0.5% | | | |
U.K. Gilts
0.875%, due 07/31/335 | | GBP | 160,000 | | | $ | 152,700 | | |
1.000%, due 01/31/325 | | GBP | 149,000 | | | | 150,997 | | |
1.250%, due 07/31/515 | | GBP | 274,000 | | | | 167,467 | | |
1.625%, due 10/22/285 | | GBP | 234,000 | | | | 268,290 | | |
3.500%, due 01/22/455 | | GBP | 40,000 | | | | 43,025 | | |
3.750%, due 10/22/535 | | GBP | 40,000 | | | | 43,267 | | |
| | | | | | 825,746 | | |
Total non-U.S. government agency obligations
(cost $7,882,547) | | | | | 6,628,766 | | |
U.S. government agency obligations: 6.2% | | | |
United States: 6.2% | | | |
Federal Home Loan Mortgage Corp.
1.500%, due 10/01/51 | | | 299,249 | | | | 223,396 | | |
2.000%, due 02/01/51 | | | 837,701 | | | | 659,592 | | |
2.500%, due 11/01/50 | | | 191,041 | | | | 160,367 | | |
3.000%, due 01/01/52 | | | 118,594 | | | | 101,281 | | |
4.500%, due 08/01/52 | | | 200,292 | | | | 188,978 | | |
Federal National Mortgage Association
2.000%, due 04/01/51 | | | 229,775 | | | | 181,936 | | |
2.500%, due 08/01/51 | | | 368,992 | | | | 302,616 | | |
2.500%, due 11/01/51 | | | 457,025 | | | | 376,172 | | |
2.500%, due 02/01/52 | | | 226,756 | | | | 189,026 | | |
3.000%, due 08/01/50 | | | 435,523 | | | | 377,782 | | |
3.000%, due 03/01/52 | | | 351,356 | | | | 303,387 | | |
3.500%, due 02/01/49 | | | 413,383 | | | | 372,002 | | |
4.000%, due 05/01/51 | | | 390,998 | | | | 363,191 | | |
4.500%, due 01/01/53 | | | 420,935 | | | | 396,897 | | |
Government National Mortgage Association
2.000%, due 01/20/52 | | | 463,428 | | | | 375,182 | | |
2.500%, due 08/20/51 | | | 516,528 | | | | 434,556 | | |
3.000%, due 10/20/45 | | | 65,131 | | | | 57,764 | | |
3.000%, due 12/20/45 | | | 74,408 | | | | 65,991 | | |
3.000%, due 04/20/52 | | | 214,081 | | | | 186,438 | | |
3.500%, due 01/20/50 | | | 197,230 | | | | 178,452 | | |
Government National Mortgage Association, TBA
5.500% | | | 275,000 | | | | 272,850 | | |
| 6.000% | | | 100,000 | | | | 100,410 | | |
| 6.500% | | | 225,000 | | | | 228,114 | | |
| 7.000% | | | 75,000 | | | | 76,370 | | |
Uniform Mortgage-Backed Security, TBA
2.000% | | | 1,000,000 | | | | 782,051 | | |
| 2.500% | | | 450,000 | | | | 367,454 | | |
| 3.500% | | | 200,000 | | | | 176,951 | | |
| 4.000% | | | 375,000 | | | | 343,093 | | |
| 5.000% | | | 775,000 | | | | 748,848 | | |
| 5.500% | | | 425,000 | | | | 419,008 | | |
| 6.000% | | | 450,000 | | | | 451,183 | | |
| 6.500% | | | 50,000 | | | | 50,881 | | |
Total U.S. government agency obligations
(cost $9,787,528) | | | | | 9,512,219 | | |
| | | Face
amount3 | | Value | |
U.S. Treasury obligations: 4.5% | |
United States: 4.5% | |
U.S. Treasury Bonds
1.125%, due 08/15/40 | | | 310,000 | | | $ | 188,761 | | |
1.250%, due 05/15/50 | | | 360,000 | | | | 178,425 | | |
2.500%, due 02/15/46 | | | 180,000 | | | | 126,830 | | |
2.750%, due 11/15/42 | | | 170,000 | | | | 130,282 | | |
2.750%, due 08/15/47 | | | 133,000 | | | | 96,882 | | |
2.875%, due 05/15/43 | | | 617,000 | | | | 479,139 | | |
3.000%, due 11/15/45 | | | 100,000 | | | | 77,430 | | |
4.375%, due 02/15/38 | | | 110,000 | | | | 109,815 | | |
U.S. Treasury Notes
0.375%, due 12/31/25 | | | 250,000 | | | | 233,799 | | |
0.625%, due 08/15/30 | | | 1,110,000 | | | | 889,561 | | |
0.750%, due 03/31/26 | | | 250,000 | | | | 236,983 | | |
0.875%, due 06/30/26 | | | 650,000 | | | | 602,977 | | |
1.125%, due 02/15/31 | | | 450,000 | | | | 367,998 | | |
1.250%, due 03/31/28 | | | 40,000 | | | | 35,623 | | |
1.250%, due 06/30/28 | | | 540,000 | | | | 477,731 | | |
1.250%, due 09/30/28 | | | 270,000 | | | | 237,262 | | |
1.250%, due 08/15/31 | | | 200,000 | | | | 162,312 | | |
1.625%, due 11/30/26 | | | 858,000 | | | | 799,549 | | |
1.625%, due 08/15/29 | | | 196,000 | | | | 171,753 | | |
1.625%, due 05/15/31 | | | 350,000 | | | | 293,754 | | |
2.000%, due 02/15/25 | | | 70,000 | | | | 68,569 | | |
2.125%, due 05/15/25 | | | 70,000 | | | | 68,187 | | |
2.750%, due 08/15/32 | | | 200,000 | | | | 177,977 | | |
3.875%, due 08/15/33 | | | 256,000 | | | | 246,280 | | |
4.125%, due 11/15/32 | | | 300,000 | | | | 294,949 | | |
4.625%, due 02/28/25 | | | 120,000 | | | | 119,507 | | |
Total U.S. Treasury obligations
(cost $7,635,111) | | | | | 6,872,335 | | |
| | | Number of
shares | | | |
Exchange traded funds: 7.7% | |
iShares J.P. Morgan USD Emerging
Markets Bond ETF2 | | | 53,620 | | | | 4,744,298 | | |
SPDR Portfolio High Yield Bond ETF | | | 306,000 | | | | 7,108,380 | | |
Total exchange traded funds
(cost $11,365,090) | | | | | 11,852,678 | | |
Investment companies: 29.5% | |
PACE High Yield Investments8 | | | 1,040,891 | | | | 9,107,796 | | |
PACE International Emerging Markets
Equity Investments8 | | | 746,830 | | | | 9,835,756 | | |
PACE International Equity Investments8 | | | 790,428 | | | | 14,409,498 | | |
UBS All China Equity Fund8 | | | 468,854 | | | | 1,992,631 | | |
UBS Emerging Markets Equity
Opportunity Fund8 | | | 1,237,573 | | | | 9,888,204 | | |
Total investment companies
(cost $46,693,340) | | | | | 45,233,885 | | |
7
UBS Global Allocation Fund
Portfolio of investments
| | | Number of
shares | | Value | |
Short-term investments: 3.5% | |
Investment companies: 3.5% | |
State Street Institutional U.S. Government
Money Market Fund, 5.254%9
(cost $5,336,939) | | | 5,336,939 | | | $ | 5,336,939 | | |
| | | Face
amount3 | | | |
Short-term U.S. Treasury obligations: 3.8% | |
United States: 3.8% | |
U.S. Treasury Bills
5.302%, due 08/08/249 | | | 1,100,000 | | | | 1,094,044 | | |
5.367%, due 10/17/249 | | | 900,000 | | | | 886,023 | | |
5.326%, due 11/21/249 | | | 4,000,000 | | | | 3,918,411 | | |
Total Short-term U.S. Treasury obligations
(Cost $5,898,478) | | | | | 5,898,478 | | |
| | | Number of
shares | | Value | |
Investment of cash collateral from securities loaned: 4.0% | |
Money market funds: 4.0% | |
State Street Navigator Securities Lending
Government Money Market
Portfolio, 5.276%9
(cost $6,132,415) | | | 6,132,415 | | | $ | 6,132,415 | | |
Total investments
(cost $155,669,938): 104.7% | | | | | 160,740,114 | | |
Liabilities in excess of other assets: (4.7%) | | | (7,267,771 | ) | |
Net assets: 100.0% | | $ | 153,472,343 | | |
For a listing of defined portfolio acronyms that are used throughout the Portfolio of investments as well as the tables that follow, please refer to the Glossary of terms used in the Portfolio of investments.
Futures contracts
Number of
contracts | | Currency | | | | Expiration
date | | Current
notional
amount | | Value | | Unrealized
appreciation
(depreciation) | |
Index futures buy contracts: | | | |
| | 50 | | | EUR | | | | EURO STOXX 50 Index Futures | | September 2024 | | $ | 2,649,863 | | | $ | 2,637,751 | | | $ | (12,112 | ) | |
| | 422 | | | EUR | | | | EURO STOXX Bank Index Futures | | September 2024 | | | 3,114,876 | | | | 3,108,225 | | | | (6,651 | ) | |
| | 154 | | | EUR | | | | Euro High Yield Bond Index Futures | | September 2024 | | | 9,331,600 | | | | 9,302,507 | | | | (29,093 | ) | |
| | 33 | | | USD | | | | MSCI World Quality Futures | | September 2024 | | | 1,656,118 | | | | 1,656,600 | | | | 482 | | |
| | 115 | | | USD | | | | S&P 500 E-Mini Index Futures | | September 2024 | | | 31,897,228 | | | | 31,748,625 | | | | (148,603 | ) | |
| | 20 | | | JPY | | | | TSE TOPIX Index Futures | | September 2024 | | | 3,467,898 | | | | 3,493,691 | | | | 25,793 | | |
Interest rate futures buy contracts: | | | |
| | 79 | | | AUD | | | | Australian Bond 10 Year Futures | | September 2024 | | | 6,036,922 | | | | 5,985,185 | | | | (51,737 | ) | |
| | 49 | | | EUR | | | | Euro Bund 10 Year Futures | | September 2024 | | | 6,856,321 | | | | 6,906,966 | | | | 50,645 | | |
| | 63 | | | GBP | | | | United Kingdom Long Gilt Bond Futures | | September 2024 | | | 7,737,454 | | | | 7,770,306 | | | | 32,852 | | |
| | Total | | | | | | | | | $ | 72,748,280 | | | $ | 72,609,856 | | | $ | (138,424 | ) | |
Index futures sell contracts: | | | |
| | 36 | | | USD | | | | MSCI Europe USD NTR Futures | | September 2024 | | $ | (3,491,446 | ) | | $ | (3,456,720 | ) | | $ | 34,726 | | |
| | 52 | | | AUD | | | | ASX SPI 200 Index Futures | | September 2024 | | | (6,715,778 | ) | | | (6,740,110 | ) | | | (24,332 | ) | |
| | 8 | | | CAD | | | | S&P TSX 60 Index Futures | | September 2024 | | | (1,509,937 | ) | | | (1,532,692 | ) | | | (22,755 | ) | |
| | 202 | | | USD | | | | MSCI Emerging Markets Index Futures | | September 2024 | | | (11,073,040 | ) | | | (10,990,820 | ) | | | 82,220 | | |
8
UBS Global Allocation Fund
Portfolio of investments
Futures contracts—(concluded)
Number of
contracts | | Currency | | | | Expiration
date | | Current
notional
amount | | Value | | Unrealized
appreciation
(depreciation) | |
Interest rate futures sell contracts: | |
| | 22 | | | JPY | | | | Japan Government Bond 10 Year Futures | | September 2024 | | $ | (1,959,867 | ) | | $ | (1,951,681 | ) | | $ | 8,186 | | |
U.S. Treasury futures sell contracts: | |
| | 37 | | | USD | | | | U.S. Treasury Note 10 Year Futures | | September 2024 | | | (4,051,450 | ) | | | (4,069,422 | ) | | | (17,972 | ) | |
Total | | | | | | | | $ | (28,801,518 | ) | | $ | (28,741,445 | ) | | $ | 60,073 | | |
Net unrealized appreciation (depreciation) | | | | | | | | | | | | $ | (78,351 | ) | |
Forward foreign currency contracts
Counterparty | | Sell | | Purchase | | Settlement
date | | Unrealized
appreciation
(depreciation) | |
BOA | | BRL | 8,394,515 | | | USD | 1,575,000 | | | 07/24/24 | | $ | 77,170 | | |
BOA | | USD | 1,592,867 | | | NZD | 2,610,000 | | | 07/24/24 | | | (3,109 | ) | |
CIBC | | CNH | 74,240,000 | | | USD | 10,271,116 | | | 07/24/24 | | | 83,359 | | |
CIBC | | USD | 790,000 | | | CAD | 1,081,057 | | | 07/24/24 | | | 617 | | |
CITI | | EUR | 5,835,000 | | | CHF | 5,546,778 | | | 07/24/24 | | | (65,405 | ) | |
CITI | | USD | 790,000 | | | COP | 3,129,980,000 | | | 07/24/24 | | | (38,772 | ) | |
GSI | | MXN | 42,001,240 | | | CAD | 3,220,000 | | | 07/24/24 | | | 66,801 | | |
GSI | | MXN | 36,538,760 | | | USD | 1,954,553 | | | 07/24/24 | | | (35,970 | ) | |
HSBC | | EUR | 745,000 | | | USD | 803,477 | | | 07/24/24 | | | 4,795 | | |
HSBC | | NZD | 11,030,000 | | | USD | 6,516,149 | | | 07/24/24 | | | (202,255 | ) | |
HSBC | | USD | 431,495 | | | TWD | 13,900,000 | | | 07/24/24 | | | (2,038 | ) | |
JPMCB | | CNH | 11,196,839 | | | USD | 1,560,000 | | | 07/24/24 | | | 23,488 | | |
JPMCB | | IDR | 5,720,300,000 | | | USD | 350,853 | | | 07/24/24 | | | 1,632 | | |
JPMCB | | KRW | 290,000,000 | | | USD | 210,846 | | | 07/24/24 | | | (90 | ) | |
MSCI | | AUD | 1,770,000 | | | USD | 1,172,294 | | | 07/24/24 | | | (9,172 | ) | |
MSCI | | CHF | 6,215,000 | | | USD | 6,896,582 | | | 07/24/24 | | | (39,176 | ) | |
MSCI | | USD | 5,488,406 | | | BRL | 28,970,000 | | | 07/24/24 | | | (319,299 | ) | |
MSCI | | USD | 2,643,523 | | | COP | 10,474,166,000 | | | 07/24/24 | | | (129,614 | ) | |
MSCI | | USD | 241,726 | | | MYR | 1,152,000 | | | 07/24/24 | | | 2,827 | | |
SSB | | AUD | 1,250,000 | | | USD | 811,345 | | | 07/24/24 | | | (23,023 | ) | |
SSB | | CAD | 6,125,000 | | | USD | 4,466,934 | | | 07/24/24 | | | (12,503 | ) | |
SSB | | EUR | 4,070,000 | | | USD | 4,353,267 | | | 07/24/24 | | | (10,001 | ) | |
SSB | | GBP | 1,285,000 | | | USD | 1,590,085 | | | 07/24/24 | | | (34,493 | ) | |
SSB | | USD | 1,120,252 | | | EUR | 1,035,000 | | | 07/24/24 | | | (10,674 | ) | |
SSB | | USD | 170,259 | | | GBP | 135,000 | | | 07/24/24 | | | 416 | | |
SSB | | USD | 120,107 | | | GBP | 95,000 | | | 07/24/24 | | | (2 | ) | |
SSB | | USD | 2,214,269 | | | JPY | 338,100,000 | | | 07/24/24 | | | (105,799 | ) | |
SSB | | USD | 4,531,737 | | | MXN | 78,540,000 | | | 07/24/24 | | | (253,111 | ) | |
SSB | | USD | 4,972,211 | | | NOK | 54,740,000 | | | 07/24/24 | | | 157,613 | | |
SSB | | USD | 479,244 | | | SGD | 650,000 | | | 07/24/24 | | | 611 | | |
Net unrealized appreciation (depreciation) | | $ | (875,177 | ) | |
9
UBS Global Allocation Fund
Portfolio of investments
Fair valuation summary
The following is a summary of the fair valuations according to the inputs used as of June 30, 2024 in valuing the Fund's investments. In the event a fund holds investments for which fair value is measured using the NAV per share practical expedient (or its equivalent), a separate column will be added to the fair value hierarchy table; this is intended to permit reconciliation to the amounts presented in the Portfolio of investments:
Description | | Unadjusted
quoted prices in
active market for
identical investments
(Level 1) | | Other significant
observable inputs
(Level 2) | | Unobservable
inputs
(Level 3) | | Total | |
Assets | |
Common stocks | | $ | 32,053,703 | | | $ | 11,292,882 | | | $ | — | | | $ | 43,346,585 | | |
Exchange traded funds | | | 11,852,678 | | | | — | | | | — | | | | 11,852,678 | | |
Investment companies | | | 45,233,885 | | | | — | | | | — | | | | 45,233,885 | | |
Asset-backed securities | | | — | | | | 3,050,528 | | | | — | | | | 3,050,528 | | |
Corporate bonds | | | — | | | | 15,848,567 | | | | — | | | | 15,848,567 | | |
Mortgage-backed securities | | | — | | | | 1,026,719 | | | | — | | | | 1,026,719 | | |
Non-U.S. government agency obligations | | | — | | | | 6,628,766 | | | | — | | | | 6,628,766 | | |
U.S. government agency obligations | | | — | | | | 9,512,219 | | | | — | | | | 9,512,219 | | |
U.S. Treasury obligations | | | — | | | | 6,872,335 | | | | — | | | | 6,872,335 | | |
Short-term investments | | | — | | | | 5,336,939 | | | | — | | | | 5,336,939 | | |
Short-term U.S. Treasury obligations | | | — | | | | 5,898,478 | | | | — | | | | 5,898,478 | | |
Investment of cash collateral from securities loaned | | | — | | | | 6,132,415 | | | | — | | | | 6,132,415 | | |
Futures contracts | | | 174,385 | | | | 60,519 | | | | — | | | | 234,904 | | |
Forward foreign currency contracts | | | — | | | | 419,329 | | | | — | | | | 419,329 | | |
Total | | $ | 89,314,651 | | | $ | 72,079,696 | | | $ | — | | | $ | 161,394,347 | | |
Liabilities | |
Futures contracts | | $ | (270,160 | ) | | $ | (43,095 | ) | | $ | — | | | $ | (313,255 | ) | |
Forward foreign currency contracts | | | — | | | | (1,294,506 | ) | | | — | | | | (1,294,506 | ) | |
Total | | $ | (270,160 | ) | | $ | (1,337,601 | ) | | $ | — | | | $ | (1,607,761 | ) | |
At June 30, 2024, there were no transfers in or out of Level 3.
Portfolio footnotes
† Amount represents less than 0.05% or (0.05)%.
* Non-income producing security.
1 Security exempt from registration pursuant to Rule 144A under the Securities Act of 1933. These securities are considered liquid, unless noted otherwise, and may be resold in transactions exempt from registrations, normally to qualified institutional buyers. Securities exempt from registration pursuant to Rule 144A, in the amount of $2,435,080, represented 1.6% of the Fund's net assets at period end.
2 Security, or portion thereof, was on loan at the period end.
3 In U.S. dollars unless otherwise indicated.
4 Floating or variable rate securities. The rates disclosed are as of June 30, 2024. For securities based on a published reference rate and spread, the reference rate and spread are indicated within the description. Variable rate securities with a floor or ceiling feature are disclosed at the inherent rate, where applicable. Certain variable rate securities are not based on a published reference rate and spread, but are determined by the issuer or agent and are based on current market conditions; these securities do not indicate a reference rate and spread in the description.
5 Security was purchased pursuant to Regulation S under the Securities Act of 1933, which exempts from registration securities offered and sold outside of the United States. Such a security cannot be sold in the United States without either an effective registration statement filed pursuant to the Securities Act of 1933, or pursuant to an exemption from registration.
6 Zero coupon bond.
10
UBS Global Allocation Fund
Portfolio of investments
7 Debt security whose principal and/or interest payments are adjusted for inflation, unlike debt securities that make fixed principal and interest payments. The interest rate paid by the securities is fixed, while the principal value rises or falls based on changes in an index. Thus, if inflation occurs, the principal and interest payments on the securities are adjusted accordingly to protect investors from inflationary loss. During a deflationary period, the principal and interest payments decrease, although the securities' principal amounts will not drop below their face amounts at maturity. In exchange for the inflation protection, the securities generally pay lower interest rates than typical government securities from the issuer's country. Only if inflation occurs will securities offer a higher real yield than a conventional security of the same maturity.
8 The table below details the Fund's investment in a fund advised by the same Advisor as the Fund. The Fund does not pay advisory fees that are retained by the Advisor in connection with its investment in other investment companies advised by the Advisor, but may pay other expenses associated with such investments (such as sub-advisory fees paid to other parties, if any).
Security description | | Value
06/30/23 | | Purchases
during the
year
ended
06/30/24 | | Sales
during the
year
ended
06/30/24 | | Net
realized
gain (loss)
during the
year
ended
06/30/24 | | Change in
net unrealized
appreciation
(depreciation)
during the
year
ended
06/30/24 | | Value
06/30/24 | | Net income
earned from
affiliate for the
year
ended
06/30/24 | | Shares
06/30/24 | |
UBS Emerging Markets Equity
Opportunity Fund | | $ | 10,907,589 | | | $ | 318,196 | | | $ | 2,140,000 | | | $ | (665,386 | ) | | $ | 1,467,805 | | | $ | 9,888,204 | | | $ | 318,196 | | | | 1,237,572 | | |
PACE High Yield Investments | | | 8,669,888 | | | | 524,022 | | | | 460,000 | | | | (52,335 | ) | | | 426,221 | | | | 9,107,796 | | | | 524,022 | | | | 1,040,891 | | |
PACE International Equity
Investments | | | 18,861,873 | | | | 591,278 | | | | 6,285,700 | | | | 188,158 | | | | 1,053,889 | | | | 14,409,498 | | | | 591,278 | | | | 790,428 | | |
PACE International Emerging
Markets Equity Investments | | | 11,349,594 | | | | 134,952 | | | | 2,190,000 | | | | 91,278 | | | | 449,932 | | | | 9,835,756 | | | | 134,952 | | | | 746,830 | | |
UBS All China Equity Fund | | | 2,215,101 | | | | 64,093 | | | | — | | | | — | | | | (286,563 | ) | | | 1,992,631 | | | | 64,093 | | | | 468,854 | | |
| | | $ | 52,004,045 | | | $ | 1,632,541 | | | $ | 11,075,700 | | | $ | (438,285 | ) | | $ | 3,111,284 | | | $ | 45,233,885 | | | $ | 1,632,541 | | | | |
9 Rate shown reflects yield at June 30, 2024.
See accompanying notes to financial statements.
11
UBS Emerging Markets Equity Opportunity Fund
Portfolio of investments
| | | Number of
shares | | Value | |
Common stocks: 95.7% | |
Brazil: 7.5% | |
Hypera SA | | | 1,012,000 | | | $ | 5,195,685 | | |
MercadoLibre, Inc.* | | | 5,447 | | | | 8,951,600 | | |
Petroleo Brasileiro SA, ADR | | | 696,720 | | | | 10,095,473 | | |
Vale SA | | | 917,700 | | | | 10,214,360 | | |
| | | | | | 34,457,118 | | |
China: 20.8% | |
China Mengniu Dairy Co. Ltd. | | | 5,199,000 | | | | 9,304,208 | | |
Gree Electric Appliances, Inc. of Zhuhai, Class A | | | 730,100 | | | | 3,939,092 | | |
Kweichow Moutai Co. Ltd., Class A | | | 70,661 | | | | 14,236,920 | | |
Midea Group Co. Ltd., Class A | | | 568,146 | | | | 5,037,041 | | |
PDD Holdings, Inc., ADR* | | | 142,216 | | | | 18,907,617 | | |
Ping An Insurance Group Co. of China Ltd., Class H | | | 2,770,000 | | | | 12,549,698 | | |
Tencent Holdings Ltd. | | | 663,300 | | | | 31,467,169 | | |
| | | | | | 95,441,745 | | |
Hungary: 2.2% | |
OTP Bank Nyrt | | | 199,180 | | | | 9,879,848 | | |
India: 16.1% | |
Axis Bank Ltd. | | | 1,112,143 | | | | 16,854,314 | | |
Bandhan Bank Ltd.1 | | | 1,465,418 | | | | 3,578,332 | | |
Eicher Motors Ltd. | | | 201,200 | | | | 11,266,799 | | |
HDFC Bank Ltd. | | | 1,006,626 | | | | 20,327,998 | | |
Reliance Industries Ltd. | | | 585,331 | | | | 21,942,084 | | |
| | | | | | 73,969,527 | | |
Indonesia: 2.9% | |
Bank Central Asia Tbk. PT | | | 21,717,500 | | | | 13,141,052 | | |
Malaysia: 0.4% | |
CIMB Group Holdings Bhd. | | | 1,185,800 | | | | 1,708,448 | | |
Mexico: 3.2% | |
Grupo Financiero Banorte SAB de CV, Class O | | | 1,893,747 | | | | 14,756,635 | | |
Russia: 0.0%† | |
Sberbank of Russia PJSC*,2,3 | | | 3,568,865 | | | | 0 | | |
Yandex NV, Class A*,2,3 | | | 257,600 | | | | 0 | | |
| | | | | | 0 | | |
Saudi Arabia: 2.0% | |
Saudi National Bank | | | 912,031 | | | | 8,996,497 | | |
| | | Number of
shares | | Value | |
Common stocks—(concluded) | |
South Africa: 5.5% | |
Anglo American PLC | | | 312,844 | | | $ | 9,886,018 | | |
MTN Group Ltd. | | | 1,256,795 | | | | 5,848,355 | | |
Naspers Ltd., Class N | | | 49,460 | | | | 9,713,565 | | |
| | | | | | 25,447,938 | | |
South Korea: 18.3% | |
KB Financial Group, Inc. | | | 146,210 | | | | 8,316,445 | | |
Kia Corp. | | | 174,776 | | | | 16,354,018 | | |
Samsung Electronics Co. Ltd. | | | 590,636 | | | | 34,761,159 | | |
Samsung SDI Co. Ltd. | | | 24,316 | | | | 6,209,106 | | |
SK Hynix, Inc. | | | 108,716 | | | | 18,450,035 | | |
| | | | | | 84,090,763 | | |
Taiwan: 14.7% | |
ASE Technology Holding Co. Ltd. | | | 1,408,000 | | | | 7,293,876 | | |
MediaTek, Inc. | | | 324,000 | | | | 13,954,154 | | |
Taiwan Semiconductor Manufacturing Co. Ltd. | | | 1,569,000 | | | | 46,485,725 | | |
| | | | | | 67,733,755 | | |
Thailand: 2.1% | |
PTT Exploration & Production PCL, NVDR | | | 2,344,400 | | | | 9,691,124 | | |
Total common stocks
(cost $476,068,105) | | | | | 439,314,450 | | |
Preferred stocks: 1.6% | |
Brazil: 1.6% | |
Banco Bradesco SA
(cost $11,405,595) | | | 3,305,459 | | | | 7,320,367 | | |
Short-term investments: 0.6% | |
Investment companies: 0.6% | |
State Street Institutional U.S. Government
Money Market Fund, 5.254%4
(cost $2,925,840) | | | 2,925,840 | | | | 2,925,840 | | |
Total investments: 97.9%
(cost $490,399,540) | | | | | 449,560,657 | | |
Other assets in excess of liabilities: 2.1% | | | | | 9,647,474 | | |
Net assets: 100.0% | | | | $ | 459,208,131 | | |
For a listing of defined portfolio acronyms that are used throughout the Portfolio of investments as well as the tables that follow, please refer to the Glossary of terms used in the Portfolio of investments.
12
UBS Emerging Markets Equity Opportunity Fund
Portfolio of investments
Fair valuation summary
The following is a summary of the fair valuations according to the inputs used as of June 30, 2024 in valuing the Fund's investments. In the event a fund holds investments for which fair value is measured using the NAV per share practical expedient (or its equivalent), a separate column will be added to the fair value hierarchy table; this is intended to permit reconciliation to the amounts presented in the Portfolio of investments:
Description | | Unadjusted
quoted prices in
active market for
identical investments
(Level 1) | | Other significant
observable inputs
(Level 2) | | Unobservable
inputs
(Level 3) | | Total | |
Assets | |
Common stocks | | $ | 68,121,370 | | | $ | 371,193,080 | | | $ | 0 | | | $ | 439,314,450 | | |
Preferred stocks | | | 7,320,367 | | | | — | | | | — | | | | 7,320,367 | | |
Short-term investments | | | — | | | | 2,925,840 | | | | — | | | | 2,925,840 | | |
Total | | $ | 75,441,737 | | | $ | 374,118,920 | | | $ | 0 | | | $ | 449,560,657 | | |
At June 30, 2024, there were no transfers in or out of Level 3.
Portfolio footnotes
† Amount represents less than 0.05% or (0.05)%.
* Non-income producing security.
1 Security exempt from registration pursuant to Rule 144A under the Securities Act of 1933. These securities are considered liquid, unless noted otherwise, and may be resold in transactions exempt from registrations, normally to qualified institutional buyers. Securities exempt from registration pursuant to Rule 144A, in the amount of $3,578,332, represented 0.8% of the Fund's net assets at period end.
2 Security fair valued by the Valuation Committee under the direction of the Board of Trustees.
3 Significant unobservable inputs were used in the valuation of this security; i.e. Level 3.
4 Rate shown reflects yield at June 30, 2024.
See accompanying notes to financial statements.
13
UBS Engage For Impact Fund
Portfolio of investments
| | | Number of
shares | | Value | |
Common stocks: 99.0% | |
Canada: 1.8% | |
Canadian Pacific Kansas City Ltd.1 | | | 11,499 | | | $ | 905,597 | | |
China: 1.0% | |
China Mengniu Dairy Co. Ltd. | | | 275,000 | | | | 492,144 | | |
France: 3.9% | |
Danone SA | | | 33,109 | | | | 2,027,919 | | |
Germany: 2.8% | |
Infineon Technologies AG | | | 39,784 | | | | 1,460,085 | | |
Indonesia: 3.5% | |
Bank Mandiri Persero Tbk. PT | | | 4,906,000 | | | | 1,835,402 | | |
Ireland: 3.4% | |
AIB Group PLC | | | 330,910 | | | | 1,747,565 | | |
Japan: 7.4% | |
Chugai Pharmaceutical Co. Ltd.1 | | | 36,500 | | | | 1,299,705 | | |
JTOWER, Inc.*,1 | | | 21,000 | | | | 220,791 | | |
Recruit Holdings Co. Ltd. | | | 28,600 | | | | 1,538,885 | | |
Shimano, Inc. | | | 5,100 | | | | 788,173 | | |
| | | | | | 3,847,554 | | |
Mexico: 1.9% | |
America Movil SAB de CV | | | 663,000 | | | | 564,248 | | |
Grupo Financiero Banorte SAB de CV, Class O | | | 53,989 | | | | 420,698 | | |
| | | | | | 984,946 | | |
Netherlands: 2.5% | |
Aalberts NV | | | 20,994 | | | | 850,105 | | |
OCI NV1 | | | 19,143 | | | | 467,535 | | |
| | | | | | 1,317,640 | | |
Portugal: 3.3% | |
Galp Energia SGPS SA | | | 80,614 | | | | 1,702,638 | | |
Spain: 2.8% | |
Befesa SA2 | | | 6,453 | | | | 213,504 | | |
Iberdrola SA1 | | | 94,992 | | | | 1,232,515 | | |
| | | | | | 1,446,019 | | |
Switzerland: 6.6% | |
Alcon, Inc. | | | 23,571 | | | | 2,095,269 | | |
Sandoz Group AG | | | 35,854 | | | | 1,299,637 | | |
| | | | | | 3,394,906 | | |
United Kingdom: 7.1% | |
AstraZeneca PLC | | | 14,043 | | | | 2,185,554 | | |
Spectris PLC | | | 42,444 | | | | 1,489,157 | | |
| | | | | | 3,674,711 | | |
| | | Number of
shares | | Value | |
Common stocks—(concluded) | |
United States: 51.0% | |
Aptiv PLC* | | | 15,270 | | | $ | 1,075,313 | | |
Autodesk, Inc.* | | | 7,089 | | | | 1,754,173 | | |
Bio-Rad Laboratories, Inc., Class A* | | | 2,395 | | | | 654,098 | | |
Broadcom, Inc. | | | 1,448 | | | | 2,324,807 | | |
CF Industries Holdings, Inc. | | | 11,049 | | | | 818,952 | | |
Coursera, Inc.* | | | 18,047 | | | | 129,217 | | |
Dexcom, Inc.* | | | 8,607 | | | | 975,862 | | |
Digital Realty Trust, Inc. | | | 5,885 | | | | 894,814 | | |
Ecolab, Inc. | | | 4,589 | | | | 1,092,182 | | |
Enphase Energy, Inc.* | | | 4,832 | | | | 481,799 | | |
Ingersoll Rand, Inc. | | | 17,112 | | | | 1,554,454 | | |
Linde PLC | | | 3,640 | | | | 1,597,268 | | |
Micron Technology, Inc. | | | 16,259 | | | | 2,138,546 | | |
Montrose Environmental Group, Inc.* | | | 12,523 | | | | 558,025 | | |
NIKE, Inc., Class B | | | 9,989 | | | | 752,871 | | |
Primo Water Corp. | | | 63,094 | | | | 1,379,235 | | |
Pure Storage, Inc., Class A* | | | 14,526 | | | | 932,714 | | |
Regal Rexnord Corp. | | | 9,172 | | | | 1,240,238 | | |
Rivian Automotive, Inc., Class A*,1 | | | 31,889 | | | | 427,950 | | |
Roper Technologies, Inc. | | | 1,807 | | | | 1,018,534 | | |
ServiceNow, Inc.* | | | 1,085 | | | | 853,537 | | |
SLM Corp. | | | 40,792 | | | | 848,066 | | |
Sprouts Farmers Market, Inc.* | | | 13,769 | | | | 1,151,915 | | |
Trimble, Inc.* | | | 16,194 | | | | 905,569 | | |
Zoom Video Communications, Inc., Class A* | | | 14,106 | | | | 834,934 | | |
| | | | | | 26,395,073 | | |
Total common stocks
(cost $46,062,258) | | | | | 51,232,199 | | |
Short-term investments: 1.3% | |
Investment companies: 1.3% | |
State Street Institutional U.S. Government
Money Market Fund, 5.254%3
(cost $687,539) | | | 687,539 | | | | 687,539 | | |
Investment of cash collateral from securities loaned: 6.1% | |
Money market funds: 6.1% | |
State Street Navigator Securities Lending
Government Money Market
Portfolio, 5.276%3
(cost $3,155,901) | | | 3,155,901 | | | | 3,155,901 | | |
Total investments: 106.4%
(cost $49,905,698) | | | | | 55,075,639 | | |
Liabilities in excess of other assets: (6.4%) | | | | | (3,328,374 | ) | |
Net assets: 100.0% | | | | $ | 51,747,265 | | |
For a listing of defined portfolio acronyms that are used throughout the Portfolio of investments as well as the tables that follow, please refer to the Glossary of terms used in the Portfolio of investments.
14
UBS Engage For Impact Fund
Portfolio of investments
Fair valuation summary
The following is a summary of the fair valuations according to the inputs used as of June 30, 2024 in valuing the Fund's investments. In the event a fund holds investments for which fair value is measured using the NAV per share practical expedient (or its equivalent), a separate column will be added to the fair value hierarchy table; this is intended to permit reconciliation to the amounts presented in the Portfolio of investments:
Description | | Unadjusted
quoted prices in
active market for
identical investments
(Level 1) | | Other significant
observable inputs
(Level 2) | | Unobservable
inputs
(Level 3) | | Total | |
Assets | |
Common stocks | | $ | 28,285,616 | | | $ | 22,946,583 | | | $ | — | | | $ | 51,232,199 | | |
Short-term investments | | | — | | | | 687,539 | | | | — | | | | 687,539 | | |
Investment of cash collateral from securities loaned | | | — | | | | 3,155,901 | | | | — | | | | 3,155,901 | | |
Total | | $ | 28,285,616 | | | $ | 26,790,023 | | | $ | — | | | $ | 55,075,639 | | |
At June 30, 2024, there were no transfers in or out of Level 3.
Portfolio footnotes
* Non-income producing security.
1 Security, or portion thereof, was on loan at the period end.
2 Security exempt from registration pursuant to Rule 144A under the Securities Act of 1933. These securities are considered liquid, unless noted otherwise, and may be resold in transactions exempt from registrations, normally to qualified institutional buyers. Securities exempt from registration pursuant to Rule 144A, in the amount of $213,504, represented 0.4% of the Fund's net assets at period end.
3 Rate shown reflects yield at June 30, 2024.
See accompanying notes to financial statements.
15
UBS International Sustainable Equity Fund
Portfolio of investments
| | | Number of
shares | | Value | |
Common stocks: 97.9% | |
Australia: 1.0% | |
Brambles Ltd. | | | 158,477 | | | $ | 1,529,291 | | |
Brazil: 0.6% | |
Suzano SA | | | 88,042 | | | | 897,886 | | |
Canada: 5.9% | |
Canadian Pacific Kansas City Ltd.1 | | | 27,201 | | | | 2,142,199 | | |
Gildan Activewear, Inc.1 | | | 69,823 | | | | 2,648,379 | | |
Royal Bank of Canada1 | | | 34,227 | | | | 3,643,992 | | |
Shopify, Inc., Class A* | | | 12,000 | | | | 792,600 | | |
| | | | | | 9,227,170 | | |
China: 1.0% | |
Ping An Insurance Group Co. of China Ltd., Class H | | | 334,000 | | | | 1,513,213 | | |
Denmark: 0.9% | |
Genmab AS* | | | 5,739 | | | | 1,438,155 | | |
Finland: 0.6% | |
Neste OYJ | | | 52,851 | | | | 943,099 | | |
France: 5.4% | |
AXA SA | | | 37,319 | | | | 1,222,990 | | |
Cie Generale des Etablissements Michelin SCA | | | 70,818 | | | | 2,737,193 | | |
Danone SA | | | 46,898 | | | | 2,872,493 | | |
Ubisoft Entertainment SA* | | | 75,856 | | | | 1,659,972 | | |
| | | | | | 8,492,648 | | |
Germany: 3.9% | |
HUGO BOSS AG | | | 17,856 | | | | 802,863 | | |
Infineon Technologies AG | | | 47,867 | | | | 1,756,734 | | |
Knorr-Bremse AG | | | 30,789 | | | | 2,353,354 | | |
SAP SE | | | 5,529 | | | | 1,110,641 | | |
| | | | | | 6,023,592 | | |
Ireland: 2.6% | |
AIB Group PLC | | | 766,288 | | | | 4,046,835 | | |
Italy: 3.3% | |
Infrastrutture Wireless Italiane SpA1,2 | | | 127,376 | | | | 1,326,709 | | |
PRADA SpA | | | 299,000 | | | | 2,227,987 | | |
Prysmian SpA | | | 25,739 | | | | 1,589,048 | | |
| | | | | | 5,143,744 | | |
Japan: 21.5% | |
Chugai Pharmaceutical Co. Ltd. | | | 35,100 | | | | 1,249,853 | | |
FANUC Corp. | | | 74,300 | | | | 2,039,736 | | |
ITOCHU Corp.1 | | | 79,400 | | | | 3,903,158 | | |
Keyence Corp. | | | 7,300 | | | | 3,195,049 | | |
Mitsubishi UFJ Financial Group, Inc. | | | 268,000 | | | | 2,892,263 | | |
NEC Corp.1 | | | 24,300 | | | | 2,003,693 | | |
Nippon Telegraph & Telephone Corp. | | | 2,411,400 | | | | 2,280,227 | | |
OBIC Business Consultants Co. Ltd. | | | 69,800 | | | | 2,941,207 | | |
Shin-Etsu Chemical Co. Ltd. | | | 51,500 | | | | 2,002,404 | | |
SoftBank Group Corp. | | | 22,600 | | | | 1,453,659 | | |
Sony Group Corp. | | | 55,400 | | | | 4,721,251 | | |
| | | Number of
shares | | Value | |
Common stocks—(continued) | |
Japan—(concluded) | |
Toyota Motor Corp. | | | 143,100 | | | $ | 2,936,049 | | |
West Japan Railway Co. | | | 51,400 | | | | 959,098 | | |
Yamaha Motor Co. Ltd.1 | | | 111,800 | | | | 1,039,382 | | |
| | | | | | 33,617,029 | | |
Luxembourg: 1.4% | |
Eurofins Scientific SE1 | | | 43,039 | | | | 2,154,918 | | |
Netherlands: 6.9% | |
| ASML Holding NV | | | 3,110 | | | | 3,169,606 | | |
Koninklijke Philips NV* | | | 141,034 | | | | 3,546,800 | | |
OCI NV1 | | | 72,680 | | | | 1,775,086 | | |
Universal Music Group NV1 | | | 73,815 | | | | 2,195,868 | | |
| | | | | | 10,687,360 | | |
Norway: 1.6% | |
Equinor ASA | | | 85,119 | | | | 2,438,132 | | |
Portugal: 0.9% | |
Galp Energia SGPS SA | | | 68,982 | | | | 1,456,960 | | |
South Korea: 2.3% | |
SK Hynix, Inc. | | | 20,904 | | | | 3,547,588 | | |
Spain: 2.6% | |
Banco de Sabadell SA | | | 1,563,086 | | | | 3,017,766 | | |
Iberdrola SA1 | | | 74,298 | | | | 964,011 | | |
| | | | | | 3,981,777 | | |
Switzerland: 7.7% | |
Alcon, Inc. | | | 26,968 | | | | 2,397,235 | | |
Barry Callebaut AG, Registered Shares1 | | | 825 | | | | 1,344,924 | | |
DSM-Firmenich AG | | | 20,184 | | | | 2,272,822 | | |
Novartis AG, Registered Shares | | | 31,043 | | | | 3,305,199 | | |
Sandoz Group AG | | | 74,737 | | | | 2,709,069 | | |
| | | | | | 12,029,249 | | |
Taiwan: 3.1% | |
Taiwan Semiconductor Manufacturing Co. Ltd., ADR | | | 27,857 | | | | 4,841,825 | | |
United Kingdom: 15.4% | |
Ashtead Group PLC | | | 39,219 | | | | 2,614,874 | | |
AstraZeneca PLC | | | 24,507 | | | | 3,814,097 | | |
HSBC Holdings PLC | | | 181,942 | | | | 1,570,523 | | |
Legal & General Group PLC | | | 899,965 | | | | 2,577,109 | | |
London Stock Exchange Group PLC | | | 35,107 | | | | 4,162,929 | | |
NatWest Group PLC | | | 665,994 | | | | 2,620,081 | | |
Spectris PLC | | | 49,943 | | | | 1,752,261 | | |
St. James's Place PLC | | | 134,750 | | | | 925,981 | | |
Unilever PLC | | | 74,012 | | | | 4,060,019 | | |
| | | | | | 24,097,874 | | |
United States: 7.5% | |
Aon PLC, Class A | | | 4,315 | | | | 1,266,798 | | |
Aptiv PLC* | | | 35,860 | | | | 2,525,261 | | |
James Hardie Industries PLC, CDI* | | | 75,900 | | | | 2,375,488 | | |
16
UBS International Sustainable Equity Fund
Portfolio of investments
| | | Number of
shares | | Value | |
Common stocks—(concluded) | |
United States—(concluded) | |
Schlumberger NV | | | 76,778 | | | $ | 3,622,386 | | |
Schneider Electric SE | | | 8,208 | | | | 1,967,834 | | |
| | | | | | 11,757,767 | | |
Zambia: 1.8% | |
First Quantum Minerals Ltd.1 | | | 216,939 | | | | 2,849,599 | | |
Total common stocks
(cost $142,980,856) | | | | | 152,715,711 | | |
| | | Number of
shares | | Value | |
Investment of cash collateral from securities loaned: 12.7% | |
Money market funds: 12.7% | |
State Street Navigator Securities Lending
Government Money Market
Portfolio, 5.276%3
(cost $19,808,678) | | | 19,808,678 | | | $ | 19,808,678 | | |
Total investments: 110.6%
(cost $162,789,534) | | | | | 172,524,389 | | |
Liabilities in excess of other assets: (10.6%) | | | (16,508,336 | ) | |
Net assets: 100.0% | | $ | 156,016,053 | | |
For a listing of defined portfolio acronyms that are used throughout the Portfolio of investments as well as the tables that follow, please refer to the Glossary of terms used in the Portfolio of investments.
Fair valuation summary
The following is a summary of the fair valuations according to the inputs used as of June 30, 2024 in valuing the Fund's investments. In the event a fund holds investments for which fair value is measured using the NAV per share practical expedient (or its equivalent), a separate column will be added to the fair value hierarchy table; this is intended to permit reconciliation to the amounts presented in the Portfolio of investments:
Description | | Unadjusted
quoted prices in
active market for
identical investments
(Level 1) | | Other significant
observable inputs
(Level 2) | | Unobservable
inputs
(Level 3) | | Total | |
Assets | |
Common stocks | | $ | 25,230,925 | | | $ | 127,484,786 | | | $ | — | | | $ | 152,715,711 | | |
Investment of cash collateral from securities loaned | | | — | | | | 19,808,678 | | | | — | | | | 19,808,678 | | |
Total | | $ | 25,230,925 | | | $ | 147,293,464 | | | $ | — | | | $ | 172,524,389 | | |
At June 30, 2024, there were no transfers in or out of Level 3.
Portfolio footnotes
* Non-income producing security.
1 Security, or portion thereof, was on loan at the period end.
2 Security exempt from registration pursuant to Rule 144A under the Securities Act of 1933. These securities are considered liquid, unless noted otherwise, and may be resold in transactions exempt from registrations, normally to qualified institutional buyers. Securities exempt from registration pursuant to Rule 144A, in the amount of $1,326,709, represented 0.9% of the Fund's net assets at period end.
3 Rate shown reflects yield at June 30, 2024.
See accompanying notes to financial statements.
17
UBS US Dividend Ruler Fund
Portfolio of investments
| | | Number of
shares | | Value | |
Common stocks: 98.3% | |
Air freight & logistics: 2.3% | |
United Parcel Service, Inc., Class B | | | 33,088 | | | $ | 4,528,093 | | |
Banks: 4.4% | |
JPMorgan Chase & Co. | | | 43,581 | | | | 8,814,693 | | |
Beverages: 2.8% | |
Coca-Cola Co. | | | 87,774 | | | | 5,586,815 | | |
Biotechnology: 2.2% | |
AbbVie, Inc. | | | 25,841 | | | | 4,432,248 | | |
Building products: 1.5% | |
Trane Technologies PLC | | | 9,291 | | | | 3,056,089 | | |
Capital markets: 6.5% | |
BlackRock, Inc. | | | 7,932 | | | | 6,245,023 | | |
Morgan Stanley | | | 68,759 | | | | 6,682,687 | | |
| | | | | | 12,927,710 | | |
Chemicals: 3.1% | |
Linde PLC | | | 13,872 | | | | 6,087,172 | | |
Commercial services & supplies: 0.9% | |
Republic Services, Inc. | | | 9,662 | | | | 1,877,713 | | |
Electric utilities: 2.9% | |
NextEra Energy, Inc. | | | 80,507 | | | | 5,700,701 | | |
Ground transportation: 3.2% | |
Union Pacific Corp. | | | 27,794 | | | | 6,288,670 | | |
Health care equipment & supplies: 2.7% | |
Abbott Laboratories | | | 50,825 | | | | 5,281,226 | | |
Health care providers & services: 3.6% | |
UnitedHealth Group, Inc. | | | 14,162 | | | | 7,212,140 | | |
Hotels, restaurants & leisure: 2.0% | |
McDonald's Corp. | | | 15,335 | | | | 3,907,971 | | |
Household products: 2.3% | |
Procter & Gamble Co. | | | 28,215 | | | | 4,653,218 | | |
Industrial conglomerates: 1.2% | |
Honeywell International, Inc. | | | 10,891 | | | | 2,325,664 | | |
Industrial REITs: 2.2% | |
Prologis, Inc. | | | 38,214 | | | | 4,291,814 | | |
Insurance: 4.1% | |
Chubb Ltd. | | | 18,407 | | | | 4,695,258 | | |
Marsh & McLennan Cos., Inc. | | | 16,139 | | | | 3,400,810 | | |
| | | | | | 8,096,068 | | |
| | | Number of
shares | | Value | |
Common stocks—(concluded) | |
IT services: 3.5% | |
Accenture PLC, Class A | | | 23,091 | | | $ | 7,006,040 | | |
Oil, gas & consumable fuels: 4.8% | |
Exxon Mobil Corp. | | | 42,195 | | | | 4,857,488 | | |
Phillips 66 | | | 34,026 | | | | 4,803,451 | | |
| | | | | | 9,660,939 | | |
Pharmaceuticals: 2.3% | |
Johnson & Johnson | | | 31,533 | | | | 4,608,863 | | |
Professional services: 2.8% | |
Automatic Data Processing, Inc. | | | 23,700 | | | | 5,656,953 | | |
Semiconductors & semiconductor equipment: 13.8% | |
Analog Devices, Inc. | | | 31,122 | | | | 7,103,908 | | |
Broadcom, Inc. | | | 7,098 | | | | 11,396,052 | | |
Taiwan Semiconductor Manufacturing Co. Ltd., ADR | | | 51,700 | | | | 8,985,977 | | |
| | | | | | 27,485,937 | | |
Software: 17.0% | |
Microsoft Corp. | | | 53,040 | | | | 23,706,228 | | |
Oracle Corp. | | | 72,564 | | | | 10,246,037 | | |
| | | | | | 33,952,265 | | |
Specialty retail: 6.2% | |
Home Depot, Inc. | | | 21,592 | | | | 7,432,830 | | |
TJX Cos., Inc. | | | 45,319 | | | | 4,989,622 | | |
| | | | | | 12,422,452 | | |
Total common stocks
(cost $162,507,983) | | | | | 195,861,454 | | |
Short-term investments: 2.2% | |
Investment companies: 2.2% | |
State Street Institutional U.S. Government
Money Market Fund, 5.254%1
(cost $4,412,124) | | | 4,412,124 | | | | 4,412,124 | | |
Total investments: 100.5%
(cost $166,920,107) | | | | | 200,273,578 | | |
Liabilities in excess of other assets: (0.5%) | | | | | (937,496 | ) | |
Net assets: 100.0% | | | | $ | 199,336,082 | | |
For a listing of defined portfolio acronyms that are used throughout the Portfolio of investments as well as the tables that follow, please refer to the Glossary of terms used in the Portfolio of investments.
18
UBS US Dividend Ruler Fund
Portfolio of investments
Fair valuation summary
The following is a summary of the fair valuations according to the inputs used as of June 30, 2024 in valuing the Fund's investments. In the event a fund holds investments for which fair value is measured using the NAV per share practical expedient (or its equivalent), a separate column will be added to the fair value hierarchy table; this is intended to permit reconciliation to the amounts presented in the Portfolio of investments:
Description | | Unadjusted
quoted prices in
active market for
identical investments
(Level 1) | | Other significant
observable inputs
(Level 2) | | Unobservable
inputs
(Level 3) | | Total | |
Assets | |
Common stocks | | $ | 195,861,454 | | | $ | — | | | $ | — | | | $ | 195,861,454 | | |
Short-term investments | | | — | | | | 4,412,124 | | | | — | | | | 4,412,124 | | |
Total | | $ | 195,861,454 | | | $ | 4,412,124 | | | $ | — | | | $ | 200,273,578 | | |
At June 30, 2024, there were no transfers in or out of Level 3.
Portfolio footnotes
1 Rate shown reflects yield at June 30, 2024.
See accompanying notes to financial statements.
19
UBS US Quality Growth At Reasonable Price Fund
Portfolio of investments
| | | Number of
shares | | Value | |
Common stocks: 98.1% | |
Aerospace & defense: 1.4% | |
TransDigm Group, Inc. | | | 3,112 | | | $ | 3,975,922 | | |
Beverages: 1.4% | |
Coca-Cola Co. | | | 60,784 | | | | 3,868,902 | | |
Broadline retail: 8.3% | |
Amazon.com, Inc.* | | | 123,636 | | | | 23,892,657 | | |
Capital markets: 1.9% | |
Ameriprise Financial, Inc. | | | 7,250 | | | | 3,097,127 | | |
S&P Global, Inc. | | | 5,499 | | | | 2,452,554 | | |
| | | | | | 5,549,681 | | |
Chemicals: 1.8% | |
Sherwin-Williams Co. | | | 16,796 | | | | 5,012,430 | | |
Financial services: 4.9% | |
Mastercard, Inc., Class A | | | 12,614 | | | | 5,564,792 | | |
Visa, Inc., Class A | | | 32,763 | | | | 8,599,305 | | |
| | | | | | 14,164,097 | | |
Ground transportation: 1.4% | |
Union Pacific Corp. | | | 18,185 | | | | 4,114,538 | | |
Health care equipment & supplies: 3.9% | |
Abbott Laboratories | | | 25,854 | | | | 2,686,489 | | |
Boston Scientific Corp.* | | | 51,593 | | | | 3,973,177 | | |
Intuitive Surgical, Inc.* | | | 10,462 | | | | 4,654,021 | | |
| | | | | | 11,313,687 | | |
Health care providers & services: 1.9% | |
UnitedHealth Group, Inc. | | | 10,789 | | | | 5,494,406 | | |
Hotels, restaurants & leisure: 2.1% | |
Chipotle Mexican Grill, Inc.* | | | 93,900 | | | | 5,882,835 | | |
Insurance: 1.5% | |
Progressive Corp. | | | 19,917 | | | | 4,136,960 | | |
Interactive media & services: 11.9% | |
Alphabet, Inc., Class A | | | 94,715 | | | | 17,252,337 | | |
Meta Platforms, Inc., Class A | | | 33,295 | | | | 16,788,005 | | |
| | | | | | 34,040,342 | | |
Life sciences tools & services: 2.0% | |
Danaher Corp. | | | 9,226 | | | | 2,305,116 | | |
Thermo Fisher Scientific, Inc. | | | 6,187 | | | | 3,421,411 | | |
| | | | | | 5,726,527 | | |
| | | Number of
shares | | Value | |
Common stocks—(concluded) | |
Machinery: 1.4% | |
Parker-Hannifin Corp. | | | 8,157 | | | $ | 4,125,892 | | |
Pharmaceuticals: 4.1% | |
Eli Lilly & Co. | | | 13,089 | | | | 11,850,519 | | |
Semiconductors & semiconductor equipment: 14.5% | |
Advanced Micro Devices, Inc.* | | | 36,270 | | | | 5,883,357 | | |
Applied Materials, Inc. | | | 16,352 | | | | 3,858,908 | | |
ASML Holding NV, Registered Shares | | | 4,969 | | | | 5,081,945 | | |
Broadcom, Inc. | | | 7,141 | | | | 11,465,090 | | |
NVIDIA Corp. | | | 124,437 | | | | 15,372,947 | | |
| | | | | | 41,662,247 | | |
Software: 20.1% | |
Adobe, Inc.* | | | 10,016 | | | | 5,564,289 | | |
Intuit, Inc. | | | 9,486 | | | | 6,234,294 | | |
Microsoft Corp. | | | 86,075 | | | | 38,471,221 | | |
Palo Alto Networks, Inc.* | | | 7,673 | | | | 2,601,224 | | |
Salesforce, Inc. | | | 18,846 | | | | 4,845,306 | | |
| | | | | | 57,716,334 | | |
Specialized REITs: 1.3% | |
American Tower Corp. | | | 19,273 | | | | 3,746,286 | | |
Specialty retail: 3.9% | |
O'Reilly Automotive, Inc.* | | | 4,647 | | | | 4,907,511 | | |
TJX Cos., Inc. | | | 57,930 | | | | 6,378,093 | | |
| | | | | | 11,285,604 | | |
Technology hardware, storage & peripherals: 8.4% | |
Apple, Inc. | | | 114,843 | | | | 24,188,233 | | |
Total common stocks
(cost $210,113,656) | | | | | 281,748,099 | | |
Short-term investments: 1.9% | |
Investment companies: 1.9% | |
State Street Institutional U.S. Government
Money Market Fund, 5.254%1
(cost $5,496,881) | | | 5,496,881 | | | | 5,496,881 | | |
Total investments: 100.0%
(cost $215,610,537) | | | | | 287,244,980 | | |
Other assets in excess of liabilities: 0.0%† | | | | | 38,869 | | |
Net assets: 100.0% | | | | $ | 287,283,849 | | |
For a listing of defined portfolio acronyms that are used throughout the Portfolio of investments as well as the tables that follow, please refer to the Glossary of terms used in the Portfolio of investments.
20
UBS US Quality Growth At Reasonable Price Fund
Portfolio of investments
Fair valuation summary
The following is a summary of the fair valuations according to the inputs used as of June 30, 2024 in valuing the Fund's investments. In the event a fund holds investments for which fair value is measured using the NAV per share practical expedient (or its equivalent), a separate column will be added to the fair value hierarchy table; this is intended to permit reconciliation to the amounts presented in the Portfolio of investments:
Description | | Unadjusted
quoted prices in
active market for
identical investments
(Level 1) | | Other significant
observable inputs
(Level 2) | | Unobservable
inputs
(Level 3) | | Total | |
Assets | |
Common stocks | | $ | 281,748,099 | | | $ | — | | | $ | — | | | $ | 281,748,099 | | |
Short-term investments | | | — | | | | 5,496,881 | | | | — | | | | 5,496,881 | | |
Total | | $ | 281,748,099 | | | $ | 5,496,881 | | | $ | — | | | $ | 287,244,980 | | |
At June 30, 2024, there were no transfers in or out of Level 3.
Portfolio footnotes
† Amount represents less than 0.05% or (0.05)%.
* Non-income producing security.
1 Rate shown reflects yield at June 30, 2024.
See accompanying notes to financial statements.
21
UBS U.S. Small Cap Growth Fund
Portfolio of investments
| | | Number of
shares | | Value | |
Common stocks: 96.7% | |
Aerospace & defense: 3.0% | |
AeroVironment, Inc.* | | | 12,874 | | | $ | 2,345,127 | | |
BWX Technologies, Inc. | | | 17,663 | | | | 1,677,985 | | |
| | | | | | 4,023,112 | | |
Air freight & logistics: 1.0% | |
GXO Logistics, Inc.* | | | 25,650 | | | | 1,295,325 | | |
Automobile components: 1.3% | |
Modine Manufacturing Co.* | | | 17,490 | | | | 1,752,323 | | |
Banks: 2.3% | |
Columbia Banking System, Inc. | | | 44,008 | | | | 875,319 | | |
First Bancorp/Southern Pines NC | | | 33,113 | | | | 1,056,967 | | |
Prosperity Bancshares, Inc. | | | 18,103 | | | | 1,106,817 | | |
| | | | | | 3,039,103 | | |
Biotechnology: 12.5% | |
Arcellx, Inc.* | | | 13,670 | | | | 754,447 | | |
Arcturus Therapeutics Holdings, Inc.* | | | 22,387 | | | | 545,123 | | |
Arrowhead Pharmaceuticals, Inc.* | | | 25,011 | | | | 650,036 | | |
Avidity Biosciences, Inc.* | | | 32,065 | | | | 1,309,855 | | |
Cabaletta Bio, Inc.* | | | 48,491 | | | | 362,713 | | |
Crinetics Pharmaceuticals, Inc.* | | | 20,986 | | | | 939,963 | | |
Halozyme Therapeutics, Inc.* | | | 16,260 | | | | 851,374 | | |
Ideaya Biosciences, Inc.* | | | 21,570 | | | | 757,323 | | |
Immunocore Holdings PLC, ADR* | | | 13,501 | | | | 457,549 | | |
Immunovant, Inc.* | | | 28,167 | | | | 743,609 | | |
Insmed, Inc.* | | | 22,376 | | | | 1,499,192 | | |
Kymera Therapeutics, Inc.* | | | 24,513 | | | | 731,713 | | |
Kyverna Therapeutics, Inc.* | | | 15,200 | | | | 114,000 | | |
Nuvalent, Inc., Class A* | | | 13,000 | | | | 986,180 | | |
Protagonist Therapeutics, Inc.* | | | 37,826 | | | | 1,310,671 | | |
Prothena Corp. PLC* | | | 10,547 | | | | 217,690 | | |
Rhythm Pharmaceuticals, Inc.* | | | 21,573 | | | | 885,787 | | |
Vaxcyte, Inc.* | | | 13,890 | | | | 1,048,834 | | |
Viking Therapeutics, Inc.* | | | 38,000 | | | | 2,014,380 | | |
Xencor, Inc.* | | | 26,822 | | | | 507,740 | | |
| | | | | | 16,688,179 | | |
Broadline retail: 1.4% | |
Global-e Online Ltd.* | | | 52,200 | | | | 1,893,294 | | |
Building products: 3.4% | |
AZEK Co., Inc.* | | | 61,589 | | | | 2,594,745 | | |
Simpson Manufacturing Co., Inc. | | | 11,798 | | | | 1,988,317 | | |
| | | | | | 4,583,062 | | |
Construction & engineering: 3.2% | |
Comfort Systems USA, Inc. | | | 6,693 | | | | 2,035,475 | | |
MasTec, Inc.* | | | 20,477 | | | | 2,190,834 | | |
| | | | | | 4,226,309 | | |
Consumer staples distribution & retail: 1.7% | |
Performance Food Group Co.* | | | 33,828 | | | | 2,236,369 | | |
| | | Number of
shares | | Value | |
Common stocks—(continued) | |
Containers & packaging: 1.2% | |
Graphic Packaging Holding Co. | | | 59,271 | | | $ | 1,553,493 | | |
Diversified consumer services: 1.7% | |
Duolingo, Inc.* | | | 10,518 | | | | 2,194,791 | | |
Electrical equipment: 0.1% | |
Shoals Technologies Group, Inc., Class A* | | | 27,706 | | | | 172,885 | | |
Electronic equipment, instruments & components: 1.4% | |
Itron, Inc.* | | | 19,320 | | | | 1,911,907 | | |
Energy equipment & services: 1.7% | |
Weatherford International PLC* | | | 18,815 | | | | 2,303,897 | | |
Financial services: 3.0% | |
Essent Group Ltd. | | | 18,927 | | | | 1,063,508 | | |
Flywire Corp.* | | | 57,445 | | | | 941,523 | | |
Shift4 Payments, Inc., Class A*,1 | | | 26,665 | | | | 1,955,878 | | |
| | | | | | 3,960,909 | | |
Health care equipment & supplies: 0.6% | |
Artivion, Inc.* | | | 17,863 | | | | 458,186 | | |
iRhythm Technologies, Inc.* | | | 3,444 | | | | 370,712 | | |
| | | | | | 828,898 | | |
Health care providers & services: 5.3% | |
HealthEquity, Inc.* | | | 15,775 | | | | 1,359,805 | | |
NeoGenomics, Inc.* | | | 33,440 | | | | 463,813 | | |
R1 RCM, Inc.* | | | 82,233 | | | | 1,032,846 | | |
RadNet, Inc.* | | | 50,679 | | | | 2,986,007 | | |
Surgery Partners, Inc.* | | | 51,343 | | | | 1,221,450 | | |
| | | | | | 7,063,921 | | |
Hotel & resort REITs: 2.4% | |
Ryman Hospitality Properties, Inc. | | | 32,157 | | | | 3,211,198 | | |
Hotels, restaurants & leisure: 5.9% | |
Bloomin' Brands, Inc. | | | 58,163 | | | | 1,118,474 | | |
Churchill Downs, Inc. | | | 13,863 | | | | 1,935,275 | | |
Dave & Buster's Entertainment, Inc.* | | | 29,807 | | | | 1,186,617 | | |
First Watch Restaurant Group, Inc.* | | | 78,500 | | | | 1,378,460 | | |
Shake Shack, Inc., Class A* | | | 24,709 | | | | 2,223,810 | | |
| | | | | | 7,842,636 | | |
Household durables: 1.6% | |
TopBuild Corp.* | | | 5,547 | | | | 2,137,093 | | |
Insurance: 0.3% | |
Bowhead Specialty Holdings, Inc.* | | | 17,700 | | | | 448,518 | | |
IT services: 4.0% | |
Couchbase, Inc.* | | | 76,359 | | | | 1,394,315 | | |
DigitalOcean Holdings, Inc.* | | | 34,425 | | | | 1,196,269 | | |
Wix.com Ltd.* | | | 17,108 | | | | 2,721,370 | | |
| | | | | | 5,311,954 | | |
22
UBS U.S. Small Cap Growth Fund
Portfolio of investments
| | | Number of
shares | | Value | |
Common stocks—(continued) | |
Life sciences tools & services: 3.6% | |
Medpace Holdings, Inc.* | | | 9,893 | | | $ | 4,074,432 | | |
Repligen Corp.* | | | 5,849 | | | | 737,325 | | |
| | | | | | 4,811,757 | | |
Machinery: 2.3% | |
Chart Industries, Inc.* | | | 8,967 | | | | 1,294,297 | | |
SPX Technologies, Inc.* | | | 12,737 | | | | 1,810,437 | | |
| | | | | | 3,104,734 | | |
Metals & mining: 1.6% | |
ATI, Inc.* | | | 37,753 | | | | 2,093,404 | | |
Oil, gas & consumable fuels: 2.5% | |
Gulfport Energy Corp.* | | | 11,458 | | | | 1,730,158 | | |
SM Energy Co. | | | 36,129 | | | | 1,561,857 | | |
| | | | | | 3,292,015 | | |
Personal care products: 1.6% | |
BellRing Brands, Inc.* | | | 36,876 | | | | 2,107,095 | | |
Pharmaceuticals: 1.1% | |
Arvinas, Inc.* | | | 18,930 | | | | 503,917 | | |
Intra-Cellular Therapies, Inc.* | | | 14,452 | | | | 989,817 | | |
| | | | | | 1,493,734 | | |
Semiconductors & semiconductor equipment: 4.6% | |
Impinj, Inc.* | | | 18,663 | | | | 2,925,799 | | |
Universal Display Corp. | | | 15,524 | | | | 3,263,921 | | |
| | | | | | 6,189,720 | | |
Software: 15.6% | |
Appfolio, Inc., Class A* | | | 8,857 | | | | 2,166,156 | | |
Braze, Inc., Class A* | | | 36,981 | | | | 1,436,342 | | |
Confluent, Inc., Class A* | | | 71,037 | | | | 2,097,723 | | |
CyberArk Software Ltd.* | | | 10,665 | | | | 2,916,024 | | |
DoubleVerify Holdings, Inc.* | | | 55,708 | | | | 1,084,635 | | |
Elastic NV* | | | 20,366 | | | | 2,319,891 | | |
Gitlab, Inc., Class A* | | | 32,599 | | | | 1,620,822 | | |
Rubrik, Inc., Class A* | | | 29,600 | | | | 907,536 | | |
Sprout Social, Inc., Class A* | | | 32,015 | | | | 1,142,295 | | |
Varonis Systems, Inc.* | | | 52,578 | | | | 2,522,167 | | |
Zeta Global Holdings Corp., Class A* | | | 146,118 | | | | 2,578,983 | | |
| | | | | | 20,792,574 | | |
| | | Number of
shares | | Value | |
Common stocks—(concluded) | |
Technology hardware, storage & peripherals: 2.7% | |
Pure Storage, Inc., Class A* | | | 55,233 | | | $ | 3,546,511 | | |
Textiles, apparel & luxury goods: 0.8% | |
Tapestry, Inc. | | | 25,998 | | | | 1,112,454 | | |
Trading companies & distributors: 1.3% | |
Boise Cascade Co. | | | 14,651 | | | | 1,746,692 | | |
Total common stocks
(cost $106,200,009) | | | | | 128,969,866 | | |
Short-term investments: 1.7% | |
Investment companies: 1.7% | |
State Street Institutional U.S. Government
Money Market Fund, 5.254%2
(cost $2,220,829) | | | 2,220,829 | | | | 2,220,829 | | |
Total investments: 98.4%
(cost $108,420,838) | | | | | 131,190,695 | | |
Other assets in excess of liabilities: 1.6% | | | | | 2,124,093 | | |
Net assets: 100.0% | | | | $ | 133,314,788 | | |
For a listing of defined portfolio acronyms that are used throughout the Portfolio of investments as well as the tables that follow, please refer to the Glossary of terms used in the Portfolio of investments.
23
UBS U.S. Small Cap Growth Fund
Portfolio of investments
Fair valuation summary
The following is a summary of the fair valuations according to the inputs used as of June 30, 2024 in valuing the Fund's investments. In the event a fund holds investments for which fair value is measured using the NAV per share practical expedient (or its equivalent), a separate column will be added to the fair value hierarchy table; this is intended to permit reconciliation to the amounts presented in the Portfolio of investments:
Description | | Unadjusted
quoted prices in
active market for
identical investments
(Level 1) | | Other significant
observable inputs
(Level 2) | | Unobservable
inputs
(Level 3) | | Total | |
Assets | |
Common stocks | | $ | 128,969,866 | | | $ | — | | | $ | — | | | $ | 128,969,866 | | |
Short-term investments | | | — | | | | 2,220,829 | | | | — | | | | 2,220,829 | | |
Total | | $ | 128,969,866 | | | $ | 2,220,829 | | | $ | — | | | $ | 131,190,695 | | |
At June 30, 2024, there were no transfers in or out of Level 3.
Portfolio footnotes
* Non-income producing security.
1 Security, or portion thereof, was on loan at the period end.
2 Rate shown reflects yield at June 30, 2024.
See accompanying notes to financial statements.
24
UBS Sustainable Development Bank Bond Fund
Portfolio of investments
| | | Face
amount | | Value | |
Non-U.S. government agency obligations: 99.0% | |
Supranationals: 99.0% | |
African Development Bank
0.875%, due 07/22/26 | | $ | 1,700,000 | | | $ | 1,571,082 | | |
4.375%, due 11/03/27 | | | 600,000 | | | | 595,314 | | |
4.375%, due 03/14/28 | | | 1,600,000 | | | | 1,587,671 | | |
Agence Francaise de Developpement EPIC
0.625%, due 01/22/261 | | | 2,000,000 | | | | 1,868,188 | | |
Asian Development Bank
1.500%, due 03/04/31 | | | 800,000 | | | | 664,074 | | |
1.750%, due 09/19/29 | | | 1,000,000 | | | | 874,556 | | |
1.875%, due 01/24/30 | | | 700,000 | | | | 611,324 | | |
3.875%, due 09/28/32 | | | 500,000 | | | | 479,735 | | |
3.875%, due 06/14/33 | | | 450,000 | | | | 429,298 | | |
4.000%, due 01/12/33 | | | 500,000 | | | | 482,249 | | |
4.125%, due 01/12/34 | | | 100,000 | | | | 97,213 | | |
Asian Infrastructure Investment Bank
0.500%, due 05/28/25 | | | 300,000 | | | | 287,364 | | |
0.500%, due 01/27/26 | | | 1,400,000 | | | | 1,306,550 | | |
3.750%, due 09/14/27 | | | 300,000 | | | | 292,092 | | |
4.000%, due 01/18/282 | | | 200,000 | | | | 196,050 | | |
4.125%, due 01/18/29 | | | 200,000 | | | | 197,150 | | |
4.250%, due 03/13/34 | | | 1,200,000 | | | | 1,172,844 | | |
Council of Europe Development Bank
0.875%, due 09/22/26 | | | 1,300,000 | | | | 1,193,934 | | |
1.375%, due 02/27/25 | | | 900,000 | | | | 876,937 | | |
4.125%, due 01/24/29 | | | 200,000 | | | | 197,052 | | |
European Bank for Reconstruction & Development
0.500%, due 11/25/25 | | | 300,000 | | | | 281,837 | | |
0.500%, due 01/28/26 | | | 1,700,000 | | | | 1,586,140 | | |
4.125%, due 01/25/29 | | | 600,000 | | | | 591,173 | | |
4.250%, due 03/13/34 | | | 600,000 | | | | 587,563 | | |
4.375%, due 03/09/28 | | | 750,000 | | | | 745,383 | | |
European Investment Bank
1.250%, due 02/14/31 | | | 800,000 | | | | 655,410 | | |
1.750%, due 03/15/29 | | | 400,000 | | | | 354,269 | | |
3.625%, due 07/15/30 | | | 750,000 | | | | 717,634 | | |
3.750%, due 02/14/33 | | | 2,100,000 | | | | 1,994,868 | | |
IDB Trust Services Ltd.
0.908%, due 06/25/251 | | | 400,000 | | | | 382,904 | | |
Inter-American Development Bank
1.125%, due 07/20/28 | | | 2,000,000 | | | | 1,751,375 | | |
1.125%, due 01/13/31 | | | 5,700,000 | | | | 4,621,470 | | |
2.250%, due 06/18/29 | | | 4,900,000 | | | | 4,421,604 | | |
3.125%, due 09/18/28 | | | 2,550,000 | | | | 2,415,188 | | |
3.500%, due 09/14/29 | | | 1,800,000 | | | | 1,719,322 | | |
3.500%, due 04/12/33 | | | 2,350,000 | | | | 2,182,727 | | |
4.500%, due 09/13/33 | | | 2,100,000 | | | | 2,097,515 | | |
Inter-American Investment Corp.
0.625%, due 02/10/261 | | | 1,500,000 | | | | 1,398,300 | | |
1.750%, due 10/02/241 | | | 500,000 | | | | 495,225 | | |
4.125%, due 02/15/28 | | | 100,000 | | | | 97,894 | | |
| | | Face
amount | | Value | |
Non-U.S. government agency obligations—(concluded) | |
Supranationals—(concluded) | |
International Bank for Reconstruction & Development
0.750%, due 08/26/30 | | $ | 2,500,000 | | | $ | 2,004,395 | | |
0.875%, due 05/14/30 | | | 2,500,000 | | | | 2,040,394 | | |
1.250%, due 02/10/31 | | | 4,100,000 | | | | 3,346,375 | | |
1.625%, due 11/03/31 | | | 3,700,000 | | | | 3,049,929 | | |
1.750%, due 10/23/29 | | | 3,100,000 | | | | 2,705,165 | | |
2.500%, due 03/29/32 | | | 2,000,000 | | | | 1,747,777 | | |
3.625%, due 09/21/29 | | | 400,000 | | | | 384,451 | | |
3.875%, due 02/14/30 | | | 1,400,000 | | | | 1,359,358 | | |
4.000%, due 07/25/30 | | | 1,050,000 | | | | 1,024,737 | | |
4.000%, due 01/10/31 | | | 350,000 | | | | 340,758 | | |
4.500%, due 04/10/31 | | | 150,000 | | | | 150,326 | | |
4.750%, due 11/14/33 | | | 1,300,000 | | | | 1,325,916 | | |
International Development Association
0.750%, due 06/10/271 | | | 2,100,000 | | | | 1,877,119 | | |
1.000%, due 12/03/301 | | | 2,400,000 | | | | 1,936,862 | | |
International Finance Corp.
0.375%, due 07/16/25 | | | 600,000 | | | | 571,060 | | |
0.750%, due 10/08/26 | | | 1,200,000 | | | | 1,098,812 | | |
0.750%, due 08/27/30 | | | 1,150,000 | | | | 922,836 | | |
2.125%, due 04/07/26 | | | 675,000 | | | | 643,870 | | |
3.625%, due 09/15/25 | | | 200,000 | | | | 196,612 | | |
4.375%, due 01/15/27 | | | 100,000 | | | | 99,288 | | |
4.500%, due 07/13/28 | | | 200,000 | | | | 200,076 | | |
Isdb Trust Services No. 2 SARL
1.262%, due 03/31/261 | | | 800,000 | | | | 749,624 | | |
4.598%, due 03/14/281 | | | 1,250,000 | | | | 1,242,630 | | |
4.754%, due 05/15/291 | | | 400,000 | | | | 401,320 | | |
Kreditanstalt fuer Wiederaufbau
4.125%, due 07/15/33 | | | 700,000 | | | | 681,099 | | |
4.750%, due 10/29/302 | | | 700,000 | | | | 712,017 | | |
Nordic Investment Bank
3.375%, due 09/08/27 | | | 2,800,000 | | | | 2,695,509 | | |
4.375%, due 03/14/28 | | | 900,000 | | | | 892,829 | | |
Total non-U.S. government agency obligations
(cost $84,001,954) | | | | | 78,479,622 | | |
| | | Number of
shares | | | |
Short-term investments: 0.5% | |
Investment companies: 0.5% | |
State Street Institutional U.S. Government
Money Market Fund, 5.254%3
(cost $399,832) | | | 399,832 | | | | 399,832 | | |
25
UBS Sustainable Development Bank Bond Fund
Portfolio of investments
| | | Number of
shares | | Value | |
Investment of cash collateral from securities loaned: 0.7% | |
Money market funds: 0.7% | |
State Street Navigator Securities Lending
Government Money Market
Portfolio, 5.276%3
(cost $524,250) | | | 524,250 | | | $ | 524,250 | | |
Total investments: 100.2%
(cost $84,926,036) | | | | | 79,403,704 | | |
Liabilities in excess of other assets: (0.2%) | | | | | (157,936 | ) | |
Net assets: 100.0% | | | | $ | 79,245,768 | | |
For a listing of defined portfolio acronyms that are used throughout the Portfolio of investments as well as the tables that follow, please refer to the Glossary of terms used in the Portfolio of investments.
Fair valuation summary
The following is a summary of the fair valuations according to the inputs used as of June 30, 2024 in valuing the Fund's investments. In the event a fund holds investments for which fair value is measured using the NAV per share practical expedient (or its equivalent), a separate column will be added to the fair value hierarchy table; this is intended to permit reconciliation to the amounts presented in the Portfolio of investments:
Description | | Unadjusted
quoted prices in
active market for
identical investments
(Level 1) | | Other significant
observable inputs
(Level 2) | | Unobservable
inputs
(Level 3) | | Total | |
Assets | |
Non-U.S. government agency obligations | | $ | — | | | $ | 78,479,622 | | | $ | — | | | $ | 78,479,622 | | |
Short-term investments | | | — | | | | 399,832 | | | | — | | | | 399,832 | | |
Investment of cash collateral from securities loaned | | | — | | | | 524,250 | | | | — | | | | 524,250 | | |
Total | | $ | — | | | $ | 79,403,704 | | | $ | — | | | $ | 79,403,704 | | |
At June 30, 2024, there were no transfers in or out of Level 3.
Portfolio footnotes
1 Security was purchased pursuant to Regulation S under the Securities Act of 1933, which exempts from registration securities offered and sold outside of the United States. Such a security cannot be sold in the United States without either an effective registration statement filed pursuant to the Securities Act of 1933, or pursuant to an exemption from registration.
2 Security, or portion thereof, was on loan at the period end.
3 Rate shown reflects yield at June 30, 2024.
See accompanying notes to financial statements.
26
UBS Multi Income Bond Fund
Portfolio of investments
| | | Face
amount1 | | Value | |
Asset-backed securities: 6.0% | |
Cayman Islands: 3.7% | |
ARES LVIII CLO Ltd.,
Series 2020-58A, Class DR,
3 mo. USD Term SOFR + 3.200%,
8.529%, due 01/15/352,3 | | | 250,000 | | | $ | 250,265 | | |
Sixth Street CLO XVIII Ltd.,
Series 2021-18A, Class D,
3 mo. USD Term SOFR + 3.162%,
8.486%, due 04/20/342,3 | | | 250,000 | | | | 250,631 | | |
Wellfleet CLO Ltd.,
Series 2020-1A, Class C,
3 mo. USD Term SOFR + 3.962%,
9.290%, due 04/15/332,3 | | | 250,000 | | | | 249,194 | | |
| | | | | | 750,090 | | |
United States: 2.3% | |
AmeriCredit Automobile Receivables Trust,
Series 2020-2, Class C,
1.480%, due 02/18/26 | | | 73,773 | | | | 73,244 | | |
Drive Auto Receivables Trust,
Series 2020-2, Class D,
3.050%, due 05/15/28 | | | 104,789 | | | | 104,646 | | |
Exeter Automobile Receivables Trust,
Series 2022-2A, Class B,
3.650%, due 10/15/26 | | | 18,743 | | | | 18,725 | | |
Santander Drive Auto Receivables Trust
Series 2020-4, Class D,
1.480%, due 01/15/27 | | | 81,565 | | | | 80,558 | | |
Series 2023-3, Class A3,
5.610%, due 10/15/27 | | | 200,000 | | | | 199,917 | | |
| | | | | | 477,090 | | |
Total asset-backed securities
(cost $1,215,679) | | | | | 1,227,180 | | |
Corporate bonds: 74.0% | |
Australia: 0.5% | |
Glencore Funding LLC
4.000%, due 04/16/252 | | | 100,000 | | | | 98,624 | | |
Belgium: 0.7% | |
Anheuser-Busch Cos. LLC/Anheuser-Busch InBev
Worldwide, Inc.
4.900%, due 02/01/46 | | | 165,000 | | | | 152,123 | | |
Brazil: 1.0% | |
Petrobras Global Finance BV
7.375%, due 01/17/27 | | | 200,000 | | | | 206,076 | | |
Canada: 2.5% | |
NOVA Chemicals Corp.
5.250%, due 06/01/272 | | | 250,000 | | | | 239,139 | | |
Teck Resources Ltd.
3.900%, due 07/15/30 | | | 300,000 | | | | 278,327 | | |
| | | | | | 517,466 | | |
| | | Face
amount1 | | Value | |
Corporate bonds—(continued) | |
Chile: 0.9% | |
Corp. Nacional del Cobre de Chile
5.125%, due 02/02/334 | | | 200,000 | | | $ | 189,625 | | |
China: 1.6% | |
Agile Group Holdings Ltd.
5.750%, due 01/02/254 | | | 200,000 | | | | 12,500 | | |
BOC Aviation Ltd.
3.250%, due 04/29/254 | | | 250,000 | | | | 245,135 | | |
NXP BV/NXP Funding LLC/NXP USA, Inc.
3.875%, due 06/18/26 | | | 65,000 | | | | 63,198 | | |
| | | | | | 320,833 | | |
Colombia: 0.6% | |
Ecopetrol SA
5.375%, due 06/26/26 | | | 120,000 | | | | 117,456 | | |
Germany: 1.0% | |
Volkswagen Group of America Finance LLC
4.625%, due 11/13/252 | | | 200,000 | | | | 197,612 | | |
Ireland: 1.5% | |
AerCap Ireland Capital DAC/AerCap Global
Aviation Trust
4.450%, due 04/03/26 | | | 300,000 | | | | 294,467 | | |
Mexico: 0.6% | |
Petroleos Mexicanos
6.700%, due 02/16/32 | | | 150,000 | | | | 125,501 | | |
Qatar: 1.2% | |
QNB Finance Ltd.
2.750%, due 02/12/274 | | | 250,000 | | | | 234,375 | | |
United Kingdom: 2.4% | |
Barclays PLC
4.836%, due 05/09/28 | | | 200,000 | | | | 193,112 | | |
HSBC Holdings PLC
6.500%, due 09/15/37 | | | 100,000 | | | | 103,672 | | |
Lloyds Banking Group PLC
4.582%, due 12/10/25 | | | 200,000 | | | | 196,359 | | |
| | | | | | 493,143 | | |
United States: 59.5% | |
AbbVie, Inc.
4.500%, due 05/14/35 | | | 100,000 | | | | 94,326 | | |
AEP Texas, Inc.
Series E,
6.650%, due 02/15/33 | | | 50,000 | | | | 52,360 | | |
Series G,
4.150%, due 05/01/49 | | | 50,000 | | | | 37,408 | | |
Air Lease Corp.
2.875%, due 01/15/26 | | | 50,000 | | | | 47,971 | | |
Allison Transmission, Inc.
4.750%, due 10/01/272 | | | 150,000 | | | | 144,886 | | |
Aramark Services, Inc.
5.000%, due 02/01/282 | | | 100,000 | | | | 96,712 | | |
27
UBS Multi Income Bond Fund
Portfolio of investments
| | | Face
amount1 | | Value | |
Corporate bonds—(continued) | |
United States—(continued) | |
ASGN, Inc.
4.625%, due 05/15/282 | | | 150,000 | | | $ | 141,461 | | |
AT&T, Inc.
3.800%, due 12/01/57 | | | 58,000 | | | | 40,521 | | |
4.300%, due 02/15/30 | | | 300,000 | | | | 287,411 | | |
Avantor Funding, Inc.
4.625%, due 07/15/282 | | | 275,000 | | | | 261,690 | | |
Bank of America Corp.
4.200%, due 08/26/24 | | | 100,000 | | | | 99,748 | | |
6.110%, due 01/29/37 | | | 125,000 | | | | 129,876 | | |
Series DD,
(fixed, converts to FRN on 03/10/26),
6.300%, due 03/10/263,5,6 | | | 110,000 | | | | 110,093 | | |
Series Z,
(fixed, converts to FRN on 10/23/24),
6.500%, due 10/23/243,5,6 | | | 100,000 | | | | 99,784 | | |
Blue Owl Technology Finance Corp. II
6.750%, due 04/04/292 | | | 70,000 | | | | 68,481 | | |
Boyd Gaming Corp.
4.750%, due 12/01/27 | | | 200,000 | | | | 192,494 | | |
Broadcom, Inc.
3.137%, due 11/15/352 | | | 300,000 | | | | 240,236 | | |
Capital One Financial Corp.
3.750%, due 07/28/26 | | | 300,000 | | | | 289,572 | | |
Carrier Global Corp.
2.722%, due 02/15/30 | | | 50,000 | | | | 44,172 | | |
CCO Holdings LLC/CCO Holdings Capital Corp.
5.500%, due 05/01/262 | | | 75,000 | | | | 74,118 | | |
Celanese U.S. Holdings LLC
6.379%, due 07/15/32 | | | 100,000 | | | | 102,758 | | |
CF Industries, Inc.
5.150%, due 03/15/34 | | | 50,000 | | | | 47,947 | | |
Charter Communications Operating LLC/Charter
Communications Operating Capital
4.200%, due 03/15/28 | | | 350,000 | | | | 330,763 | | |
Citigroup, Inc.
5.500%, due 09/13/25 | | | 300,000 | | | | 299,669 | | |
6.675%, due 09/13/43 | | | 50,000 | | | | 54,506 | | |
Series P,
(fixed, converts to FRN on 05/15/25),
5.950%, due 05/15/253,6 | | | 100,000 | | | | 99,347 | | |
Series T,
(fixed, converts to FRN on 08/15/26),
6.250%, due 08/15/263,5,6 | | | 100,000 | | | | 99,930 | | |
Civitas Resources, Inc.
8.375%, due 07/01/282 | | | 100,000 | | | | 104,783 | | |
Comcast Corp.
2.887%, due 11/01/51 | | | 64,000 | | | | 39,929 | | |
2.937%, due 11/01/56 | | | 67,000 | | | | 40,415 | | |
3.969%, due 11/01/47 | | | 38,000 | | | | 29,639 | | |
Concentrix Corp.
6.850%, due 08/02/335 | | | 100,000 | | | | 98,962 | | |
ConocoPhillips Co.
3.758%, due 03/15/42 | | | 250,000 | | | | 198,215 | | |
| | | Face
amount1 | | Value | |
Corporate bonds—(continued) | |
United States—(continued) | |
Continental Resources, Inc.
4.375%, due 01/15/28 | | | 250,000 | | | $ | 240,350 | | |
DCP Midstream Operating LP
5.375%, due 07/15/25 | | | 159,000 | | | | 158,403 | | |
Dell International LLC/EMC Corp.
5.850%, due 07/15/25 | | | 250,000 | | | | 250,606 | | |
Delta Air Lines, Inc.
7.000%, due 05/01/252 | | | 150,000 | | | | 151,134 | | |
Duke Energy Ohio, Inc.
4.300%, due 02/01/49 | | | 50,000 | | | | 40,165 | | |
Edison International
Series A,
(fixed, converts to FRN on 03/15/26),
5.375%, due 03/15/263,6 | | | 95,000 | | | | 92,544 | | |
Energizer Holdings, Inc.
4.375%, due 03/31/292 | | | 100,000 | | | | 90,465 | | |
Energy Transfer LP
5.400%, due 10/01/47 | | | 50,000 | | | | 44,729 | | |
5.500%, due 06/01/27 | | | 50,000 | | | | 50,142 | | |
EQT Corp.
3.900%, due 10/01/27 | | | 370,000 | | | | 353,647 | | |
Equinix, Inc.
3.900%, due 04/15/32 | | | 60,000 | | | | 54,557 | | |
Exelon Corp.
4.450%, due 04/15/46 | | | 50,000 | | | | 41,232 | | |
Expedia Group, Inc.
3.800%, due 02/15/28 | | | 250,000 | | | | 237,939 | | |
Extra Space Storage LP
5.400%, due 02/01/34 | | | 100,000 | | | | 97,882 | | |
FedEx Corp.
4.550%, due 04/01/46 | | | 50,000 | | | | 41,661 | | |
Fifth Third Bank NA
3.950%, due 07/28/25 | | | 200,000 | | | | 196,440 | | |
Fortress Transportation & Infrastructure
Investors LLC
5.500%, due 05/01/282 | | | 100,000 | | | | 96,955 | | |
Fox Corp.
5.576%, due 01/25/49 | | | 25,000 | | | | 22,953 | | |
GE Capital International Funding Co.
Unlimited Co.
3.373%, due 11/15/25 | | | 200,000 | | | | 194,414 | | |
General Motors Co.
6.600%, due 04/01/36 | | | 300,000 | | | | 313,917 | | |
Gilead Sciences, Inc.
4.750%, due 03/01/46 | | | 50,000 | | | | 44,564 | | |
Global Payments, Inc.
5.400%, due 08/15/32 | | | 50,000 | | | | 48,990 | | |
GLP Capital LP/GLP Financing II, Inc.
5.250%, due 06/01/25 | | | 200,000 | | | | 198,326 | | |
Goldman Sachs Group, Inc.
5.150%, due 05/22/45 | | | 30,000 | | | | 28,063 | | |
Series Q,
(fixed, converts to FRN on 08/10/24),
5.500%, due 08/10/243,6 | | | 100,000 | | | | 99,346 | | |
28
UBS Multi Income Bond Fund
Portfolio of investments
| | | Face
amount1 | | Value | |
Corporate bonds—(continued) | |
United States—(continued) | |
Harley-Davidson Financial Services, Inc.
3.350%, due 06/08/252 | | | 300,000 | | | $ | 292,964 | | |
HCA, Inc.
5.250%, due 06/15/26 | | | 200,000 | | | | 199,106 | | |
International Game Technology PLC
6.500%, due 02/15/252 | | | 214,000 | | | | 214,116 | | |
JPMorgan Chase & Co.
(fixed, converts to FRN on 01/23/28),
3.509%, due 01/23/293 | | | 150,000 | | | | 141,849 | | |
Series X,
(fixed, converts to FRN on 10/01/24),
6.100%, due 10/01/243,6 | | | 100,000 | | | | 100,097 | | |
KB Home
7.250%, due 07/15/30 | | | 50,000 | | | | 51,511 | | |
KeyCorp
4.150%, due 10/29/25 | | | 75,000 | | | | 73,324 | | |
Kinder Morgan, Inc.
4.300%, due 03/01/28 | | | 150,000 | | | | 145,626 | | |
5.550%, due 06/01/45 | | | 40,000 | | | | 37,309 | | |
Kroger Co.
6.900%, due 04/15/38 | | | 25,000 | | | | 27,799 | | |
Kyndryl Holdings, Inc.
6.350%, due 02/20/34 | | | 50,000 | | | | 50,799 | | |
Level 3 Financing, Inc.
10.500%, due 05/15/302 | | | 184,000 | | | | 182,236 | | |
Liberty Mutual Group, Inc.
4.569%, due 02/01/292 | | | 155,000 | | | | 151,106 | | |
LYB International Finance BV
4.875%, due 03/15/44 | | | 50,000 | | | | 43,501 | | |
Marathon Petroleum Corp.
4.750%, due 09/15/44 | | | 70,000 | | | | 59,683 | | |
Masco Corp.
1.500%, due 02/15/28 | | | 400,000 | | | | 350,808 | | |
MetLife, Inc.
6.400%, due 12/15/36 | | | 110,000 | | | | 111,337 | | |
Mileage Plus Holdings LLC/Mileage Plus
Intellectual Property Assets Ltd.
6.500%, due 06/20/272 | | | 54,000 | | | | 54,108 | | |
Morgan Stanley
4.300%, due 01/27/45 | | | 50,000 | | | | 42,368 | | |
4.350%, due 09/08/26 | | | 140,000 | | | | 136,931 | | |
Series M, 5.875%, due 09/15/263,6 | | | 105,000 | | | | 102,965 | | |
Nabors Industries, Inc.
7.375%, due 05/15/272 | | | 50,000 | | | | 50,860 | | |
Navient Corp.
6.750%, due 06/15/26 | | | 100,000 | | | | 100,347 | | |
Newell Brands, Inc.
4.875%, due 06/01/25 | | | 200,000 | | | | 197,094 | | |
Olin Corp.
5.125%, due 09/15/27 | | | 200,000 | | | | 194,000 | | |
OneMain Finance Corp.
3.500%, due 01/15/27 | | | 100,000 | | | | 93,695 | | |
| | | Face
amount1 | | Value | |
Corporate bonds—(concluded) | |
United States—(concluded) | |
Oracle Corp.
4.000%, due 11/15/47 | | | 50,000 | | | $ | 37,854 | | |
Quanta Services, Inc.
0.950%, due 10/01/24 | | | 100,000 | | | | 98,715 | | |
Reworld Holding Corp.
4.875%, due 12/01/292 | | | 150,000 | | | | 136,909 | | |
Rocket Mortgage LLC/Rocket Mortgage
Co.-Issuer, Inc.
2.875%, due 10/15/262 | | | 300,000 | | | | 280,166 | | |
Sabine Pass Liquefaction LLC
5.000%, due 03/15/27 | | | 200,000 | | | | 198,313 | | |
Sabre GLBL, Inc.
8.625%, due 06/01/272,5 | | | 100,000 | | | | 92,127 | | |
Science Applications International Corp.
4.875%, due 04/01/282 | | | 100,000 | | | | 95,432 | | |
Seagate HDD
Cayman5,
5.750%, due 12/01/34 | | | 80,000 | | | | 77,658 | | |
Sempra
(fixed, converts to FRN on 10/15/25),
4.875%, due 10/15/253,6 | | | 95,000 | | | | 93,178 | | |
Sirius XM Radio, Inc.
3.125%, due 09/01/262,5 | | | 250,000 | | | | 235,209 | | |
Smyrna Ready Mix Concrete LLC
6.000%, due 11/01/282 | | | 100,000 | | | | 97,697 | | |
United Rentals North America, Inc.
4.875%, due 01/15/285 | | | 50,000 | | | | 48,460 | | |
Walt Disney Co.
4.950%, due 10/15/45 | | | 50,000 | | | | 46,433 | | |
WESCO Distribution, Inc.
7.250%, due 06/15/282 | | | 50,000 | | | | 50,897 | | |
| | | | | | 12,084,194 | | |
Total corporate bonds
(cost $15,680,176) | | | | | 15,031,495 | | |
Mortgage-backed securities: 5.7% | |
United States: 5.7% | |
Arbor Multifamily Mortgage Securities Trust,
Series 2021-MF3, Class B,
2.511%, due 10/15/542 | | | 150,000 | | | | 120,450 | | |
BBCMS Trust,
Series 2015-SRCH, Class B,
4.498%, due 08/10/352 | | | 135,000 | | | | 119,830 | | |
BX Mortgage Trust,
Series 2021-PAC, Class D,
1 mo. USD Term SOFR + 1.413%,
6.742%, due 10/15/362,3 | | | 175,000 | | | | 170,367 | | |
BX Trust,
Series 2021-LGCY, Class D,
1 mo. USD Term SOFR + 1.416%,
6.746%, due 10/15/362,3 | | | 400,000 | | | | 388,788 | | |
29
UBS Multi Income Bond Fund
Portfolio of investments
| | | Face
amount1 | | Value | |
Mortgage-backed securities—(concluded) | |
United States—(concluded) | |
Extended Stay America Trust,
Series 2021-ESH, Class D,
1 mo. USD Term SOFR + 2.364%,
7.694%, due 07/15/382,3 | | | 317,728 | | | $ | 317,530 | | |
FREMF Mortgage Trust,
Series 2017-K64, Class B,
4.134%, due 05/25/502,3 | | | 50,000 | | | | 47,983 | | |
Starwood Retail Property Trust,
Series 2014-STAR, Class C,
U.S. (Fed) Prime Rate,
8.500%, due 11/15/272,3 | | | 125,000 | | | | 313 | | |
Total mortgage-backed securities
(cost $1,358,956) | | | | | 1,165,261 | | |
Non-U.S. government agency obligations: 7.9% | |
Brazil: 1.6% | |
Brazil Notas do Tesouro Nacional
Series F,
10.000%, due 01/01/33 | | BRL | 2,050,000 | | | | 323,997 | | |
Indonesia: 0.6% | |
Indonesia Government International Bonds
6.625%, due 02/17/372 | | | 100,000 | | | | 111,594 | | |
Mexico: 0.6% | |
Mexico Government International Bonds
Series MTN,
4.750%, due 03/08/44 | | | 150,000 | | | | 120,225 | | |
Panama: 0.1% | |
Panama Government International Bonds
3.870%, due 07/23/60 | | | 50,000 | | | | 28,484 | | |
Peru: 1.0% | |
Peru Government International Bonds
7.350%, due 07/21/25 | | | 200,000 | | | | 203,937 | | |
Poland: 0.5% | |
Republic of Poland Government International
Bonds
5.750%, due 11/16/32 | | | 100,000 | | | | 103,587 | | |
Supranationals: 1.0% | |
Africa Finance Corp.
4.375%, due 04/17/264 | | | 200,000 | | | | 193,563 | | |
Turkey: 2.5% | |
Turkiye Government Bonds
12.600%, due 10/01/25 | | TRY | 17,900,000 | | | | 413,654 | | |
| | | | | Face
amount1 | | Value | |
Non-U.S. government agency obligations—(concluded) | |
Turkey—(concluded) | |
Turkiye Government International Bonds
6.875%, due 03/17/36 | | | | TRY | 100,000 | | | $ | 94,594 | | |
| | | | | | | | 508,248 | | |
Total non-U.S. government agency obligations
(cost $1,749,911) | | | | | | | 1,593,635 | | |
U.S. Treasury obligations: 2.1% | |
United States: 2.1% | |
U.S. Treasury Notes,
4.375%, due 05/15/34
(cost $424,589) | | | | | 420,000 | | | | 420,131 | | |
| | | | | Number of
shares | | | |
Short-term investments: 1.2% | |
Investment companies: 1.2% | |
State Street Institutional U.S. Government
Money Market Fund, 5.254%7
(cost $244,409) | | | | | 244,409 | | | | 244,409 | | |
| | | Number of
contracts | | Notional
amount | | | |
Options Purchased: 0.0%† | |
Put options: 0.0%† | |
CDX.NA.IG.42,
strike @ 60.000,
expires 06/20/2029
(Counterparty: BOA)
(cost $5,200) | | | 2,000,000 | | | $ | 120,000,000 | | | | 667 | | |
| | | | | Number of
shares | | | |
Investment of cash collateral from securities loaned: 2.9% | |
Money market funds: 2.9% | |
State Street Navigator Securities Lending
Government Money Market
Portfolio, 5.276%7
(cost $593,325) | | | | | 593,325 | | | | 593,325 | | |
Total investments: 99.8%
(cost $21,272,245) | | | | | | | 20,276,103 | | |
Other assets in excess of liabilities: 0.2% | | | | | | | 43,447 | | |
Net assets: 100.0% | | | | | | $ | 20,319,550 | | |
For a listing of defined portfolio acronyms that are used throughout the Portfolio of investments as well as the tables that follow, please refer to the Glossary of terms used in the Portfolio of investments.
30
UBS Multi Income Bond Fund
Portfolio of investments
Options written
Notional
amount | | Number of
contracts | | Put
options | | Counterparty | | Expiration
date | | Premiums
received | | Current
Value | | Unrealized
appreciation
(depreciation) | |
USD | (160,000,000 | ) | | | (2,000,000 | ) | | CDX.NA.IG.42,
strike @80.000 | | BOA | | 6/20/29 | | $ | 2,020 | | | $ | (65 | ) | | $ | 1,955 | | |
Futures contracts
Number of
contracts | | Currency | | | | Expiration
date | | Current
notional
amount | | Value | | Unrealized
appreciation
(depreciation) | |
U.S. Treasury futures buy contracts: | | | |
| | 31 | | | USD | | | | U.S. Treasury Note 10 Year Futures | | September 2024 | | $ | 3,377,672 | | | $ | 3,409,516 | | | $ | 31,844 | | |
| | 3 | | | USD | | | | U.S. Treasury Note 2 Year Futures | | September 2024 | | | 610,715 | | | | 612,656 | | | | 1,941 | | |
| | 36 | | | USD | | | | U.S. Treasury Note 5 Year Futures | | September 2024 | | | 3,822,773 | | | | 3,836,812 | | | | 14,039 | | |
| | 20 | | | USD | | | | Ultra U.S. Treasury Note 10 Year Futures | | September 2024 | | | 2,262,897 | | | | 2,270,625 | | | | 7,728 | | |
| | Total | | | | | | | | | $ | 10,074,057 | | | $ | 10,129,609 | | | $ | 55,552 | | |
Interest rate futures sell contracts: | | | |
| | 9 | | | EUR | | | | Euro Bund 10 Year Futures | | September 2024 | | $ | (1,253,272 | ) | | $ | (1,268,627 | ) | | $ | (15,355 | ) | |
| | 14 | | | EUR | | | | EURO Schatz 2 Year Index Futures | | September 2024 | | | (1,578,555 | ) | | | (1,584,792 | ) | | | (6,237 | ) | |
| | Total | | | | | | | | | $ | (2,831,827 | ) | | $ | (2,853,419 | ) | | $ | (21,592 | ) | |
| | Net unrealized appreciation (depreciation) | | | | | | | | | | | | | $ | 33,960 | | |
Centrally cleared interest rate swap agreements
Notional
amount
(000) | | Maturity
date | | Payment
frequency | | Payments
made
by the
portfolio8 | | Payments
received
by the
portfolio8 | | Value | | Unrealized
appreciation
(depreciation) | |
NZD | 2,500 | | | 02/19/27 | | Quarterly | | 3 mo. NZD Bank Bill | | | 4.805 | % | | $ | 18,252 | | | $ | 18,252 | | |
NZD | 1,000 | | | 06/15/33 | | Quarterly | | 3 mo. NZD Bank Bill | | | 4.456 | | | | (1,251 | ) | | | (1,251 | ) | |
NZD | 400 | | | 07/18/33 | | Quarterly | | 3 mo. NZD Bank Bill | | | 4.520 | | | | 2,922 | | | | 2,922 | | |
| | Total | | | | | | | | | | | $ | 19,923 | | | $ | 19,923 | | |
Forward foreign currency contracts
Counterparty | | Sell | | Purchase | | Settlement
date | | Unrealized
appreciation
(depreciation) | |
BB | | USD | 94,963 | | | MXN | 1,800,000 | | | 09/10/24 | | $ | 2,370 | | |
BOA | | USD | 46,980 | | | NGN | 70,000,000 | | | 11/07/24 | | | (4,071 | ) | |
CITI | | EUR | 80,000 | | | USD | 85,790 | | | 07/17/24 | | | 54 | | |
CITI | | USD | 76,502 | | | NZD | 125,000 | | | 07/17/24 | | | (364 | ) | |
31
UBS Multi Income Bond Fund
Portfolio of investments
Forward foreign currency contracts—(concluded)
Counterparty | | Sell | | Purchase | | Settlement
date | | Unrealized
appreciation
(depreciation) | |
CITI | | MXN | 1,800,000 | | | USD | 97,695 | | | 09/10/24 | | $ | 362 | | |
CITI | | USD | 205,605 | | | IDR | 3,300,000,000 | | | 11/21/24 | | | (4,655 | ) | |
GSI | | USD | 46,885 | | | NGN | 70,000,000 | | | 11/07/24 | | | (3,977 | ) | |
Net unrealized appreciation (depreciation) | | $ | (10,281 | ) | |
Fair valuation summary
The following is a summary of the fair valuations according to the inputs used as of June 30, 2024 in valuing the Fund's investments. In the event a fund holds investments for which fair value is measured using the NAV per share practical expedient (or its equivalent), a separate column will be added to the fair value hierarchy table; this is intended to permit reconciliation to the amounts presented in the Portfolio of investments:
Description | | Unadjusted
quoted prices in
active market for
identical investments
(Level 1) | | Other significant
observable inputs
(Level 2) | | Unobservable
inputs
(Level 3) | | Total | |
Assets | |
Asset-backed securities | | $ | — | | | $ | 1,227,180 | | | $ | — | | | $ | 1,227,180 | | |
Corporate bonds | | | — | | | | 15,031,495 | | | | — | | | | 15,031,495 | | |
Mortgage-backed securities | | | — | | | | 1,165,261 | | | | — | | | | 1,165,261 | | |
Non-U.S. government agency obligations | | | — | | | | 1,593,635 | | | | — | | | | 1,593,635 | | |
U.S. Treasury obligations | | | — | | | | 420,131 | | | | — | | | | 420,131 | | |
Short-term investments | | | — | | | | 244,409 | | | | — | | | | 244,409 | | |
Options purchased | | | — | | | | 667 | | | | — | | | | 667 | | |
Investment of cash collateral from securities loaned | | | — | | | | 593,325 | | | | — | | | | 593,325 | | |
Futures contracts | | | 55,552 | | | | — | | | | — | | | | 55,552 | | |
Swap agreements | | | — | | | | 21,174 | | | | — | | | | 21,174 | | |
Forward foreign currency contracts | | | — | | | | 2,786 | | | | — | | | | 2,786 | | |
Total | | $ | 55,552 | | | $ | 20,300,063 | | | $ | — | | | $ | 20,355,615 | | |
Liabilities | |
Options written | | $ | — | | | $ | (65 | ) | | $ | — | | | $ | (65 | ) | |
Futures contracts | | | (21,592 | ) | | | — | | | | — | | | | (21,592 | ) | |
Swap agreements | | | — | | | | (1,251 | ) | | | — | | | | (1,251 | ) | |
Forward foreign currency contracts | | | — | | | | (13,067 | ) | | | — | | | | (13,067 | ) | |
Total | | $ | (21,592 | ) | | $ | (14,383 | ) | | $ | — | | | $ | (35,975 | ) | |
At June 30, 2024, there were no transfers in or out of Level 3.
Portfolio footnotes
† Amount represents less than 0.05% or (0.05)%.
1 In U.S. dollars unless otherwise indicated.
32
UBS Multi Income Bond Fund
Portfolio of investments
2 Security exempt from registration pursuant to Rule 144A under the Securities Act of 1933. These securities are considered liquid, unless noted otherwise, and may be resold in transactions exempt from registrations, normally to qualified institutional buyers. Securities exempt from registration pursuant to Rule 144A, in the amount of $5,967,068, represented 29.4% of the Fund's net assets at period end.
3 Floating or variable rate securities. The rates disclosed are as of June 30, 2024. For securities based on a published reference rate and spread, the reference rate and spread are indicated within the description. Variable rate securities with a floor or ceiling feature are disclosed at the inherent rate, where applicable. Certain variable rate securities are not based on a published reference rate and spread, but are determined by the issuer or agent and are based on current market conditions; these securities do not indicate a reference rate and spread in the description.
4 Security was purchased pursuant to Regulation S under the Securities Act of 1933, which exempts from registration securities offered and sold outside of the United States. Such a security cannot be sold in the United States without either an effective registration statement filed pursuant to the Securities Act of 1933, or pursuant to an exemption from registration.
5 Security, or portion thereof, was on loan at the period end.
6 Perpetual investment. Date shown reflects the next call date.
7 Rate shown reflects yield at June 30, 2024.
8 Payments made or received are based on the notional amount.
See accompanying notes to financial statements.
33
The UBS Funds
Glossary of terms used in the Portfolio of investments
June 30, 2024 (unaudited)
Portfolio acronyms:
ABS Asset-backed Security
ADR American Depositary Receipt
AGM Assured Guaranty Municipal
AID Anticipation Certificates of Indebtedness
AMBAC American Municipal Bond Assurance Corporation
AMT Alternative Minimum Tax
ARM Adjustable Rate Mortgage
BAM Build Americal Mutual
BBSW Bank Bill Swap Rate
BOBL Bundesobligationen
CDO Collateralized Debt Obligation
CJSC Closed Joint Stock Company
CLO Collateralized Loan Obligation
CMT Constant Maturity Treasury Index
COFI Cost of Funds Index
COP Certificate of Participation
CPI Consumer Price Index
DAC Designated Activity Company
DIP Debtor-in-possession
ETF Exchange Traded Fund
EURIBOR Euro Interbank Offered Rate
FHA Federal Housing Administration
FHLB Federal Home Loan Bank
FHLMC Federal Home Loan Mortgage Corporation
FNMA Federal National Mortgage Association
FRN Floating Rate Note
GDR Global Depositary Receipt
GMAC General Motors Acceptance Corporation
GNMA Government National Mortgage Association
GO General Obligation
GSAMP Goldman Sachs Asset Mortgage Passthrough
GTD Guaranteed
IO Interest Only
JSC Joint Stock Company
LIBOR London Interbank Offered Rate
MGIC Mortgage Guaranty Insurance Corporation
MTA Monthly Treasury Average Index
NVDR Non-Voting Depository Receipt
OAT Obligation Assimilables du Trésor (French Government Bonds)
OBFR Overnight Bank Funding Rate
OTC Over The Counter
PJSC Private Joint Stock Company
PO Principal Only
PSF Permanent School Fund
RASC Retirement Administration Service Center
RBA IOCR RBA Interbank Overnight Cash Rate
REIT Real Estate Investment Trust
REMIC Real Estate Mortgage Investment Conduit
RPI Retail Price Index
SBA Small Business Administration
SCH BD GTY School Bond Guaranty
SIFMA Municipal Swap Index Yield
SOFR Secured Overnight Financing Rate
SONIA Sterling Overnight Index Average
SPDR Standard and Poor's Depository Receipts
ST APPROP State Appropriation
STRIP Separate Trading of Registered Interest and Principal of Securities
TBA To-Be-Announced Security
TIPS Treasury inflation protected securities
UMBS Uniform Mortgage-Backed Securities
VRD Variable rate demand notes are payable on demand. The interest rates shown are the current rates as of period end and reset periodically.
Currency type abbreviations:
ARS Argentine Peso
AUD Australian Dollar
BRL Brazilian Real
CAD Canadian Dollar
CHF Swiss Franc
CLP Chilean Peso
CNH Chinese Yuan Renminbi Offshore
CNY Chinese Yuan Renminbi
COP Colombian Peso
CZK Czech Koruna
DKK Danish Krone
EUR Euro
GBP British Pound
HKD Hong Kong Dollar
HUF Hungarian Forint
IDR Indonesian Rupiah
ILS Israeli Shekel
INR Indian Rupee
JPY Japanese Yen
KRW South Korean Won
MXN Mexican Peso
MYR Malaysian Ringgit
NOK Norwegian Krone
NZD New Zealand Dollar
PEN Peruvian Sol
PHP Philippine Peso
PLN Polish Zloty
RON Romanian Leu
RUB Russian Ruble
SEK Swedish Krona
SGD Singapore Dollar
THB Thai Baht
TRY Turkish Lira
TWD Taiwan Dollar
USD United States Dollar
ZAR South African Rand
Counterparty acronyms:
ANZ Australia and New Zealand Banking Group
BB Barclays Bank PLC
BNP BNP Paribas
BOA Bank of America
CIBC Canadian Imperial Bank of Commerce
CITI Citibank NA
CSI Credit Suisse International
DB Deutsche Bank AG
GS Goldman Sachs
GSI Goldman Sachs International
HSBC HSBC Bank PLC
JPMCB JPMorgan Chase Bank
MSCI Morgan Stanley & Co. International PLC
NAT National Westminster
RBC Royal Bank of Canada
RBS Royal Bank of Scotland PLC
SCB Standard Chartered Bank
SG Societe Generale
SSB State Street Bank and Trust Co.
TD Toronto-Dominion Bank
WBC Westpac Banking Corp.
See accompanying notes to financial statements.
34
Financial statements
Statement of assets and liabilities—June 30, 2024
| | | UBS
All China
Equity Fund | | UBS
Global
Allocation Fund | | UBS
Emerging
Markets Equity
Opportunity Fund | |
Assets: | |
Investments, at cost | |
Unaffiliated issuers | | $ | 4,147,961 | | | $ | 108,976,598 | | | $ | 490,399,540 | | |
Affiliated issuers | | | — | | | | 46,693,340 | | | | — | | |
Foreign currency | | | 5,482 | | | | 728,065 | | | | 7,584,189 | | |
Investments, at value | |
Unaffiliated issuers1 | | $ | 2,828,450 | | | $ | 115,506,229 | | | $ | 449,560,657 | | |
Affiliated issuers | | | — | | | | 45,233,885 | | | | — | | |
Foreign currency | | | 5,483 | | | | 725,294 | | | | 7,581,747 | | |
Cash | | | 32,203 | | | | — | | | | — | | |
Cash collateral on futures | | | — | | | | 3,816,275 | | | | — | | |
Cash collateral for forward foreign currency contracts | | | — | | | | 100,000 | | | | — | | |
Due from broker | | | — | | | | 478,543 | | | | — | | |
Receivable for investments sold | | | — | | | | 958,488 | | | | 810,656 | | |
Receivable for fund shares sold | | | — | | | | 10 | | | | 2,643,028 | | |
Receivable for interest and dividends | | | 13,527 | | | | 346,610 | | | | 2,814,037 | | |
Receivable for foreign tax reclaims | | | — | | | | 122,525 | | | | 22,852 | | |
Receivable from affiliate | | | 40,537 | | | | — | | | | — | | |
Receivable for variation margin on futures contracts | | | — | | | | 18,801 | | | | — | | |
Receivable for variation margin on centrally cleared swap agreements | | | — | | | | 16 | | | | — | | |
Unrealized appreciation on forward foreign currency contracts | | | — | | | | 419,329 | | | | — | | |
Other assets | | | 13,268 | | | | 31,840 | | | | 43,971 | | |
Total assets | | | 2,933,468 | | | | 167,757,845 | | | | 463,476,948 | | |
Liabilities: | |
Due to broker | | | — | | | | 95,325 | | | | — | | |
Payable for cash collateral from securities loaned | | | — | | | | 6,132,415 | | | | — | | |
Payable for investments purchased | | | 30,117 | | | | 5,082,254 | | | | 1,818,991 | | |
Payable for fund shares redeemed | | | — | | | | 1,375,317 | | | | 28,614 | | |
Payable to affiliate | | | — | | | | 61,795 | | | | 118,636 | | |
Payable to Trustees | | | 7,876 | | | | 14,725 | | | | 28,386 | | |
Payable to custodian | | | 5,015 | | | | 25,142 | | | | 222,346 | | |
Payable for foreign withholding taxes and foreign capital gains taxes | | | 672 | | | | 119 | | | | 1,835,095 | | |
Unrealized depreciation on forward foreign currency contracts | | | — | | | | 1,294,506 | | | | — | | |
Accrued expenses and other liabilities | | | 124,378 | | | | 203,904 | | | | 216,749 | | |
Total liabilities | | | 168,058 | | | | 14,285,502 | | | | 4,268,817 | | |
Net assets | | $ | 2,765,410 | | | $ | 153,472,343 | | | $ | 459,208,131 | | |
Net assets consist of: | |
Beneficial interest | | $ | 4,581,045 | | | $ | 151,910,129 | | | $ | 623,225,131 | | |
Distributable earnings (accumulated losses) | | | (1,815,635 | ) | | | 1,562,214 | | | | (164,017,000 | ) | |
Net assets | | $ | 2,765,410 | | | $ | 153,472,343 | | | $ | 459,208,131 | | |
1 Includes $94,609; $6,564,645; $0, respectively of investments in securities on loan, at value, plus accrued interest and dividends, if any.
See accompanying notes to financial statements
35
Financial statements
Statement of assets and liabilities—June 30, 2024 (continued)
| | | UBS
All China
Equity Fund | | UBS
Global
Allocation Fund | | UBS
Emerging
Markets Equity
Opportunity Fund | |
Class A | |
Net assets | | $ | — | | | $ | 117,334,588 | | | $ | — | | |
Shares outstanding | | | — | | | | 10,557,362 | | | | — | | |
Net asset value and redemption proceeds per share | | $ | — | | | $ | 11.11 | | | $ | — | | |
Maximum offering price per share (NAV per share plus maximum sales charge) | | $ | — | | | $ | 11.76 | | | $ | — | | |
Class P | |
Net assets | | $ | 773,847 | | | $ | 36,137,755 | | | $ | 90,926,310 | | |
Shares outstanding | | | 181,888 | | | | 3,137,291 | | | | 11,381,861 | | |
Net asset value, offering price and redemption value per share | | $ | 4.25 | | | $ | 11.52 | | | $ | 7.99 | | |
Class P2 | |
Net assets | | $ | 1,991,563 | | | $ | — | | | $ | 368,281,821 | | |
Shares outstanding | | | 468,854 | | | | — | | | | 46,083,415 | | |
Net asset value and offering price per share2 | | $ | 4.25 | | | $ | — | | | $ | 7.99 | | |
2 Assumes shares were held a sufficient period or are otherwise not subject to a redemption fee.
See accompanying notes to financial statements
36
Financial statements
Statement of assets and liabilities—June 30, 2024 (continued)
| | | UBS
Engage For
Impact Fund | | UBS
International
Sustainable
Equity Fund | | UBS
US Dividend
Ruler Fund | |
Assets: | |
Investments, at cost | |
Unaffiliated issuers | | $ | 49,905,698 | | | $ | 162,789,534 | | | $ | 166,920,107 | | |
Foreign currency | | | 89,603 | | | | 250,450 | | | | — | | |
Investments, at value | |
Unaffiliated issuers1 | | $ | 55,075,639 | | | $ | 172,524,389 | | | $ | 200,273,578 | | |
Foreign currency | | | 88,900 | | | | 250,205 | | | | — | | |
Cash | | | 54,883 | | | | 181 | | | | 12,990 | | |
Receivable for investments sold | | | — | | | | 4,594,715 | | | | — | | |
Receivable for fund shares sold | | | 115 | | | | 110,608 | | | | 224,265 | | |
Receivable for interest and dividends | | | 60,711 | | | | 178,773 | | | | 142,740 | | |
Receivable for foreign tax reclaims | | | 58,959 | | | | 673,675 | | | | — | | |
Receivable from affiliate | | | 23,281 | | | | — | | | | — | | |
Receivable for variation margin on futures contracts | | | — | | | | — | | | | — | | |
Receivable for variation margin on centrally cleared swap agreements | | | — | | | | — | | | | — | | |
Unrealized appreciation on forward foreign currency contracts | | | — | | | | — | | | | — | | |
Other assets | | | 18,742 | | | | 35,112 | | | | 40,989 | | |
Total assets | | | 55,381,230 | | | | 178,367,658 | | | | 200,694,562 | | |
Liabilities: | |
Options and swaptions written, at value (premiums received $0;
$0 and $0, respectively) | | | — | | | | — | | | | — | | |
Due to broker | | | — | | | | — | | | | — | | |
Credit facility payable | | | — | | | | 782,381 | | | | — | | |
Payable for cash collateral from securities loaned | | | 3,155,901 | | | | 19,808,678 | | | | — | | |
Payable for investments purchased | | | 259,207 | | | | 1,353,848 | | | | 962,921 | | |
Payable for fund shares redeemed | | | 71,862 | | | | 105,026 | | | | 143,361 | | |
Payable to affiliate | | | — | | | | 87,849 | | | | 87,818 | | |
Payable to Trustees | | | 10,139 | | | | 15,027 | | | | 16,070 | | |
Payable to custodian | | | 9,696 | | | | 25,178 | | | | 3,282 | | |
Payable for foreign withholding taxes and foreign capital gains taxes | | | 5,049 | | | | 18,790 | | | | 7,235 | | |
Unrealized depreciation on forward foreign currency contracts | | | — | | | | — | | | | — | | |
Accrued expenses and other liabilities | | | 122,111 | | | | 154,828 | | | | 137,793 | | |
Total liabilities | | | 3,633,965 | | | | 22,351,605 | | | | 1,358,480 | | |
Net assets | | $ | 51,747,265 | | | $ | 156,016,053 | | | $ | 199,336,082 | | |
Net assets consist of: | |
Beneficial interest | | $ | 46,421,037 | | | $ | 166,998,281 | | | $ | 161,546,143 | | |
Distributable earnings (accumulated losses) | | | 5,326,228 | | | | (10,982,228 | ) | | | 37,789,939 | | |
Net assets | | $ | 51,747,265 | | | $ | 156,016,053 | | | $ | 199,336,082 | | |
1 Includes $4,261,744; $21,593,703; $0, respectively of investments in securities on loan, at value, plus accrued interest and dividends, if any.
See accompanying notes to financial statements
37
Financial statements
Statement of assets and liabilities—June 30, 2024 (continued)
| | | UBS
Engage For
Impact Fund | | UBS
International
Sustainable
Equity Fund | | UBS
US Dividend
Ruler Fund | |
Class A | |
Net assets | | $ | — | | | $ | 3,921,363 | | | $ | — | | |
Shares outstanding | | | — | | | | 393,444 | | | | — | | |
Net asset value and redemption proceeds per share | | $ | — | | | $ | 9.97 | | | $ | — | | |
Maximum offering price per share (NAV per share plus maximum sales charge) | | $ | — | | | $ | 10.55 | | | $ | — | | |
Class P | |
Net assets | | $ | 5,133,246 | | | $ | 107,245,812 | | | $ | 175,102,424 | | |
Shares outstanding | | | 407,782 | | | | 10,747,735 | | | | 11,520,792 | | |
Net asset value, offering price and redemption value per share | | $ | 12.59 | | | $ | 9.98 | | | $ | 15.20 | | |
Class P2 | |
Net assets | | $ | 46,614,019 | | | $ | 44,848,878 | | | $ | 24,233,658 | | |
Shares outstanding | | | 3,701,581 | | | | 4,500,996 | | | | 1,595,852 | | |
Net asset value and offering price per share2 | | $ | 12.59 | | | $ | 9.96 | | | $ | 15.19 | | |
2 Assumes shares were held a sufficient period or are otherwise not subject to a redemption fee.
See accompanying notes to financial statements
38
Financial statements
Statement of assets and liabilities—June 30, 2024 (continued)
| | | UBS
US Quality
Growth At
Reasonable
Price Fund | | UBS
U.S. Small Cap
Growth Fund | | UBS
Sustainable
Development Bank
Bond Fund | | UBS
Multi Income
Bond Fund | |
Assets: | |
Investments, at cost | |
Unaffiliated issuers | | $ | 215,610,537 | | | $ | 108,420,838 | | | $ | 84,926,036 | | | $ | 21,272,245 | | |
Foreign currency | | | — | | | | — | | | | — | | | | 63,855 | | |
Investments, at value | |
Unaffiliated issuers1 | | $ | 287,244,980 | | | $ | 131,190,695 | | | $ | 79,403,704 | | | $ | 20,276,103 | | |
Foreign currency | | | — | | | | — | | | | — | | | | 62,052 | | |
Cash | | | — | | | | — | | | | 38,262 | | | | 33,136 | | |
Cash collateral on futures | | | — | | | | — | | | | — | | | | 201,714 | | |
Cash collateral on swap agreements | | | — | | | | — | | | | — | | | | 58,053 | | |
Receivable for investments sold | | | — | | | | 4,541,247 | | | | 872,561 | | | | 142,653 | | |
Receivable for fund shares sold | | | 356,119 | | | | 68,069 | | | | 1,924 | | | | — | | |
Receivable for interest and dividends | | | 89,105 | | | | 75,546 | | | | 559,176 | | | | 292,016 | | |
Receivable for foreign tax reclaims | | | — | | | | — | | | | — | | | | — | | |
Receivable from affiliate | | | — | | | | — | | | | 35,172 | | | | 38,133 | | |
Receivable for variation margin on futures contracts | | | — | | | | — | | | | — | | | | 34,110 | | |
Receivable for variation margin on centrally cleared
swap agreements | | | — | | | | — | | | | — | | | | 24,323 | | |
Unrealized appreciation on forward foreign currency contracts | | | — | | | | — | | | | — | | | | 2,786 | | |
Other assets | | | 43,869 | | | | 20,110 | | | | 19,837 | | | | 42,680 | | |
Total assets | | | 287,734,073 | | | | 135,895,667 | | | | 80,930,636 | | | | 21,207,759 | | |
Liabilities: | |
Options and swaptions written, at value (premiums received
$0; $0; $0 and $2,020, respectively) | | | — | | | | — | | | | — | | | | 65 | | |
Due to broker | | | — | | | | — | | | | — | | | | 14,767 | | |
Payable for cash collateral from securities loaned | | | — | | | | — | | | | 524,250 | | | | 593,325 | | |
Payable for investments purchased | | | — | | | | 2,172,059 | | | | 901,047 | | | | 101,410 | | |
Payable for fund shares redeemed | | | 99,446 | | | | 136,664 | | | | 126,977 | | | | 20,208 | | |
Payable to affiliate | | | 178,806 | | | | 102,543 | | | | — | | | | — | | |
Payable to Trustees | | | 19,275 | | | | 13,838 | | | | 11,353 | | | | 8,686 | | |
Payable to custodian | | | 3,251 | | | | 6,778 | | | | 3,333 | | | | 14,000 | | |
Payable for foreign withholding taxes and foreign capital
gains taxes | | | — | | | | — | | | | — | | | | — | | |
Unrealized depreciation on forward foreign currency contracts | | | — | | | | — | | | | — | | | | 13,067 | | |
Accrued expenses and other liabilities | | | 149,446 | | | | 148,997 | | | | 117,908 | | | | 122,681 | | |
Total liabilities | | | 450,224 | | | | 2,580,879 | | | | 1,684,868 | | | | 888,209 | | |
Net assets | | $ | 287,283,849 | | | $ | 133,314,788 | | | $ | 79,245,768 | | | $ | 20,319,550 | | |
Net assets consist of: | |
Beneficial interest | | $ | 215,544,005 | | | $ | 120,424,194 | | | $ | 90,055,839 | | | $ | 26,569,967 | | |
Distributable earnings (accumulated losses) | | | 71,739,844 | | | | 12,890,594 | | | | (10,810,071 | ) | | | (6,250,417 | ) | |
Net assets | | $ | 287,283,849 | | | $ | 133,314,788 | | | $ | 79,245,768 | | | $ | 20,319,550 | | |
1 Includes $0; $1,955,878; $512,552; $581,327, respectively of investments in securities on loan, at value, plus accrued interest and dividends, if any.
See accompanying notes to financial statements
39
Financial statements
Statement of assets and liabilities—June 30, 2024 (concluded)
| | | UBS
US Quality
Growth At
Reasonable
Price Fund | | UBS
U.S. Small Cap
Growth Fund | | UBS
Sustainable
Development Bank
Bond Fund | | UBS
Multi Income
Bond Fund | |
Class A | |
Net assets | | $ | — | | | $ | 13,412,658 | | | $ | — | | | $ | 287,440 | | |
Shares outstanding | | | — | | | | 773,597 | | | | — | | | | 21,615 | | |
Net asset value and redemption proceeds per share | | $ | — | | | $ | 17.34 | | | $ | — | | | $ | 13.30 | | |
Maximum offering price per share (NAV per share plus
maximum sales charge) | | $ | — | | | $ | 18.35 | | | $ | — | | | $ | 13.82 | | |
Class P | |
Net assets | | $ | 287,283,849 | | | $ | 119,902,130 | | | $ | 14,516,599 | | | $ | 20,031,043 | | |
Shares outstanding | | | 17,270,459 | | | | 5,698,922 | | | | 1,557,788 | | | | 1,505,614 | | |
Net asset value, offering price and redemption value per share | | $ | 16.63 | | | $ | 21.04 | | | $ | 9.32 | | | $ | 13.30 | | |
Class P2 | |
Net assets | | $ | — | | | $ | — | | | $ | 64,729,169 | | | $ | 1,067 | | |
Shares outstanding | | | — | | | | — | | | | 6,956,563 | | | | 80 | | |
Net asset value and offering price per share2 | | $ | — | | | $ | — | | | $ | 9.30 | | | $ | 13.34 | * | |
* Actual net asset value per share presented differs from calculated net asset value per share due to rounding.
2 Assumes shares were held a sufficient period or are otherwise not subject to a redemption fee.
See accompanying notes to financial statements
40
Statement of operations
For the year ended June 30, 2024
| | | UBS
All China
Equity Fund | | UBS
Global
Allocation Fund | | UBS
Emerging
Markets Equity
Opportunity Fund | |
Investment income: | |
Unaffiliated dividends | | $ | 92,359 | | | $ | 1,221,731 | | | $ | 13,011,535 | | |
Affiliated dividends | | | — | | | | 1,632,541 | | | | — | | |
Interest | | | 8,669 | | | | 2,489,176 | | | | 450,279 | | |
Securities lending | | | 3,521 | | | | 20,758 | | | | 5,582 | | |
Foreign tax withheld | | | (4,790 | ) | | | (27,072 | ) | | | (1,527,070 | ) | |
Total income | | | 99,759 | | | | 5,337,134 | | | | 11,940,326 | | |
Expenses: | |
Investment advisory and administration fees | | | 26,772 | | | | 1,391,847 | | | | 4,380,290 | | |
Service fees—Class A | | | — | | | | 306,097 | | | | — | | |
Transfer agency and related services fees—Class A | | | — | | | | 83,875 | | | | — | | |
Transfer agency and related services fees—Class P | | | 8,985 | | | | 14,233 | | | | 13,816 | | |
Transfer agency and related services fees—Class P2 | | | — | | | | — | | | | 44,257 | | |
Custody and fund accounting fees | | | 9,195 | | | | 68,617 | | | | 428,393 | | |
Trustees fees | | | 28,169 | | | | 54,235 | | | | 101,967 | | |
Professional services fees | | | 184,334 | | | | 215,493 | | | | 179,192 | | |
Printing and shareholder report fees | | | 7,004 | | | | 69,406 | | | | 41,033 | | |
Federal and state registration fees | | | 22,421 | | | | 34,143 | | | | 36,792 | | |
Insurance expense | | | 235 | | | | 14,106 | | | | 39,717 | | |
Interest expense | | | — | | | | — | | | | 21,387 | | |
Proxy expense | | | 17,528 | | | | 18,144 | | | | 17,575 | | |
Other expenses | | | 51,261 | | | | 78,784 | | | | 165,854 | | |
Total expenses | | | 355,904 | | | | 2,348,980 | | | | 5,470,273 | | |
Fee waivers and/or expense reimbursements by Advisor* | | | (323,175 | ) | | | (513,590 | ) | | | (3,614,205 | ) | |
Net expenses | | | 32,729 | | | | 1,835,390 | | | | 1,856,068 | | |
Net investment income (loss) | | | 67,030 | | | | 3,501,744 | | | | 10,084,258 | | |
Net realized gain (loss) on: | |
Investments in unaffiliated issuers (including foreign capital gain tax expense
of $0; $0, and $503,741, respectively) | | | (188,143 | ) | | | 3,269,491 | | | | (3,502,406 | ) | |
Investments in affiliated issuers | | | — | | | | (366,081 | ) | | | — | | |
Futures contracts | | | — | | | | 4,284,681 | | | | — | | |
Swap agreements | | | — | | | | (272,552 | ) | | | — | | |
Forward foreign currency contracts | | | — | | | | 821,289 | | | | — | | |
Foreign currency transactions | | | (133 | ) | | | 158,139 | | | | (222,719 | ) | |
Net realized gain (loss) | | | (188,276 | ) | | | 7,894,967 | | | | (3,725,125 | ) | |
Change in net unrealized appreciation (depreciation) on: | |
Investments in unaffiliated issuers (net of change in deferred foreign capital
gain taxes of $0; $0 and $(939,536) , respectively) | | | (197,519 | ) | | | 1,963,340 | | | | 42,957,659 | | |
Investments in affiliated issuers | | | — | | | | 3,111,284 | | | | — | | |
Futures contracts | | | — | | | | (929,771 | ) | | | — | | |
Swap agreements | | | — | | | | (17,695 | ) | | | — | | |
Forward foreign currency contracts | | | — | | | | (1,328,389 | ) | | | — | | |
Translation of other assets and liabilities denominated in foreign currency | | | 44 | | | | (275,216 | ) | | | 48,802 | | |
Net change in unrealized appreciation (depreciation) | | | (197,475 | ) | | | 2,523,553 | | | | 43,006,461 | | |
Net realized and unrealized gain (loss) from investment activities | | | (385,751 | ) | | | 10,418,520 | | | | 39,281,336 | | |
Net increase (decrease) in net assets resulting from operations | | $ | (318,721 | ) | | $ | 13,920,264 | | | $ | 49,365,594 | | |
* Refer to note Investment advisory fees and other transactions with affiliates for additional details.
See accompanying notes to financial statements
41
Statement of operations
For the year ended June 30, 2024 (continued)
| | | UBS
Engage For
Impact Fund | | UBS
International
Sustainable
Equity Fund | | UBS
US Dividend
Ruler Fund | |
Investment income: | |
Unaffiliated dividends | | $ | 908,944 | | | $ | 3,876,501 | | | $ | 3,677,002 | | |
Interest | | | 32,106 | | | | 71,972 | | | | 173,962 | | |
Securities lending | | | 10,137 | | | | 23,480 | | | | 281 | | |
Foreign tax withheld | | | (71,212 | ) | | | (425,155 | ) | | | (23,352 | ) | |
Total income | | | 879,975 | | | | 3,546,798 | | | | 3,827,893 | | |
Expenses: | |
Investment advisory and administration fees | | | 425,848 | | | | 1,375,128 | | | | 972,161 | | |
Service fees—Class A | | | — | | | | 10,048 | | | | — | | |
Transfer agency and related services fees—Class A | | | — | | | | 3,161 | | | | — | | |
Transfer agency and related services fees—Class P | | | 1,194 | | | | 9,151 | | | | 73,960 | | |
Transfer agency and related services fees—Class P2 | | | 23,143 | | | | 24,496 | | | | 7,246 | | |
Custody and fund accounting fees | | | 22,617 | | | | 55,221 | | | | 24,927 | | |
Trustees fees | | | 36,665 | | | | 54,154 | | | | 57,778 | | |
Professional services fees | | | 175,833 | | | | 185,101 | | | | 164,091 | | |
Printing and shareholder report fees | | | 15,979 | | | | 41,449 | | | | 45,905 | | |
Federal and state registration fees | | | 37,108 | | | | 48,411 | | | | 47,400 | | |
Insurance expense | | | 4,147 | | | | 14,101 | | | | 11,984 | | |
Interest expense | | | — | | | | 924 | | | | — | | |
Proxy expense | | | 17,534 | | | | 18,111 | | | | 17,553 | | |
Other expenses | | | 54,097 | | | | 49,424 | | | | 39,726 | | |
Total expenses | | | 814,165 | | | | 1,888,880 | | | | 1,462,731 | | |
Fee waivers and/or expense reimbursements by Advisor* | | | (635,614 | ) | | | (622,387 | ) | | | (668,244 | ) | |
Net expenses | | | 178,551 | | | | 1,266,493 | | | | 794,487 | | |
Net investment income (loss) | | | 701,424 | | | | 2,280,305 | | | | 3,033,406 | | |
Net realized gain (loss) on: | |
Investments in unaffiliated issuers | | | 1,843,245 | | | | (5,381,210 | ) | | | 3,120,098 | | |
Foreign currency transactions | | | 3,717 | | | | (4,668 | ) | | | — | | |
Net realized gain (loss) | | | 1,846,962 | | | | (5,385,878 | ) | | | 3,120,098 | | |
Change in net unrealized appreciation (depreciation) on: | |
Investments in unaffiliated issuers | | | 4,389,037 | | | | 15,931,811 | | | | 21,938,773 | | |
Translation of other assets and liabilities denominated in foreign currency | | | (507 | ) | | | (291 | ) | | | — | | |
Net change in unrealized appreciation (depreciation) | | | 4,388,530 | | | | 15,931,520 | | | | 21,938,773 | | |
Net realized and unrealized gain (loss) from investment activities | | | 6,235,492 | | | | 10,545,642 | | | | 25,058,871 | | |
Net increase (decrease) in net assets resulting from operations | | $ | 6,936,916 | | | $ | 12,825,947 | | | $ | 28,092,277 | | |
* Refer to note Investment advisory fees and other transactions with affiliates for additional details.
See accompanying notes to financial statements
42
Statement of operations
For the year ended June 30, 2024 (continued)
| | | UBS
US Quality
Growth At
Reasonable
Price Fund | | UBS
U.S. Small Cap
Growth Fund | | UBS
Sustainable
Development Bank
Bond Fund | |
Investment income: | |
Unaffiliated dividends | | $ | 1,809,866 | | | $ | 635,520 | | | $ | — | | |
Interest | | | 233,406 | | | | 215,576 | | | | 2,300,059 | | |
Securities lending | | | — | | | | 5,102 | | | | 4,423 | | |
Foreign tax withheld | | | (3,215 | ) | | | — | | | | — | | |
Total income | | | 2,040,057 | | | | 856,198 | | | | 2,304,482 | | |
Expenses: | |
Investment advisory and administration fees | | | 1,314,831 | | | | 1,155,359 | | | | 184,223 | | |
Service fees—Class A | | | — | | | | 34,389 | | | | — | | |
Transfer agency and related services fees—Class A | | | — | | | | 12,719 | | | | — | | |
Transfer agency and related services fees—Class P | | | 107,707 | | | | 58,050 | | | | 4,052 | | |
Transfer agency and related services fees—Class P2 | | | — | | | | — | | | | 24,618 | | |
Custody and fund accounting fees | | | 31,959 | | | | 26,986 | | | | 14,720 | | |
Trustees fees | | | 68,233 | | | | 49,487 | | | | 41,767 | | |
Professional services fees | | | 163,810 | | | | 160,019 | | | | 163,263 | | |
Printing and shareholder report fees | | | 53,018 | | | | 37,860 | | | | 18,024 | | |
Federal and state registration fees | | | 25,241 | | | | 34,097 | | | | 35,496 | | |
Insurance expense | | | 15,898 | | | | 10,267 | | | | 7,669 | | |
Interest expense | | | — | | | | — | | | | 139 | | |
Proxy expense | | | 17,556 | | | | 20,612 | | | | 17,724 | | |
Other expenses | | | 38,469 | | | | 39,861 | | | | 58,000 | | |
Total expenses | | | 1,836,722 | | | | 1,639,706 | | | | 569,695 | | |
Fee waivers and/or expense reimbursements by Advisor* | | | (675,835 | ) | | | (348,160 | ) | | | (413,440 | ) | |
Net expenses | | | 1,160,887 | | | | 1,291,546 | | | | 156,255 | | |
Net investment income (loss) | | | 879,170 | | | | (435,348 | ) | | | 2,148,227 | | |
Net realized gain (loss) on: | |
Investments in unaffiliated issuers | | | 6,184,043 | | | | (2,884,085 | ) | | | (2,216,098 | ) | |
Net realized gain (loss) | | | 6,184,043 | | | | (2,884,085 | ) | | | (2,216,098 | ) | |
Change in net unrealized appreciation (depreciation) on: | |
Investments in unaffiliated issuers | | | 57,067,922 | | | | 15,799,222 | | | | 2,361,584 | | |
Net change in unrealized appreciation (depreciation) | | | 57,067,922 | | | | 15,799,222 | | | | 2,361,584 | | |
Net realized and unrealized gain (loss) from investment activities | | | 63,251,965 | | | | 12,915,137 | | | | 145,486 | | |
Net increase (decrease) in net assets resulting from operations | | $ | 64,131,135 | | | $ | 12,479,789 | | | $ | 2,293,713 | | |
* Refer to note Investment advisory fees and other transactions with affiliates for additional details.
See accompanying notes to financial statements
43
Statement of operations
For the year ended June 30, 2024 (concluded)
| | | UBS
Multi Income
Bond Fund | |
Investment income: | |
Interest | | $ | 1,262,869 | | |
Securities lending | | | 3,046 | | |
Total income | | | 1,265,915 | | |
Expenses: | |
Investment advisory and administration fees | | | 127,287 | | |
Service fees—Class A | | | 920 | | |
Transfer agency and related services fees—Class A | | | 170 | | |
Transfer agency and related services fees—Class P | | | 21,026 | | |
Transfer agency and related services fees—Class P21 | | | 11 | | |
Custody and fund accounting fees | | | 35,921 | | |
Trustees fees | | | 31,332 | | |
Professional services fees | | | 177,133 | | |
Printing and shareholder report fees | | | 24,443 | | |
Federal and state registration fees | | | 52,694 | | |
Insurance expense | | | 14,133 | | |
Interest expense | | | 110 | | |
Proxy expense | | | 17,690 | | |
Other expenses | | | 40,054 | | |
Total expenses | | | 542,924 | | |
Fee waivers and/or expense reimbursements by Advisor* | | | (380,319 | ) | |
Net expenses | | | 162,605 | | |
Net investment income (loss) | | | 1,103,310 | | |
Net realized gain (loss) on: | |
Investments in unaffiliated issuers | | | (484,144 | ) | |
Options and swaptions written | | | 18,877 | | |
Futures contracts | | | (314,175 | ) | |
Swap agreements | | | (53,525 | ) | |
Forward foreign currency contracts | | | (1,169 | ) | |
Foreign currency transactions | | | (4,654 | ) | |
Net realized gain (loss) | | | (838,790 | ) | |
Change in net unrealized appreciation (depreciation) on: | |
Investments in unaffiliated issuers | | | 483,977 | | |
Options and swaptions written | | | 1,955 | | |
Futures contracts | | | 28,348 | | |
Swap agreements | | | (9,337 | ) | |
Forward foreign currency contracts | | | (17,485 | ) | |
Translation of other assets and liabilities denominated in foreign currency | | | (3,472 | ) | |
Net change in unrealized appreciation (depreciation) | | | 483,986 | | |
Net realized and unrealized gain (loss) from investment activities | | | (354,804 | ) | |
Net increase (decrease) in net assets resulting from operations | | $ | 748,506 | | |
* Refer to note Investment advisory fees and other transactions with affiliates for additional details.
1 For the period from October 11, 2023 (commencement of operations) through June 30, 2024.
See accompanying notes to financial statements
44
Statement of changes in net assets
| | | UBS All China Equity Fund | | UBS Global Allocation Fund | |
| | | For the years ended June 30, | | For the years ended June 30, | |
| | | 2024 | | 2023 | | 2024 | | 2023 | |
From operations: | |
Net investment income (loss) | | $ | 67,030 | | | $ | 67,526 | | | $ | 3,501,744 | | | $ | 2,993,852 | | |
Net realized gain (loss) | | | (188,276 | ) | | | (138,376 | ) | | | 7,894,967 | | | | (7,479,234 | ) | |
Net change in unrealized appreciation (depreciation) | | | (197,475 | ) | | | (788,748 | ) | | | 2,523,553 | | | | 11,041,998 | | |
Net increase (decrease) in net assets resulting from operations | | | (318,721 | ) | | | (859,598 | ) | | | 13,920,264 | | | | 6,556,616 | | |
Total distributions—Class A | | | — | | | | — | | | | (2,672,032 | ) | | | (6,280,248 | ) | |
Total distributions—Class P | | | (17,617 | ) | | | (9,183 | ) | | | (845,783 | ) | | | (1,825,896 | ) | |
Total distributions—Class P2 | | | (64,093 | ) | | | (45,620 | ) | | | — | | | | — | | |
Total distributions | | | (81,710 | ) | | | (54,803 | ) | | | (3,517,815 | ) | | | (8,106,144 | ) | |
From beneficial interest transactions: | |
Proceeds from shares sold | | | — | | | | — | | | | 2,050,683 | | | | 1,501,047 | | |
Cost of shares redeemed | | | — | | | | (370,000 | ) | | | (34,027,891 | ) | | | (26,521,495 | ) | |
Shares issued on reinvestment of dividends and distributions | | | 74,843 | | | | 51,202 | | | | 3,211,534 | | | | 7,496,051 | | |
Net increase (decrease) in net assets from beneficial interest transactions | | | 74,843 | | | | (318,798 | ) | | | (28,765,674 | ) | | | (17,524,397 | ) | |
Net increase (decrease) in net assets | | | (325,588 | ) | | | (1,233,199 | ) | | | (18,363,225 | ) | | | (19,073,925 | ) | |
Net assets: | |
Beginning of year | | | 3,090,998 | | | | 4,324,197 | | | | 171,835,568 | | | | 190,909,493 | | |
End of year | | $ | 2,765,410 | | | $ | 3,090,998 | | | $ | 153,472,343 | | | $ | 171,835,568 | | |
See accompanying notes to financial statements
45
Statement of changes in net assets (continued)
| | | UBS Emerging Markets Equity
Opportunity Fund | | UBS Engage For Impact Fund | |
| | | For the years ended June 30, | | For the years ended June 30, | |
| | | 2024 | | 2023 | | 2024 | | 2023 | |
From operations: | |
Net investment income (loss) | | $ | 10,084,258 | | | $ | 15,343,732 | | | $ | 701,424 | | | $ | 702,566 | | |
Net realized gain (loss) | | | (3,725,125 | ) | | | (107,145,472 | ) | | | 1,846,962 | | | | (2,047,250 | ) | |
Net change in unrealized appreciation (depreciation) | | | 43,006,461 | | | | 82,556,142 | | | | 4,388,530 | | | | 7,573,633 | | |
Net increase (decrease) in net assets resulting from operations | | | 49,365,594 | | | | (9,245,598 | ) | | | 6,936,916 | | | | 6,228,949 | | |
Total distributions—Class A | | | — | | | | — | | | | — | | | | — | | |
Total distributions—Class P | | | (2,251,387 | ) | | | (2,089,531 | ) | | | (36,021 | ) | | | (73,680 | ) | |
Total distributions—Class P2 | | | (11,476,025 | ) | | | (14,412,684 | ) | | | (728,463 | ) | | | (580,604 | ) | |
Total distributions | | | (13,727,412 | ) | | | (16,502,215 | ) | | | (764,484 | ) | | | (654,284 | ) | |
From beneficial interest transactions: | |
Proceeds from shares sold | | | 100,613,797 | | | | 278,307,307 | | | | 4,955,539 | | | | 11,877,913 | | |
Cost of shares redeemed | | | (138,838,362 | ) | | | (389,845,793 | ) | | | (10,866,739 | ) | | | (13,607,295 | ) | |
Shares issued on reinvestment of dividends and distributions | | | 11,718,783 | | | | 9,740,921 | | | | 733,665 | | | | 588,987 | | |
Net increase (decrease) in net assets from beneficial interest transactions | | | (26,505,782 | ) | | | (101,797,565 | ) | | | (5,177,535 | ) | | | (1,140,395 | ) | |
Net increase (decrease) in net assets | | | 9,132,400 | | | | (127,545,378 | ) | | | 994,897 | | | | 4,434,270 | | |
Net assets: | |
Beginning of year | | | 450,075,731 | | | | 577,621,109 | | | | 50,752,368 | | | | 46,318,098 | | |
End of year | | $ | 459,208,131 | | | $ | 450,075,731 | | | $ | 51,747,265 | | | $ | 50,752,368 | | |
See accompanying notes to financial statements
46
Statement of changes in net assets (continued)
| | | UBS International Sustainable
Equity Fund | | UBS US Dividend Ruler Fund | |
| | | For the years ended June 30, | | For the years ended June 30, | |
| | | 2024 | | 2023 | | 2024 | | 2023 | |
From operations: | |
Net investment income (loss) | | $ | 2,280,305 | | | $ | 2,093,131 | | | $ | 3,033,406 | | | $ | 2,615,383 | | |
Net realized gain (loss) | | | (5,385,878 | ) | | | (12,561,436 | ) | | | 3,120,098 | | | | 1,093,427 | | |
Net change in unrealized appreciation (depreciation) | | | 15,931,520 | | | | 36,348,581 | | | | 21,938,773 | | | | 15,813,243 | | |
Net increase (decrease) in net assets resulting from operations | | | 12,825,947 | | | | 25,880,276 | | | | 28,092,277 | | | | 19,522,053 | | |
Total distributions—Class A | | | (26,614 | ) | | | (478,922 | ) | | | — | | | | — | | |
Total distributions—Class P | | | (893,638 | ) | | | (17,852,715 | ) | | | (4,136,323 | ) | | | (3,137,305 | ) | |
Total distributions—Class P2 | | | (757,657 | ) | | | (5,506,792 | ) | | | (686,494 | ) | | | — | | |
Total distributions | | | (1,677,909 | ) | | | (23,838,429 | ) | | | (4,822,817 | ) | | | (3,137,305 | ) | |
From beneficial interest transactions: | |
Proceeds from shares sold | | | 27,860,596 | | | | 37,940,925 | | | | 53,372,354 | | | | 53,593,182 | | |
Cost of shares redeemed | | | (41,253,441 | ) | | | (113,699,099 | ) | | | (33,357,815 | ) | | | (39,594,074 | ) | |
Shares issued on reinvestment of dividends and distributions | | | 1,495,226 | | | | 21,042,606 | | | | 3,995,595 | | | | 2,843,290 | | |
Net increase (decrease) in net assets from beneficial interest transactions | | | (11,897,619 | ) | | | (54,715,568 | ) | | | 24,010,134 | | | | 16,842,398 | | |
Net increase (decrease) in net assets | | | (749,581 | ) | | | (52,673,721 | ) | | | 47,279,594 | | | | 33,227,146 | | |
Net assets: | |
Beginning of year | | | 156,765,634 | | | | 209,439,355 | | | | 152,056,488 | | | | 118,829,342 | | |
End of year | | $ | 156,016,053 | | | $ | 156,765,634 | | | $ | 199,336,082 | | | $ | 152,056,488 | | |
See accompanying notes to financial statements
47
Statement of changes in net assets (continued)
| | | UBS US Quality Growth At
Reasonable Price Fund | | UBS U.S. Small Cap Growth Fund | |
| | | For the years ended June 30, | | For the years ended June 30, | |
| | | 2024 | | 2023 | | 2024 | | 2023 | |
From operations: | |
Net investment income (loss) | | $ | 879,170 | | | $ | 957,361 | | | $ | (435,348 | ) | | $ | (265,725 | ) | |
Net realized gain (loss) | | | 6,184,043 | | | | (4,619,323 | ) | | | (2,884,085 | ) | | | (5,136,507 | ) | |
Net change in unrealized appreciation (depreciation) | | | 57,067,922 | | | | 37,202,941 | | | | 15,799,222 | | | | 22,510,208 | | |
Net increase (decrease) in net assets resulting from operations | | | 64,131,135 | | | | 33,540,979 | | | | 12,479,789 | | | | 17,107,976 | | |
Total distributions—Class A | | | — | | | | — | | | | — | | | | (988,042 | ) | |
Total distributions—Class P | | | (952,900 | ) | | | (1,657,283 | ) | | | — | | | | (5,504,921 | ) | |
Total distributions | | | (952,900 | ) | | | (1,657,283 | ) | | | — | | | | (6,492,963 | ) | |
From beneficial interest transactions: | |
Proceeds from shares sold | | | 84,967,516 | | | | 64,709,673 | | | | 19,034,319 | | | | 14,504,448 | | |
Cost of shares redeemed | | | (48,292,186 | ) | | | (78,567,798 | ) | | | (23,292,275 | ) | | | (34,554,999 | ) | |
Shares issued on reinvestment of dividends and distributions | | | 886,143 | | | | 1,539,152 | | | | — | | | | 6,261,965 | | |
Net increase (decrease) in net assets from beneficial interest transactions | | | 37,561,473 | | | | (12,318,973 | ) | | | (4,257,956 | ) | | | (13,788,586 | ) | |
Net increase (decrease) in net assets | | | 100,739,708 | | | | 19,564,723 | | | | 8,221,833 | | | | (3,173,573 | ) | |
Net assets: | |
Beginning of year | | | 186,544,141 | | | | 166,979,418 | | | | 125,092,955 | | | | 128,266,528 | | |
End of year | | $ | 287,283,849 | | | $ | 186,544,141 | | | $ | 133,314,788 | | | $ | 125,092,955 | | |
See accompanying notes to financial statements
48
Statement of changes in net assets (concluded)
| | | UBS Sustainable Development
Bank Bond Fund | | UBS Multi Income Bond Fund | |
| | | For the years ended June 30, | | For the years ended June 30, | |
| | | 2024 | | 2023 | | 2024 | | 2023 | |
From operations: | |
Net investment income (loss) | | $ | 2,148,227 | | | $ | 1,450,792 | | | $ | 1,103,310 | | | $ | 1,115,457 | | |
Net realized gain (loss) | | | (2,216,098 | ) | | | (1,528,138 | ) | | | (838,790 | ) | | | (224,982 | ) | |
Net change in unrealized appreciation (depreciation) | | | 2,361,584 | | | | (1,285,627 | ) | | | 483,986 | | | | 241,112 | | |
Net increase (decrease) in net assets resulting from operations | | | 2,293,713 | | | | (1,362,973 | ) | | | 748,506 | | | | 1,131,587 | | |
Total distributions—Class A | | | — | | | | — | | | | (13,480 | ) | | | (17,716 | ) | |
Total distributions—Class P | | | (389,656 | ) | | | (173,546 | ) | | | (872,725 | ) | | | (898,418 | ) | |
Total distributions—Class P2 | | | (1,758,282 | ) | | | (1,275,743 | ) | | | (32 | )1 | | | — | | |
Return of Capital—Class P | | | — | | | | (12,438 | ) | | | — | | | | — | | |
Return of Capital—Class P2 | | | — | | | | (91,434 | ) | | | — | | | | — | | |
Total distributions | | | (2,147,938 | ) | | | (1,553,161 | ) | | | (886,237 | ) | | | (916,134 | ) | |
From beneficial interest transactions: | |
Proceeds from shares sold | | | 16,939,340 | | | | 30,385,330 | | | | 11,278 | | | | 83,048 | | |
Cost of shares redeemed | | | (25,675,012 | ) | | | (19,862,973 | ) | | | (4,185,431 | ) | | | (4,328,840 | ) | |
Shares issued on reinvestment of dividends and distributions | | | 1,839,854 | | | | 1,420,433 | | | | 693,326 | | | | 697,316 | | |
Net increase (decrease) in net assets from beneficial interest transactions | | | (6,895,818 | ) | | | 11,942,790 | | | | (3,480,827 | ) | | | (3,548,476 | ) | |
Net increase (decrease) in net assets | | | (6,750,043 | ) | | | 9,026,656 | | | | (3,618,558 | ) | | | (3,333,023 | ) | |
Net assets: | |
Beginning of year | | | 85,995,811 | | | | 76,969,155 | | | | 23,938,108 | | | | 27,271,131 | | |
End of year | | $ | 79,245,768 | | | $ | 85,995,811 | | | $ | 20,319,550 | | | $ | 23,938,108 | | |
1 For the period from October 11, 2023 (commencement of operations) through June 30, 2024.
See accompanying notes to financial statements
49
UBS All China Equity Fund
Financial highlights
The table below sets forth financial data for one share of beneficial interest outstanding throughout each period presented.
Class P
| | | Years ended June 30, | | Period ended | |
| | | 2024 | | 2023 | | 2022 | | June 30, 20211 | |
Net asset value, beginning of period | | $ | 4.88 | | | $ | 6.33 | | | $ | 8.84 | | | $ | 10.00 | | |
Net investment income (loss)2 | | | 0.08 | | | | 0.08 | | | | 0.03 | | | | 0.03 | | |
Net realized and unrealized gains (losses) | | | (0.61 | ) | | | (1.48 | ) | | | (2.49 | ) | | | (1.19 | ) | |
Net increase (decrease) from operations | | | (0.53 | ) | | | (1.40 | ) | | | (2.46 | ) | | | (1.16 | ) | |
Dividends from net investment income | | | (0.10 | ) | | | (0.05 | ) | | | (0.05 | ) | | | — | | |
Net asset value, end of period | | $ | 4.25 | | | $ | 4.88 | | | $ | 6.33 | | | $ | 8.84 | | |
Total investment return3 | | | (10.93 | )% | | | (22.14 | )% | | | (27.86 | )% | | | (11.60 | )% | |
Ratios to average net assets: | |
Expenses before fee waivers and/or expense reimbursements | | | 13.08 | % | | | 10.49 | % | | | 19.95 | % | | | 20.92 | %4 | |
Expenses after fee waivers and/or expense reimbursements | | | 1.70 | % | | | 1.45 | % | | | 1.10 | % | | | 1.10 | %4 | |
Net investment income (loss) | | | 1.74 | % | | | 1.43 | % | | | 0.46 | % | | | 1.06 | %4 | |
Supplemental data: | |
Net assets, end of period (000's) | | $ | 774 | | | $ | 875 | | | $ | 1,128 | | | $ | 1,767 | | |
Portfolio turnover | | | 6 | % | | | 1 | % | | | 13 | % | | | 6 | % | |
Class P2
| | | Years ended June 30, | | Period ended | |
| | | 2024 | | 2023 | | June 30, 20225 | |
Net asset value, beginning of period | | $ | 4.88 | | | $ | 6.34 | | | $ | 5.86 | | |
Net investment income (loss)2 | | | 0.11 | | | | 0.12 | | | | 0.05 | | |
Net realized and unrealized gains (losses) | | | (0.60 | ) | | | (1.48 | ) | | | 0.43 | | |
Net increase (decrease) from operations | | | (0.49 | ) | | | (1.36 | ) | | | 0.48 | | |
Dividends from net investment income | | | (0.14 | ) | | | (0.10 | ) | | | — | | |
Net asset value, end of period | | $ | 4.25 | | | $ | 4.88 | | | $ | 6.34 | | |
Total investment return3 | | | (10.04 | )% | | | (21.50 | )% | | | 8.19 | % | |
Ratios to average net assets: | |
Expenses before fee waivers and/or expense reimbursements | | | 11.99 | % | | | 9.52 | % | | | 7.65 | %4 | |
Expenses after fee waivers and/or expense reimbursements | | | 0.91 | % | | | 0.65 | % | | | 0.30 | %4 | |
Net investment income (loss) | | | 2.54 | % | | | 2.28 | % | | | 4.50 | %4 | |
Supplemental data: | |
Net assets, end of period (000's) | | $ | 1,992 | | | $ | 2,216 | | | $ | 3,196 | | |
Portfolio turnover | | | 6 | % | | | 1 | % | | | 13 | % | |
1 For the period February 24, 2021 (commencement of operations) through June 30, 2021.
2 Calculated using the average share method.
3 Total investment return is calculated assuming a $10,000 investment on the first day of each period reported, reinvestment of all dividends and distributions, if any, at net asset value on the ex-dividend dates, and a sale at net asset value on the last day of each period reported. The figures do not include any applicable sales charges; results would be lower if they were included. Total investment return for periods less than one year has not been annualized. Returns do not reflect the deduction of taxes that a shareholder would pay on Fund dividends/distributions or the redemption of Fund shares.
4 Annualized.
5 For the period from April 21, 2022 (commencement of operations) through June 30, 2022.
See accompanying notes to financial statements
50
UBS Global Allocation Fund
Financial highlights
The table below sets forth financial data for one share of beneficial interest outstanding throughout each year presented.
Class A
| | | Years ended June 30, | |
| | | 2024 | | 2023 | | 2022 | | 2021 | | 2020 | |
Net asset value, beginning of year | | $ | 10.38 | | | $ | 10.48 | | | $ | 14.61 | | | $ | 11.82 | | | $ | 12.56 | | |
Net investment income (loss)1 | | | 0.23 | | | | 0.17 | | | | 0.11 | | | | 0.12 | | | | 0.12 | | |
Net realized and unrealized gain (loss) | | | 0.73 | | | | 0.21 | | | | (1.83 | ) | | | 2.89 | | | | 0.02 | | |
Net increase (decrease) from operations | | | 0.96 | | | | 0.38 | | | | (1.72 | ) | | | 3.01 | | | | 0.14 | | |
Dividends from net investment income | | | (0.23 | ) | | | — | | | | (0.16 | ) | | | (0.07 | ) | | | (0.35 | ) | |
Distributions from net realized gains | | | — | | | | (0.48 | ) | | | (2.25 | ) | | | (0.15 | ) | | | (0.53 | ) | |
Total dividends and distributions | | | (0.23 | ) | | | (0.48 | ) | | | (2.41 | ) | | | (0.22 | ) | | | (0.88 | ) | |
Net asset value, end of year | | $ | 11.11 | | | $ | 10.38 | | | $ | 10.48 | | | $ | 14.61 | | | $ | 11.82 | | |
Total investment return2 | | | 9.51 | % | | | 3.82 | % | | | (14.05 | )% | | | 25.58 | % | | | 0.79 | % | |
Ratios to average net assets: | |
Expenses before fee waivers and/or expense reimbursements | | | 1.54 | % | | | 1.48 | % | | | 1.39 | % | | | 1.41 | % | | | 1.42 | %3 | |
Expenses after fee waivers and/or expense reimbursements | | | 1.21 | % | | | 1.21 | % | | | 1.20 | % | | | 1.20 | % | | | 1.20 | %3 | |
Net investment income (loss) | | | 2.15 | % | | | 1.61 | % | | | 0.82 | % | | | 0.85 | % | | | 1.01 | % | |
Supplemental data: | |
Net assets, end of year (000's) | | $ | 117,335 | | | $ | 132,855 | | | $ | 146,850 | | | $ | 192,772 | | | $ | 174,159 | | |
Portfolio turnover | | | 82 | % | | | 148 | % | | | 125 | % | | | 128 | % | | | 120 | % | |
Class P
| | | Years ended June 30, | |
| | | 2024 | | 2023 | | 2022 | | 2021 | | 2020 | |
Net asset value, beginning of year | | $ | 10.75 | | | $ | 10.82 | | | $ | 15.00 | | | $ | 12.13 | | | $ | 12.87 | | |
Net investment income (loss)1 | | | 0.26 | | | | 0.20 | | | | 0.14 | | | | 0.15 | | | | 0.16 | | |
Net realized and unrealized gains (losses) | | | 0.77 | | | | 0.21 | | | | (1.87 | ) | | | 2.97 | | | | 0.02 | | |
Net increase (decrease) from operations | | | 1.03 | | | | 0.41 | | | | (1.73 | ) | | | 3.12 | | | | 0.18 | | |
Dividends from net investment income | | | (0.26 | ) | | | — | | | | (0.20 | ) | | | (0.10 | ) | | | (0.39 | ) | |
Distributions from net realized gains | | | — | | | | (0.48 | ) | | | (2.25 | ) | | | (0.15 | ) | | | (0.53 | ) | |
Total dividends and distributions | | | (0.26 | ) | | | (0.48 | ) | | | (2.45 | ) | | | (0.25 | ) | | | (0.92 | ) | |
Net asset value, end of year | | $ | 11.52 | | | $ | 10.75 | | | $ | 10.82 | | | $ | 15.00 | | | $ | 12.13 | | |
Total investment return2 | | | 9.74 | % | | | 3.99 | % | | | (13.78 | )% | | | 25.88 | % | | | 1.02 | % | |
Ratios to average net assets: | |
Expenses before fee waivers and/or expense reimbursements | | | 1.26 | % | | | 1.20 | % | | | 1.11 | % | | | 1.14 | % | | | 1.14 | %3 | |
Expenses after fee waivers and/or expense reimbursements | | | 0.96 | % | | | 0.96 | % | | | 0.95 | % | | | 0.95 | % | | | 0.95 | %3 | |
Net investment income (loss) | | | 2.38 | % | | | 1.86 | % | | | 1.07 | % | | | 1.10 | % | | | 1.27 | % | |
Supplemental data: | |
Net assets, end of year (000's) | | $ | 36,138 | | | $ | 38,980 | | | $ | 44,059 | | | $ | 56,383 | | | $ | 51,311 | | |
Portfolio turnover | | | 82 | % | | | 148 | % | | | 125 | % | | | 128 | % | | | 120 | % | |
1 Calculated using the average share method.
2 Total investment return is calculated assuming a $10,000 investment on the first day of each year reported, reinvestment of all dividends and distributions, if any, at net asset value on the ex-dividend dates, and a sale at net asset value on the last day of each year reported. The figures do not include any applicable sales charges, redemption or program fees; results would be lower if they were included. Returns do not reflect the deduction of taxes that a shareholder would pay on Fund dividends/distributions or the redemption of Fund shares.
3 Includes interest expense representing less than 0.005%.
See accompanying notes to financial statements
51
UBS Emerging Markets Equity Opportunity Fund
Financial highlights
The table below sets forth financial data for one share of beneficial interest outstanding throughout each year presented.
Class P
| | | Years ended June 30, | |
| | | 2024 | | 2023 | | 2022 | | 2021 | | 2020 | |
Net asset value, beginning of year | | $ | 7.38 | | | $ | 7.61 | | | $ | 12.39 | | | $ | 9.23 | | | $ | 9.28 | | |
Net investment income (loss)1 | | | 0.12 | | | | 0.18 | | | | 0.20 | | | | 0.09 | | | | 0.19 | | |
Net realized and unrealized gains (losses) | | | 0.66 | | | | (0.24 | ) | | | (3.92 | ) | | | 3.18 | | | | 0.002 | | |
Net increase (decrease) from operations | | | 0.78 | | | | (0.06 | ) | | | (3.72 | ) | | | 3.27 | | | | 0.19 | | |
Dividends from net investment income | | | (0.17 | ) | | | (0.17 | ) | | | (0.12 | ) | | | (0.11 | ) | | | (0.24 | ) | |
Distributions from net realized gains | | | — | | | | — | | | | (0.94 | ) | | | — | | | | — | | |
Total dividends and distributions | | | (0.17 | ) | | | (0.17 | ) | | | (1.06 | ) | | | (0.11 | ) | | | (0.24 | ) | |
Net asset value, end of year | | $ | 7.99 | | | $ | 7.38 | | | $ | 7.61 | | | $ | 12.39 | | | $ | 9.23 | | |
Total investment return3 | | | 10.76 | % | | | (0.80 | )% | | | (31.71 | )% | | | 35.51 | % | | | 1.84 | % | |
Ratios to average net assets: | |
Expenses before fee waivers and/or expense reimbursements | | | 1.20 | %4 | | | 1.18 | % | | | 1.15 | %4 | | | 1.08 | % | | | 1.19 | % | |
Expenses after fee waivers and/or expense reimbursements | | | 1.01 | %4 | | | 1.02 | % | | | 1.00 | %4 | | | 1.00 | % | | | 1.04 | % | |
Net investment income (loss) | | | 1.61 | % | | | 2.47 | % | | | 1.98 | % | | | 0.73 | % | | | 2.14 | % | |
Supplemental data: | |
Net assets, end of year (000's) | | $ | 90,926 | | | $ | 103,168 | | | $ | 132,423 | | | $ | 274,359 | | | $ | 100,543 | | |
Portfolio turnover | | | 42 | % | | | 65 | % | | | 57 | % | | | 41 | % | | | 50 | % | |
Class P2
| | | Years ended June 30, | |
| | | 2024 | | 2023 | | 2022 | | 2021 | | 2020 | |
Net asset value, beginning of year | | $ | 7.40 | | | $ | 7.68 | | | $ | 12.52 | | | $ | 9.30 | | | $ | 9.31 | | |
Net investment income (loss)1 | | | 0.18 | | | | 0.23 | | | | 0.30 | | | | 0.18 | | | | 0.26 | | |
Net realized and unrealized gains (losses) | | | 0.65 | | | | (0.24 | ) | | | (3.96 | ) | | | 3.22 | | | | 0.002 | | |
Net increase (decrease) from operations | | | 0.83 | | | | (0.01 | ) | | | (3.66 | ) | | | 3.40 | | | | 0.26 | | |
Dividends from net investment income | | | (0.24 | ) | | | (0.27 | ) | | | (0.24 | ) | | | (0.18 | ) | | | (0.27 | ) | |
Distributions from net realized gains | | | — | | | | — | | | | (0.94 | ) | | | — | | | | — | | |
Total dividends and distributions | | | (0.24 | ) | | | (0.27 | ) | | | (1.18 | ) | | | (0.18 | ) | | | (0.27 | ) | |
Net asset value, end of year | | $ | 7.99 | | | $ | 7.40 | | | $ | 7.68 | | | $ | 12.52 | | | $ | 9.30 | | |
Total investment return3 | | | 11.51 | % | | | 0.02 | % | | | (31.10 | )% | | | 36.66 | % | | | 2.66 | % | |
Ratios to average net assets: | |
Expenses before fee waivers and/or expense reimbursements | | | 1.20 | %4 | | | 1.17 | % | | | 1.13 | %4 | | | 1.06 | % | | | 1.17 | % | |
Expenses after fee waivers and/or expense reimbursements | | | 0.25 | %4 | | | 0.22 | % | | | 0.19 | %4 | | | 0.12 | % | | | 0.22 | % | |
Net investment income (loss) | | | 2.38 | % | | | 3.14 | % | | | 2.90 | % | | | 1.56 | % | | | 2.88 | % | |
Supplemental data: | |
Net assets, end of year (000's) | | $ | 368,282 | | | $ | 346,908 | | | $ | 445,198 | | | $ | 761,661 | | | $ | 375,791 | | |
Portfolio turnover | | | 42 | % | | | 65 | % | | | 57 | % | | | 41 | % | | | 50 | % | |
1 Calculated using the average share method.
2 Amount represents less than $0.005 per share.
3 Total investment return is calculated assuming a $10,000 investment on the first day of each year reported, reinvestment of all dividends and distributions, if any, at net asset value on the ex-dividend dates, and a sale at net asset value on the last day of each year reported. The figures do not include any applicable sales charges, redemption or program fees; results would be lower if they were included. Returns do not reflect the deduction of taxes that a shareholder would pay on Fund dividends/distributions or the redemption of Fund shares.
4 Includes interest expense representing less than 0.005%.
See accompanying notes to financial statements
52
UBS Engage For Impact Fund
Financial highlights
The table below sets forth financial data for one share of beneficial interest outstanding throughout each year presented.
Class P
| | | Years ended June 30, | |
| | | 2024 | | 2023 | | 2022 | | 2021 | | 2020 | |
Net asset value, beginning of year | | $ | 11.15 | | | $ | 9.97 | | | $ | 14.26 | | | $ | 10.14 | | | $ | 10.81 | | |
Net investment income (loss)1 | | | 0.10 | | | | 0.09 | | | | 0.14 | | | | 0.03 | | | | 0.08 | | |
Net realized and unrealized gains (losses) | | | 1.42 | | | | 1.19 | | | | (2.82 | ) | | | 4.19 | | | | (0.45 | ) | |
Net increase (decrease) from operations | | | 1.52 | | | | 1.28 | | | | (2.68 | ) | | | 4.22 | | | | (0.37 | ) | |
Dividends from net investment income | | | (0.08 | ) | | | — | | | | (0.08 | ) | | | (0.02 | ) | | | (0.11 | ) | |
Distributions from net realized gains | | | — | | | | (0.10 | ) | | | (1.53 | ) | | | (0.08 | ) | | | (0.19 | ) | |
Total dividends and distributions | | | (0.08 | ) | | | (0.10 | ) | | | (1.61 | ) | | | (0.10 | ) | | | (0.30 | ) | |
Net asset value, end of year | | $ | 12.59 | | | $ | 11.15 | | | $ | 9.97 | | | $ | 14.26 | | | $ | 10.14 | | |
Total investment return2 | | | 13.67 | % | | | 12.90 | % | | | (21.28 | )% | | | 41.70 | % | | | (3.77 | )% | |
Ratios to average net assets: | |
Expenses before fee waivers and/or expense reimbursements | | | 1.55 | % | | | 1.53 | % | | | 1.44 | % | | | 1.69 | % | | | 2.27 | % | |
Expenses after fee waivers and/or expense reimbursements | | | 0.88 | % | | | 0.87 | % | | | 0.85 | % | | | 0.85 | % | | | 0.85 | % | |
Net investment income (loss) | | | 0.82 | % | | | 0.86 | % | | | 1.04 | % | | | 0.27 | % | | | 0.75 | % | |
Supplemental data: | |
Net assets, end of year (000's) | | $ | 5,133 | | | $ | 5,776 | | | $ | 6,312 | | | $ | 7,816 | | | $ | 26,241 | | |
Portfolio turnover | | | 28 | % | | | 21 | % | | | 39 | % | | | 78 | % | | | 43 | % | |
Class P2
| | | Years ended June 30, | | Period ended | |
| | | 2024 | | 2023 | | 2022 | | June 30, 20213 | |
Net asset value, beginning of period | | $ | 11.19 | | | $ | 9.99 | | | $ | 14.29 | | | $ | 13.64 | | |
Net investment income (loss)1 | | | 0.17 | | | | 0.16 | | | | 0.22 | | | | 0.09 | | |
Net realized and unrealized gains (losses) | | | 1.41 | | | | 1.19 | | | | (2.82 | ) | | | 0.56 | | |
Net increase (decrease) from operations | | | 1.58 | | | | 1.35 | | | | (2.60 | ) | | | 0.65 | | |
Dividends from net investment income | | | (0.18 | ) | | | (0.05 | ) | | | (0.17 | ) | | | — | | |
Distributions from net realized gains | | | — | | | | (0.10 | ) | | | (1.53 | ) | | | — | | |
Total dividends and distributions | | | (0.18 | ) | | | (0.15 | ) | | | (1.70 | ) | | | 0.00 | | |
Net asset value, end of period | | $ | 12.59 | | | $ | 11.19 | | | $ | 9.99 | | | $ | 14.29 | | |
Total investment return2 | | | 14.29 | % | | | 13.62 | % | | | (20.77 | )% | | | 4.77 | % | |
Ratios to average net assets: | |
Expenses before fee waivers and/or expense reimbursements | | | 1.58 | % | | | 1.56 | % | | | 1.42 | % | | | 2.24 | %4 | |
Expenses after fee waivers and/or expense reimbursements | | | 0.28 | % | | | 0.28 | % | | | 0.25 | % | | | 0.25 | %4 | |
Net investment income (loss) | | | 1.42 | % | | | 1.51 | % | | | 1.64 | % | | | 1.80 | %4 | |
Supplemental data: | |
Net assets, end of period (000's) | | $ | 46,614 | | | $ | 44,976 | | | $ | 40,006 | | | $ | 42,692 | | |
Portfolio turnover | | | 28 | % | | | 21 | % | | | 39 | % | | | 78 | % | |
1 Calculated using the average share method.
2 Total investment return is calculated assuming a $10,000 investment on the first day of each period reported, reinvestment of all dividends and distributions, if any, at net asset value on the ex-dividend dates, and a sale at net asset value on the last day of each period reported. The figures do not include any applicable sales charges; results would be lower if they were included. Total investment return for periods less than one year has not been annualized. Returns do not reflect the deduction of taxes that a shareholder would pay on Fund dividends/distributions or the redemption of Fund shares.
3 For the period February 23, 2021 (commencement of operations) through June 30, 2021.
4 Annualized.
See accompanying notes to financial statements
53
UBS International Sustainable Equity Fund
Financial highlights
The table below sets forth financial data for one share of beneficial interest outstanding throughout each year presented.
Class A
| | | Years ended June 30, | |
| | | 2024 | | 2023 | | 2022 | | 2021 | | 2020 | |
Net asset value, beginning of year | | $ | 9.28 | | | $ | 9.12 | | | $ | 12.48 | | | $ | 9.62 | | | $ | 10.01 | | |
Net investment income (loss)1 | | | 0.09 | | | | 0.07 | | | | 0.08 | | | | 0.05 | | | | 0.16 | | |
Net realized and unrealized gain (loss) | | | 0.66 | | | | 1.23 | | | | (2.38 | ) | | | 2.93 | | | | (0.42 | ) | |
Net increase (decrease) from operations | | | 0.75 | | | | 1.30 | | | | (2.30 | ) | | | 2.98 | | | | (0.26 | ) | |
Dividends from net investment income | | | (0.06 | ) | | | (0.01 | ) | | | (0.12 | ) | | | (0.12 | ) | | | (0.13 | ) | |
Distributions from net realized gains | | | — | | | | (1.13 | ) | | | (0.94 | ) | | | — | | | | — | | |
Total dividends and distributions | | | (0.06 | ) | | | (1.14 | ) | | | (1.06 | ) | | | (0.12 | ) | | | (0.13 | ) | |
Net asset value, end of year | | $ | 9.97 | | | $ | 9.28 | | | $ | 9.12 | | | $ | 12.48 | | | $ | 9.62 | | |
Total investment return2 | | | 8.14 | % | | | 15.68 | % | | | (19.68 | )% | | | 31.09 | % | | | (2.73 | )% | |
Ratios to average net assets: | |
Expenses before fee waivers and/or expense reimbursements | | | 1.50 | %3 | | | 1.49 | %3 | | | 1.37 | %3 | | | 1.33 | % | | | 1.41 | %3 | |
Expenses after fee waivers and/or expense reimbursements | | | 1.26 | %3 | | | 1.26 | %3 | | | 1.25 | %3 | | | 1.25 | % | | | 1.25 | %3 | |
Net investment income (loss) | | | 0.95 | % | | | 0.82 | % | | | 0.70 | % | | | 0.45 | % | | | 1.60 | % | |
Supplemental data: | |
Net assets, end of year (000's) | | $ | 3,921 | | | $ | 4,103 | | | $ | 4,754 | | | $ | 9,081 | | | $ | 7,442 | | |
Portfolio turnover | | | 47 | % | | | 7 | % | | | 53 | % | | | 52 | % | | | 41 | % | |
Class P
| | | Years ended June 30, | |
| | | 2024 | | 2023 | | 2022 | | 2021 | | 2020 | |
Net asset value, beginning of year | | $ | 9.29 | | | $ | 9.15 | | | $ | 12.53 | | | $ | 9.66 | | | $ | 10.04 | | |
Net investment income (loss)1 | | | 0.12 | | | | 0.09 | | | | 0.09 | | | | 0.09 | | | | 0.18 | | |
Net realized and unrealized gains (loss) | | | 0.65 | | | | 1.23 | | | | (2.37 | ) | | | 2.93 | | | | (0.41 | ) | |
Net increase (decrease) from operations | | | 0.77 | | | | 1.32 | | | | (2.28 | ) | | | 3.02 | | | | (0.23 | ) | |
Dividends from net investment income | | | (0.08 | ) | | | (0.05 | ) | | | (0.16 | ) | | | (0.15 | ) | | | (0.15 | ) | |
Distributions from net realized gains | | | — | | | | (1.13 | ) | | | (0.94 | ) | | | — | | | | — | | |
Total dividends and distributions | | | (0.08 | ) | | | (1.18 | ) | | | (1.10 | ) | | | (0.15 | ) | | | (0.15 | ) | |
Net asset value, end of year | | $ | 9.98 | | | $ | 9.29 | | | $ | 9.15 | | | $ | 12.53 | | | $ | 9.66 | | |
Total investment return2 | | | 8.36 | % | | | 16.00 | % | | | (19.50 | )% | | | 31.40 | % | | | (2.40 | )% | |
Ratios to average net assets: | |
Expenses before fee waivers and/or expense reimbursements | | | 1.18 | %3 | | | 1.27 | %3 | | | 1.11 | %3 | | | 1.05 | % | | | 1.12 | %3 | |
Expenses after fee waivers and/or expense reimbursements | | | 1.01 | %3 | | | 1.01 | %3 | | | 1.00 | %3 | | | 0.99 | % | | | 1.00 | %3 | |
Net investment income (loss) | | | 1.25 | % | | | 0.97 | % | | | 0.74 | % | | | 0.79 | % | | | 1.82 | % | |
Supplemental data: | |
Net assets, end of year (000's) | | $ | 107,246 | | | $ | 107,863 | | | $ | 164,377 | | | $ | 380,983 | | | $ | 203,078 | | |
Portfolio turnover | | | 47 | % | | | 7 | % | | | 53 | % | | | 52 | % | | | 41 | % | |
1 Calculated using the average share method.
2 Total investment return is calculated assuming a $10,000 investment on the first day of each year reported, reinvestment of all dividends and distributions, if any, at net asset value on the ex-dividend dates, and a sale at net asset value on the last day of each year reported. The figures do not include any applicable sales charges, redemption or program fees; results would be lower if they were included. Returns do not reflect the deduction of taxes that a shareholder would pay on Fund dividends/distributions or the redemption of Fund shares.
3 Includes interest expense representing less than 0.005%.
4 For the period October 30, 2020 (commencement of operations) through June 30, 2021
5 Annualized.
54
UBS International Sustainable Equity Fund
Financial highlights
The table below sets forth financial data for one share of beneficial interest outstanding throughout each period presented.
Class P2
| | | Years ended June 30, | | Period ended | |
| | | 2024 | | 2023 | | 2022 | | June 30, 20214 | |
Net asset value, beginning of period | | $ | 9.29 | | | $ | 9.18 | | | $ | 12.59 | | | $ | 10.05 | | |
Net investment income (loss)1 | | | 0.19 | | | | 0.17 | | | | 0.20 | | | | 0.14 | | |
Net realized and unrealized gains (loss) | | | 0.64 | | | | 1.23 | | | | (2.41 | ) | | | 2.55 | | |
Net increase (decrease) from operations | | | 0.83 | | | | 1.40 | | | | (2.21 | ) | | | 2.69 | | |
Dividends from net investment income | | | (0.16 | ) | | | (0.16 | ) | | | (0.26 | ) | | | (0.15 | ) | |
Distributions from net realized gains | | | — | | | | (1.13 | ) | | | (0.94 | ) | | | — | | |
Total dividends and distributions | | | (0.16 | ) | | | (1.29 | ) | | | (1.20 | ) | | | (0.15 | ) | |
Net asset value, end of period | | $ | 9.96 | | | $ | 9.29 | | | $ | 9.18 | | | $ | 12.59 | | |
Total investment return2 | | | 9.08 | % | | | 16.83 | % | | | (18.84 | )% | | | 26.90 | % | |
Ratios to average net assets: | |
Expenses before fee waivers and/or expense reimbursements | | | 1.23 | %3 | | | 1.22 | %3 | | | 1.12 | %3 | | | 1.08 | %5 | |
Expenses after fee waivers and/or expense reimbursements | | | 0.26 | %3 | | | 0.26 | %3 | | | 0.25 | %3 | | | 0.22 | %5 | |
Net investment income (loss) | | | 1.98 | % | | | 1.88 | % | | | 1.76 | % | | | 1.78 | %5 | |
Supplemental data: | |
Net assets, end of period (000's) | | $ | 44,849 | | | $ | 44,800 | | | $ | 40,308 | | | $ | 41,571 | | |
Portfolio turnover | | | 47 | % | | | 7 | % | | | 53 | % | | | 52 | % | |
1 Calculated using the average share method.
2 Total investment return is calculated assuming a $10,000 investment on the first day of each year reported, reinvestment of all dividends and distributions, if any, at net asset value on the ex-dividend dates, and a sale at net asset value on the last day of each year reported. The figures do not include any applicable sales charges, redemption or program fees; results would be lower if they were included. Returns do not reflect the deduction of taxes that a shareholder would pay on Fund dividends/distributions or the redemption of Fund shares.
3 Includes interest expense representing less than 0.005%.
4 For the period October 30, 2020 (commencement of operations) through June 30, 2021
5 Annualized.
See accompanying notes to financial statements
55
UBS US Dividend Ruler Fund
Financial highlights
The table below sets forth financial data for one share of beneficial interest outstanding throughout each period presented.
Class P
| | | Years ended June 30, | | Period ended | |
| | | 2024 | | 2023 | | 2022 | | June 30, 20211 | |
Net asset value, beginning of period | | $ | 13.34 | | | $ | 11.83 | | | $ | 12.82 | | | $ | 10.00 | | |
Net investment income (loss)2 | | | 0.24 | | | | 0.25 | | | | 0.23 | | | | 0.20 | | |
Net realized and unrealized gains (losses) | | | 2.02 | | | | 1.57 | | | | (0.84 | ) | | | 2.72 | | |
Net increase (decrease) from operations | | | 2.26 | | | | 1.82 | | | | (0.61 | ) | | | 2.92 | | |
Dividends from net investment income | | | (0.30 | ) | | | (0.16 | ) | | | (0.16 | ) | | | (0.05 | ) | |
Distributions from net realized gains | | | (0.10 | ) | | | (0.15 | ) | | | (0.22 | ) | | | (0.05 | ) | |
Total dividends and distributions | | | (0.40 | ) | | | (0.31 | ) | | | (0.38 | ) | | | (0.10 | ) | |
Net asset value, end of period | | $ | 15.20 | | | $ | 13.34 | | | $ | 11.83 | | | $ | 12.82 | | |
Total investment return3 | | | 17.31 | % | | | 15.60 | % | | | (5.01 | )% | | | 29.37 | % | |
Ratios to average net assets: | |
Expenses before fee waivers and/or expense reimbursements | | | 0.87 | % | | | 0.94 | % | | | 0.83 | % | | | 1.57 | %4 | |
Expenses after fee waivers and/or expense reimbursements | | | 0.51 | % | | | 0.51 | % | | | 0.50 | % | | | 0.50 | %4 | |
Net investment income (loss) | | | 1.75 | % | | | 1.98 | % | | | 1.76 | % | | | 1.72 | %4 | |
Supplemental data: | |
Net assets, end of period (000's) | | $ | 175,102 | | | $ | 137,806 | | | $ | 118,829 | | | $ | 81,981 | | |
Portfolio turnover | | | 26 | % | | | 34 | % | | | 29 | % | | | 24 | % | |
Class P2
| | | Year ended
June 30, 2024 | | Period ended
June 30, 20235 | |
Net asset value, beginning of period | | $ | 13.35 | | | $ | 12.10 | | |
Net investment income (loss)2 | | | 0.29 | | | | 0.08 | | |
Net realized and unrealized gains (losses) | | | 2.02 | | | | 1.17 | | |
Net increase (decrease) from operations | | | 2.31 | | | | 1.25 | | |
Dividends from net investment income | | | (0.37 | ) | | | — | | |
Distributions from net realized gains | | | (0.10 | ) | | | — | | |
Total dividends and distributions | | | (0.47 | ) | | | — | | |
Net asset value, end of period | | $ | 15.19 | | | $ | 13.35 | | |
Total investment return3 | | | 17.74 | % | | | 10.33 | % | |
Ratios to average net assets: | |
Expenses before fee waivers and/or expense reimbursements | | | 0.85 | % | | | 1.18 | %4 | |
Expenses after fee waivers and/or expense reimbursements | | | 0.16 | % | | | 0.18 | %4 | |
Net investment income (loss) | | | 2.10 | % | | | 2.16 | %4 | |
Supplemental data: | |
Net assets, end of period (000's) | | $ | 24,234 | | | $ | 14,250 | | |
Portfolio turnover | | | 26 | % | | | 34 | % | |
1 For the period from July 9, 2020 (commencement of operations) through June 30, 2021.
2 Calculated using the average share method.
3 Total investment return is calculated assuming a $10,000 investment on the first day of each period reported, reinvestment of all dividends and distributions, if any, at net asset value on the ex-dividend dates, and a sale at net asset value on the last day of each period reported. The figures do not include any applicable sales charges; results would be lower if they were included. Total investment return for periods less than one year has not been annualized. Returns do not reflect the deduction of taxes that a shareholder would pay on Fund dividends/distributions or the redemption of Fund shares.
4 Annualized.
5 For the period March 15, 2023 (commencement of operations) through June 30, 2023.
See accompanying notes to financial statements
56
UBS US Quality Growth At Reasonable Price Fund
Financial highlights
The table below sets forth financial data for one share of beneficial interest outstanding throughout each period presented.
Class P
| | | Years ended June 30, | | Period ended | |
| | | 2024 | | 2023 | | 2022 | | June 30, 20211 | |
Net asset value, beginning of period | | $ | 12.75 | | | $ | 10.68 | | | $ | 13.10 | | | $ | 10.00 | | |
Net investment income (loss)2 | | | 0.06 | | | | 0.06 | | | | 0.04 | | | | 0.04 | | |
Net realized and unrealized gains (losses) | | | 3.88 | | | | 2.12 | | | | (2.05 | ) | | | 3.10 | | |
Net increase (decrease) from operations | | | 3.94 | | | | 2.18 | | | | (2.01 | ) | | | 3.14 | | |
Dividends from net investment income | | | (0.06 | ) | | | — | | | | (0.03 | ) | | | (0.01 | ) | |
Distributions from net realized gains | | | — | | | | (0.11 | ) | | | (0.38 | ) | | | (0.03 | ) | |
Total dividends and distributions | | | (0.06 | ) | | | (0.11 | ) | | | (0.41 | ) | | | (0.04 | ) | |
Net asset value, end of period | | $ | 16.63 | | | $ | 12.75 | | | $ | 10.68 | | | $ | 13.10 | | |
Total investment return3 | | | 30.98 | % | | | 20.59 | % | | | (16.06 | )% | | | 31.49 | % | |
Ratios to average net assets: | |
Expenses before fee waivers and/or expense reimbursements | | | 0.80 | % | | | 0.84 | % | | | 0.79 | % | | | 1.23 | %4 | |
Expenses after fee waivers and/or expense reimbursements | | | 0.51 | % | | | 0.51 | % | | | 0.50 | % | | | 0.50 | %4 | |
Net investment income (loss) | | | 0.38 | % | | | 0.54 | % | | | 0.28 | % | | | 0.32 | %4 | |
Supplemental data: | |
Net assets, end of period (000's) | | $ | 287,284 | | | $ | 186,544 | | | $ | 166,979 | | | $ | 116,538 | | |
Portfolio turnover | | | 27 | % | | | 41 | % | | | 30 | % | | | 29 | % | |
1 For the period from July 9, 2020 (commencement of operations) through June 30, 2021.
2 Calculated using the average share method.
3 Total investment return is calculated assuming a $10,000 investment on the first day of each period reported, reinvestment of all dividends and distributions, if any, at net asset value on the ex-dividend dates, and a sale at net asset value on the last day of each period reported. The figures do not include any applicable sales charges; results would be lower if they were included. Total investment return for periods less than one year has not been annualized. Returns do not reflect the deduction of taxes that a shareholder would pay on Fund dividends/distributions or the redemption of Fund shares.
4 Annualized.
See accompanying notes to financial statements
57
UBS U.S. Small Cap Growth Fund
Financial highlights
The table below sets forth financial data for one share of beneficial interest outstanding throughout each year presented.
Class A
| | | Years ended June 30, | |
| | | 2024 | | 2023 | | 2022 | | 2021 | | 2020 | |
Net asset value, beginning of year | | $ | 15.72 | | | $ | 14.62 | | | $ | 28.15 | | | $ | 19.74 | | | $ | 19.49 | | |
Net investment income (loss)1 | | | (0.09 | ) | | | (0.07 | ) | | | (0.13 | ) | | | (0.25 | ) | | | (0.11 | ) | |
Net realized and unrealized gain (loss) | | | 1.71 | | | | 2.05 | | | | (7.78 | ) | | | 11.88 | | | | 1.79 | | |
Net increase (decrease) from operations | | | 1.62 | | | | 1.98 | | | | (7.91 | ) | | | 11.63 | | | | 1.68 | | |
Distributions from net realized gains | | | — | | | | (0.88 | ) | | | (5.62 | ) | | | (3.22 | ) | | | (1.43 | ) | |
Net asset value, end of year | | $ | 17.34 | | | $ | 15.72 | | | $ | 14.62 | | | $ | 28.15 | | | $ | 19.74 | | |
Total investment return2 | | | 10.30 | % | | | 14.23 | % | | | (33.31 | )% | | | 59.94 | % | | | 9.33 | % | |
Ratios to average net assets: | |
Expenses before fee waivers and/or expense reimbursements | | | 1.57 | % | | | 1.55 | % | | | 1.46 | % | | | 1.43 | % | | | 1.60 | %3 | |
Expenses after fee waivers and/or expense reimbursements | | | 1.26 | % | | | 1.25 | % | | | 1.24 | % | | | 1.24 | % | | | 1.24 | %3 | |
Net investment income (loss) | | | (0.57 | )% | | | (0.43 | )% | | | (0.57 | )% | | | (0.98 | )% | | | (0.63 | )% | |
Supplemental data: | |
Net assets, end of year (000's) | | $ | 13,413 | | | $ | 15,276 | | | $ | 17,387 | | | $ | 35,268 | | | $ | 22,909 | | |
Portfolio turnover | | | 51 | % | | | 35 | % | | | 40 | % | | | 63 | % | | | 79 | % | |
Class P
| | | Years ended June 30, | |
| | | 2024 | | 2023 | | 2022 | | 2021 | | 2020 | |
Net asset value, beginning of year | | $ | 19.03 | | | $ | 17.47 | | | $ | 32.44 | | | $ | 22.37 | | | $ | 21.84 | | |
Net investment income (loss)1 | | | (0.06 | ) | | | (0.03 | ) | | | (0.08 | ) | | | (0.22 | ) | | | (0.08 | ) | |
Net realized and unrealized gains (losses) | | | 2.07 | | | | 2.47 | | | | (9.21 | ) | | | 13.51 | | | | 2.04 | | |
Net increase (decrease) from operations | | | 2.01 | | | | 2.44 | | | | (9.29 | ) | | | 13.29 | | | | 1.96 | | |
Dividends from net investment income | | | — | | | | — | | | | (0.06 | ) | | | — | | | | — | | |
Distributions from net realized gains | | | — | | | | (0.88 | ) | | | (5.62 | ) | | | (3.22 | ) | | | (1.43 | ) | |
Total dividends and distributions | | | — | | | | (0.88 | ) | | | (5.68 | ) | | | (3.22 | ) | | | (1.43 | ) | |
Net asset value, end of year | | $ | 21.04 | | | $ | 19.03 | | | $ | 17.47 | | | $ | 32.44 | | | $ | 22.37 | | |
Total investment return2 | | | 10.56 | % | | | 14.48 | % | | | (33.13 | )% | | | 60.29 | % | | | 9.62 | % | |
Ratios to average net assets: | |
Expenses before fee waivers and/or expense reimbursements | | | 1.28 | % | | | 1.31 | % | | | 1.21 | % | | | 1.16 | % | | | 1.29 | %3 | |
Expenses after fee waivers and/or expense reimbursements | | | 1.01 | % | | | 1.00 | % | | | 0.99 | % | | | 0.99 | % | | | 0.99 | %3 | |
Net investment income (loss) | | | (0.32 | )% | | | (0.17 | )% | | | (0.31 | )% | | | (0.74 | )% | | | (0.37 | )% | |
Supplemental data: | |
Net assets, end of year (000's) | | $ | 119,902 | | | $ | 109,817 | | | $ | 110,879 | | | $ | 178,971 | | | $ | 92,754 | | |
Portfolio turnover | | | 51 | % | | | 35 | % | | | 40 | % | | | 63 | % | | | 79 | % | |
1 Calculated using the average share method.
2 Total investment return is calculated assuming a $10,000 investment on the first day of each year reported, reinvestment of all dividends and distributions, if any, at net asset value on the ex-dividend dates, and a sale at net asset value on the last day of each year reported. The figures do not include any applicable sales charges, redemption or program fees; results would be lower if they were included. Returns do not reflect the deduction of taxes that a shareholder would pay on Fund dividends/distributions or the redemption of Fund shares.
3 Includes interest expense representing less than 0.005%.
See accompanying notes to financial statements
58
UBS Sustainable Development Bank Bond Fund
Financial highlights
The table below sets forth financial data for one share of beneficial interest outstanding throughout each year presented.
Class P
| | | Years ended June 30, | |
| | | 2024 | | 2023 | | 2022 | | 2021 | | 2020 | |
Net asset value, beginning of year | | $ | 9.28 | | | $ | 9.62 | | | $ | 10.60 | | | $ | 11.17 | | | $ | 10.58 | | |
Net investment income (loss)1 | | | 0.24 | | | | 0.17 | | | | 0.10 | | | | 0.13 | | | | 0.21 | | |
Net realized and unrealized gains (losses) | | | 0.03 | | | | (0.34 | ) | | | (0.97 | ) | | | (0.31 | ) | | | 0.63 | | |
Net increase (decrease) from operations | | | 0.27 | | | | (0.17 | ) | | | (0.87 | ) | | | (0.18 | ) | | | 0.84 | | |
Dividends from net investment income | | | (0.23 | ) | | | (0.16 | ) | | | (0.10 | ) | | | (0.12 | ) | | | (0.21 | ) | |
Distributions from net realized gains | | | — | | | | — | | | | (0.01 | ) | | | (0.27 | ) | | | (0.04 | ) | |
Return of capital | | | — | | | | (0.01 | ) | | | — | | | | — | | | | — | | |
Total dividends and distributions and return of capital | | | (0.23 | ) | | | (0.17 | ) | | | (0.11 | ) | | | (0.39 | ) | | | (0.25 | ) | |
Net asset value, end of year | | $ | 9.32 | | | $ | 9.28 | | | $ | 9.62 | | | $ | 10.60 | | | $ | 11.17 | | |
Total investment return2 | | | 2.99 | % | | | (1.75 | )% | | | (8.13 | )% | | | (1.70 | )% | | | 8.03 | % | |
Ratios to average net assets: | |
Expenses before fee waivers and/or expense reimbursements | | | 0.69 | %3 | | | 0.68 | % | | | 0.56 | % | | | 0.80 | % | | | 1.07 | %3 | |
Expenses after fee waivers and/or expense reimbursements | | | 0.27 | %3 | | | 0.27 | % | | | 0.25 | % | | | 0.25 | % | | | 0.25 | %3 | |
Net investment income (loss) | | | 2.55 | % | | | 1.78 | % | | | 1.01 | % | | | 1.18 | % | | | 1.94 | % | |
Supplemental data: | |
Net assets, end of year (000's) | | $ | 14,517 | | | $ | 14,937 | | | $ | 8,052 | | | $ | 17,510 | | | $ | 37,414 | | |
Portfolio turnover | | | 28 | % | | | 22 | % | | | 47 | % | | | 16 | % | | | 80 | % | |
Class P2
| | | Years ended June 30, | | Period ended | |
| | | 2024 | | 2023 | | 2022 | | June 30, 20214 | |
Net asset value, beginning of period | | $ | 9.27 | | | $ | 9.61 | | | $ | 10.59 | | | $ | 11.09 | | |
Net investment income (loss)1 | | | 0.24 | | | | 0.17 | | | | 0.12 | | | | 0.08 | | |
Net realized and unrealized gains (losses) | | | 0.04 | | | | (0.33 | ) | | | (0.97 | ) | | | (0.23 | ) | |
Net increase (decrease) from operations | | | 0.28 | | | | (0.16 | ) | | | (0.85 | ) | | | (0.15 | ) | |
Dividends from net investment income | | | (0.25 | ) | | | (0.17 | ) | | | (0.12 | ) | | | (0.08 | ) | |
Distributions from net realized gains | | | — | | | | — | | | | (0.01 | ) | | | (0.27 | ) | |
Return of capital | | | — | | | | (0.01 | ) | | | — | | | | — | | |
Total dividends and distributions and return of capital | | | (0.25 | ) | | | (0.18 | ) | | | (0.13 | ) | | | (0.35 | ) | |
Net asset value, end of period | | $ | 9.30 | | | $ | 9.27 | | | $ | 9.61 | | | $ | 10.59 | | |
Total investment return2 | | | 3.04 | % | | | (1.62 | )% | | | (8.08 | )% | | | (1.34 | )% | |
Ratios to average net assets: | |
Expenses before fee waivers and/or expense reimbursements | | | 0.70 | %3 | | | 0.66 | % | | | 0.56 | % | | | 0.68 | %5 | |
Expenses after fee waivers and/or expense reimbursements | | | 0.17 | %3 | | | 0.16 | % | | | 0.15 | % | | | 0.15 | %5 | |
Net investment income (loss) | | | 2.64 | % | | | 1.83 | % | | | 1.15 | % | | | 1.09 | %5 | |
Supplemental data: | |
Net assets, end of period (000's) | | $ | 64,729 | | | $ | 71,059 | | | $ | 68,917 | | | $ | 65,659 | | |
Portfolio turnover | | | 28 | % | | | 22 | % | | | 47 | % | | | 16 | % | |
1 Calculated using the average share method.
2 Total investment return is calculated assuming a $10,000 investment on the first day of each period reported, reinvestment of all dividends and distributions, if any, at net asset value on the ex-dividend dates, and a sale at net asset value on the last day of each period reported. The figures do not include any applicable sales charges; results would be lower if they were included. Total investment return for periods less than one year has not been annualized. Returns do not reflect the deduction of taxes that a shareholder would pay on Fund dividends/distributions or the redemption of Fund shares.
3 Includes interest expense representing less than 0.005%.
4 For the period October 30, 2020 (commencement of operations) through June 30, 2021
5 Annualized.
See accompanying notes to financial statements
59
UBS Multi Income Bond Fund
Financial highlights
The table below sets forth financial data for one share of beneficial interest outstanding throughout each year presented.
Class A
| | | Years ended June 30, | |
| | | 2024 | | 2023 | | 2022 | | 2021 | | 2020 | |
Net asset value, beginning of year | | $ | 13.38 | | | $ | 13.27 | | | $ | 15.66 | | | $ | 15.64 | | | $ | 15.09 | | |
Net investment income (loss)1 | | | 0.62 | | | | 0.55 | | | | 0.27 | | | | 0.30 | | | | 0.41 | | |
Net realized and unrealized gain (loss) | | | (0.20 | ) | | | — | | | | (2.42 | ) | | | (0.02 | ) | | | 0.50 | | |
Net increase (decrease) from operations | | | 0.42 | | | | 0.55 | | | | (2.15 | ) | | | 0.28 | | | | 0.91 | | |
Dividends from net investment income | | | (0.50 | ) | | | (0.44 | ) | | | (0.24 | ) | | | (0.26 | ) | | | (0.36 | ) | |
Net asset value, end of year | | $ | 13.30 | | | $ | 13.38 | | | $ | 13.27 | | | $ | 15.66 | | | $ | 15.64 | | |
Total investment return2 | | | 3.24 | % | | | 4.25 | % | | | (13.91 | )% | | | 1.83 | % | | | 6.14 | % | |
Ratios to average net assets: | |
Expenses before fee waivers and/or expense reimbursements | | | 2.63 | %3 | | | 2.22 | % | | | 1.92 | % | | | 1.73 | % | | | 1.59 | %3 | |
Expenses after fee waivers and/or expense reimbursements | | | 0.97 | %3 | | | 0.89 | % | | | 0.75 | % | | | 0.75 | % | | | 0.75 | %3 | |
Net investment income (loss) | | | 4.66 | % | | | 4.09 | % | | | 1.80 | % | | | 1.90 | % | | | 2.66 | % | |
Supplemental data: | |
Net assets, end of year (000's) | | $ | 287 | | | $ | 501 | | | $ | 570 | | | $ | 681 | | | $ | 650 | | |
Portfolio turnover | | | 32 | % | | | 24 | % | | | 248 | % | | | 169 | % | | | 209 | % | |
Class P
| | | Years ended June 30, | |
| | | 2024 | | 2023 | | 2022 | | 2021 | | 2020 | |
Net asset value, beginning of year | | $ | 13.39 | | | $ | 13.28 | | | $ | 15.67 | | | $ | 15.65 | | | $ | 15.10 | | |
Net investment income (loss)1 | | | 0.66 | | | | 0.58 | | | | 0.31 | | | | 0.34 | | | | 0.45 | | |
Net realized and unrealized gains (losses) | | | (0.21 | ) | | | 0.01 | | | | (2.43 | ) | | | (0.02 | ) | | | 0.50 | | |
Net increase (decrease) from operations | | | 0.45 | | | | 0.59 | | | | (2.12 | ) | | | 0.32 | | | | 0.95 | | |
Dividends from net investment income | | | (0.54 | ) | | | (0.48 | ) | | | (0.27 | ) | | | (0.30 | ) | | | (0.40 | ) | |
Net asset value, end of year | | $ | 13.30 | | | $ | 13.39 | | | $ | 13.28 | | | $ | 15.67 | | | $ | 15.65 | | |
Total investment return2 | | | 3.42 | % | | | 4.51 | % | | | (13.68 | )% | | | 2.07 | % | | | 6.40 | % | |
Ratios to average net assets: | |
Expenses before fee waivers and/or expense reimbursements | | | 2.45 | %3 | | | 2.04 | % | | | 1.71 | % | | | 1.52 | % | | | 1.38 | %3 | |
Expenses after fee waivers and/or expense reimbursements | | | 0.73 | %3 | | | 0.64 | % | | | 0.50 | % | | | 0.50 | % | | | 0.50 | %3 | |
Net investment income (loss) | | | 4.99 | % | | | 4.34 | % | | | 2.06 | % | | | 2.15 | % | | | 2.92 | % | |
Supplemental data: | |
Net assets, end of year (000's) | | $ | 20,031 | | | $ | 23,437 | | | $ | 26,702 | | | $ | 34,629 | | | $ | 37,048 | | |
Portfolio turnover | | | 32 | % | | | 24 | % | | | 248 | % | | | 169 | % | | | 209 | % | |
1 Calculated using the average share method.
2 Total investment return is calculated assuming a $10,000 investment on the first day of each period reported, reinvestment of all dividends and distributions, if any, at net asset value on the ex-dividend dates, and a sale at net asset value on the last day of each year reported. The figures do not include any applicable sales charges; redemption or program fees results would be lower if they were included. Total investment return for periods less than one year has not been annualized. Returns do not reflect the deduction of taxes that a shareholder would pay on Fund dividends/distributions or the redemption of Fund shares.
3 Includes interest expense representing less than 0.005%.
4 For the period from October 11, 2023 (commencement of operations) through June 30, 2024.
5 Annualized.
60
UBS Multi Income Bond Fund
Financial highlights
The table below sets forth financial data for one share of beneficial interest outstanding throughout each period presented.
Class P2
| | | Period ended
June 30, 20244 | |
Net asset value, beginning of period | | $ | 12.93 | | |
Net investment income (loss)1 | | | 0.53 | | |
Net realized and unrealized gains (losses) | | | 0.29 | | |
Net increase (decrease) from operations | | | 0.82 | | |
Dividends from net investment income | | | (0.41 | ) | |
Net asset value, end of period | | $ | 13.34 | | |
Total investment return2 | | | 6.65 | % | |
Ratios to average net assets: | |
Expenses before fee waivers and/or expense reimbursements | | | 3.84 | %3,5 | |
Expenses after fee waivers and/or expense reimbursements | | | 0.26 | %3,5 | |
Net investment income (loss) | | | 5.56 | %5 | |
Supplemental data: | |
Net assets, end of period (000's) | | $ | 1 | | |
Portfolio turnover | | | 32 | % | |
See accompanying notes to financial statements
61
The UBS Funds
Notes to financial statements
Organization and significant accounting policies
The UBS Funds (the "Trust") is an open-end management investment company registered with the US Securities and Exchange Commission ("SEC") under the Investment Company Act of 1940 (the "1940 Act"), as amended, currently offering multiple series representing separate investment portfolios. The Trust is a Delaware statutory trust organized on August 13, 1993. The trustees of the Trust have authority to issue an unlimited number of shares of beneficial interest at par value of $0.001 per share.
The Trust has ten Funds available for investment, each having its own investment objectives and policies: UBS All China Equity Fund, UBS Global Allocation Fund, UBS Emerging Markets Equity Opportunity Fund, UBS Engage For Impact Fund, UBS International Sustainable Equity Fund, UBS US Dividend Ruler Fund, UBS US Quality Growth At Reasonable Price Fund, UBS U.S. Small Cap Growth Fund, UBS Sustainable Development Bank Bond Fund, and UBS Multi Income Bond Fund, (each a "Fund", and collectively, the "Funds"). Each of the Funds is classified as a diversified investment company with the exception of UBS All China Equity Fund, UBS US Quality Growth At Reasonable Price Fund and UBS Sustainable Development Bank Bond Fund, which are classified as non-diversified for purposes of the 1940 Act.
UBS Asset Management (Americas) LLC ("UBS AM"), (formerly, UBS Asset Management (Americas) Inc.), is the investment advisor and administrator for the Funds. UBS Asset Management (US) Inc. ("UBS AM (US)") serves as principal underwriter for the Funds. UBS AM and UBS AM (US) are indirect wholly owned subsidiaries of UBS Group AG. UBS Group AG is an internationally diversified organization with headquarters in Zurich, Switzerland. UBS Group AG operates in many areas of the financial services industry.
The Funds currently offer Class A and Class P shares, with the exception of (1) UBS All China Equity Fund, UBS Emerging Markets Equity Opportunity Fund, UBS Engage For Impact Fund, UBS International Sustainable Equity Fund, UBS US Dividend Ruler Fund, UBS Sustainable Development Bank Bond Fund and UBS Multi Income Bond Fund, which currently also offer Class P2 shares and (2) UBS US Quality Growth At Reasonable Price Fund is currently only offering Class P shares. Each class represents interests in the same assets of the applicable Fund and the classes are identical except for differences in their sales charge structures, ongoing service and distribution charges, fee waiver/expense cap/expense reimbursement arrangements and certain transfer agency and related services expenses. All classes of shares have equal voting privileges except that each class has exclusive voting rights with respect to its service and/or distribution plan, if any. Class P and Class P2 shares have no service or distribution plan.
The Trust accounts separately for the assets, liabilities and operations of each Fund. Expenses directly attributable to each Fund are charged to that Fund's operations; expenses which are applicable to all Funds are allocated among them on a pro rata basis.
In the normal course of business, the Funds may enter into contracts that contain a variety of representations that provide indemnification for certain liabilities. The Funds' maximum exposure under these arrangements is unknown, as this would involve future claims that may be made against the Funds that have not yet occurred. However, the Funds have not had any prior claims or losses pursuant to these contracts and expect the risk of loss to be remote.
Under certain circumstances, shareholders of the Funds may receive payment for redemptions in securities rather than in cash.
The Financial Accounting Standards Board ("FASB") Accounting Standards Codification ("ASC") is the exclusive reference of authoritative US generally accepted accounting principles ("US GAAP") recognized by the FASB to be applied by nongovernmental entities. Rules and interpretive releases of the SEC under authority of federal laws are also sources of authoritative US GAAP for SEC registrants. The Funds' financial statements are prepared in accordance with US GAAP, which may require the use of management estimates and assumptions. Actual results could differ from those estimates.
62
The UBS Funds
Notes to financial statements
In October 2022, the SEC adopted the Tailored Shareholder Reports for Mutual Funds and Exchange-Traded Funds rule and reform amendments requiring open-end management investment companies, including mutual funds and exchange-traded funds, to transmit concise and visually engaging semi-annual and annual tailored shareholder reports that highlight key information, including fund expenses, performance, and holdings to shareholders. Certain information from the Fund's current shareholder reports, including the Fund's investment portfolio, financial statements and financial highlights, will not appear in the tailored shareholder report but will be filed on a semiannual basis on Form N-CSR. This information will be available online, mailed upon request and filed on a semiannual basis. The rule and form amendments have a compliance date of July 24, 2024.
The following is a summary of significant accounting policies:
Investment transactions, investment income and expenses: Investment transactions are recorded on the trade date. Realized gains and losses from investment transactions and foreign exchange transactions are calculated using the identified cost method. Dividend income and expense are recorded net of withholding taxes on the ex-dividend date ("ex-date") except in the case of certain dividends from foreign securities which are recorded as soon after the ex-date as the respective Fund, using reasonable diligence, becomes aware of such dividends. Interest income is recorded on an accrual basis. Discounts are accreted and premiums are amortized as adjustments to interest income and the identified cost of investments.
Income, expenses (excluding class-specific expenses) and realized/unrealized gains/losses are allocated proportionately to each class of shares based upon the relative net asset value of outstanding shares (or the value of dividend eligible shares, as appropriate) of each class at the beginning of the day after adjusting for current capital share activity of the respective classes. Class specific expenses are charged directly to the applicable class of shares.
Dividends and distributions: Dividends and distributions to shareholders are recorded on the ex-dividend date. The amount of dividends from net investment income and distributions from net realized capital gains and/or return of capital are determined in accordance with US federal income tax regulations, which may differ from US GAAP. These "book/tax" differences are either considered temporary or permanent in nature. To the extent these differences are permanent in nature, such amounts are reclassified within the capital accounts based on their federal tax-basis treatment; temporary differences do not require reclassification.
Foreign currency translation: The books and records of the Funds are maintained in US dollars. Foreign currency amounts are translated into US dollars as follows: (1) the foreign currency market value of investment securities and other assets and liabilities stated in foreign currencies are translated into US dollars based on the current exchange rates each business day; and (2) purchases and sales of investment securities and income and expenses are translated at the rate of exchange prevailing on the respective dates of such transactions. The resulting exchange gains and losses are included in the Statement of operations.
The Funds do not generally isolate the effect of fluctuations in foreign exchange rates from the effect of the changes in the market prices of securities. However, the Funds do isolate the effect of fluctuations in foreign exchange rates when determining the realized gain or loss upon the sale or maturity of foreign currency-denominated securities pursuant to US federal income tax regulations. Net realized foreign currency transaction gain (loss) is treated as ordinary income (loss) for income tax reporting purposes.
Concentration of risk: Investing in securities of foreign issuers and currency transactions may involve certain considerations and risks not typically associated with investments in the United States. These risks include revaluation of currencies, adverse fluctuations in foreign currency values and possible adverse political, social and economic developments, including those particular to a specific industry, country or region, which could cause the securities and
63
The UBS Funds
Notes to financial statements
their markets to be less liquid and prices more volatile than those of comparable US companies and US government securities. These risks are greater with respect to securities of issuers located in emerging market countries in which some Funds in the Trust invest.
Small capitalization ("small cap") companies may be more vulnerable than larger capitalization ("large cap") companies to adverse business or economic developments. Small cap companies may also have limited product lines, markets or financial resources, and may be dependent on a relatively small management group. Securities of such companies may be less liquid and more volatile than securities of large cap companies or the market averages in general and therefore may involve greater risk than investing in large cap companies. In addition, small cap companies may not be well-known to the investing public, may not have institutional ownership and may have only cyclical, static or moderate growth prospects.
The ability of the issuers of debt securities held by the Funds to meet their obligations may be affected by economic, political and other developments particular to a specific industry, country, state or region.
Investments in bonds with ratings of BB (Standard & Poor's Financial Services LLC or Fitch Ratings, Inc.) or Ba (Moody's Investors Service, Inc.) or below (commonly referred to as "high yield" bonds), or deemed of equivalent quality, have an increased risk of defaulting or otherwise being unable to honor a financial obligation. These securities are considered to be predominantly speculative with respect to an issuer's capacity to pay interest and repay principal in accordance with the terms of the obligations. Lower-quality bonds are more likely to be subject to an issuer's default or downgrade than investment grade (higher-quality) bonds.
Many financial instruments, financings or other transactions to which a Fund may be a party use or may use a floating rate based on the London Interbank Offered Rate ("LIBOR"). LIBOR is widely used in financial markets. In July 2017, the United Kingdom's financial regulatory body announced that after 2021 it will cease its active encouragement of banks to provide the quotations needed to sustain LIBOR. That announcement suggests that LIBOR may cease to be published or utilized after that time. Various financial industry groups have begun planning for that transition, but the effect of the transition process and its ultimate success cannot yet be determined. The transition process may lead to increased volatility and illiquidity in markets for instruments the terms of which are based on LIBOR. It could also lead to a reduction in the value of some LIBOR-based investments and reduce the effectiveness of new hedges placed against existing LIBOR-based investments. Since the usefulness of LIBOR as a benchmark could deteriorate during the transition period. The willingness and ability of issuers to include enhanced provisions in new and existing contracts or instruments also remains uncertain. Any of these factors may adversely affect a Fund's performance or NAV. Certain LIBOR tenors were discontinued by the end of 2021, while the discontinuation of others were extended to December 2024.
The conflict between Ukraine and the Russian Federation has resulted in significant volatility and uncertainty in financial markets. NATO, EU and G7 member countries have imposed severe and coordinated sanctions against Russia. Restrictive measures have also been imposed by Russia, and some securities traded in that country have materially declined in value and/or may no longer be tradable. These actions have resulted in significant disruptions to investing activities and businesses with operations in Russia. The longer-term impact to geopolitical norms, supply chains and investment valuations is uncertain.
Valuation of investments
Each Fund generally calculates its net asset value on days that the New York Stock Exchange ("NYSE") is open. The Fund calculates net asset value as of the close of regular trading on the NYSE (generally, 4:00 p.m., Eastern time). The NYSE normally is not open, and the Fund does not price its shares, on most national holidays and Good Friday. To the extent that the Fund's assets are traded in other markets on days when the NYSE is not open, the value of the Fund's assets may be affected on those days. If trading on the NYSE is halted for the day before 4:00 p.m., Eastern time, the Fund's net asset value per share generally will still be calculated as of the close of regular trading
64
The UBS Funds
Notes to financial statements
on the NYSE. The time at which the Fund calculates its net asset value and until which purchase, sale or exchange orders are accepted may be changed as permitted by the SEC.
Each Fund calculates its net asset value based on the current market value, where available, for its portfolio investments. The Fund normally obtains market values for its investments from independent pricing sources and broker-dealers. Independent pricing sources may use reported last sale prices, official market closing prices, current market quotations or valuations from computerized "evaluation" systems that derive values based on comparable investments. An evaluation system incorporates parameters such as security quality, maturity and coupon, and/or research and evaluations by its staff, including review of broker-dealer market price quotations, if available, in determining the valuation of the portfolio investments. Investments also may be valued based on appraisals derived from information concerning the investment or similar investments received from recognized dealers in those holdings.
Investments traded in the over-the-counter ("OTC") market and listed on The NASDAQ Stock Market, Inc. ("NASDAQ") normally are valued at the NASDAQ Official Closing Price. Other OTC securities are valued at the last bid price on the valuation date available prior to valuation. Investments which are listed on U.S. and foreign stock exchanges normally are valued at the market closing price, the last sale price on the day the securities are valued or, lacking any sales on such day, at the last available bid price. Investments listed on foreign stock exchanges may be fair valued based on significant events that have occurred subsequent to the close of the foreign markets. In cases where investments are traded on more than one exchange, the investments are valued on the exchange designated as the primary market by UBS AM. If a market value is not readily available from an independent pricing source for a particular investment, that investment is valued at fair value as determined in good faith by UBS AM as the valuation designee appointed by Trust's Board of Trustees (the "Board") pursuant to Rule 2a-5 under the 1940 Act. Foreign currency exchange rates are generally determined as of the close of the NYSE.
Certain investments in which the Fund invests are traded in markets that close before 4:00 p.m., Eastern time. Normally, developments that occur between the close of the foreign markets and 4:00 p.m., Eastern time, will not be reflected in the Fund's net asset value. However, if the Fund determines that such developments are so significant that they will materially affect the value of the Fund's investments, the Fund may adjust the previous closing prices to reflect what is believed to be the fair value of these investments as of 4:00 p.m., Eastern time.
Certain Funds may use a systematic fair valuation model provided by an independent third party to value investments principally traded in foreign markets in order to adjust for possible stale pricing that may occur between the close of the foreign exchanges and the time for valuation. The systematic fair valuation model may use calculations based on indices of domestic securities and other appropriate indicators, such as prices of relevant ADRs and futures contracts. If an investment is valued at a "fair value," that value is likely to be different from the last quoted market price for the investment. The use of the fair valuation model may result in securities being transferred between Level 1 and Level 2 of the fair valuation hierarchy at the end of the reporting period.
The amortized cost method of valuation, which approximates market value, generally is used to value short-term debt instruments with 60 days or less remaining to maturity, unless UBS AM determines that this does not represent fair value.
Investments in open-end investment companies are valued at the daily closing net asset value of the respective investment company. Pursuant to the Fund's use of the practical expedient within ASC Topic 820, Fair Value Measurement, investments in investment companies without publicly published prices are also valued at the daily net asset value.
All investments quoted in foreign currencies are valued daily in U.S. dollars on the basis of the foreign currency exchange rates prevailing at the time such valuation is determined by the Fund's custodian.
65
The UBS Funds
Notes to financial statements
Futures contracts are generally valued at the settlement price established each day on the exchange on which they are traded. Forward foreign currency contracts are valued daily using forward exchange rates quoted by independent pricing services.
Swaps are marked-to-market daily based upon values from third-party vendors or quotations from market makers to the extent available. In the event that market quotations are not readily available or deemed unreliable, the swap is valued at fair value as determined in good faith by or under the direction of the Board.
The Board has designated UBS AM as the valuation designee pursuant to Rule 2a-5 under the 1940 Act, and delegated to UBS AM the responsibility for making fair value determinations with respect to portfolio holdings. UBS AM, as the valuation designee, is responsible for periodically assessing any material risks associated with the determination of the fair value of investments; establishing and applying fair value methodologies; testing the appropriateness of fair value methodologies; and overseeing and evaluating third-party pricing services. UBS AM has engaged the Equities, Fixed Income, and Multi-Asset Valuation Committee (the "VC") to assist with its designated responsibilities as valuation designee with respect to the Fund's portfolio holdings. The VC is comprised of representatives of management. The VC provides reports to the Board at each quarterly meeting regarding any investments that have been fair valued, valued pursuant to standing instructions approved by the VC, or where non-vendor pricing sources had been used to make fair value determinations when sufficient information exists during the prior quarter. Fair valuation determinations are subject to review at least monthly by the VC during scheduled meetings. Pricing decisions, processes, and controls over fair value determinations are subject to internal and external reviews, including annual internal compliance reviews and periodic internal audit reviews.
The types of investments for which such fair value pricing may be necessary include, but are not limited to: foreign investments under some circumstances; securities of an issuer that has entered into a restructuring; investments whose trading has been halted or suspended; fixed income securities that are in default and for which there is no current market value quotation; and investments that are restricted as to transfer or resale. The need to fair value the Fund's portfolio investments may also result from low trading volume in foreign markets or thinly traded domestic investments, and when a security that is subject to a trading limit or collar on the exchange or market on which it is primarily traded reaches the "limit up" or "limit down" price and no trading has taken place at that price. Various factors may be reviewed in order to make a good faith determination of an investment's fair value. These factors include, but are not limited to, fundamental analytical data relating to the investment; the nature and duration of restrictions on disposition of the investment; and the evaluation of forces which influence the market in which the investment is purchased and sold. Valuing investments at fair value involves greater reliance on judgment than valuing investments that have readily available market quotations. Fair value determinations can also involve reliance on quantitative models employed by a fair value pricing service.
US GAAP requires disclosure regarding the various inputs that are used in determining the value of each Fund's investments. These inputs are summarized into the three broad levels listed below:
Level 1—Unadjusted quoted prices in active markets for identical investments.
Level 2—Other significant observable inputs, including but not limited to, quoted prices for similar investments, interest rates, prepayment speeds and credit risks.
Level 3—Unobservable inputs inclusive of the Funds' own assumptions in determining the fair value of investments.
In accordance with the requirements of US GAAP, a fair value hierarchy has been included near the end of each Fund's Portfolio of investments.
66
The UBS Funds
Notes to financial statements
Investments
Asset-backed securities: Certain Funds may invest in asset-backed securities ("ABS"), representing interests in pools of certain types of underlying installment loans, home equity loans, leases of various types of real and personal property and receivables from revolving lines of credit (credit cards). Such assets are securitized through the use of trusts or special purpose corporations. The yield characteristics of ABS differ from those of traditional debt securities. One such major difference is that principal may be prepaid at any time because the underlying obligations generally may be prepaid at any time. ABS may decrease in value as a result of increases in interest rates and may benefit less than other fixed-income securities from declining interest rates because of the risk of prepayment.
Mortgage-backed securities: Certain Funds may invest in mortgage-backed securities ("MBS"), representing direct or indirect interests in pools of underlying mortgage loans that are secured by real property. These securities provide investors with payments consisting of both principal and interest as the mortgages in the underlying mortgage pools are paid.
The timely payment of principal and interest (but not the market value) on MBS issued or guaranteed by Ginnie Mae (formally known as the Government National Mortgage Association or GNMA) is backed by Ginnie Mae and the full faith and credit of the US government. Obligations issued by Fannie Mae (formally known as the Federal National Mortgage Association or FNMA) and Freddie Mac (formally known as the Federal Home Loan Mortgage Company or FHLMC) are historically supported only by the credit of the issuer, but currently are guaranteed by the US government in connection with such agencies being placed temporarily into conservatorship by the US government.
Some MBS are sponsored or issued by private entities. Payments of principal and interest (but not the market value) of such private MBS may be supported by pools of mortgage loans or other MBS that are guaranteed, directly or indirectly, by the US government or one of its agencies or instrumentalities, or they may be issued without any government guarantee of the underlying mortgage assets but with some form of non-government credit enhancement.
Collateralized mortgage obligations ("CMO") are a type of MBS. A CMO is a debt security that may be collateralized by whole mortgage loans or mortgage pass-through securities. The mortgage loans or mortgage pass-through securities are divided into classes or tranches with each class having its own characteristics. Investors typically receive payments out of the interest and principal on the underlying mortgages. The portions of these payments that investors receive, as well as the priority of their rights to receive payments, are determined by the specific terms of the CMO class.
The yield characteristics of MBS differ from those of traditional debt securities. Among the major differences are that interest and principal payments are made more frequently, usually monthly, and that principal may be prepaid at any time because the underlying mortgage loans or other obligations generally may be prepaid at any time. Prepayments on a pool of mortgage loans are influenced by a variety of economic, geographic, social and other factors. Generally, prepayments on fixed-rate mortgage loans will increase during a period of falling interest rates and decrease during a period of rising interest rates. Certain classes of CMOs and other MBS are structured in a manner that makes them extremely sensitive to changes in prepayment rates. Such classes include interest-only ("IO") and principal-only ("PO") classes. IOs are entitled to receive all or a portion of the interest, but none (or only a nominal amount) of the principal payments, from the underlying mortgage assets. If the mortgage assets underlying an IO experience greater than anticipated principal prepayments, then the total amount of interest payments allocable to the IO class, and therefore the yield to investors, generally will be reduced. Conversely, PO classes are entitled to receive all or a portion of the principal payments, but none of the interest, from the underlying mortgage assets. PO classes are purchased at substantial discounts from par, and the yield to investors will be reduced if principal payments are slower than expected.
67
The UBS Funds
Notes to financial statements
Real estate investment trusts: Certain Funds may invest in real estate investment trusts ("REITs"). Distributions from a REIT are initially recorded as dividend income and may subsequently be recharacterized by the REIT at the end of its tax year as a return of capital and/or capital gains. The Fund estimates the character of dividends received from REITs for financial reporting purposes based on the distribution history of each REIT. Once actual distribution characterizations are made available by the REITs, typically after calendar year end, the Fund updates its accounting and/or tax books and records.
Restricted securities: The Funds may invest in securities that are subject to legal or contractual restrictions on resale. These securities generally may be resold in transactions exempt from registration or to the public if the securities are registered. Disposal of these securities may involve time-consuming negotiations and expense, and prompt sale at an acceptable price may be difficult. Information regarding restricted securities, if any, is included in each Fund's portfolio footnotes.
Securities traded on to-be-announced basis: Certain Funds may from time to time purchase, or short sell, securities on a to-be-announced ("TBA") basis. In a TBA transaction, the Fund commits to purchasing securities for which all specific information is not yet known at the time of the trade, particularly the face amount and maturity date of the underlying securities. Securities purchased on a TBA basis are not settled until they are delivered to the Fund, normally 15 to 45 days later. Beginning on the date the Fund enters into a TBA transaction, cash, U.S. government securities or other liquid securities are segregated in an amount equal in value to the purchase price of the TBA security. These transactions are subject to market fluctuations and their current value is determined in the same manner as for other securities.
Short sales: UBS U.S. Small Cap Growth Fund and UBS Multi Income Bond Fund may engage in short sale transactions in which the Fund sells a security it does not own (or does not have the right to acquire at no added cost), in anticipation of a decline in the security's price.
The Fund must borrow the security to make delivery to the buyer. The initial amount of a short sale is recorded as a liability which is marked to market daily. Fluctuations in the value of this liability are recorded as unrealized appreciation or depreciation on the Statement of operations. The Fund will realize a loss as a result of the short sale if the price of the security increases between the date of the short sale and the date on which the Fund replaces the borrowed security, and the Fund will realize a gain if the security declines in price between those same dates. The Fund segregates collateral, consisting of cash or liquid assets, sufficient to collateralize the market value of the investments sold short. The Fund incurs transaction costs, including dividend expense, borrowing costs and interest expenses in connection with opening, maintaining and closing short sales. These dividends and interest are booked as an expense or liability to the Fund.
Because a Fund's loss on a short sale arises from increases in the value of the investment sold short, such loss, like the potential increase in price of the security sold short, is theoretically unlimited. The Fund's investments held long could also decline in value at the same time the value of the investment sold short increases, thereby increasing the Fund's potential for loss. There is also the risk that the counterparty to a short sale transaction may fail to honor its contract terms, causing a loss to the Fund.
For the period ended June 30, 2024, UBS U.S. Small Cap Growth Fund and UBS Multi Income Bond Fund did not engage in short sale transactions.
Treasury Inflation Protected Securities: Certain Funds may purchase Treasury inflation protected securities ("TIPS") which are debt securities issued by the US Treasury. TIPS adjust for inflation based on changes in the published Consumer Price Index ("CPI"). During periods of inflation when the CPI index increases, the principal amount of the debt to which the rate of interest is applied increases, which in turn increases the yield. During periods of deflation when the CPI index decreases, the principal amount of the debt to which the rate of interest is
68
The UBS Funds
Notes to financial statements
applied decreases, which in turn lowers the yield. At maturity, TIPS return the higher of the principal amount at maturity or the initial face amount of the debt.
Derivative instruments
Purchased options: Certain Funds may purchase put and call options, including, but not limited to, options on foreign or US securities, indices, foreign currencies, options on futures contracts and options on swap agreements (commonly referred to as swaptions), in order to gain exposure to or protect against changes in the markets or in an attempt to enhance income or gains. Purchasing call options tends to increase exposure to the underlying instrument. Purchasing put options tends to decrease exposure to the underlying instrument.
The Funds pay a premium which is included on the Statement of assets and liabilities as an investment and subsequently marked to market to reflect the current value of the option. Premiums paid for purchasing options which expire are treated as realized losses. Purchased options are shown as portfolio holdings within the Portfolio of investments and are included in the Statement of assets and liabilities in investments, at value.
The risk associated with purchasing put and call options is limited to the premium paid. Premiums paid for purchasing options which are exercised or closed are added to the amounts paid or offset against the proceeds on the underlying future, security or currency transaction to determine the realized gain or loss.
Option writing: Certain Funds may write (sell) put and call options, including, but not limited to, options on foreign or US securities, indices, foreign currencies, options on futures contracts and options on swap agreements (commonly referred to as swaptions), in order to gain exposure to or protect against changes in the markets or in an attempt to enhance income or gains.
When a Fund writes a call or a put option, an amount equal to the premium received by the Fund is included on the Fund's Statement of assets and liabilities as a liability. The amount of the liability is subsequently marked-to-market to reflect the current market value of the option written. If an option which the Fund has written either expires on its stipulated expiration date or the Fund enters into a closing purchase transaction, the Fund realizes a gain (or loss if the cost of a closing purchase transaction exceeds the premium received when the option was written) without regard to any unrealized gain or loss on the underlying security or derivative instrument, and the liability related to such option is extinguished. If a call option, which a Fund has written, is exercised, the Fund recognizes a realized gain or loss (long-term or short-term, depending on the holding period of the underlying security) from the sale of the underlying security or derivative instrument and the proceeds from the sale are increased by the premium originally received. If a put option, which a Fund has written, is exercised, the amount of the premium originally received reduces the cost of the security or derivative instrument which the Fund purchases upon exercise of the option.
In writing an option, a Fund bears the market risk of an unfavorable change in the price of the derivative instrument, security, or currency underlying the written option. Exercise of an option written by a Fund could result in the Fund selling or buying a derivative instrument, security or currency at a price different from current market value.
In the normal course of trading activities, the Fund trades and holds certain fair valued derivative contracts that constitute guarantees. Such contracts include written put options, where the Fund will be obligated to purchase securities at specified prices (i.e. the options are exercised by the counterparties). It also includes written swaptions, where the Fund will be obligated to enter into a swap agreement. The maximum payout for these contracts is limited to the number of put option contracts written and the related strike prices, respectively. Maximum payout amounts could be offset by the subsequent sale, if any, of assets obtained via the execution of a payout event.
Written options, if any, are included in the Statement of assets and liabilities in options and swaptions written, at value.
69
The UBS Funds
Notes to financial statements
Futures contracts: Certain Funds may purchase or sell futures contracts to increase or reduce their exposure to an asset class without purchasing or selling the underlying securities, either as a hedge or to enhance income or realized gains. Generally, a futures contract is a standard binding agreement to buy or sell a specified quantity of an underlying reference asset, such as a specific security or currency, at a specified price at a specified later date.
Upon entering into a futures contract, a Fund is required to deliver to a broker an amount of cash and/or US government securities equal to a certain percentage of the contract amount. This amount is known as the "initial margin". Subsequent payments, known as "variation margin", generally are made or received by a Fund, depending on the daily fluctuations in the value of the underlying futures contracts, except that in the case of certain futures contracts that are held through swap contracts. Such variation margin is recorded for financial statement purposes on a daily basis as an unrealized appreciation or depreciation on futures until the futures contract is closed or expires, at which time the net gain or loss is reclassified to realized gain or loss on futures.
Using futures contracts involves various risks, including market, interest rate and equity risks. Risks of entering into futures contracts include the possibility that there may be an illiquid market or that a change in the value of the contract may not correlate with changes in the value of the underlying securities. To the extent that market prices move in an unexpected direction, there is a risk that a Fund will not achieve the anticipated benefits of the futures contract or may realize a loss.
Futures contracts, if any, are shown as fund holdings within the Portfolio of investments. Variation margin, if applicable, is shown in Variation margin receivable or payable on futures contracts within the Statement of Assets and Liabilities.
Swap agreements: Certain Funds may engage in swap agreements, including, but not limited to, interest rate, credit default and total return swap agreements. A Fund expects to enter into these transactions to preserve a return or spread on a particular investment or to hedge a portion of the portfolio's duration, to protect against any increase in the price of securities the Fund anticipates purchasing at a later date, to gain exposure to certain markets in the most economical way possible or in an attempt to enhance income or gains.
The Funds accrue for interim payments on swap agreements on a daily basis, with the net amount recorded within unrealized appreciation or depreciation of swap agreements. Once interim payments are settled in cash, the net amount is recorded as realized gain or loss on swap agreements, in addition to realized gain or loss recorded upon the termination of swap agreements on the Statement of operations. Fluctuations in the value of swap agreements are recorded for financial statement purposes as unrealized appreciation or depreciation on swap agreements.
Certain Funds may enter into interest rate swap agreements with another party to receive or pay interest (e.g., an exchange of fixed rate payments for floating rate payments) to protect themselves from interest rate fluctuations. This type of swap is an agreement that obligates two parties to exchange a series of cash flows at specified intervals based upon or calculated by reference to a specified interest rate(s) for a specified amount. The payment flows are usually netted against each other, with the difference being paid by one party to the other. Interest rate swap agreements are subject to general market risk, liquidity risk, counterparty risk and interest rate risk.
Credit default swap agreements involve commitments to make or receive payments in the event of a default of a security or other credit event of the referenced obligation. As a buyer, the Fund would make periodic payments to the counterparty, and the Fund would receive payments only upon the occurrence of a default or credit event. If no default or credit event occurs, the Fund will lose its periodic stream of payments over the term of the contract. However, if a default or a credit event does occur, the Fund typically would receive full notional value for the referenced obligation that may have little or no value. As a seller, the Fund would receive periodic payments from the counterparty, and the Fund would make payments only upon the occurrence of a default or a credit event. If no default or credit event occurs, the Fund will gain the periodic stream of payments it received over the term of the
70
The UBS Funds
Notes to financial statements
contract and the counterparty will lose its periodic stream of payments over the term of the contract. However, if a default or credit event occurs, the Fund typically would pay full notional value for the referenced obligation that may have little or no value. Credit default swap agreements may involve greater risks than if the Fund had invested in the referenced obligation directly and are subject to general market risk, liquidity risk and credit risk.
Credit default swap agreements on credit indices involve one party making a stream of payments to another party in exchange for the right to receive a specified return in the event of a write-down, principal shortfall, interest shortfall or default of all or part of the referenced entities comprising the credit index. A credit index is a list of a basket of credit instruments or exposures designed to be representative of some part of the credit market as a whole. These indices are made up of referenced credits that are judged by a poll of dealers to be the most liquid entities in the credit default swap market based on the sector of the index. Components of the indices may include, but are not limited to, investment grade securities, high yield securities, asset backed securities, emerging markets, and/or various credit ratings within each sector. Credit indices are traded using credit default swaps with standardized terms including a fixed spread and standard maturity dates. An index credit default swap references all the names in the index, and if there is a default, the credit event is settled based on that name's weight in the index. The composition of the indices changes periodically, usually every six months, and for most indices, each name has an equal weight in the index. A Fund may use credit default swap agreements on credit indices to hedge a portfolio of credit default swaps or bonds with a credit default swap on indices which is less expensive than it would be to buy many credit default swaps to achieve a similar effect. Credit default swap agreements on credit indices are benchmarks for protecting investors owning bonds against default, and traders use them to speculate on changes in credit quality.
Credit default swap agreements on corporate issues or sovereign issues of an emerging market country involve one party making a stream of payments to another party in exchange for the right to receive a specified return in the event of a default or other credit event. If a credit event occurs and cash settlement is not elected, a variety of other obligations may be delivered in lieu of the specific referenced obligation. The ability to deliver other obligations may result in a cheapest-to-deliver option (the buyer of protection's right to choose the deliverable obligation with the lowest value following a credit event). A Fund may use credit default swap agreements on corporate issues or sovereign issues of an emerging market country to provide a measure of protection against defaults of the issuers (i.e., to reduce risk where the Fund owns or has exposure to the referenced obligation) or to take an active long or short position with respect to the likelihood of a particular issuer's default.
The maximum potential amount of future payments (undiscounted) that a Fund as a seller of protection could be required to make under a credit default swap agreement would be an amount equal to the notional amount of the agreement, which may exceed the amount of the value reflected on the Statement of assets and liabilities. Notional amounts of all credit default swap agreements outstanding as of the period end for which a Fund is the seller of protection are disclosed under the section "Credit default swap agreements on credit indices—sell protection" in the Portfolio of investments. These potential amounts would be partially offset by any recovery values of the respective referenced obligations, upfront payments received upon entering into the agreement, or net amounts received from the settlement of buy protection credit default swap agreements entered into, if any, by a Fund for the same referenced entity or entities.
Total return swap agreements involve commitments to pay or receive interest in exchange for a market-linked return based on a notional amount. To the extent the total return of the security or index underlying the transaction exceeds or falls short of the offsetting interest rate obligation, the Fund will receive a payment from or make a payment to the counterparty, respectively. Total return swap agreements are marked-to-market daily, and the change, if any, is recorded as unrealized appreciation or depreciation. Total return swap agreements are subject to general market risk, liquidity risk, counterparty risk, interest rate risk, credit risk and the risk that there may be unfavorable changes in the underlying investments or instruments.
71
The UBS Funds
Notes to financial statements
The use of swap agreements involves investment techniques, risks, and transaction costs different from those associated with ordinary portfolio security transactions, including assumptions about market conditions, interest rates, and other applicable factors. As a result, the performance of the Fund will be different than if it had used ordinary portfolio security transactions. OTC swap agreements do not involve the delivery of securities and are subject to counterparty risk. If the other party to a swap agreement defaults and fails to consummate the transaction, the Fund's risk of loss will consist of the net amount of interest or other payments that the Fund is contractually entitled to receive. Therefore, the Fund would consider the creditworthiness of the counterparty to a swap agreement in evaluating potential credit risk.
Certain clearinghouses offer clearing for limited types of derivatives transactions, such as interest rate and credit default swap agreements. Centrally cleared swap agreements must be transacted through a futures commission merchant ("FCM") and cleared through a clearinghouse that serves as a central counterparty. The performance of a centrally cleared swap transaction is effectively guaranteed by a central clearinghouse, thereby reducing the Fund's exposure to the credit risk of its original counterparty. The Fund will be required to post specified levels of margin with the clearinghouse or at the instruction of the clearinghouse; the margin required by a clearinghouse may be greater than the margin the Fund would be required to post in an uncleared transaction. Centrally cleared swap agreements, if any, are reported on the Statement of assets and liabilities based on variation margin receivable or payable, if any.
Swap agreements, if any, are shown as portfolio holdings within the Portfolio of investments.
Forward foreign currency contracts: Certain Funds may enter into forward foreign currency contracts as part of their investment objective, for purposes of risk management or to hedge the US dollar value of portfolio securities denominated in a particular currency. Generally, a forward foreign currency contract is a commitment to purchase or sell a foreign currency at a future date at a negotiated forward rate. Non-deliverable forward foreign currency contracts are settled with the counterparty in US dollars, or another fully convertible currency, without the physical delivery of foreign currency. Forward foreign currency contracts, if any, are reported on the Portfolio of investments.
Fluctuations in the value of open forward foreign currency contracts are recorded daily for book purposes as unrealized appreciation or depreciation on forward foreign currency contracts by the Funds. Realized gains and losses on forward foreign currency contracts include net gains or losses recognized by the Funds on contracts which have been sold or matured.
Risks may arise upon entering into forward foreign currency contracts from the potential inability of counterparties to meet the terms of their contracts and from unanticipated movements in the value of foreign currencies relative to the US dollar.
Derivatives by underlying risk: Investment companies value their derivatives at fair value and recognize changes in fair value through the Statement of operations. Under US GAAP, investment companies do not qualify for hedge accounting. Accordingly, even though a Fund's investments in derivatives may represent economic hedges, they are considered to be "non-hedge transactions" for purposes of disclosure under US GAAP.
The volume of derivatives as disclosed in each Fund's portfolio of investments is representative of the volume of derivatives outstanding during the period ended June 30, 2024.
Swap agreements, forward foreign currency contracts, swaptions and options written entered into by the Funds may contain credit-risk related contingent features that could be triggered subject to certain circumstances. Such circumstances include agreed upon net asset value thresholds. If triggered, the derivative counterparty could request additional cash margin and/or terminate the derivative contract. The aggregate fair value of the derivative contracts
72
The UBS Funds
Notes to financial statements
that are in a net liability position that contain these triggers can be found in the Fund's Portfolio of investments. The aggregate fair value of assets that are already posted as collateral as of June 30, 2024 is reflected in the Statement of assets and liabilities.
At June 30, 2024, the Funds had the following derivatives categorized by underlying risk:
Asset derivatives1
| | | Interest
rate risk | | Foreign
exchange
risk | | Credit risk | | Equity risk | | Total value | |
UBS Global Allocation Fund | |
Futures contracts | | $ | 91,683 | | | $ | — | | | $ | — | | | $ | 143,221 | | | $ | 234,904 | | |
Forward foreign currency contracts | | | — | | | | 419,329 | | | | — | | | | — | | | | 419,329 | | |
Total value | | $ | 91,683 | | | $ | 419,329 | | | $ | — | | | $ | 143,221 | | | $ | 654,233 | | |
UBS Multi Income Bond Fund | |
Options and swaptions purchased | | $ | — | | | $ | — | | | $ | 667 | | | $ | — | | | $ | 667 | | |
Futures contracts | | | 55,552 | | | | — | | | | — | | | | — | | | | 55,552 | | |
Swap agreements | | | 21,174 | | | | — | | | | — | | | | — | | | | 21,174 | | |
Forward foreign currency contracts | | | — | | | | 2,786 | | | | — | | | | — | | | | 2,786 | | |
Total value | | $ | 76,726 | | | $ | 2,786 | | | $ | 667 | | | $ | — | | | $ | 80,179 | | |
1 In the Statement of assets and liabilities, options and swaptions purchased, if any, are shown within investments, at value, swap agreements (except centrally cleared swap agreements) are shown within swap agreements, at value, while forward foreign currency contracts are shown using unrealized appreciation on forward foreign currency contracts. Futures contracts are reported in the table above using cumulative appreciation of futures contracts and centrally cleared swap agreements are reported at value, as reported in the futures contracts and centrally cleared swap agreements tables at the end of the Portfolio of investments, respectively, but only the variation margin to be received, if any, is reported within the Statement of assets and liabilities.
Liability derivatives1
| | | Interest
rate risk | | Foreign
exchange
risk | | Credit risk | | Equity risk | | Total value | |
UBS Global Allocation Fund | |
Futures Contracts | | $ | (69,709 | ) | | $ | — | | | $ | — | | | $ | (243,546 | ) | | $ | (313,255 | ) | |
Forward foreign currency contracts | | | — | | | | (1,294,506 | ) | | | — | | | | — | | | | (1,294,506 | ) | |
Total | | $ | (69,709 | ) | | $ | (1,294,506 | ) | | $ | — | | | $ | (243,546 | ) | | $ | (1,607,761 | ) | |
UBS Multi Income Bond Fund | |
Written Swaption Contracts | | $ | — | | | $ | — | | | $ | (65 | ) | | $ | — | | | $ | (65 | ) | |
Futures Contracts | | | (21,592 | ) | | | — | | | | — | | | | — | | | | (21,592 | ) | |
Swap Contracts | | | (1,251 | ) | | | — | | | | — | | | | — | | | | (1,251 | ) | |
Forward foreign currency contracts | | | — | | | | (13,067 | ) | | | — | | | | — | | | | (13,067 | ) | |
Total | | $ | (22,843 | ) | | $ | (13,067 | ) | | $ | (65 | ) | | $ | — | | | $ | (35,975 | ) | |
1 In the Statement of assets and liabilities, options and swaptions written, if any, are shown within options and swaptions written, at value, swap agreements (except centrally cleared swap agreements) are shown within swap agreements, at value, while forward foreign currency contracts are shown within unrealized depreciation on forward foreign currency contracts. Futures contracts are reported in the table above using cumulative depreciation of futures contracts and centrally cleared swap agreements are reported at value, as reported in the futures contracts and centrally cleared swap agreements tables at the end of the Portfolio of investments, respectively, but only the variation margin to be paid, if any, is reported within the Statement of assets and liabilities.
73
The UBS Funds
Notes to financial statements
During the period ended June 30, 2024, net realized gain (loss) from derivatives were as follows:
Realized gain (loss)1
| | | Interest
rate risk | | Foreign
exchange
risk | | Credit risk | | Equity risk | | Total Value | |
UBS Global Allocation Fund | |
Options and swaptions purchased | | $ | — | | | $ | — | | | $ | — | | | $ | 53,295 | | | $ | 53,295 | | |
Futures contracts | | | (906,291 | ) | | | — | | | | — | | | | 5,190,972 | | | | 4,284,681 | | |
Swap agreements | | | — | | | | — | | | | 212,223 | | | | (484,775 | ) | | | (272,552 | ) | |
Forward foreign currency contracts | | | — | | | | 821,289 | | | | — | | | | — | | | | 821,289 | | |
Total net realized gains (loss) | | $ | (906,291 | ) | | $ | 821,289 | | | $ | 212,223 | | | $ | 4,759,492 | | | $ | 4,886,713 | | |
UBS Multi Income Bond Fund | |
Options and swaptions written | | $ | 16,048 | | | $ | 2,829 | | | $ | — | | | $ | — | | | $ | 18,877 | | |
Futures contracts | | | (314,175 | ) | | | — | | | | — | | | | — | | | | (314,175 | ) | |
Swap agreements | | | (85,484 | ) | | | — | | | | (41,535 | ) | | | 73,494 | | | | (53,525 | ) | |
Forward foreign currency contracts | | | — | | | | (1,169 | ) | | | — | | | | — | | | | (1,169 | ) | |
Total net realized gains (loss) | | $ | (383,611 | ) | | $ | 1,660 | | | $ | (41,535 | ) | | $ | 73,494 | | | $ | (349,992 | ) | |
1 The net realized gain (loss) is shown in the Statement of operations in net realized gain (loss) on futures contracts, options and swaptions written, swap agreements and forward foreign currency contracts, unless otherwise noted. The net realized gain (loss) on options and swaptions purchased is shown in the Statement of operations in net realized gain (loss) on investments.
During the period ended June 30, 2024, net unrealized appreciation (depreciation) from derivatives were as follows:
Net change in unrealized appreciation (depreciation)1
| | | Interest
rate risk | | Foreign
exchange
risk | | Credit risk | | Equity risk | | Total value | |
UBS Global Allocation Fund | |
Futures contracts | | $ | 127,528 | | | $ | — | | | $ | — | | | $ | (1,057,299 | ) | | $ | (929,771 | ) | |
Swap agreements | | | — | | | | — | | | | (68,475 | ) | | | 50,780 | | | | (17,695 | ) | |
Forward foreign currency contracts | | | — | | | | (1,328,389 | ) | | | — | | | | — | | | | (1,328,389 | ) | |
Net change in appreciation (depreciation) | | $ | 127,528 | | | $ | (1,328,389 | ) | | $ | (68,475 | ) | | $ | (1,006,519 | ) | | $ | (2,275,855 | ) | |
UBS Multi Income Bond Fund | |
Options and swaptions purchased | | $ | — | | | $ | — | | | $ | (4,533 | ) | | $ | — | | | $ | (4,533 | ) | |
Options and swaptions written | | | — | | | | 1,955 | | | | — | | | | — | | | | 1,955 | | |
Futures contracts | | | (16,207 | ) | | | — | | | | — | | | | 44,555 | | | | 28,348 | | |
Swap agreements | | | 25,969 | | | | — | | | | 19,416 | | | | (54,722 | ) | | | (9,337 | ) | |
Forward foreign currency contracts | | | — | | | | (17,485 | ) | | | — | | | | — | | | | (17,485 | ) | |
Net change in appreciation (depreciation) | | $ | 9,762 | | | $ | (15,530 | ) | | $ | 14,883 | | | $ | (10,167 | ) | | $ | (1,052 | ) | |
1 The change in net unrealized appreciation (depreciation) is shown in the Statement of operations in change in net unrealized appreciation (depreciation) on futures contracts, options and swaptions written, swap agreements and forward foreign currency contracts, unless otherwise noted. The change in net unrealized appreciation (depreciation) of options and swaptions purchased is shown in the Statement of operations in change in net unrealized appreciation (depreciation) on investments.
74
The UBS Funds
Notes to financial statements
Offsetting of certain derivatives: The Funds typically enter into International Swaps and Derivatives Association, Inc. Master Agreements ("ISDA Master Agreements") or similar master agreements with its OTC derivative contract counterparties in order to, among other things, reduce their credit risk to counterparties. ISDA Master Agreements include provisions for general obligations, representations, collateral and events of default or termination. Under an ISDA Master Agreement, the Funds typically may offset with the counterparty certain derivative financial instrument's payables and/or receivables with collateral held and/or posted and create one single net payment (close-out netting) in the event of default or termination. The Statement of assets and liabilities is presented gross of any netting.
At June 30, 2024, derivative assets and liabilities (by type) on a gross basis and derivatives subject to an enforceable master netting arrangement ("MNA") or similar were as follows:
UBS Global Allocation Fund
Derivative Financial Instruments: | | Assets | | Liabilities | |
Total gross amount of derivative assets and liabilities in the Statement of assets and liabilities1 | | $ | 654,233 | | | $ | (1,607,761 | ) | |
Derivatives not subject to a MNA or similar agreements | | | (234,904 | ) | | | 313,255 | | |
Total gross amount of assets and liabilities subject to MNA or similar agreements | | $ | 419,329 | | | $ | (1,294,506 | ) | |
The following tables present the Fund's derivative assets and liabilities by counterparty net of amounts available for offset under a MNA and net of the related collateral received/pledged by the Fund as of the period end.
Counterparty | | Gross amount
of assets | | Financial
instruments
and derivatives
available for
offset | | Collateral
received2 | | Net amount
of assets | |
BOA | | $ | 77,170 | | | $ | (3,109 | ) | | $ | — | | | $ | 74,061 | | |
CIBC | | | 83,976 | | | | — | | | | — | | | | 83,976 | | |
GSI | | | 66,801 | | | | (35,970 | ) | | | — | | | | 30,831 | | |
HSBC | | | 4,795 | | | | (4,795 | ) | | | — | | | | — | | |
JPMCB | | | 25,120 | | | | (90 | ) | | | 100,000 | | | | 125,030 | | |
MSCI | | | 2,827 | | | | (2,827 | ) | | | — | | | | — | | |
SSB | | | 158,640 | | | | (158,640 | ) | | | — | | | | — | | |
Total | | $ | 419,329 | | | $ | (205,431 | ) | | $ | 100,000 | | | $ | 313,898 | | |
Counterparty | | Gross amount
of liabilities | | Financial
instruments
and derivatives
available for
offset | | Collateral
pledged2 | | Net amount
of liabilities | |
BOA | | $ | (3,109 | ) | | $ | 3,109 | | | $ | — | | | $ | — | | |
CITI | | | (104,177 | ) | | | — | | | | — | | | | (104,177 | ) | |
GSI | | | (35,970 | ) | | | 35,970 | | | | — | | | | — | | |
HSBC | | | (204,293 | ) | | | 4,795 | | | | — | | | | (199,498 | ) | |
JPMCB | | | (90 | ) | | | 90 | | | | — | | | | — | | |
MSCI | | | (497,261 | ) | | | 2,827 | | | | — | | | | (494,434 | ) | |
SSB | | | (449,606 | ) | | | 158,640 | | | | — | | | | (290,966 | ) | |
Total | | $ | (1,294,506 | ) | | $ | 205,431 | | | $ | — | | | $ | (1,089,075 | ) | |
75
The UBS Funds
Notes to financial statements
1 In the Statement of assets and liabilities, options purchased are shown within investments of unaffiliated issuers, at value, swap agreements (except centrally cleared swap agreements) are shown within outstanding swap agreements, at value, while forward foreign currency contracts are shown within unrealized appreciation of forward foreign currency contracts. Futures contracts are reported in the table above using cumulative appreciation on futures contracts and centrally cleared swap agreements, if any, are reported at value, as reported in the futures contracts and centrally cleared swap agreements tables at the end of the Portfolio of investments, respectively, but only the variation margin to be received, if any, is reported within the Statement of assets and liabilities.
2 In some instances, the actual collateral received and/or pledged may be more than the amount shown and may be comprised of cash collateral, non-cash collateral or combination of both.
UBS Multi Income Bond Fund
Derivative Financial Instruments: | | Assets | | Liabilities | |
Total gross amount of derivative assets and liabilities in the Statement of assets and liabilities1 | | $ | 80,179 | | | $ | (35,975 | ) | |
Derivatives not subject to a MNA or similar agreements | | | (76,726 | ) | | | 22,843 | | |
Total gross amount of assets and liabilities subject to MNA or similar agreements | | $ | 3,453 | | | $ | (13,132 | ) | |
The following tables present the Fund's derivative assets and liabilities by counterparty net of amounts available for offset under a MNA and net of the related collateral received/pledged by the Fund as of the period end.
Counterparty | | Gross amount
of assets | | Financial
instruments
and derivatives
available for
offset | | Collateral
received2 | | Net amount
of assets | |
BB | | $ | 2,370 | | | $ | — | | | $ | — | | | $ | 2,370 | | |
BOA | | | 667 | | | | (667 | ) | | | — | | | | — | | |
CITI | | | 416 | | | | (416 | ) | | | — | | | | — | | |
Total | | $ | 3,453 | | | $ | (1,083 | ) | | $ | — | | | $ | 2,370 | | |
Counterparty | | Gross amount
of liabilities | | Financial
instruments
and derivatives
available for
offset | | Collateral
pledged2 | | Net amount
of liabilities | |
BOA | | $ | (4,136 | ) | | $ | 667 | | | $ | — | | | $ | (3,469 | ) | |
CITI | | | (5,019 | ) | | | 416 | | | | — | | | | (4,603 | ) | |
GSI | | | (3,977 | ) | | | — | | | | — | | | | (3,977 | ) | |
Total | | $ | (13,132 | ) | | $ | 1,083 | | | $ | — | | | $ | (12,049 | ) | |
1 In the Statement of assets and liabilities, options purchased are shown within investments of unaffiliated issuers, at value, swap agreements (except centrally cleared swap agreements) are shown within outstanding swap agreements, at value, while forward foreign currency contracts are shown within unrealized appreciation of forward foreign currency contracts. Futures contracts are reported in the table above using cumulative appreciation on futures contracts and centrally cleared swap agreements, if any, are reported at value, as reported in the futures contracts and centrally cleared swap agreements tables at the end of the Portfolio of investments, respectively, but only the variation margin to be received, if any, is reported within the Statement of assets and liabilities.
2 In some instances, the actual collateral received and/or pledged may be more than the amount shown and may be comprised of cash collateral, non-cash collateral or combination of both.
76
The UBS Funds
Notes to financial statements
Investment advisory fees and other transactions with affiliates
The Advisor, a registered investment advisor, provides the Funds with investment management services. As compensation for these services, each Fund pays the Advisor a monthly fee, accrued daily and paid monthly, based on each Fund's respective average daily net assets in accordance with the following per annum schedule:
Fund | | Annual rate as a percentage of
each Fund's average daily net assets | |
UBS All China Equity Fund | | 0.850% up to $250 million
0.825% above $250 million up to $500 million
0.800% above $500 million up to $750 million
0.775% above $750 million up to $1 billion
0.750 above $1 billion | |
UBS Global Allocation Fund | | 0.800% up to $500 million
0.750% above $500 million up to $1 billion
0.700% above $1 billion up to $1.5 billion
0.675% above $1.5 billion up to $2 billion
0.650% above $2 billion up to $3 billion
0.630% above $3 billion up to $6 billion
0.610% above $6 billion | |
UBS Emerging Markets Equity Opportunity Fund | | 0.900% up to $250 million
0.875% above $250 million up to $500 million
0.850% above $500 million up to $750 million
0.825% above $750 million up to $1 billion
0.750% above $1 billion | |
UBS Engage For Impact Fund | | 0.750% up to $250 million
0.725% above $250 million | |
UBS International Sustainable Equity Fund | | 0.800% up to $250 million
0.775% above $250 million up to $500 million
0.750% above $500 million up to $750 million
0.725% above $750 million up to $1 billion
0.675% above $1 billion up to $2 billion
0.650% above $2 billion | |
UBS US Dividend Ruler Fund | | 0.5000% up to $250 million
0.4875% above $250 million up to $500 million
0.4750% above $500 million up to $750 million
0.4625% above $750 million up to $1 billion
0.4500% above $1 billion up to $2 billion
0.4375% above $2 billion | |
UBS US Quality Growth At Reasonable Price Fund | | 0.500% all assets | |
UBS U.S. Small Cap Growth Fund | | 0.850% up to $250 million
0.825% above $250 million up to $500 million
0.800% above $500 million up to $750 million
0.775% above $750 million up to $1 billion
0.725% above $1 billion up to $2 billion
0.700% above $2 billion | |
UBS Sustainable Development Bank Bond Fund | | 0.150% up to $250 million
0.145% above $250 million up to $500 million
0.140% above $500 million up to $750 million
0.135% above $750 million up to $1 billion
0.130% above $1 billion | |
UBS Multi Income Bond Fund | | 0.500% up to $250 million
0.490% above $250 million up to $500 million
0.480% above $500 million up to $750 million
0.470% above $750 million | |
77
The UBS Funds
Notes to financial statements
For UBS All China Equity Fund, UBS Global Allocation Fund, UBS Emerging Markets Equity Opportunity Fund, UBS Engage For Impact Fund, UBS US Dividend Ruler Fund, UBS US Quality Growth At Reasonable Price Fund, UBS U.S. Small Cap Growth Fund, UBS Sustainable Development Bank Bond Fund, and UBS Multi Income Bond Fund, the Advisor has agreed to waive its fees and/or reimburse expenses (excluding expenses incurred through investment in other investment companies, interest, taxes, brokerage commissions and extraordinary expenses, such as proxy related expenses) to the extent necessary so that the Funds' operating expenses (excluding expenses incurred through investment in other investment companies, interest, taxes, brokerage commissions, dividend expense and security loan fees for securities sold short and extraordinary expenses, such as proxy related expenses) do not exceed the expense limit of each class of shares as indicated in the following table.
For UBS International Sustainable Equity Fund, the Advisor has agreed to waive its fees and reimburse expenses (excluding expenses incurred through investment in other investment companies, interest, taxes, brokerage commissions and extraordinary expenses, such as proxy related expenses) so that the Fund's ordinary operating expenses (excluding expenses incurred through investment in other investment companies, interest, taxes, brokerage commissions and extraordinary expenses, such as proxy related expenses) do not exceed the limit of each class of shares as indicated in the following table. The contractual fee waiver and/or expense reimbursement agreement for each Fund, except UBS International Sustainable Equity Fund, will remain in place through the period ending June 30, 2024. The fee waiver and/or expense reimbursement agreement for UBS International Sustainable Equity Fund is irrevocable. Investment advisory fees, including the dollar amount waived or reimbursed, for the period ended June 30, 2024 were as follows:
Fund | | Class A
expense cap | | Class P
expense cap | | Class P2
expense cap | | Amount
due to
(due from)
advisor | | Advisory
fees
incurred | | Fees waived/
expenses
reimbursed | |
UBS All China Equity Fund | | | 1.35 | % | | | 1.10 | % | | | 0.30 | % | | $ | (40,877 | ) | | $ | 24,601 | | | $ | (323,175 | ) | |
UBS Global Allocation Fund | | | 1.20 | | | | 0.95 | | | | — | | | | 28,186 | | | | 1,272,546 | | | | (513,590 | ) | |
UBS Emerging Markets Equity Opportunity Fund | | | 1.25 | | | | 1.00 | | | | 0.40 | | | | 102,991 | | | | 4,039,412 | | | | (3,614,205 | ) | |
UBS Engage For Impact Fund | | | 1.10 | | | | 0.85 | | | | 0.25 | | | | (29,418 | ) | | | 387,135 | | | | (635,614 | ) | |
UBS International Sustainable Equity Fund | | | 1.25 | | | | 1.00 | | | | 0.25 | | | | 81,185 | | | | 1,257,260 | | | | (622,387 | ) | |
UBS US Dividend Ruler Fund | | | N/A | | | | 0.50 | | | | 0.15 | | | | 76,085 | | | | 845,357 | | | | (668,244 | ) | |
UBS US Quality Growth At Reasonable Price Fund | | | N/A | | | | 0.50 | | | | — | | | | 161,534 | | | | 1,143,331 | | | | (675,835 | ) | |
UBS U.S. Small Cap Growth Fund | | | 1.24 | | | | 0.99 | | | | 0.15 | | | | 91,746 | | | | 1,061,681 | | | | (348,160 | ) | |
UBS Sustainable Development Bank Bond Fund | | | 0.35 | | | | 0.25 | | | | 0.15 | | | | (45,016 | ) | | | 122,815 | | | | (413,440 | ) | |
UBS Multi Income Bond Fund | | | 0.90 | | | | 0.65 | | | | 0.20 | | | | (40,707 | ) | | | 110,684 | | | | (380,319 | ) | |
For UBS All China Equity Fund Class P2, UBS Emerging Markets Opportunity Fund Class P2, UBS Engage For Impact Fund Class P2, UBS International Sustainable Equity Fund Class P2, UBS US Dividend Ruler Fund Class P2, UBS Sustainable Development Bank Bond Fund Class P2 and UBS Multi Income Bond Fund Class P2, the Advisor has entered into a written agreement pursuant to which the Advisor has agreed to waive all or portion of management fees. For the period ended June 30, 2024, the advisory fees waived was $17,675, $3,202,253, $347,170, $356,441, $97,748, $99,451 and $3 respectively. In addition, these waivers are included within the fees waived/expenses reimbursed amount disclosed in the table above.
Each Fund, except for UBS International Sustainable Equity Fund and UBS Emerging Markets Equity Opportunity Fund Class P2, will reimburse the Advisor for expenses it waives or reimburses for a period of three years following such expense waivers or reimbursements, provided that the reimbursement by a Fund of the Advisor will not cause the total operating expense ratio to exceed the contractual limit as then may be in effect for the Fund. The expenses waived or reimbursed for the period ended June 30, 2024 are subject to repayment through June 30, 2027.
78
The UBS Funds
Notes to financial statements
At June 30, 2024, the following Funds had remaining fee waivers and expense reimbursements subject to repayment to the Advisor and respective dates of expiration as follows:
Fund | | Fee waivers/
expense
reimbursements
subject to
repayment | | Expires
June 30,
2025 | | Expires
June 30,
2026 | | Expires
June 30,
2027 | |
UBS All China Equity Fund—Class P | | $ | 430,664 | | | $ | 253,147 | | | $ | 84,777 | | | $ | 92,740 | | |
UBS All China Equity Fund—Class P2 | | | 433,122 | | | | 30,2031 | | | | 190,159 | | | | 212,760 | | |
UBS Global Allocation Fund—Class A | | | 1,109,440 | | | | 331,216 | | | | 374,509 | | | | 403,715 | | |
UBS Global Allocation Fund—Class P | | | 297,362 | | | | 86,790 | | | | 100,697 | | | | 109,875 | | |
UBS Emerging Markets Equity Opportunity Fund—Class P | | | 667,831 | | | | 304,903 | | | | 177,843 | | | | 185,085 | | |
UBS Engage For Impact Fund—Class P | | | 131,515 | | | | 47,256 | | | | 48,590 | | | | 35,669 | | |
UBS Engage For Impact Fund—Class P2 | | | 672,618 | | | | 191,959 | | | | 227,885 | | | | 252,774 | | |
UBS International Sustainable Equity Fund—Class A | | | 19,102 | | | | — | | | | 9,453 | | | | 9,649 | | |
UBS International Sustainable Equity Fund—Class P | | | 522,957 | | | | — | | | | 340,367 | | | | 182,590 | | |
UBS International Sustainable Equity Fund—Class P2 | | | 104,044 | | | | — | | | | 47,393 | | | | 56,651 | | |
UBS US Dividend Ruler Fund—Class P | | | 1,459,616 | | | | 371,750 | | | | 554,617 | | | | 533,249 | | |
UBS US Dividend Ruler Fund—Class P2 | | | 47,007 | | | | — | | | | 16,4412 | | | | 30,566 | | |
UBS US Quality Growth At Reasonable Price Fund—Class P | | | 1,740,738 | | | | 471,365 | | | | 593,538 | | | | 675,835 | | |
UBS U.S. Small Cap Growth Fund—Class A | | | 153,972 | | | | 59,364 | | | | 51,132 | | | | 43,476 | | |
UBS U.S. Small Cap Growth Fund—Class P | | | 979,935 | | | | 324,286 | | | | 350,965 | | | | 304,684 | | |
UBS Sustainable Development Bank Bond Fund—Class P | | | 155,811 | | | | 50,356 | | | | 40,688 | | | | 64,767 | | |
UBS Sustainable Development Bank Bond Fund—Class P2 | | | 667,940 | | | | 178,409 | | | | 242,235 | | | | 247,296 | | |
UBS Multi Income Bond Fund—Class A | | | 21,452 | | | | 8,184 | | | | 7,160 | | | | 6,108 | | |
UBS Multi Income Bond Fund—Class P | | | 1,112,606 | | | | 387,277 | | | | 351,145 | | | | 374,185 | | |
UBS Multi Income Bond Fund—Class P2 | | | 23 | | | | — | | | | — | | | | 233 | | |
1 For the period from April 21, 2022 (commencement of operations) through June 30, 2022.
2 For the period from March 15, 2023 (commencement of operations) through June 30, 2023.
3 For the period from October 11, 2023 (commencement of operations) through June 30, 2024.
Each Fund pays UBS AM a monthly administration fee that is accrued daily and paid monthly at an annual rate of 0.075% of the average daily net assets of such Fund. As of and for the period ended June 30, 2024, the Funds owed and incurred administrative fees as follows:
Fund | | Administrative
fees owed | | Administrative
fees incurred | |
UBS All China Equity Fund | | $ | 340 | | | $ | 2,171 | | |
UBS Global Allocation Fund | | | 9,597 | | | | 119,301 | | |
UBS Emerging Markets Equity Opportunity Fund | | | 15,645 | | | | 340,878 | | |
UBS Engage For Impact Fund | | | 6,137 | | | | 38,713 | | |
UBS International Sustainable Equity Fund | | | 8,864 | | | | 117,868 | | |
UBS US Dividend Ruler Fund | | | 11,733 | | | | 126,804 | | |
UBS US Quality Growth At Reasonable Price Fund | | | 17,272 | | | | 171,500 | | |
UBS U.S. Small Cap Growth Fund | | | 8,181 | | | | 93,678 | | |
UBS Sustainable Development Bank Bond Fund | | | 9,844 | | | | 61,408 | | |
UBS Multi Income Bond Fund | | | 2,527 | | | | 16,603 | | |
For UBS Emerging Markets Equity Opportunity Fund Class P2, UBS International Sustainable Equity Fund Class P2, UBS US Dividend Ruler Fund Class P2 and UBS Sustainable Development Bank Bond Fund Class P2, the Advisor has entered into a written agreement pursuant to which the Advisor has agreed to waive its retained administration
79
The UBS Funds
Notes to financial statements
fees. For the period ended June 30, 2024, the administration fees waived were $226,867, $17,056, $6,681 and $1,926, respectively and such amounts are not subject to future recoupment.
The Funds may invest in shares of certain affiliated investment companies also advised or managed by the Advisor. Investments in affiliated investment companies for the period ended June 30, 2024 have been included near the end of each Fund's Portfolio of investments.
During the period ended June 30, 2024, the Funds listed below paid broker commissions to affiliates of the investment advisor as detailed in the below table. These broker commissions are reflected in the Statement of assets and liabilities within investments at cost of unaffiliated issuers, and the Statement of operations within net realized gain (loss) on, and/or change in net unrealized appreciation (depreciation) on investments and/or futures contracts.
Fund | | UBS Group AG | |
UBS Emerging Markets Equity Opportunity Fund | | $ | 11,220 | | |
UBS Engage For Impact Fund | | | 115 | | |
UBS International Sustainable Equity Fund | | | 4,109 | | |
During the period ended June 30, 2024, none of the Funds engaged in purchase and sale transactions where an affiliate was underwriter.
Service and distribution plans
UBS AM (US) is the principal underwriter of each Fund's shares. The Trust has adopted distribution and/or service plans ("the Plans") pursuant to Rule 12b-1 under the 1940 Act for Class A shares. The Plans govern payments made for the expenses incurred in the service and/or distribution of Class A shares. Annual fees under the Plans as a percentage of the average daily net assets of each representative class of each of the Funds are as follows:
Fund | | Class A | |
UBS Global Allocation Fund | | | 0.25 | % | |
UBS International Sustainable Equity Fund | | | 0.25 | | |
UBS U.S. Small Cap Growth Fund | | | 0.25 | | |
UBS Multi Income Bond Fund | | | 0.25 | | |
UBS AM (US) also receives the proceeds of the initial sales charges paid upon purchases of Class A shares and the contingent deferred sales charges paid by shareholders upon certain redemptions of Class A shares. At June 30, 2024, certain Funds owed UBS AM (US) service and distribution fees, and for the period ended June 30, 2024, certain Funds were informed by UBS AM (US) that it had earned sales charges as follows:
Fund | | Service and
distribution
fees owed | |
UBS Global Allocation Fund—Class A | | $ | 24,012 | | |
UBS U.S. Small Cap Growth Fund—Class A | | | 2,616 | | |
UBS Multi Income Bond Fund—Class A | | | 47 | | |
Transfer agency and related services fees
UBS Financial Services Inc. provides certain services to the Funds pursuant to a delegation of authority from BNY Mellon Investment Servicing (US) Inc. ("BNY Mellon"), the Funds' transfer agent, and is compensated for these services by BNY Mellon, not the Funds.
80
The UBS Funds
Notes to financial statements
For the period ended June 30, 2024, UBS Financial Services Inc. received from BNY Mellon, not the Funds, total delegated service fees as follows:
Fund | | Delegated service
fees earned | |
UBS Global Allocation Fund | | $ | 39,913 | | |
UBS Emerging Markets Equity Opportunity Fund | | | 28,872 | | |
UBS Engage For Impact Fund | | | 9,114 | | |
UBS International Sustainable Equity Fund | | | 16,692 | | |
UBS US Dividend Ruler Fund | | | 42,557 | | |
UBS US Quality Growth At Reasonable Price Fund | | | 55,680 | | |
UBS U.S. Small Cap Growth Fund | | | 4,420 | | |
UBS Sustainable Development Bank Bond Fund | | | 10,694 | | |
UBS Multi Income Bond Fund | | | 648 | | |
Securities lending
Each Fund may lend securities up to 331/3% of its total assets to qualified broker-dealers or institutional investors. The loans are initially secured by cash, U.S. government securities and irrevocable letters of credit in an amount at least equal to 102% of the market value of the securities loaned with respect to domestic securities and 105% of the market value of the securities loaned with respect to foreign securities. In the event that the market value of the cash, U.S. government securities, and irrevocable letters of credit securing the loan falls below 100% of the market value for domestic securities, and 103% for foreign securities, the borrower must provide additional cash, U.S. government securities, and irrevocable letters of credit so that the total securing the loan is at least 102% of the market value for domestic securities and 105% of the market value for foreign securities.
Each Fund will regain ownership of loaned securities to exercise certain beneficial rights; however, each Fund may bear the risk of delay in recovery of, or even loss of rights in, the securities loaned should the borrower fail financially. The Fund receives compensation for lending its securities from interest or dividends earned on the cash, U.S. government securities and irrevocable letters of credit held as collateral, net of fee rebates paid to the borrower plus reasonable administrative and custody fees. Cash collateral received is invested in State Street Navigator Securities Lending Government Money Market Fund, which is included in the Fund's Portfolio of investments. State Street Bank and Trust Company serves as the Fund's lending agent.
At June 30, 2024, the following Funds had securities on loan at value, cash collateral and non-cash collateral as follows:
Fund | | Value of
securities on loan | | Cash
collateral | | Non-cash
collateral* | | Total
collateral | | Security types
held as non-cash collateral | |
UBS All China Equity Fund | | $ | 94,609 | | | $ | — | | | $ | 99,855 | | | $ | 99,855 | | | U.S. Treasury Notes and U.S. Treasury Bills | |
UBS Global Allocation Fund | | | 6,564,645 | | | | 6,132,415 | | | | 673,724 | | | | 6,806,139 | | | U.S. Treasury Notes and U.S. Treasury Bills | |
UBS Engage For Impact Fund | | | 4,261,744 | | | | 3,155,901 | | | | 1,357,675 | | | | 4,513,576 | | | U.S. Treasury Notes and U.S. Treasury Bills | |
UBS International Sustainable Equity Fund | | | 21,593,703 | | | | 19,808,678 | | | | 2,969,966 | | | | 22,778,644 | | | U.S. Treasury Notes and U.S. Treasury Bills | |
UBS U.S. Small Cap Growth Fund | | | 1,955,878 | | | | — | | | | 2,017,053 | | | | 2,017,053 | | | U.S. Treasury Notes and U.S. Treasury Bills | |
UBS Sustainable Development Bank Bond Fund | | | 512,552 | | | | 524,250 | | | | — | | | | 524,250 | | | | |
UBS Multi Income Bond Fund | | | 581,327 | | | | 593,325 | | | | — | | | | 593,325 | | | | |
* These securities are held for the benefit of the Fund at the Fund's custodian. The Fund cannot repledge or resell this collateral. As such, this collateral is excluded from the Statement of assets and liabilities.
81
The UBS Funds
Notes to financial statements
The table below represents the disaggregation at June 30, 2024 of the gross amount of recognized liabilities for securities lending transactions. As the securities loaned are subject to termination by the Funds or the borrower at any time, the remaining contractual maturities of the transactions presented below are considered to be overnight and continuous.
| | | Type of securities loaned | | Total gross
amount of
recognized | |
Fund | | Equity
securities | | Corporate
bonds | | liabilities for
securities
lending
transactions | |
UBS Global Allocation Fund | | $ | 6,132,415 | | | $ | — | | | $ | 6,132,415 | | |
UBS Engage For Impact Fund | | | 3,155,901 | | | | — | | | | 3,155,901 | | |
UBS International Sustainable Equity Fund | | | 19,808,678 | | | | — | | | | 19,808,678 | | |
UBS Sustainable Development Bank Bond Fund | | | — | | | | 524,250 | | | | 524,250 | | |
UBS Multi Income Bond Fund | | | — | | | | 593,325 | | | | 593,325 | | |
Bank line of credit
The Fund participates with other funds managed by UBS AM in a $185 million committed credit facility (the "Committed Credit Facility") with State Street Bank and Trust Company. The Committed Credit Facility is to be utilized for temporary financing until the settlement of sales or purchases of portfolio securities, the repurchase or redemption of shares of the participating Fund at the request of shareholders and other temporary or emergency purposes. The expiration date of the line of credit agreement is March 31, 2025.
Interest on amounts borrowed is calculated based on the prevailing rates in effect at the time of borrowing. The funds covered by the Committed Credit Facility have agreed to pay an annual 25 basis point commitment fee on the average daily balance of the Committed Credit Facility not utilized. Commitment fees have been allocated among the funds in the Committed Credit Facility as follows: 50% of the allocation is based on the relative asset size of funds and the other 50% of the allocation is based on utilization.
For the period ended June 30, 2024, the following Funds had borrowings as follows:
Fund | | Average daily
amount of
borrowing
outstanding | | Days
outstanding | | Interest
expense | | Weighted average
annualized
interest rate | |
UBS Emerging Markets Equity Opportunity Fund | | $ | 7,683,923 | | | | 15 | | | $ | 21,387 | | | | 6.680 | % | |
UBS International Sustainable Equity Fund | | | 829,605 | | | | 6 | | | | 924 | | | | 6.680 | | |
UBS Sustainable Development Bank Bond Fund | | | 374,236 | | | | 2 | | | | 139 | | | | 6.680 | | |
UBS Multi Income Bond Fund | | | 594,522 | | | | 1 | | | | 110 | | | | 6.680 | | |
At June 30, 2024, UBS International Sustainable Equity Fund had outstanding borrowings of $782,381.
82
The UBS Funds
Notes to financial statements
Purchases and sales of securities
For the period ended June 30, 2024, aggregate purchases and sales of portfolio securities, excluding short-term securities, were as follows:
Fund | | Purchases | | Sales | |
UBS All China Equity Fund | | $ | 261,553 | | | $ | 155,879 | | |
UBS Global Allocation Fund | | | 61,630,919 | | | | 80,082,196 | | |
UBS Emerging Markets Equity Opportunity Fund | | | 185,140,043 | | | | 213,116,815 | | |
UBS Engage For Impact Fund | | | 14,502,454 | | | | 19,587,145 | | |
UBS International Sustainable Equity Fund | | | 72,985,497 | | | | 86,321,100 | | |
UBS US Dividend Ruler Fund | | | 66,096,267 | | | | 43,824,335 | | |
UBS US Quality Growth At Reasonable Price Fund | | | 94,848,628 | | | | 59,507,875 | | |
UBS U.S. Small Cap Growth Fund | | | 62,069,592 | | | | 68,591,759 | | |
UBS Sustainable Development Bank Bond Fund | | | 22,956,398 | | | | 29,813,483 | | |
UBS Multi Income Bond Fund | | | 6,635,170 | | | | 9,904,940 | | |
Shares of beneficial interest
There is an unlimited number of $0.001 par value shares of beneficial interest authorized. Transactions in shares of beneficial interest for each of the Funds were as follows:
UBS All China Equity Fund
For the year ended June 30, 2024:
| | | Class P | | Class P2 | |
| | | Shares | | Amount | | Shares | | Amount | |
Shares sold | | | — | | | $ | — | | | | — | | | $ | — | | |
Shares repurchased | | | — | | | | — | | | | — | | | | — | | |
Dividends reinvested | | | 2,488 | | | | 10,750 | | | | 14,940 | | | | 64,093 | | |
Net increase (decrease) | | | 2,488 | | | $ | 10,750 | | | | 14,940 | | | $ | 64,093 | | |
For the year ended June 30, 2023:
| | | Class P | | Class P2 | |
| | | Shares | | Amount | | Shares | | Amount | |
Shares sold | | | — | | | $ | — | | | | — | | | $ | — | | |
Shares repurchased | | | — | | | | — | | | | (59,011 | ) | | | (370,000 | ) | |
Dividends reinvested | | | 1,078 | | | | 5,582 | | | | 8,841 | | | | 45,620 | | |
Net increase (decrease) | | | 1,078 | | | $ | 5,582 | | | | (50,170 | ) | | $ | (324,380 | ) | |
83
The UBS Funds
Notes to financial statements
UBS Global Allocation Fund
For the year ended June 30, 2024:
| | | Class A | | Class P | |
| | | Shares | | Amount | | Shares | | Amount | |
Shares sold | | | 27,577 | | | $ | 283,624 | | | | 162,675 | | | $ | 1,767,059 | | |
Shares repurchased | | | (2,495,258 | ) | | | (26,316,216 | ) | | | (722,665 | ) | | | (7,711,675 | ) | |
Dividends reinvested | | | 230,680 | | | | 2,422,142 | | | | 72,688 | | | | 789,392 | | |
Net increase (decrease) | | | (2,237,001 | ) | | $ | (23,610,450 | ) | | | (487,302 | ) | | $ | (5,155,224 | ) | |
For the year ended June 30, 2023:
| | | Class A | | Class P | |
| | | Shares | | Amount | | Shares | | Amount | |
Shares sold | | | 22,638 | | | $ | 226,451 | | | | 119,529 | | | $ | 1,274,596 | | |
Shares repurchased | | | (1,820,227 | ) | | | (18,736,816 | ) | | | (734,082 | ) | | | (7,784,679 | ) | |
Dividends reinvested | | | 586,059 | | | | 5,801,983 | | | | 165,436 | | | | 1,694,068 | | |
Net increase (decrease) | | | (1,211,530 | ) | | $ | (12,708,382 | ) | | | (449,117 | ) | | $ | (4,816,015 | ) | |
UBS Emerging Markets Equity Opportunity Fund
For the year ended June 30, 2024:
| | | Class P | | Class P2 | |
| | | Shares | | Amount | | Shares | | Amount | |
Shares sold | | | 3,756,404 | | | $ | 27,510,821 | | | | 9,803,767 | | | $ | 73,102,976 | | |
Shares repurchased | | | (6,611,261 | ) | | | (49,203,654 | ) | | | (11,935,465 | ) | | | (89,634,708 | ) | |
Dividends reinvested | | | 263,050 | | | | 1,941,306 | | | | 1,330,269 | | | | 9,777,477 | | |
Net increase (decrease) | | | (2,591,807 | ) | | $ | (19,751,527 | ) | | | (801,429 | ) | | $ | (6,754,255 | ) | |
For the year ended June 30, 2023:
| | | Class P | | Class P2 | |
| | | Shares | | Amount | | Shares | | Amount | |
Shares sold | | | 4,828,737 | | | $ | 35,768,862 | | | | 32,657,395 | | | $ | 242,538,445 | | |
Shares repurchased | | | (8,506,483 | ) | | | (62,314,712 | ) | | | (44,885,703 | ) | | | (327,531,081 | ) | |
Dividends reinvested | | | 243,790 | | | | 1,760,164 | | | | 1,108,438 | | | | 7,980,757 | | |
Net increase (decrease) | | | (3,433,956 | ) | | $ | (24,785,686 | ) | | | (11,119,870 | ) | | $ | (77,011,879 | ) | |
84
The UBS Funds
Notes to financial statements
UBS Engage For Impact Fund
For the year ended June 30, 2024:
| | | Class P | | Class P2 | |
| | | Shares | | Amount | | Shares | | Amount | |
Shares sold | | | 6,395 | | | $ | 75,424 | | | | 418,214 | | | $ | 4,880,115 | | |
Shares repurchased | | | (117,244 | ) | | | (1,380,832 | ) | | | (798,268 | ) | | | (9,485,907 | ) | |
Dividends reinvested | | | 671 | | | | 7,893 | | | | 61,926 | | | | 725,772 | | |
Net increase (decrease) | | | (110,178 | ) | | $ | (1,297,515 | ) | | | (318,128 | ) | | $ | (3,880,020 | ) | |
For the year ended June 30, 2023:
| | | Class P | | Class P2 | |
| | | Shares | | Amount | | Shares | | Amount | |
Shares sold | | | 243,832 | | | $ | 2,534,030 | | | | 889,835 | | | $ | 9,343,883 | | |
Shares repurchased | | | (360,030 | ) | | | (3,839,252 | ) | | | (931,436 | ) | | | (9,768,043 | ) | |
Dividends reinvested | | | 1,104 | | | | 11,327 | | | | 56,357 | | | | 577,660 | | |
Net increase (decrease) | | | (115,094 | ) | | $ | (1,293,895 | ) | | | 14,756 | | | $ | 153,500 | | |
UBS International Sustainable Equity Fund
For the year ended June 30, 2024:
| | | Class A | | Class P | | Class P2 | |
| | | Shares | | Amount | | Shares | | Amount | | Shares | | Amount | |
Shares sold | | | 21,728 | | | $ | 198,556 | | | | 2,303,053 | | | $ | 21,889,151 | | | | 615,735 | | | $ | 5,772,889 | | |
Shares repurchased | | | (72,521 | ) | | | (687,267 | ) | | | (3,242,309 | ) | | | (30,957,107 | ) | | | (1,019,190 | ) | | | (9,609,067 | ) | |
Dividends reinvested | | | 2,299 | | | | 21,423 | | | | 77,099 | | | | 718,563 | | | | 81,471 | | | | 755,240 | | |
Net increase (decrease) | | | (48,494 | ) | | $ | (467,288 | ) | | | (862,157 | ) | | $ | (8,349,393 | ) | | | (321,984 | ) | | $ | (3,080,938 | ) | |
For the year ended June 30, 2023:
| | | Class A | | Class P | | Class P2 | |
| | | Shares | | Amount | | Shares | | Amount | | Shares | | Amount | |
Shares sold | | | 17,976 | | | $ | 159,778 | | | | 3,225,134 | | | $ | 28,484,587 | | | | 1,039,920 | | | $ | 9,296,560 | | |
Shares repurchased | | | (150,344 | ) | | | (1,340,222 | ) | | | (11,406,068 | ) | | | (100,961,200 | ) | | | (1,269,525 | ) | | | (11,397,677 | ) | |
Dividends reinvested | | | 53,124 | | | | 440,395 | | | | 1,826,515 | | | | 15,123,541 | | | | 664,081 | | | | 5,478,670 | | |
Net increase (decrease) | | | (79,244 | ) | | $ | (740,049 | ) | | | (6,354,419 | ) | | $ | (57,353,072 | ) | | | 434,476 | | | $ | 3,377,553 | | |
85
The UBS Funds
Notes to financial statements
UBS US Dividend Ruler Fund
For the year ended June 30, 2024:
| | | Class P | | Class P2 | |
| | | Shares | | Amount | | Shares | | Amount | |
Shares sold | | | 2,976,224 | | | $ | 41,803,441 | | | | 865,837 | | | $ | 11,568,913 | | |
Shares repurchased | | | (2,059,761 | ) | | | (28,568,099 | ) | | | (354,434 | ) | | | (4,789,716 | ) | |
Dividends reinvested | | | 275,944 | | | | 3,761,118 | | | | 17,254 | | | | 234,477 | | |
Net increase (decrease) | | | 1,192,407 | | | $ | 16,996,460 | | | | 528,657 | | | $ | 7,013,674 | | |
For the year ended June 30, 2023:
| | | Class P | | Class P21 | |
| | | Shares | | Amount | | Shares | | Amount | |
Shares sold | | | 3,147,227 | | | $ | 39,071,372 | | | | 1,139,721 | | | $ | 14,521,810 | | |
Shares repurchased | | | (3,092,731 | ) | | | (38,662,552 | ) | | | (72,526 | ) | | | (931,522 | ) | |
Dividends reinvested | | | 230,974 | | | | 2,843,290 | | | | — | | | | — | | |
Net increase (decrease) | | | 285,470 | | | $ | 3,252,110 | | | | 1,067,195 | | | $ | 13,590,288 | | |
1 For the period from March 15, 2023 (commencement of operations) through June 30, 2023.
UBS US Quality Growth At Reasonable Price Fund
For the year ended June 30, 2024:
| | | Class P | |
| | | Shares | | Amount | |
Shares sold | | | 5,950,493 | | | $ | 84,967,516 | | |
Shares repurchased | | | (3,373,474 | ) | | | (48,292,186 | ) | |
Dividends reinvested | | | 62,581 | | | | 886,143 | | |
Net increase (decrease) | | | 2,639,600 | | | $ | 37,561,473 | | |
For the year ended June 30, 2023:
| | | Class P | |
| | | Shares | | Amount | |
Shares sold | | | 5,748,065 | | | $ | 64,709,673 | | |
Shares repurchased | | | (6,894,527 | ) | | | (78,567,798 | ) | |
Dividends reinvested | | | 146,866 | | | | 1,539,152 | | |
Net increase (decrease) | | | (999,596 | ) | | $ | (12,318,973 | ) | |
86
The UBS Funds
Notes to financial statements
UBS U.S. Small Cap Growth Fund
For the year ended June 30, 2024:
| | | Class A | | Class P | |
| | | Shares | | Amount | | Shares | | Amount | |
Shares sold | | | 69,575 | | | $ | 1,153,947 | | | | 922,906 | | | $ | 17,880,372 | | |
Shares repurchased | | | (267,822 | ) | | | (4,144,640 | ) | | | (995,938 | ) | | | (19,147,635 | ) | |
Dividends reinvested | | | — | | | | — | | | | — | | | | — | | |
Net increase (decrease) | | | (198,247 | ) | | $ | (2,990,693 | ) | | | (73,032 | ) | | $ | (1,267,263 | ) | |
For the year ended June 30, 2023:
| | | Class A | | Class P | |
| | | Shares | | Amount | | Shares | | Amount | |
Shares sold | | | 58,600 | | | $ | 902,775 | | | | 737,787 | | | $ | 13,601,673 | | |
Shares repurchased | | | (336,553 | ) | | | (5,129,740 | ) | | | (1,626,545 | ) | | | (29,425,259 | ) | |
Dividends reinvested | | | 60,544 | | | | 857,906 | | | | 315,473 | | | | 5,404,059 | | |
Net increase (decrease) | | | (217,409 | ) | | $ | (3,369,059 | ) | | | (573,285 | ) | | $ | (10,419,527 | ) | |
UBS Sustainable Development Bank Bond Fund
For the year ended June 30, 2024:
| | | Class P | | Class P2 | |
| | | Shares | | Amount | | Shares | | Amount | |
Shares sold | | | 469,713 | | | $ | 4,372,413 | | | | 1,354,870 | | | $ | 12,566,927 | | |
Shares repurchased | | | (530,654 | ) | | | (4,929,685 | ) | | | (2,250,877 | ) | | | (20,745,327 | ) | |
Dividends reinvested | | | 9,550 | | | | 88,160 | | | | 190,000 | | | | 1,751,694 | | |
Net increase (decrease) | | | (51,391 | ) | | $ | (469,112 | ) | | | (706,007 | ) | | $ | (6,426,706 | ) | |
For the year ended June 30, 2023:
| | | Class P | | Class P2 | |
| | | Shares | | Amount | | Shares | | Amount | |
Shares sold | | | 1,144,928 | | | $ | 10,798,107 | | | | 2,092,649 | | | $ | 19,587,223 | | |
Shares repurchased | | | (378,732 | ) | | | (3,581,831 | ) | | | (1,745,151 | ) | | | (16,281,142 | ) | |
Dividends reinvested | | | 5,939 | | | | 55,563 | | | | 146,047 | | | | 1,364,870 | | |
Net increase (decrease) | | | 772,135 | | | $ | 7,271,839 | | | | 493,545 | | | $ | 4,670,951 | | |
87
The UBS Funds
Notes to financial statements
UBS Multi Income Bond Fund
For the period ended June 30, 2024:
| | | Class A | | Class P | | Class P21 | |
| | | Shares | | Amount | | Shares | | Amount | | Shares | | Amount | |
Shares sold | | | — | | | $ | — | | | | 769 | | | $ | 10,278 | | | | 78 | | | $ | 1,000 | | |
Shares repurchased | | | (16,665 | ) | | | (218,942 | ) | | | (297,135 | ) | | | (3,966,489 | ) | | | — | | | | — | | |
Dividends reinvested | | | 858 | | | | 11,340 | | | | 51,472 | | | | 681,954 | | | | 2 | | | | 32 | | |
Net increase (decrease) | | | (15,807 | ) | | $ | (207,602 | ) | | | (244,894 | ) | | $ | (3,274,257 | ) | | | 80 | | | $ | 1,032 | | |
1 For the period from October 11, 2023 (commencement of operations) through June 30, 2024.
For the year ended June 30, 2023:
| | | Class A | | Class P | |
| | | Shares | | Amount | | Shares | | Amount | |
Shares sold | | | 5,690 | | | $ | 76,022 | | | | 524 | | | $ | 7,026 | | |
Shares repurchased | | | (12,299 | ) | | | (163,846 | ) | | | (312,016 | ) | | | (4,164,994 | ) | |
Dividends reinvested | | | 1,116 | | | | 14,864 | | | | 51,216 | | | | 682,452 | | |
Net increase (decrease) | | | (5,493 | ) | | $ | (72,960 | ) | | | (260,276 | ) | | $ | (3,475,516 | ) | |
Federal tax status
It is each Fund's policy to comply with all requirements of the Internal Revenue Code applicable to regulated investment companies and to distribute substantially all of its taxable income to its shareholders. In addition, by distributing during each calendar year substantially all of its net investment income, net realized capital gains and certain other amounts, if any, each Fund intends not to be subject to a federal excise tax. Accordingly, no federal income tax provision was required.
The tax character of distributions paid during the fiscal years ended June 30, 2024 and June 30, 2023 were as follows:
| | 2024 | |
| Fund | | Distributions paid
from tax-exempt
income | | Distributions
paid from
ordinary income | | Distributions
paid from
long term
realized
capital gains | | Total
distributions
paid | |
UBS All China Equity Fund | | $ | — | | | $ | 81,710 | | | $ | — | | | $ | 81,710 | | |
UBS Global Allocation Fund | | | — | | | | 3,517,815 | | | | — | | | | 3,517,815 | | |
UBS Emerging Markets Equity Opportunity Fund | | | — | | | | 13,727,412 | | | | — | | | | 13,727,412 | | |
UBS Engage For Impact Fund | | | — | | | | 764,484 | | | | — | | | | 764,484 | | |
UBS International Sustainable Equity Fund | | | — | | | | 1,677,909 | | | | — | | | | 1,677,909 | | |
UBS US Dividend Ruler Fund | | | — | | | | 3,615,809 | | | | 1,207,008 | | | | 4,822,817 | | |
UBS US Quality Growth At Reasonable Price Fund | | | — | | | | 952,900 | | | | — | | | | 952,900 | | |
UBS U.S. Small Cap Growth Fund | | | — | | | | — | | | | — | | | | — | | |
UBS Sustainable Development Bank Bond Fund | | | — | | | | 2,147,938 | | | | — | | | | 2,147,938 | | |
UBS Multi Income Bond Fund | | | — | | | | 886,237 | | | | — | | | | 886,237 | | |
88
The UBS Funds
Notes to financial statements
| | | 2023 | |
Fund | | Distributions paid
from tax-exempt
income | | Distributions
paid from
ordinary income | | Distributions
paid from net
long-term
capital gains | | Return of capital | | Total
distributions
paid | |
UBS All China Equity Fund | | $ | — | | | $ | 54,803 | | | $ | — | | | $ | — | | | $ | 54,803 | | |
UBS Global Allocation Fund | | | — | | | | 2,501 | | | | 8,103,643 | | | | — | | | | 8,106,144 | | |
UBS Emerging Markets Equity Opportunity Fund | | | — | | | | 16,502,215 | | | | — | | | | — | | | | 16,502,215 | | |
UBS Engage For Impact Fund | | | — | | | | 204,616 | | | | 449,668 | | | | — | | | | 654,284 | | |
UBS International Sustainable Equity Fund | | | — | | | | 1,451,391 | | | | 22,387,038 | | | | — | | | | 23,838,429 | | |
UBS US Dividend Ruler Fund | | | — | | | | 1,627,541 | | | | 1,509,764 | | | | — | | | | 3,137,305 | | |
UBS US Quality Growth At Reasonable Price Fund | | | — | | | | 2,657 | | | | 1,654,626 | | | | — | | | | 1,657,283 | | |
UBS U.S. Small Cap Growth Fund | | | — | | | | — | | | | 6,492,963 | | | | — | | | | 6,492,963 | | |
UBS Sustainable Development Bank Bond Fund | | | — | | | | 1,449,289 | | | | — | | | | 103,872 | | | | 1,553,161 | | |
UBS Multi Income Bond Fund | | | — | | | | 916,134 | | | | — | | | | — | | | | 916,134 | | |
For federal income tax purposes, the estimated cost and unrealized appreciation (depreciation) in value of investments, including derivatives, held at June 30, 2024 were as follows:
| Fund | | Cost of investments | | Gross unrealized
appreciation | | Gross unrealized
depreciation | | Net unrealized
appreciation
(depreciation)
on investments | |
UBS All China Equity Fund | | $ | 4,190,321 | | | $ | 10,171 | | | $ | (1,372,042 | ) | | $ | (1,361,871 | ) | |
UBS Global Allocation Fund | | | 156,286,493 | | | | 12,342,633 | | | | (8,119,214 | ) | | | 4,223,419 | | |
UBS Emerging Markets Equity Opportunity Fund | | | 508,314,221 | | | | 40,758,638 | | | | (99,512,202 | ) | | | (58,753,564 | ) | |
UBS Engage For Impact Fund | | | 50,030,367 | | | | 10,389,696 | | | | (5,344,424 | ) | | | 5,045,272 | | |
UBS International Sustainable Equity Fund | | | 166,368,348 | | | | 17,430,825 | | | | (11,274,784 | ) | | | 6,156,041 | | |
UBS US Dividend Ruler Fund | | | 167,157,268 | | | | 35,584,210 | | | | (2,467,900 | ) | | | 33,116,310 | | |
UBS US Quality Growth At Reasonable Price Fund | | | 217,322,392 | | | | 70,823,535 | | | | (900,947 | ) | | | 69,922,588 | | |
UBS U.S. Small Cap Growth Fund | | | 108,878,038 | | | | 33,714,908 | | | | (11,402,251 | ) | | | 22,312,657 | | |
UBS Sustainable Development Bank Bond Fund | | | 85,362,121 | | | | 60,892 | | | | (6,019,309 | ) | | | (5,958,417 | ) | |
UBS Multi Income Bond Fund | | | 21,319,014 | | | | 108,064 | | | | (1,160,437 | ) | | | (1,052,373 | ) | |
The difference between book and tax basis appreciation (depreciation) on investment is primarily attributed to tax deferral of losses on wash sales, tax treatment of certain derivatives and mark-to-market of passive foreign investment companies.
At June 30, 2024, the components of accumulated earnings (deficit) on a tax basis were as follows:
| Fund | | Undistributed
tax-exempt
income | | Undistributed
ordinary
income | | Undistributed
long-term
capital gains | | Accumulated
capital and
other losses | | Unrealized
appreciation
(depreciation) | | Other
temporary
differences | | Total | |
UBS All China Equity Fund | | $ | — | | | $ | 40,191 | | | $ | — | | | $ | (491,330 | ) | | $ | (1,361,867 | ) | | $ | (2,629 | ) | | $ | (1,815,635 | ) | |
UBS Global Allocation Fund | | | — | | | | 2,730,605 | | | | — | | | | (5,377,825 | ) | | | 4,212,723 | | | | (3,289 | ) | | | 1,562,214 | | |
UBS Emerging Markets Equity Opportunity Fund | | | — | | | | 8,118,204 | | | | — | | | | (111,841,256 | ) | | | (60,278,262 | ) | | | (15,686 | ) | | | (164,017,000 | ) | |
UBS Engage For Impact Fund | | | — | | | | 407,173 | | | | — | | | | (100,881 | ) | | | 5,042,208 | | | | (22,272 | ) | | | 5,326,228 | | |
UBS International Sustainable Equity Fund | | | — | | | | 2,396,415 | | | | — | | | | (19,534,813 | ) | | | 6,156,170 | | | | — | | | | (10,982,228 | ) | |
UBS US Dividend Ruler Fund | | | — | | | | 1,555,166 | | | | 3,140,205 | | | | — | | | | 33,116,310 | | | | (21,742 | ) | | | 37,789,939 | | |
UBS US Quality Growth At Reasonable Price Fund | | | — | | | | 874,355 | | | | 972,413 | | | | — | | | | 69,922,589 | | | | (29,513 | ) | | | 71,739,844 | | |
UBS U.S. Small Cap Growth Fund | | | — | | | | — | | | | — | | | | (9,422,063 | ) | | | 22,312,657 | | | | — | | | | 12,890,594 | | |
UB Sustainable Development Bank Bond Fund | | | — | | | | — | | | | — | | | | (4,837,653 | ) | | | (5,958,417 | ) | | | (14,001 | ) | | | (10,810,071 | ) | |
UBS Multi Income Bond Fund | | | — | | | | 664,598 | | | | — | | | | (5,857,341 | ) | | | (1,057,674 | ) | | | — | | | | (6,250,417 | ) | |
89
The UBS Funds
Notes to financial statements
Net capital losses recognized by the Funds, may be carried forward indefinitely, and retain their character as short-term and/or long-term losses. These carryforwards are available as a reduction, to the extent provided in regulations, of future realized capital gains. To the extent that such losses are used to offset future net realized capital gains, it is probable these gains will not be distributed.
At June 30, 2024, the following Funds had net capital losses that will be carried forward indefinitely, as follows:
Fund | | Short-term losses | | Long-term losses | | Net capital losses | |
UBS All China Equity Fund | | $ | 190,664 | | | $ | 300,666 | | | $ | 491,330 | | |
UBS Global Allocation Fund | | | 5,377,825 | | | | — | | | | 5,377,825 | | |
UBS Emerging Markets Equity Opportunity Fund | | | 33,517,237 | | | | 78,324,019 | | | | 111,841,256 | | |
UBS Engage For Impact Fund | | | 100,881 | | | | — | | | | 100,881 | | |
UBS International Sustainable Equity Fund | | | 466,178 | | | | 19,068,635 | | | | 19,534,813 | | |
UBS US Dividend Ruler Fund | | | — | | | | — | | | | — | | |
UBS US Quality Growth At Reasonable Price Fund | | | — | | | | — | | | | — | | |
UBS U.S. Small Cap Growth Fund | | | — | | | | 9,422,063 | | | | 9,422,063 | | |
UBS Sustainable Development Bank Bond Fund | | | 454,533 | | | | 4,383,120 | | | | 4,837,653 | | |
UBS Multi Income Bond Fund | | | 3,290,309 | | | | 2,567,032 | | | | 5,857,341 | | |
During the fiscal year ended, the following Funds utilized capital loss carryforwards to offset current year realized gains:
| Fund | | Capital loss
carryforwards
utilized | |
UBS Global Allocation Fund | | $ | 6,192,230 | | |
UBS Engage For Impact Fund | | | 1,822,311 | | |
UBS US Quality Growth At Reasonable Price Fund | | | 5,052,887 | | |
At June 30, 2024, the effect of permanent "book/tax" reclassifications resulted in increases and decreases to components of the Funds' net assets as follows:
| Fund | | Distributable
earnings (losses) | | Beneficial
Interest | |
UBS U.S. Small Cap Growth Fund | | $ | 435,348 | | | $ | (435,348 | ) | |
UBS Sustainable Development Bank Bond Fund | | | 1,214 | | | | (1,214 | ) | |
These differences are primarily due to net operating losses.
ASC 740-10 "Income Taxes—Overall" sets forth a minimum threshold for financial statement recognition of the benefit of a tax position taken or expected to be taken. The Funds have conducted an analysis and concluded, as of June 30, 2024, that there are no significant uncertain tax positions taken or expected to be taken that would require recognition in the financial statements. It is each Fund's policy to record any significant foreign tax exposures in the financial statements. The Funds recognize interest and penalties, if any, related to uncertain tax positions as income tax expense in the Statement of operations. During the period ended June 30, 2024, the Funds did not incur any interest or penalties.
Under the applicable foreign tax laws, gains on certain securities held in certain foreign countries may be subject to taxes that will be paid by the Funds.
90
The UBS Funds
Notes to financial statements
Each of the tax years in the four year fiscal period ended June 30, 2024 or since inception in the case of UBS All China Equity Fund, UBS US Dividend Ruler Fund and UBS US Quality Growth At Reasonable Price Fund remains subject to examination by the Internal Revenue Service and state taxing authorities and/or non-US tax authorities.
Subsequent Event—UBS All China Equity Fund
At the recommendation of UBS AM, the Board of Trustees of the Trust determined that it is in the best interests of the Fund and its shareholders to liquidate and dissolve the Fund pursuant to a Plan of Liquidation. The liquidation is expected to be completed on or about September 23, 2024. In connection with the liquidation, the Board approved, effective June 24, 2024, the closure of each class of the Fund to new investments, including new investors, additional purchases from existing investors and purchases for exchange from other funds.
91
Report of independent registered public accounting firm
To the Shareholders and the Board of Trustees of The UBS Funds
Opinion on the Financial Statements
We have audited the accompanying statements of assets and liabilities of The UBS Funds (the "Trust"), (comprising UBS All China Equity Fund, UBS Global Allocation Fund, UBS Emerging Markets Equity Opportunity Fund, UBS Engage For Impact Fund, UBS International Sustainable Equity Fund, UBS US Dividend Ruler Fund, UBS US Quality Growth At Reasonable Price Fund, UBS U.S. Small Cap Growth Fund, UBS Sustainable Development Bank Bond Fund and UBS Multi Income Bond Fund (collectively referred to as the "Funds")), including the portfolios of investments, as of June 30, 2024, and the related statements of operations and changes in net assets, and the financial highlights for each of the periods indicated in the table below and the related notes (collectively referred to as the "financial statements"). In our opinion, the financial statements present fairly, in all material respects, the financial position of each of the Funds comprising The UBS Funds at June 30, 2024, and the results of their operations, changes in net assets and financial highlights for each of the periods indicated in the table below, in conformity with U.S. generally accepted accounting principles.
Funds comprising The UBS Funds | | Statement of operations | | Statements of changes in
net assets | | Financial highlights | |
UBS Global Allocation Fund
UBS International Sustainable Equity Fund
UBS U.S. Small Cap Growth Fund
UBS Multi Income Bond Fund
UBS Emerging Markets Equity Opportunity Fund
UBS Engage for Impact Fund
UBS Sustainable Development Bank Bond Fund | | For the year ended June 30, 2024 | | For each of the two years in the period ended June 30, 2024 | | For each of the five years in the period ended June 30, 2024 | |
UBS All China Equity Fund | | For the year ended June 30, 2024 | | For each of the two years in the period ended June 30, 2024 | | For each of the three years in the period ended June 30, 2024 and the period from February 24, 2021 (commencement of operations) through June 30, 2021 | |
UBS US Dividend Ruler Fund
UBS US Quality Growth At Reasonable Price Fund | | For the year ended June 30, 2024 | | For each of the two years in the period ended June 30, 2024 | | For each of the three years in the period ended June 30, 2024 and the period from July 9, 2020 (commencement of operations) through June 30, 2021 | |
Basis for Opinion
These financial statements are the responsibility of the Trust's management. Our responsibility is to express an opinion on each of the Funds' financial statements based on our audits. We are a public accounting firm registered with the Public Company Accounting Oversight Board (United States) ("PCAOB") and are required to be independent with respect to the Trust in accordance with the U.S. federal securities laws and the applicable rules and regulations of the Securities and Exchange Commission and the PCAOB.
We conducted our audits in accordance with the standards of the PCAOB. Those standards require that we plan and perform the audit to obtain reasonable assurance about whether the financial statements are free of material
92
Report of independent registered public accounting firm (concluded)
misstatement, whether due to error or fraud. The Trust is not required to have, nor were we engaged to perform, an audit of the Trust's internal control over financial reporting. As part of our audits we are required to obtain an understanding of internal control over financial reporting but not for the purpose of expressing an opinion on the effectiveness of the Trust's internal control over financial reporting. Accordingly, we express no such opinion.
Our audits included performing procedures to assess the risks of material misstatement of the financial statements, whether due to error or fraud, and performing procedures that respond to those risks. Such procedures included examining, on a test basis, evidence regarding the amounts and disclosures in the financial statements. Our procedures included confirmation of securities owned as of June 30, 2024, by correspondence with the custodian and brokers; when replies were not received from brokers, we performed other auditing procedures. Our audits also included evaluating the accounting principles used and significant estimates made by management, as well as evaluating the overall presentation of the financial statements. We believe that our audits provide a reasonable basis for our opinion.
We have served as the auditor of one or more UBS investment companies since 1978.
New York, New York
August 23, 2024
93
Federal tax information (unaudited)
We are required by Subchapter M of the Internal Revenue Code of 1986, as amended, to advise you in writing as to the federal tax status of distributions received by shareholders during the fiscal year. Accordingly, the amount of ordinary dividends paid that qualify for the dividends received deduction for corporate shareholders and the amount of foreign tax credit to be passed through to shareholders are as follows:
Fund | | Dividends
received
deduction | | Long-term
capital gain | | Foreign tax
credit | |
UBS All China Equity Fund | | $ | — | | | $ | — | | | $ | 4,790 | | |
UBS Global Allocation Fund | | | 482,151 | | | | — | | | | — | | |
UBS Emerging Markets Equity Opportunity Fund | | | — | | | | — | | | | 2,004,158 | | |
UBS Engage For Impact Fund | | | 183,227 | | | | — | | | | — | | |
UBS International Sustainable Equity Fund | | | — | | | | — | | | | 336,100 | | |
UBS US Dividend Ruler Fund | | | 3,615,809 | | | | 1,207,008 | | | | — | | |
UBS US Quality Growth At Reasonable Price Fund | | | 952,900 | | | | — | | | | — | | |
UBS U.S. Small Cap Growth Fund | | | — | | | | — | | | | — | | |
UBS Municipal Bond Fund | | | — | | | | — | | | | — | | |
UBS Sustainable Development Bank Bond Fund | | | — | | | | — | | | | — | | |
UBS Multi Income Bond Fund | | | — | | | | — | | | | — | | |
Also, for the fiscal period ended June 30, 2024, the foreign source income for information reporting purposes for UBS All China Equity Fund was $92,359, UBS Emerging Markets Equity Opportunity Fund was $13,011,535 and for UBS International Sustainable Equity Fund was $3,876,501.
For the taxable period ended June 30, 2024, the Funds designate the amounts below as the maximum amount that may be considered qualified dividend income for individual shareholders.
Fund | | Maximum amount
considered
qualified dividend
income | |
UBS All China Equity Fund | | $ | 52,873 | | |
UBS Global Allocation Fund | | | 1,037,171 | | |
UBS Emerging Markets Equity Opportunity Fund | | | 11,572,198 | | |
UBS Engage For Impact Fund | | | 878,829 | | |
UBS International Sustainable Equity Fund | | | 2,014,009 | | |
UBS US Dividend Ruler Fund | | | 3,615,809 | | |
UBS US Quality Growth At Reasonable Price Fund | | | 952,900 | | |
UBS U.S. Small Cap Growth Fund | | | — | | |
UBS Municipal Bond Fund | | | — | | |
UBS Sustainable Development Bank Bond Fund | | | — | | |
UBS Multi Income Bond Fund | | | — | | |
Shareholders should not use the above information to prepare their tax returns. Since the Funds' fiscal year end is not the calendar year end, another notification will be sent with respect to calendar year 2024. Such notification, which will reflect the amount to be used by calendar year taxpayers on their federal income tax returns, will be made in conjunction with Form 1099 DIV and will be mailed in February 2025. Shareholders are advised to consult their own tax advisers with respect to the tax consequences of their investment in each of the Funds.
94
PRESORTED
STANDARD
U.S. POSTAGE
PAID
COMPUTERSHARE

UBS Asset Management (Americas) LLC
787 Seventh Avenue
New York, NY 10019-6028
(b) Included as part of the financial statements to shareholders filed under Item 7(a) of this form.
Item 8. Changes in and Disagreements with Accountants for Open-End Management Investment Companies.
Not applicable.
Item 9. Proxy Disclosures for Open-End Management Investment Companies.
Shareholder meeting results
A special meeting of shareholders of the series of The UBS Funds (the "Trust") was held on Tuesday, November 21, 2023 (the "Meeting"). The Meeting was held for the following purposes:
Proposals | | Affected Fund(s) | |
1. To elect four Trustees to the Board | | All Funds | |
2. To approve changes to the fundamental investment restrictions regarding: | | | |
2.A. Borrowing | | All Funds | |
2.B. Issuing Senior Securities | | All Funds | |
2.C. Real Estate | | All Funds | |
2.D. Commodities | | UBS Emerging Markets Equity Opportunity Fund
UBS Global Allocation Fund
UBS International Sustainable Equity Fund
UBS U.S. Small Cap Growth Fund
UBS Multi Income Bond Fund | |
2.E. Making Loans | | All Funds | |
2.F. Concentration | | UBS International Sustainable Equity Fund | |
2.G. Diversification | | UBS International Sustainable Equity Fund | |
2.H. Underwriting | | UBS International Sustainable Equity Fund
UBS Emerging Markets Equity Opportunity Fund
UBS U.S. Small Cap Growth Fund | |
3. To allow the Board to amend a Fund's investment objective without Shareholder approval. | | UBS Emerging Markets Equity Opportunity Fund
UBS Global Allocation Fund
UBS International Sustainable Equity Fund
UBS U.S. Small Cap Growth Fund
UBS Multi Income Bond Fund | |
4. To approve changing the Fund's sub-classification from "diversified" to "non-diversified" and the elimination of the related fundamental investment restriction. | | UBS Emerging Markets Equity Opportunity Fund | |
5. To approve the elimination of the fundamental investment restrictions regarding:
5.A. Investing for control or management
5.B. Purchasing securities on margin
5.C. Investing in unseasoned issuers
5.D. Investments in other investment companies
5.E. Investments in puts, calls and straddles
5.F. Investments in oil, gas and/or mineral exploration or development programs or leases | | UBS International Sustainable Equity Fund | |
6. To adopt a "manager of managers" investment advisory structure whereby UBS AM, the Fund's investment advisor, would be able to hire and replace sub-advisors of the Fund without Shareholder approval | | UBS All China Equity Fund
UBS Engage For Impact Fund
UBS Global Allocation Fund
UBS U.S. Small Cap Growth Fund
UBS Multi Income Bond Fund
UBS Sustainable Development Bank Bond Fund
UBS US Dividend Ruler Fund
UBS US Quality Growth At Reasonable Price Fund | |
Proposal 1: To Elect Four Trustees to the Board. Trustees were elected by shareholders of all series of The UBS Funds. The results of voting were as follows:*
| | | Votes For | | Votes Withheld | |
Adela Cepeda | | | 75,621,538.177 | | | | 1,309,094.988 | | |
Rodrigo Garcia | | | 75,634,543.071 | | | | 1,296,090.094 | | |
Muhammad Gigani | | | 75,482,869.709 | | | | 1,447,763.456 | | |
Abbie. J. Smith | | | 75,622,836.880 | | | | 1,307,796.285 | | |
* Results are for all series of The UBS Funds.
Proposal 2: To Approve Changes to Certain Funds' Fundamental Investment Restrictions. Proposals 2.A-2.H passed with respect to UBS International Sustainable Equity Fund. UBS Global Allocation Fund, UBS Engage for Impact Fund, UBS Multi Income Bond Fund, UBS Sustainable Development Bank Bond Fund and UBS US Dividend Ruler Fund did not receive sufficient shareholder votes to pass Proposals 2.A-2.H, as applicable. A quorum was not present for UBS All China Equity Fund, UBS Emerging Markets Equity Opportunity Fund, UBS U.S. Small Cap Growth Fund and UBS US Quality Growth At Reasonable Price Fund. The results of voting were as follows:
| | | Votes For | | Votes Against | | Votes Abstain | | Broker Non-Votes | |
UBS International Sustainable Equity Fund | |
Proposal 2.A. Borrowing | | | 7,736,769.381 | | | | 84,731.459 | | | | 121,936.675 | | | | 1,375,578.000 | | |
Proposal 2.B. Issuing Senior Securities | | | 7,737,729.216 | | | | 84,251.413 | | | | 121,456.886 | | | | 1,375,578.000 | | |
Proposal 2.C. Real Estate | | | 7,729,724.167 | | | | 97,905.397 | | | | 115,807.951 | | | | 1,375,578.000 | | |
Proposal 2.D. Commodities | | | 7,702,384.690 | | | | 65,758.563 | | | | 175,294.262 | | | | 1,375,578.000 | | |
Proposal 2.E. Making Loans | | | 7,729,621.048 | | | | 89,540.181 | | | | 124,276.286 | | | | 1,375,578.000 | | |
Proposal 2.F. Concentration | | | 7,716,388.517 | | | | 78,633.678 | | | | 148,415.320 | | | | 1,375,578.000 | | |
Proposal 2.G. Diversification | | | 7,729,180.805 | | | | 74,503.547 | | | | 139,753.163 | | | | 1,375,578.000 | | |
Proposal 2.H. Underwriting | | | 7,720,068.703 | | | | 75,651.068 | | | | 147,717.744 | | | | 1,375,578.000 | | |
| | | Votes For | | Votes Against | | Votes Abstain | | Broker Non-Votes | |
UBS Global Allocation Fund | |
Proposal 2.A. Borrowing | | | 3,057,197.402 | | | | 491,567.369 | | | | 210,323.297 | | | | 7,463,241.747 | | |
Proposal 2.B. Senior Securities | | | 3,079,312.751 | | | | 431,194.695 | | | | 248,580.622 | | | | 7,463,241.747 | | |
Proposal 2.C. Real Estate | | | 3,080,981.195 | | | | 372,743.425 | | | | 305,363.448 | | | | 7,463,241.747 | | |
Proposal 2.D. Commodities | | | 2,878,065.582 | | | | 542,379.484 | | | | 338,643.002 | | | | 7,463,241.747 | | |
Proposal 2E. Making Loans | | | 2,852,408.428 | | | | 552,023.346 | | | | 354,656.294 | | | | 7,463,241.747 | | |
| | | Votes For | | Votes Against | | Votes Abstain | | Broker Non-Votes | |
UBS Engage For Impact Fund | |
Proposal 2.A. Borrowing | | | 670,258.316 | | | | 36,423.203 | | | | 56,579.748 | | | | 2,053,913.664 | | |
Proposal 2.B. Senior Securities | | | 671,606.984 | | | | 36,199.163 | | | | 55,455.120 | | | | 2,053,913.664 | | |
Proposal 2.C. Real Estate | | | 661,752.782 | | | | 44,572.780 | | | | 56,935.705 | | | | 2,053,913.664 | | |
Proposal 2.E. Making Loans | | | 665,709.828 | | | | 38,956.576 | | | | 58,594.863 | | | | 2,053,913.664 | | |
| | | Votes For | | Votes Against | | Votes Abstain | | Broker Non-Votes | |
UBS Multi Income Bond Fund | |
Proposal 2.A. Borrowing | | | 361,960.310 | | | | 41,197.061 | | | | 17,056.282 | | | | 695,302.291 | | |
Proposal 2.B. Senior Securities | | | 367,985.938 | | | | 38,542.208 | | | | 13,685.507 | | | | 695,302.291 | | |
Proposal 2C. Real Estate | | | 357,335.511 | | | | 34,474.208 | | | | 28,403.934 | | | | 695,302.291 | | |
Proposal 2.D. Commodities | | | 358,627.730 | | | | 36,536.208 | | | | 25,049.715 | | | | 695,302.291 | | |
Proposal 2.E. Making Loans | | | 353,171.589 | | | | 47,999.653 | | | | 19,042.411 | | | | 695,302.291 | | |
| | Votes For | | Votes Against | | Votes Abstain | | Broker Non-Votes | |
UBS Sustainable Development Bank Bond Fund | |
Proposal 2.A. Borrowing | | | 1,489,562.831 | | | | 59,169.150 | | | | 89,434.019 | | | | 4,138,838.392 | | |
Proposal 2.B. Issuing Senior Securities | | | 1,491,824.425 | | | | 55,341.361 | | | | 91,000.214 | | | | 4,138,838.392 | | |
Proposal 2.C. Real Estate | | | 1,484,890.997 | | | | 63,576.093 | | | | 89,698.910 | | | | 4,138,838.392 | | |
Proposal 2.E. Making Loans | | | 1,482,572.175 | | | | 57,731.641 | | | | 97,862.184 | | | | 4,138,838.392 | | |
| | | Votes For | | Votes Against | | Votes Abstain | | Broker Non-Votes | |
UBS US Dividend Ruler Fund | |
Proposal 2.A. Borrowing | | | 1,049,794.969 | | | | 82,722.087 | | | | 67,549.892 | | | | 4,722,046.806 | | |
Proposal 2.B. Issuing Senior Securities | | | 1,049,085.452 | | | | 77,830.187 | | | | 73,151.309 | | | | 4,722,046.806 | | |
Proposal 2.C. Real Estate | | | 1,036,062.006 | | | | 92,695.660 | | | | 71,309.282 | | | | 4,722,046.806 | | |
Proposal 2.E. Making Loans | | | 1,010,125.604 | | | | 122,795.229 | | | | 67,146.115 | | | | 4,722,046.806 | | |
Proposal 3: To Allow the Board of Trustees to Amend Certain Funds' Investment Objectives without Shareholder Approval. UBS Global Allocation Fund, UBS International Sustainable Equity Fund and UBS Multi Income Bond Fund did not receive sufficient shareholder votes to pass Proposal 3. A quorum was not present for UBS Emerging Markets Equity Opportunity Fund and UBS U.S. Small Cap Growth Fund. The results of voting were as follows:
| | | Votes For | | Votes Against | | Votes Abstain | | Broker Non-Votes | |
UBS Global Allocation Fund | | | 2,500,043.312 | | | | 1,067,698.902 | | | | 191,345.854 | | | | 7,463,241.747 | | |
UBS International Sustainable Equity Fund | | | 5,282,477.938 | | | | 2,526,246.452 | | | | 134,713.125 | | | | 1,375,578.000 | | |
UBS Multi Income Bond Fund | | | 324,192.122 | | | | 83,263.750 | | | | 12,757.781 | | | | 695,302.291 | | |
Proposal 4: To Approve Changing UBS Emerging Markets Equity Opportunity Fund's Sub-Classification From "Diversified" to "Non-Diversified" and the Elimination of the Related Fundamental Investment Restriction. A quorum was not present for UBS Emerging Markets Equity Opportunity Fund.
Proposal 5: To Approve the Elimination of Certain of UBS International Sustainable Equity Fund's Fundamental Investment Restrictions. Proposals 5.A-5.F passed with respect to UBS International Sustainable Equity Fund. The results of voting were as follows:
| | | Votes For | | Votes Against | | Votes Abstain | | Broker Non-Votes | |
Proposal 5A. Investing for Control or Management | | | 7,662,790.911 | | | | 149,171.771 | | | | 131,474.833 | | | | 1,375,578.000 | | |
Proposal 5.B. Purchasing Securities on Margin | | | 7,662,500.345 | | | | 150,494.658 | | | | 130,442.512 | | | | 1,375,578.000 | | |
Proposal 5.C. Investing in Unseasoned Issuers | | | 7,647,913.633 | | | | 168,365.810 | | | | 127,158.072 | | | | 1,375,578.000 | | |
Proposal 5.D. Investments in Other Investment Companies | | | 7,671,591.761 | | | | 135,251.478 | | | | 136,594.276 | | | | 1,375,578.000 | | |
Proposal 5.E. Investments in Puts, Calls and Straddles | | | 7,621,878.012 | | | | 158,484.194 | | | | 163,075.309 | | | | 1,375,578.000 | | |
Proposal 5.F. Investments in Oil, Gas and/or Mineral
Exploration or Development Programs or Leases | | | 7,552,519.947 | | | | 270,577.336 | | | | 120,340.232 | | | | 1,375,578.000 | | |
Proposal 6: To Adopt a "Manager of Managers" Investment Advisory Structure for Certain Funds. UBS Engage for Impact Fund, UBS Global Allocation Fund, UBS Multi Income Bond Fund, UBS Sustainable Development Bank Bond Fund and UBS US Dividend Ruler Fund did not receive sufficient shareholder votes to pass Proposal 6. A quorum was not present for UBS All China Equity Fund, UBS U.S. Small Cap Growth Fund and UBS US Quality Growth At Reasonable Price Fund. The results of voting were as follows:
| | | Votes For | | Votes Against | | Votes Abstain | | Broker Non-Votes | |
UBS Engage For Impact Fund | | | 645,539.605 | | | | 62,278.441 | | | | 55,443.221 | | | | 2,053,913.664 | | |
UBS Global Allocation Fund | | | 3,092,777.400 | | | | 453,472.452 | | | | 212,838.216 | | | | 7,463,241.747 | | |
UBS Multi Income Bond Fund | | | 342,319.363 | | | | 41,944.123 | | | | 35,950.167 | | | | 695,302.291 | | |
UBS Sustainable Development Bank Bond Fund | | | 1,445,108.233 | | | | 79,021.153 | | | | 114,036.614 | | | | 4,138,838.392 | | |
UBS US Dividend Ruler Fund | | | 994,103.470 | | | | 117,297.406 | | | | 88,666.072 | | | | 4,722,046.806 | | |
Item 10. Remuneration Paid to Directors, Officers, and Others of Open-End Management Investment Companies.
(1) All board members and all members of any advisory board for regular compensation: $496,439
(2) Each board member and each member of an advisory board for special compensation: Not applicable.
(3) All officers: Not applicable.
(4) Each person of whom any officer or director of the registrant is an affiliated person: Not applicable.
Item 11. Statement Regarding Basis for Approval of Investment Advisory Contract.
February 27, 2024 Meetings
At the meeting of the Board of Trustees (the "Board") of The UBS Funds (the "Trust"), held on February 27, 2024 (the "February Meeting"), the Board, including those Trustees who are not "interested persons" (as defined in the Investment Company Act of 1940, as amended (the "1940 Act")) of the Trust or UBS Asset Management (Americas) Inc. (the "Advisor" or "UBS AM")) and its affiliates (together, the "Independent Trustees"), considered amendments (the "Amendments") to the investment advisory agreements (the "Advisory Agreements") between the Trust and the Advisor for the UBS All China Equity Fund, UBS Emerging Markets Equity Opportunity Fund, UBS Engage For Impact Fund, UBS Global Allocation Fund, UBS International Sustainable Equity Fund, UBS U.S. Small Cap Growth Fund, UBS Sustainable Development Bank Bond Fund, UBS Multi Income Bond Fund, UBS US Dividend Ruler Fund and UBS US Quality Growth At Reasonable Price Fund (each a "Fund," and together, the "Funds").
At the February Meeting, the Advisor reported that the Board was being asked to approve Amendments to each of the Advisory Agreements relating to the Funds to reflect the proposed reorganization of the Advisor from a Delaware corporation to a Delaware limited liability company (the "Reorganization"). The Advisor reported that in June 2023, UBS Group AG ("UBS") acquired Credit Suisse Group AG ("Credit Suisse") and that as part of the integration of Credit Suisse into UBS, UBS AM will merge or otherwise consolidate with Credit Suisse Asset Management, LLC ("CSAM"). To facilitate the consolidation of UBS AM and CSAM, the Advisor reported that it will effect the Reorganization through a change of its form of organization from a corporation to a limited liability company organized under the laws of the state of Delaware in a conversion pursuant to Delaware statute and to a change in its name to UBS Asset Management (Americas) LLC.
The Advisor represented, and the Board considered, that the Reorganization will involve no change to: (i) the investment processes and strategies employed in the management of the Funds' assets; (ii) the nature and level of services provided to the Funds; (iii) the individuals primarily responsible for the day-to-day management of Fund assets; or (iv) the trustees and officers of the Funds. The Advisor further reported that the personnel who primarily provide investment management services to the Funds pursuant to the Agreements prior to the Reorganization will continue to serve in such roles immediately after the Reorganization. It was noted that the Amendments contain no changes to the Agreements other than to reflect UBS AM's new name and form of organization resulting from the Reorganization, and all other provisions of the Agreements would remain in full force and effect, including contractual fee provisions. Accordingly, the Boards considered the information provided in connection with its prior review of the renewal of the Agreements in considering the approval of the Amendments.
After full consideration of the information discussed above, the Board, including a majority of the Independent Trustees, with the assistance of independent counsel, concluded that the approval of the Amendments to the Advisory Agreement for each Fund was in the interests of the Fund and its shareholders.
June 6-7, 2024 Meetings
At the meeting of the Board of Trustees (the "Board") of The UBS Funds (the "Trust"), held on June 6 and 7, 2024 (the "Meeting"), the Board, including those Trustees who are not "interested persons" (as defined in the Investment Company Act of 1940, as amended (the "1940 Act")) of the Trust or UBS Asset Management (Americas) LLC (the "Advisor") and its affiliates (together, the "Independent Trustees"), considered the continuation of the investment advisory agreements (the "Advisory Agreements") between the Trust and the Advisor for the UBS All China Equity Fund, UBS Emerging Markets Equity Opportunity Fund, UBS Engage For Impact Fund, UBS Global Allocation Fund, UBS International Sustainable Equity Fund, UBS U.S. Small Cap Growth Fund, UBS Sustainable Development Bank Bond Fund, UBS Multi Income Bond Fund, UBS US Dividend Ruler Fund and UBS US Quality Growth At Reasonable Price Fund (each a "Fund," and together, the "Funds"). Prior to the Meeting, the Independent Trustees' counsel had sent to the Advisor a request detailing the information that the Independent Trustees wished to receive in connection with their consideration of the continuation of the Advisory Agreements. The Independent Trustees met with their independent counsel, as well as an independent consultant engaged by the Board to assist in the annual Advisory Agreement review process on May 28, 2024 and June 6, 2024, to discuss the materials provided to them in response to the information request, including materials prepared by the Advisor, as well as reports prepared by Broadridge Financial Solutions, Inc. ("Broadridge Reports"), an independent statistical compilation company, providing comparative expense information on an actual and contractual basis and comparative performance information for the Funds. The Independent Trustees also reviewed information provided in response to their request for additional information from the Advisor in connection with the Advisory Agreements. The Board also made reference to information and material that had been provided to the Independent Trustees throughout the year at Board meetings.
At the Meeting, the Board considered a number of factors in connection with its deliberations concerning the continuation of the Advisory Agreement for each Fund, including: (i) the nature, extent, and quality of the services provided by the Advisor to the Fund; (ii) the performance of the Fund and the Advisor; (iii) the Fund's expenses, costs of the services to be provided and profits to be realized by the Advisor and its affiliates from the relationship with the Fund; and (iv) whether economies of scale are realized by the Advisor with respect to the Fund, as it grows larger, and the extent to which the economies of scale are reflected in the level of the management fees charged.
Nature, extent, and quality of services.
In considering the nature, extent, and quality of the services provided by the Advisor to a Fund, the Board reviewed the material presented by the Advisor describing the various services provided to each Fund. The Board noted that in addition to investment management services, the Advisor provides each Fund with operational, legal, and compliance support. The Board also considered the scope and depth of the Advisor's organization and the experience and expertise of the professionals currently providing investment management and other services to the Funds. The Board considered that the Advisor was a well-established investment management organization employing investment personnel with significant experience in the investment management industry. The Board also considered that, effective May 1, 2024, the Advisor acquired Credit Suisse Asset Management, LLC. The Board considered that this transaction has increased the Advisor's asset management capabilities, expanded the Advisor's presence in key markets, and broadened the Advisor's product offering. The Board also considered the Advisor's in-house research capabilities, as well as other research services available to it, including research services available to the Advisor as a result of securities transactions effected for the Funds and the Advisor's other investment management clients, and noted that the Advisor had extensive global research capabilities.
The Board also evaluated the Advisor's portfolio management process for each Fund, including the use of risk management techniques and the proprietary technologies utilized to structure the Fund's portfolio. The Board noted that various presentations had been made by investment personnel at Board meetings throughout the year concerning the Funds' investment performance and investment strategies.
The Board also noted and discussed the services that the Advisor and its affiliates provide to the Funds under other agreements with the Trust, including administration services provided by the Advisor, underwriting services provided by UBS Asset Management (US) Inc. ("UBS AM (US)"), and sub-transfer agency services provided by UBS Financial Services Inc. ("UBS Financial Services"). In connection with the non-investment management services, the Board also considered the quarterly reports that the Advisor provides to the Board throughout the year pertaining to brokerage commissions, soft dollars, portfolio valuations, and Rule 12b-1 fees, among others. In addition, the Board considered the presentations provided with respect to distribution strategies for the Funds. The Board noted management's continuing endeavors and expenditures to address areas of heightened concern in the mutual fund industry, including geopolitical concerns, and comply with new regulations applicable to the Fund, such as business continuity testing following Russia's invasion of Ukraine, compliance with the SEC's new "tailored shareholder report" requirements, proxy vote reporting and the Rule 35d-1 (names rule) amendments. After analyzing the services provided by the Advisor to each Fund, both quantitatively and qualitatively, including the impact of these services on investment performance, the Board concluded that the nature, extent, and quality of services provided to each Fund were consistent with the operational requirements of each Fund, and met the needs of the Fund's shareholders.
Performance.
In evaluating the performance of each Fund, the Board analyzed the Broadridge Reports, which compared the performance of each Fund with other funds in its respective peer universe over various time periods. The Board also reviewed the memoranda provided by the Advisor providing an analysis of the markets and the Funds' performance during the past year. In reviewing the Broadridge Reports, the Board noted that for the one-year period ended February 29, 2024, the UBS U.S. Small Cap Growth Fund, UBS All China Equity Fund and UBS US Dividend Ruler Fund had appeared in the second performance quintile of their respective performance universe; and the UBS International Sustainable Equity Fund and UBS Quality Growth At Reasonable Price Fund appeared in the third performance quintile of their respective performance universe. The Board further noted that for the one-year period ended February 29, 2024, the UBS Global Allocation Fund, UBS Engage For Impact Fund and UBS Sustainable Development Bank Bond Fund appeared in the fourth performance quintile of their respective performance universe; and the UBS Emerging Markets Equity Opportunity Fund and UBS Multi Income Bond Fund appeared in the fifth performance quintile of their respective performance universe, with each such Fund's annualized total return below the median of its respective performance universe during such period. In evaluating the performance of the Funds following a sustainable investing focused strategy, the Board also considered how the Advisor evaluates whether a sustainable investing Fund is achieving its sustainable investing mandate.
At the Board's request, the Advisor further addressed the performance data for the UBS International Sustainable Equity Fund, UBS Quality Growth At Reasonable Price Fund, UBS Global Allocation Fund, UBS Engage For Impact Fund, UBS Sustainable Development Bank Bond Fund, UBS Emerging Markets Equity Opportunity Fund and UBS Multi Income Bond Fund, each of which had Class P shares' performance ranking below the 50th percentile within its performance universe for the one-year period ended February 29, 2024.
In explaining the performance of the UBS International Sustainable Equity Fund for the one-year period ended February 29, 2024, the Advisor noted that the Fund was in the 56th percentile of its performance universe and its performance was only 48 basis points (i.e., 0.48%) below the performance universe median. The Advisor explained that the Fund's underperformance was due mostly to stock selection in the energy and consumer staples sectors. In discussing the Fund's performance, the Advisor also addressed the Fund's sustainable strategy and its performance with respect to its sustainability metrics.
In explaining the performance of the UBS Quality Growth At Reasonable Price Fund for the one-year period ended February 29, 2024, the Advisor stated that the Fund was in the 58th percentile of its performance universe. The Advisor also noted that while the Fund's performance was below the performance universe median for the one-year
period, the Fund was in the 1st quintile (4th percentile) of the performance universe for the three-year period ended February 29, 2024.
In explaining the performance of the UBS Global Allocation Fund for the one-year period ended February 29, 2024, the Advisor reported that tactical asset allocation decisions and security selection decisions negatively impacted the Fund's relative performance. Within asset allocation, the Advisor noted that the last three years have been an eventful and challenging time for active managers, with major macro events like the Russia/Ukraine war, the Israel/Hamas war and the Silicon Valley Bank collapse. The Advisor then reviewed the impact of various overweighted and underweighted Fund positions that affected the Fund's performance.
In explaining the performance of the UBS Engage For Impact Fund for the one-year period ended February 29, 2024, the Advisor explained that performance was driven primarily by stock selection in the materials and financials sectors, and that stock selection in consumer discretionary and information technology sectors detracted the most from performance. The Advisor highlighted the Fund's two main detractors as not owning stock in NVIDIA and the investment team's position in China Mengniu Dairy. The Advisor also explained differences between the Fund's holdings and the holdings of funds included in its performance universe due to the Fund's impact strategy, and the Board considered how the Advisor measures whether the Fund is achieving its impact strategy.
In explaining the performance of the Sustainable Development Bank Bond Fund for the one-year period ended February 29, 2024, the Advisor explained that the Fund underperformed its peer universe because the Fund employs a different investment mandate than the other funds in the peer universe. The Advisor noted that most of the funds in the Refinitiv Lipper Global Income Fund category, the Fund's performance universe, utilize a wide range of security types, while the Fund only invests in multilateral development bank securities.
In explaining the performance of the UBS Emerging Markets Equity Opportunity Fund for the one-year period ended February 29, 2024, the Advisor reported that underperformance was mainly driven by market concerns over intensifying competition in the Chinese e-commerce sector, which were a drag on the Fund's Chinese holdings and hindered performance recovery in the first quarter of 2023. The Advisor noted that it had instituted enhancements to its investment process, including the format of sector review and review of its long-term assumptions in investments to allow the Advisor to be able to better mitigate potential negative impacts of various market actions.
In explaining the performance of the UBS Multi Income Bond Fund for the one-year period ended February 29, 2024, the Advisor reported that while the Fund underperformed in its peer universe, which is a heterogenous collection of funds with different investment styles and strategies, it provided positive returns consistent with its investment objective and investment strategies. The Advisor noted that the Fund outperformed its benchmark, the Bloomberg US Aggregate Bond Index, for the one-year period ending February 29, 2024.
The Board concluded that the Advisor's explanations provided a sound basis for understanding the performance of each Fund that underperformed in comparison to its peer universe. The Board determined, after analyzing the performance data, that the performance of each Fund was acceptable as compared with relevant performance standards, given the investment strategies and risk profile of each Fund, the expectations of the shareholder base and the current market environment.
Fund fees and expenses.
When considering the fees and expenses borne by each Fund, and the reasonableness of the management fees paid to the Advisor in light of the services provided to each Fund, the Board compared the fees charged by the Advisor to each Fund to fees charged to the funds in its peer group for comparable services, as provided in the Broadridge Reports, on both an actual (taking into account expense limitation arrangements) and a contractual basis (assuming all funds in the peer expense group were similar in size to the respective Fund).
In examining the Broadridge Reports, and in reviewing comparative costs, it was noted that the UBS Global Allocation Fund, UBS All China Equity Fund, UBS Sustainable Development Bank Bond Fund, UBS US Dividend Ruler Fund and UBS US Quality Growth At Reasonable Price Fund had a contractual management fee rate lower than or equal to the Broadridge median of its respective expense group.
The Board noted that the UBS International Sustainable Equity Fund, UBS U.S. Small Cap Growth Fund, UBS Emerging Markets Equity Opportunity Fund, UBS Engage For Impact Fund and UBS Multi Income Bond Fund had a contractual management fee rate higher than the Broadridge median in its respective Broadridge expense group.
The Advisor also noted, however, that the results of such expense comparisons showed that the actual management fee rate for each Fund was equal to or lower than the Broadridge median of the Fund's respective Broadridge expense group. In addition, the Board reviewed the actual total expenses of each Fund and noted that each Fund had total expenses that were comparable to or lower than the Broadridge median in its respective Broadridge expense group, except for the UBS International Sustainable Equity Fund, UBS U.S. Small Cap Growth Fund and UBS Multi Income Bond Fund. After reviewing the fee and expense information, the Board asked the Advisor to further discuss the fees and expenses of the UBS International Sustainable Equity Fund, UBS U.S. Small Cap Growth Fund, UBS Emerging Markets Equity Opportunity Fund, UBS Engage For Impact Fund and UBS Multi Income Bond Fund.
The Advisor first addressed the UBS International Sustainable Equity Fund, which reported contractual management fees and total expenses that were higher than its Broadridge peer group median. The Advisor highlighted that the Fund's total expense ratio is five basis points (i.e., 0.05%) higher than the peer group median. The Advisor further highlighted its belief that the Fund's actual management fee decreased 13 basis points (i.e., 0.13%) year over year and remains competitive with the current expense cap in place, as illustrated by the Fund's Class P shares' ranking in the 33rd percentile of the peer group. As such, the Advisor reported that it did not view the Fund as an outlier with respect to expenses.
The Advisor next addressed the UBS U.S. Small Cap Growth Fund, which reported contractual management fees and total expenses higher than its Broadridge peer group median. The Advisor highlighted that the Fund's total expense ratio is only 2.3 basis points (i.e., 0.023%) higher than the peer group median. The Advisor further noted that due to the waiver associated with the Fund's expense cap, the Fund's actual management fees are ranked in the 1st percentile of the peer group. Thus, the Advisor reported that it did not view the Fund as an outlier with respect to expenses.
The Advisor then addressed the UBS Emerging Markets Equity Opportunity Fund, which reported contractual management fees higher than its Broadridge peer group median. The Advisor highlighted that the Fund's actual management fee and total expense ratio both ranked in the 39th percentiles, respectively. As such, the Advisor did not consider the Fund to be an expense outlier.
The Advisor next addressed the UBS Engage For Impact Fund, which reported contractual management fees higher than its Broadridge peer group median. The Advisor highlighted that the Fund's actual management fee and total expense ratio both ranked in the 1st and 17th percentiles, respectively. As such, the Advisor did not consider the Fund to be an expense outlier.
The Advisor then addressed the UBS Multi Income Bond Fund, which reported contractual management fees and total expense higher than its Broadridge peer group median. The Advisor noted that the difference between the Fund's contractual management fee and the expense group median is 2.5 basis points (i.e., 0.025%). The Advisor further noted that the combination of the Fund's asset level and the current expense limitation agreement results in the Fund waiving the actual advisory and actual administration fees (both comprising the actual management fee)
in their entirety. With the expense limitation agreement currently in place, the Fund's Class P shares' actual management fee ranks in the 1st percentile within its expense peer group, and the actual total expenses for the Fund's Class P shares rank in the 64th percentile in the expense peer group, and are only 1.5 basis points (i.e., 0.015%) higher than the expense peer group median. As such, the Advisor does not view the Fund as an outlier.
The Board also considered the extent to which the Advisor currently waives management fees and/or reimburses expenses for a Fund and its share classes, including the basis for the Advisor's determination that any such waivers and/or reimbursements do not and will not result in cross-subsidization by one share class of another share class of a Fund.
The Board also received and considered information about the fee rates charged to other funds and accounts that are managed by the Advisor, including the Advisor's explanations of differences among such funds and accounts where relevant. After discussing the information about the other funds and accounts with the Advisor, the Board determined that the fees charged by the Advisor to the Funds were within a reasonable range, giving effect to differences in services performed for such other funds and accounts as compared to such fee rates. The Board, after reviewing all pertinent material, concluded that the management fee payable under each Fund's Advisory Agreement was fair and reasonable, both on an absolute basis and in comparison with the fees of other funds identified in its expense group.
Costs and profitability.
The Board considered the costs of providing services to the Funds and the profitability of the Funds to the Advisor and its affiliates by reviewing the profitability analysis provided by the Advisor, including information about its fee revenues and expenses. The Board reviewed the profitability of each Fund to the Advisor and its affiliates, and the compensation that was received for providing services to each Fund. The profitability analysis, which provided information for the last two calendar years, included schedules relating to the revenue and expenses attributable to: (i) the investment advisory and administration services provided by the Advisor; (ii) the distribution and shareholder services provided by UBS AM (US) and UBS Financial Services; (iii) the transfer agency-related services provided by UBS Financial Services; and (iv) all services provided by the Advisor, UBS AM (US), and UBS Financial Services shown on a consolidated basis. In discussing the profitability analysis with the Board, the Advisor, as requested by the Board, provided the Board with a presentation on the methodology utilized in the profitability analysis, including changes to such methodology from the prior year. The Board noted that the methodology used for the profitability analysis provided to the Board for purposes of its annual review of the Advisory Agreements was reasonable. The Advisor also explained to the Board the reasons for any changes in profitability of each Fund from last calendar year to this calendar year.
The Board also considered "fallout" or ancillary benefits to the Advisor or its affiliates as the result of their relationship with the Funds; for example, the ability to attract other clients due to the Advisor's role as investment advisor to the Funds and the research services available to the Advisor through soft dollar brokerage commissions. The Independent Trustees also considered the ancillary benefits received by the Advisor's affiliates, UBS Securities LLC and UBS Group AG, in the form of commissions for executing securities transactions for the Funds. Upon closely examining the information provided concerning the Advisor's profitability, the Board concluded that the level of profits realized by the Advisor and its affiliates with respect to each Fund, if any, was reasonable in relation to the nature and quality of the services that were provided.
Economies of scale.
The Board also discussed whether economies of scale are realized by the Advisor with respect to each Fund as it grows larger, and the extent to which this is reflected in the level of management fees charged. The Board noted that with respect to most Funds, any actual or potential economies of scale are, or will be, shared with the Fund and its shareholders through existing management fee breakpoints so that as the Fund grows in size, its effective management fee declines. The Board noted that each Fund, except the UBS US Quality Growth At Reasonable Price
Fund had a breakpoint schedule that provided for continuing breakpoint(s) past the current asset level for the Fund. Based on each Fund's fees and expenses and the Advisor's profitability analysis, the Board concluded that any actual or potential economies of scale would be reasonably shared with a Fund and its shareholders.
After full consideration of the factors discussed above, with no single factor identified as being of paramount importance, the Board, including a majority of the Independent Trustees, with the assistance of independent counsel, concluded that the continuation of the Advisory Agreement for each Fund was in the interests of the Fund and its shareholders.
Item 12. Disclosure of Proxy Voting Policies and Procedures for Closed-End Management Investment Companies.
Not applicable to the registrant.
Item 13. Portfolio Managers of Closed-End Management Investment Companies.
Not applicable to the registrant.
Item 14. Purchases of Equity Securities by Closed-End Management Investment Company and Affiliated Purchasers.
Not applicable to the registrant.
Item 15. Submission of Matters to a Vote of Security Holders.
The Nominating, Compensation and Governance Committee will consider nominees recommended by Qualifying Fund Shareholders if an Independent Trustee vacancy on the Board occurs. A Qualifying Fund Shareholder is a shareholder that: (i) owns of record, or beneficially through a financial intermediary, 1/2 of 1% or more of the Trust's outstanding shares and (ii) has been a shareholder of at least 1/2 of 1% of the Trust's total outstanding shares for 12 months or more prior to submitting the recommendation to the Nominating Committee. In order to recommend a nominee, a Qualifying Fund Shareholder should send a letter to the chairperson of the Nominating Committee, Ms. Abbie Smith, care of Keith A. Weller, the Secretary of The UBS Funds at UBS Asset Management, One North Wacker Drive, Chicago, Illinois 60606, and indicate on the envelope "Nominating Committee." The Qualifying Fund Shareholder's letter should include: (i) the name and address of the Qualifying Fund Shareholder making the recommendation; (ii) the number of shares of each class and series of shares of the Trust which are owned of record and beneficially by such Qualifying Fund Shareholder and the length of time that such shares have been so owned by the Qualifying Fund Shareholder; (iii) a description of all arrangements and understandings between such Qualifying Fund Shareholder and any other person or persons (naming such person or persons) pursuant to which the recommendation is being made; (iv) the name and address of the nominee; and (v) the nominee's resume or curriculum vitae. The Qualifying Fund Shareholder's letter must be accompanied by a written consent of the individual to stand for election if nominated for the Board and to serve if elected by shareholders.
Item 16. Controls and Procedures.
| (a) | The registrant’s principal executive officer and principal financial officer have concluded that the registrant’s disclosure controls and procedures (as defined in Rule 30a-3(c) under the Investment Company Act of 1940, as amended) are effective based on their evaluation of these controls and procedures as of a date within 90 days of the filing date of this document. |
| (b) | The registrant’s principal executive officer and principal financial officer are aware of no changes in the registrant’s internal control over financial reporting that occurred during the second fiscal quarter of the period covered by this report that has materially affected, or is reasonably likely to materially affect, the registrant’s internal control over financial reporting. |
Item 17. Disclosure of Securities Lending Activities for Closed-End Management Investment Companies.
Not applicable to the registrant.
Item 18. Recovery of Erroneously Awarded Compensation.
Not applicable.
Item 19. Exhibits.
| (a) | (2) Any policy required by the listing standards adopted pursuant to Rule 10D-1 under the Exchange Act (17 CFR 240.10D-1) by the registered national securities exchange or registered national securities association upon which the registrant’s securities are listed. Not applicable to the registrant. |
| (a) | (4) Written solicitation to purchase securities under Rule 23c-1 under the Investment Company Act of 1940 sent or given during the period covered by the report by or on behalf of the registrant to 10 or more persons. Not applicable to the registrant. |
| (a) | (5) Change in the registrant’s independent public accountant. Provide the information called for by Item 4 of Form 8-K under the Exchange Act (17 CFR 249.308). Unless otherwise specified by Item 4, or related to and necessary for a complete understanding of information not previously disclosed, the information should relate to events occurring during the reporting period. Not applicable. |
SIGNATURES
Pursuant to the requirements of the Securities Exchange Act of 1934 and the Investment Company Act of 1940, the registrant has duly caused this report to be signed on its behalf by the undersigned, thereunto duly authorized.
The UBS Funds
| By: | /s/ Mark E. Carver | |
| | Mark E. Carver | |
| | President | |
| | | |
| Dated: | September 9, 2024 | |
Pursuant to the requirements of the Securities Exchange Act of 1934 and the Investment Company Act of 1940, this report has been signed below by the following persons on behalf of the registrant and in the capacities and on the dates indicated.
| By: | /s/ Mark E. Carver | |
| | Mark E. Carver | |
| | President | |
| | | |
| Dated: | September 9, 2024 | |
| | | |
| By: | /s/ Joanne M. Kilkeary | |
| | Joanne M. Kilkeary | |
| | Vice President, Treasurer and Principal Accounting Officer | |
| | | |
| Dated: | September 9, 2024 | |