UNITED STATES
SECURITIES AND EXCHANGE COMMISSION
Washington, D.C. 20549
FORM N-CSR
CERTIFIED SHAREHOLDER REPORT OF
REGISTERED MANAGEMENT INVESTMENT COMPANIES
Investment Company Act file number: | 811-06652 |
|
|
Exact name of registrant as specified in charter: | Aberdeen Investment Funds |
|
|
Address of principal executive offices: | 1900 Market Street, Suite 200 |
| Philadelphia, PA 19103 |
|
|
Name and address of agent for service: | Ms. Andrea Melia |
| Aberdeen Standard Investments Inc. |
| 1900 Market Street, Suite 200 |
| Philadelphia, PA 19103 |
|
|
Registrant’s telephone number, including area code: | 866-667-9231 |
|
|
Date of fiscal year end: | October 31 |
|
|
Date of reporting period: | October 31, 2019 |
Item 1. Reports to Shareholders.
![]()
Aberdeen Investment Funds
Annual Report
October 31, 2019
Aberdeen Select International Equity Fund
Class A – BJBIX ¢ Institutional Class – JIEIX
Aberdeen Global Equity Impact Fund (formerly, Aberdeen Select International Equity Fund II)
Class A – JETAX ¢ Institutional Class – JETIX
Aberdeen Total Return Bond Fund
Class A – BJBGX ¢ Institutional Class – JBGIX
Aberdeen Global High Income Fund
Class A – BJBHX ¢ Institutional Class – JHYIX
Beginning with reports for the period ending April 30, 2021, as permitted by regulations adopted by the Securities and Exchange Commission, paper copies of the Funds’ shareholder reports like this one will no longer be sent by mail, unless you specifically request paper copies of the reports from Aberdeen Investment Funds or from your financial intermediary, such as a broker-dealer or bank. Instead, the reports will be made available on a website, and you will be notified by mail each time a report is posted and provided with a website link to access the report.
If you already elected to receive shareholder reports electronically, you will not be affected by this change and you need not take any action. You may elect to receive shareholder reports and other communications from the Fund or your financial intermediary electronically following the instructions included with this disclosure or by contacting your financial intermediary or the Funds.
You may elect to receive all future reports in paper free of charge. You can inform the Funds or your financial intermediary that you wish to continue receiving paper copies of your shareholder reports by following the instructions included with this disclosure or by contacting the Funds at (866) 667-9231 or your financial intermediary. Your election to receive reports in paper will apply to all funds held with your financial intermediary or with the Trust.
![]()
Table of Contents
|
|
|
|
Market Review |
| Page 1 |
|
|
|
|
|
Aberdeen Select International Equity Fund |
| Page 3 |
|
|
|
|
|
Aberdeen Global Equity Impact Fund (formerly, Aberdeen Select International Equity Fund II) |
| Page 9 |
|
|
|
|
|
Aberdeen Total Return Bond Fund |
| Page 15 |
|
|
|
|
|
Aberdeen Global High Income Fund |
| Page 27 |
|
|
|
|
|
Financial Statements |
| Page 38 |
|
|
|
|
|
Notes to Financial Statements |
| Page 53 |
|
|
|
|
|
Report of Independent Registered Public Accounting Firm |
| Page 72 |
|
|
|
|
|
Other Tax Information |
| Page 73 |
|
|
|
|
|
Shareholder Expense Examples |
| Page 74 |
|
|
|
|
|
Supplemental Information |
| Page 75 |
|
|
|
|
|
Management of the Funds |
| Page 79 |
|
|
|
|
|
Investors should carefully consider a fund’s investment objectives, risks, fees, charges and expenses before investing any money. To obtain this and other fund information, please call 866-667-9231 to request a prospectus, or download a prospectus at www.aberdeenstandard.com/en-us/us/investor/fund-centre. Please read it carefully before investing any money.
Investing in mutual funds involves risk, including possible loss of principal.
Aberdeen Investment Funds is distributed by Aberdeen Fund Distributors LLC, Member FINRA, 1900 Market Street, Suite 200, Philadelphia, PA 19103.
Aberdeen Standard Investments Inc. (“ASII”) (formerly, Aberdeen Asset Management Inc.) has been registered as an investment adviser under the Investment Advisers Act of 1940 since August 23, 1995.
Statement Regarding Availability of Quarterly Portfolio Schedule.
The complete schedule of portfolio holdings for each fund of Aberdeen Investment Funds (each a “Fund” and collectively, the “Funds”) is included in the Funds’ semi-annual and annual reports to shareholders. Aberdeen Investment Funds also files complete schedules of portfolio holdings for each Fund with the Securities and Exchange Commission (the “Commission”) for the first and third quarters of each fiscal year on Form N-Q (or as an exhibit to its reports on Form N-Q’s successor form, Form N-PORT). The Funds’ Form N-Q and Form N-PORT filings are available on the Commission’s website at http://www.sec.gov and the Funds make the information on Form N-Q (or the exhibit to Form N-PORT) available to shareholders on upon request without charge by calling 1-866-667-9231.
Statement Regarding Availability of Proxy Voting Record.
Information regarding the policies and procedures that the Funds use to determine how to vote proxies relating to portfolio securities is available without charge, upon request, by calling 1-866-667-9231. The information is also included in the Funds’ Statement of Additional Information, which is available on the Funds’ website at www.aberdeenstandard.com/en-us/us/investor/fund-centre and on the Commission’s website at www.sec.gov.
Information relating to how each Fund voted proxies relating to portfolio securities held during the most recent twelve months ended June 30 is available by August 30 of the relevant year: (i) upon request and without charge by calling 1-866-667-9231; and (ii) on the Commission’s website at www.sec.gov.
Market Review
The ongoing trade dispute between the U.S. and China – the world’s two largest economies – framed the backdrop of the global financial markets for much of the 12-month period ended October 31, 2019. It shared the spotlight in the second half of the period with the shift by most global central banks to an accommodative monetary policy. The uncertainties created by the ongoing trade spat, together with the U.S. Federal Reserve’s (Fed) interest-rate hike in defiance of political pressure and market expectations, caused a sharp sell-off in global equities in December 2018. Moving into 2019, investors’ optimism on a dovish monetary policy shift from the Fed and the European Central Bank (ECB) led to a recovery in the global markets. The rally was interrupted in May and again in August 2019, by a breakdown in U.S.-China trade negotiations. Nonetheless, subsequent reconciliatory gestures between both countries revived the markets each time. The Fed cut interest rates in three increments of 25 basis points (bps) – 0.25% – in July, September and October 2019. The ECB also reduced its benchmark interest rate further into negative territory, and launched another round of bond purchases. Prospects of an interim U.S.-China deal and a three-month extension of the UK’s Brexit deadline buoyed global equity markets towards the end of the reporting period.
Global equities weathered countless stretches of volatility yet garnered double-digit gains over the 12-month reporting period. The Morgan Stanley Capital International (MSCI) World Index,1 a global equity market benchmark, returned 13.2% for the period. Shares of U.S. companies, as represented by the broader-market S&P 500 Index,2 returned 14.3% for the period, in line with the 14.2% return of the Asia-Pacific region, as measured by the MSCI All Country (AC) Asia Pacific ex Japan Index.3 European and Japanese stocks lagged the overall global market for the reporting period, with the MSCI Europe Index4 and the Tokyo Stock Price Index (TOPIX)5 returning 10.9% and 9.6%, respectively.
The U.S. equity market was bolstered during the reporting period by investors’ optimism regarding the Fed’s monetary policy easing and generally positive corporate earnings reports. This offset the negative impact of concerns about a possible global economic slowdown and trade policies in the U.S. under the administration of President Donald Trump. Trade tensions escalated in the summer of 2019, when President Trump threatened to impose additional tariffs on Chinese imports after negotiations stalled. Investors’ worries subsequently diminished towards the end of the reporting period as the U.S. and China appeared to reach a partial trade deal. Nonetheless, the trade situation between the two countries remains fluid and volatile.
The vicissitudes of U.S.-China trade relations caused the Asia-Pacific region markets to fluctuate significantly over the reporting period. Signs that trade talks were progressing supported investors’ risk appetite in early 2019, but the mood soured as renewed tensions led to more tariff hikes. Investors’ optimism returned later in the period as the U.S. and China appeared to reach a partial trade deal. However, the trade war added to investors’ worries about slowing global economic growth.
Emerging-market stocks, as measured by the MSCI Emerging Markets Index,6 returned 12.3% for the reporting period. In addition to the impact of trade tensions and global monetary bank policy easing, key national elections influenced investors in Brazil, Mexico, Thailand, India and Indonesia. The market in China was supported by the Chinese government’s pro-growth policies, which included several cuts to the required-reserve ratio for banks, relaxed funding rules for infrastructure projects, and targeted efforts to spur domestic demand.
International real estate equities, as measured by the Financial Times Stock Exchange European Public Real Estate Association/National Association of Real Estate Investment Trusts (FTSE EPRA/NAREIT) Global ex U.S. Index,7 returned 20.6% for the reporting period, substantially outperforming the broader global equity market. The strongest performers were mostly emerging markets, including Indonesia, Mexico and Brazil. All of these countries had previously been among the hardest hit by investors’ worries about how global trade may react to the ongoing U.S. trade renegotiations. However, developed markets also saw strong performance over the period.
During the reporting period, global fixed-income markets benefited from the bold monetary policy responses from central banks, particularly the Fed. U.S. Treasury yields moved significantly lower across the curve as over US$16 trillion in global bonds traded at negative yields as of the end of the reporting period. Yields on the two- and ten-year Treasury notes fell 135 bps and 146 bps to 1.52% and 1.69%, respectively, over the reporting period. Consequently, the spread between the two- and ten-year Treasury yields narrowed by 11 bps to +17 bps after having inverted8 during the summer of 2019. The ECB reduced its Eurozone growth and inflation forecasts. In an effort to combat this expected weakening, the ECB cut the deposit rate by 10 bps to -0.5%, and resumed its asset-purchase program. Asian bonds also provided strong total returns over the period. With Asian credit yields at five-year highs, investors returned to the market, sparking a tightening in credit spreads. Chinese high-yield bonds, particularly those of Chinese property developers, were the primary beneficiaries of investors’ search for yield.
Outlook
Global equity prices have continued to rise despite deteriorating macroeconomic data. The global manufacturing contraction and weakening trade activity have cast a long shadow over most economies. For the most part, the service sector has been resilient, but whether it will remain so in the coming months, in our view, is worth monitoring. Other market-moving developments include the outcomes of U.S.-China trade talks and Brexit. We think that the “tit-for-tat” tariffs in the U.S.-China trade dispute indicate that trade policy has an increasingly greater influence on financial markets than monetary policy. The slowdown in global manufacturing triggered by trade uncertainty appears to be spilling over and affecting other sectors, labor markets and consumer spending. We believe that monetary policy easing by most global central banks should continue to provide some support for stocks. In most cases, we think that it will be reactive and gradual, and may not be substantial enough to change the global economy’s current trajectory.
Market Review (concluded)
Brexit
The ongoing negotiations surrounding the UK’s exit from the European Union (“EU”) (“Brexit”) have yet to provide clarity on what the outcome will be for the UK or Europe. The UK remains a member of the EU until the legally established departure, which is now expected to be on or before January 31, 2020 (the “Exit Day”). Until Exit Day, all existing EU-derived laws and regulations will continue to apply in the UK. Those laws will remain applicable for an additional transitional period following Exit Day under the exit deal struck between the UK and the EU. Following the UK general election in December 2019, which returned a Conservative Party majority, the agreement is expected to be approved by the UK Parliament. In any event, the UK has undertaken a process of “onshoring” all EU legislation, pursuant to which there appears, at this stage, to be no policy changes to EU law. However, there remain various open questions regarding how cross-border financial services will work post-Exit Day. Whether or not a Fund invests in securities of issuers located in Europe (whether the EU, Eurozone or UK) or with significant exposure to European, EU, Eurozone or UK issuers or countries, the unavoidable uncertainties and events related to Brexit could negatively affect the value and liquidity of a Fund’s investments, increase taxes and costs of business and cause volatility in currency exchange rates and interest rates. Brexit could adversely affect the performance of contracts in existence at the date of Brexit and European, UK or worldwide political, regulatory, economic or market conditions and could contribute to instability in political institutions, regulatory agencies and financial markets. Brexit could also lead to legal uncertainty and politically divergent national laws and regulations as a new relationship between the UK and EU is defined and the UK determines which EU laws to replace or replicate. Any of these effects of Brexit, and others that cannot be anticipated, could adversely affect a Fund’s business, results of operations and financial condition. In addition, the risk that Standard Life Aberdeen plc, the
parent of the companies that provide investment advisory and sub-advisory services to the Funds and which is headquartered in the UK, fails to adequately prepare for Brexit could have significant customer, reputation and capital impacts for Standard Life Aberdeen plc and its subsidiaries, including those providing services to the Funds. However, Standard Life Aberdeen plc and its subsidiaries have detailed contingency planning in place to seek to manage the consequences of Brexit on the Funds and to avoid any disruption on the Funds and to the services they provide. Given the fluidity and complexity of the situation, however, we cannot assure that the Funds will not be adversely impacted despite these preparations.
Aberdeen Standard Investments
___________________________________
1 | The MSCI World Index tracks the performance of large- and mid-cap stocks across 23 developed-market countries. |
2 | The S&P 500 Index is an unmanaged index considered representative of the U.S. stock market. |
3 | The MSCI AC Asia Pacific ex Japan Index tracks the performance of large and mid-cap stocks across two of three developed-market countries (excluding Japan) and nine emerging markets countries in Asia. |
4 | The MSCI Europe Index tracks the performance of large- and mid-cap stocks across 15 developed-market countries in Europe. |
5 | The Tokyo Stock Price Index (TOPIX) is a market capitalization-weighted index of large- and mid-sized companies listed on the Tokyo Stock Exchange. |
6 | The MSCI Emerging Markets Index tracks the performance of large and mid-cap stocks across 24 emerging-market countries. |
7 | The FTSE EPRA/NAREIT Global ex U.S. Index is an unmanaged index considered representative of real estate companies and real estate investment trusts (REITs) outside the U.S. |
8 | An inverted yield curve occurs in an interest-rate environment in which long-term debt instruments have a lower yield than short-term debt instruments of the same credit quality. |
Indexes are unmanaged and have been provided for comparison purposes only. No fees or expenses are reflected. You cannot invest directly in an index.
Aberdeen Select International Equity Fund (Unaudited)
As of February 28, 2019, the Fund made changes to its principal investment strategies. Although continuing to employ a fundamental bottom-up equity investment process, the Fund now utilizes an investment philosophy that focuses on change. Although the Fund continues to seek long-term growth of capital by investing in equity securities of non-U.S. issuers, it employs a fundamental, bottom-up investment process that recognizes market inefficiencies when a company undergoes or faces material changes. Performance information for periods prior to February 28, 2019 reflects the Fund’s previous investment strategies. Please see the Fund’s prospectus dated February 28, 2019, as amended, for further information.
Aberdeen Select International Equity Fund (Institutional Class shares net of fees) returned 15.34% for the 12-month period ending October 31, 2019, versus the 11.84% return of its benchmark, the Morgan Stanley Capital International (MSCI) All Country (AC) World ex-USA Index, during the same period.
In the fourth quarter of 2018, it appeared that the Fed was not going to reduce interest rates in response to weaker economic data. Inflation concerns had led to Fed’s to increase its benchmark interest rate by 25 basis points (bps) – 0.25% – in December 2018. Consequently, U.S. Treasury yields moved higher and a potential recession in the U.S. worried investors. The Fed subsequently cut interest rates in three increments of 25 basis points (0.25%) in July, September and October 2019. Investors’ concerns about economic growth in China proved to be excessive. In the UK, although the Brexit process has been very “noisy,” it appeared to be nearing resolution at the end of the reporting period.
Although the trade talks between the U.S and China drove volatility in global equity markets, there was some progress towards the end of the reporting period. However, we believe that volatility remains likely. In our view, the prospects for global economic growth and corporate profitability are tied to monetary policy, fiscal policy and political stability.
The Fund outperformed its benchmark, the MSCI AC World ex-USA Index, for the reporting period. Because the Fund changed some of its principal investment strategies as of February 28, 2019, we will highlight key performance contributors and detractors, as well as portfolio activity, for the last eight months of the reporting period.
At the stock level, Welcia Holdings Co. Ltd., a retail drugstore chain operator in Japan, was a key contributor to Fund performance for the reporting period. As we had anticipated, the company saw lower costs and improved sales growth during the period. Nice Ltd., an Israel-based customer engagement solutions provider, benefited from a shift to cloud computing solutions. Media content provider Entertainment One Ltd. was the target of a successful acquisition bid from U.S.-based toymaker Hasbro Inc. (which the Fund does not hold), which hopes to capitalize on the merchandise opportunity. Shares of UK-based defense contractor BAE Systems plc rose after the company demonstrated that it was able to deliver projects to customers more efficiently.
Conversely the Fund’s holding in UK-based litigation finance provider Burford Capital Ltd. weighed on performance for the reporting period as its shares fell after a short-seller accused it of poor governance and accounting policies. We maintain our view that Burford Capital is one of the strongest companies in the litigation finance business, as indicated by its sustained business momentum and its robust responses to the accusations. Shares of Danish medical device maker Ambu B.V. declined after it removed its chief executive officer and reduced its earnings forecast for its 2018-2019 fiscal year. We believe the Ambu’s product is still competitive compared to those of its peers and the fundamental opportunity remains, though we think that positive results will take longer to achieve.
During the reporting period, we initiated a holding in UK-based salmon farmer Mowi Ltd, as we believe the company is capable of adding value to its product and capitalizing on rising demand for sustainable sources of protein. We also initiated a position in Italian industrial firm Prysmian S.p.A. because we believed that the market was discounting excessive concerns related to a company contract. In our view, Prysmian’s future contract potential was not being recognized in its share price.
Stock valuations through 2019 have recovered significantly as global central banks have cut interest rates. We believe that the increased liquidity may improve global economic growth and restore business and consumer confidence. We think that there is evidence that monetary policy has real implications in the U.S., Europe and Asia, particularly with regard to data related to consumer spending, industrial orders and trade. In our view, global leading economic indicators recently have become supportive of equities. We can see variables related to data. We believe that further policy action, such as the election promises that we have seen in the UK, are capable of bolstering global economic growth.
In our view, equities currently are cheap relative to bonds, and there is potential for risk premia* in the market to reverse following a period of investors’ risk aversion. Our investment philosophy leads us to position the Fund with sizable exposures to specific companies. Our insights into each company’s business, rather than its sector or country of domicile, drive our stock-selection process.
Portfolio Management:
Aberdeen Global Equity Team
PAST PERFORMANCE DOES NOT GUARANTEE FUTURE RESULTS.
The performance quoted represents past performance, which does not guarantee future results. Class A shares have up to a 0.25% 12b-1 fee. The investment return and principal value of an investment will fluctuate so that an investor’s shares, when redeemed, may be worth more or less than their original cost. Current performance of the Fund may be lower or higher than the performance quoted. Performance data current to the most recent month-end may be obtained by calling 866-667-9231 or visiting www.aberdeenstandard.com/en-us/us/investor/fund-centre.
Investing in mutual funds involves risk, including the possible loss of principal. There is no assurance that the investment objective of any fund will be achieved. Indexes are unmanaged and have been provided for comparison purposes only. No fees or expenses are reflected. You cannot invest directly in an index.
* Risk premium is the return in excess of the risk-free rate of return an investment is expected to yield; an asset’s risk premium is a form of compensation for investors who tolerate the extra risk compared to that of a risk-free asset.
| 2019 Annual Report |
Aberdeen Select International Equity Fund (Unaudited) (concluded)
Risk Considerations
Foreign securities may be more volatile, harder to price and less liquid than U.S. securities. They are subject to different accounting and regulatory standards and currency exchange rate, political and economic risks. Fluctuation in currency exchange rates may impact a Fund’s returns more greatly to the extent a Fund does not hedge currency exposure or hedging techniques are unsuccessful. The foregoing risks are enhanced in emerging market countries.
Equity stocks of small and mid-cap companies carry greater risk and more volatility than equity stocks of larger, more established companies.
Stocks issued by large cap companies subject the Fund to the risk that those stocks may underperform stocks issued by companies with smaller capitalizations or the market as a whole.
Investing a significant portion of the Fund’s assets in securities of companies conducting business in a broadly related group of industries within an economic sector may make the Fund more vulnerable to unfavorable developments in that sector.
Please read the prospectus for more detailed information regarding these and other risks.
Aberdeen Select International Equity Fund (Unaudited)
Average Annual Total Return |
|
|
| 1 Yr. |
| 5 Yr. |
| 10 Yr. |
|
Class A |
|
|
| 15.02% |
| 2.12% |
| 2.35% |
|
Institutional Class |
|
|
| 15.34% |
| 2.39% |
| 2.61% |
|
* Performance shown for periods after December 16, 2016 reflect the Fund’s receipt of payment from some European jurisdictions related to prior years (2005-2008) in accordance with European Union law under Article 63 of the Treaty on the Functioning of the European Union (the “Article 63 EU Tax Reclaims”). The receipt of these extraordinary payments increased the Fund’s performance for all periods that include December 2016, February 2017, July 2017, October 2017, February 2019, March 2019 and September 2019 in a manner that may not recur in the future, and the Fund’s performance was significantly higher than it would have been absent receipt of the Article 63 EU Tax Reclaims. For Class A, the average annual total return excluding the receipt of Article 63 EU Tax Reclaims was 12.13%, –0.11%, and 1.23%, respectively, for the 1-year, 5-year, and 10-year periods ended October 31, 2019. For Institutional Class, the average annual total return excluding the receipt of Article 63 EU Tax Reclaims was 12.41%, 0.10%, and 1.45%, respectively, for the 1-year, 5-year, and 10-year periods ended October 31, 2019. There can be no assurance that the Fund will receive additional Article 63 EU Tax Reclaim payments or maintain this level of performance in the future. Please see Note 2(g) and the Fund’s prospectus dated February 28, 2019 for further information.
As of February 28, 2019, the Fund made changes to its principal investment strategies. Performance information for periods prior to February 28, 2019 reflects the Fund’s previous investment strategies. Please see the Fund’s prospectus dated February 28, 2019, as amended, for further information.
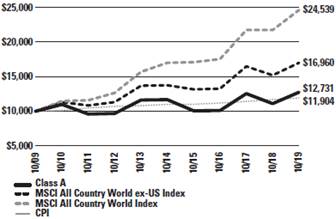
Performance of a $10,000 Investment (as of October 31, 2019)
Comparative performance of $10,000 invested in Class A shares of the Aberdeen Select International Equity Fund, Morgan Stanley Capital International All Country World ex-USA Index (MSCI ACWI ex-USA Index), and the Consumer Price Index (CPI) over a 10-year period ended October 31, 2019. Unlike the Fund’s returns, the returns for these unmanaged indexes do not reflect any fees or expenses. Investors cannot invest directly in market indexes.
The MSCI ACWI ex-USA Index captures large and mid cap representation across 22 of 23 Developed Markets (DM) countries (excluding the United States (U.S.) and 24 Emerging Markets (EM) countries). With 2,163 constituents, the index covers approximately 85% of the global equity opportunity set outside the U.S.
The CPI is a measure of the average change over time in the prices paid by urban consumers for a market basket of consumer goods and services.
Investment return and principal value will fluctuate, and when redeemed, shares may be worth more or less than original cost. Past performance is no guarantee of future results. The Average Annual Total Return table and performance graph do not reflect the deduction of taxes that a shareholder would pay on Fund distributions or the redemption of Fund shares. Investing in mutual funds involves market risk, including loss of principal. Performance returns assume the reinvestment of all distributions. Performance returns reflect fee waivers and reimbursements in effect without which returns would have been lower.
| 2019 Annual Report |
Aberdeen Select International Equity Fund (Unaudited)
Portfolio Summary (as a percentage of net assets)
October 31, 2019 (Unaudited)
Asset Allocation |
|
|
|
Common Stocks |
| 102.3% |
|
Short-Term Investment |
| 4.2% |
|
Liabilities in Excess of Other Assets |
| (6.5%) |
|
|
| 100.0% |
|
The following table summarizes the composition of the Fund’s portfolio, in Standard & Poor’s Global Industry Classification Standard (GICS) sectors, expressed as a percentage of net assets. The GICS structure consists of 11 sectors, 24 industry groups, 69 industries and 158 sub-industries. As of October 31, 2019, the Fund did not have more than 25% of its assets invested in any single industry or industry group. The sectors as classified by GICS, are comprised of several industries.
Top Sectors |
|
|
|
Consumer Staples |
| 19.6% |
|
Financials |
| 15.1% |
|
Industrials |
| 13.5% |
|
Health Care |
| 12.9% |
|
Communication Services |
| 12.3% |
|
Consumer Discretionary |
| 11.8% |
|
Information Technology |
| 4.3% |
|
Materials |
| 3.3% |
|
Energy |
| 3.3% |
|
Utilities |
| 3.2% |
|
Other |
| 0.7% |
|
|
| 100.0% |
|
Top Holdings* |
|
|
|
NICE Ltd. |
| 4.3% |
|
Asahi Intecc Co. Ltd. |
| 4.3% |
|
Treasury Wine Estates Ltd. |
| 3.7% |
|
Shenzhou International Group Holdings Ltd. |
| 3.4% |
|
Koninklijke DSM NV |
| 3.3% |
|
TOTAL SA |
| 3.2% |
|
Enel SpA |
| 3.2% |
|
Mowi ASA |
| 3.1% |
|
Nestle SA |
| 3.1% |
|
Vonovia SE |
| 3.0% |
|
Other |
| 65.4% |
|
|
| 100.0% |
|
* For the purpose of listing top holdings, Short-Term Investments are included as part of Other.
Top Countries |
|
|
|
France |
| 13.9% |
|
China |
| 11.0% |
|
United Kingdom |
| 11.0% |
|
Japan |
| 10.4% |
|
Canada |
| 7.3% |
|
Netherlands |
| 6.0% |
|
Italy |
| 5.9% |
|
Switzerland |
| 5.6% |
|
United States |
| 5.5% |
|
Norway |
| 4.6% |
|
Other |
| 18.8% |
|
|
| 100.0% |
|
Statement of Investments
October 31, 2019
Aberdeen Select International Equity Fund
|
|
|
|
|
| |
|
|
|
|
|
| |
|
| Shares |
| Value |
| |
COMMON STOCKS (102.3%) |
|
|
|
|
| |
AUSTRALIA (3.7%) |
|
|
|
|
| |
Consumer Staples (3.7%) |
|
|
|
|
| |
Treasury Wine Estates Ltd. (a) |
| 450,552 |
| $ | 5,462,106 |
|
BELGIUM (2.1%) |
|
|
|
|
| |
Consumer Staples (2.1%) |
|
|
|
|
| |
Anheuser-Busch InBev SA (a) |
| 38,186 |
| 3,082,274 |
| |
CANADA (7.3%) |
|
|
|
|
| |
Communication Services (2.8%) |
|
|
|
|
| |
Entertainment One Ltd. (a) |
| 568,400 |
| 4,104,978 |
| |
Consumer Discretionary (2.5%) |
|
|
|
|
| |
Restaurant Brands International, Inc. |
| 57,340 |
| 3,751,414 |
| |
Consumer Staples (2.0%) |
|
|
|
|
| |
Alimentation Couche-Tard, Inc., Class B |
| 96,800 |
| 2,903,045 |
| |
|
|
|
| 10,759,437 |
| |
CHINA (11.0%) |
|
|
|
|
| |
Communication Services (1.6%) |
|
|
|
|
| |
Tencent Holdings Ltd. (a) |
| 58,200 |
| 2,360,762 |
| |
Consumer Discretionary (7.1%) |
|
|
|
|
| |
Alibaba Group Holding Ltd., ADR (b) |
| 22,484 |
| 3,972,248 |
| |
Shenzhou International Group Holdings Ltd. (a) |
| 359,100 |
| 4,962,277 |
| |
Trip.com Group Ltd., ADR (b) |
| 46,800 |
| 1,543,932 |
| |
|
|
|
| 10,478,457 |
| |
Financials (2.3%) |
|
|
|
|
| |
Ping An Insurance Group Co. of China Ltd., H Shares (a) |
| 295,000 |
| 3,404,825 |
| |
|
|
|
| 16,244,044 |
| |
DENMARK (4.3%) |
|
|
|
|
| |
Health Care (4.3%) |
|
|
|
|
| |
Ambu AS NV (a) |
| 151,247 |
| 2,377,550 |
| |
Novo Nordisk AS, Class B (a) |
| 71,972 |
| 3,957,646 |
| |
|
|
|
| 6,335,196 |
| |
FRANCE (13.9%) |
|
|
|
|
| |
Communication Services (3.6%) |
|
|
|
|
| |
Ubisoft Entertainment SA (a)(b) |
| 32,055 |
| 1,894,426 |
| |
Vivendi SA (a) |
| 125,134 |
| 3,484,681 |
| |
|
|
|
| 5,379,107 |
| |
Consumer Discretionary (2.2%) |
|
|
|
|
| |
Kering SA (a) |
| 5,636 |
| 3,206,863 |
| |
Energy (3.3%) |
|
|
|
|
| |
TOTAL SA (a) |
| 90,702 |
| 4,795,251 |
| |
Financials (1.9%) |
|
|
|
|
| |
AXA SA (a) |
| 106,065 |
| 2,807,669 |
| |
Industrials (2.9%) |
|
|
|
|
| |
Vinci SA (a) |
| 38,400 |
| 4,308,335 |
| |
|
|
|
| 20,497,225 |
| |
|
|
|
|
|
| |
|
|
|
|
|
| |
|
| Shares |
| Value |
| |
GERMANY (3.0%) |
|
|
|
|
| |
Real Estate (3.0%) |
|
|
|
|
| |
Vonovia SE (a) |
| 84,400 |
| $ | 4,494,709 |
|
HONG KONG (2.4%) |
|
|
|
|
| |
Financials (2.4%) |
|
|
|
|
| |
AIA Group Ltd. (a) |
| 362,200 |
| 3,606,867 |
| |
INDONESIA (2.0%) |
|
|
|
|
| |
Financials (2.0%) |
|
|
|
|
| |
Bank Rakyat Indonesia Persero Tbk PT (a) |
| 9,635,500 |
| 2,887,135 |
| |
ISRAEL (4.3%) |
|
|
|
|
| |
Information Technology (4.3%) |
|
|
|
|
| |
NICE Ltd. (a)(b) |
| 40,037 |
| 6,315,452 |
| |
ITALY (5.9%) |
|
|
|
|
| |
Industrials (2.7%) |
|
|
|
|
| |
Prysmian SpA (a) |
| 174,537 |
| 4,037,441 |
| |
Utilities (3.2%) |
|
|
|
|
| |
Enel SpA (a) |
| 608,500 |
| 4,716,093 |
| |
|
|
|
| 8,753,534 |
| |
JAPAN (10.4%) |
|
|
|
|
| |
Consumer Staples (4.3%) |
|
|
|
|
| |
Pigeon Corp. (a) |
| 46,000 |
| 2,245,643 |
| |
Welcia Holdings Co. Ltd. (a) |
| 71,200 |
| 4,091,169 |
| |
|
|
|
| 6,336,812 |
| |
Health Care (6.1%) |
|
|
|
|
| |
Asahi Intecc Co. Ltd. (a) |
| 228,800 |
| 6,295,522 |
| |
Shionogi & Co. Ltd. (a) |
| 45,500 |
| 2,731,041 |
| |
|
|
|
| 9,026,563 |
| |
|
|
|
| 15,363,375 |
| |
LATVIA (0.0%) |
|
|
|
|
| |
Financials (0.0%) |
|
|
|
|
| |
AS Parex Banka (b)(c)(d)(f) |
| 1,424,182 |
| – |
| |
NETHERLANDS (6.0%) |
|
|
|
|
| |
Financials (2.7%) |
|
|
|
|
| |
ASR Nederland NV (a) |
| 110,476 |
| 4,049,895 |
| |
Materials (3.3%) |
|
|
|
|
| |
Koninklijke DSM NV (a) |
| 41,096 |
| 4,877,599 |
| |
|
|
|
| 8,927,494 |
| |
NORWAY (4.6%) |
|
|
|
|
| |
Communication Services (1.5%) |
|
|
|
|
| |
Telenor ASA (a) |
| 121,100 |
| 2,266,477 |
| |
Consumer Staples (3.1%) |
|
|
|
|
| |
Mowi ASA (a) |
| 188,845 |
| 4,610,074 |
| |
|
|
|
| 4,610,074 |
| |
|
|
|
| 6,876,551 |
| |
Statement of Investments (concluded)
October 31, 2019
Aberdeen Select International Equity Fund
|
|
|
|
|
| |
|
|
|
|
|
| |
|
| Shares |
| Value |
| |
COMMON STOCKS (continued) |
|
|
|
|
| |
POLAND (1.3%) |
|
|
|
|
| |
Consumer Staples (1.3%) |
|
|
|
|
| |
Dino Polska SA (a)(b)(e) |
| 48,537 |
| $ | 1,891,486 |
|
SWEDEN (2.2%) |
|
|
|
|
| |
Industrials (2.2%) |
|
|
|
|
| |
Assa Abloy AB, Class B (a) |
| 139,947 |
| 3,323,512 |
| |
SWITZERLAND (5.6%) |
|
|
|
|
| |
Consumer Staples (3.1%) |
|
|
|
|
| |
Nestle SA (a) |
| 42,710 |
| 4,569,172 |
| |
Financials (2.5%) |
|
|
|
|
| |
Zurich Insurance Group AG (a) |
| 9,571 |
| 3,748,961 |
| |
|
|
|
| 8,318,133 |
| |
UNITED KINGDOM (11.0%) |
|
|
|
|
| |
Communication Services (2.8%) |
|
|
|
|
| |
Cineworld Group PLC (a) |
| 1,427,887 |
| 4,114,555 |
| |
Health Care (2.5%) |
|
|
|
|
| |
Genus PLC (a) |
| 97,605 |
| 3,667,142 |
| |
Industrials (5.7%) |
|
|
|
|
| |
BAE Systems PLC (a) |
| 595,861 |
| 4,450,909 |
| |
RELX PLC (a) |
| 165,776 |
| 3,989,061 |
| |
|
|
|
| 8,439,970 |
| |
|
|
|
| 16,221,667 |
| |
UNITED STATES (1.3%) |
|
|
|
|
| |
Financials (1.3%) |
|
|
|
|
| |
Burford Capital Ltd. (a) |
| 164,500 |
| 1,872,860 |
| |
Total Common Stocks |
|
|
| 151,233,057 |
| |
|
|
|
|
|
| |
|
|
|
|
|
| |
|
| Shares |
| Value |
| |
SHORT-TERM INVESTMENT (4.2%) |
|
|
|
|
| |
UNITED STATES (4.2%) |
|
|
|
|
| |
State Street Institutional U.S. Government Money Market Fund, Premier Class, 1.75% (g) |
| 6,196,342 |
| $ | 6,196,342 |
|
Total Short-Term Investment |
|
|
| 6,196,342 |
| |
Total Investments |
|
|
| 157,429,399 |
| |
Liabilities in Excess of Other Assets—(6.5)% |
|
|
| (9,567,712 | ) | |
Net Assets—100.0% |
|
|
| $ | 147,861,687 |
|
(a) | Fair Values are determined pursuant to procedures approved by the Fund’s Board of Trustees. Unless otherwise noted, securities are valued by applying valuation factors to the exchange traded price. See Note 2 (a) of the accompanying Notes to Financial Statements. | |
(b) | Non-income producing security. | |
(c) | The Fund’s adviser has deemed this security to be illiquid based upon procedures approved by the Board of Trustees. Illiquid securities held by the Fund represent 0.00% of net assets as of October 31, 2019. | |
(d) | Level 3 security. See Note 2 (a) of the accompanying Notes to Financial Statements. | |
(e) | Denotes a security issued under Regulation S or Rule 144A. | |
(f) | Illiquid security. | |
(g) | Registered investment company advised by State Street Global Advisors. The rate shown is the 7 day yield as of October 31, 2019. | |
(h) | See accompanying Notes to Financial Statements for tax unrealized appreciation/(depreciation) of securities. | |
ADR | American Depositary Receipt | |
PLC | Public Limited Company | |
Aberdeen Global Equity Impact Fund (Unaudited)
As of February 28, 2019, the Fund changed its name from Aberdeen Select International Equity Fund II, its benchmark to the Morgan Stanley Capital International (MSCI) All Country (AC) World Index, and made changes to its principal investment strategies. Performance information for periods prior to February 28, 2019 reflects the Fund’s previous investment strategies. As of February 28, 2019, as a non-fundamental policy, under normal circumstances, the Fund invests at least 80% of the value of its net assets, plus any borrowings for investment purposes, in equity securities issued by companies that are located throughout the world (including the U.S). The Fund invests in securities of companies that aim to create positive measurable environmental and/or social impacts. The Adviser generally aligns its impact assessment to the United Nations Sustainable Development Goals. Please see the Fund’s prospectus dated February 28, 2019, as amended, for further information.
Aberdeen Global Equity Impact Fund (Institutional Class shares net of fees) returned 14.99% for the 12-month period ending October 31, 2019, versus the 13.22% return of its current benchmark, the MSCI All Country (AC) World Index, and the 13.35% return of its former benchmark, the MSCI World Index, during the same period.
Global equities posted gains over the 12-month period ended October 31, 2019, which was marked by the push and pull of U.S.-China trade relations and a pivot in the U.S. Federal Reserve’s (Fed) monetary policy. Near the end of 2018, a spike in U.S., Treasury yields sparked market jitters, compelling investors to reassess global stock valuations. As the Fed raised its benchmark interest rate for a fourth time in December 2018, despite political pressure, the U.S broader-market S&P 500 Index2 slipped into bear-market territory, dragging global markets with it. However, stock prices rebounded in early 2019, with investors cheering progress in U.S.-China trade negotiations and the Fed’s unexpected decision to stand pat on further rate hikes. The rally was interrupted in May 2019, and again in August, by a breakdown in U.S.-China trade talks and escalating tensions. Nonetheless, subsequent reconciliatory gestures between both countries revived the global markets each time. The Fed cut interest rates in three increments of 25 basis points (0.25%) in July, September and October 2019. The European Central Bank also lowered its benchmark interest rate further into negative territory, and launched another round of bond-buying. Prospects of an interim U.S.-China deal and an extension of Brexit for three months gave stocks another lift towards the end of the reporting period.
The Fund outperformed its benchmark, the MSCI AC World Index, for the 12-month period ended October 31, 2019. Because the Fund was restructured to a new global impact investment strategy in the last eight months of the reporting period, we will highlight key performance contributors and detractors, as well as portfolio activity, for the last eight months of the reporting period.
The Fund seeks to deliver positive returns, as well as quantifiable and measurable social or environmental impact. Therefore, we look to invest in companies that we believe fulfill both criteria.
At the stock level, U.S. data-center provider Equinix Inc. was a key contributor to Fund performance for the reporting period. The company’s shares rose steadily as it benefited from the boom in cloud computing. Equinix significantly expanded its global portfolio during the reporting period, including a US$1 billion joint venture with Singapore’s GIC Private Ltd. (which the Fund does not hold) to build data centers in Europe. Data centers comprise about 3% of global energy demand,3 which in our view makes Equinix’s commitment to move to 100% renewable power stand out in the industry. The Fund’s holding in U.S.-based warehouse giant Prologis Inc. similarly continued to ride the growth in e-commerce, and the stock price was resilient despite investors’ concerns about global trade flows. The Fund’s holding in U.S.-based NextEra Energy Inc., the world’s largest producer of wind and solar energy, benefited from low interest rates and the continuing decline in the cost of renewables, which in our view demonstrates solid value creation within its renewables business.
Conversely, the Fund’s position in UK-based pharmaceutical services firm Clinigen Group plc was hampered over the reporting period by investors’ concerns over declining sales of virology drug Foscavir and its gearing4 level. Micro-lending institution Asa International Ltd. registered slowing business growth amid a tough operating environment. Currency depreciation in Pakistan and Ghana, as well as weakening asset quality in Sri Lanka, weighed on the company’s earnings. Finally, the Fund’s lack of a position in technology giant Apple Inc. also detracted from performance, as its shares rose on sales that generally exceeded the market’s estimates during the reporting period.
Regarding Fund activity during the reporting period, we initiated a holding in U.S.-based payment-processing services firm Mastercard Inc., as part of the Fund’s new investment strategy. We believe that the company has solid growth prospects which have not been fully factored into the share price, and we have a favorable view of management’s 2020 target to help 500 million people worldwide gain access to the banking system. We established a new position in Prologis Inc., which has benefited from the growth of e-commerce. In our view, all of the company’s new developments are built to high environmental standards, which allow the firm to be more efficient in using water and energy. Another new addition to the Fund was renewable and infrastructure investment company John Laing Group plc, which we believe has many opportunities as it continues on its diversification5 path. We feel that the company’s investments are in line with many of the United Nations’ Sustainable Development Goals, including improving road safety and supporting economic development.
1 The MSCI World Index is an unmanaged index considered representative of stocks of developed countries. Indexes are unmanaged and have been provided for comparison purposes only. No fees or expenses are reflected. You cannot invest directly in an index.
2 The S&P 500 Index is an unmanaged index considered representative of the U.S. stock market.
3 Source: Data Economy, “Data Centers ‘Going Green’ to Reduce a Carbon Footprint Larger than the Airline Industry,” January 27, 2017.
4 Gearing refers to the ratio of a company’s debt to equity, and is used to measure a company’s financial leverage.
5 Diversification does not ensure a profit or protect against a loss in a declining market.
| 2019 Annual Report | 9 |
Aberdeen Global Equity Impact Fund (Unaudited) (concluded)
Global equity prices have continued to rise despite deteriorating macroeconomic data. The global manufacturing contraction and weakening trade activity have cast a deep shadow over most economies. For the most part, the service sector has been resilient, but whether it will remain so in the coming months is worth monitoring, in our view. Other market-moving developments include the outcomes of U.S.-China trade talks and Brexit. We believe that monetary policy easing by most global central banks should continue to provide some support for stocks. In most cases, we think that it most likely will be reactive and gradual, and may not be substantial enough to change the global economy’s current trajectory.
Against this backdrop of unpredictable trade and political developments, the Fund remains relatively defensively positioned. We regularly review the investment case for all of the Fund’s holdings to assess whether they are able to both deliver positive financial returns and make a positive environmental or social impact. We look to invest in companies which we believe have a clear intention to solve a global issue. Ultimately, we seek to deliver positive returns and measure the impact returns as the specific contribution by the Fund’s holdings towards achieving the United Nation’s Sustainable Development Goals.
Portfolio Management:
Aberdeen Global Equity Team
PAST PERFORMANCE DOES NOT GUARANTEE FUTURE RESULTS.
The performance quoted represents past performance, which does not guarantee future results. Class A Shares have up to a 0.25% 12b-1 fee. The investment return and principal value of an investment will fluctuate so that an investor’s shares, when redeemed, may be worth more or less than their original cost. Current performance of the Fund may be lower or higher than the performance quoted. Performance data current to the most recent month-end may be obtained by calling 866-667-9231 or visiting www.aberdeenstandard.com/en-us/us/investor/fund-centre.
Investing in mutual funds involves risk, including the possible loss of principal. There is no assurance that the investment objective of any fund will be achieved. Indexes are unmanaged and have been provided for comparison purposes only. No fees or expenses are reflected. You cannot invest directly in an index.
Risk Considerations
Foreign securities may be more volatile, harder to price and less liquid than U.S. securities. They are subject to different accounting and regulatory standards and currency exchange rate, political and economic risks. Fluctuation in currency exchange rates may impact a Fund’s returns more greatly to the extent a Fund does not hedge currency exposure or hedging techniques are unsuccessful. The foregoing risks are enhanced in emerging market countries.
Equity stocks of small- and mid-cap companies carry greater risk and more volatility than equity stocks of larger, more established companies.
In implementing the Fund’s ESG (Environmental, Social and Governance) impact investment strategy, the Adviser may select or exclude securities of issuers in certain industries, sectors, regions or countries for reasons other than the issuer’s investment performance. For this reason, the Fund may underperform other funds that do not implement an ESG impact strategy.
The definition of “impact investing” will vary according to an investor’s beliefs and values. There is no guarantee that the Adviser’s definition of impact investing, security selection criteria or investment judgment will reflect the beliefs or values of any particular investor.
Please read the prospectus for more detailed information regarding these and other risks.
10 | 2019 Annual Report |
|
Aberdeen Global Equity Impact Fund (Unaudited)
Average Annual Total Return |
| 1 Yr. |
| 5 Yr. |
| 10 Yr. |
|
Class A |
| 14.76% |
| 1.76% |
| 2.44% |
|
Institutional Class |
| 14.99% |
| 2.03% |
| 2.71% |
|
* Performance shown for periods after February 1, 2017 reflect the Fund’s receipt of payment from some European jurisdictions related to prior years (2005-2009) in accordance with European Union law under Article 63 of the Treaty on the Functioning of the European Union (the “Article 63 EU Tax Reclaims”). The receipt of these extraordinary payments increased the Fund’s performance for all periods that include February 2017, October 2017, August 2018, February 2019, and September 2019 in a manner that may not recur in the future, and the Fund’s performance was significantly higher than it would have been absent receipt of the Article 63 EU Tax Reclaims. For Class A, the average annual total return excluding the receipt of Article 63 EU Tax Reclaims was 13.56%, 0.56%, and 1.84%, respectively, for the 1-year, 5-year, and 10-year periods ended October 31, 2019. For Institutional Class, the average annual total return excluding the receipt of Article 63 EU Tax Reclaims was 13.81%, 0.83%, and 2.10%, respectively, for the 1-year, 5-year, and 10-year periods ended October 31, 2019. There can be no assurance that the Fund will receive additional Article 63 EU Tax Reclaim payments or maintain this level of performance in the future. Please see the Fund’s prospectus dated February, 28, 2019 for further information.
As of February 28, 2019, the Fund made changes to its principal investment strategies. Performance information for periods prior to February 28, 2019 reflects the Fund’s previous investment strategy. Please see the Fund’s prospectus dated February 28, 2019, as amended, for further information.
Performance of a $10,000 Investment (as of October 31, 2019)
Comparative performance of $10,000 invested in Class A shares of the Aberdeen Global Equity Impact Fund, Morgan Stanley Capital International All Country World ex-US Index (MSCI ACWI ex-US Index), Morgan Stanley Capital International All Country World Index (MSCI ACWI) and the Consumer Price Index (CPI) over a 10-year
period ended October 31, 2019. Unlike the Fund’s returns, the returns for these unmanaged indexes do not reflect any fees or expenses. Investors cannot invest directly in market indexes.
On February 28, 2019, the MSCI ACWI became the Fund’s benchmark, replacing the MSCI ACWI ex-US Index. The MSCI ACWI and the MSCI ACWI ex-US Index are unmanaged indices considered representative of developed and emerging market stock markets.
MSCI ACWI captures large and mid cap representation across 23 Developed Markets (DM) and 24 Emerging Markets (EM) countries. With 2,774 constituents, the index covers approximately 85% of the global investable equity opportunity set.
The MSCI ACWI ex-US Index captures large and mid cap representation across 22 of 23 Developed Markets (DM) countries (excluding the United States (U.S.) and 24 Emerging Markets (EM) countries). With 2,163 constituents, the index covers approximately 85% of the global equity opportunity set outside the U.S.
The CPI is a measure of the average change over time in the prices paid by urban consumers for a market basket of consumer goods and services.
Investment return and principal value will fluctuate, and when redeemed, shares may be worth more or less than original cost. Past performance is no guarantee of future results. The Average Annual Total Return table and performance graph do not reflect the deduction of taxes that a shareholder would pay on Fund distributions or the redemption of Fund shares. Investing in mutual funds involves market risk, including loss of principal. Performance returns assume the reinvestment of all distributions. Performance returns reflect fee waivers and reimbursements in effect without which returns would have been lower.
| 2019 Annual Report | 11 |
Aberdeen Global Equity Impact Fund (Unaudited)
Portfolio Summary (as a percentage of net assets)
October 31, 2019 (Unaudited)
Asset Allocation |
|
|
|
Common Stocks |
| 102.4% |
|
Short-Term Investment |
| 1.6% |
|
Liabilities in Excess of Other Assets |
| (4.0%) |
|
|
| 100.0% |
|
The following table summarizes the composition of the Fund’s portfolio, in Standard & Poor’s Global Industry Classification Standard (GICS) sectors, expressed as a percentage of net assets. The GICS structure consists of 11 sectors, 24 industry groups, 69 industries and 158 sub-industries. As of October 31, 2019, the Fund did not have more than 25% of its assets invested in any single industry or industry group. The sectors as classified by GICS, are comprised of several industries.
Top Sectors |
|
|
|
Health Care |
| 19.6% |
|
Industrials |
| 16.9% |
|
Information Technology |
| 16.0% |
|
Real Estate |
| 11.9% |
|
Financials |
| 10.3% |
|
Materials |
| 7.3% |
|
Utilities |
| 7.1% |
|
Communication Services |
| 6.3% |
|
Consumer Discretionary |
| 4.4% |
|
Consumer Staples |
| 2.6% |
|
Other |
| (2.4%) |
|
|
| 100.0% |
|
Top Holdings* |
|
|
|
Prologis, Inc., REIT |
| 4.0% |
|
UnitedHealth Group, Inc. |
| 4.0% |
|
Mastercard, Inc., Class A |
| 4.0% |
|
Equinix, Inc., REIT |
| 3.9% |
|
Safaricom PLC |
| 3.8% |
|
John Laing Group PLC |
| 3.3% |
|
Umicore SA |
| 3.3% |
|
NextEra Energy, Inc. |
| 3.1% |
|
salesforce.com, Inc. |
| 3.0% |
|
Merck & Co., Inc. |
| 2.9% |
|
Other |
| 64.7% |
|
|
| 100.0% |
|
* For the purpose of listing top holdings, Short-Term Investments are included as part of Other.
Top Countries |
|
|
|
United States |
| 40.5% |
|
United Kingdom |
| 15.6% |
|
Denmark |
| 6.6% |
|
Australia |
| 5.1% |
|
Kenya |
| 3.8% |
|
Netherlands |
| 3.7% |
|
China |
| 3.6% |
|
Brazil |
| 3.5% |
|
Germany |
| 3.3% |
|
Belgium |
| 3.3% |
|
Other |
| 11.0% |
|
|
| 100.0% |
|
12 | 2019 Annual Report |
|
Statement of Investments
October 31, 2019
Aberdeen Global Equity Impact Fund
|
|
|
|
|
| |
|
|
|
|
|
| |
|
| Shares |
| Value |
| |
COMMON STOCKS (102.4%) |
|
|
|
|
| |
AUSTRALIA (5.1%) |
|
|
|
|
| |
Industrials (3.0%) |
|
|
|
|
| |
Brambles Ltd. (a) |
| 83,100 |
| $ | 686,991 |
|
Cleanaway Waste Management Ltd. (a) |
| 954,300 |
| 1,212,909 |
| |
|
|
|
| 1,899,900 |
| |
Real Estate (2.1%) |
|
|
|
|
| |
Goodman Group, REIT (a) |
| 130,200 |
| 1,292,790 |
| |
|
|
|
| 3,192,690 |
| |
BELGIUM (3.3%) |
|
|
|
|
| |
Materials (3.3%) |
|
|
|
|
| |
Umicore SA (a) |
| 49,600 |
| 2,047,488 |
| |
BRAZIL (3.5%) |
|
|
|
|
| |
Consumer Discretionary (1.3%) |
|
|
|
|
| |
YDUQS Part |
| 85,900 |
| 840,687 |
| |
Financials (2.2%) |
|
|
|
|
| |
Banco Bradesco SA |
| 169,680 |
| 1,389,849 |
| |
|
|
|
| 2,230,536 |
| |
CHINA (3.6%) |
|
|
|
|
| |
Financials (2.5%) |
|
|
|
|
| |
Ping An Insurance Group Co. of China Ltd., H Shares (a) |
| 133,500 |
| 1,540,827 |
| |
Health Care (1.1%) |
|
|
|
|
| |
Wuxi Biologics Cayman, Inc. (a)(b)(c) |
| 61,500 |
| 722,715 |
| |
|
|
|
| 2,263,542 |
| |
DENMARK (6.6%) |
|
|
|
|
| |
Health Care (2.5%) |
|
|
|
|
| |
Novo Nordisk AS, Class B (a) |
| 28,800 |
| 1,583,675 |
| |
Industrials (2.0%) |
|
|
|
|
| |
Vestas Wind Systems AS (a) |
| 15,300 |
| 1,246,457 |
| |
Utilities (2.1%) |
|
|
|
|
| |
Orsted AS (a)(b) |
| 15,000 |
| 1,316,575 |
| |
|
|
|
| 4,146,707 |
| |
FRANCE (2.4%) |
|
|
|
|
| |
Health Care (1.2%) |
|
|
|
|
| |
Orpea (a) |
| 5,900 |
| 710,614 |
| |
Industrials (1.2%) |
|
|
|
|
| |
Schneider Electric SE (a) |
| 8,300 |
| 771,405 |
| |
|
|
|
| 1,482,019 |
| |
GEORGIA (0.6%) |
|
|
|
|
| |
Consumer Staples (0.6%) |
|
|
|
|
| |
Georgia Healthcare Group PLC (b) |
| 184,900 |
| 406,569 |
| |
GERMANY (3.3%) |
|
|
|
|
| |
Information Technology (1.3%) |
|
|
|
|
| |
Infineon Technologies AG (a) |
| 43,100 |
| 834,794 |
| |
|
|
|
|
|
| |
|
|
|
|
|
| |
|
| Shares |
| Value |
| |
Materials (2.0%) |
|
|
|
|
| |
Covestro AG (a)(b) |
| 26,400 |
| $ | 1,267,778 |
|
|
|
|
| 2,102,572 |
| |
HONG KONG (2.4%) |
|
|
|
|
| |
Financials (2.4%) |
|
|
|
|
| |
AIA Group Ltd. (a) |
| 152,000 |
| 1,513,649 |
| |
INDONESIA (2.3%) |
|
|
|
|
| |
Financials (2.3%) |
|
|
|
|
| |
Bank Rakyat Indonesia Persero Tbk PT (a) |
| 4,897,800 |
| 1,467,553 |
| |
KENYA (3.8%) |
|
|
|
|
| |
Communication Services (3.8%) |
|
|
|
|
| |
Safaricom PLC |
| 8,288,200 |
| 2,386,970 |
| |
NETHERLANDS (3.7%) |
|
|
|
|
| |
Consumer Staples (2.0%) |
|
|
|
|
| |
Koninklijke Ahold Delhaize (a) |
| 50,500 |
| 1,258,463 |
| |
Information Technology (1.7%) |
|
|
|
|
| |
ASML Holding NV (a) |
| 4,000 |
| 1,048,457 |
| |
|
|
|
| 2,306,920 |
| |
NORWAY (2.5%) |
|
|
|
|
| |
Communication Services (2.5%) |
|
|
|
|
| |
Telenor ASA (a) |
| 84,500 |
| 1,581,481 |
| |
SOUTH KOREA (2.4%) |
|
|
|
|
| |
Information Technology (2.4%) |
|
|
|
|
| |
Samsung SDI Co. Ltd. (a) |
| 7,700 |
| 1,502,622 |
| |
TAIWAN (2.4%) |
|
|
|
|
| |
Industrials (2.4%) |
|
|
|
|
| |
Voltronic Power Technology Corp. (a) |
| 67,200 |
| 1,487,533 |
| |
UNITED KINGDOM (15.6%) |
|
|
|
|
| |
Consumer Discretionary (1.7%) |
|
|
|
|
| |
Countryside Properties PLC (a)(b) |
| 233,800 |
| 1,070,088 |
| |
Financials (0.9%) |
|
|
|
|
| |
ASA International Group PLC (b) |
| 155,100 |
| 574,599 |
| |
Health Care (5.2%) |
|
|
|
|
| |
Clinigen Healthcare Ltd. (a)(c) |
| 165,600 |
| 1,782,304 |
| |
GlaxoSmithKline PLC (a) |
| 65,900 |
| 1,509,435 |
| |
|
|
|
| 3,291,739 |
| |
Industrials (5.8%) |
|
|
|
|
| |
John Laing Group PLC (a)(b) |
| 433,400 |
| 2,052,265 |
| |
RELX PLC (a) |
| 64,700 |
| 1,557,675 |
| |
|
|
|
| 3,609,940 |
| |
Materials (2.0%) |
|
|
|
|
| |
DS Smith PLC (a) |
| 271,400 |
| 1,258,270 |
| |
|
|
|
| 9,804,636 |
| |
See accompanying Notes to Financial Statements.
2019 Annual Report 13
Statement of Investments (concluded)
October 31, 2019
Aberdeen Global Equity Impact Fund
|
|
|
|
|
| |
|
|
|
|
|
| |
|
| Shares |
| Value |
| |
COMMON STOCKS (continued) |
|
|
|
|
| |
UNITED STATES (38.9%) |
|
|
|
|
| |
Consumer Discretionary (1.4%) |
|
|
|
|
| |
Chegg, Inc. (c) |
| 27,900 |
| $ | 855,414 |
|
Health Care (9.6%) |
|
|
|
|
| |
HMS Holdings Corp. (c) |
| 50,300 |
| 1,644,307 |
| |
Merck & Co., Inc. |
| 21,400 |
| 1,854,524 |
| |
UnitedHealth Group, Inc. |
| 10,000 |
| 2,527,000 |
| |
|
|
|
| 6,025,831 |
| |
Industrials (2.5%) |
|
|
|
|
| |
Ingersoll-Rand PLC |
| 12,600 |
| 1,598,814 |
| |
Information Technology (10.6%) |
|
|
|
|
| |
Accenture PLC, Class A |
| 7,800 |
| 1,446,276 |
| |
Autodesk, Inc. (c) |
| 5,700 |
| 839,952 |
| |
Mastercard, Inc., Class A |
| 9,000 |
| 2,491,290 |
| |
salesforce.com, Inc. (c) |
| 12,200 |
| 1,909,178 |
| |
|
|
|
| 6,686,696 |
| |
Real Estate (9.8%) |
|
|
|
|
| |
American Tower Corp., REIT |
| 5,300 |
| 1,155,824 |
| |
Equinix, Inc., REIT |
| 4,300 |
| 2,437,154 |
| |
Prologis, Inc., REIT |
| 28,900 |
| 2,536,264 |
| |
|
|
|
| 6,129,242 |
| |
Utilities (5.0%) |
|
|
|
|
| |
American Water Works Co., Inc. |
| 10,000 |
| 1,232,700 |
| |
NextEra Energy, Inc. |
| 8,100 |
| 1,930,554 |
| |
|
|
|
| 3,163,254 |
| |
|
|
|
| 24,459,251 |
| |
Total Common Stocks |
|
|
| 64,382,738 |
| |
|
|
|
|
|
| |
|
|
|
|
|
| |
|
| Shares |
| Value |
| |
SHORT-TERM INVESTMENT (1.6%) |
|
|
|
|
| |
UNITED STATES (1.6%) |
|
|
|
|
| |
State Street Institutional U.S. Government Money Market Fund, Premier Class, 1.75% (d) |
| 998,062 |
| $ | 998,062 |
|
Total Short-Term Investment |
|
|
| 998,062 |
| |
Total Investments |
|
|
| 65,380,800 |
| |
Liabilities in Excess of Other Assets—(4.0)% |
|
|
| (2,510,748 | ) | |
Net Assets—100.0% |
|
|
| $ | 62,870,052 |
|
(a) | Fair Values are determined pursuant to procedures approved by the Fund’s Board of Trustees. Unless otherwise noted, securities are valued by applying valuation factors to the exchange traded price. See Note 2 (a) of the accompanying Notes to Financial Statements. | |
(b) | Denotes a security issued under Regulation S or Rule 144A. | |
(c) | Non-income producing security. | |
(d) | Registered investment company advised by State Street Global Advisors. The rate shown is the 7 day yield as of October 31, 2019. | |
(e) | See accompanying Notes to Statements of Investments for tax unrealized appreciation/(depreciation) of securities. | |
PLC | Public Limited Company | |
REIT | Real Estate Investment Trust | |
See accompanying Notes to Financial Statements.
14 2019 Annual Report
Aberdeen Total Return Bond Fund (Unaudited)
Aberdeen Total Return Bond Fund (Institutional Class shares net of fees) returned 12.02% for the 12-month period ended October 31, 2019, versus the 11.51% return of its benchmark, the Bloomberg Barclays U.S. Aggregate Bond Index, during the same period.
Global financial markets experienced periods of significant volatility over the reporting period. Investors were concerned about slower global economic growth that was worsening and more widespread, large disruptions on the geopolitical front due to trade wars and government changes, as well as global central banks embarking on another round of monetary policy easing. The trade dispute between the U.S. and China garnered the global markets’ attention periodically over the reporting period. Tensions escalated again in the summer of 2019 when U.S. President Donald Trump threatened to impose tariffs on more Chinese imports after talks stalled. Investors’ concerns eased in September as both countries exchanged goodwill gestures to pave the way for the resumption of talks in October. However, a partial accord appeared to face hurdles as of the end of the reporting period.
In the first quarter of 2019, the U.S. Federal Reserve (Fed) pivoted from its projection in December 2018, of three more interest-rate hikes when financial conditions tightened towards the end of that year. The central bank not only removed its hawkish-tilting forward policy guidance in January 2019, but consequently cemented the “patient” stance in March by indicating that there will be no rate hikes for the remainder of the year and moving to taper its balance-sheet runoff well ahead of the market’s expectations. After raising its benchmark interest rate by 0.25% to a range of 2.25% to 2.50% following its meeting in December 2018, the Fed then steadily guided the market towards monetary policy easing, implementing three 0.25% rate cuts in July, September and October 2019. Consequently, the federal funds rate ended the reporting period in a range of 1.50% to 1.75%. However, none of the rate reductions were approved in a unanimous vote by the Federal Open Market Committee. In its statement announcing the policy action in October 2019, the Fed appeared to take a more noncommittal stance regarding future rate cuts, commenting that it “will continue to monitor the implications of incoming information for the economic outlook as it assesses the appropriate path of the target range for the federal funds rate.”
In early 2019, the European Central Bank (ECB) lowered its growth and inflation forecasts for the full calendar year, while committing to hold the deposit rate at -0.4% well into 2020, and planning for a new round of targeted longer-term refinancing operations (TLTRO) funding much earlier than the market had anticipated. The ECB subsequently slashed interest rates on deposits in September 2019, pushing them further into negative territory, at -0.50%. The ECB also announced
that it would be restarting its quantitative easing program on November 1, 2019, at a monthly rate of €20 billion (roughly US$22.3 billion) on an open-ended basis. Central bankers from smaller economies, including Australia, Norway, the UK and Switzerland took the opportunity to deliver further monetary policy easing.
Accommodative monetary policies not only provided support to global economies through interest rate-sensitive sectors, but buoyed business and investor confidence. Consequently, financial conditions eased meaningfully around the world as recession fears receded, while asset prices rebounded strongly from the stressed levels at the end of 2019. The U.S. fixed-income market, as measured by the Bloomberg Barclays U.S. Aggregate Bond Index, returned 11.51% over the 12-month period ended October 31, 2019, bolstered largely by the Fed’s dovish monetary policy. U.S. Treasury yields moved significantly lower across the curve as over US$16 trillion in global bonds traded at negative yields as of the end of the reporting period. Yields on the two- and ten-year Treasury notes fell 135 and 146 basis points (bps) to 1.52% and 1.69%, respectively, over the reporting period. Consequently, the ten to two-year yield curve narrowed by 11 bps to +17 bps after having inverted1 during the summer of 2019. U.S. corporate bonds, as measured by the Bloomberg Barclays U.S. Corporate Bond Index,2 returned 15.37% for the reporting period, outperforming the 11.08% return of comparable-duration3 U.S. Treasury securities for the reporting period. U.S. agency mortgage-backed securities (MBS) lagged the overall market as their performance was hampered by higher prepayments and volatility, as well as fewer purchases by the Fed. Foreign assets, particularly higher-yielding emerging-market bonds, also registered strong gains.
The Fund’s international investments, particularly through our effective management of foreign currency exposures, contributed significantly to Fund’s outperformance versus its benchmark for the reporting period. As we had believed that the fear of catastrophic monetary policy mistakes and global recession was not warranted, in the fourth quarter of 2018, we positioned the Fund in an effort to benefit from the Fed’s monetary policy pivot in early 2019. We focused on countries whose asset prices have low correlation5 with those in the U.S. due to macroeconomic uncertainties. The Fund’s investments in Indonesia and India saw strong performance for the reporting period, not only because they have higher yields, but they also are less affected by the U.S.-China trade conflict. Asset prices in countries whose economies rely heavily on commodity exports, particularly those in emerging markets, rebounded sharply during the reporting period. The Fund’s holdings in local bonds and currencies in South Africa, Chile, Colombia and, to a lesser extent, Russia, were the leading generators of alpha6 to Fund performance over the reporting
1 | An inverted yield curve occurs in an interest-rate environment in which long-term debt instruments have a lower yield than short-term debt instruments of the same credit quality. |
2 | The Bloomberg Barclays U.S. Corporate Bond Index tracks the performance of U.S. dollar-denominated investment-grade, fixed-rate, taxable corporate bonds. Companies whose bonds are rated as “investment-grade” usually have a lower chance of defaulting on their debt than those rated as “non-investment grade.” These bonds generally are issued by long-established companies with strong balance sheets. Bonds rated BBB or above by major credit rating agencies are considered investment-grade. Indexes are unmanaged and have been provided for comparison purposes only. No fees or expenses are reflected. You cannot invest directly in an index. |
3 | Duration is an estimate of bond price sensitivity to changes in interest rates. The higher the duration, the greater the change (i.e., higher risk) in relation to interest-rate movements. |
4 | The Bloomberg Barclays U.S. Treasury Index tracks the performance of U.S. dollar-denominated, fixed-rate, nominal debt issued by the U.S. Treasury. |
5 | Correlation measures the degree to which the prices of two securities move in relation to each other. |
6 | Alpha is a measure of performance that takes the volatility of a mutual fund and compares its risk-adjusted performance to a benchmark index. |
2019 Annual Report 15
Aberdeen Total Return Bond Fund (Unaudited) (continued)
period. Opportunistic deployments of risk budget7 also had a positive impact as we took advantage of market volatility relating to the trade war and Fed monetary policy. For example, we initiated a position in the Japanese yen when in our judgement, investors had become risk-averse, while we tactically added to the Fund’s Korean won position when the trade war fears escalated.
Strong security selection in the Fund’s core U.S. market segment8 bolstered performance for the reporting period, which more than offset the slightly negative impact of asset allocation. We produced positive alpha in the corporate sector by investing in securities of issuers in which we have conviction, despite being cautious on the sector overall. The Fund’s investments in the MBS sector also contributed to performance attributable to the allocation to securities that had better prepayment and volatility protection. Mortgage-backed securities without government backing benefited from improvement in the U.S. housing market. Our expectation of slightly higher inflation expectation did not transpire as higher labor costs were not strong enough to counteract the deflationary impact from the advancement of technology. The gains from the Fund’s holdings in Treasury Inflation-Protected Securities (TIPs) dissipated when the economy appeared to be too weak to lead to higher inflation. The Fund’s bias toward yield curve-flattening9 detracted marginally from Fund performance for the reporting period.
We employed derivatives over the reporting period, including U.S. Treasury futures and options, in an effort to manage the Fund’s overall yield-curve and interest-rate exposure, and protect the Fund from sharply rising yields. We utilized foreign exchange forwards10 in an effort to gain exposure to foreign markets efficiently and to hedge currency risks from sovereign bond holdings. Our use of currency forwards11 bolstered the Fund’s performance in global investments against the strength of the U.S. dollar.
Global economic growth recently has continued its downward drift, with recession risks rising further, in our view. Trade tensions and adverse political developments exacerbated already weak global trade and manufacturing. There was little evidence of a boost to the global economy from Chinese government stimuli or from generally easy global central bank monetary policy. We believe the pace of U.S. economic growth will slow towards an annualized rate of 1% over the next 12 months.12 However, our base case is that a recession can be avoided in the US due to still-resilient consumer spending and the stimulus from easy monetary policy. In our view, U.S. consumer spending should be bolstered by solid employment, rising income, sound household balance sheets, and upbeat sentiment. We expect the Fed to be on hold but ready to provide more support over the next 12 months,12 while ECB most likely will implement its significant package of measures of policy cuts and quantitative easing.
Our conviction in our forecast is relatively low, as weakness in the U.S. economy appeared to have broadened beyond manufacturing to the services sector, while households that have been the bulwark of U.S. growth are facing some headwinds. These include slowing labor demand and deterioration in corporate earnings growth; the possibility that tariffs may fall more heavily on consumer goods; and signs of peaking consumer confidence. We believe that, despite U.S. economic activity indicating few signs of overheating, there is no cause for complacency due to the “financialization” of the economy. We see several largely political swing factors that can either tip the economy into a recession or propel a recovery.
We believe that the largest global economic risk is from trade policy. The threat of trade and other conflicts between the U.S. and China currently is the largest headwind, in our opinion, and further escalation, despite the current truce, remains a possibility. The huge uncertainty and effects on confidence can easily push the fragile global economy into recession. However, should U.S. President Donald Trump and China’s President Xi Jinping be able to reach a comprehensive trade deal, we feel that global growth could accelerate in a synchronized fashion.
We think that U.S. monetary policy is another important swing factor due to a divided Federal Open Market Committee, which is facing policy limits. As we previously noted, our forecast is that the Fed will lean towards more policy accommodation in the next 12 months. This is based on our expectation that U.S. growth will synchronize with the slower pace globally while low inflation will give the Fed space to use “make-up” strategy to maintain loose monetary policy. Nonetheless, we do not think that pre-emptive interest-rate cuts can effectively counter the damages from a prolonged trade war. However, should the trade war threat diminish further, financial markets become more exuberant, or inflation unexpectedly picks up due to higher tariffs, we believe that the Fed may underdeliver. In that case, we believe that the central bank may fall behind the curve while global financial markets have little tolerance for disappointment.
Political risks and fiscal policies present more uncertainty to our outlook. We anticipate no meaningful fiscal expansion in our investment horizon beyond the current moderately loose conditions. However, there is growing speculation and appetite for increases in fiscal spending. Low interest rates not only have shown their limit of stimulus, but they provide inducement for budgetary expansion. In the interim, with rising populism, nationalism and protectionism, politics are driving global policy more than ever and are more difficult to predict. The outcomes for Brexit, anti-government protests in Hong Kong, Middle East conflicts, politics in Germany and Italy, and particularly the U.S. presidential election in 2020, can result in changes in the world economy and markets.
7 | Risk budgeting comprises the review of individual fund risk and return contributions and then reallocating assets in an effort to maximize performance. |
8 | The Fund’s investment universe includes six global fixed income market segments: core (U.S. investment-grade fixed income); major (Eurozone, Japan and the UK, among others); satellites (including, but not limited to Canada, Hong Kong and Switzerland); convergence (Czech Republic, Hungary and Poland, among others); commodity (including, but not limited to, Australia, Chile and Russia); and low correlation (Brazil, China and Mexico, among others). |
9 | Yield curve-flattening refers to the narrowing of the yield spread between long- and short-term fixed-income securities. |
10 | A foreign exchange forward is a binding contract in the foreign exchange market that locks in the exchange rate for the purchase or sale of a currency on a future date. |
11 | A currency forward is a binding contract in the foreign exchange market that locks in the exchange rate for the purchase or sale of a currency on a future date. |
12 | Forecasts and estimates are offered as opinion and are not reflective of potential performance, are not guaranteed and actual events or results may differ materially. |
16 2019 Annual Report
Aberdeen Total Return Bond Fund (Unaudited) (concluded)
In our opinion, these areas of risk and their “toss-up” nature will make the calibration of global growth and policy paths more difficult. At these late economic and credit cycles, the heightened uncertainties compel us to maintain the Fund’s conservative positioning and diversification,13 especially given the unpredictable and largely circular nature of the global economic drivers. Economic growth challenges, the Fed’s accommodative policy stance, and worldwide chase for yield moved us to position the Fund with a long duration relative to that of the benchmark Bloomberg Barclays U.S. Aggregate Bond Index. However, U.S. Treasury real yields are close to zero and are relatively expensive, in our view, especially when considering increasing Treasury supply. The U.S. dollar is facing headwinds from Fed rate cuts and balance-sheet expansion as U.S. growth decelerates to global levels. Nonetheless, we believe that the yield advantage in the U.S., as well as investors’ demand for safe-haven assets, will provide support for capital flows. Therefore, we have positioned the Fund with a duration that is close to that of its benchmark and will be nimble changing the exposure.
As we believe that the Fed will help to prolong the current economic cycle, we want the Fund to stay invested by focusing on assets for which we see fundamental soundness or better relative value. We maintain our structural preference for securitized products, particularly those that are consumer- and housing-related. First, as consumers are the healthier part of the economy, we believe that strong household balance sheets, rising income, and Fed monetary policy easing should provide a sound fundamental underpinning. Secondly, there is limited excess in consumer credit, with loans generally well-structured and provisioned. Specifically, residential mortgage lending standards remain tight, while we think that housing prices can continue to rise with constrained new home-building. Finally, valuations in the securitized sector are generally less elevated than those in the corporate sector. Agency MBS recently have cheapened further due to Fed offloading, higher volatility, and higher prepayments. Consequently, we maintain the Fund’s large exposure to MBS, which are not represented in the benchmark index, while we have reduced the underweight to agency MBS. We focus on high-quality and low-beta14 commercial mortgage-backed securities (CMBS) and asset-backed securities (ABS). We remain cautious on the corporate sector due to elevated leverage, deterioration in underwriting, lower liquidity, and relatively high valuations.
In our view, foreign markets, specifically in emerging economies, can offer a diversification benefit as they appear to be pricing in a higher risk premium15 from global trade wars. We are more vigilant in country selection as we believe that the global growth backdrop and threat of idiosyncratic risks16 argue against yield-chasing. We are opportunistic and strive to be agile and flexible in our investment process, particularly with regard to the management of currency risks.
Portfolio Management:
Aberdeen North American Fixed Income Team
PAST PERFORMANCE DOES NOT GUARANTEE FUTURE RESULTS.
The performance quoted represents past performance, which does not guarantee future results. Class A shares have up to a 0.25% 12b-1 fee. The investment return and principal value of an investment will fluctuate so that an investor’s shares, when redeemed, may be worth more or less than their original cost. Current performance of the Fund may be lower or higher than the performance quoted. Performance data current to the most recent month-end may be obtained by calling 866-667-9231 or visiting www.aberdeenstandard.com/en-us/us/investor/fund-centre.
Investing in mutual funds involves risk, including possible loss of principal. There is no assurance that the investment objective of any fund will be achieved. Indexes are unmanaged and have been provided for comparison purposes only. No fees or expenses are reflected. You cannot invest directly in an index.
Risk Considerations
Fixed income securities are subject to certain risks including, but not limited to: interest rate (changes in interest rates may cause a decline in the market value of an investment), credit (changes in the financial condition of the issuer, borrower, counterparty, or underlying collateral), prepayment (debt issuers may repay or refinance their loans or obligations earlier than anticipated), and extension (principal repayments may not occur as quickly as anticipated, causing the expected maturity of a security to increase).
Investments in asset-backed and mortgage-backed securities include additional risks that investors should be aware which include those associated with fixed income securities, as well as increased susceptibility to adverse economic developments.
The Fund may use derivatives as a substitute for taking a position or reducing exposure to underlying assets. Derivatives are speculative and may hurt the Fund’s performance. They present the risk of disproportionately increased losses and/or reduced gains when the financial asset or measure to which the derivative is linked changes in unexpected ways.
Foreign securities may be more volatile, harder to price and less liquid than U.S. securities. They are subject to different accounting and regulatory standards and currency exchange rate, political and economic risks. Fluctuation in currency exchange rates may impact a Fund’s returns more greatly to the extent a Fund does not hedge currency exposure or hedging techniques are unsuccessful. The foregoing risks are enhanced in emerging market countries.
Municipal securities can be affected by adverse tax, legislative or political changes and the financial condition of the issuers of municipal securities.
Investing a significant portion of the Fund’s assets in securities of companies conducting business in a broadly related group of industries within an economic sector may make the Fund more vulnerable to unfavorable developments in that sector.
Please read the prospectus for more detailed information regarding these and other risks.
13 | Diversification does not ensure a profit or protect against a loss in a declining market. |
14 | Beta is a measure of the volatility of a portfolio in comparison to a benchmark index. A beta over 1.0 means that the investment has been more volatile than the benchmark, while a beta of less than 1.0 represents less volatility. |
15 | Risk premium is the return in excess of the risk-free rate of return an investment is expected to yield; an asset’s risk premium is a form of compensation for investors who tolerate the extra risk compared to that of a risk-free asset. |
16 | Idiosyncratic risk is endemic to a country, individual asset, a group of assets, or a specific asset class. |
2019 Annual Report 17
Aberdeen Total Return Bond Fund (Unaudited)
Average Annual Total Return |
|
|
| 1 Yr. |
| 5 Yr. |
| 10 Yr. |
|
Class A |
|
|
| 11.72% |
| 3.03% |
| 3.82% |
|
Institutional Class |
|
|
| 12.02% |
| 3.29% |
| 4.09% |
|
Performance of a $10,000 Investment (as of October 31, 2019)
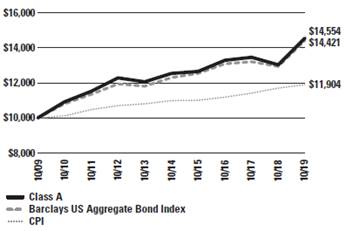
Comparative performance of $10,000 invested in Class A shares of the Aberdeen Total Return Bond Fund, Barclays U.S. Aggregate Bond Index and the Consumer Price Index (CPI) over a 10-year period ended October 31, 2019. Unlike the Fund’s returns, the returns for these unmanaged indexes do not reflect any fees or expenses. Investors cannot invest directly in market indexes.
The Barclays U.S. Aggregate Bond Index (the “U.S. Aggregate”) is a broad-based flagship benchmark that measures the investment grade, U.S. Dollar-denominated, fixed-rate taxable bond market. The index includes Treasuries, government-related and corporate securities, MBS (agency fixed-rate and hybrid ARM pass-throughs), ABS and CMBS (agency and non-agency). Provided the necessary inclusion rules are met, U.S. Aggregate eligible securities also contribute to the multi-currency Bloomberg Barclays Global Aggregate Bond Index and the Bloomberg Barclays U.S. Universal Index, which includes high yield and emerging markets debt.
The CPI is a measure of the average change over time in the prices paid by urban consumers for a market basket of consumer goods and services.
Investment return and principal value will fluctuate, and when redeemed, shares may be worth more or less than original cost. Past performance is no guarantee of future results. The Average Annual Total Return table and performance graph do not reflect the deduction of taxes that a shareholder would pay on Fund distributions or the redemption of Fund shares. Investing in mutual funds involves market risk, including loss of principal. Performance returns assume the reinvestment of all distributions. Performance returns reflect fee waivers and reimbursements in effect without which returns would have been lower.
18 |
2019 Annual Report |
|
Aberdeen Total Return Bond Fund (Unaudited)
Portfolio Summary (as a percentage of net assets)
October 31, 2019 (Unaudited)
Asset Allocation |
|
|
|
Corporate Bonds |
| 21.9% |
|
U.S. Treasuries |
| 19.2% |
|
U.S. Agencies |
| 17.1% |
|
Asset-Backed Securities |
| 10.0% |
|
Commercial Mortgage-Backed Securities |
| 8.7% |
|
Agency Mortgage-Backed Securities |
| 7.3% |
|
Non-Agency Mortgage-Backed Securities |
| 7.2% |
|
Government Bonds |
| 3.6% |
|
Municipal Bonds |
| 3.5% |
|
Short-Term Investment |
| 2.8% |
|
Liabilities in Excess of Other Assets |
| (1.3%) |
|
|
| 100.0% |
|
The following chart summarizes the composition of the Fund’s portfolio, expressed as a percentage of net assets. The industries listed below may include more than one industry group. As of October 31, 2019, the Fund did not have more than 25% of its assets invested in any industry group.
Top Industries |
|
|
|
Commercial Banks |
| 4.8% |
|
Electric Utilities |
| 2.5% |
|
Supranational |
| 2.0% |
|
Diversified Telecommunication Services |
| 1.6% |
|
Aerospace & Defense |
| 1.4% |
|
Auto Manufacturers |
| 1.2% |
|
Healthcare Providers & Services |
| 0.9% |
|
Pharmaceutical |
| 0.9% |
|
Computers & Peripherals |
| 0.8% |
|
Software |
| 0.7% |
|
Other |
| 83.2% |
|
|
| 100.0% |
|
Top Holdings* |
|
|
|
U.S. Treasury Bond 02/15/2049 |
| 3.8% |
|
U.S. Treasury Note 06/15/2021 |
| 3.8% |
|
U.S. Treasury Note 02/28/2023 |
| 2.4% |
|
U.S. Treasury Note 02/28/2021 |
| 2.2% |
|
Canada Housing Trust No 1 12/15/2024 |
| 2.1% |
|
International Bank for Reconstruction & Development, Series GDIF 07/26/2024 |
| 2.0% |
|
U.S. Treasury Bond 08/15/2048 |
| 2.0% |
|
Federal National Mortgage Association 01/01/2048 |
| 1.3% |
|
Federal National Mortgage Association 11/13/2049 |
| 1.2% |
|
Government National Mortgage Association, MBS 05/20/2048 |
| 1.8% |
|
Other |
| 77.4% |
|
|
| 100.0% |
|
* For the purpose of listing top holdings, Short-Term Investments are included as part of Other.
Top Countries |
|
|
|
United States |
| 90.6% |
|
Canada |
| 3.5% |
|
United Kingdom |
| 2.7% |
|
Supranational |
| 2.0% |
|
Italy |
| 1.1% |
|
Denmark |
| 0.5% |
|
Netherlands |
| 0.5% |
|
China |
| 0.4% |
|
Other |
| (1.3%) |
|
|
| 100.0% |
|
| 2019 Annual Report | 19 |
Statement of Investments
October 31, 2019
Aberdeen Total Return Bond Fund
|
| Shares or |
| Value |
| ||
ASSET-BACKED SECURITIES (10.0%) |
|
|
| ||||
UNITED STATES (10.0%) |
|
|
|
|
| ||
American Express Credit Account Master Trust, Series 2017-3, Class A, ABS (USD), 1.77%, 11/15/2022 |
| $ | 918,000 |
| $ | 917,655 |
|
AmeriCredit Automobile Receivables Trust 2018-2, Series 2018-2, Class A2A, ABS (USD), 2.86%, 11/18/2021 |
| 480,043 |
| 480,816 |
| ||
BMW Vehicle Lease Trust, Series 2017-2, Class A3, ABS (USD), 2.07%, 10/20/2020 |
| 479,870 |
| 479,878 |
| ||
Citibank Credit Card Issuance Trust, Series 2017-A3, Class A3, ABS (USD), 1.92%, 04/07/2022 |
| 815,000 |
| 815,248 |
| ||
CNH Equipment Trust, Series 2017-A, Class A3, (USD), 2.07%, 05/16/2022 |
| 544,076 |
| 544,261 |
| ||
Daimler Trucks Retail Trust, Series 2018-1, Class A4, ABS (USD), 3.03%, 11/15/2024 (a) |
| 1,005,000 |
| 1,014,476 |
| ||
Ford Credit Auto Lease Trust, Series 2017-B, Class A4 (USD), 2.17%, 02/15/2021 |
| 844,000 |
| 844,194 |
| ||
Ford Credit Auto Owner Trust, Series 2018-1, Class A (USD), 3.19%, 07/15/2031 (a) |
| 846,000 |
| 884,814 |
| ||
Ford Credit Floorplan Master Owner Trust A, Series 2019-3, Class A1, ABS (USD), 2.23%, 09/15/2024 |
| 970,000 |
| 975,594 |
| ||
GM Financial Automobile Leasing Trust 2018-3, Series 2018-3, Class C, ABS (USD), 3.70%, 07/20/2022 |
| 1,173,000 |
| 1,192,560 |
| ||
Hertz Vehicle Financing LLC 2018-3, Series 2018-3A, Class A, ABS, (USD), 4.03%, 07/25/2024 (a) |
| 957,000 |
| 1,008,241 |
| ||
Honda Auto Receivables 2016-3 Owner Trust, Series 2016-3, Class A4, ABS (USD), 1.33%, 11/18/2022 |
| 680,694 |
| 680,410 |
| ||
Honda Auto Receivables 2019-3 Owner Trust, Series 2019-3, Class A2, ABS (USD), 1.90%, 04/15/2022 |
| 866,000 |
| 865,946 |
| ||
John Deere Owner Trust, Series 2017-B, Class A3, (USD), 1.82%, 10/15/2021 |
| 613,286 |
| 612,710 |
| ||
Nissan Auto Lease Trust, Series 2019-B, Class A2A, ABS (USD), 2.27%, 10/15/2021 |
| 574,000 |
| 575,418 |
| ||
SLM Student Loan Trust Series 2011-2, Class A1, (USD), 1M USD LIBOR + 0.600%, 2.42%, 11/25/2027 (b) |
| 347,392 |
| 348,285 |
| ||
Series 2013-2, Class A, (USD), 1M USD LIBOR + 0.450%, 2.27%, 09/25/2043 (b) |
| 1,018,674 |
| 1,009,827 |
| ||
SLM Student Loan Trust 2012-3, Series 2012-3, Class A, ABS, (USD), 1M USD LIBOR + 0.650%, 2.47%, 12/27/2038 (b) |
| 905,256 |
| 896,879 |
| ||
|
| Shares or |
| Value |
| ||
Synchrony Credit Card Master Note Trust, Series 2015-1, Class A, (USD), 2.37%, 03/15/2023 |
| $ | 762,000 |
| $ | 762,836 |
|
Tesla Auto Lease Trust, Series 2018-A, Class D, ABS (USD), 3.30%, 05/20/2020 (a) |
| 928,000 |
| 930,434 |
| ||
Towd Point Mortgage Trust 2018-4, Series 2018-4, Class A1, ABS, (USD), 3.00%, 06/25/2058 (a)(b) |
| 664,996 |
| 683,858 |
| ||
Towd Point Mortgage Trust 2018-6, Series 2018-6, Class A1A, ABS, (USD), 3.75%, 03/25/2058 (a)(b) |
| 864,942 |
| 896,025 |
| ||
Towd Point Mortgage Trust 2019-3, Series 2019-3, Class M2, ABS (USD), 4.25%, 02/25/2059 (a)(b) |
| 754,557 |
| 809,194 |
| ||
|
|
|
| 18,229,559 |
| ||
Total Asset-Backed Securities |
|
|
| 18,229,559 |
| ||
COMMERCIAL MORTGAGE-BACKED SECURITIES (8.7%) |
| ||||||
UNITED STATES (8.7%) |
|
|
|
|
| ||
Citigroup Commercial Mortgage Trust 2016-C3, Series 2016-C3, Class B (USD), 3.67%, 11/15/2049 (b) |
| 652,000 |
| 679,050 |
| ||
COMM 2014-LC15 Mortgage Trust, Series 2014-LC15, Class B, (USD), 4.60%, 04/10/2047 (b) |
| 521,826 |
| 558,451 |
| ||
CSAIL 2016-C7 Commercial Mortgage Trust, Series 2016-C7, Class C, (USD), 4.38%, 11/15/2049 (b) |
| 741,000 |
| 759,237 |
| ||
Federal Home Loan Mortgage Corp., Series 2017-DNA1, Class M2, CMO, FRN (USD), 1M USD LIBOR + 3.250%, 5.07%, 07/25/2029 (b) |
| 539,000 |
| 565,011 |
| ||
Federal National Mortgage Association Series 2016-C02, Class 1M2, CMO, FRN (USD), 1M USD LIBOR + 6.000%, 7.82%, 09/25/2028 (b) |
| 890,631 |
| 971,020 |
| ||
Series 2017-C07, Class 2M1, CMO, (USD), 2.47%, 05/25/2030 (b) |
| 308,420 |
| 308,387 |
| ||
FREMF Mortgage Trust, Series 2018-K85, Class C (USD), 4.32%, 11/25/2028 (a)(b) |
| 608,000 |
| 645,728 |
| ||
GS Mortgage Securities Corp. Trust, Series 2017-GPTX, Class C (USD), 3.30%, 05/10/2034 (a) |
| 775,000 |
| 776,290 |
| ||
JP Morgan Chase Commercial Mortgage Securities Trust 2012-CIBX, Series 2012-CBX, Class AS (USD), 4.27%, 06/15/2045 |
| 1,029,000 |
| 1,079,008 |
| ||
JP Morgan Mortgage Trust 2015-IVR2, Series 2015-IVR2, Class A5, CMO, (USD), 2.81%, 01/25/2045 (a)(b) |
| 599,127 |
| 599,251 |
| ||
JP Morgan Mortgage Trust 2019-6, Series 2019-6, Class A15, CMO (USD), 3.50%, 12/25/2049 (a)(b) |
| 791,126 |
| 798,698 |
| ||
See accompanying Notes to Financial Statements.
20
| 2019 Annual Report |
|
Statement of Investments (continued)
October 31, 2019
Aberdeen Total Return Bond Fund
|
| Shares or |
| Value |
| ||
COMMERCIAL MORTGAGE-BACKED SECURITIES (continued) |
| ||||||
UNITED STATES (continued) |
|
|
|
|
| ||
Morgan Stanley Bank of America Merrill Lynch Trust 2012-C5, Series 2012-C5, Class B, (USD), 4.44%, 08/15/2045 (b) |
| $ | 787,000 |
| $ | 824,812 |
|
Morgan Stanley Capital I Trust, Series 2017-CLS, Class A (USD), 2.61%, 11/15/2034 (a)(b) |
| 881,000 |
| 880,446 |
| ||
New Residential Mortgage Loan Trust 2019-2, Series 2019-2A, Class A1, CMO, (USD), 4.25%, 12/25/2057 (a)(b) |
| 434,416 |
| 455,067 |
| ||
Nomura Asset Acceptance Corp. Alternative Loan Trust, Series 2005-WF1, Series 2005-WF1, Class 1A1, CMO, (USD), 5.68%, 03/25/2035 (b) |
| 287,991 |
| 308,890 |
| ||
Sequoia Mortgage Trust 2018-CH4, Series 2018-CH4, Class A13, CMO, (USD), 4.50%, 10/25/2048 (a)(b) |
| 816,250 |
| 863,516 |
| ||
SFAVE Commercial Mortgage Securities Trust Series 2015-5AVE, Class C (USD), 4.39%, 01/05/2043 (a)(b) |
| 870,000 |
| 861,053 |
| ||
Series 2015-5AVE, Class D (USD), 4.39%, 01/05/2043 (a)(b) |
| 341,000 |
| 330,658 |
| ||
UBS Commercial Mortgage Trust, Series 2019-C17, Class AS (USD), 3.20%, 10/15/2052 |
| 973,000 |
| 1,000,663 |
| ||
WFRBS Commercial Mortgage Trust Series 2013-C11, Class B (USD), 3.71%, 03/15/2045 (b) |
| 693,000 |
| 719,012 |
| ||
Series 2012-C9, Class AS (USD), 3.39%, 11/15/2045 |
| 991,000 |
| 1,021,303 |
| ||
Series 2012-C10, Class AS, (USD), 3.24%, 12/15/2045 |
| 996,000 |
| 1,020,797 |
| ||
|
|
|
| 16,026,348 |
| ||
Total Commercial Mortgage-Backed Securities |
|
|
| 16,026,348 |
| ||
NON-AGENCY MORTGAGE-BACKED SECURITIES (7.2%) |
| ||||||
UNITED STATES (7.2%) |
|
|
|
|
| ||
Agate Bay Mortgage Trust, Series 2014-3, Class B2, (USD), 3.82%, 11/25/2044 (a)(b) |
| 731,972 |
| 754,255 |
| ||
CHL Mortgage Pass-Through Trust, Series 2005-21, Class A2 (USD), 5.50%, 10/25/2035 |
| 347,289 |
| 316,191 |
| ||
Citigroup Mortgage Loan Trust, Series 2005-11, Class A3 (USD), 1 year CMT + 2.400%, 4.19%, 11/25/2035 (b) |
| 224,540 |
| 227,980 |
| ||
Federal National Mortgage Association, Series 2018-C03, Class 1M1 (USD), 2.50%, 10/25/2030 (b) |
| 366,698 |
| 366,721 |
| ||
Flagstar Mortgage Trust, Series 2017-2, Class B2, (USD), 4.12%, 10/25/2047 (a)(b) |
| 1,205,618 |
| 1,249,958 |
| ||
GSR Mortgage Loan Trust, Series 2005-6F, Class 1A6 (USD), 5.25%, 07/25/2035 |
| 351,508 |
| 369,109 |
| ||
|
| Shares or |
| Value |
| ||
IndyMac INDA Mortgage Loan Trust, Series 2005-AR2, Class 3A1 (USD), 4.18%, 01/25/2036 (b) |
| $ | 428,030 |
| $ | 397,067 |
|
JP Morgan Mortgage Trust Series 16-1, Class A13 (USD), 3.50%, 05/25/2046 (a)(b) |
| 579,153 |
| 578,125 |
| ||
Series 2005-A5, Class 2A2 (USD), 4.42%, 08/25/2035 (b) |
| 365,026 |
| 382,571 |
| ||
Series 2006-S1, Class 2A6 (USD), 6.00%, 04/25/2036 |
| 455,677 |
| 477,196 |
| ||
Series 2013-1, Class B1 (USD), 3.52%, 03/25/2043 (a)(b) |
| 751,289 |
| 764,333 |
| ||
Series 2014-IVR3, Class 3A1 (USD), 2.72%, 09/25/2044 (a)(b) |
| 383,904 |
| 381,475 |
| ||
Series 2016-5, Class A1 (USD), 2.68%, 12/25/2046 (a)(b) |
| 496,189 |
| 496,506 |
| ||
Series 2017-1, Class A3, (USD), 3.50%, 01/25/2047 (a)(b) |
| 42 |
| 43 |
| ||
Series 2018-6, Class B2 (USD), 3.98%, 12/25/2048 (a)(b) |
| 982,010 |
| 1,019,975 |
| ||
New Residential Mortgage Loan Trust, Series 2017-2A, Class A3, (USD), 4.00%, 03/25/2057 (a)(b) |
| 683,594 |
| 718,322 |
| ||
PHH Mortgage Trust, Series 2008-CIM1, Class 21A1 (USD), 6.00%, 05/25/2038 |
| 544,214 |
| 552,664 |
| ||
Sequoia Mortgage Trust Series 2017-CH1, Class A13, (USD), 4.00%, 08/25/2047 (a)(b) |
| 595,833 |
| 629,332 |
| ||
Series 2017-CH2, Class A13 (USD), 4.00%, 12/25/2047 (a)(b) |
| 902,867 |
| 953,159 |
| ||
Structured Asset Securities Corp., Series 2004-18H, Class A5 (USD), 4.75%, 10/25/2034 |
| 677,219 |
| 712,376 |
| ||
Thornburg Mortgage Securities Trust Series 2007-4, Class 2A1 (USD), 4.01%, 09/25/2037 (b) |
| 357,423 |
| 359,646 |
| ||
Series 2007-4, Class 3A1 (USD), 4.04%, 09/25/2037 (b) |
| 22,867 |
| 22,982 |
| ||
WaMu Mortgage Pass Through Certificates, Series 2005-AR7, Class A3 (USD), 4.26%, 08/25/2035 (b) |
| 412,676 |
| 421,937 |
| ||
Wells Fargo Mortgage Backed Securities Trust, Series 2006-10, Class A4 (USD), 6.00%, 08/25/2036 |
| 357,858 |
| 360,109 |
| ||
WinWater Mortgage Loan Trust, Series 2015-2, Class B3, (USD), 3.91%, 02/20/2045 (a)(b) |
| 602,627 |
| 619,442 |
| ||
|
|
|
| 13,131,474 |
| ||
Total Non-Agency Mortgage-Backed Securities |
|
|
| 13,131,474 |
| ||
CORPORATE BONDS (21.9%) |
|
|
|
|
| ||
CANADA (0.4%) |
|
|
|
|
| ||
Diversified Telecommunication Services (0.4%) |
|
|
| ||||
Rogers Communications, Inc. (USD), 3.70%, 11/15/2049 |
| 700,000 |
| 714,926 |
| ||
See accompanying Notes to Financial Statements.
| 2019 Annual Report | 21 |
Statement of Investments (continued)
October 31, 2019
Aberdeen Total Return Bond Fund
|
| Shares or |
| Value |
| ||
CORPORATE BONDS (continued) |
|
|
|
|
| ||
CHINA (0.4%) |
|
|
|
|
| ||
Internet (0.4%) |
|
|
|
|
| ||
Tencent Holdings Ltd. (USD), 3.58%, 04/11/2026 (a) |
| $ | 750,000 |
| $ | 782,859 |
|
DENMARK (0.5%) |
|
|
|
|
| ||
Commercial Banks (0.5%) |
|
|
|
|
| ||
Danske Bank AS (USD), 5.00%, 01/12/2022 (a) |
| 945,000 |
| 995,643 |
| ||
ITALY (0.6%) |
|
|
|
|
| ||
Commercial Banks (0.6%) |
|
|
|
|
| ||
UniCredit SpA (USD), 6.57%, 01/14/2022 (a) |
| 932,000 |
| 1,003,385 |
| ||
NETHERLANDS (0.5%) |
|
|
|
|
| ||
Semiconductors (0.5%) |
|
|
|
|
| ||
NXP BV / NXP Funding LLC (USD), 5.35%, 03/01/2026 (a) |
| 787,000 |
| 886,738 |
| ||
SUPRANATIONAL (2.0%) |
|
|
|
|
| ||
Supranational (2.0%) |
|
|
|
|
| ||
International Bank for Reconstruction & Development, Series GDIF (CAD), 1.80%, 07/26/2024 |
| 4,767,000 |
| 3,623,260 |
| ||
UNITED KINGDOM (2.7%) |
|
|
|
|
| ||
Commercial Banks (2.2%) |
|
|
|
|
| ||
HSBC Holdings PLC, (fixed rate to 09/12/2025, variable rate thereafter) (USD), 4.29%, 09/12/2026 |
| 1,545,000 |
| 1,670,580 |
| ||
Lloyds Banking Group PLC (USD), 3.90%, 03/12/2024 |
| 1,000,000 |
| 1,056,421 |
| ||
Royal Bank of Scotland Group PLC, (fixed rate to 03/22/2024, variable rate thereafter) (USD), 4.27%, 03/22/2025 |
| 1,043,000 |
| 1,106,623 |
| ||
Royal Bank of Scotland Group PLC, (fixed rate to 11/01/2024, variable rate thereafter) (USD), 3.75%, 11/01/2029 |
| 200,000 |
| 201,750 |
| ||
|
|
|
| 4,035,374 |
| ||
Diversified Telecommunication Services (0.5%) |
| ||||||
Vodafone Group PLC (USD), 4.88%, 06/19/2049 |
| 840,000 |
| 944,215 |
| ||
|
|
|
| 4,979,589 |
| ||
UNITED STATES (14.8%) |
|
|
|
|
| ||
Aerospace & Defense (1.4%) |
|
|
|
|
| ||
United Technologies Corp. |
|
|
|
|
| ||
(USD), 6.05%, 06/01/2036 |
| 551,000 |
| 740,222 |
| ||
(USD), 6.13%, 07/15/2038 |
| 1,285,000 |
| 1,780,740 |
| ||
|
|
|
| 2,520,962 |
| ||
Auto Manufacturers (1.2%) |
|
|
|
|
| ||
Ford Holdings LLC (USD), 9.30%, 03/01/2030 |
| 1,290,000 |
| 1,609,359 |
| ||
|
| Shares or |
| Value |
| ||
General Motors Co. (USD), 5.40%, 04/01/2048 |
| $ | 595,000 |
| $ | 604,054 |
|
|
|
|
| 2,213,413 |
| ||
Beverages (0.6%) |
|
|
|
|
| ||
PepsiCo, Inc. (USD), 2.88%, 10/15/2049 |
| 1,080,000 |
| 1,053,756 |
| ||
Chemicals (0.3%) |
|
|
|
|
| ||
Sherwin-Williams Co. (USD), 3.95%, 01/15/2026 |
| 540,000 |
| 576,146 |
| ||
Commercial Banks (1.5%) |
|
|
|
|
| ||
Bank of America Corp., (fixed rate to 04/23/2039, variable rate thereafter) (USD), 4.08%, 04/23/2040 |
| 880,000 |
| 988,749 |
| ||
Citigroup, Inc., (fixed rate to 11/05/2029, variable rate thereafter), FRN (USD), 2.98%, 11/05/2030 |
| 756,000 |
| 762,371 |
| ||
JPMorgan Chase & Co., (fixed rate to 04/23/2028, variable rate thereafter) (USD), 4.01%, 04/23/2029 |
| 966,000 |
| 1,054,900 |
| ||
|
|
|
| 2,806,020 |
| ||
Computers & Peripherals (0.8%) |
|
|
|
|
| ||
Apple, Inc. (USD), 3.85%, 05/04/2043 |
| 1,315,000 |
| 1,476,077 |
| ||
Diversified Financial Services (0.6%) |
|
|
| ||||
American Express Co. (USD), 3.40%, 02/27/2023 |
| 1,080,000 |
| 1,125,798 |
| ||
Diversified Telecommunication Services (0.7%) |
|
|
| ||||
Verizon Communications, Inc. (USD), 3.88%, 02/08/2029 |
| 1,112,000 |
| 1,229,779 |
| ||
Electric Utilities (2.5%) |
|
|
|
|
| ||
Entergy Texas, Inc. |
|
|
|
|
| ||
(USD), 4.00%, 03/30/2029 |
| 531,000 |
| 589,182 |
| ||
(USD), 3.55%, 09/30/2049 |
| 805,000 |
| 832,493 |
| ||
Mississippi Power Co. (USD), 3.95%, 03/30/2028 |
| 560,000 |
| 613,441 |
| ||
PSEG Power LLC (USD), 5.13%, 04/15/2020 |
| 480,000 |
| 486,694 |
| ||
Public Service Co. of Colorado, Series 34 (USD), 3.20%, 03/01/2050 |
| 650,000 |
| 667,332 |
| ||
Sempra Energy (USD), 2.40%, 02/01/2020 |
| 1,320,000 |
| 1,320,633 |
| ||
|
|
|
| 4,509,775 |
| ||
Energy Equipment & Services (0.6%) |
|
|
| ||||
Western Midstream Operating LP (USD), 4.65%, 07/01/2026 |
| 1,070,000 |
| 1,069,245 |
| ||
Food Products (0.5%) |
|
|
|
|
| ||
Kraft Heinz Foods Co. (USD), 3.75%, 04/01/2030 (a) |
| 860,000 |
| 878,982 |
| ||
Healthcare Providers & Services (0.9%) |
|
|
| ||||
Kaiser Foundation Hospitals, Series 2019 (USD), 3.27%, 11/01/2049 |
| 305,000 |
| 310,521 |
| ||
Quest Diagnostics, Inc. (USD), 3.45%, 06/01/2026 |
| 1,240,000 |
| 1,302,573 |
| ||
|
|
|
| 1,613,094 |
| ||
See accompanying Notes to Financial Statements.
22 |
2019 Annual Report |
|
Statement of Investments (continued)
October 31, 2019
Aberdeen Total Return Bond Fund
|
| Shares or |
| Value |
| ||
CORPORATE BONDS (continued) |
|
|
|
|
| ||
UNITED STATES (continued) |
|
|
|
|
| ||
Oil, Gas & Consumable Fuels (0.3%) |
|
|
|
| |||
Occidental Petroleum Corp. (USD), 3.20%, 08/15/2026 |
| $ | 590,000 |
| $ | 597,248 |
|
Pharmaceutical (0.9%) |
|
|
|
|
| ||
CVS Health Corp. (USD), 2.88%, 06/01/2026 |
| 1,595,000 |
| 1,606,817 |
| ||
Real Estate Investment Trust (REIT) Funds (0.6%) |
|
| |||||
American Tower Corp. (USD), 3.95%, 03/15/2029 |
| 1,089,000 |
| 1,172,663 |
| ||
Retail (0.5%) |
|
|
|
|
| ||
McDonald’s Corp. (USD), 3.63%, 09/01/2049 |
| 978,000 |
| 990,794 |
| ||
Software (0.7%) |
|
|
|
|
| ||
Electronic Arts, Inc. (USD), 4.80%, 03/01/2026 |
| 330,000 |
| 376,642 |
| ||
Fiserv, Inc. (USD), 3.20%, 07/01/2026 |
| 830,000 |
| 867,200 |
| ||
|
|
|
| 1,243,842 |
| ||
Transportation (0.2%) |
|
|
|
|
| ||
Union Pacific Corp. (USD), 3.55%, 08/15/2039 |
| 341,000 |
| 360,239 |
| ||
|
|
|
| 27,044,650 |
| ||
Total Corporate Bonds |
|
|
| 40,031,050 |
| ||
MUNICIPAL BONDS (3.5%) |
|
|
|
|
| ||
UNITED STATES (3.5%) |
|
|
|
|
| ||
CALIFORNIA (1.4%) |
|
|
|
|
| ||
Los Angeles Unified School District General Obligation Unlimited Bonds (USD), 6.76%, 07/01/2034 |
| 630,000 |
| 883,329 |
| ||
Regents of the University of California Medical Center Pooled Revenue, Series H (USD), 6.55%, 05/15/2048 |
| 1,135,000 |
| 1,683,716 |
| ||
|
|
|
| 2,567,045 |
| ||
CONNECTICUT (0.9%) |
|
|
|
|
| ||
State of Connecticut General Obligation Unlimited Bonds, Series A (USD), 5.85%, 03/15/2032 |
| 1,205,000 |
| 1,595,287 |
| ||
MASSACHUSETTS (0.3%) |
|
|
|
|
| ||
State of Commonwealth of Massachusetts, Series H (USD), 2.90%, 09/01/2049 |
| 520,000 |
| 500,276 |
| ||
NEW YORK (0.2%) |
|
|
|
|
| ||
State of New York State Thruway Authority, Series M (USD), 3.50%, 01/01/2042 |
| 485,000 |
| 492,707 |
| ||
PENNSYLVANIA (0.6%) |
|
|
|
|
| ||
Pennsylvania State General Obligation Unlimited Bonds (Build America Bonds), Series B (USD), 4.65%, 02/15/2026 |
| 1,050,000 |
| 1,157,678 |
| ||
|
|
|
| 6,312,993 |
| ||
Total Municipal Bonds |
|
|
| 6,312,993 |
| ||
|
| Shares or |
| Value |
| ||
GOVERNMENT BONDS (3.6%) |
|
|
|
|
| ||
CANADA (3.1%) |
|
|
|
|
| ||
Canada Housing Trust No 1 |
| $ | 4,970,000 |
| $ | 3,785,290 |
|
(CAD), 2.10%, 09/15/2029 (a) |
| 2,500,000 |
| 1,943,930 |
| ||
|
|
|
| 5,729,220 |
| ||
ITALY (0.5%) |
|
|
|
|
| ||
Republic of Italy Government International Bond (USD), 2.88%, 10/17/2029 |
| 920,000 |
| 901,367 |
| ||
Total Government Bonds |
|
|
| 6,630,587 |
| ||
U.S. AGENCIES (17.1%) |
|
|
|
|
| ||
UNITED STATES (17.1%) |
|
|
|
|
| ||
Federal Home Loan Mortgage Corp. |
| 889,000 |
| 959,940 |
| ||
Series K089, Class A2 (USD), 3.56%, 01/25/2029 |
| 827,556 |
| 915,431 |
| ||
Series K090, Class A2 (USD), 3.42%, 02/25/2029 |
| 900,000 |
| 986,307 |
| ||
Series 2016-HQA4, Class M2 (USD), 1M USD LIBOR + 1.300%, 3.12%, 04/25/2029 (b) |
| 876,470 |
| 879,246 |
| ||
Series 2017-DNA3, Class M1, (USD), 2.57%, 03/25/2030 (b) |
| 650,079 |
| 650,432 |
| ||
MBS (USD), 3.00%, 10/01/2046 |
| 664,277 |
| 684,393 |
| ||
MBS (USD), 4.00%, 01/01/2047 |
| 1,557,506 |
| 1,641,310 |
| ||
MBS (USD), 4.00%, 06/01/2049 |
| 706,557 |
| 733,183 |
| ||
MBS (USD), 3.50%, 07/01/2049 |
| 1,248,829 |
| 1,291,010 |
| ||
MBS (USD), 3.50%, 09/01/2049 |
| 1,331,733 |
| 1,367,803 |
| ||
Federal National Mortgage Association, Series 2017-C06, Class 2M1 (USD), 1M USD LIBOR + 0.750%, 2.57%, 02/25/2030 (b) |
| 38,596 |
| 38,596 |
| ||
Federal National Mortgage Association |
| 1,068,192 |
| 1,099,041 |
| ||
MBS (USD), 4.50%, 12/01/2046 |
| 613,735 |
| 649,739 |
| ||
MBS (USD), 4.00%, 07/01/2048 |
| 831,459 |
| 866,276 |
| ||
MBS (USD), 5.00%, 09/01/2048 |
| 760,382 |
| 812,553 |
| ||
MBS (USD), 4.50%, 01/01/2049 |
| 806,853 |
| 849,019 |
| ||
MBS (USD), 4.00%, 06/01/2049 |
| 1,163,530 |
| 1,207,855 |
| ||
MBS (USD), 4.00%, 07/01/2049 |
| 1,291,462 |
| 1,342,222 |
| ||
(USD), 3.00%, 11/13/2049 |
| 2,390,000 |
| 2,428,560 |
| ||
FREMF 2016-K57 Mortgage Trust, Series 2016-K57, Class C (USD), 3.92%, 08/25/2049 (a)(b) |
| 1,037,000 |
| 1,044,118 |
| ||
FREMF 2017-K71 Mortgage Trust, Series 2017-K71, Class C (USD), 3.75%, 11/25/2050 (a)(b) |
| 525,000 |
| 539,939 |
| ||
Government National Mortgage Association |
| 1,263,564 |
| 1,311,132 |
| ||
MBS (USD), 3.50%, 03/20/2046 |
| 1,462,020 |
| 1,533,719 |
| ||
MBS (USD), 3.00%, 10/20/2046 |
| 1,590,383 |
| 1,644,564 |
| ||
MBS (USD), 4.50%, 06/20/2047 |
| 630,280 |
| 663,302 |
| ||
See accompanying Notes to Financial Statements.
|
2019 Annual Report |
23 |
Statement of Investments (continued)
October 31, 2019
Aberdeen Total Return Bond Fund
|
| Shares or |
| Value |
| ||
U.S. AGENCIES (continued) |
|
|
|
|
| ||
UNITED STATES (continued) |
|
|
|
|
| ||
MBS (USD), 3.50%, 02/20/2048 |
| $ | 918,025 |
| $ | 964,671 |
|
MBS (USD), 4.00%, 05/20/2048 |
| 1,842,681 |
| 1,950,442 |
| ||
MBS (USD), 4.00%, 05/20/2048 |
| 1,448,672 |
| 1,542,180 |
| ||
MBS (USD), 4.00%, 09/20/2048 |
| 667,157 |
| 709,909 |
| ||
|
|
|
| 31,306,892 |
| ||
Total U.S. Agencies |
|
|
| 31,306,892 |
| ||
U.S. TREASURIES (19.2%) |
|
|
|
|
| ||
UNITED STATES (19.2%) |
|
|
|
|
| ||
U.S. Treasury Bond |
| 3,054,200 |
| 3,590,236 |
| ||
(USD), 3.00%, 02/15/2049 |
| 5,909,400 |
| 6,966,628 |
| ||
(USD), 2.88%, 05/15/2049 |
| 783,500 |
| 902,800 |
| ||
U.S. Treasury Note |
| 3,972,100 |
| 4,018,493 |
| ||
(USD), 2.13%, 05/31/2021 |
| 1,876,700 |
| 1,892,315 |
| ||
(USD), 2.63%, 06/15/2021 |
| 6,810,000 |
| 6,921,992 |
| ||
(USD), 2.50%, 01/15/2022 |
| 1,062,400 |
| 1,084,229 |
| ||
(USD), 2.50%, 02/15/2022 |
| 2,242,600 |
| 2,290,693 |
| ||
(USD), 2.63%, 02/28/2023 |
| 4,262,600 |
| 4,413,956 |
| ||
(USD), 2.63%, 12/31/2023 |
| 370,000 |
| 386,303 |
| ||
(USD), 2.50%, 02/28/2026 |
| 1,075,600 |
| 1,134,002 |
| ||
(USD), 1.38%, 08/31/2026 |
| 570,200 |
| 561,714 |
| ||
(USD), 1.63%, 09/30/2026 |
| 595,300 |
| 595,928 |
| ||
(USD), 1.63%, 08/15/2029 |
| 421,700 |
| 419,180 |
| ||
|
|
|
| 35,178,469 |
| ||
Total U.S. Treasuries |
|
|
| 35,178,469 |
| ||
AGENCY MORTGAGE-BACKED SECURITIES (7.3%) |
| ||||||
UNITED STATES (7.3%) |
|
|
|
|
| ||
Federal Home Loan Mortgage Corp. (USD), 3.00%, 02/01/2032 |
| 790,786 |
| 816,077 |
| ||
(USD), 5.00%, 10/01/2041 |
| 361,701 |
| 398,060 |
| ||
(USD), 3.00%, 10/01/2046 |
| 1,050,487 |
| 1,079,704 |
| ||
(USD), 3.50%, 03/01/2048 |
| 922,221 |
| 970,505 |
| ||
(USD), 3.50%, 04/01/2048 |
| 952,827 |
| 1,007,821 |
| ||
Federal National Mortgage Association |
| 734,214 |
| 757,445 |
| ||
(USD), 4.50%, 07/01/2040 |
| 944,621 |
| 1,022,589 |
| ||
(USD), 3.00%, 03/01/2047 |
| 1,235,676 |
| 1,275,393 |
| ||
(USD), 3.50%, 12/01/2047 |
| 1,459,966 |
| 1,548,313 |
| ||
(USD), 3.50%, 01/01/2048 |
| 1,370,428 |
| 1,441,548 |
| ||
(USD), 3.50%, 02/01/2048 |
| 1,110,814 |
| 1,181,499 |
| ||
MBS (USD), 4.00%, 01/01/2048 |
| 1,048,587 |
| 1,132,857 |
| ||
Government National Mortgage Association (USD), 4.50%, 12/20/2045 |
| 732,971 |
| 784,840 |
| ||
|
|
|
| 13,416,651 |
| ||
Total Agency Mortgage-Backed Securities |
|
|
| 13,416,651 |
| ||
|
| Shares or |
| Value |
| ||
SHORT-TERM INVESTMENT (2.8%) |
|
|
|
|
| ||
UNITED STATES (2.8%) |
|
|
|
|
| ||
State Street Institutional U.S. Government Money Market Fund, Premier Class, 1.75% (c) |
| $ | 5,175,662 |
| $ | 5,175,662 |
|
Total Short-Term Investment |
|
|
| 5,175,662 |
| ||
Total Investments |
|
|
| 185,439,685 |
| ||
Liabilities in Excess of Other Assets—(1.3)% |
|
|
| (2,358,692 | ) | ||
Net Assets—100.0% |
|
|
| $ | 183,080,993 |
| |
(a) Denotes a security issued under Regulation S or Rule 144A.
(b) Variable Rate Instrument. The rate shown is based on the latest available information as of October 31, 2019. Certain variable rate securities are not based on a published reference rate and spread but are determined by the issuer or agent and are based on current market conditions. These securities do not indicate a reference rate and spread in their description.
(c) Registered investment company advised by State Street Global Advisors. The rate shown is the 7 day yield as of October 31, 2019.
(d) See accompanying Notes to Financial Statements for tax unrealized appreciation/(depreciation) of securities.
CAD Canadian Dollar
CLP Chilean Peso
CMT Constant Maturity Treasury
COP Colombian Peso
GBP British Pound Sterling
HUF Hungarian Forint
INR Indian Rupee
JPY Japanese Yen
PLC Public Limited Company
USD U.S. Dollar
ZAR South African Rand
See accompanying Notes to Financial Statements.
24 |
2019 Annual Report |
|
Statement of Investments (continued)
October 31, 2019
Aberdeen Total Return Bond Fund
At October 31, 2019, the Fund held the following futures contracts:
Futures Contracts |
| Number of |
| Expiration |
| Notional |
| Market |
| Unrealized |
|
LONG CONTRACT POSITIONS |
|
|
|
|
|
|
|
|
|
|
|
Canadian Government Bond—10 year |
| 17 |
| 12/18/2019 |
| $ 1,860,436 |
| $ 1,833,331 |
| $(27,105 | ) |
United States Treasury Note 6%—10 year |
| 5 |
| 12/19/2019 |
| 651,876 |
| 651,485 |
| (391 | ) |
United States Treasury Note 6%—2 year |
| 77 |
| 12/31/2019 |
| 16,610,531 |
| 16,601,320 |
| (9,211 | ) |
United States Treasury Note 6%—Long Bond |
| 6 |
| 12/19/2019 |
| 985,875 |
| 968,250 |
| (17,625 | ) |
United States Treasury Note 6%—Ultra Bond |
| 10 |
| 12/19/2019 |
| 1,930,781 |
| 1,897,500 |
| (33,281 | ) |
|
|
|
|
|
|
|
|
|
| $(87,613 | ) |
SHORT CONTRACT POSITIONS |
|
|
|
|
|
|
|
|
|
|
|
United States Treasury Note 6%—10 year |
| (20 | ) | 12/19/2019 |
| $(2,843,516 | ) | $(2,842,188 | ) | $ 1,328 |
|
United States Treasury Note 6%—5 year |
| (19 | ) | 12/31/2019 |
| (2,251,797 | ) | (2,264,859 | ) | (13,062 | ) |
|
|
|
|
|
|
|
|
|
| $(11,734 | ) |
|
|
|
|
|
|
|
|
|
| $(99,347 | ) |
At October 31, 2019, the Fund’s open forward foreign currency exchange contracts were as follows:
|
|
|
|
|
|
|
|
|
|
| Unrealized |
|
Purchase Contracts |
|
|
|
| Amount |
| Amount |
|
|
| Appreciation/ |
|
Settlement Date* |
| Counterparty |
|
| Purchased |
| Sold |
| Fair Value |
| (Depreciation) |
|
British Pound/United States Dollar |
|
|
|
|
|
|
|
|
|
| ||
11/18/2019 |
| Goldman Sachs |
| GBP | 1,347,477 | USD | 1,718,328 |
| $1,746,213 |
| $27,885 |
|
Canadian Dollar/United States Dollar |
|
|
|
|
|
|
|
|
|
| ||
12/12/2019 |
| Royal Bank of Canada |
| CAD | 2,343,000 | USD | 1,791,586 |
| 1,779,208 |
| (12,378 | ) |
Chilean Peso/United States Dollar |
|
|
|
|
|
|
|
|
|
| ||
11/04/2019 |
| JPMorgan Chase |
| CLP | 1,335,686,000 | USD | 1,838,522 |
| 1,801,087 |
| (37,435 | ) |
Colombian Peso/United States Dollar |
|
|
|
|
|
|
|
|
|
| ||
11/25/2019 |
| Citibank |
| COP | 6,271,016,000 | USD | 1,828,285 |
| 1,854,053 |
| 25,768 |
|
Hungarian Forint/United States Dollar |
|
|
|
|
|
|
|
|
|
| ||
11/25/2019 |
| HSBC Bank |
| HUF | 541,355,215 | USD | 1,838,812 |
| 1,839,320 |
| 508 |
|
Indian Rupee/United States Dollar |
|
|
|
|
|
|
|
|
|
| ||
12/02/2019 |
| HSBC Bank |
| INR | 128,690,000 | USD | 1,811,897 |
| 1,804,803 |
| (7,094 | ) |
Japanese Yen/United States Dollar |
|
|
|
|
|
|
|
|
|
| ||
12/13/2019 |
| Citibank |
| JPY | 391,440,000 | USD | 3,667,054 |
| 3,633,462 |
| (33,592 | ) |
South African Rand/United States Dollar |
|
|
|
|
|
|
|
|
|
| ||
11/08/2019 |
| Barclays Bank |
| ZAR | 27,670,002 | USD | 1,827,376 |
| 1,830,196 |
| 2,820 |
|
|
|
|
|
|
|
|
|
| $16,288,342 |
| $(33,518 | ) |
See accompanying Notes to Financial Statements.
| 2019 Annual Report | 25 |
Statement of Investments (concluded)
October 31, 2019
Aberdeen Total Return Bond Fund
|
|
|
|
|
|
|
|
|
| Unrealized |
| |
Sale Contracts |
|
| Amount |
| Amount |
|
|
| Appreciation/ |
| ||
Settlement Date* |
| Counterparty | Purchased |
| Sold |
| Fair Value |
| (Depreciation) |
| ||
United States Dollar/British Pound |
|
|
|
|
|
|
|
|
| |||
11/18/2019 |
| HSBC Bank | USD | 1,718,691 | GBP | 1,347,477 |
| $ 1,746,213 |
| $(27,522 | ) | |
United States Dollar/Canadian Dollar |
|
|
|
|
|
|
|
|
| |||
12/12/2019 |
| JPMorgan Chase | USD | 7,519,279 | CAD | 9,958,184 |
| 7,561,964 |
| (42,685 | ) | |
12/12/2019 |
| Royal Bank of Canada | USD | 3,619,229 | CAD | 4,775,000 |
| 3,626,000 |
| (6,771 | ) | |
United States Dollar/Chilean Peso |
|
|
|
|
|
|
|
|
| |||
11/04/2019 |
| JPMorgan Chase | USD | 1,864,312 | CLP | 1,335,686,000 |
| 1,801,087 |
| 63,225 |
| |
United States Dollar/Colombian Peso |
|
|
|
|
|
|
|
|
| |||
11/25/2019 |
| Goldman Sachs | USD | 1,851,496 | COP | 6,271,016,000 |
| 1,854,053 |
| (2,557 | ) | |
United States Dollar/Hungarian Forint |
|
|
|
|
|
|
|
|
| |||
11/25/2019 |
| Citibank | USD | 1,827,107 | HUF | 541,355,215 |
| 1,839,320 |
| (12,213 | ) | |
United States Dollar/Japanese Yen |
|
|
|
|
|
|
|
|
| |||
12/13/2019 |
| Citibank | USD | 3,634,271 | JPY | 391,440,000 |
| 3,633,463 |
| 808 |
| |
United States Dollar/South African Rand |
|
|
|
|
|
|
|
|
| |||
11/08/2019 |
| Citibank | USD | 1,820,836 | ZAR | 27,670,002 |
| 1,830,196 |
| (9,360 | ) | |
|
|
|
|
|
|
|
| $23,892,296 |
| $ (37,075 | ) | |
Total unrealized appreciation on open forward foreign currency exchange contracts |
|
|
| $121,014 |
| |||||||
Total unrealized depreciation on open forward foreign currency exchange contracts |
|
|
| (191,607 | ) | |||||||
* Certain contracts with different trade dates and like characteristics have been shown net.
See accompanying Notes to Financial Statements.
26
| 2019 Annual Report |
|
Aberdeen Global High Income Fund (Unaudited)
Aberdeen Global High Income Fund (Institutional Class shares net of fees) returned 7.91% for the 12-month period ending October 31, 2019, versus the. 9.52% return of its benchmark, the ICE Bank of America Merrill Lynch (BofA ML) Global High Yield Constrained Index (hedged into U.S. dollars), during the same period.
The beginning of the reporting period was extremely volatile for the global high-yield market. After U.S. high-yield credit spreads, as measured by the ICE BofA ML U.S. High Yield Index,1 narrowed in October 2018, November and December were characterized by steady spread-widening, with the peak spreads nearing 550 basis points (bps) — the widest level in nearly three years. Myriad factors, including mixed economic data, concerns that the U.S. Federal Reserve (Fed) was making a monetary policy error by raising interest rates, falling oil prices, and trade tensions drove the sell-off. The UK’s long-running attempt to withdraw from the European Union (EU) acted as a handbrake on economic activity and investment. Industrial production and export data from Germany indicated notable economic deterioration. As an asset class, global high yield was also hampered by large retail fund outflows as investors rotated out of fixed-rate high-yield securities into floating-rate leveraged loans.
Moving into 2019, dovish monetary policy shifts from the Fed, the European Central Bank (ECB) and the People’s Bank of China (PBoC) helped global high-yield markets to recover. In January and February 2019, the ICE BofA ML Global High Yield Constrained Index posted the strongest two-month rally in its history. Rotation out of floating-rate leveraged loan funds and back into fixed-rate high-yield issues, combined with very low new issuance in the market, drove a strong technically driven rally.
In the second quarter of 2019, investor sentiment around central banks and U.S./China trade relations continued to drive the market. Global economic growth concerns were superseded by supportive comments from both the Fed and the ECB. The G20 summit resulted in a new U.S.-China trade “truce” to allow for more negotiations and a hold on further tariff action. Consequently, there was significant intra-quarter volatility. During this period, a dramatic move in government bonds, with the U.S. Treasury yield rallying 80 basis points (bps), supported the market. Emerging markets led the way in terms of total returns, with Europe a close second. BB rated2 issues were the strongest performers among ratings class, as they the most interest-rate-sensitive securities. Issuers rated CCC and below were the most notable underperformers for the second quarter.
During the summer of 2019, accommodative monetary policy actions by both the ECB and the Fed continued to support risk assets, despite numerous macroeconomic headwinds. Higher-quality debt outperformed lower-quality issues. The energy sector was hit
particularly hard on the back of global economic growth concerns and an overall aversion to lower-quality, commodity-focused credits.
While the market was weak early in October 2019, risk assets gained ground after the tone improved around the trade dispute between the U.S. and China. Political developments also suggested a lower likelihood of a hard Brexit as the UK government negotiated a deal with the EU. New issuance remained strong, and higher-quality bonds easily outperformed their lower-quality counterparts. Consequently, the difference in spreads between U.S. BB and CCC rated bonds finished the reporting period at multi-decade high levels.
The Fund’s positions in global wind turbine producer Senvion S.A., lottery and gaming operator Intralot S.A., rent-to-own retailer BrightHouse Group plc, oil and gas company Sanchez Energy Corp., and Caribbean wireless operator Digicel Group Ltd. hampered the Fund’s performance relative to its benchmark, the ICE BofA ML Global High Yield Constrained Index, for the reporting period.
Senvion encountered financial difficulties following operational issues on the execution of several large projects. We believed that the company was heading towards a restructuring, and exited the Fund’s holding in the bonds during the reporting period. Intralot’s bond prices fell after the company lost the rights to manage the Turkey Lottery. BrightHouse Group’s operating results were hindered by investors’ concerns about the departure of the company’s former chief executive officer in March. We exited the Fund’s holding in Sanchez Energy as we believed that the company had a relatively weak business outlook. Finally, Digicel’s bonds reacted negatively to weaker-than-expected results over the reporting period. Unfavorable currency translation effects and higher subscriber acquisition costs had a negative impact on the company’s cash flow. Conversely, the Fund’s position in MDC Holdings Inc., a U.S.-based homebuilder, enhanced performance for the reporting period. Fund performance also was bolstered by holdings in Brazilian state-owned oil company Petróleo Brasileiro S.A. (Petrobras), Swedish diesel refinery company Preem Evolution Diesel, and supermarket chain operator Albertsons Companies. Other contributors to Fund performance included holdings in Cheniere Energy Inc., a U.S.-based liquefied natural gas producer, and Canadian oil company MEG Energy Corp.
The bond prices of Petrobras moved higher as the company reduced debt and Jair Bolsonaro, whose policies generally are considered to be market-friendly, was elected as Brazil’s president in late October 2018. The Fund’s holding in Preem rose as the company benefited from strong refining margins. Albertsons Companies’ operating results over the reporting period were bolstered mainly by better-than-expected same-store sales and improved margins, attributable primarily to retail gasoline sales. Investors anticipate that
1 | The ICE Bank of America Merrill Lynch U.S. High Yield Index tracks the performance of below-investment-grade, US-dollar-denominated corporate bonds publicly issued in the U.S. domestic market. Indexes are unmanaged and have been provided for comparison purposes only. No fees or expenses are reflected. You cannot invest directly in an index. |
2 | S&P Global Ratings’ credit ratings express the agency’s opinion about the ability and willingness of an issuer, such as a corporation or state or city government, to meet its financial obligations in full and on time. Typically, ratings are expressed as letter grades that range, for example, from AAA to D to communicate the agency’s opinion of relative level of credit risk. Ratings from AA to CCC may be modified by the addition of a plus (+) or minus (-) sign to show relative standing within the major rating categories. |
| 2019 Annual Report | 27 |
Aberdeen Global High Income Fund (Unaudited) (continued)
MDC Holdings’ business fundamentals will improve due to lower interest rates, which should make the company’s homes more affordable.
Overall, the first six months of the reporting period was unusually active in terms of trading as we reduced the Fund’s risk positioning. We initiated positions in several companies during this period, including educational software company Ascend Learning LLC; diversified financial services company Bank of America Corp.; building products distributors Tecnoglass Inc. and Builders FirstSource Inc.; energy services providers Calfrac Well Services Ltd. and U.S.A. Compression Partners LLC; and healthcare services providers Centene Corp., DaVita Inc., HCA Healthcare Inc., and Encompass Health Corp.
Also during the first half of the reporting period, we exited positions in several companies that had reached our target valuations: Albertsons Companies; auto rental company Avis Budget Group Inc.; packaging company BWAY Corp.; gaming operator Golden Nugget Inc.; and oil and gas companies Hilcorp Energy Co., and Nostrum Oil & Gas plc. Additionally, we exited several of the Fund’s positions in companies that we believed had relative weak business outlooks: diversified telecommunications company Frontier Communications Corp.; luxury goods retailer Neiman Marcus Group Inc.; mining company Nyrstar N.V.; and business process automation software and services company Exela Technologies Inc.
We increased the Fund’s exposure to the technology sector over the reporting period as we found what we viewed as attractive new issues and secondary opportunities. The Fund’s weighting in the media non-cable sector also increased, attributable primarily to the addition of positions in Netflix Inc. and Gray Television Inc.
The U.S.-China trade war appeared to come to a head in May 2019. Along with mixed economic data and increased political concerns in Europe, this led to spread-widening, particularly for CCC rated issues. Accordingly, we focused Fund activity thereafter largely on improving credit quality. In the primary market, we initiated holdings in higher-quality BB rated issues such as amusement park operator Cedar Fair LP, environmental services company Clean Harbors Inc. In the UK sterling market, we participated in a new issue from media company Entertainment One Ltd.
In the summer of 2019, we initiated positions in several higher-quality issues, including sports marketing company Diamond Sports Group; global metal packaging producer Trivium Packaging; Brazilian protein company JBS S.A.; and Banco Bilbao Vizcaya Argentaria, S.A. (BBVA), a Spanish bank with significant emerging-market exposure. We funded these purchases by exiting the Fund’s positions in lower-quality issues, including cable operator Radiate Holdings; oilfield services company Calfrac Well Services Ltd; acute care facility owner/operator Surgery Centers; alloy wheel producer Superior Industries Inc., and miner Vedanta Resources.
The Fund employs derivatives, including foreign exchange forwards and credit default swaps. The Fund utilizes foreign exchange forwards3 to hedge its exposure to changes in the value of its holdings due to movements in currency exchange rates. The Fund can use credit default swaps4 to gain, or hedge, exposure to specific companies. The Fund may also employ credit default swap indices primarily for the purpose of managing market exposure. The use of derivatives did not have a significant impact on the Fund’s total return during the 12-month period ended October 31, 2019.
We think that global central bank actions will support economic growth rather than stimulate it. In our view, trade tension and politics will remain in the headlines, creating continued uncertainty. We also anticipate that demand for yield will persist, providing technical support to the global high-yield asset class. The large and growing portion of the market that is trading at distressed levels increases the average spread, masking the tight spread levels of the remainder of the market (particularly BB rated issues) are trading. For example, the spreads between BB and BBB rated issues are nearing their historical lows. On a relative value basis, spreads in Europe compare reasonably well to those in the U.S., but we maintain a slight preference for the U.S. due to its relatively stronger economic backdrop. We continue to prefer developed markets to emerging markets. We have been looking for value in BBB rated securities that are not represented in the Fund’s benchmark index and in B rated issues, while we think that few CCC rated bonds look attractive. However, we continue to search for those bonds that we believe have been “thrown out with the bathwater” and scrutinize the Fund’s relatively more risky holdings to ensure that we are comfortable with these credits.
Portfolio Management:
Aberdeen Global High Yield Team
PAST PERFORMANCE DOES NOT GUARANTEE FUTURE RESULTS.
The performance quoted represents past performance, which does not guarantee future results. Class A shares have up to a 0.25% 12b-1 fee. The investment return and principal value of an investment will fluctuate so that an investor’s shares, when redeemed, may be worth more or less than their original cost. Current performance of the Fund may be lower or higher than the performance quoted. Performance data current to the most recent month-end may be obtained by calling 866-667-9231 or visiting www.aberdeenstandard.com/en-us/us/investor/fund-centre.
Investing in mutual funds involves risk, including the possible loss of principal. There is no assurance that the investment objective of any fund will be achieved. Indexes are unmanaged and have been provided for comparison purposes only. No fees or expenses are reflected. You cannot invest directly in an index.
Risk Considerations
Fixed income securities are subject to certain risks including, but not limited to: interest rate (changes in interest rates may cause a decline in the market value of an investment), credit (changes in the financial condition of the issuer, borrower, counterparty, or underlying
3 | A foreign exchange forward is a binding contract in the foreign exchange market that locks in the exchange rate for the purchase or sale of a currency on a future date. |
4 | A credit default swap is a financial derivative or contract that allows an investor to “swap” or offset their credit risk with that of another investor. |
28
| 2019 Annual Report |
|
Aberdeen Global High Income Fund (Unaudited) (concluded)
collateral), prepayment (debt issuers may repay or refinance their loans or obligations earlier than anticipated), and extension (principal repayments may not occur as quickly as anticipated, causing the expected maturity of a security to increase).
Non-investment-grade debt securities (high yield/junk bonds) may be subject to greater market fluctuations, risk of default or loss of income and principal than higher-rated securities.
The Fund may use derivatives as a substitute for taking a position or reducing exposure to underlying assets. Derivatives are speculative and may hurt the Fund’s performance. They present the risk of disproportionately increased losses and/or reduced gains when the financial asset or measure to which the derivative is linked changes in unexpected ways.
Foreign securities may be more volatile, harder to price and less liquid than U.S. securities. They are subject to different accounting and regulatory standards and currency exchange rate, political and economic risks. Fluctuation in currency exchange rates may impact a Fund’s returns more greatly to the extent a Fund does not hedge currency exposure or hedging techniques are unsuccessful. The foregoing risks are enhanced in emerging market countries.
Investing a significant portion of the Fund’s assets in securities of companies conducting business in a broadly related group of industries within an economic sector may make the Fund more vulnerable to unfavorable developments in that sector.
Please read the prospectus for more detailed information regarding these and other risks.
| 2019 Annual Report | 29 |
Aberdeen Global High Income Fund (Unaudited)
Average Annual Total Return |
|
|
| 1 Yr. |
| 5 Yr. |
| 10 Yr. |
|
Class A |
|
|
| 7.65% |
| 2.51% |
| 5.50% |
|
Institutional Class |
|
|
| 7.91% |
| 2.75% |
| 5.76% |
|
Performance of a $10,000 Investment (as of October 31, 2019)
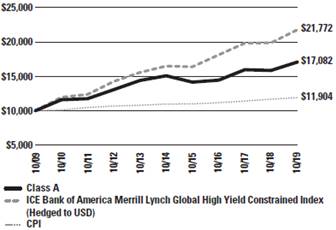
Comparative performance of $10,000 invested in Class A shares of the Aberdeen Global High Income Fund, ICE Bank of America Merrill Lynch Global High Yield Constrained Index (Hedged to USD) and the Consumer Price Index (CPI) over a 10-year period ended October 31, 2019. Unlike the Fund’s returns, the returns for these unmanaged indexes do not reflect any fees or expenses. Investors cannot invest directly in market indexes.
The ICE BofA Merrill Lynch Global High Yield Constrained Index (Hedged to the USD) tracks the performance of USD, CAD, GBP and EUR denominated below investment grade corporate debt publicly issued in the major domestic or eurobond markets but caps issuer exposure at 2%.
The CPI is a measure of the average change over time in the prices paid by urban consumers for a market basket of consumer goods and services.
Investment return and principal value will fluctuate, and when redeemed, shares may be worth more or less than original cost. Past performance is no guarantee of future results. The Average Annual Total Return table and performance graph do not reflect the deduction of taxes that a shareholder would pay on Fund distributions or the redemption of Fund shares. Investing in mutual funds involves market risk, including loss of principal. Performance returns assume the reinvestment of all distributions. Performance returns reflect fee waivers and reimbursements in effect without which returns would have been lower.
30 2019 Annual Report
Aberdeen Global High Income Fund (Unaudited)
Portfolio Summary (as a percentage of net assets)
October 31, 2019 (Unaudited)
Asset Allocation |
|
|
|
Corporate Bonds |
| 95.5% |
|
Short-Term Investment |
| 2.9% |
|
Bank Loans |
| 1.3% |
|
Common Stocks |
| 0.1% |
|
Other Assets in Excess of Liabilities |
| 0.2% |
|
|
| 100.0% |
|
The following chart summarizes the composition of the Fund’s portfolio, expressed as a percentage of net assets. The industries listed below may include more than one industry group. As of October 31, 2019, the Fund did not have more than 25% of its assets invested in any industry group.
Top Industries |
|
|
|
Media |
| 13.0% |
|
Diversified Telecommunication Services |
| 10.8% |
|
Oil, Gas & Consumable Fuels |
| 5.6% |
|
Commercial Banks |
| 5.5% |
|
Healthcare Providers & Services |
| 3.8% |
|
Pharmaceutical |
| 3.7% |
|
Diversified Financial Services |
| 3.5% |
|
Home Builders |
| 3.5% |
|
Food Products |
| 3.2% |
|
Entertainment |
| 3.2% |
|
Other |
| 44.2% |
|
|
| 100.0% |
|
Top Holdings* |
|
|
|
Sprint Corp. 09/15/2023 |
| 1.6% |
|
Cheniere Corpus Christi Holdings LLC 03/31/2025 |
| 1.3% |
|
CCO Holdings LLC / CCO Holdings Capital Corp. 02/15/2026 |
| 1.3% |
|
CSC Holdings LLC 10/15/2025 |
| 1.3% |
|
Tenet Healthcare Corp. 07/15/2024 |
| 1.1% |
|
Lennar Corp. 11/29/2027 |
| 1.0% |
|
IWH UK Midco Limited, 2017 Term Loan B 01/31/2025 |
| 1.0% |
|
Dell International LLC / EMC Corp. 10/01/2029 |
| 1.0% |
|
Meredith Corp. 02/01/2026 |
| 1.0% |
|
Sappi Papier Holding GmbH 06/15/2032 |
| 1.0% |
|
Other |
| 88.4% |
|
|
| 100.0% |
|
* For the purpose of listing top holdings, Short-Term Investments are included as part of Other.
Top Countries |
|
|
|
United States |
| 61.5% |
|
Netherlands |
| 4.6% |
|
United Kingdom |
| 4.2% |
|
Luxembourg |
| 3.0% |
|
France |
| 2.2% |
|
Canada |
| 2.1% |
|
Sweden |
| 1.9% |
|
Brazil |
| 1.8% |
|
Mexico |
| 1.5% |
|
South Africa |
| 1.5% |
|
Other |
| 15.7% |
|
|
| 100.0% |
|
2019 Annual Report 31
Statement of Investments
October 31, 2019
Aberdeen Global High Income Fund
|
| Shares or |
| Value |
| ||
CORPORATE BONDS (95.5%) |
|
|
|
|
| ||
ARGENTINA (0.7%) |
|
|
|
|
| ||
Telecom Argentina SA (USD), 6.50%, 06/15/2021 (a) |
| $ | 1,031,000 |
| $ | 976,872 |
|
Transportadora de Gas del Sur SA (USD), 6.75%, 05/02/2025 (a) |
| 575,000 |
| 480,700 |
| ||
|
|
|
| 1,457,572 |
| ||
AUSTRALIA (0.4%) |
|
|
|
|
| ||
Mineral Resources Ltd. (USD), 8.13%, 05/01/2027 (a) |
| 882,000 |
| 928,305 |
| ||
BRAZIL (1.8%) |
|
|
|
|
| ||
CSN Resources SA (USD), 7.63%, 02/13/2023 (a) |
| 810,000 |
| 839,160 |
| ||
NBM US Holdings, Inc. (USD), 7.00%, 05/14/2026 (a) |
| 1,149,000 |
| 1,218,514 |
| ||
Petrobras Global Finance BV (USD), 5.09%, 01/15/2030 (a) |
| 1,685,000 |
| 1,785,679 |
| ||
|
|
|
| 3,843,353 |
| ||
CANADA (2.1%) |
|
|
|
|
| ||
Bombardier, Inc. |
| 1,110,000 |
| 1,060,494 |
| ||
(USD), 7.88%, 04/15/2027 (a) |
| 269,000 |
| 253,532 |
| ||
Clearwater Seafoods, Inc. (USD), 6.88%, 05/01/2025 (a) |
| 1,125,000 |
| 1,155,937 |
| ||
Entertainment One Ltd. (GBP), 4.63%, 07/15/2026 (a) |
| 729,000 |
| 1,022,679 |
| ||
Teck Resources Ltd. (USD), 6.25%, 07/15/2041 |
| 1,005,000 |
| 1,119,956 |
| ||
|
|
|
| 4,612,598 |
| ||
CHINA (0.5%) |
|
|
|
|
| ||
Shimao Property Holdings Ltd. (USD), 5.20%, 01/30/2025 (a) |
| 1,045,000 |
| 1,082,959 |
| ||
CONGO (0.3%) |
|
|
|
|
| ||
HTA Group Ltd. (USD), 9.13%, 03/08/2022 (a) |
| 560,000 |
| 582,490 |
| ||
DENMARK (0.9%) |
|
|
|
|
| ||
Danske Bank AS, (fixed rate to 04/06/2022, variable rate thereafter) (EUR), 5.88%, 04/06/2022 (a)(b) |
| 850,000 |
| 1,010,383 |
| ||
DKT Finance ApS (USD), 9.38%, 06/17/2023 (a) |
| 921,000 |
| 982,247 |
| ||
|
|
|
| 1,992,630 |
| ||
DOMINICAN REPUBLIC (0.4%) |
|
|
|
|
| ||
AES Andres BV / Dominican Power Partners / Empresa Generadora de Electricidad It (USD), 7.95%, 05/11/2026 (a) |
| 765,000 |
| 814,733 |
| ||
EL SALVADOR (0.2%) |
|
|
|
|
| ||
AES El Salvador Trust II (USD), 6.75%, 03/28/2023 (a) |
| 500,000 |
| 498,130 |
| ||
|
| Shares or |
| Value |
| ||
FRANCE (1.2%) |
|
|
|
|
| ||
Altice France SA |
| $ | 103,000 |
| $ | 115,261 |
|
(USD), 7.38%, 05/01/2026 (a) |
| 978,000 |
| 1,047,286 |
| ||
(EUR), 5.88%, 02/01/2027 (a) |
| 320,000 |
| 393,458 |
| ||
(EUR), 3.38%, 01/15/2028 (a) |
| 254,000 |
| 283,810 |
| ||
Casino Guichard Perrachon SA |
| 400,000 |
| 413,623 |
| ||
(EUR), 4.50%, 03/07/2024 (a) |
| 400,000 |
| 384,221 |
| ||
|
|
|
| 2,637,659 |
| ||
GEORGIA (0.2%) |
|
|
|
|
| ||
Bank of Georgia JSC (USD), 6.00%, 07/26/2023 (a) |
| 500,000 |
| 516,450 |
| ||
GERMANY (1.0%) |
|
|
|
|
| ||
Nidda BondCo GmbH (EUR), 5.00%, 09/30/2025 (a) |
| 305,000 |
| 346,970 |
| ||
Nidda Healthcare Holding GmbH (EUR), 3.50%, 09/30/2024 (a) |
| 623,000 |
| 717,414 |
| ||
Tele Columbus AG (EUR), 3.88%, 05/02/2025 (a) |
| 984,000 |
| 1,067,626 |
| ||
|
|
|
| 2,132,010 |
| ||
ISRAEL (1.2%) |
|
|
|
|
| ||
Teva Pharmaceutical Finance Co. BV, Series 2 (USD), 3.65%, 11/10/2021 |
| 1,400,000 |
| 1,344,140 |
| ||
Teva Pharmaceutical Finance Netherlands III BV (USD), 3.15%, 10/01/2026 |
| 1,625,000 |
| 1,222,812 |
| ||
|
|
|
| 2,566,952 |
| ||
ITALY (1.0%) |
|
|
|
|
| ||
Telecom Italia Capital SA (USD), 6.00%, 09/30/2034 |
| 1,950,000 |
| 2,081,625 |
| ||
JAMAICA (0.2%) |
|
|
|
|
| ||
Digicel Group One Ltd. (USD), 8.25%, 12/30/2022 (a) |
| 930,000 |
| 549,863 |
| ||
JERSEY (1.0%) |
|
|
|
|
| ||
LHC3 PLC (EUR), 4.13%, 08/15/2024 (a)(c) |
| 784,000 |
| 900,494 |
| ||
Newday Bondco PLC (GBP), 7.38%, 02/01/2024 (a) |
| 975,000 |
| 1,218,871 |
| ||
|
|
|
| 2,119,365 |
| ||
LUXEMBOURG (3.0%) |
|
|
|
|
| ||
Altice Financing SA (USD), 7.50%, 05/15/2026 (a) |
| 1,035,000 |
| 1,099,687 |
| ||
Altice Finco SA (USD), 8.13%, 01/15/2024 (a) |
| 950,000 |
| 979,688 |
| ||
Altice Luxembourg SA |
| 283,000 |
| 346,050 |
| ||
(USD), 10.50%, 05/15/2027 (a) |
| 579,000 |
| 654,994 |
| ||
ARD Finance SA (USD), 7.13%, 09/15/2023 (c) |
| 1,200,000 |
| 1,246,500 |
| ||
Galapagos SA (EUR), 5.38%, 06/15/2021 (a)(d)(h) |
| 60,500 |
| – |
| ||
Mangrove Luxico III, 7.78%, 10/09/25 (a) |
| 650,557 |
| 657,887 |
| ||
Kleopatra Holdings 1 SCA (EUR), 9.25%, 06/30/2023 (a)(c) |
| 834,115 |
| 463,283 |
| ||
See accompanying Notes to Financial Statements.
32 2019 Annual Report
Statement of Investments (continued)
October 31, 2019
Aberdeen Global High Income Fund
|
| Shares or |
| Value |
| ||
CORPORATE BONDS (continued) |
|
|
|
|
| ||
LUXEMBOURG (continued) |
|
|
|
|
| ||
LHMC Finco 2 Sarl (EUR), 7.25%, 10/02/2025 (a)(c) |
| $ | 250,000 |
| $ | 279,871 |
|
Matterhorn Telecom SA (EUR), 3.13%, 09/15/2026 (a) |
| 762,000 |
| 851,983 |
| ||
|
|
|
| 6,579,943 |
| ||
MEXICO (1.5%) |
|
|
|
|
| ||
CEMEX Finance LLC (USD), 6.00%, 04/01/2024 (a) |
| 1,365,000 |
| 1,398,852 |
| ||
Cemex SAB de CV (USD), 7.75%, 04/16/2026 (a) |
| 1,055,000 |
| 1,138,092 |
| ||
Sixsigma Networks Mexico SA de CV (USD), 7.50%, 05/02/2025 (a) |
| 750,000 |
| 750,000 |
| ||
|
|
|
| 3,286,944 |
| ||
NETHERLANDS (4.3%) |
|
|
|
|
| ||
Cimpress NV (USD), 7.00%, 06/15/2026 (a) |
| 1,130,000 |
| 1,192,150 |
| ||
ING Groep NV, (fixed rate to 04/16/2025, variable rate thereafter) (USD), 6.50%, 04/16/2025 (b) |
| 1,027,000 |
| 1,091,085 |
| ||
Lincoln Financing SARL |
| 743,000 |
| 844,639 |
| ||
(EUR), 3.88%, 04/01/2024 (a)(e) |
| 166,000 |
| 184,603 |
| ||
OCI NV |
| 741,000 |
| 842,966 |
| ||
(USD), 5.25%, 11/01/2024 (a) |
| 470,000 |
| 486,450 |
| ||
Trivium Packaging Finance BV (USD), 5.50%, 08/15/2026 (a) |
| 1,135,000 |
| 1,188,912 |
| ||
UPCB Finance VII Ltd. (EUR), 3.63%, 06/15/2029 (a) |
| 1,266,000 |
| 1,485,533 |
| ||
Ziggo Bond Co. BV (EUR), 4.63%, 01/15/2025 (a) |
| 679,000 |
| 779,333 |
| ||
Ziggo BV (USD), 5.50%, 01/15/2027 (a) |
| 1,300,000 |
| 1,371,500 |
| ||
|
|
|
| 9,467,171 |
| ||
NIGERIA (0.4%) |
|
|
|
|
| ||
IHS Netherlands Holdco BV (USD), 8.00%, 09/18/2027 (a) |
| 760,000 |
| 794,352 |
| ||
PANAMA (0.6%) |
|
|
|
|
| ||
C&W Senior Financing DAC (USD), 6.88%, 09/15/2027 (a) |
| 879,000 |
| 925,148 |
| ||
Cable Onda SA (USD), 4.50%, 01/30/2030 (a) |
| 335,000 |
| 339,445 |
| ||
|
|
|
| 1,264,593 |
| ||
PORTUGAL (0.4%) |
|
|
|
|
| ||
Caixa Geral de Depositos SA, (fixed rate to 03/30/2022, variable rate thereafter) (EUR), 10.75%, 03/30/2022 (a)(b) |
| 600,000 |
| 782,066 |
| ||
REPUBLIC OF IRELAND (0.4%) |
|
|
|
|
| ||
Ardagh Packaging Finance PLC / Ardagh Holdings USA, Inc. (GBP), 4.75%, 07/15/2027 (a) |
| 656,000 |
| 876,304 |
| ||
|
| Shares or |
| Value |
| ||
SOUTH AFRICA (1.5%) |
|
|
|
|
| ||
Liquid Telecommunications Financing PLC (USD), 8.50%, 07/13/2022 (a) |
| $ | 1,150,000 |
| $ | 1,144,940 |
|
Sappi Papier Holding GmbH (USD), 7.50%, 06/15/2032 (a)(f) |
| 2,017,000 |
| 2,092,637 |
| ||
|
|
|
| 3,237,577 |
| ||
SPAIN (1.2%) |
|
|
|
|
| ||
Banco Bilbao Vizcaya Argentaria SA, Series 9 (fixed rate to 03/05/2025, variable rate thereafter) (USD), 6.50%, 03/05/2025 (b) |
| 800,000 |
| 825,026 |
| ||
Cirsa Finance International Sarl (USD), 7.88%, 12/20/2023 (a) |
| 361,000 |
| 381,411 |
| ||
(EUR), 3.63%, 09/30/2025 (a)(e) |
| 408,000 |
| 458,696 |
| ||
Telefonica Europe BV, Series NC5 (fixed rate to 09/04/2023, variable rate thereafter) (EUR), 3.00%, 09/04/2023 (a)(b) |
| 900,000 |
| 1,032,873 |
| ||
|
|
|
| 2,698,006 |
| ||
SWEDEN (1.9%) |
|
|
|
|
| ||
Intrum AB |
| 806,000 |
| 902,612 |
| ||
(EUR), 3.00%, 09/15/2027 (a) |
| 705,000 |
| 760,732 |
| ||
Unilabs Subholding AB (EUR), 5.75%, 05/15/2025 (a) |
| 1,500,000 |
| 1,727,320 |
| ||
Verisure Holding AB (EUR), 3.50%, 05/15/2023 (a) |
| 700,000 |
| 804,256 |
| ||
|
|
|
| 4,194,920 |
| ||
SWITZERLAND (1.2%) |
|
|
|
|
| ||
Credit Suisse Group AG, (fixed rate to 12/18/2024, variable rate thereafter) (USD), 6.25%, 12/18/2024 (a)(b) |
| 1,115,000 |
| 1,188,869 |
| ||
UBS Group AG, (fixed rate to 02/19/2025, variable rate thereafter) (USD), 7.00%, 02/19/2025 (a)(b) |
| 1,339,000 |
| 1,492,985 |
| ||
|
|
|
| 2,681,854 |
| ||
TURKEY (1.4%) |
|
|
|
|
| ||
Akbank Turk AS, (fixed rate to 03/16/2027, variable rate thereafter) (USD), 7.20%, 03/16/2027 (a) |
| 949,000 |
| 896,349 |
| ||
KOC Holding (USD), 5.25%, 03/15/2023 (a) |
| 820,000 |
| 828,200 |
| ||
Turk Telekomunikasyon (USD), 4.88%, 06/19/2024 (a) |
| 740,000 |
| 725,200 |
| ||
Turkiye Garanti Bankasi (USD), 5.88%, 03/16/2023 (a) |
| 200,000 |
| 202,799 |
| ||
Turkiye Garanti Bankasi AS (USD), 5.25%, 09/13/2022 (a) |
| 450,000 |
| 451,125 |
| ||
|
|
|
| 3,103,673 |
| ||
UKRAINE (0.6%) |
|
|
|
|
| ||
Metinvest BV (USD), 8.50%, 04/23/2026 (a) |
| 680,000 |
| 712,072 |
| ||
MHP Lux SA (USD), 6.95%, 04/03/2026 (a) |
| 619,000 |
| 638,300 |
| ||
|
|
|
| 1,350,372 |
| ||
See accompanying Notes to Financial Statements.
2019 Annual Report 33
Statement of Investments (continued)
October 31, 2019
Aberdeen Global High Income Fund
|
| Shares or |
| Value |
| ||
CORPORATE BONDS (continued) |
|
|
|
|
| ||
UNITED KINGDOM (4.2%) |
|
|
|
|
| ||
Arqiva Broadcast Finance PLC (GBP), 6.75%, 09/30/2023 (a) |
| $ | 800,000 |
| $ | 1,110,115 |
|
Ashtead Capital, Inc. |
| 289,000 |
| 290,084 |
| ||
(USD), 4.25%, 11/01/2029 (a) |
| 823,000 |
| 831,230 |
| ||
BrightHouse Finco Ltd., PIK, (GBP), 9.00%, 05/15/2023 (a)(c) |
| 758,150 |
| 196,414 |
| ||
Corral Petroleum Holdings AB (EUR), 11.75%, 05/15/2021 (a)(c) |
| 760,000 |
| 885,771 |
| ||
CYBG PLC, (fixed rate to 12/08/2022, variable rate thereafter) (GBP), 8.00%, 12/08/2022 (a)(b) |
| 1,065,000 |
| 1,367,477 |
| ||
Pinewood Finance Co. Ltd. (GBP), 3.25%, 09/30/2025 (a) |
| 422,000 |
| 558,937 |
| ||
Pinnacle Bidco PLC (GBP), 6.38%, 02/15/2025 (a) |
| 800,000 |
| 1,102,343 |
| ||
Royal Bank of Scotland Group PLC (fixed rate to 08/15/2021, variable rate thereafter) (USD), 8.63%, 08/15/2021 (b) |
| 1,200,000 |
| 1,293,000 |
| ||
Virgin Media Finance PLC (USD), 5.75%, 01/15/2025 (a) |
| 1,410,000 |
| 1,452,300 |
| ||
|
|
|
| 9,087,671 |
| ||
UNITED STATES (58.5%) |
|
|
|
|
| ||
ACI Worldwide, Inc. (USD), 5.75%, 08/15/2026 (a) |
| 1,854,000 |
| 1,965,240 |
| ||
Advanced Drainage Systems, Inc. (USD), 5.00%, 09/30/2027 (a) |
| 211,000 |
| 215,748 |
| ||
Ally Financial, Inc. |
| 681,000 |
| 711,236 |
| ||
(USD), 5.13%, 09/30/2024 |
| 374,000 |
| 411,213 |
| ||
Avantor, Inc. (EUR), 4.75%, 10/01/2024 (a) |
| 1,400,000 |
| 1,659,633 |
| ||
Avis Budget Car Rental LLC / Avis Budget Finance, Inc. |
| 341,000 |
| 355,066 |
| ||
(USD), 5.75%, 07/15/2027 (a) |
| 283,000 |
| 289,368 |
| ||
Banff Merger Sub, Inc. |
| 215,000 |
| 224,769 |
| ||
(USD), 9.75%, 09/01/2026 (a) |
| 840,000 |
| 782,250 |
| ||
Bausch Health Americas, Inc. (USD), 8.50%, 01/31/2027 (a) |
| 786,000 |
| 882,049 |
| ||
Bausch Health Cos, Inc. (USD), 7.00%, 03/15/2024 (a) |
| 885,000 |
| 925,865 |
| ||
Bausch Health Cos. Inc. (EUR), 4.50%, 05/15/2023 (a) |
| 1,020,000 |
| 1,150,119 |
| ||
Berry Global, Inc. (USD), 4.88%, 07/15/2026 (a) |
| 1,591,000 |
| 1,672,539 |
| ||
Bruin E&P Partners LLC (USD), 8.88%, 08/01/2023 (a) |
| 951,000 |
| 627,660 |
| ||
Builders FirstSource, Inc. |
| 1,237,000 |
| 1,286,480 |
| ||
(USD), 6.75%, 06/01/2027 (a) |
| 97,000 |
| 105,245 |
| ||
Calpine Corp. (USD), 5.25%, 06/01/2026 (a) |
| 1,230,000 |
| 1,279,200 |
| ||
CCO Holdings LLC / CCO Holdings Capital Corp. |
| 2,670,000 |
| 2,819,520 |
| ||
(USD), 5.38%, 06/01/2029 (a) |
| 435,000 |
| 464,363 |
| ||
|
| Shares or |
| Value |
| ||
CDW LLC / CDW Finance Corp. (USD), 4.25%, 04/01/2028 |
| $ | 1,327,000 |
| $ | 1,373,578 |
|
Cedar Fair LP (USD), 5.25%, 07/15/2029 (a) |
| 837,000 |
| 897,683 |
| ||
Century Communities, Inc. |
| 1,032,000 |
| 1,073,280 |
| ||
(USD), 6.75%, 06/01/2027 (a) |
| 934,000 |
| 999,380 |
| ||
CenturyLink, Inc., Series V (USD), 5.63%, 04/01/2020 |
| 1,075,000 |
| 1,088,437 |
| ||
Change Healthcare Holdings LLC / Change Healthcare Finance, Inc. (USD), 5.75%, 03/01/2025 (a) |
| 1,700,000 |
| 1,739,440 |
| ||
Cheniere Corpus Christi Holdings LLC (USD), 5.88%, 03/31/2025 |
| 2,605,000 |
| 2,888,528 |
| ||
Cheniere Energy Partners LP, Series WI (USD), 5.25%, 10/01/2025 |
| 753,000 |
| 779,355 |
| ||
Chesapeake Energy Corp. (USD), 8.00%, 01/15/2025 |
| 840,000 |
| 554,400 |
| ||
Clean Harbors, Inc. |
| 858,000 |
| 894,414 |
| ||
(USD), 5.13%, 07/15/2029 (a) |
| 120,000 |
| 127,800 |
| ||
Colfax Corp. |
| 317,000 |
| 336,020 |
| ||
(USD), 6.38%, 02/15/2026 (a) |
| 601,000 |
| 650,583 |
| ||
CommScope, Inc. |
| 1,396,000 |
| 1,434,390 |
| ||
(USD), 8.25%, 03/01/2027 (a) |
| 314,000 |
| 297,430 |
| ||
Consolidated Communications, Inc. (USD), 6.50%, 10/01/2022 |
| 1,610,000 |
| 1,453,025 |
| ||
Crestwood Midstream Partners LP / Crestwood Midstream Finance Corp. (USD), 5.63%, 05/01/2027 (a) |
| 1,260,000 |
| 1,267,900 |
| ||
CSC Holdings LLC |
| 753,000 |
| 801,945 |
| ||
(USD), 10.88%, 10/15/2025 (a) |
| 1,925,000 |
| 2,172,285 |
| ||
(USD), 6.50%, 02/01/2029 (a) |
| 422,000 |
| 471,321 |
| ||
(USD), 5.75%, 01/15/2030 (a) |
| 211,000 |
| 221,814 |
| ||
Cumulus Media New Holdings, Inc. (USD), 6.75%, 07/01/2026 (a) |
| 1,260,000 |
| 1,335,600 |
| ||
DaVita, Inc. (USD), 5.13%, 07/15/2024 |
| 785,000 |
| 801,304 |
| ||
Dell International LLC / EMC Corp. (USD), 5.88%, 06/15/2021 (a) |
| 386,000 |
| 391,937 |
| ||
(USD), 6.02%, 06/15/2026 (a) |
| 435,000 |
| 496,499 |
| ||
(USD), 5.30%, 10/01/2029 (a) |
| 1,962,000 |
| 2,167,586 |
| ||
Delta Air Lines, Inc. |
| 1,135,000 |
| 1,193,265 |
| ||
(USD), 3.75%, 10/28/2029 |
| 1,103,000 |
| 1,098,445 |
| ||
Diamond Sports Group LLC / Diamond Sports Finance Co. |
| 873,000 |
| 912,285 |
| ||
(USD), 6.63%, 08/15/2027 (a) |
| 966,000 |
| 994,980 |
| ||
Diamondback Energy, Inc. (USD), 5.38%, 05/31/2025 |
| 1,005,000 |
| 1,050,225 |
| ||
DISH DBS Corp. |
| 1,680,000 |
| 1,756,961 |
| ||
(USD), 5.00%, 03/15/2023 |
| 1,005,000 |
| 1,012,538 |
| ||
Encompass Health Corp. |
| 1,095,000 |
| 1,116,900 |
| ||
(USD), 4.50%, 02/01/2028 |
| 274,000 |
| 280,165 |
| ||
(USD), 4.75%, 02/01/2030 |
| 274,000 |
| 282,563 |
| ||
See accompanying Notes to Financial Statements.
34 2019 Annual Report
Statement of Investments (continued)
October 31, 2019
Aberdeen Global High Income Fund
|
| Shares or |
| Value |
| ||
CORPORATE BONDS (continued) |
|
|
|
|
| ||
UNITED STATES (continued) |
|
|
|
|
| ||
Energizer Gamma Acquisition BV (EUR), 4.63%, 07/15/2026 (a) |
| $ | 695,000 |
| $ | 817,291 |
|
ESH Hospitality, Inc. (USD), 4.63%, 10/01/2027 (a) |
| 909,000 |
| 911,363 |
| ||
GCI LLC |
| 630,000 |
| 682,763 |
| ||
(USD), 6.88%, 04/15/2025 |
| 660,000 |
| 693,825 |
| ||
General Motors (Escrow Shares) (USD), 8.80%, 03/01/2049 (g)(h) |
| 7,200,000 |
| – |
| ||
(USD), 8.38%, 07/15/2049 (g)(h) |
| 3,550,000 |
| – |
| ||
General Motors Financial Co., Inc., (fixed rate to 09/30/2027, variable rate thereafter), Series A, (USD), 5.75%, 09/30/2027 (b) |
| 1,163,000 |
| 1,123,004 |
| ||
GLP Capital LP / GLP Financing II, Inc. (USD), 5.38%, 11/01/2023 |
| 725,000 |
| 787,495 |
| ||
Graham Holdings Co. (USD), 5.75%, 06/01/2026 (a) |
| 1,364,000 |
| 1,456,070 |
| ||
HCA, Inc. (USD), 7.50%, 02/15/2022 |
| 1,020,000 |
| 1,131,690 |
| ||
International Game Technology PLC (EUR), 3.50%, 06/15/2026 (a) |
| 1,372,000 |
| 1,623,915 |
| ||
IQVIA, Inc. (EUR), 2.25%, 01/15/2028 (a) |
| 498,000 |
| 567,361 |
| ||
Iron Mountain, Inc. (USD), 5.25%, 03/15/2028 (a) |
| 1,160,000 |
| 1,218,000 |
| ||
j2 Cloud Services LLC / j2 Global Co-Obligor, Inc. (USD), 6.00%, 07/15/2025 (a) |
| 1,584,000 |
| 1,683,000 |
| ||
JBS Investments II GmbH (USD), 5.75%, 01/15/2028 (a) |
| 814,000 |
| 848,188 |
| ||
JBS USA LUX SA / JBS USA Finance, Inc. (USD), 5.75%, 06/15/2025 (a) |
| 1,475,000 |
| 1,532,156 |
| ||
JBS USA LUX SA / JBS USA Food Co. / JBS USA Finance, Inc. (USD), 5.50%, 01/15/2030 (a) |
| 1,135,000 |
| 1,221,544 |
| ||
JPMorgan Chase & Co., (fixed rate to 11/01/2022, variable rate thereafter), Series CC (USD), 4.63%, 11/01/2022 (b) |
| 860,000 |
| 853,550 |
| ||
Lennar Corp. |
| 1,124,000 |
| 1,188,630 |
| ||
(USD), 4.75%, 11/29/2027 |
| 2,135,000 |
| 2,305,800 |
| ||
Live Nation Entertainment, Inc. (USD), 4.75%, 10/15/2027 (a) |
| 535,000 |
| 557,791 |
| ||
MDC Holdings, Inc. (USD), 6.00%, 01/15/2043 |
| 1,855,000 |
| 1,931,519 |
| ||
Meredith Corp. (USD), 6.88%, 02/01/2026 |
| 2,053,000 |
| 2,116,089 |
| ||
MGM Resorts International (USD), 4.63%, 09/01/2026 |
| 1,035,000 |
| 1,086,750 |
| ||
Midcontinent Communications / Midcontinent Finance Corp. (USD), 5.38%, 08/15/2027 (a) |
| 642,000 |
| 672,495 |
| ||
Moss Creek Resources Holdings, Inc. (USD), 7.50%, 01/15/2026 (a) |
| 1,509,000 |
| 1,018,575 |
| ||
MPT Operating Partnership LP / MPT Finance Corp. (USD), 5.00%, 10/15/2027 |
| 1,133,000 |
| 1,192,482 |
| ||
|
| Shares or |
| Value |
| ||
Navient Corp. |
| $ | 520,000 |
| $ | 556,400 |
|
(USD), 5.50%, 01/25/2023 |
| 1,183,000 |
| 1,228,841 |
| ||
Netflix, Inc. |
| 820,000 |
| 903,025 |
| ||
(USD), 6.38%, 05/15/2029 (a) |
| 1,135,000 |
| 1,274,037 |
| ||
New Enterprise Stone & Lime Co., Inc. (USD), 10.13%, 04/01/2022 (a) |
| 1,805,000 |
| 1,868,175 |
| ||
Nine Energy Service, Inc. (USD), 8.75%, 11/01/2023 (a) |
| 237,000 |
| 177,750 |
| ||
Novelis Corp. (USD), 5.88%, 09/30/2026 (a) |
| 1,355,000 |
| 1,422,885 |
| ||
NRG Energy, Inc. |
| 508,000 |
| 556,275 |
| ||
(USD), 5.25%, 06/15/2029 (a) |
| 449,000 |
| 481,553 |
| ||
Oasis Petroleum, Inc. |
| 643,000 |
| 564,233 |
| ||
(USD), 6.88%, 01/15/2023 |
| 1,302,000 |
| 1,126,230 |
| ||
OI European Group BV (USD), 4.00%, 03/15/2023 (a) |
| 1,090,000 |
| 1,084,550 |
| ||
Parsley Energy LLC / Parsley Finance Corp. (USD), 5.63%, 10/15/2027 (a) |
| 1,765,000 |
| 1,822,362 |
| ||
Perrigo Finance Unlimited Co. (USD), 4.38%, 03/15/2026 |
| 1,415,000 |
| 1,463,715 |
| ||
Photo Holdings Merger Sub, Inc. (USD), 8.50%, 10/01/2026 (a) |
| 779,000 |
| 685,621 |
| ||
Post Holdings, Inc. (USD), 5.00%, 08/15/2026 (a) |
| 1,145,000 |
| 1,190,914 |
| ||
Qwest Capital Funding, Inc. |
| 1,015,000 |
| 959,175 |
| ||
(USD), 7.75%, 02/15/2031 |
| 1,020,000 |
| 986,850 |
| ||
Sirius XM Radio, Inc. (USD), 5.50%, 07/01/2029 (a) |
| 1,225,000 |
| 1,324,164 |
| ||
Six Flags Entertainment Corp. (USD), 4.88%, 07/31/2024 (a) |
| 1,200,000 |
| 1,239,000 |
| ||
SM Energy Co. (USD), 6.75%, 09/15/2026 |
| 1,180,000 |
| 1,011,850 |
| ||
Sprint Corp. (USD), 7.88%, 09/15/2023 |
| 3,150,000 |
| 3,476,812 |
| ||
Staples, Inc. |
| 1,410,000 |
| 1,466,682 |
| ||
(USD), 10.75%, 04/15/2027 (a) |
| 695,000 |
| 722,800 |
| ||
Steel Dynamics, Inc. (USD), 5.00%, 12/15/2026 |
| 849,000 |
| 904,355 |
| ||
SunCoke Energy Partners LP / SunCoke Energy Partners Finance Corp. (USD), 7.50%, 06/15/2025 (a) |
| 1,165,000 |
| 990,250 |
| ||
T-Mobile USA, Inc. (USD), 6.50%, 01/15/2026 |
| 1,080,000 |
| 1,155,708 |
| ||
Tecnoglass, Inc. (USD), 8.20%, 01/31/2022 (a) |
| 1,417,000 |
| 1,533,902 |
| ||
Tenet Healthcare Corp. |
| 2,342,000 |
| 2,412,260 |
| ||
(USD), 6.25%, 02/01/2027 (a) |
| 605,000 |
| 641,052 |
| ||
TransDigm, Inc. (USD), 6.00%, 07/15/2022 |
| 450,000 |
| 457,650 |
| ||
USA Compression Partners LP / USA Compression Finance Corp. (USD), 6.88%, 09/01/2027 (a) |
| 913,000 |
| 913,000 |
| ||
Viking Cruises Ltd. (USD), 6.25%, 05/15/2025 (a) |
| 1,380,000 |
| 1,438,650 |
| ||
Viper Energy Partners LP (USD), 5.38%, 11/01/2027 (a) |
| 134,000 |
| 135,340 |
| ||
See accompanying Notes to Financial Statements.
2019 Annual Report 35
Statement of Investments (continued)
October 31, 2019
Aberdeen Global High Income Fund
|
| Shares or |
| Value |
| ||
CORPORATE BONDS (continued) |
|
|
|
|
| ||
UNITED STATES (continued) |
|
|
|
|
| ||
Vistra Operations Co. LLC (USD), 5.63%, 02/15/2027 (a) |
| $ | 1,120,000 |
| $ | 1,187,200 |
|
Western Midstream Operating LP (USD), 4.50%, 03/01/2028 |
| 183,000 |
| 174,597 |
| ||
(USD), 4.75%, 08/15/2028 |
| 1,062,000 |
| 1,029,988 |
| ||
WPX Energy, Inc. |
| 501,000 |
| 558,615 |
| ||
(USD), 5.75%, 06/01/2026 |
| 866,000 |
| 870,330 |
| ||
Wyndham Destinations, Inc. |
| 1,000,000 |
| 1,060,000 |
| ||
(USD), 6.35%, 10/01/2025 |
| 945,000 |
| 1,046,588 |
| ||
|
|
|
| 127,566,554 |
| ||
ZAMBIA (1.3%) |
|
|
|
|
| ||
First Quantum Minerals Ltd. |
| 860,000 |
| 862,687 |
| ||
(USD), 6.88%, 03/01/2026 (a) |
| 1,989,000 |
| 1,946,734 |
| ||
|
|
|
| 2,809,421 |
| ||
Total Corporate Bonds |
|
|
| 208,198,115 |
| ||
BANK LOANS (1.3%) |
|
|
|
|
| ||
FRANCE (1.0%) |
|
|
|
|
| ||
IWH UK Midco Limited, 2017 Term Loan B (EUR), 4.00%, 01/31/2025 |
| 2,000,000 |
| 2,208,293 |
| ||
NETHERLANDS (0.3%) |
|
|
|
|
| ||
TMF Group Holding B.V., 2017 EUR 2nd Lien Term Loan (EUR), 6.88%, 05/04/2026 |
| 750,000 |
| 737,144 |
| ||
Total Bank Loans |
|
|
| 2,945,437 |
| ||
COMMON STOCKS (0.1%) |
|
|
|
|
| ||
UNITED KINGDOM (0.0%) |
|
|
|
|
| ||
Brighthouse Financial, Inc. (f)(g)(h) |
| 35,521 |
| – |
| ||
UNITED STATES (0.1%) |
|
|
|
|
| ||
Cenveo Enterprises, Inc. (f)(g)(h)(i) |
| 9,806 |
| 156,896 |
| ||
Total Common Stocks |
|
|
| 156,896 |
| ||
|
| Shares or |
| Value |
| ||
SHORT-TERM INVESTMENT (2.9%) |
|
|
|
|
| ||
UNITED STATES (2.9%) |
|
|
|
|
| ||
State Street Institutional U.S. Government Money Market Fund, Premier Class, 1.75% (j) |
| $ | 6,329,910 |
| $ | 6,329,910 |
|
Total Short-Term Investment |
|
|
| 6,329,910 |
| ||
Total Investments |
|
|
| 217,630,358 |
| ||
Other Assets in Excess of Liabilities—0.2% |
|
|
| 383,216 |
| ||
Net Assets—100.0% |
|
|
| $ | 218,013,574 |
| |
(a) | Denotes a security issued under Regulation S or Rule 144A. |
|
|
(b) | Perpetual bond. This is a bond that has no maturity date, is redeemable and pays a steady stream of interest indefinitely. The maturity date presented for these instruments represents the next call/put date. |
|
|
(c) | Payment-in-kind. This is a type of bond that pays interest in additional bonds rather than in cash. |
|
|
(d) | Security is in default. |
|
|
(e) | Variable Rate Instrument. The rate shown is based on the latest available information as of October 31, 2019. Certain variable rate securities are not based on a published reference rate and spread but are determined by the issuer or agent and are based on current market conditions. These securities do not indicate a reference rate and spread in their description. |
|
|
(f) | Illiquid security. |
|
|
(g) | Level 3 security. See Note 2(a) of the accompanying Notes to Financial Statements. |
|
|
(h) | This security was fair valued by the Fund’s pricing committee as approved by the Fund’s Board of Trustees. See Note 2(a) of the accompanying Notes to Statements of Investments. |
|
|
(i) | Security is Delisted. |
|
|
(j) | Registered investment company advised by State Street Global Advisors. The rate shown is the 7 day yield as of October 31, 2019. |
|
|
(k) | See accompanying Notes to Financial Statements for tax unrealized appreciation/(depreciation) of securities. |
EUR |
| Euro Currency |
GBP |
| British Pound Sterling |
PIK |
| Payment In Kind |
PLC |
| Public Limited Company |
USD |
| U.S. Dollar |
At October 31, 2019, the Fund’s open forward foreign currency exchange contracts were as follows:
|
|
|
|
|
|
|
|
|
|
|
|
Purchase Contracts |
|
|
| Amount |
| Amount |
|
|
| Unrealized |
|
Settlement Date* |
| Counterparty |
| Purchased |
| Sold |
| Fair Value |
| Appreciation |
|
Euro/United States Dollar |
|
|
|
|
|
|
|
|
| ||
01/09/2020 |
| Citibank N.A. |
| EUR347,000 |
| USD384,100 |
| $ 388,851 |
| $ 4,751 |
|
01/09/2020 |
| UBS AG |
| EUR143,000 |
| USD160,006 |
| 160,247 |
| 241 |
|
|
|
|
|
|
|
|
| $ 549,098 |
| $ 4,992 |
|
See accompanying Notes to Financial Statements.
36 2019 Annual Report
Statement of Investments (concluded)
October 31, 2019
Aberdeen Global High Income Fund
|
|
|
|
|
|
|
|
|
|
|
|
Sale Contracts |
|
|
| Amount |
| Amount |
|
|
| Unrealized |
|
Settlement Date* |
| Counterparty |
| Purchased |
| Sold |
| Fair Value |
| Depreciation |
|
United States Dollar/British Pound |
|
|
|
|
|
|
|
|
| ||
11/14/2019 |
| UBS AG |
| USD 884,816 |
| GBP 700,000 |
| $ 907,026 |
| $ (22,210 | ) |
01/09/2020 |
| Citibank N.A. |
| USD 6,292,363 |
| GBP 5,078,000 |
| 6,593,019 |
| (300,656 | ) |
United States Dollar/Euro |
|
|
|
|
|
|
|
|
|
|
|
11/14/2019 |
| Citibank N.A. |
| USD 831,071 |
| EUR 750,000 |
| 837,017 |
| (5,946 | ) |
01/09/2020 |
| Citibank N.A. |
| USD26,272,362 |
| EUR23,741,000 |
| 26,604,337 |
| (331,975 | ) |
01/09/2020 |
| UBS AG |
| USD 2,007,668 |
| EUR 1,807,000 |
| 2,024,937 |
| (17,269 | ) |
|
|
|
|
|
|
|
| $ 36,966,336 |
| $(678,056 | ) |
Unrealized appreciation on forward foreign currency exchange contracts |
|
|
| $ 4,992 |
| ||||||
Unrealized depreciation on forward foreign currency exchange contracts |
|
|
| (678,056 | ) | ||||||
* Certain contracts with different trade dates and like characteristics have been shown net.
See accompanying Notes to Financial Statements.
2019 Annual Report 37
Statements of Assets and Liabilities
October 31, 2019
|
|
|
|
|
|
|
|
|
| ||||
|
| Aberdeen |
| Aberdeen |
| Aberdeen |
| Aberdeen |
| ||||
Assets: |
|
|
|
|
|
|
|
|
| ||||
Investments in securities, at fair value |
| $ | 151,233,057 |
| $ | 64,382,738 |
| $ | 180,264,023 |
| $ | 211,300,448 |
|
Short-term investments |
| 6,196,342 |
| 998,062 |
| 5,175,662 |
| 6,329,910 |
| ||||
Cash collateral pledged for futures |
| – |
| – |
| 317,050 |
| – |
| ||||
Foreign currency, at fair value |
| 4,810 |
| 26,540 |
| 66,740 |
| – |
| ||||
Interest and dividends receivable |
| 133,178 |
| 49,251 |
| 858,135 |
| 3,154,754 |
| ||||
Receivable for investments sold |
| – |
| – |
| 722,248 |
| 2,025,758 |
| ||||
Receivable for capital shares issued |
| 50,831 |
| 4,717 |
| 725,514 |
| 101,471 |
| ||||
Unrealized appreciation on forward foreign currency exchange contracts |
| – |
| – |
| 121,014 |
| 4,992 |
| ||||
Tax reclaim receivable |
| 272,173 |
| 105,249 |
| – |
| – |
| ||||
Prepaid expenses |
| 4,159 |
| 1,726 |
| 5,818 |
| 6,240 |
| ||||
Total assets |
| 157,894,550 |
| 65,568,283 |
| 188,256,204 |
| 222,923,573 |
| ||||
Liabilities: |
|
|
|
|
|
|
|
|
| ||||
Due to custodian |
| – |
| – |
| – |
| 25 |
| ||||
Payable for investments purchased |
| – |
| – |
| 4,642,736 |
| 3,321,444 |
| ||||
Unrealized depreciation on forward foreign currency exchange contracts |
| – |
| – |
| 191,607 |
| 678,056 |
| ||||
Payable for capital shares redeemed |
| 49,495 |
| 16,045 |
| 6,736 |
| 547,681 |
| ||||
Payable for income taxes (See note 2g of the Notes to Financial Statements) |
| 9,691,823 |
| 2,522,118 |
| – |
| – |
| ||||
Cash due to broker for forward foreign currency contracts |
| – |
| – |
| 50,000 |
| – |
| ||||
Variation margin payable for futures contracts |
| – |
| – |
| 99,347 |
| – |
| ||||
Accrued expenses and other payables: |
|
|
|
|
|
|
|
|
| ||||
Sub-transfer agent and administrative services fees |
| 51,400 |
| 34,517 |
| 22,661 |
| 135,824 |
| ||||
Investment advisory fees |
| 96,042 |
| 20,992 |
| 33,436 |
| 62,216 |
| ||||
Audit fees |
| 36,360 |
| 36,360 |
| 49,640 |
| 50,140 |
| ||||
Custodian fees |
| 28,849 |
| 19,926 |
| 26,451 |
| 30,714 |
| ||||
Distribution fees |
| 25,190 |
| 7,281 |
| 5,496 |
| 24,786 |
| ||||
Legal fees |
| 6,397 |
| 2,702 |
| 8,033 |
| 9,656 |
| ||||
Transfer agent fees |
| 5,242 |
| 4,258 |
| 4,761 |
| 5,415 |
| ||||
Other |
| 42,065 |
| 34,032 |
| 34,307 |
| 44,042 |
| ||||
Total liabilities |
| 10,032,863 |
| 2,698,231 |
| 5,175,211 |
| 4,909,999 |
| ||||
Net Assets |
| $ | 147,861,687 |
| $ | 62,870,052 |
| $ | 183,080,993 |
| $ | 218,013,574 |
|
Cost: |
|
|
|
|
|
|
|
|
| ||||
Investments in securities, at cost |
| $ | 150,319,713 |
| $ | 61,401,440 |
| $ | 174,535,445 |
| $ | 208,603,685 |
|
Short-term investment |
| 6,196,342 |
| 998,062 |
| 5,175,662 |
| 6,329,910 |
| ||||
Foreign currency |
| 4,737 |
| 26,382 |
| 66,255 |
| 145 |
| ||||
Net Assets Consist of: |
|
|
|
|
|
|
|
|
| ||||
Par value |
| $ | 5,457 |
| $ | 5,420 |
| $ | 13,607 |
| $ | 25,934 |
|
Paid in capital in excess of par value |
| 558,649,595 |
| 84,551,369 |
| 178,840,952 |
| 450,611,348 |
| ||||
Distributable earnings (accumulated loss) |
| (410,793,365 | ) | (21,686,737 | ) | 4,226,434 |
| (232,623,708 | ) | ||||
Net Assets |
| $ | 147,861,687 |
| $ | 62,870,052 |
| $ | 183,080,993 |
| $ | 218,013,574 |
|
Net Assets: |
|
|
|
|
|
|
|
|
| ||||
Class A Shares |
| $ | 120,471,848 |
| $ | 34,932,659 |
| $ | 26,639,271 |
| $ | 116,125,503 |
|
Institutional Class Shares |
| 27,389,839 |
| 27,937,393 |
| 156,441,722 |
| 101,888,071 |
| ||||
Total |
| $ | 147,861,687 |
| $ | 62,870,052 |
| $ | 183,080,993 |
| $ | 218,013,574 |
|
|
|
|
|
|
|
|
|
|
| ||||
Amounts listed as “–” are $0 or round to $0.
See accompanying Notes to Financial Statements.
| 2019 Annual Report |
|
Statements of Assets and Liabilities (concluded)
October 31, 2019
|
|
|
|
|
|
|
|
|
| ||||
|
| Aberdeen |
| Aberdeen |
| Aberdeen |
| Aberdeen |
| ||||
Shares Outstanding* |
|
|
|
|
|
|
|
|
| ||||
Class A Shares |
| 4,469,572 |
| 3,015,148 |
| 1,952,428 |
| 13,331,578 |
| ||||
Institutional Class Shares |
| 987,434 |
| 2,404,814 |
| 11,654,339 |
| 12,602,325 |
| ||||
Total |
| 5,457,006 |
| 5,419,962 |
| 13,606,767 |
| 25,933,903 |
| ||||
Net asset value and redemption price per share |
|
|
|
|
|
|
|
|
| ||||
Class A Shares |
| $ | 26.95 |
| $ | 11.59 |
| $ | 13.64 |
| $ | 8.71 |
|
Institutional Class Shares |
| $ | 27.74 |
| $ | 11.62 |
| $ | 13.42 |
| $ | 8.08 |
|
|
|
|
|
|
|
|
|
|
|
|
|
|
|
* Under the Trust Agreement, the Trustees have authority to issue an unlimited number of shares of beneficial interest, par value $.001 per share. The Board of Trustees is authorized to reclassify and issue any unissued shares to any number of additional series without shareholder approval.
Amounts listed as “–” are $0 or round to $0.
See accompanying Notes to Financial Statements.
| 2019 Annual Report |
|
Statements of Operations
For the Year Ended October 31, 2019
|
|
|
|
|
|
|
|
|
| ||||
|
| Aberdeen |
| Aberdeen |
| Aberdeen |
| Aberdeen |
| ||||
INVESTMENT INCOME: |
|
|
|
|
|
|
|
|
| ||||
Dividend income |
| $ | 4,156,558 |
| $ | 1,548,166 |
| $ | – |
| $ | 161,590 |
|
Interest income |
| 5,553,612 | (a) | 1,027,939 | (a) | 6,649,725 |
| 13,447,705 |
| ||||
Foreign tax withholding |
| (363,490 | ) | (111,622 | ) | – |
| – |
| ||||
Total Income |
| 9,346,680 |
| 2,464,483 |
| 6,649,725 |
| 13,609,295 |
| ||||
EXPENSES: |
|
|
|
|
|
|
|
|
| ||||
Investment advisory fees |
| 1,247,219 |
| 525,546 |
| 678,971 |
| 1,440,140 |
| ||||
Trustee fees |
| 101,889 |
| 42,279 |
| 138,749 |
| 132,583 |
| ||||
Legal fees |
| 73,632 |
| 31,494 |
| 102,888 |
| 121,592 |
| ||||
Audit fees |
| 1,970 |
| 26,970 |
| 50,955 |
| 50,880 |
| ||||
Printing fees |
| 49,743 |
| 40,963 |
| 31,919 |
| 53,018 |
| ||||
Custodian fees |
| 217,316 |
| 173,591 |
| 179,858 |
| 209,344 |
| ||||
Transfer agent fees |
| 25,590 |
| 20,176 |
| 23,178 |
| 27,252 |
| ||||
Distribution fees Class A |
| 307,381 |
| 88,475 |
| 75,481 |
| 304,344 |
| ||||
Sub-transfer agent and administrative service fees Class A |
| 47,167 |
| 23,332 |
| 11,536 |
| 84,915 |
| ||||
Sub-transfer agent and administrative service fees Class I |
| 4,463 |
| 11,452 |
| 11,129 |
| 50,938 |
| ||||
Income taxes on recovered refunds (b) |
| 2,338,571 |
| 429,744 |
| – |
| – |
| ||||
Registration and filing fees |
| 37,349 |
| 36,219 |
| 33,012 |
| 29,028 |
| ||||
Other |
| 65,517 |
| 33,014 |
| 64,007 |
| 161,343 |
| ||||
Total expenses before reimbursed/waived expenses |
| 4,517,807 |
| 1,483,255 |
| 1,401,683 |
| 2,665,377 |
| ||||
Interest expense |
| 2,033 |
| 13 |
| – |
| 5,094 |
| ||||
Total operating expenses before reimbursed/waived expenses |
| 4,519,840 |
| 1,483,268 |
| 1,401,683 |
| 2,670,471 |
| ||||
Expenses reimbursed |
| (92,601 | ) | (153,956 | ) | (462,934 | ) | (688,255 | ) | ||||
Expenses waived by investment adviser |
| (7,485 | ) | (3,155 | ) | (9,700 | ) | (11,078 | ) | ||||
Total operating expenses |
| 4,419,754 |
| 1,326,157 |
| 929,049 |
| 1,971,138 |
| ||||
Net Investment Income |
| 4,926,926 |
| 1,138,326 |
| 5,720,676 |
| 11,638,157 |
| ||||
Realized gain/(loss) on investment transactions |
| (8,225,959 | ) | (1,877,502 | ) | 1,760,047 |
| (12,462,759 | ) | ||||
Realized gain on futures contracts |
| – |
| – |
| 588,613 |
| – |
| ||||
Written options |
| – |
| – |
| (4,218 | ) | – |
| ||||
Realized gain/(loss) on forward foreign currency exchange contracts |
| – |
| – |
| 187,886 |
| 3,345,167 |
| ||||
Realized gain/(loss) on foreign currency transactions |
| 181,000 |
| 94,745 |
| (20,850 | ) | (79,116 | ) | ||||
Net realized gain/(loss) from investments, futures, written options, credit default swaps, forward foreign currency exchange contracts and foreign currency transactions |
| (8,044,959 | ) | (1,782,757 | ) | 2,511,478 |
| (9,196,708 | ) | ||||
Net change in unrealized appreciation/(depreciation) on investment transactions |
| 24,270,413 |
| 9,398,259 |
| 13,419,003 |
| 15,378,266 |
| ||||
Net change in unrealized appreciation/(depreciation) on futures contracts |
| – |
| – |
| 70,657 |
| – |
| ||||
Net change in unrealized appreciation/(depreciation) on forward foreign currency exchange rate contracts |
| – |
| – |
| 392,615 |
| (2,138,575 | ) | ||||
Net change in unrealized appreciation/(depreciation) on translation of assets and liabilities denominated in foreign currencies |
| (165,414 | ) | (94,035 | ) | 17,398 |
| 37,031 |
| ||||
Net change in unrealized appreciation/(depreciation) from investments, futures, forward foreign currency exchange contracts and translation of assets and liabilities denominated in foreign currencies |
| 24,104,999 |
| 9,304,224 |
| 13,899,673 |
| 13,276,722 |
| ||||
Net realized/unrealized gain from investments, futures, forward foreign currency exchange contracts and translation of assets and liabilities denominated in foreign currencies |
| 16,060,040 |
| 7,521,467 |
| 16,411,151 |
| 4,080,014 |
| ||||
CHANGE IN NET ASSETS RESULTING FROM OPERATIONS |
| $ | 20,986,966 |
| $ | 8,659,793 |
| $ | 22,131,827 |
| $ | 15,718,171 |
|
|
|
|
|
|
|
|
|
|
| ||||
(a) Interest income includes interest payments related to prior year recovered tax refunds paid to the Fund during the year ended October 31, 2019. See note 2g of the Notes to Financial Statements.
(b) See note 2g of the Notes to Financial Statements
Amounts listed as “–” are $0 or round to $0.
See accompanying Notes to Financial Statements.
| 2019 Annual Report |
|
Statements of Changes in Net Assets
|
|
|
|
|
|
|
|
|
|
|
|
| ||||
|
| Aberdeen Select International |
|
| Aberdeen Global |
| ||||||||||
|
| Year Ended |
|
| Year Ended |
|
| Year Ended |
|
| Year Ended |
| ||||
FROM INVESTMENT ACTIVITIES: |
|
|
|
|
|
|
|
|
|
|
|
| ||||
Operations: |
|
|
|
|
|
|
|
|
|
|
|
| ||||
Net investment income |
| $ | 4,926,926 |
|
| $ | 182,023 |
|
| $ | 1,138,326 |
|
| $ | 649,096 |
|
Net realized gain/(loss) from investments, futures, written options, credit default swaps, forward foreign currency exchange contracts and foreign currency transactions |
| (8,044,959 | ) |
| (22,255,480 | ) |
| (1,782,757 | ) |
| 334,443 |
| ||||
Net change in unrealized appreciation/(depreciation) on investments, futures, forward foreign currency exchange contracts and translation of assets and liabilities denominated in foreign currencies |
| 24,104,999 |
|
| 1,237,614 |
|
| 9,304,224 |
|
| (9,314,740 | ) | ||||
Changes in net assets resulting from operations |
| 20,986,966 |
|
| (20,835,843 | ) |
| 8,659,793 |
|
| (8,331,201 | ) | ||||
Distributions to Shareholders From: |
|
|
|
|
|
|
|
|
|
|
|
| ||||
Distributable earnings: |
|
|
|
|
|
|
|
|
|
|
|
| ||||
Class A |
| (1,053,676 | ) |
| (7,071,105 | ) |
| (624,526 | ) |
| (1,331,275 | ) | ||||
Institutional Class |
| (228,588 | ) |
| (1,478,487 | ) |
| (502,461 | ) |
| (1,222,394 | ) | ||||
Tax return of capital: |
|
|
|
|
|
|
|
|
|
|
|
| ||||
Class A |
| – |
|
| (173,166 | ) |
| – |
|
| – |
| ||||
Institutional Class |
| – |
|
| (35,698 | ) |
| – |
|
| – |
| ||||
Change in net assets from shareholder distributions |
| (1,282,264 | ) |
| (8,758,456 | ) |
| (1,126,987 | ) |
| (2,553,669 | ) | ||||
Change in net assets from capital transactions |
| (24,858,894 | ) |
| (30,050,513 | ) |
| (9,103,793 | ) |
| (18,695,783 | ) | ||||
Change in net assets |
| (5,154,192 | ) |
| (59,644,812 | ) |
| (1,570,987 | ) |
| (29,580,653 | ) | ||||
Net Assets: |
|
|
|
|
|
|
|
|
|
|
|
| ||||
Beginning of year |
| 153,015,879 |
|
| 212,660,691 |
|
| 64,441,039 |
|
| 94,021,692 |
| ||||
End of year |
| $ | 147,861,687 |
|
| $ | 153,015,879 |
|
| $ | 62,870,052 |
|
| $ | 64,441,039 |
|
|
|
|
|
|
|
|
|
|
|
|
|
| ||||
Amounts listed as “–” are $0 or round to $0.
See accompanying Notes to Financial Statements.
| 2019 Annual Report | 41
|
Statements of Changes in Net Assets (concluded)
|
| Aberdeen Select International |
|
| Aberdeen Global |
| ||||||||||
|
| Year Ended |
|
| Year Ended |
|
| Year Ended |
|
| Year Ended |
| ||||
CAPITAL TRANSACTIONS: |
|
|
|
|
|
|
|
|
|
|
|
| ||||
Class A Shares |
|
|
|
|
|
|
|
|
|
|
|
| ||||
Proceeds from shares issued |
| $ | 932,190 |
|
| $ | 2,307,128 |
|
| $ | 929,818 |
|
| $ | 1,878,438 |
|
Dividends reinvested |
| 1,029,521 |
|
| 7,041,129 |
|
| 612,786 |
|
| 1,297,934 |
| ||||
Cost of shares redeemed |
| (23,972,777 | ) |
| (35,814,374 | ) |
| (6,778,782 | ) |
| (10,537,897 | ) | ||||
Total Class A |
| (22,011,066 | ) |
| (26,466,117 | ) |
| (5,236,178 | ) |
| (7,361,525 | ) | ||||
Institutional Class Shares |
|
|
|
|
|
|
|
|
|
|
|
| ||||
Proceeds from shares issued |
| 678,275 |
|
| 1,675,098 |
|
| 629,241 |
|
| 1,580,032 |
| ||||
Dividends reinvested |
| 219,031 |
|
| 1,461,156 |
|
| 458,213 |
|
| 1,088,727 |
| ||||
Cost of shares redeemed |
| (3,745,134 | ) |
| (6,720,650 | ) |
| (4,955,069 | ) |
| (14,003,017 | ) | ||||
Total Institutional Class |
| (2,847,828 | ) |
| (3,584,396 | ) |
| (3,867,615 | ) |
| (11,334,258 | ) | ||||
Change in net assets from capital transactions: |
| $ | (24,858,894 | ) |
| $ | (30,050,513 | ) |
| $ | (9,103,793 | ) |
| $ | (18,695,783 | ) |
SHARE TRANSACTIONS: |
|
|
|
|
|
|
|
|
|
|
|
| ||||
Class A Shares |
|
|
|
|
|
|
|
|
|
|
|
| ||||
Issued |
| 37,236 |
|
| 85,211 |
|
| 86,577 |
|
| 162,758 |
| ||||
Reinvested |
| 45,594 |
|
| 260,590 |
|
| 62,979 |
|
| 110,651 |
| ||||
Redeemed |
| (959,483 | ) |
| (1,330,636 | ) |
| (628,136 | ) |
| (910,651 | ) | ||||
Total Class A Shares |
| (876,653 | ) |
| (984,835 | ) |
| (478,580 | ) |
| (637,242 | ) | ||||
Institutional Class Shares |
|
|
|
|
|
|
|
|
|
|
|
| ||||
Issued |
| 26,162 |
|
| 61,355 |
|
| 57,741 |
|
| 135,907 |
| ||||
Reinvested |
| 9,445 |
|
| 52,768 |
|
| 47,044 |
|
| 92,895 |
| ||||
Redeemed |
| (145,433 | ) |
| (246,053 | ) |
| (464,528 | ) |
| (1,198,195 | ) | ||||
Total Institutional Class Shares |
| (109,826 | ) |
| (131,930 | ) |
| (359,743 | ) |
| (969,393 | ) | ||||
Total change in shares: |
| (986,479 | ) |
| (1,116,765 | ) |
| (838,323 | ) |
| (1,606,635 | ) | ||||
|
|
|
|
|
|
|
|
|
|
|
|
| ||||
Amounts listed as “–” are $0 or round to $0.
See accompanying Notes to Financial Statements.
42
| 2019 Annual Report |
|
Statements of Changes in Net Assets
|
| Aberdeen Total |
|
| Aberdeen Global |
| ||||||||||
|
| Year Ended |
|
| Year Ended |
|
| Year Ended |
|
| Year Ended |
| ||||
FROM INVESTMENT ACTIVITIES: |
|
|
|
|
|
|
|
|
|
|
|
| ||||
Operations: |
|
|
|
|
|
|
|
|
|
|
|
| ||||
Net investment income |
| $ | 5,720,676 |
|
| $ | 8,187,219 |
|
| $ | 11,638,157 |
|
| $ | 16,188,790 |
|
Net realized gain/(loss) from investments, futures, written options, credit default swaps, forward foreign currency exchange contracts and foreign currency transactions |
| 2,511,478 |
|
| (5,355,576 | ) |
| (9,196,708 | ) |
| (467,548 | ) | ||||
Net change in unrealized appreciation/(depreciation) on investments, futures, forward foreign currency exchange contracts and translation of assets and liabilities denominated in foreign currencies |
| 13,899,673 |
|
| (10,891,422 | ) |
| 13,276,722 |
|
| (17,323,603 | ) | ||||
Changes in net assets resulting from operations |
| 22,131,827 |
|
| (8,059,779 | ) |
| 15,718,171 |
|
| (1,602,361 | ) | ||||
Distributions to Shareholders From: |
|
|
|
|
|
|
|
|
|
|
|
| ||||
Distributable earnings: |
|
|
|
|
|
|
|
|
|
|
|
| ||||
Class A |
| (665,549 | ) |
| (1,788,716 | ) |
| (8,223,692 | ) |
| (7,480,796 | ) | ||||
Institutional Class |
| (4,279,060 | ) |
| (8,364,634 | ) |
| (7,225,670 | ) |
| (6,447,145 | ) | ||||
Tax return of capital: |
|
|
|
|
|
|
|
|
|
|
|
| ||||
Class A |
| – |
|
| (65,475 | ) |
| (1,106,741 | ) |
| – |
| ||||
Institutional Class |
| – |
|
| (283,631 | ) |
| (907,505 | ) |
| – |
| ||||
Change in net assets from shareholder distributions |
| (4,944,609 | ) |
| (10,502,456 | ) |
| (17,463,608 | ) |
| (13,927,941 | ) | ||||
Change in net assets from capital transactions |
| (45,958,942 | ) |
| (85,359,490 | ) |
| (1,298,829 | ) |
| (152,600,288 | ) | ||||
Change in net assets |
| (28,771,724 | ) |
| (103,921,725 | ) |
| (3,044,266 | ) |
| (168,130,590 | ) | ||||
Net Assets: |
|
|
|
|
|
|
|
|
|
|
|
| ||||
Beginning of year |
| 211,852,717 |
|
| 315,774,442 |
|
| 221,057,840 |
|
| 389,188,430 |
| ||||
End of year |
| $ | 183,080,993 |
|
| $ | 211,852,717 |
|
| $ | 218,013,574 |
|
| $ | 221,057,840 |
|
|
|
|
|
|
|
|
|
|
|
|
|
| ||||
Amounts listed as “–” are $0 or round to $0.
See accompanying Notes to Financial Statements.
| 2019 Annual Report | 43
|
Statements of Changes in Net Assets (concluded)
|
| Aberdeen Total |
|
| Aberdeen Global |
| ||||||||||
|
| Year Ended |
|
| Year Ended |
|
| Year Ended |
|
| Year Ended |
| ||||
CAPITAL TRANSACTIONS: |
|
|
|
|
|
|
|
|
|
|
|
| ||||
Class A Shares |
|
|
|
|
|
|
|
|
|
|
|
| ||||
Proceeds from shares issued |
| $ | 2,917,417 |
|
| $ | 7,871,952 |
|
| $ | 17,021,572 |
|
| $ | 33,252,402 |
|
Dividends reinvested |
| 627,533 |
|
| 1,732,792 |
|
| 9,020,455 |
|
| 7,236,969 |
| ||||
Cost of shares redeemed |
| (18,081,858 | ) |
| (30,339,018 | ) |
| (40,539,921 | ) |
| (86,356,169 | ) | ||||
Total Class A |
| (14,536,908 | ) |
| (20,734,274 | ) |
| (14,497,894 | ) |
| (45,866,798 | ) | ||||
Institutional Class Shares |
|
|
|
|
|
|
|
|
|
|
|
| ||||
Proceeds from shares issued |
| 43,494,897 |
|
| 58,728,635 |
|
| 90,133,868 |
|
| 27,801,473 |
| ||||
Dividends reinvested |
| 3,980,238 |
|
| 8,056,332 |
|
| 6,701,900 |
|
| 4,402,502 |
| ||||
Cost of shares redeemed |
| (78,897,169 | ) |
| (131,410,183 | ) |
| (83,636,703 | ) |
| (138,937,465 | ) | ||||
Total Institutional Class |
| (31,422,034 | ) |
| (64,625,216 | ) |
| 13,199,065 |
|
| (106,733,490 | ) | ||||
Change in net assets from capital transactions: |
| $ | (45,958,942 | ) |
| $ | (85,359,490 | ) |
| $ | (1,298,829 | ) |
| $ | (152,600,288 | ) |
SHARE TRANSACTIONS: |
|
|
|
|
|
|
|
|
|
|
|
| ||||
Class A Shares |
|
|
|
|
|
|
|
|
|
|
|
| ||||
Issued |
| 218,340 |
|
| 608,191 |
|
| 1,981,597 |
|
| 3,631,984 |
| ||||
Reinvested |
| 47,490 |
|
| 133,012 |
|
| 1,067,956 |
|
| 805,725 |
| ||||
Redeemed |
| (1,390,448 | ) |
| (2,356,639 | ) |
| (4,727,209 | ) |
| (9,537,476 | ) | ||||
Total Class A Shares |
| (1,124,618 | ) |
| (1,615,436 | ) |
| (1,677,656 | ) |
| (5,099,767 | ) | ||||
Institutional Class Shares |
|
|
|
|
|
|
|
|
|
|
|
| ||||
Issued |
| 3,336,557 |
|
| 4,641,880 |
|
| 11,283,918 |
|
| 3,263,080 |
| ||||
Reinvested |
| 305,676 |
|
| 628,597 |
|
| 849,709 |
|
| 523,726 |
| ||||
Redeemed |
| (6,090,047 | ) |
| (10,441,273 | ) |
| (10,534,928 | ) |
| (16,313,815 | ) | ||||
Total Institutional Class Shares |
| (2,447,814 | ) |
| (5,170,796 | ) |
| 1,598,699 |
|
| (12,527,009 | ) | ||||
Total change in shares: |
| (3,572,432 | ) |
| (6,786,232 | ) |
| (78,957 | ) |
| (17,626,776 | ) | ||||
|
|
|
|
|
|
|
|
|
|
|
|
| ||||
Amounts listed as “–” are $0 or round to $0.
See accompanying Notes to Financial Statements.
44
| 2019 Annual Report |
|
Financial Highlights
Selected Data for Each Share of Capital Outstanding Throughout the Periods Indicated
Aberdeen Select International Equity Fund
|
|
|
|
| Investment Activities |
|
| Distributions |
|
|
|
| ||||||||
|
|
|
|
|
|
|
|
|
|
|
|
|
|
|
|
|
|
|
|
|
|
|
|
|
|
|
|
|
|
|
|
|
|
|
|
|
|
|
|
|
|
|
| Net |
|
| Net |
| Net |
| Total |
|
| Net |
| Tax |
| Total |
|
| Net |
|
Class A Shares |
|
|
|
|
|
|
|
|
|
|
|
|
|
|
|
|
|
|
|
|
Year Ended October 31, 2019 |
| $23.64 |
|
| $0.81 | (e) | $ 2.70 |
| $ 3.51 |
|
| $(0.20 | ) | $ – |
| $(0.20 | ) |
| $26.95 |
|
Year Ended October 31, 2018 |
| 28.01 |
|
| 0.01 |
| (3.20 | ) | (3.19 | ) |
| (1.15 | ) | (0.03 | ) | (1.18 | ) |
| 23.64 |
|
Year Ended October 31, 2017 |
| 22.26 |
|
| 1.75 | (f) | 4.22 |
| 5.97 |
|
| (0.22 | ) | – |
| (0.22 | ) |
| 28.01 |
|
Year Ended October 31, 2016 |
| 22.82 |
|
| 0.45 | (g) | (0.29 | ) | 0.16 |
|
| (0.72 | ) | – |
| (0.72 | ) |
| 22.26 |
|
Year Ended October 31, 2015 |
| 28.00 |
|
| 0.62 | (i) | (4.60 | ) | (3.98 | ) |
| (1.20 | ) | – |
| (1.20 | ) |
| 22.82 |
|
Institutional Class Shares |
|
|
|
|
|
|
|
|
|
|
|
|
|
|
|
|
|
|
|
|
Year Ended October 31, 2019 |
| 24.27 |
|
| 0.91 | (e) | 2.77 |
| 3.68 |
|
| (0.21 | ) | – |
| (0.21 | ) |
| 27.74 |
|
Year Ended October 31, 2018 |
| 28.73 |
|
| 0.09 |
| (3.30 | ) | (3.21 | ) |
| (1.22 | ) | (0.03 | ) | (1.25 | ) |
| 24.27 |
|
Year Ended October 31, 2017 |
| 22.84 |
|
| 1.72 | (f) | 4.46 |
| 6.18 |
|
| (0.29 | ) | – |
| (0.29 | ) |
| 28.73 |
|
Year Ended October 31, 2016 |
| 23.40 |
|
| 0.51 | (g) | (0.28 | ) | 0.23 |
|
| (0.79 | ) | – |
| (0.79 | ) |
| 22.84 |
|
Year Ended October 31, 2015 |
| 28.69 |
|
| 0.67 | (i) | (4.68 | ) | (4.01 | ) |
| (1.28 | ) | – |
| (1.28 | ) |
| 23.40 |
|
(a) | Net investment income/(loss) is based on average shares outstanding during the period. |
(b) | Includes interest expense that amounts to less than 0.01%. |
(c) | During the period, certain fees were waived and/or reimbursed. If such waivers/reimbursements had not occurred, the ratios would have been as indicated. |
(d) | Portfolio turnover is calculated on the basis of the Fund as a whole without distinguishing among the classes of shares. |
(e) | Included within Net Investment Income per share, Total Return, and Ratio of Net Investment Income to Average Net Assets are the effects of withholding tax refunds (Note 2g of the Notes to Financial Statements). If such amounts were excluded, the Net Investment Income per share, Total Return, and Ratio of Net Investment Loss to Average Net Assets for Class A Shares would have been $0.28, 12.13%, and 1.13%, respectively. For Institutional Class Shares, these amounts would have been $0.37, 12.41%, and 1.42%, respectively. |
(f) | Included within Net Investment Income per share, Total Return, and Ratio of Net Investment Income to Average Net Assets are the effects of withholding tax refunds (Note 2g of the Notes to Financial Statements). If such amounts were excluded, the Net Investment Loss per share, Total Return, and Ratio of Net Investment Loss to Average Net Assets for Class A Shares would have been $(0.14), 20.27%, and (0.55)%, respectively. For Institutional Class Shares, these amounts would have been $(0.24), 20.55%, and (0.92)%, respectively. |
(g) | Included within Net Investment Income per share, Total Return, and Ratio of Net Investment Income to Average Net Assets are the effects of a one-time reimbursement for overbilling of prior years’ custodian out-of-pocket fees. If such amounts were excluded, the impact to the Net Investment Income per share, Total Return, and Ratio of Net Investment Income to Average Net Assets for Class A Shares would have been reduced by $0.03, 0.13%, and 0.13%, respectively. For Institutional Class Shares, these amounts would have been reduced by $0.03, 0.13%, and 0.13%, respectively. |
Amounts listed as “–” are $0 or round to $0.
See accompanying Notes to Financial Statements.
45 2019 Annual Report
Financial Highlights (continued)
Selected Data for Each Share of Capital Outstanding Throughout the Periods Indicated
Aberdeen Select International Equity Fund (concluded)
|
|
| Ratios/Supplemental Data | ||||||||||||||
|
|
|
| ||||||||||||||
Total Return |
|
| Net Assets |
| Ratio of |
| Ratio of Expenses |
| Ratio of Expenses |
| Ratio of |
| Portfolio |
| |||
|
|
|
|
|
|
|
|
|
|
|
|
|
|
|
| ||
15.02 | %(e) |
|
| $120,472 |
| 1.44% |
| 2.99% |
| 3.06% |
| 3.24 | %(e) |
| 132 | % |
|
(11.93 | %) |
|
| 126,383 |
| 1.54% |
| 2.50% |
| 2.50% |
| 0.05 | % |
| 19 | % |
|
27.14 | %(f) |
|
| 177,342 |
| 1.42% |
| 3.93% |
| 3.93% |
| 7.02 | %(f) |
| 18 | % |
|
0.99 | %(g)(h) |
|
| 182,094 |
| 1.35% |
| 1.42% |
| 1.42% |
| 2.08 | %(g) |
| 23 | % |
|
(14.62 | %)(i) |
|
| 242,444 |
| 1.28% |
| 1.28% |
| 1.28% |
| 2.47 | %(i) |
| 11 | % |
|
|
|
|
|
|
|
|
|
|
|
|
|
|
|
|
|
|
|
15.34 | %(e) |
|
| 27,390 |
| 1.18% |
| 2.77% |
| 2.82% |
| 3.53 | %(e) |
| 132 | % |
|
(11.71 | %) |
|
| 26,633 |
| 1.30% |
| 2.22% |
| 2.23% |
| 0.33 | % |
| 19 | % |
|
27.42 | %(f) |
|
| 35,318 |
| 1.17% |
| 3.46% |
| 3.46% |
| 6.65 | %(f) |
| 18 | % |
|
1.30 | %(g)(h) |
|
| 32,094 |
| 1.10% |
| 1.17% |
| 1.17% |
| 2.31 | %(g) |
| 23 | % |
|
(14.40 | %)(i) |
|
| 43,633 |
| 1.04% |
| 1.04% |
| 1.04% |
| 2.56 | %(i) |
| 11 | % |
|
(h) | Included within Net Realized and Unrealized Gains (Losses) on Investment per share is a payment that was made from affiliate, during the fiscal year ended October 31, 2016, which contributed $113,111 to the Select International Equity Fund to correctly record an aged dividend receivable at its net realizable value inclusive of currency fluctuations. If such payment was excluded, the total return would have been 0.94% for Class A Shares and 1.21% for Institutional Class Shares. |
(i) | Included within Net Investment Income per share, Total Return, and Ratio of Net Investment Income to Average Net Assets are the effects of withholding tax refunds (Note 2g of the Notes to Financial Statements). If such amounts were excluded, the Net Investment Income per share, Total Return, and Ratio of Net Investment Income to Average Net Assets for Class A Shares would have been $0.53, (15.03%), and 2.11%, respectively. For Institutional Class Shares, these amounts would have been $0.58, (14.80%), and 2.20%, respectively. |
2019 Annual Report 46
Financial Highlights (continued)
Selected Data for Each Share of Capital Outstanding Throughout the Periods Indicated
Aberdeen Global Equity Impact Fund
|
|
|
|
| Investment Activities |
|
| Distributions |
|
|
|
| ||||||
|
|
|
|
|
|
|
|
|
|
|
|
|
|
|
|
|
|
|
|
|
|
|
|
|
|
|
|
|
|
|
|
|
|
|
|
|
|
|
| Net |
|
| Net |
| Net |
| Total |
|
| Net |
| Total |
|
| Net |
|
Class A Shares |
|
|
|
|
|
|
|
|
|
|
|
|
|
|
|
|
|
|
Year Ended October 31, 2019 |
| $10.29 |
|
| $0.18 | (e) | $ 1.30 |
| $ 1.48 |
|
| $(0.18 | ) | $(0.18 | ) |
| $11.59 |
|
Year Ended October 31, 2018 |
| 11.95 |
|
| 0.08 |
| (1.41 | ) | (1.33 | ) |
| (0.33 | ) | (0.33 | ) |
| 10.29 |
|
Year Ended October 31, 2017 |
| 9.79 |
|
| 0.43 | (f) | 1.89 |
| 2.32 |
|
| (0.16 | ) | (0.16 | ) |
| 11.95 |
|
Year Ended October 31, 2016 |
| 10.03 |
|
| 0.14 | (g) | (0.08 | ) | 0.06 |
|
| (0.30 | ) | (0.30 | ) |
| 9.79 |
|
Year Ended October 31, 2015 |
| 12.23 |
|
| 0.21 | (i) | (1.89 | )(i) | (1.68 | ) |
| (0.52 | ) | (0.52 | ) |
| 10.03 |
|
Institutional Class Shares |
|
|
|
|
|
|
|
|
|
|
|
|
|
|
|
|
|
|
Year Ended October 31, 2019 |
| 10.30 |
|
| 0.21 | (e) | 1.30 |
| 1.51 |
|
| (0.19 | ) | (0.19 | ) |
| 11.62 |
|
Year Ended October 31, 2018 |
| 11.96 |
|
| 0.10 |
| (1.40 | ) | (1.30 | ) |
| (0.36 | ) | (0.36 | ) |
| 10.30 |
|
Year Ended October 31, 2017 |
| 9.81 |
|
| 0.45 | (f) | 1.88 |
| 2.33 |
|
| (0.18 | ) | (0.18 | ) |
| 11.96 |
|
Year Ended October 31, 2016 |
| 10.04 |
|
| 0.16 | (g) | (0.06 | ) | 0.10 |
|
| (0.33 | ) | (0.33 | ) |
| 9.81 |
|
Year Ended October 31, 2015 |
| 12.25 |
|
| 0.24 | (i) | (1.90 | )(i) | (1.66 | ) |
| (0.55 | ) | (0.55 | ) |
| 10.04 |
|
(a) | Net investment income/(loss) is based on average shares outstanding during the period. |
(b) | During the period, certain fees were waived and/or reimbursed. If such waivers/reimbursements had not occurred, the ratios would have been as indicated. |
(c) | Portfolio turnover is calculated on the basis of the Fund as a whole without distinguishing among the classes of shares. |
(d) | Includes interest expense that amounts to less than 0.01%. |
(e) | Included within Net Investment Income per share, Total Return, and Ratio of Net Investment Income to Average Net Assets are the effects of withholding tax refunds (Note 2g of the Notes to Financial Statements). If such amounts were excluded, the Net Investment Income per share, Total Return, and Ratio of Net Investment Loss to Average Net Assets for Class A Shares would have been $0.08, 13.56%, and 0.77%, respectively. For Institutional Class Shares, these amounts would have been $0.11, 13.81%, and 1.03%, respectively. |
(f) | Included within Net Investment Income per share, Total Return, and Ratio of Net Investment Income to Average Net Assets are the effects of withholding tax refunds (Note 2g of the Notes to Financial Statements). If such amounts were excluded, the Net Investment Loss per share, Total Return, and Ratio of Net Investment Loss to Average Net Assets for Class A Shares would have been $(0.06), 20.03%, and (0.61)%, respectively. For Institutional Class Shares, these amounts would have been $(0.04), 20.24%, and (0.37)%, respectively. |
(g) | Included within Net Investment Income per share, Total Return, and Ratio of Net Investment Income to Average Net Assets are the effects of a one-time reimbursement for overbilling of prior years’ custodian out-of-pocket fees. If such amounts were excluded, the impact to the Net Investment Income per share, Total Return, and Ratio of Net Investment Income to Average Net Assets for Class A Shares would have been reduced by $0.02, 0.21%, and 0.20%, respectively. For Institutional Class Shares, these amounts would have been by reduced $0.03, 0.31%, and 0.19%, respectively. |
Amounts listed as “–” are $0 or round to $0.
See accompanying Notes to Financial Statements.
47 2019 Annual Report
Financial Highlights (continued)
Selected Data for Each Share of Capital Outstanding Throughout the Periods Indicated
Aberdeen Global Equity Impact Fund (concluded)
|
|
| Ratios/Supplemental Data |
| |||||||||||||||||
Total Return |
|
| Net Assets |
| Ratio of |
| Ratio of Expenses |
| Ratio of Expenses |
| Ratio of |
| Portfolio |
| |||||||
|
|
|
|
|
|
|
|
|
|
|
|
|
|
|
|
|
|
|
|
|
|
14.76 | %(e) |
|
| $34,933 |
|
| 1.53 | % |
| 2.21 | %(d) |
| 2.47 | %(d) |
| 1.69 | %(e) |
| 125 | % |
|
(11.48 | %) |
|
| 35,964 |
|
| 1.77 | % |
| 2.44 | %(d) |
| 2.44 | %(d) |
| 0.72 | % |
| 19 | % |
|
24.10 | %(f) |
|
| 49,363 |
|
| 1.58 | % |
| 3.14 | %(d) |
| 3.15 | %(d) |
| 3.98 | %(f) |
| 13 | % |
|
0.83 | %(g)(h) |
|
| 59,390 |
|
| 1.45 | % |
| 1.49 | %(d) |
| 1.50 | %(d) |
| 1.49 | %(g) |
| 23 | % |
|
(14.16 | %)(i)(j) |
|
| 79,263 |
|
| 1.38 | % |
| 1.38 | %(d) |
| 1.38 | %(d) |
| 1.93 | %(i) |
| 12 | % |
|
|
|
|
|
|
|
|
|
|
|
|
|
|
|
|
|
|
|
|
|
|
|
14.99 | %(e) |
|
| 27,937 |
|
| 1.28 | % |
| 1.97 | %(d) |
| 2.20 | %(d) |
| 1.95 | %(e) |
| 125 | % |
|
(11.23 | %) |
|
| 28,477 |
|
| 1.52 | % |
| 2.22 | %(d) |
| 2.23 | %(d) |
| 0.89 | % |
| 19 | % |
|
24.32 | %(f) |
|
| 44,659 |
|
| 1.33 | % |
| 2.88 | %(d) |
| 2.89 | %(d) |
| 4.22 | %(f) |
| 13 | % |
|
1.25 | %(g)(h) |
|
| 44,191 |
|
| 1.22 | % |
| 1.26 | %(d) |
| 1.27 | %(d) |
| 1.71 | %(g) |
| 23 | % |
|
(13.96 | %)(i)(j) |
|
| 69,000 |
|
| 1.13 | % |
| 1.13 | %(d) |
| 1.13 | %(d) |
| 2.16 | %(i) |
| 12 | % |
|
(h) | Included within Net Realized and Unrealized Gains (Losses) on Investment per share is a payment that was made from affiliate, during the fiscal year ended October 31, 2016, which contributed $127,579 to the Global Equity Impact Fund, to correctly record an aged dividend receivable at its net realizable value inclusive of currency fluctuations. If such payment was excluded, the total return would have been 0.73% for Class A Shares and 1.04% for Institutional Class Shares. |
(i) | Included within Net Investment Income per share, Total Return, and Ratio of Net Investment Income to Average Net Assets are the effects of withholding tax refunds (Note 2g of the Notes to Financial Statements). If such amounts were excluded, the Net Investment Income per share, Total Return, and Ratio of Net Investment Income to Average Net Assets for Class A Shares would have been $0.18, (14.42%), and 1.66%, respectively. For Institutional Class Shares, these amounts would have been $0.21, (14.22%), and 1.89%, respectively. |
(j) | Included within Net Realized and Unrealized Gains (Losses) on Investment per share is a payment that was made from affiliate, during the fiscal year ended October 31, 2015, which contributed $305,291 to the Global Equity Impact Fund, to correctly record an aged dividend receivable at its net realizable value inclusive of currency fluctuations. If such payment was excluded, the total return would have been (14.33%) for Class A Shares and (14.13%) for Institutional Class Shares. |
2019 Annual Report 48
Financial Highlights (continued)
Selected Data for Each Share of Capital Outstanding Throughout the Periods Indicated
Aberdeen Total Return Bond Fund
|
|
|
|
|
|
|
|
|
|
|
|
|
|
|
|
|
|
|
|
|
|
|
|
|
|
|
| Investment Activities |
|
| Distributions |
|
|
|
| ||||||||||
|
|
|
|
|
|
|
|
|
|
|
|
|
|
|
|
|
|
|
|
|
|
|
|
| Net |
|
| Net |
| Net |
| Total |
|
| Net |
| Net |
| Tax |
| Total |
|
| Net |
|
|
|
|
|
|
|
|
|
|
|
|
|
|
|
|
|
|
|
|
|
|
|
|
Class A Shares |
|
|
|
|
|
|
|
|
|
|
|
|
|
|
|
|
|
|
|
|
|
|
Year Ended October 31, 2019 |
| $12.49 |
|
| $0.36 |
| $ 1.09 |
| $ 1.45 |
|
| $(0.30 | ) | $ – |
| $ – |
| $(0.30 | ) |
| $13.64 |
|
Year Ended October 31, 2018 |
| 13.33 |
|
| 0.34 |
| (0.74 | ) | (0.40 | ) |
| (0.35 | ) | (0.07 | ) | (0.02 | ) | (0.44 | ) |
| 12.49 |
|
Year Ended October 31, 2017 |
| 13.83 |
|
| 0.33 |
| (0.18 | ) | 0.15 |
|
| (0.18 | ) | (0.47 | ) | – |
| (0.65 | ) |
| 13.33 |
|
Year Ended October 31, 2016 |
| 13.32 |
|
| 0.34 |
| 0.32 |
| 0.66 |
|
| (0.15 | ) | – |
| – |
| (0.15 | ) |
| 13.83 |
|
Year Ended October 31, 2015 |
| 13.60 |
|
| 0.32 |
| (0.19 | ) | 0.13 |
|
| (0.22 | ) | (0.17 | ) | (0.02 | ) | (0.41 | ) |
| 13.32 |
|
Institutional Class Shares |
|
|
|
|
|
|
|
|
|
|
|
|
|
|
|
|
|
|
|
|
|
|
Year Ended October 31, 2019 |
| 12.30 |
|
| 0.39 |
| 1.07 |
| 1.46 |
|
| (0.34 | ) | – |
| – |
| (0.34 | ) |
| 13.42 |
|
Year Ended October 31, 2018 |
| 13.14 |
|
| 0.37 |
| (0.74 | ) | (0.37 | ) |
| (0.38 | ) | (0.07 | ) | (0.02 | ) | (0.47 | ) |
| 12.30 |
|
Year Ended October 31, 2017 |
| 13.64 |
|
| 0.36 |
| (0.18 | ) | 0.18 |
|
| (0.21 | ) | (0.47 | ) | – |
| (0.68 | ) |
| 13.14 |
|
Year Ended October 31, 2016 |
| 13.14 |
|
| 0.36 |
| 0.33 |
| 0.69 |
|
| (0.19 | ) | – |
| – |
| (0.19 | ) |
| 13.64 |
|
Year Ended October 31, 2015 |
| 13.43 |
|
| 0.35 |
| (0.20 | ) | 0.15 |
|
| (0.25 | ) | (0.17 | ) | (0.02 | ) | (0.44 | ) |
| 13.14 |
|
(a) | Net investment income/(loss) is based on average shares outstanding during the period. |
(b) | During the period, certain fees were waived and/or reimbursed. If such waivers/reimbursements had not occurred, the ratios would have been as indicated. |
(c) | Portfolio turnover is calculated on the basis of the Fund as a whole without distinguishing among the classes of shares. |
Amounts listed as “–” are $0 or round to $0.
See accompanying Notes to Financial Statements.
49 | 2019 Annual Report |
|
Financial Highlights (continued)
Selected Data for Each Share of Capital Outstanding Throughout the Periods Indicated
Aberdeen Total Return Bond Fund (concluded)
|
|
|
|
| ||||||||||||||
|
|
| Ratios/Supplemental Data |
| ||||||||||||||
|
|
|
|
|
|
|
|
|
|
|
|
| ||||||
|
|
|
|
|
|
|
|
|
|
|
|
| ||||||
Total Return |
|
| Net Assets |
| Ratio of Expenses |
| Ratio of Expenses |
| Ratio of Net |
| Portfolio Turnover |
| ||||||
|
|
|
|
|
|
|
|
|
|
|
|
|
|
|
|
|
|
|
11.72 | % |
|
| $ 26,639 |
|
| 0.69 | % |
| 0.98 | % |
| 2.75 | % |
| 141 | % |
|
(3.19 | %) |
|
| 38,426 |
|
| 0.69 | %(d) |
| 0.88 | % |
| 2.67 | % |
| 148 | % |
|
1.21 | %(e) |
|
| 62,556 |
|
| 0.69 | %(d) |
| 0.76 | % |
| 2.46 | % |
| 151 | % |
|
5.02 | % |
|
| 65,242 |
|
| 0.69 | %(d) |
| 0.74 | % |
| 2.47 | % |
| 151 | % |
|
0.91 | % |
|
| 75,595 |
|
| 0.69 | %(d) |
| 0.71 | % |
| 2.37 | % |
| 102 | % |
|
|
|
|
|
|
|
|
|
|
|
|
|
|
|
|
|
|
|
|
12.02 | % |
|
| 156,442 |
|
| 0.44 | % |
| 0.68 | % |
| 2.98 | % |
| 141 | % |
|
(2.96 | %) |
|
| 173,427 |
|
| 0.44 | %(d) |
| 0.62 | % |
| 2.93 | % |
| 148 | % |
|
1.50 | %(e) |
|
| 253,218 |
|
| 0.44 | %(d) |
| 0.51 | % |
| 2.71 | % |
| 151 | % |
|
5.29 | % |
|
| 454,335 |
|
| 0.44 | %(d) |
| 0.47 | % |
| 2.72 | % |
| 151 | % |
|
1.12 | % |
|
| 927,387 |
|
| 0.44 | %(d) |
| 0.45 | % |
| 2.62 | % |
| 102 | % |
|
|
|
|
|
|
|
|
|
|
|
|
|
|
|
|
|
|
|
|
(d) | Includes interest expense that amounts to less than 0.01%. |
(e) | The total return shown above includes the impact of financial statement rounding of the NAV per share and/or financial statement adjustments. |
| 2019 Annual Report | 50 |
Financial Highlights (continued)
Selected Data for Each Share of Capital Outstanding Throughout the Periods Indicated
Aberdeen Global High Income Fund
|
|
|
|
| Investment Activities |
|
| Distributions |
|
|
|
| ||||||||||
|
| Net |
|
| Net |
| Net |
| Total |
|
| Net |
| Net |
| Tax |
| Total |
|
| Net |
|
Class A Shares |
|
|
|
|
|
|
|
|
|
|
|
|
|
|
|
|
|
|
|
|
|
|
Year Ended October 31, 2019 |
| $ 8.74 |
|
| $0.44 |
| $ 0.19 |
| $ 0.63 |
|
| $(0.58 | ) | $ – |
| $(0.08 | ) | $(0.66 | ) |
| $ 8.71 |
|
Year Ended October 31, 2018 |
| 9.23 |
|
| 0.50 |
| (0.56 | ) | (0.06 | ) |
| (0.43 | ) | – |
| – |
| (0.43 | ) |
| 8.74 |
|
Year Ended October 31, 2017 |
| 8.80 |
|
| 0.52 |
| 0.38 |
| 0.90 |
|
| (0.43 | ) | – |
| (0.04 | ) | (0.47 | ) |
| 9.23 |
|
Year Ended October 31, 2016 |
| 8.98 |
|
| 0.49 |
| (0.33 | ) | 0.16 |
|
| (0.34 | ) | – |
| – |
| (0.34 | ) |
| 8.80 |
|
Year Ended October 31, 2015 |
| 10.38 |
|
| 0.62 |
| (1.22 | ) | (0.60 | ) |
| (0.44 | ) | (0.25 | ) | (0.11 | ) | (0.80 | ) |
| 8.98 |
|
Institutional Class Shares |
|
|
|
|
|
|
|
|
|
|
|
|
|
|
|
|
|
|
|
|
|
|
Year Ended October 31, 2019 |
| 8.16 |
|
| 0.43 |
| 0.17 |
| 0.60 |
|
| (0.61 | ) | – |
| (0.07 | ) | (0.68 | ) |
| 8.08 |
|
Year Ended October 31, 2018 |
| 8.65 |
|
| 0.49 |
| (0.53 | ) | (0.04 | ) |
| (0.45 | ) | – |
| – |
| (0.45 | ) |
| 8.16 |
|
Year Ended October 31, 2017 |
| 8.28 |
|
| 0.51 |
| 0.35 |
| 0.86 |
|
| (0.45 | ) | – |
| (0.04 | ) | (0.49 | ) |
| 8.65 |
|
Year Ended October 31, 2016 |
| 8.47 |
|
| 0.48 |
| (0.31 | ) | 0.17 |
|
| (0.36 | ) | – |
| – |
| (0.36 | ) |
| 8.28 |
|
Year Ended October 31, 2015 |
| 9.85 |
|
| 0.61 |
| (1.16 | ) | (0.55 | ) |
| (0.47 | ) | (0.25 | ) | (0.11 | ) | (0.83 | ) |
| 8.47 |
|
(a) | Net investment income/(loss) is based on average shares outstanding during the period. |
(b) | Includes interest expense that amounts to less than 0.01%. |
(c) | During the period, certain fees were waived and/or reimbursed. If such waivers/reimbursements had not occurred, the ratios would have been as indicated. |
Amounts listed as “–” are $0 or round to $0.
See accompanying Notes to Financial Statements.
51 | 2019 Annual Report |
|
Financial Highlights (concluded)
Selected Data for Each Share of Capital Outstanding Throughout the Periods Indicated
Aberdeen Global High Income Fund (concluded)
|
|
|
|
| ||||||||||||||
|
|
| Ratios/Supplemental Data |
| ||||||||||||||
|
|
|
|
|
|
|
|
|
|
|
|
| ||||||
|
|
|
|
|
|
|
|
|
|
|
|
| ||||||
Total Return |
|
| Net Assets |
| Ratio of Expenses |
| Ratio of Expenses |
| Ratio of Net |
| Portfolio Turnover |
| ||||||
|
|
|
|
|
|
|
|
|
|
|
|
|
|
|
|
|
|
|
7.65 | % |
|
| $ 116,126 |
|
| 1.00 | % |
| 1.33 | % |
| 5.14 | % |
| 98 | % |
|
(0.66 | %) |
|
| 131,219 |
|
| 1.00 | % |
| 1.22 | % |
| 5.56 | % |
| 37 | % |
|
10.50 | % |
|
| 185,613 |
|
| 1.00 | % |
| 1.14 | % |
| 5.79 | % |
| 51 | % |
|
1.91 | % |
|
| 233,369 |
|
| 1.00 | % |
| 1.06 | % |
| 5.76 | % |
| 72 | % |
|
(6.01 | %)(e) |
|
| 522,964 |
|
| 1.00 | % |
| 1.04 | % |
| 6.43 | % |
| 79 | % |
|
|
|
|
|
|
|
|
|
|
|
|
|
|
|
|
|
|
|
|
7.91 | % |
|
| 101,888 |
|
| 0.75 | % |
| 1.05 | % |
| 5.39 | % |
| 98 | % |
|
(0.43 | %) |
|
| 89,839 |
|
| 0.75 | % |
| 0.95 | % |
| 5.80 | % |
| 37 | % |
|
10.76 | % |
|
| 203,575 |
|
| 0.75 | % |
| 0.87 | % |
| 6.01 | % |
| 51 | % |
|
2.21 | % |
|
| 351,466 |
|
| 0.75 | % |
| 0.79 | % |
| 6.00 | % |
| 72 | % |
|
(5.85 | %) |
|
| 797,494 |
|
| 0.75 | % |
| 0.76 | % |
| 6.68 | % |
| 79 | % |
|
(d) | Portfolio turnover is calculated on the basis of the Fund as a whole without distinguishing among the classes of shares. |
(e) | The total return shown above includes the impact of financial statement adjustments to the NAV per share. |
| 2019 Annual Report | 52 |
Notes to Financial Statements
October 31, 2019
1. Organization
Aberdeen Investment Funds (the “Trust”) was organized as a business trust under the laws of the State of Massachusetts by a Master Trust Agreement adopted on April 30, 1992 and is registered with the U.S. Securities and Exchange Commission (“SEC”) under the Investment Company Act of 1940, as amended (the “1940 Act”) as an open-end management investment company. As of October 31, 2019, the Trust offered four diversified, open-ended investment funds: Aberdeen Select International Equity Fund (the “Select International Equity Fund”), Aberdeen Global Equity Impact Fund (formerly the Aberdeen Select International Equity Fund II) (“Global Equity Impact Fund”), Aberdeen Total Return Bond Fund (the “Total Return Bond Fund”), and Aberdeen Global High Income Fund (the “Global High Income Fund”). Each series of the Trust is also referred to herein as a “Fund” or collectively, the “Funds”.
Under the Trust Agreement, the Trustees have authority to issue an unlimited number of shares of beneficial interest, par value $.001 per share. The Board of Trustees is authorized to reclassify and issue any unissued shares to any number of additional series without shareholder approval.
Each of the Funds offers multiple share classes. As of October 31, 2019, all of the Funds offered Class A and Institutional Class shares. The classes of shares are offered to different types of investors and have different expense structures, as outlined in the Funds’ prospectus. Each class of shares has exclusive voting rights with respect to matters that affect that class. Income, realized gains and losses, unrealized appreciation and depreciation, and expenses that are not attributable to a specific class are allocated daily to each class based on its relative net assets. Expenses directly attributable to a Fund are charged to that Fund. Other expenses are allocated to the respective Fund based on average daily net assets.
Each Fund has distinct investment objectives. Following are the objectives for the Funds:
Fund Name | Investment Objective |
Select International Equity Fund | Seeks long-term growth of capital. |
Global Equity Impact Fund | Seeks long-term growth of capital. |
Total Return Bond Fund | Seeks to provide total return, which is derived from capital appreciation and income. |
Global High Income Fund | Seeks to maximize total return, principally through a high level of current income, and secondarily |
| through capital appreciation. |
|
|
2. Summary of Significant Accounting Policies
The Trust is an investment company and accordingly follows the investment company accounting and reporting guidance of the Financial Accounting Standards Board (“FASB”) Accounting Standard Codification Topic 946 Financial Services-Investment Companies. The following is a summary of significant accounting policies followed by the Funds in the preparation of their financial statements. The policies conform to generally accepted accounting principles in the United States of America (“GAAP”). The preparation of financial statements requires management to make estimates and assumptions that affect the reported amounts of assets and liabilities, disclosure of contingent assets and liabilities at the date of the financial statements, and the reported amounts of income and expenses for the period. Actual results could differ from those estimates. The books and records of the Funds are maintained in U.S. Dollars.
a. Security Valuation
The Funds value their securities at current market value or fair value, consistent with regulatory requirements. “Fair value” is defined in the Funds’ Valuation and Liquidity Procedures as the price that could be received to sell an asset or paid to transfer a liability in an orderly transaction between willing market participants without a compulsion to transact at the measurement date.
In accordance with the authoritative guidance on fair value measurements and disclosures under GAAP, the Funds disclose the fair value of their investments using a three-level hierarchy that classifies the inputs to valuation techniques used to measure the fair value. The hierarchy assigns Level 1, the highest level, measurements to valuations based upon unadjusted quoted prices in active markets for identical assets, Level 2 measurements to valuations based upon other significant observable inputs, including adjusted quoted prices in active markets for similar assets, and Level 3, the lowest level, measurements to valuations based upon unobservable inputs that are significant to the valuation. Inputs refer broadly to the assumptions that market participants would use in pricing the asset or liability, including assumptions about risk, for example, the risk inherent in a particular valuation technique used to measure fair value including a pricing model and/or the risk inherent in the inputs to the valuation technique. Inputs may be observable or unobservable. Observable inputs are inputs that reflect the assumptions market participants would use in pricing the asset or liability, which are based on market data obtained from sources independent of the reporting entity. Unobservable inputs are inputs that reflect the reporting entity’s own assumptions about the assumptions market participants would use in pricing the asset or liability developed based on the best information available in the circumstances. A financial instrument’s level within the fair value hierarchy is based upon the lowest level of any input that is significant to the fair value measurement. Open-end mutual funds are valued at the respective net asset value (“NAV”) as reported by such company. The prospectuses for the registered open-end management investment companies in which a Fund invests explain the circumstances under which those companies will
53 2019 Annual Report
Notes to Financial Statements (continued)
October 31, 2019
use fair value pricing and the effects of using fair value pricing. Closed-end funds and exchange-traded funds (“ETFs”) are valued at the market price of the security at the Valuation Time. A security using any of these pricing methodologies is determined to be a Level 1 investment.
Equity securities that are traded on an exchange are valued at the last quoted sale price on the principal exchange on which the security is traded at the “Valuation Time” subject to application, when appropriate, of the valuation factors described in the paragraph below. Under normal circumstances, the Valuation Time is as of the close of regular trading on the New York Stock Exchange (usually 4:00 p.m. Eastern Time). In the absence of a sale price, the security is valued at the mean of the bid/ask price quoted at the close on the principal exchange on which the security is traded. Securities traded on NASDAQ are valued at the NASDAQ official closing price.
Foreign equity securities that are traded on foreign exchanges that close prior to Valuation Time are valued by applying valuation factors to the last sale price or the mean price as noted above. Valuation factors are provided by an independent pricing service provider approved by the Board. These valuation factors are used when pricing a Fund’s portfolio holdings to estimate market movements between the time foreign markets close and the time a Fund values such foreign securities. These valuation factors are based on inputs such as depositary receipts, indices, futures, sector indices/ETFs, exchange rates, and local exchange opening and closing prices of each security. When prices with the application of valuation factors are utilized, the value assigned to the foreign securities may not be the same as quoted or published prices of the securities on their primary markets. A security that applies a valuation factor is determined to be a Level 2 investment because the exchange-traded price has been adjusted. Valuation factors are not utilized if the independent pricing service provider is unable to provide a valuation factor or if the valuation factor falls below a predetermined threshold; in such case, the security is determined to be a Level 1 investment.
Long-term debt and other fixed-income securities are valued at the last quoted or evaluated bid price on the valuation date provided by an independent pricing service provider approved by the Board of Trustees of the Trust (the “Board”). If there are no current day bids, the security is valued at the previously applied bid. Pricing services generally price debt securities assuming orderly transactions of an institutional “round lot” size, and the strategies employed by the Aberdeen Standard Investments Inc. (formerly, Aberdeen Asset Management Inc.)(“Aberdeen,” the “Adviser” or “ASII”) generally trade in round lot sizes. In certain circumstances, fixed income securities may be held or transactions may be conducted in smaller, “odd lot” sizes. Odd lots may trade at lower or, occasionally, higher prices than institutional round lot trades. Short-term debt securities (such as commercial paper and U.S. treasury bills) having a remaining maturity of 60 days or less are valued at the last quoted or evaluated bid price on the valuation date provided by an independent pricing service, or on the basis of amortized cost if it represents the best approximation for fair value. Debt and other fixed-income securities are generally determined to be Level 2 investments.
Short-term investments are comprised of cash and cash equivalents invested in short-term investment funds which are redeemable daily. The Funds sweep available cash into the State Street Institutional U.S. Government Money Market Fund, a “government money market fund” pursuant to Rule 2a-7 under the 1940 Act, which has an objective to maintain a $1.00 NAV, which is not guaranteed. Registered investment companies are valued at their net asset value as reported by such company. Generally, these investment types are categorized as Level 1 investments.
Derivative instruments are generally valued according to the following procedures. Exchange traded derivatives are generally Level 1 investments and over-the-counter derivatives are generally Level 2 investments. Forward currency exchange contracts are generally valued based on the current spot exchange rates and the forward exchange rate points (ex. 1-month, 3-month) that are obtained from an approved pricing agent. Based on the actual settlement dates of the forward contracts held, an interpolated value of the forward points is combined with the spot exchange rate to derive the valuation. Futures contracts are generally valued at the most recent settlement price as of NAV determination. Swap agreements are generally valued by an approved pricing agent based on the terms of the swap agreement (including future cash flows). When market quotations or exchange rates are not readily available, or if the Adviser concludes that such market quotations do not accurately reflect fair value, the fair value of a Fund’s assets are determined in good faith in accordance with the Valuation Procedures.
In the event that a security’s market quotations are not readily available or are deemed unreliable (for reasons other than because the foreign exchange on which it trades closed before the Valuation Time (as defined below)), the security is valued at fair value as determined by the Funds’ Pricing Committee (the “Pricing Committee”), taking into account the relevant factors and surrounding circumstances using Valuation and Liquidity Procedures approved by the Board. Under normal circumstances, the Valuation Time is as of the close of regular trading on the New York Stock Exchange (usually 4:00 p.m. Eastern Time). A security that has been fair valued by the Pricing Committee may be classified as Level 2 or Level 3 depending on the nature of the inputs.
The three-level hierarchy of inputs is summarized below:
· Level 1 – quoted prices in active markets for identical investments;
· Level 2 – other significant observable inputs (including quoted prices for similar securities, interest rates, prepayment speeds, and credit risk); or
· Level 3 – significant unobservable inputs (including a Fund’s own assumptions in determining the fair value of investments).
2019 Annual Report 54
Notes to Financial Statements (continued)
October 31, 2019
A summary of standard inputs is listed below:
Security Type | Standard Inputs |
Foreign equities utilizing a fair value factor | Depositary receipts, indices, futures, sector indices/ETFs, exchange rates, and local exchange opening and closing prices of each security. |
Debt and other fixed-income securities | Reported trade data, broker-dealer price quotations, benchmark yields, issuer spreads on comparable securities, credit quality, yield, and maturity. |
Forward foreign currency contracts | Forward exchange rate quotations. |
Swap agreements | Market information pertaining to the underlying reference assets, i.e., credit spreads, credit event probabilities, fair values, forward rates, and volatility measures. |
The following is a summary of the inputs used as of October 31, 2019 in valuing the Funds’ investments and other financial instruments at fair value. The inputs or methodology used for valuing securities are not necessarily an indication of the risk associated with investing in those securities.
Please refer to the Statements of Investments for a detailed breakout of the security types:
|
|
|
| LEVEL 2 – Other |
| LEVEL 3 – Significant |
|
|
| |||||
|
| LEVEL 1 – Quoted |
| Significant Observable |
| Unobservable |
|
|
| |||||
Investments, at Value |
| Prices ($) |
| Inputs ($) |
| Inputs ($) |
| Total ($) |
| |||||
Select International Equity Fund |
|
|
|
|
|
|
|
|
| |||||
Investments in Securities |
|
|
|
|
|
|
|
|
| |||||
Common Stocks |
| 12,170,639 |
| 139,062,418 |
| – |
| 151,233,057 |
| |||||
Short-Term Investment |
|
| 6,196,342 |
|
| – |
|
| – |
|
| 6,196,342 |
| |
|
|
| 18,366,981 |
|
| 139,062,418 |
|
| – |
|
| 157,429,399 |
| |
|
|
|
|
|
|
|
|
|
| |||||
Global Equity Impact Fund |
|
|
|
|
|
|
|
|
| |||||
Investments in Securities |
|
|
|
|
|
|
|
|
| |||||
Common Stocks |
| 30,057,925 |
| 34,324,813 |
| – |
| 64,382,738 |
| |||||
Short-Term Investment |
|
| 998,062 |
|
| – |
|
| – |
|
| 998,062 |
| |
|
|
| 31,055,987 |
|
| 34,324,813 |
|
| – |
|
| 65,380,800 |
| |
|
|
|
|
|
|
|
|
|
| |||||
Total Return Bond Fund |
|
|
|
|
|
|
|
|
| |||||
Investments in Securities |
|
|
|
|
|
|
|
|
| |||||
Asset-Backed Securities |
| – |
| 18,229,559 |
| – |
| 18,229,559 |
| |||||
Commercial Mortgage-Backed Securities |
| – |
| 16,026,348 |
| – |
| 16,026,348 |
| |||||
Non-Agency Mortgage-Backed Securities |
| – |
| 13,131,474 |
| – |
| 13,131,474 |
| |||||
Corporate Bonds |
| – |
| 40,031,050 |
| – |
| 40,031,050 |
| |||||
Municipal Bonds |
| – |
| 6,312,993 |
| – |
| 6,312,993 |
| |||||
Government Bonds |
| – |
| 6,630,587 |
| – |
| 6,630,587 |
| |||||
U.S. Agencies |
| – |
| 31,306,892 |
| – |
| 31,306,892 |
| |||||
U.S. Treasuries |
| – |
| 35,178,469 |
| – |
| 35,178,469 |
| |||||
Agency Mortgage-Backed Securities |
| – |
| 13,416,651 |
| – |
| 13,416,651 |
| |||||
Short-Term Investment |
| 5,175,662 |
| – |
| – |
| 5,175,662 |
| |||||
55 2019 Annual Report
Notes to Financial Statements (continued)
October 31, 2019
Investments, at Value |
| Level 1 |
| Level 2 |
| Level 3 |
| Total |
| ||||
Other Financial Instruments |
|
|
|
|
|
|
|
|
| ||||
Assets |
|
|
|
|
|
|
|
|
| ||||
Futures Contracts |
| 1,328 |
| – |
| – |
| 1,328 |
| ||||
Forward Foreign Currency Exchange Contracts |
| – |
| 121,014 |
| – |
| 121,014 |
| ||||
Liabilities |
|
|
|
|
|
|
|
|
| ||||
Futures Contracts |
| (100,675 | ) | – |
| – |
| (100,675 | ) | ||||
Forward Foreign Currency Exchange Contracts |
|
| – |
|
| (191,607 | ) |
| – |
|
| (191,607 | ) |
|
|
| 5,076,315 |
|
| 180,193,430 |
|
| – |
|
| 185,269,745 |
|
|
|
|
|
|
|
|
|
|
| ||||
Global High Income Fund |
|
|
|
|
|
|
|
|
| ||||
Investments in Securities |
|
|
|
|
|
|
|
|
| ||||
Corporate Bonds |
| – |
| 208,198,115 |
| – |
| 208,198,115 |
| ||||
Bank Loans |
| – |
| 2,945,437 |
| – |
| 2,945,437 |
| ||||
Common Stocks |
| – |
| – |
| 156,896 |
| 156,896 |
| ||||
Short-Term Investment |
| 6,329,910 |
| – |
| – |
| 6,329,910 |
| ||||
Other Financial Instruments |
|
|
|
|
|
|
|
|
| ||||
Assets |
|
|
|
|
|
|
|
|
| ||||
Forward Foreign Currency Exchange Contracts |
| – |
| 4,992 |
| – |
| 4,992 |
| ||||
Liabilities |
|
|
|
|
|
|
|
|
| ||||
Forward Foreign Currency Exchange Contracts |
|
| – |
|
| (678,056 | ) |
| – |
|
| (678,056 | ) |
|
|
| 6,329,910 |
|
| 210,470,488 |
|
| 156,896 |
|
| 216,957,294 |
|
|
|
|
|
|
|
|
|
|
| ||||
Amounts listed as “–” are $0 or round to $0.
Level 3 investments held on Global High Income Fund, at the beginning, during and at the end of the fiscal year end period in relation to net assets were not significant (less than 0.07% of total net assets) and accordingly, a reconciliation of Level 3 assets for the year ended October 31, 2019 is not presented. The valuation technique used at October 31, 2019 was a single unadjusted broker quote. The inputs utilized by the broker to value the investment were not available.
b. Restricted Securities
Restricted securities are privately-placed securities whose resale is restricted under U.S. securities laws. The Funds may invest in restricted securities, including unregistered securities eligible for resale without registration pursuant to Rule 144A and privately-placed securities of U.S. and non-U.S. issuers offered outside the U.S. without registration pursuant to Regulation S under the Securities Act of 1933, as amended. Rule 144A securities may be freely traded among certain qualified institutional investors, such as the Funds, but resale of such securities in the U.S. is permitted only in limited circumstances.
c. Foreign Currency Translation
Foreign securities, currencies, and other assets and liabilities denominated in foreign currencies are translated into U.S. Dollars at the exchange rate of said currencies against the U.S. Dollar, as of the Valuation Time, as provided by an independent pricing service. Purchases and sales of securities, and income and expenses are translated at the prevailing rate of exchange on the respective date of these transactions. The Funds do not isolate that portion of the results of operations resulting from changes in foreign exchange rates on investments from fluctuations arising from changes in market prices of securities held. These fluctuations are included with the net realized and unrealized gain or loss from investments within the Statements of Operations.
Investments in emerging markets can be riskier and more volatile than investments in the United States and other developed markets. Adverse political and economic developments can make it more difficult for the Select International Equity Fund and Global Equity Impact Fund to sell
2019 Annual Report 56
Notes to Financial Statements (continued)
October 31, 2019
foreign securities which could reduce the NAV of the Funds. In contrast to more established markets, emerging markets may have governments that are less stable and markets that are less liquid, increasing your investment risk.
d. Derivative Financial Instruments
Certain Funds are authorized to use derivatives to manage currency risk, credit risk, and interest rate risk and to replicate, or use as a substitute for, physical securities. Losses may arise due to changes in the value of the contract or if the counterparty does not perform under the contract. The use of derivative instruments involves, to varying degrees, elements of market risk in excess of the amount recognized in the Statements of Assets and Liabilities.
Forward Foreign Currency Exchange Contracts
A forward foreign currency exchange contract (“forward contract”) involves an obligation to purchase and sell a specific currency at a future date, which may be any fixed number of days from the date of the contract agreed upon by the parties, at a price set at the time of the contract. Forward contracts are used to manage a Fund’s currency exposure in an efficient manner. They are used to sell unwanted currency exposure that comes with holding securities in a market, or to buy currency exposure where the exposure from holding securities is insufficient to give the desired currency exposure either in absolute terms or relative to a particular benchmark or index. The use of forward contracts allows for the separation of investment decision-making between foreign exchange holdings and their currencies. The forward contract is marked-to-market daily and the change in market value is recorded by a Fund as unrealized appreciation/(depreciation). Forward contracts’ prices are received daily from an independent pricing provider. When the forward contract is closed, a Fund records a realized gain or loss equal to the difference between the value at the time it was opened and the value at the time it was closed. These realized and unrealized gains and losses are reported on the Statements of Operations. During the fiscal year ended October 31, 2019, the Funds used forward contracts to hedge some of the Funds’ foreign currency holdings. Managing active currency risk involves both hedging currency risk and adding currency risk in excess of underlying bond positions. A Fund may also enter into forward contracts to obtain potential appreciation of a foreign currency, which also adds currency risk.
Futures Contracts
Certain Funds may invest in financial futures contracts (“futures contracts”) for the purpose of hedging their existing portfolio securities, or securities that a Fund intends to purchase, against fluctuations in value caused by changes in prevailing market interest rates or prices. Futures contracts may also be entered into for non-hedging purposes; however, in those instances, the aggregate initial margin and premiums required to establish a Fund’s positions may not exceed 5% of a Fund’s NAV after taking into account unrealized profits and unrealized losses on any such contract into which it has entered.
Upon entering into a futures contract, a Fund is required to pledge to the broker an amount of cash and/or other assets equal to a certain percentage of the contract amount. This payment is known as “initial margin”. Subsequent payments, known as “variation margin,” are calculated each day, depending on the daily fluctuations in the fair value/market value of the underlying assets. An unrealized gain/(loss) equal to the variation margin is recognized on a daily basis. When the contract expires or is closed, the gain/(loss) is realized and is presented in the Statements of Operations as a net realized gain/(loss) on futures contracts. Futures contracts are valued daily at their last quoted sale price on the exchange on which they are traded.
A “sale” of a futures contract means a contractual obligation to deliver the securities or foreign currency called for by the contract at a fixed price at a specified time in the future. A “purchase” of a futures contract means a contractual obligation to acquire the securities or foreign currency at a fixed price at a specified time in the future.
Should market conditions change unexpectedly, a Fund may not achieve the anticipated benefits of the futures contracts and may realize a loss. The use of futures transactions for hedging purposes involves the risk of imperfect correlation in movements in the price of futures contracts, interest rates and the value/market value of the underlying hedged assets. During the fiscal year ended October 31, 2019, U.S. Treasury futures contracts were used to manage Total Return Bond Fund’s overall curve and interest rate exposure.
Options
Options are instruments that provide a right to buy (call) or sell (put) a particular security or an index of securities at a fixed price within a certain time period. Options differ from forward and futures contracts in that the buyer of the option has no obligation to perform under the contract. An option is out-of-the money if the exercise price of the option is above, in the case of a call option, or below, in the case of a put option, the current price (or interest rate or yield for certain options) of the referenced security or instrument. Use of put and call options may result in losses to a Fund, force the sale or purchase of portfolio securities at inopportune times or for prices higher than (in the case of put
57 2019 Annual Report
Notes to Financial Statements (continued)
October 31, 2019
options) or lower than (in the case of call options) current market values, limit the amount of appreciation a Fund can realize on its investments or cause a Fund to hold a security it might otherwise sell. The Funds did not hold options as of October 31, 2019.
Swaps
The Total Return Bond Fund enters into interest rate swaps to manage interest-rate exposure. The Global High Income Fund uses credit default swaps to gain, or hedge, exposure to specific companies. A swap is an agreement that obligates two parties to exchange a series of cash flows and/or meet certain obligations at specified intervals based upon or calculated by reference to changes in specified prices or rates (interest rates in the case of interest rate swaps, currency exchange rates in the case of currency swaps) or the occurrence of a credit event with respect to an underlying reference obligation (in the case of a credit default swap) for a specified amount of an underlying asset or notional principal amount. A Fund will enter into swaps only on a net basis, which means that the two payment streams are netted out, with a Fund receiving or paying, as the case may be, only the amount of the difference between the two payments. Except for currency swaps and credit default swaps, the notional principal amount is used solely to calculate the payment streams but is not exchanged. With respect to currency swaps, actual principal amounts of currencies may be exchanged by the counterparties at the initiation, and again upon the termination of the transaction.
Traditionally, swaps were customized, privately negotiated agreements executed between two parties (“OTC Swaps”) but since 2013, certain swaps are required to be cleared pursuant to rules and regulations related to the Dodd – Frank Wall Street Reform and Consumer Protection Act (“Dodd Frank”) and/or Regulation (EU) No 648/2012 on OTC Derivatives, Central Counterparties and Trade Repositories (“EMIR”) (“Cleared Swaps”). Like OTC Swaps, Cleared Swaps are negotiated bilaterally. Unlike OTC Swaps, the act of clearing results in two swaps executed between each of the parties and a central counterparty (“CCP”), and thus the counterparty credit exposure of the parties is to the CCP rather than to one another. Upon entering into a Cleared Swap, a Fund is required to pledge an amount of cash and/or other assets equal to a certain percentage of the contract amount. This payment is known as “initial margin”. Subsequent payments, known as “variation margin,” are calculated each day, depending on the daily fluctuations in the fair value/market value of the underlying assets. An unrealized gain/(loss) equal to the variation margin is recognized on a daily basis. When the contract matures or is terminated, the gain or loss is realized and is presented in the Statements of Operations as a net realized gain or loss on swap contracts. As of March 2017, a Fund may be required to provide variation and/or initial margin for OTC Swaps pursuant to further rules and regulations related to Dodd Frank and EMIR. The margin requirements associated with OTC Swaps and Cleared Swaps may not be the same.
Entering into swap agreements involves, to varying degrees, elements of credit, market and interest rate risk in excess of the amounts reported on the Statement of Assets and Liabilities. Such risks involve the possibility that there will be no liquid market for these agreements, that the counterparty to the agreements may default on its obligation to perform and that there may be unfavorable changes in the value of the index or securities underlying the agreement. The Funds’ maximum risk of loss from counterparty risk related to swaps is the fair value of the contract. This risk is mitigated by the posting of collateral by the counterparties to the Funds to cover the Funds’ exposure to the counterparty.
Interest Rate Swaps
A Fund uses interest rate swap contracts to manage its exposure to interest rates. Interest rate swap contracts typically represent the exchange between a Fund and a counterparty of respective commitments to make variable rate and fixed rate payments with respect to a notional amount of principal. Interest rate swap contracts may have a term that is greater than one year, but typically require periodic interim settlement in cash, at which time the specified value of the variable interest rate is reset for the next settlement period. Net payments of interest are recorded as realized gains or losses. During the period that the swap contract is open, the contract is marked-to-market as the net amount due to or from a Fund and changes in the value of swap contracts are recorded as unrealized gains or losses.
Credit Default Swaps
A credit default swap is an agreement whereby one party, the buyer, is obligated to pay the other party, the seller, a periodic stream of payments over the term of the contract in return for a contingent payment upon the occurrence of a credit event with respect to an underlying reference obligation. A Fund might use credit default swap contracts to limit or to reduce risk exposure of the Fund to defaults of corporate and sovereign issues (i.e., to reduce risk when the Fund owns or has exposure to such issuers). A Fund also might use credit default swap contracts to create direct or synthetic short or long exposure to domestic or foreign corporate debt securities or certain sovereign debt securities to which the Fund is not otherwise exposed.
2019 Annual Report 58
Notes to Financial Statements (continued)
October 31, 2019
Summary of Derivative Instruments
Certain Funds may use derivatives for various purposes as noted above. The following is a summary of the location of fair value amounts of derivatives, not accounted for as hedging instruments, as of October 31, 2019:
|
| Location on the Statement of Assets and Liabilities |
| ||
Derivative Instrument Risk Type |
| Asset Derivatives |
| Liability Derivatives |
|
Interest Rate Risk |
| Variation margin receivable for futures contracts |
| Variation margin payable for futures contracts |
|
|
| Variation margin receivable for centrally cleared interest rate swap contracts |
| Variation margin payable for centrally cleared interest rate swap contracts |
|
Foreign Exchange Risk |
| Unrealized appreciation on forward foreign currency exchange contracts |
| Unrealized depreciation on forward foreign currency exchange contracts |
|
Credit Risk |
| Variation margin receivable for centrally cleared credit default swap contracts |
| Variation margin payable for centrally cleared credit default swap contracts |
|
The following is a summary of the fair value of derivative instruments, not accounted for as hedging instruments, as of October 31, 2019:
Total Return Bond Fund |
| Asset Derivatives |
| Liability Derivatives |
| ||||
Derivatives not accounted for as |
|
|
|
|
|
|
| ||
hedging instruments |
| Statement of Assets and |
| Fair Value |
| Statement of Assets and |
| Fair Value |
|
Forward foreign currency exchange contracts (foreign exchange risk) |
| Unrealized appreciation on forward foreign currency exchange contracts |
| $121,014 |
| Unrealized depreciation on forward foreign currency exchange contracts |
| $191,607 |
|
Futures contracts |
| Variation margin receivable for futures contracts |
| 1,328 |
| Variation margin payable for futures contracts |
| 100,675 |
|
Total |
|
|
| $122,342 |
|
|
| $292,282 |
|
Global High Income Fund |
| Asset Derivatives |
| Liability Derivatives |
| ||||
Derivatives not accounted for as |
|
|
|
|
|
|
| ||
hedging instruments |
| Statement of Assets and |
| Fair Value |
| Statement of Assets and |
| Fair Value |
|
Forward foreign currency exchange contracts (foreign exchange risk) |
| Unrealized appreciation on forward foreign currency exchange contracts |
| $4,992 |
| Unrealized depreciation on forward foreign currency exchange contracts |
| $678,056 |
|
Total |
|
|
| $4,992 |
|
|
| $678,056 |
|
59 | 2019 Annual Report |
|
Notes to Financial Statements (continued)
October 31, 2019
A reconciliation of the gross amounts on the Statements of Assets and Liabilities as of October 31, 2019 to the net amounts by broker and derivative type, including any collateral received or pledged, is included in the following tables:
|
|
|
| Gross Amounts Not Offset |
|
|
| Gross Amounts Not Offset |
| ||||||||
|
| Gross Amounts |
| Financial |
| Collateral |
| Net Amount(3) |
| Gross Amounts |
| Financial |
| Collateral |
| Net Amount(3) |
|
Description |
| Assets |
| Liabilities |
| ||||||||||||
Total Return Bond Fund |
|
|
|
|
|
|
|
|
|
|
|
|
|
|
|
|
|
Forward foreign currency(2) |
|
|
|
|
|
|
|
|
|
|
|
|
|
|
|
|
|
Barclays Bank |
| $ 2,820 |
| $ – |
| $– |
| $ 2,820 |
| $ – |
| $ – |
| $– |
| $ – |
|
Citibank |
| 26,576 |
| (26,576 | ) | – |
| – |
| 55,165 |
| (26,576 | ) | – |
| 28,589 |
|
Goldman Sachs |
| 27,885 |
| (2,557 | ) | – |
| 25,328 |
| 2,557 |
| (2,557 | ) | – |
| – |
|
HSBC Bank |
| 508 |
| (508 | ) | – |
| – |
| 34,616 |
| (508 | ) | – |
| 34,108 |
|
JPMorgan Chase |
| 63,225 |
| (63,225 | ) | – |
| – |
| 80,120 |
| (63,225 | ) | – |
| 16,895 |
|
Royal Bank of Canada |
| – |
| – |
| – |
| – |
| 19,149 |
| – |
| – |
| 19,149 |
|
|
|
|
| Gross Amounts Not Offset |
|
|
| Gross Amounts Not Offset |
| ||||||||
|
| Gross Amounts |
| Financial |
| Collateral |
| Net Amount(3) |
| Gross Amounts |
| Financial |
| Collateral |
| Net Amount(3) |
|
Description |
| Assets |
| Liabilities |
| ||||||||||||
Global High Income Fund |
|
|
|
|
|
|
|
|
|
|
|
|
|
|
|
|
|
Forward foreign currency(2) |
|
|
|
|
|
|
|
|
|
|
|
|
|
|
|
|
|
Citibank N.A. |
| $4,751 |
| $(4,751 | ) | $– |
| $– |
| $638,577 |
| $(4,751 | ) | $– |
| $633,826 |
|
UBS AG |
| 241 |
| (241 | ) | – |
| – |
| 39,479 |
| (241 | ) | – |
| 39,238 |
|
The effect of derivative instruments on the Statement of Operations for the fiscal year ended October 31, 2019:
Aberdeen Total Return Bond Fund |
| Location of Gain or (Loss) on Derivatives |
| Realized Gain or (Loss) on Derivatives |
| Change in Unrealized Appreciation/ (Depreciation) on Derivatives |
|
| Realized/Unrealized Gain/(Loss) from Futures Contracts and Forward Foreign Currency Exchange Contracts |
|
|
|
|
Forward foreign currency exchange contracts |
|
|
|
|
|
|
(foreign exchange risk) |
|
|
| $187,886 |
| $392,615 |
Futures contracts |
|
|
|
|
|
|
(interest rate risk) |
|
|
| 588,613 |
| 70,657 |
Total |
|
|
| $776,499 |
| $463,272 |
| 2019 Annual Report | 60 |
Notes to Financial Statements (continued)
October 31, 2019
Aberdeen Global High Income Fund |
| Location of Gain or (Loss) on Derivatives |
| Realized Gain or (Loss) on Derivatives |
| Change in Unrealized Appreciation/ (Depreciation) on Derivatives |
|
| Realized/Unrealized |
|
|
|
|
Forward foreign currency exchange contracts |
|
|
|
|
|
|
(foreign exchange risk) |
|
|
| $3,345,167 |
| $(2,138,575) |
Total |
|
|
| $3,345,167 |
| $(2,138,575) |
Information about derivatives reflected as of the date of this report is generally indicative of the type of activity for the fiscal year ended October 31, 2019. The table below summarizes the weighted average values of derivatives holdings by the Funds during the fiscal year ended October 31, 2019.
Fund |
| Purchase Forward Foreign Currency Contracts (Average Notional Value) |
| Sale Forward Foreign Currency Contracts (Average Notional Value) |
| Long Futures Contracts (Average Notional Value) |
| Short Futures Contracts (Average Notional Value) |
|
Total Return Bond Fund |
| $29,309,313 |
| $61,389,580 |
| $27,021,851 |
| $10,343,306 |
|
Global High Income Fund |
| 8,291,542 |
| 46,063,542 |
| – |
| – |
|
The Funds value derivatives at fair value, as described in the results of operations. Accordingly, the Funds do not follow hedge accounting even for derivatives employed as economic hedges.
e. Bank Loans
Global High Income Fund may invest in bank loans. Bank loans include floating and fixed-rate debt obligations. Floating rate loans are debt obligations issued by companies or other entities with floating interest rates that reset periodically. Bank loans may include, but are not limited to, term loans, delayed funding loans, bridge loans and revolving credit facilities. Loan interest will primarily take the form of assignments purchased in the primary or secondary market but may include participants. Floating rate loans are secured by specific collateral of the borrower and are senior to most other securities of the borrower (e.g., common stock or debt instruments) in the event of bankruptcy. Floating rate loans are often issued in connection with recapitalizations, acquisitions, leveraged buyouts, and refinancings. Floating rate loans are typically structured and administered by a financial institution that acts as the agent of the lenders participating in the floating rate loan. Floating rate loans may be acquired directly through the agent, as an assignment from another lender who holds a direct interest in the floating rate loan, or as a participation interest in another lender’s portion of the floating rate loan.
Global High Income Fund may enter into, or acquire participation in, delayed funding loans and revolving credit facilities. Delayed funding loans and revolving credit facilities are borrowings in which the Global High Income Fund agrees to make loans up to a maximum amount upon demand by the borrowing issuer for a specified term. A revolving credit facility differs from a delayed funding loan in that as the borrowing issuer repays the loan, an amount equal to the repayment is again made available to the borrowing issuer under the facility. The borrowing issuer may at any time borrow and repay amounts so long as, in the aggregate, at any given time the amount borrowed does not exceed the maximum amount established by the loan agreement. Delayed funding loans and revolving credit facilities usually provide for floating or variable rates of interest.
There are a number of risks associated with an investment in bank loans including credit risk, interest rate risk, illiquid securities risk, and prepayment risk. There is also the possibility that the collateral securing a loan, if any, may be difficult to liquidate or be insufficient to cover the amount owed under the loan. These risks could cause a Fund to lose income or principal on a particular investment, which in turn could affect the return. In addition, bank loans may settle on a delayed basis, resulting in the proceeds from the sale of such loans not being readily available to make additional investments or to meet a Fund’s redemption obligations. To the extent the extended settlement process gives rise to short-term liquidity needs, a Fund may hold additional cash, sell investments or temporarily borrow from banks or other lenders.
61 | 2019 Annual Report |
|
Notes to Financial Statements (continued)
October 31, 2019
f. Security Transactions, Investment Income and Expenses
Security transactions are recorded on the trade date. Realized and unrealized gains/(losses) from security and currency transactions are calculated on the identified cost basis. Dividend income is recorded on the ex-dividend date except for certain dividends on foreign securities, which are recorded as soon as a Fund is informed after the ex-dividend date. Interest income is recorded on an accrual basis using the effective interest method. Expenses are recorded on an accrual basis. Expenses directly attributable to a Fund are charged to that Fund. Expenses not directly attributable to a Fund are allocated proportionately among all Funds of the Trust. For each of the Funds, the method for allocating income, fund level expenses, and realized and unrealized gains or losses among classes is based on the total net asset value of each class’s shares in proportion to the total net assets of the relevant Fund. Expenses specific to a class (such as Rule 12b-1 and Transfer Agent fees) are charged to that class.
g. Foreign Taxes
Funds that invest in foreign securities are subject to foreign taxes that may be imposed by certain countries in which the Funds invest. The Funds generally record foreign taxes based on applicable foreign tax law. The Funds incur withholding taxes on certain foreign dividends and interest, and those taxes are accrued at the time the associated income is recorded. The Funds file withholding tax reclaims in certain jurisdictions to recover a portion of amounts previously withheld. The Funds record a reclaim receivable based on, among other things, a jurisdiction’s legal obligation to pay reclaims as well as payment history and market convention.
The Select International Equity Fund and Global Equity Impact Fund (collectively, the “Equity Funds”) have received payments for Article 63 EU Tax Reclaims related to prior years (2005-2015). The Article 63 EU Tax Reclaim payments received by the Equity Funds from certain EU countries as of the date of this report significantly increased the Select International Equity Fund’s performance from December 16, 2016 and the Global Equity Impact Fund’s performance from February 1, 2017. Without these payments, each Equity Fund’s performance would have been lower during this period. In the tax years for which the Equity Funds filed Article 63 EU Tax Reclaims, certain shareholders were able to reduce their federal income taxes based upon the amount of taxes that these Funds paid to foreign jurisdictions. The receipt by the Equity Funds of the tax reclaims from these jurisdictions will also result in tax liability to the relevant Fund to offset the tax benefits that shareholders received in the past, the precise amount of the tax is uncertain and subject to settlement negotiations with the U.S. Internal Revenue Service (“U.S. IRS”). Based on information available as of the date of this report, an estimated tax amount has been accrued and is reflected within each Equity Fund’s net asset value and performance. Furthermore, upon final determination of the U.S. IRS, if the actual tax payable is greater than the amount currently accrued, and subject to the level of assets under management at the time of any subsequent adjustments, the relevant Equity Fund’s expenses, net asset value and performance may be materially adversely impacted. The precise amount of the tax remains uncertain as the matter remains unsettled with the U.S. IRS.
The Equity Funds have Article 63 EU Tax Reclaims outstanding related to prior years (2005-2015). Consistent with U.S. GAAP accrual requirements, the Equity Funds have recognized the Article 63 EU Tax Reclaims when a payment has been received, and have not recorded a receivable amount for any outstanding Article 63 EU Tax Reclaims because there is limited historical precedent for U.S. funds collecting reclaims of this magnitude and the total amount of the reclaims that these funds may receive in the future is uncertain. Any additional amounts to which the Equity Funds may be entitled, if and when recorded, likely would result in an increase in the net asset value per share of each fund at that time. In addition, Article 63 EU Tax Reclaims amounts received will be subject to tax. The U.S. IRS has not yet determined the amount of taxes that the Equity Funds must pay on these amounts. For tax accounting purposes, interest payments received on these payments (if any) are treated as income and will be distributed in due course. Additionally, fluctuations in the value of foreign currencies may affect an Equity Fund’s tax liability, because the U.S. IRS may require the Fund to pay any taxes owed on interest payments on Article 63 EU Tax Reclaims amounts in U.S. Dollars based on the foreign currency exchange rate with the applicable jurisdiction that was in effect at the time the Article 63 EU Tax Reclaims amounts were received by the Fund. As of October 31, 2019, the total amount of outstanding reclaims filed by the Equity Funds in the countries that may be affected by the European courts’ decisions (namely, The Netherlands, Spain, Germany, France, and Sweden) represents approximately 7.4% and 11.1%, respectively, of net assets of Select International Equity Fund and Global Equity Impact Fund before the impact of interest or any tax or additional costs incurred in the pursuit of such reclaims. These amounts net of estimated taxes (but excluding the impact of interest or tax on such interest) represent 4.3% and 6.0%, respectively, of net assets of Select International Equity Fund and Global Equity Impact Fund. These percentages will change depending on the fluctuations of the net assets of the Funds. Receipt by a Fund of these amounts will make the Fund’s performance seem higher than it would be as a result of the performance of its portfolio investments.
| 2019 Annual Report | 62 |
Notes to Financial Statements (continued)
October 31, 2019
The payments received on tax reclaims (including interest payments) within the year ended October 31, 2019 and from prior periods were as follows:
|
|
|
| Percent of Total |
| Received | |
|
| Amount |
| Net Assets |
| Date Range | |
Select International Equity Fund |
|
|
|
|
|
| |
Withholding Tax Refunds Received from Country: |
|
|
|
|
|
| |
|
|
|
|
|
|
| |
Finland |
| $ | 1,355,000 |
| 0.35%* |
| 5/21/2015 |
Poland |
| 16,452,314 |
| 7.74%** |
| 12/16/16-2/24/2017 | |
Poland |
| 5,504,000 |
| 3.72%**** |
| 12/12/2018-9/4/2019 | |
Global Equity Impact Fund |
|
|
|
|
|
| |
Withholding Tax Refunds Received from Country: |
|
|
|
|
|
| |
|
|
|
|
|
|
| |
Finland |
| $ | 500,000 |
| 0.25%* |
| 5/21/2015 |
Poland |
| 4,400,193 |
| 4.68%** |
| 2/1/2017-2/24/2017 | |
Poland |
| 380,000 |
| 0.59%*** |
| 8/22/2018 | |
Poland |
| 1,011,000 |
| 1.61%**** |
| 2/12/2019-9/4/2019 | |
* As of October 31, 2015
** As of October 31, 2017
*** As of October 31, 2018
**** As of October 31, 2019
h. Distributions
Distributions from net investment income, if any, are declared and paid monthly for the Total Return Bond Fund and Global High Income Fund. Distributions from net investment income, if any, are declared and paid annually for the Select International Equity Fund and Global Equity Impact Fund. The Funds will also declare and pay distributions annually from net realized gains on investment transactions and net realized foreign exchange gains, if any. Dividends and distributions to shareholders are recorded on the ex-dividend date. Additional distributions of net investment income and capital gains may be made at the discretion of the Board to avoid the application of the excise tax imposed under Section 4982 of the Internal Revenue Code of 1986, as amended (the “Code”), for certain undistributed amounts.
Dividends and distributions to shareholders are determined in accordance with federal income tax regulations, which may differ from GAAP. These differences are primarily due to differing treatments of income and gains on various investment securities held by the Funds, timing differences and differing characterization of distributions made by the Funds as a whole.
i. Federal Income Taxes
Each Fund intends to continue to qualify as a “regulated investment company” by complying with the provisions available to certain investment companies, as defined in Subchapter M of the Code, and to make distributions of net investment income and net realized capital gains sufficient to relieve the Funds from all federal income taxes. Therefore, no federal income tax provision is required.
Management of the Funds has concluded that there are no significant uncertain tax positions that would require recognition in the financial statements. Since tax authorities can examine previously filed tax returns, the Funds’ U.S. federal and state tax returns for each of the four fiscal years up to the most recent fiscal year ended October 31, 2019 are subject to such review.
3. Agreements and Transactions with Affiliates
a. Investment Adviser
Under the Investment Advisory Agreements with the Funds, effective May 22, 2013, the Adviser manages the Funds in accordance with the policies and procedures established by the Board. Prior to May 22, 2013, the Funds were managed by Artio Global Management LLC (the “Predecessor Adviser”), which was acquired by the Adviser’s parent company on May 21, 2013.
63 | 2019 Annual Report |
|
Notes to Financial Statements (continued)
October 31, 2019
For services provided under the terms of the current Investment Advisory Agreement, each Fund pays the Adviser an annual management fee (as a percentage of its average daily net assets) paid monthly according to the following schedule:
Fund |
| Fee Schedule |
|
|
Select International Equity Fund |
| Of the first $500 million |
| 0.800% |
|
| On the next $1.5 billion |
| 0.780% |
|
| Over $2 billion |
| 0.750% |
Global Equity Impact Fund |
| Of the first $500 million |
| 0.800% |
|
| On the next $1.5 billion |
| 0.780% |
|
| Over $2 billion |
| 0.750% |
Total Return Bond Fund |
| On all assets |
| 0.350% |
Global High Income Fund |
| Of the first $5 billion |
| 0.650% |
|
| On the next $2.5 billion |
| 0.630% |
|
| On the next $2.5 billion |
| 0.600% |
|
| Over $10 billion |
| 0.590% |
Effective February 28, 2019, the management fees for the Equity Funds were reduced to the rates noted above. Prior to that date, each of the Equity Funds paid monthly an annual management fee (as a percentage of its average daily net assets) at a rate of 0.90% of the first $5 billion, 0.88% on the next $2.5 billion and 0.85% over $7.5 billion.
The Adviser has engaged the services of an affiliate, Aberdeen Asset Managers Limited, as subadviser on behalf of the Equity Funds (the “Subadviser”), pursuant to the subadvisory agreements. The Subadviser manages a portion of the Equity Funds’ investments and has responsibility for making all investment decisions for the portion of a Fund’s assets that it manages. Pursuant to the subadvisory agreements, the Adviser pays fees to the Subadviser.
The Trust and the Adviser have entered into written contracts (“Expense Limitation Agreements”) limiting operating expenses for all classes of each Fund from exceeding the amounts listed in the table below. For each Fund noted below, this contractual limitation may not be terminated without the approval of the Board until the earlier of (a) the termination of the Investment Advisory Agreement or (b) the end of February, 2020 for the Total Return Bond Fund and Global High Income Fund and the end of February, 2021 for the Select International Equity Fund and Global Equity Impact Fund. This limit excludes certain expenses, including taxes, interest, brokerage commissions, and other expenditures which are capitalized in accordance with GAAP, and other extraordinary expenses not incurred in the ordinary course of each Fund’s business.
|
| Class A | Institutional |
Fund |
| Limit | Class Limit |
Select International Equity Fund |
| 1.35% | 1.10% |
Global Equity Impact Fund |
| 1.35% | 1.10% |
Total Return Bond Fund |
| 0.69% | 0.44% |
Global High Income Fund |
| 1.00% | 0.75% |
The Adviser has agreed to continue to waive a portion of its management fee for each of the Funds at the annual rate of 0.005% of the respective Funds’ average daily assets. The waiver may be terminated at any time by the Board.
The Adviser may request and receive reimbursement from a Fund of the advisory fees waived and other expenses reimbursed pursuant to the Expense Limitation Agreements at a later date not to exceed three years from the fiscal year in which the corresponding reimbursement to the Funds was made.
However, no reimbursement will be made for fees waived unless:
(i) the total annual expense ratio of the class making such reimbursement is less than the limit set forth above; and
(ii) the payment of such reimbursement is approved by the Board on a quarterly basis (the “Reimbursement Requirements”).
If the Board approves any changes in the waiver terms or limitations, reimbursements are only permitted to the extent that the terms of the Expense Limitation Agreements in effect at the time of the waiver are met at the time that reimbursement is approved. Except as provided for in the Expense Limitation Agreements, reimbursement of amounts previously waived or assumed by the Adviser is not permitted.
| 2019 Annual Report | 64 |
Notes to Financial Statements (continued)
October 31, 2019
As of October 31, 2019, to the extent the Reimbursement Requirements are met, the cumulative potential reimbursements for each Fund, based on expenses reimbursed by the Adviser would be:
Fund |
| Amount Fiscal Year 2017 (Expires 10/31/20) |
| Amount Fiscal Year 2018 (Expires 10/31/21) |
| Amount Fiscal Year 2019 (Expires 10/31/22) |
|
| Total* |
Select International Equity Fund |
| $ – |
| $ – |
| $ 92,601 |
|
| $ 92,601 |
Global Equity Impact Fund |
| – |
| – |
| 153,956 |
|
| 153,956 |
Total Return Bond Fund |
| 257,618 |
| 499,844 |
| 462,934 |
|
| 1,220,396 |
Global High Income Fund |
| 525,704 |
| 591,864 |
| 688,255 |
|
| 1,805,823 |
* Amounts reported are due to expire throughout the respective 3-year expiration period presented above.
Amounts listed as “—” are $0 or round to $0.
4. Distributor and Shareholder Services
The Trust and Aberdeen Fund Distributors, LLC (the “Distributor”) are parties to the current Underwriting Agreement (the “Underwriting Agreement”) whereby the Distributor acts as principal underwriter for the Funds’ shares.
The Trust has adopted a Distribution Plan (the “Plan”) pursuant to Rule 12b-1 under the 1940 Act with respect to certain classes of shares. The Plan permits the Funds to compensate the Distributor, for expenses associated with the distribution-related and/or shareholder services provided by such entities. These fees are paid to the Distributor and are either kept or paid to shareholders’ financial advisors or other intermediaries for distribution and shareholder services. Although actual distribution expenses may be more or less, under the Plan, the Funds pay the Distributor an annual fee of 0.25% for Class A shares.
Under its terms, the Plan shall remain in effect from year to year, provided such continuance is approved annually by a vote of a majority of the Board members and a majority of those Board members who are not “interested persons” of the Funds and who have no direct or indirect financial interest in the operation of the Plan or in any agreement related to the Plan.
The Adviser or an affiliate of the Adviser may pay additional amounts from its own resources to dealers or other financial intermediaries, for aid in distribution or for aid in providing administrative services to shareholders.
5. Investment Transactions
Purchases and sales of securities (excluding short-term securities) for the fiscal year ended October 31, 2019, were as follows:
Fund |
| Purchases |
| Sales |
Select International Equity Fund |
| $ 202,913,285 |
| $ 224,914,032 |
Global Equity Impact Fund |
| 81,641,193 |
| 89,968,175 |
Total Return Bond Fund |
| 242,193,367 |
| 285,070,770 |
Global High Income Fund |
| 208,402,814 |
| 214,029,477 |
6. Portfolio Investment Risks
a. Asset-Backed Securities Risk
Like traditional fixed income securities, the value of asset-backed securities typically increases when interest rates fall and decreases when interest rates rise. Certain asset-backed securities may also be subject to the risk of prepayment.
b. Bank Loan Risk
There are a number of risks associated with an investment in bank loans including credit risk, interest rate risk, illiquid securities risk, and prepayment risk. There is also the possibility that the collateral securing a loan, if any, may be difficult to liquidate or be insufficient to cover the amount owed under the loan. Bank loans have significantly longer settlement periods (e.g., longer than seven days) than more traditional investments resulting in the proceeds from the sale of such loans not being readily available to make additional investments or to meet a Fund’s redemption obligations. In addition, loans are not registered under the federal securities laws like stocks and bonds, so investors in
65 | 2019 Annual Report |
|
Notes to Financial Statements (continued)
October 31, 2019
loans have less protection against improper practices than investors in registered securities. These risks could cause a Fund to lose income or principal on a particular investment, which in turn could affect a Fund’s returns.
c. Country/Regional Focus Risk
Significant exposure to a single country or geographical region involves increased currency, political, regulatory and other risks. Market swings in the targeted country or geographical region likely will have a greater effect on portfolio performance than they would in a more geographically diversified fund.
d. Corporate Bonds Risk
Corporate bonds are debt instruments issued by domestic or foreign corporations or similar entities. Corporate bonds can decline in value in response to changes in the financial condition of the issuer and involve a risk of loss in case of issuer default or insolvency.
e. Credit Default Swap Risk
Credit default swap contracts, a type of derivative instrument, involve special risks and may result in losses to the Fund. Credit default swap contracts may in some cases be illiquid, and they increase credit risk since the Fund has exposure to both the issuer of the referenced obligation and the counterparty to the credit default swap contracts. Swaps may be difficult to unwind or terminate. The swap market could be disrupted or limited as a result of recent legislation, and these changes could adversely affect the Fund. Additionally, to the extent the Fund sells credit default swap contracts, the Fund effectively adds economic leverage to its portfolio because, in addition to its total net assets, the Fund is subject to investment exposure on the notional amount of the swap in the event of a default of the referenced debt obligation.
f. Derivatives Risk (Including Options, Futures and Swaps)
Derivatives are speculative and may hurt a Fund’s performance. Derivatives present the risk of disproportionately increased losses and/or reduced opportunities for gains when the financial asset or measure to which the derivative is linked changes in unexpected ways. The potential benefits to be derived from the Fund’s options, futures and derivatives strategy are dependent upon the portfolio managers’ ability to discern pricing inefficiencies and predict trends in markets, which decisions could prove to be inaccurate. This requires different skills and techniques than predicting changes in the price of individual debt securities, and there can be no assurance that the use of this strategy will be successful.
Hedged Exposure Risk – Losses generated by a derivative or practice used by a Fund for hedging purposes should be substantially offset by gains on the hedged investment depending on the degree of correlation between the hedging instrument and the assets hedged. However, while hedging can reduce or eliminate losses, it can also reduce or eliminate gains.
Correlation Risk – A Fund is exposed to the risk that changes in the value of a hedging instrument will not match those of the investment being hedged.
Counterparty Risk – Derivative transactions depend on the creditworthiness of the counterparty and the counterparty’s ability to fulfill its contractual obligations.
Speculative Exposure Risk – To the extent that a derivative or practice is not used as a hedge, a Fund is directly exposed to its risks. Gains or losses from speculative positions in a derivative may be much greater than the derivative’s original cost. For example, potential losses from writing uncovered call options and from speculative short sales are unlimited.
g. Emerging Markets Risk
Certain Funds are subject to Emerging Markets Risk. This is a magnification of the risks that apply to foreign investments. These risks are greater for securities of companies in emerging market countries because the countries may have less stable governments, more volatile currencies and less established markets (see “Foreign Securities Risk” below).
h. Foreign Currency Exposure Risk
The value of foreign currencies relative to the U.S. Dollar fluctuates in response to market, economic, political, regulatory, geopolitical or other conditions. A decline in the value of a foreign currency versus the U.S. Dollar reduces the value in U.S. Dollars of investments denominated in that foreign currency. This risk may impact a Fund more greatly to the extent the Fund does not hedge its currency risk, or hedging techniques used by the Adviser are unsuccessful.
i. Foreign Securities Risk
Foreign securities may be more volatile, harder to price and less liquid than U.S. securities. They are subject to different accounting and regulatory standards, and political and economic risks.
| 2019 Annual Report | 66 |
Notes to Financial Statements (continued)
October 31, 2019
j. High-Yield Bonds and Other Lower-Rated Securities Risk
A Fund’s investments in high-yield bonds (commonly referred to as “junk bonds”) and other lower-rated securities will subject the Fund to substantial risk of loss. Investments in high-yield bonds are speculative and issuers of these securities are generally considered to be less financially secure and less able to repay interest and principal than issuers of investment-grade securities. Prices of high-yield bonds tend to be very volatile. These securities are less liquid than investment-grade debt securities and may be difficult to price or sell, particularly in times of negative sentiment toward high-yield securities.
k. Illiquid Securities Risk
Illiquid securities are assets which may not be sold or disposed of in the ordinary course of business within seven days at approximately the price at which a Fund has valued the investment on its books and may include such securities as those not registered under U.S. securities laws or securities that cannot be sold in public transactions. An inability to sell a portfolio position can adversely affect a Fund’s value or prevent the Fund from being able to take advantage of other investment opportunities. Over recent years, the capacity of dealers to make markets in fixed income securities has been outpaced by the growth in the size of the fixed income markets. Liquidity risk may be magnified in a rising interest rate environment or when investor redemptions from fixed income funds may be higher than normal, due to the increased supply in the market that would result from selling activity.
Each Fund employs proprietary procedures and tests using third-party and internal data inputs that seek to assess and manage the liquidity of its portfolio holdings. A Fund’s procedures and tests take into account relevant market, trading and other factors, and monitor whether liquidity assessments should be adjusted based on changed market conditions. These procedures and tests are designed to assist a Fund in determining its ability to meet redemption requests in various market conditions. In light of the dynamic nature of markets, there can be no assurance that these procedures and tests will enable a Fund to ensure that it has sufficient liquidity to meet redemption requests.
l. Impact Investing Risk
In implementing the Fund’s ESG (Environmental, Social and Governance) investment strategy, the Adviser may select or exclude securities of issuers in certain industries, sectors, regions or countries for reasons other than the issuer’s investment performance. For this reason, the Fund may underperform other funds that do not implement an ESG strategy. ESG investing is qualitative and subjective by nature. In addition, the Fund may be required to sell a security when it might otherwise be disadvantageous for it to do so. Securities of companies with ESG practices may shift into and out of favor depending on market and economic conditions. The definition of “impact investing” will vary according to an investor’s beliefs and values. There is no guarantee that the Adviser’s definition of impact investing, security selection criteria or investment judgment will reflect the beliefs or values of any particular investor.
m. Impact of Large Redemptions and Purchases of Fund Shares Risk
Occasionally, shareholders may make large redemptions or purchases of Fund shares, which may cause a Fund to have to sell securities or invest additional cash. These transactions may adversely affect a Fund’s performance and increase transaction costs. In addition, large redemption requests may exceed the cash balance of a Fund and result in credit line borrowing fees and/or overdraft charges to the Fund until the sale of portfolio securities to cover the redemption request settle. For additional information on redemptions, please see the Statements of Changes in Net Assets.
n. Issuer Risk
The value of a security may decline for reasons directly related to the issuer, such as management performance, financial leverage and reduced demand for the issuer’s goods or service.
o. Large-Cap Securities Risk
Stocks issued by large cap companies subject a Fund to the risk that those stocks may underperform stocks issued by companies with smaller capitalizations or the market as a whole.
p. Leverage Risk
Certain transactions may give rise to a form of leverage. Such transactions may include, among others, loans of securities, and the use of when-issued, delayed delivery or forward commitment transactions. The use of derivatives may also cause leveraging risk.
q. Management Risk
Each Fund is subject to the risk that the Adviser may make poor security selections. The Adviser and its portfolio managers apply their own investment techniques and risk analyses in making investment decisions for the Funds, and there can be no guarantee that these decisions will achieve the desired results for the Funds. In addition, the Adviser may select securities that underperform the relevant market of other funds with similar investment objectives and strategies.
67 | 2019 Annual Report |
|
Notes to Financial Statements (continued)
October 31, 2019
r. Market Risk
Deteriorating market conditions might cause a general weakness in the market that reduces the prices of securities in that market in which a Fund invests.
s. Mid-Cap Securities Risk
Securities of medium-sized companies tend to be more volatile and less liquid than securities of larger companies.
t. Municipal Securities Risk
Certain Funds may invest in municipal bonds which may be significantly affected by political and economic changes, including inflation, as well as uncertainties in the municipal market related to taxation, legislative changes, or the rights of municipal security holders. Municipal Bonds have varying levels of sensitivity to changes in interest rates. In general, the price of a Municipal Bond can fall when interest rates rise and can rise when interest rates fall. Interest rate risk is generally lower for shorter-term Municipal Bonds and higher for long term Municipal Bonds. Under certain market conditions, the Adviser may purchase Municipal Bonds that the Adviser perceives are undervalued. Undervalued Municipal Bonds are subject to the same market volatility and principal and interest rate risks described above. Lower quality Municipal Bonds involve greater risk of default or price changes due to changes in the credit quality of the issuer. The value of lower quality Municipal Bonds often fluctuates in response to political or economic developments and can decline significantly over short periods of time or during periods of general or regional economic difficulty. In the case of tax-exempt Municipal Bonds, if the Internal Revenue Service or state tax authorities determine that an issuer of a tax-exempt Municipal Bond has not complied with applicable tax requirements, interest from the security could become taxable at the federal, state and/or local level, and the security could decline significantly in value. Municipal Bonds are subject to credit or default risk. Credit risk is the risk that the issuer of a municipal security might not make interest and principal payments on the security as they become due.
u. Portfolio Turnover Risk
The Fund may engage in active and frequent trading of portfolio securities to achieve its investment objective. High portfolio turnover necessarily results in greater transaction costs which may reduce Fund performance. It may also result in greater realization of gains, which may include short-term gains taxable at ordinary income tax rates.
v. Private Placements and Other Restricted Securities Risk
Investments in private placements and other restricted securities, including Regulation S Securities and Rule 144A Securities, could have the effect of increasing a Fund’s level of illiquidity. Private placements and restricted securities may be less liquid than other investments because such securities may not always be readily sold in broad public markets and a Fund might be unable to dispose of such securities promptly or at prices reflecting their true value.
w. Small-Cap Securities Risk
Securities of smaller companies are usually less stable in price and less liquid than those of larger, more established companies. Therefore, they generally involve greater risk.
x. Sovereign Debt Risk
Periods of economic and political uncertainty may result in the illiquidity and increased price volatility of a foreign government’s debt securities held by a Fund and impact an issuer’s ability and willingness to pay interest or repay principal when due. A Fund may have limited recourse to compel payment in the event of a default. A foreign government’s default on its debt securities may cause the value of securities held by a Fund to decline significantly.
y. Valuation Risk
The price that a Fund could receive upon the sale of any particular portfolio investment may differ from the Fund’s valuation of the investment, particularly for securities that trade in thin or volatile markets or that are valued using a fair valuation methodology or a price provided by an independent pricing service. As a result, the price received upon the sale of an investment may be less than the value ascribed by a Fund, and such Fund could realize a greater than expected loss or lesser than expected gain upon the sale of the investment. A Fund’s ability to value its investments may also be impacted by technological issues and/or errors by pricing services or other third-party service providers.
| 2019 Annual Report | 68 |
Notes to Financial Statements (continued)
October 31, 2019
z. Variable and Floating Rate Securities Risk
For floating and variable rate obligations, there may be a lag between an actual change in the underlying interest rate benchmark and the reset time for an interest payment of such an obligation, which could harm or benefit a Fund, depending on the interest rate environment or other circumstances.
Please read the prospectus for more detailed information regarding these and other risks.
7. Contingencies
In the normal course of business, the Funds may provide general indemnifications pursuant to certain contracts and organizational documents. The Funds’ maximum exposure under these arrangements is dependent on future claims that may be made against the Funds, and therefore, cannot be estimated; however, the Funds expect, the risk of loss from such claims to be remote.
8. Tax Information
As of October 31, 2019, the tax cost of securities and the breakdown of unrealized appreciation/(depreciation) for each Fund were as follows:
|
| Tax Cost of |
| Unrealized |
| Unrealized |
| Net |
|
Select International Equity Fund |
| $156,519,970 |
| $15,883,093 |
| $(14,973,664 | ) | $ 909,429 |
|
Global Equity Impact Fund |
| 62,399,502 |
| 5,650,977 |
| (2,669,679 | ) | 2,981,298 |
|
Total Return Bond Fund |
| 181,024,904 |
| 5,031,478 |
| (616,697 | ) | 4,414,781 |
|
Global High Income Fund |
| 214,958,566 |
| 8,580,606 |
| (5,908,814 | ) | 2,671,792 |
|
The tax character of distributions paid during the fiscal year ended October 31, 2019 was as follows (total distributions paid may differ from the Statements of Changes in Net Assets because for tax purposes dividends are recognized when actually paid):
|
| Distributions paid from |
| ||||||||||
Fund |
| Ordinary |
| Net Long Term |
| Total |
| Tax Exempt |
| Return of |
| Total |
|
Select International Equity Fund |
| $ 1,282,264 |
| $– |
| $ 1,282,264 |
| $– |
| $ – |
| $ 1,282,264 |
|
Global Equity Impact Fund |
| 1,126,987 |
| – |
| 1,126,987 |
| – |
| – |
| 1,126,987 |
|
Total Return Bond Fund |
| 4,944,609 |
| – |
| 4,944,609 |
| – |
| – |
| 4,944,609 |
|
Global High Income Fund |
| 15,449,362 |
| – |
| 15,449,362 |
| – |
| 2,014,246 |
| 17,463,608 |
|
Amounts listed as “–” are $0 or round to $0.
The tax character of distributions paid during the fiscal year ended October 31, 2018 was as follows (total distributions paid may differ from the Statements of Changes in Net Assets because for tax purposes dividends are recognized when actually paid):
|
| Distributions paid from |
| ||||||||||
Fund |
| Ordinary |
| Net Long Term |
| Total |
| Tax Exempt |
| Return of |
| Total |
|
Select International Equity Fund |
| $ 8,549,592 |
| $ – |
| $ 8,549,592 |
| $– |
| $208,864 |
| $ 8,758,456 |
|
Global Equity Impact Fund |
| 2,553,669 |
| – |
| 2,553,669 |
| – |
| – |
| 2,553,669 |
|
Total Return Bond Fund |
| 8,515,486 |
| 1,637,864 |
| 10,153,350 |
| – |
| 349,106 |
| 10,502,456 |
|
Global High Income Fund |
| 13,927,941 |
| – |
| 13,927,941 |
| – |
| – |
| 13,927,941 |
|
Amounts listed as “–” are $0 or round to $0.
69 | 2019 Annual Report |
|
Notes to Financial Statements (continued)
October 31, 2019
As of October 31, 2019, the components of accumulated earnings/(deficit) on a tax basis were as follows:
Fund |
| Undistributed |
| Undistributed |
| Undistributed |
| Accumulated |
| Distributions |
| Late Year |
| Other |
| Unrealized |
| Accumulated |
| Total |
|
Select International Equity Fund |
| $– |
| $5,979,259 |
| $– |
| $– |
| $– |
| $– |
| $ – |
| $ 904,329 |
| $ (417,676,953 | ) | $ (410,793,365 | ) |
Global Equity Impact Fund |
| – |
| 1,294,955 |
| – |
| – |
| – |
| – |
| (1,991 | ) | 2,979,830 |
| (25,959,531 | ) | (21,686,737 | ) |
Total Return Bond Fund |
| – |
| 736,857 |
| – |
| – |
| – |
| – |
| – |
| 4,415,001 |
| (925,420 | ) | 4,226,438 |
|
Global High Income Fund |
| – |
| – |
| – |
| – |
| – |
| – |
| – |
| 2,679,669 |
| (235,303,374 | ) | (232,623,705 | ) |
* The difference between the book-basis and tax-basis unrealized appreciation/(depreciation) is attributable primarily to tax deferral of losses on wash sales.
** As of October 31, 2019, for Federal income tax purposes, these Funds have capital loss carryforwards available to offset capital gains, if any, to the extent provided by the Treasury regulations, with no expiration.
As of October 31, 2019, for federal tax purposes, capital loss carryforwards, as shown in the table below, were available to the extent provided by the regulations to offset future realized gains on each respective fund with no expiration.
Fund |
| Amount |
| Expires |
|
Select International Equity Fund |
| $ 15,747,962 |
| Unlimited (Short-Term) |
|
Select International Equity Fund |
| 401,928,991 |
| Unlimited (Long-Term) |
|
Global Equity Impact Fund |
| 1,077,952 |
| Unlimited (Short-Term) |
|
Global Equity Impact Fund |
| 24,881,579 |
| Unlimited (Long-Term) |
|
Total Return Bond Fund |
| 925,420 |
| Unlimited (Long-Term) |
|
Global High Income Fund |
| 53,779,090 |
| Unlimited (Short-Term) |
|
Global High Income Fund |
| 181,524,284 |
| Unlimited (Long-Term) |
|
Under the Regulated Investment Company Modernization Act of 2010, the Funds are permitted to carry forward capital losses incurred in taxable years beginning after December 22, 2010 or on the date of their formation, whichever is later, for an unlimited period. Post-enactment capital losses that are carried forward will retain their character as either short-term or long-term capital losses rather than being considered all short-term as under previous law.
GAAP requires that certain components of net assets be adjusted to reflect permanent differences between financial and tax reporting. Accordingly, the table below details the necessary reclassifications, which are a result of permanent differences primarily attributable to non-deductible excise taxes, paydown adjustments and adjustments related to reclaim expenses. These reclassifications have no effect on net assets or NAVs per share.
|
| Paid-in |
| Distributable Earnings/ |
|
Fund |
| Capital |
| (Accumulated Loss) |
|
Select International Equity Fund |
| $(2,338,571 | ) | $2,338,571 |
|
Global Equity Impact Fund |
| (429,744 | ) | 429,744 |
|
Total Return Bond Fund |
| (160,470 | ) | 160,470 |
|
Global High Income Fund |
| (22,613 | ) | 22,613 |
|
| 2019 Annual Report | 70 |
Notes to Financial Statements (concluded)
October 31, 2019
9. Significant Shareholders
As of October 31, 2019, the Funds had shareholders with the percentage ownership indicated, which are considered significant shareholders (holdings greater than 5.0%) for financial reporting purposes:
Fund |
| Record |
| Number of |
|
Select International Equity Fund |
| 67.46% |
| 3 |
|
Global Equity Impact Fund |
| 51.73 |
| 4 |
|
Total Return Bond Fund |
| 66.15 |
| 6 |
|
Global High Income Fund |
| 70.94 |
| 7 |
|
10. Line of Credit
The Trust on behalf of each of the Funds noted in the table below (the “Borrowers”) entered into a Credit Agreement (the “Agreement”) with State Street Bank and Trust Company (the “Bank”). The Agreement provides for a revolving credit facility (the “Credit Facility”) to be utilized for temporary or emergency purposes to fund shareholder redemptions or for other short-term liquidity purposes. The amount of the Credit Facility was $25,000,000 for the fiscal year ended October 31, 2019. The Funds may draw up to their stated sublimit (subject to certain other limitations therein):
|
| Sublimit |
| Average Outstanding |
| Average Weighted |
| Days |
|
Select International Equity Fund |
| $25,000,000 |
| $1,628,336 |
| 3.73% |
| 12 |
|
Global Equity Impact Fund |
| 25,000,000 |
| 31,250 |
| 3.67 |
| 4 |
|
In addition, the Trust on behalf of the Global High Income Fund entered into a separate Credit Agreement (the “Global High Income Fund Credit Agreement”) with the Bank. The Global High Income Fund Credit Agreement provides for a revolving credit facility (the “Global High Income Fund Credit Facility”) to be utilized for temporary or emergency purposes to fund shareholder redemptions or for other short-term liquidity purposes. The amount of the Global High Income Fund Credit Facility was $40,000,000 for the fiscal year ended October 31, 2019. The Global High Income Fund may draw the entire $40,000,000 (subject to certain limitations).
|
| Sublimit |
| Average Outstanding |
| Average Weighted |
| Days |
|
Global High Income Fund |
| $40,000,000 |
| $2,101,064 |
| 3.62% |
| 22 |
|
Principal on each outstanding loan made under the Agreement and the Global High Income Fund Credit Agreement bears the interest at a variable rate per annum equal to the higher of (a) the Federal Funds Rate as in effect on that day (not less than zero) plus 1.25% or (b) the One-Month London Interbank Offered Rate as in effect on that day (not less than zero) plus 1.25%. In addition, the Borrowers shall pay to the Bank a commitment fee at the rate of 0.25% per annum on the daily unused portion of each of the Credit Facility or Global High Income Fund Credit Facility, as applicable, which is allocated among the Borrowers in such manner as is determined by the Board to be reasonable.
11. Recent Accounting Pronouncements
In March 2017, the Financial Accounting Standards Board (FASB) issued Accounting Standards Update No. 2017-08, “Receivables – Nonrefundable Fees and Other Costs (Subtopic 310-20), Premium Amortization on Purchased Callable Debt Securities” (ASU 2017-08). ASU 2017-08 amends the amortization period for certain purchased callable debt securities held at a premium, shortening such period to the earliest call date. The amendments are effective for fiscal years, and interim periods within those fiscal years, beginning after December 15, 2018. Management is currently evaluating the impact that adopting ASU 2017-08 will have on the financial statements.
12. Subsequent Events
Management has evaluated the need for disclosures and/or adjustments resulting from subsequent events through the date the financial statements were issued. Based on this evaluation, no disclosures and/or adjustments were required to the financial statements as of October 31, 2019.
71 | 2019 Annual Report |
|
Report of Independent Registered Public Accounting Firm
To the Shareholders and Board of Trustees of Aberdeen Investment Funds:
Opinion on the Financial Statements
We have audited the accompanying statement of assets and liabilities of the Aberdeen Investment Funds comprised of Aberdeen Select International Equity Fund, Aberdeen Global Equity Impact Fund (formerly, Aberdeen Select International Equity Fund II), Aberdeen Total Return Bond Fund, and Aberdeen Global High Income Fund (each, a Fund and collectively, the Funds), including the statement of investments, as of October 31, 2019, the related statement of operations for the year then ended, the statements of changes in net assets for each of the years in the two-year period then ended, and the related notes (collectively, the financial statements) and the financial highlights for each of the years in the five-year period then ended. In our opinion, the financial statements and financial highlights present fairly, in all material respects, the financial position of each Fund as of October 31, 2019, the results of its operations for the year then ended, the changes in its net assets for each of the years in the two-year period then ended, and the financial highlights for each of the years in the five-year period then ended, in conformity with U.S. generally accepted accounting principles.
Basis for Opinion
These financial statements and financial highlights are the responsibility of the Funds’ management. Our responsibility is to express an opinion on these financial statements and financial highlights based on our audits. We are a public accounting firm registered with the Public Company Accounting Oversight Board (United States) (PCAOB) and are required to be independent with respect to the Funds in accordance with the U.S. federal securities laws and the applicable rules and regulations of the Securities and Exchange Commission and the PCAOB.
We conducted our audits in accordance with the standards of the PCAOB. Those standards require that we plan and perform the audit to obtain reasonable assurance about whether the financial statements and financial highlights are free of material misstatement, whether due to error or fraud. Our audits included performing procedures to assess the risks of material misstatement of the financial statements and financial highlights, whether due to error or fraud, and performing procedures that respond to those risks. Such procedures included examining, on a test basis, evidence regarding the amounts and disclosures in the financial statements and financial highlights. Such procedures also included confirmation of securities owned as of October 31, 2019, by correspondence with the custodian, brokers, or by other appropriate auditing procedures when replies from brokers were not received. Our audits also included evaluating the accounting principles used and significant estimates made by management, as well as evaluating the overall presentation of the financial statements and financial highlights. We believe that our audits provide a reasonable basis for our opinion.
![]()
We have served as the auditor of one or more Aberdeen investment companies since 2009.
Philadelphia, Pennsylvania
December 27, 2019
| 2019 Annual Report | 72 |
Other Tax Information (Unaudited)
For the period ended October 31, 2019, certain dividends paid by the Funds may be subject to a maximum tax rate of 15% as provided for by the Jobs and Growth Tax Relief Reconciliation Act of 2003. The Funds intend to designate the maximum amount allowable as taxed at a maximum rate of 15%. Complete information will be reported in conjunction with your 2019 Form 1099-DIV.
The Funds intend to elect to pass through to their shareholders the credit for taxes paid in foreign countries during its fiscal year ended October 31, 2019. In accordance with the current tax laws, the foreign income and foreign tax per share (for a share outstanding as of October 31, 2019) were as follows:
Fund |
| Foreign Tax |
|
Select International Equity Fund |
| $0.0666 |
|
Global Equity Impact Fund |
| $0.0206 |
|
For the year ended October 31, 2019, the following Funds paid qualified dividend income as follows:
Fund |
| Qualified |
|
Select International Equity Fund |
| 51.39% |
|
Global Equity Impact Fund |
| 89.14% |
|
For the taxable year ended October 31, 2019, the following percentage of income dividends paid by the Funds qualify for the dividends received deduction available to corporate shareholders:
Fund |
| Dividends Received |
|
Select International Equity Fund |
| 0.26% |
|
Global Equity Impact Fund |
| 2.55% |
|
73 | 2019 Annual Report |
|
Shareholder Expense Examples (Unaudited)
As a shareholder of the Aberdeen Investment Funds you incur ongoing costs, including investment advisory fees, shareholder service fees, distribution fees and other Fund expenses. The examples below are intended to help you understand your ongoing costs (in dollars) of investing in the Funds and to compare these costs with the ongoing costs of investing in other mutual funds.
The examples assume that you had a $1,000 investment in the Class at the beginning of the reporting period, May 1, 2019 and continued to hold your shares at the end of the reporting period, October 31, 2019.
Actual Expenses
The table below provides information about actual account values and actual expenses. You may use the information together with the amount you invested, to estimate the expenses that you paid over the period. Simply divide your account value by $1,000 (for example, an $8,600 account value divided by $1,000 = 8.6), then multiply the result by the number under the heading entitled “Actual Expenses Paid During Period” for the class of a Fund that you own to estimate the expenses you paid on your account during the period.
Hypothetical Example for Comparison Purposes
The table below provides information about hypothetical account values and hypothetical expenses based on the Class’ actual expense ratio and an assumed rate of return of 5% per year before expenses, which is not the Class’ actual return. The hypothetical account values and expenses may not be used to estimate the actual ending account balance or expenses you paid for the period. You may use this information to compare the ongoing costs of investing in the Class of a Fund and other funds. To do so, compare the 5% hypothetical example with the 5% hypothetical examples that appear in the shareholder reports of the other funds.
|
|
|
| Beginning Account |
| Actual |
| Hypothetical |
| Actual Expenses |
| Hypothetical |
| Annualized |
|
Select International Equity Fund |
| Class A |
| $1,000.00 |
| $1,015.40 |
| $1,021.88 |
| $3.35 |
| $3.36 |
| 0.66% |
|
|
| Institutional Class |
| $1,000.00 |
| $1,016.90 |
| $1,023.09 |
| $2.14 |
| $2.14 |
| 0.42% |
|
Global Equity Impact Fund |
| Class A |
| $1,000.00 |
| $1,045.10 |
| $1,018.40 |
| $6.96 |
| $6.87 |
| 1.35% |
|
|
| Institutional Class |
| $1,000.00 |
| $1,046.80 |
| $1,019.66 |
| $5.68 |
| $5.60 |
| 1.10% |
|
Total Return Bond Fund |
| Class A |
| $1,000.00 |
| $1,054.00 |
| $1,021.73 |
| $3.57 |
| $3.52 |
| 0.69% |
|
|
| Institutional Class |
| $1,000.00 |
| $1,055.10 |
| $1,022.99 |
| $2.28 |
| $2.24 |
| 0.44% |
|
Global High Income Fund |
| Class A |
| $1,000.00 |
| $1,036.90 |
| $1,020.16 |
| $5.13 |
| $5.09 |
| 1.00% |
|
|
| Institutional Class |
| $1,000.00 |
| $1,038.80 |
| $1,021.43 |
| $3.85 |
| $3.82 |
| 0.75% |
|
* Expenses are equal to the Fund’s annualized expense ratio multiplied by the average account value over the period multiplied by 184/365 (to reflect the one-half year period).
1 Represents the hypothetical 5% return before expenses.
| 2019 Annual Report | 74 |
Supplemental Information (Unaudited)
At an in-person meeting of the Board held on June 10, 2019, the Board, including a majority of the Board Members who are not “interested persons” of the Trust (the “Independent Trustees”) as that term is defined in the 1940 Act, voted to renew for a one-year period the advisory agreement (the “Advisory Agreement”) between the Adviser and the Trust, on behalf of each of Select International Equity Fund, Global Equity Impact Fund, Total Return Bond Fund and Global High Income Fund (collectively, the “Funds”). The Board, including a majority of the Independent Trustees, also voted to renew for a one-year period the sub-advisory agreement between the Adviser and the Sub-Adviser with respect to Select International Equity Fund and Global Equity Impact Fund (the “Sub-Advisory Agreement” and, together with the Advisory Agreement, the “Advisory Agreements”). The Sub-Adviser is an affiliate of the Adviser. The Adviser and the Sub-Adviser are sometimes referred to collectively as the “Advisers.”
In addition to the meeting on June 10, 2019, the Investment Management and Service Contracts Committee (the “Committee”) met on March 26, 2019, April 17, 2019, and May 22, 2019 to discuss, among other things: the peer groups proposed by an independent third party to be used for comparison of the Funds’ fees and performance; the Funds’ performance and expenses, including in-person interviews with the Advisers’ management personnel; information provided by the Advisers in response to an information request made on behalf of the Independent Trustees by their independent legal counsel; supplemental information requested from the Advisers that the Independent Trustees believed to be reasonably necessary for their review of the Advisory Agreements; and the legal standards applicable to the Board’s review.
At the request of the Committee, the Independent Trustee who is not a member of the Committee attended and participated in the Committee’s meetings.
In connection with the contract review meetings, the Independent Trustees reviewed a variety of information provided by the Advisers relating to the Funds, the Advisory Agreements and the Advisers, including comparative performance, fee and expense information and other information regarding the nature, extent and quality of services provided by the Advisers under their respective Advisory Agreements. The materials provided generally included, among other items:
· information on the investment performance of each Fund and comparative performance of peer groups of funds and each Fund’s performance benchmark;
· information on each Fund’s advisory fees and other expenses, including information comparing each Fund’s advisory fees and other expenses to those of a peer group of funds and information about any applicable expense limitations and fee “breakpoints;”
· sales and redemption data with respect to each Fund;
· information about the profitability of the Advisory Agreements to the Advisers;
· reports prepared by the Advisers in response to requests submitted by the Independent Trustees’ independent legal counsel on behalf of the Independent Trustees; and
· a memorandum from the Independent Trustees’ independent legal counsel regarding the responsibilities of the Board in considering the continuation of investment advisory and investment sub-advisory arrangements under the 1940 Act and relevant state law.
The Board, including the Independent Trustees, also considered other matters such as:
· the Advisers’ financial results and financial condition;
· each Fund’s investment objective and strategies;
· the Advisers’ investment personnel and operations;
· arrangements relating to the distribution of the Funds’ shares and the related costs;
· the procedures employed to determine the value of the Funds’ assets;
· the allocation of the Funds’ brokerage, if any, including, if applicable, allocations to brokers affiliated with the Advisers and the use, if any, of “soft” commission dollars to pay Fund expenses and to pay for research and other similar services;
· the resources devoted to, and the record of compliance with, the Funds’ investment policies and restrictions, policies on personal securities transactions and other compliance policies; and
· possible conflicts of interest.
The Board also considered the nature, extent and quality of the services provided to the Funds by the Advisers’ affiliates. Throughout the process, the Independent Trustees were afforded the opportunity to ask questions of and request additional materials from the Advisers.
In addition to the materials requested by the Independent Trustees in connection with their annual consideration of the continuation of the Advisory Agreements, the Board receives materials in advance of each regular quarterly meeting of the Board that provides information relating to the services provided by the Advisers, including detailed information about the Funds’ investment performance. This information generally includes, among other things, third-party performance rankings for various periods (including prior to the Advisers’ management of the Funds) comparing
75 | 2019 Annual Report |
|
Supplemental Information (Unaudited) (continued)
each Fund against its peer group, total return information for various periods, and details of sales and redemptions of each Fund’s shares for the period. The Board also receives periodic presentations from the portfolio management teams in connection with the performance of the Funds.
The Independent Trustees were advised by independent legal counsel throughout the process. The Independent Trustees consulted in executive sessions with such independent counsel regarding consideration of the renewal of the Advisory Agreements. In considering whether to approve the continuation of the Advisory Agreements, the Board, including the Independent Trustees, did not identify any single factor as determinative. Individual Board Members may have evaluated the information presented differently from one another, giving different weights to various factors. Matters considered by the Board, including the Independent Trustees, in connection with their approval of the continuation of the Advisory Agreements included the factors listed below.
The nature, extent and quality of the services provided to the Funds under the Advisory Agreements. The Board considered the nature, extent and quality of the services provided by the Advisers, as applicable, to the Funds and the resources dedicated to each Fund by the Advisers and their affiliates. The Board considered, among other things:
· The Advisers’ investment experience;
· The background and experience of the Advisers’ senior management personnel and the qualifications, background and responsibilities of the portfolio managers that are primarily responsible for the day-to-day portfolio management services for each Fund;
· The allocation of responsibilities among the Advisers;
· The Advisers’ roles in coordinating the activities of the Funds’ other service providers;
· Information provided on a regular basis by the Trust’s Chief Compliance Officer regarding the effectiveness of the Advisers’ compliance policies and procedures;
· The Advisers’ risk management processes;
· The Advisers’ focus on monitoring the performance of the Funds and addressing performance matters;
· The benefits to shareholders of investing in a mutual fund that is part of a family of funds that offers shareholders the right to exchange shares of one type of fund for shares of another type of fund, and provides a variety of fund and shareholder services; and
· Its knowledge of management and the quality of the performance of management’s duties through Board meetings, discussion and reports during the preceding year.
After reviewing these and related factors, the Board determined that the nature, extent and quality of the services provided to the Funds by the Advisers were extensive in nature and of high quality and supported the renewal of the Advisory Agreements.
Investment performance. The Board requested and received information about the performance of each Fund over various time periods, including information that compared the performance of each Fund to the performance of a relevant peer group of funds and its performance benchmark. When applicable, the Board considered the performance of each Fund compared to the performance of comparable funds or accounts managed by the Adviser and its affiliates. In addition, the Board reviewed data prepared by an independent third party which analyzed the performance of each Fund using a variety of performance metrics.
The Board considered the Advisers’ performance and reputation generally, the performance of the Aberdeen fund family generally, and the Advisers’ responsiveness to the Board’s concerns about performance and their willingness to take steps intended to improve performance from the time they commenced management of the Funds in 2013.
In addition to the foregoing, the Board considered the specific factors set forth below with respect to the performance of each Fund for the periods ended March 31, 2019. In each case, the Board noted that the Advisers assumed management of each Fund on May 22, 2013, and that the Funds’ performance for periods prior to that time reflects the performance of the Funds’ previous investment adviser.
Aberdeen Select International Equity Fund. The Board noted that the Select International Equity Fund had performance in the third quintile when compared to its performance group over the year-to-date, fourth quintile for the 1- and 5-year periods, fifth quintile for the 2-year period, first quintile for the 3-year period, and third quintile for the 4-year period. The Board took note that on February 28, 2019, the Fund changed its investment strategy to a “focus on change” strategy, and that the performance reflected in the benchmark comparisons to its peers was attributed to its prior investment strategy. The Board considered the effect of the change in investment strategy on the Fund’s performance since February 28 and its expected performance going forward. The Board determined that it would continue to closely monitor the Fund’s performance.
Aberdeen Global Equity Impact Fund (formerly, Aberdeen Select International Equity Fund II). The Board noted that the Global Equity Impact Fund had performance in the fifth quintile when compared to its performance group over all of the periods reviewed. However, the Board considered the fact that on February 28, 2019, the Fund changed its investment strategy to a global equity impact strategy, and that it no longer operates as an international equity fund. The Board noted that at the time the Fund changed its investment strategy, it also changed its name to Aberdeen Global Equity Impact Fund, which the Advisers believed better reflects the Fund’s new investment strategy. The Board took note that the Fund’s
| 2019 Annual Report | 76 |
Supplemental Information (Unaudited) (continued)
performance as reflected in the benchmark comparisons to its peers was attributable to its prior investment strategy. The Board considered the effect of the change in investment strategy on the Fund’s performance since February 28 and its expected performance going forward. The Board determined that it would continue to closely monitor the Fund’s performance.
Aberdeen Global High Income Fund. The Board noted that the Global High Income Fund had performance in the third quintile when compared to its performance group over the year-to-date, fourth quintile for the 1-year period, third quintile for the 2-year period, and fifth quintile for the 3-, 4-, 5- and 10-year periods. The Board brought the Fund’s performance to management’s attention and discussed with the Adviser any steps that had been or could be taken to enhance performance in the future. The Board determined that it would continue to closely monitor the Fund’s performance.
Aberdeen Total Return Bond Fund. The Board noted that the Total Return Bond Fund had performance in the second quintile when compared to its performance group over the year-to-date and 3-year period, fifth quintile for the 1-year period and third quintile for the 2-, 4-, 5- and 10-year periods. The Board brought the Fund’s performance to management’s attention and discussed with the Advisers any steps that had been or could be taken to enhance performance in the future. The Board noted that it would continue to closely monitor the Fund’s performance.
Fees paid for advisory services and expenses. The Board considered the fees charged to the Funds for advisory services as well as the total expense levels of the Funds. This information included comparisons (provided both by management and by an independent third party) of each Fund’s net management fee and total expense level to those of its peer group (the “Expense Group”) and information about the advisory fees charged by the Adviser to separately managed accounts with similar investment strategies.
In comparing each Fund’s net management fee to that of comparable funds, the Board noted that the management fee included advisory fees, but not administration fees. In considering the fees charged to any comparable accounts, the Board considered, among other things, management’s discussion of the different services required to manage the different types of accounts. In evaluating each Fund’s advisory fee, the Board also took into account the demands, complexity and quality of the investment management of the Funds.
The Board also noted that the Adviser pays the sub-advisory fees for Select International Equity Fund and Global Equity Impact Fund out of its advisory fee. The Board also considered that the Adviser had entered into expense limitation agreements with respect to the Funds, pursuant to which the Adviser agreed to waive a portion of its advisory fee and/or reimburse certain expenses to limit each such Fund’s total annual operating expenses for a period of time. Additionally, the Board considered that effective as of May 21, 2013, the Adviser agreed to waive a portion of its management fees for each of the Funds at the annual rate of 0.005% of the respective Fund’s average daily net assets.
The Board also considered other benefits directly or indirectly received by the Adviser and its affiliates from their relationships with the Funds, such as the engagement of affiliates of the Adviser to provide distribution services to the Funds.
In addition to the factors described above, the Board considered the specific factors set forth below with respect to each Fund’s fees and expenses. The Board considered the advisory fees, both contractual and after waivers and reimbursements, and also considered total expenses, both including Rule 12b-1 fees and excluding such fees.
Select International Equity Fund. The Board noted that the Fund’s contractual management fees are above the peer group median, ranked 9 of 14 funds, and that the Fund’s actual management fees are below the peer group median, ranked 6 of 14 funds. The Board also considered that the Fund’s total expenses, both including Rule 12b-1 fees and excluding such fees, ranked 13 of 14 funds in the peer group. The Board noted that as of February 28, 2019, the Fund directly pays certain fees to financial intermediaries for administrative services that were previously paid by the Adviser. However, the Board noted that the Adviser has decreased its management fees from an effective rate of 0.90% to 0.80% and has agreed generally to cap the Fund’s total expenses at 1.10% for Institutional Class Shares and 1.35% for Class A Shares (subject to certain exclusions) for at least two years.
Global Equity Impact Fund. The Board noted that the Fund’s contractual management fees are above the peer group median, ranked 9 of 10 funds, and that the Fund’s actual management fees are below the peer group median, ranked 5 of 10 funds. The Board also considered that the Fund’s total expenses, both including Rule 12b-1 fees and excluding such fees, ranked 10 of 10 funds in the peer group. The Board noted that as of February 28, 2019, the Fund directly pays certain fees to financial intermediaries for administrative services that were previously paid by the Adviser. However, the Board noted that the Adviser has decreased its management fees from an effective rate of 0.90% to 0.80% and has agreed generally to cap the Fund’s total expenses at 1.10% for Institutional Class Shares and 1.35% for Class A Shares (subject to certain exclusions) for at least two years.
Global High Income Fund. The Board considered that the Fund’s contractual management fees are above the peer group median, ranked 11 of 16 funds, and that the Fund’s actual management fees are below the peer group median, ranked 3 of 16 funds. The Board noted that the Fund’s total expenses, both including Rule 12b-1 fees and excluding such fees, are slightly lower than the median, ranked 7 and 8, respectively, of 16 funds in the peer group. The Board noted that as of February 28, 2019, the Fund directly pays certain fees to financial intermediaries for administrative services that were previously paid by the Adviser, and that the Adviser has agreed to cap the Fund’s expenses at current levels for at least one year.
77 | 2019 Annual Report |
|
Supplemental Information (Unaudited) (concluded)
Aberdeen Total Return Bond Fund. The Board considered that the Fund’s contractual management fees are below the peer group median, ranked 7 of 18 funds, and that the Fund’s actual management fees are below the peer group median, ranked 1 of 18 funds. The Board noted that the Fund’s total expenses, both including Rule 12b-1 fees and excluding such fees, are lower than the median, ranked 5 of 18 funds in the peer group. The Board noted that as of February 28, 2019, the Fund directly pays certain fees to financial intermediaries for administrative services that were previously paid by the Adviser, and that the Adviser has agreed to cap the Fund’s expenses at current levels for at least one year.
The Independent Trustees asked for, and received, information about the fees paid by other funds and accounts managed by the Adviser. The Independent Trustees considered the nature of the other accounts, which included comingled and separately managed accounts. The Independent Trustees noted the differences in managing the Funds compared to other accounts managed by the Advisers, including, among other things, the complexity of managing the Funds in light of regulatory, tax and compliance considerations resulting from the Funds’ status as registered investment companies.
After reviewing these and related factors, and taking into account management’s discussion regarding Fund expenses, the Board concluded that the advisory fees and, as applicable, the sub-advisory fees, were fair and reasonable, and that the costs of these services generally and the related profitability of the Adviser and its affiliates from their relationships with the Funds were reasonable and supported the renewal of the Advisory Agreements.
Economies of Scale. The Board considered the existence of any economies of scale in the provision of services by the Advisers and whether those economies would be shared with the Funds through breakpoints in the investment advisory fees or other means, such as expense waivers or limitations. The Board noted that the Funds benefitted from an expense limitation agreement, and that the fees of the Select International Equity Fund, Global Equity Impact Fund and Global High Income Fund were subject to breakpoints, albeit at much higher levels than the Funds’ current net assets. The Board considered the Adviser’s belief that the Total Return Bond Fund does not have breakpoints at this time because this Fund has a lower overall fee structure.
The Board also considered the potential effect of each Fund’s size on fees, noting that if a Fund’s assets increase over time, the Fund may realize other economies of scale if assets increase proportionally more than some expenses. The Board took note of the decline in the Funds’ assets and the effect of such decline on the Funds’ expense ratios.
Profitability and costs. The Board examined the profitability of the Advisers and its affiliates on a Fund-by-Fund basis. The Board also considered information about the expense allocation methodology used to calculate profitability. When reviewing the Advisers’ profitability, the Board considered guidance from the Securities and Exchange Commission and the courts regarding adviser profitability, the performance of the Funds, the expense levels of the Funds, and whether the Adviser had implemented breakpoints, if any, and expense limitations, with respect to the Funds. The Board noted that over the past two years, the Advisers’ profitability attributable to the Funds declined significantly as a result of the decline of the Funds’ assets. The Advisers provided assurances that they were committed to continuing to provide a high level of services to the Funds.
Other factors. The Board also considered other factors, which included, but were not limited to, the following:
· the effect of any market and economic volatility on the performance, asset levels and expense ratios of the Funds;
· whether the Funds have operated in accordance with their investment objectives, the Funds’ record of compliance with their investment restrictions, and the compliance programs of the Trust and the Advisers. The Trustees also considered the compliance-related resources that the Advisers and their affiliates provide to the Funds;
· the Advisers’ financial condition and ability to continue to provide a high level of service under the Advisory Agreements; and
· so-called “fallout benefits” to the Advisers, such as the benefits of research made available to the Advisers by reason of brokerage commissions generated by the Funds’ securities transactions or reputational and other indirect benefits. The Board considered any possible conflicts of interest associated with these fallout and other benefits, and the reporting, disclosure and other processes in place to disclose and monitor such possible conflicts of interest.
* * *
Based on their evaluation of factors that they deemed to be material, including but not limited to those factors described above, the Independent Trustees concluded, in the exercise of their reasonable business judgment, that the advisory fee and, as applicable, sub-advisory fee structures, were reasonable in light of the nature and quality of the services provided, and recommended that renewal of the Advisory Agreements would be in the best interest of each Fund and its shareholders. Accordingly, the Board, with the Independent Trustees voting separately, approved the Advisory Agreements for an additional one-year period.
| 2019 Annual Report | 78 |
Management of the Funds (Unaudited)
As of October 31, 2019
Board of Trustees and Officers of the Funds
Name, Address, |
| Position(s) |
| Principal Occupation |
| Number of |
| Other |
Trustees who are not Interested Persons (as Defined in the 1940 Act) of the Funds | ||||||||
|
|
|
|
|
|
|
|
|
Antoine Bernheim**** |
| Trustee of the Trust since November 2004; Chairman of the Fund Complex since December 2008. |
| President, Dome Capital Management, Inc., 1984-present (investment advisory firm); President, The U.S. Offshore Funds Directory, 1990-present (publishing). |
| 4 |
| Alphadyne International Fund, Alphadyne International (Erisa) Fund, Alphadyne Global Rates Fund, 2018-present |
|
|
|
|
|
|
|
|
|
Thomas Gibbons**** |
| Trustee of the Trust since November 2004. |
| President, Cornerstone Associates Management, 1987-present (consulting firm). |
| 4 |
| None |
|
|
|
|
|
|
|
|
|
Peter Wolfram**** |
| Trustee of the Trust since June 1992. |
| Partner, Kelley Drye & Warren LLP, 1983-present (law firm). |
| 4 |
| None |
|
|
|
|
|
|
|
|
|
* | Each Trustee serves during the lifetime of the Funds or until he or she dies, resigns, retires, is declared bankrupt or incompetent, or is removed or, if sooner, until the next special meeting of the Funds’ shareholders and until the election and qualification of his or her successor. The current retirement age is 75. |
|
|
** | The Aberdeen Fund Complex consists of the Trust, which contains four portfolios, Aberdeen Funds (which contains 24 portfolios), Aberdeen Standard Investments ETFs (which contains 5 portfolios), Aberdeen Asia-Pacific Income Fund, Inc., Aberdeen Global Income Fund, Inc., Aberdeen Australia Equity Fund, Inc., Aberdeen Emerging Markets Equity Income Fund, Inc., The India Fund, Inc., Aberdeen Japan Equity Fund, Inc., Aberdeen Income Credit Strategies Fund, Aberdeen Global Dynamic Dividend Fund, Aberdeen Global Premier Properties Fund, and Aberdeen Total Dynamic Dividend Fund. |
|
|
*** | Directorships (excluding Fund Complex) held in (1) any other investment companies registered under the 1940 Act, (2) any company with a class of securities registered pursuant to Section 12 of the Securities Exchange Act of 1934, as amended (the “Exchange Act”) or (3) any company subject to the requirements of Section 15(d) of the Exchange Act. |
�� |
|
**** | Each Trustee may be contacted by writing to the Trustee c/o Aberdeen Standard Investments Inc., 1900 Market Street, Suite 200, Philadelphia, Pennsylvania 19103, Attn: Alan Goodson. |
79 | 2019 Annual Report |
|
Management of the Funds (Unaudited) (continued)
As of October 31, 2019
Name, Address, |
| Position(s) |
| Principal Occupation |
| Number of |
| Other |
Trustee who is an Interested Person (as Defined in the 1940 Act) of the Funds | ||||||||
|
|
|
|
|
|
|
|
|
Bev Hendry****† |
| Trustee of the Trust since February 2017 |
| Chairman – Americas for Aberdeen Standard Investments (2018-present); Chief Executive Officer – Americas for Aberdeen Asset Management PLC (2014-2018); Chief Operating Officer for Hansberger Global Investors (2008-2014) |
| 4 |
| Aberdeen Standard Investments Inc. (2014-present) (investment adviser) |
|
|
|
|
|
|
|
|
|
* | Each Trustee serves during the lifetime of the Funds or until he or she dies, resigns, retires, is declared bankrupt or incompetent, or is removed or, if sooner, until the next special meeting of the Funds’ shareholders and until the election and qualification of his or her successor. The current retirement age is 75. |
|
|
** | The Aberdeen Fund Complex consists of the Trust, which contains four portfolios, Aberdeen Funds (which contains 24 portfolios), Aberdeen Standard Investments ETFs (which contains 5 portfolios), Aberdeen Asia-Pacific Income Fund, Inc., Aberdeen Global Income Fund, Inc., Aberdeen Australia Equity Fund, Inc., Aberdeen Emerging Markets Equity Income Fund, Inc., The India Fund, Inc., Aberdeen Japan Equity Fund, Inc., Aberdeen Income Credit Strategies Fund, Aberdeen Global Dynamic Dividend Fund, Aberdeen Global Premier Properties Fund, and Aberdeen Total Dynamic Dividend Fund. |
|
|
*** | Directorships (excluding Fund Complex) held in (1) any other investment companies registered under the 1940 Act, (2) any company with a class of securities registered pursuant to Section 12 of the Securities Exchange Act of 1934, as amended (the “Exchange Act”) or (3) any company subject to the requirements of Section 15(d) of the Exchange Act. |
|
|
**** | Each Trustee may be contacted by writing to the Trustee c/o Aberdeen Standard Investments Inc., 1900 Market Street, Suite 200, Philadelphia, Pennsylvania 19103, Attn: Alan Goodson. |
|
|
† | Mr. Hendry is considered to be an “interested person” of the Funds as defined in the 1940 Act because of his affiliation with the Adviser. |
| 2019 Annual Report | 80 |
Management of the Funds (Unaudited) (continued)
As of October 31, 2019
Officers of the Funds
Name, Address, |
| Position(s) |
| Principal Occupation |
Bev Hendry* |
| President and Chief Executive Officer Officer of the Trust since 2014 |
| Chairman – Americas for Aberdeen Standard Investments (2018-present); Chief Executive Officer – Americas for Aberdeen Asset Management PLC (2014-2018); Chief Operating Officer for Hansberger Global Investors (2008-2014) |
|
|
|
|
|
Joseph Andolina* |
| Chief Compliance Officer, Anti-Money Laundering and Identity Theft Officer and Vice President Officer of the Trust since 2019 |
| Currently, Chief Risk Officer and Head of Conduct and Compliance – Americas and Vice President for Aberdeen Standard Investments Inc. Mr. Andolina joined ASI in 2012 |
|
|
|
|
|
Andrea Melia* |
| Chief Financial Officer and Treasurer Officer of the Trust since 2013 |
| Currently, Vice President and Head of Fund Operations, Traditional Assets – Americas for Aberdeen Standard Investments Inc. Ms. Melia joined ASI in September 2009. |
|
|
|
|
|
Megan Kennedy* |
| Assistant Secretary and Vice President Officer of the Trust since 2013 |
| Currently, Head of Product Management for Aberdeen Standard Investments Inc. Ms. Kennedy joined ASI in 2005. |
|
|
|
|
|
Lucia Sitar* |
| Chief Legal Officer and Vice President Officer of the Trust since 2013 |
| Currently, Vice President and Managing U.S. Counsel for Aberdeen Standard Investments Inc. Ms. Sitar joined ASI in July 2007. |
|
|
|
|
|
Alan Goodson* |
| Vice President Officer of the Trust since 2013 |
| Currently, Head of Product – U.S., overseeing Product Management and Product Development for registered and unregistered investment companies in the U.S. and Canada. Mr. Goodson is Director and Vice President of Aberdeen Standard Investments Inc. and joined ASI in 2000. |
|
|
|
|
|
Dominic Byrne |
| Vice President Officer of the Trust since 2019 |
| Currently, Deputy Head of Global Equities for Aberdeen Standard Investments. Mr. Byrne joined ASI in 2000. |
|
|
|
|
|
Steven Logan* |
| Vice President Officer of the Trust since 2016 |
| Currently, Head of Euro High Yield & Global Leverage Loans for Aberdeen Standard Investments. Mr. Logan joined ASI following the SWIP acquisition in April 2014. |
|
|
|
|
|
81 | 2019 Annual Report |
|
Management of the Funds (Unaudited) (concluded)
As of October 31, 2019
Name, Address, |
| Position(s) |
| Principal Occupation |
Ben Moser* |
| Vice President Officer of the Trust since 2018 |
| Currently, Head of Investor Services US. Mr. Moser joined ASI in July 2008. |
|
|
|
|
|
Lynn Chen |
| Vice President Officer of the Trust since 2016 |
| Currently, Head of Total Return Bond for Aberdeen Standard Investments Inc. Ms. Chen joined ASI in May 2013 following the acquisition of Artio Global Management. |
|
|
|
|
|
Rebecca Gilding |
| Secretary Officer of the Trust since 2019 |
| Vice President and Managing Counsel, State Street Bank and Trust Company (since 2016). |
|
|
|
|
|
Eric Olsen* |
| Assistant Treasurer Officer of the Trust since 2016 |
| Currently, Deputy Head of Fund Operations, Traditional Assets – Americas for Aberdeen Standard Investments Inc. Mr. Olsen joined ASI in August 2013. |
|
|
|
|
|
Brian O’Neill* |
| Assistant Treasurer Officer of the Trust since 2013 |
| Currently, Senior Fund Administration Manager – U.S. for Aberdeen Standard Investments Inc. Mr. O’Neill joined ASI in 2008. |
|
|
|
|
|
Jeffrey Cotton* |
| Vice President – Compliance Officer of the Trust since 2017 |
| Currently, Chief Risk Officer – Europe, the Middle East and Africa. Mr. Cotton joined ASI in 2010. |
|
|
|
|
|
Stephen Varga* |
| Assistant Secretary Officer of the Trust since 2017 |
| Currently, Senior Product Manager for Aberdeen Standard Investments Inc. Mr. Varga joined ASI in 2011. |
|
|
|
|
|
1 | Pursuant to the Trust’s By-laws, officers of the Trust are elected by the Board of Trustees to hold such office until his or her successor is chosen and qualified, or until they resign or are removed from office. |
|
|
* | Mr. Hendry, Mr. Cotton, Ms. Melia, Mr. Olsen, Mr. O’Neill, Ms. Kennedy, Ms. Sitar, Mr. Goodson, Mr. Logan, Mr. Andolina, Mr. Moser, and Mr. Varga hold officer position(s) in one or more of the following: Aberdeen Funds, Aberdeen Standard Investments ETFs, Aberdeen Asia-Pacific Income Fund, Inc., Aberdeen Global Income Fund, Inc., Aberdeen Australia Equity Fund, Inc., Aberdeen Emerging Markets Equity Income Fund, Inc., The India Fund, Inc., Aberdeen Japan Equity Fund, Inc., Aberdeen Income Credit Strategies Fund, Aberdeen Global Dynamic Dividend Fund, Aberdeen Global Premier Properties Fund, and Aberdeen Total Dynamic Dividend Fund, each of which may also be deemed to be a part of the same “Fund Complex” as the Funds. |
| 2019 Annual Report | 82 |
Management Information
|
Trustees | Distributor |
Antoine Bernheim, Chairman | Aberdeen Fund Distributors LLC |
Thomas Gibbons | 1900 Market Street, Suite 200 |
Bev Hendry | Philadelphia, PA 19103 |
Peter Wolfram |
|
| Fund Administrator, Custodian & Fund Accountant |
Investment Adviser | State Street Bank and Trust Company |
Aberdeen Standard Investments Inc. | 1 Lincoln Street |
1900 Market Street, Suite 200 | Boston, MA 02111 |
Philadelphia, PA 19103 |
|
| Independent Registered Public Accounting Firm |
Transfer Agent | KPMG LLP |
DST Asset Manager Solutions, Inc. | 1601 Market Street |
430 W. 7th Street Ste. 219534 | Philadelphia, PA 19103 |
Kansas City, MO 64105-1407 |
|
| Fund Counsel |
| Shearman & Sterling LLP |
| 599 Lexington Avenue |
| New York, NY 10022 |
|
Aberdeen Standard Investments Inc.
1900 Market Street, Suite 200
Philadelphia, PA 19103
aberdeenstandard.com/us
AOE-0377-AR |
|

Item 2. Code of Ethics.
(a) As of October 31, 2019, the Registrant had adopted a code of ethics that applies to the Registrant’s principal executive officer, principal financial officer, principal accounting officer or controller, or persons performing similar functions, regardless of whether these individuals are employed by the Registrant or a third party (the “Code of Ethics”).
(b) No disclosures are required by this Item 2(b).
(c) During the period covered by the report, no material changes were made to the provisions of the Code of Ethics.
(d) During the period covered by the report, the Registrant did not grant any waivers to the provisions of the Code of Ethics.
(e) Not applicable.
(f) The Code of Ethics is included with this Form N-CSR as Exhibit 13(a)(1).
Item 3. Audit Committee Financial Expert.
The Registrant’s Board of Trustees has determined that there is at least one member who qualifies as an “audit committee financial expert” serving on its Audit Committee. Mr. Antoine Bernheim is the “audit committee financial expert” and is considered to be an “Independent Trustee” as each term is defined in Item 3 of Form N-CSR.
Item 4. Principal Accountant Fees and Services.
Fiscal |
| (a) |
| (b) |
| (c)1 |
| (d)2 |
October 31, 2019 |
| $137,700 |
| $ - |
| $34,800 |
| $56,902 |
|
|
|
|
|
|
|
|
|
October 31, 2018 |
| $137,700 |
| $ - |
| $34,800 |
| $55,539 |
1 The Tax Fees are the aggregate fees billed for professional services rendered by KPMG LLP for the review of Form 1120-RIC, Form 8613, and review of excise tax distribution calculations.
2 Fees include services related to pursuing Article 63 European Union Tax Reclaims related to prior years.
(e)(1) Audit Committee Pre-Approval Policies and Procedures. The Registrant’s audit committee pre-approves all audit and non-audit services to be performed by the Registrant’s accountant before the accountant is engaged by the Registrant to perform such services.
(e)(2) The percentage of services described in each of paragraphs (b) through (d) of this Item that were approved by the audit committee pursuant to paragraph (c)(7)(i)(C) of Rule 2-01 of Regulation S-X are as follows:
(b) None.
(c) None.
(d) Not applicable.
(f) Not applicable.
(g) The aggregate non-audit fees billed by the Registrant’s accountant for services rendered to the Registrant and to the Registrant’s investment adviser and all entities controlling, controlled by, or under common control with the Adviser that provide services to the Registrant for the Registrant’s fiscal years ended October 31, 2019 and October 31, 2018 were $761,041 and $895,227, respectively.
(h) The Registrant’s Audit Committee of the Board of Trustees has considered whether the provision of non-audit services that were rendered to the Registrant’s investment adviser (not including any sub-adviser whose role is primarily portfolio management and is subcontracted with or overseen by another investment adviser), and any entity controlling, controlled by, or under common control with the investment adviser that provides ongoing services to the Registrant that were not pre-approved pursuant to paragraph (c)(7)(ii) or Rule 2-01 of Regulation S-X is compatible with maintaining the principal accountant’s independence and has concluded that it is.
Item 5. Audit Committee of Listed Registrants.
Not applicable.
Item 6. Investments
(a) Included as part of the Reports to Shareholders filed under Item 1 of this Form N-CSR.
(b) Not applicable.
Item 7. Disclosure of Proxy Voting Policies and Procedures for Closed-End Management Investment Companies.
Not applicable.
Item 8. Portfolio Managers of Closed-end Management Investment Companies.
Not applicable.
Item 9. Purchases of Equity Securities by Closed-End Management Investment Company and Affiliated Purchasers.
Not applicable.
Item 10. Submission of Matters to a Vote of Security Holders.
During the period ended October 31, 2019, there were no material changes to the procedures by which shareholders may recommend nominees to the Registrant’s Board of Trustees.
Item 11. Controls and Procedures.
(a) The Registrant’s principal executive and principal financial officers, or persons performing similar functions, have concluded that the Registrant’s disclosure controls and procedures (as defined in Rule 30a-3(c) under the Investment Company Act of 1940 (the “Act”) (17 CFR 270.30a-3(c))) are effective, as of a date within 90 days of the filing date of the report that includes the disclosure required by this paragraph,
based on the evaluation of these controls and procedures required by Rule 30a-3(b) under the Act (17 CFR 270.30a-3(b)) and Rule 13a-15(b) or 15d-15(b) under the Securities Exchange Act of 1934 (17 CFR 240.13a-15(b) or 240.15d-15(b)).
(b) There were no changes in the Registrant’s internal control over financial reporting (as defined in Rule 30a-3(d) under the Act (17 CFR 270.30a-3(d)) that occurred during the period covered by this report that has materially affected, or are reasonably likely to materially affect, the Registrant’s internal control over financial reporting.
Item 12. Disclosure of Securities Lending Activities for Closed-End Management Investment Companies.
Not applicable.
Item 13. Exhibits.
(a)(1) The Code of Ethics of the Registrant for the period covered by this report as required pursuant to Item 2 of this Form N-CSR.
(a)(2) Certifications pursuant to Rule 30a-2(a) under the Act and Section 302 of the Sarbanes-Oxley Act of 2002 are attached hereto.
(a)(3) Not applicable.
(a)(4) Not applicable.
(b) Certifications pursuant to Rule 30a-2(b) under the Act and Section 906 of the Sarbanes-Oxley Act of 2002 are attached hereto.
SIGNATURES
Pursuant to the requirements of the Securities Exchange Act of 1934 and the Investment Company Act of 1940, as amended, the Registrant has duly caused this report to be signed on its behalf by the undersigned, thereunto duly authorized.
Aberdeen Investment Funds
By: | /s/ Bev Hendry |
|
Bev Hendry | ||
Principal Executive Officer of | ||
Aberdeen Investment Funds | ||
Date: January 8, 2020
Pursuant to the requirements of the Securities Exchange Act of 1934 and the Investment Company Act of 1940, as amended, this report has been signed below by the following persons on behalf of the Registrant and in the capacities and on the dates indicated.
By: | /s/ Bev Hendry |
|
Bev Hendry | ||
Principal Executive Officer of | ||
Aberdeen Investment Funds | ||
| ||
Date: January 8, 2020 | ||
By: | /s/ Andrea Melia |
|
Andrea Melia | ||
Principal Financial Officer of | ||
Aberdeen Investment Funds | ||
| ||
Date: January 8, 2020 | ||