UNITED STATES
SECURITIES AND EXCHANGE COMMISSION
Washington, D.C. 20549
FORM N-CSR
CERTIFIED SHAREHOLDER REPORT OF REGISTERED
MANAGEMENT INVESTMENT COMPANIES
Investment Company Act file number: 811-06652
Aberdeen Investment Funds
Exact name of registrant as specified in charter:
1735 Market Street, 32nd Floor
Philadelphia, PA 19103
Address of principal executive offices:
Ms. Andrea Melia
Aberdeen Asset Management Inc.
1735 Market Street, 32nd Floor
Philadelphia, PA 19103
Name and address of agent for service:
Registrant’s telephone number, including area code: 866-667-9231
Date of fiscal year end: October 31
Date of reporting period: October 31, 2018
Item 1. Reports to Shareholders.

Aberdeen Investment Funds
Annual Report
October 31, 2018
Aberdeen Select International Equity Fund
Aberdeen Select International Equity Fund II
Aberdeen Total Return Bond Fund
Aberdeen Global High Income Fund

| Page 1 | ||||
| Page 3 | ||||
| Page 10 | ||||
| Page 16 | ||||
| Page 28 | ||||
| Page 38 | ||||
| Page 52 | ||||
| Page 72 | ||||
| Page 73 | ||||
| Page 74 | ||||
| Page 75 | ||||
| Page 79 | ||||
Investors should carefully consider a fund’s investment objectives, risks, fees, and expenses before investing any money. To obtain this and other fund information, please call 866-667-9231 to request a prospectus, or download a prospectus at www.aberdeen-asset.us. Please read it carefully before investing any money.
Investing in mutual funds involves risk, including possible loss of principal.
Aberdeen Select International Equity Fund, Aberdeen Select International Equity Fund II, Aberdeen Total Return Bond Fund, and Aberdeen Global High Income Fund, (each a “Fund” and collectively the “Funds”) are distributed by Aberdeen Fund Distributors, LLC, Member FINRA, 1735 Market Street, 32nd Floor, Philadelphia, PA 19103.
Aberdeen Asset Management Inc. (AAMI) has been registered as an investment adviser under the Investment Advisers Act of 1940 since August 23,1995. Registration with the Securities and Exchange Commission does not imply any certain level of skill or training.
Statement Regarding Availability of Quarterly Portfolio Schedule.
The complete schedule of portfolio holdings for the Aberdeen Investment Funds is included in the Funds’ semi-annual and annual reports to shareholders. The Funds file complete schedules of portfolio holdings for each Fund with the Securities and Exchange Commission (the “SEC”) for the first and third quarters of each fiscal year on Form N-Q. The Funds’ Forms N-Q are available on the SEC’s website at http://www.sec.gov. The Funds’ Forms N-Q may be reviewed and copied at the SEC’s Public Reference Room in Washington, DC, and information on the operation of the Public Reference Room may be obtained by calling 800-SEC-0330. The Funds make their most recent Forms N-Q available to shareholders on www.aberdeen-asset.us or upon request without charge.
Statement Regarding Availability of Proxy Voting Record.
Information regarding the policies and procedures that the Funds use to determine how to vote proxies relating to portfolio securities is available without charge, upon request, by calling 866-667-9231. The information is also included in the Funds’ Statement of Additional Information, which is available on the Funds’ website at www.aberdeen-asset.us and on the SEC’s website at www.sec.gov.
Information relating to how each Fund voted proxies relating to portfolio securities held during the most recent twelve months ended June 30 is available by August 30 of the relevant year: (i) upon request and without charge by calling 866-667-9231; and (ii) on the SEC’s website at www.sec.gov.
Global financial markets weathered numerous bouts of significant volatility during the 12-month period ended October 31, 2018, capped off by a major downturn in October 2018. Global stock markets in aggregate gained ground for the first few months of the period, as generally upbeat corporate earnings reports, tax reform in the U.S., and relatively steady economic growth buoyed investors’ confidence. However, market sentiment soon turned negative amid concerns that rising inflation could lead to more aggressive global central bank monetary policy, as well as fears of a possible global trade war spurred by tensions between the U.S and China. Global equities recovered during the third quarter of 2018, led by the U.S., with the broader-market Standard and Poor’s (S&P) 500 Index1 climbing 7.7% – its strongest quarterly performance since 2013. Nonetheless, in an apparent case of “financial whiplash,” global markets declined sharply towards the end of the reporting period in October. Investors were rattled by concerns ranging from lower corporate earnings estimates to the impact of continued monetary policy normalization. There also was a spike in U.S. Treasury yields during the month, triggered by expectations of further U.S. Federal Reserve (Fed) interest-rate increases. Shares of technology companies tumbled as higher interest rates led to investors’ apprehension about the rising valuations in the sector.
There was divergent performance among the regional stock markets during the 12-month reporting period. The Morgan Stanley Capital International (MSCI) World Index,2 a global equity market benchmark, posted a modest gain of 1.7% for the period, despite the vast majority of its constituents recording losses for the period. The U.S. was the lone major developed market to garner a positive return, while European stocks declined and were the weakest performers. Global emerging equity markets, as represented by the MSCI Emerging Markets Index,3 fell 12.2% over the reporting period, hampered by the strengthening U.S. dollar, which weighed on vulnerable economies with substantial foreign debt. The escalating trade tensions between the U.S. and China had a negative impact on Asia-Pacific stock markets, which declined 11.8% for the period, as measured by the MSCI All Country (AC) Asia Pacific ex Japan Index.4
While shares of U.S. companies could not avoid the sell-off in the global financial markets in October 2018, they finished the 12-month reporting period in positive territory. The U.S. market was bolstered for most of the period by generally positive economic data and corporate earnings reports, as well as the tax reform legislation that was enacted in late 2017. Many large-cap companies responded to the reduction of the top U.S. corporate tax rate from 35% to 21% by increasing their dividend payments and accelerating share repurchases. Late in the period, however, as investors worried that rising wage pressure and inflation could force the Fed to tighten monetary policy more aggressively than previously forecast. U.S. large-cap stocks, as represented by the S&P 500 Index, gained 7.4% during the reporting period, substantially outperforming the corresponding 2.8% and 1.9% returns of their mid- and small-cap counterparts, as measured by the Russell Midcap5 and Russell 20006 indices, respectively.
Shares of large-cap companies in the Asia-Pacific region fell sharply over the reporting period, hampered in part by investors’ concerns about a possible U.S.-China trade war. In June 2018, the administration of U.S. President Donald Trump assessed tariffs on US$50 billion in Chinese imports. Three months later, the U.S. placed an additional US$200 billion of levies on Chinese imports. China responded without escalating rhetoric while allowing its currency, the renminbi, to depreciate further against the U.S. dollar. Additionally, the weak investor sentiment in mainland China was compounded by fears over the country’s moderating economic growth.
One of the key reasons for the weakness in emerging-market equities was the liquidity squeeze on the U.S. dollar, stemming from the U.S. tax reforms that encouraged U.S. companies to repatriate7 their cash, as well as the Fed’s hawkish monetary policy stance. Turkey bore the brunt of the downturn amid worries about the central bank’s unwillingness to adopt orthodox economic policies and the government’s deteriorating relations with the U.S. In Mexico, Andres Lopez Obrador, the left-wing candidate, won Mexico’s presidential election in July 2018. While this outcome was expected, the market has become increasingly concerned with his plans to unwind some of the reforms that had occurred under his predecessor, Pena Nieto. Japan’s longest economic growth streak in 28 years stalled in the first quarter of 2018, but the economy subsequently resumed its momentum. An upgrade of second-quarter 2018 gross domestic product (GDP) data was attributable to an increase in capital investments. This was partly the result of the tight Japanese labor market, which saw the unemployment rate reach its lowest since the 1990s, boosting investments in labor-saving technologies.
Regarding the global fixed-income markets during the reporting period, capital outflows from emerging markets quickened due to the Fed’s ongoing rate-hike cycle and rising U.S. Treasury yields. As monetary policy normalization accelerated in the West, the easing cycle also came to an end in most parts of Asia. Indonesia’s central bank led the charge, raising its benchmark interest rate five times over the reporting period in a bid to stem the falling Indonesian rupiah as most emerging-market currencies succumbed to broad U.S.-dollar strength. Central banks in the Philippines and India also increased interest rates, but more in response to rising inflation, given the threat posed by higher global oil prices after U.S. President Trump reimposed economic sanctions on Iran. Yields on U.S. Treasuries rose, with two-, five- and ten year yields increasing by 127, 97 and 77 basis points (bps), respectively, over the reporting period, and this pressured higher-quality, lower-yielding and longer duration8 credit. U.S. and European high-yield markets saw marginal gains over the reporting period. Corporate earnings remained supported by generally positive economic growth, while default rates remained low. Supply was also lower than that in 2017 as companies, faced with rising borrowing costs, responded by reducing new issuance. However, investor sentiment in the U.S. deteriorated towards the end of the reporting period as trade tensions with China worsened and businesses began to forecast more conservative revenues and profitability in the ensuing quarters.
| 2018 Annual Report | 1 |
Market Review (concluded)
Global real estate equity markets faced a challenging environment during the reporting period. While the Financial Times Stock Exchange European Public Real Estate Association/National Association of Real Estate Investment Trusts (FTSE EPRA/NAREIT) Global Real Estate Index9 ended the period with a modest negative return, there were considerable variations in country-level returns. The performance of real estate markets in developed countries was modestly positive, while emerging markets generally posted negative returns for the reporting period.
Outlook
As we near the end of 2018, global financial markets are beset by worries over rising interest rates, trade tensions and a slowing global economy. Although the U.S. market initially appeared to be indifferent to these concerns, the technology rally which had underpinned the current bull market appears to have faltered. Other threats remain, including Italy’s fiscal problems and political uncertainty in Europe caused by negotiations surrounding the UK’s exit from the EU (“Brexit”), which have yet to provide clarity on what the outcome will be for the UK or Europe.
The UK remains a member of the EU until the legally established departure date of March 29, 2019 and, until such date, all existing EU-derived laws and regulations continue to apply in the UK. Those laws may continue to apply for a transitional period, depending on whether a deal is struck and, if so, what that deal is. In any event, the UK’s on-shoring of EU legislation currently envisages no policy changes to EU law. However, the EU has not yet provided any material cushion from the effects of Brexit for financial services as a matter of EU law. Whether or not a Fund invests in securities of issuers located in Europe (whether the EU, Eurozone or UK) or with significant exposure to European, EU, Eurozone or UK issuers or countries, the unavoidable uncertainties and events related to Brexit could negatively affect the value and liquidity of a Fund’s investments, increase taxes and costs of business and cause volatility in currency exchange rates and interest rates. Brexit could adversely affect the performance of contracts in existence at the date of Brexit and European, UK or worldwide political, regulatory, economic or market conditions and could contribute to instability in political institutions, regulatory agencies and financial markets. Brexit could also lead to legal uncertainty and politically divergent national laws and regulations as a new relationship between the UK and EU is defined and the UK determines which EU laws to replace or replicate. Any of these effects of Brexit, and others that cannot be anticipated, could adversely affect a Fund’s business, results of operations and financial condition. In addition, the risk that Standard Life Aberdeen plc, the parent of the companies that provide investment advisory and sub-advisory services to the Funds and which is headquartered in the UK, fails to adequately prepare for Brexit could have significant customer, reputation and capital impacts for Standard Life Aberdeen plc and its subsidiaries, including those providing services to the Funds; however, we have detailed contingency planning in place to seek to manage the consequences of Brexit on the Funds and to avoid any disruption on the Funds and to the services we provide. Given the fluidity and complexity of the situation, however, we cannot assure that the Funds will not be adversely impacted despite our preparations.
We remain cautious on the growing divergence across global markets, with strength in U.S. macroeconomic data contrasting with slowing growth across other economies and markets. With the U.S. economy gradually moving closer towards full capacity, the Federal Reserve maintains its monetary policy tightening stance and is expected to continue to raise interest rates into 2019. In Asia, China continues to balance further trade-related responses towards the U.S. with managing and maintaining its closely monitored economic growth rates.
Aberdeen Standard Investments
| 1 | The S&P 500 Index is an unmanaged index considered representative of the U.S. stock market. Indexes are unmanaged and have been provided for comparison purposes only. No fees or expenses are reflected. You cannot invest directly in an index. |
| 2 | The MSCI World Index tracks the performance of large- and mid-cap stocks across 23 developed-market countries. |
| 3 | The MSCI Emerging Markets Index tracks the performance of large- and mid-cap stocks across 24 emerging-market countries. |
| 4 | The MSCI AC Asia Pacific ex Japan Index tracks the performance of large and mid-cap representation across two of three developed-market countries (excluding Japan) and nine emerging-market countries in Asia. |
| 5 | The Russell Midcap Index is an unmanaged index considered representative of U.S. mid-cap stocks. |
| 6 | The Russell 2000 Index is an unmanaged index considered representative of U.S. small-cap stocks. |
| 7 | Repatriation refers to a corporation’s conversion of any offshore capital back to the currency of the country in which the corporation is based. |
| 8 | Duration is an estimate of bond price sensitivity to changes in interest rates. The higher the duration, the greater the change (i.e., higher risk) in relation to interest-rate movements. |
| 9 | The FTSE EPRA/NAREIT Index is an unmanaged index considered representative of real estate companies and REITs outside the U.S. |
| 2 | Annual Report 2018 |
Aberdeen Select International Equity Fund (Unaudited)
The Aberdeen Select International Equity Fund (Institutional Class shares net of fees) returned -11.71% for the 12-month period ended October 31, 2018, versus -7.80% for its benchmark, the MSCI All Country (AC) World ex-USA Index, during the same period. For broader comparison, the average return of the Fund’s peer category of International Large-Cap Growth Funds (comprising 71 funds), as measured by Lipper, Inc., was -8.01%.
International equities declined over the reporting period. Investors were initially optimistic towards global economic growth, but investor sentiment turned more negative as the period progressed. Worries that rising inflation could compel more aggressive monetary policy, and a flare-up in trade tensions – especially as U.S.-China trade relations deteriorated amid rounds of brinkmanship – led to higher market volatility. The U.S. broader-market Standard & Poor’s (S&P) 500 Index1 initially shrugged off these concerns to record its longest bull run in history, supported by strong corporate earnings growth and a strengthening U.S. dollar. However, a spike in U.S. Treasury yields at the end of the reporting period triggered a slide in share prices as investors reassessed global stock valuations. Emerging markets also came under pressure due to the appreciating U.S. dollar.
The Fund underperformed its benchmark, the MSCI AC World ex-USA Index, for the reporting period due to negative stock selection.
At the stock level, South Korean beauty and cosmetics firm AmorePacific Group was a key detractor from the Fund’s relative performance, as the company’s shares declined after its results generally missed the market’s expectations. We are monitoring the stock’s performance. Shares of German pharmaceutical and life sciences group Bayer declined following an adverse court decision against weed-killers made by Monsanto, which the company recently acquired. While the damages have been reduced on appeal as we expected, the guilty verdict was upheld. We continue to monitor the situation closely. Brazilian fuel distributor Ultrapar Participacoes S.A.’s stock price moved lower eased in tandem with the broader Brazilian equity market, which declined due to an extended strike by truckers and concerns over economic reforms. We subsequently exited the Fund’s position in the company.
Conversely, the Fund’s position in Italy-listed Tenaris S.A., which supplies steel pipes for the energy industry, was a key positive contributor to the relative performance for the reporting period as its shares were buoyed by the rising oil price. German industrial gas supplier Linde plc was a key contributor to relative performance for the reporting period. The company’s stock price advanced on its positive operating profits as well as progress towards the completion of its US$45 billion merger with rival Praxair. Shares of UK exchange-listed consumer credit information services company Experian plc rose on robust results for its 2017 fiscal year and a favorable outlook for 2018.
Regarding portfolio activity over the period, we initiated a holding in Yum China, a leading restaurant-chain operator, as we like its mix of brands and believe that it may potentially benefit from attractive business prospects in China. We trimmed the Fund’s holdings in Shin-Etsu Chemical Co. and Taiwan Semiconductor Manufacturing Co. in an effort to diversify2 the Fund’s exposure to the semiconductor industry by reinvesting the sales proceeds into a new position in Infineon Technologies. We believe that Infineon Technologies is a high-quality business with a net-cash balance sheet that is well-established in automotive end-markets, and also serves the industrial automation market. Additionally, we initiated holdings in Chinese internet giant Tencent Holdings, as we think that the business offers good long-term growth opportunities and brings further diversification to the Fund, and Deutsche Boerse, as we believe that it is a well-managed securities exchange trading at an attractive valuation. We also established new positions in Swiss security group Dormakaba, which in our view possesses solid presence in various global markets and good financial metrics; Auckland International Airport, the largest airport in New Zealand, which we believe has a solid regional position and an effective strategy for medium- and long-term growth; Australia-based wine-maker Treasury Wine Estates, as we believe that it is well-positioned to benefit from growth internationally and its expansion of the premium range; British speciality chemicals company Croda, which in our view is a high-quality business poised to benefit from increasing demand for natural ingredients; and luxury products maker LVMH Moët Hennessy Louis Vuitton S.E., which as we think that it has a healthy diversified portfolio of brands and a good track record.
In contrast, we exited the Fund’s position in Canadian telecommunications company Telus Corp. to fund what we believed were better opportunities elsewhere. We sold the Fund’s shares in Hong Kong rail and property firm MTR Corporation. In our view, the stock’s valuation has captured many of the positives within the business, but not some of the risks associated with expanding the rail franchise beyond its core geographical areas. We also sold the Fund’s shares in Tenaris, as we considered the stock to be fully valued; hospitality chain Whitbread following its plans to sell its Costa Coffee business; and Ultrapar due to its deteriorating fundamentals and increased regulatory constraint. Furthermore, we exited the Fund’s position in South African telecom MTN Group given rising political risk attributable to a proposed fine by the Nigerian government, which alleged that the company illegally moved funds out of that country. Finally, we exited the positions in Singapore telecom Singtel due to the intense competition that the company faces, and Australia-based global mining giant BHP Billiton, as we believed that there were better opportunities elsewhere.
Global markets are beset by worries over rising interest rates, trade tensions and a slowing global economy. Although the U.S. market
| 1 | The S&P 500 Index is an unmanaged index considered representative of the U.S. stock market. Indexes are unmanaged and have been provided for comparison purposes only. No fees or expenses are reflected. You cannot invest directly in an index. |
| 2 | Diversification does not ensure a profit or protect against a loss in a declining market. |
| 2018 Annual Report | 3 |
Aberdeen Select International Equity Fund (Unaudited)
initially appeared to be indifferent to these concerns, the technology rally which had underpinned the current bull market appears to have faltered. Other threats remain, including political uncertainty in Europe caused by tumultuous Brexit negotiations and Italy’s fiscal problems.
While the continued health of corporate earnings goes some way in calming investors’ nerves, we think that politics is increasingly overshadowing central bank policy to become the main driving force of market sentiment. In our view, shifting political alliances may keep markets on their toes but, at the same time, may provide discerning investors with opportunities to take advantage of mispricing of stocks. Amid such periods of uncertainty, we think that investors increasingly will seek high-quality stocks with defensive characteristics, which we believe should bode well for the Fund’s performance.
Portfolio Management:
Aberdeen Global Equity Team
PAST PERFORMANCE DOES NOT GUARANTEE FUTURE RESULTS.
The performance quoted represents past performance, which does not guarantee future results. Class A shares have up to a 0.25% 12b-1 fee. The investment return and principal value of an investment will fluctuate so that an investor’s shares, when redeemed, may be worth more or less than their original cost. Current performance of the Fund may be lower or higher than the performance quoted. Performance data current to the most recent month-end may be obtained by calling 866-667-9231 or visiting www.aberdeen-asset.us.
Investing in mutual funds involves risk, including the possible loss of principal. There is no assurance that the investment objective of any fund will be achieved. Indexes are unmanaged and have been provided for comparison purposes only. No fees or expenses are reflected. You cannot invest directly in an index.
Lipper is a leading global provider of mutual fund information and analysis to fund companies, financial intermediaries and media organizations.
Risk Considerations
Foreign securities may be more volatile, harder to price and less liquid than U.S. securities. They are subject to different accounting and regulatory standards and currency exchange rate, political and economic risks. Fluctuation in currency exchange rates may impact a Fund’s returns more greatly to the extent a Fund does not hedge currency exposure or hedging techniques are unsuccessful. The foregoing risks are enhanced in emerging market countries.
Equity stocks of small and mid-cap companies carry greater risk and more volatility than equity stocks of larger, more established companies.
Stocks issued by large cap companies subject the Fund to the risk that those stocks may underperform stocks issued by companies with smaller capitalizations or the market as a whole.
Investing a significant portion of the Fund’s assets in securities of companies conducting business in a broadly related group of industries within an economic sector may make the Fund more vulnerable to unfavorable developments in that sector.
Please read the prospectus for more detailed information regarding these and other risks.
| 4 | Annual Report 2018 |
Aberdeen Select International Equity Fund (Unaudited)
| Average Annual Total Return* (For periods ended October 31, 2018) | 1 Yr. | 5 Yr. | 10 Yr. | |||||||
Class A** | (11.93%) | (0.71% | ) | 2.58% | ||||||
Institutional Class** | (11.71%) | (0.46% | ) | 2.83% | ||||||
| * | Performance shown for periods after December 16, 2016 reflect the Fund’s receipt of payment from some European jurisdictions related to prior years (2005-2008) in accordance with European Union law under Article 63 of the Treaty on the Functioning of the European Union (the “Article 63 EU Tax Reclaims”). The receipt of these extraordinary payments increased the Fund’s performance for all periods that include December 2016 and February 2017 in a manner that may not recur in the future, and the Fund’s performance was significantly higher than it would have been absent receipt of the Article 63 EU Tax Reclaims. For Class A, the average annual total return excluding the receipt of Article 63 EU Tax Reclaims was (11.93)%, (1.81)%, and 2.01%, respectively, for the 1-year, 5-year, and 10-year periods ended October 31, 2018. For Institutional Class, the average annual total return excluding the receipt of Article 63 EU Tax Reclaims was (11.71)%, (1.55)%, and 2.26%, respectively, for the 1-year, 5-year, and 10-year periods ended October 31, 2018. There can be no assurance that the Fund will receive additional Article 63 EU Tax Reclaim payments or maintain this level of performance in the future. Please see Note 2(g) and the Fund’s prospectus dated February 28, 2018 for further information. |
| ** | Class A shares and Institutional Class shares are not subject to any sales charges. |
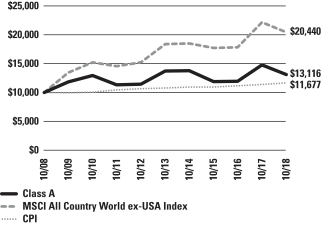
Performance of a $10,000 Investment (as of October 31, 2018)

Comparative performance of $10,000 invested in Class A shares of the Aberdeen Select International Equity Fund, Morgan Stanley Capital International All Country World ex-US Index (MSCI ACWI ex-USA Index), and the Consumer Price Index (CPI) over a 10-year period ended October 31, 2018. Unlike the Fund’s returns, the returns for these unmanaged indexes do not reflect any fees or expenses. Investors cannot invest directly in market indexes.
The MSCI ACWI ex-USA Index captures large and mid cap representation across 22 of 23 Developed Markets (DM) countries (excluding the United States (U.S.) and 24 Emerging Markets (EM) countries). With 2,163 constituents, the index covers approximately 85% of the global equity opportunity set outside the U.S.
The CPI is a measure of the average change over time in the prices paid by urban consumers for a market basket of consumer goods and services.
Investment return and principal value will fluctuate, and when redeemed, shares may be worth more or less than original cost. Past performance is no guarantee of future results. The Average Annual Total Return table and performance graph do not reflect the deduction of taxes that a shareholder would pay on Fund distributions or the redemption of Fund shares. Investing in mutual funds involves market risk, including loss of principal. Performance returns assume the reinvestment of all distributions.
| 2018 Annual Report | 5 |
Aberdeen Select International Equity Fund (Unaudited) (concluded)
Portfolio Summary (as a percentage of net assets)
October 31, 2018 (Unaudited)
| Asset Allocation | ||||
Common Stocks | 94.3% | |||
Preferred Stocks | 8.7% | |||
Short-Term Investment | 0.3% | |||
Government Bonds | –% | |||
Liabilities in Excess of Other Assets | (3.3%) | |||
| 100.0% | ||||
The following table summarizes the composition of the Fund’s portfolio, in Standard & Poor’s Global Industry Classification Standard (GICS) sectors, expressed as a percentage of net assets. The GICS structure consists of 11 sectors, 24 industry groups, 69 industries and 158 sub-industries. As of October 31, 2018, the Fund did not have more than 25% of its assets invested in any single industry or industry group.
| Top Sectors | ||||
Financials | 18.3% | |||
Consumer Staples | 17.7% | |||
Industrials | 15.1% | |||
Health Care | 13.3% | |||
Information Technology | 12.2% | |||
Consumer Discretionary | 7.0% | |||
Materials | 6.5% | |||
Communication Services | 6.2% | |||
Real Estate | 4.0% | |||
Energy | 2.7% | |||
Other | (3.0%) | |||
| 100.0% | ||||
| Top Holdings* | ||||
Taiwan Semiconductor Manufacturing Co. Ltd. | 3.2% | |||
AIA Group Ltd. | 3.2% | |||
Samsung Electronics Co. Ltd., Preferred Shares | 3.1% | |||
Novartis AG | 2.8% | |||
Banco Bradesco SA, ADR, Preferred Shares, 1.94% | 2.8% | |||
Henkel AG & Co. KGaA, Preferred Shares, 1.33% | 2.7% | |||
Roche Holding AG | 2.7% | |||
Jardine Matheson Holdings Ltd. | 2.7% | |||
Royal Dutch Shell PLC, B Shares | 2.7% | |||
Japan Tobacco, Inc. | 2.6% | |||
Other | 71.5% | |||
| 100.0% | ||||
| * | For the purpose of listing top holdings, Short-Term Investments are included as part of Other. |
| Top Countries | ||||
United Kingdom | 19.3% | |||
Japan | 14.5% | |||
Germany | 11.8% | |||
Switzerland | 9.1% | |||
Hong Kong | 6.9% | |||
China | 4.3% | |||
South Korea | 4.2% | |||
Taiwan | 3.2% | |||
Canada | 3.2% | |||
Sweden | 3.1% | |||
Other | 20.4% | |||
| 100.0% | ||||
| 6 | Annual Report 2018 |
Statement of Investments
October 31, 2018
Aberdeen Select International Equity Fund
| Shares or Principal Amount | Value | |||||||
COMMON STOCKS (94.3%) | ||||||||
AUSTRALIA (2.6%) | ||||||||
Consumer Staples (1.0%) | ||||||||
Treasury Wine Estates Ltd. (a) | 144,744 | $ | 1,557,961 | |||||
Health Care (1.6%) | ||||||||
CSL Ltd. (a) | 18,500 | 2,469,697 | ||||||
| 4,027,658 | ||||||||
CANADA (3.2%) | ||||||||
Industrials (1.5%) | ||||||||
Ritchie Bros Auctioneers, Inc. | 69,000 | 2,320,878 | ||||||
Materials (1.7%) | ||||||||
Nutrien Ltd. | 48,640 | 2,574,896 | ||||||
| 4,895,774 | ||||||||
CHINA (4.3%) | ||||||||
Communication Services (1.8%) | ||||||||
Tencent Holdings Ltd. (a) | 81,400 | 2,788,704 | ||||||
Consumer Discretionary (2.5%) | ||||||||
Yum China Holdings, Inc. | 104,100 | 3,755,928 | ||||||
| 6,544,632 | ||||||||
FRANCE (2.7%) | ||||||||
Consumer Discretionary (1.1%) | ||||||||
LVMH Moet Hennessy Louis Vuitton SA (a) | 5,500 | 1,668,730 | ||||||
Consumer Staples (1.6%) | ||||||||
L’Oreal SA (a) | 11,200 | 2,523,430 | ||||||
| 4,192,160 | ||||||||
GERMANY (9.0%) | ||||||||
Financials (1.2%) | ||||||||
Deutsche Boerse AG (a) | 14,200 | 1,794,490 | ||||||
Health Care (4.4%) | ||||||||
Bayer AG (a) | 38,226 | 2,930,116 | ||||||
Fresenius Medical Care AG & Co. KGaA (a) | 49,100 | 3,855,160 | ||||||
| 6,785,276 | ||||||||
Information Technology (1.4%) | ||||||||
Infineon Technologies AG (a) | 110,600 | 2,216,080 | ||||||
Materials (2.0%) | ||||||||
Linde PLC (b) | 18,172 | 2,981,378 | ||||||
| 13,777,224 | ||||||||
HONG KONG (6.9%) | ||||||||
Financials (3.2%) | ||||||||
AIA Group Ltd. (a) | 636,400 | 4,841,122 | ||||||
Industrials (2.7%) | ||||||||
Jardine Matheson Holdings Ltd. (a) | 71,300 | 4,117,105 | ||||||
Real Estate (1.0%) | ||||||||
Swire Pacific Ltd., Class A (a) | 151,500 | 1,573,886 | ||||||
| 10,532,113 | ||||||||
INDIA (1.7%) | ||||||||
Financials (1.7%) | ||||||||
HDFC Bank Ltd., ADR | 28,600 | 2,542,826 | ||||||
ISRAEL (2.2%) | ||||||||
Information Technology (2.2%) | ||||||||
Check Point Software Technologies Ltd. (b) | 30,400 | 3,374,400 | ||||||
JAPAN (14.5%) | ||||||||
Consumer Discretionary (1.5%) | ||||||||
Shimano, Inc. (a) | 17,200 | 2,349,093 | ||||||
Consumer Staples (2.6%) | ||||||||
Japan Tobacco, Inc. (a) | 154,000 | 3,957,077 | ||||||
Financials (1.9%) | ||||||||
Japan Exchange Group, Inc. (a) | 164,400 | 2,944,521 | ||||||
Health Care (1.8%) | ||||||||
Sysmex Corp. (a) | 39,700 | 2,784,538 | ||||||
Industrials (1.6%) | ||||||||
FANUC Corp. (a) | 14,000 | 2,435,537 | ||||||
Information Technology (2.3%) | ||||||||
Keyence Corp. (a) | 7,200 | 3,517,341 | ||||||
Materials (1.7%) | ||||||||
Shin-Etsu Chemical Co. Ltd. (a) | 30,800 | 2,573,663 | ||||||
Real Estate (1.1%) | ||||||||
Daito Trust Construction Co. Ltd. (a) | 12,700 | 1,674,347 | ||||||
| 22,236,117 | ||||||||
LATVIA (0.0%) | ||||||||
Financials (0.0%) | ||||||||
AS Parex Banka (a)(b)(c)(d) | 1,424,182 | – | ||||||
MEXICO (2.4%) | ||||||||
Consumer Staples (2.4%) | ||||||||
Fomento Economico Mexicano SAB de CV, ADR | 42,700 | 3,632,489 | ||||||
NEW ZEALAND (1.1%) | ||||||||
Industrials (1.1%) | ||||||||
Auckland International Airport Ltd. (a) | 370,300 | 1,693,407 | ||||||
PHILIPPINES (1.9%) | ||||||||
Real Estate (1.9%) | ||||||||
Ayala Land, Inc. (a) | 3,919,300 | 2,908,135 | ||||||
SINGAPORE (2.1%) | ||||||||
Financials (2.1%) | ||||||||
Oversea-Chinese Banking Corp. Ltd. (a) | 410,358 | 3,187,846 | ||||||
SOUTH KOREA (1.1%) | ||||||||
Consumer Staples (1.1%) | ||||||||
Amorepacific Group (a) | 30,800 | 1,688,160 | ||||||
SWEDEN (3.1%) | ||||||||
Industrials (3.1%) | ||||||||
Atlas Copco AB, A Shares (a) | 129,500 | 3,201,467 | ||||||
Epiroc AB, Class A (b) | 181,000 | 1,589,435 | ||||||
| 4,790,902 | ||||||||
See accompanying Notes to Financial Statements.
| 2018 Annual Report | 7 |
Statement of Investments (continued)
October 31, 2018
Aberdeen Select International Equity Fund
| Shares or Principal Amount | Value | |||||||
SWITZERLAND (9.1%) | ||||||||
Consumer Staples (2.4%) | ||||||||
Nestle SA (a) | 43,700 | $ | 3,689,289 | |||||
Health Care (5.5%) | ||||||||
Novartis AG (a) | 49,400 | 4,326,071 | ||||||
Roche Holding AG (a) | 17,000 | 4,137,161 | ||||||
| 8,463,232 | ||||||||
Industrials (1.2%) | ||||||||
dormakaba Holding AG (a)(b) | 2,446 | 1,764,645 | ||||||
| 13,917,166 | ||||||||
TAIWAN (3.2%) | ||||||||
Information Technology (3.2%) | ||||||||
Taiwan Semiconductor Manufacturing Co. Ltd. (a) | 657,000 | 4,932,352 | ||||||
THAILAND (2.0%) | ||||||||
Financials (2.0%) | ||||||||
Kasikornbank PCL (a) | 522,100 | 3,143,875 | ||||||
UNITED KINGDOM (19.3%) | ||||||||
Communication Services (4.4%) | ||||||||
Inmarsat PLC (a) | 559,700 | 3,254,896 | ||||||
Vodafone Group PLC (a) | 1,861,400 | 3,500,434 | ||||||
| 6,755,330 | ||||||||
Consumer Staples (3.8%) | ||||||||
British American Tobacco PLC (a) | 70,300 | 3,047,524 | ||||||
Diageo PLC (a) | 77,700 | 2,686,207 | ||||||
| 5,733,731 | ||||||||
Energy (2.7%) | ||||||||
Royal Dutch Shell PLC, B Shares (a) | 124,800 | 4,070,093 | ||||||
Financials (3.4%) | ||||||||
Prudential PLC (a) | 161,600 | 3,235,819 | ||||||
Standard Chartered PLC (a) | 285,100 | 1,998,182 | ||||||
| 5,234,001 | ||||||||
Industrials (3.9%) | ||||||||
Experian PLC (a) | 153,200 | 3,523,477 | ||||||
Rolls-Royce Holdings PLC (a) | 229,700 | 2,463,345 | ||||||
| 5,986,822 | ||||||||
Materials (1.1%) | ||||||||
Croda International PLC (a) | 27,471 | 1,692,092 | ||||||
| 29,472,069 | ||||||||
UNITED STATES (1.9%) | ||||||||
Consumer Discretionary (1.9%) | ||||||||
Samsonite International SA (a)(b)(e) | 990,900 | 2,857,737 | ||||||
VENEZUELA (0.0%) | ||||||||
Financials (0.0%) | ||||||||
Banco Venezolano de Credito SA (b)(c)(d) | 156 | – | ||||||
Industrials (0.0%) | ||||||||
Cemex Venezuela SACA-I (b)(c)(d) | 15,843,815 | – | ||||||
| – | ||||||||
Total Common Stocks | 144,347,040 | |||||||
GOVERNMENT BONDS (0.0%) | ||||||||
VENEZUELA (0.0%) | ||||||||
Bonos de la Deuda Publica Nacional (VEF), 0.00%, (b)(c)(d) | 69,500,000 | – | ||||||
Total Government Bonds | – | |||||||
PREFERRED STOCKS (8.7%) | ||||||||
BRAZIL (2.8%) | ||||||||
Financials (2.8%) | ||||||||
Banco Bradesco SA, ADR, Preferred Shares, 1.94% | 468,481 | 4,295,971 | ||||||
GERMANY (2.8%) | ||||||||
Consumer Staples (2.8%) | ||||||||
Henkel AG & Co. KGaA, Preferred Shares, 1.33% (a) | 38,200 | 4,173,531 | ||||||
SOUTH KOREA (3.1%) | ||||||||
Information Technology (3.1%) | ||||||||
Samsung Electronics Co. Ltd., Preferred Shares (a) | 150,900 | 4,761,005 | ||||||
UNITED KINGDOM (0.0%) | ||||||||
Industrials (0.0%) | ||||||||
Rolls-Royce Holdings PLC, C Shares (b) | 10,566,200 | 13,505 | ||||||
Total Preferred Stocks | 13,244,012 | |||||||
SHORT-TERM INVESTMENT (0.3%) | ||||||||
UNITED STATES (0.3%) | ||||||||
State Street Institutional U.S. Government Money Market Fund, Premier Class, | $ | 451,376 | 451,376 | |||||
Total Short-Term Investment | 451,376 | |||||||
Total Investments | 158,042,430 | |||||||
Liabilities in Excess of Other Assets—(3.3)% | (5,026,551 | ) | ||||||
Net Assets—100.0% | $ | 153,015,879 | ||||||
| (a) | Fair Values are determined pursuant to procedures approved by the Fund’s Board of Trustees. Unless otherwise noted, securities are valued by applying valuation factors to the exchange traded price. See Note 2(a) of the accompanying Notes to Financial Statements. |
| (b) | Non-income producing security. |
| (c) | The Fund’s adviser has deemed this security to be illiquid based upon procedures approved by the Board of Trustees. Illiquid securities held by the Fund represent 0.00% of net assets as of October 31, 2018. |
| (d) | Level 3 security. See Note 2(a) of the accompanying Notes to Financial Statements. |
| (e) | Denotes a security issued under Regulation S or Rule 144A. |
See accompanying Notes to Financial Statements.
| 8 | Annual Report 2018 |
Statement of Investments (concluded)
October 31, 2018
Aberdeen Select International Equity Fund
| (f) | Registered investment company advised by State Street Global Advisors. The rate shown is the 7 day yield as of October 31, 2018. |
| (g) | See accompanying Notes to Financial Statements for tax unrealized appreciation/(depreciation) of securities. |
| ADR | American Depositary Receipt |
| PLC | Public Limited Company |
See accompanying Notes to Financial Statements.
| 2018 Annual Report | 9 |
Aberdeen Select International Equity Fund II (Unaudited)
The Aberdeen Select International Equity Fund II (Institutional Class shares net of fees) returned -11.23% for the 12-month period ended October 31, 2018, versus -7.80% for its benchmark, the MSCI All Country (AC) World ex-USA Index, during the same period. For broader comparison, the average return of the Fund’s peer category of International Large-Cap Growth Funds (comprising 71 funds), as measured by Lipper, Inc., was –8.01%.
International equities declined over the reporting period. Investors were initially optimistic towards global economic growth, but investor sentiment turned more negative as the period progressed. Worries that rising inflation could compel more aggressive monetary policy, and a flare-up in trade tensions–especially as U.S.-China trade relations deteriorated amid rounds of brinkmanship–led to higher market volatility. The U.S. broader-market Standard & Poor’s (S&P) 500 Index1 initially shrugged off these concerns to record its longest bull run in history, supported by strong corporate earnings growth and a strengthening U.S. dollar. However, a spike in U.S. Treasury yields at the end of the reporting period triggered a slide in share prices as investors reassessed global stock valuations. Emerging markets also came under pressure due to the appreciating U.S. dollar.
The Fund underperformed its benchmark, the MSCI AC World ex-USA Index, for the reporting period due to negative stock selection.
At the stock level, South Korean beauty and cosmetics firm AmorePacific Group was a key detractor from the Fund’s relative performance, as the company’s shares declined after its results generally missed the market’s expectations. We are monitoring the stock’s performance. Shares of German pharmaceutical and life sciences group Bayer declined following an adverse court decision against weed-killers made by Monsanto, which the company recently acquired. While the damages have been reduced on appeal as we expected, the guilty verdict was upheld. We continue to monitor the situation closely. Brazilian fuel distributor Ultrapar Participacoes S.A.’s stock price moved lower eased in tandem with the broader Brazilian equity market, which declined due to an extended strike by truckers and concerns over economic reforms. We subsequently exited the Fund’s position in the company.
Conversely, the Fund’s position in German industrial gas supplier Linde plc was a key contributor to relative performance for the reporting period. The company’s stock price advanced on its positive operating profits as well as progress towards the completion of its US$45 billion merger with rival Praxair. Shares of UK exchange-listed consumer credit information services company Experian plc rose on robust results for its 2017 fiscal year and a favorable outlook for 2018. The stock price of Italy-listed Tenaris S.A., which supplies steel pipes for the energy industry, was buoyed by the rising oil price.
Regarding portfolio activity over the period, we initiated a holding in Yum China, a leading restaurant-chain operator, as we like its mix of brands and believe that it may potentially benefit from attractive business prospects in China. We trimmed the Fund’s holdings in Shin-Etsu Chemical Co. and Taiwan Semiconductor Manufacturing Co. in an effort to diversify2 the Fund’s exposure to the semiconductor industry by reinvesting the sales proceeds into a new position in Infineon Technologies. We believe that Infineon Technologies is a high-quality business with a net-cash balance sheet that is well-established in automotive end-markets, and also serves the industrial automation market. Additionally, we initiated holdings in Chinese internet giant Tencent Holdings, as we think that the business offers good long-term growth opportunities and brings further diversification to the Fund, and Deutsche Boerse, as we believe that it is a well-managed securities exchange trading at an attractive valuation. We also established new positions in Swiss security group Dormakaba, which in our view possesses solid presence in various global markets and good financial metrics; Auckland International Airport, the largest airport in New Zealand, which we believe has a solid regional position and an effective strategy for medium- and long-term growth; Australia-based wine-maker Treasury Wine Estates, as we believe that it is well-positioned to benefit from growth internationally and its expansion of the premium range; British speciality chemicals company Croda, which in our view is a high-quality business poised to benefit from increasing demand for natural ingredients; and luxury products maker LVMH Moët Hennessy Louis Vuitton S.E., which as we think that it has a healthy diversified portfolio of brands and a good track record.
In contrast, we exited the Fund’s position in Canadian telecommunications company Telus Corp. to fund what we believed were better opportunities elsewhere. We sold the Fund’s shares in Hong Kong rail and property firm MTR Corporation. In our view, the stock’s valuation has captured many of the positives within the business, but not some of the risks associated with expanding the rail franchise beyond its core geographical areas. We also sold the Fund’s shares in Tenaris, as we considered the stock to be fully valued; hospitality chain Whitbread following its plans to sell its Costa Coffee business; and Ultrapar due to its deteriorating fundamentals and increased regulatory constraint. Furthermore, we exited the Fund’s position in South African telecom MTN Group given rising political risk attributable to a proposed fine by the Nigerian government, which alleged that the company illegally moved funds out of that country. Finally, we exited the positions in Singapore telecom Singtel due to the intense competition that the company faces, and Australia-based global mining giant BHP Billiton, as we believed that there were better opportunities elsewhere.
| 1 | The S&P 500 Index is an unmanaged index considered representative of the U.S. stock market. Indexes are unmanaged and have been provided for comparison purposes only. No fees or expenses are reflected. You cannot invest directly in an index. |
| 2 | Diversification does not ensure a profit or protect against a loss in a declining market. |
| 10 | Annual Report 2018 |
Aberdeen Select International Equity Fund II (Unaudited)
Global markets are beset by worries over rising interest rates, trade tensions and a slowing global economy. Although the U.S. market initially appeared to be indifferent to these concerns, the technology rally which had underpinned the current bull market appears to have faltered. Other threats remain, including political uncertainty in Europe caused by tumultuous Brexit negotiations and Italy’s fiscal problems.
While the continued health of corporate earnings goes some way in calming investors’ nerves, we think that politics is increasingly overshadowing central bank policy to become the main driving force of market sentiment. In our view, shifting political alliances may keep markets on their toes but, at the same time, may provide discerning investors with opportunities to take advantage of mispricing of stocks. Amid such periods of uncertainty, we think that investors increasingly will seek high-quality stocks with defensive characteristics, which we believe should bode well for the Fund’s performance.
Portfolio Management:
Aberdeen Global Equity Team
PAST PERFORMANCE DOES NOT GUARANTEE FUTURE RESULTS.
The performance quoted represents past performance, which does not guarantee future results. Class A Shares have up to a 0.25% 12b-1 fee. The investment return and principal value of an investment will fluctuate so that an investor’s shares, when redeemed, may be worth more or less than their original cost. Current performance of the Fund may be lower or higher than the performance quoted. Performance data current to the most recent month-end may be obtained by calling 866-667-9231 or visiting www.aberdeen-asset.us.
Investing in mutual funds involves risk, including the possible loss of principal. There is no assurance that the investment objective of any fund will be achieved. Indexes are unmanaged and have been provided for comparison purposes only. No fees or expenses are reflected. You cannot invest directly in an index.
Lipper is a leading global provider of mutual fund information and analysis to fund companies, financial intermediaries and media organizations.
Risk Considerations
Foreign securities may be more volatile, harder to price and less liquid than U.S. securities. They are subject to different accounting and regulatory standards and currency exchange rate, political and economic risks. Fluctuation in currency exchange rates may impact a Fund’s returns more greatly to the extent a Fund does not hedge currency exposure or hedging techniques are unsuccessful. The foregoing risks are enhanced in emerging market countries.
Equity stocks of small- and mid-cap companies carry greater risk and more volatility than equity stocks of larger, more established companies.
Stocks issued by large cap companies subject the Fund to the risk that those stocks may underperform stocks issued by companies with smaller capitalizations or the market as a whole.
Investing a significant portion of the Fund’s assets in securities of companies conducting business in a broadly related group of industries within an economic sector may make the Fund more vulnerable to unfavorable developments in that sector.
Please read the prospectus for more detailed information regarding these and other risks.
| 2018 Annual Report | 11 |
Aberdeen Select International Equity Fund II (Unaudited)
Average Annual Total Return* (For periods ended October 31, 2018) | 1 Yr. | 5 Yr. | 10 Yr. | |||||||
Class A** | (11.48%) | (0.91% | ) | 2.75% | ||||||
Institutional Class** | (11.23%) | (0.66% | ) | 3.02% | ||||||
| * | Performance shown for periods after February 1, 2017 reflect the Fund’s receipt of payment from some European jurisdictions related to prior years (2005-2009) in accordance with European Union law under Article 63 of the Treaty on the Functioning of the European Union (the “Article 63 EU Tax Reclaims”). The receipt of these extraordinary payments increased the Fund’s performance for all periods that include February 2017 in a manner that may not recur in the future, and the Fund’s performance was significantly higher than it would have been absent receipt of the Article 63 EU Tax Reclaims. For Class A, the average annual total return excluding the receipt of Article 63 EU Tax Reclaims was (11.73)%, (1.63)% and 2.38%, respectively, for the 1-year, 5-year, and 10-year periods ended October 31, 2018. For Institutional Class, the average annual total return excluding the receipt of Article 63 EU Tax Reclaims was (11.48)%, (1.37) and 2.65%, respectively, for the 1-year, 5-year, and 10-year periods ended October 31, 2018. There can be no assurance that the Fund will receive additional Article 63 EU Tax Reclaim payments or maintain this level of performance in the future. Please see the Fund’s prospectus dated February, 28, 2018 for further information. |
| ** | Class A shares and Institutional Class shares are not subject to any sales charges. |
Performance of a $10,000 Investment (as of October 31, 2018)
Comparative performance of $10,000 invested in Class A shares of the Aberdeen Select International Equity Fund II, Morgan Stanley Capital International All Country World ex-US Index (MSCI ACWI ex-USA Index), and the Consumer Price Index (CPI) over a 10-year period ended October 31, 2018. Unlike the Fund’s returns, the returns for these unmanaged indexes do not reflect any fees or expenses. Investors cannot invest directly in market indexes.
The MSCI ACWI ex-USA Index captures large and mid cap representation across 22 of 23 Developed Markets (DM) countries (excluding the United States (U.S.) and 24 Emerging Markets (EM) countries). With 2,163 constituents, the index covers approximately 85% of the global equity opportunity set outside the U.S.
The CPI is a measure of the average change over time in the prices paid by urban consumers for a market basket of consumer goods and services.
Investment return and principal value will fluctuate, and when redeemed, shares may be worth more or less than original cost. Past performance is no guarantee of future results. The Average Annual Total Return table and performance graph do not reflect the deduction of taxes that a shareholder would pay on Fund distributions or the redemption of Fund shares. Investing in mutual funds involves market risk, including loss of principal. Performance returns assume the reinvestment of all distributions.
| 12 | Annual Report 2018 |
Aberdeen Select International Equity Fund II (Unaudited) (concluded)
Portfolio Summary (as a percentage of net assets)
October 31, 2018 (Unaudited)
| Asset Allocation | ||||
Common Stocks | 92.9% | |||
Preferred Stocks | 8.7% | |||
Short-Term Investment | 0.5% | |||
Liabilities in Excess of Other Assets | (2.1%) | |||
| 100.0% | ||||
The following table summarizes the composition of the Fund’s portfolio, in Standard & Poor’s Global Industry Classification Standard (GICS) sectors, expressed as a percentage of net assets. The GICS structure consists of 11 sectors, 24 industry groups, 69 industries and 158 sub-industries. As of October 31, 2018, the Fund did not have more than 25% of its assets invested in any single industry or industry group.
| Top Sectors | ||||
Financials | 18.2% | |||
Consumer Staples | 17.3% | |||
Industrials | 14.9% | |||
Health Care | 13.1% | |||
Information Technology | 12.2% | |||
Consumer Discretionary | 6.8% | |||
Materials | 6.3% | |||
Communication Services | 6.2% | |||
Real Estate | 4.0% | |||
Energy | 2.6% | |||
Other | (1.6%) | |||
| 100.0% | ||||
| Top Holdings* | ||||
Samsung Electronics Co. Ltd., Preferred Shares | 3.2% | |||
Taiwan Semiconductor Manufacturing Co. Ltd. | 3.2% | |||
AIA Group Ltd. | 3.1% | |||
Novartis AG | 2.8% | |||
Banco Bradesco SA, ADR, Preferred Shares, 1.94% | 2.8% | |||
Jardine Matheson Holdings Ltd. | 2.7% | |||
Henkel AG & Co. KGaA, Preferred Shares, 1.33% | 2.7% | |||
Roche Holding AG | 2.6% | |||
Royal Dutch Shell PLC, B Shares | 2.6% | |||
Japan Tobacco, Inc. | 2.5% | |||
Other | 71.8% | |||
| 100.0% | ||||
| * | For the purpose of listing top holdings, Short-Term Investments are included as part of Other. |
| Top Countries | ||||
United Kingdom | 18.9% | |||
Japan | 14.4% | |||
Germany | 11.6% | |||
Switzerland | 9.0% | |||
Hong Kong | 6.8% | |||
South Korea | 4.3% | |||
China | 4.2% | |||
Taiwan | 3.2% | |||
Sweden | 3.1% | |||
Canada | 3.1% | |||
Other | 21.4% | |||
| 100.0% | ||||
| 2018 Annual Report | 13 |
Statement of Investments
October 31, 2018
Aberdeen Select International Equity Fund II
| Shares or Principal Amount | Value | |||||||
COMMON STOCKS (92.9%) | ||||||||
AUSTRALIA (2.5%) | ||||||||
Consumer Staples (1.0%) | ||||||||
Treasury Wine Estates Ltd. (a) | 59,850 | $ | 644,199 | |||||
Health Care (1.5%) | ||||||||
CSL Ltd. (a) | 7,000 | 934,480 | ||||||
| 1,578,679 | ||||||||
CANADA (3.1%) | ||||||||
Industrials (1.4%) | ||||||||
Ritchie Bros Auctioneers, Inc. | 27,000 | 908,170 | ||||||
Materials (1.7%) | ||||||||
Nutrien Ltd. | 20,400 | 1,079,931 | ||||||
| 1,988,101 | ||||||||
CHINA (4.2%) | ||||||||
Communication Services (1.8%) | ||||||||
Tencent Holdings Ltd. (a) | 33,700 | 1,154,537 | ||||||
Consumer Discretionary (2.4%) | ||||||||
Yum China Holdings, Inc. | 43,300 | 1,562,264 | ||||||
| 2,716,801 | ||||||||
FRANCE (2.7%) | ||||||||
Consumer Discretionary (1.1%) | ||||||||
LVMH Moet Hennessy Louis Vuitton SA (a) | 2,300 | 697,833 | ||||||
Consumer Staples (1.6%) | ||||||||
L’Oreal SA (a) | 4,700 | 1,058,939 | ||||||
| 1,756,772 | ||||||||
GERMANY (8.9%) | ||||||||
Financials (1.2%) | ||||||||
Deutsche Boerse AG (a) | 5,900 | 745,598 | ||||||
Health Care (4.4%) | ||||||||
Bayer AG (a) | 16,034 | 1,229,045 | ||||||
Fresenius Medical Care AG & Co. KGaA (a) | 20,000 | 1,570,330 | ||||||
| 2,799,375 | ||||||||
Information Technology (1.4%) | ||||||||
Infineon Technologies AG (a) | 45,900 | 919,693 | ||||||
Materials (1.9%) | ||||||||
Linde PLC (b) | 7,546 | 1,238,030 | ||||||
| 5,702,696 | ||||||||
HONG KONG (6.8%) | ||||||||
Financials (3.1%) | ||||||||
AIA Group Ltd. (a) | 264,800 | 2,014,345 | ||||||
Industrials (2.7%) | ||||||||
Jardine Matheson Holdings Ltd. (a) | 30,000 | 1,732,302 | ||||||
Real Estate (1.0%) | ||||||||
Swire Pacific Ltd., Class A (a) | 62,000 | 644,099 | ||||||
| 4,390,746 | ||||||||
INDIA (1.6%) | ||||||||
Financials (1.6%) | ||||||||
HDFC Bank Ltd., ADR | 11,800 | 1,049,138 | ||||||
ISRAEL (2.2%) | ||||||||
Information Technology (2.2%) | ||||||||
Check Point Software Technologies Ltd. (b) | 12,600 | 1,398,600 | ||||||
JAPAN (14.4%) | ||||||||
Consumer Discretionary (1.5%) | ||||||||
Shimano, Inc. (a) | 7,100 | 969,684 | ||||||
Consumer Staples (2.5%) | ||||||||
Japan Tobacco, Inc. (a) | 63,200 | 1,623,943 | ||||||
Financials (2.1%) | ||||||||
Japan Exchange Group, Inc. (a) | 75,000 | 1,343,303 | ||||||
Health Care (1.8%) | ||||||||
Sysmex Corp. (a) | 16,600 | 1,164,316 | ||||||
Industrials (1.6%) | ||||||||
FANUC Corp. (a) | 5,800 | 1,009,008 | ||||||
Information Technology (2.2%) | ||||||||
Keyence Corp. (a) | 2,900 | 1,416,707 | ||||||
Materials (1.6%) | ||||||||
Shin-Etsu Chemical Co. Ltd. (a) | 12,700 | 1,061,218 | ||||||
Real Estate (1.1%) | ||||||||
Daito Trust Construction Co. Ltd. (a) | 5,300 | 698,743 | ||||||
| 9,286,922 | ||||||||
MEXICO (2.3%) | ||||||||
Consumer Staples (2.3%) | ||||||||
Fomento Economico Mexicano SAB de CV, ADR | 17,600 | 1,497,232 | ||||||
NEW ZEALAND (1.1%) | ||||||||
Industrials (1.1%) | ||||||||
Auckland International Airport Ltd. (a) | 153,100 | 700,137 | ||||||
PHILIPPINES (1.9%) | ||||||||
Real Estate (1.9%) | ||||||||
Ayala Land, Inc. (a) | 1,630,100 | 1,209,540 | ||||||
SINGAPORE (2.1%) | ||||||||
Financials (2.1%) | ||||||||
Oversea-Chinese Banking Corp. Ltd. (a) | 177,899 | 1,382,000 | ||||||
SOUTH KOREA (1.1%) | ||||||||
Consumer Staples (1.1%) | ||||||||
Amorepacific Group (a) | 12,800 | 701,573 | ||||||
SWEDEN (3.1%) | ||||||||
Industrials (3.1%) | ||||||||
Atlas Copco AB, A Shares (a) | 53,900 | 1,332,503 | ||||||
Epiroc AB, Class A (b) | 75,300 | 661,240 | �� | |||||
| 1,993,743 | ||||||||
See accompanying Notes to Financial Statements.
| 14 | Annual Report 2018 |
Statement of Investments (concluded)
October 31, 2018
Aberdeen Select International Equity Fund II
| Shares or Principal Amount | Value | |||||||
SWITZERLAND (9.0%) | ||||||||
Consumer Staples (2.4%) | ||||||||
Nestle SA (a) | 18,400 | $ | 1,553,385 | |||||
Health Care (5.4%) | ||||||||
Novartis AG (a) | 20,400 | 1,786,474 | ||||||
Roche Holding AG (a) | 7,000 | 1,703,537 | ||||||
| 3,490,011 | ||||||||
Industrials (1.2%) | ||||||||
dormakaba Holding AG (a)(b) | 1,034 | 745,970 | ||||||
| 5,789,366 | ||||||||
TAIWAN (3.2%) | ||||||||
Information Technology (3.2%) | ||||||||
Taiwan Semiconductor Manufacturing Co. Ltd. (a) | 271,000 | 2,034,501 | ||||||
THAILAND (2.0%) | ||||||||
Financials (2.0%) | ||||||||
Kasikornbank PCL (a) | 215,800 | 1,299,460 | ||||||
UNITED KINGDOM (18.9%) | ||||||||
Communication Services (4.4%) | ||||||||
Inmarsat PLC (a) | 232,800 | 1,353,832 | ||||||
Vodafone Group PLC (a) | 777,500 | 1,462,119 | ||||||
| 2,815,951 | ||||||||
Consumer Staples (3.7%) | ||||||||
British American Tobacco PLC (a) | 29,300 | 1,270,163 | ||||||
Diageo PLC (a) | 32,300 | 1,116,660 | ||||||
| 2,386,823 | ||||||||
Energy (2.6%) | ||||||||
Royal Dutch Shell PLC, B Shares (a) | 51,600 | 1,682,827 | ||||||
Financials (3.3%) | ||||||||
Prudential PLC (a) | 67,400 | 1,349,592 | ||||||
Standard Chartered PLC (a) | 112,300 | 787,078 | ||||||
| 2,136,670 | ||||||||
Industrials (3.8%) | ||||||||
Experian PLC (a) | 63,800 | 1,467,348 | ||||||
Rolls-Royce Holdings PLC (a) | 95,500 | 1,024,160 | ||||||
| 2,491,508 | ||||||||
Materials (1.1%) | ||||||||
Croda International PLC (a) | 11,306 | 696,400 | ||||||
| 12,210,179 | ||||||||
UNITED STATES (1.8%) | ||||||||
Consumer Discretionary (1.8%) | ||||||||
Samsonite International SA (a)(b)(c) | 411,700 | 1,187,335 | ||||||
Total Common Stocks | 59,873,521 | |||||||
PREFERRED STOCKS (8.7%) | ||||||||
BRAZIL (2.8%) | ||||||||
Financials (2.8%) | ||||||||
Banco Bradesco SA, ADR, Preferred Shares, 1.94% | 193,567 | 1,775,009 | ||||||
GERMANY (2.7%) | ||||||||
Consumer Staples (2.7%) | ||||||||
Henkel AG & Co. KGaA, Preferred Shares, 1.33% (a) | 15,800 | 1,726,225 | ||||||
SOUTH KOREA (3.2%) | ||||||||
Information Technology (3.2%) | ||||||||
Samsung Electronics Co. Ltd., Preferred Shares (a) | 65,500 | 2,066,573 | ||||||
UNITED KINGDOM (0.0%) | ||||||||
Industrials (0.0%) | ||||||||
Rolls-Royce Holdings PLC, C Shares (b) | 4,393,000 | 5,615 | ||||||
Total Preferred Stocks | 5,573,422 | |||||||
SHORT-TERM INVESTMENT (0.5%) | ||||||||
UNITED STATES (0.5%) | ||||||||
State Street Institutional U.S. Government Money Market Fund, Premier Class, 2.09% (d) | 332,172 | 332,172 | ||||||
Total Short-Term Investment | 332,172 | |||||||
Total Investments | 65,779,115 | |||||||
Liabilities in Excess of Other Assets—(2.1)% | (1,338,076 | ) | ||||||
Net Assets—100.0% | $ | 64,441,039 | ||||||
| (a) | Fair Values are determined pursuant to procedures approved by the Fund’s Board of Trustees. Unless otherwise noted, securities are valued by applying valuation factors to the exchange traded price. See Note 2(a) of the accompanying Notes to Financial Statements. |
| (b) | Non-income producing security. |
| (c) | Denotes a security issued under Regulation S or Rule 144A. |
| (d) | Registered investment company advised by State Street Global Advisors. The rate shown is the 7 day yield as of October 31, 2018. |
| (e) | See accompanying Notes to Financial Statements for tax unrealized appreciation/(depreciation) of securities. |
| ADR | American Depositary Receipt |
| PLC | Public Limited Company |
See accompanying Notes to Financial Statements.
| 2018 Annual Report | 15 |
Aberdeen Total Return Bond Fund (Unaudited)
The Aberdeen Total Return Bond Fund (Institutional Class shares net of fees) returned -2.96% for the 12-month period ended October 31, 2018, versus the -2.05% return of its benchmark, the Bloomberg Barclays U.S. Aggregate Bond Index, for the same period. For broader comparison, the average return of the Fund’s Lipper peer category of Core Bond Funds (comprising 221 funds) was -2.01% for the period.
Following a relatively calm period in 2017, volatility returned to global financial markets in the first quarter of 2018, with a major expansion of U.S. fiscal policy, some nascent signs of inflation, and fear of a trade war. U.S. economic growth remained solid over the 12-month reporting period, with momentum and expectations accelerating and then receding somewhat. The labor market continued to tighten, with U.S. payrolls expanding by a monthly average of 210,000 during the 12-month reporting period, and the unemployment rate dipped 0.4 percentage point to 3.7% – its lowest level since December 1969.1 The labor force participation rate2 rose 0.2 percentage point, ending the reporting period at 62.9%.3 With such tight labor supply and the Consumer Price Index (CPI), an inflation indicator, approaching the U.S. Federal Reserve’s (Fed’s) annualized target rate of 2%, the economy received an unusual and large late-cycle fiscal boost, as the Republican majority in the U.S. Congress enacted tax reform legislation in December 2017. The tax reform bill cuts tax rates for corporations and individuals and reduces or eliminates some personal deductions, with estimated cost of more than $1.5 trillion over 10 years. The package is very favorable to corporations, which we believe should be supportive of credit markets as well as business and consumer sentiment. Congress also passed a budget that includes a $400 billion fiscal stimulus package.
The Fed, under the leadership of new Chair Jerome Powell, who succeeded Janet Yellen in early February 2018, appeared to be increasingly confident that the U.S. economy can withstand higher interest rates. Over the reporting period, the central bank raised its benchmark interest rate in four increments of 25 basis points (bps) to a range of 2.00% to 2.25% following its meetings in December 2017, and March, June and September 2018, and revised upward its expectations for the pace at which it will increase rates in 2019. U.S. companies generally reported strong fourth-quarter 2017 earnings results as they began to communicate the effect of the recently implemented U.S. tax cuts on their profits, while estimates of profit growth rose. Investors’ exuberance was curtailed by several economic data releases indicating signs of higher wages and inflation. Political uncertainty further unsettled the markets as the administration of President Donald Trump ramped up its threat of trade wars amid White House cabinet reshuffling. The U.S. announced tariffs on $50 billion in Chinese imports, and the Chinese government responded more promptly than expected. The threat of escalation of geopolitical hotspots also exacerbated the jittery market.
In the second quarter of 2018, the global financial markets were dominated by increasing concerns about trade conflicts, political discords in Europe and Japan, as well as an anticipation of reduced monetary stimuli. U.S. President Donald Trump upped the ante, introducing or proposing broader import tariffs in a faster and larger fashion against China and other regions. Italian bonds weakened significantly versus comparable-duration4 German Bunds as Euroskeptic5 political parties formed a government. In Germany, Chancellor Angela Merkel’s coalition government was under increasing strain. Prime Minister Mariano Rajoy of Spain was forced to resign and was replaced by Socialist party leader Pedro Sánchez. In the UK, Brexit negotiations appeared increasingly fraught for the government as deadlines for critical decisions loom. In Japan, the ruling Liberal Democratic Party (LDP) government was mired in a cronyism scandal in which Prime Minister Shinzo Abe’s popularity plummeted. U.S. Treasury yields reversed their uptrend as investors sought safe-haven assets against mounting political risks.
The U.S. was the bright spot and dominant force in global economic and financial markets and political developments in the third quarter. The U.S. saw strong economic growth, a very tight labor market and signs of moderate inflation uplift. Corporate earnings were robust, with mergers-and-acquisition (M&A) activity reaching a post-global credit crisis high, while monetary policy remained relatively easy. The U.S. Federal Open Market Committee (FOMC) became more confident in signaling a steady path of interest-rate increases that led to a another 25-bps increase and a higher expected terminal rate.6 Meanwhile, a quasi-trade war materialized, with U.S. President Donald Trump dominating the conversation. The U.S. started to levy tariffs on an additional US$200 billion of Chinese imports and is seeking to implement another US$260 billion. China responded in kind without escalating rhetoric while allowing its currency, the renminbi, depreciate a further 3.7% against the U.S. dollar. President Trump also threatened to impose up to a 25% tariff on autos manufactured in European Union (EU) member nations, which his meeting with EU President Donald Tusk defused the chance of imminent action. Toward the end of the quarter, the U.S. finally reached an agreement with Mexico on the modification of the North American Free Trade Agreement (NAFTA), as well as a new trade agreement with Korea.
Despite continued threats from trade, growth stabilized above-historical trend levels across Europe, with purchasing managers indexes (PMIs) hovering in the mid-50s (indicating economic expansion). Eurozone inflation readings remained subdued, with only
| 1,3 | Source: U.S. Department of Labor, November 2018. |
| 2 | The labor force participation rate comprises the percentage of the U.S. population aged 16 years and older working or actively seeking work. |
| 4 | Duration is an estimate of bond price sensitivity to changes in interest rates. The higher the duration, the greater the change (i.e., higher risk) in relation to interest-rate movements. |
| 5 | Euroskeptics are opposed to increasing the powers of the European Union. |
| 6 | The terminal rate is the federal funds rate that is consistent with full employment and capacity utilization and stable prices. |
| 16 | Annual Report 2018 |
Aberdeen Total Return Bond Fund (Unaudited)
pockets of wage growth in the core markets, which enabled the European Central Bank (ECB) to double down on dovish monetary policy guidance. Italian budgetary fears have kept Italian yields elevated and core bonds well bid. While we think that the fundamental outlook for the UK remains uncertain due to Brexit headwinds, third-quarter 2018 data broadly have surprised to the upside relative to the markets’ expectations, allowing the Monetary Policy Committee (MPC) to hike its benchmark interest rate in August. At its July meeting the Bank of Japan (BoJ) tweaked the language around yield curve control7 to increase the flexibility around the 0% 10-year yield target. Policy sustainability is cited as the driving rationale, and the Japanese government bond (JGB) yield curve bear steepened.8 Trade tensions exacerbated existing growth challenges in China. Fixed investment and retail sales slowed along with credit growth. However, the Chinese government began to expand fiscal and regulatory measures in addition to loosening monetary policy.
The Fund’s international exposure to both bonds and currencies significantly hampered relative performance for the quarter. The Fund’s investments in the commodity market segment were the main source of its underperformance, as local currency government bonds in South Africa and Russia experienced substantial declines. Local currency Norwegian government bonds lagged comparable-duration U.S. Treasuries, while the benefits from the currency exposure in Chile was not enough to cushion losses from the Colombian peso and Australian dollar. Within the Fund’s low correlation segment,9 the Indian rupee was hard hit as oil prices rose sharply during the quarter. Indonesian government bonds declined notably, but our currency-hedging activities offset some of the losses. The Fund’s exposure in its major market segment was limited to the Japanese yen, which failed to act as a safe-haven asset as trade war rhetoric expanded. The euro declined and its neighboring currencies experienced collateral damage; the Fund’s Swedish krona position recorded a negative return for the quarter despite strong economic growth as inflation in that nation remained subdued. The holding in the Czech koruna marginally detracted from Fund performance as well, even though its central bank hiked interest rates due to strong growth.
Conversely, the Fund’s investments in its U.S. core market contributed to the performance relative to the benchmark index for the quarter. Sector allocation decisions produced positive results, particularly from the exposure to collateralized mortgage obligations (CMOs). Overall security selection also generated positive alpha,10 with corporate bonds posting strong performance largely from banks and energy names, which was augmented by gains from our emphasis on short-maturity asset-backed securities (ABS).
Fund performance also benefited from the addition of risk exposure to corporate and securitized credits that we had implemented in the second quarter and in August 2018, when spreads had widened with volatility. Specifically, the primary contributor was the compression of the Libor overnight indexed swap (OIS) spread,11 which drove short-end spreads tighter as we had expected and where the Fund had heavy exposure. Moreover, the Fund’s sizable underweight in the weakest-performing sector over the quarter, agency MBS, had a positive impact on performance. Unfortunately, the Fund’s investments in local currency foreign bonds continued to underperform, as the strong U.S. dollar remained a significant headwind. We added exposure, particularly in emerging markets (EMs), when contagion from Italy and a few problematic high-yielding EM countries affected global markets. When numerous countries were hit in waves without regard to their fundamentals, we increased the Fund’s weighting in a few conviction trades since we believe that a reasonable amount of recession-like risk has been priced into these markets.
We employed derivatives over the reporting period, including U.S. Treasury futures, in an effort to manage the Fund’s overall yield-curve and interest-rate exposure, and protect the Fund from sharply rising yields. We utilized foreign exchange forwards12 in an effort to gain exposure to foreign markets efficiently and to hedge currency risks from sovereign bond holdings. Our use of futures bolstered the Fund’s performance in global interest-rate allocation and yield-curve positioning. The derivatives positions did not have a significant impact on Fund performance for the reporting period.
We believe that the global economy will be strong in the near term, but may slow over the next year or two to historical trend levels, driven by fading fiscal and monetary stimuli. In our opinion, the extent of the slowdown will depend on the magnitude of monetary tightening and its impact on financial conditions, as well as
| 7 | The Bank of Japan employs yield curve control to keep the 10-year Japanese government bond yield at zero in an effort to steepen the yield curve, thereby increasing the difference between the yields of short- and long-term term bonds. |
| 8 | A bear steepener is the widening of the yield curve caused by long-term rates increasing at a faster rate than short-term rates, leading to a larger spread between the two rates. |
| 9 | The Fund’s investment universe includes six global fixed-income market segments: Core (U.S. investment-grade fixed income); Major (Eurozone, Japan and the UK, among others); Satellites (including, but not limited to Canada, Hong Kong and Switzerland); Convergence (Czech Republic, Hungary and Poland, among others); Commodity (including, but not limited to, Australia, Chile and Russia); and Low Correlation (Brazil, China and Mexico, among others). |
| 10 | Alpha is a measure of performance that takes the volatility of a mutual fund and compares its risk-adjusted performance to a benchmark index. |
| 11 | The London Interbank Offered Rate (Libor) is the most common benchmark interest rate index used to make adjustments to variable-rate loans and credit cards. Global banks use Libor when charging each other for short-term loans. The overnight indexed swap (OIS) is an interest rate swap in which the overnight rate being exchanged for a fixed interest rate. |
| 12 | A foreign exchange forward is a binding contract in the foreign exchange market that locks in the exchange rate for the purchase or sale of a currency on a future date. |
| 2018 Annual Report | 17 |
Aberdeen Total Return Bond Fund (Unaudited)
developments on trade and other geopolitical events, although we think that the probability of a recession has increased. We feel that the deceleration of economic growth in emerging markets, particularly in China, is not as dire as that market appears to be pricing in. Despite the limitation from high leverage, we believe that the Chinese government will loosen fiscal and regulatory measures to counter the headwind from trade conflicts, in addition to further easing monetary policy. There are other levers and non-tariff measures that China can use in response to an aggressive stance by the U.S., including an outside risk of currency devaluation. Populist governments pose risks with late-cycle fiscal expansion. The instability of the Italian government and Brexit in the UK represent many geopolitical risks facing the markets. The mismatch between the politicians’ promises and what they can do to keep the deficit in a range acceptable to the EU will be challenging though not unachievable, in our view. We think that the most likely outcome for Brexit is to kick the can down the road, though the odds that there will be no deal have increased.
We think that risks to our base case scenario are twofold: Acceleration of inflation pressure due to above-capacity economic growth, a tight labor market, and trade frictions. When inflation fear grips markets, both bonds and stocks may underperform. The Fund has positions in Treasury Inflation-Protected Securities (TIPS) in an effort to hedge the risk as we believe the premiums for these issues are low. A quasi-trade war has materialized, which we believe will remain an issue and may worsen with China. However, there recently appeared to be an easing of tensions between the U.S. and other key markets. We feel that a small drag on the global economy is priced into the market, with a significant hit on EMs, transportation, commodities other than oil, and in non-U.S. equities. The tail risk13 of a major trade war is a threat to most risk markets and will lead to continued volatility, in our judgment. Consequently, despite a very unfavorable supply/demand environment in the U.S. Treasury market, we have scaled down our interest-rate expectations in the U.S. and major markets to reflect both a U.S. economic slowdown and the increased risk of a global risk event feeding back into the U.S.
In our view, the strong U.S. household credit environment favors residential mortgage credits, short-maturity ABS, and single-borrower CMBS.14 The Fund remains underweight relative to the benchmark Bloomberg Barclays U.S. Aggregate Bond Index to agency MBS in an effort to reduce the Fund’s exposure to market volatility, while replacing them with non-agency MBS, which benefit from still-improving housing credits and offer better convexity.15 We feel that high-quality and short duration ABS are a safe way to play the improving labor market. We believe that low-beta16 and down in capital structure bonds are still the most efficient way to play the divergent CMBS market.
Portfolio Management:
Aberdeen North American Fixed Income Team
PAST PERFORMANCE DOES NOT GUARANTEE FUTURE RESULTS.
The performance quoted represents past performance, which does not guarantee future results. Class A shares have up to a 0.25% 12b-1 fee. The investment return and principal value of an investment will fluctuate so that an investor’s shares, when redeemed, may be worth more or less than their original cost. Current performance of the Fund may be lower or higher than the performance quoted. Performance data current to the most recent month-end may be obtained by calling 866-667-9231 or visiting www.aberdeen-asset.us.
Investing in mutual funds involves risk, including possible loss of principal. There is no assurance that the investment objective of any fund will be achieved. Indexes are unmanaged and have been provided for comparison purposes only. No fees or expenses are reflected. You cannot invest directly in an index.
Lipper is a leading global provider of mutual fund information and analysis to fund companies, financial intermediaries and media organizations.
Risk Considerations
Fixed income securities are subject to certain risks including, but not limited to: interest rate (changes in interest rates may cause a decline in the market value of an investment), credit (changes in the financial condition of the issuer, borrower, counterparty, or underlying collateral), prepayment (debt issuers may repay or refinance their loans or obligations earlier than anticipated), and extension (principal repayments may not occur as quickly as anticipated, causing the expected maturity of a security to increase).
Investments in asset-backed and mortgage-backed securities include additional risks that investors should be aware which include those associated with fixed income securities, as well as increased susceptibility to adverse economic developments.
Derivatives are speculative and may hurt the Fund’s performance. They present the risk of disproportionately increased losses and/or reduced gains when the financial asset or measure to which the derivative is linked changes in unexpected ways.
Foreign securities may be more volatile, harder to price and less liquid than U.S. securities. They are subject to different accounting and regulatory standards and currency exchange rate, political and economic risks. Fluctuation in currency exchange rates may impact a Fund’s returns more greatly to the extent a Fund does not hedge currency exposure or hedging techniques are unsuccessful. The foregoing risks are enhanced in emerging market countries.
| 13 | Tail risk represents the risk that an investment will change by more than three standard deviations from its mean. Standard deviation is a statistical measurement that sheds light on historical volatility. For example, a volatile stock will have a high standard deviation while the deviation of a stable blue chip stock will be lower. A large dispersion indicates how much the return on the fund is deviating from the expected normal returns. |
| 14 | Single-borrower CMBS comprise transactions collateralized by a single mortgage loan to a single borrower. The loan can be secured by one or more properties. |
| 15 | Convexity is a measure of the relationship between bond prices and bond yields that demonstrates how the duration of a bond changes as the interest rate changes. |
| 16 | Beta is a measure of the volatility of a portfolio in comparison to a benchmark index. |
| 18 | Annual Report 2018 |
Aberdeen Total Return Bond Fund (Unaudited)
Municipal securities can be affected by adverse tax, legislative or political changes and the financial condition of the issuers of municipal securities.
Investing a significant portion of the Fund’s assets in securities of companies conducting business in a broadly related group of industries within an economic sector may make the Fund more vulnerable to unfavorable developments in that sector.
Please read the prospectus for more detailed information regarding these and other risks.
| 2018 Annual Report | 19 |
Aberdeen Total Return Bond Fund (Unaudited)
Average Annual Total Return (For periods ended October 31, 2018) | 1 Yr. | 5 Yr. | 10 Yr. | |||||||
Class A* | -3.19% | 1.56% | 4.33% | |||||||
Institutional Class* | -2.96% | 1.81% | 4.59% | |||||||
| * | Class A shares and Institutional Class shares are not subject to any sales charges. |
Performance of a $10,000 Investment (as of October 31, 2018)

Comparative performance of $10,000 invested in Class A shares of the Aberdeen Total Return Bond Fund, Barclays US Aggregate Bond Index and the Consumer Price Index (CPI) over a 10-year period ended October 31, 2018. Unlike the Fund’s returns, the returns for these unmanaged indexes do not reflect any fees or expenses. Investors cannot invest directly in market indexes.
The Bloomberg Barclays U.S. Aggregate Bond Index (the “U.S. Aggregate”) is a broad-based flagship benchmark that measures the investment grade, U.S. Dollar-denominated, fixed-rate taxable bond market. The index includes Treasuries, government-related and corporate securities, MBS (agency fixed-rate and hybrid ARM pass-throughs), ABS and CMBS (agency and non-agency). Provided the necessary inclusion rules are met, U.S. Aggregate eligible securities also contribute to the multi-currency Bloomberg Barclays Global Aggregate Bond Index and the Bloomberg Barclays U.S. Universal Index, which includes high yield and emerging markets debt.
The CPI is a measure of the average change over time in the prices paid by urban consumers for a market basket of consumer goods and services.
Investment return and principal value will fluctuate, and when redeemed, shares may be worth more or less than original cost. Past performance is no guarantee of future results. The Average Annual Total Return table and performance graph do not reflect the deduction of taxes that a shareholder would pay on Fund distributions or the redemption of Fund shares. Investing in mutual funds involves market risk, including loss of principal. Performance returns assume the reinvestment of all distributions. Performance returns reflect fee waivers and reimbursements in effect without which returns would have been lower.
| 20 | Annual Report 2018 |
Aberdeen Total Return Bond Fund (Unaudited) (concluded)
Portfolio Summary (as a percentage of net assets)
October 31, 2018 (Unaudited)
| Asset Allocation | ||||
Corporate Bonds | 20.7% | |||
Agency Mortgage-Backed Securities | 19.7% | |||
Non-Agency Mortgage-Backed Securities | 12.0% | |||
Government Bonds | 10.2% | |||
Asset-Backed Securities | 10.1% | |||
U.S. Treasuries | 8.6% | |||
Commercial Mortgage-Backed Securities | 8.5% | |||
U.S. Agencies | 3.9% | |||
Municipal Bonds | 3.8% | |||
Short-Term Investment | 0.7% | |||
Other Assets in Excess of Liabilities | 1.8% | |||
| 100.0% | ||||
The following chart summarizes the composition of the Fund’s portfolio, expressed as a percentage of net assets. The industries listed below may include more than one industry group. As of October 31, 2018, the Fund did not have more than 25% of its assets invested in any industry group.
| Top Industries | ||||
Commercial Banks | 8.0% | |||
Electric Utilities | 3.1% | |||
Aerospace & Defense | 1.5% | |||
Auto Manufacturers | 1.5% | |||
Media | 1.1% | |||
Diversified Financial Services | 1.1% | |||
Pharmaceutical | 0.8% | |||
Healthcare Providers & Services | 0.8% | |||
Energy Equipment & Services | 0.7% | |||
Beverages | 0.6% | |||
Other | 80.8% | |||
| 100.0% | ||||
| Top Holdings* | ||||
U.S. Treasury Bond 05/15/2048 | 2.2% | |||
U.S. Treasury Note 08/15/2028 | 1.8% | |||
International Finance Corp. 08/15/2022 | 1.7% | |||
Citigroup, Inc. 07/15/2039 | 1.5% | |||
Treasury Inflation Protected Security 04/15/2023 | 1.3% | |||
Treasury Inflation Protected Security 01/15/2028 | 1.2% | |||
Russian Federal Bond - OFZ, Series 6212 01/19/2028 | 1.2% | |||
Norway Government Bond 02/17/2027 | 1.1% | |||
Ford Holdings LLC 03/01/2030 | 1.1% | |||
Queensland Treasury Corp. 08/21/2030 | 1.0% | |||
Other | 85.9% | |||
| 100.0% | ||||
| * | For the purpose of listing top holdings, Short-Term Investments are included as part of Other. |
| Top Countries | ||||
United States | 82.5% | |||
Russia | 2.2% | |||
South Africa | 2.2% | |||
Indonesia | 2.0% | |||
Supranational | 1.7% | |||
United Kingdom | 1.2% | |||
Norway | 1.1% | |||
Sweden | 1.1% | |||
Australia | 1.0% | |||
Canada | 0.8% | |||
Other | 4.2% | |||
| 100.0% | ||||
| 2018 Annual Report | 21 |
Statement of Investments
October 31, 2018
Aberdeen Total Return Bond Fund
| Shares or Principal Amount | Value (US$) | |||||||
ASSET-BACKED SECURITIES (10.1%) | ||||||||
UNITED STATES (10.1%) | ||||||||
Ally Master Owner Trust, Series 2018-2, Class A, ABS (USD), 3.29%, 05/15/2023 | $ | 1,072,000 | $ | 1,069,607 | ||||
American Express Credit Account Master Trust |
| |||||||
Series 2017-6, Class A, (USD), 2.04%, 05/15/2023 | 952,000 | 931,226 | ||||||
Series 2018-9, Class A, ABS, FRN (USD), 2.66%, 04/15/2026 (a) | 981,000 | 981,884 | ||||||
BA Credit Card Trust, Series 2017-A2, Class A2, ABS (USD), 1.84%, 01/17/2023 | 1,308,000 | 1,278,056 | ||||||
BMW Vehicle Lease Trust, Series 2017-2, Class A3, ABS (USD), 2.07%, 10/20/2020 | 1,148,000 | 1,136,982 | ||||||
Citibank Credit Card Issuance Trust |
| |||||||
Series 2014-A1, Class A1 (USD), 2.88%, 01/23/2023 | 885,000 | 878,776 | ||||||
Series 2017-A3, Class A3, ABS (USD), 1.92%, 04/07/2022 | 1,185,000 | 1,164,925 | ||||||
CNH Equipment Trust |
| |||||||
Series 2017-A, Class A3, (USD), 2.07%, 05/16/2022 | 797,000 | 788,395 | ||||||
Series 2018-A, Class A3, ABS (USD), 3.12%, 07/17/2023 | 879,353 | 876,696 | ||||||
Daimler Trucks Retail Trust, Series 2018-1, Class A4, ABS (USD), 3.03%, 11/15/2024 (b) | 1,125,000 | 1,121,290 | ||||||
Discover Card Execution Note Trust, Series 2016-A4, Class A4, (USD), 1.39%, 03/15/2022 | 1,465,000 | 1,445,185 | ||||||
Ford Credit Auto Lease Trust, Series 2017-B, Class A4 (USD), 2.17%, 02/15/2021 | 791,000 | 781,236 | ||||||
Ford Credit Auto Owner Trust, Series 2018-1, Class A (USD), 3.19%, 07/15/2031 (b) | 846,000 | 817,785 | ||||||
GM Financial Automobile Leasing Trust 2018-3, Series 2018-3, Class C, ABS (USD), 3.70%, 07/20/2022 | 1,050,000 | 1,047,631 | ||||||
Hertz Vehicle Financing LLC 2018-3, Series 2018-3A, Class A, ABS, (USD), 4.03%, 07/25/2024 (b) | 1,247,000 | 1,241,619 | ||||||
John Deere Owner Trust, Series 2017-B, Class A3, (USD), 1.82%, 10/15/2021 | 1,117,000 | 1,101,224 | ||||||
Nissan Auto Receivables Owner Trust, Series 2018-B, Class A4, ABS (USD), 3.16%, 12/16/2024 | 841,000 | 835,399 | ||||||
SLM Student Loan Trust |
| |||||||
Series 2011-1, Class A1, (USD), 1M USD LIBOR + 0.520%, 2.80%, 03/25/2026 (a) | 206,961 | 207,428 | ||||||
Series 2011-2, Class A1, (USD), 1M USD LIBOR + 0.600%, 2.88%, 11/25/2027 (a) | 560,855 | 563,249 | ||||||
Series 2013-2, Class A, (USD), 1M USD LIBOR + 0.450%, 2.73%, 09/25/2043 (a) | 494,834 | 495,350 | ||||||
Synchrony Credit Card Master Note Trust, Series 2015-1, Class A, (USD), 2.37%, 03/15/2023 | 942,000 | 931,950 | ||||||
Tesla Auto Lease Trust, Series 2018-A, Class D, ABS (USD), 3.30%, 05/20/2020 (b) | 782,000 | 777,586 | ||||||
Towd Point Mortgage Trust 2018-6, Series 2018-6, Class A1A, ABS, VRN, (USD), 3.75%, 03/25/2058 (a)(b) | 1,016,962 | 1,012,727 | ||||||
| 21,486,206 | ||||||||
Total Asset-Backed Securities | 21,486,206 | |||||||
COMMERCIAL MORTGAGE-BACKED SECURITIES (8.5%) |
| |||||||
UNITED STATES (8.5%) | ||||||||
Caesars Palace Las Vegas Trust, Series 2017-VICI, Class A (USD), 3.53%, 10/15/2034 (b) | 951,000 | 948,893 | ||||||
Commercial Mortgage Trust |
| |||||||
Series 2014-TWC, Class B, (USD), 1M LIBOR + 1.600%, 3.88%, 02/13/2032 (a)(b) | 690,000 | 690,216 | ||||||
Series 2016-DC2, Class ASB (USD), 3.55%, 02/10/2049 | 791,000 | 791,333 | ||||||
FREMF Mortgage Trust | ||||||||
Series 2012-K21, Class C, (USD), 3.94%, 07/25/2045 (a)(b) | 996,583 | 986,917 | ||||||
Series 2013-K29, Class C, VRN, (USD), 3.48%, 05/25/2046 (a)(b) | 813,000 | 788,873 | ||||||
GS Mortgage Securities Corp. Trust |
| |||||||
Series 2012-SHOP, Class B (USD), 3.31%, 06/05/2031 (b) | 1,023,000 | 1,022,529 | ||||||
Series 2017-GPTX, Class C (USD), 3.30%, 05/10/2034 (b) | 775,000 | 756,788 | ||||||
Hilton USA Trust, Series 2016-SFP, Class C, (USD), 4.12%, 11/05/2035 (b) | 939,000 | 931,070 | ||||||
JP Morgan Chase Commercial Mortgage Securities Trust 2012-CIBX, Series 2012-CBX, Class AS (USD), 4.27%, 06/15/2045 | 1,329,000 | 1,351,637 | ||||||
Morgan Stanley Bank of America Merrill Lynch Trust 2012-C5, Series 2012-C5, Class B, VRN (USD), 4.44%, 08/15/2045 (a) | 1,017,000 | 1,030,223 | ||||||
Morgan Stanley Capital I Trust |
| |||||||
Series 2017-CLS, Class A (USD), 2.98%, 11/15/2034 (a)(b) | 1,001,000 | 1,000,377 | ||||||
Series 2018-MP, Class A (USD), 4.42%, 07/11/2040 (b) | 932,000 | 943,083 | ||||||
Series 2018-H3, Class AS (USD), 4.43%, 07/15/2051 | 914,000 | 926,043 | ||||||
Sequoia Mortgage Trust, Series 2018-6, Class A4 (USD), 4.00%, 07/25/2048 (a)(b) | 779,034 | 780,130 | ||||||
Sequoia Mortgage Trust 2018-CH4, Series 2018-CH4, Class A13, CMO, VRN, (USD), 4.50%, 10/25/2048 (a)(b) | 816,250 | 816,956 | ||||||
SFAVE Commercial Mortgage Securities Trust |
| |||||||
Series 2015-5AVE, Class B (USD), 4.39%, 01/05/2043 (a)(b) | 370,000 | 339,311 | ||||||
Series 2015-5AVE, Class C (USD), 4.39%, 01/05/2043 (a)(b) | 820,000 | 707,295 | ||||||
WFRBS Commercial Mortgage Trust |
| |||||||
Series 2013-C11, Class B (USD), 3.71%, 03/15/2045 (a) | 1,023,000 | 1,010,254 | ||||||
See accompanying Notes to Financial Statements.
| 22 | Annual Report 2018 |
Statement of Investments (continued)
October 31, 2018
Aberdeen Total Return Bond Fund
| Shares or Principal Amount | Value (US$) | |||||||
Series 2012-C9, Class AS (USD), 3.39%, 11/15/2045 | $ | 1,051,000 | $ | 1,037,123 | ||||
Series 2012-C10, Class AS, (USD), 3.24%, 12/15/2045 | 1,116,000 | 1,093,666 | ||||||
| 17,952,717 | ||||||||
Total Commercial Mortgage-Backed Securities |
| 17,952,717 | ||||||
NON-AGENCY MORTGAGE-BACKED SECURITIES (12.0%) |
| |||||||
UNITED STATES (12.0%) |
| |||||||
Agate Bay Mortgage Trust, Series 2014-3, Class B2, (USD), 3.82%, 11/25/2044 (a)(b) | 755,986 | 742,083 | ||||||
CHL Mortgage Pass-Through Trust, Series 2005-21, Class A2 (USD), 5.50%, 10/25/2035 | 408,449 | 379,496 | ||||||
Citigroup Mortgage Loan Trust, Series 2005-11, Class A3 (USD), 1 year CMT + 2.400%, 4.99%, 11/25/2035 (a) | 369,799 | 369,780 | ||||||
CSMC Trust |
| |||||||
Series 2013-7, Class A11 (USD), 3.50%, 08/25/2043 (a)(b) | 898,919 | 864,156 | ||||||
Series 2014-WIN2, Class B1, (USD), 3.99%, 10/25/2044 (a)(b) | 1,370,647 | 1,364,997 | ||||||
Federal National Mortgage Association, Series 2018-C03, Class 1M1 (USD), 2.96%, 10/25/2030 (a) | 735,060 | 734,859 | ||||||
Flagstar Mortgage Trust, Series 2017-2, Class B2, (USD), 4.14%, 10/25/2047 (a)(b) | 1,232,080 | 1,185,454 | ||||||
GSR Mortgage Loan Trust, Series 2005-6F, Class 1A6 (USD), 5.25%, 07/25/2035 | 448,873 | 466,899 | ||||||
IndyMac INDA Mortgage Loan Trust, Series 2005-AR2, Class 3A1 (USD), 3.98%, 01/25/2036 (a) | 526,181 | 486,258 | ||||||
JP Morgan Mortgage Trust |
| |||||||
Series 16-1, Class A13 (USD), 3.50%, 05/25/2046 (a)(b) | 653,415 | 621,612 | ||||||
Series 2005-A4, Class 3A1 (USD), 4.16%, 07/25/2035 (a) | 222,925 | 225,723 | ||||||
Series 2005-A5, Class 2A2 (USD), 4.50%, 08/25/2035 (a) | 540,903 | 558,001 | ||||||
Series 2006-S1, Class 2A6 (USD), 6.00%, 04/25/2036 | 571,065 | 601,426 | ||||||
Series 2013-1, Class B1 (USD), 3.50%, 03/25/2043 (a)(b) | 860,975 | 852,987 | ||||||
Series 2014-IVR3, Class 3A1 (USD), 2.73%, 09/25/2044 (a)(b) | 492,324 | 477,683 | ||||||
Series 2014-IVR6, Class AM (USD), 2.76%, 07/25/2044 (a)(b) | 383,193 | 379,989 | ||||||
Series 2016-5, Class A1 (USD), 2.64%, 12/25/2046 (a)(b) | 648,064 | 635,967 | ||||||
Series 2017-1, Class A3, (USD), 3.50%, 01/25/2047 (a)(b) | 49 | 48 | ||||||
Series 2017-2, Class A5, (USD), 3.50%, 05/25/2047 (a)(b) | 1,017,088 | 995,752 | ||||||
Series 2018-6, Class B2 (USD), 4.01%, 12/25/2048 (a)(b) | 1,004,796 | 954,237 | ||||||
New Residential Mortgage Loan Trust |
| |||||||
Series 2014-2A, Class A3 (USD), 3.75%, 05/25/2054 (a)(b) | 589,871 | 587,571 | ||||||
Series 2017-1A, Class A1, (USD), 4.00%, 02/25/2057 (a)(b) | 1,136,783 | 1,139,150 | ||||||
Series 2017-2A, Class A3, (USD), 4.00%, 03/25/2057 (a)(b) | 830,348 | 833,500 | ||||||
PHH Mortgage Trust, Series 2008-CIM1, Class 21A1 (USD), 6.00%, 05/25/2038 | 765,950 | 779,369 | ||||||
Sequoia Mortgage Trust |
| |||||||
Series 2017-1, Class A4 (USD), 3.50%, 02/25/2047 (a)(b) | 994,815 | 974,568 | ||||||
Series 2017-1, Class B2, (USD), 3.64%, 02/25/2047 (a)(b) | 671,513 | 642,019 | ||||||
Series 2017-CH1, Class A13, (USD), 4.00%, 08/25/2047 (a)(b) | 595,833 | 579,417 | ||||||
Series 2017-CH2, Class A13 (USD), 4.00%, 12/25/2047 (a)(b) | 902,867 | 878,565 | ||||||
Series 2018-5, Class A4 (USD), 3.50%, 05/25/2048 (a)(b) | 1,470,107 | 1,439,305 | ||||||
Series 2018-6, Class A19 (USD), 4.00%, 07/25/2048 (a)(b) | 1,672,989 | 1,649,083 | ||||||
Structured Asset Securities Corp., Series 2004-18H, Class A5 (USD), 4.75%, 10/25/2034 | 841,901 | 861,974 | ||||||
Thornburg Mortgage Securities Trust |
| |||||||
Series 2007-4, Class 2A1 (USD), 4.29%, 09/25/2037 (a) | 450,685 | 450,712 | ||||||
Series 2007-4, Class 3A1 (USD), 4.22%, 09/25/2037 (a) | 48,077 | 48,267 | ||||||
WaMu Mortgage Pass Through Certificates, Series 2005-AR7, Class A3 (USD), 4.08%, 08/25/2035 (a) | 571,400 | 575,437 | ||||||
Wells Fargo Mortgage Backed Securities Trust, Series 2006-10, Class A4 (USD), 6.00%, 08/25/2036 | 455,256 | 453,332 | ||||||
WinWater Mortgage Loan Trust, Series 2015-2, Class B3, (USD), 3.91%, 02/20/2045 (a)(b) | 618,594 | 598,629 | ||||||
| 25,388,305 | ||||||||
Total Non-Agency Mortgage-Backed Securities |
| 25,388,305 | ||||||
CORPORATE BONDS (20.7%) |
| |||||||
BELGIUM (0.6%) |
| |||||||
Beverages (0.6%) |
| |||||||
Anheuser-Busch InBev Worldwide, Inc. (USD), 8.20%, 01/15/2039 | 935,000 | 1,256,213 | ||||||
CANADA (0.8%) |
| |||||||
Commercial Banks (0.8%) |
| |||||||
Canadian Imperial Bank of Commerce (USD), 2.10%, 10/05/2020 | 1,799,000 | 1,758,247 | ||||||
FRANCE (0.7%) |
| |||||||
Electric Utilities (0.7%) |
| |||||||
Electricite de France SA (USD), 4.50%, 09/21/2028 (b) | 1,563,000 | 1,511,177 | ||||||
See accompanying Notes to Financial Statements.
| 2018 Annual Report | 23 |
Statement of Investments (continued)
October 31, 2018
Aberdeen Total Return Bond Fund
| Shares or Principal Amount | Value (US$) | |||||||
ITALY (0.6%) |
| |||||||
Electric Utilities (0.6%) |
| |||||||
Enel Finance International NV (USD), 3.63%, 05/25/2027 (b) | $ | 1,400,000 | $ | 1,215,558 | ||||
SPAIN (0.5%) |
| |||||||
Commercial Banks (0.5%) |
| |||||||
Banco Santander SA (USD), 3.80%, 02/23/2028 | 1,200,000 | 1,066,118 | ||||||
SWEDEN (1.1%) |
| |||||||
Commercial Banks (1.1%) |
| |||||||
Skandinaviska Enskilda Banken AB (USD), 2.63%, 03/15/2021 | 1,356,000 | 1,325,883 | ||||||
Svenska Handelsbanken AB (USD), 2.45%, 03/30/2021 | 955,000 | 931,144 | ||||||
| 2,257,027 | ||||||||
UNITED KINGDOM (1.2%) |
| |||||||
Commercial Banks (1.2%) |
| |||||||
HSBC Holdings PLC (USD), (fixed rate to 06/19/2029, variable rate thereafter), 4.58% | 1,320,000 | 1,306,290 | ||||||
Santander UK Group Holdings PLC (USD), 3.57%, 01/10/2023 | 1,310,000 | 1,265,530 | ||||||
| 2,571,820 | ||||||||
UNITED STATES (15.2%) |
| |||||||
Aerospace & Defense (1.5%) |
| |||||||
United Technologies Corp. |
| |||||||
(USD), 3.95%, 08/16/2025 | 1,350,000 | 1,336,877 | ||||||
(USD), 6.05%, 06/01/2036 | 508,000 | 573,536 | ||||||
(USD), 6.13%, 07/15/2038 | 1,115,000 | 1,268,918 | ||||||
| 3,179,331 | ||||||||
Auto Manufacturers (1.5%) |
| |||||||
Ford Holdings LLC (USD), 9.30%, 03/01/2030 | 1,890,000 | 2,276,226 | ||||||
General Motors Co. (USD), 5.00%, 04/01/2035 | 1,000,000 | 873,644 | ||||||
| 3,149,870 | ||||||||
Commercial Banks (4.4%) |
| |||||||
Bank of America Corp. (USD), (fixed rate to 07/21/2028, variable rate thereafter), 3.59% | 1,780,000 | 1,673,004 | ||||||
Citigroup, Inc. (USD), 8.13%, 07/15/2039 | 2,330,000 | 3,253,253 | ||||||
Citizens Bank NA/Providence (USD), 2.25%, 10/30/2020 | 1,248,000 | 1,215,917 | ||||||
JPMorgan Chase & Co. (USD), (fixed rate to 04/23/2029, variable rate thereafter), 4.01% | 2,090,000 | 2,026,440 | ||||||
Morgan Stanley (USD), (fixed rate to 07/22/2028, variable rate thereafter), 3.59% | 1,300,000 | 1,217,467 | ||||||
| 9,386,081 | ||||||||
Computers & Peripherals (0.6%) |
| |||||||
Apple, Inc. (USD), 3.75%, 11/13/2047 | 1,370,000 | 1,229,598 | ||||||
Diversified Financial Services (1.1%) |
| |||||||
American Express Co. (USD), 3.40%, 02/27/2023 | 1,360,000 | 1,333,284 | ||||||
KKR Group Finance Co. III LLC (USD), 5.13%, 06/01/2044 (b) | 891,000 | 863,878 | ||||||
| 2,197,162 | ||||||||
Electric Utilities (1.8%) |
| |||||||
Edison International (USD), 2.13%, 04/15/2020 | 300,000 | 294,262 | ||||||
PSEG Power LLC (USD), 5.13%, 04/15/2020 | 480,000 | 490,899 | ||||||
Sempra Energy |
| |||||||
(USD), 9.80%, 02/15/2019 | 723,000 | 736,824 | ||||||
(USD), 1.63%, 10/07/2019 | 227,000 | 223,741 | ||||||
(USD), 2.40%, 02/01/2020 | 1,320,000 | 1,304,028 | ||||||
WEC Energy Group, Inc. (USD), 3.38%, 06/15/2021 | 819,000 | 816,724 | ||||||
| 3,866,478 | ||||||||
Energy Equipment & Services (0.7%) |
| |||||||
Plains All American Pipeline LP / PAA Finance Corp. (USD), 4.90%, 02/15/2045 | 800,000 | 699,205 | ||||||
Sunoco Logistics Partners Operations LP (USD), 5.30%, 04/01/2044 | 870,000 | 779,729 | ||||||
| 1,478,934 | ||||||||
Healthcare Providers & Services (0.8%) |
| |||||||
Quest Diagnostics, Inc. (USD), 3.45%, 06/01/2026 | 1,740,000 | 1,628,057 | ||||||
Insurance (0.5%) |
| |||||||
Brighthouse Financial, Inc., Series WI (USD), 3.70%, 06/22/2027 | 1,300,000 | 1,118,665 | ||||||
Media (1.1%) |
| |||||||
Charter Communications Operating LLC / Charter Communications Operating Capital (USD), 5.75%, 04/01/2048 | 920,000 | 870,644 | ||||||
Comcast Corp. (USD), 3.15%, 03/01/2026 | 1,600,000 | 1,496,229 | ||||||
| 2,366,873 | ||||||||
Pharmaceutical (0.8%) |
| |||||||
CVS Health Corp. (USD), 2.88%, 06/01/2026 | 1,945,000 | 1,762,021 | ||||||
Retail (0.4%) |
| |||||||
McDonald’s Corp. (USD), 3.25%, 06/10/2024 | 901,000 | 876,299 | ||||||
| 32,239,369 | ||||||||
Total Corporate Bonds |
| 43,875,529 | ||||||
MUNICIPAL BONDS (3.8%) |
| |||||||
UNITED STATES (3.8%) |
| |||||||
CALIFORNIA (1.8%) |
| |||||||
Los Angeles Unified School District General Obligation Unlimited Bonds (USD), 6.76%, 07/01/2034 | 1,080,000 | 1,361,070 | ||||||
Regents of the University of California Medical Center Pooled Revenue | ||||||||
Series H (USD), 6.55%, 05/15/2048 | 1,485,000 | 1,902,820 | ||||||
Series F (USD), 6.58%, 05/15/2049 | 380,000 | 486,932 | ||||||
| 3,750,822 | ||||||||
CONNECTICUT (0.9%) |
| |||||||
State of Connecticut General Obligation Unlimited Bonds, Series A (USD), 5.85%, 03/15/2032 | 1,605,000 | 1,806,893 | ||||||
See accompanying Notes to Financial Statements.
| 24 | Annual Report 2018 |
Statement of Investments (continued)
October 31, 2018
Aberdeen Total Return Bond Fund
| Shares or Principal Amount | Value (US$) | |||||||
PENNSYLVANIA (1.1%) |
| |||||||
Pennsylvania State General Obligation Unlimited Bonds (Build America Bonds) | ||||||||
Series B (USD), 4.65%, 02/15/2026 | $ | 1,050,000 | $ | 1,091,884 | ||||
(USD), 5.35%, 05/01/2030 | 1,300,000 | 1,330,719 | ||||||
| 2,422,603 | ||||||||
| 7,980,318 | ||||||||
Total Municipal Bonds |
| 7,980,318 | ||||||
GOVERNMENT BONDS (10.2%) |
| |||||||
AUSTRALIA (1.0%) |
| |||||||
Queensland Treasury Corp. (AUD), 3.50%, 08/21/2030 (b) | 3,093,000 | 2,236,644 | ||||||
INDONESIA (2.0%) |
| |||||||
Indonesia Treasury Bond |
| |||||||
Series FR56 (IDR), 8.38%, 09/15/2026 | 18,584,000,000 | 1,204,396 | ||||||
Series FR64 (IDR), 6.13%, 05/15/2028 | 22,464,000,000 | 1,241,227 | ||||||
Series FR72 (IDR), 8.25%, 05/15/2036 | 19,223,000,000 | 1,183,538 | ||||||
Series FR75 (IDR), 7.50%, 05/15/2038 | 11,749,000,000 | 664,637 | ||||||
| 4,293,798 | ||||||||
NORWAY (1.1%) |
| |||||||
Norway Government Bond (NOK), 1.75%, 02/17/2027 (b) | 20,847,000 | 2,446,947 | ||||||
RUSSIA (2.2%) |
| |||||||
Russian Federal Bond — OFZ |
| |||||||
Series 6212 (RUB), 7.05%, 01/19/2028 | 177,450,000 | 2,460,426 | ||||||
Series 6221 (RUB), 7.70%, 03/23/2033 | 151,620,000 | 2,155,542 | ||||||
| 4,615,968 | ||||||||
SOUTH AFRICA (2.2%) |
| |||||||
Republic of South Africa Government Bond, Series R186 (ZAR), 10.50%, 12/21/2026 | 17,060,000 | 1,226,262 | ||||||
South Africa Government Bond |
| |||||||
Series R186 (ZAR), 10.50%, 12/21/2026 | 19,810,000 | 1,423,930 | ||||||
Series 2037 (ZAR), 8.50%, 01/31/2037 | 32,920,000 | 1,921,798 | ||||||
| 4,571,990 | ||||||||
SUPRANATIONAL (1.7%) |
| |||||||
International Finance Corp. (AUD), 2.80%, 08/15/2022 | 4,944,000 | 3,535,555 | ||||||
Total Government Bonds |
| 21,700,902 | ||||||
U.S. AGENCIES (3.9%) |
| |||||||
UNITED STATES (3.9%) |
| |||||||
Federal Home Loan Mortgage Corp. |
| |||||||
Series 2016-HQA4, Class M2 (USD), 1M USD LIBOR + 1.300%, 3.59%, 04/25/2029 (a) | 1,635,000 | 1,653,785 | ||||||
Series 2017-C06, Class 2M1 (USD), 1M USD LIBOR + 0.750%,, 3.03%, 02/25/2030 (a) | 946,591 | 947,053 | ||||||
Series 2017-DNA3, Class M1, (USD), 3.03%, 03/25/2030 (a) | 975,839 | 978,262 | ||||||
Government National Mortgage Association |
| |||||||
MBS (USD), 4.50%, 06/20/2047 | 1,033,227 | 1,060,576 | ||||||
MBS (USD), 4.00%, 05/20/2048 | 2,024,205 | 2,039,949 | ||||||
MBS (USD), 4.00%, 05/20/2048 | 1,635,081 | 1,648,817 | ||||||
| 8,328,442 | ||||||||
Total U.S. Agencies |
| 8,328,442 | ||||||
U.S. TREASURIES (8.6%) |
| |||||||
UNITED STATES (8.6%) |
| |||||||
Treasury Inflation Protected Security |
| |||||||
(USD), 0.63%, 04/15/2023 (c) | 2,755,083 | 2,702,564 | ||||||
(USD), 0.38%, 07/15/2027 (c) | 1,236,900 | 1,164,152 | ||||||
(USD), 0.50%, 01/15/2028 (c) | 2,739,496 | 2,588,859 | ||||||
(USD), 0.88%, 02/15/2047 (c) | 2,388,527 | 2,139,877 | ||||||
U.S. Treasury Bond |
| |||||||
(USD), 2.75%, 08/15/2047 | 355,300 | 312,581 | ||||||
(USD), 2.75%, 11/15/2047 | 860,300 | 756,392 | ||||||
(USD), 3.13%, 05/15/2048 | 4,963,900 | 4,707,561 | ||||||
U.S. Treasury Note (USD), 2.88%, 08/15/2028 | 3,830,000 | 3,739,187 | ||||||
| 18,111,173 | ||||||||
Total U.S. Treasuries |
| 18,111,173 | ||||||
AGENCY MORTGAGE-BACKED SECURITIES (19.7%) |
| |||||||
UNITED STATES (19.7%) |
| |||||||
Federal Home Loan Mortgage Corp. |
| |||||||
(USD), 2.50%, 11/01/2031 | 1,066,985 | 1,021,211 | ||||||
(USD), 3.00%, 02/01/2032 | 1,160,837 | 1,137,617 | ||||||
(USD), 5.00%, 10/01/2041 | 416,649 | 439,749 | ||||||
(USD), 4.00%, 03/01/2042 | 1,023,258 | 1,032,477 | ||||||
(USD), 4.50%, 07/01/2042 | 1,538,913 | 1,594,438 | ||||||
(USD), 4.00%, 07/01/2046 | 1,740,608 | 1,748,208 | ||||||
(USD), 4.00%, 09/01/2046 | 466,077 | 467,718 | ||||||
(USD), 3.00%, 10/01/2046 | 1,480,343 | 1,402,956 | ||||||
(USD), 3.00%, 12/01/2046 | 969,547 | 918,525 | ||||||
(USD), 4.00%, 03/01/2047 | 866,609 | 869,390 | ||||||
(USD), 4.50%, 04/01/2047 | 854,154 | 875,226 | ||||||
(USD), 3.50%, 03/01/2048 | 1,017,432 | 993,263 | ||||||
(USD), 3.50%, 04/01/2048 | 1,460,237 | 1,427,416 | ||||||
MBS (USD), 2.50%, 06/01/2031 | 1,671,716 | 1,600,034 | ||||||
Federal National Mortgage Association |
| |||||||
(USD), 3.00%, 01/01/2030 | 1,165,624 | 1,146,131 | ||||||
(USD), 4.50%, 07/01/2040 | 1,222,449 | 1,262,078 | ||||||
(USD), 4.00%, 11/01/2043 | 606,387 | 609,118 | ||||||
(USD), 4.00%, 11/01/2044 | 1,886,275 | 1,909,402 | ||||||
(USD), 3.50%, 06/01/2045 | 688,279 | 672,878 | ||||||
(USD), 3.50%, 06/01/2046 | 1,794,306 | 1,753,217 | ||||||
(USD), 3.50%, 06/01/2046 | 1,242,001 | 1,214,229 | ||||||
(USD), 4.00%, 07/01/2046 | 843,836 | 844,676 | ||||||
(USD), 4.50%, 09/01/2046 | 1,353,595 | 1,397,367 | ||||||
(USD), 3.00%, 10/01/2046 | 2,111,558 | 1,999,202 | ||||||
(USD), 4.00%, 02/01/2047 | 1,025,579 | 1,026,274 | ||||||
(USD), 3.00%, 03/01/2047 | 1,958,800 | 1,858,266 | ||||||
(USD), 12M USD LIBOR + 1.602%, 2.89%, 06/01/2047 (a) | 1,070,693 | 1,059,470 | ||||||
(USD), 3.50%, 12/01/2047 | 2,193,235 | 2,145,906 | ||||||
(USD), 3.50%, 01/01/2048 | 1,934,395 | 1,888,528 | ||||||
(USD), 3.50%, 02/01/2048 | 1,574,297 | 1,542,751 | ||||||
See accompanying Notes to Financial Statements.
| 2018 Annual Report | 25 |
Statement of Investments (continued)
October 31, 2018
Aberdeen Total Return Bond Fund
| Shares or Principal Amount | Value (US$) | |||||||
MBS (USD), 3.00%, 07/01/2045 | $ | 1,112,957 | $ | 1,063,007 | ||||
MBS (USD), 4.00%, 01/01/2048 | 1,545,389 | 1,555,962 | ||||||
Government National Mortgage Association (USD), 4.50%, 12/20/2045 | 1,158,471 | 1,204,658 | ||||||
| 41,681,348 | ||||||||
Total Agency Mortgage-Backed Securities | 41,681,348 | |||||||
SHORT-TERM INVESTMENT (0.7%) | ||||||||
UNITED STATES (0.7%) | ||||||||
State Street Institutional U.S. Government Money Market Fund, Premier Class, 2.09% (d) | 1,546,053 | 1,546,053 | ||||||
Total Short-Term Investment | 1,546,053 | |||||||
Total Investments |
| 208,050,993 | ||||||
Other Assets in Excess of Liabilities—1.8% |
| 3,801,724 | ||||||
Net Assets—100.0% |
| $ | 211,852,717 | |||||
| (a) | Variable rate instrument. The rate shown is based on the latest available information as of October 31, 2018. Certain variable rate securities are not based on a published reference rate and spread but are determined by the issuer or agent and are based on current market conditions. These securities do not indicate a reference rate and spread in their description. |
| (b) | Denotes a security issued under Regulation S or Rule 144A. |
| (c) | Inflation linked security. |
| (d) | Registered investment company advised by State Street Global Advisors. The rate shown is the 7 day yield as of October 31, 2018. |
| (e) | See accompanying Notes to Financial Statements for tax unrealized appreciation/(depreciation) of securities. |
| AUD | Australian Dollar |
| CLP | Chilean Peso |
| COP | Colombian Peso |
| CZK | Czech Koruna |
| IDR | Indonesian Rupiah |
| INR | Indian Rupee |
| JPY | Japanese Yen |
| KRW | South Korean Won |
| MXN | Mexican Peso |
| NOK | Norwegian Krone |
| PLC | Public Limited Company |
| RUB | New Russian Ruble |
| SEK | Swedish Krona |
| USD | U.S. Dollar |
| ZAR | South African Rand |
At October 31, 2018, the Fund held the following futures contracts:
| Futures Contracts | Number of Contracts Long/(Short) | Expiration Date | Notional Amount | Market Value | Unrealized Appreciation/ (Depreciation) | |||||||||||||||
| LONG CONTRACT POSITIONS | ||||||||||||||||||||
United States Treasury Note 6%-2 year | 4 | 12/31/2018 | $ | 845,500 | $ | 842,625 | $ | (2,875 | ) | |||||||||||
United States Treasury Note 6%-5 year | 104 | 12/31/2018 | 11,674,164 | 11,687,812 | 13,648 | |||||||||||||||
United States Treasury Note 6%-10 year | 151 | 12/19/2018 | 17,938,438 | 17,884,063 | (54,375 | ) | ||||||||||||||
United States Treasury Note 6%-Long Bond | 11 | 12/19/2018 | 1,520,937 | 1,519,375 | (1,562 | ) | ||||||||||||||
United States Treasury Note 6%-Ultra Long | 46 | 12/19/2018 | 7,226,145 | 6,864,063 | (362,082 | ) | ||||||||||||||
| $ | (407,246 | ) | ||||||||||||||||||
| SHORT CONTRACT POSITIONS | ||||||||||||||||||||
Australian 10 Year Bond | (31 | ) | 12/17/2018 | $ | (2,840,952 | ) | $ | (2,840,952 | ) | $ | — | |||||||||
United States Treasury Note 6%-10 year | (141 | ) | 12/19/2018 | (17,877,664 | ) | (17,640,422 | ) | 237,242 | ||||||||||||
| $ | 237,242 | |||||||||||||||||||
| $ | (170,004 | ) | ||||||||||||||||||
At October 31, 2018, the Fund’s open forward foreign currency exchange contracts were as follows:
| Purchase Contracts Settlement Date* | Counterparty | Amount | Amount | Fair Value | Unrealized Appreciation/ (Depreciation) | |||||||||||||||||||||
| Australian Dollar/United States Dollar 12/14/2018 | Citibank | AUD | 506,595 | USD | 365,626 | $ | 358,908 | $ | (6,718 | ) | ||||||||||||||||
| Chilean Peso/United States Dollar 11/23/2018 | Barclays Bank | CLP | 1,962,546,024 | USD | 2,906,661 | 2,820,250 | (86,411 | ) | ||||||||||||||||||
| 11/23/2018 | Citibank | CLP | 1,796,467,000 | USD | 2,693,930 | 2,581,589 | (112,341 | ) | ||||||||||||||||||
| Colombian Peso/United States Dollar 11/28/2018 | Barclays Bank | COP | 8,077,397,301 | USD | 2,716,918 | 2,505,895 | (211,023 | ) | ||||||||||||||||||
| Crech Koruna/United States Dollar 12/27/2018 | Citibank | CZK | 61,409,000 | USD | 2,830,693 | 2,698,147 | (132,546 | ) | ||||||||||||||||||
| 12/27/2018 | UBS | CZK | 17,469,000 | USD | 796,362 | 767,541 | (28,821 | ) | ||||||||||||||||||
See accompanying Notes to Financial Statements.
| 26 | Annual Report 2018 |
Statement of Investments (concluded)
October 31, 2018
Aberdeen Total Return Bond Fund
| Purchase Contracts Settlement Date* | Counterparty | Amount | Amount | Fair Value | Unrealized Appreciation/ (Depreciation) | |||||||||||||||||||||||
| Indian Rupee/United States Dollar 11/09/2018 | Barclays Bank | INR | 193,578,000 | USD | 2,741,122 | $ | 2,612,918 | $ | (128,204 | ) | ||||||||||||||||||
| 11/09/2018 | Citibank | INR | 202,397,707 | USD | 2,878,235 | 2,731,966 | (146,269 | ) | ||||||||||||||||||||
| 11/09/2018 | HSBC Bank | INR | 158,922,000 | USD | 2,143,106 | 2,145,131 | 2,025 | |||||||||||||||||||||
| Indonesian Rupiah/United States Dollar 12/03/2018 | HSBC Bank | IDR | 71,083,915,519 | USD | 4,670,934 | 4,649,959 | (20,975 | ) | ||||||||||||||||||||
| Japanese Yen/United States Dollar 12/26/2018 | Citibank | JPY | 285,760,000 | USD | 2,545,878 | 2,544,497 | (1,381 | ) | ||||||||||||||||||||
| Mexican Peso/United States Dollar 11/29/2018 | Citibank | MXN | 52,158,000 | USD | 2,688,894 | 2,557,474 | (131,420 | ) | ||||||||||||||||||||
| Norwegian Krone/United States Dollar 11/28/2018 | Royal Bank of Canada | NOK | 22,349,000 | USD | 2,715,694 | 2,653,996 | (61,698 | ) | ||||||||||||||||||||
| South African Rand/United States Dollar 11/15/2018 | Citibank | ZAR | 4,204,497 | USD | 288,069 | 284,557 | (3,512 | ) | ||||||||||||||||||||
| 11/15/2018 | UBS | ZAR | 38,678,750 | USD | 2,623,125 | 2,617,748 | (5,377 | ) | ||||||||||||||||||||
| 01/24/2019 | Citibank | ZAR | 67,333,015 | USD | 4,571,666 | 4,516,785 | (54,881 | ) | ||||||||||||||||||||
| South Korean Won/United States Dollar 11/13/2018 | Citibank | KRW | 5,307,900,500 | USD | 4,690,202 | 4,650,784 | (39,418 | ) | ||||||||||||||||||||
| Swedish Krona/United States Dollar 11/26/2018 | Citibank | SEK | 21,306,000 | USD | 2,343,689 | 2,332,660 | (11,029 | ) | ||||||||||||||||||||
| $ | 46,030,805 | $ | (1,179,999 | ) | ||||||||||||||||||||||||
| Sale Contracts Settlement Date* | Counterparty | Amount Purchased | Amount Sold | Fair Value | Unrealized Appreciation/ (Depreciation) | |||||||||||||||||||||||
| United States Dollar/Australian Dollar 12/14/2018 | Royal Bank of Canada | USD | 3,848,803 | AUD | 5,395,423 | $ | 3,822,504 | $ | 26,299 | |||||||||||||||||||
| United States Dollar/Chilean Peso 11/23/2018 | HSBC Bank | USD | 1,235,768 | CLP | 819,376,000 | 1,177,473 | 58,295 | |||||||||||||||||||||
| United States Dollar/Colombian Peso 11/28/2018 | Citibank | USD | 2,676,407 | COP | 8,077,397,301 | 2,505,895 | 170,512 | |||||||||||||||||||||
| United States Dollar/Indian Rupee 11/09/2018 | Citibank | USD | 1,790,070 | INR | 133,217,000 | 1,798,164 | (8,094 | ) | ||||||||||||||||||||
| 11/09/2018 | Westpac Banking Corp. | USD | 1,218,659 | INR | 88,962,082 | 1,200,811 | 17,848 | |||||||||||||||||||||
| United States Dollar/Indonesian Rupiah 12/03/2018 | Westpac Banking Corp. | USD | 4,764,977 | IDR | 71,083,915,519 | 4,649,959 | 115,018 | |||||||||||||||||||||
| United States Dollar/Japanese Yen 12/26/2018 | Royal Bank of Canada | USD | 2,511,557 | JPY | 285,760,000 | 2,544,496 | (32,939 | ) | ||||||||||||||||||||
| United States Dollar/Mexican Peso 11/29/2018 | Goldman Sachs | USD | 2,694,967 | MXN | 52,158,000 | 2,557,474 | 137,493 | |||||||||||||||||||||
| United States Dollar/Norwegian Krone 11/28/2018 | Citibank | USD | 2,750,211 | NOK | 22,349,000 | 2,653,996 | 96,215 | |||||||||||||||||||||
| United States Dollar/South African Rand 11/15/2018 | Citibank | USD | 2,663,735 | ZAR | 38,678,750 | 2,617,748 | 45,987 | |||||||||||||||||||||
| 11/15/2018 | JPMorgan Chase Bank | USD | 291,413 | ZAR | 4,204,497 | 284,557 | 6,856 | |||||||||||||||||||||
| 01/24/2019 | Goldman Sachs | USD | 4,173,098 | ZAR | 61,033,015 | 4,094,173 | 78,925 | |||||||||||||||||||||
| 01/24/2019 | Royal Bank of Canada | USD | 426,988 | ZAR | 6,300,000 | 422,612 | 4,376 | |||||||||||||||||||||
| $ | 30,329,862 | $ | 716,791 | |||||||||||||||||||||||||
| Unrealized appreciation on forward foreign currency exchange contracts |
| $ | 759,849 | |||||||||||||||||||||||||
| Unrealized depreciation on forward foreign currency exchange contracts |
| (1,223,057 | ) | |||||||||||||||||||||||||
| * | Certain contracts with different trade dates and like characteristics have been shown net. |
See accompanying Notes to Financial Statements.
| 2018 Annual Report | 27 |
Aberdeen Global High Income Fund (Unaudited)
The Aberdeen Global High Income Fund (Institutional Class shares net of fees) returned -0.43% for the 12-month period ended October 31, 2018, versus the 0.21% return of its benchmark, the ICE Bank of America Merrill Lynch (BofA ML) Global High Yield Constrained Index (hedged to U.S. dollars), during the same period. For broader comparison, the average return of the peer category of High Yield Funds (comprising 265 funds), as measured by Lipper, Inc., was 0.59% for the period.
Global high-yield markets, as measured by the ICE Bank of America Merrill Lynch (BofA ML) Global High Yield Constrained Index, posted a modestly positive return of 0.21% for the 12-month period ended October 31, 2018. The environment was significantly different than that in 2017, when synchronized global economic growth propelled virtually all risk assets globally to positive returns. The various regional markets displayed significant dispersion. The economic backdrop in the U.S. was supported by tax cuts and, for most of the period, rebounding energy prices. Yields on U.S. Treasuries rose, with five- and ten year yields increasing by 97 and 77 basis points (bps), respectively, over the reporting period, and this pressured higher-quality, lower-yielding and longer duration1 credit. However, the strong growth environment helped the lower-rated CCC2 segment of U.S. high-yield market to perform particularly well, until the month of October, whereupon a sharp collapse in the oil price caused this part of the market to give up a large part of their gains. By credit rating, U.S. BB, B and CCC rated securities returned -0.88%, 1.61% and 4.52%, respectively, over the 12-month reporting period.
Emerging markets struggled with country-specific problems in Turkey, Venezuela, Russia and Argentina. Trade tensions and the imposition of tariffs, principally aimed at China by the U.S., caused significant volatility. In addition, rising U.S. interest rates caused the U.S. dollar to rally, which historically has tended to be broadly negative for emerging markets as the burden of servicing U.S. dollar-denominated debt becomes greater.
In Europe, high-yield spreads performed poorly over the reporting period, widening from around 240 basis points (bps) to 350 bps, attributable to several reasons. At the end of 2017, a number of large capital structures were refinanced and these served both to extend the duration and widen the average spread of the index. Bond issuers in the construction sector also saw some significant underperformance. Spreads on bonds of large index constituents Altice, a telecom (which the Fund holds), and French grocer Casino Guichard Perrachon (which the Fund does not hold), have also widened as companies’ results over the reporting period generally did not meet investors’ expectations. The cessation of the European Central Bank’s quantitative easing program was well-flagged earlier in the summer of 2018, and in anticipation of a weaker market technical, investors have taken money out of credit markets in Europe. These outflows have also been exacerbated by the relative lack of yield in Europe versus a more attractive yield in U.S. dollar assets. A new populist government in Italy and its challenge of European Union (EU) budget deficit rules caused a wholesale repricing of risk in Italy. In the United Kingdom (UK), while the move in risk premia was modest during the reporting period, the looming deadline for the UK to leave the EU was a headwind for sterling-denominated assets.
The main positive contributors to the Fund’s relative performance for the reporting period included Bausch Health (formerly Valeant), which performed strongly as the business stabilized, and due to its termed out and reduced debt, and restored investor confidence; we took profits on the holding during the rally. The bonds of UK consumer credit card lender Newday performed well as its profits improved and the company outperformed low expectations. The bonds of luxury retailed Neiman Marcus recorded strong returns over the reporting period as the company showed signs of improvement in operational performance. European refiner Preem also provided strong returns, along with cinema chain AMC, which was supported by a strong film slate and in the face of highly competitive market. Restaurant and gaming business Landry’s was also a strong outperformer for the period.
Notable detractors from the Fund’s relative performance included the holding in Sanchez Energy Corp., as the oil and gas exploration and production company experienced poor drilling performance. Despite some good asset coverage, a complex debt load is putting pressure on the company. The bonds of integrated mining and metals company Nyrstar fell sharply over the reporting period. The company’s debt had grown due to a large capital investment in a new smelter which, once operational, was expected to significantly drive higher earnings. However, as a result of a sharp decline in the zinc price, combined with record-low revenues from zinc treatment charges, we believed that the company was unlikely to be able to deleverage its balance sheet in line with investor expectations. We subsequently exited the Fund’s position in the bonds at a loss. The bonds of retail drugstore and pharmacy operator Rite-Aid Corp. fell after shareholders surprisingly rejected the proposed acquisition of the company by Albertsons. Wind turbine manufacturer Senvion saw its bond prices drop due to weak domestic German and global markets. While the company’s profitability recently has fallen sharply, we believe that there may be a recovery beginning in 2019. Finally the bonds of Intralot, an international gaming company specializing in lottery contracts, underperformed the overall market as the company’s profits in Turkey declined attributable to the depreciation of the Turkish lira and an increase in leverage.
| 1 | Duration is an estimate of bond price sensitivity to changes in interest rates. The higher the duration, the greater the change (i.e., higher risk) in relation to interest-rate movements. |
| 2 | Standard & Poor’s credit ratings express the agency’s opinion about the ability and willingness of an issuer, such as a corporation or state or city government, to meet its financial obligations in full and on time. Typically, ratings are expressed as letter grades that range, for example, from AAA to D to communicate the agency’s opinion of relative level of credit risk. Ratings from AA to CCC may be modified by the addition of a plus (+) or minus (-) sign to show relative standing within the major rating categories. |
| 28 | Annual Report 2018 |
Aberdeen Global High Income Fund (Unaudited)
The Fund employs derivatives, including foreign exchange forwards3 and credit default swaps.4 The Fund utilizes foreign exchange forwards to hedge its exposure to changes in the value of its holdings due to movements in currency exchange rates. The Fund can use credit default swaps to gain, or hedge, exposure to specific companies. The Fund may also employ credit default swap indices primarily for the purpose of managing market exposure. The derivatives positions contributed approximately 1.00% to the Fund’s absolute return for the reporting period.
Global credit markets have experienced an extraordinary period of several years in which low government bond yields, low inflation and decent economic growth have underpinned demand for credit as well as positive returns. Looking at the landscape today, global economic growth is no longer synchronized, yields are rising, and spreads have also been widening in the majority of credit markets. Volatility has increased and idiosyncratic event risk has returned. Economic growth is slowing in western markets and we believe that a strong dollar creates a headwind for emerging markets. While we think that the sharp correction in the oil price heightens risks for those weaker oil producers, for the majority of companies and consumers, the benefits of cheaper energy are greater. A lower oil price puts downward pressure on inflation, U.S. Treasury yields and ultimately, the dollar, thereby creating a form of shock absorber. While growth is slowing in the U.S., a recession is not expected for some time. In Europe, the European Central Bank (ECB) will finish its bond-buying program in December 2018, but interest-rate hikes remain some way off and monetary conditions are still accommodative. While spreads have widened, when comparing regions by credit rating, they have moved far more in Europe and emerging markets than in the U.S. high-yield market, which now looks relatively expensive to us. The move in credit spreads has been sharp and while some capital structures now look vulnerable, we feel that there are opportunities. As we look at the year ahead, credit is now significantly cheaper than 12 months ago, discounting an environment that is likely too bearish and, therefore, has the scope to generate stronger returns than in the past year, in our view.
Index definitions
The performance of the global high-yield market is measured by the ICE Bank of America Merrill Lynch (BofA ML) Global High Yield Constrained Index, which tracks the performance of U.S. dollar-, Canadian dollar-, euro- and sterling-denominated, below-investment-grade corporate debt publicly issued in the major domestic or eurobond markets.
CCC rated credit is represented by the BofA ML CCC & Lower U.S. High Yield Constrained Index; BB rated credit is represented by the ICE BofA ML BB U.S. High Yield Constrained Index; B rated credit is represented by the ICE BofA ML Single-B U.S. High Yield Constrained Index.
European high yield is represented by the ICE BofA ML Euro High Yield Constrained Index, which tracks the performance of euro- and British pound sterling-denominated below-investment-grade corporate debt publicly issued in the eurobond, sterling domestic or euro domestic markets globally.
All indices are hedged to U.S. dollars.
Indexes are unmanaged and have been provided for comparison purposes only. No fees or expenses are reflected. You cannot invest directly in an index.
Portfolio Management:
Aberdeen Global High Yield Team
PAST PERFORMANCE DOES NOT GUARANTEE FUTURE RESULTS.
The performance quoted represents past performance, which does not guarantee future results. Class A shares have up to a 0.25% 12b-1 fee. The investment return and principal value of an investment will fluctuate so that an investor’s shares, when redeemed, may be worth more or less than their original cost. Current performance of the Fund may be lower or higher than the performance quoted. Performance data current to the most recent month-end may be obtained by calling 866-667-9231 or visiting www.aberdeen-asset.us.
Investing in mutual funds involves risk, including the possible loss of principal. There is no assurance that the investment objective of any fund will be achieved. Indexes are unmanaged and have been provided for comparison purposes only. No fees or expenses are reflected. You cannot invest directly in an index.
Lipper is a leading global provider of mutual fund information and analysis to fund companies, financial intermediaries and media organizations.
Risk Considerations
Fixed income securities are subject to certain risks including, but not limited to: interest rate (changes in interest rates may cause a decline in the market value of an investment), credit (changes in the financial condition of the issuer, borrower, counterparty, or underlying collateral), prepayment (debt issuers may repay or refinance their loans or obligations earlier than anticipated), and extension (principal repayments may not occur as quickly as anticipated, causing the expected maturity of a security to increase).
Non-investment-grade debt securities (high yield/junk bonds) may be subject to greater market fluctuations, risk of default or loss of income and principal than higher-rated securities.
Derivatives are speculative and may hurt the Fund’s performance. They present the risk of disproportionately increased losses and/or reduced gains when the financial asset or measure to which the derivative is linked changes in unexpected ways.
Foreign securities may be more volatile, harder to price and less liquid than U.S. securities. They are subject to different accounting and
| 3 | A foreign exchange forward is a binding contract in the foreign exchange market that locks in the exchange rate for the purchase or sale of a currency on a future date. |
| 4 | A credit default swap is a financial derivative or contract that allows an investor to “swap” or offset their credit risk with that of another investor. |
| 2018 Annual Report | 29 |
Aberdeen Global High Income Fund (Unaudited)
regulatory standards and currency exchange rate, political and economic risks. Fluctuation in currency exchange rates may impact a Fund’s returns more greatly to the extent a Fund does not hedge currency exposure or hedging techniques are unsuccessful. The foregoing risks are enhanced in emerging market countries.
Investing a significant portion of the Fund’s assets in securities of companies conducting business in a broadly related group of industries within an economic sector may make the Fund more vulnerable to unfavorable developments in that sector.
Please read the prospectus for more detailed information regarding these and other risks.
| 30 | Annual Report 2018 |
Aberdeen Global High Income Fund (Unaudited)
| Average Annual Total Return (For periods ended October 31, 2018) | 1 Yr. | 5 Yr. | 10 Yr. | |||||||
Class A* | (0.66%) | 1.94% | 8.52% | |||||||
Institutional Class* | (0.43%) | 2.19% | 8.78% | |||||||
| * | Class A shares and Institutional Class shares are not subject to any sales charges. |
Performance of a $10,000 Investment (as of October 31, 2018)

Comparative performance of $10,000 invested in Class A shares of the Aberdeen Global High Income Fund, BofA Merrill Lynch Global High Yield Constrained Index (Hedged to USD) and the Consumer Price Index (CPI) over a 10-year period ended October 31, 2018. Unlike the Fund’s returns, the returns for these unmanaged indexes do not reflect any fees or expenses. Investors cannot invest directly in market indexes.
The ICE Bank of America Merrill Lynch Global High Yield Constrained Index (hedged to the U.S. Dollar) tracks the performance of USD, CAD, GBP and EUR denominated below investment grade corporate debt publicly issued in the major domestic or eurobond markets but caps issuer exposure at 2%.
The CPI is a measure of the average change over time in the prices paid by urban consumers for a market basket of consumer goods and services.
Investment return and principal value will fluctuate, and when redeemed, shares may be worth more or less than original cost. Past performance is no guarantee of future results. The Average Annual Total Return table and performance graph do not reflect the deduction of taxes that a shareholder would pay on Fund distributions or the redemption of Fund shares. Investing in mutual funds involves market risk, including loss of principal. Performance returns assume the reinvestment of all distributions. Performance returns reflect fee waivers and reimbursements in effect without which returns would have been lower.
| 2018 Annual Report | 31 |
Aberdeen Global High Income Fund (Unaudited) (concluded)
Portfolio Summary (as a percentage of net assets)
October 31, 2018 (Unaudited)
| Asset Allocation | ||||
Corporate Bonds | 94.1% | |||
Bank Loans | 3.0% | |||
Common Stocks | 0.2% | |||
Other Assets in Excess of Liabilities | 2.7% | |||
| 100.0% | ||||
The following chart summarizes the composition of the Fund’s portfolio, expressed as a percentage of net assets. The industries listed below may include more than one industry group. As of October 31, 2018, the Fund did not have more than 25% of its assets invested in any industry group.
| Top Industries | ||||
Diversified Telecommunication Services | 10.2% | |||
Oil, Gas & Consumable Fuels | 7.9% | |||
Media | 7.4% | |||
Commercial Banks | 6.9% | |||
Diversified Financial Services | 6.0% | |||
Food Products | 4.1% | |||
Healthcare Providers & Services | 4.1% | |||
Retail | 3.2% | |||
Chemicals | 2.9% | |||
Energy Equipment & Services | 2.8% | |||
Other | 44.5% | |||
| 100.0% | ||||
| Top Holdings | ||||
Newday Bondco PLC 02/01/2024 | 1.7% | |||
CYBG PLC 12/08/2022 | 1.5% | |||
United Rentals North America, Inc. 07/15/2025 | 1.5% | |||
Unilabs Subholding AB 05/15/2025 | 1.5% | |||
Senvion Holding GmbH 10/25/2022 | 1.4% | |||
JBS USA LUX SA / JBS USA Finance, Inc. 06/15/2025 | 1.4% | |||
Telesat Canada / Telesat LLC 11/15/2024 | 1.4% | |||
Petrobras Global Finance BV 01/27/2025 | 1.3% | |||
Golden Nugget, Inc. 10/01/2025 | 1.3% | |||
Corral Petroleum Holdings AB 05/15/2021 | 1.3% | |||
Other | 85.7% | |||
| 100.0% | ||||
| Top Countries | ||||
United States | 45.0% | |||
United Kingdom | 11.3% | |||
Luxembourg | 3.4% | |||
Canada | 3.3% | |||
Netherlands | 3.2% | |||
Brazil | 3.1% | |||
Germany | 2.8% | |||
Jersey | 2.1% | |||
France | 2.0% | |||
Spain | 1.8% | |||
Other | 22.0% | |||
| 100.0% | ||||
| 32 | Annual Report 2018 |
Statement of Investments
October 31, 2018
Aberdeen Global High Income Fund
| Shares or Principal Amount | Value (US$) | |||||||
BANK LOANS (3.0%) | ||||||||
FRANCE (0.5%) | ||||||||
Financiere Sun S.A.S., 2017 EUR Term Loan B (EUR), 3.00%, 03/14/2023 | $ | 1,000,000 | $ | 1,129,212 | ||||
NETHERLANDS (0.4%) | ||||||||
TMF Group Holding B.V., 2017 EUR 2nd Lien Term Loan (EUR), 6.88%, 05/03/2026 | 750,000 | 848,780 | ||||||
UNITED KINGDOM (2.1%) | ||||||||
EG Finco Limited, 2018 EUR Incremental Term Loan (EUR), 0.00%, 02/07/2025 | – | – | ||||||
EG Group Limited | ||||||||
2018 EUR Term Loan B1 (EUR), 4.00%, 02/06/2025 | 995,000 | 1,130,207 | ||||||
2018 GBP Term Loan B (GBP), 4.75%, 02/06/2025 | 995,000 | 1,276,806 | ||||||
IWH UK Midco Limited, 2017 Term Loan B (EUR), 4.00%, 01/31/2025 | 2,000,000 | 2,252,087 | ||||||
| 4,659,100 | ||||||||
Total Bank Loans | 6,637,092 | |||||||
COMMON STOCKS (0.2%) | ||||||||
UNITED KINGDOM (0.1%) | ||||||||
Brighthouse Financial, Inc. (e)(j) | 88,182 | 225,428 | ||||||
UNITED STATES (0.1%) | ||||||||
Cenveo Enterprises, Inc. (e)(g)(i)(j)(k) | 9,806 | 274,779 | ||||||
Total Common Stocks | 500,207 | |||||||
CORPORATE BONDS (94.1%) | ||||||||
ARGENTINA (0.9%) | ||||||||
Cablevision SA (USD), 6.50%, 06/15/2021 (a) | 1,031,000 | 1,007,802 | ||||||
IRSA Propiedades Comerciales SA (USD), 8.75%, 03/23/2023 (a) | 535,000 | 534,337 | ||||||
Transportadora de Gas del Sur SA, REGS (USD), 6.75%, 05/02/2025 (a) | 575,000 | 539,068 | ||||||
| 2,081,207 | ||||||||
BELGIUM (0.4%) | ||||||||
Nyrstar Netherlands Holdings BV (EUR), 6.88%, 03/15/2024 (a) | 1,200,000 | 816,799 | ||||||
BRAZIL (3.1%) | ||||||||
Azul Investments LLP (USD), 5.88%, 10/26/2024 (a) | 988,000 | 890,445 | ||||||
Banco do Brasil SA (USD), (fixed rate to 06/18/2024, variable rate thereafter), 9.00% (a)(b) | 1,000,000 | 1,035,000 | ||||||
Marfrig Holdings Europe BV, REGS (USD), 8.00%, 06/08/2023 (a) | 1,585,000 | 1,606,794 | ||||||
Petrobras Global Finance BV |
| |||||||
(USD), 5.30%, 01/27/2025 | 2,985,000 | 2,846,943 | ||||||
(USD), 8.75%, 05/23/2026 | 500,000 | 558,425 | ||||||
| 6,937,607 | ||||||||
CANADA (3.3%) | ||||||||
Bombardier, Inc. (USD), 7.50%, 03/15/2025 (a) | 705,000 | 704,789 | ||||||
Entertainment One Ltd. (GBP), 6.88%, 12/15/2022 (a) | $ | 950,000 | $ | 1,259,826 | ||||
Taseko Mines Ltd. (USD), 8.75%, 06/15/2022 (a) | 1,733,000 | 1,707,005 | ||||||
Teine Energy Ltd. (USD), 6.88%, 09/30/2022 (a) | 526,000 | 523,370 | ||||||
Telesat Canada / Telesat LLC (USD), 8.88%, 11/15/2024 (a) | 2,885,000 | 3,072,525 | ||||||
| 7,267,515 | ||||||||
CHILE (0.5%) | ||||||||
Latam Finance Ltd. (USD), 6.88%, 04/11/2024 (a) | 1,172,000 | 1,140,942 | ||||||
CHINA (0.2%) | ||||||||
eHi Car Services Ltd. (USD), 5.88%, 08/14/2022 (a) | 585,000 | 507,462 | ||||||
CONGO (0.3%) | ||||||||
HTA Group Ltd. (USD), 9.13%, 03/08/2022 (a) | 560,000 | 570,500 | ||||||
DENMARK (0.4%) | ||||||||
DKT Finance ApS (USD), 9.38%, 06/17/2023 (a) | 921,000 | 967,050 | ||||||
DOMINICAN REPUBLIC (0.4%) | ||||||||
AES Andres BV / Dominican Power Partners / Empresa Generadora de Electricidad It (USD), 7.95%, 05/11/2026 (a) | 765,000 | 783,176 | ||||||
EL SALVADOR (0.2%) | ||||||||
AES El Salvador Trust II (USD), 6.75%, 03/28/2023 (a) | 500,000 | 458,755 | ||||||
FRANCE (1.5%) | ||||||||
Altice France SA (USD), 7.38%, 05/01/2026 (a) | 978,000 | 936,132 | ||||||
SPCM SA (USD), 4.88%, 09/15/2025 (a) | 2,455,000 | 2,270,875 | ||||||
| 3,207,007 | ||||||||
GEORGIA (0.2%) | ||||||||
Bank of Georgia JSC (USD), 6.00%, 07/26/2023 (a) | 500,000 | 490,230 | ||||||
GERMANY (2.8%) |
| |||||||
Nidda BondCo GmbH (EUR), 5.00%, 09/30/2025 (a) | 305,000 | 333,259 | ||||||
Nidda Healthcare Holding GmbH (EUR), 3.50%, 09/30/2024 (a) | 623,000 | 695,056 | ||||||
Platin 1426 GmbH |
| |||||||
(EUR), 5.38%, 06/15/2023 (a) | 308,000 | 337,955 | ||||||
(EUR), 6.88%, 06/15/2023 (a) | 134,000 | 150,713 | ||||||
PrestigeBidCo GmbH (EUR), 6.25%, 12/15/2023 (a) | 837,000 | 1,006,249 | ||||||
Senvion Holding GmbH (EUR), 3.88%, 10/25/2022 (a) | 3,256,000 | 3,152,794 | ||||||
Tele Columbus AG (EUR), 3.88%, 05/02/2025 (a) | 533,000 | 557,857 | ||||||
| 6,233,883 | ||||||||
GREECE (0.6%) |
| |||||||
Intralot Capital Luxembourg SA (EUR), 5.25%, 09/15/2024 (a) | 1,625,000 | 1,421,606 | ||||||
See accompanying Notes to Financial Statements.
| 2018 Annual Report | 33 |
Statement of Investments (continued)
October 31, 2018
Aberdeen Global High Income Fund
| Shares or Principal Amount | Value (US$) | |||||||
GUATEMALA (0.2%) |
| |||||||
Industrial Senior Trust (USD), 5.50%, 11/01/2022 (a) | $ | 500,000 | $ | 487,505 | ||||
INDIA (0.7%) |
| |||||||
Vedanta Resources PLC (USD), 6.13%, 08/09/2024 (a) | 1,776,000 | 1,567,043 | ||||||
ITALY (1.4%) |
| |||||||
Telecom Italia Capital SA (USD), 6.00%, 09/30/2034 | 1,950,000 | 1,759,875 | ||||||
Wind Tre SpA (USD), 5.00%, 01/20/2026 (a) | 1,606,000 | 1,367,027 | ||||||
| 3,126,902 | ||||||||
JAMAICA (0.5%) |
| |||||||
Digicel Group Ltd. (USD), 8.25%, 09/30/2020 (a) | 1,575,000 | 1,126,141 | ||||||
JERSEY (2.1%) |
| |||||||
LHC3 PLC (EUR), 4.13%, 08/15/2024 (a)(d) | 784,000 | 881,107 | ||||||
Newday Bondco PLC (GBP), 7.38%, 02/01/2024 (a) | 3,120,000 | 3,738,959 | ||||||
| 4,620,066 | ||||||||
KAZAKHSTAN (0.3%) |
| |||||||
Nostrum Oil & Gas Finance BV (USD), 8.00%, 07/25/2022 (a) | 650,000 | 557,544 | ||||||
LUXEMBOURG (3.4%) |
| |||||||
Altice Financing SA (USD), 7.50%, 05/15/2026 (a) | 1,960,000 | 1,842,400 | ||||||
Altice Finco SA (USD), 8.13%, 01/15/2024 (a) | 950,000 | 933,375 | ||||||
ARD Finance SA (USD), 7.13%, 09/15/2023 (d) | 1,200,000 | 1,163,250 | ||||||
Galapagos SA (EUR), 5.38%, 06/15/2021 (a) | 1,500,000 | 1,491,700 | ||||||
Kleopatra Holdings 1 SCA (EUR), 8.50%, 06/30/2023 (a)(d) | 762,000 | 554,073 | ||||||
Matterhorn Telecom Holding SA (EUR), 4.88%, 05/01/2023 (a) | 1,273,000 | 1,467,097 | ||||||
| 7,451,895 | ||||||||
MAURITIUS (0.5%) |
| |||||||
Liquid Telecommunications Financing PLC (USD), 8.50%, 07/13/2022 (a) | 1,150,000 | 1,172,855 | ||||||
MEXICO (0.5%) |
| |||||||
Elementia SAB de CV (USD), 5.50%, 01/15/2025 (a) | 611,000 | 564,417 | ||||||
Grupo Posadas SAB de CV (USD), 7.88%, 06/30/2022 (a) | 575,000 | 584,344 | ||||||
| 1,148,761 | ||||||||
NETHERLANDS (2.8%) |
| |||||||
ING Groep NV (USD), (fixed rate to 04/16/2025, variable rate thereafter), 6.50% (b) | 2,027,000 | 1,921,596 | ||||||
InterXion Holding (EUR), 4.75%, 06/15/2025 (a) | 567,000 | 669,507 | ||||||
Lincoln Finance Ltd. (EUR), 6.88%, 04/15/2021 (a) | 1,800,000 | 2,106,560 | ||||||
OCI (EUR), 5.00%, 04/15/2023 (a) | 232,000 | 275,913 | ||||||
Ziggo BV (USD), 5.50%, 01/15/2027 (a) | 1,300,000 | 1,192,750 | ||||||
| 6,166,326 | ||||||||
NIGERIA (1.0%) |
| |||||||
IHS Netherlands Holdco BV (USD), 9.50%, 10/27/2021 (a) | $ | 1,075,000 | $ | 1,081,759 | ||||
United Bank for Africa PLC (USD), 7.75%, 06/08/2022 (a) | 575,000 | 576,529 | ||||||
Zenith Bank PLC (USD), 7.38%, 05/30/2022 (a) | 596,000 | 602,991 | ||||||
| 2,261,279 | ||||||||
PANAMA (0.4%) |
| |||||||
C&W Senior Financing DAC (USD), 6.88%, 09/15/2027 (a) | 879,000 | 837,248 | ||||||
REPUBLIC OF IRELAND (1.4%) |
| |||||||
Ardagh Packaging Finance PLC / Ardagh Holdings USA, Inc. | ||||||||
(USD), 7.25%, 05/15/2024 (a) | 2,235,000 | 2,246,175 | ||||||
(GBP), 4.75%, 07/15/2027 (a) | 656,000 | 795,736 | ||||||
| 3,041,911 | ||||||||
RUSSIA (1.2%) |
| |||||||
GTLK Europe DAC (USD), 5.95%, 07/19/2021 (a) | 500,000 | 489,315 | ||||||
Sberbank of Russia Via SB Capital SA (USD), 6.13%, 02/07/2022 (a) | 1,030,000 | 1,053,690 | ||||||
VEON Holdings BV (USD), 4.95%, 06/16/2024 (a) | 1,174,000 | 1,111,273 | ||||||
| 2,654,278 | ||||||||
SOUTH AFRICA (0.9%) |
| |||||||
Sappi Papier Holding GmbH (USD), 7.50%, 06/15/2032 (a)(e)(f) | 2,017,000 | 2,011,958 | ||||||
SPAIN (1.8%) |
| |||||||
Codere Finance 2 Luxembourg SA, (EUR), 6.75%, 11/01/2021 (a) | 2,326,000 | 2,483,137 | ||||||
Haya Finance 2017 SA (EUR), 5.25%, 11/15/2022 (a) | 1,099,000 | 1,159,764 | ||||||
LHMC Finco Sarl (USD), 7.88%, 12/20/2023 (a) | 402,000 | 404,613 | ||||||
| 4,047,514 | ||||||||
SWEDEN (1.5%) |
| |||||||
Unilabs Subholding AB (EUR), 5.75%, 05/15/2025 (a) | 3,000,000 | 3,312,537 | ||||||
SWITZERLAND (0.6%) |
| |||||||
UBS Group Funding Switzerland AG (USD), (fixed rate to 02/19/2025, variable rate thereafter), 7.00% (a)(b) | 1,339,000 | 1,394,234 | ||||||
TURKEY (1.2%) |
| |||||||
Akbank Turk AS (USD), (fixed rate to 03/16/2027, variable rate thereafter), 7.20% (a) | 949,000 | 800,796 | ||||||
KOC Holding, REGS (USD), 5.25%, 03/15/2023 (a) | 820,000 | 770,210 | ||||||
Turk Telekomunikasyon, REGS (USD), 4.88%, 06/19/2024 (a) | 740,000 | 640,130 | ||||||
See accompanying Notes to Financial Statements.
| 34 | Annual Report 2018 |
Statement of Investments (continued)
October 31, 2018
Aberdeen Global High Income Fund
| Shares or Principal Amount | Value (US$) | |||||||
Turkiye Garanti Bankasi AS (USD), 5.25%, 09/13/2022 (a) | $ | 450,000 | $ | 414,567 | ||||
| 2,625,703 | ||||||||
UKRAINE (0.3%) |
| |||||||
MHP Lux SA (USD), 6.95%, 04/03/2026 (a) | 619,000 | 572,055 | ||||||
UNITED ARAB EMIRATES (0.5%) |
| |||||||
Shelf Drilling Holdings Ltd. (USD), 8.25%, 02/15/2025 (a) | 998,000 | 1,000,495 | ||||||
UNITED KINGDOM (9.1%) |
| |||||||
BrightHouse Finco Ltd., PIK, (GBP), 9.00%, 05/15/2023 (a)(d) | 1,077,037 | 1,139,194 | ||||||
Cabot Financial Luxembourg SA (GBP), 8.38%, 08/01/2020 (a) | 502,000 | 648,073 | ||||||
Corral Petroleum Holdings AB (EUR), 11.75%, 05/15/2021 (a)(d) | 2,290,000 | 2,763,506 | ||||||
CYBG PLC (GBP), (fixed rate to 12/08/2022, variable rate thereafter), 8.00% (a)(b) | 2,640,000 | 3,403,975 | ||||||
Fiat Chrysler Automobiles (USD), 5.25%, 04/15/2023 | 2,610,000 | 2,596,950 | ||||||
Galaxy Finco Ltd. (GBP), 7.88%, 11/15/2021 (a) | 1,600,000 | 2,019,779 | ||||||
KCA Deutag UK Finance PLC (USD), 9.63%, 04/01/2023 (a) | 895,000 | 841,300 | ||||||
Pizzaexpress Financing 2 PLC (GBP), 6.63%, 08/01/2021 (a) | 1,078,000 | 1,227,934 | ||||||
Royal Bank of Scotland Group PLC (USD), (fixed rate to 08/15/2021, variable rate thereafter), 8.63% (b) | 1,200,000 | 1,261,500 | ||||||
Saga PLC (GBP), 3.38%, 05/12/2024 (a) | 811,000 | 968,950 | ||||||
TVL Finance PLC (GBP), 8.50%, 05/15/2023 (a) | 713,600 | 965,483 | ||||||
Virgin Media Secured Finance PLC (GBP), 5.50%, 01/15/2025 (a) | 1,754,100 | 2,285,251 | ||||||
| 20,121,895 | ||||||||
UNITED STATES (45.7%) |
| |||||||
ACI Worldwide, Inc. (USD), 5.75%, 08/15/2026 (a) | 1,069,000 | 1,069,000 | ||||||
Albertsons Cos. LLC / Safeway, Inc. / New Albertson’s, Inc. / Albertson’s LLC (USD), 5.75%, 03/15/2025 | 3,096,000 | 2,724,480 | ||||||
Alliance Data Systems Corp. (USD), 5.88%, 11/01/2021 (a) | 1,125,000 | 1,144,462 | ||||||
AMC Entertainment Holdings, Inc. (GBP), 6.38%, 11/15/2024 | 1,534,000 | 1,960,681 | ||||||
Apergy Corp. (USD), 6.38%, 05/01/2026 (a) | 1,176,000 | 1,190,700 | ||||||
Avis Budget Car Rental LLC / Avis Budget Finance, Inc. | ||||||||
(USD), 6.38%, 04/01/2024 (a) | 978,000 | 933,990 | ||||||
(USD), 5.25%, 03/15/2025 (a) | 423,000 | 376,470 | ||||||
Banff Merger Sub, Inc. |
| |||||||
(EUR), 8.38%, 09/01/2026 (a) | 215,000 | 241,202 | ||||||
(USD), 9.75%, 09/01/2026 (a) | 955,000 | 916,800 | ||||||
Bausch Health Cos. Inc. (EUR), 4.50%, 05/15/2023 (a) | 1,020,000 | 1,117,802 | ||||||
Blue Racer Midstream LLC / Blue Racer Finance Corp. (USD), 6.13%, 11/15/2022 (a) | 1,379,000 | 1,406,580 | ||||||
Bruin E&P Partners LLC (USD), 8.88%, 08/01/2023 (a) | $ | 951,000 | $ | 936,735 | ||||
BWAY Holding Co. (EUR), 4.75%, 04/15/2024 (a) | 482,000 | 549,704 | ||||||
Calpine Corp. (USD), 5.75%, 01/15/2025 | 1,255,000 | 1,121,405 | ||||||
CCO Holdings LLC / CCO Holdings Capital Corp. (USD), 5.75%, 02/15/2026 (a) | 850,000 | 841,500 | ||||||
Change Healthcare Holdings LLC / Change Healthcare Finance, Inc. (USD), 5.75%, 03/01/2025 (a) | 1,700,000 | 1,661,750 | ||||||
Cheniere Corpus Christi Holdings LLC (USD), 5.88%, 03/31/2025 | 2,125,000 | 2,188,750 | ||||||
Cheniere Energy Partners LP, Series WI (USD), 5.25%, 10/01/2025 | 419,000 | 411,144 | ||||||
Commercial Metals Co. (USD), 5.75%, 04/15/2026 (a) | 1,241,000 | 1,191,360 | ||||||
CSC Holdings LLC |
| |||||||
(USD), 6.63%, 10/15/2025 (a) | 753,000 | 788,768 | ||||||
(USD), 10.88%, 10/15/2025 (a) | 1,925,000 | 2,220,969 | ||||||
Dell International LLC / EMC Corp. (USD), 5.88%, 06/15/2021 (a) | 583,000 | 591,029 | ||||||
Diamond BC BV (EUR), 5.63%, 08/15/2025 (a) | 833,000 | 887,363 | ||||||
Energizer Gamma Acquisition BV (EUR), 4.63%, 07/15/2026 (a) | 695,000 | 806,085 | ||||||
Energizer Gamma Acquisition, Inc. (USD), 6.38%, 07/15/2026 (a) | 77,000 | 77,000 | ||||||
Exela Intermediate LLC / Exela Finance, Inc. (USD), 10.00%, 07/15/2023 (a) | 1,595,000 | 1,658,321 | ||||||
Frontier Communications Corp. (USD), 10.50%, 09/15/2022 | 1,670,000 | 1,390,275 | ||||||
General Motors (Escrow Shares) |
| |||||||
(USD), 8.80%, 03/01/2049 (g)(j) | 7,200,000 | – | ||||||
(USD), 8.38%, 07/15/2049 (g)(j) | 3,550,000 | – | ||||||
Golden Nugget, Inc. (USD), 8.75%, 10/01/2025 (a) | 2,725,000 | 2,799,937 | ||||||
Goodyear Tire & Rubber Co. (The) (USD), 5.13%, 11/15/2023 | 945,000 | 927,045 | ||||||
Graham Holdings Co. (USD), 5.75%, 06/01/2026 (a) | 539,000 | 543,043 | ||||||
Grinding Media, Inc. / Moly-Cop AltaSteel Ltd. (USD), 7.38%, 12/15/2023 (a) | 400,000 | 411,000 | ||||||
Harland Clarke Holdings Corp. |
| |||||||
(USD), 6.88%, 03/01/2020 (a) | 1,075,000 | 1,056,188 | ||||||
(USD), 8.38%, 08/15/2022 (a) | 1,060,000 | 956,650 | ||||||
HCA, Inc. |
| |||||||
(USD), 7.50%, 02/15/2022 | 1,020,000 | 1,106,700 | ||||||
(USD), 5.88%, 02/15/2026 | 1,462,000 | 1,494,895 | ||||||
(USD), 5.25%, 06/15/2026 | 855,000 | 869,963 | ||||||
Hilcorp Energy I LP / Hilcorp Finance Co. (USD), 5.75%, 10/01/2025 (a) | 2,628,000 | 2,555,730 | ||||||
Iron Mountain, Inc. (USD), 5.25%, 03/15/2028 (a) | 1,230,000 | 1,103,925 | ||||||
JBS USA LUX SA / JBS USA Finance, Inc. (USD), 5.75%, 06/15/2025 (a) | 3,230,000 | 3,100,800 | ||||||
JPMorgan Chase & Co., Series CC (USD), (fixed rate to 11/01/2022, variable rate thereafter), 4.63% (b) | 1,975,000 | 1,828,060 | ||||||
Lennar Corp. (USD), 4.50%, 04/30/2024 | 1,220,000 | 1,156,316 | ||||||
See accompanying Notes to Financial Statements.
| 2018 Annual Report | 35 |
Statement of Investments (continued)
October 31, 2018
Aberdeen Global High Income Fund
| Shares or Principal Amount | Value (US$) | |||||||
Meredith Corp. (USD), 6.88%, 02/01/2026 (a) | $ | 1,703,000 | $ | 1,703,000 | ||||
Meritage Homes Corp. (USD), 6.00%, 06/01/2025 | 1,212,000 | 1,178,670 | ||||||
Moss Creek Resources Holdings, Inc. (USD), 7.50%, 01/15/2026 (a) | 1,509,000 | 1,451,960 | ||||||
Motors Liquidation Co. (MPM Escrow Shares) (USD), 8.88%, 10/15/2020 (g)(j) | 14,578,000 | – | ||||||
MPT Operating Partnership LP / MPT Finance Corp. (USD), 5.00%, 10/15/2027 | 1,133,000 | 1,064,680 | ||||||
Nationstar Mortgage LLC / Nationstar Capital Corp. (USD), 6.50%, 07/01/2021 | 2,550,000 | 2,548,648 | ||||||
Neiman Marcus Group Ltd., LLC (USD), 8.00%, 10/15/2021 (a) | 1,218,000 | 730,800 | ||||||
New Enterprise Stone & Lime Co., Inc. (USD), 10.13%, 04/01/2022 (a) | 1,805,000 | 1,886,225 | ||||||
Nine Energy Service, Inc. (USD), 8.75%, 11/01/2023 (a) | 206,000 | 209,348 | ||||||
Northwest Hardwoods, Inc. (USD), 7.50%, 08/01/2021 (a) | 1,768,000 | 1,520,480 | ||||||
Novelis Corp. (USD), 5.88%, 09/30/2026 (a) | 1,155,000 | 1,088,588 | ||||||
NRG Energy, Inc. |
| |||||||
(USD), 6.25%, 05/01/2024 | 259,000 | 264,408 | ||||||
(USD), 7.25%, 05/15/2026 | 928,000 | 986,000 | ||||||
Oasis Petroleum, Inc. (USD), 6.88%, 01/15/2023 | 1,000,000 | 1,008,750 | ||||||
Park-Ohio Industries, Inc. (USD), 6.63%, 04/15/2027 | 224,000 | 222,320 | ||||||
PBF Logistics LP / PBF Logistics Finance Corp. (USD), 6.88%, 05/15/2023 | 1,767,000 | 1,797,922 | ||||||
Post Holdings, Inc. (USD), 5.00%, 08/15/2026 (a) | 1,890,000 | 1,743,525 | ||||||
Prestige Brands, Inc. (USD), 6.38%, 03/01/2024 (a) | 428,000 | 422,650 | ||||||
Radiate Holdco LLC / Radiate Finance, Inc. |
| |||||||
(USD), 6.88%, 02/15/2023 (a) | 512,000 | 491,520 | ||||||
(USD), 6.63%, 02/15/2025 (a) | 1,460,000 | 1,365,100 | ||||||
Rite Aid Corp. (USD), 6.13%, 04/01/2023 (a) | 1,560,000 | 1,325,025 | ||||||
Sable International Finance Ltd. (USD), 6.88%, 08/01/2022 (a) | 1,760,000 | 1,837,000 | ||||||
Sanchez Energy Corp. (USD), 6.13%, 01/15/2023 | 2,315,000 | 856,550 | ||||||
Sirius XM Radio, Inc. (USD), 6.00%, 07/15/2024 (a) | 480,000 | 490,704 | ||||||
Sprint Corp. |
| |||||||
(USD), 7.88%, 09/15/2023 | 2,325,000 | 2,481,937 | ||||||
(USD), 7.63%, 03/01/2026 | 662,000 | 688,480 | ||||||
Staples, Inc. (USD), 8.50%, 09/15/2025 (a) | 950,000 | 859,750 | ||||||
Summit Materials LLC / Summit Materials Finance Corp. (USD), 5.13%, 06/01/2025 (a) | 24,000 | 21,480 | ||||||
T-Mobile USA, Inc. (USD), 6.50%, 01/15/2026 | 1,080,000 | 1,136,700 | ||||||
Tempo Acquisition LLC / Tempo Acquisition Finance Corp. (USD), 6.75%, 06/01/2025 (a) | 1,545,000 | 1,471,149 | ||||||
Tenet Healthcare Corp. (USD), 4.63%, 07/15/2024 | 2,342,000 | 2,257,337 | ||||||
TopBuild Corp. (USD), 5.63%, 05/01/2026 (a) | $ | 903,000 | $ | 860,108 | ||||
TransDigm, Inc. |
| |||||||
(USD), 6.00%, 07/15/2022 | 450,000 | 452,250 | ||||||
(USD), 6.50%, 07/15/2024 | 935,000 | 945,135 | ||||||
United Rentals North America, Inc. (USD), 5.50%, 07/15/2025 | 3,425,000 | 3,337,234 | ||||||
Valvoline, Inc. (USD), 5.50%, 07/15/2024 | 2,055,000 | 2,042,156 | ||||||
Vistra Energy Corp. (USD), 7.38%, 11/01/2022 | 1,940,000 | 2,012,750 | ||||||
WPX Energy, Inc. |
| |||||||
(USD), 8.25%, 08/01/2023 | 875,000 | 983,281 | ||||||
(USD), 5.75%, 06/01/2026 | 156,000 | 155,220 | ||||||
WR Grace & Co-Conn (USD), 5.63%, 10/01/2024 (a) | 1,830,000 | 1,862,025 | ||||||
Wyndham Destinations, Inc. |
| |||||||
(USD), 4.15%, 04/01/2024 | 1,000,000 | 962,500 | ||||||
(USD), 6.35%, 10/01/2025 | 945,000 | 940,275 | ||||||
Zayo Group LLC / Zayo Capital, Inc. (USD), 6.00%, 04/01/2023 | 1,000,000 | 1,020,000 | ||||||
| 100,998,217 | ||||||||
VENEZUELA (0.4%) | ||||||||
Petroleos de Venezuela SA (USD), 6.00%, 05/16/2024 (a)(h)(i) | 5,000,000 | 857,500 | ||||||
ZAMBIA (0.9%) | ||||||||
First Quantum Minerals Ltd. |
| |||||||
(USD), 7.00%, 02/15/2021 (a) | 915,000 | 894,596 | ||||||
(USD), 6.88%, 03/01/2026 (a) | 1,218,000 | 1,053,570 | ||||||
| 1,948,166 | ||||||||
Total Corporate Bonds | 207,993,767 | |||||||
Total Investments |
| 215,131,066 | ||||||
Other Assets in Excess of Liabilities—2.7% |
| 5,926,774 | ||||||
Net Assets—100.0% |
| $ | 221,057,840 | |||||
| (a) | Denotes a security issued under Regulation S or Rule 144A. |
| (b) | Perpetual bond. This is a bond that has no maturity date, is redeemable and pays a steady stream of interest indefinitely. The maturity date presented for these instruments represents the next call/put date. |
| (c) | Variable rate instrument. The rate shown is based on the latest available information as of October 31, 2018. Certain variable rate securities are not based on a published reference rate and spread but are determined by the issuer or agent and are based on current market conditions. These securities do not indicate a reference rate and spread in their description. |
| (d) | Payment-in-kind. This is a type of bond that pays interest in additional bonds rather than in cash. |
| (e) | Illiquid security - The Fund’s adviser has deemed this security to be illiquid based upon procedures approved by the Board of Trustees. Illiquid securities held by the Fund represent 1.03% of net assets as of October 31, 2018. |
| (g) | This security was fair valued by the Fund’s pricing committee as approved by the Fund’s Board of Trustees. See Note 2(a) of the accompanying Notes to Statements of Investments. |
| (h) | Sinkable security. |
| (i) | Security is in default. |
| (j) | Level 3 security. See Note 2(a) of the accompanying Notes to Financial Statements. |
| (k) | Security is Delisted. |
See accompanying Notes to Financial Statements.
| 36 | Annual Report 2018 |
Statement of Investments (concluded)
October 31, 2018
Aberdeen Global High Income Fund
| (l) | See accompanying Notes to Financial Statements for tax unrealized appreciation/(depreciation) of securities. |
| EUR | Euro Currency |
| GBP | British Pound Sterling |
| PIK | Payment In Kind |
| PLC | Public Limited Company |
| USD | U.S. Dollar |
At October 31, 2018, the Fund’s open forward foreign currency exchange contracts were as follows:
| Purchase Contracts Settlement Date* | Counterparty | Amount Purchased | Amount Sold | Fair Value | Unrealized Appreciation/ (Depreciation) | |||||||||||||||||||||||
| British Pound/United States Dollar 11/30/2018 | Barclays Bank | GBP | 14,000 | USD | 18,205 | $ | 17,916 | $ | (289 | ) | ||||||||||||||||||
| Euro/United States Dollar | ||||||||||||||||||||||||||||
11/14/2018 | Barclays Bank | EUR | 13,000 | USD | 14,997 | 14,738 | (259 | ) | ||||||||||||||||||||
11/14/2018 | Citibank | EUR | 1,355,000 | USD | 1,577,944 | 1,536,160 | (41,784 | ) | ||||||||||||||||||||
11/14/2018 | Goldman Sachs | EUR | 2,220,500 | USD | 2,528,497 | 2,517,375 | (11,122 | ) | ||||||||||||||||||||
11/14/2018 | HSBC Bank | EUR | 172,000 | USD | 200,755 | 194,996 | (5,759 | ) | ||||||||||||||||||||
11/14/2018 | JPMorgan Chase Bank | EUR | 100,000 | USD | 117,362 | 113,370 | (3,992 | ) | ||||||||||||||||||||
| 11/14/2018 | Royal Bank of Canada | EUR | 78,500 | USD | 90,913 | 88,995 | (1,918 | ) | ||||||||||||||||||||
| $ | 4,483,550 | $ | (65,123 | ) | ||||||||||||||||||||||||
| Sale Contracts Settlement Date* | Counterparty | Amount Purchased | Amount Sold | Fair Value | Unrealized Appreciation | |||||||||||||||||||||||
| United States Dollar/British Pound 11/30/2018 | Citibank | USD | 23,074,865 | GBP | 17,700,000 | $ | 22,651,290 | $ | 423,575 | |||||||||||||||||||
| United States Dollar/Euro | ||||||||||||||||||||||||||||
| 11/14/2018 | HSBC Bank | USD | 40,870,196 | EUR | 35,074,000 | 39,763,296 | 1,106,900 | |||||||||||||||||||||
| 11/14/2018 | Westpac Banking Corp. | USD | 11,496 | EUR | 10,000 | 11,337 | 159 | |||||||||||||||||||||
| $ | 62,425,923 | $ | 1,530,634 | |||||||||||||||||||||||||
| * | Certain contracts with different trade dates and like characteristics have been shown net. |
See accompanying Notes to Financial Statements.
| 2018 Annual Report | 37 |
Statements of Assets and Liabilities
October 31, 2018
| Aberdeen Select International Equity Fund | Aberdeen Select International Equity Fund II | Aberdeen Total Return Bond Fund | Aberdeen Global High Income Fund | |||||||||||||
Assets: | ||||||||||||||||
Investments in securities, at fair value | $ | 157,591,054 | $ | 65,446,943 | $ | 206,504,940 | $ | 215,131,066 | ||||||||
Short-term investments | 451,376 | 332,172 | 1,546,053 | – | ||||||||||||
Cash collateral pledged for futures | – | – | 664,506 | – | ||||||||||||
Foreign currency, at fair value | 698,815 | 16,164 | 350,708 | – | ||||||||||||
Cash at broker for forward foreign currency exchange contracts | – | – | 540,000 | – | ||||||||||||
Cash | – | – | – | 390,626 | ||||||||||||
Receivable for investments sold | 1,514,827 | 838,255 | 4,900,219 | 7,580,761 | ||||||||||||
Interest and dividends receivable | 278,343 | 118,021 | 1,429,908 | 4,020,769 | ||||||||||||
Unrealized appreciation on forward foreign currency exchange contracts | – | – | 759,849 | 1,530,634 | ||||||||||||
Receivable for capital shares issued | 2,609 | 15,508 | 17,570 | 22,160 | ||||||||||||
Receivable from Adviser (Note 3) | 675 | 285 | 88,635 | 22,754 | ||||||||||||
Tax reclaim receivable | 519,410 | 144,626 | – | – | ||||||||||||
Prepaid expenses | 4,086 | 1,795 | 5,970 | 6,791 | ||||||||||||
|
|
|
|
|
|
|
| |||||||||
Total assets | 161,061,195 | 66,913,769 | 216,808,358 | 228,705,561 | ||||||||||||
|
|
|
|
|
|
|
| |||||||||
Liabilities: | ||||||||||||||||
Due to custodian | – | – | – | 37 | ||||||||||||
Cash due to broker for forward foreign currency exchange contracts | – | – | 40,000 | – | ||||||||||||
Payable for investments purchased | 300,434 | 123,365 | 3,097,535 | 3,567,907 | ||||||||||||
Unrealized depreciation on forward foreign currency exchange contracts | – | – | 1,223,057 | 65,123 | ||||||||||||
Payable for capital shares redeemed | 40,192 | 47,228 | 166,893 | 326,547 | ||||||||||||
Payable for income taxes on recovered refunds (See note 2g of the Notes to Financial Statements) | 7,353,252 | 2,092,374 | – | – | ||||||||||||
Variation margin payable for futures contracts | – | – | 170,004 | – | ||||||||||||
Bank loan payable (Note 10) | – | – | – | 3,325,000 | ||||||||||||
Accrued expenses and other payables: | ||||||||||||||||
Investment advisory fees | 121,429 | 51,405 | 65,916 | 124,748 | ||||||||||||
Audit fees | 70,750 | 45,750 | 48,900 | 49,400 | ||||||||||||
Custodian fees | 34,162 | 25,806 | 48,288 | 41,160 | ||||||||||||
Distribution fees | 27,875 | 8,003 | 8,519 | 28,423 | ||||||||||||
Legal fees | 15,170 | 6,057 | 19,381 | 13,067 | ||||||||||||
Transfer agent fees | 7,693 | 7,039 | 5,171 | 8,198 | ||||||||||||
Other | 74,359 | 65,703 | 61,977 | 98,111 | ||||||||||||
|
|
|
|
|
|
|
| |||||||||
Total liabilities | 8,045,316 | 2,472,730 | 4,955,641 | 7,647,721 | ||||||||||||
|
|
|
|
|
|
|
| |||||||||
Net Assets | $ | 153,015,879 | $ | 64,441,039 | $ | 211,852,717 | $ | 221,057,840 | ||||||||
|
|
|
|
|
|
|
| |||||||||
Cost: | ||||||||||||||||
Investments in securities, at cost | $ | 180,948,123 | $ | 71,863,904 | $ | 214,195,365 | $ | 227,812,569 | ||||||||
Short-term investment | 451,376 | 332,172 | 1,546,053 | – | ||||||||||||
Foreign currency | 700,020 | 16,190 | 359,353 | 142 | ||||||||||||
Net Assets Consist of: | ||||||||||||||||
Par value | $ | 6,443 | $ | 6,258 | $ | 17,179 | $ | 26,013 | ||||||||
Paid in capital in excess of par value | 585,846,074 | 94,084,068 | 224,956,792 | 453,946,957 | ||||||||||||
Distributable accumulated loss | (432,836,638 | ) | (29,649,287 | ) | (13,121,254 | ) | (232,915,130 | ) | ||||||||
|
|
|
|
|
|
|
| |||||||||
Net Assets | $ | 153,015,879 | $ | 64,441,039 | $ | 211,852,717 | $ | 221,057,840 | ||||||||
|
|
|
|
|
|
|
| |||||||||
Net Assets | ||||||||||||||||
Class A Shares | $ | 126,383,343 | $ | 35,964,137 | $ | 38,425,954 | $ | 131,219,172 | ||||||||
Institutional Class Shares | 26,632,536 | 28,476,902 | 173,426,763 | 89,838,668 | ||||||||||||
|
|
|
|
|
|
|
| |||||||||
Total | $ | 153,015,879 | $ | 64,441,039 | $ | 211,852,717 | $ | 221,057,840 | ||||||||
|
|
|
|
|
|
|
| |||||||||
Amounts listed as “–” are $0 or round to $0.
See accompanying Notes to Financial Statements.
| 38 | Annual Report 2018 |
Statements of Assets and Liabilities (concluded)
October 31, 2018
| Aberdeen Select International Equity Fund | Aberdeen Select International Equity Fund II | Aberdeen Total Return Bond Fund | Aberdeen Global High Income Fund | |||||||||||||
Shares Outstanding* | ||||||||||||||||
Class A Shares | 5,346,225 | 3,493,728 | 3,077,046 | 15,009,234 | ||||||||||||
Institutional Class Shares | 1,097,260 | 2,764,557 | 14,102,153 | 11,003,626 | ||||||||||||
|
|
|
|
|
|
|
| |||||||||
Total | 6,443,485 | 6,258,285 | 17,179,199 | 26,012,860 | ||||||||||||
|
|
|
|
|
|
|
| |||||||||
Net asset value and redemption price per share | ||||||||||||||||
Class A Shares | $ | 23.64 | $ | 10.29 | $ | 12.49 | $ | 8.74 | ||||||||
Institutional Class Shares | $ | 24.27 | $ | 10.30 | $ | 12.30 | $ | 8.16 | ||||||||
| * | Under the Trust Agreement, the Trustees have authority to issue an unlimited number of shares of beneficial interest, par value $.001 per share. The Board of Trustees is authorized to reclassify and issue any unissued shares to any number of additional series without shareholder approval. |
Amounts listed as “–” are $0 or round to $0.
See accompanying Notes to Financial Statements.
| 2018 Annual Report | 39 |
Statements of Operations
For the Year Ended October 31, 2018
| Aberdeen Select International Equity Fund | Aberdeen Select International Equity Fund II | Aberdeen Total Return Bond Fund | Aberdeen Global High Income Fund | |||||||||||||
INVESTMENT INCOME: | ||||||||||||||||
Dividend income | $ | 5,130,342 | $ | 2,533,780 | (a) | $ | – | $ | – | |||||||
Interest income | 115,926 | 12,927 | 9,526,930 | 18,724,618 | ||||||||||||
Foreign tax withholding | (394,099 | ) | (171,722 | ) | (22,820 | ) | – | |||||||||
Other income | – | 172,694 | (c) | 70,904 | 13,278 | |||||||||||
|
|
|
|
|
|
|
| |||||||||
Total Income | 4,852,169 | 2,547,679 | 9,575,014 | 18,737,896 | ||||||||||||
|
|
|
|
|
|
|
| |||||||||
EXPENSES: | ||||||||||||||||
Investment advisory fees | 1,714,122 | 730,547 | 995,204 | 1,858,723 | ||||||||||||
Distribution fees Class A | 394,765 | 111,221 | 133,322 | 401,596 | ||||||||||||
Income taxes on recovered refunds (b) | 1,813,354 | 554,992 | – | – | ||||||||||||
Transfer agent fees | 34,818 | 30,539 | 28,657 | 44,292 | ||||||||||||
Trustee fees | 124,327 | 53,414 | 169,732 | 196,500 | ||||||||||||
Legal fees | 57,978 | 29,959 | 100,776 | 87,149 | ||||||||||||
Printing fees | 58,774 | 42,340 | 47,807 | 73,440 | ||||||||||||
Custodian fees | 197,538 | 144,737 | 248,450 | 224,647 | ||||||||||||
Registration and filing fees | 46,657 | 41,294 | 41,416 | 36,522 | ||||||||||||
Audit fees | 95,633 | 70,650 | 48,760 | 49,833 | ||||||||||||
Other | 141,322 | 92,162 | 84,378 | 179,734 | ||||||||||||
|
|
|
|
|
|
|
| |||||||||
Total expenses before reimbursed/waived expenses | 4,679,288 | 1,901,855 | 1,898,502 | 3,152,436 | ||||||||||||
Interest expense | 381 | 787 | 3,354 | 2,832 | ||||||||||||
|
|
|
|
|
|
|
| |||||||||
Total operating expenses before reimbursed/waived expenses | 4,679,669 | 1,902,642 | 1,901,856 | 3,155,268 | ||||||||||||
Expenses reimbursed | – | – | (499,844 | ) | (591,864 | ) | ||||||||||
Expenses waived by investment adviser | (9,523 | ) | (4,059 | ) | (14,217 | ) | (14,298 | ) | ||||||||
|
|
|
|
|
|
|
| |||||||||
Total operating expenses | 4,670,146 | 1,898,583 | 1,387,795 | 2,549,106 | ||||||||||||
|
|
|
|
|
|
|
| |||||||||
Net Investment Income | 182,023 | 649,096 | 8,187,219 | 16,188,790 | ||||||||||||
|
|
|
|
|
|
|
| |||||||||
Realized gain/(loss) on investment transactions | (20,835,407 | ) | 359,137 | (5,731,111 | ) | (967,868 | ) | |||||||||
Realized gain/(loss) on futures contracts | – | – | (614,173 | ) | – | |||||||||||
Realized gain/(loss) on written options | – | – | (15,768 | ) | – | |||||||||||
Realized gain/(loss) on credit default swap contracts | – | – | – | (345 | ) | |||||||||||
Realized gain/(loss) on forward foreign currency exchange contracts | – | (432 | ) | 1,204,946 | 541,490 | |||||||||||
Realized gain/(loss) on foreign currency transactions | (1,420,073 | ) | (24,262 | ) | (199,470 | ) | (40,825 | ) | ||||||||
|
|
|
|
|
|
|
| |||||||||
Net realized gain/(loss) from investments, futures, written options, credit default swap contracts, forward foreign currency exchange contracts and foreign currency transactions | (22,255,480 | ) | 334,443 | (5,355,576 | ) | (467,548 | ) | |||||||||
|
|
|
|
|
|
|
| |||||||||
Net change in unrealized appreciation/(depreciation) on investment transactions | (568,861 | ) | (9,407,868 | ) | (8,883,561 | ) | (19,154,005 | ) | ||||||||
Net change in unrealized appreciation/(depreciation) on futures contracts | – | – | (206,260 | ) | – | |||||||||||
Net change in unrealized appreciation/(depreciation) on forward foreign currency exchange contracts | – | – | (1,800,814 | ) | 1,867,631 | |||||||||||
Net change in unrealized appreciation/(depreciation) on translation of assets and liabilities denominated in foreign currencies | 1,806,475 | 93,128 | (787 | ) | (37,229 | ) | ||||||||||
|
|
|
|
|
|
|
| |||||||||
Net change in unrealized appreciation/(depreciation) from investments, futures, forward foreign currency exchange contracts and translation of assets and liabilities denominated in foreign currencies | 1,237,614 | (9,314,740 | ) | (10,891,422 | ) | (17,323,603 | ) | |||||||||
|
|
|
|
|
|
|
| |||||||||
Net realized/unrealized (loss) from investments, futures, written options, credit default swaps, forward foreign currency exchange contracts and foreign currency transactions | (21,017,866 | ) | (8,980,297 | ) | (16,246,998 | ) | (17,791,151 | ) | ||||||||
|
|
|
|
|
|
|
| |||||||||
CHANGE IN NET ASSETS RESULTING FROM OPERATIONS | $ | (20,835,843 | ) | $ | (8,331,201 | ) | $ | (8,059,779 | ) | $ | (1,602,361 | ) | ||||
|
|
|
|
|
|
|
| |||||||||
| (a) | Dividend income includes one-time withholding tax refunds paid to the Fund during the year ended October 31, 2018 for taxes withheld. See note 2g of the Notes to Financial Statements. |
| (b) | See note 2g of the Notes to Financial Statements |
| (c) | Other income includes litigation proceeds paid to the Fund during the year ended October 31, 2018. |
Amounts listed as “–” are $0 or round to $0.
See accompanying Notes to Financial Statements.
| 40 | Annual Report 2018 |
Statements of Changes in Net Assets
| Aberdeen Select International Equity Fund | Aberdeen Select International Equity Fund II | |||||||||||||||
| Year Ended October 31, 2018 | Year Ended October 31, 2017 | Year Ended October 31, 2018 | Year Ended October 31, 2017 | |||||||||||||
FROM INVESTMENT ACTIVITIES: | ||||||||||||||||
Operations: | ||||||||||||||||
Net investment income | $ | 182,023 | $ | 15,120,451 | $ | 649,096 | $ | 3,923,361 | ||||||||
Net realized gain/(loss) from investments, forward foreign currency exchange contracts and foreign currency transactions | (22,255,480 | ) | (753,987 | ) | 334,443 | (892,977 | ) | |||||||||
Net change in unrealized appreciation/(depreciation) on investments and translation of assets and liabilities denominated in foreign currencies | 1,237,614 | 37,155,178 | (9,314,740 | ) | 17,213,463 | |||||||||||
|
|
|
|
|
|
|
| |||||||||
Changes in net assets resulting from operations | (20,835,843 | ) | 51,521,642 | (8,331,201 | ) | 20,243,847 | ||||||||||
|
|
|
|
|
|
|
| |||||||||
Distributions to Shareholders From(a): | ||||||||||||||||
Distributable earnings | ||||||||||||||||
Class A | (7,071,105 | ) | (1,729,501 | ) | (1,331,275 | ) | (794,000 | ) | ||||||||
Institutional Class | (1,478,487 | ) | (384,167 | ) | (1,222,394 | ) | (804,604 | ) | ||||||||
Tax return of capital | ||||||||||||||||
Class A | (173,166 | ) | – | – | – | |||||||||||
Institutional Class | (35,698 | ) | – | – | – | |||||||||||
|
|
|
|
|
|
|
| |||||||||
Change in net assets from shareholder distributions | (8,758,456 | ) | (2,113,668 | ) | (2,553,669 | ) | (1,598,604 | ) | ||||||||
|
|
|
|
|
|
|
| |||||||||
Change in net assets from capital transactions | (30,050,513 | ) | (50,934,914 | ) | (18,695,783 | ) | (28,203,733 | ) | ||||||||
|
|
|
|
|
|
|
| |||||||||
Change in net assets | (59,644,812 | ) | (1,526,940 | ) | (29,580,653 | ) | (9,558,490 | ) | ||||||||
|
|
|
|
|
|
|
| |||||||||
Net Assets: | ||||||||||||||||
Beginning of year | 212,660,691 | 214,187,631 | 94,021,692 | 103,580,182 | ||||||||||||
|
|
|
|
|
|
|
| |||||||||
End of year | $ | 153,015,879 | $ | 212,660,691 | $ | 64,441,039 | $ | 94,021,692 | ||||||||
|
|
|
|
|
|
|
| |||||||||
CAPITAL TRANSACTIONS: | ||||||||||||||||
Class A Shares | ||||||||||||||||
Proceeds from shares issued | $ | 2,307,128 | $ | 7,176,305 | $ | 1,878,438 | $ | 2,613,795 | ||||||||
Dividends reinvested | 7,041,129 | 1,674,291 | 1,297,934 | 767,912 | ||||||||||||
Cost of shares redeemed | (35,814,374 | ) | (54,675,238 | ) | (10,537,897 | ) | (23,223,934 | ) | ||||||||
|
|
|
|
|
|
|
| |||||||||
Total Class A | (26,466,117 | ) | (45,824,642 | ) | (7,361,525 | ) | (19,842,227 | ) | ||||||||
|
|
|
|
|
|
|
| |||||||||
Institutional Class Shares | ||||||||||||||||
Proceeds from shares issued | 1,675,098 | 12,287,211 | 1,580,032 | 3,231,423 | ||||||||||||
Dividends reinvested | 1,461,156 | 369,916 | 1,088,727 | 716,120 | ||||||||||||
Cost of shares redeemed | (6,720,650 | ) | (17,767,399 | ) | (14,003,017 | ) | (12,309,049 | ) | ||||||||
|
|
|
|
|
|
|
| |||||||||
Total Institutional Class | (3,584,396 | ) | (5,110,272 | ) | (11,334,258 | ) | (8,361,506 | ) | ||||||||
|
|
|
|
|
|
|
| |||||||||
Change in net assets from capital transactions: | $ | (30,050,513 | ) | $ | (50,934,914 | ) | $ | (18,695,783 | ) | $ | (28,203,733 | ) | ||||
|
|
|
|
|
|
|
| |||||||||
SHARE TRANSACTIONS: | ||||||||||||||||
Class A Shares | ||||||||||||||||
Issued | 85,211 | 282,021 | 162,758 | 242,700 | ||||||||||||
Reinvested | 260,590 | 77,802 | 110,651 | 81,867 | ||||||||||||
Redeemed | (1,330,636 | ) | (2,208,424 | ) | (910,651 | ) | (2,257,994 | ) | ||||||||
|
|
|
|
|
|
|
| |||||||||
Total Class A Shares | (984,835 | ) | (1,848,601 | ) | (637,242 | ) | (1,933,427 | ) | ||||||||
|
|
|
|
|
|
|
| |||||||||
Institutional Class Shares | ||||||||||||||||
Issued | 61,355 | 473,495 | 135,907 | 297,315 | ||||||||||||
Reinvested | 52,768 | 16,792 | 92,895 | 76,427 | ||||||||||||
Redeemed | (246,053 | ) | (666,446 | ) | (1,198,195 | ) | (1,146,114 | ) | ||||||||
|
|
|
|
|
|
|
| |||||||||
Total Institutional Class Shares | (131,930 | ) | (176,159 | ) | (969,393 | ) | (772,372 | ) | ||||||||
|
|
|
|
|
|
|
| |||||||||
Total change in shares: | (1,116,765 | ) | (2,024,760 | ) | (1,606,635 | ) | (2,705,799 | ) | ||||||||
| �� |
|
|
|
|
|
| |||||||||
| (a) | Per Securities and Exchange Commission release #33-10532 “Disclosure Update and Simplification”; a Fund is no longer required to differentiate distributions from earnings as either from net investment income or net realized capital gains. Please see Note 8 for the fiscal year October 31, 2017 distribution designations. |
Amounts listed as “–” are $0 or round to $0.
See accompanying Notes to Financial Statements.
| 2018 Annual Report | 41 |
Statements of Changes in Net Assets (concluded)
| Aberdeen Total Return Bond Fund | Aberdeen Global High Income Fund | |||||||||||||||
| Year Ended October 31, 2018 | Year Ended October 31, 2017 | Year Ended October 31, 2018 | Year Ended October 31, 2017 | |||||||||||||
FROM INVESTMENT ACTIVITIES: | ||||||||||||||||
Operations: | ||||||||||||||||
Net investment income | $ | 8,187,219 | $ | 16,188,790 | $ | 16,188,790 | $ | 25,542,545 | ||||||||
Net realized gain/(loss) from investments, futures, written options, credit default swaps, forward foreign currency exchange contracts and foreign currency transactions | (5,355,576 | ) | 2,026,752 | (467,548 | ) | (18,222,953 | ) | |||||||||
Net change in unrealized appreciation/(depreciation) on investments, futures, forward foreign currency exchange contracts and translation of assets and liabilities denominated in foreign currencies | (10,891,422 | ) | (9,877,747 | ) | (17,323,603 | ) | 35,412,922 | |||||||||
|
|
|
|
|
|
|
| |||||||||
Changes in net assets resulting from operations | (8,059,779 | ) | 2,776,127 | (1,602,361 | ) | 42,732,514 | ||||||||||
|
|
|
|
|
|
|
| |||||||||
Distributions to Shareholders From(a): | ||||||||||||||||
Distributable earnings | ||||||||||||||||
Class A | (1,788,716 | ) | (3,091,446 | ) | (7,480,796 | ) | (9,732,798 | ) | ||||||||
Institutional Class | (8,364,634 | ) | (19,718,579 | ) | (6,447,145 | ) | (13,130,842 | ) | ||||||||
Tax return of capital | ||||||||||||||||
Class A | (65,475 | ) | – | – | (804,998 | ) | ||||||||||
Institutional Class | (283,631 | ) | – | – | (951,720 | ) | ||||||||||
|
|
|
|
|
|
|
| |||||||||
Change in net assets from shareholder distributions | (10,502,456 | ) | (22,810,025 | ) | (13,927,941 | ) | (24,620,358 | ) | ||||||||
|
|
|
|
|
|
|
| |||||||||
Change in net assets from capital transactions | (85,359,490 | ) | (183,768,674 | ) | (152,600,288 | ) | (213,758,294 | ) | ||||||||
|
|
|
|
|
|
|
| |||||||||
Change in net assets | (103,921,725 | ) | (203,802,572 | ) | (168,130,590 | ) | (195,646,138 | ) | ||||||||
|
|
|
|
|
|
|
| |||||||||
Net Assets: | ||||||||||||||||
Beginning of year | 315,774,442 | 519,577,014 | 389,188,430 | 584,834,568 | ||||||||||||
|
|
|
|
|
|
|
| |||||||||
End of year | $ | 211,852,717 | $ | 315,774,442 | $ | 221,057,840 | $ | 389,188,430 | ||||||||
|
|
|
|
|
|
|
| |||||||||
CAPITAL TRANSACTIONS: | ||||||||||||||||
Class A Shares | ||||||||||||||||
Proceeds from shares issued | $ | 7,871,952 | $ | 15,274,583 | $ | 33,252,402 | $ | 53,455,321 | ||||||||
Dividends reinvested | 1,732,792 | 2,885,508 | 7,236,969 | 10,134,195 | ||||||||||||
Cost of shares redeemed | (30,339,018 | ) | (18,528,123 | ) | (86,356,169 | ) | (120,391,587 | ) | ||||||||
|
|
|
|
|
|
|
| |||||||||
Total Class A | (20,734,274 | ) | (368,032 | ) | (45,866,798 | ) | (56,802,071 | ) | ||||||||
|
|
|
|
|
|
|
| |||||||||
Institutional Class Shares | ||||||||||||||||
Proceeds from shares issued | 58,728,635 | 58,714,536 | 27,801,473 | 59,736,716 | ||||||||||||
Dividends reinvested | 8,056,332 | 17,967,234 | 4,402,502 | 7,881,677 | ||||||||||||
Cost of shares redeemed | (131,410,183 | ) | (260,082,412 | ) | (138,937,465 | ) | (224,574,616 | ) | ||||||||
|
|
|
|
|
|
|
| |||||||||
Total Institutional Class | (64,625,216 | ) | (183,400,642 | ) | (106,733,490 | ) | (156,956,223 | ) | ||||||||
|
|
|
|
|
|
|
| |||||||||
Change in net assets from capital transactions: | $ | (85,359,490 | ) | $ | (183,768,674 | ) | $ | (152,600,288 | ) | $ | (213,758,294 | ) | ||||
|
|
|
|
|
|
|
| |||||||||
SHARE TRANSACTIONS: | ||||||||||||||||
Class A Shares | ||||||||||||||||
Issued | 608,191 | 1,150,715 | 3,631,984 | 5,969,227 | ||||||||||||
Reinvested | 133,012 | 221,027 | 805,725 | 1,141,452 | ||||||||||||
Redeemed | (2,356,639 | ) | (1,396,949 | ) | (9,537,476 | ) | (13,523,934 | ) | ||||||||
|
|
|
|
|
|
|
| |||||||||
Total Class A Shares | (1,615,436 | ) | (25,207 | ) | (5,099,767 | ) | (6,413,255 | ) | ||||||||
|
|
|
|
|
|
|
| |||||||||
Institutional Class Shares | ||||||||||||||||
Issued | 4,641,880 | 4,494,195 | 3,263,080 | 7,080,491 | ||||||||||||
Reinvested | 628,597 | 1,396,806 | 523,726 | 946,727 | ||||||||||||
Redeemed | (10,441,273 | ) | (19,924,605 | ) | (16,313,815 | ) | (26,954,236 | ) | ||||||||
|
|
|
|
|
|
|
| |||||||||
Total Institutional Class Shares | (5,170,796 | ) | (14,033,604 | ) | (12,527,009 | ) | (18,927,018 | ) | ||||||||
|
|
|
|
|
|
|
| |||||||||
Total change in shares: | (6,786,232 | ) | (14,058,811 | ) | (17,626,776 | ) | (25,340,273 | ) | ||||||||
|
|
|
|
|
|
|
| |||||||||
| (a) | Per Securities and Exchange Commission release #33-10532 “Disclosure Update and Simplification”; a Fund is no longer required to differentiate distributions from earnings as either from net investment income or net realized capital gains. Please see Note 8 for the fiscal year October 31, 2017 distribution designations. |
Amounts listed as “–” are $0 or round to $0.
See accompanying Notes to Financial Statements.
| 42 | Annual Report 2018 |
This page intentionally left blank.
Financial Highlights
Selected Data for Each Share of Capital Outstanding Throughout the Periods Indicated
Aberdeen Select International Equity Fund
| Investment Activities | Distributions | |||||||||||||||||||||||||||||||
| Net Asset Value, Beginning of Period | Net Investment Income (a) | Net Realized and Unrealized Gains (Losses) on Investments | Total from Investment Activities | Net Investment Income | Tax Return of Capital | Total Distributions | Net Asset Value, End of Period | |||||||||||||||||||||||||
Class A Shares | ||||||||||||||||||||||||||||||||
Year Ended October 31, 2018 | $ | 28.01 | $ | 0.01 | $ | (3.20 | ) | $ | (3.19 | ) | $ | (1.15 | ) | $ | (0.03 | ) | $ | (1.18 | ) | $ | 23.64 | |||||||||||
Year Ended October 31, 2017 | 22.26 | 1.75 | (e) | 4.22 | 5.97 | (0.22 | ) | – | (0.22 | ) | 28.01 | |||||||||||||||||||||
Year Ended October 31, 2016 | 22.82 | 0.45 | (f) | (0.29 | ) | 0.16 | (0.72 | ) | – | (0.72 | ) | 22.26 | ||||||||||||||||||||
Year Ended October 31, 2015 | 28.00 | 0.62 | (h) | (4.60 | ) | (3.98 | ) | (1.20 | ) | – | (1.20 | ) | 22.82 | |||||||||||||||||||
Year Ended October 31, 2014 | 28.63 | 1.09 | (1.12 | ) | (0.03 | ) | (0.60 | ) | – | (0.60 | ) | 28.00 | ||||||||||||||||||||
Institutional Class Shares | ||||||||||||||||||||||||||||||||
Year Ended October 31, 2018 | 28.73 | 0.09 | (3.30 | ) | (3.21 | ) | (1.22 | ) | (0.03 | ) | (1.25 | ) | 24.27 | |||||||||||||||||||
Year Ended October 31, 2017 | 22.84 | 1.72 | (e) | 4.46 | 6.18 | (0.29 | ) | – | (0.29 | ) | 28.73 | |||||||||||||||||||||
Year Ended October 31, 2016 | 23.40 | 0.51 | (f) | (0.28 | ) | 0.23 | (0.79 | ) | – | (0.79 | ) | 22.84 | ||||||||||||||||||||
Year Ended October 31, 2015 | 28.69 | 0.67 | (h) | (4.68 | ) | (4.01 | ) | (1.28 | ) | – | (1.28 | ) | 23.40 | |||||||||||||||||||
Year Ended October 31, 2014 | 29.33 | 1.19 | (1.16 | ) | 0.03 | (0.67 | ) | – | (0.67 | ) | 28.69 | |||||||||||||||||||||
| (a) | Net investment income/(loss) is based on average shares outstanding during the period. |
| (b) | Includes interest expense that amounts to less than 0.01%. |
| (c) | During the period, certain fees were waived and/or reimbursed. If such waivers/reimbursements had not occurred, the ratios would have been as indicated. |
| (d) | Portfolio turnover is calculated on the basis of the Fund as a whole without distinguishing among the classes of shares. |
| (e) | Included within Net Investment Income per share, Total Return, and Ratio of Net Investment Income to Average Net Assets are the effects of withholding tax refunds (Note 2g of the Notes to Financial Statements). If such amounts were excluded, the Net Investment Loss per share, Total Return, and Ratio of Net Investment Loss to Average Net Assets for Class A Shares would have been $(0.14), 20.27%, and (0.55)%, respectively. For Institutional Class Shares, these amounts would have been $(0.24), 20.55%, and (0.92)%, respectively. |
Amounts listed as “–” are $0 or round to $0.
See accompanying Notes to Financial Statements.
| 44 | Annual Report 2018 |
Financial Highlights (continued)
Selected Data for Each Share of Capital Outstanding Throughout the Periods Indicated
Aberdeen Select International Equity Fund (concluded)
| Ratios/Supplemental Data | ||||||||||||||||||||||||||
| Total Return | Net Assets at End of Period (000’s) | Ratio of Expenses (Net of Reimbursement/Waivers and Excluding Accruals for Estimated Tax Due on Foreign Tax Refund Recoveries) to Average Net Assets | Ratio of Expenses (Net of Reimbursements/ Waivers) to Average Net Assets (b) | Ratio of Expenses (Prior to Reimbursements) to Average Net Assets (b)(c) | Ratio of Net Investment Income to Average Net Assets | Portfolio (d) | ||||||||||||||||||||
| (11.93 | %) | $ | 126,383 | 1.54 | % | 2.50 | % | 2.50 | % | 0.05 | % | 19 | % | |||||||||||||
| 27.14 | %(e) | 177,342 | 1.42 | % | 3.93 | % | 3.93 | % | 7.02 | %(e) | 18 | % | ||||||||||||||
| 0.99 | %(f)(g) | 182,094 | 1.35 | % | 1.42 | % | 1.42 | % | 2.08 | %(f) | 23 | % | ||||||||||||||
| (14.62 | %)(h) | 242,444 | 1.28 | % | 1.28 | % | 1.28 | % | 2.47 | %(h) | 11 | % | ||||||||||||||
| (0.04 | %) | 397,911 | 1.26 | % | 1.26 | % | 1.26 | % | 3.83 | % | 12 | % | ||||||||||||||
| (11.71 | %) | 26,633 | 1.30 | % | 2.22 | % | 2.23 | % | 0.33 | % | 19 | % | ||||||||||||||
| 27.42 | %(e) | 35,318 | 1.17 | % | 3.46 | % | 3.46 | % | 6.65 | %(e) | 18 | % | ||||||||||||||
| 1.30 | %(f)(g) | 32,094 | 1.10 | % | 1.17 | % | 1.17 | % | 2.31 | %(f) | 23 | % | ||||||||||||||
| (14.40 | %)(h) | 43,633 | 1.04 | % | 1.04 | % | 1.04 | % | 2.56 | %(h) | 11 | % | ||||||||||||||
| 0.19 | % | 82,014 | 1.02 | % | 1.02 | % | 1.03 | % | 4.06 | % | 12 | % | ||||||||||||||
| (f) | Included within Net Investment Income per share, Total Return, and Ratio of Net Investment Income to Average Net Assets are the effects of a one-time reimbursement for overbilling of prior years’ custodian out-of-pocket fees. If such amounts were excluded, the impact to the Net Investment Income per share, Total Return, and Ratio of Net Investment Income to Average Net Assets for Class A Shares would have been reduced by $0.03, 0.13%, and 0.13%, respectively. For Institutional Class Shares, these amounts would have been reduced by $0.03, 0.13%, and 0.13%, respectively. |
| (g) | Included within Net Realized and Unrealized Gains (Losses) on Investment per share is a payment that was made from affiliate, during the fiscal year ended October 31, 2016, which contributed $113,111 to the Select International Equity Fund to correctly record an aged dividend receivable at its net realizable value inclusive of currency fluctuations. If such payment was excluded, the total return would have been 0.94% for Class A Shares and 1.21% for Institutional Class Shares. |
| (h) | Included within Net Investment Income per share, Total Return, and Ratio of Net Investment Income to Average Net Assets are the effects of withholding tax refunds (Note 2g of the Notes to Financial Statements). If such amounts were excluded, the Net Investment Income per share, Total Return, and Ratio of Net Investment Income to Average Net Assets for Class A Shares would have been $0.53, (15.03%), and 2.11%, respectively. For Institutional Class Shares, these amounts would have been $0.58, (14.80%), and 2.20%, respectively. |
| 2018 Annual Report | 45 |
Financial Highlights (continued)
Selected Data for Each Share of Capital Outstanding Throughout the Periods Indicated
Aberdeen Select International Equity Fund II
| Investment Activities | Distributions | |||||||||||||||||||||||||||
| Net Asset Value, Beginning of Period | Net Investment Income (a) | Net Realized and Unrealized Gains (Losses) on Investments | Total from Investment Activities | Net Investment Income | Total Distributions | Net Asset Value, End of Period | ||||||||||||||||||||||
Class A Shares | ||||||||||||||||||||||||||||
Year Ended October 31, 2018 | $ | 11.95 | $ | 0.08 | $ | (1.41 | ) | $ | (1.33 | ) | $ | (0.33 | ) | $ | (0.33 | ) | $ | 10.29 | ||||||||||
Year Ended October 31, 2017 | 9.79 | 0.43 | (e) | 1.89 | 2.32 | (0.16 | ) | (0.16 | ) | 11.95 | ||||||||||||||||||
Year Ended October 31, 2016 | 10.03 | 0.14 | (f) | (0.08 | ) | 0.06 | (0.30 | ) | (0.30 | ) | 9.79 | |||||||||||||||||
Year Ended October 31, 2015 | 12.23 | 0.21 | (h) | (1.89 | )(i) | (1.68 | ) | (0.52 | ) | (0.52 | ) | 10.03 | ||||||||||||||||
Year Ended October 31, 2014 | 12.18 | 0.42 | (0.36 | ) | 0.06 | (0.01 | ) | (0.01 | ) | 12.23 | ||||||||||||||||||
Institutional Class Shares | ||||||||||||||||||||||||||||
Year Ended October 31, 2018 | 11.96 | 0.10 | (1.40 | ) | (1.30 | ) | (0.36 | ) | (0.36 | ) | 10.30 | |||||||||||||||||
Year Ended October 31, 2017 | 9.81 | 0.45 | (e) | 1.88 | 2.33 | (0.18 | ) | (0.18 | ) | 11.96 | ||||||||||||||||||
Year Ended October 31, 2016 | 10.04 | 0.16 | (f) | (0.06 | ) | 0.10 | (0.33 | ) | (0.33 | ) | 9.81 | |||||||||||||||||
Year Ended October 31, 2015 | 12.25 | 0.24 | (h) | (1.90 | )(i) | (1.66 | ) | (0.55 | ) | (0.55 | ) | 10.04 | ||||||||||||||||
Year Ended October 31, 2014 | 12.20 | 0.46 | (0.38 | ) | 0.08 | (0.03 | ) | (0.03 | ) | 12.25 | ||||||||||||||||||
| (a) | Net investment income/(loss) is based on average shares outstanding during the period. |
| (b) | During the period, certain fees were waived and/or reimbursed. If such waivers/reimbursements had not occurred, the ratios would have been as indicated. |
| (c) | Includes interest expense that amounts to less than 0.01%. |
| (d) | Portfolio turnover is calculated on the basis of the Fund as a whole without distinguishing among the classes of shares. |
| (e) | Included within Net Investment Income per share, Total Return, and Ratio of Net Investment Income to Average Net Assets are the effects of withholding tax refunds (Note 2g of the Notes to Financial Statements). If such amounts were excluded, the Net Investment Loss per share, Total Return, and Ratio of Net Investment Loss to Average Net Assets for Class A Shares would have been $(0.06), 20.03%, and (0.61)%, respectively. For Institutional Class Shares, these amounts would have been $(0.04), 20.24%, and (0.37)%, respectively. |
Amounts listed as “–” are $0 or round to $0.
See accompanying Notes to Financial Statements.
| 46 | Annual Report 2018 |
Financial Highlights (continued)
Selected Data for Each Share of Capital Outstanding Throughout the Periods Indicated
Aberdeen Select International Equity Fund II (concluded)
| Ratios/Supplemental Data | ||||||||||||||||||||||||||
| Total Return | Net Assets at End of Period (000’s) | Ratio of Expenses (Net of Reimbursement/Waivers and Excluding Accruals for Estimated Tax Due on Foreign Tax Refund Recoveries) to Average Net Assets | Ratio of Expenses (Net of Reimbursements/ Waivers) to Average Net Assets (b)(c) | Ratio of Expenses (Prior to Reimbursements) to Average Net Assets (b)(c) | Ratio of Net Investment Income to Average Net Assets | Portfolio Turnover (d) | ||||||||||||||||||||
| (11.48 | %) | $ | 35,964 | 1.77 | % | 2.44 | % | 2.44 | % | 0.72 | % | 19 | % | |||||||||||||
| 24.10 | %(e) | 49,363 | 1.58 | % | 3.14 | % | 3.15 | % | 3.98 | %(e) | 13 | % | ||||||||||||||
| 0.83 | %(f)(g) | 59,390 | 1.45 | % | 1.49 | % | 1.50 | % | 1.49 | %(f) | 23 | % | ||||||||||||||
| (14.16 | %)(h)(i) | 79,263 | 1.38 | % | 1.38 | % | 1.38 | % | 1.93 | %(h) | 12 | % | ||||||||||||||
| 0.46 | % | 120,387 | 1.32 | % | 1.32 | % | 1.33 | % | 3.41 | % | 11 | % | ||||||||||||||
| (11.23 | %) | 28,477 | 1.52 | % | 2.22 | % | 2.23 | % | 0.89 | % | 19 | % | ||||||||||||||
| 24.32 | %(e) | 44,659 | 1.33 | % | 2.88 | % | 2.89 | % | 4.22 | %(e) | 13 | % | ||||||||||||||
| 1.25 | %(f)(g) | 44,191 | 1.22 | % | 1.26 | % | 1.27 | % | 1.71 | %(f) | 23 | % | ||||||||||||||
| (13.96 | %)(h)(i) | 69,000 | 1.13 | % | 1.13 | % | 1.13 | % | 2.16 | %(h) | 12 | % | ||||||||||||||
| 0.64 | % | 108,665 | 1.10 | % | 1.10 | % | 1.11 | % | 3.69 | % | 11 | % | ||||||||||||||
| (f) | Included within Net Investment Income per share, Total Return, and Ratio of Net Investment Income to Average Net Assets are the effects of a one-time reimbursement for overbilling of prior years’ custodian out-of-pocket fees. If such amounts were excluded, the impact to the Net Investment Income per share, Total Return, and Ratio of Net Investment Income to Average Net Assets for Class A Shares would have been reduced by $0.02, 0.21%, and 0.20%, respectively. For Institutional Class Shares, these amounts would have been by reduced $0.03, 0.31%, and 0.19%, respectively. |
| (g) | Included within Net Realized and Unrealized Gains (Losses) on Investment per share is a payment that was made from affiliate, during the fiscal year ended October 31, 2016, which contributed $127,579 to the Select International Equity Fund II, to correctly record an aged dividend receivable at its net realizable value inclusive of currency fluctuations. If such payment was excluded, the total return would have been 0.73% for Class A Shares and 1.04% for Institutional Class Shares. |
| (h) | Included within Net Investment Income per share, Total Return, and Ratio of Net Investment Income to Average Net Assets are the effects of withholding tax refunds (Note 2g of the Notes to Financial Statements). If such amounts were excluded, the Net Investment Income per share, Total Return, and Ratio of Net Investment Income to Average Net Assets for Class A Shares would have been $0.18, (14.42%), and 1.66%, respectively. For Institutional Class Shares, these amounts would have been $0.21, (14.22%), and 1.89%, respectively. |
| (i) | Included within Net Realized and Unrealized Gains (Losses) on Investment per share is a payment that was made from affiliate, during the fiscal year ended October 31, 2015, which contributed $305,291 to the Select International Equity Fund II, to correctly record an aged dividend receivable at its net realizable value inclusive of currency fluctuations. If such payment was excluded, the total return would have been (14.33%) for Class A Shares and (14.13%) for Institutional Class Shares. |
| 2018 Annual Report | 47 |
Financial Highlights (continued)
Selected Data for Each Share of Capital Outstanding Throughout the Periods Indicated
Aberdeen Total Return Bond Fund
| Investment Activities | Distributions | |||||||||||||||||||||||||||||||||||
| Net Asset Value, Beginning of Period | Net Investment Income (a) | Net Realized and Unrealized Gains (Losses) on Investments | Total from Investment Activities | Net Investment Income | Net Realized Gains | Tax Return of Capital | Total Distributions | Net Asset Value, End of Period | ||||||||||||||||||||||||||||
Class A Shares | ||||||||||||||||||||||||||||||||||||
Year Ended October 31, 2018 | $ | 13.33 | $ | 0.34 | $ | (0.74 | ) | $ | (0.40 | ) | $ | (0.35 | ) | $ | (0.07 | ) | $ | (0.02 | ) | $ | (0.44 | ) | $ | 12.49 | ||||||||||||
Year Ended October 31, 2017 | 13.83 | 0.33 | (0.18 | ) | 0.15 | (0.18 | ) | (0.47 | ) | – | (0.65 | ) | 13.33 | |||||||||||||||||||||||
Year Ended October 31, 2016 | 13.32 | 0.34 | 0.32 | 0.66 | (0.15 | ) | – | – | (0.15 | ) | 13.83 | |||||||||||||||||||||||||
Year Ended October 31, 2015 | 13.60 | 0.32 | (0.19 | ) | 0.13 | (0.22 | ) | (0.17 | ) | (0.02 | ) | (0.41 | ) | 13.32 | ||||||||||||||||||||||
Year Ended October 31, 2014 | 13.30 | 0.34 | 0.18 | 0.52 | (0.22 | ) | – | – | (0.22 | ) | 13.60 | |||||||||||||||||||||||||
Institutional Class Shares | ||||||||||||||||||||||||||||||||||||
Year Ended October 31, 2018 | 13.14 | 0.37 | (0.74 | ) | (0.37 | ) | (0.38 | ) | (0.07 | ) | (0.02 | ) | (0.47 | ) | 12.30 | |||||||||||||||||||||
Year Ended October 31, 2017 | 13.64 | 0.36 | (0.18 | ) | 0.18 | (0.21 | ) | (0.47 | ) | – | (0.68 | ) | 13.14 | |||||||||||||||||||||||
Year Ended October 31, 2016 | 13.14 | 0.36 | 0.33 | 0.69 | (0.19 | ) | – | – | (0.19 | ) | 13.64 | |||||||||||||||||||||||||
Year Ended October 31, 2015 | 13.43 | 0.35 | (0.20 | ) | 0.15 | (0.25 | ) | (0.17 | ) | (0.02 | ) | (0.44 | ) | 13.14 | ||||||||||||||||||||||
Year Ended October 31, 2014 | 13.13 | 0.37 | 0.18 | 0.55 | (0.25 | ) | – | – | (0.25 | ) | 13.43 | |||||||||||||||||||||||||
| (a) | Net investment income/(loss) is based on average shares outstanding during the period. |
| (b) | During the period, certain fees were waived and/or reimbursed. If such waivers/reimbursements had not occurred, the ratios would have been as indicated. |
| (c) | Includes interest expense that amounts to less than 0.01%. |
Amounts listed as “–” are $0 or round to $0.
See accompanying Notes to Financial Statements.
| 48 | Annual Report 2018 |
Financial Highlights (continued)
Selected Data for Each Share of Capital Outstanding Throughout the Periods Indicated
Aberdeen Total Return Bond Fund (concluded)
| Ratios/Supplemental Data | ||||||||||||||||||||||
| Total Return | Net Assets at End of Period (000’s) | Ratio of Expenses (Net of Reimbursements/ Waivers) to Average Net Assets (c) | Ratio of Expenses (Prior to Reimbursements) to Average Net Assets (b)(c) | Ratio of Net Investment Income to Average Net Assets | Portfolio Turnover (d) | |||||||||||||||||
| (3.19 | %) | $ | 38,426 | 0.69 | % | 0.88 | % | 2.67 | % | 148 | % | |||||||||||
| 1.21 | %(e) | 62,556 | 0.69 | % | 0.76 | % | 2.46 | % | 151 | % | ||||||||||||
| 5.02 | % | 65,242 | 0.69 | % | 0.74 | % | 2.47 | % | 151 | % | ||||||||||||
| 0.91 | % | 75,595 | 0.69 | % | 0.71 | % | 2.37 | % | 102 | % | ||||||||||||
| 3.96 | % | 152,196 | 0.68 | % | 0.69 | % | 2.56 | % | 128 | % | ||||||||||||
| (2.96 | %) | 173,427 | 0.44 | % | 0.62 | % | 2.93 | % | 148 | % | ||||||||||||
| 1.50 | %(e) | 253,218 | 0.44 | % | 0.51 | % | 2.71 | % | 151 | % | ||||||||||||
| 5.29 | % | 454,335 | 0.44 | % | 0.47 | % | 2.72 | % | 151 | % | ||||||||||||
| 1.12 | % | 927,387 | 0.44 | % | 0.45 | % | 2.62 | % | 102 | % | ||||||||||||
| 4.25 | % | 1,361,252 | 0.42 | % | 0.43 | % | 2.81 | % | 128 | % | ||||||||||||
| (d) | Portfolio turnover is calculated on the basis of the Fund as a whole without distinguishing among the classes of shares. |
| (e) | The total return shown above includes the impact of financial statement rounding of the NAV per share and/or financial statement adjustments. |
| 2018 Annual Report | 49 |
Financial Highlights (continued)
Selected Data for Each Share of Capital Outstanding Throughout the Periods Indicated
Aberdeen Global High Income Fund
| Investment Activities | Distributions | |||||||||||||||||||||||||||||||||||
| Net Asset Value, Beginning of Period | Net Investment Income (a) | Net Realized and Unrealized Gains (Losses) on Investments | Total from Investment Activities | Net Investment Income | Net Realized Gains | Tax Return of Capital | Total Distributions | Net Asset Value, End of Period | ||||||||||||||||||||||||||||
Class A Shares | ||||||||||||||||||||||||||||||||||||
Year Ended October 31, 2018 | $ | 9.23 | $ | 0.50 | $ | (0.56 | ) | $ | (0.06 | ) | $ | (0.43 | ) | $ | – | $ | – | $ | (0.43 | ) | $ | 8.74 | ||||||||||||||
Year Ended October 31, 2017 | 8.80 | 0.52 | 0.38 | 0.90 | (0.43 | ) | – | (0.04 | ) | (0.47 | ) | 9.23 | ||||||||||||||||||||||||
Year Ended October 31, 2016 | 8.98 | 0.49 | (0.33 | ) | 0.16 | (0.34 | ) | – | – | (0.34 | ) | 8.80 | ||||||||||||||||||||||||
Year Ended October 31, 2015 | 10.38 | 0.62 | (1.22 | ) | (0.60 | ) | (0.44 | ) | (0.25 | ) | (0.11 | ) | (0.80 | ) | 8.98 | |||||||||||||||||||||
Year Ended October 31, 2014 | 10.61 | 0.62 | (0.13 | ) | 0.49 | (0.61 | ) | (0.11 | ) | – | (0.72 | ) | 10.38 | |||||||||||||||||||||||
Institutional Class Shares | ||||||||||||||||||||||||||||||||||||
Year Ended October 31, 2018 | 8.65 | 0.49 | (0.53 | ) | (0.04 | ) | (0.45 | ) | – | – | (0.45 | ) | 8.16 | |||||||||||||||||||||||
Year Ended October 31, 2017 | 8.28 | 0.51 | 0.35 | 0.86 | (0.45 | ) | – | (0.04 | ) | (0.49 | ) | 8.65 | ||||||||||||||||||||||||
Year Ended October 31, 2016 | 8.47 | 0.48 | (0.31 | ) | 0.17 | (0.36 | ) | – | – | (0.36 | ) | 8.28 | ||||||||||||||||||||||||
Year Ended October 31, 2015 | 9.85 | 0.61 | (1.16 | ) | (0.55 | ) | (0.47 | ) | (0.25 | ) | (0.11 | ) | (0.83 | ) | 8.47 | |||||||||||||||||||||
Year Ended October 31, 2014 | 10.10 | 0.61 | (0.11 | ) | 0.50 | (0.64 | ) | (0.11 | ) | – | (0.75 | ) | 9.85 | |||||||||||||||||||||||
| (a) | Net investment income/(loss) is based on average shares outstanding during the period. |
| (b) | During the period, certain fees were waived and/or reimbursed. If such waivers/reimbursements had not occurred, the ratios would have been as indicated. |
| (c) | Includes interest expense that amounts to less than 0.01%. |
Amounts listed as “–” are $0 or round to $0.
See accompanying Notes to Financial Statements.
| 50 | Annual Report 2018 |
Financial Highlights (concluded)
Selected Data for Each Share of Capital Outstanding Throughout the Periods Indicated
Aberdeen Global High Income Fund (concluded)
| Ratios/Supplemental Data | ||||||||||||||||||||||
| Total Return | Net Assets at End of Period (000’s) | Ratio of Expenses (Net of Reimbursements/ Waivers) to Average Net Assets (b)(c) | Ratio of Expenses (Prior to Reimbursements) to Average Net Assets (b)(c) | Ratio of Net Investment Income to Average Net Assets | Portfolio Turnover (d) | |||||||||||||||||
| (0.66 | %) | $ | 131,219 | 1.00 | % | 1.22 | % | 5.56 | % | 37 | % | |||||||||||
| 10.50 | % | 185,613 | 1.00 | % | 1.14 | % | 5.79 | % | 51 | % | ||||||||||||
| 1.91 | % | 233,369 | 1.00 | % | 1.06 | % | 5.76 | % | 72 | % | ||||||||||||
| (6.01 | %)(e) | 522,964 | 1.00 | % | 1.04 | % | 6.43 | % | 79 | % | ||||||||||||
| 4.70 | % | 823,808 | 1.00 | % | 1.01 | % | 5.76 | % | 96 | % | ||||||||||||
| (0.43 | %) | 89,839 | 0.75 | % | 0.95 | % | 5.80 | % | 37 | % | ||||||||||||
| 10.76 | % | 203,575 | 0.75 | % | 0.87 | % | 6.01 | % | 51 | % | ||||||||||||
| 2.21 | % | 351,466 | 0.75 | % | 0.79 | % | 6.00 | % | 72 | % | ||||||||||||
| (5.85 | %) | 797,494 | 0.75 | % | 0.76 | % | 6.68 | % | 79 | % | ||||||||||||
| 5.01 | % | 1,561,293 | 0.74 | % | 0.75 | % | 6.01 | % | 96 | % | ||||||||||||
| (d) | Portfolio turnover is calculated on the basis of the Fund as a whole without distinguishing among the classes of shares. |
| (e) | The total return shown above includes the impact of financial statement adjustments to the NAV per share. |
| 2018 Annual Report | 51 |
October 31, 2018
1. Organization
Aberdeen Investment Funds (the “Trust”) was organized as a business trust under the laws of the State of Massachusetts by a Master Trust Agreement adopted on April 30, 1992 and is registered with the U.S. Securities and Exchange Commission (“SEC”) under the Investment Company Act of 1940, as amended (the “1940 Act”) as an open-end management investment company. As of October 31, 2018, the Trust offered four diversified, open-ended investment funds: Aberdeen Select International Equity Fund (the “Select International Equity Fund”), Aberdeen Select International Equity Fund II (the “Select International Equity Fund II”), Aberdeen Total Return Bond Fund (the “Total Return Bond Fund”), and Aberdeen Global High Income Fund (the “Global High Income Fund”). Each series of the Trust is also referred to herein as a “Fund” or collectively, the “Funds”.
Under the Trust Agreement, the Trustees have authority to issue an unlimited number of shares of beneficial interest, par value $.001 per share. The Board of Trustees is authorized to reclassify and issue any unissued shares to any number of additional series without shareholder approval.
Each of the Funds offers multiple share classes. As of October 31, 2018, all of the Funds offered Class A and Institutional Class shares. The classes of shares are offered to different types of investors and have different expense structures, as outlined in the Funds’ prospectus. Each class of shares has exclusive voting rights with respect to matters that affect that class. Income, realized gains and losses, unrealized appreciation and depreciation, and expenses that are not attributable to a specific class are allocated daily to each class based on its relative net assets. Expenses directly attributable to a Fund are charged to that Fund. Other expenses are allocated to the respective Fund based on average daily net assets.
Each Fund has distinct investment objectives. Following are the objectives for the Funds:
| Fund Name | Investment Objective | |
Select International Equity Fund | Seeks long-term growth of capital. | |
Select International Equity Fund II | Seeks long-term growth of capital. | |
Total Return Bond Fund | Seeks to provide total return, which is derived from capital appreciation and income. | |
Global High Income Fund | Seeks to maximize total return, principally through a high level of current income, and secondarily through capital appreciation. |
2. Summary of Significant Accounting Policies
The Trust is an investment company and accordingly follows the investment company accounting and reporting guidance of the Financial Accounting Standards Board (“FASB”) Accounting Standard Codification Topic 946 Financial Services-Investment Companies. The following is a summary of significant accounting policies followed by the Funds in the preparation of their financial statements. The policies conform to generally accepted accounting principles in the United States of America (“GAAP”). The preparation of financial statements requires management to make estimates and assumptions that affect the reported amounts of assets and liabilities, disclosure of contingent assets and liabilities at the date of the financial statements, and the reported amounts of income and expenses for the period. Actual results could differ from those estimates. The books and records of the Funds are maintained in U.S. Dollars.
| a. | Security Valuation |
The Funds value their securities at current market value or fair value, consistent with regulatory requirements. “Fair value” is defined in the Funds’ Valuation and Liquidity Procedures as the price that could be received to sell an asset or paid to transfer a liability in an orderly transaction between willing market participants without a compulsion to transact at the measurement date.
In accordance with the authoritative guidance on fair value measurements and disclosures under GAAP, the Funds disclose the fair value of their investments using a three-level hierarchy that classifies the inputs to valuation techniques used to measure the fair value. The hierarchy assigns Level 1, the highest level, measurements to valuations based upon unadjusted quoted prices in active markets for identical assets, Level 2 measurements to valuations based upon other significant observable inputs, including adjusted quoted prices in active markets for similar assets, and Level 3, the lowest level, measurements to valuations based upon unobservable inputs that are significant to the valuation. Inputs refer broadly to the assumptions that market participants would use in pricing the asset or liability, including assumptions about risk, for example, the risk inherent in a particular valuation technique used to measure fair value including a pricing model and/or the risk inherent in the inputs to the valuation technique. Inputs may be observable or unobservable. Observable inputs are inputs that reflect the assumptions market participants would use in pricing the asset or liability, which are based on market data obtained from sources independent of the reporting entity. Unobservable inputs are inputs that reflect the reporting entity’s own assumptions about the assumptions market participants would use in pricing the asset or liability developed based on the best information available in the circumstances. A financial instrument’s level within the fair value hierarchy is based upon the lowest level of any input that is significant to the fair value measurement. Open-end mutual funds are valued at the respective net asset value (“NAV”) as reported by such company. The prospectuses for the registered open-end management investment companies in which a Fund invests explain the circumstances under
| 52 | Annual Report 2018 |
Notes to Financial Statements (continued)
October 31, 2018
which those companies will use fair value pricing and the effects of using fair value pricing. Closed-end funds and exchange-traded funds (“ETFs”) are valued at the market price of the security at the Valuation Time. A security using any of these pricing methodologies is determined to be a Level 1 investment.
Equity securities that are traded on an exchange are valued at the last quoted sale price on the principal exchange on which the security is traded at the “Valuation Time” subject to application, when appropriate, of the valuation factors described in the paragraph below. Under normal circumstances, the Valuation Time is as of the close of regular trading on the New York Stock Exchange (usually 4:00 p.m. Eastern Time). In the absence of a sale price, the security is valued at the mean of the bid/ask price quoted at the close on the principal exchange on which the security is traded. Securities traded on NASDAQ are valued at the NASDAQ official closing price.
Foreign equity securities that are traded on foreign exchanges that close prior to Valuation Time are valued by applying valuation factors to the last sale price or the mean price as noted above. Valuation factors are provided by an independent pricing service provider approved by the Board. These valuation factors are used when pricing a Fund’s portfolio holdings to estimate market movements between the time foreign markets close and the time a Fund values such foreign securities. These valuation factors are based on inputs such as depositary receipts, indices, futures, sector indices/ETFs, exchange rates, and local exchange opening and closing prices of each security. When prices with the application of valuation factors are utilized, the value assigned to the foreign securities may not be the same as quoted or published prices of the securities on their primary markets. A security that applies a valuation factor is determined to be a Level 2 investment because the exchange-traded price has been adjusted. Valuation factors are not utilized if the independent pricing service provider is unable to provide a valuation factor or if the valuation factor falls below a predetermined threshold; in such case, the security is determined to be a Level 1 investment.
Long-term debt and other fixed-income securities are valued at the last quoted or evaluated bid price on the valuation date provided by an independent pricing service provider approved by the Board of Trustees of the Trust (the “Board”). If there are no current day bids, the security is valued at the previously applied bid. Pricing services generally price debt securities assuming orderly transactions of an institutional “round lot” size, and the strategies employed by the Adviser generally trade in round lot sizes. In certain circumstances, fixed income securities may be held or transactions may be conducted in smaller, “odd lot” sizes. Odd lots may trade at lower or, occasionally, higher prices than institutional round lot trades. Short-term debt securities (such as commercial paper and U.S. treasury bills) having a remaining maturity of 60 days or less are valued at the last quoted or evaluated bid price on the valuation date provided by an independent pricing service, or on the basis of amortized cost if it represents the best approximation for fair value. Debt and other fixed-income securities are generally determined to be Level 2 investments.
Short-term investments are comprised of cash and cash equivalents invested in short-term investment funds which are redeemable daily. The Funds sweep available cash into the State Street Institutional U.S. Government Money Market Fund, a “government money market fund” pursuant to Rule 2a-7 under the 1940 Act, which has an objective to maintain a $1.00 NAV, which is not guaranteed. Registered investment companies are valued at their net asset value as reported by such company. Generally, these investment types are categorized as Level 1 investments.
Derivative instruments are generally valued according to the following procedures. Exchange traded derivatives are generally Level 1 investments and over-the-counter derivatives are generally Level 2 investments. Forward currency exchange contracts are generally valued based on the current spot exchange rates and the forward exchange rate points (ex. 1-month, 3-month) that are obtained from an approved pricing agent. Based on the actual settlement dates of the forward contracts held, an interpolated value of the forward points is combined with the spot exchange rate to derive the valuation. Futures contracts are generally valued at the most recent settlement price as of NAV determination. Swap agreements are generally valued by an approved pricing agent based on the terms of the swap agreement (including future cash flows). When market quotations or exchange rates are not readily available, or if the Adviser concludes that such market quotations do not accurately reflect fair value, the fair value of a Fund’s assets are determined in good faith in accordance with the Valuation Procedures.
In the event that a security’s market quotations are not readily available or are deemed unreliable (for reasons other than because the foreign exchange on which it trades closed before the Valuation Time (as defined below)), the security is valued at fair value as determined by the Funds’ Pricing Committee (the “Pricing Committee”), taking into account the relevant factors and surrounding circumstances using Valuation and Liquidity Procedures approved by the Board. Under normal circumstances, the Valuation Time is as of the close of regular trading on the New York Stock Exchange (usually 4:00 p.m. Eastern Time). A security that has been fair valued by the Pricing Committee may be classified as Level 2 or Level 3 depending on the nature of the inputs.
The three-level hierarchy of inputs is summarized below:
| • | Level 1- quoted prices in active markets for identical investments; |
| • | Level 2- other significant observable inputs (including quoted prices for similar securities, interest rates, prepayment speeds, and credit risk); or |
| • | Level 3- significant unobservable inputs (including a Fund’s own assumptions in determining the fair value of investments). |
| 2018 Annual Report | 53 |
Notes to Financial Statements (continued)
October 31, 2018
A summary of standard inputs is listed below:
| Security Type | Standard Inputs | |
Foreign equities utilizing a fair value factor | Depositary receipts, indices, futures, sector indices/ETFs, exchange rates, and local exchange opening and closing prices of each security. | |
Debt and other fixed-income securities | Reported trade data, broker-dealer price quotations, benchmark yields, issuer spreads on comparable securities, credit quality, yield, and maturity. | |
Forward foreign currency contracts | Forward exchange rate quotations. | |
Swap agreements | Market information pertaining to the underlying reference assets, i.e., credit spreads, credit event probabilities, fair values, forward rates, and volatility measures. |
The following is a summary of the inputs used as of October 31, 2018 in valuing the Funds’ investments and other financial instruments at fair value. The inputs or methodology used for valuing securities are not necessarily an indication of the risk associated with investing in those securities.
Please refer to the Statements of Investments for a detailed breakout of the security types:
| LEVEL 1–Quoted Prices ($) | LEVEL 2–Other Significant Observable Inputs ($) | LEVEL 3–Significant Unobservable Inputs ($) | Total ($) | |||||||||||||
| Select International Equity Fund | ||||||||||||||||
| Investments in Securities | ||||||||||||||||
Common Stocks | 22,772,230 | 121,574,812 | – | (1) | 144,347,042 | |||||||||||
Government Bonds | – | – | – | (1) | – | |||||||||||
Preferred Stocks | 4,309,476 | 8,934,536 | – | 13,244,012 | ||||||||||||
Short-Term Investment | 451,376 | – | – | 451,376 | ||||||||||||
|
|
|
|
|
|
|
| |||||||||
| 27,533,082 | 130,509,348 | – | 158,042,430 | |||||||||||||
|
|
|
|
|
|
|
| |||||||||
| 1 | Represents a security that is fair valued at zero pursuant to procedures approved by the Fund’s Board of Trustees. |
| Investments, at Value | Level 1 | Level 2 | Level 3 | Total | ||||||||||||
| Select International Equity Fund II | ||||||||||||||||
| Investments in Securities | ||||||||||||||||
Common Stocks | 9,394,605 | 50,478,916 | – | 59,873,521 | ||||||||||||
Preferred Stocks | 1,780,624 | 3,792,798 | – | 5,573,422 | ||||||||||||
Short-Term Investment | 332,172 | – | – | 332,172 | ||||||||||||
|
|
|
|
|
|
|
| |||||||||
| 11,507,401 | 54,271,714 | – | 65,779,115 | |||||||||||||
|
|
|
|
|
|
|
| |||||||||
| Investments, at Value | Level 1 | Level 2 | Level 3 | Total | ||||||||||||
| Total Return Bond Fund | ||||||||||||||||
| Investments in Securities | ||||||||||||||||
Asset-Backed Securities | – | 21,486,206 | – | 21,486,206 | ||||||||||||
Commercial Mortgage-Backed Securities | – | 17,952,717 | – | 17,952,717 | ||||||||||||
Non-Agency Mortgage-Backed Securities | – | 25,388,305 | – | 25,388,305 | ||||||||||||
Corporate Bonds | – | 43,875,529 | – | 43,875,529 | ||||||||||||
Municipal Bonds | – | 7,980,318 | – | 7,980,318 | ||||||||||||
Government Bonds | – | 21,700,902 | – | 21,700,902 | ||||||||||||
U.S. Agencies | – | 8,328,442 | – | 8,328,442 | ||||||||||||
U.S. Treasuries | – | 18,111,173 | – | 18,111,173 | ||||||||||||
Agency Mortgage-Backed Securities | – | 41,681,348 | – | 41,681,348 | ||||||||||||
Short-Term Investment | 1,546,053 | – | – | 1,546,053 | ||||||||||||
| 54 | Annual Report 2018 |
Notes to Financial Statements (continued)
October 31, 2018
| Investments, at Value | Level 1 | Level 2 | Level 3 | Total | ||||||||||||
| Total Return Bond Fund (continued) | ||||||||||||||||
| Other Financial Instruments | ||||||||||||||||
| Assets | ||||||||||||||||
Futures Contracts | 250,890 | – | – | 250,890 | ||||||||||||
Forward Foreign Currency Exchange Contracts | – | 759,849 | – | 759,849 | ||||||||||||
| Liabilities | ||||||||||||||||
Futures Contracts | (420,894 | ) | – | – | (420,894 | ) | ||||||||||
Forward Foreign Currency Exchange Contracts | – | (1,223,057 | ) | – | (1,223,057 | ) | ||||||||||
|
|
|
|
|
|
|
| |||||||||
| 1,376,049 | 206,041,732 | – | 207,417,781 | |||||||||||||
|
|
|
|
|
|
|
| |||||||||
| Investments, at Value | Level 1 | Level 2 | Level 3 | Total | ||||||||||||
| Global High Income Fund | ||||||||||||||||
| Investments in Securities | ||||||||||||||||
Corporate Bonds | – | 207,993,767 | – | (1) | 207,993,767 | |||||||||||
Bank Loans | – | 6,637,092 | – | 6,637,092 | ||||||||||||
Common Stocks | – | – | 500,207 | 500,207 | ||||||||||||
| Other Financial Instruments | ||||||||||||||||
| Assets | ||||||||||||||||
Forward Foreign Currency Exchange Contracts | – | 1,530,634 | – | 1,530,634 | ||||||||||||
| Liabilities | ||||||||||||||||
Forward Foreign Currency Exchange Contracts | – | (65,123 | ) | – | (65,123 | ) | ||||||||||
|
|
|
|
|
|
|
| |||||||||
| – | 216,096,370 | 500,207 | 216,596,577 | |||||||||||||
|
|
|
|
|
|
|
| |||||||||
| 1 | Represents a security that is fair valued at zero pursuant to procedures approved by the Fund’s Board of Trustees. |
Amounts listed as “–” are $0 or round to $0.
| Global High Income Fund Rollforward of Level 3 Fair Value Measurement For the Period Ended October 31, 2018 | ||||||||||||||||||||||||||||||||||||||||
| Investments in Securities | Balance as of October 31, 2017 | Accrued Discounts (Premiums) | Realized Gain (Loss) | Change in Unrealized Appreciation (Depreciation) | Net Purchases | Net Sales | Net Transfers in to Level 3 | Net Transfers out of Level 3 | Balance as of October 31, 2018 | Change in Unrealized Appreciation (Depreciation) from Investments Held at October 31, 2018 | ||||||||||||||||||||||||||||||
Bank Loans | ||||||||||||||||||||||||||||||||||||||||
Italy | $ | 2,940,129 | $ | 3,250 | $ | (408,222 | ) | $ | 454,621 | $ | – | (2,989,778 | ) | $ | – | $ | – | $ | – | $ | – | |||||||||||||||||||
Common Stocks | ||||||||||||||||||||||||||||||||||||||||
United Kingdom | – | – | – | (360,159 | ) | 585,587 | – | – | – | 225,428 | (360,159 | ) | ||||||||||||||||||||||||||||
United States | – | – | (241,442 | ) | (209,303 | ) | – | (793,856 | ) | 1,519,380 | – | 274,779 | (209,303 | ) | ||||||||||||||||||||||||||
Corporate Bonds | ||||||||||||||||||||||||||||||||||||||||
United States | – | – | – | – | – | – | – | – | – | – | ||||||||||||||||||||||||||||||
TOTAL | $ | 2,940,129 | $ | 3,250 | $ | (649,664 | ) | $ | (114,841 | ) | $ | 585,587 | $ | (3,783,634 | ) | $ | 1,519,380 | $ | – | $ | 500,207 | $ | (569,462 | ) | ||||||||||||||||
The following is quantitative information about Level 3 fair value measurements:
| Description | Fair Value at 10/31/18 ($) | Valuation Technique(s) | Unobservable Inputs | Range | Weighted Average | |||||||||||||||
Global High Income Fund | ||||||||||||||||||||
Common Stock | $ | 225,428 | Broker Pricing | Bid/Ask Spread | $ | 2.56 | $ | 2.56 | ||||||||||||
Common Stock | 274,779 | Broker Pricing | Bid/Ask Spread | 28.02 | 28.02 | |||||||||||||||
| 2018 Annual Report | 55 |
Notes to Financial Statements (continued)
October 31, 2018
Broker Pricing: Includes indicative broker quotes that cannot be corroborated by observable market data.
| b. | Restricted Securities |
Restricted securities are privately-placed securities whose resale is restricted under U.S. securities laws. The Funds may invest in restricted securities, including unregistered securities eligible for resale without registration pursuant to Rule 144A and privately-placed securities of U.S. and non-U.S. issuers offered outside the U.S. without registration pursuant to Regulation S under the Securities Act of 1933, as amended. Rule 144A securities may be freely traded among certain qualified institutional investors, such as the Funds, but resale of such securities in the U.S. is permitted only in limited circumstances.
| c. | Foreign Currency Translation |
Foreign securities, currencies, and other assets and liabilities denominated in foreign currencies are translated into U.S. Dollars at the exchange rate of said currencies against the U.S. Dollar, as of the Valuation Time, as provided by an independent pricing service. Purchases and sales of securities, and income and expenses are translated at the prevailing rate of exchange on the respective date of these transactions. The Funds do not isolate that portion of the results of operations resulting from changes in foreign exchange rates on investments from fluctuations arising from changes in market prices of securities held. These fluctuations are included with the net realized and unrealized gain or loss from investments within the Statements of Operations.
Investments in emerging markets can be riskier and more volatile than investments in the United States and other developed markets. Adverse political and economic developments can make it more difficult for the Select International Equity Fund and Select International Equity Fund II to sell foreign securities which could reduce the NAV of the Funds. In contrast to more established markets, emerging markets may have governments that are less stable and markets that are less liquid, increasing your investment risk. At October 31, 2018, the Select International Equity Fund held Venezuelan securities and held Venezuelan Bolivar. Venezuela currently imposes foreign exchange controls which prohibit the Select International Equity Fund from repatriating dividends, interest, or other income from investments or proceeds from the sale of Venezuelan securities. The Venezuelan securities and Venezuelan Bolivar have been fair valued at $0.
| d. | Derivative Financial Instruments |
Certain Funds are authorized to use derivatives to manage currency risk, credit risk, and interest rate risk and to replicate, or use as a substitute for, physical securities. Losses may arise due to changes in the value of the contract or if the counterparty does not perform under the contract. The use of derivative instruments involves, to varying degrees, elements of market risk in excess of the amount recognized in the Statements of Assets and Liabilities.
Forward Foreign Currency Exchange Contracts
A forward foreign currency exchange contract (“forward contract”) involves an obligation to purchase and sell a specific currency at a future date, which may be any fixed number of days from the date of the contract agreed upon by the parties, at a price set at the time of the contract. Forward contracts are used to manage a Fund’s currency exposure in an efficient manner. They are used to sell unwanted currency exposure that comes with holding securities in a market, or to buy currency exposure where the exposure from holding securities is insufficient to give the desired currency exposure either in absolute terms or relative to the benchmark. The use of forward contracts allows the separation of decision-making between markets and their currencies. The forward contract is marked-to-market daily and the change in market value is recorded by a Fund as unrealized appreciation/(depreciation). Forward contracts’ prices are received daily from an independent pricing provider. When the forward contract is closed, a Fund records a realized gain or loss equal to the difference between the value at the time it was opened and the value at the time it was closed. These realized and unrealized gains and losses are reported on the Statements of Operations. During the fiscal year ended October 31, 2018, the Funds used forward contracts to hedge some of the Funds’ foreign currency holdings. Managing active currency risk involves both hedging currency risk and adding currency risk in excess of underlying bond positions. A Fund may also enter into forward contracts to obtain potential appreciation of a foreign currency, which also adds currency risk.
Futures Contracts
Certain Funds may invest in financial futures contracts (“futures contracts”) for the purpose of hedging their existing portfolio securities, or securities that a Fund intends to purchase, against fluctuations in value caused by changes in prevailing market interest rates or prices. Futures contracts may also be entered into for non-hedging purposes; however, in those instances, the aggregate initial margin and premiums required to establish a Fund’s positions may not exceed 5% of a Fund’s NAV after taking into account unrealized profits and unrealized losses on any such contract into which it has entered.
Upon entering into a futures contract, a Fund is required to pledge to the broker an amount of cash and/or other assets equal to a certain percentage of the contract amount. This payment is known as “initial margin”. Subsequent payments, known as “variation margin,” are calculated each day, depending on the daily fluctuations in the fair value/market value of the underlying assets. An unrealized gain/(loss)
| 56 | Annual Report 2018 |
Notes to Financial Statements (continued)
October 31, 2018
equal to the variation margin is recognized on a daily basis. When the contract expires or is closed, the gain/(loss) is realized and is presented in the Statements of Operations as a net realized gain/(loss) on futures contracts. Futures contracts are valued daily at their last quoted sale price on the exchange on which they are traded.
A “sale” of a futures contract means a contractual obligation to deliver the securities or foreign currency called for by the contract at a fixed price at a specified time in the future. A “purchase” of a futures contract means a contractual obligation to acquire the securities or foreign currency at a fixed price at a specified time in the future.
Should market conditions change unexpectedly, a Fund may not achieve the anticipated benefits of the futures contracts and may realize a loss. The use of futures transactions for hedging purposes involves the risk of imperfect correlation in movements in the price of futures contracts, interest rates and the value/market value of the underlying hedged assets. During the fiscal year ended October 31, 2018, U.S. Treasury futures contracts were used to manage Total Return Bond Fund’s overall curve and interest rate exposure.
Options
Options are instruments that provide a right to buy (call) or sell (put) a particular security or an index of securities at a fixed price within a certain time period. Options differ from forward and futures contracts in that the buyer of the option has no obligation to perform under the contract. An option is out-of-the money if the exercise price of the option is above, in the case of a call option, or below, in the case of a put option, the current price (or interest rate or yield for certain options) of the referenced security or instrument. Use of put and call options may result in losses to a Fund, force the sale or purchase of portfolio securities at inopportune times or for prices higher than (in the case of put options) or lower than (in the case of call options) current market values, limit the amount of appreciation a Fund can realize on its investments or cause a Fund to hold a security it might otherwise sell. The Funds did not hold options as of October 31, 2018.
Swaps
The Total Return Bond Fund enters into interest rate swaps to manage interest-rate exposure. The Global High Income Fund uses credit default swaps to gain, or hedge, exposure to specific companies. A swap is an agreement that obligates two parties to exchange a series of cash flows and/or meet certain obligations at specified intervals based upon or calculated by reference to changes in specified prices or rates (interest rates in the case of interest rate swaps, currency exchange rates in the case of currency swaps) or the occurrence of a credit event with respect to an underlying reference obligation (in the case of a credit default swap) for a specified amount of an underlying asset or notional principal amount. A Fund will enter into swaps only on a net basis, which means that the two payment streams are netted out, with a Fund receiving or paying, as the case may be, only the amount of the difference between the two payments. Except for currency swaps and credit default swaps, the notional principal amount is used solely to calculate the payment streams but is not exchanged. With respect to currency swaps, actual principal amounts of currencies may be exchanged by the counterparties at the initiation, and again upon the termination of the transaction.
Traditionally, swaps were customized, privately negotiated agreements executed between two parties (“OTC Swaps”) but since 2013, certain swaps are required to be cleared pursuant to rules and regulations related to the Dodd–Frank Wall Street Reform and Consumer Protection Act (“Dodd Frank”) and/or Regulation (EU) No 648/2012 on OTC Derivatives, Central Counterparties and Trade Repositories (“EMIR”) (“Cleared Swaps”). Like OTC Swaps, Cleared Swaps are negotiated bilaterally. Unlike OTC Swaps, the act of clearing results in two swaps executed between each of the parties and a central counterparty (“CCP”), and thus the counterparty credit exposure of the parties is to the CCP rather than to one another. Upon entering into a Cleared Swap, a Fund is required to pledge an amount of cash and/or other assets equal to a certain percentage of the contract amount. This payment is known as “initial margin”. Subsequent payments, known as “variation margin,” are calculated each day, depending on the daily fluctuations in the fair value/market value of the underlying assets. An unrealized gain/(loss) equal to the variation margin is recognized on a daily basis. When the contract matures or is terminated, the gain or loss is realized and is presented in the Statements of Operations as a net realized gain or loss on swap contracts. As of March 2017, a Fund may be required to provide variation and/or initial margin for OTC Swaps pursuant to further rules and regulations related to Dodd Frank and EMIR. The margin requirements associated with OTC Swaps and Cleared Swaps may not be the same.
Entering into swap agreements involves, to varying degrees, elements of credit, market and interest rate risk in excess of the amounts reported on the Statement of Assets and Liabilities. Such risks involve the possibility that there will be no liquid market for these agreements, that the counterparty to the agreements may default on its obligation to perform and that there may be unfavorable changes in the value of the index or securities underlying the agreement. The Funds’ maximum risk of loss from counterparty risk related to swaps is the fair value of the contract. This risk is mitigated by the posting of collateral by the counterparties to the Funds to cover the Funds’ exposure to the counterparty.
Interest Rate Swaps
A Fund uses interest rate swap contracts to manage its exposure to interest rates. Interest rate swap contracts typically represent the exchange between a Fund and a counterparty of respective commitments to make variable rate and fixed rate payments with respect to a notional
| 2018 Annual Report | 57 |
Notes to Financial Statements (continued)
October 31, 2018
amount of principal. Interest rate swap contracts may have a term that is greater than one year, but typically require periodic interim settlement in cash, at which time the specified value of the variable interest rate is reset for the next settlement period. Net payments of interest are recorded as realized gains or losses. During the period that the swap contract is open, the contract is marked-to-market as the net amount due to or from a Fund and changes in the value of swap contracts are recorded as unrealized gains or losses.
Credit Default Swaps
A credit default swap is an agreement whereby one party, the buyer, is obligated to pay the other party, the seller, a periodic stream of payments over the term of the contract in return for a contingent payment upon the occurrence of a credit event with respect to an underlying reference obligation. A Fund might use credit default swap contracts to limit or to reduce risk exposure of the Fund to defaults of corporate and sovereign issues (i.e., to reduce risk when the Fund owns or has exposure to such issuers). A Fund also might use credit default swap contracts to create direct or synthetic short or long exposure to domestic or foreign corporate debt securities or certain sovereign debt securities to which the Fund is not otherwise exposed.
Summary of Derivative Instruments
Certain Funds may use derivatives for various purposes as noted above. The following is a summary of the location of fair value amounts of derivatives, not accounted for as hedging instruments, as of October 31, 2018:
| Location on the Statement of Assets and Liabilities | ||||
| Derivative Instrument Risk Type | Asset Derivatives | Liability Derivatives | ||
Interest Rate Risk | Variation margin receivable for futures contracts | Variation margin payable for futures contracts | ||
Foreign Exchange Risk | Unrealized appreciation on forward foreign currency exchange contracts | Unrealized depreciation on forward foreign currency exchange contracts | ||
The following is a summary of the fair value of derivative instruments, not accounted for as hedging instruments, as of October 31, 2018:
| Total Return Bond Fund | Asset Derivatives | Liability Derivatives | ||||||||||
| Derivatives not accounted for as hedging instruments and risk exposure | Statement of Assets and Liabilities Location | Fair Value | Statement of Assets and Liabilities Location | Fair Value | ||||||||
| Forward foreign exchange contracts | ||||||||||||
(foreign exchange risk) | Unrealized appreciation on forward currency exchange contracts | $ | 759,849 | Unrealized depreciation on forward currency exchange contracts | $ | 1,223,057 | ||||||
| Futures contracts | ||||||||||||
(interest rate risk) | Variation margin receivable for futures contracts | $ | 250,890 | Variation margin payable for futures contracts | $ | 420,894 | ||||||
Total | $ | 1,010,740 | $ | 1,643,952 | ||||||||
| Global High Income Fund | Asset Derivatives | Liability Derivatives | ||||||||||
| Derivatives not accounted for as hedging instruments and risk exposure | Statement of Assets and Liabilities Location | Fair Value | Statement of Assets and Liabilities Location | Fair Value | ||||||||
| Forward foreign exchange contracts | ||||||||||||
(foreign exchange risk) | Unrealized appreciation on forward currency exchange contracts | $ | 1,530,634 | Unrealized depreciation on forward currency exchange contracts | $ | 65,123 | ||||||
Total | $ | 1,530,634 | $ | 65,123 | ||||||||
| 58 | Annual Report 2018 |
Notes to Financial Statements (continued)
October 31, 2018
A reconciliation of the gross amounts on the Statements of Assets and Liabilities as of October 31, 2018 to the net amounts by broker and derivative type, including any collateral received or pledged, is included in the following tables:
| Gross Amounts Not Offset in Statement of Assets & Liabilities | Gross Amounts Not Offset in Statement of Assets and Liabilities | |||||||||||||||||||||||||||||||
| Description | Gross Amounts of Assets Presented in Statement of Financial Position | Financial Instruments | Collateral Received (1) | Net Amount (3) | Gross Amounts of Liabilities Presented in Statement of Financial Position | Financial Instruments | Collateral Pledged (1) | Net Amount (3) | ||||||||||||||||||||||||
| Assets | Liabilities | |||||||||||||||||||||||||||||||
| Total Return Bond Fund |
| |||||||||||||||||||||||||||||||
Forward foreign currency exchange contracts (2) | ||||||||||||||||||||||||||||||||
Barclays Bank | $ | – | $ | – | $ | – | $ | – | $ | 425,638 | $ | – | $ | – | $ | 425,638 | ||||||||||||||||
Citibank | 312,714 | (312,714 | ) | – | – | 647,609 | (312,714 | ) | – | 334,895 | ||||||||||||||||||||||
Goldman Sachs | 216,418 | – | – | 216,418 | – | – | – | – | ||||||||||||||||||||||||
HSBC Bank | 60,320 | (20,975 | ) | – | 39,345 | 20,975 | (20,975 | ) | – | – | ||||||||||||||||||||||
JPMorgan Chase Bank | 6,856 | – | – | 6,856 | – | – | – | – | ||||||||||||||||||||||||
Royal Bank of Canada | 30,675 | (30,675 | ) | – | – | 94,637 | (30,675 | ) | – | 63,962 | ||||||||||||||||||||||
UBS | – | – | – | – | 34,198 | – | – | 34,198 | ||||||||||||||||||||||||
Westpac Banking Corp. | 132,866 | – | – | 132,866 | – | – | – | – | ||||||||||||||||||||||||
| 1. | In some instances, the actual collateral received and/or pledged may be more than the amount shown here due to overcollateralization. |
| 2. | Includes financial instruments which are not subject to a master netting arrangement across funds, or another similar arrangement. |
| 3. | Net amounts represent the net receivables/(payable) that would be due from/to the counterparty in the event of default. Exposure from financial derivative instruments can only be netted across transactions governed under the same master netting agreement with the same legal entity. |
| Gross Amounts Not Offset in Statement of Assets & Liabilities | Gross Amounts Not Offset in Statement of Assets and Liabilities | |||||||||||||||||||||||||||||||
| Description | Gross Amounts of Assets Presented in Statement of Financial Position | Financial Instruments | Collateral Received (1) | Net Amount (3) | Gross Amounts of Liabilities Presented in Statement of Financial Position | Financial Instruments | Collateral Pledged (1) | Net Amount (3) | ||||||||||||||||||||||||
| Assets | Liabilities | |||||||||||||||||||||||||||||||
| Global High Income Fund |
| |||||||||||||||||||||||||||||||
Forward foreign currency exchange contracts (2) | ||||||||||||||||||||||||||||||||
Barclays Bank | $ | – | $ | – | $ | – | $ | – | $ | 548 | $ | – | $ | – | $ | 548 | ||||||||||||||||
Citibank | 423,575 | (41,784 | ) | – | 381,791 | 41,784 | (41,784 | ) | – | – | ||||||||||||||||||||||
Goldman Sachs | – | – | – | – | 11,122 | – | – | 11,122 | ||||||||||||||||||||||||
HSBC Bank | 1,106,900 | (5,759 | ) | – | 1,101,141 | 5,759 | (5,759 | ) | – | – | ||||||||||||||||||||||
JPMorgan Chase Bank | – | – | – | – | 3,992 | – | – | 3,992 | ||||||||||||||||||||||||
Royal Bank of Canada | – | – | – | – | 1,918 | – | – | 1,918 | ||||||||||||||||||||||||
Westpac Banking Corp. | 159 | – | – | 159 | – | – | – | – | ||||||||||||||||||||||||
| 1. | In some instances, the actual collateral received and/or pledged may be more than the amount shown here due to overcollateralization. |
| 2. | Includes financial instruments which are not subject to a master netting arrangement across funds, or another similar arrangement. |
| 3. | Net amounts represent the net receivables/(payable) that would be due from/to the counterparty in the event of default. Exposure from financial derivative instruments can only be netted across transactions governed under the same master netting agreement with the same legal entity. |
| 2018 Annual Report | 59 |
Notes to Financial Statements (continued)
October 31, 2018
The effect of derivative instruments on the Statement of Operations for the fiscal year ended October 31, 2018:
| Aberdeen Total Return Bond Fund | Location of Gain or (Loss) on Derivatives | Realized Gain or (Loss) on Derivatives | Change in Unrealized Appreciation/ (Depreciation) on Derivatives | |||||||
| Realized/Unrealized Gain/(Loss) from Investments, Futures Contracts, Written Options, Forward Foreign Currency Exchange Contracts and Foreign Currency Transactions | ||||||||||
| Forward foreign exchange contracts | ||||||||||
(foreign exchange risk) | $ | 1,204,946 | $ | (1,800,814 | ) | |||||
| Futures contracts | ||||||||||
(interest rate risk) | $ | (614,173 | ) | $ | (206,260 | ) | ||||
| Written Options | (15,768 | ) | – | |||||||
Total | $ | 575,005 | $ | (2,007,074 | ) | |||||
| Aberdeen Global High Income Fund | Location of Gain or (Loss) on Derivatives | Realized Gain or (Loss) on Derivatives | Change in Unrealized Appreciation/ (Depreciation) on Derivatives | |||||||
| Realized/Unrealized Gain/(Loss) from Investments, Swap Contracts, Forward Foreign Currency Exchange Contracts and Foreign Currency Transactions | ||||||||||
| Credit default swaps | ||||||||||
(credit risk) | $ | (345 | ) | $ | – | |||||
| Forward foreign exchange contracts | ||||||||||
(foreign exchange risk) | $ | 541,490 | $ | 1,867,631 | ||||||
Total | $ | 541,145 | $ | 1,867,631 | ||||||
Information about derivatives reflected as of the date of this report is generally indicative of the type of activity for the fiscal year ended October 31, 2018. The table below summarizes the weighted average values of derivatives holdings by the Funds during the fiscal year ended October 31, 2018.
| Fund | Purchase Forward Foreign Currency Contracts (Average Notional Value) | Sale Forward Foreign Currency Contracts (Average Notional Value) | Long Futures Contracts (Average Notional Value) | Short Futures Contracts (Average Notional Value) | Credit Default Swaps (Average Notional Value) | Written Option Contracts (Average Notional Value) | ||||||||||||||||||
Total Return Bond Fund | $ | 106,059,778 | $ | 108,025,859 | $ | 52,632,210 | $ | 18,844,701 | – | ** | ||||||||||||||
Global High Income Fund | 15,595,761 | 83,575,110 | – | – | * | – | ||||||||||||||||||
| * | The Fund did not hold credit default swaps for a significant period of time during the fiscal year ended October 31, 2018. |
| ** | The Fund did not hold written options for a significant period of time during the fiscal year ended October 31, 2018. |
The Funds value derivatives at fair value, as described in the results of operations. Accordingly, the Funds do not follow hedge accounting even for derivatives employed as economic hedges.
| 60 | Annual Report 2018 |
Notes to Financial Statements (continued)
October 31, 2018
| e. | Bank Loans |
Global High Income Fund may invest in bank loans. Bank loans include floating and fixed-rate debt obligations. Floating rate loans are debt obligations issued by companies or other entities with floating interest rates that reset periodically. Bank loans may include, but are not limited to, term loans, delayed funding loans, bridge loans and revolving credit facilities. Loan interest will primarily take the form of assignments purchased in the primary or secondary market but may include participants. Floating rate loans are secured by specific collateral of the borrower and are senior to most other securities of the borrower (e.g., common stock or debt instruments) in the event of bankruptcy. Floating rate loans are often issued in connection with recapitalizations, acquisitions, leveraged buyouts, and refinancings. Floating rate loans are typically structured and administered by a financial institution that acts as the agent of the lenders participating in the floating rate loan. Floating rate loans may be acquired directly through the agent, as an assignment from another lender who holds a direct interest in the floating rate loan, or as a participation interest in another lender’s portion of the floating rate loan.
Global High Income Fund may enter into, or acquire participation in, delayed funding loans and revolving credit facilities. Delayed funding loans and revolving credit facilities are borrowings in which the Global High Income Fund agrees to make loans up to a maximum amount upon demand by the borrowing issuer for a specified term. A revolving credit facility differs from a delayed funding loan in that as the borrowing issuer repays the loan, an amount equal to the repayment is again made available to the borrowing issuer under the facility. The borrowing issuer may at any time borrow and repay amounts so long as, in the aggregate, at any given time the amount borrowed does not exceed the maximum amount established by the loan agreement. Delayed funding loans and revolving credit facilities usually provide for floating or variable rates of interest.
There are a number of risks associated with an investment in bank loans including credit risk, interest rate risk, illiquid securities risk, and prepayment risk. There is also the possibility that the collateral securing a loan, if any, may be difficult to liquidate or be insufficient to cover the amount owed under the loan. These risks could cause a Fund to lose income or principal on a particular investment, which in turn could affect the return. In addition, bank loans may settle on a delayed basis, resulting in the proceeds from the sale of such loans not being readily available to make additional investments or to meet a Fund’s redemption obligations. To the extent the extended settlement process gives rise to short-term liquidity needs, a Fund may hold additional cash, sell investments or temporarily borrow from banks or other lenders.
| f. | Security Transactions, Investment Income and Expenses |
Security transactions are recorded on the trade date. Realized and unrealized gains/(losses) from security and currency transactions are calculated on the identified cost basis. Dividend income is recorded on the ex-dividend date except for certain dividends on foreign securities, which are recorded as soon as a Fund is informed after the ex-dividend date. Interest income is recorded on an accrual basis using the effective interest method. Expenses are recorded on an accrual basis. Expenses directly attributable to a Fund are charged to that Fund. Expenses not directly attributable to a Fund are allocated proportionately among all Funds of the Trust. For each of the Funds, the method for allocating income, fund level expenses, and realized and unrealized gains or losses among classes is based on the total net asset value of each class’s shares in proportion to the total net assets of the relevant Fund. Expenses specific to a class (such as Rule 12b-1 and Transfer Agent fees) are charged to that class.
| g. | Foreign Taxes |
Funds that invest in foreign securities are subject to foreign taxes that may be imposed by certain countries in which the Funds invest. The Funds generally record foreign taxes based on applicable foreign tax law. The Funds incur withholding taxes on certain foreign dividends and interest, and those taxes are accrued at the time the associated income is recorded. The Funds file withholding tax reclaims in certain jurisdictions to recover a portion of amounts previously withheld. The Funds record a reclaim receivable based on, among other things, a jurisdiction’s legal obligation to pay reclaims as well as payment history and market convention.
The Select International Equity Fund and Select International Equity Fund II (collectively, the “International Equity Funds”) have received payments for Article 63 EU Tax Reclaims related to prior years (2005-2015). The Article 63 EU Tax Reclaim payments received by the International Equity Funds from certain EU countries as of the date of this report significantly increased the Select International Equity Fund’s performance from December 16, 2016 and the Select International Equity Fund II’s performance from February 1, 2017. Without these payments, each International Equity Fund’s performance would have been lower during this period. In the tax years for which the International Equity Funds filed Article 63 EU Tax Reclaims, certain shareholders were able to reduce their federal income taxes based upon the amount of taxes that these Funds paid to foreign jurisdictions. The receipt by the International Equity Funds of the tax reclaims from these jurisdictions will also result in tax liability to the relevant Fund to offset the tax benefits that shareholders received in the past, the precise amount of the tax is uncertain and subject to settlement negotiations with the U.S. Internal Revenue Service (“U.S. IRS”). Based on information available as of the date of this report, an estimated tax amount has been accrued and is reflected within each International Equity Fund’s net asset value and performance. Furthermore, upon final determination of the U.S. IRS, if the actual tax payable is greater than the amount currently accrued, and subject to the level of assets under management at the time of any subsequent adjustments, the relevant International Equity Fund’s expenses, net asset value and performance may be materially adversely impacted. On November 20,
| 2018 Annual Report | 61 |
Notes to Financial Statements (continued)
October 31, 2018
2017, based on information obtained during informal discussions with the U.S. IRS, the estimated tax amount accrued within the International Equity Funds was adjusted, resulting in an impact of -0.86% and -0.42%, respectively, to net assets of Select International Equity Fund and Select International Equity Fund II. The precise amount of the tax remains uncertain as the matter remains unsettled with the U.S. IRS.
The International Equity Funds have Article 63 EU Tax Reclaims outstanding related to prior years (2005-2015). Consistent with U.S. GAAP accrual requirements, the International Equity Funds have recognized the Article 63 EU Tax Reclaims when a payment has been received, and have not recorded a receivable amount for any outstanding Article 63 EU Tax Reclaims because there is limited historical precedent for U.S. funds collecting reclaims of this magnitude and the total amount of the reclaims that these funds may receive in the future is uncertain. Any additional amounts to which the International Equity Funds may be entitled, if and when recorded, likely would result in an increase in the net asset value per share of each fund at that time. In addition, Article 63 EU Tax Reclaims amounts received will be subject to tax. The U.S. IRS has not yet determined the amount of taxes that the International Equity Funds must pay on these amounts. For tax accounting purposes, interest payments received on these payments (if any) are treated as income and will be distributed in due course. Additionally, fluctuations in the value of foreign currencies may affect an International Equity Fund’s tax liability, because the U.S. IRS may require the Fund to pay any taxes owed on interest payments on Article 63 EU Tax Reclaims amounts in U.S. Dollars based on the foreign currency exchange rate with the applicable jurisdiction that was in effect at the time the Article 63 EU Tax Reclaims amounts were received by the Fund. As of October 31, 2018, the total amount of outstanding reclaims filed by the International Equity Funds in the countries that may be affected by the European courts’ decisions (namely, The Netherlands, Spain, Germany, France, and Sweden) represents approximately 7.1% and 11.2%, respectively, of net assets of Select International Equity Fund and Select International Equity Fund II before the impact of interest or any tax or additional costs incurred in the pursuit of such reclaims. These amounts net of estimated taxes (but excluding the impact of interest or tax on such interest) represent 4.1% and 6.4%, respectively, of net assets of Select International Equity Fund and Select International Equity Fund II. These percentages will change depending on the fluctuations of the net assets of the Funds. Receipt by a Fund of these amounts will make the Fund’s performance seem higher than it would be as a result of the performance of its portfolio investments.
The payments received on tax reclaims within the year ended October 31, 2018 and from prior periods were as follows:
| Amount | Percent of Total Net Assets | Received Date Range | ||||||||||
| Select International Equity Fund | ||||||||||||
| Withholding Tax Refunds Received from Country: | ||||||||||||
Finland | $ | 1,355,000 | 0.35% | * | 5/21/2015 | |||||||
Poland | 16,452,314 | 7.74% | ** | 12/16/16-2/24/17 | ||||||||
| Select International Equity Fund II | ||||||||||||
| Withholding Tax Refunds Received from Country: | ||||||||||||
Finland | $ | 500,000 | 0.25% | * | 5/21/2015 | |||||||
Poland | 4,400,193 | 4.68% | ** | 2/1/2017-2/24/17 | ||||||||
Poland | 380,000 | 0.59% | *** | 8/22/2018 | ||||||||
| * | As of October 31, 2015 |
| ** | As of October 31, 2017 |
| *** | As of October 31, 2018 |
| h. | Distributions |
Distributions from net investment income, if any, are declared and paid monthly for the Total Return Bond Fund and Global High Income Fund. Distributions from net investment income, if any, are declared and paid annually for the Select International Equity Fund and Select International Equity Fund II. The Funds will also declare and pay distributions annually from net realized gains on investment transactions and net realized foreign exchange gains, if any. Dividends and distributions to shareholders are recorded on the ex-dividend date. Additional distributions of net investment income and capital gains may be made at the discretion of the Board to avoid the application of the excise tax imposed under Section 4982 of the Internal Revenue Code of 1986, as amended (the “Code”), for certain undistributed amounts.
Dividends and distributions to shareholders are determined in accordance with federal income tax regulations, which may differ from GAAP. These differences are primarily due to differing treatments of income and gains on various investment securities held by the Funds, timing differences and differing characterization of distributions made by the Funds as a whole.
| 62 | Annual Report 2018 |
Notes to Financial Statements (continued)
October 31, 2018
| i. | Federal Income Taxes |
Each Fund intends to continue to qualify as a “regulated investment company” by complying with the provisions available to certain investment companies, as defined in Subchapter M of the Code, and to make distributions of net investment income and net realized capital gains sufficient to relieve the Funds from all federal income taxes. Therefore, no federal income tax provision is required.
Management of the Funds has concluded that there are no significant uncertain tax positions that would require recognition in the financial statements. Since tax authorities can examine previously filed tax returns, the Funds’ U.S. federal and state tax returns for each of the four fiscal years up to the most recent fiscal year ended October 31 are subject to such review.
3. Agreements and Transactions with Affiliates
| a. | Investment Adviser |
Under the Investment Advisory Agreements with the Funds, effective May 22, 2013, the Adviser manages the Funds in accordance with the policies and procedures established by the Board. Prior to May 22, 2013, the Funds were managed by Artio Global Management LLC (the “Predecessor Adviser”), which was acquired by the Adviser’s parent company on May 21, 2013.
For services provided under the terms of the current Investment Advisory Agreement, each Fund pays the Adviser an annual management fee (as a percentage of its average daily net assets) paid monthly according to the following schedule:
| Fund | Fee Schedule | |||||||
Select International Equity Fund | Of the first $5 billion | 0.900% | ||||||
| On the next $2.5 billion | 0.880% | |||||||
| Over $7.5 billion | 0.850% | |||||||
Select International Equity Fund II | Of the first $5 billion | 0.900% | ||||||
| On the next $2.5 billion | 0.880% | |||||||
| Over $7.5 billion | 0.850% | |||||||
Total Return Bond Fund | On all assets | 0.350% | ||||||
Global High Income Fund | Of the first $5 billion | 0.650% | ||||||
| On the next $2.5 billion | 0.630% | |||||||
| On the next $2.5 billion | 0.600% | |||||||
| Over $10 billion | 0.590% | |||||||
The Adviser has engaged the services of an affiliate, Aberdeen Asset Managers Limited, as subadviser on behalf of the International Equity Funds (the “Subadviser”), pursuant to the subadvisory agreements. The Subadviser manages a portion of the International Equity Funds’ investments and has responsibility for making all investment decisions for the portion of a Fund’s assets that it manages. Pursuant to the subadvisory agreements, the Adviser pays fees to the Subadviser.
The Trust and the Adviser have entered into written contracts (“Expense Limitation Agreements”) limiting operating expenses for all classes of each Fund from exceeding the amounts listed in the table below. For each Fund noted below, this contractual limitation may not be terminated without the approval of the Board until the earlier of (a) the termination of the Investment Advisory Agreement or (b) the end of February, 2019. This limit excludes certain expenses, including taxes, interest, brokerage commissions, and other expenditures which are capitalized in accordance with GAAP, and other extraordinary expenses not incurred in the ordinary course of each Fund’s business.
| Fund | Class A Limit | Institutional Class Limit | ||||
Total Return Bond Fund | 0.69% | 0.44 | % | |||
Global High Income Fund | 1.00% | 0.75 | % | |||
The Adviser has agreed to continue to waive a portion of its management fee for each of the Funds at the annual rate of 0.005% of the respective Funds’ average daily assets. The waiver may be terminated at any time by the Board.
The Adviser may request and receive reimbursement from a Fund of the advisory fees waived and other expenses reimbursed pursuant to the Expense Limitation Agreements at a later date not to exceed three years from the fiscal year in which the corresponding reimbursement to the Funds was made.
| 2018 Annual Report | 63 |
Notes to Financial Statements (continued)
October 31, 2018
However, no reimbursement will be made for fees waived unless:
(i) the total annual expense ratio of the class making such reimbursement is less than the limit set forth above; and
(ii) the payment of such reimbursement is approved by the Board on a quarterly basis (the “Reimbursement Requirements”).
If the Board approves any changes in the waiver terms or limitations, reimbursements are only permitted to the extent that the terms of the Expense Limitation Agreements in effect at the time of the waiver are met at the time that reimbursement is approved. Except as provided for in the Expense Limitation Agreements, reimbursement of amounts previously waived or assumed by the Adviser is not permitted.
As of October 31, 2018, to the extent the Reimbursement Requirements are met, the cumulative potential reimbursements for each Fund, based on expenses reimbursed by the Adviser would be:
| Fund | Amount Fiscal Year 2016 (Expires 10/31/19) | Amount Fiscal Year 2017 (Expires 10/31/20) | Amount Fiscal Year 2018 (Expires 10/31/21) | Total* | ||||||||||||
Select International Equity Fund | $ | – | $ | – | $ | – | $ | – | ||||||||
Select International Equity Fund II | – | – | – | – | ||||||||||||
Total Return Bond Fund | 262,142 | 257,618 | 499,844 | 1,019,604 | ||||||||||||
Global High Income Fund | 367,227 | 525,704 | 591,864 | 1,484,795 | ||||||||||||
| * | Amounts reported are due to expire throughout the respective 3-year expiration period presented above. |
Amounts listed as “–” are $0 or round to $0.
4. Distributor and Shareholder Services
The Trust and Aberdeen Fund Distributors, LLC (the “Distributor”) are parties to the current Underwriting Agreement (the “Underwriting Agreement”) whereby the Distributor acts as principal underwriter for the Funds’ shares. Prior to May 22, 2013, Quasar Distributors, LLC (“Quasar”) was the distributor of the Funds.
The Trust has adopted a Distribution Plan (the “Plan”) pursuant to Rule 12b-1 under the 1940 Act with respect to certain classes of shares. The Plan permits the Funds to compensate the Distributor, for expenses associated with the distribution-related and/or shareholder services provided by such entities. These fees are paid to the Distributor and are either kept or paid to shareholders’ financial advisors or other intermediaries for distribution and shareholder services. Although actual distribution expenses may be more or less, under the Plan, the Funds pay the Distributor an annual fee of 0.25% for Class A shares.
Under its terms, the Plan shall remain in effect from year to year, provided such continuance is approved annually by a vote of a majority of the Board members and a majority of those Board members who are not “interested persons” of the Funds and who have no direct or indirect financial interest in the operation of the Plan or in any agreement related to the Plan.
The Adviser or an affiliate of the Adviser may pay additional amounts from its own resources to dealers or other financial intermediaries, for aid in distribution or for aid in providing administrative services to shareholders.
5. Investment Transactions
Purchases and sales of securities (excluding short-term securities) for the fiscal year ended October 31, 2018, were as follows:
| Fund | Purchases | Sales | ||||||
Select International Equity Fund | $ | 37,789,348 | $ | 76,604,044 | ||||
Select International Equity Fund II | 15,536,181 | 34,655,634 | ||||||
Total Return Bond Fund | 388,032,818 | 465,963,924 | ||||||
Global High Income Fund | 101,564,594 | 232,755,709 | ||||||
6. Portfolio Investment Risks
| a. | Active Trading Risk |
A Fund may engage in active and frequent trading of portfolio securities to achieve their investment objective. If a Fund does trade this way, it may incur increased costs, which can lower the actual return of the Fund.
| 64 | Annual Report 2018 |
Notes to Financial Statements (continued)
October 31, 2018
| b. | Asset-Backed Securities Risk |
Like traditional fixed income securities, the value of asset-backed securities typically increases when interest rates fall and decreases when interest rates rise. Certain asset-backed securities may also be subject to the risk of prepayment.
| c. | Bank Loan Risk |
There are a number of risks associated with an investment in bank loans including credit risk, interest rate risk, illiquid securities risk, and prepayment risk. There is also the possibility that the collateral securing a loan, if any, may be difficult to liquidate or be insufficient to cover the amount owed under the loan. Bank loans have significantly longer settlement periods (e.g., longer than seven days) than more traditional investments resulting in the proceeds from the sale of such loans not being readily available to make additional investments or to meet a Fund’s redemption obligations. In addition, loans are not registered under the federal securities laws like stocks and bonds, so investors in loans have less protection against improper practices than investors in registered securities. These risks could cause a Fund to lose income or principal on a particular investment, which in turn could affect a Fund’s returns.
| d. | Country/Regional Focus Risk |
Significant exposure to a single country or geographical region involves increased currency, political, regulatory and other risks. Market swings in the targeted country or geographical region likely will have a greater effect on portfolio performance than they would in a more geographically diversified fund.
| e. | Corporate Bonds Risk |
Corporate bonds are debt instruments issued by domestic or foreign corporations or similar entities. Corporate bonds can decline in value in response to changes in the financial condition of the issuer and involve a risk of loss in case of issuer default or insolvency.
| f. | Credit Default Swap Risk |
Credit default swap contracts, a type of derivative instrument, involve special risks and may result in losses to the Fund. Credit default swap contracts may in some cases be illiquid, and they increase credit risk since the Fund has exposure to both the issuer of the referenced obligation and the counterparty to the credit default swap contracts. Swaps may be difficult to unwind or terminate. The swap market could be disrupted or limited as a result of recent legislation, and these changes could adversely affect the Fund. Additionally, to the extent the Fund sells credit default swap contracts, the Fund effectively adds economic leverage to its portfolio because, in addition to its total net assets, the Fund is subject to investment exposure on the notional amount of the swap in the event of a default of the referenced debt obligation.
| g. | Credit Risk |
A debt instrument’s price depends, in part, on the credit quality of the issuer, borrower, counterparty, or underlying collateral and can decline in response to changes in the financial condition of the issuer, borrower, counterparty, or underlying collateral, or changes in specific or general market, economic, industry, political, regulatory, geopolitical, or other conditions.
| h. | Cybersecurity Risk |
Cybersecurity incidents may allow an unauthorized party to gain access to Fund assets, customer data (including private shareholder information), or proprietary information, or cause the Fund, the Adviser and/or its service providers (including, but not limited to, Fund accountants, custodians, sub-custodians, transfer agents and financial intermediaries) to suffer data breaches, data corruption or lose operational functionality.
| i. | Derivatives Risk (Including Options, Futures and Swaps) |
Derivatives are speculative and may hurt a Fund’s performance. Derivatives present the risk of disproportionately increased losses and/or reduced opportunities for gains when the financial asset or measure to which the derivative is linked changes in unexpected ways. The potential benefits to be derived from the Fund’s options, futures and derivatives strategy are dependent upon the portfolio managers’ ability to discern pricing inefficiencies and predict trends in markets, which decisions could prove to be inaccurate. This requires different skills and techniques than predicting changes in the price of individual debt securities, and there can be no assurance that the use of this strategy will be successful.
Hedged Exposure Risk – Losses generated by a derivative or practice used by a Fund for hedging purposes should be substantially offset by gains on the hedged investment depending on the degree of correlation between the hedging instrument and the assets hedged. However, while hedging can reduce or eliminate losses, it can also reduce or eliminate gains.
Correlation Risk – A Fund is exposed to the risk that changes in the value of a hedging instrument will not match those of the investment being hedged.
Counterparty Risk – Derivative transactions depend on the creditworthiness of the counterparty and the counterparty’s ability to fulfill its contractual obligations.
| 2018 Annual Report | 65 |
Notes to Financial Statements (continued)
October 31, 2018
Speculative Exposure Risk – To the extent that a derivative or practice is not used as a hedge, a Fund is directly exposed to its risks. Gains or losses from speculative positions in a derivative may be much greater than the derivative’s original cost. For example, potential losses from writing uncovered call options and from speculative short sales are unlimited.
| j. | Emerging Markets Risk |
Certain Funds are subject to Emerging Markets Risk. This is a magnification of the risks that apply to foreign investments. These risks are greater for securities of companies in emerging market countries because the countries may have less stable governments, more volatile currencies and less established markets (see “Foreign Securities Risk” below).
| k. | Extension Risk |
Principal repayments may not occur as quickly as anticipated, causing the expected maturity of a security to increase. Rapidly rising interest rates may cause prepayments to occur more slowly than expected, thereby lengthening the maturity of the securities held by the Fund and making their prices more sensitive to rate changes and more volatile.
| l. | Foreign Currency Exposure Risk |
The value of foreign currencies relative to the U.S. Dollar fluctuates in response to market, economic, political, regulatory, geopolitical or other conditions. A decline in the value of a foreign currency versus the U.S. Dollar reduces the value in U.S. Dollars of investments denominated in that foreign currency. This risk may impact a Fund more greatly to the extent the Fund does not hedge its currency risk, or hedging techniques used by the Adviser are unsuccessful.
| m. | Foreign Securities Risk |
Foreign securities may be more volatile, harder to price and less liquid than U.S. securities. They are subject to different accounting and regulatory standards, and political and economic risks.
| n. | High-Yield Bonds and Other Lower-Rated Securities Risk |
A Fund’s investments in high-yield bonds (commonly referred to as “junk bonds”) and other lower-rated securities will subject the Fund to substantial risk of loss. Investments in high-yield bonds are speculative and issuers of these securities are generally considered to be less financially secure and less able to repay interest and principal than issuers of investment-grade securities. Prices of high-yield bonds tend to be very volatile. These securities are less liquid than investment-grade debt securities and may be difficult to price or sell, particularly in times of negative sentiment toward high-yield securities.
| o. | Illiquid Securities Risk |
Illiquid securities are assets which may not be sold or disposed of in the ordinary course of business within seven days at approximately the price at which a Fund has valued the investment on its books and may include such securities as those not registered under U.S. securities laws or securities that cannot be sold in public transactions. An inability to sell a portfolio position can adversely affect a Fund’s value or prevent the Fund from being able to take advantage of other investment opportunities. Over recent years, the capacity of dealers to make markets in fixed income securities has been outpaced by the growth in the size of the fixed income markets. Liquidity risk may be magnified in a rising interest rate environment or when investor redemptions from fixed income funds may be higher than normal, due to the increased supply in the market that would result from selling activity.
Each Fund employs proprietary procedures and tests using third-party and internal data inputs that seek to assess and manage the liquidity of its portfolio holdings. A Fund’s procedures and tests take into account relevant market, trading and other factors, and monitor whether liquidity assessments should be adjusted based on changed market conditions. These procedures and tests are designed to assist a Fund in determining its ability to meet redemption requests in various market conditions. In light of the dynamic nature of markets, there can be no assurance that these procedures and tests will enable a Fund to ensure that it has sufficient liquidity to meet redemption requests.
| p. | Impact of Large Redemptions and Purchases of Fund Shares Risk |
Occasionally, shareholders may make large redemptions or purchases of Fund shares, which may cause a Fund to have to sell securities or invest additional cash. These transactions may adversely affect a Fund’s performance and increase transaction costs. In addition, large redemption requests may exceed the cash balance of a Fund and result in credit line borrowing fees and/or overdraft charges to the Fund until the sale of portfolio securities to cover the redemption request settle. For additional information on redemptions, please see the Statements of Changes in Net Assets.
| q. | Interest Rate Risk |
A Fund’s fixed income investments are subject to interest rate risk, which generally causes the value of a fixed income portfolio to decrease when interest rates rise resulting in a decrease in the Fund’s net assets. A Fund may be subject to a greater risk of rising interest rates due to the current period of historically low rates and the effect of potential government fiscal policy initiatives and resulting market reaction to those initiatives. Interest rate fluctuations tend to have a greater impact on fixed income securities with a greater time to maturity and/or
| 66 | Annual Report 2018 |
Notes to Financial Statements (continued)
October 31, 2018
lower coupon. In periods of market volatility, the market values of fixed income securities may be more sensitive to changes in interest rates. A Fund with a longer average portfolio duration will be more sensitive to changes in interest rates than a Fund with a shorter average portfolio duration.
| r. | Issuer Risk |
The value of a security may decline for reasons directly related to the issuer, such as management performance, financial leverage and reduced demand for the issuer’s goods or service.
| s. | Large-Cap Securities Risk |
Stocks issued by large cap companies subject a Fund to the risk that those stocks may underperform stocks issued by companies with smaller capitalizations or the market as a whole.
| t. | Leverage Risk |
Certain transactions may give rise to a form of leverage. Such transactions may include, among others, loans of securities, and the use of when-issued, delayed delivery or forward commitment transactions. The use of derivatives may also cause leveraging risk.
| u. | Management Risk |
Each Fund is subject to the risk that the Adviser may make poor security selections. The Adviser and its portfolio managers apply their own investment techniques and risk analyses in making investment decisions for the Funds, and there can be no guarantee that these decisions will achieve the desired results for the Funds. In addition, the Adviser may select securities that underperform the relevant market of other funds with similar investment objectives and strategies.
| v. | Market Risk |
Deteriorating market conditions might cause a general weakness in the market that reduces the prices of securities in that market in which a Fund invests.
| w. | Mid-Cap Securities Risk |
Securities of medium-sized companies tend to be more volatile and less liquid than securities of larger companies.
| x. | Mortgage-Related Securities Risk |
Certain Funds may invest in mortgage-related securities. Rising interest rates may cause an issuer to exercise its right to pay principal later than expected which tends to extend the duration of mortgage-related securities, making them more sensitive to changes in interest rates. As a result, in a period of rising interest rates, a Fund that holds mortgage-related securities may exhibit additional volatility. This is known as extension risk. In addition, mortgage-related securities are subject to prepayment risk. When interest rates decline, borrowers may pay off their mortgages sooner than expected. This can reduce the returns of a Fund because the Fund will have to reinvest that money at the lower prevailing interest rates.
| y. | Municipal Securities Risk |
Certain Funds may invest in municipal bonds which may be significantly affected by political and economic changes, including inflation, as well as uncertainties in the municipal market related to taxation, legislative changes, or the rights of municipal security holders. Municipal Bonds have varying levels of sensitivity to changes in interest rates. In general, the price of a Municipal Bond can fall when interest rates rise and can rise when interest rates fall. Interest rate risk is generally lower for shorter-term Municipal Bonds and higher for long term Municipal Bonds. Under certain market conditions, the Adviser may purchase Municipal Bonds that the Adviser perceives are undervalued. Undervalued Municipal Bonds are subject to the same market volatility and principal and interest rate risks described above. Lower quality Municipal Bonds involve greater risk of default or price changes due to changes in the credit quality of the issuer. The value of lower quality Municipal Bonds often fluctuates in response to political or economic developments and can decline significantly over short periods of time or during periods of general or regional economic difficulty. In the case of tax-exempt Municipal Bonds, if the Internal Revenue Service or state tax authorities determine that an issuer of a tax-exempt Municipal Bond has not complied with applicable tax requirements, interest from the security could become taxable at the federal, state and/or local level, and the security could decline significantly in value. Municipal Bonds are subject to credit or default risk. Credit risk is the risk that the issuer of a municipal security might not make interest and principal payments on the security as they become due.
| z. | Prepayment Risk |
As interest rates decline, debt issuers may repay or refinance their loans or obligations earlier than anticipated. The issuers of fixed income securities may, therefore, repay principal in advance. This forces a Fund to reinvest the proceeds from the principal prepayments at lower rates, which reduces the Fund’s income.
| 2018 Annual Report | 67 |
Notes to Financial Statements (continued)
October 31, 2018
| aa. | Private Placements and Other Restricted Securities Risk |
Investments in private placements and other restricted securities, including Regulation S Securities and Rule 144A Securities, could have the effect of increasing a Fund’s level of illiquidity. Private placements and restricted securities may be less liquid than other investments because such securities may not always be readily sold in broad public markets and a Fund might be unable to dispose of such securities promptly or at prices reflecting their true value.
| bb. | Small-Cap Securities Risk |
Securities of smaller companies are usually less stable in price and less liquid than those of larger, more established companies. Therefore, they generally involve greater risk.
| cc. | Sovereign Debt Risk |
Periods of economic and political uncertainty may result in the illiquidity and increased price volatility of a foreign government’s debt securities held by a Fund and impact an issuer’s ability and willingness to pay interest or repay principal when due. A Fund may have limited recourse to compel payment in the event of a default. A foreign government’s default on its debt securities may cause the value of securities held by a Fund to decline significantly.
| dd. | Valuation Risk |
The price that a Fund could receive upon the sale of any particular portfolio investment may differ from the Fund’s valuation of the investment, particularly for securities that trade in thin or volatile markets or that are valued using a fair valuation methodology or a price provided by an independent pricing service. As a result, the price received upon the sale of an investment may be less than the value ascribed by a Fund, and such Fund could realize a greater than expected loss or lesser than expected gain upon the sale of the investment. A Fund’s ability to value its investments may also be impacted by technological issues and/or errors by pricing services or other third-party service providers.
| ee. | Variable and Floating Rate Securities Risk |
For floating and variable rate obligations, there may be a lag between an actual change in the underlying interest rate benchmark and the reset time for an interest payment of such an obligation, which could harm or benefit a Fund, depending on the interest rate environment or other circumstances.
Please read the prospectus for more detailed information regarding these and other risks.
7. Contingencies
In the normal course of business, the Funds may provide general indemnifications pursuant to certain contracts and organizational documents. The Funds’ maximum exposure under these arrangements is dependent on future claims that may be made against the Funds, and therefore, cannot be estimated; however, based on experience, the risk of loss from such claims is considered remote.
8. Tax Information
As of October 31, 2017 the breakdown of distributions per class from net investment income and from net realized gains were as follows:
| Distributions from Net Income | Distributions from Net Realized Gains | |||||||||||||||
| Fund | Class A | Institutional Class | Class A | Institutional Class | ||||||||||||
Aberdeen Select International Equity Fund | (1,729,501 | ) | (384,167 | ) | – | – | ||||||||||
Aberdeen Select International Equity Fund II | (794,000 | ) | (804,604 | ) | – | – | ||||||||||
Aberdeen Total Return Bond Fund | (856,565 | ) | (5,137,062 | ) | (2,234,881 | ) | (14,581,517 | ) | ||||||||
Aberdeen Global High Income Fund | (9,732,798 | ) | (13,130,842 | ) | – | – | ||||||||||
As of October 31, 2018, the tax cost of securities and the breakdown of unrealized appreciation/(depreciation) for each Fund were as follows:
| Tax Cost of Securities | Unrealized Appreciation | Unrealized Depreciation | Net Unrealized Appreciation/ (Depreciation) | |||||||||||||
Select International Equity Fund | $ | 181,397,973 | $ | 14,672,321 | $ | (38,027,865 | ) | $ | (23,355,544 | ) | ||||||
Select International Equity Fund II | 72,115,884 | 6,335,848 | (12,672,617 | ) | (6,336,769 | ) | ||||||||||
Total Return Bond Fund | 215,818,106 | 570,466 | (8,337,579 | ) | (7,767,113 | ) | ||||||||||
Global High Income Fund | 229,255,095 | 2,533,714 | (16,657,743 | ) | (14,124,029 | ) | ||||||||||
| 68 | Annual Report 2018 |
Notes to Financial Statements (continued)
October 31, 2018
The tax character of distributions paid during the fiscal year ended October 31, 2018 was as follows (total distributions paid may differ from the Statements of Changes in Net Assets because for tax purposes dividends are recognized when actually paid):
| Distributions paid from | ||||||||||||||||||||||||
| Fund | Ordinary Income* | Net Long Term Capital Gains* | Total Taxable Distributions | Tax Exempt Distributions | Return of Capital | Total Distributions Paid | ||||||||||||||||||
Select International Equity Fund | $ | 8,549,592 | $ | – | $ | 8,549,592 | $ | – | $ | 208,864 | $ | 8,758,456 | ||||||||||||
Select International Equity Fund II | 2,553,669 | – | 2,553,669 | – | – | 2,553,669 | ||||||||||||||||||
Total Return Bond Fund | 8,515,486 | 1,637,864 | 10,153,350 | – | 349,106 | 10,502,456 | ||||||||||||||||||
Global High Income Fund | 13,927,941 | – | 13,927,941 | – | – | 13,927,941 | ||||||||||||||||||
The tax character of distributions paid during the fiscal year ended October 31, 2017 was as follows (total distributions paid may differ from the Statements of Changes in Net Assets because for tax purposes dividends are recognized when actually paid):
| Distributions paid from | ||||||||||||||||||||||||
| Fund | Ordinary Income* | Net Long Term Capital Gains* | Total Taxable Distributions | Tax Exempt Distributions | Return of Capital | Total Distributions Paid | ||||||||||||||||||
Select International Equity Fund | $ | 2,113,668 | $ | – | $ | 2,113,668 | $ | – | $ | – | $ | 2,113,668 | ||||||||||||
Select International Equity Fund II | 1,598,604 | – | 1,598,604 | – | – | 1,598,604 | ||||||||||||||||||
Total Return Bond Fund | 17,888,949 | 4,921,076 | 22,810,025 | – | – | 22,810,025 | ||||||||||||||||||
Global High Income Fund | 22,863,640 | – | 22,863,640 | – | 1,756,718 | 24,620,358 | ||||||||||||||||||
Amounts listed as “–” are $0 or round to $0.
As of October 31, 2018, the components of accumulated earnings/(deficit) on a tax basis were as follows:
| Fund | Undistributed Tax Exempt Income | Undistributed Ordinary Income | Undistributed Long-Term Capital Gains | Accumulated Earnings | Distributions Payable | Late Year Ordinary and Post-October Capital Loss Deferrals | Other Temporary Differences | Unrealized Appreciation/ (Depreciation)* | Accumulated Capital and Other Losses** | Total Accumulated Earnings/ (Deficit) | ||||||||||||||||||||||||||||||
Select International Equity Fund | $ | – | $ | – | $ | – | $ | – | $ | – | $ | – | $ | – | $ | (23,195,230 | ) | $ | (409,641,408 | ) | $ | (432,836,638 | ) | |||||||||||||||||
Select International Equity Fund II | – | 817,438 | – | – | – | – | (5,978 | ) | (6,342,784 | ) | (24,117,963 | ) | (29,649,287 | ) | ||||||||||||||||||||||||||
Total Return Bond Fund | – | – | – | – | – | – | (5,956 | ) | (7,914,593 | ) | (5,200,701 | ) | (13,121,250 | ) | ||||||||||||||||||||||||||
Global High Income Fund | – | 4,941,078 | – | – | – | – | – | (12,687,674 | ) | (225,168,534 | ) | (232,915,130 | ) | |||||||||||||||||||||||||||
| * | The difference between the book-basis and tax-basis unrealized appreciation/(depreciation) is attributable primarily to tax deferral of losses on wash sales. |
| ** | As of October 31, 2018, for Federal income tax purposes, these Funds have capital loss carryforwards available to offset capital gains, if any, to the extent provided by the Treasury regulations, with no expiration. |
As of October 31, 2018 for Federal income tax purposes, the following Funds have capital loss carry forwards available to offset capital gains, if any, to the extent provided by the Treasury regulations, with no expiration.
| Fund | Amount | Expires | ||||||
Select International Equity Fund | $ | 15,639,317 | Unlimited (Short-Term) | |||||
Select International Equity Fund | 394,002,091 | Unlimited (Long-Term) | ||||||
Select International Equity Fund II | 1,793,627 | Unlimited (Short-Term) | ||||||
Select International Equity Fund II | 22,324,336 | Unlimited (Long-Term) | ||||||
Total Return Bond Fund | 3,823,282 | Unlimited (Short-Term) | ||||||
Total Return Bond Fund | 1,377,419 | Unlimited (Long-Term) | ||||||
Global High Income Fund | 53,084,248 | Unlimited (Short-Term) | ||||||
Global High Income Fund | 172,084,286 | Unlimited (Long-Term) | ||||||
| 2018 Annual Report | 69 |
Notes to Financial Statements (continued)
October 31, 2018
Under the Regulated Investment Company Modernization Act of 2010, the Funds are permitted to carry forward capital losses incurred in taxable years beginning after December 22, 2010 or on the date of their formation, whichever is later, for an unlimited period. However, any losses incurred during those taxable years will be required to be utilized prior to the losses incurred in pre-enactment taxable years. As a result of this ordering rule, pre-enactment capital loss carryforwards may be more likely to expire unused. Additionally, post-enactment capital losses that are carried forward will retain their character as either short-term or long-term capital losses rather than being considered all short-term as under previous law.
GAAP requires that certain components of net assets be adjusted to reflect permanent differences between financial and tax reporting. Accordingly, the table below details the necessary reclassifications, which are a result of permanent differences primarily attributable to foreign currency gain/(loss), class action – Focus Media, Polish reclaim interest income, litigation, expired capital loss carryforward, Polish reclaim adjustment, paydown gain/(loss), equalization, distribution re-designations, capital gains tax reclass, and a security spinoff. These reclassifications. These reclassifications have no effect on net assets or NAVs per share.
| Fund | Paid-in Capital | Distributable Earnings | ||||||
Select International Equity Fund | $ | (1,820,864 | ) | $ | 1,820,864 | |||
Select International Equity Fund II | (121,537,716 | ) | 121,537,716 | |||||
Total Return Bond Fund | – | – | ||||||
Global High Income Fund | – | – | ||||||
9. Significant Shareholders
As of October 31, 2018, the Funds had shareholders with the percentage ownership indicated, which are considered significant shareholders (holdings greater than 5.0%) for financial reporting purposes:
| Fund | Record Ownership % | Number of Account Owners | ||||
Select International Equity Fund | 63.2 | % | 2 | |||
Select International Equity Fund II | 51.3 | 3 | ||||
Total Return Bond Fund | 66.2 | 7 | ||||
Global High Income Fund | 71.2 | 6 | ||||
10. Line of Credit
The Trust on behalf of each of the Funds noted in the table below (the “Borrowers”) entered into a Credit Agreement (the “Agreement”) with State Street Bank and Trust Company (the “Bank”). The Agreement provides for a revolving credit facility (the “Credit Facility”) to be utilized for temporary or emergency purposes to Fund shareholder redemptions or for other short-term liquidity purposes. The amount of the Credit Facility was $25,000,000 for the fiscal year ended October 31, 2018. The Funds may draw up to their stated sublimit (subject to certain other limitations therein):
| Sublimit Amount | Average Outstanding Daily Balance | Average Weighted Interest Rate | Days Utilized | |||||||||||||
Select International Equity | $ | 25,000,000 | $ | 414,312 | 2.65 | % | 12 | |||||||||
Select International Equity II | $ | 25,000,000 | 1,960,000 | 2.75 | % | 5 | ||||||||||
Total Return Bond Fund | $ | 25,000,000 | 1,899,895 | 3.36 | % | 14 | ||||||||||
In addition, the Trust on behalf of the Global High Income Fund entered into a separate Credit Agreement (the “Global High Income Fund Credit Agreement”) with the Bank. The Global High Income Fund Credit Agreement provides for a revolving credit facility (the “Global High Income Fund Credit Facility”) to be utilized for temporary or emergency purposes to Fund shareholder redemptions or for other short-term liquidity purposes. The amount of the Global High Income Fund Credit Facility was $50,000,000 for the fiscal year ended October 31, 2018. The Global High Income Fund may draw the entire $50,000,000 (subject to certain limitations).
| Sublimit Amount | Average Outstanding Daily Balance | Average Weighted Interest Rate | Days Utilized | |||||||||||||
Global High Income Fund | $ | 50,000,000 | $ | 2,711,472 | 3.16 | % | 14 | |||||||||
| 70 | Annual Report 2018 |
Notes to Financial Statements (concluded)
October 31, 2018
Principal on each outstanding loan made under the Agreement and the Global High Income Fund Credit Agreement bears the interest at a variable rate per annum equal to the higher of (a) the Federal Funds Rate as in effect on that day (not less than zero) plus 1.25% or (b) the One-Month London Interbank Offered Rate as in effect on that day (not less than zero) plus 1.25%. In addition, the Borrowers shall pay to the Bank a commitment fee at the rate of 0.25% per annum on the daily unused portion of each of the Credit Facility or Global High Income Fund Credit Facility, as applicable, which is allocated among the Borrowers in such manner as is determined by the Board to be reasonable.
11. Recent Accounting Pronouncements
On August 17, 2018, the SEC voted to adopt amendments to certain of its disclosure requirements that have become redundant, duplicative, overlapping, outdated, or superseded, in light of other SEC disclosure requirements, U.S. GAAP, or changes in the information environment. The SEC will also be referring certain SEC disclosure requirements that overlap with, but require information incremental to, U.S. GAAP to the Financial Accounting Standards Board for potential incorporation into U.S. GAAP. The amendments are intended to facilitate the disclosure of information to investors and simplify compliance without significantly altering the total mix of information provided to investors. The amendments are intended to facilitate the disclosure of information to investors and simplify compliance without significantly altering the total mix of information provided to investors. The amendments became effective November 5, 2018.
On August 28, 2018, the FASB issued Accounting Standards Update (ASU) 2018-13, Fair Value Measurement (Topic 820): Disclosure Framework – Changes to the Disclosure Requirements for Fair Value Measurement. ASU 2018-13 includes removals, additions and modifications to the disclosure requirements for fair value measurements that are intended to improve the effectiveness of disclosures in the notes to financial statements. The amendments in ASU 2018-13 are effective for all entities for fiscal years, and interim periods within those fiscal years, beginning after December 15, 2019. An entity is permitted to early adopt any removed or modified disclosures upon issuance of this ASU and delay adoption of the additional disclosures until their effective date. Aberdeen has evaluated ASU 2018-13 and determined that there is no significant impact on the Trust’s financial statements. Aberdeen has early adopted the following ASU 2018-13 guidance in the Trust’s financial statements pertaining to the removal of (i) the amount of and reasons for transfers between Level 1 and Level 2 of the fair value hierarchy and (ii) the policy for timing of transfers between levels.
12. Subsequent Events
Management has evaluated the need for disclosures and/or adjustments resulting from subsequent events through the date the financial statements were issued. Based on this evaluation, no disclosures and/or adjustments were required to the financial statements as of October 31, 2018 except as provided below.
On December 13, 2018, the Board of Trustees of Aberdeen Investment Funds (the “Board”) approved changes to the principal investment strategies of the Aberdeen Select International Equity Fund (the ‘Fund”). Beginning February 28, 2019, in addition to its normal investment process, and in recognition that the market is not efficient at pricing the fundamentals that drive a company’s share price when the company undergoes or faces material change, the Fund’s investment team will focus on securing and analyzing information about the fast changing corporate prospects of companies, concentrating on the most important factors that drive the market price of the investment, which is based on first-hand research and disciplined company evaluation. The Fund will also expand its purchase and sale of forward foreign currency exchange contracts and other financial derivative instruments. In connection with these aforementioned changes, the portfolio management team of the Fund will change. The Management Fees will be reduced to 0.80% for both the Class A Shares and Institutional Class Shares. Also, Aberdeen Investment Funds and Aberdeen Asset Management Inc. (“AAMI” or the “Adviser”) have entered into written contracts limiting operating expenses to 1.10% for Institutional Class and 1.35% for Class A shares of the Fund, which may not be terminated before February 28, 2021 without approval from the Independent Trustees. Each of the changes described in this subsequent event note shall take effect on or about February 28, 2019.
Also on December 13, 2018, the Board approved a change in the Aberdeen Select International Fund II’s name to the Aberdeen Global Equity Impact Fund (the “Fund”) and related changes to the principal investment strategies of the Fund. Beginning on or about February 28, 2019, the Fund’s new policy, which will be non-fundamental, will be to invest, under normal circumstances, at least 80% of the value of its net assets, plus any borrowings for investment purposes, in equity securities issued by companies located throughout the world (including the U.S.). Also, the Fund will seek to invest in securities of companies that aim to create positive measurable environmental and/or social impacts. In connection with these aforementioned changes, the portfolio management team of the Fund will change and the Fund’s benchmark will change. The Management Fees will be reduced to 0.80% for both the Class A Shares and Institutional Class Shares. Also, Aberdeen Investment Funds and the Adviser have entered into written contracts limiting operating expenses to 1.10% for Institutional Class and 1.35% for Class A shares of the Fund, which may not be terminated before February 28, 2021 without approval from the Independent Trustees. Each of the changes described in this subsequent event note shall take effect on or about February 28, 2019.
| 2018 Annual Report | 71 |
Report of Independent Registered Public Accounting Firm
To the Shareholders and Board of Trustees of Aberdeen Investment Funds:
Opinion on the Financial Statements
We have audited the accompanying statements of assets and liabilities of the Aberdeen Investment Funds comprised of Aberdeen Select International Equity Fund, Aberdeen Select International Equity Fund II, Aberdeen Total Return Bond Fund, and Aberdeen Global High Income Fund (collectively, the Funds), including the statements of investments, as of October 31, 2018, the related statements of operations for the year then ended, the statements of changes in net assets for each of the years in the two-year period then ended, and the related notes (collectively, the financial statements) and the financial highlights for each of the years in the five-year period then ended. In our opinion, the financial statements and financial highlights present fairly, in all material respects, the financial position of the Funds as of October 31, 2018, the results of their operations for the year then ended, the changes in their net assets for each of the years in the two-year period then ended, and the financial highlights for each of the years in the five-year period then ended, in conformity with U.S. generally accepted accounting principles.
Basis for Opinion
These financial statements and financial highlights are the responsibility of the Funds’ management. Our responsibility is to express an opinion on these financial statements and financial highlights based on our audits. We are a public accounting firm registered with the Public Company Accounting Oversight Board (United States) (PCAOB) and are required to be independent with respect to the Funds in accordance with the U.S. federal securities laws and the applicable rules and regulations of the Securities and Exchange Commission and the PCAOB.
We conducted our audits in accordance with the standards of the PCAOB. Those standards require that we plan and perform the audit to obtain reasonable assurance about whether the financial statements and financial highlights are free of material misstatement, whether due to error or fraud. Our audits included performing procedures to assess the risks of material misstatement of the financial statements and financial highlights, whether due to error or fraud, and performing procedures that respond to those risks. Such procedures included examining, on a test basis, evidence regarding the amounts and disclosures in the financial statements and financial highlights. Such procedures also included confirmation of securities owned as of October 31, 2018, by correspondence with the custodian, brokers, or by other appropriate auditing procedures when replies from brokers were not received. Our audits also included evaluating the accounting principles used and significant estimates made by management, as well as evaluating the overall presentation of the financial statements and financial highlights. We believe that our audits provide a reasonable basis for our opinion.

We have served as the auditor of one or more Aberdeen investment companies since 2009.
Philadelphia, Pennsylvania
December 27, 2018
| 72 | Annual Report 2018 |
Other Tax Information (Unaudited)
For the period ended October 31, 2018, certain dividends paid by the Funds may be subject to a maximum tax rate of 15% as provided for by the Jobs and Growth Tax Relief Reconciliation Act of 2003. The Funds intend to designate the maximum amount allowable as taxed at a maximum rate of 15%. Complete information will be reported in conjunction with your 2018 Form 1099-DIV.
During the year ended October 31, 2018, the following Fund designated dividends as long-term capital gains:
| Fund | Amount | |||
Total Return Bond Fund | $ | 1,637,864 | ||
Pursuant to Section 852 of the Internal Revenue Code, the amount designated as long-term capital gains distribution in connection with share redemptions.
The Funds intend to elect to pass through to their shareholders the credit for taxes paid in foreign countries during its fiscal year ended October 31, 2018. In accordance with the current tax laws, the foreign income and foreign tax per share (for a share outstanding as of October 31, 2018) were as follows:
| Fund | Foreign Tax | |||
Select International Equity Fund | $ | 0.0612 | ||
Select International Equity Fund II | $ | 0.0268 | ||
| 2018 Annual Report | 73 |
Shareholder Expense Examples (Unaudited)
As a shareholder of the Aberdeen Investment Funds you incur ongoing costs, including investment advisory fees, shareholder service fees, distribution fees and other Fund expenses. The examples below are intended to help you understand your ongoing costs (in dollars) of investing in the Funds and to compare these costs with the ongoing costs of investing in other mutual funds.
The examples assume that you had a $1,000 investment in the Class at the beginning of the reporting period, May 1, 2018 and continued to hold your shares at the end of the reporting period, October 31, 2018.
Actual Expenses
The table below provides information about actual account values and actual expenses. You may use the information together with the amount you invested, to estimate the expenses that you paid over the period. Simply divide your account value by $1,000 (for example, an $8,600 account value divided by $1,000 = 8.6), then multiply the result by the number under the heading entitled “Actual Expenses Paid During Period” for the class of a Fund that you own to estimate the expenses you paid on your account during the period.
Hypothetical Example for Comparison Purposes
The table below provides information about hypothetical account values and hypothetical expenses based on the Class’ actual expense ratio and an assumed rate of return of 5% per year before expenses, which is not the Class’ actual return. The hypothetical account values and expenses may not be used to estimate the actual ending account balance or expenses you paid for the period. You may use this information to compare the ongoing costs of investing in the Class of a Fund and other funds. To do so, compare the 5% hypothetical example with the 5% hypothetical examples that appear in the shareholder reports of the other funds.
| Beginning Account Value, May 1, 2018 | Actual Ending Account Value, October 31, 2018 | Hypothetical Ending Account Value | Actual Expenses Paid During Period* | Hypothetical Expenses Paid During Period*1 | Annualized Expense Ratio | |||||||||||||||||||||
Select International Equity Fund2 | Class A | $ | 1,000.00 | $ | 876.20 | $ | 1,016.94 | $ | 7.76 | $ | 8.34 | 1.64% | ||||||||||||||
Institutional Class | $ | 1,000.00 | $ | 877.10 | $ | 1,018.15 | $ | 6.62 | $ | 7.12 | 1.40% | |||||||||||||||
Select International Equity Fund II2 | Class A | $ | 1,000.00 | $ | 879.50 | $ | 1,015.63 | $ | 9.00 | $ | 9.65 | 1.90% | ||||||||||||||
Institutional Class | $ | 1,000.00 | $ | 881.10 | $ | 1,016.84 | $ | 7.87 | $ | 8.44 | 1.66% | |||||||||||||||
Total Return Bond Fund | Class A | $ | 1,000.00 | $ | 985.80 | $ | 1,021.73 | $ | 3.45 | $ | 3.52 | 0.69% | ||||||||||||||
Institutional Class | $ | 1,000.00 | $ | 987.00 | $ | 1,022.99 | $ | 2.20 | $ | 2.24 | 0.44% | |||||||||||||||
Global High Income Fund | Class A | $ | 1,000.00 | $ | 995.10 | $ | 1,020.16 | $ | 5.03 | $ | 5.09 | 1.00% | ||||||||||||||
Institutional Class | $ | 1,000.00 | $ | 996.20 | $ | 1,021.43 | $ | 3.77 | $ | 3.82 | 0.75% | |||||||||||||||
| * | Expenses are equal to the Fund’s annualized expense ratio multiplied by the average account value over the period multiplied by 184/365 (to reflect the one-half year period). |
| 1 | Represents the hypothetical 5% return before expenses. |
| 2 | Uncertain taxes and costs associated with Article 63 EU Tax Reclaims are not included in the expense table above for Select International Equity Fund and Select International Equity Fund II. In addition to the operating expenses shown in the table above and based on the information available as of the date of this Report, the Fund has accrued an estimated tax expense for the potential taxes and costs of the Article 63 EU Tax Reclaims, which is not included in the table above. If these taxes and costs were included in the table above, the annualized expense ratio and actual expenses paid would materially increase. |
| 74 | Annual Report 2018 |
Supplemental Information (Unaudited)
Board Consideration of Advisory and Sub-Advisory Agreements – Aberdeen Investment Funds
At an in-person meeting of the Board of Trustees of the Aberdeen Investment Funds (the “Trust”) held on June 13, 2018, the Board, including a majority of the Board Members who are not “interested persons” of the Trust (the “Independent Trustees”) as that term is defined in the Investment Company Act of 1940, as amended (the “1940 Act”), voted to renew for a one-year period the advisory agreement (the “Advisory Agreement”) between Aberdeen Asset Management Inc. (the “Adviser”) and the Trust, on behalf of each of Aberdeen Select International Equity Fund, Aberdeen Select International Equity Fund II, Aberdeen Total Return Bond Fund and Aberdeen Global High Income Fund (collectively, the “Funds”). The Board, including a majority of the Independent Trustees, also voted to renew for a one-year period the sub-advisory agreement between the Adviser and Aberdeen Asset Managers Limited (the “Sub-Adviser”) with respect to Select International Equity Fund and Select International Equity Fund II (the “Sub-Advisory Agreement” and, together with the Advisory Agreement, the “Advisory Agreements”). The Sub-Adviser is an affiliate of the Adviser. The Adviser and the Sub-Adviser are sometimes referred to collectively as the “Advisers.”
In addition to the meeting on June 13, 2018, the Investment Management and Service Contracts Committee (the “Committee”) met on March 23, 2018, April 18, 2018, May 17, 2018 and June 8, 2018 to discuss, among other things: the peer groups proposed by an independent third party to be used for comparison of the Funds’ fees and performance; the Funds’ performance and expenses, including in-person interviews with the Advisers’ management personnel; information provided by the Advisers in response to an information request made on behalf of the Independent Trustees by their independent legal counsel; supplemental information requested from the Advisers that the Independent Trustees believed to be reasonably necessary for their review of the Advisory Agreements; and the legal standards applicable to the Board’s review.
At the request of the Committee, the Independent Trustees who are not members of the Committee attended and participated in the Committee’s meetings.
In connection with the contract review meetings, the Independent Trustees reviewed a variety of information provided by the Advisers relating to the Funds, the Advisory Agreements and the Advisers, including comparative performance, fee and expense information and other information regarding the nature, extent and quality of services provided by the Advisers under their respective Advisory Agreements. The materials provided generally included, among other items:
| • | information on the investment performance of each Fund and comparative performance of peer groups of funds and each Fund’s performance benchmark; |
| • | information on each Fund’s advisory fees and other expenses, including information comparing each Fund’s advisory fees and other expenses to those of a peer group of funds and information about any applicable expense limitations and fee “breakpoints;” |
| • | sales and redemption data with respect to each Fund; |
| • | information about the profitability of the Advisory Agreements to the Advisers; |
| • | reports prepared by the Advisers in response to requests submitted by the Independent Trustees’ independent legal counsel on behalf of the Independent Trustees; and |
| • | a memorandum from the Independent Trustees’ independent legal counsel regarding the responsibilities of the Board in considering the continuation of investment advisory and investment sub-advisory arrangements under the 1940 Act and relevant state law. |
The Board, including the Independent Trustees, also considered other matters such as:
| • | the Advisers’ financial results and financial condition; |
| • | each Fund’s investment objective and strategies; |
| • | the Advisers’ investment personnel and operations; |
| • | arrangements relating to the distribution of the Funds’ shares and the related costs; |
| • | the procedures employed to determine the value of the Funds’ assets; |
| • | the allocation of the Funds’ brokerage, if any, including, if applicable, allocations to brokers affiliated with the Advisers and the use, if any, of “soft” commission dollars to pay Fund expenses and to pay for research and other similar services; |
| • | the resources devoted to, and the record of compliance with, the Funds’ investment policies and restrictions, policies on personal securities transactions and other compliance policies; and |
| • | possible conflicts of interest. |
| 2018 Annual Report | 75 |
Supplemental Information (Unaudited) (continued)
The Board also considered the nature, extent and quality of the services provided to the Funds by the Advisers’ affiliates. Throughout the process, the Independent Trustees were afforded the opportunity to ask questions of and request additional materials from the Advisers.
In addition to the materials requested by the Independent Trustees in connection with their annual consideration of the continuation of the Advisory Agreements, the Board receives materials in advance of each regular quarterly meeting of the Board that provides information relating to the services provided by the Advisers, including detailed information about the Funds’ investment performance. This information generally includes, among other things, third-party performance rankings for various periods (including prior to the Advisers’ management of the Funds) comparing each Fund against its peer group, total return information for various periods, and details of sales and redemptions of each Fund’s shares for the period. The Board also receives periodic presentations from the portfolio management teams in connection with the performance of the Funds.
The Independent Trustees were advised by independent legal counsel throughout the process. The Independent Trustees consulted in executive sessions with such independent counsel regarding consideration of the renewal of the Advisory Agreements. In considering whether to approve the continuation of the Advisory Agreements, the Board, including the Independent Trustees, did not identify any single factor as determinative. Individual Board Members may have evaluated the information presented differently from one another, giving different weights to various factors. Matters considered by the Board, including the Independent Trustees, in connection with their approval of the continuation of the Advisory Agreements included the factors listed below.
The nature, extent and quality of the services provided to the Funds under the Advisory Agreements. The Board considered the nature, extent and quality of the services provided by the Advisers, as applicable, to the Funds and the resources dedicated to each Fund by the Advisers and their affiliates. The Board considered, among other things:
| • | The Advisers’ investment experience; |
| • | The background and experience of the Advisers’ senior management personnel and the qualifications, background and responsibilities of the portfolio managers that are primarily responsible for the day-to-day portfolio management services for each Fund; |
| • | The allocation of responsibilities among the Advisers; |
| • | The Adviser’s role in coordinating the activities of the Funds’ other service providers; |
| • | Information provided on a regular basis by the Trust’s Chief Compliance Officer regarding the effectiveness of the Advisers’ compliance policies and procedures; |
| • | The Advisers’ risk management processes; |
| • | The Advisers’ focus on monitoring the performance of the Funds and addressing performance matters; |
| • | The benefits to shareholders of investing in a mutual fund that is part of a family of funds that offers shareholders the right to exchange shares of one type of fund for shares of another type of fund, and provides a variety of fund and shareholder services; and |
| • | Its knowledge of management and the quality of the performance of management’s duties through Board meetings, discussion and reports during the preceding year. |
After reviewing these and related factors, the Board determined that the nature, extent and quality of the services provided to the Funds by the Advisers were extensive in nature and of high quality and supported the renewal of the Advisory Agreements.
Investment performance. The Board requested and received information about the performance of each Fund over various time periods, including information that compared the performance of each Fund to the performance of a relevant peer group of funds and its performance benchmark. When applicable, the Board considered the performance of each Fund compared to the performance of comparable funds or accounts managed by the Adviser and its affiliates. In addition, the Board reviewed data prepared by an independent third party which analyzed the performance of each Fund using a variety of performance metrics.
The Board considered the Advisers’ performance and reputation generally, the performance of the Aberdeen fund family generally, and the Advisers’ responsiveness to the Board’s concerns about performance and their willingness to take steps intended to improve performance from the time they commenced management of the Funds in 2013.
In addition to the foregoing, the Board considered the specific factors set forth below with respect to the performance of each Fund for the periods ended March 31, 2018. In each case, the Board noted that the Advisers assumed management of each Fund on May 22, 2013, and that the Funds’ performance for periods prior to that time reflects the performance of the Funds’ previous investment adviser.
| 76 | Annual Report 2018 |
Supplemental Information (Unaudited) (continued)
Aberdeen Select International Equity Fund. The Board noted that the Select International Equity Fund had performance in the fourth quintile when compared to its performance group over the year-to-date, fifth quintile for the 1-year period, second quintile for the 2-year period, and third quintile for the 3-, 4- and 5-year periods. The Board took note of the effect that tax reclaim payments received since December 1, 2016 had on the performance of the Select International Equity Fund, and considered that the Fund’s performance would have been lower without the tax reclaim payments. The Board brought the Fund’s performance to management’s attention and discussed with the Advisers any steps that had been or could be taken to enhance performance in the future. The Board determined that it would continue to closely monitor the Fund’s performance.
Aberdeen Select International Equity Fund II. The Board noted that the Select International Equity Fund II had performance in the third quintile when compared to its performance group over the year-to-date, fifth quintile for the 1- and 4-year periods, first quintile for the 2-year period, and fourth quintile for the 3- and 5-year periods. The Board took note of the effect that tax reclaim payments received since December 1, 2016 had on the performance of the Select International Equity Fund II, and considered that the Fund’s performance would have been lower without the tax reclaim payments. The Board brought the Fund’s performance to management’s attention and discussed with the Advisers any steps that had been or could be taken to enhance performance in the future. The Board determined that it would continue to closely monitor the Fund’s performance.
Aberdeen Global High Income Fund. The Board noted that the Global High Income Fund had performance in the second quintile when compared to its performance group over the year-to-date, first quintile for the 1-year period, fourth quintile for the 2-year period, and fifth quintile for the 3-, 4-, 5- and 10-year periods. The Board noted changes made to the portfolio management team for the Global High Income Fund during 2016 and resulting changes to the investment process. The Board determined that it would continue to closely monitor the Fund’s performance.
Aberdeen Total Return Bond Fund. The Board noted that the Total Return Bond Fund had performance in the second quintile when compared to its performance group over the year-to-date, 1-, 2- and 3-year periods, third quintile for the 4- and 5-year periods, and fourth quintile for the 10-year period. The Board noted changes made to the portfolio management team for the Total Return Bond Fund during 2016 and resulting changes to the investment process. The Board noted that it would continue to closely monitor the Fund’s performance.
Fees paid for advisory services and expenses. The Board considered the fees charged to the Funds for advisory services as well as the total expense levels of the Funds. This information included comparisons (provided both by management and by an independent third party) of each Fund’s net management fee and total expense level to those of its peer group (the “Expense Group”) and information about the advisory fees charged by the Adviser to separately managed accounts with similar investment strategies.
In comparing each Fund’s net management fee to that of comparable funds, the Board noted that the management fee included advisory fees, but not administration fees. In considering the fees charged to any comparable accounts, the Board considered, among other things, management’s discussion of the different services required to manage the different types of accounts. In evaluating each Fund’s advisory fee, the Board also took into account the demands, complexity and quality of the investment management of the Funds.
The Board also noted that the Adviser pays the sub-advisory fees for Select International Equity Fund and Select International Equity Fund II out of its advisory fee. The Board also considered that the Adviser had entered into expense limitation agreements with respect to the Aberdeen Global High Income Fund and the Aberdeen Total Return Bond Fund, pursuant to which the Adviser agreed to waive a portion of its advisory fee and/or reimburse certain expenses to limit each such Fund’s total annual operating expenses for a period of time. Additionally, the Board considered that effective as of May 21, 2013, the Adviser agreed to waive a portion of its management fees for each of the Funds at the annual rate of 0.005% of the respective Fund’s average daily net assets.
The Board also considered other benefits directly or indirectly received by the Adviser and its affiliates from their relationships with the Funds, such as the engagement of affiliates of the Adviser to provide distribution services to the Funds.
In addition to the factors described above, the Board considered the specific factors set forth below with respect to each Fund’s fees and expenses. The Board considered the advisory fees, both contractual and after waivers and reimbursements, and also considered total expenses, both including Rule 12b-1 fees and excluding such fees.
Aberdeen Select International Equity Fund. The Board noted that the Fund’s contractual management fees and actual management fees are above the peer group median, ranked 8 and 11, respectively, of 12 funds. The Board also considered that the Fund’s total expenses, both including Rule 12b-1 fees and excluding such fees, ranked 11 of 12 funds in the peer group. The Board noted the continued decline in assets of the Select International Equity Fund, which resulted in fixed expenses being spread among lower assets.
Aberdeen Select International Equity Fund II. The Board noted that the Fund’s contractual management fees and actual management fees are above the peer group median, ranked 9 and 10, respectively, of 11 funds The Board also considered that the Fund’s total expenses, both including Rule 12b-1 fees and excluding such fees, ranked 10 of 11 funds in the peer group. The Board noted the continued decline in assets of the Select International Equity Fund II, which resulted in fixed expenses being spread among lower assets.
| 2018 Annual Report | 77 |
Supplemental Information (Unaudited) (concluded)
Aberdeen Global High Income Fund. The Board considered that the Fund’s contractual management fees and actual management fees are slightly above the peer group median, ranked 9 of 17 funds. The Board noted that the Fund’s total expenses, both including Rule 12b-1 fees and excluding such fees, are slightly lower than the median, ranked 6 of 17 funds in the peer group.
Aberdeen Total Return Bond Fund. The Board considered that the Fund’s contractual management fees are below the peer group median, ranked 6 of 19 funds, and that the Fund’s actual management fees are below the peer group median, ranked 5 of 19 funds. The Board noted that the Fund’s total expenses, both including Rule 12b-1 fees and excluding such fees, are lower than the median, ranked 8 of 19 funds in the peer group.
The Independent Trustees asked for, and received, information about the fees paid by other funds and accounts managed by the Adviser. The Independent Trustees considered the nature of the other accounts, which included comingled and separately managed accounts. The Independent Trustees noted the differences in managing the Funds compared to other accounts managed by the Advisers, including, among other things, the complexity of managing the Funds in light of regulatory, tax and compliance considerations resulting from the Funds’ status as registered investment companies.
After reviewing these and related factors, and taking into account management’s discussion regarding Fund expenses, the Board concluded that the advisory fees and, as applicable, the sub-advisory fees, were fair and reasonable, and that the costs of these services generally and the related profitability of the Adviser and its affiliates from their relationships with the Funds were reasonable and supported the renewal of the Advisory Agreements.
Economies of Scale. The Board considered the existence of any economies of scale in the provision of services by the Advisers and whether those economies would be shared with the Funds through breakpoints in the investment advisory fees or other means, such as expense waivers or limitations. The Board noted that the Global High Income Fund and the Total Return Bond Fund benefitted from an expense limitation agreement, and that the fees of Select International Equity Fund, Select International Equity Fund II and Global High Income Fund were subject to breakpoints, albeit at much higher levels than the Funds’ current net assets. The Board considered the Adviser’s belief that the Total Return Bond Fund does not have breakpoints at this time because this Fund has a lower overall fee structure.
The Board also considered the potential effect of each Fund’s size on fees, noting that if a Fund’s assets increase over time, the Fund may realize other economies of scale if assets increase proportionally more than some expenses. The Board took note of the decline in the Funds’ assets and the effect of such decline on the Funds’ expense ratios.
Profitability and costs. The Board examined the profitability of the Advisers and its affiliates on a Fund-by-Fund basis. The Board also considered information about the expense allocation methodology used to calculate profitability. When reviewing the Advisers’ profitability, the Board considered guidance from the Securities and Exchange Commission and the courts regarding adviser profitability, the performance of the Funds, the expense levels of the Funds, and whether the Adviser had implemented breakpoints, if any, and expense limitations, with respect to the Funds. The Board noted that over the past two years, the Advisers’ profitability attributable to the Funds declined significantly as a result of the decline of the Funds’ assets. The Advisers provided assurances that the Advisers were committed to continuing to provide a high level of services to the Funds.
Other factors. The Board also considered other factors, which included, but were not limited to, the following:
| • | the effect of any market and economic volatility on the performance, asset levels and expense ratios of the Funds; |
| • | whether the Funds have operated in accordance with their investment objectives, the Funds’ record of compliance with their investment restrictions, and the compliance programs of the Trust and the Advisers. The Trustees also considered the compliance-related resources that the Advisers and their affiliates provide to the Funds; |
| • | the Advisers’ financial condition and ability to continue to provide a high level of service under the Advisory Agreements; and |
| • | so-called “fallout benefits” to the Advisers, such as the benefits of research made available to the Advisers by reason of brokerage commissions generated by the Funds’ securities transactions or reputational and other indirect benefits. The Board considered any possible conflicts of interest associated with these fallout and other benefits, and the reporting, disclosure and other processes in place to disclose and monitor such possible conflicts of interest. |
* * *
Based on their evaluation of factors that they deemed to be material, including but not limited to those factors described above, the Independent Trustees concluded, in the exercise of their reasonable business judgment, that the advisory fee and, as applicable, sub-advisory fee structures, were reasonable in light of the nature and quality of the services provided, and recommended that renewal of the Advisory Agreements would be in the best interest of each Fund and its shareholders. Accordingly, the Board, with the Independent Trustees voting separately, approved the Advisory Agreements for an additional one-year period.
| 78 | Annual Report 2018 |
Management of the Funds (Unaudited)
As of October 31, 2018
Board of Trustees and Officers of the Funds
| Name, Address, and Age | Position(s) Held, Length of Time Served and Term of Office* | Principal Occupation During Past 5 Years | Number of Portfolios In Fund Complex Overseen by Trustee** | Other Directorships Held by Trustee During Past 5 Years*** | ||||
Trustees who are not Interested Persons (as Defined in the 1940 Act) of the Funds | ||||||||
Antoine Bernheim**** 65 | Trustee of the Trust since November 2004; Chairman of the Fund Complex since December 2008. | President, Dome Capital Management, Inc., 1984–present (investment advisory firm); Chairman, Dome Securities Corp., 1995–2012 (broker/dealer); President, The U.S. Offshore Funds Directory, 1990–present (publishing). | 4 | None | ||||
Thomas Gibbons**** 71 | Trustee of the Trust since November 2004. | President, Cornerstone Associates Management, 1987–present (consulting firm). | 4 | None | ||||
Robert S. Matthews****†† 75 | Trustee of the Trust since June 1992. | Managing Partner, Matthews & Co., 1990–present (certified public accounting firm). | 4 | None | ||||
Peter Wolfram**** 65 | Trustee of the Trust since June 1992. | Partner, Kelley Drye & Warren LLP, 1983–present (law firm). | 4 | Friends of Atlantik-Bruecke e.V. Foundation, 2004–present. | ||||
| * | Each Trustee serves during the lifetime of the Funds or until he or she dies, resigns, retires, is declared bankrupt or incompetent, or is removed or, if sooner, until the next special meeting of the Funds’ shareholders and until the election and qualification of his or her successor. The current retirement age is 75. |
| ** | The Aberdeen Fund Complex consists of the Trust which currently consists of four portfolios, Aberdeen Funds, Aberdeen Standard Investments ETFs, Aberdeen Asia-Pacific Income Fund, Inc., Aberdeen Global Income Fund, Inc., Aberdeen Australia Equity Fund, Inc., Aberdeen Emerging Markets Equity Income Fund, Inc., The India Fund, Inc., Aberdeen Income Credit Strategies Fund Aberdeen Global Dynamic Dividend Fund, Aberdeen Total Dynamic Dividend Fund, Aberdeen Global Premier Properties Fund and Aberdeen Japan Equity Fund, Inc. |
| *** | Directorships (excluding Fund Complex) held in (1) any other investment companies registered under the 1940 Act, (2) any company with a class of securities registered pursuant to Section 12 of the Securities Exchange Act of 1934, as amended (the “Exchange Act”) or (3) any company subject to the requirements of Section 15(d) of the Exchange Act. |
| **** | Each Trustee may be contacted by writing to the Trustee c/o Aberdeen Asset Management Inc., 1735 Market Street, 32nd Floor, Philadelphia, Pennsylvania 19103, Attn: Alan Goodson. |
| †† | Mr. Matthews retired from the Board of Trustees on October 31, 2018 |
| 2018 Annual Report | 79 |
Management of the Funds (Unaudited) (continued)
As of October 31, 2018
| Name, Address, and Age | Position(s) Held, Length of Time Served and Term of Office* | Principal Occupation During Past 5 Years | Number of Portfolios in Fund Complex Overseen by Trustee** | Other Directorships Held by Trustee During Past 5 Years*** | ||||
Trustee who is an Interested Person (as Defined in the 1940 Act) of the Funds | ||||||||
Bev Hendry****† 64 | Trustee of the Trust since February 2017 | Chairman–Americas for Aberdeen Standard Investments (2018-present); Chief Executive Officer–Americas for Aberdeen Asset Management PLC (2014–2018); Chief Operating Officer for Hansberger Global Investors (2008–2014) | 4 | Aberdeen Asset Management Inc. (2014–present) (investment adviser) | ||||
| * | Each Trustee serves during the lifetime of the Funds or until he or she dies, resigns, retires, is declared bankrupt or incompetent, or is removed or, if sooner, until the next special meeting of the Funds’ shareholders and until the election and qualification of his or her successor. The current retirement age is 75. |
| ** | The Aberdeen Fund Complex consists of the Trust which currently consists of four portfolios, Aberdeen Funds, Aberdeen Standard Investments ETFs, Aberdeen Asia-Pacific Income Fund, Inc., Aberdeen Global Income Fund, Inc., Aberdeen Australia Equity Fund, Inc., Aberdeen Emerging Markets Equity Income Fund, Inc., The India Fund, Inc., Aberdeen Income Credit Strategies Fund Aberdeen Global Dynamic Dividend Fund, Aberdeen Total Dynamic Dividend Fund, Aberdeen Global Premier Properties Fund and Aberdeen Japan Equity Fund, Inc. |
| *** | Directorships (excluding Fund Complex) held in (1) any other investment companies registered under the 1940 Act, (2) any company with a class of securities registered pursuant to Section 12 of the Securities Exchange Act of 1934, as amended (the “Exchange Act”) or (3) any company subject to the requirements of Section 15(d) of the Exchange Act. |
| **** | Each Trustee may be contacted by writing to the Trustee c/o Aberdeen Asset Management Inc., 1735 Market Street, 32nd Floor, Philadelphia, Pennsylvania 19103, Attn: Alan Goodson. |
| † | Mr. Hendry is considered to be an “interested person” of the Funds as defined in the 1940 Act because of his affiliation with the Adviser. |
| 80 | Annual Report 2018 |
Management of the Funds (Unaudited) (continued)
As of October 31, 2018
Officers of the Funds
| Name, Address, and Age | Position(s) Held, Length of Time Served and Term of Office1 | Principal Occupation During Past 5 Years | ||
Bev Hendry* Aberdeen Asset Management Inc. 1735 Market Street, 32nd Floor Philadelphia, PA 19103 65 | President and Chief Executive Officer Officer of the Trust | Chairman–Americas for Aberdeen Standard Investments (2018-present); Chief Executive Officer–Americas for Aberdeen Asset Management PLC (2014-2018); Chief Operating Officer for Hansberger Global Investors (2008-2014) | ||
Jeffrey Cotton* Aberdeen Asset Management Inc. 1735 Market Street, 32nd Floor Philadelphia, PA 19103 41 | Chief Compliance Officer, Anti-Money Laundering and Identity Theft Officer and Vice President Officer of the Trust | Currently, Director and Vice President and Head of Compliance–Americas for Aberdeen Asset Management Inc. and Interim Global Head of Conduct & Compliance for Aberdeen Standard Investments. Mr. Cotton joined Aberdeen in 2010 | ||
Andrea Melia* Aberdeen Asset Management Inc. 1735 Market Street, 32nd Floor, Philadelphia, PA 19103 49 | Chief Financial Officer and Treasurer Officer of the Trust | Currently, Vice President and Head of Fund Operations, Traditional Assets–Americas for Aberdeen Asset Management Inc. Ms. Melia joined Aberdeen Asset Management Inc. in September 2009. | ||
Megan Kennedy* Aberdeen Asset Management Inc. 1735 Market Street, 32nd Floor Philadelphia, PA 19103 44 | Assistant Secretary and Vice President Officer of the Trust | Currently, Head of Product Management for Aberdeen Asset Management Inc. Ms. Kennedy joined Aberdeen Asset Management Inc. in 2005 as a Senior Fund Administrator. Ms. Kennedy was promoted to Assistant Treasurer Collective Funds/North American Mutual Funds in February 2008 and promoted to Treasurer Collective Funds/North American Mutual Funds in July 2008. | ||
Lucia Sitar* Aberdeen Asset Management Inc. 1735 Market Street, 32nd Floor Philadelphia, PA 19103 47 | Chief Legal Officer and Vice President Officer of the Trust since 2013 | Currently, Vice President and Managing U.S. Counsel for Aberdeen Asset Management Inc. Ms. Sitar joined Aberdeen Asset Management Inc. in July 2007. | ||
Alan Goodson* Aberdeen Asset Management Inc. 1735 Market Street, 32nd Floor Philadelphia, PA 19103 44 | Vice President Officer of the Trust since 2013 | Currently, Head of Product–U.S., overseeing Product Management and Product Development for registered and unregistered investment companies in the U.S. and Canada. Mr. Goodson is Director and Vice President of Aberdeen Asset Management Inc. and joined Aberdeen in 2000. | ||
Stephen Docherty* Aberdeen Asset Management Inc. 1735 Market Street, 32nd Floor Philadelphia, PA 19103 48 | Vice President Officer of the Trust since 2013 | Currently, Head of Global Equities for Aberdeen Standard Investments. Mr. Docherty joined Aberdeen Standard Investments in 1994. |
| 2018 Annual Report | 81 |
Management of the Funds (Unaudited) (continued)
As of October 31, 2018
| Name, Address, and Age | Position(s) Held, Length of Time Served and Term of Office1 | Principal Occupation During Past 5 Years | ||
Steven Logan* Aberdeen Asset Management Inc. 1735 Market Street, 32nd Floor Philadelphia, PA 19103 50 | Vice President Officer of the Trust since 2016 | Currently, Head of Euro High Yield & Global Leverage Loans for Aberdeen Standard Investments. Mr. Logan joined Aberdeen following the SWIP acquisition in April 2014. Mr. Logan joined SWIP in 2001 as an Investment Director and became Head of European High Yield in 2006 | ||
Ben Moser* Aberdeen Asset Management Inc. 1735 Market Street, 32nd Floor Philadelphia, PA 19103 39 | Vice President Officer of the Trust since 2018 | Currently, Head of Investor Services US. Mr. Moser joined Aberdeen Asset Management in July 2008. | ||
Jennifer Nichols* Aberdeen Asset Management Inc. 1735 Market Street, 32nd Floor Philadelphia, PA 19103 40 | Vice President Officer of the Trust since 2013 | Currently, Head of Legal–Americas for Aberdeen Asset Management Inc. Director and Vice President for Aberdeen Asset Management Inc. (since October 2006). | ||
Lynn Chen Aberdeen Asset Management Inc. 1735 Market Street, 32nd Floor Philadelphia, PA 19103 55 | Vice President Officer of the Trust since 2016 | Currently, Head of Total Return Bond for Aberdeen Asset Management Inc. Ms. Chen joined Aberdeen Asset Management Inc. in May 2013 following the acquisition of Artio Global Management. From 2002-2013, she held a role similar to a Senior Investment Manager with Artio Global Management’s Fixed Income Group. | ||
Hugh Young* Aberdeen Asset Management Inc. 1735 Market Street, 32nd Floor Philadelphia, PA 19103 60 | Vice President Officer of the Trust | Currently, Managing Director of Aberdeen Standard Investments (Asia) Limitedand member of the Executive Management Committee and Director of Aberdeen Asset Management PLC (since 1991 and 2011, respectively). Mr. Young joined Aberdeen in 1991. | ||
Brian Link State Street Bank and Trust Company 100 Huntington, CHP0026 Boston, MA 02116 46 | Secretary Officer of the Trust since 2014 | Vice President and Managing Counsel, State Street Bank and Trust Company (since 2007). | ||
Eric Olsen* Aberdeen Asset Management Inc. 1735 Market Street, 32nd Floor Philadelphia, PA 19103 48 | Assistant Treasurer Officer of the Trust | Currently, Deputy Head of Fund Operations, Traditional Assets–Americas for Aberdeen Asset Management Inc. Mr. Olsen joined Aberdeen Asset Management Inc. in August 2013. Prior to joining Aberdeen Asset Management Inc., Mr. Olsen was a Director of Financial Reporting for BNY Mellon Asset Servicing and had worked with BNY Mellon since 1998. | ||
Brian O’Neill* Aberdeen Asset Management Inc. 1735 Market Street, 32nd Floor, Philadelphia, PA 19103 50 | Assistant Treasurer Officer of the Trust since 2013 | Currently, Senior Fund Administration Manager–U.S. for Aberdeen Asset Management Inc. Mr. O’Neill joined Aberdeen Asset Management Inc. in 2008. |
| 82 | Annual Report 2018 |
Management of the Funds (Unaudited) (concluded)
As of October 31, 2018
| Name, Address, and Age | Position(s) Held, Length of Time Served and Term of Office1 | Principal Occupation During Past 5 Years | ||
Joseph Andolina* Aberdeen Asset Management Inc. 1735 Market Street, 32nd Floor, Philadelphia, PA 19103 40 | Vice President–Compliance Officer of the Trust since 2017 | Currently, Deputy Chief Risk Officer and Head of Conduct and Compliance-Americas and Vice President for Aberdeen Asset Management Inc. Mr. Andolina joined Aberdeen in 2012. | ||
Andrew Kim* Aberdeen Asset Management Inc. 1735 Market Street, 32nd Floor, Philadelphia, PA 19103 35 | Assistant Secretary Officer of the Trust since 2017 | Currently, Senior Product Manager for Aberdeen Asset Management Inc. Mr. Kim joined Aberdeen Asset Management Inc. in 2013. Prior to joining Aberdeen Asset Management Inc., Mr. Kim worked at Weil, Gotshal & Manges LLP as a patent litigation paralegal. | ||
Stephen Varga* Aberdeen Asset Management Inc. 1735 Market Street, 32nd Floor, Philadelphia, PA 19103 33 | Assistant Secretary Officer of the Trust since 2017 | Currently, Product Manager for Aberdeen Asset Management Inc. Mr. Varga joined Aberdeen Asset Management Inc. in 2011. |
| 1 | Pursuant to the Trust’s By-laws, officers of the Trust are elected by the Board of Trustees to hold such office until his or her successor is chosen and qualified, or until they resign or are removed from office. |
| * | Mr. Hendry, Mr. Cotton, Ms. Melia, Mr. O’Neill, Ms. Kennedy, Ms. Sitar, Mr. Goodson, Mr. Young, Ms. Nichols, Mr. Logan, Mr. Andolina, Mr. Moser, Mr. Kim and Mr. Varga hold officer position(s) in one or more of the following: Aberdeen Funds, Aberdeen Standard Investments ETFs, Aberdeen Asia-Pacific Income Fund, Inc., Aberdeen Global Income Fund, Inc., Aberdeen Australia Equity Fund, Inc., Aberdeen Emerging Markets Equity Income Fund, Inc., The India Fund, Inc., Aberdeen Income Credit Strategies Fund Aberdeen Global Dynamic Dividend Fund, Aberdeen Total Dynamic Dividend Fund, Aberdeen Global Premier Properties Fund and Aberdeen Japan Equity Fund, Inc. |
, each of which may also be deemed to be a part of the same “Fund Complex” as the Funds.
| 2018 Annual Report | 83 |
Management Information
Trustees
Antoine Bernheim, Chairman
Thomas Gibbons
Bev Hendry
Robert S. Matthews
Peter Wolfram
Officers
Bev Hendry, President and Chief Executive Officer
Jeffrey Cotton, Chief Compliance Officer, Vice President and Anti-Money Laundering and Identity Theft Officer
Andrea Melia, Treasurer and Chief Financial Officer
Brian Link, Secretary
Megan Kennedy, Assistant Secretary and Vice President
Lucia Sitar, Chief Legal Officer and Vice President
Joseph Andolina, Vice President – Compliance
Lynn Chen, Vice President
Alan Goodson, Vice President
Stephen Docherty, Vice President
Steven Logan, Vice President
Ben Moser, Vice President
Jennifer Nichols, Vice President
Hugh Young, Vice President
Brian O’Neill, Assistant Treasurer
Eric Olsen, Assistant Treasurer
Andrew Kim, Assistant Secretary
Stephen Varga, Assistant Secretary
Investment Adviser
Aberdeen Asset Management Inc.
1735 Market Street, 32nd Floor
Philadelphia, PA 19103
Transfer Agent
DST Asset Manager Solutions, Inc. (formerly, Boston Financial Data Services, Inc.)
333 West 11th Street
Kansas City, MO 64105
Distributor
Aberdeen Fund Distributors LLC
1735 Market Street, 32nd Floor
Philadelphia, PA 19103
Fund Administrator, Custodian & Fund Accountant
State Street Bank and Trust Company
1 Heritage Drive, 3rd Floor
North Quincy, MA 02171
Independent Registered Public Accounting Firm
KPMG LLP
1601 Market Street
Philadelphia, PA 19103
Fund Counsel
Shearman & Sterling LLP
599 Lexington Avenue
New York, NY 10022
Aberdeen Asset Management Inc. 1735 Market Street, 32nd Floor Philadelphia, PA 19103 aberdeen-asset.us | |
AOE-0377-AR
Item 2. Code of Ethics.
(a) As of October 31, 2018, the Registrant had adopted a code of ethics that applies to the Registrant’s principal executive officer, principal financial officer, principal accounting officer or controller, or persons performing similar functions, regardless of whether these individuals are employed by the Registrant or a third party (the “Code of Ethics”).
(c) During the period covered by the report, no material changes were made to the provisions of the Code of Ethics.
(d) During the period covered by the report, the Registrant did not grant any waivers to the provisions of the Code of Ethics.
(f) The Code of Ethics is included with this Form N-CSR as Exhibit 13(a)(1).
Item 3. Audit Committee Financial Expert.
The Registrant’s Board of Trustees has determined that there is at least one member who qualifies as an “audit committee financial expert” serving on its Audit Committee. Mr. Antoine Bernheim is the “audit committee financial expert” and is considered to be an “Independent Trustee” as each term is defined in Item 3 of Form N-CSR.
Item 4. Principal Accountant Fees and Services.
Fiscal Year Ended | (a) Audit Fees | (b) Audit-Related Fees | (c)1 Tax Fees | (d)2 All Other Fees | ||||||||||||
October 31, 2018 | $ | 137,700 | $ | — | $ | 34,800 | $ | 55,539 | ||||||||
October 31, 2017 | $ | 140,500 | $ | — | $ | 34,300 | $ | 50,000 | ||||||||
| 1 | The Tax Fees are the aggregate fees billed for professional services rendered by KPMG LLP for the review of Form 1120-RIC, Form 8613, and review of excise tax distribution calculations. |
| 2 | Fees include services related to pursuing Article 63 European Union Tax Reclaims related to prior years. |
(e)(1) Audit Committee Pre-Approval Policies and Procedures. The Registrant’s audit committee pre-approves all audit and non-audit services to be performed by the Registrant’s accountant before the accountant is engaged by the Registrant to perform such services.
(e)(2) The percentage of services described in each of paragraphs (b) through (d) of this Item that were approved by the audit committee pursuant to paragraph (c)(7)(i)(C) of Rule 2-01 of Regulation S-X are as follows:
(b) None.
(c) None.
(d) Not applicable.
(f) Not applicable.
(g) The aggregate non-audit fees billed by the Registrant’s accountant for services to the Registrant and to the Registrant’s investment adviser and all entities controlling, controlled by, or under common control with the Adviser that provide services to the Registrant for the Registrant’s fiscal years ended October 31, 2018 and October 31, 2017 were $895,227 and $722,000, respectively.
(h) The Registrant’s Audit Committee of the Board of Trustees has considered whether the provision of non-audit services that were rendered to the Registrant’s investment adviser (not including any sub-adviser whose role is primarily portfolio management and is subcontracted with or overseen by another investment adviser), and any entity controlling, controlled by, or under common control with the investment adviser that provides ongoing services to the Registrant that were not pre-approved pursuant to paragraph (c)(7)(ii) or Rule 2-01 of Regulation S-X is compatible with maintaining the principal accountant’s independence and has concluded that it is.
Item 5. Audit Committee of Listed Registrants.
Not applicable
Item 6. Investments
(a) Included as part of the Reports to Shareholders filed under Item 1 of this Form N-CSR.
(b) Not applicable.
Item 7. Disclosure of Proxy Voting Policies and Procedures for Closed-End Management Investment Companies.
Not applicable.
Item 8. Portfolio Managers of Closed-end Management Investment Companies.
Not applicable.
Item 9. Purchases of Equity Securities by Closed-End Management Investment Company and Affiliated Purchasers.
Not applicable.
Item 10. Submission of Matters to a Vote of Security Holders.
During the period ended October 31, 2018, there were no material changes to the procedures by which shareholders may recommend nominees to the Registrant’s Board of Trustees.
Item 11. Controls and Procedures.
(a) The Registrant’s principal executive and principal financial officers, or persons performing similar functions, have concluded that the Registrant’s disclosure controls and procedures (as defined in Rule 30a-3(c) under the Investment Company Act of 1940 (the “Act”) (17 CFR 270.30a-3(c))) are effective, as of a date within 90 days of the filing date of the report that includes the disclosure required by this paragraph, based on the evaluation of these controls and procedures required by Rule 30a-3(b) under the
Act (17 CFR 270.30a3(b)) and Rule 13a-15(b) or 15d-15(b) under the Securities Exchange Act of 1934 (17 CFR 240.13a-15(b) or 240.15d15(b)).
(b) There were no changes in the Registrant’s internal control over financial reporting (as defined in Rule 30a-3(d) under the Act (17 CFR 270.30a-3(d)) that occurred during the second fiscal quarter of the period covered by this report that has materially affected, or are reasonably likely to materially affect, the Registrant’s internal control over financial reporting.
Item 12. Disclosure of Securities Lending Activities for Closed-End Management Investment Companies.
Not applicable.
Item 13. Exhibits.
(a)(1) The Code of Ethics of the Registrant for the period covered by this report as required pursuant to Item 2 of this Form N-CSR.
(a)(2) Certifications pursuant to Rule 30a-2(a) under the Act and Section 302 of the Sarbanes-Oxley Act of 2002 are attached hereto.
(a)(3) Not applicable.
(a)(4) Not applicable.
(b) Certifications pursuant to Rule 30a-2(b) under the Act and Section 906 of the Sarbanes-Oxley Act of 2002 are attached hereto.
SIGNATURES
Pursuant to the requirements of the Securities Exchange Act of 1934 and the Investment Company Act of 1940, as amended, the Registrant has duly caused this report to be signed on its behalf by the undersigned, thereunto duly authorized.
| Aberdeen Investment Funds | ||
| By: | /s/ Bev Hendry | |
| Bev Hendry | ||
Principal Executive Officer of Aberdeen Investment Funds
Date: January 4, 2019 | ||
Pursuant to the requirements of the Securities Exchange Act of 1934 and the Investment Company Act of 1940, as amended, this report has been signed below by the following persons on behalf of the Registrant and in the capacities and on the dates indicated.
| By: | /s/ Bev Hendry | |
| Bev Hendry | ||
| Principal Executive Officer of | ||
| Aberdeen Investment Funds | ||
| Date: January 4, 2019 | ||
| By: | /s/ Andrea Melia | |
| Andrea Melia | ||
| Principal Financial Officer of | ||
| Aberdeen Investment Funds | ||
| Date: January 4, 2019 | ||