UNITED STATES
SECURITIES AND EXCHANGE COMMISSION
Washington, D.C. 20549
FORM N-CSR
CERTIFIED SHAREHOLDER REPORT OF
REGISTERED MANAGEMENT INVESTMENT COMPANIES
| Investment Company Act file number: | 811-06652 | |
| Exact name of registrant as specified in charter: | Aberdeen Investment Funds | |
| Address of principal executive offices: | 1735 Market Street, 32nd Floor | |
| Philadelphia, PA 19103 | ||
| Name and address of agent for service: | Ms. Andrea Melia | |
| Aberdeen Asset Management Inc. | ||
| 1735 Market Street, 32nd Floor | ||
| Philadelphia, PA 19103 | ||
| Registrant’s telephone number, including area code: | 866-667-9231 | |
| Date of fiscal year end: | October 31 | |
| Date of reporting period: | October 31, 2015 | |
Item 1. Reports to Shareholders.

Aberdeen Investment Funds
Annual Report
October 31, 2015
Aberdeen Select International Equity Fund
Aberdeen Select International Equity Fund II
Aberdeen Total Return Bond Fund
Aberdeen Global High Income Fund

| Page 2 | ||||
| Page 3 | ||||
| Page 9 | ||||
| Page 15 | ||||
| Page 28 | ||||
| Page 46 | ||||
| Page 54 | ||||
| Page 73 | ||||
| Page 74 | ||||
| Page 75 | ||||
| Page 76 | ||||
| Page 80 | ||||
Investors should carefully consider a fund’s investment objectives, risks, fees, and expenses before investing any money. To obtain this and other fund information, please call 866-667-9231 to request a prospectus, or download a prospectus at www.aberdeen-asset.us. Please read it carefully before investing any money.
Investing in mutual funds involves risk, including possible loss of principal.
Aberdeen Select International Equity Fund, Aberdeen Select International Equity Fund II, Aberdeen Total Return Bond Fund, and Aberdeen Global High Income Fund, (each a “Fund” and collectively the “Funds”) are distributed by Aberdeen Fund Distributors, LLC, Member FINRA, 1735 Market Street, 32nd Floor, Philadelphia, PA 19103.
Aberdeen Asset Management Inc. (AAMI) has been registered as an investment adviser under the Investment Advisers Act of 1940 since August 23,1995.
Statement Regarding Availability of Quarterly Portfolio Schedule.
The complete schedule of portfolio holdings for the Aberdeen Investment Funds is included in the Funds’ semi-annual and annual reports to shareholders. The Aberdeen Investment Funds file complete schedules of portfolio holdings for each Fund with the Securities and Exchange Commission (the “SEC”) for the first and third quarters of each fiscal year on Form N-Q. The Funds’ Forms N-Q are available on the SEC’s website at http://www.sec.gov. The Funds’ Forms N-Q may be reviewed and copied at the SEC’s Public Reference Room in Washington, DC, and information on the operation of the Public Reference Room may be obtained by calling 800-SEC-0330. The Funds make their most recent Forms N-Q available to shareholders on www.aberdeen-asset.us or upon request without charge.
Statement Regarding Availability of Proxy Voting Record.
Information regarding the policies and procedures that the Funds use to determine how to vote proxies relating to portfolio securities is available without charge, upon request, by calling 866-667-9231. The information is also included in the Funds’ Statement of Additional Information, which is available on the Funds’ website at www.aberdeen-asset.us and on the SEC’s website at www.sec.gov.
Information relating to how each Fund voted proxies relating to portfolio securities held during the most recent twelve months ended June 30 is available by August 30 of the relevant year: (i) upon request and without charge by calling 866-667-9231; and (ii) on the SEC’s website at www.sec.gov.
The global financial markets weathered some turbulence over the 12-month period ended October 31, 2015. The main contributors to the volatility included the decline in global energy and commodity prices; concerns over decelerating economic growth in Europe and Asia (particularly China); aggressive quantitative easing (QE) programs from the European Central Bank (ECB) and the Bank of Japan; and uncertainty surrounding U.S. monetary policy. Later in the period, China’s devaluation of the yuan was also a factor.
The Morgan Stanley Capital International (MSCI) World Index, a global equity market benchmark, posted a modest gain of 2.3% for the reporting period. Shares of U.S. companies outperformed their European and Asian large-cap counterparts, The U.S. broader-market Standard & Poor’s (S&P) 500 Index advanced 5.2%, versus the 0.3% and -10.2% returns of the Financial Times Stock Exchange (FTSE) World Europe Index and the MSCI All-Country (AC) Asia-Pacific ex-Japan Index, respectively. Emerging-market stocks declined sharply, with the MSCI Emerging Markets (EM) Index returning -14.2%. There was significant weakness across the EM asset class, most notably in Latin America.
The U.S. equity market’s positive performance over the reporting period was attributable primarily to generally upbeat economic data and corporate earnings reports. The nation’s gross domestic product (GDP) increased in each quarter over the 12-month period, benefiting mainly from an upturn in consumer spending. Regarding monetary policy, the U.S. Federal Reserve (Fed) maintained the federal funds rate at or near 0% over the 12-month period, citing concerns about low inflation and global economic and geopolitical uncertainties. Towards the end of the period, however, a strong employment report led to growing speculation in the financial markets that the Fed could announce its first rate hike since 2006 before the end of the 2015 calendar year. The Fed subsequently raised the federal funds rate by 0.25% on December 16, noting that it sees the risks to the outlook for both economic activity and the labor market as balanced. The small increase still leaves borrowing costs exceptionally low. However, it may mark the beginning of the end of near-zero borrowing costs, a legacy of the worst financial crisis to hit the world economy in modern times.
European equities posted small gains despite investors’ worries regarding a possible Greek exit from the Eurozone, as well as the Swiss central bank’s unexpected de-pegging of the franc from the euro. Although the ECB maintained its QE program as the Eurozone economy gained modest momentum, we feel that risks remain. We believe that the ongoing weakness in oil prices may provide a renewed boost to household incomes and spending. UK stocks recorded losses during the reporting period and underperformed versus their European counterparts. While UK GDP rose modestly in all four quarters, the upturn was unbalanced; the service sector comprised the bulk of the growth, while there was a contraction in manufacturing.
Emerging markets stocks performed relatively well early in the reporting period in response to global monetary easing. Nonetheless, investors subsequently appeared to be unnerved by Greece’s financial crisis and renewed concerns over China’s economic slowdown. Latin America was the weakest-performing region. Brazil led the downturn, as S&P1 downgraded the country’s credit-rating to below-investment-grade. Additionally, dissatisfaction over the economy and the corruption scandal surrounding state-owned oil company Petrobras culminated in mass demonstrations calling for President Dilma Rousseff’s impeachment. Chinese equities saw only modest losses during the reporting period, as optimism over the central bank’s unexpected rate cut and the launch of a stock-trading link between Hong Kong and Shanghai counterbalanced concerns over weak economic data.
There was divergent performance among global fixed-income markets over the reporting period spurred by worries over economic growth and central banks’ monetary policy. Investment-grade bonds, as measured by the Barclays Global Aggregate Bond Index, lost ground. European issues were the weakest performers amid concerns regarding Greece’s future in the Eurozone and relatively sluggish economic data. U.S. investment-grade securities ended the reporting period with modest gains as yields declined in all but the shortest segments of the U.S. Treasury yield curve. Global high-yield securities outperformed their investment-grade counterparts. The Bank of America Merrill Lynch Global High Yield Constrained Index returned -0.6% for the reporting period, as strength in the European market partially offset weakness in the U.S. and Canada. Emerging-market debt, as represented by the J.P. Morgan EMBI Global Diversified Index, gained 0.4% for the period. The direction of oil price movements negatively drove investor sentiment in certain credits, but those countries less affected by the volatility of commodity prices benefited from yield-hungry investors looking beyond developed markets.
Outlook
We expect global growth in 2016 to be supported by improving trends in the developed-market economies.2 In the U.S., third-quarter 2015 GDP growth came in at an annualized rate of 1.5%, down from the 3.9% increase in the previous quarter. We believe that the “bumpy ride” could continue, though solid domestic momentum may potentially support growth in the fourth quarter of 2015.
With U.S. third-quarter earnings generally exceeding expectations and signs that the Chinese economy may be stabilizing at a slower growth rate, we are uncertain if recent global equity market gains can be extended or if they merely constitute a short-lived rally. Persistent disinflationary pressures in both developed- and emerging-market economies also may continue to weigh on investor sentiment. Despite the global headwinds, our fundamentals-driven equity investment process remains underpinned by a focus on high-quality companies.
Anne Richards
Chief Investment Officer
Aberdeen Asset Management
| 1 | Standard & Poor’s credit ratings express the agency’s opinion about the ability and willingness of an issuer, such as a corporation or state or city government, to meet its financial obligations in full and on time. Typically, ratings are expressed as letter grades that range, for example, from “AAA” to “D” to communicate the agency’s opinion of relative level of credit risk. Ratings from “AA” to “CCC” may be modified by the addition of a plus (+) or minus (-) sign to show relative standing within the major rating categories. |
| 2 | Forecasts and estimates are offered as opinion and are not reflective of potential performance, are not guaranteed and actual events or results may differ materially. |
Indexes are unmanaged and have been provided for comparison purposes only. No fees or expenses are reflected. You cannot invest directly in an index.
Annual Report 2015
2
Aberdeen Select International Equity Fund (Unaudited)
The Aberdeen Select International Equity Fund (Institutional Class shares net of fees)1 returned -14.40% for the 12-month period ended October 31, 2015, versus -4.26% for its benchmark, the MSCI All Country (AC) World ex USA Index, during the same period. For broader comparison, the average return of the Fund’s peer category of International Multi-Cap Growth Funds (consisting of 129 funds), as measured by Lipper, Inc., was 0.17% for the period.
International equities declined during the 12-month period ended October 31, 2015. Global market volatility, concerns over the health of the world economy and uncertainty about U.S. monetary policy weighed on investor sentiment for much of the period. Although the U.S. Federal Reserve (Fed) officially ended its bond-buying program, the Bank of Japan’s increased stimulus, along with the launch of the European Central Bank’s quantitative easing, kept markets awash with liquidity. However, concerns over a commodity rout soon took over. Oversupply worries were exacerbated by the prospect of a resumption of crude oil production in Iran following an agreement with several major Western nations to monitor the country’s nuclear program. Equity markets heavily exposed to natural resources, such as those in Russia, Brazil and Nigeria, suffered the most from declining energy and commodity prices. Towards the end of the review period, macroeconomic headlines reflected expectations of slowing global growth and deflationary pressures – most recently, the fallout from China’s decision to marginally devalue the yuan in August 2015 amid further contractions in manufacturing. The International Monetary Fund (IMF) warned of a rising risk of global recession as it again downgraded its growth outlook. Although it initially appeared that the Fed was on track to normalize interest rates, concerns over the health of the world economy prompted it to keep rates near all-time lows. Investor sentiment was slightly dented at the end of the review period by the Fed’s hawkish statements indicating that a December rate lift-off was still firmly in the cards.
The top detractors from the Fund’s performance relative to its benchmark for the reporting period were Banco Bradesco, miner Vale and UK engineering company Weir Group. Banco Bradesco’s shares slumped following the largest acquisition in its history – UK exchange-listed bank HSBC’s money-losing Brazilian operations – and Standard & Poor’s2 downgrade of Brazil’s rating to below-investment-grade had a knock-on effect on the lender’s perceived creditworthiness. Lower iron ore prices and softening end-markets hampered Vale’s results over the reporting period. Weir Group’s profits declined on the back of the oil price slump, and it was pushed out of the FTSE 100 Index. The company cut jobs and launched a savings drive, largely in its natural gas fracking-focused U.S. division, in response to the market downturn.
The main contributors to Fund performance for the period were semiconductor maker Samsung Electronics, Japan Tobacco and British American Tobacco. Samsung will repurchase and cancel US$10 billion in common and preferred shares, which the Fund owns. This marks the biggest buyback in Samsung’s history and the first time in 10 years that it will cancel shares. The company also posted better-than-expected corporate results over the reporting period, attributable to improved earnings across most of its business units and a favorable currency translation3 effect. Japan Tobacco posted healthy corporate results over the period, supported by overseas sales of its flagship cigarette brands, which include Winston, Camel and Benson & Hedges. In April 2015, Japan Tobacco entered the U.S. vapor market by acquiring electronic cigarette company Logic Technology Development for an undisclosed sum. British American Tobacco benefited from better-than-expected results during the period, as its key brands continued to gain market share.
Regarding Fund activity over the reporting period, we initiated holdings in UK insurance company Prudential, as we believe that it is an attractive franchise with a sound balance sheet; Israel-based IT services company Check Point Software, which in our view has a solid market position within infrastructure software and network security; Fresenius Medical Care, a German healthcare services provider, which we feel is well-placed to benefit from aging population trends and steady growth in the global dialysis market; and German household products manufacturer Henkel, which has an established market position in its core portfolio, which includes industrial adhesives. We believe that Henkel’s business is financially well-managed, and the capable management team has demonstrated the ability to earn robust returns on invested capital. We also established a new position in Singapore lender OCBC in a move to bring the Fund in line with our Europe, Australasia and Far East (EAFE) model. Previously, there were restrictions on buying the stock due to holding limits.
Conversely, we exited the positions in South32, whose stock we had received when it was spun off from its parent, Australian miner BHP Billiton, earlier this year; UK utility company Centrica due to increased regulatory and political interference; oil and gas exploration and production company Eni due to our concerns over the sustainability of its dividend; oil and gas company Petrochina after a period of relative share price strength; Brazilian state-owned oil company Petrobras because we felt that its business quality was deteriorating; and Schindler Holding on our valuation concerns and weakening end-markets, particularly China, which in our view is the most important new market for elevator installations worldwide.
In our opinion, the renewed prospect of higher U.S. borrowing costs may keep investors nervous in the near term. With U.S. third-quarter
| 1 | The performance quoted represents past performance, which does not guarantee future results. The investment return and principal value of an investment will fluctuate so that an investor’s shares, when redeemed, may be worth more or less than their original cost. Current performance of the Fund may be lower or higher than the performance quoted. Performance data current to the most recent month-end may be obtained by calling 866-667-9231 or visiting aberdeen-asset.us. |
| 2 | Standard & Poor’s credit ratings express the agency’s opinion about the ability and willingness of an issuer, such as a corporation or state or city government, to meet its financial obligations in full and on time. Typically, ratings are expressed as letter grades that range, for example, from “AAA” to “D” to communicate the agency’s opinion of relative level of credit risk. Ratings from “AA” to “CCC” may be modified by the addition of a plus (+) or minus (-) sign to show relative standing within the major rating categories. |
| 3 | Currency translation comprises the process of quoting the amount of money denominated in one currency in the denomination of another currency on a corporate balance sheet. |
2015 Annual Report
3
Aberdeen Select International Equity Fund (Unaudited) (concluded)
2015 earnings reports generally exceeding expectations thus far, and signs that the Chinese economy may be stabilizing at a slower growth rate, we believe that it remains to be seen if recent gains can be extended, or if they merely constitute a short-lived rally. Persistent disinflationary pressures in both developed and emerging economies also may potentially continue to weigh on investor sentiment. Despite the global headwinds, quality serves to underline our fundamentals-driven investment process. Rather than chasing momentum, we continue to focus on a bottom-up approach in an effort to build a diversified4 portfolio of well-managed businesses.
Portfolio Management:
Aberdeen Global Equity Team
PAST PERFORMANCE DOES NOT GUARANTEE FUTURE RESULTS.
The performance quoted represents past performance, which does not guarantee future results. Class A shares have up to a 0.25% 12b-1 fee. The investment return and principal value of an investment will fluctuate so that an investor’s shares, when redeemed, may be worth more or less than their original cost. Current performance of the Fund may be lower or higher than the performance quoted. Performance data current to the most recent month-end may be obtained by calling 866-667-9231 or visiting www.aberdeen-asset.us.
Investing in mutual funds involves risk, including the possible loss of principal. There is no assurance that the investment objective of any fund will be achieved. Indexes are unmanaged and have been provided for comparison purposes only. No fees or expenses are reflected. You cannot invest directly in an index.
Lipper is a leading global provider of mutual fund information and analysis to fund companies, financial intermediaries and media organizations.
Risk Considerations
Foreign securities may be more volatile, harder to price and less liquid than U.S. securities. They are subject to different accounting and regulatory standards, political and economic risks and, to the extent denominated in foreign currencies, currency exchange rate risk (unless otherwise hedged). These risks are enhanced in emerging markets countries.
Equity stocks of small and mid-cap companies carry greater risk and more volatility than equity stocks of larger, more established companies.
Stocks issued by large cap companies subject the Fund to the risk that those stocks may underperform stocks issued by companies with smaller capitalizations or the market as a whole.
Investing a significant portion of the Fund’s assets in securities of companies conducting business in a broadly related group of industries within an economic sector may make the Fund more vulnerable to unfavorable developments in that sector.
Please read the prospectus for more detailed information regarding these and other risks.
| 4 | Diversification does not ensure a profit or protect against a loss in a declining market. |
Annual Report 2015
4
Aberdeen Select International Equity Fund (Unaudited)
Average Annual Total Return (For periods ended October 31, 2015) | 1 Yr. | 5 Yr. | 10 Yr. | |||||||
Class A | (14.62%) | (2.50% | ) | 0.65% | ||||||
Institutional Class | (14.40%) | (2.27% | ) | 0.90% | ||||||
2015 Annual Report
5
Aberdeen Select International Equity Fund (Unaudited)
Performance of a $10,000 Investment (as of October 31, 2015)
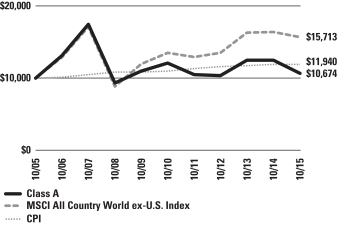
Comparative performance of $10,000 invested in Class A shares of the Aberdeen Select International Equity Fund, Morgan Stanley Capital International All Country World ex-U.S. Index (MSCI ACWI ex-U.S. Index), and the Consumer Price Index (CPI) over a 10-year period ended October 31, 2015. Unlike the Fund’s returns, the returns for these unmanaged indexes do not reflect any fees or expenses. Investors cannot invest directly in market indexes.
The MSCI ACWI ex-U.S. Index captures large and mid cap representation across 22 of 23 Developed Markets (DM) countries (excluding the United States (U.S.) and 23 Emerging Markets (EM) countries). With 1,839 constituents, the index covers approximately 85% of the global equity opportunity set outside the U.S.
The CPI is a measure of the average change over time in the prices paid by urban consumers for a market basket of consumer goods and services.
Investment return and principal value will fluctuate, and when redeemed, shares may be worth more or less than original cost. Past performance is no guarantee of future results. The Average Annual Total Return table and performance graph do not reflect the deduction of taxes that a shareholder would pay on Fund distributions or the redemption of Fund shares. Investing in mutual funds involves market risk, including loss of principal. Performance returns assume the reinvestment of all distributions. Performance returns reflect fee waivers and reimbursements in effect without which returns would have been lower.
Portfolio Summary (as a percentage of net assets)
October 31, 2015 (Unaudited)
| Asset Allocation | ||||
Common Stocks | 89.0% | |||
Preferred Stocks | 9.2% | |||
Repurchase Agreement | 1.3% | |||
Exchange Traded Funds | –% | 1 | ||
Government Bonds | –% | 1 | ||
Other assets in excess of liabilities | 0.5% | |||
| 100.0% | ||||
| 1 | Represents a security that is fair valued at zero pursuant to procedures approved by the Fund’s Board of Trustees. See Note 2(a) of the accompanying Notes to Financial Statements. |
The following table summarizes the composition of the Fund’s portfolio, in Standard & Poor’s Global Industry Classification Standard (GICS) sectors, expressed as a percentage of net assets. The GICS structure consists of 10 sectors, 24 industry groups, 67 industries and 156 sub-industries. As of October 31, 2015, the Fund did not have more than 25% of its assets invested in any industry group.
| Top Sectors | ||||
Financials | 18.2% | |||
Consumer Staples | 18.0% | |||
Industrials | 15.9% | |||
Information Technology | 11.3% | |||
Health Care | 10.6% | |||
Materials | 9.1% | |||
Telecommunication Services | 7.7% | |||
Energy | 6.3% | |||
Utilities | 1.1% | |||
Other | 1.8% | |||
| 100.0% | ||||
| Top Holdings* | ||||
Roche Holding AG | 4.5% | |||
Novartis AG | 4.3% | |||
Samsung Electronics Co. Ltd., Preferred Shares | 4.2% | |||
Japan Tobacco, Inc. | 4.0% | |||
British American Tobacco PLC | 3.8% | |||
Nestle SA | 3.5% | |||
Taiwan Semiconductor Manufacturing Co. Ltd. | 3.5% | |||
Royal Dutch Shell PLC, B Shares | 3.3% | |||
Fomento Economico Mexicano SAB de CV, ADR | 3.2% | |||
Shin-Etsu Chemical Co. Ltd. | 3.1% | |||
Other | 62.6% | |||
| 100.0% | ||||
| * | For the purpose of listing top holdings, repurchase agreements are included as part of Other. |
| Top Countries | ||||
United Kingdom | 22.4% | |||
Switzerland | 13.9% | |||
Japan | 10.9% | |||
Hong Kong | 6.1% | |||
Canada | 5.7% | |||
Singapore | 5.3% | |||
Germany | 5.1% | |||
Sweden | 4.9% | |||
France | 4.4% | |||
Republic of South Korea | 4.2% | |||
Other | 17.1% | |||
| 100.0% | ||||
Annual Report 2015
6
Statement of Investments
October 31, 2015
Aberdeen Select International Equity Fund
| Shares or Principal Amount | Value | |||||||
COMMON STOCKS (89.0%) | ||||||||
CANADA (5.7%) | ||||||||
Industrials (2.2%) | ||||||||
Canadian National Railway Co. | 104,600 | $ | 6,389,111 | |||||
Materials (1.9%) | ||||||||
Potash Corp. of Saskatchewan, Inc. | 269,400 | 5,455,577 | ||||||
Telecommunication Services (1.6%) | ||||||||
TELUS Corp. | 133,700 | 4,462,120 | ||||||
| 16,306,808 | ||||||||
FRANCE (4.4%) | ||||||||
Consumer Staples (1.8%) | ||||||||
Casino Guichard-Perrachon SA (a) | 87,600 | 5,033,036 | ||||||
Industrials (1.5%) | ||||||||
Schneider Electric SE (a) | 73,400 | 4,427,131 | ||||||
Utilities (1.1%) | ||||||||
Engie (a) | 181,300 | 3,172,894 | ||||||
| 12,633,061 | ||||||||
GERMANY (3.4%) | ||||||||
Health Care (1.8%) | ||||||||
Fresenius Medical Care AG & Co. KGaA (a) | 57,200 | 5,148,429 | ||||||
Materials (1.6%) | ||||||||
Linde AG (a) | 26,200 | 4,544,532 | ||||||
| 9,692,961 | ||||||||
HONG KONG (6.1%) | ||||||||
Financials (3.8%) | ||||||||
AIA Group Ltd. (a) | 1,308,600 | 7,664,340 | ||||||
Swire Pacific Ltd., Class A (a) | 264,000 | 3,060,301 | ||||||
| 10,724,641 | ||||||||
Industrials (2.3%) | ||||||||
Jardine Matheson Holdings Ltd. (a) | 121,500 | 6,606,724 | ||||||
| 17,331,365 | ||||||||
ISRAEL (2.0%) | ||||||||
Information Technology (2.0%) | ||||||||
Check Point Software Technologies Ltd. (b) | 68,990 | 5,860,011 | ||||||
ITALY (1.4%) | ||||||||
Energy (1.4%) | ||||||||
Tenaris SA, ADR | 161,700 | 4,086,159 | ||||||
JAPAN (10.9%) | ||||||||
Consumer Staples (4.0%) | ||||||||
Japan Tobacco, Inc. (a) | 332,100 | 11,494,575 | ||||||
Financials (1.3%) | ||||||||
Daito Trust Construction Co. Ltd. (a) | 33,500 | 3,626,251 | ||||||
Industrials (2.5%) | ||||||||
FANUC Corp. (a) | 40,800 | 7,198,811 | ||||||
Materials (3.1%) | ||||||||
Shin-Etsu Chemical Co. Ltd. (a) | 151,600 | 9,015,523 | ||||||
| 31,335,160 | ||||||||
LATVIA (0.0%) | ||||||||
Financials (0.0%) | ||||||||
AS Parex Banka (a)(b) | 1,424,182 | 2 | ||||||
MEXICO (3.2%) | ||||||||
Consumer Staples (3.2%) | ||||||||
Fomento Economico Mexicano | 93,000 | 9,215,370 | ||||||
SERBIA (0.0%) | ||||||||
Industrials (0.0%) | ||||||||
Toza Markovic ad Kikinda (a)(b)(c)(d) | 78,160 | 0 | ||||||
SINGAPORE (5.3%) | ||||||||
Financials (2.6%) | ||||||||
City Developments Ltd. (a) | 706,000 | 3,995,474 | ||||||
Oversea-Chinese Banking Corp. Ltd. (a) | 540,229 | 3,472,512 | ||||||
| 7,467,986 | ||||||||
Telecommunication Services (2.7%) | ||||||||
Singapore Telecommunications Ltd. (a) | 2,692,600 | 7,650,355 | ||||||
| 15,118,341 | ||||||||
SOUTH AFRICA (1.9%) | ||||||||
Telecommunication Services (1.9%) | ||||||||
MTN Group Ltd. (a) | 475,800 | 5,416,798 | ||||||
SWEDEN (4.9%) | ||||||||
Financials (1.5%) | ||||||||
Nordea Bank AB (a) | 401,300 | 4,427,797 | ||||||
Industrials (1.8%) | ||||||||
Atlas Copco AB, A Shares (a) | 198,462 | 5,172,056 | ||||||
Information Technology (1.6%) | ||||||||
Telefonaktiebolaget LM Ericsson, B Shares (a) | 458,600 | 4,463,326 | ||||||
| 14,063,179 | ||||||||
SWITZERLAND (13.9%) | ||||||||
Consumer Staples (3.5%) | ||||||||
Nestle SA (a) | 131,400 | 10,035,535 | ||||||
Financials (1.6%) | ||||||||
Zurich Insurance Group AG (a)(b) | 16,935 | 4,469,145 | ||||||
Health Care (8.8%) | ||||||||
Novartis AG (a) | 135,600 | 12,283,821 | ||||||
Roche Holding AG (a) | 47,800 | 12,977,646 | ||||||
| 25,261,467 | ||||||||
| 39,766,147 | ||||||||
TAIWAN (3.5%) | ||||||||
Information Technology (3.5%) | ||||||||
Taiwan Semiconductor | 2,347,000 | 9,889,473 | ||||||
See accompanying Notes to Financial Statements.
2015 Annual Report
7
Statement of Investments (concluded)
October 31, 2015
Aberdeen Select International Equity Fund
| Shares or Principal Amount | Value | |||||||
UNITED KINGDOM (22.4%) | ||||||||
Consumer Staples (3.8%) | ||||||||
British American Tobacco PLC (a) | 182,900 | $ | 10,866,007 | |||||
Energy (4.9%) | ||||||||
John Wood Group PLC (a) | 509,200 | 4,674,647 | ||||||
Royal Dutch Shell PLC, B Shares (a) | 360,000 | 9,426,559 | ||||||
| 14,101,206 | ||||||||
Financials (5.6%) | ||||||||
HSBC Holdings PLC (a) | 747,200 | 5,837,848 | ||||||
Prudential PLC (a) | 186,500 | 4,355,983 | ||||||
Standard Chartered PLC (a) | 519,897 | 5,771,186 | ||||||
| 15,965,017 | ||||||||
Industrials (5.6%) | ||||||||
Experian PLC (a) | 357,800 | 6,096,934 | ||||||
Rolls-Royce Holdings PLC (a)(b) | 559,706 | 5,918,616 | ||||||
Weir Group PLC (The) (a) | 253,600 | 4,166,105 | ||||||
| 16,181,655 | ||||||||
Materials (1.0%) | ||||||||
BHP Billiton PLC (a) | 174,300 | 2,786,015 | ||||||
Telecommunication Services (1.5%) | ||||||||
Vodafone Group PLC (a) | 1,273,600 | 4,191,331 | ||||||
| 64,091,231 | ||||||||
VENEZUELA (0.0%) | ||||||||
Financials (0.0%) | ||||||||
Banco Provincial SA-Banco Universal (a)(c) | 18,422 | 0 | ||||||
Banco Venezolano de Credito SA (a)(b)(c) | 156 | 0 | ||||||
| – | ||||||||
Industrials (0.0%) | ||||||||
Cemex Venezuela SACA-I (a)(b)(c) | 15,843,815 | 0 | ||||||
| – | ||||||||
Total Common Stocks | 254,806,066 | |||||||
EXCHANGE TRADED FUNDS (0.0%) | ||||||||
RUSSIA (0.0%) | ||||||||
Renaissance Pre-IPO Fund (a)(b)(c) | 92,634 | 0 | ||||||
Total Exchange Traded Funds | 0 | |||||||
GOVERNMENT BONDS (0.0%) | ||||||||
VENEZUELA (0.0%) | ||||||||
Bonos de la Deuda Publica Nacional (VEF), | 49,500,000 | – | ||||||
Bonos de la Deuda Publica Nacional (VEF), | 10,000,000 | – | ||||||
Bonos de la Deuda Publica Nacional (VEF), | 20,000,000 | – | ||||||
| – | ||||||||
Total Government Bonds | 0 | |||||||
PREFERRED STOCKS (9.2%) | ||||||||
BRAZIL (3.3%) | ||||||||
Financials (1.8%) | ||||||||
Banco Bradesco SA, ADR, Preferred Shares | 957,200 | 5,207,168 | ||||||
Materials (1.5%) | ||||||||
Vale SA, ADR, Preferred Shares | 1,136,400 | 4,091,040 | ||||||
| 9,298,208 | ||||||||
GERMANY (1.7%) | ||||||||
Consumer Staples (1.7%) | ||||||||
Henkel AG & Co. KGaA, Preferred Shares (a) | 44,300 | 4,804,487 | ||||||
REPUBLIC OF SOUTH KOREA (4.2%) | ||||||||
Information Technology (4.2%) | ||||||||
Samsung Electronics Co. Ltd., Preferred Shares (a) | 11,600 | 12,115,963 | ||||||
UNITED KINGDOM (0.0%) | ||||||||
Industrials (0.0%) | ||||||||
Rolls-Royce Holdings PLC, Preferred Shares (b) | 51,884,746 | 79,986 | ||||||
Total Preferred Stocks | 26,298,644 | |||||||
REPURCHASE AGREEMENT (1.3%) | ||||||||
UNITED STATES (1.3%) | ||||||||
Repurchase Agreement, Fixed Income Clearing Corp., 0.00%, dated 10/30/2015, due 11/02/2015, repurchase price $3,623,854 collateralized by U.S. Treasury Notes, maturing 03/31/2022; total market value of $3,701,069 | $ | 3,623,854 | 3,623,854 | |||||
Total Repurchase Agreement | 3,623,854 | |||||||
Total Investments | 284,728,564 | |||||||
Other assets in excess of liabilities—0.5% | 1,349,074 | |||||||
Net Assets—100.0% | $ | 286,077,638 | ||||||
| (a) | Fair Valued Security. Fair Values are determined pursuant to procedures approved by the Fund’s Board of Trustees. See Note 2(a) of the accompanying Notes to Financial Statements. |
| (b) | Non-income producing security. |
| (c) | The Fund’s adviser has deemed this security to be illiquid based upon procedures approved by the Board of Trustees. Illiquid securities held by the Fund represent 0.00% of net assets as of October 31, 2015. |
| (d) | Investment in affiliate. |
| (e) | See accompanying Notes to Financial Statements for tax unrealized appreciation/depreciation of securities. |
| ADR | American Depositary Receipt |
See accompanying Notes to Financial Statements.
Annual Report 2015
8
Aberdeen Select International Equity Fund II (Unaudited)
Aberdeen Select International Equity Fund II (Institutional Class shares net of fees)1 returned -13.96% for the 12-month period ended October 31, 2015, versus -4.26% for its benchmark, the MSCI All Country (AC) World ex U.S.A. Index, during the same period. For broader comparison, the average return of the Fund’s peer category of International Multi-Cap Growth Funds (consisting of 129 funds), as measured by Lipper, Inc., was 0.17% for the period.
International equities declined during the 12-month period ended October 31, 2015. Global market volatility, concerns over the health of the world economy and uncertainty about U.S. monetary policy weighed on investor sentiment for much of the period. Although the U.S. Federal Reserve (Fed) officially ended its bond-buying program, the Bank of Japan’s increased stimulus, along with the launch of the European Central Bank’s quantitative easing, kept markets awash with liquidity. However, concerns over a commodity rout soon took over. Oversupply worries were exacerbated by the prospect of a resumption of crude oil production in Iran following an agreement with several major Western nations to monitor the country’s nuclear program. Equity markets heavily exposed to natural resources, such as those in Russia, Brazil and Nigeria, suffered the most from declining energy and commodity prices. Towards the end of the review period, macroeconomic headlines reflected expectations of slowing global growth and deflationary pressures – most recently, the fallout from China’s decision to marginally devalue the yuan in August 2015 amid further contractions in manufacturing. The International Monetary Fund (IMF) warned of a rising risk of global recession as it again downgraded its growth outlook. Although it initially appeared that the Fed was on track to normalize interest rates, concerns over the health of the world economy prompted it to keep rates near to all-time lows. Investor sentiment was slightly dented at the end of the review period by the Fed’s hawkish statements indicating that a December rate lift-off was still firmly in the cards.
The top detractors from the Fund’s performance relative to its benchmark, the MSCI AC World ex USA Index, for the reporting period were Banco Bradesco, miner Vale and UK engineering company Weir Group. Banco Bradesco’s shares slumped following the largest acquisition in its history – UK exchange-listed bank HSBC’s money-losing Brazilian operations – and Standard & Poor’s2 downgrade of Brazil’s rating to below-investment-grade had a knock-on effect on the lender’s perceived creditworthiness. Lower iron ore prices and softening end-markets hampered Vale’s results over the reporting period. Weir Group’s profits declined on the back of the oil price slump, and it was pushed out of the FTSE 100 Index. The company cut jobs and launched a savings drive, largely in its natural gas fracking-focused U.S. division, in response to the market downturn.
The main contributors to Fund performance for the period were semiconductor maker Samsung Electronics, Japan Tobacco and British American Tobacco. Samsung will repurchase and cancel US$10 billion in common and preferred shares, which the Fund owns. This marks the biggest buyback in Samsung’s history and the first time in 10 years that it will cancel shares. The company also posted better-than-expected corporate results over the reporting period, attributable to improved earnings across most of its business units and a favorable currency translation3 effect. Japan Tobacco posted healthy corporate results over the period, supported by overseas sales of its flagship cigarette brands, which include Winston, Camel and Benson & Hedges. In April 2015, Japan Tobacco entered the U.S. vapor market by acquiring electronic cigarette company Logic Technology Development for an undisclosed sum. British American Tobacco benefited from better-than-expected results during the period, as its key brands continued to gain market share.
Regarding Fund activity over the reporting period, we initiated holdings in UK insurance company Prudential, as we believe that it is an attractive franchise with a sound balance sheet; Israel-based IT services company Check Point Software, which in our view has a solid market position within infrastructure software and network security; Fresenius Medical Care, a German healthcare services provider, which we feel is well-placed to benefit from aging population trends and steady growth in the global dialysis market; and German household products manufacturer Henkel, which has an established market position in its core portfolio, which includes industrial adhesives. We believe that Henkel’s business is financially well-managed, and the capable management team has demonstrated the ability to earn robust returns on invested capital. We also established a new position in Singapore lender OCBC in a move to bring the Fund in line with our Europe, Australasia and Far East (EAFE) model. Previously, there were restrictions on buying the stock due to holding limits.
Conversely, we exited the positions in South32, whose stock we had received when it was spun off from its parent, Australian miner BHP Billiton, earlier this year; UK utility company Centrica due to increased regulatory and political interference; oil and gas exploration and production company Eni due to our concerns over the sustainability of its dividend; oil and gas company Petrochina after a period of relative share price strength; Brazilian state-owned oil company Petrobras because we felt that its business quality was deteriorating; and Schindler Holding on our valuation concerns and weakening end-markets, particularly China, which in our view is the most important new market for elevator installations worldwide.
In our opinion, the renewed prospect of higher U.S. borrowing costs may keep investors nervous in the near term. With U.S. third-quarter
| 1 | The performance quoted represents past performance, which does not guarantee future results. The investment return and principal value of an investment will fluctuate so that an investor’s shares, when redeemed, may be worth more or less than their original cost. Current performance of the Fund may be lower or higher than the performance quoted. Performance data current to the most recent month-end may be obtained by calling 866-667-9231 or visiting aberdeen-asset.us. |
| 2 | Standard & Poor’s credit ratings express the agency’s opinion about the ability and willingness of an issuer, such as a corporation or state or city government, to meet its financial obligations in full and on time. Typically, ratings are expressed as letter grades that range, for example, from “AAA” to “D” to communicate the agency’s opinion of relative level of credit risk. Ratings from “AA” to “CCC” may be modified by the addition of a plus (+) or minus (-) sign to show relative standing within the major rating categories. |
| 3 | Currency translation comprises the process of quoting the amount of money denominated in one currency in the denomination of another currency on a corporate balance sheet. |
2015 Annual Report
9
Aberdeen Select International Equity Fund II (Unaudited) (concluded)
2015 earnings reports generally exceeding expectations thus far, and signs that the Chinese economy may be stabilizing at a slower growth rate, we believe that it remains to be seen if recent gains can be extended, or if they merely constitute a short-lived rally. Persistent disinflationary pressures in both developed and emerging economies also may potentially continue to weigh on investor sentiment. Despite the global headwinds, quality serves to underline our fundamentals-driven investment process. Rather than chasing momentum, we continue to focus on a bottom-up approach in an effort to build a diversified portfolio of well-managed businesses.
Portfolio Management:
Aberdeen Global Equity Team
PAST PERFORMANCE DOES NOT GUARANTEE FUTURE RESULTS.
The performance quoted represents past performance, which does not guarantee future results. Class A Shares have up to a 0.25% 12b-1 fee. The investment return and principal value of an investment will fluctuate so that an investor’s shares, when redeemed, may be worth more or less than their original cost. Current performance of the Fund may be lower or higher than the performance quoted. Performance data current to the most recent month-end may be obtained by calling 866-667-9231 or visiting www.aberdeen-asset.us.
Investing in mutual funds involves risk, including the possible loss of principal. There is no assurance that the investment objective of any fund will be achieved. Indexes are unmanaged and have been provided for comparison purposes only. No fees or expenses are reflected. You cannot invest directly in an index.
Lipper is a leading global provider of mutual fund information and analysis to fund companies, financial intermediaries and media organizations.
Risk Considerations
Foreign securities may be more volatile, harder to price and less liquid than U.S. securities. They are subject to different accounting and regulatory standards, political and economic risks and, to the extent denominated in foreign currencies, currency exchange rate risk (unless otherwise hedged). These risks are enhanced in emerging markets countries.
Equity stocks of small- and mid-cap companies carry greater risk and more volatility than equity stocks of larger, more established companies.
Stocks issued by large cap companies subject the Fund to the risk that those stocks may underperform stocks issued by companies with smaller capitalizations or the market as a whole.
Investing a significant portion of the Fund’s assets in securities of companies conducting business in a broadly related group of industries within an economic sector may make the Fund more vulnerable to unfavorable developments in that sector.
Please read the prospectus for more detailed information regarding these and other risks.
Annual Report 2015
10
Aberdeen Select International Equity Fund II (Unaudited)
Average Annual Total Return (For periods ended October 31, 2015) | 1 Yr. | 5 Yr. | 10 Yr. | |||||||
Class A | (14.16%) | (1.81% | ) | 1.26% | ||||||
Institutional Class | (13.96%) | (1.57% | ) | 1.52% | ||||||
2015 Annual Report
11
Aberdeen Select International Equity Fund II (Unaudited)
Performance of a $10,000 Investment (as of October 31, 2015)
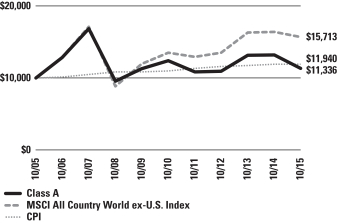
Comparative performance of $10,000 invested in Class A shares of the Aberdeen Select International Equity Fund II, Morgan Stanley Capital International All Country World ex-U.S. Index (MSCI ACWI ex-U.S. Index), and the Consumer Price Index (CPI) over a 10-year period ended October 31, 2015. Unlike the Fund’s returns, the returns for these unmanaged indexes do not reflect any fees or expenses. Investors cannot invest directly in market indexes.
The MSCI ACWI ex-U.S. Index captures large and mid cap representation across 22 of 23 Developed Markets (DM) countries (excluding the United States (U.S.) and 23 Emerging Markets (EM) countries). With 1,839 constituents, the index covers approximately 85% of the global equity opportunity set outside the U.S.
The CPI is a measure of the average change over time in the prices paid by urban consumers for a market basket of consumer goods and services.
Investment return and principal value will fluctuate, and when redeemed, shares may be worth more or less than original cost. Past performance is no guarantee of future results. The Average Annual Total Return table and performance graph do not reflect the deduction of taxes that a shareholder would pay on Fund distributions or the redemption of Fund shares. Investing in mutual funds involves market risk, including loss of principal. Performance returns assume the reinvestment of all distributions. Performance returns reflect fee waivers and reimbursements in effect without which returns would have been lower.
Portfolio Summary (as a percentage of net assets)
October 31, 2015 (Unaudited)
| Asset Allocation | ||||
Common Stocks | 85.9% | |||
Preferred Stocks | 9.6% | |||
Repurchase Agreement | 3.7% | |||
Other assets in excess of liabilities | 0.8% | |||
| 100.0% | ||||
The following table summarizes the composition of the Fund’s portfolio, in Standard & Poor’s Global Industry Classification Standard (GICS) sectors, expressed as a percentage of net assets. The GICS structure consists of 10 sectors, 24 industry groups, 67 industries and 156 sub-industries. As of October 31, 2015, the Fund did not have more than 25% of its assets invested in any industry group.
| Top Sectors | ||||
Consumer Staples | 17.2% | |||
Financials | 16.8% | |||
Industrials | 15.9% | |||
Information Technology | 11.9% | |||
Health Care | 10.4% | |||
Materials | 9.2% | |||
Telecommunication Services | 7.1% | |||
Energy | 5.9% | |||
Utilities | 1.1% | |||
Other | 4.5% | |||
| 100.0% | ||||
| Top Holdings* | ||||
Samsung Electronics Co. Ltd., Preferred Shares | 4.8% | |||
Roche Holding AG | 4.5% | |||
Novartis AG | 4.2% | |||
Japan Tobacco, Inc. | 4.0% | |||
British American Tobacco PLC | 3.7% | |||
Taiwan Semiconductor Manufacturing Co. Ltd. | 3.6% | |||
Nestle SA | 3.5% | |||
Shin-Etsu Chemical Co. Ltd. | 3.3% | |||
Royal Dutch Shell PLC, B Shares | 3.1% | |||
Fomento Economico Mexicano SAB de CV, ADR | 2.7% | |||
Other | 62.6% | |||
| 100.0% | ||||
| * | For the purpose of listing top holdings, repurchase agreements are included as part of Other. |
| Top Countries | ||||
United Kingdom | 21.0% | |||
Switzerland | 13.7% | |||
Japan | 10.8% | |||
Hong Kong | 5.9% | |||
Canada | 5.5% | |||
Singapore | 5.0% | |||
Sweden | 4.9% | |||
Germany | 4.9% | |||
Republic of South Korea | 4.8% | |||
France | 4.4% | |||
Other | 19.1% | |||
| 100.0% | ||||
Annual Report 2015
12
Statement of Investments
October 31, 2015
Aberdeen Select International Equity Fund II
| Shares or Principal Amount | Value | |||||||
COMMON STOCKS (85.9%) | ||||||||
CANADA (5.5%) | ||||||||
Industrials (2.1%) | ||||||||
Canadian National Railway Co. | 51,100 | $ | 3,121,258 | |||||
Materials (1.9%) | ||||||||
Potash Corp. of Saskatchewan, Inc. | 137,100 | 2,776,390 | ||||||
Telecommunication Services (1.5%) | ||||||||
TELUS Corp. | 68,000 | 2,269,440 | ||||||
| 8,167,088 | ||||||||
FRANCE (4.4%) | ||||||||
Consumer Staples (1.7%) | ||||||||
Casino Guichard-Perrachon SA (a) | 44,000 | 2,528,009 | ||||||
Industrials (1.6%) | ||||||||
Schneider Electric SE (a) | 39,500 | 2,382,448 | ||||||
Utilities (1.1%) | ||||||||
Engie (a) | 88,200 | 1,543,570 | ||||||
| 6,454,027 | ||||||||
GERMANY (3.3%) | ||||||||
Health Care (1.7%) | ||||||||
Fresenius Medical Care AG & Co. KGaA (a) | 28,600 | 2,574,214 | ||||||
Materials (1.6%) | ||||||||
Linde AG (a) | 13,400 | 2,324,303 | ||||||
| 4,898,517 | ||||||||
HONG KONG (5.9%) | ||||||||
Financials (3.7%) | ||||||||
AIA Group Ltd. (a) | 676,800 | 3,963,950 | ||||||
Swire Pacific Ltd., Class A (a) | 125,000 | 1,449,006 | ||||||
| 5,412,956 | ||||||||
Industrials (2.2%) | ||||||||
Jardine Matheson Holdings Ltd. (a) | 61,200 | 3,327,832 | ||||||
| 8,740,788 | ||||||||
ISRAEL (2.0%) | ||||||||
Information Technology (2.0%) | ||||||||
Check Point Software Technologies Ltd. (b) | 34,510 | 2,931,279 | ||||||
ITALY (1.4%) | ||||||||
Energy (1.4%) | ||||||||
Tenaris SA, ADR | 82,700 | 2,089,829 | ||||||
JAPAN (10.8%) | ||||||||
Consumer Staples (4.0%) | ||||||||
Japan Tobacco, Inc. (a) | 169,200 | 5,856,315 | ||||||
Financials (1.0%) | ||||||||
Daito Trust Construction Co. Ltd. (a) | 13,700 | 1,482,974 | ||||||
Industrials (2.5%) | ||||||||
FANUC Corp. (a) | 20,800 | 3,669,982 | ||||||
Materials (3.3%) | ||||||||
Shin-Etsu Chemical Co. Ltd. (a) | 83,000 | 4,935,939 | ||||||
| 15,945,210 | ||||||||
MEXICO (2.7%) | ||||||||
Consumer Staples (2.7%) | ||||||||
Fomento Economico Mexicano SAB de CV, ADR | 40,700 | 4,032,963 | ||||||
SINGAPORE (5.0%) | ||||||||
Financials (2.5%) | ||||||||
City Developments Ltd. (a) | 349,100 | 1,975,665 | ||||||
Oversea-Chinese Banking Corp. Ltd. (a) | 270,062 | 1,735,919 | ||||||
| 3,711,584 | ||||||||
Telecommunication Services (2.5%) | ||||||||
Singapore Telecommunications Ltd. (a) | 1,304,900 | 3,707,550 | ||||||
| 7,419,134 | ||||||||
SOUTH AFRICA (1.7%) | ||||||||
Telecommunication Services (1.7%) | ||||||||
MTN Group Ltd. (a) | 221,900 | 2,526,245 | ||||||
SWEDEN (4.9%) | ||||||||
Financials (1.3%) | ||||||||
Nordea Bank AB (a) | 182,700 | 2,015,845 | ||||||
Industrials (2.1%) | ||||||||
Atlas Copco AB, A Shares (a) | 118,900 | 3,098,616 | ||||||
Information Technology (1.5%) | ||||||||
Telefonaktiebolaget LM Ericsson, B Shares (a) | 225,500 | 2,194,679 | ||||||
| 7,309,140 | ||||||||
SWITZERLAND (13.7%) | ||||||||
Consumer Staples (3.5%) | ||||||||
Nestle SA (a) | 67,200 | 5,132,329 | ||||||
Financials (1.5%) | ||||||||
Zurich Insurance Group AG (a)(b) | 8,711 | 2,298,832 | ||||||
Health Care (8.7%) | ||||||||
Novartis AG (a) | 69,100 | 6,259,676 | ||||||
Roche Holding AG (a) | 24,400 | 6,624,572 | ||||||
| 12,884,248 | ||||||||
| 20,315,409 | ||||||||
TAIWAN (3.6%) | ||||||||
Information Technology (3.6%) | ||||||||
Taiwan Semiconductor Manufacturing Co. Ltd. (a) | 1,278,000 | 5,385,065 | ||||||
UNITED KINGDOM (21.0%) | ||||||||
Consumer Staples (3.7%) | ||||||||
British American Tobacco PLC (a) | 92,500 | 5,495,383 | ||||||
See accompanying Notes to Financial Statements.
2015 Annual Report
13
Statement of Investments (concluded)
October 31, 2015
Aberdeen Select International Equity Fund II
| Shares or Principal Amount | Value | |||||||
Energy (4.5%) | ||||||||
John Wood Group PLC (a) | 230,300 | $ | 2,114,240 | |||||
Royal Dutch Shell PLC, B Shares (a) | 171,700 | 4,495,945 | ||||||
| 6,610,185 | ||||||||
Financials (5.1%) | ||||||||
HSBC Holdings PLC (a) | 380,713 | 2,974,498 | ||||||
Prudential PLC (a) | 94,800 | 2,214,194 | ||||||
Standard Chartered PLC (a) | 213,210 | 2,366,766 | ||||||
| 7,555,458 | ||||||||
Industrials (5.4%) | ||||||||
Experian PLC (a) | 185,100 | 3,154,116 | ||||||
Rolls-Royce Holdings PLC (a)(b) | 272,450 | 2,881,025 | ||||||
Weir Group PLC (The) (a) | 116,200 | 1,908,917 | ||||||
| 7,944,058 | ||||||||
Materials (0.9%) | ||||||||
BHP Billiton PLC (a) | 88,700 | 1,417,783 | ||||||
Telecommunication Services (1.4%) | ||||||||
Vodafone Group PLC (a) | 647,100 | 2,129,562 | ||||||
| 31,152,429 | ||||||||
Total Common Stocks | 127,367,123 | |||||||
PREFERRED STOCKS (9.6%) | ||||||||
BRAZIL (3.2%) | ||||||||
Financials (1.7%) | ||||||||
Banco Bradesco SA, ADR, Preferred Shares | 462,600 | 2,516,544 | ||||||
Materials (1.5%) | ||||||||
Vale SA, ADR, Preferred Shares | 610,300 | 2,197,080 | ||||||
| 4,713,624 | ||||||||
GERMANY (1.6%) | ||||||||
Consumer Staples (1.6%) | ||||||||
Henkel AG & Co. KGaA, Preferred Shares (a) | 22,100 | 2,396,821 | ||||||
REPUBLIC OF SOUTH KOREA (4.8%) | ||||||||
Information Technology (4.8%) | ||||||||
Samsung Electronics Co. Ltd., Preferred Shares (a) | 6,800 | 7,102,461 | ||||||
UNITED KINGDOM (0.0%) | ||||||||
Industrials (0.0%) | ||||||||
Rolls-Royce Holdings PLC, Preferred Shares (b) | 25,256,115 | 38,935 | ||||||
Total Preferred Stocks | 14,251,841 | |||||||
REPURCHASE AGREEMENT (3.7%) | ||||||||
UNITED STATES (3.7%) | ||||||||
Repurchase Agreement, Fixed Income Clearing Corp., 0.00%, dated 10/30/2015, due 11/02/2015, repurchase price $5,474,023, collateralized by U.S. Treasury Notes, maturing 03/31/2022; total market value of $5,583,981 | 5,474,023 | 5,474,023 | ||||||
Total Repurchase Agreement | 5,474,023 | |||||||
Total Investments | 147,092,987 | |||||||
Other assets in excess of liabilities—0.8% | 1,170,531 | |||||||
Net Assets—100.0% | $ | 148,263,518 | ||||||
| (a) | Fair Valued Security. Fair Values are determined pursuant to procedures approved by the Fund’s Board of Trustees. See Note 2(a) of the accompanying Notes to Financial Statements. |
| (b) | Non-income producing security. |
| (c) | See accompanying Notes to Financial Statements for tax unrealized appreciation/depreciation of securities. |
| ADR | American Depositary Receipt |
See accompanying Notes to Financial Statements.
Annual Report 2015
14
Aberdeen Total Return Bond Fund (Unaudited)
The Aberdeen Total Return Bond Fund (Institutional Class shares net of fees)1 returned 1.12% for the 12-month period ended October 31, 2015, versus the 1.96% return of its benchmark, the Barclays U.S. Aggregate Bond Index, for the same period. For broader comparison, the average return of the Fund’s Lipper peer category of Core Bond Funds (consisting of 175 funds) was 1.15% for the period.
The global fixed-income markets experienced some volatility over the 12-month period ended October 31, 2015. In the U.S., the broader-market Barclays U.S. Aggregate Bond Index returned 1.96%; yields declined in all but the shortest segments of the U.S. Treasury yield curve during the period. The yields on the one-year Treasury bill and the two- and three-year note rose 0.23%, 0.23% and 0.10%, respectively – to 0.34%, 0.75% and 1.05% over the reporting period. At the same time, yields on the five- and ten-year notes decreased by corresponding margins of 9 and 19 basis points (bps), ending the period at 1.52% and 2.14%, respectively. Consequently, the two- to ten-year yield curve narrowed by 43 bps over the reporting period.
A combination of a strengthening U.S. dollar, falling oil and commodity prices, and economic growth concerns in Europe and Asia (particularly China) caused volatility to spike in global risk markets throughout the period. There was continued speculation regarding the timing of an interest rate hike from the Federal Reserve (Fed). Despite generally improving economic data reports for most of the period, the Fed maintained its benchmark interest rate near zero, citing concerns about low inflation and global uncertainties. Nevertheless, “Fed speak” seemingly was more hawkish towards the end of the review period, with the central bank indicating a strong inclination to raise rates in December unless economic data suggest otherwise.
U.S. economic data reports generally were positive over the 12-month reporting period. Gross domestic product (GDP) recorded gains in three of the four quarters during this timeframe; the only glitch was an annualized decline of 0.2% in the first quarter of 2015. However, GDP growth for the three other quarters was uneven, including a slowdown from an annualized rate of 3.9% to 1.5% between the second and third quarters of 2015, as a downturn in private inventory investment offset an increase in consumer spending. According to the U.S. Department of Labor, the U.S. economy added an average of nearly 150,000 jobs per month over the 12-month reporting period, and the unemployment rate fell 0.8 percentage point to 5.0%. Additionally, average hourly earnings rose 2.5% for the 12-month period ended October 31, 2015, outpacing the core inflation rate (excluding food and energy costs) of 1.9%. However, the labor force participation rate2 remained at its lowest level in 38 years, indicating that fewer potential workers are actively seeking employment.
The most notable detractor from Fund performance during the reporting period was the Fund’s underweight U.S. duration3 profile relative to the benchmark Barclays U.S. Aggregate Bond Index. Fund performance was also hindered by foreign exchange (FX) positions in the New Zealand dollar and the Mexican peso, along with foreign government bond holdings in Brazil.
Two of the main contributors to Fund performance over the period were positions in structured products such as non-agency mortgage-backed securities (MBS), asset-backed securities (ABS), and commercial mortgage-backed securities (CMBS), along with positive security selection within the investment-grade4 corporate sector.
Regarding the use of derivatives during the reporting period, we employed U.S. Treasury futures to manage the Fund’s overall curve and interest rate exposure, and we used currency forwards to hedge some of the Fund’s FX holdings. This resulted in a contribution of approximately 1.10% to the Fund’s total return for the period.
The most notable change to the Fund’s positioning over the reporting period was the reduction in the global duration underweight relative to the benchmark Barclays U.S. Aggregate Bond Index. As yields declined towards the end of 2014, we began to decrease the underweight duration because the market was not performing as we expected, and we chose to control risk in case rates continued to fall.
We were able to take advantage of the market dislocation late in the reporting period due to the Fund’s conservative positioning. We increased the exposure to the corporate sector as valuations improved, and we intend to continue to add issues that we believe have compelling risk/reward. In the securitized sectors, we have moved the Fund back close to its historically high overweight versus the benchmark to CMBS and continue to increase the overweight to non-agency MBS at the expense of agency MBS. We maintain the Fund’s U.S. Treasury yield curve position, favoring the ten-year segment of the curve over the three- to five-year segment. We believe bonds in the Eurozone and in some commodity-oriented countries still offer better capital appreciation potential or sheltering effects versus U.S. assets, particularly Treasuries. We returned to focusing on non-U.S. dollar assets after the Fed’s decision to keep interest rates on hold; consequently, we increased the Fund’s exposure to the Mexican peso.
| 1 | PAST PERFORMANCE DOES NOT GUARANTEE FUTURE RESULTS. The performance data quoted represents past performance and current returns may be lower or higher. The investment return and principal value will fluctuate so that an investor’s shares, when redeemed, may be worth more or less than the original cost. To obtain performance information current to the most recent month-end, which may be higher or lower than the performance shown above, please call 866-667-9231 or go to www.aberdeen-asset.us. |
| 2 | The labor force participation rate is expressed as a percentage of the U.S. population aged 16 years and older working or actively seeking work. |
| 3 | Duration is an estimate of bond price sensitivity to changes in interest rates. The higher the duration, the greater the change (i.e., higher risk) in relation to interest-rate movements. |
| 4 | Standard & Poor’s credit ratings express the agency’s opinion about the ability and willingness of an issuer, such as a corporation or state or city government, to meet its financial obligations in full and on time. Typically, ratings are expressed as letter grades that range, for example, from “AAA” to “D” to communicate the agency’s opinion of relative level of credit risk. Ratings from “AA” to “CCC” may be modified by the addition of a plus (+) or minus (-) sign to show relative standing within the major rating categories. |
2015 Annual Report
15
Aberdeen Total Return Bond Fund (Unaudited) (concluded)
At the end of the period on October 31, 2015, the Fund’s largest holdings were in the corporate and MBS sectors. The most notable overweight positions relative to the benchmark included CMBS, ABS, and non-U.S. dollar assets (which are not represented in the index). In contrast, the Fund was most underweight in U.S. Treasuries and agency MBS.
Looking ahead, could this be the “beginning of the end” of the global central bank policy convergence we have seen over the last few years? Although the Fed did not tighten monetary policy at the Federal Open Market Committee meeting in September, should U.S. growth not decelerate as quickly as current market pricing implies, forward expectations of the Fed’s normalization path most likely will need to be adjusted upward. At the same time, as European economic growth remains sluggish, should disinflation re-emerge, we think that the European Central Bank may find that it needs to ease monetary policy through additional quantitative easing. In Asia, if inflation expectations decline further, given Japan’s technical recession, the Bank of Japan may expand further on its quantitative and qualitative monetary easing program.
In China, we do not anticipate collapsing growth, but rather a stabilization at a lower level in the medium term. We think that Chinese policymakers will increase stimulus and intervention to maintain growth and market stability if challenged. Elsewhere, we believe central banks will be influenced by the crosscurrents from the Fed and China, given the central banks’ room to maneuver in a low-inflation environment. We think that emerging-market countries will have to wrestle with headwinds from a strong U.S. dollar, as well as with jitters about China’s growth. In our view, countries with strong underlying fundamentals will be at an advantage once global growth and market sentiment improves.
Given the previously noted monetary policy uncertainty, we expect market volatility to remain high and market liquidity to potentially decline. Within the U.S., non-agency MBS may potentially benefit from an upside surprise in the housing market, with less exposure to refinancing activity from “lower for longer” rates, giving these issues a preferable risk profile to agency MBS as volatility trades at expensive levels. We believe that the CMBS sector remains supported by sound fundamentals, though we are concerned about increasing supply and slippage of underwriting standards. Despite improving valuations, corporate credit still faces risks from lower liquidity and increasing supply. We are monitoring uncertainties regarding not only Fed policy, but also balance sheet re-leveraging and stress in some segments. We think that high-quality taxable municipal securities provide good diversification in this market environment.
Portfolio Management:
Aberdeen North American Fixed Income Team
PAST PERFORMANCE DOES NOT GUARANTEE FUTURE RESULTS.
The performance quoted represents past performance, which does not guarantee future results. Class A shares have up to a 0.25% 12b-1 fee. The investment return and principal value of an investment will fluctuate so that an investor’s shares, when redeemed, may be worth more or less than their original cost. Current performance of the Fund may be lower or higher than the performance quoted. Performance data current to the most recent month-end may be obtained by calling 866-667-9231 or visiting www.aberdeen-asset.us.
Investing in mutual funds involves risk, including possible loss of principal. There is no assurance that the investment objective of any fund will be achieved. Indexes are unmanaged and have been provided for comparison purposes only. No fees or expenses are reflected. You cannot invest directly in an index.
Lipper is a leading global provider of mutual fund information and analysis to fund companies, financial intermediaries and media organizations.
Risk Considerations
Fixed income securities are subject to certain risks including, but not limited to: interest rate (changes in interest rates may cause a decline in the market value of an investment), credit (changes in the financial condition of the issuer, borrower, counterparty, or underlying collateral), prepayment (debt issuers may repay or refinance their loans or obligations earlier than anticipated), and extension (principal repayments may not occur as quickly as anticipated, causing the expected maturity of a security to increase).
Investments in asset-backed and mortgage-backed securities include additional risks that investors should be aware which include those associated with fixed income securities, as well as increased susceptibility to adverse economic developments.
Derivatives are speculative and may hurt the Fund’s performance. They present the risk of disproportionately increased losses and/or reduced gains when the financial asset or measure to which the derivative is linked changes in unexpected ways.
Foreign securities may be more volatile, harder to price and less liquid than U.S. securities and are subject to different accounting and regulatory standards, political and economic risks and, to the extent denominated in foreign currencies, currency exchange rate risk (unless otherwise hedged). These risks are enhanced in emerging markets countries.
Municipal securities can be affected by adverse tax, legislative or political changes and the financial condition of the issuers of municipal securities.
Investing a significant portion of the Fund’s assets in securities of companies conducting business in a broadly related group of industries within an economic sector may make the Fund more vulnerable to unfavorable developments in that sector.
Please read the prospectus for more detailed information regarding these and other risks.
Annual Report 2015
16
Aberdeen Total Return Bond Fund (Unaudited)
Average Annual Total Return (For periods ended October 31, 2015) | 1 Yr. | 5 Yr. | 10 Yr. | |||||||
Class A | 0.91% | 2.99% | 4.78% | |||||||
Institutional Class | 1.12% | 3.26% | 5.05% | |||||||
2015 Annual Report
17
Aberdeen Total Return Bond Fund (Unaudited)
Performance of a $10,000 Investment (as of October 31, 2015)

Comparative performance of $10,000 invested in Class A shares of the Aberdeen Total Return Bond Fund, Barclays U.S. Aggregate Index and the Consumer Price Index (CPI) over a 10-year period ended October 31, 2015. Unlike the Fund’s returns, the returns for these unmanaged indexes do not reflect any fees or expenses. Investors cannot invest directly in market indexes.
The Barclays U.S. Aggregate Index is a broad-based flagship benchmark that measures the investment grade, U.S. Dollar-denominated, fixed-rate taxable bond market. The index includes Treasuries, government-related and corporate securities, MBS (agency fixed-rate and hybrid ARM pass-throughs), ABS and CMBS (agency and non-agency). Provided the necessary inclusion rules are met, U.S. Aggregate eligible securities also contribute to the multi-currency Global Aggregate Index and the U.S. Universal Index, which includes high yield and emerging markets debt.
The CPI is a measure of the average change over time in the prices paid by urban consumers for a market basket of consumer goods and services.
Investment return and principal value will fluctuate, and when redeemed, shares may be worth more or less than original cost. Past performance is no guarantee of future results. The Average Annual Total Return table and performance graph do not reflect the deduction of taxes that a shareholder would pay on Fund distributions or the redemption of Fund shares. Investing in mutual funds involves market risk, including loss of principal. Performance returns assume the reinvestment of all distributions. Performance returns reflect fee waivers and reimbursements in effect without which returns would have been lower.
Portfolio Summary (as a percentage of net assets)
October 31, 2015 (Unaudited)
| Asset Allocation | ||||
Corporate Bonds | 36.2% | |||
Non-Agency Mortgage-Backed Securities | 14.1% | |||
Commercial Mortgage-Backed Securities | 11.8% | |||
U.S. Agencies | 9.7% | |||
Asset-Backed Securities | 9.0% | |||
Government Bonds | 7.3% | |||
Municipal Bonds | 5.5% | |||
Repurchase Agreement | 4.8% | |||
U.S. Treasuries | 2.8% | |||
Liabilities in excess of other assets | (1.2)% | |||
| 100.0% | ||||
The following chart summarizes the composition of the Fund’s portfolio, in Bloomberg Industry Classification System (“BICS”), expressed as a percentage of net assets. As of October 31, 2015, the Fund did not have more than 25% of its assets invested in any industry group.
| Top Industry Groups | ||||
Commercial Banks | 9.5% | |||
Oil, Gas & Consumable Fuels | 2.8% | |||
Media | 2.1% | |||
Beverages | 1.8% | |||
Electric Utilities | 1.8% | |||
Software | 1.5% | |||
Diversified Financial Services | 1.4% | |||
Transportation | 1.3% | |||
Energy Equipment & Services | 1.3% | |||
Insurance | 1.3% | |||
Other | 75.2% | |||
| 100.0% | ||||
| Top Holdings* | ||||
Spain Government Bond 04/30/2025 | 3.0% | |||
Canada Housing Trust No 1 12/15/2020 | 1.0% | |||
State of California General Obligation Unlimited Bonds 04/01/2039 | 0.9% | |||
Los Angeles Unified School District General Obligation Unlimited Bonds 07/01/2034 | 0.9% | |||
New Zealand Government Bond, Series 423 04/15/2023 | 0.9% | |||
Microsoft Corp. 11/03/2045 | 0.8% | |||
Time Warner Cos., Inc. 02/01/2024 | 0.8% | |||
Carnival Corp. 10/15/2020 | 0.8% | |||
Wells Fargo & Co. 06/03/2026 | 0.8% | |||
Federal Home Loan Mortgage Corp., TBA 11/01/2030 | 0.8% | |||
Other | 89.3% | |||
| 100.0% | ||||
| * | For the purpose of listing top holdings, repurchase agreements are included as part of Other. |
| Top Countries | ||||
United States | 83.8% | |||
Spain | 3.0% | |||
Netherlands | 2.8% | |||
New Zealand | 1.9% | |||
Canada | 1.7% | |||
Australia | 1.5% | |||
Supranational | 1.2% | |||
France | 1.0% | |||
Sweden | 0.8% | |||
Panama | 0.8% | |||
Other | 1.5% | |||
| 100.0% | ||||
Annual Report 2015
18
Statement of Investments
October 31, 2015
Aberdeen Total Return Bond Fund
| Shares or Principal Amount | Value (US$) | |||||||
ASSET-BACKED SECURITIES (9.0%) | ||||||||
UNITED STATES (9.0%) | ||||||||
Ally Auto Recivables Trust | ||||||||
Series 2013-1, Class A3, ABS (USD), 0.63%, 05/15/2017 | $ | 1,421,051 | $ | 1,420,901 | ||||
Series 2015-2, Class A3 (USD), 1.49%, 11/15/2019 | 2,620,000 | 2,624,749 | ||||||
Ally Master Owner Trust | ||||||||
Series 2014-1, Class A1 (USD), 0.67%, 01/15/2019 (a) | 3,105,000 | 3,100,400 | ||||||
Series 2014-5, Class A2, ABS (USD), 1.60%, 10/15/2019 | 4,017,000 | 4,029,336 | ||||||
Avis Budget Rental Car Funding AESOP LLC, Series 2015-2A, Class A (USD), 2.63%, 12/20/2021 (b) | 2,890,000 | 2,902,250 | ||||||
BMW Vehicale Lease Trust, Series 2015-2, Class A3 (USD), 1.40%, 02/20/2019 | 3,870,000 | 3,866,938 | ||||||
Capital One Multi-Asset Execution Trust, Series 2006-B1, Class B1 (USD), 0.48%, 01/15/2019 (a) | 2,900,000 | 2,896,378 | ||||||
Chase Issuance Trust | ||||||||
Series 2007-B1, Class B1 (USD), 0.45%, 04/15/2019 (a) | 3,640,000 | 3,621,189 | ||||||
Series 2007-C1, Class C1, ABS (USD), 0.66%, 04/15/2019 (a) | 2,960,000 | 2,948,900 | ||||||
Chesapeake Funding LLC, Series 2013-1A, Class A (USD), 0.64%, 01/07/2025 (a)(b) | 1,154,814 | 1,153,835 | ||||||
Citibank Credit Card Issuance Trust, Series 2013-A10, Class A10, ABS (USD), 0.73%, 02/07/2018 | 3,420,000 | 3,421,048 | ||||||
CNH Equipment Trust, Series 2013-A, Class A3 (USD), 0.69%, 06/15/2018 | 1,129,308 | 1,129,426 | ||||||
CNH Wholesale Master Note Trust, Series 2013-2A, Class A (USD), 0.80%, 08/15/2019 (a)(b) | 4,940,000 | 4,933,865 | ||||||
Ford Credit Auto Owner Trust, Series 2013-B, Class A3 (USD), 0.57%, 10/15/2017 | 679,463 | 679,347 | ||||||
Ford Credit Floorplan Master Owner Trust, Series 2015-4, Class A2 (USD), 0.80%, 08/15/2020 (a) | 3,990,000 | 3,988,347 | ||||||
GE Dealer Floorplan Master Note Trust | ||||||||
Series 2014-2, Class A, ABS (USD), 0.64%, 10/20/2019 (a) | 3,940,000 | 3,914,643 | ||||||
Series 2015-2, Class A (USD), 0.85%, 01/20/2022 (a) | 4,640,000 | 4,618,296 | ||||||
GM Financial Automobile Leasing Trust | ||||||||
Series 2014-2A, Class A3 (USD), 1.22%, 01/22/2018 (b) | 2,930,000 | 2,931,609 | ||||||
Series 2015-2, Class A2B (USD), 0.61%, 04/20/2018 (a) | 3,490,000 | 3,485,024 | ||||||
Honda Auto Receivables Owner Trust, Series 2014-1, Class A3 (USD), 0.67%, 11/21/2017 | 3,940,000 | 3,936,837 | ||||||
Mercedes Benz Auto Lease Trust, Series 2015-B, Class A4 (USD), 1.53%, 05/17/2021 | 2,820,000 | 2,820,669 | ||||||
Mercedes-Benz Auto Receivables Trust, Series 2015-1, Class A2B (USD), 0.47%, 06/15/2018 (a) | 4,070,000 | 4,067,005 | ||||||
Navistar Financial Dealer Note Master Trust, Series 2014-1, Class A (USD), 0.95%, 10/25/2019 (a)(b) | 3,120,000 | 3,106,883 | ||||||
Navistar Financial Dealer Note Master Trust II, Series 2015-1, Class A (USD), 1.60%, 06/25/2020 (a)(b) | 3,750,000 | 3,747,969 | ||||||
Nissan Auto Receivables Owner Trust, Series 2013-B, Class A3 (USD), 0.84%, 11/15/2017 | 1,321,001 | 1,321,464 | ||||||
SLM Student Loan Trust | ||||||||
Series 2011-1, Class A1 (USD), 0.72%, 03/25/2026 (a) | 1,572,518 | 1,553,788 | ||||||
Series 2011-2, Class A1 (USD), 0.80%, 11/25/2027 (a) | 2,744,773 | 2,712,299 | ||||||
Series 2013-2, Class A (USD), 0.65%, 09/25/2026 (a) | 3,034,323 | 2,950,464 | ||||||
United States Small Business Administration | ||||||||
Series 2006-P10A, Class 1 (USD), 5.41%, 02/10/2016 | 313 | 316 | ||||||
Series 2007-P10A, Class 1 (USD), 5.46%, 02/10/2017 | 607,168 | 637,617 | ||||||
Volkswagen Auto Loan Enhanced Trust | ||||||||
Series 2013-1, Class A3 (USD), 0.56%, 08/21/2017 | 1,381,985 | 1,379,918 | ||||||
Series 2013-2, Class A3 (USD), 0.70%, 04/20/2018 | 2,795,697 | 2,787,298 | ||||||
Series 2014-1, Class A2 (USD), 0.42%, 03/20/2017 | 872,368 | 871,769 | ||||||
Volvo Financial Equipment LLC, Series 2013-1A, Class A3 (USD), 0.74%, 03/15/2017 (b) | 1,164,834 | 1,164,892 | ||||||
| 90,725,669 | ||||||||
Total Asset-Backed Securities | 90,725,669 | |||||||
COMMERCIAL MORTGAGE-BACKED SECURITIES (11.8%) |
| |||||||
UNITED STATES (11.8%) | ||||||||
Avenue of Americas Mortgage Trust, Series 2015-1177, Class A (USD), 2.96%, 12/13/2029 (b) | 2,150,000 | 2,180,129 | ||||||
Banc of America Commercial Mortgage Trust, Series 2006-5, Class AM (USD), 5.45%, 09/10/2047 | 1,950,000 | 1,999,258 | ||||||
Banc of America Merrill Lynch Trust, Series 2015-200P, Class A (USD), 3.22%, 04/14/2033 (b) | 1,950,000 | 1,959,697 | ||||||
Barclays Commercial Mortgage Securities Trust, Series 2015-SLP, Class B (USD), 1.80%, 02/15/2028 (a)(b) | 2,690,000 | 2,664,309 | ||||||
Bear Stearns Commercial Mortgage Securities Trust | ||||||||
Series 2005-PW10, Class AM (USD), 5.45%, 12/11/2040 (a) | 3,869,267 | 3,869,341 | ||||||
Series 2006-PW13, Class A4, CMO (USD), 5.54%, 09/11/2041 | 4,748,234 | 4,832,823 | ||||||
Series 2007-PW17, Class AM (USD), 0.88%, 06/11/2050 (a)(b) | 6,054,750 | 5,957,661 | ||||||
See accompanying Notes to Financial Statements.
2015 Annual Report
19
Statement of Investments (continued)
October 31, 2015
Aberdeen Total Return Bond Fund
| Shares or Principal Amount | Value (US$) | |||||||
CD Commercial Mortgage Trust, Series 2007-CD4, Class A4 (USD), 5.32%, 12/11/2049 | $ | 4,432,372 | $ | 4,544,053 | ||||
Citigroup Commercial Mortgage Trust, Series 2007-C6, Class AM (USD), 5.71%, 12/10/2049 (a) | 2,500,000 | 2,602,584 | ||||||
COMM 2013-300P Mortgage Trust, Series 2013-300P, Class A1, (USD), 4.35%, 08/10/2030 (b) | 3,510,000 | 3,824,128 | ||||||
COMM 2014-TWC Mortgage Trust, Series 2014-TWC, Class B (USD), 1.79%, 02/13/2032 (a)(b) | 2,420,000 | 2,410,105 | ||||||
COMM 2015-PC1 Mortgage Trust, Series 2015-PC1, Class A5 (USD), 3.90%, 07/10/2050 | 3,550,000 | 3,755,487 | ||||||
Commercial Mortgage Pass Through Certificates, Series 2006-C4, Class A3 (USD), 5.47%, 09/15/2039 | 3,715,289 | 3,786,931 | ||||||
Commercial Mortgage Trust, Series 2007-GG11, Class A4 (USD), 5.74%, 12/10/2049 | 4,214,362 | 4,402,498 | ||||||
CSAIL Commercial Mortgage Trust, Series 2015-C3, Class A4 (USD), 3.72%, 08/15/2048 | 3,720,000 | 3,879,171 | ||||||
FDIC Guaranteed Notes Trust, Series 2010-C1, Class A (USD), 2.98%, 12/06/2020 (b) | 2,096,128 | 2,142,423 | ||||||
FREMF Mortgage Trust | ||||||||
Series 2011-K704, Class B (USD), 4.54%, 10/25/2030 (a)(b) | 4,030,000 | 4,245,246 | ||||||
Series 2011-K703, Class B (USD), 4.88%, 07/25/2044 (a)(b) | 3,500,000 | 3,710,769 | ||||||
Series 2013-K29, Class B (USD), 3.48%, 05/25/2046 (a)(b) | 1,890,000 | 1,860,382 | ||||||
Series 2011-K11, Class B (USD), 4.42%, 12/25/2048 (a)(b) | 1,221,000 | 1,301,328 | ||||||
GS Mortgage Securites Corp. Trust, Series 2012-SHOP, Class A (USD), 2.93%, 06/05/2031 (b) | 4,030,000 | 4,148,939 | ||||||
GS Mortgage Securities Trust, Series 2015-GC32, Class A4 (USD), 3.76%, 07/10/2048 | 1,630,000 | 1,709,397 | ||||||
GSCCRE Commercial Mortgage Trust, Series 2015-HULA, Class B (USD), | 3,250,000 | 3,254,103 | ||||||
Hilton USA Trust 2013-HLT, Series 2013-HLT, Class CFX, (USD), 3.71%, 11/05/2030 (b) | 2,845,000 | 2,855,705 | ||||||
JP Morgan Chase Commercial Mortgage Securities Trust | ||||||||
Series 2014-INN, Class A (USD), 1.12%, 06/15/2029 (a)(b) | 3,530,000 | 3,508,448 | ||||||
Series 2015-UES, Class C (USD), 3.74%, 09/05/2032 (a)(b) | 3,270,000 | 3,361,888 | ||||||
JPMBB Commercial Mortgage Securities Trust | ||||||||
Series 2015-C31, Class A3 (USD), 3.80%, 08/15/2048 | 2,400,000 | 2,514,794 | ||||||
Series 2015-C28, Class A3 (USD), 2.91%, 10/15/2048 | 3,510,000 | 3,444,103 | ||||||
LB-UBS Commercial Mortgage Trust, Series 2006-C4, Class AM (USD), 5.84%, 06/15/2038 (a) | 2,320,000 | 2,378,587 | ||||||
ML-CFC Commercial Mortgage Trust, Series 2006-3, Class A4 (USD), 5.41%, 07/12/2046 (a) | 6,122,519 | 6,246,898 | ||||||
Morgan Stanley Bank of America Merrill Lynch Trust, Series 2015-C26, Class A5 (USD), 3.53%, 11/15/2048 (c) | 2,960,000 | 3,048,723 | ||||||
Morgan Stanley Capital I Trust | ||||||||
Series 2006-IQ12, Class AM (USD), 5.37%, 12/15/2043 | 2,360,000 | 2,440,882 | ||||||
Series 2007-IQ16, Class A4 (USD), 5.81%, 12/12/2049 | 2,695,453 | 2,847,545 | ||||||
SFAVE Commercial Mortgage Securities Trust, Series 2015-5AVE, Class C (USD), 4.39%, 01/05/2035 (a)(b) | 3,460,000 | 3,288,451 | ||||||
Wachovia Bank Commercial Mortgage Trust, Series 2006-C28, Class AM (USD), 5.60%, 10/15/2048 (a) | 3,115,000 | 3,210,462 | ||||||
Wells Fargo Commercial Mortgage Trust | ||||||||
Series 2015-C29, Class ASB (USD), 3.40%, 06/15/2048 | 1,870,000 | 1,933,584 | ||||||
Series 2015-LC22, Class ASB (USD), 3.57%, 09/15/2058 | 2,080,000 | 2,171,962 | ||||||
| 118,292,794 | ||||||||
Total Commercial Mortgage-Backed Securities |
| 118,292,794 | ||||||
NON-AGENCY MORTGAGE-BACKED SECURITIES (14.1%) |
| |||||||
UNITED STATES (14.1%) | ||||||||
Alternative Loan Trust | ||||||||
Series 2004-28CB, Class 3A1 (USD), 6.00%, 01/25/2035 | 3,151,632 | 3,079,342 | ||||||
Series 2005-86CB, Class A8 (USD), 5.50%, 02/25/2036 | 2,758,808 | 2,585,572 | ||||||
Banc of America Mortgage Trust, Series 2004-7, Class 2A3 (USD), 5.75%, 08/25/2034 | 608,458 | 635,581 | ||||||
Bear Stearns Adjustable Rate Mortgage Trust, Series 2004-3, Class 4A (USD), 2.83%, 07/25/2034 (a) | 940,703 | 925,946 | ||||||
CHL Mortgage Pass-Through Trust, Series 2005-21, Class A2 (USD), 5.50%, 10/25/2035 | 802,834 | 801,793 | ||||||
Citigroup Mortgage Loan Trust | ||||||||
Series 2005-11, Class A3 (USD), 2.74%, 11/25/2035 (a) | 1,639,492 | 1,572,188 | ||||||
Series 2014-A, Class A (USD), 4.00%, 01/25/2035 (a)(b) | 1,922,183 | 1,998,039 | ||||||
Series 2014-J1, Class A1 (USD), 3.50%, 06/25/2044 (a)(b) | 3,366,215 | 3,395,302 | ||||||
Credit Suisse Mortgage Capital Trust | ||||||||
Series 2013-6, Class2A1 (USD), 3.50%, 08/25/2043 (a)(b) | 2,997,263 | 3,049,744 | ||||||
Series 2013-7, Class A11 (USD), 3.50%, 08/25/2043 (a)(b) | 5,432,417 | 5,517,988 | ||||||
Credit Suisse Mortgage Trust | ||||||||
Series 2013-7, Class A2 (USD), 3.00%, 08/25/2043 (a)(b) | 1,186,439 | 1,164,853 | ||||||
Series 2015-WIN1, Class A6 (USD), 3.50%, 12/25/2044 (a)(b) | 3,070,596 | 3,090,135 | ||||||
EverBank Mortgage Loan Trust, Series 2013-2, Class A (USD), 3.00%, 06/25/2043 (a)(b) | 3,035,016 | 3,011,943 | ||||||
See accompanying Notes to Financial Statements.
Annual Report 2015
20
Statement of Investments (continued)
October 31, 2015
Aberdeen Total Return Bond Fund
| Shares or Principal Amount | Value (US$) | |||||||
FDIC Guaranteed Notes Trust, Series 2010-S2, Class 2A (USD), 2.57%, 07/29/2047 (b) | $ | 1,410,830 | $ | 1,431,523 | ||||
FDIC Trust, Series 2010-R1, Class A (USD), 2.18%, 05/25/2050 (b) | 1,800,573 | 1,814,315 | ||||||
Federal Home Loan Mortgage Corp., Series 2015-HQA1, Class M2, CMO (USD), 2.84%, 03/25/2028 (a) | 4,790,000 | 4,784,599 | ||||||
GSR Mortgage Loan Trust, Series 2005-6F, Class 1A6 (USD), 5.25%, 07/25/2035 | 1,866,762 | 1,934,680 | ||||||
IndyMac INDA Mortgage Loan Trust | ||||||||
Series 2005-AR2, Class 3A1 (USD), 2.68%, 01/25/2036 (a) | 2,652,015 | 2,374,618 | ||||||
Series 2006-AR1, Class A1 (USD), 4.73%, 08/25/2036 (a) | 373,958 | 360,308 | ||||||
JP Morgan Mortgage Trust | ||||||||
Series 2005-A2, Class 3A2 (USD), 2.42%, 04/25/2035 (a) | 1,543,432 | 1,502,878 | ||||||
Series 2005-A4, Class 3A1 (USD), 2.31%, 07/25/2035 (a) | 1,817,608 | 1,816,807 | ||||||
Series 2005-A5, Class 2A2 (USD), 2.78%, 08/25/2035 (a) | 1,365,232 | 1,373,705 | ||||||
Series 2006-S1, Class 2A6 (USD), 6.00%, 04/25/2036 | 2,060,509 | 2,174,727 | ||||||
Series 2013-1, Class 1A2 (USD), 3.00%, 03/25/2043 (a)(b) | 3,238,933 | 3,209,161 | ||||||
Series 2013-1, Class B1 (USD), 3.53%, 03/25/2043 (a)(b) | 2,960,885 | 2,952,625 | ||||||
Series 2013-2, Class A2 (USD), 3.50%, 05/25/2043 (a)(b) | 3,442,281 | 3,509,890 | ||||||
Series 2013-3, Class A3 (USD), 3.46%, 07/25/2043 (a)(b) | 4,352,166 | 4,393,307 | ||||||
Series 2014-1, Class 2A2 (USD), 3.50%, 01/25/2044 (a)(b) | 4,035,200 | 4,134,696 | ||||||
Series 2014-IVR3, Class 3A1 (USD), 3.00%, 09/25/2044 (a)(b) | 3,540,016 | 3,554,902 | ||||||
Series 2014-IVR6, Class AM, CMO (USD), 2.89%, 07/25/2044 (a)(b) | 4,412,985 | 4,428,440 | ||||||
MASTR Adjustable Rate Mortgages Trust, Series 2006-2, Class 4A1 (USD), 2.72%, 02/25/2036 (a) | 1,013,011 | 999,164 | ||||||
Merrill Lynch Mortgage Investors Trust | ||||||||
Series 2006-1, Class 2A1 (USD), 2.13%, 02/25/2036 (a) | 1,860,518 | 1,841,229 | ||||||
Series 2007-2, Class 2A1 (USD), 2.62%, 06/25/2037 (a) | 1,497,408 | 1,444,101 | ||||||
Series 2007-3, Class 2A2 (USD), 2.71%, 09/25/2037 (a) | 1,361,324 | 1,336,317 | ||||||
NCUA Guaranteed Notes Trust | ||||||||
Series 2010-R2, Class 1A (USD), 0.56%, 11/06/2017 (a) | 1,487,720 | 1,490,352 | ||||||
Series 2010-R3, Class 1A (USD), 0.75%, 12/08/2020 (a) | 2,649,165 | 2,668,413 | ||||||
New Residential Mortgage Loan Trust | ||||||||
Series 2014-1A, Class A (USD), 3.75%, 01/25/2054 (a)(b) | 1,217,197 | 1,259,003 | ||||||
Series 2014-2A, Class A3 (USD), 3.75%, 05/25/2054 (b) | 2,617,778 | 2,694,869 | ||||||
PHH Mortgage Trust, Series 2008-CIM1, Class 21A1 (USD), 6.00%, 05/25/2038 | 1,795,659 | 1,880,955 | ||||||
Sequoia Mortgage Trust | ||||||||
Series 2013-4, Class A2 (USD), 2.50%, 04/25/2043 (a) | 2,957,920 | 2,857,236 | ||||||
Series 2013-5, Class A1 (USD), 2.50%, 05/25/2043 (a)(b) | 5,045,617 | 4,823,413 | ||||||
Series 2013-6, Class A1 (USD), 2.50%, 05/25/2043 (a) | 1,643,296 | 1,597,630 | ||||||
Series 2014-3, Class A8 (USD), 4.00%, 10/25/2044 (a)(b) | 2,880,577 | 2,963,421 | ||||||
Series 2015-1, Class A1 (USD), 3.50%, 01/25/2045 (a)(b) | 4,513,740 | 4,553,587 | ||||||
Series 2015-2, Class A1 (USD), 3.50%, 05/25/2045 (a)(b) | 4,240,772 | 4,275,559 | ||||||
Structured Agency Credit Risk | ||||||||
Series 2014-HQ2, Class M2, CMO (USD), 2.40%, 09/25/2024 (a) | 3,480,000 | 3,469,462 | ||||||
Series 2015-DNA1, Class M2 (USD), 2.05%, 10/25/2027 (a) | 3,320,000 | 3,288,060 | ||||||
Series 2015-DNA2, Class M2, CMO (USD), 2.80%, 12/25/2027 (a) | 3,830,000 | 3,827,381 | ||||||
Series 2015-HQ1, Class M2, CMO (USD), 2.40%, 03/25/2025 (a) | 3,350,000 | 3,352,882 | ||||||
Structured Asset Securities Corp., Series 2004-18H, Class A5 (USD), 4.75%, 10/25/2034 | 3,290,860 | 3,305,177 | ||||||
Thornburg Mortgage Securities Trust | ||||||||
Series 2007-4, Class 2A1 (USD), 4.00%, 09/25/2037 (a) | 3,099,897 | 3,058,267 | ||||||
Series 2007-4, Class 3A1 (USD), 6.09%, 09/25/2037 (a) | 230,581 | 239,632 | ||||||
WaMu Mortgage Pass Through Certificates, Series 2005-AR7, Class A3 (USD), 2.48%, 08/25/2035 (a) | 3,994,488 | 3,998,790 | ||||||
Wells Fargo Mortgage Backed Securities Trust | ||||||||
Series 2005-AR13, Class 4A1 (USD), 2.74%, 05/25/2035 (a) | 2,392,168 | 2,357,344 | ||||||
Series 2006-10, Class A4 (USD), 6.00%, 08/25/2036 | 1,113,134 | 1,138,541 | ||||||
Series 2006-19, Class A4 (USD), 5.25%, 12/26/2036 | 525,178 | 528,203 | ||||||
| 141,828,595 | ||||||||
Total Non-Agency Mortgage-Backed Securities |
| 141,828,595 | ||||||
CORPORATE BONDS (36.2%) | ||||||||
AUSTRALIA (0.9%) | ||||||||
Commercial Banks (0.9%) | ||||||||
KfW (AUD), 6.00%, 08/20/2020 (d) | 3,000,000 | 2,462,678 | ||||||
National Australia Bank Ltd. (USD), 1.25%, 03/08/2018 (b) | 6,780,000 | 6,745,422 | ||||||
| 9,208,100 | ||||||||
CANADA (0.2%) | ||||||||
Commercial Banks (0.2%) | ||||||||
National Bank of Canada (USD), 1.45%, 11/07/2017 | 2,110,000 | 2,110,741 | ||||||
See accompanying Notes to Financial Statements.
2015 Annual Report
21
Statement of Investments (continued)
October 31, 2015
Aberdeen Total Return Bond Fund
| Shares or Principal Amount | Value (US$) | |||||||
FRANCE (1.0%) | ||||||||
Apparel (0.3%) | ||||||||
LVMH Moet Hennessy Louis Vuitton SE (USD), 1.63%, 06/29/2017 (b) | $ | 2,950,000 | $ | 2,970,313 | ||||
Beverages (0.7%) | ||||||||
Pernod-Ricard SA (USD), 4.25%, 07/15/2022 (b) | 6,840,000 | 7,095,351 | ||||||
| 10,065,664 | ||||||||
GUERNSEY (0.6%) | ||||||||
Commercial Banks (0.6%) | ||||||||
Credit Suisse Group Funding Guernsey Ltd. (USD), 3.80%, 09/15/2022 (b) | 6,240,000 | 6,306,381 | ||||||
ITALY (0.6%) | ||||||||
Commercial Banks (0.6%) | ||||||||
Intesa Sanpaolo SpA (USD), 3.13%, 01/15/2016 | 5,540,000 | 5,563,877 | ||||||
LUXEMBOURG (0.2%) | ||||||||
Miscellaneous Manufacturing (0.2%) | ||||||||
Pentair Finance SA (USD), 3.15%, 09/15/2022 | 2,628,000 | 2,483,087 | ||||||
NETHERLANDS (2.8%) | ||||||||
Auto Manufacturers (0.4%) | ||||||||
Volkswagen International Finance (USD), 1.15%, 11/20/2015 (b) | 4,650,000 | 4,647,173 | ||||||
Commercial Banks (1.5%) | ||||||||
ABN AMRO Bank | ||||||||
(USD), 2.50%, 10/30/2018(b) | 3,250,000 | 3,297,398 | ||||||
(USD), 4.75%, 07/28/2025(b) | 2,420,000 | 2,441,528 | ||||||
Cooperatieve Centrale Raiffeisen-Boerenleenbank BA (USD), 4.38%, 08/04/2025 | 2,630,000 | 2,688,583 | ||||||
ING Bank (USD), 2.50%, 01/14/2016 (b) | 6,330,000 | 6,355,251 | ||||||
| 14,782,760 | ||||||||
Electric Utilities (0.5%) | ||||||||
Enel Finance International (USD), 6.00%, 10/07/2039 (b) | 4,080,000 | 4,677,724 | ||||||
Oil, Gas & Consumable Fuels (0.4%) | ||||||||
Shell International Finance BV (USD), 3.25%, 05/11/2025 | 3,780,000 | 3,782,064 | ||||||
| 27,889,721 | ||||||||
NORWAY (0.5%) | ||||||||
Commercial Banks (0.5%) | ||||||||
DNB Bank ASA (USD), 3.20%, 04/03/2017 (b) | 5,020,000 | 5,149,411 | ||||||
PANAMA (0.8%) | ||||||||
Leisure Time (0.8%) | ||||||||
Carnival Corp. (USD), 3.95%, 10/15/2020 | 7,330,000 | 7,666,667 | ||||||
SUPRANATIONAL (1.2%) | ||||||||
Banks (1.2%) | ||||||||
International Bank for Reconstruction & Development | 8,110,000 | 6,011,829 | ||||||
(NZD), 4.63%, 02/26/2019 | 8,530,000 | 6,055,847 | ||||||
| 12,067,676 | ||||||||
SWEDEN (0.8%) | ||||||||
Commercial Banks (0.8%) | ||||||||
Nordea Bank AB (USD), 3.13%, 03/20/2017 (b) | 4,300,000 | 4,411,344 | ||||||
Svenska Handelsbanken AB (USD), 2.50%, 01/25/2019 | 3,470,000 | 3,536,576 | ||||||
| 7,947,920 | ||||||||
UNITED KINGDOM (0.5%) | ||||||||
Oil, Gas & Consumable Fuels (0.5%) | ||||||||
BP Capital Markets PLC (USD), 0.70%, 11/06/2015 | 4,631,000 | 4,631,190 | ||||||
UNITED STATES (26.1%) | ||||||||
Aerospace & Defense (0.4%) | ||||||||
United Technologies Corp. | ||||||||
(USD), 6.70%, 08/01/2028 | 680,000 | 876,555 | ||||||
(USD), 4.15%, 05/15/2045 | 3,370,000 | 3,277,932 | ||||||
| 4,154,487 | ||||||||
Auto Manufacturers (0.5%) | ||||||||
Toyota Motor Credit Corp. (USD), 2.80%, 01/11/2016 | 4,845,000 | 4,868,634 | ||||||
Beverages (1.1%) | ||||||||
Anheuser-Busch InBev Worldwide, Inc. (USD), 2.50%, 07/15/2022 | 4,490,000 | 4,271,256 | ||||||
Mead Johnson Nutrition Co. (USD), 4.13%, 11/15/2025 | 1,410,000 | 1,427,137 | ||||||
PepsiCo, Inc. (USD), 0.70%, 02/26/2016 | 5,320,000 | 5,323,639 | ||||||
| 11,022,032 | ||||||||
Biotechnology (0.3%) | ||||||||
Gilead Sciences, Inc. | ||||||||
(USD), 4.80%, 04/01/2044 | 2,150,000 | 2,175,600 | ||||||
(USD), 4.75%, 03/01/2046 | 1,300,000 | 1,318,201 | ||||||
| 3,493,801 | ||||||||
Commercial Banks (4.4%) | ||||||||
Bank of America Corp. (USD), 4.20%, 08/26/2024 | 6,070,000 | 6,114,445 | ||||||
Capital One NA (USD), 1.47%, 08/17/2018 (a) | 3,300,000 | 3,330,261 | ||||||
Citigroup, Inc. (USD), 4.40%, 06/10/2025 | 7,300,000 | 7,393,163 | ||||||
Goldman Sachs Group, Inc. (The) | ||||||||
(USD), 4.00%, 03/03/2024 | 5,790,000 | 5,970,092 | ||||||
(USD), 4.25%, 10/21/2025 | 2,250,000 | 2,253,656 | ||||||
JPMorgan Chase & Co. | ||||||||
(USD), 4.35%, 08/15/2021 | 6,550,000 | 7,025,281 | ||||||
(USD), 3.90%, 07/15/2025 | 2,260,000 | 2,316,938 | ||||||
Morgan Stanley (USD), 4.00%, 07/23/2025 | 2,060,000 | 2,120,951 | ||||||
Wells Fargo & Co. (USD), 4.10%, 06/03/2026 | 7,450,000 | 7,601,846 | ||||||
| 44,126,633 | ||||||||
Computers & Peripherals (1.1%) | ||||||||
Apple, Inc. (USD), 3.20%, 05/13/2025 | 4,290,000 | 4,364,045 | ||||||
Hewlett Packard Enterprise Co. (USD), 3.60%, 10/15/2020 (b) | 3,760,000 | 3,791,073 | ||||||
International Business Machines Corp. (USD), 6.22%, 08/01/2027 | 2,445,000 | 3,003,079 | ||||||
| 11,158,197 | ||||||||
See accompanying Notes to Financial Statements.
Annual Report 2015
22
Statement of Investments (continued)
October 31, 2015
Aberdeen Total Return Bond Fund
| Shares or Principal Amount | Value (US$) | |||||||
Cosmetics/Personal Care (0.7%) | ||||||||
Procter & Gamble Co. (The) (USD), 6.45%, 01/15/2026 | $ | 5,760,000 | $ | 7,405,050 | ||||
Diversified Financial Services (1.4%) |
| |||||||
Harley-Davidson Financial Services, Inc. (USD), 3.88%, 03/15/2016 (b) | 5,260,000 | 5,322,752 | ||||||
KKR Group Finance Co. III LLC (USD), 5.13%, 06/01/2044 (b) | 2,540,000 | 2,515,641 | ||||||
Legg Mason, Inc. (USD), 5.63%, 01/15/2044 | 2,900,000 | 3,021,988 | ||||||
PACCAR Financial Corp. (USD), 0.80%, 02/08/2016 | 2,710,000 | 2,713,106 | ||||||
| 13,573,487 | ||||||||
Diversified Telecommunication Services (0.4%) |
| |||||||
Verizon Communications, Inc. (USD), 4.86%, 08/21/2046 | 4,390,000 | 4,218,948 | ||||||
Electric Utilities (1.3%) | ||||||||
Duke Energy Carolinas LLC, Series A (USD), 6.00%, 12/01/2028 | 4,593,000 | 5,628,267 | ||||||
Edison International (USD), 3.75%, 09/15/2017 | 3,915,000 | 4,066,761 | ||||||
Exelon Corp. (USD), 5.10%, 06/15/2045 | 1,170,000 | 1,208,827 | ||||||
Louisville Gas & Electric Co., Series _ (USD), 4.38%, 10/01/2045 | 1,780,000 | 1,849,187 | ||||||
| 12,753,042 | ||||||||
Energy Equipment & Services (1.3%) | ||||||||
Energy Transfer Partners LP (USD), 4.15%, 10/01/2020 | 5,000,000 | 5,019,810 | ||||||
Plains All American Pipeline LP / PAA Finance Corp. (USD), 3.65%, 06/01/2022 | 4,660,000 | 4,566,581 | ||||||
Williams Partners LP (USD), 3.90%, 01/15/2025 | 3,897,000 | 3,318,416 | ||||||
| 12,904,807 | ||||||||
Food & Staples (0.1%) | ||||||||
Tiffany & Co. (USD), 4.90%, 10/01/2044 | 1,140,000 | 1,091,844 | ||||||
Food Products (0.3%) | ||||||||
Kraft Heinz Foods Co. (USD), 5.20%, 07/15/2045 (b) | 1,340,000 | 1,426,101 | ||||||
Sysco Corp. (USD), 4.85%, 10/01/2045 | 1,780,000 | 1,860,123 | ||||||
| 3,286,224 | ||||||||
Healthcare Products (0.7%) | ||||||||
Becton Dickinson and Co. (USD), 4.69%, 12/15/2044 | 3,486,000 | 3,552,959 | ||||||
Medtronic, Inc. (USD), 4.38%, 03/15/2035 | 3,626,000 | 3,762,519 | ||||||
| 7,315,478 | ||||||||
Healthcare Providers & Services (0.5%) | ||||||||
Quest Diagnostics, Inc. (USD), 4.70%, 03/30/2045 | 2,230,000 | 2,018,079 | ||||||
UnitedHealth Group, Inc. (USD), 2.70%, 07/15/2020 | 2,710,000 | 2,769,446 | ||||||
| 4,787,525 | ||||||||
Insurance (1.3%) | ||||||||
American International Group, Inc. | ||||||||
(USD), 4.13%, 02/15/2024 | 1,520,000 | 1,606,201 | ||||||
(USD), 4.50%, 07/16/2044 | 3,970,000 | 3,903,129 | ||||||
New York Life Global Funding (USD), 2.10%, 01/02/2019 (b) | 3,640,000 | 3,666,121 | ||||||
Principal Life Global Funding II (USD), 1.00%, 12/11/2015 (b) | 3,680,000 | 3,682,767 | ||||||
| 12,858,218 | ||||||||
Iron/Steel (0.2%) | ||||||||
Glencore Funding LLC (USD), 4.00%, 04/16/2025 (b) | 2,440,000 | 1,894,521 | ||||||
Leisure Time (0.3%) | ||||||||
Harley-Davidson, Inc. (USD), 4.63%, 07/28/2045 | 2,750,000 | 2,730,362 | ||||||
Media (2.1%) | ||||||||
21st Century Fox America, Inc. | ||||||||
(USD), 7.75%, 01/20/2024 | 530,000 | 666,778 | ||||||
(USD), 7.43%, 10/01/2026 | 2,062,000 | 2,522,908 | ||||||
(USD), 7.30%, 04/30/2028 | 2,622,000 | 3,145,603 | ||||||
CBS Corp. (USD), 2.30%, 08/15/2019 | 3,150,000 | 3,123,030 | ||||||
Comcast Corp. (USD), 4.60%, 08/15/2045 | 3,180,000 | 3,301,823 | ||||||
Time Warner Cos., Inc. (USD), 7.57%, 02/01/2024 | 6,570,000 | 8,157,483 | ||||||
| 20,917,625 | ||||||||
Metals & Mining (0.2%) | ||||||||
Glencore Funding LLC (USD), 4.63%, 04/29/2024 (b) | 2,880,000 | 2,304,000 | ||||||
Miscellaneous Manufacturing (0.3%) | ||||||||
Pentair Finance SA (USD), 1.88%, 09/15/2017 | 3,190,000 | 3,163,462 | ||||||
Oil, Gas & Consumable Fuels (1.9%) | ||||||||
Chevron Corp. (USD), 0.43%, 02/22/2017 (a) | 3,370,000 | 3,368,480 | ||||||
Devon Energy Corp. (USD), 7.95%, 04/15/2032 | 4,560,000 | 5,616,963 | ||||||
Marathon Petroleum Corp. (USD), 4.75%, 09/15/2044 | 2,476,000 | 2,253,925 | ||||||
Noble Energy, Inc. (USD), 5.25%, 11/15/2043 | 3,070,000 | 2,837,785 | ||||||
Valero Energy Corp. (USD), 9.38%, 03/15/2019 | 3,774,000 | 4,579,806 | ||||||
| 18,656,959 | ||||||||
Pharmaceutical (0.4%) | ||||||||
AbbVie, Inc. (USD), 3.20%, 11/06/2022 | 1,020,000 | 1,011,422 | ||||||
Baxalta, Inc. (USD), 5.25%, 06/23/2045 (b) | 2,710,000 | 2,766,276 | ||||||
| 3,777,698 | ||||||||
Retail (0.9%) | ||||||||
CVS Health Corp. | ||||||||
(USD), 3.50%, 07/20/2022 | 1,540,000 | 1,591,022 | ||||||
(USD), 5.13%, 07/20/2045 | 2,340,000 | 2,518,462 | ||||||
Lowe’s Cos., Inc. | ||||||||
(USD), 6.88%, 02/15/2028 | 1,600,000 | 2,072,469 | ||||||
(USD), 4.38%, 09/15/2045 | 540,000 | 550,903 | ||||||
Wal-Mart Stores, Inc. (USD), 0.60%, 04/11/2016 | 2,110,000 | 2,112,454 | ||||||
| 8,845,310 | ||||||||
See accompanying Notes to Financial Statements.
2015 Annual Report
23
Statement of Investments (continued)
October 31, 2015
Aberdeen Total Return Bond Fund
| Shares or Principal Amount | Value (US$) | |||||||
Semiconductors (1.2%) | ||||||||
Intel Corp. | ||||||||
(USD), 3.10%, 07/29/2022 | $ | 4,670,000 | $ | 4,809,811 | ||||
(USD), 4.90%, 07/29/2045 | 1,230,000 | 1,282,186 | ||||||
QUALCOMM, Inc. (USD), 3.00%, 05/20/2022 | 5,730,000 | 5,663,251 | ||||||
| 11,755,248 | ||||||||
Software (1.5%) | ||||||||
Microsoft Corp. (USD), 4.45%, 11/03/2045 | 8,080,000 | 8,212,755 | ||||||
Oracle Corp. (USD), 2.80%, 07/08/2021 | 7,100,000 | 7,221,701 | ||||||
| 15,434,456 | ||||||||
Transportation (1.3%) | ||||||||
Burlington Northern Santa Fe LLC | ||||||||
(USD), 4.90%, 04/01/2044 | 4,630,000 | 4,850,768 | ||||||
(USD), 4.70%, 09/01/2045 | 2,260,000 | 2,310,457 | ||||||
CSX Corp. (USD), 3.95%, 05/01/2050 | 1,720,000 | 1,501,255 | ||||||
FedEx Corp. (USD), 4.90%, 01/15/2034 | 4,550,000 | 4,753,649 | ||||||
| 13,416,129 | ||||||||
| 261,914,177 | ||||||||
Total Corporate Bonds |
| 363,004,612 | ||||||
MUNICIPAL BONDS (5.5%) | ||||||||
UNITED STATES (5.5%) | ||||||||
CALIFORNIA (2.5%) | ||||||||
Los Angeles Unified School District General Obligation Unlimited Bonds | ||||||||
(USD), 5.76%, 07/01/2029 | 1,425,000 | 1,687,143 | ||||||
(USD), 6.76%, 07/01/2034 | 6,880,000 | 9,045,067 | ||||||
San Francisco City & County Public Utilities Commission Water, Revenue Bonds (USD), 6.00%, 11/01/2040 | 3,100,000 | 3,746,908 | ||||||
State of California General Obligation Unlimited Bonds | ||||||||
(USD), 7.55%, 04/01/2039 | 6,170,000 | 9,112,967 | ||||||
(USD), 7.35%, 11/01/2039 | 1,150,000 | 1,632,413 | ||||||
| 25,224,498 | ||||||||
CONNECTICUT (0.5%) | ||||||||
State of Connecticut General Obligation Unlimited Bonds | ||||||||
(USD), 5.09%, 10/01/2030 | 855,000 | 957,173 | ||||||
Series A (USD), 5.85%, 03/15/2032 | 3,530,000 | 4,172,107 | ||||||
| 5,129,280 | ||||||||
FLORIDA (0.2%) | ||||||||
Florida Hurricane Catastrophe Fund Finance Corp., Revenue Bonds, Series A (USD), 1.30%, 07/01/2016 | 2,370,000 | 2,380,736 | ||||||
MASSACHUSETTS (0.5%) | ||||||||
Commonwealth of Massachusetts General Obligation Limited Bonds | ||||||||
Series E (USD), 4.20%, 12/01/2021 | 3,280,000 | 3,566,246 | ||||||
(USD), 4.91%, 05/01/2029 | 1,160,000 | 1,346,980 | ||||||
| 4,913,226 | ||||||||
NEW YORK (1.1%) | ||||||||
New York City Municipal Water Finance Authority Revenue Bonds (Build America Bonds) (USD), 5.44%, 06/15/2043 | 3,805,000 | 4,551,313 | ||||||
New York City Transitional Finance Authority Revenue Bonds (Qualified School Construction BD) | ||||||||
(USD), 5.27%, 05/01/2027 | 2,150,000 | 2,477,639 | ||||||
(USD), 5.01%, 08/01/2027 | 2,170,000 | 2,463,145 | ||||||
New York State Dormitory Authority Revenue Bonds (Build America Bonds) (USD), 5.50%, 03/15/2030 | 810,000 | 952,106 | ||||||
| 10,444,203 | ||||||||
PENNSYLVANIA (0.3%) | ||||||||
Pennsylvania State General Obligation Unlimited Bonds (Build America Bonds), Series B (USD), 4.65%, 02/15/2026 | 2,900,000 | 3,133,102 | ||||||
TEXAS (0.4%) | ||||||||
State of Texas, Series A (USD), 4.63%, 04/01/2033 | 3,220,000 | 3,570,626 | ||||||
| 54,795,671 | ||||||||
Total Municipal Bonds | 54,795,671 | |||||||
GOVERNMENT BONDS (7.3%) |
| |||||||
AUSTRALIA (0.6%) | ||||||||
Australia Government Bond | ||||||||
(AUD), 1.25%, 02/21/2022 (b)(e) | 4,730,000 | 3,847,454 | ||||||
Series 139 (AUD), 3.25%, 04/21/2025 (b) | 2,940,000 | 2,208,571 | ||||||
| 6,056,025 | ||||||||
CANADA (1.5%) | ||||||||
Canada Housing Trust No 1 | ||||||||
(CAD), 1.25%, 12/15/2020 (b) | 13,280,000 | 10,112,036 | ||||||
(CAD), 2.55%, 03/15/2025 (b) | 6,180,000 | 4,930,341 | ||||||
| 15,042,377 | ||||||||
NEW ZEALAND (1.9%) | ||||||||
New Zealand Government Bond | ||||||||
(NZD), 5.00%, 03/15/2019 (b) | 6,880,000 | 5,014,876 | ||||||
Series 423 (NZD), 5.50%, 04/15/2023 (b) | 11,360,000 | 8,964,149 | ||||||
Series 0427 (NZD), 4.50%, 04/15/2027 (b) | 6,900,000 | 5,203,107 | ||||||
| 19,182,132 | ||||||||
REPUBLIC OF SOUTH KOREA (0.3%) | ||||||||
Korea Housing Finance Corp. (USD), 1.63%, 09/15/2018 (b) | 3,230,000 | 3,189,744 | ||||||
SPAIN (3.0%) | ||||||||
Spain Government Bond (EUR), 1.60%, 04/30/2025 (b) | 26,850,000 | 29,534,911 | ||||||
Total Government Bonds |
| 73,005,189 | ||||||
See accompanying Notes to Financial Statements.
Annual Report 2015
24
Statement of Investments (continued)
October 31, 2015
Aberdeen Total Return Bond Fund
| Shares or Principal Amount | Value (US$) | |||||||
U.S. AGENCIES (9.7%) | ||||||||
UNITED STATES (9.7%) | ||||||||
Federal Home Loan Mortgage Corp. | ||||||||
(USD), 6.50%, 05/01/2022 | $ | 1,218 | $ | 1,393 | ||||
TBA (USD), 2.50%, 11/01/2030 | 7,440,000 | 7,570,926 | ||||||
(USD), 6.50%, 08/01/2036 | 437,758 | 500,675 | ||||||
(USD), 6.50%, 09/01/2037 | 39,562 | 45,237 | ||||||
(USD), 6.50%, 05/01/2038 | 1,109,170 | 1,268,989 | ||||||
(USD), 6.50%, 09/01/2038 | 91,031 | 104,115 | ||||||
(USD), 6.50%, 10/01/2038 | 758,256 | 867,176 | ||||||
(USD), 6.50%, 10/01/2038 | 2,478 | 2,835 | ||||||
(USD), 6.50%, 11/01/2038 | 408,506 | 467,001 | ||||||
(USD), 6.50%, 12/01/2038 | 438,876 | 508,847 | ||||||
(USD), 5.00%, 10/01/2041 | 4,682,017 | 5,190,354 | ||||||
(USD), 3.00%, 02/01/2043 | 2,837,027 | 2,870,275 | ||||||
(USD), 4.50%, 10/01/2043 | 3,724,381 | 4,035,690 | ||||||
(USD), 4.50%, 10/01/2043 | 2,032,259 | 2,201,475 | ||||||
(USD), 4.50%, 07/01/2044 | 2,130,394 | 2,306,581 | ||||||
(USD), 4.00%, 11/01/2044 | 4,534,645 | 4,834,911 | ||||||
(USD), 4.00%, 11/01/2044 | 3,080,351 | 3,283,925 | ||||||
(USD), 3.11%, 02/01/2045 (a) | 4,369,480 | 4,509,565 | ||||||
Federal National Mortgage Association | ||||||||
(USD), 3.50%, 10/01/2023 | 2,249,174 | 2,378,816 | ||||||
(USD), 3.50%, 10/01/2023 | 2,222,194 | 2,349,747 | ||||||
(USD), 2.49%, 02/01/2036 (a) | 214,784 | 228,402 | ||||||
(USD), 5.50%, 03/01/2038 | 4,163,644 | 4,701,545 | ||||||
(USD), 5.00%, 04/01/2040 | 1,272,202 | 1,409,382 | ||||||
(USD), 5.00%, 05/01/2040 | 1,217,311 | 1,344,319 | ||||||
(USD), 4.50%, 12/01/2040 | 2,267,567 | 2,464,954 | ||||||
(USD), 5.00%, 02/01/2041 | 1,225,946 | 1,358,151 | ||||||
(USD), 5.00%, 04/01/2041 | 1,291,006 | 1,428,803 | ||||||
(USD), 3.50%, 03/01/2042 | 1,735,947 | 1,810,826 | ||||||
(USD), 3.50%, 06/01/2042 | 3,140,790 | 3,272,492 | ||||||
(USD), 4.00%, 06/01/2043 | 3,157,712 | 3,389,741 | ||||||
(USD), 4.50%, 03/01/2044 | 1,925,053 | 2,086,547 | ||||||
(USD), 4.50%, 04/01/2044 | 4,252,181 | 4,632,386 | ||||||
(USD), 4.50%, 05/01/2044 | 4,504,501 | 4,908,731 | ||||||
(USD), 4.50%, 08/01/2044 | 1,875,440 | 2,034,174 | ||||||
(USD), 3.07%, 01/01/2045 (a) | 6,220,335 | 6,412,071 | ||||||
(USD), 3.50%, 02/01/2045 | 3,623,012 | 3,783,015 | ||||||
(USD), 3.00%, 06/01/2045 | 3,981,925 | 4,030,441 | ||||||
Government National Mortgage Association | ||||||||
(USD), 6.00%, 04/15/2037 | 142,708 | 161,982 | ||||||
(USD), 6.00%, 06/15/2037 | 170,407 | 192,342 | ||||||
(USD), 6.00%, 09/15/2037 | 251,893 | 284,316 | ||||||
(USD), 6.00%, 11/15/2037 | 686,950 | 781,524 | ||||||
(USD), 6.00%, 11/15/2037 | 161,131 | 183,302 | ||||||
(USD), 6.00%, 12/15/2037 | 151,839 | 172,645 | ||||||
(USD), 6.00%, 12/15/2037 | 55,771 | 63,414 | ||||||
(USD), 6.00%, 01/15/2038 | 119,946 | 136,374 | ||||||
(USD), 6.00%, 04/15/2038 | 226,714 | 257,806 | ||||||
(USD), 6.00%, 07/15/2038 | 83,787 | 95,404 | ||||||
(USD), 6.00%, 08/15/2038 | 27,173 | 31,103 | ||||||
(USD), 6.00%, 09/15/2038 | 331,217 | 373,851 | ||||||
| 97,328,576 | ||||||||
Total U.S. Agencies |
| 97,328,576 | ||||||
U.S. TREASURIES (2.8%) | ||||||||
UNITED STATES (2.8%) | ||||||||
Treasury Inflation Protected Security (USD), 0.75%, 02/15/2045 (e) | 1,801,502 | 1,601,941 | ||||||
U.S. Treasury Bonds | ||||||||
(USD), 3.13%, 08/15/2044 | 6,850,000 | 7,107,012 | ||||||
(USD), 2.50%, 02/15/2045 | 2,250,000 | 2,049,815 | ||||||
U.S. Treasury Inflation Index Bonds (USD), 0.63%, 02/15/2043 (e) | 5,058,657 | 4,368,363 | ||||||
U.S. Treasury Notes | ||||||||
(USD), 1.63%, 06/30/2020 | 580,000 | 583,489 | ||||||
(USD), 1.38%, 10/31/2020 | 5,040,000 | 5,003,626 | ||||||
(USD), 2.00%, 08/15/2025 | 7,120,000 | 7,026,273 | ||||||
| 27,740,519 | ||||||||
Total U.S. Treasuries |
| 27,740,519 | ||||||
REPURCHASE AGREEMENT (4.8%) | ||||||||
UNITED STATES (4.8%) | ||||||||
Repurchase Agreement, Fixed Income Clearing Corp., 0.00%, dated 10/30/2015, due 11/02/2015, repurchase price $48,790,041, Collateralized by U.S. Treasury Notes, maturing 03/31/2022; total market value of $49,767,669 | 48,790,041 | 48,790,041 | ||||||
Total Repurchase Agreement |
| 48,790,041 | ||||||
Total Investments |
| 1,015,511,666 | ||||||
Liabilities in excess of other assets—(1.2)% | (12,529,597 | ) | ||||||
Net Assets—100.0% | $ | 1,002,982,069 | ||||||
| (a) | Variable or Floating Rate Security. Rate disclosed is as of October 31, 2015. |
| (b) | Denotes a security issued under Regulation S or Rule 144A. |
| (c) | Fair Valued Security. Fair Values are determined pursuant to procedures approved by the Fund’s Board of Trustees. See Note 2(a) of the accompanying Notes to Financial Statements. |
| (d) | This security is government guaranteed. |
| (e) | Inflation linked security. |
| (f) | See accompanying Notes to Financial Statements for tax unrealized appreciation/depreciation of securities. |
| AUD | Australian Dollar |
| CAD | Canadian Dollar |
| CLP | Chilean Peso |
| COP | Colombian Peso |
| EUR | Euro Currency |
| GBP | British Pound Sterling |
| IDR | Indonesian Rupiah |
| INR | Indian Rupee |
| MXN | Mexican Peso |
| NZD | New Zealand Dollar |
| TBA | Securities purchased on a forward commitment basis with an appropriate principal amount and no definitive maturity date. The actual principal and maturity date will be determined upon settlement date. |
| USD | U.S. Dollar |
See accompanying Notes to Financial Statements.
2015 Annual Report
25
Statement of Investments (continued)
October 31, 2015
Aberdeen Total Return Bond Fund
At October 31, 2015, the Fund held the following futures contracts:
| Futures Contracts | Counterparty | Number of Contracts Long (Short) | Expiration Date | Unrealized Appreciation/ (Depreciation) | ||||||||||
Euro BUXL Futures-30 year | UBS | 34 | 12/08/2015 | $ | (42,697 | ) | ||||||||
United States Treasury Note 6%-5 year | UBS | (33 | ) | 12/31/2015 | 27,586 | |||||||||
United States Treasury Note 6%-10 year | UBS | (18 | ) | 12/21/2015 | 22,219 | |||||||||
United States Treasury Note 6%-Long Bond | UBS | (21 | ) | 12/21/2015 | 43,969 | |||||||||
United States Treasury Note 6%-Ultra Long | UBS | 108 | 12/21/2015 | (222,750 | ) | |||||||||
| $ | (171,673 | ) | ||||||||||||
At October 31, 2015, the Fund’s open forward foreign currency exchange contracts were as follows:
| Purchase Contracts Settlement Date* | Counterparty | Amount Purchased | Amount Sold | Fair Value | Unrealized Appreciation/ (Depreciation) | |||||||||||||||||||||
| Australian Dollar/United States Dollar 12/21/2015 | Barclays Bank PLC | AUD | 1,616,475 | USD | 1,169,241 | $ | 1,149,922 | $ | (19,319 | ) | ||||||||||||||||
| 12/21/2015 | Royal Bank of Canada | AUD | 141,925 | USD | 102,323 | 100,962 | (1,361 | ) | ||||||||||||||||||
| British Pound/United States Dollar 11/03/2015 | Citibank N.A. | GBP | 3,327,000 | USD | 5,191,385 | 5,128,901 | (62,484 | ) | ||||||||||||||||||
| 11/13/2015 | Barclays Bank PLC | GBP | 6,583,728 | USD | 10,092,223 | 10,148,829 | 56,606 | |||||||||||||||||||
| Canadian Dollar/United States Dollar 12/18/2015 | Citibank N.A. | CAD | 6,633,403 | USD | 5,037,216 | 5,071,634 | 34,418 | |||||||||||||||||||
| 12/18/2015 | Deutsche Bank AG | CAD | 6,639,112 | USD | 5,041,504 | 5,075,998 | 34,494 | |||||||||||||||||||
| 12/18/2015 | Westpac Banking Corp. | CAD | 6,633,403 | USD | 5,030,641 | 5,071,634 | 40,993 | |||||||||||||||||||
| Chilean Peso/United States Dollar 11/09/2015 | Barclays Bank PLC | CLP | 6,880,771,743 | USD | 10,106,942 | 9,943,989 | (162,953 | ) | ||||||||||||||||||
| Colombian Peso/United States Dollar 11/17/2015 | JPMorgan Chase Bank N.A. | COP | 43,982,130,527 | USD | 15,062,167 | 15,158,014 | 95,847 | |||||||||||||||||||
| Euro/United States Dollar 11/18/2015 | Barclays Bank PLC | EUR | 16,536,396 | USD | 18,567,657 | 18,187,582 | (380,075 | ) | ||||||||||||||||||
| 11/19/2015 | Barclays Bank PLC | EUR | 7,276,194 | USD | 8,064,596 | 8,002,835 | (61,761 | ) | ||||||||||||||||||
| 11/19/2015 | Royal Bank of Canada | EUR | 15,957,173 | USD | 17,971,302 | 17,550,744 | (420,558 | ) | ||||||||||||||||||
| Indian Rupee/United States Dollar 11/16/2015 | Westpac Banking Corp. | INR | 526,017,967 | USD | 8,037,557 | 8,030,675 | (6,882 | ) | ||||||||||||||||||
| Indonesian Rupiah/United States Dollar 11/18/2015 | JPMorgan Chase Bank N.A. | IDR | 328,724,711,008 | USD | 23,126,184 | 23,918,407 | 792,223 | |||||||||||||||||||
| Mexican Peso/United States Dollar 11/18/2015 | Deutsche Bank AG | MXN | 90,562,045 | USD | 5,496,604 | 5,477,036 | (19,568 | ) | ||||||||||||||||||
| 11/23/2015 | Barclays Bank PLC | MXN | 41,698,865 | USD | 2,517,009 | 2,520,902 | 3,893 | |||||||||||||||||||
| 11/23/2015 | JPMorgan Chase Bank N.A. | MXN | 83,397,731 | USD | 5,045,112 | 5,041,803 | (3,309 | ) | ||||||||||||||||||
| 11/23/2015 | Royal Bank of Canada | MXN | 83,397,731 | USD | 5,048,227 | 5,041,803 | (6,424 | ) | ||||||||||||||||||
| New Zealand Dollar/United States Dollar 11/04/2015 | Royal Bank of Canada | NZD | 12,915,692 | USD | 8,499,325 | 8,745,232 | 245,907 | |||||||||||||||||||
| $ | 159,366,902 | $ | 159,687 | |||||||||||||||||||||||
See accompanying Notes to Financial Statements.
Annual Report 2015
26
Statement of Investments (concluded)
October 31, 2015
Aberdeen Total Return Bond Fund
| Sale Contracts Settlement Date* | Counterparty | Amount Purchased | Amount Sold | Fair Value | Unrealized Appreciation/ (Depreciation) | |||||||||||||||||||||
| United States Dollar/British Pound 11/03/2015 | Barclays Bank PLC | USD | 5,187,322 | GBP | 3,327,000 | $ | 5,128,901 | $ | 58,421 | |||||||||||||||||
| 11/13/2015 | Deutsche Bank AG | USD | 10,079,826 | GBP | 6,583,728 | 10,148,829 | (69,003 | ) | ||||||||||||||||||
| United States Dollar/Canadian Dollar 12/18/2015 | Royal Bank of Canada | USD | 19,894,417 | CAD | 26,428,195 | 20,205,937 | (311,520 | ) | ||||||||||||||||||
| 12/18/2015 | Westpac Banking Corp. | USD | 10,037,207 | CAD | 13,289,563 | 10,160,666 | (123,459 | ) | ||||||||||||||||||
| United States Dollar/Colombian Peso 11/17/2015 | JPMorgan Chase Bank N.A. | USD | 5,007,073 | COP | 14,660,710,175 | 5,052,671 | (45,598 | ) | ||||||||||||||||||
| United States Dollar/Euro 11/18/2015 | Barclays Bank PLC | USD | 2,500,466 | EUR | 2,241,686 | 2,465,522 | 34,944 | |||||||||||||||||||
| 11/18/2015 | Citibank N.A. | USD | 30,086,289 | EUR | 27,030,735 | 29,729,797 | 356,492 | |||||||||||||||||||
| 11/18/2015 | Deutsche Bank AG | USD | 10,094,756 | EUR | 8,876,938 | 9,763,314 | 331,442 | |||||||||||||||||||
| 11/19/2015 | Barclays Bank PLC | USD | 26,046,329 | EUR | 23,408,769 | 25,746,498 | 299,831 | |||||||||||||||||||
| 11/19/2015 | Royal Bank of Canada | USD | 26,060,280 | EUR | 23,408,768 | 25,746,497 | 313,783 | |||||||||||||||||||
| United States Dollar/Indonesian Rupiah 11/18/2015 | JPMorgan Chase Bank N.A. | USD | 13,567,318 | IDR | 192,924,632,253 | 14,037,429 | (470,111 | ) | ||||||||||||||||||
| United States Dollar/Mexican Peso 11/18/2015 | Barclays Bank PLC | USD | 5,411,616 | MXN | 90,562,045 | 5,477,036 | (65,420 | ) | ||||||||||||||||||
| 11/23/2015 | Barclays Bank PLC | USD | 5,061,472 | MXN | 83,397,731 | 5,041,803 | 19,669 | |||||||||||||||||||
| United States Dollar/New Zealand Dollar 11/04/2015 | Royal Bank of Canada | USD | 5,720,625 | NZD | 9,037,992 | 6,119,636 | (399,011 | ) | ||||||||||||||||||
| 11/04/2015 | Westpac Banking Corp. | USD | 23,123,449 | NZD | 35,435,638 | 23,993,515 | (870,066 | ) | ||||||||||||||||||
| 01/29/2016 | Westpac Banking Corp. | USD | 4,578,291 | NZD | 6,865,085 | 4,619,806 | (41,515 | ) | ||||||||||||||||||
| $ | 203,437,857 | $ | (981,121 | ) | ||||||||||||||||||||||
| * | Certain contracts with different trade dates and like characteristics have been shown net. |
See accompanying Notes to Financial Statements.
2015 Annual Report
27
Aberdeen Global High Income Fund (Unaudited)
The Aberdeen Global High Income Fund (Institutional Class shares net of fees)1 returned -5.85% for the 12-month period ended October 31, 2015, versus the -0.63% return of its benchmark, the Bank of America Merrill Lynch (BofA ML) Global High Yield Constrained Index (hedged to U.S. dollars), during the same period. For broader comparison, the average return of the Fund’s Lipper peer category of High Yield Funds (consisting of 217 funds) was -2.24% for the period.
Global high-yield markets experienced substantial volatility during the 12-month period ended October 31, 2015, amid investors’ concerns over future U.S. Federal Reserve (Fed) interest-rate policy, declining commodity prices, and deteriorating economic conditions in many emerging markets. These factors drove modestly negative returns and higher yields globally over the period, as high-yield investors demanded more compensation for risk in the asset class despite higher equity prices and only marginally higher interest rates in the U.S.
In the face of the previously cited headwinds, the global high-yield market, as measured by the BofA ML Global High Yield Constrained Index (hedged to U.S. dollars), recorded a total return of -0.63% for the reporting period, and generally lagged both equities and investment-grade corporate credit.2 The majority of the weakness in global high-yield credit markets over the period was centered on the U.S. and emerging markets, while Europe outperformed. The U.S. high-yield sector, as measured by BofA ML U.S. High Yield Master II Index, 3 returned -2.05% for the period. Emerging-market corporate credit suffered similarly during the period, returning -2.13%, as measured by the BofA ML U.S. Emerging Markets Corporate Plus Index (hedged to U.S. dollars).4 The decline in energy and commodity prices and the declines in many emerging market currencies were largely responsible for the negative returns in the emerging-markets corporate credit sector over the period. In sharp contrast, the European high-yield market, as represented by the BofA ML Global High Yield European Issuers Constrained Index (hedged to U.S. dollars)5 posted a gain of 4.87% for the 12-month period.
The outperformance of European high-yield credit relative to the U.S. and emerging markets was attributable partly to continued accommodative monetary policy from the European Central Bank (ECB), compared to increasingly restrictive policy in the U.S. The ECB’s accommodative policy served to drive interest rates lower in Europe throughout the period, which was a substantial tailwind to European high-yield credit. The European market also was supported by substantial fund inflows during the period, in contrast to the U.S. and emerging markets, which saw substantial fund outflows, thereby hampering performance in these markets. Sharply lower energy prices over the reporting period had a notable impact on U.S. high-yield credit returns relative to Europe, given the greater exposure to energy in the U.S. At the end of the reporting period, the energy sector represented nearly 13% of the BofA ML U.S. High Yield Master II Index compared to roughly 7% in Europe.
Several factors detracted from the Fund’s relative performance versus the benchmark BofA ML Global High Yield Constrained Index during the reporting period. Within the energy sector, the Fund’s holding in Deep Ocean, a specialty deepwater services provider, detracted from performance as the company’s securities came under pressure in conjunction with the severe global downturn in oil prices over the period. Additionally, the Fund’s positions in two coal companies, Arch Coal and Alpha Natural Resources, weighed on performance, as both companies struggled to support large debt loads through a protracted decline in the price of coal. Alpha Natural Resources filed for bankruptcy protection in August 2015. We exited the Fund’s remaining holding in Alpha Natural Resources debt shortly thereafter. Finally, the Fund’s holdings in Verso and Newpage debt detracted from performance as the a long-anticipated merger of the two companies failed to deliver the anticipated synergies quickly enough to offset the negative impact of declining coated paper prices on the company’s financial results.
More broadly, certain elements of the Fund’s positioning detracted from performance in the period. The Fund’s underweight to BB-rated credits2 in favor of lower-rated issues created a significant headwind as higher-rated credits generally outperformed over the course of the previous year. Similarly, the Fund’s underweight to European high-yield bonds relative to the benchmark hurt performance, as that market outperformed versus other global high-yield markets. Furthermore, the Fund’s underweight to banking credits hindered performance as the sector posted strong returns over the period.
Several individual positions had a positive impact on Fund performance throughout the reporting period. The Fund’s holding in consumer products company Sun Products Corp. outperformed versus its peers over the period as the company’s financial position was bolstered by a cost-savings program, an asset sale and lower commodity prices. Fund performance also was enhanced by the position in Maison du Monde, a French home goods retailer, as the company experienced strong sales and cash-flow growth in 2015, driving financial leverage lower over the period. Finally, Fund performance was bolstered by the holding in Building Materials Corp. of America, a supplier of roofing materials, which benefited from positive homebuilding trends in the U.S. during the review period.
In terms of sector positioning, the Fund’s performance relative to the benchmark benefited from an underweight to the overall energy sector and a higher-credit-quality bias within this sector, which saw steep declines on the back of weak petrochemical prices. The corollary to weakness in energy prices over the period was a tailwind to the transportation sector as issuers benefited from lower fuel prices.
| 1 | The performance quoted represents past performance, which does not guarantee future results. The investment return and principal value of an investment will fluctuate so that an investor’s shares, when redeemed, may be worth more or less than their original cost. Current performance of the Fund may be lower or higher than the performance quoted. Performance data current to the most recent month-end may be obtained by calling 866-667-9231 or visiting www.aberdeen-asset.us. |
| 2 | Standard & Poor’s is an international credit rating agency that evaluates credit risk. Agency credit ratings are expressed as letter grades that range from “AAA” to “D” to communicate the respective agency’s opinion of relative level of credit risk. |
28
Annual Report 2015
Aberdeen Global High Income Fund (Unaudited) (continued)
Regarding the use of derivatives during the reporting period, we employed credit default swaps3 to hedge certain positions, as well as to gain long credit exposure. We believe that in certain situations, credit default swaps provide a more efficient hedge relative to cash bonds. Additionally, we used currency forwards to hedge some of the Fund’s foreign exchange holdings. Overall, the use of derivatives contributed approximately 2.78% to Fund performance for the 12-month period ended October 31, 2015.
We initiated several holdings during the reporting period, including the bonds of McGraw-Hill Global Education, the publisher of education materials, given our view that the company was well-positioned to capitalize on changes in an evolving industry. We made a significant investment in Inmarsat, a global mobile satellite services provider, as we believe that the company will continue to dominate its niche market and benefit from expected growth in the provision of higher bandwidth solutions to its customers.
We also established a new position in Sinclair Broadcasting, a U.S. television broadcaster. We believed that the company would benefit from the receipt of higher retransmission fees for the distribution of content by cable and satellite companies within its business footprint, and we felt that the company’s spectrum assets were undervalued by the market. Finally, we purchased issues of Crown Castle International, a cell phone tower leasing company, given our expectation that the company’s bonds would be upgraded to investment-grade in the near term.
Conversely, we exited the Fund’s position in the Verso Paper bonds after the company’s results deteriorated amid declining prices for coated paper, a dynamic that we anticipated to continue. Given our expectation for lower energy prices in the intermediate term, we exited the Fund’s position in Clayton Williams Energy, a U.S. energy exploration and production company. We also exited the position in the holding company bonds of AES Corporation, a global power utility, due to our concerns over the potential for higher leverage and structural subordination.4 Additionally, we sold the Fund’s holding in Cobre Del Mayo, a Mexican copper miner, as the company’s financial results over the period were pressured by declining copper prices.
We believe that the investment landscape may offer high-yield investors both opportunities and potential challenges in 2016. We think that the most important driver of high-yield returns in the U.S., economic growth, will remain slightly positive over the next 12 months. Given this backdrop, we feel that defaults should remain near their recent low levels, thereby providing support for the U.S. high-yield market.
In Europe, we anticipate that accommodative central bank policy will continue to provide a tailwind to the asset class. We believe that there will be continued volatility in emerging markets as many of these economies struggle with the implications of weaker energy and commodity prices.
In our opinion, several of the key themes from 2015 may continue into the upcoming calendar year. Notably, the large extent of investor sentiment may be driven by central bank policies in both the U.S. and Europe. We believe that U.S. credit markets could remain hyper-focused on the potential magnitude and timing of future interest rate increases from the Fed. In contrast, we feel that European investors may be acutely focused on the likelihood of additional quantitative easing measures. Deviations from expectations in either market may potentially result in temporary bouts of volatility. We also anticipate that commodity prices may remain volatile over the next year, leading to continued investor focus on these high-yield sectors.
Overall, we think that, as of the end of the reporting period, market pricing offered adequate compensation for the risks associated with the asset class in an expectedly benign default environment over the next year. However, we also believe that there may be some intra-period volatility arising from global macroeconomic concerns or topical industry sectors such as energy or commodities.
Portfolio Management:
Aberdeen North American Fixed Income Team
PAST PERFORMANCE DOES NOT GUARANTEE FUTURE RESULTS.
The performance quoted represents past performance, which does not guarantee future results. Class A shares have up to a 0.25% 12b-1 fee. The investment return and principal value of an investment will fluctuate so that an investor’s shares, when redeemed, may be worth more or less than their original cost. Current performance of the Fund may be lower or higher than the performance quoted. Performance data current to the most recent month-end may be obtained by calling 866-667-9231 or visiting www.aberdeen-asset.us.
Investing in mutual funds involves risk, including the possible loss of principal. There is no assurance that the investment objective of any fund will be achieved. Indexes are unmanaged and have been provided for comparison purposes only. No fees or expenses are reflected. You cannot invest directly in an index.
Lipper is a leading global provider of mutual fund information and analysis to fund companies, financial intermediaries and media organizations.
Risk Considerations
Fixed income securities are subject to certain risks including, but not limited to: interest rate (changes in interest rates may cause a decline in the market value of an investment), credit (changes in the financial condition of the issuer, borrower, counterparty, or underlying collateral), prepayment (debt issuers may repay or refinance their loans or obligations earlier than anticipated), and extension (principal repayments may not occur as quickly as anticipated, causing the expected maturity of a security to increase).
Non-investment-grade debt securities (highyield/junk bonds) may be subject to greater market fluctuations, risk of default or loss of income and principal than higher-rated securities.
| 3 | A credit default swap is a type of contract that offers a guarantee against the non-payment of a loan. |
| 4 | In structural subordination, a lender to a company will not have access to the assets of the company’s subsidiary until after all of the subsidiary’s creditors have been paid and the remaining assets have been distributed to the company as an equity-holder. |
2015 Annual Report
29
Aberdeen Global High Income Fund (Unaudited) (concluded)
Derivatives are speculative and may hurt the Fund’s performance. They present the risk of disproportionately increased losses and/or reduced gains when the financial asset or measure to which the derivative is linked changes in unexpected ways.
Foreign securities may be more volatile, harder to price and less liquid than U.S. securities; and are subject to different accounting and regulatory standards, political and economic risks and, to the extent denominated in foreign currencies, currency exchange rate risk (unless otherwise hedged). These risks are enhanced in emerging markets countries.
Investing a significant portion of the Fund’s assets in securities of companies conducting business in a broadly related group of industries within an economic sector may make the Fund more vulnerable to unfavorable developments in that sector.
Please read the prospectus for more detailed information regarding these and other risks.
Annual Report 2015
30
Aberdeen Global High Income Fund (Unaudited)
Average Annual Total Return (For periods ended October 31, 2015) | 1 Yr. | 5 Yr. | 10 Yr. | |||||||
Class A | (6.11%) | 4.07% | 6.57% | |||||||
Institutional Class | (5.85%) | 4.34% | 6.85% | |||||||
2015 Annual Report
31
Aberdeen Global High Income Fund (Unaudited)
Performance of a $10,000 Investment (as of October 31, 2015)

Comparative performance of $10,000 invested in Class A shares of the Aberdeen Global High Income Fund, BofA ML Global High Yield Constrained Index (hedged to the U.S. Dollar) and the Consumer Price Index (CPI) over a 10-year period ended October 31, 2015. Unlike the Fund’s returns, the returns for these unmanaged indexes do not reflect any fees or expenses. Investors cannot invest directly in market indexes.
The BofA ML Global High Yield Constrained Index (hedged to the U.S. Dollar) tracks the performance of USD, CAD, GBP and EUR denominated below investment grade corporate debt publicly issued in the major domestic or eurobond markets but caps issuer exposure at 2%.
The CPI is a measure of the average change over time in the prices paid by urban consumers for a market basket of consumer goods and services.
Investment return and principal value will fluctuate, and when redeemed, shares may be worth more or less than original cost. Past performance is no guarantee of future results. The Average Annual Total Return table and performance graph do not reflect the deduction of taxes that a shareholder would pay on Fund distributions or the redemption of Fund shares. Investing in mutual funds involves market risk, including loss of principal. Performance returns assume the reinvestment of all distributions. Performance returns reflect fee waivers and reimbursements in effect without which returns would have been lower.
Portfolio Summary (as a percentage of net assets)
October 31, 2015 (Unaudited)
| Asset Allocation | ||||
Corporate Bonds | 77.4% | |||
Bank Loans | 12.2% | |||
Repurchase Agreement | 2.4% | |||
Government Bonds | 1.5% | |||
Common Stocks | 1.1% | |||
Government Agencies | 1.1% | |||
Preferred Stocks | 0.9% | |||
Other assets in excess of liabilities | 3.4% | |||
| 100.0% | ||||
The following chart summarizes the composition of the Fund’s portfolio, in Bloomberg Industry Classification System (“BICS”), expressed as a percentage of net assets. As of October 31, 2015, the Fund did not have more than 25% of its assets invested in any industry group.
| Top Industry Groups | ||||
Diversified Telecommunication Services | 8.3% | |||
Commercial Banks | 7.4% | |||
Oil, Gas & Consumable Fuels | 5.9% | |||
Diversified Financial Services | 4.3% | |||
Healthcare Providers & Services | 3.4% | |||
Commercial Services & Supplies | 3.5% | |||
Electric Utilities | 2.9% | |||
Chemicals | 2.9% | |||
Real Estate | 2.8% | |||
Media | 2.5% | |||
Other | 56.1% | |||
| 100.0% | ||||
| Top Holdings* | ||||
Sprint Corp. 09/15/2023 | 1.4% | |||
Asurion LLC 03/03/2021 | 1.2% | |||
Cenveo Corp. 08/01/2019 | 1.2% | |||
Annington Finance No 5 PLC 01/15/2023 | 1.2% | |||
Unique Pub Finance Co. PLC (The), Series M 03/28/2024 | 1.2% | |||
Isola USA Corp. 11/29/2018 | 1.1% | |||
Commercial Barge Line Co. 09/22/2019 | 1.0% | |||
MEG Energy Corp. 01/30/2023 | 1.0% | |||
Inmarsat Finance PLC 05/15/2022 | 1.0% | |||
Crown Castle International Corp. 01/15/2023 | 1.0% | |||
Other | 88.7% | |||
| 100.0% | ||||
| * | For the purpose of listing top holdings, repurchase agreements are included as part of Other. |
| Top Countries | ||||
United States | 58.0% | |||
United Kingdom | 9.3% | |||
Canada | 5.2% | |||
Indonesia | 2.8% | |||
France | 2.2% | |||
Luxembourg | 1.7% | |||
Republic of Ireland | 1.9% | |||
Switzerland | 1.9% | |||
Germany | 1.8% | |||
Spain | 1.5% | |||
Other | 13.7% | |||
| 100.0% | ||||
Annual Report 2015
32
Statement of Investments
October 31, 2015
Aberdeen Global High Income Fund
| Shares or Principal Amount | Value (US$) | |||||||
CORPORATE BONDS (77.4%) | ||||||||
AUSTRALIA (0.4%) | ||||||||
QBE Insurance Group Ltd. (USD), 6.75%, 12/02/2044 (a)(b) | $ | 5,281,000 | $ | 5,492,240 | ||||
BRAZIL (0.5%) | ||||||||
Banco do Brasil SA (USD), 9.00%, 06/18/2024 (a)(b)(c) | 5,250,000 | 3,648,750 | ||||||
Petrobras International Finance Co. SA (USD), 7.88%, 03/15/2019 | 2,416,000 | 2,295,200 | ||||||
| 5,943,950 | ||||||||
CANADA (5.2%) | ||||||||
Air Canada (USD), 6.75%, 10/01/2019 (a) | 6,355,000 | 6,752,188 | ||||||
First Quantum Minerals Ltd. (USD), 7.25%, 10/15/2019 (a) | 5,246,000 | 4,118,110 | ||||||
Gateway Casinos & Entertainment Ltd. (CAD), 8.50%, 11/26/2020 (a) | 11,027,000 | 8,306,512 | ||||||
Kissner Milling Co. Ltd. (USD), 7.25%, 06/01/2019 (a) | 7,020,000 | 7,151,625 | ||||||
MEG Energy Corp. | ||||||||
(USD), 6.38%, 01/30/2023 (a) | 15,375,000 | 13,030,313 | ||||||
(USD), 7.00%, 03/31/2024 (a) | 183,000 | 159,210 | ||||||
Northgroup Preferred Capital Corp. (USD), 6.38%, 10/15/2017 (a)(b)(c) | 7,970,000 | 8,089,550 | ||||||
SCM Insurance Services, Inc. (CAD), 9.25%, 08/22/2019 (d) | 13,600,000 | 10,244,723 | ||||||
Valeant Pharmaceuticals International, Inc. | ||||||||
(EUR), 4.50%, 05/15/2023 (a) | 8,385,000 | 7,524,444 | ||||||
(USD), 6.13%, 04/15/2025 (a) | 4,125,000 | 3,490,781 | ||||||
| 68,867,456 | ||||||||
CHINA (0.4%) | ||||||||
Country Garden Holdings Co. (USD), 7.50%, 01/10/2023 (a) | 2,611,000 | 2,712,636 | ||||||
Wanda Properties International Co. Ltd. (USD), 7.25%, 01/29/2024 (a) | 2,050,000 | 2,256,207 | ||||||
| 4,968,843 | ||||||||
COLOMBIA (0.3%) | ||||||||
Pacific Exploration and Production Corp. | ||||||||
(USD), 5.13%, 03/28/2023 (a) | 6,471,000 | 2,394,270 | ||||||
(USD), 5.63%, 01/19/2025 (a) | 5,506,000 | 2,092,280 | ||||||
| 4,486,550 | ||||||||
FRANCE (2.2%) | ||||||||
Credit Agricole SA (USD), 7.88%, 01/23/2024 (a)(b)(c) | 3,640,000 | 3,744,188 | ||||||
Magnolia BC SA (EUR), 9.00%, 08/01/2020 (a) | 9,405,000 | 11,199,063 | ||||||
Numericable-SFR SAS (USD), 6.00%, 05/15/2022 (a) | 7,502,000 | 7,539,510 | ||||||
Societe Generale SA | ||||||||
(USD), 7.88%, 12/18/2023 (a)(b)(c) | 5,162,000 | 5,191,062 | ||||||
(USD), 8.00%, 09/29/2025 (a)(b)(c) | 1,800,000 | 1,821,660 | ||||||
| 29,495,483 | ||||||||
GERMANY (1.0%) | ||||||||
ALBA Group PLC & Co. KG (EUR), 8.00%, 05/15/2018 (a) | 4,375,000 | 4,426,093 | ||||||
Safari Holding Verwaltungs GmbH (EUR), 8.25%, 02/15/2021 (a) | 7,435,000 | 8,544,633 | ||||||
| 12,970,726 | ||||||||
GUATEMALA (0.8%) | ||||||||
Cementos Progreso Trust (USD), 7.13%, 11/06/2023 (a) | 7,385,000 | 7,698,862 | ||||||
Comunicaciones Celulares SA (USD), 6.88%, 02/06/2024 (a) | 3,352,000 | 2,706,740 | ||||||
| 10,405,602 | ||||||||
INDONESIA (1.1%) | ||||||||
Ottawa Holdings Pte Ltd. (USD), 5.88%, 05/16/2018 (a) | 4,350,000 | 2,218,500 | ||||||
Pelabuhan Indonesia II PT (USD), 4.25%, 05/05/2025 (a) | 13,581,000 | 12,494,520 | ||||||
| 14,713,020 | ||||||||
ITALY (0.8%) | ||||||||
Wind Acquisition Finance SA (USD), 7.38%, 04/23/2021 (a) | 9,926,000 | 10,025,260 | ||||||
LUXEMBOURG (1.7%) | ||||||||
ArcelorMittal (USD), 7.75%, 10/15/2039 (b) | 7,475,000 | 6,409,812 | ||||||
Bank of New York Mellon Luxembourg SA (The), Series PRX (EUR), 4.47%, 12/15/2050 (b) | 9,600,000 | 5,938,112 | ||||||
Coveris Holdings SA (USD), 7.88%, 11/01/2019 (a) | 1,525,000 | 1,456,375 | ||||||
Millicom International Cellular SA (USD), 6.00%, 03/15/2025 (a) | 1,443,000 | 1,194,083 | ||||||
OHL Investments SA, Series OHL, (EUR), 4.00%, 04/25/2018 (a) | 6,300,000 | 6,311,223 | ||||||
Trinseo Materials Operating SCA / Trinseo Materials Finance, Inc. | ||||||||
(EUR), 6.38%, 05/01/2022 (a) | 745,000 | 820,468 | ||||||
(USD), 6.75%, 05/01/2022 (a) | 770,000 | 773,850 | ||||||
| 22,903,923 | ||||||||
MALTA (0.3%) | ||||||||
VistaJet Malta Finance PLC / VistaJet Co. Finance LLC (USD), 7.75%, 06/01/2020 (a) | 4,408,000 | 3,834,960 | ||||||
MEXICO (1.2%) | ||||||||
Alfa SAB de CV | ||||||||
(USD), 5.25%, 03/25/2024 (a) | 2,730,000 | 2,883,563 | ||||||
(USD), 6.88%, 03/25/2044 (a) | 6,935,000 | 6,943,669 | ||||||
Axtel SAB de CV (USD), 9.00%, 01/31/2020 (a)(b)(e) | 6,341,000 | 6,515,377 | ||||||
| 16,342,609 | ||||||||
See accompanying Notes to Financial Statements.
2015 Annual Report
33
Statement of Investments (continued)
October 31, 2015
Aberdeen Global High Income Fund
| Shares or Principal Amount | Value (US$) | |||||||
NETHERLANDS (0.8%) | ||||||||
Constellium NV (USD), 8.00%, 01/15/2023 (a) | $ | 4,980,000 | $ | 4,245,450 | ||||
ING Groep NV (USD), 6.50%, 04/16/2025 (b)(c) | 6,000,000 | 5,801,250 | ||||||
| 10,046,700 | ||||||||
PARAGUAY (0.2%) | ||||||||
Banco Regional SAECA (USD), 8.13%, 01/24/2019 (a) | 2,772,000 | 2,855,160 | ||||||
REPUBLIC OF IRELAND (1.9%) | ||||||||
Ardagh Packaging Finance PLC / Ardagh Holdings USA, Inc. (USD), 6.75%, 01/31/2021 (a) | 3,600,000 | 3,708,000 | ||||||
Argon Capital PLC for Royal Bank of Scotland (GBP), 2.91%, 12/31/2015 (b)(c) | 3,203,000 | 4,246,459 | ||||||
Endo Ltd. / Endo Finance LLC / Endo Finco, Inc. (USD), 6.00%, 07/15/2023 (a) | 9,392,000 | 9,438,960 | ||||||
Fly Leasing Ltd. (USD), 6.38%, 10/15/2021 | 7,097,000 | 7,327,652 | ||||||
| 24,721,071 | ||||||||
RUSSIA (0.7%) | ||||||||
Lukoil International Finance BV (USD), 4.56%, 04/24/2023 (a) | 10,520,000 | 9,792,616 | ||||||
SOUTH AFRICA (0.6%) | ||||||||
Sappi Papier Holding GmbH (USD), 7.50%, 06/15/2032 (a) | 8,504,000 | 7,993,760 | ||||||
SWITZERLAND (1.9%) | ||||||||
Credit Suisse Group AG (USD), 7.50%, 12/11/2023 (a)(b)(c) | 7,335,000 | 7,759,293 | ||||||
UBS Group AG (USD), | 5,559,000 | 5,836,950 | ||||||
Unilabs Subholding AB (EUR), 8.50%, 07/15/2018 (a) | 9,405,000 | 10,840,292 | ||||||
| 24,436,535 | ||||||||
UKRAINE (0.1%) | ||||||||
Mriya Agro Holding PLC (USD), 9.45%, 04/19/2018 (a)(b)(f) | 10,755,000 | 1,613,250 | ||||||
UNITED KINGDOM (9.3%) | ||||||||
Annington Finance No 5 PLC (GBP), 13.00%, 01/15/2023 (a)(g) | 8,726,876 | 15,248,416 | ||||||
Avanti Communications Group PLC (USD), 10.00%, 10/01/2019 (a) | 13,733,000 | 12,291,035 | ||||||
Barclays Bank PLC (GBP), 6.13%, 04/19/2027 (b)(c) | 6,586,000 | 10,566,879 | ||||||
Galaxy Bidco Ltd. (GBP), 5.59%, 11/15/2019 (a)(b) | 2,025,000 | 3,130,167 | ||||||
Galaxy Finco Ltd. (GBP), 7.88%, 11/15/2021 (a) | 1,600,000 | 2,466,559 | ||||||
Hastings Insurance Group Finance PLC | ||||||||
(GBP), 6.58%, 10/21/2019 (a)(b) | 3,680,000 | 5,698,047 | ||||||
(GBP), 8.00%, 10/21/2020 (a) | 2,625,000 | 4,348,218 | ||||||
HBOS Sterling Finance Jersey LP (GBP), 7.88%, 12/09/2031 (b)(c) | 285,000 | 567,610 | ||||||
Inmarsat Finance PLC (USD), 4.88%, 05/15/2022 (a) | 13,094,000 | 13,028,530 | ||||||
International Personal Finance PLC (EUR), 5.75%, 04/07/2021 (a) | 4,313,000 | 4,481,938 | ||||||
Interoute Finco PLC (EUR), 7.38%, 10/15/2020 (a) | 3,586,000 | 4,178,369 | ||||||
Jaguar Land Rover Automotive PLC (GBP), 3.88%, 03/01/2023 (a) | 4,330,000 | 6,323,346 | ||||||
Lloyds Bank PLC (GBP), 13.00%, 01/22/2029 (b)(c) | 4,475,000 | 12,040,102 | ||||||
Matalan Finance PLC (GBP), 6.88%, 06/01/2019 (a) | 2,480,000 | 3,400,420 | ||||||
Royal Bank of Scotland Group PLC | ||||||||
VRN (USD), 7.50%, 08/10/2020 (b)(c) | 2,090,000 | 2,168,375 | ||||||
VRN (USD), 8.00%, 08/10/2025 (b)(c) | 1,090,000 | 1,141,775 | ||||||
Unique Pub Finance Co. PLC (The), Series M (GBP), 7.40%, 03/28/2024 | 9,506,000 | 15,094,076 | ||||||
Virgin Media Secured Finance PLC (GBP), 5.50%, 01/15/2025 (a) | 4,302,000 | 6,598,800 | ||||||
| 122,772,662 | ||||||||
UNITED STATES (45.3%) | ||||||||
AAF Holdings LLC/AAF Finance Co. (USD), 12.00%, 07/01/2019 (a)(b)(d)(g) | 6,012,210 | 6,327,851 | ||||||
Ally Financial, Inc. (USD), 5.13%, 09/30/2024 | 5,845,000 | 6,180,795 | ||||||
Altice US Finance I Corp. (USD), 5.38%, 07/15/2023 (a) | 7,773,000 | 7,885,708 | ||||||
Arch Coal, Inc. (USD), 7.25%, 10/01/2020 | 6,996,000 | 218,625 | ||||||
Axiall Corp. (USD), 4.88%, 05/15/2023 | 1,275,000 | 1,216,828 | ||||||
Blue Racer Midstream LLC / Blue Racer Finance Corp. (USD), | 4,944,000 | 4,647,360 | ||||||
Building Materials Corp. of America (USD), 5.38%, 11/15/2024 (a) | 11,145,000 | 11,521,144 | ||||||
Building Materials Holding Corp. (USD), 9.00%, 09/15/2018 (a) | 9,280,000 | 9,877,632 | ||||||
CalAtlantic Group, Inc. (USD), 5.88%, 11/15/2024 | 4,250,000 | 4,483,750 | ||||||
California Resources Corp. | ||||||||
(USD), 5.50%, 09/15/2021 | 5,375,000 | 3,722,188 | ||||||
(USD), 6.00%, 11/15/2024 | 7,887,000 | 5,392,736 | ||||||
Calpine Corp. (USD), 5.75%, 01/15/2025 | 6,830,000 | 6,497,038 | ||||||
Carrizo Oil & Gas, Inc. | ||||||||
(USD), 7.50%, 09/15/2020 | 1,728,000 | 1,732,320 | ||||||
(USD), 6.25%, 04/15/2023 | 5,190,000 | 4,962,938 | ||||||
CenturyLink, Inc. | ||||||||
Series W (USD), 6.75%, 12/01/2023 | 1,265,000 | 1,260,130 | ||||||
Series P (USD), 7.60%, 09/15/2039 | 2,830,000 | 2,433,800 | ||||||
Series U (USD), 7.65%, 03/15/2042 | 4,460,000 | 3,835,600 | ||||||
Cenveo Corp. (USD), 6.00%, 08/01/2019 (a) | 17,229,000 | 15,204,592 | ||||||
Chaparral Energy, Inc. (USD), 7.63%, 11/15/2022 | 5,834,000 | 1,954,390 | ||||||
CHS/Community Health Systems, Inc. (USD), 6.88%, 02/01/2022 | 11,547,000 | 11,691,337 | ||||||
Constellis Holdings LLC / Constellis Finance Corp. (USD), 9.75%, 05/15/2020 (a) | 5,860,000 | 5,325,275 | ||||||
Continental Resources, Inc. (USD), 4.90%, 06/01/2044 | 9,565,000 | 7,272,929 | ||||||
See accompanying Notes to Financial Statements.
Annual Report 2015
34
Statement of Investments (continued)
October 31, 2015
Aberdeen Global High Income Fund
| Shares or Principal Amount | Value (US$) | |||||||
Crown Castle International Corp. | ||||||||
(USD), 4.88%, 04/15/2022 | $ | 807,000 | $ | 856,429 | ||||
(USD), 5.25%, 01/15/2023 | 11,936,000 | 12,890,880 | ||||||
DPH Holdings Corp. (USD), 6.55%, 06/15/2006 (d)(f) | 1,500,000 | 45,188 | ||||||
DR Horton, Inc. | ||||||||
(USD), 4.75%, 02/15/2023 | 2,070,000 | 2,137,275 | ||||||
(USD), 5.75%, 08/15/2023 | 9,880,000 | 10,843,300 | ||||||
Dynegy, Inc. | ||||||||
(USD), 6.75%, 11/01/2019 | 2,000,000 | 2,005,000 | ||||||
(USD), 7.38%, 11/01/2022 | 7,155,000 | 7,208,662 | ||||||
(USD), 7.63%, 11/01/2024 | 3,335,000 | 3,360,013 | ||||||
Eagle Spinco, Inc. (USD), 4.63%, 02/15/2021 | 924,000 | 903,210 | ||||||
Energy Future Intermediate Holding Co. LLC / EFIH Finance, Inc. (USD), 11.75%, 03/01/2022 (a)(f) | 5,179,486 | 5,561,473 | ||||||
First Data Corp. | ||||||||
(USD), 10.63%, 06/15/2021 | 1,771,000 | 1,981,306 | ||||||
(USD), 11.75%, 08/15/2021 | 3,707,000 | 4,235,248 | ||||||
(USD), 5.38%, 08/15/2023 (a) | 5,301,000 | 5,407,020 | ||||||
(USD), 7.00%, 12/01/2023 (a)(h) | 3,311,000 | 3,377,220 | ||||||
First Maryland Capital I (USD), 1.32%, 01/15/2027 (b) | 5,640,000 | 4,688,250 | ||||||
Florida East Coast Holdings Corp. (USD), 9.75%, 05/01/2020 (a) | 12,485,000 | 11,423,775 | ||||||
Frontier Communications Corp. | ||||||||
(USD), 8.88%, 09/15/2020 (a) | 90,000 | 93,656 | ||||||
(USD), 10.50%, 09/15/2022 (a) | 10,114,000 | 10,518,560 | ||||||
(USD), 11.00%, 09/15/2025 (a) | 1,607,000 | 1,688,346 | ||||||
General Electric Capital Corp., Series A (USD), 7.13%, 06/15/2022 (b)(c) | 5,000,000 | 5,881,250 | ||||||
General Motors (Escrow Shares) | ||||||||
(USD), 7.13%, 07/15/2013 (d)(h) | 2,240,000 | – | ||||||
(USD), 8.25%, 07/15/2023 (d)(h) | 35,495,000 | – | ||||||
(USD), 8.10%, 06/15/2024 (d)(h) | 2,485,000 | – | ||||||
(USD), 7.38%, 05/23/2048 (d)(h) | 3,460,000 | – | ||||||
(USD), 8.80%, 03/01/2049 (d)(h) | 7,200,000 | – | ||||||
(USD), 8.38%, 07/15/2049 (d)(h) | 3,550,000 | – | ||||||
GenOn Americas Generation LLC (USD), 8.50%, 10/01/2021 | 3,961,000 | 3,139,093 | ||||||
GenOn Energy, Inc. | ||||||||
(USD), 7.88%, 06/15/2017 | 8,930,000 | 8,327,225 | ||||||
(USD), 9.88%, 10/15/2020 | 1,500,000 | 1,250,625 | ||||||
Goldman Sachs Group, Inc., Series M, (USD), 5.38%, 05/10/2020 (b)(c) | 1,960,000 | 1,942,850 | ||||||
Hardwoods Acquisition, Inc. (USD), 7.50%, 08/01/2021 (a) | 10,060,000 | 9,305,500 | ||||||
HCA, Inc. (USD), 5.25%, 04/15/2025 | 8,185,000 | 8,502,169 | ||||||
Hilcorp Energy I LP / Hilcorp Finance Co. (USD), 5.75%, 10/01/2025 (a) | 733,000 | 681,690 | ||||||
Hornbeck Offshore Services, Inc. (USD), 5.00%, 03/01/2021 | 1,922,000 | 1,479,940 | ||||||
Intelsat Jackson Holdings SA (USD), 6.63%, 12/15/2022 | 6,379,000 | 5,071,305 | ||||||
International Lease Finance Corp. (USD), 6.25%, 05/15/2019 | 2,334,000 | 2,544,060 | ||||||
Jarden Corp. (USD), 5.00%, 11/15/2023 (a) | 987,000 | 1,019,078 | ||||||
JBS USA LLC / JBS USA Finance, Inc. (USD), 5.75%, 06/15/2025 (a) | 9,312,000 | 9,055,920 | ||||||
Jefferies Finance LLC / JFIN Co-Issuer Corp. | ||||||||
(USD), 7.38%, 04/01/2020 (a) | 1,010,000 | 994,850 | ||||||
(USD), 6.88%, 04/15/2022 (a) | 5,195,000 | 4,909,275 | ||||||
Jones Energy Holdings LLC / Jones Energy Finance Corp. (USD), 6.75%, 04/01/2022 | 6,511,000 | 5,257,633 | ||||||
Kinder Morgan, Inc. (USD), 7.80%, 08/01/2031 | 10,164,000 | 10,321,074 | ||||||
Kindred Healthcare, Inc. (USD), 8.75%, 01/15/2023 | 6,215,000 | 6,638,397 | ||||||
Kraft Heinz Foods Co. (USD), 7.13%, 08/01/2039 (a) | 7,266,000 | 9,317,570 | ||||||
Kratos Defense & Security Solutions, Inc. (USD), 7.00%, 05/15/2019 | 8,075,000 | 6,459,193 | ||||||
Landry’s Holdings II, Inc. (USD), 10.25%, 01/01/2018 (a) | 10,515,000 | 10,856,737 | ||||||
Landry’s, Inc. (USD), 9.38%, 05/01/2020 (a) | 2,486,000 | 2,678,665 | ||||||
Lennar Corp. (USD), 4.88%, 12/15/2023 | 6,706,000 | 6,714,382 | ||||||
Level 3 Financing, Inc. | ||||||||
(USD), 5.38%, 08/15/2022 | 4,504,000 | 4,599,710 | ||||||
(USD), 5.38%, 01/15/2024 | 1,000,000 | 1,015,000 | ||||||
MHGE Parent LLC / MHGE Parent Finance, Inc. (USD), 8.50%, 08/01/2019 (a) | 12,140,000 | 12,397,975 | ||||||
Micron Technology, Inc. (USD), 5.63%, 01/15/2026 (a) | 4,433,000 | 4,178,103 | ||||||
Momentive Performance Materials, Inc. | ||||||||
(USD), 8.88%, 10/15/2020(h) | 14,840,000 | – | ||||||
(USD), 3.88%, 10/24/2021 | 14,840,000 | 11,946,200 | ||||||
Morgan Stanley, Series J, (USD), 5.55%, 07/15/2020 (b)(c) | 1,964,000 | 1,964,000 | ||||||
Nationstar Mortgage LLC / Nationstar Capital Corp. (USD), 6.50%, 07/01/2021 | 3,475,000 | 3,192,656 | ||||||
Neiman Marcus Group Ltd., LLC (USD), 8.00%, 10/15/2021 (a) | 6,449,000 | 6,731,144 | ||||||
New Enterprise Stone & Lime Co Inc. (USD), 13.00%, 03/15/2018 (g) | 11,837,097 | 12,325,377 | ||||||
NewStar Financial, Inc. (USD), 7.25%, 05/01/2020 | 6,562,000 | 6,570,202 | ||||||
NRG Energy, Inc. (USD), 6.25%, 05/01/2024 | 1,910,000 | 1,719,000 | ||||||
NWH Escrow Corp. (USD), 7.50%, 08/01/2021 (a) | 1,972,000 | 1,774,800 | ||||||
Oasis Petroleum, Inc. | ||||||||
(USD), 6.88%, 03/15/2022 | 1,698,000 | 1,456,035 | ||||||
(USD), 6.88%, 01/15/2023 | 10,000,000 | 8,700,000 | ||||||
Palace Entertainment Holdings LLC / Palace Entertainment Holdings Corp. (USD), 8.88%, 04/15/2017 (a) | 12,841,000 | 12,479,847 | ||||||
PBF Logistics LP / PBF Logistics Finance Corp. (USD), 6.88%, 05/15/2023 (a) | 1,767,000 | 1,652,145 | ||||||
PNC Preferred Funding Trust I (USD), 1.99%, 03/15/2017 (a)(b)(c) | 7,510,000 | 6,759,000 | ||||||
Sabine Pass Liquefaction LLC | ||||||||
(USD), 5.63%, 04/15/2023 | 1,380,000 | 1,349,813 | ||||||
(USD), 5.75%, 05/15/2024 | 9,409,000 | 9,126,730 | ||||||
(USD), 5.63%, 03/01/2025(a) | 3,125,000 | 3,007,813 | ||||||
Sanchez Energy Corp. (USD), 6.13%, 01/15/2023 | 1,804,000 | 1,316,920 | ||||||
Scientific Games International, Inc. (USD), 7.00%, 01/01/2022 (a) | 7,822,000 | 7,900,220 | ||||||
See accompanying Notes to Financial Statements.
2015 Annual Report
35
Statement of Investments (continued)
October 31, 2015
Aberdeen Global High Income Fund
| Shares or Principal Amount | Value (US$) | |||||||
Service Corp. International (USD), 5.38%, 05/15/2024 | $ | 11,420,000 | $ | 12,233,675 | ||||
Sinclair Television Group, Inc. | ||||||||
(USD), 6.13%, 10/01/2022 | 2,510,000 | 2,591,575 | ||||||
(USD), 5.63%, 08/01/2024 (a) | 10,955,000 | 10,776,981 | ||||||
Sprint Corp. (USD), 7.88%, 09/15/2023 | 20,315,000 | 18,842,162 | ||||||
State Street Capital Trust IV (USD), 1.34%, 06/01/2077 (b) | 5,740,000 | 4,642,225 | ||||||
Sun Products Corp. (USD), 7.75%, 03/15/2021 (a) | 12,960,000 | 12,214,800 | ||||||
Tenet Healthcare Corp. | ||||||||
(USD), 3.84%, 06/15/2020 (a)(b) | 3,614,000 | 3,604,965 | ||||||
(USD), 6.75%, 06/15/2023 | 10,841,000 | 10,813,897 | ||||||
TransDigm, Inc. | ||||||||
(USD), 6.00%, 07/15/2022 | 2,770,000 | 2,811,550 | ||||||
(USD), 6.50%, 07/15/2024 | 4,825,000 | 4,933,563 | ||||||
(USD), 6.50%, 05/15/2025 (a) | 4,955,000 | 5,054,100 | ||||||
Triumph Group, Inc. (USD), 5.25%, 06/01/2022 | 4,260,000 | 3,849,975 | ||||||
Tronox Finance LLC (USD), 7.50%, 03/15/2022 (a) | 7,641,000 | 5,425,110 | ||||||
United Rentals North America, Inc. | ||||||||
(USD), 6.13%, 06/15/2023 | 2,190,000 | 2,296,215 | ||||||
(USD), 5.75%, 11/15/2024 | 5,470,000 | 5,579,400 | ||||||
(USD), 5.50%, 07/15/2025 | 4,725,000 | 4,730,906 | ||||||
Wise Metals Group LLC / Wise Alloys Finance Corp. (USD), 8.75%, 12/15/2018 (a) | 3,566,000 | 3,387,700 | ||||||
WR Grace & Co-Conn | ||||||||
(USD), 5.13%, 10/01/2021 (a) | 4,926,000 | 5,135,355 | ||||||
(USD), 5.63%, 10/01/2024 (a) | 6,330,000 | 6,559,462 | ||||||
XPO Logistics, Inc. (USD), 7.88%, 09/01/2019 (a) | 5,523,000 | 5,578,230 | ||||||
Zayo Group LLC / Zayo Capital, Inc. (USD), 6.00%, 04/01/2023 (a) | 9,485,000 | 9,693,670 | ||||||
| 598,136,464 | ||||||||
VIETNAM (0.7%) | ||||||||
Vingroup JSC (USD), 11.63%, 05/07/2018 (a) | 9,240,000 | 9,844,804 | ||||||
Total Corporate Bonds | 1,022,663,644 | |||||||
GOVERNMENT BONDS (1.5%) | ||||||||
ARGENTINA (0.5%) | ||||||||
Argentina Bonar Bonds | ||||||||
Series X (USD), 7.00%, 04/17/2017 | 4,357,558 | 4,326,571 | ||||||
(USD), 8.75%, 05/07/2024 (b)(d) | 2,672,897 | 2,712,468 | ||||||
| 7,039,039 | ||||||||
GHANA (0.3%) | ||||||||
Republic of Ghana (USD), 7.88%, 08/07/2023 (a) | 4,560,000 | 3,933,935 | ||||||
INDONESIA (0.6%) | ||||||||
Indonesia Government International Bond (USD), 5.88%, 01/15/2024 (a) | 6,910,000 | 7,655,333 | ||||||
MOZAMBIQUE (0.1%) | ||||||||
Mozambique EMATUM Finance 2020 BV (USD), 6.31%, 09/11/2020 (a)(i) | 759,950 | 679,410 | ||||||
Total Government Bonds | 19,307,717 | |||||||
GOVERNMENT AGENCIES (1.1%) | ||||||||
INDONESIA (1.1%) | ||||||||
Pertamina Persero PT | ||||||||
(USD), 4.30%, 05/20/2023 (a) | 10,705,000 | 10,153,628 | ||||||
(USD), 6.00%, 05/03/2042 (a) | 4,450,000 | 3,880,623 | ||||||
| 14,034,251 | ||||||||
Total Government Agencies | 14,034,251 | |||||||
BANK LOANS (12.2%) | ||||||||
GERMANY (0.8%) | ||||||||
Colouroz Investment (Flint) (USD), 8.25%, 09/06/2022 | 7,095,000 | 7,000,402 | ||||||
Klockner-Pentaplast of America, Inc. (USD), 5.00%, 04/28/2020 | 2,353,019 | 2,358,901 | ||||||
KP Germany Erste GmbH (USD), 5.00%, 04/28/2020 | 1,005,564 | 1,008,078 | ||||||
| 10,367,381 | ||||||||
ITALY (0.8%) | ||||||||
Inter Media Communication (FCE) (EUR), 5.50%, 06/05/2019 | 9,877,706 | 9,993,061 | ||||||
SPAIN (1.5%) | ||||||||
IDCSalud Holding S.L.U. (EUR), 8.25%, 11/28/2022 | 9,223,000 | 10,145,696 | ||||||
Telepizza SA (TPZM) (EUR), 7.00%, 10/20/2020 | 9,320,000 | 10,239,773 | ||||||
| 20,385,469 | ||||||||
UNITED STATES (9.1%) | ||||||||
Arch Coal, Inc. (USD), 6.25%, 05/16/2018 (b) | 8,027,423 | 4,214,397 | ||||||
Asurion LLC (USD), 8.50%, 03/03/2021 (b) | 17,316,000 | 15,662,322 | ||||||
Birch Communications, Inc. (USD), 7.75%, 07/18/2020 (b) | 8,335,611 | 8,293,933 | ||||||
Cengage Learning, Inc. (USD), 7.00%, 03/31/2020 (b) | 12,374,450 | 12,320,312 | ||||||
Commercial Barge Line Co. (USD), 7.50%, 09/22/2019 (b) | 13,155,864 | 13,098,307 | ||||||
Del Monte Foods, Inc. (USD), 8.25%, 08/18/2021 (b) | 12,970,000 | 11,781,079 | ||||||
Isola USA Corp. (USD), 9.25%, 11/29/2018 (d) | 18,336,087 | 13,706,225 | ||||||
New Media Holdings II, LLC (USD), 7.25%, 06/04/2020 | 4,400,944 | 4,389,942 | ||||||
Newpage Corp. (USD), 9.50%, 02/11/2021 (b) | 20,286,028 | 10,599,450 | ||||||
SkillSoft Corp. (USD), 9.25%, 04/28/2022 (b) | 12,360,000 | 9,620,196 | ||||||
Texas Competitive Electric Co. (USD), 4.68%, 10/10/2016 | 7,678,621 | 2,489,155 | ||||||
See accompanying Notes to Financial Statements.
Annual Report 2015
36
Statement of Investments (continued)
October 31, 2015
Aberdeen Global High Income Fund
| Shares or Principal Amount | Value (US$) | |||||||
Visant Corp. (USD), 7.00%, 09/23/2021 (b) | $ | 10,113,435 | $ | 10,051,196 | ||||
YRC Worldwide, Inc. (USD), 8.00%, 02/13/2019 (b) | 4,583,123 | 4,399,798 | ||||||
| 120,626,312 | ||||||||
Total Bank Loans | 161,372,223 | |||||||
COMMON STOCKS (1.1%) | ||||||||
NORWAY (0.8%) | ||||||||
Deep Ocean (d)(h)(j) | 1,427,968 | 11,244,457 | ||||||
UNITED STATES (0.3%) | ||||||||
Cengage Learning Holdings II LP (k) | 140,874 | 3,380,976 | ||||||
Lear Corp. | 1,174 | 146,821 | ||||||
| 3,527,797 | ||||||||
Total Common Stocks | 14,772,254 | |||||||
PREFERRED STOCKS (0.9%) | ||||||||
UNITED STATES (0.9%) | ||||||||
Ally Financial, Inc., Preferred Shares | 4,451 | 4,558,520 | ||||||
GMAC Capital Trust I, Preferred Shares, Series 2 | 258,150 | 6,668,014 | ||||||
Merrill Lynch Capital Trust II, Preferred Shares | 1,600 | 41,184 | ||||||
| 11,267,718 | ||||||||
Total Preferred Stocks | 11,267,718 | |||||||
REPURCHASE AGREEMENT (2.4%) | ||||||||
UNITED STATES (2.4%) | ||||||||
Repurchase Agreement, Fixed Income Clearing Corp., 0.00%, dated 10/30/2015, due 11/02/2015, repurchase price $31,618,666, collateralized by U.S. Treasury Notes, maturing 10/31/2019-11/30/2019; total market value of $32,252,319 | 31,618,666 | 31,618,666 | ||||||
Total Repurchase Agreement | 31,618,666 | |||||||
Total Investments | 1,275,036,473 | |||||||
Other assets in excess of liabilities—3.4% |
| 45,421,329 | ||||||
Net Assets—100.0% | $ | 1,320,457,802 | ||||||
| (a) | Denotes a security issued under Regulation S or Rule 144A. |
| (b) | Variable or Floating Rate Security. Rate disclosed is as of October 31, 2015. |
| (c) | Perpetual bond. This is a bond that has no maturity date, is redeemable and pays a steady stream of interest indefinitely. |
| (d) | The Fund’s adviser has deemed this security to be illiquid based upon procedures approved by the Board of Trustees. Illiquid securities held by the Fund represent 3.35% of net assets as of October 31, 2015. |
| (e) | Indicates a stepped coupon bond. This bond was issued with a low coupon that gradually increases over the life of the bond. |
| (f) | Security is in default. |
| (g) | Payment-in-kind. This is a type of bond that pays interest in additional bonds rather than in cash. |
| (h) | This security was fair valued by the Fund’s pricing committee as approved by the Fund’s Board of Trustees. See Note 2(a) of the accompanying Notes to Statements of Investments. |
| (i) | This security is government guaranteed. |
| (j) | Investment in affiliate. |
| (k) | Non-income producing security. |
| (l) | See accompanying Notes to Financial Statements for tax unrealized appreciation/depreciation of securities. |
| CAD | Canadian Dollar |
| EUR | Euro Currency |
| GBP | British Pound Sterling |
| NOK | Norwegian Krone |
| USD | U.S. Dollar |
See accompanying Notes to Financial Statements.
2015 Annual Report
37
Statement of Investments (continued)
October 31, 2015
Aberdeen Global High Income Fund
At October 31, 2015, the Fund’s open forward foreign currency exchange contracts were as follows:
| Purchase Contracts Settlement Date* | Counterparty | Amount Purchased | Amount Sold | Fair Value | Unrealized Appreciation/ (Depreciation) | |||||||||||||||||||||||
| British Pound/United States Dollar | ||||||||||||||||||||||||||||
11/18/2015 | Barclays Bank PLC | GBP | 8,000,000 | USD | 12,123,808 | $ | 12,331,650 | $ | 207,842 | |||||||||||||||||||
11/18/2015 | Deutsche Bank AG | GBP | 13,074,000 | USD | 20,119,977 | 20,152,999 | 33,022 | |||||||||||||||||||||
| Euro/United States Dollar | ||||||||||||||||||||||||||||
01/11/2016 | Citibank N.A. | EUR | 1,042,500 | USD | 1,150,773 | 1,147,861 | (2,912 | ) | ||||||||||||||||||||
| Norwegian Krone/United States Dollar | ||||||||||||||||||||||||||||
11/13/2015 | Barclays Bank PLC | NOK | 45,773,000 | USD | 5,465,580 | 5,386,214 | (79,366 | ) | ||||||||||||||||||||
| 11/13/2015 | Westpac Banking Corp. | NOK | 16,898,500 | USD | 2,036,229 | 1,988,485 | (47,744 | ) | ||||||||||||||||||||
| $ | 41,007,209 | $ | 110,842 | |||||||||||||||||||||||||
| Sale Contracts Settlement Date* | Counterparty | Amount | Amount Sold | Fair Value | Unrealized Appreciation/ (Depreciation) | |||||||||||||||||||||
| United States Dollar/British Pound | ||||||||||||||||||||||||||
11/18/2015 | Citibank N.A. | USD | 123,285,417 | GBP | 79,039,500 | $ | 121,835,930 | $ | 1,449,487 | |||||||||||||||||
11/18/2015 | Deutsche Bank AG | USD | 862,901 | GBP | 559,000 | 861,674 | 1,227 | |||||||||||||||||||
11/18/2015 | Royal Bank of Canada | USD | 2,480,013 | GBP | 1,603,500 | 2,471,725 | 8,288 | |||||||||||||||||||
| United States Dollar/Canadian Dollar | ||||||||||||||||||||||||||
12/08/2015 | Citibank N.A. | USD | 18,839,674 | CAD | 24,806,500 | 18,966,888 | (127,214 | ) | ||||||||||||||||||
| United States Dollar/Euro | ||||||||||||||||||||||||||
12/04/2015 | Royal Bank of Canada | USD | 64,867,783 | EUR | 57,864,500 | 63,655,958 | 1,211,825 | |||||||||||||||||||
01/11/2016 | Citibank N.A. | USD | 48,412,954 | EUR | 42,535,000 | 46,833,838 | 1,579,116 | |||||||||||||||||||
01/26/2016 | Deutsche Bank AG | USD | 11,717,332 | EUR | 10,486,500 | 11,550,050 | 167,282 | |||||||||||||||||||
01/29/2016 | Deutsche Bank AG | USD | 3,098,654 | EUR | 2,802,500 | 3,086,931 | 11,723 | |||||||||||||||||||
| United States Dollar/Norwegian Krone | ||||||||||||||||||||||||||
| 11/13/2015 | Barclays Bank PLC | USD | 19,218,110 | NOK | 159,395,000 | 18,756,374 | 461,736 | |||||||||||||||||||
| $ | 288,019,368 | $ | 4,763,470 | |||||||||||||||||||||||
* Certain contracts with different trade dates and like characteristics have been shown net.
See accompanying Notes to Financial Statements.
Annual Report 2015
38
Statement of Investments (concluded)
October 31, 2015
Aberdeen Global High Income Fund
At October 31, 2015, the Fund held the following credit default swaps:
Buy Protection:
| Counterparty | Expiration Date | Notional Amount | Swap Details | Unrealized Appreciation/ (Depreciation) | Implied Credit Spread* | |||||||||||||
Barclays Bank PLC | 09/20/2018 | 5,035,000 | Receive: Bombardier, Inc. Pay: Fixed rate equal to 5.00% | $ | 205,926 | 8.49% | ||||||||||||
JPMorgan Chase Bank N.A. | 09/20/2020 | 4,180,000 | Receive: Bombardier, Inc. Pay: Fixed rate equal to 5.00% | 406,293 | 9.63% | |||||||||||||
| Goldman Sachs | 03/20/2020 | 10,565,000 | Receive: Transocean, Inc. Pay: Fixed rate equal to 5.00% | 312,813 | 8.85% | |||||||||||||
| $ | 925,032 | |||||||||||||||||
Sell Protection:
| Counterparty | Expiration Date | Notional Amount | Swap Details | Unrealized Appreciation/ (Depreciation) | Implied Credit Spread* | |||||||||||||
Goldman Sachs International | 03/20/2018 | 1,265,000 | Pay: Rite Aid Receive: Fixed rate equal to 5.00% | $ | 191,287 | 0.14% | ||||||||||||
Deutsche Bank | 03/20/2018 | 3,460,000 | Pay: Rite Aid Receive: Fixed rate equal to 5.00% | 514,554 | 0.14% | |||||||||||||
Goldman Sachs International | 03/20/2018 | 5,000,000 | Pay: Rite Aid Receive: Fixed rate equal to 5.00% | 743,576 | 0.14% | |||||||||||||
Morgan Stanley | 06/20/2018 | 450,000 | Pay: New Albertsons Receive: Fixed rate equal to 5.00% | 80,515 | 1.09% | |||||||||||||
| Morgan Stanley | 06/20/2018 | 4,515,000 | Pay: New Albertsons Receive: Fixed rate equal to 5.00% | 819,125 | 1.09% | |||||||||||||
| $ | 2,349,057 | |||||||||||||||||
| * | Implied credit spreads, represented in absolute terms, are utilized in determining the market value of credit default swaps agreements on corporate issues or sovereign issues and serve as an indicator of the current status of the payment/performance risk and represent the likelihood or risk of default for the credit derivative. The implied credit spread of particular reference entity reflects the cost of buying/selling protection and may include upfront payments required to be made prior to entering into the agreement. For credit default swap with asset-backed securities or credit indices as the underlying assets, the quoted market prices and resulting market values serve as an indicator of the current status of the payment/performance risk. Wider credit spreads and increasing market values, in absolute terms when compared to the notional amount of the swap, represent a deterioration of the reference entity’s credit soundness and a greater likelihood or risk of default or other credit event occurring as defined under the terms of the agreement. |
See accompanying Notes to Financial Statements.
2015 Annual Report
39
Statements of Assets and Liabilities
October 31, 2015
| Aberdeen Select International Equity Fund | Aberdeen Select International Equity Fund II | Aberdeen Total Return Bond Fund | Aberdeen Global High Income Fund | |||||||||||||
Assets: | ||||||||||||||||
Investments in securities, at fair value | $ | 281,104,710 | $ | 141,618,964 | $ | 966,721,625 | $ | 1,232,173,350 | ||||||||
Affiliated securities, at fair value (Note 6) | – | – | – | 11,244,457 | ||||||||||||
Repurchase agreements | 3,623,854 | 5,474,023 | 48,790,041 | 31,618,666 | ||||||||||||
|
|
|
|
|
|
|
| |||||||||
Total investments | 284,728,564 | 147,092,987 | 1,015,511,666 | 1,275,036,473 | ||||||||||||
|
|
|
|
|
|
|
| |||||||||
Foreign currency, at fair value | 7,932 | 15,404 | 659,526 | 20,643,619 | ||||||||||||
Cash collateral pledged for futures | – | – | 457,119 | – | ||||||||||||
Cash | – | 70,000 | 255,456 | 2,132,247 | ||||||||||||
Cash on deposit for broker | – | – | – | 70,000 | ||||||||||||
Receivable for investments sold | 1,049,753 | 442,488 | 19,398,134 | 24,980,225 | ||||||||||||
Interest and dividends receivable | 1,134,627 | 834,949 | 5,258,523 | 21,315,101 | ||||||||||||
Unrealized appreciation on forward foreign currency exchange contracts | – | – | 2,718,963 | 5,131,548 | ||||||||||||
Receivable for capital shares issued | 9,962 | 5,083 | 414,654 | 760,778 | ||||||||||||
Variation margin receivable for futures contracts | – | – | 55,916 | – | ||||||||||||
Variation margin receivable for centrally cleared credit default swaps | – | – | – | 7,097 | ||||||||||||
Open credit default swap contracts, at value | – | – | – | 3,906,789 | ||||||||||||
Tax reclaim receivable | 852,389 | 462,430 | – | – | ||||||||||||
Prepaid expenses | 5,982 | 2,854 | 18,849 | 29,684 | ||||||||||||
Receivable from adviser (Note 3) | – | 305,291 | – | – | ||||||||||||
|
|
|
|
|
|
|
| |||||||||
Total assets | 287,789,209 | 149,231,486 | 1,044,748,806 | 1,354,013,561 | ||||||||||||
|
|
|
|
|
|
|
| |||||||||
Liabilities: | ||||||||||||||||
Due to custodian | – | – | – | 386,148 | ||||||||||||
Payable for investments purchased | 523,851 | 458,610 | 34,155,904 | 25,523,924 | ||||||||||||
Unrealized depreciation on forward foreign currency exchange contracts | – | – | 3,540,397 | 257,236 | ||||||||||||
Distributions payable | – | – | 3,260 | – | ||||||||||||
Payable for capital shares redeemed | 791,060 | 205,727 | 3,494,069 | 1,940,357 | ||||||||||||
Collateral due to broker | 1,504 | 70,000 | – | – | ||||||||||||
Collateral due to broker for centrally cleared credit default swaps | – | – | – | 4,320,000 | ||||||||||||
Accrued expenses and other payables: | ||||||||||||||||
Investment advisory fees | 219,361 | 113,160 | 286,295 | 712,721 | ||||||||||||
Legal fees | 20,884 | 11,479 | 76,444 | 97,373 | ||||||||||||
Distribution fees | 51,977 | 16,821 | 16,164 | 110,942 | ||||||||||||
Transfer agent fees | 9,404 | 10,301 | 15,111 | 43,610 | ||||||||||||
Custodian fees | 9,327 | 6,785 | 19,414 | 26,584 | ||||||||||||
Audit fees | 8,492 | 8,013 | 12,641 | 13,854 | ||||||||||||
Other | 75,711 | 67,072 | 147,038 | 123,010 | ||||||||||||
|
|
|
|
|
|
|
| |||||||||
Total liabilities | 1,711,571 | 967,968 | 41,766,737 | 33,555,759 | ||||||||||||
|
|
|
|
|
|
|
| |||||||||
Net Assets | $ | 286,077,638 | $ | 148,263,518 | $ | 1,002,982,069 | $ | 1,320,457,802 | ||||||||
|
|
|
|
|
|
|
| |||||||||
Cost: | ||||||||||||||||
Investments in securities, at cost | $ | 371,758,972 | $ | 169,760,930 | $ | 963,953,481 | $ | 1,323,296,048 | ||||||||
Affiliated securities, at cost (Note 6) | 4,264,296 | – | – | 30,083,125 | ||||||||||||
Repurchase agreements | 3,623,854 | 5,474,023 | 48,790,041 | 31,618,666 | ||||||||||||
Up-front payments made on open credit default swaps | – | – | – | 715,300 | ||||||||||||
Up-front payments received on open credit default swaps | – | – | – | (1,376,985 | ) | |||||||||||
Foreign currency | 1,589,455 | 15,466 | 631,289 | 20,841,239 | ||||||||||||
Net Assets Consist of: | ||||||||||||||||
Par value | $ | 12,489 | $ | 14,770 | $ | 76,225 | $ | 152,430 | ||||||||
Paid in capital in excess of par value | 2,685,255,265 | 2,891,414,486 | 1,001,897,916 | 1,513,585,846 | ||||||||||||
Accumulated net investment income/(loss) | 7,683,121 | 3,787,566 | (398,993 | ) | (6,976,141 | ) | ||||||||||
Accumulated net realized loss from investments and foreign currency transactions | (2,310,291,883 | ) | (2,717,823,333 | ) | (364,015 | ) | (84,186,706 | ) | ||||||||
Net unrealized appreciation/(depreciation) on investments and translation of assets and liabilities denominated in foreign currencies | (96,581,354 | ) | (29,129,971 | ) | 1,770,936 | (102,117,627 | ) | |||||||||
|
|
|
|
|
|
|
| |||||||||
Net Assets | $ | 286,077,638 | $ | 148,263,518 | $ | 1,002,982,069 | $ | 1,320,457,802 | ||||||||
|
|
|
|
|
|
|
| |||||||||
Annual Report 2015
40
Statements of Assets and Liabilities (concluded)
October 31, 2015
| Aberdeen Select International Equity Fund | Aberdeen Select International Equity Fund II | Aberdeen Total Return Bond Fund | Aberdeen Global High Income Fund | |||||||||||||
Net Assets | ||||||||||||||||
Class A Shares | $ | 242,444,194 | $ | 79,263,084 | $ | 75,595,445 | $ | 522,963,648 | ||||||||
Institutional Class Shares | 43,633,444 | 69,000,434 | 927,386,624 | 797,494,154 | ||||||||||||
|
|
|
|
|
|
|
| |||||||||
Total | $ | 286,077,638 | $ | 148,263,518 | $ | 1,002,982,069 | $ | 1,320,457,802 | ||||||||
|
|
|
|
|
|
|
| |||||||||
Shares Outstanding | ||||||||||||||||
Class A Shares | 10,624,703 | 7,899,070 | 5,673,814 | 58,261,236 | ||||||||||||
Institutional Class Shares | 1,864,723 | 6,870,640 | 70,551,505 | 94,169,111 | ||||||||||||
|
|
|
|
|
|
|
| |||||||||
Total | 12,489,426 | 14,769,710 | 76,225,319 | 152,430,347 | ||||||||||||
|
|
|
|
|
|
|
| |||||||||
Net asset value and redemption price per share | ||||||||||||||||
Class A Shares | $ | 22.82 | $ | 10.03 | (a) | $ | 13.32 | $ | 8.98 | (a) | ||||||
Institutional Class Shares | $ | 23.40 | $ | 10.04 | (a) | $ | 13.14 | $ | 8.47 | |||||||
| (a) | The NAV shown above differs from the traded NAV on October 31, 2015 due to financial statement adjustments. |
Amounts listed as “–” are $0 or round to $0.
See accompanying Notes to Financial Statements.
2015 Annual Report
41
Statements of Operations
For the Year Ended October 31, 2015
| Aberdeen Select International Equity Fund | Aberdeen Select International Equity Fund II | Aberdeen Total Fund | Aberdeen Global High Income Fund | |||||||||||||
INVESTMENT INCOME: | ||||||||||||||||
Dividend income | $ | 12,204,972 | $ | 6,188,087 | $ | – | $ | 1,832,857 | ||||||||
Interest income | 1,429,473 | 121 | 40,621,807 | 137,539,733 | ||||||||||||
Foreign tax withholding | (979,912 | ) | (494,145 | ) | – | 1,609 | ||||||||||
Other income | 1,334,260 | (a) | 480,569 | (a) | 1,428,672 | 87,658 | ||||||||||
|
|
|
|
|
|
|
| |||||||||
| 13,988,793 | 6,174,632 | 42,050,479 | 139,461,857 | |||||||||||||
|
|
|
|
|
|
|
| |||||||||
EXPENSES: | ||||||||||||||||
Investment advisory fees | 3,381,502 | 1,685,626 | 4,811,536 | 12,207,239 | ||||||||||||
Distribution fees Class A | 768,390 | 239,705 | 306,921 | 1,657,577 | ||||||||||||
Transfer agent fees | 55,604 | 63,432 | 78,691 | 274,995 | ||||||||||||
Trustee fees | 73,000 | 37,742 | 275,734 | 364,250 | ||||||||||||
Legal fees | 60,180 | 46,634 | 196,351 | 258,943 | ||||||||||||
Printing fees | 54,897 | 45,555 | 189,460 | 155,124 | ||||||||||||
Custodian fees | 107,979 | 73,540 | 233,954 | 343,968 | ||||||||||||
Registration and filing fees | 56,339 | 34,734 | 61,933 | 130,708 | ||||||||||||
Audit fees | 32,765 | 26,569 | 45,520 | 55,144 | ||||||||||||
Other | 85,766 | 106,347 | 306,969 | 587,570 | ||||||||||||
|
|
|
|
|
|
|
| |||||||||
Total expenses before reimbursed/waived expenses | 4,676,422 | 2,359,884 | 6,507,069 | 16,035,518 | ||||||||||||
Interest expense (Note 11) | 3,350 | 2,811 | – | 13,838 | ||||||||||||
|
|
|
|
|
|
|
| |||||||||
Total operating expenses before reimbursed/waived expenses | 4,679,772 | 2,362,695 | 6,507,069 | 16,049,356 | ||||||||||||
Expenses reimbursed (Note 3) | – | – | (82,622 | ) | (198,764 | ) | ||||||||||
Expenses waived by investment adviser (Note 3) | (18,786 | ) | (9,365 | ) | (68,736 | ) | (93,902 | ) | ||||||||
|
|
|
|
|
|
|
| |||||||||
Total operating expenses | 4,660,986 | 2,353,330 | 6,355,711 | 15,756,690 | ||||||||||||
|
|
|
|
|
|
|
| |||||||||
Net Investment Income | 9,327,807 | 3,821,302 | 35,694,768 | 123,705,167 | ||||||||||||
|
|
|
|
|
|
|
| |||||||||
Realized gain/(loss) on investment transactions | (40,141,379 | ) | (4,170,485 | ) | (23,697,620 | ) | (155,195,263 | ) | ||||||||
Realized gain/(loss) on credit default swap contracts | – | – | (15,855 | ) | 2,389,054 | |||||||||||
Realized gain/(loss) on futures contracts | – | – | (552,910 | ) | – | |||||||||||
Realized gain/(loss) on foreign currency forward and spot contracts transactions | (1,623,907 | ) | (23,605 | ) | 19,190,787 | 48,014,664 | ||||||||||
Payment from affiliate (Note 3) | – | 305,291 | – | – | ||||||||||||
|
|
|
|
|
|
|
| |||||||||
Net realized loss from investments and foreign currency transactions | (41,765,286 | ) | (3,888,799 | ) | (5,075,598 | ) | (104,791,545 | ) | ||||||||
|
|
|
|
|
|
|
| |||||||||
Net change in unrealized appreciation/(depreciation) on investment transactions | (24,293,981 | ) | (26,498,842 | ) | (11,529,346 | ) | (114,718,398 | ) | ||||||||
Net change in unrealized appreciation/(depreciation) on credit default swap contracts | – | – | – | (4,434,296 | ) | |||||||||||
Net change in unrealized appreciation/(depreciation) on futures contracts | – | – | (104,829 | ) | – | |||||||||||
Net change in unrealized appreciation/(depreciation) on translation of assets and liabilities denominated in foreign currencies | (370,343 | ) | (952,874 | ) | (3,906,707 | ) | (11,424,616 | ) | ||||||||
|
|
|
|
|
|
|
| |||||||||
Net change in unrealized appreciation/(depreciation) from investments and translation of assets and liabilities denominated in foreign currencies | (24,664,324 | ) | (27,451,716 | ) | (15,540,882 | ) | (130,577,310 | ) | ||||||||
|
|
|
|
|
|
|
| |||||||||
Net realized/unrealized loss from investments and foreign currency transactions | (66,429,610 | ) | (31,340,515 | ) | (20,616,480 | ) | (235,368,855 | ) | ||||||||
|
|
|
|
|
|
|
| |||||||||
CHANGE IN NET ASSETS RESULTING FROM OPERATIONS | $ | (57,101,803 | ) | $ | (27,519,213 | ) | $ | 15,078,288 | $ | (111,663,688 | ) | |||||
|
|
|
|
|
|
|
| |||||||||
| (a) | Includes withholding tax refunds, see Note 2h of the Notes to Financial Statements. |
Amounts listed as “–” are $0 or round to $0.
See accompanying Notes to Financial Statements.
Annual Report 2015
42
Statements of Changes in Net Assets
| Aberdeen Select International Equity Fund | Aberdeen Select International Equity Fund II | |||||||||||||||
| Year Ended October 31, 2015 | Year Ended October 31, 2014 | Year Ended October 31, 2015 | Year Ended October 31, 2014 | |||||||||||||
FROM INVESTMENT ACTIVITIES: | ||||||||||||||||
Operations: | ||||||||||||||||
Net investment income | $ | 9,327,807 | $ | 21,948,903 | $ | 3,821,302 | $ | 9,720,569 | ||||||||
Net realized gain/(loss) from investments and foreign currency transactions (including payment from affiliate) | (41,765,286 | ) | (11,605,199 | ) | (3,888,799 | ) | 6,540,721 | |||||||||
Net change in unrealized appreciation/(depreciation) on investments and translation of assets and liabilities denominated in foreign currencies | (24,664,324 | ) | (8,857,908 | ) | (27,451,716 | ) | (14,526,993 | ) | ||||||||
|
|
|
|
|
|
|
| |||||||||
Changes in net assets resulting from operations | (57,101,803 | ) | 1,485,796 | (27,519,213 | ) | 1,734,297 | ||||||||||
|
|
|
|
|
|
|
| |||||||||
Distributions to Shareholders From: | ||||||||||||||||
Net investment income: | ||||||||||||||||
Class A | (16,428,379 | ) | (11,058,718 | ) | (4,809,380 | ) | (69,226 | ) | ||||||||
Institutional Class | (3,496,500 | ) | (2,430,830 | ) | (4,729,021 | ) | (331,201 | ) | ||||||||
|
|
|
|
|
|
|
| |||||||||
Change in net assets from shareholder distributions | (19,924,879 | ) | (13,489,548 | ) | (9,538,401 | ) | (400,427 | ) | ||||||||
|
|
|
|
|
|
|
| |||||||||
Common Stock Transactions: | ||||||||||||||||
Change in net assets from capital transactions | (116,820,137 | ) | (173,886,783 | ) | (43,730,663 | ) | (98,186,443 | ) | ||||||||
|
|
|
|
|
|
|
| |||||||||
Change in net assets | (193,846,819 | ) | (185,890,535 | ) | (80,788,277 | ) | (96,852,573 | ) | ||||||||
|
|
|
|
|
|
|
| |||||||||
Net Assets: | ||||||||||||||||
Beginning of year | 479,924,457 | 665,814,992 | 229,051,795 | 325,904,368 | ||||||||||||
|
|
|
|
|
|
|
| |||||||||
End of year | $ | 286,077,638 | $ | 479,924,457 | $ | 148,263,518 | $ | 229,051,795 | ||||||||
|
|
|
|
|
|
|
| |||||||||
Accumulated net investment income at end of year | $ | 7,683,121 | $ | 19,497,739 | $ | 3,787,566 | $ | 9,328,109 | ||||||||
|
|
|
|
|
|
|
| |||||||||
CAPITAL TRANSACTIONS: | ||||||||||||||||
Class A Shares | ||||||||||||||||
Proceeds from shares issued | $ | 4,811,603 | $ | 8,706,701 | $ | 11,051,363 | $ | 9,367,139 | ||||||||
Dividends reinvested | 16,112,995 | 10,795,351 | 4,669,220 | 66,355 | ||||||||||||
Cost of shares redeemed | (111,824,230 | ) | (166,295,966 | ) | (37,598,671 | ) | (57,833,700 | ) | ||||||||
|
|
|
|
|
|
|
| |||||||||
Total Class A | (90,899,632 | ) | (146,793,914 | ) | (21,878,088 | ) | (48,400,206 | ) | ||||||||
|
|
|
|
|
|
|
| |||||||||
Institutional Class Shares | ||||||||||||||||
Proceeds from shares issued | 1,723,909 | 4,143,592 | 4,387,592 | 7,838,242 | ||||||||||||
Dividends reinvested | 3,368,549 | 2,318,673 | 4,113,653 | 283,163 | ||||||||||||
Cost of shares redeemed | (31,012,963 | ) | (33,555,134 | ) | (30,353,820 | ) | (57,907,642 | ) | ||||||||
|
|
|
|
|
|
|
| |||||||||
Total Institutional Class | (25,920,505 | ) | (27,092,869 | ) | (21,852,575 | ) | (49,786,237 | ) | ||||||||
|
|
|
|
|
|
|
| |||||||||
Change in net assets from capital transactions: | $ | (116,820,137 | ) | $ | (173,886,783 | ) | $ | (43,730,663 | ) | $ | (98,186,443 | ) | ||||
|
|
|
|
|
|
|
| |||||||||
SHARE TRANSACTIONS: | ||||||||||||||||
Class A Shares | ||||||||||||||||
Issued | 189,629 | 308,600 | 1,026,899 | 759,666 | ||||||||||||
Reinvested | 637,886 | 397,912 | 422,554 | 5,628 | ||||||||||||
Redeemed | (4,413,829 | ) | (5,876,767 | ) | (3,391,374 | ) | (4,714,982 | ) | ||||||||
|
|
|
|
|
|
|
| |||||||||
Total Class A Shares | (3,586,314 | ) | (5,170,255 | ) | (1,941,921 | ) | (3,949,688 | ) | ||||||||
|
|
|
|
|
|
|
| |||||||||
Institutional Class Shares | ||||||||||||||||
Issued | 66,093 | 141,870 | 391,640 | 624,839 | ||||||||||||
Reinvested | 130,311 | 83,556 | 372,614 | 24,017 | ||||||||||||
Redeemed | (1,189,930 | ) | (1,147,728 | ) | (2,763,043 | ) | (4,722,115 | ) | ||||||||
|
|
|
|
|
|
|
| |||||||||
Total Institutional Class Shares | (993,526 | ) | (922,302 | ) | (1,998,789 | ) | (4,073,259 | ) | ||||||||
|
|
|
|
|
|
|
| |||||||||
Total change in shares: | (4,579,840 | ) | (6,092,557 | ) | (3,940,710 | ) | (8,022,947 | ) | ||||||||
|
|
|
|
|
|
|
| |||||||||
See accompanying Notes to Financial Statements.
2015 Annual Report
43
Statements of Changes in Net Assets (concluded)
| Aberdeen Total Return Bond Fund | Aberdeen Global High Income Fund | |||||||||||||||
| Year Ended October 31, 2015 | Year Ended October 31, 2014 | Year Ended October 31, 2015 | Year Ended October 31, 2014 | |||||||||||||
FROM INVESTMENT ACTIVITIES: | ||||||||||||||||
Operations: | ||||||||||||||||
Net investment income | $ | 35,694,768 | $ | 42,952,619 | $ | 123,705,167 | $ | 158,294,160 | ||||||||
Net realized gain/(loss) from investments and foreign currency transactions | (5,075,598 | ) | 2,177,584 | (104,791,545 | ) | 45,226,698 | ||||||||||
Net change in unrealized appreciation/(depreciation) on investments and translation of assets and liabilities denominated in foreign currencies | (15,540,882 | ) | 17,723,993 | (130,577,310 | ) | (73,457,477 | ) | |||||||||
|
|
|
|
|
|
|
| |||||||||
Changes in net assets resulting from operations | 15,078,288 | 62,854,196 | (111,663,688 | ) | 130,063,381 | |||||||||||
|
|
|
|
|
|
|
| |||||||||
Distributions to Shareholders From: | ||||||||||||||||
Net investment income: | ||||||||||||||||
Class A | (2,128,685 | ) | (2,317,155 | ) | (29,921,233 | ) | (58,784,001 | ) | ||||||||
Institutional Class | (24,545,585 | ) | (26,727,765 | ) | (62,514,715 | ) | (104,537,053 | ) | ||||||||
Net realized gains: | ||||||||||||||||
Class A | (1,774,676 | ) | – | (19,357,727 | ) | (10,366,807 | ) | |||||||||
Institutional Class | (16,506,438 | ) | – | (37,810,111 | ) | (16,935,520 | ) | |||||||||
Tax return of capital | ||||||||||||||||
Class A | (139,855 | ) | – | (7,343,917 | ) | – | ||||||||||
Institutional Class | (1,437,186 | ) | – | (13,557,044 | ) | – | ||||||||||
|
|
|
|
|
|
|
| |||||||||
Change in net assets from shareholder distributions | (46,532,425 | ) | (29,044,920 | ) | (170,504,747 | ) | (190,623,381 | ) | ||||||||
|
|
|
|
|
|
|
| |||||||||
Common Stock Transactions: | ||||||||||||||||
Change in net assets from capital transactions | (479,011,379 | ) | (123,507,424 | ) | (782,474,860 | ) | (107,132,402 | ) | ||||||||
|
|
|
|
|
|
|
| |||||||||
Change in net assets | (510,465,516 | ) | (89,698,148 | ) | (1,064,643,295 | ) | (167,692,402 | ) | ||||||||
|
|
|
|
|
|
|
| |||||||||
Net Assets: | ||||||||||||||||
Beginning of year | 1,513,447,585 | 1,603,145,733 | 2,385,101,097 | 2,552,793,499 | ||||||||||||
|
|
|
|
|
|
|
| |||||||||
End of year | $ | 1,002,982,069 | $ | 1,513,447,585 | $ | 1,320,457,802 | $ | 2,385,101,097 | ||||||||
|
|
|
|
|
|
|
| |||||||||
Accumulated net investment income/(loss) at end of year | $ | (398,993 | ) | $ | (1,281,442 | ) | $ | (6,976,141 | ) | $ | (1,187,763 | ) | ||||
|
|
|
|
|
|
|
| |||||||||
CAPITAL TRANSACTIONS: | ||||||||||||||||
Class A Shares | ||||||||||||||||
Proceeds from shares issued | $ | 37,097,408 | $ | 66,730,738 | $ | 263,981,338 | $ | 491,906,310 | ||||||||
Dividends reinvested | 3,949,037 | 2,258,635 | 51,945,174 | 65,307,706 | ||||||||||||
Cost of shares redeemed | (114,703,680 | ) | (72,960,043 | ) | (519,101,949 | ) | (716,052,886 | ) | ||||||||
|
|
|
|
|
|
|
| |||||||||
Total Class A | (73,657,235 | ) | (3,970,670 | ) | (203,175,437 | ) | (158,838,870 | ) | ||||||||
|
|
|
|
|
|
|
| |||||||||
Institutional Class Shares | ||||||||||||||||
Proceeds from shares issued | 303,606,043 | 337,708,864 | 515,517,331 | 857,985,100 | ||||||||||||
Dividends reinvested | 40,271,196 | 24,841,421 | 75,342,754 | 75,297,454 | ||||||||||||
Cost of shares redeemed | (749,231,383 | ) | (482,087,039 | ) | (1,170,159,508 | ) | (881,576,086 | ) | ||||||||
|
|
|
|
|
|
|
| |||||||||
Total Institutional Class | (405,354,144 | ) | (119,536,754 | ) | (579,299,423 | ) | 51,706,468 | |||||||||
|
|
|
|
|
|
|
| |||||||||
Change in net assets from capital transactions: | $ | (479,011,379 | ) | $ | (123,507,424 | ) | $ | (782,474,860 | ) | $ | (107,132,402 | ) | ||||
|
|
|
|
|
|
|
| |||||||||
SHARE TRANSACTIONS: | ||||||||||||||||
Class A Shares | ||||||||||||||||
Issued | 2,748,452 | 4,920,576 | 26,975,595 | 46,021,750 | ||||||||||||
Reinvested | 292,904 | 168,402 | 5,371,018 | 6,129,870 | ||||||||||||
Redeemed | (8,556,002 | ) | (5,434,499 | ) | (53,425,599 | ) | (66,959,027 | ) | ||||||||
|
|
|
|
|
|
|
| |||||||||
Total Class A Shares | (5,514,646 | ) | (345,521 | ) | (21,078,986 | ) | (14,807,407 | ) | ||||||||
|
|
|
|
|
|
|
| |||||||||
Institutional Class Shares | ||||||||||||||||
Issued | 22,822,380 | 25,459,872 | 55,398,609 | 84,457,459 | ||||||||||||
Reinvested | 3,029,667 | 1,875,489 | 8,227,773 | 7,443,445 | ||||||||||||
Redeemed | (56,681,811 | ) | (36,390,145 | ) | (128,014,246 | ) | (87,153,414 | ) | ||||||||
|
|
|
|
|
|
|
| |||||||||
Total Institutional Class Shares | (30,829,764 | ) | (9,054,784 | ) | (64,387,864 | ) | 4,747,490 | |||||||||
|
|
|
|
|
|
|
| |||||||||
Total change in shares: | (36,344,410 | ) | (9,400,305 | ) | (85,466,850 | ) | (10,059,917 | ) | ||||||||
|
|
|
|
|
|
|
| |||||||||
See accompanying Notes to Financial Statements.
Annual Report 2015
44
This page intentionally left blank.
Financial Highlights
Selected Data for Each Share of Capital Outstanding Throughout the Periods Indicated
Aberdeen Select International Equity Fund
| Investment Activities | Distributions | |||||||||||||||||||||||||||||||
| Net Asset Value, Beginning of Period | Net (a) | Net Realized and Unrealized Gains (Losses) on Investments | Total from Investment Activities | Net Investment Income | Tax Return of Capital | Total Distributions | Net Asset Value, End of Period | |||||||||||||||||||||||||
Class A Shares | ||||||||||||||||||||||||||||||||
Year Ended October 31, 2015 | $ | 28.00 | $ | 0.62 | (e) | $ | (4.60 | ) | $ | (3.98 | ) | $ | (1.20 | ) | $ | – | $ | (1.20 | ) | $ | 22.82 | |||||||||||
Year Ended October 31, 2014 | 28.63 | 1.09 | (1.12 | ) | (0.03 | ) | (0.60 | ) | – | (0.60 | ) | 28.00 | ||||||||||||||||||||
Year Ended October 31, 2013 | 23.84 | 0.37 | 4.55 | 4.92 | (0.13 | ) | – | (0.13 | ) | 28.63 | ||||||||||||||||||||||
Year Ended October 31, 2012 | 24.55 | 0.30 | (0.62 | ) | (0.32 | ) | (0.39 | ) | – | (0.39 | ) | 23.84 | ||||||||||||||||||||
Year Ended October 31, 2011 | 28.87 | 0.19 | (4.00 | ) | (3.81 | ) | (0.51 | ) | – | (0.51 | ) | 24.55 | ||||||||||||||||||||
Institutional Class Shares | ||||||||||||||||||||||||||||||||
Year Ended October 31, 2015 | 28.69 | 0.67 | (e) | (4.68 | ) | (4.01 | ) | (1.28 | ) | – | (1.28 | ) | 23.40 | |||||||||||||||||||
Year Ended October 31, 2014 | 29.33 | 1.19 | (1.16 | ) | 0.03 | (0.67 | ) | – | (0.67 | ) | 28.69 | |||||||||||||||||||||
Year Ended October 31, 2013 | 24.44 | 0.31 | 4.80 | 5.11 | (0.22 | ) | – | (0.22 | ) | 29.33 | ||||||||||||||||||||||
Year Ended October 31, 2012 | 25.20 | 0.36 | (0.64 | ) | (0.28 | ) | (0.48 | ) | – | (0.48 | ) | 24.44 | ||||||||||||||||||||
Year Ended October 31, 2011 | 29.64 | 0.28 | (4.13 | ) | (3.85 | ) | (0.59 | ) | – | (0.59 | ) | 25.20 | ||||||||||||||||||||
| (a) | Net investment income (loss) is based on average shares outstanding during the period. |
| (b) | During the period, certain fees were waived and/or reimbursed. If such waivers/reimbursements had not occurred, the ratios would have been as indicated. |
| (c) | Includes interest expense that amounts to less than 0.01%. |
Amounts listed as “–” are $0 or round to $0.
See accompanying Notes to Financial Statements.
Annual Report 2015
46
Financial Highlights (continued)
Selected Data for Each Share of Capital Outstanding Throughout the Periods Indicated
Aberdeen Select International Equity Fund (concluded)
| Ratios/Supplemental Data | ||||||||||||||||||||||
| Total Return | Net Assets at End of Period (000’s) | Ratio of Expenses to Average Net Assets | Ratio of Net Investment Income to Average Net Assets | Ratio of Expenses (Prior to Waived Expenses) to Average Net Assets (b)(c) | Portfolio Turnover (d) | |||||||||||||||||
| (14.62 | %)(e) | $ | 242,444 | 1.28 | % | 2.47 | %(e) | 1.28 | % | 11 | % | |||||||||||
| (0.04 | %) | 397,911 | 1.26 | % | 3.83 | % | 1.26 | % | 12 | % | ||||||||||||
| 20.70 | % | 554,922 | 1.25 | % | 1.39 | % | 1.26 | % | 94 | % | ||||||||||||
| (1.14 | %) | 877,738 | 1.23 | % | 1.30 | % | 1.24 | % | 35 | % | ||||||||||||
| (13.49 | %) | 2,059,255 | 1.29 | % | 0.65 | % | 1.30 | % | 41 | % | ||||||||||||
| (14.40 | %)(e) | 43,633 | 1.04 | % | 2.56 | %(e) | 1.04 | % | 11 | % | ||||||||||||
| 0.19 | % | 82,014 | 1.02 | % | 4.06 | % | 1.03 | % | 12 | % | ||||||||||||
| 21.04 | % | 110,893 | 1.03 | % | 1.15 | % | 1.04 | % | 94 | % | ||||||||||||
| (0.93 | %) | 1,138,838 | 1.00 | % | 1.51 | % | 1.01 | % | 35 | % | ||||||||||||
| (13.31 | %) | 3,687,999 | 1.05 | % | 0.95 | % | 1.05 | % | 41 | % | ||||||||||||
| (d) | Portfolio turnover is calculated on the basis of the Fund as a whole without distinguishing among the classes of shares. |
| (e) | Included within Net Investment Income per share, Total Return, and Ratio of Net Investment Income to Average Net Assets are the effects of withholding tax refunds (Note 2h of the Notes to Financial Statements). If such amounts were excluded, the Net Investment Income per share, Total Return, and Ratio of Net Investment Income to Average Net Assets for Class A Shares would have been $0.53, (15.03%), and 2.11%, respectively. For Institutional Class Shares, these amounts would have been $0.58, (14.80%), and 2.20%, respectively. |
2015 Annual Report
47
Financial Highlights (continued)
Selected Data for Each Share of Capital Outstanding Throughout the Periods Indicated
Aberdeen Select International Equity Fund II
| Investment Activities | Distributions | |||||||||||||||||||||||||||||||
| Net Asset Value, Beginning of Period | Net (a) | Net Realized and Unrealized Gains (Losses) on Investments | Total from Investment Activities | Net Investment Income | Tax Return of Capital | Total Distributions | Net Asset Value, End of Period | |||||||||||||||||||||||||
Class A Shares | ||||||||||||||||||||||||||||||||
Year Ended October 31, 2015 | $ | 12.23 | $ | 0.21 | (f) | $ | (1.89 | )(e) | $ | (1.68 | ) | $ | (0.52 | ) | $ | – | $ | (0.52 | ) | $ | 10.03 | |||||||||||
Year Ended October 31, 2014 | 12.18 | 0.42 | (0.36 | ) | 0.06 | (0.01 | ) | – | (0.01 | ) | 12.23 | |||||||||||||||||||||
Year Ended October 31, 2013 | 10.38 | 0.13 | 1.92 | 2.05 | (0.25 | ) | – | (0.25 | ) | 12.18 | ||||||||||||||||||||||
Year Ended October 31, 2012 | 10.46 | 0.12 | (0.05 | ) | 0.07 | (0.15 | ) | – | (0.15 | ) | 10.38 | |||||||||||||||||||||
Year Ended October 31, 2011 | 12.18 | 0.07 | (1.56 | ) | (1.49 | ) | (0.23 | ) | – | (0.23 | ) | 10.46 | ||||||||||||||||||||
Institutional Class Shares | ||||||||||||||||||||||||||||||||
Year Ended October 31, 2015 | 12.25 | 0.24 | (f) | (1.90 | )(e) | (1.66 | ) | (0.55 | ) | – | (0.55 | ) | 10.04 | |||||||||||||||||||
Year Ended October 31, 2014 | 12.20 | 0.46 | (0.38 | ) | 0.08 | (0.03 | ) | – | (0.03 | ) | 12.25 | |||||||||||||||||||||
Year Ended October 31, 2013 | 10.45 | 0.11 | 1.97 | 2.08 | (0.33 | ) | – | (0.33 | ) | 12.20 | ||||||||||||||||||||||
Year Ended October 31, 2012 | 10.54 | 0.14 | (0.04 | ) | 0.10 | (0.19 | ) | – | (0.19 | ) | 10.45 | |||||||||||||||||||||
Year Ended October 31, 2011 | 12.27 | 0.10 | (1.57 | ) | (1.47 | ) | (0.26 | ) | – | (0.26 | ) | 10.54 | ||||||||||||||||||||
| (a) | Net investment income (loss) is based on average shares outstanding during the period. |
| (b) | During the period, certain fees were waived and/or reimbursed. If such waivers/reimbursements had not occurred, the ratios would have been as indicated. |
Amounts listed as “–” are $0 or round to $0.
See accompanying Notes to Financial Statements.
Annual Report 2015
48
Financial Highlights (continued)
Selected Data for Each Share of Capital Outstanding Throughout the Periods Indicated
Aberdeen Select International Equity Fund II (concluded)
| Ratios/Supplemental Data | ||||||||||||||||||||||
| Total Return | Net Assets at End of Period (000’s) | Ratio of Expenses to Average Net Assets (d) | Ratio of Net Investment Income to Average Net Assets | Ratio of Expenses (Prior to Waived Expenses) to Average Net Assets (b)(d) | Portfolio Turnover (c) | |||||||||||||||||
| (14.16 | %)(e)(f) | $ | 79,263 | 1.38 | % | 1.93 | %(f) | 1.38 | % | 12 | % | |||||||||||
| 0.46 | % | 120,387 | 1.32 | % | 3.41 | % | 1.33 | % | 11 | % | ||||||||||||
| 20.00 | % | 168,028 | 1.21 | % | 1.19 | % | 1.23 | % | 97 | % | ||||||||||||
| 0.91 | % | 278,360 | 1.30 | % | 1.21 | % | 1.32 | % | 34 | % | ||||||||||||
| (12.61 | %) | 1,310,435 | 1.28 | % | 0.54 | % | 1.28 | % | 51 | % | ||||||||||||
| (13.96 | %)(e)(f) | 69,000 | 1.13 | % | 2.16 | %(f) | 1.13 | % | 12 | % | ||||||||||||
| 0.64 | % | 108,665 | 1.10 | % | 3.69 | % | 1.11 | % | 11 | % | ||||||||||||
| 20.36 | % | 157,876 | 1.04 | % | 1.02 | % | 1.04 | % | 97 | % | ||||||||||||
| 1.11 | % | 806,052 | 1.01 | % | 1.33 | % | 1.02 | % | 34 | % | ||||||||||||
| (12.31 | %) | 3,666,631 | 1.04 | % | 0.79 | % | 1.04 | % | 51 | % | ||||||||||||
| (c) | Portfolio turnover is calculated on the basis of the Fund as a whole without distinguishing among the classes of shares. |
| (d) | Includes interest expense that amounts to less than 0.01%. |
| (e) | Included within Net Realized and Unrealized Gains (Losses) on Investment per share is a payment from affiliate (See Note 3). If such payment was excluded, the total return would have been (14.33%) for Class A Shares and (14.13%) for Institutional Class Shares. |
| (f) | Included within Net Investment Income per share, Total Return, and Ratio of Net Investment Income to Average Net Assets are the effects of withholding tax refunds (Note 2h of the Notes to Financial Statements). If such amounts were excluded, the Net Investment Income per share, Total Return, and Ratio of Net Investment Income to Average Net Assets for Class A Shares would have been $0.18, (14.42%), and 1.66%, respectively. For Institutional Class Shares, these amounts would have been $0.21, (14.22%), and 1.89%, respectively. |
2015 Annual Report
49
Financial Highlights (continued)
Selected Data for Each Share of Capital Outstanding Throughout the Periods Indicated
Aberdeen Total Return Bond Fund
| Investment Activities | Distributions | |||||||||||||||||||||||||||||||||||
| Net Asset Value, Beginning of Period | Net Investment Income (a) | Net Realized and Unrealized Gains (Losses) on Investments | Total from Investment Activities | Net Investment Income | Net Realized Gains | Tax Return of Capital | Total Distributions | Net Asset Value, End of Period | ||||||||||||||||||||||||||||
Class A Shares | ||||||||||||||||||||||||||||||||||||
Year Ended October 31, 2015 | $ | 13.60 | $ | 0.32 | $ | (0.19 | ) | $ | 0.13 | $ | (0.22 | ) | $ | (0.17 | ) | $ | (0.02 | ) | $ | (0.41 | ) | $ | 13.32 | |||||||||||||
Year Ended October 31, 2014 | 13.30 | 0.34 | 0.18 | 0.52 | (0.22 | ) | – | – | (0.22 | ) | 13.60 | |||||||||||||||||||||||||
Year Ended October 31, 2013 | 14.17 | 0.31 | (0.56 | ) | (0.25 | ) | (0.29 | ) | (0.30 | ) | (0.03 | ) | (0.62 | ) | 13.30 | |||||||||||||||||||||
Year Ended October 31, 2012 | 14.02 | 0.34 | 0.56 | 0.90 | (0.49 | ) | (0.26 | ) | – | (0.75 | ) | 14.17 | ||||||||||||||||||||||||
Year Ended October 31, 2011 | 14.24 | 0.55 | 0.18 | 0.73 | (0.47 | ) | (0.48 | ) | – | (0.95 | ) | 14.02 | ||||||||||||||||||||||||
Institutional Class Shares | ||||||||||||||||||||||||||||||||||||
Year Ended October 31, 2015 | 13.43 | 0.35 | (0.20 | ) | 0.15 | (0.25 | ) | (0.17 | ) | (0.02 | ) | (0.44 | ) | 13.14 | ||||||||||||||||||||||
Year Ended October 31, 2014 | 13.13 | 0.37 | 0.18 | 0.55 | (0.25 | ) | – | – | (0.25 | ) | 13.43 | |||||||||||||||||||||||||
Year Ended October 31, 2013 | 14.03 | 0.35 | (0.56 | ) | (0.21 | ) | (0.36 | ) | (0.30 | ) | (0.03 | ) | (0.69 | ) | 13.13 | |||||||||||||||||||||
Year Ended October 31, 2012 | 13.91 | 0.38 | 0.55 | 0.93 | (0.55 | ) | (0.26 | ) | – | (0.81 | ) | 14.03 | ||||||||||||||||||||||||
Year Ended October 31, 2011 | 14.16 | 0.58 | 0.18 | 0.76 | (0.53 | ) | (0.48 | ) | – | (1.01 | ) | 13.91 | ||||||||||||||||||||||||
| (a) | Net investment income (loss) is based on average shares outstanding during the period. |
| (b) | During the period, certain fees were waived and/or reimbursed. If such waivers/reimbursements had not occurred, the ratios would have been as indicated. |
Amounts listed as “–” are $0 or round to $0.
See accompanying Notes to Financial Statements.
Annual Report 2015
50
Financial Highlights (continued)
Selected Data for Each Share of Capital Outstanding Throughout the Periods Indicated
Aberdeen Total Return Bond Fund (concluded)
| Ratios/Supplemental Data | ||||||||||||||||||||||
| Total Return | Net Assets at End of Period (000’s) | Ratio of Expenses to Average Net Assets | Ratio of Net Investment Income to Average Net Assets | Ratio of Expenses (Prior to Reimbursements/ Waived Expenses) to Average Net Assets (b) | Portfolio Turnover (c) | |||||||||||||||||
| 0.91 | % | $ | 75,595 | 0.69 | % | 2.37 | % | 0.71 | % | 102 | % | |||||||||||
| 3.96 | % | 152,196 | 0.68 | % | 2.56 | % | 0.69 | % | 128 | % | ||||||||||||
| (1.81 | %) | 153,370 | 0.68 | % | 2.29 | % | 0.70 | % | 265 | % | ||||||||||||
| 6.64 | % | 247,217 | 0.69 | % | 2.47 | % | 0.69 | % | 236 | % | ||||||||||||
| 5.49 | % | 271,444 | 0.69 | % | 3.96 | % | 0.71 | % | 219 | % | ||||||||||||
| 1.12 | % | 927,387 | 0.44 | % | 2.62 | % | 0.45 | % | 102 | % | ||||||||||||
| 4.25 | % | 1,361,252 | 0.42 | % | 2.81 | % | 0.43 | % | 128 | % | ||||||||||||
| (1.59 | %) | 1,449,776 | 0.42 | % | 2.56 | % | 0.43 | % | 265 | % | ||||||||||||
| 6.97 | % | 1,849,138 | 0.41 | % | 2.73 | % | 0.41 | % | 236 | % | ||||||||||||
| 5.79 | % | 1,498,733 | 0.44 | % | 4.20 | % | 0.45 | % | 219 | % | ||||||||||||
| (c) | Portfolio turnover is calculated on the basis of the Fund as a whole without distinguishing among the classes of shares. |
2015 Annual Report
51
Financial Highlights (continued)
Selected Data for Each Share of Capital Outstanding Throughout the Periods Indicated
Aberdeen Global High Income Fund
| Investment Activities | Distributions | |||||||||||||||||||||||||||||||||||
| Net Asset Value, Beginning of Period | Net (a) | Net Realized and Unrealized Gains (Losses) on Investments | Total from Investment Activities | Net Investment Income | Net Realized Gains | Tax Return of Capital | Total Distributions | Net Asset Value, End of Period | ||||||||||||||||||||||||||||
Class A Shares | ||||||||||||||||||||||||||||||||||||
Year Ended October 31, 2015 | $ | 10.38 | $ | 0.62 | $ | (1.22 | ) | $ | (0.60 | ) | $ | (0.44 | ) | $ | (0.25 | ) | $ | (0.11 | ) | $ | (0.80 | ) | $ | 8.98 | ||||||||||||
Year Ended October 31, 2014 | 10.61 | 0.62 | (0.13 | ) | 0.49 | (0.61 | ) | (0.11 | ) | – | (0.72 | ) | 10.38 | |||||||||||||||||||||||
Year Ended October 31, 2013 | 10.30 | 0.72 | 0.30 | 1.02 | (0.71 | ) | – | – | (0.71 | ) | 10.61 | |||||||||||||||||||||||||
Year Ended October 31, 2012 | 10.14 | 0.73 | 0.34 | 1.07 | (0.74 | ) | (0.16 | ) | (0.01 | ) | (0.91 | ) | 10.30 | |||||||||||||||||||||||
Year Ended October 31, 2011 | 11.06 | 0.77 | (0.62 | ) | 0.15 | (0.79 | ) | (0.28 | ) | – | (1.07 | ) | 10.14 | |||||||||||||||||||||||
Institutional Class Shares | ||||||||||||||||||||||||||||||||||||
Year Ended October 31, 2015 | 9.85 | 0.61 | (1.16 | ) | (0.55 | ) | (0.47 | ) | (0.25 | ) | (0.11 | ) | (0.83 | ) | 8.47 | |||||||||||||||||||||
Year Ended October 31, 2014 | 10.10 | 0.61 | (0.11 | ) | 0.50 | (0.64 | ) | (0.11 | ) | – | (0.75 | ) | 9.85 | |||||||||||||||||||||||
Year Ended October 31, 2013 | 9.84 | 0.71 | 0.29 | 1.00 | (0.74 | ) | – | – | (0.74 | ) | 10.10 | |||||||||||||||||||||||||
Year Ended October 31, 2012 | 9.72 | 0.73 | 0.31 | 1.04 | (0.74 | ) | (0.16 | ) | (0.02 | ) | (0.92 | ) | 9.84 | |||||||||||||||||||||||
Year Ended October 31, 2011 | 10.64 | 0.76 | (0.59 | ) | 0.17 | (0.81 | ) | (0.28 | ) | – | (1.09 | ) | 9.72 | |||||||||||||||||||||||
| (a) | Net investment income (loss) is based on average shares outstanding during the period. |
| (b) | During the period, certain fees were waived and/or reimbursed. If such waivers/reimbursements had not occurred, the ratios would have been as indicated. |
| (c) | Includes interest expense that amounts to less than 0.01%. |
Amounts listed as “–” are $0 or round to $0.
See accompanying Notes to Financial Statements.
Annual Report 2015
52
Financial Highlights (concluded)
Selected Data for Each Share of Capital Outstanding Throughout the Periods Indicated
Aberdeen Global High Income Fund (concluded)
| Ratios/Supplemental Data | ||||||||||||||||||||||
| Total Return | Net Assets at End of Period (000’s) | Ratio of Expenses to Average Net Assets | Ratio of Net Investment Income to Average Net Assets | Ratio of Expenses (b)(c) | Portfolio Turnover (d) | |||||||||||||||||
| (6.01 | %)(e) | $ | 522,964 | 1.00 | % | 6.43 | % | 1.04 | % | 79 | % | |||||||||||
| 4.70 | % | 823,808 | 1.00 | % | 5.76 | % | 1.01 | % | 96 | % | ||||||||||||
| 10.20 | % | 999,250 | 0.99 | % | 6.83 | % | 1.00 | % | 57 | % | ||||||||||||
| 11.22 | % | 1,066,487 | 0.99 | % | 7.26 | % | 1.01 | % | 62 | % | ||||||||||||
| 1.30 | % | 1,308,597 | 0.99 | % | 7.19 | % | 1.00 | % | 78 | % | ||||||||||||
| (5.85 | %) | 797,494 | 0.75 | % | 6.68 | % | 0.76 | % | 79 | % | ||||||||||||
| 5.01 | % | 1,561,293 | 0.74 | % | 6.01 | % | 0.75 | % | 96 | % | ||||||||||||
| 10.53 | % | 1,553,543 | 0.75 | % | 7.10 | % | 0.75 | % | 57 | % | ||||||||||||
| 11.49 | % | 2,130,565 | 0.73 | % | 7.53 | % | 0.74 | % | 62 | % | ||||||||||||
| 1.52 | % | 2,077,865 | 0.73 | % | 7.44 | % | 0.74 | % | 78 | % | ||||||||||||
| (d) | Portfolio turnover is calculated on the basis of the Fund as a whole without distinguishing among the classes of shares. |
| (e) | The total return shown above includes the impact of financial statement adjustments. |
2015 Annual Report
53
October 31, 2015
1. Organization
Aberdeen Investment Funds (the “Trust”) was organized as a business trust under the laws of the State of Massachusetts by a Master Trust Agreement adopted on April 30, 1992 and is registered with the U.S. Securities and Exchange Commission (“SEC”) under the Investment Company Act of 1940, as amended (the “1940 Act”) as an open-end management investment company. As of October 31, 2015, the Trust offered four diversified, open-ended investment funds: Aberdeen Select International Equity Fund (the “Select International Equity Fund”), Aberdeen Select International Equity Fund II (the “Select International Equity Fund II”), Aberdeen Total Return Bond Fund (the “Total Return Bond Fund”) and Aberdeen Global High Income Fund (the “Global High Income Fund”). Each series of the Trust is also referred to herein as a “Fund” or collectively, the “Funds”.
Each of the Funds offers multiple share classes. As of October 31, 2015, all of the Funds offered Class A and Institutional Class shares. The classes of shares are offered to different types of investors and have different expense structures, as outlined in the Funds’ prospectus. Each class of shares has exclusive voting rights with respect to matters that affect that class. Income, realized gains and losses, unrealized appreciation and depreciation, and expenses that are not attributable to a specific class are allocated daily to each class based on its relative net assets. Expenses directly attributable to a Fund are charged to that Fund. Other expenses are allocated to the respective Fund based on average daily net assets.
Each Fund has distinct investment objectives. Following are the objectives for the Funds:
| Fund Name | Investment Objective | |
Select International Equity Fund | Seeks long-term growth of capital. | |
Select International Equity Fund II | Seeks long-term growth of capital. | |
Total Return Bond Fund | Seeks to provide total return, which consists of two components: (1) changes in the market value of the Fund’s portfolio securities (both realized and unrealized appreciation/depreciation) and (2) income received from its portfolio securities. | |
Global High Income Fund | Seeks to maximize total return, principally through a high level of current income, and secondarily through capital appreciation. |
2. Summary of Significant Accounting Policies
The following is a summary of significant accounting policies followed by the Funds in the preparation of their financial statements. The policies conform to accounting principles generally accepted in the United States of America (“GAAP”). The preparation of financial statements requires management to make estimates and assumptions that affect the reported amounts of assets and liabilities, disclosure of contingent assets and liabilities at the date of the financial statements, and the reported amounts of income and expenses for the period. Actual results could differ from those estimates. The books and records of the Funds are maintained in U.S. Dollars.
| a. | Security Valuation |
The Funds value their securities at current market value or fair value consistent with the Funds’ valuation procedures (“Valuation Procedures”) and regulatory requirements.
Each Fund’s assets for which market quotations are readily available are valued at fair value on the basis of quotations furnished by a pricing service or provided by securities dealers. Equity investments are generally valued using the last sale price or official closing price taken from the primary market in which each security trades, or if no sales occurred during the day, at the mean of the current quoted bid and ask prices.
Foreign equity securities that are traded on foreign exchanges that close prior to 4:00 pm Eastern time (“Valuation Time”) are valued by applying valuation factors to the last sale price or the mean price as noted above. Valuation factors are provided by an independent pricing service provider. These valuation factors are used when pricing a Fund’s portfolio holdings to estimate market movements between the time foreign markets close and the time a Fund values such foreign securities. These valuation factors are based on inputs such as depositary receipts, indices, futures, sector indices/ETFs, exchange rates, and local exchange opening and closing prices of each security. When prices with the application of valuation factors are utilized, the value assigned to the foreign securities may not be the same as quoted or published prices of the securities on their primary markets. Valuation factors are not utilized if the independent pricing service provider is unable to provide a valuation factor or if the valuation factor falls below a predetermined threshold.
Fixed income securities are generally valued using prices provided directly by independent third party services or provided directly from one or more broker dealers or market makers, each in accordance with the Valuation Procedures approved by the Trust’s Board of Trustees (the
Annual Report 2015
54
Notes to Financial Statements (continued)
October 31, 2015
“Board”). The pricing services may use valuation models or matrix pricing, which consider yield or prices with respect to comparable bond quotations from bond dealers or by reference to other securities that are considered comparable in such characteristics as credit rating, interest rates and maturity date, to determine current fair value. Pricing services generally price debt securities assuming orderly transactions of an institutional “round lot” size, but some trades occur in smaller “odd lot” size that may be effected at lower prices than institutional round lot trades.
Assets and liabilities initially expressed in foreign currency will be converted into U.S. Dollar values. Short-term debt securities (such as commercial paper and U.S. treasury bills) having a remaining maturity of 60 days or less are valued at the last quoted or evaluated bid price on the valuation date provided by an independent pricing service, or on the basis of amortized cost if it represents the best approximation for fair value. To the extent each Fund invests in other open-ended funds, the Fund will calculate its Net Asset Value (“NAV”) based upon the NAV of the underlying funds in which it invests. The prospectuses of these underlying funds explain the circumstances under which they will use good faith fair value pricing and the effects of such fair value pricing.
Derivative instruments are generally valued according to the following procedures. For forward currency exchange contracts the market value is interpolated by the pricing agent by using forward spot points obtained from an authorized pricing service. Futures contracts are generally valued at the most recent settlement price as of net asset value (“NAV”) determination. Generally for swap agreements, if quotes are unavailable from authorized pricing services swap pricing is determined using a modeling tool which considers and forecasts the impact of cash flow projections, prevailing and expected interest rate movements, and potential credit events. Swap prices are generally evaluated based upon the latest available data provided by the counterparty and rely upon an industry accepted modeling tool.
When market quotations or exchange rates are not readily available, or if the Funds’ investment adviser, Aberdeen Asset Management Inc. (the “Adviser”), concludes that such market quotations do not accurately reflect fair value, the fair value of a Fund’s assets are determined in good faith in accordance with the Valuation Procedures. For options, swaps and warrants, a fair value price may be determined using readily available market quotations, prices provided by independent pricing services, or by using modeling tools provided by industry accepted financial data service providers. Key inputs to such tools may include yield and prices from comparable or reference assets, maturity or expiration dates, ratings, and interest rates. In addition, the Adviser, through its pricing committee, may determine the fair value price in accordance with the Valuation Procedures approved by the Board.
In accordance with the authoritative guidance on fair value measurements and disclosures under GAAP, the Funds disclose the fair value of their investments using a three-level hierarchy that classifies the inputs to valuation techniques used to measure the fair value. The hierarchy assigns Level 1 measurements to valuations based upon unadjusted quoted prices in active markets for similar assets, Level 2 measurements to valuations based upon significant observable inputs, including adjusted quoted prices in active markets for identical assets, and Level 3 measurements to valuations based upon unobservable inputs that are significant to the valuation. Inputs refer broadly to the assumptions that market participants would use in pricing the asset or liability, including assumptions about risk, for example, the risk inherent in a particular valuation technique used to measure fair value including a pricing model and/or the risk inherent in the inputs to the valuation technique. Inputs may be observable or unobservable. Observable inputs are inputs that reflect the assumptions market participants would use in pricing the asset or liability, which are based on market data obtained from sources independent of the reporting entity. Unobservable inputs are inputs that reflect the reporting entity’s own assumptions about the assumptions market participants would use in pricing the asset or liability developed based on the best information available in the circumstances. A financial instrument’s level within the fair value hierarchy is based upon the lowest level of any input that is significant to the fair value measurement. The three-level hierarchy of inputs is summarized below:
| • | Level 1- quoted prices in active markets for similar investments; |
| • | Level 2- other significant observable inputs (including quoted prices for similar securities, interest rates, prepayment speeds, and credit risk); or |
| • | Level 3- significant unobservable inputs (including the Fund’s own assumptions in determining the fair value of investments). |
For movements between the Levels with the fair value hierarchy, the Funds have adopted a policy of recognizing transfers at the end of each period. As described above, certain foreign securities are valued utilizing valuation factors provided by an independent pricing service to reflect any significant market movements between the time foreign markets close and the time the Fund values such foreign securities. The utilization of valuation factors may result in transfers between Level 1 and Level 2. Select International Equity Fund II and Total Return Bond Fund had no transfers between levels.
2015 Annual Report
55
Notes to Financial Statements (continued)
October 31, 2015
The following is a summary of significant transfers during the year ended October 31, 2015:
| Fund | Transfer from Level 1 | Transfer from Level 2 | Transfer from Level 3 | |||
Global High Income Fund | $3,380,976 | $8,659,382 | $16,195,380 | |||
Select International Equity Fund1 | – | – | – |
| 1 | Banco Provincial SA-Banco Universal transferred from Level 1 to Level 3 because the security was fair valued by the Fund’s Pricing Committee as of October 31, 2015 pursuant to procedures approved by the Fund’s Board of Trustees. |
The following is a summary of the inputs used as of October 31, 2015 in valuing the Funds’ investments and other financial instruments at fair value. The inputs or methodology used for valuing securities are not necessarily an indication of the risk associated with investing in those securities.
| LEVEL 1-Quoted Prices ($) | LEVEL 2-Other Significant Observable Inputs ($) | LEVEL 3-Significant Unobservable Inputs ($) | Total ($) | |||||||||||||
| Select International Equity Fund | ||||||||||||||||
| Investments in Securities | ||||||||||||||||
Common Stocks | 35,468,348 | 219,337,718 | – | 254,806,066 | ||||||||||||
Preferred Stocks | 9,378,194 | 16,920,450 | – | 26,298,644 | ||||||||||||
Exchange Traded Funds1 | – | – | – | – | ||||||||||||
Government Bonds1 | – | – | – | – | ||||||||||||
Repurchase Agreement | – | 3,623,854 | – | 3,623,854 | ||||||||||||
|
|
|
|
|
|
|
| |||||||||
| 44,846,542 | 239,882,022 | – | 284,728,564 | |||||||||||||
|
|
|
|
|
|
|
| |||||||||
1 Represents a security that is fair valued at zero pursuant to procedures approved by the Fund’s Board of Trustees. |
| |||||||||||||||
| Select International Equity Fund II | ||||||||||||||||
| Investments in Securities | ||||||||||||||||
Common Stocks | 17,221,159 | 110,145,964 | – | 127,367,123 | ||||||||||||
Preferred Stocks | 4,752,559 | 9,499,282 | – | 14,251,841 | ||||||||||||
Repurchase Agreement | – | 5,474,023 | – | 5,474,023 | ||||||||||||
|
|
|
|
|
|
|
| |||||||||
| 21,973,718 | 125,119,269 | – | 147,092,987 | |||||||||||||
|
|
|
|
|
|
|
| |||||||||
| Total Return Bond Fund | ||||||||||||||||
| Investments in Securities | ||||||||||||||||
Asset-Backed Securities | – | 90,725,669 | – | 90,725,669 | ||||||||||||
Commercial Mortgage-Backed Securities | – | 118,292,794 | – | 118,292,794 | ||||||||||||
Corporate Bonds | – | 363,004,612 | – | 363,004,612 | ||||||||||||
Government Bonds | – | 73,005,189 | – | 73,005,189 | ||||||||||||
Municipal Bonds | – | 54,795,671 | – | 54,795,671 | ||||||||||||
Non-Agency Mortgage-Backed Securities | – | 141,828,595 | – | 141,828,595 | ||||||||||||
Repurchase Agreement | – | 48,790,041 | – | 48,790,041 | ||||||||||||
U.S. Agencies | – | 97,328,576 | – | 97,328,576 | ||||||||||||
U.S. Treasuries | – | 27,740,519 | – | 27,740,519 | ||||||||||||
Other Financial Instruments | ||||||||||||||||
Assets | ||||||||||||||||
Futures Contracts | 93,774 | – | – | 93,774 | ||||||||||||
Forward Foreign Currency Exchange Contracts | – | 2,718,963 | – | 2,718,963 | ||||||||||||
Liabilities | ||||||||||||||||
Futures Contracts | (265,447 | ) | – | – | (265,447 | ) | ||||||||||
Forward Foreign Currency Exchange Contracts | – | (3,540,397 | ) | – | (3,540,397 | ) | ||||||||||
|
|
|
|
|
|
|
| |||||||||
| (171,673 | ) | 1,014,690,232 | – | 1,014,518,559 | ||||||||||||
|
|
|
|
|
|
|
| |||||||||
Annual Report 2015
56
Notes to Financial Statements (continued)
October 31, 2015
| Investments, at Value | LEVEL 1-Quoted Prices ($) | LEVEL 2-Other Significant Observable Inputs ($) | LEVEL 3-Significant Unobservable Inputs ($) | Total ($) | ||||||||||||
| Global High Income Fund | ||||||||||||||||
| Investments in Securities | ||||||||||||||||
Bank Loans | – | 130,081,092 | 31,291,131 | 161,372,223 | ||||||||||||
Corporate Bonds | – | 1,012,373,733 | 10,289,911 | 1,022,663,644 | ||||||||||||
Common Stocks | 146,821 | – | 14,625,433 | 14,772,254 | ||||||||||||
Government Agencies | – | 14,034,251 | – | 14,034,251 | ||||||||||||
Government Bonds | – | 19,307,717 | – | 19,307,717 | ||||||||||||
Preferred Stocks | 6,709,198 | 4,558,520 | – | 11,267,718 | ||||||||||||
Repurchase Agreement | – | 31,618,666 | – | 31,618,666 | ||||||||||||
Other Financial Instruments | ||||||||||||||||
Assets | ||||||||||||||||
Forward Foreign Currency Exchange Contracts | – | 5,131,548 | – | 5,131,548 | ||||||||||||
Credit Default Swap Contracts | – | 3,274,089 | – | 3,274,089 | ||||||||||||
Liabilities | ||||||||||||||||
Forward Foreign Currency Exchange Contracts | – | (257,236 | ) | – | (257,236 | ) | ||||||||||
|
|
|
|
|
|
|
| |||||||||
| 6,856,019 | 1,220,122,380 | 56,206,475 | 1,283,184,874 | |||||||||||||
|
|
|
|
|
|
|
| |||||||||
| Amounts listed as “–” are $0 or round to $0. |
Select International Equity Fund
Rollforward of Level 3 Fair Value Measurement
For the Year Ended October 31, 2015
| Investments in Securities | Balance as of October 31, 2014 | Accrued Discounts (Premiums) | Realized Gain (Loss) | Change in Unrealized Appreciation (Depreciation) | Net Purchases | Net Sales | Net Transfers in to Level 3 | Net Transfers out of Level 3 | Balance as of October 31, 2015 | Change in Unrealized Appreciation (Depreciation) from Investments Held at October 31, 2015 | ||||||||||||||||||||||||||||||
COMMON STOCK | ||||||||||||||||||||||||||||||||||||||||
Bulgaria | $ | 1,780,964 | $ | – | $ | (22,825,390 | ) | $ | 21,160,724 | $ | – | $ | (116,298 | ) | $ | – | $ | – | $ | – | $ | – | ||||||||||||||||||
Latvia | – | – | – | – | – | – | – | – | – | – | ||||||||||||||||||||||||||||||
Serbia | – | – | – | – | – | – | – | – | – | – | ||||||||||||||||||||||||||||||
Venezuela | – | – | – | – | – | – | – | – | – | – | ||||||||||||||||||||||||||||||
GOVERNMENT BONDS | ||||||||||||||||||||||||||||||||||||||||
Venezuela | 968,864 | (4,583 | ) | – | (964,281 | ) | – | – | – | – | – | (964,281 | ) | |||||||||||||||||||||||||||
EXCHANGE TRADED FUNDS | ||||||||||||||||||||||||||||||||||||||||
Russia | – | – | – | – | – | – | – | – | – | – | ||||||||||||||||||||||||||||||
TOTAL | $ | 2,749,828 | $ | (4,583 | ) | $ | (22,825,390 | ) | $ | 20,196,443 | $ | – | $ | (116,298 | ) | $ | – | $ | – | $ | – | $ | (964,281 | ) | ||||||||||||||||
2015 Annual Report
57
Notes to Financial Statements (continued)
October 31, 2015
Global High Income Fund
Rollforward of Level 3 Fair Value Measurement
For the Year Ended October 31, 2015
| Investments in Securities | Balance as of October 31, 2014 | Accrued Discounts (Premiums) | Realized Gain (Loss) | Change in Unrealized Appreciation (Depreciation) | Net Purchases | Net Sales | Net Transfers in to Level 3 | Net Transfers out of Level 3 | Balance as of October 31, 2015 | Change in Unrealized Appreciation (Depreciation) from Investments Held at October 31, 2015 | ||||||||||||||||||||||||||||||
BANK LOANS | ||||||||||||||||||||||||||||||||||||||||
Ethiopia | $ | 6,754,979 | $ | – | $ | (787,500 | ) | $ | 4,495,021 | $ | – | $ | (10,462,500 | ) | $ | – | $ | – | $ | – | $ | – | ||||||||||||||||||
Italy | 17,323,265 | 65,033 | (1,194,748 | ) | (1,788,264 | ) | – | (4,412,225 | ) | – | – | 9,993,061 | (1,788,264 | ) | ||||||||||||||||||||||||||
United States | 72,391,303 | 155,897 | (8,060,069 | ) | (1,739,474 | ) | 4,401,000 | (38,269,402 | ) | 8,614,195 | (16,195,380 | ) | 21,298,070 | (344,596 | ) | |||||||||||||||||||||||||
COMMON STOCK | ||||||||||||||||||||||||||||||||||||||||
Norway | 37,722,113 | – | – | (26,477,656 | ) | – | – | – | – | 11,244,457 | (26,477,656 | ) | ||||||||||||||||||||||||||||
United States | – | – | – | – | – | – | 3,380,976 | – | 3,380,976 | – | ||||||||||||||||||||||||||||||
CORPORATE BONDS | ||||||||||||||||||||||||||||||||||||||||
Canada | 16,420,744 | 27,303 | (467,027 | ) | (1,673,541 | ) | – | (4,062,756 | ) | – | – | 10,244,723 | (1,673,541 | ) | ||||||||||||||||||||||||||
United States | – | – | – | – | – | – | 45,188 | – | 45,188 | – | ||||||||||||||||||||||||||||||
TOTAL | $ | 150,612,404 | $ | 248,233 | $ | (10,509,344 | ) | $ | (27,183,914 | ) | $ | 4,401,000 | $ | (57,206,883 | ) | $ | 12,040,359 | $ | (16,195,380 | ) | $ | 56,206,475 | $ | (33,060,518 | ) | |||||||||||||||
The following is quantitative information about level 3 fair value measurements:
| Description | Fair Value at 10/31/15 ($) | Valuation Technique(s) | Unobservable Inputs | Range | Weighted Average | |||||||||||||
Global High Income Fund | ||||||||||||||||||
Bank Loans | $ | 31,291,131 | Broker Pricing | Bid/Ask Spread | $ | 52.50-101.17 | $ | 88.83 | ||||||||||
Common Stocks | 11,244,457 | Evaluated Pricing | Bid/Ask Spread | 7.9 | 7.9 | |||||||||||||
Common Stocks | 3,380,976 | Broker Pricing | Bid/Ask Spread | 24.0 | 24.0 | |||||||||||||
Corporate Bonds | 10,289,911 | Broker Pricing | Bid/Ask Spread | 3.01-75.33 | 68.15 | |||||||||||||
Evaluated Pricing: In determining the fair value of the Common Stock as of October 31, 2015, the Global High Income Fund took an average of the values calculated using the Income Approach – Discounted Cash Flow Method and the Market Approach – Guideline Public Company Method, weighted equally, to derive an evaluated price.
Income Approach: A well-established technique used to estimate the equity value of a company through an analysis of projected income, such as using the Discounted Cash Flow Method. Using this analysis, value is indicated from all of the future cash flows attributable to the subject company discounted to present value at a required rate of return. If debt free cash flows are used, any long-term debt is deducted from the indicated value of the invested capital to determine equity value.
Market Approach: References actual transactions in the equity of the enterprise being valued or transactions in similar enterprises that are traded in private and public markets. Third-party transactions in the equity of an entity generally represent the best estimate of fair value if they are completed at arm’s length. The Guideline Public Company Method involves identifying and selecting publicly traded companies with financial and operating characteristics similar to the company being valued. Once publicly traded companies are identified, valuation multiples can be derived, adjusted for comparability, and then applied to the subject company to estimate the value of its equity or invested capital. Similarly, the Comparable Transactions Method analyzes transactions involving target companies operating in industries similar to the subject company. While it is known that no two companies are exactly alike, nor are any two transactions structured identically, consideration is given to comparisons of the capital structure, operations, size, and profitability, as well as other operating characteristics of the target companies. Once comparable transactions for reasonable targets are identified, valuation multiples can be derived, adjusted for comparability, and then applied to the subject company to estimate the value of its equity or invested capital.
| b. | Repurchase Agreements |
The Funds may enter into repurchase agreements under the terms of a Master Repurchase Agreement. It is each Fund’s policy that its custodian/counterparty segregate the underlying collateral securities, consisting of government securities, the value of which exceeds the principal amount of the repurchase transaction, including accrued interest. The repurchase price generally equals the price paid by a Fund plus interest negotiated on the basis of current short-term rates. To the extent that any repurchase transaction exceeds one business day, the collateral is valued on a daily basis to determine its adequacy. If the counterparty defaults and the value of the collateral declines or if bankruptcy proceedings are commenced with respect to the counterparty of the security, realization of the collateral by the Funds may be
Annual Report 2015
58
Notes to Financial Statements (continued)
October 31, 2015
delayed or limited. Repurchase agreements are subject to contractual netting arrangements with the counterparty, Fixed Income Clearing Corp. For additional information on individual repurchase agreements, see the Statements of Investments.
| c. | Restricted Securities |
Restricted securities are privately-placed securities whose resale is restricted under U.S. securities laws. The Funds may invest in restricted securities, including unregistered securities eligible for resale without registration pursuant to Rule 144A and privately-placed securities of U.S. and non-U.S. issuers offered outside the U.S. without registration pursuant to Regulation S under the Securities Act of 1933, as amended. Rule 144A securities may be freely traded among certain qualified institutional investors, such as the Funds, but resale of such securities in the U.S. is permitted only in limited circumstances.
| d. | Foreign Currency Translation |
Foreign currency amounts are translated into U.S. Dollars at the current rate of exchange as of Valutaion Time to determine the value of investments, assets and liabilities. Purchases and sales of securities, and income and expenses are translated at the prevailing rate of exchange on the respective date of these transactions. The Funds do not isolate that portion of the results of operations resulting from changes in foreign exchange rates on investments from fluctuations arising from changes in market prices of securities held. These fluctuations are included with the net realized and unrealized gain or loss from investments and foreign currencies within the Statements of Operations.
Foreign securities, currencies, and other assets and liabilities denominated in foreign currencies are translated into U.S. Dollars at the exchange rate of said currencies against the U.S. Dollar, as of the Valuation Time, as provided by an independent pricing service.
Investments in emerging markets can be riskier and more volatile than investments in the United States and other developed markets. Adverse political and economic developments can make it more difficult for the Select International Equity Fund and Select International Equity Fund II to sell foreign securities which could reduce the NAV of the Funds. In contrast to more established markets, emerging markets may have governments that are less stable and markets that are less liquid, increasing your investment risk. At October 31, 2015, the Select International Equity Fund had 0.00% of its net assets invested in Venezuelan securities and held Venezuelan Bolivar valued at 0.00% of the Fund’s net assets. Venezuela currently imposes foreign exchange controls which prohibit the Select International Equity Fund from repatriating dividends, interest, or other income from investments or proceeds from the sale of Venezuelan securities.
| e. | Derivative Financial Instruments |
Certain Funds are authorized to use derivatives to manage currency risk, credit risk, and interest rate risk and to replicate, or use as a substitute for, physical securities. Losses may arise due to changes in the value of the contract or if the counterparty does not perform under the contract. The use of derivative instruments involves, to varying degrees, elements of market risk in excess of the amount recognized in the Statements of Assets and Liabilities.
Forward Foreign Currency Exchange Contracts
A forward foreign currency exchange contract (“forward contract”) involves an obligation to purchase and sell a specific currency at a future date, which may be any fixed number of days from the date of the contract agreed upon by the parties, at a price set at the time of the contract. Forward contracts are used to manage a Fund’s currency exposure in an efficient manner. They are used to sell unwanted currency exposure that comes with holding securities in a market, or to buy currency exposure where the exposure from holding securities is insufficient to give the desired currency exposure either in absolute terms or relative to the benchmark. The use of forward contracts allows the separation of decision-making between markets and their currencies. The forward contract is marked-to-market daily and the change in market value is recorded by a Fund as unrealized appreciation or depreciation. Forward contracts’ prices are received daily from an independent pricing provider. When the forward contract is closed, a Fund records a realized gain or loss equal to the difference between the value at the time it was opened and the value at the time it was closed. These realized and unrealized gains and losses are reported on the Statements of Operations. During the year ended October 31, 2015, the Funds used forward contracts to hedge some of the Funds’ foreign currency holdings. Managing active currency risk involves both hedging currency risk and adding currency risk in excess of underlying bond positions. A Fund may also enter into forward contracts to obtain potential appreciation of a foreign currency, which also adds currency risk.
Futures Contracts
Certain Funds may invest in financial futures contracts (“futures contracts”) for the purpose of hedging their existing portfolio securities, or securities that a Fund intends to purchase, against fluctuations in value caused by changes in prevailing market interest rates or prices. Futures contracts may also be entered into for non-hedging purposes; however, in those instances, the aggregate initial margin and premiums required to establish a Fund’s positions may not exceed 5% of a Fund’s NAV after taking into account unrealized profits and unrealized losses on any such contract it has entered.
2015 Annual Report
59
Notes to Financial Statements (continued)
October 31, 2015
Upon entering into a futures contract, a Fund is required to pledge to the broker an amount of cash and/or other assets equal to a certain percentage of the contract amount. This payment is known as “initial margin”. Subsequent payments, known as “variation margin,” are calculated each day, depending on the daily fluctuations in the fair value/market value of the underlying assets. An unrealized gain/(loss) equal to the variation margin is recognized on a daily basis. When the contract expires or is closed, the gain/(loss) is realized and is presented in the Statements of Operations as a net realized gain/(loss) on futures contracts. Futures contracts are valued daily at their last quoted sale price on the exchange on which they are traded.
A “sale” of a futures contract means a contractual obligation to deliver the securities or foreign currency called for by the contract at a fixed price at a specified time in the future. A “purchase” of a futures contract means a contractual obligation to acquire the securities or foreign currency at a fixed price at a specified time in the future.
Should market conditions change unexpectedly, a Fund may not achieve the anticipated benefits of the futures contracts and may realize a loss. The use of futures transactions for hedging purposes involves the risk of imperfect correlation in movements in the price of futures contracts, interest rates and the value/market value of the underlying hedged assets. During the year ended October 31, 2015, U.S. Treasury futures contracts were used to manage Total Return Bond Fund’s overall curve and interest rate exposure.
Swaps
Certain Funds enter into swaps to efficiently gain or hedge interest rate or currency risk. A swap is an agreement that obligates two parties to exchange a series of cash flows at specified intervals based upon or calculated by reference to changes in specified prices or rates for a specified amount of an underlying asset or notional principal amount. A Fund will enter into swaps only on a net basis, which means that the two payment streams are netted out, with a Fund receiving or paying, as the case may be, only the net amount of the difference between the two payments. Risks may arise as a result of the failure of the counterparty to the swap contract to comply with the terms of the swap contract. The loss incurred by the failure of a counterparty is generally limited to the net interest payment to be received by a Fund, and/or the termination value at the end of the contract. Therefore, a Fund considers the creditworthiness of each counterparty to a swap contract in evaluating potential credit risk. Additionally, risks may arise from unanticipated movements in interest rates or in the value of the underlying reference asset or index. A Fund records unrealized gains/(losses) on a daily basis representing the value and the current net receivable or payable relating to open swap contracts. Net amounts received or paid on the swap contract are recorded as realized gains/(losses). Fluctuations in the value of swap contracts are recorded for financial statement purposes as unrealized appreciation or depreciation of swap contracts. Realized gains/(losses) from terminated swaps are included in net realized gains/(losses) on swap contracts transactions.
Certain Funds are a party to International Swap Dealers Association, Inc. Master Agreements (“ISDA Master Agreements”). These agreements are with select counterparties and they govern transactions, including certain over-the-counter derivative and foreign exchange contracts, entered into by certain Funds and the counterparty. The ISDA Master Agreements maintain provisions for general obligations, representations, agreements, collateral, and events of default or termination. The occurrence of a specified event of termination may give a counterparty the right to terminate all of its contracts and affect settlement of all outstanding transactions under the applicable ISDA Master Agreement. To the extent a Fund engages in transactions under these agreements, it is subject to counterparty risk, which is described with respect to swaps both above and below.
Certain swaps entered into after June 10, 2013, including some interest rate swaps and credit default swaps, must be cleared pursuant to U.S. Commodity Futures Trading Commission (“CFTC”) regulations. As a result, these swaps can no longer be traded over-the-counter and are subject to various regulations and rules of the CFTC.
Entering into swap agreements involves, to varying degrees, elements of credit and market risk in excess of the amounts recognized on the Statements of Assets and Liabilities. Such risks involve the possibility that there will be no liquid market for these agreements, that the counterparty to the agreements may default on its obligation to perform and that there may be unfavorable changes in the value of the index or securities underlying the agreement. The Funds’ maximum risk of loss from counterparty risk related to swaps is the fair value of the contract. This risk is mitigated by having a master netting agreement between the Funds and the counterparties and by the posting of collateral by the counterparties to the Funds to cover the Funds’ exposure to the counterparty. A Fund must also segregate liquid assets to “cover” its obligations under the swap.
Credit Default Swaps
A credit default swap is a credit derivative contract between two counterparties. The buyer makes periodic payments to the seller, and in return receives protection if an underlying financial instrument defaults. A Fund might use credit default swap contracts to limit or to reduce risk exposure of the Fund to defaults of corporate and sovereign issuers (i.e., to reduce risk when the Fund owns or has exposure to such issuers). A Fund also might use credit default swap contracts, to create direct or synthetic short or long exposure to domestic or foreign corporate debt securities or certain sovereign debt securities to which the Fund is not otherwise exposed. As the seller in a credit default
Annual Report 2015
60
Notes to Financial Statements (continued)
October 31, 2015
swap contract, a Fund would be required to pay the par (or other agreed-upon) value of a referenced debt obligation to the counterparty in the event of a default (or similar event) by a third party, such as a U.S. or foreign issuer, on the debt obligation. In return, a Fund would receive from the counterparty a periodic stream of payments over the term of the contract, provided that no event of default (or similar event) occurs. If no event of default (or similar event) occurs, a Fund would keep the stream of payments and would have no payment of obligations. As the seller in a credit default swap contract, a Fund effectively would add economic leverage to its portfolio because, in addition to its total net assets, a Fund would be subject to investment exposure on the notional amount of the swap. As the purchaser in a credit default swap contract, a Fund would function as the counterparty referenced in the preceding paragraph. This would involve the risk that the investment might expire worthless. It also would involve credit risk that the seller may fail to satisfy its payment obligations to a Fund in the event of a default (or similar event). As the purchaser in a credit default swap contract, a Fund’s investment would generate income only in the event of an actual default (or similar event) by the issuer of the underlying obligation. During the year ended October 31, 2015, Global High Income Fund employed CDX (a basket of credit derivatives) to hedge overall beta risk, a measure of the volatility, or systematic risk, of a security or a portfolio in comparison to the market as a whole. The Global High Income Fund also employed individual credit default swaps to hedge individual exposures as well as to initiate new long positions that are more efficient than the cash market.
Summary of Derivative Instruments
Certain Funds may use derivatives for various purposes as noted above.
| Location on the Statement of Assets and Liabilities | ||||
| Derivative Instrument Risk Type | Asset Derivatives | Liability Derivatives | ||
| Interest Rate Risk | Unrealized appreciation on futures contracts | Unrealized depreciation on futures contracts | ||
| Variation margin receivable for futures contracts | Variation margin payable for futures contracts | |||
| Foreign Exchange Risk | Unrealized appreciation on forward foreign currency exchange contracts | Unrealized depreciation on forward foreign currency exchange contracts | ||
| Credit Risk | Unrealized appreciation on swap contracts | Unrealized depreciation on swap contracts | ||
The following is a summary of the fair value of Derivative Instruments, not accounted for as hedging instruments, as of October 31, 2015:
| Asset Derivatives | ||||||||||||
| Funds | Total Value at October 31, 2015 | Credit Default Swaps (Credit Risk) | Forward Foreign Exchange Contracts (Foreign Exchange Risk) | Futures Contracts (Interest Rate Risk) | ||||||||
Total Return Bond Fund | $2,812,737 | $ | – | $2,718,963 | $ | 93,774 | ||||||
Global High Income Fund | 9,038,337 | 3,906,789 | 5,131,548 | – | ||||||||
| Liability Derivatives | ||||||||||||
| Funds | Total Value at October 31, 2015 | Credit Default Swaps (Credit Risk) | Forward Foreign Exchange Contracts (Foreign Exchange Risk) | Futures Contracts (Interest Rate Risk) | ||||||||
Total Return Bond Fund | $3,805,770 | $ | – | $3,540,397 | $ | 265,373 | ||||||
Global High Income Fund | 257,236 | – | 257,236 | – | ||||||||
2015 Annual Report
61
Notes to Financial Statements (continued)
October 31, 2015
A reconciliation of the gross amounts on the Statements of Assets and Liabilities as of October 31, 2015 to the net amounts by broker and derivative type, including any collateral received or pledged, is included in the following tables:
Gross Amounts Not Offset | ||||||||||||||||||||||||||||||||
| Gross Amounts of Assets | Gross Amounts of Liabilities | |||||||||||||||||||||||||||||||
| Description | Financial Position | Financial Instruments | Collateral Received(1) | Net Amount(3) | Financial Position | Financial Instruments | Collateral Pledged(1) | Net Amount(3) | ||||||||||||||||||||||||
Global High Income Fund | ||||||||||||||||||||||||||||||||
Forward foreign currency contracts | ||||||||||||||||||||||||||||||||
Barclays Bank PLC(2) | $ | 669,578 | $ | (79,366 | ) | $ | – | $ | 590,212 | $ | 79,366 | $ | (79,366 | ) | $ | – | $ | – | ||||||||||||||
Citibank N.A.(2) | 3,028,603 | (130,126 | ) | – | 2,898,477 | 130,126 | (130,126 | ) | – | – | ||||||||||||||||||||||
Deutsche Bank AG(2) | 213,254 | – | – | 213,254 | – | – | – | – | ||||||||||||||||||||||||
Royal Bank of Canada(2) | 1,220,113 | – | – | 1,220,113 | – | – | – | – | ||||||||||||||||||||||||
Westpac Banking Corp. | – | – | – | – | 47,744 | – | – | 47,744 | ||||||||||||||||||||||||
| 1. | In some instances, the actual collateral received and/or pledged may be more than the amount shown here due to overcollateralization. |
| 2. | Includes financial instrument (forwards) which are not subject to master netting arrangement, across Funds, or other another similar arrangement. |
| 3. | Net amounts represent the net receivables/(payable) that would be due from/to the counterparty in the event of default. Exposure from financial derivative instruments can only be netted across transactions governed under the same master netting agreement with the same legal entity. |
Gross Amounts Not Offset | ||||||||||||||||||||||||||||||||
| Gross Amounts of Assets | Gross Amounts of Liabilities | |||||||||||||||||||||||||||||||
| Description | Financial Position | Financial Instruments | Collateral Received(1) | Net Amount(3) | Financial Position | Financial Instruments | Collateral Pledged(1) | Net Amount(3) | ||||||||||||||||||||||||
Total Return Bond Fund | ||||||||||||||||||||||||||||||||
Forward foreign currency contracts | ||||||||||||||||||||||||||||||||
Barclays Bank PLC(2) | $ | 473,364 | $ | (473,364 | ) | $ | – | $ | – | $ | 689,528 | $ | (473,364 | ) | $ | – | $ | 216,164 | ||||||||||||||
Citibank N.A.(2) | 390,910 | (62,484 | ) | – | 328,426 | 62,484 | (62,484 | ) | – | – | ||||||||||||||||||||||
Deutsche Bank AG(2) | 365,936 | (88,571 | ) | – | 277,365 | 88,571 | (88,571 | ) | – | – | ||||||||||||||||||||||
JPMorgan Chase Bank N.A. | 888,070 | (519,018 | ) | – | 369,052 | 519,018 | (519,018 | ) | – | – | ||||||||||||||||||||||
Royal Bank of Canada(2) | 559,690 | (559,690 | ) | – | – | 1,138,874 | (559,690 | ) | – | 579,184 | ||||||||||||||||||||||
Westpac Banking Corp. | 40,993 | (40,993 | ) | – | – | 1,041,922 | (40,993 | ) | – | 1,000,929 | ||||||||||||||||||||||
| 1. | In some instances, the actual collateral received and/or pledged may be more than the amount shown here due to overcollateralization. |
| 2. | Includes financial instrument (forwards) which are not subject to master netting arrangement, across funds, or other another similar arrangement. |
| 3. | Net amounts represent the net receivables/(payable) that would be due from/to the counterparty in the event of default. Exposure from financial derivative instruments can only be netted across transactions governed under the same master netting agreement with the same legal entity. |
The Effect of Derivative Instruments on the Statement of Operations for the year ended October 31, 2015:
| Realized Gain or (Loss) on Derivatives Recognized in the Statement of Operations | ||||||||||||||||
| Funds | Total | Credit Default Swaps (Credit Risk) | Forward Foreign Exchange Contracts (Foreign Exchange Risk) | Futures Contracts (Interest Rate Risk) | ||||||||||||
Total Return Bond Fund | $ | 19,197,545 | $ | (15,855 | ) | $ | 19,766,310 | $ | (552,910 | ) | ||||||
Global High Income Fund | 57,805,640 | 2,389,054 | 55,416,586 | – | ||||||||||||
Annual Report 2015
62
Notes to Financial Statements (continued)
October 31, 2015
| Change in Unrealized Appreciation (Depreciation) on Derivatives Recognized in the Statement of Operations | ||||||||||||||||
| Funds | Total | Credit Default (Credit Risk) | Forward Foreign Exchange Contracts (Foreign Exchange Risk) | Futures Contracts (Interest Rate Risk) | ||||||||||||
Total Return Bond Fund | $ | (4,071,762 | ) | $ | – | $ | (3,966,933 | ) | $ | (104,829 | ) | |||||
Global High Income Fund | (15,557,333 | ) | (4,434,296 | ) | (11,123,037 | ) | – | |||||||||
Information about derivatives reflected as of the date of this report is generally indicative of the type of activity for the year ended October 31, 2015. The table below summarizes the weighted average values of derivatives holdings by the Funds during the year ended October 31, 2015.
| Fund | Forward foreign exchange contracts (Average Notional Value) | Futures contracts (Average Notional Value) | Swap contracts (Average Notional Value) | |||||||||
Total Return Bond Fund | $ | 359,739,087 | $ | (4,611,261 | ) | $ | – | |||||
Global High Income Fund | 433,298,044 | – | 50,705,088 | |||||||||
The Funds value derivatives at fair value, as described in the results of operations. Accordingly, the Funds do not follow hedge accounting even for derivatives employed as economic hedges.
| f. | Bank Loans |
Global High Income Fund may invest in bank loans. Bank loans include floating and fixed-rate debt obligations. Floating rate loans are debt obligations issued by companies or other entities with floating interest rates that reset periodically. Bank loans may include, but are not limited to, term loans, delayed funding loans, bridge loans and revolving credit facilities. Loan interest will primarily take the form of assignments purchased in the primary or secondary market but may include participants. Floating rate loans are secured by specific collateral of the borrower and are senior to most other securities of the borrower (e.g., common stock or debt instruments) in the event of bankruptcy. Floating rate loans are often issued in connection with recapitalizations, acquisitions, leveraged buyouts, and refinancings. Floating rate loans are typically structured and administered by a financial institution that acts as the agent of the lenders participating in the floating rate loan. Floating rate loans may be acquired directly through the agent, as an assignment from another lender who holds a direct interest in the floating rate loan, or as a participation interest in another lender’s portion of the floating rate loan.
Global High Income Fund may enter into, or acquire participation in, delayed funding loans and revolving credit facilities. Delayed funding loans and revolving credit facilities are borrowings in which the Global High Income Fund agrees to make loans up to a maximum amount upon demand by the borrowing issuer for a specified term. A revolving credit facility differs from a delayed funding loan in that as the borrowing issuer repays the loan, an amount equal to the repayment is again made available to the borrowing issuer under the facility. The borrowing issuer may at any time borrow and repay amounts so long as, in the aggregate, at any given time the amount borrowed does not exceed the maximum amount established by the loan agreement. Delayed funding loans and revolving credit facilities usually provide for floating or variable rates of interest.
There are a number of risks associated with an investment in bank loans including credit risk, interest rate risk, illiquid securities risk, and prepayment risk. There is also the possibility that the collateral securing a loan, if any, may be difficult to liquidate or be insufficient to cover the amount owed under the loan. These risks could cause a Fund to lose income or principal on a particular investment, which in turn could affect the Fund’s returns. In addition, bank loans may settle on a delayed basis, resulting in the proceeds from the sale of such loans not being readily available to make additional investments or to meet a Fund’s redemption obligations. To the extent the extended settlement process gives rise to short-term liquidity needs, a Fund may hold additional cash, sell investments or temporarily borrow from banks or other lenders.
As of October 31, 2015, Global High Income Fund held one unfunded commitment with a cost and fair value of $6,114,395 and $6,161,671, respectively (par of 6,303,500 USD). The Fund did not hold any bridge term loans.
| g. | Security Transactions, Investment Income and Expenses |
Security transactions are recorded on the trade date. Realized and unrealized gains/(losses) from security and currency transactions are calculated on the identified cost basis. Dividend income is recorded on the ex-dividend date except for certain dividends on foreign
2015 Annual Report
63
Notes to Financial Statements (continued)
October 31, 2015
securities, which are recorded as soon as a Fund is informed after the ex-dividend date. Interest income is recorded on an accrual basis using the effective interest method. Expenses are recorded on an accrual basis. Expenses directly attributable to a Fund are charged to that Fund. Expenses not directly attributable to a Fund are allocated proportionately among all Funds of the Trust. For each of the Funds, the method for allocating income, fund level expenses, and realized and unrealized gains or losses among classes is based on the total net asset value of each class’s shares in proportion to the total net assets of the relevant Fund. Expenses specific to a class (such as Rule 12b-1 and Transfer Agent fees) are charged to that class.
| h. | Foreign Taxes |
Funds that invest in foreign securities are subject to foreign taxes that may be imposed by certain countries in which the Funds invest. The Funds generally record foreign taxes based on applicable foreign tax law. The Funds incur withholding taxes on certain foreign dividends and interest, and those taxes are accrued at the time the associated income is recorded. The Funds file withholding tax reclaims in certain jurisdictions to recover a portion of amounts previously withheld. The Funds record a reclaim receivable based on, among other things, a jurisdiction’s legal obligation to pay reclaims as well as payment history and market convention. In consideration of recent decisions rendered by European courts, the Select International Equity Fund and Select International Equity Fund II (the “International Equity Funds”) have filed for additional reclaims related to prior years in accordance with European Union law. However, consistent with US GAAP accrual requirements, the International Equity Funds have not recorded a corresponding receivable amount because there is limited historical precedent for US funds collecting reclaims of this magnitude and the total amount of the reclaims that these funds may receive in the future is uncertain. Any amounts to which the International Equity Funds may be entitled, if and when recorded, likely would result in an increase in the net asset value per share of each fund at that time. As of October 31, 2015, the total amount of reclaims filed for the International Equity Funds in the countries that may be affected by the European courts’ decisions (namely, Spain, Finland, France, Germany, The Netherlands, and Poland) represents approximately 8% of the net asset value per share for each of the International Equity Funds; however, the recovery of any or all of this amount and timing of recovery, if any, is uncertain. On May 21, 2015, the Select International Equity Fund and the Select International Equity Fund II (collectively “the Funds”) received withholding tax refunds of $1,355,000 (0.35% of total net assets) and $500,000 (0.25% of total net assets), respectively, from the Finnish Tax Authority (FTA) in connection with the Funds’ filing of withholding tax reclaims for taxes that were previously paid by the Funds to the FTA. The tax refund amounts are included in other income on the accompanying Statement of Operations.
| i. | Distributions |
Distributions from net investment income, if any, are declared and paid monthly for the Total Return Bond Fund and Global High Income Fund. Distributions from net investment income, if any, are declared and paid annually for the Select International Equity Fund and Select International Equity Fund II. The Funds will also declare and pay distributions annually from net realized gains on investment transactions and net realized foreign exchange gains, if any. Dividends and distributions to shareholders are recorded on the ex-dividend date. Additional distributions of net investment income and capital gains may be made at the discretion of the Board to avoid the application of the excise tax imposed under Section 4982 of the Internal Revenue Code of 1986, as amended (the “Code”), for certain undistributed amounts.
Dividends and distributions to shareholders are determined in accordance with federal income tax regulations, which may differ from GAAP. These differences are primarily due to differing treatments of income and gains on various investment securities held by the Funds, timing differences and differing characterization of distributions made by the Funds as a whole.
| j. | Federal Income Taxes |
Each Fund intends to continue to qualify as a “regulated investment company” by complying with the provisions available to certain investment companies, as defined in Subchapter M of the Code, and to make distributions of net investment income and net realized capital gains sufficient to relieve the Funds from all, federal income taxes. Therefore, no federal income tax provision is required.
Management of the Funds has concluded that there are no significant uncertain tax positions that would require recognition in the financial statements. Since tax authorities can examine previously filed tax returns, the Funds’ U.S. federal and state tax returns for each of the four fiscal years up to the most recent fiscal year ended October 31 are subject to such review.
3. Agreements and Transactions with Affiliates
| a. | Investment Adviser |
Under the Investment Advisory Agreements with the Funds, effective May 22, 2013, Aberdeen Asset Management Inc. (“Aberdeen” or the “Adviser”) manages the Funds in accordance with the policies and procedures established by the Board. Prior to May 22, 2013, the Funds were managed by Artio Global Management LLC (the “Predecessor Adviser”).
Annual Report 2015
64
Notes to Financial Statements (continued)
October 31, 2015
For services provided under the terms of the current Investment Advisory Agreement, each Fund pays the Adviser an annual management fee (as a percentage of its average daily net assets) paid monthly according to the following schedule:
| Fund | Fee Schedule | |||||||
Select International Equity Fund | Of the first $5 billion | 0.900% | ||||||
| On the next $2.5 billion | 0.880% | |||||||
| Over $7.5 billion | 0.850% | |||||||
Select International Equity Fund II | Of the first $5 billion | 0.900% | ||||||
| On the next $2.5 billion | 0.880% | |||||||
| Over $7.5 billion | 0.850% | |||||||
Total Return Bond Fund | On all assets | 0.350% | ||||||
Global High Income Fund | Of the first $5 billion | 0.650% | ||||||
| On the next $2.5 billion | 0.630% | |||||||
| On the next $2.5 billion | 0.600% | |||||||
| Over $10 billion | 0.590% | |||||||
The Adviser has engaged the services of Aberdeen Asset Managers Limited (the “Subadviser”), an affiliate, pursuant to the subadvisory agreements. The Subadviser manages a portion of certain of the Funds’ investments and has responsibility for making all investment decisions for the portion of a Fund’s assets that it manages. Pursuant to the subadvisory agreements, the Adviser pays fees to the Subadviser. For the year ended October 31, 2015, the Adviser paid the following amounts to the Subadviser for its services to the respective Funds:
| Fund | Amount | |||
Select International Equity Fund | $ | 2,197,977 | ||
Select International Equity Fund II | 1,095,657 | |||
Certain of the Funds and Aberdeen have entered into written contracts (“Expense Limitation Agreements”) limiting operating expenses for all classes of each Fund from exceeding the amounts listed below. This contractual limitation may not be terminated without the approval of the Board until the earlier of (a) the termination of the Investment Advisory Agreement or (b) the end of February, 2016. This limit excludes certain expenses, including taxes, interest, brokerage commissions, and other expenditures which are capitalized in accordance with GAAP, and other extraordinary expenses not incurred in the ordinary course of the Fund’s business.
| Fund | Class A Limit | Institutional Class Limit | ||||
Total Return Bond Fund | 0.69% | 0.44 | % | |||
Global High Income Fund | 1.00% | 0.75 | % | |||
The Adviser has agreed to continue to waive a portion of its management fee for each of the Funds at the annual rate of 0.005% of the respective Funds’ average daily assets. The waiver may be terminated at any time by the Board.
Aberdeen may request and receive reimbursement from a Fund of the advisory fees waived and other expenses reimbursed pursuant to the Expense Limitation Agreements at a later date not to exceed three years from the fiscal year in which the corresponding reimbursement to the Funds was made. However, no reimbursement will be made for fees waived prior to May 21, 2013 by the Predecessor Adviser.
For fees waived on or after May 22, 2013, no reimbursement will be made unless:
| (i) | the total annual expense ratio of the class making such reimbursement is less than the limit set forth above; and |
| (ii) | the payment of such reimbursement is approved by the Board on a quarterly basis (the “Reimbursement Requirements”). |
If the Board approves any changes in the waiver terms or limitations, reimbursements are only permitted to the extent that the terms of the Expense Limitation Agreements in effect at the time of the waiver are met at the time that reimbursement is approved. Except as provided for in the Expense Limitation Agreements, reimbursement of amounts previously waived or assumed by Aberdeen is not permitted.
2015 Annual Report
65
Notes to Financial Statements (continued)
October 31, 2015
As of October 31, 2015, to the extent the Reimbursement Requirements are met, the cumulative potential reimbursements for each Fund, based on expenses reimbursed by Aberdeen would be:
| Fund | Amount 2013 | Amount 2014 | Amount 2015 | Total* | ||||||||||||
Select International Equity Fund | $ | – | $ | – | $ | – | $ | – | ||||||||
Select International Equity Fund II | – | – | – | – | ||||||||||||
Total Return Bond Fund | 11,826 | 22,047 | 82,622 | 116,495 | ||||||||||||
Global High Income Fund | – | 75,716 | 198,764 | 274,480 | ||||||||||||
| * | Amounts reported are due to expire throughout the respective 3-year expiration period presented above. |
| Amounts listed as “–” are $0 or round to $0. |
An accounting correction to reflect an aged dividend receivable for an ADR at its net realizable value inclusive of currency fluctuations resulted in an amount due to the Select International Equity Fund II. To rectify the matter, the Adviser agreed to contribute $305,291 to the Select International Equity Fund II. This amount is reflected as a payment from affiliate in the accompanying Statement of Operations.
4. Distributor and Shareholder Services
The Funds and Aberdeen Fund Distributors, LLC (the “Distributor” or “AFD”) are parties to the current Underwriting Agreement (the “Underwriting Agreement”) whereby the Distributor acts as principal underwriter for the Funds’ shares. Prior to May 22, 2013, Quasar Distributors, LLC (“Quasar”) was the Distributor of the Funds.
The Funds have adopted a Distribution and Shareholder Services Plan (the “Plan”), pursuant to Rule 12b-1 under the 1940 Act. Under the Plan, each Fund’s Class A shares may compensate certain financial institutions, including the Distributor, for certain distribution, shareholder servicing, administrative and accounting services. The Funds’ Class A shares may expend an aggregate amount, on an annual basis, not to exceed 0.25% of the value of the average daily net assets of a Fund attributable to Class A shares. The Funds will adjust accruals accordingly for any unused or surplus balances on an annual basis. The Adviser may pay additional marketing and other distribution costs out of its profits.
Under its terms, the Funds’ Plan shall remain in effect from year to year, provided such continuance is approved annually by a vote of a majority of the Board members and a majority of those Board members who are not “interested persons” of the Funds and who have no direct or indirect financial interest in the operation of the Plan or in any agreement related to the Plan.
5. Investment Transactions
Purchases and sales of securities (excluding short-term securities) for the year ended October 31, 2015, were as follows:
| Fund | Purchases | Sales | ||||||
Select International Equity Fund | $ | 41,786,352 | $ | 171,126,525 | ||||
Select International Equity Fund II | 21,052,517 | 72,624,211 | ||||||
Total Return Bond Fund | 1,343,509,568 | 1,706,372,793 | ||||||
Global High Income Fund | 1,387,431,337 | 2,071,213,267 | ||||||
6. Investments in Affiliated Issuers
An affiliated issuer, as defined under the Investment Company Act of 1940, as amended includes, an issuer in which a Fund holds 5% or more of the issuer’s outstanding voting securities. A summary of the Funds’ investments in securities of these issuers for the year ended October 31, 2015 is set forth below:
| Affiliate | Shares Held October 31, 2015 | Purchases (Cost) | Sales (Proceeds) | Dividend Income | Fair Value October 31, 2015 | |||||||||||||||
Select International Equity Fund |
| |||||||||||||||||||
Toza Markovic ad Kikinda | 78,160 | $ | – | $ | – | $ | – | $ | – | |||||||||||
Global High Income Fund | ||||||||||||||||||||
Deep Ocean | 1,427,968 | $ | – | $ | – | $ | – | $ | 11,244,457 | |||||||||||
Annual Report 2015
66
Notes to Financial Statements (continued)
October 31, 2015
7. Portfolio Investment Risks
| a. | Active Trading Risk |
A Fund may engage in active and frequent trading of portfolio securities to achieve its investment objective. If a Fund does trade this way, it may incur increased costs, which can lower the actual return of the Fund.
| b. | Asset-Backed Securities Risk |
Like traditional fixed income securities, the value of asset-backed securities typically increases when interest rates fall and decreases when interest rates rise. Certain asset-backed securities may also be subject to the risk of prepayment.
| c. | Bank Loan Risk |
There are a number of risks associated with an investment in bank loans including credit risk, interest rate risk, illiquid securities risk, and prepayment risk. There is also the possibility that the collateral securing a loan, if any, may be difficult to liquidate or be insufficient to cover the amount owed under the loan. These risks could cause a Fund to lose income or principal on a particular investment, which in turn could affect a Fund’s returns. In addition, bank loans may settle on a delayed basis, resulting in the proceeds from the sale of such loans not being readily available to make additional investments or to meet a Fund’s redemption obligations. To the extent the extended settlement process gives rise to short-term liquidity needs, a Fund may hold additional cash, sell investments or temporarily borrow from banks or other lenders.
| d. | Credit Default Swap Risk |
Credit default swap contracts, a type of derivative instrument, involve special risks and may result in losses to the Fund. Credit default swaps may in some cases be illiquid, and they increase credit risk since the Fund has exposure to both the issuer of the referenced obligation and the counterparty to the credit default swap. Swaps may be difficult to unwind or terminate. The swap market could be disrupted or limited as a result of recent legislation, and these changes could adversely affect the Fund. Additionally, to the extent the Fund sells credit default swap contracts, the Fund effectively adds economic leverage to its portfolio because, in addition to its total net assets, the Fund is subject to investment exposure on the notional amount of the swap in the event of a default of the referenced debt obligation.
| e. | Credit Risk |
A debt instrument’s price depends, in part, on the credit quality of the issuer, borrower, counterparty, or underlying collateral and can decline in response to changes in the financial condition of the issuer, borrower, counterparty, or underlying collateral, or changes in specific or general market, economic, industry, political, regulatory, geopolitical, or other conditions. High yield bonds (“junk bonds”) may be subject to an increased risk of default, a more limited secondary market than investment grade bonds, and greater price volatility.
| f. | Delayed Funding Loans and Revolving Credit Facilities Risk |
There are a number of risks associated with an investment in delayed funding loans and revolving credit facilities including credit, interest rate and liquidity risk and the risks of being a lender. There may be circumstances under which the borrowing issuer’s credit risk may be deteriorating and yet a Fund may be obligated to make loans to the borrowing issuer as the borrowing issuer’s credit continues to deteriorate, including at a time when the borrowing issuer’s financial condition makes it unlikely that such amounts will be repaid. Delayed funding loans and revolving credit facilities may be subject to restrictions on transfer, and only limited opportunities may exist to resell such instruments.
| g. | Derivatives Risk (Including Options, Futures and Swaps) |
Derivatives are speculative and may hurt the Fund’s performance. Derivatives present the risk of disproportionately increased losses and/or reduced opportunities for gains when the financial asset or measure to which the derivative is linked changes in unexpected ways. The potential benefits to be derived from the Fund’s derivatives strategy are dependent upon the portfolio managers’ ability to discern pricing inefficiencies and predict trends in markets, which decisions could prove to be inaccurate. This requires different skills and techniques than predicting changes in the price of individual securities, and there can be no assurance that the use of this strategy will be successful.
Hedged Exposure Risk – Losses generated by a derivative or practice used by the Fund for hedging purposes should be offset in part by gains on the hedged investment depending on the degree of correlation between the hedging instrument and the assets hedged. However, while hedging can reduce or eliminate losses, it can also reduce or eliminate gains.
Correlation Risk – The Fund is exposed to the risk that changes in the value of a hedging instrument will not match those of the investment being hedged.
Counterparty Risk – Derivative transactions depend on the creditworthiness of the counterparty and the counterparty’s ability to fulfill its contractual obligations.
| h. | Emerging Markets Risk |
A magnification of the risks that apply to foreign investments. These risks are greater for securities of companies in emerging market countries because the countries may have less stable governments, more volatile currencies and less established markets (see “Foreign Securities Risk” below).
2015 Annual Report
67
Notes to Financial Statements (continued)
October 31, 2015
| i. | Foreign Currency Exposure Risk |
The value of foreign currencies relative to the U.S. Dollar fluctuates in response to market, economic, political, regulatory, geopolitical or other conditions. A decline in the value of a foreign currency versus the U.S. Dollar reduces the value in U.S. Dollars of investments denominated in that foreign currency.
| j. | Foreign Securities Risk |
Foreign securities may be more volatile, harder to price and less liquid than U.S. securities. Foreign securities also may involve risks relating to the impact of currency exchange rate fluctuations; such risks may impact the Funds more greatly to the extent a Fund does not hedge its currency risk, or hedging techniques used by the Adviser are unsucessful.
| k. | High-Yield Bonds and Other Lower-Rated Securities Risk |
A Fund’s investments in high-yield bonds (commonly referred to as “junk bonds”) and other lower-rated securities will subject the Fund to substantial risk of loss. Investments in high-yield bonds are speculative and issuers of these securities are generally considered to be less financially secure and less able to repay interest and principal than issuers of investment-grade securities. Prices of high-yield bonds tend to be very volatile. These securities are less liquid than investment-grade debt securities and may be difficult to price or sell, particularly in times of negative sentiment toward high-yield securities.
| l. | Illiquid Securities Risk |
Illiquid securities are assets which may not be sold or disposed of in the ordinary course of business within seven days at approximately the price at which the Fund has valued the investment on its books and may include such securities as those not registered under U.S. securities laws or securities that cannot be sold in public transactions. An inability to sell a portfolio position can adversely affect the Fund’s value or prevent the Fund from being able to take advantage of other investment opportunities. Illiquid securities and relatively less liquid securities may also be difficult to value.
The Fund employs proprietary procedures and tests using third-party and internal data inputs that seek to assess and manage the liquidity of its portfolio holdings. The Fund’s procedures and tests take into account relevant market, trading and other factors, and monitor whether liquidity assessments should be adjusted based on changed market conditions. These procedures and tests are designed to assist the Fund in determining its ability to meet redemption requests in various market conditions. In light of the dynamic nature of markets, there can be no assurance that these procedures and tests will enable the Fund to ensure that it has sufficient liquidity to meet redemption requests.
| m. | Impact of Large Redemptions and Purchases of Fund Shares |
Occasionally, shareholders may make large redemptions or purchases of a Fund’s shares, which may cause the Fund to have to sell securities or invest additional cash. These transactions may adversely affect the Fund’s performance and increase transaction costs. In addition, large redemption requests may exceed the cash balance of the Fund and result in credit line borrowing fees or overdraft charges to the Fund until the sale of portfolio securities to cover the redemption request settle.
| n. | Interest Rate Risk |
A Fund’s fixed income investments are subject to interest rate risk, which generally causes the value of a fixed income portfolio to decrease when interest rates rise resulting in a decrease in the Fund’s net assets. The Fund may be subject to a greater risk of rising interest rates due to the current period of historically low rates and the effect of potential government fiscal policy initiatives and resulting market reaction to those initiatives. Interest rate fluctuations tend to have a greater impact on fixed income-securities with a greater time to maturity and/or lower coupon. In periods of market volatility, the market values of fixed income securities may be more sensitive to changes in interest rates.
| o. | Large-Cap Securities Risk |
Stocks issued by large cap companies subject the Fund to the risk that those stocks may underperform stocks issued by companies with smaller capitalizations or the market as a whole. Large cap companies may be unable to respond as quickly as smaller- and mid-sized
companies can to new competitive pressures and may lack the growth potential of those securities. Historically, large cap companies do not recover as quickly as smaller companies do from market declines.
| p. | Leverage Risk |
Certain transactions may give rise to a form of leverage. Such transactions may include, among others, loans of securities, and the use of when-issued, delayed delivery or forward commitment transactions. The use of derivatives may also cause leveraging risk.
| q. | Market Risk |
Deteriorating market conditions might cause a general weakness in the market that reduces the prices of securities in that market in which a Fund invests.
| r. | Mid-Cap Securities Risk |
Stocks of mid-cap companies tend to be more volatile and less liquid than larger company stocks of larger companies.
Annual Report 2015
68
Notes to Financial Statements (continued)
October 31, 2015
| s. | Mortgage-Related Securities Risk |
A Fund may invest in mortgage-related securities. Rising interest rates may cause an issuer to exercise its right to pay principal later than expected which tends to extend the duration of mortgage-related securities, making them more sensitive to changes in interest rates. As a result, in a period of rising interest rates, a Fund that holds mortgage-related securities may exhibit additional volatility. This is known as extension risk. In addition, mortgage-related securities are subject to prepayment risk. When interest rates decline, borrowers may pay off their mortgages sooner than expected. This can reduce the returns of a Fund because the Fund will have to reinvest that money at the lower prevailing interest rates.
| t. | Municipal Securities Risk |
A Fund may invest in municipal bonds which may be significantly affected by political and economic changes, including inflation, as well as uncertainties in the municipal market related to taxation, legislative changes, or the rights of municipal security holders. Municipal Bonds have varying levels of sensitivity to changes in interest rates. In general, the price of a Municipal Bond can fall when interest rates rise and can rise when interest rates fall. Interest rate risk is generally lower for shorter-term Municipal Bonds and higher for long term Municipal Bonds. Under certain market conditions, the Adviser may purchase Municipal Bonds that the Adviser perceives are undervalued. Undervalued Municipal Bonds are subject to the same market volatility and principal and interest rate risks described above. Lower quality Municipal Bonds involve greater risk of default or price changes due to changes in the credit quality of the issuer. The value of lower quality Municipal Bonds often fluctuates in response to political or economic developments and can decline significantly over short periods of time or during periods of general or regional economic difficulty. In the case of tax-exempt Municipal Bonds, if the Internal Revenue Service or state tax authorities determine that an issuer of a tax-exempt Municipal Bond has not complied with applicable tax requirements, interest from the security could become taxable at the federal, state and/or local level, and the security could decline significantly in value. Municipal Bonds are subject to credit or default risk. Credit risk is the risk that the issuer of a municipal security might not make interest and principal payments on the security as they become due.
| u. | Prepayment Risk |
As interest rates decline, debt issuers may repay or refinance their loans or obligations earlier than anticipated. The issuers of fixed income securities may, therefore, repay principal in advance. This forces a Fund to reinvest the proceeds from the principal prepayments at lower rates, which reduces the Fund’s income.
| v. | Private Placements and Other Restricted Securities Risk |
Investments in private placements and other restricted securities, including Regulation S Securities and Rule 144A Securities, could have the effect of increasing a Fund’s level of illiquidity. Private placements and restricted securities may be less liquid than other investments because such securities may not always be readily sold in broad public markets and a Fund might be unable to dispose of such securities promptly or at prices reflecting their true value.
| w. | Sector Risk |
To the extent that the Fund has a significant portion of its assets invested in securities of companies conducting business in a broadly related group of industries within an economic sector, the Fund may be more vulnerable to unfavorable developments in that economic sector than funds that invest more broadly.
| x. | Securities Selection Risk |
The investment team may select securities that underperform the stock market or other funds with similar investment objectives and strategies.
| y. | Small-Cap Securities Risk |
Stocks of smaller companies are usually less stable in price and less liquid than those of larger, more established companies. Therefore, they generally involve greater risk.
| z. | Structured Notes Risk |
Structured notes are specially-designed derivative debt instruments in which the terms may be structured by the purchaser and the issuer of the note. The amount of principal repayments and/or interest payments is based upon the movement of one or more “factors,” such as currency or interest rates. In some cases, the impact of the movements of these factors may increase or decrease through the use of multipliers or deflators. Structured notes may vary from money market quality to below investment grade. Depending on the factor used and use of multipliers or deflators, however, changes in interest rates and movement of the factor may cause significant price fluctuations or may cause particular structured notes to become illiquid.
Please read the prospectus for more detailed information regarding these and other risks.
2015 Annual Report
69
Notes to Financial Statements (continued)
October 31, 2015
8. Contingencies
In the normal course of business, the Funds may provide general indemnifications pursuant to certain contracts and organizational documents. The Funds’ maximum exposure under these arrangements is dependent on future claims that may be made against the Funds, and therefore, cannot be estimated; however, based on experience, the risk of loss from such claims is considered remote.
9. Tax Information
As of October 31, 2015, the tax cost of securities and the breakdown of unrealized appreciation/(depreciation) for each Fund were as follows:
| Tax Cost of Securities | Unrealized Appreciation | Unrealized Depreciation | Net Unrealized Appreciation (Depreciation) | |||||||||||||
Select International Equity Fund | $ | 379,934,485 | $ | 14,457,666 | $ | (109,663,587 | ) | $ | (95,205,921 | ) | ||||||
Select International Equity Fund II | 175,394,578 | 7,392,248 | (35,693,839 | ) | (28,301,591 | ) | ||||||||||
Total Return Bond Fund | 1,013,521,023 | 14,864,314 | (12,873,671 | ) | 1,990,643 | |||||||||||
Global High Income Fund | 1,385,423,798 | 22,474,148 | (132,861,473 | ) | (110,387,325 | ) | ||||||||||
The tax character of distributions paid during the fiscal year ended October 31, 2015 was as follows (total distributions paid may differ from the Statements of Changes in Net Assets because for tax purposes dividends are recognized when actually paid):
| Distributions paid from | ||||||||||||||||||||||||
| Fund | Ordinary Income | Net Long Term Capital Gains | Total Taxable Distributions | Tax Exempt Distributions | Return of Capital | Total Distributions Paid | ||||||||||||||||||
Select International Equity Fund | $ | 19,924,879 | $ | – | $ | 19,924,879 | $ | – | $ | – | $ | 19,924,879 | ||||||||||||
Select International Equity Fund II | 9,538,401 | – | 9,538,401 | – | – | 9,538,401 | ||||||||||||||||||
Total Return Bond Fund | 23,348,183 | 21,607,201 | 44,955,384 | – | 1,577,041 | 46,532,425 | ||||||||||||||||||
Global High Income Fund | 103,149,950 | 46,453,836 | 149,603,786 | – | 20,900,961 | 170,504,747 | ||||||||||||||||||
The tax character of distributions paid during the fiscal year ended October 31, 2014 was as follows (total distributions paid may differ from the Statements of Changes in Net Assets because for tax purposes dividends are recognized when actually paid):
| Distributions paid from | ||||||||||||||||||||||||
| Fund | Ordinary Income | Net Long Term Capital Gains | Total Taxable Distributions | Tax Exempt Distributions | Return of Capital | Total Distributions Paid | ||||||||||||||||||
Select International Equity Fund | $ | 13,489,548 | $ | – | $ | 13,489,548 | $ | – | $ | – | $ | 13,489,548 | ||||||||||||
Select International Equity Fund II | 400,427 | – | 400,427 | – | – | 400,427 | ||||||||||||||||||
Total Return Bond Fund | 29,044,920 | – | 29,044,920 | – | – | 29,044,920 | ||||||||||||||||||
Global High Income Fund | 163,321,054 | 27,302,327 | 190,623,381 | – | – | 190,623,381 | ||||||||||||||||||
As of October 31, 2015, the components of accumulated earnings (deficit) on a tax basis were as follows:
| Fund | Undistributed Tax Exempt Income | Undistributed Ordinary Income | Undistributed Long-Term Capital Gains | Accumulated Earnings | Distributions Payable | Late Year Ordinary and Post-October Capital Loss Deferrals | Other Temporary Differences | Unrealized Appreciation/ Depreciation* | Accumulated Capital and Other Losses** | Total Accumulated Earnings (Deficit) | ||||||||||||||||||||||||||||||
Select International Equity Fund | $ | – | $ | 7,467,582 | $ | – | $ | – | $ | – | $ | – | $ | 500,761 | $ | (96,868,717 | ) | $ | (2,310,289,742 | ) | $ | (2,399,190,116 | ) | |||||||||||||||||
Select International Equity Fund II | – | 3,882,372 | – | – | – | – | 50,871 | (29,289,596 | ) | (2,717,809,385 | ) | (2,743,165,738 | ) | |||||||||||||||||||||||||||
Annual Report 2015
70
Notes to Financial Statements (continued)
October 31, 2015
| Fund | Undistributed Tax Exempt Income | Undistributed Ordinary Income | Undistributed Long-Term Capital Gains | Accumulated Earnings | Distributions Payable | Late Year Ordinary and Post-October Capital Loss Deferrals | Other Temporary Differences | Unrealized Appreciation/ Depreciation* | Accumulated Capital and Other Losses** | Total Accumulated Earnings (Deficit) | ||||||||||||||||||||||||||||||
Total Return Bond Fund | $ | – | $ | – | $ | – | $ | – | $ | – | $ | – | $ | (1,350,902 | ) | $ | 2,358,830 | $ | – | $ | 1,007,928 | |||||||||||||||||||
Global High Income Fund | – | – | – | – | – | – | (6,903,383 | ) | (102,543,582 | ) | (83,833,509 | ) | (193,280,474 | ) | ||||||||||||||||||||||||||
| * | The difference between the book-basis and tax-basis unrealized appreciation/(depreciation) is attributable primarily to tax deferral of losses on wash sales. |
| ** | As of October 31, 2015, for Federal income tax purposes, the following Funds have capital loss carryforwards available to offset capital gains, if any, to the extent provided by the Treasury regulations, which expire in the years set forth below. |
| Fund | Amount | Expires | ||||
Select International Equity Fund | $ | 314,780,611 | 2016 (Short-Term) | |||
Select International Equity Fund | 1,643,693,179 | 2017 (Short-Term) | ||||
Select International Equity Fund | 18,624,351 | Unlimited (Short-Term) | ||||
Select International Equity Fund | 333,191,601 | Unlimited (Long-Term) | ||||
Select International Equity Fund II | 1,379,336,238 | 2016 (Short-Term) | ||||
Select International Equity Fund II | 1,211,390,775 | 2017 (Short-Term) | ||||
Select International Equity Fund II | 121,152,924 | 2018 (Short-Term) | ||||
Select International Equity Fund II | 1,419,889 | Unlimited (Short-Term) | ||||
Select International Equity Fund II | 4,509,559 | Unlimited (Long-Term) | ||||
Global High Income Fund | 23,104,660 | Unlimited (Short-Term) | ||||
Global High Income Fund | 60,728,849 | Unlimited (Long-Term) | ||||
Under the Regulated Investment Company Modernization Act of 2010, the Funds are permitted to carry forward capital losses incurred in taxable years beginning after December 22, 2010 for an unlimited period. However, any losses incurred during those taxable years will be required to be utilized prior to the losses incurred in pre-enactment taxable years. As a result of this ordering rule, pre-enactment capital loss carryforwards may be more likely to expire unused. Additionally, post-enactment capital losses that are carried forward will retain their character as either short-term or long-term capital losses rather than being considered all short-term as under previous law.
GAAP requires that certain components of net assets be adjusted to reflect permanent differences between financial and tax reporting. Accordingly, the table below details the necessary reclassifications, which are a result of permanent differences primarily attributable to foreign currency gain (loss), swap adjustments, book/tax differences related to amortization of premiums and discounts, paydowngains (losses) and redesignation of distributions. These reclassifications have no effect on net assets or net asset values per share.
| Fund | Paid-in Capital | Accumulated Net Investment Income/(Loss) | Accumulated Net Realized Gain/(Loss) | |||||||||
Select International Equity Fund | $ | (1 | ) | $ | (1,217,546 | ) | $ | 1,217,547 | ||||
Select International Equity Fund II | – | 176,556 | (176,556 | ) | ||||||||
Total Return Bond Fund | – | (8,138,049 | ) | 8,138,049 | ||||||||
Global High Income Fund | – | (37,057,597 | ) | 37,057,597 | ||||||||
10. Significant Shareholders
As of October 31, 2015, the following Funds had shareholders with the percentage ownership indicated, which are considered significant shareholders (holdings greater than 5.0%) for financial reporting purposes:
| Fund | Record Ownership % | Number of Account Owners | ||||
Select International Equity Fund | 62.3 | % | 2 | |||
Select International Equity Fund II | 54.9 | 3 | ||||
Total Return Bond Fund | 69.4 | 2 | ||||
Global High Income Fund | 68.4 | 6 | ||||
2015 Annual Report
71
Notes to Financial Statements (concluded)
October 31, 2015
11. Line of Credit
Aberdeen Investment Funds (the “Borrowers”) entered into a Credit Agreement (the “Agreement”) with State Street Bank and Trust Company (the “Bank”). The Agreement provides for a revolving credit facility (the “Credit Facility”) to be utilized for temporary or emergency purposes to fund shareholder redemptions or for other short-term liquidity purposes. The amount of the Credit Facility was $100,000,000* for the year ended October 31, 2015. The Funds may draw up to their stated sublimit (subject to certain other limitations therein):
| Sublimit Amount | Average Outstanding Daily Balance | Average Weighted Interest Rate | Days Utilized | |||||||||||||
Select International Equity | $ | 100,000,000 | $ | 1,550,041 | 1.381% | 52 | ||||||||||
Select International Equity II | $ | 100,000,000 | $ | 1,231,375 | 1.384% | 53 | ||||||||||
Total Return Bond Fund | $ | 100,000,000 | – | – | 0 | |||||||||||
| * | The Credit Facility was reduced from $175,000,000 to $100,000,000 on April 20, 2015. |
In addition, the Global High Income Fund entered into a separate Credit Agreement (the “Global High Income Fund Credit Agreement”) with the Bank. The Global High Income Fund Credit Agreement provides for a revolving credit facility (the “Global High Income Fund Credit Facility”) to be utilized for temporary or emergency purposes to fund shareholder redemptions or for other short-term liquidity purposes. The amount of the Global High Income Fund Credit Facility was $150,000,000** for the year ended October 31, 2015. The Global High Income Fund may draw the entire $150,000,000 (subject to certain limitations).
| Sublimit Amount | Average Outstanding Daily Balance | Average Weighted Interest Rate | Days Utilized | |||||||||||||
Global High Income Fund | $ | 150,000,000 | $ | 12,385,014 | 1.381% | 29 | ||||||||||
| ** | The Global High Income Fund Credit Facility was reduced from $250,000,000 to $150,000,000 on April 20, 2015. |
Principal on each outstanding loan made under the Agreement and the Global High Income Fund Credit Agreement shall bear the interest at a variable rate per annum equal to the higher of (a) the Federal Funds Rate as in effect on that day plus 1.25% and (b) the Overnight London Interbank Offered Rate (“LIBOR”) as in effect on that day plus 1.25%. In addition, the Borrowers shall pay to the Bank a commitment fee at the rate of 0.18% per annum on the daily unused portion of each of the Credit Facility or Global High Income Fund Credit Facility, as applicable, which is allocated among the Borrowers in such manner as is determined by the Board to be reasonable. The commitment fee was increased from 0.10% to 0.18% per annum on the daily unused portion of each of the Credit Facility or Global High Income Credit Facility on April 20, 2015.
12. Subsequent Events
Management has evaluated the need for disclosures and/or adjustments resulting from subsequent events through the date the financial statements were issued. Based on this evaluation, no disclosures and/or adjustments were required to the financial statements as of October 31, 2015.
Annual Report 2015
72
Report of Independent Registered Public Accounting Firm
The Shareholders and Board of Trustees
Aberdeen Investment Funds:
We have audited the accompanying statements of assets and liabilities, including the statements of investments, of the Aberdeen Investment Funds comprised of the Aberdeen Select International Equity Fund, Aberdeen Select International Equity Fund II, Aberdeen Total Return Bond Fund, and Aberdeen Global High Income Fund, (collectively, the “Funds”), as of October 31, 2015, and the related statements of operations for the year then ended, the statements of changes in net assets for each of the years in the two-year period then ended and the financial highlights for each of the years in the five-year period then ended. These financial statements and financial highlights are the responsibility of the Funds’ management. Our responsibility is to express an opinion on these financial statements and financial highlights based on our audits.
We conducted our audits in accordance with the standards of the Public Company Accounting Oversight Board (United States). Those standards require that we plan and perform the audit to obtain reasonable assurance about whether the financial statements and financial highlights are free of material misstatement. An audit includes examining, on a test basis, evidence supporting the amounts and disclosures in the financial statements. Our procedures included confirmation of securities owned as of October 31, 2015, by correspondence with custodians and brokers, or by other appropriate auditing procedures. An audit also includes assessing the accounting principles used and significant estimates made by management, as well as evaluating the overall financial statement presentation. We believe that our audits provide a reasonable basis for our opinion.
In our opinion, the financial statements and financial highlights referred to above present fairly, in all material respects, the financial position of the Funds as of October 31, 2015, the results of their operations for the year then ended, the changes in their net assets for each of the years in the two-year period then ended, and the financial highlights for each of the years in the five-year period then ended, in conformity with U.S. generally accepted accounting principles.

Philadelphia, Pennsylvania
January 11, 2016
2015 Annual Report
73
Other Tax Information (Unaudited)
For the period ended October 31, 2015, certain dividends paid by the Funds may be subject to a maximum tax rate of 15% as provided for by the Jobs and Growth Tax Relief Reconciliation Act of 2003. The Funds intend to designate the maximum amount allowable as taxed at a maximum rate of 15%. Complete information will be reported in conjunction with your 2015 Form 1099-DIV.
During the year ended October 31, 2015, the following Funds designated dividends as long-term capital gains:
| Fund | Amount | |||
Total Return Bond Fund | $ | 21,607,201 | ||
Global High Income Fund | $ | 46,453,836 | ||
The Funds intend to elect to pass through to their shareholders the credit for taxes paid in foreign countries during its fiscal year ended October 31, 2015. In accordance with the current tax laws, the foreign income and foreign tax per share (for a share outstanding as of October 31, 2015) was as follows:
| Fund | Foreign Tax | |||
Select International Equity Fund | 1.03392 | % | ||
For the year ended October 31, 2015, the following Funds paid qualified dividend income:
| Fund | Qualified Dividend Income | |||
Select International Equity Fund | 81.50 | % | ||
Select International Equity Fund II | 83.00 | % | ||
Global High Income Fund | 1.91 | % | ||
For the taxable year ended October 31, 2015, the following percentage of income dividends paid by the Funds qualify for the dividends received deduction available to corporate shareholders:
| Fund | Dividend Received Deduction | |||
Global High Income Fund | 1.91 | % | ||
Annual Report 2015
74
Shareholder Expense Examples (Unaudited)
As a shareholder of the Aberdeen Investment Funds you incur ongoing costs, including investment advisory fees, shareholder service fees, distribution fees and other Fund expenses. The examples below are intended to help you understand your ongoing costs (in dollars) of investing in the Funds and to compare these costs with the ongoing costs of investing in other mutual funds.
The examples assume that you had a $1,000 investment in the Class at the beginning of the reporting period, May 1, 2015 and continued to hold your shares at the end of the reporting period, October 31, 2015.
Actual Expenses
The table below provides information about actual account values and actual expenses. You may use the information together with the amount you invested, to estimate the expenses that you paid over the period. Simply divide your account value by $1,000 (for example, an $8,600 account value divided by $1,000 = 8.6), then multiply the result by the number under the heading entitled “Actual Expenses Paid During Period” for the class of a Fund that you own to estimate the expenses you paid on your account during the period.
Hypothetical Example for Comparison Purposes
The table below provides information about hypothetical account values and hypothetical expenses based on the Class’ actual expense ratio and an assumed rate of return of 5% per year before expenses, which is not the Class’ actual return. The hypothetical account values and expenses may not be used to estimate the actual ending account balance or expenses you paid for the period. You may use this information to compare the ongoing costs of investing in the Class of a Fund and other funds. To do so, compare the 5% hypothetical example with the 5% hypothetical examples that appear in the shareholder reports of the other funds.
| Beginning Account Value, May 1, 2015 | Actual Ending Account Value, October 31, 2015 | Hypothetical Ending Account Value | Actual Expenses Paid During Period* | Hypothetical Expenses Paid During Period*1 | Annualized Expense Ratio** | |||||||||||||||||||||
Select International Equity Fund | ||||||||||||||||||||||||||
Class A | $ | 1,000.00 | $ | 857.90 | $ | 1,018.85 | $ | 5.90 | $ | 6.41 | 1.26% | |||||||||||||||
Institutional Class | $ | 1,000.00 | $ | 859.00 | $ | 1,020.11 | $ | 4.73 | $ | 5.14 | 1.01% | |||||||||||||||
Select International Equity Fund II | ||||||||||||||||||||||||||
Class A | $ | 1,000.00 | $ | 863.80 | $ | 1,018.30 | $ | 6.44 | $ | 6.97 | 1.37% | |||||||||||||||
Institutional Class | $ | 1,000.00 | $ | 864.60 | $ | 1,019.56 | $ | 5.26 | $ | 5.70 | 1.12% | |||||||||||||||
Total Return Bond Fund | Class A | $ | 1,000.00 | $ | 992.70 | $ | 1,021.73 | $ | 3.47 | $ | 3.52 | 0.69% | ||||||||||||||
Institutional Class | $ | 1,000.00 | $ | 993.90 | $ | 1,022.99 | $ | 2.21 | $ | 2.24 | 0.44% | |||||||||||||||
Global High Income Fund | Class A | $ | 1,000.00 | $ | 939.40 | $ | 1,020.16 | $ | 4.89 | $ | 5.09 | 1.00% | ||||||||||||||
Institutional Class | $ | 1,000.00 | $ | 941.60 | $ | 1,021.43 | $ | 3.67 | $ | 3.82 | 0.75% | |||||||||||||||
| * | Expenses are equal to the Fund’s annualized expense ratio multiplied by the average account value over the period multiplied by 184/365 (to reflect the one-half year period). |
| ** | The expense ratio presented represents a six-month, annualized ratio. |
| 1 | Represents the hypothetical 5% return before expenses. |
2015 Annual Report
75
Supplemental Information (Unaudited)
Disclosure in Aberdeen Investment Funds Shareholder Report dated October 31, 2015
Board Consideration of Advisory and Sub-Advisory Agreements
At an in-person meeting of the Board of Trustees of the Aberdeen Investment Funds (the “Trust”) held on June 17, 2015, the Board, including a majority of the Board Members who are not considered to be “interested persons” of the Trust (the “Independent Board Members”) under the Investment Company Act of 1940, as amended (the “1940 Act”), approved for an annual period the continuation of the Trust’s advisory agreement (the “Advisory Agreement”) between the Trust and Aberdeen Asset Management Inc. (the “Adviser”) with respect the each of Aberdeen Select International Equity Fund, Aberdeen Select International Equity Fund II, Aberdeen Total Return Bond Fund and Aberdeen Global High Income Fund (the “Funds”); and the sub-advisory agreement between the Adviser and Aberdeen Asset Managers Limited (the “Sub-Adviser”) with respect to certain of the Funds (the “Sub-Advisory Agreement” and, together with the Advisory Agreement, the “Advisory Agreements”). The Sub-Adviser is an affiliate of the Adviser. The Adviser and the Sub-Adviser are sometimes referred to collectively as the “Advisers.”
In addition to the meeting on June 17, 2015, the Independent Board Members met on April 15, 2015, May 18, 2015, May 28, 2015, and June 5, 2015, to discuss, among other things: the peer groups proposed by an independent third party to be used for comparison of fees and performance; the Funds’ performance and expenses, including in-person interviews with the Advisers’ management personnel; the information request provided to the Advisers on behalf of the Independent Board Members by their independent legal counsel; supplemental information that they requested from the Advisers that they believed reasonably necessary for their review; the response of the Advisers to the information requests; and the legal standards that apply to their review.
In addition, the Investment Management and Service Contracts Committee met periodically to discuss the contract review process as a whole, the selection of the peer group by an independent third party, the independent third party’s report and the information provided by the Adviser.
In connection with the contract review meetings, the Independent Board Members reviewed a variety of information provided by the Advisers, both initially and supplementally, relating to the Funds, the Advisory Agreements and the Advisers, including comparative performance, fee and expense information and other information regarding the nature, extent and quality of services provided by the Advisers under their respective Advisory Agreements. The materials provided to the Board generally included, among other items:
| • | information on the investment performance of the Funds and comparative performance of peer groups of funds and the Funds’ performance benchmarks; |
| • | information on the Funds’ advisory fees and other expenses, including information comparing each Fund’s advisory fees and other expenses to those of a peer group of funds and information about any applicable expense limitations and fee “breakpoints;” |
| • | sales and redemption data with respect to each Fund; |
| • | information about the profitability of the Advisory Agreements to the Advisers; |
| • | reports prepared by the Advisers in response to requests submitted by the Independent Board Members’ independent legal counsel on behalf of the Independent Board Members; and |
| • | a memorandum from the Independent Board Members’ independent legal counsel on the responsibilities of the Board in considering for approval investment advisory and investment sub-advisory arrangements under the 1940 Act and state law. |
The Board, including the Independent Board Members, also considered other matters such as:
| • | the Advisers’ financial results and financial condition; |
| • | each Fund’s investment objective and strategies; |
| • | the Advisers’ investment personnel and operations; |
| • | arrangements relating to the distribution of the Funds’ shares and the related costs; |
| • | the procedures employed to determine the value of the Funds’ assets; |
| • | the allocation of the Funds’ brokerage, if any, including, if applicable, allocations to brokers affiliated with the Advisers and the use, if any, of “soft” commission dollars to pay Fund expenses and to pay for research and other similar services; |
| • | the resources devoted to, and the record of compliance with, the Funds’ investment policies and restrictions, policies on personal securities transactions and other compliance policies; and |
| • | possible conflicts of interest. |
Annual Report 2015
76
Supplemental Information (Unaudited) (continued)
The Board also considered the nature, extent and quality of the services provided to the Funds by the Adviser’s affiliates. Throughout the process, the Independent Board Members were afforded the opportunity to ask questions of and request additional materials from the Adviser and the Sub-Adviser.
In addition to the materials requested by the Independent Board Members in connection with their annual consideration of the continuation of the Advisory Agreements, the Independent Board Members receive materials in advance of each regular quarterly meeting of the Board that provided information relating to the services provided by the Advisers, including detailed information about the Funds’ investment performance. This information generally includes, among other things, third-party performance rankings for various periods (including prior to the Advisers’ management of the Funds) comparing each Fund against its peer group, total return information for various periods, and details of sales and redemptions of each Fund’s shares for the period. The Board also receives periodic presentations from the portfolio management teams in connection with the performance of the Funds.
The Independent Board Members were advised by separate independent legal counsel throughout the process. The Independent Board Members also consulted in executive sessions with counsel to the Independent Board Members regarding consideration of the renewal of the Advisory Agreements. In considering whether to approve the continuation of the Advisory Agreements, the Board, including the Independent Board Members, did not identify any single factor as determinative. Individual Board members may have evaluated the information presented differently from one another, giving different weights to various factors. Matters considered by the Board, including the Independent Board Members, in connection with their approval of the continuation of the Advisory Agreements included the factors listed below.
The nature, extent and quality of the services provided to the Funds under the Advisory Agreements. The Board considered the nature, extent and quality of the services provided by Advisers, as applicable, to the Funds and the resources dedicated to the Funds by the Advisers and their affiliates. The Board considered, among other things:
| • | The Advisers’ investment experience; |
| • | The background and experience of the Advisers’ senior management personnel and the qualifications, background and responsibilities of the portfolio managers that are primarily responsible for the day-to-day portfolio management services for the Funds; |
| • | The allocation of responsibilities among the Advisers; |
| • | The Advisers’ role in coordinating the activities of the Funds’ other service providers; |
| • | Information provided on a regular basis by the Chief Compliance Officer of the Trust regarding the effectiveness of the Advisers’ compliance policies and procedures; |
| • | The Advisers’ risk management processes; |
| • | The Advisers’ focus on monitoring the performance of the Funds and addressing performance matters; |
| • | The benefits to shareholders of investing in a mutual fund that is part of a family of funds that offers shareholders the right to exchange shares of one type of fund for shares of another type of fund, and provides a variety of fund and shareholder services; and |
| • | Its knowledge of management and the quality of the performance of management’s duties through Board meetings, discussion and reports during the preceding year. |
After reviewing these and related factors, the Board concluded that the nature, extent and quality of the services provided to the Funds by the Advisers were extensive in nature and of high quality and supported the renewal of the Advisory Agreements.
Investment performance. The Board requested, and received, information about the performance of the Funds over various time periods, including information that compared the performance of each Fund to the performance of relevant peer groups of funds and its performance benchmark. When applicable, the Board considered the performance of each Fund compared to the performance of comparable funds or accounts managed by the Adviser and its affiliates. In addition, the Board reviewed data prepared by an independent third party which analyzed the performance of each Fund using a variety of performance metrics.
The Board considered the Advisers’ performance and reputation generally, the performance of the Aberdeen fund family generally, and the Advisers’ responsiveness to the Board’s concerns about performance and their willingness to take steps intended to improve performance from the time they commenced management of the Funds in 2013.
In addition to the foregoing, the Board considered the specific factors set forth below with respect to the performance of each Fund for the periods ended March 31, 2015. In each case, the Board noted that the Advisers assumed management of each Fund on May 22, 2013, and that the Funds’ performance for periods prior to that time reflects the performance of the Funds’ previous investment adviser.
2015 Annual Report
77
Supplemental Information (Unaudited) (continued)
Aberdeen Select International Equity Fund. The Board noted that the Select International Equity Fund had performance in the bottom quintile when compared to its peer group over the 1-, 3-, 4- and 5-year periods, and had performance in the fourth quintile over the 2-year period. The Board noted that it would closely monitor the Fund’s performance.
Aberdeen Select International Equity Fund II. The Board noted that for the 1-, 4- and 5-year periods, the Select International Equity Fund II ranked in the bottom quintile, but that for the 2- and 3- year periods, it ranked in the fourth and third quintiles, respectively. The Board noted that it would closely monitor the Fund’s performance.
Aberdeen Global High Income Fund. The Board noted that the Fund compared favorably against the funds in its peer group and in the performance universe for the 1-, 2-, 3- and 5-year periods, and noted that it ranked in the first quintile over the 10-year period when compared against funds in the performance universe. The Board noted less favorable performance in the 4-year period, and that the Board would continue to closely monitor the Fund’s performance.
Aberdeen Total Return Bond Fund. The Board noted that the Fund underperformed its peer group average, performing in the fifth quintile, for the 1-, 2- and 3-year periods, but that performance was in the fourth quintile for 4- and 5-year periods. The Board noted that it would continue to closely monitor the Fund’s performance.
Fees paid for advisory services and expenses. The Board considered the fees charged to the Funds for advisory services as well as the total expense levels of the Funds. This information included comparisons (provided both by management and by an independent third party) of each Fund’s net management fee and total expense level to those of its peer group (the “Expense Group”) and information about the advisory fees charged by the Adviser to separately managed accounts with a similar investment strategy.
In comparing each Fund’s net management fee to that of comparable funds, the Board noted that such fee included advisory fees, but not fund administration fees. In considering the fees charged to any comparable accounts, the Board considered, among other things, management’s discussion of the differences required to manage the different types of accounts. In evaluating each of the Fund’s advisory fees, the Board also took into account the demands, complexity and quality of the investment management of the Funds.
The Board also noted that the sub-advisory fees, as applicable, for the Funds are paid by the Adviser, not the Funds, out of its advisory fee. The Board also considered that the Adviser had entered into expense limitation agreements with respect to the Aberdeen Global High Income Fund and the Aberdeen Total Return Bond Fund, pursuant to which the Adviser agreed to waive a portion of its advisory fee and/or reimburse certain expenses as a means of limiting each Fund’s total annual operating expenses for a period of time. Additionally, the Adviser has agreed to waive a portion of its management fees for each of the Funds at the annual rate of 0.005% of the respective Fund’s average daily net assets.
The Board also considered other benefits directly or indirectly received by the Adviser and its affiliates from their relationships with the Funds, such as the engagement of affiliates of the Adviser to provide distribution services to the Funds.
In addition to the factors described above, the Board considered the specific factors set forth below with respect to each Fund’s fees and expenses. The Board considered the advisory fees, both contractual and after waivers and reimbursements, and also considered total expenses, both including Rule 12b-1 fees and excluding such fees.
Aberdeen Select International Equity Fund. The Board noted that the Fund’s contractual management fees are equal to the peer group median, ranking 5 of 9 funds, while the Fund’s actual management fees are slightly lower than the peer group median, ranking 4 of 9 funds. The Board considered, however, that the Fund’s total expenses are lower than the median, ranking 3 of 9 funds in the peer group.
Aberdeen Select International Equity Fund II. The Board considered that the Fund’s contractual management fees are above the peer group median, ranking 7 of 9 funds, and that the Fund’s actual management fees are slightly greater than the median, ranking of 6 of 9 funds. The Board noted that the Fund’s total expenses are equal to the median, ranking 5 of 9 funds in the peer group.
Aberdeen Global High Income Fund. The Board considered that the Fund’s contractual management fees are equal to the peer group median, ranking 5 of 9, and that the Fund’s actual management fees are below the peer group median, ranking 4 of 9 funds. The Board noted that the Fund’s total expenses are lower than the median, ranking 2 of 9 funds in the peer group. The Board noted the complexity of the securities held in the Fund’s portfolio.
Aberdeen Total Return Bond Fund. The Board considered that the Fund’s contractual management fees are below the peer group median, ranking 4 of 15 funds, and that the Fund’s actual management fees are below the peer group median, ranking 5 of 15 funds. The Board noted that the Fund’s total expenses, both including Rule 12b-1 fees, and excluding such fees, are lower than the median, ranking 6 of 15 and 2 of 15 funds in the peer group, respectively.
The Independent Board Members asked for, and received, information about the fees paid by other funds and accounts managed by the Adviser. The Independent Board Members considered the nature of the other accounts, which included comingled and separately managed accounts. The
Annual Report 2015
78
Supplemental Information (Unaudited) (concluded)
Independent Board Members noted the differences in managing the Funds compared to other accounts managed by the Advisers, including, among other things, the complexity of managing the Funds in light of regulatory, tax and compliance considerations resulting from the Funds’ status as registered investment companies.
After reviewing these and related factors, and taking into account management’s discussion regarding Fund expenses, the Board concluded that the advisory fee, and as applicable, the sub-advisory fees, were fair and reasonable, and that the costs of these services generally and the related profitability of the Adviser and its affiliates from their relationships with the Funds were reasonable and supported the renewal of the Advisory Agreements.
Economies of Scale. The Board considered the existence of any economies of scale in the provision of services by the Advisers and whether those economies would be shared with the Funds through breakpoints in the investment advisory fees or other means, such as expense waivers or limitations. The Board noted that the Aberdeen Global High Income Fund and the Aberdeen Total Return Bond Fund benefitted from an expense limitation agreement, and that the fees of Select International Equity Fund, Select International Equity Fund II and Global High Income Fund were subject to breakpoints. The Board considered the Adviser’s belief that the Total Return Bond Fund does not have breakpoints at this time because this Fund has a lower overall fee structure.
The Board also considered the potential effect of each Fund’s growth and size on fees, noting that if a Fund’s assets increase over time, the Fund may realize other economies of scale if assets increase proportionally more than some expenses.
Profitability and costs. The Board also examined the profitability of the Adviser and its affiliates on a Fund-by-Fund basis. The Board also considered information about the allocation of expenses used to calculate profitability. When reviewing the Adviser’s profitability, the Board also considered guidance from the Securities and Exchange Commission and the courts regarding adviser profitability, the performance of the Funds, the expense levels of the Funds, and whether the Adviser had implemented breakpoints, if any, and expense limitations, with respect to the Funds.
Other factors. The Board also considered other factors, which included, but were not limited to, the following:
| • | the effect of any market and economic volatility on the performance, asset levels and expense ratios of the Funds; |
| • | whether the Funds have operated in accordance with their investment objectives, the Funds’ record of compliance with their investment restrictions, and the compliance programs of the Trust and the Adviser. The Trustees also considered the compliance-related resources that the Adviser and its affiliates provide to the Funds; |
| • | the Adviser’s financial condition and its ability to continue to provide a high level of service under the Advisory Agreements; and |
| • | so-called “fallout benefits” to the Adviser, such as the benefits of research made available to the Adviser by reason of brokerage commissions generated by the Funds’ securities transactions or reputational and other indirect benefits. The Board considered any possible conflicts of interest associated with these fallout and other benefits, and the reporting, disclosure and other processes in place to disclose and monitor such possible conflicts of interest. |
* * *
Based on their evaluation of factors that they deemed to be material, including those factors described above, the Independent Board Members concluded that the advisory fee, and as applicable, sub-advisory fee structures, were reasonable in light of the nature and quality of the services provided, and recommended that renewal of the Advisory Agreements would be in the best interest of each Fund and its shareholders. Accordingly, the Board, and the Independent Board Members voting separately, approved the Advisory Agreements for an additional one-year period.
Annual Report 2015
79
Management of the Funds (Unaudited)
As of October 31, 2015
Board of Trustees and Officers of the Funds
| Name, Address, And Year of Birth | Position(s) Held, Length of Time Served And Term of Office* | Principal Occupation During Past 5 Years | Number of Portfolios In Fund Complex Overseen by Trustee** | Other Directorships | ||||
Trustees who are not Interested Persons (as Defined in the 1940 Act) of the Funds | ||||||||
Antoine Bernheim**** 62 | Trustee since November 2004; Chairman of the Fund Complex since December 2008. | President, Dome Capital Management, Inc., 1984–present (investment advisory firm); Chairman, Dome Securities Corp., 1995–2012 (broker/dealer); President, The U.S. Offshore Funds Directory, 1990–present (publishing). | 4 | None | ||||
Thomas Gibbons**** 68 | Trustee since November 2004. | President, Cornerstone Associates Management, 1987–present (consulting firm). | 4 | None | ||||
Cynthia Hostetler**** 53 | Trustee since September 2011. | Member of the Board of Directors of the Edgen Group (energy), 2012–2013, TriLinc Global Impact Fund, 2013–present, Vulcan Materials Company, 2014–present and Independent Directors Council (August 2014–present); Vice President of Investment Funds, Overseas Private Investment Corporation, 2001–2009; President, First Manhattan Bancorporation, 1991–2006. | 4 | Director, Edgen Group (NYSE: EDG) 2012–2013; Director, TriLinc Global Impact Fund, 2013–present; Director, Vulcan Materials Company (NYSE: VMC), 2014–present (construction materials). | ||||
Robert S. Matthews**** 72 | Trustee since June 1992. | Managing Partner, Matthews & Co., 1990–present (certified public accounting firm). | 4 | Trustee, Allstate Financial Investment Trust, 2008–2009, (investment company). | ||||
Peter Wolfram**** 62 | Trustee since June 1992. | Partner, Kelley Drye & Warren LLP, 1983–present (law firm). | 4 | Friends of Atlantik-Bruecke e.V. Foundation, 2004–present. | ||||
| * | Each Trustee serves during the lifetime of the Funds or until he or she dies, resigns, retires, is declared bankrupt or incompetent, or is removed or, if sooner, until the next special meeting of the Funds’ shareholders and until the election and qualification of his or her successor. The current retirement age is 75. |
| ** | The Aberdeen Fund Complex consists of the Trust which currently consists of four portfolios, Aberdeen Funds, Aberdeen Asia-Pacific Income Fund, Inc., Aberdeen Global Income Fund, Inc., Aberdeen Australia Equity Fund, Inc., Aberdeen Chile Fund, Inc., Aberdeen Israel Fund, Inc., Aberdeen Indonesia Fund, Inc., Aberdeen Latin America Equity Fund, Inc., Aberdeen Emerging Markets Smaller Company Opportunities Fund, Inc., Aberdeen Singapore Fund, Inc., The Asia Tigers Fund, Inc., The India Fund, Inc., Aberdeen Greater China Fund, Inc. and Aberdeen Japan Equity Fund, Inc. |
| *** | Directorships held in (1) any other investment companies registered under the 1940 Act, (2) any company with a class of securities registered pursuant to Section 12 of the Securities Exchange Act of 1934, as amended (the “Exchange Act”) or (3) any company subject to the requirements of Section 15(d) of the Exchange Act. |
| **** | Each Trustee may be contacted by writing to the Trustee c/o Aberdeen Asset Management Inc., 1735 Market Street, 32nd Floor, Philadelphia, Pennsylvania 19103, Attn: Alan Goodson. |
Annual Report 2015
80
Management of the Funds (Unaudited) (continued)
As of October 31, 2015
| Name, Address, and Year of Birth | Position(s) Held, Length of Time Served and Term of Office* | Principal Occupation During Past 5 Years | Number of Portfolios In Fund Complex Overseen by Trustee** | Other Directorships Held by Trustee During Past 5 Years*** | ||||
Trustee who is an Interested Person (as Defined in The 1940 Act) of the Funds | ||||||||
Andrew Smith****† 47 | Trustee since September 2014. | Co-Head of Americas for Aberdeen since June 2014. Mr. Smith is Chief Operating Officer of Aberdeen Asset Management Inc. He held various roles since he joined Aberdeen including Chief Compliance Officer for their North American Closed End Funds as well as Chief Financial Officer and Chief Operating Officer for Aberdeen in the Americas. Andrew joined Aberdeen in December 2000 as the result of the acquisition of Murray Johnstone. | 4 | Aberdeen Asset Management Inc. (2009-2015) (investment adviser) | ||||
| * | Each Trustee serves during the lifetime of the Funds or until he or she dies, resigns, retires, is declared bankrupt or incompetent, or is removed or, if sooner, until the next special meeting of the Funds’ shareholders and until the election and qualification of his or her successor. The current retirement age is 75. |
| ** | The Aberdeen Fund Complex consists of the Trust, which currently consists of four portfolios, Aberdeen Funds, Aberdeen Asia-Pacific Income Fund, Inc., Aberdeen Global Income Fund, Inc., Aberdeen Australia Equity Fund, Inc., Aberdeen Chile Fund, Inc., Aberdeen Israel Fund, Inc., Aberdeen Indonesia Fund, Inc., Aberdeen Latin America Equity Fund, Inc., Aberdeen Emerging Markets Smaller Company Opportunities Fund, Inc., Aberdeen Singapore Fund, Inc., The Asia Tigers Fund, Inc., The India Fund, Inc., Aberdeen Greater China Fund, Inc. and Aberdeen Japan Equity Fund, Inc. |
| *** | Directorships held in (1) any other investment companies registered under the 1940 Act, (2) any company with a class of securities registered pursuant to Section 12 of the Securities Exchange Act of 1934, as amended (the “Exchange Act”) or (3) any company subject to the requirements of Section 15(d) of the Exchange Act. |
| **** | Each Trustee may be contacted by writing to the Trustee c/o Aberdeen Asset Management Inc., 1735 Market Street, 32nd Floor, Philadelphia, Pennsylvania 19103, Attn: Alan Goodson. |
| † | Mr. Smith is considered to be an “interested person” of the Funds as defined in the 1940 Act because of his affiliation with the Adviser. |
2015 Annual Report
81
Management of the Funds (Unaudited) (continued)
As of October 31, 2015
Officers of the Funds
| Name, Address, and Year of Birth | Position(s) of Time Served | Principal Occupation During Past 5 Years | ||
Bev Hendry* Aberdeen Asset Management Inc. 1735 Market Street, 32nd Floor Philadelphia, PA 19103 62 | President and Chief Executive Officer Officer of the Trust since September 2014 | Currently, Co-Head of Americas and Director and Chief Financial Officer for Aberdeen Asset Management Inc. since June 2014. He first joined Aberdeen in 1987 and helped establish Aberdeen’s business in the Americas in Fort Lauderdale. Mr. Hendry left Aberdeen in 2008 when the company moved to consolidate its headquarters in Philadelphia. Mr. Hendry re-joined Aberdeen from Hansberger Global Investors in Fort Lauderdale, Florida, where he worked for six years as Chief Operating Officer. | ||
Jeffrey Cotton* Aberdeen Asset Management Inc. 1735 Market Street, 32nd Floor Philadelphia, PA 19103 38 | Chief Compliance Officer, Anti-Money Laundering and Identity Theft Officer and Vice President Officer of the Trust since 2013 | Currently, Director and Vice President and Head of Compliance – Americas for Aberdeen Asset Management Inc. Mr. Cotton joined Aberdeen in 2010. Prior to joining Aberdeen, Mr. Cotton was a Senior Compliance Officer at Old Mutual Asset Management (2009-2010) supporting its affiliated investment advisers and mutual fund platform. Mr. Cotton was also a Vice President and Senior Compliance Manager at Bank of America/Columbia Management (2006-2009). | ||
Sofia Rosala* Aberdeen Asset Management Inc. 1735 Market Street, 32nd Floor, Philadelphia, PA 19103 41 | Deputy Fund Chief Compliance Officer and Vice President Officer of the Trust since 2013 | Currently, Vice President, Deputy Head of Compliance and Adviser Chief Compliance Officer for Aberdeen Asset Management Inc. (since July, 2012). Prior to joining Aberdeen, Ms. Rosala was Counsel for Vertex, Inc. from April 2011 to June 2012. She was also an Associate Attorney with Morgan, Lewis and Bockius from May 2008 – April 2011. | ||
Andrea Melia* Aberdeen Asset Management Inc. 1735 Market Street, 32nd Floor, Philadelphia, PA 19103 46 | Chief Financial Officer and Treasurer Officer of the Trust since 2013 | Currently, Vice President and Head of Fund Administration – U.S. for Aberdeen Asset Management Inc. Ms. Melia joined Aberdeen Asset Management Inc. in September 2009. Prior to joining Aberdeen, Ms. Melia was Director of fund administration and accounting oversight for Princeton Administrators LLC, a division of BlackRock Inc. and had worked with Princeton Administrators since 1992. | ||
Megan Kennedy* Aberdeen Asset Management Inc. 1735 Market Street, 32nd Floor Philadelphia, PA 19103 41 | Assistant Secretary and Vice President Officer of the Trust since 2013 | Currently, Head of Product Management for Aberdeen Asset Management Inc. Ms. Kennedy joined Aberdeen Asset Management Inc. in 2005 as a Senior Fund Administrator. Ms. Kennedy was promoted to Assistant Treasurer Collective Funds/North American Mutual Funds in February 2008 and promoted to Treasurer Collective Funds/North American Mutual Funds in July 2008. |
Annual Report 2015
82
Management of the Funds (Unaudited) (continued)
As of October 31, 2015
| Name, Address, and Year of Birth | Position(s) of Time Served | Principal Occupation During Past 5 Years | ||
Lucia Sitar* Aberdeen Asset Management Inc. 1735 Market Street, 32nd Floor Philadelphia, PA 19103 44 | Chief Legal Officer and Vice President Officer of the Trust since 2013 | Currently, Vice President and Managing U.S. Counsel for Aberdeen Asset Management Inc. Ms. Sitar joined Aberdeen Asset Management Inc. in July 2007. | ||
Alan Goodson* Aberdeen Asset Management Inc. 1735 Market Street, 32nd Floor Philadelphia, PA 19103 41 | Vice President Officer of the Trust since 2013 | Currently, Director, Vice President and Head of Product – U.S, overseeing Product Management, Product Development and Investor Services for Aberdeen’s registered and unregistered investment companies in the U.S. and Canada. Mr. Goodson is Vice President of Aberdeen Asset Management Inc. and joined Aberdeen in 2000. | ||
Stephen Docherty* Aberdeen Asset Management Inc. 1735 Market Street, 32nd Floor Philadelphia, PA 19103 45 | Vice President Officer of the Trust since 2013 | Currently, Head of Global Equities for Aberdeen Asset Managers Limited. Mr. Docherty joined Aberdeen Asset Managers Limited in 1994. | ||
Greg Hopper Aberdeen Asset Management Inc. 1735 Market Street, 32nd Floor Philadelphia, PA 19103 58 | Vice President Officer of the Trust since 2002 | Currently, Head of Global High Yield for Aberdeen Asset Management Inc. Prior to joining Aberdeen, Mr. Hopper served as Senior Vice President (2009 – 2013) and First Vice President of Artio Global Management LLC (2002 – 2009). | ||
Jennifer Nichols* Aberdeen Asset Management Inc. 1735 Market Street, 32nd Floor Philadelphia, PA 19103 37 | Vice President Officer of the Trust since 2013 | Currently, Global Head of Legal for Aberdeen. Director and Vice President for Aberdeen Asset Management Inc. (since October 2006). | ||
Donald Quigley Aberdeen Asset Management Inc. 1735 Market Street, 32nd Floor Philadelphia, PA 19103 50 | Vice President Officer of the Trust since 2001 | Currently, Head of US Total Return Bond for Aberdeen Asset Management Inc. Prior to joining Aberdeen, Mr. Quigley served as Senior Vice President and Head of High Grade Fixed-Income of Artio Global Management LLC (2001 – 2013). | ||
Andrew Smith Aberdeen Asset Management Inc. 1735 Market Street, 32nd Floor Philadelphia, PA 19103 47 | Vice President Officer of the Trust since 2013 | Currently, Co-Head of Americas for Aberdeen since June 2014. Mr. Smith is Director and Chief Operating Officer of Aberdeen Asset Management Inc. He held various roles since he joined Aberdeen including Chief Compliance Officer for their North American Closed End Funds as well as Chief Financial Officer and Chief Operating Officer for Aberdeen in the Americas. Andrew joined Aberdeen in December 2000 as the result of the acquisition of Murray Johnstone. | ||
Hugh Young* Aberdeen Asset Management Inc. 1735 Market Street, 32nd Floor Philadelphia, PA 19103 57 | Vice President Officer of the Trust since 2013 | Currently, Managing Director of Aberdeen Asset Management Asia Limited (“AAMAL”) (since 1991) and member of the Executive Management Committee and Director of Aberdeen Asset Management PLC (since 1991 and 2011, respectively). Mr. Young joined Aberdeen in 1991. |
2015 Annual Report
83
Management of the Funds (Unaudited) (concluded)
As of October 31, 2015
| Name, Address, and Year of Birth | Position(s) of Time Served | Principal Occupation During Past 5 Years | ||
Brian Link State Street Bank and Trust Company 100 Huntington, CHP0026 Boston, MA 02116 43 | Secretary Officer of the Trust since September 2014 | Vice President and Managing Counsel, State Street Bank and Trust Company (since 2007). | ||
Pamela Wade* Aberdeen Asset Management Inc. 1735 Market Street, 32nd Floor Philadelphia, PA 19103 44 | Assistant Secretary Officer of the Trust since 2013 | Currently, Senior Product Manager for Aberdeen Asset Management Inc. Ms. Wade joined Aberdeen Asset Management Inc. in 2012 as Senior Product Manager. Prior to joining Aberdeen Asset Management Inc., Ms. Wade was a Vice President and Assistant Counsel with BNY Mellon Asset Servicing (2007-2012). | ||
Brian O’Neill* Aberdeen Asset Management Inc. 1735 Market Street, 32nd Floor Philadelphia, PA 19103 47 | Assistant Treasurer Officer of the Trust since 2013 | Currently, Senior Fund Administration Manager – U.S. for Aberdeen Asset Management Inc. Mr. O’Neill joined Aberdeen Asset Management Inc. in 2008. Prior to joining Aberdeen Asset Management Inc., Mr. O’Neill was a Director of Fund Accounting with Nationwide Funds Group (2002-2008). |
| 1 | Pursuant to the Trust’s By-laws, officers of the Trust are elected by the Board of Trustees to hold such office until his or her successor is chosen and qualified, or until they resign or are removed from office. |
| * | Mr. Hendry, Mr. Cotton, Ms. Rosala, Ms. Melia, Mr. O’Neill, Ms. Kennedy, Ms. Sitar, Mr. Goodson, Mr. Young, Ms. Wade and Ms. Nichols hold officer position(s) in one or more of the following: Aberdeen Asia-Pacific Income Fund, Inc., Aberdeen Australia Equity Fund, Inc., Aberdeen Global Income Fund, Inc., Aberdeen Chile Fund, Inc., Aberdeen Israel Fund, Inc., Aberdeen Indonesia Fund, Inc., Aberdeen Latin America Equity Fund, Inc., Aberdeen Emerging Markets Smaller Company Opportunities Fund, Inc., Aberdeen Singapore Fund, Inc., The Asia Tigers Fund, Inc., The India Fund, Inc., Aberdeen Greater China Fund, Inc., Aberdeen Funds, Aberdeen Japan Equity Fund, Inc., each of which may also be deemed to be a part of the same “Fund Complex” as the Funds. |
Annual Report 2015
84
Management Information
Trustees
Antoine Bernheim, Chairman
Thomas Gibbons
Cynthia Hostetler
Robert S. Matthews
Andrew Smith
Peter Wolfram
Officers
Bev Hendry, President and Chief Executive Officer
Jeffrey Cotton, Chief Compliance Officer, Vice President and Anti-Money Laundering and Identity Theft Officer
Sofia Rosala, Deputy Chief Compliance Officer and Vice President
Andrea Melia, Treasurer and Chief Financial Officer
Brian Link, Secretary
Megan Kennedy, Assistant Secretary and Vice President
Lucia Sitar, Chief Legal Officer and Vice President
Alan Goodson, Vice President
Stephen Docherty, Vice President
Greg Hopper, Vice President
Jennifer Nichols, Vice President
Donald Quigley, Vice President
Andrew Smith, Vice President
Hugh Young, Vice President
Pamela Wade, Assistant Secretary
Brian O’Neill, Assistant Treasurer
Investment Adviser
Aberdeen Asset Management Inc.
1735 Market Street, 32nd Floor
Philadelphia, PA 19103
Transfer Agent
Boston Financial Data Services, Inc.
30 Dan Road
Canton, MA 02021
Distributor
Aberdeen Fund Distributors LLC
1735 Market Street, 32nd Floor
Philadelphia, PA 19103
Fund Administrator, Custodian & Fund Accountant
State Street Bank and Trust Company
1 Iron Street 5th Floor
Boston, MA 02210
Independent Registered Public Accounting Firm
KPMG LLP
1601 Market Street
Philadelphia, PA 19103
Fund Counsel
Morrison & Foerster LLP
250 West 55th Street
New York, NY 10019-9601
Aberdeen Asset Management Inc. 1735 Market Street, 32nd Floor Philadelphia, PA 19103 aberdeen-asset.us |
|
AOE-0377-AR
Item 2. Code of Ethics.
(a) As of October 31, 2015, the Registrant had adopted a code of ethics that applies to the Registrant’s principal executive officer, principal financial officer, principal accounting officer or controller, or persons performing similar functions, regardless of whether these individuals are employed by the Registrant or a third party (the “Code of Ethics”).
(c) During the period covered by the report, the Code of Ethics was revised in order to amend the definition of “employee” to extend Sarbanes-Oxley whistleblower protection to employees of private contractors that provide service to the Registrant in accordance with the Supreme Court decision in Lawson v. FMR LLC, 134 S. Ct. 1158 (2014).
(d) During the period covered by the report, the Registrant did not grant any waivers to the provisions of the Code of Ethics.
(f) The Code of Ethics is included with this Form N-CSR as Exhibit 12(a)(1).
Item 3. Audit Committee Financial Expert.
The Registrant’s Board of Trustees has determined that there is at least one member who qualifies as an “Audit Committee Financial Expert” serving on its Audit Committee. Mr. Robert S. Matthews is the “Audit Committee Financial Expert” and is considered to be an “Independent Trustee” as each term is defined in Item 3 of Form N-CSR.
Item 4. Principal Accountant Fees and Services.
Fiscal
Year Ended | (a)
Audit Fees | (b)
Audit-Related Fees | (c)1
Tax Fees | (d)
All Other Fees | ||||
October 31, 2015 | $156,000 | $5,250 | $33,000 | $ - | ||||
October 31, 2014 | $147,325 | $10,000 | $29,088 | $ - | ||||
| 1 | The Tax Fees are the aggregate fees billed for professional services rendered by KPMG LLP for the review of Form 1120-RIC, Form 8613, and review of excise tax distribution calculations. |
(e)(1) Audit Committee Pre-Approval Policies and Procedures. The Registrant’s audit committee pre-approves all audit and non-audit services to be performed by the Registrant’s accountant before the accountant is engaged by the Registrant to perform such services.
(e)(2) The percentage of services described in each of paragraphs (b) through (d) of this Item that were approved by the audit committee pursuant to paragraph (c)(7)(i)(C) of Rule 2-01 of Regulation S-X are as follows:
(b) None.
(c) None.
(d) Not applicable.
(f) Not applicable.
(g) The aggregate non-audit fees billed by the Registrant’s accountant for services to the Registrant and to the Registrant’s investment adviser and all entities controlling, controlled by, or under common control with the Adviser that provide services to the Registrant for the Registrant’s fiscal years ended October 31, 2015 and October 31, 2014 were $180,745 and $584,188, respectively.
(h) The Registrant’s Audit Committee of the Board of Trustees has considered whether the provision of non-audit services that were rendered to the Registrant’s investment adviser (not including any sub-adviser whose role is primarily portfolio management and is subcontracted with or overseen by another investment adviser), and any entity controlling, controlled by, or under common control with the investment adviser that provides ongoing services to the Registrant that were not pre-approved pursuant to paragraph (c)(7)(ii) or Rule 2-01 of Regulation S-X is compatible with maintaining the principal accountant’s independence and has concluded that it is.
Item 5. Audit Committee of Listed Registrants.
Not applicable.
Item 6. Schedule of Investments
(a) Included as part of the Reports to Shareholders filed under Item 1 of this Form N-CSR.
(b) Not applicable.
Item 7. Disclosure of Proxy Voting Policies and Procedures for Closed-End Management Investment Companies.
Not applicable.
Item 8. Portfolio Managers of Closed-end Management Investment Companies.
Not applicable.
Item 9. Purchases of Equity Securities by Closed-End Management Investment Company and Affiliated Purchasers.
Not applicable.
Item 10. Submission of Matters to a Vote of Security Holders.
During the period ended October 31, 2015, there were no material changes to the procedures by which shareholders may recommend nominees to the registrant’s Board of Trustees.
Item 11. Controls and Procedures.
(a) The Registrant’s principal executive and principal financial officers, or persons performing similar functions, have concluded that the Registrant’s disclosure controls and procedures (as defined in Rule 30a-3(c) under the Investment Company Act of 1940 (the “Act”) (17 CFR 270.30a-3(c))) are effective, as of a date within 90 days of the filing date of the report that includes the disclosure required by this paragraph, based on the evaluation of these controls and procedures required by Rule 30a-3(b) under the Act (17 CFR 270.30a3(b)) and Rule 13a-15(b) or 15d-15(b) under the Securities Exchange Act of 1934 (17 CFR 240.13a-15(b) or 240.15d15(b)).
(b) There were no changes in the Registrant’s internal control over financial reporting (as defined in Rule 30a-3(d) under the Act (17 CFR 270.30a-3(d)) that occurred during the second fiscal quarter of the period covered by this report that has materially affected, or are reasonably likely to materially affect, the registrant’s internal control over financial reporting. However, subsequent to the Registrant’s last fiscal year, a control enhancement has been implemented so that aged dividend receivables are evaluated to determine if the net realizable value could be subject to currency fluctuations regardless of whether the receivable is denominated in a foreign currency or the fund’s functional currency.
Item 12. Exhibits.
(a)(1) The Code of Ethics of the registrant for the period covered by this report as required pursuant to Item 2 of this Form N-CSR.
(a)(2) Certifications of the registrant pursuant to Rule 30a-2(a) under the Act are exhibits to this report.
(a)(3) Not applicable.
(b) Certifications of the registrant pursuant to Rule 30a-2(b) under the Act are exhibits to this report.
SIGNATURES
Pursuant to the requirements of the Securities Exchange Act of 1934 and the Investment Company Act of 1940, the registrant has duly caused this report to be signed on its behalf by the undersigned, thereunto duly authorized.
Aberdeen Investment Funds
By: /s/ Bev Hendry
Bev Hendry
Principal Executive Officer
Aberdeen Investment Funds
Date: January 11, 2016
Pursuant to the requirements of the Securities Exchange Act of 1934 and the Investment Company Act of 1940, this report has been signed below by the following persons on behalf of the registrant and in the capacities and on the dates indicated.
By: /s/ Bev Hendry
Bev Hendry
Principal Executive Officer
Aberdeen Investment Funds
Date: January 11, 2016
By: /s/ Andrea Melia
Andrea Melia
Principal Financial Officer
Aberdeen Investment Funds
Date: January 11, 2016